

Page 1

ACS - 2600 RTM
User’s Manual
ACS2600RTM-900-01 Rev. B / December 2012
moc.yelhtiek.www
*PACS2600RTM90001B*
ACS2600RTM-900-01
ECNEDIFNOC FO ERUSAEM RETAERG A
Page 2

ACS - 2600 RTM User's Manual
© 2011-2012, Keithley Instruments, Inc.
Cleveland, Ohio, U.S.A.
All rights reserved.
Any unauthorized reproduction, photocopy, or use of the information herein, in whole or in part,
without the prior written approval of Keithley Instruments, Inc. is strictly prohibited.
All Keithley Instruments product names are trademarks or registered trademarks of Keithley
Instruments, Inc. Other brand names are trademarks or registered trademarks of their respective
holders.
Document number: ACS2600RTM-900-01 Rev. B / December 2012
Page 3

Safety precautions
The following safety precautions should be observed before using this product and any associated instrumentation. Although
some instruments and accessories would normally be used with nonhazardous voltages, there are situations where hazardous
conditions may be present.
This product is intended for use by qualified personnel who recognize shock hazards and are familiar with the safety precautions
required to avoid possible injury. Read and follow all installation, operation, and maintenance information carefully before using
the product. Refer to the user documentation for complete product specifications.
If the product is used in a manner not specified, the protection provided by the product warranty may be impaired.
The types of product users are:
Responsible body is the individual or group responsible for the use and maintenance of equipment, for ensuring that the
equipment is operated within its specifications and operating limits, and for ensuring that operators are adequately trained.
Operators use the product for its intended function. They must be trained in electrical safety procedures and proper use of the
instrument. They must be protected from electric shock and contact with hazardous live circuits.
Maintenance personnel perform routine procedures on the product to keep it operating properly, for example, setting the line
voltage or replacing consumable materials. Maintenance procedures are described in the user documentation. The procedures
explicitly state if the operator may perform them. Otherwise, they should be performed only by service personnel.
Service personnel are trained to work on live circuits, perform safe installations, and repair products. Only properly trained
service personnel may perform installation and service procedures.
Keithley Instruments products are designed for use with electrical signals that are rated Measurement Category I and
Measurement Category II, as described in the International Electrotechnical Commission (IEC) Standard IEC 60664. Most
measurement, control, and data I/O signals are Measurement Category I and must not be directly connected to mains voltage or
to voltage sources with high transient overvoltages. Measurement Category II connections require protection for high transient
overvoltages often associated with local AC mains connections. Assume all measurement, control, and data I/O connections are
for connection to Category I sources unless otherwise marked or described in the user documentation.
Exercise extreme caution when a shock hazard is present. Lethal voltage may be present on cable connector jacks or test
fixtures. The American National Standards Institute (ANSI) states that a shock hazard exists when voltage levels greater than
30 V RMS, 42.4 V peak, or 60 VDC are present. A good safety practice is to expect that hazardous voltage is present in any
unknown circuit before measuring.
Operators of this product must be protected from electric shock at all times. The responsible body must ensure that operators
are prevented access and/or insulated from every connection point. In some cases, connections must be exposed to potential
human contact. Product operators in these circumstances must be trained to protect themselves from the risk of electric shock. If
the circuit is capable of operating at or above 1000 V, no conductive part of the circuit may be exposed.
Do not connect switching cards directly to unlimited power circuits. They are intended to be used with impedance-limited
sources. NEVER connect switching cards directly to AC mains. When connecting sources to switching cards, install protective
devices to limit fault current and voltage to the card.
Before operating an instrument, ensure that the line cord is connected to a properly-grounded power receptacle. Inspect the
connecting cables, test leads, and jumpers for possible wear, cracks, or breaks before each use.
When installing equipment where access to the main power cord is restricted, such as rack mounting, a separate main input
power disconnect device must be provided in close proximity to the equipment and within easy reach of the operator.
For maximum safety, do not touch the product, test cables, or any other instruments while power is applied to the circuit under
test. ALWAYS remove power from the entire test system and discharge any capacitors before: connecting or disconnecting
cables or jumpers, installing or removing switching cards, or making internal changes, such as installing or removing jumpers.
Do not touch any object that could provide a current path to the common side of the circuit under test or power line (earth)
ground. Always make measurements with dry hands while standing on a dry, insulated surface capable of withstanding the
voltage being measured.
The instrument and accessories must be used in accordance with its specifications and operating instructions, or the safety of
the equipment may be impaired.
Page 4
Do not exceed the maximum signal levels of the instruments and accessories, as defined in the specifications and operating
information, and as shown on the instrument or test fixture panels, or switching card.
When fuses are used in a product, replace with the same type and rating for continued protection against fire hazard.
Chassis connections must only be used as shield connections for measuring circuits, NOT as protective earth (safety ground)
connections.
If you are using a test fixture, keep the lid closed while power is applied to the device under test. Safe operation requires the use
of a lid interlock.
If a screw is present, connect it to protective earth (safety ground) using the wire recommended in the user documentation.
The symbol on an instrument means caution, risk of danger. The user should refer to the operating instructions located in
the user documentation in all cases where the symbol is marked on the instrument.
The
contact with these voltages.
The
The symbol indicates a connection terminal to the equipment frame.
If this
properly disposed of according to federal, state, and local laws.
The WARNING heading in the user documentation explains dangers that might result in personal injury or death. Always read
the associated information very carefully before performing the indicated procedure.
The CAUTION heading in the user documentation explains hazards that could damage the instrument. Such damage may
invalidate the warranty.
Instrumentation and accessories shall not be connected to humans.
Before performing any maintenance, disconnect the line cord and all test cables.
To maintain protection from electric shock and fire, replacement components in mains circuits — including the power
transformer, test leads, and input jacks — must be purchased from Keithley Instruments. Standard fuses with applicable national
safety approvals may be used if the rating and type are the same. Other components that are not safety-related may be
purchased from other suppliers as long as they are equivalent to the original component (note that selected parts should be
purchased only through Keithley Instruments to maintain accuracy and functionality of the product). If you are unsure about the
applicability of a replacement component, call a Keithley Instruments office for information.
To clean an instrument, use a damp cloth or mild, water-based cleaner. Clean the exterior of the instrument only. Do not apply
cleaner directly to the instrument or allow liquids to enter or spill on the instrument. Products that consist of a circuit board with
no case or chassis (e.g., a data acquisition board for installation into a computer) should never require cleaning if handled
according to instructions. If the board becomes contaminated and operation is affected, the board should be returned to the
factory for proper cleaning/servicing.
symbol on an instrument means caution, risk of electric shock. Use standard safety precautions to avoid personal
symbol on an instrument shows that the surface may be hot. Avoid personal contact to prevent burns.
symbol is on a product, it indicates that mercury is present in the display lamp. Please note that the lamp must be
Safety precaution revision of November 2012.
Page 5

Table of Contents
ACS 2600-RTM .......................................................................................................... 1-1
Introduction .......................................................................................................................... 1-1
WLR and ACS 2600-RTM overview .................................................................................... 1-2
Instrument connection scheme ............................................................................................ 1-3
Sequential and parallel......................................................................................................... 1-6
Sequential versus parallel ......................................................................................................... 1-7
ACS 2600-based RTM general settings .............................................................................. 1-8
Add a new device ...................................................................................................................... 1-8
Device setting ............................................................................................................................ 1-9
Add a new RTM ...................................................................................................................... 1-10
Test module settings ............................................................................................................... 1-11
Run a 2600-based RTM .......................................................................................................... 1-12
Preference settings ................................................................................................................. 1-13
Data logging ............................................................................................................................ 1-14
Data analysis ...................................................................................................................... 1-19
HCI and NBTI ............................................................................................................. 2-1
Test principle ........................................................................................................................ 2-1
Instrument connection .......................................................................................................... 2-3
Test flow ............................................................................................................................... 2-4
Settings ................................................................................................................................ 2-6
Pre-Stress Tests settings .......................................................................................................... 2-7
Stress settings ......................................................................................................................... 2-10
Measure settings ..................................................................................................................... 2-13
Post-Stress Tests .................................................................................................................... 2-13
Preference settings ................................................................................................................. 2-14
Global variables ................................................................................................................. 2-15
Formulator .......................................................................................................................... 2-16
Parameter extraction functions ................................................................................................ 2-17
Data recording .................................................................................................................... 2-23
Fast NBTI ................................................................................................................... 3-1
Test principle ........................................................................................................................ 3-1
Sequential versus parallel .................................................................................................... 3-2
Measure phase timing .......................................................................................................... 3-2
T0 Measurement ....................................................................................................................... 3-3
Inter delay ................................................................................................................................. 3-3
Sample test step timing setting ................................................................................................. 3-4
Post raw data ....................................................................................................................... 3-5
Time dependent dielectric breakdown .................................................................... 4-1
Test principle ........................................................................................................................ 4-1
Page 6

Table of Contents
2600 RTM User's Manual
ACS -
Instrument connection .......................................................................................................... 4-2
Test flow ............................................................................................................................... 4-3
Settings ................................................................................................................................ 4-5
Stress-measure time sequence settings ................................................................................... 4-6
Breakdown settings ................................................................................................................... 4-7
Data compression setting .......................................................................................................... 4-8
Dynamic limit setting ............................................................................................................... 4-10
Stress voltage compensation setting ....................................................................................... 4-11
High-capacitance mode .......................................................................................................... 4-12
Device and SMU settings ........................................................................................................ 4-13
Failure determination ......................................................................................................... 4-14
Initial test ................................................................................................................................. 4-14
Stress-measure sequence ...................................................................................................... 4-14
Post-test .................................................................................................................................. 4-15
Failure mode ........................................................................................................................... 4-15
Data recording .................................................................................................................... 4-15
Voltage ramp ............................................................................................................. 5-1
Test principle ........................................................................................................................ 5-1
Instrument connection .......................................................................................................... 5-2
Test flow ............................................................................................................................... 5-4
Settings ................................................................................................................................ 5-6
General settings ........................................................................................................................ 5-7
Stress voltage compensation setting ......................................................................................... 5-7
High-capacitance mode ............................................................................................................ 5-9
Device and SMU settings ........................................................................................................ 5-10
Breakdown settings ................................................................................................................. 5-11
Failure determination ......................................................................................................... 5-11
Initial test ................................................................................................................................. 5-12
Ramp test ................................................................................................................................ 5-12
Post-test .................................................................................................................................. 5-13
Failure mode ........................................................................................................................... 5-13
Data recording .................................................................................................................... 5-14
Ramped current ........................................................................................................ 6-1
Test principle ........................................................................................................................ 6-1
Instrument connection .......................................................................................................... 6-2
Test flow ............................................................................................................................... 6-4
Settings ................................................................................................................................ 6-6
General settings ........................................................................................................................ 6-7
Device and SMU settings .......................................................................................................... 6-8
Breakdown settings ................................................................................................................... 6-8
ii ACS2600RTM-900-01 Rev. B / December 2012
Failure determination ........................................................................................................... 6-9
Initial test ................................................................................................................................... 6-9
Ramp test ................................................................................................................................ 6-10
Post-ramp test ......................................................................................................................... 6-10
Failure mode ........................................................................................................................... 6-10
Page 7

ACS
of Contents
- 2600 RTM User's Manual Table
Data recording .................................................................................................................... 6-11
Electromigration ....................................................................................................... 7-1
Test principle ........................................................................................................................ 7-1
Instrument connection .......................................................................................................... 7-2
Test flow ............................................................................................................................... 7-3
Settings ................................................................................................................................ 7-6
Timing settings .......................................................................................................................... 7-6
Generl settings .......................................................................................................................... 7-7
Device and SMU settings .......................................................................................................... 7-8
Exit criteria ........................................................................................................................... 7-9
Data recording .................................................................................................................... 7-10
Poly heater ................................................................................................................ 8-1
Test principle ........................................................................................................................ 8-1
Instrument connection .......................................................................................................... 8-1
Test flow ............................................................................................................................... 8-3
Settings ................................................................................................................................ 8-6
Timing settings .......................................................................................................................... 8-7
General settings ........................................................................................................................ 8-8
Device and SMU settings .......................................................................................................... 8-9
Exit criteria ......................................................................................................................... 8-10
Data recording .................................................................................................................... 8-11
ACS2600RTM-900-01 Rev. B / December 2012 iii
Page 8
Data analysis .......................................................................... 1-19
In this section:
Introduction .............................................................................. 1-1
WLR and ACS 2600-RTM overview ......................................... 1-2
Instrument connection scheme ................................................ 1-3
Sequential and parallel ............................................................. 1-6
ACS 2600-based RTM general settings ................................... 1-7
Introduction
If you have any questions after reviewing this information, contact your local Keithley Instruments
representative or call one of our applications engineers at 1-888-KEITHLEY (1-888-534-8453) within
the U.S. and Canada. You can also visit the Keithley Instruments website at www.keithley.com for
updated worldwide contact information.
Section 1
ACS 2600-RTM
Also, for further reference on ACS software, refer to the Automated Characterization Suite (ACS)
Reference Manual (document number ACS-901-01). Additionally, refer to the supplied
documentation that is located on the Keithley Instruments CD-ROM that was shipped with your
purchase. You can also visit the Keithley Instruments website at www.keithley.com to search for
updated information by model number.
When the Series 2600B System SourceMeter® instruments are referenced, it also includes the Series
2600A System SourceMeter instruments, since these two series of instruments are fully
interchangeable. However, the following instruments are not supported in ACS Basic: Model 2604B,
Model 2614B, and Model 2634B.
Page 9

Section
2600 RTM User's Manual
1: ACS 2600-RTM ACS -
WLR and ACS 2600-RTM overview
The wafer level reliability (WLR) test is used to perform a series of reliability tests to the wafer level
devices prior to packaging. These tests usually apply certain stresses (voltage, current, or
temperature) to the device and monitors the parameters that change over a period of time until
reaching the defined failure condition, or maximum testing time. The degradation rate of the device or
material can then be obtained through statistical analysis of the test data.
The ACS 2600-RTM package is a group of reliability tests for the Series 2600B and Series 2600
SourceMeters
®
. These tests operate on a single device or multiple devices (sequential or parallel).
The tests are designed for, but not limited to, silicon based CMOS wafer process technologies. The
ACS 2600-RTM tests are referred to as 2600-based reliability test modules (RTM) in ACS.
Additionally, there are other types of modules in ACS: interactive test module (ITM); python test
module (PTM); C language test module (CTM), and script test module (STM). These modules can
also be used in a S500 or S530 parametric test systems. All of the 2600-based RTMs are able to
execute in sequential or parallel.
There are three 2600-based RTM test categories:
1. Device reliability:
• HCI/NBTI: Hot carrier injection (HCI), and negative bias temperature instability (NBTI). HCI is a process
where high-lateral electrical fields in a MOSFET generate hot carriers (high-energy electrons or holes)
that can damage the MOS-gate-oxide interface and degrade the device's I-V characteristics. NBTI is
primarily experienced by p-channel MOSFETs, and is thermally activated, which may seriously affect a
PMOS device reliability and manifests itself as an increase in the threshold voltage. The test procedures
of HCI and NBTI are identical, however, they are stressed in different ranges.
• NBTI_FAST_SWITCHING: For NBTI reliability testing. This test is able to use a special method to
minimize the recover time of a CMOS device when an effective measurement is implemented after one
stress.
2. Gate oxide:
• TDDB_CVS: Time dependent dielectric breakdown (TDDB), under constant voltage stress (CVS). This
mechanism causes the dielectric to breakdown and become electrically shorted after a period of
operating time. The TDDB test is used to obtain acceleration parameters of "wear-out time" required to
predict TDDB of the CMOS gate dielectrics.
• VRamp: Voltage ramp (VRamp) test. This test uses a ramped voltage stress on capacitors, or gate
oxide, to characterize the defects of dielectric at lower electrical fields.
• JRamp/TDDB_CCS: Ramped current (JRamp) test, and time dependent dielectric breakdown (TDDB),
under constant current stress (CCS). JRamp uses a ramped current stress on capacitors, or gate
oxides, to characterize the defects of dielectric at higher electrical fields. The JRamp is also able to
achieve the bounded JRamp test, provided that the current is set to ramp up to a specified level and
then held until breakdown. The bounded JRamp test provides a very repeatable charge-to-breakdown
(Qbd) measurement. The TDDB_CCS uses constant current as stress to the oxide.
3. Metal
• Iso_EM: Isothermal electromigration test. This test is used to determine the relative rate of
electromigration in a metal line at a specified stress temperature. Also, this test induces a temperature
in the metal line by joule heating at a high current density.
• Poly_Heater: The poly heater test has the same test flow as the Iso_EM test. The difference between
Iso_EM and Poly_Heater is that the Iso_EM uses the DUT (device under test) itself to generate the heat
and the Poly_Heater uses another poly material as a heater to heat the DUT.
All of the 2600-based RTM tests (HCI/NBTI, NBTI_FAST_SWITCHING, TDDB_CVS, VRamp,
JRamp/TDDB_CCS, Iso_EM, and Poly_Heater) use Keithley Instruments Series 2600B or Series
2600 SourceMeters
®
. They are specifically optimized for SMUs with a per-pin connection scheme for
better test throughput. The test algorithms for all of the 2600-based RTMs are based on, but not
limited to, JEDEC standards.
1-2 ACS2600RTM-900-01 Rev. B / December 2012
Page 10
ACS
RTM
- 2600 RTM User's Manual Section 1: ACS 2600-
Instrument connection scheme
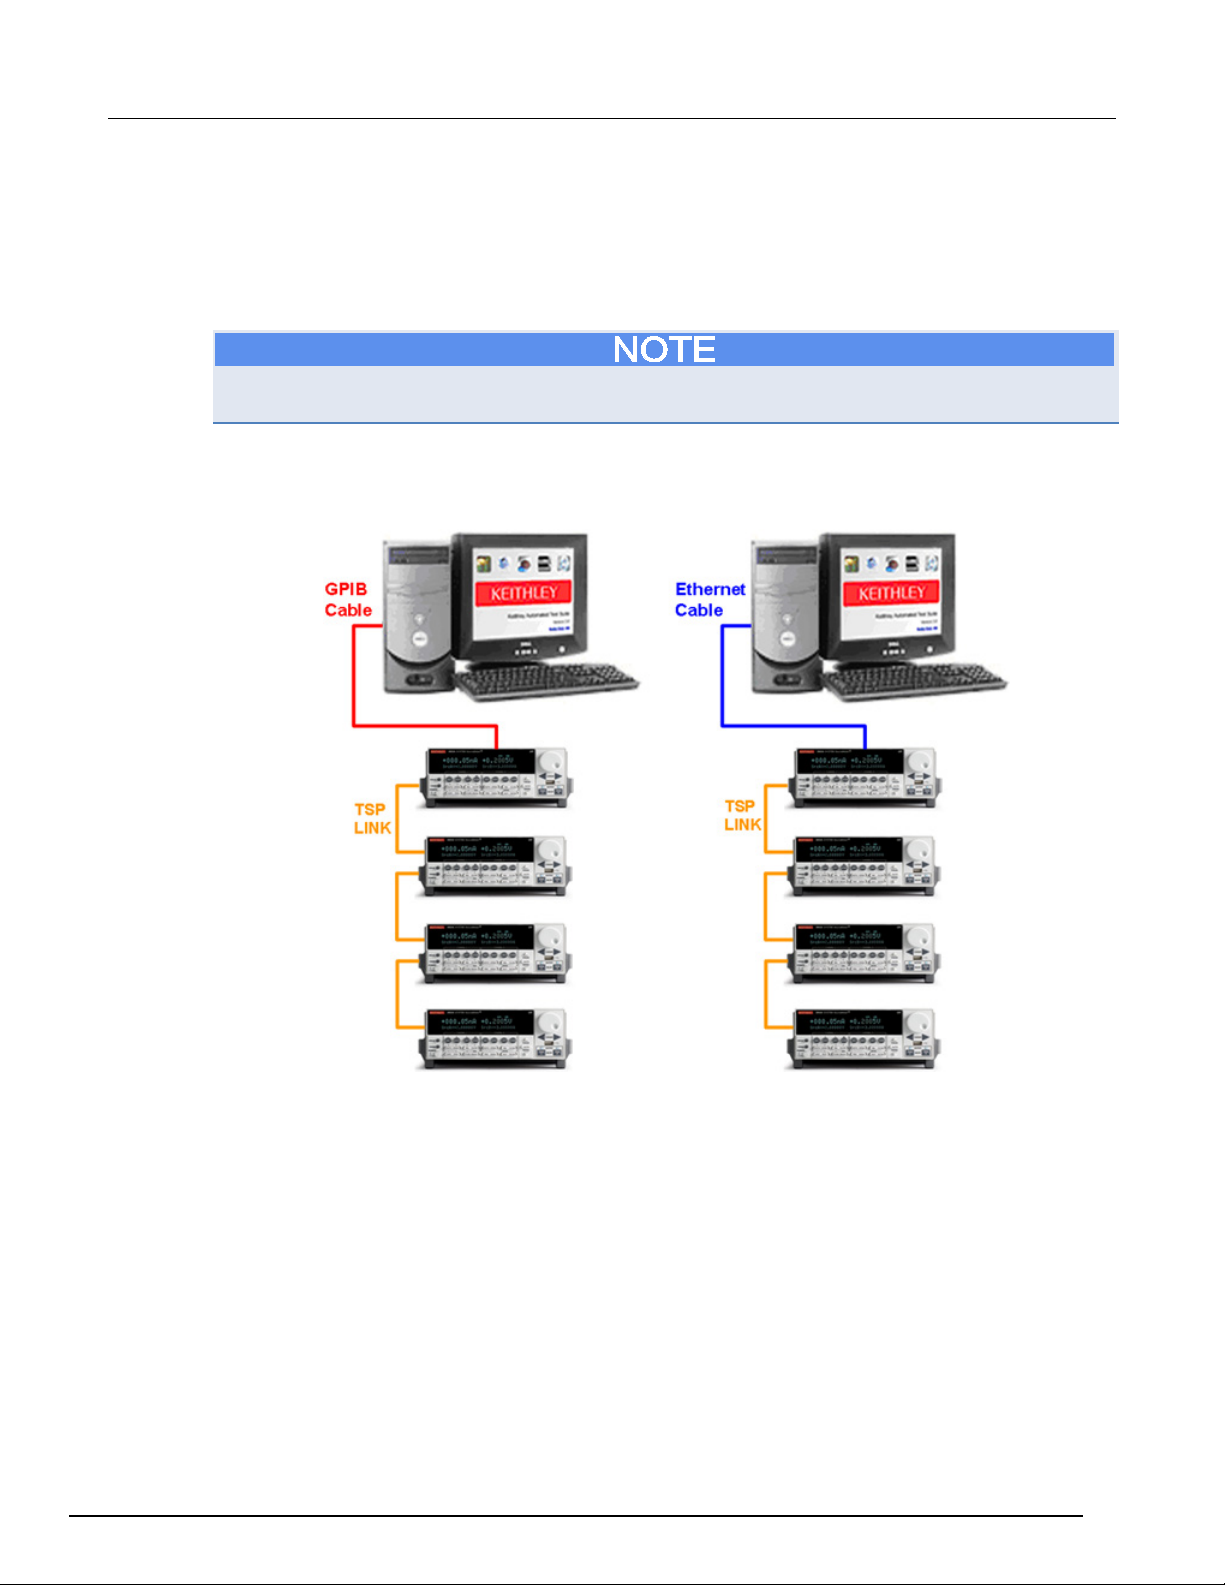
The Series 2600B and Series 2600 can be connected to a computer (controller) through a GPIB or
Ethernet connection. On each GPIB address, or Ethernet IP address, a group of instruments can be
connected in series through the TSP-Link
®
as Node 1, Node 2, Node 3, etc.
It is highly recommended that one tester uses instruments of the same model (for instance, Model
2636A). Also, all of the instrument's firmware must be the same version.
Typical connection scheme: Single GPIB or Ethernet group with one or more instruments. The
instruments are connected using TSP-Link in a daisy-chain configuration.
Figure 1: typical connection scheme
ACS2600RTM-900-01 Rev. B / December 2012 1-3
Page 11
Section
2600 RTM User's Manual
1: ACS 2600-RTM ACS -
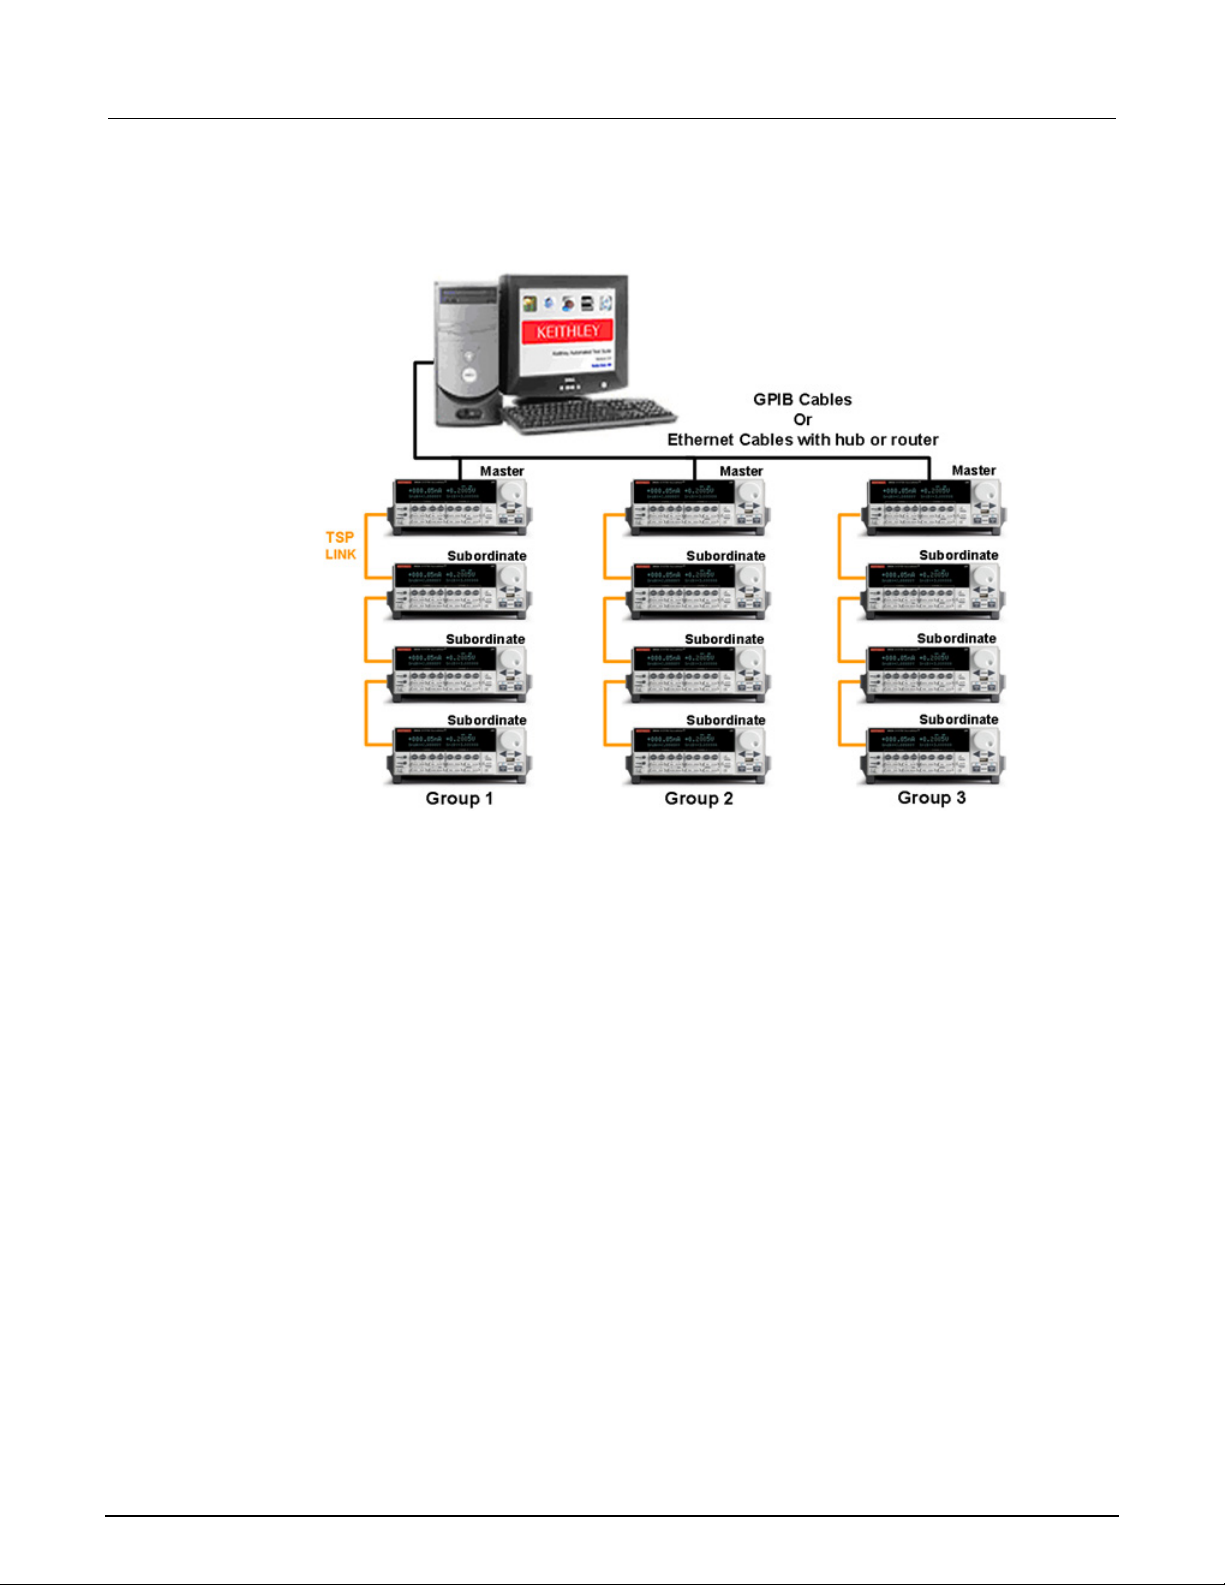
Multiple GPIB or Ethernet connection scheme (for example, groups with several instruments): The
instruments are connected in groups using TSP-Link in a daisy-chain configuration.
Figure 2: GPIB or Ethernet connection scheme
In the multiple-group GPIB or Ethernet connection scheme, each group of instruments has a unique
GPIB address, or IP address. Within a group, there will always be a Master instrument and at least
one Subordinate. The Master node must be set to 1, and each instrument within a group must have a
unique node number (1 - 64). For more information on how to setup the daisy-chain TSP-Link
instrument network, refer to the Series 2600B Reference Manual (document number 2600B-901-01).
1-4 ACS2600RTM-900-01 Rev. B / December 2012
Page 12
ACS
RTM
- 2600 RTM User's Manual Section 1: ACS 2600-
SMU designation in ACS
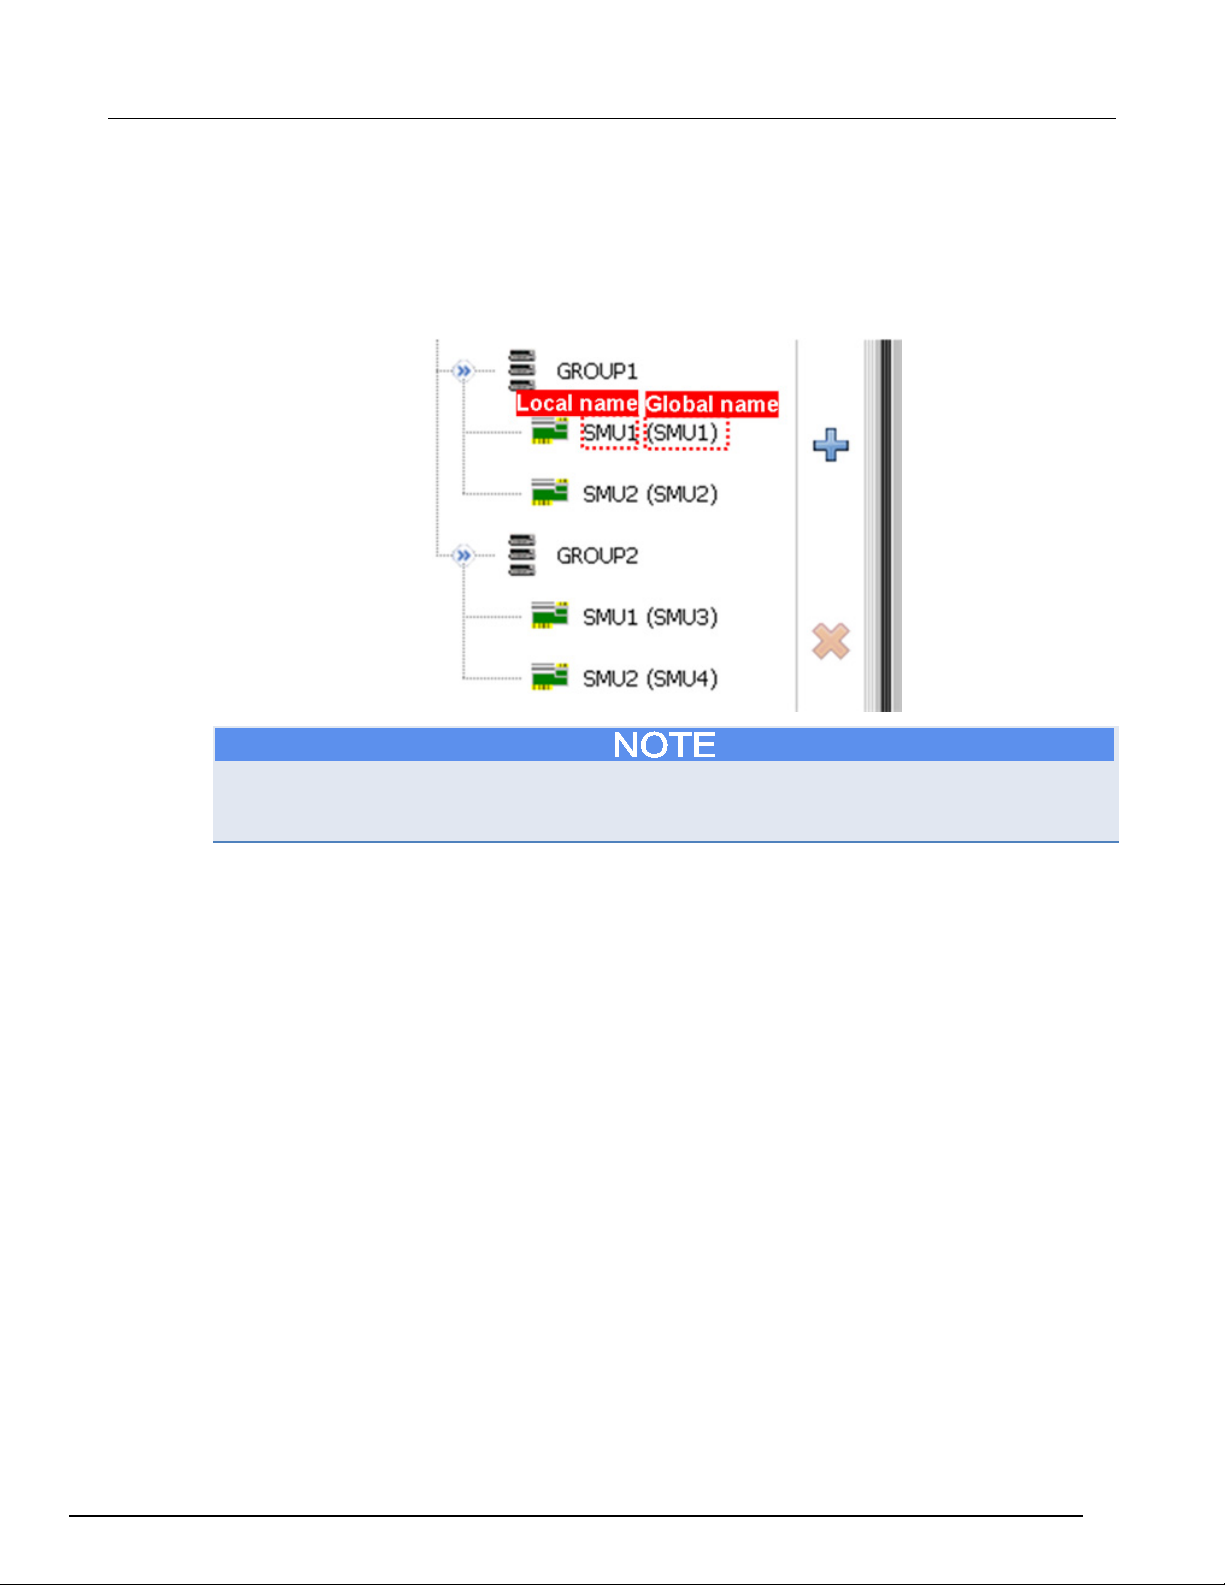
When ACS starts, it will assign names for each SMU. For an instrument configuration, each SMU has
a unique global name (SMU1, SMU2, SMU3, etc.). Within each GPIB group, or Ethernet group, the
SMU also has a local name (the local name is used within the group). These can be found on the
hardware navigator in the Configure Hardware interface (see the next figure).
Figure 3: SMU designation in ACS
Only the Series 2600B, Series 2600, and Model 4200 SMU has a local name. Due to a single GPIB
address or IP address, these instruments are able to form a multiple instruments network. The Series
2600B and Series 2600 use TSP-Link, while the Model 4200 can have several SMU cards.
ACS2600RTM-900-01 Rev. B / December 2012 1-5
Page 13
Section
2600 RTM User's Manual
1: ACS 2600-RTM ACS -
Sequential and parallel
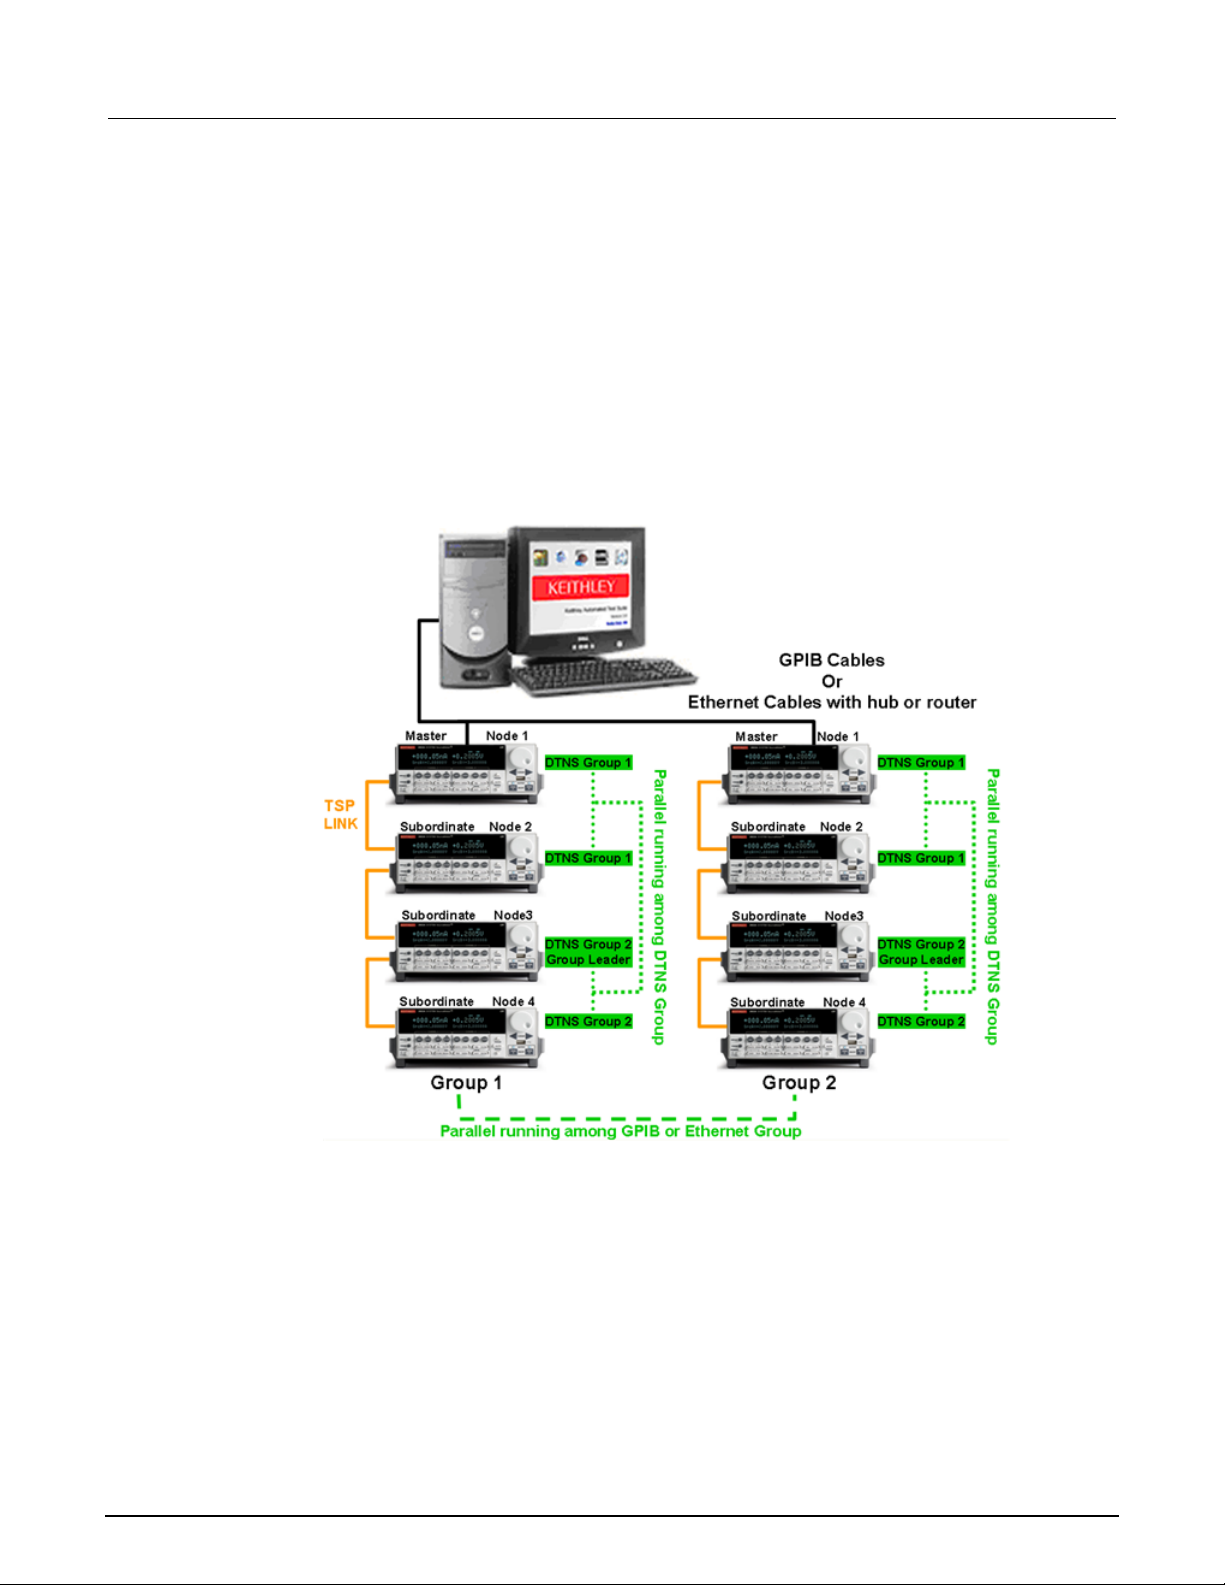
All of the 2600-based RTMs can be run sequentially or in parallel. The parallel operation will be
achieved using the following two methods:
1. ACS will recognize all of the GPIB groups, or Ethernet groups, to run in parallel. Each group will
execute the same test flow when the group is selected on the device setting interface (see next
figure).
2. Within the GPIB group, or Ethernet group, the TSP-Link network of instruments can be set to a
DTNS (dynamic TSP-Link network subdivision) group, or groups, for parallel running. The DTNS
group (sub-networks) is also recognized as a sub-group in ACS. Each sub-group is connected to
one sub-device (see next figure).
Figure 4: Sequential or parallel connection scheme
1-6 ACS2600RTM-900-01 Rev. B / December 2012
Page 14
ACS
RTM
- 2600 RTM User's Manual Section 1: ACS 2600-
Sequential versus parallel
When you add a 2600-based RTM, you will have to choose either Sequential or Parallel (see the
figure named:DTNS group run in sequence). These settings determine the running mode within a
group (GPIB or Ethernet) and note that the mode between groups is always parallel. Parallel testing
means that each sub-device runs all tests at the same time and sequential testing means that the
sub-devices run only one test at a time.
Example 1: The connection scheme in the figure named: GPIB or Ethernet connection scheme, has
12 instruments in three groups, and each group has one master with three subordinates. The three
groups will run tests in parallel; and within each group four instruments will run sequentially.
Example 2: The connection scheme in the figure named: Sequential or parallel connection scheme,
has eight instruments in two groups, and each group has two DTNS groups. The two groups will run
tests in parallel; and the two DTNS groups also run in parallel.
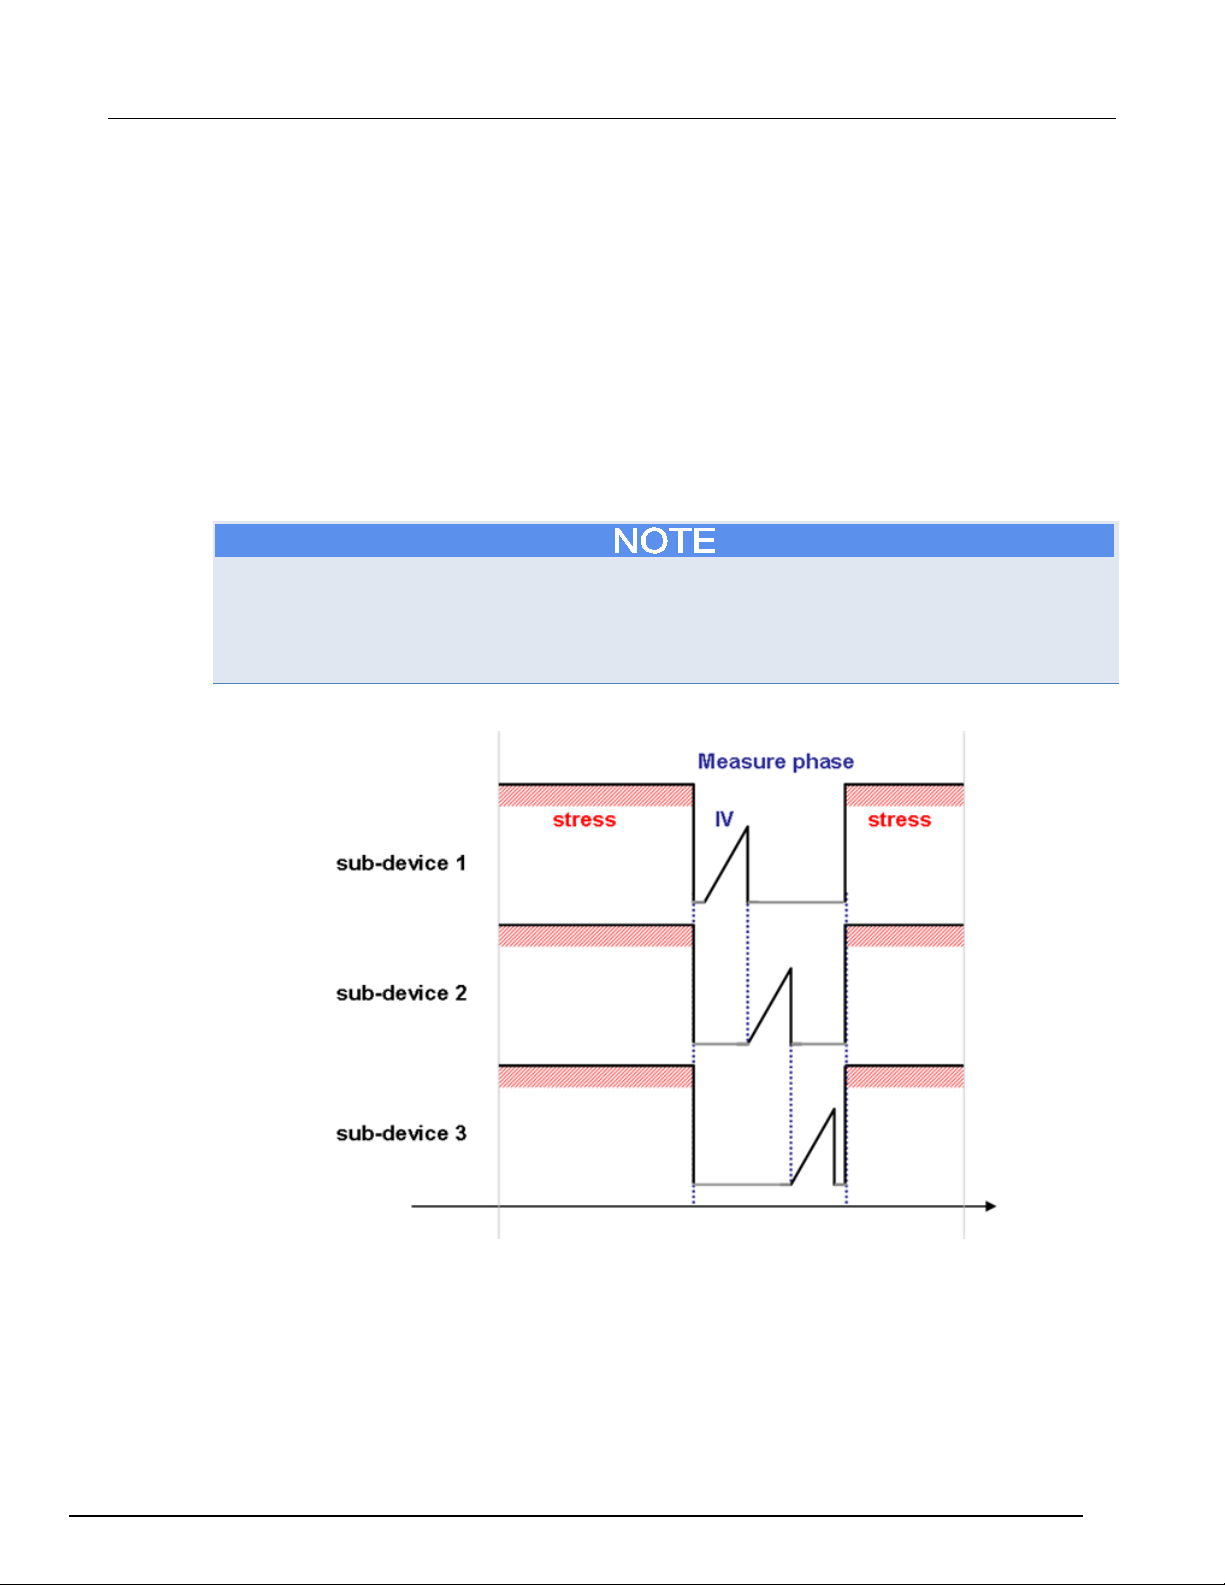
The following 2600-based RTMs have a different sequential timing diagram: HCI/NBTI; TDDB_CVS;
VRamp; JRamp/TDDB_CCS. These 2600-based RTMs will incur the source stress simultaneously
and they will measure the affect sequentially. Note that the NBTI_FAST_SWITCHING test runs in
sequential mode, which means it tests a sub-device until it is finished and then it will test the next
sub-device.
Figure 5: Sequential timing diagram
ACS2600RTM-900-01 Rev. B / December 2012 1-7
Page 15
Section
2600 RTM User's Manual
1: ACS 2600-RTM ACS -
ACS 2600-based RTM general settings
The ACS 2600-based RTM tests can be added to the test tree. The RTM is at the test modules level
in the test tree, which is the same level as the ITM, PTM, STM, and CTM.
Add a new device
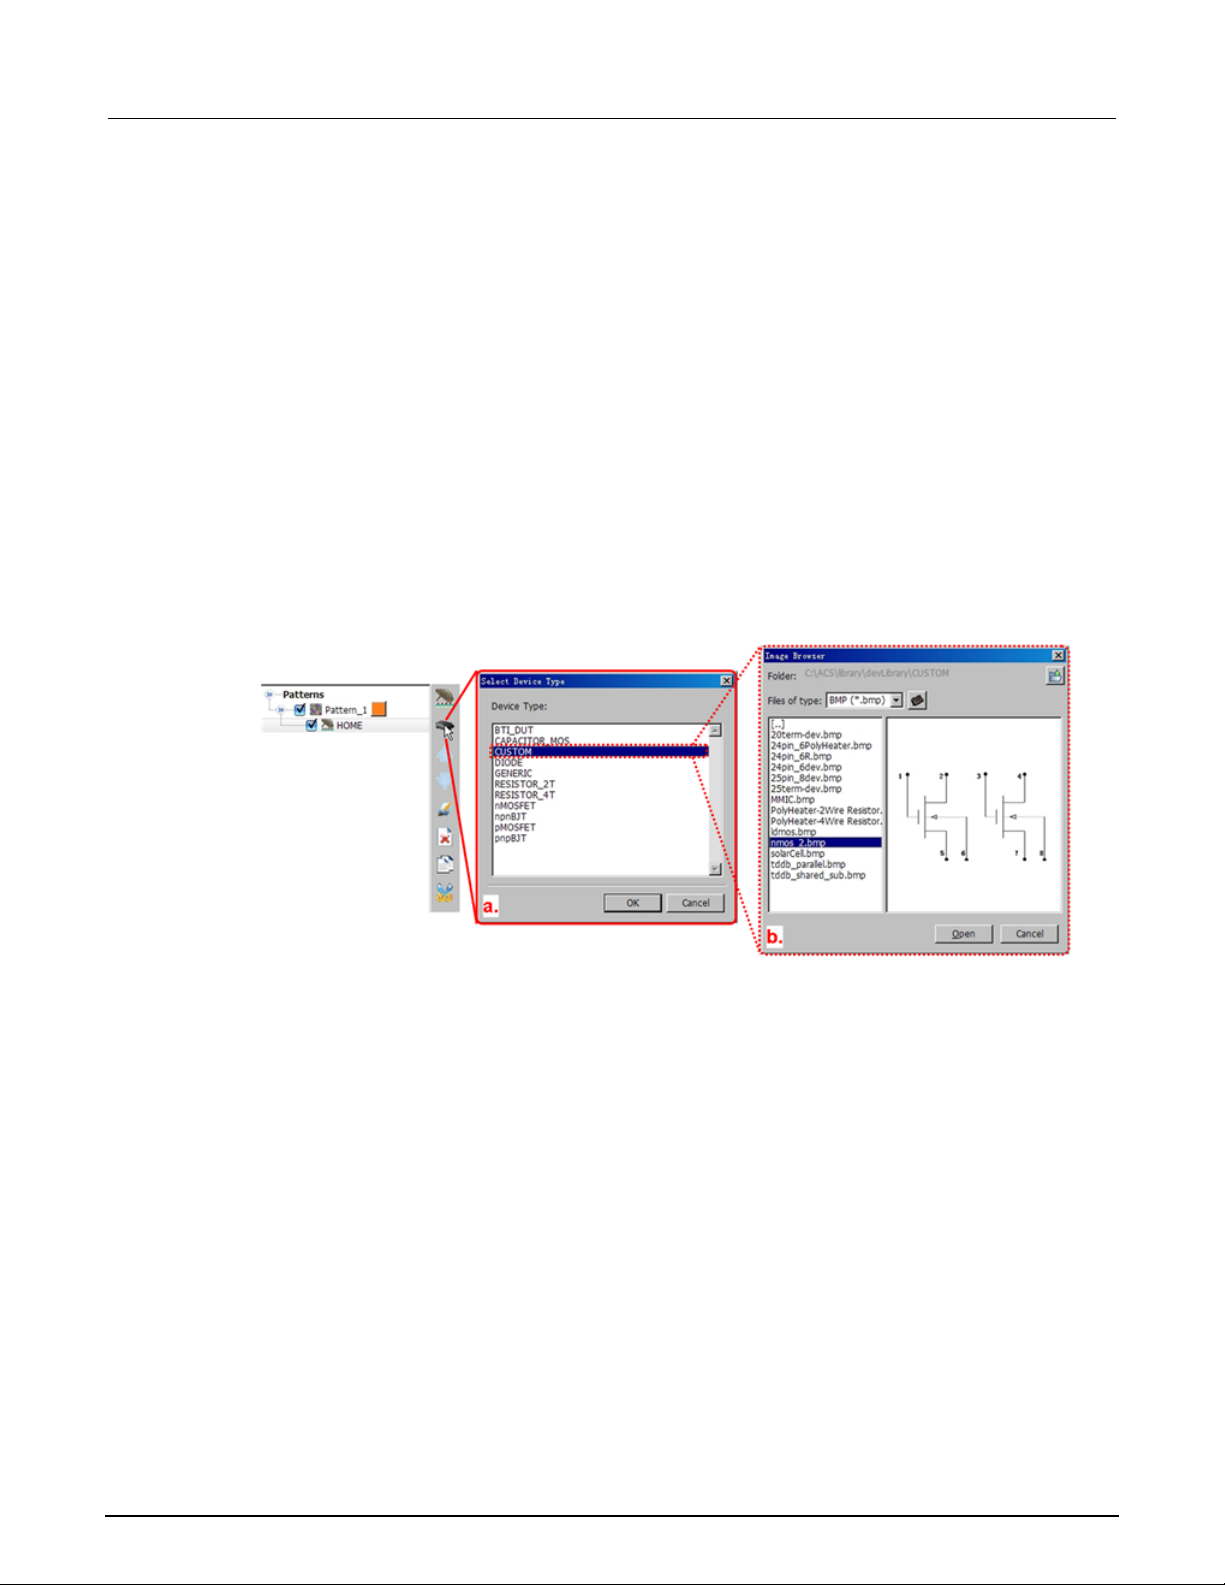
ACS software contains basic types of semiconductor devices. Additionally, there is a CUSTOM
category that includes several multiple-pin device types. These devices enable test and measurement
of several components when a probe is connected to a probe card. All of the components are
designated as sub-devices in ACS, and all of the components together are called the device, which is
part of the test tree. The next figure is an example of how to add a device that contains two
NMOSFETs as two sub-devices.
The next figure (a.) shows the device type list and the sub-devices. Also, the Image Browser (b.)
shows the CUSTOM devices list, which contains multiple sub-devices. All of the multiple sub-devices
are appropriate for the ACS 2600-RTM tests.
Figure 6: Select a device type
1-8 ACS2600RTM-900-01 Rev. B / December 2012
Page 16
ACS
RTM
- 2600 RTM User's Manual Section 1: ACS 2600-
Device setting
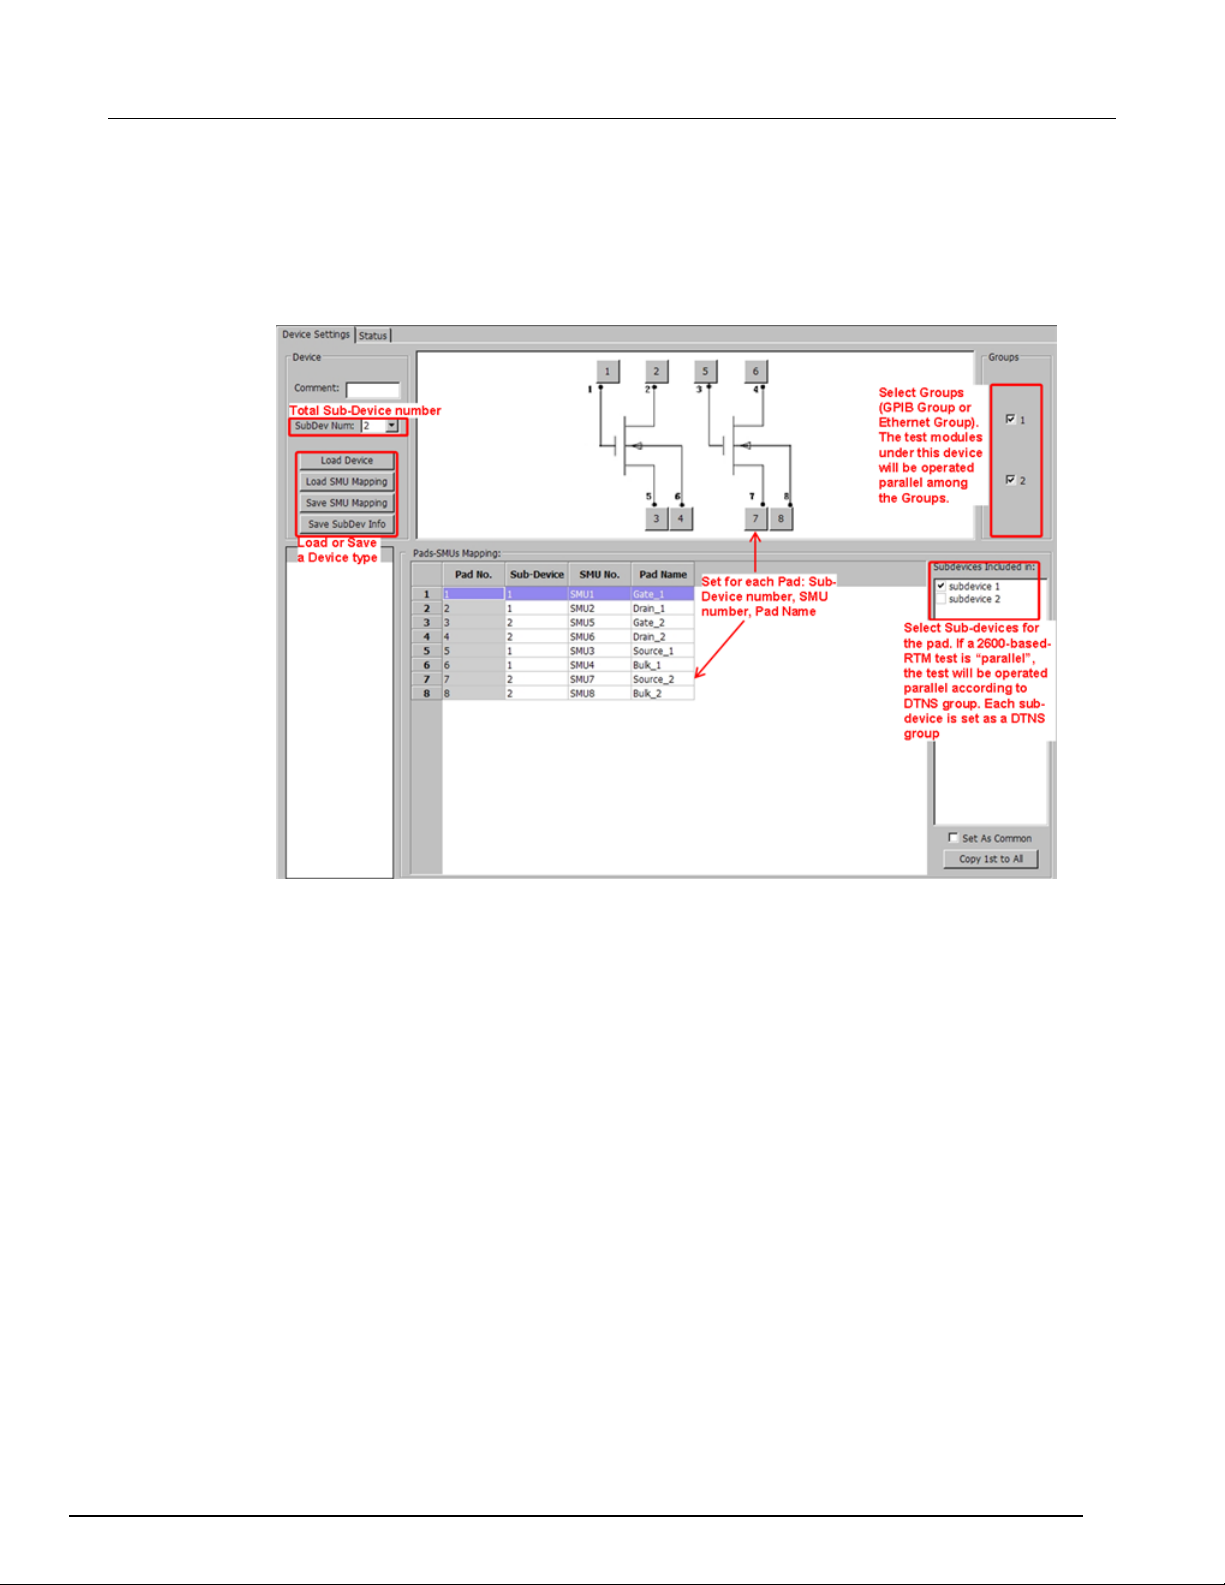
The settings on the Device Settings tab will determine the test that runs in an instrument
configuration. The settings must be consistent with the real instrument connection.
Figure 7: The Device Settings tab
ACS2600RTM-900-01 Rev. B / December 2012 1-9
Page 17
Section
2600 RTM User's Manual
1: ACS 2600-RTM ACS -
If you have selected multiple groups, the instrument's configuration in each group must be the same
(including the instrument model). For example, if there are three Model 2636As in group 1, then group
2 must also have three Model 2636As. The device settings will automatically apply to all the selected
groups.
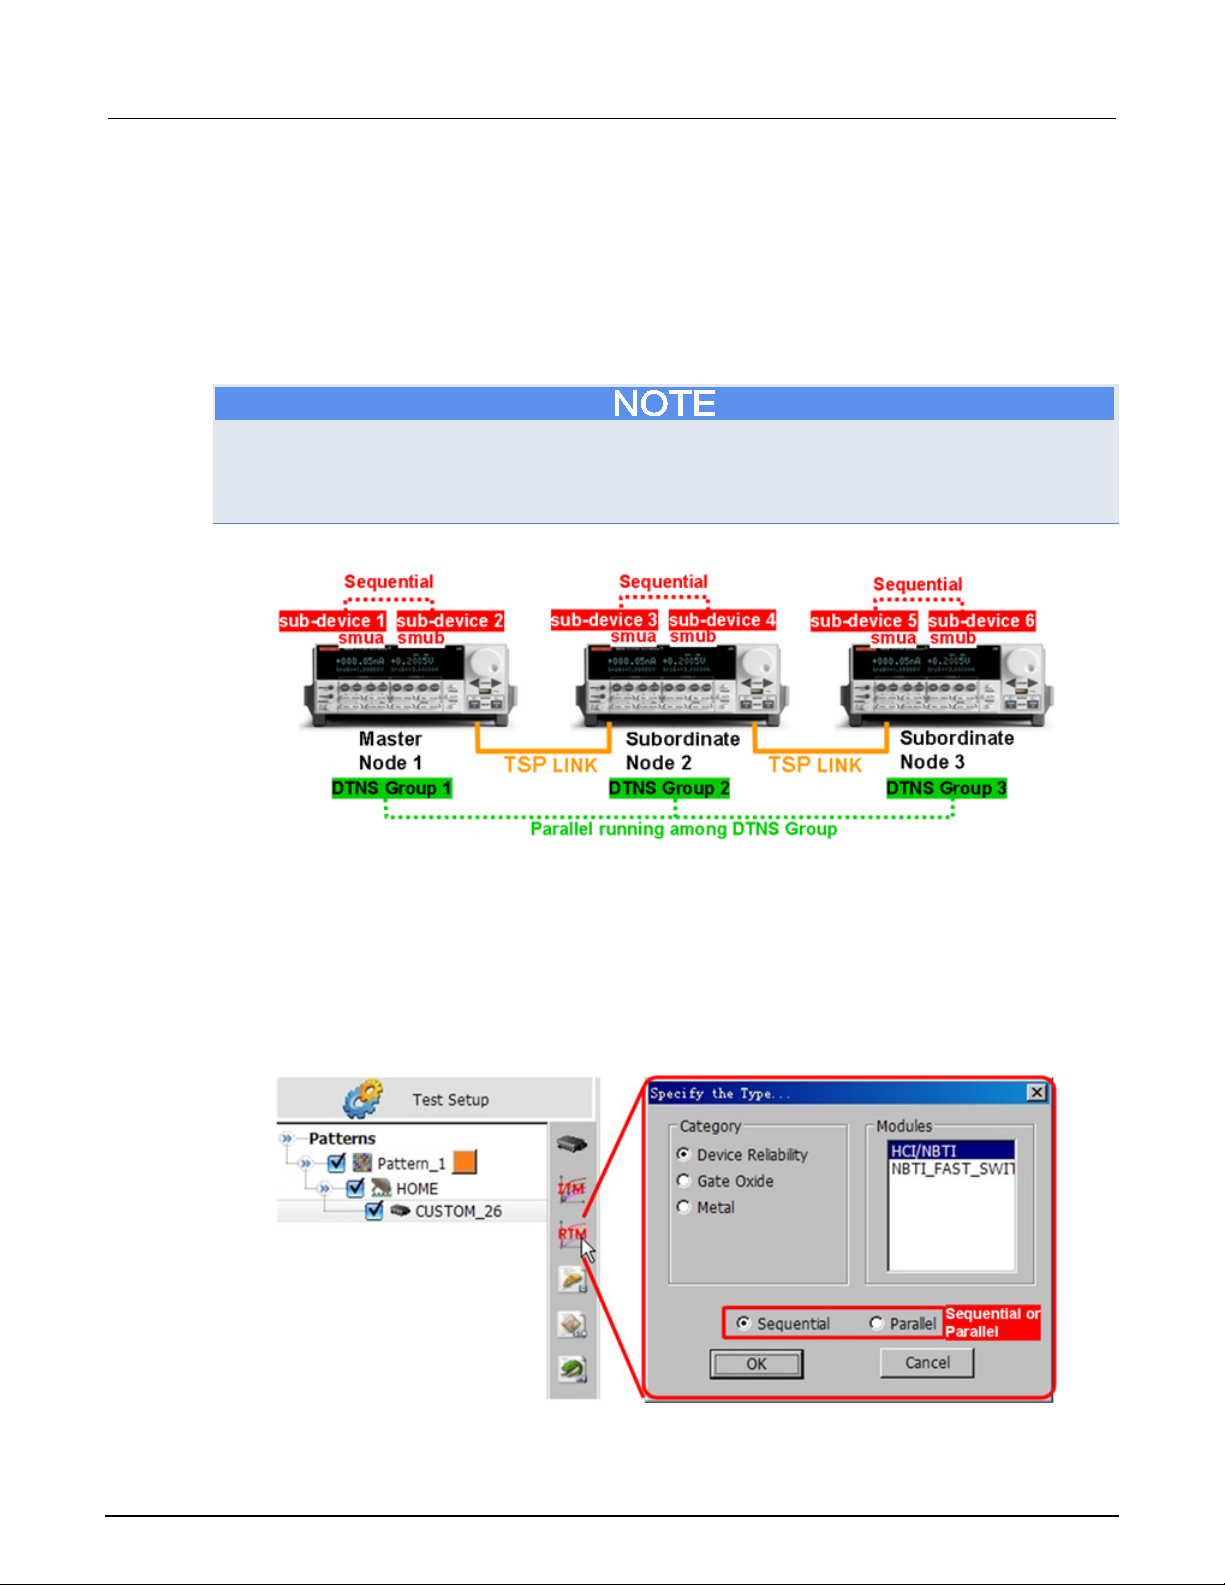
If you want to add a 2600-based RTM test to run in parallel, ACS will automatically create DTNS
groups according to the configuration of the sub-devices and pad settings. Each sub-device will be
set as one DTNS group if the sub-device has been set to a pad. To run parallel testing, each pad
must have only one sub-device.
If you have the Series 2600B or Series 2600 instruments that have two SMUs, it is highly
recommended that the two SMUs are set to the same sub-device. If you assign the two SMUs to
different sub-devices, the instrument configuration will contain two separate DTNS group numbers,
and the two sub-devices will run sequentially as opposed to running in parallel.
Figure 8: DTNS group run in sequence
Add a new RTM
Click the RTM icon to add a new 2600-based RTM test.
In the dialog box that opens, select the type of test that is needed and select Sequential or Parallel.
The Sequential and Parallel options are for a GPIB or Ethernet group. If you select Parallel, it will
create a DTNS group based on the sub-devices.
Figure 9: Add a RTM test
1-10 ACS2600RTM-900-01 Rev. B / December 2012
Page 18
ACS
RTM
- 2600 RTM User's Manual Section 1: ACS 2600-
Test module settings
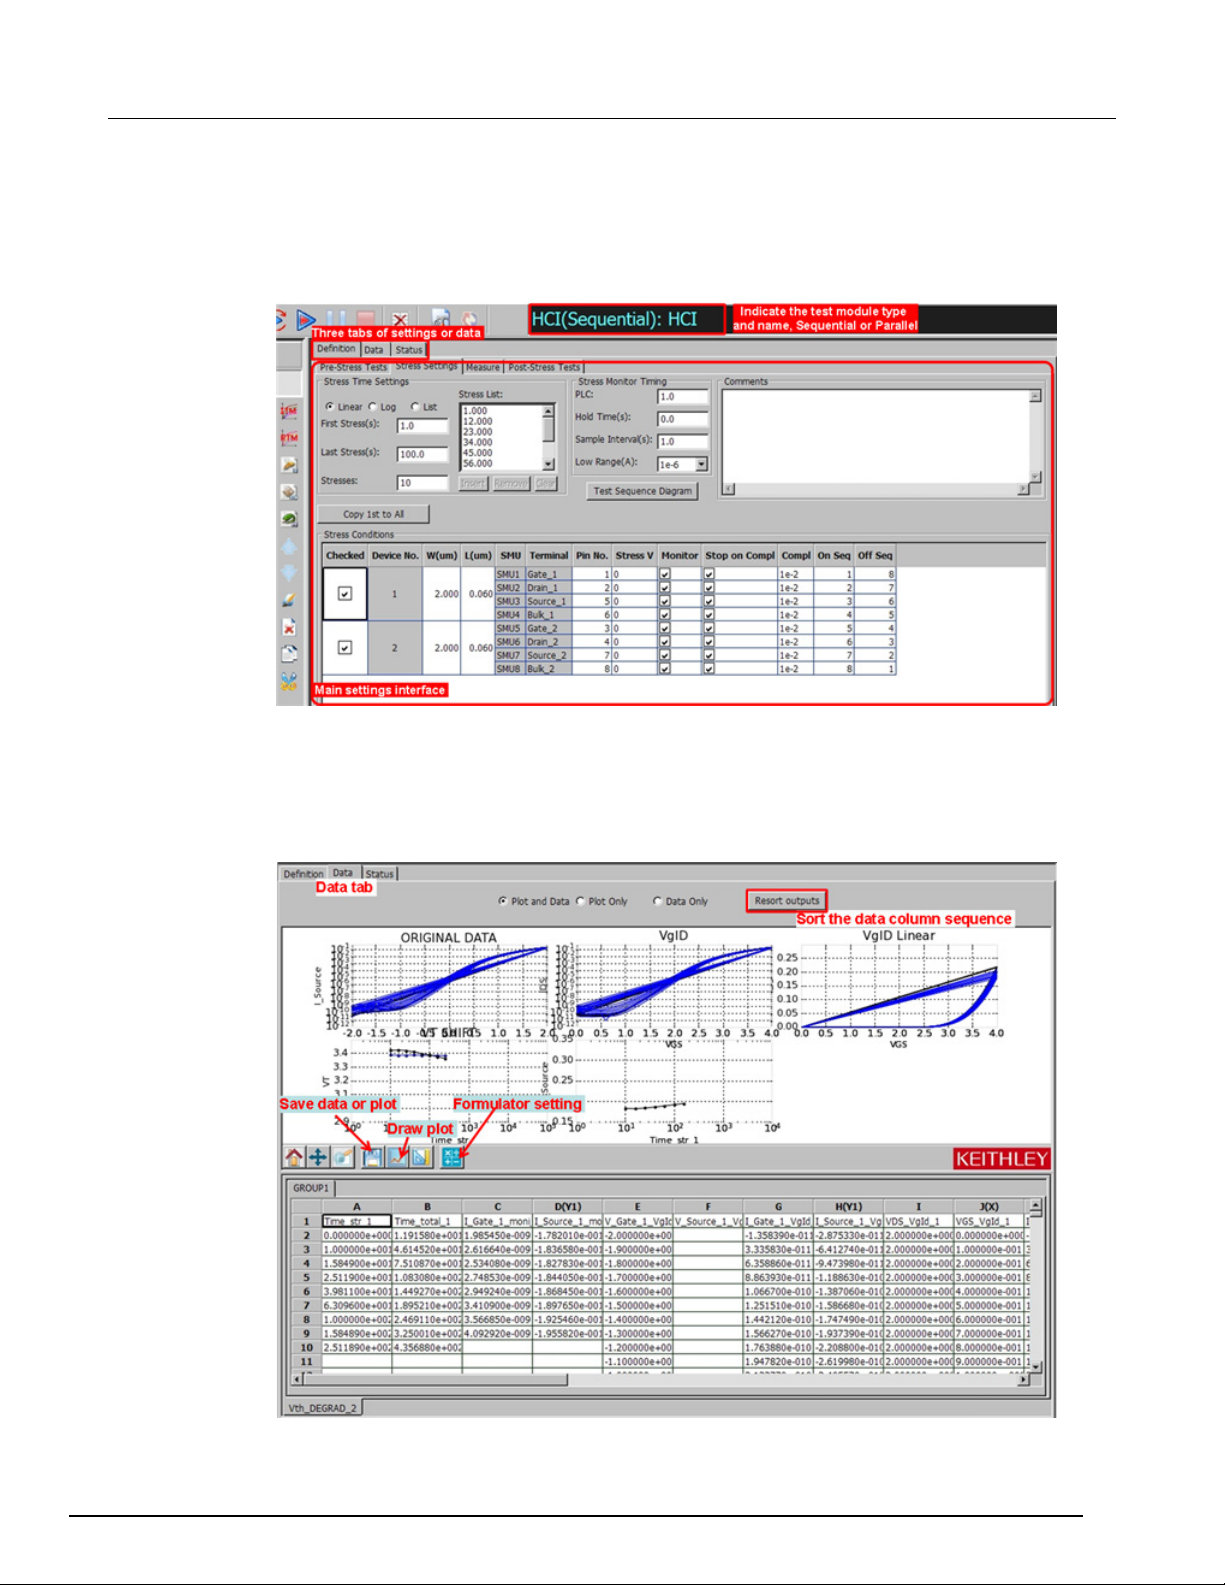
The 2600-based RTM tabs that are used for configuration are shown in the next figure.
Figure 10: RTM configuration tabs
There are three tabs used for configuring the 2600-based RTM:
• Definition: settings for stress, measure, timing, exit criteria, etc. These settings define the test flow
and data acquisition. Different RTM tests have their own Definition tab. Note that some tests have
multiple tabs for definition settings.
• Data: shows the measured data in the table, plot, or both.
ACS2600RTM-900-01 Rev. B / December 2012 1-11
Page 19

Section
2600 RTM User's Manual
1: ACS 2600-RTM ACS -
• Status: lists the test setting information in a text format.
Run a 2600-based RTM
Manually run: Select a node in the test tree, then select the Start icon on the tool bar. All of the
selected tests under this node will be executed sequentially. The test results data will be logged and
saved as a .csv file.
Automation: 2600-based RTM tests run in Automation with control of the probe station for automated
testing at the cassette level. The settings are in the Automation panel (refer to the ACS Reference
Manual for more information; document number: ACS-901-01). The results of the test data is logged
and saved as a .csv file, .db file, or .kdf file.
1-12 ACS2600RTM-900-01 Rev. B / December 2012
Page 20
ACS
RTM
- 2600 RTM User's Manual Section 1: ACS 2600-
Preference settings
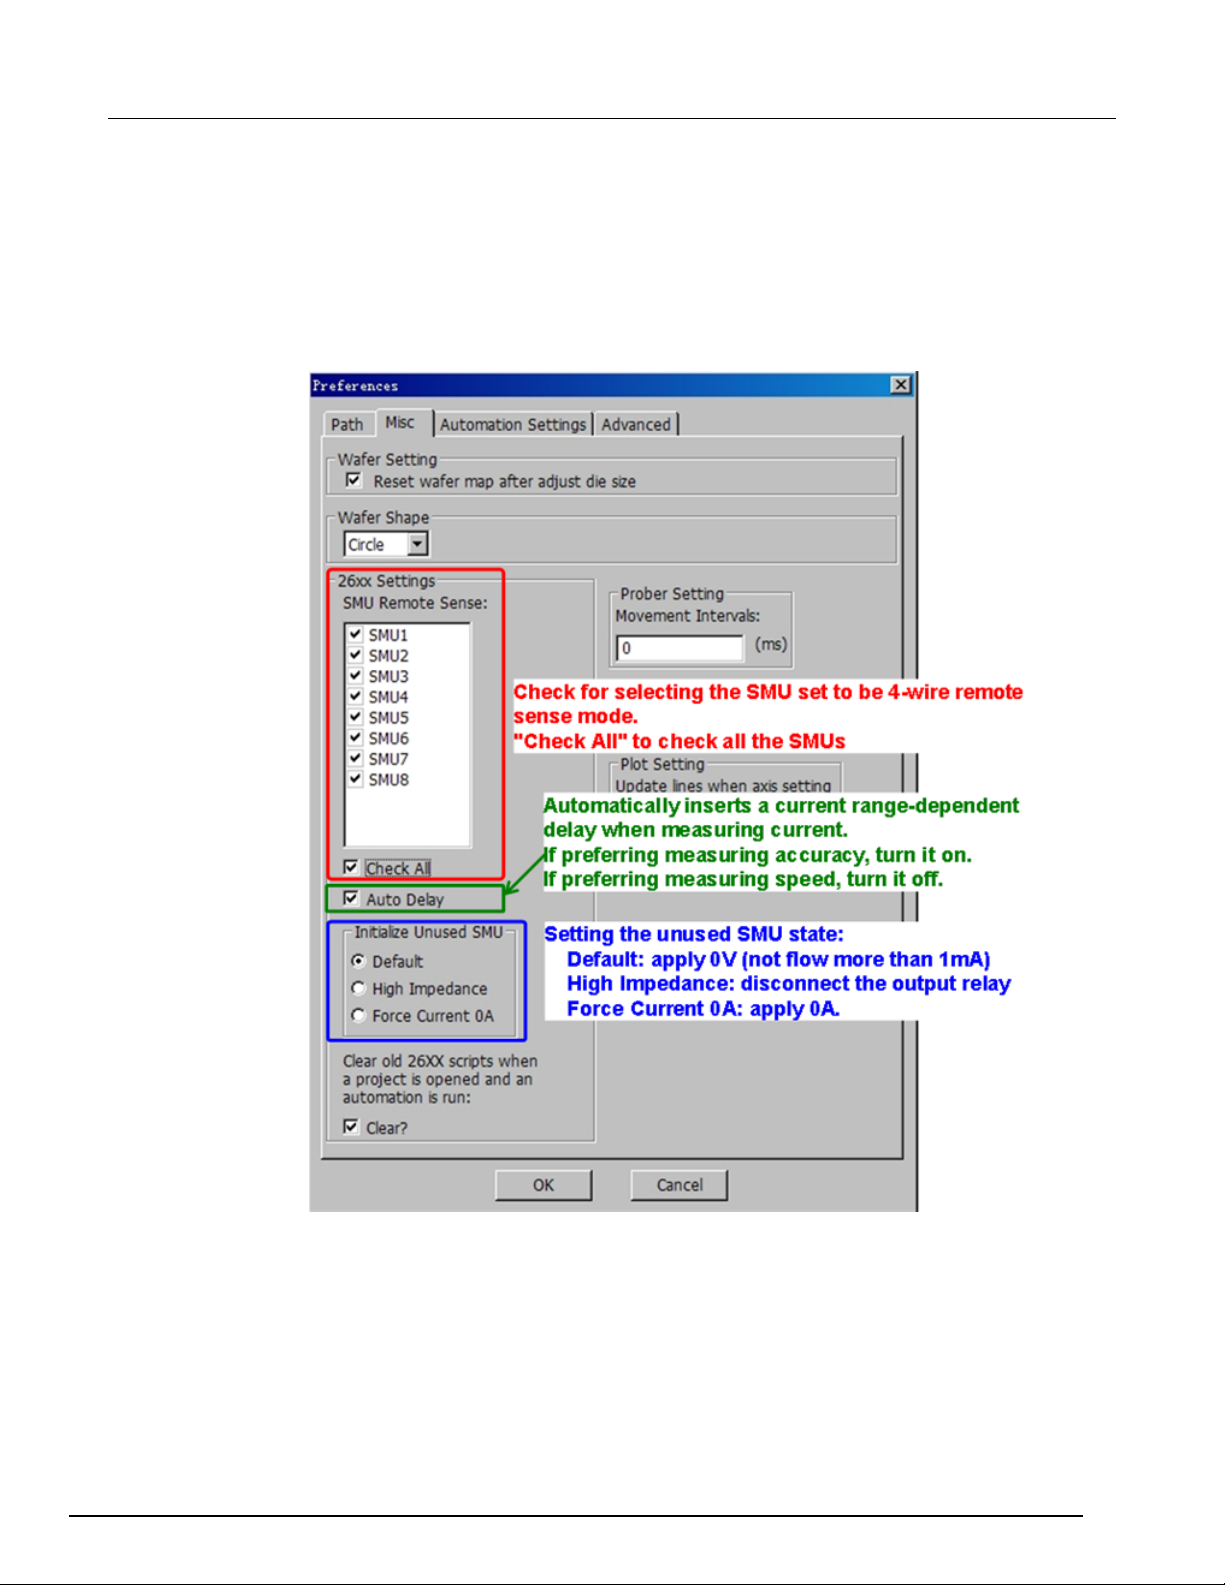
Some settings for the Series 2600 and Series 2600B SourceMeters can affect the 2600-based RTM,
such as the running stability or speed. To get to the Preferences settings do the following: With ACS
open, go to Tools->Preferences->Misc. In the Misc tab you can select the SMUs you need, choose
Auto Delay, if needed, and set the state for any unused SMUs (see next figure).
Figure 11: 2600-based RTM Preferences
ACS2600RTM-900-01 Rev. B / December 2012 1-13
Page 21
Section
2600 RTM User's Manual
\data\<test_module_name>.csv
The location of the .csv file if you
click "Save All" function
.csvbak
\temp\<test_module_name>.csvbak
The backup file in case there is an
error when saving the .csv file
Automated
.csv
\csv\<Lotname>_WaferInfo\Wafer_1_<time>.csv
sv
Comma separated value format
.db
\db\<Lotname>.db
Binary format file, can be imported to
.kdf
\kdf\<Lotname>.kdf
Keithley Data Format file, can be
.tmp
\RTM_temp\ curdata_<date and time>.tmp
Temporary data file in case of data
logging error
realtime .csv
\Realtime_Data\Realtime_Data_<date and time>.csv
Log the realtime plot data
1: ACS 2600-RTM ACS -
You must choose the preference settings for the RTM or ITM instruments before running a test. If you
change the preferences, the settings will be effective at the beginning of the next execution of the
RTM or ITM test.
Also, you should use the Initialize Unused SMU option when you need to isolate the devices. This
option enables you to control multiple isolated devices.
If you are accomplishing multiple device probing, it's possible that some of the probed devices have
broken due to the trial test or for other reasons. The broken devices can affect other devices
depending on the issue. For example, with leakage, noise, or inducing breakdown through an
electrical short.
The Series 2600 and Series 2600B SourceMeters have output relays and several off modes which
can benefit you if you need to test multiple devices.
Some 2600-based RTMs have the ability to isolate the break down in devices during a test sequence.
See the details in each section describing the RTM tests.
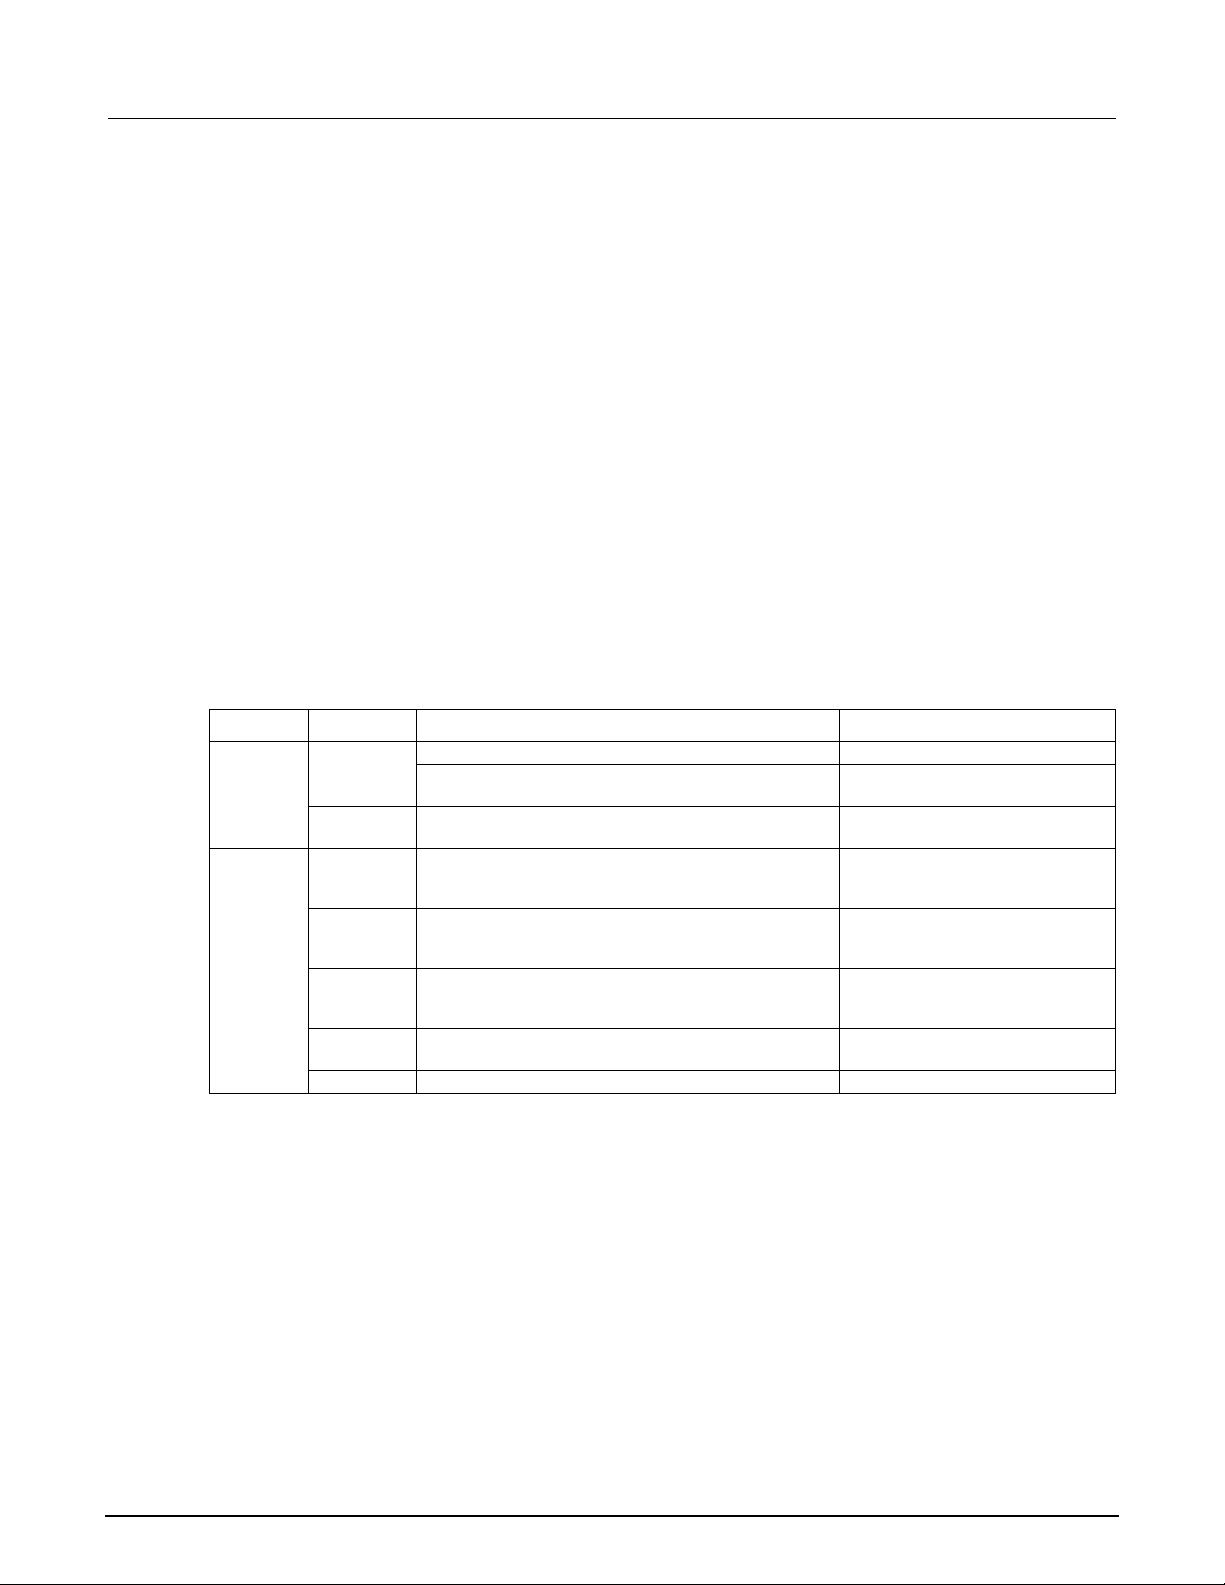
Data logging
When you have test data that is logged and saved, you can find the data files in the following
locations depending on what kind of test is run and the file type that is created. Also, the path for all of
the ACS log files will have the following path as a prefix (where "C" is the computer hard drive):
C:\ACS\Projects\<Project_Name>:
Test type File type File path Comments
Manual
.csv
\temp\<test_module_name>.csv The temporary .csv data file
\csv\<Lotname>_WaferInfo\Wafer_1\Site_n1p1_<time>.c
KDAT (Keithley Data Analysis Tool)
for advanced data analysis
imported to ACS wafer level plot and
statistics for analysis
1-14 ACS2600RTM-900-01 Rev. B / December 2012
Page 22
ACS
RTM
- 2600 RTM User's Manual Section 1: ACS 2600-
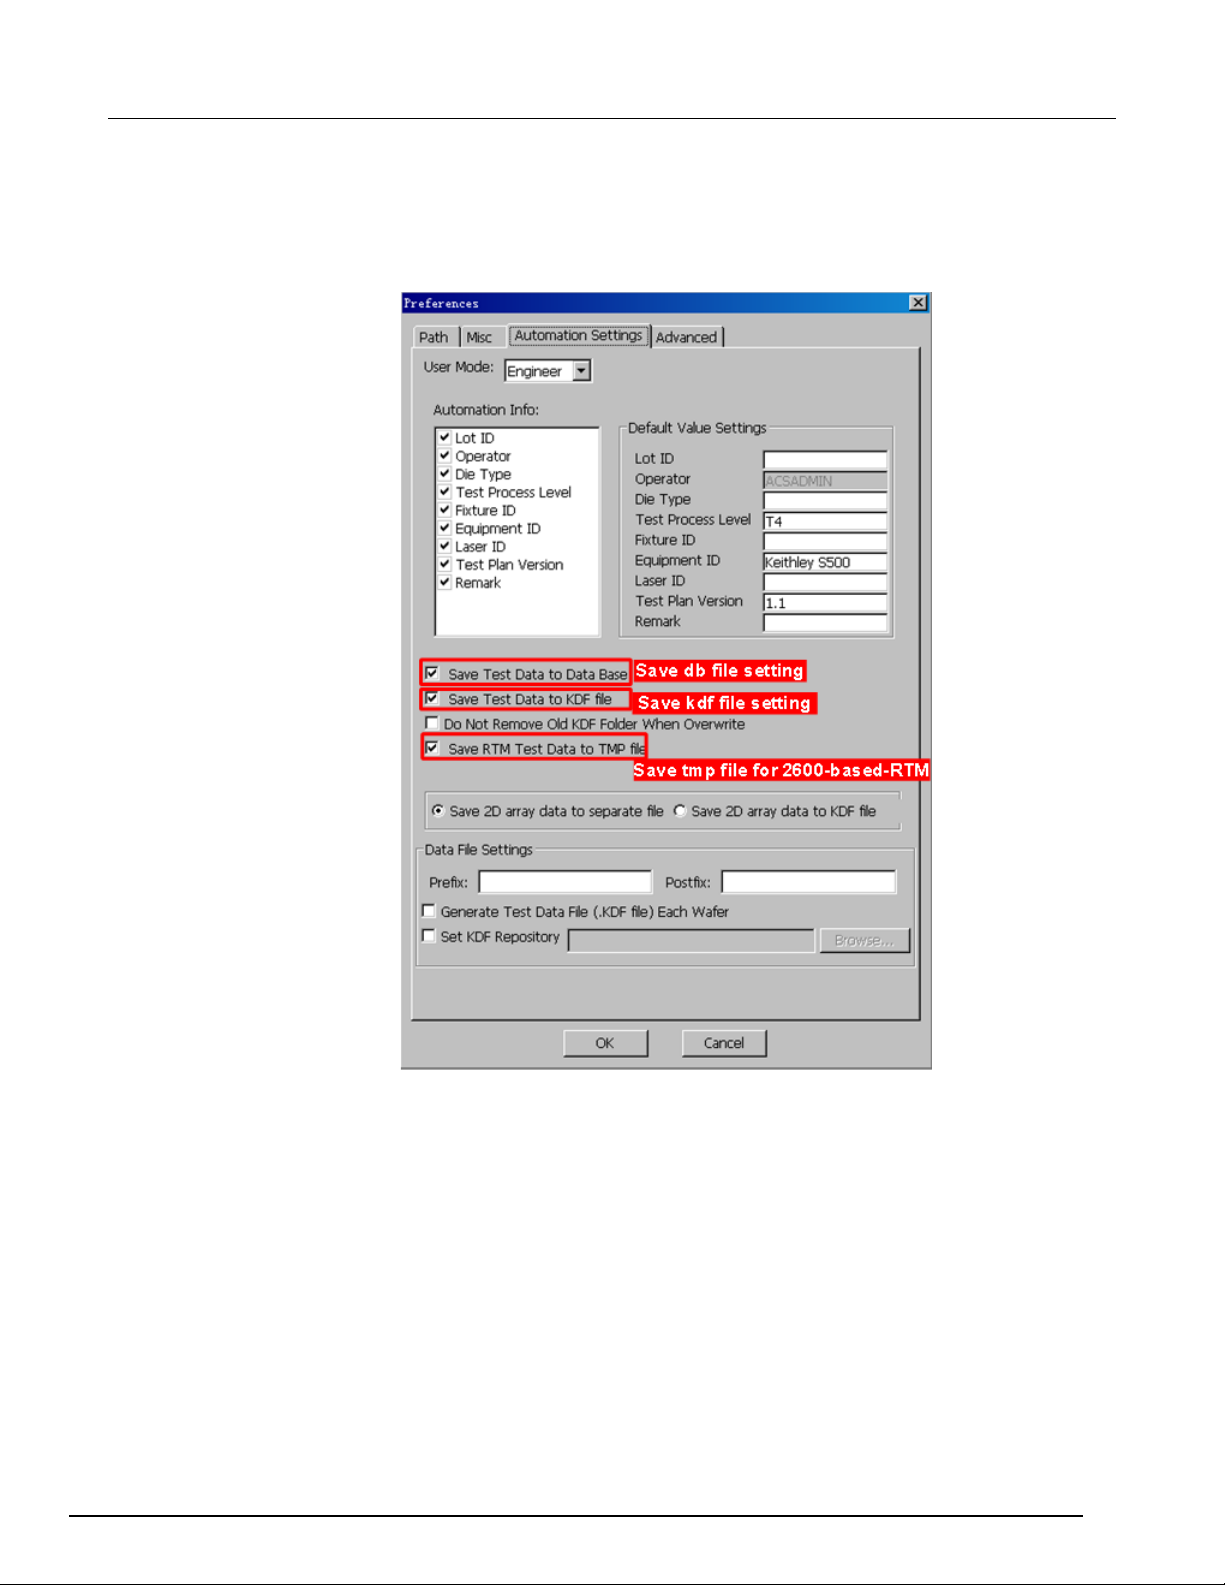
If you want to configure and enable the file types to save for data analysis, you will have to open the
Preferences dialog box in the Tools drop-down menu and go to the Automation Settings tab (see next
figure).
Figure 12: Preferences on the Automation Settings tab
ACS2600RTM-900-01 Rev. B / December 2012 1-15
Page 23
Section
2600 RTM User's Manual
Real time data
\temp\<test_module_name>.csv
Progress monitor
auto_update_manual_run_plot=1
Automatically update the graph on ACS data tab.
Excel.
auto_update_manual_run_plot=0
Manually update the graph by Reflesh button (See detail
Excel.
Abort operation or
1: ACS 2600-RTM ACS -
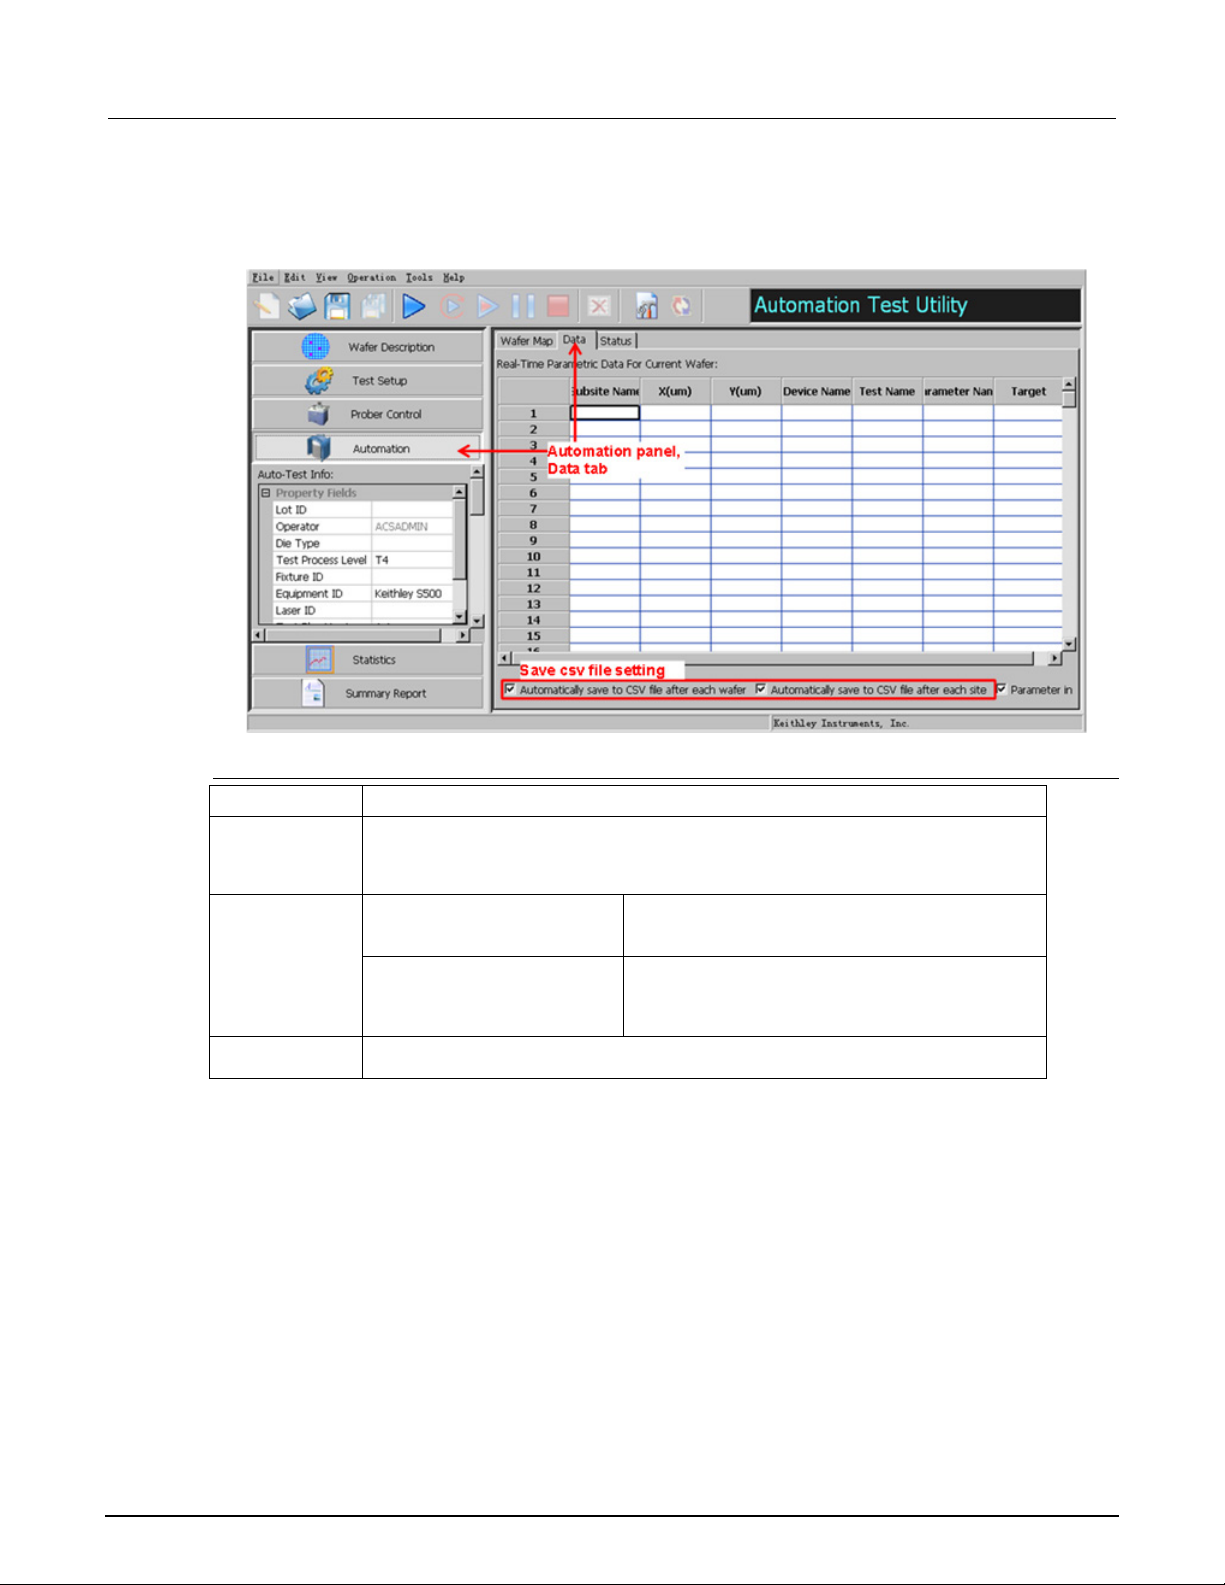
In the Automation panel, go to the Data tab and select the Automatically save to CSV file after each
wafer and you can select the Automatically save to CSV file after each site (see next figure).
Figure 13: Automation panel Data tab
Manually update data
Event Security service or possible options
save
unexpected crash
\temp\<test_module_name>.csvbak
Copy the .csv file above and open in an external tool like
below).
Copy the .csv file above and open in an external tool like
Secure data by copying the .csv file above.
1-16 ACS2600RTM-900-01 Rev. B / December 2012
Page 24
ACS
RTM
- 2600 RTM User's Manual Section 1: ACS 2600-
Occasionally, some 2600-based RTM tests can be used for long term testing (several days or even
several weeks). This long term testing is used to gather a tremendous amount of data in order to
analyze the data. For the purpose of data security, when you manually conduct tests, ACS will
automatically log the data to a .csv file and a .csvbak file over a period of time. The .csv file logs all of
the current data results, while the .csvbak file logs the data results since the last time the data was
saved manually. Note that when you update and save a .csv file, it will overwrite the previous file (this
includes the .csvbak file). Both of the temporary files .csv and .csvbak are located at the following
default location on your computer: \ACS\Projects\<project name>\temp\<test_module_name>.csv,
\ACS\Projects\<project name>\temp\<test_module_name>.csvbak. However, if you select the Save
All function on the tool bar, the .csv file will be permanently saved to the following default location on
your computer: ACS\Projects\<project name>\data\<test_module_name>.csv
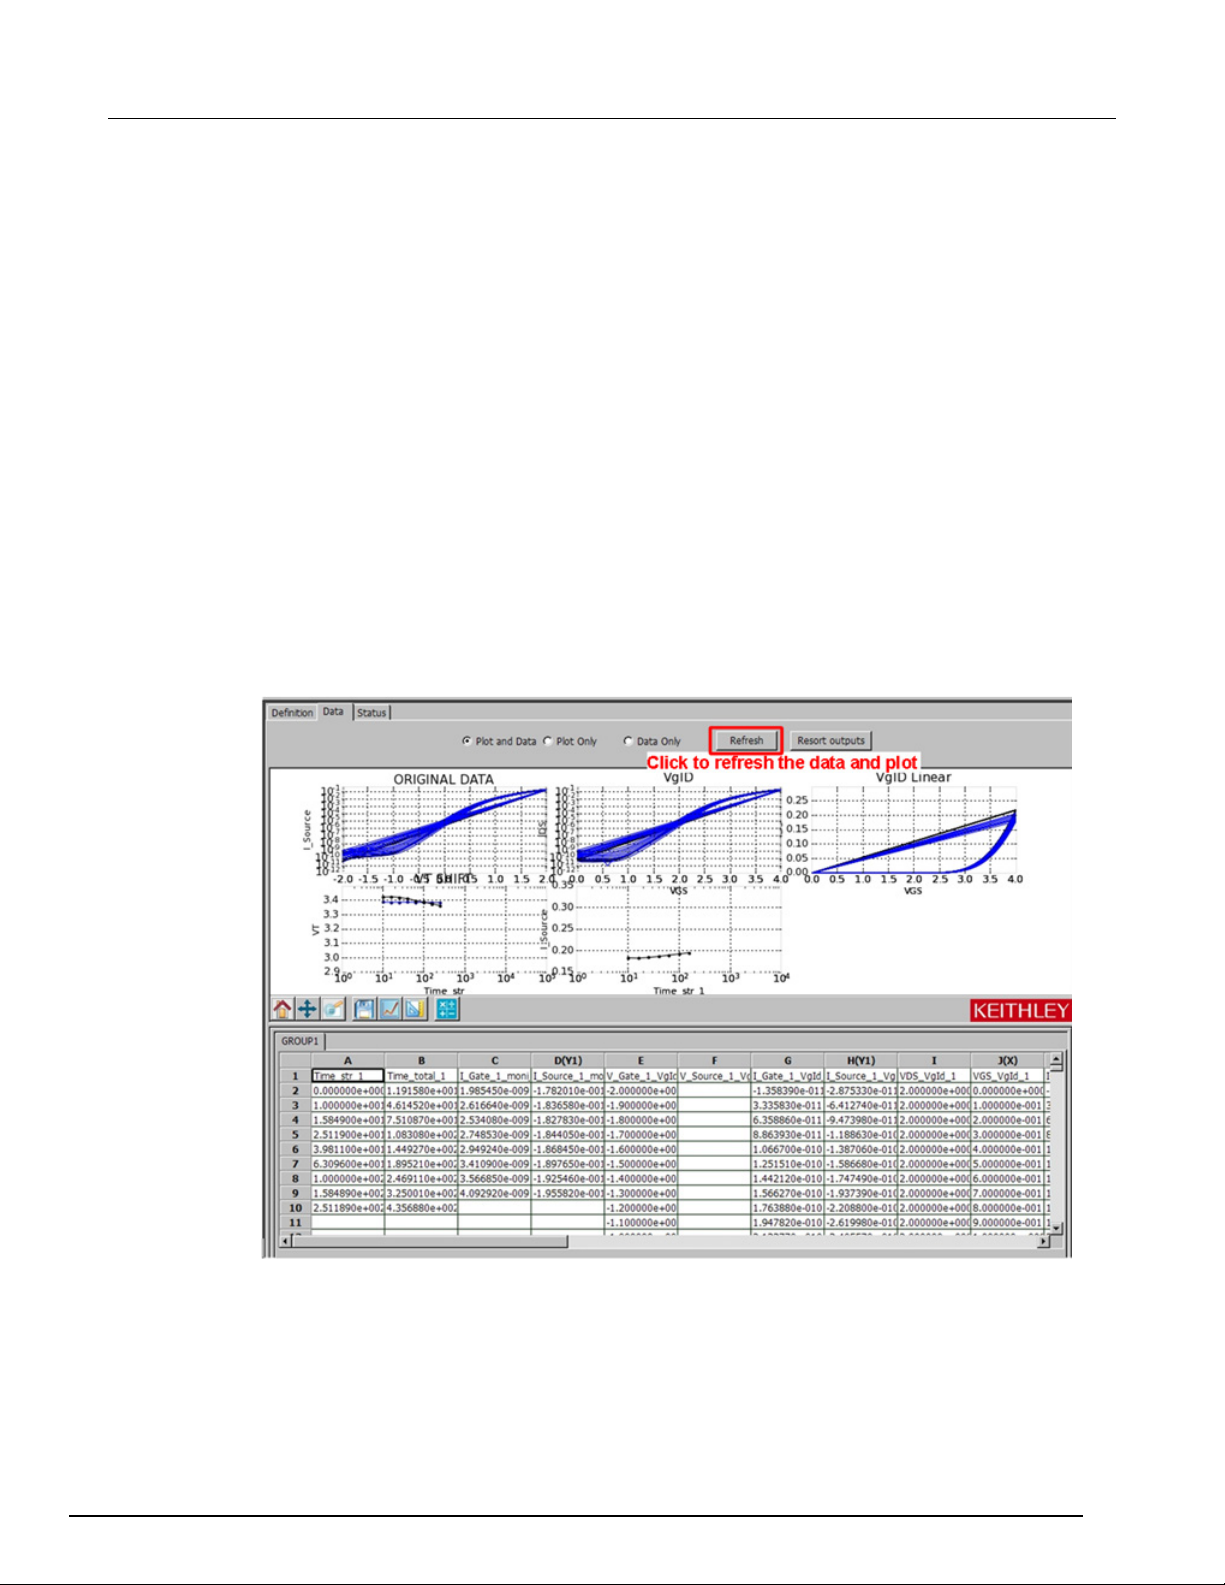
The data results are displayed in the data tab, and plot is available. The data and plot in the data tab
will update over a certain period of time. However, since some ACS 2600-based RTM tests are long
term tests, frequently updating data is not necessary. Although, if desired, ACS provides an option to
manually update the data and plot.
In the file \ACS\KATS\ ACS_setting.ini setting auto_update_manual_run_plot=0" enables manually
updating the data and plot. The data and plot will update only you select the Refresh function.
However, note that if the refresh updates a large amount of data, it will take a while to be displayed.
Figure 14: Manually update and plot data
ACS2600RTM-900-01 Rev. B / December 2012 1-17
Page 25
Section
2600 RTM User's Manual
Real time data save
\RTM_temp\ curdata_<date and time>.tmp
unexpected tester behavior.
auto_update_manual_run_plot=1
Automatically update the graphs in the Real-time Plot window.
auto_update_manual_run_plot=0
Manually update the Real-time Plot using the Refresh function
below).
Abort operation or
1: ACS 2600-RTM ACS -
Automation data security
Event Security service or possible options
Progress monitor
unexpected crash
Note: .kdf, .csv, .db file are not updated in real time, but updated at test end or site end. Thus, they
cannot be an alternate option to secure data and prevent user from data loss by abort operation or
(see detail below).
Export the .csv file by using the Export data function (see detail
Secure the .tmp data above and convert to a .csv or .db file (see detail below).
In Automation, the data results can be logged as a .csv, .db, or .kdf file. However, some long term
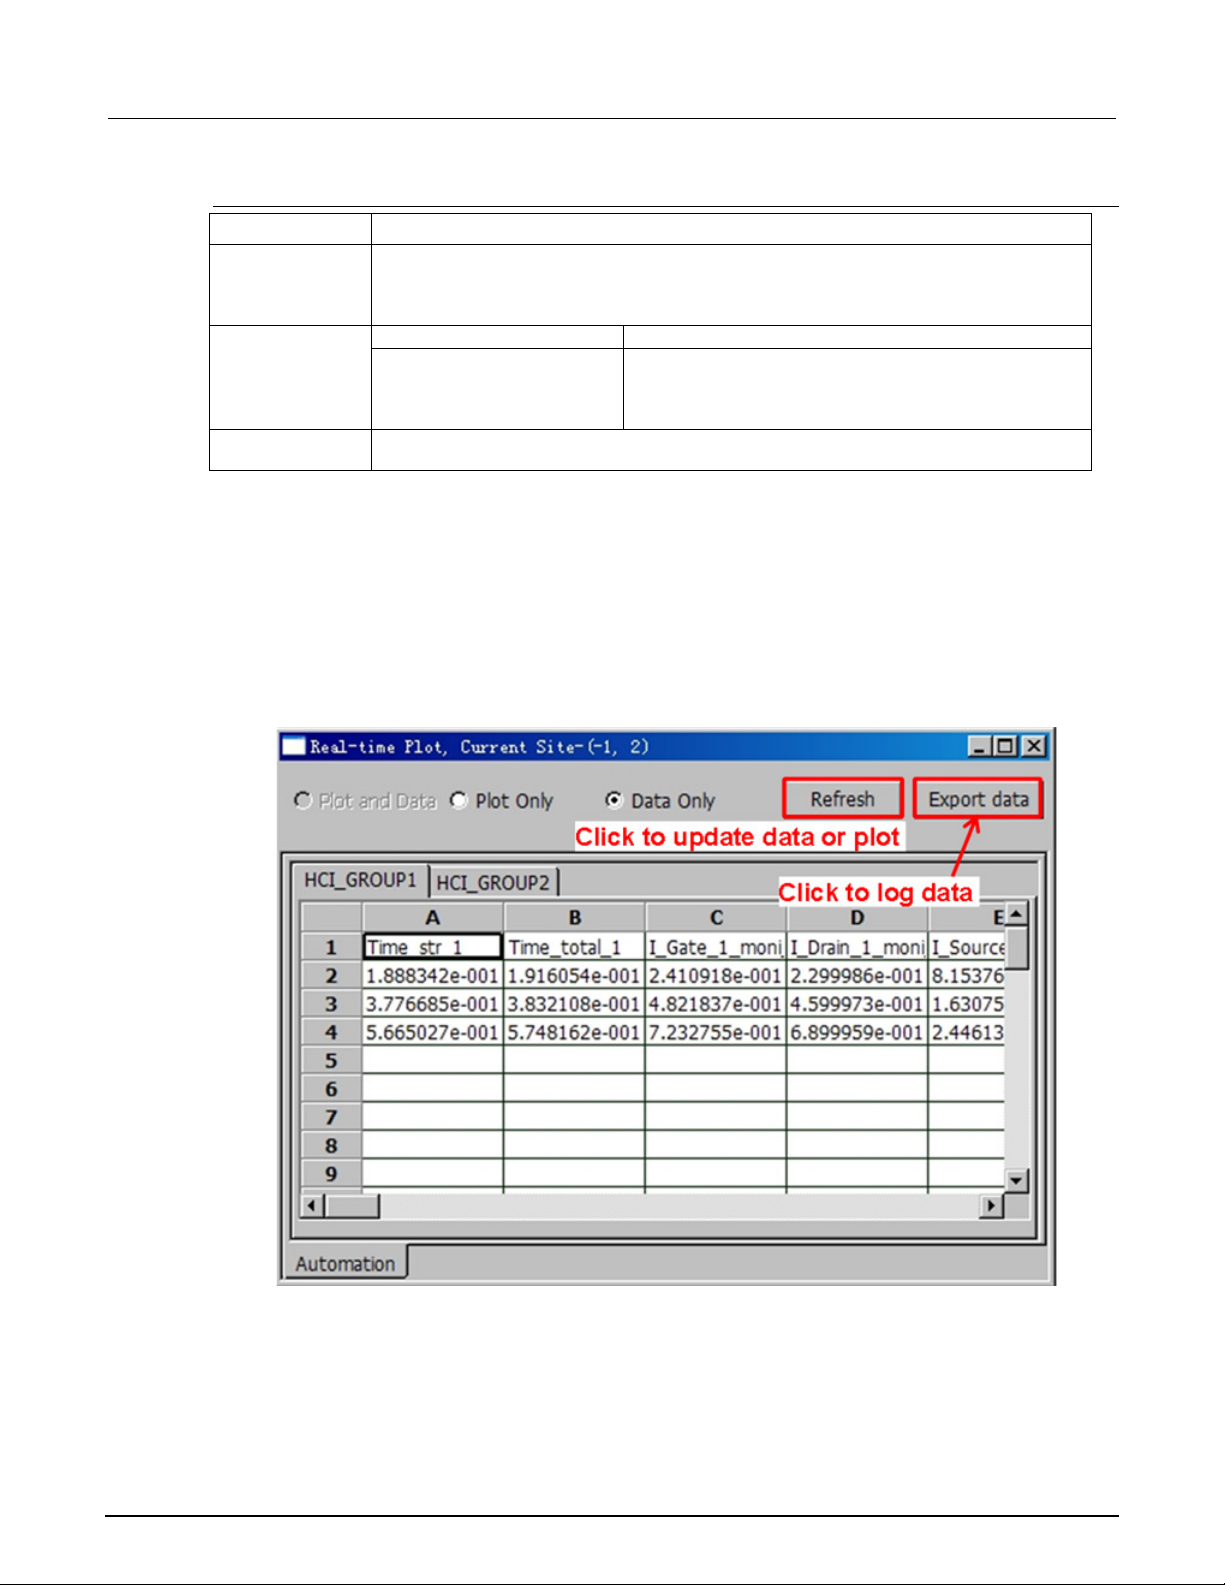
tests need to analyze data while the test is still running. ACS provides a Real-time Plot, Current Site(-1, 2)(see the next figure) that displays the selected test results. (For more details about the real-time
plot, refer to ACS Reference manual; document number: ACS-901-01). By default, the plot or data in
real-time will automatically update a certain period of time. However, similar to the manual update, it
can be set to manually refresh.
In the file that is located in the following location: \ACS\KATS\ ACS_setting.ini, the setting for the
"auto_update_realtime_plot=0" enables a manual update.
Figure 15: Real-time plot
1-18 ACS2600RTM-900-01 Rev. B / December 2012
Page 26
ACS
RTM
- 2600 RTM User's Manual Section 1: ACS 2600-
Refresh function: updates the displayed data or plot.
Export Data function: logs data and saves the file to the following location on your hard drive:
\ACS\Projects\<project name>\Realtime_Data\ Realtime_Data_<date and time>.csv.
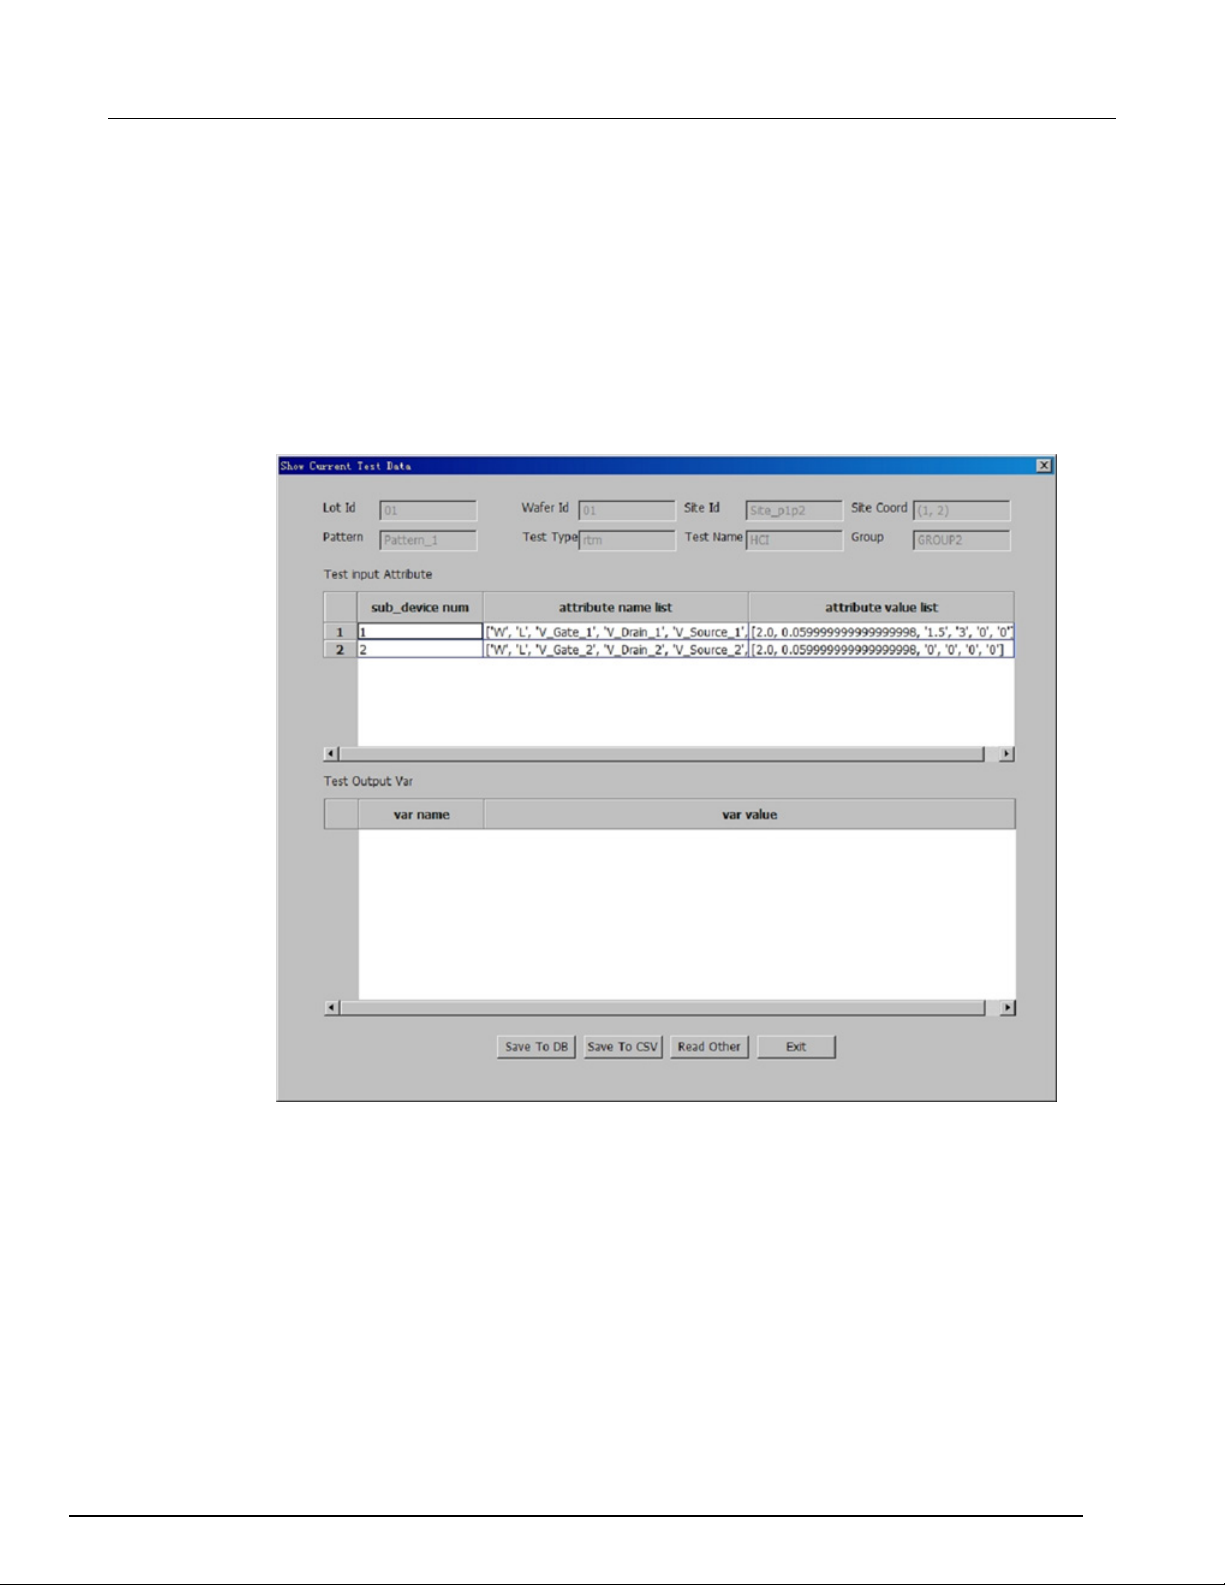
In addition, for the 2600-based RTM tests, ACS logs the data of the test running to a temporary file in
the following location: \ACS\Projects\<project name>\RTM_temp\ curdata_<date and time>.tmp. The
temporary file is used to log data in case the current test that is running stops inadvertently. ACS also
provides a tool to read the temporary file that will convert it to a .db or .csv file. The tool can be
accessed in the tool bar by going to Tools and select the Read Current Test Data in the drop-down
menu.
Figure 16: Show Current Test Data
Data analysis
Most of the 2600-based RTM tests are in accelerated conditions which are higher than normal
working conditions (for example, exceeding normal stress conditions). The data results will provide
statistical analysis regarding prediction time for a device to degrade or breakdown.
• The ACS software Statistics function is able to import a .kdf file for various statistical analysis.
The detailed description is in the ACS Reference manual (document nubmer: ACS-901-01).
• Keithley Instruments, Inc. provides a separate tool for statistical analysis that is named KDAT. For
more information, contact your local Keithley office.
ACS2600RTM-900-01 Rev. B / December 2012 1-19
Page 27

Data recording ........................................................................ 2-23
In this section:
Test principle ............................................................................ 2-1
Instrument connection .............................................................. 2-3
Test flow ................................................................................... 2-4
Settings .................................................................................... 2-6
Global variables ..................................................................... 2-15
Formulator .............................................................................. 2-16
Test principle
Hot carrier injection (HCI) is a process where high-lateral electrical fields in a MOSFET generate hot
carriers (high-energy electrons or holes) that can damage the MOS-gate-oxide interface and degrade
the device's current and voltage (I-V) characteristics. The threshold voltage of the MOSFET will
change over time due to HCI. The HCI test measures the change of the MOSFET parameters when
the device is under a voltage stress.
Section 2
HCI and NBTI
Negative bias temperature instability (NBTI) experienced by a p-channel MOSFET, which is thermally
activated, may affect the PMOS device reliability with the manifestation of increased threshold
voltage. The temperature of the DUT is usually controlled by a hot chuck on a probe station. The
electric test procedures of HCI and NBTI are identical. The Series 2600A and Series 2600
SourceMeters are used to implement the HCI/NBTI test.
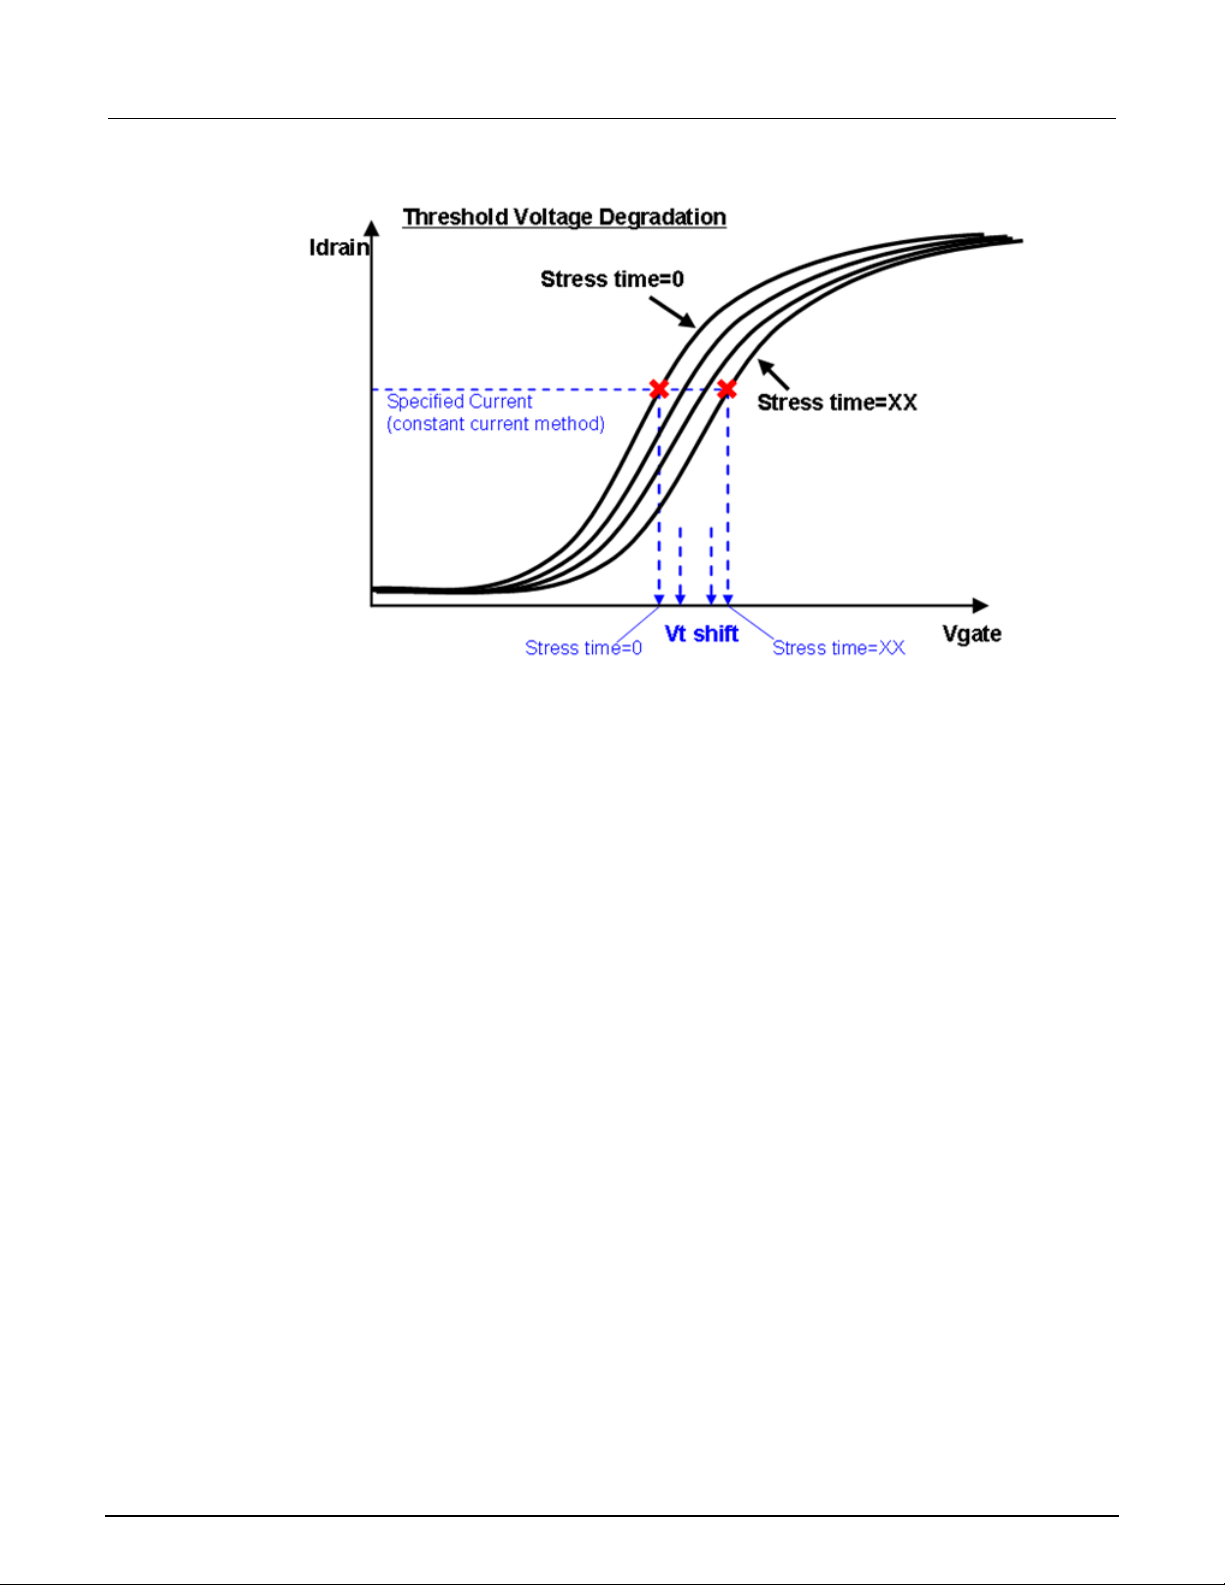
The next figure shows parameter changes to the MOSFET over stress time. For example, the
threshold voltage, which increases with the stress time, affects the MOSFET parameters.
Page 28
Section
2600 RTM User's Manual
2: HCI and NBTI ACS -
Figure 17: MOSFET threshold voltage
The HCI/NBTI test has three stages: pre-stress test, stress-measure sequence, and post-stress test.
The pre-stress test verifies the functionality of the device, the stress-measure sequence applies a
constant voltage stress to the device and measures the parameter changes. And the post-stress test
characterizes the device after the stress stage. The stress-measure sequence has two phases: stress
phase and measure phase.
2-2 ACS2600RTM-900-01 Rev. B / December 2012
Page 29
ACS
HCI and NBTI
- 2600 RTM User's Manual Section 2:
Instrument connection
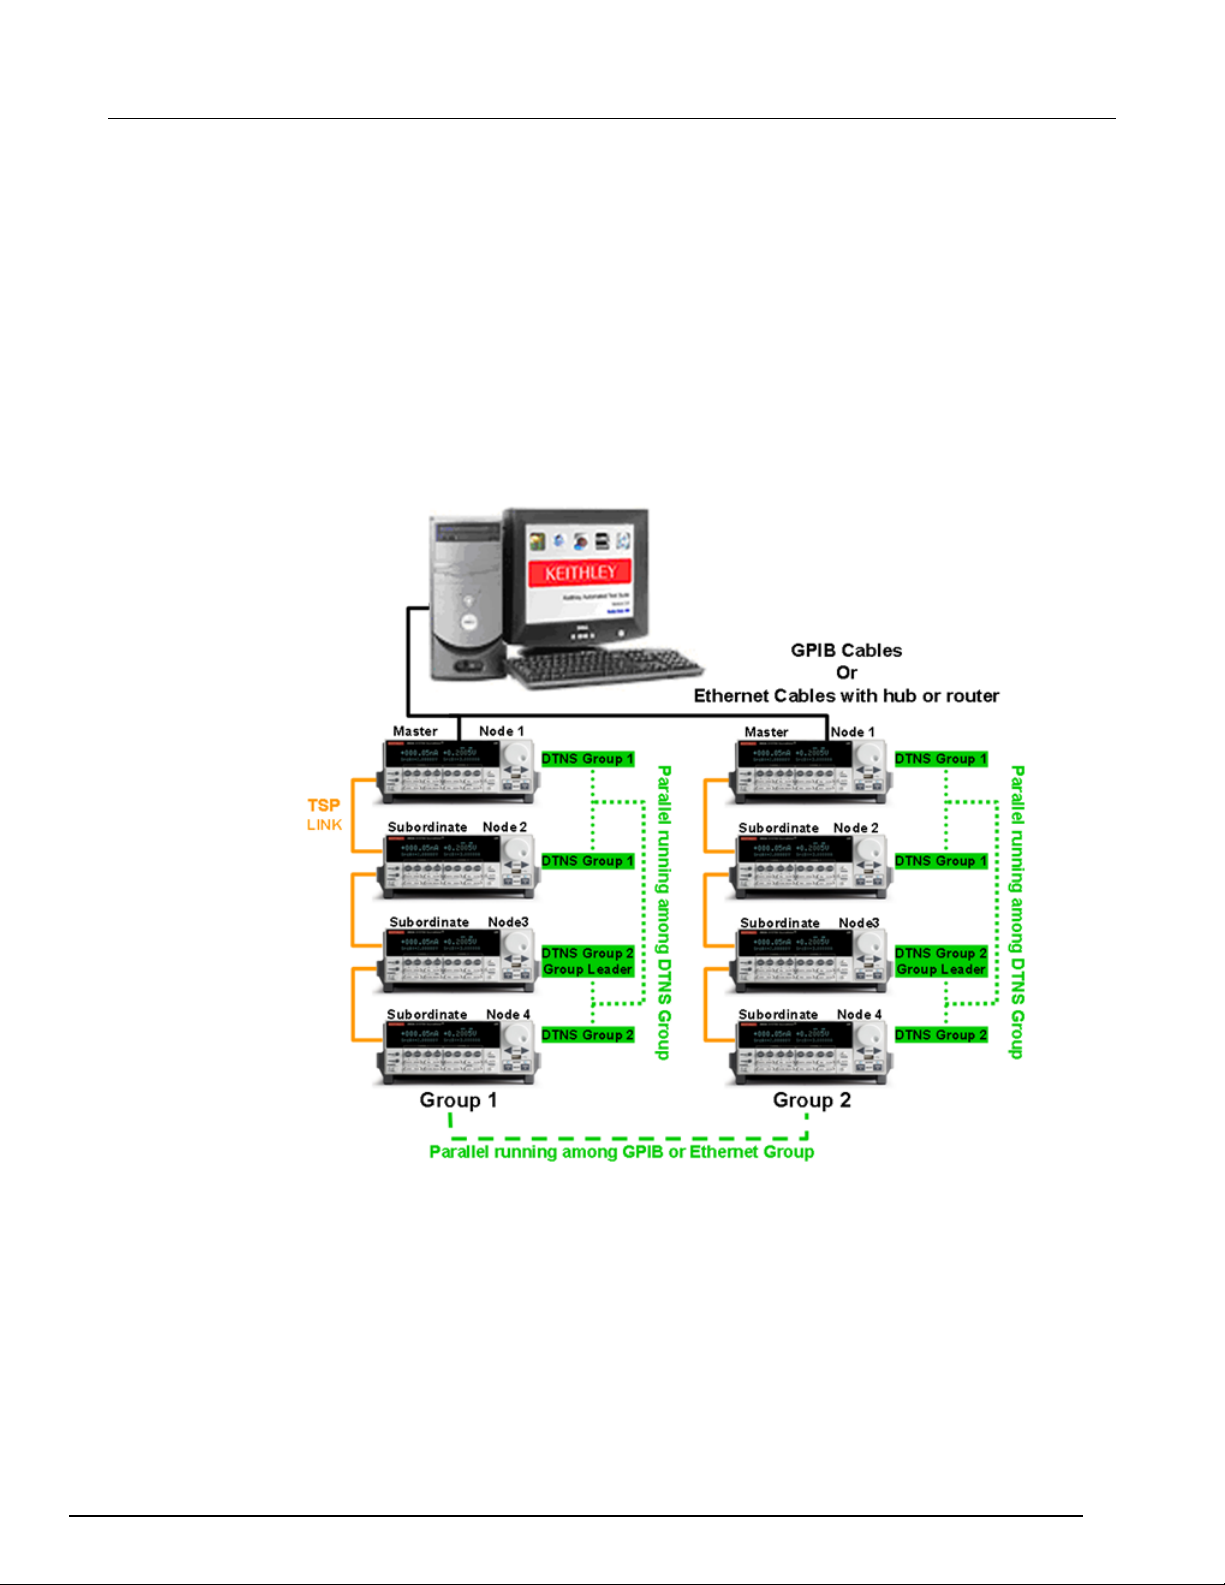
The HCI/NBTI test uses the Series 2600B or Series 2600 SourceMeters. Multiple SourceMeters can
be arranged in multiple groups (GPIB or Ethernet) to allow for parallel testing. Within each group, you
can also setup multiple sub-devices for sequential or parallel testing. With the parallel testing, each
sub-device is set as a sub-group (DTNS Group). The SourceMeters in a connection scheme must
have the same firmware. The 2600B SourceMeters and the 2600 SourceMeters (for instance, the A
and non-A versions) cannot be used together. A typical connection scheme is shown in the next
figure. A typical connection scheme is below (two GPIB or Ethernet Groups [Group 1 and 2], each
Group has 3 instruments, Node 1 [Master] and 2 are set DTNS group 1 [sub-group 1], Node 3 and 4
are set DTNS group 2 [sub-group 2]):
Figure 18: A typical instrument connection scheme
ACS2600RTM-900-01 Rev. B / December 2012 2-3
Page 30
Section
nual
2: HCI and NBTI ACS - 2600 RTM User's Ma
Test flow
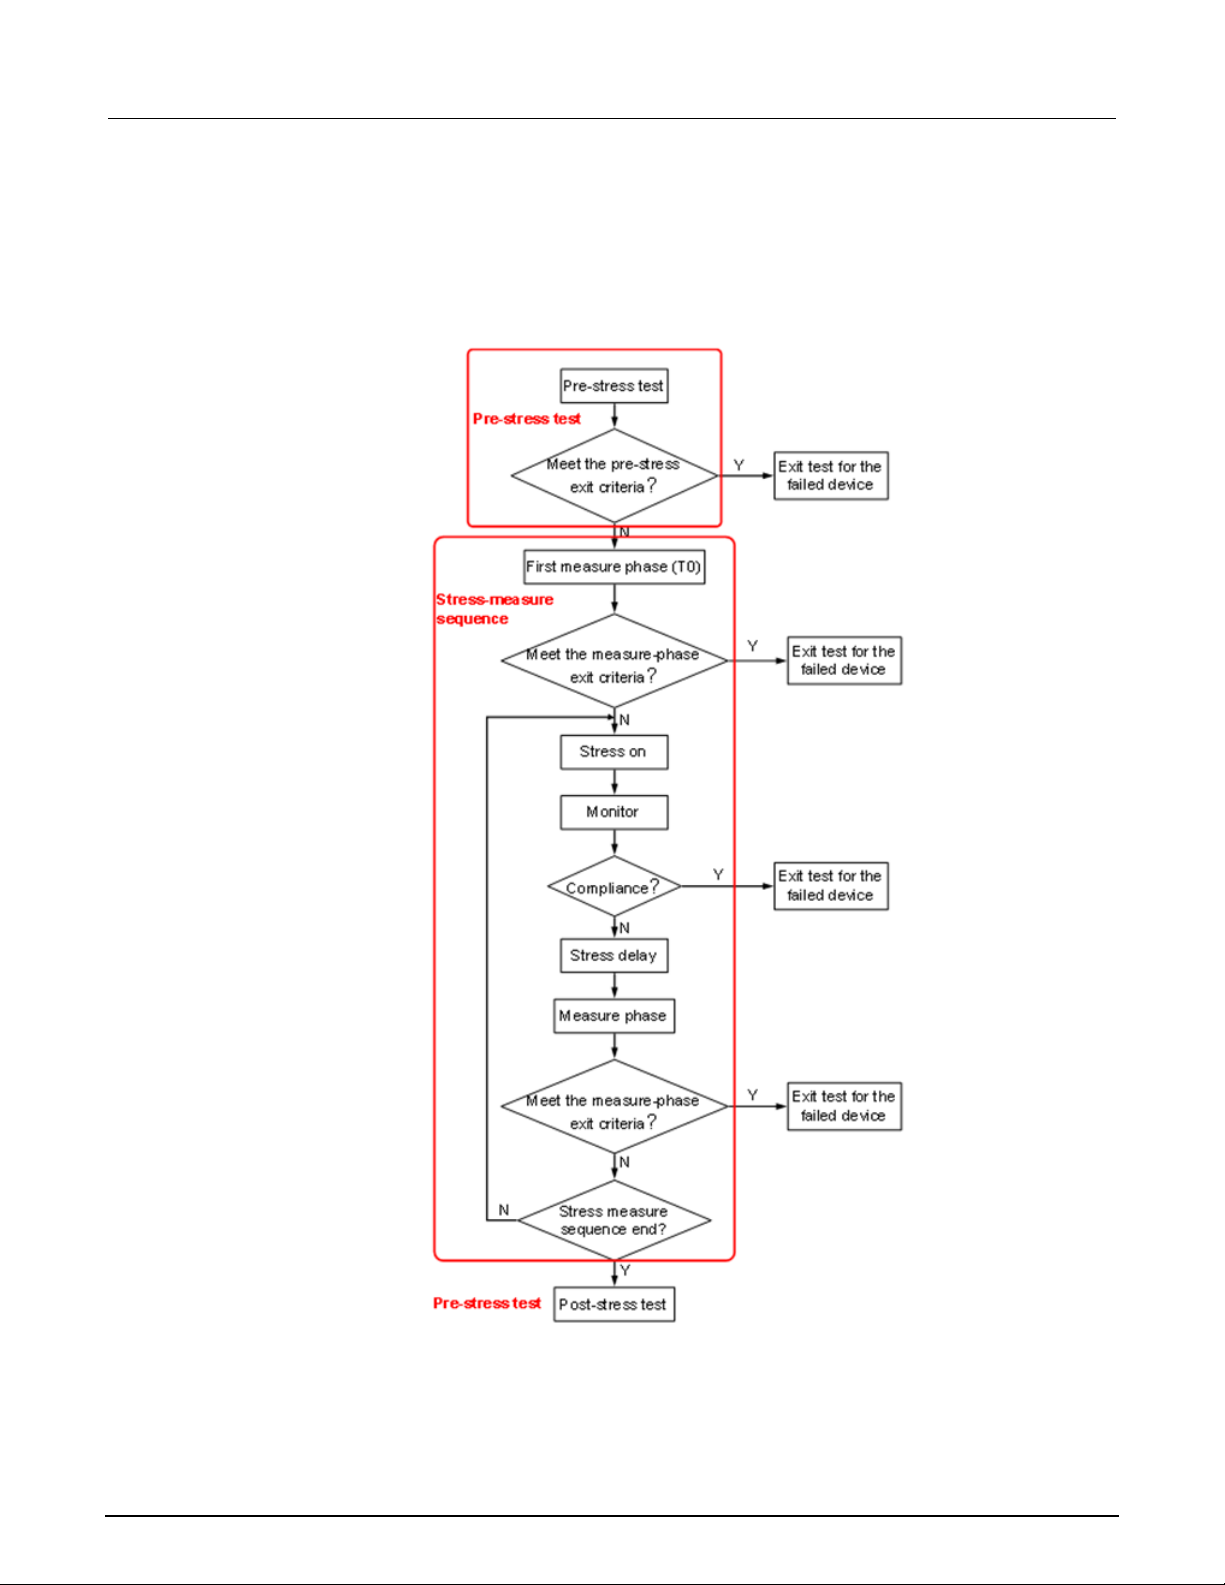
The HCI/NBTI test flow is based on the following P-Channel MOSFET procedures and standards:
JESD90, JESD60A, JESD28-A. The integrated test flow is shown in the next figure:
Figure 19: Test flow of HCI_NBTI test
2-4 ACS2600RTM-900-01 Rev. B / December 2012
Page 31

ACS
HCI and NBTI
- 2600 RTM User's Manual Section 2:
The Pre-Stress Tests are used to verify the characteristics of the device, and are used to select the
"good" device for the next test.
The stress-measure sequence is the main loop of the HCI/NBTI test. It will apply voltage stress to the
device, and extract the device parameter changes.
The Post-Stress Tests are used to verify the characteristics of the device after the HCI/NBTI test.
The waveform of the HCI/NBTI test is in the next figure:
Figure 20: Waveform diagram of HCI_NBTI
ACS2600RTM-900-01 Rev. B / December 2012 2-5
Page 32
Section
2600 RTM User's Manual
2: HCI and NBTI ACS -
Settings
Several device types can be selected in the device level of the test tree. For a single device, only the
nMOSFET and pMOSFET are meaningful. For multiple devices, in the CUSTOM option, the following
device types for the HCI/NBTI are available: 20term_dev; 24pin_6dev; 25pin_8dev; 25term_dev;
nmos_2 device. Some of the device types have common terminals (that is, they have a common
gate).
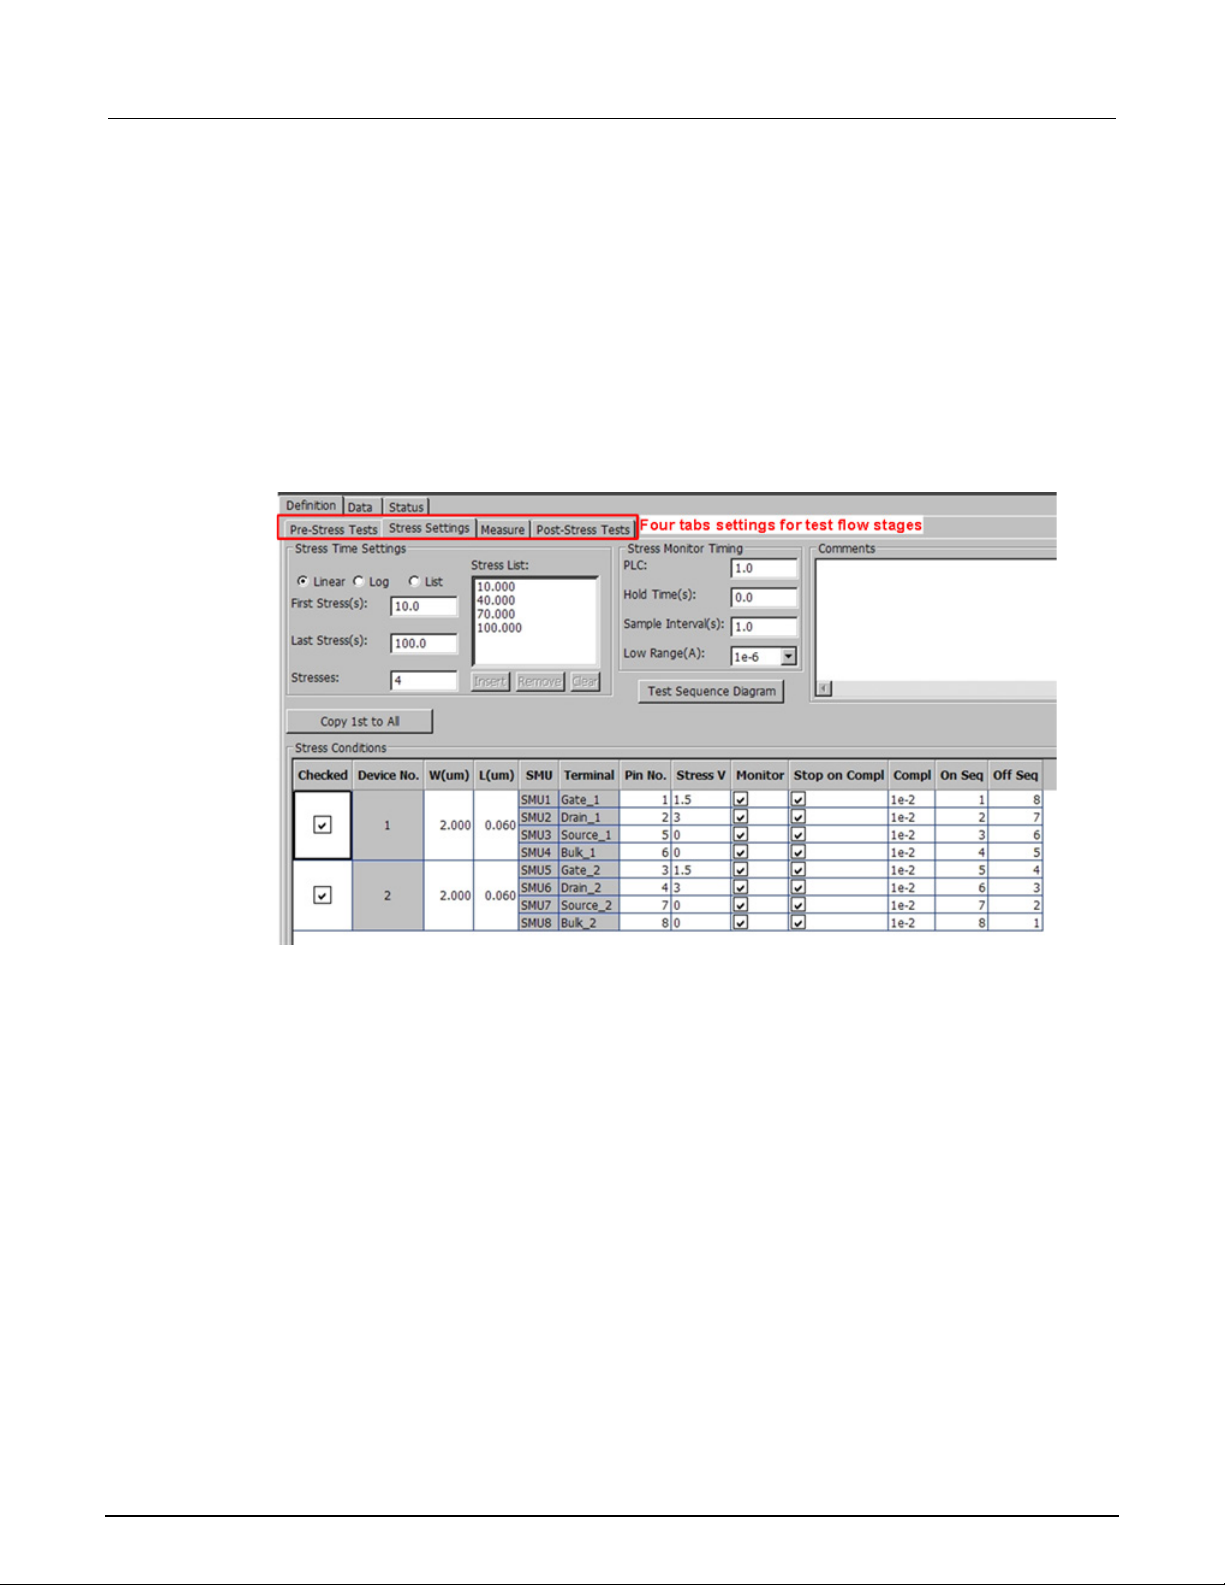
You can add an HCI/NBTI test under the specified device. The GUI for the HCI/NBTI test is as shown
in the next figure. The GUI settings consist of four tabs: Pre-Stress Tests; Stress Settings; Measure;
Post-Stress Tests.
Figure 21: GUI settings for HCI_NBTI test
2-6 ACS2600RTM-900-01 Rev. B / December 2012
Page 33
ACS
HCI and NBTI
- 2600 RTM User's Manual Section 2:
Pre-Stress Tests settings
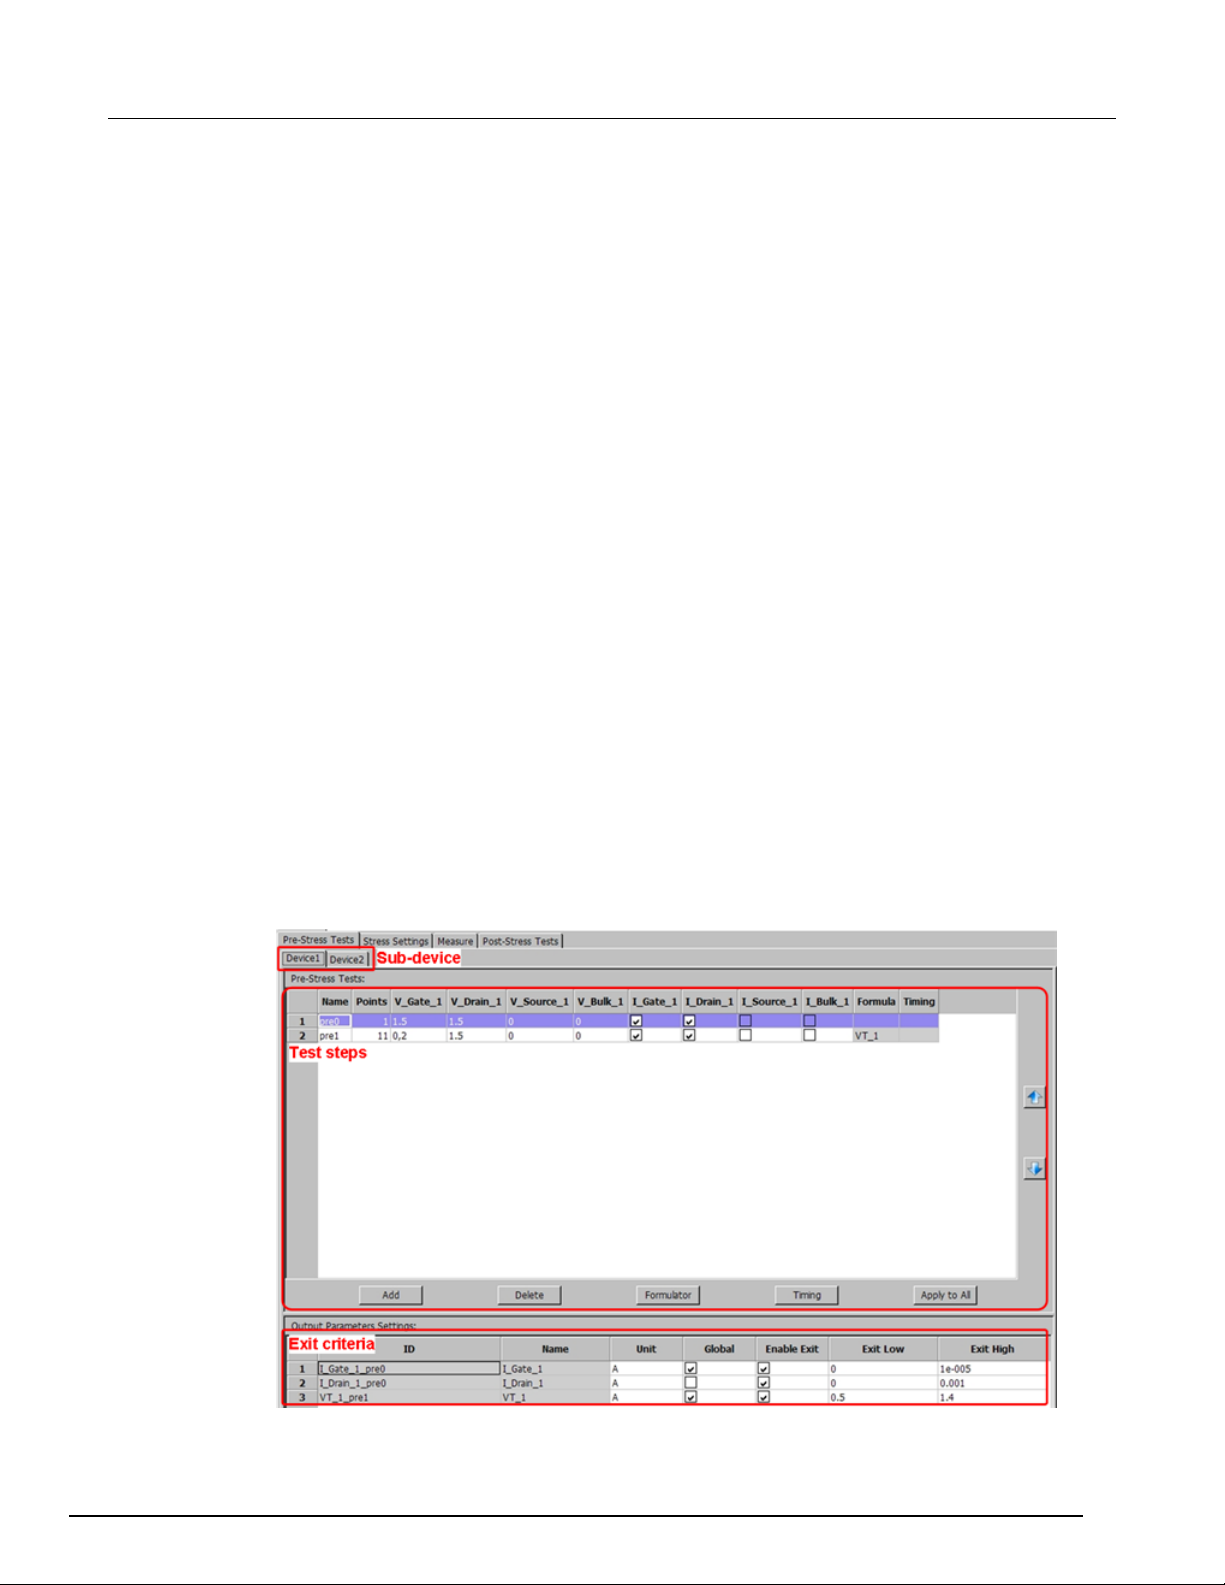
The Pre-Stress Tests tab is where you setup test steps in the pre-stress stage. In this stage, all of the
test steps are executed sequentially.
There are five functions at the bottom of the GUI, and there are two functions on the right side.
Add: adds one test step at a time.
Delete: deletes one test step at a time.
Formulator: edits the formula of the selected test step.
Timing: edits the timing of the selected test step.
Apply to All: applies the current settings to all of the sub-devices.
Up and down arrows: move the selected test step up or down as needed.
In the Pre-Stress Tests parameters, you can make changes as needed:
A. Points: the amount of data points measured. For a sample test, it is one or more than one (log
the average value). For a sweep, it must be more than one.
B. V_<pad>: set the bias voltage to the specific pad, the unit is volt (for example, V_Gate_1 is 1.5,
apply 1.5V bias to Gate_1 pad). If the test is a sweep test, the setting value should be two values
separated by a comma (for example, 0,2). This indicates the sweep start voltage is 0, and the
stop voltage is 2. Also, the global variable can be set as an input.
C. I_<pad>: select to measure the current of the specific pad, the unit is amp.
D. Formula: double click the cell to open a dialog box for adding formulas, which extract parameters
from the forcing values and measured values.
E. Timing: double click the cell to open a dialog box for the timing settings.
The Pre-Stress Tests setting tab is shown in the next figure. Each sub-device has its own tab for the
Pre-Stress Test settings. The sub-device is defined at the device level of the Test tree.
Figure 22: GUI settings for the sub-device
ACS2600RTM-900-01 Rev. B / December 2012 2-7
Page 34
Section
2600 RTM User's Manual
2: HCI and NBTI ACS -
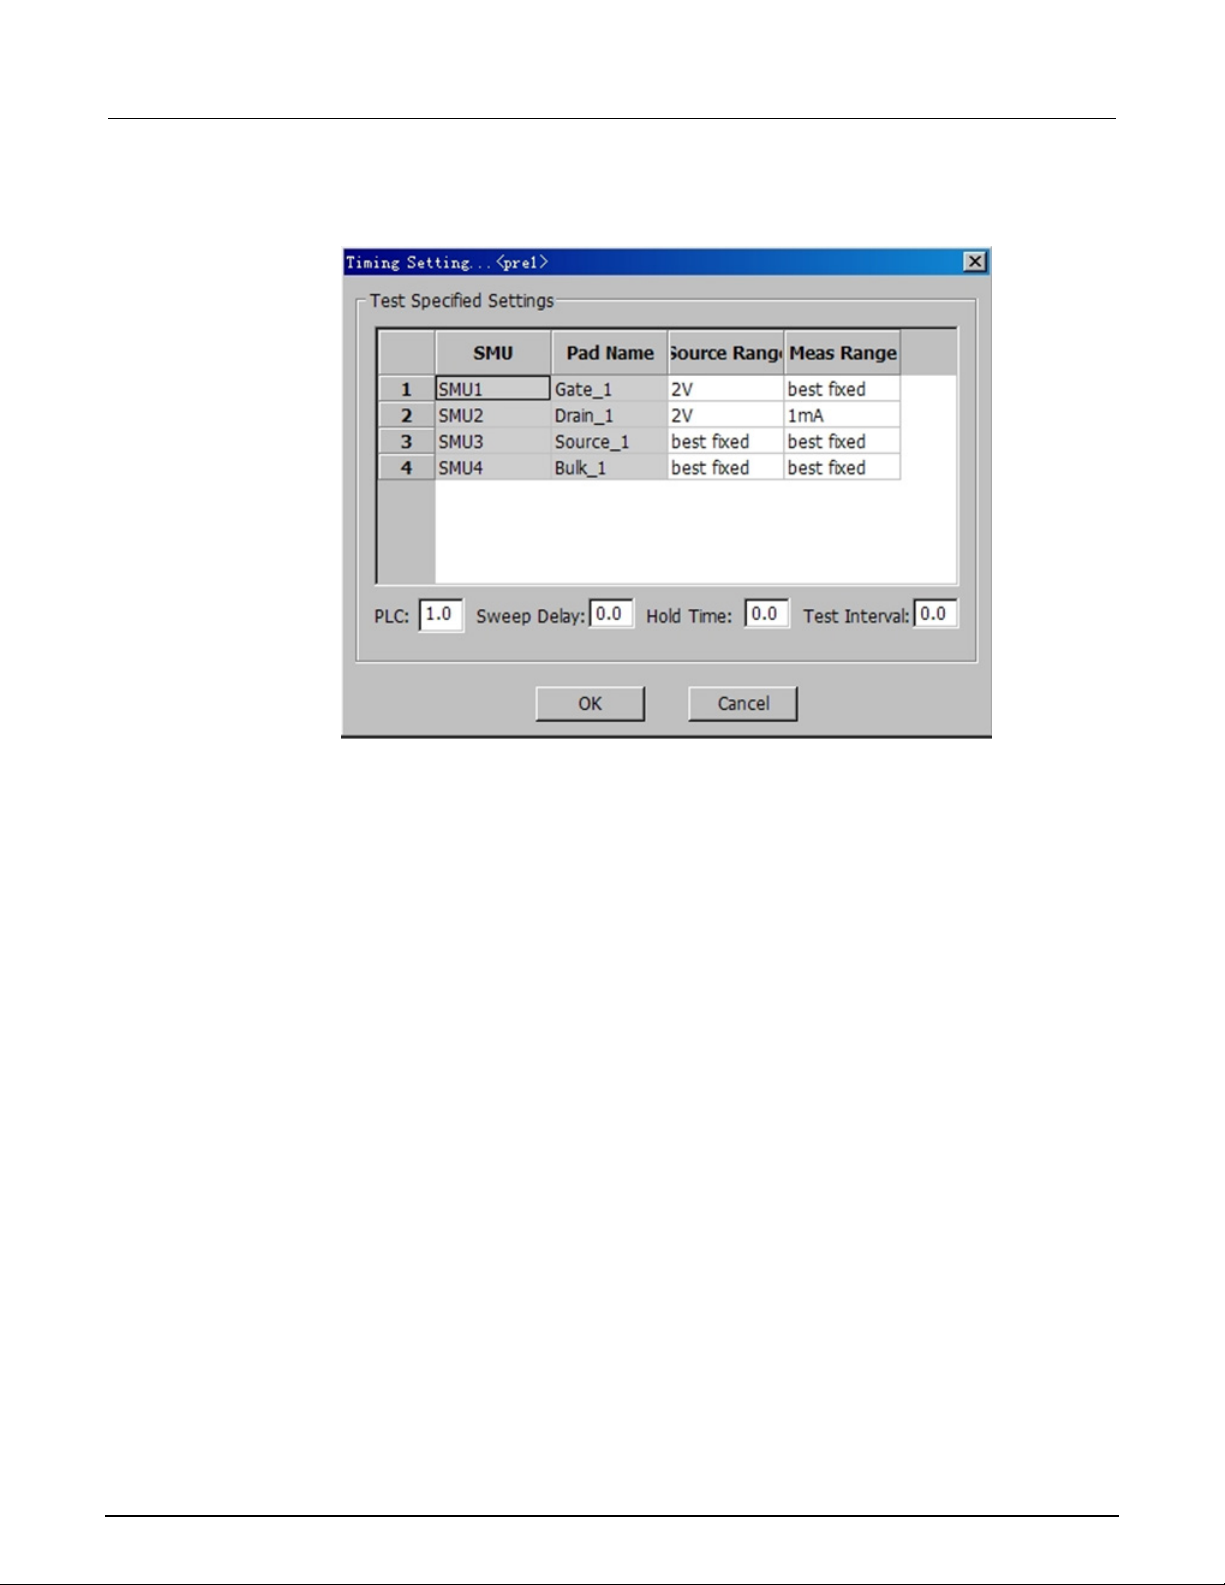
You can configure the timing settings in the Time Setting dialog box as shown in the following figure.
Figure 23: Timing Setting
2-8 ACS2600RTM-900-01 Rev. B / December 2012
Page 35
ACS
HCI and NBTI
- 2600 RTM User's Manual Section 2:
The Timing Setting parameters descriptions:
• Source Range: sets the voltage source range to auto, best fixed, or a fixed range.
• Best fixed: sets the source range to a (force voltage)×1.01 in a sample test, or the (highest sweep
voltage absolute value)×1.01 in a sweep test.
• Meas Range: sets the current measure range to auto, best fixed, or a fixed range.
• Best fixed: sets the measure range to auto range in a sample test; Or, it sets the (highest current
absolute value)×1.01 in a sweep test. The highest current is measured by forcing the highest voltage in
the sweep prior to the sweep test. This will introduce a "trial test" before the sweep to find the "best
fixed" measure range.
• PLC: power line cycle; 0.001~25.
• Sweep Delay: delay time between sweep points.
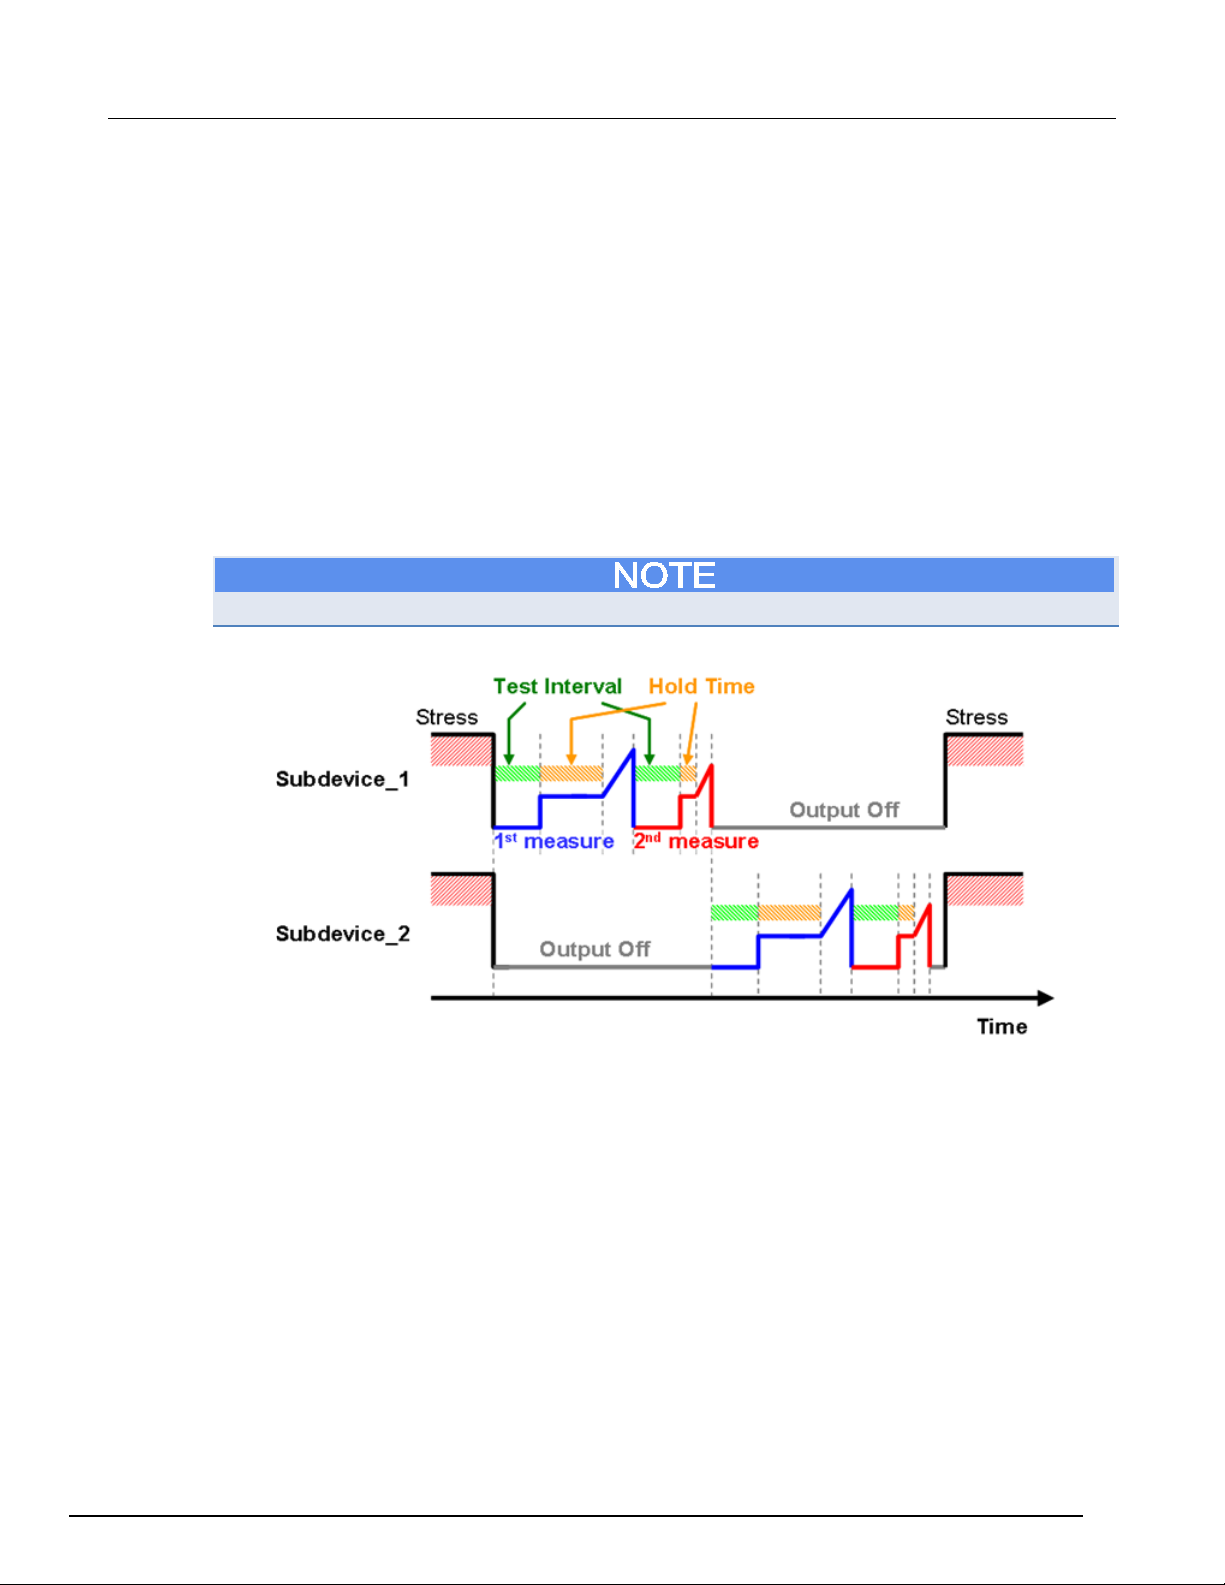
• Hold Time: hold time before the sweep.
• Test Interval: delay time before this test step.
If you set the Source Range and the Meas Range to a fixed range, it will increase the sweep speed.
Figure 24: Measure sequence diagram
ACS2600RTM-900-01 Rev. B / December 2012 2-9
Page 36
Section
2600 RTM User's Manual
2: HCI and NBTI ACS -
Output Parameter Settings
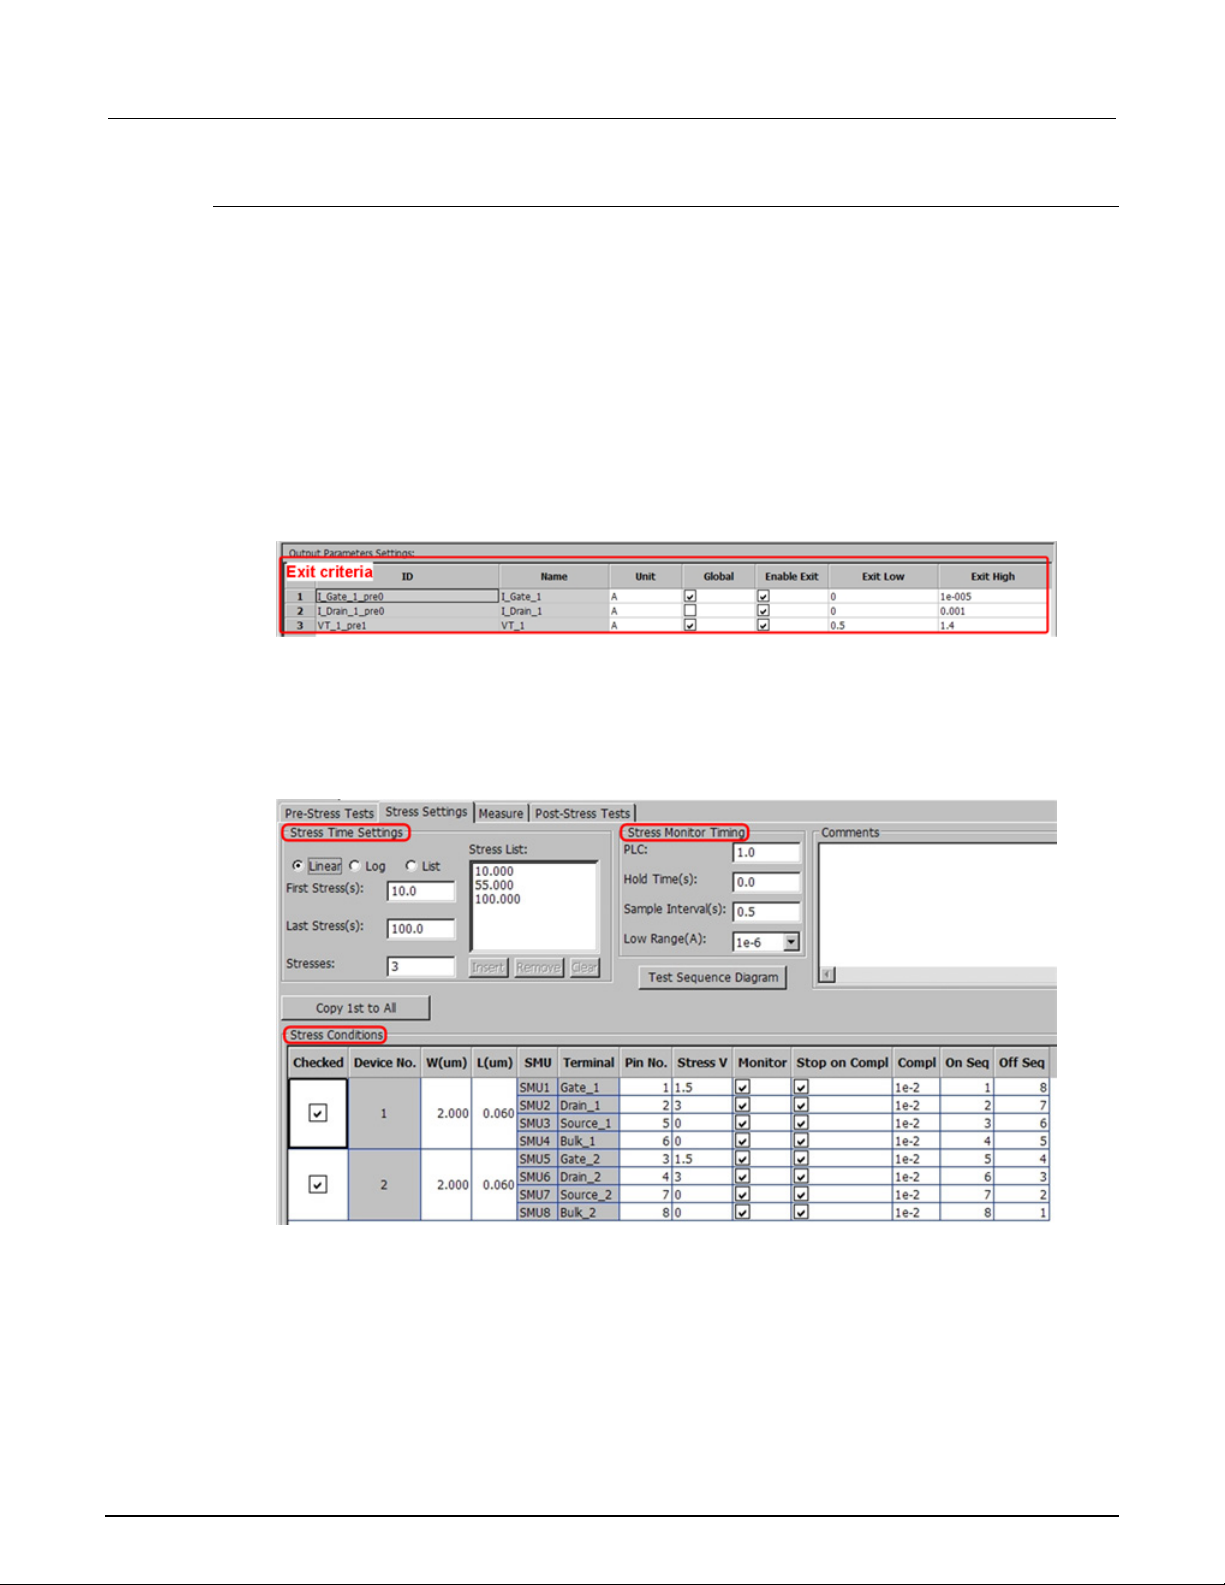
In the Output Parameters Settings of the Pre-Stress Tests tab, the GUI is used to setup the exit
criteria for the measured parameter or calculations from a formula (see the next figure).
• Global: select this option to set the parameter to a global variable, which can be used in the other
settings.
• Enable Exit: select this option to enable the exit criteria based on the Exit Low and/or the Exit
High parameters.
• Exit Low: the minimum value for the parameter. If the device is below the minimum value, the test
for this device will end.
• Exit High: the maximum value for the parameter. If the device exceeds the limit, the test for this
device will end.
Figure 25: Output Parameters Settings (exit criterai)
Stress settings
The Stress Settings tab is used to setup the Stress Time Setting, Stress Monitor Timing, and the
Stress Conditions (see next figure).
Figure 26: Stress Settings GUI
2-10 ACS2600RTM-900-01 Rev. B / December 2012
Page 37
ACS
HCI and NBTI
- 2600 RTM User's Manual Section 2:
Stress time settings
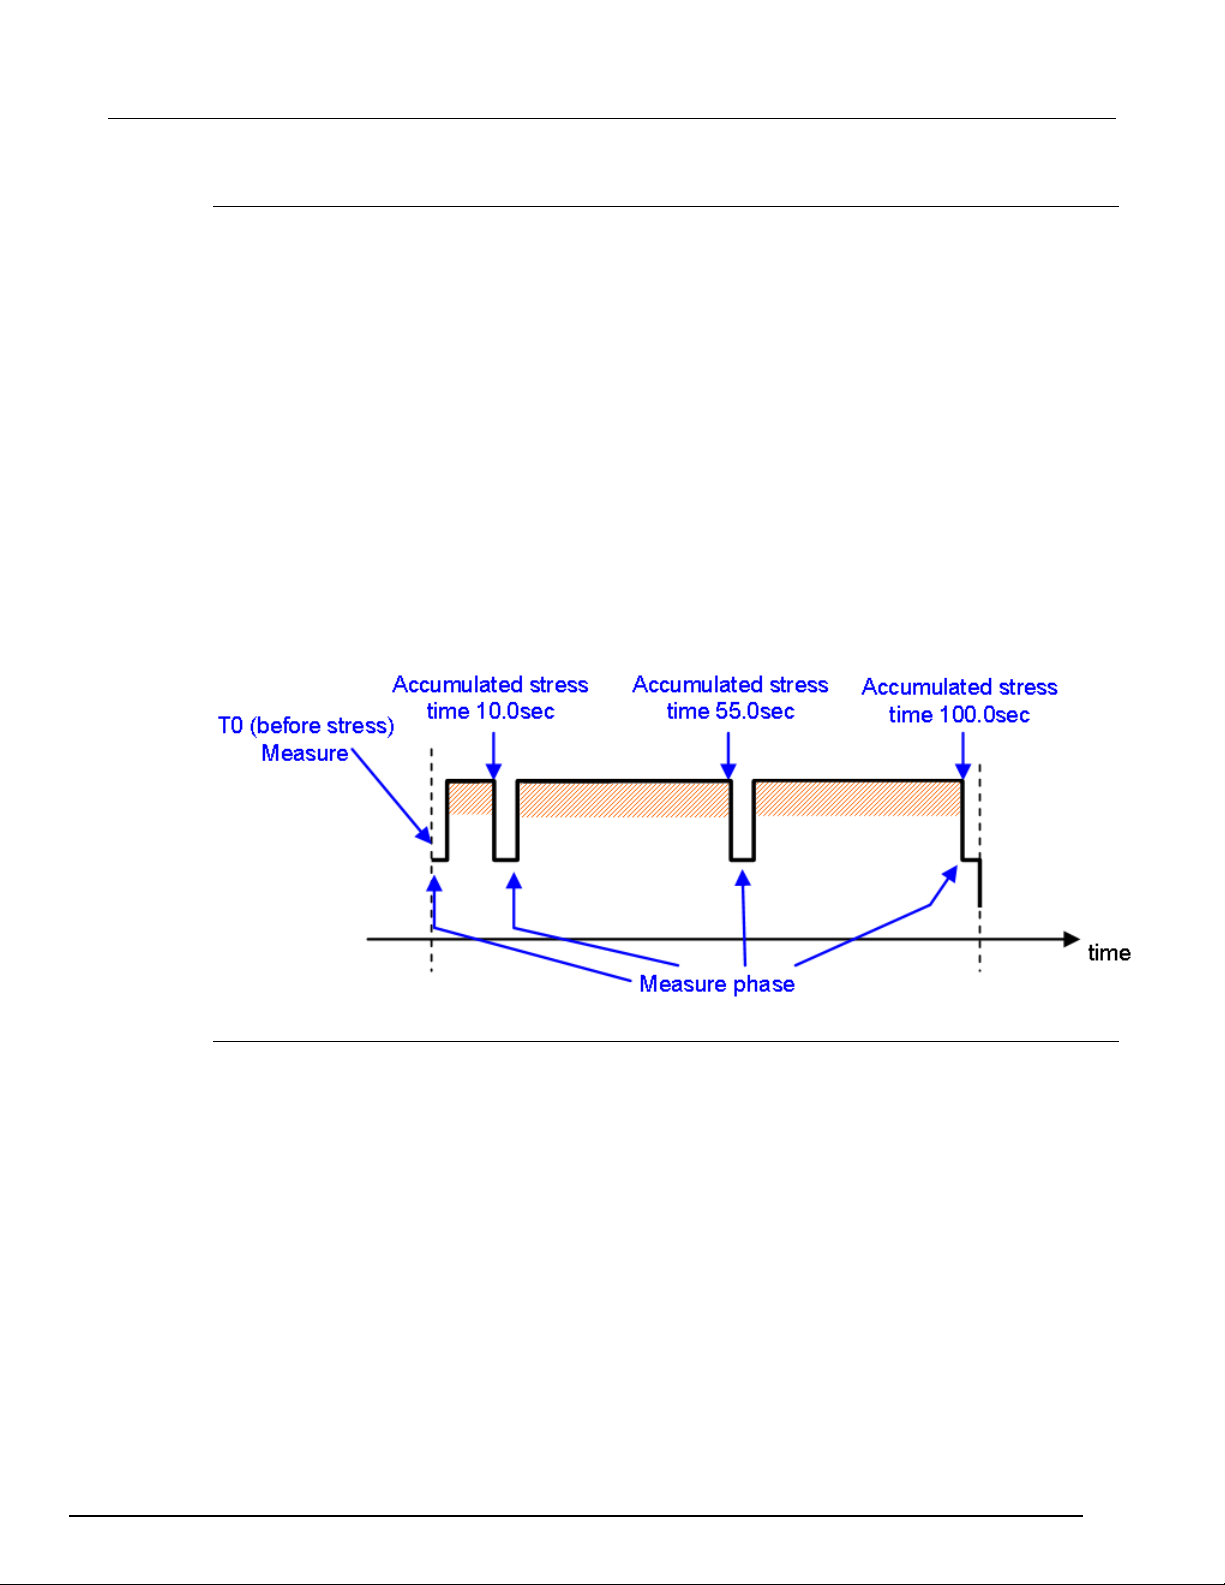
The Stress Time Settings GUI is used to setup the timing of stress-measure sequence, which
indicates each stress period during the stress phase.
Linear: the stress list is a linear distribution, and indicates the total number of stresses. The values
are automatically generated using the First Stress and Last Stress.
Log: the log data is indicated in the Stress List distribution, and the number of values in the list is
indicated in each decade of the Stresses/Decade. The values are automatically generated using the
First Stress, Last Stress, and Stresses data.
List: you can specify the individual stress times in this area. The list is edited by using the Insert,
Remove, and Clear functions.
First Stress(s): the period of time that the first stress phase lasts.
Last Stress(s): the total time for the stress phase (all the values in the stress list).
Stresses or Stresses/Decade: the points of the linear stress list, or the points per decade of the log
stress list.
Stress List: lists all of the stress times (see the next figure):
Figure 27: Stress-measure sequence waveform
Stress monitor timing
The Stress Monitor Timing is the measurement of current during the stress phase. Each stress phase
has stress monitor timing.
PLC: power line cycle; 0.001~25.
Hold Time(s): when stress is enabled, the voltage will hold the setting time before monitoring.
Sample Interval(s): during the stress phase after monitoring, the compliance of the device is checked
during the sample interval as long as the "Stop on Compl" is selected in the Stress Conditions section
of the tab.
ACS2600RTM-900-01 Rev. B / December 2012 2-11
Low Range(A): the lowest current measure range that will be used in auto ranging.
Page 38

Section
2600 RTM User's Manual
2: HCI and NBTI ACS -
Stress conditions
The Stress Conditions section for the stress setup lists all of the devices and SMUs that are assigned
in the device level of the test tree.
Device No.: the device SMU and Terminal are all set at the device level.
W(um) and L(um): these are MOSFET device dimensions. The W and L are set at the device level,
and are not available for editing here. If they are under multiple-devices (more than one sub-device),
W and L can be edited. Note that W and L can be used as variables in formulas.
Stress V: the stress voltage set for the pad during the stress phase.
Monitor: monitors the current of this pad.
Stop on Compl: select if you want the test to determine if the device branch on the pad is in
compliance. If in compliance, the test for the device will exit.
Compl: sets the compliance value (unit is amps).
On Seq: sets the sequence that the SMUs apply to the stress voltage. The sequence of one SMU
must vary from others.
Off Seq: sets the sequence that the SMUs turn off the stress voltage. The sequence of one SMU
must vary from others.
The On Seq and Off Seq: enable the SMU output to turn on or off on in a certain sequence for a
special device. For example, if depletion-mode for an nMOSFET should be applied, a negative
voltage on the gate first will set the device to off.
The Copy 1st to All function is used to copy the settings of the first sub-device to all of the other subdevices.
2-12 ACS2600RTM-900-01 Rev. B / December 2012
Page 39
ACS
HCI and NBTI
- 2600 RTM User's Manual Section 2:
Measure settings
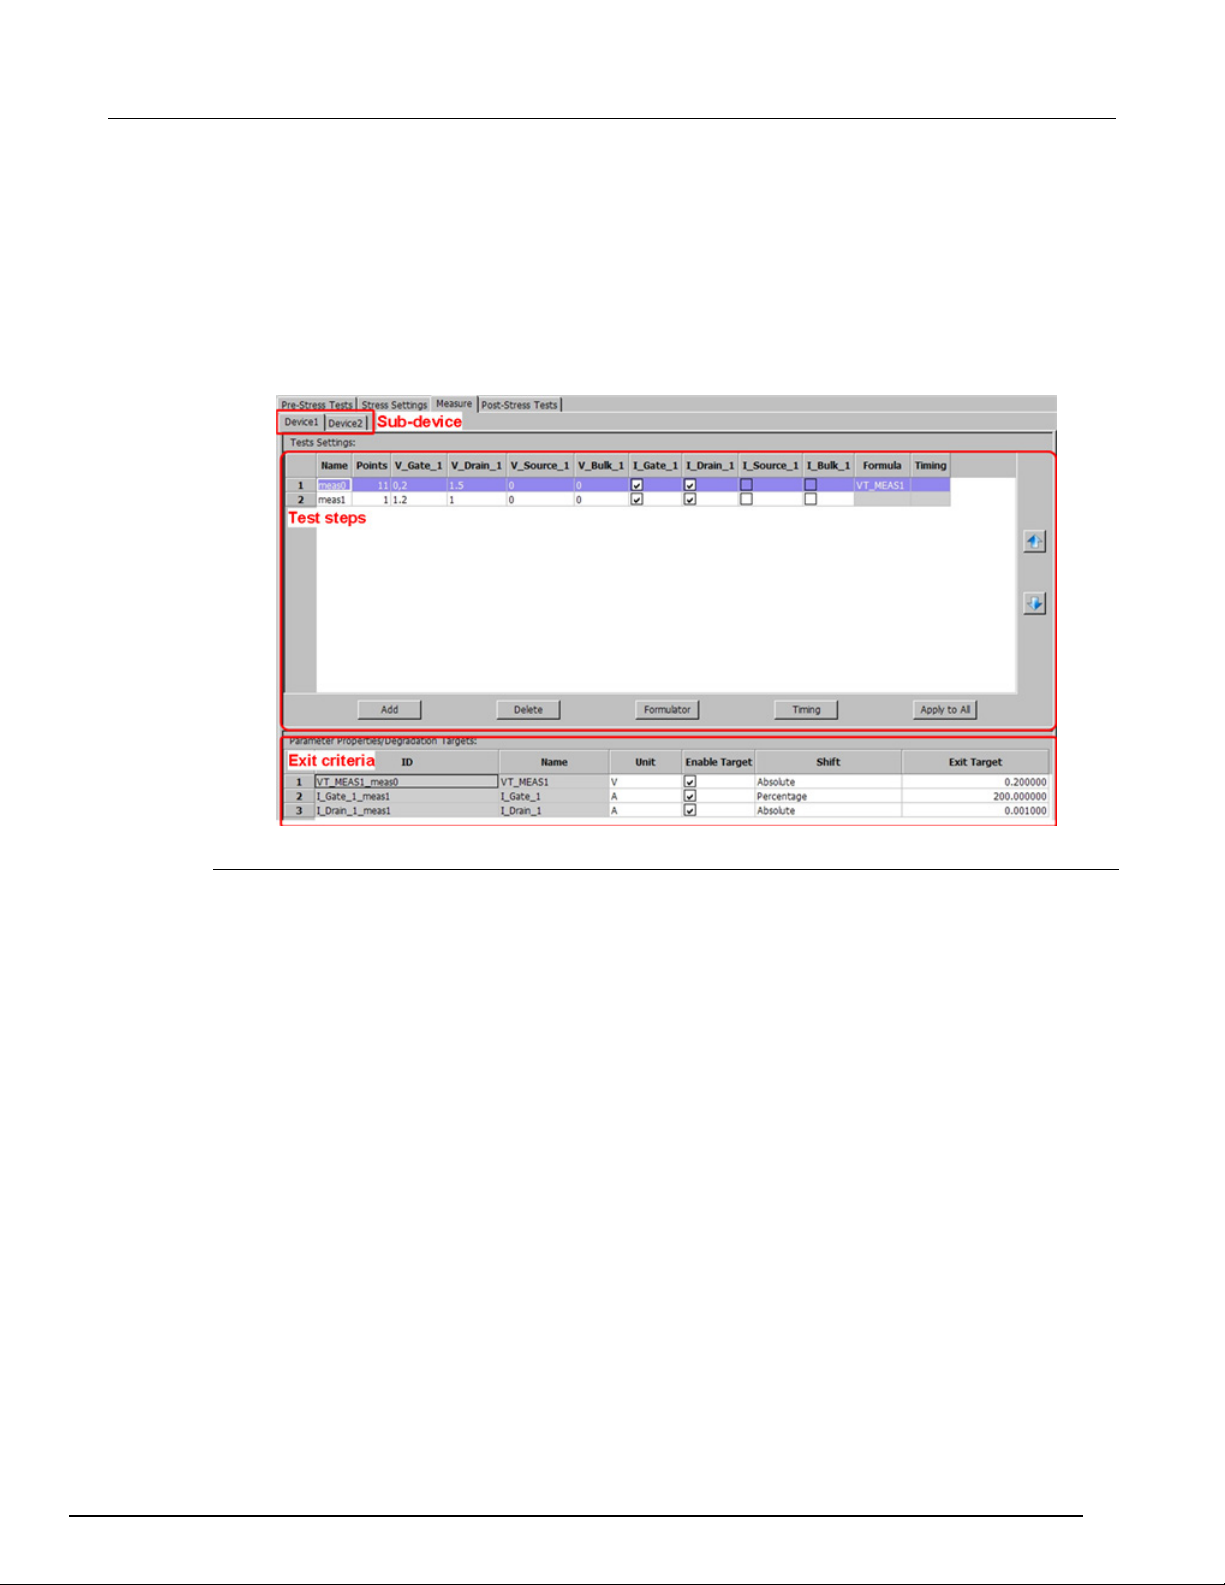
The Measure tab is used to setup the measure phase test steps and the exit criteria.
Note that each tab has settings for the related sub-device.
The Measure settings tab contains similar settings as the Pre-Stress Tests tab. Refer to the
description of the Pre-Stress Tests for details.
Figure 28: Measure phase settings
Parameter properties/degradation targets
This GUI is used to setup the exit criteria for the measured or calculated parameters. The parameter
change will be tracked after each stress phase, and if the parameter shifts to a target level, the test
for the device will exit.
Enable Target: select this option to enable the parameter to exit device testing, if the parameters are
reached.
Shift: select the method to determine what triggers an end to device testing (an absolute value or a
percentage of a value).
Exit Target: absolute value shift from the reference value or a percentage shift from the reference
value.
The reference value is the parameter measured or calculated in the first measure phase. For
example, in the previous figure, the "VT_MEAS1_meas0" parameter is set to "Absolute" and the Exit
Target is 0.2. If the difference (absolute value) between "VT_MEAS1_meas0" in the current measure
phase and T0 measure phase is more than 0.2V, the test for the device will exit.
Post-Stress Tests
The Post-Stress Tests tab is used to setup the post-stress stage. The GUI is similar to the Pre-Stress
Tests. Refer to Pre-Stress Tests for more a more detailed description. The only difference is that
there is no exit criteria setting for parameters on the Post-Stress Tests tab.
ACS2600RTM-900-01 Rev. B / December 2012 2-13
Page 40
Section
2600 RTM User's Manual
2: HCI and NBTI ACS -
Preference settings
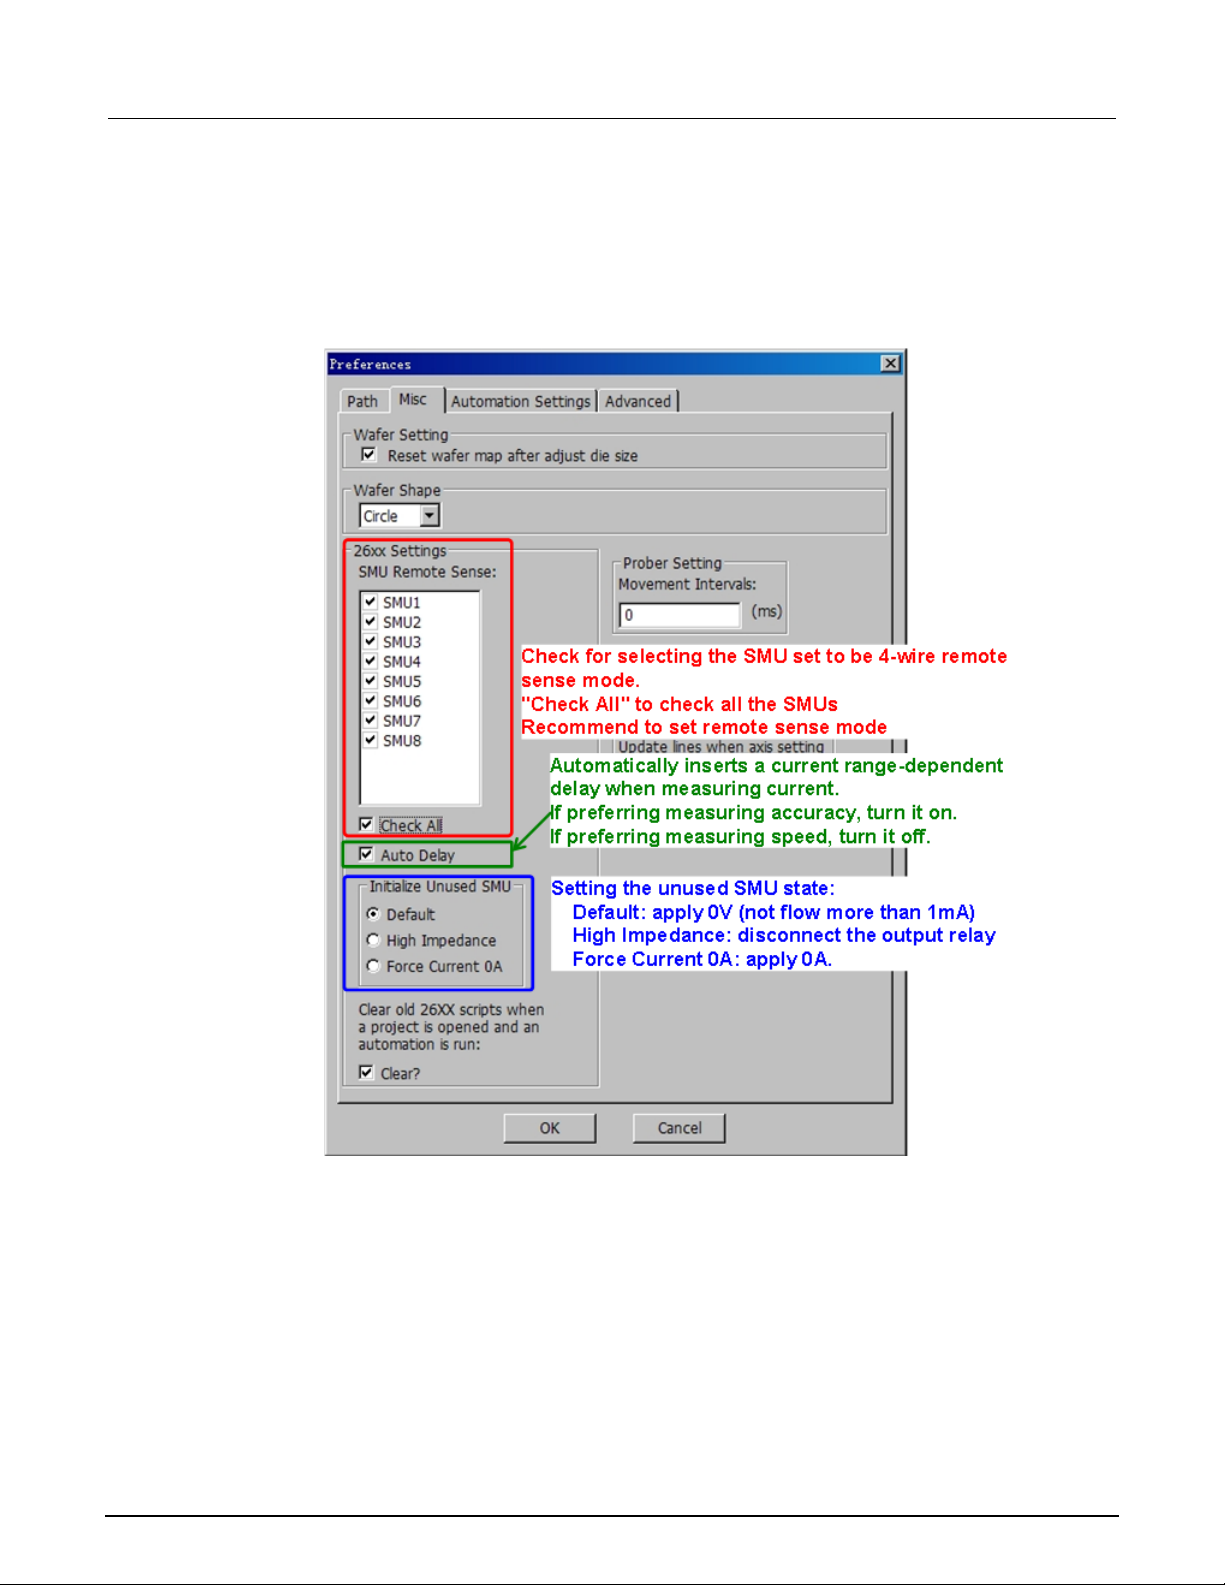
If you want to configure and enable the tests for running the HCI/NBTI that affect the test
performance, you will have to open Preferences in the Tools drop-down menu and go to the Misc tab
(see next figure).
Figure 29: Preferences settings for HCI_NBTI
2-14 ACS2600RTM-900-01 Rev. B / December 2012
Page 41
ACS
NBTI
- 2600 RTM User's Manual Section 2: HCI and
Global variables
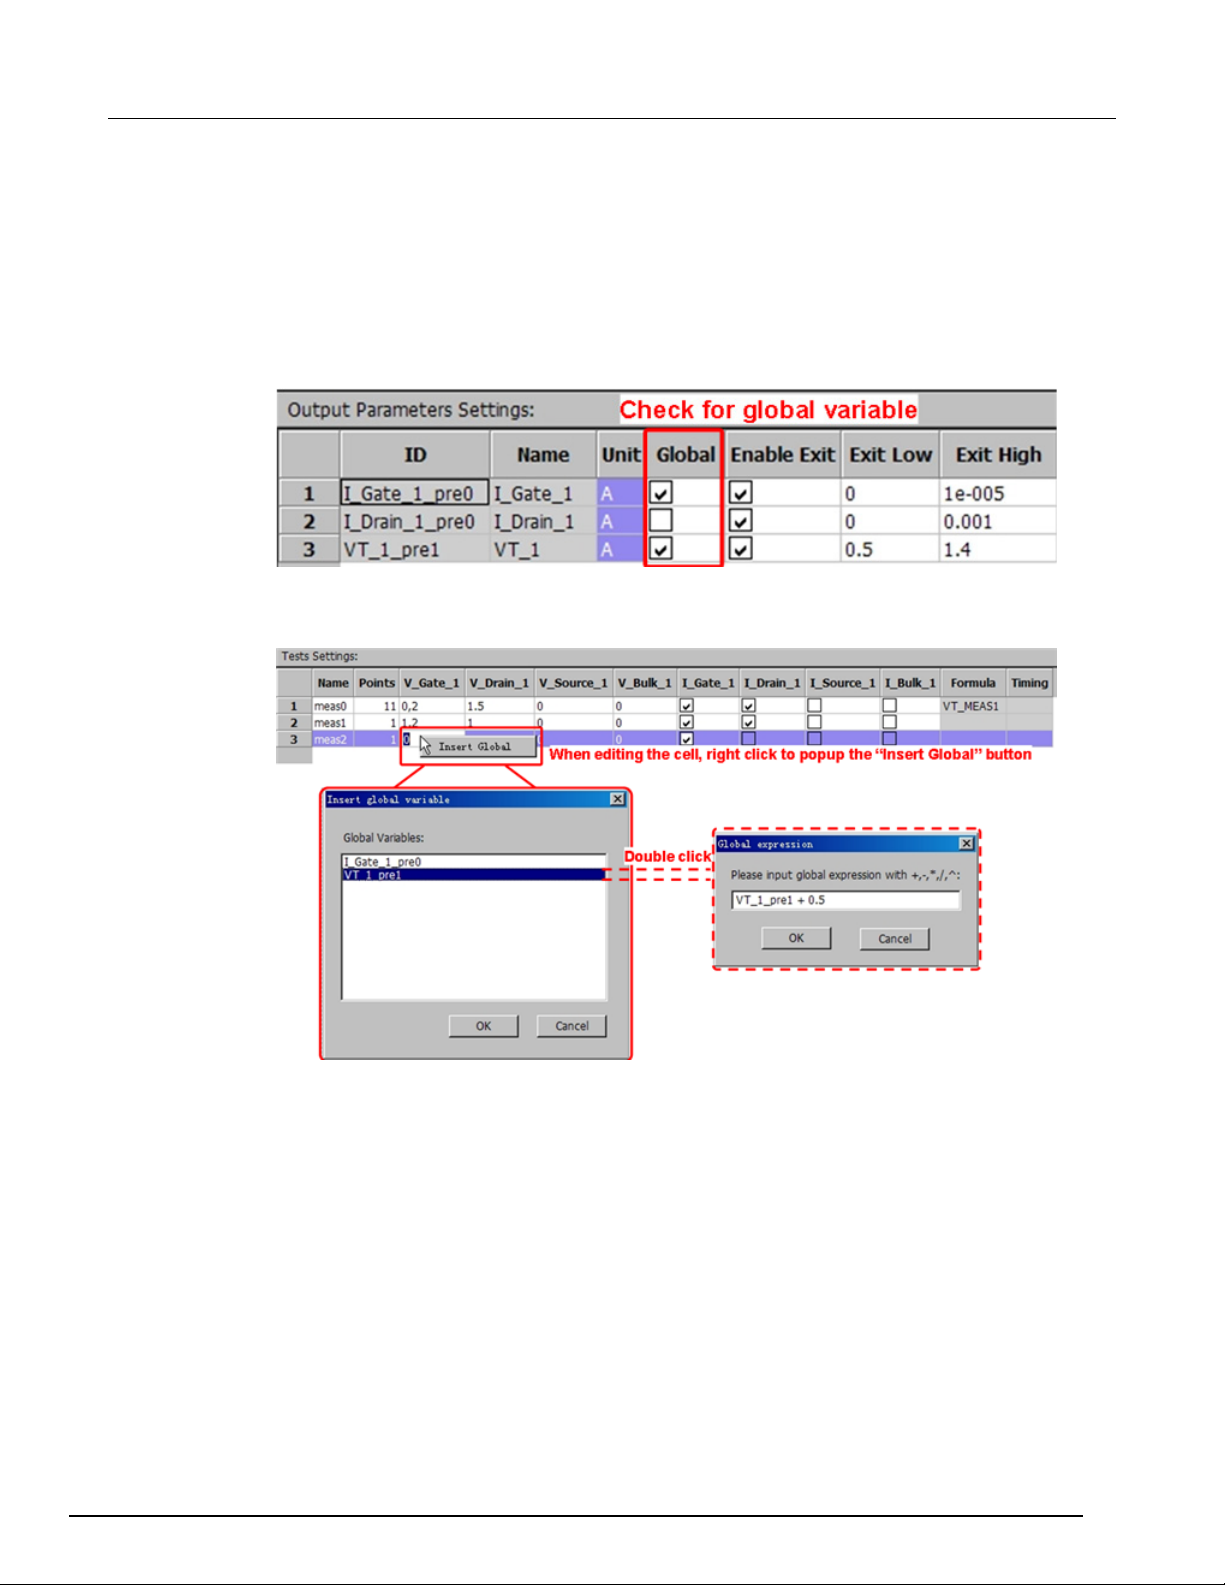
In the pre-stress and post-stress stages, a measured or calculated parameter can be set as a global
variable. These global varibales can be used as input values in the pre-stress test steps, measure
phase, and post-stress. For example, in the Pre-Stress Tests settings, select the Global option to
make it a global variable (see next figure).
Once a global variable has been set, it can be used as input (see next figure).
Figure 30: The Global variable
Figure 31: Insert a global variable
If you want to edit the "V_Gate_1" cell, right click the cell and you will see the "Insert Global" function.
Click the Insert Global function and the Insert global variable dialog box opens. You can select the
variable that is needed by double clicking it (for example, that VT_1_pre1). When you double click the
variable, it will open another dialog box. In this box you can edit the expression (for example,
VT_1_pre1 + 0.5). This expression will be used as the input. Also, the global expression can be used
as a value for the sweep (for example, in a cell as 0, VT_1_pre1).
ACS2600RTM-900-01 Rev. B / December 2012 2-15
Page 42
Section
2600 RTM User's Manual
2: HCI and NBTI ACS -
Formulator
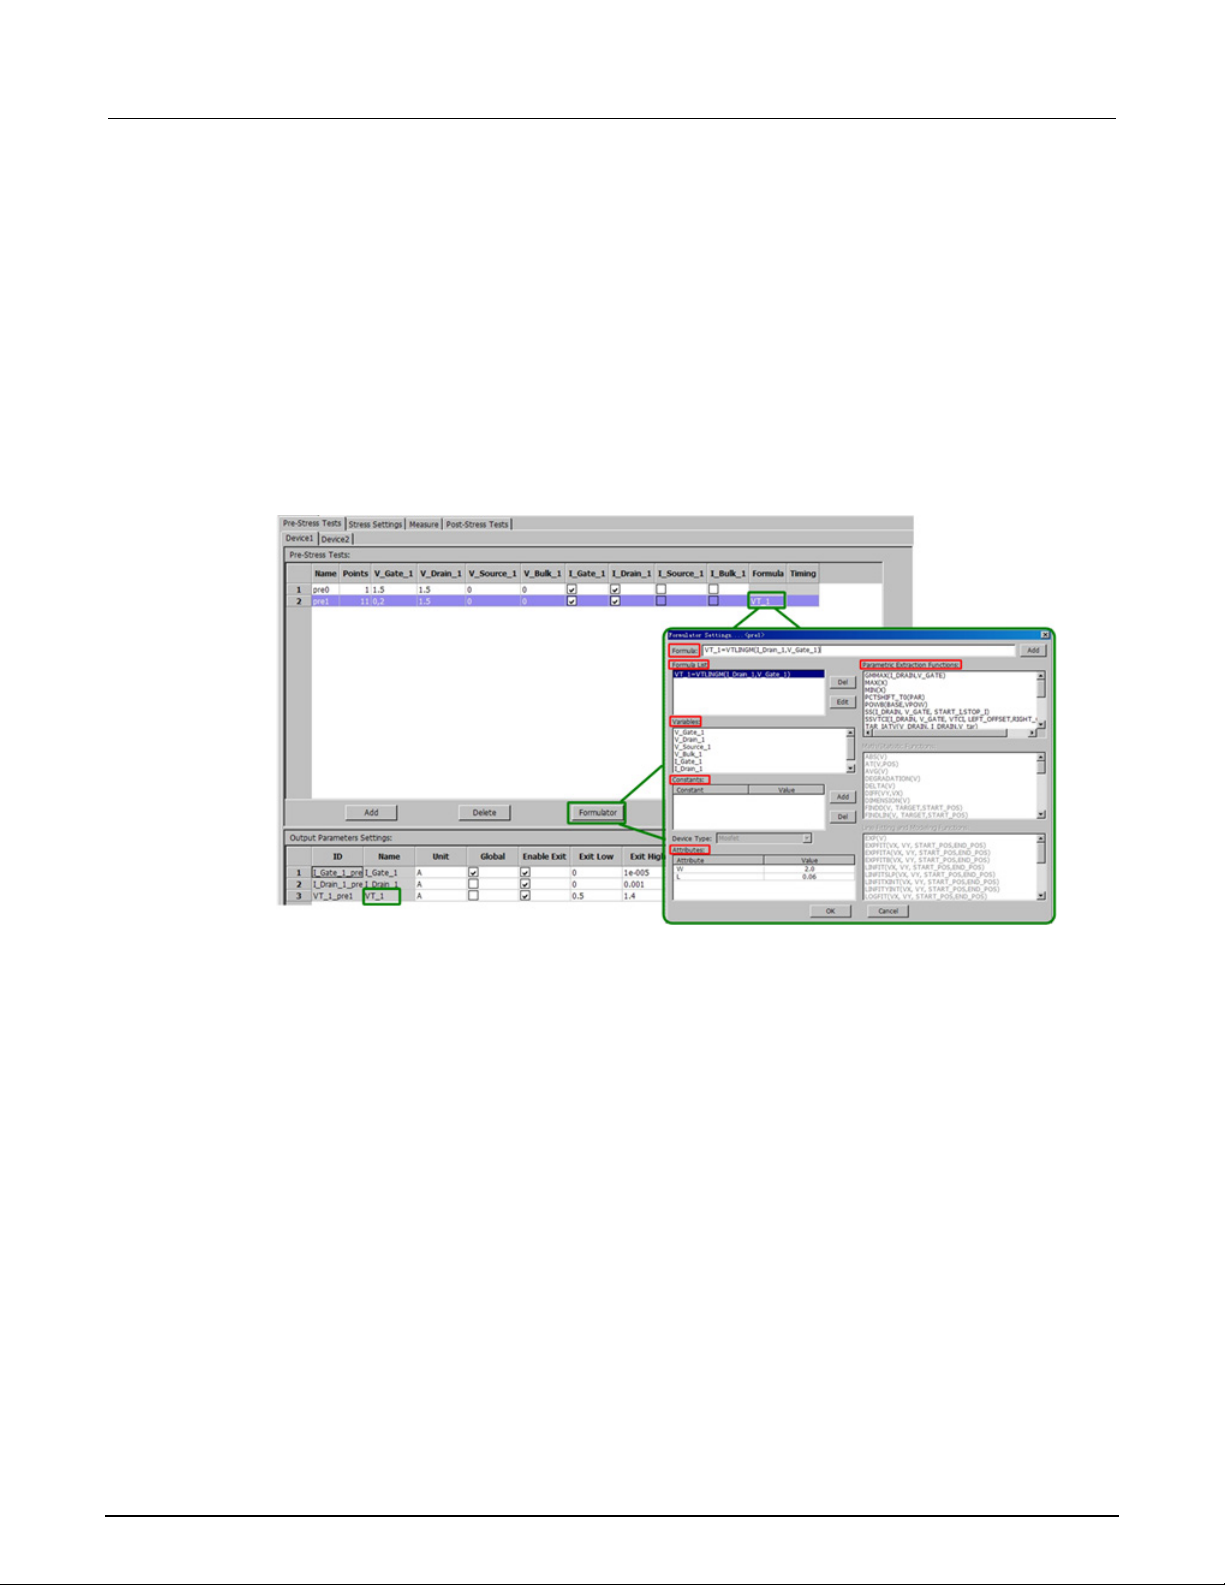
In Pre-Stress Tests, Measure, and Post-Stress Tests, a formula can be added to a test step. As in the
next figure, click the Formulator function, or double click the "formula" cell and a dialog box opens
(see the next figure; the "Formulator Settings") to add or edit formula to the selected test step. The
formula is used to extract a device parameter from the measured data. The parameter calculated
using the formula can be logged for analysis and set as an input value in the following test steps. The
formula is "real-time," which means the formula will be calculated once the current test step is
completed. The extracted parameter will be logged and tracked for later use.
The formula settings are much like the Formulator in Data tab. Though the available formula functions
are less, the functions include most of the parameter extractions of the MOSFET.
Figure 32: Formulator Settings
Formula: formula editing area.
Formula List: the existing formulas.
Variables: lists all of the variables that can be used in the formula. Theses variables are forced and
selected in the test step.
Constants: area for editing constant variables, which can be used in a formula.
Attributes: the attributes of a device, usually the W and L. The W and L can be used as a variable in a
formula. They are set in the Device level in the Test tree (for a single device) or on the Stress
Settings tab (for multiple sub-devices).
Parameter Extraction Functions: lists all the available formula functions.
In the Formula List, Variables, Constants, Attributes or Parameter Extraction Functions area, double
clicking any item will add that string to the Formula area for editing. As in the previous figure, the
"VT_1=VTLINGM(I_Drain_1,V_Gate_1)" is edited using the formula output name ("VT_1") and using
the variables ("I_Drain_1" and "V_Gate_1"). Select Add to add this formula to the Formula List. Select
OK to complete this action and "VT_1" will be displayed in the formula cell. And "VT_1" will be added
into the Output parameter settings (exit criteria), and "VT_1" will be automatically added a postfix
"_pre1" from the test step name.
2-16 ACS2600RTM-900-01 Rev. B / December 2012
Page 43
ACS
HCI and NBTI
- 2600 RTM User's Manual Section 2:
Parameter extraction functions
This area lists all the available formula functions. If the test step is a one point test, only these
functions are available: VADD, VDIV, VMULT, VSUB. If the test step is a sweep test, all of the functions
are available.
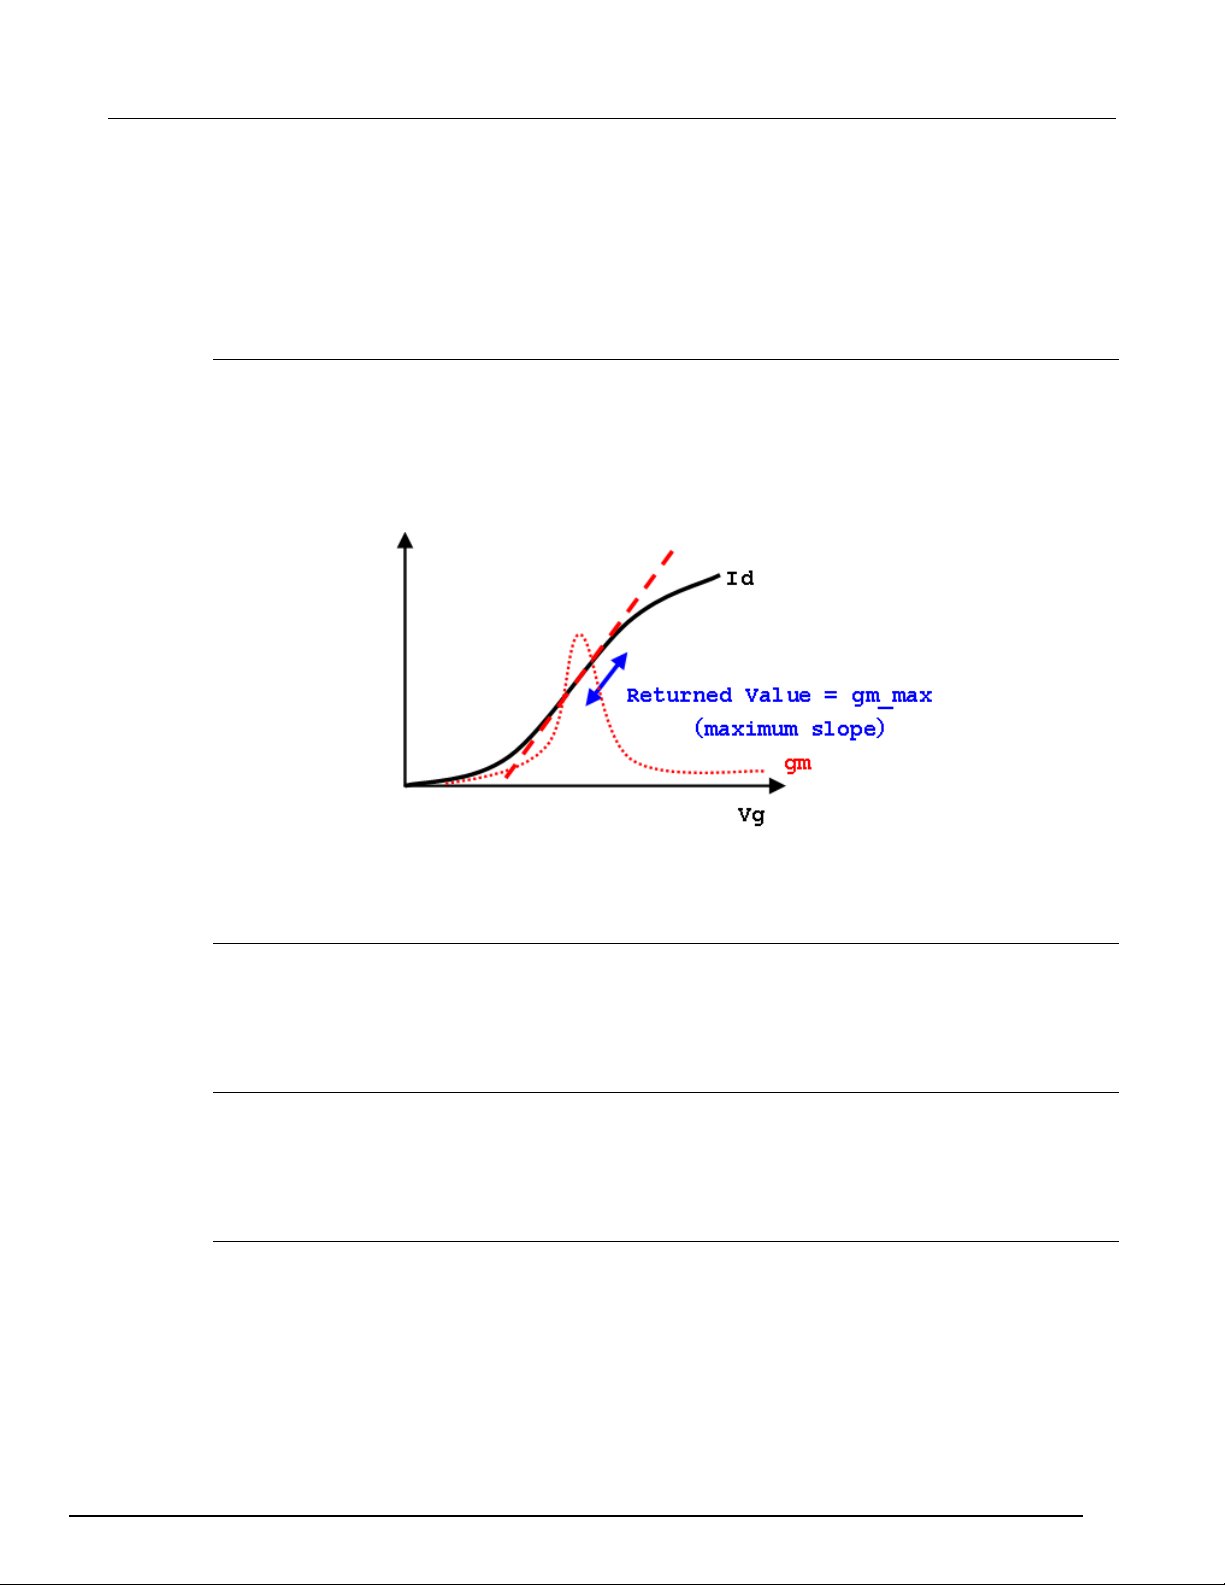
GMMAX
Purpose: return the maximum transconductance (also known as mutual conductance) from I_DRAIN
and V_GATE.
Format:
GMMAX(I_DRAIN, V_GATE)
Figure 33: GMMAX parameters
Example:
Gmmax = GMMAX(I_DRAIN, V_GATE)
MAX
Purpose: return the maximum value of the data array.
Format:
MAX(X)
MIN
Purpose: return the minimum value of the data array.
Format:
MIN(X)
PCTSHIFT_TO
Purpose: return the shift percentage from T0 measurement of the value.
Format:
PCTSHIFT_T0(PAR)
ACS2600RTM-900-01 Rev. B / December 2012 2-17
Page 44
Section
2600 RTM User's Manual
2: HCI and NBTI ACS -
POWB
Purpose: return the data or data array, which is the power value calculated by a constant BASE and
an index or index array VPOW.
Format:
POWB(BASE,VPOW)
BASE: the base value
VPOW: one data or data array. If VPOW is one data, the return value is one single data. If VPOW is a
data array, the return value is a data array with the same length and one-to-one correspondent to
VPOW.
Example:
V2pow = POWB(2, V_DRAIN)
SS
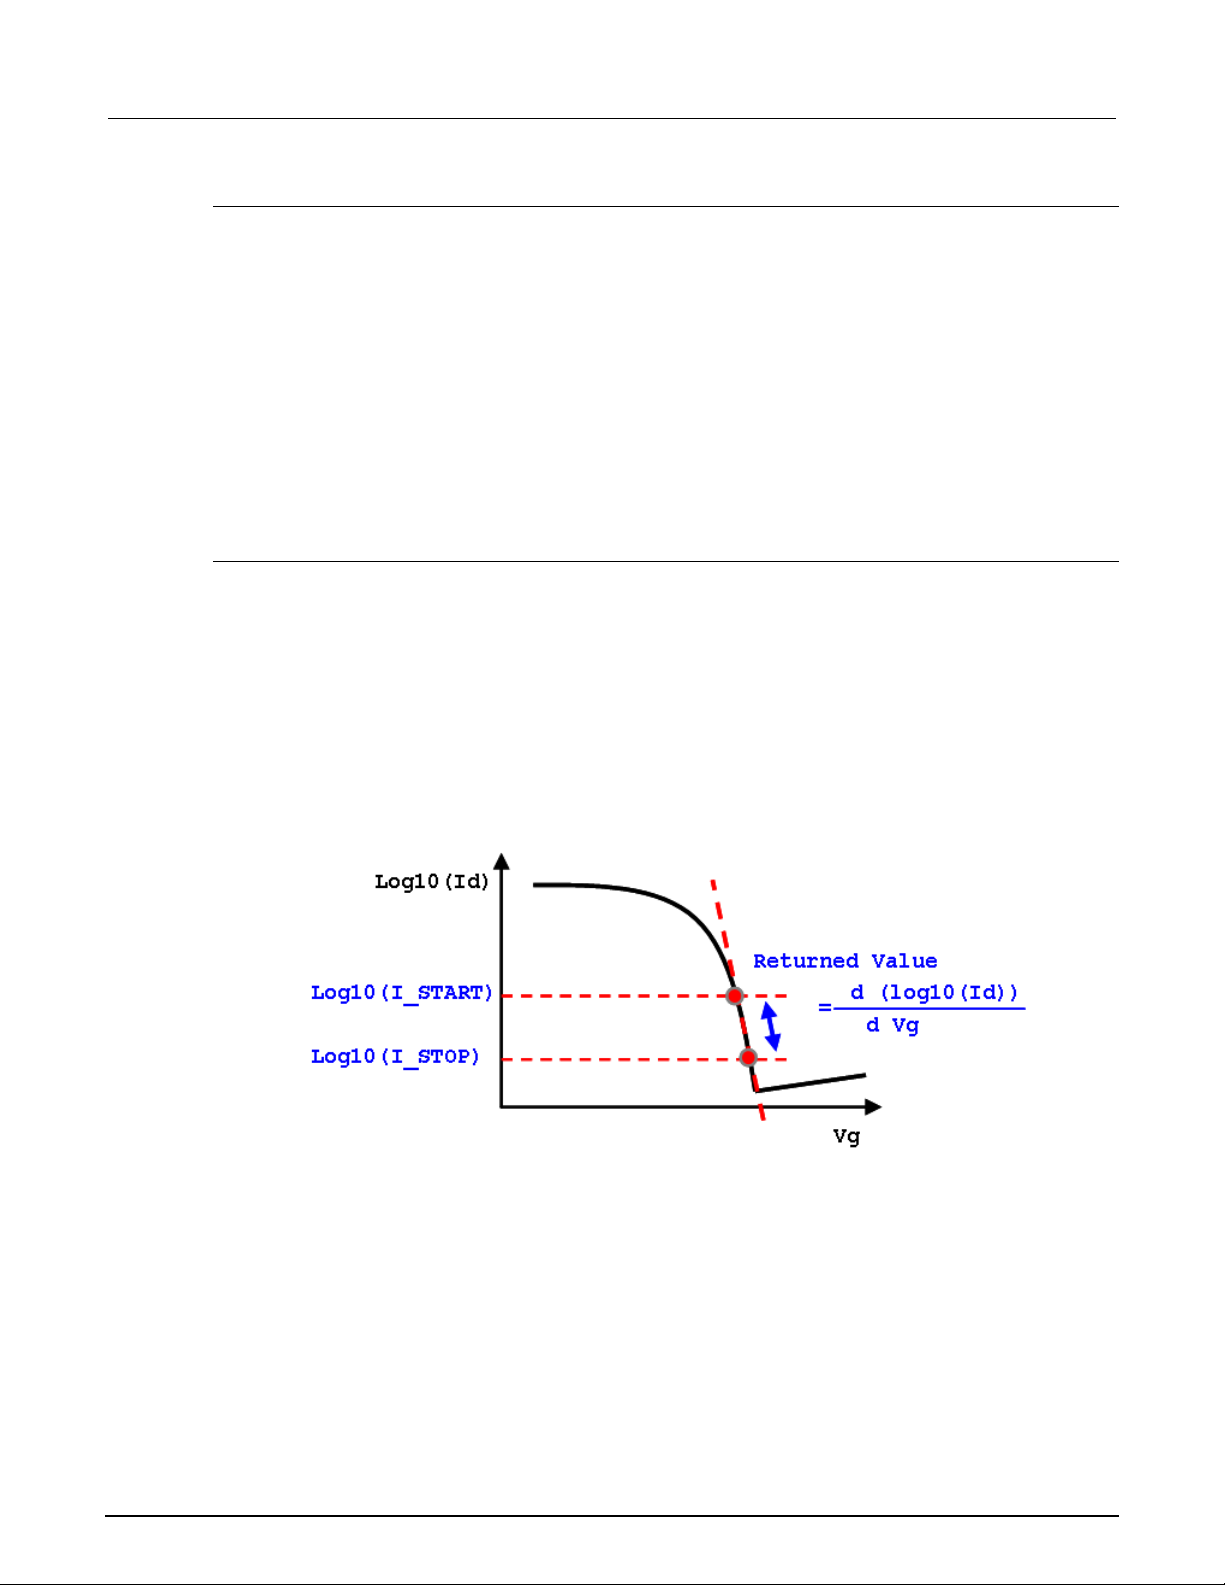
Purpose: extract the sub-threshold swing between a certain duration of current (START_I to STOP_I).
Format:
SS(I_DRAIN, V_GATE, START_I,STOP_I)
I_DRAIN: the drain current measured in the test.
V_GATE: the gate voltage forced in the test.
START_I: the start current to define the calculation region.
STOP_I: the stop current to define the calculation region.
Figure 34: SS parameters
Example:
S0=SS (I_Drain_1, V_Gate_1, 1.3e-5, 1.5e-5)
2-18 ACS2600RTM-900-01 Rev. B / December 2012
Page 45
ACS
HCI and NBTI
- 2600 RTM User's Manual Section 2:
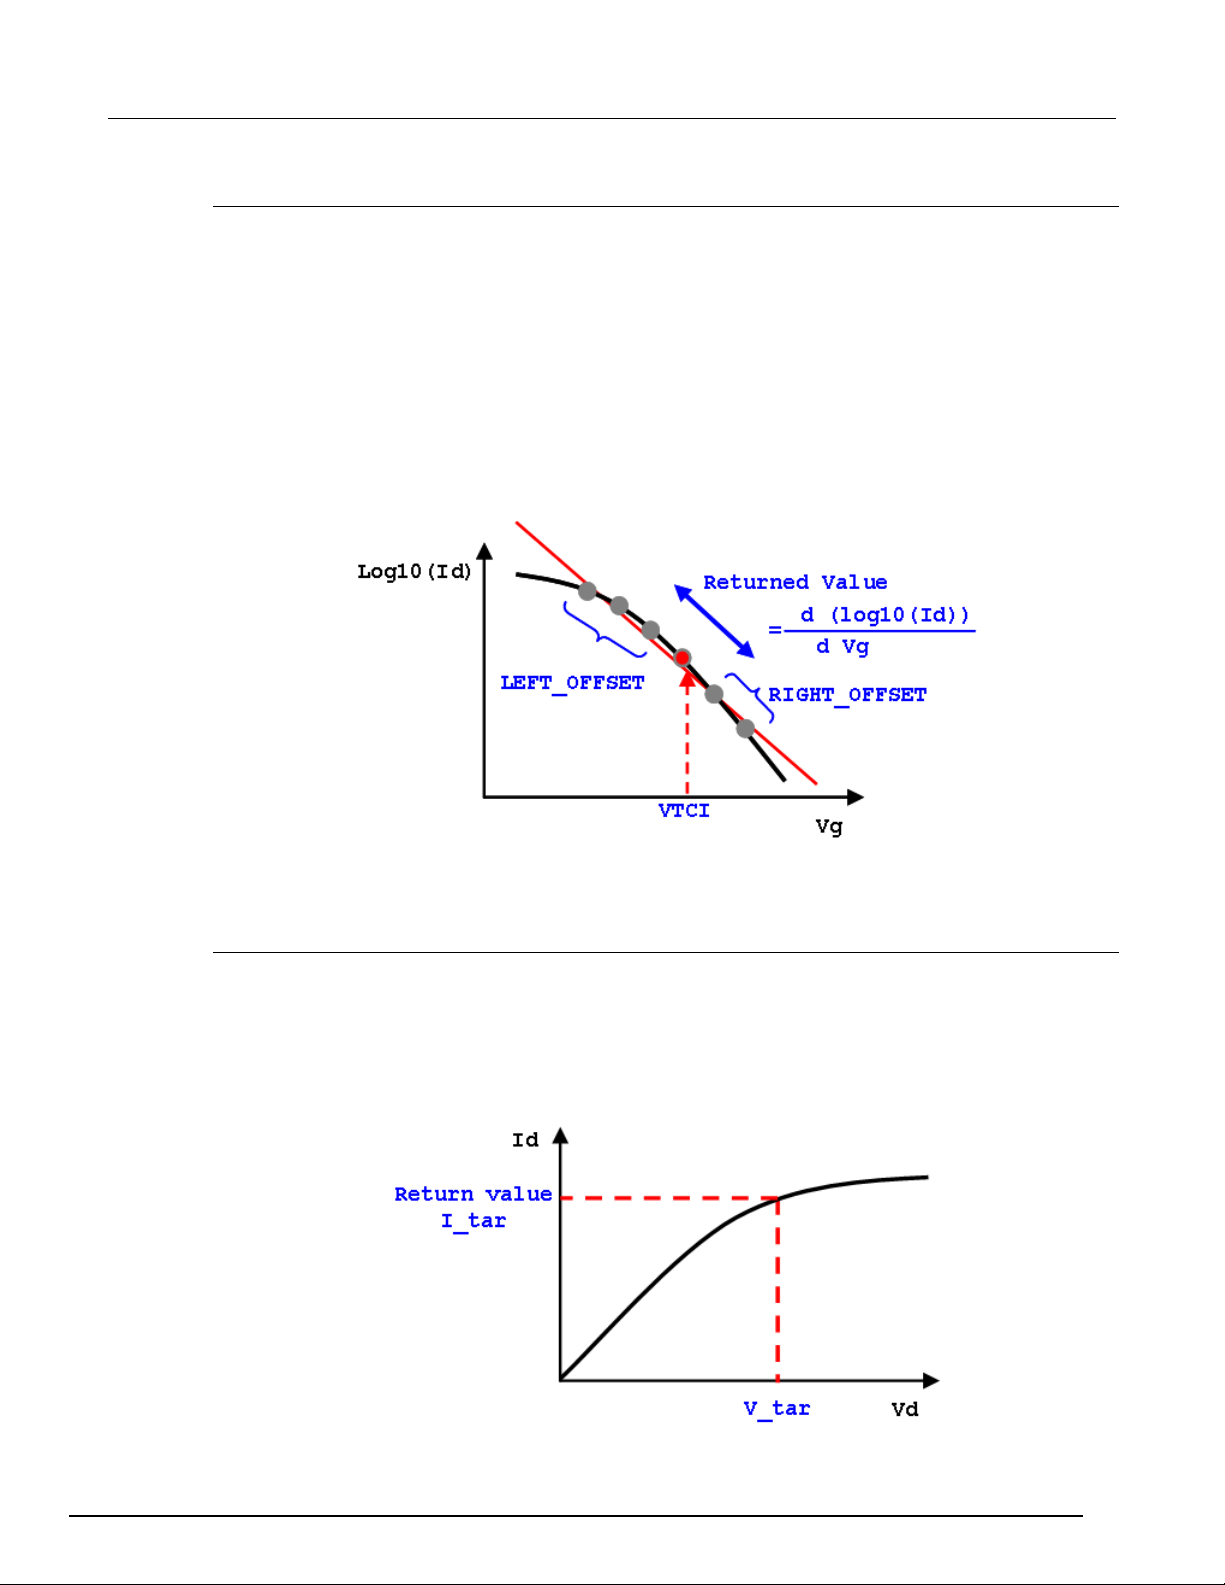
SSVTCI
Purpose: extract the sub-threshold swing for a certain duration between the left offset and right offset
of the constant current threshold voltage.
Format:
SSVTCI(I_DRAIN, V_GATE, VTCI,LEFT_OFFSET,RIGHT_OFFSET)
I_DRAIN: the drain current measured in the test.
V_GATE: the gate voltage.
VTCI: constant current threshold voltage.
LEFT_OFFSET, RIGHT_OFFSET: left offset and right offset of the constant current threshold voltage.
Figure 35: SSVTI parameters
Example:
SLOPE=SSVTCI(I_Drain_1,V_Gate_1,VTH,-0.1,0.1)
TAR_IATV
Purpose: For two data arrays, I and V, in order to find the target I_tar corresponding to V_tar. I and V
are two one-to-one correspondent data arrays.
Format:
TAR_IATV(V_DRAIN, I_DRAIN,V_tar)
Figure 36: TAR_IATV parameters
ACS2600RTM-900-01 Rev. B / December 2012 2-19
Page 46

Section
2600 RTM User's Manual
2: HCI and NBTI ACS -
Example:
Idsat=TAR_IATV(V_Drain_1, V_Drain_1, 1.0)
VADD
Purpose: return the sum value of V1+V2.
Format:
VADD(V1,V2)
Remark: If V1 and V2 are all single data, it will return the sum value. If V1 and V2 are all data arrays
with the same length, it will return the sum arrays (one-to-one sum). If one is a single data and the
other is a data array, it will return the sum arrays (every data of the array adds the single data).
VDIV
Purpose: return the result of V1 divided by V2.
Format:
VDIV(V1,V2)
Remark: If V1 and V2 are all single data, it will return the results of V1 divided by V2. If V1 and V2 are
all data arrays with the same length, it will return the divided result of the arrays (one-to-one result). If
one is a single data and the other is a data array, it will return the divided arrays result (every data of
the array corresponds to the single data).
VGISUBMAX
Purpose: Extrapolates the gate voltage at the point of the maximum sub-current of the MOSFET.
Format:
VMULT
Purpose: returns the product value of V1 multiplied by V2.
Format:
VMULT(V1,V2)
Remark: If V1 and V2 are all single data, it will return the product value. If V1 and V2 are all data
arrays with the same length, it will return the product arrays (one-to-one product). If one is a single
data and the other is a data array, it will return the product arrays (every data of the array multiples
the single data).
VSUB
Purpose: return the results of V1 minus V2.
Format:
VSUB(V1,V2)
Remark: If V1 and V2 are all single data, it will return the results of V1 minus V2. If V1 and V2 are all
data arrays with the same length, it will return the arrays subtraction results (one-to-one result). If one
is a single data and the other is a data array, it will return the array subtraction results (every data of
the array is correspondent to the single data).
2-20 ACS2600RTM-900-01 Rev. B / December 2012
Page 47
ACS
HCI and NBTI
- 2600 RTM User's Manual Section 2:
VTCI
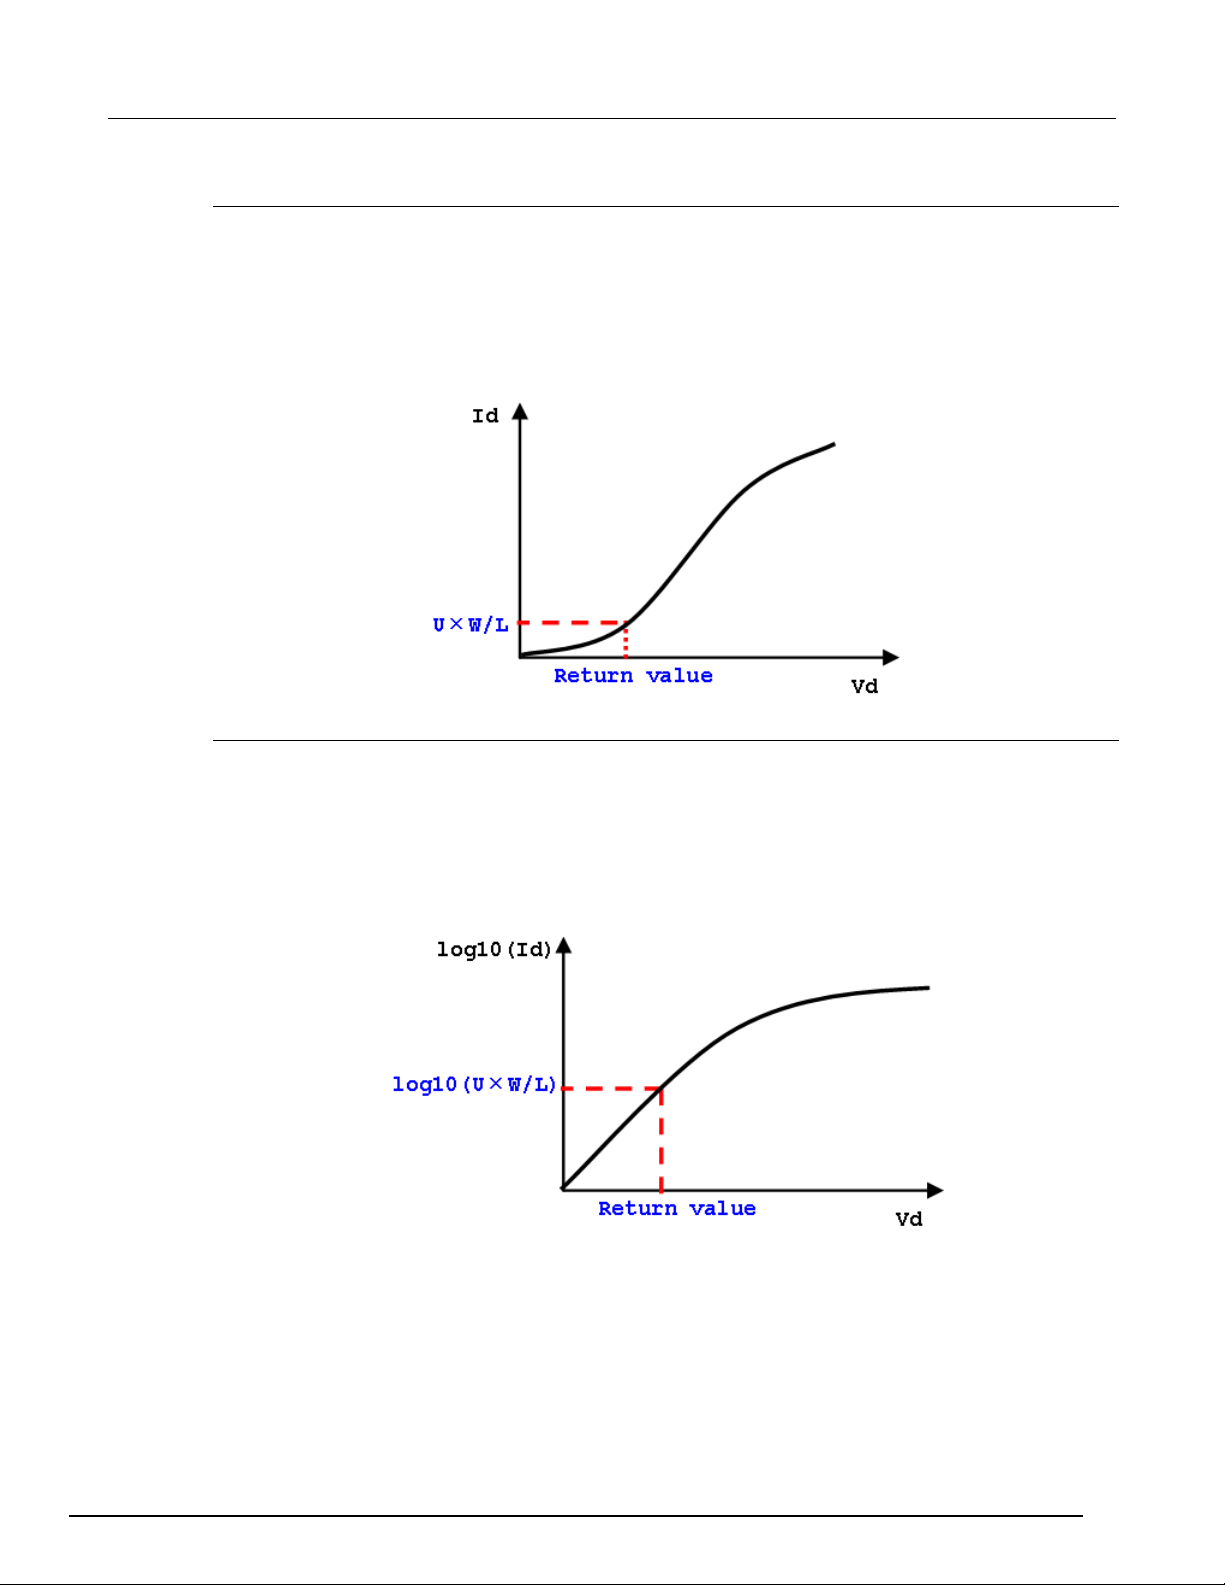
Purpose: calculate the constant current threshold voltage, as defined by VTCI=VGS(@ID=U×W/L).
The W and L are the gate width and gate length. The U is an empirical drain current per square of the
channel (refer to JEDEC standard JESD28-A, JESD60A).
Format:
VTCI(U, W, L, I_DRAIN,V_GATE)
Figure 37: VTCI parameters
VTCI_LOG10
Purpose: calculate the constant current threshold voltage, as defined by VTCI=VGS(@ID=U×W/L).
The W and L are the gate width and gate length. The U is the drain current per square of the channel
(refer to JEDEC standard JESD28-A, JESD60A). The VTCI is obtained by log10(Id) versus Vdrain.
Format:
VTCI_LOG10(U, W, L, I_DRAIN,V_GATE)
Figure 38: VTCI_LOG10 parameters
ACS2600RTM-900-01 Rev. B / December 2012 2-21
Page 48
Section
2600 RTM User's Manual
2: HCI and NBTI ACS -
VTLINGM
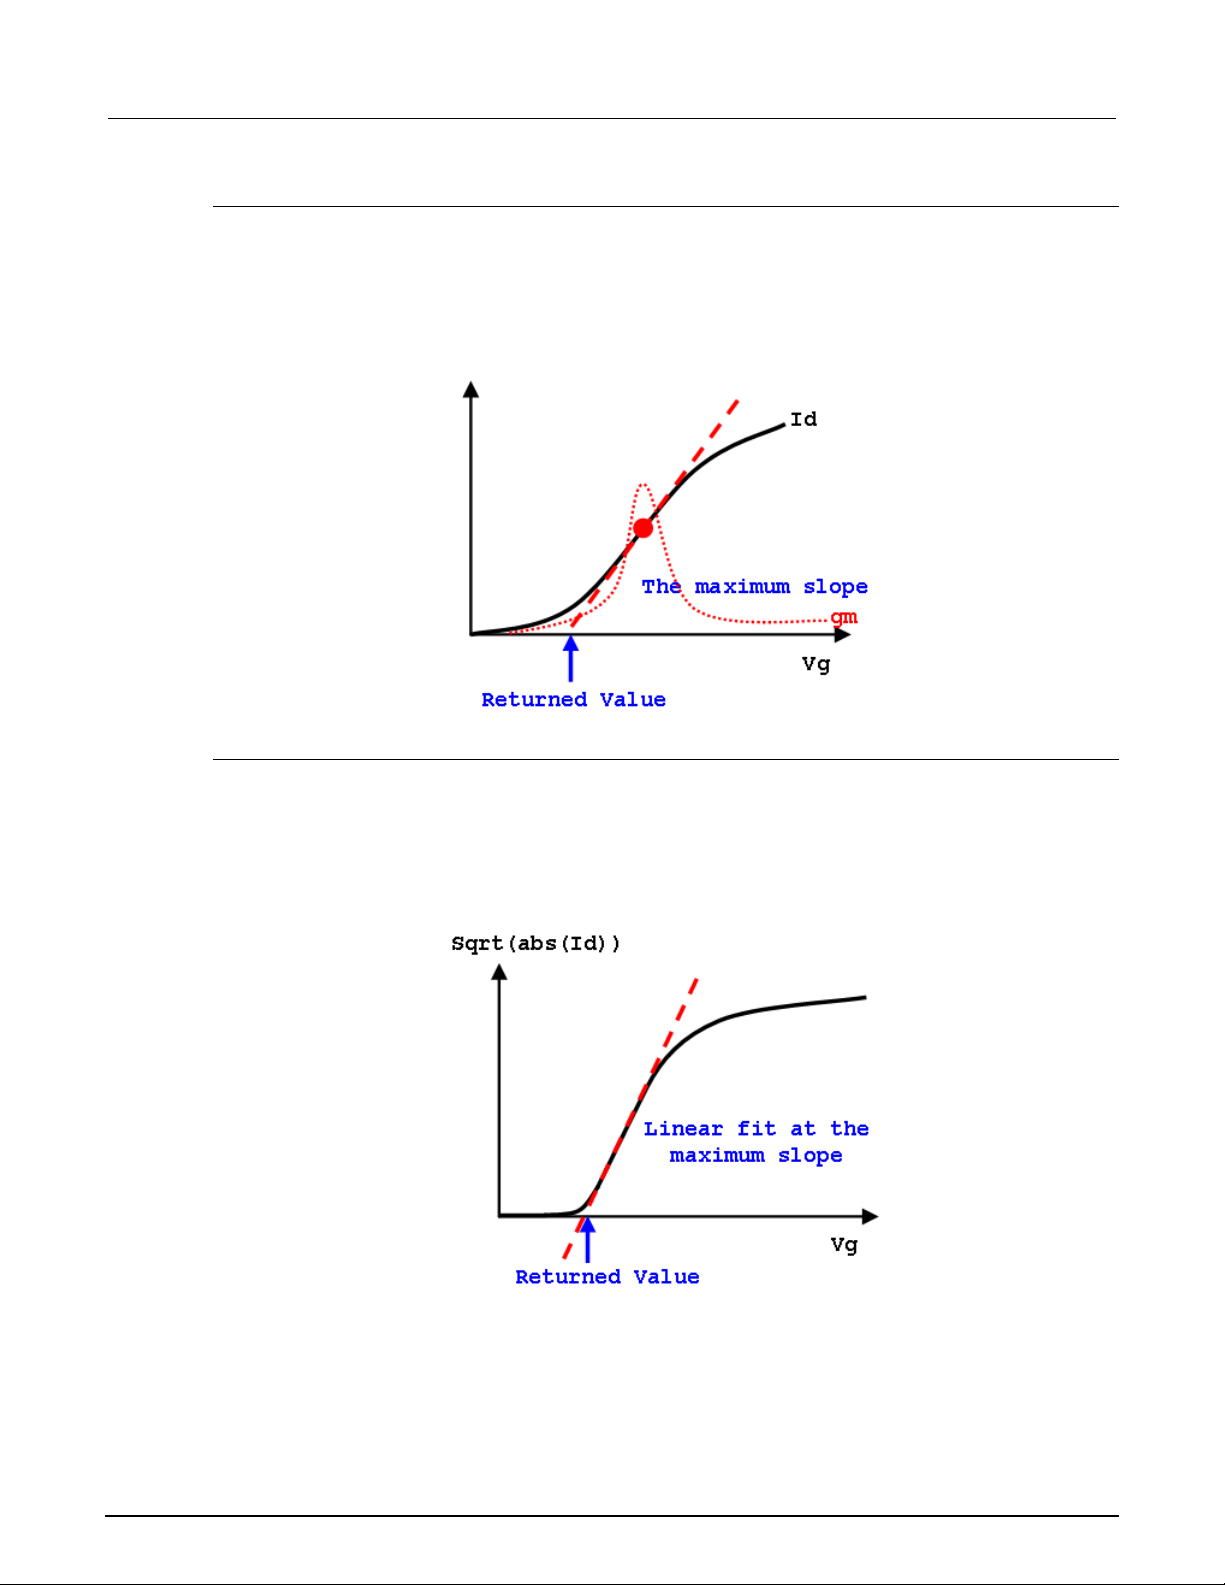
Purpose: extract the threshold voltage from the maximum transconductance (gmmax). Return the Vg
intercept of the linear fit of Id versus the Vg at the maximum gm point.
Format:
VTLINGM(I_DRAIN,V_GATE)
Figure 39: VTLINGM parameters
VTSATGM
Purpose: extract the threshold voltage of the saturation region. Return the Vg intercept of the linear fit
of the sqrt(abs(Id)) versus the Vg at the maximum slope point.
Format:
VTSATGM(I_DRAIN,V_GATE)
Figure 40: VTSATGM parameters
2-22 ACS2600RTM-900-01 Rev. B / December 2012
Page 49
ACS
HCI and NBTI
Time_str_<sn>
S
The accumulated stress time
Time_total_<sn>
S
The total time including measure phase.
I_<pad>_moni_<sn>
(for example, I_Gate_1_moni_1)
A
The measured current in monitor (stress phase).
I_<pad>_<test step name>_<sn>
A
In pre-stress test, measure phase, post-stress
<Param>_<pad>_<sn>
the formulator
-
The calculated formula parameter value.
NOTE: <sn> is number of sub-devices; <pad> is the pad name.
- 2600 RTM User's Manual Section 2:
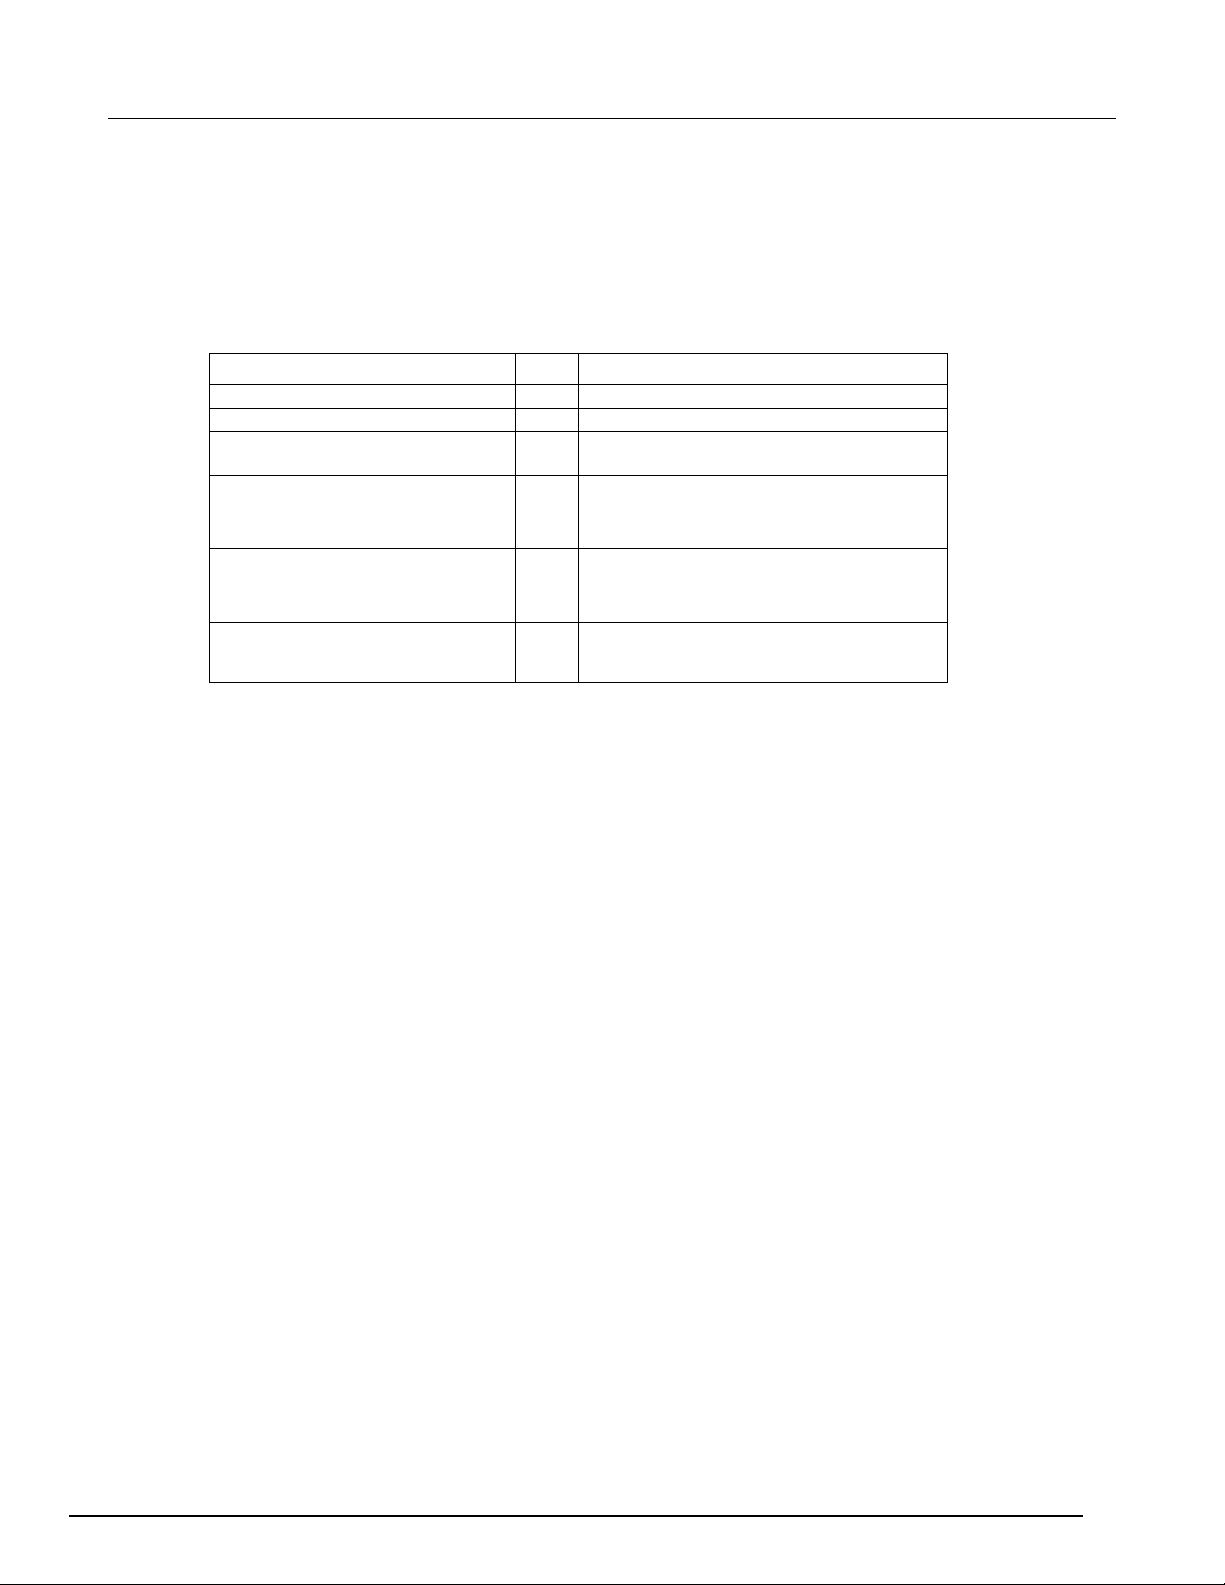
Data recording
The test result data is displayed in Data tab, and will be logged as a .kdf, .db, or .csv file if in
Automation mode. The data for multiple groups is displayed in multiple tabs in the Data tab. The
output data for sub-devices is distinguished by the parameter name suffixes. The output parameters
for one group are shown in the next table:
Parameter Unit Comment
V_<pad>_<test step name>_<sn>
(for example, V_Drain_1_pre0_1,
V_Gate_1_meas1_1)
(for example, I_Drain_1_pre0_1,
I_Gate_1_meas1_1)
Param is the parameter name defined in
V
In pre-stress test, measure phase, post-stress
test, the forcing voltage value of certain test step.
Sweep points are all listed.
test, the measured current value of certain test
step.Sweep points are all listed.
ACS2600RTM-900-01 Rev. B / December 2012 2-23
Page 50

Post raw data ........................................................................... 3-5
In this section:
Test principle ............................................................................ 3-1
Sequential versus parallel ........................................................ 3-2
Measure phase timing .............................................................. 3-2
Test principle
The negative bias temperature instability (NBTI) test (NBTI_FAST_SWITCHING) is used to obtain the
degradation of a MOSFET device, for a duration of time and under stress. The
NBTI_FAST_SWITCHING test is the same as the HCI/NBTI test. However, when the stress is off, the
device will recover to "heal" the degradation, which possibly leads to a more optimistic lifetime
prediction. The NBTI_FAST_SWITCHING test uses several methods to minimum the recover time. In
the measure phase, NBTI_FAST_SWITCHING takes less time for one test step and is able to bias an
"inter stress" level between test steps. The measurement induced recover time will lead to less shift.
Section 3
Fast NBTI
The NBTI_FAST_SWITCHING is similar to the test flow of the HCI/NBTI test (refer to the previous
section for more information).
Figure 41: Voltage and time shift curve
Page 51
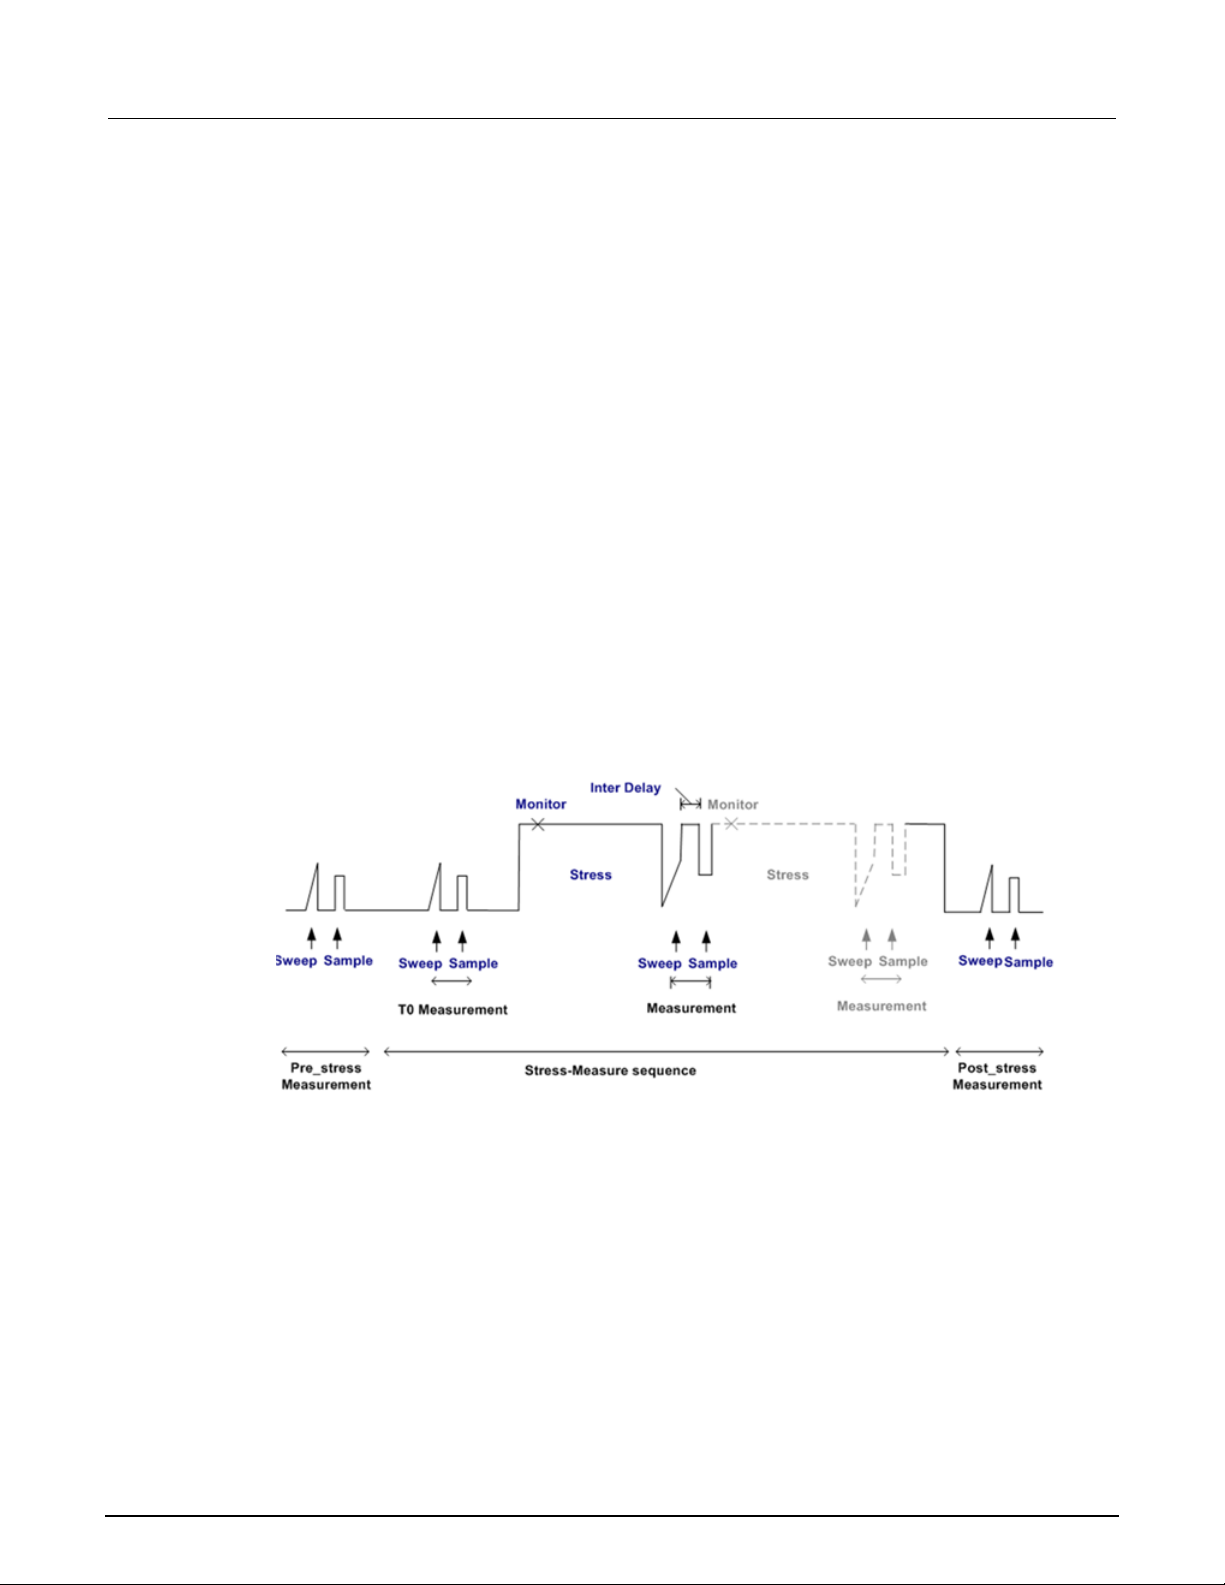
Section
2600 RTM User's Manual
3: Fast NBTI ACS -
Sequential versus parallel
For multiple sub-devices, NBTI_FAST_SWITCHING can be set to sequential or parallel. Parallel
testing will establish its own test flow for each sub-device, while sequential testing will setup one test
flow for all of the sub-devices. The NBTI_FAST_SWITCHING sequential test works in serial mode,
which means that after testing one sub-device is complete then the next sub-device is tested. This is
different from HCI/NBTI, VRamp, JRamp and TDDB_CVS tests. The reason is that timing control is
extremely strict for NBTI_FAST_SWITCHING. Therefore, it is recommended that you use parallel
testing for multiple sub-devices if you are concerned about the amount of timed needed to complete
all of the testing.
Measure phase timing
The NBTI_FAST_SWITCHING test has three stages:
1. Pre-Stress measurement
2. Stress-Measure sequence
3. Post-Stress measurement
The timing diagram in the next figure shows these stages. The pre-stress, post-stress, and stress
phase of the stress-measure sequence are the same as the HCI/NBTI test, while the measure phase
has a few more settings on the timing control.
Figure 42: NBTI_FAST_SWITCHING timing diagram
3-2 ACS2600RTM-900-01 Rev. B / December 2012
Page 52
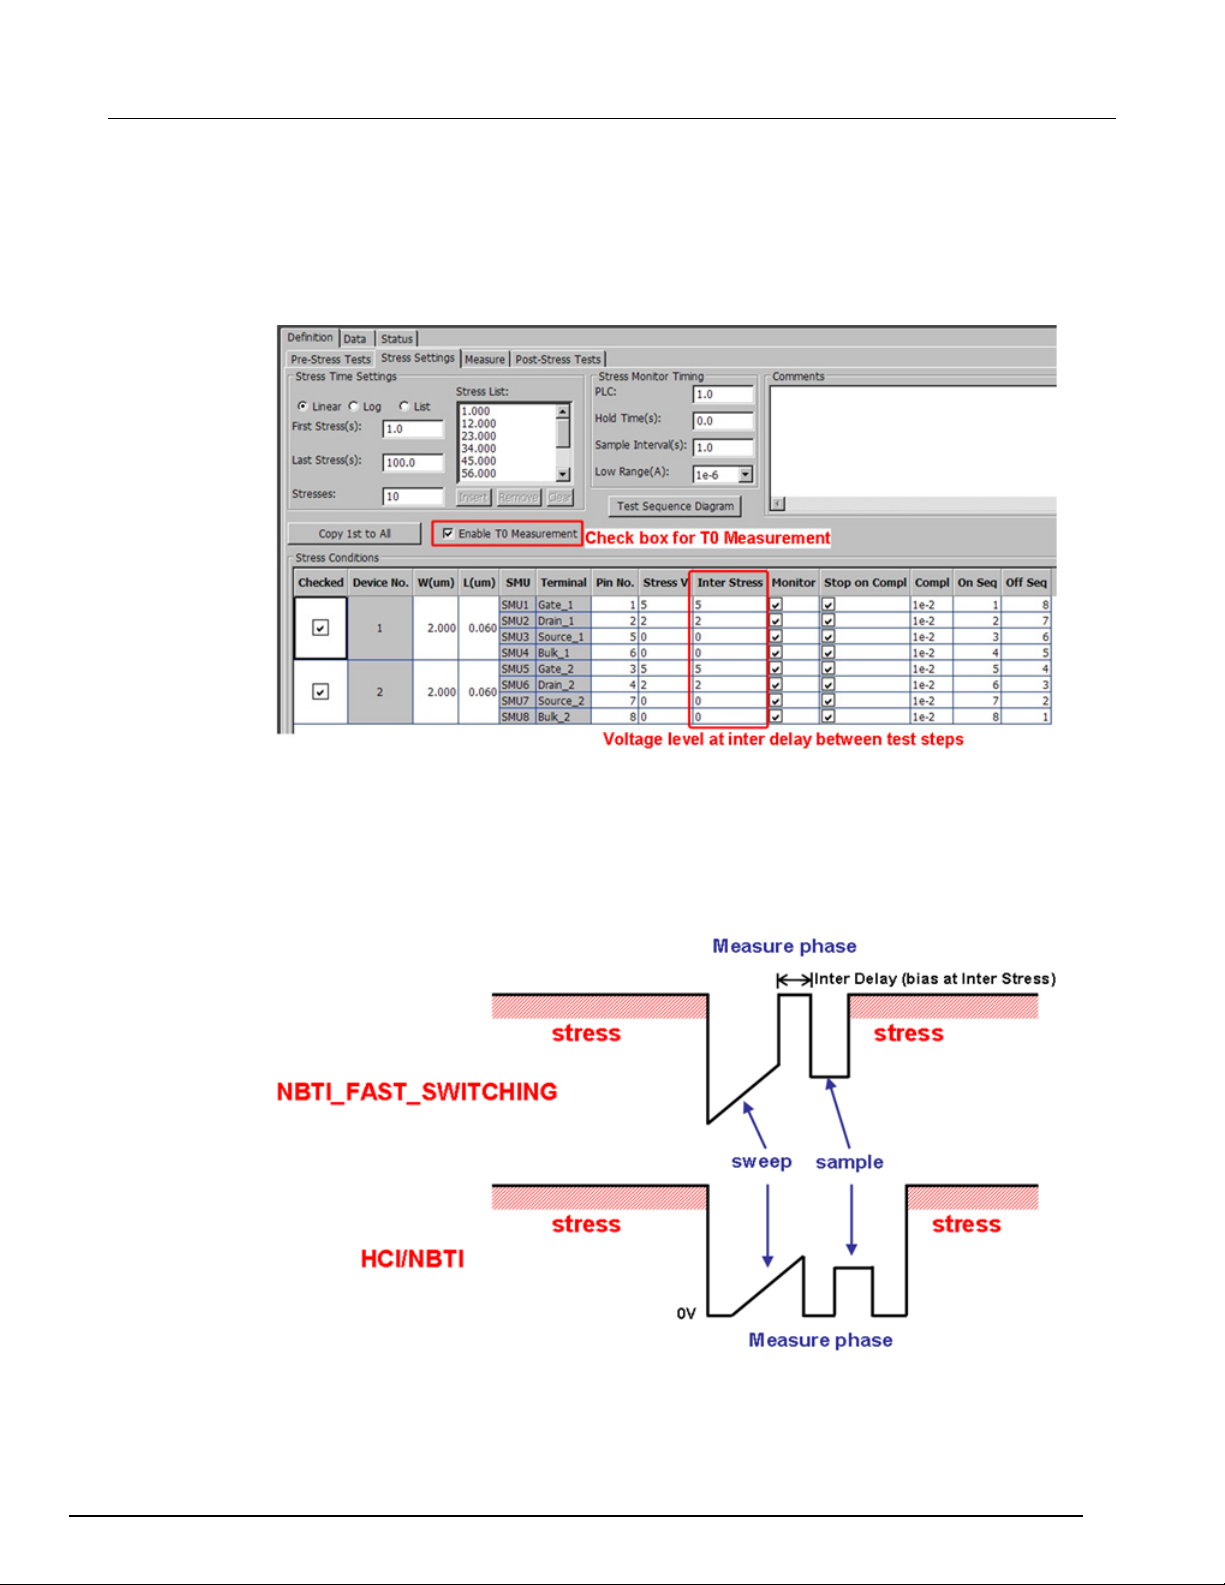
ACS
Fast NBTI
- 2600 RTM User's Manual Section 3:
T0 Measurement
The T0 Measurement is the first measure phase in the stress-measure sequence before the stress in
applied. In the NBTI_FAST_SWITCHING test, the T0 Measurement is optional (see next figure).
Figure 43: Stress Settings for T0 Measurement
Inter delay
The Inter delay is the delay time between two test steps in the measure phase. An inter stress voltage
level will be applied to the pad according to the settings (see next figure). The inter delay will not
affect the T0 measurement.
Figure 44: Measure phase of NBTI_FAST_SWITCHING and HCI_NBTI
ACS2600RTM-900-01 Rev. B / December 2012 3-3
Page 53
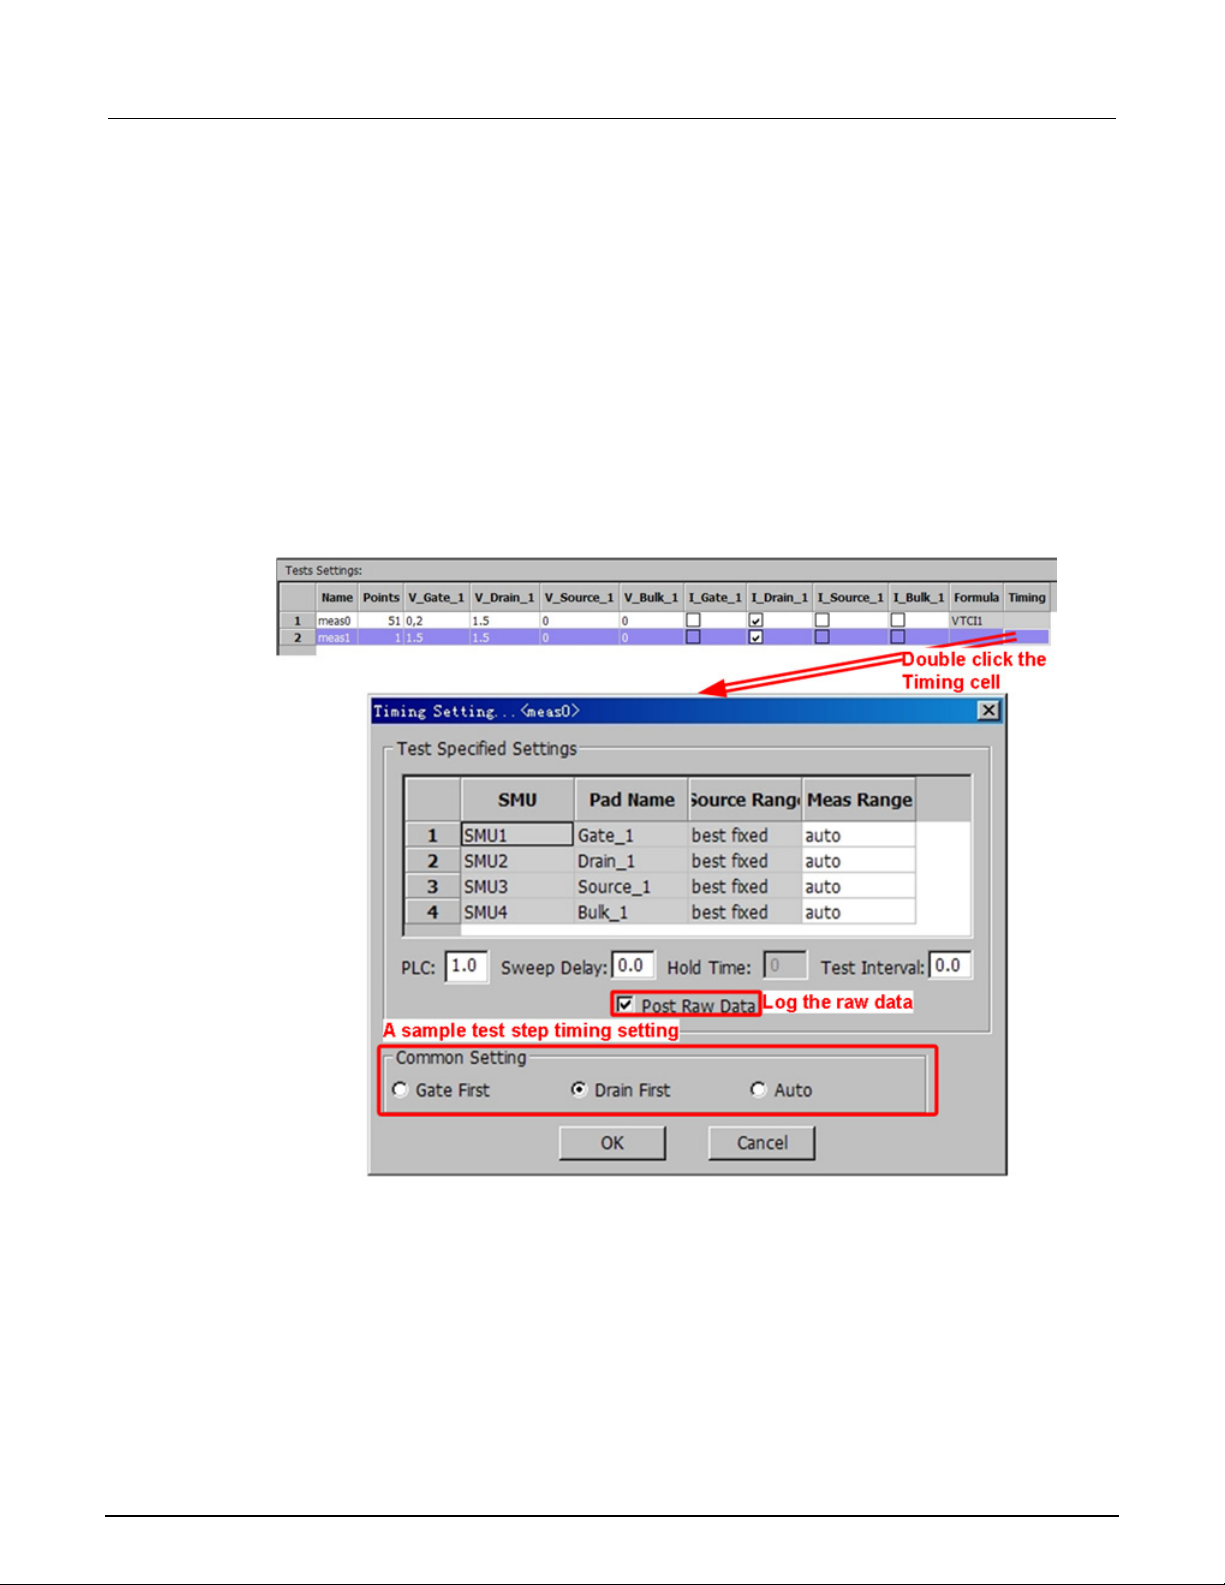
Section
2600 RTM User's Manual
3: Fast NBTI ACS -
• During the measure phase, HCI/NBTI will lower the bias to 0 volts and then execute the test
steps. The NBTI_FAST_SWITCHING test will directly go to the test step from the stress voltage
level.
• After one test step is completed, the HCI/NBTI will lower the bias to 0 volts before the next test
step. The NBTI_FAST_SWITCHING will bias at the inter stress phase and then go to the next
test step. The intermediate time is called inter delay. The inter stress level is set in the stress
conditions.
Sample test step timing setting
A sample test step is a test step that has a fixed bias (compared to sweep). It is used to reduce the
measurement time. The NBTI_FAST_SWITCHING test has a timing control for the sample test in the
measure phase test step. In the next figure, the Common Setting is used to select a timing mode for
all of the sample test steps in measure phase.
Figure 45: Test Settings and Timing Setting
3-4 ACS2600RTM-900-01 Rev. B / December 2012
Page 54
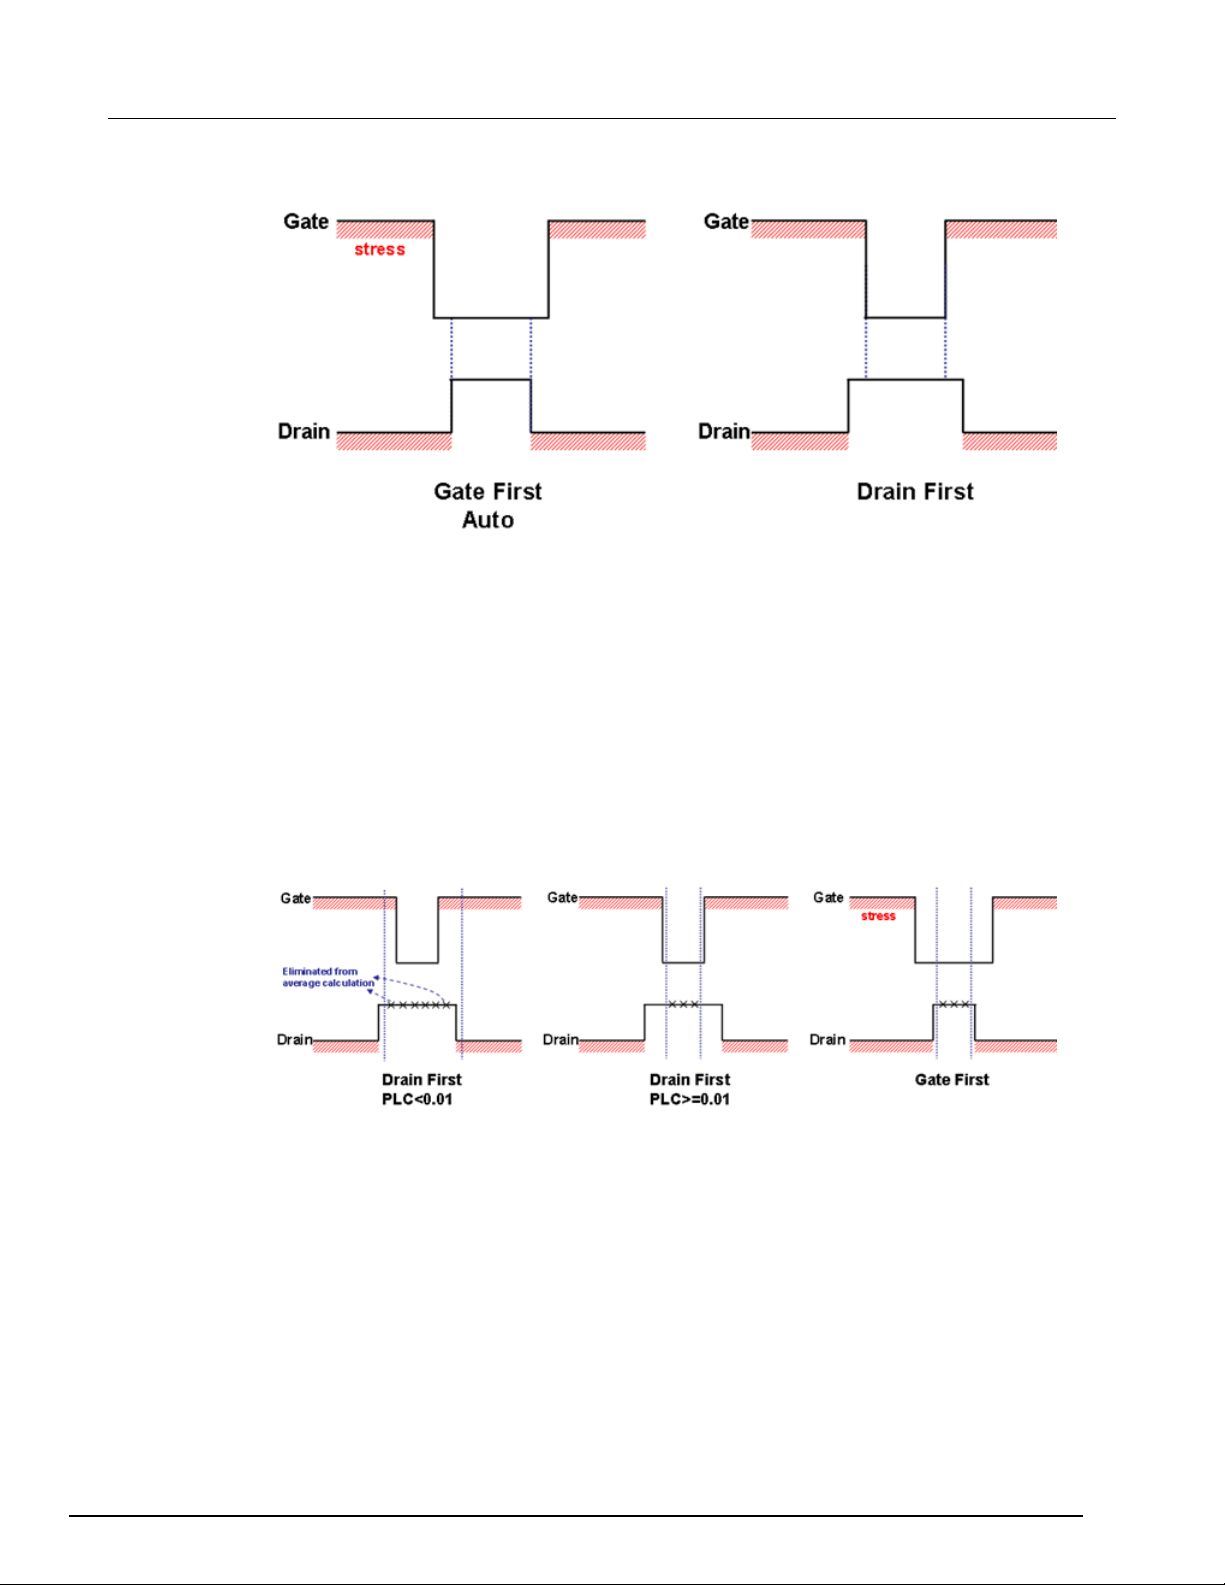
ACS
Fast NBTI
- 2600 RTM User's Manual Section 3:
Figure 46: Timing Setting flow diagram
Post raw data
In a sample test step, if the points are set to more than one, an average value of the measured
current will be calculated and logged. Post raw data will enable logging for all of the measured data
rather than only the calculated average value (post raw data must be selected to enable this
function).
In order to reduce the recover time, when the Drain First PLC<0.01 is selected, the test flow overlaps
the current measure around the specific test step and extracts the precise value from several
measured data points. Within all of the measured data, the ones that are not in the measured region
will be eliminated from the average calculation (see next figure). Enable the Post Raw Data function
in order to log the data.
Figure 47: Multiple points sample test step diagram
ACS2600RTM-900-01 Rev. B / December 2012 3-5
Page 55
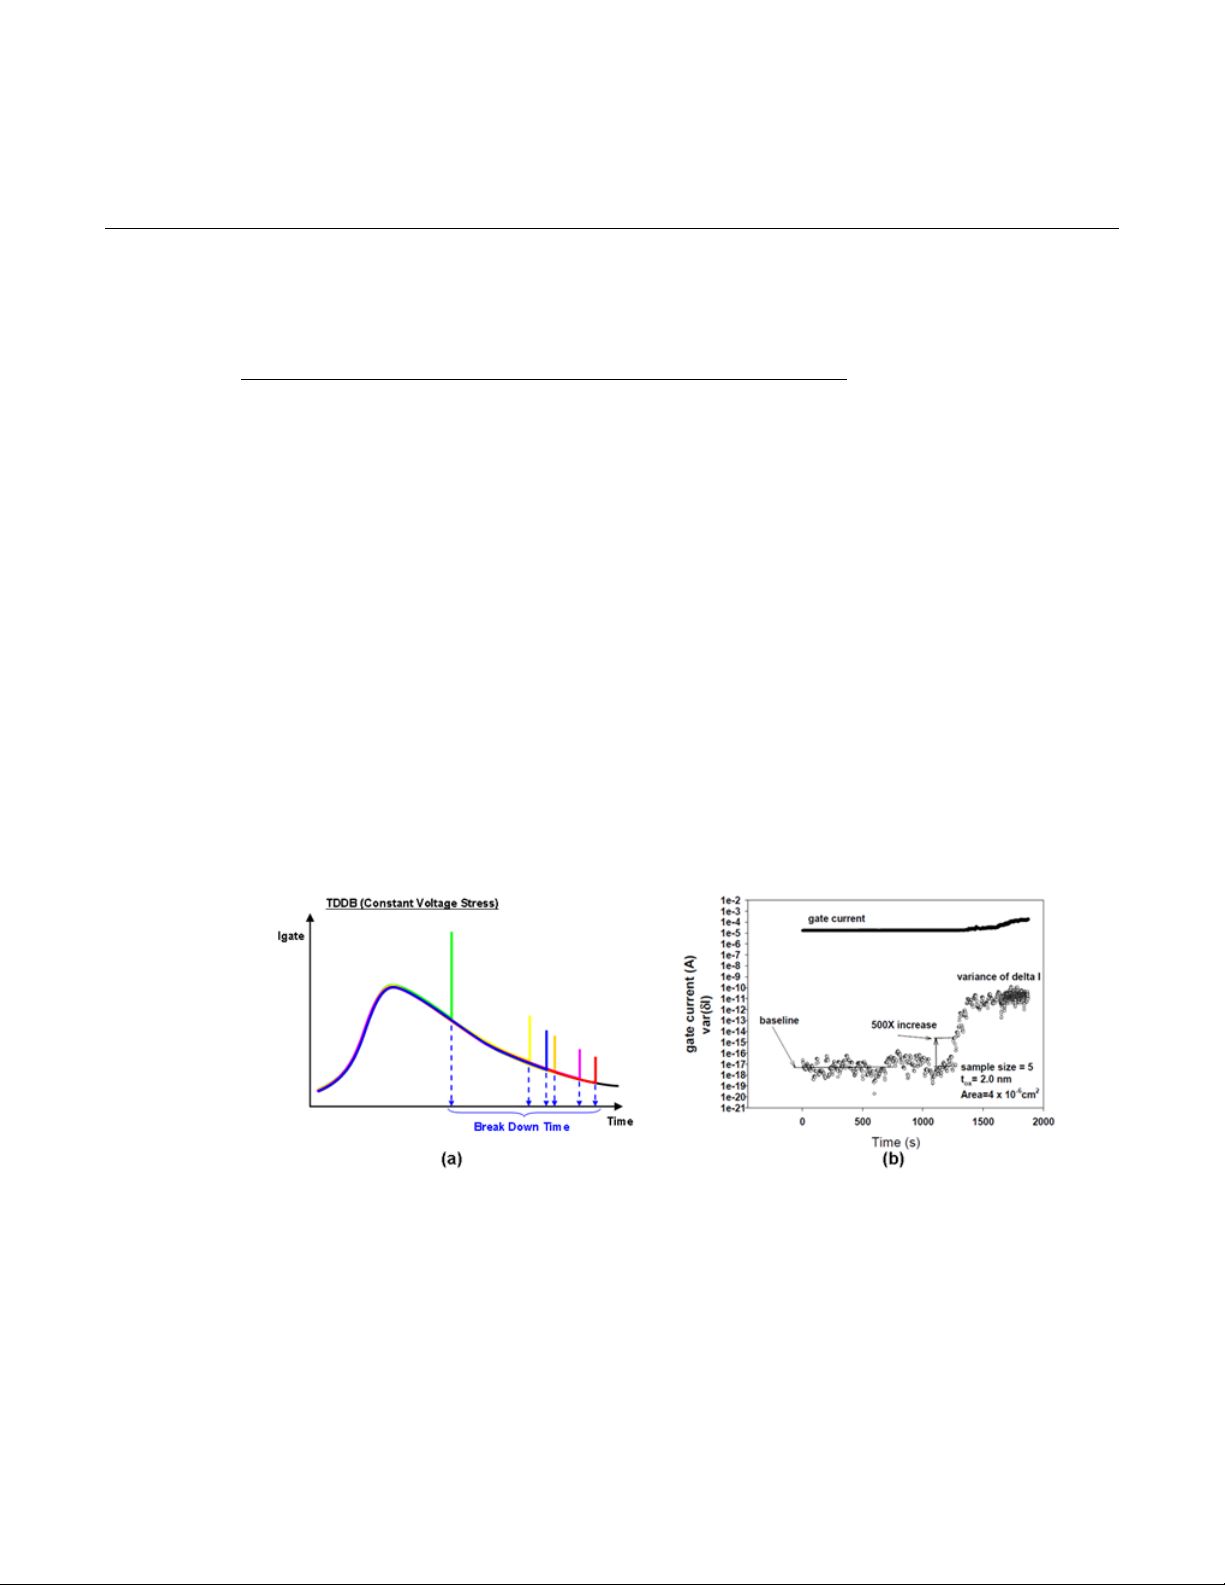
Data recording ........................................................................ 4-15
In this section:
Test principle ............................................................................ 4-1
Instrument connection .............................................................. 4-2
Test flow ................................................................................... 4-3
Settings .................................................................................... 4-5
Failure determination ............................................................. 4-14
Test principle
The time dependent dielectric breakdown (TDDB) test is intended to estimate the acceleration
parameters needed to predict the "wear-out" time of a MOSFET gate oxide. This describes the TDDB
test under constant voltage stress (CVS). The TDDB_CVS test is normally run for long time (several
hours to several days). The stress voltage is higher than the working voltage of a MOSFET and is
used to accelerate the breakdown. The test result is statistically analyzed to predict the normal "wearout" time. The next figure shows a typical TDDB_CVS test result for a MOSFET. Note that the (a)
illustration is of a measured gate current versus the stress time, and (b) is a gate current vs. time and
noise vs. time
Section 4
Time dependent dielectric breakdown
Figure 48: Typical TDDB_CVS test result
The TDDB_CVS test has three stages: optional pre-test, stress stage (main loop of the stressmeasure sequence), and on optional post-test. The pre-test is used to verify the functionality of the
device, the stress stage is used to apply a constant voltage stress to the device until breakdown, and
the post-test is used to characterize the device after the stress stage.
Page 56
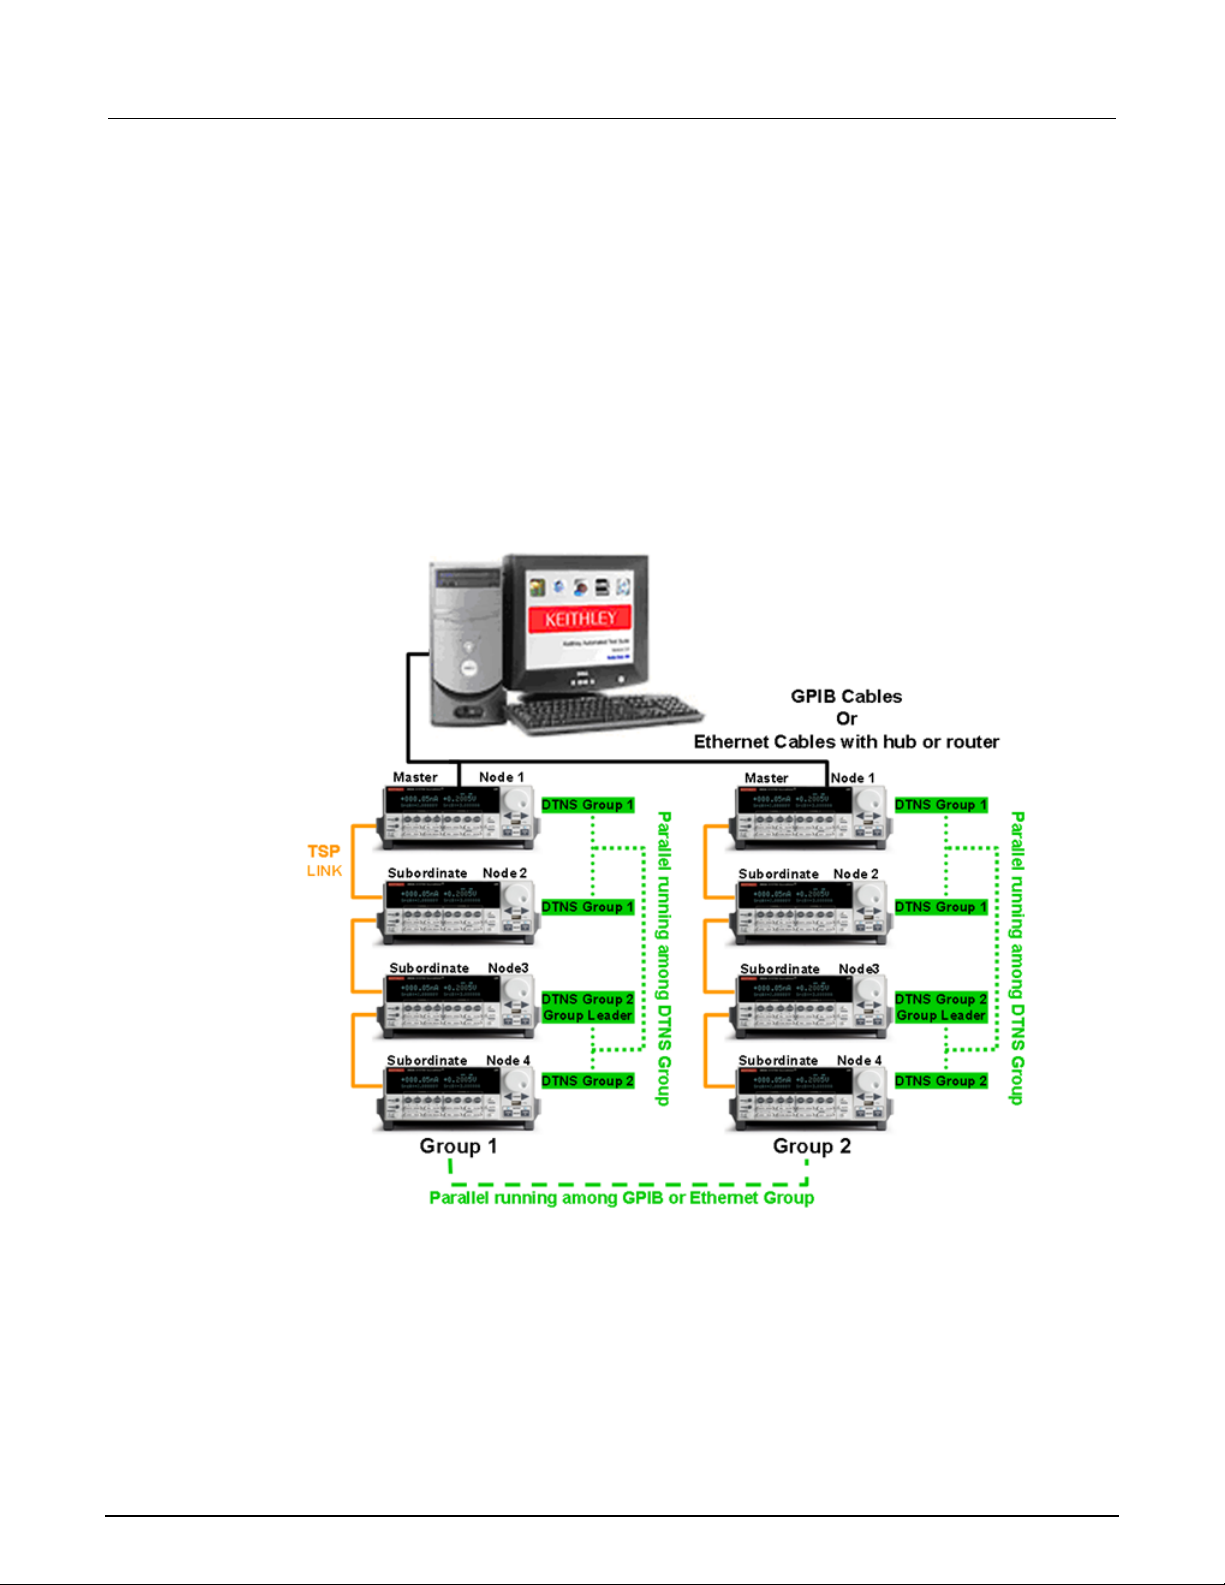
Section
2600 RTM User's Manual
4: Time dependent dielectric breakdown ACS -
Instrument connection
The TDDB_CVS test applies a stress voltage to a MOSFET gate, and set GND (ground) to bulk,
source, and drain. The test uses the Series 2600A or Series 2600 SourceMeters. Multiple
SourceMeters can be setup as a connection scheme for multiple devices in a configuration of
different groups (GPIB or Ethernet Group) for a parallel test. Within each group, you can also setup
multiple sub-devices for sequential or parallel run. In parallel run, each sub-device will be set as a
sub-group (DTNS group). Note that the SourceMeters in a group (connection scheme) must have the
same firmware. The 2600B SourceMeters and the 2600 SourceMeters (for instance, the A and non-A
versions) cannot be used together. A typical connection scheme is shown in the next figure. A typical
connection scheme that shows two GPIB or Ethernet Groups (Group 1 and Group 2) is shown in the
next figure. Each Group has four instruments: Node 1 (master) and Node 2 is set to a DTNS group 1
(sub-group 1), Node 3 and 4 are set to DTNS group 2 (sub-group 2):
Figure 49: A typical instrument connection scheme
Due to limited memory space and instrument communication speed, the connection scheme requires
care in setting the sample interval in order to avoid memory and logging errors. A connection scheme
with more instruments requires a longer sample interval. However, if you are using proper data
compression, the logged data will be largely decreased (but it is still able to demonstrate the whole
curve) and avoid the limited memory problem.
4-2 ACS2600RTM-900-01 Rev. B / December 2012
Page 57

ACS
Time dependent dielectric breakdown
- 2600 RTM User's Manual Section 4:
Test flow
The TDDB_CVS test flow is based on the JESD92 standard. The parameters are also defined with
reference to JESD92. The test flow is shown in the next figure. If a sub-device fail during the pre-test
or breaks down during the stress-measure sequence, all of the SMUs related to the sub-device will be
set output off. The output off mode is High_Z (high impedance), which means the output relay is
open. The High_Z mode is automatically set to "used" SMUs. For "unused" SMUs, if you want to set
output off mode to High_Z, you need to select Tools->Preferences->Misc, select "High Impedance" in
"Initialize unused SMU."
ACS2600RTM-900-01 Rev. B / December 2012 4-3
Page 58
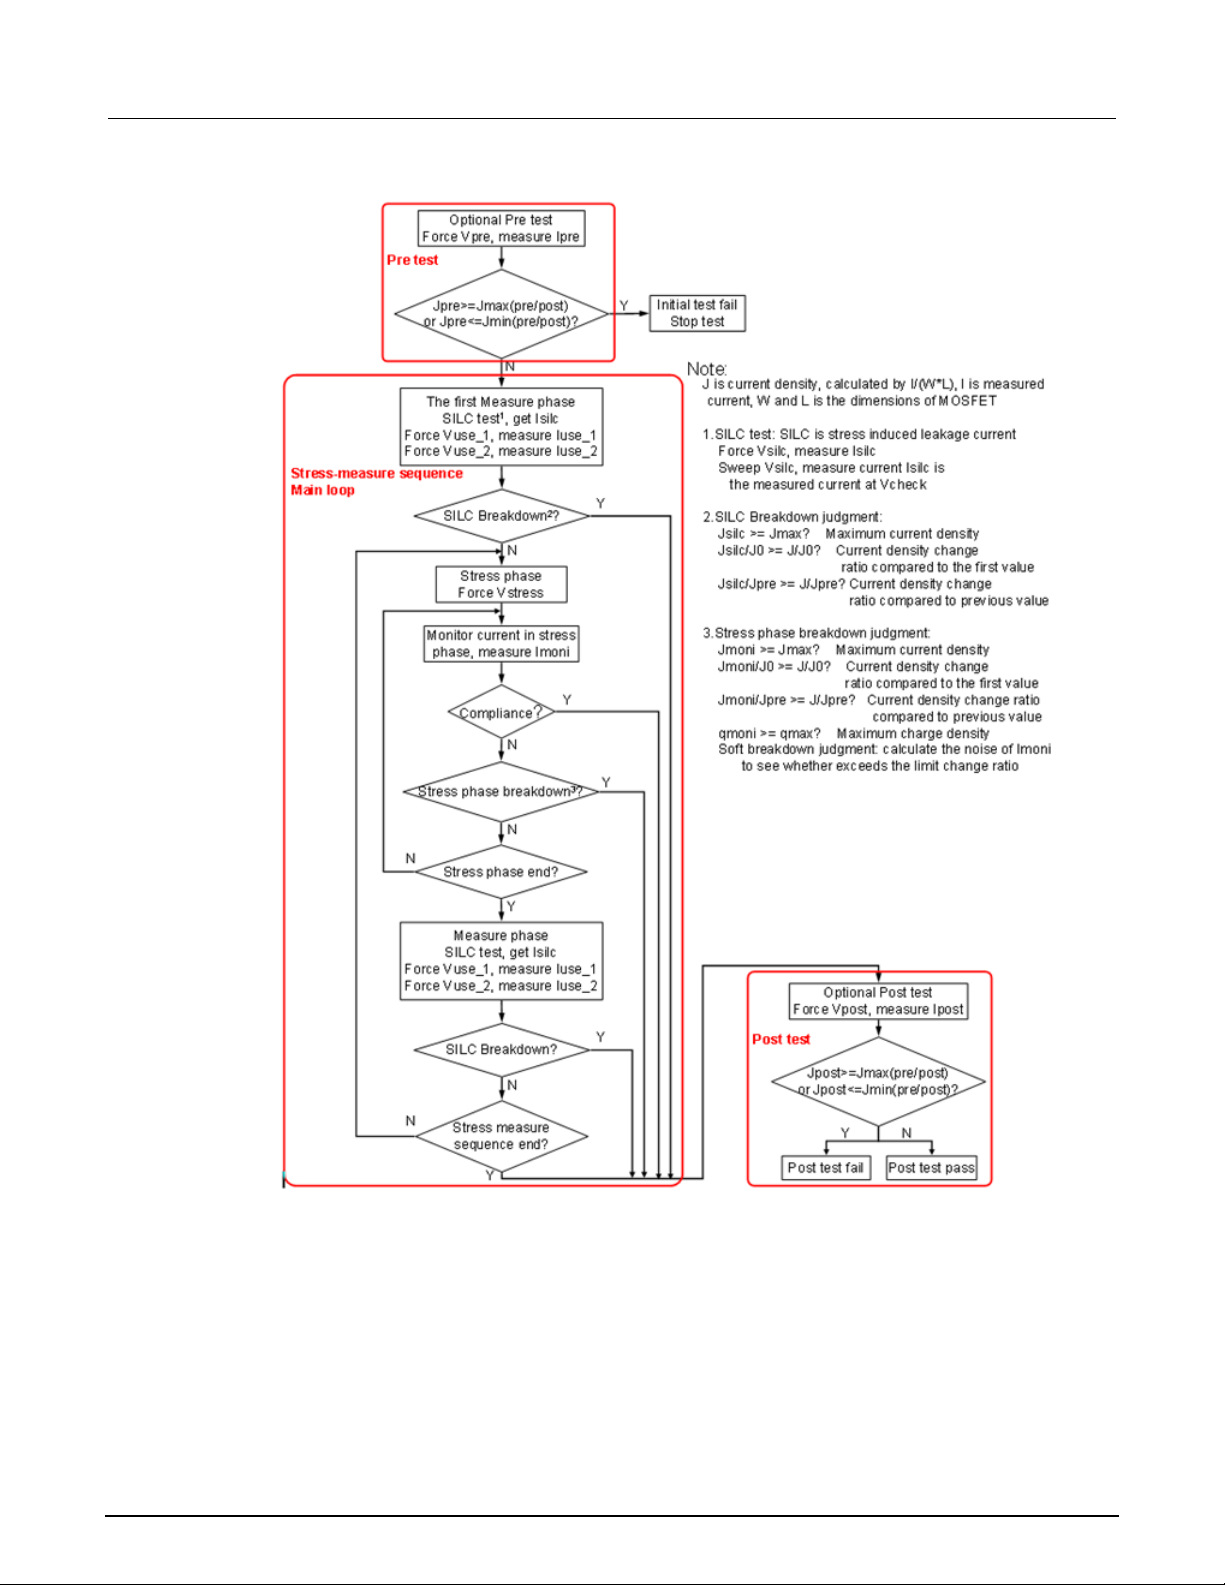
Section
2600 RTM User's Manual
4: Time dependent dielectric breakdown ACS -
Figure 50: Test flow of TDDB_CVS
4-4 ACS2600RTM-900-01 Rev. B / December 2012
Page 59
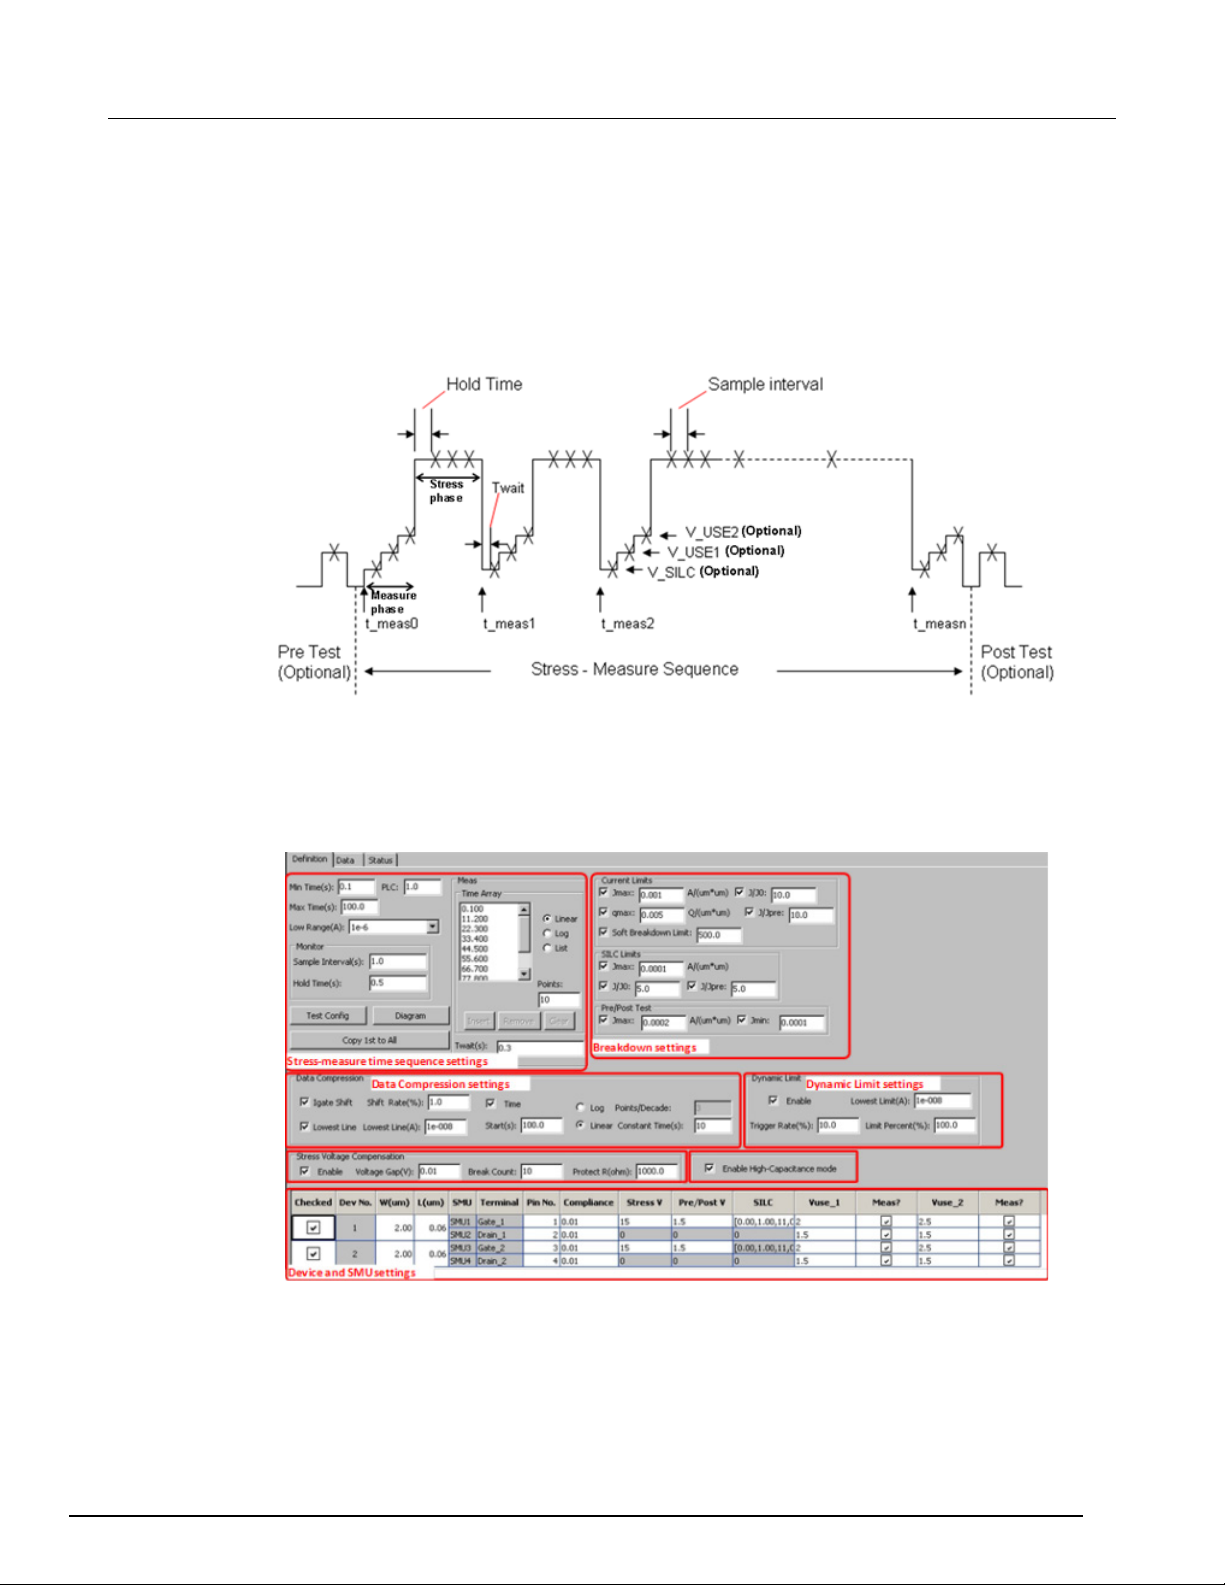
ACS
Time dependent dielectric breakdown
- 2600 RTM User's Manual Section 4:
Pre-test: optional pre-test; force Vpre and measure Ipre.
Post-test: optional post-test; force Vpost and measure Ipost. Vpre and Vpost are equal.
Stress-measure sequence: main loop of TDDB_CVS test.
The waveform of TDDB_CVS test is shown in the next figure (note that the pre/post tests, SILC
V_USE1 V_USE2 [measure phase] tests are optional):
Figure 51: Waveform of TDDB_CVS test
Settings
The Definition tab GUI of the TDDB_CVS settings are shown in the next figure:
Figure 52: GUI for the TDDB_CVS
ACS2600RTM-900-01 Rev. B / December 2012 4-5
Page 60
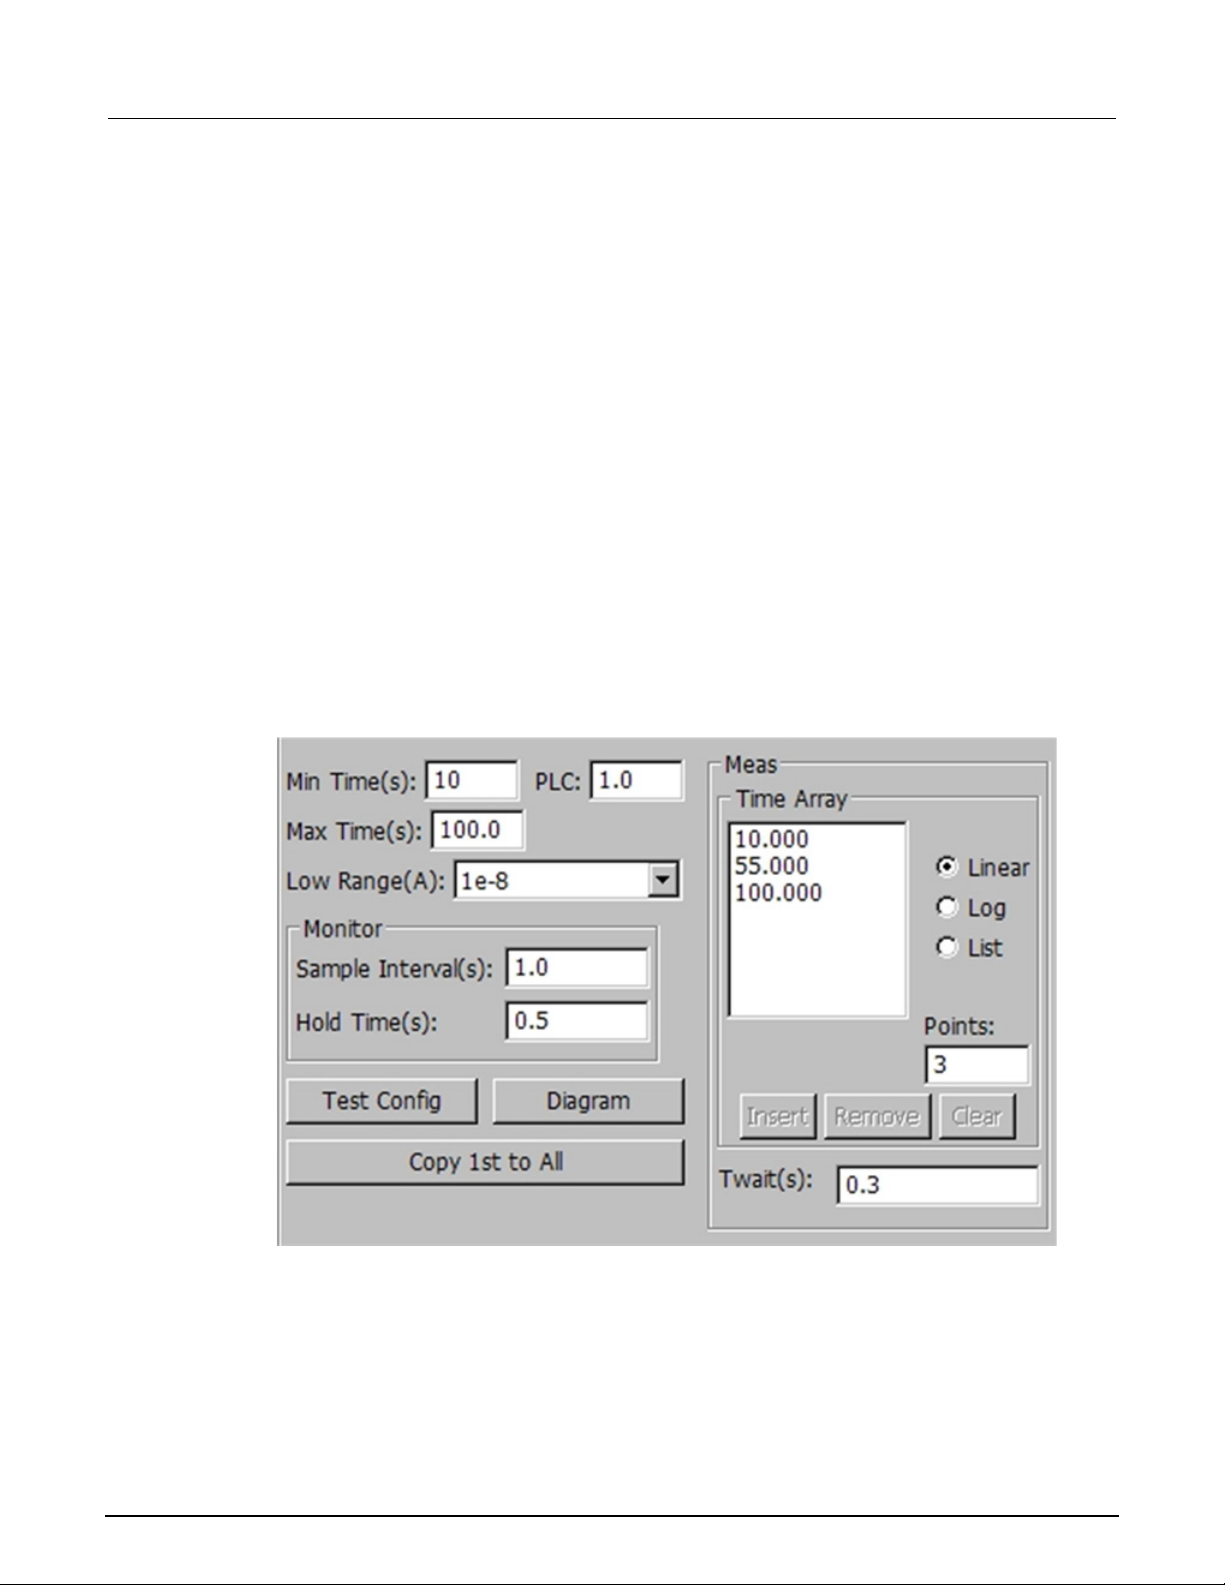
Section
2600 RTM User's Manual
4: Time dependent dielectric breakdown ACS -
Stress-measure time sequence settings
PLC: number of power line cycles, 0.001~25.
Min Time (s): the starting measure phase time.
Max Time (s): the ending measure phase time.
Low Range (A): the lowest current measure range that will be used during auto ranging.
Monitor: monitor time settings. Monitor is defined as current measurements during the stress phase.
• Sample Interval(s): the time interval between two monitor points.
• Hold Time(s): During the stress phase, this is the amount of time the stress voltage will be applied
before the monitor measurement is made.
Time Array: the measure phase stress intervals. The first measure phase time is the Min Time
(excluding the very first measure phase before stress phase), and the last measure phase time is the
Max Time.
• Linear: the measure phase times are a linear distribution with an equally spaced number of points set
by the Points field.
• Log: the measure phase times are a log distribution, and every decade has Points/Decade number of
values.
• List: the measure phase times are a customized list of values.
Figure 53: Stress measure time sequence settings
4-6 ACS2600RTM-900-01 Rev. B / December 2012
Page 61
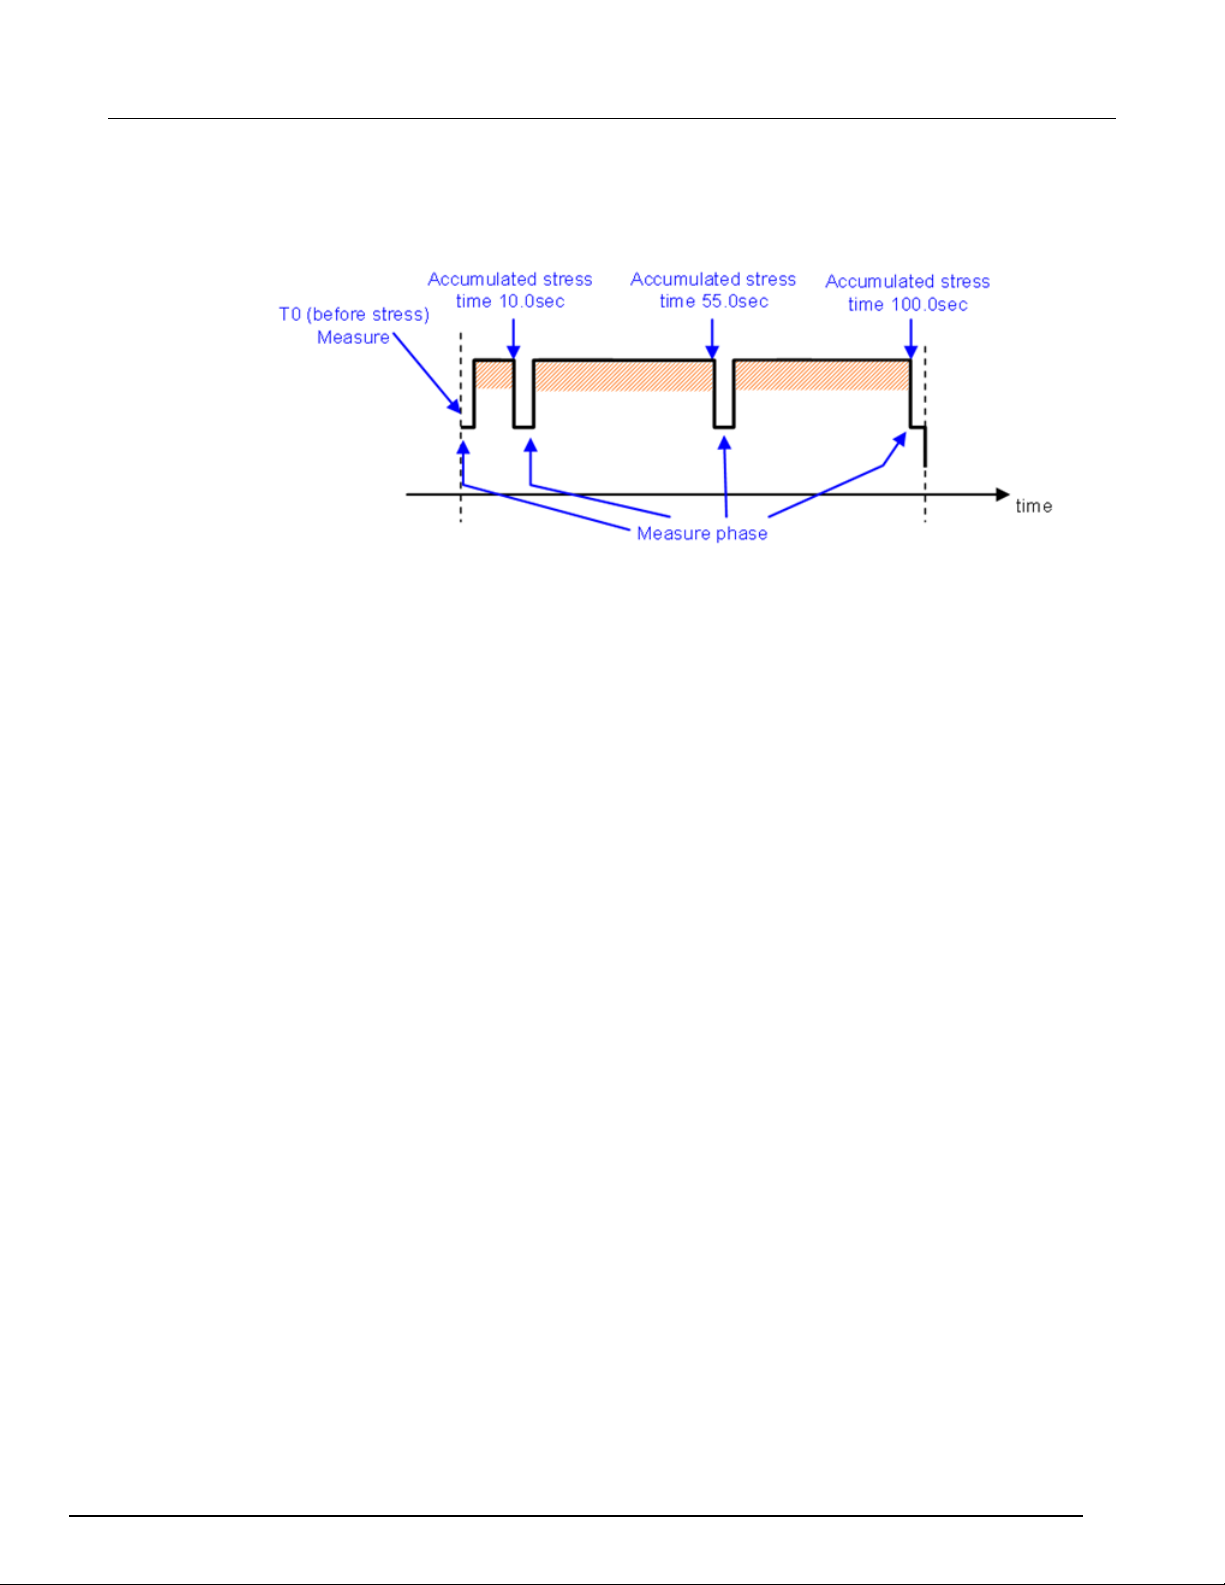
ACS
Time dependent dielectric breakdown
- 2600 RTM User's Manual Section 4:
For the Time Array shown in Figure 6 (10, 55, 100), the stress-measure sequence voltage waveform
is illustrated in Figure 7: . T0 measure is the very first measure phase before any stress
Figure 54: Stress measure sequence waveform
Twait (s): When coming to a measure phase, the software will wait Twait seconds before any
measurement (SILC, Vuse_1 or Vuse_2).
Test Config: clicking this button will pop up a window allowing the user to select whether to operate
the optional test steps: Pre/Post test, SILC test, Vuse_1, Vuse_2.
Breakdown settings
Current Limits: the breakdown settings used during current monitoring. If these fields are selected,
they will be used to evaluate the device under test.
• Jmax: the maximum current density. The current density is calculated by Igate/(W×L). The W and L are
gate width and length, which is set in the test tree device (for a single sub-device) or SMU settings
(multiple sub-devices). If the monitor current density exceeds this value, the device has failed by
definition.
• J/J0: the current density change ratio compared to the first value. If the monitor current density change
ratio exceeds this value, the device has failed by definition.
• qmax: the maximum accumulated charge density. The accumulated charge density is calculated by the
accumulated gate charge divided by the gate area. If it exceeds this value, the device has failed by
definition.
• J/Jpre: current density change ratio compared to the previous value. If monitor current density change
ratio exceeds this value, the device has failed by definition.
• Soft Breakdown Limit: the soft breakdown judgment factor. The soft breakdown judgment is made by
calculating the current noise using the last five measured monitor currents, and then checking if the
current noise setting "Soft Breakdown Limit" times are larger than the baseline noise. The calculation of
the current noise and noise baseline is referred to JESD92.
SILC (stress induced leakage current) Limits: the breakdown settings for the SILC test.
• Jmax: the maximum current density. If the SILC current density exceeds this value, the device has
failed by definition.
• J/J0: the current density change ratio compared to the first value. If the SILC current density change
ratio exceeds this value, the device has failed by definition.
• J/Jpre: the current density change ratio compared to the previous value. If the SILC current density
change ratio exceeds this value, the device has failed by definition.
ACS2600RTM-900-01 Rev. B / December 2012 4-7
Page 62
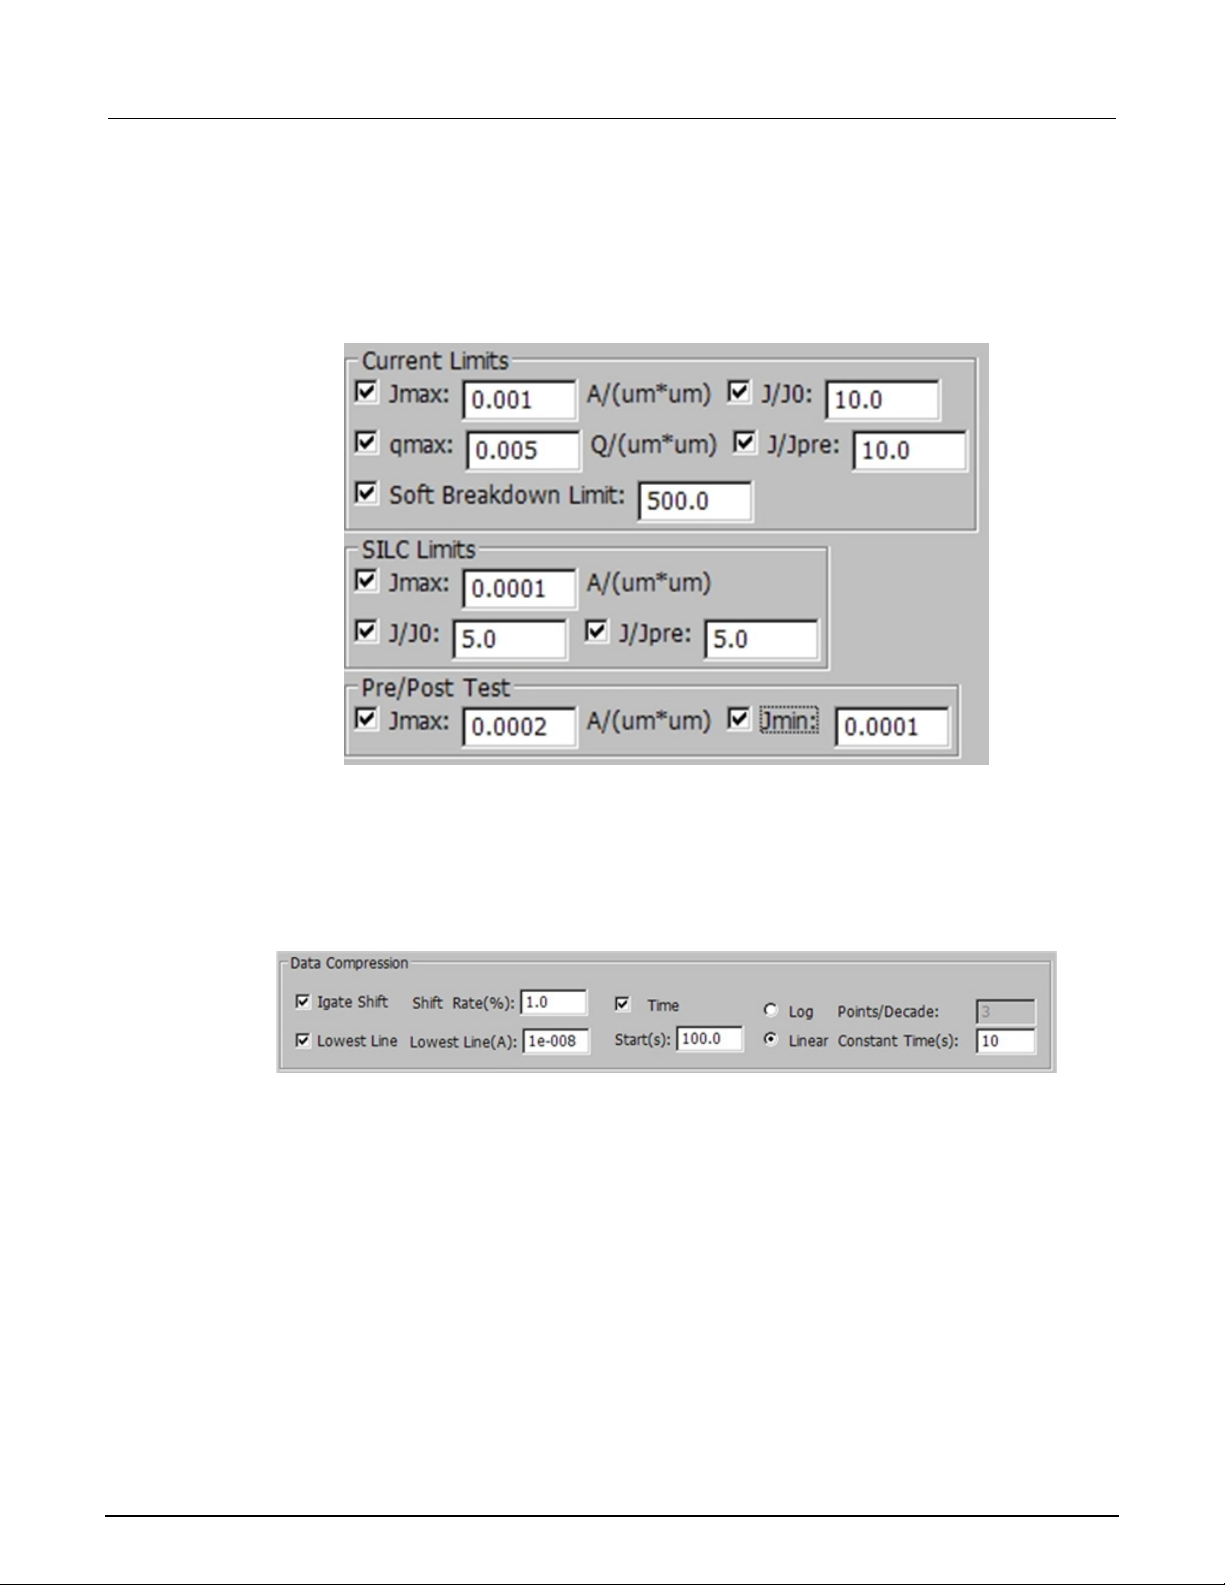
Section
2600 RTM User's Manual
4: Time dependent dielectric breakdown ACS -
Pre/Post-Test: breakdown of settings for the Pre-test and Post-test.
• Jmax: the maximum current density. If the Pre-test current or Post-test current densities exceed this
value, the device has failed by definition.
• Jmax: the minimum current density. If the Pre-test current or Post-test current densities are lower than
this value, the device has failed by definition.
Figure 55: Breakdown settings
Data compression setting
ACS will log the compressed data according to the following settings (see the next figure). This
function can reduce the total amount of data without losing the parameter change tracking
information.
Figure 56: Data Compression setting
4-8 ACS2600RTM-900-01 Rev. B / December 2012
Page 63
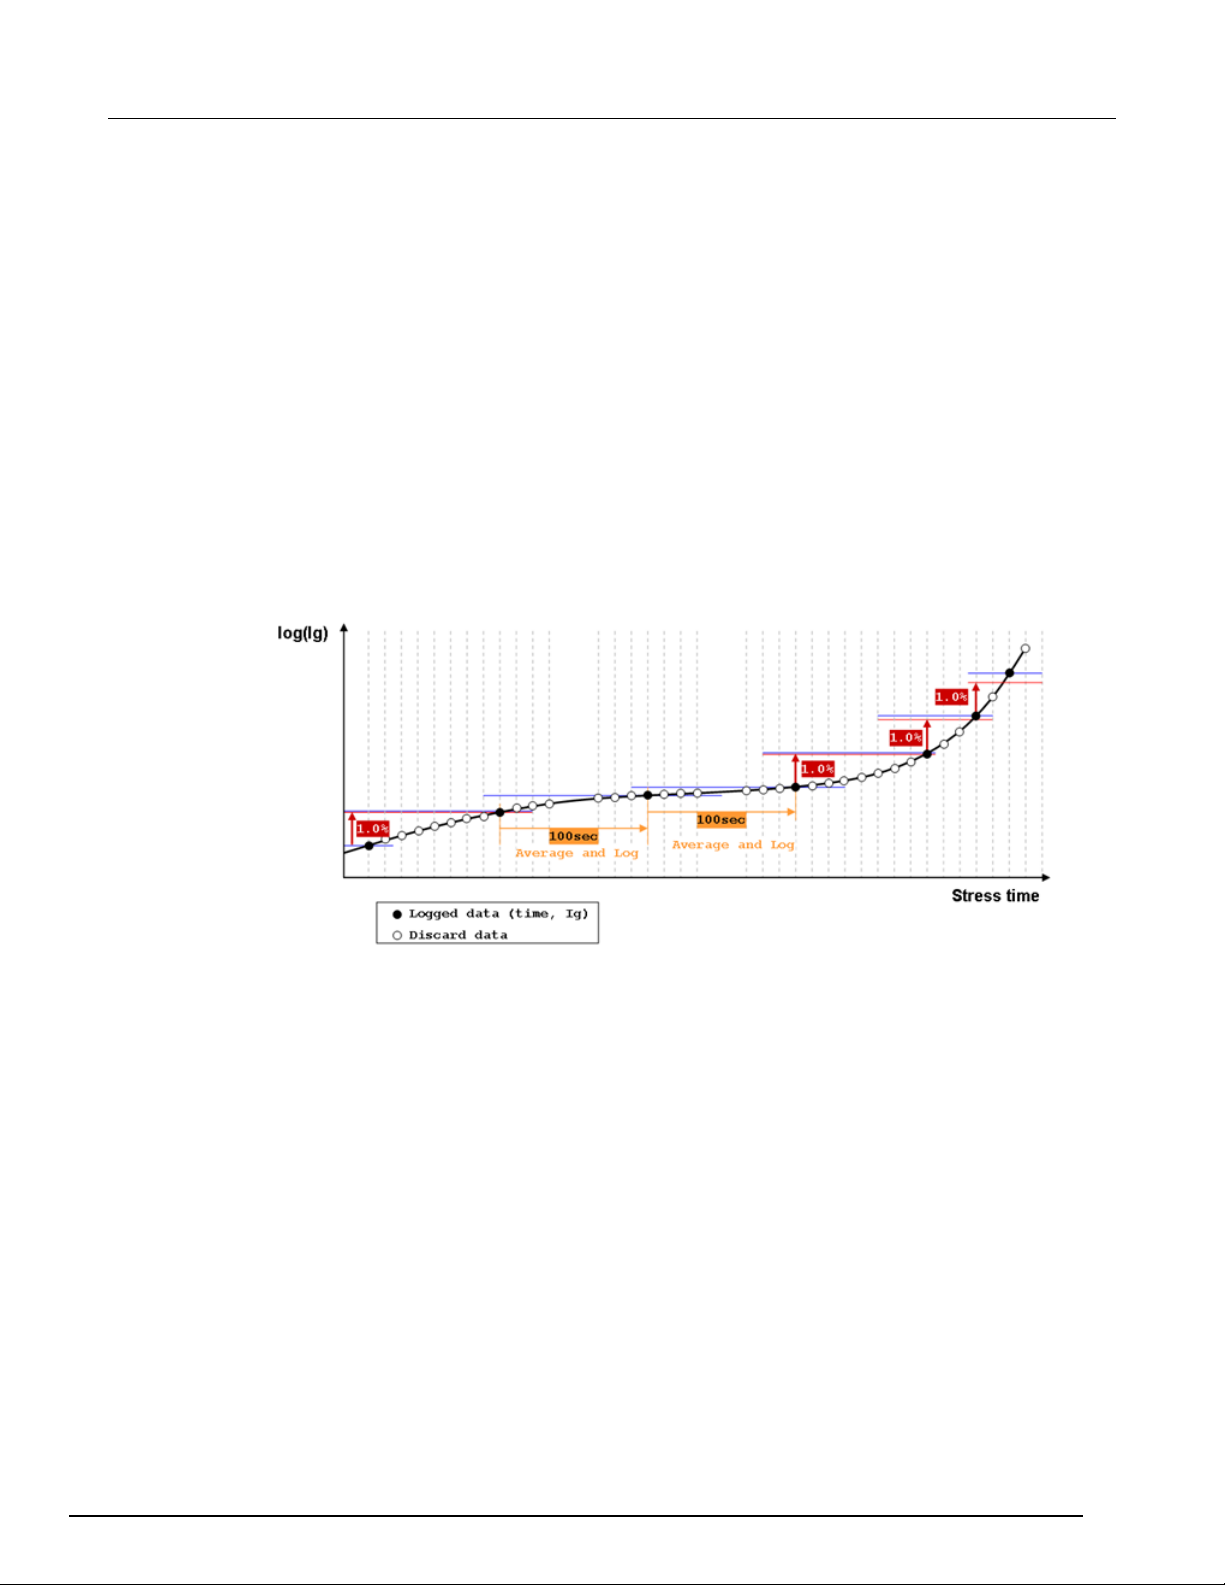
ACS
Time dependent dielectric breakdown
- 2600 RTM User's Manual Section 4:
Igate Shift: if the Igate shifts the "Shift Rate" percentage and this parameter is selected, it will be
logged.
• Shift Rate (%): if the current measured data change ratio exceeds the Shift Rate percentage as
compared to the previous logged data, the data will be logged.
• Lowest Line(A): if the absolute value of the measured data is lower than this value, Igate Shift will not
be effective. When current is near the noise level, this function will be effective to prevent all of the
measured data from being logged.
Time: When this is selected, the logged data will be time-compressed. For Linear or Log, only one
option can be selected.
• Linear: Every Constant Time(s) seconds, one data point is logged. The data is the mean value of the
time period.
• Log: Every decade, a Points/Decade number of data points are logged. The data is the measured value
at each time point.
Start(s): before the time of stress, the Data Compression will not be effective. The data before this
time will be logged.
Figure 57: Data compression diagram
ACS2600RTM-900-01 Rev. B / December 2012 4-9
Page 64
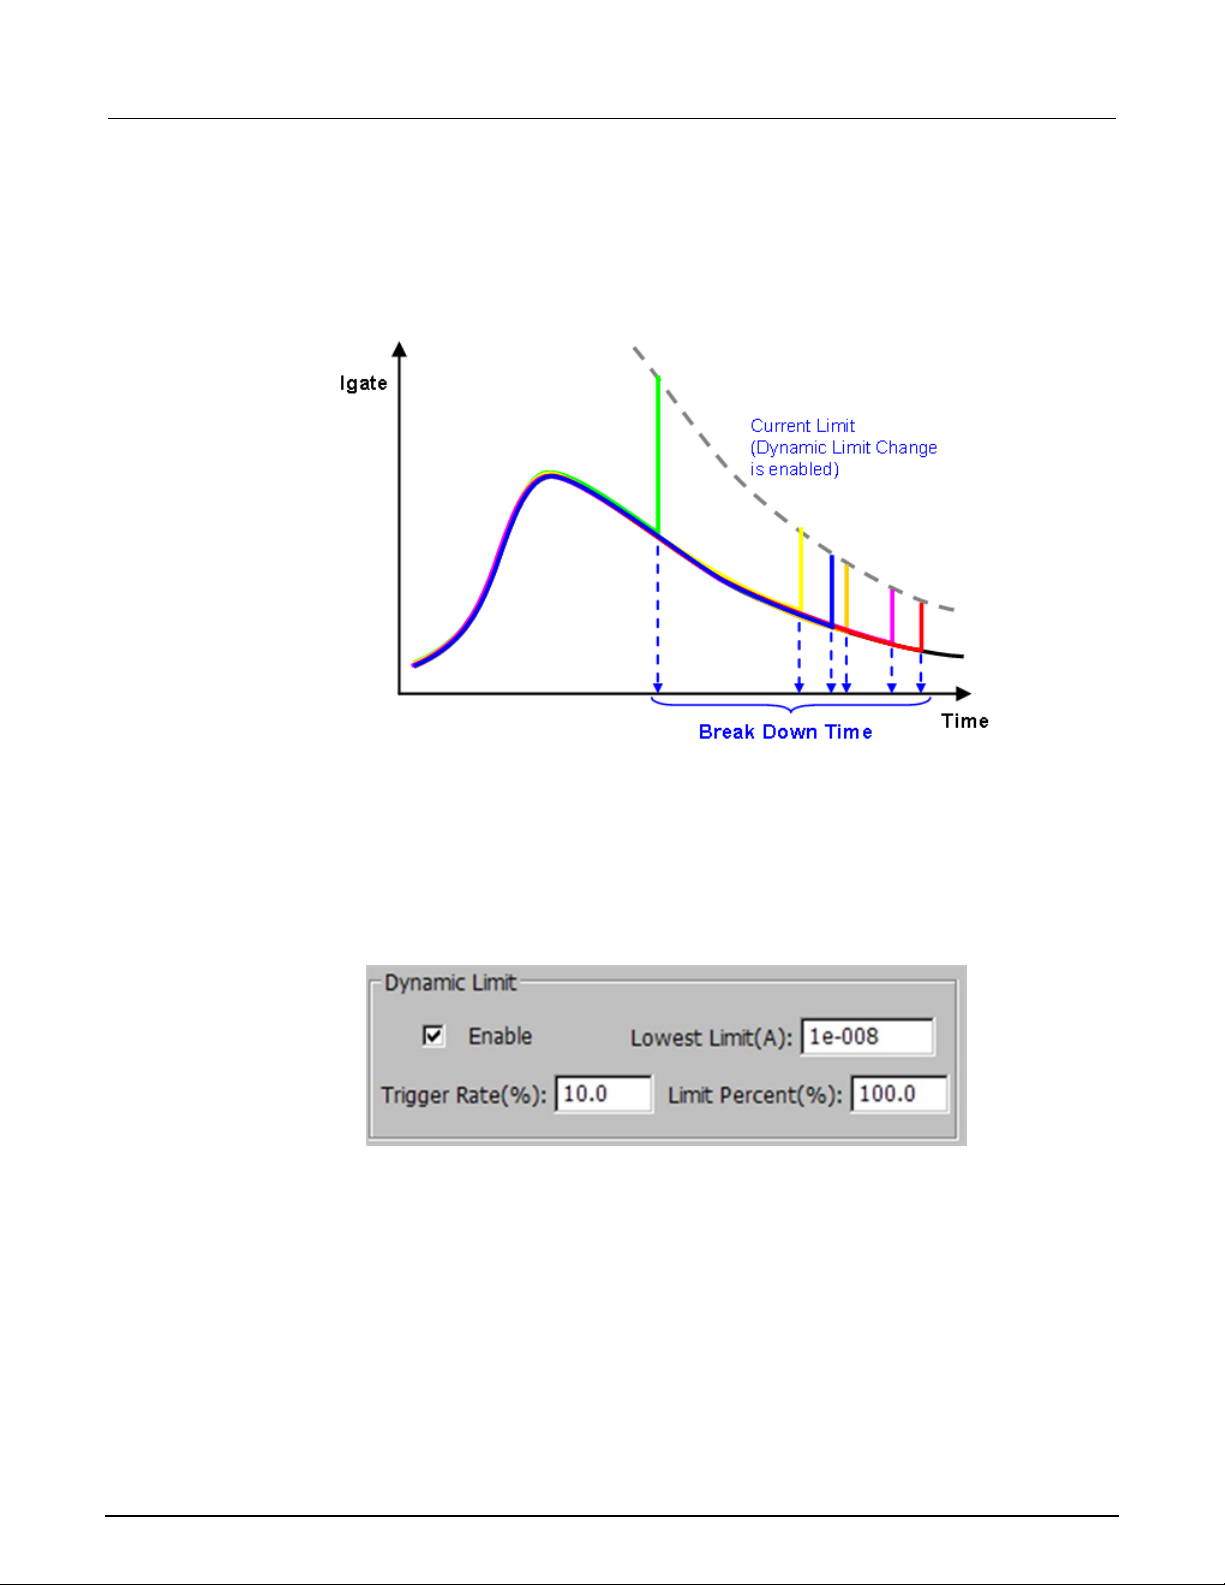
Section
User's Manual
4: Time dependent dielectric breakdown ACS - 2600 RTM
Dynamic limit setting
The Dynamic Limits Change allows the limit values for the gate SMU to vary. The next figure is an
example of a Dynamic Limits Change with a varying limit.
Figure 58: Diagram of Dynamic Limit change
The Series 2600B and Series 2600 SourceMeters can set the current limits when applying the
voltage. The output current will be clamped to the set limit to prevent damage to the DUT. The
Dynamic Limit setting enables the dynamic limit change feature. When enabled, the limit value will
vary according to the settings. The limit value can be set as a multiple of the measured current. If the
current changes smoothly, the limit will not be reached. However, if the current changes suddenly,
which indicates a breakdown, the output will be clamped to the limit value and protect the DUT from
severe damage.
Figure 59: Dynamic Limit settings
Lowest Limit(A): if the gate current is lower than this value, the Dynamic Limit will not be applied.
Trigger Rate(%): if the gate current changes, the Trigger Rate percent as compared to the previous
value, the limit value will change.
Limit Percent(%): the limit value will be set as the (100%+Limit Percent) multiplier of the measured
gate current.
4-10 ACS2600RTM-900-01 Rev. B / December 2012
Page 65
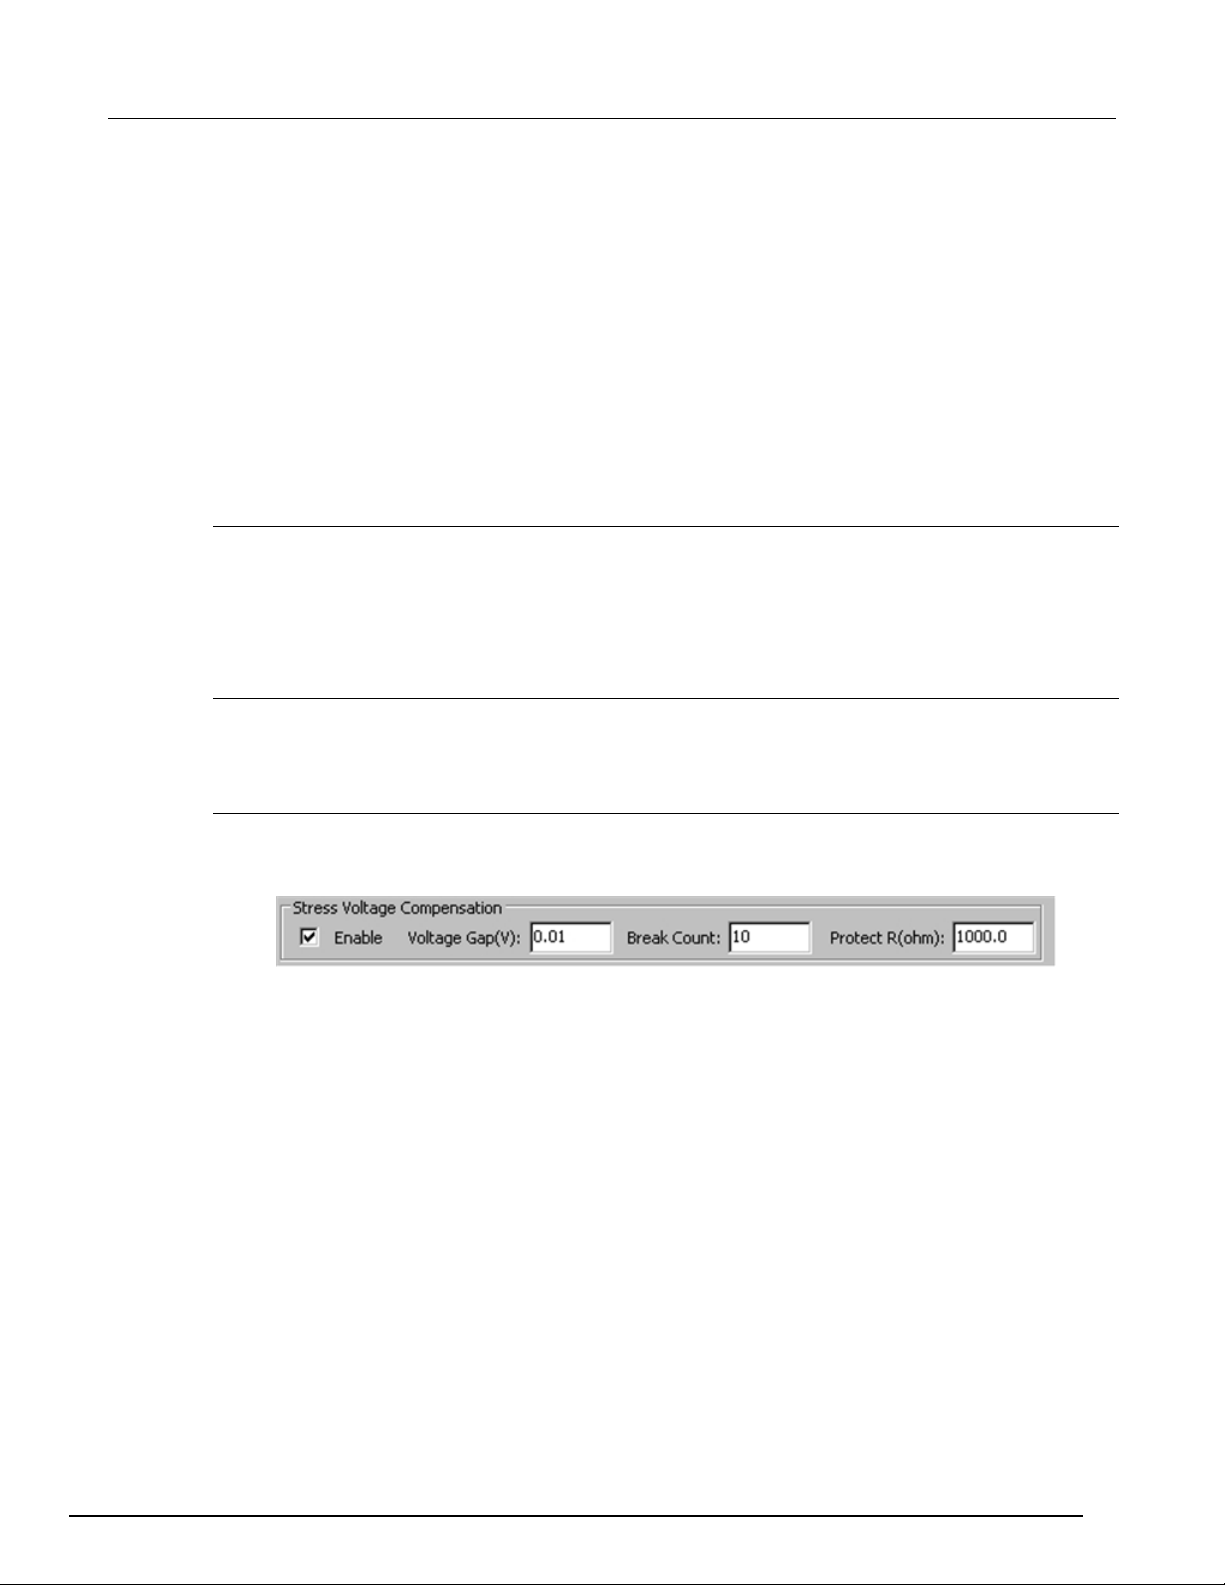
ACS
Time dependent dielectric breakdown
- 2600 RTM User's Manual Section 4:
Stress voltage compensation setting
In some cases, for instance, when testing high-power devices, a protection resistor is inserted in
series with the SMU in order to prevent the rush current at break-down point and prevent oscillation.
The inserted protection resistor will cause a voltage drop, which means the SMU forcing voltage
should be compensated in order to maintain a constant voltage stress on the device. To get the
desired stress voltage on the device, the SMU forcing voltage should make a compensation to
achieve the proper value.
The voltage compensation has two phases:
• Initial speed up loop at the start of the stress
• Voltage compensation during the stress
Initial speed up loop
At the start of the stress, an initial speed up loop is used to get the voltage on the device under test
(Vdut) close to the desired stress voltage (Vtarget).
If the absolute value of (Vdut - Vtarget) is greater than the Voltage Gap (user-specified), then the loop
will continue; if it is less than the Voltage Gap, the loop will end.
Voltage compensation
The voltage compensation during the stress will calculate the next force voltage for every sample
interval using the following two equations.
Stress voltage compensation equations
The following settings (see next figure) are the necessary parameters for the voltage compensation:
Figure 60: Stress Voltage Compensation settings
ACS2600RTM-900-01 Rev. B / December 2012 4-11
Page 66
Section
2600 RTM User's Manual
4: Time dependent dielectric breakdown ACS -
Enable: Enable the stress voltage compensation function. Check the box to enable the stress voltage
compensation function.
Voltage Gap(V): Allowed maximum voltage difference between Vtarget and Vdut; used to determine
the compensation loop.
Break Count: Maximum count of the voltage compensation loop.
Protect R(ohm): Resistance for the protection resistor (dRact).
When the stress voltage compensation is enabled, the actual voltage on a device (Vdut) will be
posted in the Data tab. The column name is "V_dut_<sn>" ("sn" is the number of the device).
The following two equations are used:
Vcomp = Vtarget + Idut * dRact,
• Vcomp is the voltage force at loop n+ 1
• Vtarget is the desired stress voltage target on the device under test (DUT)
• Idut is the measured current at loop n
• dRact is the resistance of the protection resistor
Vdut = Vcomp – Idut * dRact
• Vdut is the actual voltage stress on the DUT
• Vcomp is the force voltage at loop n
• Idut is the measured current at loop n
• dRact is the resistance of the protection resistor
High-capacitance mode
In some cases the device under test (DUT) has high capacitance, for example in a high-power
device, therefore, the SMU should be set to high-capacitance mode for better measurement.
When high-capacitance mode is enabled, a minimum load capacitance of 100 nF is recommended. In
absence of this minimum load capacitance, overshoot and ringing may occur.
In order to enable high-capacitance, select the Enable High-Capacitance mode option (see the next
figure). Also, the SMU low range and current compliance value must be greater than or equal to 1e-6.
For more details about the Series 2600B instrument high-capacitance mode, refer to the Series
2600B Reference manual.
Figure 61: Enabled high-capacitance mode
4-12 ACS2600RTM-900-01 Rev. B / December 2012
Page 67
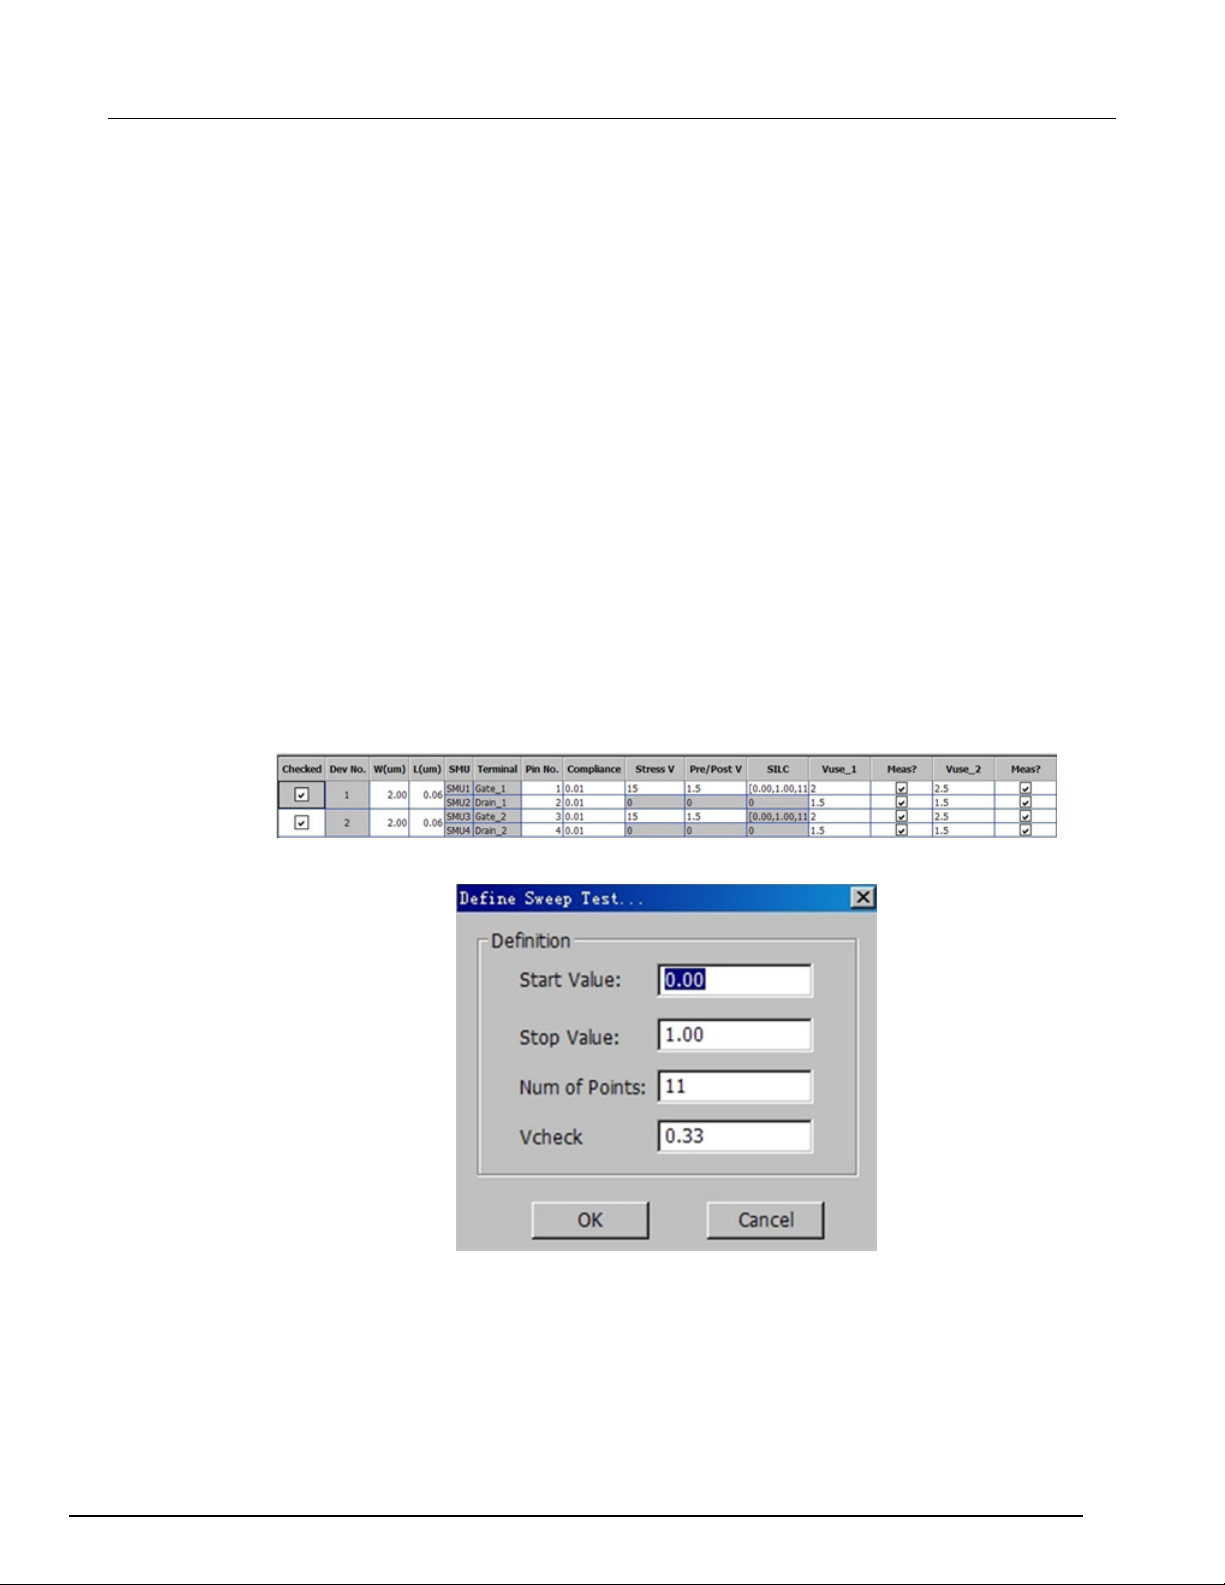
ACS
Time dependent dielectric breakdown
- 2600 RTM User's Manual Section 4:
Device and SMU settings
The device and SMU settings are all set at the device level. For example, all of the devices and
SMUs that are assigned in the device level of the test tree such as, the Group No., Dev No., SMU
and Terminal are shown in the next figure.
W(um), L(um): the MOSFET device dimensions. These parameters are used to calculate the gate
current density and charge density.
Compl: the current compliance (limit) value.
Stress V: (Only available for the gate terminal.) Sets the gate stress voltage value.
Pre/Post V: (Only available for the gate terminal.) Sets the gate pre-test and post-test bias voltage
values.
SILC: (Only available for the gate terminal.) Sets the SILC test bias voltage value or sweep voltages.
Double clicking the cell will enable a dialog box to open where you can change the sweep voltage
settings (see next figure).
• Start Value: sweep start voltage, units are volts.
• Stop Value: sweep stop voltage, units are volts.
• Num of Points: the number of points in the sweep.
• Vcheck: the measured gate current when under Vcheck bias is defined as Isilc.
Figure 62: Device and SMU settings
Figure 63: SILC sweep voltage settings
Vuse_1 and Meas?: the Vuse_1 is the value at the measure phase. If the check box for Meas? is
selected, the current will be measured.
Vuse_2 and Meas?: the Vuse_2 is the value at the measure phase. If the check box for Meas? is
selected, the current will be measured.
ACS2600RTM-900-01 Rev. B / December 2012 4-13
Page 68

Section
2600 RTM User's Manual
4: Time dependent dielectric breakdown ACS -
Failure determination
Initial test
The TDDB_CVS testing begins by performing a pre-test. The pre-test applies a gate bias voltage in
the Pre/Post V and measures the gate current as Ipre. If the calculated gate current density exceeds
the high limit Jmax, or the low limit Jmin, the device has failed the initial test by definition, and testing
will end. In multiple device tests, the testing for the failed device will end, while the others will
continue to be tested.
Stress-measure sequence
During the stress phase, the monitor current Imoni will be used to determine if a breakdown occurs
during testing. In the measure phase, the SILC test current Isilc will be used to determine if a
breakdown occurs. If a breakdown occurs, the test flow for the device will exit the stress-measure
sequence and jump to the post-test, and the device has failed by definition (a BD [breakdown] has
occurred).
Stress phase breakdown
Maximum current density Jmax: if the current density exceeds the Jmax, the device has failed by
definition and jumps to the post-test.
Current density ratio J/J0: if the current density changes ratio (is larger than the setting value)
compared to the first value in J0, the device has failed by definition.
Current density ratio J/Jpre: if the current density change ratio (is larger than the setting value)
compared to the previous value Jpre, the device has failed by definition.
Maximum charge density qmax: if the charge density exceeds qmax, the the device has failed by
definition.
Soft breakdown limit: calculates the noise of Imoni, to see if it exceeds the limit change ratio. If the
noise setting value is larger than the baseline noise, the device has failed by definition. The
calculation algorithm of the monitor current noise and the baseline noise is based on the JEDEC
standard JESD92.
Measure phase breakdown
Stress-induced leakage current (SILC) is measured during the measure phase to determine a
breakdown in the device.
Maximum current density Jmax: if the SILC current density exceeds Jmax, the device has failed by
definition and jumps to the post-test.
Current density ratio J/J0: if the SILC current density changes ratio (is larger than the setting value)
as compared to the first value J0, the device has failed by definition.
Current density ratio J/Jpre: if the SILC current density change ratio (is larger than the setting value)
as compared to the previous value Jpre, the device has failed by definition.
4-14 ACS2600RTM-900-01 Rev. B / December 2012
Page 69
ACS
Time dependent dielectric breakdown
Initial (type 1)
Fail
N/A
N/A
Catastrophic (type 2)
Pass
Fail
Fail
Masked Catastrophic (type 3)
Pass
Pass
Fail
Non-catastrophic (type 4)
Pass
Fail
Pass
Monitor fail (type 5)
N/A
Fail
N/A
All pass (type 6)
Pass
Pass
Pass
Time_stress_<sn>
S
Stress phase time stamps
I_<pad>_pre_<sn>
A
Measured current in Pre test
I_<pad>_post_<sn>
A
Measured current in Post test
V_SILC_<sn>
V
Applied voltage at SILC test
Measured current at Vcheck when SILC test is set as sweep
I_SILC_<sn>
A
Measured current in SILC test
I_<pad>_use1_<sn>
A
Measured current under Vuse1 in measure phase. <pad>
can be gate, drain, or source
I_<pad>_use2_<sn>
A
Measured current under Vuse2 in measure phase. <pad>
can be gate, drain, or source
Inoise_<pad>
A
Noise level of the gate current, for soft breakdown judgment
Q_<pad>
C
Accumulated gate charge
Tbd_<sn>
S
Breakdown time
Qbd_<sn>
C
Quantity of charge when breakdown
Ibd_<sn>
A
Breakdown current
<sn>: the number of the sub-device.<pad>: pad name, usually the gate in TDDB_CVS. For example, sub-
- 2600 RTM User's Manual Section 4:
Post-test
The Post-test applies a gate bias voltage (Vpost) and measures the gate current (Ipost). If the
calculated gate current density exceeds the high limit (Jmax) or the low limit (Jmin), the the device
has failed the post-test by definition.
Failure mode
According to the pass or fail conditions for the Initial, BD (breakdown),and Post-tests, the failure
modes are categorized as shown in the next table:
Failure type Initial test BD test Post-test
Data recording
The data test results are displayed in the Data tab, and will be logged in the .kdf, .db, or the .csv file if
executed in Automation mode. The data for multiple groups is displayed in multiple tabs within the
Data tab. The output data for sub-devices is distinguished by the parameter name suffixes. The
output parameters for one group are shown in the next table:
Parameter Unit Comment
Time_meas_<sn> S Measure phase time stamps
I_SILC_check_<sn> A
I_<pad> A Monitor gate current at stress phase
voltage
BD_type_<sn> - Breakdown type (fail mode)
I_gate_last_<sn> A The last measured gate current before breakdown
device 1, pad name Gate_1, the measured pre-test current is I_Gate_1_pre_1.
ACS2600RTM-900-01 Rev. B / December 2012 4-15
Page 70
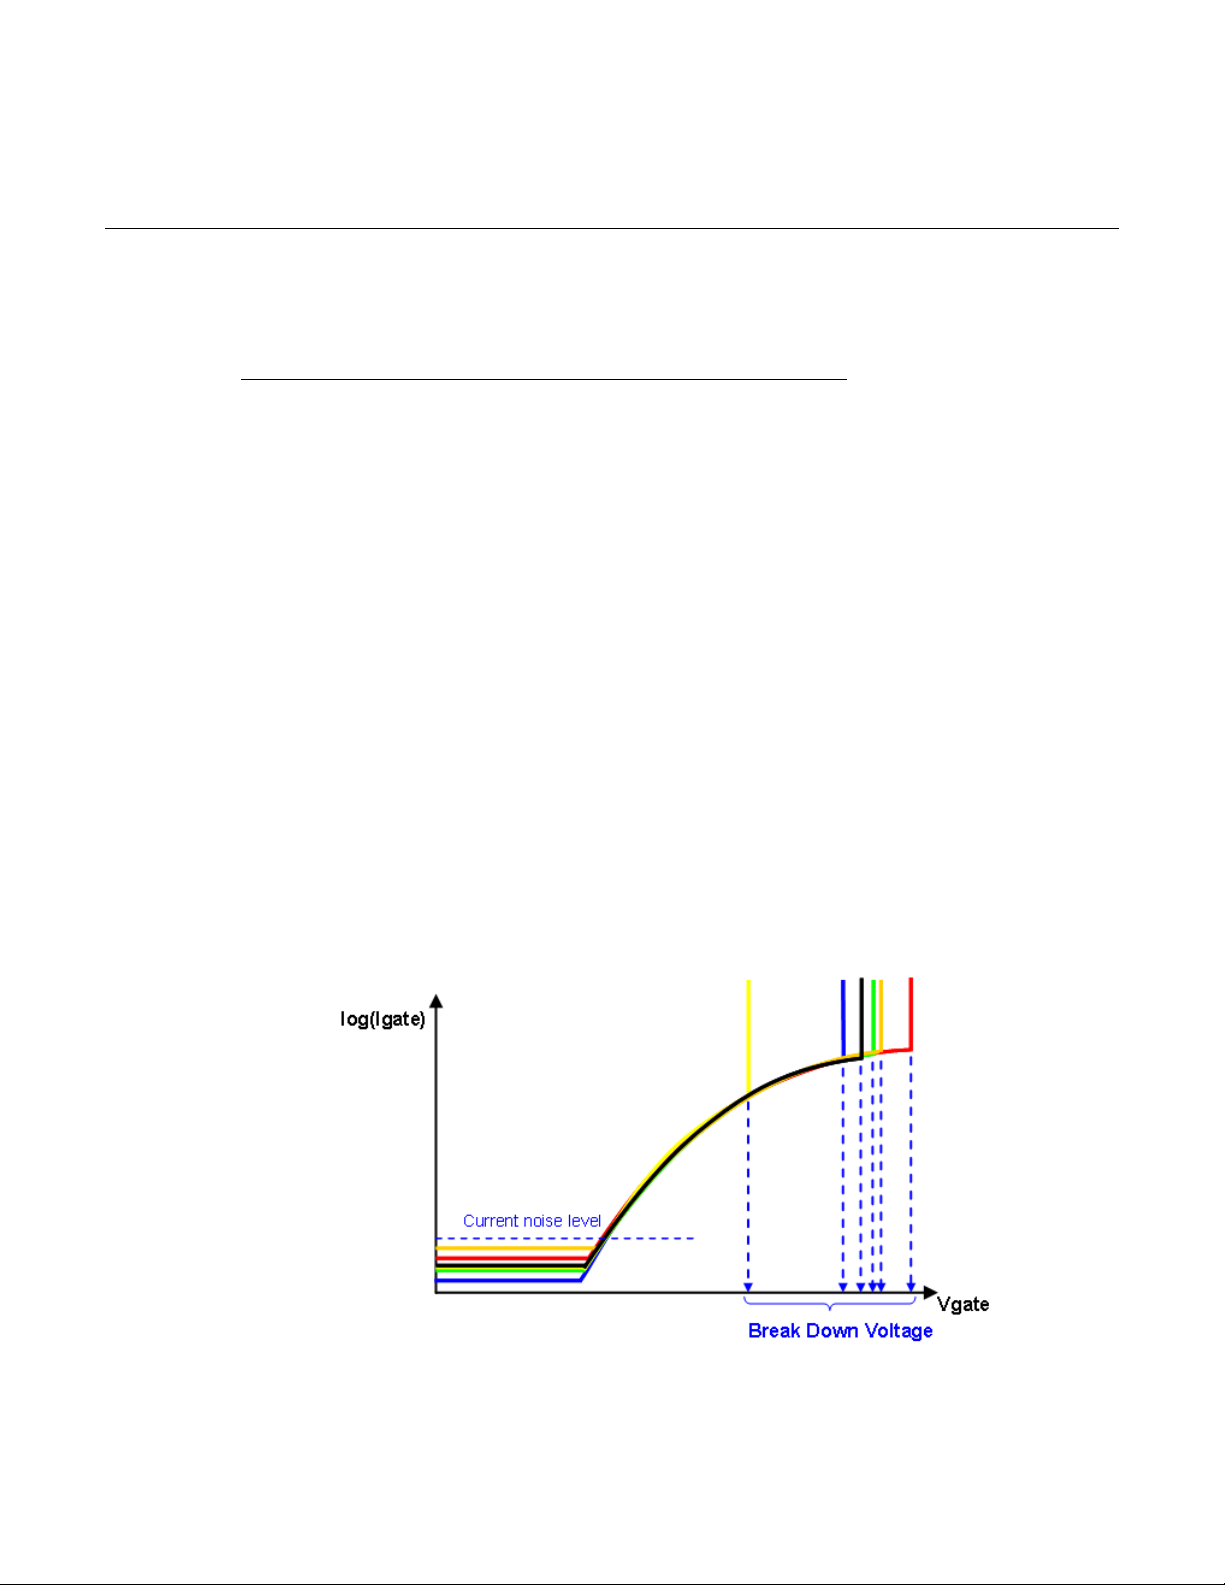
Data recording ........................................................................ 5-14
In this section:
Test principle ............................................................................ 5-1
Instrument connection .............................................................. 5-2
Test flow ................................................................................... 5-4
Settings .................................................................................... 5-6
Failure determination ............................................................. 5-11
Test principle
The voltage-ramp (VRamp) test uses a ramped voltage stress on the capacitors or gate oxides to
characterize the defects of dielectrics at lower electrical fields. The stressed voltage starts at a lower
level and ramps linearly until the oxide breakdown occurs. VRamp tests are often applied to oxides
where characterization of the defects at lower electric fields is important (JESD35-A). The VRamp test
uses the Series 2600A or Series 2600 SourceMeters for sourcing and measuring.
Section 5
Voltage ramp
The VRamp test has three stages: Pre-test, stress stage, and post-test. Pre-test is used to verify the
functionality of the device, the stress stage is used to apply the ramped voltage stress to the device
until breakdown, and the post-test is used to characterize the device after the stress stage. The
VRamp test provides a ramped voltage stress that is able to set up to five segments. Each voltage
ramp is able to set its own ramp rate. This test is appropriate for finding the breakdown voltage of a
test structure.
Figure 64: VRamp test result diagram
Page 71
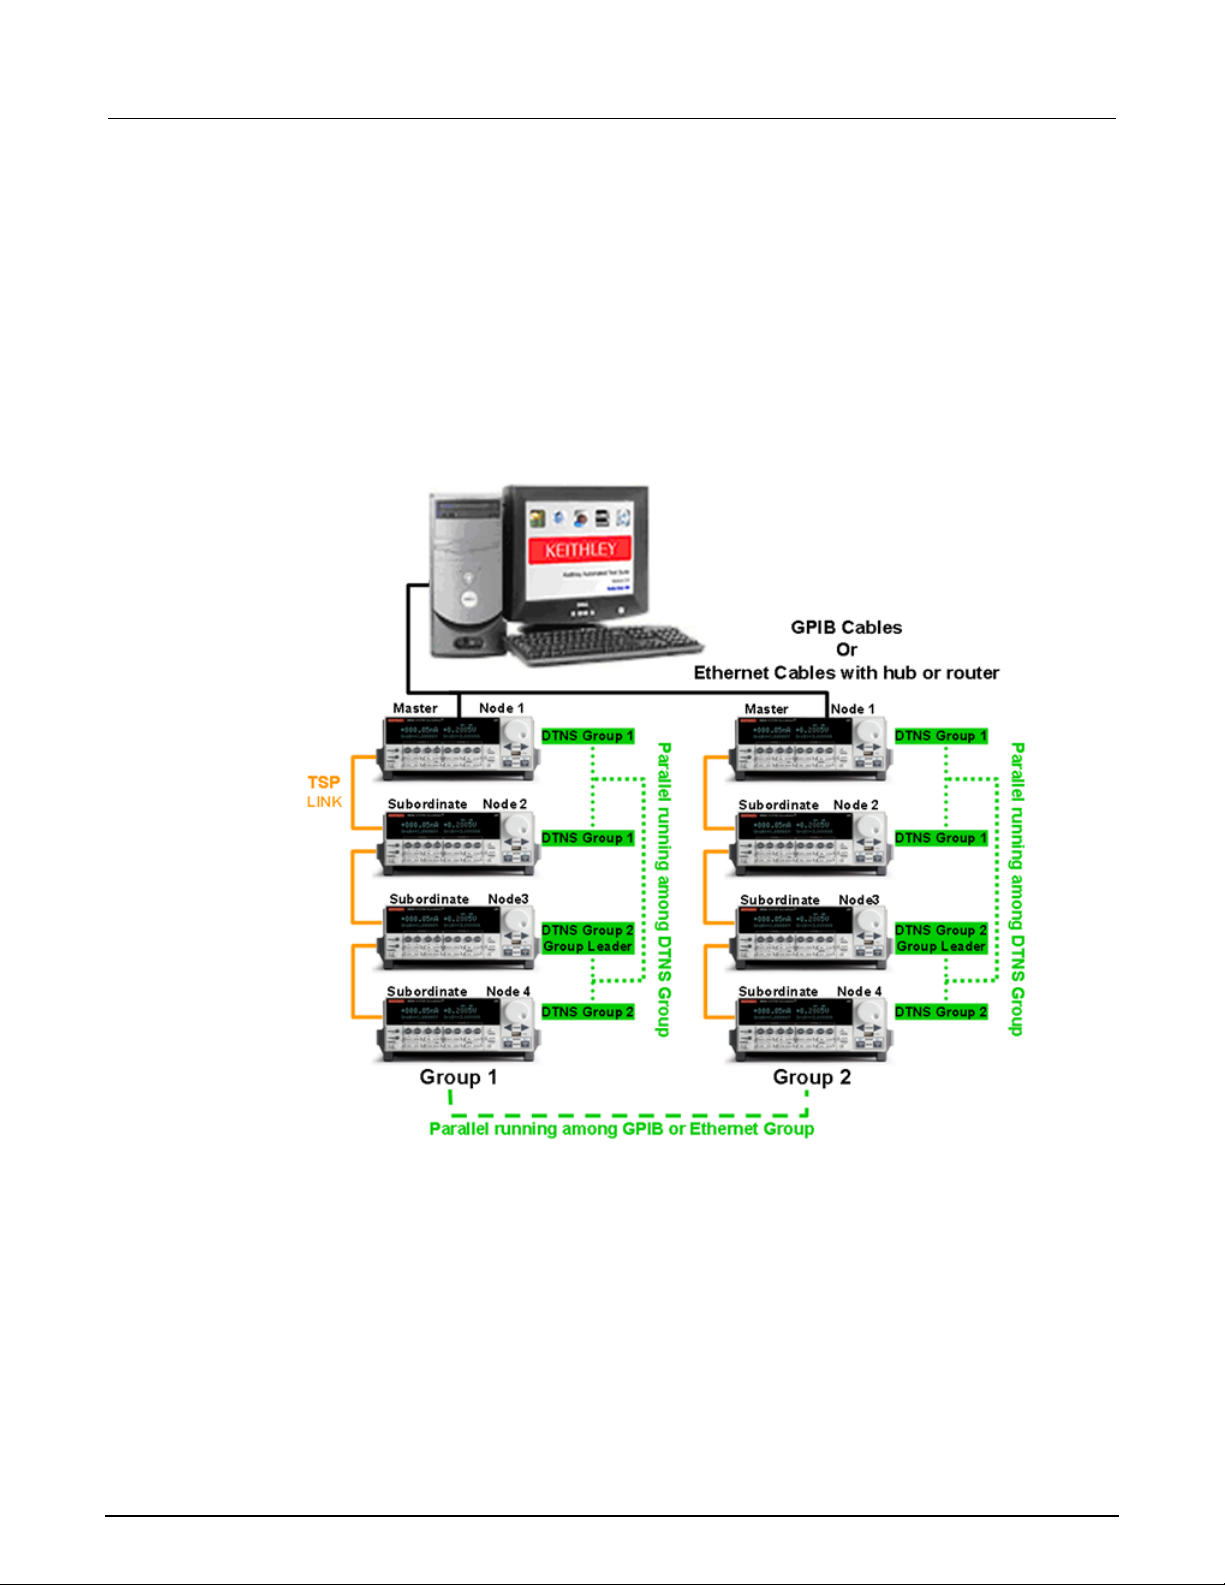
Section
2600 RTM User's Manual
5: Voltage ramp ACS -
Instrument connection
The VRamp test applies ramped voltages to the gate, and bulk, and the source and drain are
connected to ground (GND). The test module uses the Series 2600B or Series 2600 SourceMeters.
The SourceMeters can be setup for different groups (GPIB or Ethernet) for parallel testing. Within
each group, you can also setup multiple sub-devices for sequential or parallel testing. In a parallel
test, each sub-device will be set as a sub-group (DTNS Group). The SourceMeters connected
together within a group must have the same firmware. The 2600B SourceMeters and the 2600
SourceMeters (for instance, the A and non-A versions) cannot be used together. A typical connection
scheme is shown in the next figure:
Figure 65: A typical instrument connection scheme
5-2 ACS2600RTM-900-01 Rev. B / December 2012
Page 72
ACS
Voltage ramp
1 × 16
Sequential
0.2
1
Parallel
0.2
1.2
Parallel
0.2
0.3
Sequential
0.2
0.2
Parallel
0.2
0.3
16 × 1
Sequential
0.2
0.5
1
2
module is added, refer to the next figure.
- 2600 RTM User's Manual Section 5:
Due to limited memory space and communication speed of the instruments, the ramp rate and stress
interval settings will be affected by how the instruments are arranged. A connection scheme with
more instruments will need more time to accomplish a stress interval. The next table lists the stress
interval settings for some typical instrument configurations. The smallest recommended settings are
shown for each configuration:
Instrument configuration1 Mode2
2 × 8
4 × 4
Instrument configuration "n × m" represents a connection scheme of n Groups;
every group has m nodes. For example, in the next figure, the instrument
configuration is 2 × 4.
Mode means the execution mode of the VRamp module. It is selected when the test
Sequential 0.2 0.3
Ramp rate (V/s) Stress Interval
(s)
ACS2600RTM-900-01 Rev. B / December 2012 5-3
Page 73
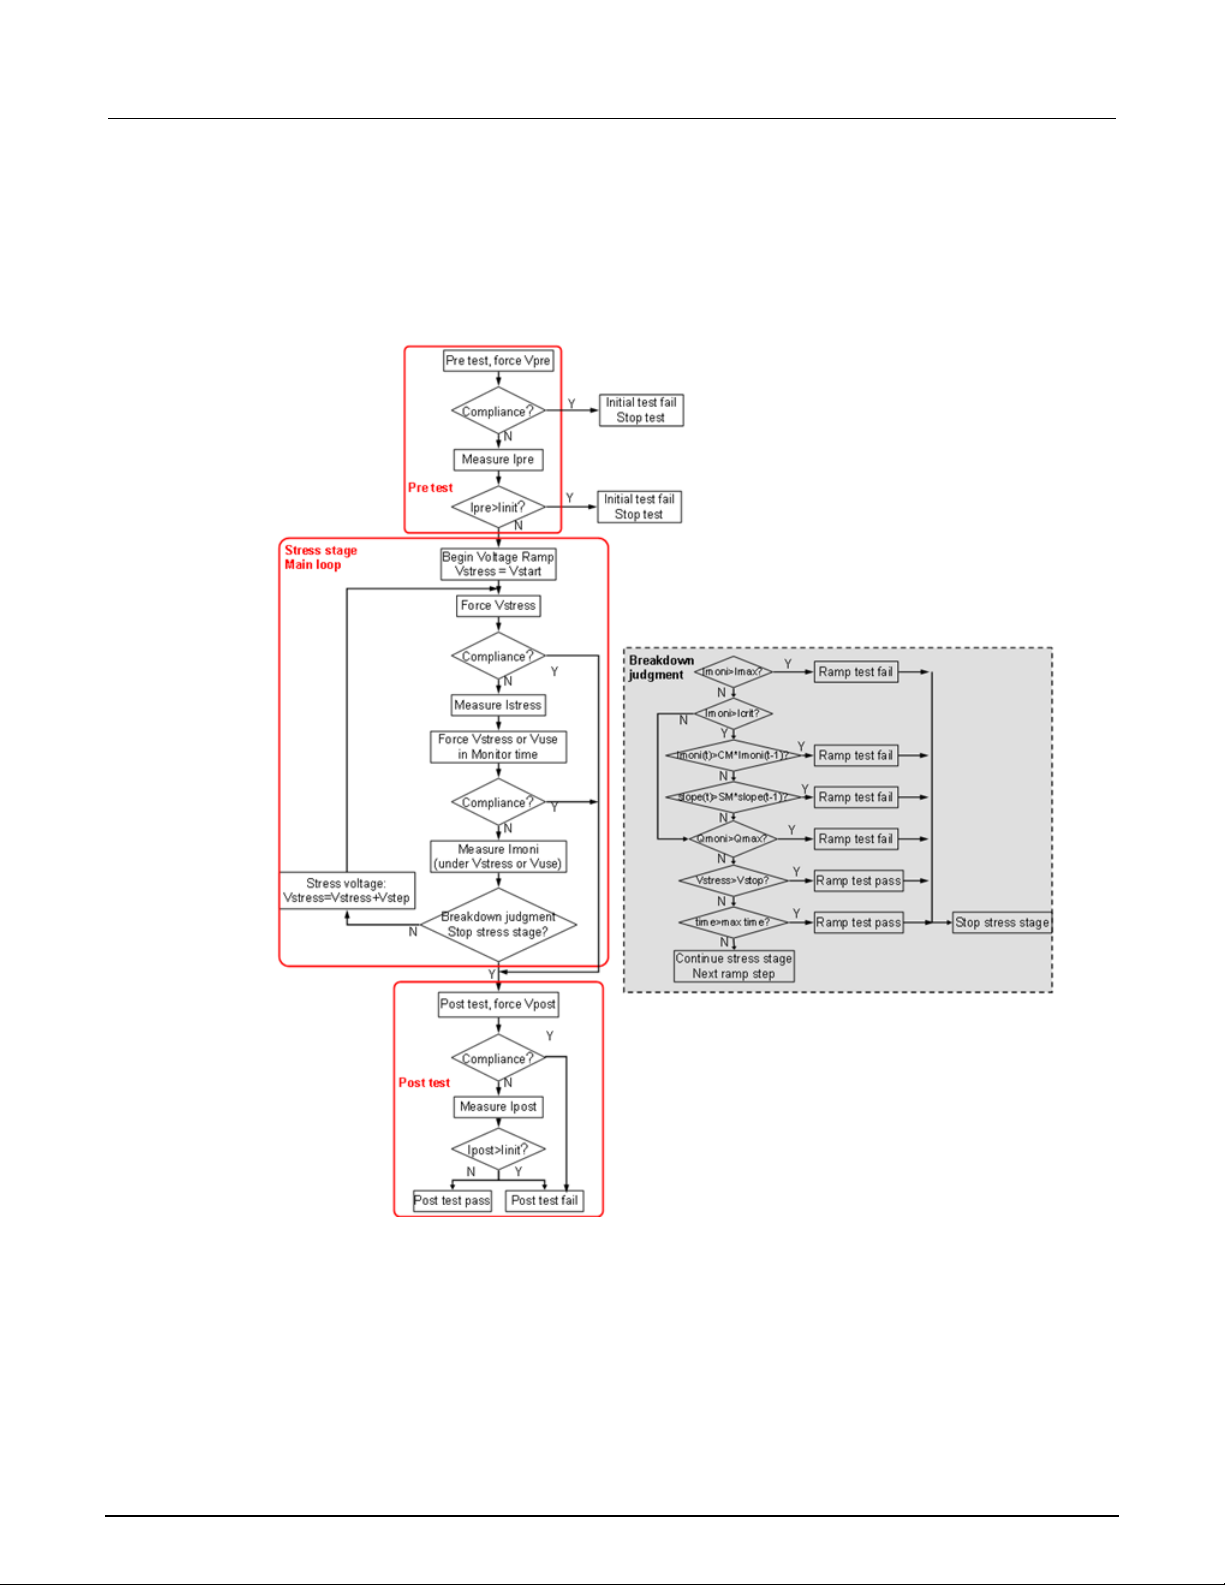
Section
2600 RTM User's Manual
5: Voltage ramp ACS -
Test flow
The VRamp test flow is based on the JESD35-A standard. The VRamp parameters are also defined
by the JESD35-A standard. The VRampl test flow is shown in the next figure:
Figure 66: VRamp test flow
5-4 ACS2600RTM-900-01 Rev. B / December 2012
Page 74
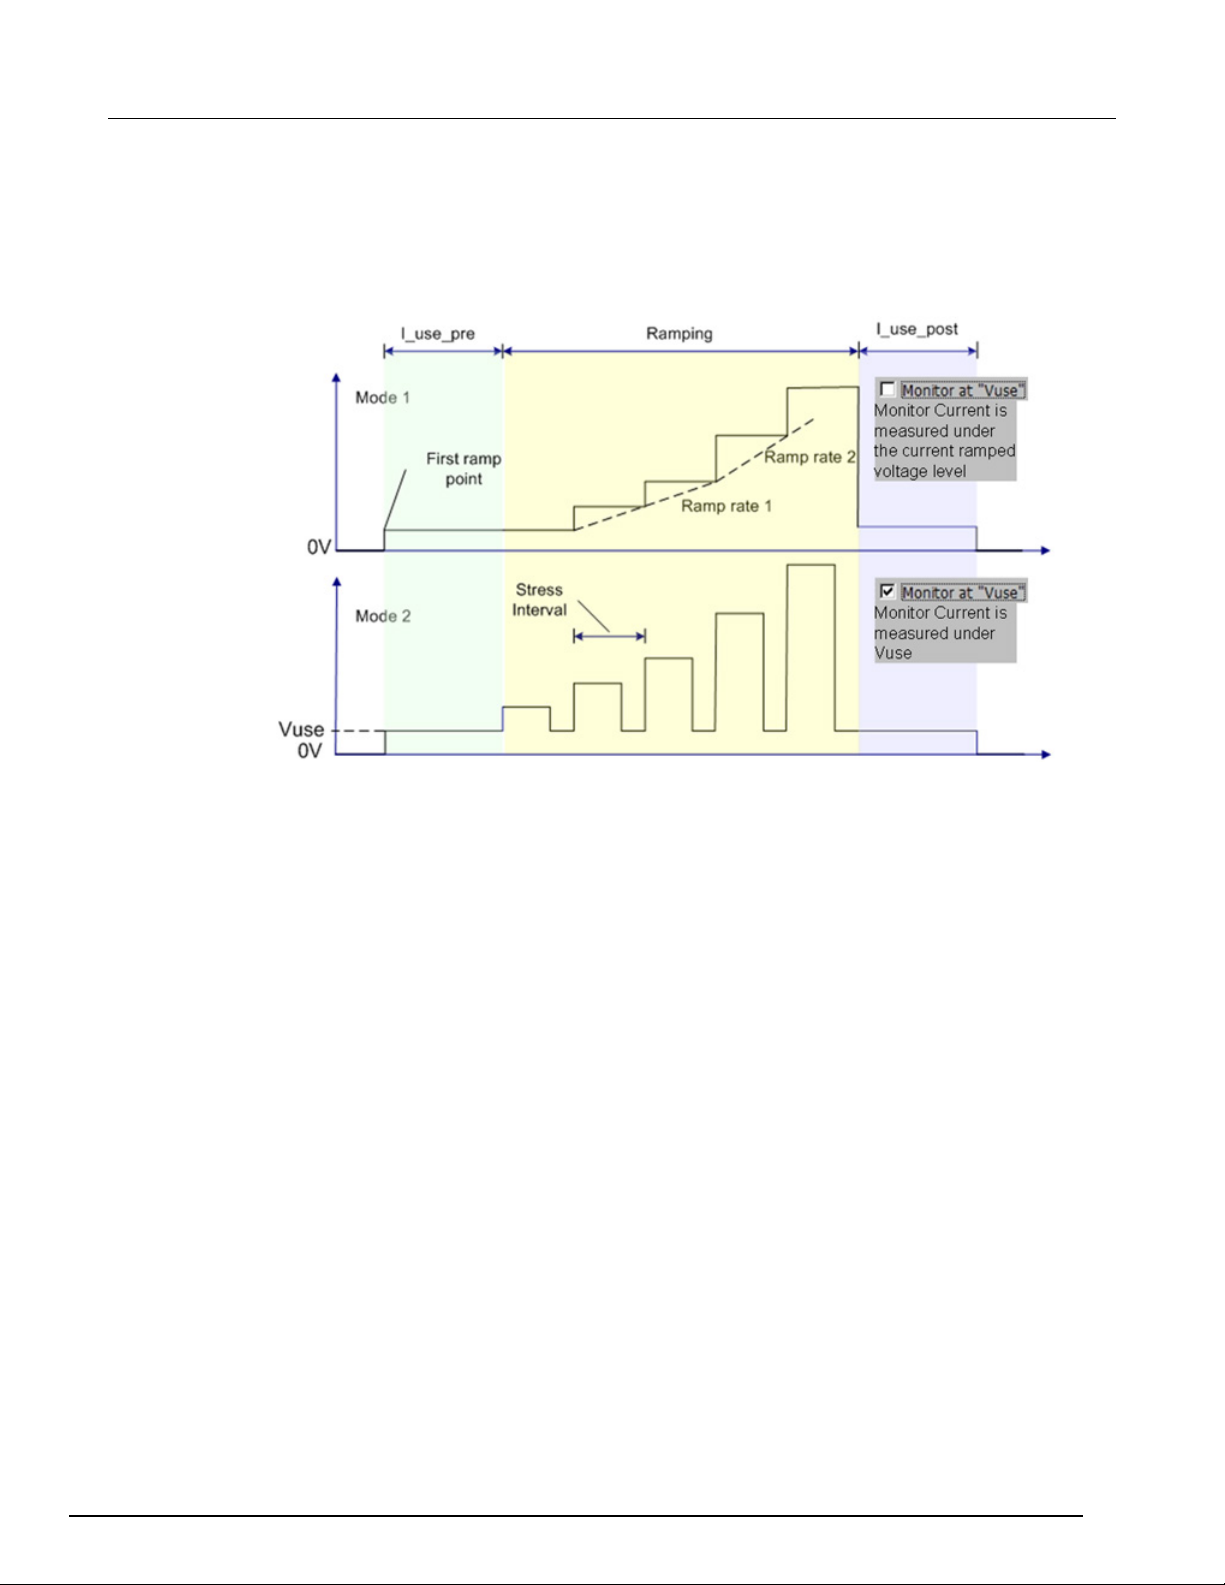
A
CS - 2600 RTM User's Manual Section 5:
Voltage ramp
The pre-ramp test: forces the Vpre and measures the Ipre.
The post-ramp test: forces Vpost and measures Ipost.
The stress phase: the main loop of the VRamp test; two waveform types (see next figure):
Figure 67: Stress waveform
ACS2600RTM-900-01 Rev. B / December 2012 5-5
Page 75
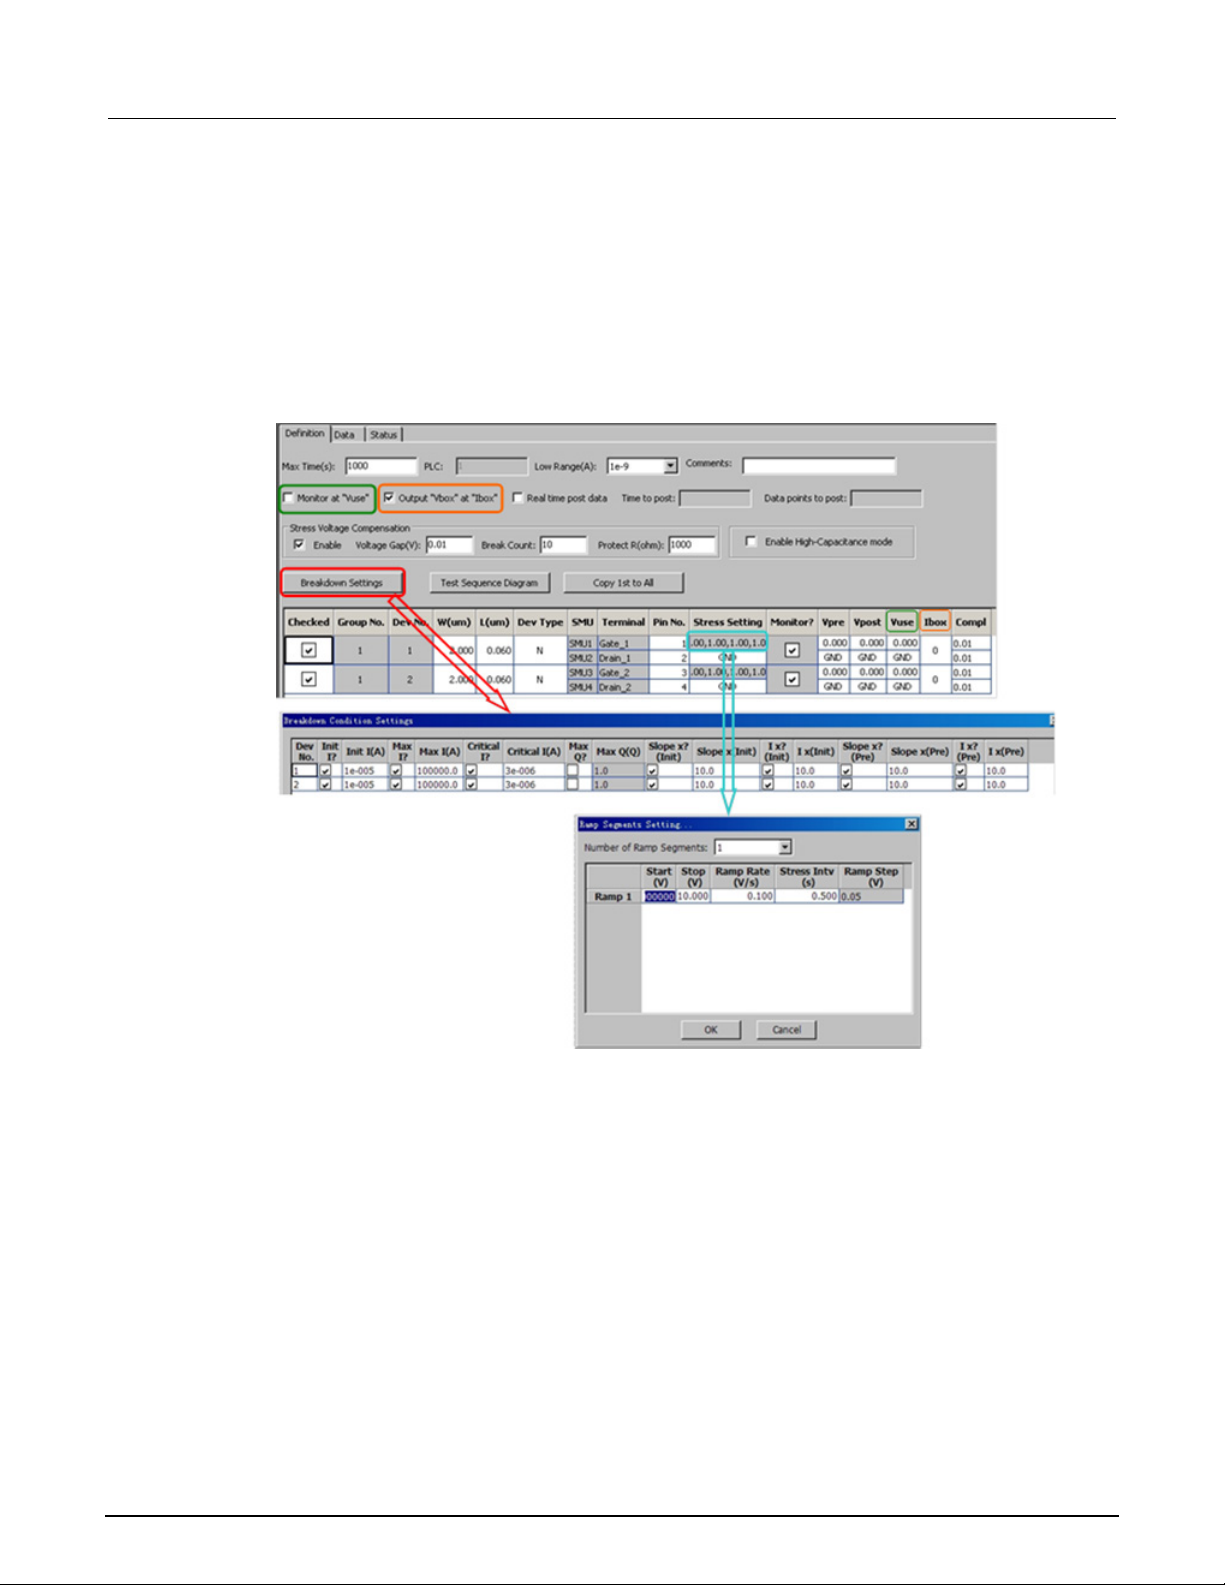
Section
2600 RTM User's Manual
5: Voltage ramp ACS -
Settings
The VRamp test characterizes the gate oxide reliability property for a MOSFET; and in the test drain,
the source and bulk are set to ground (GND). Thus, the device can be extracted as a capacitor. When
you select multiple sub-devices at the device level in the test tree, the "tddb_parallel" and
"tddb_shared_sub" in "CUSTOM" are appropriate for a VRamp.
The VRamp GUI for testing is shown in the next figure:
Figure 68: GUI for VRamp
5-6 ACS2600RTM-900-01 Rev. B / December 2012
Page 76
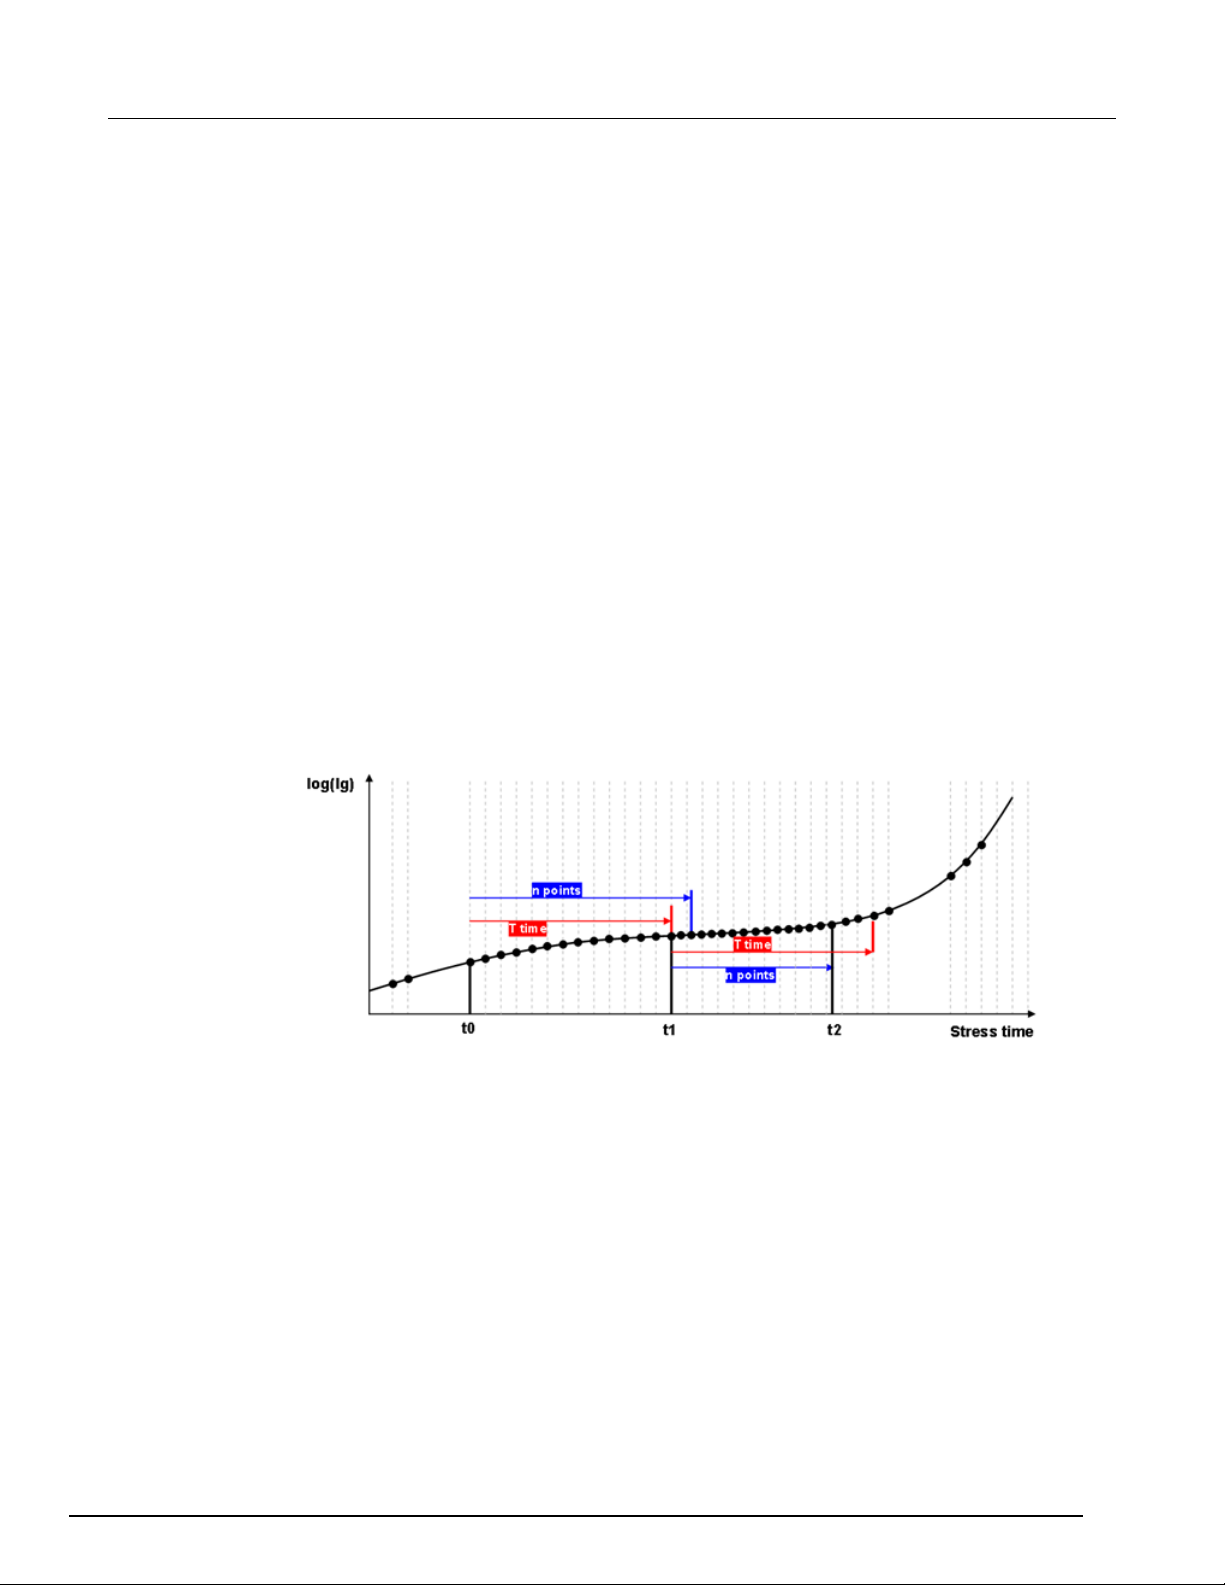
ACS
Voltage ramp
- 2600 RTM User's Manual Section 5:
General settings
Max Time (s): the maximum time for the voltage ramp. When the max time is reached, the ramp test
will stop and the device is considered to have passed.
PLC: number of power line cycles. This parameter is constant and cannot be changed.
Low Range (A): the lowest current measure range that is used during auto ranging.
Monitor at Vuse: if selected, the current is monitored when the Vuse voltage is applied (see next
figure).
Output Vbox at Ibox: When selected, Vbox will be one of the output parameters. Ibox is an
optional measured current level for which the stress voltage is recorded, while Vbox is the applied
voltage at the step where the oxide current exceeds Ibox (JESD35-A). The output voltage is the first
ramp voltage that causes the current to exceed Ibox.
Real-time post-data:
• When deselected, the test module will post all the data after the entire ramp test is done.
• When selected, the time to post and data point to post options are enabled. The test data will be post
and be sent from the instruments to ACS after every "Time to post" time interval or after the specified
number of points, based on the data points to point setting. These settings are critical when the VRamp
module is used in a large scale ramp test. If multiple instruments are used in one Group (for example,
up to eight Model 2636As in one Group) with an extended ramp test, this option is safe for data logging
and transferring.
Figure 69: Real-time post-data diagram
Stress voltage compensation setting
In some cases, for instance, when testing high-power devices, a protection resistor is inserted in
series with the SMU in order to prevent the rush current at break-down point and prevent oscillation.
The inserted protection resistor will cause a voltage drop, which means the SMU forcing voltage
should be compensated in order to maintain a constant voltage stress on the device. To get the
desired stress voltage on the device, the SMU forcing voltage should make a compensation to
achieve the proper value.
The voltage compensation has two phases:
• Initial speed up loop at the start of the stress
• Voltage compensation during the stress
ACS2600RTM-900-01 Rev. B / December 2012 5-7
Page 77
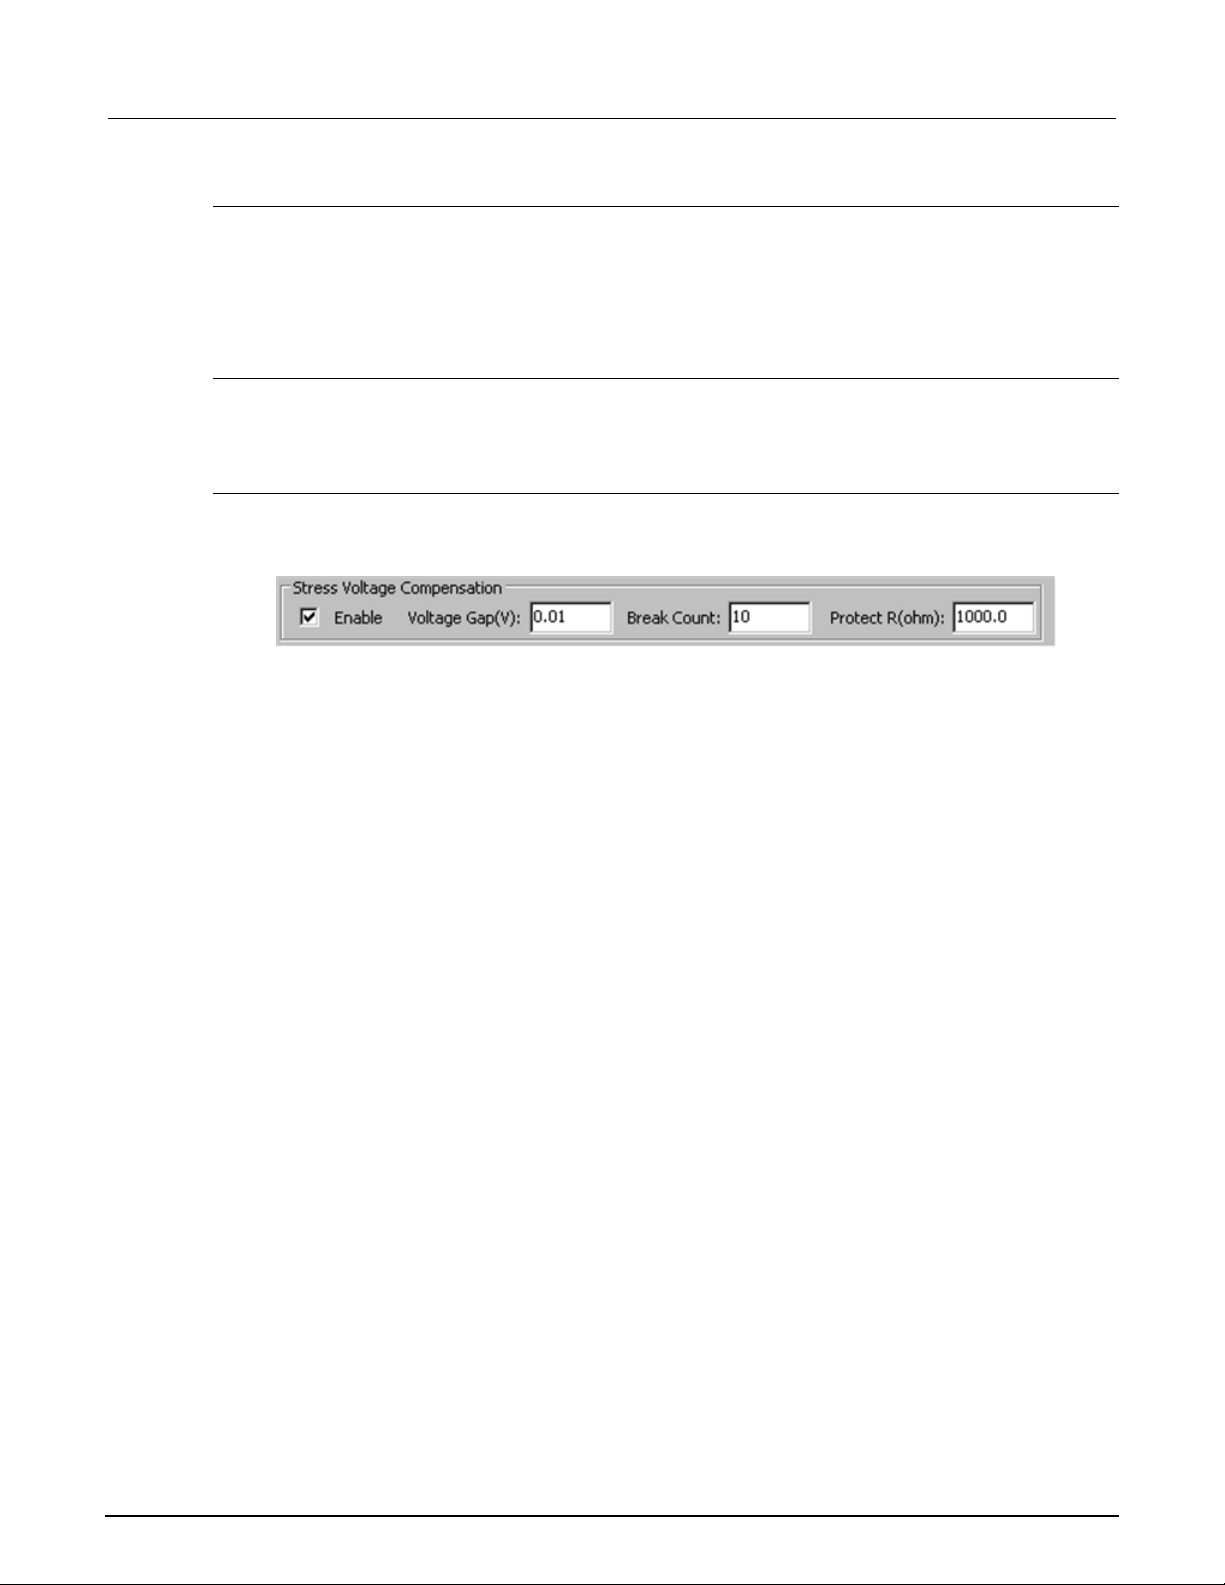
Section
2600 RTM User's Manual
5: Voltage ramp ACS -
Initial speed up loop
At the start of the stress, an initial speed up loop is used to get the voltage on the device under test
(Vdut) close to the desired stress voltage (Vtarget).
If the absolute value of (Vdut - Vtarget) is greater than the Voltage Gap (user-specified), then the loop
will continue; if it is less than the Voltage Gap, the loop will end.
Voltage compensation
The voltage compensation during the stress will calculate the next force voltage for every sample
interval using the following two equations.
Stress voltage compensation equations
The following settings (see next figure) are the necessary parameters for the voltage compensation:
Figure 70: Stress Voltage Compensation settings
Enable: Enable the stress voltage compensation function. Check the box to enable the stress voltage
compensation function.
Voltage Gap(V): Allowed maximum voltage difference between Vtarget and Vdut; used to determine
the compensation loop.
Break Count: Maximum count of the voltage compensation loop.
Protect R(ohm): Resistance for the protection resistor (dRact).
When the stress voltage compensation is enabled, the actual voltage on a device (Vdut) will be
posted in the Data tab. The column name is "V_dut_<sn>" ("sn" is the number of the device).
The following two equations are used:
Vcomp = Vtarget + Idut * dRact,
• Vcomp is the voltage force at loop n+ 1
• Vtarget is the desired stress voltage target on the device under test (DUT)
• Idut is the measured current at loop n
• dRact is the resistance of the protection resistor
Vdut = Vcomp – Idut * dRact
• Vdut is the actual voltage stress on the DUT
• Vcomp is the force voltage at loop n
• Idut is the measured current at loop n
• dRact is the resistance of the protection resistor
5-8 ACS2600RTM-900-01 Rev. B / December 2012
Page 78
ACS
Voltage ramp
- 2600 RTM User's Manual Section 5:
High-capacitance mode
In some cases the device under test (DUT) has high capacitance, for example in a high-power
device, therefore, the SMU should be set to high-capacitance mode for better measurement.
When high-capacitance mode is enabled, a minimum load capacitance of 100 nF is recommended. In
absence of this minimum load capacitance, overshoot and ringing may occur.
In order to enable high-capacitance, select the Enable High-Capacitance mode option (see the next
figure). Also, the SMU low range and current compliance value must be greater than or equal to 1e-6.
For more details about the Series 2600B instrument high-capacitance mode, refer to the Series
2600B Reference manual.
Figure 71: Enabled high-capacitance mode
ACS2600RTM-900-01 Rev. B / December 2012 5-9
Page 79
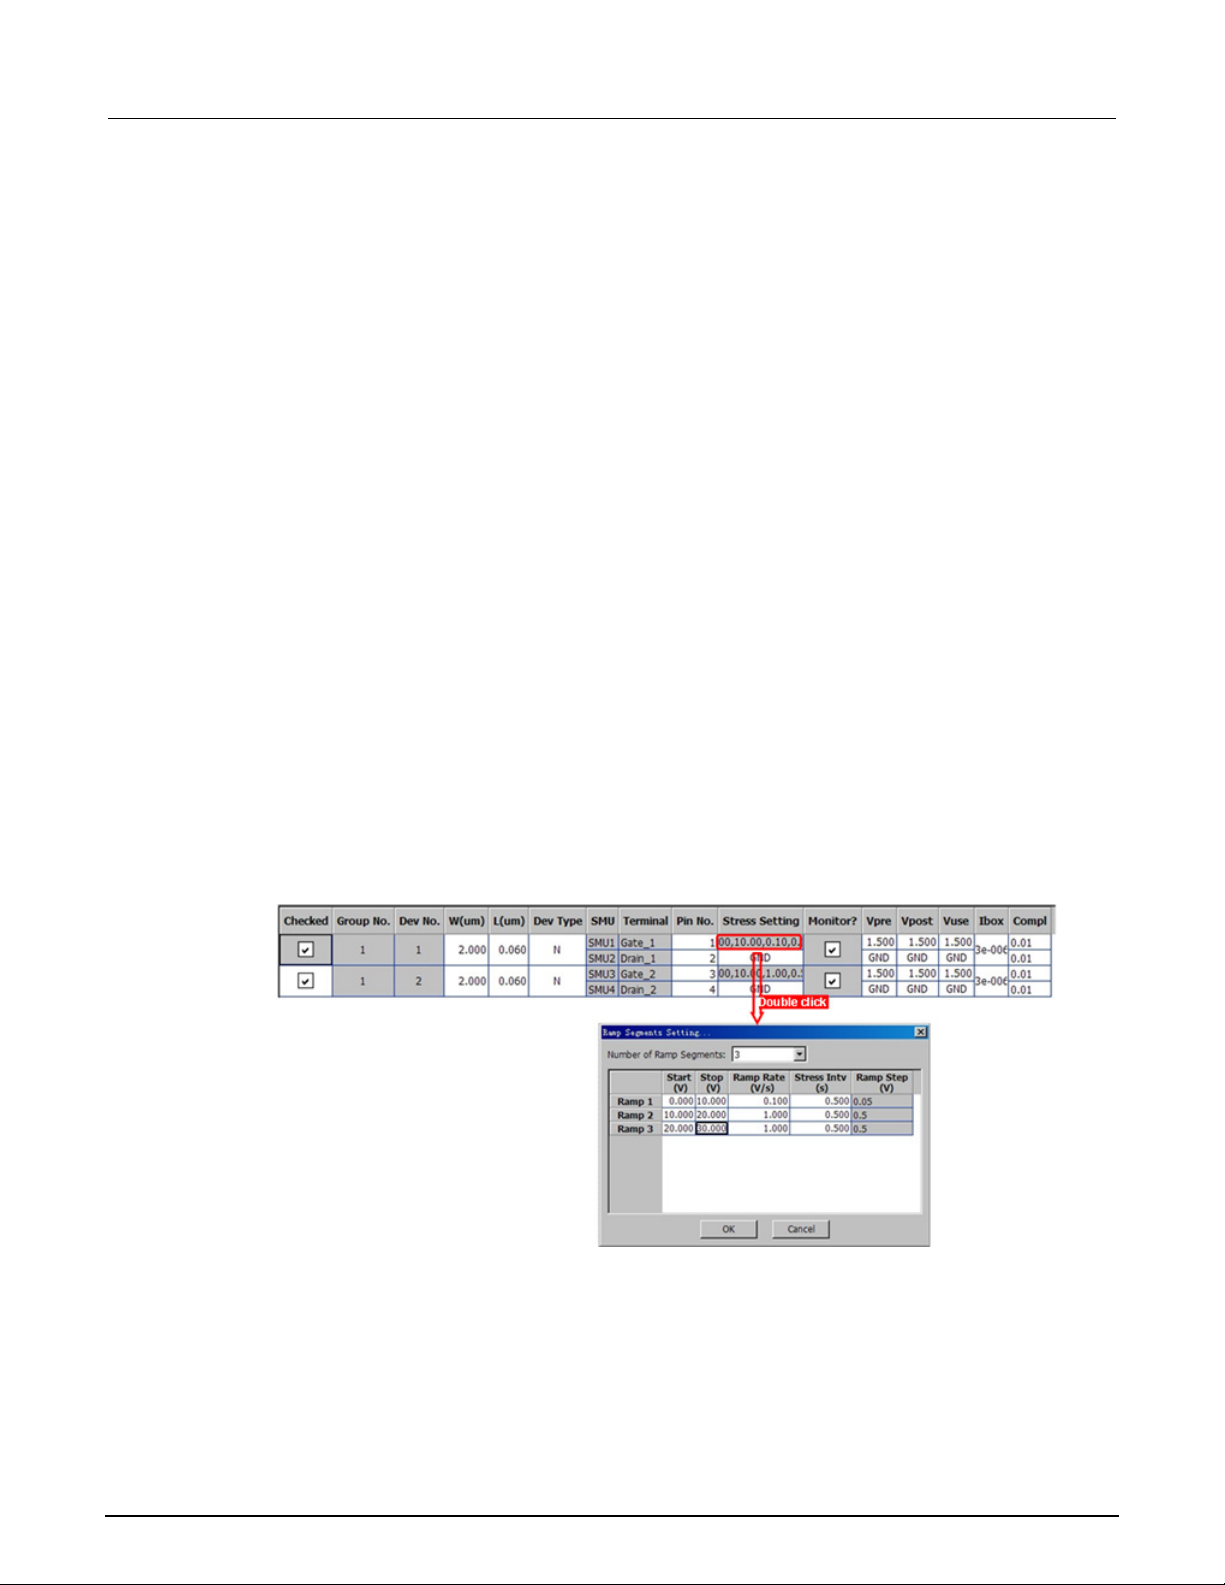
Section
2600 RTM User's Manual
5: Voltage ramp ACS -
Device and SMU settings
The device and SMU settings are all set at the device level. For example, all of the devices and
SMUs that are assigned in the device level of the test tree such as, the Group No., Dev No., SMU
and Terminal are shown in the next figure.
W(um), L(um): determine the MOSFET device dimensions.
Dev Type: "N" for NMOS, "P" for PMOS.
Stress Setting: For the gate, double clicking the cell enables a dialog box to open that is for the stress
ramp segment settings. For other terminals, select GND or OPEN. GND: force 0V. OPEN: force 0A.
• Number of Ramp Segments: up to five can be specified.
• Start (V): start voltage of the ramp segment. It is the same as the stop voltage of the previous segment.
• Stop (V): stop voltage of the ramp segment. It is the same as the start voltage of the next segment.
• Ramp Rate (V/s): the voltage ramp rate of the ramp segments. Each segment has its own ramp rate.
• Stress Intv (s): stress interval which is the time between two ramp steps. All the stress intervals are the
same for all segments.
• Ramp Step (V): calculated from the ramp rate and stress interval.
Monitor: monitors the current during each ramp step (this is always selected).
Vpre: the applied voltage for the pre-ramp test.
Vpost: the applied voltage for the post-ramp test.
Vuse: the voltage applied when the "Monitor at Vuse" is selected.
Ibox: when the "Output Vbox at Ibox" is selected. The log for the step voltage Vbox when the current
exceeds the value for the first time.
Compl: the current compliance (limit) value.
Figure 72: Device and SMU settings for VRamp
5-10 ACS2600RTM-900-01 Rev. B / December 2012
Page 80
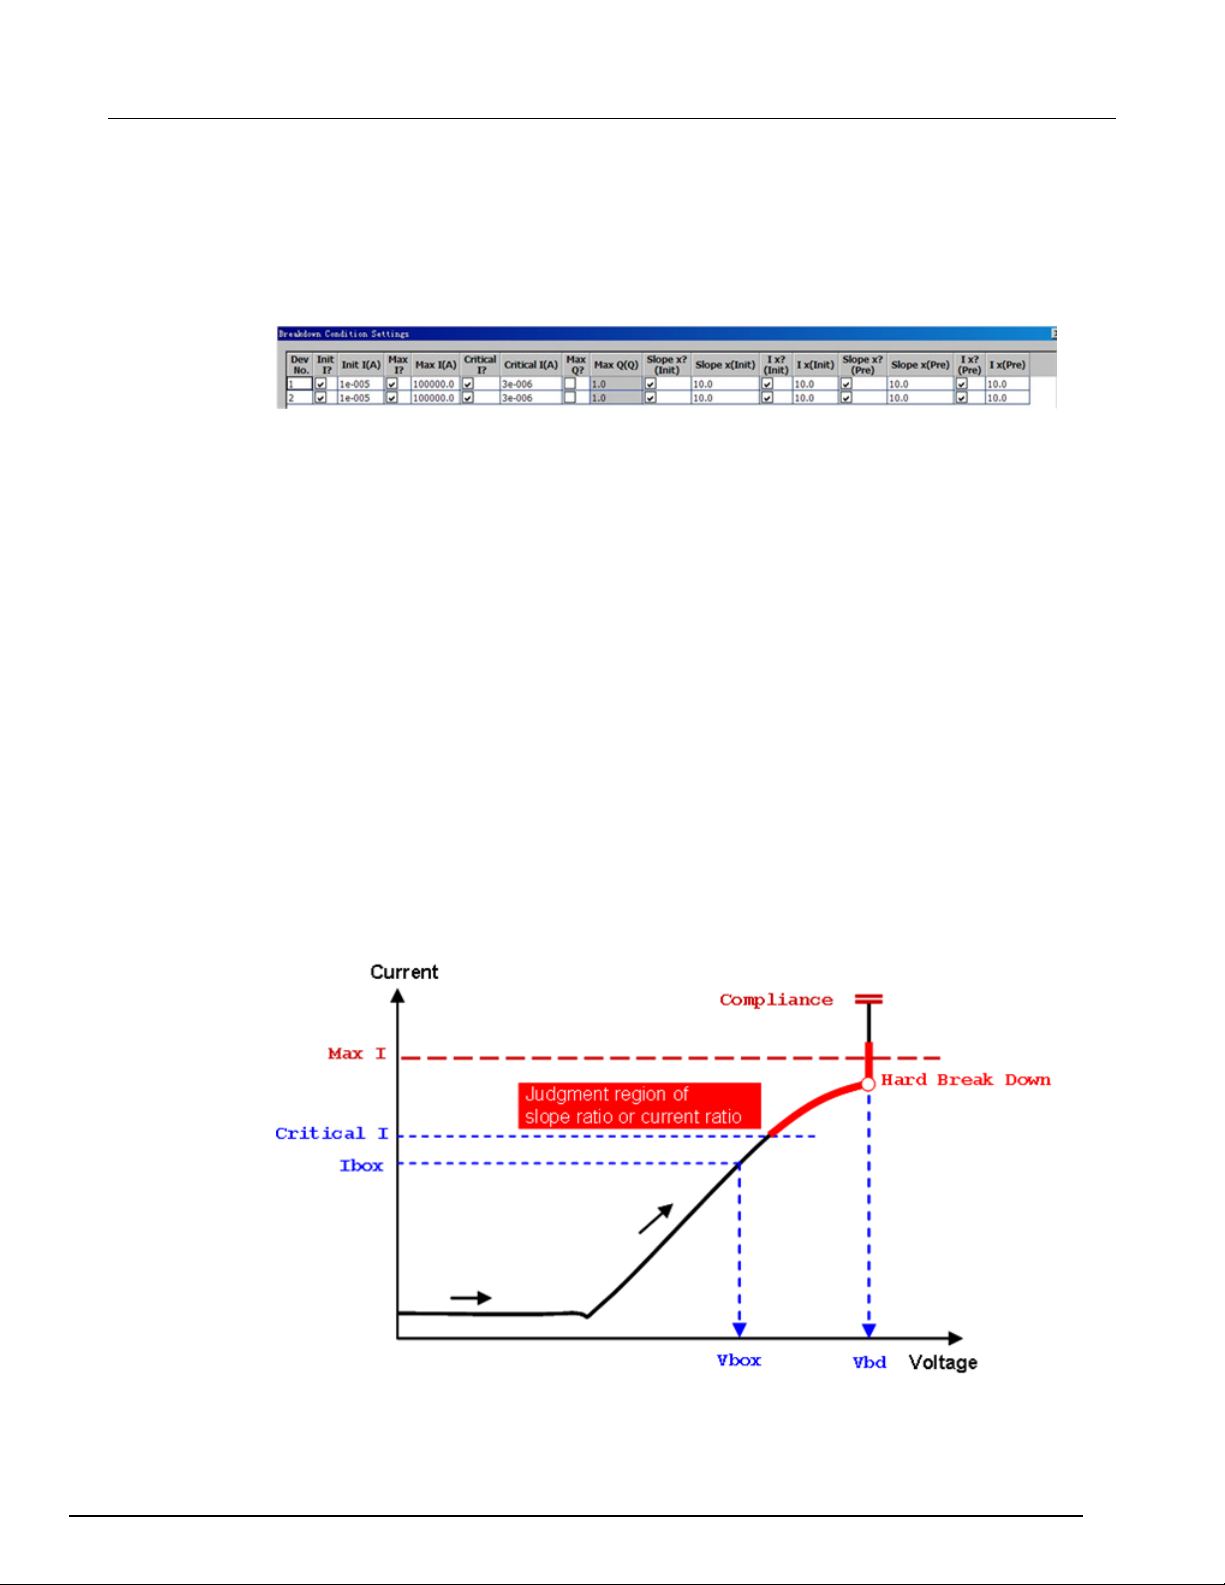
ACS
Voltage ramp
- 2600 RTM User's Manual Section 5:
Breakdown settings
When the "Breakdown Settings" function is selected, a dialog box containing all of the breakdown
criteria settings opens (see next figure):
Figure 73: Breakdown settings for VRamp
Init I: initial current for the VRamp that is used during the pre-ramp and post-ramp testing.
Max I: maximum current used during the stress ramp phase.
Critical I: critical current used during the stress ramp phase. If the current exceeds this value, more
breakdown judgments (Slope x (Pre) and I x (Pre)) will be performed.
Max Q: maximum charge quantity used during the stress ramp phase.
*Slope x (Init): checks the difference between the current and voltage to determine if the "x times"
exceeds the initial slope.
*I x (Init): checks to determine if the current exceeds "x times" of the initial current.
Slope x (Pre): checks to determine if the current versus voltage slope exceeds "x times" the previous
slope.
I x (Pre): checks to determine if the current exceeds "x times" the previous current.
*Slope x (Init) and I x (Init) are not available in the VRamp test module.
Failure determination
The results from a test failure are shown in the next figure:
Figure 74: Fail test results
ACS2600RTM-900-01 Rev. B / December 2012 5-11
Page 81
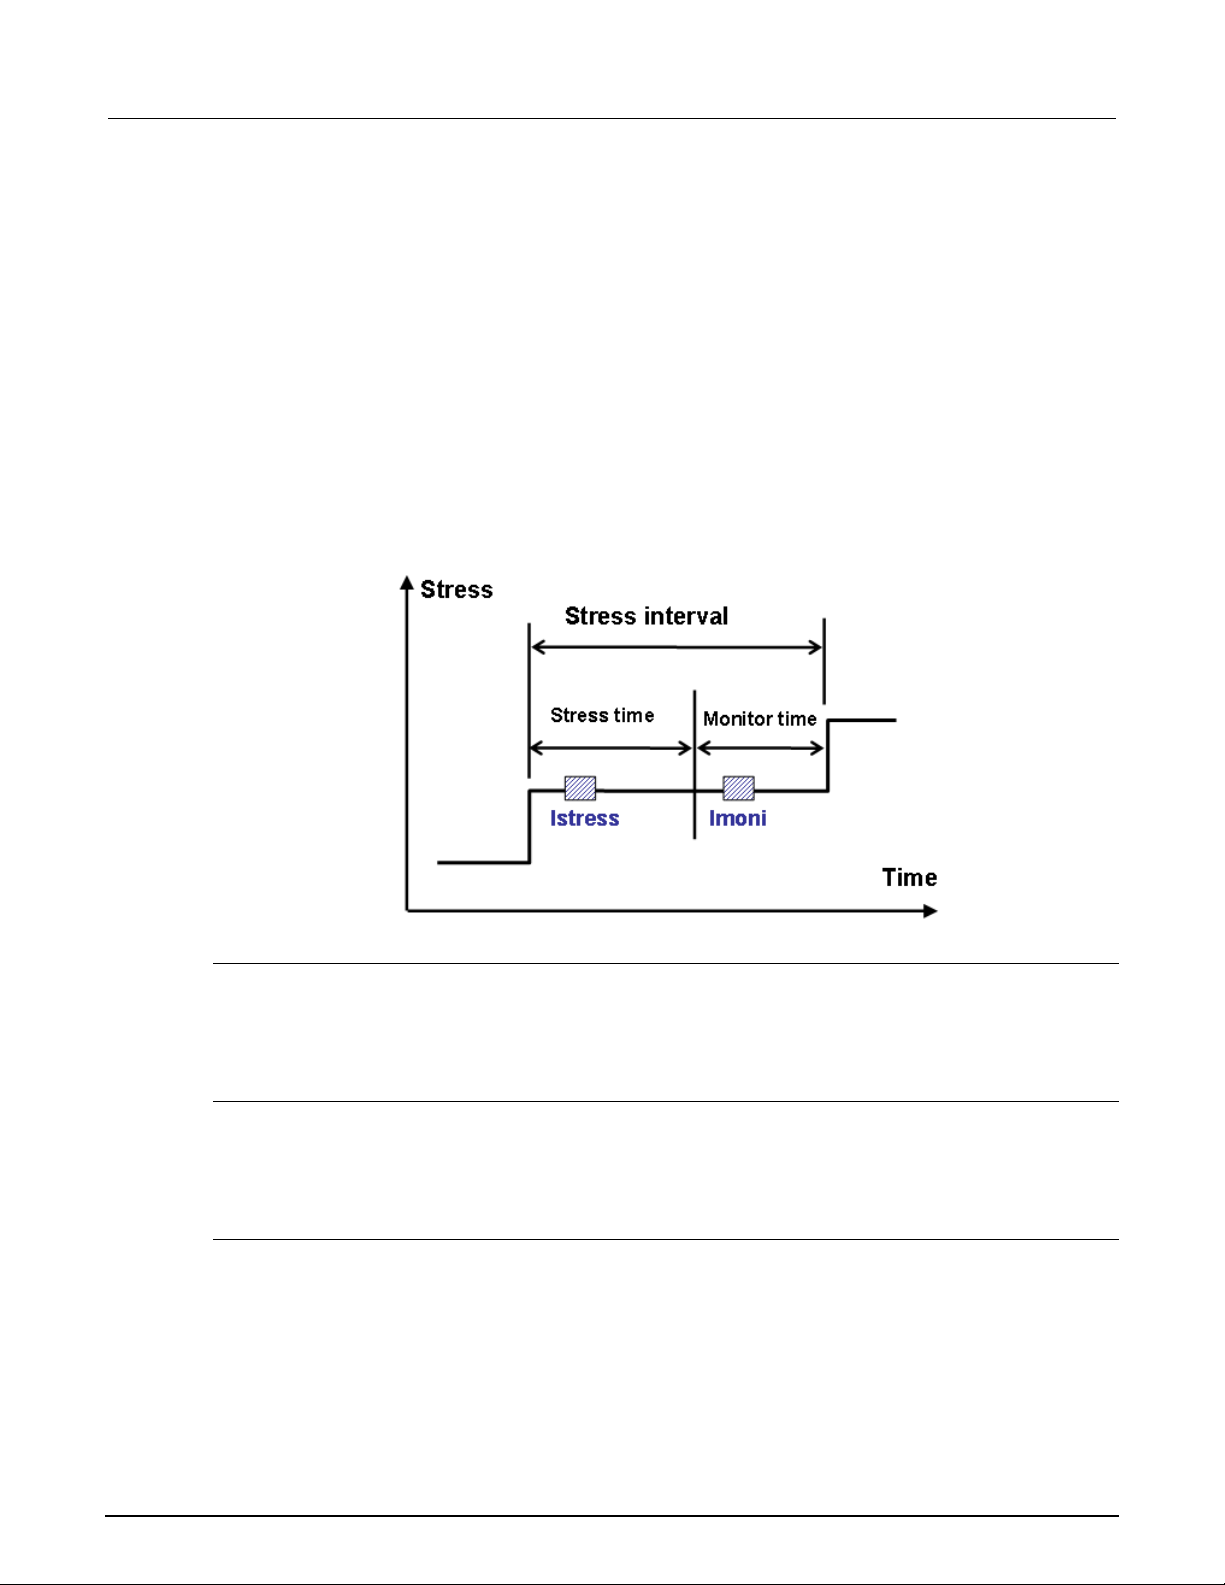
Section
2600 RTM User's Manual
5: Voltage ramp ACS -
Initial test
The VRamp test begins by performing a pre-ramp test. The pre-ramp test applies a gate bias voltage
(Vpre) and measures the gate current as Ipre. If Ipre exceeds the current limit, the device is
considered to have failed the initial test, and the test will terminate. In the case of multiple device
tests, the test flow for the failed device will end, however, testing will continue for the other devices.
Ramp test
The current measurements for one ramp step are Istress and Imoni. Istress is measured at
the ramp voltage level. Imoni is measured at either the ramp voltage level or Vuse (see next figure
for the two different modes). To ensure that the current measurement is performed correctly, the
stress interval must be set to more than 70ms. The Monitor time will be 30ms for less than 12
devices, 50ms for more than 12 but less than 32 devices, and 100ms for 32 or greater devices.
Figure 75: Timing diagram of a ramp step
Maximum current
Refer to the Max I field in the breakdown settings window. If the measured monitor current in a ramp
step exceeds the Max I setting, the test flow for this device will exit the ramp test loop for the postramp test, and the device is considered to have failed the ramp.
Maximum charge
Refer to the "Max Q" field the in the breakdown settings window. If the calculated charge quantity
exceeds the Max Q value, the testing for this device will exit the ramp test loop for the post-ramp test,
and the device is considered to have failed the ramp test.
Current factor
Refer to Critical I and I x (Pre) in the breakdown settings GUI. If Critical I is selected and the monitor
current is larger than the critical current, the monitor current will be compared to the previous monitor
current. If the monitor is larger than the CM times the previous monitor current (CM is the setting
factor), the device is considered to have failed the ramp test.
5-12 ACS2600RTM-900-01 Rev. B / December 2012
Page 82
ACS
Voltage ramp
Masked Catastrophic (type 3)
Pass
Pass
Fail
Non-catastrophic (type 4)
Pass
Fail
Pass
Monitor fail (type 5)
N/A
Fail
N/A
All pass (type 6)
Pass
Pass
Pass
- 2600 RTM User's Manual Section 5:
Current slope versus voltage
Refer to "Critical I" and "Slope x (Pre)" in the breakdown settings window. If "Critical I" is selected and
the monitor current is larger than the critical current, the monitor current versus voltage slope will be
compared to the previous slope. If the slope is larger than the SM times of the previous slope (SM is
the setting factor), the device is considered to have failed the ramp test.
Post-test
When the ramp test is completed, or exits due to breakdown, a post-ramp test is performed by
applying a gate voltage (Vpost) and measuring the current (Ipost). If Ipost exceeds the fail
current (Iinit), the device is considered to have failed the post-test.
Failure mode
According to the pass or fail criteria for the Initial, Ramp, and Post-tests, the failure modes are
categorized in the next table:
Failure type Initial test BD test Post-test
Initial (type 1) Fail N/A N/A
Catastrophic (type 2) Pass Fail Fail
ACS2600RTM-900-01 Rev. B / December 2012 5-13
Page 83

Section
2600 RTM User's Manual
Time_<sn>
S
Time stamps
I_<pad>_pre_<sn>
A
Measured current in Pre test
V_<pad>_str_<sn>
V
The ramped voltage level
Measured current at ramped voltage level in ramp step
I_<pad>_moni_<sn>
A
Measured monitor current in ramp step "monitor time"
Q_<pad>_moni_<sn>
C
Accumulated gate charge
I_<pad>_post_<sn>
A
Measured current in Post-ramp test
Vbox_<pad>_<sn>
V
The first ramp voltage when the current exceeds Ibox
Vcritical_<sn>
V
The first ramp voltage when current exceeds Icrit
Tbd_<sn>
S
Breakdown time
Ibd_<sn>
A
Breakdown current
Qbd_<sn>
C
Quantity of charge when breakdown
<sn>: the number of the sub-device.<pad>: pad name, usually the gate in VRamp. For example, sub-device 1,
5: Voltage ramp ACS -
Data recording
The test results data are displayed on the Data tab, and will be logged as a .kdf, .db, or .csv file if run
in the Automation mode. Data for multiple Groups are displayed using multiple tabs within the Data
tab. The output data for different sub-devices is distinguished by the parameter names. The output
parameters for one group are in the following table:
Parameter Unit Comment
I_<pad>_str_<sn> A
Vbd_<sn> V Breakdown voltage
Fail_mode_<sn> - Fail mode
pad name Gate_1, the ramped voltage level is V_Gate_1_str_1.
"stress time"
5-14 ACS2600RTM-900-01 Rev. B / December 2012
Page 84
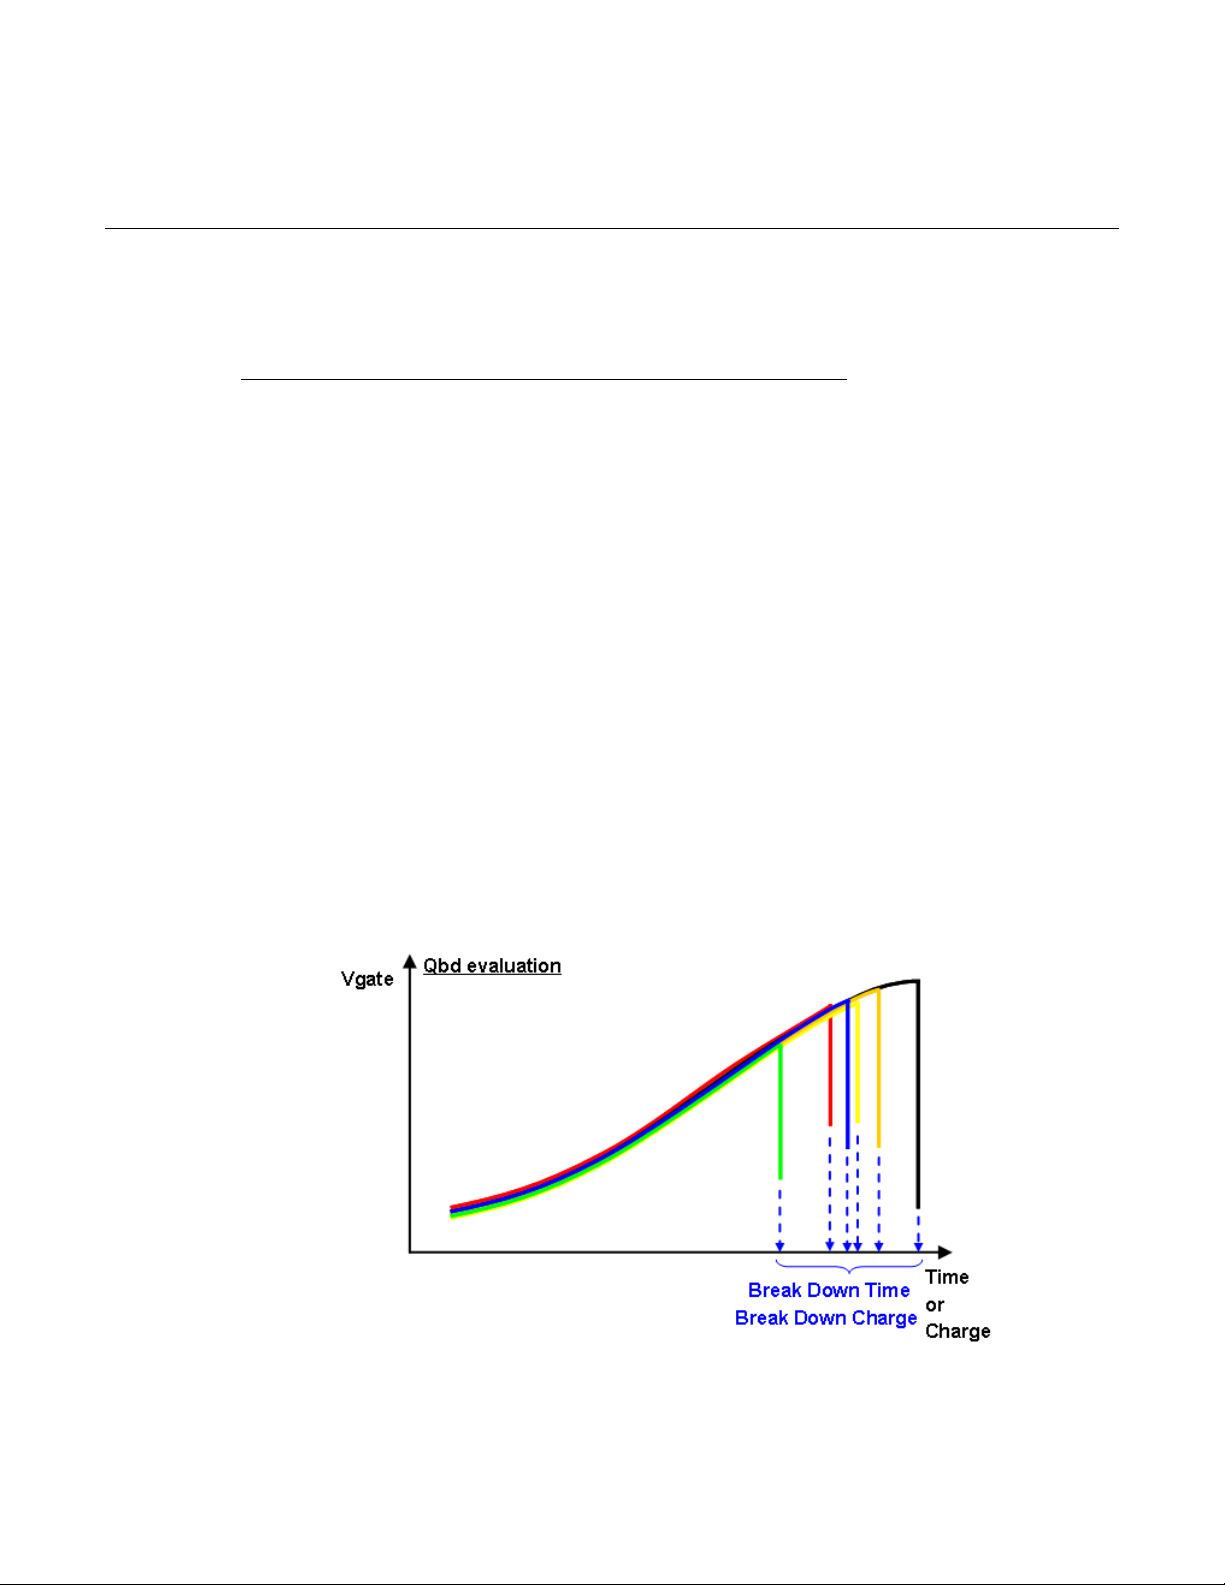
Data recording ........................................................................ 6-11
In this section:
Test principle ............................................................................ 6-1
Instrument connection .............................................................. 6-2
Test flow ................................................................................... 6-4
Settings .................................................................................... 6-6
Failure determination ............................................................... 6-9
Test principle
The ramped current (JRamp) test uses a ramped current stress applied to capacitors or gate oxides
to characterize dielectric defects that appear at higher electrical fields. The JRamp test is also able to
perform the bounded JRamp test, provided that the current is set to ramp up to a specified level and
then is held until breakdown. The TDDB_CCS (time dependent dielectric breakdown test under
constant current stress) uses constant current as stress to the oxide, which can be achieved by
setting it as a bounded JRamp or by setting the multiplier between the two stress currents to one.
Section 6
Ramped current
The JRamp/TDDB_CCS module test flow has three phases: pre-test, stress phase, post-test. The
pre-test is used to verify that the functionality of the device and stress phase are used to apply a
ramped current waveform to the device until it breaks down, and the post-test is used to characterize
the device after the ramp.
Figure 76: Diagram of JRamp_TDDB_CCS test results
Page 85
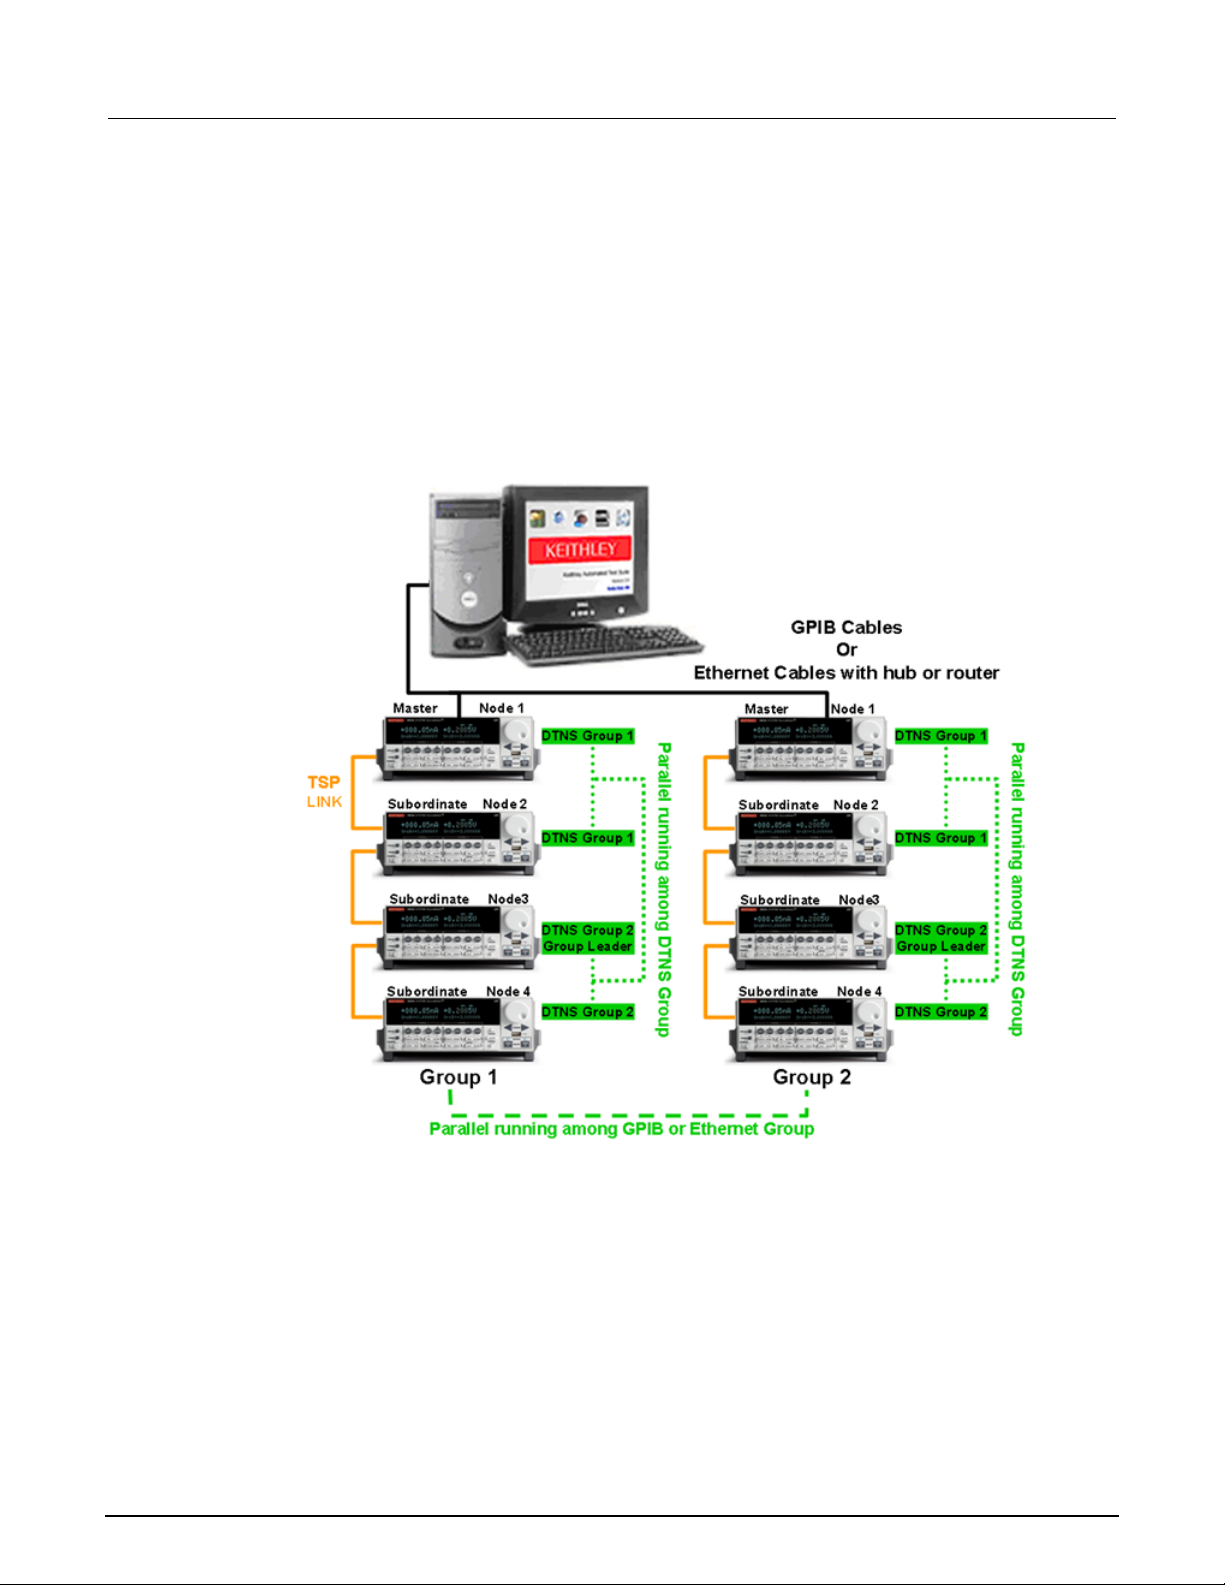
Section
2600 RTM User's Manual
6: Ramped current ACS -
Instrument connection
For a MOSFET device under test (DUT), the JRamp/TDDB_CCS applies a stress current to the gate
and bulk, and the source and drain are connected to to ground (GND). The test module uses the
Series 2600A or Series 2600 SourceMeters. Multiple SourceMeters can be setup as a connection
scheme for multiple devices in a configuration of different groups (GPIB or Ethernet Group) for
parallel testing. Within each group, you can also setup multiple sub-devices for sequential or parallel
tests. In a parallel test, each sub-device will be set as a sub-group (DTNS Group). The 2600B
SourceMeters and the 2600 SourceMeters (for instance, the A and non-A versions) cannot be used
together. A typical connection scheme is shown in the next figure:
Figure 77: A typical instrument connection scheme
6-2 ACS2600RTM-900-01 Rev. B / December 2012
Page 86
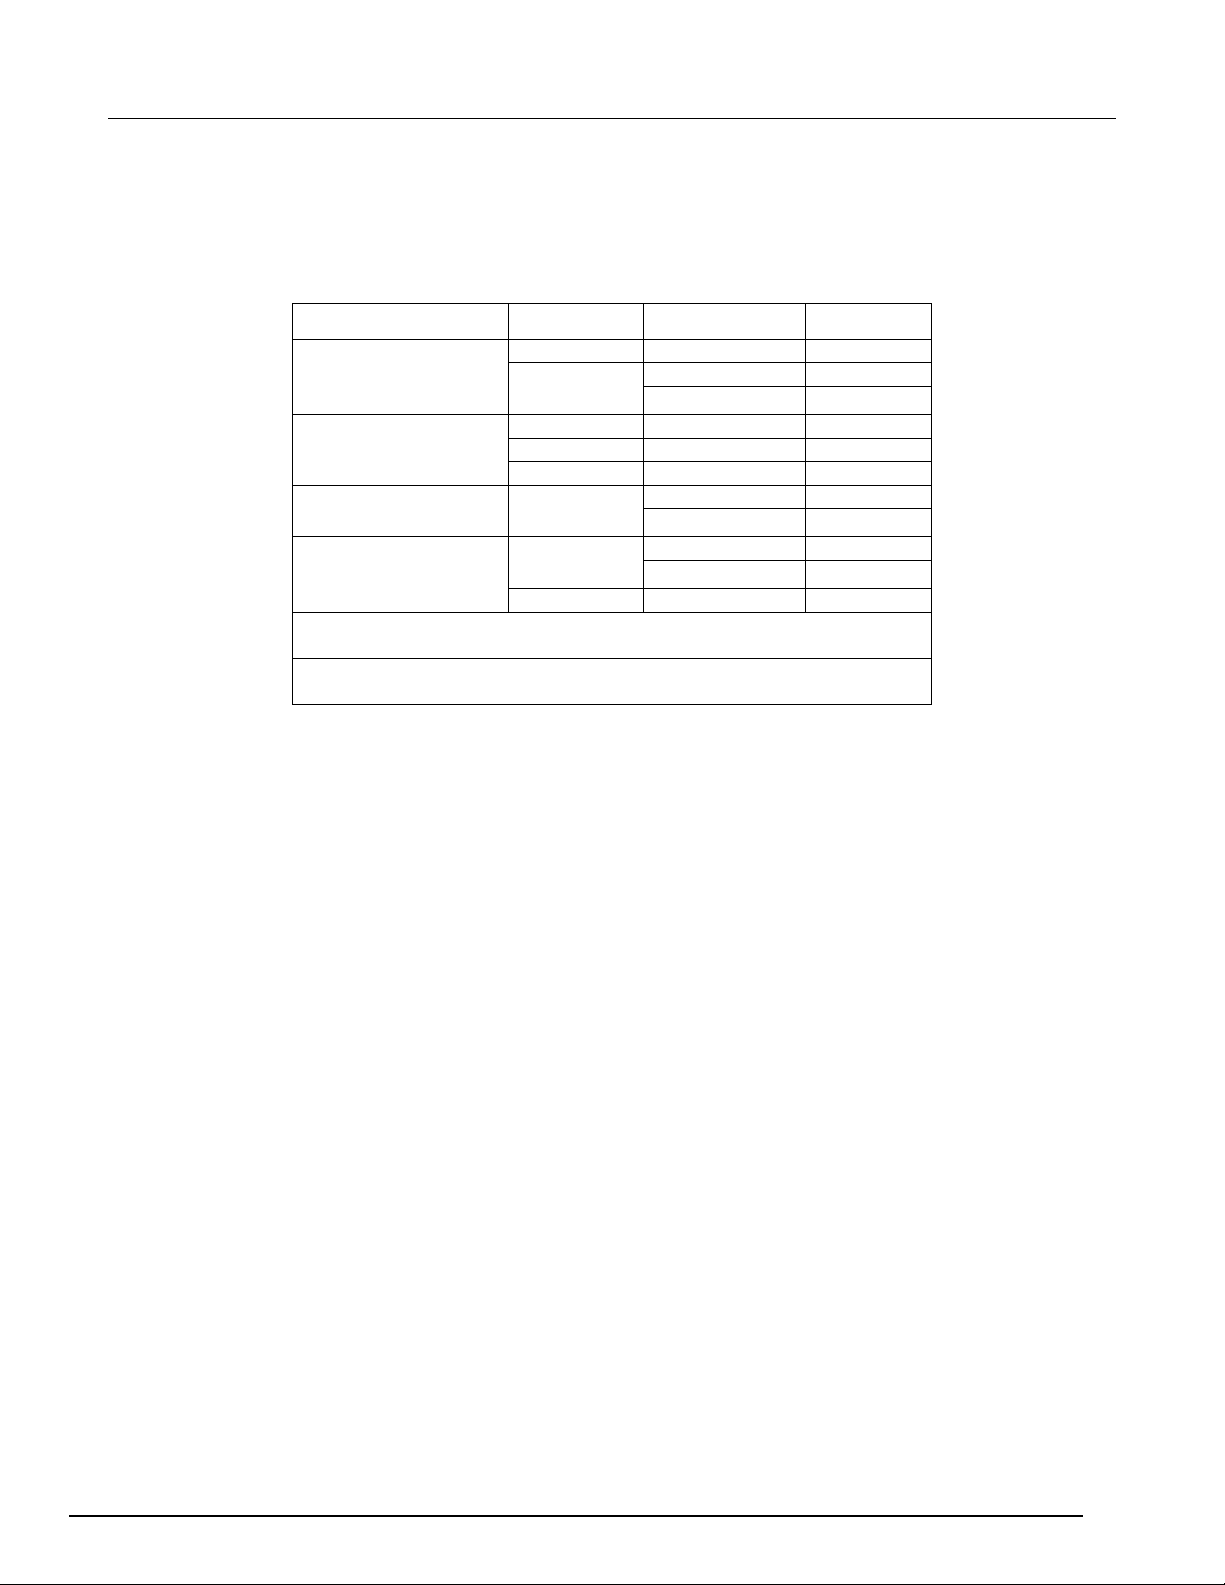
ACS
Ramped current
1 × 16
Sequential
1
57600
0.07
3600
0.5
4000
2 × 8
Sequential
0.07
10800
Parallel
0.3
10000
Sequential
0.2
10000
1
57600
0.07
10000
8 × 2
Sequential
0.1
10000
1
57600
Parallel
0.1
10000
1
group has m nodes. For example in Figure 1, the instrument configuration is 2 × 4
2
- 2600 RTM User's Manual Section 6:
Due to limited memory space and communication speed of the instruments, the ramp rate and stress
interval settings will be affected by how the instruments are arranged. A connection scheme with
more instruments will need more time to accomplish a stress interval. The next table lists the stress
interval settings for some typical instrument configurations. The smallest recommended settings are
shown for each configuration.
Instrument configuration1 Mode2
4 × 4
Instrument configuration "n × m" represents a connection scheme of n Groups, every
Mode means the execution mode of the JRamp/TDDB_CCS test. It is selected when
the test is added, refer to Figure 1
Parallel
Parallel
Stress interval Max time
ACS2600RTM-900-01 Rev. B / December 2012 6-3
Page 87
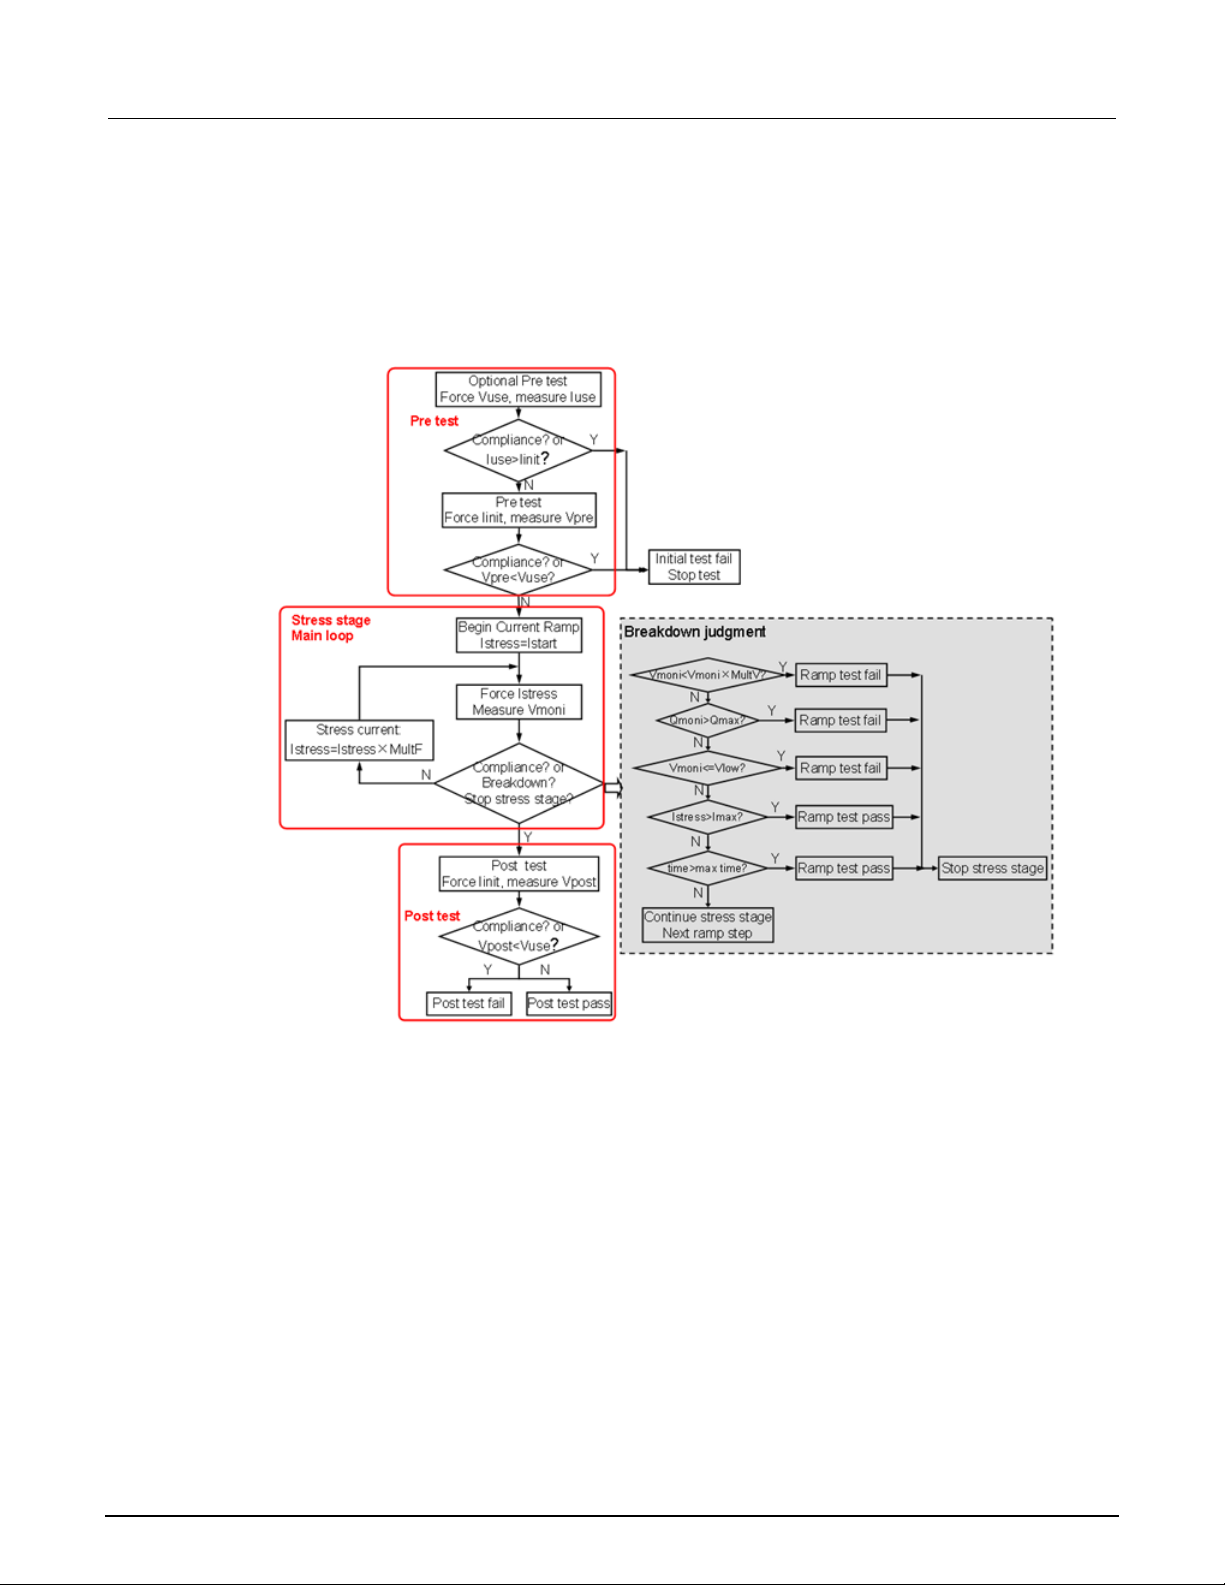
Section
2600 RTM User's Manual
6: Ramped current ACS -
Test flow
The JRamp/TDDB_CCS test flow is based on the JESD35-A standard. The JRamp/TDDB_CCS
parameters are also defined by the JESD35-A standard. The JRamp/TDDB_CCS test flow is shown
in the next figure:
Figure 78: JRamp_TDDB_CCS test flow
6-4 ACS2600RTM-900-01 Rev. B / December 2012
Page 88
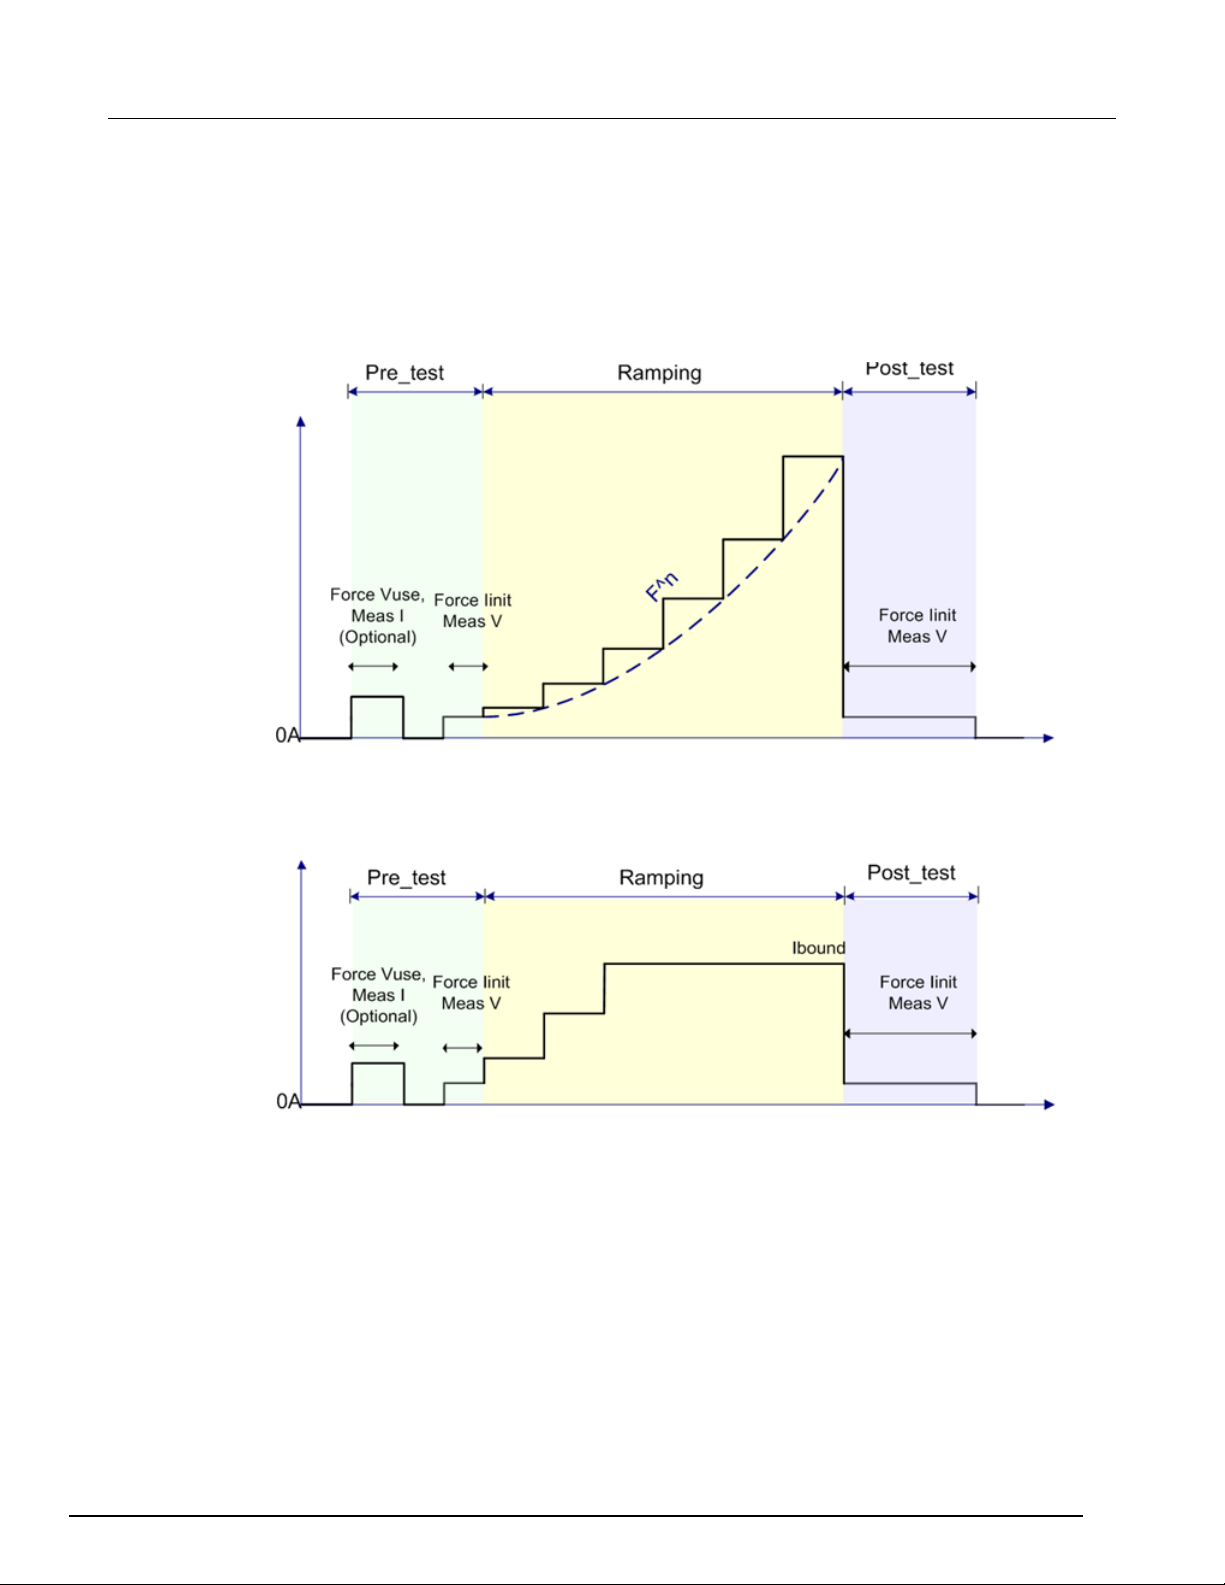
ACS
Ramped current
- 2600 RTM User's Manual Section 6:
The pre-test: optional pre-test forces Vuse to measure Iuse. the pre-test forces Iinit and measures
Vpre.
The post-test: force Iinit and measure Vpost
The stress phase: main loop of the JRamp/TDDB_CCS test. the stress waveform is shown in the next
figure:
Figure 79: JRamp_TDDB stress waveform
If you select "Ibound", the current will ramp to a constant value and is held at this value for the
duration of the test. The waveform is shown in the next figure:
Figure 80: Stress waveform of Ibound
ACS2600RTM-900-01 Rev. B / December 2012 6-5
Page 89
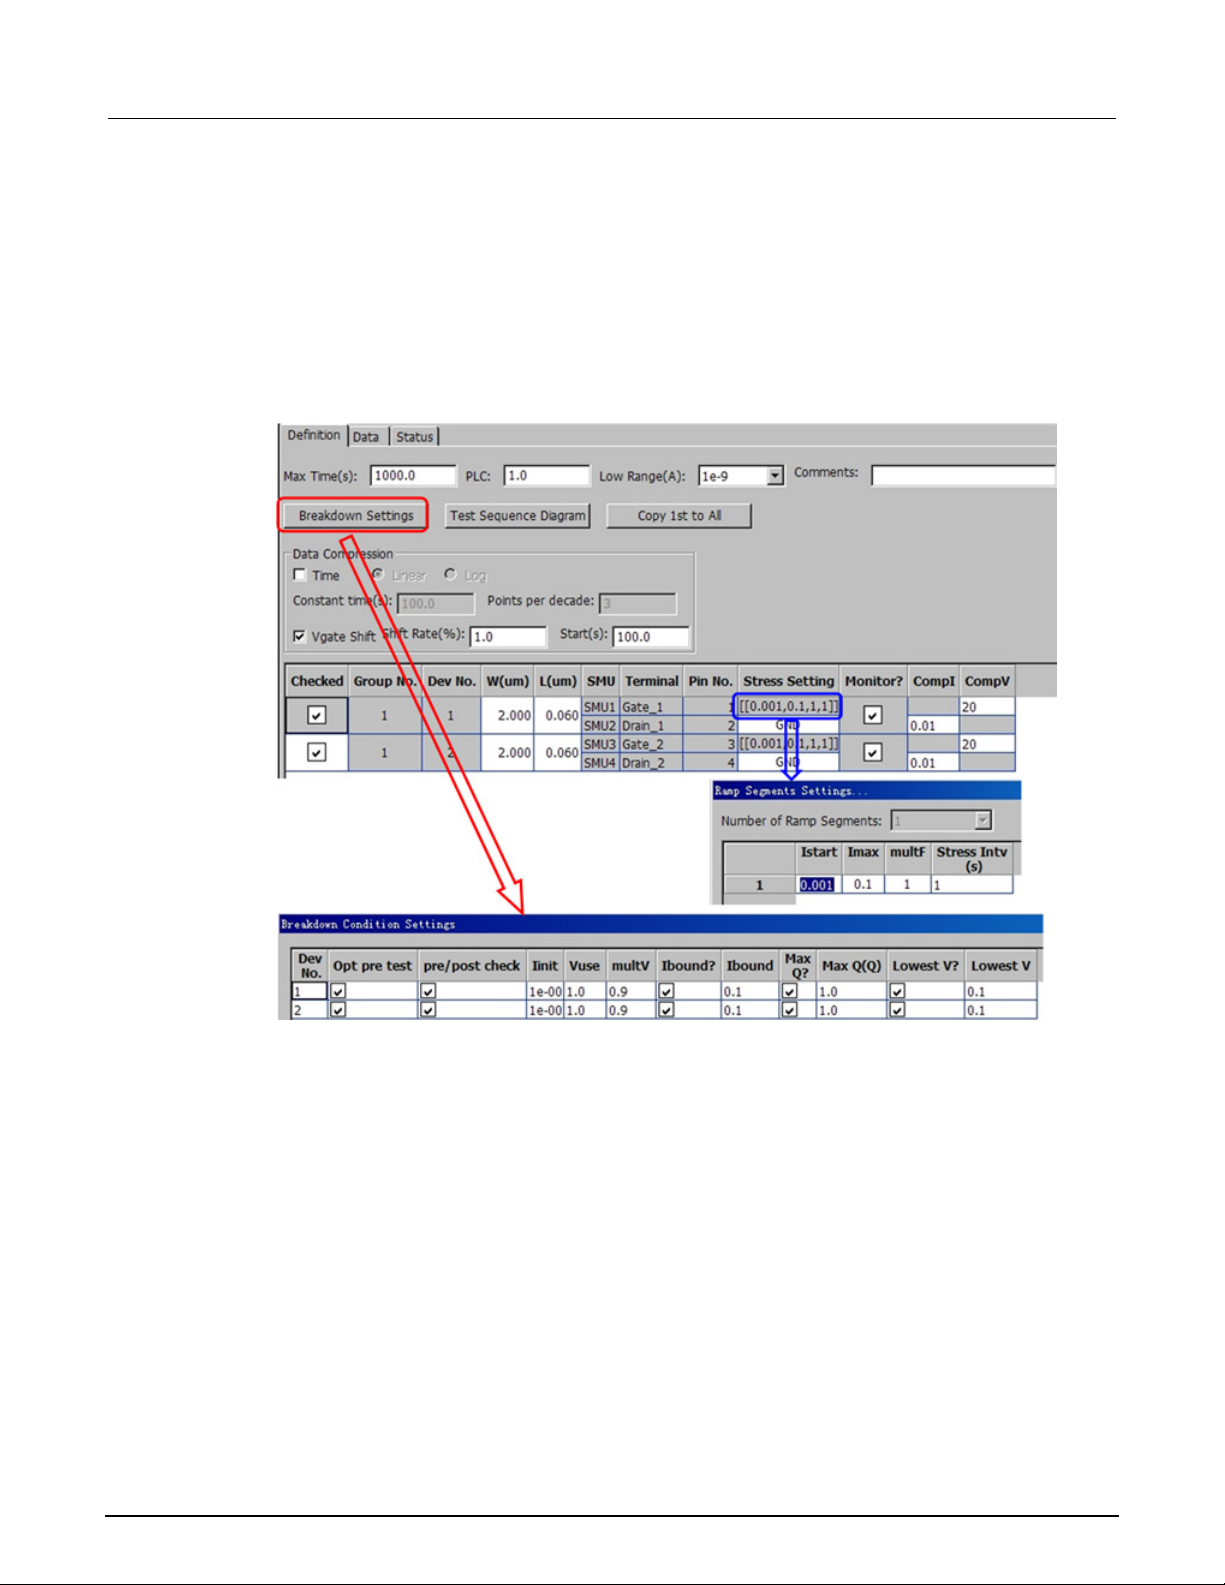
Section
2600 RTM User's Manual
6: Ramped current ACS -
Settings
The JRamp/TDDB_CCS test characterizes the gate oxide reliability property for a MOSFET. Note that
the test drain, source, and bulk are all set to ground (GND). Thus, the device can be extracted as a
capacitor. When you select multiple sub-device modules in the device level of the test tree, the
"tddb_parallel" and "tddb_shared_sub" in "CUSTOM" are appropriate for the JRamp/TDDB_CCS test.
The JRamp/TDDB_CCS GUI for testing in shown in the next figure:
Figure 81: GUI for the JRamp/TDDB_CCS
6-6 ACS2600RTM-900-01 Rev. B / December 2012
Page 90
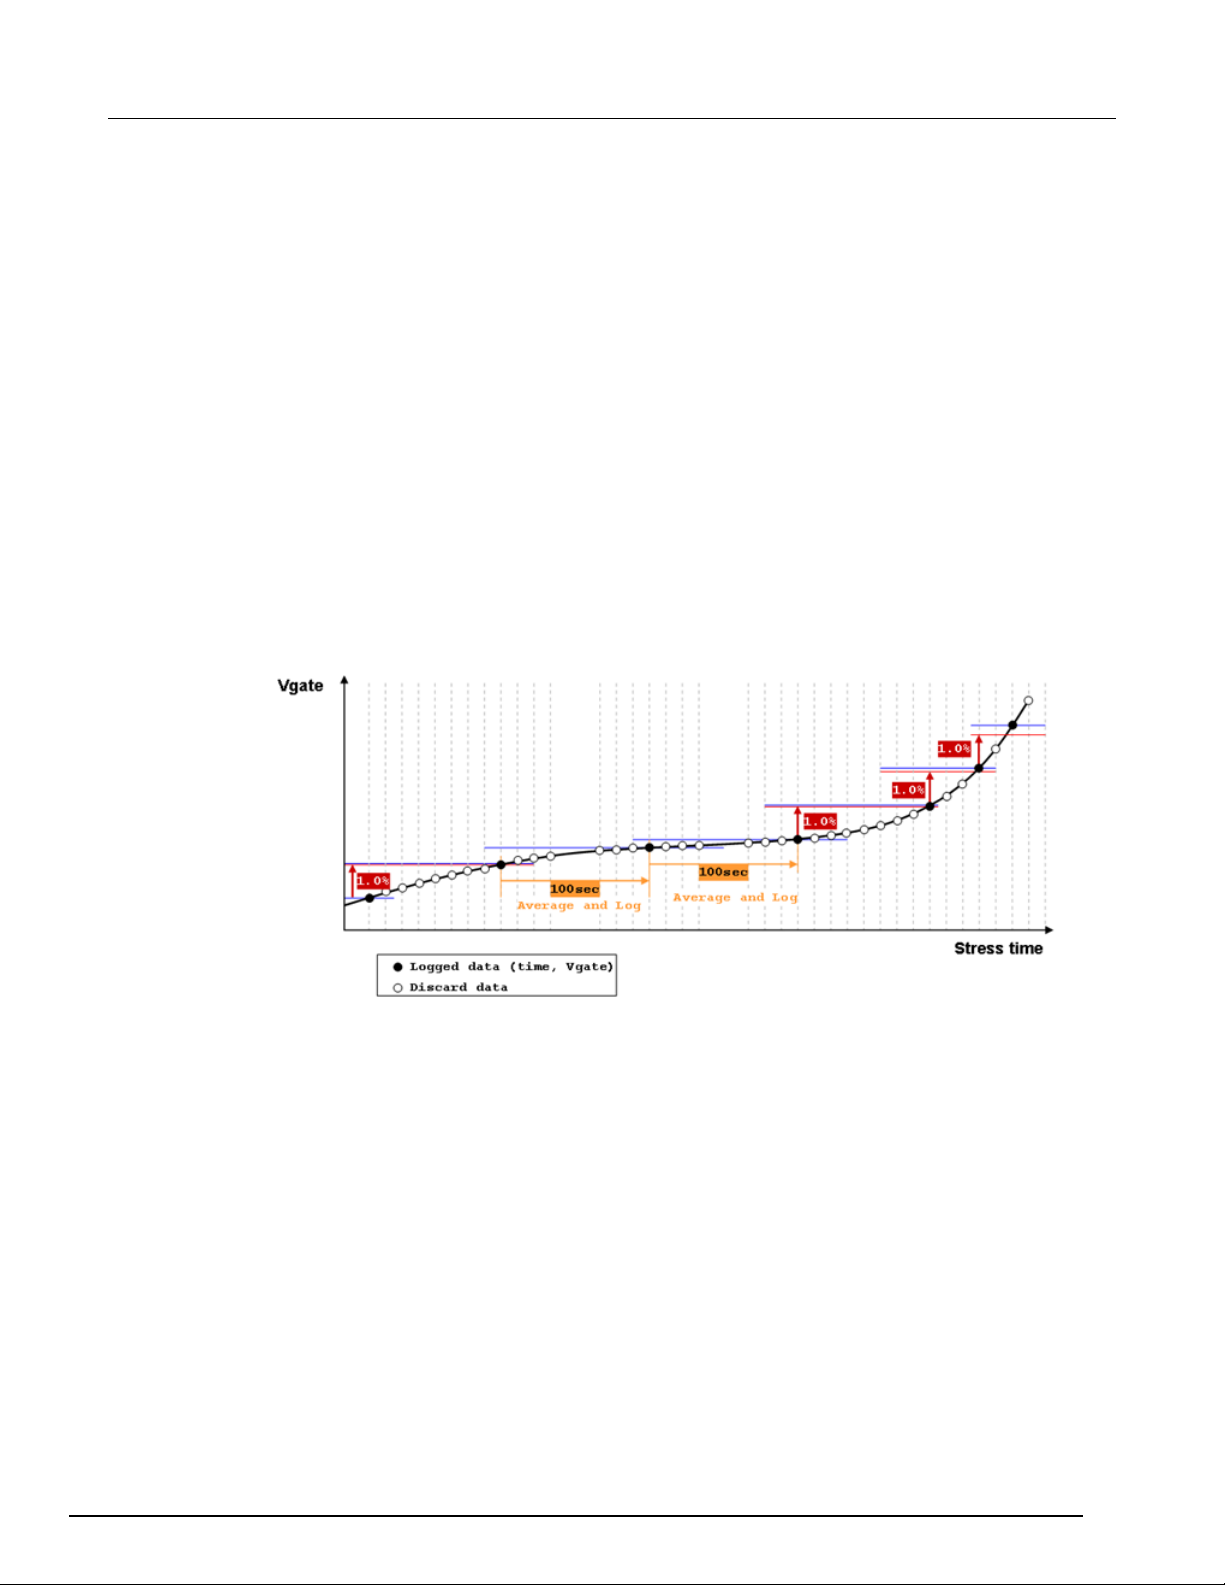
ACS
Ramped current
- 2600 RTM User's Manual Section 6:
General settings
Max Time (s): the maximum time for the current ramp time. When the max time is reached, the ramp
test will stop and the device is considered to have passed.
PLC: number of power line cycles.
Low Range (A): the lowest current measure range that is used in auto ranging.
Data Compression: log compressed data according to the settings. This function can reduce the total
amount of data without losing track of the parameter changes.
Time: Linear or Log (only one option can be selected).
Linear: For the Constant time measured, one data is logged. The data is the mean value of the
period.
Log: Every decade, a "Points per decade" number of data is logged. The data is the measured
value at the time point.
Vgate Shift: if the measured data shifted the "Shift Rate", it will be logged.
Start (s): at the beginning of a ramp, after the data compression time setting as been applied.
Figure 82: JRamp/TDDB_CCS data compression diagram
ACS2600RTM-900-01 Rev. B / December 2012 6-7
Page 91
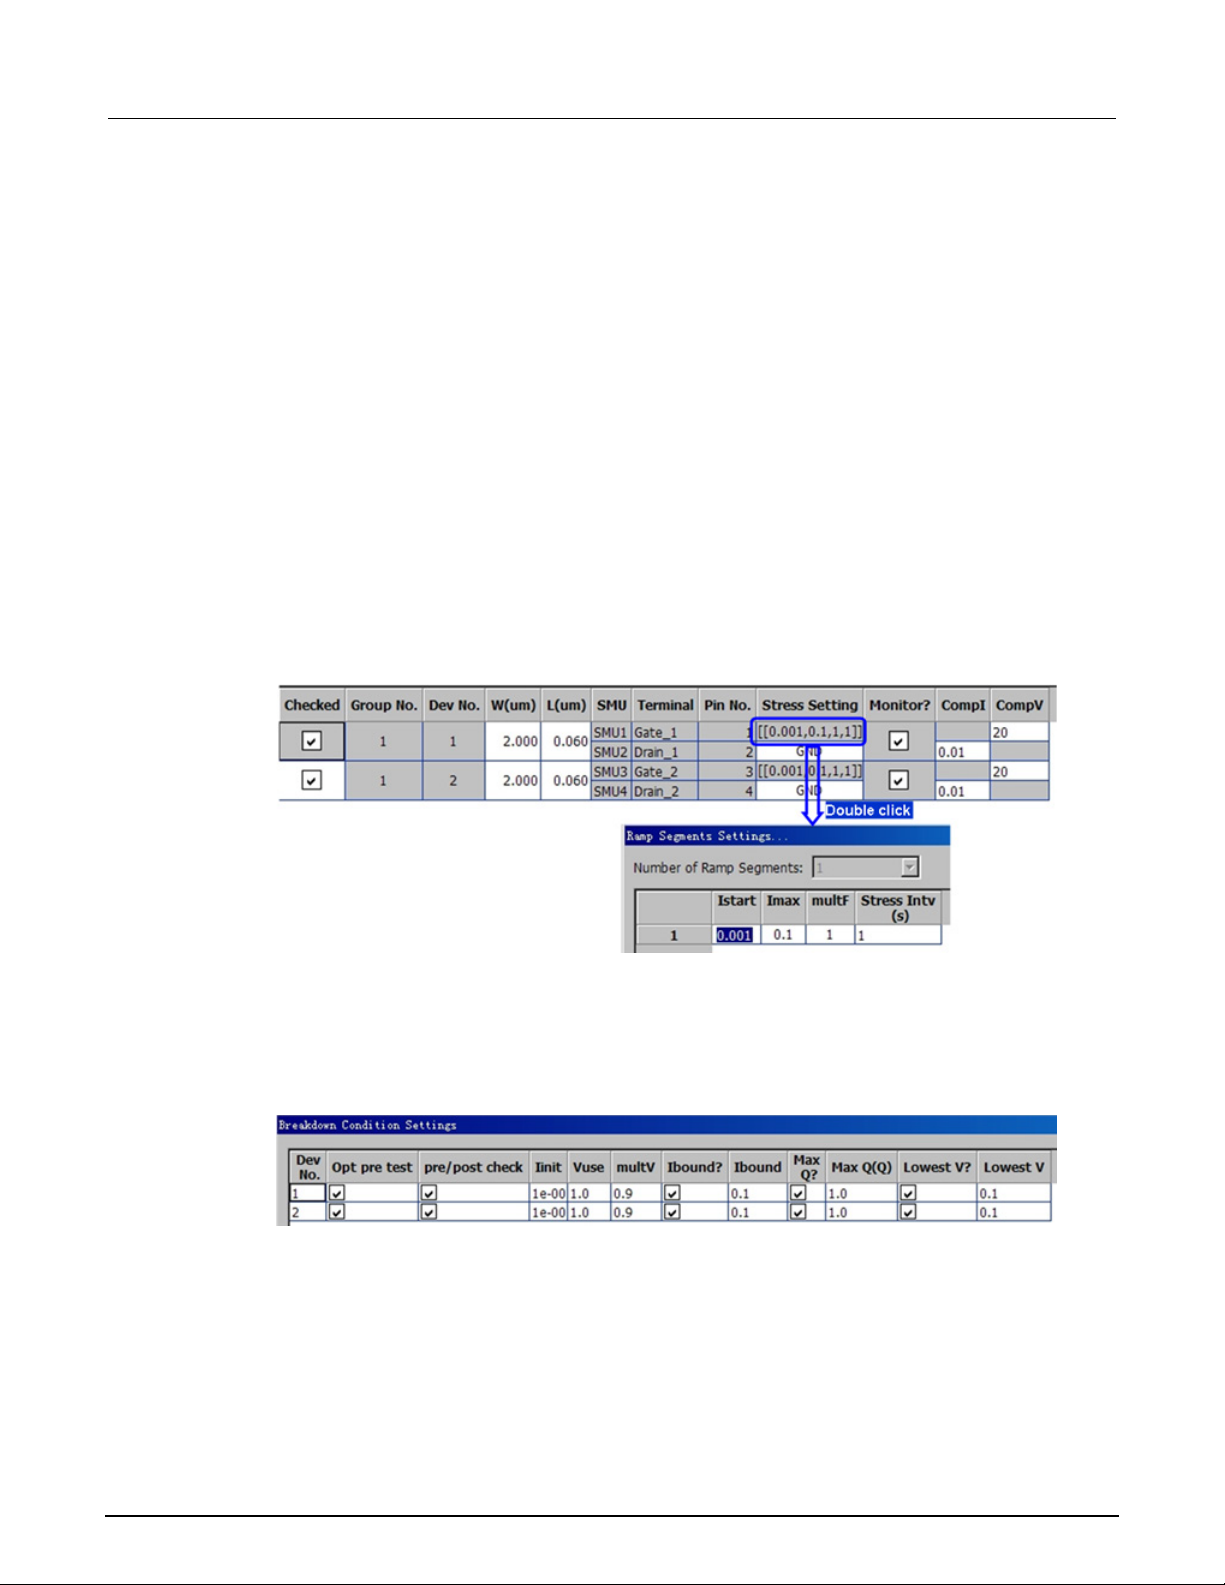
Section
2600 RTM User's Manual
6: Ramped current ACS -
Device and SMU settings
The device and SMU settings are all set at the device level. For example, all of the devices and
SMUs that are assigned in the device level of the test tree such as, the Group No., Dev No., SMU
and Terminal are shown in the next figure.
W(um), L(um): determine the MOSFET device dimensions.
Stress Setting: For the gate, double clicking the cell enables a dialog box to open that is for the stress
ramp segment settings. For other terminals, select GND or OPEN. GND: force 0V. OPEN: force 0A.
• Istart: start the current of the ramp.
• Imax: stop the (maximum) current of the ramp.
• multF: the factor of each ramp step. The next ramp current after the Istress is Istress×multF.
• Stress Intv (s): stress interval time between two ramp steps.
Monitor: monitors the voltage during each ramp step (this is always selected).
CompI: the current compliance limit.
CompV: the voltage compliance limit.
Figure 83: Device and SMU settings for JRamp/TDDB_CCS
Breakdown settings
When the "Breakdown Settings" function is selected, a dialog box containing all of the breakdown
criteria settings opens (see next figure):
Figure 84: Breakdown settings for JRamp/TDDB_CCS
6-8 ACS2600RTM-900-01 Rev. B / December 2012
Page 92
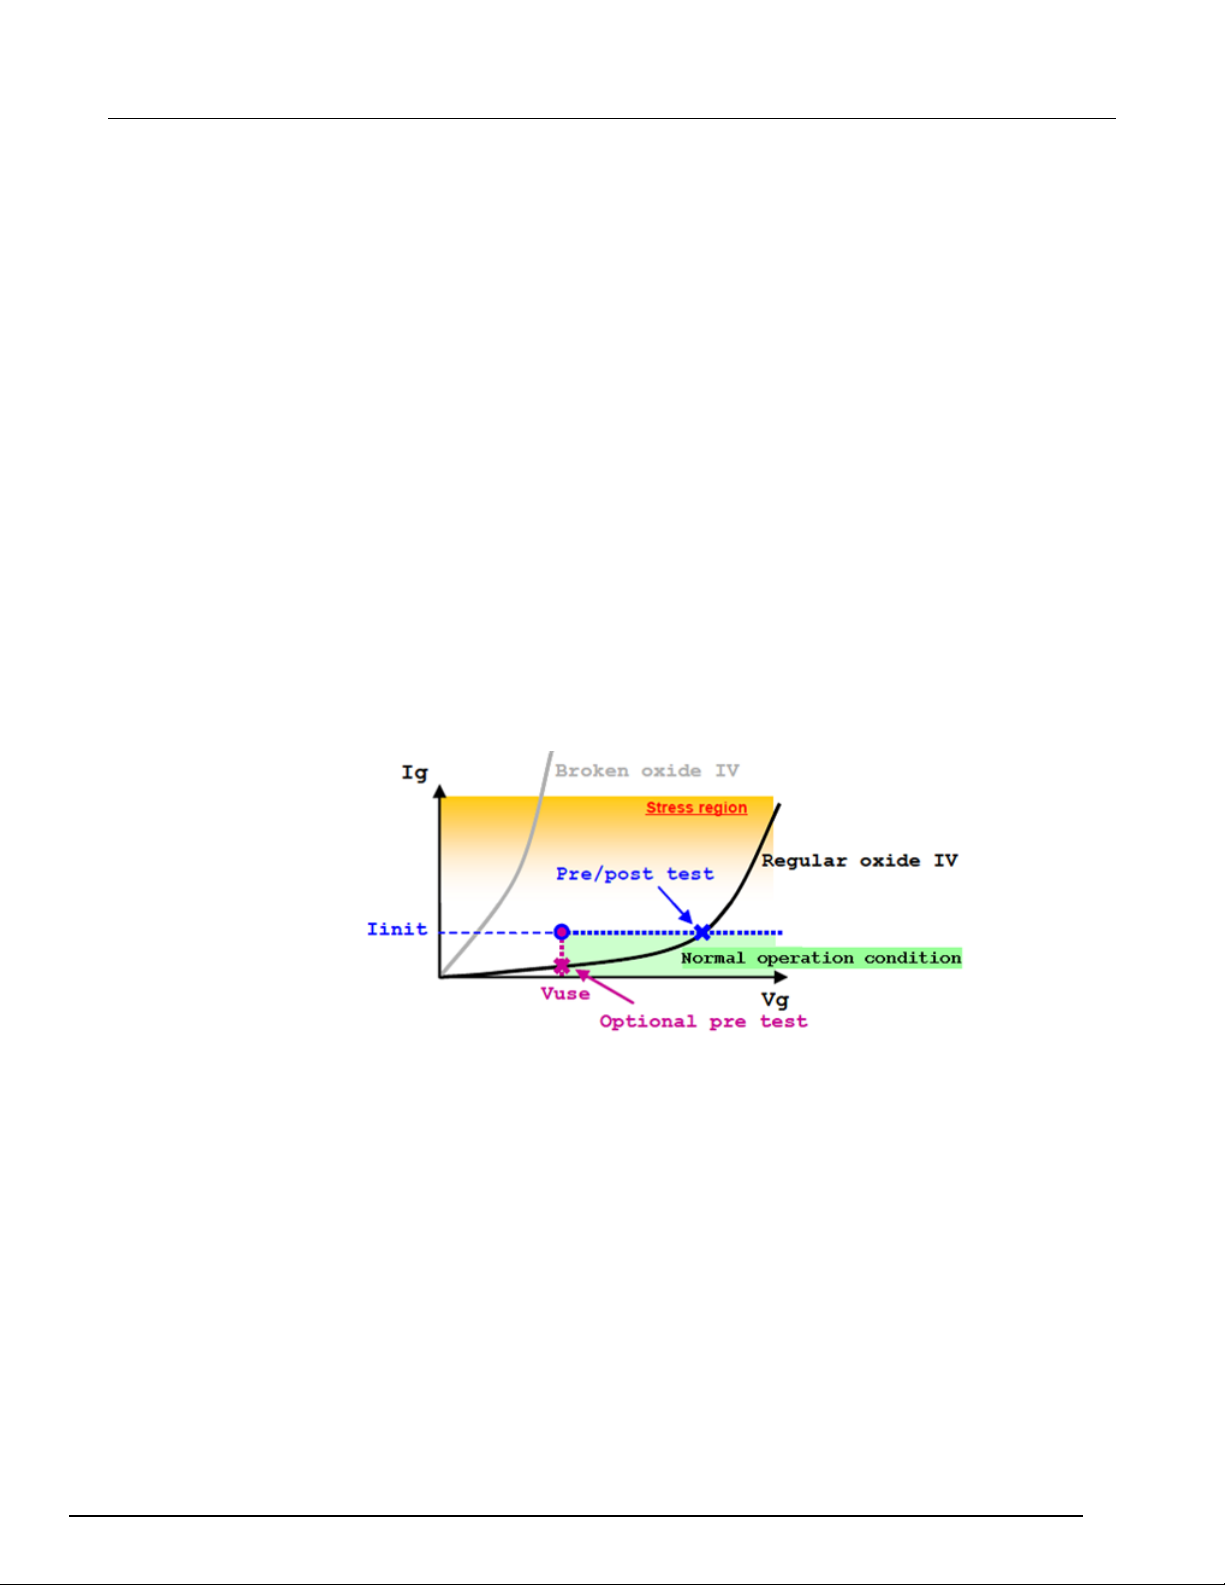
ACS
Ramped current
- 2600 RTM User's Manual Section 6:
Opt pre-test: if selected, the test will run the optional pre-test at the beginning of the flow.
pre/post check: if selected, the test will check the results of the pre-test and post-test for pass or fail.
The pre-test and post-test are always in the flow, while this option is used to indicate whether to
check the results.
Iinit: in the optional pre-test, used to determine if the measured current Iuse exceeds the Iinit. In the
pre-test and post-test, the force Iinit is used to determine if the measured voltage (Vpre and Vpost)
are lower than Vuse.
Vuse: forced value in the optional pre-test, and the voltage judgment used the pre-test and post-test.
multV: determines if the voltage is lower than the multV times the previous multV. The value is 0~1.0.
Ibound: select if needed for a bounded JRamp test. For a bounded JRamp test, the current will ramp
from the Istart to the Ibound and hold on the Ibound until the breakdown or max time is reached. The
maximum time of the stress phase is the minor one of Istart to Imax time and Max Time.
Max Q: determines if the maximum charge quantity is larger than this value.
Lowest V: determines if the voltage is lower than this value.
Failure determination
The results from a test failure are shown in the next figure:
Initial test
In the optional pre-test, a voltage (Vuse) is applied to the gate. If the measured current (Iuse) is
larger than Iinit, the device is considered to have failed the initial test.
Figure 85: Fail test results for JRamp/TDDB_CCS
In the pre-test, a current (Iinit) is applied to the gate. If the sourcing SMU is in compliance or the
measured voltage (Vpre) is lower than Vuse, the device is considered to have failed the initial test
If the device is considered to have failed the initial test, the test for the device will terminate.
ACS2600RTM-900-01 Rev. B / December 2012 6-9
Page 93
Section
2600 RTM User's Manual
Initial (type 1)
Fail
N/A
N/A
Masked Catastrophic (type 3)
Pass
Pass
Fail
Non-catastrophic (type 4)
Pass
Fail
Pass
Monitor fail (type 5)
N/A
Fail
N/A
All pass (type 6)
Pass
Pass
Pass
6: Ramped current ACS -
Ramp test
In a ramp step, a current (Istress) is applied to the gate and voltage (Vmoni) is measured.
Compliance check: if the sourcing SMU is in compliance, the device is considered to have failed the
ramp test.
Voltage factor: if the measured Vmoni is lower than the previous ramp step voltage times the multV,
the device is considered to have failed the ramp test.
Lowest voltage: if the measured Vmoni is lower than lowest V, the device is considered to have
failed the ramp test.
Maximum charge: if the calculated Qmoni is larger than the Qmax, the device is considered to have
failed the ramp test. The accumulated charge Qmoni is calculated according to stress current and
stress interval.
Post-ramp test
When the ramp test is completed, or exits due to breakdown, a post-ramp test is performed by
applying a gate current (Iinit) and measuring the voltage as Vpost. If the sourcing SMU is in
compliance or Vpost is lower than Vuse, the device is considered to have failed the post-test.
Failure mode
According to the pass or fail criteria for the Initial, Ramp, and Post-tests, the failure modes are
categorized in the next table:
Failure type Initial test Ramp test Post-test
Catastrophic (type 2) Pass Fail Fail
6-10 ACS2600RTM-900-01 Rev. B / December 2012
Page 94
ACS
Ramped current
Time_<sn>
S
Time stamps
I_<pad>_pre_<sn>
A
Measured current in optional Pre-ramp test
V_<pad>_prer_<sn>
V
Measured voltage in Pre-ramp test
I_<pad>_moni_<sn>
A
Force current value in ramp step
V_<pad>_moni_<sn>
V
Measured voltage in ramp step
Q_<pad>_moni_<sn>
C
Accumulated gate charge
Tbd_<sn>
S
Breakdown time
Vbd_<sn>
V
Breakdown voltage
Qbd_<sn>
C
Quantity of charge when breakdown
Fail_mode_<sn>
-
Fail mode
<sn>: the number of the sub-device.<pad>: pad name, usually the gate in JRamp/TDDB_CCS. For example,
sub-device 1, pad name Gate_1, the measured voltage in ramp steps is V_Gate_1_moni_1.
- 2600 RTM User's Manual Section 6:
Data recording
The test results data are displayed on the Data tab, and will be logged as a .kdf, .db, or .csv file if run
in the Automation mode. Data for multiple Groups are displayed using multiple tabs within the Data
tab. The output data for different sub-devices is distinguished by the parameter names. The output
parameters for one group are in the following table:
Parameter Unit Comment
V_<pad>_post_<sn> V Measured voltage in Post-ramp test
Ibd_<sn> A Breakdown current
ACS2600RTM-900-01 Rev. B / December 2012 6-11
Page 95
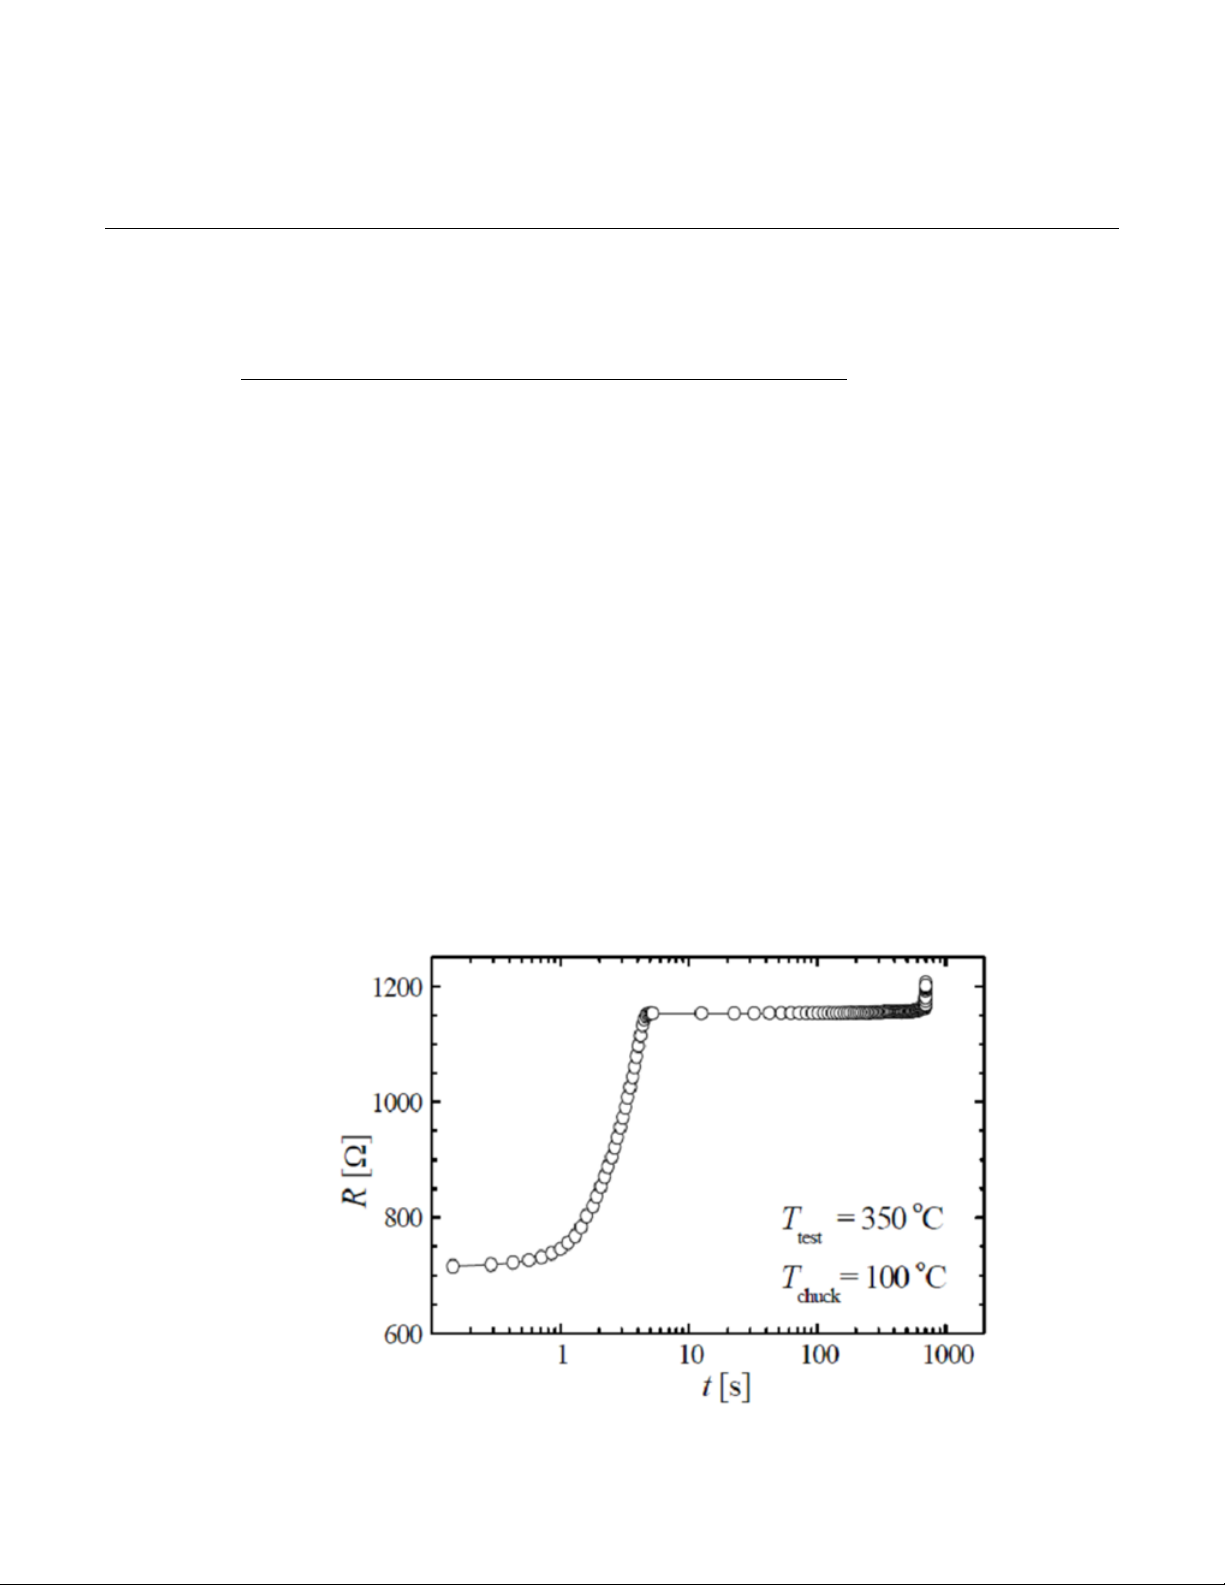
Data recording ........................................................................ 7-10
In this section:
Test principle ............................................................................ 7-1
Instrument connection .............................................................. 7-2
Test flow ................................................................................... 7-3
Settings .................................................................................... 7-6
Exit criteria ............................................................................... 7-9
Test principle
Electromigration is the phenomenon of material movement resulting from electrical current, and is a
major reliability concern for metallization. The isothermal electromigration test (Iso_EM) is an
accelerated electromigration test performed on microelectronic metallizations. In the isothermal test,
an attempt is made to maintain a constant mean temperature of the line under test. This is done by
varying the stress current and therefore, the amount of Joule heating imparted to the line (based on
the JESD61A-01 standard). The Iso_EM test uses the Series 2600A or Series 2600 SourceMeters for
sourcing and measuring.
Section 7
Electromigration
The Iso_EM test uses an isolated thermal algorithm to heat the metallization to a constant
temperature and hold this temperature until the metallization fails. The test result is used to predict
the metallization "wear out" time.
Figure 86: Diagram of Iso_EM test results
Page 96
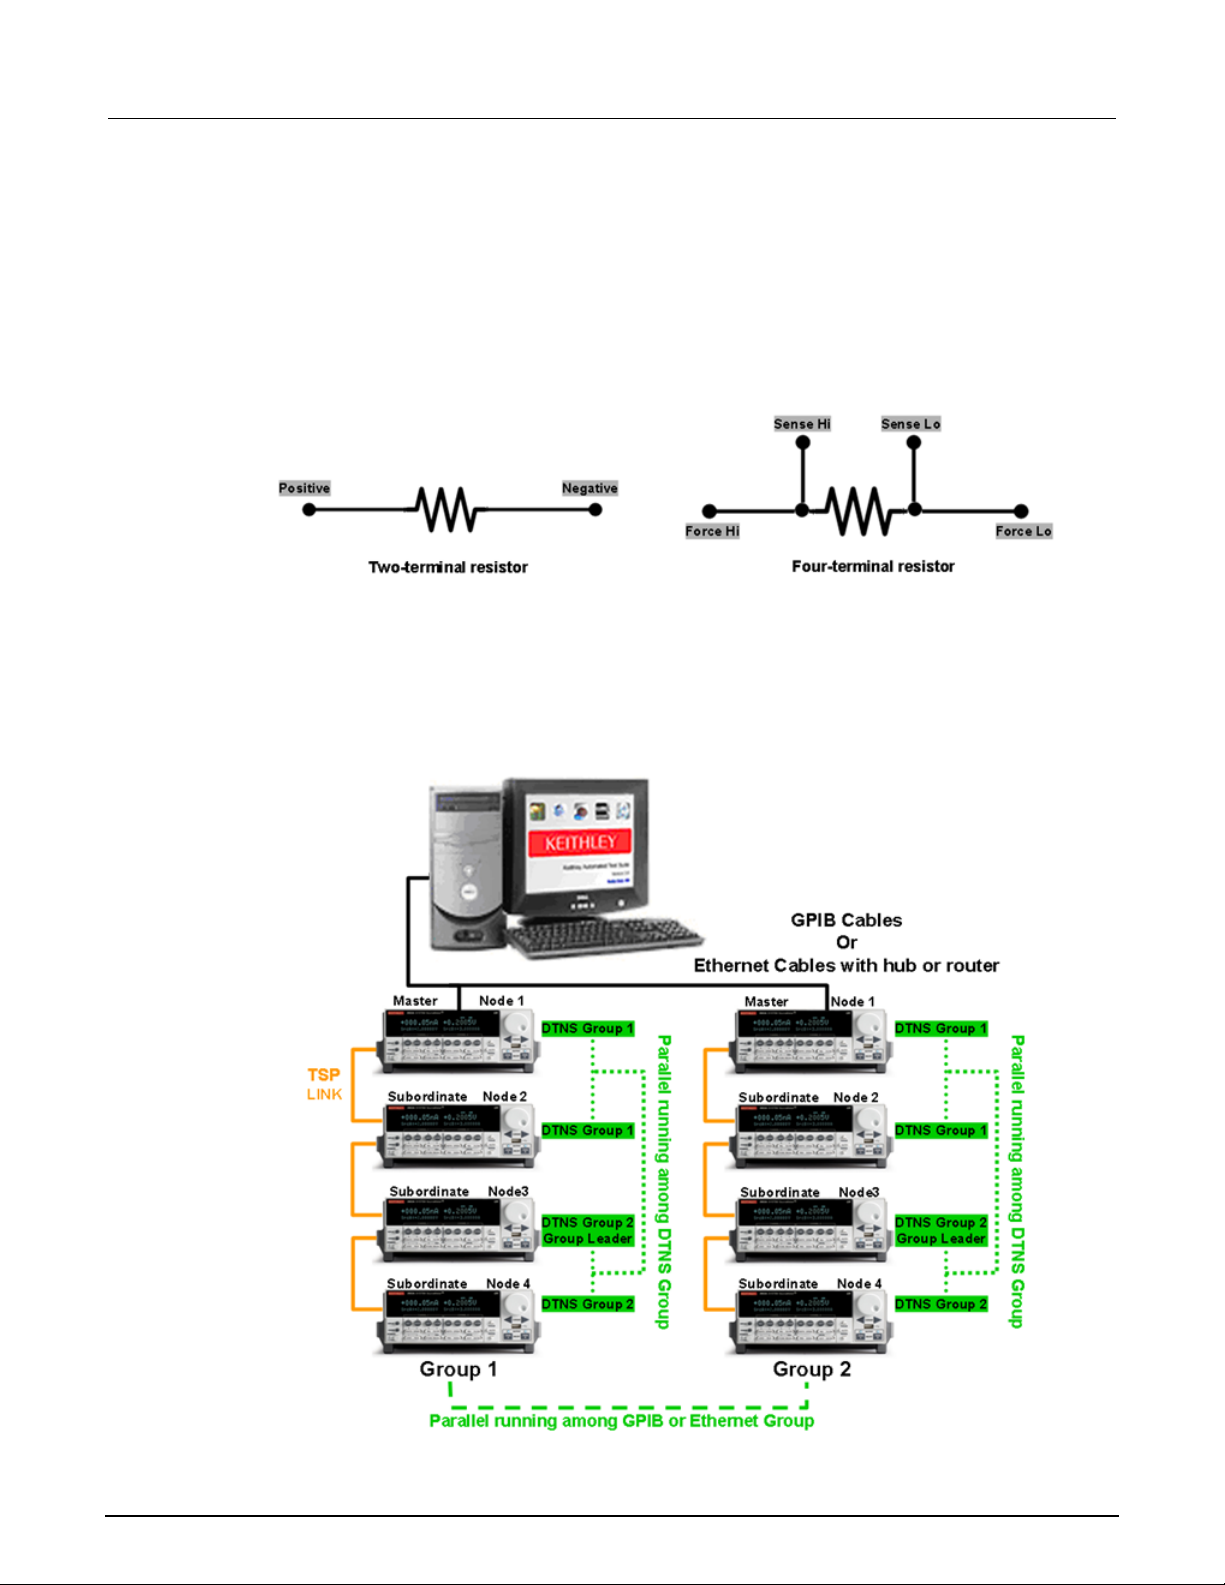
Section
2600 RTM User's Manual
7: Electromigration ACS -
Instrument connection
The Iso_EM test uses a two-terminal or a four-terminal resistor device. For two-terminal resistors,
current is forced and voltage is measured at the "positive" terminal and the "negative" terminal is
biased at 0V. For four-terminal resistors, current is forced at the 'Force Hi" terminal, the "Force Lo"
terminal is set to 0V, the "Sense Hi" terminal is set to 0A, and voltage is measured between "Sense
Hi" and "Sense Lo".
Figure 87: Two-terminal and four-terminal resistor device
The test uses Series 2600B or Series 2600 SourceMeters. The SourceMeters can be setup as
different groups (GPIB or Ethernet) for parallel testing. Within each group, you can also setup multiple
sub-devices for sequential or parallel testing. In a parallel test, each sub-device will be set as a subgroup (DTNS Group). The SourceMeters in a connection scheme must have the same firmware. The
2600B SourceMeters and the 2600 SourceMeters (for instance, the A and non-A versions) cannot be
used together. A typical connection scheme is shown in the next figure:
Figure 88: A typical instrument connection scheme
7-2 ACS2600RTM-900-01 Rev. B / December 2012
Page 97
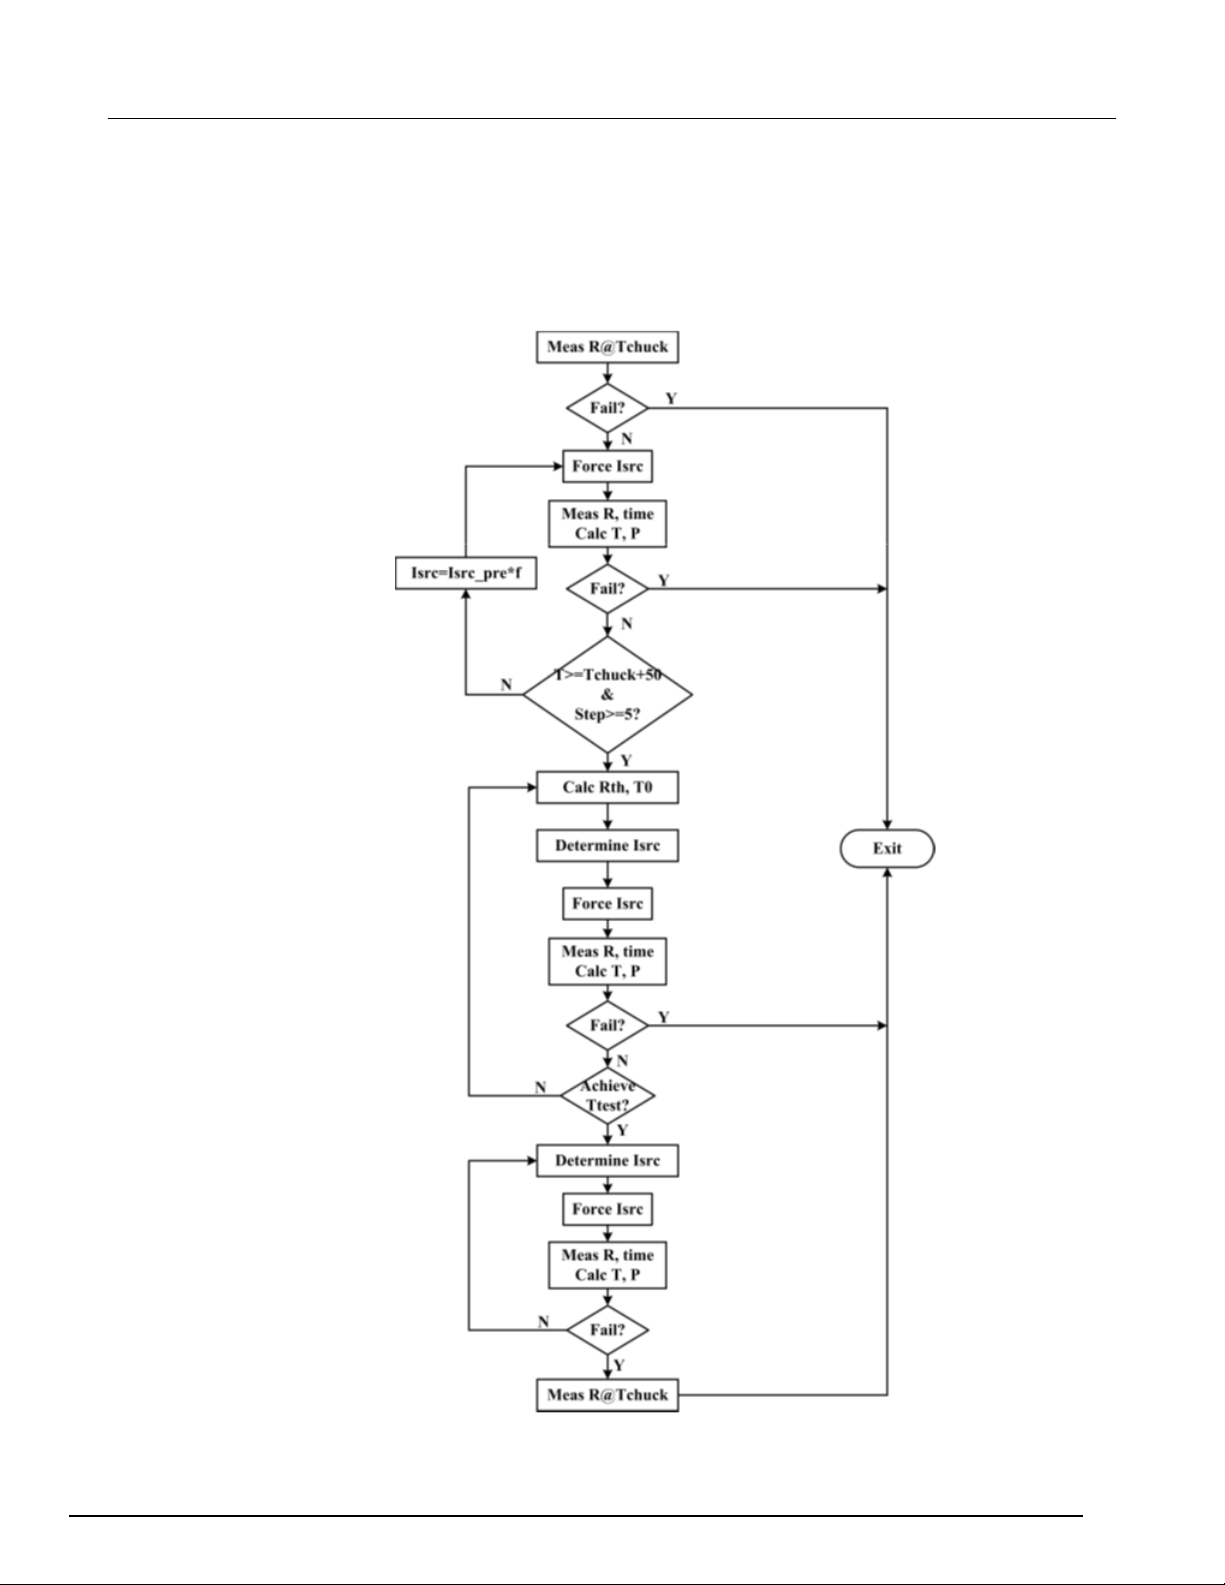
ACS
- 2600 RTM User's Manual Section 7: Electromigration
Test flow
The Iso_EM test flow is based on the JEDEC standard JESD61A-01 (see next figure).
Figure 89: Test flow of Iso_EM
ACS2600RTM-900-01 Rev. B / December 2012 7-3
Page 98

Section
2600 RTM User's Manual
7: Electromigration ACS -
According to the JEDEC Standard JESD61A.01, the test contains five parts:
1. Determination of R at chuck temperature
2. Initialization phase
3. Temperature staircase and convergence phase
4. Stress phase
5. Post-fail measurement
The temperature is increased during the 2nd and the 3rd part of the test and is kept constant during
the 4th part. The detailed algorithm can be found in the JEDEC standard document.. During the entire
process, the test is performed by forcing a current and measuring the resultant voltage; R is
calculated using Ohm's Law and the temperature is calculated using the TCR (temperature coefficient
of resistance).
A. Determination of R at chuck temperature: In this part, a small current (Iinit) is forced through the
resistor in both polarities and R is measured and averaged. If the average R value exceeds the
given criterion (Rchuck_fail), the test will end.
B. Initialization phase: R@Tchuck+50 is estimated by the TCR and the exit criterion in this phase is
calculated from this R value and an input shift. The test begins when the first current in this phase
is applied. The current forced increases by a factor (fcurrent). This phase ends when the
temperature exceeds Tchuck+50 and after at least five steps. If the R value exceeds the given
criterion, the test will end.
C. Temperature staircase and convergence phase: This phase is composed of two sub-phases:
Temperature staircase and Convergence. The R value at Ttest is estimated and the exit criterion
is determined by R@Ttest and a shift value.
• Temperature staircase: In this part, the current is calculated (from the relationship of T~R and T~P) and
increased so that the temperature will increase almost linearly by ΔT. This part ends when the
temperature achieves (Ttest-2×ΔT).
• Convergence: In this part, the current is calculated (from the relationship of T~R and T~P) and forced
so that the temperature will converge to Ttest quickly and smoothly.
D. Stress phase: In this phase, the temperature is kept constant by keeping power constant (from
the relationship of T~P). The R value obtained at the beginning of this phase and a shift value
determines the exit criterion.
E. Post-fail measurement: After the device fails, the R will be measured again using the same
current for R@Tchuck.
An example test results diagram is shown in the next figure:
7-4 ACS2600RTM-900-01 Rev. B / December 2012
Page 99
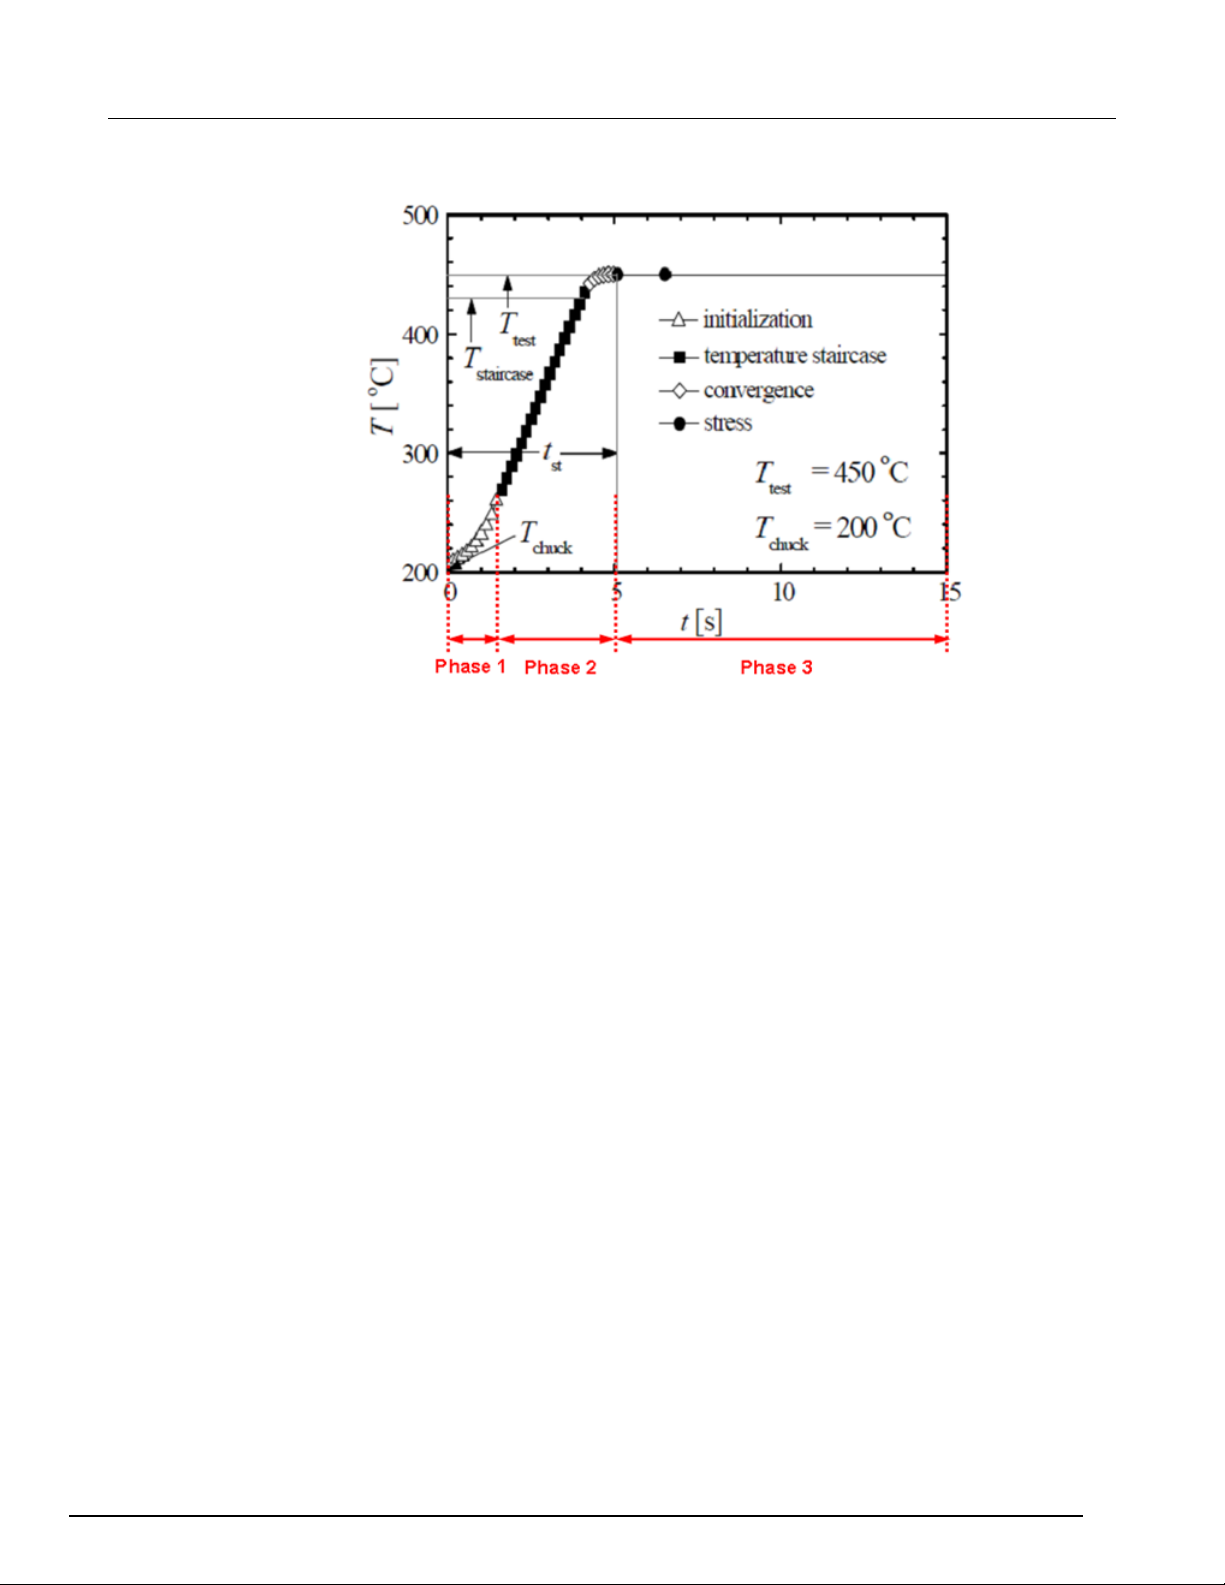
ACS
- 2600 RTM User's Manual Section 7: Electromigration
Figure 90: Result diagram of Iso_EM
Initialization (Phase1): this phase begins at Tchuck and ends at about Tchuck + 50 0C;
Temperature staircase (Phase2/part 1): the temperature increases linearly to a certain temperature
step until about Ttest-2×step.
Convergence (Phase2/part 2): the temperature converges to Ttest rapidly and smoothly.
Stress (Phase 3): the stress phase continues until the resistor fails or reaches the maximum time.
ACS2600RTM-900-01 Rev. B / December 2012 7-5
Page 100
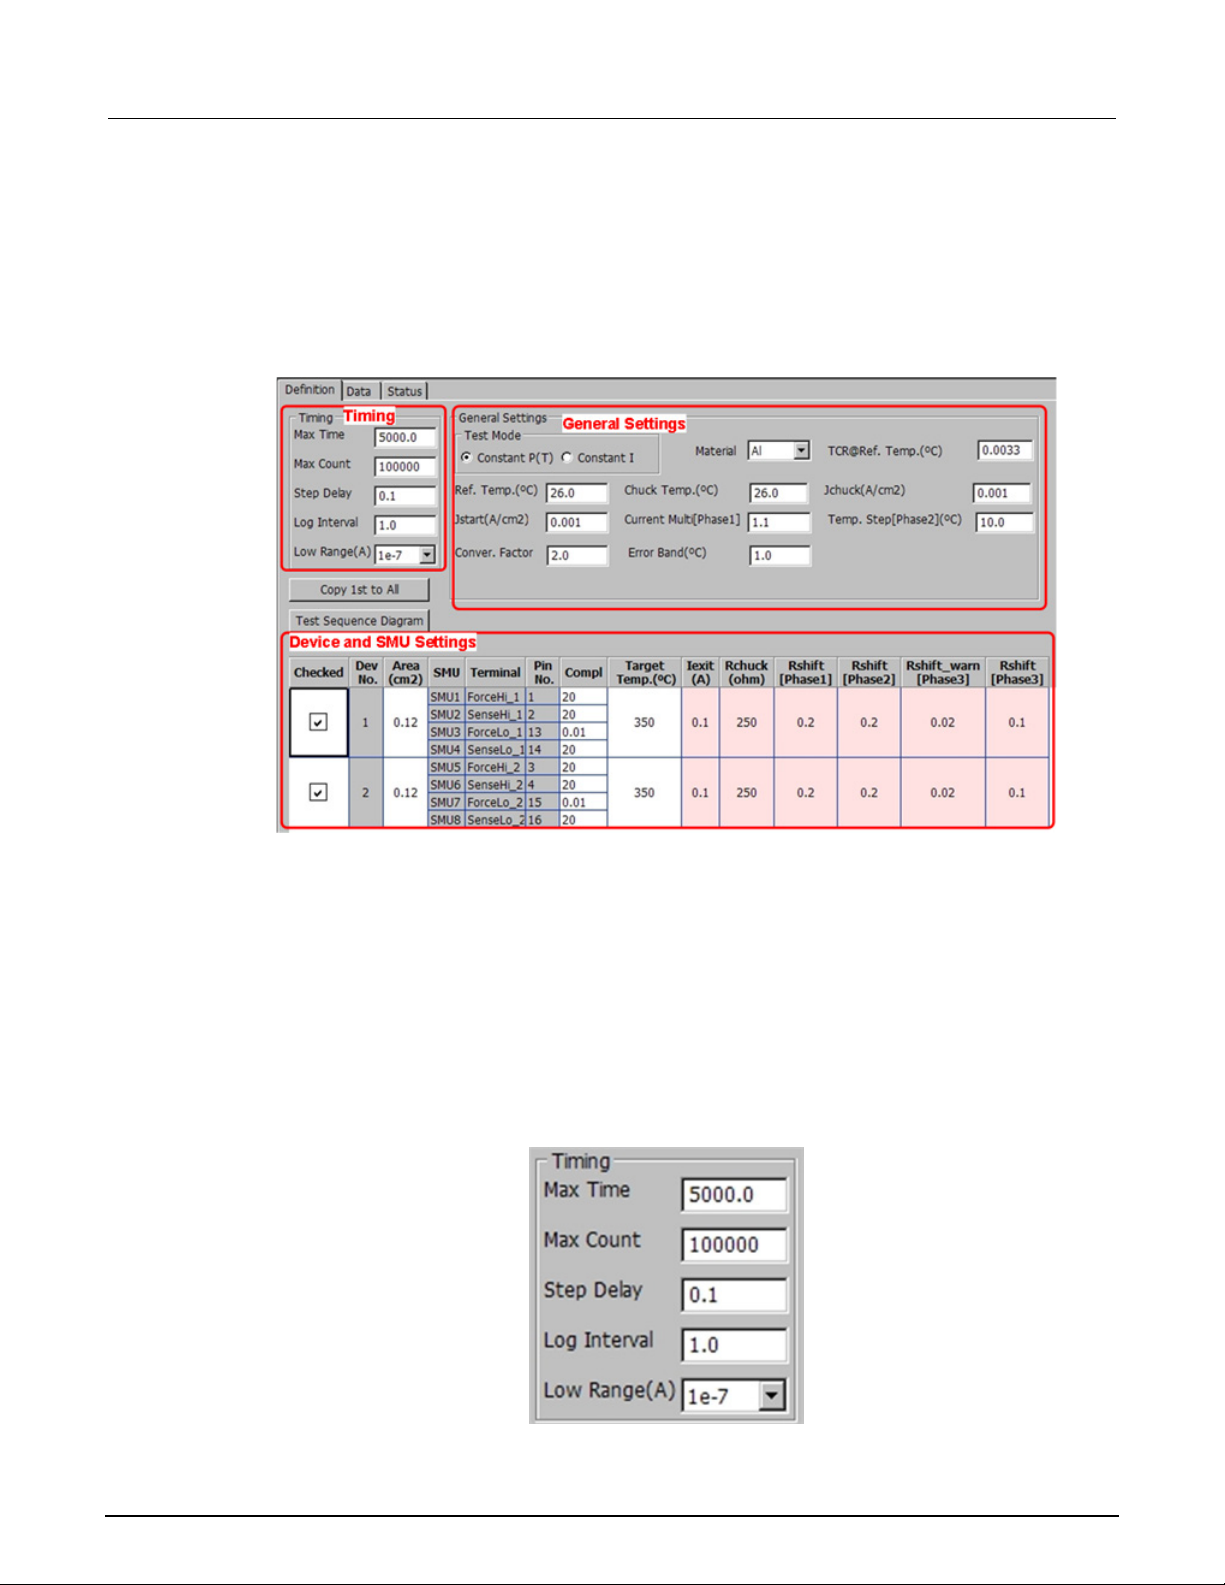
Section
2600 RTM User's Manual
7: Electromigration ACS -
Settings
For a single sub-device, the Iso_EM test can use the "Resistor_2T" or "Resistor_4T" device type; for
multiple sub-devices, the test can use the "24pin_6R" device type in the "Custom" category.
The GUI for the Iso_EM is shown in the next figure:
Figure 91: GUI for Iso_EM
Timing settings
Max Time: maximum test time (in seconds)
Max Count: largest number of data measurements
Once a test reaches either the Max Time or Max Count, the data measurements will end.
Step Delay: measurement cycle (in seconds; recommended in [0.05, 0.5])
Log Interval: data record interval in Phase 3 (in seconds)
Low Range: the lowest current measure range that will be used during auto ranging
Figure 92: Timing settings GUI
7-6 ACS2600RTM-900-01 Rev. B / December 2012
 Loading...