

Page 1

Security Threat Response Manager
STRM Log Management Users Guide
Release 2008.2 R2
Juniper Networks, Inc.
1194 North Mathilda Avenue
Sunnyvale, CA 94089
USA
408-745-2000
www.juniper.net
Part Number: 530-027300-01, Revision 1
Page 2

Copyright Notice
Copyright © 2008 Juniper Networks, Inc. All rights reserved. Juniper Networks and the Juniper Networks logo are registered trademarks of Juniper
Networks Inc. in the United States and other countries. All other trademarks, service marks, registered trademarks, or registered service marks in this
document are the property of Juniper Networks or their respective owners. All specifications are subject to change without notice. Juniper Networks
assumes no responsibility for any inaccuracies in this document or for any obligation to update information in this document. Juniper Networks reserves
the right to change, modify, transfer, or otherwise revise this publication without notice.
FCC Statement
The following information is for FCC compliance of Class A devices: This equipment has been tested and found to comply with the limits for a Class A
digital device, pursuant to part 15 of the FCC rules. These limits are designed to provide reasonable protection against harmful interference when the
equipment is operated in a commercial environment. The equipment generates, uses, and can radiate radio-frequency energy and, if not installed and
used in accordance with the instruction manual, may cause harmful interference to radio communications. Operation of this equipment in a residential
area is likely to cause harmful interference, in which case users will be required to correct the interference at their own expense. The following
information is for FCC compliance of Class B devices: The equipment described in this manual generates and may radiate radio-frequency energy. If it
is not installed in accordance with NetScreen’s installation instructions, it may cause interference with radio and television reception. This equipment has
been tested and found to comply with the limits for a Class B digital device in accordance with the specifications in part 15 of the FCC rules. These
specifications are designed to provide reasonable protection against such interference in a residential installation. However, there is no guarantee that
interference will not occur in a particular installation. If this equipment does cause harmful interference to radio or television reception, which can be
determined by turning the equipment off and on, the user is encouraged to try to correct the interference by one or more of the following measures:
Reorient or relocate the receiving antenna. Increase the separation between the equipment and receiver. Consult the dealer or an experienced radio/TV
technician for help. Connect the equipment to an outlet on a circuit different from that to which the receiver is connected.
Caution: Changes or modifications to this product could void the user's warranty and authority to operate this device.
Disclaimer
THE SOFTWARE LICENSE AND LIMITED WARRANTY FOR THE ACCOMPANYING PRODUCT ARE SET FORTH IN THE INFORMATION PACKET
THAT SHIPPED WITH THE PRODUCT AND ARE INCORPORATED HEREIN BY THIS REFERENCE. IF YOU ARE UNABLE TO LOCATE THE
SOFTWARE LICENSE OR LIMITED WARRANTY, CONTACT YOUR JUNIPER NETWORKS REPRESENTATIVE FOR A COPY.
STRM Log Management Users Guide
Release 2008.2 R2
Copyright © 2008, Juniper Networks, Inc.
All rights reserved. Printed in USA.
Revision History
September 2008—Revision 1
The information in this document is current as of the date listed in the revision history.
2
Page 3

CONTENTS
ABOUT THIS GUIDE
Conventions 1
Technical Documentation 1
Contacting Customer Support 1
1 ABOUT STRM LOG MANAGEMENT SLIM
Logging In to STRM Log Management 3
Dashboard 4
Event Viewer 5
Reports 5
Using STRM Log Management 6
Sorting Results 6
Refreshing the Interface 6
Pausing the Interface 6
Investigating IP Addresses 6
STRM Log Management Time 7
Accessing On-line Help 7
STRM Log Management Administration Console 8
2 USING THE DASHBOARD
About the Dashboard 9
Using the Dashboard 10
Event Viewer 10
Events Over Time 10
Events By Severity 11
Top Devices 11
Reports 12
System Summary 12
Adding Items 13
3 USING THE EVENT VIEWER
Using the Event Viewer Interface 16
Using the Toolbar 16
Using the Right-Click Menu Options 16
Viewing Events 17
Viewing Normalized Events 17
Page 4

Viewing Raw Events 20
Viewing Aggregate Normalized Events 21
Using the Search 27
Searching Events 27
Deleting Saved Searches 30
Modifying Event Mapping 31
Exporting Events 33
4 CONFIGURING RULES
Viewing Rules 36
Enabling/Disabling Rules 37
Creating a Rule 37
Event Rule Tests 47
Copying a Rule 52
Deleting a Rule 53
Grouping Rules 53
Viewing Groups 53
Creating a Group 54
Editing a Group 55
Copying an Item to Another Group(s) 56
Deleting an Item from a Group 57
Assigning an Item to a Group 58
Editing Building Blocks 58
5 MANAGING REPORTS
Using the Reports Interface 62
Using the Navigation Menu 62
Using the Toolbar 63
Viewing Reports 63
Grouping Reports 64
Creating a Group 65
Editing a Group 66
Copying a Template to Another Group 66
Deleting a Template From a Group 67
Assigning a Report to a Group 68
Creating a Report 68
Creating a Template 69
Configuring Charts 76
Selecting a Graph Type 85
Using Default Report Templates 86
Generating a Report 87
Duplicating a Report 87
Sharing a Report 88
Branding Your Report 88
Page 5

A DEFAULT RULES AND BUILDING BLOCKS
Default Rules 91
Default Building Blocks 101
A GLOSSARY
INDEX
Page 6

Page 7

ABOUT THIS GUIDE
The STRM Log Management Users Guide provides information on managing
STRM Log Management including the Dashboard, Reports, and Event Viewer
interfaces.
Conventions Table 1 lists conventions that are used throughout this guide.
Table 1 Icons
Icon Type Description
Information note Information that describes important features or
instructions.
Caution Information that alerts you to potential loss of
data or potential damage to an application,
system, device, or network.
Warning Information that alerts you to potential personal
injury.
Technical Documentation
You can access technical documentation, technical notes, and release notes
directly from the Juniper Networks support web site at https://juniper.net/support.
Once you access the Juniper Networks support web site, locate the product and
software release for which you require documentation.
Your comments are important to us. Please send your e-mail comments about this
guide or any of the Juniper Networks documentation to:
documentation@juniper.com.
Include the following information with your comments:
• Document title
• Page number
STRM Log Management Users Guide
Page 8

2 ABOUT THIS GUIDE
Contacting Customer Support
To help you resolve any issues that you may encounter when installing or
maintaining STRM Log Management, you can contact Customer Support as
follows:
• Log a support request 24/7: https://juniper.net/support
For access to the Juniper Networks support web site, please contact Customer
Support.
• Access Juniper Networks support and Self-Service support using e-mail:
support@juniper.net
• Telephone assistance: 1-800-638-8296.
STRM Log Management Users Guide
Page 9

1
ABOUT STRM LOG MANAGEMENT
STRM Log Management is a network security management platform that provides
situational awareness and compliance support through security event correlation,
analysis, and reporting. This chapter provides an overview of the STRM Log
Management interface including:
• Logging In to STRM Log Management
• Dashboard
• Event Viewer
• Reports
• Using STRM Log Management
• STRM Log Management Administration Console
Note: When navigating STRM Log Management, do not use the browser Back
button. Use the navigation options available with STRM Log Management to
navigate the interface.
Logging In to STRM Log Management
Step 1 Open your web browser.
Step 2 Log in to STRM Log Management:
Step 3 Click Login To STRM Log Management.
To login to STRM Log Management:
https://<
Where <
The default values are:
Username: admin
Password: <root password>
Where
during the installation process. For more information, see the STRM Log
Management Installation Guide.
For your STRM Log Management Console, a default license key provides you
access to the interface for 5 weeks. A window appears providing the date that the
IP Address>
IP Address> is the IP address of the STRM Log Management system.
<root password> is the password assigned to STRM Log Management
STRM Log Management Users Guide
Page 10
4 ABOUT STRM LOG MANAGEMENT
temporary license key will expire. For information on installing a permanent license
key, see the STRM Log Management Administration Guide.
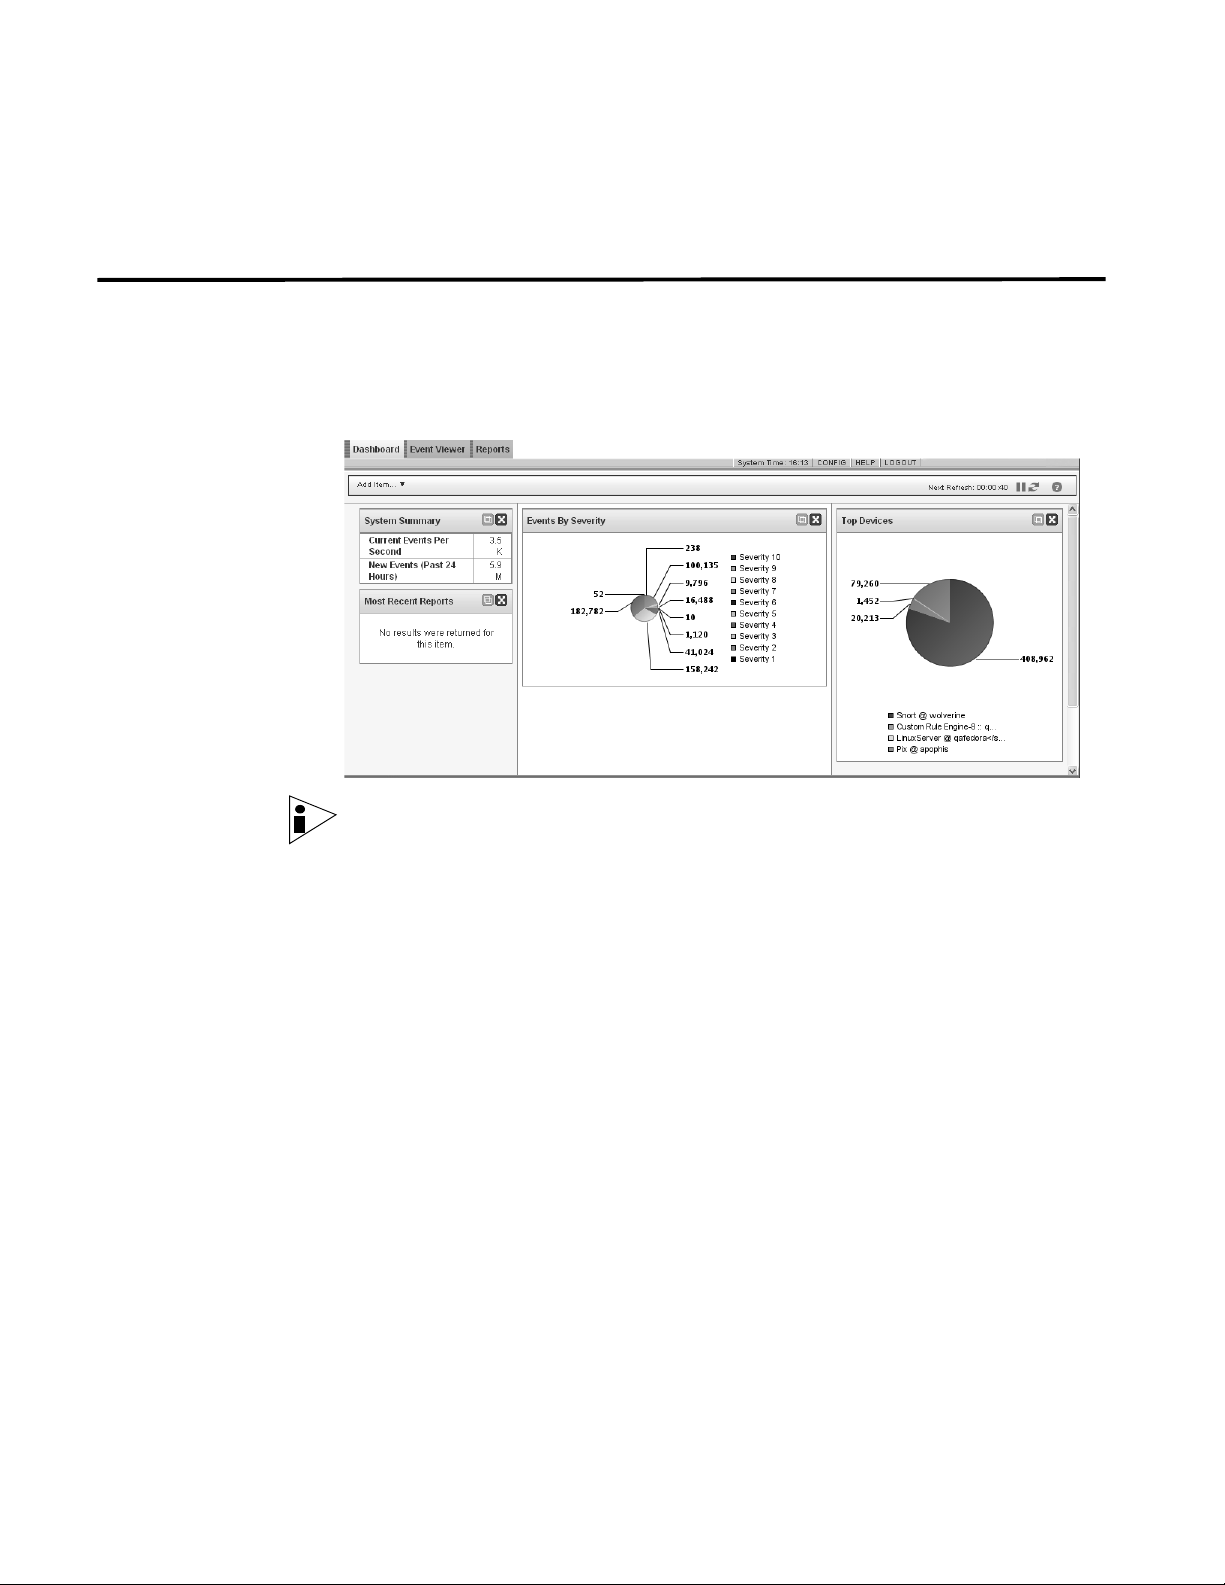
Dashboard The Dashboard tab is the default interface that appears when you log in to STRM
Log Management. The Dashboard tab provides summary and detailed information
on events occurring on your network. The Dashboard is customizable on a per
user basis to focus on individual user’s security or network operations
responsibilities.
Note: For more information on using the Dashboard, see Chapter 2 Using the
Dashboard.
STRM Log Management Users Guide
Page 11
Event Viewer 5
Event Viewer The Event Viewer allows you to view event logs being sent to STRM Log
Management in real-time, or through searches. The Event Viewer is a powerful
tool for performing in-depth investigations on event data.
Note: For more information, see Chapter 3 Using the Event Viewer.
Reports Reports is a flexible and robust reporting package that allows you to create,
distribute, and manage reports for any data within STRM Log Management.
Reports allows you to create customized reports for operational and executive use
by combining any combination of information into a single report. You can also use
the many pre-installed report templates included with STRM Log Management.
The Reports tab also allows you to brand your reports with your customized logos
enabling you to support various unique logos for each report. This is beneficial for
distributing reporting to different audiences.
Note: For more information on Reports, see Chapter 5 Managing Reports.
STRM Log Management Users Guide
Page 12
6 ABOUT STRM LOG MANAGEMENT
Using STRM Log
Management
Sorting Results In the Event Viewer tab you can sort the resulting tables by clicking on a column
Using STRM Log Management, you can:
• Sort the results. See Sorting Results.
• Refresh the interface. See Refreshing the Interface.
• Pause the current display. See Pausing the Interface.
• Further investigate an IP address. See Investigating IP Addresses.
• View the time of the STRM Log Management Console. See STRM Log
Management Time.
• View the STRM Log Management on-line Help. See Accessing On-line Help
heading. A single click of the desired column sorts the results in descending order
and a second click on the heading sorts the results in ascending order. An arrow at
the top of the column indicates the direction of the sort.
For example, if you wish to sort the events by Name, click the Name heading. An
arrow appears in the column heading to indicate the results are sorted in
descending order.
Click the Name column heading again if you wish to sort the information in
ascending order.
Refreshing the
Interface
The Event Viewer and the Dashboard allow you to refresh the interface. This
refresh option is located in the right corner of the interface. The timer indicates the
amount of time since the interface was refreshed. To refresh the interface, click the
refresh icon.
Pausing the Interface You can use the refresh timer, located on the right, to pause the current display. To
pause the interface, click the pause icon . The timer flashes red to indicate the
current display is paused. Click the icon again to restart the timer.
Investigating IP
Addresses
You can use the right-mouse button (right-click) on any IP address to access
additional menus, which allow you to further investigate that IP address. The menu
options include:
Note: For information on customizing the right-click menu, see the Customizing
the Right-Click Menu Technical Note.
STRM Log Management Users Guide
Page 13

Using STRM Log Management 7
Table 1- 1 Additional Options
Menu Sub-Menu Description
Information DNS Lookup Searches for DNS entries based on the IP
address.
WHOIS Lookup Searches for the registered owner of a
remote IP address (Default system server:
whois.crsnic.net.)
Port Scan Performs a NMAP scan of the selected IP
address. This option is only available if
NMAP is installed on your system. For more
information on installing NMAP, see your
vendor documentation.
STRM Log
Management Time
Accessing On-line
Help
The right corner of the STRM Log Management interface displays STRM Log
Management time, which is the time of the STRM Log Management Console. The
STRM Log Management Console time synchronizes all STRM Log Management
appliances within the STRM Log Management deployment, and is used to
determine the time events were received from other devices for proper time sync
correlation.
You can access the STRM Log Management on-line Help through the main STRM
Log Management interface. To access the on-line Help, click Help > Help
Contents. The Help interface appears.
STRM Log Management Users Guide
Page 14

8 ABOUT STRM LOG MANAGEMENT
STRM Log Management Administration Console
The STRM Log Management Administration Console is a client-based application
that provides administrative users access to administrative functionality including:
• System Configuration - Allows you configure system wide STRM Log
Management settings including, users, thresholds, system settings, backup and
recovery, license keys, network hierarchy, authentication, or automatic
updates.
• Access the deployment editor - Allows you to manage the individual
components of your STRM Log Management deployment.
• Configure sensor devices - Allows you to configure sensor devices, which
provide events to your deployment through DSMs.
All configuration updates using the Administration Console are saved to a staging
area. Once all changes are complete, you can deploy the configuration changes or
all configuration settings to the remainder of your deployment.
For more information regarding the STRM Log Management Administration
Console, see the STRM Log Management Administration Guide.
STRM Log Management Users Guide
Page 15

2
USING THE DASHBOARD
The Dashboard allows you to create a customized portal to monitor any data
STRM Log Management collects, to which you have access. The Dashboard is the
default view when you log in to STRM Log Management and allows you to monitor
several areas of your network at the same time. Normal activity and suspicious
behaviors can be investigated directly from the Dashboard. Also, you can detach
an item and monitor the item directly from your desktop.
This chapter includes:
• About the Dashboard
• Event Viewer
• Reports
• System Summary
• Adding Items
About the Dashboard
The Dashboard allows you to monitor your security event behavior. By default, for
non-administrative users, the Dashboard is empty. For administrative users, the
Dashboard displays the following:
• System Summary
• Events - Average Events Per Second
• Events By Severity
• Most Recent Reports
• Top Devices
Note: The items that appear on your Dashboard depends on the access you have
been granted. For more information on user roles, see the STRM Log
Management Administration Guide.
The content that appears on the Dashboard is user-specific. You can design the
Dashboard as you wish, as the changes made within a STRM Log Management
session affect only your system. The next time you log in, STRM Log Management
reflects your last Dashboard configuration.
STRM Log Management Users Guide
Page 16

10 USING THE DASHBOARD
You can move and position items to meet your requirements. You can stack items
in one panel or distribute them evenly within the three panels. When positioning
items, each item automatically resizes in proportion to the panel. The Dashboard
interface refreshes regularly to display the most recent information.
Using the Dashboard You can add, remove, or detach items on the Dashboard. Once added, each item
appears with a titlebar. Using the Dashboard, you can:
• Adding Items - Provides the list of items that you can add to your Dashboard.
You can monitor the following items:
- Event Viewer
- Reports
- System Summary
• Removing an Item - To remove an item from the Dashboard, click the red icon
located in the upper right corner of the item.
A confirmation window appears before an item is removed. Removing an item
does not remove the item from STRM Log Management. Removing an item
clears the item from the Dashboard. You can add the item again at any time.
• Detaching an Item - To detach an item from the Dashboard, click the green
icon located in the upper right of the item. Detaching an item does not remove
the item from STRM Log Management; detaching an item duplicates the data in
a new window.
Detaching an item allows you to temporarily monitor one or more particular
items on your desktop. You can detach the item then remove the item from the
Dashboard - the detached window remains open and refreshes during
scheduled intervals. If you close the STRM Log Management application, the
detached window remains open for monitoring and continues to refresh until
you manually close the window or shut down your computer system.
Note: STRM Log Management does not save the status of a detached Dashboard
item when you end your STRM Log Management session.
Event Viewer You can add several Event Viewer items to your Dashboard. The Event Viewer
allows you to monitor and investigate events in real-time. Event Viewer options
include:
• Events Over Time
• Events By Severity
• Top Devices
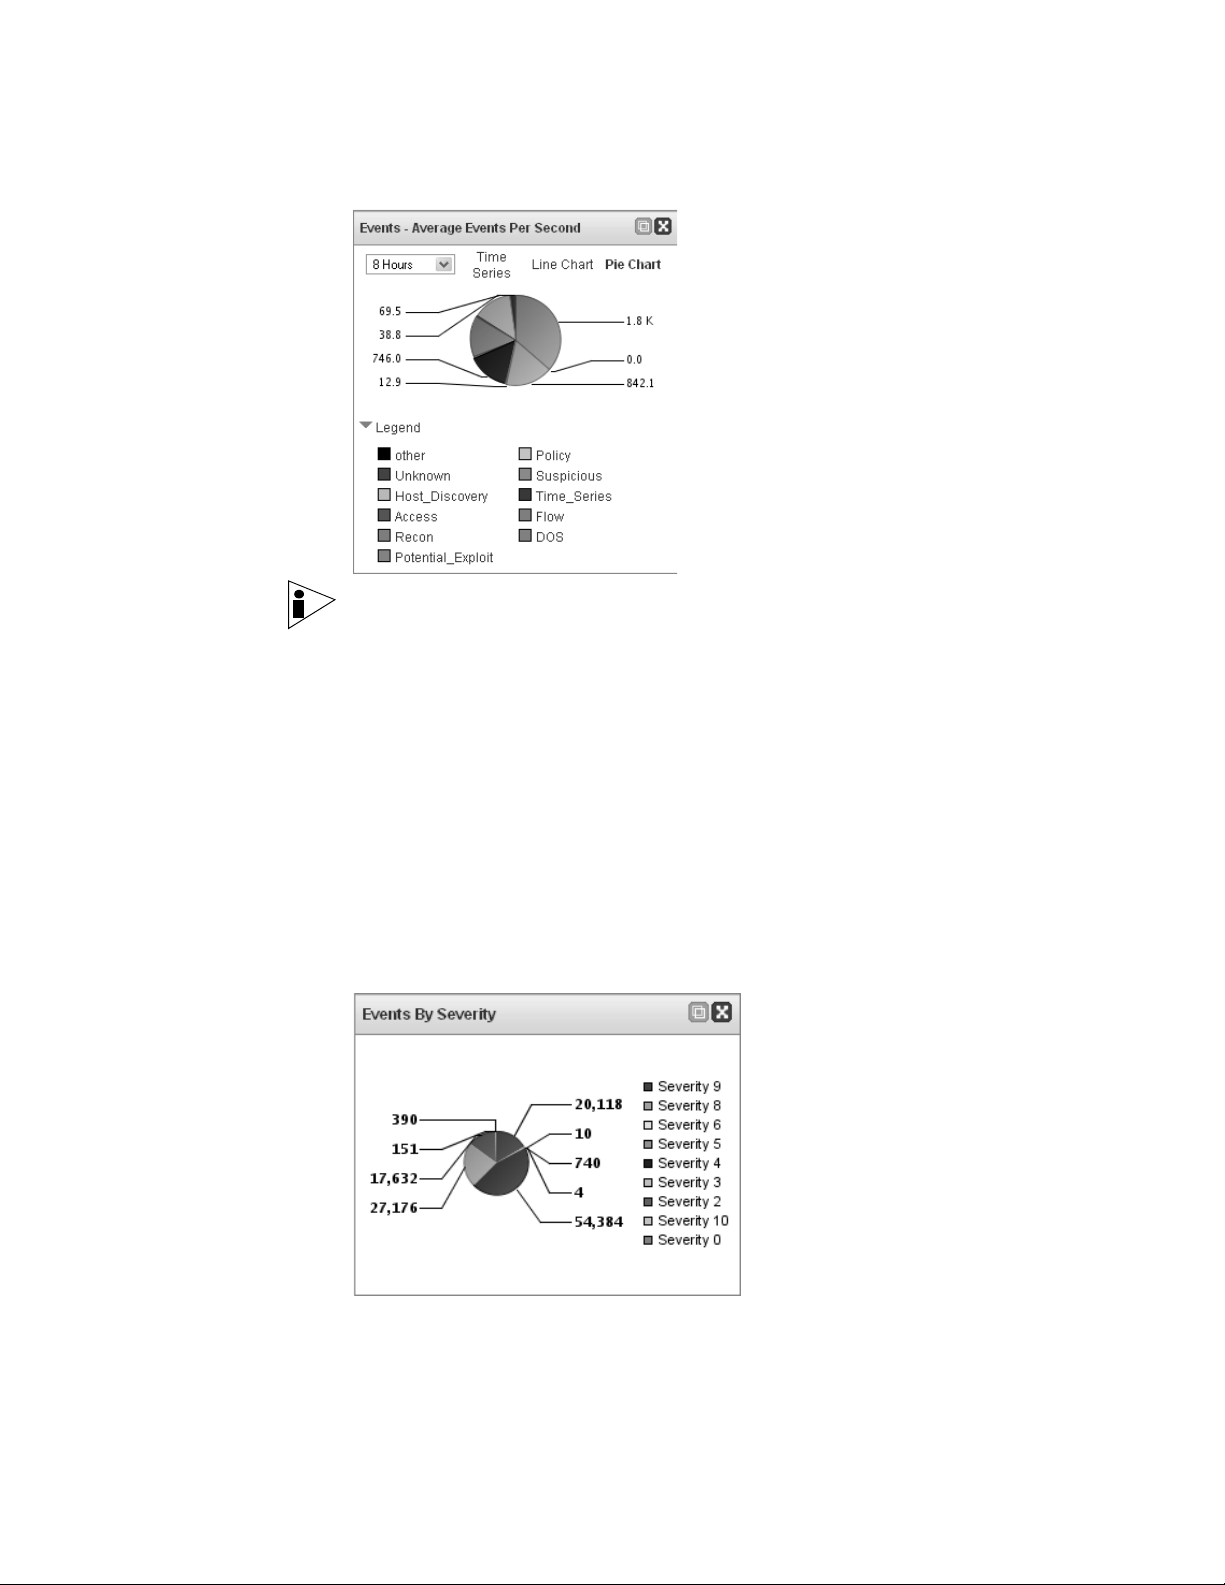
Events Over Time The Events Over Time option displays events received over the last 8 hours in 15
minute intervals, categorized by the event category.
STRM Log Management Users Guide
Page 17
Event Viewer 11
Note: You must have the required permissions to access Event Viewer items.
To customize your display:
• Period of Time - Using the drop-down list box, select the period of time you
wish the Dashboard graph to display.
• Chart Type - You can display the data using a Time Series (default), Line
Chart, or Pie Chart. To change the chart type, click Time Series, Line Chart or
Pie Chart at the top of the graph.
Events By Severity The Events By Severity item displays a pie chart that specifies the number of
active events grouped by severity. This item allows you to see the number of
events that are being received by the level of severity that has been assigned.
Severity indicates the amount of threat an attacker poses in relation to how
prepared the target is for the attack. The range of severity is 0 (low) to 10 (high).
Top Devices The Top Devices item displays a pie chart that specifies the top 10 devices that
sent events to STRM Log Management within the last 15 minutes. The number of
events sent from the specified device is indicated in the pie chart. This item allows
STRM Log Management Users Guide
Page 18
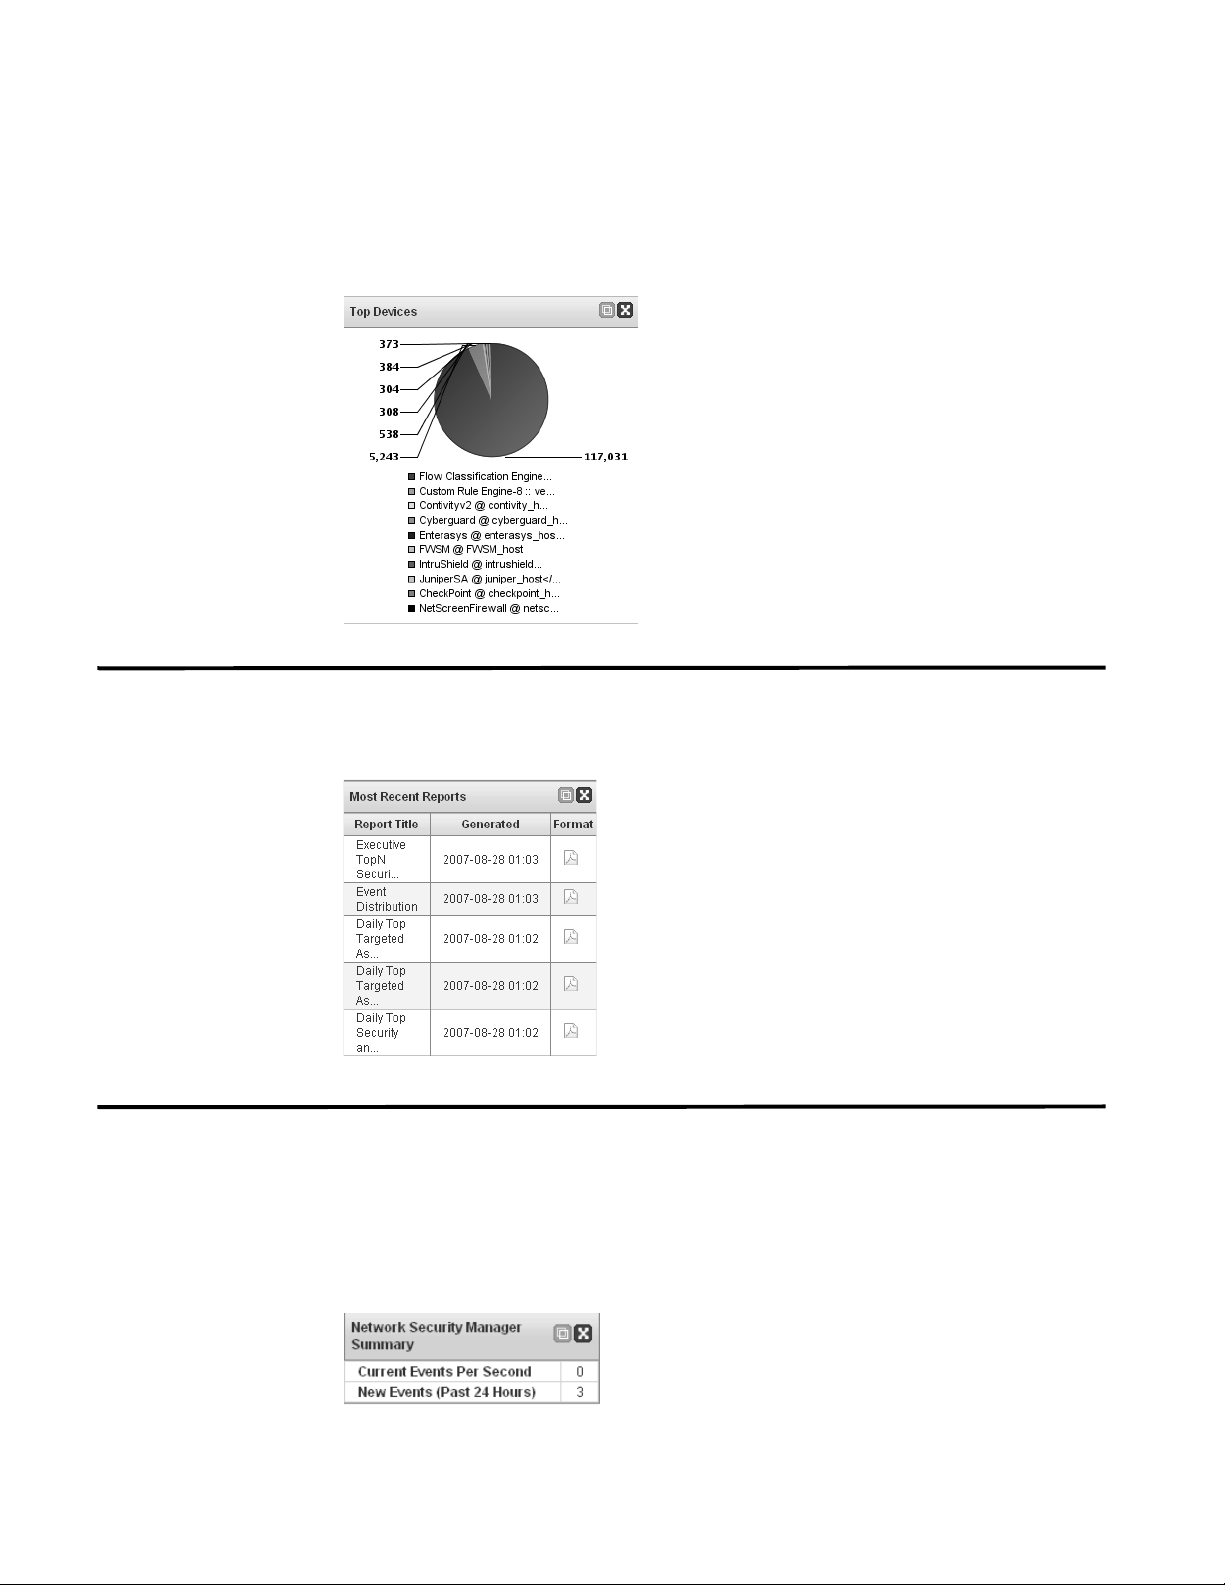
12 USING THE DASHBOARD
you to view potential changes in behavior, for example, if a firewall device that is
typically not in the top 10 list is now contributing to a large percentage of the
overall message count, you should investigate this occurrence.
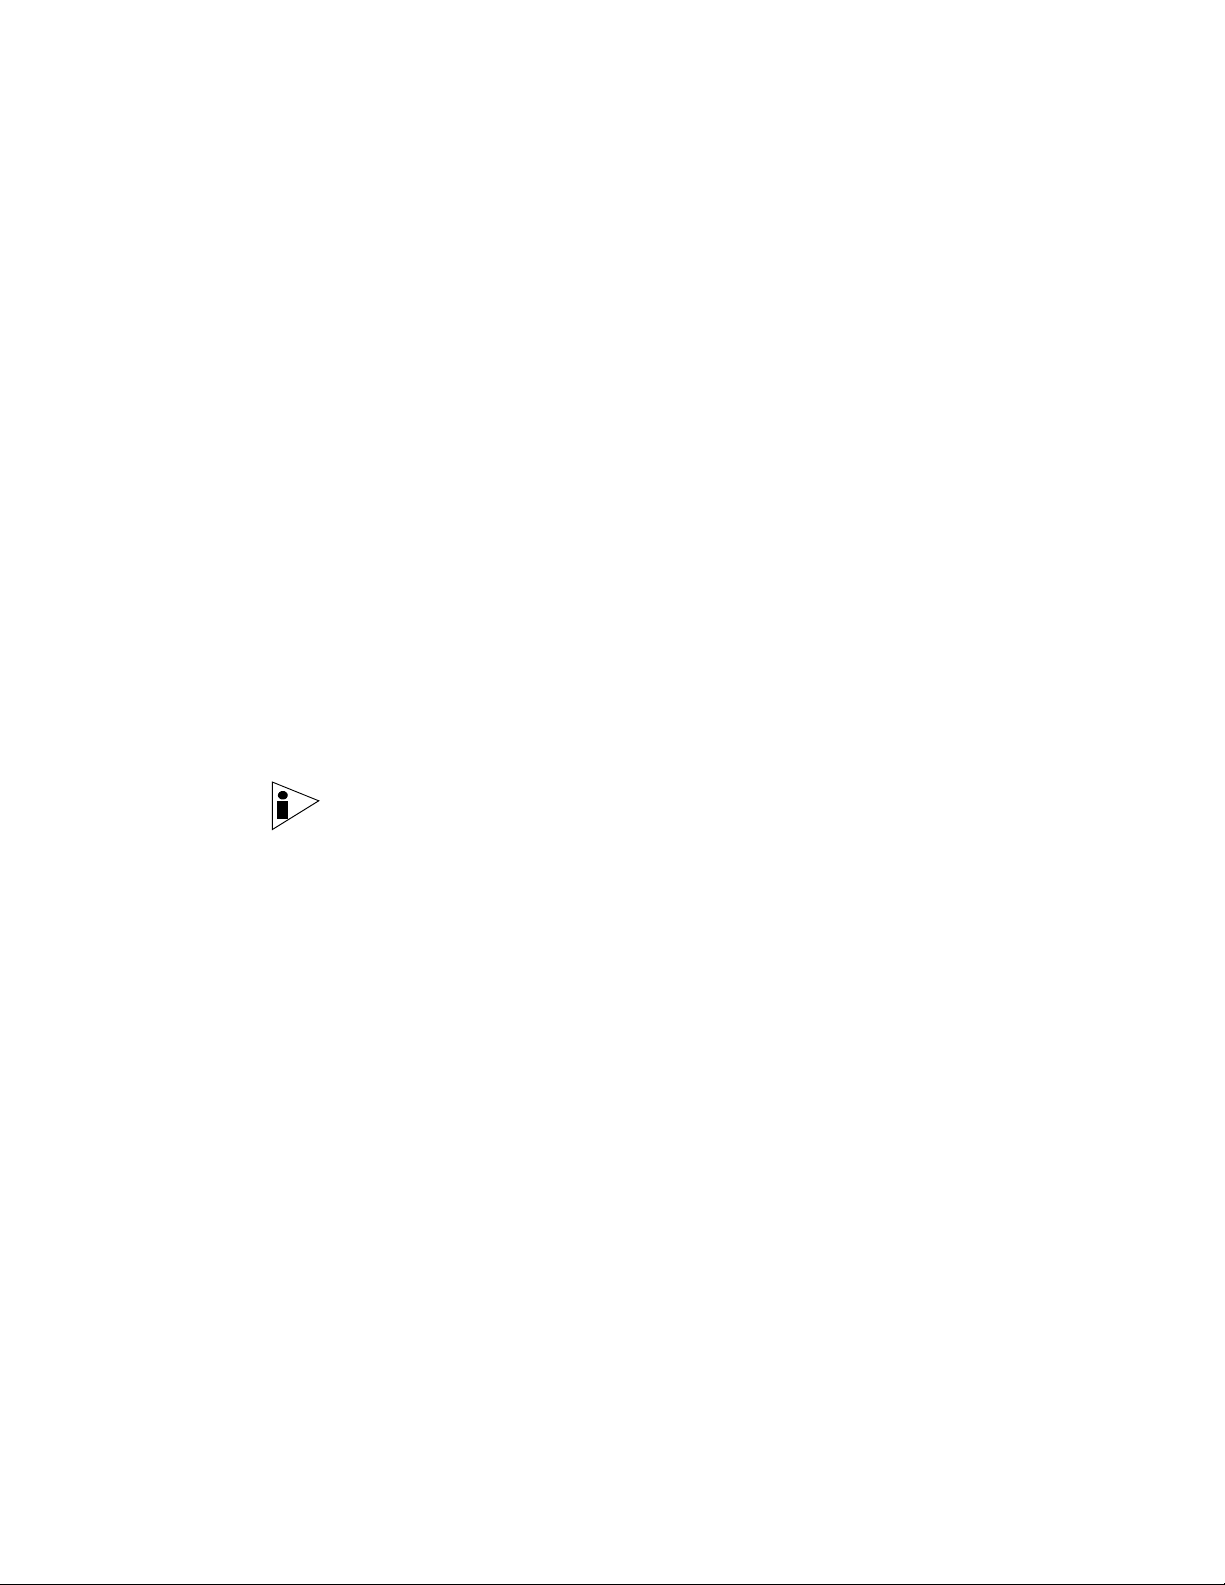
Reports The Reports option allows you to display the top recently generated reports. The
display provides the report title, the time and date the report was generated, and
the format of the report.
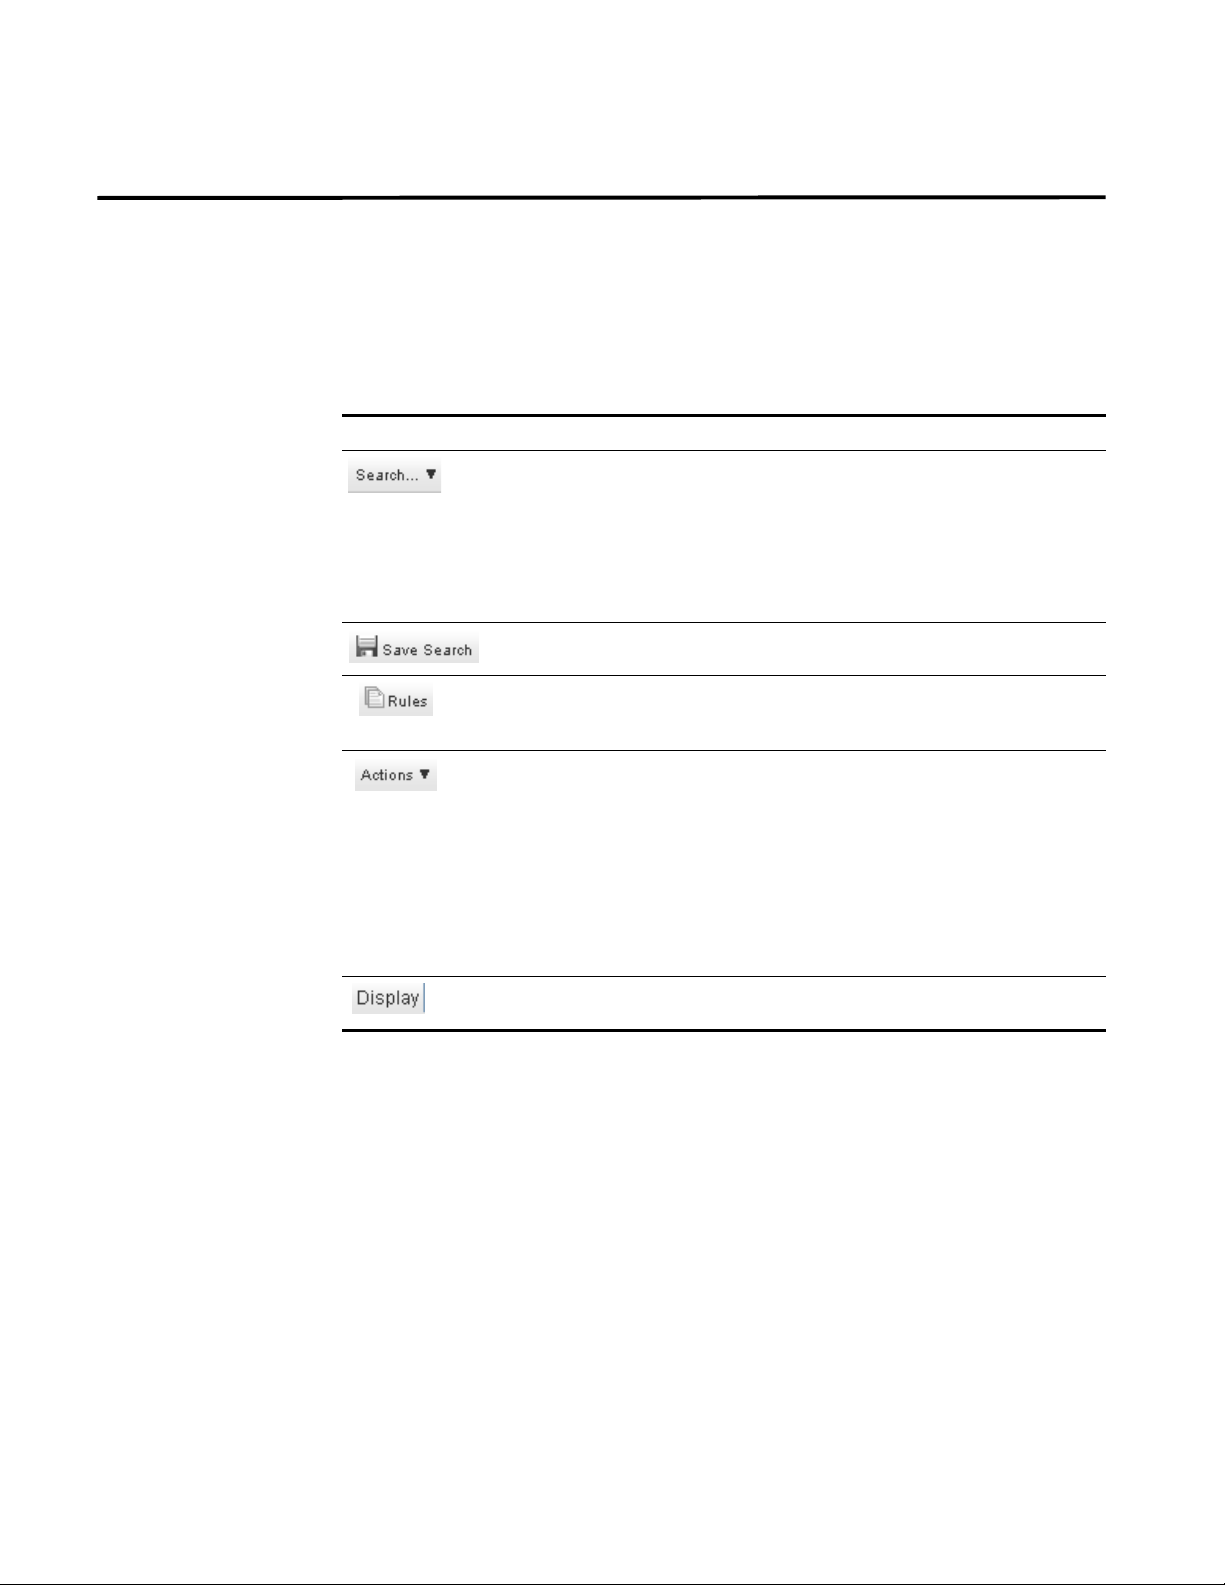
System Summary The Summary item provides a high-level summary of activity within the past 24
hours. Within the summary item, you can view the following information:
• Current Events Per Second - Specifies the number of current events per
second.
• New Events (Past 24 Hours) - Specifies the total number of new events
received within the last 24 hours.
STRM Log Management Users Guide
Page 19

Adding Items 13
Adding Items You can add multiple displays to the Dashboard interface. To add an item to the
Dashboard:
Step 1 Click the Dashboard tab.
The Dashboard interface appears.
Step 2 From the toolbar, click Add Item.
A list of menu items appears.
Step 3 Navigate through the categories, options include:
• Event Viewer
• Reports
• System Summary
Each panel highlights as you pass an item over the panel signalling an item can be
dropped into that panel. If the item titlebar is above the titlebar of an existing item,
the new item assumes position above the existing item.
STRM Log Management Users Guide
Page 20

Page 21
3
USING THE EVENT VIEWER
An event is an action that occurs on a network or a host. The Event Viewer allows
you to monitor and investigate events in real-time or perform advanced searches.
You must have permission to view the Event Viewer interface. For more
information on assigning roles, see the STRM Log Management Administration
Guide.
This chapter provides information on using the Event Viewer including:
• Using the Event Viewer Interface
• Viewing Events
• Using the Search
• Modifying Event Mapping
• Exporting Events
Note: When STRM Log Management normalizes events, the system normalizes
names as well. Therefore, the name that appears in the Event Viewer may not
match the name that appears in the event.
STRM Log Management Users Guide
Page 22
16 USING THE EVENT VIEWER
Using the Event Viewer Interface
This section provides information on using the Event Viewer interface including:
• Using the Toolbar
• Using the Right-Click Menu Options
Using the Toolbar Using the toolbar, you can access the following options:
Table 3-1 Toolbar Options
Option Description
Allows you to perform advanced searches on events including:
• Edit Search - Allows you to perform a search.
• Quick Searches - Allows you to perform previously saved
searches. This option only appears when you have saved
search criteria.
For more information, see
Allows you to save the current search criteria.
Allows you to configure custom event rules to detect a single event
(within certain properties) or event sequences. For information on
rules, see
Allows you to perform the following actions:
• Show All - Removes all filters on search criteria and presents
all events.
• Print - Allows you to print the events displayed in the window.
• Export to XML - Allows you to export events in XML format.
See
• Export to CSV - Allows you to export events in CSV format.
See
Allows you to display events grouped by criteria specified in the
drop-down list box.
Chapter 4 Configuring Rules.
Exporting Events.
Exporting Events.
Using the Search.
Using the Right-Click
Menu Options
Using the right mouse button (right-click), you can access the Filter menu options,
which allows you to filter on the selected event, depending on the selected item in
the event. For example, if you right-click on a Category of IP Protocol Anomaly, the
following filter options appear:
Filter on Category is IP Protocol Anomaly
Filter on Category is not IP Protocol Anomaly
STRM Log Management Users Guide
Page 23
Viewing Events 17
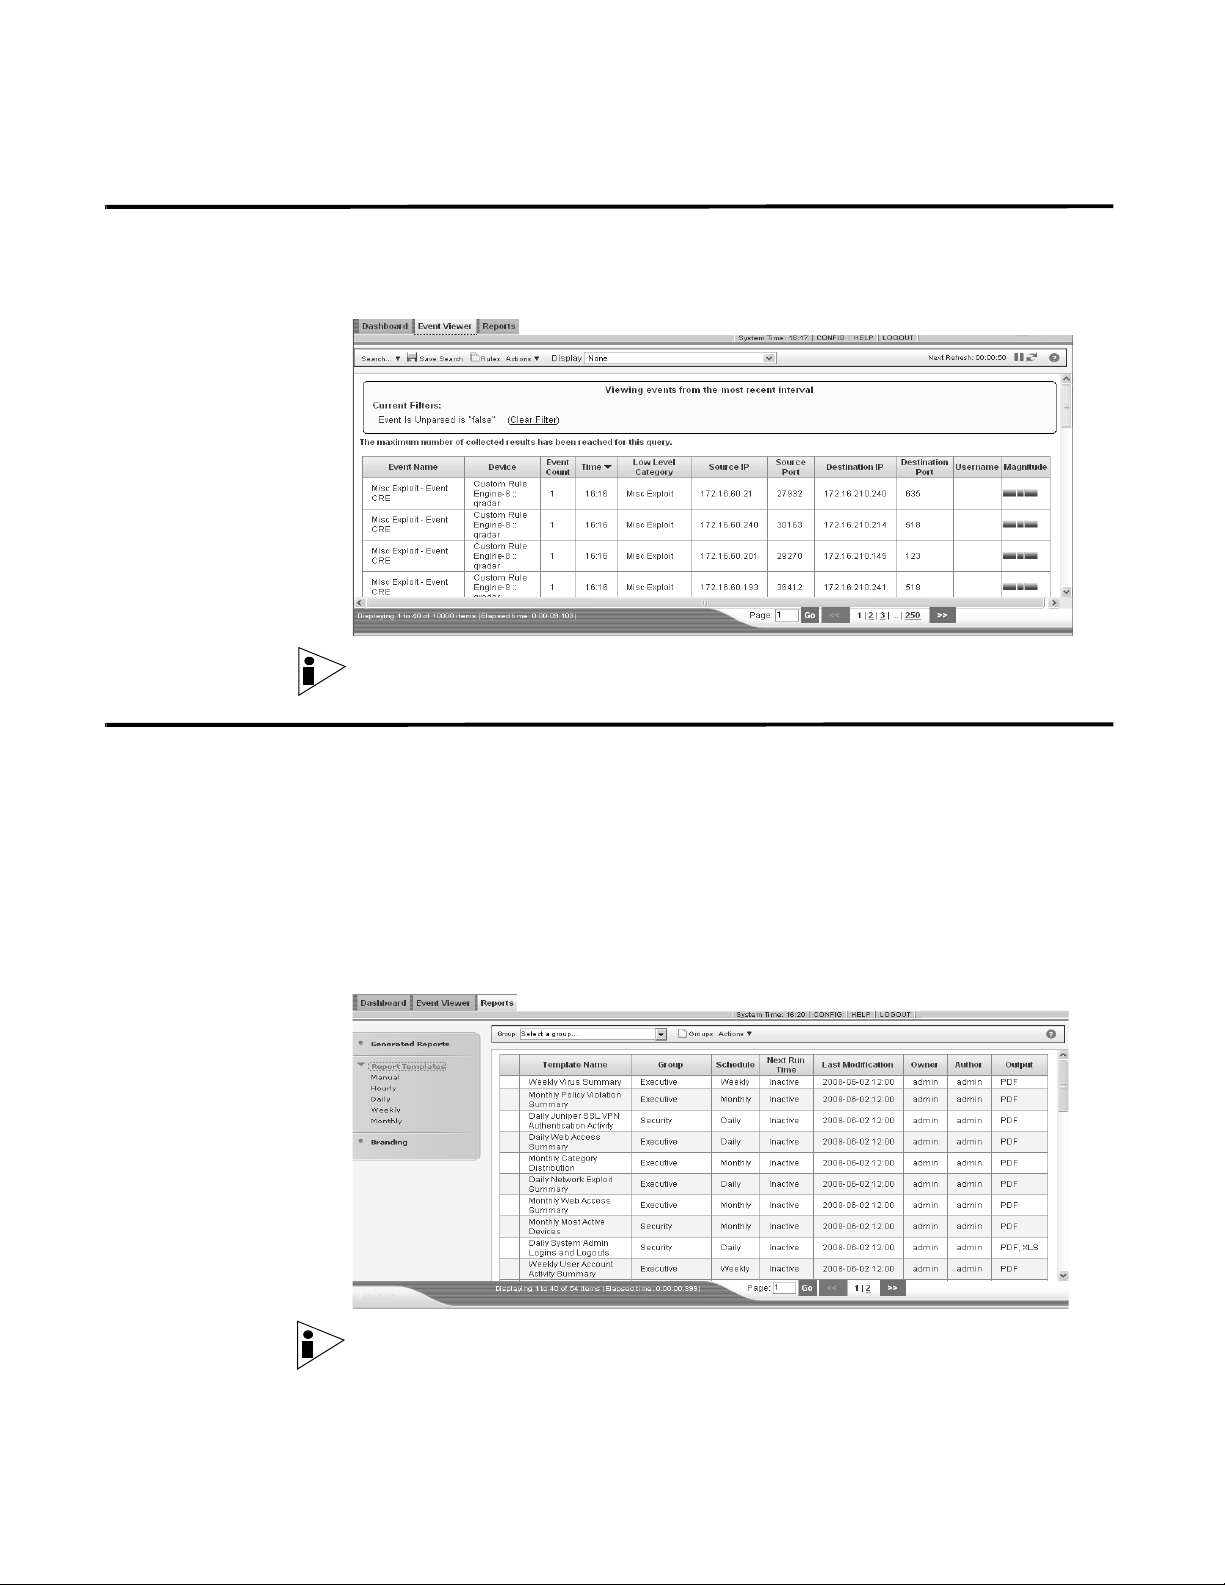
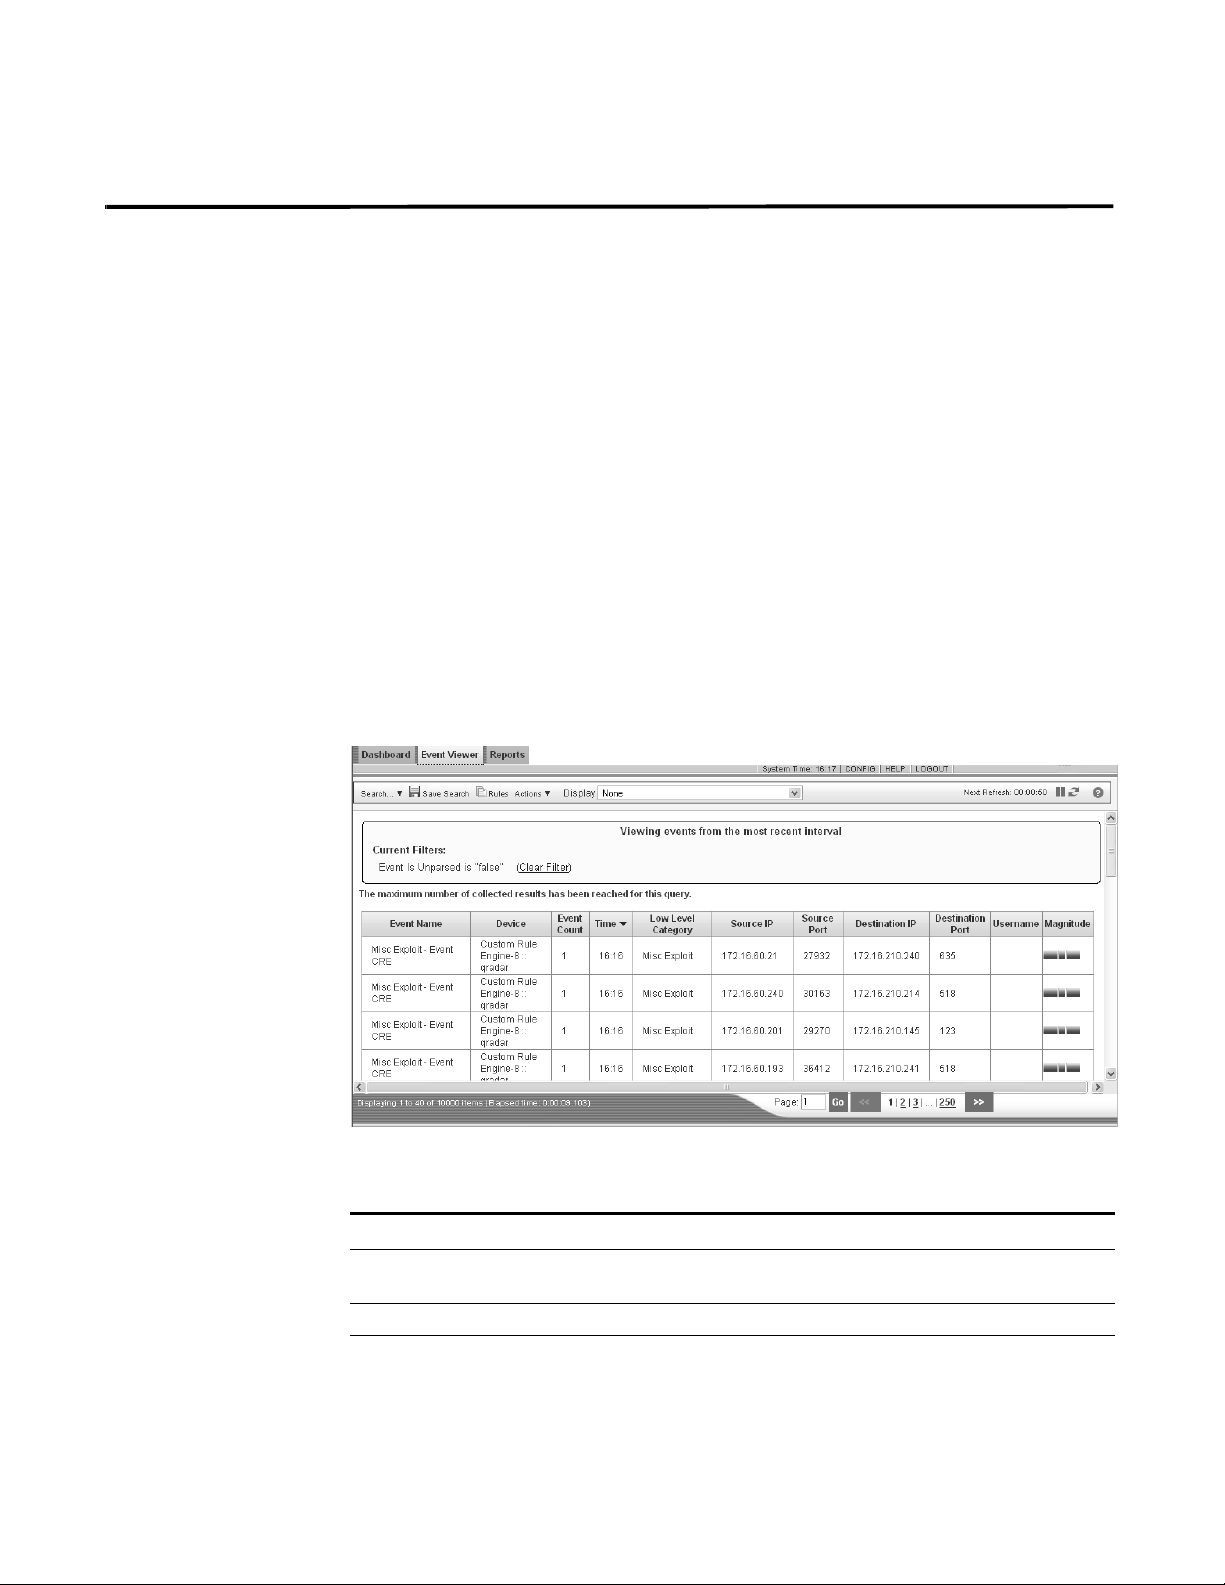
Viewing Events By default, the Event Viewer interface displays normalized events. Initially, the
Event Viewer displays events that occurred during the previous minute and the
interface refreshes each minute.
You can sort the resulting tables by clicking on a column heading. A single click of
the desired column sorts the results in descending order and a second click on the
heading sorts the results in ascending order. An arrow at the top of the column
indicates the direction of the sort.
You can also view events using the following options:
• Viewing Normalized Events
• Viewing Raw Events
• Viewing Aggregate Normalized Events
Viewing Normalized
Events
Step 1 Click the Event Viewer tab.
Step 2 From the Display drop-down list box, select None.
To view normalized events:
The Event Viewer window appears.
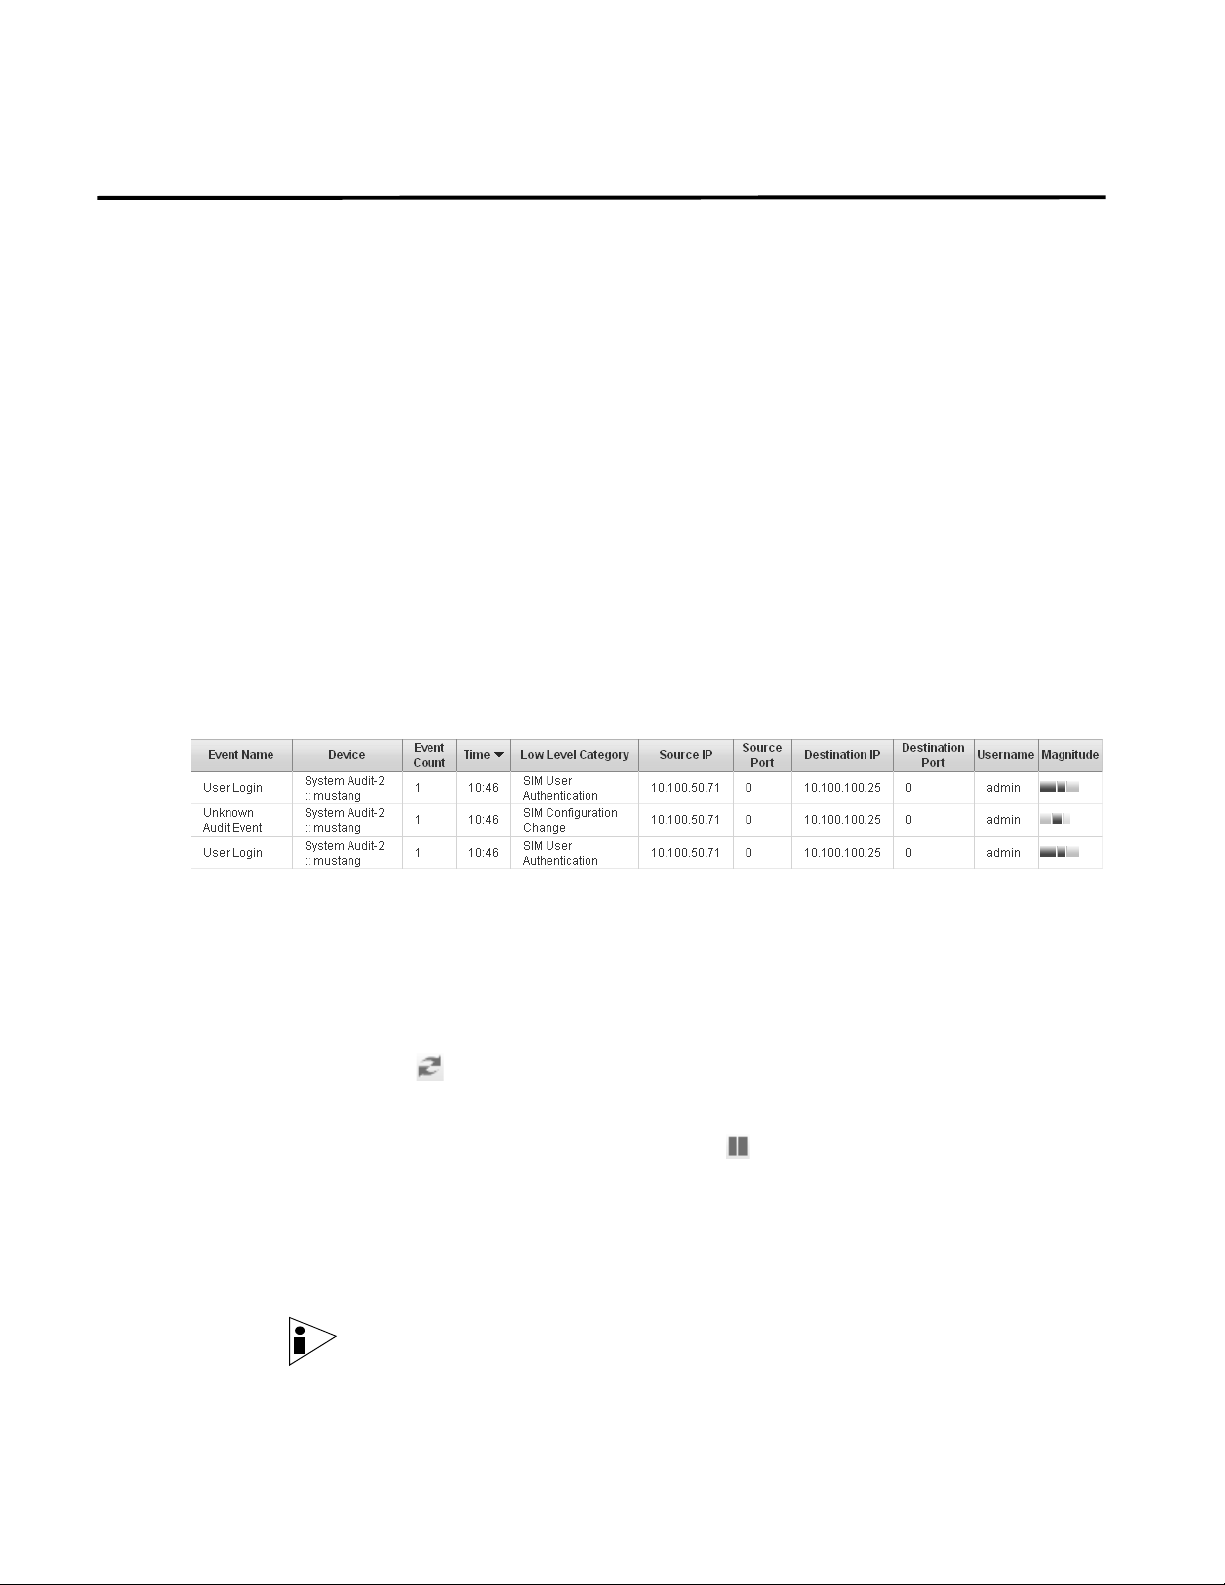
Table 3- 2 Event Viewer
Parameter Description
Current Filters The top of the table displays the details of the filter applied to the
search results. To clear these filter values, click Clear Filter.
Event Name Specifies the normalized name of the event.
Device Specifies the device that sent the event to STRM Log
Management.
STRM Log Management Users Guide
Page 24
18 USING THE EVENT VIEWER
Table 3-2 Event Viewer (continued)
Parameter Description
Event Count Specifies the total number of bundled events that constitute this
normalized event. Events are bundled when many of the same
type of event for the same source and destination IP address are
seen within a short period of time.
Time Specifies the date and time that STRM Log Management
received the event.
Low Level
Category
Specifies the low-level category associated to this event. For
more information on event categories, see the Event Category
Correlation Reference Guide.
Source IP Specifies the source IP address of the event.
Source Port Specifies the source port of the event.
Destination IP Specifies the destination IP address of the event.
Destination Port Specifies the destination port of the event.
Username Specifies the username associated with this event. Usernames
are often available in authentication related events. For all other
types of events where the username is not available, this field is
empty.
Magnitude Specifies the magnitude of this event. Variables include
credibility, relevance, and severity. Point your mouse to the
magnitude bar to display values and the calculated magnitude.
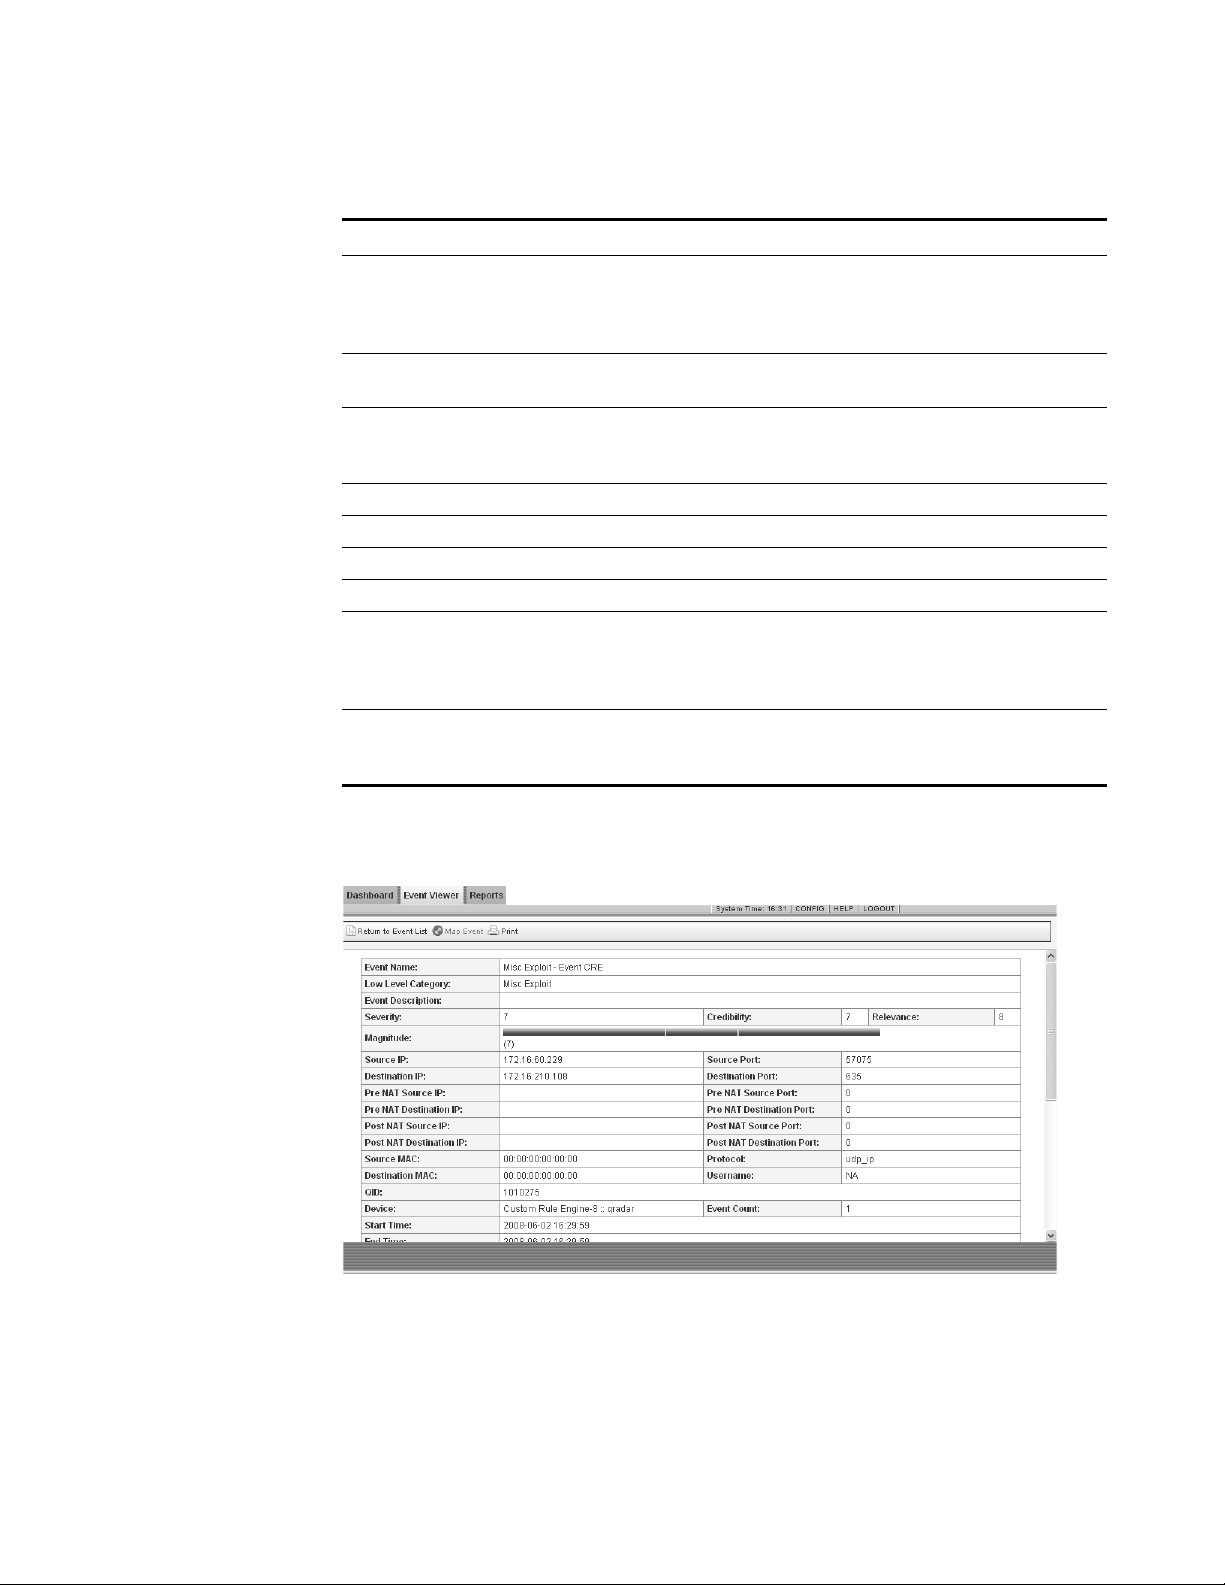
Step 3 Double-click the event you wish to view in greater detail.
The event details window appears.
The details results provides the following information:
STRM Log Management Users Guide
Page 25

Viewing Events 19
Table 3- 3 Event Details
Parameter Description
Event Name Specifies the normalized name of the event.
Low Level
Category
Specifies the low-level category of this event.
For more information on categories, see the Event Category
Correlation Reference Guide.
Event Description Specifies a description of the event, if available.
Severity Specifies the severity of this event.
Credibility Specifies the credibility of this event.
Relevance Specifies the relevance of this event.
Magnitude Specifies the magnitude for this event.
Source IP Specifies the source IP address of the event.
Source Port Specifies the source port of this event.
Destination IP Specifies the destination IP address of the event.
Destination Port Specifies the destination port of this event.
Pre NAT Source IPNetwork Address Translation (NAT) translates an IP address in
one network to a different IP address in another network. For a
firewall or another device capable of NAT, this parameter
indicates the source IP address before the NAT values were
applied.
Pre NAT Source
Port
Pre NAT
Destination IP
For a firewall or another device capable of NAT, this parameter
indicates the source port before the NAT values were applied.
For a firewall or another device capable of NAT, this parameter
indicates the destination IP address before the NAT values were
applied.
Pre NAT
Destination Port
For a firewall or another device capable of NAT, this parameter
indicates the destination port before the NAT values were
applied.
Post NAT Source IPFor a firewall or another device capable of NAT, this parameter
indicates the source IP address after the NAT values were
applied.
Post NAT Source
Port
Post NAT
Destination IP
For a firewall or another device capable of NAT, this parameter
indicates the source port after the NAT values were applied.
For a firewall or another device capable of NAT, this parameter
indicates the destination IP address after the NAT values were
applied.
Post NAT
Destination Port
For a firewall or another device capable of NAT, this parameter
indicates the destination port after the NAT values were applied.
Protocol Specifies the protocol associated with this event.
Username Specifies the username associated with this event, if available.
QID Specifies the STRM Log Management identifier for this event.
Each event has a unique QID. For information on mapping a QID,
see
Modifying Event Mapping.
STRM Log Management Users Guide
Page 26
20 USING THE EVENT VIEWER
Table 3-3 Event Details (continued)
Parameter Description
Device Specifies the device that sent the event to STRM Log
Management.
Event Count Specifies the total number of bundled events that constitute this
normalized event. Events are bundled when many of the same
type of event for the same source and destination IP address are
seen within a short period of time.
Start Time Specifies the time of the first event, as reported to STRM Log
Management by the device.
End Time Specifies the end time of the last event, as reported to STRM Log
Management by the device.
Device Time Specifies the system time of the device.
Payload Specifies payload content from the event. To view the payload in
Hex, click Hex. To view the payload in UTF, click UTF. To view in
Base64, click Base64.
Matched Custom
Rules
Specifies custom rules that have matched to this event. For more
information on rules, see the STRM Log Management
Administration Guide.
Annotations Specifies the annotation or notes for this event.
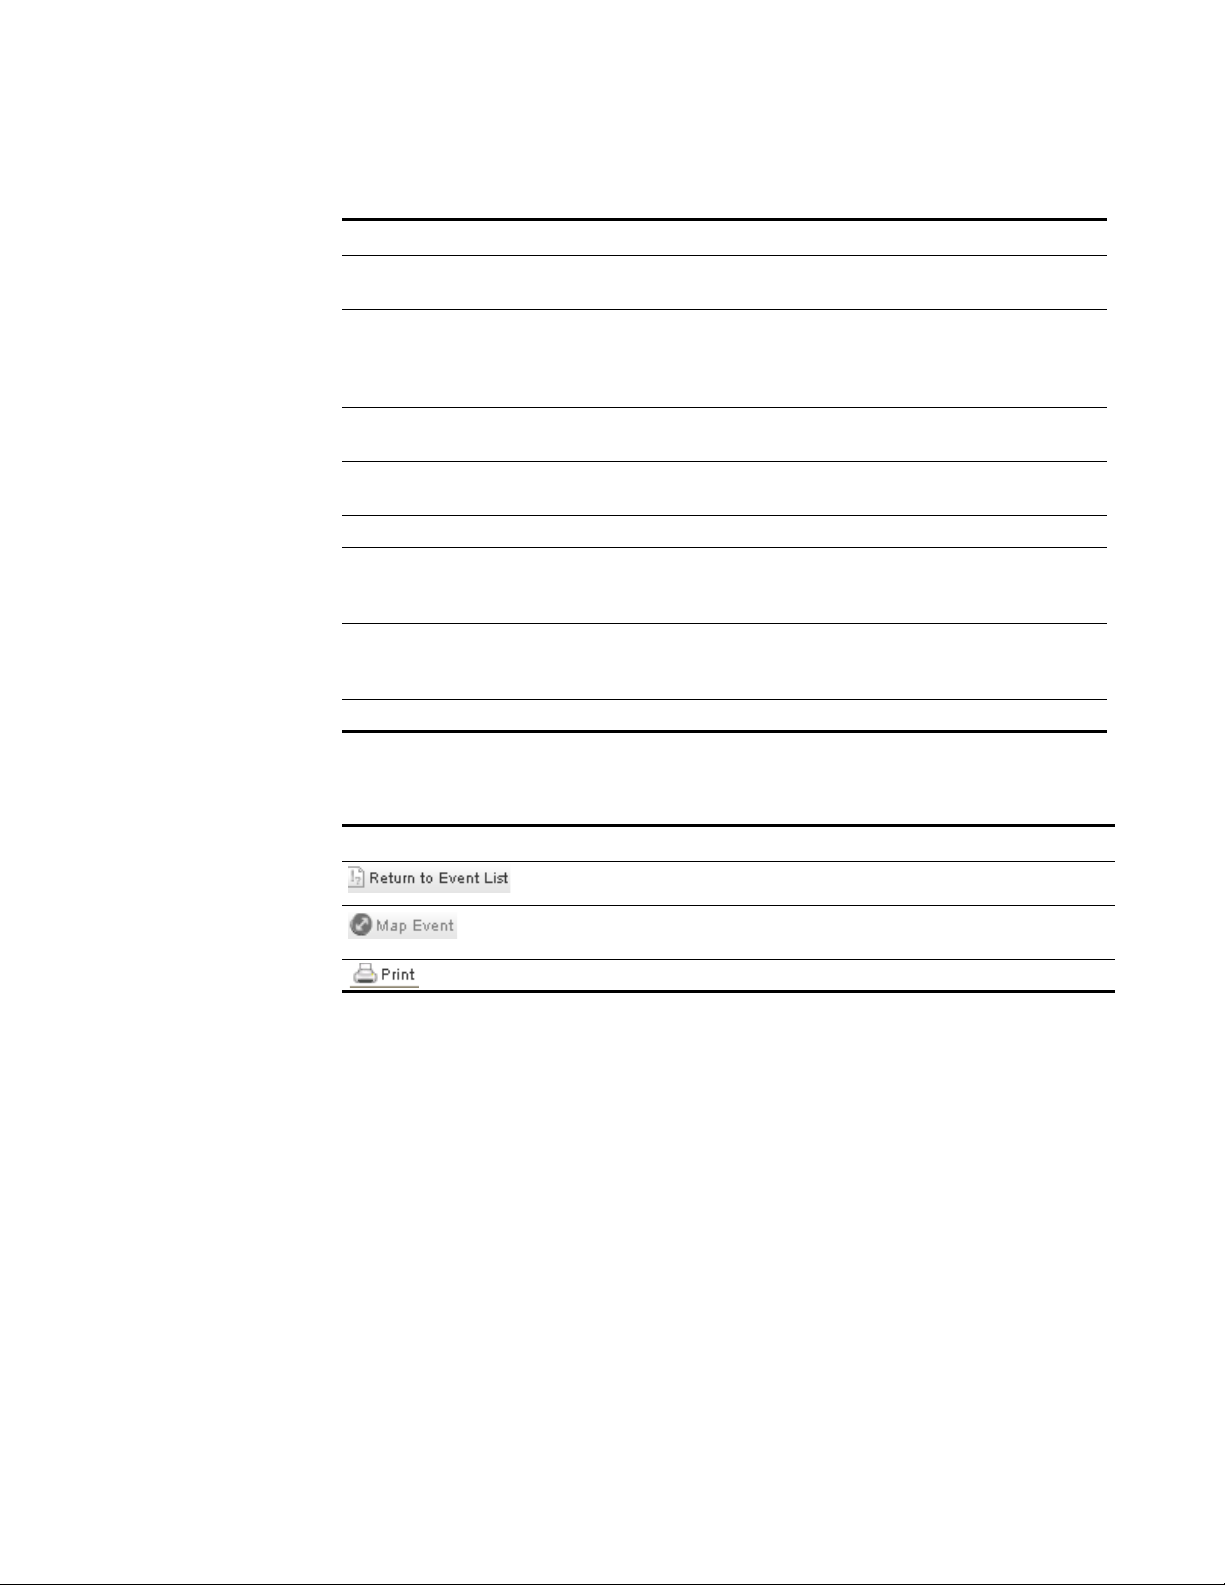
The event details provides the following functions:
Table 3-4 Event Details Toolbar
Icon Function
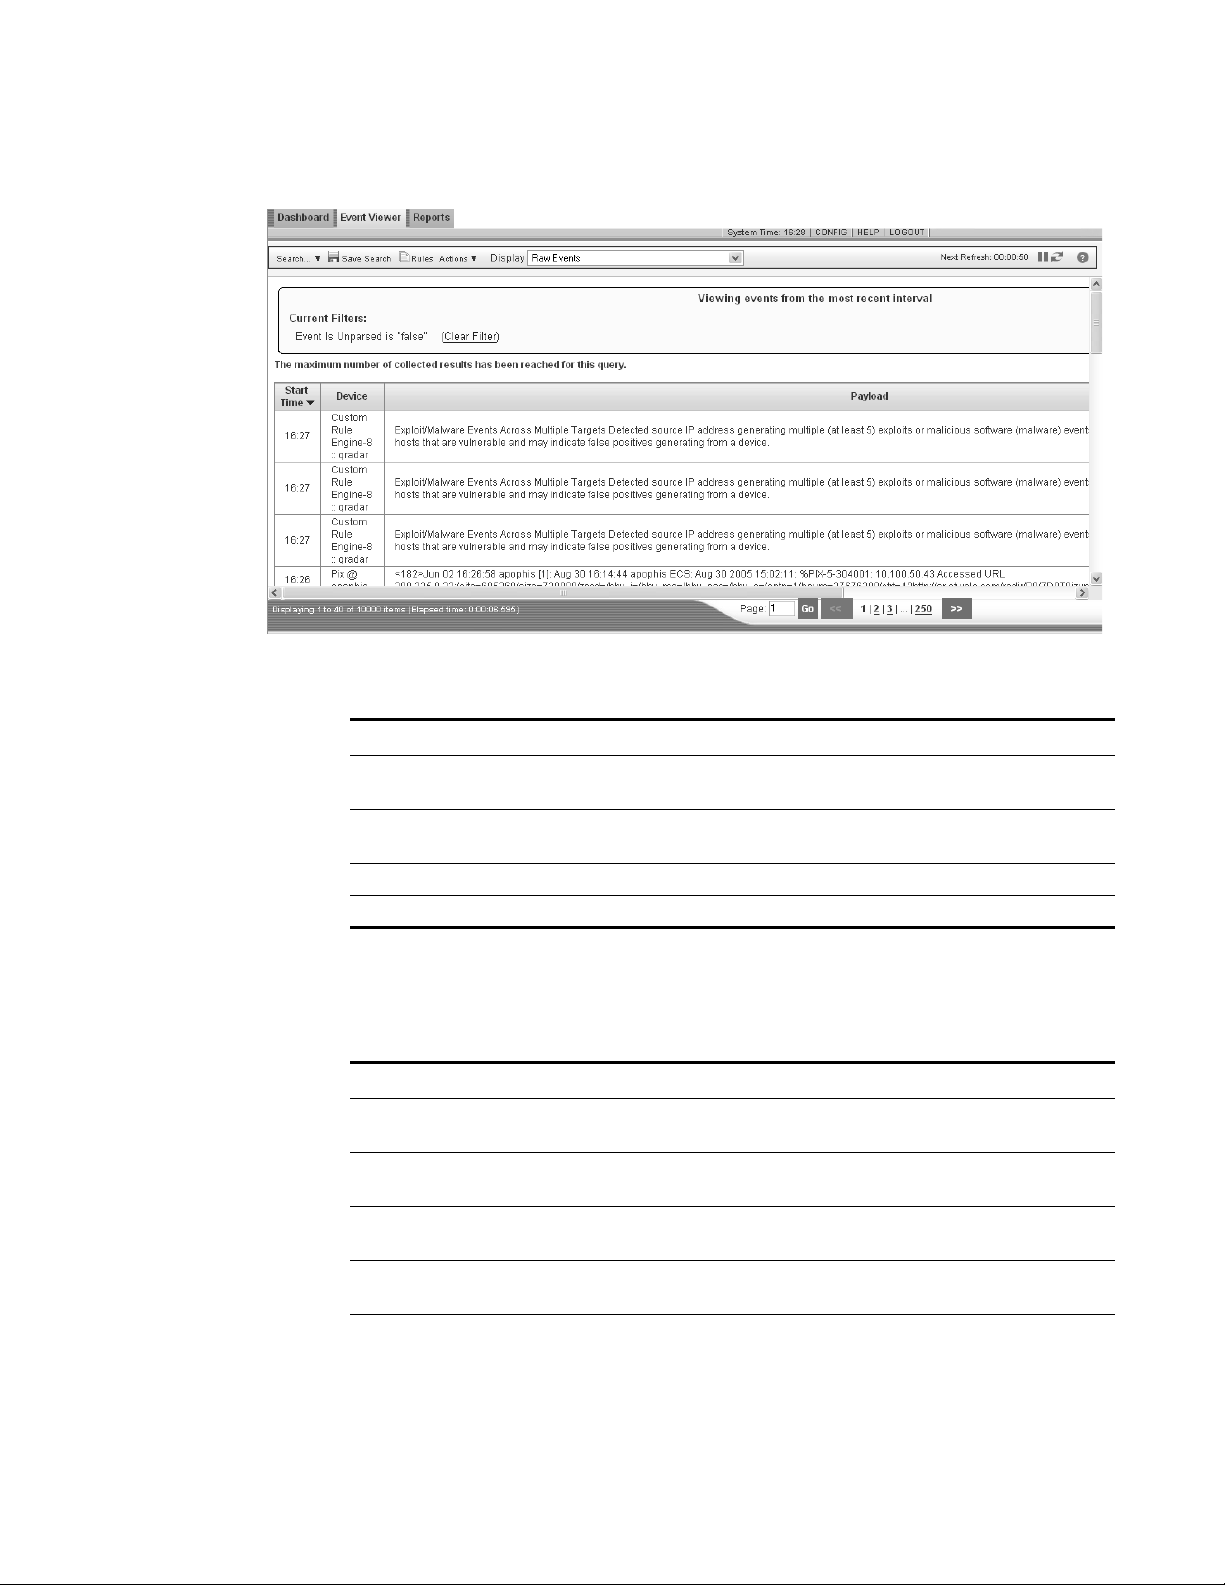
Viewing Raw Events To view raw event data:
Step 1 Click the Event Viewer tab.
The Event Viewer window appears.
Step 2 From the Display drop-down list box, select Raw Events.
Raw event data appears
Allows you to return to the list of events.
Allows you to edit the event mapping. For more information,
see
Modifying Event Mapping.
Allows you to print the event details.
STRM Log Management Users Guide
Page 27
Viewing Events 21
The raw events window results provides the following information:
Table 3- 5 Raw Events Parameters
Viewing Aggregate Normalized Events
Parameter Description
Current Filters The top of the table displays the details of the filter applied to the
search results. To clear these filter values, click Clear Filter.
Start Time Specifies the time of the first event, as reported to STRM Log
Management by the device.
Device Specifies the device that originated the event.
Payload Specifies the original event payload information in UTF-8 format.
Using the Event Viewer, you can view events aggregated (grouped) by various
options.
Table 3- 6 Aggregate Normalized Events
Aggregate Option Description
Event Name Displays a summarized list of events grouped by the
normalized name of the event.
Source IP Displays a summarized list of events grouped by the source
IP address of the event.
Destination IP Displays a summarized list of events grouped by the
destination IP address of the event.
Source Port Displays a summarized list of events grouped by the source
port address of the event.
Destination Port Displays a summarized list of events grouped by the
destination port address of the event.
STRM Log Management Users Guide
Page 28

22 USING THE EVENT VIEWER
Table 3-6 Aggregate Normalized Events (continued)
Aggregate Option Description
High Level Category Displays a summarized list of events grouped by the
high-level category of the event.
For more information on categories, see the Event Category
Correlation Reference Guide.
Low Level Category Displays a summarized list of events grouped by the
low-level category of the event.
For more information on categories, see the Event Category
Correlation Reference Guide.
Magnitude Displays a summarized list of events grouped by the
magnitude for this event. The variables used to calculate
magnitude include credibility, relevance, and severity.
Credibility Credibility indicates the integrity of an event as determined
by the credibility rating from source devices. Credibility
increases as the multiple sources results grouped by the
credibility of the event. This aggregate option displays a
summarized list of events grouped by the credibility of the
event.
Severity Severity indicates the amount of threat an attacker poses in
relation to how prepared the target is for the attack. This
value is mapped to an event category that is correlated to
the offense. This aggregate option displays a summarized
list of events grouped by the severity of the event.
Relevance Relevance indicates the significance of an event. This option
displays a summarized list of events grouped by the
relevance of the event.
Username Displays a summarized list of events grouped by the
username associated with the events.
Device Displays a summarized list of events grouped by the devices
that sent the event to STRM Log Management.
Device Type Device Type indicates the type of device that originated the
event. This aggregate option displays a summarized list of
events grouped by device type.
Device Group Displays a summarized list of events grouped by device
group.
Network Displays a summarized list of events grouped by the network
associated with the event.
Src IP/ Dst IP / Dst
Port/ User
Displays a summarized list of events grouped by the source
IP address, destination IP address, destination port, and the
user.
Src IP/ Dst IP / Dst
Port/ Event Name
Displays a summarized list of events grouped by the source
IP address, destination IP address, destination port, and the
name of the event.
Src IP/ Event Name/
User
Displays a summarized list of events grouped by the source
IP address, event name, and user.
STRM Log Management Users Guide
Page 29

Viewing Events 23
Table 3- 6 Aggregate Normalized Events (continued)
Aggregate Option Description
Src IP/ Dst IP/ Event
Name/ User
Displays a summarized list of events grouped by the source
IP address, destination IP address, event name, and user.
Src IP/ Dst IP/ User Displays a summarized list of events grouped by the source
IP address, destination IP address , and the username
associated with the event.
Src IP / Dst IP Displays a summarized list of events grouped by traffic from
the source IP address to destination IP address.
Dst IP/ Port Displays a summarized list of events grouped by destination
IP address and port.
Event Name/ Device Displays a summarized list of events grouped by the event
name and the device that sent the event to STRM Log
Management.
Device/ High Level Cat Displays a summarized list of events grouped by the device
that sent the event to STRM Log Management and the
high-level category.
For more information on categories, see the Event Category
Correlation Reference Guide.
Device/ High Level
Cat./ Low Level Cat.
Displays a summarized list of events grouped by the device
that sent the event to STRM Log Management and the high
and low-level categories.
Matched Custom Rule Displays a summarized list of events grouped by the
associated custom rule.
Event Name/ Device
Group
Device Group/ High
Level Cat
Displays a summarized list of events grouped by the event
name and the device group.
Displays a summarized list of events grouped by the device
group and the high-level category.
For more information on categories, see the Event Category
Correlation Reference Guide.
Device Group/ High
Level Cat/ Low Level
Cat
Displays a summarized list of events grouped by the device
group and the low-level category.
For more information on categories, see the Event Category
Correlation Reference Guide.
Src IP/ MAC Displays a summarized list of events grouped by the source
IP address and the source MAC address.
Src NAT/ Dst NAT Network Address Translation (NAT) translates an IP address
in one network to a different IP address in another network.
The list of events that appears includes a summarized list of
events grouped by the source and destination information
(IP address and port) before and after NAT was applied.
Src IP/ High Level Cat Displays a summarized list of events grouped by the source
IP address and the high-level category. The aggregate
results provides a list of source IP addresses.
For more information on categories, see the Event Category
Correlation Reference Guide.
STRM Log Management Users Guide
Page 30

24 USING THE EVENT VIEWER
Table 3-6 Aggregate Normalized Events (continued)
Aggregate Option Description
Src IP/ Low Level Cat Displays a summarized list of events grouped by the source
IP address and the low-level category.
For more information on categories, see the Event Category
Correlation Reference Guide.
Dst IP/ High Level Cat Displays a summarized list of events grouped by the
destination IP address and the high-level category.
For more information on categories, see the Event Category
Correlation Reference Guide.
Dst IP/ Low Level Cat Displays a summarized list of events grouped by the
destination IP address and the low-level category.
For more information on categories, see the Event Category
Correlation Reference Guide.
Src IP / Dst IP/ High
Level Cat
Displays a summarized list of events grouped by the source
IP address to destination IP addresses and the high-level
category.
For more information on categories, see the Event Category
Correlation Reference Guide.
Src IP / Dst IP/ Low
Level Cat
Displays a summarized list of events grouped by the source
IP address to destination IP addresses and the low-level
category.
For more information on categories, see the Event Category
Correlation Reference Guide.
To view aggregate normalized events:
Step 1 Click the Event Viewer tab.
The Event Viewer window appears.
Step 2 From the Display drop-down list box, select the desired option. For more
information, see Table 3-6 Aggregate Normalized Events.
The event information appears.
Note: The column layout of the data depends on the chosen display option.
STRM Log Management Users Guide
Page 31

Viewing Events 25
The events window results provides the following information:
Table 3- 7 Event Name Parameters
Parameter Description
Current Filters The top of the table displays the details of the filter applied to the
search results. To clear these filter values, click Clear Filter.
Graphs Displays a bar chart representing the top 10 aggregates,
depending on the chosen aggregate option. Click Hide Chart if
you wish to remove the graph from your display.
Legend Reference A colored box in this field associated this event to the graph.
Event Name Specifies the normalized name of the event.
Source IP Specifies the source IP address associated with this event. If
there are multiple IP addresses associated with this event, this
field indicates Multiple and the number.
Destination IP Specifies the destination IP address associated with this event. If
there are multiple IP addresses associated with this event, this
field indicates Multiple and the number.
Destination Port Specifies the destination ports associated with this event. If there
are multiple ports associated with this event, this field indicates
Multiple and the number.
Device Specifies the device that sent the event to STRM Log
Management. If there are multiple devices associated with this
event, this field indicates Multiple and the number.
STRM Log Management Users Guide
Page 32

26 USING THE EVENT VIEWER
Table 3-7 Event Name Parameters (continued)
Parameter Description
Category Specifies the low-level category of this event. If there are multiple
categories associated with this event, this field indicates Multiple
and the number.
For more information on categories, see the Event Category
Correlation Reference Guide.
Protocol Specifies the protocol ID associated with this event.
Username Specifies the username associated with this event, if available.
Max Magnitude Specifies the maximum calculated magnitude for all summarized
events. Variables used to calculate magnitude include credibility,
relevance, and severity.
Count Specifies the total number of bundled events that constitute this
normalized event. Events are bundled when many of the same
type of event for the same source and destination IP address are
seen within a short period of time.
STRM Log Management Users Guide
Page 33

Using the Search 27
Using the Search The Event Viewer allows you to search for a specific event or a set of events. You
can also save event search criteria for future use. This section provides
information on searching events including:
• Searching Events
• Deleting Saved Searches
Searching Events To search events:
Step 1 Click the Event Viewer tab.
The Event Viewer window appears.
Step 2 Choose one of the following options:
a If you have previously saved search criteria you wish to use for this search,
select Search > Quick Searches from the drop-down list box.
b If you wish to start a new search, select Search > Edit Search from the
drop-down list box.
The search window appears.
Step 3 Enter values for the desired filter criteria:
STRM Log Management Users Guide
Page 34

28 USING THE EVENT VIEWER
Table 3-8 Event Search Criteria
Parameter Description
Saved Searches Using the drop-down list box, select a previously saved search
you wish to apply to this search, if desired.
Other options include:
• Delete - Using the drop-down list box, select the search you
wish to delete. Click Delete.
• Include in my Quick Searches - Select the check box if you
wish to include this search in your Quick Search items, which
is available in the Search drop-down list box.
• Share with Everyone - Select the check box if you wish to
share the saved search with all other STRM Log Management
users.
Time Range Choose one of the following options:
• Real Time - Select this option if you wish to filter on events
while in auto-refresh mode.
• Recent - Select the option and, using the drop-down list box,
specify the time range you wish to filter.
• Specific Interval - Select the option and, using the calendar,
specify the date and time range you wish to filter.
Test and Filters
Add Filter Options Using the options, define your specific search criteria including:
• From the first drop-down list box, select an attribute you wish
to search. For example, Any IP, Source Port, or Protocol.
• From the second drop-down list box, select the modifier you
wish to use for the search. The list of modifiers that appear
depends on the attribute selected in the first list.
• In the text field, enter specific information related to your
search.
For example, if you select Destination IP from the first drop-down
list box, Equals from the second drop-down list box, and enter
10.100.10.100 for the destination IP address you wish to search,
the search results returns results for this criteria.
For each criteria you wish to add to the filter, enter the desired
values and click Add Filter to add the filter to the Current Filter
list. Repeat for all filters you wish to add to the search criteria.
Current Filters Lists current search criteria filters. To remove any listed filter,
select the filter and click Remove Selected Filters.
Search Parameters
Sort/Aggregate Using the drop-down list box, specify whether you wish to sort
your search results by criteria specified in the By drop-down list
box or view your search results using an Aggregate value.
By Using the drop-down list box, select additional event criteria you
wish to use when searching
STRM Log Management Users Guide
Page 35

Table 3- 8 Event Search Criteria (continued)
Parameter Description
Search Order Specify the order you wish to display for the search results. The
options are: Descending or Ascending.
Step 4 Click Filter.
If you selected a sort criteria in your Search Parameters, the normalized events
appear. For more information on your search results, see Viewing Normalized
Events.
If you selected an aggregate value in your Search Parameters, the aggregate
events appear. For more information on your search results, see Viewing
Aggregate Normalized Events.
The results appear. If the number of returned events exceeds the value configured
in the Web Max Matched Results parameter in the System Settings window (for
more information, see the STRM Log Management Administration Guide), a
message appears indicating that only the maximum search results are provided.
Step 5 To save the specified search criteria for future use:
a Click Save Search.
Using the Search 29
The Save Search window appears.
b Enter values for the parameters:
Table 3- 9 Save Search Parameters
Parameter Description
Search Name Specify a name you wish to assign to this search criteria.
Time Range Choose one of the following options:
• Real Time - Select this option if you wish to filter on events while
in auto-refresh mode.
• Recent - Select the option and, using the drop-down list box,
specify the time range you wish to filter.
• Specific Interval - Select the option and, using the calendar,
specify the date and time range you wish to filter.
STRM Log Management Users Guide
Page 36

30 USING THE EVENT VIEWER
Table 3-9 Save Search Parameters
c Click OK.
Parameter Description
Include in my
Quick
Select the check box if you wish to include this search in your Quick
Search items, which is available in the Search drop-down list box.
Searches
Share with
Everyone
Select the check box if you wish to share these search requirements
with all other STRM Log Management users.
Deleting Saved
Searches
Step 1 Click the Event Viewer tab.
Step 2 From the Search drop-down list box, select Edit Search.
Step 3 In the Saved Searches drop-down list box, select the search you wish to delete.
Step 4 Click Delete.
To delete previously saved searches:
The Event Viewer window appears.
The filter/search window appears.
STRM Log Management Users Guide
Page 37

Modifying Event Mapping 31
Modifying Event Mapping
STRM automatically maps an event of a Device Support Module (DSM), also
known as a sensor device, for normalization purposes. Using the event mapping
tool, you can associate or map a normalized or raw event to a high-level and
low-level category (or QID). This allows STRM Log Management to map unknown
device events to known STRM events so that they can be categorized and
correlated appropriately.
STRM Log Management may receive events from DSMs that the system is unable
to categorize. STRM Log Management categorizes these types of events as
unknown. These events may occur for several reasons including:
• User-defined Events - Some DSMs, such as SNORT, allow you to create
user-defined events.
• New Events or Older Events - Third party devices may update their software
with maintenance releases to support new events that STRM may not support.
To modify event mapping:
Step 1 Click the Event Viewer tab.
The Event Viewer window appears.
Step 2 For any normalized event, double-click the event you wish to map.
For more information on viewing normalized events, seeViewing Normalized
Events. For information on viewing raw events, see Viewing Raw Events.
Step 3 Click Map Event.
The Device Event window appears.
STRM Log Management Users Guide
Page 38

32 USING THE EVENT VIEWER
Step 4 Choose one of the following options:
a If you know the QID that you wish to map to this event, enter the desired QID in
the Enter QID field. Go to Step 6.
b If you wish to search for a particular QID, go to Step 5.
Step 5 To search for a particular QID or high and low-level categories that you wish to
map this event to:
a In the High-Level Category drop-down list box, specify the high-level category
you wish to apply to this event.
b In the Low-Level Category drop-down list box, specify the low-level category
you wish to apply to this event.
A list of QIDs appears.
c From the QID list, select the QID you wish to assign to this normalized event.
Step 6 Click Ok.
STRM Log Management Users Guide
Page 39

Exporting Events 33
Exporting Events You can export events in Extensible Markup Language (XML) or Comma
Separated Values (CSV).
To export events:
Step 1 Click the Event Viewer tab.
The Event Viewer window appears.
Step 2 Choose one of the following:
a If you wish to export the event(s) in XML format, select Export to XML from the
Actions drop-down list box.
b If you wish to export the event(s) in CSV format, select Export to CSV from the
Actions drop-down list box
The status window appears. When the export is complete, the window disappears
or click Notify When Done to resume your activities and receive a notification
when the export is complete.
STRM Log Management Users Guide
Page 40

34 USING THE EVENT VIEWER
STRM Log Management Users Guide
Page 41

4
CONFIGURING RULES
An event is an incident that is detected by your security devices in your enterprise.
You can create an event rule to events by performing a series of tests. If all the
conditions of a test are true, the rule generate a response. Building blocks are
rules without a response. Responses to a rule include:
• Generation of an event
• Generation of a response to an external system (syslog, SNMP)
• Send an e-mail
The tests in each rule can also reference other building blocks and rules. You do
not need to create rules in any specific order since the system will check for
dependencies each time a new rule is added, edited, or deleted. If a rule that is
referenced by another rule is deleted or disabled, a warning appears and action is
not taken.
Each rule may contain the following components:
• Functions - With functions, you can use building blocks and other rules to
create a multi-event function. You can also OR rules together, using the when
we see an event match any of the following rules function.
• Building blocks - A building block is a rule without a response and is
commonly used as a common variable in multiple rules or used to build
complex rules or logic that you wish to use in other rules. You can save a group
of tests as building blocks for use with other functions. Building blocks allow you
to re-use specific rule tests in other rules. For example, you can save a building
block that includes the IP addresses of all mail servers in your network and then
use that building block to exclude those hosts from another rule. The building
block defaults are provided as guidelines, which should be reviewed and edited
based on the needs of your network.
• Tests - Property of an event, such as, source IP address, severity of event, or
rate analysis.
A user with non-administrative access can create rules for areas of the network
that they have access. You must have the appropriate role access to manage
rules.
STRM Log Management Users Guide
Page 42

36 CONFIGURING RULES
This chapter includes:
• Viewing Rules
• Enabling/Disabling Rules
• Creating a Rule
• Copying a Rule
• Deleting a Rule
• Grouping Rules
• Editing Building Blocks
Viewing Rules To view deployed rules, rule type, and status:
Step 1 Select the Event Viewer tab.
The Event Viewer window appears.
Step 2 Click Rules.
The Rules List window appears.
Step 3 In the Display drop-down list box, select Rules.
The list of deployed rules appear. For more information on default rules and
building blocks, see Appendix A Default Rules and Building Blocks.
Step 4 Select the rule you wish to view.
In the Rule and Notes fields, descriptive information appears.
STRM Log Management Users Guide
Page 43

Enabling/Disabling Rules 37
Enabling/Disabling
To enable or disable a rule:
Rules
Step 1 Select the Event Viewer tab.
The Event Viewer window appears.
Step 2 Click Rules.
The Rules List window appears.
Step 3 In the Display drop-down list box, select Rules.
The list of deployed rules appear.
Step 4 Select the rule you wish to enable or disable.
Step 5 From the Actions drop-down list box, select Enable/Disable.
The Enable column indicates the status.
Creating a Rule To create a new rule:
Step 1 Select the Event Viewer tab.
The Event Viewer window appears.
Step 2 Click Rules.
The Rules List window appears.
Step 3 From the Actions drop-down list box, select New Event Rule.
The Custom Rule wizard appears.
STRM Log Management Users Guide
Page 44

38 CONFIGURING RULES
Note: If you do not wish to view the Welcome to the Custom Rules Wizard window
again, select the Skip this page when running the rules wizard check box.
Step 4 Read the introductory text. Click Next.
The Rules Test Stack Editor window appears.
Step 5 To add a test to a rule:
STRM Log Management Users Guide
Page 45

Creating a Rule 39
In the Test Group drop-down list box, select the type of test you wish to apply to
a
this rule.
The resulting list of tests appear. For information on tests, see Event Rule
Tes ts .
b For each test you wish to add to the rule, select the + sign beside the test.
The selected test(s) appear in the Rule field.
c For each test added to the Rule field that you wish to identify as an excluded
test, click and at the beginning of the test.
The and appears as and not.
d For each test added to the Rule field, you must customize the variables of the
test. Click the underlined configurable parameter to configure. See Event Rule
Tes ts .
e Repeat for all tests you wish to apply to this rule.
Step 6 In the enter rule name here field, enter a name you wish to assign to this rule.
Step 7 To export the configured tests as building blocks to use with other rules:
a Click Export as Building Block.
The Save Building Block window appears.
b Enter the name you wish to assign to this building block.
c Click Save.
Step 8 To assign multi-event functions to the rule, select Functions from the Test Group
drop-down list box and configure the function:
The functions include:
STRM Log Management Users Guide
Page 46

40 CONFIGURING RULES
Table 4-1 Functions Group
Test Description Default Test Name Parameters
Multi-Rule
Event Function
Allows you to use saved
building blocks and other rules
to populate this test. The event
has to match either all or any of
the selected rules. If you wish to
create an OR statement for this
rule test, specify the any
when an event
matches any of the
following rules
Configure the following parameters:
• any - Specify either any or all of
the configured rules apply to this
test.
• rules - Specify the rules you wish
this test to consider.
parameter.
Multi-Rule
Event Function
Allows you to use saved
building blocks or other rules to
populate this test. This function
allows you to detect a specific
sequence of selected rules
involving a source and
destination within a configured
time period.
when all of these
rules, in order, from
the same IP
address/Port/QID/
Event/Device/
Category {default:
source IP} to the
same destination IP,
over this many time
intervals
Configure the following parameters:
• these rules - Specify the rules you
wish this test to consider.
• in - Specify whether you wish this
rule to consider in or in any order.
• the same - Specify if you wish this
rule to consider the same or any of
the source to destination port or IP
address.
• IP address/Port/QID/
Event/Device/ Category - Specify
whether you wish this rule to
consider a source IP address,
source port, QID, device event ID,
device, or category.
• the same - Specify if you wish this
rule to consider the same or any of
the source to destination port or IP
address.
• destination IP - Specify whether
you wish this rule to consider a
destination IP or port.
• this many - Specify the number of
time intervals you wish this rule to
consider.
• time intervals - Specify the time
interval you wish this rule to
consider. The options are:
seconds, minutes, hours, or days.
STRM Log Management Users Guide
Page 47

Table 4- 1 Functions Group (continued)
Test Description Default Test Name Parameters
Multi-Rule
Event Function
Allows you to use saved
building blocks or other rules to
populate this test. You can use
this function to detect a number
of specified rules, in sequence,
involving a source and
destination within a configured
time interval.
when at least this
number of these
rules, in order, from
the same IP
address/Port/QID/
Event/Device/
Category {default:
source IP} to the
same destination IP,
over this many time
intervals
Configure the following parameters:
• this number - Specify the number
of rules you wish this function to
consider.
• these rules - Specify the rules you
wish this test to consider.
• in - Specify whether you wish this
rule to consider in or in any order.
• the same - Specify if you wish this
rule to consider the same or any of
the source to destination port or IP
address.
• IP address/Port/QID/
Event/Device/ Category - Specify
whether you wish this rule to
consider a source IP address,
source port, QID, device event ID,
device, or category,
• the same - Specify if you wish this
rule to consider the same or any of
the source to destination port or IP
address.
• destination IP - Specify whether
you wish this rule to consider a
destination IP or port.
• this many - Specify the number of
time intervals you wish this rule to
consider.
• time intervals - Specify the time
interval you wish this rule to
consider. The options are:
seconds, minutes, hours, or days.
Multi-Event
Sequence
Function
Between Hosts
Allows you to detect a sequence
of selected rules involving the
same source and destination
hosts within the configured time
intervals. You can also use
saved building blocks and other
rules to populate this test.
when this sequence of
rules, involving the
same source and
destination hosts in
this many time
intervals
Configure the following parameters:
• of rules - Specify the rules you
wish this test to consider
• this many - Specify the number of
time intervals you wish this test to
consider.
• time intervals - Specify the time
measurement value, seconds,
minutes, hours, or days you wish
to apply to this test.
Creating a Rule 41
STRM Log Management Users Guide
Page 48

42 CONFIGURING RULES
Table 4-1 Functions Group (continued)
Test Description Default Test Name Parameters
Multi-Event
Counter
Function
Allows you to test the number of
events from configured
conditions, such as, source IP
address. You can also use
building blocks and other rules
to populate this test.
when a(n) IP address/
Port/QID/Event/
Device/Category
{default: anything}
emitting/receiving
more than 5 {default}
of these rules across
more than 5 {default}
IP address /Port /QID/
Event/Device/
Category {default:
destination IP}, over
10 {default} minutes
Configure the following parameters:
• IP address/ Port/QID/Event/
Device/Category - Specify the
source you wish this test to
consider. The options are:
anything, a source IP, a source
Port, a QID, Device Event ID, or a
Device.
• more than - Specify if you wish
this test to consider more than or
exactly the number of rules.
• 5 - Specify the number of rules you
wish this test to consider.
• these rules - Specify the rules you
wish this test to consider.
• more than - Specify if you wish
this test to consider more than or
exactly the number of destination
IP address(es), destination port(s),
QID(s), Device Event ID(s), or
Device(s).
• 5 - Specify the number of IP
addresses, ports, QIDs, events,
devices, or categories you wish
this test to consider.
• IP address /Port /QID/
Event/Device/ Category - Specify
the destination you wish this test to
consider. The options are:
anything, destination IP(s),
destination port(s), QID(s), device
event ID(s), or device(s).
• 10 - Specify the time value you
wish to assign to this test.
• minutes - Specify the time
measurement value, seconds,
minutes, hours, or days that you
wish to apply to this test.
STRM Log Management Users Guide
Page 49

Table 4- 1 Functions Group (continued)
Test Description Default Test Name Parameters
Multi-Rule
Function
You can also use building
blocks or existing rules to
populate this test. Allows you to
detect a series of rules for a
specific IP address or port
followed by a series of specific
rules for a specific port or IP
address.
when all of these
rules, in order, with
the same destination
IP address/port
followed by all of these
rules in order with the
same IP address/port
from the previous
source, within this
many time intervals
Configure the following parameters:
• rules - Specify the rules you wish
this test to consider.
• in - Specify if you wish this test to
consider rules in a specific order.
• destination - Specify whether you
wish this test to consider
destination or source IP address or
port.
• IP address/Port - Specify if you
wish this test to consider the IP
address or port.
• rules - Specify the rules you wish
this test to consider.
• in - Specify if you wish this test to
consider rules in a specific order.
• IP address/port - Specify if you
wish this test to consider the IP
address or port.
• this many - Specify the number of
time intervals you wish this rule to
consider.
• time intervals - Specify the time
interval you wish this rule to
consider. The options are:
seconds, minutes, hours, or days.
Creating a Rule 43
STRM Log Management Users Guide
Page 50

44 CONFIGURING RULES
Table 4-1 Functions Group (continued)
Test Description Default Test Name Parameters
Multi-Rule
Function
You can also use building
blocks or existing rules to
populate this test. Allows you to
detect a number of specific rules
for a specific IP address or port
followed by a number of specific
rules for a specific port or IP
address.
when at least this
number of these
rules, in order, with
the same destination
IP address/port
followed by at least
this number of these
rules in order with the
same IP address/port
from the previous
source, within this
many time intervals
Configure the following parameters:
• this number - Specify the number
of rules you wish this test to
consider.
• rules - Specify the rules you wish
this test to consider.
• in - Specify if you wish this test to
consider rules in a specific order.
• destination - Specify whether you
wish this test to consider
destination or source IP address or
port.
• IP address/port - Specify if you
wish this test to consider the IP
address or port.
• this number - Specify the number
of rules you wish this test to
consider.
• rules - Specify the rules you wish
this test to consider.
• in - Specify if you wish this test to
consider rules in a specific order.
• IP address/port - Specify if you
wish this test to consider the IP
address or port.
• source - Specify if you wish this
test to consider source or
destination.
• this many - Specify the number of
time intervals you wish this rule to
consider.
• time intervals - Specify the time
interval you wish this rule to
consider. The options are:
seconds, minutes, hours, or days.
STRM Log Management Users Guide
Page 51

Table 4- 1 Functions Group (continued)
Test Description Default Test Name Parameters
Multi-Rule
Function
You can also use building
blocks or existing rules to
populate this test. Allows you to
detect the selected rules with
same source information across
more than the configured
number of destinations within a
configured time period.
when any of these
rules with the same IP
address/Port/QID/
Event/Device/
Category more than 5
times, across more
than 5 IP address/
Port/QID/Event/
Device/Category
within 10 minutes
Configure the following parameters:
• rules - Specify the rules you wish
this test to consider.
• IP address/Port/QID/
Event/Device/ Category - Specify
whether you wish this rule to
consider a source IP address,
source port, QID, device event ID,
device, or category.
• 5 - Specify the number of rules you
wish this test to consider.
• more than - Specify if you wish
this test to consider more than or
exactly the number of destination
IP address(es), destination port(s),
QID(s), Device Event ID(s), or
Device(s).
• 5 - Specify the number of IP
addresses, ports, QIDs, events,
devices, or categories you wish
this test to consider.
• IP address/ Port/QID/Event/
Device/Category - Specify the
destination you wish this test to
consider. The options are:
anything, destination IP(s),
destination port(s), QID(s), Device
Event ID(s), or Device(s).
• 10 - Specify the time value you
wish to assign to this test.
• minutes - Specify the time
measurement value, seconds,
minutes, hours, or days that you
wish to apply to this test.
Creating a Rule 45
Step 9
In the groups area, select the check box(es) of the groups to which you wish to
assign this rule. For more information on grouping rules, see Grouping Rules.
Step 10 In the Notes field, enter any notes you wish to include for this rule. Click Next.
The Rule Responses window appears, which allows you to configure the action
STRM Log Management takes when the event sequence is detected.
Step 11 Configure the following parameters:
STRM Log Management Users Guide
Page 52

46 CONFIGURING RULES
Table 4-2 Event Rule Response Parameters
Parameter Description
Severity Select the check box if you wish this rule to set or
adjust severity to the configured level. Once
selected, you can configure the desired level.
Credibility Select the check box if you wish this rule to set or
adjust credibility to the configured level. Once
selected, you can configure the desired level.
Relevance Select the check box if you wish this rule to set or
adjust relevance to the configured level. Once
selected, you can configure the desired level.
Dispatch New Event Select the check box to dispatch a new event in
addition to the original event, which will be
processed like all other events in the system.
The Dispatch New Event parameters appear when
you select the check box. By default, the check box
is clear.
Event Name Specify the name of the event you wish to display in
the Event Viewer.
Event Description Specify a description for the event. The description
appears in the Annotations of the event details.
Severity Specify the severity for the event. The range is 1
(lowest) to 10 (highest) and the default is 1. The
Severity appears in the Annotation of the event
details.
Credibility Specify the credibility of the event. The range is 1
(lowest) to 10 (highest) and the default is 10.
Credibility appears in the Annotation of the event
details.
Relevance Specify the relevance of the event. The range is 1
(lowest) to 10 (highest) and the default is 1.
Relevance appears in the Annotation of the event
details.
High-Level Category Specify the high-level event category you wish this
rule to use when processing events.
For more information on event categories, see the
Event Category Correlation Reference Guide.
Low-Level Category Specify the low-level event category you wish this
rule to use when processing events.
For more information on event categories, see the
Event Category Correlation Reference Guide.
Email Select the check box to display the email options. By
default, the check box is clear.
Enter e-mail address
to notify
Specify the e-mail address(es) to send notification if
the event generates. Separate multiple e-mail
addresses using a comma.
STRM Log Management Users Guide
Page 53

Creating a Rule 47
Table 4- 2 Event Rule Response Parameters (continued)
Parameter Description
Send to SysLog Select the check box if you wish to log the event. By
default, the check box is clear.
For example, the syslog output may resemble:
Sep 28 12:39:01 localhost.localdomain
ECS: Rule 'Name of Rule' Fired:
172.16.60.219:12642 ->
172.16.210.126:6666 6, Event Name:
SCAN SYN FIN, QID: 1000398, Category:
1011, Notes: Event description
Response Limiter Specify the frequency you wish this rule to respond.
Enable Rule Select the check box to enable this rule. By default,
the check box is selected.
Step 12
Click Next.
The Rule Summary window appears.
Step 13 Review the configured rule. Click Finish.
Event Rule Tests This section provides information on the tests you can apply to the rules including:
• Event Property Tests
• IP/Port Tests
• Date/Time Tests
• Device Tests
Event Property Tests
The event property test group includes:
STRM Log Management Users Guide
Page 54

48 CONFIGURING RULES
Table 4-3 Event Property Tests
Test Description Default Test Name Parameters
Local Network
Object
IP Protocol Valid when the IP protocol of
Event Payload
Search
Valid when the event occurs
in the specified network.
the event is one of the
configured protocols.
Each event contains a copy
of the original unnormalized
when the local network is
one of the following
networks
when the IP protocol is
one of the following
protocols
when the Event Payload
contains this string
one of the following - Specify the
areas of the network you wish this test
to apply.
protocols - Specify the protocols you
wish to add to this test.
this string - Specify the text string you
wish include for this test.
event. This test is valid
when the entered search
string is included anywhere
in the event payload.
QID of Event A QID is a unique identifier
for events. This test is valid
when the event identifier is a
configured QID.
when the event QID is one
of the following QIDs
QIDs - Use of the following options to
locate QIDs:
• Select the Browse By Category
option and using the drop-down list
boxes, select the high and low-level
category QIDs you wish to locate.
• Select the QID Search option and
enter the QID or name you wish to
locate. Click Search.
Attack Context Attack Context is the
relationship between the
attacker and target. For
example, a local attacker to
a remote target.
Valid if the attack context is
one of the following:
• Local to Local
• Local to Remote
• Remote to Local
• Remote to Remote
Event
Category
Valid when the event
category is the same as the
configured category, for
example, Denial of Service
(DoS) attack.
when the attack context is
this context
when the event category
for the event is one of the
following categories
this context - Specify the context you
wish this test to consider. The options
are:
• Local to Local
• Local to Remote
• Remote to Local
• Remote to Remote
categories - Specify the event
category you wish this test to
consider.
For more information on event
categories, see the Event Category
Correlation Reference Guide.
Severity Valid when the event
severity is greater than, less
than, or equal to the
configured value. The
default is 5.
when the event severity is
greater than 5 {default}
Configure the following parameters:
• greater than - Specify whether the
severity is greater than, less than,
or equal to the configured value.
• this value - Specify the index,
which is a value from 0 to 10.
STRM Log Management Users Guide
Page 55

Table 4- 3 Event Property Tests (continued)
Test Description Default Test Name Parameters
Credibility Valid when the event
credibility is greater than,
less than, or equal to the
configured value. The
default is 5.
when the event credibility
is greater than 5
{default}
Configure the following parameters:
• greater than - Specify whether the
credibility is greater than, less than,
or equal to the configured value.
• this value - Specify the index,
which is a value from 0 to 10.
Relevance Valid when the event
relevance is greater than,
less than, or equal to the
configured value. The
default is 5.
when the event relevance
is greater than 5
{default}
Configure the following parameters:
• greater than - Specify whether the
relevance is greater than, less than,
or equal to the configured value.
• this value - Specify the index,
which is a value from 0 to 10.
Source
Location
Destination
Location
Geographic Valid when the source of
Valid when the source IP
address of the event is
either local or remote.
Valid when the destination
IP address of the event is
either local or remote.
this event is located in the
configured geographic
when the source is local
or remote {default:
remote}
when the destination is
local or remote {default:
remote}
when the attacker is
located in this
geographic location
local or remote - Specify either local
or remote traffic.
local or remote - Specify either local
or remote traffic.
this geographic location - Specify
the geographic regions you wish this
test to consider.
region.
Rate Analysis STRM Log Management
monitors event rates of all
when the event has been
marked with rate analysis
source IP addresses/QIDs
and destination IP
addresses/QIDs and marks
events that exhibit abnormal
rate behavior.
Valid when the event has
been marked for rate
analysis.
Creating a Rule 49
STRM Log Management Users Guide
Page 56

50 CONFIGURING RULES
Table 4-3 Event Property Tests (continued)
Test Description Default Test Name Parameters
False Positive
Tuning
When you tune false
positive events in the Event
Viewer, the resulting tuning
values appear in this test. If
you wish to remove a false
positive tuning, you can edit
this test to remove the
necessary tuning values.
when the false positive
signature matches one of
the following signatures
signatures - Specify the false positive
signature you wish this test to
consider. Enter the signature in the
following format:
<CAT|QID|ANY>:<value>:<source
IP>:<dest IP>
Where:
<CAT|QID|ANY> - Specify whether
you wish this false positive signature
to consider a category (CAT), Q1 Labs
Identifier (QID), or any value.
<value> - Specify the value for the
<CAT|QID|ANY> parameter. For
example, if you specified QID, you
must specify the QID value.
<source IP> - Specify the source IP
address you wish this false positive
signature to consider.
<dest IP> - Specify the destination IP
address you wish this false positive
signature to consider.
Username Valid when the configured
username is associated with
an event.
when the event(s)
username is this string
Configure the following parameters:
• is - Specify the value you wish to
associate with this test. Options
include: is, contains, starts with, or
ends with.
• this string - Specify a username
you wish this test to consider.
IP/Port Tests
The IP/Port tests include:
Table 4-4 IP / Port Test Group
Test Description Default Test Name Parameters
Source Port Valid when the source port
of the event is one of the
when the source port is one
of the following ports
ports - Specify the ports you wish
this test to consider.
configured source port(s).
Destination Port Valid when the destination
port of the event is one of
when the destination port is
one of the following ports
ports - Specify the ports you wish
this test to consider.
the configured destination
port(s).
Local Port Valid when the local port of
the event is one of the
when the local port is one
of the following ports
ports - Specify the ports you wish
this test to consider.
configured local port(s).
STRM Log Management Users Guide
Page 57

Table 4- 4 IP / Port Test Group (continued)
Test Description Default Test Name Parameters
Remote Port Valid when the remote port
of the event is one of the
when the remote port is one
of the following ports
ports - Specify the ports you wish
this test to consider.
configured remote port(s).
Source IP
Address
Valid when the source IP
address of the event is one
of the configured IP
when the source IP is one
of the following IP
addresses
IP addresses - Specify the IP
address(es) you wish this test to
consider.
address(es).
Destination IP
Address
Valid when the destination
IP address of the event is
one of the configured IP
when the destination IP is
one of the following IP
addresses
IP addresses - Specify the IP
address(es) you wish this test to
consider.
address(es).
Local IP
Address
Valid when the local IP
address of the event is one
of the configured IP
when the local IP is one of
the following IP addresses
IP addresses - Specify the IP
address(es) you wish this test to
consider.
address(es).
Remote IP
Address
Valid when the remote IP
address of the event is one
of the configured IP
when the remote IP is one
of the following IP
addresses
IP addresses - Specify the IP
address(es) you wish this test to
consider.
address(es).
IP Address Valid when the source or
destination IP address of
the event is one of the
when either the source or
destination IP is one of the
following IP addresses
IP addresses - Specify the IP
address(es) you wish this test to
consider.
configured IP address(es).
Creating a Rule 51
Date/Time Tests
The date and time tests include:
Table 4- 5 Date/Time Tests
Test Description Default Test Name Parameters
Event Day Valid when the event occurs
on the configured day of the
month.
when the event(s)
occur on the selected
day of the month
Configure the following parameters:
• on - Specify if you wish this test
to consider on, after, or before the
configured day.
• selected - Specify the day of the
month you wish this test to
consider.
Event Week Valid when the event occurs
on the configured days of the
week.
Event Time Valid when the event occurs
on the after the configured
time.
when the event(s)
occur on any of these
days of the week
when the event(s)
occur after this time
these days of the week - Specify
the days of the week you wish this
test to consider.
Configure the following parameters:
• after - Specify if you wish this test
to consider after, before, or at the
configured time.
• this time - Specify the time you
wish this test to consider.
STRM Log Management Users Guide
Page 58

52 CONFIGURING RULES
Device Tests
The device tests include:
Table 4-6 Device Tests
Test Description Default Test Name Parameters
Source Device Valid when one of the
configured source devices is
the source of the event.
Source Device
Type
Valid when one of the
configured device types is the
source of the event
when the event(s) were
detected by one or
more of these device
when the event(s) were
detected by one or
more of these device
these devices - Specify the devices
that you wish this test to detect.
these device types - Specify the
devices that you wish this test to
detect.
types
Devices Valid when the event(s) have
not been detected by the
configured devices.
when the event(s)
have not been
detected by one or
more of these devices
for 300 seconds.
Configure the following parameters:
• these devices - Specify the
devices you wish this test to
consider.
• 300 - Specify the time, in
seconds, you wish this test to
consider.
Device Groups Valid when an event is
detected by the configured
device groups
when the event(s) were
detected by one or
more of these device
these device groups - Specify the
groups you wish this rule to
consider.
groups
Copying a Rule To copy a rule:
Step 1 Select the Event Viewer tab.
The Event Viewer window appears.
Step 2 Click Rules.
The Rules List window appears.
Step 3 In the Display drop-down list box, select Rules.
Step 4 Select the rule you wish to duplicate.
Step 5 From the Actions drop-down list box, select Duplicate.
Step 6 In the Enter name for the copied rule, enter a name for the new rule. Click Ok.
The duplicated rule appears.
Step 7 Click Edit to edit the tests for the rule.
For more information on editing the rule, see Creating a Rule.
STRM Log Management Users Guide
Page 59

Deleting a Rule 53
Deleting a Rule To delete a rule:
Step 1 Select the Event Viewer tab.
The Event Viewer window appears.
Step 2 Click Rules.
The Rules List window appears.
Step 3 In the Display drop-down list box, select Rules.
Step 4 Select the rule you wish to duplicate.
Step 5 From the Actions drop-down list box, select Delete.
Grouping Rules You can group and view your rules and building blocks based on functionality.
Categorizing your rules or building blocks into groups allows you to efficiently view
and track your rules. For example, you can view all rules related to compliance. By
default, the Rules interface displays all rules and building blocks.
As you create new rules, you have a choice whether you wish to assign the rule to
an existing group. For information on assigning a group to a using the rule wizard,
see Creating a Rule.
Note: You must have administrative access to create, edit, or delete groups. For
more information on user roles, see the STRM Log Management Administration
Guide.
This sections provides information on grouping rules and building blocks including:
• Viewing Groups
• Creating a Group
• Editing a Group
• Copying an Item to Another Group(s)
• Deleting an Item from a Group
• Assigning an Item to a Group
Viewing Groups To view rules or building blocks using groups:
Step 1 Select the Event Viewer tab.
The Event Viewer window appears.
Step 2 Click Rules.
The Rules List window appears.
Step 3 From the Display drop-down list box, select whether you wish to view Rules or
Building blocks.
Step 4 Form the Filter drop-down list box, select the group category you wish to view.
STRM Log Management Users Guide
Page 60
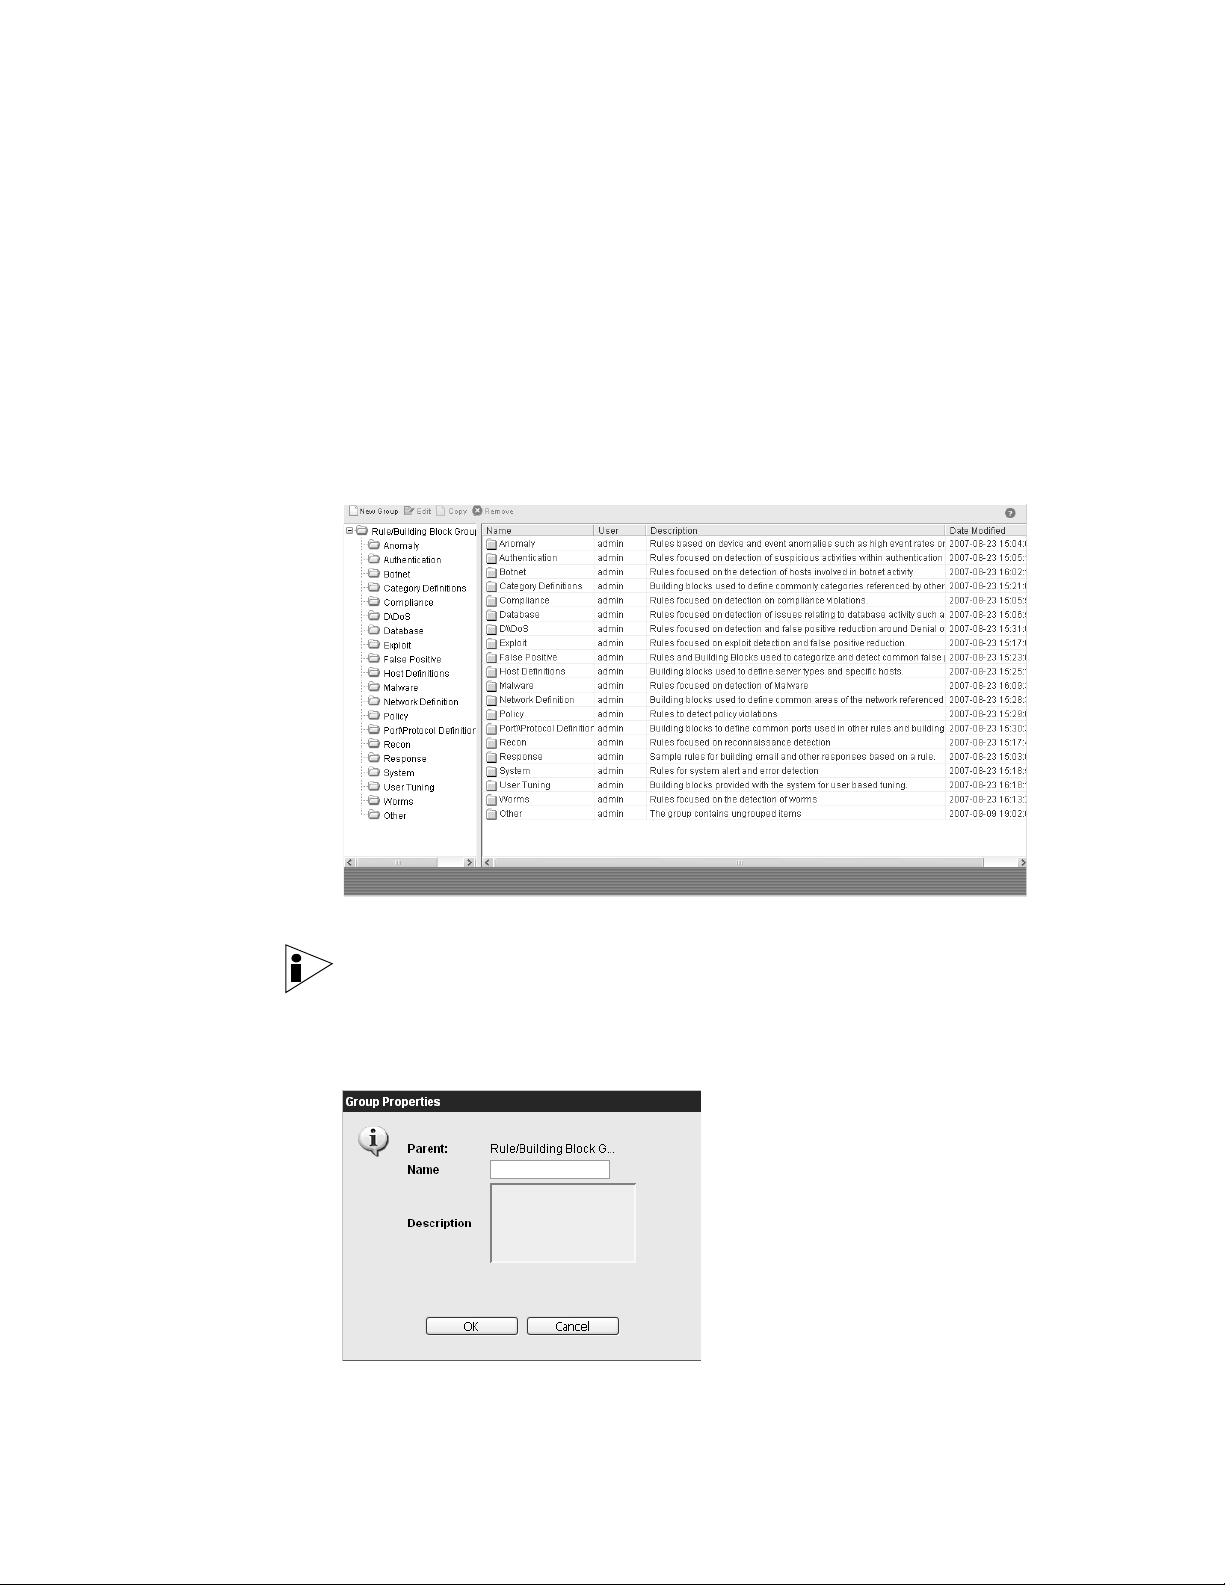
54 CONFIGURING RULES
Step 5 The list of items assigned to that group appear.
Creating a Group To create a group:
Step 1 Select the Event Viewer tab.
The Event Viewer window appears.
Step 2 Click Rules.
The Rules List window appears.
Step 3 Click Groups.
The Group window appears.
Step 4 From the menu tree, select the group under which you wish to create a new group.
Note: Once you create the group, you can drag and drop menu tree items to
change the organization of the tree items.
Step 5 Click New Group.
The Group Properties window appears.
Step 6 Enter values for the parameters:
STRM Log Management Users Guide
Page 61

• Name - Specify the name you wish to assign to the new group. The name may
be up to 255 characters in length.
• Description - Specify a description you wish to assign to this group. The
description may be up to 255 characters in length.
Step 7 Click Ok.
Step 8 If you wish to change the location of the new group, click the new group and drag
the folder to the desired location in your menu tree.
Step 9 Close the Groups window.
Editing a Group To edit a group:
Step 1 Select the Event Viewer tab.
The Event Viewer window appears.
Step 2 Click Rules.
The Rules List window appears.
Step 3 Click Groups.
The Group window appears.
Grouping Rules 55
Step 4 From the menu tree, select the group you wish to edit.
Step 5 Click Edit.
The Group Properties window appears.
Step 6 Update values for the parameters, as necessary:
• Name - Specify the name you wish to assign to the new group. The name may
be up to 255 characters in length.
• Description - Specify a description you wish to assign to this group. The
description may be up to 255 characters in length.
STRM Log Management Users Guide
Page 62

56 CONFIGURING RULES
Step 7 Click Ok.
Step 8 If you wish to change the location of the group, click the new group and drag the
Step 9 Close the Groups window.
folder to the desired location in your menu tree.
Copying an Item to
Another Group(s)
Step 1 Select the Event Viewer tab.
Step 2 Click Rules.
Step 3 Click Groups.
Using the groups functionality, you can copy a rule or building block to one or
many groups. To copy a rule or building block:
The Event Viewer window appears.
The Rules List window appears.
The Group window appears.
Step 4 From the menu tree, select the rule or building block you wish to copy to another
group.
Step 5 Click Copy.
The Choose Group window appears.
STRM Log Management Users Guide
Page 63

Grouping Rules 57
Step 6
Step 7 Click Assign Groups.
Step 8 Close the Groups window.
Deleting an Item from
a Group
Step 1 Select the Event Viewer tab.
Step 2 Click Rules.
Step 3 Click Groups.
Step 4 From the menu tree, select the top level group.
Step 5 From the list of groups, select the group you wish to delete.
Step 6 Click Remove.
Select the check box for the group(s) to which you wish to copy the rule or building
block.
To delete a rule or building block from a group:
Note: Deleting a group removes this rule or building block from the Rules
interface. Deleting an item from a group does not delete the rule or building block
from the Rules interface.
The Event Viewer window appears.
The Rules List window appears.
The Group window appears.
A confirmation window appears.
Step 7 Click Ok.
Step 8 If you wish to change the location of the new group, click the new group and drag
the folder to the desired location in your menu tree.
Step 9 Close the Groups window.
STRM Log Management Users Guide
Page 64

58 CONFIGURING RULES
Assigning an Item to
a Group
Step 1 Select the Event Viewer tab.
Step 2 Click Rules.
Step 3 Select the rule or building block you wish to assign to a group.
Step 4 From the Actions drop-down list box, select Assign Groups.
Step 5 Click Assign Groups.
Editing Building Blocks
Step 1 Select the Event Viewer tab.
To assign a rule or building block to a group:
The Event Viewer window appears.
The Rules List window appears.
The Choose Group window appears.
Building blocks allow you to re-use specific rule tests in other rules. For example,
you can save a building block that excludes the IP addresses of all mail servers in
your deployment from the rule.
To edit a building block:
The Event Viewer window appears.
Step 2 Click Rules.
The Rules List window appears.
Step 3 In the Display drop-down list box, select Building Blocks.
The Building Blocks appear.
Step 4 Double-click the building block you wish to edit.
The Custom Rules Wizard appears.
STRM Log Management Users Guide
Page 65

Editing Building Blocks 59
Step 5 Update the building block, as necessary. Click Next.
Step 6 Continue through the wizard. For more information, see Creating a Rule.
The Rule Summary appears.
STRM Log Management Users Guide
Page 66

60 CONFIGURING RULES
Step 7 Click Finish.
STRM Log Management Users Guide
Page 67

5
MANAGING REPORTS
The Reports interface allows you to create, distribute, and manage reports. You
can use the Report Wizard to create executive and operational level reports.
STRM Log Management provides default templates that you can use to generate
your report data, using various intervals. You can edit any template to present
customized data when distributing reports to other STRM Log Management users,
however, administrative users can see all reports created by STRM Log
Management users.
Reports also allows you to brand your documents with customized logos, which
enables you to support unique logos for each report. This is beneficial when
distributing reporting to different audiences.
This chapter includes:
• Using the Reports Interface
• Viewing Reports
• Grouping Reports
• Creating a Report
• Using Default Report Templates
• Generating a Report
• Duplicating a Report
• Branding Your Report
Note: To brand reports with custom logos, you must upload and configure your
logos before you begin using the Report Wizard, see Branding Your Report.
STRM Log Management Users Guide
Page 68

62 MANAGING REPORTS
Using the Reports Interface
Using the Navigation
Menu
This section provides information on using the Reports interface including:
• Using the Navigation Menu
• Using the Toolbar
The default main Reports interface displays generated reports. The navigation
menu provides access to reports, templates, and branding including:
Table 5-1 Navigation Menu Options
Menu Columns Description
Generated
Reports
Report Title Displays the name of the report. By default, the report title
Group Displays the group to which this report belongs.
Schedule Displays the frequency in which the report generates.
Generated Displays the date and time the report was generated.
Owner Displays the STRM Log Management user that generated
Template
Author
Format Displays the available viewing formats.
Report
Templates
Template
Name
Group Displays the group to which this report belongs.
Schedule Displays the frequency in which the report generates.
Next Run
Time
Last
Modification
Owner Displays the STRM Log Management user that generated
Displays all generated reports. Reports listed in this panel
are available for immediate viewing. The Generated
Reports panel lists reports with the following details
in a default template is a duplicate of the template name.
the report.
Displays the user that created the template that
generated this report.
Displays existing report templates. STRM Log
Management provides a series of default templates that
are ready for immediate access, see
Report Templates
By default, templates are sorted by the report title. You
can access templates in the Report Templates panel; or,
click the arrow beside the Report Templates menu item
and select the group (frequency) folder. The Reports
Templates panel lists the configured templates with the
following details:
Displays the template name.
Displays the time in which the report is expected to
generate.
Displays the last modification date.
the report.
.
Using Default
STRM Log Management Users Guide
Page 69

Table 5- 1 Navigation Menu Options (continued)
Menu Columns Description
Author Displays the STRM Log Management user that created
the template.
Output Displays the report format.
Branding Navigates to the report branding option. See Branding
Your Report
Using the Toolbar You can perform the following actions:
Table 5- 2 Toolbar Icon Descriptions
Option Description
Group Using the drop-down list box, allows you to view reports
assigned to a specific group. For more information, see
Grouping Reports.
Allows you to manage report groups. For more information,
see
Grouping Reports.
Allows you to perform the following actions:
• Create - Allows you to create a new template. For more
information, see
• Edit - Allows you to edit the selected template. You can
also double-click a template to edit the content.
• Duplicate - Allows you to duplicate/rename a report. For
more information, see
• Assign Groups - Allows you to assign a report template to
a report group. For more information, see
Reports
• Share - Allows you to share report templates with other
.
users. You must have administrative privileges to share
report templates. For more information, see
Report
• Toggle Scheduling -Allows you to toggle active/inactive
.
for the selected template.
• Generate Report - Generates a report from the selected
template. For more information, see
• Delete - Deletes the selected template. Hold the CTRL key
and click on the templates you wish to delete.
Viewing Reports 63
.
Creating a Report.
Duplicating a Report.
Grouping
Sharing a
Generating a Report.
Viewing Reports You can view reports displayed in the Generated Reports interface. These reports
have been previously created, generated, and optionally distributed. You can only
view reports to which you have access. Reports may be formatted in one or all of
the following formats:
• PDF - Portable Document Format
STRM Log Management Users Guide
Page 70

64 MANAGING REPORTS
Step 1 Click the Reports tab.
Step 2 Click Generated Reports from the navigation menu.
Step 3 For the report you wish to view, click the icon that represents the format in which
• HTML - Hyper Text Markup Language format
• RTF - Rich Text Format
• XML - Extensible Markup Language
• XLS - Microsoft Excel format.
The XML and XLS formats are only available for reports using a single chart table
format (portrait or landscape).
Note: If you are currently using the FireFox browser and you select the RTF report
format, this may launch a new browser window. This does not affect STRM Log
Management; this is a result of the FireFox browser configuration. Close the
window and continue with your STRM Log Management session.
To view a generated report:
The main Reports interface appears.
you wish to view the report.
The report opens in the selected format.
Grouping Reports The Reports interface allows you to view your report and report templates based
on functionality. Categorizing your reports into groups allows you to efficiently view
and track your reports. For example, you can view all reports related to
compliance. By default, the Reports interface displays all reports, however, you
can view your reports the using one of the following default groups:
• Compliance
• Executive
• Network Management
• Security
• VoIP
As you create new reports, you can either assign the report to an existing group,
create a new group, or do not assign the report to any group. For information on
assigning a group to a using the report wizard, see Creating a Report.
Note: You must have administrative access to create, edit, or delete groups. For
more information on user roles, see the STRM Log Management Administration
Guide.
This sections provides information on grouping reports including:
• Creating a Group
STRM Log Management Users Guide
Page 71

• Editing a Group
• Copying a Template to Another Group
• Deleting a Template From a Group
• Assigning a Report to a Group
Creating a Group To create a group:
Step 1 Click the Reports tab.
The Reports interface appears.
Step 2 Click the Report Templates menu option.
A list of templates appears.
Step 3 Click Groups.
The Reports Group window appears.
Grouping Reports 65
Step 4 From the menu tree, select the group under which you wish to create a new group.
Note: Once you create the group, you can drag and drop menu tree items to
change the organization of the tree items.
Step 5 Click New Group.
The Group Properties window appears.
Step 6 Enter values for the parameters:
STRM Log Management Users Guide
Page 72

66 MANAGING REPORTS
• Name - Specify the name you wish to assign to the new group. The name may
be up to 255 characters in length.
• Description - Specify a description you wish to assign to this group. The
description may be up to 255 characters in length. This field is optional.
Step 7 Click Ok.
Step 8 If you wish to change the location of the new group, click the new group and drag
the folder to the desired location in your menu tree.
Step 9 Close the Report Groups window.
Editing a Group To edit a group:
Step 1 Click the Reports tab.
The Reports interface appears.
Step 2 Click the Report Templates menu option.
A list of templates appears.
Step 3 Click Groups.
The Reports Group window appears.
Step 4 From the menu tree, select the group you wish to edit.
Step 5 Click Edit.
The Group Properties window appears.
Step 6 Update values for the parameters, as necessary:
• Name - Specify the name you wish to assign to the new group. The name may
be up to 255 characters in length.
• Description - Specify a description you wish to assign to this group. The
description may be up to 255 characters in length. This field is optional.
Step 7 Click Ok.
Step 8 If you wish to change the location of the group, click the new group and drag the
folder to the desired location in your menu tree.
Step 9 Close the Report Groups window.
STRM Log Management Users Guide
Page 73

Grouping Reports 67
Copying a Template
to Another Group
Step 1 Click the Reports tab.
Step 2 Click the Report Templates menu option.
Step 3 Click Groups.
Step 4 From the menu tree, select the template you wish to copy to another group.
Using the groups functionality, you can copy a template from one group to another.
To copy a template:
The Reports interface appears.
A list of templates appears.
The Reports Group window appears.
Step 5 Click Copy.
Step 6 Select the group or groups to which you wish to copy the template.
Step 7 Click Assign Groups.
Step 8 Close the Report Groups window.
Deleting a Template
From a Group
Step 1 Click the Reports tab.
The Choose Group window appears.
To delete a template from a group:
Note: Removing a template from a group only removes this template from the
group. Removing a template does not delete the template from Reports interface.
The Reports interface appears.
STRM Log Management Users Guide
Page 74

68 MANAGING REPORTS
Step 2 Click the Report Templates menu option.
Step 3 Click Groups.
Step 4 From the menu tree, select the top level group.
Step 5 From the list of groups, select the group you wish to delete.
Step 6 Click Remove.
Step 7 Click Ok.
Step 8 Close the Report Groups window.
A list of templates appears.
The Reports Group window appears.
A confirmation window appears.
Assigning a Report
to a Group
Step 1 Click the Reports tab.
Step 2 Choose one of the following options:
Step 3 Select the report(s) you wish to assign to a group.
Step 4 Click Assign Groups.
Step 5 From the Item Groups list, select the check box of the group you wish to assign to
Step 6 Click Assign Groups.
You can assign a generated report or report template to a group. To assign a
report to a group:
The Reports interface appears.
a To assign a generated report to a group, click the Generated Reports menu
option.
A list of templates appears.
b To assign a report template report to a group, click the Report Templates
menu option.
A list of templates appears.
The Choose Group window appears.
this report template.
Creating a Report You can access the Report Wizard from the toolbar in the Reports Templates
interface to create a new report. When a report is complete, you can use the
template to create other reports using many of the same configurations.
The Report Wizard provides a step-by-step guide in designing, scheduling, and
generating your reports. The wizard uses the following elements:
• Layout - Determines the positioning and size of each container.
• Container - Placeholder for the featured content.
STRM Log Management Users Guide
Page 75

• Content - Definition of the chart that is placed in the container.
This section includes:
• Creating a Template
• Configuring Charts
• Selecting a Graph Type
Creating a Template To create a template:
Step 1 Click the Reports tab.
The Reports interface appears.
Step 2 From the Actions drop-down list box, select Create.
The Report Wizard appears.
Creating a Report 69
Note: Select the check box if you wish to disable the Welcome page.
STRM Log Management Users Guide
Page 76

70 MANAGING REPORTS
Step 3 Select a scheduling option. Click Next.
Table 5-3 Report Scheduling
Parameter Default Settings
This report should be scheduled to run
Manually Generates a report one time only. This is the default setting;
however, you may generate this report as often as required.
Hourly Schedules the report to generate at the end of each hour
using the data from the previous hour.
Using the drop-down list boxes, select a time frame to begin
and end the reporting cycle. A report is generated for each
hour within this time frame. Time is available in half-hour
increments. The default is 1:00 a.m for both From and To.
Daily Schedules the report to generate each day using the data
from the previous day. Each chart on a report allows you to
select the previous 24 hours of the day, or select a specific
time frame from the previous day.
Click the check boxes beside each day you wish to generate
a report. Also, using the drop-down list box, select a time to
begin the reporting cycle. Time is available in half-hour
increments. The default is 1:00 a.m.
Weekly Schedules the report to generate each week using the data
from the previous week.
Select the day you wish to generate the report. Default is
Monday. Using the drop-down list box, select a time to begin
the reporting cycle. Time is available in half-hour increments.
The default is 1:00 a.m.
STRM Log Management Users Guide
Page 77

Creating a Report 71
Table 5- 3 Report Scheduling (continued)
Parameter Default Settings
Monthly Schedules the report to generate each month using the data
from the previous month.
Using the drop-down list box, select the date you wish to
generate the report. The default is the 1st day. Also, using
the drop-down list box, select a time to begin the reporting
cycle. Time is available in half-hour increments. The default
is 1:00 a.m.
Allow this report to generate manually
Yes Enables manual generation of this report.
No Disables manual generation of this report.
The Report Layout window appears.
A report can consist of several data. Your network and security data can be
presented in a variety of styles, such as tables, pie charts, and bar charts. Styles
consist of a number of options, such as delta or baseline.
When selecting the layout of a report, consider the type of report you wish to
create - do not choose a small chart container for graph content that may display a
large number of objects. Each graph is complete with a legend and a list of
networks from which the content is derived; choose a large enough container to
hold the data. To preview how each chart displays a data, see Selecting a Graph
Type.
STRM Log Management Users Guide
Page 78
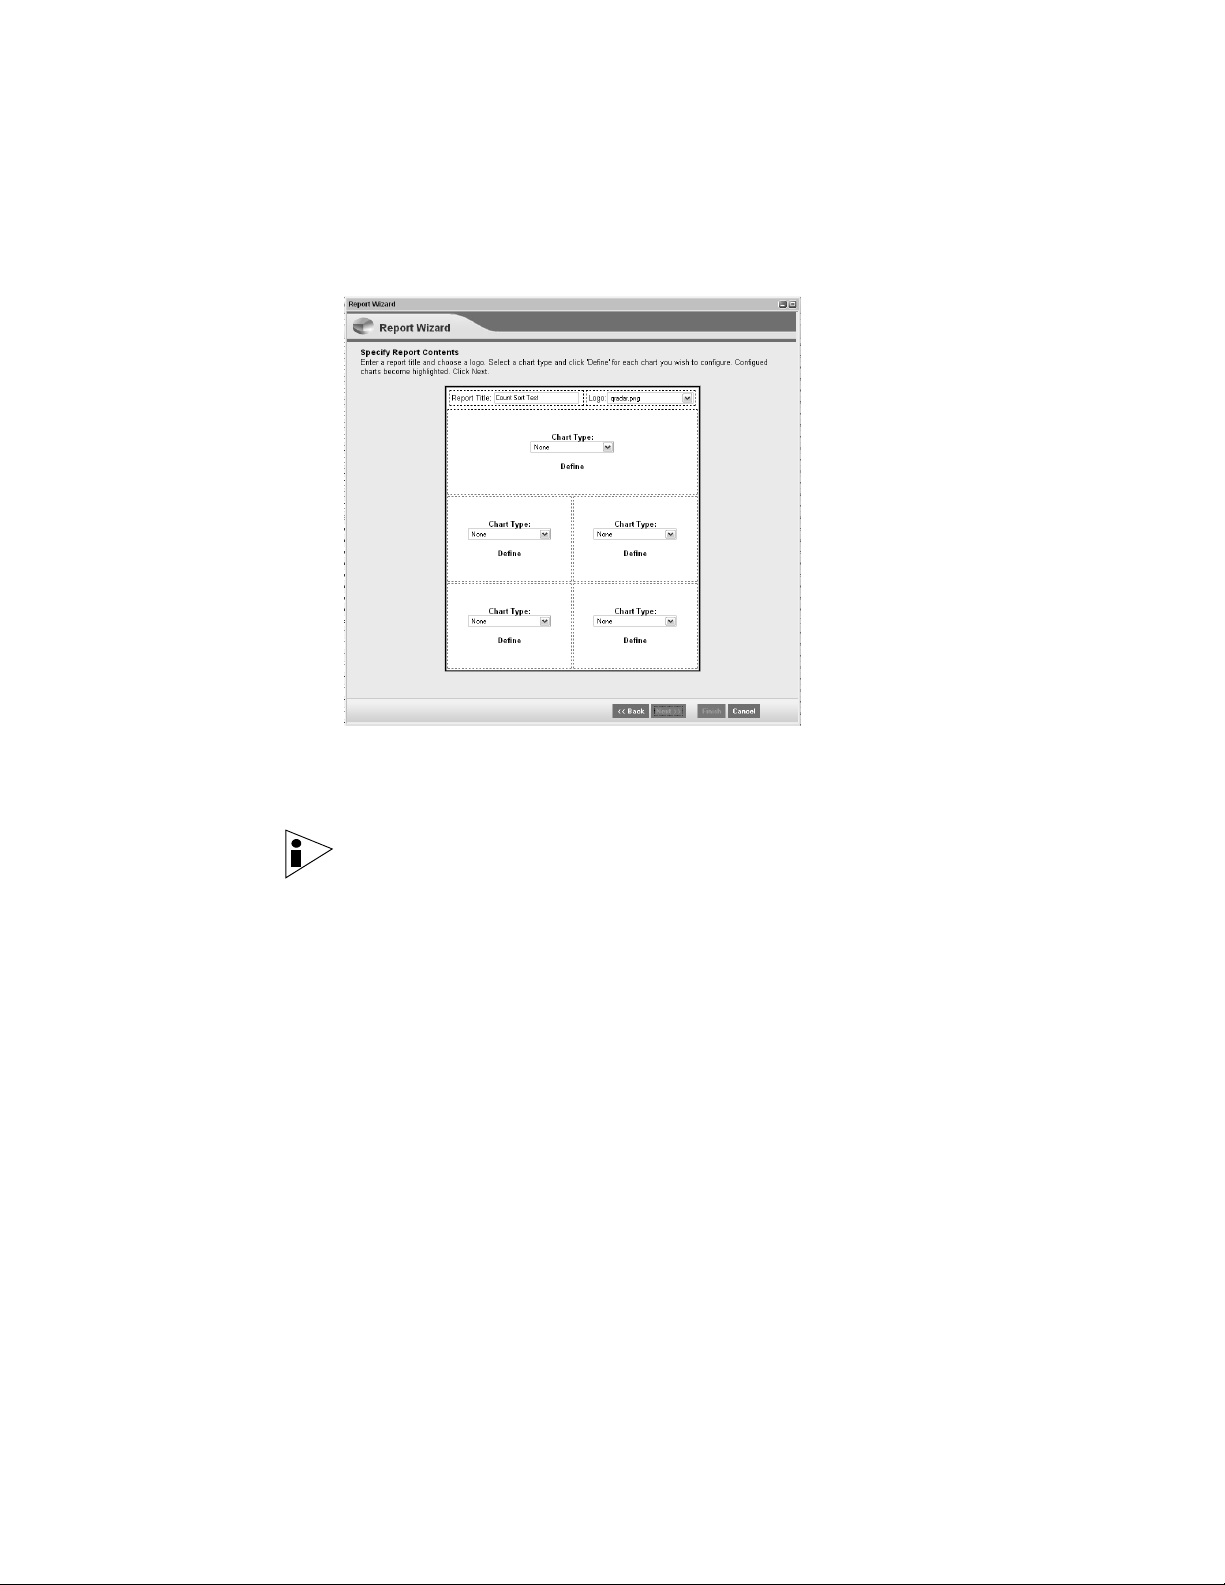
72 MANAGING REPORTS
Step 4 From the Orientation drop-down list box, select the page orientation and then click
the desired layout. Click Next.
The Specify Report Contents window appears:
Step 5 Select values for the following parameters:
• Report Title - Specify a title for your report. The title can be up to 100
characters in length - do not use special characters.
Note: Your report is saved by the title name you enter in this field.
• Logo - Using the drop-down list box, select a logo. By default, the STRM Log
Management logo is displayed. Other logos may be uploaded and used, see
Branding Your Report.
• Chart Type - Using the drop-down list box, select a chart for your container
including:
- Event/Logs
- Time Series
- TopN Time Series
The Container Details window appears.
Step 6 Configure your chart.
For detailed information on configuring your chart, see Configuring Charts.
Step 7 Click Save Container Details for each container in a report.
The Specify Report Contents window appears. The configured container is
highlighted.
Step 8 Repeat the configuration process for each container you wish to define and click
Next.
STRM Log Management Users Guide
Page 79

Creating a Report 73
The Layout Preview window appears providing a preview of how your data
appears.
Note: Charts that appear in the preview window do not display actual data. This is
a graphical representation of the layout you have configured.
Step 9 Preview your report. Click Next:
The Report Format window appears. The default is PDF.
Step 10 Select the check box for any or all formats for report viewing. Click Next.
Note: Generated reports can be one to two megabytes in size, depending on the
selected output format. We recommend the use of the PDF format; PDF format is
smaller in size and does not consume a large quantity of disk space to store.
The Report Distribution Channels window appears. The default is Report Console.
STRM Log Management Users Guide
Page 80

74 MANAGING REPORTS
Step 11 Select the desired distribution channels. Click Next.
Table 5-4 Report Distribution
Parameter Sub-Parameter Description
Report
Console
Select the check box if you wish to send the
report to the Reports interface.
Note: You must have appropriate network
permissions to share your report with other
users. For more information on permissions,
see the STRM Log Management
Administration Guide.
Email Select the check box if you wish to distribute
the report using e-mail.
Enter the report
distribution email
address(es)
Specify the e-mail address(es) for each
destination you wish to send the report;
e-mail addresses are comma separated.
Maximum characters for this parameter is
255.
Note: E-mail recipients receive this e-mail
from no_reply_reports@STRM.
Include Report as
attachment (PDF/RTF)
Include link to Report
Console
Select the check box to send the report as
an attachment.
Select the check box to include a link in your
e-mail.
The Finishing Up window appears.
STRM Log Management Users Guide
Page 81

Creating a Report 75
Step 12
Enter values for the following parameters. Click Next.
Table 5- 5 Finishing Up
Parameter Description
Report Template
Description
Groups Specify the group(s) to which you wish to assign this report. For
Would you like to
run the report
now?
The Report Summary window appears displaying details for your report. You can
select the tabs available in the summary window to preview your report selections.
Step 13 Click Finish.
If you have selected the Execute Report option from the Finishing Up window, the
report immediately generates. If you have not selected this option, the report
template is saved and generates as scheduled.
Specify a description for this template. This description appears
on the Report Summary page and is included in the report
distribution e-mail.
more information on groups, see
Grouping Reports.
Select the check box if you wish to generate the report when the
wizard is complete. By default, the check box is clear.
STRM Log Management Users Guide
Page 82

76 MANAGING REPORTS
Configuring Charts The chart type determines how your data and network objects are presented in
your report. Data can be charted with several characteristics and created in a
single report.
The following chart types are available for each template:
• Event/Logs
• Time Series
• TopN Time Series
Event/Logs
The Event/Logs Chart allows you to view event information for a specific period of
time.
Figure 5-1 Event/Logs Report
STRM Log Management Users Guide
Page 83

Enter values for the following parameters:
Creating a Report 77
Table 5- 6 Event/Logs Chart Container Details
Parameter Description
Container Details - Events/Logs
Chart Title Specify a chart title to a maximum of 100 characters.
Chart Sub-Title Clear the check box to change the automatically created
sub-title. Enter a title to a maximum of 100 characters.
Graph Type Using the drop-down list box, select the type of graph you
wish to appear on your report. Options include:
• Bar - When selecting this option, you must also select the
Timeline Interval from the Additional Details section.
• Pie - When selecting this option, you must also select
either total or percent.
• Table - When selecting this option (full page width
container only), you must also select the Timeline Interval
from the Additional Details section.
Note: For an example of how each type of graph charts data,
see
Selecting a Graph Type.
Graph Using the drop-down list box, select the number of
events/logs you wish to appear in the report.
Scheduling The scheduling options depend on the template type you
have selected.
STRM Log Management Users Guide
Page 84

78 MANAGING REPORTS
Table 5-6 Event/Logs Chart Container Details (continued)
Parameter Description
Manually Using the calendar, select range of dates you wish this report
to consider. The default is the current date.
Using the drop-down list boxes, select a time to begin and
end generating the report. Time is available in half-hour
increments. The default is 1:00 a.m.
Hourly Automatically graphs all data from the previous hour.
Daily Choose one of the following options:
• All data from previous 24 hours
• Data of previous day from - Using the drop-down list
boxes, select the period of time you wish the report to
consider. Time is available in half-hour increments. The
default is 1:00 a.m.
Weekly Choose one of the following options:
• All data from previous week
• Data from a previous week - Using the drop-down list
boxes, select the days to begin and end generating the
report. Default is Sunday.
Monthly Choose one of the following options:
• All data from previous month
• Data from a previous month - Using the drop-down list
boxes, select the dates to begin and end generating the
report. Default is 1st to 31st.
Graph Content
Base this event report onUsing the drop-down list box, select a previously saved
search. If you wish to create a new search, click Create New
Event Search. For more information on creating an event
search, see
Chapter 3 Using the Event Viewer.
STRM Log Management Users Guide
Page 85

Creating a Report 79
Time Series
The Time Series Chart displays options, such as pivoting and delta comparisons,
that allow you to create charts that compare a data for two different periods of time.
To configure a Time Series Chart, enter values for the following parameters:
Table 5- 7 Time Series Chart Container Details
Parameter Description
Container Details - Time Series Chart
Chart Title Specify a chart title to a maximum of 100 characters.
Chart Sub-Title Clear the check box to change the automatically created
sub-title. Enter a title to a maximum of 100 characters.
Graph Type Using the drop-down list box, select the type of graph you
wish to appear on your report. Options include:
• Line - When selecting this option, you must also select the
Timeline Interval from the Additional Details section.
• Stacked_Line -When selecting this option, you must also
select the Timeline Interval from the Additional Details
section.
• Stacked_Base_Line - When selecting this option, you
must also select the Timeline Interval and choose a
Baseline from the Additional Details section.
• Bar - When selecting this option, you must also select the
Timeline Interval from the Additional Details section.
STRM Log Management Users Guide
Page 86

80 MANAGING REPORTS
Table 5-7 Time Series Chart Container Details (continued)
Parameter Description
• Stacked_Bar - When selecting this option, you must also
select the Timeline Interval from the Additional Details
section.
• Stacked_Bar_Base_Line - When selecting this option,
you must also select the Timeline Interval and choose the
Baseline parameters.
• Delta - When selecting this option, you must also select
the Timeline Interval and select an option for the Delta
Span from the Additional Details. Delta chart represents
the difference in traffic patterns between the current
graphing interval and another equally sized interval from
the past. Use the Delta chart to model how traffic patterns
for networks, applications or event data are changing.
Note: The end date of your Delta Span must be set before
the From date of the data you are graphing.
• Pie - When selecting this option, you must also select
either total or percent.
• Table - When selecting this option (full page width
container only), you must also select the Timeline Interval
from the Additional Details section.
Note: For an example of how each type of graph charts data,
see
Selecting a Graph Type.
Scheduling The scheduling options depend on the template type you
have selected.
Manually Using the calendar, select the date. The default is the current
date.
Using the drop-down list boxes, select a time to begin and
end generating the report. Time is available in half-hour
increments. The default is 1:00 a.m.
Hourly Automatically graphs all data from the previous hour.
Daily Choose one of the following options:
• All data from previous 24 hours
• Data of previous day from - Using the drop-down list
boxes, select an hour to begin and end generating the
report. Time is available in half-hour increments. The
default is 1:00 a.m.
Weekly Choose one of the following options:
• All data from previous week
• Data from a previous week - Using the drop-down list
boxes, select the days to begin and end generating the
report. Default is Sunday.
STRM Log Management Users Guide
Page 87

Creating a Report 81
Table 5- 7 Time Series Chart Container Details (continued)
Parameter Description
Monthly Choose one of the following options:
• All data from previous month
• Data from a previous month - Using the drop-down list
boxes, select the dates to begin and end generating the
report. Default is 1st to 31st.
Additional Details
Timeline Interval Using the drop-down list box, select the time interval. Options
are based on the schedule selected. For example, a weekly
report supports intervals of one hour, one day, and one
week. A monthly report supports intervals of one day, one
week, and one month.
Baseline This option only appears if you select a base line type graph
type. Choose one of the following options:
• Individual Baseline - Creates individual baselines for
each object on the chart.
Note: This option can create many lines on chart.
• Aggregate Baseline - Creates a single baseline for the
the aggregate of all objects on the chart. Aggregate
Baseline is default.
Graph Content
Network Location Select the check box for each network you wish to chart data
for. You must select at least one network location.
View Objects Using the drop-down list box, select the events object.
Layers Using the drop-down list box, select the layer you wish to
appear on the graph. The layer options that appear depends
on the View Objects. The layer also determines the average
per second availability.
Options
Average per second Select the check box to graph the average of all objects that
are selected.
Aggregate Selected
Objects
Select the check box to graph the sum of all (view) objects or
networks that are selected.
Graph Select one of the following:
• View Objects - Displays the top view objects selected.
• Networks - Displays the top networks associated with the
view objects you have selected.
STRM Log Management Users Guide
Page 88

82 MANAGING REPORTS
Table 5-7 Time Series Chart Container Details (continued)
Parameter Description
Expand To Include Using the drop-down list box, select an option to include on
the graph. Options include:
• None - View Objects and Network Locations are graphed
exactly as shown in the View Object tree menu. This is the
default setting.
• Group - Expands chart to include Groups of a Network
Location or View Object, if the high level object is
selected.
• Leaves - Expands chart to include Network Location
leaves or View Object if the high level object is selected.
Note: Use this option to select only the Top of the Network
Location or a View Object, and display data for the groups, or
leaves. This is dependent also on the Graph Top Items
option.
Note: If you select View Objects in the Graph Top Items
option, and select Expand to include Group, this expands the
chart to include the groups for the specific View Object
selected.
TopN Time Series
The TopN Time Series chart allows you to create TopN charts for any data that
STRM Log Management logs over time. For example, you can create an Executive
Chart to represent the Top 5 Event Categories.
STRM Log Management Users Guide
Page 89

Creating a Report 83
Enter values for the following parameters:
Table 5- 8 TopN Time Series Container Details
Parameter Description
Container Details - TopN Time Series Chart
Chart Title Specify a chart title to a maximum of 100 characters.
Chart Sub-Title Clear the check box to change the automatically created sub-title.
Enter a title to a maximum of 100 characters.
Graph Type Using the drop-down list box, select the type of graph you wish to
appear on your report. Options include:
• HorizontalBar
• Pie
• Table (full page width only)
Scheduling The scheduling options depend on the chosen chart type.
Manually Using the calendar, select the date. The default is the current date.
Using the drop-down list boxes, select a time to begin and end
generating the report. Time is available in half-hour increments.
The default is 1:00 a.m.
Hourly Automatically graphs all data from the previous hour.
Daily Choose one of the following options:
• All data from previous 24 hours
• Data of previous day from - Using the drop-down list boxes,
select an hour to begin and end generating the report. Time is
available in half-hour increments. The default is 1:00 a.m.
Weekly Choose one of the following options:
• All data from previous week
• Data from a previous week - Using the drop-down list boxes,
select the days to begin and end generating the report. Default
is Sunday.
Monthly Choose one of the following options:
• All data from previous month
• Data from a previous month - Using the drop-down list boxes,
select the dates to begin and end generating the report. Default
is 1st to 31st.
Graph Content
Network Location Select the check box for each network you wish to chart the data.
You can select all networks or click the expand option to select
network groups or leaved.
View Objects Using the drop-down list box, select the View Object that
represents the type of data you wish to display. You can graphs the
number of events for the selected event categories within a
specified interval. You can sort the events by the severity,
credibility, and relevance layer.
STRM Log Management Users Guide
Page 90

84 MANAGING REPORTS
Table 5-8 TopN Time Series Container Details (continued)
Parameter Description
Layers Using the drop-down list box, select the traffic layer you wish to
appear on the graph. The layer options that appear depends on the
selected View Objects.
Options
Average per
second
Select the check box to graph the average of the selected (view)
objects for the chart.
Graph top items Using the drop-down list box, select the number of items to include
on graphs, then select one of the following:
• View Objects - Displays the top view objects selected.
• Networks - Displays the top networks associated with the view
objects you have selected.
Expand To Include Using the drop-down list box, select an option to include on the
graph. Options include:
• None - View Objects and Network Locations are graphed
exactly as shown in the View Object tree menu. This is the
default setting.
• Group - Expands chart to include Groups of a Network Location
or View Object, if the high level object is selected.
• Leaves - Expands chart to include Network Location leaves or
View Object if the high level object is selected.
Note: Use this option when selecting the Top of the Network
Location or a View Object, and display data for the groups, or
leaves. This is dependent also on the Graph Top Items option.
Note: If you select View Objects in the Graph Top Items option,
and select Expand to include Group, this expands the chart to
include the groups for the specific View Object selected.
STRM Log Management Users Guide
Page 91

Creating a Report 85
Selecting a Graph
Type
Each chart type has a variety of graphs to display your data. The available
selection is dependent on the chart type you have selected. The colors that appear
in the charts that depict network traffic are derived from the network configuration
files. Colors that appear depicting IP addresses are unique.
Table 5-9 provides examples of how STRM Log Management charts your network
and security data:
Table 5- 9 Available Graph Types
Line Graph
Available with the Time Series chart
type.
Stacked Base Line Graph
Available with the Time Series chart
type.
Stacked Line Graph
Available with the Time Series chart
type.
Stacked Bar Base Line Graph
Available with the Time Series chart
type.
Bar Graph
Available with the Time Series chart
type.
STRM Log Management Users Guide
Horizontal Bar Graph
Available with the TopN Time Series
chart.
Page 92
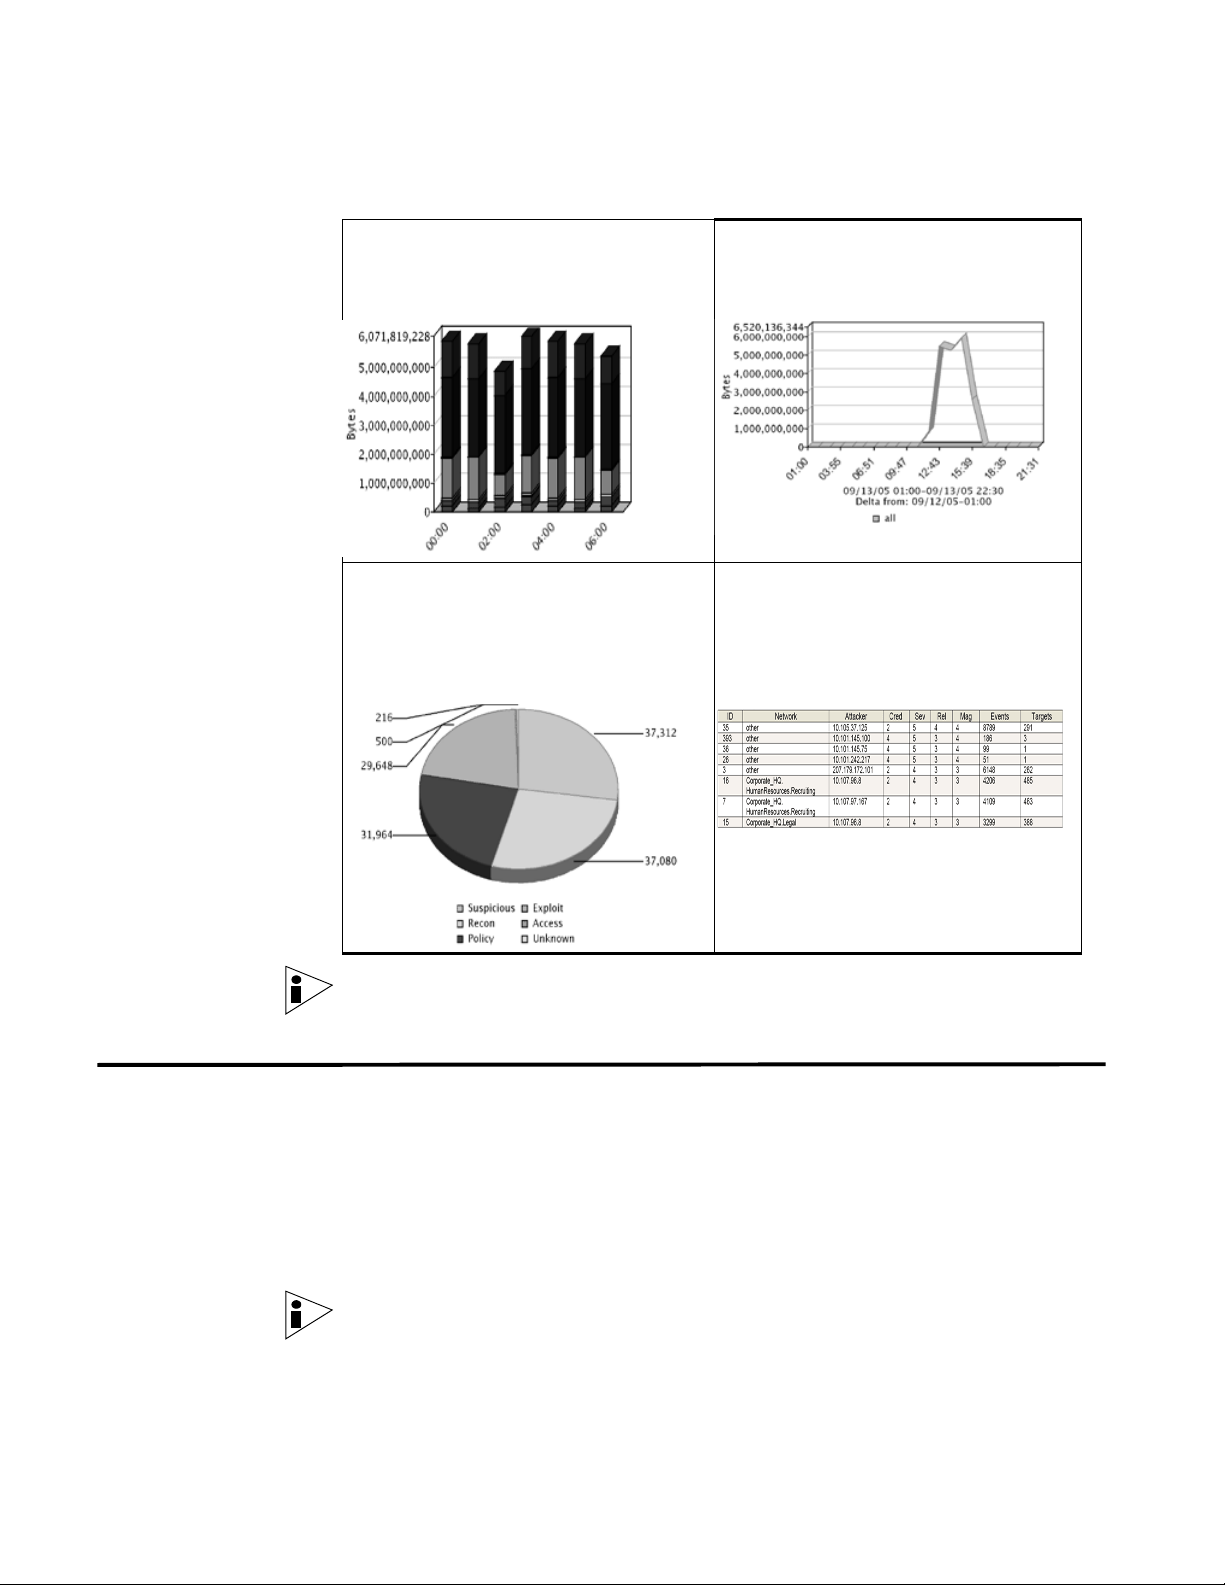
86 MANAGING REPORTS
Table 5-9 Available Graph Types (continued)
Stacked Bar Graph
Available with the Time Series chart
type.
Pie Graph
Available with the following chart type:
• Time Series
• TopN Time Series
Delta Graph
Available with the Time Series chart
type.
Table Graph
Available with the following charts:
• Time Series
• TopN Time Series
Using Default Report Templates
Note: A report designed with content displayed in a table is available only with a
full page width container.
STRM Log Management provides a series of default templates that allows you to
manipulate and customize your data. Default templates are designed for both
executive level and operational level reports.
You can generate a report from any template located in the Report Templates
panel. These templates are also found in the folders within the Report Templates
navigation menu. Templates that do not specify an interval schedule must be
manually generated; others are configured to automatically generate.
Note: By default, report titles that appears with each template has the same name
in the Generated Reports panel. When you re-configure a template and enter a
new report title, your template takes on the new name; however, the original
template remains the same.
STRM Log Management Users Guide
Page 93

Generating a Report 87
Each template is designed to capture and display your existing data. Point your
mouse to any template to preview the summary. The summary reveals how the
template is configured and the type of information the template is configured to
generate.
Note: The STRM Log Management application is configured with the timezone
used during the installation and setup of the application. Please check with your
administrator to ensure your STRM Log Management session is synchronized with
your timezone.
To customize a template:
Step 1 Click the Reports tab.
The Reports interface appears.
Step 2 Click the Report Templates menu option.
A list of templates appears.
Step 3 Point your mouse over the templates and preview the summary information.
Step 4 Double-click the desired template.
The Report Wizard appears.
Generating a Report
Duplicating a Report
Step 5 Make the necessary changes. See Creating a Report.
To generate a report:
Step 1 Click the Reports tab.
The main Reports interface appears.
Step 2 Click the Report Templates menu option.
A list of templates appears.
Step 3 Select the report you wish to generate.
Step 4 Click Generate Report.
The report generates. See Viewing Reports.
To duplicate a report:
Step 1 Click the Reports tab.
The main Reports interface appears.
Step 2 Click the Report Templates menu option.
A list of templates appears.
Step 3 Select the report you wish to duplicate.
Step 4 Click Duplicate.
STRM Log Management Users Guide
Page 94

88 MANAGING REPORTS
The enter a name window appears.
Step 5 Enter a new name, without spaces, for the template.
The new template appears.
Sharing a Report You can share report templates with other users. This allows you to provide a copy
of the selected templates for another user to edit or schedule, as necessary. Once
shared, any updates that the user makes to your shared template does not affect
your version of the template.
Note: You must have administrative privileges to share templates. Also, for a new
user to view and access report templates, an administrative user must share all the
necessary reports with the new user.
To share a template:
Step 1 Click the Reports tab.
The main Reports interface appears.
Step 2 Click the Report Templates menu option.
A list of templates appears.
Branding Your Report
Step 3 Select the report(s) you wish to share.
Step 4 Click Share.
The Share Templates window appears.
Step 5 From the list of users, select the user(s) you wish to share this report template
with.
Note: If no users with appropriate access are available, a message appears.
Step 6 Click Share.
The report template is now shared.
You can import logos and specific images to brand your reports. Report branding
is beneficial for your enterprise if you support more than one logo. When uploading
your images to STRM Log Management, the image is automatically saved as a
Portable Network Graphic (PNG). We recommend that you use graphics 144 x 50
pixels with a white background.
To brand your report:
Step 1 Click the Reports tab.
The main Reports interface appears.
Step 2 Click Branding.
The Branding window appears:
STRM Log Management Users Guide
Page 95

Branding Your Report 89
Step 3
Step 4 Select the file that contains the desired logo. Click Open.
Click Browse to browse the files located on your system.
The file name appears in the New Image field.
Step 5 Click Upload Image to upload the image to STRM Log Management.
Note: To make sure your browser displays the new logo, clear your browser
cache.
Step 6 Select the logo you wish to use as the default and click Set Default Image. This
logo appears as the first option using the drop-down menu in the Specify Content
window of the Report Wizard.
Note: If you have uploaded an image that is larger in length than the report header
can support, the image automatically resizes to fit the header; this is approximately
50 pixels in height.
STRM Log Management Users Guide
Page 96

Page 97

DEFAULT RULES AND BUILDING
A
B
LOCKS
This appendix provides the defaults for the rules and building blocks including:
• Default Rules
• Default Building Blocks
Default Rules Default rules include:
Table B-6 Default Rules
Rule
Rule Group
Default-Rule-Anomaly:
Devices with High Event
Rates
Default-Rule-Anomaly:
Excessive Database
Connections
Default-RuleAnomaly: Excessive
Firewall Accepts Across
Multiple Hosts
Default-RuleAnomaly: Excessive
Firewall Denies from
Single Source
Default-RuleAnomaly: Potential
Honeypot Access
Anomaly Event False Monitors devices for high event rates. Typically,
Anomaly Event True Reports an excessive number of successful
Anomaly Event True Reports excessive firewall accepts across
Anomaly Event True Reports excessive firewall denies from a single
Anomaly Event False Reports an event that was targeting or sourced
Type
Enabled Description
the default threshold is low for most networks
and we recommend that you adjust this value
before enabling this rule. To configure which
devices will be monitored, edit the
Default-BB-DeviceDefinition: Devices to Monitor
for High Event Rates building block.
database connections.
multiple hosts. More than 100 events were
detected across at least 100 unique destination
IP addresses in 5 minutes.
host. Detects more than 400 firewall deny
attempts from a single source to a single
destination within 5 minutes.
from a honeypot or tarpit defined address.
Before enabling this rule, you must configure the
Default-BB-HostDefinition: Honeypot like
addresses building block and create the
appropriate sentry from the Network
Surveillance interface.
STRM Log Management Users Guide
Page 98

92 DEFAULT RULES AND BUILDING BLOCKS
Table B- 6 Default Rules (continued)
Rule Group
Default-Rule-
Anomaly Event False Reports a host emitting events at a rate greater
Anomaly: Rate Analysis
Marked Events
Default-Rule-
Anomaly Event False Reports successful logins or access from an IP
Anomaly: Remote
Access from Foreign
Country
Default-Rule-
Authentication Event True Reports a host login message from a disabled
Authentication: Login
Failure to Disabled
Account
Default-Rule-
Authentication Event True Reports a host login failure message from an
Authentication: Login
Failure to Expired
Account
Default-Rule -
Authentication Event True Reports authentication failures on the same
Authentication: Login
Failures Across Multiple
Hosts
Default-Rule-
Authentication Event True Reports multiple log in failures to a single host,
Authentication: Login
Failures Followed By
Success
Default-Rule-
Authentication Event True Reports on events detected by the system when
Authentication: Login
Successful After Scan
Attempt
Default-Rule-
Authentication Event True Reports multiple log in failures to a VoIP PBX.
Authentication: Multiple
VoIP Login Failures
Default-Rule-
Authentication Event True Reports when a source IP address causes an
Authentication:
Repeated Login
Failures, Single Host
Rule
Type
Enabled Description
than normal. This may be normal, but in some
cases can be an early warning sign that the host
has changed behavior. We recommend that you
perform an event search and/or flow search to
determine if the host is exhibiting other
suspicious activity.
address known to be in a country that does not
have remote access right. Before you enable
this rule, we recommend that you configure the
Default-BB-CategoryDefinition: Countries with
no Remote Access building block.
user account. If the user is no longer a member
of the organization, we recommend that you
investigate any other received authentication
messages from the same user.
expired user account known. If the user is no
longer a member of the organization, we
recommend that you investigate any other
received authentication messages.
source IP address more than three times, across
more than three destination IP addresses within
10 minutes.
followed by a successful log in to the host.
at least one of the configured rules is detected
with the same source IP address followed by
successful authentication with the same IP
address, within 30 minutes.
authentication failure event at least seven times
to a single destination within 5 minutes.
STRM Log Management Users Guide
Page 99

Table B-6 Default Rules (continued)
Rule Group
Default-Rule-Botnet:
Botnet,Exploit Event False Reports a host connecting or attempting to
Potential Botnet
Connection (DNS)
Default-Rule-Botnet:
Botnet Event True Reports a host connecting or attempting to
Potential Botnet
Connection (IRC)
Default-Rule-
Compliance Event False Reports compliance-based events, such as,
Compliance:
Compliance Events
Become Offenses
Default-Rule-
Compliance Event False Reports excessive authentication failures to a
Compliance: Excessive
Failed Logins to
Compliance IS
Default-Rule-Database:
Database Event True Reports when a configuration modification is
Attempted Configuration
Modification by a remote
host
Default-Rule-Database:
Database Event True Reports when several authentications to a
Concurrent Logins from
Multiple Locations
Default-Rule-Database:
Database Event True Reports when there are failures followed by the
Failures Followed by
User Changes
Default-Rule-Database:
Database Event True Monitors changes to groups on a database
Groups changed from
Remote Host
Default-Rule-Database:
Database Event True Reports when there are multiple database
Multiple Database
Failures Followed by
Success
Default-Rule-Database:
Database Event True Increases the severity of a failed login attempt to
Remote Login Failure
Rule
Type
Default Rules 93
Enabled Description
connect to a DNS server on the Internet. This
may indicate a host connecting to a Botnet. The
host should be investigated for malicious code.
Do not enable this rule until you have tuned the
Default-BB-HostDefinition: DNS Servers building
block.
Note: Laptops that include wireless adapters
may cause this rule to generate alerts since the
laptops may attempt to communicate with
another IDPs DNS server. If this occurs, define
the ISPs DNS server in the
Default-BB-HostDefinition: DNS Servers building
block.
connect to an IRC server on the Internet. This
may indicate a host connecting to a Botnet. The
host should be investigated for malicious code.
clear text passwords.
compliance server within 10 minutes.
attempted to a database server from a remote
network.
database server occur across many remote IP
addresses.
addition or change of a user account.
when the change is initiated from a remote
network.
failures followed by a success within a short
period of time.
a database from a remote network.
STRM Log Management Users Guide
Page 100

94 DEFAULT RULES AND BUILDING BLOCKS
Table B- 6 Default Rules (continued)
Rule Group
Default-Rule-Database:
Database Event True Reports when a successful authentication
Remote Login Success
Default-Rule-Database:
Database Event True Reports when changes to user privileges occurs
User Rights Changed
from Remote Host
Default-Rule-DDoS
D\DoS Event False Reports network Distributed Denial of Service
Attack Detected
Default-Rule-DoS:
D\DoS Event True Reports network Denial of Service (DoS) attacks
Network DoS Attack
Detected
Default-Rule-DoS:
D\DoS Event True Reports a DoS attack against a local target that
Service DoS Attack
Detected
Default-Rule-Exploit:
Exploit Event False Reports an exploit or attack type activity from a
Exploit Followed by
Suspicious Host Activity
Default-Rule-Exploit:
Exploit Event True Reports a source IP address generating multiple
Exploit/Malware Events
Across Multiple Targets
Default-Rule-Exploit:
Exploit Event True Reports a target attempting to be exploited using
Multiple Exploit Types
Against Single target
Default-Rule-Exploit:
Exploit Event False Reports multiple failed logins to your VoIP
Potential VoIP Toll
Fraud
Default-Rule-Exploit:
Exploit Event True Reports reconnaissance followed by an exploit
Recon followed by
Exploit
Default-Rule-False
False Positive Event True Reports events that include false positive rules
Positive: False Positive
Rules and Building
Blocks
Rule
Type
Enabled Description
occurs to a database server from a remote
network.
to a database from a remote network.
(DDoS) attacks on a system.
on a system.
is known to exist and the target port is open.
source IP address followed by suspicious
account activity on the destination host within 15
minutes.
(at least 5) exploits or malicious software
(malware) events in the last 5 minutes. These
events are not targeting hosts that are
vulnerable and may indicate false positives
generating from a device.
multiple types of attacks from one or more
attackers.
hardware followed by sessions being opened. At
least 3 events were detected within 30 seconds.
This action could indicate that illegal users are
executing VoIP sessions on your network.
from the same source IP address to the same
destination port within 1 hour.
and building blocks, such as,
Default-BB-FalsePositive: Windows Server
False Positive Events. Events that match the
above conditions are stored but also dropped. If
you add any new building blocks or rules to
remove events from becoming offenses, you
must add these new rules or building blocks to
this rule.
STRM Log Management Users Guide
 Loading...