

Page 1
PC Evaluation Software
PCA3000
B 70.9701.0
Operating Manual
07.06/00420775
Page 2

H
An eLearning course on the PC Evaluation software PCA3000 is provided
for you on the Internet. The course gives you step-by-step instructions on
how to use the PCA3000 to evaluate measurement data. The most important software functions are also illustrated.
The course is available free of charge, and no license is needed.
For more information visit: http://eLearning.jumo.info
Page 3

Contents
1 Introduction 7
1.1 Preface .......................................................................................................... 7
1.2 Typographical conventions ......................................................................... 8
2 PC Evaluation Software 11
2.1 General ........................................................................................................ 11
2.2 Instruments with FDA compliance ........................................................... 11
2.3 Hardware and software requirements ...................................................... 12
3 Installation 13
3.1 Starting the installation .............................................................................. 13
4 Log-in to the program 17
5 User interface 19
5.1 Elements of the user interface .................................................................. 19
6Guide 21
6.1 Introduction ................................................................................................ 21
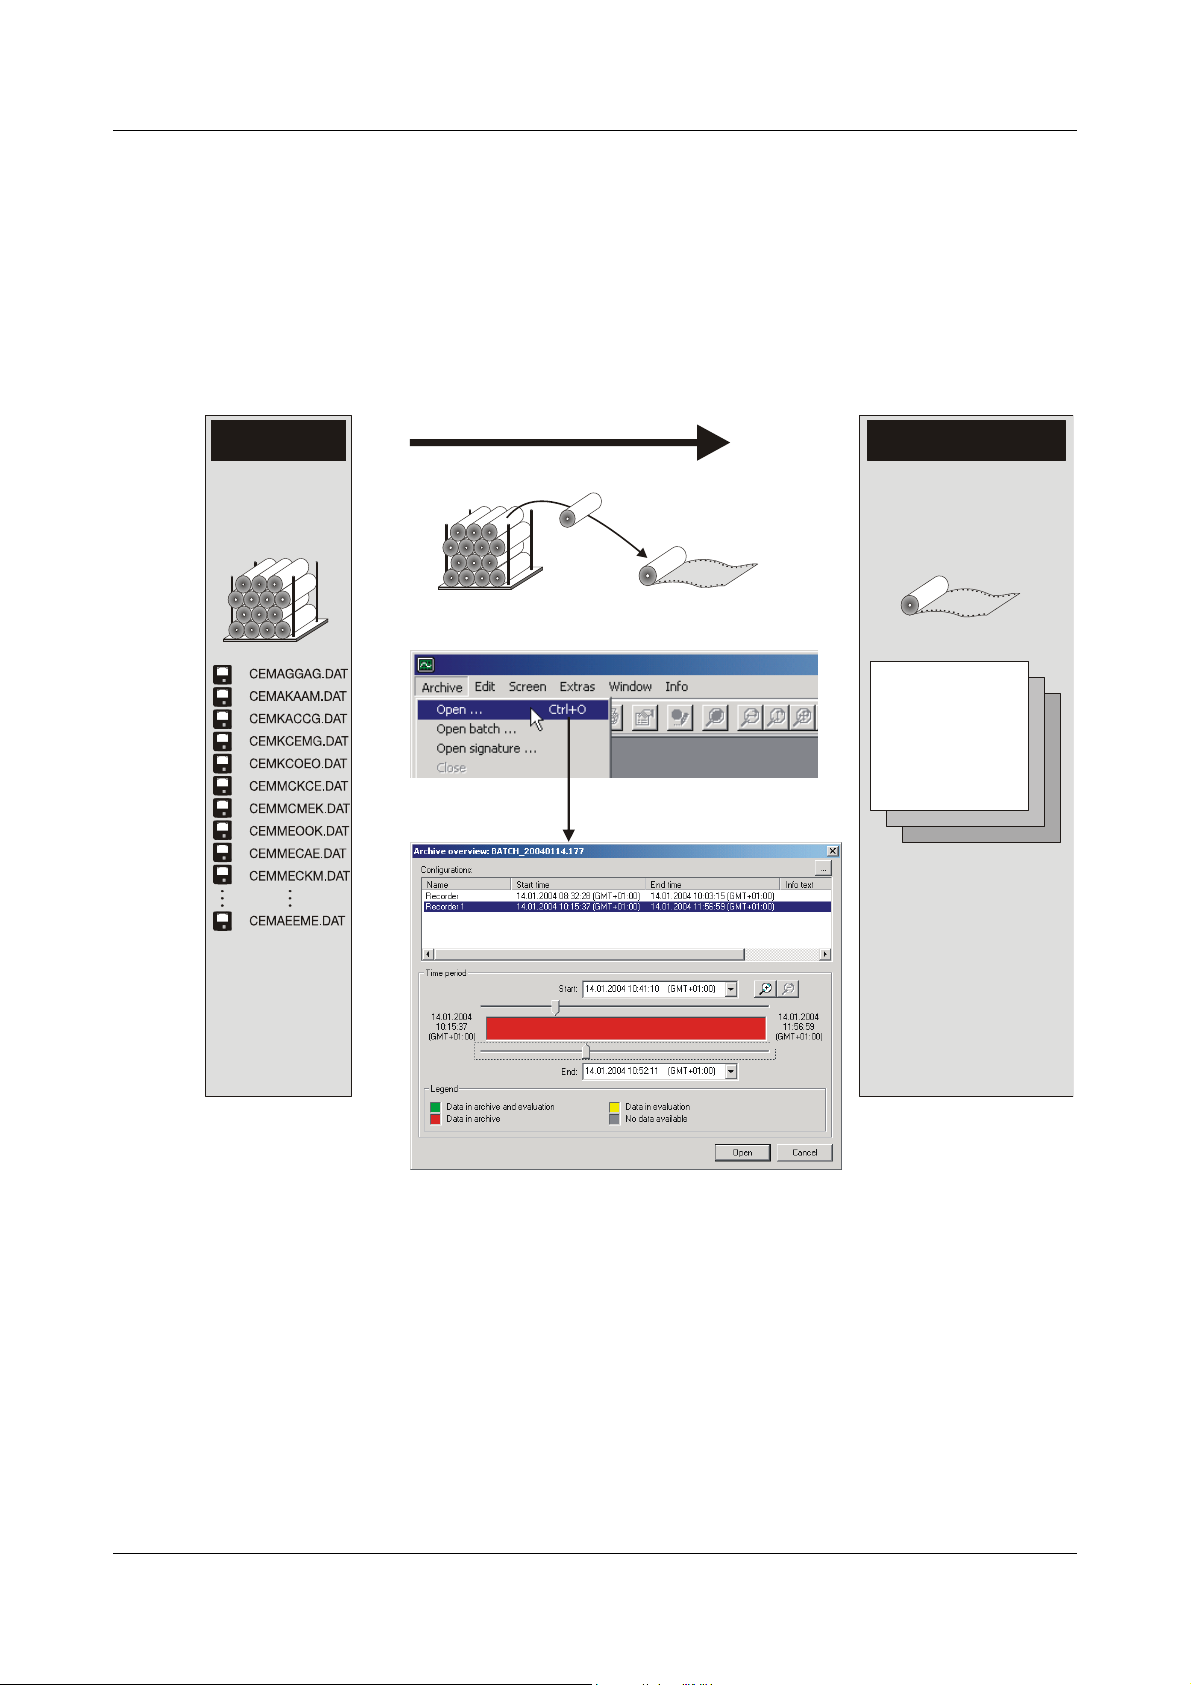
6.2 Reading in data ........................................................................................... 22
6.3 Opening the archive ................................................................................... 24
6.3.1 Selecting the time period ............................................................................. 26
6.4 Backing up data ......................................................................................... 28
6.5 Archive and evaluation directory .............................................................. 31
7 Evaluation - General 33
8 Evaluation - Graphics area 35
9 Evaluation - Table area 41
9.1 Switching registers into/out of display .................................................... 42
Page 4

Contents
9.2 Channels ..................................................................................................... 45
9.2.1 The functions of the left mouse button ........................................................ 46
9.2.2 Displays (cannot be altered directly) ............................................................ 47
9.2.3 The functions of the right mouse button ...................................................... 48
9.3 Report .......................................................................................................... 49
9.3.1 The functions of the left mouse button ........................................................ 49
9.3.2 The functions of the right mouse button ...................................................... 51
9.4 Events .......................................................................................................... 53
9.4.1 The functions of the left mouse button ........................................................ 53
9.4.2 The functions of the right mouse button ...................................................... 53
9.5 Audit trail ..................................................................................................... 56
9.5.1 The functions of the left mouse button ........................................................ 56
9.5.2 The functions of the right mouse button ...................................................... 56
9.6 Batches ....................................................................................................... 58
9.6.1 The functions of the left mouse button ........................................................ 58
9.6.2 The functions of the right mouse button ...................................................... 58
9.7 Batch signature (PC signature for batches) ............................................ 62
9.7.1 The functions of the left mouse button ........................................................ 62
9.7.2 The functions of the right mouse button ...................................................... 62
9.8 Log-off signature (PC signature for time period) .................................... 64
9.8.1 The functions of the left mouse button ........................................................ 64
9.8.2 The functions of the right mouse button ...................................................... 64
9.9 Analog: Group... .......................................................................................... 65
9.9.1 The functions of the left mouse button ........................................................ 65
9.9.2 The functions of the right mouse button ...................................................... 65
9.10 Digital: Group... ........................................................................................... 66
9.11 Printing ........................................................................................................ 67
9.12 Data export ................................................................................................. 70
10 Menu functions and toolbar 73
10.1 Archive ......................................................................................................... 73
10.2 Editing ......................................................................................................... 78
10.3 Zoom ........................................................................................................... 80
10.4 View ............................................................................................................. 81
10.5 Extras .......................................................................................................... 81
Page 5

Contents
10.6 Window ........................................................................................................ 82
10.7 Info ............................................................................................................... 83
11 Options at program start 85
12 Index 87
Page 6

Contents
Page 7

1.1 Preface
B
1 Introduction
Please read this operating manual before commissioning the software. Keep
the manual in a place that is accessible to all users at all times.
Please assist us to improve this operating manual, where necessary.
Your comments will be appreciated.
However, if any difficulties should arise during start-up, please do
H
not carry out any unauthorized manipulations. You could endanger
your rights under the instrument warranty!
Please contact the nearest subsidiary or the head office in such a
case.
7
Page 8

1 Introduction
1.2 Typographical conventions
Warning signs
The symbols for Danger and Caution are used in this manual under the
following conditions:
Caution
This symbol is used when there may be damage to equipment or data if the
A
Note signs
instructions are ignored or not followed correctly!
Note
H
v
1
abc
h
This symbol is used when your special attention is drawn to a remark.
Reference
This symbol refers to further information in other manuals, chapters or
sections.
Footnote
Footnotes are remarks that refer to specific points in the text. Footnotes
consist of two parts:
A marker in the text, and the footnote text.
The markers in the text are arranged as continuous superscript numbers.
Action
This symbol indicates that an action to be performed is described.
The individual steps are marked by this asterisk, e.g.
h Press the
h Confirm with
h key
E
8
Page 9

Representation
1 Introduction
Keys
h + E
!
Edit
device data
Keys are shown in a box. Both symbols and text are possible. If a key has a
multiple function, then the text shown is the one that corresponds to the
function that is active at the moment.
Menu items
Menu items in the software which are referred to in this manual are shown in
italics. Menu name, menu item and submenu item are separated from each
other by “
!”.
9
Page 10

1 Introduction
10
Page 11

2.1 General
2 PC Evaluation Software
The PC Evaluation software (PCA3000) is used for archiving and evaluating
data (including device audit trail data, if available). In the software, an
electronic signature can be attached to the archived data.
The PCA3000 is on a CD, together with:
- PCA Communications software (PCC),
- Setup software (only for specific instruments) and
- Documentation in the form of PDF files.
PCA3000 can be used for data from different instruments.
H
Differences may occur between the operating manual and
the individual instrument-specific functions.
2.2 Instruments with FDA compliance
The CD also contains:
- PC Security Manager software (PCS) and
- PC Audit Trail Manager software (PCAT).
For instruments with an increased security level, the software is freely available on the Internet in “read-only” mode (PCA3000 viewer), for purposes of
FDA inspection and checking.
Anybody who has been authorized by the administrator is allowed to start
and use PCA3000. The administrator uses the PC Security Manager software (PCS) to allocate authorizations.
PCA3000 is installed in conjunction with the installation of the PC
Security Manager software (PCS). In this case, the installation will be
different from the installation procedure described in Chapter 3
“Installation”.
11
Page 12

2 PC Evaluation Software
2.3 Hardware and software requirements
The following hardware and software requirements have to be met for installing and operating the software:
Minimum
configuration
Recommended
configuration
- Intel Pentium
-Microsoft Windows
- 256Mbyte main memory,
-CD drive,
-mouse,
- one free serial interface or network connection or CompactFlash memory
cards (depending on the type of data transmission to the recorder) and
- 120Mbyte free space on hard disk.
- Intel Pentium 4
-Windows XP
- 512Mbyte main memory
- 2Gbyte free space on hard disk for data
1
III or higher,
2
2000 or XP,
12
1. Intel and Pentium are registered trademarks of the Intel Corporation
2. Microsoft and Windows are registered trademarks
of the Microsoft Corporation
Page 13
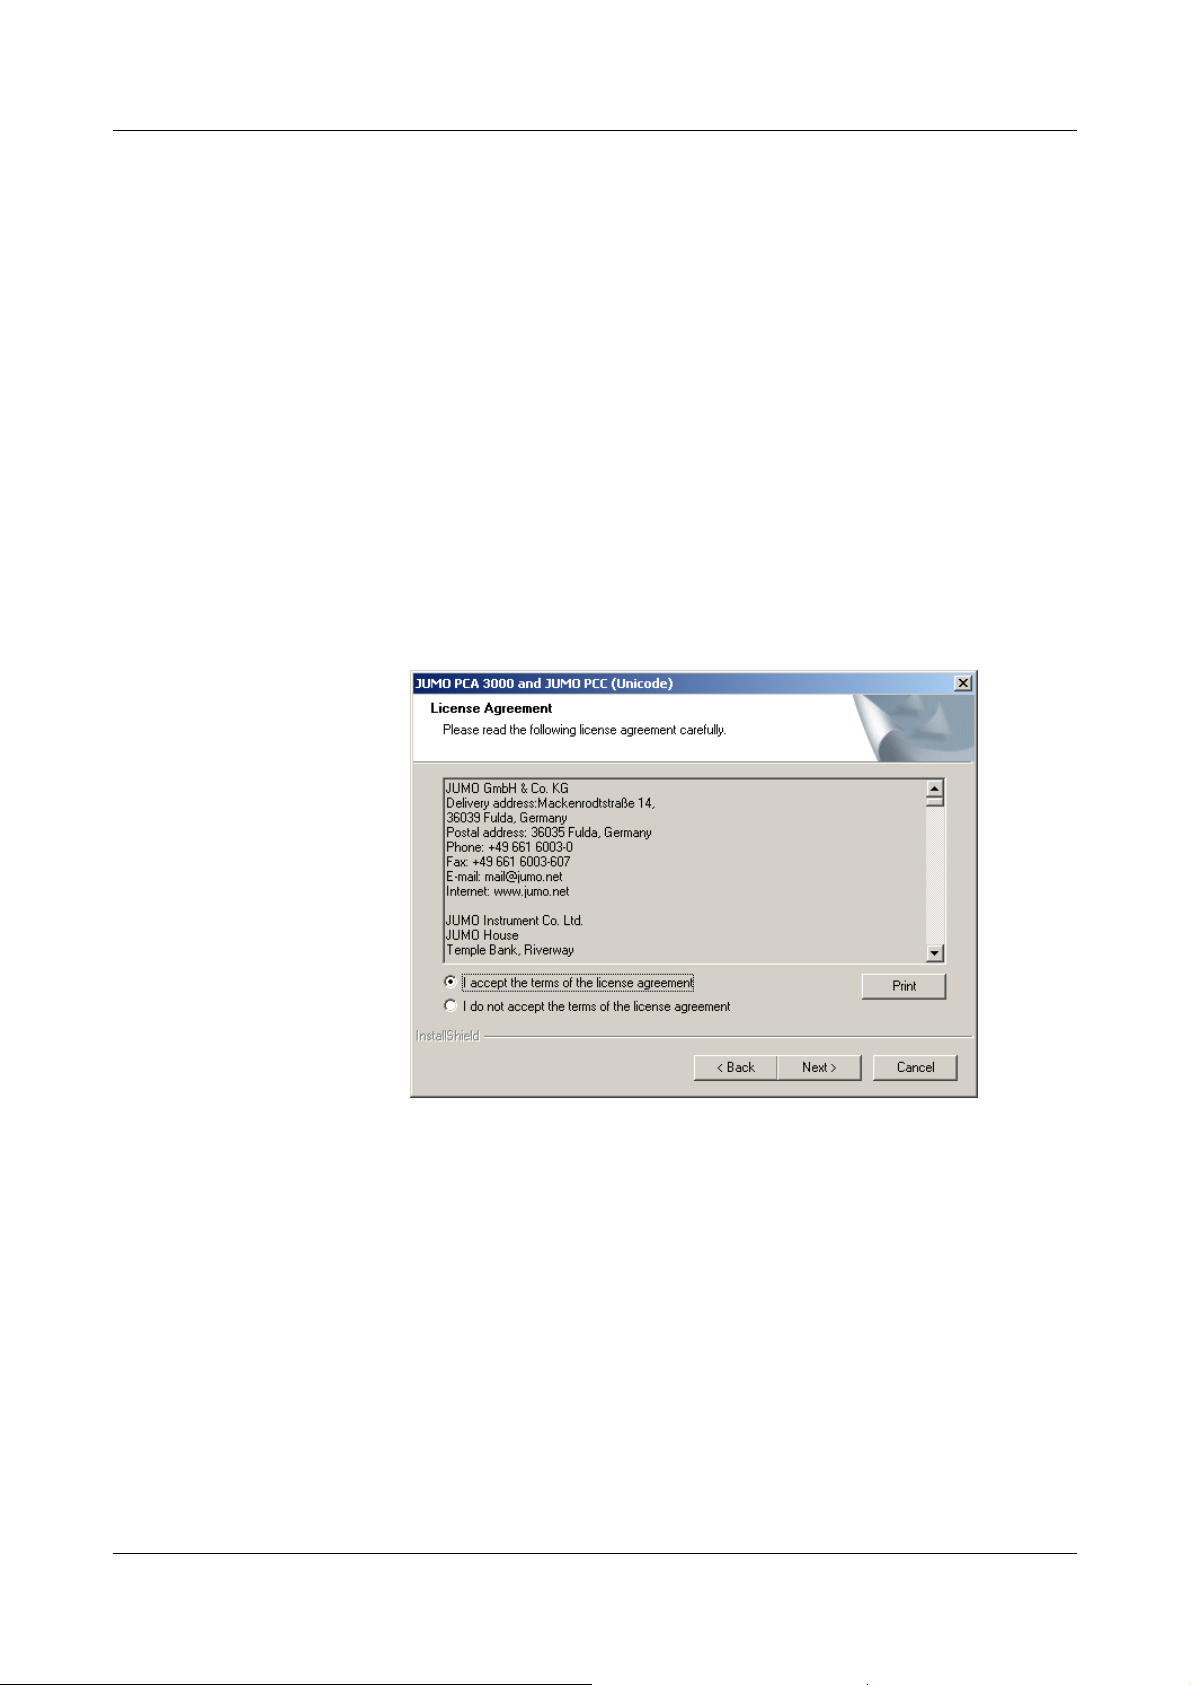
3.1 Starting the installation
3 Installation
Running the
installation
program
License
agreement
h Start Microsoft Windows
If Microsoft Windows has already been started, all Windows
H
h Insert CD into the disk drive, then close it.
After the CD has been inserted, the installation program starts automatically, if
not, proceed as follows:
h Start the file “Launch.exe” in the main directory of the CD.
Screen messages from the installation program will now lead you through the
rest of the installation.
h Read and confirm the license agreement. Accepting the agreement is the
basic precondition to be able to install the software.
programs have to be shut down before installing the setup
program.
13
Page 14
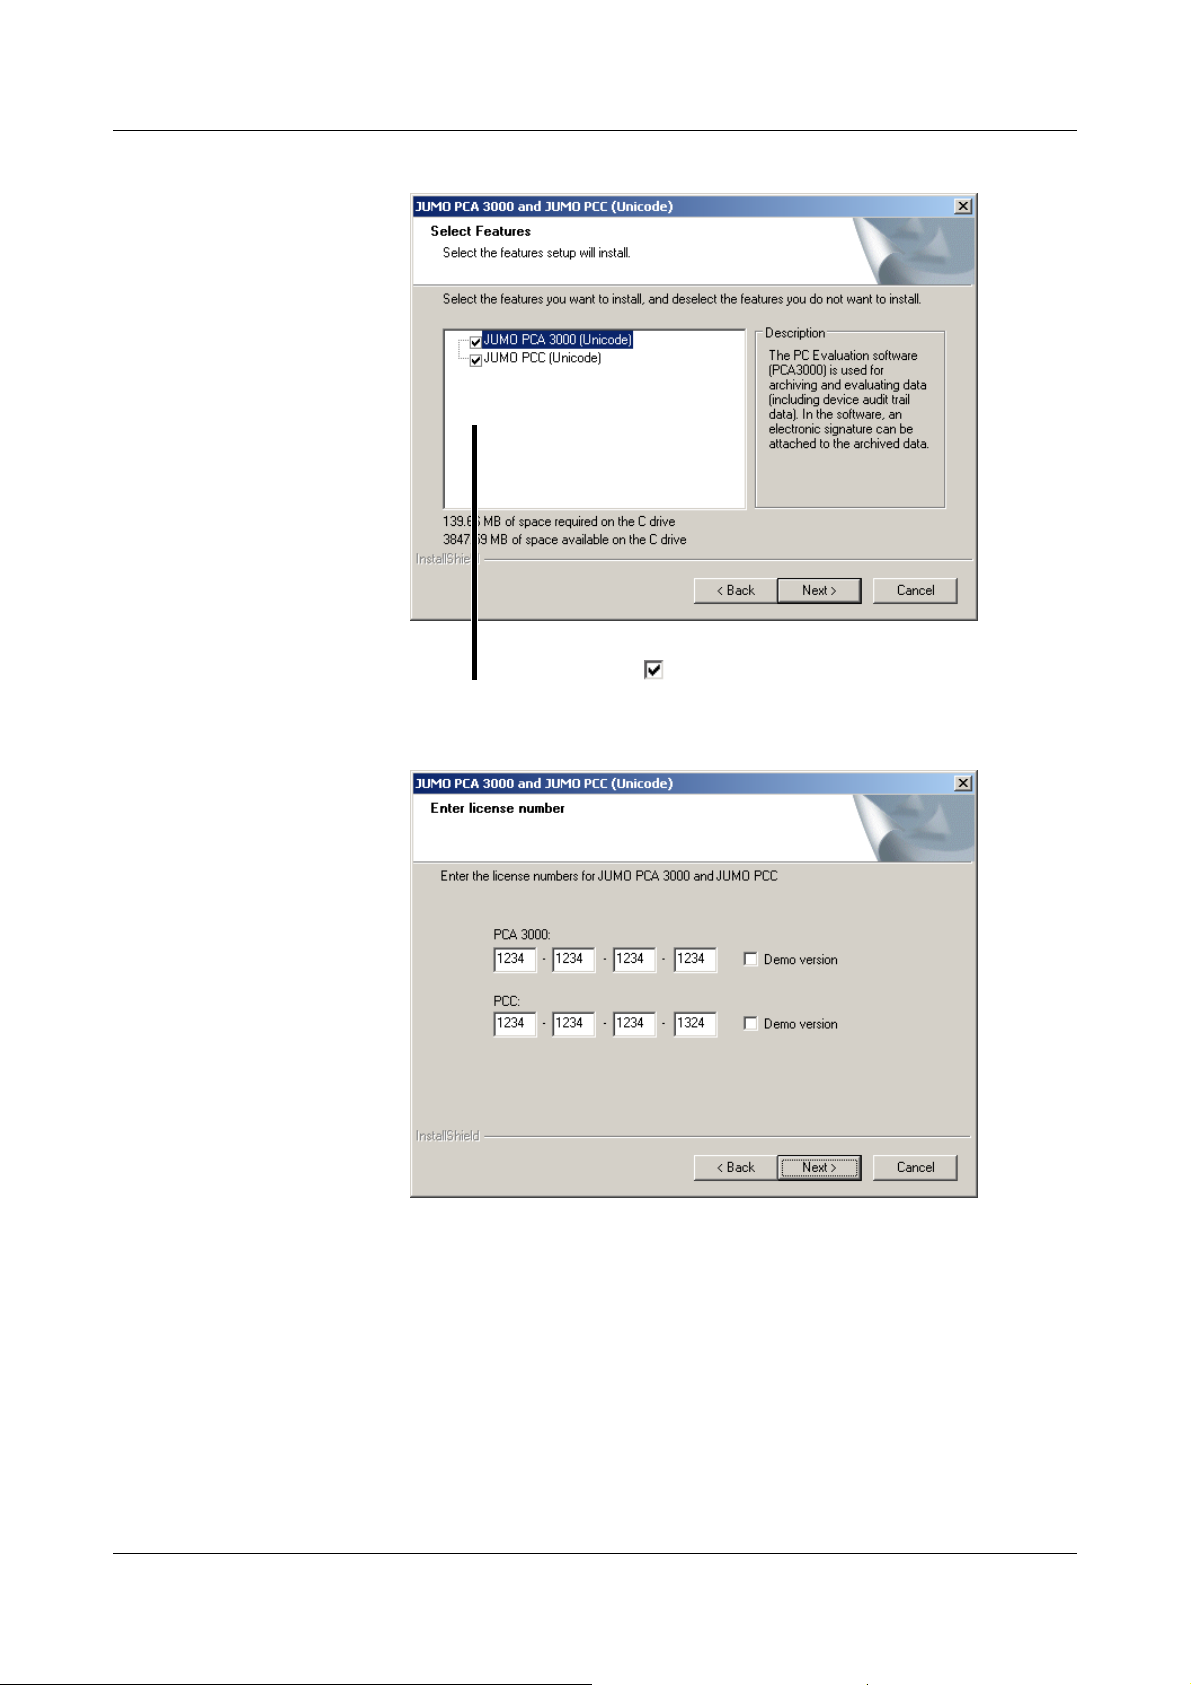
3 Installation
Available
software
License number h Now enter the required license numbers.
h Select the components that need to be installed.
Software that is to be installed must be
marked by a tick ( ).
If the “demo version” option (viewer mode) has been set during
H
Program folder Define the program folder into which the icons for starting the software are to
be copied. The directory for the program files is determined automatically.
14
installation, then some functions of this software (such as data
transmission, saving data, printing out) will be disabled.
The software can be licensed at a later stage.
Page 15

3 Installation
Installing h The final action is to click the button, to initiate the actual
installation.
Program start The selected software components will now be installed. When the installation
has been completed, start the PC Evaluation software (PCA3000) via the
Windows start menu.
15
Page 16

3 Installation
16
Page 17
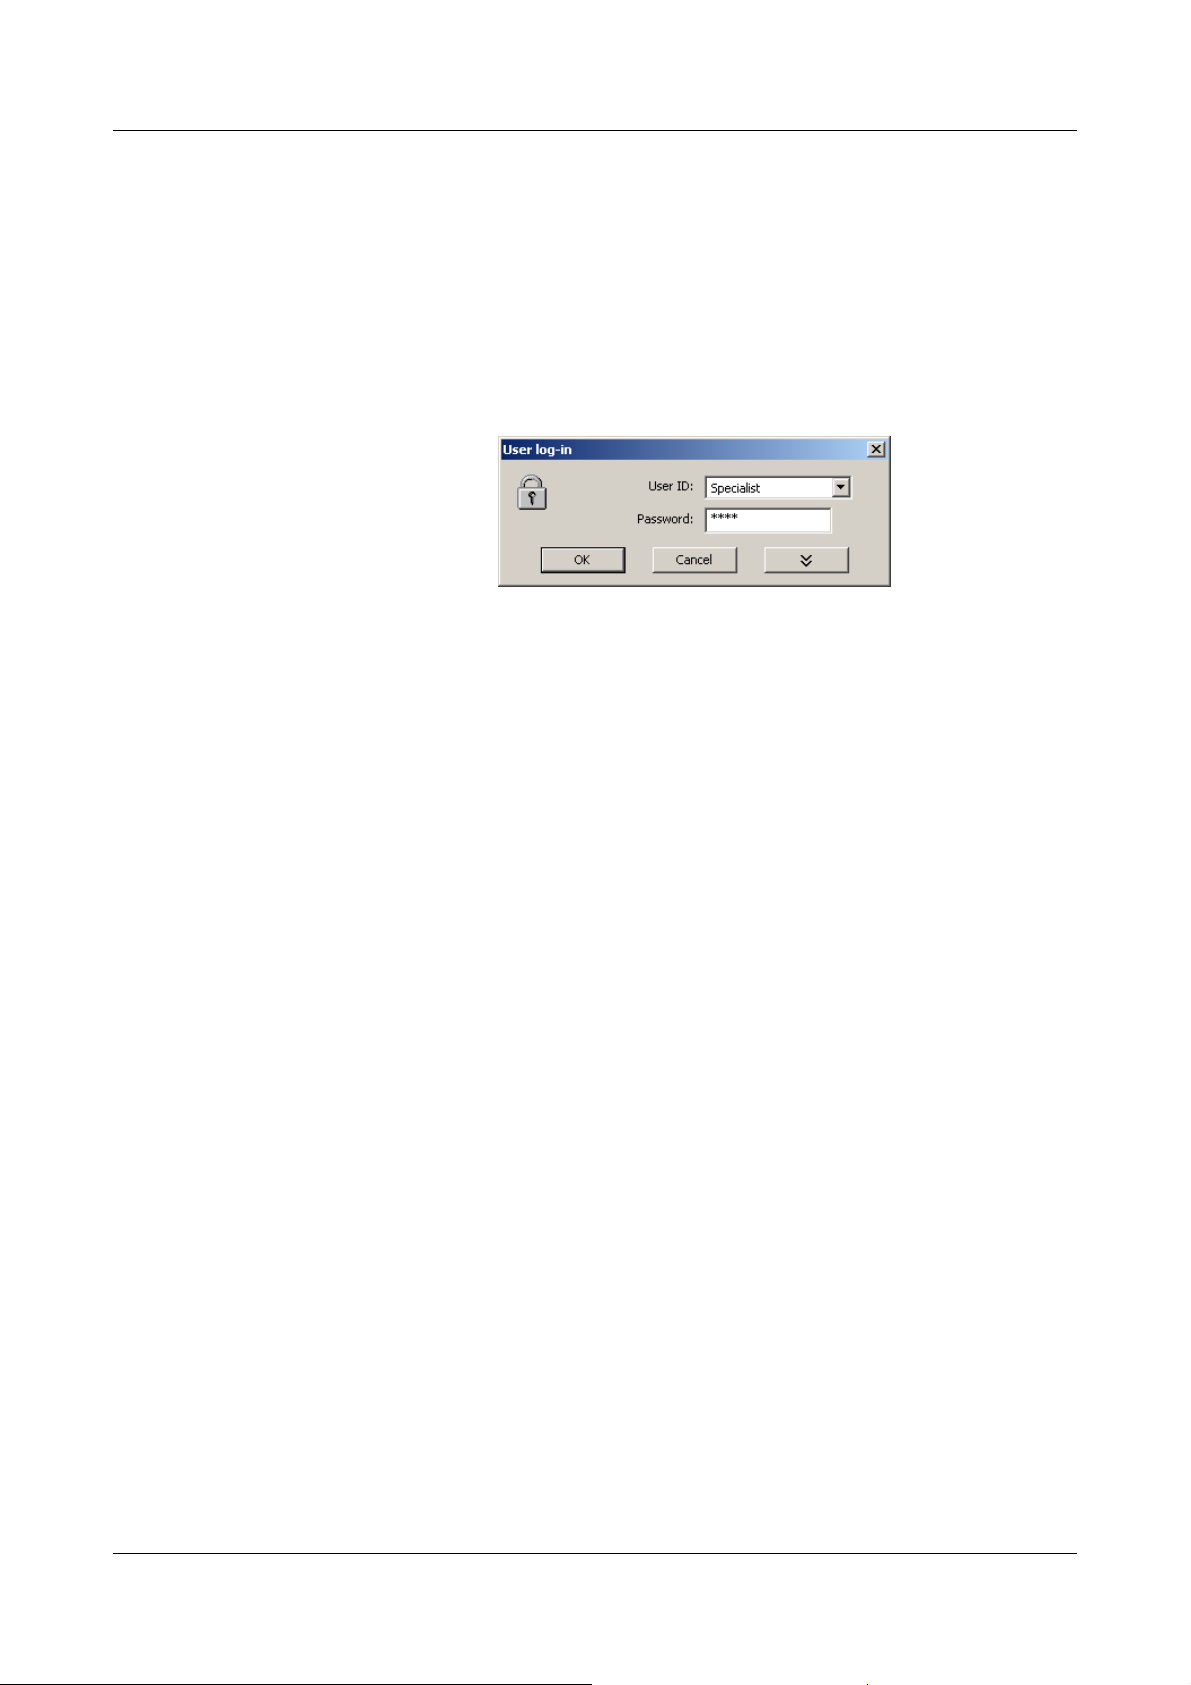
4 Log-in to the program
When the program is installed for the first time, there will be no query of the
user name and password. The query at the program start can be activated in
the Extras menu, by using the function Renew log-in / Alter password.
By activating the log-in function, it is possible to distinguish between the
“Specialist” and “Maintenance” users. These users have different authorizations with regard to the functions of the setup program.
v “Renew log-in / alter password” on page 81
When the query has been activated, proceed as follows:
h Log in.
17
Page 18

4 Log-in to the program
18
Page 19
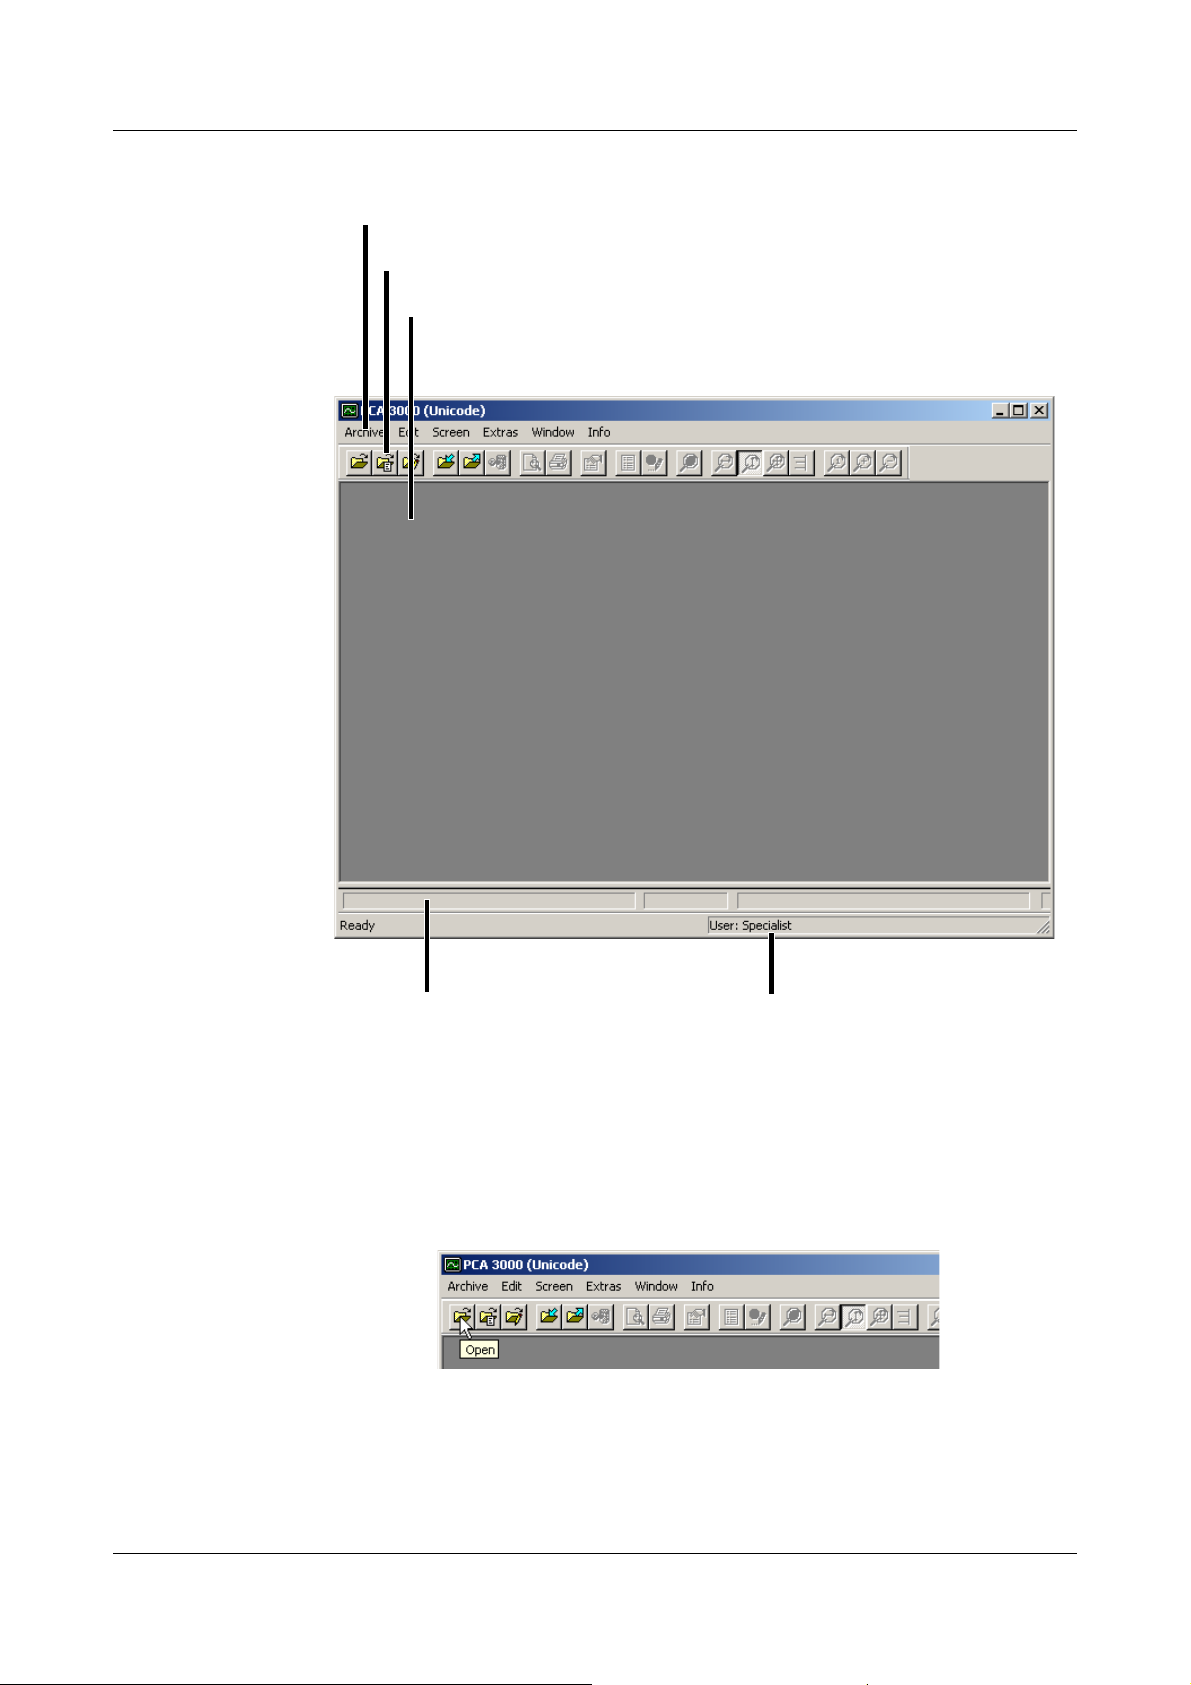
5.1 Elements of the user interface
Menu bar
To ol b ar
Working area for representation of process data
5 User interface
Details of the currently
Coordinate bar
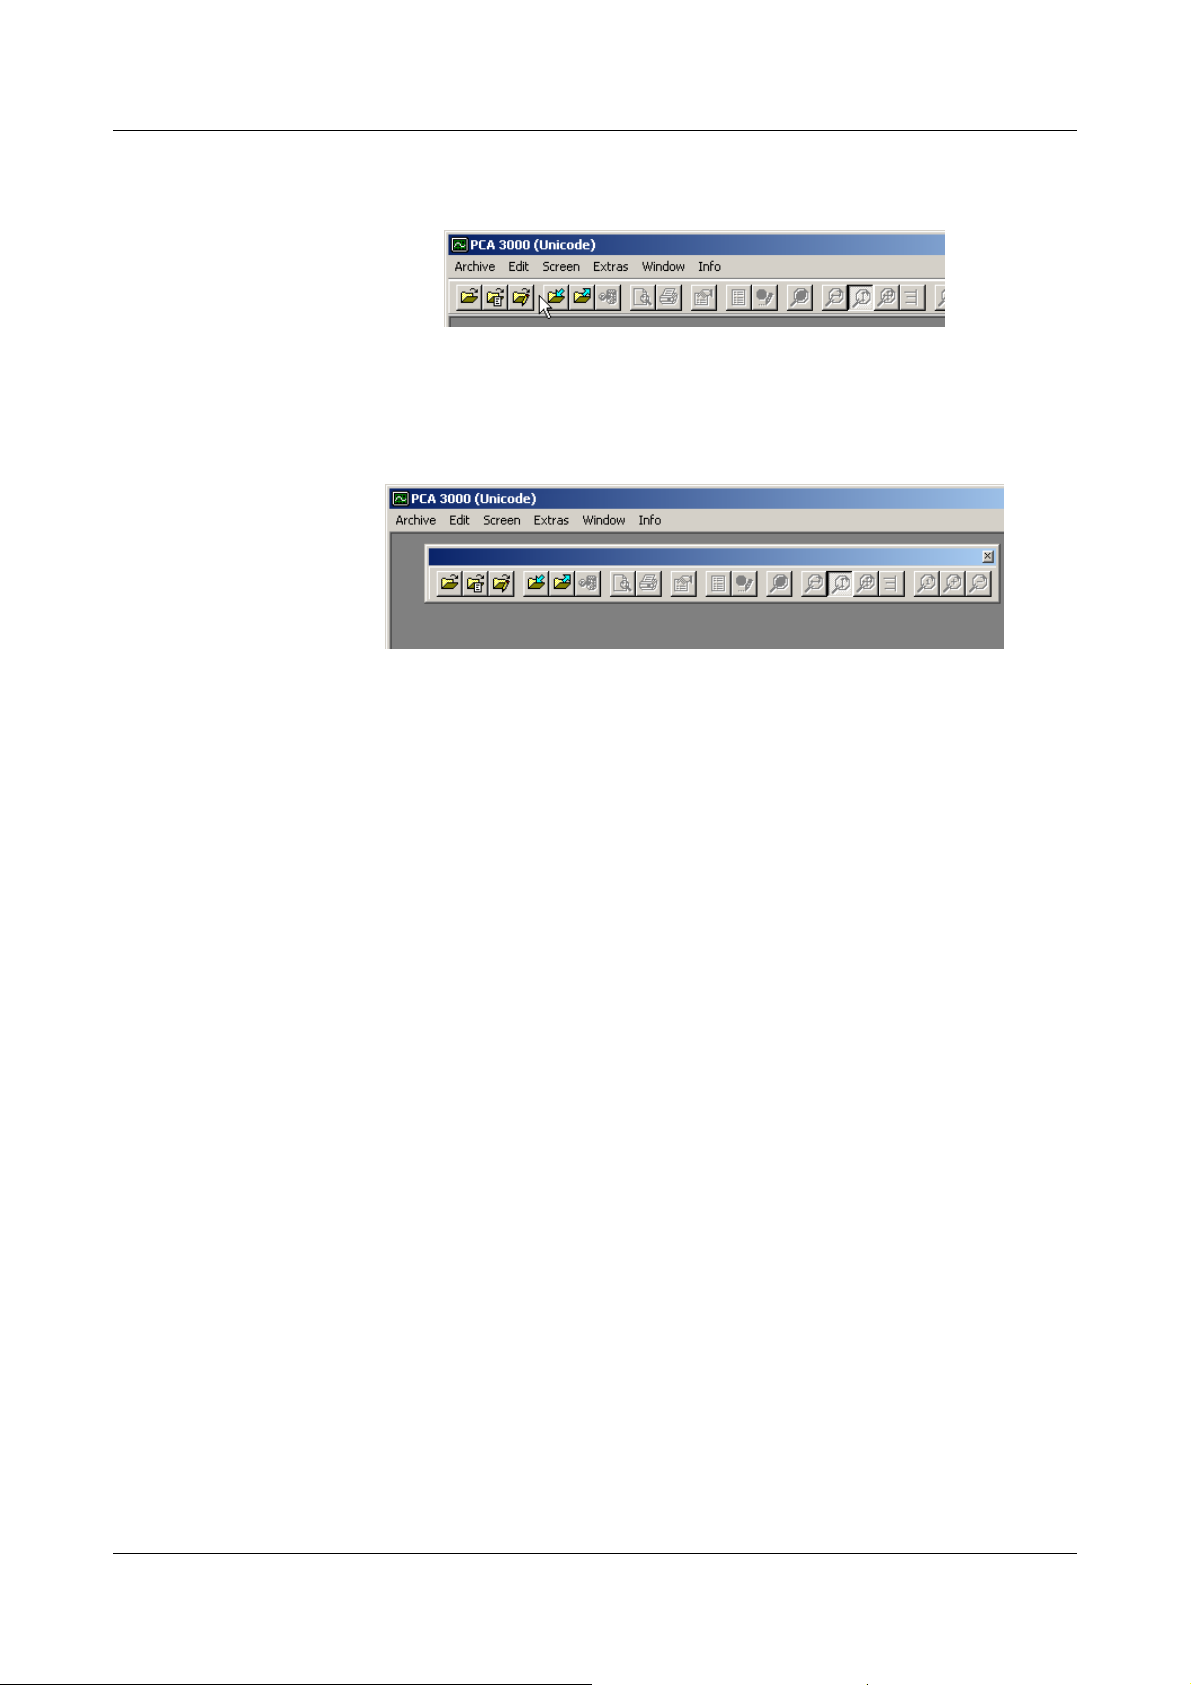
Menu bar The individual functions of the software can be started by using the menu bar.
v Chapter 10 “Menu functions and toolbar”
Toolbar The toolbar contains selected functions from the menu bar. They can be
started or activated by pressing the left mouse button. If you rest the mouse
pointer on one of the icons (tool tips), you will see the function title after a short
while.
logged-in user
19
Page 20
5 User interface
Shift toolbar The position of the toolbar can be changed, if desired.
h Please move the mouse pointer between two icon groups.
h Press the left mouse button.
h Keeping the left mouse button pressed, drag the toolbar to the desired
position.
h Now release the mouse button.
Possible positions are:
- the left or right window border (vertical orientation),
- below the menu bar (horizontal orientation),
- at the bottom edge, above the user details (horizontal orientation) or
- any position (in its own window - height and width can be changed using
the mouse).
Working area The process data are displayed here.
20
Page 21

6.1 Introduction
The following pages are intended as a guide to familiarize you with the
principle of the PC Evaluation software PCA3000.
For a better understanding, the concept is explained by analogy with
conventional pen recorders and paper charts containing process data.
6 Guide
21
Page 22
6 Guide
6.2 Reading in data
This chapter explains how you can read in and save recorder measurement
data from a CompactFlash memory card to your PC. For a faster access
during a subsequent visualization, a concept was chosen that is based on an
archive and an evaluation.
Accordingly, the archive represents the conventional paper chart deposit, the
evaluation the rolled out paper charts.
Practical experience has shown that most users initially only wish to save
(archive) their measurement data. Data are taken out of the archive and
analyzed only in the event of a fault or similar event.
Read in
F
C
The recorded
measurement data can
be read in via the
CompactFlash card or
the interface.
The PCA
communications
software is used for
reading in via the
interface.
(PCC).
Further important
information: see “Read
in data” on page 75.
data
no
yes
22
Page 23
H
6 Guide
In contrast to the preceding PCA version, the archives of the
PCA3000 software are not a directory with several files, but a
single file only. This file always carries the file extension “.177”.
The archive directory and the evaluation directory are set within the PCA3000.
Archive The default directory is set via the menu item Archive
deposit
reading in the data.
Evaluation The default directory is set via the menu item Archive
deposit
H
! Directory for archives. It can be altered at a later stage when
! Directory for evaluation. It cannot be altered when reading in data.
With extensive measurements, it may take some minutes
for the measurement data to be entered into the archive.
! Default settings ! File
! Default settings ! File
23
Page 24
6 Guide
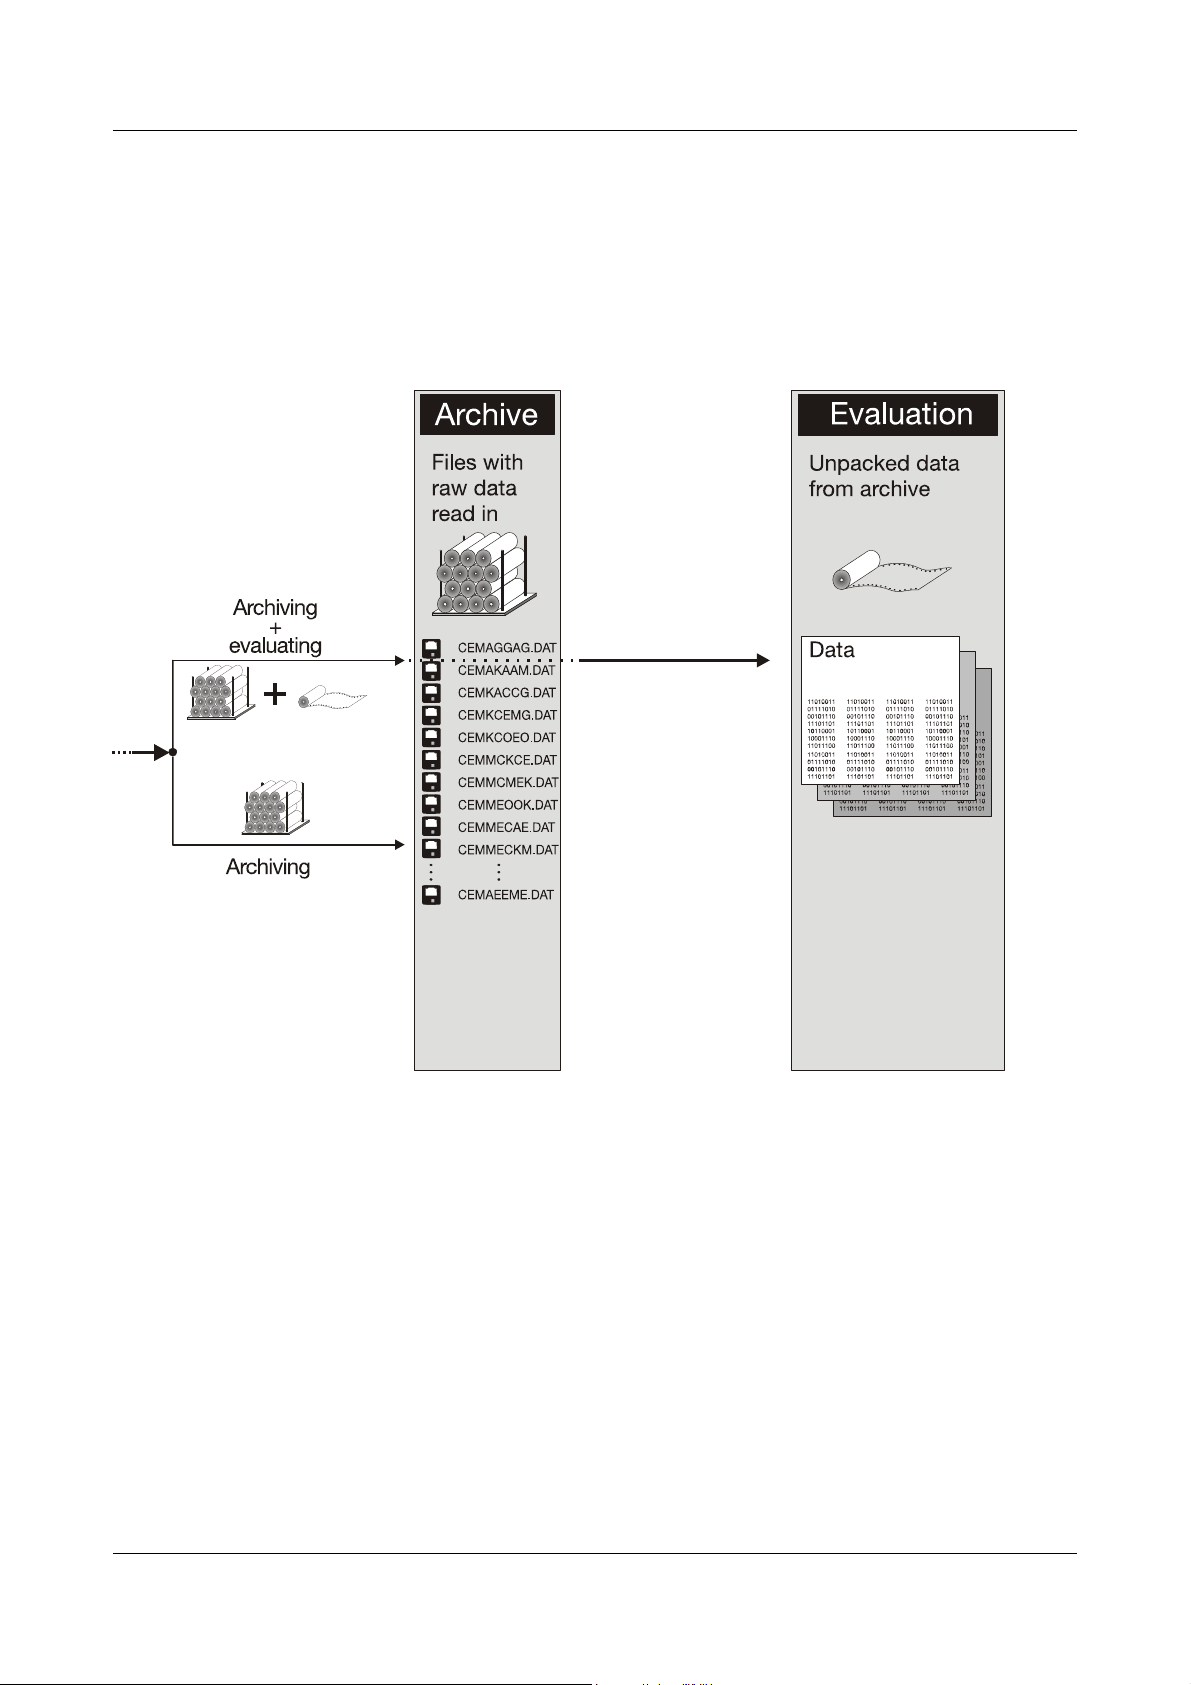
6.3 Opening the archive
Measurement data which are to be visualized are opened from the
H
Archive
Files with
raw data
read in
evaluation.
If these data are not yet available in the evaluation, they must first
be copied from the archive to the evaluation. This procedure is
carried out automatically during opening.
Open archive
Copy
Evaluation
Unpacked data
from archive
Data
Archiviert und
Archiviert und
ausgewertete
11010011
11010011
ausgewertete
Diskette (Disk 2)
01111010
01111010
00101110
00101110
11010011
11010011
Diskette (Disk 2)
11101101
11101101
01111010
01111010
10110001
10110001
00101110
00101110
11010011
10001110
10001110
11101101
11101101
01111010
11011100
11011100
10110001
10110001
00101110
10001110
10001110
11010011
11010011
11101101
11011100
11011100
01111010
01111010
10110001
00101110
00101110
10001110
11010011
11010011
11101101
11101101
11011100
01111010
01111010
00101110
00101110
11010011
11101101
11101101
01111010
00101110
11101101
11010011
01111010
00101110
11101101
10110001
11010011
10001110
01111010
11011100
00101110
11010011
11101101
01111010
10110001
00101110
10001110
11101101
11011100
11010011
01111010
00101110
11101101
11010011
01111010
00101110
11101101
10110001
10001110
11011100
11010011
01111010
00101110
11101101
11010011
01111010
00101110
11101101
10110001
11010011
10001110
01111010
11011100
00101110
11010011
11101101
01111010
10110001
00101110
10001110
11101101
11011100
11010011
01111010
00101110
11101101
11010011
01111010
00101110
11101101
10110001
10001110
11011100
11010011
01111010
00101110
11101101
11010011
01111010
00101110
11101101
10110001
10001110
11011100
11010011
01111010
00101110
11101101
24
After Archive ! Open has been selected,
the time period is selected.
v Chapter 6.3.1 “Selecting the time period”
Page 25
6 Guide
V
Open archive
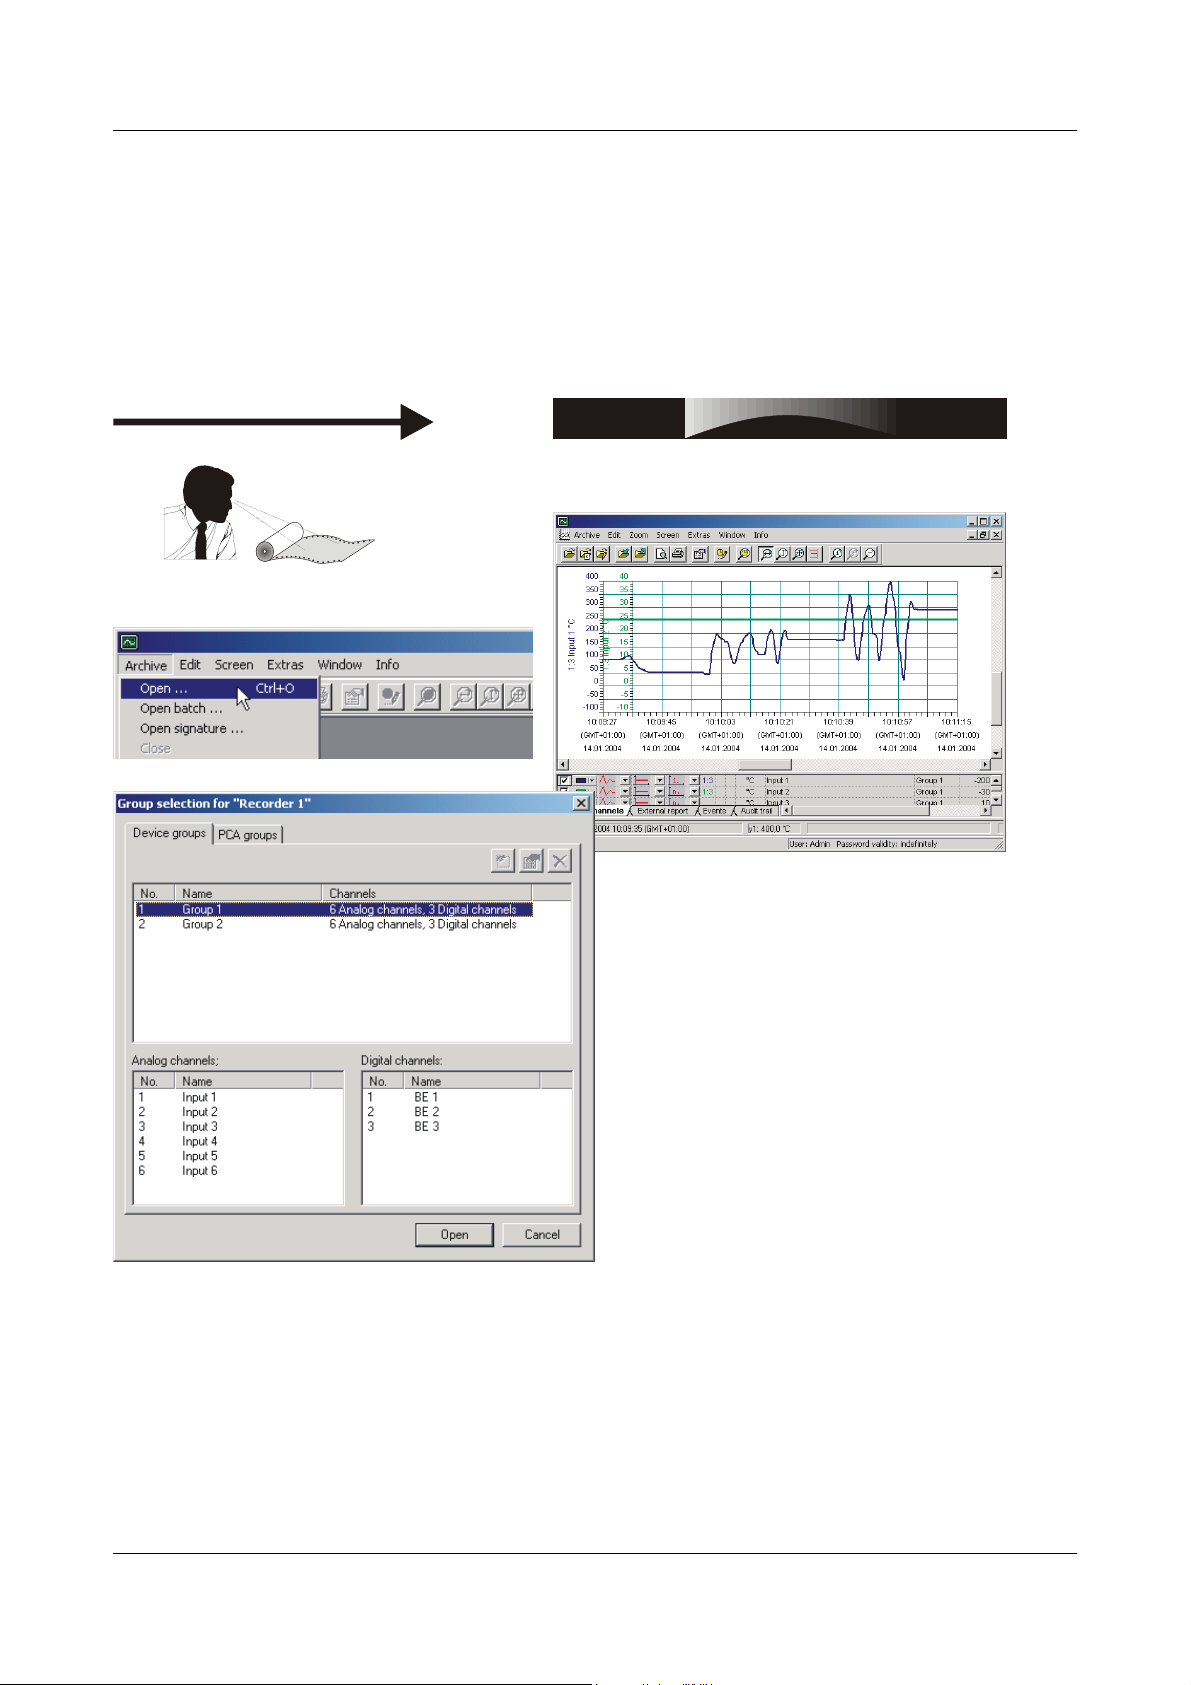
isualization
When the time period has been selected, the
required group (as generated by the paperless
recorder) is chosen before the measurement data
are displayed. User-defined groups can be compiled
in the register “PCA groups” .
Further important information:
see “Open” on page 73.
25
Page 26
6 Guide
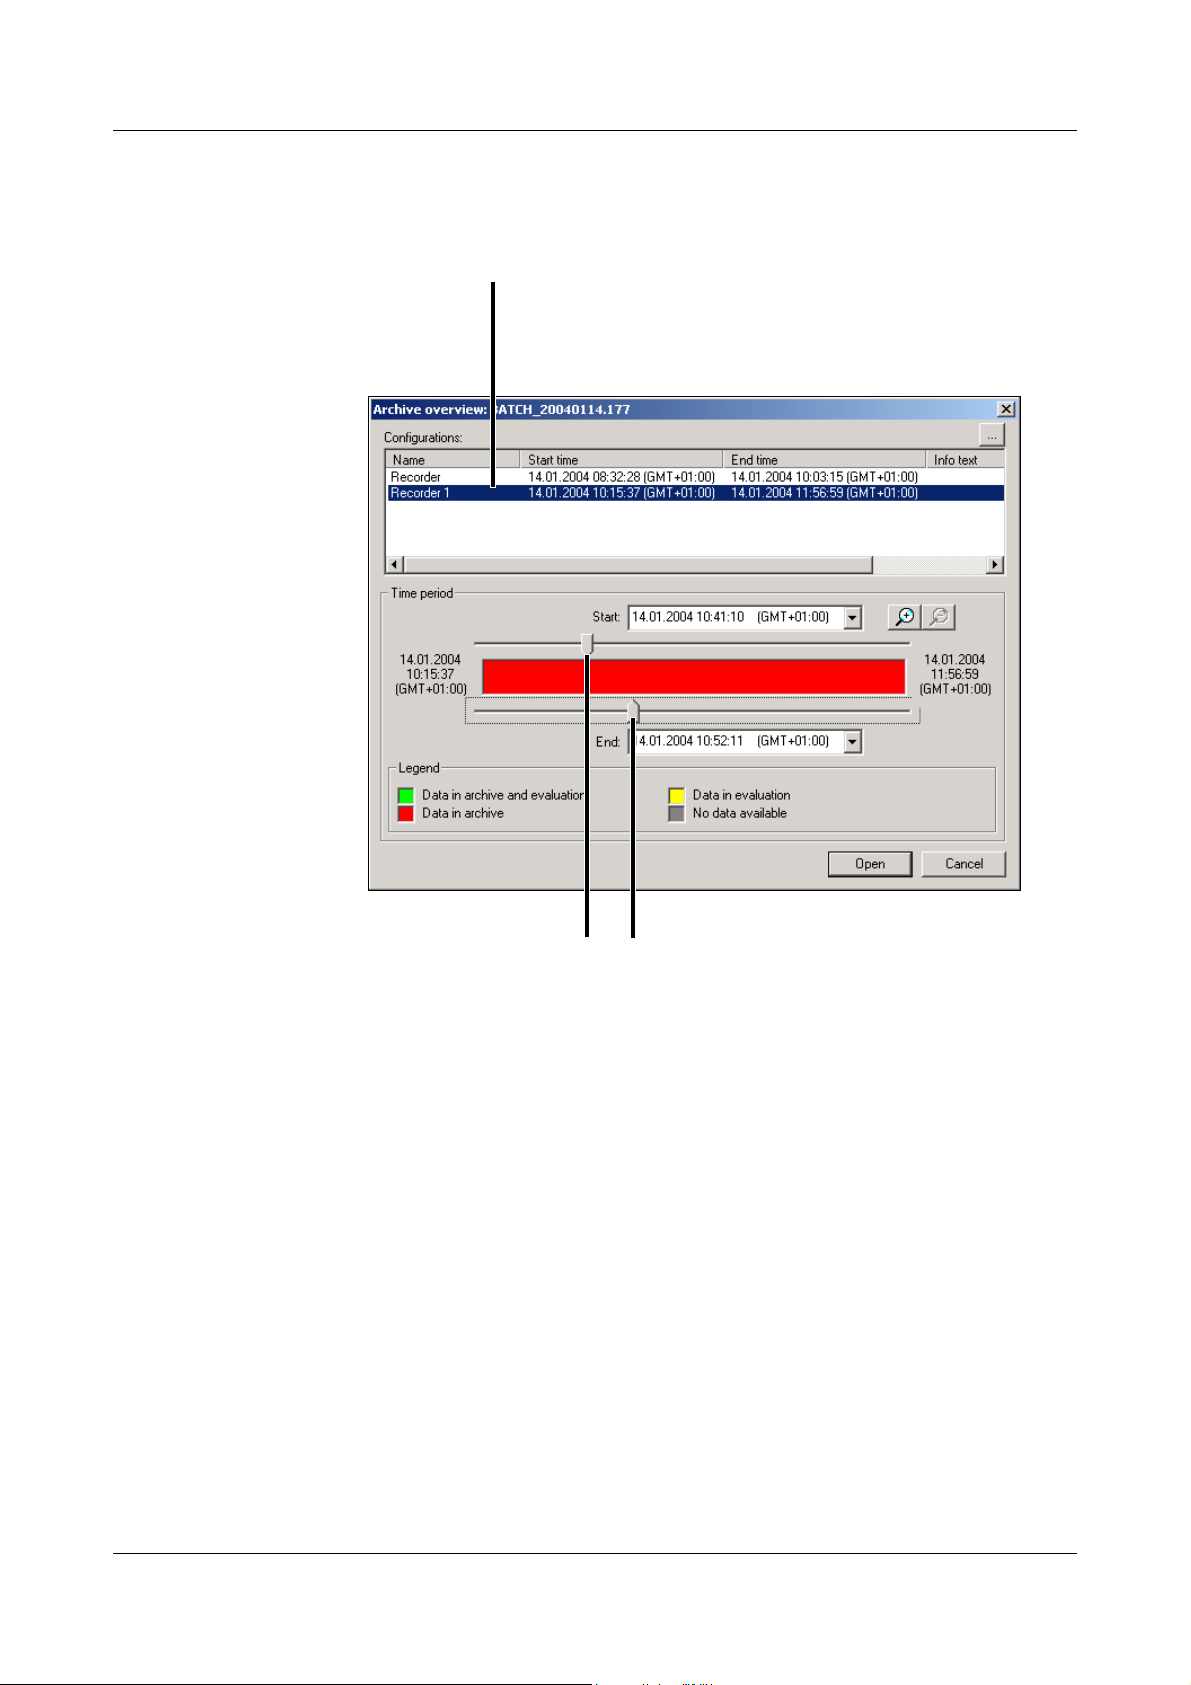
6.3.1 Selecting the time period
Selecting a data set
Each entry represents a new
configuration of a device.
Selecting a time period
The period between the two sliders is shown
graphically after activating the “Open” button.
Hold the left mouse button down when shifting
the sliders.
26
Page 27

Set the time period that was last
active.
Zoom
Zooms the time period between the
sliders over the entire width.
The sliders are repositioned.
6 Guide
Back
End time
A dialog box can be used
to determine the end time.
Start time
A dialog box can be used
to determine the start time.
Data in archive only
The data are only available in the archive. If they
are selected for display, then the software will
automatically accept them for evaluation.
27
Page 28
6 Guide
6.4 Backing up data
Save data
The Save data function serves to
- copy process data from an archive
(e.g. for general data backup),
- copy process data from an archive to a protected archive
(e.g. for passing them on for checks) and
- copy process data from an archive and simultaneously delete them
(e.g. so that the archived files do not become unnecessarily large).
Save data as
The Save data as function extends the Save data function by the possibility of
protecting the records (protected archives). Protected archives differ from the
other archives by:
- inhibiting the execution of signatures
- inhibiting the Save function
(a fresh saving of data is prevented).
- a simplified opening of the protected data.
- protected data cannot be extended
(no further read-in or appending of additional data).
28
H
The Save data as function is only available if the data are graphically displayed.
Page 29
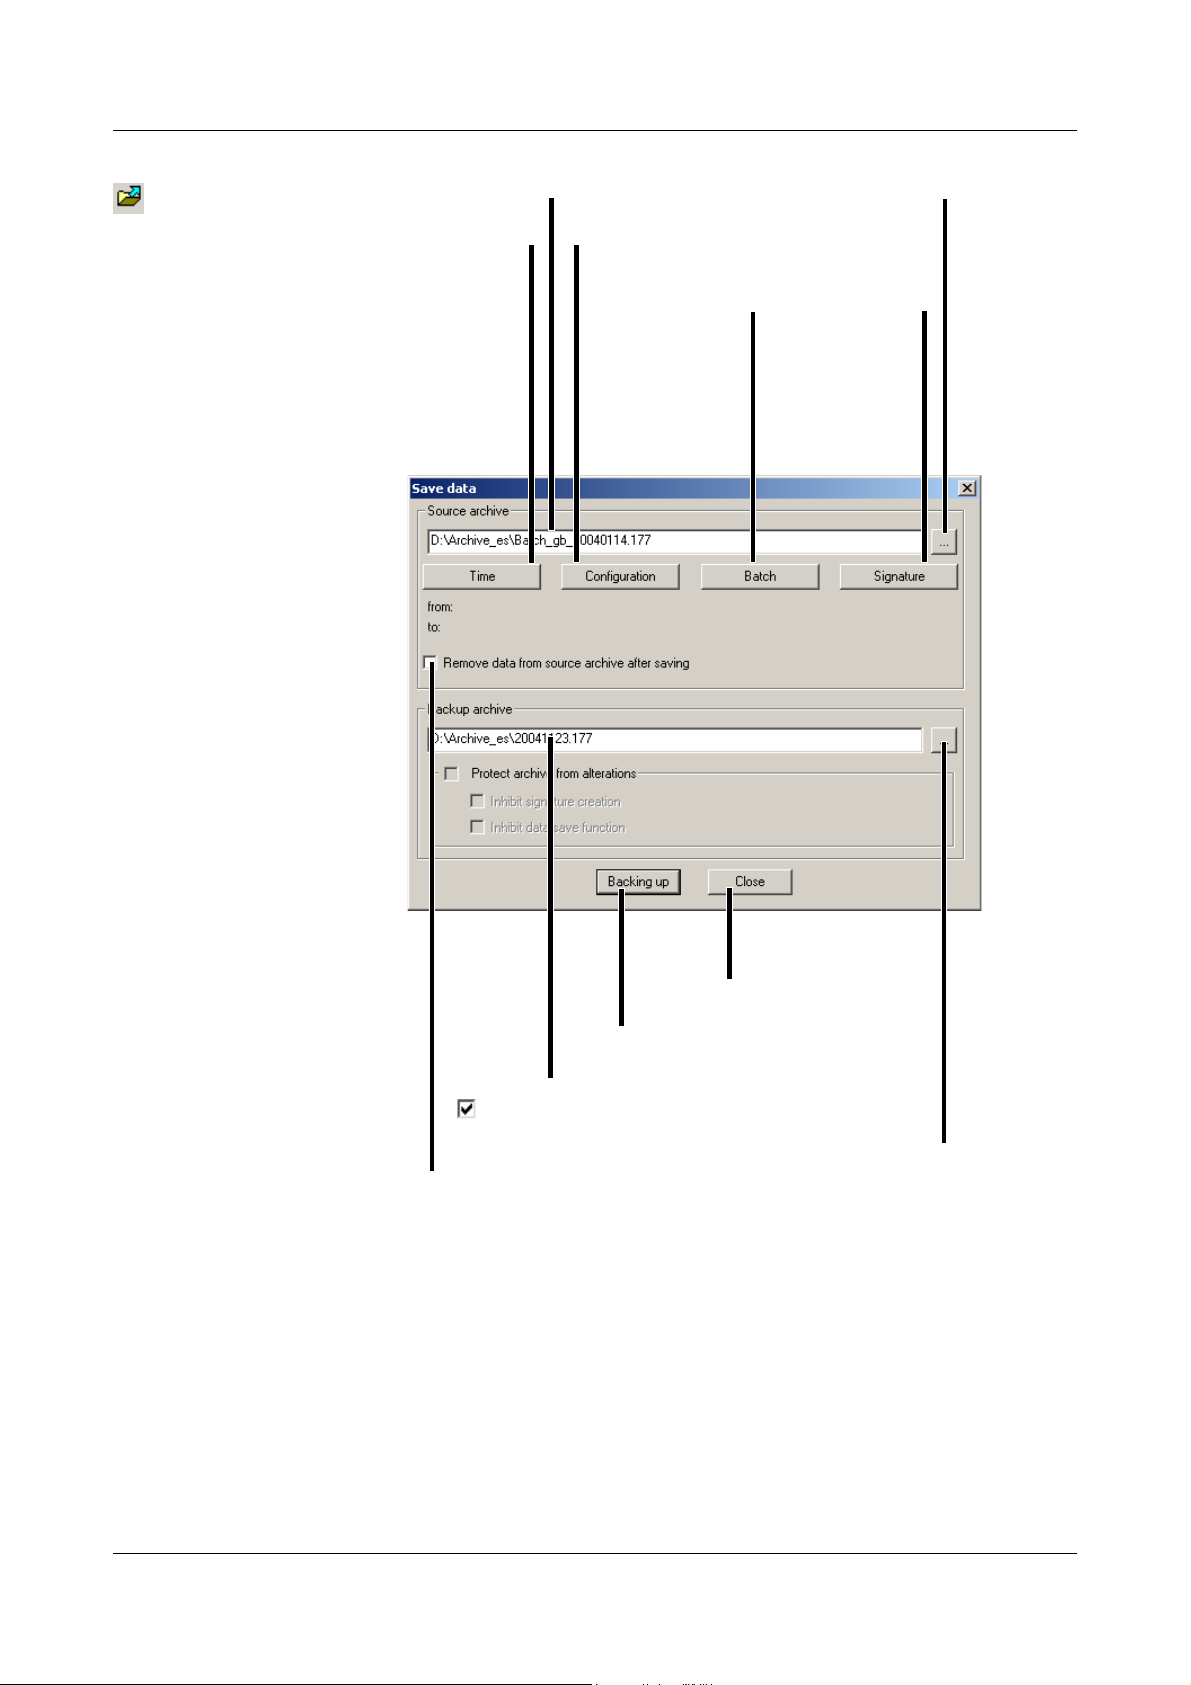
Save data
6 Guide
Archive selectionSelected archive
Select data
according to time
Select data according to
configuration
Select data
according to
batch
Select data
according to
signature
Start data backup
Selected backup archive
A means that the data
will be deleted from the
archive after backup.
Cancel data
backup
Select backup
archive
29
Page 30

6 Guide
Save data as
Selected backup archive
Selected time period
for data backup
Archive selection
Data selection
Additional text for describing the
protected archive.
v Page 79
() Prevent additional signings.
() Prevent additional backing up of data.
() Caution: If the option is inactive, a protected archive
that has already been protected can again be saved as
an unprotected one.
This protects the archive against alterations
(protected archives).
30
Page 31

6.5 Archive and evaluation directory
6 Guide
Archive
file
Evaluation
directory
File deposit The directories (for archives and for evaluation) are preset in the PCA3000
The archive file may be located in a network. Several PCs may use an archive
jointly.
The evaluation directory must not be located in a network, but locally on the
hard disk.
software, in the menu Archive ! Default settings ! File deposit.
31
Page 32

6 Guide
32
Page 33

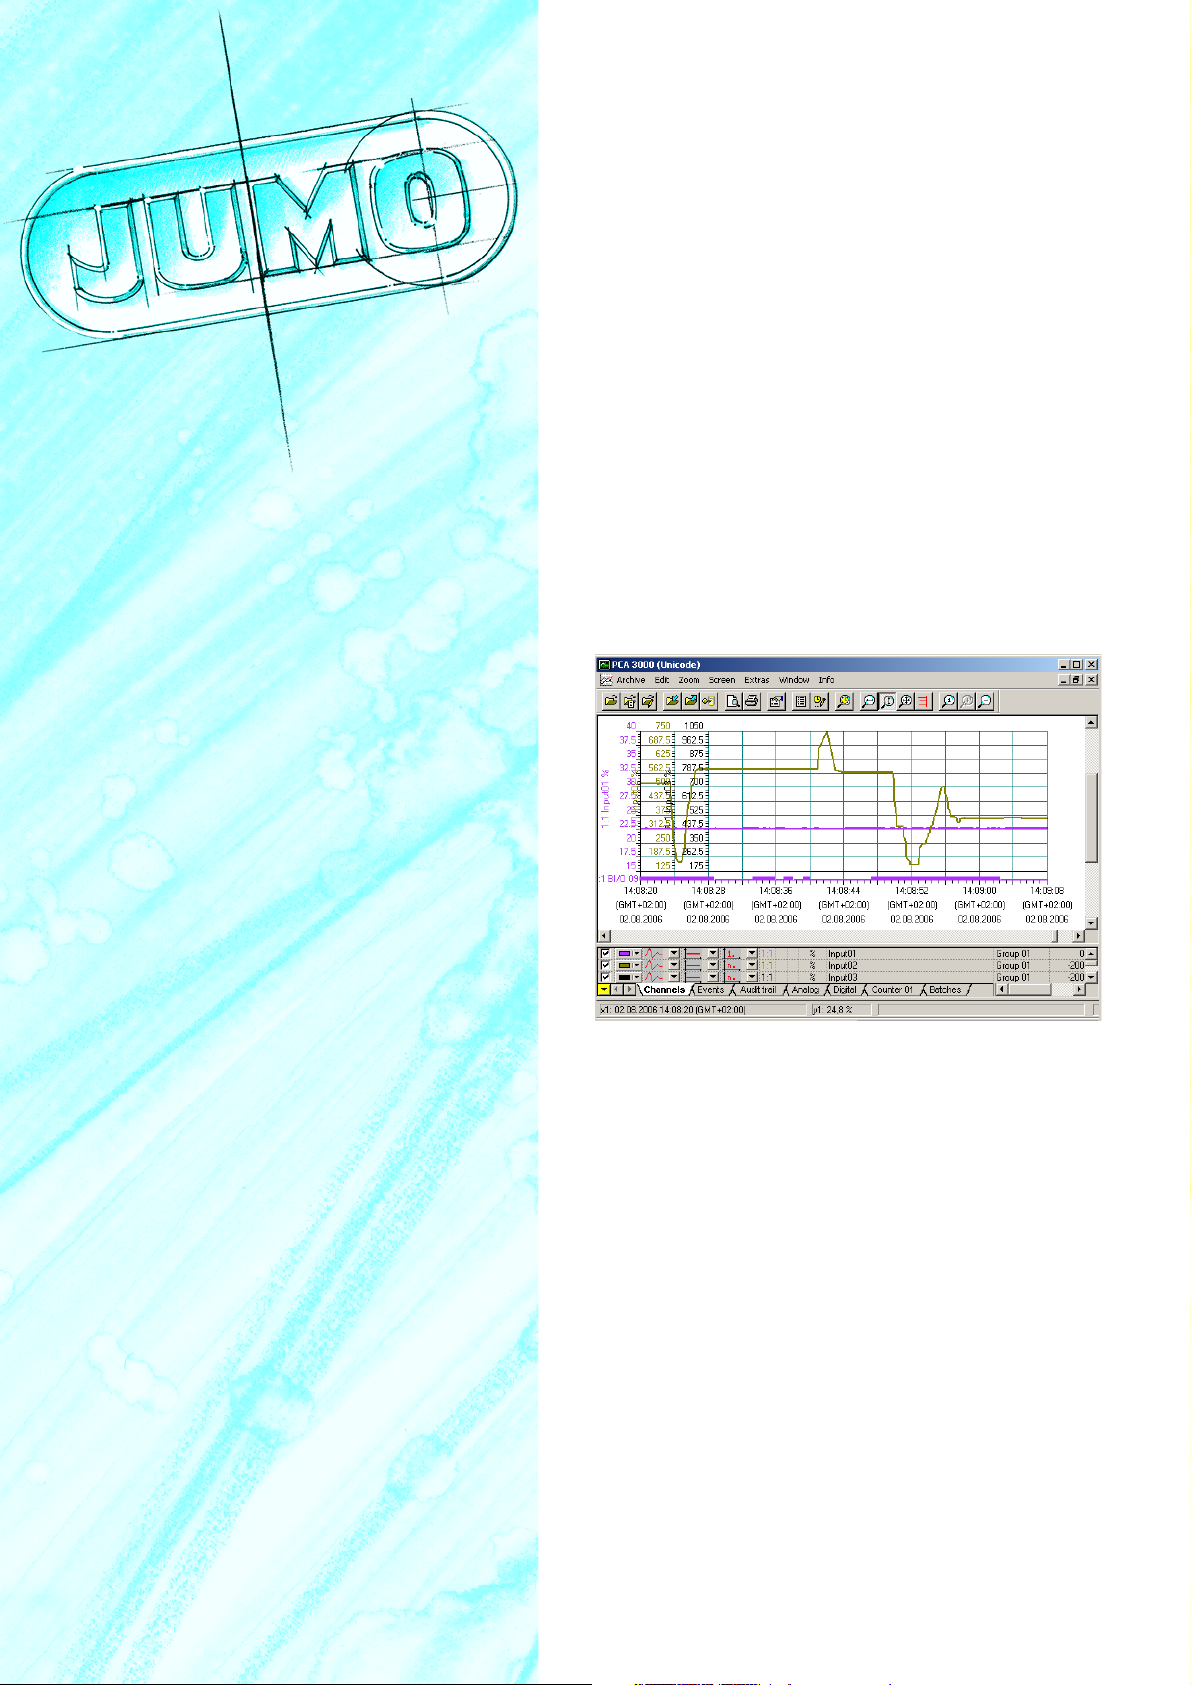
7 Evaluation - General
In Chapter 6.3 “Opening the archive” it has already been described how data
are presented for evaluation (display). The graphical representation could look
like this:
You can alter the window height by
placing the mouse pointer between the
graphics and the table area and moving
the mouse up or down (keep left mouse
button pressed).
The display is subdivided into
- a graphics area, in which the measured values are shown and
- a table area, which can be used to control the graphics and further
functions.
The graphics display will appear faster, and will also be clearer,
H
if less measurement data are used within it.
Show additional
columns in the
table area
(scroll columns).
Show additional
rows in the table
(scroll rows).
area
33
Page 34

7 Evaluation - General
34
Page 35

8 Evaluation - Graphics area
The graphics area is shared by the analog and digital signals. The analog
signals always lie above the digital signals.
analog signal
digital signal
The most important control element within the graphics is the mouse. It is
used to perform different functions.
Left
mouse button
Normally, the left mouse button will produce a zoom in the X-direction.
h Position the mouse pointer within the graphics.
h Press the left mouse button and hold it down.
h By dragging the mouse you can mark the time period
that has to be enlarged.
h Release the mouse button.
The graphics are automatically zoomed to the next possible time period.
Please note that more process data may be displayed than have been selected.
The function of the left mouse button can be controlled via the toolbar of the
software.
Guideline
Zoom X+Y axes
Zoom Y-axis
Zoom X-axis
When using the Y-zoom, please note that the channels that have an auxiliary
Y-axis (or no Y-axis) are zoomed at a fixed ratio to the main Y-axis.
Consequently, the scaling range of the auxiliary Y-axes (or of the channels
without Y-axes) is expanded under certain conditions.
A fixed ratio to the main Y-axis is thus ensured. The diagram curves will appear
in the same relationship after the Y-zoom as before the zoom.
35
Page 36

8 Evaluation - Graphics area
Right
mouse button
Search batch When you have called up the function, a dialog box will appear if the archive
If you use the right mouse button when the mouse pointer is within the
graphics, a menu appears in which various functions can be selected.
file contains batch data.
Select the required options and give all the necessary details. After activating
the button, the corresponding batch data will be automatically
displayed over the entire width of the X-axis.
36
The specified search options will be AND-linked.
If no batch is found that matches the search options, the batch that occurs
first will be shown.
Page 37

8 Evaluation - Graphics area
Full-text search with regular expressions
The active ““Full-text search with regular expressions” is also AND-linked with
the individual batch search fields.
Use the button in order to enter wildcards, or have them explained.
Wildcards
Batch info This function shows the batch texts for the displayed batch. It only becomes
available when the data of a specific batch have come into display by using
the function Search for batch.
Zoom forwards
(zoom in)
Zoom
backwards
(zoom out)
Supplementary
description
Reset zoom Reset zoom will restore the display of the entire time period for the selected
Sign time
period
Zoom forwards is used to restore the next zoom display. This function is only
available if Zoom backwards has been used previously. As an alternative to the
mouse, Zoom forwards can also be executed from the PC keyboard (page up).
Zoom backwards is used to restore the last zoom display. This function is only
available if zooming has been carried out. As an alternative to the mouse,
Zoom backwards can also be executed from the PC keyboard (page down).
The “Supplementary description” function is described on page 79.
evaluation. As an alternative to the mouse, Reset zoom can also be executed
from the PC keyboard (Home).
If you want to use the PC keyboard for zooming, the graphics area
H
This function can be used to sign the current contents of the graphics area.
After calling up the function Sign time period, a submenu will appear in which
you will be asked for the designation. The designation is defined in the device
through the parameter Configuration ! El. Signature ! Designation !
Significance and through the parameter Configuration ! El. Signature !
Designation ! El. signature. When the designation has been selected, signing
takes place by selecting the user ID and password.
must be the active window. If the table area is to be the active
window, you will have to click on the graphics first.
37
Page 38

8 Evaluation - Graphics area
Print After calling up the Print function, a submenu with additional functions
appears:
- Print preview
-Print
-Printer setup
Print !
Print preview
Print !
Print
Print !
Printer setup
Properties After calling up the Properties function, a dialog window will open. You can
Here you can get a preview of the graphics print-out.
This will start the print output.
This takes account of various printer properties (e.g. paper size and
orientation).
influence the graphics display and the function of the left mouse button by
means of selectable parameters.
Properties !
Display ratio
Properties !
Actions for left
mouse button
38
The setting cannot be altered here. Data are always displayed automatically
using the setting “Depending on X-axis zoom”.
This determines the function of the left mouse button within the graphics.
Normally, the left mouse button will produce a zoom in the X-direction.
If you choose the “Guideline” setting, then a vertical and a horizontal line
(including the current amplitude and time values) will appear after pressing the
left mouse button.The corresponding measurements are shown in the table
area (the Channels table must be active).
Page 39

8 Evaluation - Graphics area
The guideline is positioned with regard to the “real measured
H
The guideline can also be shifted from the PC keyboard by using the key
combination Shift-Cursor left or Shift-Cursor right.
H
values”, i.e. it may diverge from the optical profile of the curve,
since more measured values exist than are displayed.
The function for the left mouse button can also be controlled via
the toolbar of the software.
Guideline
Zoom X+Y-axes
Zoom Y-axis
Zoom X-axis
Properties !
Font size
Properties !
Zoom
Properties !
Increase speed
Use this setting to alter the size of the scaling for the X- and Y-axes.
This setting can be used to influence the marking of a section that has to be
spread. You can choose between continuous marking (Any) or marking at a
fixed spacing (Division).
The options “Do not display measurement info” and “Do not draw in
background” are not marked with a as a default setting, which means that
these functions are active.
Do not display measurement info
If the mouse pointer is placed on a measured value within the graphics and
rested there, a window with the current amplitude and time values will appear.
The window will disappear after a few seconds. If you deactivate the function
( ), the evaluation program has a reduced computing load and will thus
become somewhat faster.
Do not draw in background
Standard procedure is that the picture is generated without being visible to the
user and then suddenly switched into display (drawn in the background). If you
select “Do not draw in background”, the graphics is displayed online on the
screen. This means that you can observe how the curve profile is drawn. This
view mode is somewhat faster than drawing in the background.
39
Page 40

8 Evaluation - Graphics area
The difference between the two view modes will only become obvious if there
is a vast amount of data to be processed.
Maximum number of measurements displayed per channel
You can set the number of the measurements to be displayed per channel by
entering a number (from 10 to 10000) here. The higher the number, the more
measurements will be shown in the graphics. The lower the number, the less
measurements will be shown.
Caution: If the selected number of measurements is too small, the
H
graphics will be displayed faster, but you will have to partially
guess the curve profile for the actual measured values.
Properties !
Display all
measurements
Save diagram
as bitmap
Save diagram
as Jpeg
Normally, only every nth measured value is displayed (depending on the zoom
factor). This also applies to the print preview (page view) and the printout. You
can force the display or printout of all measurements by means of the
“Printout” and “Print preview” buttons.
This function saves the current contents of the graphics area as a picture in
bitmap format.
This function saves the current contents of the graphics area as a picture in
JPEG format.
40
Page 41

9 Evaluation - Table area
The table area is used to control the graphics and further functions. It is
operated similar to spreadsheet programs. The area consists of several
registers which can be switched into or out of display according to availability.
The following is available as a maximum:
- Channels
-Periodic report
-Daily report
-Monthly report
- Annual report
-External report
-Events
-Audit trail
- Batches
-Signature for batches
-Signature for log-off
- PC signature for batches
- PC signature for time period
- Analog: Group...
- Digital: Group...
Click here to select the
register as the active register
Active register
Click here to switch further
registers into display (if available)
Click here to switch registers into and out of display or
to switch columns in the registers into or out of display.
v Chapter 9.1 “Switching registers into/out of display”
The right mouse button also has a special function in the table area. When you
press the right mouse button, a dialog window opens with functions that vary
according to the active register.
41
Page 42

9 Evaluation - Table area
9.1 Switching registers into/out of display
Move the mouse pointer onto the field and
press the left mouse button
h Move the mouse pointer onto the symbol and press the left mouse
button.
Submenu
Register is shown
Register is not shown
All registers that are shown are marked with a tick ( ). Clicking it with the left
mouse button will change the display status.
If you click the entry with the left mouse button,
a submenu will open, in which you can change the data view. This allows you,
for instance, to alter the columns of a register.
Example of column
Example of register
42
Page 43

9 Evaluation - Table area
Select data
views
All changes are instantly shown in the current table area. Switching registers
into and out of display will only become permanently effective when you click
.
Show standard columns of all active registers
(standard columns are defined through PCA3000)
Show all columns of all active registers
Do not show register
Show standard register
Show all registers
Selected register
Show/hide specific columns of a
selected register
h Press the left mouse button when the mouse pointer is positioned on a
register name, in order to switch the register into/out of display, or activate
one of the buttons that are available.
The submenu “Select data views” will also appear if you double-
H
click (left mouse button) a register name, e. g. .
43
Page 44

9 Evaluation - Table area
Columns By activating the button, you can switch individual columns of an
active register into or out of display.
Show standard columns of the active register
Show all columns of the active register
Name of the active register
44
H
The submenu “Select columns” will also appear if you double-click
(left mouse button) a column name, e. g. .
Page 45

9.2 Channels
9 Evaluation - Table area
Display channel
Channel color
Line type
Line width
Y-axi s type
Ratio of displayed measurements to
actual measurements.
Display of channel unit
Channel name
Show additional
columns in the
table area
(scroll columns).
Group name
Scaling start
Scaling end
Channel description
Show additional
rows in the table
area
(scroll rows).
45
Page 46

9 Evaluation - Table area
9.2.1 The functions of the left mouse button
Display channel Each channel (analog, digital and messages) can be shown or hidden. Only
channels that are marked with a are shown in the graphics area.
Channel color Here you can select the color in which the measured values and channel-
specific data are displayed. The color affects both the graphics and the table
area.
v See “Colors” on page 77.
Line type
(analog signals)
Line type
(digital signals)
Line type
(messages)
The representation mode can be selected here (separately for each channel).
Dot
Stepped line
The representation can also be altered for the digital signals.
Stepped line Stepped dot line
The representation can also be altered for the messages.
Dot line
Stepped dot line
Line
Binary
Symbol and text Symbol
Line width Here you can select the line width for displaying the curve.
46
Page 47

9 Evaluation - Table area
Y-a xi s t yp e The axis type for a channel can be selected here. Available options are:
- main Y-axis
Please note that always only one channel can have a main Y-axis.
The Y-axis can be found at the left edge of the screen.
- auxiliary Y-axis
The auxiliary Y-axes are to the right of the main Y-axis. Scaling of the data
is adapted to the main Y axis.
-no Y-axis
No Y-axis is displayed for the selected channel.
9.2.2 Displays (cannot be altered directly)
Ratio
of displayed
measurements
...
Display for
channel unit
Channel name Shows the channel name that has been configured on the device.
Group name Shows the group name that has been configured on the device.
Scaling start Shows the scaling start that has been configured on the device.
Scaling end Shows the scaling start that has been configured on the device.
Channel
description
The current display factor is shown here. The factor changes if the
measurements are zoomed.
Example: Factor = 1:3 --> every third measurement is displayed.
The parameter “Maximum number of measurements displayed per channel”
will affect the factor.
v See “Maximum number of measurements displayed per channel” on
page 40.
Shows the unit of the channel that has been configured on the device.
Shows the channel description that has been configured on the device.
47
Page 48

9 Evaluation - Table area
9.2.3 The functions of the right mouse button
In the “Channels” register, the right mouse button is only used in connection
with printing the displayed measurement curves.
Further information on the “Printing” function can be found in Chapter 9.11
“Printing”.
48
Page 49

9.3 Report
9 Evaluation - Table area
The different registers for the report (statistics) are:
-Periodic report
-Daily report
-Monthly report
- Annual report
-External report
The individual reports that have been logged (including period, minimum,
maximum and average values) are shown for all channels
9.3.1 The functions of the left mouse button
The left mouse button can be used to alter the column width and row height of
the individual entries within the report registers.
Alter column
width
Alter row height h Position mouse between two rows
h Position mouse between two columns
h Keeping the left mouse button pressed, alter column width by dragging
with the mouse
h Release the mouse button
h Keeping the left mouse button pressed, alter row height by dragging with
the mouse
h Release the mouse button
49
Page 50

9 Evaluation - Table area
Column width
Row height
H
Please note that a column or row can be made so small that it is no
longer visible.
If you want to make it visible again, please proceed as described
below. In this example, it is assumed that in the register “Analog:
Group 1”, the column for the measurements on channel 1 has
disappeared as a result of having been shrunk.
h Position the mouse pointer in the column to the right of the
missing one (in this example: channel 2).
h Move the mouse pointer to the left until it looks as shown
below.
If the mouse pointer looks like this, you have moved it slightly
too far.
h Press the left mouse button and open out the missing column
out (drag mouse to the right).
h If you now let go of the mouse button, the column will be visible
again.
Mark section In addition, the left mouse button can be used to mark a section. These
marked sections can be exported in a text format via the “Export” function by
using the right mouse button.
h Position mouse in an entry
h Keeping the left mouse button pressed down, select the section by
dragging with the mouse
50
h Release the mouse button
Page 51

9 Evaluation - Table area
Mark column h Position the mouse in the column header
h Press the left mouse button
Mark row h Position the mouse in the left column of the row ( )
h Press the left mouse button
Additional
keys
With the help of the Shift key and the left mouse button you can mark a
section covering several rows or columns. The Ctrl key and the left mouse
button can be used to mark additional rows /columns.
9.3.2 The functions of the right mouse button
If you press the right mouse button (mouse pointer must be within the table
area), you will see the following dialog window.
Select
columns
Zoom diagram
to time period
Scroll diagram
to time period
Synchronize
time period to
diagram
Using this function, individual columns of the active table can be shown or
hidden.
v “Columns” on page 44
The measurements of the selected report are zoomed in the diagram to the
next displayable period and are graphically presented.
If the start time of the report is not within the visible time period, for example
after zooming, then “Scroll time period” is used to shift the curves so that the
start time (or the next possible one) is in line with the left window border.
The entry that matches the displayed measurements is searched for in the
table area and captured. The time shown at the left window border is decisive
here.
51
Page 52

9 Evaluation - Table area
Mark all All table data are marked.
Copy The data that are marked are copied to the Windows clipboard and can thus
be imported directly into spreadsheet programs, for example (EXCEL or
similar).
Export Using the “Export” function, you can save data in text format (*.txt) or HTML
format (*.htm) and subsequently process them. Measurements are always
exported row by row. If a column is marked, the measurements of the other
columns are also exported.
v Chapter 9.12 “Data export”
Print v Chapter 9.11 “Printing”
Adjust column
width and row
height
Adjust column
width
Adjust row
height
The column width and row height - starting from the current cell - are
automatically reset to the initial width and height.
The column width for the current column is automatically reset to the initial
width.
The row height of the current row is automatically reset to the initial height.
52
Page 53

9.4 Events
9.4.1 The functions of the left mouse button
The column width and row height of the individual entries can be altered within
the event register by using the left mouse button.
The left mouse button is also used to mark a section. These marked sections
can be exported in text format (*.txt) or HTML format (*.htm) through the
“Export” function by pressing the right mouse button.
v Chapter 9.12 “Data export”
9 Evaluation - Table area
Further information on altering the column width and row height, as well as
marking a section, can be taken from Chapter 9.3 “Report”.
9.4.2 The functions of the right mouse button
If you press the right mouse button (the mouse pointer must be within the
table area), the following dialog window open.
Select columns Using this function, individual columns of the active table can be shown or
hidden.
v “Columns” on page 44
53
Page 54

9 Evaluation - Table area
Scroll diagram
to data set
Synchronize
data sets with
diagram
Filter data sets “Filter data sets” serves to reduce the list of displayed events.
If the time for the event is not within the visible area of the diagram, for
instance after zooming, then “Scroll data set” can be used to shift the curves
so that the time (or the next possible one) is in line with the left window border.
The entry that matches the displayed measurements is searched for in the
table area and captured. The time shown at the left window border of the
diagram is decisive here.
If, for example, the “System messages” field is inactivated ( ), the messages
“New configuration”, “Power ON” and “Power OFF”, among others, will no
longer be shown.
The display in the header informs you that the current display is a filtered
selection.
The individual filter parameters are OR-linked, and additionally AND-linked
with the full-text search.
Filtering is reset when
- the graphics evaluation is closed or
- all criteria have been marked with a tick.
Example of a filter setting:
Only the event types “Low alarm”, “High alarm” or “Counter/integrator alarm”
are displayed.
Mark all data
sets
54
All table data are marked.
Page 55

9 Evaluation - Table area
Copy data sets The data that are marked are copied to the Windows clipboard and can thus
be imported directly into spreadsheet programs (EXCEL or similar).
Export data
sets
Print Further information on the “Printing” function can be found in Chapter 9.11
Adjust column
width and row
height
Adjust column
width
Adjust row
height
Using this function, you can save data in text format (*.txt) or in HTML format
(*.htm) and subsequently process them.
Measurements are always exported row by row. If a column is marked, the
measurements of the other columns are also exported.
v Chapter 9.12 “Data export”
“Printing”.
The column width and row height - starting from the current cell - are
automatically reset to the initial width and height.
The column width for the current column is automatically reset to the initial
width.
The row height of the current row is automatically reset to the initial height.
55
Page 56

9 Evaluation - Table area
9.5 Audit trail
The device audit trail entries are stored in this register. Audit trail entries that
refer to the PC software components can be evaluated through the PC Audit
Trail Manager s oftware.
9.5.1 The functions of the left mouse button
The column width and row height of the individual entries can be altered within
the audit trail register by using the left mouse button.
The left mouse button is also used to mark a section. These marked sections
can be exported in text format (*.txt) or HTML format (*.htm) through the
“Export” function by pressing the right mouse button.
v Chapter 9.12 “Data export”
Further information on altering the column width and row height, as well as
marking a section, can be taken from Chapter 9.3 “Report”.
9.5.2 The functions of the right mouse button
If you press the right mouse button (the mouse pointer must be within the
table area), you will see the following dialog window.
56
The operation largely corresponds to that described in Chapter 9.4 “Events”,
with the “Filter data sets” function deviating from it.
Page 57

9 Evaluation - Table area
Filter data sets The list of displayed audit trail entries can be reduced by using the “Filter data
sets” function.
The display in the header informs you that the current display is a filtered sel-
ection.
The audit trail entries can be filtered by means of two different filter types,
which can be activated independently of one another.
Filter types:
- audit trail events
- audit trail sources
If both filter types are activated, they are AND-linked, which means that the
audit trail event is only displayed if it is listed both in the “audit trail events” filter and the “audit trail sources” filter.
The individual filter conditions for a filter type are OR-linked, and additionally
AND-linked with the full-text search.
Filtering is reset if
- the graphics evaluation is closed or
- “audit trail events”, “audit trail sources” and full-text search have not been
activated.
57
Page 58

9 Evaluation - Table area
9.6 Batches
This register lists all the recorded batch documentation.
9.6.1 The functions of the left mouse button
The column width and row height of the individual entries can be altered within
the batch register by using the left mouse button.
The left mouse button is also used to mark a section. These marked sections
can be exported in text format (*.txt) or HTML format (*.htm) through the
“Export” function by pressing the right mouse button.
v Chapter 9.12 “Data export”
Further information on altering the column width and row height, as well as
marking a section, can be taken from Chapter 9.3 “Report”.
9.6.2 The functions of the right mouse button
If you press the right mouse button (the mouse pointer must be within the table area), you will see the following dialog window.
58
Page 59

9 Evaluation - Table area
Select
columns
Zoom diagram
to batch period
(batch range)
Scroll diagram
to batch period
(batch range)
Synchronize
batch period
(batch range)
to diagram
Search batch Specific batch documentation can be found by means of the “Search for
Using this function, individual columns of the active table can be switched into
or out of display.
v “Columns” on page 44
The measurements of the selected batch are zoomed to the next displayable
period and are graphically presented.
If the start time of the batch data is not within the visible time period, for
example after zooming, then “Scroll batch period” is used to shift the curves
so that the start time (or the next possible one) is in line with the left window
border.
The entry that matches the displayed measurements is searched for in the
table area and captured. The time shown at the left window border is decisive
here.
batch” function. The search can be made easier by applying different criteria.
Without the specification of criteria, all batch documentation is searched for.
Before you can enter a search criterion, it must be activated. Active search
criteria can be recognized by the . All activated search criteria are ANDlinked.
Continue
search for
batch
Filter batch “Filter batch” serves to reduce the list of available batches.
The “Continue search for batch” function, which is only available if the “Search
for batch” function has been performed, repeats a defined search for a
specific batch documentation.
Before you can enter a filter, it must be activated ( ).
The display in the header informs you that the current display is a filtered sel-
ection.
The batch filters refer to the individual columns in the batch list, i.e. one filter
criterion can be defined for each column. A batch will only be displayed when
all active column filter criteria have been fulfilled.
All active column filters and the full-text search are AND-linked.
59
Page 60

9 Evaluation - Table area
The columns are divided into a batch data section and a signature data section. A column criterion is true if the text entered appears in the column data.
Batch
information/
signature
In the example shown above, the three batch criteria “Batch start”, “Batch
end” and “Batch duration” occur twice. Those listed first (above the “Recipe
data” criterion) have been configured by the user. Those that follow (below the
“Recipe data” criterion) are generated by the recorder through the device software.
Filtering is reset when
- the graphical evaluation is closed or
- none of the criteria has been activated.
This function serves to display the batch information and, if available, also the
signature for the selected batch. In addition, you can view the entered recipe
data.
If a batch has not been signed yet, you can make up for it now by using this
function. Executing a signature in this way will be recorded in the register “PC
signature for batches”.
h Using the left mouse button, double-click on the field with the recipe data -
the data will now be shown in a separate window and can be viewed more
easily.
Recipe data cannot be altered. They can be transmitted to the recorder (using
the Setup program) for a batch that has not yet been completed. After the end
of the batch, the recipe data will be automatically deleted, being available only
for batch documentation.
60
Page 61

9 Evaluation - Table area
Click here to view
the recipe data
Mark all data
sets
Copy data sets The data that are marked are copied to the Windows clipboard and can thus
Export data
sets
Print v Chapter 9.11 “Printing”
Adjust column
width and row
height
Adjust column
width
Adjust row
height
All table data are marked.
be imported directly into spreadsheet programs (EXCEL or similar).
Using the “Export” function, you can save data in text format (*.txt) or HTML
format (*.htm) and subsequently process them. Measurements are always
exported row by row. If a column is marked, the measurements of the other
columns are also exported.
v Chapter 9.12 “Data export”
The column width and row height - starting from the current cell - are
automatically reset to the initial width and height.
The column width for the current column is automatically reset to the initial
width.
The row height of the current row is automatically reset to the initial height.
61
Page 62

9 Evaluation - Table area
9.7 Batch signature (PC signature for batches)
This register lists the recorded batch signatures.
There are two registers:
- signature for batch (signed on the device) and
- PC signature for batches (signed within the PCA3000).
Both have identical functions.
9.7.1 The functions of the left mouse button
The column width and row height of the individual entries can be altered within
the batch register by using the left mouse button.
The left mouse button is also used to mark a section. These marked sections
can be exported in text format (*.txt) or HTML format (*.htm) through the
“Export” function by pressing the right mouse button.
v Chapter 9.12 “Data export”
Further information on altering the column width and row height, as well as
marking a section, can be taken from Chapter 9.3 “Report”.
9.7.2 The functions of the right mouse button
If you press the right mouse button (the mouse pointer must be within the
table area), the following dialog window opens.
62
Page 63

9 Evaluation - Table area
The operation corresponds to that described in Chapter 9.3 “Report”. In
addition, there are:
Filter signatures “Filter signatures” serves to reduce the list of displayed signatures. Only those
signatures will be shown for which matching selection criteria have been
specified.
The display in the header informs you that the current display is a filtered
selection.
All active filter criteria and the full-text search are AND-linked.
63
Page 64

9 Evaluation - Table area
9.8 Log-off signature (PC signature for time period)
This register lists additional signatures.
There are two registers:
- Log-off signature (log-off on device) and
- PC signature for time period (signed within PCA3000 with the function
Edit ➔ Sign time period).
Both have identical functions.
9.8.1 The functions of the left mouse button
The column width and row height of the individual entries can be altered within
the batch register by using the left mouse button.
The left mouse button is also used to mark a section. These marked sections
can be exported in text format (*.txt) or HTML format (*.htm) through the
“Export” function by pressing the right mouse button.
v Chapter 9.12 “Data export”
Further information on altering the column width and row height, as well as
marking a section, can be taken from Chapter 9.3 “Report”.
9.8.2 The functions of the right mouse button
After pressing the right mouse button (the mouse pointer must be within the
table area), you will see the same dialog window as described in Chapter 9.7
“Batch signature (PC signature for batches)”.
64
Page 65

9.9 Analog: Group...
This register lists the measurements of the analog inputs.
<<<< = underrange >>>> = overrange
9.9.1 The functions of the left mouse button
The column width and row height of the individual entries can be altered within
the register for the analog data by using the left mouse button.
The left mouse button is also used to mark a section. These marked sections
can be exported in text format (*.txt) or HTML format (*.htm) through the
“Export” function by pressing the right mouse button.
9 Evaluation - Table area
v Chapter 9.12 “Data export”
Further information on altering the column width and row height, as well as
marking a section, can be taken from Chapter 9.3 “Report”.
9.9.2 The functions of the right mouse button
If you press the right mouse button (the mouse pointer must be within the
table area), you will see the following dialog window.
The operation corresponds to that described in Chapter 9.4 “Events”.
65
Page 66

9 Evaluation - Table area
9.10 Digital: Group...
This register lists the measurements of the digital inputs.
It provides the same functions and options as the register for the analog
measurements.
v Chapter 9.9 “Analog: Group...”
66
Page 67

9 Evaluation - Table area
9.11 Printing
After calling up the “Print” function, the following dialog window opens.
Print preview The “Print preview” function will give you a view of the page as it will be
printed. Depending on the active register, further selection options will appear
before the print preview, where you can choose which data are to be
displayed.
Print Initiates the printing procedure. Please note that, in the case of a zoomed
display, the printout may cover several pages.
Header /
Footer
Headers/footers can be defined here. Any character strings and devicespecific variables are available.
Cells for text and control elements.
You can apply a line break
by entering Ctrl+Enter
on the PC keyboard.
Select font type/size
Predefine start page number
Set paper margin
Switch between header and footer.
Device-specific variables are preceded by a “$” or a “#” sign.
The following device-specific variables are available:
67
Page 68

9 Evaluation - Table area
#USER Logged-in PC user
#NAME_USER Name of logged-in PC user
$P Page number
$N Total page number
$D Print date/time
$D{%d.%m.%y} Print date (without time)
$F Name of evaluation
$A Program name
$R Register name
#DEVICE Device name
#FABNR Device production No.
#GROUP Group name
#DESCRIPTION Supplementary description
#TIME Current time
#DATE Current date
#START_TIME Start time of evaluation
#STOP_TIME End time of evaluation
#START_DATE Start date of evaluation
#STOP_DATE End date of evaluation
#EINH_TIME Time of formatting
#EINH_DATE Date of formatting
Within the “Batches” register additionally:
#CHARGE_1_HEADER …
#CHARGE_30_HEADER
#CHARGE_1_VALUE …
#CHARGE_30_VALUE
Designation of the batch data
(column designation)
Batch data
(column value)
68
You can not only enter the device-specific variables directly, but also select
them from a list.
Page 69

9 Evaluation - Table area
h Position the mouse pointer in that field in which you want to enter the
parameter.
h Press the right mouse button.
h Position the mouse pointer on the required parameter and select it by using
the left mouse button.
Set up page The “Page setup” function offers additional functions for influencing the
appearance of the printout.
Printer
setup
The “Printer setup” function opens a Windows dialog window in which, among
others, you can select the paper size and orientation (portrait or landscape
format).
69
Page 70

9 Evaluation - Table area
9.12 Data export
The data export to EXCEL1 via a text file will be explained more fully in this
chapter by giving an example.
Export through
text file
h Open the evaluation through the Archive ➔ Open menu, or by activating the
button.
h Activate the register Analog: Group 1 by clicking on it with the left mouse
button.
Row numbering
h Mark the section by moving the mouse downwards over the row numbering
(keep left mouse button pressed). When you have marked the required
section, release the mouse button.
70
h Press the right mouse button and call up Export data sets followed by Text
file (*.txt).
h In the dialog below, choose Selected data sets and Comma as the
delimiter. Confirm the selection with OK.
h In the dialog window that opens now, you can select the path and enter the
file name under which the text file (ASCII file) is saved.
When it has been saved successfully, the file can be read into EXCEL.
1. EXCEL is a registered trademark of Microsoft Corporation
Page 71

9 Evaluation - Table area
Processing in
EXCEL
Export via
clipboard
h Start EXCEL (e.g. EXCEL 97).
h Select the Open function in the File menu.
h Switch the file type over to Text files.
h Open the file that has previously been created in PCA3000.
EXCEL will automatically start the Text Assistant for converting the data to the
EXCEL format.
h In the EXCEL Text Assistant step 1 of 3 is confirmed with “Continue”.
h With step 2 of 3, the “Tab” delimiter has to be inactivated and “Comma”
activated.
h Close the Text Assistant with “Close”.
The text file data are now available for graphical display or for computation
purposes.
Another possibility of importing data into EXCEL is provided (using the right
mouse button) within the different tables of the evaluation program PCA.
h Open the evaluation through the Archive ➔ Open menu, or by activating the
button.
h Activate the register Analog: Group 1 by a click with the left mouse button.
h Mark a column by moving the mouse onto the column header
(e.g. channel 1) and using the left mouse button.
h Call up the “Copy data sets” function with the right mouse button. The data
are now in the Windows clipboard.
h Start up EXCEL, open a worksheet and insert the data in the worksheet by
means of the EXCEL menu Edit ➔ Insert.
When exporting via the clipboard, the data are directly available in
H
a numerical format and need not be converted through the EXCEL
Text Assistant.
71
Page 72

9 Evaluation - Table area
72
Page 73

10 Menu functions and toolbar
10.1 Archive
Open This function displays measurement data from an archive graphically. How this
is done has already been described in Chapter 6.3 “Opening the archive”.
After selecting the archive to be opened, you have to first select the group
before the data can be displayed graphically. In addition to the device groups
that are available (generated within the paperless recorder), PCA groups can
be created and selected. They can be used to reorganize the device groups.
PCA groups
A click with the left mouse button
will open the register for creating
PCA groups.
Delete PCA group
Edit PCA group
Create PCA group
H
Device language
Display of the analog channels
contained in the PCA groups
Display of the PCA groups created
With instruments featuring an integrated language management or
several integrated languages, you can select the language and
thus activate different channel names and descriptions.
Display of the digital
channels contained
in the PCA groups
73
Page 74

10 Menu functions and toolbar
After activating the button, you can create the “virtual” PCA groups.
All activated channels are brought together in the PCA group after clicking
.
74
When you click , the data will be displayed graphically.
Page 75

10 Menu functions and toolbar
Open batch This function also displays measurement data from an archive graphically.
Unlike the Open function, not all the data from an archive will be shown here,
but only those of a specific batch.
Open electronic
signature
This function also displays measurement data from an archive graphically.
Unlike the Open function, not all the data from an archive will be shown here,
but only those for which a signature has been executed.
Close Closes a graphical display, but not the PCA3000 program.
Read in data This function reads measurement data from the CompactFlash memory card
into an archive. The procedure has already been described in Chapter 6.2
“Reading in data”.
All activated archives are read in. Position the mouse pointer on the
selection of available archives and press the right mouse button.
You now have further selection options for activating and deactivating
archived files.
If you left-click on
a file name, you can alter it.
Specific archives can be saved to a
separate file in this way.
Select all
files
Cancel
selection
This type of archiving is intended to achieve the simplest possible assignment
between the CF data files and the archived files. When determining the target
archive, the following sequence has to be observed:
- The device ID and the configuration ID of all data files in the “Folder for data
source” path are determined. In each case, there is only one device ID for
each device. Configuration IDs are provided for each reconfiguration
75
Page 76

10 Menu functions and toolbar
(alteration of the setting) of any device.
- Search procedure 1:
In the “Folder for target archives” path, all existing archives are searched
for a corresponding device and configuration ID, which will be determined.
The files found are made available for selection in the “Target archive” field
(click on ). The first archive that has been found will be automatically
entered in the “Target archive” field.
- Search procedure 2:
The search procedure corresponds to the first search procedure, with the
difference that only one archive with a corresponding device ID is searched
for. The second search procedure will only be started if no archive has been
found during the first one.
- If no corresponding archive was found during the two search procedures,
the “Target archive” remains empty and you can enter an archive name by
hand.
- An archive name that has been entered automatically can be manually
overwritten.
- If a target archive field remains empty, there will be an archive name query
during read-in.
- The “Folder for data source” and “Folder for target archive” settings will be
backed up after the read-in and automatically entered when the function is
called up next.
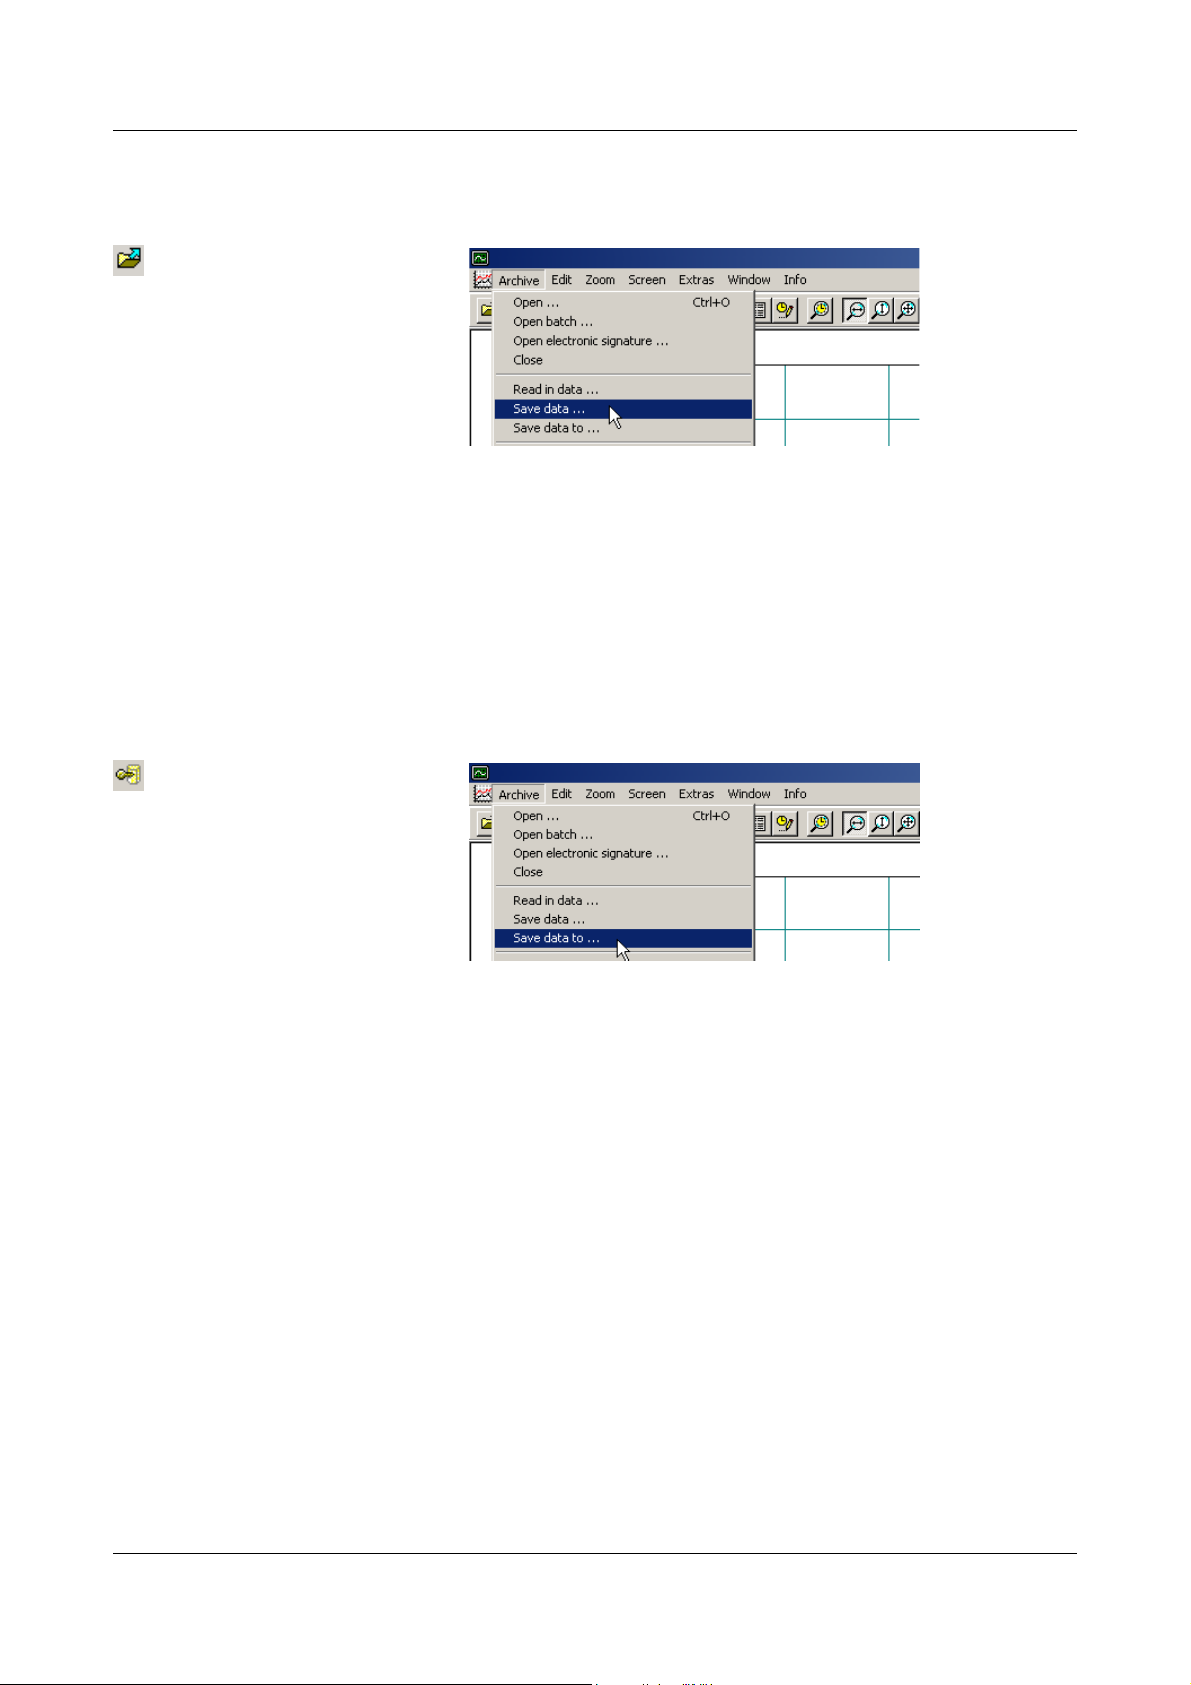
Save data This function saves measurement data from one archive to a separate file. This
file can be passed on, for example for examination purposes. The procedure
has already been described in Chapter 6.4 “Backing up data”.
Save data as This function saves measurement data from an archive into a separate file with
additional protection options. This file can be passed on for checking purposes, for example. How this is done, has already been described in Chapter 6.4
“Backing up data”.
Print preview This function serves to check the print result.
Printer setup Here you can make alterations to the settings for your printer. When the
program is started, the Windows default printer will always be set as the active
printer.
Print This function starts the print job.
Default settings
76
Here you can make alterations to the default settings for the program. The
alterations will only take effect after a fresh start of the PCA3000 software.
General
In the “General” register you can select the language that the software has to
use at the next program start.
Page 77

10 Menu functions and toolbar
File deposit
In the “File deposit” register you can determine the standard (default)
directories (paths) for the archive and evaluation directory.
v Chapter 6.5 “Archive and evaluation directory”
Colors
In the “Colors” register, the color assignment of the individual channels within
the graphics can be defined. You can define 12 colors. If more than 12
channels are visualized, as a result of external channels or logic inputs, for
example, the color sequence will be repeated. You can still alter the colors
within the graphics later on.
v Chapter 9.2 “Channels”
The color setting on the left only applies if
you have not marked the box with a tick.
77
Page 78

10 Menu functions and toolbar
10.2 Editing
Reset
evaluation
Reset archive
This function deletes all files from the evaluation directory. The data are
automatically regenerated if you make data visible through Archive ➔ Open,
for example. You can use this function for cleaning up the hard disk from time
to time.
Select the archive
that is to be reset here.
Caution:
The archive must not be displayed
graphically at this moment.
Options for resetting an archive
If no option is activated, only the files belonging to the selected archive will be
deleted from the evaluation directory. As with the Reset evaluation function,
they will be automatically regenerated when the archive is displayed
graphically again.
Delete PCA group
If the option is activated, PCA groups (generated within the PCA3000 when an
archive is opened) will be deleted. Measurement data will not be lost.
v See “PCA groups” on page 73.
Delete evaluation configuration
This option enables you to undo changes to the Channels register.
v “Channels” register: see Chapter 9.2 “Channels”
Prepare new evaluation
When this option is active, the files in the evaluation directory will be freshly
created for the specified archive at the end of the function Reset archive. This
means you will save time at the next graphical display of the archive.
78
Page 79

Supplementary
description
10 Menu functions and toolbar
Device info text
The device info text can be created using the setup
program but cannot be edited. Caution: do not confuse
“device info text” with “file info text”.
Sign time
period
Supplementary description
Here you can enter the additional text.
If a protected archive (Page 30) is created after entering the supplementary
description, the information will be permanently linked to the file; it can no
longer be deleted.
With all other archives, the “supplementary description” can be deleted again
by re-editing or through the function Edit ➔ Reset archives (option Delete PCA
groups must be activated ).
You can use this function to execute an electronic signature for the process
data that are visible in the graphics. If you have previously zoomed, the data
that are not visible are not signed.
The signature is entered in the “PC signature for time period” register.
v Chapter 9.8 “Log-off signature (PC signature for time period)”
79
Page 80

10 Menu functions and toolbar
10.3 Zoom
Zoom on date
and time
After calling up this function, you can zoom the graphics by entering a start
time and an end time.
Select date from
calendar
Use the mouse or the tabulator key to move from one field to another. Use the
mouse or the cursor keys (left, right) to move from one part of the date to
another within the field.
Enter the required time with the number keys. When you have completed the
entry with OK, the graphics is displayed.
If you cannot enter an end time, this could mean that this a time prior to the
start time. This is not possible.
Zoom X-axis If this function is active ( ), you can zoom in the X-direction within
the graphics using the left mouse button (position mouse, press left mouse
button, move mouse, release left mouse button).
Zoom Y-axis If this function is active ( ), you can zoom in the Y-direction within
the graphics using the left mouse button (position mouse, press left mouse
button, move mouse, release left mouse button).
Zoom X+Y-axes If this function is active ( ), you can zoom in the X- and Y-
direction within the graphics using the left mouse button (position mouse,
press left mouse button, move mouse, release left mouse button).
Show guideline If this function is active ( ), a guideline from the current value of
the channel to the X- and Y-axis can be switched into display within the
graphics by using the left mouse button (position mouse, press left mouse
button, then release it).
Reset zoom This function undoes all magnifications/reductions and presents the complete
data for the archive section that has been opened.
Zoom forwards
(zoom in)
The next zoomed display can be restored through this function. This function
is only available if Zoom backwards has been executed. As an alternative to
the mouse, Zoom forwards can also be executed from the PC keyboard (page
up).
80
Page 81

10 Menu functions and toolbar
Zoom
backwards
(zoom out)
The last zoomed display can be restored through this function. It is only
available if zooming has been carried out. As an alternative to the mouse,
Zoom backwards can also be executed from the PC keyboard (page down).
10.4 View
Toolbar Show/hide toolbar.
Status bar Show/hide status bar (at the lower end of the software window).
Coordinate bar Show/hide coordinate bar (at the lower end of the software window, above the
status bar).
10.5 Extras
Enable (unlock)
program
options
Renew log-in /
alter password
If the software has been installed as a viewer (“read-only” mode), then some
functions, such as saving, are disabled. This function can be used to register
the software at a later stage and so change it to a full version.
This function enables the logged-in user to log in freshly and use the options
that are also available with a fresh startup of the software.
Comment in
audit trail
v Chapter 11 “Options at program start”
This function can be used to make a manual entry in the audit trail. The entries
can be visualized by means of the PC Audit Trail Manager software.
v Additional information about the PC Audit Trail Manager software (PCAT)
can be found in the Operating Manual B 70.9704.0.
81
Page 82

10 Menu functions and toolbar
10.6 Window
Cascade Several graphical displays (open sections of an archive) are shown
overlapping.
In the “Window” menu, the individual names of the open displays are shown
and can consequently be selected and displayed.
Tile Several graphics displays (open sections of an archive) are shown side by
side.
Arrange icons If displays are minimized (click on icon), this function will position all window
titles at the lower edge of the screen - several will be positioned next to each
other.
Minimize window:
Click here to minimize a window.
Icons arranged:
82
Page 83

10 Menu functions and toolbar
10.7 Info
Info Here you can obtain information on the version number of the program. Please
have this number available if you have technical problems or queries and
contact a service representative.
Registered
license
numbers
Here you can obtain information on the license number of the program. Please
have this number available if you have technical problems or queries and
contact a service representative.
83
Page 84

10 Menu functions and toolbar
84
Page 85

11 Options at program start
When you start up the PCA3000 software, you have the opportunity of setting
various options if log-in has been activated.
Proceed as follows:
h Start the software
h Before you log in, left-click on to show the options.
Show options
The dialog window changes to ...
Change user list
after log-in
Alter password
after log-in
This function is only available if the “Administrator” or “Network user” option
was selected during the installation of the software, and only on instruments
with an increased security level.
Select the option if you want to activate a different user list after starting the
program.
If the installation was made with the “Local user” option, then the function
does not read “Change user list after log-in”, but:
Read in new rights file after log-in.
Select this option if you want to alter your password after starting the program.
85
Page 86

11 Options at program start
86
Page 87

A
Administrator 11
After log-in, alter password 85
After log-in, change user list 85
After log-in, read in new rights file 85
Altering
column width
row height 49
Archive 22–23
open 24, 33, 73
reset 78
Archive file 31
Archive reset
delete evaluation configuration
delete PCA group 78
prepare new evaluation 78
Audit trail filtering 57
49
78
B
12 Index
Batch 58
continue search 59
filtering 59
info 37
open 75
search 36, 59
sign 60
Batch information 60
Batch period
scroll
59
synchronize 59
zoom 59
C
Channel color 46
Channel description 47
Channel display 46
Channel name 47
Channel unit, display of 47
Clipboard 71
Close 75
Column width
52, 55, 61
adjust
alter 49
Column width and row height, adjusting of 52, 55, 61
Comment in audit trail 81
Commissioning 7
CompactFlash 22, 75
Continue search 59
87
Page 88

12 Index
Coordinate bar 19, 81
Copying 52, 55, 61
D
Data
read-in
save 28, 76
save as 28, 30, 76
Data export 70
Data sets
copy
export 55, 61
filtering 54
mark 54
scroll 54
synchronize 54
Default settings 76
colors 77
file deposit 77
general 76
Demo version 14
Device language 73
Device-specific variables 67–68
22, 75
55, 61
E
Electronic signature, opening of 75
Evaluation 22–24
prepare freshly 78
reset 78
Evaluation configuration, deleting of 78
Evaluation directory 31
Export 52, 55, 61, 70
through text file 70
via clipboard 71
F
File deposit 31
Filter audit trail 57
Filtering 54, 57, 59, 63
Footer 67
Full-text search 37
G
88
Graphical representation 33
Graphics area 33, 35
Graphics properties 38
Page 89

Guide 21
H
Header 67
I
Info 83
Installation 13, 15
K
Keys 9
L
License agreement 13
License number 14
License numbers 14
Line type 46
Line width 46
12 Index
M
Marking 52, 54
all 52
column 51
row 51
section 50
Marking a column 51
Marking a row 51
Marking a section 50
Marking all 52
Measurement data read-in 22
Measurement data visualization 24
Menu bar 19
N
Note signs 8
O
Opening 73
Options at program start 85
89
Page 90

12 Index
P
Page setup 69
Password alteration 81
PCA groups 25, 73
PCA groups, deleting of 78
Print
print
38
print preview 38
printer setup 38
Print preview 67, 76
Printer setup 69, 76
Printing 38, 67, 76
Processing in EXCEL 71
Program options, enabling of 81
Properties 38
actions for left mouse button 38
display all measurements 40
display ratio 38
font size 39
speed 39
zoom 39
Protected archives 28, 30, 79
R
Ratio of displayed measured values ... 47
Recipe 60
Recipe data 60
Register 41
Registered license numbers 83
Renew log-in 81
Report 49
Representation 9
Row height, adjusting of 52, 55, 61
Row height, alteration of 49
S
Save diagram as bitmap 40
Save diagram as Jpeg 40
Scaling end 47
Scaling start 47
Screen texts 9
Scroll 51, 54, 59
Search 59
Show guideline 80
Signature filtering 63
Software available 14
Software installation 13
Status bar 81
90
Page 91

Supplementary description 79
Synchronizing 51, 54, 59
T
Table
analog group
audit trail 56
batches 58
channels 45
digital group 66
events 53
PC signature for batches 62
PC signature for log-off 64
report 49
signature for batches 62
signature for log-off 64
Table area 33, 41
Time period
52
copy
scroll 51
sign 37
signing 79
synchronize 51
zoom 51
Time period selection 26
Toolbar 19, 81
Toolbar, shifting of 20
65
12 Index
W
Warning signs 8
Warranty 7
Window
arrange icons
cascade 82
tile 82
Working area 19–20
82
Y
Y-axis type 47
Z
Zoom
37, 80
in
out 37, 81
reset 37, 80
Zoom on date and time 80
91
Page 92

12 Index
Zoom X+Y-axes 80
Zoom X-axis 80
Zoom Y-axis 80
Zooming 37, 51, 59, 80
92
Page 93

Page 94

JUMO GmbH & Co. KG
Street address:
Moltkestraße 13 - 31
36039 Fulda, Germany
Delivery address:
Mackenrodtstraße 14
36039 Fulda, Germany
Postal address:
36035 Fulda, Germany
Phone: +49 661 6003-0
Fax: +49 661 6003-607
e-mail: mail@jumo.net
Internet: www.jumo.net
JUMO Instrument Co. Ltd.
JUMO House
Temple Bank, Riverway
Harlow, Essex CM20 2TT, UK
Phone: +44 1279 635533
Fax: +44 1279 635262
e-mail: sales@jumo.co.uk
Internet: www.jumo.co.uk
JUMO Process Control, Inc.
8 Technology Boulevard
Canastota, NY 13032, USA
Phone: 315-697-JUMO
1-800-554-JUMO
Fax: 315-697-5867
e-mail:
Internet: www.jumo.us
info@jumo.us
 Loading...