

Page 1

Hardware Maintenance Manual
xSeries 330
IBM
Page 2

Page 3

Hardware Maintenance Manual
xSeries 330
IBM
Page 4

Note: Before using this information and the product it supports, be sure to read the general information under
“Notices” on page 147.
First Edition (September 2000)
INTERNATIONAL BUSINESS MACHINES CORPORATION PROVIDES THIS PUBLICATION "AS IS"
WITHOUT WARRANTY OF ANY KIND, EITHER EXPRESS OR IMPLIED, INCLUDING, BUT NOT
LIMITED TO, THE IMPLIED WARRANTIES OF MERCHANTABILITY OR FITNESS FOR A PARTICULAR
PURPOSE. Some states do not allow disclaimer of express or implied warranties in certain transa ctions,
therefore, this statement may not apply to you.
This publication could include technical inaccuracies or typographical errors. Changes are periodically made
to the information herein; these changes will be incorpor ated in new editions of the publication. IBM may
make improvements and/or changes in the product(s) and/or the program(s) described in this publication at
any time.
This publication was developed for products and services offered in the United States of America. IBM ma y
not offer the products, services, or features discussed in this document in other countries, and the
information is subject to change without notice.
Consult your local IBM representative for information on the products, services, and features available in
your area.
Requests for technical information about IBM products should be made to your IBM reseller or IBM
marketing representative.
xSeries 300
© Copyright International Business Machines Corporation 2000. All rights reserved.
US Government Users Restricted Rights – Use, duplication or disclosure restricted by GSA ADP Sch edu le Cont ra ct wit h
IBM Corp.
Page 5
About this manual
This manual contains diagnostic information, a Symptom-to-FRU index, service
information, error codes, error messages, and configuration information for the IBM
xSeries 330.
Important: This manual is intended for trained se rvicers who are familiar with IBM
PC Server products.
Important safety information
Be sure to read all caution and danger statements in this book before performing any
of the instructions.
Leia todas as instruções de cuidado e perigo antes de executar qualquer operação.
®
© Copyright IBM Corp. 2000 iii
Page 6
Prenez connaissance de toutes les consignes de type Attention et
Danger avant de procéder aux opérations décrites par les instructions.
Lesen Sie alle Sicherheitshinweise, bevor Sie eine Anweisung ausführen.
Accertarsi di leggere tutti gli avvisi di attenzione e di pericolo prima d i effettuare
qualsiasi operazione.
Online Support
IBM Online Addresses
Lea atentamente todas las declaraciones de precaución y peligro ante de llevar a cabo
cualquier operación.
Use the World Wide Web (WWW) to download Diagnostic, BIOS Flash, and Device
Driver files.
File download address is:
http://www.us.pc.ibm.com/files.html
The HMM manuals online address is:
http://www.us.pc.ibm.com/cdt/hmm.html
The IBM PC Company Support Page is:
http://www.us.pc.ibm.com/support/index.html
The IBM PC Company Home Page is:
http://www.pc.ibm.com
iv Hardware Maintenance Manual: xSeries 330
Page 7

Contents
About this manual . . . . . . . . . . . . . . . . . . . iii
Important safety information . . . . . . . . . . . . . . . . . . . . . . iii
Online Support . . . . . . . . . . . . . . . . . . . . . . . . . . . . . . . . . . iv
IBM Online Addresses . . . . . . . . . . . . . . . . . . . . . . . . . iv
Chapter 1.General checkout . . . . . . . . . . . . 1
Chapter 2.General information . . . . . . . . . . 3
Features and specifications . . . . . . . . . . . . . . . . . . . . . . . . 4
What the xSeries 330 offers . . . . . . . . . . . . . . . . . . . . . . . . 5
Reliability, availability, and serviceability features . . . . 5
Server controls and indicators. . . . . . . . . . . . . . . . . . . . . . 6
Front view. . . . . . . . . . . . . . . . . . . . . . . . . . . . . . . . . . . . 6
Rear view. . . . . . . . . . . . . . . . . . . . . . . . . . . . . . . . . . . . . 7
Turning on the server . . . . . . . . . . . . . . . . . . . . . . . . . . 8
Turning off the server . . . . . . . . . . . . . . . . . . . . . . . . . . 9
Stand-by mode . . . . . . . . . . . . . . . . . . . . . . . . . . . . . 9
Chapter 3.Diagnostics. . . . . . . . . . . . . . . . 11
Diagnostic tools overview . . . . . . . . . . . . . . . . . . . . . . . . 11
POST . . . . . . . . . . . . . . . . . . . . . . . . . . . . . . . . . . . . . . . . . . 12
POST error messages. . . . . . . . . . . . . . . . . . . . . . . . . . 12
Event/error logs. . . . . . . . . . . . . . . . . . . . . . . . . . . . . . 12
Small computer system interface messages . . . . . . . . . 12
Identifying problems using status LEDs . . . . . . . . . . . . 13
Light Path Diagnostics . . . . . . . . . . . . . . . . . . . . . . . . 13
Diagnostics panel . . . . . . . . . . . . . . . . . . . . . . . . . . 14
Diagnostic programs and error messages . . . . . . . . . . . 15
Text messages . . . . . . . . . . . . . . . . . . . . . . . . . . . . . . . . 15
Starting the diagnostic programs . . . . . . . . . . . . . . . 16
Viewing the test log. . . . . . . . . . . . . . . . . . . . . . . . . . . 16
Recovering BIOS . . . . . . . . . . . . . . . . . . . . . . . . . . . . . . . . 18
Troubleshooting the Ethernet controller . . . . . . . . . . . . 19
Network connection problems. . . . . . . . . . . . . . . . . . 19
Ethernet controller troubleshooting chart . . . . . . . . 19
Ethernet controller messages. . . . . . . . . . . . . . . . . . . . . . 20
Novell NetWare or IntraNet Ware server ODI driver
teaming messages . . . . . . . . . . . . . . . . . . . . . . . . . . . . . . . 21
NDIS 4.0 (Windows NT) driver messages . . . . . . . . 22
Power checkout. . . . . . . . . . . . . . . . . . . . . . . . . . . . . . . . . 24
Replacing the battery . . . . . . . . . . . . . . . . . . . . . . . . . . . . 25
Temperature checkout . . . . . . . . . . . . . . . . . . . . . . . . . . . 26
Chapter 4.Configurin g th e se rver. . . . . . . 29
Using the Configuration/Setup Utility program. . . . . 29
Starting the Configuration/Setup Utility program 29
Choices available from the Configuration/Setup main
menu . . . . . . . . . . . . . . . . . . . . . . . . . . . . . . . . . . . . . . . . . . 29
Using passwords . . . . . . . . . . . . . . . . . . . . . . . . . . . . . 34
Power-on password . . . . . . . . . . . . . . . . . . . . . . . . 34
Administrator password . . . . . . . . . . . . . . . . . . . . 35
Using the SCSISelect utility program. . . . . . . . . . . . . . . 36
Starting the SCSISelect utility program . . . . . . . . . . 36
Choices available from the SCSISelect menu . . . . . 36
Using the Preboot eXecution Environment boot agent
utility program. . . . . . . . . . . . . . . . . . . . . . . . . . . . . . . . . . 37
Starting the PX E boot agent utility program . . . 37
Choices available from the PXE boot agent utility .
38
Chapter 5.Installing options. . . . . . . . . . . 39
Major components of the xSeries 330 server . . . . . . . . . 39
System board . . . . . . . . . . . . . . . . . . . . . . . . . . . . . . . . . . . 40
System board options connectors . . . . . . . . . . . . . . . 40
System board LEDs . . . . . . . . . . . . . . . . . . . . . . . . . . . 41
Before you begin . . . . . . . . . . . . . . . . . . . . . . . . . . . . . . . . 42
System reliability considerations. . . . . . . . . . . . . . . . 42
Working inside a server with power on . . . . . . . . . . 42
Rack installation. . . . . . . . . . . . . . . . . . . . . . . . . . . . . . . . . 43
Removing the cover. . . . . . . . . . . . . . . . . . . . . . . . . . . . . . 44
Working with adapters . . . . . . . . . . . . . . . . . . . . . . . . . . . 44
Adapter considerations . . . . . . . . . . . . . . . . . . . . . . . . 45
Installing an adapter . . . . . . . . . . . . . . . . . . . . . . . . . . 46
Hard disk drives . . . . . . . . . . . . . . . . . . . . . . . . . . . . . . . . 48
Preinstallation steps . . . . . . . . . . . . . . . . . . . . . . . . . . 48
Installing or replacing a hard disk drive. . . . . . . . . . 49
Hot-swap disk drives . . . . . . . . . . . . . . . . . . . . . . . . . . . . 50
Preinstallation steps. . . . . . . . . . . . . . . . . . . . . . . . . . . 50
Installing hot-swap disk drives . . . . . . . . . . . . . . . . . 50
Replacing a drive in a hot-swap bay . . . . . . . . . . 51
Memory . . . . . . . . . . . . . . . . . . . . . . . . . . . . . . . . . . . . . . . 53
Installing memory modules . . . . . . . . . . . . . . . . . . . . 53
Microprocessor. . . . . . . . . . . . . . . . . . . . . . . . . . . . . . . . . . 55
Installing the microprocessor. . . . . . . . . . . . . . . . . . . 56
Removing a microprocessor. . . . . . . . . . . . . . . . . . . . 57
Fan assembly replacement . . . . . . . . . . . . . . . . . . . . . . . . 59
Installing the cover . . . . . . . . . . . . . . . . . . . . . . . . . . . . . . 61
I/O connector locations and ports . . . . . . . . . . . . . . . . . 61
Input/Output ports . . . . . . . . . . . . . . . . . . . . . . . . . . 62
Serial port. . . . . . . . . . . . . . . . . . . . . . . . . . . . . . . . . 62
Universal Serial Bus ports . . . . . . . . . . . . . . . . . . . 63
Cable Chaining Technology (C2T) ports. . . . . . . 64
C2T chaining cable . . . . . . . . . . . . . . . . . . . . . . . . . 65
C2T breakout cable . . . . . . . . . . . . . . . . . . . . . . . . . 65
Ethernet ports . . . . . . . . . . . . . . . . . . . . . . . . . . . . . 67
Advanced System Management ports. . . . . . . . . 70
Working with cables . . . . . . . . . . . . . . . . . . . . . . . . . . . . . 71
Cabling the RS-485 ports. . . . . . . . . . . . . . . . . . . . . . . 71
Connecting the ASM bus. . . . . . . . . . . . . . . . . . . . 72
Connecting the servers with a C2T chain. . . . . . . . . 72
Testing the C2T chain . . . . . . . . . . . . . . . . . . . . . . . 74
Cable management. . . . . . . . . . . . . . . . . . . . . . . . . . . . 75
Chapter 6.FRU information (service only)77
Diskette/CD-ROM drives . . . . . . . . . . . . . . . . . . . . . . . . 77
Diskette/CD-ROM drive bracket . . . . . . . . . . . . . . . . . . 78
Hard disk drive backplane. . . . . . . . . . . . . . . . . . . . . . . . 79
Power supply. . . . . . . . . . . . . . . . . . . . . . . . . . . . . . . . . . . 79
PCI riser card . . . . . . . . . . . . . . . . . . . . . . . . . . . . . . . . . . . 80
System board . . . . . . . . . . . . . . . . . . . . . . . . . . . . . . . . . . . 80
Chapter 7.Sy mptom-to-FRU ind ex . . . . . . 8 3
Beep symptoms . . . . . . . . . . . . . . . . . . . . . . . . . . . . . . . . . 83
No Beep symptoms. . . . . . . . . . . . . . . . . . . . . . . . . . . . . . 85
Information panel system error LED . . . . . . . . . . . . . . . 85
Diagnostic error codes . . . . . . . . . . . . . . . . . . . . . . . . . . . 87
Error symptoms . . . . . . . . . . . . . . . . . . . . . . . . . . . . . . . . . 89
POST error codes. . . . . . . . . . . . . . . . . . . . . . . . . . . . . . . . 90
SCSI error codes. . . . . . . . . . . . . . . . . . . . . . . . . . . . . . . . . 95
Temperature error messages . . . . . . . . . . . . . . . . . . . . . . 95
Fan error messages . . . . . . . . . . . . . . . . . . . . . . . . . . . . . . 96
© Copyright IBM Corp. 2000 v
Page 8

System shutdown . . . . . . . . . . . . . . . . . . . . . . . . . . . . . . . 96
Voltage related system shutdown . . . . . . . . . . . . . . . 96
Temperature related system shutdown . . . . . . . . . . 97
DASD checkout . . . . . . . . . . . . . . . . . . . . . . . . . . . . . . . . . 97
Bus fault messages . . . . . . . . . . . . . . . . . . . . . . . . . . . . . . 97
Undetermined problems . . . . . . . . . . . . . . . . . . . . . . . . . 98
Chapter 8.Parts listing. . . . . . . . . . . . . . . 101
System. . . . . . . . . . . . . . . . . . . . . . . . . . . . . . . . . . . . . . . . 101
Keyboards. . . . . . . . . . . . . . . . . . . . . . . . . . . . . . . . . . . . . 103
Power cords . . . . . . . . . . . . . . . . . . . . . . . . . . . . . . . . 104
Chapter 9.Related service information . 107
Safety information. . . . . . . . . . . . . . . . . . . . . . . . . . . . . . 107
General safety. . . . . . . . . . . . . . . . . . . . . . . . . . . . . . . 107
Electrical safety. . . . . . . . . . . . . . . . . . . . . . . . . . . . . . 108
Safety inspection guide . . . . . . . . . . . . . . . . . . . . . . . 109
Handling electrostatic discharge-sensitive devices 110
Grounding requirements. . . . . . . . . . . . . . . . . . . . . . 111
Safety notices (multi-lingual translations) . . . . . . . 111
Send us your comments! . . . . . . . . . . . . . . . . . . . . . . . . 146
Problem determination tips . . . . . . . . . . . . . . . . . . . . . . 147
Notices. . . . . . . . . . . . . . . . . . . . . . . . . . . . . . . . . . . . . . . . 147
Trademarks. . . . . . . . . . . . . . . . . . . . . . . . . . . . . . . . . . . . 148
vi Hardware Maintenance Manual: xSeries 330
Page 9

Chapter 1. General checkout
The server diagnostic programs are stored in upgradable read-only memory (ROM)
on the system board. These programs are the primary method of testing the major
components of the server: the system board, Ethernet controller, video controller,
RAM, keyboard, mouse (pointing device), diskette drive, serial ports, and hard
drives. You can also use them to test some external devices. See “Diagnostic
programs and error messages” on page 15.
Also, if you cannot determine whether a problem is caused by the hardware or by the
software, you can run the diagnostic programs to confirm that the hardware is
working properly.
When you run the diagnostic programs, a single problem might cause several error
messages. When this occurs, work to correct the cause of the first error message.
After the cause of the first error message is corrected, the other error messages might
not occur the next time you run the test.
A failed system might be part of a shared DASD cluster (two or more systems sharing
the same external storage device(s)). Prior to running diagnostics, verify that the
failing system is not part of a shared DASD cluster.
A system might be part of a cluster if:
• The customer identifies the system as part of a cluster.
• One or more external storage units are attached to the system and at least one of
the attached storage units is additionally attached to another system or
unidentifiable source.
• One or more systems are located near the failing system.
If the failing system is suspected to be part of a shared DASD cluster, all diagnostic
tests can be run except diagnostic tests which test the storage unit (DASD residing in
the storage unit) or the storage adapter attached to the storage unit.
Notes:
1. Safety information, see “Safety information” on page 107.
2. For systems that are part of a shared DASD cluster, run one test at a time in
looped mode. Do not run all tests in looped mode, as this could enable the DASD
diagnostic tests.
3. If mult iple error codes are displayed, diagnose the first error code displayed.
4. If the computer hangs with a POST error, go to “POST error codes” on page 90.
5. For intermittent problems, check the error log; see “Event/error logs” on page 12.
1. IS THE SYSTEM PART OF A CLUSTER?
YES.Schedule maintenance with the customer. Shut down all systems related to the
cluster. Run storage test.
NO.Go to step 2.
2. IF THE SYSTEM IS NOT PART OF A CLUSTER:
• Power-off the computer and all external devic es.
• Check all cables and power cords.
• Set all display controls to the middle position.
• Power-on all external devices.
© Copyright IBM Corp. 2000 1
Page 10

• Power-on the computer.
• If the computer hangs and no error is displayed, go to “Undetermined
problems” on page 98.
• Record any POST error messages displayed on the screen. If an error is
displayed, look up the first error in the “POST error codes” on page 90.
• Check the information LED panel System Error LED; if on, see “Information
panel system error LED” on page 85.
• Check the System Error Log. If an error was recorded by the system, see
“Chapter 7. Symptom-to-FRU index,” on page 83.
• Start the Diagnostic Programs. See “Diagnostic programs and error
messages” on page 15.
• Check for the following responses:
a. One beep.
b. Readable instructions or the Main Menu.
3. DID YOU RECEIVE BOTH OF THE CORRECT RESPONSES?
NO.Find the failure symptom in“Chapter 7. Symptom-to-FRU index,” on page 83.
YES.Run the Diagnostic Programs. If necessary, refer to “Starting the diagnostic
programs” on page 16.
If you receive an error, go to“Chapter 7. Symptom-to-FRU index,” on p age 83.
If the diagnostics completed successfully a nd you still suspect a problem, see
“Undetermined problems” on page 98.
2 Hardware Maintenance Manual: xSeries 330
Page 11

Chapter 2. General information
The IBM
®
xSeries 330 server is a one U-high
1
rack-model server for highvolume network transaction processing. This high-performance, symmetric
multiprocessing (SMP) server is ideally suited for netw orking environments that
require superior microprocessor performance, efficient memory management,
flexibility, and reliable data storage.
The xSeries 330 server comes with a three-year limited warranty and IBM Server Start
Up Support. If you have access to the World Wide Web, you can obtain up-to-date
information about your xSeries 330 model and other IBM server products at the
following World Wide Web address: http://www.ibm.com/eserver/xseries
1.Racks are marked in vertical increments of 1.75 inches each. Each increment is referred to as a unit, or a "U". A one-U-high device is
1.75 inches tall.
© Copyright IBM Corp. 2000 3
Page 12

Features and specifications
The following table provides a summary of the features and specifications for the
xSeries 330 server.
Table 1. Features and Specification s.
Microprocessor:
• Intel
• 2 56 KB Level-2 cache
• Supports up to two
Memory:
• Standard: 256 MB
• Maximum: 4 GB
• Type: 133 MHz, ECC, SDRAM,
• Slots: 4 dual inline
Drives standard:
• Diskette: 1.44 MB
• CD-ROM: 24X IDE
Expansion bays:
• Two 3.5-inch slim high bays for
PCI expansion slots:
• Two 33 MHz/64-bit
Power supply:
One 200 watt (115-230 Vac)
Video:
• S3 Savage4 PRO
• Compatible with SVGA
• 8 MB SDRAM video memory
®
Pentium® III
microprocessor with MMX™
technology and SIMD
extensions
microprocessors
Registered DIMMs
LVD SCSI hard disk drives
Graphics/Video Accelerator
(integrated on system board)
Size
• Height 43.69 mm (1.72")
• Depth: 653.29 mm (25.72")
• Width: 439.93 mm (17.32")
• Weight: approximately 12.7 kg
(28lb) when fully configured
Integrated functions:
• Advanced System Management
processor
• One Ultra160 SCSI controller
• Two 10BASE-T/100BASE-TX
Intel Ethernet controllers
• Two Universal Serial Bus (USB)
ports
• Two RS-485 Advanced System
Management processor ports
(one In, one Out)
• One serial port
• Two Cable Chaining Techn ology
ports (IN, OUT)
Acoustical noise emissions:
• Sound power, idling: 6.1 bel
maximum
• Sound power, operating: 6.2 bel
maximum
Environment:
• Air temperature:
— Server on: 10º to 35º C (50.0º to
95.0º F). Altitude: 0 to 914 m
(2998.7 ft.)
— Server on: 10º to 32º C (50.0º to
89.6º F). Altitude: 914 m
(2998.7 ft.) to 2133 m (6998.0 ft.)
— Server off: 10º to 43º C (50.0º to
109.4º F). Maximum altitude:
2133 m (6998.0 ft.)
• Humidity:
— Server on: 8% to 80%
— Server off: 8% to 80%
Heat output:
Approximate heat output in British
Thermal Units (BTU) per hour
• Minimum configuration: 273 BTU
(80 watts)
• Ma ximum configuration: 751 BTU
(220 watts)
Electrical input:
• Sine-wave input (50-60 Hz)
required
• Input voltage low range:
— Minimum: 100 V ac
— Maximum: 127 V ac
• Input voltage high range:
— Minimum: 200 V ac
— Maximum: 240 V ac
• Input kilovolt-amperes (kVA)
approximately:
— Minimum: 0.08 kVA
— Maximum: 0.22 kVA
What the xSeries 330 offers
The unique design of this server takes advantage of ad vancements in symmetric
multiprocessing (SMP), data storage, and memory management. The server
combines:
4 Hardware Maintenance Manual: xSeries 330
Page 13

• Impressive performance using an innovative approach to SMP
The server supports up to two Pentium III microprocessors. The server comes
with one microprocessor installed; you can install an additional microprocessor to
enhance performance and provide SMP capability.
• Large system memory
The memory bus in the server supports up to 4 gigabytes (GB) of system memory.
The memory controller provides error correcting code (ECC) support for up to
four industry standard PC133, 3.3 V, 168-pin, 8-byte, registered, synchronousdynamic-random access memory (SDRAM) dual inline memory modules
(DIMMs).
• System-management capabilities
The server comes with an Advanced System Management Processor on the
system board. This processor, in conjunction with the systems-management
software that is provided with the server, enables you to manage the functions of
the server locally and remotely. The Advanced System Management Processor
also provides system monitoring, event recording, and dial-out alert capability.
Note: The Advanced System Management Processor is sometimes referred to as
the service processor.
Refer to the documentation provided with the system-management software for
more information.
• Integrated network environment support
The server comes with two Ethernet controllers on the system board. Each
Ethernet controller has an interface for co nnecting to 10-Mbps or 100-Mbps
networks. The server automatically selects between 10BASE-T and 100BASE-TX.
Each controller provides full-duplex (FDX) capability , which allows simultaneous
transmission and reception of data on the Ethernet local area network (LAN).
• IBM ServerGuide CDs
The ServerGuide CDs that are included with the server provide programs to help
you set up your server and install the network operating system (NOS). The
ServerGuide program detects the hardware options that are installed, and
provides the correct configuration programs and device drivers. In addition, the
ServerGuide CDs include a variety of application programs for your server.
Reliability, availability, and serviceability features
Three of the most important features in server design are reliability, availability, and
serviceability (RAS). These factors help to ensure the integrity of the data stored on
your server; that your server is available when you want to use it; and that should a
failure occur, you can easily diagnose and repair the failu re with mi nimal
inconvenience.
The following is an abbreviated list of the RAS features that your server supports.
• Menu-driven setup, system configuration, RAID configuration, and diagnostic
programs
• Power-on self-test (POST)
• Integrated Advanced System Management Processor
• Predictive Failure Alerts (PFA)
• Remote system problem-analysis support
• Power and temperature monitoring
• Hot-swap drive bays
Chapter 2. General information 5
Page 14
• Error codes and messages
• System error logging
• Upgradable BIOS, diagno stics, and Advanced System Management Processor
code
• Automatic restart after a power failure
• Parity checking on the PCI buses
• CRC checking on the SCSI buses
• Error checking and correcting (ECC) memory
• Redundant Ethernet capabilities
• Light Path Diagnostics ™ o n the system board
• Vital Product Data (VPD) on system boa rd, and SCSI backplane
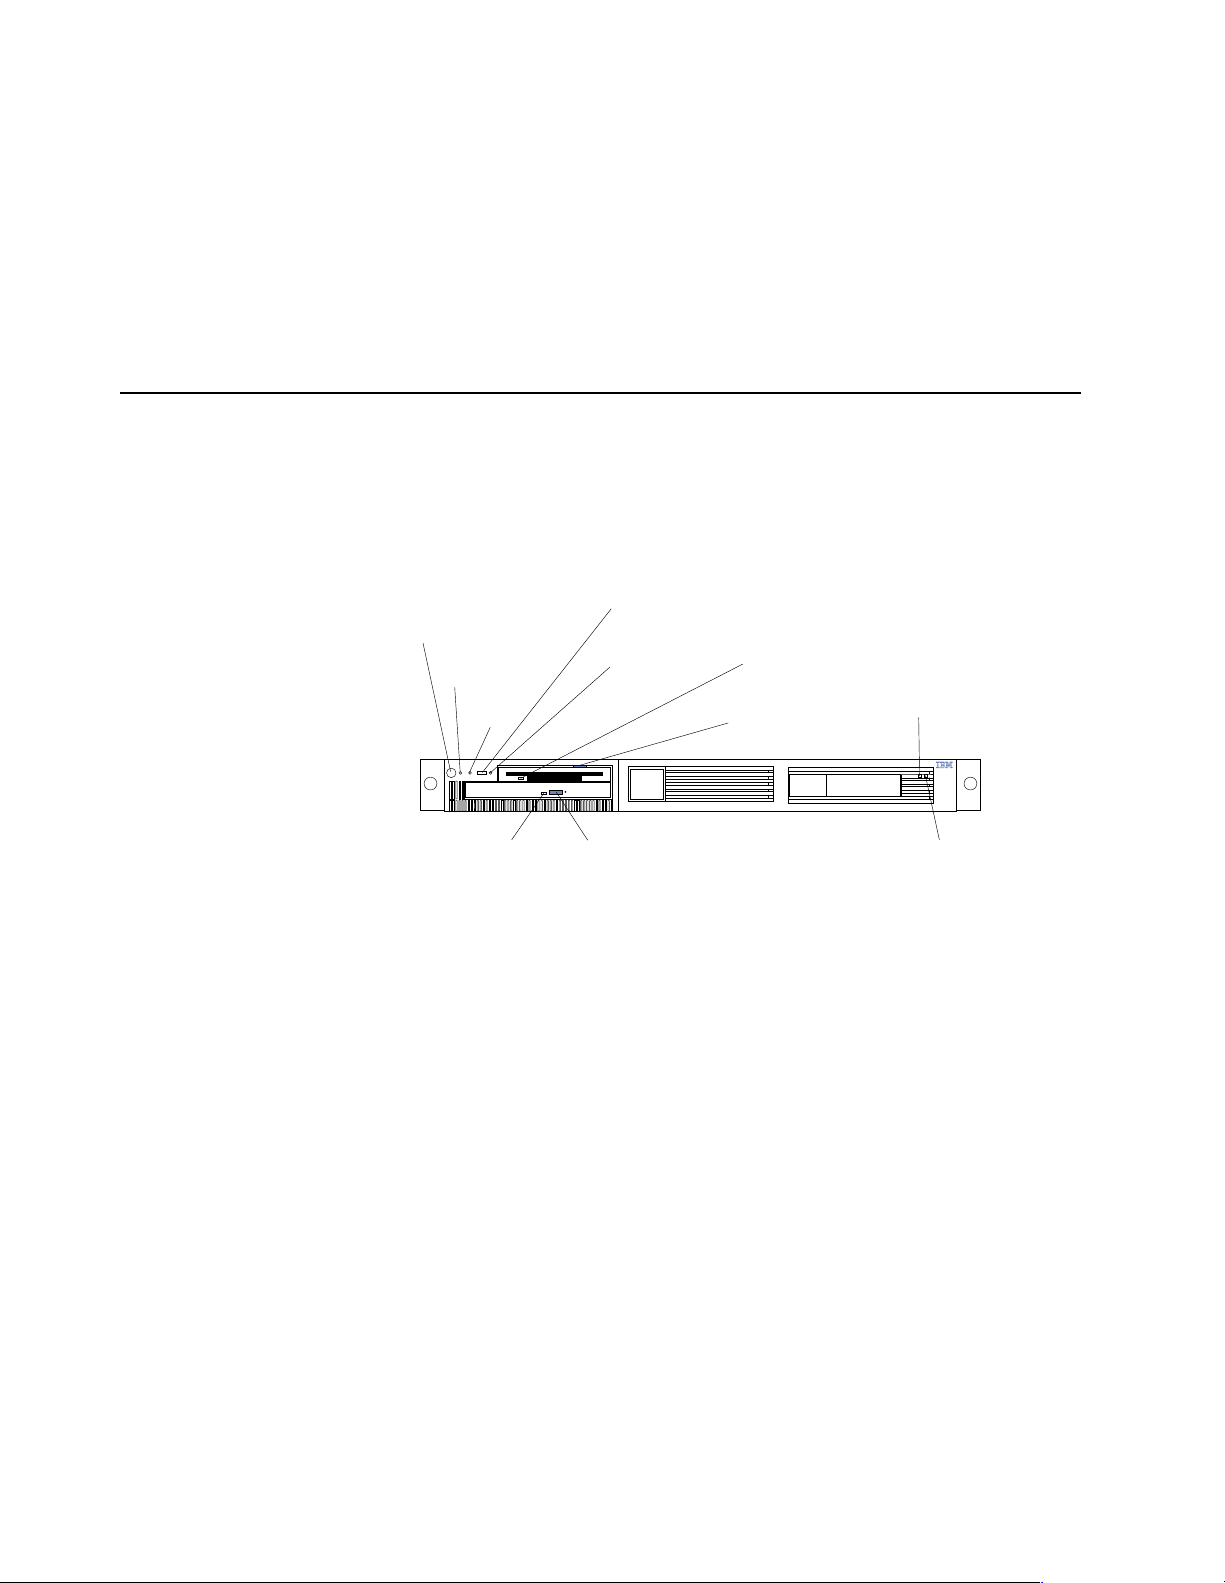
Server controls and indicators
This section identifies the controls and indicators on the front and the back of your
server.
Front view
Power control
button
Power-on
light (green)
Reset
button
Select
button/indicator
(green)
System error
light (amber)
Diskette drive
activity light
(green)
Diskette eject
button
Hard disk drive
status light (amber)
light (green)
CD eject buttonCD activity
Hard disk drive
activity light (green)
Power-control button: Press this button to manually turn the server on or off.
Power-on light: This green LED lights and stays on when you turn on your server
and blinks when the server is in standby mode.
Reset button: Press this button to reset the server and run the power-on self-test
(POST). Yo u mi ght n eed to use a pen or the end of a straightened paper clip to press
the button.
Select button/indicator: Press this button to select the server in the C2T chain. The
green LED on this button lights when the monitor, keyboard, and mouse are logically
connected to this server.
System-error light: This amber LED lights when a system error occurs. An LED on
the Light Path Diagnostic panel on the system board will also be on to further isolate
the error.
Diskette drive activity light: When this LED is on, it indicates that the diskette drive
is in use.
Diskette-eject button: Push this button to release a diskette from the drive.
Hard disk drive status lig ht: Each of the hot-s wap drives has a har d disk driv e status
light. When this amber LED is on continuously , the drive has failed. This status light
is active only with a ServeRAID adapt er installed in the server.
6 Hardware Maintenance Manual: xSeries 330
Page 15

Hard disk drive activity light: Each of the hot-swap drives has a Hard Disk Activity
light. When this green LED is flashing, the controller is accessing the drive.
CD eject button: Push this button to release a CD from the drive.
CD drive activity light: When this light is on, it indicates that the CD-ROM drive is in
use.
Rear view
Ethernet 1 speed
indicator (green)
Ethernet 1 link
indicator (green)
C2T IN port
Advanced systems
management RS-485
Select light (green)
Ethernet 2 speed
indicator (green)
Ethernet 2 link
indicator (green)
Power-on light
(green)
USB 2
USB 1
System error
light (amber)
Serial port
C2T OUT port
Ethernet 1 speed indicator: This green LED lights when the speed of the Ethernet
LAN that is connected to Ethernet port 1 is 100 Mbps.
Ethernet 1 link indicator: This green LED lights when there is an active link
connection on the 10BASE-T or 100BASE-TX interface for Ethernet port 1.
Advanced system management: The RS-485 ports (in and out) are used for creating a
system management bus between several servers.
Select light: This green LED lights when the monitor, keyboard, and mouse are
logically connected to this server. This light duplicates the Select button LED on the
front of the server.
Cable Chaining Technology OUT: This port is used to connect the server to a
keyboard, monitor, and pointing device. It is also used to connect multiple servers
together to share a single keyboard, monitor, and pointing device.
Serial port: Signal cables for modems or other serial devices connect here to the 9-pin
serial port connector.
Cable Chaining Technology IN: This port is used to connect multiple servers
together to share a single keyboard, monitor, and pointing device.
USB 2: Universal Serial Bus 2
USB 1: Universal Serial Bus 1
System-error light: This amber LED lights when a system error occurs. An LED on
the Light Path Diagnostic panel on the system board may also be on to further isolate
the error. This light duplicates the system error light on the front of the server.
Chapter 2. General information 7
Page 16

Power-on light: This green LED lights and stays on when you turn on your server
and will blink when the server is in standby mode. This light duplicates the power on
light on the front of the server.
Ethernet 2 link indicator: This green LED lights when there is an active link
connection on the 10BASE-T or 100BASE-TX interface for Ethernet port 2.
Ethernet 2 speed indicator: This green LED lights when the speed of the Ethernet
LAN connected to Ethernet port 2 is 100 Mbps.
Turning on the server
Turning on the server refers to the act of plugging the power cord of your server into
the power source and starting the operating system.
Complete the following steps to turn on the server:
1. Plug the power cord of your server into the power source.
Note: Plugging the power cord into a power source may cause the server to start
automatically . This is an acceptable action.
2. Wait 30 seconds then press the power control button on the front of the server.
• You can press the Power control button on the front of the server to start the
server.
Note: After you plug the power cord of your server into an electrical outlet, wait
approximately 20 seconds before pressing the Power control button.
During this time, the system-management processor is initializing and the
Power control button does not respond.
• If the server is turned on and a power failure occurs, the server will start
automatically when power is restored.
• The Advanced System Management Processor can also turn on the server.
CAUTION:
The power control button on the device and the power switch on the power supply (if
there is one) do not turn off the electrical current supplied to the device. The device also
might have more than one power cord. To remove all electrical current from the device,
ensure that all power cords are disconnected from the power source.
2
1
Turning off the server
Turning off the server refers to the act of disconnecting the server from the power
source.
8 Hardware Maintenance Manual: xSeries 330
Page 17

Complete the following steps to turn off the server:
1. Refer to your operating system documentation for the proper procedure to shut
down the operating system.
Note: Each operating system is different. Some will allow an immediate shut-
down, while others require and orderly shut-down procedure.
2. Press the power control button on the front of the server. This will put the server
in the stand-by mode.
3. Disconnect the server from the power source.
Note: After turning off the server, wait at least 5 seconds before you turn on the
server again.
Stand-by mode
Stand-by puts the server in a wait state. When in a wait state, the server is not
running the operating system, and all core logic is shut down, except for the service
processor.
Complete the following steps to put the server into stand-by mode:
1. Refer to your operating system documentation for the proper procedure to shutdown the operating system.
Note: Each operating system is different. Read all the documentation about
shutting down the operating system before continuing.
2. Press the power control button on the front of the server.
Chapter 2. General information 9
Page 18

10 Hardware Maintenance Manual: xSeries 330
Page 19

Chapter 3. Diagnostics
This section provides basic troubleshooting information to help you resolve some
common problems that might occur with the server.
Diagnostic tools overview
The following tools are available to help you identify and resolve hardware-related
problems:
• POST beep codes, error messages, and error logs
The power-on self-test (POST) generates be ep codes and messages to indi cate
successful test completion or the detection of a problem. See “POST” on page 12
for more information.
• Diagnostic programs and error messages
The server diagnostic programs are stored in upgradable read-only memory
(ROM) on the system board. These programs are the primary method of testing
the major components of your server. See “Diagnostic programs and error
messages” on page 15 for more information.
• Light Path Diagnostic
The Light Path Diagnostic is used to quickly identify system errors.
© Copyright IBM Corp. 2000 11
Page 20

POST
When you turn on the server, it performs a series of tests to check the operation of
server components and some of the options installed in the server. Thi s series of tests
is called the power-on self-test or POST.
If POST finishes without detecting any problems, a single beep sounds and the first
screen of your operating system or application program appears.
If POST detects a problem, more than one beep sounds and an err or m essage appea rs
on your screen. See “POST error messages” for more information.
Notes:
1. If you have a power-on password set, you must type the password and press
Enter, when prompted, before POST will continue.
2. A single problem might cause several error messages. When this occurs, work to
correct the cause of the first error message. After you correct the cause of the first
error message, the other error messages usually will not occur the next time you
run the test.
POST error messages
The table “POST error codes” on page 90 provides information about the POST error
messages that can appear during startup.
Event/error logs
The POST error log contains the three most recent error codes and messages that the
system generated during POST. The System Event/Error log contains all messages
issued during POST and all system status messages from the Advanced System
Management Processor .
To view the contents of this error log, start the Configuration/Setup Utility program;
then, select Event/Error Logs from the main menu.
Small computer system interface messages
The following table lists actions to take if you receive a SCSI error message.
Note: If the server does not have a hard disk drive, ignore any message that indicates
that the drive is not installed.
Y o u will get these messages only when running the SCSISelect Utility. See “SCSI err or
codes” on page 95.
12 Hardware Maintenance Manual: xSeries 330
Page 21

Table 2. SCSI messages.
SCSI Messages Description
All One or more of the following might be causing the pro blem.
• A failing SCSI device (adapter, drive, controller)
• An improper SCSI configuration
• Duplicate SCSI IDs in the same SCSI chain
• An improperly installed SCSI terminator
• A defective SCSI terminator
• An improperly installed cable
• A defective cable
Action:
Verify that:
• The external SCSI devices are turned on. External SCSI devices must
be turned on before the server.
• The cables for all external SCSI devices are connected correctly.
• The last device in each SCSI chain is terminated properly.
• The SCSI devices are configured correctly.
If the above items are correct, run the diagnostic programs to obtain
additional information about the failing device. If the error remains or
recurs, call for service.
Identifying problems using status LEDs
If the System Error light in the operator information panel on the front of the server is
on, one or more LEDs inside the server may be on. Use the light path diagnostics to
identify the type of error that occurred.
For LED locations see “System board LEDs” on page 41.
Light Path Diagnostics
You can use the Light Path Diagnostics built into your server to quickly identify the
type of system error that occurred. The Light Path Diagnostics panel is located on the
system board just behind PCI adapter slot 1. When you press on the Li ght Path
Diagnostics button the LED on the top right corner of the panel will illuminate. This
shows that the diagnostic circuitry is working correctly.
Your server is designed so that any LEDs that are illuminated can be re-illumi na ted
without AC power after you remove the cover. This feature helps you isolate the
problem if an error causes the server to shut down. See Table 3 on page 14.
Important: You have up to 12 hours to use the Light Path Diagnostic LED’s after AC
power has been removed from the server. After 12 hours you must power the server
up again to be able to use the Light Path Diagnostic LEDs to help locate system errors.
Chapter 3. Diagnost ics 13
Page 22
To view the LEDs on the system board:
1. Turn off the server and any peripheral devices.
2. Remove the cables.
3. Remove the server from the rack and place it on a flat, non-conductive surface.
4. Remove the server cover (see “Removing the cover” on page 44).
Note: Refer to “Working inside a server with power on” on page 42 for
instructions and precautions for working in the server with the power on.
5. Press and hold the Light Path Diagnostics (blue) button on the diagnostics panel.
The LEDs will illuminate while the switch is pressed.
Note: You can illuminate the LEDs for a maximum o f tw o minutes. After that
time, the circuit that powers the LEDs is exhausted.
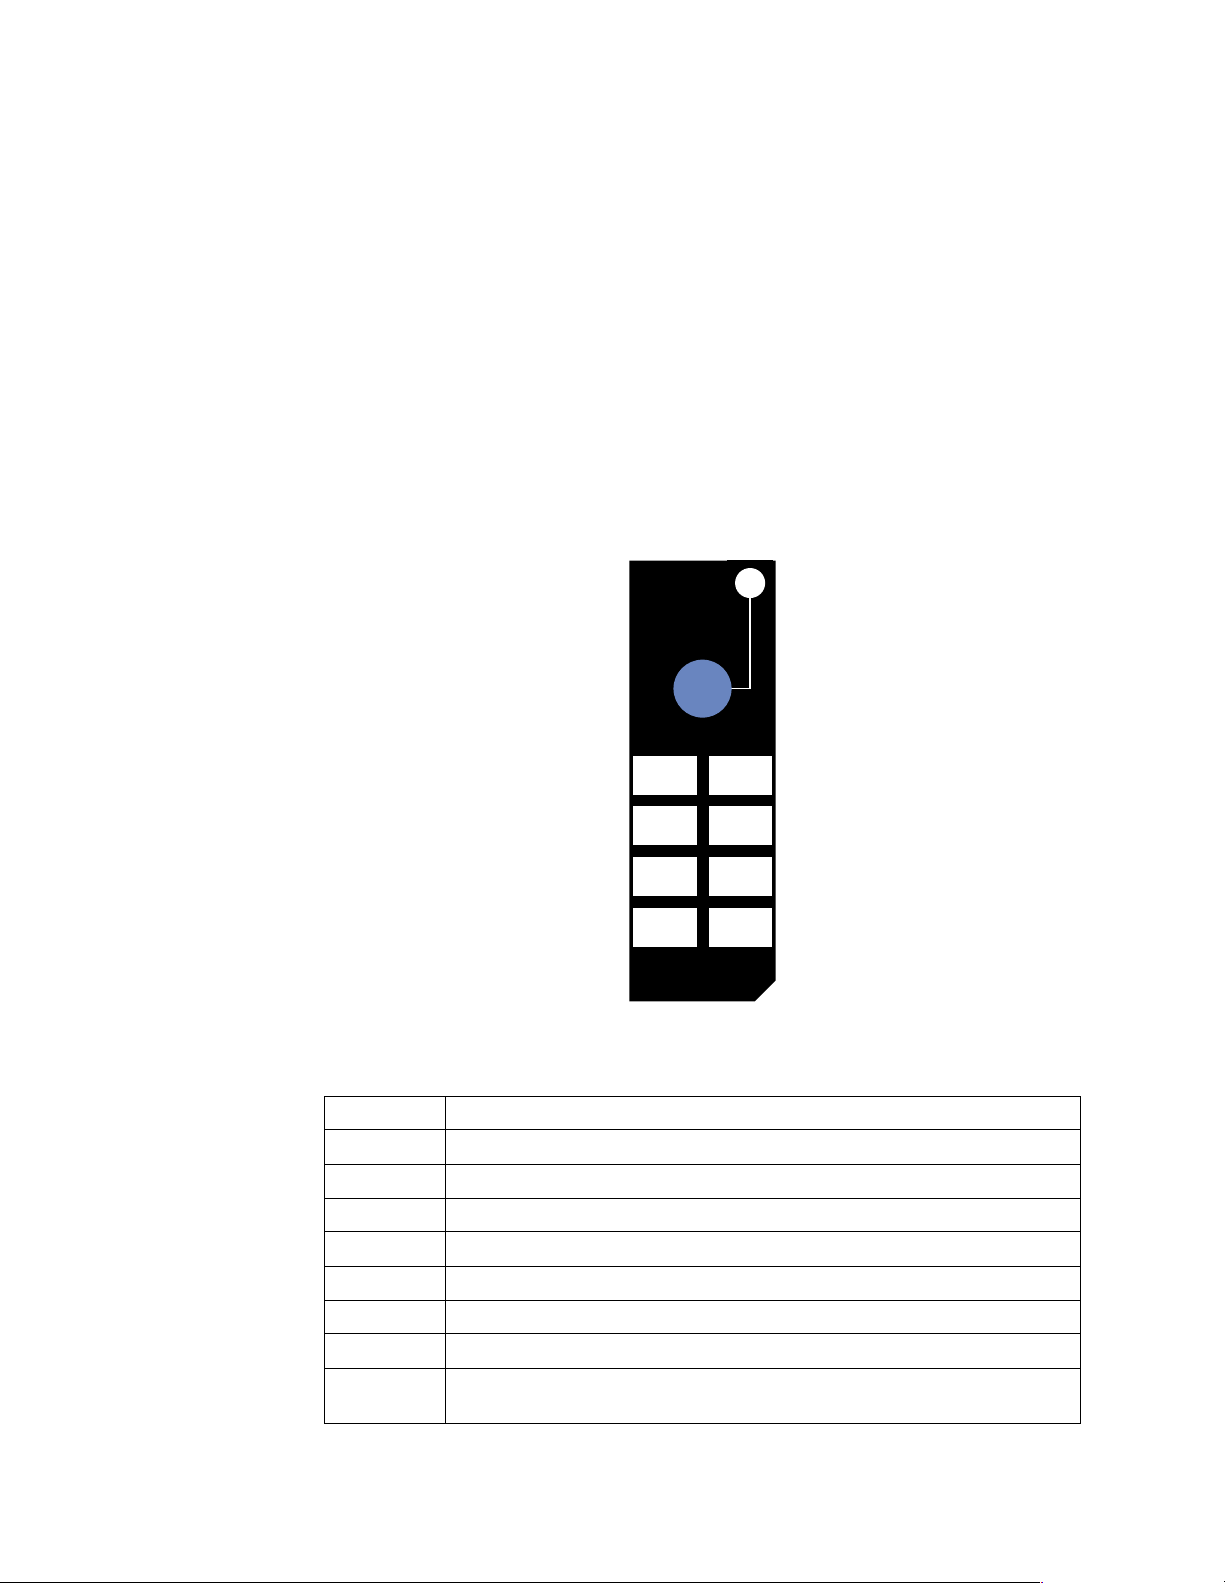
Diagnostics panel
The following illustration shows the LEDs on the diagnostics panel on th e system
board. See Table 3 for information on identifying p roblems using these LEDs.
Light
Path
PS
TEMP
FAN
SP
Table 3. Light Path Diagnostics.
LED Description
PS Power supply error
MEM Memory error occurred
TEMP System temperature exceeded maximum rating
CPU Microprocessor error
FAN Fan failed or operating slowly
VRM Voltage regulator module error
SP Error occurred on SP bus
PCI Error occurred on an adapter in PCI slot 1 or 2, or one of the PCI service
devices integrated on the system board.
MEM
CPU
VRM
PCI
See “Information panel syste m error LED” on page 85 for appropriate action.
14 Hardware Maintenance Manual: xSeries 330
Page 23

Diagnostic pr ogr ams and error messages
The server diagnostic programs are stored in upgradable read-only memory (ROM)
on the system board. These programs are the primary method of testing the major
components of the server.
Sometimes the first error to occur causes additional errors. In this case, the server
displays more than one error message. Always follow the suggested action
instructions for the first error message that appears.
The following sections contain the error codes that might appea r in the detailed test
log and summary log when runnin g the diagnostic programs.
The error code format is as follows:
fff-ttt-iii-date-cc-text message
where:
fff is the three-digit function code that indicates the function being
tested when the error occurred. For example, function code 089 is for
the microprocessor.
ttt is the three-digit failure code that indicates the exact test failure that
was encountered.
iii is the three-digit device ID.
date is the date that the diagnostic test was run and the error recorded.
cc is the check digit that is used to verify the validity of the information.
text message is the diagnostic message that indicates the reason for the problem.
Text messages
The diagnostic text message format is as follows:
Function Name: Result (test specific string)
where:
Function Name
is the name of the function being tested when the error occurred. This
corresponds to the function code (fff) given in the previous list.
Result can be one of the following:
Passed This result occurs when the diagnostic test completes without any
Failed This result occurs when the diagnostic test discovers an error.
User Aborted
Not Applicable
Aborted This result occurs when the test could not proceed because of the
errors.
This result occurs when you stop the diagnostic test before it is
complete.
This result occurs when you specify a diagnostic test for a device that
is not present.
system configuration.
Chapter 3. Diagnost ics 15
Page 24

Warning This result occurs when a possible problem is reported during the
diagnostic test, such as when a device that is to be tested is not
installed.
Test Specific String
This is additional information that you can use to analyze the problem.
Starting the diagnostic programs
You can press F1 while running the diagnostic programs to obtain Help information.
You also can press F1 from within a help screen to obtain online documentation from
which you can select different categories. To exit Help and return to where you left
off, press Esc.
To start the diagnostic programs :
1. Turn on the server and watch the screen.
2. When the message F2 for Diagnostics appears, press F2.
3. Type in the appropriate password; then, press Enter.
4. Select either Extended or Basic from the top of the screen.
5. When the Diagnostic Programs screen appears, select the test you want to run
from the list that appears; then, follow the instructions on the screen.
Notes:
a. If the se rver stops during testing and you cannot continue, restart the server
and try running the diagnostic programs aga in.
b. The keyboard and mouse (pointing device) tests assume that a keyboard and
mouse are attached to the server.
c. If you run the diagnostic programs with no mouse attached to the server, you
will not be able to navigate between test categories using the Next Cat and
Prev Cat buttons. All other functions provided by mouse-selectable buttons
are also available using the functio n keys.
d. You can test the USB keyboard by using the regular keyboard test. The
regular mouse test can test a USB mouse. Also, you can run the USB hub test
only if there are no USB devices attached.
e. You can view server configuration information (such as system configuration,
memory contents, interrupt request (IRQ) use, direct memory access (DMA)
use, device drivers, and so on) by selecting Hardware Info from the top of the
screen.
When the tests have completed, you can view the Test Log by selecting Utility from
the top of the screen.
If the hardware checks out OK but the problem persists during normal server
operations, a software error might be the cause. If you suspect a software problem,
refer to the information that comes with the software package.
Viewing the test log
The test log will not contain any info rmation until after the diagnostic program has
run.
Note: If you already are running the diagnostic programs, begin with step 3 on page
17.
To view the test log:
16 Hardware Maintenance Manual: xSeries 330
Page 25

1. Turn on the server and watch the screen.
If the server is on, shut down your operating system and restart the server:
2. When the message F2 for Diagnostics appears, press F2.
If a power-on password is set, the server prompts you for it. Type in the
appropriate password; then, press Enter.
3. Wh en the Diagnostic Programs screen app ears, select Utility from the top of the
screen.
4. Select View Test Log from the list that appears; then, follow the instructions on
the screen.
The system maintains the test-log data while the server is powered on. When you
turn off the power to the server, the test log is cleared.
Chapter 3. Diagnost ics 17
Page 26
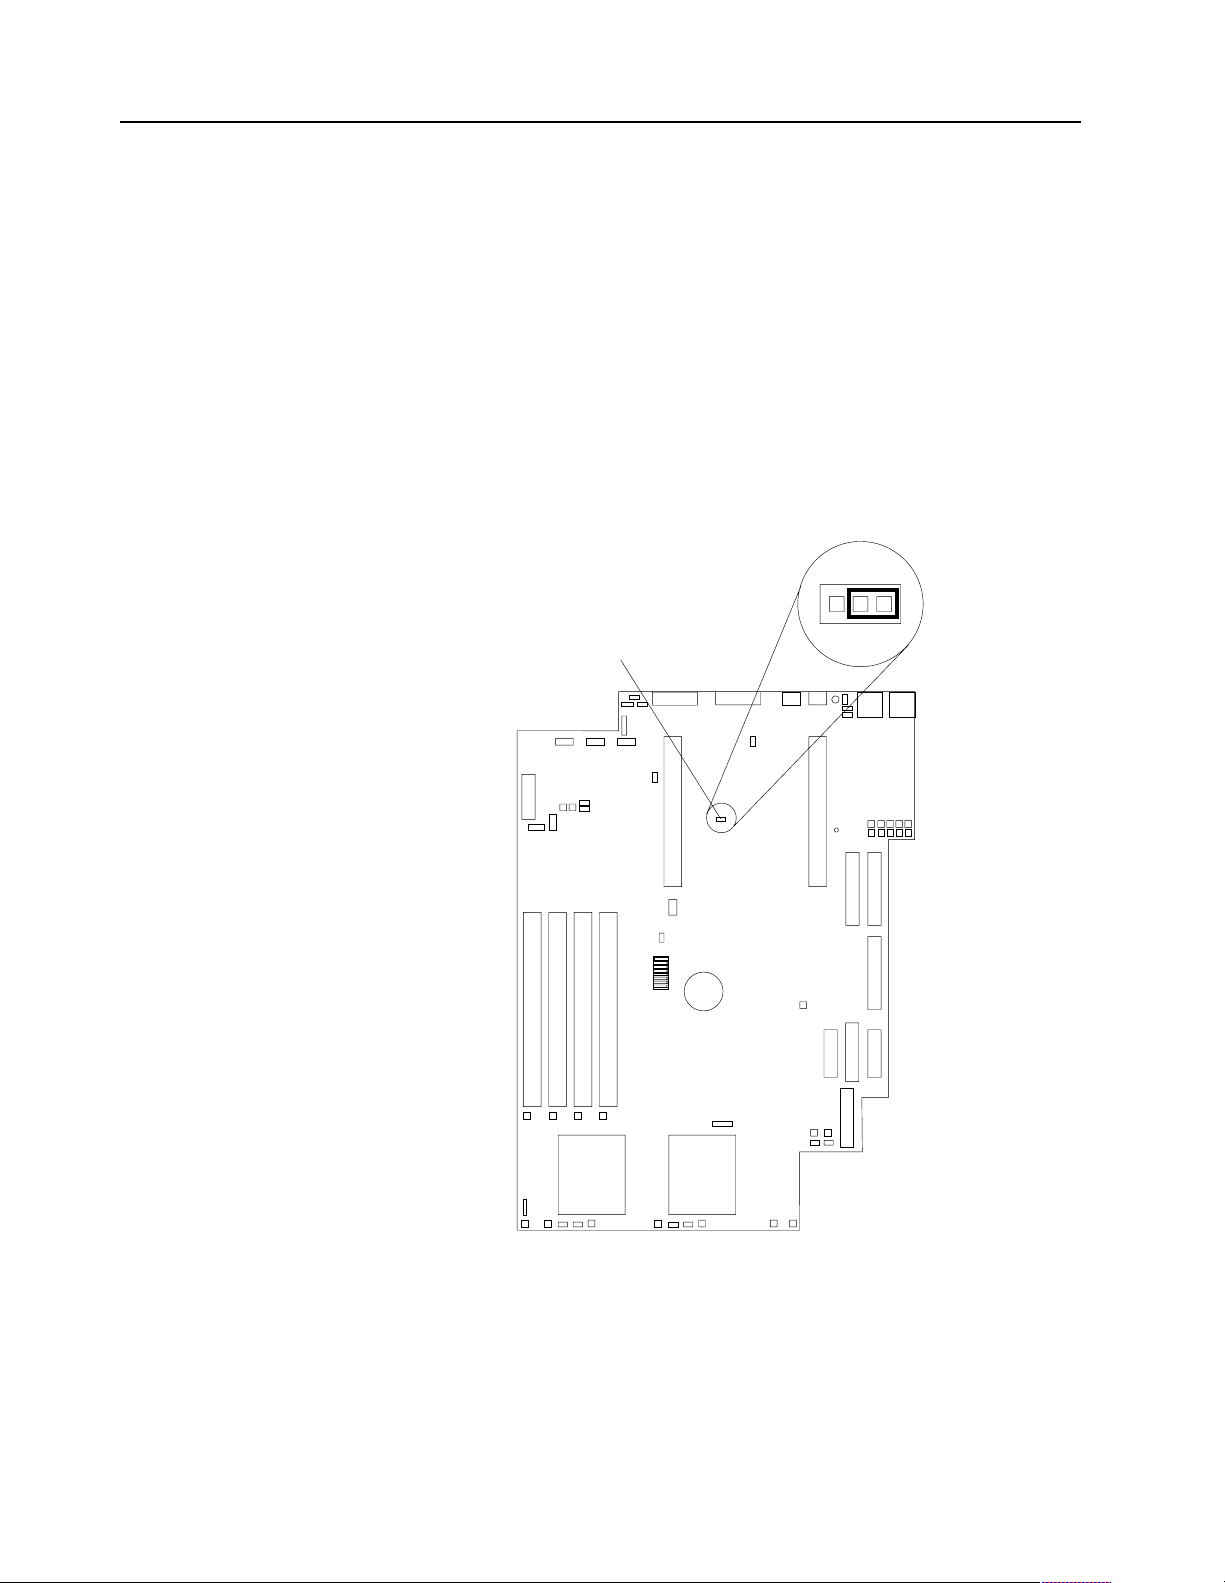
Recovering BIOS
If the BIOS has become corrupted, such as fro m a power failur e during a flash update,
you can recover the BIOS using the BIOS code page jumper and a BIOS flash diskette.
Note: You can obtain a BIOS flash diskette from one of the following sources:
To recover the BIOS:
1. Turn off the server and peripheral devices and disconnect all external cables and
2. Locate the BIOS code page jumper (J19) on the system board.
• Use the ServerGuide program to make a BIOS flash diskette.
• Download a BIOS flash diskette from the World Wide Web. Go to http:
//www.pc.ibm.com/support/, select IBM Server Support, and make the
selections for your server.
• Contact your IBM service representative.
power cords; then, remove the cover.
BIOS code
page jumper
(J19)
1 2 3
3. Place a jumper on pins 1 and 2 to enable BIOS back page.
4. Reconnect all external cables and power cords and turn on the peripheral devices.
5. Insert the BIOS Flash Diskette in the diskette drive.
6. Restart the server. The system begins the power-on self-test (POST) and BIOS
flash.
7. Select 1 - Update POST/BIOS from t h e m enu that contains v a r io us flash (update)
options.
18 Hardware Maintenance Manual: xSeries 330
Page 27

8. When prompted as to whether you want to save the current code to a diskette,
select N.
9. When prompted to choose a language, select a language (from 0 to 7) and press
Enter to accept your choice.
10. Do not reboot your system at this time.
11. Remove the BIOS Flash Diskette from the diskette drive.
12. Turn the server off.
13. Move the jumper on J19 to pins 2 and 3 to return to normal startup mode.
14. Restart the server. The system should start up normally.
Troubleshooting the Ethernet controller
This section provides troubleshooting information for problems that might occur with
the 10/100 Mbps Ethernet controller:
Network connection problems
If the Ethernet controller cannot connect to the network, check the following:
• Make sure that the cable is installed correctly.
The network cable must be securely attached at all connections. If the cable is
attached but the problem persists, try a different cable.
If you set the Ethernet controller to operate at 100 Mbps, you must use Category 5
cabling.
If you directly connect two workstations (without a hub), or if you are not using a
hub with X ports, use a crossover cable.
Note: T o determine whether a hub has an X port, check the port label. If the label
contains an X, the hub has an X port.
• Determine if the hub supports auto-negotiation. If n ot, try co nfiguring the
integrated Ethernet controller manually to match the speed and duplex mode of
the hub.
• Check the LAN activity light on the front of the server. The LAN activity light
illuminates when the Ethernet controller sends or receives data over the Ethernet
Network. If the LAN activity light is off, make sure that the hub and network are
operating and that the correct device drivers are loaded.
• Make sure that you are using the correct device drivers, supplied with the server.
• Check for operating system-specific causes for the problem.
• Make sure that the device drivers on the client and server are using the same
protocol.
• Test the Ethernet controller:
How you test the Ethernet controller depends on which operating system you are
using (see the Ethernet controller device driver README file).
Ethernet controller troubleshooting chart
You can use the following troubleshooting chart to find solutions to 10/100 Mbps
Ethernet controller problems that have definite symptoms.
Chapter 3. Diagnost ics 19
Page 28

Table 4. Ethernet troubleshooting chart.
Ethernet controller problem Suggested Action
The server stops running
when loading device drivers.
Data is incorrect or sporadic. Check the following:
The Ethernet controller
stopped working when
another adapter was added
to the server.
The PCI BIOS interrupt settings are incorrect.
Check the following:
• Determine if the interrupt (IRQ) setting assigned to the Ethernet controller is also
assigned to another device in the Configuration/Setup Utility program.
Although interrupt sharing is allowed for PCI devices, some devices do not
function well when they share an interrupt with a dissimilar PCI device. Try
changing the IRQ assigned to the Ethernet controller or the other device. For
example, for NetWare Versions 3 and 4 it is recommended that disk controllers not
share interrupts with LAN controllers.
• Make sure that you are using the most recent device driver available from the
World Wide Web.
• Run the network diagnostic program.
• Make sure that you are using Category 5 cabling when operating the server at 100
Mbps.
• Make sure that the cables do not run close to noise-inducing sources like
fluorescent ligh ts.
Check the following:
• Make sure that the cable is connected to the Ethernet controller.
• Make sure that your PCI system BIOS is current.
• Reseat the adapter.
• Determine if the interrupt (IRQ) setting assigned to the Ethernet adapter is also
assigned to another device in the Configuration/Setup Utility program.
Although interrupt sharing is allowed for PCI devices, some devices do not
function well when they share an interrupt with a dissimilar PCI device. Try
changing the IRQ assigned to the Ethernet adapter or the other device.
The Ethernet controller
stopped working without
apparent cause.
Check the following:
• Run diagnostics for the Ethernet controller.
• Try a differ ent connector on the hub.
• Reinstall the device drivers. Refer to your operating-system documentation and to
the ServerGuide information.
Ethernet controller messages
The integrated Ethernet controller might display messages f rom the following device
drivers:
• Novell™ NetWare™ or IntraNetWare Server ODI
• NDIS Adapter for level 4.0 (Windows NT)
• SCO™ UNIX LLI
20 Hardware Maintenance Manual: xSeries 330
Page 29

Novell NetWare or IntraNetWare server ODI driver
teaming messages
This section provides explanations of the error messages for the Novell NetWare or
IntraNetWare server ODI driver, and suggested actions to resolve each problem.
Table 5. NetWare driver messages for the Ethernet controller.
Message Description
Couldn’t allocate r eso u rces Explanation: An unknown error has occurred when trying to allocate needed
resources for the AFT Module. Action:
• Check the server configuration. If the problem persists, contact your
network supplier.
• Verify that the Ethernet controller is enabled. If the Ethernet controller is
enabled, run the diagnostic prog ra ms.
AF T group for primary adapter in slot
nnn already exists.
Error locating DCT addresses in
internal table. Make sure that you
have loaded LAN drivers after
loading AFT.NLM.
Explanation: An attempt was made to rebind an adapter already in an AFT
group. Action: Check the AFT slot numbers for existing AFT teams. If the
problem persists, contact your network supplier.
Explanation: The bind command was entered pr ior to loading the device
driver. The device driver must be loaded after loading AFT.NLM but before
any bind command can be issued. Action: Load the driver for the supported
adapter and try loading t he AFT module again. If the problem persists, cont act
your network supplier.
Insufficient number of arguments
specified.
Duplicate slot numbers detected. Explanation: An attempt has been made to bind the same slot number more
’Xxx’ is not supported for AFT team. Explanation: A bind command has been issued for adapters not supported by
Primary and Secondary adapters do
not match. AFT group is not created.
Requested number of Secondary
cards are not found.
Failed to create AFT group. Make
sure that the drivers for supported
adapters are loaded, primary adapter
is bound to protocols, and secondary
adapter is not bound to any protocols.
Error identifying s lot num bers fo r the
specified board names.
Explanation: The appropriate or expected number of parameters was not
entered in a command. Action: Check the parameters required for the given
command. If the problem persists, contact your network supplier.
than once. Action: Check the slot numbers entered during the bind. Adapter
slot numbers must be valid and unique. If the problem persists, contact your
network supplier.
AFT.NLM. Action: Make sure that you attempt to bind only adapters
supported by AFT.NLM.
Explanation: A bind command was entered for an adapter team that is a
combination of server and client adapters. An AFT team must be a grouping of
the same classification of adapter. Action: Verify that all the adapters boun d in
a team are of the same classification.
Explanation: The number of adapters specified in the bind command could
not be located. Action: Verify the numbers and slot locations of the adapters to
be bound. If the problem persists, contact your network supplier.
Explanation: Binding of protocol failed. Protocol is either not bound to any
adapter or is bou nd to m ore than o ne adapt er in th e gr oup. Action: Ensur e t hat
the protocol is bound to only adapter in an AFT team.
Explanation: The mapping between the bo ard name entered and the slot
number for an adapter could not be estab lished. Actio n: Check the boar d name
for the adapter before issuing the bind command. If the problem persists,
contact your network supplier.
Chapter 3. Diagnost ics 21
Page 30

Table 5. NetWare driver messages for the Ethernet controller.
Can’t unbind specified slot from AFT
group. Make sure that the slot you
specified is for the primary ada pter in
an AFT group.
LAN adapter at slot nnnn (Port 0xaa)
failed to reset. Check the state of the
adapter.
AFT is not supported on this version
of NetWare(TM).
Failed to allocate resources tags. Explanation: An unknown error has occurred when trying to allocate needed
Please unload all LAN drivers before
unloading AFT.NLM.
Explanation: The number entered in the unbind command was not the
primary adapter in an AFT group. Action: Reissue the unbind command and
specify the slot number for the primary adapter.
Explanation: The adapter that you specified could not be initialized. Action:
1. Load the driver for the supported adapter.
2. Check that the adapter is seated properly in the slot and try loading the
AFT module again.
If the problem persists, contact your network supplier.
Explanation: The NetWare on your server is not a version supported by AFT.
Action: Load and bind AFT only on supported versions of NetWare (current ly
version 4.11 and above).
resources for the AFT module. Action: Check Server Configuration. If the
problem persists, contact your network supplier.
Explanation: An attempt was made to unload the AFT.NLM module before
unloading the adapter driver. Action: Unload the adapter driver before
unloading the AFT module.
NDIS 4.0 (Windows NT) driver messages
This section contains the error messages for the NDIS 4.0 drivers. The explan ation and
recommended action are included with each message.
Table 6. NDIS (Windows NT or Windows 2000) driver messages for the Ethernet controller.
Error code (hex) Description
0x00 Explanation: The driver could not register the specified interrupt. Action: Using the
Configuration/Setup utility, make sure that a PCI interrupt is assigned to your Ethernet card, and
that Ethernet is enabled.
0x01 Explanation: One of the PCI cards did not get the required resources. Action: Using the
Configuration/Setup utility, make sure that a PCI interrupt is assigned to your Ethernet card, and
that Ethernet is enabled.
0x02 Explanation: Bad node address (multicast address). Action: Make sure the locally administered
address is valid, if one is specified. The address can not be a multicast address.
0x03 Explanation: Failed self-test. Action: Make sure a cable is attached to the Ethernet connector. If the
problem persists, call for service.
0x0D Explanation: Could not allocate enough memory for transmit queues. Action:
1. From the Windows NT desktop, select Start -> Control Panel -> Networks -> Adapters.
2. Select your IBM Ethernet adapter from the list.
3. Select Properties -> Advanced.
4. Lower the resource values that apply to the transmit queue.
0x0E Explanation: Could not allocate enough memory for receive queue. Action:
1. From the Windows NT desktop, select Start -> Control Panel -> Networks -> Adapters.
2. Select your IBM Ethernet adapter from the list.
3. Select Properties -> Advanced.
4. Lower the resource values that apply to the receive queue.
22 Hardware Maintenance Manual: xSeries 330
Page 31

Table 6. NDIS (Windows NT or Windows 2000) driver messages for the Ethernet controller.
Error code (hex) Description
0x0F Explanation: Could not allocate enough memory for other structures. Action:
1. From the Windows NT desktop, select Start -> Control Panel -> Networks -> Adapters.
2. Select your IBM Ethernet adapter from the list.
3. Select Properties -> Advanced.
4. Lower the value for the resource named in the message.
0x10 Explanation: Did not find any Eth ern et co ntro llers . Action: Using t he Configur ation /Setup utility,
make sure that Ethernet is enabled.
0x11 Explanation: Multiple Ethernet controllers found, but none matched the required ID. Action:
Using the Configuration/Setup utility, make sure that Ethernet is enabled.
0x13 Explanation: Did not find any Ethernet controllers that matched the required subven/subdev.
Action: Using the Configuration/Setup utility, make sure that Ethernet is enabled.
0x16 Explanation: Single adapter found but multiple instance s tried to load. Action: Using the
Configuration/Setup utility, make sure that Ethernet is enabled, and that the slot containing the
IBM Netfinity 10/100 Ethernet Adapter or the I BM 10/100 Etherjet PCI adapter is enab led.
0x17 Explanation: Slot parameter not specified in the registry. Action: Remove the adapter driver and
reinstall it. If the problem persists, call for service.
All other 4character
hexadecimal
codes
Action: Call for service.
Ethernet teaming messages:
Table 7. NDIS (Windows NT or Windows 2000) driver teaming messages for the Ethernet controller.
Event ID Type Description
01 Error Explanation: Team Name and physical adapter name are th e same. This is
an invalid configuration. Action: Reconfigure the adapter team by doubleclicking the PROSet icon in the control panel.
02 Error Explanation: Unable to allocate required resources. Action: Free some
memory resources and restart.
03 Error Explanation: Unab le to read required registry parameters. Action:
Reconfigure the adapter team by double-clicking the PROSet icon in the
control panel.
04 Error Explanation: Unable to bind to physical adapter. Action: Reconfigure the
adapter team by double-clicking the PROSet icon in the control panel.
05 Error Explanation: Unable to initialize an adapter team. Action: Reconfigure the
adapter team by double-clicking the PROSet icon in the control panel.
06 Informational Explanation: Team nn. Primary adapter is initialized. Action: None.
07 Informational Explanation: Team nn. Secondary adapter is initialized. Action: None.
08 Informational Explanation: Team nn. Virtual adapter or Team is initialized. Action: None.
09 Informational Explanation: Team nn. Primary adapter is switching over. Action: None.
10 Warning Explanation: Team nn. Adapter link down. Action: Make sure the adapter
is functioning properly.
11 Informational Explanation: Team nn. Secondary adapter took over. Action: None.
Chapter 3. Diagnost ics 23
Page 32

Table 7. NDIS (Windows NT or Windows 2000) driver teaming messages for the Ethernet controller.
Event ID Type Description
12 Warning Explanation: Team nn. Secondary adap ter is deactivated from the Team.
Action: Make sure the secondary adapter is functioning properly and that
the adapter cable is securely connected to th e LAN.
13 Informational Explanation: Team nn. Secondary adapter has rejoined the Team. Action:
None.
14 Informational Explanation: Team nn. Secondary adapter link is up. Action: None.
15 Error Explanation: Team nn. The last adapter has lost its link. Network
connection has been lost. Action: Shut down the server and replace the
adapters; then, restart the serv er to reestablish th e connection.
16 Informational Explanation: Team nn. An adapter has re-established the link. Network
connection has been restored. Action: None.
17 Informational Explanation: Team nn. Preferred primary adapter has been detected.
Action: None.
18 Informational Explanation: Team nn. Preferred secondary adapter has been detected.
Action: None.
19 Informational Explanation: Team nn. Preferred primary adapter took over. Action: None.
20 Informational Explanation: Team nn. Preferred secondary adapter took over. Action:
None.
21 Warning Explanation: Team nn. Primary adapter does not sense any Probes. Possible
reason: partitioned Team. Action: Make sure the cables of the adapter team
are connected to the same LAN segment. Reconfigure the team if necessary.
Power che ckout
Power problems can be difficult to troubleshoot. For instance, a short circuit can exist
anywhere on any of the power distribution busses. Usually a short circuit will cause
the power subsystem to shut down because of an overcurrent condition.
A general procedure for troubleshooting power problems is as follows:
1. Power off the system and disconnect the AC cord(s). Disconnect all external
cables and remove server from the rack.
Note: To determine if the power switch assembly needs to be replaced turn on
microswitch 5 on switch block 1 (power-on override) and reconnect the
AC cord. If the system powers on within 40 seconds then replace the
switch assembly.
2. Check for loose cables in the power subsystem. Also check for short circuits, for
instance if there is a loose screw causing a short circuit on a circuit board.
3. Remove adapters and disc onnect the cables and power connectors to all internal
and external devices until system is at minimum configuration required for
power-on.
Note: Minimum configuration requirements are:
a. 1 Power supply
b. System board
c. 1 Microprocessor
d. 1 Terminator card
e. Memory module (with a minimum of 128 MB DIMM)
4. Reconnect the AC cord and power on the system. If the system powers up
successfully, replace adapters a nd d e vices one at a time until the problem is
24 Hardware Maintenance Manual: xSeries 330
Page 33

isolated. If system does not power up from minimal configuration, replace FRUs
of minimal configuration one at a time until the problem is isolated.
To use this method it is important to know the minimum configuration required for a
system to power-up.
Replacing the battery
When replacing the battery you must replace it with a lithium battery of the same
type, from the same manufacturer. To avoid possible danger read and follow the
safety statement below.
To order replacement batteries, call 1-800-772-2227 within the United States, and 1800-465-7999 or 1-80 0-465-6666 with in Canada. Out side the U.S. and Canada, call your
IBM reseller or IBM marketing representative.
Note: After you replace the battery, you must reconfigure your server and reset the
system date and time.
CAUTION:
When replacing the battery, use only IBM Part Number 33F8354 or an equivalent
type battery recommended by the manufacturer. If your system has a module
containing a lithium battery, replace it only with the same module type made by
the same manufacturer. The battery contains lithium and can explode if not
properly used, handled, or disposed of.
Do not:
• Throw or immerse into water
• Heat to more than 100
• Repair or disassemble
Dispose of the battery as required by local ordinances or regulations.
To replace the battery:
1. Read “Before you be gi n” on page 42, and follow any special handling and
installation instructions supplied with the replacement battery.
2. Turn off the server and peripheral devices and disconnect all external cables and
power cords.
3. Remove the server from the rack (see “Rack installation” on page 43).
4. Remove the cover (see “Removing the cover” on page 44).
5. Remove the battery:
a. Use one finger to lift the battery clip over the battery.
b. Use one finger to slightly slide the battery out from its socket. The spring
mechanism will push the battery out toward you as you slide it from the
socket.
c. Use your thumb and index finger to pull the battery from under the battery
clip.
°C (212°F)
Chapter 3. Diagnost ics 25
Page 34

d. Ensure that the battery clip is touching the base of the battery socket by
pressing gently on the clip.
6. Insert the new battery:
a. Tilt the battery so that you can insert it into the socket, under the battery clip.
b. As you slide it under the battery clip, press the battery down into the socket.
7. Reinstall the server cover and connect the cables.
8. Turn on the server.
9. Start the Configuration/Setup Utility program and set configuration parameters.
• Set the system date and time.
• Set the power-on password.
• Reconfigure the server.
Temperature check out
Proper cooling of the system is important for proper operation and system reliability.
For a typical Netfinity server, you should make sure:
• Each of the drive bays has either a drive or a filler panel installed
• The top cover is in place during normal operation
• There is at le as t 50 mm (2 i n ches ) of ventilated space at the si des o f t he server and
100 mm (4 inches) at the rear of the server
• The top cover is removed for no longer than 30 minutes while the server is
operating
• A removed hot-swap drive is replaced within two minutes of removal
• Cables for optional adapters are routed according to the instructions provided
with the adapters (ensure that cables are not restricting air flow)
• The fans are operating correctly and the air flow is good
• A failed fan is replaced within 48 hours
In addition, ensure that the environmental specifications for the system are met. See
“Features and specifications” on page 4.
26 Hardware Maintenance Manual: xSeries 330
Page 35

Note: The server is not designed to operate in an enclosed environment. Th e x Series
300 should not reside behind a glass door in its rack enclosure.
For more information on specific temperature error messages, see “Temperature error
messages” on page 95.
Chapter 3. Diagnost ics 27
Page 36

28 Hardware Maintenance Manual: xSeries 330
Page 37

Chapter 4. Configuring the server
The following configuration programs are provided with the server:
• Configuration/Setup Utility
This program is part of the basic input/output system (BIOS) that comes with the
server . You can use this program to configure serial and parallel port assignments,
change interrupt request (IRQ) settings, change the drive startup sequence, set the
date and time, and set passwords. See “Using the Configuration/Setup Utility
program” for more information.
• SCSISelect Utility
With the built-in SCSISelect Utility program, you can configure the devices that
are attached to the integrated SCSI controller. Use this program to change default
values, resolve configuration conflicts, and perform a low-level format on a SCSI
hard disk drive. See “Using the SCSISelect utility program” on page 36 for more
information.
• PXE Boot Agent Utility
The Preboot eXecution Environment (PXE) Boot Agent Utility program is part of
the basic input/output system (BIOS) code that comes with your server. You can use
this program to change netw ork boot protocols and boot order, to select OS wake
up support, and to set menu wait times.
• ServeRAID programs
If there is a ServeRAID adapter installed in the server, you must use the
ServeRAID configuration program to define and configure your disk-array
subsystem before you install yo ur operating system.
Using the Configuration/Setup Utility program
This section provides the instructions needed to start the Configuration/Setup Utility
program and descriptions of the menu choices available.
Starting the Configuration/Setup Utility program
To start the Configuration/Setup Utility program:
1. Turn on the server and watch the monitor screen.
2. When the message Press F1 for Configuration/Setup appears, press F1.
Note: If you have set both levels of passwords (user and administrator), you
must enter the administrator password to access the full
Configuration/Setup me nu.
3. Follow the instructions that appear on the screen.
Choices available from the Configuration/Setup main
menu
From the Configuration/Setup Utility main menu, you can select settings that you
want to change. The Configuration /S e tup Utility main menu is similar to the
following:
© Copyright IBM Corp. 2000 29
Page 38

IBM Netfinity Setup - © IBM Corporation 1998
Configuration/Setup Utility
•
System Summary
•
System Information
•
Devices and I/O Ports
•
Date and Time
•
System Security
•
Start Options
•
Advanced Setup
•
Error Logs
Save Settings
Restore Settings
Load Default Settings
Exit Setup
<F1> Help < > < > Move
<Esc> Exit <Enter> Select
↑↓
Notes:
1. You can press F1 to display Help information for a selected menu item.
2. The choices on some menus might differ slightly, depending on the BIOS version
in the server.
Descriptions of the choices available from the main menu are as follows:
• System Summary
Select this choice to display configuration information. This includes the type and
speed of the microprocessors and the amount of memory installed.
Changes that you make to configuration settings appear on this summary screen.
You cannot edit the fields.
This choice appears on both the full and limited Configuration/Setup Utility
menus.
• System Information
Select this choice to display information about the server. Changes that you make
on other menus might appear on this summary screen. Y ou cannot edit any fields.
The System Information choice appears only on the full Configuration/Setup
Utility main menu.
— Product Data
Select this choice to view system information, such as the machine type and
model, the server serial number, and the revision level or issue date of the
BIOS stored in the flash electronically erasable programmable ROM
(EEPROM).
— System Card Data
Select this choice to view vital product data (VPD) for some server
components.
• Devices and I/O Ports
30 Hardware Maintenance Manual: xSeries 330
Page 39

Select this choice to view or change the assignments for devices and input/output
ports. This choice appears only on the full Configuration/Setup Utility main
menu.
This choice also allows you to enable or disable the integrated SCSI, and Ethernet
controllers.
— The default settin g is Enable for all the controllers. If you select Disable, the
system will not configure the disabled device and the operating system will
not see the device. (This is equivalent to unplugging the device.)
— If the on-board SCSI controller is disabled and no other storage device is
installed, operating syst em startup cannot occur.
Select System Service Processor Settings to view the interrupt-request setting
(IRQ) used by the Advanced System Management Processor (system service
processor). You can then use the arrow keys to select a new IRQ setting for the
Advanced System Management Processor from the list of available choices.
• Date and Time
Select this choice to set the system date and time and to change the system time
sent to the Advanced System Management Processor (service processor) when the
server is started. This choice appears only on the full Configuration/Setup Utility
main menu.
The system time is in a 24-hour format: hour:minute:second.
You can set a time delta to be added or subtracted from the system time that is
sent to the service processor (Advanced System Management Processor) each
time the server is started. Use the number keys to enter the hours and minutes
and + or
− to add or subtract from the system time. If you want the system clock
time to be the same as the Advanced System Management Processor clock time,
leave the value set at its default of 0.
• System Security
Select this choice to set passwords or a system owner’s name. This choice appears
only on the full Configuration/Setup Utility main menu.
You can implement two levels of password protection:
— Power-on Password
Select this choice to set or change a power-on password. See “Using
passwords” on page 34 for more information.
— Administrator Password
Select this choice to set or change an administrator password.
Attention: If an administrator password is set and then forgotten, it cannot be
overridden or removed. You must replace the system board.
The administrator password provides access to all choices on the
Configuration/Setup Utility main m e nu. You can set, change, or delete both
Chapter 4. Co nf iguring the server 31
Page 40

the administrator and power-on passwords, and allow a power-on password
to be changed by the user.
See“Using passwords” on page 34 for more information.
• Start Options
Select this choice to view or change the start options. This choice appears only on
the full Configuration/Setup Util ity main menu. Start options take effect when
you start the server.
You can select keyboard operating characteristics, such as the keyboard speed.
You also can specify whether the keyboard number lock starts on or off. You also
can enable the server to run without a diskette drive, monitor, or keybo a rd.
Note: To determine if you should configure your server to operat e without a
keyboard see Table 16 on page 73.
The server uses a startup sequence to determine the device from which the
operating system loads. For example, you can define a startup sequence that
checks for a startable diskette in the diskette drive, then checks the hard disk
drive in bay 1, and then checks a network adapter.
If the Boot Fail Count choice is enabled, you must restart the system three times
to restore the system BIOS default settings. If this choice is disabled, the system
BIOS defaults can only be restored from the Configuration /Setup Utility main
menu.
You can enable a virus-detection test that checks for changes in the master boot
record at startup.
• Advanced Setup
Select this choice to change values for advanced hardware features, such as cache
control, and PCI configuration. This choice appears only on the full
Configuration/Setup Utility main menu.
A warning message appears above the choices on this menu to alert you that the
system might malfunction if these options are configured incorrectly. Fo llow the
instructions on the screen carefully.
— Processor Serial Number Access
Select this choice to identify if the microprocessor serial number in the
microprocessor is readable.
— System Partition Visibility
Select this choice to identify if the System Partition is visible. To make the
System Partition visible, set this value to Visible. To make the System
Partition invisible, set this value to Hidden.
— Core Chipset Control
Select this choice to modify settings that control features of the core chip set
on the system board.
32 Hardware Maintenance Manual: xSeries 330
Page 41

Attention: Do not make changes here unless directed to do so by an IBM
authorized service representative.
— Cache Control
Select this choice to enable or disable the microprocessor cache. In addition,
you can set the microprocessor cache mode to write-back (WB) or writethrough (WT). Selecting write-back mode will provide the maximum system
performance.
— PC I Slot/Device Information
Select this choice to view and identify system resources used by PCI devices.
PCI devices automatically communicate with the server confi guration
information. This usually results in automatic configuration of a PCI device.
Attention: You must use the menu selections to save custom settings for the
PCI Slot/Device Information choice. The save, restore and load default
settings choices on the main menu of the Configuration/Setup Utility do not
save the PCI Slot/Device Inform ation settings.
PCI Device Control allows you to enable or disable the PCI slots from this
menu.
– The default setting is Enable for all the PCI slots. If you select Disable, the
system will not configure the disabled device and the operating system
will not see the device. (This is equivalent to unplugging the device.)
— Memory Settings
Select this choice to manually disable or enable a bank of memory.
If a memory error is detected during POST or memory configuration, the
server will automatically disable the failin g memory bank and continue
operating with reduced memory capacity. If this occurs, you must manually
enable the memory bank after the problem is corrected. Select Memory
Settings from the Advanced Setup menu, use the arrow keys to highlight the
bank that you want to enable; then, use the arrow keys to select Enable.
• Error Logs
Select this choice to view or clear error logs.
— Select POST Error Log to view the three most recent error codes and
messages that the system generated during POST.
Select Clear error logs from the POST Error Log menu to clear the error log.
— Select System Event/Error Log to view the system event/error log. The
system event/error log contains all the system error and warning messages
that the system has generated. You can use the arrow keys to move between
pages in the system event/error log.
Select Clear error logs from the System Event/Error Log menu to clear the
error or event log.
• Save Settings
Select this choice to save your customized settings.
• Restore Settings
Select this choice to delete your changes and restore the previous settings.
• Load Default Settings
Chapter 4. Co nf iguring the server 33
Page 42

Select this choice to cancel your changes and restore the factory settings.
• Exit Setup
If you have made any changes, the program will prompt you to save the changes
or exit without saving the changes.
Using passwords
The System Security choice appears only on the full Configuration/Setup Utility
menu. After you select this choice, you can implement two levels of password
protection: power-on password and administrator password.
Po wer-on password
After you set a power-on password, you can enable the unattended-start mode. This
locks the keyboard and mouse, but allows the sys tem to start the operating system.
The keyboard and mouse remain locked until you enter the correct password.
You can use any combination of up to seven characters (A–Z, a–z, 0–9 and blanks) for
your power-on password. Keep a record of your password in a secure place. If you
forget the power-on password, you can regain access to the server through one of the
following methods:
• If an administrator password is set, enter the administrator password at the
power-on prompt. Start the Configuration/Setup Utility program and change the
power-on password.
• Change the position of the password override jumper as described in “Setting the
password override switch”.
• Remove the battery and then install the battery.
Setting the password override switch: The following illustration shows the location
of the password override switch, switch 8 of switch block 1, on the system board.
Note: The illustrations in this docume nt might differ slightly from your hardware.
Switch block
(SW1)
OFF
To set the password override switch:
1. Review the information in “Before you beg in” on page 42.
1 2 3 4 5 6 7 8
34 Hardware Maintenance Manual: xSeries 330
Page 43

2. Turn off the server and peripheral devices and disconnect all external cables and
power cords; then, remove the cover. See “Removing the cover” on page 44.
3. Toggle switch 8 on switch block 1 on the system board. This clears the power-on
password for one boot cycle.
Note: This means that you can now start or power-up the server one time
without having to use the power-on password. But if you do not use the
Configuration/Setup Utility program to cha nge or delete the password,
the next time you start the server the original power-on password will be
reinstated.
4. Connect the server to a power source, keyboard, monitor, and mouse.
5. Power-up the server.
Note: You can now start the Configuration/Setup Utility program and either delete
the old or set a new power-on password.
Administrator password
Select this choice to set an administrator password. The administrator password
provides access to all choices on the Configuration/Setup Utility main menu. You can
set, change, or delete both the administrator and power-on passwords, and allow a
power-on password to be changed by the user.
Attention: If an administrator password is set and then forgotten, it cannot be
overridden or removed. You must replace the system board.
The following table provides a summary of the password features.
Table 8. Power-on and administrator password features.
Type of password Result s
Power-on password • Enter the password to complete the system startup .
• A limited set of choices is available on the
Configuration/Setup Utilit y m ain menu .
Administrator
password
Administrator and
power-on password
• No password is required to start the system.
• Enter the password to access the Configuration/Setup Utility
program.
• All choices are available on the Configuration/Setup Utility
main menu.
• You can enter either password to complete the system startup.
• The administrator password provides access to all choices on
the Configuration/Setup Utility main menu. You can set,
change, or delete both the administrator and power-on
passwords, and allow a power-on password to be changed by
the user .
• The power-on password provides access to a limited set of
choices on the Configuration/Setup Utility main menu. This
limited access might include changing or deleting the poweron password.
Chapter 4. Co nf iguring the server 35
Page 44

Using the SCSISelect utility program
SCSISelect is a built-in, menu-driven configuration utility program that you can use
to:
• View the default SCSI IDs
• Locate and correct configuration conflicts
• Perform a low-level format on a SCSI hard disk
The following sections provide the instructions needed to star t the SCSISelect Utility
and descriptions of the menu choices available.
Note: If the server has a RAID adapter installed, use the configuration method
supplied with the RAID adapter to view or change SCSI settings for attached
devices.
Starting the SCSISelect utility program
To start the SCSISelect utility program:
1. Turn on the server.
2. When the <<< Press <CTRL><A> for SCSISelect™ Utility! >>> pr ompt appears,
press Ctrl+A.
Note: If an administrator password has been set, a prompt appears asking you to
enter the password to start the SCSISelect Utility program.
3. Use the arrow keys to select a choice from the menu.
• Press Esc to return to the previous menu.
• Press the F5 key to switch between color and monochrome modes (if your
monitor permits).
4. Follow the instructions on the screen to change the settings of the selected items;
then, press Enter.
Choices available from the SCSISelect menu
The following choices appear on the SC SISe lect Utility menu:
• Configure/View Host Adapter Settings
Select this choice to view or change the SCSI controller settings. To reset the SCSI
controller to its default values, press F6; then, follow the instructions that appea r
on the screen.
You can view or change the following controller settings:
— Host Adapter SCSI ID
Select this choice to view the SCSI controller ID, normally 7.
— SCSI Parity Checking
Select this choice to view the assigned value of Enabled.
— Host Adapter SCSI Termination
Select this choice to view the assigned value of Enabled.
— Boot Device Options
36 Hardware Maintenance Manual: xSeries 330
Page 45

Select this choice to configure startable device parameters. Before you can
make updates, you must know the ID of the device whose parameters you
want to configure.
— SCSI Device Configuration
Select this choice to configure SCSI device parameters. Before you can make
updates, you must know the ID of the device whose parameters you want to
configure.
Note: The Maximum Sync Transfer Rate repr esents the transfer rate for Ultra
SCSI devices.
– The transfer rate for Ultra3 SCSI LVD devices is 160.0
– The transfer rate for Ultra2 SCSI LVD devices is 80.0
– The transfer rate for Fast SCSI devices is 20.0
— Advanced Configuration Options
Select this choice to view or change the settings for advanced configuration
options.
• SCSI Disk Utilities
Select this choice to view the SCSI IDs that are assigned to each device or to
format a SCSI device.
To use the utility program, select a drive from the list. Read the screens carefully
before making a selection.
Note: If you press Ctrl+A before the selected drives are ready, an Unexpected
SCSI Command Failure screen might appear. Restart the server and watch
the SCSISelect messages as each drive spins up. After the drive that you
want to view or format spins up, press Ctrl+A.
Using the Preboot eXecution Environment boot agent
utility program
The Preboot eXecution Environment (PXE) boot agent is a built-in, menu-driven
configuration utility program that you can use to:
• Change network startup (boot) protocols
• Change startup (boot) order
• Select whether or not to display setup prompt
• Set menu wait time
• Select OS wake up support
Starting the PXE boot agent utility program
The following sections provide the instructions needed to start the PXE Boot Agent
Utility and descriptions of the men u choices available.
To start the PXE Boot Agent Utility program:
1. Turn on the server.
2. When the Initializing Intel (R) Boot Agent Version X.X.XX
PXE 2.0 Build XXX (WfM 2.0) prompt appears, press Ctrl+S.
Chapter 4. Co nf iguring the server 37
Page 46

Note: By default you will have 2 seconds after the prompt appears on the screen
to press Ctrl+S.
3. Use the arrow keys or press Enter to select a choice from the menu.
• Press Esc to return to the previous menu.
• Press the F4 key to exit.
4. Follow the instructions on the screen to change the settings of the selected items;
then, press Enter.
Choices available from the PXE boot agent
utility
The following choices appear on the PXE boot agent utility menu:
• Network Boot Protocol
PXE is the default value for this menu item.
Note: Do not change this value. There are no other network boot protocols
supported.
• Boot Order
Select this choice to change the order in which boot devices are queried.
— Try local drives first, then network (Default)
— Try network only
— Try local drives only
— Try network first, then local drives
• Show setup prompt
Select this choice to either display the PXE setup prompt or disable it. Disable is
the default setting.
When this choice is enabled Press Ctrl+S to enter the setup menu will appear on
the screen under the initializing prompt.
• Setup time wait menu
Select this choice to set up the amount of time (in seconds) that the system will
pause during initialization for a Ctrl+ S input.
— 2 seconds (Default)
— 3 s ec onds
— 5 s ec onds
— 8 s ec onds
• Legacy OS wake up support Select this choice to
allow/disallow a non-windows operating system to use adapter remote wake up
capability.
— Disabled (Default)
— Enabled
38 Hardware Maintenance Manual: xSeries 330
Page 47

Chapter 5. Installing options
This chapter provides instructions to help you add options to the server. Some
option-removal instructions are provided, in case you need to remove one option to
install another. For a list of supported options for the server , see the Server Proven list
at: http://www.ibm.com/pc/compat
Major components of the xSeries 330 server
The following illustration shows the locations of major components in the server.
Clear shield
Clip
Terminator card
Memory module
Air baffle
Heatsink
Microprocessor
Fans
Light Path
Diagnostics
Hard disk drive
filler panel
Hard disk drive
© Copyright IBM Corp. 2000 39
Page 48

System board
System board options connectors
The illustrations in the following sections show the components on the system board.
The following illustration identifies the connectors on the system board.
Serial port A
(J52)
BIOS code
page jumper
(J19)
DIMM 4
(J47)
DIMM 3
(J41)
DIMM 2
(J34)
DIMM 1
(J32)
Microprocessor 2
(U79)
Microprocessor 1
(U47)
Operator
information
panel (J43)
Management port
(J53)
Serial port B
(J51)
Fan 5 (J35)
C2T (out)
port (U61)
Fan 4 (J24)Fan 6 (J38)
C2T (in)
port (U38)
USB 2
port (J15)
Switch block
(SW1)
Battery
Fan 3 (J22)
USB 1
port (J13)
RS-485 (Advanced
System Management
interconnect) ports (J5)
Ethernet
ports (J1)
PCI slot 2
64 bit
33 MHz (J23)
PCI slot 1
64 bit
33 MHz (J10)
Primary IDE
(J7)
Secondary
IDE (J2)
SCSI signal
(J4)
Power (J3)
Power (J6)
Diskette (J11)
SCSI hard disk
drive power (J8)
Fan 1 (J12)
Fan 2 (J14)
CD Power (J17)
System board jumper blocks
Any jumper blocks on the system board that are not shown in the illustration are
reserved. For normal operation of the system, no jumpers should be installed on any
of the jumper blocks. See “Recovering BIOS” on page 18 for information about the
Flash ROM page-swap jumper.
System board switch block
The switch block contains microswitches 1-8. As pictured in this illustration, switch 1
is at the top of the switch block and switch 8 is at the bottom. For more information
about this switch block see “Setting the password override switch” on page 34.
40 Hardware Maintenance Manual: xSeries 330
Page 49

The following table describes the function for each switch.
Table 9. Switch es 1-8.
Switch number Switch description
1 Reserved.
2 Reserved.
3 Reserved.
4 Reserved.
5 Force power-on. The default setting is Off (disabled).
6 Reserved. The default setting is Off.
7 Reserved. The default setting is Off.
8 Bypass power-on password.
System board LEDs
The following illustration identifies the LEDs on the system board.
When toggled to the opposite position, bypasses the power-on password,
if one is set, for one boot cycle. See “Setting the password override
switch” on page 34.
Power-on
indicator
(CR47)
DIMM 1
failure
(CR 38)
DIMM 2
failure
(CR 39)
DIMM 3
failure
(CR 46)
DIMM 4
failure
(CR 54)
Fan 6
failure (CR48)
Fan 4
failure (CR33)
PCI
CPU
VRM
MEM
PS
SP
FAN
Light
Path
TEMP
Microprocessor 1
failure (CR26)
Light path
diagnostic circuit
verification LED
Light path
diagnostic
panel
Light path
diagnostics
button
Fan 1
failure
(CR15)
Fan 2
failure
(CR17)
Microprocessor 2
failure (CR53)
Fan 5
failure (CR40)
Fan 3
failure (CR31)
Chapter 5. In st alling options 41
Page 50

Before you begin
Before you begin to install options in the server, read the following information:
• Become familiar with the safety an d handling guidelines specified under
• Make sure that you have an adequate number of properly grounded electrical
• Back up all important data before you make changes to disk drives.
• Have a small, flat-blade screwdriver available.
• For a list of supported options for the server, refer to
• For your convenience during setup and service you might want to have a
System reliability considerations
“Handling electrostatic discharge-sensitive devices” on page 110, and read the
safety statements in “Safety information” on page 107. These guidelines will help
you work safely while working with the server or options.
outlets for the server, monitor, and any other options that you intend to install.
http://www.ibm.com/pc/us/compat on the World Wide Web.
separate location where you can temporarily connect the server to a power source
(using a separate power cord), keyboard, monitor, and mouse (using a separate
C2T device breakout cable). Additional C2T cables are available in the cable
option kit.
To help ensure proper cooling and system reliability, make sure:
• Each of the drive bays has either a drive or a filler panel installed.
• The cover is in place during normal operations, or is removed for no longer than
30 minutes while the server is operating.
• There is space around the server to allow the server cooling system to work
properly. Leave about 127 mm (5 in.) of space around the front and rear of the
server.
• Cables for optional adapters are routed according to the instructions provided
with the adapters.
• A failed fan is replaced within 48 hours.
Working inside a server with power on
Your server is designed to operate safely while turned on with the cover removed.
Follow these guidelines when you work inside a server that is turned on:
• Avoid loose-fitting clothing on you r fo rearms. Button long-sleeved shirts before
working inside the server; do not wear cuff links while you are working inside the
server.
• Do not allow your necktie or scarf to hang inside the server.
• Remove jewelry, such as bracelets, rings, necklaces, and loose-fitting wrist
watches.
• Remove items from your shirt pocket (such as pens or pencils) that could fall into
the server as you lean over it.
• Take care to avoid dropping any metallic objects, such as paper clips, hair pins, or
screws, into the server.
42 Hardware Maintenance Manual: xSeries 330
Page 51

Rack installation
Do the following to install the server in the rack. Reverse the steps to remove the
server from the rack.
1. Lift and place the server on the lower edge of the mounting bracket.
2. Slide the server as far back as it will go.
3. Using the thumb screws on the front of the server; secure the server to the
brackets.
4. If you have additional servers to install, repeat steps 1 through 3 for each xSeries
330.
5. Install all exter nal cables and power cords to the serve rs.
Chapter 5. In st alling options 43
Page 52

Removing the cover
The following information describes h ow to remove the cover.
Complete the following steps to remove the cover from the server:
1. Review the information in “Before you beg in” on page 42.
2. Turn off the server and all attached devices and disconnect all external cables and
power cords.
3. Remove the server from the rack (see “Rack installation” on page 43).
4. Remove the two screws from the rear of the server.
5. Pull out on the cover release lever at the back of the server, to release the cover.
6. Slide the cover back, then up and off the server.
Attention: For proper cooling and airflow, replace the cover before turning on
the server. Operating the server for extended periods of time (over 30 minutes)
with the cover removed might damage server components.
7. Remove the clear shield that covers the inside of the server.
Note: It is not necessary to remove the shield when you are installing memory
Working with adapters
Cover release
lever
modules or installing an adapter in the PCI slots.
Screws
The server comes with two peripheral component interconnect (PCI) adapter slots on
the system board with riser cards installed in the m.
Attention: Your server also comes with an integrated video controller on the system
board. When you install a video ada p ter in a PCI slot, the server BIOS automatically
disables the integrated video controller. This allows the video adapter in the PCI slot
to control the video function s for your monitor.
The following illustration shows the location of the 33 MHz PCI expansion slots on
the system board.
Note: The illustrations in this docume nt might differ slightly from your hardware.
44 Hardware Maintenance Manual: xSeries 330
Page 53

Adapter considerations
PCI slot 2
64 bit
33 MHz (J23)
PCI slot 1
64 bit
33 MHz (J10)
Before you install adapters, review the following:
• Locate the documentation that comes with the adapter and follow those
instructions in addition to the instructio ns in this chapter. If you need to change
the switch settings or jumper settings on your adapter, follow the instructions that
come with the adapter.
• You can install 32-bit or 64-bit full-length or half-length adapters in the expansion
slots. Full-length adapters are installed in slot 1; half-length adapters are installed
in either slot 1 or 2.
• Your server supports 5.0 V and universal PCI adapters; it does not support 3.3 V
only adapters.
• Your server uses a rotational interrupt technique to configure PCI adapters.
Because of this technique, you can install PCI adapters that currently do not
support sharing of PCI interrupts.
• PCI slots 1 and 2 and the integrated SCSI controller are on PCI bus B; the system
board and all other integrated devices are on PCI bus A.
Note: PCI bus A = bus 0; PCI bus B = bus 1.
• The system scans PCI slots 1 and 2 to assign system resources. By d efault the
system starts (boots) devices in the following order: System SCSI devices, then
PCI devices.
Note: To change the boot precedence, start the Configuration/Setup Utility,
select Start Options from the main menu; then, select the PCI SCSI
adapter boot option.
Chapter 5. In st alling options 45
Page 54

Installing an adapter
Complete the following steps to install a n adapter:
Attention: When you handle electrostatic discharge (ESD) sensitive devices, take
precautions to avoid damage from static electricity. For details on handling these
devices, refer to “Handling electrostatic discharge-sensitive devices” on page 110.
1. Review the safety precautions that are listed in “Chapter 9. Related service
information,” on page 107.
2. Turn off the server and peripheral devices and disconnect all external cables and
power cords.
3. Remove the server from the rack; then, remove the cover as shown. For more
information see “Removing the cover” on page 44.
Cover release
lever
4. Remove the expansion slot clip that holds the expansion slot cover in place by
sliding it upward and off the frame of the server.
Note: The illustrations in this docume nt might differ slightly from your
hardware.
Screws
46 Hardware Maintenance Manual: xSeries 330
Page 55

Retention
latch
Tab
Adapter
card
Expansion
slot
Expansion
slot clip
Expansion
slot cover
5. Remove the expansion-slot cover.
6. Refer to the documentation that comes with your adapter for any cabling
instructions.
Attention: You should route adapter cabl es before you insta ll the adapter.
7. Set any jumpers or switches as described by the adapter manufacturer.
8. Install the adap ter:
Note: When installing an adapter into slot 2, skip steps a and d.
a. Open the adapter retention latch by pushing the blue tab to release it. Then
push the latch up to the full open position.
b. Carefully grasp the adapter by its top edge or upper corners, and align it with
the connector on the PCI riser-card.
c. Press the adapter firmly into the riser-card connector.
Attention: When you install an adapter, be sure the adapter is correctly
seated in the riser-card connector before you turn on the server. Improperly
seated adapters might cause damage to the system board, the riser-card, or
the adapter.
d. Push down on the blue adapter retention latch unt il it clicks into place,
securing the adapter.
e. Replace the expansion slot clip by sliding it down until it latches in to place
and holds the adapter securely.
9. Connect the internal cables to the adapter.
Chapter 5. In st alling options 47
Page 56

Attention: Route cables so that they do not block the flow of air from the fans.
Note: When installing a ServeRAID adapter remove the cable from the SCSI
connector (J4) on the system board and attach it to the ServeRAID adapter.
Air flow
Hard disk drives
10. Install the cover see “Removing the cover” on page 44.
11. Turn on the server.
The server supports two 1-inch (26 mm) slim 3.5-inch low voltage differential (LVD)
hard disk drives. If you can hot-swap hard disk drives.
Notes:
1. You can hot-swap a hard disk drive only if a ServeRAID adapter configured as
RAID1 is installed in the syst em. If yo u use any other ServeRAID or SCSI
configuration, you cannot hot-swap the hard disk drive.
2. For more information on hot-swap disk drives refer to “Hot-swap disk drives” on
page 50.
Each hard disk drive tray has a status and an activity light located on the upper-right
corner of tray (see “Server controls and indicators” on page 6 for the location of the
status and activity indicators). These lights are used to show when there is drive
activity or, in some cases, when there is a problem with your hard disk drive.
• The drive must be a low voltage differential drive (LVD), and have a single
connector attached (SCA) connector.
• The hard disk drive bays connect to a SCSI backplane. This backplane is the
printed circuit board behind the bay and is connected to J4 on the system board.
• The backplane controls the SCSI IDs for the hard disk drives.
Preinstallation steps
Before you install a hard disk drive, review the following.
48 Hardware Maintenance Manual: xSeries 330
Page 57
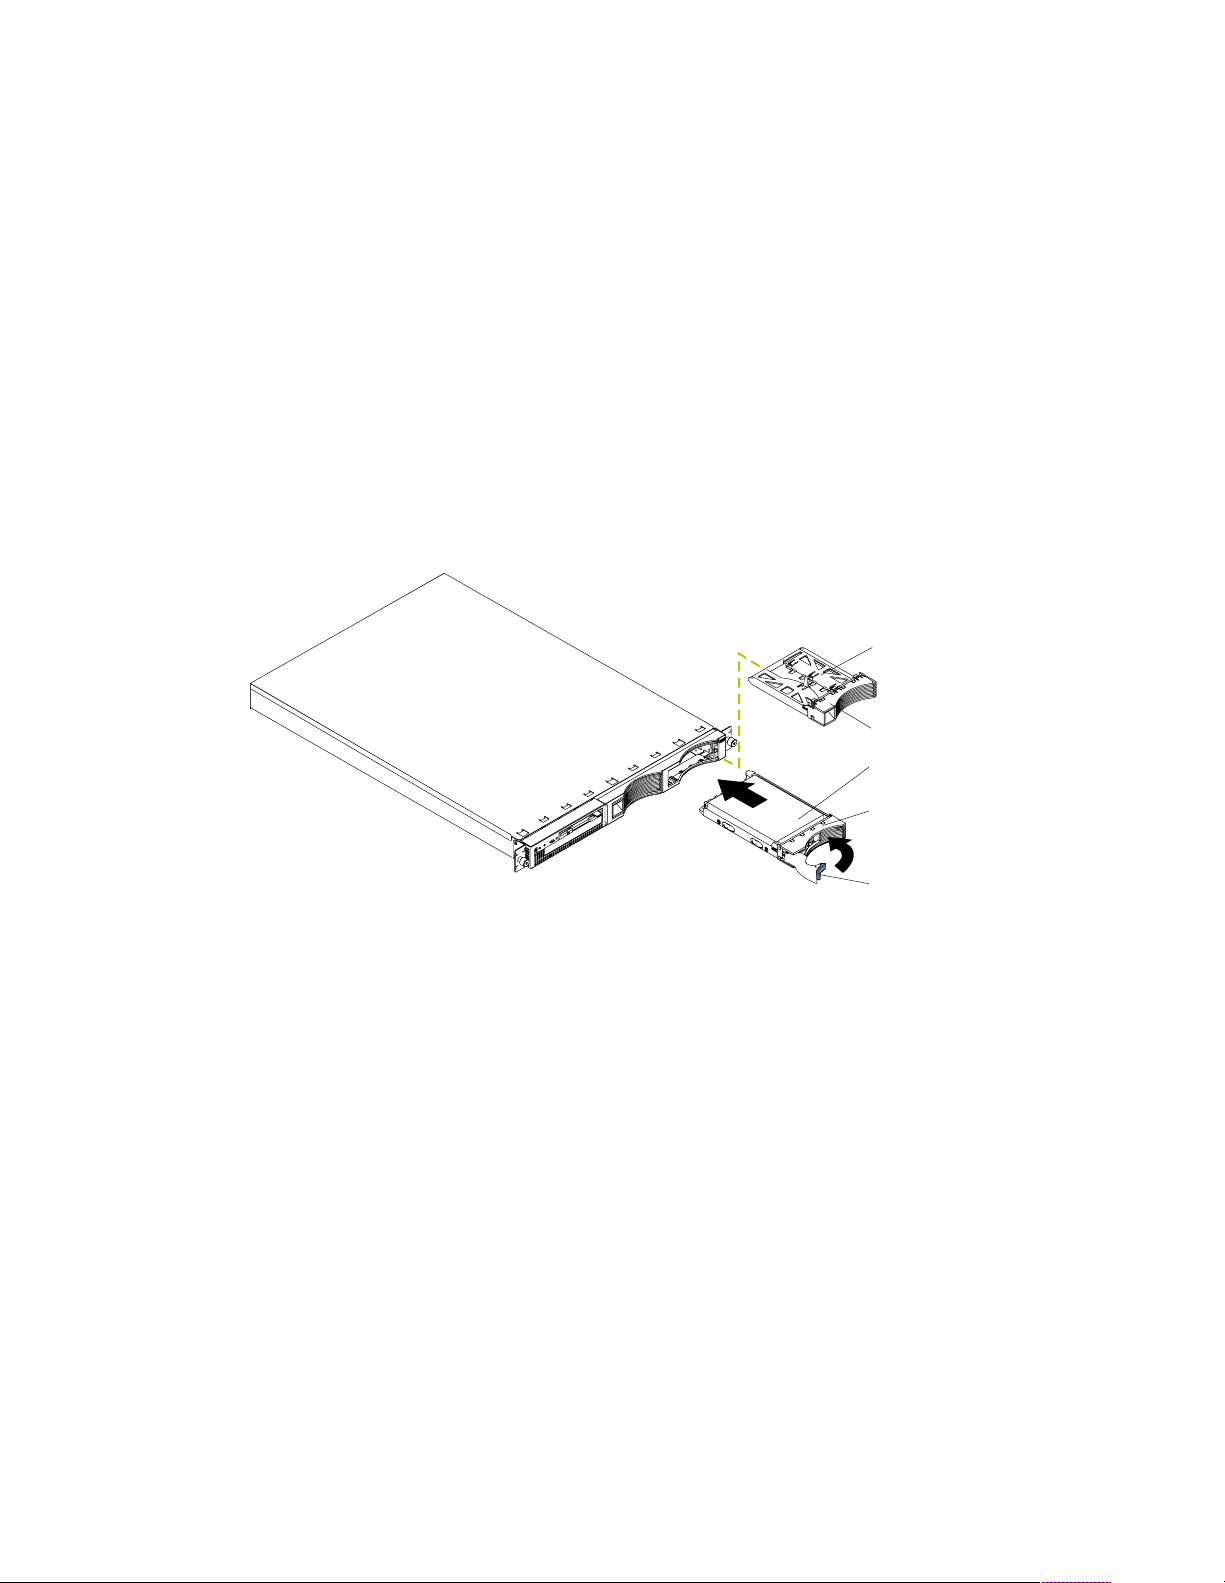
• Inspect the drive tray for any signs of damage.
• Ensure that the drive is installed properly in the tray.
• To maintain proper system cooling, do not operate the server for more than two
minutes without either a drive or a filler panel installed in each bay.
• If your server has a ServeRAID adapter installed; refer to the documentation
provided with the ServeRAID adapter for information about adding a drive.
• Read the safety precautions listed in “Safety information” on page 107, “Handling
electrostatic discharge-sensitive devices” on page 110.
• Check the instructions that come with the drive for more information about
installing the drive.
Installing or replacing a hard disk drive
Refer to the following illustration to install a hard disk drive:
Note: The illustrations in this docume nt might differ slightly from your hardware.
Slim filler
Filler panel
Hard disk drive
Drive tray
Drive tray handle
(in open position)
Attention:
• When you handle electrostatic discharge (ESD) sensitive devices, take precautions
to avoid damage from static electricity. For details on handling these devices,
refer to “Handling electrostatic discharge-sensitive devices” on page 110.
1. Review the information in “Before you beg in” on page 42.
2. Turn off th e server and all attached devices, and disconnect all external cables and
power cords.
3. Remove the filler panel or defective hard drive from one of the hard disk drive
bays.
4. Install the new hard disk drive in the drive bay:
a. Ensure the tray handle is open (that is, perpendicular to the drive).
b. Align the rails on the drive assembly with the guide rails in the drive bay.
c. Gently push the drive assembly into the bay until the drive connects to the
backplane.
d. Push the tray handle toward the closed position until it locks the drive in
place.
5. Reconnect the external cables and power cords; then, turn on the server.
Chapter 5. In st alling options 49
Page 58

6. Check the hard disk drive status indicators to verify that the hard disk drives are
operating properly. (See “Server controls and indicators” on page 6 for the
location of the status indicators.)
• When the green light flashes rapidly (three flashes per second), the controller
Replacing a hard disk drive is done in the same manner as installing a new hard disk
drive.
If the server has a Redundant Arra y of Independent Disks (ServeRAID) adapter
installed, you can hot-swap drives. For more information about hot-swapping drives
refer to the documentation provided with the ServeRAID adapter, “Hot-swap disk
drives”, and to the notes under “Hard disk drives” on page 48.
Hot-swap disk drives
Your server can be configured with hardware to let you continue to operate your
system while removing or installing ha rd disk dri ves (or hot-swapping). To do this
you need a ServeRAID adapter, h ard disk drive, and the hard disk drive tray.
• Each hard disk drive that you plan to insta ll must have an accompanying hard
disk drive tray.
• The drive must be a low-voltage differential drive (LVD), and have a single
connector attached (SCA) connector.
• The hard disk drive bays connect to a SCSI backplane. This backplane is the
printed circuit board behind the bay and is connected to the ServeRAID adapter.
• The backplane controls the SCSI IDs for the hard disk drives.
is identifying the drive.
Preinstallation steps
Before you install a hard disk drive, review the following.
• Inspect the drive tray for any signs of damage.
• Ensure that the drive is installed properly in the tray.
• To maintain proper system cooling, do not operate the server for more than two
minutes without either a drive or a filler panel installed in each bay.
• If your server has a ServeRAID adapter installed; refer to the documentation
provided with the ServeRAID adapter for information about adding a drive.
• Read the safety precautions listed in “Safety information” on page 107, “Handling
electrostatic discharge-sensitive devices” on page 110.
• Check the instructions that come with the drive to see if you need to set any
switches or jumpers on the drive.
Installing hot-swap disk drives
Note: The illustrations in this docume nt might differ slightly from your hardware.
50 Hardware Maintenance Manual: xSeries 330
Page 59
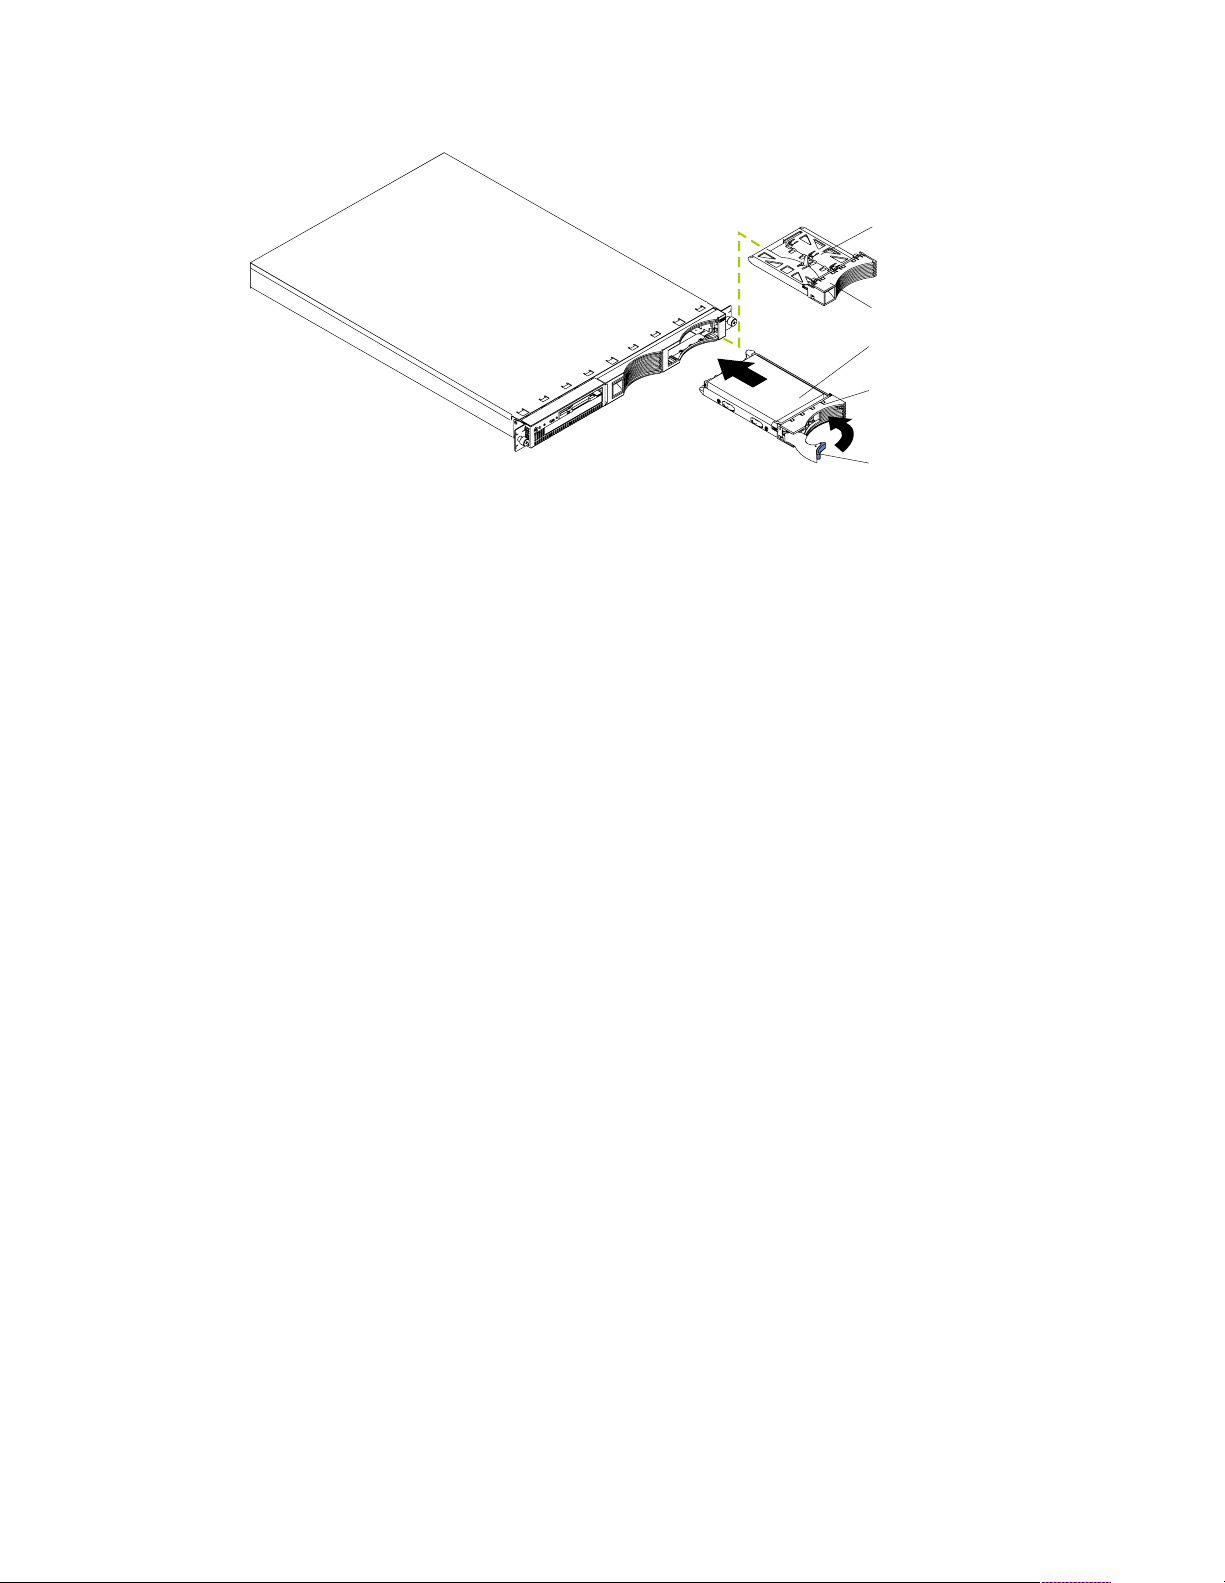
Slim filler
Filler panel
Hard disk drive
Drive tray
Drive tray handle
(in open position)
Complete the following steps to install a hot-swap drive in a hot-swap drive bay:
Attention:
• To maintain proper system cooling, do not operate the server for more than two
minutes without either a drive or a filler panel installed for each bay.
• When you handle electrostatic discharge sensitive devices (ESD ), take pr ecautions
to avoid damage from static electricity. For details on handling these devices,
refer to “Handling electrostatic discharge-sensitive devices” on page 110.
1. Remove the filler panel from one of the empty hot-swap bays by inserting your
finger into the depression at the left side of the filler panel a nd pulling it away
from the server.
2. Install the hard disk drive in the hot-swap bay:
a. Ensure the tray handle is open (that is, perpendicular to the drive).
b. Align the rails on the drive assembly with the guide rails in the drive bay.
c. Gently push the drive assembly into the bay until the drive connects to the
backplane.
d. Push the tray handle toward the closed position until it locks the drive in
place.
3. Check the hard disk drive status indicators to verify that the hard disk drives are
operating properly. See “Server controls and indicators” on page 6 for the
location of the status indicators.)
• When a ServeRAID adapter is installed and:
— The amber light is on continuously, the drive had failed.
— The green light flashes slowly (one flash per second), the drive is being
rebuilt.
— The green light flashes rapidly (three flashes per second), the controller is
identifying the drive.
Replacing a drive in a hot-swap bay
You do not have to turn off the server to remove or install the hot-swap drives.
1. Before you remove a hot-swap ha rd disk drive that is not defective, back up all
important data.
Chapter 5. In st alling options 51
Page 60

2. To avoi d damage to a har d disk dr ive, do not r emove the dri ve fr om the hot- swap
bay until it has had time to spin down ( approximately 30 seconds). Handle the
drive carefully.
3. Before you replace a hot-swap d r ive, make sure it is defective. If you partially or
completely remove a good drive instead of a defective one, the server might lose
valuable data.
This situation is especially relevant if the server has a ServeRAID adapter
installed and you assigned ServeRAID level 0 or 1 to the logical drives in your
disk array. The ServeRAID adapter can rebuild the data that you need, provided
that certain conditions are met. Refer to the information provided with the
ServeRAID adapter for further details.
Refer to the following illustration whil e y ou perform the steps in this procedure.
Note: The illustrations in this docume nt might differ slightly from your hardware.
Slim filler
Filler panel
Hard disk drive
Drive tray
Drive tray handle
(in open position)
Complete the following steps to replace a drive in a hot-swap bay:
1. Before you begin, read the documentation that comes with your drive.
2. Locate the defective drive (look for an amber Hard Disk Status light on the front
of the drive).
3. Remove the defective hard disk drive:
a. Move the handle on the drive to th e open po sition (perpendicular to the
drive)
b. Pull the hot-swap drive assembly from the bay.
4. Install the hard disk drive in the hot-swap bay:
a. Ensure the tray handle is open (that is, perpendicular to the drive).
b. Align the rails on the drive assembly with the guide rails in the drive bay.
c. Gently push the drive assembly into the bay until the drive connects to the
backplane.
d. Push the tray handle toward the closed position until it locks the drive in
place.
5. Check the hard disk drive status indicators to verify that the hard disk drive is
installed properly (see “Server controls and indicators” on page 6 for the location
of the status indicators).
• When a ServeRAID adapter is installed and:
— The amber lig ht is on continuously, the drive has failed.
52 Hardware Maintenance Manual: xSeries 330
Page 61

Memory
— The green light flashes slowly (one flash per second), the drive is being
rebuilt.
— The green light flashes rapidly (three flashes per second), the controller is
identifying the drive.
Adding memory to the server is an easy way to improve system performance. You
can increase the amount of memory in the server by installing options called memory-
module kits. Each kit contains one industry-standard, dual-inline memory module
(DIMM). Your server uses a noninterleaved memory configuration, which allows you
to add, remove, or replace one DIMM at a time. In an interleaved system you would
have to add, remove, or replace memory in sets.
The server comes with a dual inline memory module (DIMM) installed on the system
board in DIMM slot 1.
Note: Install additional DIMMs in the following order: DIMM connector 2, then 3,
then 4. (See the following illustrat ion for memory connector locations.)
Connector 1
Connector 2
Connector 3
Connector 4
Installing memory modules
Complete the following steps to install a DIM M:
Attention: When you handle electrostatic discharge-sensitive devices (ESD), take
precautions to avoid damage from static electricity. For details on handling these
devices, refer to “Handling electrostatic discharge-sensitive devices” on page 110.
1. Review the information in “Before yo u begin” on page 42 and the documentation
that comes with your option.
2. Turn off the server and peripheral devices and disconnect the power cord and all
external cables; then, remove the cover (see “Removing the cover” on page 44 for
details).
3. If necessary, remove the PCI card in slot 2 for easier access to the DIMM
connectors.
4. Touch the static-protective package containing the DIMM to any unpainted metal
surface on the server. Then, remove the DIMM from the package.
Chapter 5. In st alling options 53
Page 62
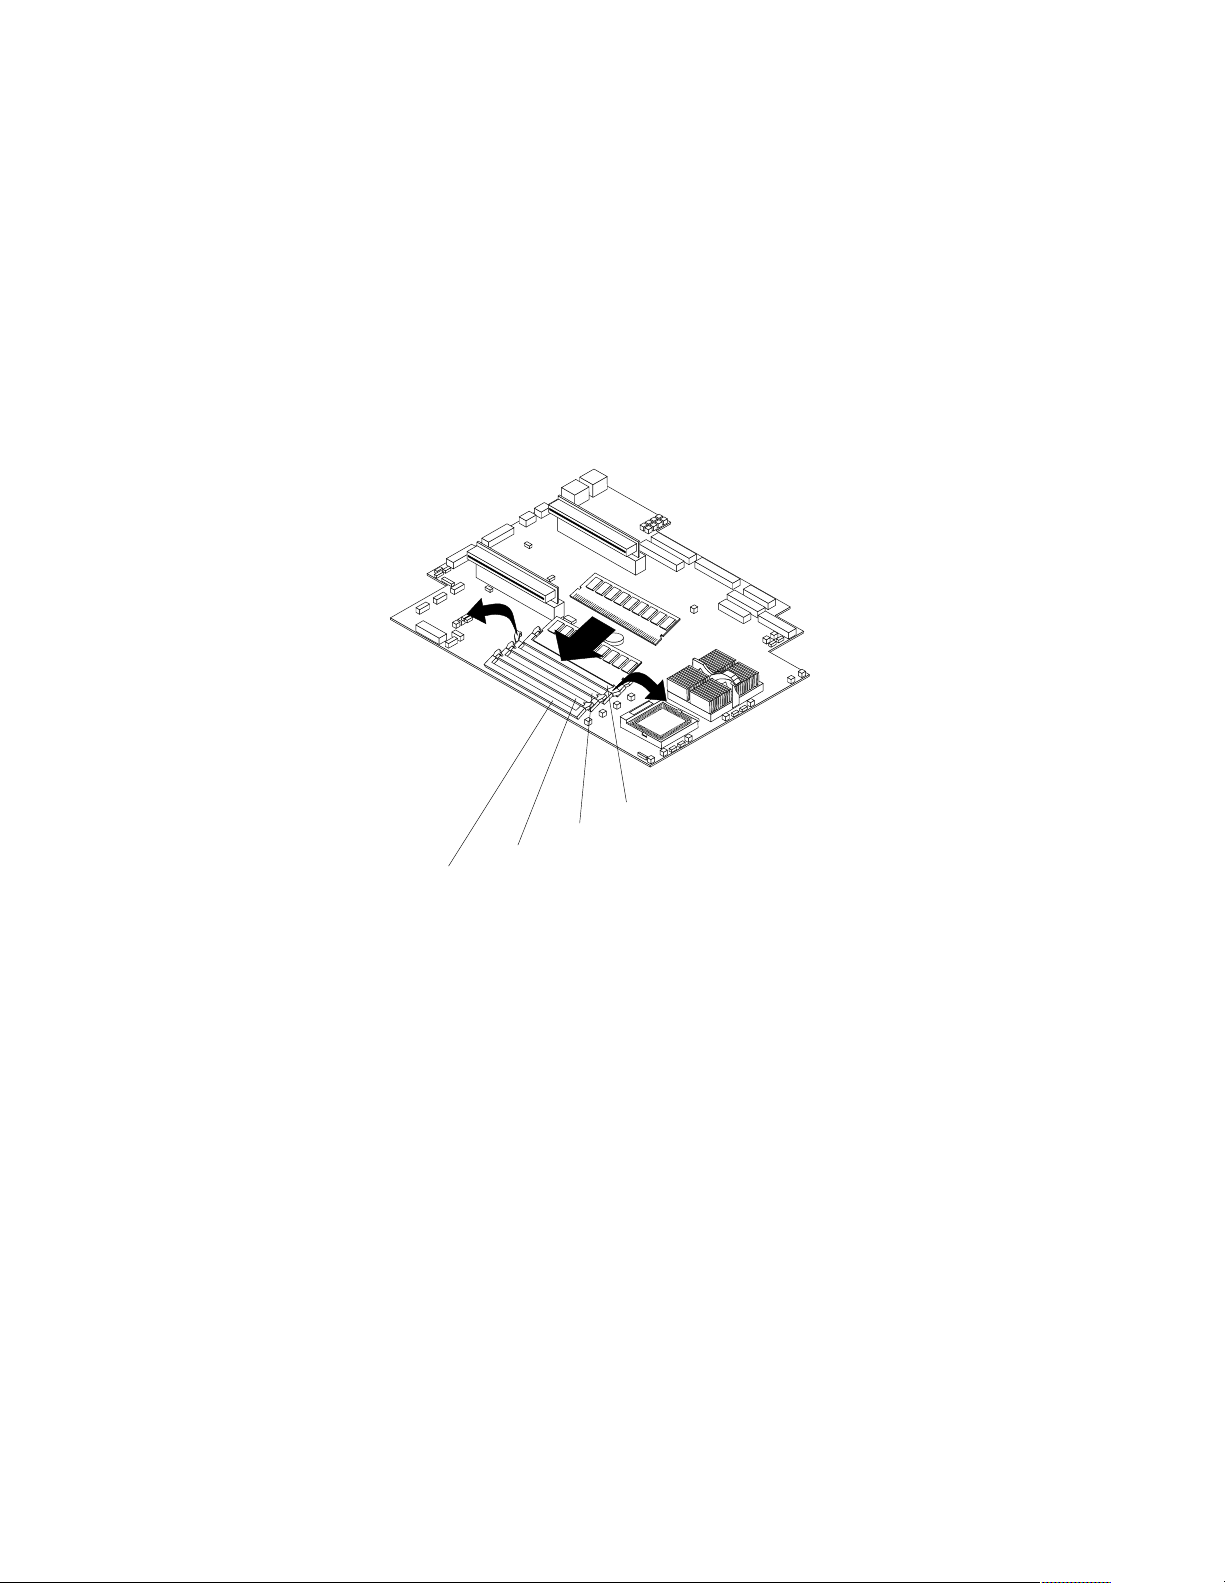
Attention: To avoid breaking the retaining clips or damaging the DIMM
connectors, handle the clips gently.
5. Install the DIMM in the connector.
Attention: To prevent damage to the DIMM connectors do not force the memory
module into the connector.
a. Turn the DIMM so that the index slots align correctly with the conn ector.
Note: The DIMM has two index slots, one in the center and the other on the
left half of the DIMMS connector edge.
b. Insert the DIMM into the connector by pressing on both corners of the DIMM
at the same time. Be sure to press straight into the connector.
Connector 1
Connector 2
Connector 3
Connector 4
c. When installing a memory module be sure that no gap exists between the
DIMM and the retaining clips. If a gap does exist between the memory
module and the retaining clips: open the retaining clips, remove the DIMM ;
then, reinsert the DIMM properly.
Note: It is a good idea to install or remove any other options at this time.
6. Turn on the server.
Attention: When you restart the server, the system displays a message indicating
that the memory configuration has changed.
• If you installed additional memory, start the Configuration/Setup Utility
program and select Save Settings.
• If you just replaced a failed DIMM, you must start the Configuration/Setup
Utility program, select Advanced Setup, select Memory Settings , highlight
the connector or bank of connectors that you want to enabled, and then select
Enable.
• In some memory configurations, the 3-3-3 beep code might sound during
POST followed by a blank display screen. If this occurs and the Boo t Fail
Count feature in the Start Options of the Configuration/Setup Utility is set to
Enabled (its default setting), you must restart the server three times (a "threeboot reset") to force the system BIOS to reset the memory connector or bank of
connectors from Disabled to Enabled.
54 Hardware Maintenance Manual: xSeries 330
Page 63
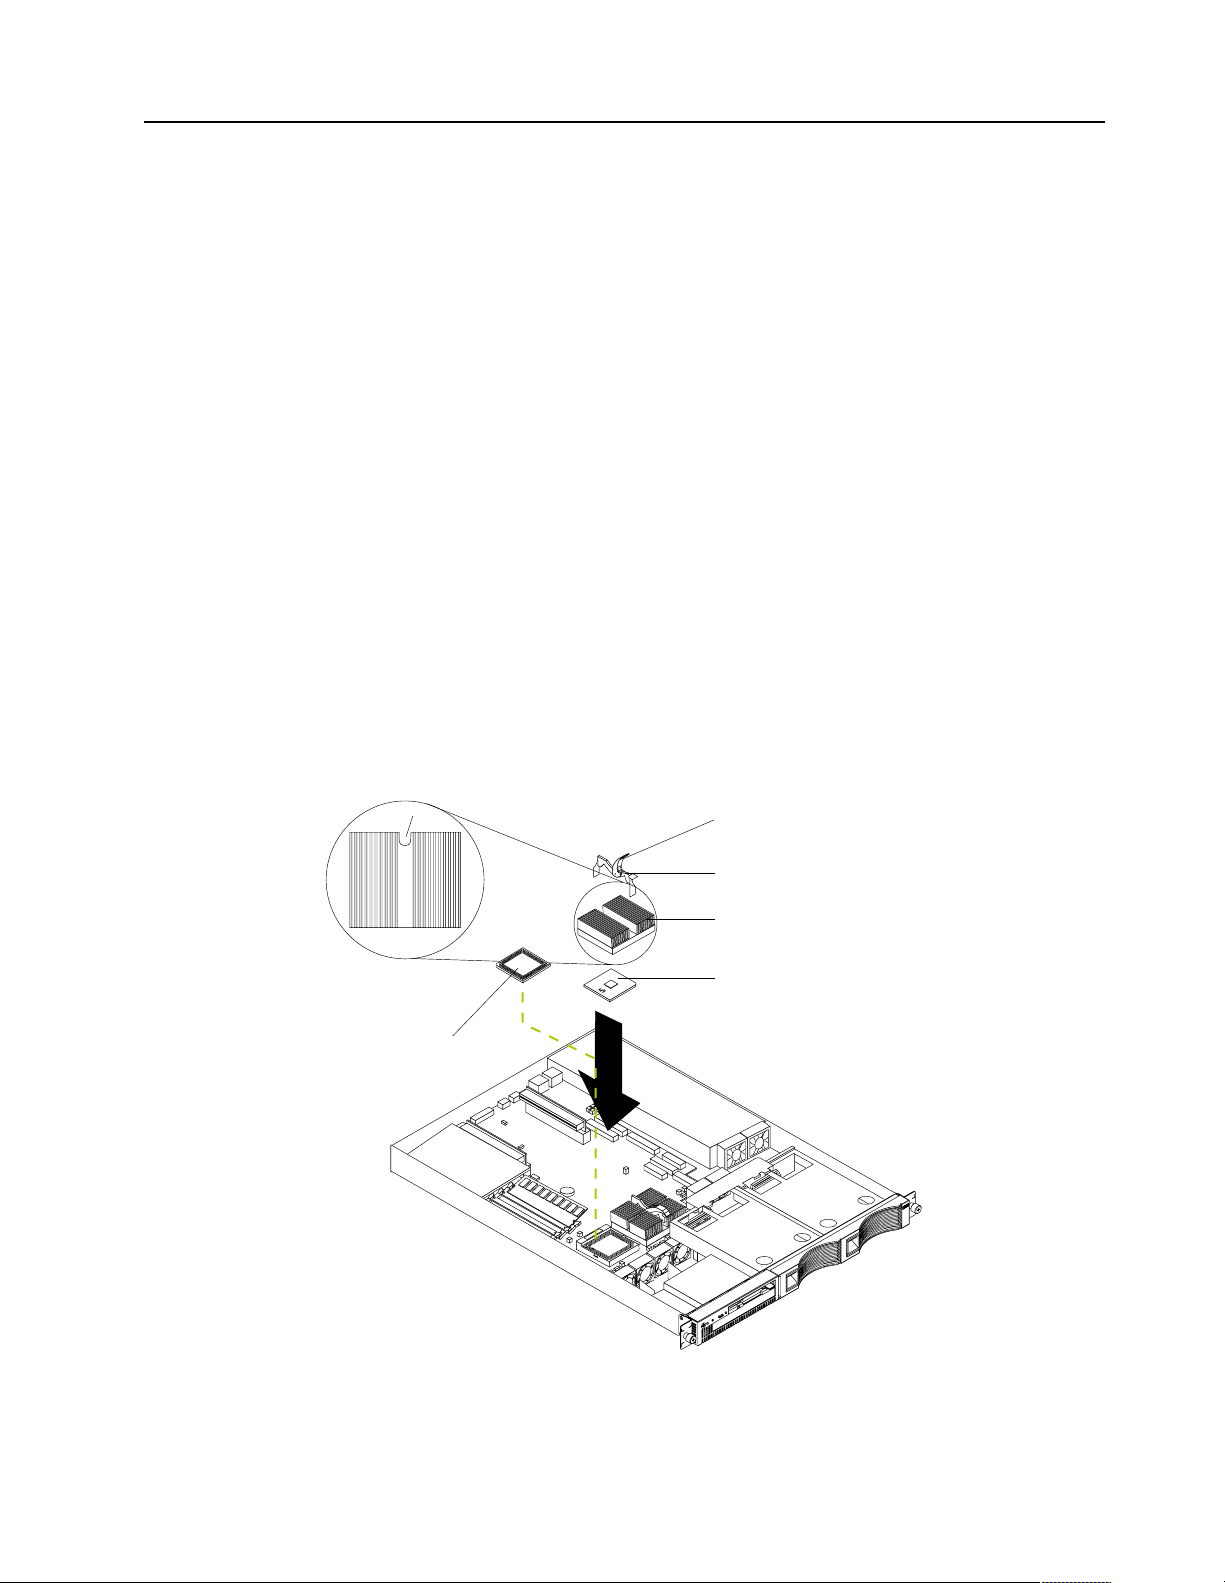
Microprocessor
The server comes with one or two microprocessors installed on the system board. If
you have two, or had one and you installed a second microprocessor, the server can
operate as a symmetric multiprocessing (SMP) server. With SMP, certain operating
systems and application programs can distribute the processing load between the
microprocessors. This enhances performance for database and point-of-sale
applications, integrated manufacturing solutions, and other applications.
Notes:
1. Before you ins tall a new microprocessor, review the documentation that comes
with the microprocessor, so that you can determine whether you need to update
the server basic input/output system (BIOS). The latest level of BIOS for the
server is available through the World Wide Web.
2. Obtain an SMP-capable operating system (opti ona l) . For a list of supported
operating systems, see http://www.ibm.com/pc/us/compat/ on the World
Wide Web.
3. If the server comes with one microprocessor, it is installed in microprocessor
connector 1. This is the startup (boot) microprocessor. If you install a second
microprocessor in microprocessor connector 2, the two microprocessors will
share the system load after the system has started.
Attention: To avoid damage and ensure proper server operation install
microprocessors that are the same type, and have the same cache size and the same
clock speed. Microprocessor internal clock frequencies and external clock fr equencies
must be identical. See the ServerProven list at http://www.ibm.com/pc/compat for
a list of microprocessors for use with the server.
Slot
Top view of
heatsink
Terminator card
Heatsink release
lever
Clip
Heatsink
Microprocessor
Chapter 5. In st alling options 55
Page 64

Installing the microprocessor
Complete the following steps to install a n ad d itional microprocessor:
Attention: When you handle electrostatic discharge-sensitive devices (ESD), take
precautions to avoid damage from static electricity. For details on handling these
devices, refer to the following Web site and use a search term of ESD:
http://www.ibm.com/
1. Review the safety precautions listed in “Safety information” on page 107.
2. Turn off the server and peripheral devices and disconnect the power cord and all
external cables; then remove the cover (see “Removing the cover” on page 44 for
details).
3. Remove the clear shield from the server and store it in a safe place.
4. Lift up the microprocessor release lever and remove the terminator card from the
microprocessor connector. (After you remove the new microprocessor from the
static-protective package, place the terminator card in the bag and store it in a safe
place. You will need to install the terminator card again if you ever remove the
microprocessor and do not replace the microprocessor.)
5. Install the microprocessor:
a. Touch the static-protective package containing the new micr oprocessor to any
unpainted metal surface on the server; then, remove the microprocessor from
the package.
b. Orient the microprocessor over the microprocessor connector as shown in the
illustration. Carefully press the microprocessor into the connector.
Note: To avoid bending the pins on the microprocessor, do not use excessive
force when pressing it into the connector.
Microprocessor
orientation indicator
Microprocessor
release lever
Microprocessor
Microprocessor
connector
Rear of server
56 Hardware Maintenance Manual: xSeries 330
Page 65

6. Push the microprocessor release lever down to lock the microprocessor into place.
7. Install the heat sink on the microprocessor:
a. Peel the plastic protective strip off the bottom of the heat sink. Make sure the
square of thermal material is still on the bottom of the heat sink.
b. Align and place the heat sink on top of the microprocessor.
Note: Locate the slot in the channel of the heat sink. Orientate the heat sink
so the slot will be at the rear of the server.
c. Align and place the clip over the heat sin; then, snap the clip into place over
the heat sink with the heat sink release lever in the up position.
Note: If you remove the microprocessor later, remember to install the
terminator card in the appropriate microprocessor connector.
d. Press the heat sink release lever down into the locked position once the clip is
in place.
8. Replace the clear shield, then go to “Installing the cover” on page 61.
Note: It is very important to replace the clear shield.
9. Start the server and run the Configuration/Setup Utility program.
Removing a microprocessor
Do the following to remove a microprocessor:
Note: Do not use any tools when removing the microprocessor.
Attention: When you handle Electrostatic Discharge-Sensitive devices (ESD), take
precautions to avoid damage from static electricity. For details on handling these
devices, refer to “Handling electrostatic discharge-sensitive devices” on page 110.
1. Review the safety precautions listed in “Safety information” on page 107.
2. Turn off the server and peripheral devices and disconnect the power cord and all
external cables; then remove the cover (see “Removing the cover” on page 44 for
details).
3. Remove the clear shield from the server and store it in a safe place.
4. To remove microprocessor #2:
a. Remove the clip from the heat sink by pushing forward on the back of the clip
and up on the lever. After the clip releases from the heat sink, lift it up and off
the heat sink.
Note: A thermal material is used between the heatsink and the processor.
This material, when heated and cooled, causes the heatsink to adhere
to the processor. Some force may be required to remove the heatsink.
b. Firmly grasp the heat sink and lift it off the microprocessor.
Attention: Do not use excessive force or tools to remove the heatsink.
c. Discard the used heatsink.
d. Lift up the release lever and remove the microprocessor from the connector.
Store the microprocessor in a static-protective bag for possible future use.
Note: If you are installing a new microprocessor, go to “Installing the
microprocessor” on page 56.
If you are not replacing the microprocessor , then you must reinstall the
terminator card. Push the release latch down to lock the terminator
card into place.
Chapter 5. In st alling options 57
Page 66

Note: It is very important to replace the clear shield.
Slot
Top view of
heatsink
Terminator card
Heatsink release
lever
Clip
Heatsink
Microprocessor
5. To remove microprocessor #1:
a. Remove the adapter board retainer latch:
1) Lift up on the release latch.
2) Remove the screws and put them in a safe place.
3) Lif t the retainer latch up and off the system board.
b. Follow steps a on page 57 through d on page 57.
c. After the replacement microprocessor, reinstall the adapter board retainer
latch by reversing step a. above.
Note: If a terminator card is being installed in microprocessor slot #1, it is
not necessary to replace the adapter retainer latch.
58 Hardware Maintenance Manual: xSeries 330
Page 67

Slot
Heatsink release
lever
Clip
Heatsink
Top view of
heatsink
Terminator card
Fan assembly replacement
The server comes with six replaceable fans.
Attention: Replace a fan that has failed within 48 hours to help ensure proper
cooling.
Microprocessor
Retainer clip
The following illustration shows the replacement of a fan.
Note: The illustrations in this document might differ slightly from your hardware.
Air flow
Complete the following steps to replace the fan assembly:
Chapter 5. In st alling options 59
Page 68

1. Review the safety precautions listed in “Safety information” on page 107.
2. Turn off the server and peripherals; disconnect cables and cords.
3. Remove the cover. See “Removing the cover” on page 44 for details.
4. Determine which fan to replace by checking the LED at each fan; a lit LED
indicates the fan to replace. See “Identifying problems using status LEDs” on
page 13.
Note: The fan LEDs are illuminated by the light path d iagnostic circuit, and will
remain lit for up to 12 hours after the AC power has been removed from
the server.
5. Remove the fan from the server:
a. Disconnect the fan cable from the system board.
b. Lift the fan away from the server.
6. In stall the replacement fan:
a. Orientate the fan so that the air flow arrow on the side of the fan is facing or
pointing toward the rear of the server.
Note: Proper air flow is from the front to the rear of the server.
b. Push the replacement fan assembly into the server until it clicks into place.
c. Connect the fan cable to the system board.
d. If the FAN LED is lit, reseat the fan.
7. In stall the co ver (see “Installing the cover” on page 61).
8. Start up the system , the system error light will either remain on or turn off. If the
system error light remains on you will have to turn off the server to perform
further troubleshooting.
60 Hardware Maintenance Manual: xSeries 330
Page 69

Installing the cover
The following information describes the cover installation procedure.
To install the server cover:
1. Clear any cables that might impede the replacement of the clear shield or the
2. Install the clear shield, if it was removed.
3. Inst all the cover by placing it into position and sliding it forward. Make sure the
4. Ins t all the screws and secure the cover as show n.
5. Reinstall the server in the rack (see “Rack installatio n” on page 43).
6. Reconnect the power cord and all external cables to the server, then plug the
Screws
cover.
Note: Thermal considerations require that the clear shield be ins talled before
operating the server.
cover engages the tabs at the front and rear of the server.
Attention: Before sliding the cover forward make sure that all of the tabs on the
cover will engage the ledge at the front of the server properly . If all of the tabs do
not engage the ledge properly, it will be extremely difficult to remove the cover.
power cords into electrical outlets.
I/O connector locations and ports
The following illustration shows the input/output connectors (por ts) and the
expansion slots on the rear of the server. For pin assignments and other details about
these connectors, see “Input/Output ports” on page 62.
Chapter 5. In st alling options 61
Page 70
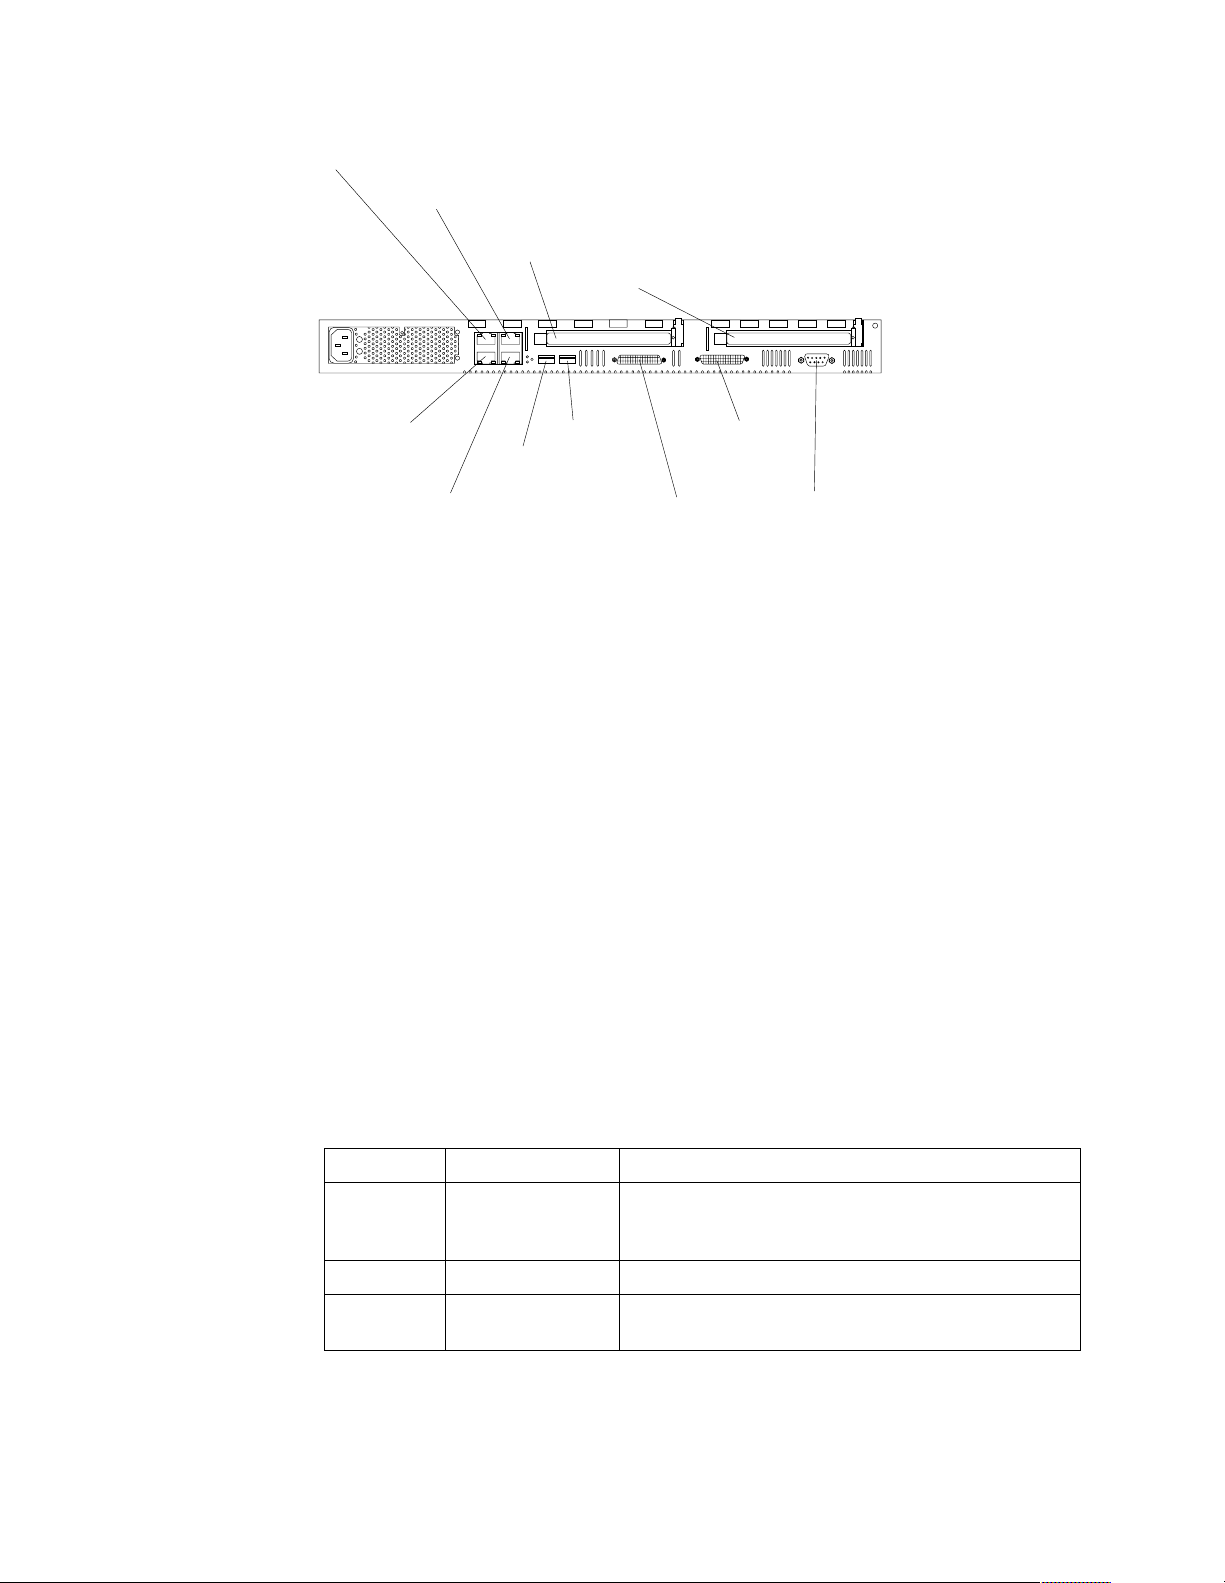
Ethernet 1
RS-485 (Advanced
System Management
Interconnect) A
Ethernet 2
RS-485 (Advanced
System Management
Interconnect) B
Input/Output ports
This section provides information about the input/output (I/O) ports on the server.
These ports include the following:
• Cable Chaining Technology (C2T) ports
• Serial port
• Universal Serial Bus (USB) ports
• Ethernet ports
• Advanced System Management (ASM) ports
PCI slot 1
USB 1
USB 2
PCI slot 2
C2T in
C2T out
Serial port
Serial port
Your server has one standard serial port. Some application programs require specific
ports, and some modems function properly only at certain communication port
addresses. Y ou might need to use the Configuration/Setup Utility program to change
communication port address assignments to prevent or resolve address conflicts. This
serial port is also manually configurable from inside of the server. The following table
lists the function of each of the connecto r s which can be used to manually configure
the serial port. You will also need to refer to the figure in “System board options
connectors” on page 40.
Connectors Port Description
J52 Serial A / Systems
Management Port
J51 Serial Port B Used by OS only.
J53 Management Port Used by Advanced System Management Processor to
Viewing or changing the serial-port assignments: To view or change the serial-port
assignments:
1. Restart the server and watch the monitor screen.
Default connection. Used by OS and Advanced System
Management Processor. Modem can be connected so
that the system can dial out during problems.
utilize modem dial up functions.
62 Hardware Maintenance Manual: xSeries 330
Page 71

2. When the message Press F1 for Configuration/Setup appears, press F1.
3. From the main menu, select Devices and I/O Ports; then, press Enter.
Note: The Devices and I/O Ports choice appears only on the full configuration
menu. If you set two levels of passwords, you mus t enter the
administrator password to access the full configuration menu.
4. Select the serial port; then, use the arrow keys to advance through the settings
available.
5. Select Save Settings; then, select Exit Setup to exit from the Configuration/Setup
Utility main menu.
Serial-port connector: The following table shows the pin-number assignments for
the 9-pin, male D-shell serial-port connector on the rear of the server. These pinnumber assignments conform to the industry standard.
1
69
5
Table 10. Serial-port connectors pin-number assignments.
Pin Signal Pin Signal
1 Data carrier detect 6 Data set ready
2 Receive data 7 Request to send
3 Transmit data 8 Clear to send
4 Data terminal ready 9 Ring indicator
5 Signal ground
Universal Serial Bus ports
Your server has two Universal Seria l Bus (USB) ports, which configure automatically.
USB is an emerging serial interface standard for telephony and multimedia devices. It
uses Plug and Play technology to determine the type of device attached to the
connector.
Notes:
1. If you attach a sta ndard (non-USB) keybo ard to the keyboard connector, the USB
ports and devices will be disabled during the power-on self-test (POST).
2. If you install a USB keyboard that has a mouse port, the USB keyboard emulates a
mouse and you will not be able to disable the mouse settings in the
Configuration/Setup Utility program.
USB cables and hubs: You need a 4-pin cable to connect devices to USB 1 or USB 2. If
you plan to attach more than two USB devices, you must use a hub to connect th e
devices. The hub provides multiple connectors for attaching additional external USB
devices.
USB technology provides up to 12 megabits-per-second (Mbps) speed with a
maximum of 127 external devices and a maximum signal distance of five meters (16
ft.) per segment.
USB-port connectors: Each USB port has an external connector on the rear of the
server for attaching USB compatible devices.
Chapter 5. In st alling options 63
Page 72

The following table shows the pin-number assignments for the USB-port connectors
on the rear of the server.
Table 11. USB-port connector pin-numb er ass ignments.
Pin Signal
1VCC
2-Data
3+Data
4Ground
Cable Chaining Technology (C2T) ports
There are two C2T ports on the rear of the server. (They are labeled IN and OUT.)
These ports, in conjunction with the C2T Chaining and the C2T breakout cables, are
used to connect in a chain a maximum of 42 servers, allowing them to share a single
video monitor, mouse, and keyboard.
Note: For best results, the highest video resolution that should be used with the C2T
chain is 1024 x 768.
Connect the C2T breakout cable to the C2T OUT port of server 1. Server 1 is usually
the server at the bottom of the rack. Connect the white connector of a C2T chaining
cable to the C2T IN port of server 1. Connect the black connector of the C2T chaining
cable to the C2T OUT port of the server above it. Refer to the following illustration
for additional information. Repeat steps B and C for the other servers until all are
connected together.
Note: The C2T breakout cables are available in the C2T cable option kit.
4
In
In Out
In
In
Video
Out
3
2
Out
1
Out
Mouse
Keyboard
64 Hardware Maintenance Manual: xSeries 330
Page 73
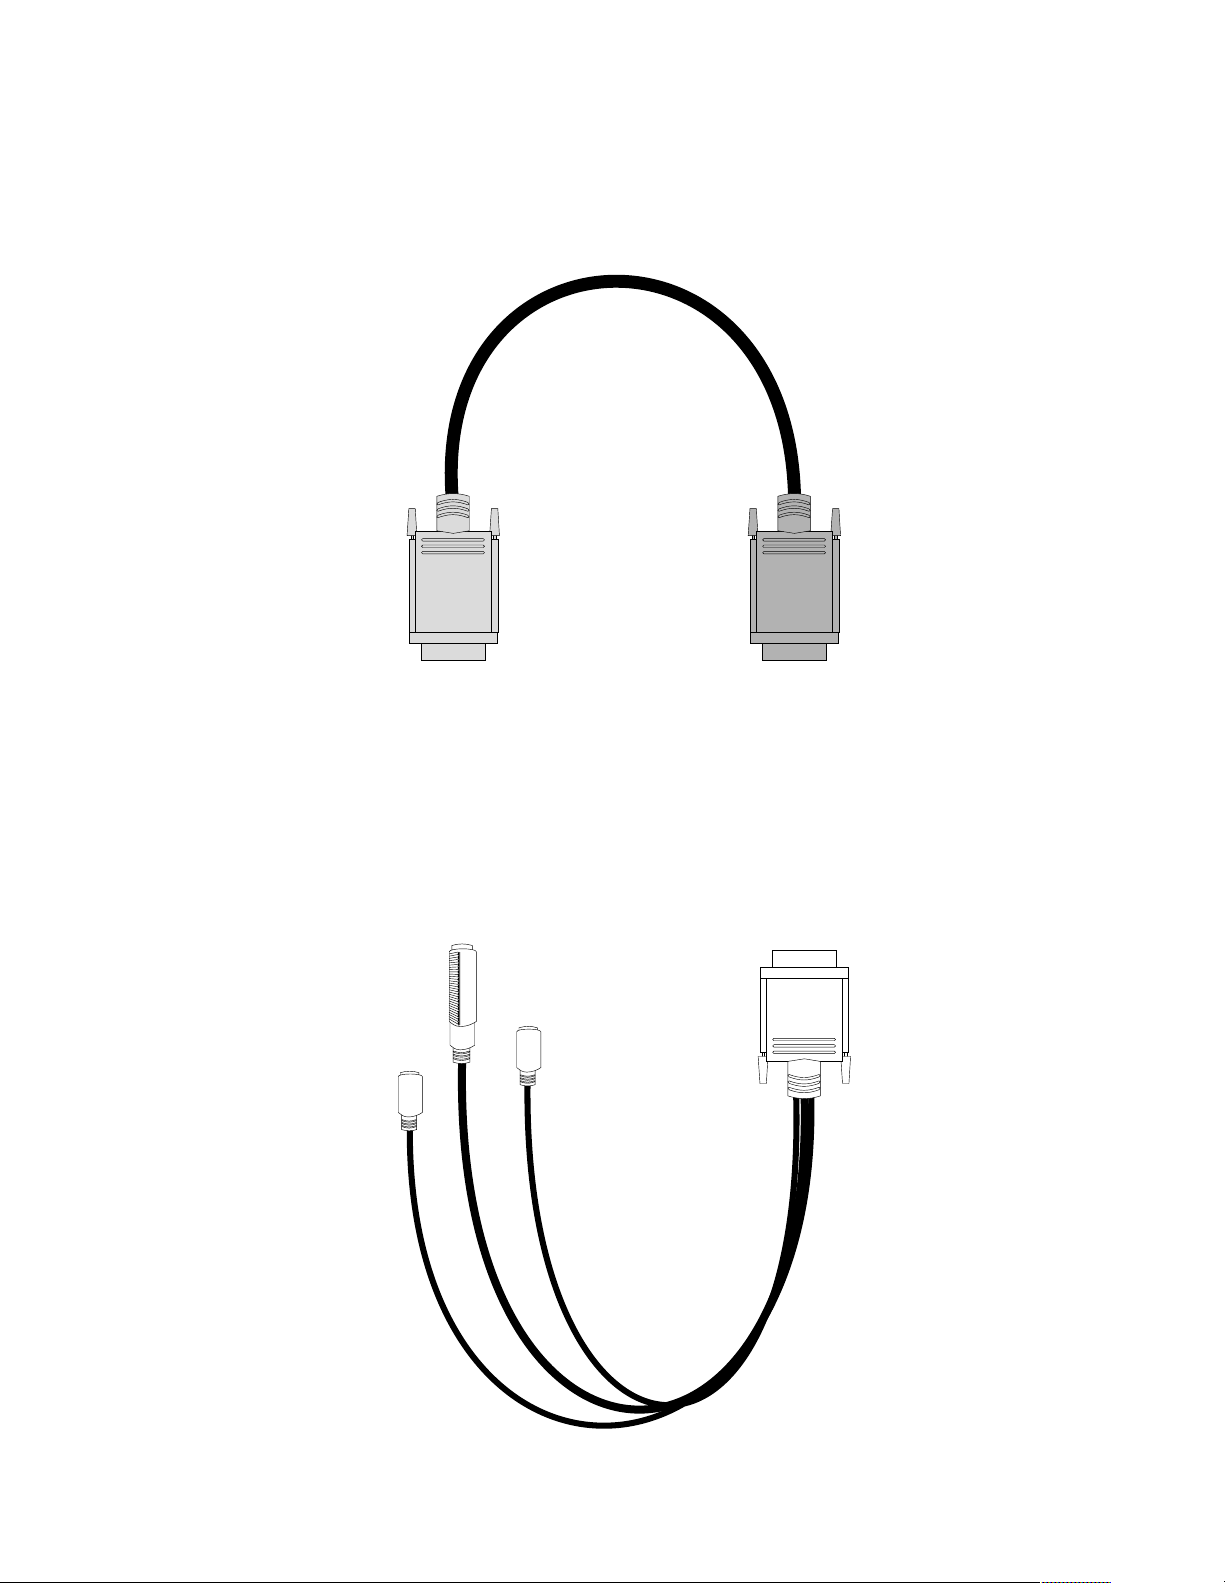
C2T chaining cable
The C2T Chaining cable is designed to prevent the accidental connection of two OUT
connectors with physically different connector shells and different color connector
covers (Black = OUT, White = IN).
C2T breakout cable
A keyboard, monitor, and mouse or pointing device are connected to the server
through the device breakout cable. The keyboard and mouse cables have icons of a
keyboard and a mouse on their respective cable connectors for easy identification.
Chapter 5. In st alling options 65
Page 74

Keyboard connector: There is one keyboard connector on the end of the device
breakout cable. This connector is identified by the keyboard icon.
Note: If you attach a standard (non-USB) keyboard to the keyboard connector, the
USB ports and devices will be disabled during the power-on self-test (POST).
The following table shows the pin-number a ssignments for the keyboard connector
on the end of the cable.
6
4
2
5
3
1
Table 12. Keyboard-connector (6-pin female) number assignments .
Pin I/O Signal
1 I/O Data
2N/AReserved
3N/AGround
4N/A+5 V dc
5I/OKeyboard clock
6N/AReserved
Video connector: The following table shows the pin-number assignments for the 15pin analog video connector on the end of the C2T device breakout cable. This cable is
not labeled but is easily identified by the dark blue 15-pin connector.
5
1
1115
Table 13. Video-connector (15-pin female) number assignments.
Pin Signal Pin Signal Pin Signal
1 Red 6 Ground 11 Not connected
2 Green or monochrome 7 Ground 12 DDC SDA
3 Blue 8 Ground 13 Horizontal synchronization
(Hsync)
4Not connected 9+5 V dc
DDC
5 Ground 10 Ground 15 DDC SCL
14 Vertical synchronization (Vsync)
Auxiliary-device (pointing device) connector: On the end of the C2T device
breakout cable, there is one auxiliary-device connector that supports a mouse or other
pointing device. This connector is identified by the mouse icon.
66 Hardware Maintenance Manual: xSeries 330
Page 75
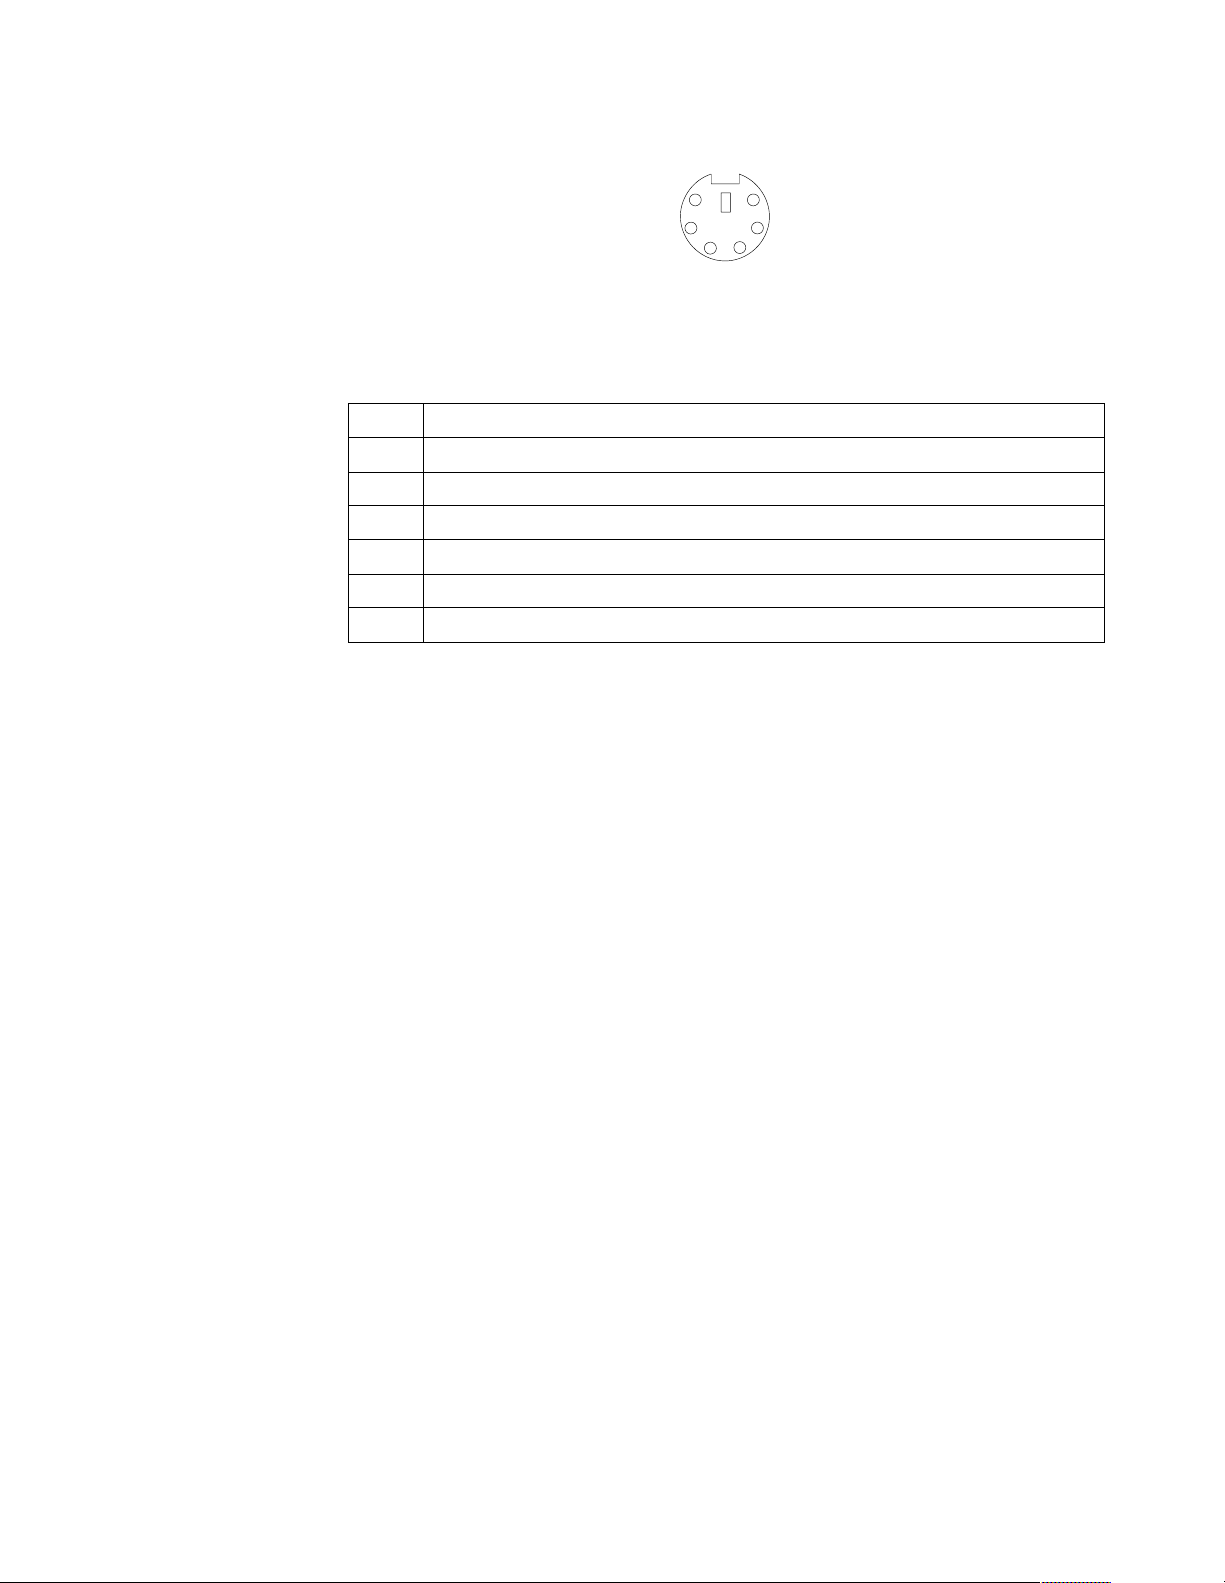
The following table shows the pin-number assignments for the auxiliary-device
connector on the end of the cable.
6
4
2
5
3
1
Table 14. Auxiliary or pointing-device-connector (6 pin female) number assignments .
Pin Signal
1Data
2Not connected
3Ground
4+5 V dc
5Clock
6Not connected
Ethernet ports
The server comes with two integrated Ethernet controllers. This controller provides
an interface for connecting to 10-Mbps or 100-Mbps networks and provides fullduplex (FDX) capability, which enables simulta neous transmission and reception of
data on the Ethernet local area network (LAN).
To access the Ethernet port, connect a Category 3, 4 or 5 unshielded twisted-pair
(UTP) cable to the RJ-45 connector on the rear of the server.
Note: The 100BASE-TX Fast Ethernet standard requires that the cabling in the
network be Category 5 or higher.
Configuring the Ethernet controller: When you connect the server to the network,
the Ethernet controller for that Ethernet port automatically detects the data-transfer
rate (10 Mbps or 100 Mbps) on the network and then sets the controller to operate at
the appropriate rate. In addition, if the Ethernet port that the server is connected to
supports auto-negotiation, the Ethernet controller will set the appropriate duplex
state. That is, the Ethernet controller w ill adjust to the network data rate, whethe r the
data rate is standard Ethernet (10BASE-T), Fast Ethernet (100BASE-TX), half duplex
(HDX), or full duplex (FDX). The controller supports half-duplex (HDX) and fullduplex (FDX) modes at both speeds.
The Ethernet controller is a PCI Plug and Play device. You do not need to set any
jumpers or configure the controller for your operating system before you use the
Ethernet controller. However, you must install a device driver to enable your
operating system to address the Ethernet controllers. The device drivers ar e provided
on the ServerGuide CDs.
Failover for redundant Ethernet: The IBM Netfinity 10/100 Ethernet Adapter or the
IBM 10/100 Etherjet PCI family of adapters are optional redundant network interface
cards (NIC adapter) that you can install in your server. If you install this NIC adapter
and connect it to the same logical segment as the primary Ethernet controller, you can
configure the server to support a failover function. You can configure either the
integrated Ethernet controller or the NIC adapter as the primary Ethernet controller.
In failover mode, if the primary Ethernet controller detects a link failu re, all Ethernet
Chapter 5. In st alling options 67
Page 76

traffic associated with it is switched to the redundant (secondary) controller. This
switching occurs without any user intervention . When the primary link is restored to
an operational state, the Ethernet traffic switches back to the primary Ethernet
controller.
High Performance Ethernet Modes: Your Ethernet controller supports optional
modes, such as teaming, priority packets, and virtual LANs, which provide higher
performance and throughput for your server.
Teaming Mode: Your Ethernet controller provides options, called teaming options.
These options increase throughput and fault tolerance when running with Windows
NT 4.0 or NetWare 4.1x or later.
• Adapter fault tolerance (AFT) provides automatic redundancy for your adapter.
If the primary adapter fails, the secondary adapter takes ov er. Adapter fault
tolerance supports from 2 to 4 adapters per team.
• Adaptive load balancing ( ALB) allows you to balance the transmission data flow
among 2 to 4 adapters. ALB also includes the AFT option. You can use ALB with
any 100BASE-TX switch.
• Cisco Fast EtherChannel (FEC) creates a team of 2 to 4 adapters to increase
transmission and reception thoughput. FEC also includes the AFT option. You
can only use FEC with a switch tha t has FEC capability.
Teaming requires you to use both of the integrated Ethernet controllers. For
additional information about the teaming modes, refer to the docum e ntation that
comes with these additional adapters.
Priority Packet Mode: Priority Packet is a traffic-prioritization utility that enables you
to set up filters to process high-priority traffic before normal traffic. You can send
information from critical nodes or applications with an indicated priority. Because
you set this priority at the host or entry point of the network, the network devices can
base forwarding decisions on priority information defined in the packet.
Priority Packet information is available on the IBM Networking Web site at:
http://www.ibm.com/networking/support
Priority Packet prioritizes traffic based on priority filters. These are parameters you
assign to outgoing (transmit) packets. Using the Priority Filter Wizard, you can set up
predefined or custom priority filters based on a node (MAC) address, Ethernet type,
or by various properties of the protocol and port. Priority Packet provides two
different methods for prioritizing traffic: IEEE 802.1p tagging and High Priority
Queue.
IEEE 802.1p is a new IEEE standard for tagging, or adding additional bytes of
information to packets with different priority levels. Packets are tagged with 4
additional bytes, which increase the packet size and indicate a priority level. When
you send these packets out on the network, the higher priority packets are transferred
first. Priority packet tagging (also known as Traffic Class Expediting) allows the
adapter to work with other elements of the network (such as switches and routers) to
deliver priority packets first. You can assign specific priority levels from 0 (low) to 7
(high).
Y ou can assign values to packets based on their priority when you use the IEEE 802.1p
standard for packet tagging. This method requires a network infrastructure that
supports packet tagging. The routing devices receiving and transferring these packets
on your network must support 802 . 1p f or ta gging to be effective.
After you set up the priority filter in Priority Packet, you must launch IBMSet and
select 802.1p/802.1Q Tagging on the Advanced tab.
68 Hardware Maintenance Manual: xSeries 330
Page 77

Note: IEEE 802.1p tagging increases the size of the packets it tags. Some hubs and
switches will not recognize the larger packets and will drop them. Check your
hub or switch documentation to see if they support 802.1p. (You can configure
the switch to strip the tags from the packets and send it on to the next
destination as normal traffic.) If these devices do not support 802.1p or if you
are not sure, use High Priority Queue (HPQ) to prioritize network traffic.
The requirements for effectively using IEEE 802.1p tagging are:
• The other devices receiving and routing 802.1p tagged packets must support
802.1p.
• The adapters on these devices must support 802.1p. The Ethernet controller in all
IBM Netfinity 10/100 Ethernet Security Adapters and IBM 10/100 Ethernet
Server Adapters support 802.1p.
• The adapter cannot be assigned to an adapter team.
• If you are setting up VLANs and packet tagging on the same adapter,
802.1p/802.1Q Tagging must be enabled on the IBMSet Advanced tab.
If your network infrastructure devices do not support IEEE 802.1p or you ar e not sur e,
you can still define filters and send packets as high priority. While High Priority
Queue (HPQ) does not provide the precise priority levels of 802.1p tagging, it does
assign traffic as either high or low priority and sends high priority packets first.
Therefore, if there are multiple applications on a system sending packets, the packets
from the application with a filter are sent out first. HPQ does not change network
routing, nor does it add any information to the packets.
To assign HPQ, you can specify it using Priority Packet when you create or assign a
filter.
To effectively use HPQ tagging, the adapter cannot be assigned to an adapter team.
V i r tual LAN Mode: A virtual LAN (VLAN) is a logical grouping of networ k d evices
put together as a LAN, regardless of their physical grouping or collision domains.
Using VLANs increases network performance and improves networ k security.
VLANs offer you the ability to group users and devices together into logical
workgroups. This can simplify network administration when connecting clients to
servers that are geographically dispersed across the building, campus, or enterprise
network.
Normally, VLANs are configured at the switch and any computer can be a m ember of
one VLAN per installed network adapter. Your Ethernet controller supersedes this by
communicating directly with the switch, al lowing multiple VLANs on a single
network adapter (up to 64 VLANs).
To set up VLAN membership, your Ethernet controller must be attached to a switch
that has VLAN capability. You also need to use Windows NT 4.0 or later, or Novell
NetWare 4.1x or later.
Notes:
1. Windows NT versions prior to 4.0 do not support VLANs.
2. VLANs require NT 4.0 with Service Pack 3.0 and the NDIS driver hotfix from
Microsoft.
3. In Windows NT, VLANs cannot be implemented on controllers that have been
configured for teaming options. NetWare can support teaming options and
VLANs on the same adapters.
To join a VLAN from Windows NT 4.0:
Chapter 5. In st alling options 69
Page 78

1. Create a VLAN on the switch. Use the parameters you assign there to join the
VLAN from the server. Refer to your switch documentation for more
information.
2. Double- c lick the Network icon in the Control Panel window.
3. On the Adapters tab, select the adapter you want to be on the VLAN and select
Properties.
4. In IBMSet, select Join VL AN. Note that VLANs cannot be assigned to adapters
that are already defined to have an adapter teaming option.
5. Enter the VLAN ID and VLAN name. The VLAN ID must match the VLAN ID of
the switch. The ID range is from 1 to 1000. The VLAN name is for information
only and does not need to match the name on the switch.
6. Select Join VLAN. Repeat steps 3 through 5 for each VLAN you want the server
to join. The VLANs you add are listed on the Adapters tab.
7. Select Close and restart the computer.
Ethernet port connector: The following table shows the pin-number assignments for
the RJ-45 connector. These assignments apply to both 10BASE-T and 100BASE-TX
devices.
Table 15. Ethernet RJ-45 connector pin-number ass ig nme nts..
Pin Signal Pin Signal
1 Transmit data+ 5 Not connected
2 Transmit data- 6 Receive data 3 Receive data+ 7 Not connected
4 Not connected 8 Not connected
Advanced System Management ports
There are two kinds of Advanced System Management ports: a Management port
(Serial port A), and RS-485 ports.
Management Port (Serial port A)
This port uses a standard D-shell serial-port connector, labeled A on the rear of the
server. You can attach a dedicated modem to the D-shell connector on the rear of the
server to communicate with the integrated Advanced System Management Processor .
For more in formatio n see “Serial port” on page 62.
RS-485 ports
The RS-485 ports on the rear of the server enable you to connect the Advanced System
Management Processors of several rack-mounted servers so that the y can
communicate with each other in half-duplex mode.
70 Hardware Maintenance Manual: xSeries 330
Page 79

Working with cables
The server ha s two dif fer e nt cabl ing sc heme s, the Adv anced System Manag ement bus
(ASM) and the Cable Chaining Technology (C2T). The following sections discuss
each of these options. While reading about these options, keep in mind that they are
independent of each other.
Note: Refer to the following illustration to locate the connectors on the back of your
The ASM connectors on the back of the server are referred to in this book as RS-485
(A) and RS-485 (B).
Note: The illustrations in this docume nt might differ slightly from your hardware.
server.
Ethernet 1
RS-485 (Advanced
System Management
Interconnect) A
PCI slot 1
Ethernet 2
USB 1
RS-485 (Advanced
System Management
Interconnect) B
Cabling the RS-485 ports
You can use the RS-485 connectors to create an Advanced System Management bus
between several xSeries 330 servers.
Before you begin, review the following:
USB 2
PCI slot 2
C2T in
C2T out
Serial port
Important: The Advanced System Management bus is designed to support up to 12
units or servers. However, when using the Advanced System Management PCI
adapter, the bus uses the PCI adapter as another unit. In this case, you can connect a
maximum of 11 units or servers together.
• You can hot-swap the cables in the Advanced System Management bus.
• You can connect up t o 12 uni ts t o ge ther i f you are using seri al (m an agemen t ) po rt
A as your Advanced System Management port.
• When connecting an xSeries 330 server to another server type you must install an
Advanced System Management adapter into PCI slot 1 or use the serial port as
your Advanced System Management port.
• When the Advanced System Management PCI adapter is added to the xSeries
330, you can connect up to 11 additional servers together.
• Use standard Ethernet cables with RJ-14 connectors.
Chapter 5. In st alling options 71
Page 80

Eth
Note: For more information about the Advanced System Management PCI adapter
refer to the documentation that came with the adapter.
Connecting the ASM bus
The servers in the Advanced System Management bus are referenced by their
assigned addresses and not their position in the rack.
Complete the following steps to connect the ASM bus:
1. Turn off the servers.
2. Locate the RS-485 ports on the rear of the server and an Ethernet cable with RJ-14
connectors on both ends.
3. Connect one end of the cable to the RS-485 (A) port.
4. Connect the other end of the cable to the RS-485 (B) port on the next server.
ernet cable
with RJ-14 connectors
RS-485(A)
RS-485(B)
RS-485(B)
RS-485(B)
RS-485(A)
RS-485(A)
5. Repeat steps 3 and 4 to connect up to 12 units together.
Connecting the servers with a C2T chain
To share the same monitor, keyboard, and pointing device with several servers you
must connect the ser v ers together with Cable Chaining Technology (C2T) chaining
cables using the C2T IN and C2T OUT ports.
Before you begin review the following:
• The supported maximum number of servers connected in a single chain with C2T
chaining cables is 42.
• When connecting servers across a gap that is larger than 3U or located on two
separate racks you must use a C2T chaining cable that is 2 meters (6.5 ft.) long,
which is available in the C2T cable option kit.
Note: Only one 2-m (6.5 ft.) long cable can be used in the C2T chain.
• The C2T interconnect cables can be hot-swapped.
Attention: For optimum results, do not touch the chassis with the pins of the C2T
cable connector when hot adding or removing systems from the chain.
• Servers are numbered by their position in the chain (1 through nn). If one server
is removed from the chain, all successive servers are renumber ed. For example, if
the twelfth server is removed from a chain of 15 servers, then servers 13 through
15 will then be renumbered to 12 through 14.
72 Hardware Maintenance Manual: xSeries 330
Page 81

• The C2T numbering is independent of any other server reference. Changing the
servers position in the C2T chain will not effect their IP addresses.
Note:
Operational notes:
1. Server 1 (usually th e server at the botto m of the rack) is the server to which you
connect the C2T device break out cable.
2. Server 1 must not be turned off (powered down) for the chain to work properly.
3. If server 1 is turned off (powered down) it must be removed from the chain and
replaced by the next server in the chain.
4. For the chain to operate properly no more than two adjacent servers can be
unplugged from the wall outlet at the same time.
5. If you are using a fla t p an e l monitor, you might need to adjust the image lock on
your monitor when multiple servers are connected using C2T interconnect cables.
To adjust this image, select one of the middle servers in the chain by pressing the
select button on the front of the server; then, adjust the image lock accordingly.
For more information on how to adjust the image lock, refer to the documentation
that came with your flat panel monitor.
6. When removing or replacing servers, or changing cables in the chain, it is possible
for more than one select LED to be illuminated on the servers in the chain. To
clear all but the selected server LED, press the select button on any one of the
servers in the chain.
7. If you turn off a selected server you must select another server that is powered up.
For the location of the select button see “Server controls and indicators” on page
6.
8. For your C2T chain to work properly with your operating-system, enable or
disable the settings as shown in the following table.
Table 16. C2T Configuration /Se tup set tin gs..
OS USB Legacy Keyboardless Operation
Win NT 4.0 Disabled Enabled
Win 2000 Enabled Enabled
Redhat Linux Disabled Enabled
Complete the following steps to connect the servers:
1. Gather several of the C2T cables.
Note: The server comes with a short C2T chaining cable that can span
approximately 3 Us if needed. A longer C2T cable is available in the C2T
cable option kit.
2. Connect the servers together:
a. Connect the C2T breakout cable to the C2T OUT port of server 1.
Note: Server 1 is usually the server at the bottom of the rack.
b. Connect the white connector of a C2T chaining cable to the C2T IN port of
server 1.
c. Connect the black connector of the C2T chaining cable to the C2T OUT port of
the server above it. Refer to the following illustration for additional
information.
d. Repeat steps b. and c. for the other servers until all are connected together.
Chapter 5. In st alling options 73
Page 82
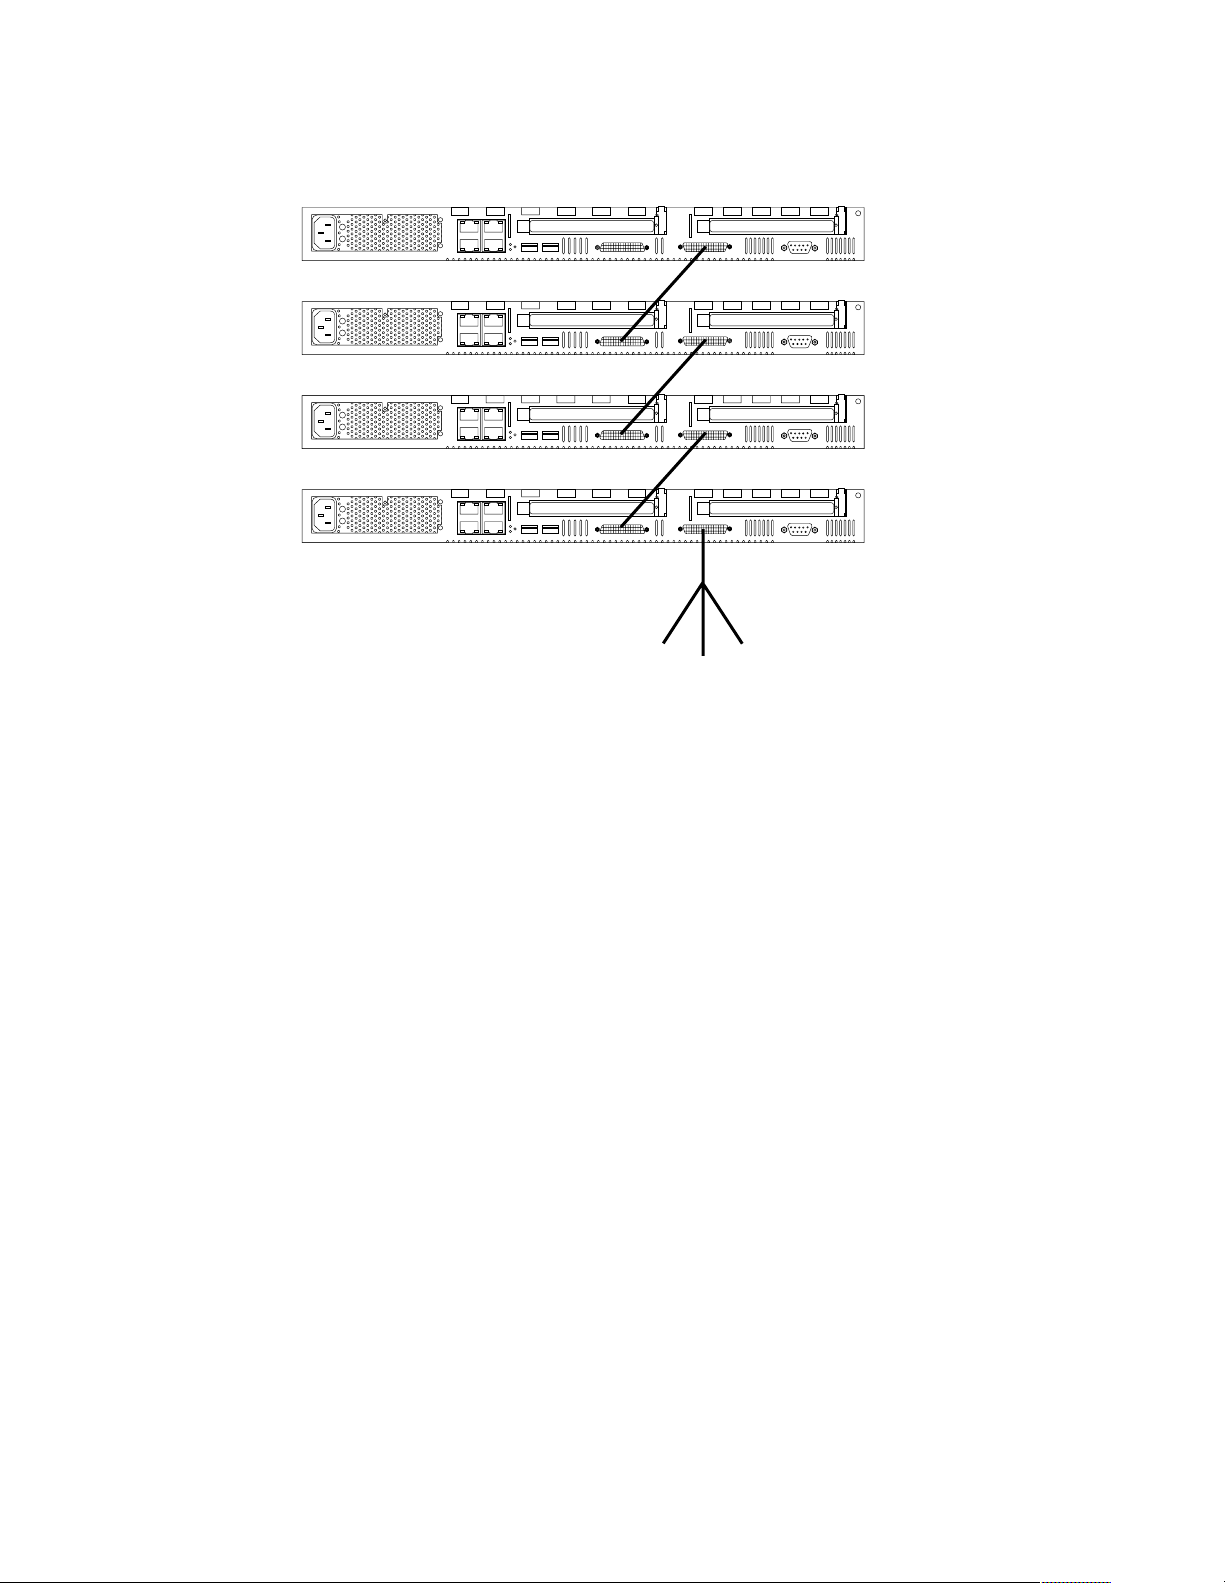
3. Turn the servers on and check the operation of the monitor, pointing device, and
keyboard with each server. (See “Testing the C2T chain” for testing in stru ctions).
4
In
In Out
In
In
Video
Out
3
2
Out
1
Out
Mouse
Keyboard
Note: Write-on adhesive labels have been provided so that you can label the servers
position in the rack.
Testing the C2T chain
If the monitor, keyboard and mouse are known to be good, the only verification
needed to be performed after connecting the C2T chain is the verification of the
connections of the servers in the chain.
Follow these steps to test the C2T cabling:
1. Turn on all the servers and the monitor, verify that the light in the select button
on server 1 in the C2T chain is lighted indicating it is selected. If it is not, press the
select button.
2. Verify that the monitor is working.
3. Boot an operating system that has a mouse or pointing device driver. Verify the
functionality of the mouse or pointing device.
4. Test your keyboard by typing a few words within an application.
5. Use your keyboard to switch to the last server in the chain. For example, if there
are 42 servers in the chain: Press NumLock twice, press 4, press 2, press Enter.
The monitor screen should go blank after the second NumLock, then become
active again after the Enter is pressed showing the screen output of the selected
server. Verify the keyboard and mouse functionality. If successful, the C2T chain
is tested.
Note: If you were unable to perform steps 2 through 4, verify that the C2T breakout
cable is properly connected to the C2T OUT port of server 1. Retry the test
steps 2 through 4. If the problem persists, disconnect the C2T chaining cable
from the C2T IN port of server 1. Retry the test. If the problem persists, the
problem is due to either a faulty breakout cable or a faulty server. If the
problem ceased to exist after the chaining cable was disconnected, the problem
is probably caused by an anomaly in the chain. A procedure that could be
74 Hardware Maintenance Manual: xSeries 330
Page 83

used to identify the failing node (cable or system) consists of reconnecting the
chain a node at a time until the failing node is isolated.
Cable management
Use the cable ties and hook-and-loop straps that are supplied with your server to
secure the cables.
Note: Do not secure cables too tightly. Over tightening can cause internal damage to
cables.
Chapter 5. In st alling options 75
Page 84

76 Hardware Maintenance Manual: xSeries 330
Page 85

Chapter 6. FRU information (service only)
Field Replacement Units (FRUs) should be replaced by qualified service personnel
only.
Note: Read“Safety informatio n” on page 107 and “Before you begin” on page 42.
Diskette/CD-ROM drives
To remove the diskette/CD-ROM drive:
1. Power off the server.
2. Remove the cover. See “Removing the cover” on page 44.
3. Disconnect the cables for the floppy disk drive and the CD-ROM drive from the
system board.
4. Remove the fans. See “Fan assembly replacement” on page 59.
5. Remove the screws.
6. Gently pull back and up to remove the drives from the chassis.
© Copyright IBM Corp. 2000 77
Page 86

Diskette/CD-ROM drive bracket
Slim adapter board
Diskette drive
retaining wire
Metal tab
CD-ROM drive
retaining wire
Diskette drive
Bracket
CD-ROM drive
To remove the diskette/CD-ROM drive bracket:
Note: Read“Safety informatio n” on page 107 and “Before you begin” on page 42.
1. Remove the diskette/CD-ROM drive. See “Diskette/CD-ROM drives” on page
77.
2. Remove the diskette drive:
a. Remove th e di skette d r ive retaining wire by releasing it from the metal tab
and removing it from the holes, and put it in a safe place.
b. Lift the diskette drive up on one side until it will separates from the bracket.
c. Diskette drive cable:
1) The diskette drive cable is removed by gently pulling the cable up until it
is released from the connector.
2) To replace the diskette drive cable, pull up on the connector latch until it
is unlocked; then, insert the end of the cable into the connector and gently
push down on the connector latch until it clicks into place.
3. Remove the CD-ROM drive:
a. Remove the CD-ROM drive retaining wire by releasing it from the metal tab
and removing it from the holes, and put it in a safe place.
b. Gently loosen the connector of the slim adapter board from the CD-ROM
drive connector until it pulls free; slide the slim adapter board down until it
clears the notches on the bracket and remove it.
c. Slide the bracket toward the rear and remove it.
78 Hardware Maintenance Manual: xSeries 330
Page 87

Hard disk drive bac kplane
To remove the hard disk drive backplane:
Note: Read“Safety informatio n” on page 107 and “Before you begin” on page 42.
1. Power off the server.
2. Remove the cover. See “Removing the cover” on page 44.
3. Disconnect the backplane cable from the system board.
4. Pull out the hard drives in order to disconnect them from the backplane.
5. Remove the screw from the top of the backplane bracket.
6. Gently but firmly lift the backplane bracket and board up from the chassis.
Power supply
To remove the power supply:
Note: Read“Safety informatio n” on page 107 and “Before you begin” on page 42.
1. Power off the server.
Chapter 6. FRU information (serv ice on ly) 79
Page 88

PCI riser card
System board
2. Remove the cover. See “Removing the cover” on page 44.
3. Disconnect the cables that connect the power supply to the system board.
4. Remove the screws (2) from the side of the chassis.
5. Remove the screws at the back of the chassis and power supply.
6. Slide the power supply away from the side of the chassis and lift up to remove.
To remove the PCI riser card:
Note: Read“Safety informatio n” on page 107 and “Before you begin” on page 42.
1. Power off the server.
2. Remove the cover. See “Removing the cover” on page 44.
3. Remove any adapters and put them in a safe place.
4. Disconnect cables.
5. Gently lift up on the card to disconnect it from the system board port.
To remove the system board:
Note: Read“Safety informatio n” on page 107 and “Before you begin” on page 42.
1. Power off the server.
2. Remove the cover. See “Removing the cover” on page 44.
3. Disconnect all cables from the system board.
80 Hardware Maintenance Manual: xSeries 330
Page 89

4. Remove the adapter retaining latch (see “Removing a microprocessor” on page
57).
5. Remove the microprocessors. See “Removing a microprocessor” on page 57.
6. Remove the memory modules. See “Installing memory modules” on page 53.
7. Remove screws from the system board.
8. Remove the four screws from the rear of the server.
9. Pull up on the system board to remove from the chassis.
Chapter 6. FRU information (serv ice on ly) 81
Page 90

82 Hardware Maintenance Manual: xSeries 330
Page 91

Chapter 7. Symptom-to-FRU index
This index supports Netfinity 41 00R servers. The Symptom-to-FRU lists symptoms,
errors, and the possible causes. The most likely cause is listed first. Use this
Symptom-to-FRU index to help you decide which FRUs to have available when
servicing the computer.
The POST BIOS displays POST error codes and messages on the screen.
Beep symptoms
Beep symptoms are short tones or a series of short tones separated by pauses
(intervals without sound). See the following examples.
Note: One beep after successfully completing POST indicates the system is
functioning properly.
Beeps Description
1-2-3 • One beep
• A pause (or break)
• Two beeps
• A pause (or break)
• Three Beeps
4 Four continuous beeps
Beep/Symptom FRU/Action
1-1-2 (Processor register test
failed)
1-1-3 (CMOS write/read test failed) 1. Battery
1-1-4 (BIOS EEPROM checksum
failed)
1-2-1 (Programmable Interval
Timer failed)
1-2-2 (DMA initialization failed) 1. System Board
1-2-3 (DMA page register
write/read failed)
1-2-4 (RAM refresh verification
failed)
1-3-1 (1st 64K RAM test failed) 1. DIMM
1. Optional Processor (if installed)
2. Processor
2. System Board
1. DIMM
2. System Board
1. System Board
1. System Board
1. DIMM
2. System Board
2. System Board
1-3-2 (1st 64K RAM parity test
failed)
© Copyright IBM Corp. 2000 83
1. DIMM
2. System Board
Page 92

Beep/Symptom FRU/Action
2-1-1 (Secondary DMA register
failed)
2-1-2 (Primary DMA register failed) 1. System Board
2-1-3 (Primary interrupt mask
register failed)
1. System Board
1. System Board
2-1-4 (Secondary interrupt mask
register failed)
2-2-2 (Keyboard controller failed) 1. Keyboard
2-2-3 (CMOS power failure and
checksum checks failed)
2-2-4 (CMOS configuration
information validation failed)
2-3-1 (Screen initialization failed) 1. System Board
2-3-2 (Screen memory failed) 1. System Board
2-3-3 (Screen retrace failed) 1. System Board
2-3-4 (Search for video ROM failed) 1. System Board
2-4-1 (Video failed; screen believed
operable)
3-1-1 (Timer tick interrupt failed) 1. System Board
3-1-2 (Interval timer channel 2
failed)
3-1-3 (RAM test failed above
address OFFFFH))
1. System Board
2. System Board
1. Battery
2. System Board
1. Battery
2. System Board
1. System Board
1. System Board
1. DIMM
2. System Board
3-1-4 (Time-Of-Day clock failed) 1. Battery
2. System Board
3-2-1 (Serial port failed) 1. System Board
3-2-2 (Parallel port failed) 1. System Board
3-2-4 (Failure comparing CMOS
memory size against actual)
3-3-1 (Memory size mismatch
occurred; see "Memory Settings" on
page 33)
3-3-2 (Critical SMBUS error
occurred)
1. DIMM
2. System Board
3. Battery
1. DIMM Board
2. System Board
3. Battery
1. Disconnect the server power cord from outlet, wait 30 seconds and retry.
2. System Board
3. DIMMs
4. DASD Backplane
5. DASD Power Cab l e
84 Hardware Maintenance Manual: xSeries 330
Page 93

Beep/Symptom FRU/Action
3-3-3 (No operational memory in
system)
Two Short Beeps (Information only,
the configuration has changed)
Three Short Beeps 1. DIMM
One Continuous Beep 1. Processor
Repeating Short Beeps 1. Keyboard
One Long and One Short Beep 1. Video adapter (if present)
One Long and Two Short Beeps 1. Video adapter (if present)
1. Install or reseat the memory modules, then do a 3 boot reset. (See “Using
the Configuration/Setup Utility program” on page 29)
2. DIMMs
3. System Board
1. Run Diagnostics
2. Run Configuration/Setup
2. System Board
2. Optional Processor (if installed)
3. System Board
2. System Board
2. System Board
2. System Board
Two Long and Two Short Beeps 1. Video adapter
No Beep symptoms
No Beep Symptom FRU/Action
No beep after completing POST
and the system operates
correctly.
No beep and no video (System
Attention LED is OFF)
No beep and no video (System
Attention LED is ON)
1. System Board
1. See “Undetermined problems” on page 98
1. See “Information panel system error LED”
Information panel system error LED
The system error LED is turned on when an error is detected. Push the button beside
the LED display on the system board to illuminate the LEDs. If the system error LED
is on, remove the cover and check the diagnostic panel LEDs. The following is a
complete list of diagnostic panel LEDs followed by the FRU/Action for correcting the
problem. The following chart is valid only when the system error LED is on.
Note: If a diagnostic panel LED is on an d the information LED panel system error
LED is off, there is probably an LED problem. Run LED diagnostics.
Notes:
1. To locate the LEDs on the system board see “System board LEDs” on page 41.
Chapter 7. Symptom-t o-FRU index 85
Page 94

2. Check the System Erro r Log for a dditional information bef ore replacing a FRU.
3. The DIMM error LEDs, processor error LEDs, and VRM err or LEDs turn of f w hen
the system is powered down.
Diagnostic Panel LED FRU/Action
All LEDs off (Check
System Error Log for error
condition, then clear System Error
Log when the problem is found.)
CPU LED on (The LED
next to the failing CPU should be
on.)
VRM LED on 1. System Board
DASD LED on (The LED
located next to the drive bay that
the failing drive is installed in will
be turned on.)
FAN LED on 1. Check individual fan LEDs.
MEM LED on (The LED next to
the failing DIMM is on.)
PCI LED on 1. Remove PCI adapters from slots 1-2.
PS LED on 1. Power Supply
TEMP LED on (look at test cases) 1. Ambient temperature must be w ithin normal ope rating specifications. Se e
1. System Error Log is 75% full; clear the log.
2. PFA alert; check Netfinity log (Netfinity Manager or Netfinity Director) for
failure; clear PFA alert; remove AC power for at least 20 seconds, reconnect,
then power up system.
3. Run Information Panel diagnostics.
1. Processor 1 or 2.
2. System Board.
1. Failing drive.
2. Be sure the fans are operating correctly and the air flow is good.
3. SCSI Backplane.
2. Replace respective fan.
3. System Board.
1. DIMM.
2. Failing DIMM in slot J1-J4.
3. System Board
2. System Board.
2. System Board
“Features and specific ations” on page 4.
2. Ensure fans are operating correctly.
3. Examine System Error Log.
a. System over recommended temperature
b. Power switch assembly
c. DASD over recommended temperature
1) Overheating hard drive
2) DASD Backplane
3) System Board
d. System over recommended temperature for CPU X (where X is CPU
number,) (CPU LED also on)
1) CPU X
2) System Board
e. System Board over recommended temperature
1) System Board.
86 Hardware Maintenance Manual: xSeries 330
Page 95

Diagnostic err or codes
Note: In the following error codes, if XXX is 000, 195, or 197 do not replace a FRU.
The description for these error codes are:
000 The test passed.
195 The Esc key was pressed to abort the test.
197 This is a warning error and may not indicate a hardware failure.
For all error codes, replace/follow the FRU/Action indicated.
Error Code/Symptom FRU/Action
001-XXX-000 (Failed core tests) 1. System Board
001-XXX-001 (Failed core tests) 1. System Board
001-250-000 (Failed System Board
ECC)
001-250-001 (Failed Processor
Board ECC)
005-XXX-000 (Failed Video test) 1. Video adapter (if installed)
011-XXX-000 (Failed COM1 Serial
Port test)
011-XXX-001 (Failed COM2
Serial Port test)
014-XXX-000 (Failed Parallel Port
test)
015-XXX-001 (USB interface not found,
board damaged)
015-XXX-198 (USB device connected during
USB test)
020-XXX-000 (Failed PCI Interface
test)
1. System Board
1. System Board
2. System Board
1. Check loopback plug connected to externalized serial port
2. Check cable from externalized port to system board. Should connect
to Serial Port A on the system board (J52).
3. System Board
1. Check loopback plug connected to externalized serial port
2. Check cable from externalized port to system board. Should connect
to Serial Port B on the system board (J51).
3. System Board
1. System Board
1. System Board
1. Remove USB devices from USB1 an d USB2.
2. System Board
1. System Board
030-XXX-000 (Failed Internal SCSI
interface test)
035-XXX-099 1. No RAID adapters were found.
035-XXX-S99 (Failed RAID test on PCI
slot S, check System Error Log before
replacing a FRU)
035-XXX-SNN (Check System Error Log
before replacing a FRU, NN = SCSI ID of
failing fixed disk)
Chapter 7. Symptom-t o-FRU index 87
1. System Board
2. If adapter is installed re-check connection.
1. RAID Adapter
2. SCSI Backplane
3. Cable
1. Fixed Disk with SCSI ID NN on RAID adapter in PCI slot S.
Page 96

Error Code/Symptom FRU/Action
035-253-S99 (RAID adapter
initialization failure)
089-XXX-001 (Failed Microprocessor
test)
089-XXX-002 (Failed
Optional Microprocessor test)
165-XXX-000 (Failed Service Processor
test)
180-XXX-000 (Diagnostics LED failure) 1. Run Diagnostic LED test for the failing LED.
180-XXX-001 (Failed information LED
panel test)
1. ServeRAID Adapter in slot S is not configured properly. Obtain
the basic and extended configuration status and refer to the
ServeRAID Hardware Maintenance Manual for more information.
2. Cable
3. SCSI Backplane
4. Adapter
1. Microprocessor 1
2. System Board
1. Microprocessor 2
2. System Board
1. System Board
1. Switch Card / Information LED Panel
180-XXX-003 (Failed System Board LED
test)
180-XXX-005 (Failed SCSI
Backplane LED test)
201-XXX-0NN (Failed Memory test,
see "Memory Settings" on page 33)
201-XXX-999 (Multiple DIMM failure, see
error text)
202-XXX-001 (Failed System Cache
test)
202-XXX-002 (Failed System Cache test) 1. Microprocessor 2
206-XXX-000 (Failed Diskette Drive
test)
1. System Board
1. SCSI Backplane
2. SCSI Backplane Cable
3. System Board
1. DIMM Location slots 1-4 where NN = DIMM location.
Note: NN 1=DIMM 1 NN 2=DIMM 2 NN 3=DIMM 3 NN
4=DIMM 4
2. System Board
1. See error text for failing DIMMs
2. System Board
1. Microprocessor 1
2. System Board
2. System Board
1. Try test with another diskette
2. Cable
3. Diskette Drive
4. System Board
215-XXX-000 (Failed IDE CD-ROM
test)
217-XXX-000 (Failed Fixed Disk
test)
Note: If RAID is configured, the fixed
disk number refers to the RAID
logical array
1. CD-ROM Drive Cables
2. CD-ROM Drive
3. System Board
1. Fixed Disk 1
2. System Board
88 Hardware Maintenance Manual: xSeries 330
Page 97

Error Code/Symptom FRU/Action
217-XXX-001 (Failed BIOS Fixed Disk
test)
Note: If RAID is configured, the fixed
disk number refers to the RAID
logical array
1. Fixed Disk 2
2. System Board
264-XXX-0NN (Failed Tape Drive
test)
264-XXX-999 (Errors on multiple tape
drives, see error text for more info)
301-XXX-000 (Failed Keyboard test) 1. Keyboard
405-XXX-000 (Failed Ethernet test
on controller on the System Board)
405-XXX-A0N (Failed Ethernet test on
adapter in slot A)
415-XXX-000 (Failed Modem test) 1. Cable
1. Tape Cartridge, if user executed the Read/Write Tape Drive test
(failure code of XXX = 256)
2. SCSI or Power Cable connected to tape drive with SCSI ID NN.
3. Tape Drive with SCSI ID NN. (Refer to the Help and Service
Information appendix of the tape drive’s User Guide.)
4. System Board or SCS I Contr oll er. (Run SCSI Controller Diagnost ic to
determine if the SCSI bus is functioning properly.)
1. See error messages/text in the PC Doctor error log for detailed
information on each individual tape drive error.
2. System Board
1. Verify that Ethernet is not disabled in BIOS.
2. System Board
1. For A=0, system board
2. For A >0, adapter in PCI slot A
Note: Ensure modem is present and attached to server.
2. Modem
3. System Board
Error symptoms
Error Symptom FRU/Action
CD is not working properly. 1. Clean the CD.
2. Run CD-ROM diagnostics
3. CD-ROM Drive
CD-ROM drive tray is not working.
(The serve r must be powered-on)
CD-ROM drive is not recognized.1.Run Configuration/Setup, enable primary IDE channel.
1. Insert the en d o f a pa per cl ip into the man ual tray-release opening.
2. Run CD-ROM diagnostics
3. CD-ROM Drive
2. Check cables and jumpers.
3. Check for correct device driver.
4. Run CD-ROM diagnostics
5. CD-ROM Drive
6. System Board
Chapter 7. Symptom-t o-FRU index 89
Page 98

Error Symptom FRU/Action
Power switch does not work and reset
button does work. (SW 1-5 is force power-
on switch.)
1. Reseat connector
2. Switch Card
3. System Board
Diskette drive in-use light stays on, or the
system bypasses the diskette drive, or the
diskette drive does not work
Monitor problems (general). Some IBM
monitors have th eir own self-tests. If you
suspect a problem with the monitor, refer to
the information that comes with the
monitor for adjusting and testing
instructions.
No video 1. Make sure corr ect machine is sel e cted.
1. If there is a diskette in the drive, verify that:
a. The diskette drive is enabled in t he Con figu r at ion/ Se tup u t ilit y
program.
b. The diskette is good and not damaged. (Try another diskette if
you have one.)
c. The diskette is inserted correctly in the drive.
d. The diskette contains the necessary files to start the server.
e. The software program is OK.
f. Cable is installed correctly (proper orientation)
2. Run Diskette Drive Diagnostics
3. Cable
4. Diskette Drive
5. System Board
1. Monitor
2. Run Video Diagnostics. If diagnostics pass, the problem may be a
video driver.
3. Display Adapter / System Board
2. Make sure all cables are locked down.
POST error codes
In the following error codes, X can be any number or letter.
Error Code/Symptom FRU/Action
062 (Three consecutive
boot failures using the default
configuration.)
101, 102 (System and processor
error)
106 (System and processor error) 1. System Board
111 (Channel check error) 1. Failing adapter
114 (Adapter read-only memory error) 1. Failing Adapter
1. Run Configuration/Setup
2. Battery
3. System Board
4. Processor
1. System Board
2. Memory DIMM
3. System Board
2. Run Diagnostics
90 Hardware Maintenance Manual: xSeries 330
Page 99

Error Code/Symptom FRU/Action
129 (Internal cache error) 1. Processor
2. Optional Processor (if installed)
3. System Board.
151 (Real time clock error) 1. Run Diagnostics
2. Battery
3. System Board
161 (Real time clock battery error) 1. Run Configuration/Setup
2. Battery
3. System Board
162 (Device Configuration Error)
Note: Be sure to load th e defau lt settin gs
and any additional desired
settings; then, sa v e th e
configuration.
1. Run Configuration/Setup
2. Battery
3. Failing Device
4. System Board
163 (Real-Time Clock error) 1. Run Configuration/Setup
2. Battery
3. System Board
164 (Memory configuration changed,
see "Memory settings" on page 33.)
1. Run Configuration/Setup
2. DIMM
3. System Board.
165(Service Processor failure) 1. System Board.
175 (Hardware error) 1. System Board
176 (Computer cover or cable cover was
removed without a key being used)
1. Run Configuration/Setup
2. System Board
177, 178 (Security hardware error) 1. Run Configuration/Setup
2. System Board
184 (Power-on password corrupted) 1. Run Configuration/Setup
2. System Board
185 (Drive startup sequence
information corrupted)
186 (Security hardware control logic
failed)
1. Run Configuration/Setup
2. System Board
1. Run Configuration/Setup
2. System Board
187 (VPD serial number not set.) 1. Set serial number in Setup
2. System Board
188 (Bad EEPROM CRC #2) 1. Run Configuration/Setup
2. System Board
189 (An attempt was made to
1. Run Configuration/Setup, enter the administrator password
access the server with invalid passwords)
Chapter 7. Symptom-t o-FRU index 91
Page 100

Error Code/Symptom FRU/Action
201 (Memory test error, see "Memory
Settings" on page 33.) If the server does
not have the latest level of BIOS installed,
update the BIOS to the latest level and run
the diagnostic program again.
229 (Cache error) 1. Processor
1. DIMM
2. System Board
2. Optional Processor (if installed)
262 (DRAM parity configuration
error)
289 (DIMM has been disabled by the
user or system, see "Memory Settings" on
page 33.)
301 (Keyboard or keyboard controller
error)
303 (Keyboard controller error) 1. System Board
602 (Invalid diskette boot record) 1. Diskette
604 (Diskette drive error) 1. Run Configuration/Setup and Diagnostics
605 (Unlock failure) 1. Diskette Drive
1. Run configuration / setup
2. Battery
3. System Board
1. Run Configuration/Setup, if disabled by user
2. Disabled DIMM, if not disabled by user.
3. System Board.
1. Keyboard
2. System Board
2. Diskette Drive
3. Cable
4. System Board
2. Diskette Drive
3. Drive Cable
4. System Board
2. Drive Cable
3. System Board
662 (Diskette drive configuration error) 1. Run Configuration/Setup and Diagnostics
2. Diskette Drive
3. Drive Cable
4. System Board
762 (Coprocessor configuration error) 1. Run configuration setup
2. Battery
3. Processor
962 (Parallel port error) 1. Disconnect external cable on parallel port.
2. Run Configuration/Setup
3. System Board
11XX (System board serial port 1 or 2
error)
1. Disconnect external cable on serial port.
2. Run Configuration/Setup
3. System Board
92 Hardware Maintenance Manual: xSeries 330
 Loading...