

Page 1

IBM Cognos Transformer
Version 10.1.1
User Guide
Page 2

Note
Before using this information and the product it supports, read the information in “Notices” on page 377.
Product Information
This document applies to IBM Cognos Business Intelligence Version 10.1.1 and may also apply to subsequent
releases. To check for newer versions of this document, visit the IBM Cognos Information Centers
(http://publib.boulder.ibm.com/infocenter/cogic/v1r0m0/index.jsp).
Licensed Materials - Property of IBM
© Copyright IBM Corporation 2007, 2011.
US Government Users Restricted Rights – Use, duplication or disclosure restricted by GSA ADP Schedule Contract
with IBM Corp.
Page 3

Contents
Introduction .................................xiii
Chapter 1. What's New? .............................1
New Features in Version 10.1.1 .............................1
New Features in Version 10.1.0 .............................1
Publishing Cube Groups ..............................1
Deprecated Features in Version 10.1.0 ...........................1
Removed Features in Version 10.1.0............................1
PowerCube Connection (PCConn) Utility .........................1
Framework Manager Externalized Queries ........................2
Chapter 2. Planning Your Model .........................3
Dimensional Modeling Workflow ............................3
Analyzing Your Requirements and Source Data .......................4
Preprocessing Your Data ..............................4
Building a Prototype................................6
Refining Your Model ...............................8
Diagnose and Resolve Any Design Problems .......................9
Upgrade an IBM Cognos Series 7 Model..........................11
Chapter 3. Data Sources for Your Model .....................13
Techniques for Designing Data Sources ..........................13
Data Source Types .................................13
IBM Cognos Package or Report ............................14
Business Viewpoint Studio .............................18
IBM InfoSphere Warehouse Cubing Services .......................18
TM1 Cubes ..................................19
Impromptu Query Definition File ...........................19
Delimited-field Text with Column Titles .........................19
Delimited-field Text ...............................19
Access Table ..................................20
Access Query ..................................20
Excel Crosstab .................................20
Excel Database .................................20
PowerHouse Portable Subfile ............................21
Fixed-field Text .................................21
Fixed Field and Record Without CR LF .........................21
Designing Successful IBM Cognos PowerCubes .......................21
Conformed Dimensions ..............................21
IBM Cognos Business Keys .............................22
Member Unique Names ..............................22
Resolving Uniqueness Problems in Your Data Source ....................23
Creating a Model .................................24
Creating a Model Using an IBM Cognos Package or Report ..................25
Creating a Model Using an SAP BW Package .......................27
Creating a Model Using Other Data Sources .......................28
Edit Existing Prompts in IBM Cognos Reports and Packages ...................29
Generate a File of Prompt Values for Use in the Command Line.................31
Remove Obsolete Prompts .............................31
Specifying a Segmenting Prompt for an SAP BW Query ....................32
Change a Data Source Type ..............................33
Create Dimensions from the Dimension Map Using OLAP and DMR Packages .............33
Adding an IBM Cognos Data Source to an Existing Model ...................34
Add Additional Queries to Existing IBM Cognos Data Sources .................35
Adding Other Data Sources to an Existing Model.......................36
© Copyright IBM Corp. 2007, 2011 iii
Page 4

Synchronizing Columns with Your Data Source .......................37
Synchronizing Columns with Text Data Files or IQDs ....................38
Connecting to an IQD Data Source ...........................39
Isolation Levels for an IQD Data Source .........................39
Example - Using an .iqd File to Access a UNIX Data Source ..................40
Modify the SQL Query in an IQD Data Source .......................40
Character Sets Used with Delimited Text Data Sources .....................41
Named Ranges ..................................41
Example - Specifying Named Ranges for a Multipage Crosstab .................41
Example - Specifying a Named Range for a Spreadsheet Database ................42
PowerHouse Data Source Parameters...........................43
Using Multiple Data Sources in Your Model ........................43
Data Source Scope ................................44
Control When the Source Data Is Read .........................46
Defining Columns .................................47
Troubleshooting Issues Related to Column Names .....................48
Troubleshooting Issues Related to Date Columns ......................48
Define Columns in a Fixed-field Text Data Source .....................49
Scale Input Values ................................50
Set the Level of Detail for Dates ...........................51
Specify Monthly or Quarterly Time Arrays ........................51
Modify Date Categories When Spanning Two Centuries ...................54
Signons.....................................54
Creating a Data Source Signon ............................55
Creating an IBM Cognos Signon ...........................56
Chapter 4. Structuring Your Data Into Dimensions .................57
AutoDesign ...................................57
Creating a New Dimension ..............................58
Creating Dimensions in the Dimension Map Using Relational Data Sources .............58
Creating Dimensions from the Dimension Map Using OLAP and DMR Packages ...........58
Define a Calculated Column ..............................59
Example - Using a Calculated Column to Add an Exception Dimension ..............60
Example - Using a Calculated Column to Support Allocated Measures ..............60
Adding Levels and Categories to a Dimension........................61
Add Source Levels to a Dimension ..........................61
Add Manual Levels to a Dimension ..........................62
Create Categories Manually .............................63
Creating Calculated Categories ............................63
Order Categories Within Levels............................66
Order Categories Using a Global Preference Setting .....................67
Create Unbalanced Level Hierarchies Within a Dimension...................67
Drill-down Paths .................................68
Create an Alternate Drill-down Path ...........................68
Define a Scenario Dimension and a Cube Opening Level ....................69
Setting Up the Time Dimension.............................70
Creating the Time Dimension ............................71
Format Date Values................................73
Set up Fiscal Years, Quarters, and Months ........................74
Set up Calendar and Fiscal Years Within a Single Time Dimension ................74
Specify How Weeks Split When Spanning a Higher-level Time Period ...............75
Set up Lunar Time Periods .............................76
Specify How Extra Weeks Get Added to Lunar Years ....................77
Limit the Range of Dates Included in the Model ......................77
Set up a Custom Time Dimension ...........................78
Setting Up Relative Time Categories ...........................79
Set the Current Period Automatically ..........................80
Set the Current Period Manually ...........................81
Track Changes in a Measure over a Specific Time Period ...................81
Track Changes in a Measure for a Period-to-Date ......................82
Track Changes in a Measure over Several Time Periods....................83
iv IBM Cognos Transformer Version 10.1.1: User Guide
Page 5

Track Changes in a Measure in Future Time Periods .....................84
Track Monthly Performance Measures in Different Time Periods .................85
Setting up Special Categories .............................85
Create a New Special Category ............................85
Create Special Category Levels ............................86
Disable Rollup on Special Categories ..........................87
Resolving the Parentage of Orphan Categories........................88
Resolve Invalid Date Errors ..............................88
Adjust the Date Range to Encompass Early and Late Dates ...................89
Set up a Manual Level for Unknown Categories .......................89
Prevent New Categories from Being Added to a Dimension ...................90
Verifying Your Model ................................90
Generating Categories from a Specified Data Source .....................91
Chapter 5. Modeling Your Key Performance Measures ...............93
Add a Regular Measure ...............................94
Define a Measure Folder ...............................95
Define a Measure that Counts Categories .........................95
Define a Calculated Measure .............................97
Define When Measures are Calculated ..........................97
Specify How Missing Values Appear ...........................98
Reverse the Sign of Measure Values in Financial Models ....................99
Cognos Transformer Functions .............................99
Controlling How Measures Roll Up ...........................100
Set a Regular Rollup Function for Measures .......................101
Create Cubes with External Rollups ..........................102
Set a Time State Rollup Function for Measures ......................103
Ignore Null and Missing Values in Specified Time State Rollups ................105
Set Regular and Time State Rollup Together .......................106
Consolidation ..................................107
Example - Consolidating Data Using Duplicates Rollup (Sum) .................107
Set a Duplicates Rollup Function for Measures ......................108
Allocating Measures ................................109
Show the Scope for a Measure............................110
Set Dimension Allocation .............................111
Set Level Allocation ...............................112
Set Category Allocation ..............................113
Suppress Allocation ...............................114
Setting Up Currency Conversion ............................115
Enabling Conversion Using a Base Currency Table .....................116
Enable Conversion Using a Euro Table .........................118
Update a Currency Table Manually ..........................121
Chapter 6. Creating PowerCubes ........................123
Create a Single PowerCube..............................123
Create a Cube Group................................125
Defining a Time-based Partitioned Cube .........................125
Advantages of a Time-based Partitioned Cube ......................126
Disadvantages of a Time-based Partitioned Cube .....................126
Create a Time-based Partitioned Cube Group .......................128
Processing Issues Related to Time-based Partitioned Cubes ..................128
Customizing a Time-based Partitioned Cube .......................131
Exclude Measures from a Cube ............................131
Omit Dimensions from a Cube ............................132
Customizing Cube Content with Views..........................132
Create a Dimension View .............................133
Omit Categories Using Suppress ...........................134
Omit Categories Using Cloak ............................135
Omit Categories Using Exclude ...........................136
Omit Descendant Categories Using Summarize ......................137
Contents v
Page 6

Omit Categories Using Apex ............................138
Setting Up Drill-through Targets ............................139
Drill Through in IBM Cognos BI ...........................139
Drill Through in IBM Cognos Series 7 .........................140
Use Alternate Data Sources for Cube Creation .......................143
Build a Subset of Your Cube Data for Testing Purposes ....................143
Update the PowerCube Metadata............................144
Check Cube Status ................................144
Chapter 7. Adding Security ..........................147
PowerCubes with IBM Cognos Series 7 Security ......................147
Choosing the Type of Security to be Applied ........................147
IBM Cognos Security Objects .............................148
Create Member-based Security ............................149
Update Model Security ..............................151
Union of Custom Views ...............................151
Example - Two Custom Views, Each with an Apex in the Same Dimension .............152
Example - Apexed Custom View Cloaked by Another Custom View in the Same Dimension .......153
Example - Apexed Custom View Excluded by Another Custom View in the Same Dimension ......153
Example - Union of Two Apexed Custom Views in Different Dimensions .............154
Example - Union of Two Multi-dimensional Apexed Custom Views ...............154
Example - Union of Excluded Categories in Two Dimensions .................155
Examples - Unions of Excluded Categories in the Same Dimension ...............155
Example - Union of Excluded and Cloaked Categories in the Same Dimension ...........156
Example - Union of a Custom Views with Omitted Dimensions ................156
Create Password-protected Cubes ...........................157
Combining Custom Views with Dimension Views ......................157
Block Total Values for Parent Categories with Excluded Children .................158
Upgrade an IBM Cognos Series 7 Secured PowerCube ....................158
Chapter 8. PowerCubes in Production Environments ...............161
Managing Languages and Locales ...........................161
Publishing PowerCubes ...............................162
Publishing a PowerCube Using the Wizard .......................163
Publishing a PowerCube Using Settings Stored in the Model .................165
Creating a Publish Specification to Publish One PowerCube ..................166
Creating a Publish Specification to Publish All PowerCubes in the Model .............167
Publishing a Cube Group .............................168
PowerCube Load Balancing .............................168
Maintaining Models and Cubes ............................169
Source Data Updates ...............................169
Model Updates .................................169
Cube Updates .................................170
Automatic Creation of Multifile Cubes .........................170
Recovering a Failed Model .............................171
Matching Model and Source Columns .........................172
Move Categories When Source Data Changes ......................173
Cleaning up Your Models and Cubes .........................174
Modifying a PowerCube..............................179
Update Cubes Incrementally ............................179
Choosing a Partitioning Strategy ...........................180
Updating Published PowerCubes and PowerCube Connections..................186
Copying and Activating a Newer Version of a Published PowerCube...............187
Activating a Published PowerCube Using pcactivate ....................189
Chapter 9. Guidelines for Optimizing Production Environments...........191
Building PowerCubes in UNIX or Linux .........................191
Guidelines for Model Design, Cube Creation, and System Maintenance Process ...........192
Setting Up Data Sources for UNIX and Linux Cubes ....................192
Using IBM Cognos Reports to Create a Data Source ....................193
vi IBM Cognos Transformer Version 10.1.1: User Guide
Page 7

Adding Security to a UNIX or Linux Cube .......................194
Controlling Processing with Preference Settings or Environment Variables ..............194
Preferences ..................................195
Environment Variables ..............................200
Addressing Common UNIX and Linux Processing Problems...................200
Checking UNIX and Linux Job Status .........................200
Scheduling Batch UNIX and Linux Production Jobs ....................201
Improving Performance in a UNIX Production Environment .................201
Performing Incremental Updates on UNIX and Linux ....................201
Example - Updating a Model Using an MDL Script.....................201
Example - Restarting a Failed Process from a Checkpoint File .................202
Example - Restarting a Failed Process from the Beginning ..................202
Reducing Build Times for Large PowerCubes ........................202
Multiprocessing with Cognos Transformer Server .....................203
Memory Allocation ...............................204
Reconfiguration of the Hard Drive ..........................204
Allocating Sufficient Space for the Temporary Files .....................205
Optimization of the Operating Environment .......................205
Redistributing Files ...............................206
Optimization of Gateway Settings for IBM Cognos Series 7 IQDs ................207
Keeping Model and Cube Sizes Within Practical Limits ...................207
Using the Log File to Analyze Processing Bottlenecks ....................208
Appendix A. Command Line Options ......................209
Command Line Syntax ...............................210
Command Line Options ...............................211
-a option ...................................213
-c option ...................................214
-d option ...................................214
-e option ...................................217
-f option ...................................217
-g option ...................................225
-h option ...................................226
-i option ...................................226
-j option ...................................226
-k option ...................................227
-l option ...................................228
-m option ..................................229
-n option ...................................229
-nologo option .................................230
-o option ...................................230
-ox option ..................................231
-p option ...................................231
-r option ...................................231
-s option ...................................232
-t option ...................................232
-u option ...................................233
-v option ...................................233
-x option ...................................234
-y options ..................................234
Backward Compatibility ...............................236
Sample Windows Preference Files for IBM Cognos Series 7 ..................236
Sample UNIX and Linux Preference Files for IBM Cognos Series 7 ...............237
Appendix B. Troubleshooting .........................239
Accessing Error Message Help ............................239
Known Issues When Modeling in IBM Cognos Transformer ...................239
BAPI Error Occurs After the Prompt Specification File Edited Manually ..............239
Unable to Access an IQD Data Source Using a Sybase Database Connection ............239
Unable to Use an IQD Created in Framework Manager That Contains an Oracle Stored Procedure .....240
Contents vii
Page 8

Preventing Errors When Model Calculations Use Double Quotation Marks .............240
Framework Manager and Transformer May Display Different Locale Session Parameters for Some Languages 241
Regular Columns Cannot Be Converted to Calculated Columns and Vice Versa ...........241
Transformer Takes a Long Time to Retrieve Data from an SAP-based Data Source ..........241
Categories Missing When Creating a Transformer Model Based on an SAP Query Containing a Manually
Created SAP Structure ..............................242
Error Occurs When Creating a PowerCube Containing an SAP Unbalanced Hierarchy .........242
Rebuilding a PowerCube Soon After Publishing Produces a TR0787 Error .............242
Using the cube group in the sample model Employee expenses.mdl ...............242
Known Issues When Using PowerCubes in the IBM Cognos Studios ................243
Not Yet Optimized IBM Cognos PowerCubes May Open Slowly in IBM Cognos BI ..........243
Analysis Studio Shows the Wrong Currency Symbol ....................244
Changes to Decimals in Currency Formats .......................244
Ragged or Unbalanced Hierarchies Result in Unexpected Behavior ...............245
Unable to Open the Great Outdoors Sales.mdl Sample Model and Generate Cubes ..........245
Unable to Publish a PowerCube ...........................246
Appendix C. IBM Cognos Transformer Error Messages ..............247
TR0104 ....................................247
TR0105 ....................................247
TR0106 ....................................248
TR0107 ....................................248
TR0108 ....................................248
TR0109 ....................................249
TR0110 ....................................249
TR0111 ....................................250
TR0112 ....................................250
Solution for Windows ..............................250
Solution for UNIX or Linux ............................250
TR0113 ....................................251
TR0114 ....................................251
TR0116 ....................................251
TR0118 ....................................251
TR0128 ....................................252
TR0131 ....................................252
TR0132 ....................................252
TR0133 ....................................252
TR0137 ....................................253
TR0149 ....................................253
TR0202 ....................................254
TR0203 ....................................254
TR0205 ....................................254
TR0206 ....................................254
TR0207 ....................................254
TR0208 ....................................255
TR0209 ....................................255
TR0210 ....................................255
TR0214 ....................................256
TR0215 ....................................256
TR0217 ....................................256
TR0301 ....................................257
TR0303 ....................................257
TR0404 ....................................257
TR0408 ....................................257
TR0412 ....................................258
TR0420 ....................................258
TR0423 ....................................258
TR0476 ....................................259
TR0500 ....................................259
TR0501 ....................................259
TR0502 ....................................259
viii IBM Cognos Transformer Version 10.1.1: User Guide
Page 9

TR0503 ....................................260
TR0504 ....................................260
TR0505 ....................................260
TR0507 ....................................261
TR0508 ....................................261
TR0510 ....................................261
TR0514 ....................................262
TR0515 ....................................262
TR0518 ....................................262
TR0519 ....................................262
TR0523 ....................................263
TR0524 ....................................263
TR0525 ....................................263
TR0528 ....................................264
TR0534 ....................................264
TR0535 ....................................264
TR0536 ....................................265
TR0538 ....................................265
TR0540 ....................................266
TR0541 ....................................266
TR0552 ....................................266
TR0605 ....................................267
TR0606 ....................................267
TR0607 ....................................267
TR0613 ....................................268
TR0621 ....................................268
TR0623 ....................................268
TR0624 ....................................269
TR0657 ....................................269
Matching Model and Source Columns for Text Files or IQDs .................269
Matching Model and Source Columns for IBM Cognos Data Sources ...............270
TR0700 ....................................270
TR0701 ....................................271
TR0702 ....................................271
TR0705 ....................................271
TR0713 ....................................272
TR0745 ....................................272
TR0749 ....................................273
TR0750 ....................................273
TR0751 ....................................273
TR0752 ....................................273
TR0753 ....................................274
TR0800 ....................................274
TR0802 ....................................274
TR0803 ....................................275
TR0804 ....................................275
TR0805 ....................................275
TR0806 ....................................275
TR0807 ....................................276
TR0808 ....................................276
TR0809 ....................................276
TR0810 ....................................276
TR0811 ....................................277
TR0812 ....................................277
TR0813 ....................................277
TR0815 ....................................278
TR0816 ....................................278
TR0817 ....................................278
TR0900 ....................................278
TR0904 ....................................279
TR0906 ....................................279
Contents ix
Page 10

TR0907 ....................................279
TR0914 ....................................280
TR0917 ....................................280
TR0919 ....................................280
TR1003 ....................................280
TR1005 ....................................281
TR1100....................................281
TR1101....................................281
TR1102....................................281
TR1106....................................282
TR1109....................................282
TR1304 ....................................282
TR1307 ....................................282
TR1308 ....................................283
TR1309 ....................................283
TR1310 ....................................283
TR1312 ....................................284
TR1319 ....................................284
TR1320 ....................................284
TR1502 ....................................285
TR1503 ....................................285
TR1601 ....................................285
TR1700 ....................................286
TR1703 ....................................286
TR1900 ....................................286
TR1903 ....................................287
TR1907 ....................................287
TR2000 ....................................287
TR2001 ....................................288
TR2002 ....................................288
TR2306 ....................................288
TR2307 ....................................288
TR2308 ....................................289
TR2312 ....................................289
TR2313 ....................................290
TR2314 ....................................290
TR2316 ....................................290
TR2317 ....................................291
TR2318 ....................................291
TR2319 ....................................291
TR2320 ....................................292
TR2321 ....................................292
TR2322 ....................................292
TR2323 ....................................293
TR2324 ....................................293
TR2325 ....................................293
TR2326 ....................................293
TR2502 ....................................294
TR2503 ....................................294
TR2504 ....................................294
TR2505 ....................................295
TR2506 ....................................295
TR2507 ....................................295
TR2508 ....................................296
TR2509 ....................................296
TR2510 ....................................296
TR2600 ....................................296
TR2601 ....................................297
TR2606 ....................................297
TR2608 ....................................297
TR2700 ....................................298
x IBM Cognos Transformer Version 10.1.1: User Guide
Page 11

TR2701 ....................................298
TR2702 ....................................299
TR2703 ....................................299
TR2704 ....................................299
TR2705 ....................................300
TR2706 ....................................300
TR2707 ....................................300
TR2708 ....................................301
TR2710 ....................................301
TR2711 ....................................301
TR2712 ....................................302
TR2713 ....................................302
TR2714 ....................................302
TR2715 ....................................303
TR2716 ....................................303
TR2717 ....................................303
TR2718 ....................................304
TR2719 ....................................304
TR2720 ....................................304
TR2723 ....................................305
TR2724 ....................................305
TR2725 ....................................305
TR2726 ....................................306
TR2727 ....................................306
TR2728 ....................................306
TR2729 ....................................307
TR2731 ....................................307
TR2732 ....................................307
TR2733 ....................................308
TR2734 ....................................308
TR2735 ....................................308
TR2736 ....................................309
TR2737 ....................................309
TR2740 ....................................309
TR2800 ....................................309
TR3101 ....................................310
TR3124 ....................................310
TR3311 ....................................310
TR3519 ....................................310
Appendix D. Reference ............................313
The Interface of Cognos Transformer ..........................313
Lists ....................................313
Data Source Viewer and SQL Tab...........................315
Dimension Map ................................315
Scope Maps ..................................317
Category Counts ................................318
Diagrams...................................318
Allocation Types .................................320
Category Actions in Diagrams.............................320
Category Inclusion Settings..............................322
Date Formats and Functions .............................323
Default File Locations ...............................325
cogtr.xml File Settings ...............................326
Global Preference Settings .............................327
Relative Time Settings ...............................328
Example - Creating Custom Relative Time Periods .....................329
PowerCube Optimization Methods ...........................331
Rollup Functions .................................331
Special Characters .................................334
Cognos Transformer Samples .............................335
Contents xi
Page 12

Sample Models .................................336
Sample PowerCubes ...............................336
Sample Data Sources ...............................337
Appendix E. Guidelines for Working with SAP BW Data for Use in Transformer ....339
Working with SAP BW Data Using a Package in Framework Manager ...............339
Creating a BW Query in SAP Business Explorer Query Designer ................340
Creating a Package in Framework Manager .......................343
Creating a Model in Cognos Transformer ........................347
Working with SAP BW Data Using Externalized CSV Files in Framework Manager ...........349
SAP BW Query Requirements ............................351
Framework Manager Considerations .........................352
Building PowerCubes from SAP BW Data ........................353
Appendix F. IBM Cognos Transformer Expression Editor..............355
Building Expressions ................................356
Building an If-Then-Else Calculated Expression ......................357
Functions....................................357
Date Functions .................................358
Numeric Functions ...............................362
Text Functions .................................367
Aggregate Functions ...............................371
Constants ...................................373
Operators ...................................374
Mathematical, Logical, and String Operators .......................374
Comparison Operators ..............................375
Notices ...................................377
Glossary ..................................381
A......................................381
C......................................381
D......................................381
F......................................381
G......................................382
H......................................382
I.......................................382
L......................................382
M......................................382
N......................................382
P......................................382
Q......................................383
U......................................383
Index ....................................385
xii
IBM Cognos Transformer Version 10.1.1: User Guide
Page 13

Introduction
This document is intended for use with IBM®Cognos®Transformer, the OLAP
modeling component delivered with IBM Cognos Business Intelligence.
The IBM Cognos Transformer User Guide describes PowerCube modeling procedures
and concepts, product functionality, and related terminology. It includes reference
information that supplements the task- and process-oriented topics, as well as
troubleshooting tips and detailed help for the more commonly encountered error
messages.
You can use this document to help you model and build PowerCubes with the
Cognos Transformer user interface, or to perform production-related tasks from the
Windows, UNIX, or Linux command line.
For information about creating automation scripts using Model Definition
Language (MDL), see the Cognos Transformer IBM Cognos Transformer Developer
Guide.
For information about creating automation scripts using OLE automation, see the
IBM Cognos Transformer Automation Guide.
Audience
This information is for new IBM Cognos Transformer users and IBM Cognos Series
7 cube modelers who are seeking guidance as they migrate their PowerCubes and
related applications to the IBM Cognos environment. Advanced database
administration (DBA) or data modeling skills are not required. Business-relevant
examples, samples, and code examples are supplied in context.
Finding information
To find IBM Cognos product documentation on the web, including all translated
documentation, access one of the IBM Cognos Information Centers. Release Notes
are published directly to Information Centers, and include links to the latest
technotes and APARs.
You can also read PDF versions of the product release notes and installation guides
directly from IBM Cognos product disks.
Accessibility features
This product does not currently support accessibility features that help users with
a physical disability, such as restricted mobility or limited vision, to use this
product.
Forward-looking statements
This documentation describes the current functionality of the product. References
to items that are not currently available may be included. No implication of any
future availability should be inferred. Any such references are not a commitment,
promise, or legal obligation to deliver any material, code, or functionality. The
© Copyright IBM Corp. 2007, 2011 xiii
Page 14

development, release, and timing of features or functionality remain at the sole
discretion of IBM.
Samples disclaimer
The Great Outdoors Company, GO Sales, any variation of the Great Outdoors
name, and Planning Sample depict fictitious business operations with sample data
used to develop sample applications for IBM and IBM customers. These fictitious
records include sample data for sales transactions, product distribution, finance,
and human resources. Any resemblance to actual names, addresses, contact
numbers, or transaction values is coincidental. Other sample files may contain
fictional data manually or machine generated, factual data compiled from
academic or public sources, or data used with permission of the copyright holder,
for use as sample data to develop sample applications. Product names referenced
may be the trademarks of their respective owners. Unauthorized duplication is
prohibited.
xiv IBM Cognos Transformer Version 10.1.1: User Guide
Page 15

Chapter 1. What's New?
This chapter contains a list of new and removed features for this release. It also
contains a cumulative list of similar information for previous releases. Knowing
this information will help you plan your upgrade and application deployment
strategies and the training requirements for your users.
For information about upgrading, see the IBM Cognos Business Intelligence
Installation and Configuration Guide.
For an overview of new features for this release, see the IBM Cognos Business
Intelligence New Features Guide.
For changes to previous versions, see “New Features in Version 10.1.0”
To review an up-to-date list of environments supported by IBM Cognos products,
such as operating systems, patches, browsers, Web servers, directory servers,
database servers, and application servers, visit the IBM Cognos Customer Center
http://www.ibm.com/software/data/cognos/customercenter.
New Features in Version 10.1.1
There are no new features in this release of IBM Cognos Transformer.
New Features in Version 10.1.0
These are the new features in this release of IBM Cognos Transformer.
Publishing Cube Groups
You can now publish all or selected PowerCubes in a cube group. The data source
connections and packages are automatically created or updated in IBM Cognos
Connection for all cubes in the group.
This solution does not change the way regular PowerCubes and time-based
partitioned cubes are published. For more information, see “Publishing
PowerCubes” on page 162.
Deprecated Features in Version 10.1.0
There are no deprecated features in this version.
Removed Features in Version 10.1.0
The following features are removed in version 10.1.0.
PowerCube Connection (PCConn) Utility
This utility is no longer supported by IBM Cognos Transformer. It was replaced by
the copy and activate functionality.
For more information, see “Updating Published PowerCubes and PowerCube
Connections” on page 186.
© Copyright IBM Corp. 2007, 2011 1
Page 16

Framework Manager Externalized Queries
Framework Manager IQDs, or externalized queries, are no longer supported as
data sources in Cognos Transformer. Instead, you can use IBM Cognos packages
and reports as data sources.
For more information, see “IBM Cognos Package or Report” on page 14.
2 IBM Cognos Transformer Version 10.1.1: User Guide
Page 17

Chapter 2. Planning Your Model
IBM Cognos Transformer is a data modeling tool designed for use with IBM
Cognos 8 version 8.3 and subsequent releases.
You use this component to create a model, a business presentation of the
information in one or more data sources. After you choose a supported product
locale (language), add dimensional metadata, specify the measures (performance
indicators), and apply custom views, you can create PowerCubes based on this
model. You can deploy these cubes to support OLAP reporting and analysis.
This section provides a high-level overview of the modeling and planning process
to meet the OLAP needs of your users, as well as information about how to
upgrade an IBM Cognos Series 7 Transformer model.
The documented workflow follows a logical sequence, beginning with analyzing
your requirements and building a prototype model. If you have already completed
this planning stage, you can proceed to the sections of this document that deal
with data sources (Chapter 3), dimensions (Chapter 4), and measures (Chapter 5).
Dimensional Modeling Workflow
IBM Cognos Transformer is a proven and relatively simple tool for modeling
dimensional hierarchies and levels for PowerCubes.
After you relate the dimensions to your business performance indicators, you can
create powerful, secure cubes to be used for reporting and drill-through analysis in
the IBM Cognos studios.
v Carefully analyze your users' OLAP reporting requirements.
v If you have not already done so, build a prototype model.
v Choose your transactional and structural data sources and import the facts
(measures) and metadata (dimensions).
v Map your metadata into dimensions, and your facts into measures.
v Verify the model and resolve any ambiguities.
v Organize the data in your model into customized dimension views or cube
groups.
v Apply security and create custom views to control access to sensitive
information.
v Create and publish PowerCubes to IBM Cognos Connection.
v Manage and maintain your models, cubes, and reports for optimal effectiveness.
Troubleshooting tips are provided in this document and in the Administration and
Security Guide. This document also provides an overview of the functions
supported by Cognos Transformer, and how they may be used to create calculated
expressions. For more information, see “Cognos Transformer Functions” on page
99.
For information about scripting, see the Cognos Transformer Developer Guide and
the Cognos Transformer Automation Guide.
© Copyright IBM Corp. 2007, 2011 3
Page 18

Analyzing Your Requirements and Source Data
To ensure that you develop an effective business intelligence model, we
recommend that you begin by carefully analyzing your users, the OLAP reports
they require, and your source data.
Use the following questions to analyze your users' OLAP reporting needs:
v What reports do users currently use? Which reports do they use most
frequently? Which reports do they use only rarely?
v Does each group require different reports? Are there some reports that are
required by all user groups?
v Do users need higher-level (summary) reports, detailed drill-through reports, or
both?
v How frequently are the measures in the report updated? How frequently do the
reports themselves change? Does the frequency vary from group to group?
v How often are reports required? Can you trade off frequency to ensure
accuracy? For example, if your users ask for monthly reports and the data
source is refreshed weekly, the data will always be current. However, if your
users want daily reports, the data will only be up to date on the first day of the
weekly cycle.
Analyze your source data, using questions such as the following:
v Does the data come from one source or many? What format is it in: flat files,
spreadsheets, or databases? Does it need to be converted to a supported data
source type before it is imported?
v Can you optimize existing queries by building new Cognos Transformer queries
using the metadata modeled in IBM Cognos packages or reports?
v How many records are there? By how much do you expect the volume of data
to increase?
v How much of the data is static and how much changes gradually over time?
Can you create different data sources for static and non-static data to support
incremental updates (an option that shortens cube creation time by appending
new data to a cube instead of recreating it)?
v How much data preparation is required?
Ensure that the source values that feed the categories are unique and, if feasible,
that you aggregate or otherwise preprocess your data before importing it. For
more information, see “Preprocessing Your Data.”
v Are linked measures from different data sources updated at the same time?
v Must you create additional data sources to accurately model your organization?
When you have answered these questions, you are ready to begin preparing your
source data for import and designing your prototype.
Preprocessing Your Data
Presort, clean, or consolidate your data to maximize reporting flexibility and
performance.
Preprocess data to achieve the following benefits:
v Presorted records are processed more quickly in Cognos Transformer.
v When you streamline your source data to contain only the information needed
for the model, read times are faster in Cognos Transformer.
4 IBM Cognos Transformer Version 10.1.1: User Guide
Page 19

v You can use Cognos Transformer to presummarize the data when your users do
not require access to all the details in the source.
For example, if your organization processes 50,000 transactions daily, and you
create the cube weekly, you can summarize the transactions at the weekly level
before Cognos Transformer begins processing. This will greatly speed up cube
creation.
v Consolidation, combining records with identical non-measure values, reduces the
size of the cube and improves performance in your reporting application.
Consolidation is enabled by default in Cognos Transformer. Evaluate your data
to see if it can be further consolidated by using the Duplicates rollup or
Regular rollup features of Cognos Transformer.
For consolidation purposes, non-measure values are considered identical if they
meet any of the following criteria for the particular rollup:
– The source data contains transactions with identical non-measure values.
For example, two sales of the same product are made to the same customer
on the same day, but the colors differ. If colors are omitted from a dimension
view using the Suppress or Summarize command on the Diagram menu, the
sales records will have identical non-measure values.
– Records become identical when a dimension is omitted from the cube.
For example, two sales of the same product are made at different stores on
the same day. If the Stores dimension is removed from the model, these sales
records will have identical non-measure values.
– Records become identical because of the Degree of detail setting on the Time
tab of the Column property sheet.
For example, if the Degree of detail is set to Month for a column associated
with a time dimension that includes week and day values, Cognos
Transformer ignores the week and day values in the source transactions when
consolidating records.
v For queries based on relational packages, enabling the Auto summarize feature
on the General tab of the Data Source property sheet also helps reduce the
number of rows that Cognos Transformer retrieves from the source data, further
improving cube build performance.
Separate Your Structural and Transactional Data
Processing time improves when Cognos Transformer can query your structural and
transactional information separately. You must identify which data sources contain
purely structural information, which contain transactional information (measure
values or facts), and which contain a combination of the two.
When processing queries to create a PowerCube, Cognos Transformer orders the
queries, first reading the structural queries and then reading the transactional
queries.
Ideally, you should define each dimension or drill-down path with a separate
structural data source, and then add one or more transactional data sources to
provide the measures for those dimensions. This restructuring exercise helps to
partially normalize your data, speeding up both the category generation and cube
creation stages.
The best approach is to have unique levels near the bottom of the dimensions, and
to have the transactional queries link to the dimensions using those levels. This is
basically the star schema or snowflake method of creating dimensions in a
relational database. This type of design promotes faster processing because each
Chapter 2. Planning Your Model 5
Page 20

transaction record has fewer business keys to process when identifying the
category with which the measure values are associated.
Define any transactional data sources that change frequently so that they contain a
small, concise record set, with the minimum amount of information needed to
update the data in your PowerCubes. Whenever possible, save your model with
generated category structures, to eliminate the redundant processing required to
continually rebuild them. Similarly, if your model contains long descriptions,
generate cubes from a model that is already populated with the categories
associated with those descriptions.
For more information, see “Control When the Source Data Is Read” on page 46.
Additional Data Modeling Tips
Enhance your model design by analyzing the data flow, resolving uniqueness
issues and data dictionary terms, building flexibility into your plan, and reducing
the Cognos Transformer processing load.
Consider building the following steps into your process:
v Analyze the data flow from the point at which your data is generated until the
data is input into Cognos Transformer. Determine if the data can be streamlined
or rationalized at any point, perhaps by creating a data warehouse, a series of
data marts, or a data-extract process to reorganize it.
v Resolve uniqueness issues and data dictionary terms before you merge two sets
of data into one model. Ensure data integrity by checking your column joins;
outer joins or table aliases may be required. Remember that Cognos Transformer
is not a relational database tool, and cannot perform joins between the columns
of different data sources. If you need to set up database joins, use a modeling
tool such as Framework Manager to create the joins, and then publish the
Framework Manager package for use in Cognos Transformer.
v Wherever possible, build flexibility into your plan. Use a different source file for
each aspect of your business, and organize the data sources in your model so
that each data source supplies the data for a different dimension. That way, you
can add more information into your cube as your business evolves, even if the
data comes from different software applications, platforms, departments, or
locations.
v Improve performance by continually striving to reduce the Cognos Transformer
processing load.
Building a Prototype
To field-test the accuracy of your analysis, build an initial model or prototype that
reflects the needs of the key decision makers in your company.
Base your prototype on an existing set of frequently used, stable OLAP reports,
and use the following checklist:
Procedure
1. Identify Measures
Measures are the numbers you use to gauge your organization's performance.
You should choose the critical success factors in your business as your
measures. Examples of typical measures include sales revenues, profit margins,
and response times.
6 IBM Cognos Transformer Version 10.1.1: User Guide
Page 21

If you have multiple data sources, you must relate the dimensions and levels of
your model to the data source that contains the columns to be used for each
measure.
Your model is more effective if your measures are applicable to more than one
dimension. For example, if your dimensions are products, locations, and
customers, your measures should bridge these dimensions.
2. Specify a Time Dimension
To ensure that your users can make period-to-period comparisons and visualize
trends over time, choose a time dimension that reflects and synchronizes
accounting periods and reporting schedules.
In most cases, your requirements are met by models based on the calendar or
fiscal year. Month, Quarter, and Year categories can be supplemented by
relative time categories automatically generated by Cognos Transformer, such
as YTD Growth, the percent-growth year-over-year.
If your organization uses particular time periods, such as lunar weeks and
months, or three 8-hour shifts per day, Cognos Transformer supports the
definition of custom time dimensions. Even if your query objects originate in
Framework Manager, you should import the necessary time-related items into
Cognos Transformer, and then define your time dimensions there.
3. Select the Data to be Modeled
You begin by identifying the data sources that contain the data for the model
you want to create.
Suppose that information about your customers is stored in a Customers table
and information about your products is stored in a Products table. Related
tables called Customer_Details and Product_Details provide additional
information about customers and products. Order information is stored in two
tables called Orders and Order_Details.
In keeping with good design practice, you decide to set up the Customers,
Customer_Details, Product, and Product_Details tables as structural data
sources, to provide the information that Cognos Transformer uses to build the
Customers and Products dimensions in your model.
The information about transactions is stored in the Orders and Order_Details
tables. For efficiency, you decide to combine the information in these tables into
a single data source called Order_Info.
The Order_Info data source contains the following information, all of which
you use to associate sales with particular customers and products:
v The order dates generate categories for the time dimension.
v Data about customers and sales representatives generates the header
information.
v The product, order quantity, and sales amount for each line item in an order
provide the sales measures.
v The cost of the order and discounts applied to it provide supplementary fact
data.
Example - Your Prototype Sales Model, on Paper
You can create an initial dimension map on paper, to make sure you have
identified all of the dimensions, levels, and categories needed in your PowerCube.
The measures to be associated with this dimensional hierarchy are Sales, Order
Qty, Cost, and Discount.
You map the dimensions of your prototype as follows:
Chapter 2. Planning Your Model 7
Page 22

Order date Products Locations
Year Product Group Region
Quarter Product Class Office
Month Product Name Sales Rep
Refining Your Model
Based on your paper prototype, you create the Dimension Map for your new
model in Cognos Transformer. You begin with one data source. You can enhance
the business value of your model later, by adding more sources or manipulating
the data derived from the existing data sources.
Suppose you are initially lacking information about the staffing levels in each
branch. You can either add another data source to provide this information or use
the Category Count feature of Cognos Transformer to provide this detail. The
resulting cube and OLAP reports can then deliver value-added information about
the average sales per employee.
Models can contain any combination of the following:
v regular measures, or the numeric fact data found in a transaction file
v calculated measures, or numeric data calculated from other measures,
mathematical operators, and numeric constants
v category counts, or the number of categories in a unique level for which the
measure values are not zero or missing
v calculated categories, whereby calculated expressions apply directly to any
measure
v calculated columns, whereby new data is based on values calculated from other
columns, functions, constants, and calculated columns
Product No
Use the following checklist to help refine your model:
v Add special categories to enable quicker data access.
Group your data based on attributes that may be contributing to the success of
your enterprise, such as product color or customer income.
v Add drill-down paths to provide more detail.
A dimension normally consists of a single drill-down path with one or more
drill-down levels, representing the hierarchical organization of the information.
However, you can further subdivide your dimensions, so your report users can
analyze their data at different levels of detail.
There are no restrictions on the number of levels and drill-down paths that you
use in a dimension. However, all alternate drill-down paths must converge at a
common unique level and, for performance reasons, it is best to keep a 1:10 ratio
or less between the categories in each level.
For information on drill through using categories from alternate drill paths, see
the Administration and Security Guide.
v Allocate measures to other levels or dimensions.
If your model uses multiple data sources, consider allocating measures to levels
or dimensions with which they are not normally associated. Allocation can
provide you with new insights into your data. For example, you can associate
resource-related data to financial data.
8 IBM Cognos Transformer Version 10.1.1: User Guide
Page 23

You can allocate measures over entire dimensions, over levels within an
individual dimension, or over categories within levels. When allocating
measures, use measures that come directly from your source data rather than
calculated measures, and avoid overloading your model with superfluous detail.
v Consider combining information from another functional area, such as materials
and resource planning or performance quality, with the finance or customer
profitability data already in your business model.
Begin by listing the data columns and determining if there are any gaps,
particularly in the area of cost of materials, or indicators of quality.
Next, map the new dimensions, checking that the time periods are consistent
with each other and with your financial statements. Ensure that revenue and
expense values map to those in the financial statements.
Finally, verify the relationships that exist between the various measures. If these
are not one-to-one relationships, confirm how each relates to your common
dimensions.
Example - Adding Customer Service Data to Refine Your Model
Suppose your initial model includes the following dimensional hierarchy, as well
as values for Inventory Status and Turnover Ranges.
You have data for an extensive list of measures: Sales, Order Qty, Material Cost per
Unit, Discount, Percent Gross Margin, Carrying Cost per Unit, Percent Material
Cost per Sale, Percent Carrying Cost per Sale, Sales per Customer, Percent Profit
per Segment, and Inventory Turnover.
You decide you want to monitor customer service, so you expand your model to
include indicators of service quality. The new dimensions and categories might be
encoded Reasons for Dissatisfaction or Causes of Poor Quality Service.
You must ensure that your source data provides the required measures, such as the
number of complaints, returns, and claims, or the dollar value of returns and
claims.
You can complete your model by incorporating response times, labor costs, time
lost to service claims, rework hours, scrap costs, or any other factor that
significantly affects service quality.
Diagnose and Resolve Any Design Problems
You can use any or all of the following tools and techniques to diagnose and
resolve problems in your model design.
Show Scope
To see how your measures and levels are associated with their corresponding data
sources by allocation, direct association or indirect association, use the Show Scope
command on the Edit menu.
Show Count
To verify that you have maintained a 1:10 ratio or less between the categories in
each level, use the Show Counts command on the Edit menu. Lower ratios allow
for efficient partitioning and faster cube creation times in Cognos Transformer, as
well as easier data exploration in your reporting component.
Chapter 2. Planning Your Model 9
Page 24

Show Reference
To confirm the origin of every data source column associated with your
Dimension Map and see how each is used, use the Show Reference command on
the Tools menu.
Generate Categories
To confirm how the categories in a specific data source relate to your model, use
the Generate Categories command on the Run menu, with the selected data
source. To prevent the generation of categories in specific levels or entire
dimensions, select the Prohibit automatic creation of new categories check box on
the General tab of the Level or Dimension property sheets.
Create Selected Cubes
During the prototyping stage, you may want to create only certain cubes. You can
enable or disable cube creation in one of following ways:
v Change the Cube creation option on the Processing tab of the PowerCube or
Cube Group property sheet.
v Use the Create Selected PowerCube command on the Run menu.
v Use the Model Definition Language (MDL) function CreateFromCubes. For more
information, see the Cognos Transformer Developer Guide.
Check Cube Build Status
When you build a cube in Cognos Transformer, you can check the status of the
cube build at any time without opening it by using the PowerCube Status
command on the Tools menu. You can check the status of all the cubes that are
defined for a model at the same time. If your model has more than one cube, you
can apply a filter to monitor the status of cubes enabled for creation, disabled
cubes, or both.
You can also filter the cube build status settings by selectively requesting one of
the following:
v Any status, to list all cubes associated with the model, regardless of their status.
v Errors, to list cubes that were not created because they are not valid, or failed.
v Warnings, to list all cubes for which warnings were detected during a previous
create.
v Successful, to list all cubes created without errors or warnings, having a status
of OK.
Consult the Error Message and Troubleshooting Help
In addition to the troubleshooting topics in the User Guide, help is available from
Help buttons in some error messages to help you resolve any model design
problems.
Review the Resulting Reports With Your Users
After you generate a few reports from your prototype, ask for feedback from
representative users by posing open-ended questions. If you are the IT specialist,
involve an experienced business analyst in the process.
10 IBM Cognos Transformer Version 10.1.1: User Guide
Page 25

Together, try to develop and maintain a list of follow-up questions, such as the
following:
v Does each dimension level generate valid data, with measures that are properly
associated or coordinated, for every data source?
Try to spot measures that do not roll up as expected, or that are not additive in
every dimension.
v Are ranges or qualitative values coded realistically? Are the values for key
performance indicators consistent, or is the integrity of the underlying data
suspect?
In some cases, you may need to add other measures that substitute average
figures, or industry standards, for unavailable or non-continuous values.
v Is the data at some of the lower drill-down levels too sparse to be useful?
Should the model be redesigned, or should drill-through targets be added?
Consider expressing some values as ranges rather than absolutes, to create
useful groupings such as responsiveness or rates of return, for example, or to
hide sensitive details, such as salaries.
v Could the data flowing from different databases, models, and reports be better
coordinated, perhaps by using normalized measures, to ensure that computer
resources are not overburdened?
v Has anyone developed a calculated column or exception dimension that could
be added to the standard reports for the benefit of all?
If you maintain regular contact with your report users, you can incorporate their
feedback into your model enhancements. If you change your model and cubes, use
the label and description fields for each dimension, level, and measure, so that
reports created from your model are clear and intuitive.
Upgrade an IBM Cognos Series 7 Model
To upgrade models created in earlier versions of Cognos Transformer, you must
save them in the Model Definition Language (MDL) format before you can import
them into Cognos Transformer version 8.x and later. This ensures that equivalent
definitions are created for all model objects. You can upgrade models from IBM
Cognos Transformer, versions 7.x.
You can open an IBM Cognos Series 7 model with secured cubes in Cognos
Transformer, and convert the IBM Cognos Series 7 user class views to IBM Cognos
custom views. You can then choose the authentication provider you want to use
with the custom views. For more information, see Chapter 7, “Adding Security,”
on page 147.
During the transition from a Series 7 namespace to an alternate security provider,
you can use the PowerCube property All applicable namespaces to associate all
applicable namespaces during migration testing. When you associate all the
applicable namespaces to the cube, you can ensure that the group, role, or user
dimensional filtering is consistent with that which had been applied for the IBM
Cognos Series 7 user class. This option is supported only for migration testing, and
cannot be used to deploy cubes in production environments.
You can change the data source association for IBM Cognos Series 7 .iqd files to an
IBM Cognos package or report to take advantage of the enhancements available
when using IBM Cognos data sources. You change the association after the
updated model is saved in Cognos Transformer 8.x. For more information, see
“Change a Data Source Type” on page 33.
Chapter 2. Planning Your Model 11
Page 26

When importing .mdl files from earlier versions, some features may not convert
correctly, such as legacy data that contains special characters, spaces, and quotation
marks. For more information, see the migration documentation delivered with
your version of the product.
Before you begin
Tip: If you plan to upgrade, ensure you save all your models as .mdl files before
you attempt to upgrade them.
Procedure
1. Open the model in the earlier version of Cognos Transformer and, from the
File menu, click Save As.
2. In the Save as Type box, click Exported Model Files (*.mdl).
Tip: By default, Cognos Transformer saves models in the My
Documents/Transformer/Models directory. You can set the default location to
which Cognos Transformer saves models by changing the Models directory
setting on the Directories tab of the Preferences property sheet.
3. Open your new .mdl file in the current version of Cognos Transformer, make
any required changes to the model design, and save it, again selecting the .mdl
format.
Tip: If your IBM Cognos Series 7 model includes security, you will receive a
message when you open the model in Cognos Transformer version 8.x and
later indicating that you must choose how to manage the security during the
upgrade process. For more information, see “Upgrade an IBM Cognos Series 7
Secured PowerCube” on page 158.
When you are ready to use the model in your production environment, you
may want to save it as a .py?-format file.
Models that are created using Cognos Transformer version 8.x and later (.mdl
and .pyj files) are not backward compatible with Cognos Transformer versions
7.x. As a result, we strongly recommend that you maintain the .mdl file for the
Cognos Transformer 7.x model for a period of time following an upgrade.
12 IBM Cognos Transformer Version 10.1.1: User Guide
Page 27

Chapter 3. Data Sources for Your Model
Models contain definitions of dimensions, levels, and measures. They also contain
features such as calculated measures, dimension views, or custom views that you
add to the basic PowerCube definition to meet your particular business intelligence
needs.
By querying the data in the specified sources, you create the multidimensional
PowerCubes or cube groups required by users of the IBM Cognos Business
Intelligence components, such as Analysis Studio.
Data sources can be one of the following:
v Structural (dimensional)
Contain the columns that define the model structure, such as the categories in
each dimension. Structural sources usually contain many columns and few rows.
v Transactional (fact)
Contain the columns for the measures to be tracked. They usually contain many
rows and few columns, typically one for each dimension and one for each
measure.
v Mixed
Contain the columns that define the model structure and the columns that
contain the measures to be tracked, using the same data source.
Techniques for Designing Data Sources
When setting up the data sources for your model, you should take into
consideration three principles.
These three principles are as follows:
v Where possible, design your data so that the structural information for each
dimension is provided by one source.
v Ensure that each data source contains enough information to generate the
categories for a dimension without database joins. If you must use database
joins, join queries from separate database tables using tools such as Framework
Manager, before you import the data.
v In addition to database security, be aware that different releases of Cognos
Transformer offer different options for protecting your cubes and controlling
access to information. For example, Cognos Transformer version 7.x supports
user class views whereas later versions of Cognos Transformer replace this
feature with custom views that can be associated with IBM Cognos security
objects (users, groups, and roles).
Data Source Types
Cognos Transformer supports IBM Cognos Series 7 data sources as well as
packages and reports that contain IBM Cognos query items.
This section lists the supported data sources, summarizes the information you
must specify for each data source, and identifies associated limitations.
© Copyright IBM Corp. 2007, 2011 13
Page 28

Tip: You can also click the Help button, where available, for context-sensitive
information about the parameters that you must specify.
Note: Although you can add an unlimited number of data sources or columns to
each model, you must perform any necessary joins between the various data files
before you import the data into your Cognos Transformer model. You must also
ensure that each data source contains sufficient information to provide the
necessary context for any drill-down paths specified in the model.
IBM Cognos Package or Report
You can import query items, and the associated filters and prompts, from IBM
Cognos packages and reports.
You do this by choosing the Package or Report data source type and browsing and
selecting from the available metadata.
Note: Transformer does not support IBM Cognos Finance reports or packages as a
data source. However, you can create PowerCubes directly in Cognos Finance.
After import, you can combine the IBM Cognos data with the data from other
sources as required. Individual query items can be used as source columns in the
Cognos Transformer model, and can be updated using the Modify Columns
feature. In relational packages and reports, measures appear as defined in
Framework Manager.
For more information about using packages and reports as a data source in Cognos
Transformer, see “Guidelines for Using IBM Cognos Packages and Reports as Data
Sources” on page 15 and “Creating a Model in Cognos Transformer” on page 347.
For information about modeling IBM Cognos relational and dimensionally
modeled relational (DMR) data sources, see the Framework Manager User Guide.
Dimensionally Modeled Relational Packages
When you access metadata from a dimensionally modeled relational (DMR)
package, you can import and leverage the dimensions, or import the query items
or metadata that make up those dimensions. You can also import the measure
metadata. Metadata from DMR packages can be directly accessed using:
v Insert Data Source option on the Edit menu
Using this option, you can select measures and query items. The dimensional
structure is not imported.
v Insert Dimension from Package option on the Dimension Map
Using this option, you can select dimensions, hierarchies or levels. The selected
dimensions are created in Cognos Transformer, together with queries containing
appropriate query items.
If you want to take advantage of Cognos Transformer's relative time functionality,
do not import the date dimensions from dimensional packages. Instead, use the
Insert Data Source option to import the appropriate date field to create your time
dimension.
14 IBM Cognos Transformer Version 10.1.1: User Guide
Page 29

OLAP Packages
Cognos Transformer allows you to leverage metadata from published OLAP
packages. As a result, Cognos Transformer PowerCubes can be used as high speed
data access cache methods for distributing smaller or focused areas of your
business information.
Consider the size of the resulting cube when you use another OLAP package as a
PowerCube data source. OLAP sources, such as Essbase, can include significant
amount of data that is not appropriate for PowerCubes. However, taking a specific
segment of data from these sources can be very useful, particularly if you intend to
mix that data with other data sources for further reporting or analysis.
When you use OLAP sources to populate your Cognos Transformer models
v Import the dimensions that you require.
SAP variable prompts are supported and should be used where necessary to
limit the data to a specific segment of your data source. For more information,
see “Working with SAP BW Data Using a Package in Framework Manager” on
page 339.
v Create the time dimension in the same way that you create fact queries.
Cognos Transformer does not support importing time dimensions from any
OLAP source, including PowerCubes. To create the Cognos Transformer time
dimension with relative time categories, import your time information from
either an IBM Cognos relational package or report, or from a flat file exported
from IBM Cognos BI or the original OLAP vendor.
In Cognos Transformer, you add dimensions from OLAP packages directly from
the Dimension Map. This is a practical way to begin creating conformed
dimensions and, to some extent, reusing portions of the published metadata from
the source dimension.
Using the Insert Dimension from Package option on the Dimension Map, you
can select the dimensions, hierarchies, or levels that you want to import from any
OLAP package on to the Cognos Transformer Dimension Map.
SAP BW Packages
You can use Cognos Transformer to import both dimensional and fact data from an
SAP BW query source. To do so, the SAP BW query package must be in a specific
format. The Cognos Transformer PowerCubes you create with these specifically
constructed SAP query packages can be used as high speed data access cache
methods for distributing smaller or focused areas of your business information.
There are three stages to importing an SAP BW query to access both dimensions
and facts using IBM Cognos BI:
v “Creating a BW Query in SAP Business Explorer Query Designer” on page 340
v “Creating a Package in Framework Manager” on page 343
v “Creating a Model in Cognos Transformer” on page 347
Guidelines for Using IBM Cognos Packages and Reports as Data
Sources
This section contains guidelines, best practices, and tips to help you create Cognos
Transformer models using the IBM Cognos packages and reports as data sources.
Chapter 3. Data Sources for Your Model 15
Page 30

For more information on creating Cognos Transformer models, see “Creating a
Model” on page 24.
Use List Reports
Data source queries using reports perform most efficiently when the report is a list.
Graphs, dashboards, crosstabs, and complex reports cannot be used as data source
queries.
Importing Dimensional Packages
Use the Insert Dimension from Package command when importing dimensional
packages if you want the dimensional structure maintained. This option preserves
the dimension levels and uses the smallest set of query items.
Importing Time Dimensions from Packages
When you create a query in Cognos Transformer based on a Framework Manager
package that contains hierarchical time-related categories, Cognos Transformer
interprets the time-related categories as a regular dimension and not as a time
dimension. As a result, the time dimension in your PowerCube will not contain
any relative time categories.
To avoid this problem, ensure that you import all of the data needed to define
your time dimension, and use Cognos Transformer to create the date levels and
categories.
Prompts in Report Data Sources
You can use a report with prompts as a data source in Cognos Transformer. You
must provide values for any mandatory prompts “Edit Existing Prompts in IBM
Cognos Reports and Packages” on page 29 when adding a query based on the
report data source to the model. Cognos Transformer asks you for these values
only the first time you add a query from a report data source. Any values you
provide are cached.
If you want to add a second query using the same report as a data source to your
Cognos Transformer model, you will not be prompted to provide values for
mandatory prompts. The values in the cache will be used. Although you can
refresh the source when adding the second query to force Cognos Transformer to
reprompt you for values, data will still be retrieved based on the first query.
To create two queries in your Cognos Transformer model that are based on the
same report data source, where you want to provide different values for
mandatory prompts, you must duplicate the report data source. Use one report
data source to add the first query to the model and use the duplicate report data
source to add the second query to the model.
Extra queries may appear when you import a report that contains prompt pages.
These queries can be identified by the presence of query items named Use Value
and Display Value. Avoid importing query items from these queries.
For more information about prompt support, see “Edit Existing Prompts in IBM
Cognos Reports and Packages” on page 29, and “Using IBM Cognos Reports to
Create a Data Source” on page 193.
16 IBM Cognos Transformer Version 10.1.1: User Guide
Page 31

Framework Manager Governor Settings
Cognos Transformer cannot view or override Framework Manager governor
settings with an exception of the governor setting that controls null suppression for
SAP BW data sources.
For more information on Framework Manager governor settings, see the
Framework Manager User Guide. For information about setting null suppression for
SAP BW data sources, see the Cognos Transformer context-sensitive help for the
Suppress null values for SAP BW data sources option on the General tab of the
Preferences dialog box.
Using Calculated Query Items
Review the rollup rules in Cognos Transformer when you use calculated query
items as measures to avoid incorrect rollup results. For example, a rollup rule of
Sum should not be applied to a measure that uses a calculated item when the
value is expressed as a percentage. For more information, see “Rollup Functions”
on page 331.
Folders and Shortcuts in Imported Packages
Cognos Transformer does not display empty folders and folders that contain only
calculations. Shortcuts to this type of folders, as well as empty query subjects and
namespaces, are not displayed either.
Folders that contain calculations and query subjects are displayed, but without the
calculations. Shortcuts to this type of folders are also displayed.
Handling Model Changes
When the model associated with a package or report is subsequently altered, for
example, query subjects are removed, the Cognos Transformer model that uses the
package or report as a data source is not automatically updated to reflect the
changes.
You can use the Modify Columns feature to detect and fix the changes. Otherwise,
the changes in the source model are detected only when queries are executed, or
when you run Check Model on the Cognos Transformer model.
Rollup Aggregate Settings
When you use columns from a data source that uses package-based measure query
items as measures in Cognos Transformer, Cognos Transformer maps the rollup or
regular aggregate setting of the package source query items to a corresponding
measure rollup type in Cognos Transformer. However, when you use a query item
from a data source that uses report-based measures as query items in Cognos
Transformer, Cognos Transformer always creates the measure with the default
rollup type Default (Sum) because the report metadata does not return any
aggregate settings.
When you work with a data source that uses report-based measure query items,
review the measure properties defined on that data source to ensure that the
measure has the appropriate rollup type.
Chapter 3. Data Sources for Your Model 17
Page 32

Aggregate Values in Imported Query Items
When you import a Report Studio report, a Query Studio report, or a package as a
data source where aggregate values do not match the source package or report,
you receive an error message if the report or package contains an aggregation rule
that is not supported by Cognos Transformer.
When an aggregation rule is not supported, Cognos Transformer defaults to the
Sum rollup rule.
Data Preview
Data preview windows may not show data rows grouped or sorted as they appear
in a report; however, this does not impact how Cognos Transformer uses the data
when building cubes.
Extra Query Items
When you create a data source using a report that contains groupings, the report
query sometimes shows extra query items.
The extra query items are created to support grouping, and should be ignored
when selecting the data items for the Cognos Transformer query.
Multilingual Data in Reports
When you create a data source using a report, and the report includes data in
multiple languages, some of the language characters may not display properly in
the Cognos Transformer Data Source Viewer. These characters are displayed as a
dashed line (--).
Cognos Transformer does not support reports with multilingual data as a data
source. When the operating system locale is properly set, Cognos Transformer
displays the characters for that locale.
Business Viewpoint Studio
IBM Cognos Business Viewpoint Studio provides you with one version of the truth
for dimensions used in an enterprise's performance management processes.
Business Viewpoint Studio is a controlled, collaborative, workflow-oriented
business process to manage both manual and automated changes to all data related
to how enterprises analyze and manage their business.
Business users are given the responsibility and authority to manage dimensions in
their areas of domain responsibility. By using workflows, proposed changes and
additions to dimensions are approved and validated before being distributed
throughout the enterprise. You use the Business Viewpoint Client to subscribe to
Business Viewpoint Studio master dimensional data from within Cognos
Transformer.
IBM InfoSphere Warehouse Cubing Services
IBM Cognos Transformer supports the cubing services technology of IBM
InfoSphere
®
Warehouse as a data source.
No IBM Cognos components need to be installed on the cubing services server.
18 IBM Cognos Transformer Version 10.1.1: User Guide
Page 33

TM1 Cubes
IBM Cognos Transformer supports TM1®cubes as a data source.
You must install the TM1 client on the same computer as the IBM Cognos Business
Intelligence installation.
Impromptu Query Definition File
Impromptu®Query Definition (.iqd) files are generated from IBM Cognos
Impromptu.
The .iqd files are Cognos Transformer data sources that point to source databases
specified in the cs7g.ini file located in the installation_location\CS7Gateways\bin
directory.
To use IQD data sources, IBM Cognos Series 7 IQD Bridge must be installed.
Because this component can be installed only on platforms supported by IBM
Cognos Series 7.4, IQD data sources can also be used only on Series 7-supported
platforms. The data sources used with.iqd files must be supported on the same
platforms.
For information about accessing databases using the Series 7 IQD Bridge, see
“Connecting to an IQD Data Source” on page 39.
When importing an IQD data source in Cognos Transformer, accept the default
Isolation level or specify an alternative. For more information, see “Isolation
Levels for an IQD Data Source” on page 39.
For an up-to-date list of supported environments, visit the IBM Cognos Customer
Center http://www.ibm.com/software/data/cognos/customercenter.
Delimited-field Text with Column Titles
Flat files are an excellent data source for achieving fast cube builds. Flat files are
also recommended when you want to import OLAP fact data.
With Delimited-field text with column titles, input values are obtained from a
text file with one record per line or row. The values in the first line represent
column names.
When importing a flat file data source in Cognos Transformer, specify how the
fields (column values) are delimited in the Field delimiter box, and either accept
the default Character set or specify an alternative.
You can specify Unicode as a valid character set. Using an IBM Cognos report, you
can define the fact query and the data you want to import for your PowerCube.
You can then export the report to a .csv file that can in turn be used as the fact
query data source in your Cognos Transformer model.
For more information, see “Character Sets Used with Delimited Text Data Sources”
on page 41.
Delimited-field Text
Flat files are an excellent data source for achieving fast cube builds. Flat files are
also used when you want to import OLAP fact data.
Chapter 3. Data Sources for Your Model 19
Page 34

With Delimited-field text, input values are obtained from a text file with one
record per line.
When importing a flat file data source in Cognos Transformer, specify how the
fields (column values) are delimited in the Field delimiter box, and either accept
the default Character set or specify an alternative.
In Cognos Transformer, you can specify Unicode as a valid character set. Using an
IBM Cognos report, you can define the fact query and the data you want to import
for your PowerCube. You can then export the report to a .csv file that can in turn
be used as the fact query data source in your Cognos Transformer model.
For more information, see “Character Sets Used with Delimited Text Data Sources”
on page 41.
Access Table
With an Access table, input values are obtained from a Microsoft Access file.
Cognos Transformer uses the Microsoft ActiveX Data Objects (ADO) driver to
access the data.
In Cognos Transformer, select Table or range.
Access Query
With an Access query, the source table is described in a Microsoft Access Query
(.mdb file). Cognos Transformer uses either the Microsoft ActiveX Data Objects
(ADO) driver to access the data, or runs the SQL queries stored in the .mdb file to
get the source columns from an ODBC-enabled server database.
Note: Password-protected files are not supported.
In Cognos Transformer, select Table or range.
Excel Crosstab
With an Excel crosstab, input values are obtained from an Excel crosstab file.
Cognos Transformer supports both .xls and Excel 2007 .xlsx file formats. You must
have Excel 2007 or the 2007 Office System Driver data connectivity components
installed on your computer to select the .xlsx file format when browsing for a data
source.
For more information, see “Named Ranges” on page 41.
Excel Database
With an Excel database, input values are obtained from a Microsoft Excel
spreadsheet database file.
Cognos Transformer supports both .xls and Excel 2007 .xlsx file formats. You must
have Excel 2007 or the 2007 Office System Driver data connectivity components
installed on your computer to select the .xlsx file format when browsing for a data
source.
In Cognos Transformer, select a range name from the Table or range box. For more
information, see “Named Ranges” on page 41.
20 IBM Cognos Transformer Version 10.1.1: User Guide
Page 35

PowerHouse Portable Subfile
With a PowerHouse®portable subfile, input values are obtained from a Cognos
PowerHouse 4GL portable subfile.
In Cognos Transformer, specify the portable subfile dictionary (.psd) file or the
data (.ps) file. Accept the default Character set or specify an alternative. For more
information, see “PowerHouse Data Source Parameters” on page 43.
Fixed-field Text
With Fixed-field text, input values are obtained from a text file with one record per
line. Each field starts at the byte immediately following the preceding field; the
width of each field occupies a specified number of bytes. Each row ends with a
text line delimiter.
In Cognos Transformer, manually add columns to your data source by specifying
the position and length, in bytes, of each column in the source file. Accept the
default Character set or specify an alternative.
Fixed Field and Record Without CR LF
With Fixed field and record without CR LF, input values are obtained from a text
file. Each field starts at the byte immediately following the preceding field; the
width of each field occupies a specified number of bytes. The record end is not
marked by a text line delimiter.
In Cognos Transformer, manually add columns to your data source by specifying
the position and length, in bytes, of each column in the source file. Accept the
default Character set or specify an alternative.
Designing Successful IBM Cognos PowerCubes
The most successful business intelligence applications are designed with well
planned models. This includes an analysis of how the data in the models will be
used by report and analysis users. Consider the following concepts when
designing PowerCube models for use in IBM Cognos BI products.
Conformed Dimensions
Dimensions are conformed when the data values that come from the original data
sources use the same business keys, or source data, that is used in other packages
or models in your IBM Cognos environment. Conformed dimensions allow your
users to combine or cross data sources successfully when their business needs
require that they do so.
For example, consider that your goal is to drill through to product line information
between two reports. The first report is based on a PowerCube package, and the
second report is based on a relational package. Each product line in the relational
package should include a business key, or unique identifier. In the PowerCube
model, the Source value for each category in the Product Line dimension should
reference the same data value as the business key in the relational package.
When the same business keys and source values are used throughout your IBM
Cognos application data, end user success with reporting and analysis will increase
substantially.
Chapter 3. Data Sources for Your Model 21
Page 36

Conformed dimensions are also key in successful data analysis using multiple
PowerCubes. When two cubes are to be used together, as with drill through,
ensure that the dimensional structure and the category source values are the same
in each cube model. Changes in the structure of a dimension in one cube, for
example, by adding another level, will impact both the reports and drill-through
applications that use the two cubes.
IBM Cognos Business Keys
In IBM Cognos Business Intelligence Reporting, PowerCube categories, or
members, have business keys that can be used for advanced reporting or in
drill-through scenarios. During Cognos Transformer model design, you can
determine the IBM Cognos business keys by setting the level source values.
Tip: Report Studio report authors can determine PowerCube business keys using a
calculation such as
roleValue(’business key’,[mycube].[Product Dimension].[All
Products].[Product Line])
Member Unique Names
In the IBM Cognos studios, the Member Unique Name (MUN) is the unique
identifier for locating the category or member in the data source. The MUN is
much like the business key in a table.
Cognos metadata uses the Cognos Transformer model category codes when
defining the MUN of a PowerCube category or member.
Member Unique Names are used
v as data item references for categories or members in any report specification
v as the value passed in PowerCube to PowerCube drill through in any report
v as identifiers for categories or members used in filters, expressions, parameters,
or calculations in IBM Cognos BI
v to return categories or members to IBM Cognos applications
Any time a Cognos application requests the category or member, the MUN
ensures that the unique category or member is returned.
Tip: You can view the Member Unique Name for a category or member in Report
Studio. In Report Studio, open a PowerCube package, select a category, and view
the category properties.
Each time a PowerCube category code changes, the MUN reflects the change.
When categories or members are directly referenced in expressions, filters, or
reports, and the MUN changes, the category or member is no longer found. This is
because the original MUN is contained in the report specification.
Member Unique Names can change for different reasons:
v Changes in the hierarchy and level structures can result in changes to MUNs.
v Relative time categories may change, for example, when the current quarter
moves from one to the next.
v If a source value changes, the category code used in the MUN also changes,
unless the category code is specifically set to use a unique data item in the
model design.
v The production environment may have more categories or members than the test
environment.
22 IBM Cognos Transformer Version 10.1.1: User Guide
Page 37

v The category or member may no longer exist in the data source.
To avoid these problems, use the following best practices:
v Use unique codes and keys within a dimension for the category or member
keys.
Ensure that your Cognos Transformer model source values have unique values
throughout the levels of each dimension. This ensures that the model category
codes, and therefore the MUNs, are more stable.
v Use unique conformed source values for similar dimensions between the target
and source environments when enabling drill through.
v Ensure that the business keys and dimension metadata structure are the same
between the production and test environments.
v If the data source is a package or report, do not change the business keys after
going into production.
v Resolve the non-unique keys within a dimension in the data source.
Do not use the tilde character (~) in the category codes because this might
produce unstable MUN values.
v If you have tildes within your category codes, do not use the Clean House
feature.
Using the Clean House feature will most likely change the category codes.
v Keep a backup of your .mdl file and revert to the backup .mdl model file if the
current model file becomes corrupt and requires a Clean House action.
Resolving Uniqueness Problems in Your Data Source
To avoid ambiguity problems in your reports, design your models so that no two
categories in a level represent identically-named distinct categories, such as cities
with the same name in two or more regions.
When you create models in Cognos Transformer, multiple non-unique categories
imported into the same level are made unique by appending ~### to the duplicate
codes, where ### represents an ascending numeric sequence.
The mappings between these assigned codes and their associated source values are
stored in the Cognos Transformer model for use in subsequent cube build
operations. However, errors may arise if the model is not saved after a cube
refresh, or if the processing order changes for any reason.
For example, IBM Cognos report specifications reference categories or members of
an OLAP package, including PowerCubes, using a unique identifier referred to as
Member Unique Name (MUN). This MUN is generated for each category in a
PowerCube and is based on the fully-qualified path of category codes in the
dimension, according to where the category exists within the dimension. If the
category codes change for any reason, the report specification can no longer locate
the original MUN. The report author must modify the report to point to the
updated category or member.
If your source data contains columns that populate levels that are not unique, an
error message warns you of the potential problem when you attempt to generate
categories. However, this prompting occurs only if the data source contains all the
columns required for the levels in question. If categories for some levels have
values derived from other transactional data sources, uniqueness conflicts may
arise but remain undetected. Also, if you select an optimization setting that
Chapter 3. Data Sources for Your Model 23
Page 38

maximizes query speed, Cognos Transformer does not check your model for
uniqueness conflicts. For this reason, save your model after every cube build.
To ensure successful business intelligence applications using IBM Cognos BI, the
data sources that feed your Cognos Transformer models must have unique
business keys or source values through the levels of each structural dimension that
you model. In addition, source values that conform with the business keys in other
applications used in IBM Cognos BI will have the best success rates when used
with drill-through applications and other business intelligence applications.
Using Calculated Columns to Qualify Non-unique Data
You can use Cognos Transformer calculated columns, Framework Manager, or a
query tool to render the level values unique, or simply redefine the data in your
source so that it does provide unique values. Correlate the settings in the
appropriate property sheets of your model so that your data is correctly mapped in
the relevant IBM Cognos components.
Ensure that the data sources that feed your Cognos Transformer models account
for this uniqueness. Provide conformed values to any applications that you want to
use with IBM Cognos Business Intelligence products.
Creating a Model
To create the cubes that you need for OLAP reporting, you begin by creating a
model.
This involves
v specifying the data sources for the model and any required security credentials
v defining dimensions, levels, and measures based on the selected query objects in
your IBM Cognos package or report, or the tables, rows, or columns of your
other data sources
v defining cube objects that use the contents of the model to create PowerCubes or
cube groups
You can store your models as text (.mdl) files or in binary format (.py? files, where
? is replaced by a character that represents the version of Cognos Transformer used
to create the model). In Cognos Transformer versions 8.3 and later, models are
given a .pyj extension. Binary format (.py?) files are not compatible across different
versions of Cognos Transformer. For this reason, you should always create a text
(.mdl) version of your model.
Reordering Data Sources
You can organize your data sources in a way that is meaningful for you by
reordering the data sources or the items within data sources. This can be done for
presentation purposes only.
You can reorder
v the top-level data sources, such as flat files, packages, reports
v queries within a package or a report
v columns within a data source
Tip: Dragging an item to its parent places it at the front of the list.
24 IBM Cognos Transformer Version 10.1.1: User Guide
Page 39

The order in which the data sources, queries, and columns appear in the list does
not impact the cube build performance. Also, regardless of this order, Cognos
Transformer automatically processes queries with measures last.
Creating a Model Using an IBM Cognos Package or Report
When the data source is a relational or dimensionally modeled relational (DMR)
package, you can import query items to create your structural or transactional
queries. You can have multiple data source queries associated with each package or
report you create as a data source.
You can create data source queries using reports created in Query Studio or Report
Studio using relational or DMR packages.
You cannot create data source queries using Cognos OLAP reports. For example,
Transformer does not support IBM Cognos Finance reports or packages as a data
source. However, you can create PowerCubes directly in Cognos Finance.
For more information, see “IBM Cognos Package or Report” on page 14, including
“Guidelines for Using IBM Cognos Packages and Reports as Data Sources” on
page 15.
For information about creating Cognos Transformer signons, see “Signons” on page
54.
Use the following tips when saving your model.
v By default, Cognos Transformer saves models in the My Documents/
Transformer/Models directory. You can set the default location to which Cognos
Transformer saves models by changing the Models directory setting on the
Directories tab of the Preferences property sheet on the File menu.
On Windows Vista, Cognos Transformer saves models in the
Documents/Transformer/Models directory.
v When prompted to save in binary (.py?) or text (.mdl) format, use the latter
when exporting models or, to avoid possible fragmentation problems, when you
have made a lot of changes since your last save action.
v In addition to saving your models in .mdl format, you should regularly use the
Check Model command from the Tools menu to help you diagnose and resolve
any problems in your model design.
v In Windows, the .pyj model file extension is not automatically associated with
Cognos Transformer. To open a model in Cognos Transformer by double-clicking
the .pyj file, you must first create the association in Windows.
Procedure
1. From the Cognos Transformer Welcome page, click Create a new model.
Tip: If you are already in Cognos Transformer, click New from the File menu
to open the New Model wizard.
2. Type a name for your new model and click Next.
3. In the Data source name box, enter the name of the data source and, in the
Data source type box, select Package or Report.
Tip: If you want the data source name to default to the name of the package
or report that you select in the next step, leave the Data source name box
blank.
4. Click Browse to open the metadata browser and select a package or report
from the available list.
Chapter 3. Data Sources for Your Model 25
Page 40

Tip: You can also click the drop-down arrow to select a recently used package
or report from the list.
5. In the Browse Metadata dialog box, select the package or report to use for the
data source, and click OK.
6. Click Next.
7. If you select a report as a data source and it contains mandatory prompts,
provide values for the prompts.
Cognos Transformer cannot execute queries if values are not provided for
mandatory prompts. For information about prompts, see “Edit Existing
Prompts in IBM Cognos Reports and Packages” on page 29.
8. In the Query name box, type a name for the new query.
Note: When you use the New Data Source wizard to create a new data
source, you create one query at a time.
9. In the Source list, select the query items to import and click Add to add the
selected query items to the Cognos Transformer query.
If the data source is a report and the report contains multiple queries as in the
case of some Report Studio authored reports, each query will be shown with
its relevant query items.
Tips:
v Report Studio authored reports will show queries that are associated with
the list. The relevant query items for those queries will be available for use
in Cognos Transformer.
v If the data source is a package with dimensions, you can import the
dimensions using the Insert Dimension from Package option.
10. Click OK.
11. If you want Cognos Transformer to automatically create a preliminary
dimensional structure for you, on the last page of the New Model wizard,
select the Run AutoDesign check box.
12. Click Finish.
13. If you are prompted for data source connection and signon information:
v Select the connection and click OK.
v Choose whether to enter a valid user name and password for the current
session, or create a Cognos Transformer signon for the current and
subsequent sessions:
When you enter a valid user name and password and click OK, the signon
will be used only during the current Cognos Transformer session. The
signon will not appear in the Signons list, and is not saved in the model.
To create a Cognos Transformer signon that appears in the Signons list and
is saved in the model, enter a valid user name and password and select the
Create a Transformer signon from the user name and password or select
an existing one for use with this data source check box. In the
Transformer Signon box, click the drop-down arrow to select an existing
signon, or click the Add button to open the Signon dialog box to create a
new signon. In the Signon name box, type the signon name and specify
whether to prompt for a password and click OK. If you do not select the
Prompt for password check box, in the Confirm Password dialog box,
re-type the password and click OK twice.
14. If you want to add another query to the package or report data source, click
Yes when prompted to add another query, and repeat steps 8 to 9.
15. Save the model.
26 IBM Cognos Transformer Version 10.1.1: User Guide
Page 41

Results
Use the Data Source Viewer to view sample data and, for supported data sources,
the Cognos SQL or the native database SQL.
Creating a Model Using an SAP BW Package
SAP BW packages can be used to import fact data and dimensional data.
When creating your model use the Insert Dimension from Package wizard. This
wizard
v Creates a single query for each dimension and for the facts.
v Imports facts and dimensions in the same manner as dimensionally-modeled
relational models. That is, facts and dimensions are imported at the same time.
v Ensures that the scope is set properly between the dimensions and facts.
v Populates the dimension with the appropriate business key and caption
information.
v Imports only the necessary items from the BW package required for cube
building, when the metadata is imported.
This reduces the number of attributes and keeps the data volumes to only the
necessary items for cube building.
For information about preparing SAP queries and creating packages in Framework
Manager for use in Cognos Transformer, see Appendix E, “Guidelines for Working
with SAP BW Data for Use in Transformer,” on page 339. For information about
creating an SAP package-based model, see “Creating a Model Using an SAP BW
Package.”
Procedure
1. In Cognos Transformer, click Create a new model.
2. In the New Model Wizard, click Cancel.
3. With the Dimension Map pane selected, from the Edit menu, click Insert
Dimension from Package.
4. Click Browse to open the metadata browser.
5. In the Browse Metadata dialog box, select the package that contains your SAP
BW query and click OK.
6. In the Insert Dimension from Package dialog box, click Finish.
7. In the Select Dimension and Measures from Package dialog box, click the
dimensions and measures to include in the data source.
Select a query item that will provide the dates for the PowerCube. Note that
the dates for the PowerCube can be derived entirely from the transaction data.
8. If there are errors or warnings, you are notified. In the Data Sources pane,
expand the package to view the data source queries and query items. Key
figures or measures appear in the Measures pane.
Ensure that the aggregation rule for each measure is correctly defined within
Cognos Transformer to align as closely as possible with the aggregation rule
defined in SAP BW.
Set the storage type for all measures to 64-bit floating point.
Ensure that the leaf level of each dimension is marked as unique.
SAP BW presentation hierarchies may contain ragged paths, typically in
association with the "not assigned" and "#" nodes in the hierarchy. The gaps in
these hierarchies produce blanks at the associated level in the Cognos
Chapter 3. Data Sources for Your Model 27
Page 42

Transformer hierarchy. In Cognos Transformer, it is possible to define the text
that should be used for blanks (the default text is "<blank>"). A best practice
is to define a more appropriate text for blank entries for all such levels.
9. If you want to add another query, repeat steps 3 to 7.
10. Save the model.
Creating a Model Using Other Data Sources
You can create a model using different types of supported data sources.
When you use .iqd files, ensure that the Series 7 IQD Bridge component is
installed. This component must be installed on platforms supported by IBM
Cognos Series 7 .4. For more information, see “Isolation Levels for an IQD Data
Source” on page 39.
For a Microsoft Access or Excel database, a table name or a named range of cells
from the Excel worksheet must be specified.
For more information about the parameters required for each data source type, see
Chapter 3, “Data Sources for Your Model,” on page 13.
Use the following tips when saving your model:
v By default, Cognos Transformer saves models in the My Documents/
Transformer/Models directory. You can set the default location to which Cognos
Transformer saves models by changing the Models directory setting on the
Directories tab of the Preferences property sheet on the File menu.
On Windows Vista, Cognos Transformer saves models in the
Documents/Transformer/Models directory.
v When prompted to save in binary (.py?) or text (.mdl) format, use the latter
when exporting models or, to avoid possible fragmentation problems, when you
have made a lot of changes since your last save action.
v In addition to saving your models in .mdl format, you should regularly use the
Check Model command from the Tools menu to help you diagnose and resolve
any problems in your model design.
v In Windows, the .pyj model file extension is not automatically associated with
Cognos Transformer. To open a model in Cognos Transformer by double-clicking
the .pyj file, you must first create the association in Windows.
Procedure
1. From the Cognos Transformer Welcome page, click Create a new model and
click Next.
Tip: If you are already in Cognos Transformer, click New from the File menu
to open the New Model wizard.
2. Type a name for your new model, and click Next.
3. In the Data source name box, type the name of the data source and, in the
Data source type box, select one of the available options.
4. Click Next to specify information about the data source.
The parameters depend on the data source type that you selected on the
previous page. If you selected an IQD data source, set the Isolation level.
5. Click Browse to open the data source browser and select a data source from the
available list.
6. Click Next.
28 IBM Cognos Transformer Version 10.1.1: User Guide
Page 43

7. Specify whether or not to Run AutoDesign, and click Finish.
8. Confirm that your selected items appear as expected in the Data Sources list.
Tip: To view sample data or the SQL from your data source, from the View
menu, click Data Source Viewer.
9. Save the model.
Results
If you imported measures that are not in scope for a particular dimension, or that
apply to more dimensions than your report users need, remove the extra items.
Alternatively, ensure that the scope is set correctly between the dimensions and the
fact query before you proceed.
Edit Existing Prompts in IBM Cognos Reports and Packages
You can use a report created in Query Studio or Report Studio, or an IBM Cognos
package as a data source for a model. These data sources may contain prompts
that add interactivity for users. Prompts are questions that help users customize
the information to suit their own needs. For example, a prompt may let users
select a product type. Only products belonging to the selected product type are
retrieved and shown in the report.
Prompts are either mandatory or optional; mandatory prompts require values
before Cognos Transformer can execute queries. For optional prompts in reports or
packages, Cognos Transformer does not require that you provide values.
When using a report with prompts as a data source, the user interface presented
by Cognos Transformer for prompts may be different than the user interface
presented when running the report in the IBM Cognos studio. For example, a
report with a prompt page defined to contain a single-value select drop-down list
may be presented in Cognos Transformer as a multi-value select list. This behavior
occurs because Cognos Transformer does not process any information from report
prompt pages. Ensure that you understand the purpose of each prompt when
using a report as a data source.
Many types of prompts exist, such as a text box prompt where you type a single
value, and a value prompt where you select a value from a list. The prompt type
determines the number of values you must provide, and the user interface shown
for entering those values. For example, for a single-value prompt, Cognos
Transformer uses the value when executing the query. For prompts with more than
one value, Cognos Transformer lets you define multiple values. These values are
presented in a drop-down list from which you can select more than one value
when Cognos Transformer executes the query. Note that although default values
for multi-valued prompts are supported in Cognos Transformer when using a
report as a data source, the default values do not appear. However, if you do not
provide any values for the prompt, the default values are used.
Report or package authors determine whether prompts are mandatory or optional.
You cannot change this designation within Cognos Transformer, or create prompts
using Cognos Transformer.
To create two queries in your Cognos Transformer model that are based on the
same report data source, where you want to provide different values for
mandatory prompts, you must duplicate the report data source. Use one report
Chapter 3. Data Sources for Your Model 29
Page 44

data source to add the first query to the model, and use the duplicate report data
source to add the second query to the model.
Cognos Transformer may reflect a cascade prompt as two multi- or single-select
prompts:
v The first prompt represents the first level of the original cascade prompt.
v The second prompt represents the second cascade level.
For query results in Cognos Transformer, only the second level is relevant. You
should be aware that the first prompt may appear as a multi-select prompt in
Cognos Transformer, even though the prompt in Report Studio is a drop-down list
box; in this situation, Cognos Transformer will ignore the first prompt.
When using a report that includes prompts as a data source, some types of
prompts produce supporting queries. Although these queries can be selected in
Cognos Transformer, error messages will occur if you select them. You can ignore
the messages.
Procedure
1. Right-click a query in the model and click Edit Prompts.
If the query does not contain any prompts, Cognos Transformer displays a
message indicating that no prompts were found.
2. For each prompt that you want to specify values for, in the Query Prompts
dialog box, click the Value box for the prompt that you want to define.
v An asterisk beside a prompt name identifies a mandatory prompt.
v A cross beside a prompt name identifies an obsolete prompt. This prompt
exists in the Cognos Transformer query, but cannot be found in the report or
package used as a data source.
v An arrow that points to the right beside a prompt name identifies a new
prompt. This prompt exists in the report or package used as a data source,
but cannot be found in the Cognos Transformer model.
3. Define the variable or value for the prompt:
Tips:
v For a prompt that requires a single value, such as a text box prompt, type the
value that you want used when Cognos Transformer executes the query.
v For a prompt that permits multiple values, such as a value prompt, the Enter
values for dialog box appears. Type a value in the Provide a value box.
Click the right arrow to add the value to the Choices list. Continue to type
and add values until all values you want the user to choose from appear in
the Choices list. Click OK.
v For a prompt that requires a value selected from a hierarchy, such as a Tree
prompt, the Select values for dialog box appears. Click a value and click
OK.
v For a prompt that requires a value selected from a list defined within the
report or package, such as a list of cities, the list of defined values appears
automatically. Click the value in the list.
v For a prompt that requires a value selected within a specific range, type the
initial value in the range (Range-From) box and the final value in the range
(Range-To) box.
– To quickly delete the value for one prompt, click the row in which the
prompt appears and click Clear Value.
– To quickly delete the values for all prompts, click Clear All.
30 IBM Cognos Transformer Version 10.1.1: User Guide
Page 45

– When you enter a prompt value, the data type is not verified. Entering
15oo, rather than 1500, for a numeric value does not generate an error or
warning even though the value is invalid. PowerCube creation may fail if
you use an invalid value.
4. For each prompt that you want to delete from the query, in the Query Prompts
dialog box, click the row in which the prompt appears and click Remove.
5. Click OK.
Generate a File of Prompt Values for Use in the Command
Line
You can generate an XML command file that includes prompt values for one or
more queries. This file is necessary to provide prompt values in UNIX
environments.
For more information about command line options and this command file, see
Appendix A, “Command Line Options,” on page 209.
For each query that requires prompt values, ensure that your selections are
up-to-date with the underlying package or report. “Remove Obsolete Prompts”
Procedure
1. Right-click a prompt and click Create Prompt Specification to create a
command line file for one query or click Create Prompt Specifications For All
Queries to create a command line file for all queries.
2. Choose a folder for the command line file, type a name for the command line
file, and click Save to save the command line file to your computer.
Remove Obsolete Prompts
Cognos Transformer stores prompts and their values in the Cognos Transformer
model and uses this information for data requests and to generate a prompt
specification. A prompt specification is supplied at the command line in batch
mode to override the values stored in the model.
Prompts that are no longer in a package or report are identified as obsolete. This
will occur, for example, if you remove a prompt for the report on which the model
is based and save the report. Then, when you use the Edit Prompts command, that
prompt is identified as obsolete in the Query Prompts dialog box. A prompt may
also be identified as obsolete simply because the underlying report or package is
unavailable. Once the report or package becomes available, the prompt becomes
up-to-date again. Tip: If all or several prompts are marked obsolete, verify the
connection to the server.
To ensure that your prompt selections are up-to-date with the underlying package
or report, for each data source in the model, you must remove any obsolete
prompts.
Procedure
1. In the Data Sources window, right-click the query and click Edit Prompts.
2. In the Query Prompts dialog box, in the Name list, click any obsolete prompts.
Tip: Obsolete prompts are indicated by an icon.
3. Click Remove.
You must repeat these steps for each query.
Chapter 3. Data Sources for Your Model 31
Page 46

Results
Note: Alternatively, you can remove obsolete prompts by directly editing the
prompt specification file that is generated from the model.
Specifying a Segmenting Prompt for an SAP BW Query
A segmenting prompt is used when querying a SAP BW data source for fact data.
Also known as a BEx variable, a segmenting prompt ensures that the query
retrieves a representative sampling of the fact data.
A segmenting prompt can be single value, multiple value, or a range. If you
specify a range, it must be inclusive, including a value for both the beginning and
end of the range. A segmenting prompt must be optional and have no default
value specified.
Multiple prompts, or BEx variables, are allowed. If you have multiple prompts,
you can select one as the segmenting prompt. The segmenting prompt should not
have values specified in any query. Mandatory prompts that are not specified as
the segmenting prompt must have a value specified. Optional prompts that are not
specified as the segmenting prompt may or may not have a value, as necessary.
Since prompts apply to all queries in the Cognos Transformer model but are
maintained separately for each query, the specified values should be the same in
all queries. If there is more than one fact query, each may use a different prompt as
the segmenting prompt. The queries can use the same segmenting prompt, if
suitable.
Tip: Segmentation is only supported for fact queries that have the Use stream
extract option selected on the Data Source property sheet, Source tab.
Procedure
1. In the Data Sources window, right-click the query item named Key Figures.
Key Figures contains measures.
2. In the Data Source dialog box, click the Source tab.
3. Ensure that the Use stream extract check box is selected. Click OK.
4. Right-click Key Figures again and click Edit Prompts.
The Name column in the Query Prompts dialog box lists all the prompts for
the data source.
5. In the Prompt for segmenting data list, select the prompt for segmenting the
fact data.
Only valid prompts are listed.
6. Ensure that the segmenting prompt does not have a default value specified.
Tip: To clear the values for a prompt, click the prompt in the Current prompt
values list, and click Clear Value.
7. Ensure that any mandatory prompts listed in the Current prompt values list
have a value specified.
8. Click OK.
9. When prompted to apply the prompt values to all the queries in the package,
click Yes.
32 IBM Cognos Transformer Version 10.1.1: User Guide
Page 47

Change a Data Source Type
If you decide after you import a data source in Cognos Transformer that the data
can be more effectively sourced from a different data source type, you can change
the data source.
You cannot change a data source for a query in the model to match another query
already in the model.
You cannot add or remove columns when you change a data source type.
In the data source you want to change, all columns must match references in the
new data source; you cannot match only some of the columns in the original data
source.
Procedure
1. In the Data Sources list, right click the data source you want to change, and
click Change Source Type.
2. In the New Data Source wizard, in the Data source type box, click the
drop-down arrow to select the new data source type.
You cannot change the data source name.
3. Enter the required information about the new data source type:
v For a package or report data source, click Browse to open the metadata
browser and select a package or report from the available list.
v For other data source types, specify the required information about the data
source, or click Browse to open the data source browser and select a data
source from the available list.
If you click Cancel, the entire change data source type action is canceled.
4. Click Finish.
5. In the Query Definition or Modify Columns dialog box, match the columns in
the original data source to the columns in the new data source:
v In the Source list, select a column.
v In the Model list, select the corresponding column.
v Click Match.
The Add and Remove buttons are disabled.
v When you finish matching all the columns in the original data source to
columns in the new data source, click OK.
The OK button is enabled only after all the columns in the original data
source are matched to columns in the new data source.
Create Dimensions from the Dimension Map Using OLAP and DMR
Packages
The Insert Dimension from Package option is available only from the Cognos
Transformer Dimension Map. This feature provides for dimensions to be created
efficiently to resemble the original dimensional structure from your OLAP or
dimensionally modeled relational (DMR) package as closely as possible.
When the data source is an IBM Cognos OLAP package, you must import the
dimensions from the package directly from the Dimension Map. You subsequently
import the measures from any other data source Cognos Transformer supports.
Chapter 3. Data Sources for Your Model 33
Page 48

Tip: If you want to use the measures from an OLAP source, create a relational
query against the source data used to build the original OLAP source. This
approach will provide the best possible performance.
Cognos Transformer version 8.x and later does not support parent-child
hierarchies in OLAP data source packages. If you attempt to create data sources
using OLAP packages with parent-child hierarchies, Cognos Transformer will
interpret each parent and child as unique dimensions.
Procedure
1. In a Cognos Transformer model, right-click the Dimension Map and click
Insert Dimension from Package.
2. Browse to select a dimensional package and click Finish.
3. In the dimension tree for the package, select the dimensions, hierarchies, or
levels that you want to add to your model and click OK.
The dimensions that you selected are added to the Dimension Map, and a
package data source is added to the Data Sources list. A single query for each
dimension is added under the package data source.
Where possible, Cognos Transformer includes the relevant label and business
key as the source column for each level in the imported dimension. Because
different OLAP sources behave differently, you may need to change the query
items used in the source or category code columns for the levels to ensure the
dimension is in scope with the measures for the model.
The import may include more metadata than expected. This allows you to
refine the columns that are used within the dimension.
Tip: To ensure conformed dimensions across different packages, the original
OLAP source should use unique business keys. This will help to ensure that
Cognos Transformer generates category codes that are conformed to the OLAP
source from which the dimension was created.
Adding an IBM Cognos Data Source to an Existing Model
The New Model wizard lets you specify only one data source, including one query
at a time for each package or report data source, you can use the wizard to add
the structural hierarchy (dimensional data) that is important to your business.
Before you begin
As the modeler, you must ensure that each data source has a unique name and
specify, if true, that all your category codes and source values are unique. This
precaution significantly reduces
v the possibility that end user reports will be negatively impacted by changes in
category codes
v drill-through problems
v other errors that can arise in distributed production environments
For more information, see “Resolving Uniqueness Problems in Your Data Source”
on page 23.
If you imported your dimensions to the Dimension Map from a package using the
Insert Dimension from Package option, you can add another dimension from that
package to the Dimension Map using the same option. This adds the additional
query to your package data source and completes the AutoDesign process on the
34 IBM Cognos Transformer Version 10.1.1: User Guide
Page 49

Dimension Map. If you add a query to an OLAP package data source using the
Add Query From Package or Report option, you will need to manually construct
the dimension.
You can use the Add Query From Package or Report option to add an additional
query to the data source.
Procedure
1. Right-click the empty space in the Data Sources list for your model and click
Insert Data Source.
Tip: If the Insert Data Source option is unavailable, you may have right-clicked
a package or report data source.
2. In the Data source name box, enter the name of the data source and, in the
Data source type box, select Package or Report.
Tip: If you want the data source name to default to the name of the package
that you select in the next step, leave the Data source name box blank.
3. Click Browse to open the metadata browser and select a package or report
from the available list.
Tip: You can also click the drop-down arrow to select a recently used package
or report from the list.
4. Click Next.
5. In the Query Name box, type a name for the new query.
In the New Data Source wizard, you create one query at a time.
6. In the Source list, select the query items to import and click Add to add the
selected query items to the Cognos Transformer query.
7. If you want Cognos Transformer to create preliminary dimensions in the
Dimension Map, select the AutoDesign check box.
8. Click Finish.
You will be prompted to add another query. If you want to add another query,
click Yes and repeat steps 6 and 7. If you click No, a new data source
containing the specified metadata appears. The source columns appear in the
Data Sources list and, if you selected Run AutoDesign, a preliminary
dimensional structure appears in the Dimension Map.
Tip: Use the Data Source Viewer to view sample data and, for supported data
sources, the Cognos SQL or the native database SQL.
Add Additional Queries to Existing IBM Cognos Data Sources
IBM Cognos packages and reports are shown in the Data Sources list as a single
data source with multiple associated queries. When you use the New Model
wizard or New Data Source wizard, you can add only one query at a time.
To add a second query to your package or report, use the Add Query From
Package or Report option. Add Query From Package or Report opens the Query
Definition dialog box, where you can create the new query. When you create the
new query, it is imported as an additional query under the package or report data
source.
Tip: If you imported your dimensions to the Dimension Map from a package
using the Insert Dimension from Package option, you can add another dimension
from that package to the Dimension Map using the same option. This adds the
additional query to your package data source and completes the AutoDesign
Chapter 3. Data Sources for Your Model 35
Page 50

process on the Dimension Map. If you add a query to an OLAP package data
source using the Add Query From Package or Report option, you will need to
manually construct the dimension.
You should not import query items from different query subjects unless the query
was intended for or works well with the data for that scenario. Adding query
items from multiple query subjects in a single import should be avoided, as it can
result in cross-joins or queries that are not valid.
When adding queries from a report, Cognos Transformer displays the source query
using the Query name specified in the query definition (for example, Query 1.0).
Cognos Transformer does not display the query name as defined by the Query
Name property in Query Studio or Report Studio.
Procedure
1. In the Data Sources list, right-click a package or report data source, or a query
under the package or report data source and click Add Query From Package or
Report.
Tip: If Add Query From Package or Report is not available, you may have
right-clicked the area outside the data source.
The Query Definition dialog box opens, showing the metadata from your
source package or report data source.
2. In the Query name box, type a name for the new query.
You create one query at a time.
3. In the Source list, select the query items to import and click Add to add the
selected query items to the Query definition details box.
4. Click Finish.
A new data source containing the specified metadata appears under the
original data source. The source columns appear in the Data Sources list.
Tip: Use the Data Source Viewer to view sample data and, for supported data
sources, the Cognos SQL or the native database SQL.
Adding Other Data Sources to an Existing Model
You can use different types of supported data sources for your model.
When you use .iqd files, ensure that the Series 7 IQD Bridge component is
installed. This component must be installed on IBM Cognos Series 7 version 7.4
supported platforms. For more information, see “Isolation Levels for an IQD Data
Source” on page 39.
For a Microsoft Access or Excel database, a table name or a named range of cells
from the Excel worksheet must be specified.
For more information about the parameters required for each data source type, see
Chapter 3, “Data Sources for Your Model,” on page 13.
Use the New Data Source wizard to add data sources required for your model.
Procedure
1. Right-click the empty space in the Data Sources list for your model and click
Insert Data Source.
36 IBM Cognos Transformer Version 10.1.1: User Guide
Page 51

Tip: If the Insert Data Source option is unavailable, you may have right-clicked
a package or report data source.
2. In the Data source name box, type the name of the data source and, in the
Data source type box, select one of the available options.
3. Click Next to specify information about the data source.
The parameters depend on the data source type that you selected on the
previous page.
If you selected an IQD data source generated from Impromptu , set the
Isolation level.
4. Click Browse to open the data source browser and select a data source from the
available list.
5. Click Next.
6. Specify whether or not to Run Autodesign, and click Finish.
7. Confirm that your selected items appear as expected in the Data Sources list.
Tip: To view sample data or the SQL from your data source, from the View
menu, click Data Source Viewer.
Synchronizing Columns with Your Data Source
As the modeler, you must ensure that the columns in your model reflect the
current state of your data sources. There is limited error-handling. For example, an
error message is issued if you try to add a query item that is already referenced in
your model.
You can quickly resynchronize your model columns after a data update. You can
add data source items to the model or remove columns from the model. You can
also resolve mismatches between data source items and columns in the model. For
example, if you rename data source items, Cognos Transformer may no longer be
able to match those items with their corresponding columns in the model.
You can choose to resolve mismatches manually or let Cognos Transformer attempt
to automatically resolve mismatches. For IBM Cognos data sources, Cognos
Transformer presents options for matches for your review. If Cognos Transformer
determines that mismatches are caused by a structural change in the data source,
Cognos Transformer provides a list of locations in the data source that may be
possible matches for mismatched columns. If none of the locations provided are
appropriate, or if Cognos Transformer is unable to suggest any locations in the
data source, Cognos Transformer provides a list of items in the model that are
similar to the source reference of the column. For each possible match, Cognos
Transformer shows how closely the references match by using a percentage. If
none of the items are appropriate, you can leave columns unmatched.
You can quickly resynchronize your model columns after a data update if your
model uses a single query based on a text data file, an IQD, or an IBM Cognos
package or report. Resynchronize your model by invoking the Modify Columns
command from the Tools menu.
Use the following procedure to synchronize columns with IBM Cognos data
sources.
Procedure
1. In the Data Sources list, select the query whose columns you want to modify,
and from the Tools menu, click Modify Columns.
Chapter 3. Data Sources for Your Model 37
Page 52

2. If there are columns in the model that cannot be matched to data source items,
you will get a warning message. Click No to keep these unmatched columns in
the model.
If you click Yes , Cognos Transformer deletes the unmatched columns.
3. For data source items that do not appear as columns in the model, select the
items in the Source list and click Add.
Tip: Click Refresh Source to refresh the source list for the data source. Click
Validate to check whether columns in the model violate any Framework
Manager governor settings.
4. For columns that you want to remove from the model, select the columns in
the model list and click Remove.
5. For unmatched columns identified by and X in the Matched to Source column
in the model list, do one of the following:
v To manually match query items to columns, select a data source item in the
Source list and a column in the model, and click Match.
v To allow Cognos Transformer to automatically match query items to
columns, select the columns in the model and click Auto Match.
6. If Cognos Transformer provides one or more locations in the data source that
may be appropriate for unmatched columns, do one of the following:
v If one of the locations is an appropriate match, select the location and click
Next or Finish.
v If none of the locations are an appropriate match, click Match by reference
instead and click Next.FromtheCandidates list of data source items, click
the one that you want to match to the column or click Leave unmatched.
7. Repeat step 6 for each mismatched column that Cognos Transformer attempts
to resolve.
8. For any mismatched items that Cognos Transformer cannot suggest locations
for, Cognos Transformer presents possible name changes for your review. From
the Candidates list, click the item that you want to match to the column to or
click Leave unmatched.
Synchronizing Columns with Text Data Files or IQDs
As the modeler, you must ensure that the columns in your model reflect the
current state of your data sources. You can quickly resynchronize your model
columns after a data update if your model uses a single query based on a text data
file or an IQD,
Procedure
1. In the Data Sources list, select the query whose columns you want to modify,
and from the Tools menu, click Modify Columns.
2. For data source items that do not appear as columns in the model, select the
items in the Source list and click Add.
3. For columns that you want to remove from the model, select the columns in
the Model list and click Remove.
4. For unmatched columns identified by a plus sign (+) in the Matched to Source
column in the Model list, do one of the following:
v To manually match query items to columns, select a data source item in the
Source list and a column in the model, and click Match.
v To allow Cognos Transformer to automatically match query items to
columns, click Auto Match. Review any messages that appear and click OK.
38 IBM Cognos Transformer Version 10.1.1: User Guide
Page 53

Results
Data source items are now synchronized with the model.
Connecting to an IQD Data Source
You can use Impromptu Query Definition (IQD) files to access data from local or
server-based databases, even if you do not have IBM Cognos Impromptu installed
on your modeling computer.
The .iqd file types requires that the Series 7 IQD Bridge component be installed.
This component must be installed on platforms supported by IBM Cognos Series 7
.4. The data sources used with the .iqd files must also be supported on the same
platforms.
For compatibility between the newer versions of IBM Cognos BI and versions prior
to 8.3, you must specify your IQD data source connection information in the
cs7g.ini file. This file is located in the installation_location/CS7Gateways/bin
directory.
When your IQD data source resides on a UNIX server, to change the connection
information for the data source, you must first update the model on your
Windows modeling computer and then re-deploy the model to the UNIX server.
To review an up-to-date list of environments supported by IBM Cognos products,
visit the IBM Cognos Customer Center http://www.ibm.com/software/data/
cognos/customercenter.
Isolation Levels for an IQD Data Source
When you create a data source in Cognos Transformer using an IQD, you must
specify an isolation level, typically the same one as was used when the .iqd file
was created. This is necessary so that the data is processed properly in the model.
If you must change the Isolation level, you can do so when you create your data
source using the New Data Source wizard, or later, from the Data Source property
sheet.
The following table describes the IQD isolation levels available for selection in
Cognos Transformer.
Isolation level Description
Default Uses the isolation level that was originally specified in IBM
Cognos Impromptu when the .iqd file was created.
Read Uncommitted Makes changes made by other transactions immediately
available to a transaction.
Read Committed Allows a transaction access only to rows that were committed
by other transactions.
Cursor Stability Prohibits other transactions from updating the row on which
a transaction is positioned.
Reproducible Read Ensures that rows selected or updated by one transaction are
not changed by another transaction until the first transaction
is complete.
Chapter 3. Data Sources for Your Model 39
Page 54

Isolation level Description
Phantom Protection Prohibits access by a transaction to rows inserted or deleted
since the start of the transaction.
Serializable Ensures that a set of transactions performed concurrently
produce the same result as if they were performed
sequentially.
For an up-to-date list of the relational and nonrelational databases that work with
.iqd files, visit the IBM Cognos Customer Center http://www.ibm.com/software/
data/cognos/customercenter.
Example - Using an .iqd File to Access a UNIX Data Source
Some of the data required for your sales-tracking model is stored in an Oracle
database on a UNIX server.
You use IBM Cognos Impromptu to query the ORDERS and ORDER_DETAILS tables,
saving the results in an .iqd file. You then specify this .iqd file as the source for
your model in Cognos Transformer so that you gain access to the data stored in
your Oracle database.
When changing the data source connection information for an IQD data source,
you must first update the model on your Windows modeling computer and then
re-deploy the model to the UNIX server.
Cognos Transformer can now refresh the data directly from the server holding the
Oracle database whenever categories are generated or cubes are created.
Note: The connection information for an IQD data source is stored in the cs7g.ini
file located in the installation_location\CS7Gateways\bin directory.
Modify the SQL Query in an IQD Data Source
SQL is the standard query language used to access relational database information.
For Impromptu Query Definition (.iqd) source files only, expert users can modify
the SQL in the Data Source Viewer to optimize, customize, or refine queries.
After you modify the SQL, the relationships between columns in the .iqd file and
those in the model may be lost. This caution applies if your SQL contains a
calculated expression, your .iqd file uses an input scale, or the column names of
the items below the END SQL line do not match the column names in the SQL
code.
Procedure
1. From the View menu, click Data Source Viewer.
2. To open an editing window, check the Enable Modifications check box.
3. Click the SQL tab, enter your changes and click the Preview tab to review
them.
4. Click OK to save your changes or click Cancel to close the window without
saving.
40 IBM Cognos Transformer Version 10.1.1: User Guide
Page 55

Character Sets Used with Delimited Text Data Sources
Cognos Transformer is designed to handle the more common character sets used in
delimited text data sources. However, consider the following when working with
delimiters.
v Standard delimiters such as the comma, semicolon, or space character remain the
same across character sets.
v To use the tab character as a delimiter, you must type \t (backslash t).
v Only the first byte in double-byte or multi-byte characters is examined to
confirm that a character in the input stream matches the delimiter character that
you specify in Cognos Transformer.
v With DOS outputs, the source data is rendered in the DOS Code Page (OEM)
character set, which maps to the active DOS code page. This is typically Code
Page 437, also known as the IBM PC character set, instead of the default for
Windows (ANSI or Latin 1).
v Regardless of the data source, Cognos Transformer converts the delimiter
character to the OEM character set.
For more information about character sets and code pages, see your Microsoft
Windows documentation.
Named Ranges
You must understand named ranges before you use source data from Microsoft
Excel spreadsheets, whether in crosstab or database format.
To use a crosstab as a source, you must define one or more named ranges in the
spreadsheet. These ranges establish which data becomes columns in the model.
To use a database as a source, you must define a named database range in the
spreadsheet, and also specify that range in Cognos Transformer. Cognos
Transformer reads the named ranges from the crosstab or database, and the data
class (text, numeric, or date) for each cell value.
If the Data Sources list contains columns identifying named ranges that you do
not need, delete them from the list. Deleting columns in Cognos Transformer does
not affect your spreadsheet.
Before further processing, Cognos Transformer verifies that the named range
represented by each column in the model still exists in the spreadsheet and that
the spreadsheet still contains the same number of pages, rows, and columns as it
did when you first identified it as a data source for the model. If differences exist,
you are prompted to use the Modify Columns command on the Tools menu to
add, modify, match, or remove columns as required, before proceeding.
For more information about how to define named ranges, see the documentation
provided with your spreadsheet software.
Example - Specifying Named Ranges for a Multipage Crosstab
This example shows one page of a multipage crosstab.
Row A B C D E
1 Glassware
Q1 Q2 Q3 Q4
Division
Chapter 3. Data Sources for Your Model 41
Page 56

Row A B C D E
2
3 Income-Net
Sales
4 Expenses-
Salary
5 Expenses-
Rent
6 Expenses-
Advertising
7 Expenses-
Production
8 Net Income 5,100 5,000 9,100 12,000
10,000 10,000 15,000 20,000
2,000 2,000 2,500 2,500
800 800 800 800
600 700 600 600
1,500 1,500 2,000 4,000
For this crosstab, the following ranges were named, and these range names
automatically become the columns in the model.
Name Range Name Range
Division A1 Expense A4 .. A7
Quarter B1 .. E1 Expense Amount B4 .. E7
Income B3 .. E3 Net Income B8 .. E8
For a model requiring only the Division, Quarter, Expense, and Expense Amount
columns, Cognos Transformer reads all the expense types and expense amounts for
each quarter and for each division.
Division Quarter Expense Expense Amount
Glassware Q1 Expenses-Salary 2,000
Glassware Q2 Expenses-Salary 2,000
Glassware Q3 Expenses-Salary 2,500
Glassware Q4 Expenses-Salary 2,000
Glassware Q1 Production 1,500
Glassware Q3 Production 1,500
In your Cognos Transformer model, under Glassware, the Data Sources list shows
the columns Expense Amount, Expense, Income, Net Income, and Quarter.
Example - Specifying a Named Range for a Spreadsheet
Database
You have a simple spreadsheet database that has a single named range.
Row A B C D
1 EMP_NO NAME DEPT SALARY
2 0256 Wilson TECHW 50,000
3 0141 Barnes DESIGN 60,000
4 0724 Paul DESIGN 70,000
42 IBM Cognos Transformer Version 10.1.1: User Guide
Page 57

Row A B C D
5 1290 Power DESIGN 80,000
The named range for cells A1 .. D5 is DataTable.
Cognos Transformer reads rows 1 to 5 in the range DataTable. The Data Sources
list shows the Human Resources columns EMP_NO, NAME, DEPT, and SALARY.
PowerHouse Data Source Parameters
You can specify a PowerHouse portable subfile as the data source for a model.
Dictionary component Model equivalent
Element name Column original name
Element heading Column name; the PDL multiline character
Item datatype - character Data class text and size
Datatype - portable zoned Data class: unspecified (default); Measure
Datatype - portable float Data class: unspecified (default); Measure
Datatype - portable date Data class: date; date input format:
(^) is replaced by a space character
type: 32-bit integer
type: 64-bit floating point
predefined
Instead of using the PowerHouse dictionary values to set the Output scale and
Precision properties, columns generated from a portable subfile initially have these
attributes set to zero. To modify these attribute values, use the Format tab on the
Measure property sheet.
Cognos Transformer automatically interprets the following components of the
portable subfile dictionary.
Integer and float data from portable subfiles are represented by their .psd datatype
as follows:
v Integers stored as Portable Zoned in the subfile appear as signed, zero-filled
numbers.
For example, the number 16, stored in Portable Zoned Size 6 format, appears as
+00016.
v Float data stored as Portable Float in the subfile appears in scientific notation.
For example, the number 812,333.65, stored in Portable Float format, appears as
+.8123336500000000000E+06.
Using Multiple Data Sources in Your Model
You can create more powerful views of your data by adding multiple data sources
to a single model, allowing you to combine disparate data sources into a single
PowerCube. In Cognos Transformer, you can model a single cube using any
combination of the supported data sources, giving you a unique view of your
business.
The advantages of multiple data sources include:
Chapter 3. Data Sources for Your Model 43
Page 58

v measure allocation capabilities
Measures that are not normally related to some parts of the dimensional
hierarchy can have values allocated to those parts of the dimension.
For example, suppose your sales-tracking system lacks information about
staffing levels at each branch. You include a data source that provides this
information so that you can derive valuable information, such as the average
sales per employee.
v performance improvements
When you split a single, large data source into smaller, denormalized sources,
you can shorten the processing time if the columns in all measure-containing
sources are associated with unique levels in the model. This is because Cognos
Transformer can associate such measures directly, without confirming their
context in the level hierarchy.
v integration of data from various sources
Cognos Transformer does not perform database joins between like-named
columns. Rather, it associates the data values in each source with the categories
that are generated from the columns. To create source data that joins database
tables, use IBM Cognos Impromptu, IBM Cognos, IBM Cognos Data Manager,
IBM Cognos Virtual View Manager, or a data access application.
Data Source Scope
Data sources may be associated with all or part of the Cognos Transformer
Dimension Map. To make the proper associations, all column names related to the
same level in the Dimension Map must match exactly. Also, the levels with which
these source columns are associated must be either unique or fully qualified by one
or more higher levels in the hierarchy.
The scope that appears depends on the relationship between the source columns
and the levels in the Dimension Map.
Tips
v To see the scope for a data source in your model, click it in the Data Sources list
and, from the Edit menu, click Show Scope. You can also right-click in the
Dimension Map or the Data Sources list.
v You can change the default colors of the scope map on the Dimension Map tab
of the Preferences property sheet on the File menu. Click the color swatch you
want to change and select a new color from the Color palette. Click OK twice.
Level Derived Directly
When a level is derived directly, it takes its category values from a column in the
source. For example, this source contains columns that provide category values for
all levels. The default color is dark yellow.
44 IBM Cognos Transformer Version 10.1.1: User Guide
Page 59
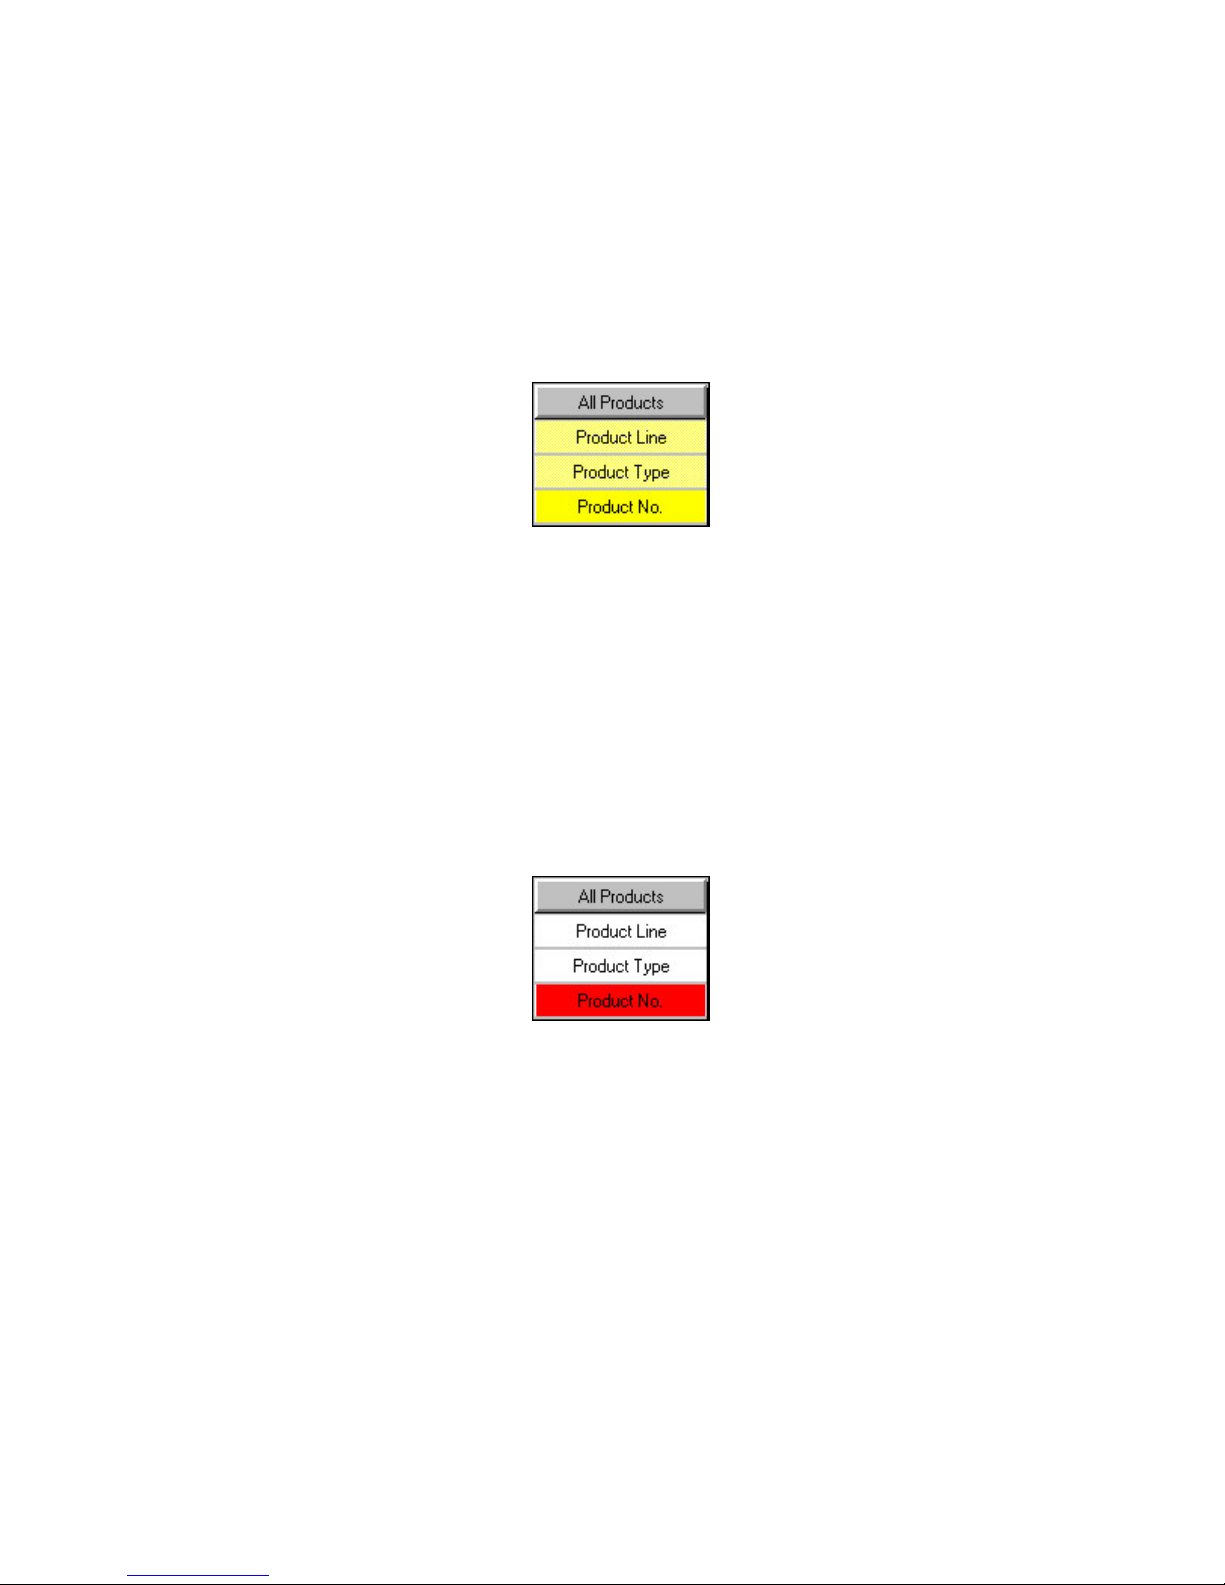
Level Derived Indirectly
When a level is derived indirectly, the source is not related to the level, but is
related to descendants of the level. The default color is light yellow.
For example, this source contains a column that provides category values for the
unique level Product No., but no columns for the ancestor levels. Product Type
and Product Line may be levels manually created by the modeler, or their category
values may come indirectly from columns in other data sources.
Level Derived From a Source with Missing Columns
When a level is derived from a source with missing columns, it cannot take its
values from the source because the source is lacking columns for the ancestor
levels, and a missing level, by definition, is not unique. The source does not
contain enough data to map column values to a level without knowing the entire
context. The default color is red.
For example, this source contains a column that provides category values for the
level Product No., but not for the ancestor levels Product Line and Product Type.
The context of the Product No. categories cannot be determined because the level
was not declared unique.
Example - Verifying the Scope of Data Sources in a Sales Model
You want to verify the scope of your data sources in a basic sales model.
The data source is as shown. The GO Data Warehouse columns of Product Line,
Product brand, and Region provide category values for the top levels in the
Products, Product Brand and Retailers dimensions, and so on.
Chapter 3. Data Sources for Your Model 45
Page 60
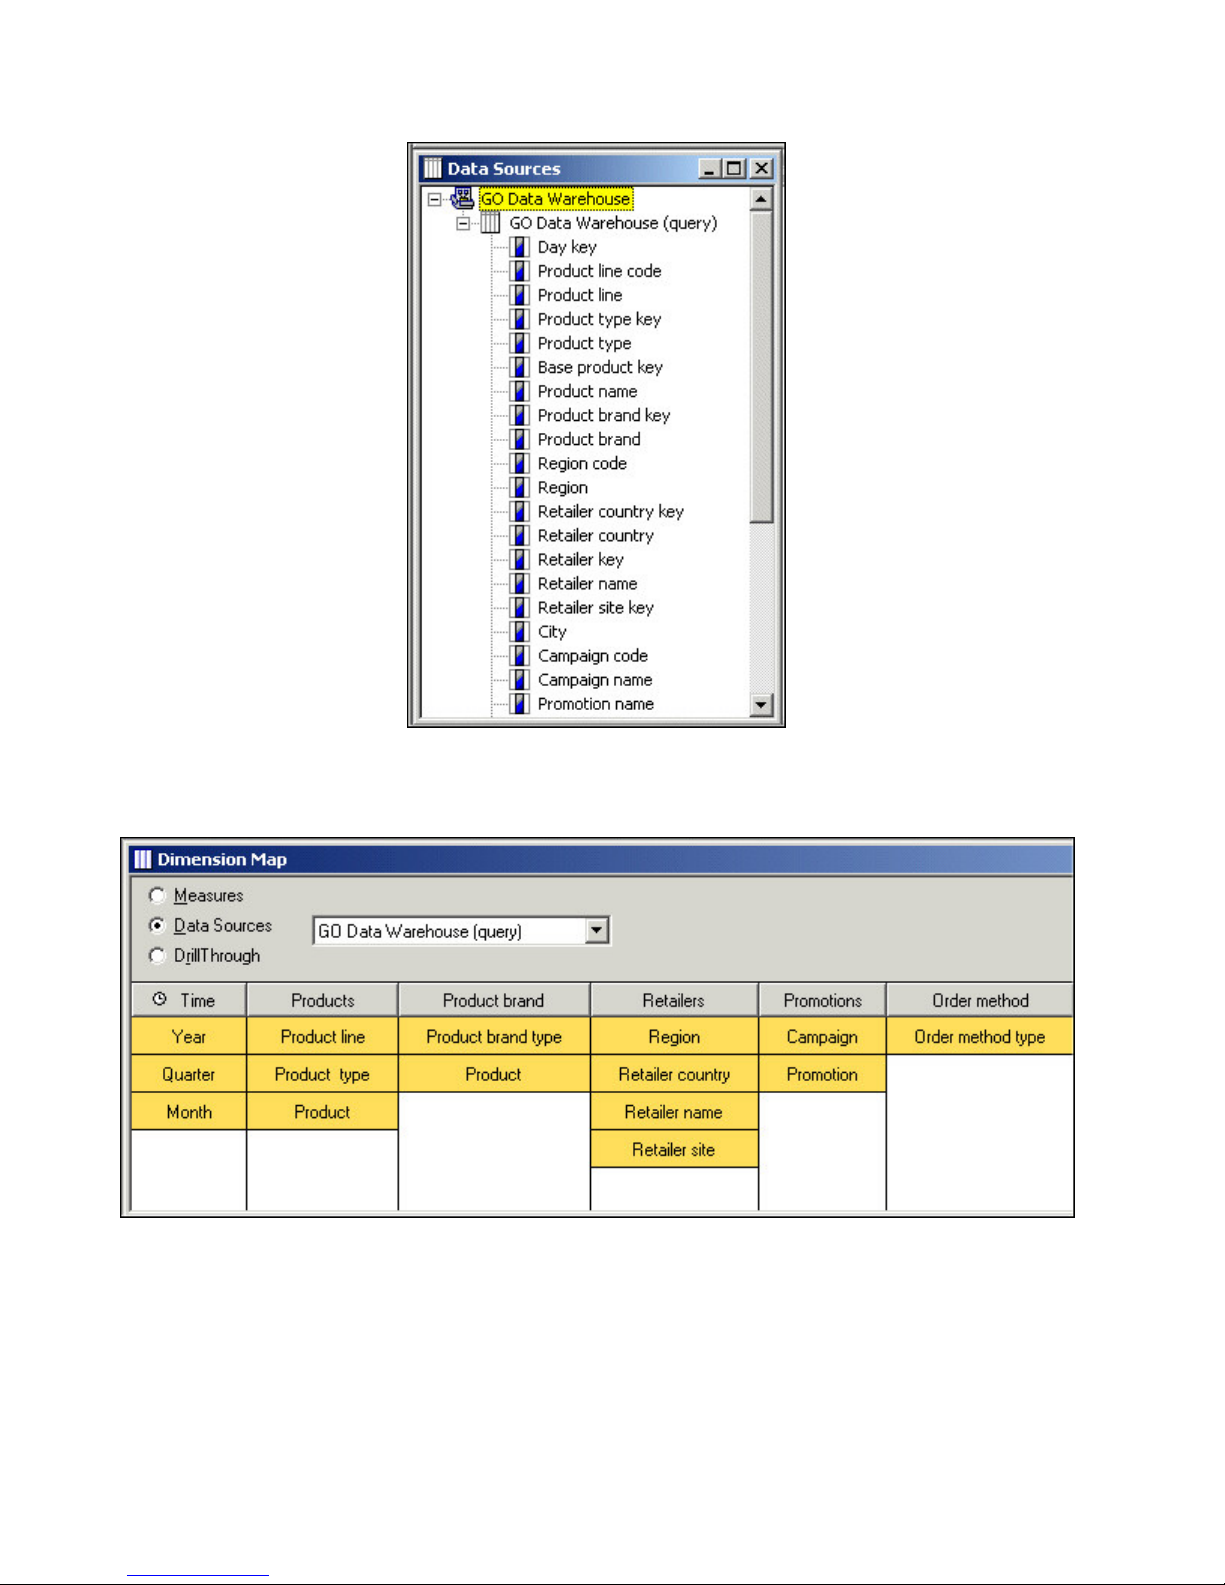
Because GO Data Warehouse contains columns for all six dimensions, its data
source scope covers all the dimensions in the model.
Control When the Source Data Is Read
In models with multiple data sources, you can control when a data source is read.
For example, a data source can be read during category generation, during cube
creation, or both. You can use this capability to avoid unnecessary processing,
resulting in a more efficient model design.
Here are some typical scenarios:
46 IBM Cognos Transformer Version 10.1.1: User Guide
Page 61

v After Cognos Transformer reads your purely structural data sources and
populates your model with data for the required category structure, you can
change the timing so that these static categories are not regenerated every time
you create the PowerCube.
v For structural data sources that frequently change, you can set the timing to
update the categories whenever you create the PowerCube.
v For transactional data sources, where the measure values are constantly
changing, you can select the Default method of PowerCube creation.
Procedure
1. In the Data Sources list, right-click the data source for which you want to
control the timing and click Properties.
2. On the General tab of the Data Source property sheet, under the Timing box,
select the Generate categories check box.
This will cause the data source to be queried whenever categories are
generated.
3. Select the PowerCube creation check box and choose what will occur when
cubes are created or updated:
v Default
Cognos Transformer reads all columns in the source that relate to levels in
the model to see if they are associated with measures. If the source is purely
structural, the cube is not created or updated, and an error message appears.
Use this option in a production environment for transactional data sources
and structural data sources that contain non-static data.
v Generate categories only
Cognos Transformer queries only for structural information when the Create
Selected PowerCube and Update Selected PowerCube commands run. If
there are measures in any of the source files, they are not retrieved.
v Create the PowerCubes
Cognos Transformer queries the source and creates or updates the cubes,
even if the source lacks measures. In a design and development environment,
use this option to override error messages and continue processing.
4. Click OK.
Defining Columns
Even if you build your dimensions and measures from in-scope data source
columns, you may have to change your column definitions to ensure that your
model delivers solid business value.
Source columns contain not only the text, date, and code values that become the
categories in your model, but also the numeric values that you select as measures,
or performance indicators. Data columns can also contain values that you may
want to use as alternate labels, short names, or textual descriptions for categories.
If you need more structural or numeric information in your model than is available
from your source data, you may be able to add it by using calculated columns. For
more information about the functions you can use when creating calculated
columns, see Appendix F, “IBM Cognos Transformer Expression Editor,” on page
355.
Chapter 3. Data Sources for Your Model 47
Page 62

As the modeler, you must ensure that your model columns remain synchronized
with their associated data sources. You can use the Data Sources list to create or
delete columns, and to examine or modify column properties.
For some data sources, Cognos Transformer can automatically identify columns
and assign default column names and properties. However, if your data sources
include IBM Cognos packages or reports, you select specific query objects from an
available list.
Any time that you create columns manually, as you must for fixed-field text files,
you must identify only those data columns that are used in the model. You can
change these assignments later.
Troubleshooting Issues Related to Column Names
When an identically named column appears in two or more data sources, Cognos
Transformer associates each column with a level that has its source column set to
the common name. However, it cannot use matching columns to perform joins on
the source files. Instead, it uses the common name to associate both columns with
categories in the dimension map, or with a measure in the model.
For example, suppose your model has an Order Header data source and an Order
Detail data source. Each contains a column named ORDER_NUMBER. Cognos
Transformer cannot join an Order Header record with an Order Detail record to
create a composite record describing a sales line in an invoice. However, Cognos
Transformer associates the values from both of these sources with a specific level
in one of the dimensions in the model.
To create a join between two columns, use a database query tool such as IBM
Cognos or IBM Cognos Impromptu before you create the data source.
Troubleshooting Issues Related to Date Columns
To obtain the data required to populate the time dimension for your model, you
need at least one data source that includes the required date values. However, in a
model with multiple data sources, date columns may appear in several source files,
and date columns may not relate to your chosen time dimension.
For example, suppose your sales-analysis model contains one source file with order
information, including the order date, and another that contains sales forecasts by
time period. For Cognos Transformer to relate values from both sources to your
chosen time dimension, you must rename the columns that contain the date values
in each source file so that they use the same name.
To ensure that you associate your date values with the appropriate dimension
levels and measures, without increasing the size of the model unnecessarily,
complete the following steps.
Note: If you want to take advantage of Cognos Transformer's relative time
functionality, do not import the date dimensions from dimensional packages.
Instead, use the Insert Data Source option to import the appropriate date field to
create your time dimension.
Procedure
1. Set the absolute range of dates allowed in the model.
2. Match the date format in the model to the format in the source file.
48 IBM Cognos Transformer Version 10.1.1: User Guide
Page 63

3. If required, specify the turn-of-the-century break-point (CenturyBreak setting).
4. Specify whether the measure values associated with these dates apply to some
or all levels in the time dimension.
Define Columns in a Fixed-field Text Data Source
When your data source is a fixed-field text file, you must define the columns using
the Column property sheet. Otherwise, Cognos Transformer does not have the
necessary information about how columns in the source file are defined and cannot
accurately populate your model.
Because this is a manual process, you can define overlapping columns or define a
column that includes other columns.
With fixed-field text sources, you cannot use the Modify Columns command on
the Tools menu to remap model columns when the structure of the source file
changes. Instead, you must manually modify the starting byte and width of each
column on its property sheet.
Procedure
1. Use the New Data Source wizard to add a fixed-field text data source.
2. From the Edit menu, click Insert Column.
3. In the Column name box, type a name for the new column.
4. On the General tab, in the Data class box, select the appropriate data type.
5. In the Position box, type the starting position of the column in a record.
The first byte in a record is byte number 1.
6. In the Size box, type the width of the column in bytes.
7. Set other properties for the column as required and click OK.
8. Repeat steps 2 to 7 for each column in the source file.
Example - Defining Fixed-field Columns
You want to define columns for a fixed-field source file in which each record is 38
bytes long and encompasses five data fields.
Procedure
You specify in the New Data Source wizard that the first field is an 8-byte numeric
field giving the date of a transaction. The next 14-byte field indicates the product
type. Note that the type Product1 uses fewer than the 14 bytes available in the
field. An 8-byte field indicates the color of each item sold. The last 8 bytes store
monetary values for the measure fields Cost (4 bytes) and Revenue (4 bytes).
Results
Cognos Transformer can now correctly interpret the columns. For example, the first
record represents a transaction that generated 330 in revenue, occurring on January
3, 2007, involving Product1, Color1, that cost 214 to produce.
Example
Column 1 Column 2 Column 3 Column 4
12345678 90123456789012 34567890 12345678
Chapter 3. Data Sources for Your Model 49
Page 64

Column 1 Column 2 Column 3 Column 4
20070103 Product1 Color1 02140330
20070103 Product1 Color2 02870335
20070103 Product2 Color1 04560508
20070103 Product2 Color3 03110388
Scale Input Values
You may want to change the number of decimal places or significant digits in your
measures to better reflect what your users are expecting in their OLAP reports or
to create calculations. Decimal values are read into the model based on a scale that
you specify. This scale is the source value, multiplied by 10, raised to the power of
the input scale. This scaling formula allows Cognos Transformer to handle values
without integer portions, such as .0003.
To properly scale your input values, you must
v Set the Input scale property for the source column.
v Set the Output scale property for the measure that uses the source column.
v Set the Precision property for the measure that uses the source column.
When you create a data source using an IBM Cognos package, Cognos Transformer
automatically uses the scale specified in the Framework Manager query, which in
turn matches the scale defined in the source database. Consequently, on the
General tab of the Column property sheet, the Input scale option always shows a
default value of zero.
Regardless of the precision supported by the source database, the overflow limit
for the 64-bit floating point storage type in Cognos Transformer is 18 significant
digits, excluding the decimal separator. When a measure value has more significant
digits after the decimal place than is specified in the precision attribute for the
model, the number is truncated and the last bit rounds up, rather than down.
Unless truncated, Cognos Transformer does not round numbers scaled using Input
scale, Output scale, and Precision.
Procedure
1. Open the Column property sheet for the measure that you want to scale.
2. On the General tab, in the Input scale box, type the appropriate value and
click OK.
Tip: For monetary amounts, this is normally the number of places after the
decimal in the source data.
3. Open the Measure property sheet for the measure that you want to scale.
4. On the General tab, in the Output scale box, type an appropriate value.
When this value matches the input scale specified in step 2, consistency is
maintained between the source data and the measures in your reports.
However, this consistency is not mandatory. Enter a value that makes sense for
the reporting needs of your users.
5. In the Precision box, type a value for the number of decimal places to appear
in the report, and click OK.
6. Repeat steps 1 to 5 for each source file column that needs scaling.
50 IBM Cognos Transformer Version 10.1.1: User Guide
Page 65

Set the Level of Detail for Dates
Values for some measures in a model often apply to time periods that are not at
the lowest level in the time dimension. In such cases, you specify the actual level
of detail to which the date values apply.
For example, actual revenue values may be derived from invoice information that
accumulates on the dates that orders are filled. In contrast, sales forecasts or
budgets are usually projected for months or quarters, not days. You can specify the
level of detail to which forecasts and budgets apply in the time dimension for your
model.
The level of detail setting that you specify for a column must be supported by the
date values stored in the associated column in your data source. For example, you
cannot specify a degree of detail of day if the date values are stored only as year
and month data, such as 200602.
If a particular measure has meaning to only one level in the time dimension, you
can allocate values for that measure to lower levels.
Procedure
1. Open the property sheet for the relevant date column and click the Time tab.
2. In the Degree of detail box, select the date level appropriate to the measure in
your data source.
For example, if the source contains a measure that provides monthly forecast
values, click Month.
3. Click OK.
Example - Aligning the Date Dimension with Available Data
Source Measures
You want to map date dimension categories to the correct measures in a data
source.
Suppose you have sales figures that are stored in the following format in your data
source:
WEEK,CUSTOMER,SALES_REP,TOTAL_SALES 20060208,Fresh Air Lte 4,Francoise
LeBlanc,4977.99 20060215,Fresh Air Lte 4,Francoise LeBlanc,2955.85
The date values are specified in YMD format, but the associated measure values
are actually weekly sales summaries by sales representative.
Procedure
You specify a Degree of detail setting of Week so that you report the correct
values.
Specify Monthly or Quarterly Time Arrays
Your transactional data is stored as quarterly or monthly values, but in general,
you roll up this information into yearly results. It may be more efficient to define
the columns in your model as members of a time array, rather than as individual
measures. A time array consists of four or twelve adjacent columns that contain
quarterly or monthly values for one year.
Chapter 3. Data Sources for Your Model 51
Page 66

You can define more than one array per model. For example, you can set up one
source file with all quarterly or all monthly arrays. Or you can set up multiple
source files, with one array type in each file, using a different array for each year
of data. However, you must use the same format in all date columns and a
different name for the first month or quarter in each array.
If you use the New Model wizard to create an initial model, remember to clear the
Run AutoDesign check box. Otherwise, all the measures appear in the Measures
list before you define your array, and you must delete them before beginning the
array definition.
Note: An array is treated as one object. Do not delete a column that is a member
of an array. If you do, all other member columns in the same array are
automatically deleted.
Before you begin
Before you import any data, ensure that your source files contain groups of
contiguous columns, such as four columns for a quarterly array, or 12 columns for
a monthly array.
Also, the data source or sources for the time array must contain at least one date
column in addition to the columns that represent the individual elements of the
array. The value in the date column must be the same for all data in the array.
To ensure that Cognos Transformer processes the array correctly, you must use the
first month of your fiscal year as the date in your date column. This specifies the
year-begin date for the year in which the array applies.
Procedure
1. Ensure that your model does not contain any objects in the Measures list.
2. Double-click the first column that you want in the time array, such as
Month_01.
3. On the Column property sheet, click the Array tab and, in the Array type box,
click 4 quarters or 12 months.
The Data Class of the subsequent columns automatically changes to Array
Member.
4. In the Date column box, click the column that contains the starting month of
your fiscal year.
This is the date column, which is usually the same value as the first month in
the array, in YYYYMM format.
5. In the Start month box, type the number of the month in which the fiscal year
begins.
6. Click OK, and drag the column to the Measures list.
7. If you want to add another data source, click the Data Sources list, click the
Insert Data Source button, and repeat step 2.
8. In the Column name box, type a different name to distinguish this column
from the first month or quarter in the previous array. You can also enter
explanatory notes on the Description tab.
9. Repeat steps 3 to 6 to add this new array to your model.
10. After you specify all the arrays that you want in your model and ensure that
the Measures list contains the initial column of each array, from the Tools
menu, click Check Model.
52 IBM Cognos Transformer Version 10.1.1: User Guide
Page 67

11. If there are no problems with your design, you can now create the cube and
confirm your results in your OLAP reporting component.
If there are problems with your model design, review the Check Model
messages to identify the issues.
Example - Consolidating Quarterly Data (Single-source Model)
You want to consolidate data using a quarterly time array.
Procedure
Your source data contains the total number of sales for each product by quarter.
You define the Q1, Q2, Q3, and Q4 columns as members of a time array, as
follows:
DATE PRODUCT Q1 Q2 Q3 Q4
200601 Product1 100 200 150 400
200601 Product2 100 175 150 350
200601 Product3 75 100 100 100
200701 Product1 110 210 160 420
200701 Product2 125 200 175 375
200701 Product3 125 150 150 150
Results
Your OLAP reports show the following.
Product 2006 2007 2006+2007
Product1 850 900 1750
Product2 775 875 1650
Product3 375 575 950
TOTALS 2000 2350 4350
Observe how using time arrays yields compact and efficiently processed cubes and
reports.
Example - Consolidating Monthly Data (Multiple-source Model)
You want to consolidate data from more than one source, using a monthly time
array.
You have one data source for each year of data. Each source file contains the total
number of items sold by retailer type (independent stores compared to department
stores) by month.
Procedure
You define the Month01 column in each data source as the first column in a
twelve-member array. You then rename the initial column names, so that Cognos
Transformer can differentiate between the two, changing the initial column in the
second array (2007) to A2Month_01, to distinguish it from Month_01 in 2006.
The consolidated data for Array 1 (2006 Months) is as follows:
DATE TYPE 01 02 03 04 05 06 07 08 09 10 11 12 200601 Sports 05 06 07 05 04 03 06
04 08 02 01 09 200601 General 10 13 07 05 14 15 06 15 08 12 10 05
The consolidated data for Array 2 (2007 Months) is as follows:
DATE TYPE 01 02 03 04 05 06 07 08 09 10 11 12 200701 Sports 10 13 07 05 14 15 06
15 08 12 10 05 200701 General 20 26 14 10 28 30 12 30 16 24 20 10
Chapter 3. Data Sources for Your Model 53
Page 68

Results
In your OLAP reports, you can use nesting to show how many items were sold by
each retailer type for the 12-month periods beginning 2006/01 and 2007/01. You
can also show the totals sold by all retailers for each year, and for all years.
Product line 2006 2007 2006+2007
Sports 60 120 180
General 120 240 360
TOTALS 180 360 540
Observe how using time arrays yields compact and efficiently processed cubes and
reports.
Modify Date Categories When Spanning Two Centuries
If your legacy data source represents date values using two-digit years and the
data spans two centuries, you can supply a CenturyBreak value, or change the
default break-point in the cogtr.xml file, so that your data is correctly incorporated
into your model.
By default, Cognos Transformer interprets the years 00 to 19 as 2000 to 2019, and
the years 20 to 99 as 1920 to 1999. For a different default setting, open the
cogtr.xml file and specify a CenturyBreak value equal to the last two digits of the
first year that you want to appear in the earlier century.
Signons
For example, set the CenturyBreak value to 80 so that the years 80 or higher are
generated in the 20th century (1980-1999) and the years prior to 80 are generated in
the 21st century (2000-2079).
If your source files have overlapping date ranges that span both centuries, such as
1900 to 1999 and 2000 to 2020, you must convert your source data to use a
four-digit (YYYY) date format rather than use a CenturyBreak setting.
Procedure
1. Close Cognos Transformer.
2. Open the cogtr.xml file and search for an existing CenturyBreak entry.
The cogtr.xml file is located in the installation_location\configuration directory.
If you cannot locate a CenturyBreak entry, Cognos Transformer uses the default
value (20), meaning that the years 00 to 19 are interpreted as 2000 to 2019 and
the years 20 to 99 are interpreted as 1920 to 1999.
3. Modify or create the CenturyBreak entry to match the date values in your data
source by typing the following, where xx is the last two digits of the first year
that you want to be in the earlier century:
<Preference Name="CenturyBreak" Value="xx"/>
4. Save the cogtr.xml file.
You create a signon in Cognos Transformer to facilitate how Cognos Transformer
accesses secured data sources when building cubes.
54 IBM Cognos Transformer Version 10.1.1: User Guide
Page 69

There are two types of Cognos Transformer signons: data source signons and IBM
Cognos signons. By defining a data source signon in the Cognos Transformer
model, you can avoid having to specify the signon information that the data source
requires to build the cube.
Creating a Data Source Signon
Data source signons are either imported with .iqd files, or can be created in
Cognos Transformer when IBM Cognos data sources have a signon defined in
Content Manager that does not have a password associated with it.
Under normal circumstances, Cognos Transformer does not interact with the data
source signon defined in Content Manager; the metadata is retrieved along with
the signon and the data is returned. However, when there is more than one data
source connection and each has more than one signon, and the signons are
configured to prompt for a password, the user must select the appropriate signon
before the data can be returned. When the data source is configured to prompt for
a password, you can create a Cognos Transformer signon to enable cube builds in
batch mode. For more information about building cubes in batch mode, see
“Command Line Options” on page 211.
The same ambiguity arises when there is no password associated with the signon
defined in Content Manager. This configuration is used as a data source that
prompts for user ID and password. When a signon has been configured without a
password, you can do one of two things to build a cube in batch mode:
v Ask the system administrator to create a Content Manager signon with a valid
password.
v Create a data source signon in Cognos Transformer.
When you create a signon, Cognos Transformer assigns the signon to the
package or report on which all subsequent queries are based.
If you do not create a signon in Cognos Transformer, you will be prompted once
during the session to create a signon, and again prior to running the first query
based on the package or report when the saved model is reopened in Cognos
Transformer.
If you do not create a Cognos Transformer signon, you will not be able to build
cubes in batch mode.
Tip: When a data source has more than one signon configured, the multiple
signons are shown on the Content Store Data Source tab in the Data Source
property sheet.
Procedure
1. Open the Cognos Transformer model.
2. Right-click in the Signons list, and click Insert Signon.
Tip: If the Signons list is not shown, from the View menu, click Signons.
3. Select the Data source signon check box.
4. In the Signon name box, type the name for the signon.
5. In the User ID box, type the user ID.
6. Do one of the following:
v To prompt for a password when accessing the data source, select the Prompt
for password check box.
v To bypass prompting when accessing the data source, clear the Prompt for
password check box and, in the Password box, type the password.
Chapter 3. Data Sources for Your Model 55
Page 70

7. Click OK.
The new data source signon appears in the Signons list and is preceded by a
special icon
Creating an IBM Cognos Signon
You can configure IBM Cognos to use authentication to an external namespace
where users are prompted for credentials as part of the logon process.
You can create a signon to build cubes in batch mode in this environment. This
signon maintains the user ID, password, and the associated namespace. Create as
many signons as the number of namespaces to which your users need to log on.
To enable Cognos Transformer to use the Cognos signon automatically, enable the
Set as auto logon property.
For more information about IBM Cognos signons, see the Administration and
Security Guide.
Tip: IBM Cognos signons must have an associated namespace to be valid.
Procedure
1. Open the Cognos Transformer model.
2. Right-click in the Signons list, and click Insert Signon.
3. In the Signon name box, type the name for the signon.
4. In the User ID box, type the user ID.
5. In the Password box, type the password.
6. To set up an automatic logon to IBM Cognos, select the Set As Auto Logon
check box.
7. In the Namespace list, select the appropriate namespace.
8. Click OK.
9. In the Confirm Password dialog box, type the password again and click OK.
10. Click OK.
The new signon appears in the Signons list and is preceded by a special icon
56 IBM Cognos Transformer Version 10.1.1: User Guide
Page 71

Chapter 4. Structuring Your Data Into Dimensions
By structuring your data into dimensions, or hierarchies that represent major
segments of your business information, you ensure that PowerCubes created from
your model support your users' OLAP reporting and analysis needs.
For example, in a sales analysis model, typical dimensions include dates of sale
(Time), sales locations (Regions), product and purchasing details (Products), and
customer information (Customers).
You can create dimensions in Cognos Transformer manually or with the Run
AutoDesign feature in the New Model wizard. When you use the AutoDesign
tool, the time and regular dimensions are structured for you, based on patterns
and relationships detected in the source data.
When you create dimensions manually, you must select the appropriate columns
from your imported Data Sources list.
AutoDesign
AutoDesign helps you make a preliminary model design and is enabled to run by
default whenever you create a new model.
When used with a supported data source, AutoDesign analyzes the data type,
column names, and structural framework of your data file. It then automatically
v creates a time dimension based on the date column
If the dates are not in a predefined format, Cognos Transformer may prompt
you to define the format.
v adds columns with numerical values to the Measures list
v places all remaining columns on the Dimension Map using a best-fit approach
You may need to change at least some of the dimensions and measures created by
AutoDesign. For example, it cannot distinguish numeric data representing
quantities from codes with a numeric format, such as order numbers.
For a more accurate initial model, you may want to manually set the Data class on
the property sheet for each column and specify which source columns are
measures by dragging those columns from the Data Sources list directly to the
Measures list.
Although AutoDesign is intended to help you create dimensions, source levels,
and measures for a new model, you can also run it against an existing model to
add dimensions and source levels from not-yet-used columns. To run the tool
against an existing model, from the Tools menu, click AutoDesign.
If your data source is a fixed-field text file, you must identify the columns in the
query before you run AutoDesign. For more information, see “Define Columns in
a Fixed-field Text Data Source” on page 49.
© Copyright IBM Corp. 2007, 2011 57
Page 72

Tip: If you do not want to use AutoDesign, you can either clear the Run
AutoDesign check box on the last page of the New Model wizard or clear the Run
AutoDesign when creating a new model check box on the AutoDesign tab of the
Preferences property sheet.
Creating a New Dimension
You need to create a dimension for each aspect of the business that your users
want to analyze.
Note: Scenario dimensions are not considered a separate dimension type. For more
information about setting up scenario dimensions, see “Define a Scenario
Dimension and a Cube Opening Level” on page 69.
For relational, DMR, and OLAP data sources, you insert new dimensions from the
Dimension Map.
Creating Dimensions in the Dimension Map Using Relational
Data Sources
You need to create a dimension for each aspect of the business that your users
want to analyze.
For a relational data source, the steps are basically the same for regular and time
dimensions. However, for the latter, you must specify whether to create the
standard time levels (Year, Quarter, and Month) or a custom set (Lunar Week,
Lunar Day, and so on).
Procedure
1. In the Dimension Map, click a dimension in the dimension line to ensure that
no level is currently selected.
2. From the Edit menu, click Insert Dimension.
A new dimension is inserted to the right of the selected dimension.
Tip: If the Dimension Map is active, but no dimension is selected, the new
dimension will be inserted at the left-most position on the Dimension Map.
3. In the Dimension name box, type a name for the new dimension.
4. In the Dimension type box, do one of the following:
v Click Regular to create any dimension that does not track time.
For more information, see “Adding Levels and Categories to a Dimension”
on page 61.
v Click Time to create a dimension that contains periods such as years,
quarters, months, and days.
For more information, see “Setting Up the Time Dimension” on page 70.
5. When you have finished setting the required properties on each of the other
tabs in the Dimension property sheet, click OK.
Creating Dimensions from the Dimension Map Using OLAP
and DMR Packages
You need to create a dimension for each aspect of the business that your users
want to analyze.
58 IBM Cognos Transformer Version 10.1.1: User Guide
Page 73

Procedure
1. In a Cognos Transformer model, right-click the Dimension Map and click
Insert Dimension from Package.
2. Browse to select a dimensional package and click Finish.
3. In the dimension tree for the package, select the dimensions, hierarchies, or
levels that you want to add to your model and click OK.
The dimensions that you selected are added to the Dimension Map, and a
package data source is added to the Data Sources list. A single query for each
dimension is added under the package data source.
Where possible, Cognos Transformer includes the relevant label and business
key as the source column for each level in the imported dimension. Because
different OLAP sources behave differently, you may need to change the query
items used in the source or category code columns for the levels to ensure the
dimension is in scope with the measures for the model.
The import may include more metadata than expected. This allows you to
refine the columns that are used within the dimension.
Tip: To ensure conformed dimensions across different packages, the original
OLAP source should use unique business keys. This will help to ensure that
Cognos Transformer generates category codes that are conformed to the OLAP
source from which the dimension was created.
Define a Calculated Column
A calculated column is an expression that uses other columns, functions, and
constants to derive new data for the model.
Use calculated columns in your dimension structure
v to create exception dimensions, or new ways of slicing and dicing your data
based on a calculation from existing source columns
v to create customized date values
v to produce new measure values
When you use a calculated column as a measure, the value is derived before any
rollup takes place. A calculated column is similar to a calculated measure with the
following exception: if the Regular timing of your calculated measure is set to
Before Rollup, no consolidation occurs. For optimal cube size and run-time
performance, calculated columns are preferable to before-rollup calculated
measures.
For more information about calculated measures, see “Define a Calculated
Measure” on page 97.
Note: If currency conversion is supported by your OLAP reporting component, the
calculated column is initially calculated using the default (base) currency. After
that, conversion occurs dynamically, followed by rollup.
Procedure
1. In the Data Sources list, click the data source to make it active and then, from
the Edit menu, click Insert Column.
2. In the Column name box, enter a name for the new column.
3. In the Column type box, click Calculated and click Calculation.
Chapter 4. Structuring Your Data Into Dimensions 59
Page 74

If you have not specified a Data class, you are prompted to specify whether the
column consists of text, date, or numeric data.
4. In the left pane of the expression editor, expand the Columns and Functions
folders as needed, select each parameter you want to use, and click the
right-arrow button to insert it into the Expression definition box in the right
pane of the editor.
Tip: You can also double-click or click and drag the parameter to add it to the
calculation.
The list of available functions varies with the Data class. For example, the
first-of-month and today functions are only available for the Date data class.
For more information, see Appendix F, “IBM Cognos Transformer Expression
Editor,” on page 355.
5. When the expression is complete, click OK.
Example - Using a Calculated Column to Add an Exception
Dimension
You want to use a calculated column to set up an exception dimension based on a
calculation from an existing source column.
Procedure
1. From the REVENUE and COST columns, you create a calculated column
MARGIN_RANGE to provide new insights into the data. You define the
margin ranges for Low, Medium, and High based on the Gross Margin formula
(Revenue-Cost)/Revenue, using the following if-then-else statement:
if ("Gross Margin" < 0.50) then (’Low’) else (if ("Gross
Margin" > 0.70) then (’High’) else (’Medium’))
2. Drag the MARGIN_RANGE column to the dimension line of the Dimension
Map to form an exception dimension.
Results
You have now segmented your data into a set of useful analytical groupings.
Example - Using a Calculated Column to Support Allocated
Measures
You can add a calculated column that consists of numeric data to be used in
measure allocation.
Suppose you have two sources of data about a professional sports team. The first
source contains data for individual players, and the second contains current and
forecast salary figures for each team.
Procedure
1. You add a calculated column to the second data source representing each
team's forecast salary based on a 13% increase for the next year, such as
"CURRENT_SALARY" * 1.13
2. You drag the calculated column to the Measures list, which makes these figures
available for allocation to the player level. For more information about how to
allocate measures, see “Allocating Measures” on page 109.
60 IBM Cognos Transformer Version 10.1.1: User Guide
Page 75

Results
Your OLAP analysis users can now see each player's salary forecast.
Adding Levels and Categories to a Dimension
Each dimension in a model contains one or more levels that represent the
information hierarchies that your users can explore as drill-down levels in their
OLAP reporting component. You can adjust or rename the levels to suit the
organization of your data, using the Cognos Transformer category viewer
(diagram).
A model may have the following level types:
v Source levels contain categories that are generated from or matched to column
values in the source data. Each source level is associated with one or more
columns in the source file through different association roles.
v Manual levels are drill-down levels not associated with source columns. You
create and maintain the categories in a manual level, and the manual level name
in the Dimension Map is preceded by a special icon.
You can add source levels to a dimension
v by using the AutoDesign tool
v by using the Insert Level command in either the Dimension Map or the levels
section of the Categories diagram and specifying the Associations for the new
level
v by dragging source columns onto the dimension line of the Dimension Map
v by dragging source columns onto the levels section of a dimension in the
Dimension Map
You add manual levels in the same way, but you do not specify a source column
for the level.
Add Source Levels to a Dimension
Source levels obtain values for their categories from columns in the Data Sources
list. You can add source levels to a dimension either on the Dimension Map or in
the Categories diagram.
Suppose the Region dimension of your sales model has three levels: Region,
Country or Region, and Branch Name. You add sales representatives to the Region
dimension by selecting the Sales Rep column from the Data Sources list and
dragging it to the spot indicated in the following image.
Chapter 4. Structuring Your Data Into Dimensions 61
Page 76

Tip: You can create a default time dimension with Year, Quarter and Month levels
by setting the Data class on the General tab of the Column property sheet to Date
and dragging the column to the Dimension Map.
Procedure
1. In the Data Sources list, select the column for which you want to create a
source level.
2. Drag the selected column to the appropriate location on either the Dimension
Map or an existing level in the Categories diagram.
On the Dimension Map, Cognos Transformer shows a small outlined box
where it will create the new level.
On the Categories diagram, Cognos Transformer inserts the new level to the
left of the level on which you drop the source column.
3. Open the Level property sheet to set or modify the level properties and click
OK.
Note: Source levels can also be added by selecting an existing level on the
Dimension Map or Categories diagram, clicking Insert Level from the Edit
menu, and specifying the Associations for the new level.
Add Manual Levels to a Dimension
Manual levels provide a means of grouping categories from various source levels
under a new, special category, or allow for intermediate groupings where there are
too many child categories to be easily seen in the OLAP reporting components.
Because categories in manual levels typically connect to source categories in a
lower level, new source categories that are not linked to a parent manual category
may appear during the generation process. You can set up a temporary placeholder
category in the manual level, where these new orphan categories can be placed by
default.
You cannot use manual levels for subsets in your reporting component.
Before you begin
Tip: If you are building the same dimension in several models, you can create a
spreadsheet to hold your manual categories and their associated source categories
and use this spreadsheet as the data source for each model.
Procedure
1. Open the Categories diagram for the dimension in which you want to create a
manual level by selecting the dimension on the Dimension Map and from the
View menu, clicking Categories.
2. At the top of the diagram, position the pointer over the right side of an existing
level.
The pointer changes to a crosshair.
3. Drag the crosshair to a position between two levels and release the mouse
button.
Cognos Transformer creates a new manual level and opens its property sheet.
4. In the Level name box, type a name for the new manual level and click OK.
62 IBM Cognos Transformer Version 10.1.1: User Guide
Page 77

5. For each intermediate category required in the manual level, create a category
manually. For more information about manual categories, see “Create
Categories Manually.”
6. Connect the categories created in Step 5 to the appropriate child source
categories in the next lowest level.
Example - Adding a Manual Level to Provide Logical Subgroups
You can add a manual level to subdivide the information for easier analysis by
report users.
Suppose your staffing model contains a dimension with 14 categories at the
country or region level. You want to subdivide the Region dimension so your users
can analyze the data more easily.
Procedure
You add a manual level that groups each set of countries or regions by
geographical region. You add the categories Americas, Europe, and AsiaPacific to
this level. You link USA and its child categories to the Americas region. You then
link the remaining country or region categories to their appropriate regional
categories.
Create Categories Manually
You can manually add categories to either source or manual levels in any
dimension by using the category viewer in the right pane of the Categories
diagram.
If you create a category in a dimension that does not yet contain a level for it,
Cognos Transformer automatically creates a new level and opens the property
sheet of the new category.
Procedure
1. Open the Categories diagram for the dimension in which you want to create a
category.
2. Expand the category viewer (right pane of the diagram) as required to show
the parent of the category to be added and position the pointer over the right
side of the parent category.
The pointer changes to a crosshair.
3. Drag the crosshair to the right and release the mouse button under the level
that is to contain the category.
Cognos Transformer creates a new category and opens its property sheet.
4. In the Category code box, type a name that uniquely identifies the category in
the dimension.
5. If the category is in a source level, enter the name of the associated source
column in the Source value box.
For the category in the model to be matched accurately, the category name
must be unique among all the source categories owned by the parent.
6. Set other properties for the category as required and click OK.
Creating Calculated Categories
You can use calculated categories to add commonly requested calculations to your
model, such as month-by-month percent growth or market share. Because the
Chapter 4. Structuring Your Data Into Dimensions 63
Page 78

calculations are computed in Cognos Transformer and then added to the
PowerCube, the results immediately appear in the OLAP reporting component for
every measure specified in the cube.
For example, you can base a calculation on the special time categories Current
Month and Last Month. You use the percent-growth function to create a new
calculated category named Monthly Growth which shows the percentage change
between these two items for all measures included in your PowerCube.
Category calculation is based on a formula and a set of categories to which the
formula applies. You compose the formula with the help of an expression editor
and a selection list of functions and operators. You then specify the categories to
which the formula applies: either a single category, a category set (if supported for
that function), or all categories in the level. Sets are convenient category groupings
that may be from the same level, or from different levels.
You can view a category calculation by opening the Calculated Category property
sheet or by using the Show Category Calculation command on the Diagram
menu.
The formula varies according to the context of each category. The applicable
formula can only reference another single category, not a category set or a level.
Separately defined categories are useful when you want to create special
groupings, such as ’Japan’+’Hong Kong’. Calculated categories are identified in the
Categories diagram by their own icon
Creating a Calculated Category at the Dimension Level
When created at the dimension level, new calculated categories become siblings of
the categories from which they are derived.
You can create calculated categories at the dimension level by using the
Dimension property sheet, or individually at the child category level, by using the
Change to Calculated Category command on the Diagram menu.
Procedure
1. Open the property sheet for the dimension that is to contain the calculated
category and click the Calculation tab.
2. Click Add.
3. In the Label box, enter a name for your calculated category.
4. If you want all the calculated categories listed together in your OLAP reporting
component, select the Group calculated categories together check box.
5. Click Calculation.
6. In the left pane of the expression editor, expand the Functions folder, select the
mathematical function you want to use, and click the right-arrow button to
insert it into the Expression definition box in the right pane of the editor.
Tip: You can also double-click or click and drag the parameter to add it to the
calculation.
7. Next, expand the Levels folder and select the appropriate level for the
expression.
Tip: You can also select and drag the appropriate level from the Categories
diagrammer, or lower pane of the Categories diagram, directly into your
64 IBM Cognos Transformer Version 10.1.1: User Guide
Page 79

expression, and type or copy-and-paste a valid calculation. For more
information, see Appendix F, “IBM Cognos Transformer Expression Editor,” on
page 355.
8. Click OK in the expression editor when you are ready to save your final
expression.
Creating a Single Calculated Category
Perform the following steps to create a single calculated category.
Procedure
1. Create a manual category in the level where you want the calculated category.
For more information, see “Create Categories Manually” on page 63.
2. Select the manual category, and from the Diagram menu, click Change to
Calculated Category.
3. In the left pane of the expression editor, expand the Functions folder, select the
mathematical function you want to use, and click the right-arrow button to
insert it into the Expression definition box in the right pane of the editor.
Tip: You can also double-click or click and drag the parameter to add it to the
calculation.
4. Next, double-click Single Category and observe that a Category code drop
location appears in the right pane of the expression editor.
The number of drop locations corresponds to the number of parameters in the
selected function.
5. Select and drag individual categories from the Categories diagrammer,or
lower pane of the Categories diagram, to each Category code drop location in
the Expression definition box.
Tip: You can also select and drag the appropriate level from the Categories
diagrammer directly into your expression, and type or copy-and-paste a valid
calculation. For more information, see Appendix F, “IBM Cognos Transformer
Expression Editor,” on page 355.
6. Click OK in the expression editor when you are ready to save your final
expression.
Defining Category Sets for Calculated Categories
Perform the following steps to define category sets for calculated categories.
Procedure
1. If you have not already done so, generate categories for your model, and open
the property sheet for the dimension in which you want to define a set.
2. Click the Calculation tab and click Add.
3. In the Label box, enter a name for your calculated category.
4. If you want all the calculated categories listed together in your OLAP
reporting component, select the Group calculated categories together check
box.
5. Click Calculation.
6. In the left pane of the expression editor, expand the Functions folder, select
the mathematical function you want to apply to your set, for example share,
and click the right-arrow button to insert the function into the Expression
definition box in the right pane of the editor.
Chapter 4. Structuring Your Data Into Dimensions 65
Page 80

7. Double-click Category Set and observe that Set 1 appears in both the left and
right panes of the expression editor.
8. Expand the levels in the Categories diagrammer, so you can select categories
for the set.
9. Select and drag the categories in your set, one by one, to the drop location for
Set 1.
10. Double-click Single Category or Category Set again, as appropriate for your
calculation, and drag the required category or categories to the drop location
in the right or left pane, respectively.
11. When you have defined all your required sets and have selected, copied, or
typed the rest of your calculated expression in the right pane, click OK.
12. Click Generate Categories and, if you previously closed the Categories
diagram, reopen it by clicking Show Diagram.
13. Expand the levels to show your new calculated categories and verify that they
appear correctly in the Categories diagram.
Order Categories Within Levels
By default, categories appear in the category viewer in the order encountered
during query processing. When a new category is generated, Cognos Transformer
places it at the end of the child category list for its parent category. You can sort
the categories alphabetically or numerically, in ascending or descending order,
based on values in the source column or another column.
You can order individual categories by dragging them from one spot in the
Categories diagram to another. However, the recommended method is to specify
an Order by column for the level that contains the categories and then modify the
Order value property for individual categories in that level. The order values will
then be automatically applied whenever new categories are added to the model.
For example, suppose the categories in the Product Type level appear in the same
order as in the source file, but you want them to appear in alphabetical order. You
select Product Type as the Order by column, and specify that categories be sorted
in ascending order.
If you create data sources using IBM Cognos reports, any sorting or grouping
defined in the reports is not supported. Similarly, if you set the Auto Group &
Summarize query property in a Report Studio report, Cognos Transformer does
not support the resulting report groupings.
Procedure
1. Open the property sheet for the level containing the categories to be ordered
and click the Order By tab.
2. If the level is a convergence level accessible from two or more drill-down paths,
then, from the Drill-down box, select the drill-down path in which the
categories are to be ordered.
Note: If the level is only a member of one drill-down path, the Drill-down box
is not shown.
3. In the Sort-by column box, click Add to specify the column whose values will
be used to determine the sort order.
4. In the New Association dialog box, click More to select the sort-by column,
and then click OK twice.
5. In the Sort order box, click either Ascending or Descending.
66 IBM Cognos Transformer Version 10.1.1: User Guide
Page 81

6. In the Sort as box, click either Alphabetic or Numeric to specify whether
values are to be interpreted as text or numbers during the sort.
7. Click OK.
Order Categories Using a Global Preference Setting
You can specify that all categories in the model use a particular sort order, rather
than manually setting the order-by preference for each category.
You can still specify a different Order by association for a given level/drill
combination. However, if you do not, the category label is used as the sort value,
and ascending is always the order used.
Procedure
1. Open the model and, from the File menu, click Model Properties.
2. On the General tab, select Use the preference setting in the Default category
ordering box to order categories globally, and click OK.
3. From the File menu, click Preferences and click the General tab.
4. Select the Order categories by default check box and click OK.
Create Unbalanced Level Hierarchies Within a Dimension
You can use subdimensions to provide different levels of detail for specific
categories, also known as unbalanced hierarchies.
For example, some branch offices may report product sales down to the item level,
whereas others may report only to the product level. You can create a
subdimension for those branches that report to the item level.
Similarly, your time dimension may contain levels for year, quarter, and month,
but your OLAP report users may not need to see the month values for the
previous year. You can use a subdimension to retain month levels in the current
year while removing them from the previous year.
Note: If a level contains a subdimension, the name of the level appears with an
ellipsis next to it on the Dimension Map.
Categories in a subdimension are independent of levels in other parts of the
dimension. Changes made to levels outside the subdimension do not affect
categories in a subdimension, and vice versa.
Procedure
1. Open the Categories diagram and select the category below which you want to
create a subdimension.
2. From the Diagram menu, click Create/Delete Subdimension.
When you expand the selected category in the Categories diagram, you see a
box enclosing that category and all categories below it.
3. Modify the categories in and outside the subdimension, as required.
4. Repeat for as many subdimensions as your users need for their business
analyses.
Chapter 4. Structuring Your Data Into Dimensions 67
Page 82
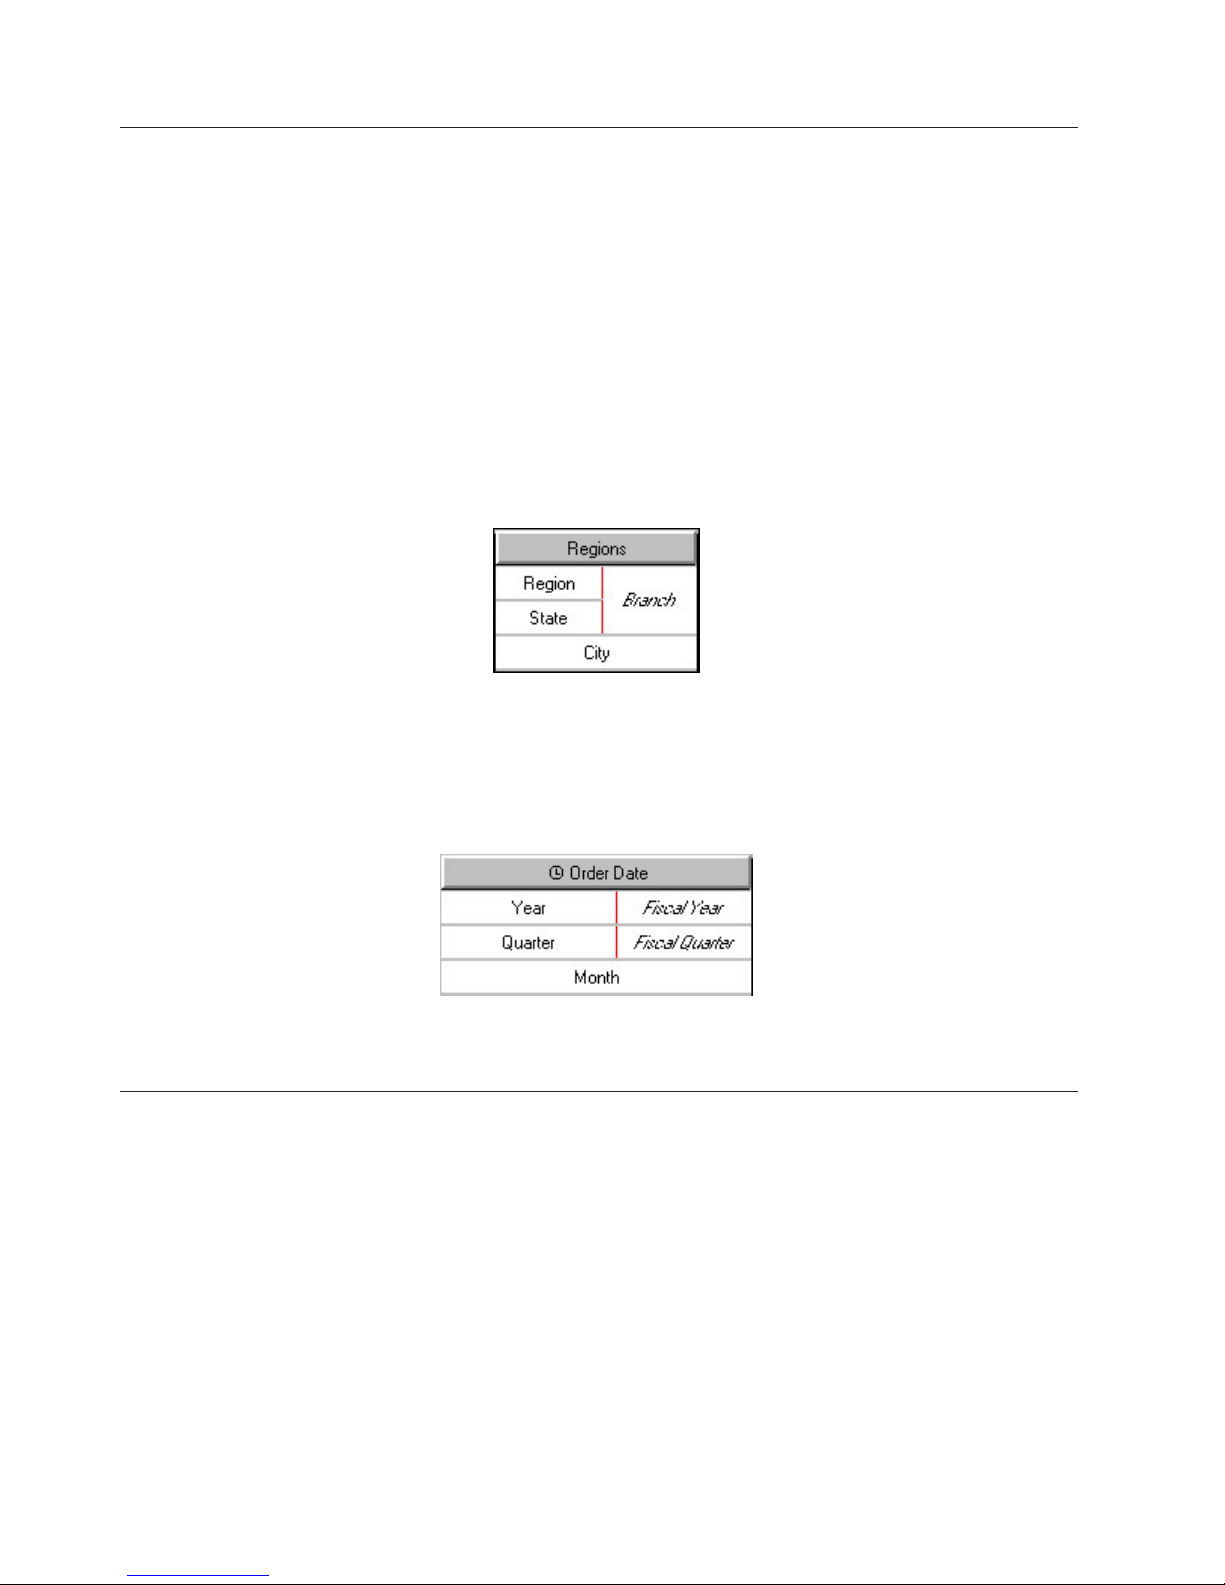
Drill-down Paths
Organizing the data in your model into meaningful hierarchies enables your OLAP
report users to analyze the business information at various levels of detail. Each
dimension consists of one or more drill-down paths that typically contain several
drill-down levels.
For example, a typical time dimension consists of the years, quarters, months,
weeks, and days when sales were made. The Products dimension organizes your
sales items by type, brand, model, color, and packaging. The Regions dimension
allows users to drill down to the data by two distinct paths.
As illustrated here, the primary path includes Region, State, and City levels,
whereas the alternate drill-down path converges on the City level by means of a
Branch level.
You can also set up paths that meet at a shared convergence level in the time
dimension, such as Year and Quarter, and Fiscal Year and Fiscal Quarter levels.
Both drill-down paths converge on the Month level. That way, your OLAP report
users can drill down to the monthly data by either the calendar year or their fiscal
year paths.
Tip: You can view and manipulate drill-down paths from the Dimensions pane of
the Categories diagram.
Create an Alternate Drill-down Path
You set up an alternate drill-down structure in a dimension to provide a different
perspective on the data. Each alternate path connects to the primary path at the
convergence level.
Note: In IBM Cognos, alternate drill-down paths are also referred to as alternate
hierarchies within the same dimension.
When you connect several parent categories to the same convergence category, you
must ensure that each category in the convergence level is unique and
unambiguous. No two categories in the level can be derived from the same source
value. Cognos Transformer prompts you to confirm uniqueness when you create
an alternate drill-down path. For more information about resolving uniqueness
problems, consult the index.
68 IBM Cognos Transformer Version 10.1.1: User Guide
Page 83

Because the category values at the convergence level and below are shared by all
drill-down paths, removing or changing a category in one path at or below the
convergence level immediately affects the same category in all other drill-down
paths.
Procedure
1. In the Dimension Map, select the level that is to be the convergence level for
the new alternate drill-down path and, from the Edit menu, click Create
Drill-Down. Alternatively, drag a column to the Dimension Map, as shown in
the following image.
Note: For a level to be a convergence level, it must be designated Unique on
its property sheet and the category values in the level must have unique and
unambiguous source values.
2. If appropriate, add intermediate (manual) levels to the new drill-down path.
For more information, see “Add Manual Levels to a Dimension” on page 62.
3. To ensure you have not introduced uniqueness problems, from the Tools menu,
click Check Model.
For more information about validating a model, see “Verifying Your Model” on
page 90.
Define a Scenario Dimension and a Cube Opening Level
Scenario dimensions are often used when budgeting and forecasting, or creating
PowerCubes for planning-related applications.
Although scenario dimensions are not a distinct dimension type, you can flag any
dimension other than the time dimension so that its data never rolls up to either
the root category or a designated parent category, which remains hidden.
You first designate a level that is a child of the non-selectable upper level in your
scenario dimension as your new default opening level. You then set the Hide the
value option for the root or parent category, to ensure that values shown at your
chosen default level never roll up to this higher level.
We recommend that you always set a default opening level for your PowerCubes.
You thereby ensure that cubes containing budget values or other scenario-like data
do not display zeros, N/A, or meaningless numbers when opened by your report
users.
When you specify a default category that is not visible to some users because of
their security profile, the default category actually shown is the highest one in the
hierarchy that the users are authorized to see. The default view for those users will
show na for all measures if the default category has the Hide the value option
enabled.
Chapter 4. Structuring Your Data Into Dimensions 69
Page 84

Procedure
1. Open the Categories diagram view of your model, right-click the category
whose values you want to show when the cube opens, and click Set as Default
Category.
2. Right-click either the root or the parent category for your scenario categories,
click Properties, and on the General tab, select the Hide the value check box.
3. Repeat Step 2 for each scenario dimension.
Note: There is no limit on the number of scenario dimensions you can define
in a cube. As long as it is not a time dimension or a measure hierarchy, any
cube dimension can be handled in this way.
4. From the Run menu, click Create PowerCubes to build the cube, and open it
in your OLAP reporting component.
5. Confirm that expected category values appear, rather than the values for the
non-selectable root or parent category, for each dimension identified as a
scenario dimension.
Setting Up the Time Dimension
The time dimension in your model contains time categories that are meaningful to
your OLAP report users, such as financial accounting periods or the dates of sales
transactions. The following time periods are supported:
v conventional date periods, such as years, quarters, months, weeks, and days
v industry-specific periods, such as 13-week manufacturing periods
v custom periods, such as fiscal years, hours, or minutes
v lunar time periods, such as lunar years or months
v relative time periods, such as year-to-date or previous quarter
Some time properties are always true. For example, there are always twelve
months in a calendar year, and four weeks in a lunar month. Because these
standard properties have been programmed into Cognos Transformer, you can
work with time in ways not possible with other dimensions. For example, you can
set up relative time categories to track period-by-period changes in the measures in
your model.
On the dimension line, a time dimension is identified by this icon
Time dimensions contain date levels arranged in descending order. The date levels
are usually some combination of Year, Quarter, Month, Week, or Day. Cognos
Transformer generates categories for the levels in a time dimension by applying
date functions to the source column that you associate with the time dimension.
Cognos Transformer prevents you from creating more than one time dimension in
a cube that has a time-state rollup applied. Even if this is not the case, we
recommend that you create only one time dimension per cube, to avoid confusion.
If you need to track both calendar and fiscal year results, set up alternate
drill-down paths in a single time dimension, converging at a common level such as
month. Or, if you want to compare values from two date columns, such as the
elapsed time between the Order Date and Shipping Date, use a calculated column
rather than two time dimensions. For more information, see “Track Monthly
Performance Measures in Different Time Periods” on page 85.
.
70 IBM Cognos Transformer Version 10.1.1: User Guide
Page 85

You are required to specify both the date source column and the Dimension name
for your time dimension. You can insert manual levels into a time dimension, but
you must specify a date function for each level so Cognos Transformer knows how
to relate the categories to their parent levels during category generation.
For example, suppose you insert the manual level Half Year between the source
levels Quarter and Year. After adding the two required categories to your new
level, you must also remember to connect Q1 and Q2 to the first half, and Q3 and
Q4 to the second half. Otherwise your time categories will not generate properly.
If the standard date functions do not meet your users' needs, you can manually
create a custom time dimension. For example, you can add irregular work shifts or
handle time-related data that comes from more than one source column. You can
mix levels that use date functions with levels that derive their categories entirely
from other source columns, such as Sales Promotions for a time period. However,
these non-date levels will not be generated if you use the Generate Date
Categories command on the Run menu.
You cannot import a time dimension from another OLAP data source. You must
use a date field as the source for your time dimension instead.
Note: If there is a null value in the date column, an invalid date category is
generated. To avoid this problem, suppress this category so that it does not appear
in the cube “Omit Categories Using Suppress” on page 134, or clean the data to
eliminate the null value.
Creating the Time Dimension
Create a time dimension using any of several methods. Whichever method you
choose, you must define or confirm the date input format. You may discover that
some of your data sources include information about their columns (sometimes
called metadata), while others do not. Cognos Transformer requires information
about how dates are formatted in order to correctly interpret them.
To create a time dimension, you can use any of the following methods:
v Use the Date Wizard.
Cognos Transformer prompts you for information about the time dimension and
then creates the dimension for you.
v Manually create a new time dimension and then successively drag the required
date columns to each level in the dimension.
Set the appropriate date function and other date-related properties for each level.
v Drag the time dimension source category from the Data Sources list to the
Dimension Map.
Note: The Data class of the time dimension source category must be set to Date.
This automatically creates a time dimension with the standard levels Year,
Quarter, and Month.
v Design the dimension before you have any items in the Data Sources list.
Insert a new dimension, setting the Dimension type to Time. Click the Time tab
on the Dimension property sheet, and you are prompted to specify the source
column containing the dates for your new time dimension in the Date Level
Creation dialog box. Click OK twice, and from the Run menu, click Generate
Date Categories.
Chapter 4. Structuring Your Data Into Dimensions 71
Page 86

Note: If you manually type the name for the source column in the Date Level
Creation dialog box, you are warned that the columns do not exist in the Data
Sources list.
Cognos Transformer uses standard date functions to generate categories in the
levels of the time dimension without actually referring to a data source. Later,
when the source file is available, you can add it to the Data Sources list and
regenerate the time dimension categories by using data from the source column.
The name you specify for the levels must match the source column name.
Most date formats can be automatically determined during the AutoDesign
process. In the time dimension, if Cognos Transformer generates a category named
Invalid Dates, it is likely that the date format is not defined, or not properly
defined, for the values in the source file. For flat files such as .asc or .csv files, the
date format is predefined in the source file. To change this default setting, you
must open the property sheet for the column that contains your dates, click the
Time tab, and use the Date input format box to specify the format you want to
use.
Create a Time Dimension Using the Date Wizard
You can use the Date Wizard to speed up creation of a time dimension for your
model. Whether your time dimension contains standard calendar or lunar time
periods, down to the Month, Week, or Day level, this wizard prompts you for the
information required in a logical sequence.
Later, if you decide to change the information, you can do so manually.
Procedure
1. From the Tools menu, click Date Wizard.
2. Type a name for the new time dimension and click Next.
3. Choose the source column that contains the date values for the new dimension
and click Next.
4. Respond to the remaining prompts.
You can click Back to return and change your response to a previous prompt.
5. When you have defined the levels in the time dimension, click Finish.
Create a Time Dimension Manually
You can create your time dimension manually to meet the particular needs of your
users. For example, you may want to provide additional relative time categories to
show period-by-period changes in the measures of your cube.
You can manually add extra date levels below or between those supplied by your
data source. You can also set up alternate drill-down paths in your time dimension,
as long as the ancestor levels for each path are compatible.
For example, both Calendar year and Calendar quarter are valid parents of
Calendar month. Similarly, both Lunar year and Lunar quarter are valid parents of
Lunar month. Additional valid time periods for each quarter include months with
a 4-4-5 week pattern, 4-5-4 week pattern, and 5-4-4 week pattern. The convergent
level for your drill-down paths, such as Week or Day, can have either calendar or
lunar parent levels.
Procedure
1. From the Edit menu, click Insert Dimension.
2. In the Dimension name box, type a name for the dimension.
72 IBM Cognos Transformer Version 10.1.1: User Guide
Page 87

3. In the Dimension type box, select Time.
4. Click the Time tab.
5. In the Date Level Creation dialog box, select Create standard levels
(Year/Quarter/Month) to allow Cognos Transformer to automatically specify
the required date structure.
6. In the source column list, select the column that contains values for the dates
in the dimension and click OK twice.
Cognos Transformer creates the new time dimension, adding the standard
levels Year, Quarter, and Month.
7. If you want to add a new level to the manual time dimension, drag the source
column for the time dimension from the Data Sources list to the new time
dimension.
8. Open the property sheet for the new level.
9. In the Level name box, type a name that reflects the date function you plan to
apply to this level, such as Week.
10. Click the Time tab.
11. In the Date function box, select the function to apply to this level, such as
Week and click OK.
Results
You can now change any of the following properties, which are usually set
automatically when you create the time dimension for your model:
v the Associations for the time dimension
Set this property on the Source tab of the Level property sheets.
v whether to always include all date categories, or only those for which source
values exist, when calculating relative time categories
Set this property in the Inclusion box on the General tab of the Level and
Category property sheets.
v the date function for each time level in the model, such as Year, Quarter, and
Month
Set this property on the Time tab of the Level property sheet.
v the format used for date values shown in the category viewer
Set this property on the Time tab of the Level property sheet.
v the column used to order the categories in each date level
Set this property on the Order By tab of the Level property sheet.
Format Date Values
If you prefer a date format that differs from the predefined default, you can
change the format used in the Categories diagram and resulting OLAP reports.
Procedure
1. Open the Level property sheet for the date level whose format you want to
change.
2. On the Time tab, click Modify Format.
3. If the format you want is listed in the Format codes box, select it and click OK.
4. To create a new format, edit the entry in the Code box and click OK.
For information about supported date codes, see “Date Formats and Functions”
on page 323.
Chapter 4. Structuring Your Data Into Dimensions 73
Page 88

Set up Fiscal Years, Quarters, and Months
By default, dates in the time dimension are organized in accordance with the
standard calendar year, with a Year begins property controlling the date when the
year starts. To set up a time dimension for a non-calendar fiscal year, you change
the Year begins property from January 1 to the first day of your fiscal year, as
applicable.
If you are creating a fiscal year as an alternate drill-down path in an existing time
dimension based on the calendar year, ensure that the two paths converge at a
level whose categories coincide exactly.
Procedure
1. Open the Categories diagram for the time dimension that is to be based on
fiscal years.
2. Open the Drill Category property sheet for the drill category and click the
Time tab.
3. In the Year begins box, type the date on which the fiscal year begins.
Choose a valid date from any year, but ensure that your specified starting date
is the first day in the first week of that year. The default format is YYYYMMDD.
4. Click OK.
Set up Calendar and Fiscal Years Within a Single Time
Dimension
In many businesses, measures are tracked over more than one time scale. A
common combination is calendar and fiscal years, where the fiscal year spans
different parts of two calendar years.
Typically, calendar and fiscal years span different months, converging at the month
level, with the same number of months in each drill-down path.
When you create alternate drill-down paths for your calendar and fiscal time
periods, the Order by column for each path must be identical at the convergence
level. Cognos Transformer automatically handles this for the first drill-down path.
However, if you add more than one alternate path, you must specify the
appropriate Order by column for each new path.
Procedure
1. If no time dimension currently exists, create one that contains standard
calendar time periods, either manually or by using the Date Wizard.
2. In the Dimension Map, select the level at which you want the calendar and
fiscal years to converge.
Note: When connecting alternate drill-down paths in the time dimension, the
Year begins property on the Time tab of the Drill Category property sheet for
an alternate path must be offset by whole units of the chosen convergence
level.
3. From the Edit menu, click Create Drill-Down.
An alternate drill-down path appears in the time dimension.
4. In the Dimension Map, click on the empty area created for the new alternate
drill-down path.
5. From the Edit menu, click Insert Level.
74 IBM Cognos Transformer Version 10.1.1: User Guide
Page 89

6. In the Level name box, type a name for the parent of the convergence level in
the new drill-down path.
For a fiscal year path connected at the Month level, the parent level name is
Fiscal Quarter.
7. In the Associations box, click Add.
8. In the New Association dialog box, select Source from the Association role
drop-down list, and click More to select the column that contains date values
for the dimension. Click OK twice.
9. Click the Time tab.
10. In the Date function list, select the function to apply to the level and click
OK.
11. To add additional levels to the alternate drill-down path, select the level you
just added and follow steps 5 through 10 for each new level.
12. Open the Categories diagram for the time dimension.
13. Open the property sheet for the drill category of the alternate drill-down path
and click the Time tab.
14. In the Year begins box, type the date on which the fiscal year starts and click
OK.
For example, if the current fiscal year started on April 1 of 2006, type
20060401.
Specify How Weeks Split When Spanning a Higher-level Time
Period
In a time dimension that includes weeks, you can choose from three options to
handle weeks that span a higher-level time period.
To specify how weeks split, choose from the following options:
v Always split the spanning week into two separate weeks, each of which includes
the days that occur in the higher-level time period.
Each part of the split week appears in the Categories diagram as a separate
week. For example, the week beginning Sunday, December 31, 2006 and ending
Saturday, January 6, 2007 appears as two weeks: 20061231 (a child of December)
and 20070101 (a child of January). Always Split is the default setting.
v Split the spanning week into two distinct weeks, but not if a 1-day week is
created as a result. Select the Split>1daysetting.
For example, Sunday, December 31, 2006 appears in the same week as 20070101.
v Place the spanning week in a specific time period: First Period, Last Period,or
Largest Period.
Procedure
1. Open the Categories diagram for the time dimension.
2. Open the Drill Category property sheet.
If the dimension contains multiple drill-down paths, open the Drill Category
property sheet for the drill-down path you want to change.
3. Click the Time tab.
4. From the Partial weeks box, select the week-spanning rule to apply and click
OK.
Chapter 4. Structuring Your Data Into Dimensions 75
Page 90

Example - Changing How Partial Weeks are Handled at the End
of the Year
In this example, you change how partial weeks are handled at the end of the
calendar year.
Because your business aligns its fiscal year with the calendar year, you do not
want Cognos Transformer to apply the default setting Always Split when
reporting the data for partial weeks at the end of the calendar year.
Procedure
In the Partial weeks box, you select the First Period setting. This places the
spanning week into the year in which that week begins, so that the data for that
week is accorded to December, the last month in the first fiscal year.
Results
The days in the partial week are associated with the December 2006 time period,
as follows:
Sunday Monday Tuesday Wednesday Thursday Friday Saturday
31123456
Set up Lunar Time Periods
Many businesses track performance according to the lunar calendar: that is, a year
has 52 weeks, with seven days in each week, yielding 364 days.
Lunar time dimensions may contain lunar years, lunar quarters, lunar months, and
other reporting periods such as 4-4-5 week months, 4-5-4 week months, and 5-4-4
week months.
Whereas lunar quarters or months must be placed in a lunar time hierarchy, you
can add weeks and day levels to your hierarchy, as children of either lunar or
standard calendar time periods.
To display the ending year (rather than the starting year) as the label for a lunar
fiscal year that spans two calendar years, select the Enable lunar fiscal labelling
option on the General tab of the Preferences property sheet on the File menu.
On the Categories diagram, the default label for each lunar month uses the format
YYYYMM. The lunar months are numbered in sequence, beginning each year with the
value 01, as specified in the Year begins property.
Lunar weeks and lunar days are labelled inYYYYMMDD format, where DD is the first
day of the week on the standard calendar.
You can use the Date Wizard to create lunar time dimensions, and choose your
required lunar time periods when prompted.
Because lunar years comprise 52 weeks and not 365 days you must ensure that the
Year begins and Week begins on properties coincide. You have two options:
v You can reset the Week begins on property for each year.
v You can accumulate the remainder days in a new category using the Add an
extra week setting on the Drill Category property sheet.
76 IBM Cognos Transformer Version 10.1.1: User Guide
Page 91

We recommend choosing this method if you want to keep the lunar year aligned
with the calendar year or your fiscal year, a requirement in most business
operations.
Procedure
1. On the Dimension Map, create a new time dimension with automatically
added levels.
2. Open the property sheet for the Year level and click the Time tab.
3. In the Date function box, select the Lunar year function to create a level based
on lunar years.
4. Repeat steps 2 and 3 for the Quarter and Month levels, selecting the
appropriate function.
Specify How Extra Weeks Get Added to Lunar Years
A lunar year contains 52 weeks of seven days each, for a total of 364 days. This
represents either one or two fewer days than the standard calendar or leap year,
respectively. However, your model design must keep each lunar year aligned with
its specified Start-of-Year day, while not falling too far out of alignment with the
calendar year.
To support this goal, you can specify whether the extra one or two days get added
as an extra week in the last month or the last quarter of the year.
When you create alternate drill-down paths in a lunar time dimension, if the
convergence level is Week, Lunar month,orLunar quarter, you must match both
the Week begins on setting and the Add an extra week setting for all drill-down
paths.
If the last lunar month in the year has five weeks in a 4-4-5 week pattern, the
surplus days create an extra week. The extra week is added to the previous lunar
month to make a 4-5-5 week pattern, rather than a 4-4-6 week pattern, which is not
valid.
Procedure
1. Open the Categories diagram for the lunar time dimension you want to
modify.
2. Open the property sheet for the drill category that you want to change and
click the Time tab.
3. In the Add an extra week box, select the setting to apply to the extra days of
each year.
Limit the Range of Dates Included in the Model
When you create the time dimension, you can limit the range of acceptable dates
so that categories that are irrelevant to your users do not appear in their OLAP
reports.
When Cognos Transformer encounters date values outside your specified range, it
generates an Early Dates or a Late Dates category, or both, depending on when
the out-of-range dates occur. In addition, if there are dates that are neither early
nor late, but can not be placed within the specified range, Cognos Transformer
generates an Invalid Dates category.
Chapter 4. Structuring Your Data Into Dimensions 77
Page 92

Procedure
1. Open the property sheet for the time dimension whose absolute range you
want to change and click the Time tab.
2. In the Earliest date and Latest date boxes, type the dates that represent the
lower and upper boundaries of the range respectively and click OK.
3. On the dimension line of the Dimension Map, click the time dimension and,
from the Run menu, click Generate Date Categories.
By default, the Range box shows the date settings you specified in step 2.
However, you can change these if you want to generate a different range of
date categories.
4. Open the Categories diagram and check for an Invalid Dates category. If this is
present, repeat steps 1 to 3, making any necessary corrections.
Set up a Custom Time Dimension
Instead of using standard date levels, with their built-in definitions and functions
for calendar and lunar time periods, you can create a time dimension that tracks
measures over custom time periods, such as work shifts and hours within shifts, or
project phases and timed sub-phases.
For example, suppose you need to track the temperatures of various pieces of
equipment in an electric generating station. The raw data is captured every two
hours, and stored in a database. The first few rows are as follows:
Shift Hour Plant Equipment Temperature
01 0200 01-6EL Primary Boiler 235
01 0400 01-6EL Primary Boiler 237
01 0600 01-6EL Primary Boiler 233
01 0800 01-6EL Primary Boiler 235
02 1000 01-6EL Primary Boiler 228
02 1200 01-6EL Primary Boiler 232
02 1400 01-6EL Primary Boiler 231
02 1600 01-6EL Primary Boiler 233
You design your model to track the data at the Hour and Shift levels, where each
work day consists of three 8-hour shifts. From this model, you create a PowerCube
that is incrementally updated every eight hours. This provides your maintenance
crews with the critical readings they need in a timely manner.
After you have created a custom time dimension, you can set up relative time
categories for the periods in that dimension. For example, if your model is
designed to show the number of patients monitored during each hour of a nursing
shift, it can also show the number monitored in the same hour of the previous
shift. For more information, see “Setting Up Relative Time Categories” on page 79.
Procedure
1. Click anywhere on the Dimension Map and, from the Edit menu, click Insert
Dimension to add a new dimension.
2. In the Dimension name box, type a meaningful name for the new dimension.
3. In the Dimension type box, select the Time option.
4. Click the Time tab.
78 IBM Cognos Transformer Version 10.1.1: User Guide
Page 93

5. In the Date Level Creation dialog box, select Do not create levels and click
OK twice.
6. Position the cursor in the Dimension Map, below your new time dimension
and, from the Edit menu, click Insert Level to open the property sheet for
your first manual level.
7. In the Associations box, click Add.
8. In the New Association dialog box, select Source from the Association role
drop-down list, and click More to select the column that contains the date
values for this first level of your time dimension. Click OK twice.
9. While still on the Level property sheet, assign other required properties for
this level.
For example, specify a different name for the level and, on the Time tab,
change Date function or Time level ranking.
10. When you are finished defining the properties for this level, click OK.
11. Repeat steps 6 through 10 for each custom time level you want to add.
Setting Up Relative Time Categories
Some of the most commonly requested reports in any organization are
period-over-period performance reports and trend analyses, how sales in the
current period compare to sales from previous periods, and how last year's budget
compares to projections for next year. By including the most commonly required
relative time categories in your cubes, you avoid the need to recalculate them in
every OLAP report.
The types of relative time categories are:
v single-category periods, such as Same Month, Prior Quarter or Same Month,
Prior Year
v to-date periods, such as Year To-Date or Quarter To-Date
v N-period running totals, such as a 2-week total in the previous month, or a
4-month total in the previous year
You can also create custom to-date and N-period relative time categories to span
specified time ranges.
When using relative time categories, ensure that you set the Inclusion property to
Always include for each level in the time dimension so that the relative dates are
calculated correctly.
Default Relative Time Categories
The following relative time categories are automatically inserted into your model.
However, you can delete them or replace them with custom time categories that
better meet your users' OLAP reporting needs.
Tip: To replace automatically generated relative time categories with custom time
categories, start with the closest built-in choice, change it to a custom relative time
category and then change only those few settings needed to customize the
category.
v Current <period>
v Last <period>
v <Higher-level periods> To-Date (Grouped), including
Chapter 4. Structuring Your Data Into Dimensions 79
Page 94

– <Higher-level periods> To-Date
– Prior <Higher-level periods> To-Date
– <Higher-level periods> To-Date Change (automatically calculated categories)
– <Higher-level periods> To-Date Growth (automatically calculated categories)
The periods depend on the date levels defined in your model.
In the Cognos Transformer Categories diagram, relative time periods appear in the
category viewer as special categories, highlighted in pale green, below the other
drill-down paths in the time dimension. Grouped special categories only appear in
reports when the time dimension contains one or more levels higher than the
current period.
Set the Current Period Automatically
Although the current period is set automatically, you should explicitly select the
column to use from the Data Sources list.
If two or more data sources contain columns that provide date values, you will
avoid ambiguity by explicitly clearing the Sets the current period check box in the
other Data Source property sheets.
Procedure
1. In the Data Sources list, successively open the property sheet for each data
source containing a date column for the time dimension.
80 IBM Cognos Transformer Version 10.1.1: User Guide
Page 95

2. On the General tab, clear the Sets the current period check box for all but the
one you want used to set the current period.
3. Open the property sheet for the time dimension and, on the Time tab, select
the Automatically set the current time period check box. Click OK.
Set the Current Period Manually
If you clear the Automatically set the current time period check box, you can set
the current period to use any date category in the time dimension.
In general, you select a date category that appears at the lowest level in the time
dimension, but this is not a mandatory requirement. Once set, each time category
is generated and, before the creation of any cubes, the latest date category at the
lowest level below the selected category is used to set the current period. This
feature is useful when you want to automatically set the current period to the
latest date in a year, rather than to the latest date in your data.
Procedure
1. Open the property sheet for the time dimension and, on the Time tab, clear the
Automatically set the current time period check box. Click OK, and open the
Categories diagram for the time dimension.
2. Select the date category that you want to be the current period and, from the
Diagram menu, click Set Current Period.
The current period is set for the time dimension and automatically updated on
the time dimension property sheet.
Track Changes in a Measure over a Specific Time Period
Businesses often need to track changes in a measure, from one time period to
another. You can use relative time categories to enable your OLAP report users to
analyze trends from month to month, quarter to quarter, and year to year.
For example, suppose your users want to gauge current sales revenues in light of
previous performance. You set up the current period for your model to
automatically use the most recent date values available after each data update.
Then, you set up relative time categories that represent last month, last quarter,
and last year, as well as the same month of the prior quarter, same quarter of the
prior year, and same month of the prior year.
Procedure
1. Open the Categories diagram for the time dimension and position the pointer
over the right side of the root category.
The pointer changes to a crosshair.
2. Drag the pointer to the right of the root category.
A new relative time category is created and its property sheet opens.
3. In the Category code box, type a name for the new category.
4. Click the Relative Time tab.
5. In the Relative time box, select the relative time period that represents the
single period for which you want to create a relative time category, and click
OK.
For a Year-Quarter-Month time dimension, the available single categories list
includes the following:
v Current Month
Chapter 4. Structuring Your Data Into Dimensions 81
Page 96

v Last Month
v Last Quarter
v Last Year
v Same Month, Prior Quarter
v Same Month, Prior Year
Note: Select Custom if you want to override any of the default selections on
the Relative Time tab. For example, you can specify the basic approach, a
different target time period for your new category, a new context in which the
period will be reported, and the corresponding offsets, to track values that
apply to a period other than the current one.
For more information about specifying custom time periods, see “Track
Changes in a Measure over Several Time Periods” on page 83 and “Track
Changes in a Measure in Future Time Periods” on page 84.
Track Changes in a Measure for a Period-to-Date
Businesses often need to track changes in a measure for a specific period to-date.
You can use relative time categories to enable your OLAP report users to analyze
growth trends for a full range of to-date time periods.
For example, suppose your users want to gauge current sales revenues in light of
previous performance. You set up the current period for your model to
automatically use the most recent date values available after each data update.
Then, you set up the following relative time categories: Current Month, Quarter
To-Date, Year To-Date, Year To-Date, and Life To-Date.
Procedure
1. Open the Categories diagram for the time dimension and position the pointer
over the right side of the root category.
The pointer changes to a crosshair.
2. Drag the pointer to the right of the root category.
A new relative time category is created and its property sheet opens.
3. In the Category code box, type a name for the new category.
4. Click the Relative Time tab.
5. In the Relative time box, select the relative time period that represents the
to-date period for which you want to create a relative time category and click
OK.
For a Year-Quarter-Month dimension, the available to-date categories list
includes the following:
v Quarter To-Date
v Year To-Date
v Life To-Date
v Quarter To-Date Grouped
v Year To-Date Grouped
v Quarter To-Date, Prior Quarter
v Year To-Date, Prior Year
Note: Select Custom if you want to override any of the default selections on
the Relative Time tab. For example, you can specify the basic approach, a
different target time period for your new category, a new context in which the
82 IBM Cognos Transformer Version 10.1.1: User Guide
Page 97

period will be reported, and the corresponding offsets, to track values that
apply to a period other than the current one.
For more information about specifying custom time periods, see “Track
Changes in a Measure over Several Time Periods” and “Track Changes in a
Measure in Future Time Periods” on page 84.
Track Changes in a Measure over Several Time Periods
In some cases, you may want to set up relative time categories that span several
specific time periods, at points in the past or the future. Several built-in relative
time categories are available, to help or, if you have an unusual reporting period
not covered by the automatically created relative time categories, you can create a
custom category.
For example, suppose your users want to use relative time categories to track sales
for prior months, quarters, and years. However, some users also want to track
sales over six-month periods prior to the current date, in both the current year and
the previous year. You set up an N-period running total category that spans the
six months leading up to the current month, this year, and last year. Your OLAP
report users can now analyze growth trends for the required time periods.
If you enter positive numbers for either the Target offset or the Context offset,
your model must include source columns with time periods later than the current
period, as positive values in these fields signal measures that are essentially
forecasts, in future time periods.
Procedure
1. Open the Categories diagram for the time dimension and position the pointer
over the right side of the root category.
The pointer changes to a crosshair.
2. Drag the pointer to the right of the root category.
A new relative time category is created and its property sheet opens.
3. In the Category code box, type a meaningful name for the new category, such
as Previous 6 Months.
4. Click the Relative Time tab.
5. In the Relative time box, select Custom.
6. In the Basic approach box, select N-Period Running Total or N-Period
Running Total (Grouped).
Grouped lets you easily create a series of categories spanning different ranges
of time.
7. In the Number of periods box, type the number of periods to include.
For example, if you are creating a 6-month running total, type the number 6.
8. In the Target period box, select the type of period for which the N-period
running total will be kept.
For example, if you are creating a 6-month running total, select Month.
9. In the Target offset box, type a number that reflects an offset for the Target
period relative to the current period.
For example, if the current period is December 2006 and you want a 6-month
running total up to (ending) November 2006, type -1.
10. In the Context period box, select a time period one or more levels higher than
the Target period, within which you want to calculate the N-period running
total.
Chapter 4. Structuring Your Data Into Dimensions 83
Page 98

For example, if you are creating a running total of 6 months, create the total
within the context of Year.
11. In the Context offset box, or in the Context range box if you selected
N-Period Running Total (Grouped) in the Basic approach box, type the
number by which the Context period is offset when the N-period running
total is created.
For example, if you are creating a 6-month running total relative to a Target
period of last year, type -1.
Your relative time dimension now contains the specified running-total time
periods.
Track Changes in a Measure in Future Time Periods
If your source data contains forecast values (that is, source columns with time
periods and date values that are later than the current period), you can add
relative time categories such as Next Quarter or Next Year to your model to report
future projections for the applicable measures.
For example, suppose the current period is December 31, 2006, but a data source
containing sales forecasts for all four quarters of 2007 is included in the Data
Sources list for the model. You create relative time categories with positive target
or context offsets, to track the Next Year and Next Quarter projections.
Procedure
1. Open the Categories diagram for the time dimension and position the pointer
over the right side of the root category.
The pointer changes to a crosshair.
2. Drag the pointer to the right of the root category.
A new relative time category is created and its property sheet opens.
3. In the Category code box, type a meaningful name for the new category, such
as Next Month.
4. Click the Relative Time tab.
5. In the Relative time box, select Custom.
6. In the Basic approach box, select the option that matches the kind of projection
that you want.
Depending on your selected approach, different controls appear on the Relative
Time tab. For a current period of December, the settings for three typical future
time periods are as follows:
Basic approach: Category Settings
Single Category: Next Month Target period=Month; Target offset=1
Period To-Date Total: Year-to-date, Next
Year
N-Period Running Total: First 6 Months,
Next Year
7. After you have set all the properties for the relative time category, click OK.
Your relative time dimension now contains the specified future time periods.
84 IBM Cognos Transformer Version 10.1.1: User Guide
To-Date Period=Year; Target period=Month;
Target offset=0; Context period=Year;
Context offset=1
Number of periods=6; Target
period=Month; Target offset=-6; Context
period=Year; Context offset=1
Page 99

Track Monthly Performance Measures in Different Time
Periods
Business users often want to see monthly performance in one time period
compared to another. You can add the extra time dimension to your model by
using the calculated columns feature. This solution doesn't require a change to the
date columns in your source data.
For example, you can use a calculated column to model monthly sales revenues,
comparing the performance in 2006 to that in 2007. Your users can see a graphic
representation of their results in their OLAP reporting component.
Procedure
1. Add a calculated column to your model.
For more information, see “Define a Calculated Column” on page 59.
2. When prompted to select a data class for your calculated column in the
Column Data Class dialog box, select Numeric and click OK.
3. In the Column Calculation dialog box, enter the following formula:
month(<Date>) where <Date> is the column used to build your time dimension.
4. Click OK twice.
The newly created calculated column appears as a new column in the data
source.
5. Drag the new calculated column from the Data Sources list to the Dimension
Map to create a new dimension.
6. Add the required levels, dimensions, and measures to your model and create
the cube.
For more information about creating cubes, see “Create a Single PowerCube”
on page 123.
Setting up Special Categories
A special category groups regular categories from any level in a dimension,
without regard for their normal hierarchical organization. Special categories are
unstructured and, unlike the categories in an alternate drill-down path, they must
be maintained manually. However, your OLAP reporting component can be set up
to show these categories in all drill-down lists, below the regular categories in the
same dimension.
Note: In IBM Cognos, special categories are often considered alternate hierarchies
within the same dimension.
By default, measure values are summarized. However, you can manually disable
the rollup option.
If a cube is based on an apexed view, whether directly or indirectly by means of a
cube group, the special categories become children of the apexed category.
Create a New Special Category
To highlight important data in the model, you can create special categories.
In the Categories diagram, the children of the special category appear both in the
main hierarchy and in the special category branch. Any changes to a regular
category within this group are reflected in both instances.
Chapter 4. Structuring Your Data Into Dimensions 85
Page 100
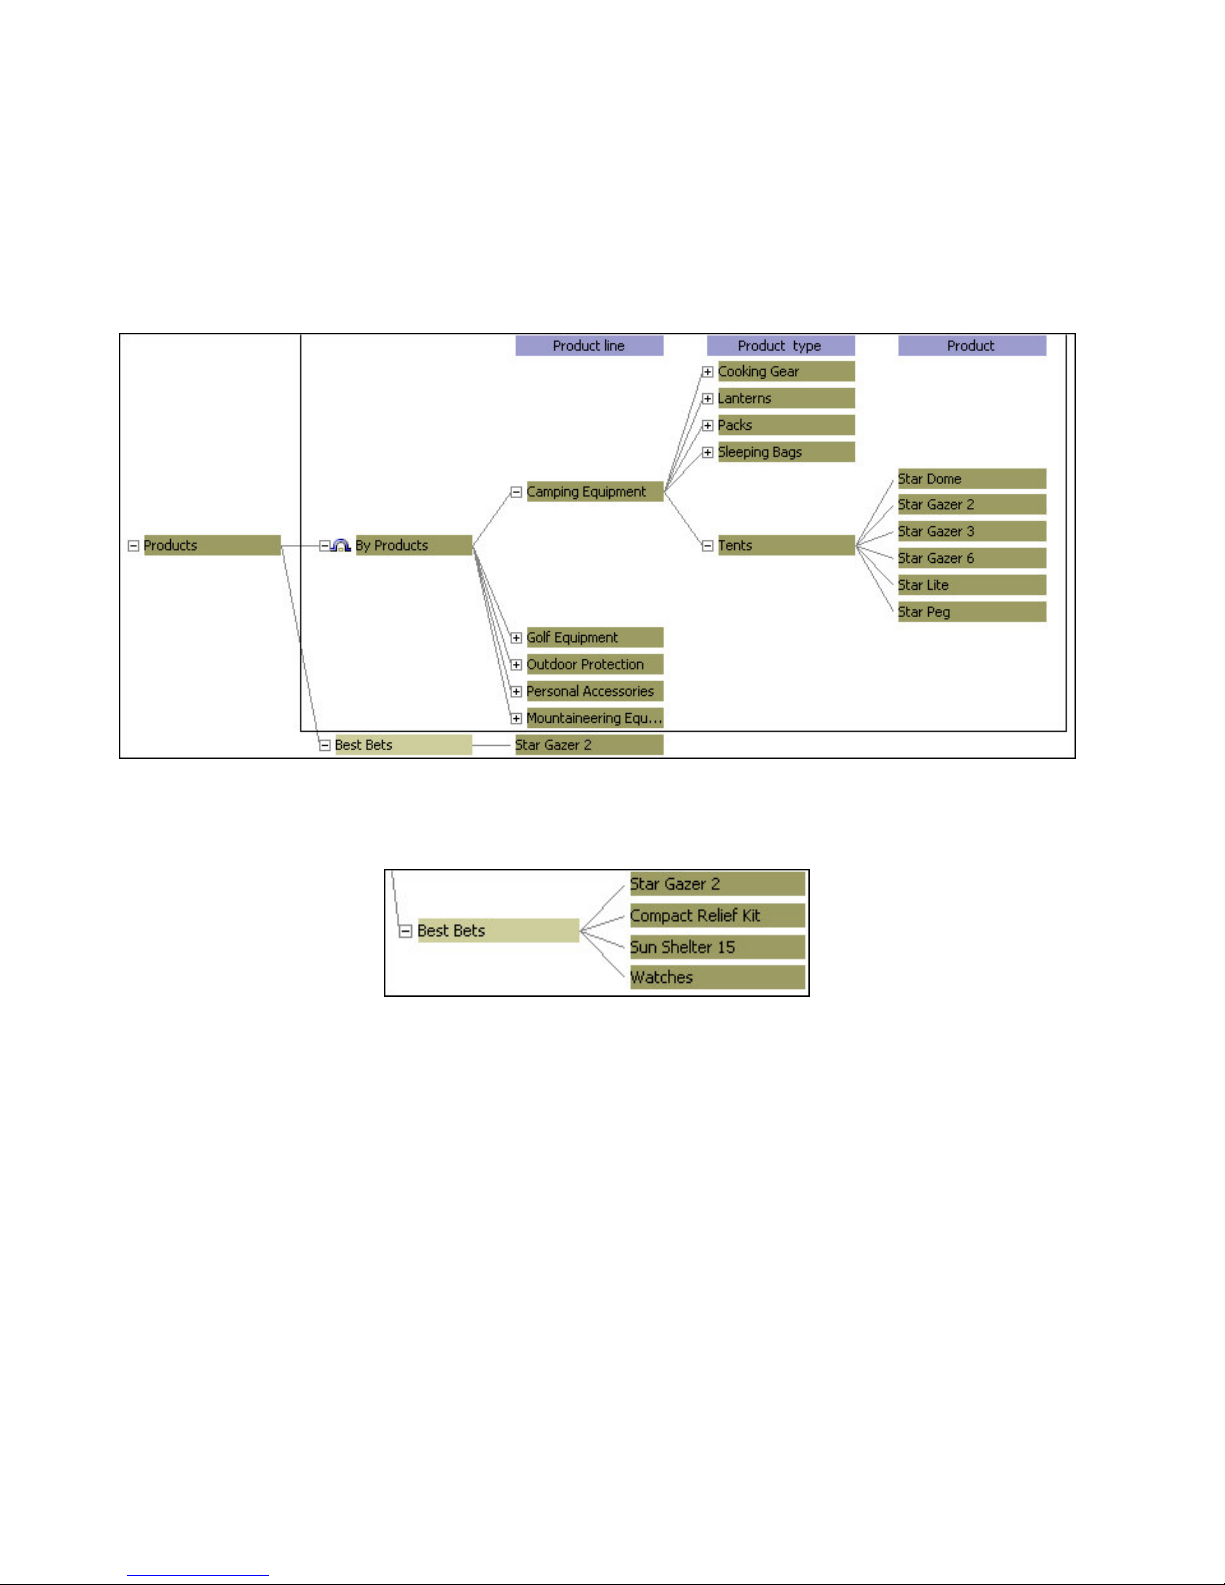
For example, suppose that one dimension in your model organizes all your
products by Product Line and Product Type. You want to group your most
promising products into a special category. These include Star Gazer-2 tents, the
Compact Relief Kit first aid kit, SunShelter-15 sunblock, and all your Watches.
You create a Best Bets special category and drag the Star Gazer-2 category to it, as
shown in this image.
You then drag the other promising product categories, in turn, from the Product
and Product Type levels to your new category, yielding the following result.
Procedure
1. Open the Categories diagram for the dimension for which you want to create
the special category and position the pointer over the right side of the root
category.
The pointer changes to a crosshair.
2. Drag the pointer to the right of the root category and release the mouse button.
A new special category is created and its property sheet opens.
3. In the Category code box, type the name of the special category and click OK.
4. Connect the special category to one or more regular categories by dragging the
regular categories to the drop location of the special category.
Create Special Category Levels
You can create drill-down levels by using special categories, thereby providing
your users with an alternate drill-down path that uses a structure not supplied by
your source data.
86 IBM Cognos Transformer Version 10.1.1: User Guide
 Loading...