

Page 1
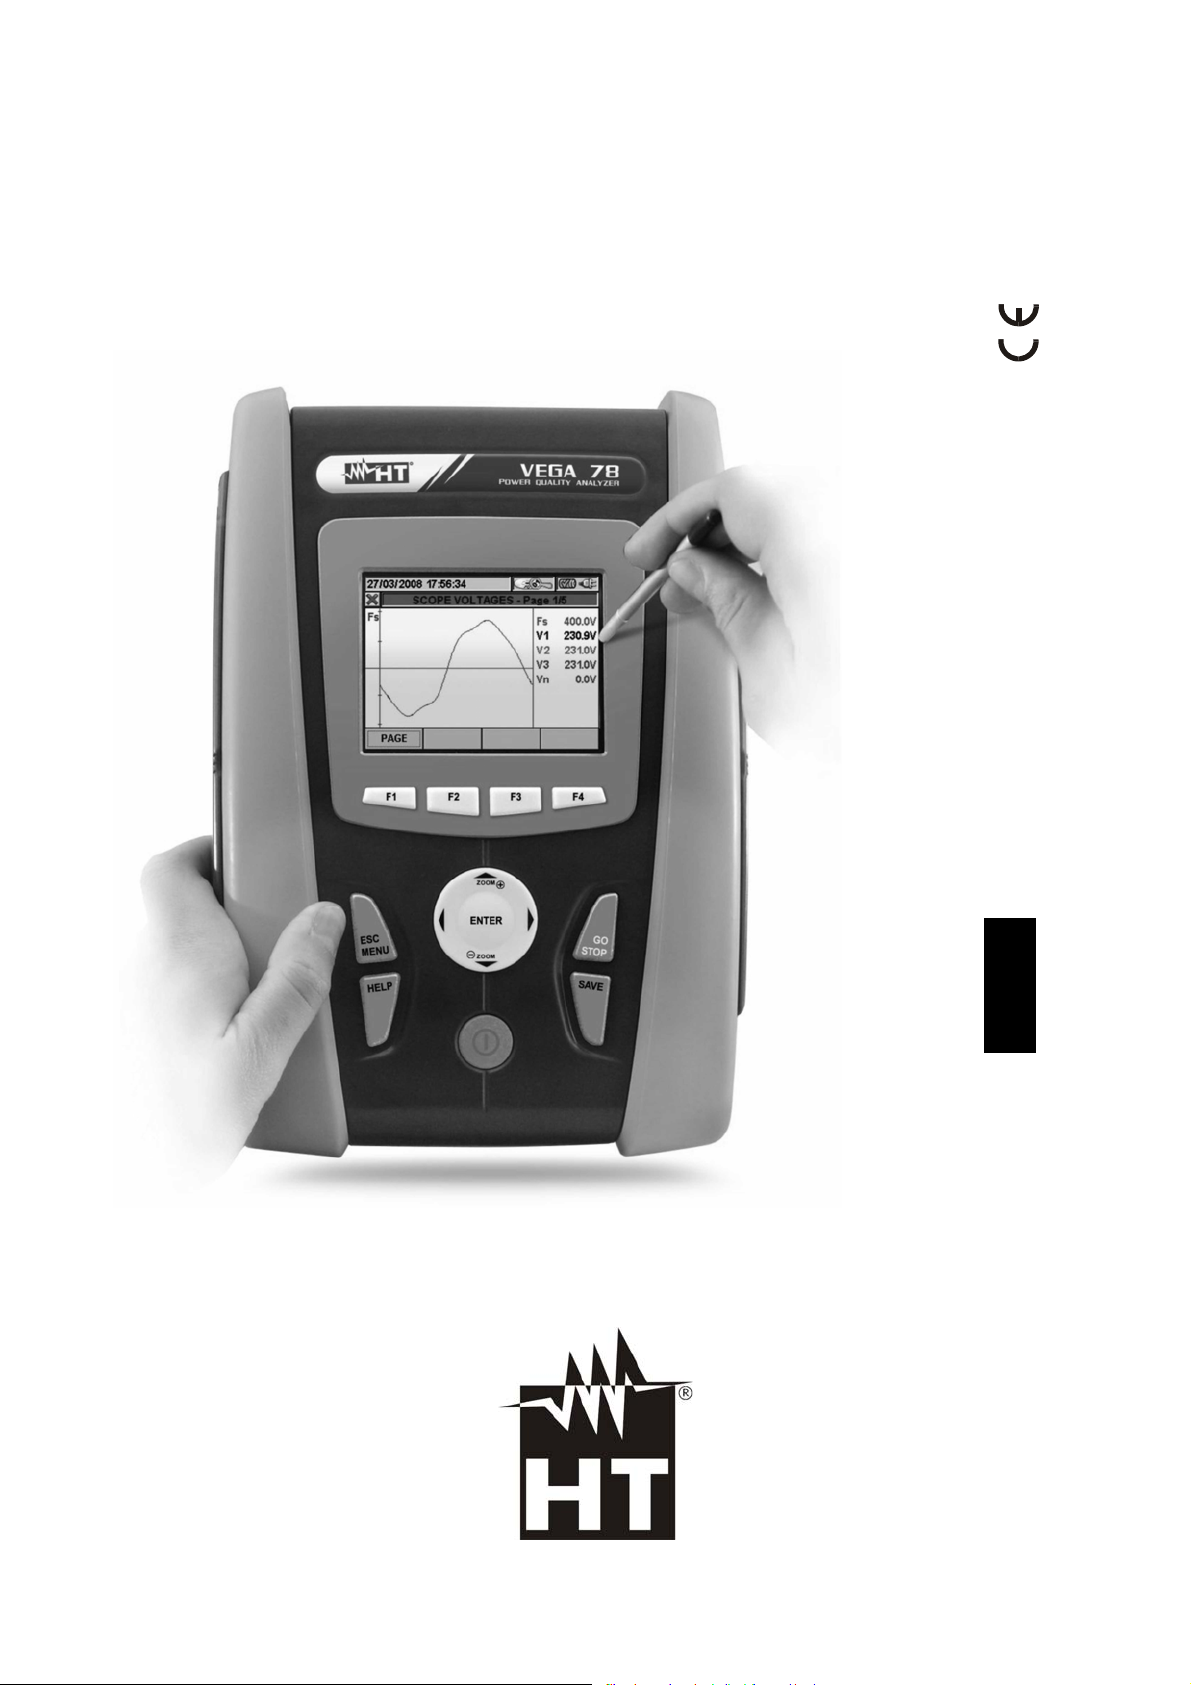
VEGA78
User manual
Copyright HT ITALIA 2013 Release EN 1.04 - 19/02/2013
Page 2

Page 3

VEGA78
Table of contents:
1. PRECAUTIONS AND SAFETY MEASURES ............................................................. 3
1.1. General ................................................................................................................................. 3
1.2. Preliminary instructions ......................................................................................................... 3
1.3. During use ............................................................................................................................. 4
1.4. After use ................................................................................................................................ 4
1.5. Measuring (overvoltage) categories definitions ..................................................................... 4
2. GENERAL DESCRIPTION ......................................................................................... 5
2.1. Introduction ........................................................................................................................... 5
2.2. Functions ............................................................................................................................... 5
2.3. Initial screen .......................................................................................................................... 5
3. PREPARE TO USE ..................................................................................................... 6
3.1. Initial check ........................................................................................................................... 6
3.2. Instrument power supply ....................................................................................................... 6
3.3. Calibration ............................................................................................................................. 6
3.4. Storage .................................................................................................................................. 6
4. HOW TO OPERATE ................................................................................................... 7
4.1. Instrument description ........................................................................................................... 7
4.2. Keyboard description ............................................................................................................ 8
4.3. Display description ................................................................................................................ 9
4.4. Reset of meter ....................................................................................................................... 9
5. GENERAL MENU ..................................................................................................... 10
5.1. General settings .................................................................................................................. 11
5.1.1. Language selection .................................................................................................................. 11
5.1.2. Date/Time settings .................................................................................................................... 12
5.1.3. Display brightness adjust .......................................................................................................... 13
5.1.4. Protection Password setting ..................................................................................................... 13
5.1.5. Sound keys setting ................................................................................................................... 14
5.1.6. Auto power off setting ............................................................................................................... 15
5.1.7. Memory type setting ................................................................................................................. 16
5.1.8. “Touch screen” calibration ........................................................................................................ 16
5.2. Real Time Values ................................................................................................................ 17
5.2.1. 4-wire three phase system – Screens sequence ..................................................................... 17
5.2.2. 3-wire three phase system – Screens sequence ..................................................................... 20
5.2.3. 3-wire ARON three phase system – Screens sequence .......................................................... 22
5.2.4. Single phase system – Screens sequence .............................................................................. 24
5.2.5. SCOPE waveforms screens ..................................................................................................... 25
5.2.6. HARM analysis screens ........................................................................................................... 28
5.2.7. Vectorial diagrams screens ...................................................................................................... 32
5.3. Analyzer Settings ................................................................................................................ 36
5.3.1. Analyzer Configuration screen ................................................................................................. 36
5.3.1.1. Setting system frequency ................................................................................................................ 38
5.3.1.2. Setting clamp type ........................................................................................................................... 38
5.3.1.3. Setting full scale of clamps .............................................................................................................. 38
5.3.1.4. Setting VT ratio ................................................................................................................................ 39
5.3.2. Advanced Settings screen ........................................................................................................ 39
5.3.2.1. Zoom graphics option ...................................................................................................................... 39
5.3.2.2. Harmonics type option ..................................................................................................................... 40
5.3.2.3. Harmonics values option ................................................................................................................. 40
5.3.2.4. Zoom with respect to the 1st harmonic option ................................................................................. 41
5.3.2.5. Average value option ....................................................................................................................... 41
5.4. Recording settings .............................................................................................................. 42
5.4.1. Recording settings screen ........................................................................................................ 42
5.4.2. Comments ................................................................................................................................ 43
5.4.2.1. Use of virtual keyboard .................................................................................................................... 43
5.4.3. Start and Stop ........................................................................................................................... 44
5.4.4. Integration period ...................................................................................................................... 44
5.4.5. Cogenerations .......................................................................................................................... 44
5.4.6. General Parameters ................................................................................................................. 45
5.4.6.1. General Parameters: sub-levels description .................................................................................... 47
EN - 1
Page 4

VEGA78
5.4.6.2. Harmonics: sub-levels description ................................................................................................... 50
5.4.7. Voltage Anomalies .................................................................................................................... 51
5.4.8. Unbalance ................................................................................................................................. 52
5.4.9. Predefined configurations ......................................................................................................... 53
5.4.10. Start a recording ....................................................................................................................... 58
5.4.10.1. Automatic start of recording ............................................................................................................. 60
5.4.11. During a recording .................................................................................................................... 61
5.5. Saved data management section ........................................................................................ 62
5.5.1. Recording analysis (Reg type) ................................................................................................. 63
5.5.1.1. Recording information ..................................................................................................................... 63
5.5.1.2. Recording graph .............................................................................................................................. 64
5.5.1.3. Dips ans swells ................................................................................................................................ 66
5.5.1.4. Analysis of consumed energy .......................................................................................................... 68
5.5.1.5. Analysis of producted energy .......................................................................................................... 69
5.5.2. Recording analysis (Istant type) ............................................................................................... 70
5.5.2.1. Recording information ..................................................................................................................... 70
5.5.2.2. Graph .............................................................................................................................................. 71
5.5.2.3. Harmonics analysis ......................................................................................................................... 77
5.5.2.4. Vectors ............................................................................................................................................ 88
5.5.2.5. Measures ......................................................................................................................................... 95
5.5.3. Transfer recordings to a external Pen Driver USB ................................................................. 102
5.5.4. Saving recordings to external Compact Flash ........................................................................ 103
5.6. Meter information .............................................................................................................. 104
6. CONNECTION OF METER TO PC (WITH WIN XP) ............................................... 105
7. MEASURING PROCEDURES ................................................................................ 106
7.1. Using of meter in a Single phase system .......................................................................... 106
7.2. Using of meter in a Three phase 4 wire system ................................................................ 107
7.3. Using of meter in a Three phase 3 wire system ................................................................ 108
7.4. Using of meter in a Three phase 3 wire ARON system..................................................... 109
8. MAINTENANCE ...................................................................................................... 110
8.1. General ............................................................................................................................. 110
8.2. Situations relative to internal battery ................................................................................. 110
8.2.1. Replacement internal battery .................................................................................................. 110
8.3. Cleaning ............................................................................................................................ 110
8.4. End of life .......................................................................................................................... 110
9. TECHNICAL SPECIFICATIONS ............................................................................. 111
9.1. Technical features ............................................................................................................. 111
9.2. General features ............................................................................................................... 113
9.3. Environment ...................................................................................................................... 113
9.3.1. Climatic condition ................................................................................................................... 113
9.4. Accessories ....................................................................................................................... 113
10. APP ENDIX – THEORETICAL OUTLINE S .............................................................. 114
10.1. Voltage Anomalies ........................................................................................................ 114
10.2. Voltage and current Harmonics ..................................................................................... 114
10.2.1. Theory ..................................................................................................................................... 114
10.2.2. Limit values for harmonic voltage ........................................................................................... 115
10.2.3. Presence of harmonics: causes ............................................................................................. 116
10.2.4. Presence of harmonics: consequences ................................................................................. 116
10.3. Supply voltage unbalance ............................................................................................. 117
10.4. Power and power factor: definitions .............................................................................. 118
10.4.1. Conventions on powers and power factors ............................................................................ 119
10.4.2. Three phase 3 wire ARON system ......................................................................................... 120
10.5. Measuring method: outlines .......................................................................................... 121
10.5.1. Integration period .................................................................................................................... 121
10.5.2. Power factor calculations ........................................................................................................ 121
11. AFTER-SALE SERVICE ......................................................................................... 122
11.1. Warranty ........................................................................................................................ 122
11.2. Service .......................................................................................................................... 122
EN - 2
Page 5
VEGA78
1. PRECAUTIONS AND SAFETY MEASURES
1.1. GENERAL
This meter has been designed in compliance to IEC/EN61010-1 directive. For your own
safety and to avoid damaging the instrument we suggest you follow the procedures hereby
prescribed and to read carefully all the notes preceded by the symbol .
Before and during measurements please take care of below points:
Do not measure voltage or current in wet or dusty places.
Do not measure in presence of gas, explosive materials or combustibles.
Do not touch the circuit under test if no measurement is being taken.
Do not touch exposed metal parts, unused terminals, circuits and so on.
Do not use the meter if it seems to be malfunctioning (i.e. if you notice deformations,
breaks, leakage of substances, absence of messages on the display and so on).
The below symbols are used in this manual and on meter:
Caution: keep to what prescribed by the manual. An incorrect use could damage
the instrument or its components.
High voltage: risk of electric shock.
Double insulation.
Ground reference.
1.2. PRELIMINARY INSTRUCTIONS
This instrument has been designed for use in places with pollution class 2.
It can be used for Voltage and Current measurements on installations of excess
voltage CAT IV 600V to earth and a 1000V maximum voltage between inputs
We recommend following the normal safety rules devised by the procedures for
carrying out operations on live systems and using the prescribed PPE to protect the
user against dangerous currents and the instrument against incorrect use
In case the lack of warning against the presence of voltage may constitute a danger for
the operator always carry out a continuity measurement before carrying out the
measurement of the live system to confirm the correct connection and condition of the
leads
Only the accessories supplied with the instrument guarantee compliance with the
safety standards. Accordingly, they must be in good conditions and, if necessary, they
must be replaced with identical models.
Do not take measurements on circuits exceeding the specified current and voltage
limits.
Before connecting cables, crocodiles and clamps to the circuit under test, make sure
that the right function has been selected.
CAUTION
Please perform a complete charging of internal battery for at least 5 hours
before using the meter the first time.
Please press and hold the ON/OFF key for about 5s when turning on the
meter the first time.
EN - 3
Page 6

VEGA78
1.3. DURING USE
Please read carefully the below points:
CAUTION
Should you fail to keep to the prescribed instructions you could damage the
instrument and/or its components or endanger your safety.
Do not touch any unused terminal when the meter is connected to the circuit on test.
When measuring current, other currents located near the leads may affect the
measuring accuracy.
When measuring current, always position the wire in the very middle of the jaws in
order to obtain the highest accuracy.
A measured value remains constant if the "HOLD" function is active. Should you notice
that the measured value remains unchanged, disable the “HOLD” function.
1.4. AFTER USE
After use, turn off the instrument by pressing ON/OFF key for a few seconds.
If you expect not to use the instrument for a long time please keep to the storage
instructions described at § 3.4.
1.5. MEASURING (OVERVOLTAGE) CATEGORIES DEFINITIONS
IEC / EN61010-1: Safety requirements for electrical equipment for measurement, control
and laboratory use, Part 1: General requirements, gives a definition of measuring
category, usually called overvoltage category. § 6.7.4: Measuring circuits:
(OMISSIS)
Circuits are divided into the following measurement categories:
Measurement category IV is for measurements performed at the source of the low-
voltage installation.
Examples are electricity meters and measurements on primary overcurrent protection
devices and ripple control units.
Measurement category III is for measurements performed in the building installation.
Examples are measurements on distribution boards, circuit breakers, wiring, including
cables, bus-bars, junction boxes, switches, socket-outlets in the fixed installation, and
equipment for industrial use and some other equipment, for example, stationary
motors with permanent connection to fixed installation.
Measurement category II is for measurements performed on circuits directly
connected to the low voltage installation.
Examples are measurements on household appliances, portable tools and similar
equipment.
Measurement category I is for measurements performed on circuits not directly
connected to MAINS.
Examples are measurements on circuits not derived from MAINS, and specially
protected (internal) MAINS-derived circuits. In the latter case, transient stresses are
variable; for that reason, the norm requires that the transient withstand capability of the
equipment is made known to the user.
EN - 4
Page 7

VEGA78
2. GENERAL DESCRIPTION
2.1. INTRODUCTION
The VEGA78 meter permits a completely new approach to the world of electrical
measures on network quality. In fact the computer assisted instruments along with
Windows CE technology permit an easy and widely fast analysis of a huge quantity of
data, which would be impossible with any other system.
2.2. FUNCTIONS
This meter are able to performs:
Real time visualization of numeric values of any electrical parameters of a single phase
and three-phase 3-wire or 4-wire systems, harmonic analysis of voltages and currents
up to 49st order, Voltage anomalies (surge and dips) with 10ms resolution, voltages
unbalance.
Real time display of any input signal waveform, histogram graphics of harmonics
analysis and vectorial diagrams of mutual angles between voltages and currents.
Recording (by pressing GO/STOP key) of this values: TRMS values of voltages,
currents, corresponding harmonics, active, reactive and apparent powers, power
factors and cosphi, active, reactive and apparent energies, voltage anomalies. It will
be possible to analyze the recorded data ONLY by transferring them to a PC.
Saving (by pressing SAVE key) of a “Instant” sampled of instantaneous values of any
parameters present at instrument input inside memory. It will be possible to analyze
the memorized data ONLY by transferring them to a PC.
2.3. INITIAL SCREEN
When turning on the instrument by pressing ON/OFF key, this below screen will appear for
a few seconds:
VEGA78
HT
Sn:13030004 Rel:1.32
Calibration Date: 09/01/2013
Here you can see (besides model code and manufacturer name):
The serial number of the meter (Sn:).
The release of internal meter Firmware (Rel:).
Date of last calibration (Calibration Date:).
EN - 5
Page 8
VEGA78
3. PREPARE TO USE
3.1. INITIAL CHECK
This meter has been checked before shipment from an electrical and mechanical point of
view. All possible precautions have been taken in order to deliver it in perfect condition.
Notwithstanding, on receipt of the instrument we suggest that you check it summarily to
make sure that no damage has occurred in transit. Should you find irregularities please
contact the carrier immediately.
Furthermore, please make sure that the parcel contains all the accessories and parts listed
at enclosed packing list. In case of discrepancies please contact your dealer. Should it be
necessary to return the instrument to the supplier please keep to the instructions given at §
11.
3.2. INSTRUMENT POWER SUPPLY
The instrument can be powered only by a rechargeable Li-ION battery (3.7V, 1900mAh)
which is included with the meter. Use only the external adapter standard supplied with
meter for charging battery (see § 8.2 for more details).
For recordings use ALWAYS the external adapter (even the instrument
allows the operator to perform a recording using internal battery).
Please perform a complete charging of internal battery for at least 5
hours before the first use of meter.
The meter uses the below options to increase the battery duration:
Automatically reduction of display brightness after about 30s from last operation
performed with meter, with external adapter not connected.
Auto Power OFF feature after about 5 minutes from the last operation on function keys
or display touch screen with external adapter not connected (see § 5.1.6).
3.3. CALIBRATION
The instrument complies with the standards mentioned in this manual. Its performance is
defined for 12 months from the purchase date.
3.4. STORAGE
To guarantee accurate measurements, after a long storage period in severe environmental
conditions wait until the instrument resumes its normal conditions (see § 9.3.1).
CAUTION
CAUTION
EN - 6
Page 9
VEGA78
g
4. HOW TO OPERATE
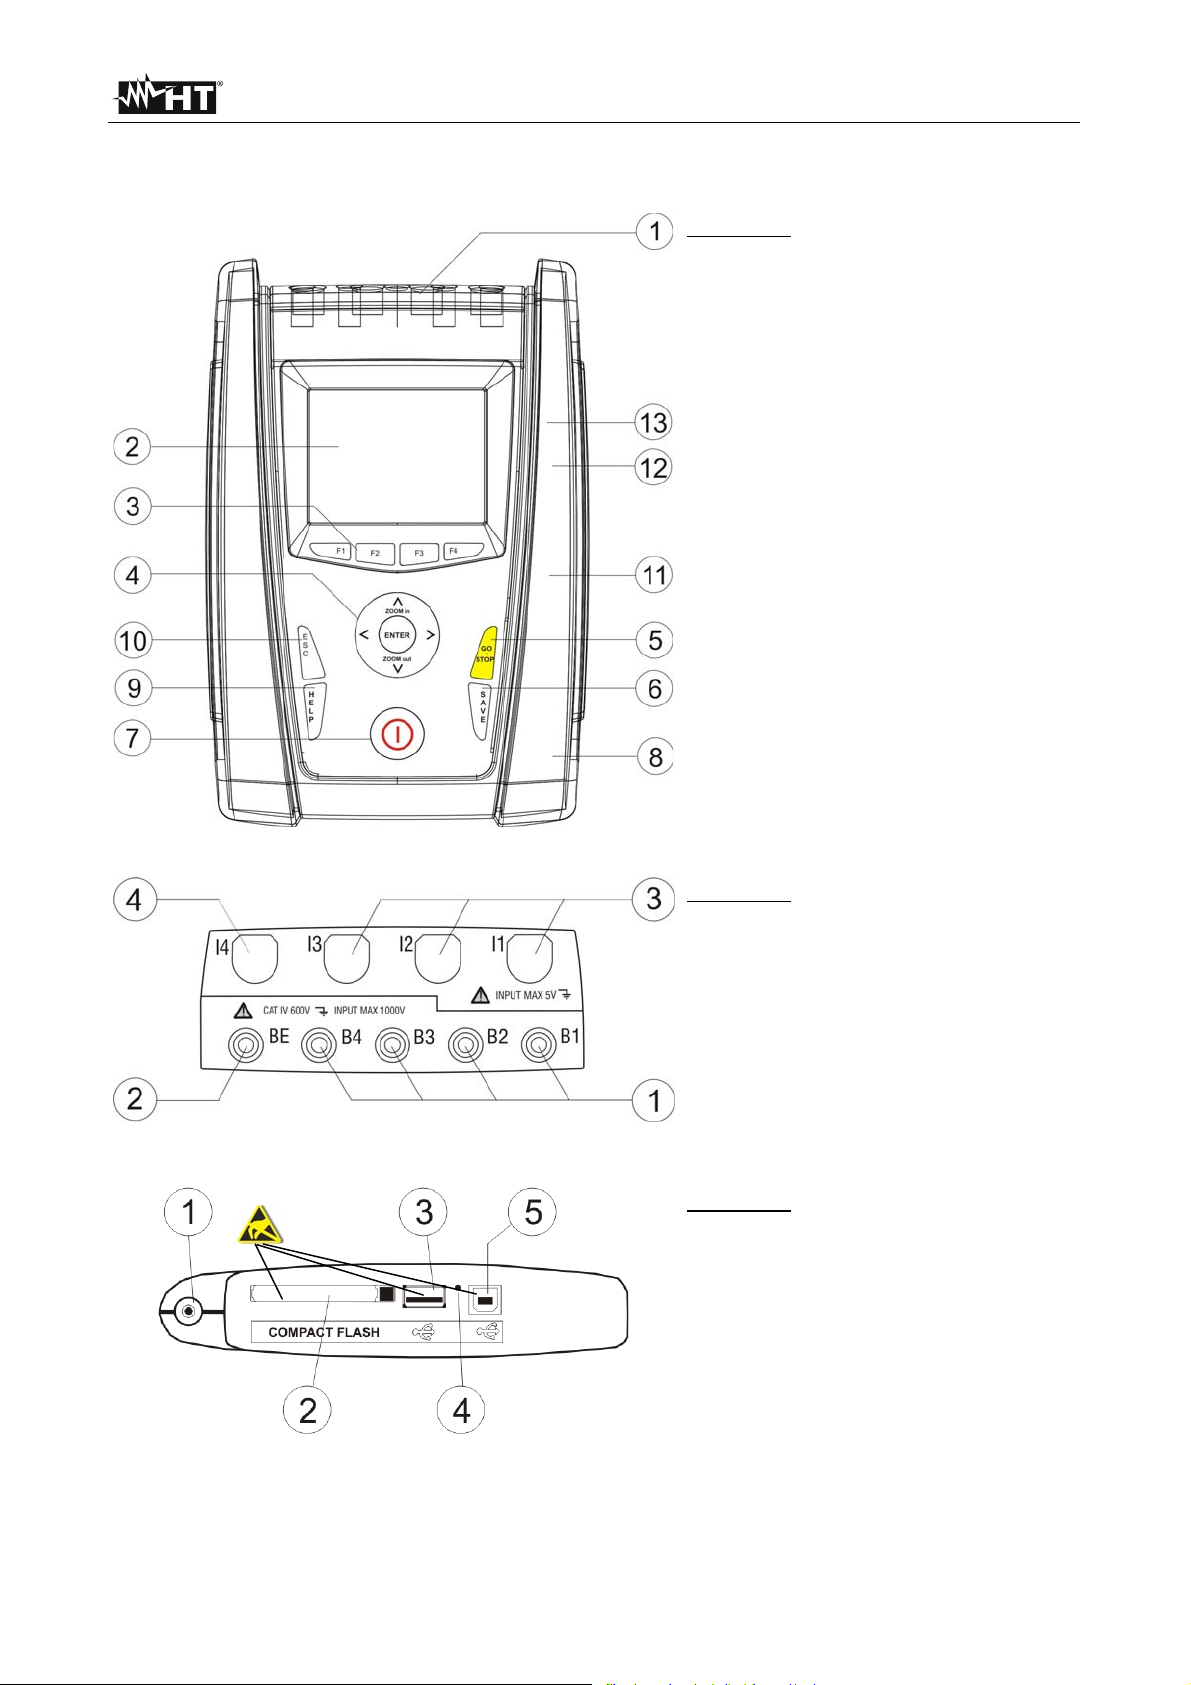
4.1. INSTRUMENT DESCRIPTION
CAPTION:
1. Voltage and Current inputs
2. TFT display with “touchscreen”
3. F1 – F4 keys
4. Arrows keys and ENTER key
5. GO/STOP key
6. SAVE key
7. ON/OFF key
8. Input for external adapter
9. HELP key
10. ESC key
11. Output per external compact flash
connection
12. Output per external USB driver
connection
13. USB output for PC connection
Fig. 1: Description of meter's front panel
CAPTION:
1. B1-B4 inputs for voltage
connections on L1, L2, L3 phases
and neutral N
2. BE input for Ground connection
3. Inputs for currents connections on
L1, L2, L3
4. Input for neutral N current
connection
Fig. 2: Description of meter's input terminals
CAPTION:
ESD Warnin
1. Input for external adapter
2. Output for compact flash (*)
3. Output for external driver USB (*)
4. RESET command
5. USB output for PC connection (*)
Fig. 3: Description of meter's output connectors
(*) Use the output connectors included into the lateral side only with meter OFF. This outputs should be
interested by electrostatic discharges (ESD).
EN - 7
Page 10
VEGA78
4.2. KEYBOARD DESCRIPTION
The below keys are available:
Key ON/OFF: Press this key to turn on the meter. Press and hold the key for few
seconds to turn off the meter.
Keys F1, F2, F3, F4: Multifunction keys. The various functions are intended from the s
shown on the bottom of display.
Key ESC: To leave a menu or a sub-menu. The smart icon which is shown
on screens performs the same function under interactive mode.
Key ENTER: Double function key:
ENTER: To confirm the settings made.
HOLD: To block the value updating in all real time screens and also
during a recording operation. “H” symbol is shown at display by
any pressing of key as for Fig. 4:
12/09/2006 – 16:55:10 H
0.0
V12
0.0
0.0
I1
0.0
TOTAL RMS VALUES – Page 1/6
V2N
0.0
V23
0.0
ZERO%
0.0
I2
0.0
V3N
0.0
V31
0.0
SEQ
000
I3
0.0
V1N
NEG%
PAGE SCOPE HARM VECTORS
VNPE
0.0
Hz
0.0
IN
0.0 A
V
V
Fig. 4: HOLD function active at display
Keys , , , /ZOOM in/ZOOM out: These arrows keys permit to select the desired
programmable parameters inside various screens. The double
function of ZOOM in and ZOOM out permits to change manually
the full scale of some graphics inside SCOPE section in order to
improve the global resolution on viewing waveforms of signals (see
§ 5.3.2). Arrow keys and permit to operate on internal pages
inside some kinds of screen.
Key SAVE: Saves an “Instant” type sampling of instantaneous values in
internal memory (see § 5.5). The same key permits also the saving
of various settings inside screens. The smart icon which is
shown on screens perform the same function under interactive
mode.
Key GO/STOP: Permits to start/stop any recording (see § 5.4.10).
Key HELP: Opens an help on line window on the meter screen with a short
description of the same screen which is instantaneously shown.
This key is active for any function.
EN - 8
Page 11
VEGA78
4.3. DISPLAY DESCRIPTION
The display is a graphic TFT colour type, 73x57mm sizes (VGA 320x240 pxls) with “touchscreen” which permits a really easy operations using standard PT400 pointer pen fitted in lateral
side of meter.
On first display’s row the system date/hour is shown by meter (see § 5.1.2 for settings). There
are also some icons relative to battery level indication or external adapter fitted and for waiting
and start of a recording. On second row the kind of selected measure is shown and the last row
shows the short s associated to F1, F4 function keys. An example of possible screen is show n
on Fig. 5:
12/09/2006 – 16:55:10
0.0
V12
0.0
0.0
I1
0.0
TOTAL RMS VALUES – Page 1/6
V2N
0.0
V23
0.0
ZERO%
0.0
I2
0.0
V3N
0.0
V31
0.0
SEQ
000
I3
0.0
VNPE
0.0
Hz
0.0
IN
0.0 A
V
V
V1N
NEG%
PAGE SCOPE HARM VECTORS
Fig. 5: Example of screen
4.4. RESET OF METER
The meter is designed with internal Reset Hardware which can be used if any functions is
blocked at display, in order to restore all correct operations. Consider the below steps to
perform Reset actions:
1. Using the PT400 pointer pen or another object softly pressing the internal part of the
little hole which is present on the lateral side of meter (see Fig. 3 – 4). The meter goes
automatically off.
2. Turn on the meter by pressing ON/OFF key and verify the correct working.
RESET operation will not erase the meter’s internal memory.
EN - 9
Page 12
VEGA78
5. GENERAL MENU
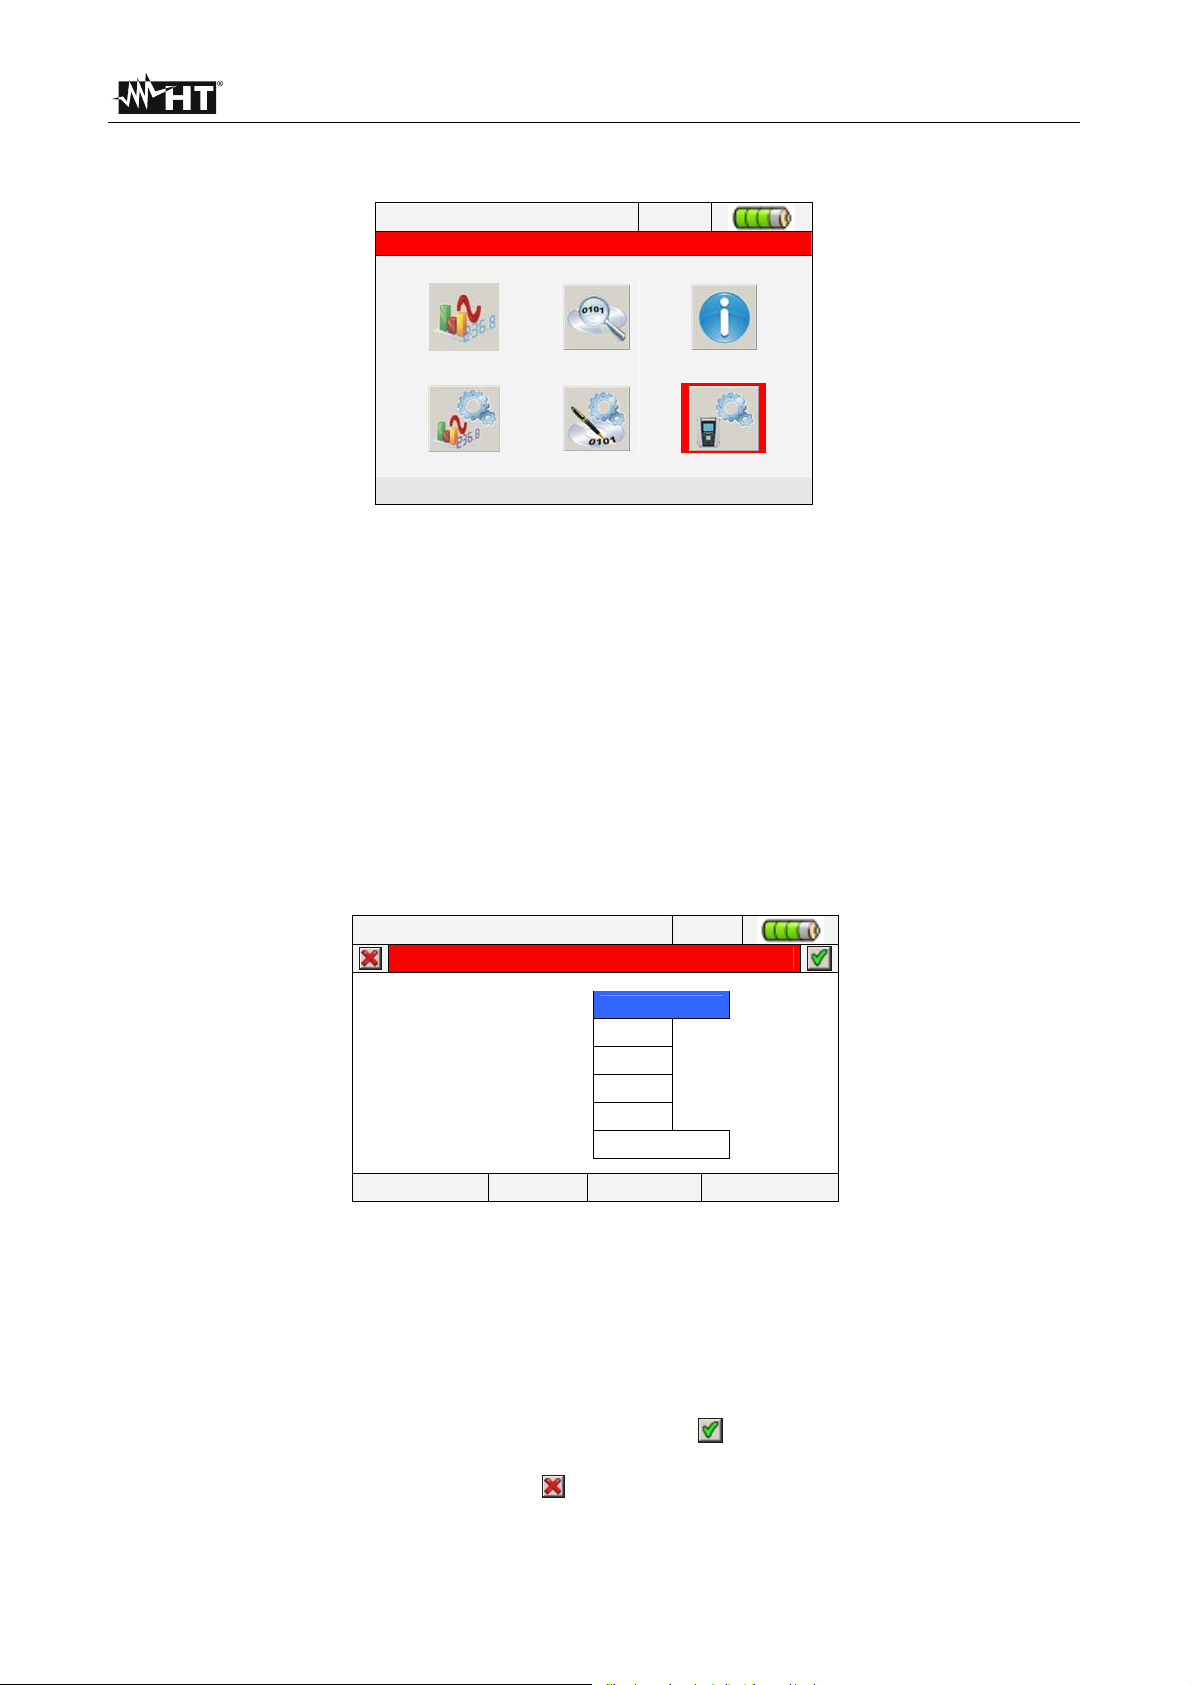
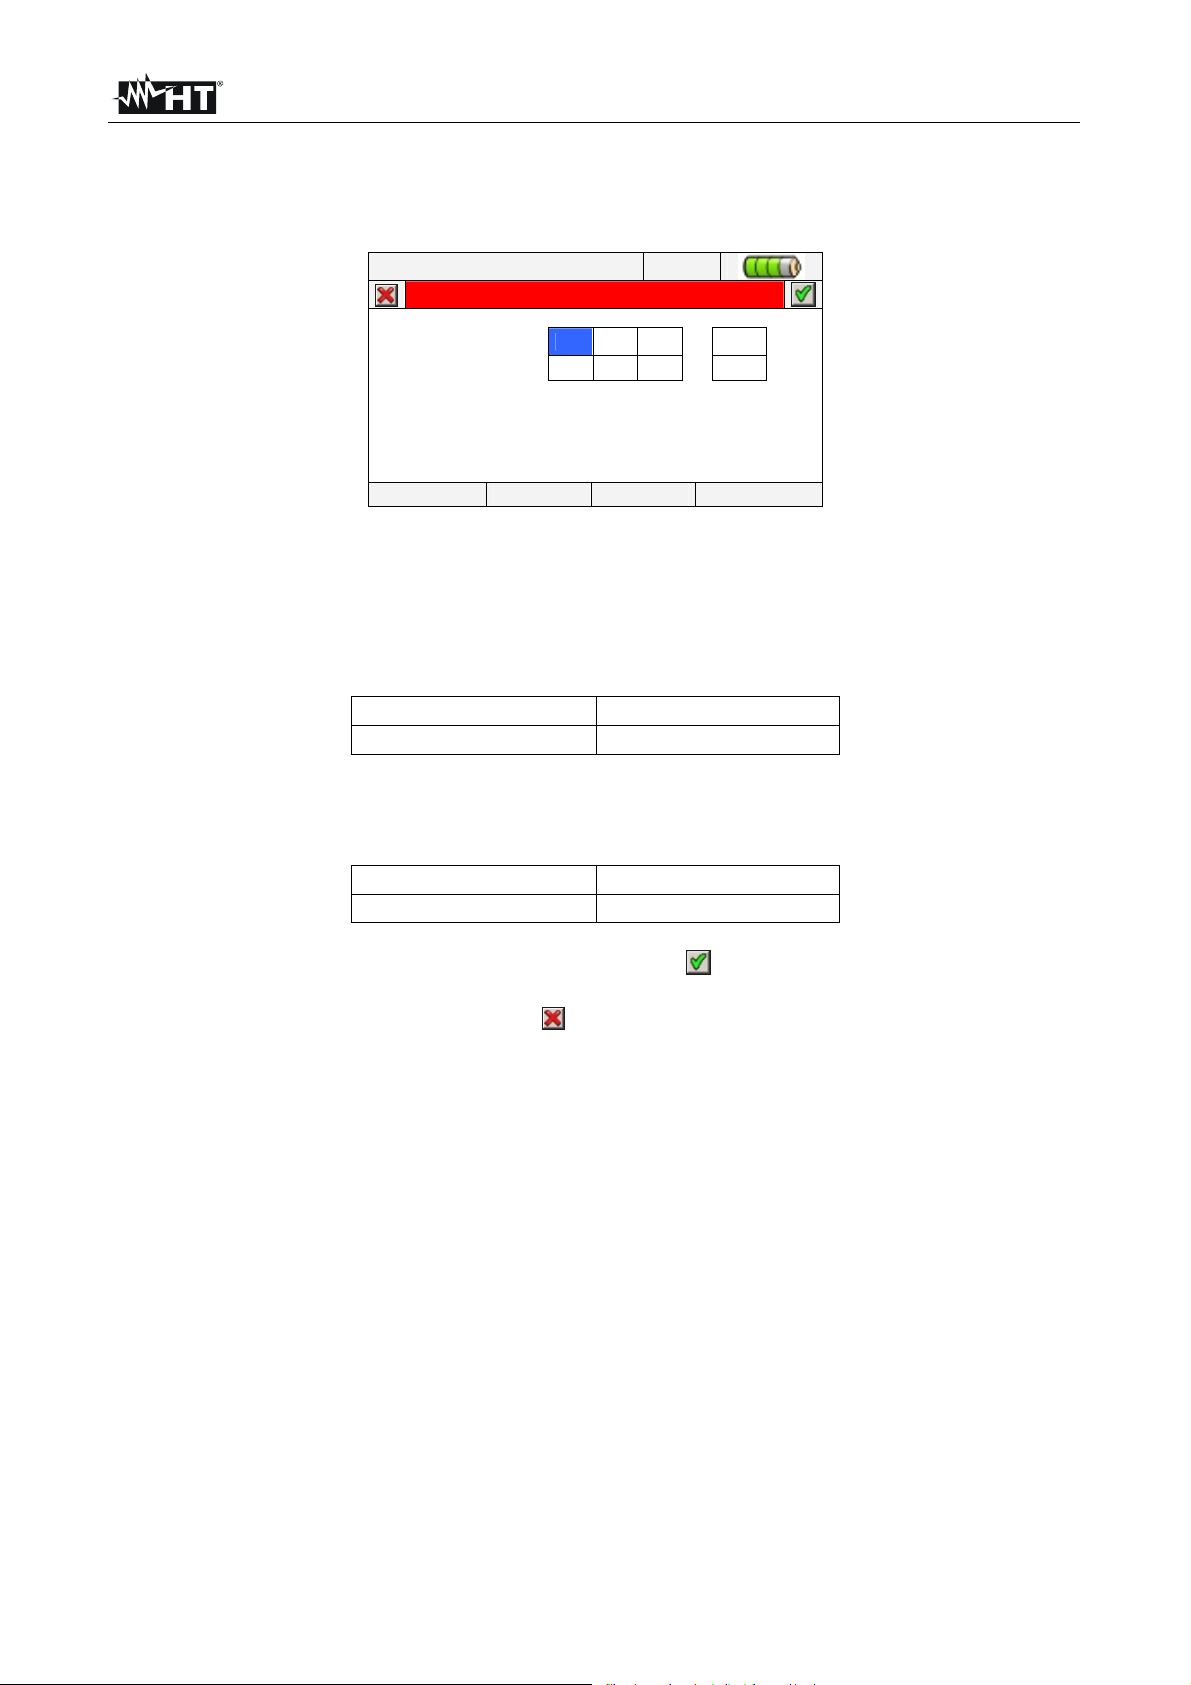
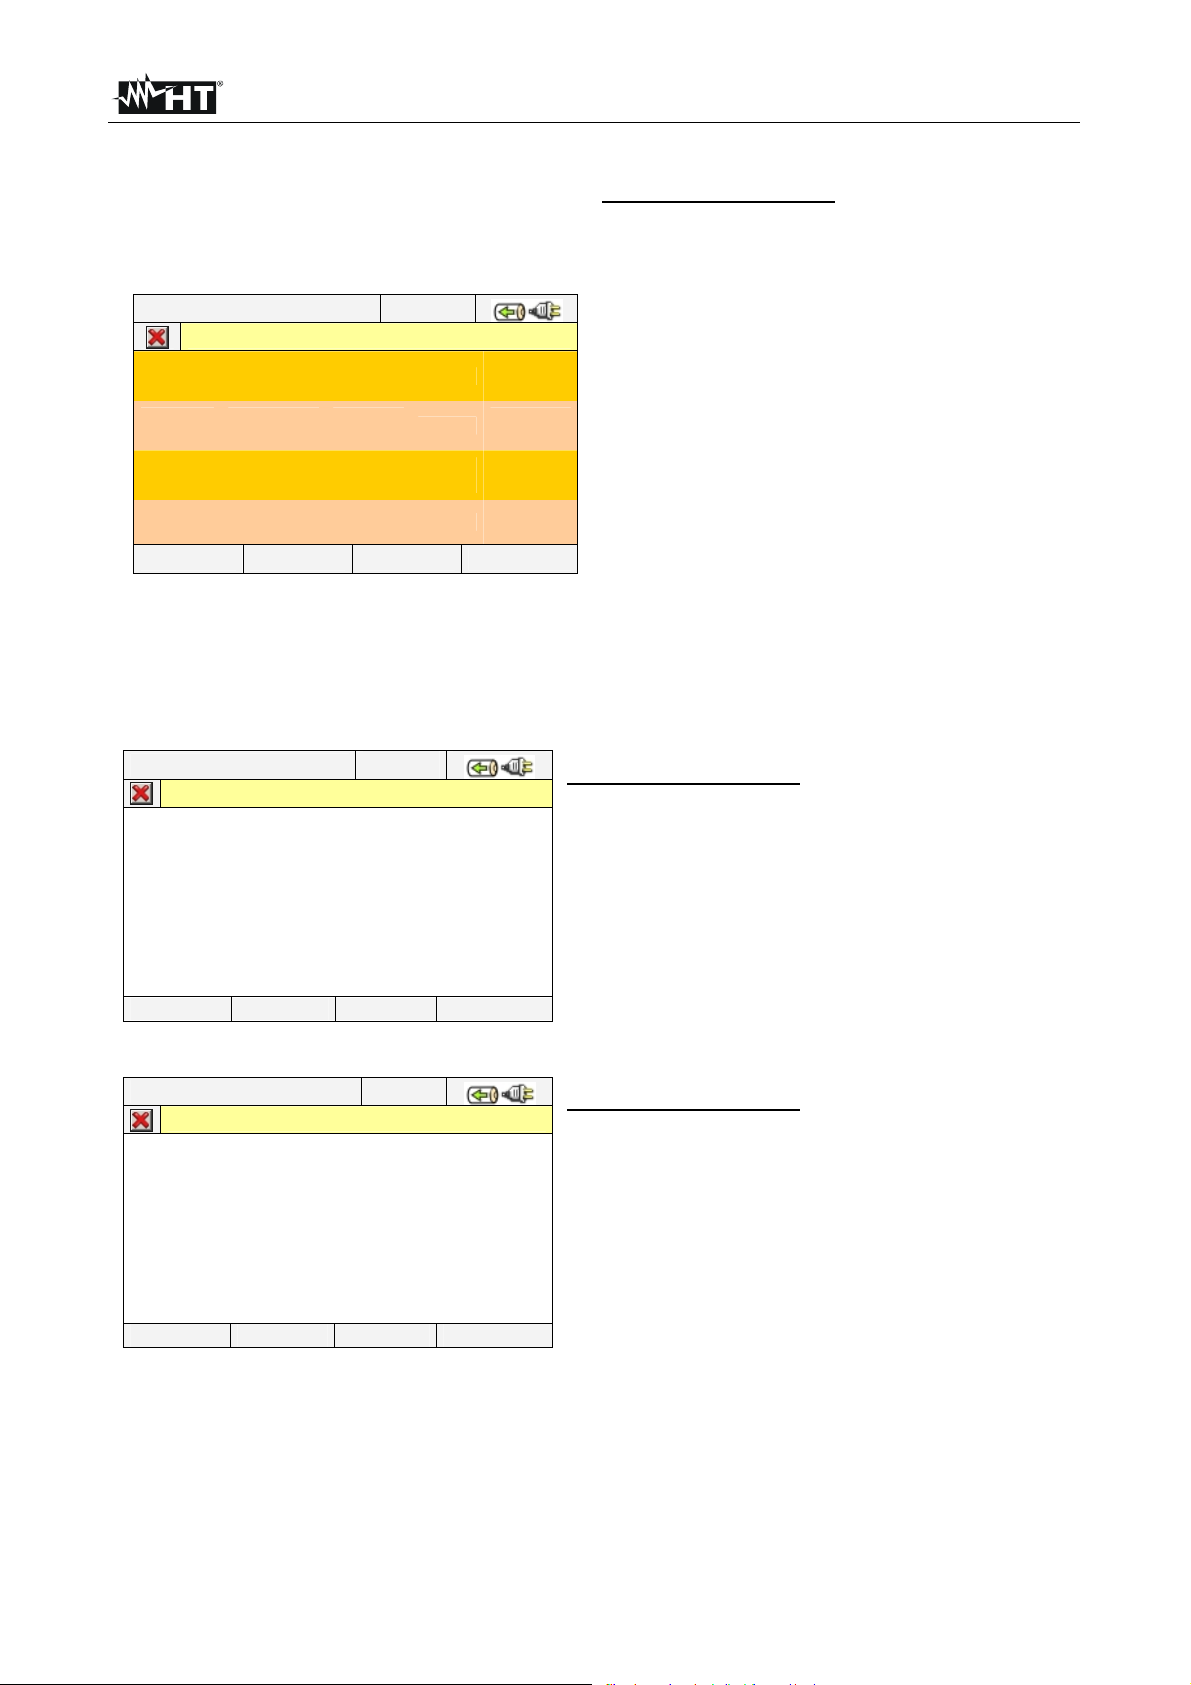
Whenever you turn on the meter, the below “Analyzer Configuration” screen is shown,
relative to the last configuration used (see Fig. 6):
12/09/2006 – 16:55:10
ANALYZER CONFIGURATION
1
2
3
N
PE
System
Freq [Hz]
Clamp Type
4WIRE
50
FLEX
CHANGE
Clamp FS [A]
VT Ratio
3000
1
OK
Fig. 6: Example of analyzer configuration
In this situation the user can decide whether modify the actual configuration by pressing
F1 key (or “CHANGE” at display – see § 5.3.1) or directly access to General Menu by
pressing F4 key (or the “OK” at display). If no action is performed within 10s the meter
automatically goes to GENERAL MENU screen.
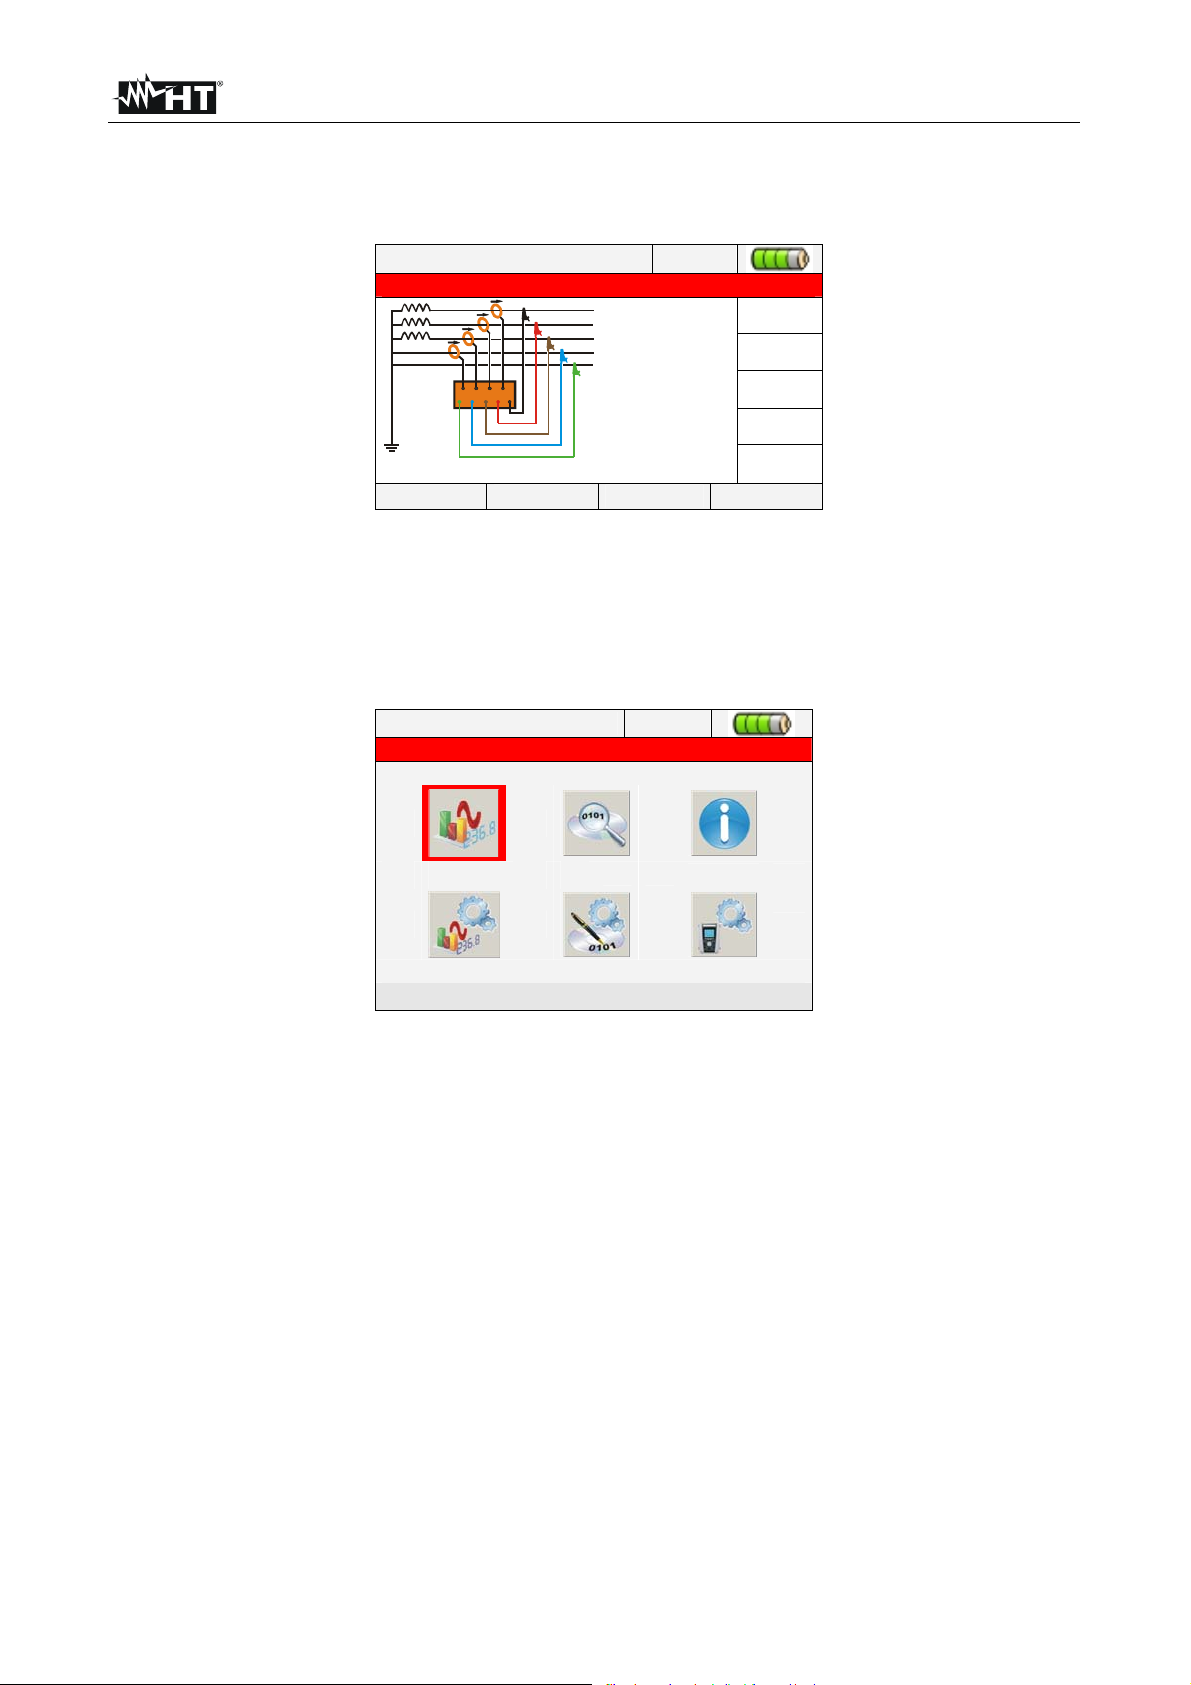
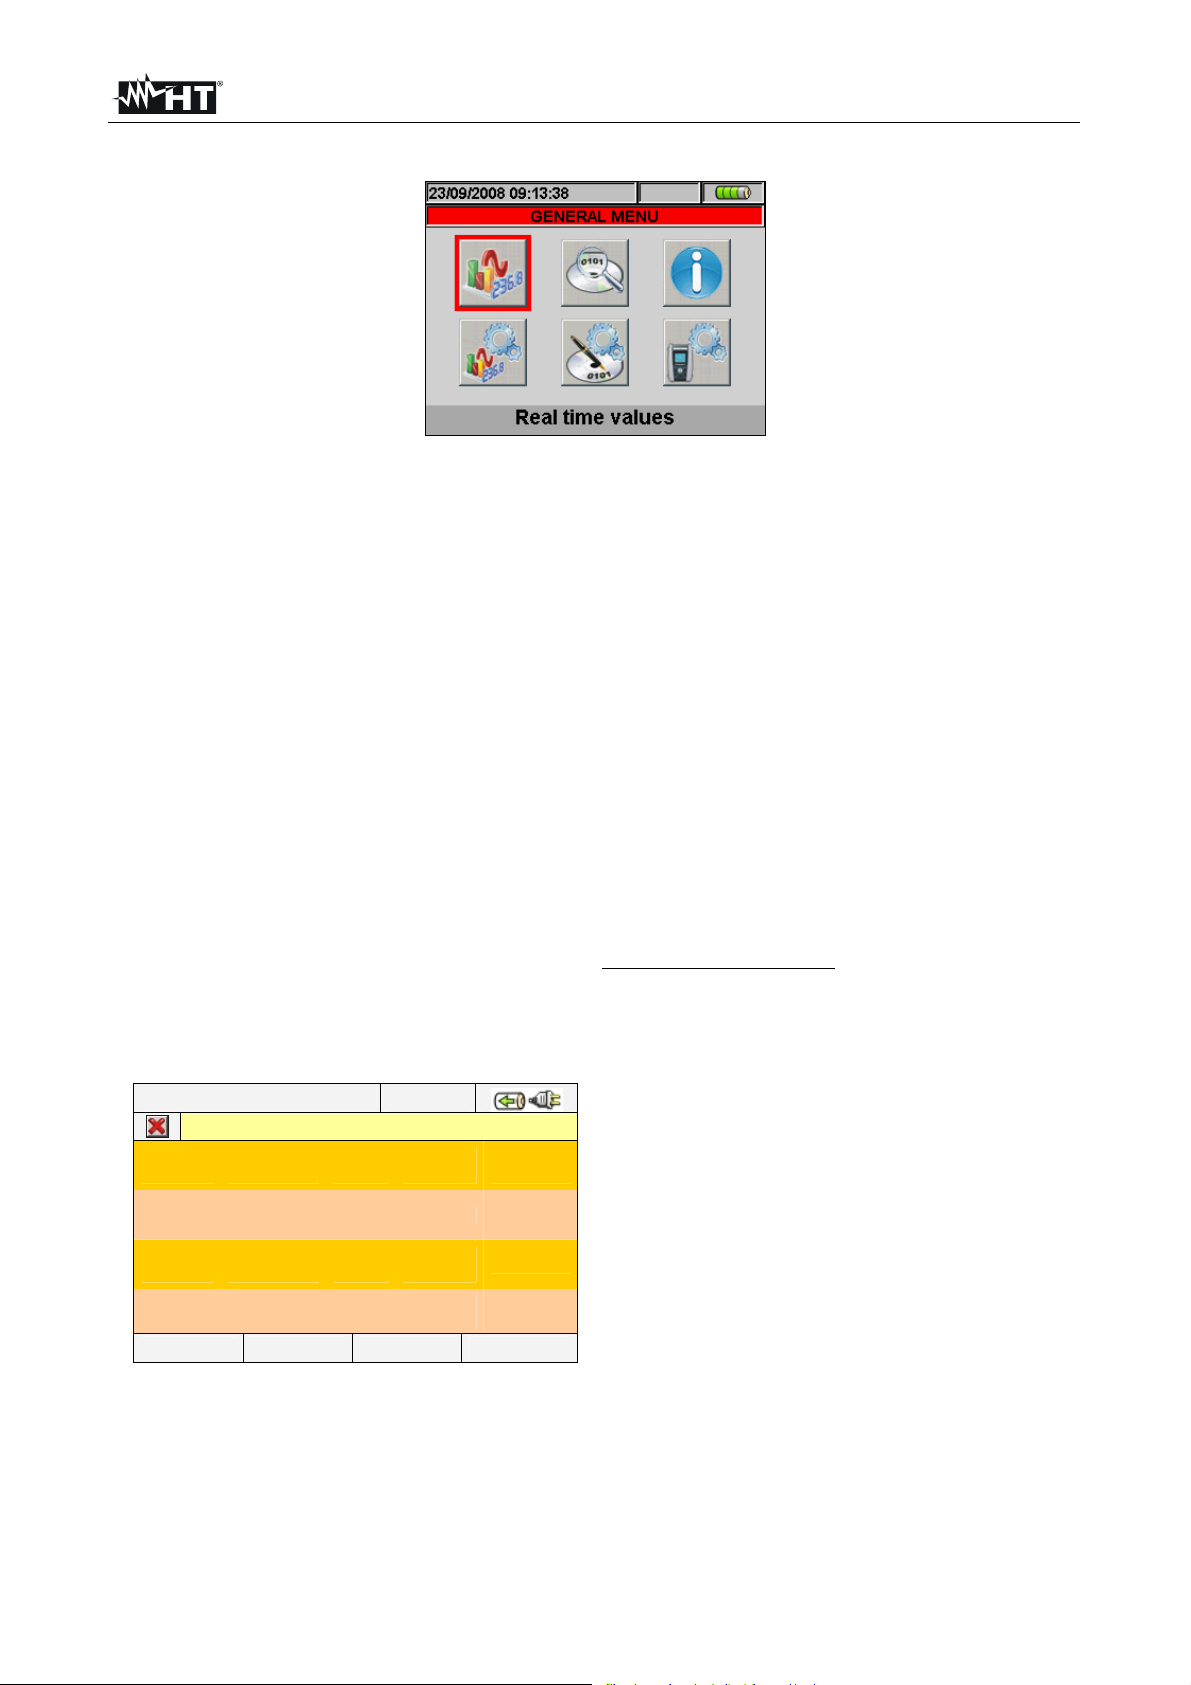
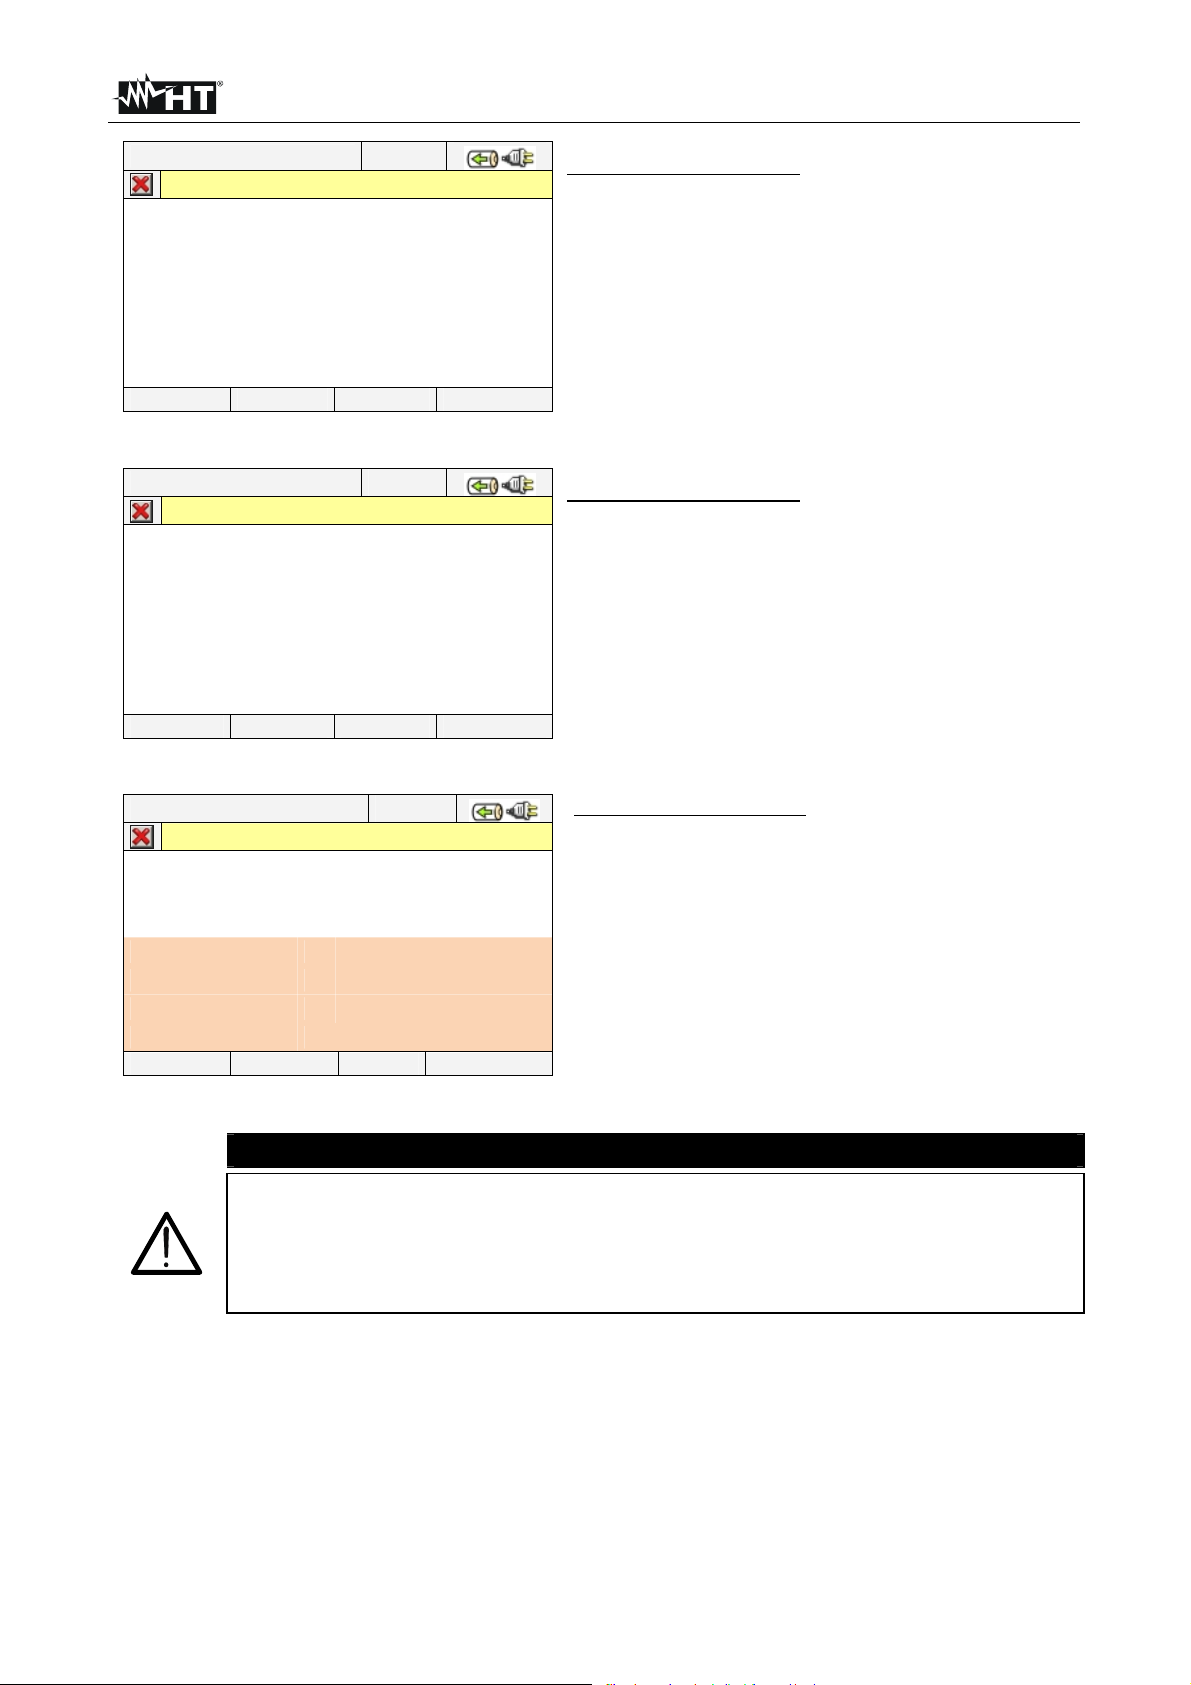
The GENERAL MENU of meter is correspondent to the screen shown in Fig. 7:
12/09/2006 – 16:55:10
GENERAL MENU
Real time values
Fig. 7: GENERAL MENU screen
The actual selected section is shown with red background at display and it’s title is shown
in the bottom of display. The below sections are available on meter:
General settings section which permits to set the system parameters of meter as
date/hour, language, display brightness, protection password, keys sound on pressure
auto power off and memory type (see § 5.1).
Real time values section which permits to see the real time measured values at
display under various formats (see § 5.2).
Analyzer settings section which permits to define the simple and advanced
configurations relative to connection of meter to the installation (see § 5.3).
Recorder settings section which permits to select the parameters for each recording
and see the information about the autonomy of meter during operation (see § 5.4).
Recording results section which permits to see the list of all recordings saved on
internal memory, for memory cancel operations and the transfer of date in external Pen
Driver USB (see § 5.5).
Meter information section which permits to access to general information about meter
(serial number, internal Firmware and Software release, etc...) (see § 5.6).
EN - 10
Page 13
VEGA78
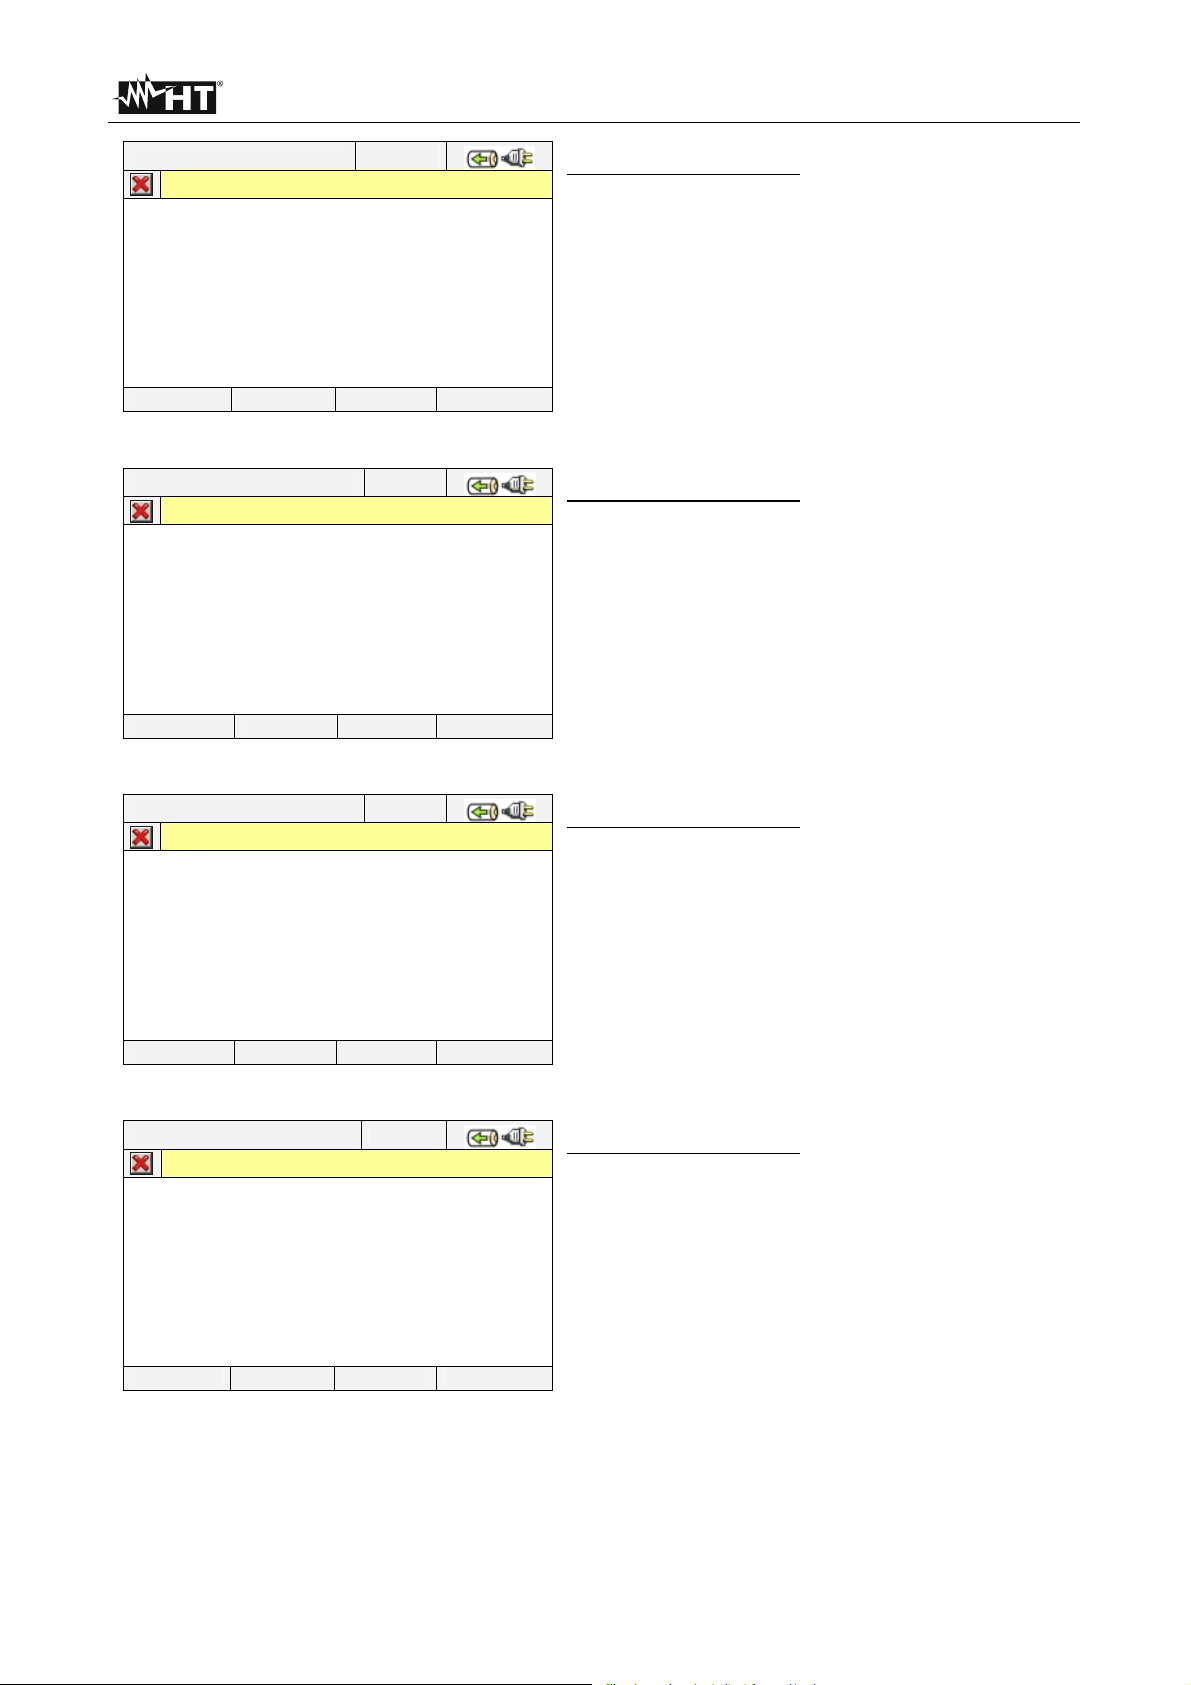
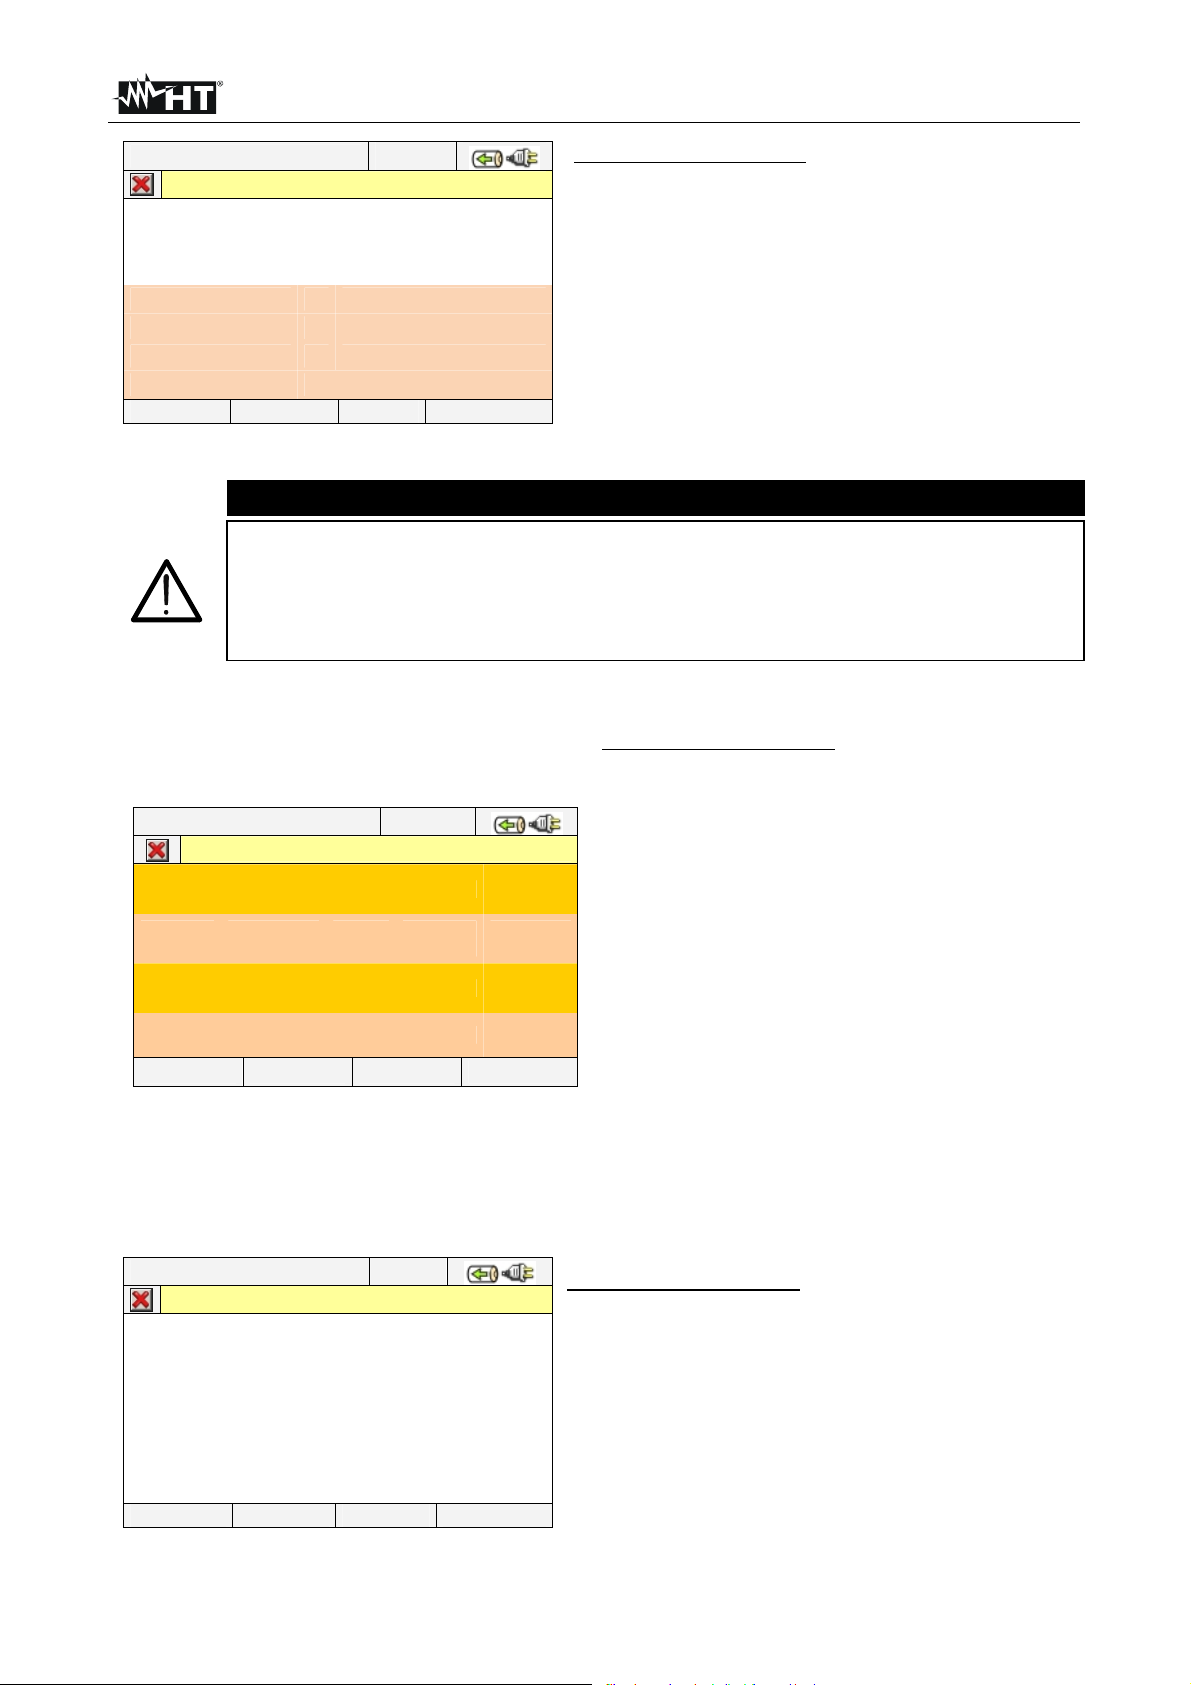
5.1. GENERAL SETTINGS
12/09/2006 – 16:55:10
MENU’ GENERAL
General settings
Fig. 8: MENU GENERAL screen - General settings section
This section permits to set the below control parameters:
System language.
System Date/Hour.
Display brightness.
Protection password during recordings.
Key sound on pressure.
Auto Power OFF Enable/Disable.
Memory type settings
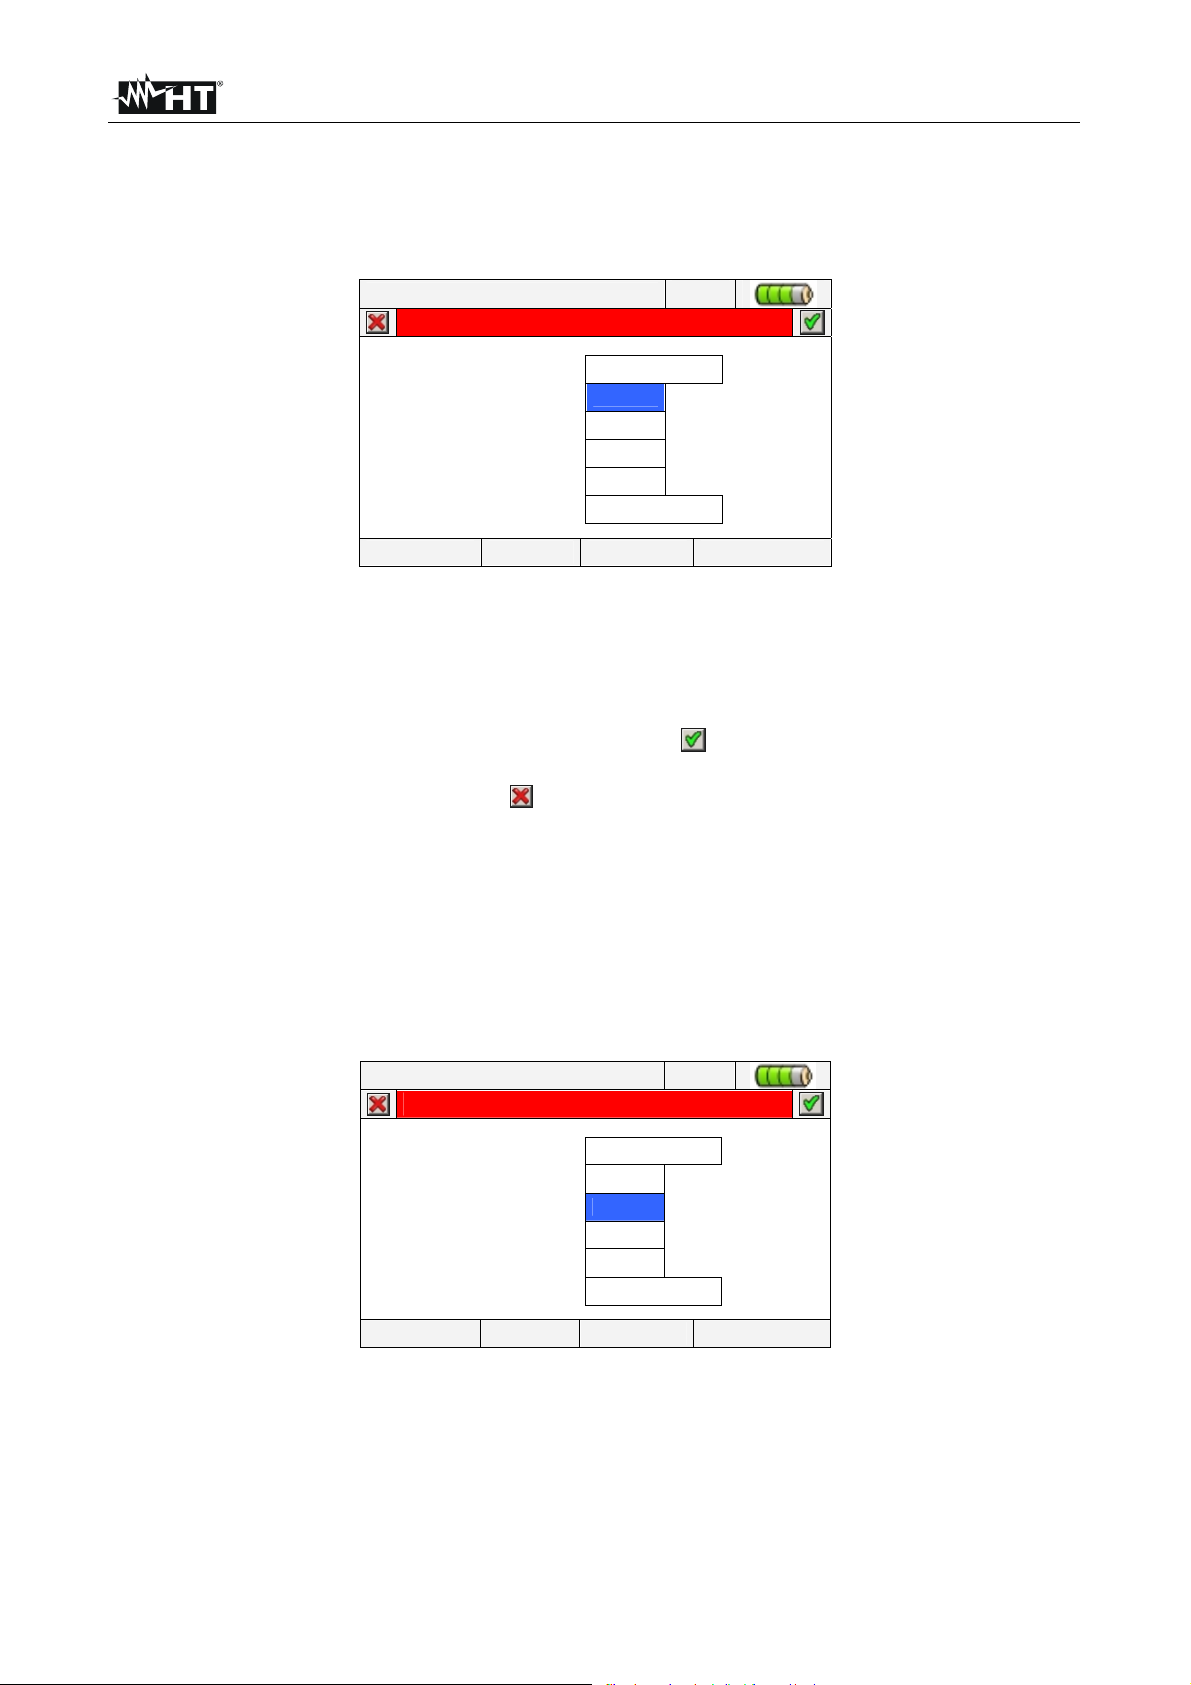
Pressing ENTER key (or touch the relative icon at display). The below screen is shown by
meter:
12/09/2006 – 16:55:10
Language ENGLISH
Brightness 75%
Password NO
Sound YES
Auto power off YES
Memory type INTERNAL
GENERAL SETTINGS
DATE MOD(+) MOD(-)
Fig. 9: General Settings screen
5.1.1. Language selection
1. Move the cursor using arrows keys on field relative to “Language”, marked with blue
background.
2. Using F3 or F4 keys (or touch MOD(+) o MOD(-)) for selection of language choosing
among the different options.
3. Pressing SAVE or ENTER keys (or the smart icon
) to save the selected option and
confirm by “Ok”. This selected parameter will be present also the turning off of meter.
4. Pressing ESC key (or the smart icon
) to exit by screen without saving any modify.
EN - 11
Page 14
VEGA78
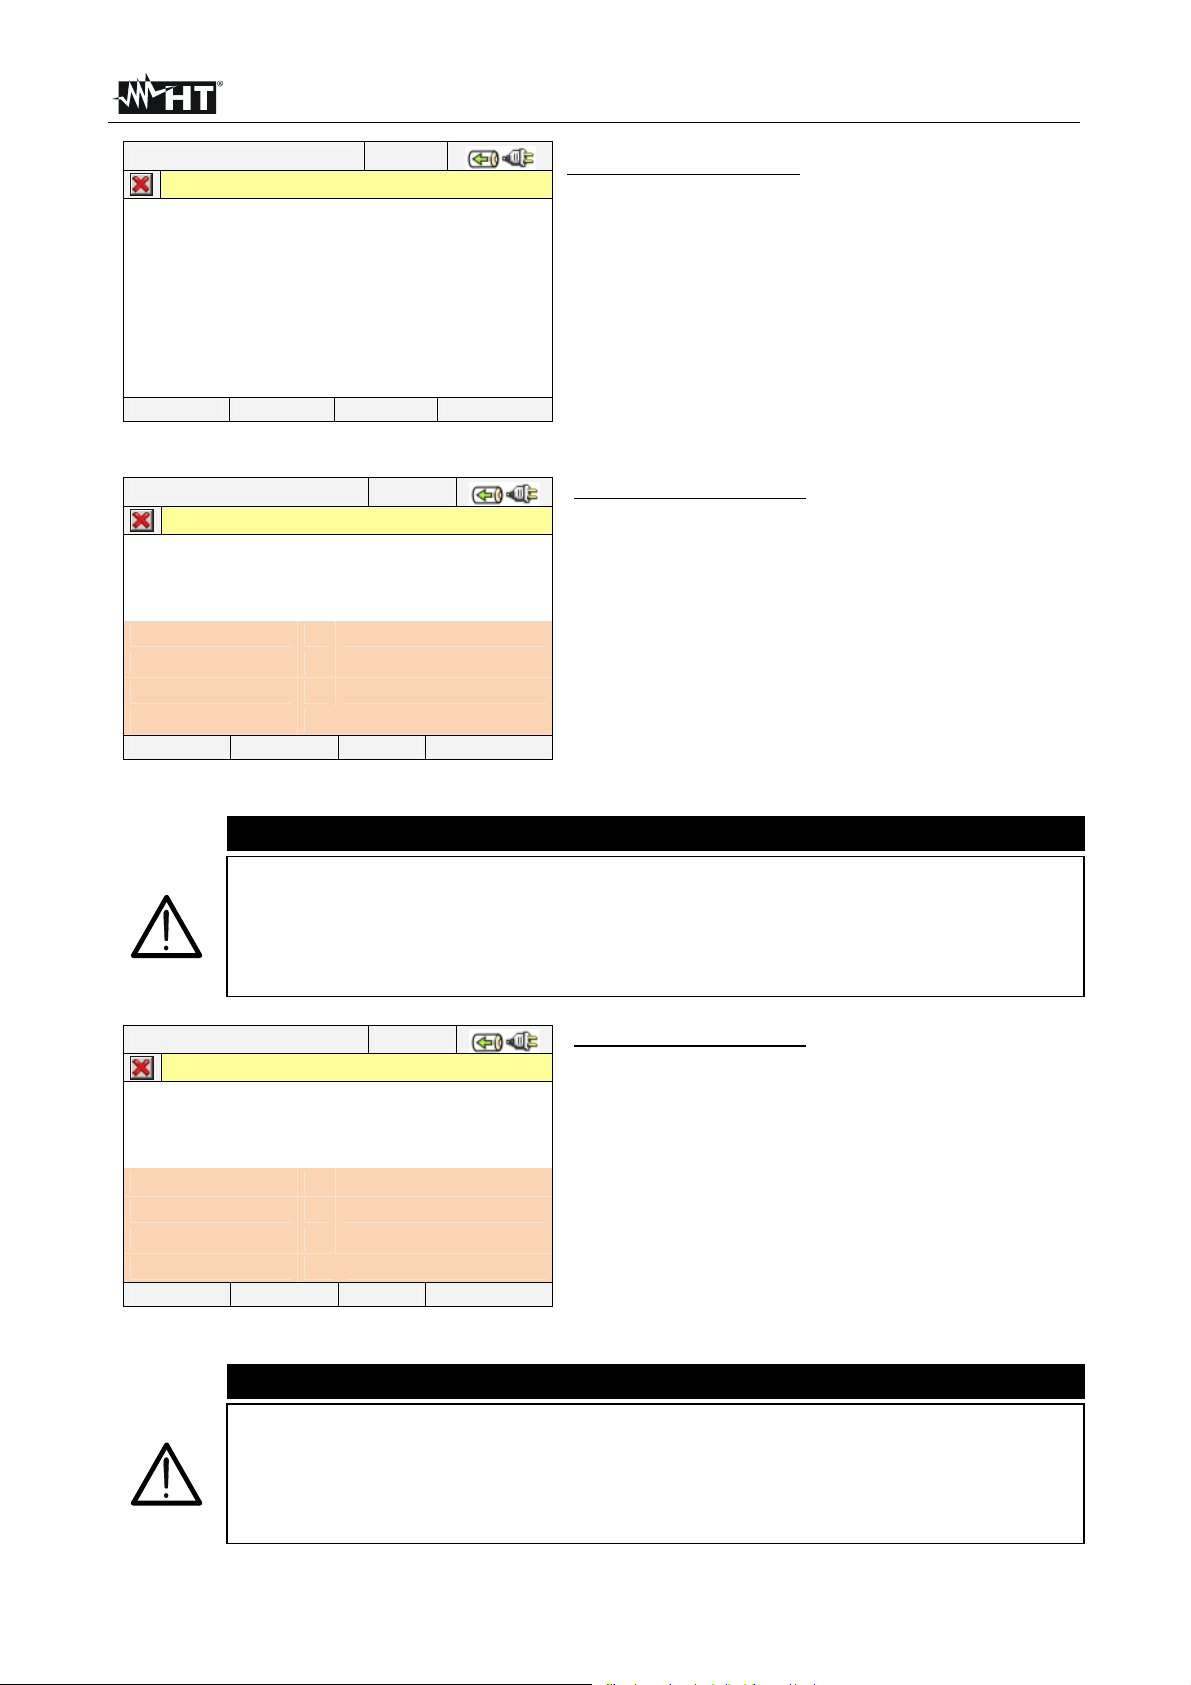
5.1.2. Date/Time settings
1. Press the F1 key (or touch DATE at display) on screen of Fig. 9. The below screen is
shown by meter:
12/09/2006 – 16:55:10
Date format 12 09 06 UE
Time format 11 56 00 24h
DATE / TIME SETTINGS
MOD(+) MOD(-)
Fig. 10: Date/Time settings screen
2. Move the cursor using arrows keys on field relative to “Date format” and “Time format”,
marked with blue background.
3. Using F3 or F4 keys (or touch MOD(+) o MOD(-)) for Date setting choosing between
the two possible formats (European EU or American US):
DD:MM:YY
MM:DD:YY
Option EU
Option US
4. Using F3 or F4 keys (alternatively touch MOD(+) o MOD(-)) for Time setting choosing
between two possible format (24 hours or 12 hours):
HH:MM:SS
HH:MM:AM(PM)
Option 24h
Option 12h
5. Press SAVE or ENTER keys (or the smart icon ) to save the selected option and
confirm by “Ok”. This selected parameter will be present also the turning off of meter.
6. Pressing ESC key (or the smart icon ) to exit by screen without saving any modify.
EN - 12
Page 15
VEGA78
5.1.3. Display brightness adjust
1. Move the cursor using arrows keys on the field relative to “Brightness”, marked with
blue background, see Fig. 11:
12/09/2006 – 16:55:10
Language ENGLISH
Brightness 75%
Password NO
Sound SI
Auto power off SI
Memory type INTERNAL
DATE MOD(+) MOD(-)
GENERAL SETTINGS
Fig. 11: Adjust brightness screen
2. Using F3 or F4 keys (alternatively touch MOD(+) o MOD(-)) for adjustment of display
brightness percentage. The meter increases or decreases this value in step of 5% for
each pressure of key.
3. Press SAVE or ENTER key (or the smart icon ) to save the selected option and
confirm by “Ok”. This selected parameter will be present also the turn off of meter.
4. Press ESC key (or the smart icon ) to quit without saving any modification.
5.1.4. Protection Password setting
The meter is provided with a protection password to avoid the risk of accidental recording
interruption.
1. Move the cursor using arrows keys on field relative to “Password” , marked it with blue
background, see Fig. 12:
12/09/2006 – 16:55:10
Language ENGLISH
Brightness 75%
Password NO
Sound SI
Auto power off SI
Memory type INTERNAL
GENERAL SETTINGS
DATE MOD(+) MOD(-)
Fig. 12: Protection password settings screen
2. Use F3 or F4 keys (alternatively touch MOD(+) o MOD(-)) to enable “YES” or disable
“NO” of Password.
EN - 13
Page 16
VEGA78
_
___
_
_
___
_
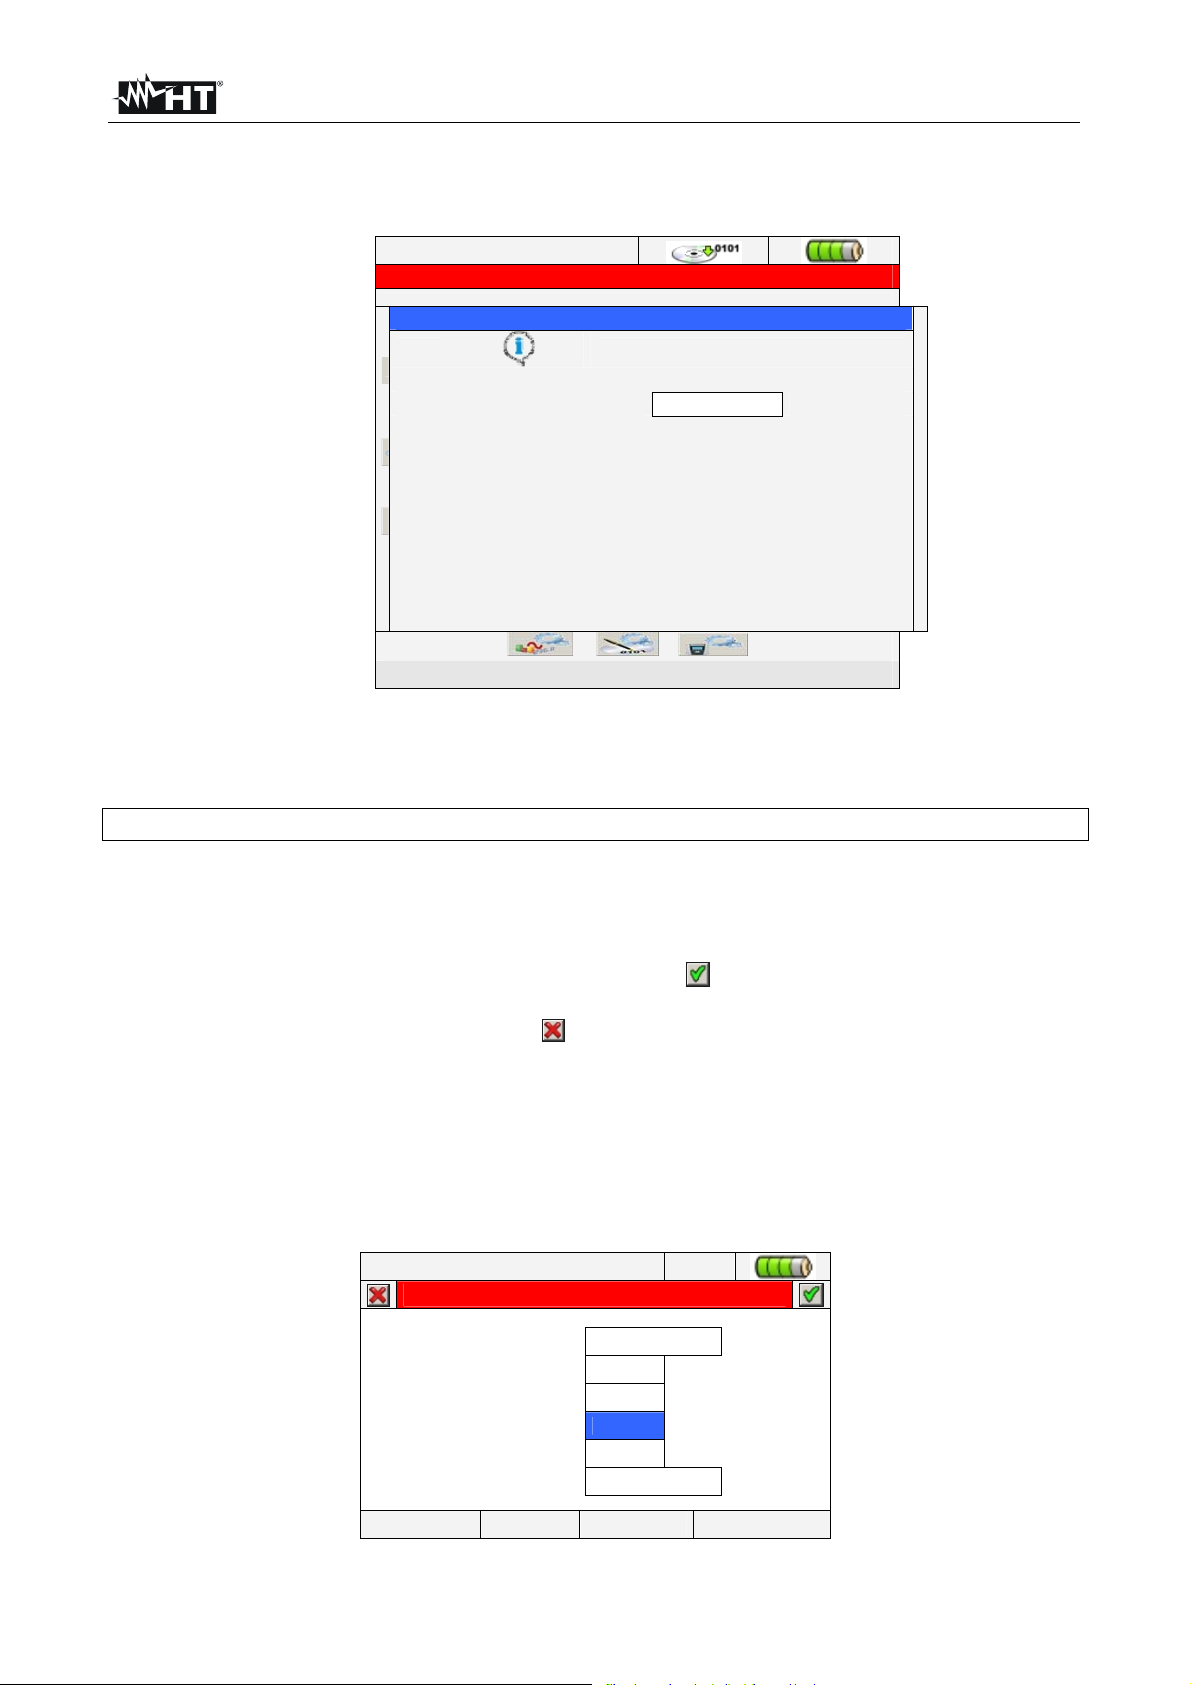
3. With Password enabled, should GO/STOP key be pressed during a recording, the
meter will not stop the operation but will require the user to insert password as shown
in the below screen:
12/09/2006 – 16:55:10
GENERAL MENU
Warning
Insert Password
* * * *
__ __ __ ____
General settings
Fig. 13: Insert Password screen
4. The fixed password (not changeable by user) to insert on meter within 10s from
warning message is the below sequence of keys:
F1, F4, F3, F2
5. If a wrong password is fitted or if more of 10s elapse, the meter will give the warning
message “Wrong Password” and it’s necessary to repeat the operation. As soon as the
correct password is fitted, the meter will stop immediately the recording running and the
correspondent icon at display (see Fig. 13) will disappear.
6. Press SAVE or ENTER keys (or the smart icon
) to save the selected option and
confirm by “Ok”. This selected parameter will be present also after turning off the meter.
7. Pressing ESC key (or the smart icon ) to quit without saving any modification.
5.1.5. Sound keys setting
The meter permits to enable a instantaneous sound for any key pressure of the frontal
panel.
1. Move the cursor using arrows keys on field relative to “Sound”, marked with blue
background, see Fig. 14:
12/09/2006 – 16:55:10
Language ENGLISH
Brightness 75%
Password NO
Sound SI
Auto power off SI
Memory type INTERNAL
GENERAL SETTINGS
DATE MOD(+) MOD(-)
Fig. 14: Keys sound settings screen
EN - 14
Page 17
VEGA78
2. Use F3 or F4 keys (alternatively touch MOD(+) o MOD(-)) to enable “YES” or disable
“NO” of keys sound.
3. Pressing SAVE or ENTER keys (or the smart icon ) to save the selected option and
confirm by “Ok”. This selected parameter will be present also after turning off the meter.
4. Press ESC key (or the smart icon ) to quit without saving any modification.
5.1.6. Auto power off setting
The meter permits to enable or disable the auto power off option in order to prevent a
quick discharge of internal battery. This feature, if selected, is active under each of the
following conditions:
No action was performed both any key or touch display for at least 5 minutes.
Meter does not supplied with external adapter.
Meter does not in recording running.
The effect is a long sound before turn off of meter.
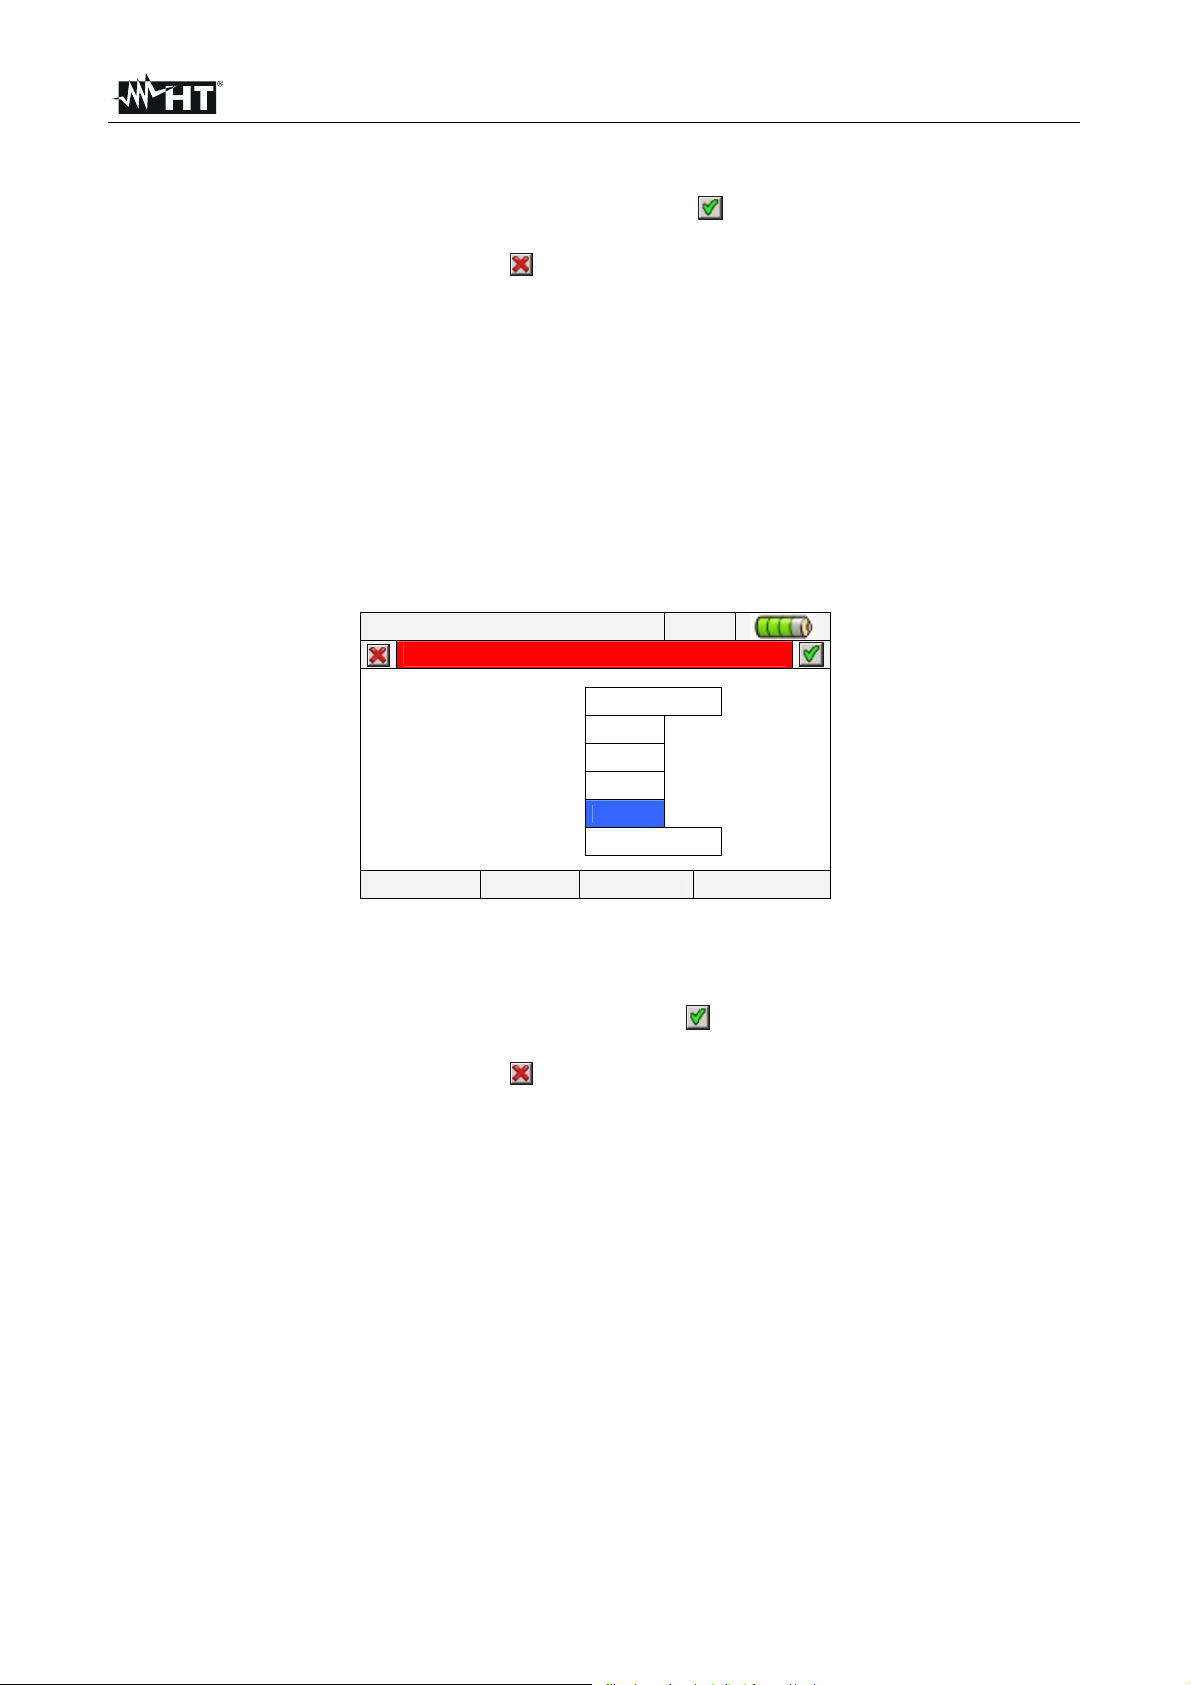
1. Move the cursor using arrows keys on the field relative to “Auto power off”, marked with
blue background, see Fig. 15:
12/09/2006 – 16:55:10
Language ENGLISH
Brightness 75%
Password NO
Sound SI
Auto power off NO
Memory type INTERNAL
GENERAL SETTINGS
DATE MOD(+) MOD(-)
Fig. 15: Auto power off setting screen
2. Use F3 or F4 keys (alternatively touch MOD(+) o MOD(-)) for enable “YES” or disable
“NO” auto power off.
3. Press SAVE or ENTER keys (or the smart icon ) to save the selected option and
confirm by “Ok”. This selected parameter will be present also after turning off the meter.
4. Press ESC key (or the smart icon ) to quit without saving any modification.
EN - 15
Page 18
VEGA78
5.1.7. Memory type setting
The meter permits saving of recordings both in its internal memory (about 15Mbytes) and
by using an external compact flash (see § 5.5.4 for details) fitted (see Fig. 3). For the
selection of memory type follow the below steps:
1. Move the cursor using arrows keys on field relative to “Memory type”, marked with blue
background, see Fig. 14:
12/09/2006 – 16:55:10
Language ENGLISH
Brightness 75%
Password NO
Sound SI
Auto power off NO
Memory type INTERNAL
DATE MOD(+) MOD(-)
GENERAL SETTINGS
Fig. 16: Memory type setting screen
2. Use F3 or F4 keys (alternatively touch MOD(+) o MOD(-)) to choose “ INTERNAL” or
“EXTERNAL” memory type.
3. Press SAVE or ENTER keys (or the smart icon ) to save the selected option and
confirm by “Ok”. This selected parameter will be present also after turning off the meter.
4. Press ESC key (or the smart icon ) to exit by screen without saving any modify.
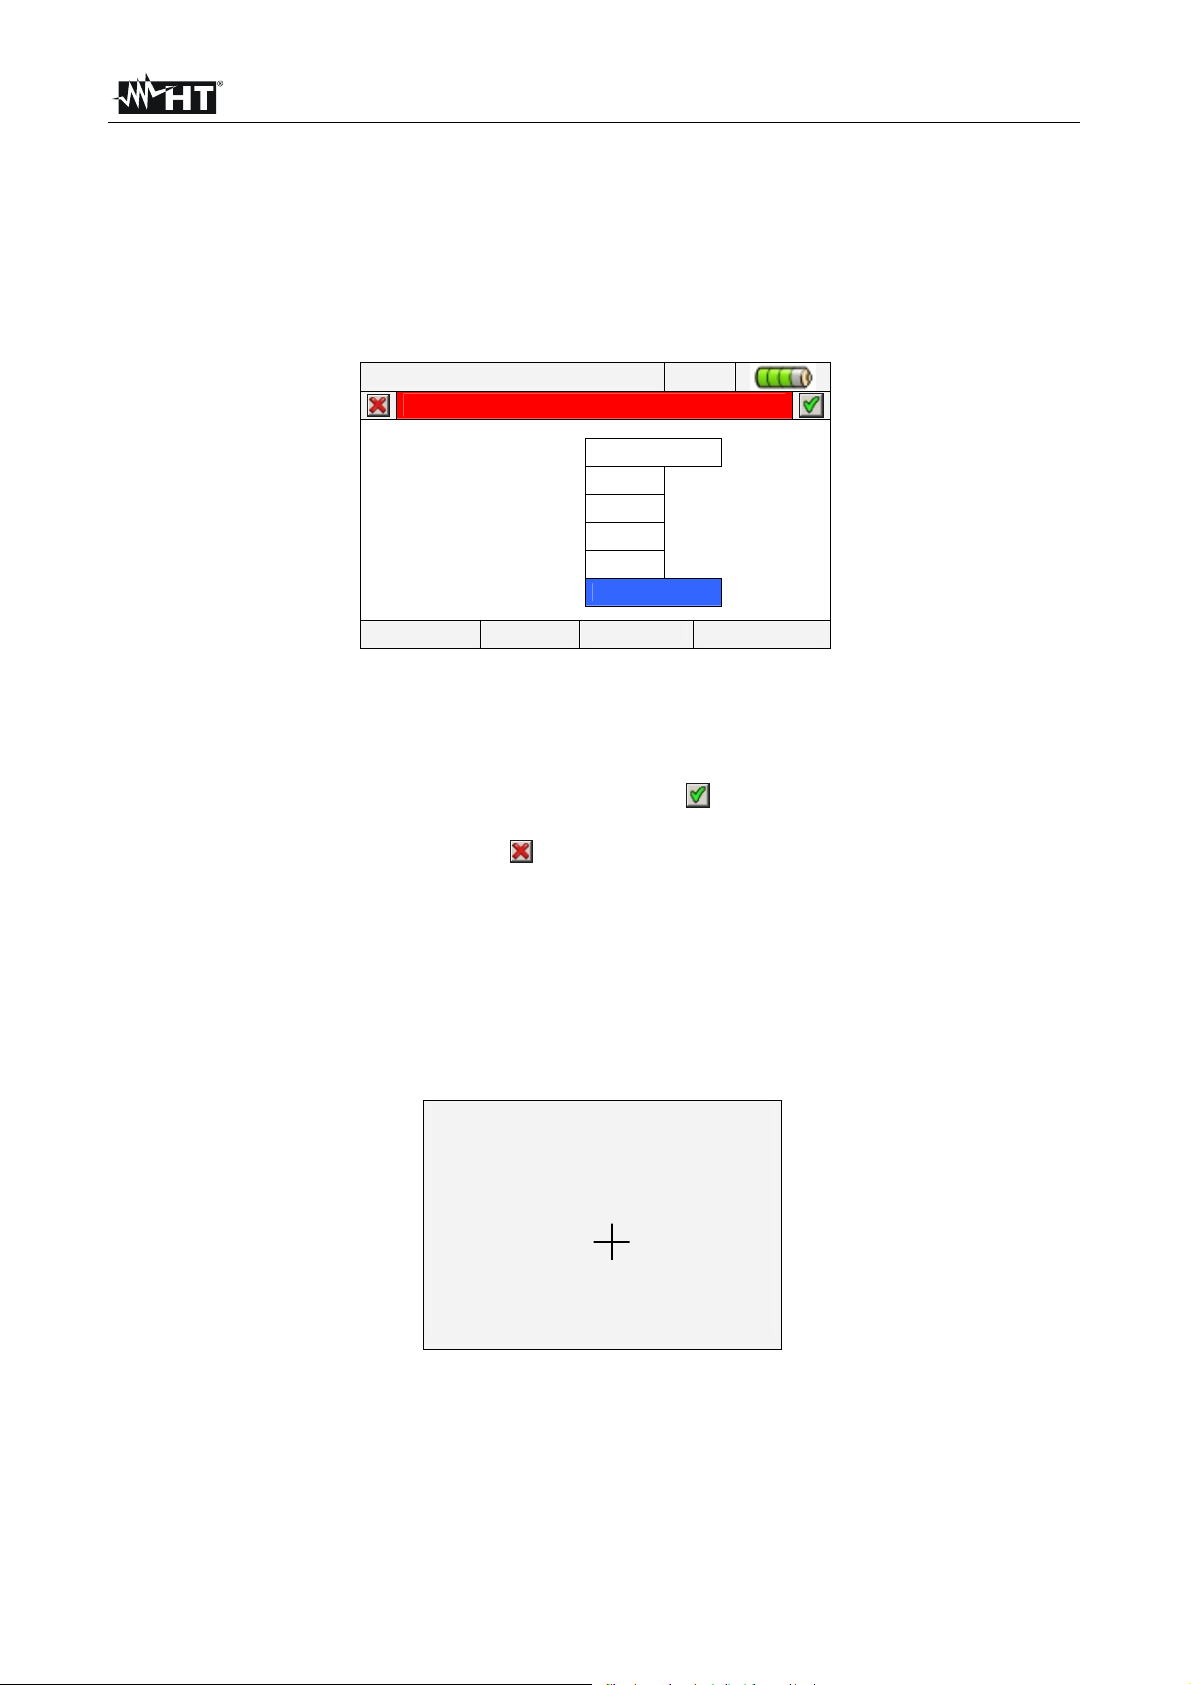
5.1.8. “Touch screen” calibration
This operation is necessary if any internal features of “touch screen” display are not
correctly positionated or not more selectable by using the PT400 pointer
1. Select the “TOUCH” item inside the “General settings” section. The message “Do You
want to calibrate touch screen?” is shown by the meter. Confirm with “Ok”. The
herewith screen is shown:
Press and briefly hold stylus on the center of the target.
Repeat as the target moves around the sceen.
Fig. 17: Touch screen calibration screen
2. By pressing and soft hold the PT400 pointer on the central point of the cross cursor
(see Fig. 17) move the cursor to the four corners of display
3. Swith off and thane turn on the meter by means of ON/OFF key to complete the
operation
EN - 16
Page 19
VEGA78
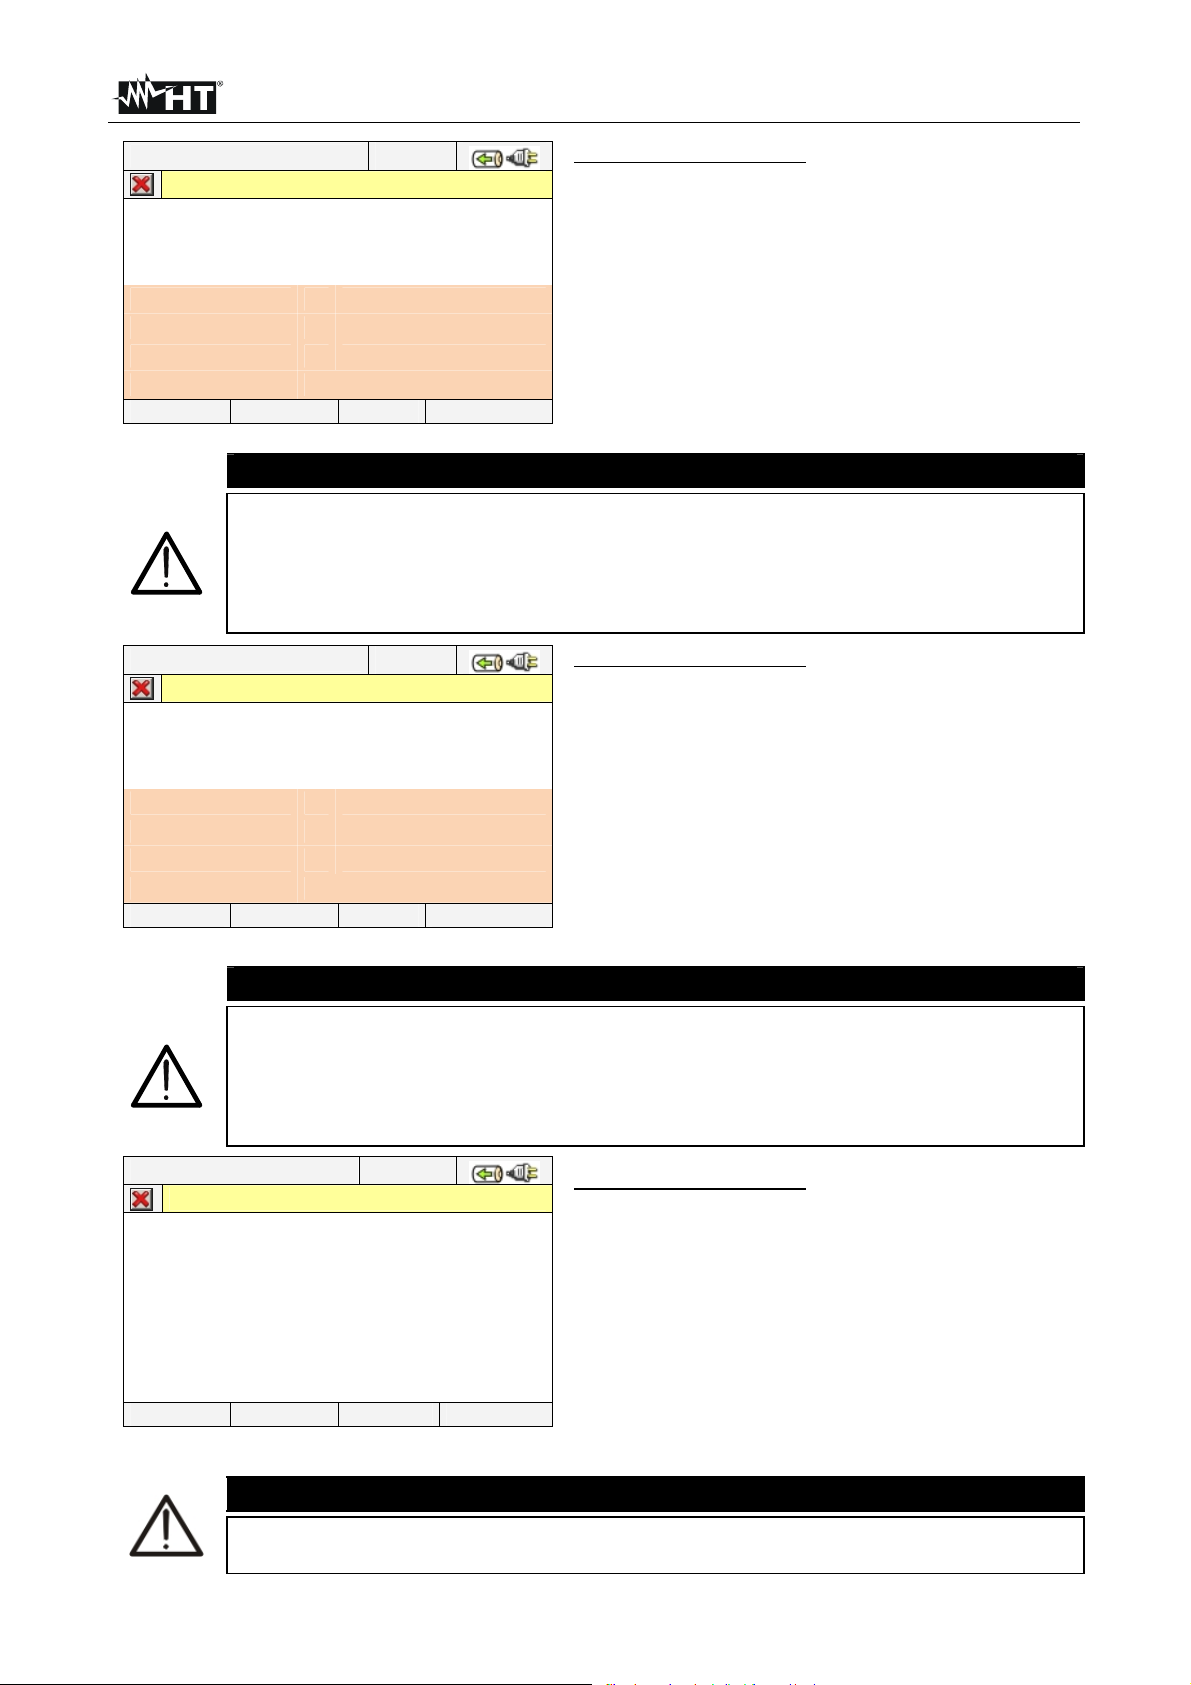
5.2. REAL TIME VALUES
Fig. 18: MENU GENERAL screen - Real time values section
In this section the real time measured values of parameters both on input channels and
internally calculated are shown by meter. In particular the following are shown:
1. AC TRMS voltages, currents and all kind of electrical parameters for any single phase
and total and voltages Unbalanced.
2. Voltage and current waveforms for any single phase and total.
3. Voltage and current harmonics up to 49th component for any single phase and total
both in numerical and histograms graphical format in absolute or percentage value with
respect to each fundamental signal.
4. Vectorial diagrams of each voltage and current with the respective phase angles in
order to define the correct nature of system loads under test.
Further in this manual the expression “Page x/y” will be used, to indicate that the current page
number (x) and the total number of pages (y) depend on the instrument settings. Pressing
cyclically F1 key or arrow keys left of right the meter shows the other pages of TRMS
measured values which are described in below pictures. Pressing ESC key to go back to
previous screens or back to GENERAL MENU
5.2.1. 4-wire three phase system – Screens sequence
12/09/2006 – 16:55:10
TOTAL RMS VALUES – Page x/y
V1N
0.0
V12
0.0
NEG%
0.0
I1
0.0
PAGE SCOPE HARM VECTORS
V2N
0.0
V23
0.0
ZERO%
0.0
I2
0.0
V3N
0.0
V31
0.0
SEQ
000
I3
0.0
VNPE
0.0
Hz
0.0
IN
0.0
Fig. 19: Page of numerical values
V
V
A
PARAMETERS CAPTION
V1N Phase-Neutral voltage L1 phase
V2N Phase-Neutral voltage L2 phase
V3N Phase-Neutral voltage L3 phase
VNPE Neutral-Ground voltage
V12 Phase L1 – Phase L2 voltage
V23 Phase L2 – Phase L3 voltage
V23 Phase L3 – Phase L1 voltage
NEG% Un balance percentage of negative tern
ZERO% Unbalance percentage of zero tern
SEQ phases sequence indication as:
”123” = > Corrected
”132” = > Reversed
”023” = > Null voltage on the Black wire
”103” = > Null voltage on the Red wire
”120” = > Null voltage on the Brown wire
”100” = > Null voltage on the Red and Brown wires
”020” = > Null voltage on the Black and Brown wires
”003” = > Null voltage on the Black and Red wires
Hz Frequency
I1 Current on L1 phase
I2 Current on L2 phase
I3 Current on L3 phase
IN Current on Neutral
EN - 17
Page 20
VEGA78
12/09/2006 – 16:55:10
TOTAL POWER VALUES – Page x/y
Patt
Preatt
Papp
Pf
CosPhi
=
=
=
=
=
0 W
0 Var
0 VA
0.00i
0.00i
PARAMETERS CAPTION:
Pact Total Active Power
Preact Total Reactive Power
Papp Total Apparent Power
Pf Total Power Factor
CosPhi Total Power factor considering fundamental
of voltage and current signals
PAGE SCOPE HARM VECTORS
Fig. 20: Page of total power values
12/09/2006 – 16:55:10
PHASE 1 RMS VALUES – Page x/y
V1N
I1
Patt1
Preatt1
Papp1
Pf1
CosPhi1
PAGE SCOPE HARM VECTORS
=
=
=
=
=
=
=
0.0 V
0.0 A
0 W
0 Var
0 VA
0.00i
0.00i
Fig. 21: Page of Phase 1 values
12/09/2006 – 16:55:10
PHASE 2 RMS VALUES – Page x/y
V2N
I2
Patt2
Preatt2
Papp2
Pf2
CosPhi2
=
=
=
=
=
=
=
0.0 V
0.0 A
0 W
0 Var
0 VA
0.00i
0.00i
PARAMETERS CAPTION:
V1N Phase-Neutral voltage L1 phase
I1 Current on L1 phase
Pact1 Active Power L1 phase
Preact1 Reactive Power L1 phase
Papp1 Apparent Power L1 phase
Pf1 Power factor L1 phase
CosPhi1 Power factor between fundamental of
voltage L1 and current L1
PARAMETERS CAPTION:
V2N Phase-Neutral voltage L2 phase
I2 Current on L2 phase
Pact2 Active Power L2 phase
Preact2 Reactive Power L2 phase
Papp2 Apparent Power L2 phase
Pf2 Power factor L2 phase
CosPhi2 Power factor between fundamental of
voltage L2 and current L2
PAGE SCOPE HARM VECTORS
Fig. 22: Page of Phase 2 values
12/09/2006 – 16:55:10
PHASE 3 RMS VALUES – Page x/y
V3N
I3
Patt3
Preatt3
Papp3
Pf3
CosPhi3
PAGE SCOPE HARM VECTORS
=
=
=
=
=
=
=
0.0 V
0.0 A
0 W
0 Var
0 VA
0.00i
0.00i
Fig. 23: Page of Phase 3 values
PARAMETERS CAPTION:
V3N Phase-Neutral voltage L3 phase
I3 Current on L3 phase
Pact3 Active Power L3 phase
Preact3 Reactive Power L3 phase
Papp3 Apparent Power L3 phase
Pf3 Power factor L3 phase
CosPhi3 Power factor between fundamental of
voltage L3 and current L3
EN - 18
Page 21
VEGA78
25/01/2013 – 16:55:10
TOT. ENERGY CONSUMPTION – Page x/y
Eact = 0 kWh
Ppeak = 0 kW
Date Ppeak : -- / -- / -- 00:00:00
Start rec. : -- / -- / -- 00:00:00
Stop rec. : -- / -- / -- 00:00:0 0
Rec. Time : - - Int. Per. : - - - Rec: - -
PAGE SCOPE HARM VECTORS
PARAMETERS CAPTION:
Eact Total active energy consumed when starting
recording.
Ppeak Maximum peak of consumed active power.
Date Ppeak Date and time in which the peak occurred.
Start rec. Date when recording was started.
Stop rec. Date when recording was stopped.
Rec. Time Time elapsed from Rec Start.
Int. Per. Value of the set integration period.
Rec Number of the recording in progress
Fig. 24: Consumed energy page
CAUTION
The Total Consumed Energy page is shown only if the instrument has been
set for the Recording of the General Parameter Total “Active Power &
Energy” (see § 5.4.6.1). Values will be shown only during or at the end of a
recording and zeroed upon starting a new recording or when the instrument
is switched off
25/01/2013 – 16:55:10
TOT. ENERGY PRODUCTION – Page x/y
Eact = 0 kWh
Ppeak = 0 kW
Date Ppeak : -- / -- / -- 00:00:00
Start rec. : -- / -- / -- 00:00:00
Stop rec. : -- / -- / -- 00:00:0 0
Rec Time : - - Int. Per. : - - - Rec: - -
PAGE SCOPE HARM VECTORS
Fig. 25: Producted energy page
PARAMETERS CAPTION:
Eact Total active energy produced when starting
recording.
Ppeak Maximum peak of produced active power.
Date Ppeak Date and time in which the peak occurred.
Start rec. Date when recording was started.
Stop rec. Date when recording was stopped.
Rec Time Time elapsed from Rec Start.
Int. Per. Value of the set integration period.
Rec Number of the recording in progress
CAUTION
The Total Produced Energy page is shown only if recording parameter “Cogeneration” has been set in the instrument (see § 5.4.5) and if general
parameter Total “Active Power & Energy” has been selected (see § 5.4.6.1).
Values will be shown only during or at the end of a recording and zeroed
12/09/2006 – 16:55:10
AVGV
AVGI
AVGPatt
AVGPreat
upon starting a new recording or when the instrument is switched off.
AVERAGE RMS VALUE – Page 9/9
=
=
=
=
0.0 V
0.0 A
0 W
0 Var
PARAMETERS CAPTION:
AVGV Average value voltage V1, V2, V3
AVGI Average value current I1, I2, I3
AVGPact Average value active power on L1, L2, L3
AVGPreact Average value reactive power on
L1,L2,L3
PAGE SCOPE HARM VECTORS
Fig. 26: Page of numerical average values
The AVERAGE RMS VALUES page will be shown only if option AVERAGE
VALUES “YES” is enabled in the Advanced Settings section (see § 5.3.2.5)
CAUTION
EN - 19
Page 22
VEGA78
5.2.2. 3-wire three phase system – Screens sequence
PARAMETERS CAPTION:
V1PE Phase L1-PE voltage
V2PE Phase L2-PE voltage
V3PE Phase L3-PE voltage
V12 Phase L1 – Phase L2 voltage
12/09/2006 – 16:55:10
TOTAL RMS VALUES – Page x/y
V1PE
0.0
V12
0.0
NEG%
0.0
I1
0.0
PAGE SCOPE HARM VECTORS
V2PE
0.0
V23
0.0
ZERO%
0.0
I2
0.0
V3PE
0.0
V31
0.0
SEQ
000
I3
0.0
Hz
0.0
V
V
A
V23 Phase L2 – Phase L3 voltage
V23 Phase L3 – Phase L1 voltage
NEG% Unbalance percentage of negative tern
ZERO% Unbalance percentage of zero tern
SEQ phases sequence indication as:
”123” = > Corrected
”132” = > Reversed
”023” = > Null voltage on the Black wire
”103” = > Null voltage on the Red wire
”120” = > Null voltage on the Brown wire
”100” = > Null voltage on the Red and Brown wires
”020” = > Null voltage on the Black and Brown wires
”003” = > Null voltage on the Black and Red wires
Hz Frequency
I1 Current on L1 phase
I2 Current on L2 phase
I3 Current on L3 phase
Fig. 27: Page of numerical values
12/09/2006 – 16:55:10
TOTAL POWER VALUES – Page x/y
Patt
Preatt
Papp
Pf
CosPhi
PAGE SCOPE HARM VECTORS
=
=
=
=
=
0 W
0 Var
0 VA
0.00i
0.00i
Fig. 28: Page of total power values
12/09/2006 – 16:55:10
PHASE 1 RMS VALUES – Page x/y
V1PE
I1
Patt1
Preatt1
Papp1
Pf1
CosPhi1
=
=
=
=
=
=
=
0.0 V
0.0 A
0 W
0 Var
0 VA
0.00i
0.00i
PARAMETERS CAPTION:
Pact Total Active Power
Preact Total Reactive Power
Papp Total Apparent Power
Pf Total Power Factor
CosPhi Total Power factor considering fundamental
of voltage and current signals
PARAMETERS CAPTION:
V1PE Phase L1-PE voltage
I1 Current on L1 phase
Pact1 Active Power L1 phase
Preact1 Reactive Power L1 phase
Papp1 Apparent Power L1 phase
Pf1 Power factor L1 phase
CosPhi1 Power factor between fundamental of
voltage L1 and current L1
PAGE SCOPE HARM VECTORS
Fig. 29: Page of numerical values of Phase 1
EN - 20
Page 23
VEGA78
12/09/2006 – 16:55:10
PHASE 2 RMS VALUES – Page x/y
V2PE
I2
Patt2
Preatt2
Papp2
Pf2
CosPhi2
=
=
=
=
=
=
=
0.0 V
0.0 A
0 W
0 Var
0 VA
0.00i
0.00i
PARAMETERS CAPTION:
V2PE Phase L2-PE voltage
I2 Current on L2 phase
Pact2 Active Power L2 phase
Preact2 Reactive Power L2 phase
Papp2 Apparent Power L2 phase
Pf2 Power factor L2 phase
CosPhi2 Power factor between fundamental of
voltage L2 and current L2
PAGE SCOPE HARM VECTORS
Fig. 30: Page numerical values of Phase 2
12/09/2006 – 16:55:10
PHASE 3 RMS VALUES – Page x/y
V3PE
I3
Patt3
Preatt3
Papp3
Pf3
CosPhi3
PAGE SCOPE HARM VECTORS
=
=
=
=
=
=
=
0.0 V
0.0 A
0 W
0 Var
0 VA
0.00i
0.00i
PARAMETERS CAPTION:
V3PE Phase L3-PE voltage
I3 Current on L3 phase
Pact3 Active Power L3 phase
Preact3 Reactive Power L3 phase
Papp3 Apparent Power L3 phase
Pf3 Power factor L3 phase
CosPhi3 Power factor between fundamental of
voltage L3 and current L3
Fig. 31: Page numerical values of Phase 3
25/01/2013 – 16:55:10
TOT. ENERGY CONSUMPTION – Page x/y
Eact = 0 kWh
Ppeak = 0 kW
Date Ppeak : -- / -- / -- 00:00:00
Start rec. : -- / -- / -- 00:00:00
Stop rec. : -- / -- / -- 00:00:0 0
Rec. Time : - - Int. Per. : - - - Rec: - -
PAGE SCOPE HARM VECTORS
Fig. 32: Consumed energy page
The Total Consumed Energy page is shown only if the instrument has been
set for the Recording of the General Parameter Total “Active Power &
Energy” (see § 5.4.6.1). Values will be shown only during or at the end of a
recording and zeroed upon starting a new recording or when the instrument
is switched off
PARAMETERS CAPTION:
Eact Total active energy consumed when starting
recording.
Ppeak Maximum peak of consumed active power.
Date Ppeak Date and time in which the peak occurred.
Start rec. Date when recording was started.
Stop rec. Date when recording was stopped.
Rec. Time Time elapsed from Rec Start.
Int. Per. Value of the set integration period.
Rec Number of the recording in progress
CAUTION
EN - 21
Page 24
VEGA78
25/01/2013 – 16:55:10
TOT. ENERGY PRODUCTION – Page x/y
Eact = 0 kWh
Ppeak = 0 kW
Date Ppeak : -- / -- / -- 00:00:00
Start rec. : -- / -- / -- 00:00:00
Stop rec. : -- / -- / -- 00:00:0 0
Rec Time : - - Int. Per. : - - - Rec: - -
PAGE SCOPE HARM VECTORS
PARAMETERS CAPTION:
Eact Total active energy produced when starting
recording.
Ppeak Maximum peak of produced active power.
Date Ppeak Date and time in which the peak occurred.
Start rec. Date when recording was started.
Stop rec. Date when recording was stopped.
Rec Time Time elapsed from Rec Start.
Int. Per. Value of the set integration period.
Rec Number of the recording in progress
Fig. 33: Producted energy page
CAUTION
The Total Produced Energy page is shown only if recording parameter “Cogeneration” has been set in the instrument (see § 5.4.5) and if general
parameter Total “Active Power & Energy” has been selected (see § 5.4.6.1).
Values will be shown only during or at the end of a recording and zeroed
upon starting a new recording or when the instrument is switched off.
5.2.3. 3-wire ARON three phase system – Screens sequence
12/09/2006 – 16:55:10
TOTAL RMS VALUES – Page x/y
V12
0.0
NEG%
0.0
I1
0.0
PAGE SCOPE HARM VECTORS
V23
0.0
ZERO%
0.0
I2
0.0
V31
0.0
SEQ
000
I3
0.0
Hz
0.0
Fig. 34: Page of numerical values
12/09/2006 – 16:55:10
V12
I1
Patt12
Preatt12
Papp12
Pf12
CosPhi12
WATTMETER12 – Page x/y
=
=
=
=
=
=
=
0.0 V
0.0 A
0 W
0 Var
0 VA
0.00i
0.00i
PARAMETERS CAPTION:
V12 Phase L1 – Phase L2 voltage
V23 Phase L2 – Phase L3 voltage
V23 Phase L3 – Phase L1 voltage
NEG% Unbalance percentage of negative tern
ZERO% Unbalance percentage of zero tern
V
A
SEQ phases sequence indication as:
”123” = > Corrected
”132” = > Reversed
”023” = > Null voltage on the Black wire
”103” = > Null voltage on the Red wire
”120” = > Null voltage on the Brown wire
”100” = > Null voltage on the Red and Brown wires
”020” = > Null voltage on the Black and Brown wires
”003” = > Null voltage on the Black and Red wires
Hz Frequency
I1 Current on L1 phase
I2 Current on L2 phase
I3 Current on L3 phase
PARAMETERS CAPTION:
V12 Phase L1 – Phase L2 voltage
I1 Current on L1 phase
Pact12 Active Power Wattmeter 12
Preact12 Reactive Power VARmeter 12
Papp12 Apparent Power VAmeter 12
Pf12 Power Factor Wattmeter 12
CosPhi12 Power Factor between fundamental of
voltage and current Wattmeter 12
PAGE SCOPE HARM VECTORS
Fig. 35: Page of numerical values Wattmeter-Varmeter 1-2
EN - 22
Page 25
VEGA78
12/09/2006 – 16:55:10
V32
I3
Patt32
Preatt32
Papp32
Pf32
CosPhi32
PAGE SCOPE HARM VECTORS
WATTMETER32 – Page x/y
=
=
=
=
=
=
=
0.0
V
0.0
A
0 W
0
Var
0 VA
0.00i
0.00i
PARAMETERS CAPTION:
V32 Phase L3 – Phase L2 voltage
I3 Current on L3 phase
Pact32 Active Power Wattmeter 32
Preact32 Reactive Power VARmeter 32
Papp32 Apparent Power VAmeter 32
Pf32 Power Factor Wattmeter 32
CosPhi32 Power Factor between fundamental of
voltage and current Wattmeter 32
Fig. 36: Page of numerical values Wattmeter-Varmeter 3-2
25/01/2013 – 16:55:10
TOT. ENERGY CONSUMPTION – Page x/y
Eact = 0 kWh
Ppeak = 0 kW
Date Ppeak : -- / -- / -- 00:00:00
Start rec. : -- / -- / -- 00:00:00
Stop rec. : -- / -- / -- 00:00:0 0
Rec. Time : - - Int. Per. : - - - Rec: - -
PAGE SCOPE HARM VECTORS
PARAMETERS CAPTION:
Eact Total active energy consumed when starting
recording.
Ppeak Maximum peak of consumed active power.
Date Ppeak Date and time in which the peak occurred.
Start rec. Date when recording was started.
Stop rec. Date when recording was stopped.
Rec. Time Time elapsed from Rec Start.
Int. Per. Value of the set integration period.
Rec Number of the recording in progress
Fig. 37: Consumed energy page
CAUTION
The Total Consumed Energy page is shown only if the instrument has been
set for the Recording of the General Parameter Total “Active Power &
Energy” (see § 5.4.6.1). Values will be shown only during or at the end of a
recording and zeroed upon starting a new recording or when the instrument
is switched off
25/01/2013 – 16:55:10
TOT. ENERGY PRODUCTION – Page x/y
Eact = 0 kWh
Ppeak = 0 kW
Date Ppeak : -- / -- / -- 00:00:00
Start rec. : -- / -- / -- 00:00:00
Stop rec. : -- / -- / -- 00:00:0 0
Rec Time : - - Int. Per. : - - - Rec: - -
PAGE SCOPE HARM VECTORS
PARAMETERS CAPTION:
Eact Total active energy produced when starting
recording.
Ppeak Maximum peak of produced active power.
Date Ppeak Date and time in which the peak occurred.
Start rec. Date when recording was started.
Stop rec. Date when recording was stopped.
Rec Time Time elapsed from Rec Start.
Int. Per. Value of the set integration period.
Rec Number of the recording in progress
Fig. 38: Producted energy page
CAUTION
The Total Produced Energy page is shown only if recording parameter “Cogeneration” has been set in the instrument (see § 5.4.5) and if general
parameter Total “Active Power & Energy” has been selected (see § 5.4.6.1).
Values will be shown only during or at the end of a recording and zeroed
upon starting a new recording or when the instrument is switched off.
EN - 23
Page 26
VEGA78
5.2.4. Single phase system – Screens sequence
12/09/2006 – 16:55:10
PHASE 1 RMS VALUES – Page x/y
V1N
VNPE
Freq
I1
Patt1
Preatt1
Papp1
Pf1
CosPhi1
PAGE SCOPE HARM VECTORS
=
=
=
=
=
=
=
=
=
0.0 V
0.0 V
0.0 Hz
0.0 A
0.0 W
0.0 VAr
0.0 VA
0.00i
0.00i
PARAMETERS CAPTION:
V1N Phase-Neutral voltage L1 phase
VNPE Neutral-Ground voltage
Freq Frequency
I1
Current on L1 phase
Pact1 Active Power L1 phase
Preact1 Reactive Power L1 phase
Papp1 Apparent Power L1 phase
Pf1 Power factor L1 phase
CosPhi1 Power factor between fundamental of
voltage L1 and current L1
Fig. 39: Page of numerical values
25/01/2013 – 16:55:10
TOT. ENERGY CONSUMPTION – Page x/y
Eact = 0 kWh
Ppeak = 0 kW
Date Ppeak : -- / -- / -- 00:00:00
Start rec. : -- / -- / -- 00:00:00
Stop rec. : -- / -- / -- 00:00:0 0
Rec. Time : - - Int. Per. : - - - Rec: - -
PAGE SCOPE HARM VECTORS
Fig. 40: Consumed energy page
The Total Consumed Energy page is shown only if the instrument has been
set for the Recording of the General Parameter Total “Active Power &
Energy” (see § 5.4.6.1). Values will be shown only during or at the end of a
recording and zeroed upon starting a new recording or when the instrument
is switched off
25/01/2013 – 16:55:10
TOT. ENERGY PRODUCTION – Page x/y
Eact = 0 kWh
Ppeak = 0 kW
Date Ppeak : -- / -- / -- 00:00:00
Start rec. : -- / -- / -- 00:00:00
Stop rec. : -- / -- / -- 00:00:0 0
Rec Time : - - Int. Per. : - - - Rec: - -
PAGE SCOPE HARM VECTORS
Fig. 41: Producted energy page
The Total Produced Energy page is shown only if recording parameter “Cogeneration” has been set in the instrument (see § 5.4.5) and if general
parameter Total “Active Power & Energy” has been selected (see § 5.4.6.1).
Values will be shown only during or at the end of a recording and zeroed
upon starting a new recording or when the instrument is switched off.
PARAMETERS CAPTION:
Eact Total active energy consumed when starting
recording.
Ppeak Maximum peak of consumed active power.
Date Ppeak Date and time in which the peak occurred.
Start rec. Date when recording was started.
Stop rec. Date when recording was stopped.
Rec. Time Time elapsed from Rec Start.
Int. Per. Value of the set integration period.
Rec Number of the recording in progress
CAUTION
PARAMETERS CAPTION:
Eact Total active energy produced when starting
recording.
Ppeak Maximum peak of produced active power.
Date Ppeak Date and time in which the peak occurred.
Start rec. Date when recording was started.
Stop rec. Date when recording was stopped.
Rec Time Time elapsed from Rec Start.
Int. Per. Value of the set integration period.
Rec Number of the recording in progress
CAUTION
EN - 24
Page 27
VEGA78
5.2.5. SCOPE waveforms screens
Starting from a any page of numerical values it’s possible to select waveforms screens of
the input signals by pressing F2 key (or touch SCOPE at display). By pressing cyclically
F1 key the below screens are shown by meter:
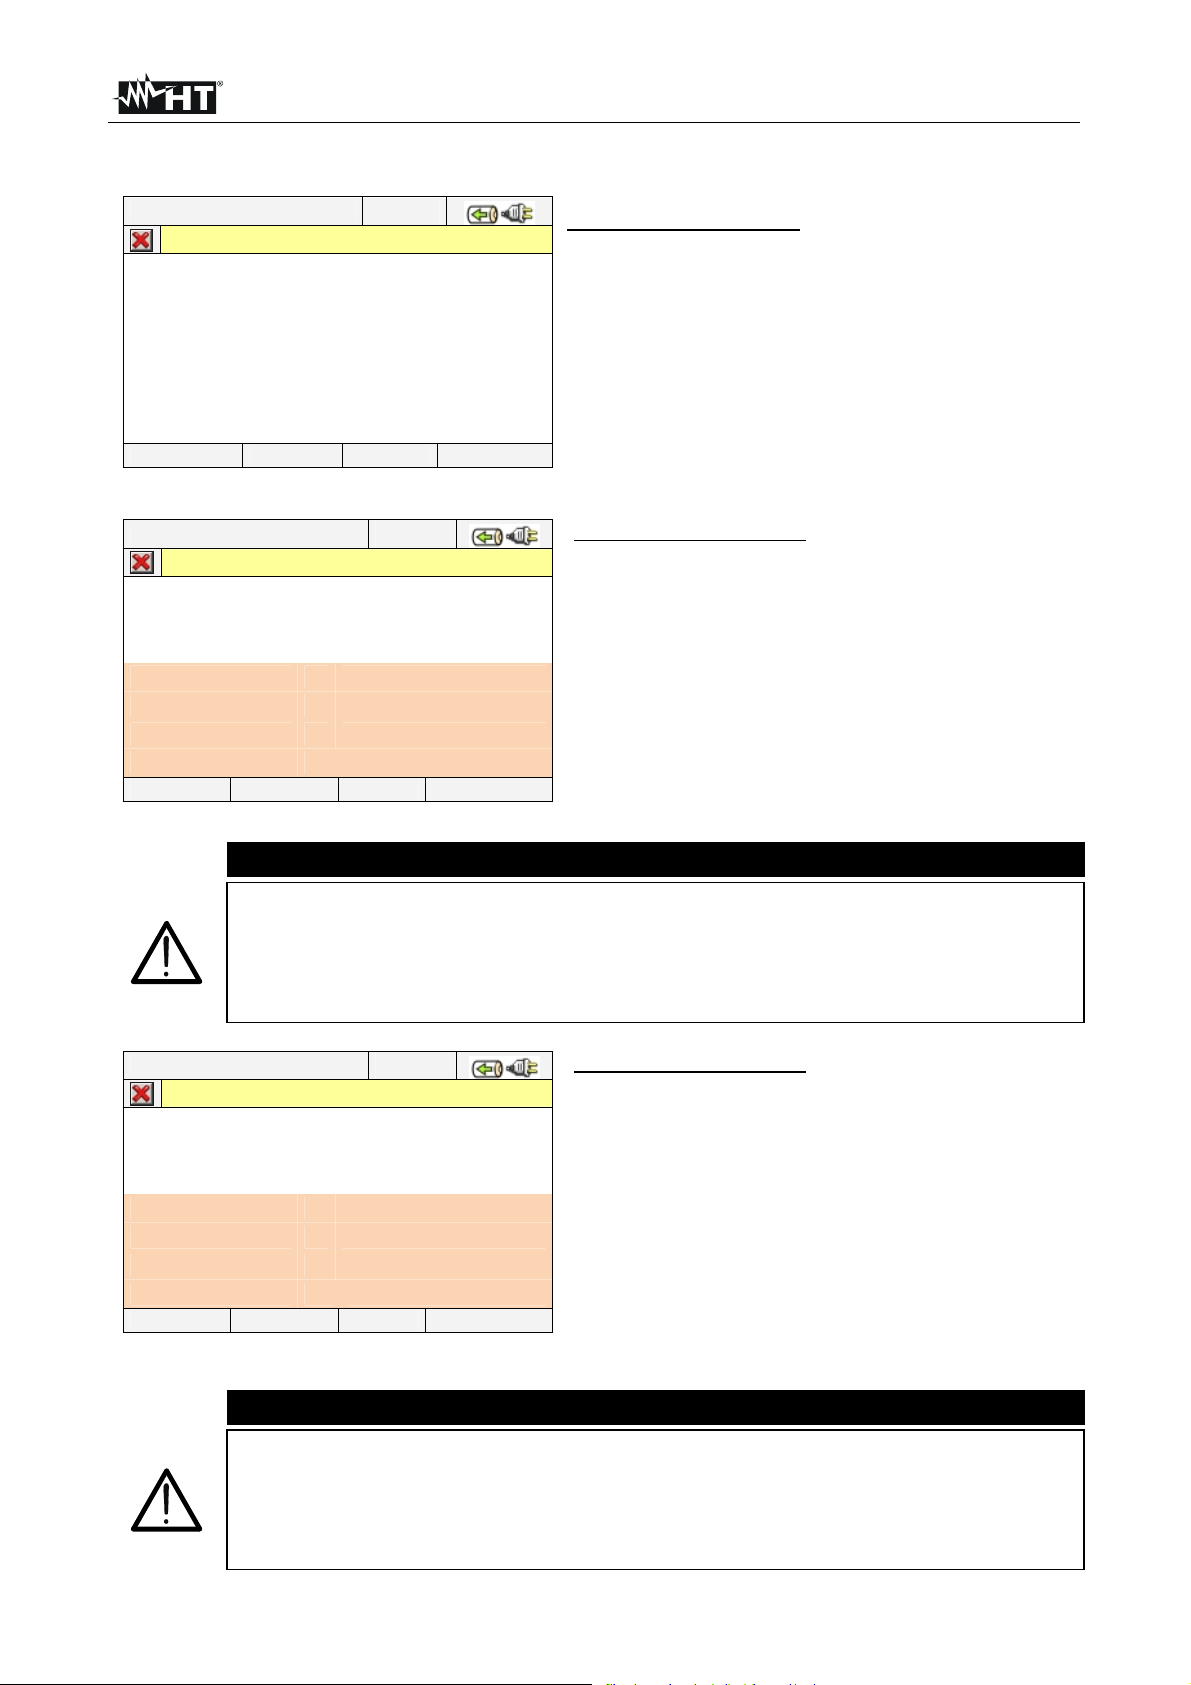
Simultaneous waveforms of voltages V1, V2, V3 and neutral voltage Vn (for three
phase 4-wire system and single phase), with their TRMS values as shown in below
screens:
12/09/2006 – 16:55:10
SCOPE VOLTAGES – Page 1/5
Fs 400.0V
V1 223.4V
V2 228.5V
V3 225.7V
Vn 0.0V
PAGE
Fig. 42: Voltage waveforms screen for 4-wire systems
12/09/2006 – 16:55:10
PAGE
SCOPE VOLTAGES – Page 1/5
Fs 400.0V
V12 378.4V
V23 382.5V
V31 379.4V
Fig. 43: Voltage waveforms screen for 3-wire systems and ARON
12/09/2006 – 16:55:10
PAGE ZOOM I
SCOPE PHASE1 – Page 1/1
Fs 400.0V
V1 228.3V
Vn 0.0V
Fs 20.0A
I1 10.2A
Fig. 44: Voltage/Current waveform screen for Single phase systems
EN - 25
Page 28
VEGA78
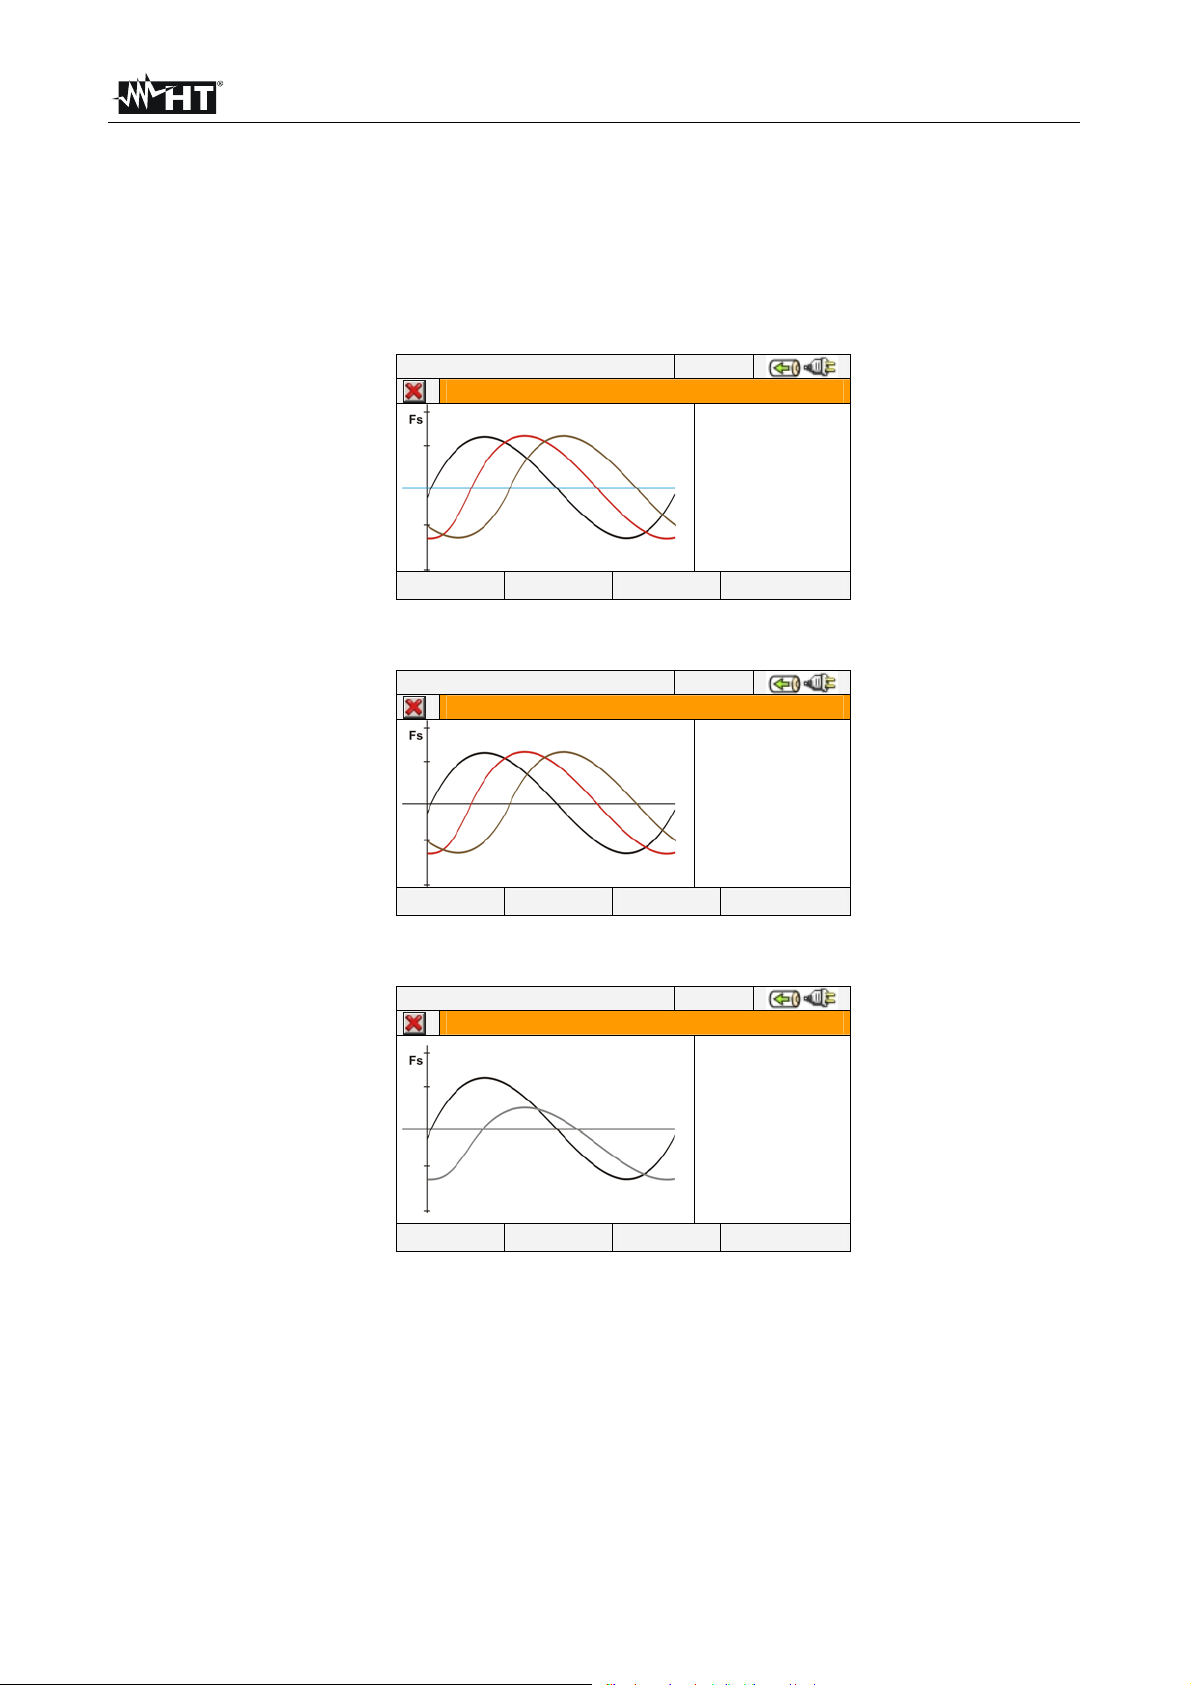
Simultaneous waveforms of currents I1, I2, I3 and neutral current In (for three phase 4-
wire system), with their TRMS values as shown in below screens:
12/09/2006 – 16:55:10
PAGE
SCOPE CURRENTS – Page 2/5
Fs 400.0A
I1 299.4A
I2 302.5A
I3 297.7A
In 97.8 A
Fig. 45: Current waveforms screen for 4-wire systems
12/09/2006 – 16:55:10
PAGE
SCOPE CURRENTS – Page 2/5
Fs 400.0A
I1 299.4A
I2 302.5A
I3 297.7A
Fig. 46: Current waveforms screen for 3-wire systems and ARON
Waveforms of signals on L1 phase, with their TRMS values, as below shown:
12/09/2006 – 16:55:10
SCOPE PHASE1 – Page 3/5
Fs 400.0V
V1 223.4V
Fs 400.0A
I1 299.4A
PAGE ZOOM V
Fig. 47: Voltage/Current waveforms screen L1 phase for 4-wire and 3-wire systems
12/09/2006 – 16:55:10
PAGE ZOOM V
SCOPE PHASE1 – Page 3/5
Fs 400.0V
V12 382.4V
Fs 400.0A
I1 201.5A
Fig. 48: Voltage/Current waveforms screen L1 phase for ARON systems
EN - 26
Page 29

VEGA78
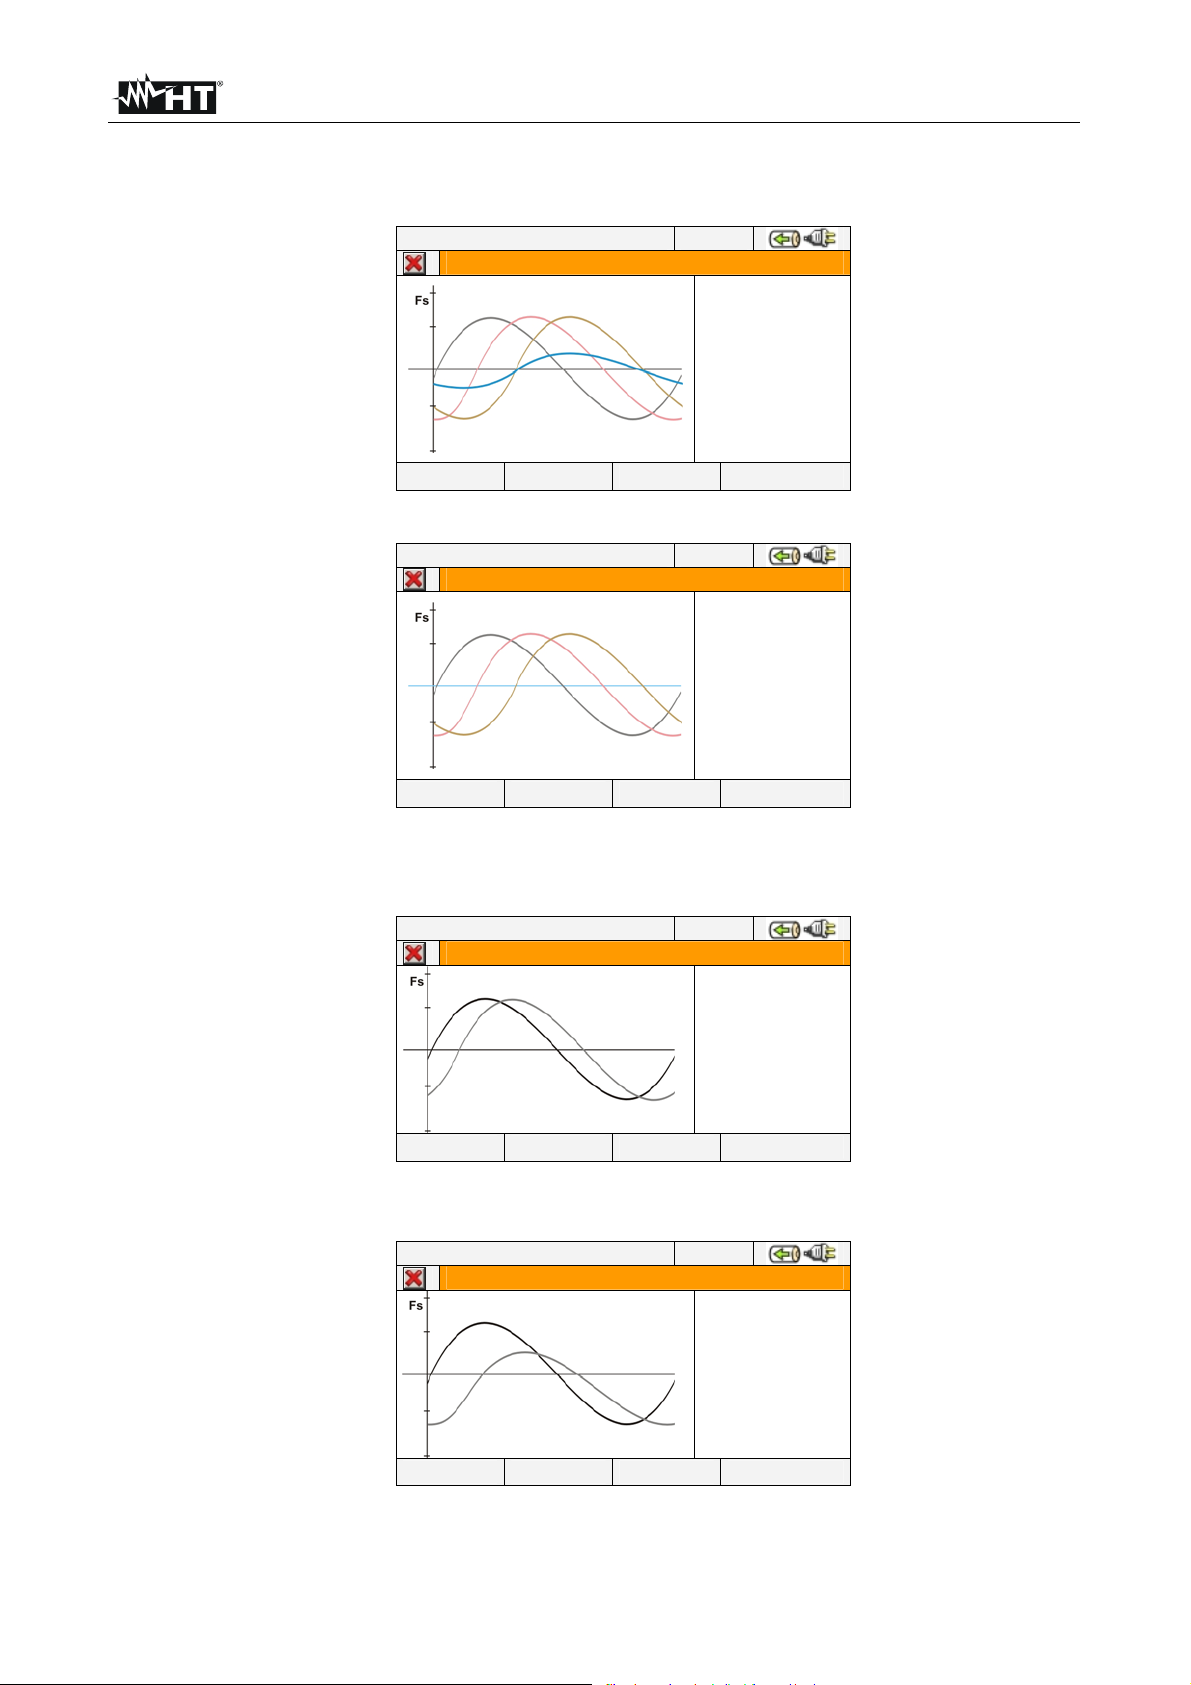
Waveforms of signals on L2 phase, with their TRMS values, as below shown:
12/09/2006 – 16:55:10
SCOPE PHASE2 – Page 4/5
Fs 400.0V
V2 228.5V
Fs 400.0A
I2 302.5A
PAGE ZOOM V
Fig. 49: Voltage/Current waveforms screen L2 phase for 4-wire systems
12/09/2006 – 16:55:10
SCOPE PHASE2 – Page 4/5
PAGE ZOOM V
Fs 400.0V
V23 389.6V
Fs 400.0A
I2 203.5A
Fig. 50: Voltage/Current waveforms screen L2 phase for 3-wire and ARON systems
Waveforms of signals on L3 phase, with their TRMS values, as below shown:
12/09/2006 – 16:55:10
SCOPE PHASE3 – Page 5/5
Fs 400.0V
V3 228.5V
Fs 400.0A
I3 297.7A
PAGE ZOOM V
Fig. 51: Voltage/Current waveforms screen L3 phase for 4-wire systems
12/09/2006 – 16:55:10
SCOPE PHASE3– Page 5/5
PAGE ZOOM V
Fs 400.0V
V31 386.6V
Fs 400.0A
I3 201.5A
Fig. 52: Voltage/Current waveforms screen L3 phase for 3-wire and ARON systems
In Manual mode inside Advanced Settings (see § 5.3.2.1) a customisation of full scale of
voltage and current graphic is possible in order to improve the resolution on readings. In
this situation pressing arrow keys ZOOM in or ZOOM out for increase or decrease the
value of desired full scale. Press F2 key to change from current full scale to voltage full
scale. Press ESC key (or the smart icon ) to quit waveforms screens and go back to
TRMS real time values screen.
EN - 27
Page 30
VEGA78
V
V
V
V
V
V
V
V
V
V
V
V
V
V
V
V
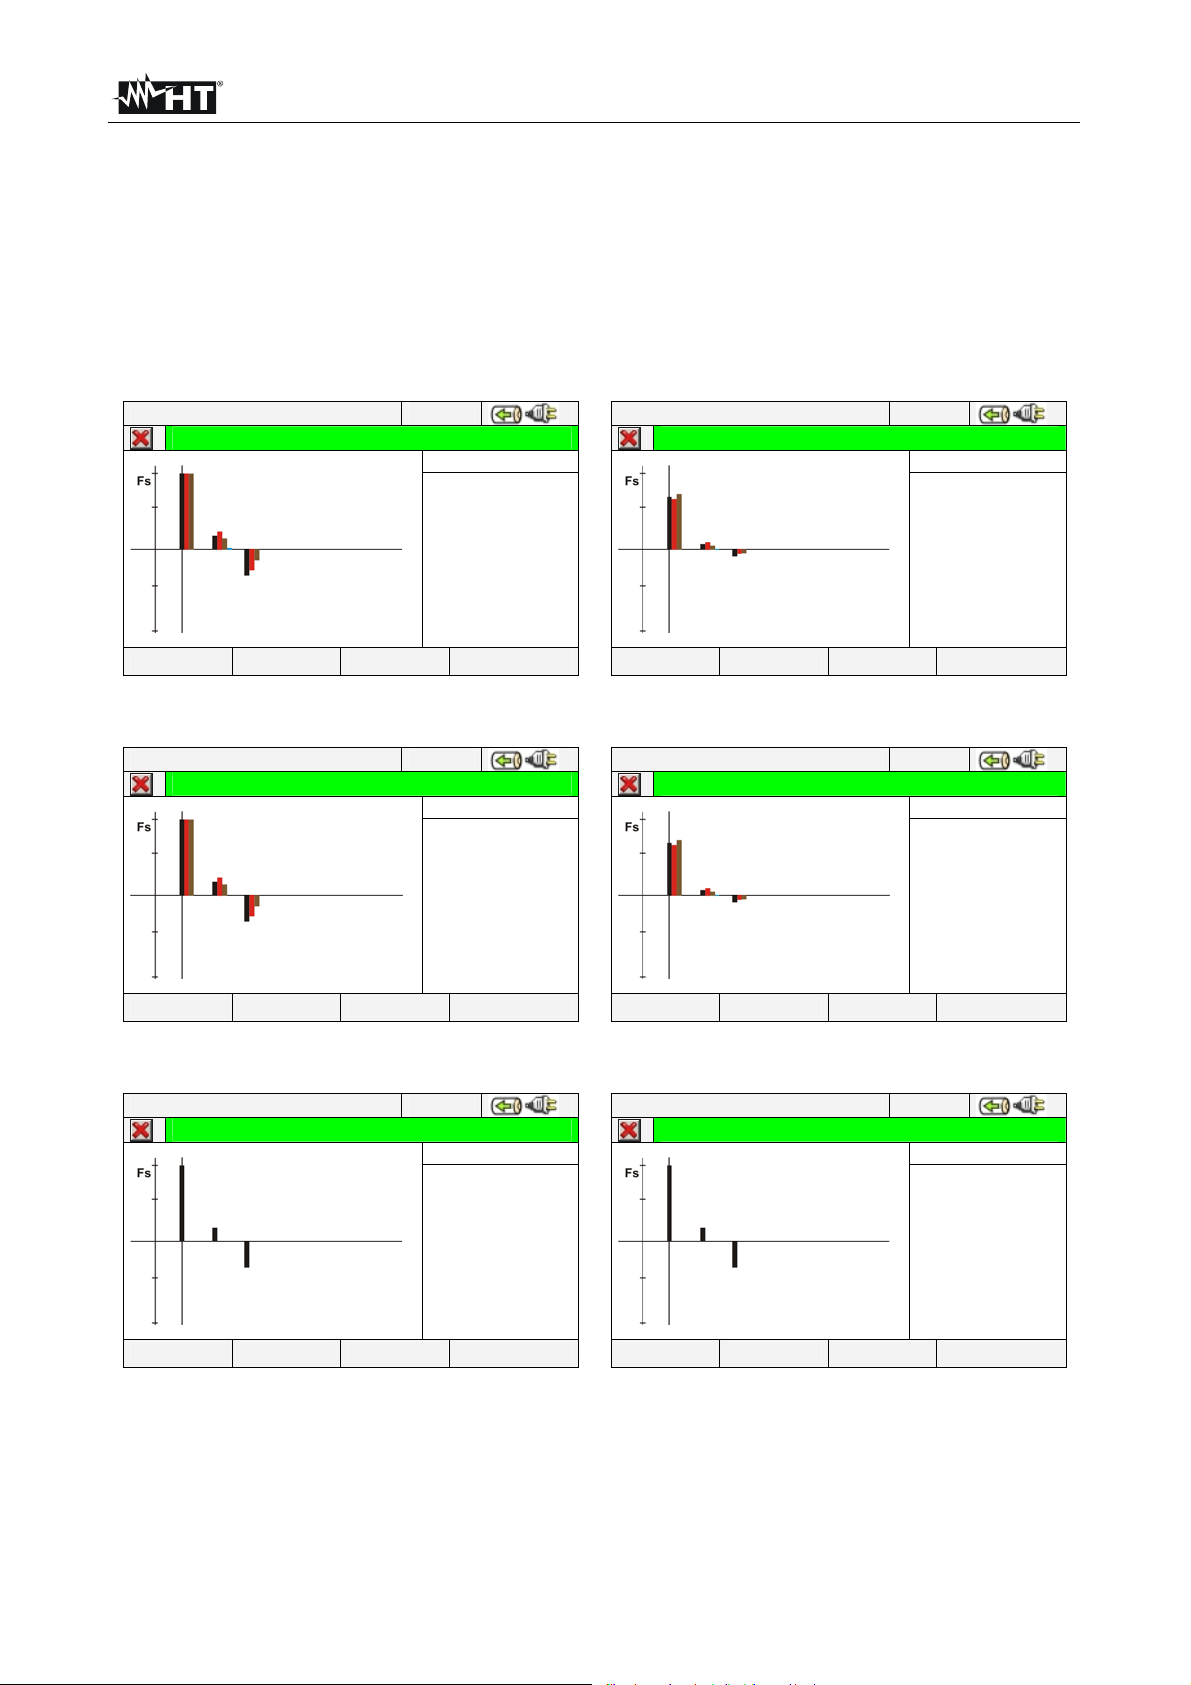
5.2.6. HARM analysis screens
Starting from any page of numerical values it’s possible to enter harmonics numerical
values and histogram graphics screens section for voltage and current input signals by
pressing F2 key (or touch HARM at display). By pressing cyclically F1 key the below
screens are shown by meter:
Harmonics values of V1, V2, V3 voltages and neutral voltage Vn (for three phase 4-
wire system), currents I1, I2, I3 and neutral current In (for three phase 4-wire
system)with THD% values both with histogram graphics and with numerical values in
percentage or absolute value, (see § 0 as below shown:
12/09/2006 – 16:55:10
TOTAL HARM VOLTAGE – Page 1/5
h 01
Fs 100%
1h
2h
3h
nh
Thd
Thd
Thd
Thd
PAGE HARM I TABLE HARM PAG
12/09/2006 – 16:55:10
TOTAL HARM VOLTAGE – Page 1/5
100.0%
100.0%
100.0%
0.0%
6.5%
5.9%
4.3%
0.0%
PAGE HARM I TABLE HARM PAG
h 01
Fs 400.0V
1h
2h
3h
nh
Thd
Thd
Thd
Thd
228.6V
225.1V
230.7V
0.0V
6.5%
5.9%
4.3%
0.0%
Fig. 53: Harmonic analysis of voltages in percentage/absolute values for 4-wire systems
12/09/2006 – 16:55:10
TOTAL HARM VOLTAGE – Page 1/4
h 01
Fs 100%
12h
23h
31h
Thd
Thd
Thd
PAGE HARM I TABLE HARM PAG
12/09/2006 – 16:55:10
TOTAL HARM VOLTAGE – Page 1/4
100.0%
100.0%
100.0%
6.5%
5.9%
6.5%
PAGE HARM I TABLE HARM PAG
h 01
Fs 400.0V
12h
23h
31h
Thd
Thd
Thd
328.4V
389.6V
386.6V
6.5%
5.9%
4.3%
Fig. 54: Harmonic analysis of voltages in percentage/absolute values for 3-wire and ARON
12/09/2006 – 16:55:10
PHASE1 HARM VOLTAGE – Pag 1/2
h 01
Fs 100%
1h
Thd
PAGE HARM I TABLE HARM PAG
12/09/2006 – 16:55:10
PHASE1 HARM VOLTAGE – Pag 1/2
100.0%
6.5%
PAGE HARM I TABLE HARM PAG
h 01
Fs 400.0V
1h
Thd
228.6V
6.5%
Fig. 55: Harmonic analysis of voltages in percentage/absolute values for Single phase
In all case the full scale of graphs is automatically set from meter depending on measured
values.
EN - 28
Page 31

VEGA78
Change to currents screens by pressing F2 key (or touch “HARM I” at display). By
pressing F1 key (or the PAGE at display) the screens of total values and each phase
currents I1, I2, I3 and In (for 4-wire and single phase systems) the main screens are
below shown:
12/09/2006 – 16:55:10
TOTAL HARM CURRENT – Pag 1/5
12/09/2006 – 16:55:10
TOTAL HARM CURRENT – Pag 1/5
h 03
Fs 100%
I1h
I2h
I3h
Inh
Thd
Thd
Thd
Thd
PAGE HARM V TABLE HARM PAG
45.3%
48.7%
37.6%
0.0%
35.5%
32.8%
42.5%
0.0%
PAGE HARM V TABLE HARM PAG
Fig. 56: Harmonic analysis of currents percentage/absolute for 4-wire systems
12/09/2006 – 16:55:10
TOTAL HARM CURRENT – Page 1/4
PAGE HARM V TABLE HARM PAG
h 03
Fs 100%
I1h
I2h
I3h
Thd
Thd
Thd
45.3%
48.7%
37.6%
35.5%
32.8%
42.5%
12/09/2006 – 16:55:10
TOTAL HARM CURRENT – Page 1/4
PAGE HARM V TABLE HARM PAG
h 03
Fs 200.0A
I1h
I2h
I3h
Inh
Thd
Thd
Thd
Thd
h 03
Fs 200.0A
I1h
I2h
I3h
Thd
Thd
Thd
90.6A
97.4A
75.2A
0.0A
35.5%
32.8%
42.5%
0.0%
90.6A
97.4A
75.2A
35.5%
32.8%
42.5%
Fig. 57: Harmonic analysis currents percentage/absolute values for 3-wire and ARON
12/09/2006 – 16:55:10
PHASE1 HARM CURRENT – Page 1/1
h 03
Fs 100%
I1h
Thd
PAGE HARM V TABLE HARM PAG
12/09/2006 – 16:55:10
PHASE1 HARM CURRENT – Page 1/1
45.3%
35.5%
PAGE HARM V TABLE HARM PAG
h 03
Fs 200.0A
I1h
Thd
90.6A
35.5%
Fig. 58: Harmonic analysis of currents percentage/absolute for Single phase systems
Change to screens of numerical values tables of harmonics voltages and currents up to
49st both percentage and absolute value (see § 0) by pressing F3 key (or touch
“TABLE” at display), as shown in below pictures:
EN - 29
Page 32

VEGA78
12/09/2006 – 16:55:10
h[%] Phase 1 Phase 2 Phase 3 Neutral
Thd% 6.5
DC
h1
h2
h3
h4 0.0 0.0 0.0 0.0
HARM I GRAPHIC HARM PAG
VOLTAGE HARMONICS
5.9 4.3 0.0
0.0 0.0 0.0 0.0
100.0 100.0 100.0 0.0
0.0 0.0 0.0 0.0
1.8 2.3 1.5 0.0
12/09/2006 – 16:55:10
VOLTAGE HARMONICS
h[V] Phase 1 Phase 2 Phase 3 Neutral
Thd% 6.5
DC
h1
h2
h3
h4 0.0 0.0 0.0 0.0
0.0 0.0 0.0 0.0
228.6 225.1 230.7 0.0
0.0 0.0 0.0 0.0
4.2 5.3 3.4 0.0
HARM I GRAPHIC HARM PAG
5.9 4.3 0.0
Fig. 59: Harmonic analysis voltages in percentage/absolute for 4-wire systems
12/09/2006 – 16:55:10
h[%] Phase 1 Phase 2 Phase 3 Neutral
Thd% 35.5
DC
h1
h2
h3
h4 0.0 0.0 0.0
HARM V GRAPHIC HARM PAG
CURRENT HARMONICS
32.8 42.5 0.0
0.0 0.0 0.0 0.0
100.0 100.0 100.0 0.0
0.0 0.0 0.0
45.3 48.7 37.6
12/09/2006 – 16:55:10
CURRENT HARMONICS
h[A] Phase 1 Phase 2 Phase 3 Neutral
Thd% 35.5
DC
h1
0.0
h2
0.0
h3
0.0
h4 0.0 0.0 0.0
0.0 0.0 0.0
199.7 200.4 197.3
0.0 0.0 0.0
90.6 97.4 75.2
HARM V GRAPHIC HARM PAG
32.8 42.5
0.0
0.0
0.0
0.0
0.0
0.0
Fig. 60: Harmonic analysis currents in percentage/absolute for 4-wire systems
12/09/2006 – 16:55:10
VOLTAGE HARMONICS
h[%] Phase 1 Phase 2 Phase 3
Thd% 6.5
DC
h1
h2
h3
0.0 0.0 0.0
100.0 100.0 100.0
0.0 0.0 0.0
1.8 2.3 1.5
5.9 4.3
h4 0.0 0.0 0.0
HARM I GRAPHIC HARM PAG
12/09/2006 – 16:55:10
VOLTAGE HARMONICS
h[V] Phase 1 Phase 2 Phase 3
Thd% 6.5
DC
h1
h2
h3
0.0 0.0 0.0
228.6 225.1 230.7
0.0 0.0 0.0
4.2 5.3 3.4
5.9 4.3
h4 0.0 0.0 0.0
HARM I GRAPHIC HARM PAG
Fig. 61: Harmonic analysis voltages in percentage/absolute for 3-wire and ARON systems
12/09/2006 – 16:55:10
CURRENT HARMONICS
h[%] Phase 1 Phase 2 Phase 3
Thd% 35.5
DC
h1
h2
h3
0.0 0.0 0.0
100.0 100.0 100.0
0.0 0.0 0.0
45.3 48.7 37.6
32.8 42.5
h4 0.0 0.0 0.0
HARM V GRAPHIC HARM PAG
12/09/2006 – 16:55:10
CURRENT HARMONICS
h[A] Phase 1 Phase 2 Phase 3
Thd% 35.5
DC
h1
h2
h3
0.0 0.0 0.0
199.7 200.4 197.3
0.0 0.0 0.0
90.6 97.4 75.2
32.8 42.5
h4 0.0 0.0 0.0
HARM V GRAPHIC HARM PAG
Fig. 62: Harmonic analysis currents in percentage/absolute for 3-wire and ARON systems
EN - 30
Page 33

VEGA78
V
V
12/09/2006 – 16:55:10
h[%] Phase 1
Thd% 6.5
DC
h1
h2
h3
h4 0.0
HARM I GRAPHIC HARM PAG
VOLTAGE HARMONICS
0.0
100.0
0.0
1.8
12/09/2006 – 16:55:10
VOLTAGE HARMONICS
h[V] Phase 1
Thd% 6.5
DC
h1
h2
h3
h4 0.0
0.0
228.6
0.0
4.2
HARM I GRAPHIC HARM PAG
Fig. 63: Harmonic analysis voltage in percentage/absolute for Single phase system
12/09/2006 – 16:55:10
h[%] Phase 1
Thd% 35.5
DC
h1
h2
h3
h4 0.0
HARM V GRAPHIC HARM PAG
CURRENT HARMONICS
0.0
100.0
0.0
45.3
12/09/2006 – 16:55:10
CURRENT HARMONICS
h[A] Phase 1
Thd% 35.5
DC
h1
h2
h3
h4 0.0
0.0
199.7
0.0
90.6
HARM V GRAPHIC HARM PAG
Fig. 64: Harmonic analysis current in percentage/absolute for Single phase system
Press F3 key to back to graphical screens and F2 key to change voltages’ or currents’
screens. Press F4 key or the up and down arrows (or touch the “HARM PAG” at display)
to show the screens relative to other harmonics orders up to 49st.
Harmonics values of single V1, V2, V3 voltages and neutral voltage Vn and single
currents I1, I2, I3 and neutral current In (for three phase 4-wire system) with THD%
values both with histogram graphics and with numerical values in percentage or
absolute value depending on the desired settings. These values are shown in four
pages selectable by pressing cyclically the F1 key (or touch the “PAGE” at display). On
Fig. 65 end Fig. 66 are display as an example, the situation relative to L1 phase for
voltage and current on 4-wire systems is shown in the next pictures:
12/09/2006 – 16:55:10
PHASE1 HARM VOLTAGE – Pag 2/5
PAGE HARM I TABLE HARM PAG
h 01
Fs 100%
1h
Thd
12/09/2006 – 16:55:10
PHASE1 HARM VOLTAGE – Pag 2/5
100.0%
6.5%
PAGE HARM I TABLE HARM PAG
h 01
Fs
1h
Thd
400.0V
228.6V
6.5%
Fig. 65: Harmonic analysis voltage V1 in percentage/absolute values for 4-wire system
EN - 31
Page 34

VEGA78
12/09/2006 – 16:55:10
PHASE1 HARM CURRENT – Pag 2/5
h 03
Fs 100%
I1h
Thd
PAGE HARM V TABLE HARM PAG
12/09/2006 – 16:55:10
PHASE1 HARM CURRENT – Pag 2/5
45.3%
35.5%
PAGE HARM V TABLE HARM PAG
h 03
Fs 200.0A
I1h
Thd
90.6A
35.5%
Fig. 66: Harmonic analysis of current I1 in percentage/absolute values for 4-wire system
5.2.7. Vectorial diagrams screens
Starting from a any page of numerical values it’s possible to select the vectorial diagrams
screens of voltage and currents by pressing F4 key (or touch “VECTORS” at display). The
aim of this feature is to show, with numerical and graphical indications, the phase angles,
expressed in degree [°] between the three voltages V1, V2 and V3 and the currents I1, I2
and I3 in order to understand in each moment the inductive or capacitive loads nature of
electrical installations. By pressing cyclically F1 key the below screens are shown by
meter:
Vectorial diagram total of phase angles among V1, V2, V3 and between V1-I1, V2-I2,
V3-I3 more than indication of percentage values of “NEG%” e “ZERO%” parameters
(see § 10.3):
12/09/2006 – 16:55:10
TOTAL DIAGRAM – Page 1/6
PAGE
NEG 0.0%
ZERO
V1^ V2
V2^ V3
V3^ V1
V1^ I1
V2^ I2
V3^ I3
0.0%
120.0°
120.0°
120.0°
60.0°
60.0°
60.0°
Fig. 67: Vectorial diagram total for 4-wire system
12/09/2006 – 16:55:10
TOTAL DIAGRAM – Page 1/6
PAGE
NEG 0.0%
ZERO
V12^ V23
V23^ V31
V31^ V12
V1^ I1
V2^ I2
V3^ I3
0.0%
120.0°
120.0°
120.0°
60.0°
60.0°
60.0°
Fig. 68: Vectorial diagram total for 3-wire and ARON systems
EN - 32
Page 35

VEGA78
V1^ I1
60.0°
12/09/2006 – 16:55:10
PHASE1 DIAGRAM – Page 1/6
PAGE
Fig. 69: Vectorial diagram total for Single phase system
The vectorial diagram of single voltages depending on the type of selected systems as
shown in below screens:
12/09/2006 – 16:55:10
VOLTAGES DIAGRAM – Page 2/6
PAGE
NEG 0.0%
ZERO
V1^ V2
V2^ V3
V3^ V1
0.0%
120.0°
120.0°
120.0°
Fig. 70: Vectorial voltage diagram for 4-wire system
12/09/2006 – 16:55:10
VOLTAGES DIAGRAM – Page 2/6
NEG 0.0%
ZERO
V12^ V23
V23^ V31
V31^ V12
0.0%
120.0°
120.0°
120.0°
PAGE
Fig. 71: Vectorial voltage diagram for 3-wire and ARON systems
The vectorial diagram of currents for 4-wire, 3-wire and ARON systems as shown in:
12/09/2006 – 16:55:10
CURRENTS DIAGRAM – Page 3/6
PAGE
I1^ I2
I2^ I3
I3^ I1
120.0°
120.0°
120.0°
Fig. 72: Vectorial currents diagram for 4-wire, 3-wire and ARON systems
EN - 33
Page 36

VEGA78
The vectorial diagram of voltage and current for each phase depending on the type of
system as shown in below screens:
12/09/2006 – 16:55:10
PHASE1 DIAGRAM – Page 4/6
V1^ I1
60.0°
PAGE
Fig. 73: Vectorial voltage-current diagram of L1 phase for 4-wire system
12/09/2006 – 16:55:10
PHASE2 DIAGRAM – Page 5/6
PAGE
V2^ I2
60.0°
Fig. 74: Vectorial diagram voltage-current of L2 phase for 4-wire system
12/09/2006 – 16:55:10
PHASE3 DIAGRAM – Page 6/6
V3^ I3
60.0°
PAGE
Fig. 75: Vectorial diagram voltage-current of L3 phase for 4-wire system
12/09/2006 – 16:55:10
PHASE1 DIAGRAM – Page 4/6
PAGE
V12^ I1
60.0°
Fig. 76: Vectorial diagram voltage-current of L1 phase for 3-wire and ARON systems
EN - 34
Page 37

VEGA78
12/09/2006 – 16:55:10
PHASE2 DIAGRAM – Page 5/6
V23^ I2
60.0°
PAGE
Fig. 77: Vectorial diagram voltage-current of L2 phase for 3-wire and ARON systems
12/09/2006 – 16:55:10
PHASE3 DIAGRAM – Page 6/6
PAGE
V31^ I3
60.0°
Fig. 78: Vectorial diagram voltage-current of L3 phase for 3-wire and ARON systems
Pressing ESC key (or smart icon at display) to exit from each screen and back to the
previous one.
The vectors of voltages are referred to the external circle on each diagram
CAUTION
and the vectors of current are referred to second circle. The vectors’ sizes
are designed so that the vector of maximum amplitude can touch the circle
and the other vectors are scaled with respect to it proportionally to their
amplitude.
The rotation positive reference associated at each vectorial diagram is
clockwise.
EN - 35
Page 38

VEGA78
5.3. ANALYZER SETTINGS
12/09/2006 – 16:55:10
GENERAL MENU
Analyzer settings
Fig. 79: Analyzer settings screen
Inside this section the meter permits to perform basic and advanced selections relative to
the type of electrical installation under test. In particular it is possible to:
Select the type of system, the frequency, the kind of current clamp, the full scale of
current clamp and the VT ratio of external voltage transformer which can be connected
with meter (Analyser Configuration).
Setting the Manual mode for the customisation of full scale on graphic screen of Real
Time section, the type of harmonic to be shown on screens, the percentage or absolute
values of harmonics, the harmonics zoom, the average calculation of voltages,
currents, active and reactive powers (Advanced Settings).
We suggest the use of smart icons and in order to perform a complete interaction with
the meter.
5.3.1. Analyzer Configuration screen
Inside the “Analyzer configuration” section a screen depending on the type of system
selected by user during the last operation is shown by meter: The instrument is granted
for a correct measurement only in connection with the following electrical systems:
Three phase system 4-wire WYE (three phase + neutral + ground).
Three phase system 3-wire DELTA (three phase + ground).
Three phase system 3-wire ARON DELTA (three phase + neutral + ground).
Single phase system (phase + neutral+ ground).
Below the possible screens of above systems’ options are described:
12/09/2006 – 16:55:10
ANALYZER CONFIGURATION
1
2
3
N
PE
System
Freq [Hz]
Clamp Type
4WIRE
50
FLEX
Clamp FS [A]
ADVANCED MOD(+) MOD(-)
VT Ratio
3000
1
Fig. 80: Analyzer configuration screen for 4-wire system
EN - 36
Page 39

VEGA78
12/09/2006 – 16:55:10
ANALYZER CONFIGURATION
System
3WIRE
Freq [Hz]
Clamp Type
Clamp FS [A]
VT Ratio
ADVANCED MOD(+) MOD(-)
50
FLEX
3000
1
Fig. 81: Analyzer Configuration screen for 3-wire system
12/09/2006 – 16:55:10
ANALYZER CONFIGURATION
ADVANCED MOD(+) MOD(-)
System
Freq [Hz]
Clamp Type
Clamp FS [A]
VT Ratio
ARON
50
FLEX
3000
1
Fig. 82: Analyzer Configuration screen for ARON system
12/09/2006 – 16:55:10
ANALYZER CONFIGURATION
System
SINGLE
Freq [Hz]
Clamp Type
Clamp FS [A]
TV Ratio
ADVANCED MOD(+) MOD(-)
50
STD
1000
1
Fig. 83: Analyzer Configuration screen for Single phase system
The connection of input signals to meter are shown in the small synoptic circuit scheme on
the left part of each screen depending on the system. For system selection perform the
below steps:
1. Move the cursor using arrows keys on field relative to “System”, marked with blue
background.
2. Use F3 or F4 keys (alternatively touch MOD(+) o MOD(-)) to select the type of system
choosing among “4-WIRE”, “3-WIRE”, “ARON” or “SINGLE” options.
3. Press SAVE or ENTER keys (or the smart icon ) to save the selected option and
confirm by “Ok”. This selected parameter will be present also after turning off the meter.
4. Press ESC key (or the smart icon ) to quit without saving any modification.
EN - 37
Page 40

VEGA78
5.3.1.1. Setting system frequency
1. Move the cursor using arrows keys on field relative to “Freq[Hz]”, marked with blue
background.
2. Use F3 or F4 keys (alternatively touch MOD(+) o MOD(-)) to select the system
frequency choosing between 50Hz or 60Hz options. This parameter is relevant ONLY if
the input voltage not permits to recognize the frequency value (for example, only the
clamps for the current measurement are connected). In this case the instrument
generates an internal synchronism equal to the value of the set frequency.
3. Press SAVE or ENTER keys (or the smart icon ) to save the selected option and
confirm by “Ok”. This selected parameter will be present also after turn off the meter.
4. Press ESC key (or the smart icon ) to quit without saving any modification.
5.3.1.2. Setting clamp type
This parameter must be always set equal to the clamp type used.
Two types of clamps are available:
STD: For Standard clamps or Current Transformer.
FLEX: For Flexible clamps.
1. Move the cursor using arrows keys on field relative to “Clamp Type”, marked with blue
background.
2. Use F3 or F4 keys (alternatively touch MOD(+) o MOD(-)) to select clamp type
choosing between STD or FLEX options.
3. Press SAVE or ENTER keys (or the smart icon ) to save the selected option and
confirm by “Ok”. This selected parameter will be present also after turn off the meter.
4. Pressing ESC key (or the smart icon ) to quit without saving any modification.
5.3.1.3. Setting full scale of clamps
CAUTION
The value of this parameter must be always equal to the full scale of the
current clamps used to take the measurement. In case multi-scale clamps are
used, the value of this parameter must be equal to the scale selected on the
clamps.
1. Move the cursor using arrows keys on field relative to “Clamps F S [A]” , marked it with
blue background.
2. Use F3 or F4 keys (alternatively touch MOD(+) o MOD(-)) to select the desired full
scale
CAUTION
In case of STD clamps any value can be set by using F3 or F4 keys
(alternatively touch MOD(+) o MOD(-)). In case of FLEX clamp only 300A or
3000A options are possible.
In case of STD clamp measured values of current < 0.1%FS are zeroed
In case of FLEX clamp with 300A range, measured values of current <1A
are zeroed.
In case of FLEX clamp with 3000A range, measured values of current <5A
are zeroed.
3. Press SAVE or ENTER keys (or the smart icon
) to save the selected option and
confirm by “Ok”. This selected parameter will be present also after turning off the meter.
4. Pressing ESC key (or the smart icon ) to quit without saving any modification.
EN - 38
Page 41

VEGA78
5.3.1.4. Setting VT ratio
The meter can be interfaced also with step-down transformers in the equipment under test.
It can display the value of he voltages present on the primary winding of these
transformers. To do this it will be necessary to set the value of the transformers’ windings
ratio.
1. Move the cursor using arrows keys on field relative to “VT Ratio” , marked it with blue
background.
2. Use F3 or F4 keys (alternatively touch MOD(+) o MOD(-)) for selec tion of desired value
from 1 to 3000. Leave the default value “1” if no voltage transformer is present on
installation.
3. Press SAVE or ENTER keys (or the smart icon ) to save the selected option and
confirm by “Ok”. This selected parameter will be present also after turning off the meter.
4. Press ESC key (or the smart icon ) to to quit without saving any modification.
5.3.2. Advanced Settings screen
By pressing F2 key (or touch the “ADVANCED” at display) in any screen of “Analyzer
Configuration” section, below screen is shown by meter:
12/09/2006 – 16:55:10
Zoom graphics MANUAL
Harm. type ALL
Harm. values ABSOLUTE
Zoom 1st harm YES
Average values NO
ADVANCED SETTINGS
MOD(+) MOD(-)
Fig. 84: Advanced Settings screen
In the above screen is possible to select advanced options which have effect in Real Time
values screens of meter.
5.3.2.1. Zoom graphics option
This option permits to select a customized full scale on each phase of voltage and current
waveforms (see Fig. 47, Fig. 49, Fig. 51) in order to better the resolution of readings.
1. Move the cursor using arrows keys on field relative to “Zoom graphics”, marked wit h
blue background.
2. Use F3 or F4 keys (alternatively touch MOD(+) o MOD(-)) to select one of below
options:
MANUAL: define a customized full scale for waveforms’ visualization choosing
among the available values. A value included from 2.0A to 5000kA it’s set for
current and included from 2.0V to 2000kV it’s set for voltage.
AUTO: the full scale values are automatically modified by the meter.
3. Press SAVE or ENTER keys (or the smart icon
) to save the selected option and
confirm by “Ok”. This selected parameter will be present also the turn off of meter.
4. Press ESC key (or the smart icon
) to quit without saving any modification.
EN - 39
Page 42

VEGA78
5.3.2.2. Harmonics type option
This option permits to select the type of harmonics which can be shown inside Real Time
values section.
1. Move the cursor using arrows keys on field relative to “Harm. type” , marked it with
blue background.
2. Use F3 or F4 keys (alternatively touch MOD(+) o MOD(-)) to select one of below
options:
ALL: The meter shows all the harmonics up to the 49st.
EVEN: The meter shows all the even harmonics up to the 49st.
ODD: The meter shows all the odd harmonics up to the 49st.
3. Press SAVE or ENTER keys (or the smart icon ) to save the selected option and
confirm by “Ok”. This selected parameter will be present also the turn off of meter.
4. Press ESC key (or the smart icon ) to quit without saving any modification.
CAUTION
Not depending on selected harmonics type for the visualization, the meter can
performs the recording of all values in any case.
5.3.2.3. Harmonics values option
This option permits to select the value of harmonics which can be shown inside Real Time
values’ section.
1. Move the cursor using arrows keys on field relative to “Harm. values” , marked it with
blue background.
2. Use F3 or F4 keys (alternatively touch MOD(+) o MOD(-)) to select one of below
options:
ABSOLUTE: The meter shows the harmonics in absolute values (in V unit for
voltages and A unit for currents).
PERCENTAGE: The meter shows the harmonics in percentage value respect each
fundamental.
3. Press SAVE or ENTER keys (or the smart icon ) to save the selected option and
confirm by “Ok”. This selected parameter will be present also the turn off of meter.
4. Press ESC key (or the smart icon ) to quit without saving any modification.
CAUTION
Independently of the harmonics value selected for display, the meter can
perform the recording of absolute values anyway.
EN - 40
Page 43

VEGA78
5.3.2.4. Zoom with respect to the 1st harmonic option
This option permits to show harmonics graphics with a zoom relative to the first harmonic
order (fundamental) or with a zoom relative to the highest amplitude harmonic inside the
Real Time values section. Also in this case the aim is to better the final resolution of
graphics.
1. Move the cursor using arrows keys on field relative to “Zoom 1st harm” , marked it
with blue background.
2. Use F3 or F4 keys (alternatively touch MOD(+) o MOD(-)) to select one of below
options:
YES: The meter performs the graphics zoom respect to the first harmonic
NO: The meter performs the graphics zoom respect to the highest amplitude
harmonics except for the first harmonic. This option is active only if the zoom
graphic option (see 5.3.2.1) is set on AUTO mode.
3. Press SAVE or ENTER keys (or the smart icon
) to save the selected option and
confirm by “Ok”. This selected parameter will be present also the turn off of meter.
4. Press ESC key (or the smart icon
) to quit without saving any modification.
5.3.2.5. Average value option
This option, available for 4-wire systems only, permits to display the arithmetic average
of TRMS values of:
Phase voltages V1, V2, V3.
Phase currents I1, I2, I3.
Active power on each phase P1, P2, P3.
The result is shown on Page 7/7 of numerical TRMS value (see Fig. 26).
1. Move the cursor using arrows keys on field relative to “Average values” , marked it
with blue background.
2. Use F3 or F4 keys (alternatively touch MOD(+) o MOD(-)) to select one of below
options:
YES: The meter shows the page 7/7 of average values inside Real Time Values
section only for 4-wire systems.
NO: The meter does not shows the page 7/7 of average values inside Real Time
Values section.
3. Press SAVE or ENTER keys (or the smart icon ) to save the selected option and
confirm by “Ok”. This selected parameter will be present also the turn off of meter.
4. Press ESC key (or the smart icon ) to quit without saving any modification.
EN - 41
Page 44

VEGA78
5.4. RECORDING SETTINGS
12/09/2006 – 16:55:10
GENERAL MENU
Recording settings
Fig. 85: Recording Settings screen selection
In this section the meter permits to define any detail relative to start and stop of recordings,
perform parameters selection for recording, the type of analysis to be carried out very
easily thanks to “touch screen” display. The use of smart icons and is particularly
recommended in this section.
5.4.1. Recording settings screen
This screen is designed with some levels and sub-levels as a typical tree Windows
structure in order to reach with extreme details the desired options. After selection of
“Recording settings” icon, see Fig. 85 the below screen is shown:
12/09/2006 – 16:55:10
Cogenerations
+ General Parameters
85/251 Parameters – Autonomy: 388d 4h
CLP/EXP PREDEF. SEL MODIFY
RECORDING SETTINGS
Comments: GENERIC PLANT
Start:Manu
Stop:Manu
Integration Period:15 min
Fig. 86: Recording settings screen
Using up and down arrows keys or touching directly the items at display the
selection/disable of internal flags inside check box is possible. Clic k on check box with “+”
symbol to cause an expansion of structure with the opening of a new sub-level inside
which new selections are possible. Click on check box with “-” symbol to go back to master
level. The displayed selection/disable of parameters is performed in the following way:
Grey text and empty check box Node completely disabled.
Black text and empty check box Node partially selected.
Black text and selected check box Node completely selected.
EN - 42
Page 45

VEGA78
The bottom bar of display included the below functions, relative to F1, F2, F3, F4 keys:
CLP/EXP: Used to collapse or expand the sub-levels.
PREDEF.: Used to open the typical configuration section (see § 5.4.9).
SEL: Used to select or disable parameters inside various levels.
MODIFY: Used to perform any parameters modify inside various levels.
On the bottom of display the number of selected parameters and the recording
autonomy, expressed in days and hours, is shown by meter. These s are dynamically
updated from meter depending on the parameters selection.
5.4.2. Comments
These option permits to insert a short comment row at display which will compare also in
print report downloaded from meter to PC. This comment text is set both using standard
TopView software (for any information please refer to software Help on line) and by using
the virtual keyboard on meter which is activated by pressing F4 key (or the MODIFY at
display). The flag of this option is always active and not disabled.
5.4.2.1. Use of virtual keyboard
With the Comments: marked in blue background at display press F4 key (or the MODIFY
at display). The below screen is shown at display:
12/09/2006 – 16:55:10
Comments:
Generic Plant
b c d e f g h
a
i j k l m n o p
q r s t u v w x
y z
Fig. 87: Virtual keyboard screen
The keys’ description of the above keyboard is shown in the below table:
Keys Description
a, b,c,…z
Cap
123
Sb
àž
<-
Standard small letters keyboard for digit comments up to
25 characters
Capital letters keyboard AZ is shown
Numerical 09 besides mathematic operation symbols
(+,-,*,/,.,=) keyboard is shown
Special symbols keyboard is shown. By pressing “abc”
key to go back to standard small letter keyboard
Special symbols with special stress keyboard are shown.
Press “abc” key to go back to standard small letter
keyboard
Backspace key to cancel character on the left of the
cursor
<- àž Sb 123 Cap
Table 1: Description of function key of virtual keyboard
EN - 43
Page 46

VEGA78
5.4.3. Start and Stop
These items permits to define the method to enable and disable the recordings with meter
(see § 5.4.10). The possible options are:
Manu: Each recording is enabled/disabled in MANUAL mode by pressing GO/STOP
key.
Auto: Each recording is enabled/disabled in AUTOMATIC mode, starting from a setting
and valid date/hour by preliminary pressing of GO/STOP key.
The default configuration is always the MANUAL mode and the flags of these s are not
disable. To change from MANUAL mode to AUTO mode (see § 5.4.10.1) performs the
below steps:
1. Move the cursor using arrows keys on the field relative to “Start:Manu” or
“Stop:Manu”, marked with blue background.
2. Press F4 key (alternatively touch the MODIFY at display). In the bottom of display a
command bar with “Manu” is shown.
3. Press F3 key (MOD(+)) or F4(MOD(-)) and select “Auto” .
4. Use left or right arrows keys to moving on date and hour fields. Using the up arrow key
or F3 (MOD(+)) key to increase the value and the down arrow key or F4 (MOD(-)) key
to decrease the value.
5. Press SAVE or ENTER keys (or the smart icon ) to save the settings. The Automatic
mode and the set date/hour are shown at display.
5.4.4. Integration period
This option permits to set the integration period (see § 10.5.1) which is the time interval
between two sequential recordings within the global duration of measurements. The flag of
this option is always active and not disabled.
1. Move the cursor using arrows keys on field relative to “Integration period” , marked it
with blue background.
2. Press F4 key (alternatively touch the MODIFY at display). In the bottom of display a
command bar with “Integration Period” is shown.
3. Press F3 key (MOD(+)) or F4(MOD(-)) or up and down keys to set the desired
integration period choosing among the below values: 1s, 5s, 10s, 30s, 1min, 2min,
5min, 10min, 15min, 30min, 60min.
4. Press SAVE key or ENTER key (or the smart icon
) to save the settings. The
integration period value is shown at display.
5.4.5. Cogenerations
The selection of this , effected both by using up or down arrows keys and directly selecting
the flag at display, enters the values of powers and energies generated (co-generation) in
the list of recorded parameters (see § 10.4.1).
EN - 44
Page 47

VEGA78
5.4.6. General Parameters
This option permits the selection of network parameters for recording operation. This level
included several sub-level for a detailed selection depending on the type of system on test
(see § 5.3.1).
Depending on the selection performed, different error screen can be shown by meter. The
below situations are possible:
12/09/2006 – 16:55:10
+
+
Error: no selected parameters
CLP/EXP PREDEF. SEL MODIFY
RECORDING SETTINGS
General Parameters
Harmonics
Voltage Anom.: 230V 6% -10%
Unbalance
Fig. 88: General Parameters section: no selection
Fig. 88 shows the situation which the error due to no parameters selection is performed
also if the “General Parameters” is selected at display. Please note the text on grey
background and the not selected check box. In this situation other type of analysis as
Harmonics, Voltage Anomalies, etc.. are not possible. Pressing F3 key (or touch “SEL” at
display) to exit from this error condition. In this order the flag of “General Parameters”
check box it will be selected and the below screen (with black text background) is shown:
12/09/2006 – 16:55:10
+
+
96/251 Parameters – Autonomy: 9d 4h
CLP/EXP PREDEF. SEL MODIFY
RECORDING SETTINGS
General Parameters
Harmonics
Voltage Anom.: 230V 6%-10%
Unbalance
Fig. 89: General Parameters section: selected parameters
In example of the above picture 96 parameters are been selected on total of maximum 251
available and the correspondent autonomy is shown automatically by meter in this case.
CAUTION
The “General Parameters” check box activated flag, automatically select the
main electrical parameters whose number depends on the selected system
(Voltages, Currents, Frequency, Power Factor, Active, Reactive, Apparent
Powers, Active, Reactive, Apparent Energies). The failure to select “General
Parameters” flag automatically doe not select the above parameters.
EN - 45
Page 48

VEGA78
The opposite situation is the error due to a too many selected parameters. In this case the
below screen is shown:
12/09/2006 – 16:55:10
+
+
Error: too many selected parameters 440/251
CLP/EXP PREDEF. SEL MODIFY
RECORDING SETTINGS
General Parameters
Harmonics
Voltage Anom.: 230V 6%-10%
Unbalance
Fig. 90: General Parameters section: too many selected parameters
In the above screen (see Fig. 90) the harmonics' selection brought about too many
selected parameters (more than 251). Not select some parameters to quit this situation.
CAUTION
The choose of a electrical for recording often increase the number of
selected parameters more than one unit only. In particular:
Frequency 1 selected parameter.
Voltage from 1 to 7 selected parameter depend on system.
Current from 1 to 4 selected parameter depend on system.
Powers and Energies from 1 to 8 selected parameter depend on
system and Cogenerations.
Power Factor from 1 to 8 selected parameter depend on system and
Cogeneration.
Harmonics: THD and DC from 1 to 8 selected parameter depend on
system.
Harmonics Odd from 25 to 100 selected parameter depend on
system.
Harmonics Even from 24 to 96 selected parameter depend on
system.
Voltage Anomalies no selected parameters.
Unbalance 1 selected parameter.
EN - 46
Page 49

VEGA78
5.4.6.1. General Parameters: sub-levels description
Press F1 key (or touch CLP/EXP at display) to expand or compress the sub-levels. The
parameters inside sub-levels are strictly depending on type of selected system (see §
5.3.1). Below there are some pictures of different possible situations:
12/09/2006 – 16:55:10
-
+ Currents
+ Active Power&Energy
8/251 Parameters – Autonomy: 109d 0h
CLP/EXP PREDEF. SEL MODIFY
RECORDING SETTINGS
General Parameters
Frequency
-
Voltages
Phase 1-Neutral
Fig. 91: General Parameters sub-level - Single phase system
Each parameter is always selectable independent from others. The below parameters
can be selected for recording in Single phase systems:
Parameter Description
Frequency Frequency of phase L1
Voltages TRMS voltages L1-N and N-PE
Currents TRMS current phase L1
Active Power & Energy Active power and energy of phase L1
Reactive Power & Energy
Reactive (inductive or capacitive) power and energy
of phase L1
Apparent Power & Energy Apparent power and energy of phase L1
Power Factor Power factor of phase L1
CosPhi
Power factor referred to fundamental of voltage and
current of phase L1
Table 2: Selectable parameters for Single phase system
Press SAVE or ENTER keys (or the smart icon
) to save each selection and confirm by
“Ok”. The main screen of Fig. 85 is shown by meter at the end of the operation.
Press ESC key (or the smart icon
) to quit without saving and back to previous screens.
12/09/2006 – 16:55:10
-
Phase2-Neutral
Phase3-Neutral
32/250 Parameters – Autonomy: 27d 6h
CLP/EXP PREDEF. SEL MODIFY
RECORDING SETTINGS
General Parameters
Frequency
-
Voltages
Phase1-Neutral
Fig. 92: General Parameters sub-level - Three phase 4-wire system
EN - 47
Page 50

VEGA78
The below parameters can be selected for recording in Three phase 4-wire systems:
Parameters Description
Frequency Frequency of phases L1, L2, L3
Voltages
TRMS voltages L1-N, L2-N, L3-N, N-PE
TRMS voltages L1-L2, L2-L3, L3-L1
Currents TRMS currents L1, L2, L3, Neutral
Active Power & Energy Active power and energy L1, L2, L3, Total
Reactive Power & Energy
Reactive (inductive or capacitive) power and energy
L1, L2, L3, Total
Apparent Power & Energy Apparent power and energy L1, L2, L3, Total
Power Factor Power factor L1, L2, L3 Total
CosPhi
Power factor referred to fundamental of voltage and
current L1, L2, L3, Total
Table 3: Selectable parameters for Three phase 4-wire system
Press SAVE or ENTER keys (or the smart icon ) to save each selection and confirm by
“Ok” . The main screen of Fig. 85 is shown by meter at the end of the operation.
Press ESC key (or the smart icon ) to quit without saving and back to previous screens.
12/09/2006 – 16:55:10
-
Phase2-PE
Phase3-PE
30/251 Parameters – Autonomy: 28d 13h
CLP/EXP PREDEF. SEL MODIFY
RECORDING SETTINGS
General Parameters
Frequency
-
Voltages
Phase1-PE
Fig. 93: General Parameters sub-level - Three phase 3-wire system
The below parameters can be selected for recording in Three phase 3-wire systems:
Parameters Description
Frequency Frequency of phases L1, L2, L3
Voltages
TRMS voltages L1-PE, L2-PE, L3-PE
TRMS voltages L1-L2, L2-L3, L3-L1
Currents TRMS currents L1, L2, L3
Active Power & Energy Active power and energy L1, L2, L3, Total
Reactive Power & Energy
Reactive (inductive or capacitive) power and energy
L1, L2, L3, Total
Apparent Power & Energy Apparent power and energy L1, L2, L3, Total
Power Factor Power factor L1, L2, L3 Total
CosPhi
Power factor referred to fundamental of voltage and
current L1, L2, L3, Total
Table 4: Selectable parameters for Three phase 3-wire system
EN - 48
Page 51

VEGA78
Press SAVE or ENTER keys (or the smart icon ) to save each selection and confirm by
“Ok”. The main screen of Fig. 85 is shown by meter at the end of the operation.
Press ESC key (or the smart icon ) to quit without saving and back to previous screens.
12/09/2006 – 16:55:10
-
Phase2-Phase3
Phase3-Phase1
22/251 Parameters – Autonomy: 38d 16h
CLP/EXP PREDEF. SEL MODIFY
RECORDING SETTINGS
General Parameters
Frequency
-
Voltages
Phase1-Phase2
Fig. 94: General Parameters sub-level - Three phase 3-wire ARON system
The below parameters can be selected for recording in Three phase 3-wire ARON
systems:
Parameters Description
Frequency Frequency of phases L1, L2, L3
Voltages TRMS voltages L1-L2, L2-L3, L3-L1
Currents TRMS currents L1, L2, L3
Active Power & Energy Active power and energy L1-L2, L3-L2, Total
Reactive Power & Energy
Reactive (inductive or capacitive) power and energy
L1-L2, L3-L2, Total
Apparent Power & Energy Apparent power and energy L1-L2, L3-L2, Total
Power Factor Power factor L1-L2, L3-L2, Total
CosPhi
Power factor referred to fundamental of voltage and
current L1-L2, L3-L2, Total
Table 5: Selectable parameters for Three phase 3-wire ARON system
Press SAVE or ENTER keys (or the smart icon ) to save each selection and confirm by
“Ok”. The main screen of Fig. 85 is shown by meter at the end of the operation.
Press ESC key (or the smart icon ) to quit without saving and back to previous screens.
EN - 49
Page 52

VEGA78
5.4.6.2. Harmonics: sub-levels description
Press F1 key (alternatively touch CLP/EXP at display) to expand or compress the
harmonics sub-levels. The parameters inside sub-levels are strictly depending on type of
selected system (see § 5.3.1). Below there are some pictures of different possible
situations:
12/09/2006 – 16:55:10
-
+ Odd
+ Even
162/251 Parameters – Autonomy: 19d 0h
CLP/EXP PREDEF. SEL MODIFY
RECORDING SETTINGS
Harmonics
-
Voltages
THD
DC
Fig. 95: Harmonics sub-levels: initial parameters selection
Inside Harmonics level there is another sub-level where an accurate selection of harmonic
parameters is possible. Move the cursor on “Odd” or “Even” using arrows key and press
F1 key (or touch CLP/EXP at display). The result, referred to Odd harmonics is below
shown:
12/09/2006 – 16:55:10
162/251 Parameters – Autonomy: 19g 0h
CMP/EXP PREDEF. SEL MODIFY
RECORDING SETTINGS
-
Odd
Harmonic1
Harmonic3
Harmonic5
Harmonic7
Harmonic9
Fig. 96: Harmonics sub-levels: odd harmonics selection
Press F3 key (alternatively touch SEL at display) to select/unselect the desired
parameters. The number of selected and recording autonomy are automatically updated
from meter. The below harmonic parameters can be selected for recording (see § 10.2):
Type of system Selectable parameters
Single phase
Three phase 4-wire
Three phase 3-wire
Three phase 3-wire ARON
THD%, DC, h01h49 (V1N, VN-PE, I1)
THD%, DC, h01h49 (V1N, V2N, V3N, VN-PE, I1, I2,
I3, IN)
THD%, DC, h01h49 (V12, V23, V31, I1, I2, I3)
THD%, DC, h01h49 (V12, V23, V31, I1, I2, I3)
Table 6: Selectable parameters of harmonic analysis
EN - 50
Page 53

VEGA78
Press SAVE or ENTER keys (or the smart icon ) to save each selection and confirm by
“Ok”. The main screen of Fig. 85 is shown by meter at the end of the operation.
Press ESC key (or the smart icon ) to quit without saving and back to previous screens.
The selection parameters of harmonic analysis require the preliminary selection of
voltages or currents inside General Parameter sub-level. The below error screen are
shown in these cases:
12/09/2006 – 16:55:10
+ Voltages
+ Currents
Unbalance
Error: no selected current
CLP/EXP TYPICAL SEL MODIFY
RECORDING SETTINGS
Harmonics
Voltage Anom.: 230V 6%-10%
Fig. 97: No selected currents error screen
To solve the error (see Fig. 97) situation of above screen select the “Current” inside
“General Parameter” sub-level (see § 5.4.6.1).
12/09/2006 – 16:55:10
+ Voltages
+ Currents
Unbalance
Error: no selected voltage
CLP/EXP PREDEF. SEL MODIFY
RECORDING SETTINGS
Harmonics
Voltage Anom.: 230V 6%-10%
Fig. 98: No selected voltages error screen
To solve the error (see Fig. 98) situation of above screen select the “Voltages” inside
“General Parameter” sub-level (see § 5.4.6.1).
5.4.7. Voltage Anomalies
This option permits to set the control parameters relative to voltage anomalies (sags,
swell, supply breaks – see § 10.1) recording which is completely independent from
periodic analysis (regulated by integration period). The below screen is shown by meter:
12/09/2006 – 16:55:10
+
+
132/251 Parameters – Autonomy: 15d 12h
CLP/EXP PREDEF. SEL MODIFY
RECORDING SETTINGS
General Parameters
Harmonics
Voltage Anom.: 230V 6%-10%
Unbalance
Fig. 99: Voltage Anomalies selection screen
EN - 51
Page 54

VEGA78
Press F4 key (alternatively touch MODIFYat display) for setting the below voltage
anomalies parameters:
Reference nominal voltage Vref depending on the type of considered system. In
particular Vref = VP-N (Single phase and three phase 4-wire systems), Vref = VP-P
(three phase 3-wire and ARON systems).
The higher threshold percentage of reference nominal voltage, selectable from 1% to
30% for voltage swell detection.
The lower threshold percentage of reference nominal voltage, selectable from 1% to
30% for voltage sags or breaks detection.
12/09/2006 – 16:55:10
+
+
Voltage Anom.: 230V 6% 10%
RECORDING SETTINGS
General Parameters
Harmonics
Voltage Anom.: 230V 6%-10%
Unbalance
MOD(+) MOD(-)
Fig. 100: Voltage Anomalies screen - setting control parameters
1. Move the cursor using arrows keys on field relative to “ Voltage Anom.” , marked it with
blue background.
2. Use up or down arrow keys or press F3 or F4 keys (alternatively touch the MOD(+) or
MOD(-) s at display) to setting the correspondent value. Pressing and holding of these
keys permits a rapid values setting, while the single pressure increase or decrease on
only unit the value. Use left or right arrow keys to move on various fields.
3. Press SAVE or ENTER keys (or the smart icon ) to save each performed setting.
CAUTION
The nominal reference value should be set depending on the type of
considered system on test and the measured voltage. A message “Wrong
Vref voltage anomalies” at the recording start is shown by meter which do
not permits the recording operation due to this wrong configuration (e.g.: 4wire system and Vref = 400V). Set the correct value in this case.
5.4.8. Unbalance
The selection of this option include on selected parameters list for recording the value of
NEG% and ZERO% s which are index of unbalance of input voltage signal respective to
negative tern and zero term (see § 10.3). “Unbalance” is not shown for single phase
systems.
EN - 52
Page 55

VEGA78
5.4.9. Predefined configurations
In order to make the recording start easier the meter includes 5 selectable predefined
configurations which describe typical situation in electrical installations, besides a “Default”
configuration which defines the initial settings from the factory. The meter also permits to
define up to 16 free configuration which can be customized, saved and recalled by user
at any time. The selection of one of these configurations automatically sets only the
necessary parameters for recording operation under that circumstance. The predefined
configurations are:
1. DEFAULT: Setting parameters of default configuration from the exit of meter by
factory.
2. VOLTAGE ANOMALIES: Setting parameters for voltage anomalies recording only
(sags, swells, breaks – see § 10.1).
3. HARMONICS: Setting parameters for voltages and currents harmonic analysis (see §
10.2).
4. POWER & ENERGY: Setting parameters for power and energy measures (see § 10.4).
Pressing F2 key (or touch PREDEF. at display) in any “Recording Settings” screen. The
meter show the below screen:
12/09/2006 – 16:55:10
PREDEFINED CONFIGURATIONS
Typical Configuration
DEFAULT
VOLTAGE ANOMALIES
HARMONICS
POWER & ENERGY
ADD REM
Fig. 101: Typical configuration screen
Select the desired typical configuration using up or down arrow keys or touch display.
Press SAVE or ENTER keys (or the smart icon
) to save the desired selection. The
warning message ”Change recording setting?” is shown by meter. Press “Ok” to confirm.
The meter automatically sets the parameters and updated the recording autonomy at
display.
To add a predefined customized configuration press the F1 key (or the ADD at display).
The warning message “Add actual configuration” is shown by meter. Press “Ok” to
confirm and activate automatically the virtual keyboard (see § 5.4.2.1) where it’s possible
to define and save the configuration name by user. At the end of these operations the
following screen is shown by meter:
12/09/2006 – 16:55:10
PREDEFINED CONFIGURATIONS
Typical Configuration
VOLTAGE ANOMALIES
HARMONICS
POWER & ENERGY
GENERIC PLANT
ADD REM
Fig. 102: Typical customized configuration screen
EN - 53
Page 56

VEGA78
In the example of Fig. 102 the typical customized configuration called “GENERIC PLANT”
was defined and can be loaded by pressing the SAVE or ENTER keys (or the smart icon
). This configuration cab be removed in any time by pressing F2 key (or the REM at display).
The warning message “Delete selected configuration?” is shown by meter. Press “Ok” to
complete the operation. Please note that the 5 predefined configuration and the DEFAULT
configuration cannot be removable by user.
Press ESC (or the smart icon ) to quit without saving any modify. Below the selected
parameters for each of predefined configuration are shown:
VOLTAGE ANOMALIES
MENU GENERAL PARAMETER SETTINGS SYSTEM
System
Freq[Hz]
Analyzer Settings
Analyzer Settings - Advanced
Recording Settings
Clamp Type
FS Clamp[A]
VT Ratio
Zoom Graphics
Harm. Type
Harm. Values
Zoom 1st Harm.
Average Values
Comments VOLTAGE ANOMALIES
Start Not modified
Stop Not modified
Integration period 1min
Cogeneration OFF
General Parameters
Voltage harmonics OFF
Current harmonics OFF
Voltage anomalies ON
Ref. Voltage anomalies
Up threshold anomalies +6%
Low threshold anomalies -10%
Unbalance
Not modified Each system
V1N, VN-PE, Hz Single phase
V12, V23, V31, Hz 3-wire, ARON
V1N, V2N, V3N, VN-PE,
Average (if activated), Hz
230V Single, 4-wire
400V 3-wire, ARON
Not available Single phase
ON 3/4-wire, ARON
Each system
4-wire
Each system
Each system
Table 7: Selected parameters of VOLTAGE ANOMALIES configuration
EN - 54
Page 57

VEGA78
HARMONICS
MENU GENERAL PARAMETER SETTINGS SYSTEM
System
Freq[Hz]
Analyzer Settings
Analyzer Settings - Advanced
Recording Settings
Clamp Type
FS Clamp[A]
VT Ratio
Zoom Graphics
Harm. Type
Harm. Values
Zoom 1st Harm.
Average Values
Comments HARMONICS
Start Not modified
Stop Not modified
Integration period 10min
Cogeneration OFF
General Parameters
Voltage harmonics THD, DC, h1, h2, h3…h25
Current harmonics THD, DC, h1, h2, h3…h25
Voltage anomalies OFF
Ref. Voltage anomalies
Up threshold anomalies OFF
Low threshold anomalies OFF
Unbalance
Not modified Each system
V1N, VN-PE, I1, Hz Single phase
V1-PE, V2-PE,
V3-PE, V12, V23, V31
I1, I2, I3, Hz
V12, V23, V31
I1, I2, I3, Hz
V1N, V2N, V3N, VN-PE,
I1, I2, I3, IN, Hz
OFF Single, 4-wire
OFF 3-wire, ARON
Not available Single phase
OFF 3/4-wire, ARON
Each system
3-wire
ARON
4-wire
Each system
Each system
Table 8: Selected parameters of HARMONICS configuration
EN - 55
Page 58

VEGA78
POWER & ENERGY
MENU GENERAL PARAMETER SETTINGS SYSTEM
System
Freq[Hz]
Analyzer Settings
Analyzer Settings
Advanced
Recording
Settings
Clamp Type
FS Clamp[A]
VT Ratio
Zoom Graphics
Harm. Type
Harm. Values
Zoom 1st Harm.
Average Values
Comments POWER & ENERGY
Start Not modified
Stop Not modified
Integration period 15min
Cogeneration ON
V12, V23, V31, I1, I2, I3, Hz
V12, V23, V31, I1, I2, I3, Hz ARON
V1N, V2N, V3N, V12, V23, V31,I1, I2, I3,
P1, Q1i, Q1c, S1, Pf1, Cosphi1, Ea1,
General Parameters
Voltage harmonics OFF
Current harmonics OFF
Voltage anomalies OFF
Ref. Voltage anomalies
Up threshold anomalies OFF
Low threshold anomalies OFF
Unbalance
Pt, P1, P2, P3, Qti, Qti1, Qti2, Qti3, Qtc,
Qtc1, Qtc2, Qtc3, St, S1, S2, S3, Pft,
Pf1, Pf2, Pf3, Cosphit, Cosphi1,
Cosphi2, Cosphi3, Eat,Eat1, Eat2, Eat3,
Erit, Eri1, Eri2, Eri3, Erct, Erc1, Erc2,
Pt, P12, P32, Qti, Q12i, Q32i, Qtc, Q12c,
Q32c, St, S12, S32, Pft, Pf12, Pf32,
Cospht, Cosphi12, Cosphi32, Eat, Ea12,
Ea32, Erit, Eri12, Eri32, Erct, Erc12,
Not modified Each system
V1N, I1 Single phase
V1-PE, V2-PE, V3-PE,
IN, Hz
Eri1, Erc1
Erc3
Erc32
OFF Single, 4-wire
OFF 3-wire, ARON
Not available Single phase
OFF 3/4-wire, ARON
Each system
3-wire
4-wire
Single phase
3-wire, 4-wire
ARON
Each system
Each system
Table 9: Selected parameters of POWER & ENERGY configuration
EN - 56
Page 59

VEGA78
DEFAULT CONFIGURATION
MENU GENERAL PARAMETER SETTINGS
System 4-wire
Freq[Hz] 50
Analyzer Settings
Analyzer Settings
Advanced
Recording Settings
Down threshold anomalies -10%
Clamp Type FLEX
FS Clamp[A] 3000
VT Ratio 1
Zoom Graphics AUTO
Harm. Type ALL
Harm. Values ABSOLUTES
Zoom 1st Harm. YES
Average Values NO
Comments DEFAULT
Start Manu
Stop Manu
Integration period 15min
Cogeneration OFF
V1N,V2N,V3N,VN-PE,V12,V23,V31,
I1, I2, I3, IN, Hz
Pt, P1,P2,P3, Qti, Qi1, Qi2, Qi3, Qtc, Qc1,
General Parameters
Voltage harmonics THD, DC, h1, h2, h3…h11
Current harmonics THD, DC, h1, h2, h3…h11
Voltage anomalies ON
Ref. Voltage anomalies 230V
Up threshold anomalies +6%
Unbalance ON
Qc2, Qc3, St, S1, S2, S3, Pft, Pft1, Pft2, Pft3,
Cosphit, Cosphi1, Cosphi2, Cosphi3, Eat,
Ea1, Ea2, Ea3, Erit, Eri1, Eri2, Eri3, Erct,
Erc1, Erc2, Erc3
Table 10: Parameters of default configuration
CAUTION
The DEFAULT configuration defines the selection of parameters on meter
from the factory, as shown in Table 10. Each new modification performed
and saved by the user on “Analyser Settings” section replaces this
configuration with new selection which can be different from the default
standard.
EN - 57
Page 60

VEGA78
5.4.10. Start a recording
The meter is designed to start a recording in MANUAL or AUTOMATIC mode (see § 5.4.3)
by pressing of GO/STOP key. A recording operation can be started exclusively under the
following screens:
MENU GENERAL (with any selected icon).
Real Time Values (in any internal screen).
12/09/2006 – 16:55:10
GENERAL MENU
12/09/2006 – 16:55:10
SCOPE VOLTAGES – Page 1/5
Fs 400.0V
V1 223.4V
V2 228.5V
V3 225.7V
Vn 0.0V
Meter information
PAGE
Fig. 103: Example of screens for recording starting
Before starting a recording press ESC key (or the smart icon ) until you get a picture as
shown in Fig. 103.This operation can be performed in the below ways:
MANUAL: Recording will start at the following minute after pressing GO/STOP key.
AUTO: After the (necessary) pressing of GO/STOP key the meter stands-by
until the set Date/Hour (see § 5.4.3) and then start automatically the
recording.
The waiting and recording run status are marked by meter with dedicated icons which are
present on the top right of display, as shown in below picture:
12/09/2006 – 16:55:10
GENERAL MENU
12/09/2006 – 16:55:10
GENERAL MENU
Meter information
Fig. 104: Meter waiting for recording
Meter information
Fig. 105: Meter in recording run
Press again GO/STOP key to stop the recording run in any time. The icon shown in Fig.
105 disappear.
EN - 58
Page 61

VEGA78
CAUTION
For recordings ALWAYS use the external power supply even though the
instrument allows the operator to perform a recording using internal
batteries.
After starting a recording a preliminary real time evaluation about the situation on electrical
installation it’s important in order to perform a correct settings, using the predefined
configurations (see § 5.4.9) if necessary.
The below warning message can be shown by meter after pressing of GO/STOP key:
Warning
Too many selected parameters
Fig. 106: Warning message of too many selected parameters
In this case of too many parameters were selected it is necessary to disable them inside
“Recordings Settings” section in order to start a correct recording.
After pressing GO/STOP key a possible warning message window is shown by meter.
Inside this window message the internal item can be different as for type and number. This
warning message, which does not block the recording start, is important for user to correct
possible errors performed during meter’s setting:
Warning
Missed external adapter
Wrong phase sequence
Negative active powers
Wrong Vref voltage anomalies
Ok
Cancel
Fig. 107: Warning message errors screen
Below the meaning of the above s of warning windows screen:
Type of error Description
Missed external adapter
Connect the external adapter to meter before start
recording
The value of “SEQ” parameter in Real Time Values
Wrong phase sequence
section (see § 5.2.1) is different from the correct
“123”. Check the phase sequence value of V1, V2, V3
voltages
One or more values of P1, P2, P3 Active Powers is
negative (see § 5.2.1). Reversing if necessary the
Negative active powers
transducer clamps of 180 degrees on phase cables in
order to obtain always positive values (except
cogeneration cases)
The nominal reference voltage value for voltage
Wrong Vref voltage anomalies
anomalies is not compliance to the type of selected
system (see § 5.4.7)
Table 11: Description of errors before start a recording
EN - 59
Page 62

VEGA78
Depending on the type and number of errors, the necessary modifications of setting
parameters should be performed. Press GO/STOP key again to start recording and verify
the possible residual error on window message.
Confirm with ENTER or press “Ok” or “Cancel” keys to close the warning window message
and start the recording by pressing GO/STOP key anyway.
As the default value of the integration periods is set at 15min (see § 10.5.1) the meter will
store data in the temporary memory for this time. Afterwards the meter will process the
results saved in the temporary memory and will save the first series of values in the
definitive memory. Therefore, if an integration period of 15 minutes has been set, the
recording will continue for about 15 minutes before producing a series of recorded values
CAUTION
Let the meter record for at least one integration period in order to save a
valid value. If the recording is interrupted before the selected integration
period has completely elapsed the data stored in the temporary memory will
not be processed and the corresponding series of values won’t be
transferred to the definitive memory.
5.4.10.1. Automatic start of recording
To start a recording under automatic mode a preliminary definition of a correct starting
Date/Hour, compatible with system date, is needed inside “Recorder Settings” section (see
§ 5.4). The below screen is shown:
12/09/2006 – 16:55:10
Cogeneration
+ General Parameters
Start: Auto 12 / 09 / 06 – 17 : 00 : 00
RECORDING SETTINGS
Comments: POWER & ENERGY
Start:Auto 12/09/2006 – 16:30
Stop:Manu
Integration Period:15 min
MOD(+) MOD(-)
12/09/2006 – 16:55:10
RECORDING SETTINGS
+ General Parameters
Error: wrong start date
CMP/EXP PREDEF. SEL MODIFY
Comments: POWER & ENERGY
Start:Auto 12/09/2006 – 16:30
Stop:Manu
Integration Period:15 min
Cogeneration
Fig. 108: Correct Date/Hour
Fig. 109: Wrong Date/Hour
1. Move the cursor using arrows keys on field relative to “Start” (and or the “Stop” ),
marked them with blue background.
2. Press F4 key (alternatively touch the MODIFY at display). In the bottom of display a
command bar with “Manu” is shown. Press F3 key (MOD(+)) or F4(MOD(-)) and select
“Auto” .Use left or right arrows keys to move on date and hour fields. Using the up
arrow key or F3 (MOD(+)) key to increase the value and the down arrow key or F4
(MOD(-)) key to decrease the value. Set a correct Date/Hour as shown in Fig. 108.
3. Press SAVE or ENTER keys (or smart icon ) to saving the settings. The screen of
Fig. 109 is shown if a wrong Date/Hour is set. Under this condition the SAVE key does
not have any effect. Repeat the steps 2 and 3 and set corrects values before pressing
SAVE key again.
EN - 60
Page 63

VEGA78
5.4.11. During a recording
After a recording is running, a check of parameters’s values and status is shown by meter
12/09/2006 – 16:55:10
GENERAL MENU
Recording results
Fig. 110: Recording Results screen - Recording running
1. Select “Recording Results” in GENERAL MENU
2. Pres ENTER or touch the correspondent icon at display. The below screen is shown:
12/09/2006 – 16:55:10
Autonomy: 0 days –22 hours
Comments: HARMONICS
Start: 12/09/2006 16:57:00
Stop: Manual
Integration Period: 5 sec
Num. Periods: 345
Anomalies: 0
MODIFY
INFO RECORDING RUNNING
Fig. 111: Info recording running screen
3. The below information are included in the above screen:
Recording autonomy, in Days/Hours, of meter with the currents selections per formed.
Comments included in the relative section (see § 5.4.2).
Type of recording start and recording stop
Real time information about integration period performed by meter
Enable of cogeneration.
Number of recorded voltage anomalies.
Type of selected system
Type of used clamp and the full scale of used clamp
Ratio of eventual external VT used.
4. Pressing ESC key (or the smart icon ) to quit from the above screen.
Each recording running is stopped and results are automatically saved by meter by
pressing of GO/STOP key or as soon as the date/hour of automatic stop is reached.
The only “Real Time Values” section is available during a recording
CAUTION
running. The message “Menu not available in recording” is shown by
meter if any section is selected. Stop recording pressing GO/STOP key
before select any section.
ON/OFF key is disabled during a recording running. The message “
Recording running. Not available function” is shown by meter. Stop
recording pressing GO/STOP key before pressing this key.
EN - 61
Page 64

VEGA78
5.5. SAVED DATA MANAGEMENT SECTION
Fig. 112: GENERAL MENU - Saved Data Management
The “Saved Data Management” section allows the user to check the content of the internal
memory after recording, to delete previous recordings and possibly to copy a recording
(one at a time) on an external USB Pen Driver connected to the instrument. By pressing
the ENTER key or selecting the icon on the display, the instrument shows the following
screen:
Fig. 113: Saved data
The instrument performs the following types of recordings:
Reg type: Recordings performed and saved automatically, both in manual and
automatic mode, of each analysis (Periodics, Harmonics, Voltage Anomalies, etc…) by
pressing the GO/STOP key.
Istant type: Instant samplings of the values displayed (numerical, waveforms,
harmonics, etc…) performed by pressing the SAVE key.
Each line of the “Saved Data Management” screen includes, further to the type of data
saved in the memory, also the information on the starting and stopping date of the event,
respectively “Time1” and “Time2” for Reg-type recordings, while date and time are
indicated for Istant instant sampling.
The following operations are possible only on the screen in Fig. 113:
1. Use the up and down a rrow keys to highlight (blue background) one of the recordings
on the screen. Press the F1 key (or the INFO item on the display). The instrument
shows the screen containing the main information regarding the recording performed
as described in § 5.5.1.
2. Press the F3 key (or the CANC.ULT item on the display) to delete the last saved
recording. The instrument shows the message “Delete last recording?”. Confirm the
operation with “Ok” or “Cancel” to go back to the screen.
3. Press the F4 key (or the CANC.TOT item on the display) to delete all recordings in
the memory. The instrument shows the message “Delete all recordings?”. Confirm the
operation with “Ok” or “Cancel” to go back to the previous screen.
EN - 62
Page 65

VEGA78
5.5.1. Recording analysis (Reg type)
This page shows the analyses which can be performed on the saved data (Reg type).
Fig. 114: Recording analysis (Reg-type data)
1. Use the up and down arrow keys to highlight on blue background one of the analyses
on the screen. Press the F1 or ENTER key (or the OPEN item or the smart icon on
the display) to confirm the type of analysis to be performed.
2. Press the ESC key (or the smart icon ) to exit the function and go back to the “Saved
data” page (Fig. 113).
5.5.1.1. Recording information
This page contains general information about the recording (Reg) file previously selected
in the Saved Data Management MENU.
Fig. 115: Recording info
1. In these conditions, the F1 key (or the MODIFY key on the display) is active and it is
possible to modify and save the comment line by using the virtual keyboard (see §
5.4.2.1).
2. Press the ESC key (or the smart icon ) to exit the function and go back to the
“Recording analysis” page (Fig. 114).
EN - 63
Page 66

VEGA78
5.5.1.2. Recording graph
By selecting the recording graph option, the following page is accessed, which enables the
user to display the recording trend (ONLY ONE parameter at a time).
Fig. 116: Selecting a parameter
1. Press the F1 key (or the PARAM item on the display) to access the page containing
the recorded quantities available for the analysis (Fig. 117).
Fig. 117: Parameter selection
The following keys are active on this page:
The up and down arrow keys move the cursor along the quantity tree.
The F1 key (or the CMP/EXP item on the dislay) compresses and expands the tree of
the quantity highlighted by the cursor.
The F2 key (or the SEL item on the dislay) selects or deselects the parameter
highlighted by the cursor.
The ENTER key (or the smart icon on the display) confirms the selection previously
made and displays the graph of the selected parameter (Fig. 118).
The CANC key deselects the parameter previously selected, independently from the
position of the cursor.
The ESC key (or smart icon ) to exit the function and go back to the “Selecting a
parameter” page (Fig. 116).
EN - 64
Page 67

VEGA78
This page shows the graph, the cursor position (cursor T) and the maximum, minimum and
average RMS values of the parameter selected by the cursor.
Fig. 118: Recording graph
The following keys are active on this page:
F1 key (or PARAM item on the display) to access the page of the selectable
parameters (Fig. 117).
F4 key (or OPTIONS item on the display) to access the page for the activation of the
“Advanced graph” (Fig. 119).
The ESC key (or smart icon ) to exit the function and go back to the “Recording
analysis” page (Fig. 114).
2. Press the F4 key (or the OPTIONS item on the display) to access the page for the
activation of the Advanced graph (Fig. 119).
Fig. 119: Options (Advanced graph)
The following keys are active on this page:
The F3 and F4 keys (or the MOD(+) and MOD(-) items on the display) enable the user
to choose YES or NO for the advanced graph.
The ENTER key (or the smart icon
on the display) confirms the selection previously
made.
The ESC key (or smart icon
) to exit the function and go back to the “Selecting a
parameter” page (Fig. 116).
EN - 65
Page 68

VEGA78
Example of advanced graph.
Let us take a recording of 2000 pixels into consideration. The VEGA78 has a display with
a useful resolution of about 200 pixels; therefore, it is not able to distinctly display all the
pixels in our recording. How does it operate then? The first pixel in the graphs of the
curves “Max value”, “Average value” and “Min value” will be the analysis of the 10 first
corresponding pixels of the recording, i.e.:
For the Max value graph, the highest value of the 10 recorded values for the
corresponding channel will be displayed.
For the Min value graph, the lowest value of the 10 recorded values for the
corresponding channel will be displayed.
For the Average value graph, the first value of the 10 recorded values for the
corresponding channel will be displayed.
Similarly, the second pixel will be the analysis of the following 10 pixels, and so on until the
whole graph is generated.
3. Press the ESC key (or the smart icon ) to exit the function and go back to the
“Selecting a parameter” page (Fig. 116).
5.5.1.3. Dips ans swells
This page shows a table containing all voltage anomalies occurred during recording.
Fig. 120: Dips ans swells
Column description:
N.: Progressive number of the anomaly.
L.: Phase in which the anomaly occurred.
Date/Time: Date/time at which the anomaly occurred.
Max/Min: Maximum/minimum value of the anomaly.
Duration: Duration of the anomaly.
Type: Type of anomaly (voltage reduction or overvoltage).
The following keys are active on this page:
The up and down arrow keys move the cursor along the voltage anomalies.
The up and down arrow keys move the column display to the right or to the left.
The F1 key (or the PAG item on the display) advances to the following page of voltage
anomalies (to be selected with the F3 or F4 key or through the items MOD (+) or MOD
(-) on the display).
The F2 key (or the PARAM item on the display) accesses the page showing the
settings for voltage anomalies (Fig. 121).
The ESC key (or smart icon ) to exit the function and go back to the “Recording
analysis” page (Fig. 114).
EN - 66
Page 69

VEGA78
This page shows the parameters set before recording voltage anomalies:
Fig. 121: Voltage Anomalies
The following non-modifiable parameters are indicated (as they have been set upon
starting the recording).
Nominal Voltage: Nominal voltage.
High Voltage: Limit high voltage.
Low Voltage: Limit low voltage.
TV: Transformation ratio of the voltage transformers.
This page also shows the total number of voltage anomalies occurred (Number of
Anomalies).
The following keys are active on this page:
The up and down arrow keys move the cursor alternatively on Type or Phase.
The F3 and F4 keys (or the MOD(+) and MOD(-) items on the display) enable the user
to filter the anomalies to be selected. It is possible to select All, Up, Down, Int (if the
cursor highlights Type) and All, Phase1, Phase2, Phase3 (if the cursor highlights
Phase).
The ENTER key (or the smart icon on the display) confirms the selection previously
made and displays the table of voltage anomalies.
The ESC key (or the smart icon
) to exit the functions and go back to the “Anomalies”
page (Fig. 120).
EN - 67
Page 70

VEGA78
5.5.1.4. Analysis of consumed energy
This page shows the Energy and Peak power values consumed while recording
25/01/2013 – 16:55:10
TOT. ENERGY CONSUMPTION – Pag x/y
Eact = 15 Wh
Ppeak = 1.31 kW
Date Ppeak : 21/01/13 16:45:00
Start rec. : 21/01/13 16:45:00
Stop rec. : 21/01/13 18:00:00
Rec. Time : 00d 1h 15m
Int. Per. : 15m
PAGE SCOPE HARM VECTORS
Fig. 122: Screen of total consumed energy
Description of the displayed values:
Eact: Total active power consumed while Recording.
Ppeak: Max. active power peak (measured on 16 periods of mains frequency)
consumed while recording
Date Ppeak: Date and time in which the power peak occurred
Start rec.: Starting date of the recording
Stop rec.: Stopping date of the recording
Rec. Time Recording time expressed in days (d), hours (h) and minutes (m)
Int. Per: Set integration period value
CAUTION
The Total Consumed Energy page is shown only if general parameter Total
“Active Power & Energy” has been recorded (see § 5.4.6.1).
EN - 68
Page 71

VEGA78
5.5.1.5. Analysis of producted energy
This page shows the Energy and Peak power values producted while recording
25/01/2013 – 16:55:10
TOT. ENERGY PRODUCTION – Pag x/y
Eact = 15 Wh
Ppeak = 1.31 kW
Date Ppeak : 21/01/13 16:45:00
Start rec. : 21/01/13 16:45:00
Stop rec. : 21/01/13 18:00:00
Rec. Time : 00d 1h 15m
Int. Per. : 15m
PAGE SCOPE HARM VECTORS
Fig. 123: Screen of total producted energy
Description of the displayed values:
Eact: Total active power produced while Recording.
Ppeak: Max. active power peak (measured on 16 periods of mains frequency)
produced while recording
Date Ppeak: Date and time in which the power peak occurred
Start rec.: Starting date of the recording
Stop rec.: Stopping date of the recording
Rec. Time Recording time expressed in days (d), hours (h) and minutes (m)
Int. Per.: Set integration period value
CAUTION
The Total Produced Energy page is shown only if general parameter Total
“Active Power & Energy” has been recorded (see § 5.4.6.1) and if the
recording parameter “Co-generation” has been enabled (see § 5.4.5).
EN - 69
Page 72

VEGA78
5.5.2. Recording analysis (Istant type)
This page shows the analyses which can be performed on the saved data (Istant type).
Fig. 124: Recording analysis (Istant-type data)
1. Use the up and down arrow keys to highlight on blue background one of the analyses
on the screen. Press the F1 or ENTER key (or the OPEN item or the smart icon on
the display) to confirm the type of analysis to be performed.
2. Press the ESC key (or the smart icon on the display) to exit the function and go back to
the “Saved data” page (Fig. 113).
5.5.2.1. Recording information
This page contains general information about the saved (Istant) file previously selected in
the Saved Data Management MENU.
Fig. 125: Recording info
1. In these conditions, the F1 key (or the MODIFY key on the display) is active and it is
possible to modify and save the comment line by using the virtual keyboard (see §
5.4.2.1).
2. Press the ESC key (or the smart icon
on the display) to exit the function and go back to
the “ R ecor d i n g a naly s i s ” p a g e (Fig. 124).
EN - 70
Page 73

VEGA78
5.5.2.2. Graph
This screen (Fig. 126) contemporarily shows the saved instant values of the waveforms of
voltages V1, V2, V3, Vn scaled according to the Full scale (Fs) and the relevant RMS
values; these values have been saved by the instrument upon pressing the SAVE key.
Fig. 126: Voltage scope in three-phase 4-wire system
The following keys are active on this page:
The up (ZOOM+) or down (ZOOM-) arrow keys zoom in or out the displayed
waveforms.
The F1 key (or the PAG item on the display) advances to the following page of saved
current values.
The ESC key (or the smart icon on the display) to exit t he function and go back to the
“Recording analysis” page (Fig. 124).
This screen (Fig. 127) contemporarily shows the saved instant values of the waveforms of
voltages V12, V23, V31 scaled according to the Full scale (Fs) and the relevant RMS
values; these values have been saved by the instrument upon pressing the SAVE key.
Fig. 127: Voltage scope in three-phase 3-wire system or Aron system
The following keys are active on this page:
The up (ZOOM+) or down (ZOOM-) arrow keys zoom in or out the displayed
waveforms.
The F1 key (or the PAG item on the display) advances to the following page of saved
current values.
The ESC key (or the smart icon on the display) to exit t he function and go back to the
“Recording analysis” page (Fig. 124).
EN - 71
Page 74

VEGA78
This screen (Fig. 128) contemporarily shows the waveforms of phase 1 voltage and current,
scaled according to the Full scale (Fs), and the relevant RMS values; these values have
been saved by the instrument upon pressing the SAVE key.
Fig. 128: Voltage and current scope in single-phase system
The following keys are active on this page:
The F2 key (or the ZOOM V or ZOOM I item on the dislay) switches between voltage
zoom and current zoom (only if the Manual zoom mode has been activated).
The up (ZOOM+) or down (ZOOM-) arrow keys zoom in or out the displayed
waveforms (only if the manual zoom mode has been activated).
The F1 key (or the PAG item on the display) advances to the following page of saved
current values.
The ESC key (or the smart icon on the display) to exit t he function and go back to the
“Recording analysis” page (Fig. 124).
This screen (Fig. 129) contemporarily shows the instant values of the waveforms of currents
I1, I2, I3, In scaled according to the Full scale (Fs) and the relevant RMS values; these
values have been saved by the instrument upon pressing the SAVE key.
Fig. 129: Current scope in three-phase 4-wire system
The following keys are active on this page:
The up (ZOOM+) or down (ZOOM-) arrow keys zoom in or out the displayed
waveforms (only if the manual zoom mode has been activated).
The F1 key (or the PAG item on the display) advances to the following page of saved
values relative to phase 1 voltage and current.
The ESC key (or the smart icon on the display) to exit t he function and go back to the
“Recording analysis” page (Fig. 124).
EN - 72
Page 75

VEGA78
This screen (Fig. 130) contemporarily shows the instant values of the waveforms of currents
I1, I2, I3 scaled according to the Full scale (Fs) and the relevant RMS values; these values
have been saved by the instrument upon pressing the SAVE key.
Fig. 130: Current scope in three-phase 3-wire system or Aron system
The following keys are active on this page:
The up (ZOOM+) or down (ZOOM-) arrow keys zoom in or out the displayed
waveforms (only if the manual zoom mode has been activated).
The F1 key (or the PAG item on the display) advances to the following page of saved
values relative to phase 1 voltage and current.
The ESC key (or the smart icon on the display) to exit t he function and go back to the
“Recording analysis” page (Fig. 124).
This screen (Fig. 131) contemporarily shows the instant values of the waveforms of voltage
V1 and current I1, scaled according to the relevant Full scale (Fs) and the relevant RMS
values; these values have been saved by the instrument upon pressing the SAVE key.
Fig. 131: Phase 1 scope in three-phase 4-wire system
The following keys are active on this page:
The F2 key (or the ZOOM V or ZOOM I item on the dislay) switches between voltage
zoom and current zoom (only if the manual zoom mode has been activated).
The up (ZOOM+) or down (ZOOM-) arrow keys zoom in or out the displayed
waveforms (only if the manual zoom mode has been activated).
The F1 key (or the PAG item on the display) advances to the following page of saved
values relative to phase 2 voltage and current.
The ESC key (or the smart icon on the display) to exit t he function and go back to the
“Recording analysis” page (Fig. 124).
EN - 73
Page 76
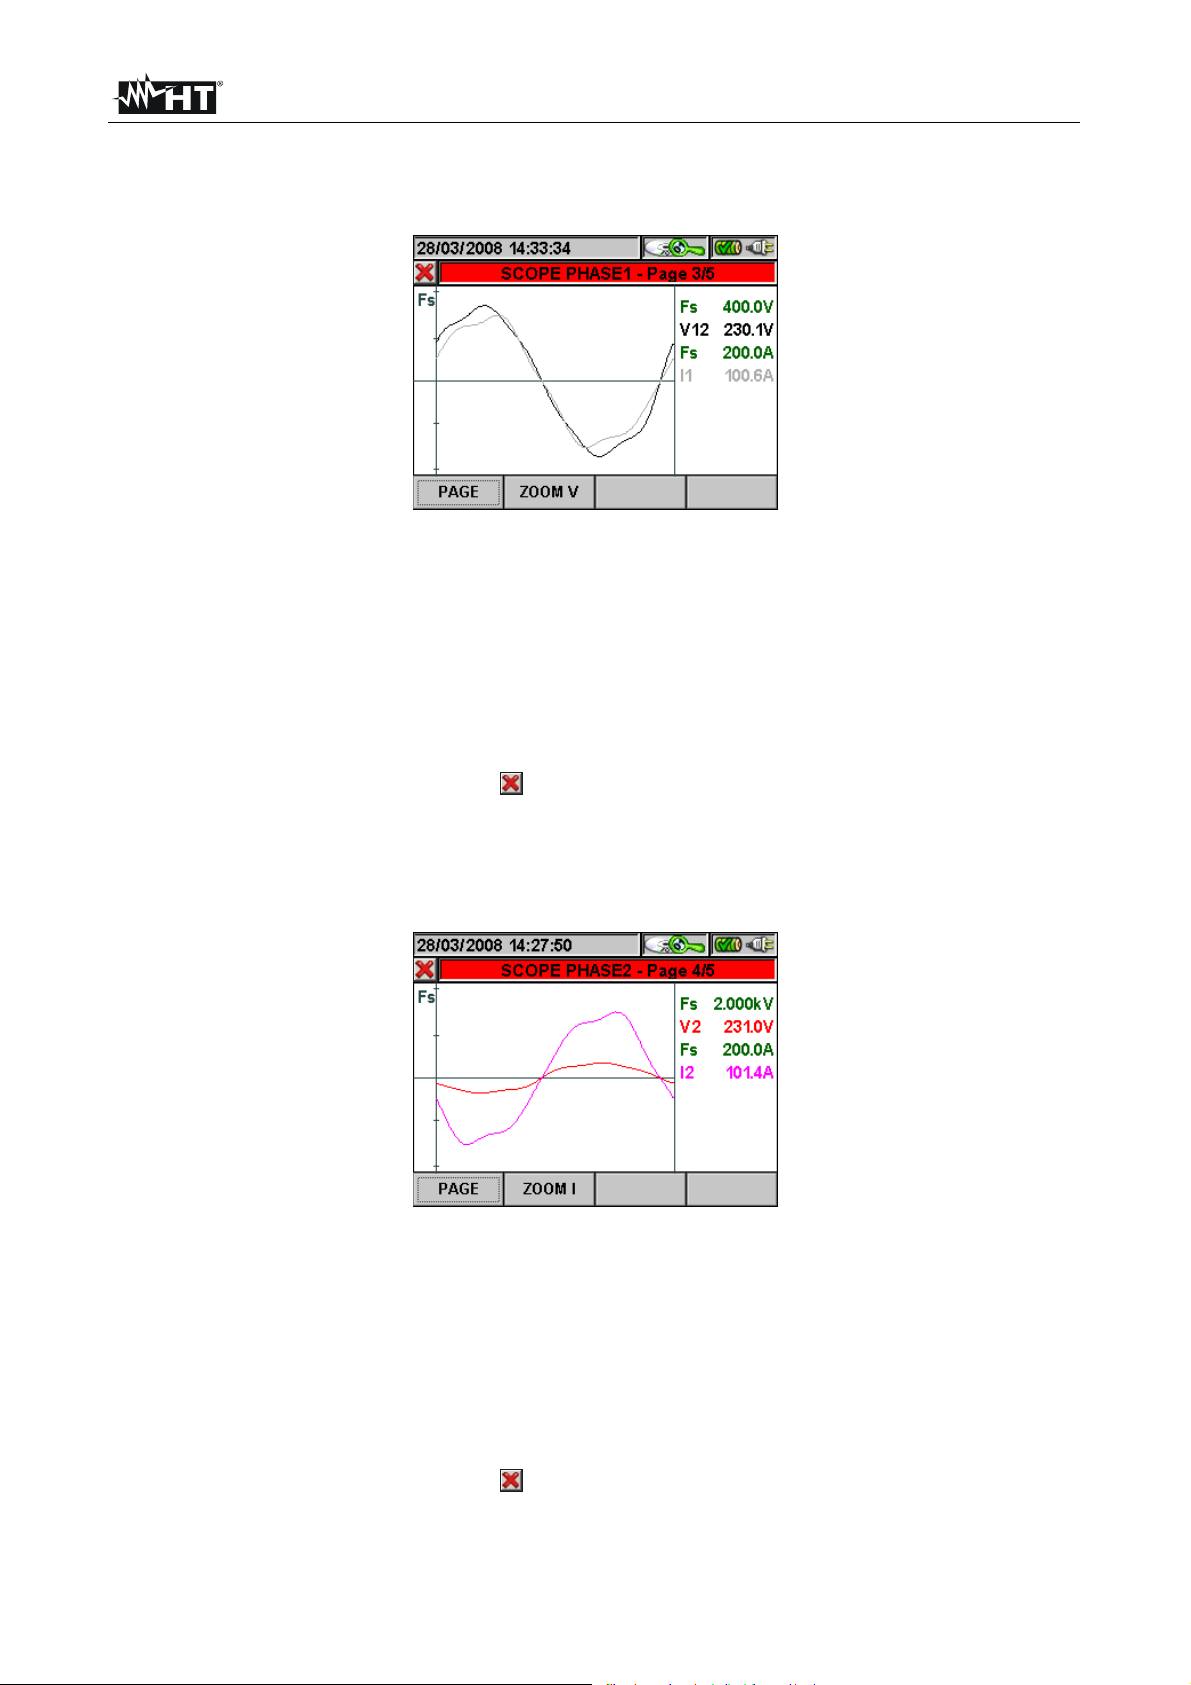
VEGA78
This screen (Fig. 132) contemporarily shows the instant values of the wavef orms of voltage
V12 and current I1, scaled according to the relevant Full scale (Fs) and the relevant RMS
values; these values have been saved by the instrument upon pressing the SAVE key.
Fig. 132: Phase 1 scope in three-phase 3-wire system or Aron system
The following keys are active on this page:
The F2 key (or the ZOOM V or ZOOM I item on the dislay) switches between voltage
zoom and current zoom (only if the manual zoom mode has been activated).
The up (ZOOM+) or down (ZOOM-) arrow keys zoom in or out the displayed
waveforms (only if the manual zoom mode has been activated).
The F1 key (or the PAG item on the display) advances to the following page of saved
values relative to phase 2 voltage and current.
The ESC key (or the smart icon on the display) to exit t he function and go back to the
“Recording analysis” page (Fig. 124).
This screen (Fig. 133) contemporarily shows the instant values of the wavef orms of voltage
V2 and current I2, scaled according to the relevant Full scale (Fs) and the relevant RMS
values; these values have been saved by the instrument upon pressing the SAVE key.
Fig. 133: Phase 2 scope in three-phase 4-wire system
The following keys are active on this page:
The F2 key (or the ZOOM V or ZOOM I item on the dislay) switches between voltage
zoom and current zoom (only if the manual zoom mode has been activated).
The up (ZOOM+) or down (ZOOM-) arrow keys zoom in or out the displayed
waveforms (only if the manual zoom mode has been activated).
The F1 key (or the PAG item on the display) advances to the following page of saved
values relative to phase 3 voltage and current.
The ESC key (or the smart icon on the display) to exit t he function and go back to the
“Recording analysis” page (Fig. 124).
EN - 74
Page 77

VEGA78
This screen (Fig. 134) contemporarily shows the instant values of the wavef orms of voltage
V23 and current I2, scaled according to the relevant Full scale (Fs) and the relevant RMS
values; these values have been saved by the instrument upon pressing the SAVE key.
Fig. 134: Phase 2 scope in three-phase 3-wire system or Aron system
The following keys are active on this page:
The F2 key (or the ZOOM V or ZOOM I item on the dislay) switches between voltage
zoom and current zoom (only if the manual zoom mode has been activated).
The up (ZOOM+) or down (ZOOM-) arrow keys zoom in or out the displayed
waveforms (only if the manual zoom mode has been activated).
The F1 key (or the PAG item on the display) advances to the following page of saved
values relative to phase 3 voltage and current.
The ESC key (or the smart icon on the display) to exit t he function and go back to the
“Recording analysis” page (Fig. 124).
This screen (Fig. 135) contemporarily shows the instant values of the wavef orms of voltage
V3 and current I3, scaled according to the relevant Full scale (Fs) and the relevant RMS
values; these values have been saved by the instrument upon pressing the SAVE key.
Fig. 135: Phase 3 scope in three-phase 4-wire system
The following keys are active on this page:
The F2 key (or the ZOOM V or ZOOM I item on the dislay) switches between voltage
zoom and current zoom (only if the manual zoom mode has been activated).
The up (ZOOM+) or down (ZOOM-) arrow keys zoom in or out the displayed
waveforms (only if the manual zoom mode has been activated).
The F1 key (or the PAG item on the display) advances to the following page of saved
voltage values.
The ESC key (or the smart icon on the display) to exit t he function and go back to the
“Recording analysis” page (Fig. 124).
EN - 75
Page 78

VEGA78
This screen (Fig. 136) contemporarily shows the instant values of the wavef orms of voltage
V31 and current I3, scaled according to the relevant Full scale (Fs) and the relevant RMS
values; these values have been saved by the instrument upon pressing the SAVE key.
Fig. 136: Phase 3 scope in three-phase 3-wire system or Aron system
The following keys are active on this page:
The F2 key (or the ZOOM V or ZOOM I item on the dislay) switches between voltage zoom
and current zoom (only if the manual zoom mode has been activated).
The up (ZOOM+) or down (ZOOM-) arrow keys zoom in or out the displayed
waveforms (only if the manual zoom mode has been activated).
The F1 key (or the PAG item on the display) advances to the following page of saved
voltage values.
The ESC key (or the smart icon on the display) to exit t he function and go back to the
“Recording analysis” page (Fig. 124).
EN - 76
Page 79

VEGA78
5.5.2.3. Harmonics analysis
This screen (Fig. 137) displays the harmonic values and the THD% value of voltages V1, V2,
V3, Vn and of currents I1, I2, I3 and of Neutral current In in a graph (scaled according to the Full
scale Fs) or in a table. The values displayed are percentage values of the fundamental or
absolute values according to the configuration set in the ANALYZER CONFIGURATION
MENU -> ADVANCED.
Fig. 137: Total harmonics in three-phase 4-wire system
Should only the voltage signals or only the current signals be connected to the instrument’s
inputs, all displayed harmonics will be shown in the upper half plane of the graph.
If both voltage and current signals are connected to the instrument’s inputs, the histogram bars
representing the harmonics will be shown respectively:
In the upper half plane of the graph if the harmonics are introduced into the relevant
electrical system from the mains.
In the lower half plane of the graph if the harmonics are injected into the relevant electrical
system from the mains
The following keys are active on this page:
The up (ZOOM+) or down (ZOOM-) arrow keys zoom in or out the histogram.
The right and left arrow keys move the cursor to the right or to the left along the
harmonics.
The F1 key (or the PAG item on the display) advances to the following page of saved
values, relative to phase 1 harmonics.
The F2 key (or the ARM V or ARM I item on the dislay) switches between total voltage
and current harmonics.
The F4 key (or the ARM PAG item on the display) displays the following harmonics
group. 0..9, 10..19, 20..29, 30..39, 40..49.
The ESC key (or the smart icon on the display) to exit t he function and go back to the
“Recording analysis” page (Fig. 124).
EN - 77
Page 80

VEGA78
The herewith screen (Fig. 138) displays the harmonic values and the THD% value of
voltages V12, V23, V31 and of currents I1, I2, I3 in a graph (scaled according to the Full
scale Fs) or in a table. The values displayed are percentage values of the fundamental or
absolute values according to the configuration set in the ANALYZER CONFIGURATION
MENU -> ADVANCED.
Fig. 138: Total harmonics in three-phase 3-wire system or Aron system
Should only the voltage signals or only the current signals be connected to the instrument’s
inputs, all displayed harmonics will be shown in the upper half plane of the graph.
If both voltage and current signals are connected to the instrument’s inputs, the histogram bars
representing the harmonics will be shown respectively:
In the upper half plane of the graph if the harmonics are introduced into the relevant
electrical system from the mains.
In the lower half plane of the graph if the harmonics are mnjected into the relevant electrical
system from the mains.
The following keys are active on this page:
The up (ZOOM+) or down (ZOOM-) arrow keys zoom in or out the histogram.
The right and left arrow keys move the cursor to the right or to the left along the
harmonics.
The F1 key (or the PAG item on the display) advances to the following page of saved
values, relative to phase 1 harmonics.
The F2 key (or the ARM V or ARM I item on the dislay) switches between total voltage
and current harmonics.
The F4 key (or the ARM PAG item on the display) displays the following harmonics
group. 0..9, 10..19, 20..29, 30..39, 40..49.
The ESC key (or the smart icon on the display) to exit t he function and go back to the
“Recording analysis” page (Fig. 124).
EN - 78
Page 81

VEGA78
This screen (Fig. 139) displays the harmonic values and the THD% value of voltage V1
and current I1 in a graph (scaled according to the Full scale Fs) or in a table. The values
displayed are percentage values of the fundamental or absolute values according to the
configuration set in the ANALYZER CONFIGURATION MENU -> ADVANCED.
Fig. 139: Phase 1 harmonics in single-phase system
Should only the voltage signals or only the current signals be connected to the instrument’s
inputs, all displayed harmonics will be shown in the upper half plane of the graph.
If both voltage and current signals are connected to the instrument’s inputs, the histogram bars
representing the harmonics will be shown respectively:
In the upper half plane of the graph if the harmonics are introduced into the relevant
electrical system from the mains.
In the lower half plane of the graph if the harmonics are injected into the relevant electrical
system from the mains.
The following keys are active on this page:
The up (ZOOM+) or down (ZOOM-) arrow keys zoom in or out the histogram.
The right and left arrow keys move the cursor to the right or to the left along the
harmonics.
The F1 key (or the PAG item on the display) advances to the following page of saved
values (only for voltage harmonics).
The F2 key (or the ARM V or ARM I item on the display) switche s between total volt age
and current harmonics.
The F4 key (or the ARM PAG item on the display) displays the following harmonics
group. 0..9, 10..19, 20..29, 30..39, 40..49.
The ESC key (or the smart icon on the display) to exit t he function and go back to the
“Recording analysis” page (Fig. 124).
EN - 79
Page 82

VEGA78
This screen (Fig. 140) displays the harmonic values and the THD% value of voltage V1
and current I1 in a graph (scaled according to the Full scale Fs) or in a table. The values
displayed are percentage values of the fundamental or absolute values according to the
configuration set in the ANALYZER CONFIGURATION MENU -> ADVANCED.
Fig. 140: Phase 1 harmonics in three-phase 4-wire system
Should only the voltage signals or only the current signals be connected to the instrument’s
inputs, all displayed harmonics will be shown in the upper half plane of the graph.
If both voltage and current signals are connected to the instrument’s inputs, the histogram bars
representing the harmonics will be shown respectively:
In the upper half plane of the graph if the harmonics are introduced into the relevant
electrical system from the mains.
In the lower half plane of the graph if the harmonics are injected into the relevant electrical
system from the mains.
The following keys are active on this page:
The up (ZOOM+) or down (ZOOM-) arrow keys zoom in or out the histogram.
The right and left arrow keys move the cursor to the right or to the left along the
harmonics.
The F1 key (or the PAG item on the display) advances to the following page of saved
values, relative to phase 2 harmonics.
The F2 key (or the ARM V or ARM I item on the dislay) switches between voltage and
current harmonics relative to Phase 1.
The F4 key (or the ARM PAG item on the display) displays the following harmonics
group. 0..9, 10..19, 20..29, 30..39, 40..49.
The ESC key (or the smart icon on the display) to exit t he function and go back to the
“Recording analysis” page (Fig. 124).
EN - 80
Page 83

VEGA78
This screen (Fig. 141) displays the harmonic values and the THD% value of voltage V12
and current I1 in a graph (scaled according to the Full scale Fs) or in a table. The values
displayed are percentage values of the fundamental or absolute values according to the
configuration set in the ANALYZER CONFIGURATION MENU -> ADVANCED.
Fig. 141: Phase 1 harmonics in three-phase 3-wire system or Aron system
The following keys are active on this page:
The up (ZOOM+) or down (ZOOM-) arrow keys zoom in or out the histogram.
The right and left arrow keys move the cursor to the right or to the left along the
harmonics.
The F1 key (or the PAG item on the display) advances to the following page of saved
values, relative to phase 2 harmonics.
The F2 key (or the ARM V or ARM I item on the dislay) switches between voltage and
current harmonics relative to Phase 1.
The F4 key (or the ARM PAG item on the display) displays the following harmonics
group. 0..9, 10..19, 20..29, 30..39, 40..49.
The ESC key (or the smart icon on the display) to exit t he function and go back to the
“Recording analysis” page (Fig. 124).
EN - 81
Page 84

VEGA78
This screen (Fig. 142) displays the harmonic values and the THD% value of voltage V2
and current I2 in a graph (scaled according to the Full scale Fs) or in a table. The values
displayed are percentage values of the fundamental or absolute values according to the
configuration set in the ANALYZER CONFIGURATION MENU -> ADVANCED.
Fig. 142: Phase 2 harmonics in three-phase 4-wire system
The following keys are active on this page:
The up (ZOOM+) or down (ZOOM-) arrow keys zoom in or out the histogram.
The right and left arrow keys move the cursor to the right or to the left along the
harmonics.
The F1 key (or the PAG item on the display) advances to the following page of saved
values, relative to phase 3 harmonics.
The F2 key (or the ARM V or ARM I item on the dislay) switches between voltage and
current harmonics relative to Phase 2.
The F4 key (or the ARM PAG item on the display) displays the following harmonics
group. 0..9, 10..19, 20..29, 30..39, 40..49.
The ESC key (or the smart icon on the display) to exit t he function and go back to the
“Recording analysis” page (Fig. 124).
EN - 82
Page 85

VEGA78
This screen (Fig. 143) displays the harmonic values and the THD% value of voltage V23
and current I2 in a graph (scaled according to the Full scale Fs) or in a table. The values
displayed are percentage values of the fundamental or absolute values according to the
configuration set in the ANALYZER CONFIGURATION MENU -> ADVANCED.
Fig. 143: Phase 2 harmonics in three-phase 3-wire system or Aron system
The following keys are active on this page:
The up (ZOOM+) or down (ZOOM-) arrow keys zoom in or out the histogram.
The right and left arrow keys move the cursor to the right or to the left along the
harmonics.
The F1 key (or the PAG item on the display) advances to the following page of saved
values, relative to phase 3 harmonics.
The F2 key (or the ARM V or ARM I item on the dislay) switches between voltage and
current harmonics relative to Phase 1.
The F4 key (or the ARM PAG item on the display) displays the following harmonics
group. 0..9, 10..19, 20..29, 30..39, 40..49.
The ESC key (or the smart icon on the display) to exit t he function and go back to the
“Recording analysis” page (Fig. 124).
EN - 83
Page 86

VEGA78
This screen (Fig. 144) displays the harmonic values and the THD% value of voltage V3
and current I3 in a graph (scaled according to the Full scale Fs) or in a table. The values
displayed are percentage values of the fundamental or absolute values according to the
configuration set in the ANALYZER CONFIGURATION MENU -> ADVANCED.
Fig. 144: Phase 3 harmonics in three-phase 4-wire system
The following keys are active on this page:
The up (ZOOM+) or down (ZOOM-) arrow keys zoom in or out the histogram.
The right and left arrow keys move the cursor to the right or to the left along the
harmonics.
The F1 key (or the PAG item on the display) advances to the following page of saved
values, relative to neutral.
The F2 key (or the ARM V or ARM I item on the dislay) switches between voltage and
current harmonics relative to Phase 3.
The F4 key (or the ARM PAG item on the display) displays the following harmonics
group. 0..9, 10..19, 20..29, 30..39, 40..49.
The ESC key (or the smart icon on the display) to exit t he function and go back to the
“Recording analysis” page (Fig. 124).
EN - 84
Page 87

VEGA78
This screen (Fig. 145) displays the harmonic values and the THD% value of voltage V31
and current I3 in a graph (scaled according to the Full scale Fs) or in a table. The values
displayed are percentage values of the fundamental or absolute values according to the
configuration set in the ANALYZER CONFIGURATION MENU -> ADVANCED.
Fig. 145: Phase 3 harmonics in three-phase 3-wire system or Aron system
The following keys are active on this page:
The up (ZOOM+) or down (ZOOM-) arrow keys zoom in or out the histogram.
The right and left arrow keys move the cursor to the right or to the left along the
harmonics.
The F1 key (or the PAG item on the display) advances to the following page of saved
values, relative to phase 3 harmonics.
The F2 key (or the ARM V or ARM I item on the dislay) switches between voltage and
current harmonics relative to Phase 1.
The F4 key (or the ARM PAG item on the display) displays the following harmonics
group. 0..9, 10..19, 20..29, 30..39, 40..49.
The ESC key (or the smart icon on the display) to exit t he function and go back to the
“Recording analysis” page (Fig. 124).
EN - 85
Page 88

VEGA78
This screen (Fig. 146) displays the harmonic values and the THD% value of neutral
voltage Vn and neutral current In in a graph (scaled according to the Full scale Fs) or in a
table. The values displayed are percentage values of the fundamental or absolute values
according to the configuration set in the ANALYZER CONFIGURATION MENU ->
ADVANCED.
Fig. 146: Neutral harmonics in three-phase 4-wire system
The following keys are active on this page:
The up (ZOOM+) or down (ZOOM-) arrow keys zoom in or out the histogram.
The right and left arrow keys move the cursor to the right or to the left along the
harmonics.
The F1 key (or the PAG item on the display) advances to the following page of saved
values relative to total harmonics.
The F2 key (or the ARM V or ARM I item on the dislay) switches between voltage and
current harmonics relative to Phase 3.
The F4 key (or the ARM PAG item on the display) displays the following harmonics
group. 0..9, 10..19, 20..29, 30..39, 40..49.
The ESC key (or the smart icon on the display) to exit t he function and go back to the
“Recording analysis” page (Fig. 124).
EN - 86
Page 89
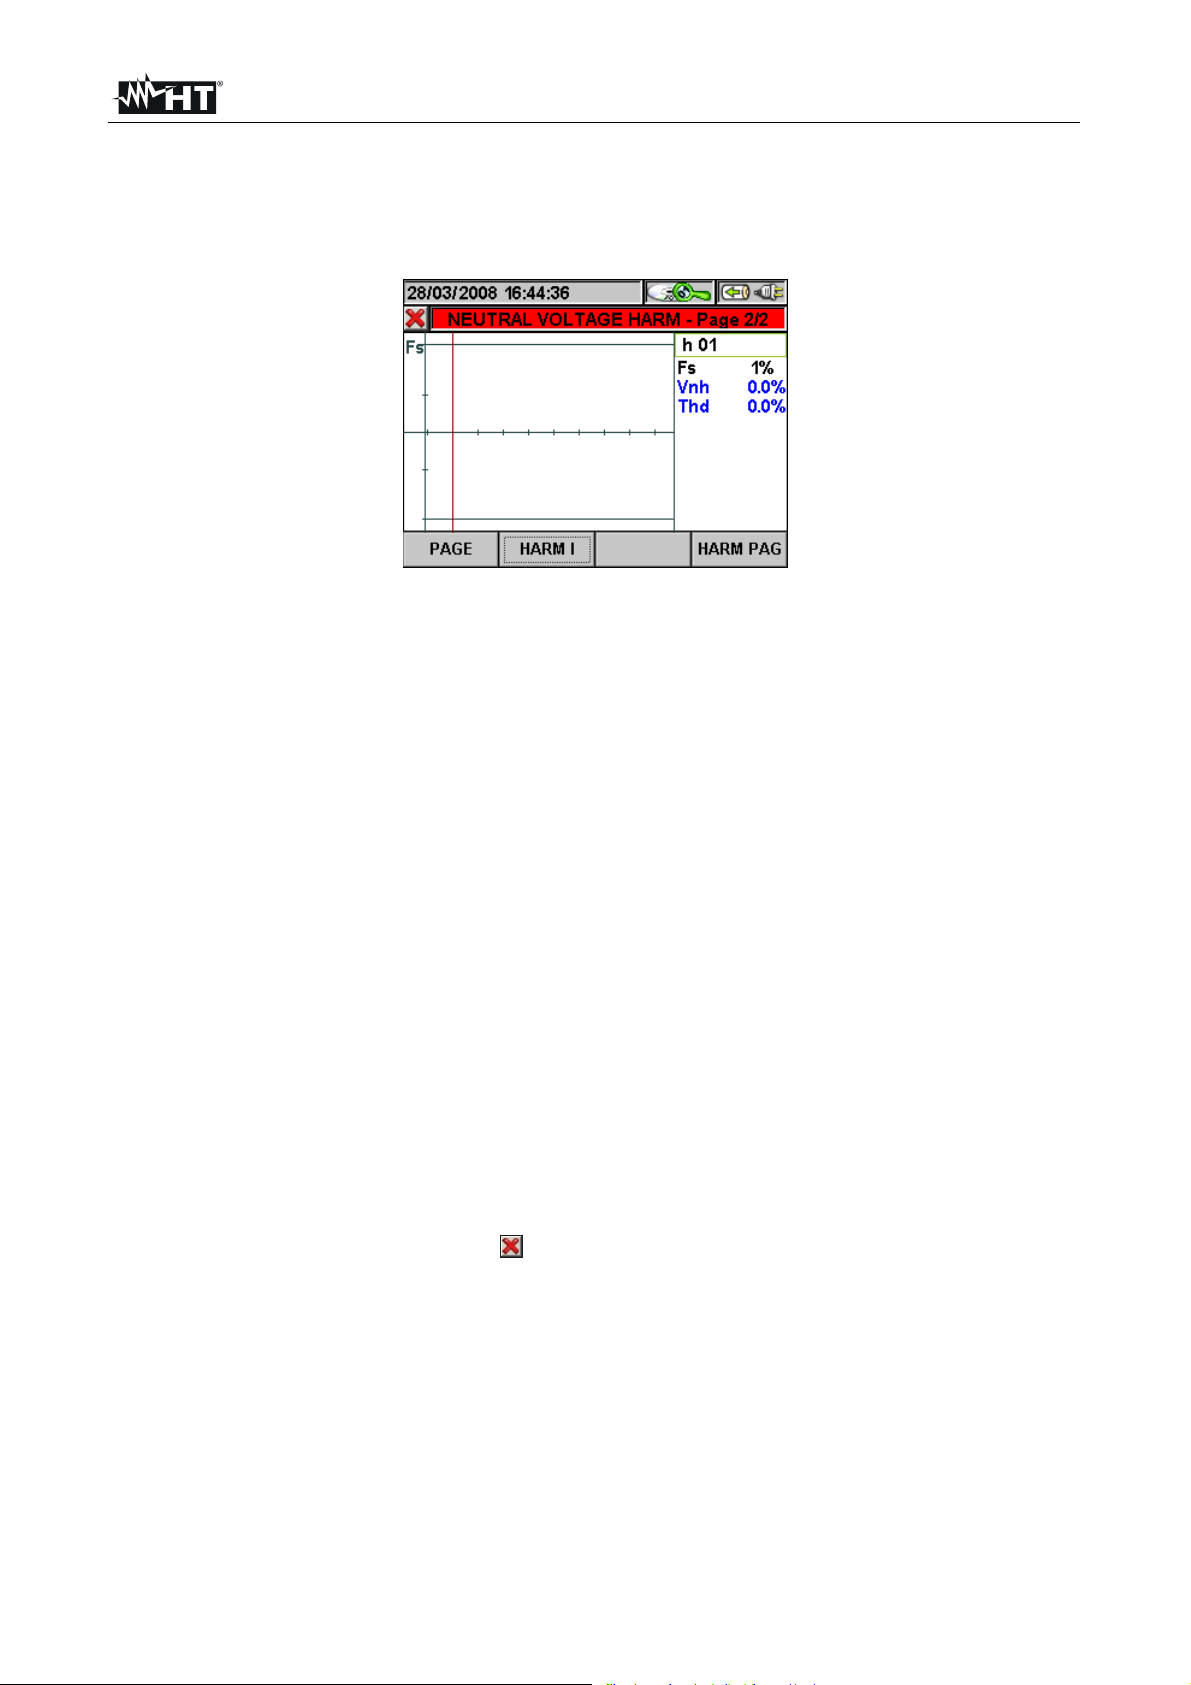
VEGA78
This screen (Fig. 147) displays the harmonic values and the THD% value of neutral
voltage Vn in a graph (scaled according to the Full scale Fs) or in a table. The values
displayed are percentage values of the fundamental or absolute values according to the
configuration set in the ANALYZER CONFIGURATION MENU -> ADVANCED.
Fig. 147: Voltage harmonics in single-phase system
Should only the voltage signals or only the current signals be connected to the instrument’s
inputs, all displayed harmonics will be shown in the upper half plane of the graph.
If both voltage and current signals are connected to the instrument’s inputs, the histogram bars
representing the harmonics will be shown respectively:
In the upper half plane of the graph if the harmonics are introduced into the relevant
electrical system from the mains.
In the lower half plane of the graph if the harmonics are injected into the relevant electrical
system from the mains.
The following keys are active on this page:
The up (ZOOM+) or down (ZOOM-) arrow keys zoom in or out the histogram.
The right and left arrow keys move the cursor to the right or to the left along the
harmonics.
The F1 key (or the PAG item on the display) advances to the following page of saved
values (only for Voltage Harmonics).
The F2 key (or the ARM V or ARM I item on the dislay) switches between voltage and
current harmonics relative to Phase 1.
The F4 key (or the ARM PAG item on the display) displays the following harmonics
group. 0..9, 10..19, 20..29, 30..39, 40..49.
The ESC key (or the smart icon on the display) to exit t he function and go back to the
“Recording analysis” page (Fig. 124).
EN - 87
Page 90

VEGA78
5.5.2.4. Vectors
This screen (Fig. 148) displays, with graphic and numeric indications, the phase delays
expressed in degrees [°] between:
Voltage V1 and V2, V2 and V3, V3 and V1.
Voltage V1 and current I1.
Voltage V2 and current I2.
Voltage V3 and current I3.
The latter allow finding out the inductive or capacitive nature of the electrical installation. In
detail:
Positive angle: Inductive load.
Negative angle: Capacitive load.
The N-PE voltage (blue) and Neutral current (pale blue) vectors are also represented.
Fig. 148: Total vector diagram in three-phase 4-wire system
The following keys are active on this page:
The F1 key (or the PAG item on the display) advances to the following page of saved
values relative to the voltage vector diagram.
The ESC key (or the smart icon on the display) to exit t he function and go back to the
“Recording analysis” page (Fig. 124).
EN - 88
Page 91
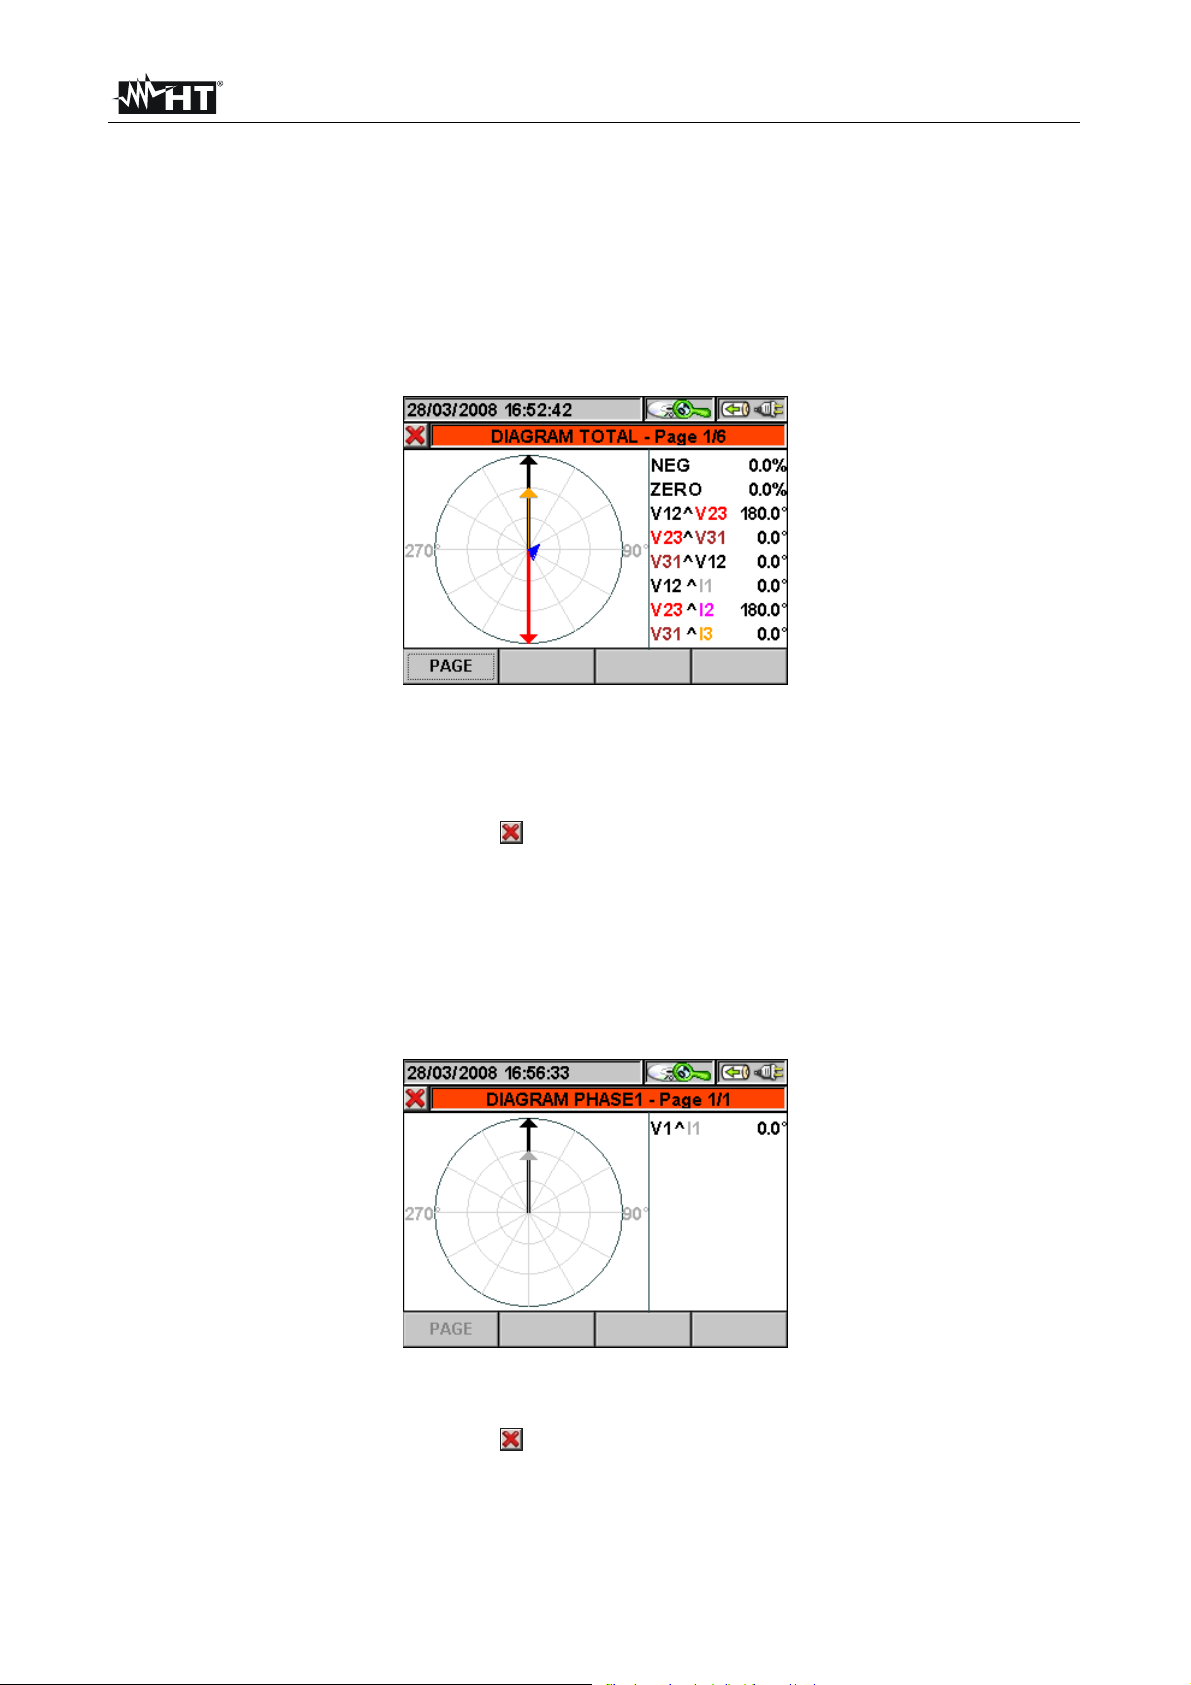
VEGA78
This screen (Fig. 149) displays, with graphic and numeric indications, the phase delays
expressed in degrees [°] between:
Voltage V12 and V23, V23 and V31, V31 and V12
Voltage V12 and current I1.
Voltage V23 and current I2.
Voltage V31 and current I3.
To correctly evaluate this vector diagram, it must be remembered that, under purely
resistive loads, the angle between the Delta voltage and the phase current is +30°.
Fig. 149: Total vector diagram in three-phase 3-wire system or Aron system
The following keys are active on this page:
The F1 key (or the PAG item on the display) advances to the following page of saved
values relative to the voltage vector diagram.
The ESC key (or the smart icon on the display) to exit t he function and go back to the
“Recording analysis” page (Fig. 124).
This screen (Fig. 150) displays, with graphic and numeric indications, the phase delays,
expressed in degrees [°], between voltage V1 and current I1, so that the inductive or
capacitive nature of the electrical installation may be found out. In detail:
Positive angle: Inductive load.
Negative angle: Capacitive load.
Fig. 150: Vector diagram in single-phase system
The following keys are active on this page:
The ESC key (or the smart icon on the display) to exit t he function and go back to the
“Recording analysis” page (Fig. 124).
EN - 89
Page 92

VEGA78
This screen (Fig. 151) displays, with graphic and numeric indications, the phase delays,
expressed in degrees [°], between voltage V1 and V2, V2 and V3, V3 and V1. Voltage
unbalance values are also displayed.
Fig. 151: Voltage vector diagram in three-phase 4-wire system
The following keys are active on this page:
The F1 key (or the PAG item on the display) advances to the following page of saved
values relative to the current vector diagram.
The ESC key (or the smart icon on the display) to exit t he function and go back to the
“Recording analysis” page (Fig. 124).
This screen (Fig. 152) displays, with graphic and numeric indications, the phase delays,
expressed in degrees [°], between voltage V12 and V23, V23 and V31, V31 and V12.
Voltage unbalance values are also displayed.
Fig. 152: Voltage vector diagram in three-phase 3-wire system or Aron system
The following keys are active on this page:
The F1 key (or the PAG item on the display) advances to the following page of saved
values relative to the current vector diagram.
The ESC key (or the smart icon
on the display) to exit the function and go back to the
“Recording analysis” page (Fig. 124).
EN - 90
Page 93

VEGA78
This screen (Fig. 153) displays, with graphic and numeric indications, the phase delays,
expressed in degrees [°], between current I1 and I2, I2 and I3, I3 and I1 and the vector
representing the neutral current.
Fig. 153: Current vector diagram in 4-wire system, 3-wire system or Aron system
The following keys are active on this page:
The F1 key (or the PAG item on the display) advances to the following page of saved
values relative to the phase 1 vector diagram.
The ESC key (or the smart icon on the display) to exit t he function and go back to the
“Recording analysis” page (Fig. 124).
This screen (Fig. 154) displays, with graphic and numeric indications, the phase delays,
expressed in degrees [°], between voltage V1 and current I1, so that the inductive or
capacitive nature of the electrical installation may be found out. In detail:
Positive angle: Inductive load.
Negative angle: Capacitive load.
Fig. 154: Phase 1 vector diagram in three-phase 4-wire system
The following keys are active on this page:
The F1 key (or the PAG item on the display) advances to the following page of saved
values relative to the phase 2 vector diagram.
The ESC key (or the smart icon on the display) to exit t he function and go back to the
“Recording analysis” page (Fig. 124).
EN - 91
Page 94

VEGA78
This screen (Fig. 155) displays, with graphic and numeric indications, the phase delays
expressed in degrees [°] between voltage V12 and current I1. To correctly evaluate this
diagram, it must be remembered that, under purely resistive loads, the angle between the
Delta voltage and the phase current is +30°.
Fig. 155: Phase 1 vector diagram in three-phase 3-wire system or Aron system
The following keys are active on this page:
The F1 key (or the PAG item on the display) advances to the following page of saved
values relative to the phase 2 vector diagram.
The ESC key (or the smart icon on the display) to exit t he function and go back to the
“Recording analysis” page (Fig. 124).
This screen (Fig. 156) displays, with graphic and numeric indications, the phase delays,
expressed in degrees [°], between voltage V2 and current I2, so that the inductive or
capacitive nature of the electrical installation may be found out. In detail:
Positive angle: Inductive load.
Negative angle: Capacitive load.
Fig. 156: Phase 2 vector diagram in three-phase 4-wire system
The following keys are active on this page:
The F1 key (or the PAG item on the display) advances to the following page of saved
values relative to the phase 3 vector diagram.
The ESC key (or the smart icon on the display) to exit t he function and go back to the
“Recording analysis” page (Fig. 124).
EN - 92
Page 95

VEGA78
This screen (Fig. 157) displays, with graphic and numeric indications, the phase delays
expressed in degrees [°] between voltage V23 and current I2. To correctly evaluate this
diagram, it must be remembered that, under purely resistive loads, the angle between the
Delta voltage and the phase current is +30°.
Fig. 157: Phase 2 vector diagram in three-phase 3-wire system or Aron system
The following keys are active on this page:
The F1 key (or the PAG item on the display) advances to the following page of saved
values relative to the phase 3 vector diagram.
The ESC key (or the smart icon on the display) to exit t he function and go back to the
“Recording analysis” page (Fig. 124).
This screen (Fig. 158) displays, with graphic and numeric indications, the phase delays,
expressed in degrees [°], between voltage V3 and current I3, so that the inductive or
capacitive nature of the electrical installation may be found out. In detail:
Positive angle: Inductive load.
Negative angle: Capacitive load.
Fig. 158: Phase 3 vector diagram in three-phase 4-wire system
The following keys are active on this page:
The F1 key (or the PAG item on the display) advances to the following page of saved
values relative to the total vector diagram.
The ESC key (or the smart icon on the display) to exit t he function and go back to the
“Recording analysis” page (Fig. 124).
EN - 93
Page 96

VEGA78
This screen (Fig. 159) displays, with graphic and numeric indications, the phase delays
expressed in degrees [°] between voltage V31 and current I3. To correctly evaluate this
diagram, it must be remembered that, under purely resistive loads, the angle between the
Delta voltage and the phase current is +30°.
Fig. 159: Phase 3 vector diagram in three-phase 3-wire system or Aron system
The following keys are active on this page:
The F1 key (or the PAG item on the display) advances to the following page of saved
values relative to the total vector diagram.
The ESC key (or the smart icon on the display) to exit t he function and go back to the
“Recording analysis” page (Fig. 124).
EN - 94
Page 97

VEGA78
5.5.2.5. Measures
In measure mode, the instrument displays the saved values in TRMS as shown in the
following figures:
In this page, the following symbols are used:
V1N Neutral - Phase L1 Voltage
V2N Neutral - Phase L2 Voltage
V3N Neutral - Phase L3 Voltage
VNPE Neutral - Ground Voltage
V12 Phase L1 - Phase L2 Voltage
V23 Phase L2 - Phase L3 Voltage
V31 Phase L3 - Phase L1 Voltage
Inv% % value of the Negative sequence unbalance
Omo% % value of the Zero sequence unbalance
SEQ Phase sequence:
”123” => Correct
”132” => Not correct
”023” => No Voltage on B1
”103” => No Voltage on B2
”120” => No Voltage on B3
”100” => No Voltage on B2 and B3
”020” => No Voltage on B1 and B3
”003” => No Voltage on B1 and B2
Hz Frequency
I1 Current on Phase L1
I2 Current on Phase L2
I3 Current on Phase L3
IN Neutral Current
Fig. 160: Page 1/5 of numeric values for three-phase 4-wire system
The following keys are active on this page:
The F1 key (or the PAG item on the display) advances to the following page of saved
values.
The ESC key (or the smart icon on the display) to exit t he function and go back to the
“Recording analysis” page (Fig. 124).
In this page, the following symbols are used:
Patt System total Active Power
Preatt Total Reactive Power
Papp Total Apparent Power
Pf Total Power Factor
CosPhi System total CosPhi
CosPhi represents the theoretical limit value which
can be reached by the Power factor if all harmonics
are eliminated from the electrical system. For
dimensioning a power factor correction system,
reference is usually made to the CosPhi parameter
value.
Fig. 161: Page 2/5 of numeric values for three-phase 4-wire system
The following keys are active on this page:
The F1 key (or the PAG item on the display) advances to the following page of saved
values.
The ESC key (or the smart icon on the display) to exit t he function and go back to the
“Recording analysis” page (Fig. 124).
EN - 95
Page 98

VEGA78
In this page, the following symbols are used:
V1N Phase L1 - Neutral Voltage
I1 Phase L1 Current
Patt1 Phase L1 Active Power
Preatt1 Phase L1 Reactive Power
Papp1 Phase L1 Apparent Power
Pf1 Phase L1 Power Factor
CosPhi1 Cosine of the Phase delay between the Phase L1
Voltage and Current fundamentals
CosPhi represents the theoretical limit value which
can be reached by the Power factor if all harmonics
are eliminated from the electrical system. For
dimensioning a power factor correction system,
reference is usually made to the CosPhi parameter
value.
Fig. 162: Page 3/5 of numeric values for three-phase 4-wire system
The following keys are active on this page:
The F1 key (or the PAG item on the display) advances to the following page of saved
values.
The ESC key (or the smart icon on the display) to exit t he function and go back to the
“Recording analysis” page (Fig. 124).
In this page, the following symbols are used:
V2N Phase L2 - Neutral Voltage
I2 Phase L2 Current
Patt2 Phase L2 Active Power
Preatt2 Phase L2 Reactive Power
Papp2 Phase L2 Apparent Power
Pf2 Phase L2 Power Factor
CosPhi2 Cosine of the Phase delay between the Phase L2
Voltage and Current fundamentals
CosPhi represents the theoretical limit value which
can be reached by the Power factor if all harmonics
are eliminated from the electrical system. For
dimensioning a power factor correction system,
reference is usually made to the CosPhi parameter
value.
Fig. 163: Page 4/5 of numeric values for three-phase 4-wire system
The following keys are active on this page:
The F1 key (or the PAG item on the display) advances to the following page of saved
values.
The ESC key (or the smart icon on the display) to exit t he function and go back to the
“Recording analysis” page (Fig. 124).
EN - 96
Page 99

VEGA78
In this page, the following symbols are used:
V3N Phase L3 - Neutral Voltage
I3 Phase L3 Current
Patt3 Phase L3 Active Power
Preatt3 Phase L3 Reactive Power
Papp3 Phase L3 apparent Power
Pf3 Phase L3 Power Factor
CosPhi3 Cosine of the Phase delay between the Phase L3
Voltage and Current fundamentals
CosPhi represents the theoretical limit value which
can be reached by the Power factor if all harmonics
are eliminated from the electrical system. For
dimensioning a power factor correction system,
reference is usually made to the CosPhi parameter
value.
Fig. 164: Page 5/5 of numeric values for three-phase 4-wire system
The following keys are active on this page:
The F1 key (or the PAG item on the display) advances to the following page of saved
values.
The ESC key (or the smart icon on the display) to exit t he function and go back to the
“Recording analysis” page (Fig. 124).
In this page, the following symbols are used:
V1PE Phase L1 - PE Voltage
V2PE Phase L2 - PE Voltage
V3PE Phase L3 - PE Voltage
V12 Phase L1 - Phase L2 Voltage
V23 Phase L2 - Phase L3 Voltage
V31 Phase L3 - Phase L1 Voltage
Inv% % value of the Negative sequence unbalance
Omo% % value of the Zero sequence unbalance
SEQ Phase sequence:
”123” => Correct
”132” => Not correct
”023” => No Voltage on B1
”103” => No Voltage on B2
”120” => No Voltage on B3
”100” => No Voltage on B2 and B3
”020” => No Voltage on B1 and B3
”003” => No Voltage on B1 and B2
Hz Frequency.
I1 Current on Phase L1
I2 Current on Phase L2
I3 Current on Phase L3
Fig. 165: Page 1/5 of numeric values for three-phase 3-wire system
The following keys are active on this page:
The F1 key (or the PAG item on the display) advances to the following page of saved
values.
The ESC key (or the smart icon on the display) to exit t he function and go back to the
“Recording analysis” page (Fig. 124).
EN - 97
Page 100

VEGA78
In this page, the following symbols are used:
Patt System total Active Power
Preatt Total Reactive Power
Papp Total Apparent Power
Pf Total Power Factor
CosPhi System total CosPhi
CosPhi represents the theoretical limit value which
can be reached by the Power factor if all harmonics
are eliminated from the electrical system. For
dimensioning a power factor correction system,
reference is usually made to the CosPhi parameter
value.
Fig. 166: Page 2/5 of numeric values for three-phase 3-wire system
The following keys are active on this page:
The F1 key (or the PAG item on the display) advances to the following page of saved
values.
The ESC key (or the smart icon on the display) to exit t he function and go back to the
“Recording analysis” page (Fig. 124).
In this page, the following symbols are used:
V1PE Phase L1 - PE Voltage
I1 Phase L1 Current
Patt1 Phase L1 Active Power
Preatt1 Phase L1 Reactive Power
Papp1 Phase L1 Apparent Power
Pf1 Phase L1 Power Factor
CosPhi1 Cosine of the phase delay between the Phase L1
voltage and current fundamentals
CosPhi represents the theoretical limit value which
can be reached by the Power factor if all harmonics
are eliminated from the electrical system. For
dimensioning a power factor correction system,
reference is usually made to the CosPhi parameter
value.
Fig. 167: Page 3/5 of numeric values for three-phase 3-wire system
The following keys are active on this page:
The F1 key (or the PAG item on the display) advances to the following page of saved
values.
The ESC key (or the smart icon on the display) to exit t he function and go back to the
“Recording analysis” page (Fig. 124).
EN - 98
 Loading...