

Page 1
User manual
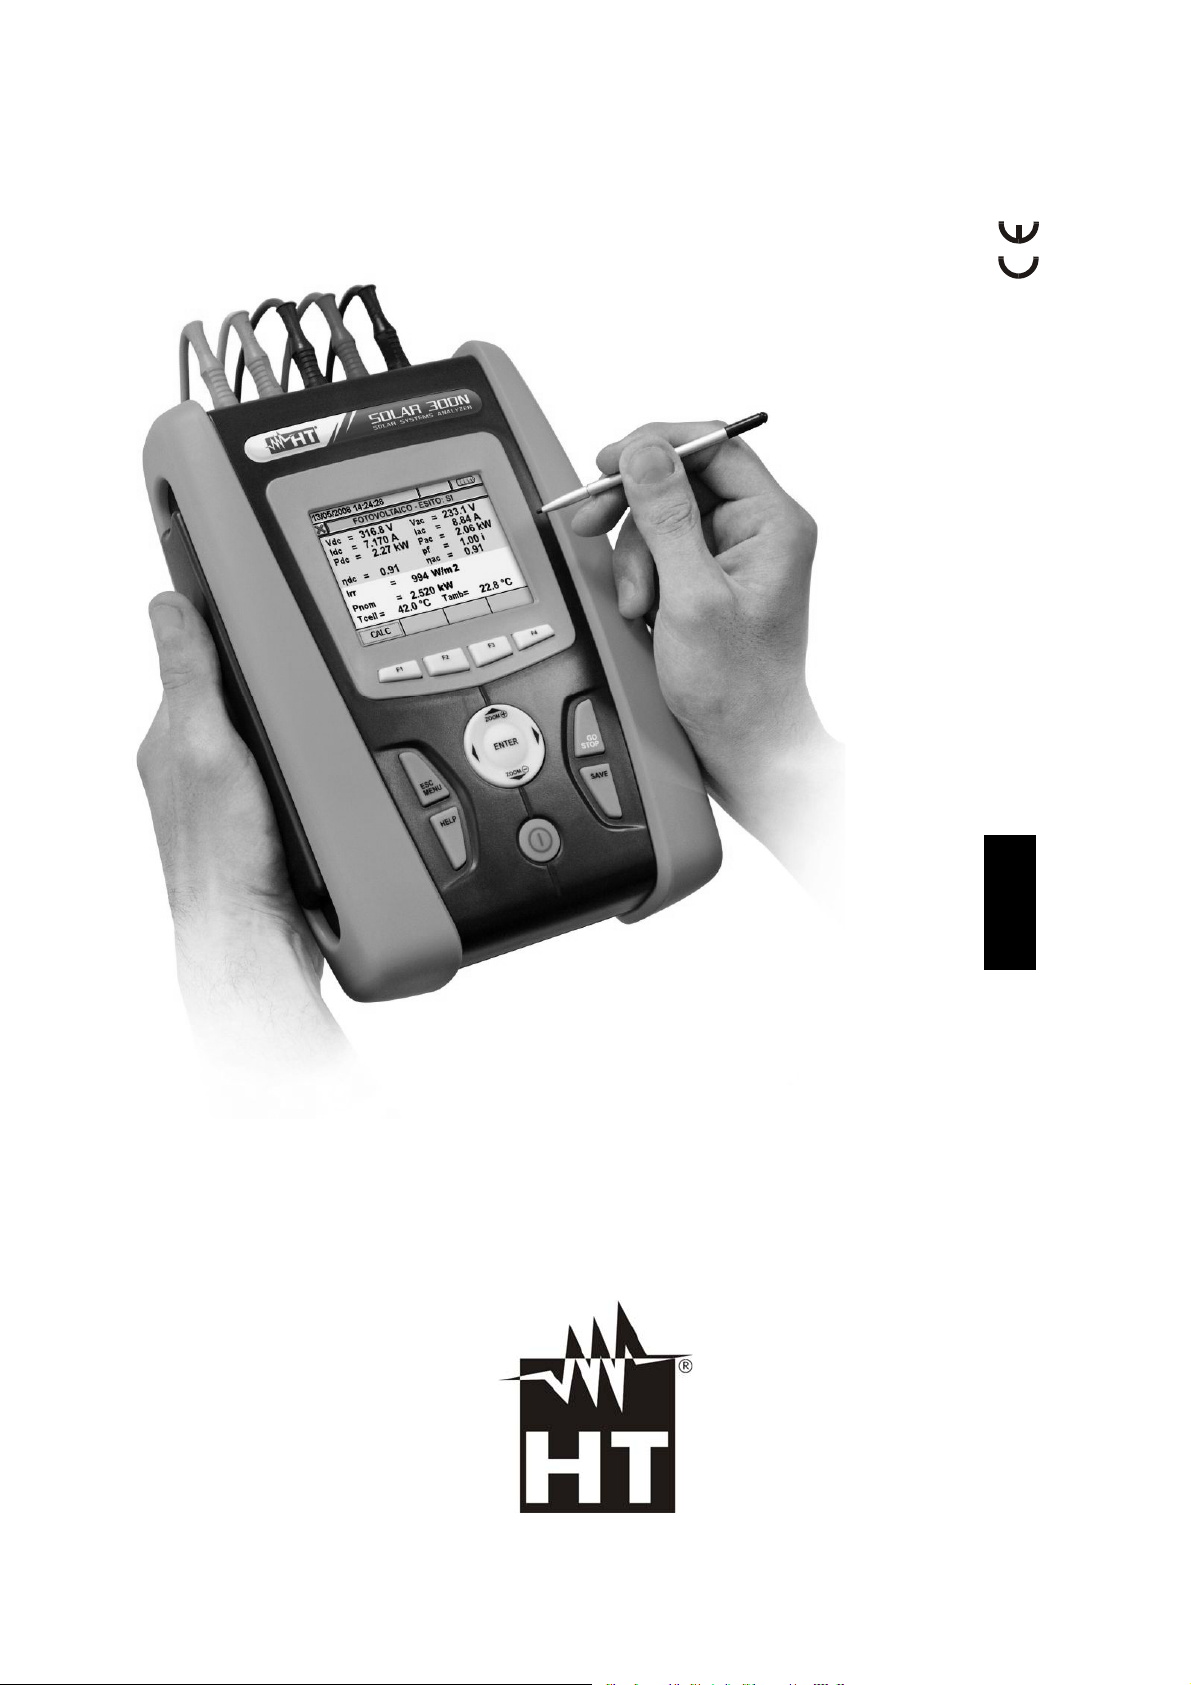
SOLAR300 – SOLAR300N
Copyright HT ITALIA 2013 Release EN 2.08 - 19/02/2013
Page 2

Page 3

SOLAR300 - SOLAR300N
Table of contents:
1. PRECAUTIONS AND SAFETY MEASURES ............................................................. 4
1.1. General ................................................................................................................................. 4
1.2. Preliminary instructions ......................................................................................................... 4
1.3. During use ............................................................................................................................. 5
1.4. After use ................................................................................................................................ 5
1.5. Measuring (overvoltage) categories definitions ..................................................................... 5
2. GENERAL DESCRIPTION ......................................................................................... 6
2.1. Introduction – PV and NPV systems ..................................................................................... 6
2.2. Functions ............................................................................................................................... 6
2.3. Initial screen .......................................................................................................................... 7
3. PREPARE TO USE ..................................................................................................... 7
3.1. Initial check ........................................................................................................................... 7
3.2. Instrument power supply ....................................................................................................... 7
3.3. Calibration ............................................................................................................................. 7
3.4. Storage .................................................................................................................................. 7
4. HOW TO OPERATE ................................................................................................... 8
4.1. Instrument description ........................................................................................................... 8
4.2. Keyboard description ............................................................................................................ 9
4.3. Display description .............................................................................................................. 10
4.4. Reset of meter ..................................................................................................................... 10
5. GENERAL MENU ..................................................................................................... 11
5.1. General settings .................................................................................................................. 12
5.1.1. Language selection .................................................................................................................. 12
5.1.2. Date/Time settings .................................................................................................................... 13
5.1.3. Display brightness adjust .......................................................................................................... 13
5.1.4. Protection Password setting ..................................................................................................... 14
5.1.5. Sound keys setting ................................................................................................................... 15
5.1.6. Auto power off setting ............................................................................................................... 15
5.1.7. Memory type setting ................................................................................................................. 16
5.1.8. “Touch screen” calibration ........................................................................................................ 16
5.2. Real Time Values ................................................................................................................ 17
5.2.1. Single-MPPT photovoltaic system screen – Single-phase output ............................................ 17
5.2.2. Single-MPPT photovoltaic system screen – Three-phase output ............................................ 18
5.2.3. Screen of photovoltaic systems with multi-MPPT inverter (only with MPP300) ....................... 18
5.2.3.1. Multi-MPPT photovoltaic system screen – Single-phase output ...................................................... 19
5.2.3.2. Multi-MPPT photovoltaic system screen – Three-phase output ...................................................... 20
5.2.4. Value screens for NPV systems ............................................................................................... 20
5.2.4.1. 4-wire three phase system – Screens sequence ............................................................................. 21
5.2.4.2. 3-wire three phase system – Screens sequence ............................................................................. 24
5.2.4.3. 3-wire ARON three phase system – Screens sequence ................................................................. 26
5.2.4.4. Single phase system – Screens sequence ...................................................................................... 28
5.2.5. SCOPE waveforms screens ..................................................................................................... 30
5.2.6. HARM analysis screens ........................................................................................................... 33
5.2.7. Vectorial diagrams screens ...................................................................................................... 37
5.3. Analyzer Settings ................................................................................................................ 41
5.3.1. Analyzer Configuration screen ................................................................................................. 41
5.3.1.1. Setting system frequency ................................................................................................................ 44
5.3.1.2. Setting clamp type ........................................................................................................................... 44
5.3.1.3. Setting full scale of clamps .............................................................................................................. 45
5.3.1.4. Setting VT ratio ................................................................................................................................ 45
5.3.2. Parameter setting screen – PV systems .................................................................................. 46
5.3.2.1. Setting the nominal power of the photovoltaic system ..................................................................... 46
5.3.2.2. Setting the Gamma parameter of photovoltaic panels ..................................................................... 46
5.3.2.3. Setting the NOCT parameter of photovoltaic panels ....................................................................... 47
5.3.2.4. Setting temperatures Tenv and Tpv ................................................................................................ 47
5.3.2.5. DC input N setting (only together with opt. MPP300) ...................................................................... 47
5.3.2.6. Selection of the relationship for Temperature effects compensations ............................................. 48
5.3.3. Advanced setting screen – PV systems ................................................................................... 49
5.3.3.1. Setting of remote unit ...................................................................................................................... 49
5.3.3.2. Setting the corrective factor of the pyranometer (only for SOLAR-01 unit) ...................................... 49
EN - 1
Page 4

SOLAR300 - SOLAR300N
5.3.3.3. Setting of minimum irradiance threshold ......................................................................................... 50
5.3.3.4. Setting of corrective constant of DC clamp ...................................................................................... 50
5.3.4. Advanced Settings screen – NPV systems .............................................................................. 51
5.3.4.1. Zoom graphics option ...................................................................................................................... 51
5.3.4.2. Harmonics type option ..................................................................................................................... 52
5.3.4.3. Harmonics values option ................................................................................................................. 52
5.3.4.4. Zoom with respect to the 1st harmonic option ................................................................................. 53
5.3.4.5. Average value option ....................................................................................................................... 53
5.4. Recording settings .............................................................................................................. 54
5.4.1. Recorder setting screen – PV systems .................................................................................... 54
5.4.1.1. Item Comments ............................................................................................................................... 55
5.4.1.2. Use of the virtual keyboard .............................................................................................................. 55
5.4.1.3. Items Start and Stop ........................................................................................................................ 56
5.4.1.4. Item Integration period..................................................................................................................... 56
5.4.1.5. Item General Parameters for use with SOLAR01 or SOLAR02 units .............................................. 56
5.4.1.6. Description of the sub-levels of item General Parameters ............................................................... 58
5.4.1.7. Item SOLAR-01 and SOLAR-02 ...................................................................................................... 59
5.4.1.8. Default settings ................................................................................................................................ 59
5.4.1.9. Item General Parameters for use with MPP300 unit ....................................................................... 61
5.4.2. Recording settings screen – NPV systems .............................................................................. 62
5.4.2.1. Comments ....................................................................................................................................... 62
5.4.2.2. Use of virtual keyboard .................................................................................................................... 63
5.4.2.3. Start and Stop ................................................................................................................................. 63
5.4.2.4. Integration period ............................................................................................................................ 64
5.4.2.5. Cogenerations ................................................................................................................................. 64
5.4.2.6. General Parameters ........................................................................................................................ 65
5.4.2.7. General Parameters: sub-levels description .................................................................................... 67
5.4.2.8. Harmonics: sub-levels description ................................................................................................... 70
5.4.2.9. Voltage Anomalies .......................................................................................................................... 72
5.4.2.10. Inrush current ................................................................................................................ .................. 73
5.4.2.11. Flicker .............................................................................................................................................. 74
5.4.2.12. Unbalance ..................................................................................................................... .................. 75
5.4.2.13. Spike ......................................................................................................................... ...................... 75
5.4.2.14. Predefined configurations ................................................................................................................ 76
5.5. Start a test on PV system .................................................................................................... 84
5.5.1. While testing ............................................................................................................................. 86
5.5.2. Stop a test ................................................................................................................................. 87
5.6. Start a recording .................................................................................................................. 88
5.6.1. Recording settings screen – NPV systems (only for NPV systems) ........................................ 91
5.6.2. During a recording .................................................................................................................... 92
5.7. Saved data management section ........................................................................................ 94
5.7.1. Recording analysis (Reg type) ................................................................................................. 95
5.7.1.1. Recording information ..................................................................................................................... 95
5.7.1.2. Recording graph .............................................................................................................................. 96
5.7.1.3. Dips ans swells ................................................................................................................................ 98
5.7.1.4. Spikes (Transients) ......................................................................................................................... 99
5.7.1.5. Inrush currents .............................................................................................................................. 101
5.7.1.6. EN50160 ....................................................................................................................................... 103
5.7.1.7. Analysis of consumed energy ........................................................................................................ 105
5.7.1.8. Analysis of producted energy ........................................................................................................ 106
5.7.2. Recording analysis (RegPV type)........................................................................................... 107
5.7.2.1. Recording information ................................................................................................................... 107
5.7.2.2. Result for data of RecPV type ....................................................................................................... 108
5.7.2.3. Result for data of RecMPP type .................................................................................................... 110
5.7.2.4. Recording graph ............................................................................................................................ 111
5.7.3. Recording analysis (Istant type) ............................................................................................. 113
5.7.3.1. Recording information ................................................................................................................... 113
5.7.3.2. Graph ............................................................................................................................................ 114
5.7.3.3. Harmonics analysis ....................................................................................................................... 120
5.7.3.4. Vectors .......................................................................................................................................... 128
5.7.3.5. Measures ....................................................................................................................................... 134
5.7.4. Transfer recordings to a external Pen Driver USB ................................................................. 142
5.7.5. Saving recordings to external Compact Flash ........................................................................ 143
5.8. Meter information .............................................................................................................. 144
6. CONNECTION OF METER TO PC (WIN XP) ......................................................... 145
7. MEASURING PROCEDURES ................................................................................ 146
EN - 2
Page 5

SOLAR300 - SOLAR300N
7.1. Tes t o f P V - 1 sys t e m w i t h r e m o t e u n i t S O L AR-0 1 .................................................................. 147
7.2. Tes t o f P V - 1 sys t e m w i t h r e m o t e u n i t S O L AR-0 2 .................................................................. 149
7.3. Tes t o f P V - 3 sys t e m w i t h r e m o t e u n i t S O L AR-0 1 .................................................................. 151
7.4. Tes t o f P V - 3 sys t e m w i t h r e m o t e u n i t S O L AR-0 2 .................................................................. 153
7.5. Test of PV syst. with Single/Multi MPPT – Single/three phase AC ......................................... 155
7.6. Rec o r d i n g i n a P V - 1 s y s t e m w i t h r e mote u n i t S O L A R - 0 1 ...................................................... 161
7.7. Rec o r d i n g i n a P V - 1 s y s t e m w i t h r e mote u n i t S O L A R - 0 2 ...................................................... 163
7.8. Rec o r d i n g i n a P V - 3 s y s t e m w i t h r e mote u n i t S O L A R - 0 1 ...................................................... 165
7.9. Rec o r d i n g i n a P V - 3 s y s t e m w i t h r e mote u n i t S O L A R - 0 2 ...................................................... 167
7.10.Recor d i n g P V s y s t . w i t h S i n g l e / M ulti M P P T – S i n g l e / t h r e e p h a s e A C .................................... 169
7.11. Using the meter in a Single phase system .................................................................... 174
7.12. Using the meter in a Three phase 4 wire system .......................................................... 175
7.13. Using the meter in a Three phase 3 wire system .......................................................... 176
7.14. Using of meter in a Three phase 3 wire ARON system ................................................. 177
8. MAINTENANCE ...................................................................................................... 178
8.1. General ............................................................................................................................. 178
8.2. Situations relative to led of SOLAR-01 unit ....................................................................... 178
8.2.1. Replacement battery of SOLAR-01 and SOLAR-02 .............................................................. 178
8.3. Situations relative to internal battery of instrument ........................................................... 178
8.3.1. Replacement internal battery .................................................................................................. 179
8.4. Cleaning ............................................................................................................................ 179
8.5. End of life .......................................................................................................................... 179
9. TECHNICAL SPECIFICATIONS ............................................................................. 180
9.1. Technical features ............................................................................................................. 180
9.2. General features ............................................................................................................... 183
9.3. Environment ...................................................................................................................... 183
9.4. Accessories ....................................................................................................................... 183
10. APPENDIX – THEORETICAL OUTLINES ............................................................. 184
10.1. Testing PV systems ....................................................................................................... 184
10.2. Recording on PV systems ............................................................................................. 185
10.3. Notes on MPPT (Maximum Power Point Tracker) ........................................................ 186
10.4. Voltage Anomalies ........................................................................................................ 187
10.5. Voltage and current Harmonics ..................................................................................... 188
10.5.1. Theory ..................................................................................................................................... 188
10.5.2. Limit values for harmonic voltage ........................................................................................... 189
10.5.3. Presence of harmonics: causes ............................................................................................. 189
10.5.4. Presence of harmonics: consequences ................................................................................. 190
10.6. Inrush currents .............................................................................................................. 191
10.7. Flicker ............................................................................................................................ 192
10.8. Supply voltage unbalance ............................................................................................. 193
10.9. Voltage fast transients (spikes) ..................................................................................... 194
10.10. Power and power factor: definitions .......................................................................... 196
10.10.1. Conventions on powers and power factors ............................................................................ 197
10.10.2. Three phase 3 wire ARON system ......................................................................................... 198
10.11. Measuring method: outlines ...................................................................................... 199
10.11.1. Integration period .................................................................................................................... 199
10.11.2. Power factor calculations ........................................................................................................ 199
11. AFTER-SALE SERVICE ......................................................................................... 200
11.1. Warranty ........................................................................................................................ 200
11.2. Service .......................................................................................................................... 200
EN - 3
Page 6
SOLAR300 - SOLAR300N
1. PRECAUTIONS AND SAFETY MEASURES
1.1. GENERAL
This meter has been designed in compliance to IEC/EN61010-1 directive. For your own
safety and to avoid damaging the instrument we suggest you follow the procedures hereby
prescribed and to read carefully all the notes preceded by the symbol
Before and during measurements please take care of below points:
The instrument consists in a main unit SOLAR300 or SOLAR300N and a remote unit
for acquisition (SOLAR-01 or SOLAR-02 generically called “SOLAR-0x except notation
specifically indicated”). If not otherwise indicated, all safety instructions are intended as
always referred to the main unit.
Do not measure voltage or current in wet or dusty places.
Do not measure in presence of gas, explosive materials or combustibles.
Do not touch the circuit under test if no measurement is being taken.
Do not touch exposed metal parts, unused terminals, circuits and so on.
Do not use the meter if it seems to be malfunctioning (i.e. if you notice deformations,
breaks, leakage of substances, absence of messages on the display and so on).
The below symbols are used in this manual and on meter:
Caution: keep to what prescribed by the manual. An incorrect use could damage
the instrument or its components
High voltage: risk of electric shock
Double insulation
Ground reference
1.2. PRELIMINARY INSTRUCTIONS
This instrument has been designed for use in places with pollution class 2.
It can be used for Voltage and Current measurements on installations of excess
voltage category IV 600V to earth and a 1000V maximum voltage between inputs.
Please keep to the usual safety standards aimed at ptrotecting against dangerous
currents and protecting the instrument against incorrect operations.
Only the accessories supplied with the instrument guarantee compliance with the
safety standards. Accordingly, they must be in good conditions and, if necessary, they
must be replaced with identical models.
Do not take measurements on circuits exceeding the specified current and voltage
limits.
Before connecting cables, crocodiles and clamps to the circuit under test, make sure
that the right function has been selected.
CAUTION
Please perform a complete charging of internal battery for at least 5 hours
before using the meter the first time.
Please press and hold the ON/OFF key for about 5s when turning on the
meter the first time.
EN - 4
Page 7
SOLAR300 - SOLAR300N
1.3. DURING USE
Please read carefully the below points:
CAUTION
Should you fail to keep to the prescribed instructions you could damage
the instrument and/or its components or endanger your safety
Do not touch any unused terminal when the meter is connected to the
circuit on test
When measuring current, other currents located near the leads may affect
the measuring accuracy
When measuring current, always position the wire in the very middle of the
jaws in order to obtain the highest accuracy
A measured value remains constant if the "HOLD" function is active.
Should you notice that the measured value remains unchanged, disable
the “HOLD” function
1.4. AFTER USE
After use, turn off the instrument by pressing ON/OFF key for a few seconds.
If you expect not to use the instrument for a long time please keep to the storage
instructions described at § 3.4.
1.5. MEASURING (OVERVOLTAGE) CATEGORIES DEFINITIONS
IEC/EN61010-1: Safety requirements for electrical equipment for measurement, control
and laboratory use, Part 1: General requirements, gives a definition of measuring
category, usually called overvoltage category. § 6.7.4: Measuring circuits:
(OMISSIS)
Circuits are divided into the following measurement categories:
Measurement category IV is for measurements performed at the source of the low-
voltage installation
Examples are electricity meters and measurements on primary overcurrent protection
devices and ripple control units
Measurement category III is for measurements performed in the building installation.
Examples are measurements on distribution boards, circuit breakers, wiring, including
cables, bus-bars, junction boxes, switches, socket-outlets in the fixed installation, and
equipment for industrial use and some other equipment, for example, stationary
motors with permanent connection to fixed installation
Measurement category II is for measurements performed on circuits directly
connected to the low voltage installation
Examples are measurements on household appliances, portable tools and similar
equipment
Measurement category I is for measurements performed on circuits not directly
connected to MAINS
Examples are measurements on circuits not derived from MAINS, and specially
protected (internal) MAINS-derived circuits. In the latter case, transient stresses are
variable; for that reason, the norm requires that the transient withstand capability of the
equipment is made known to the user
EN - 5
Page 8
SOLAR300 - SOLAR300N
2. GENERAL DESCRIPTION
2.1. Introduction – PV and NPV systems
The instrument allows a totally new approach to the measuring world when dealing with
photovoltaic systems and mains analyses on single-phase and three-phase electrical
systems; the combination between instruments provided with microprocessor and the
Windows CE technology allows analyzing a huge amount of data in such a simple and
quick way as with no other system available.
Further in this manual, the following acronyms will be used:
PV systems: Single-phase and three-phase photovoltaic systems.
NPV systems: Single-phase and three-phase non-photovoltaic electrical systems.
MPPT: Maximum Power Point Tracker (see § 10.3)
This manual covers two models: SOLAR300 and SOLAR300N. In this manual,
these models will be generically referred to as the “instrument”. In general,
whenever one of the following topics is dealt with:
Flicker (Pst, Plt)
Starting current / inrush current measurement
Analysis of fast transients on voltages (spikes)
EN50160 analysis (performed by the instrument)
Use of the accessory MPP300
this is to be considered (even if not expressly indicated) as referred to
model SOLAR300N only
2.2. FUNCTIONS
This meter is able to perform:
Real-time display of the values of the electrical and environmental quantities
(irradiation, temperature) of a photovoltaic system for generating single-phase or threephase electric power.
Calculation of the values regarding the maximum efficiency point.
Real-time display of the values of each electric quantity of a single-phase and three-
phase, 3-wire or 4-wire system, harmonic analysis of voltages and currents up to the
49th harmonic, voltage anomalies (dips and peaks) with 10ms resolution, Flicker (Pst,
Plt) display of the parameters of the unbalance on voltages, inrush current routines
and voltage spikes with 5s resolution
Real time display of any input signal waveform, histogram graphics of harmonics
analysis and vectorial diagrams of mutual angles between voltages and currents.
Recording (saving the values of the electric quantities over time in the instrument’s
memory) the values of the electrical and environmental quantities (irradiation,
temperature) of a photovoltaic system for generating single-phase or three-phase
electric power.
Recording (saving the values of the electric quantities over time in the instrument’s
memory) of this values: TRMS values of voltages, currents, corresponding harmonics,
Flicker active, reactive and apparent powers, power factors and cosphi, active,
reactive and apparent energies, voltage anomalies.
Saving (by pressing SAVE key) of a “Instant” sampled of instantaneous values of any
parameters present at instrument input inside memory.
CAUTION
EN - 6
Page 9
SOLAR300 - SOLAR300N
R
2.3. INITIAL SCREEN
When turning on the instrument by pressing ON/OFF key, this below screen will appear for
a few seconds:
Here you can see (besides model code and
SOLA
300N
Sn:1303004 Rel:1.32
Calibration Date: 25/01/2010
HT
manufacturer name):
The serial number of the meter (Sn)
The release of internal meter Firmware
(Rel.:)
Date of last calibration (Calibration Date:)
3. PREPARE TO USE
3.1. INITIAL CHECK
This meter has been checked before shipment from an electrical and mechanical point of
view. All possible precautions have been taken in order to deliver it in perfect condition.
Notwithstanding, on receipt of the instrument we suggest that you check it summarily to
make sure that no damage has occurred in transit. Should you find irregularities please
contact the carrier immediately. Furthermore, please make sure that the parcel contains all
the accessories and parts listed at enclosed packing list. In case of discrepancies please
contact your dealer. Should it be necessary to return the instrument to the supplier please
keep to the instructions given at § 11.
3.2. INSTRUMENT POWER SUPPLY
The instrument can be powered only by a rechargeable Li-ION battery (3.7V, 1900mAh)
which is included with the meter. Use only the external adapter standard supplied with
meter for charging battery (see § 8.3).
For recordings use ALWAYS the external adapter (even the instrument
allows the operator to perform a recording using internal battery)
Please perform a complete charging of internal battery for at least 5
hours before the first use of meter
The meter uses the below options to increase the battery duration:
Automatically reduction of display brightness after about 30s from last operation
performed with meter, with external adapter not connected.
Auto Power OFF feature after about 5 minutes from the last operation on function keys
or display touch screen with external adapter not connected (see § 5.1.6)
3.3. CALIBRATION
The instrument complies with the standards mentioned in this manual. Its performance is
defined for 12 months from the purchase date.
3.4. STORAGE
To guarantee accurate measurements, after a long storage period in severe environmental
conditions wait until the instrument resumes its normal conditions (see § 9.3).
CAUTION
EN - 7
Page 10
SOLAR300 - SOLAR300N
g
4. HOW TO OPERATE
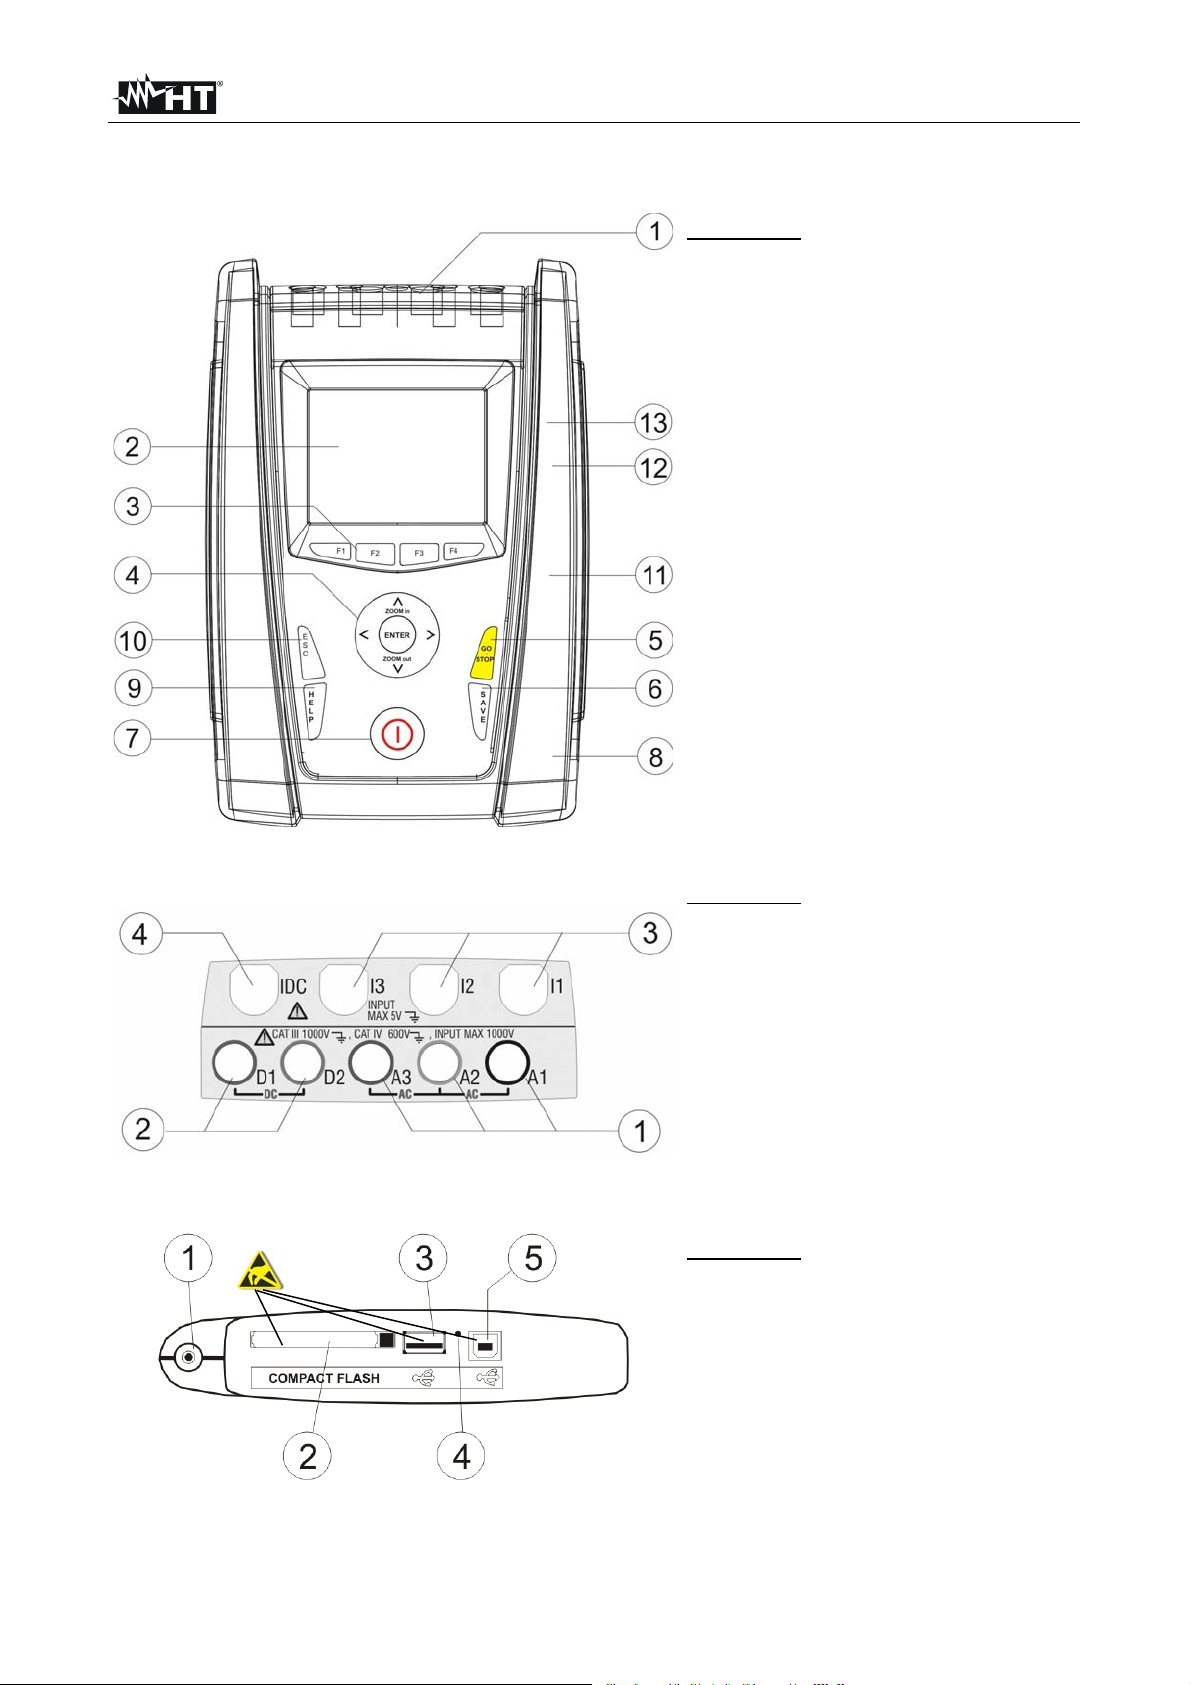
4.1. INSTRUMENT DESCRIPTION
CAPTION:
1. Voltage and Current inputs.
2. TFT display with “touchscreen”.
3. F1 – F4 keys.
4. Arrows keys and ENTER key.
5. GO/STOP key.
6. SAVE key.
7. ON/OFF key.
8. Input for external adapter.
9. HELP key.
10. ESC key.
11. Port for connection to external
Flash memory.
12. Connection to SOLAR- 0x / Port
for external USB Pen Driver.
13. USB output for PC connection.
Fig. 2: Description of meter's input terminals
ESD Warnin
Fig. 1: Description of meter's front panel
CAPTION:
1. Inputs A1-A2-A3 for the
connection of AC voltages.
2. Inputs D1-D2 for the connection
of DC voltages.and N, PE of AC
voltages.
3. Inputs for the connection of AC
current transducers on phases
L1, L2, L3.
4. Input for the connection of DC
current transducer.
CAPTION:
1. Input for external adapter
2. Slot for Compact Flash memory
(*).
3. Connection to SOLAR-0x / Port
for external USB Pen Driver (*).
4. RESET command.
5. USB output for PC connection
(*).
Fig. 3: Description of meter's output connectors
(*) Use the output connectors included into the lateral side only with meter OFF. This outputs should be
interested by electrostatic discharges (ESD).
EN - 8
Page 11
SOLAR300 - SOLAR300N
4.2. KEYBOARD DESCRIPTION
The below keys are available:
Key ON/OFF: press this key to turn on the meter. Press and hold the key for
few seconds to turn off the meter.
Keys F1, F2, F3, F4: multifunction keys. The various functions are intended from the
s shown on the bottom of display.
Key ESC: to leave a menu or a sub-menu. The smart icon which is
shown on screens performs the same function under interactive
mode.
Key ENTER: double function key:
ENTER: to confirm the settings made
HOLD: to block the value updating in all real time screens and also
during a recording operation. “H” symbol is shown at display by
any pressing of key as for Fig. 4:
Fig. 4: HOLD function active at display
Keys , , , /ZOOM in/ZOOM out: these arrows keys permit to select the
desired programmable parameters inside various screens. The
double function of ZOOM in and ZOOM out permits to change
manually the full scale of some graphics inside SCOPE section
in order to improve the global resolution on viewing waveforms
of signals (see § 5.3.2.5). Arrow keys and permit to
operate on internal pages inside some kinds of screen.
Key SAVE: saves an “Instant” type sampling of instantaneous values in
internal memory (see § 5.7). The same key permits also the
saving of various settings inside screens. The smart icon
which is shown on screens perform the same function under
interactive mode.
Key GO/STOP: permits to start/stop any recording (see § 5.6).
Key HELP: opens an help on line window on the meter screen with a short
description of the same screen which is instantaneously shown.
This key is active for any function.
EN - 9
Page 12
SOLAR300 - SOLAR300N
4.3. DISPLAY DESCRIPTION
The display is a graphic TFT colour type, 73x57mm sizes (VGA 320x240 pxls) with “touchscreen” which permits a really easy operations using standard PT400 pointer pen fitted in
lateral side of meter.
On first display’s row the system date/hour is shown by meter (see § 5.1.2 for settings).
There are also some icons relative to battery level indication or external adapter fitted and
for waiting and start of a recording. On second row the kind of selected measure is shown
and the last row shows the short s associated to F1, F4 function keys. An example of
possible screen is shown on (see Fig. 5):
Fig. 5: Example of screen
4.4. RESET OF METER
The meter is designed with internal Reset Hardware which can be used if any functions is
blocked at display, in order to restore all correct operations. Consider the below steps to
perform Reset actions:
1. Using the PT400 pointer pen or another object softly pressing the internal part of the
little hole which is present on the lateral side of meter (see Fig. 3 – Fig. 4). The meter
goes automatically off.
2. Turn on the meter by pressing ON/OFF key and verify the correct working.
RESET operation will not erase the meter’s internal memory.
EN - 10
Page 13
SOLAR300 - SOLAR300N
5. GENERAL MENU
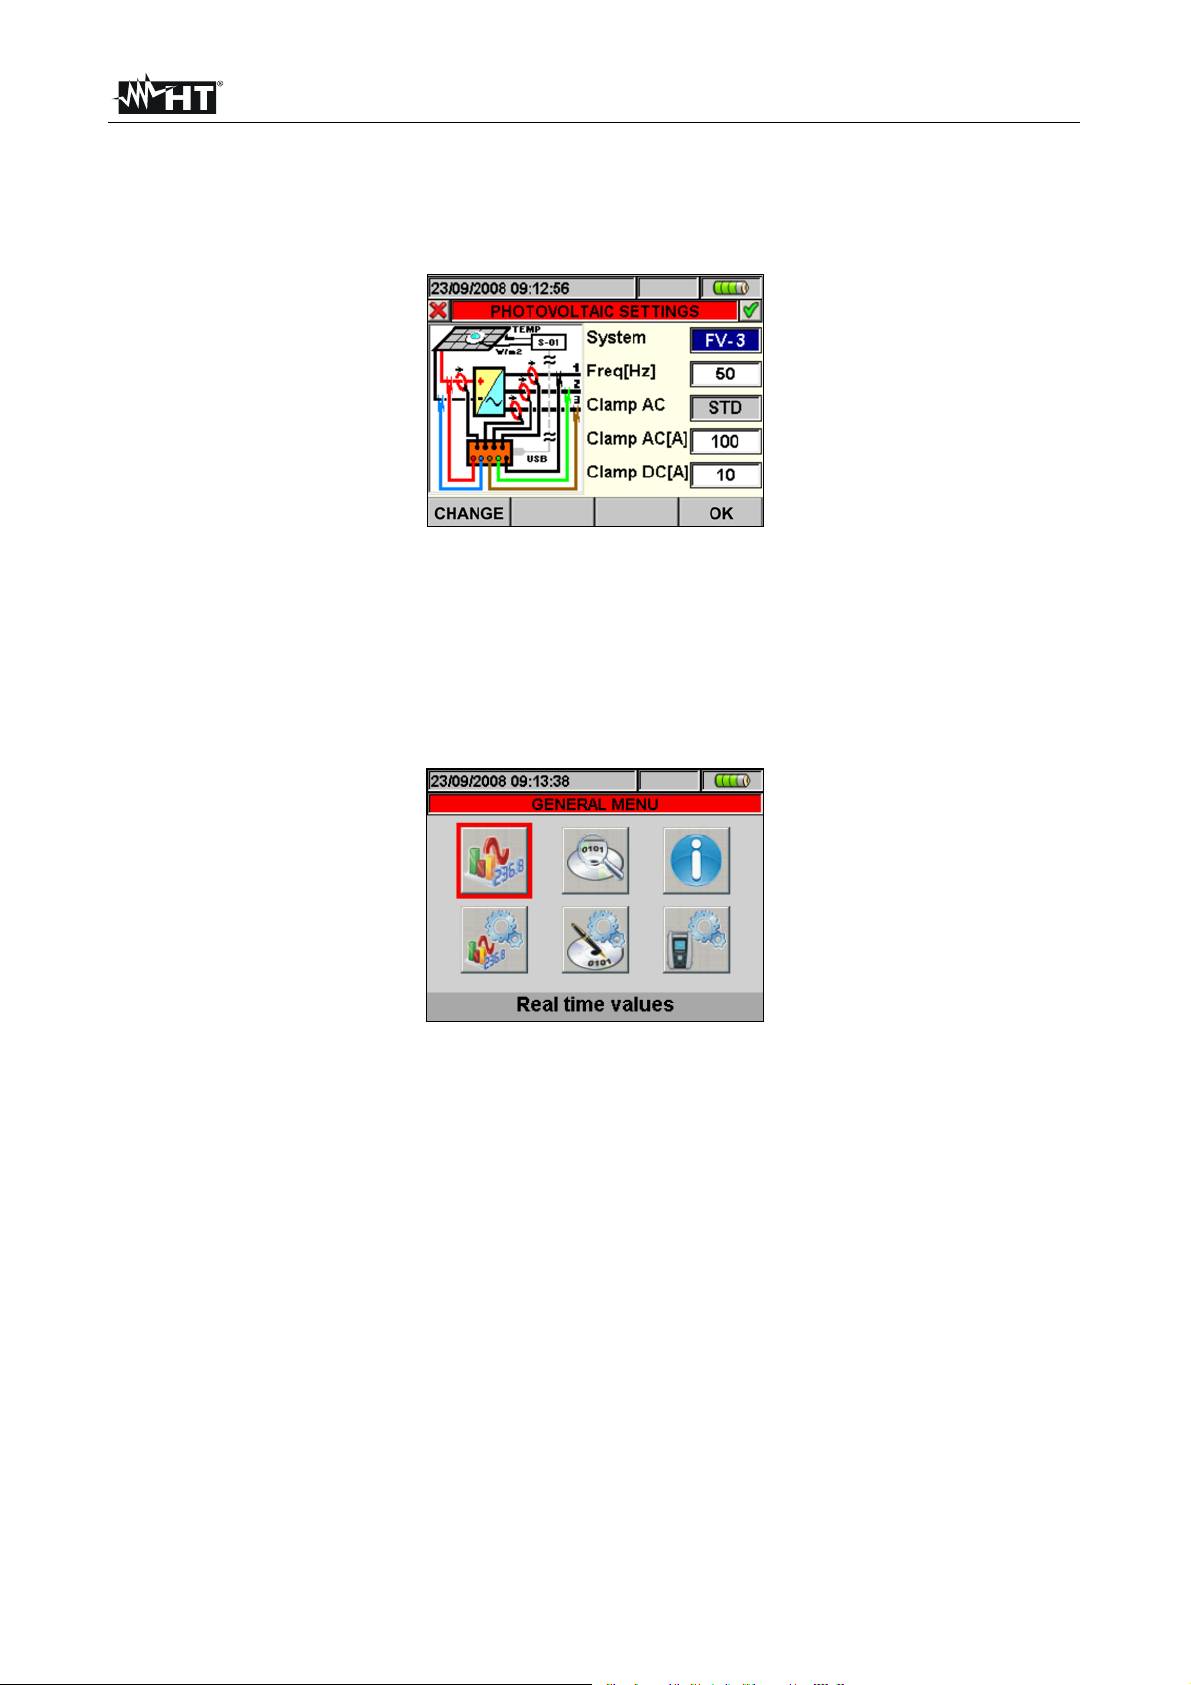
Whenever you turn on the meter, the below “Analyzer Configuration” screen is shown,
relative to the last configuration used (see Fig. 6):
Fig. 6: Example of analyzer configuration
In this situation the user can decide whether modify the actual configuration by pressing
F1 key (or “CHANGE” at display – see § 5.3.1) or directly access to General Menu by
pressing F4 key (or the “OK” at display). If no action is performed within 10s the meter
automatically goes to GENERAL MENU screen.
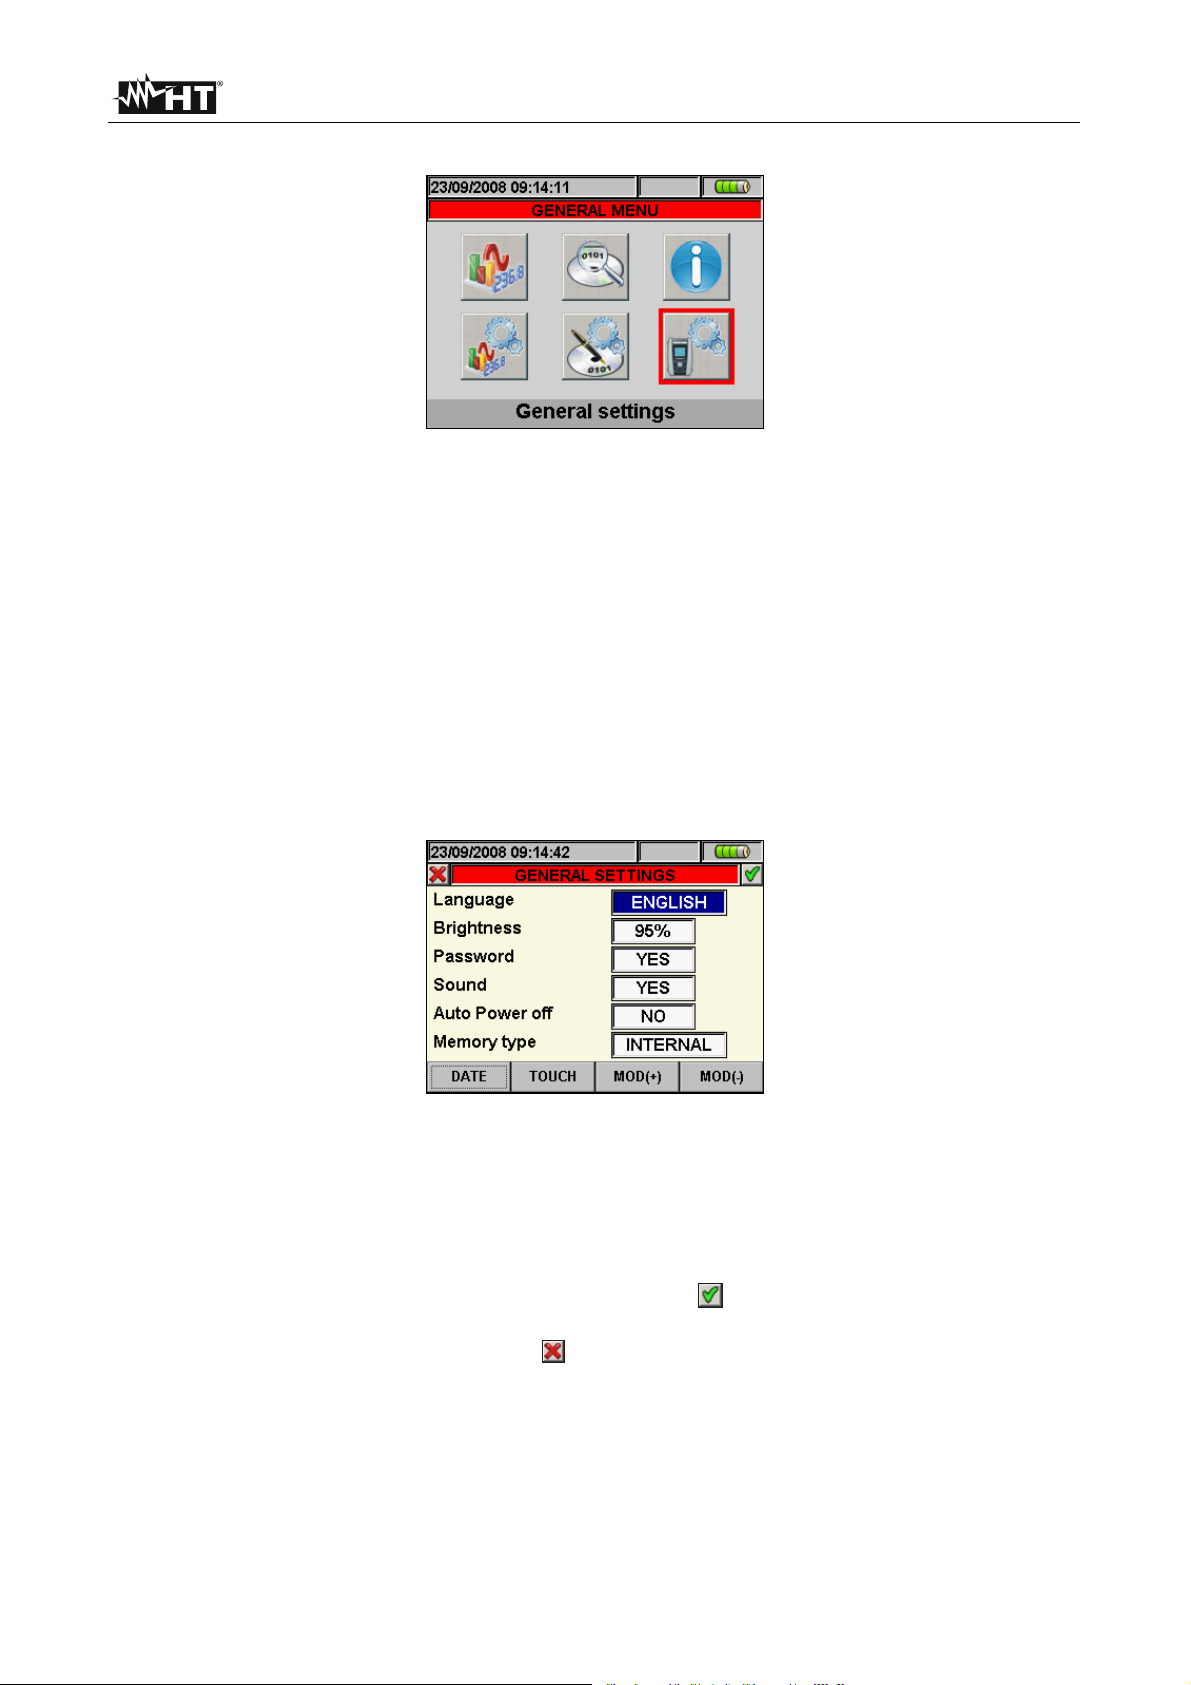
The GENERAL MENU of meter is correspondent to the screen shown in (see Fig. 7):
Fig. 7: GENERAL MENU screen
The actual selected section is shown with red background at display and it’s title is shown
in the bottom of display. The below sections are available on meter:
General settings section which permits to set the system parameters of meter as
date/hour, language, display brightness, protection password, keys sound on pressure
auto power off and memory type (see § 5.1).
Real time values section which permits to see the real time measured values at
display under various formats (see § 5.2).
Analyzer settings section which permits to define the simple and advanced
configurations relative to connection of meter to the installation (see § 5.3).
Recorder settings section which permits to select the parameters for each recording
and see the information about the autonomy of meter during operation (see § 5.4).
Recording results section which permits to see the list of all recordings saved on
internal memory, for memory cancel operations and the transfer of date in external Pen
Driver USB (see § 5.7).
Meter information section which permits to access to general information about meter
(serial number, internal Firmware and Software release, etc...) (see § 5.8).
EN - 11
Page 14
SOLAR300 - SOLAR300N
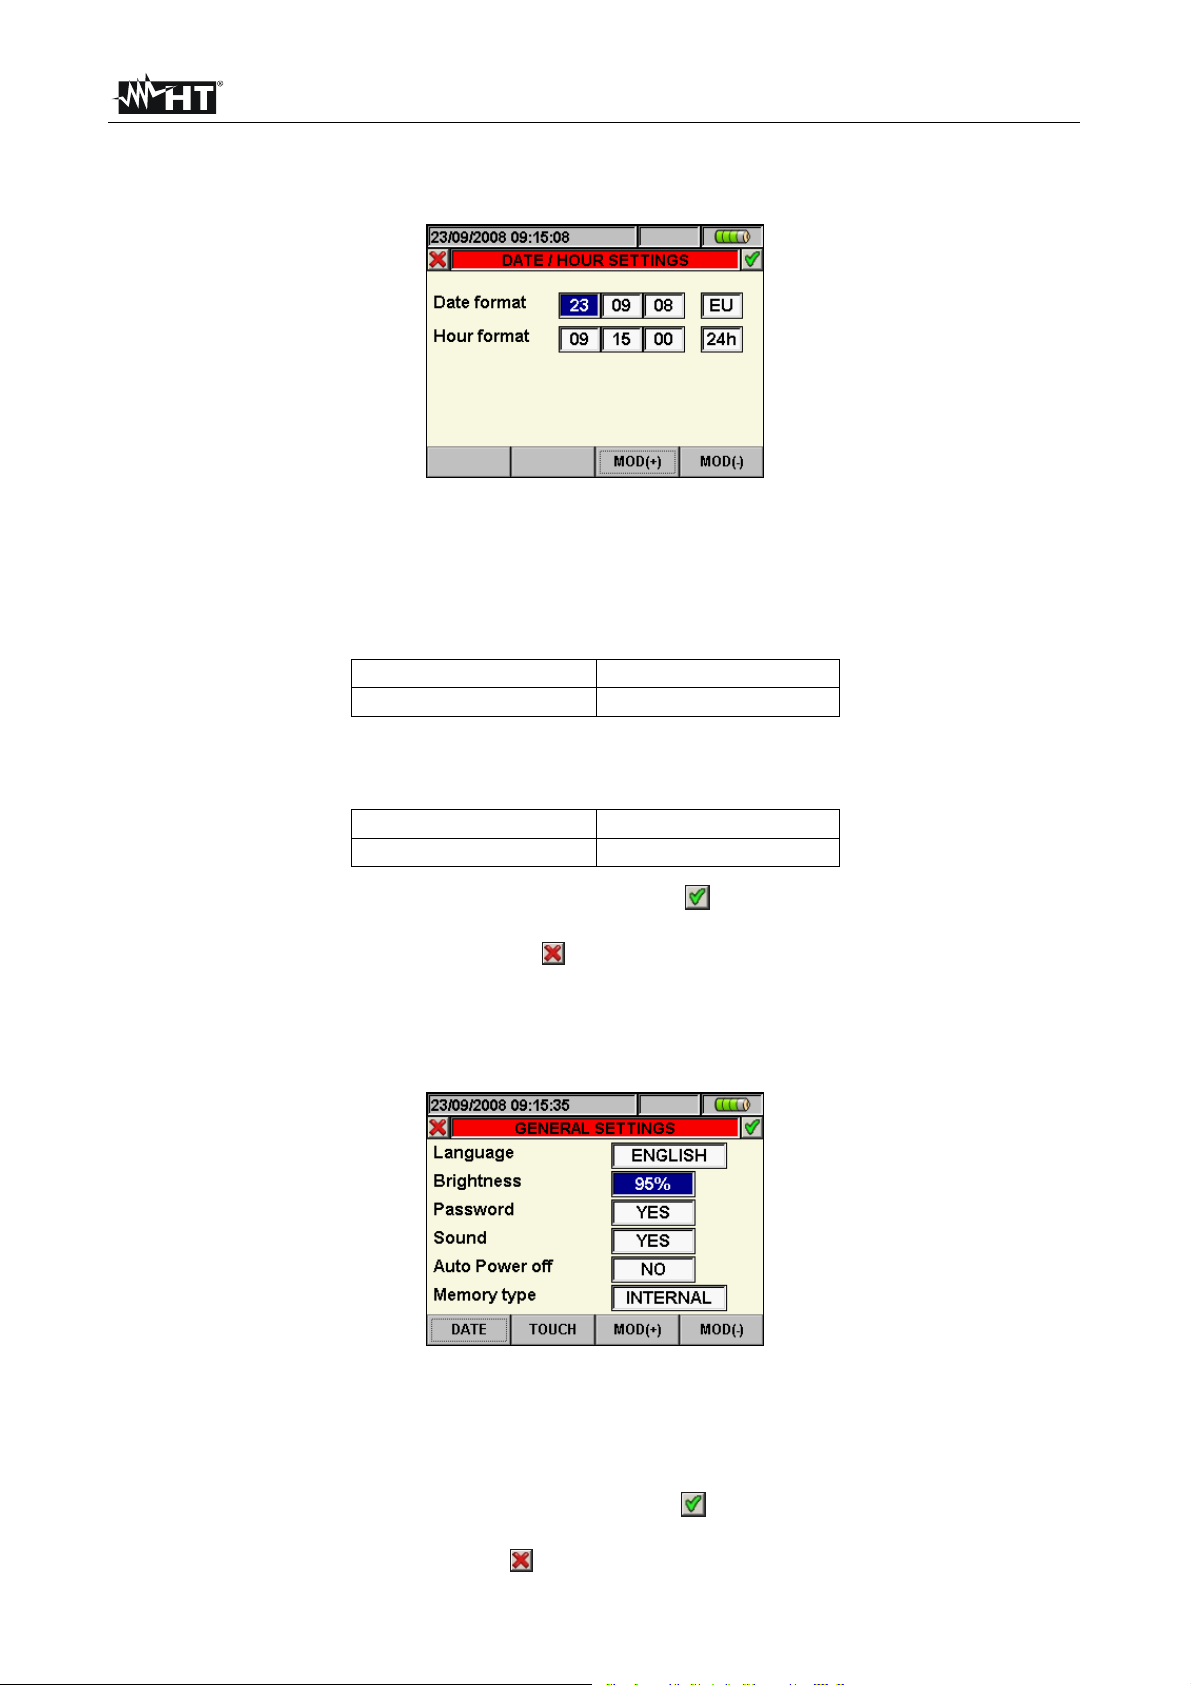
5.1. GENERAL SETTINGS
Fig. 8: MENU GENERAL screen - General settings section
This section permits to set the below control parameters:
System language
System Date/Hour
Display brightness
Protection password during recordings
Key sound on pressure
Auto Power OFF Enable/Disable
Type of memory in which to save the recordings
Perform “touch screen” display calibration (TOUCH)
Pressing ENTER key (or touch the relative icon at display). The below screen is shown by
meter:
Fig. 9: General Settings screen
5.1.1. Language selection
1. Move the cursor using arrows keys on field relative to “Language”, marked with blue
background.
2. Using F3 or F4 keys (or touch MOD(+) o MOD(-)) for selection of language choosing
among the different options.
3. Pressing SAVE or ENTER keys (or the smart icon ) to save the selected option and
confirm by “Ok”. This selected parameter will be present also the turning off of meter.
4. Pressing ESC key (or the smart icon ) to exit by screen without saving any modify.
EN - 12
Page 15
SOLAR300 - SOLAR300N
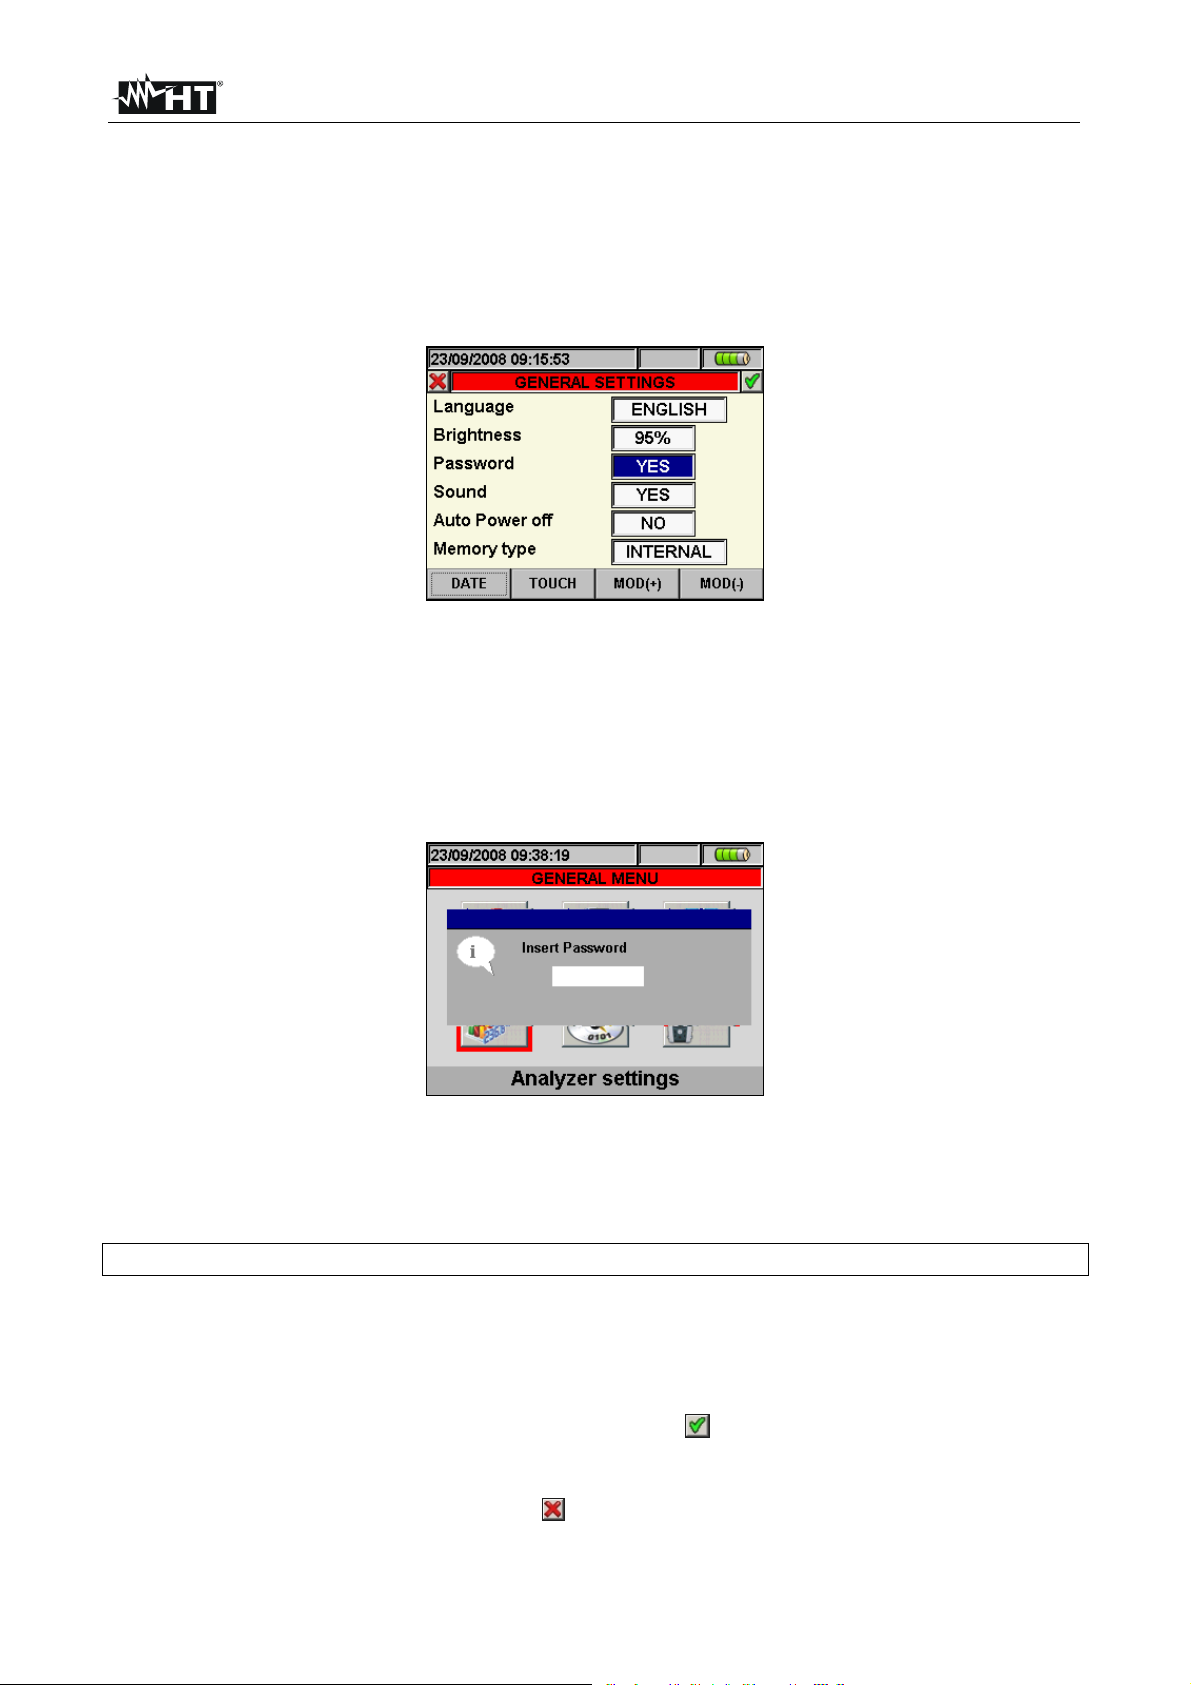
5.1.2. Date/Time settings
1. Press the F1 key (or touch DATE at display) on screen of Fig. 9. The below screen is
shown by meter:
Fig. 10: Date/Time settings screen
2. Move the cursor using arrows keys on field relative to “Date format” and “Time format”,
marked with blue background.
3. Using F3 or F4 keys (or touch MOD(+) o MOD(-)) for Date setting choosing between
the two possible formats (European EU or American US):
DD:MM:YY
MM:DD:YY
Option EU
Option US
4. Using F3 or F4 keys (alternatively touch MOD(+) o MOD(-)) for Time setting choosing
between two possible format (24 hours or 12 hours):
HH:MM:SS
HH:MM:AM(PM)
Option 24h
Option 12h
5. Press SAVE or ENTER keys (or the smart icon ) to save the selected option and
confirm by “Ok”. This selected parameter will be present also the turning off of meter.
6. Pressing ESC key (or the smart icon ) to exit by screen without saving any modify.
5.1.3. Display brightness adjust
1. Move the cursor using arrows keys on the field relative to “Brightness”, marked with
blue background:
Fig. 11: Adjust brightness screen
2. Using F3 or F4 keys (alternatively touch MOD(+) o MOD(-)) for adjustment of display
brightness percentage. The meter increases or decreases this value in step of 5% for
each pressure of key.
3. Press SAVE or ENTER key (or the smart icon ) to save the selected option and
confirm by “Ok”. This selected parameter will be present also the turn off of meter.
4. Press ESC key (or the smart icon ) to quit without saving any modification.
EN - 13
Page 16
SOLAR300 - SOLAR300N
5.1.4. Protection Password setting
The meter is provided with a protection password to avoid the risk of accidental recording
interruption.
1. Move the cursor using arrows keys on field relative to “Password” , marked it with blue
background:
Fig. 12: Protection password settings screen
2. Use F3 or F4 keys (alternatively touch MOD(+) o MOD(-)) to enable “YES” or disable
“NO” of Password.
3. With Password enabled, should GO/STOP key be pressed during a recording, the
meter will not stop the operation but will require the user to insert password as shown
in the below screen:
Fig. 13: Insert Password screen
4. The fixed password (not changeable by user) to insert on meter within 10s from
warning message is the below sequence of keys:
F1, F4, F3, F2
5. If a wrong password is fitted or if more of 10s elapse, the meter will give the warning
message “Wrong Password” and it’s necessary to repeat the operation. As soon as the
correct password is fitted, the meter will stop immediately the recording running and the
correspondent icon at display (see Fig. 13) will disappear.
6. Press SAVE or ENTER keys (or the smart icon
) to save the selected option and
confirm by “Ok”. This selected parameter will be present also after turning off the
meter.
7. Pressing ESC key (or the smart icon
) to quit without saving any modification.
EN - 14
Page 17
SOLAR300 - SOLAR300N
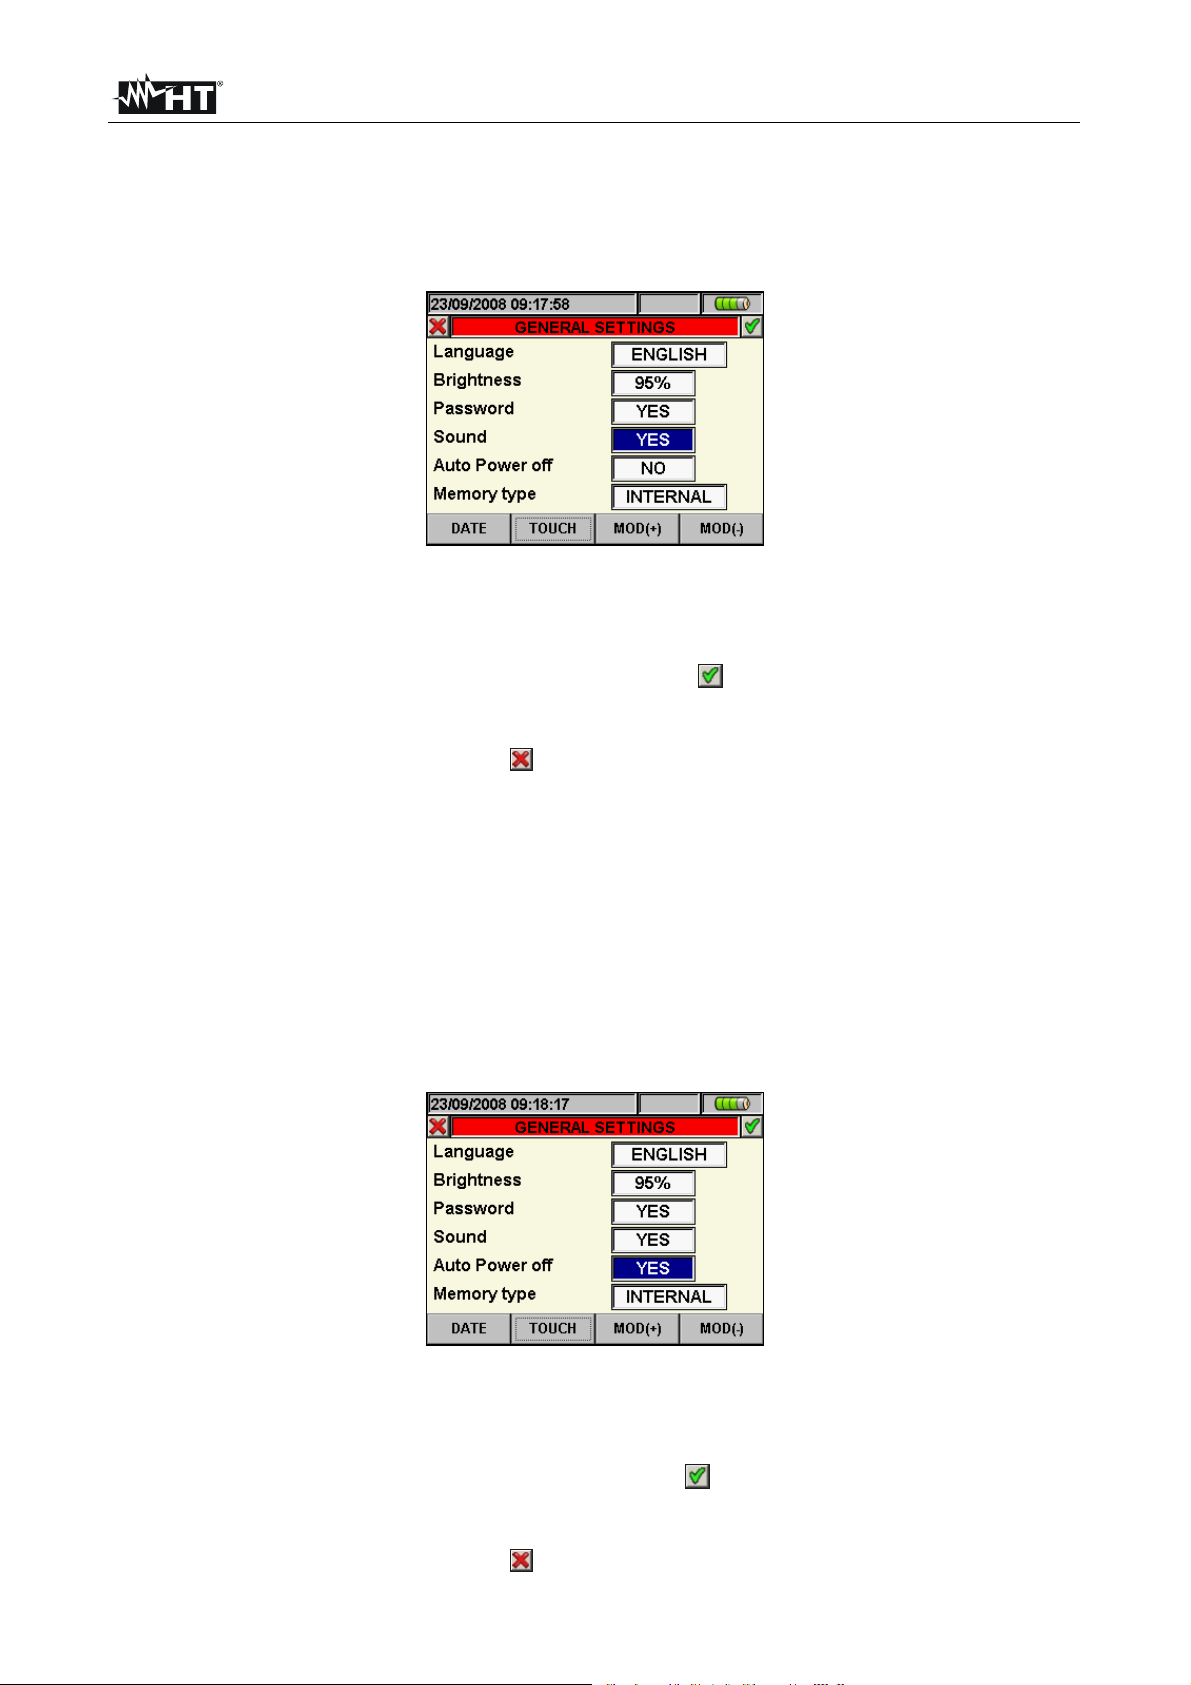
5.1.5. Sound keys setting
The meter permits to enable a instantaneous sound for any key pressure of the frontal
panel.
1. Move the cursor using arrows keys on field relative to “Sound”, marked with blue
background:
Fig. 14: Keys sound settings screen
2. Use F3 or F4 keys (alternatively touch MOD(+) o MOD(-)) to enable “YES” or disable
“NO” of keys sound.
3. Pressing SAVE or ENTER keys (or the smart icon
) to save the selected option and
confirm by “Ok”. This selected parameter will be present also after turning off the
meter.
4. Press ESC key (or the smart icon ) to quit without saving any modification.
5.1.6. Auto power off setting
The meter permits to enable or disable the auto power off option in order to prevent a
quick discharge of internal battery. This feature, if selected, is active under each of the
following conditions:
No action was performed both any key or touch display for at least 5 minutes.
Meter does not supplied with the external adapter.
Meter does not in recording running.
The effect is a long sound before turn off of meter.
1. Move the cursor using arrows keys on the field relative to “Auto power off”, marked
with blue background:
Fig. 15: Auto power off setting screen
2. Use F3 or F4 keys (alternatively touch MOD(+) o MOD(-)) for enable “YES” or disable
“NO” auto power off.
3. Press SAVE or ENTER keys (or the smart icon ) to save the selected option and
confirm by “Ok”. This selected parameter will be present also after turning off the
meter.
4. Press ESC key (or the smart icon ) to quit without saving any modification.
EN - 15
Page 18
SOLAR300 - SOLAR300N
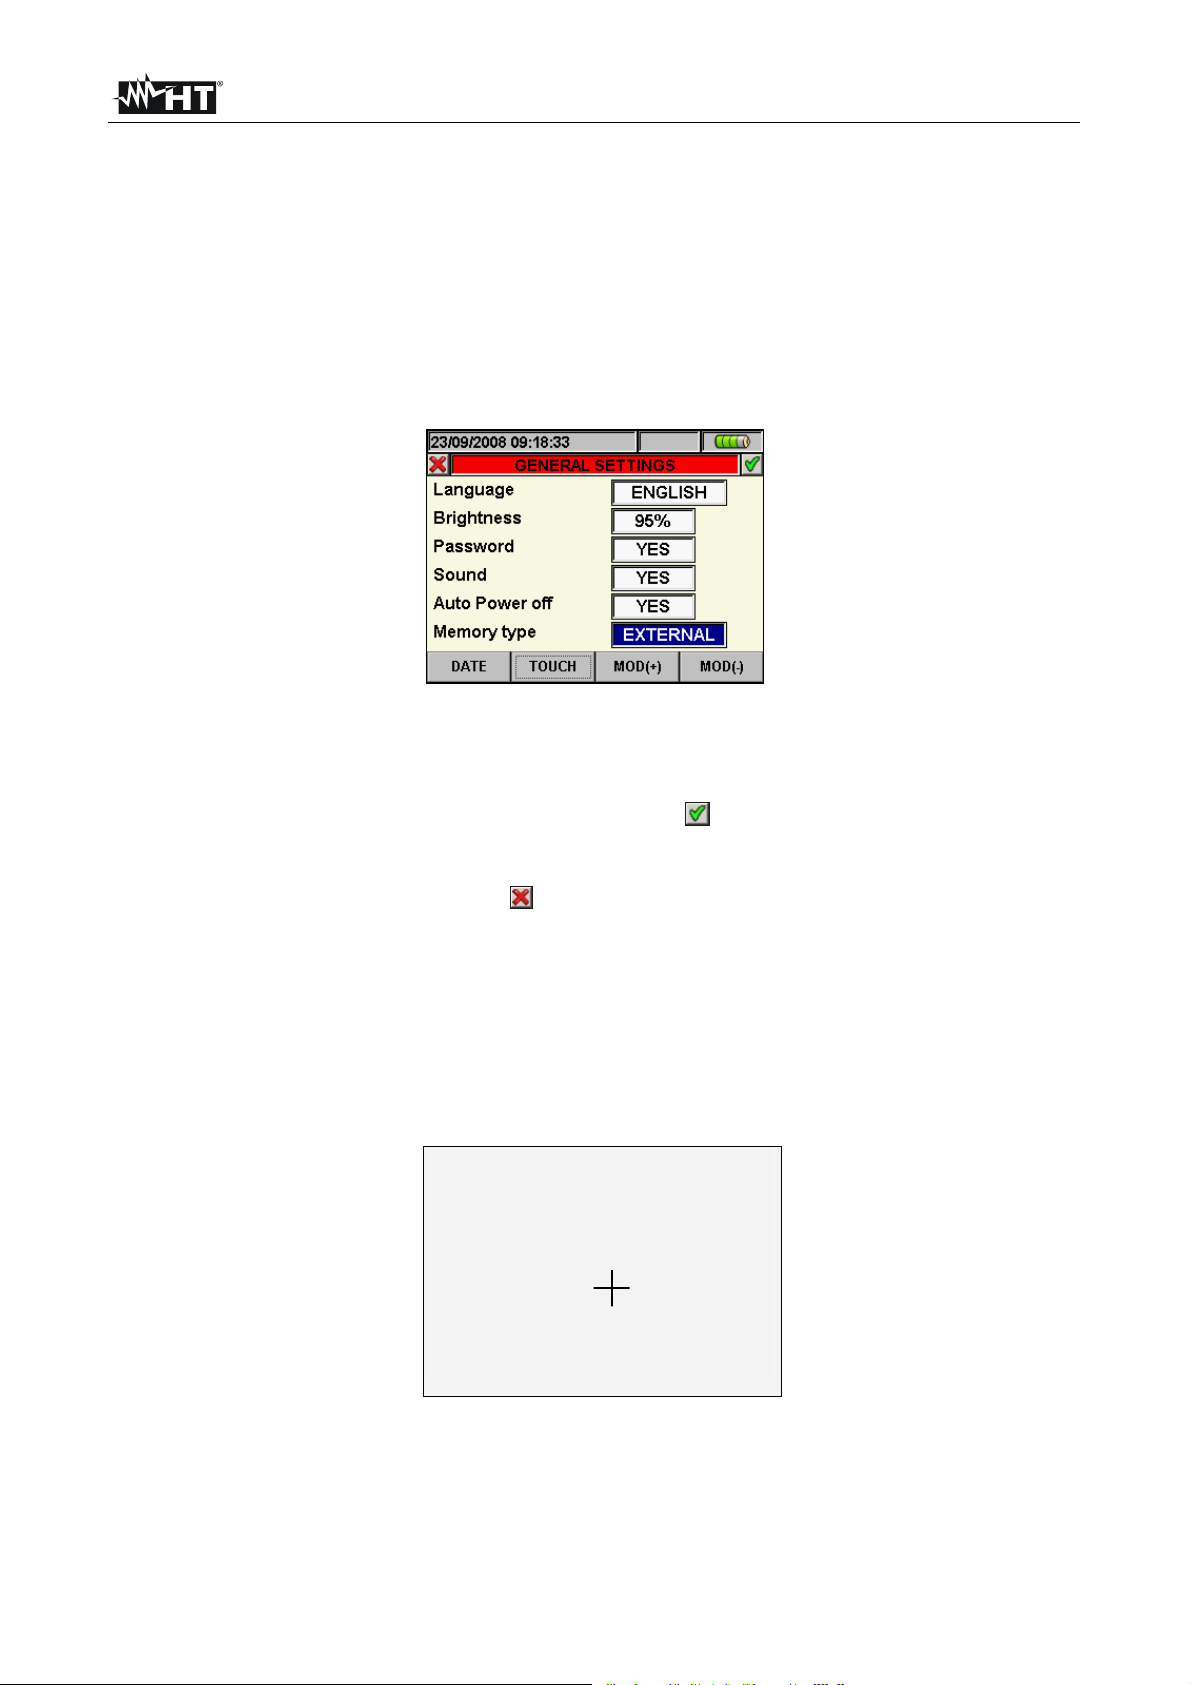
5.1.7. Memory type setting
The meter permits saving of recordings both in its internal memory (about 15Mbytes) and
by using an external compact flash (see § 5.7.5 for details) fitted (see Fig. 3). Regardless
of the capacity of the memory inserted, the maximum size of a recording is set to
32Mbytes. A Compact Flash memory of higher capacity will therefore be able to contain a
high number of recordings, each one of which will have a maximum size of 32Mbytes. For
the selection of memory type follow the below steps:
1. Move the cursor using arrows keys on field relative to “Memory type”, marked with blue
background:
Fig. 16: Memory type setting screen
2. Use F3 or F4 keys (alternatively touch MOD(+) o MOD(-)) to choose “INTERNAL” or
“EXTERNAL” memory type.
3. Press SAVE or ENTER keys (or the smart icon ) to save the selected option and
confirm by “Ok”. This selected parameter will be present also after turning off the
meter.
4. Press ESC key (or the smart icon ) to exit by screen without saving any modify
5.1.8. “Touch screen” calibration
This operation is necessary if any internal features of “touch screen” display are not
correctly positionated or not more selectable by using the PT400 pointer
1. Select the “TOUCH” item inside the “General settings” section. The message “Do You
want to calibrate touch screen?” is shown by the meter. Confirm with “Ok”. The
herewith screen is shown:
Press and briefly hold stylus on the center of the target.
Repeat as the target moves around the sceen.
Fig. 17: Touch screen calibration screen
2. By pressing and soft hold the PT400 pointer on the central point of the cross cursor
(see Fig. 17) move the cursor to the four corners of display
3. Switch off and thane turn on the meter by means of ON/OFF key to complete the
operation
EN - 16
Page 19
SOLAR300 - SOLAR300N
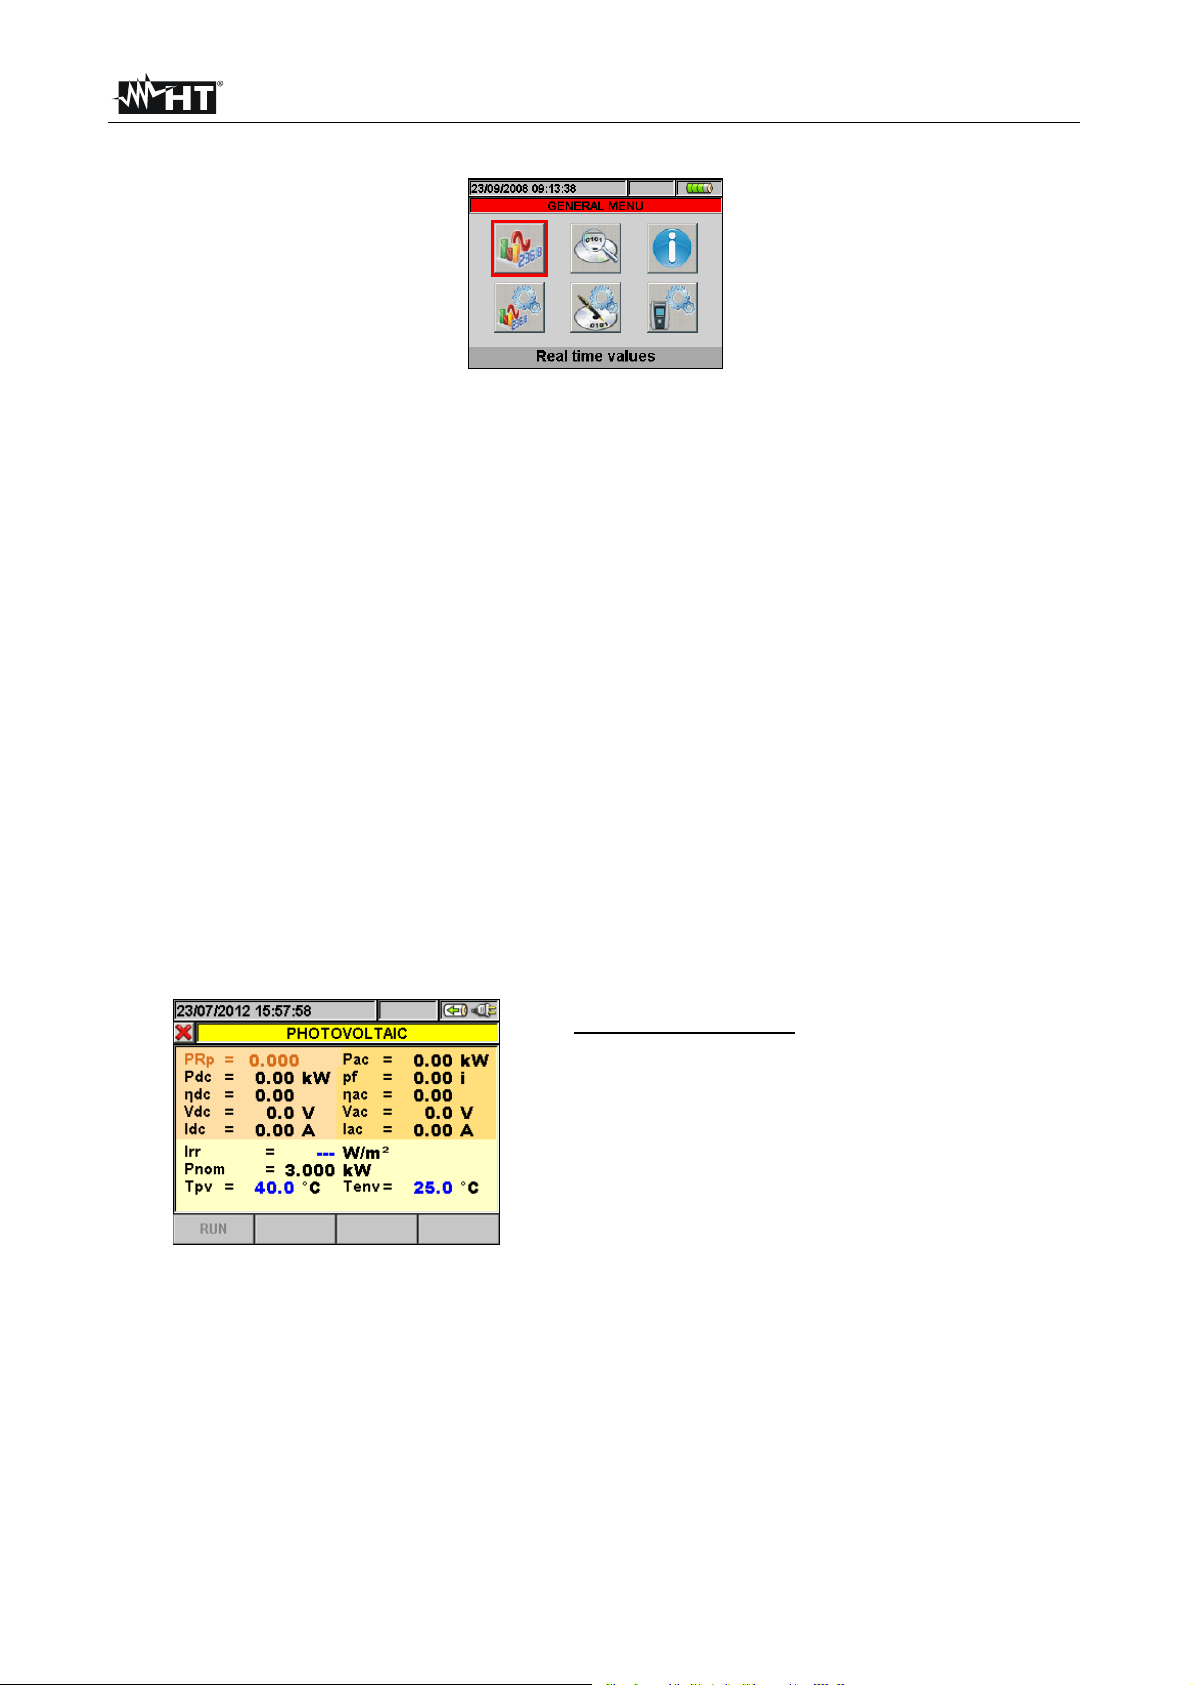
5.2. REAL TIME VALUES
Fig. 18: GENERAL MENU screen - Real time values section
In this section the real time measured values of parameters both on input channels and
internally calculated are shown by meter. In particular the following are shown:
1. Values of the electrical and environmental quantities (irradiation, temperature) of a
photovoltaic system for generating single-phase or three-phase electric power.
2. Values regarding the maximum efficiency point.
3. AC TRMS voltages, currents and all kind of electrical parameters for any single phase and
total, Flicker values and voltages Unbalanced.
4. Voltage and current waveforms for any single phase and total.
5. Voltage and current harmonics up to 49th component for any single phase and total both in
numerical and histograms graphical format in absolute or percentage value with respect to
each fundamental signal.
6. Vectorial diagrams of each vo ltage and current with the respective phase angles in order to
define the correct nature of system loads under test.
The type of data displayed is determined by the setting of the instrument in the Analyzer
Configuration mode (see §. 5.3). With reference to PV systems only, further in this manual, the
acronym MPPT (Multiple Power Point Tracker) shall indicate the characteristic of the DC/AC
converter (inverter), capable of maximizing the DC power which can be taken from the
photovoltaic field and the acronym PRp shall indicate the Performance Ratio evaluated through
active powers. See § 10.3 for further details.
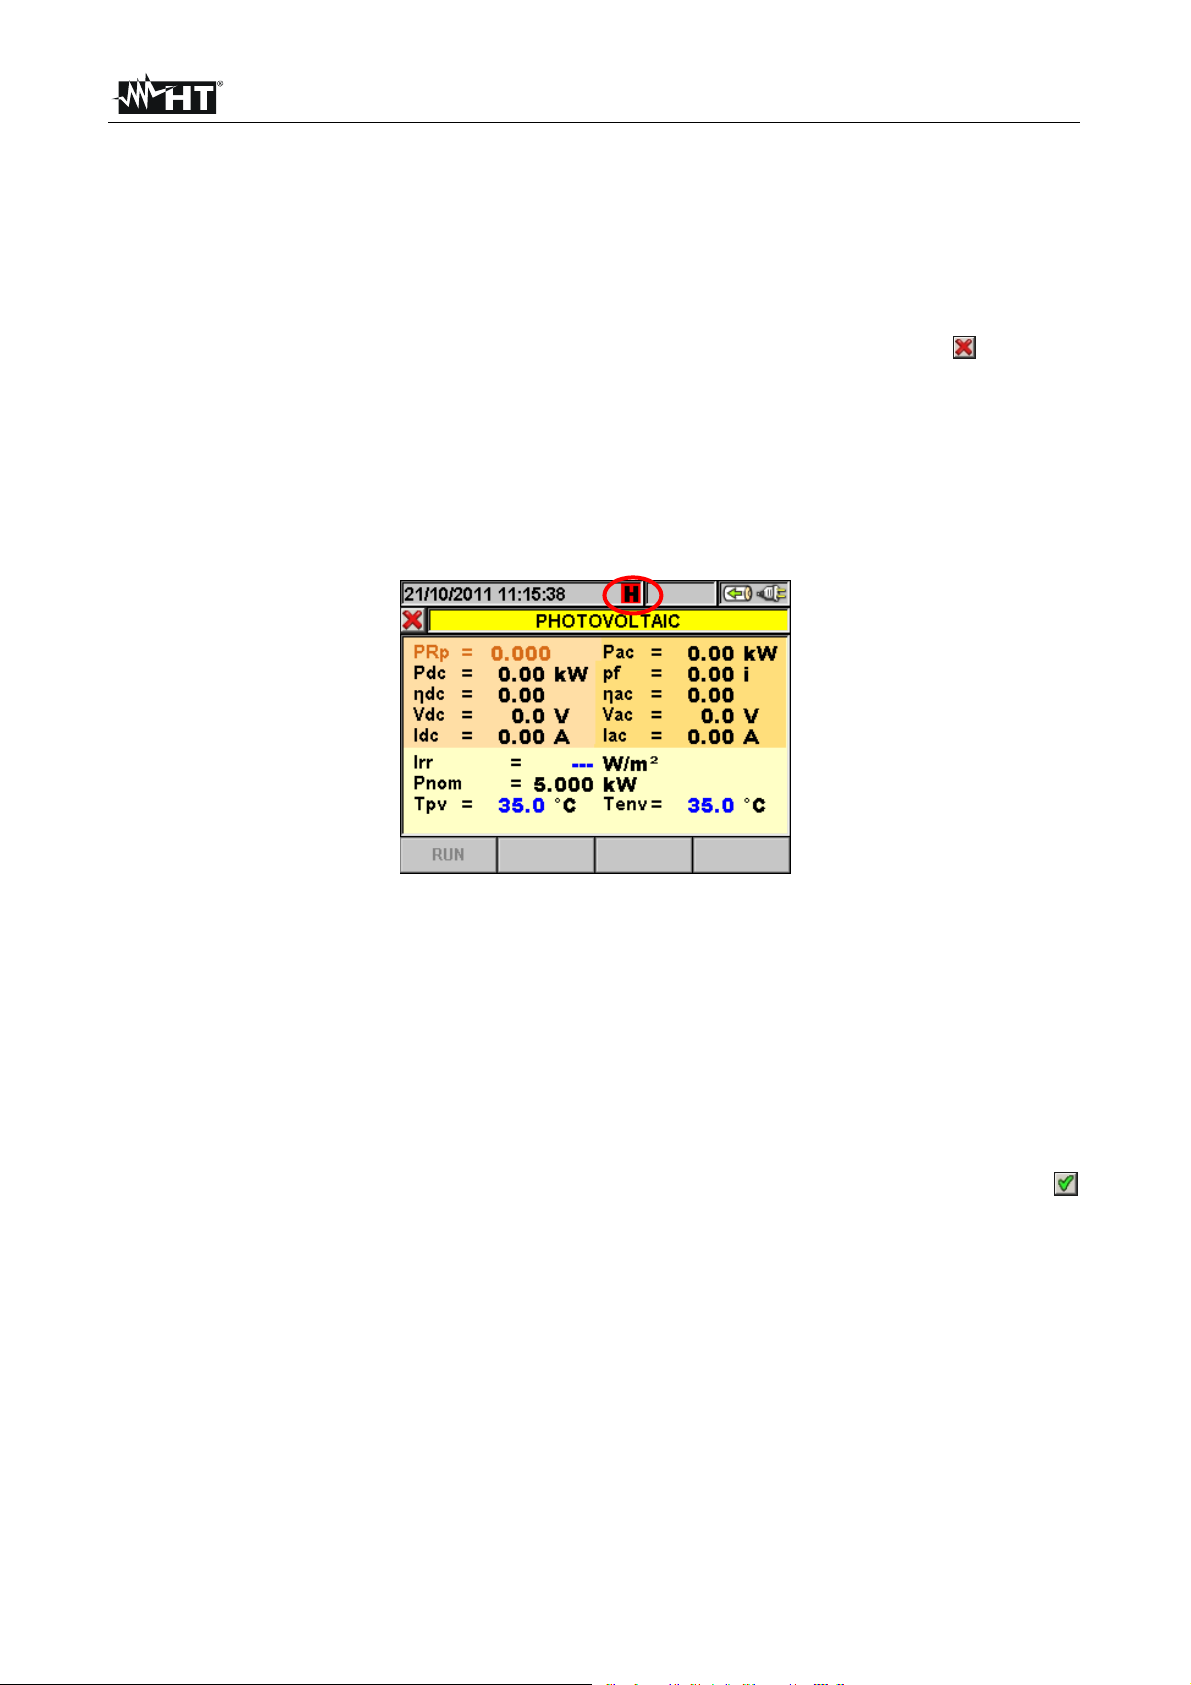
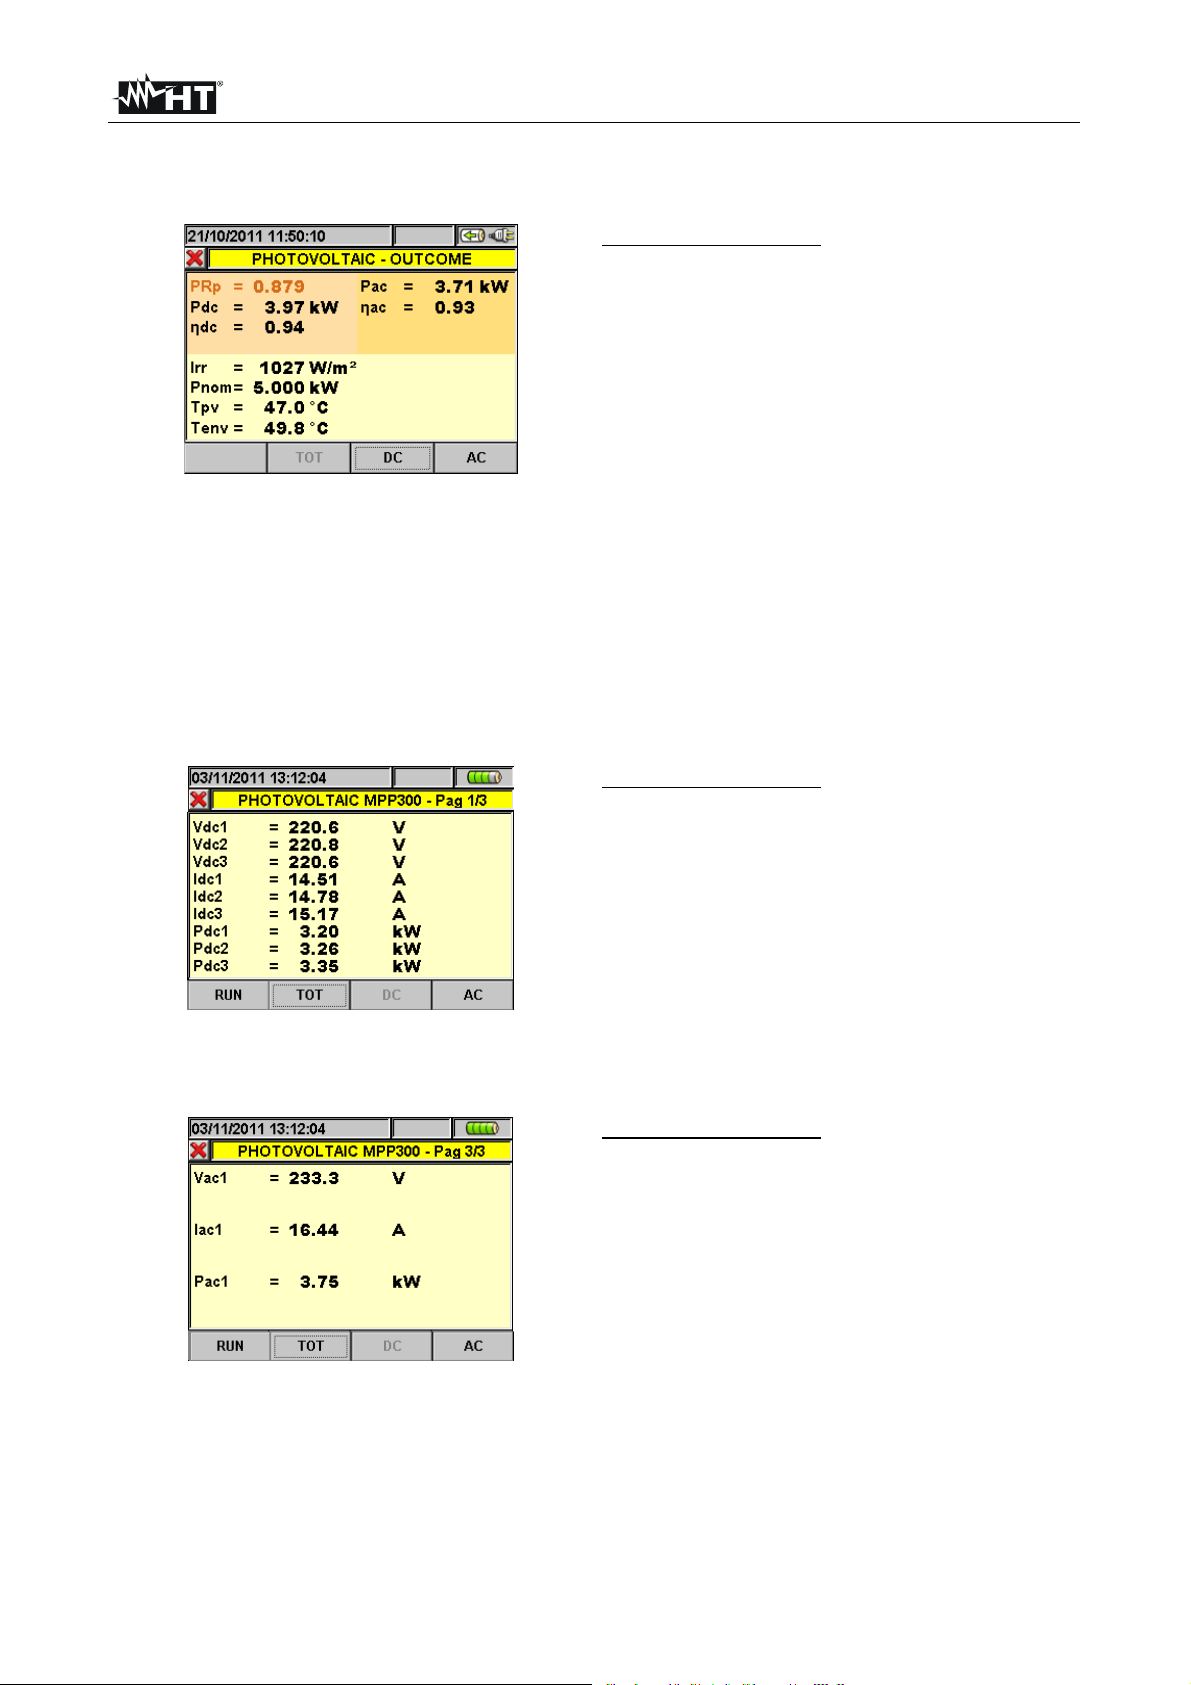
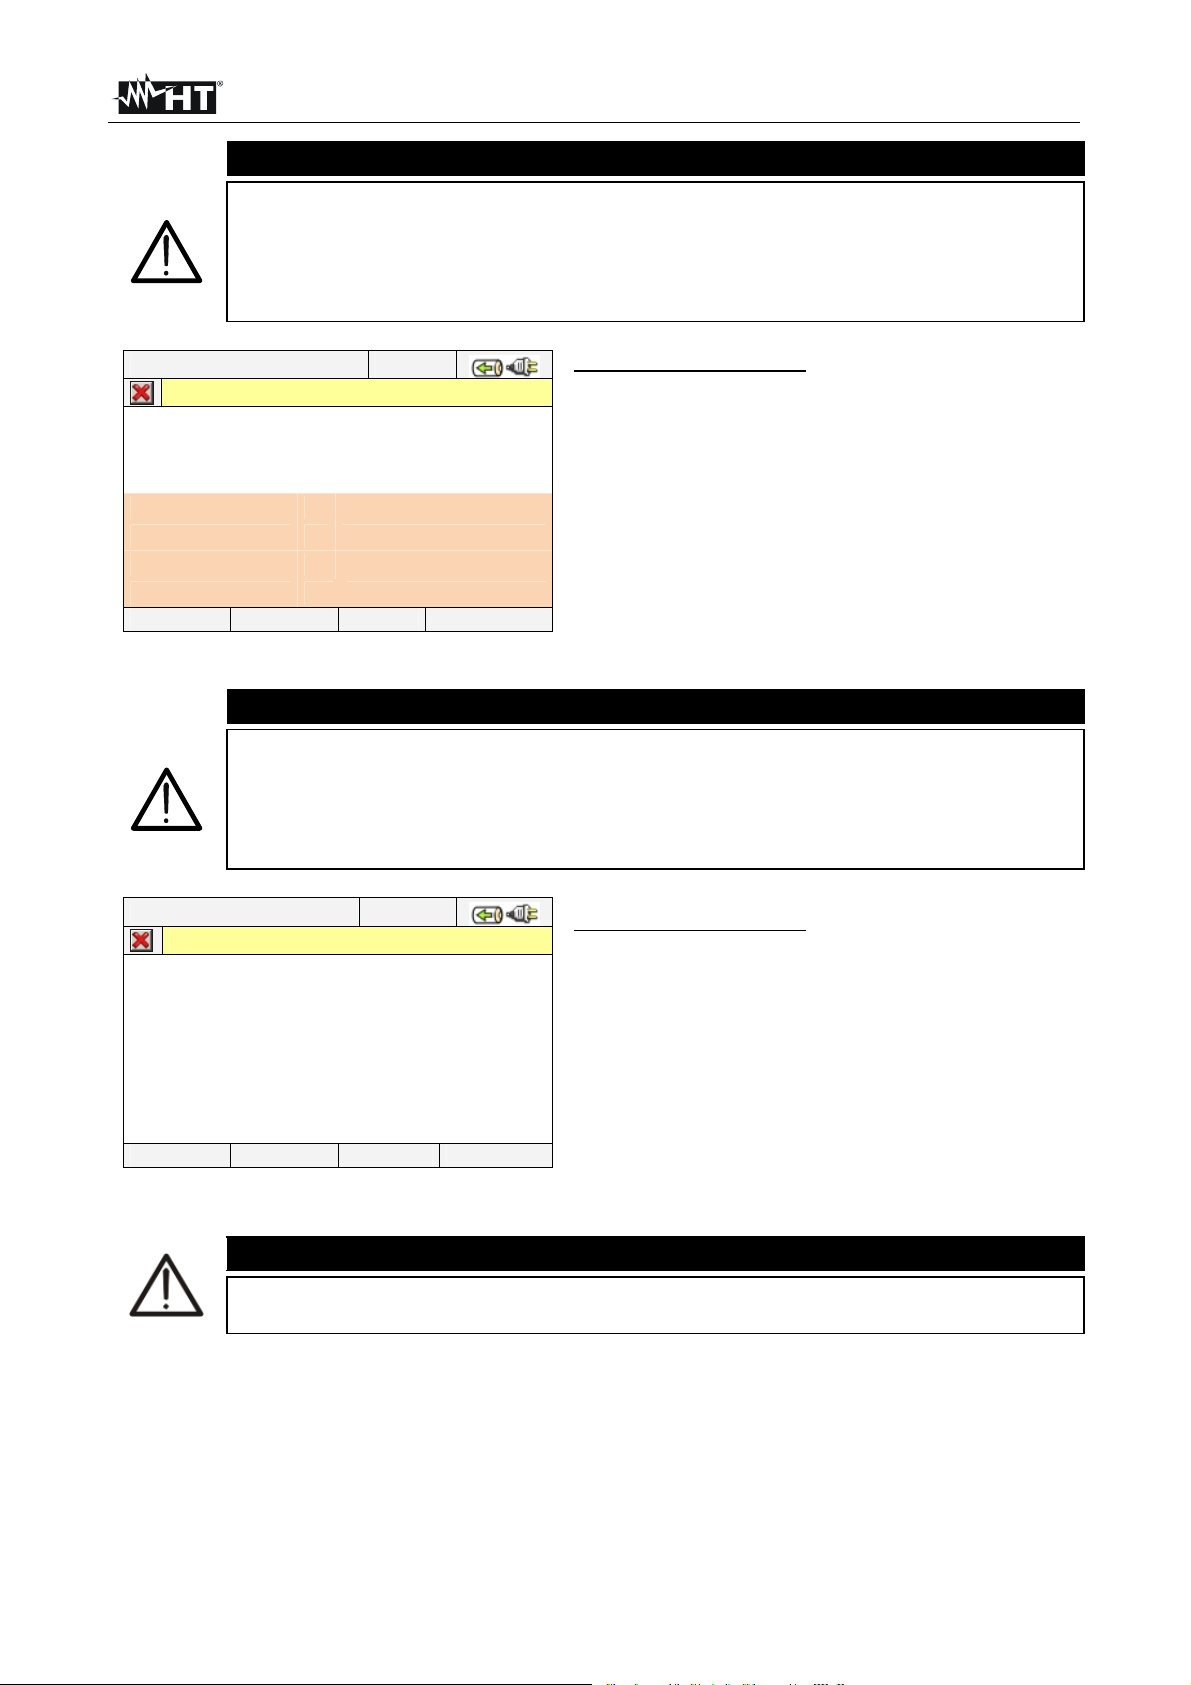
5.2.1. Single-MPPT photovoltaic system screen – Single-phase output
The instrument displays the following parameters:
DC
PV
AC
PARAMETERS CAPTION:
PRp: Performance Ratio (ref. active powers)
Pdc DC power at inverter input
Photovoltaic panel performance
DC
Vdc DC voltage at inverter input
Idc DC current at inverter input
Pac AC power at inverter output
Pf Power factor at inverter output
Inverter performance
AC
Vac AC voltage at inverter output
Iac AC current at inverter output
Tc Default temperature of photovoltaic panels
Te Default environmental tem perature
The display of the Te or Tc values in blue indicates that
the mentioned values are the default ones, as the ones
measured by SOLAR-0x are not available (see §
5.3.2.4). If the remote unit SOLAR-0x is connec ted to the
main unit, the following values are also available:
Irr Solar irradiation
Pnom Nominal power of the photovoltaic system
Tc Measured temperature of the phot. panels
Te Measured environmental temperature
Fig. 19: Page of single-phase photovoltaic systems
EN - 17
Page 20
SOLAR300 - SOLAR300N
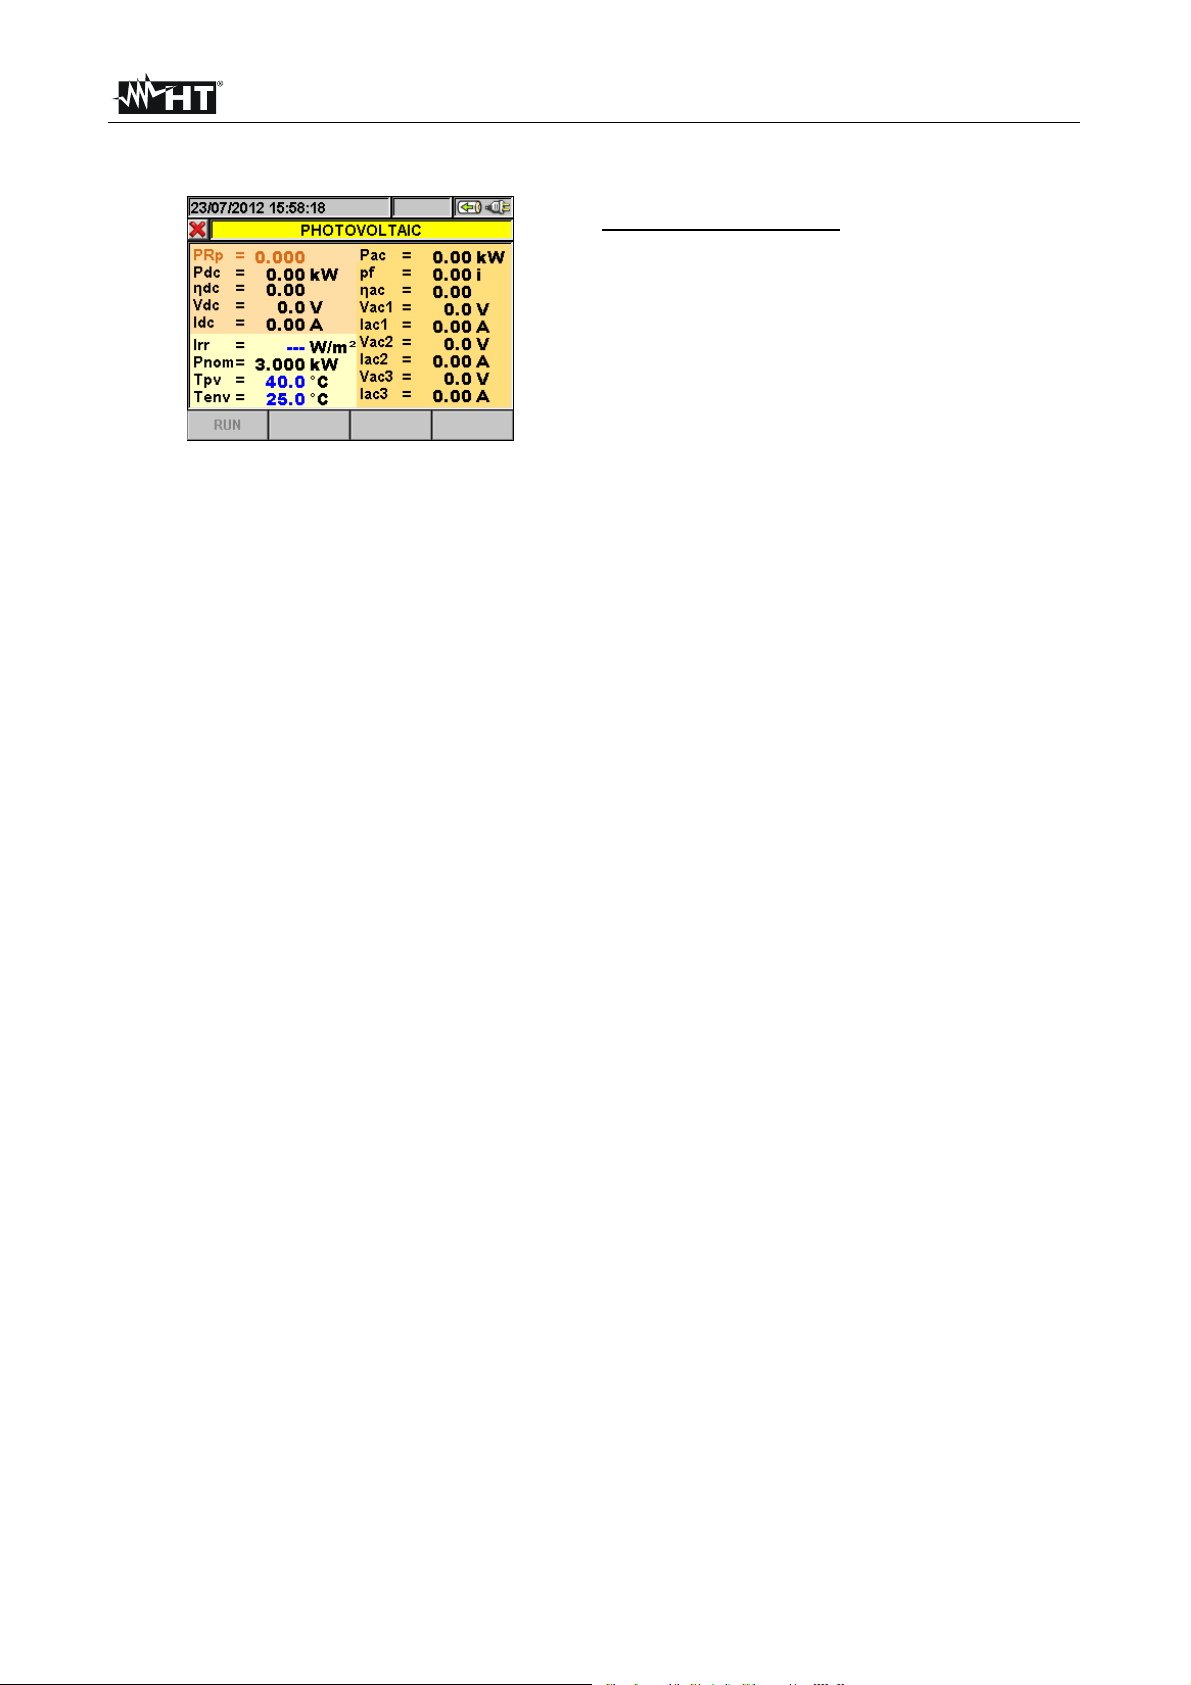
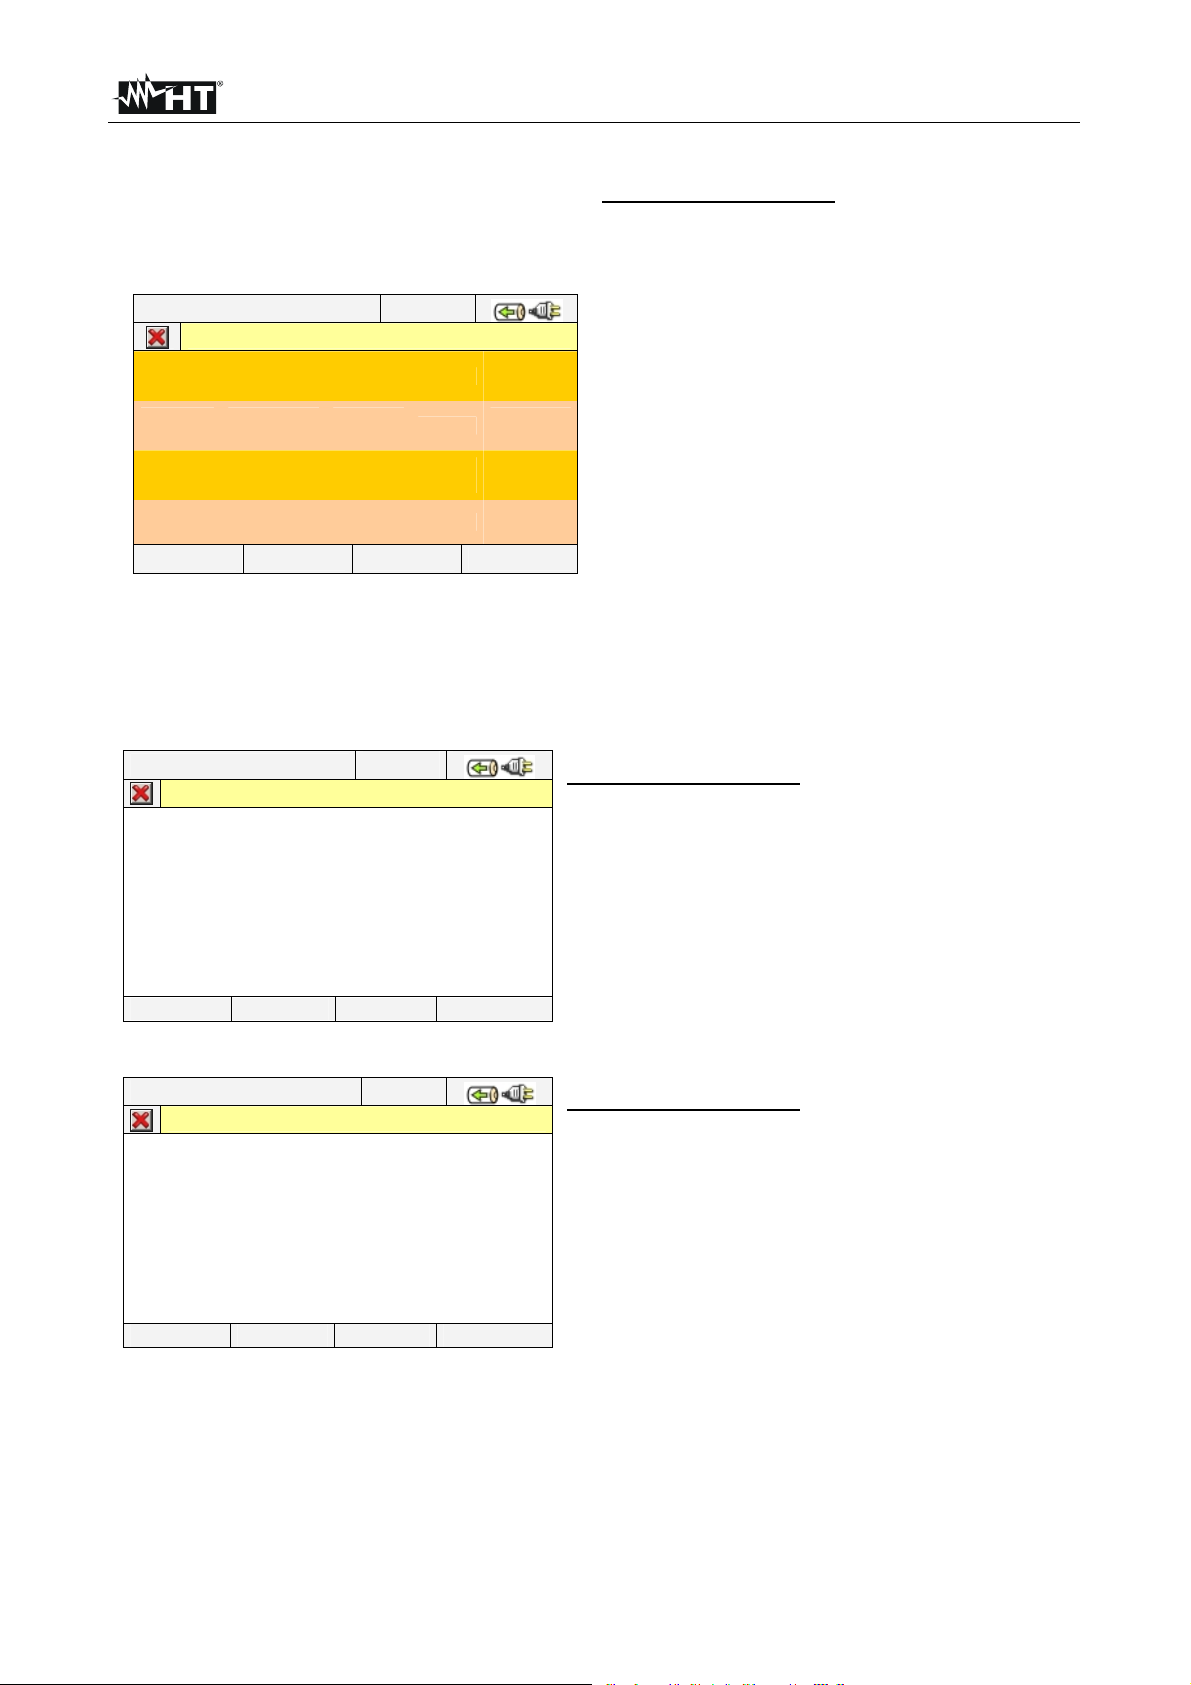
5.2.2. Single-MPPT photovoltaic system screen – Three-phase output
The instrument displays the following parameters:
DC
PV
AC
PARAMETERS CAPTION:
PRp: Performance Ratio (ref. active powers)
Pdc DC power at inverter input
Photovoltaic panel performance
DC
Vdc DC voltage at inverter input
Idc DC current at inverter input
Pac AC power at inverter output
Pf Three-phase power factor at inverter
output
Vac1,2,3 AC voltage at inverter output
Iac1,2,3 AC current at inverter output
Tpv Default temperature of photovoltaic panels
Tenv Default environmental temperature
The display of the Tenv or Tpv values in blue
indicates that the mentioned values are the
default ones, as the ones measured by SOLAR0x are not available (see § 5.3.2.4).
If the remote unit SOLAR-0x is connected to the
main, the following values are also available:
Irr Solar irradiation
Pnom Nominal power of the photovoltaic system
Tpv Measured temperature of the photovoltaic
panels
Tenv Measured environmental temperature
Three-phase inverter performance
AC
Fig. 20: Three-phase photovoltaic system page
5.2.3. Screen of photovoltaic systems with multi-MPPT inverter (only with MPP300)
For the sake of simplicity, further in this manual, the word “string” will be used, although
often the term “photovoltaic field” would be more correct. From the point of view of the
instrument, the management of a single string or of more parallel strings (photovoltaic
field) is identical.
The instrument SOLAR300N, used together with remote units SOLAR-02 and MPP300
(optional), allows testing PV systems characterized by inverters with 1 or more MPPTs
connected to the relevant PV fields (consisting in PV modules with the same direction and
inclination) and single-phase or three-phase output.
The remote unit MPP300 communicates with SOLAR300N (to manage data setting,
synchronization and download) through the USB connection cable and with the remote
unit SOLAR-02 (for recording irradiation and temperature values) via a wireless
radiofrequency (RF) connection, which is active up to a maximum distance of 1m between
the units.
For further details on the use of MPP300, please see the unit’s user manual.
EN - 18
Page 21
SOLAR300 - SOLAR300N
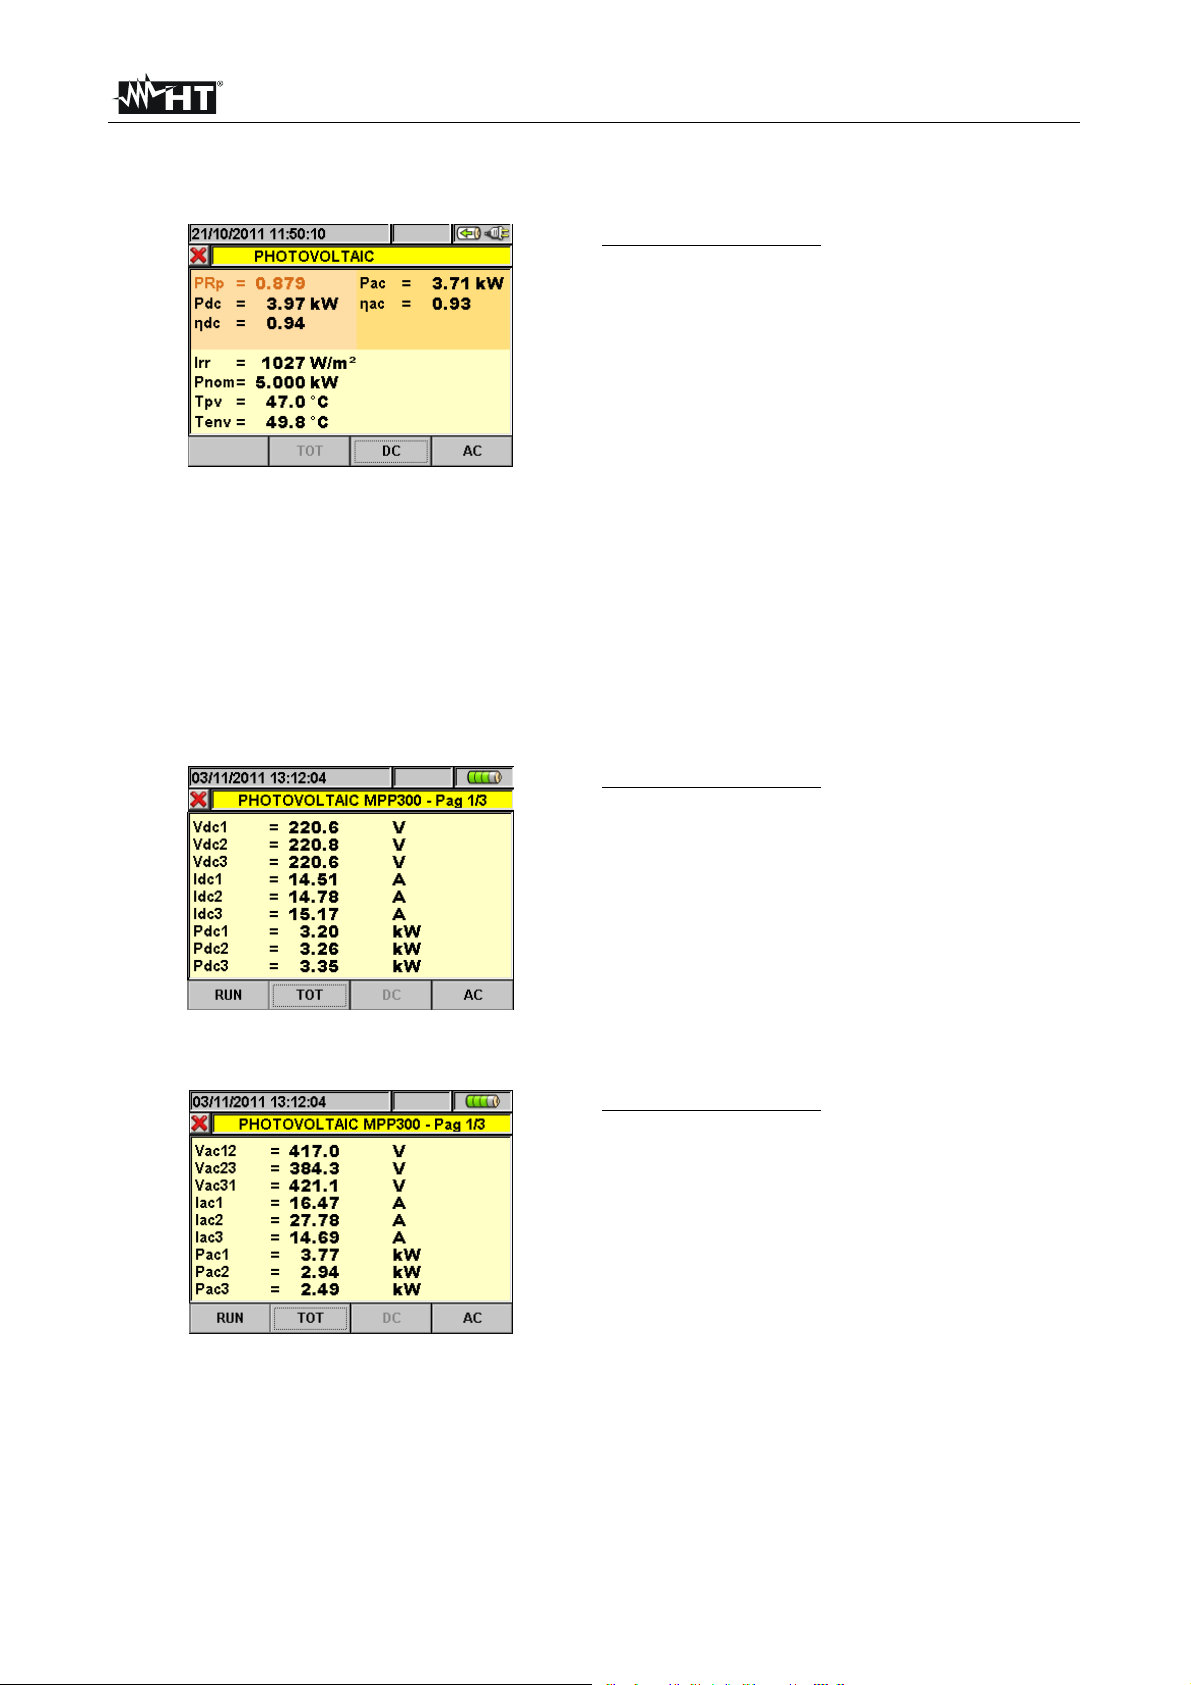
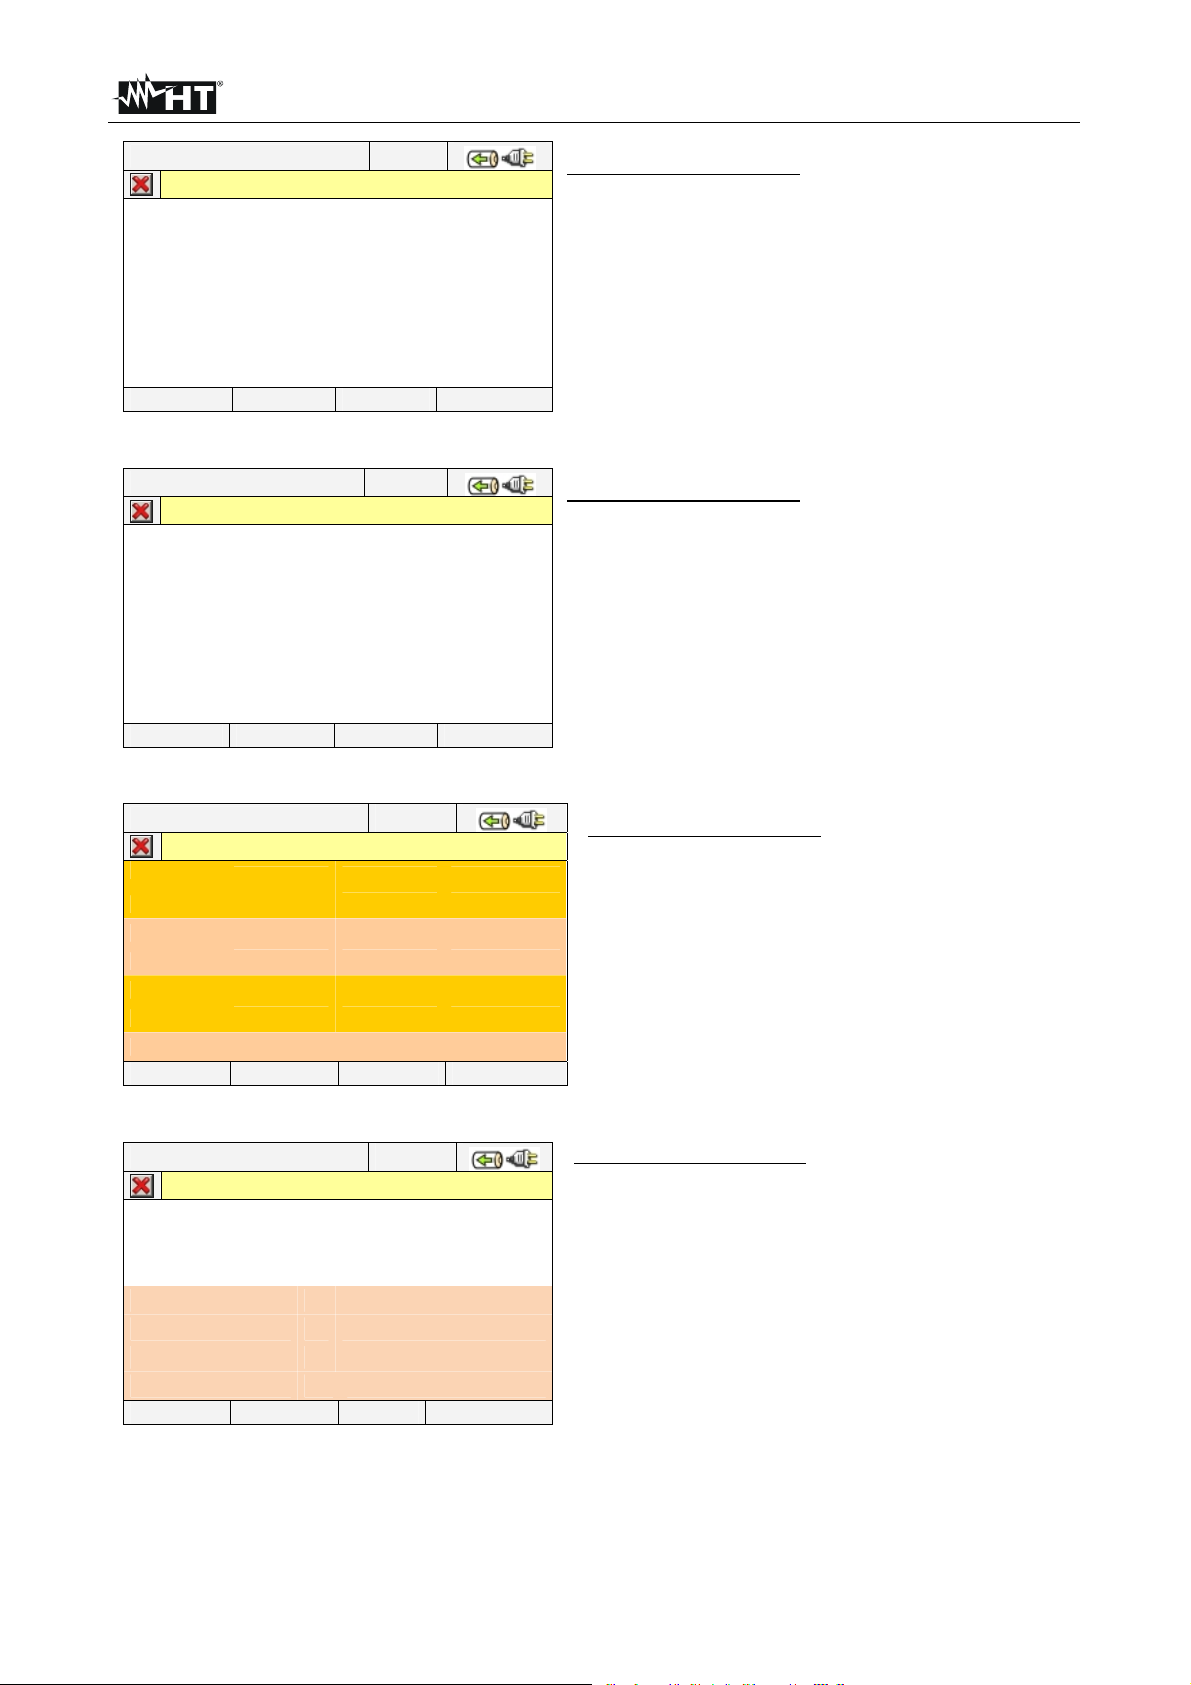
5.2.3.1. Multi-MPPT photovoltaic system screen – Single-phase output
When SOLAR300N is in connection with MPP300, the display shows the following
parameters:
DC
PV
AC
PARAMETER CAPTION:
PRp: Performance Ratio (ref. active powers)
Pdc Inverter input DC power
Photovoltaic panel performance
DC
Pac Inverter output AC power
Inverter performance
AC
Pnom Photovoltaic system rated power
If the remote unit SOLAR-02 is connected to the
MPP300, the following values are also available:
Irr Solar irradiation
Tpv Default photovoltaic panel temperature
Tenv Default environmental temperature
When Tenv or Tpv values are displayed in blue, it
means that these values are different from the
default ones, as those measured by SOLAR-02
are not available (see § 5.3.2.4)
Fig. 21: Multi-MPPT photovoltaic system screen – Single-phase output
Pressing the F3 (DC) key displays the following screen:
PARAMETER CAPTION:
Vdcx Inverter input DC voltage
Idcx Inverter input DC current
Pdcx Inverter input DC power
x=1,2,3 according to the number of MPPTs set
Fig. 22: Multi-MPPT photovoltaic system DC screen – Single-phase output
Pressing the F4 (AC) key displays the following screen:
PARAMETER CAPTION:
Vac1 Inverter output phase-neutral AC voltage
Iac1 Inverter output AC phase current
Pac1 Inverter output AC power
Fig. 23: Multi-MPPT photovoltaic system AC screen – Single-phase output
EN - 19
Page 22
SOLAR300 - SOLAR300N
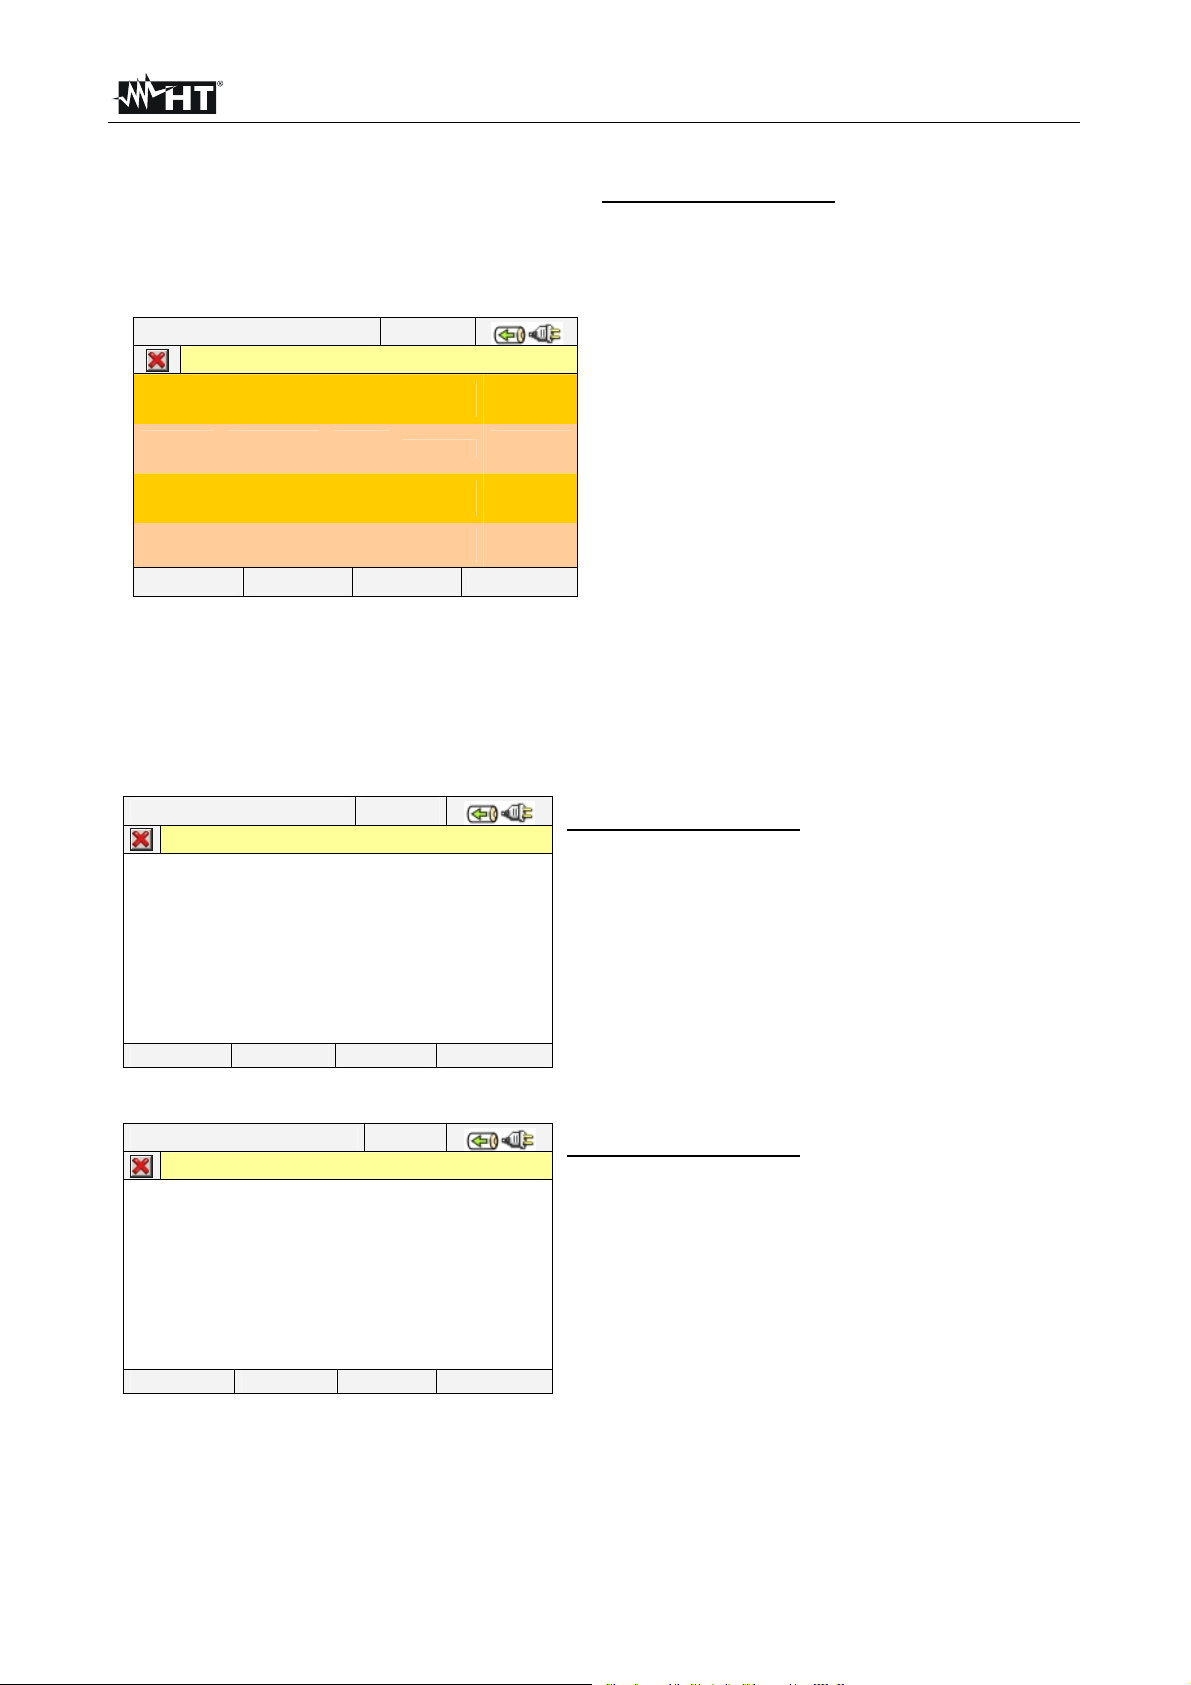
5.2.3.2. Multi-MPPT photovoltaic system screen – Three-phase output
When SOLAR300N is in connection with MPP300, the display shows the following
parameters:
DC
PV
AC
PARAMETER CAPTION:
PRp: Performance Ratio (ref. active powers)
Pdc Inverter input DC power
Photovoltaic panel performance
DC
Pac Inverter output AC power
Inverter performance
AC
Pnom Photovoltaic system rated power
If the remote unit SOLAR-02 is connected to the
MPP300, the following values are also available:
Irr Solar irradiation
Tpv Default photovoltaic panel temperature
Tenv Default environmental temperature
When Tenv or Tpv values are displayed in blue, it
means that these values are different from the
default ones, as those measured by SOLAR-02
are not available (see §5.3.2.4).
Fig. 24: Multi-MPPT photovoltaic system screen – Three-phase output
Pressing the F3 (DC) key displays the following screen:
PARAMETER CAPTION:
Vdcx Inverter input DC voltage
Idcx Inverter input DC current
Pdcx Inverter input DC power
x=1,2,3 according to the number of MPPTs set
Fig. 25: Multi-MPPT photovoltaic system DC screen – Three-phase output
Pressing the F4 (AC) key displays the following screen:
PARAMETER CAPTION:
Vacxy Inverter output phase x-phase y AC
voltage
Iacx Inverter output phase x AC current
Pacx Inverter output phase x AC power
x=1,2,3 - Phases of the system AC side
Fig. 26: Multi-MPPT photovoltaic system AC screen – Three-phase output
5.2.4. Value screens for NPV systems
Further in this manual the expression “Page x/y” will be used, to indicate that the current page
number (x) and the total number of pages (y) depend on the instrument settings. Pressing
cyclically F1 key or arrow keys left of right the meter shows the other pages of TRMS
measured values which are described in below pictures. Pressing ESC key to go back to
previous screens or back to GENERAL MENU
EN - 20
Page 23
SOLAR300 - SOLAR300N
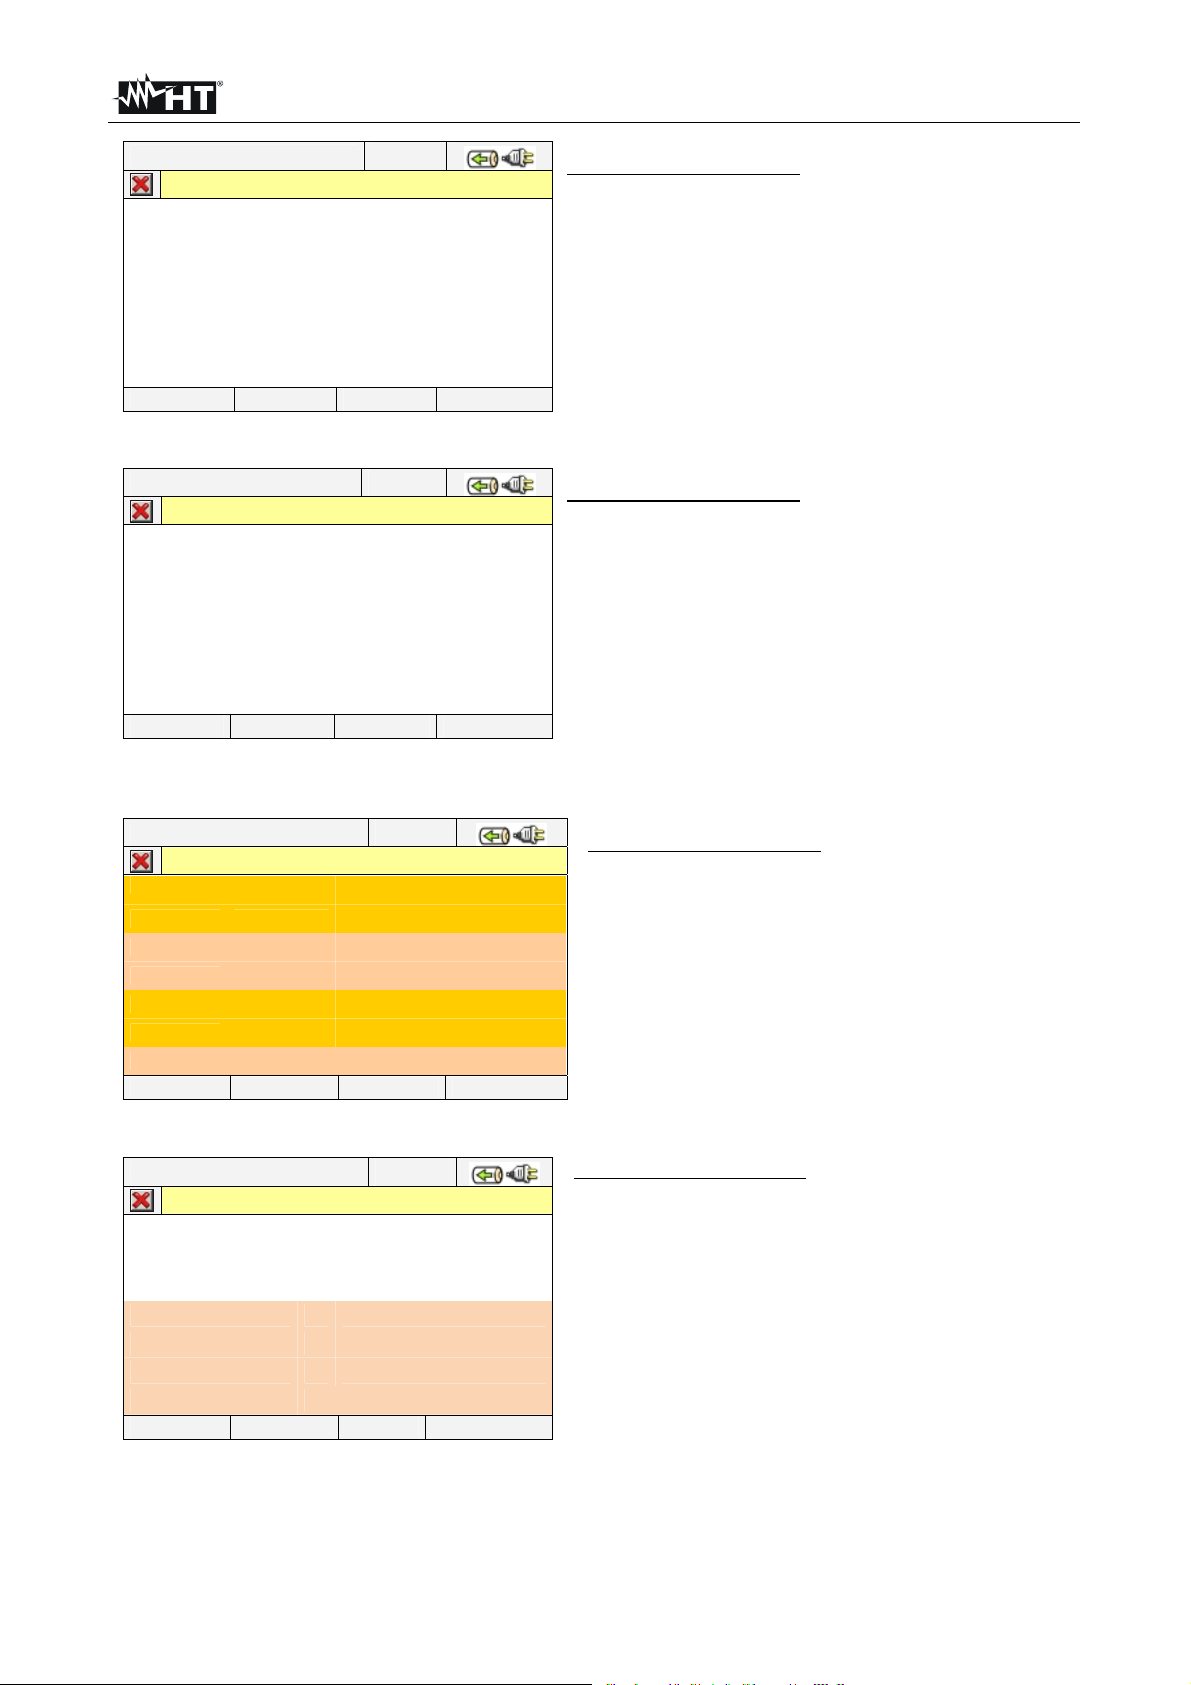
5.2.4.1. 4-wire three phase system – Screens sequence
PARAMETERS CAPTION
V1N Phase-Neutral voltage L1 phase
V2N Phase-Neutral voltage L2 phase
V3N Phase-Neutral voltage L3 phase
VNPE Neutral-Ground voltage
V12 Phase L1 – Phase L2 voltage
12/09/2006 – 16:55:10
TOTAL RMS VALUES – Page x/y
V1N
0.0
V12
0.0
NEG%
0.0
I1
0.0
PAGE SCOPE HARM VECTORS
V2N
0.0
V23
0.0
ZERO%
0.0
I2
0.0
V3N
0.0
V31
0.0
SEQ
000
I3
0.0
VNPE
0.0
Hz
0.0
IN
0.0 A
V
V
V23 Phase L2 – Phase L3 voltage
V23 Phase L3 – Phase L1 voltage
NEG% Un balance percentage of negative tern
ZERO% Unbalance percentage of zero tern
SEQ phases sequence indication as:
”123” = > Corrected
”132” = > Reversed
”023” = > Null voltage on the Black wire
”103” = > Null voltage on the Red wire
”120” = > Null voltage on the Brown wire
”100” = > Null voltage on the Red and Brown wires
”020” = > Null voltage on the Black and Brown wires
”003” = > Null voltage on the Black and Red wires
Hz Freque ncy
I1 Current on L1 phase
I2 Current on L2 phase
I3 Current on L3 phase
IN Current on Neutral
Fig. 27: Page of numerical values
12/09/2006 – 16:55:10
TOTAL POWER VALUES – Page x/y
Patt
Preatt
Papp
Pf
CosPhi
PAGE SCOPE HARM VECTORS
=
=
=
=
=
0 W
0 Var
0 VA
0.00i
0.00i
Fig. 28: Page of total power values
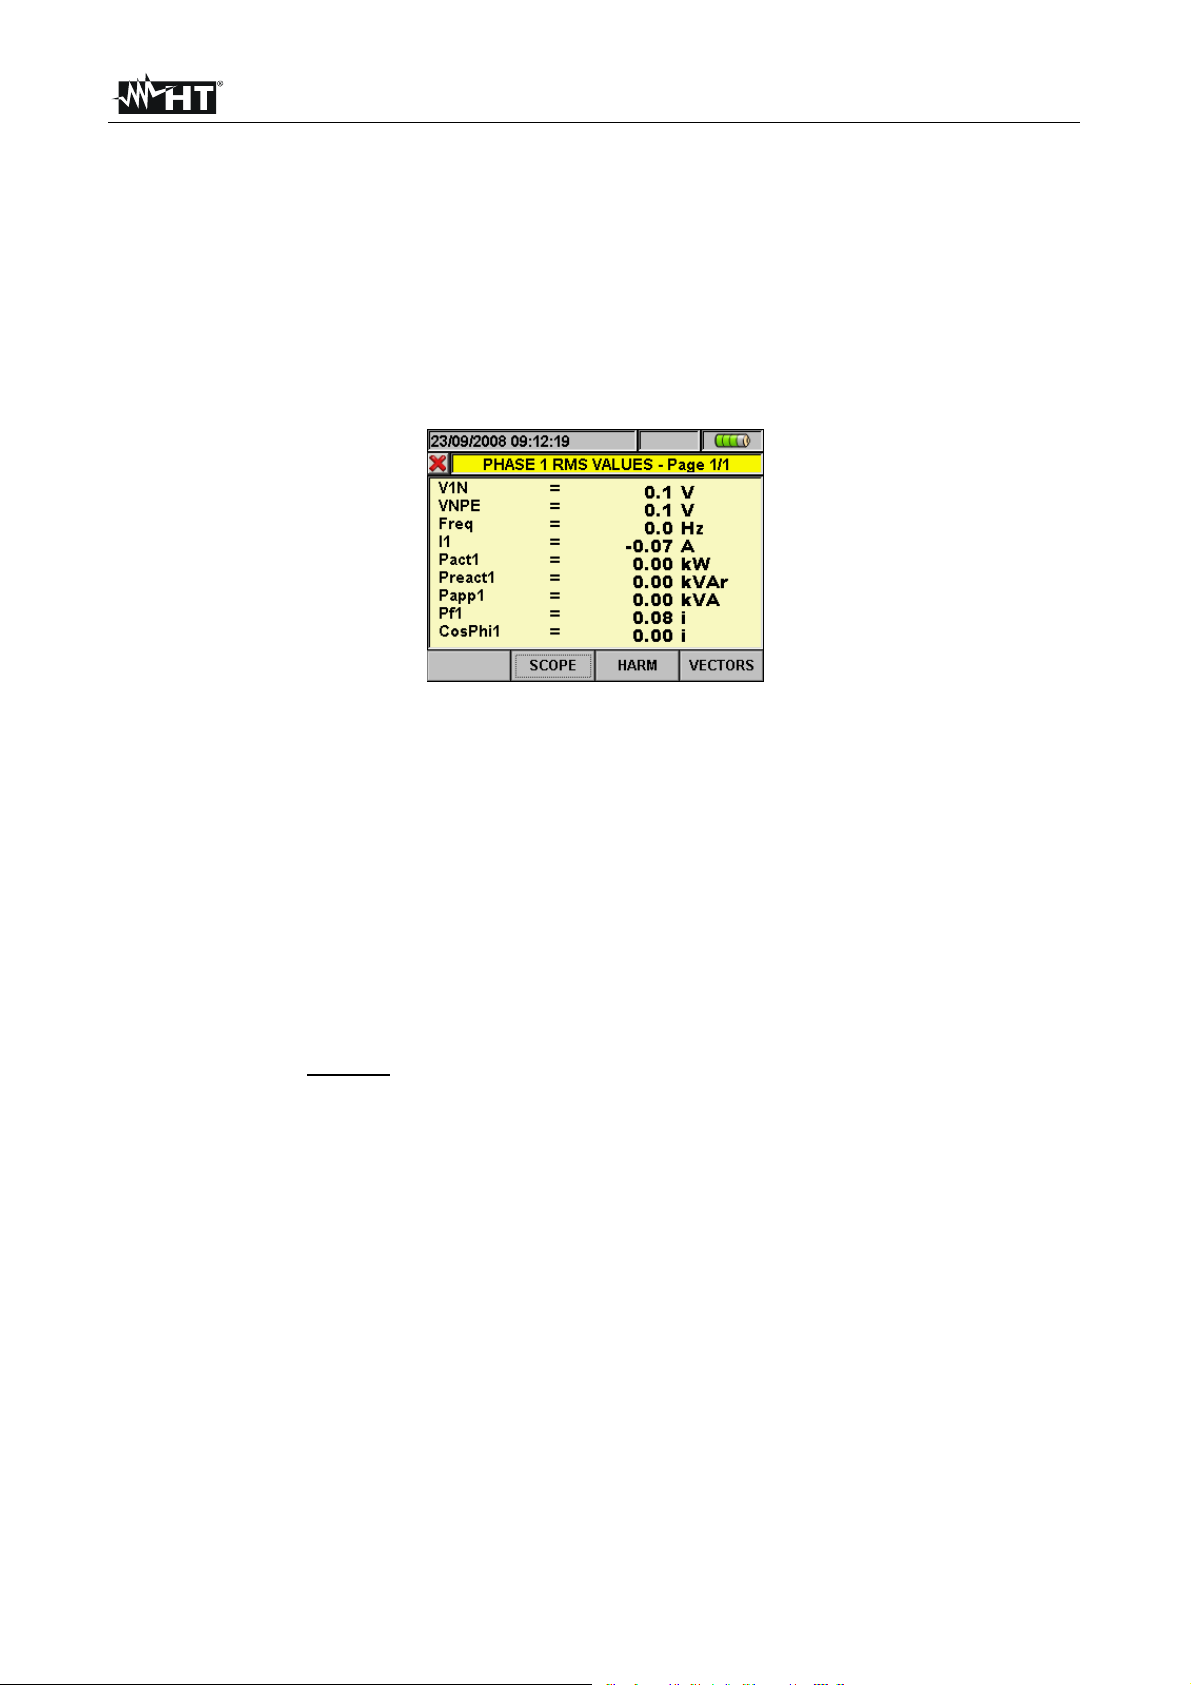
12/09/2006 – 16:55:10
PHASE 1 RMS VALUES – Page x/y
V1N
I1
Patt1
Preatt1
Papp1
Pf1
CosPhi1
=
=
=
=
=
=
=
0.0 V
0.0 A
0 W
0 Var
0 VA
0.00i
0.00i
PARAMETERS CAPTION:
Pact Total Active Power
Preact Total Reactive Power
Papp Total Apparent Power
Pf Total Power Factor
CosPhi Total Power factor considering fundamental
of voltage and current signals
PARAMETERS CAPTION:
V1N Phase-Neutral voltage L1 phase
I1 Current on L1 phase
Pact1 Active Power L1 phase
Preact1 Reactive Power L1 phase
Papp1 Apparent Power L1 phase
Pf1 Power factor L1 phase
CosPhi1 Power factor between fundamental of
voltage L1 and current L1
PAGE SCOPE HARM VECTORS
Fig. 29: Page of Phase 1 values
EN - 21
Page 24
SOLAR300 - SOLAR300N
12/09/2006 – 16:55:10
PHASE 2 RMS VALUES – Page x/y
V2N
I2
Patt2
Preatt2
Papp2
Pf2
CosPhi2
=
=
=
=
=
=
=
0.0 V
0.0 A
0 W
0 Var
0 VA
0.00i
0.00i
PARAMETERS CAPTION:
V2N Phase-Neutral voltage L2 phase
I2 Current on L2 phase
Pact2 Active Power L2 phase
Preact2 Reactive Power L2 phase
Papp2 Apparent Power L2 phase
Pf2 Power factor L2 phase
CosPhi2 Power factor between fundamental of
voltage L2 and current L2
PAGE SCOPE HARM VECTORS
Fig. 30: Page of Phase 2 values
12/09/2006 – 16:55:10
PHASE 3 RMS VALUES – Page x/y
V3N
I3
Patt3
Preatt3
Papp3
Pf3
CosPhi3
PAGE SCOPE HARM VECTORS
=
=
=
=
=
=
=
0.0 V
0.0 A
0 W
0 Var
0 VA
0.00i
0.00i
PARAMETERS CAPTION:
V3N Phase-Neutral voltage L3 phase
I3 Current on L3 phase
Pact3 Active Power L3 phase
Preact3 Reactive Power L3 phase
Papp3 Apparent Power L3 phase
Pf3 Power factor L3 phase
CosPhi3 Power factor between fundamental of
voltage L3 and current L3
Fig. 31: Page of Phase 3 values
12/09/2006 – 16:55:10
FLICKER – Page x/y
V1N V2N V3N
Pst1’ 0.0
Pst
Pst max
Plt
Plt max
Recording Time: 00h – 00min
PAGE SCOPE HARM VECTORS
0.0 0.0 0.0
0.0 0.0 0.0
0.0 0.0 0.0
0.0 0.0 0.0
0.0 0.0
Fig. 32: Page of Flicker values
25/01/2013 – 16:55:10
TOT. ENERGY CONSUMPTION – Page x/y
Eact = 0 kWh
Ppeak = 0 kW
Date Ppeak : -- / -- / -- 00:00:00
Start rec. : -- / -- / -- 00:00:0 0
Stop rec. : -- / -- / -- 00:00:00
Rec. Time : - - Int. Per. : - - - Rec: - -
PAGE SCOPE HARM VECTORS
Fig. 33: Consumed energy page
PARAMETERS CAPTION:
Pst1’ Short term severity after 1 minute
Pst Short term severity
Pstmax Maximum short term severity
Plt Long term severity
Pltmax Maximum long term severity
Recording Time real time duration of recording
expressed in HH:MM
PARAMETERS CAPTION:
Eact Total active energy consumed when starting
recording.
Ppeak Maximum peak of consumed active power.
Date Ppeak Date and time in which the peak occurred.
Start rec. Date when recording was started.
Stop rec. Date when recording was stopped.
Rec. Time Time elapsed from Rec Start.
Int. Per. Value of the set integration period.
Rec Number of the recording in progress
EN - 22
Page 25
SOLAR300 - SOLAR300N
CAUTION
The Total Consumed Energy page is shown only if the instrument has been
set for the Recording of the General Parameter Total “Active Power &
Energy” (see § 5.4.2.7). Values will be shown only during or at the end of a
recording and zeroed upon starting a new recording or when the instrument
is switched off
25/01/2013 – 16:55:10
TOT. ENERGY PRODUCTION – Page x/y
Eact = 0 kWh
Ppeak = 0 kW
Date Ppeak : -- / -- / -- 00:00:00
Start rec. : -- / -- / -- 00:00:0 0
Stop rec. : -- / -- / -- 00:00:00
Rec Time : - - Int. Per. : - - - Rec: - -
PAGE SCOPE HARM VECTORS
PARAMETERS CAPTION:
Eact Total active energy produced when starting
recording.
Ppeak Maximum peak of produced active power.
Date Ppeak Date and time in which the peak occurred.
Start rec. Date when recording was started.
Stop rec. Date when recording was stopped.
Rec Time Time elapsed from Rec Start.
Int. Per. Value of the set integration period.
Rec Number of the recording in progress
Fig. 34: Producted energy page
CAUTION
The Total Produced Energy page is shown only if recording parameter “Cogeneration” has been set in the instrument (see § 5.4.2.5) and if general
parameter Total “Active Power & Energy” has been selected (see § 5.4.2.7).
Values will be shown only during or at the end of a recording and zeroed
upon starting a new recording or when the instrument is switched off.
12/09/2006 – 16:55:10
AVERAGE RMS VALUE – Page 9/9
AVGV
AVGI
AVGPatt
AVGPreat
=
=
=
=
0.0 V
0.0 A
0 W
0 Var
PARAMETERS CAPTION:
AVGV Average value voltage V1, V2, V3
AVGI Average value current I1, I2, I3
AVGPact Average value active power on L1, L2, L3
AVGPreact Average value reactive power on
L1,L2,L3
PAGE SCOPE HARM VECTORS
Fig. 35: Page of numerical average values
The AVERAGE RMS VALUES page will be shown only if option AVERAGE
VALUES “YES” is enabled in the Advanced Settings section (see § 5.3.4.5)
CAUTION
EN - 23
Page 26
SOLAR300 - SOLAR300N
5.2.4.2. 3-wire three phase system – Screens sequence
PARAMETERS CAPTION:
V1PE Phase L1-PE voltage
V2PE Phase L2-PE voltage
V3PE Phase L3-PE voltage
V12 Phase L1 – Phase L2 voltage
12/09/2006 – 16:55:10
TOTAL RMS VALUES – Page x/y
V1PE
0.0
V12
0.0
NEG%
0.0
I1
0.0
PAGE SCOPE HARM VECTORS
V2PE
0.0
V23
0.0
ZERO%
0.0
I2
0.0
V3PE
0.0
V31
0.0
SEQ
000
I3
0.0
Hz
0.0
V
V
A
V23 Phase L2 – Phase L3 voltage
V23 Phase L3 – Phase L1 voltage
NEG% Unbalance percentage of negative tern
ZERO% Unbalance percentage of zero tern
SEQ phases sequence indication as:
”123” = > Corrected
”132” = > Reversed
”023” = > Null voltage on the Black wire
”103” = > Null voltage on the Red wire
”120” = > Null voltage on the Brown wire
”100” = > Null voltage on the Red and Brown wires
”020” = > Null voltage on the Black and Brown wires
”003” = > Null voltage on the Black and Red wires
Hz Frequency
I1 Current on L1 phase
I2 Current on L2 phase
I3 Current on L3 phase
Fig. 36: Page of numerical values
12/09/2006 – 16:55:10
TOTAL POWER VALUES – Page x/y
Patt
Preatt
Papp
Pf
CosPhi
PAGE SCOPE HARM VECTORS
=
=
=
=
=
0 W
0 Var
0 VA
0.00i
0.00i
Fig. 37: Page of total power values
12/09/2006 – 16:55:10
PHASE 1 RMS VALUES – Page 3/6
V1PE
I1
Patt1
Preatt1
Papp1
Pf1
CosPhi1
=
=
=
=
=
=
=
0.0 V
0.0 A
0 W
0 Var
0 VA
0.00i
0.00i
PARAMETERS CAPTION:
Pact Total Active Power
Preact Total Reactive Power
Papp Total Apparent Power
Pf Total Power Factor
CosPhi Total Power factor considering fundamental
of voltage and current signals
PARAMETERS CAPTION:
V1PE Phase L1-PE voltage
I1 Current on L1 phase
Pact1 Active Power L1 phase
Preact1 Reactive Power L1 phase
Papp1 Apparent Power L1 phase
Pf1 Power factor L1 phase
CosPhi1 Power factor between fundamental of
voltage L1 and current L1
PAGE SCOPE HARM VECTORS
Fig. 38: Page of numerical values of Phase 1
EN - 24
Page 27

SOLAR300 - SOLAR300N
12/09/2006 – 16:55:10
PHASE 2 RMS VALUES – Page 4/6
V2PE
I2
Patt2
Preatt2
Papp2
Pf2
CosPhi2
=
=
=
=
=
=
=
0.0 V
0.0 A
0 W
0 Var
0 VA
0.00i
0.00i
PARAMETERS CAPTION:
V2PE Phase L2-PE voltage
I2 Current on L2 phase
Pact2 Active Power L2 phase
Preact2 Reactive Power L2 phase
Papp2 Apparent Power L2 phase
Pf2 Power factor L2 phase
CosPhi2 Power factor between fundamental of
voltage L2 and current L2
PAGE SCOPE HARM VECTORS
Fig. 39: Page numerical values of Phase 2
12/09/2006 – 16:55:10
PHASE 3 RMS VALUES – Page x/y
V3PE
I3
Patt3
Preatt3
Papp3
Pf3
CosPhi3
PAGE SCOPE HARM VECTORS
=
=
=
=
=
=
=
0.0 V
0.0 A
0 W
0 Var
0 VA
0.00i
0.00i
PARAMETERS CAPTION:
V3PE Phase L3-PE voltage
I3 Current on L3 phase
Pact3 Active Power L3 phase
Preact3 Reactive Power L3 phase
Papp3 Apparent Power L3 phase
Pf3 Power factor L3 phase
CosPhi3 Power factor between fundamental of
voltage L3 and current L3
Fig. 40: Page numerical values of Phase 3
12/09/2006 – 16:55:10
FLICKER – Page x/y
V1PE V2PE V3PE
Pst1’ 0.0
Pst
Pst max
Plt
Plt max
Recording Time: 00h – 00min
PAGE SCOPE HARM VECTORS
0.0 0.0 0.0
0.0 0.0 0.0
0.0 0.0 0.0
0.0 0.0 0.0
0.0 0.0
Fig. 41: Page of Flicker values
25/01/2013 – 16:55:10
TOT. ENERGY CONSUMPTION – Page x/y
Eact = 0 kWh
Ppeak = 0 kW
Date Ppeak : -- / -- / -- 00:00:00
Start rec. : -- / -- / -- 00:00:0 0
Stop rec. : -- / -- / -- 00:00:00
Rec. Time : - - Int. Per. : - - - Rec: - -
PAGE SCOPE HARM VECTORS
Fig. 42: Consumed energy page
PARAMETERS CAPTION:
Pst1’ Short term severity after 1 minute
Pst Short term severity
Pstmax Maximum short term severity
Plt Long term severity
Pltmax Maximum long term severity
Recording Time real time duration of recording
expressed in HH:MM
PARAMETERS CAPTION:
Eact Total active energy consumed when starting
recording.
Ppeak Maximum peak of consumed active power.
Date Ppeak Date and time in which the peak occurred.
Start rec. Date when recording was started.
Stop rec. Date when recording was stopped.
Rec. Time Time elapsed from Rec Start.
Int. Per. Value of the set integration period.
Rec Number of the recording in progress
EN - 25
Page 28

SOLAR300 - SOLAR300N
CAUTION
The Total Consumed Energy page is shown only if the instrument has been
set for the Recording of the General Parameter Total “Active Power &
Energy” (see § 5.4.2.7). Values will be shown only during or at the end of a
recording and zeroed upon starting a new recording or when the instrument
is switched off
25/01/2013 – 16:55:10
TOT. ENERGY PRODUCTION – Page x/y
Eact = 0 kWh
Ppeak = 0 kW
Date Ppeak : -- / -- / -- 00:00:00
Start rec. : -- / -- / -- 00:00:0 0
Stop rec. : -- / -- / -- 00:00:00
Rec Time : - - Int. Per. : - - - Rec: - -
PAGE SCOPE HARM VECTORS
PARAMETERS CAPTION:
Eact Total active energy produced when starting
recording.
Ppeak Maximum peak of produced active power.
Date Ppeak Date and time in which the peak occurred.
Start rec. Date when recording was started.
Stop rec. Date when recording was stopped.
Rec Time Time elapsed from Rec Start.
Int. Per. Value of the set integration period.
Rec Number of the recording in progress
Fig. 43: Producted energy page
CAUTION
The Total Produced Energy page is shown only if recording parameter “Cogeneration” has been set in the instrument (see § 5.4.2.5) and if general
parameter Total “Active Power & Energy” has been selected (see § 5.4.2.7).
Values will be shown only during or at the end of a recording and zeroed
upon starting a new recording or when the instrument is switched off.
5.2.4.3. 3-wire ARON three phase system – Screens sequence
12/09/2006 – 16:55:10
TOTAL RMS VALUES – Page x/y
V12
0.0
NEG%
0.0
I1
0.0
PAGE SCOPE HARM VECTORS
V23
0.0
ZERO%
0.0
I2
0.0
V31
0.0
SEQ
000
I3
0.0
Hz
0.0
Fig. 44: Page of numerical values
V
A
PARAMETERS CAPTION:
V12 Phase L1 – Phase L2 voltage
V23 Phase L2 – Phase L3 voltage
V23 Phase L3 – Phase L1 voltage
NEG% Unbalance percentage of negative tern
ZERO% Unbalance percentage of zero tern
SEQ phases sequence indication as:
”123” = > Corrected
”132” = > Reversed
”023” = > Null voltage on the Black wire
”103” = > Null voltage on the Red wire
”120” = > Null voltage on the Brown wire
”100” = > Null voltage on the Red and Brown wires
”020” = > Null voltage on the Black and Brown wires
”003” = > Null voltage on the Black and Red wires
Hz Frequency
I1 Current on L1 phase
I2 Current on L2 phase
I3 Current on L3 phase
EN - 26
Page 29
SOLAR300 - SOLAR300N
12/09/2006 – 16:55:10
V12
I1
Patt12
Preatt12
Papp12
Pf12
CosPhi12
WATTMETER12 – Page x/y
=
=
=
=
=
=
=
0.0 V
0.0 A
0 W
0 Var
0 VA
0.00i
0.00i
PARAMETERS CAPTION:
V12 Phase L1 – Phase L2 voltage
I1 Current on L1 phase
Pact12 Active Power Wattmeter 12
Preact12 Reactive Power VARmeter 12
Papp12 Apparent Power VAmeter 12
Pf12 Power Factor Wattmeter 12
CosPhi12 Power Factor between fundamental of
voltage and current Wattmeter 12
PAGE SCOPE HARM VECTORS
Fig. 45: Page of numerical values Wattmeter-Varmeter 1-2
12/09/2006 – 16:55:10
V32
I3
Patt32
Preatt32
Papp32
Pf32
CosPhi32
WATTMETER32 – Page 4/5
=
=
=
=
=
=
=
0.0
V
0.0
A
0 W
0
Var
0 VA
0.00i
0.00i
PAGE SCOPE HARM VECTORS
PARAMETERS CAPTION:
V32 Phase L3 – Phase L2 voltage
I3 Current on L3 phase
Pact32 Active Power Wattmeter 32
Preact32 Reactive Power VARmeter 32
Papp32 Apparent Power VAmeter 32
Pf32 Power Factor Wattmeter 32
CosPhi32 Power Factor between fundamental of
voltage and current Wattmeter 32
Fig. 46: Page of numerical values Wattmeter-Varmeter 3-2
12/09/2006 – 16:55:10
FLICKER – Page 5/5
V12 V23 V31
Pst1’ 0.0
Pst
Pst max
Plt
Plt max
Recording Time: 00h – 00min
PAGE SCOPE HARM VECTORS
0.0 0.0 0.0
0.0 0.0 0.0
0.0 0.0 0.0
0.0 0.0 0.0
0.0 0.0
Fig. 47: Page of Flicker values
25/01/2013 – 16:55:10
TOT. ENERGY CONSUMPTION – Page x/y
Eact = 0 kWh
Ppeak = 0 kW
Date Ppeak : -- / -- / -- 00:00:00
Start rec. : -- / -- / -- 00:00:0 0
Stop rec. : -- / -- / -- 00:00:00
Rec. Time : - - Int. Per. : - - - Rec: - -
PAGE SCOPE HARM VECTORS
Fig. 48: Consumed energy page
PARAMETERS CAPTION:
Pst1’ Short term severity after 1 minute
Pst Short term severity
Pstmax Maximum short term severity
Plt Long term severity
Pltmax Maximum long term severity
Recording Time real time duration of recording
expressed in HH:MM
PARAMETERS CAPTION:
Eact Total active energy consumed when starting
recording.
Ppeak Maximum peak of consumed active power.
Date Ppeak Date and time in which the peak occurred.
Start rec. Date when recording was started.
Stop rec. Date when recording was stopped.
Rec. Time Time elapsed from Rec Start.
Int. Per. Value of the set integration period.
Rec Number of the recording in progress
EN - 27
Page 30
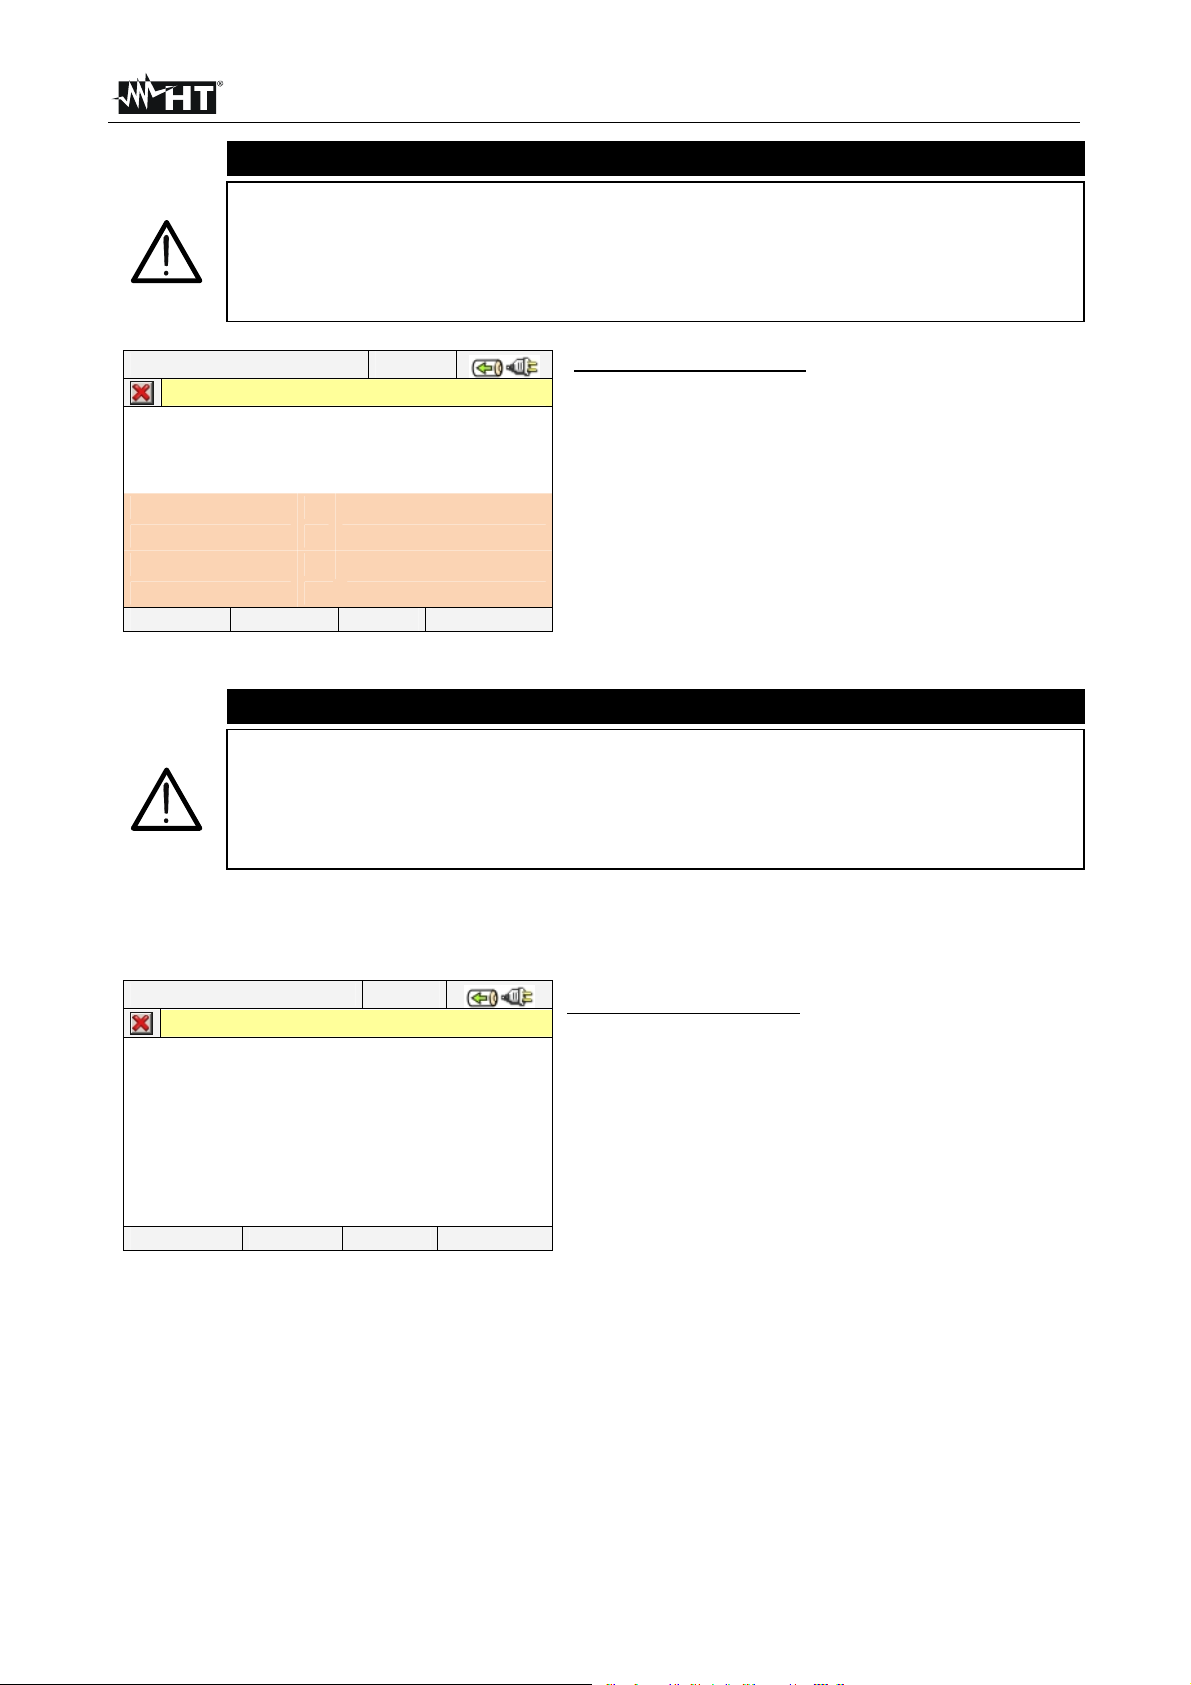
SOLAR300 - SOLAR300N
CAUTION
The Total Consumed Energy page is shown only if the instrument has been
set for the Recording of the General Parameter Total “Active Power &
Energy” (see § 5.4.2.7). Values will be shown only during or at the end of a
recording and zeroed upon starting a new recording or when the instrument
is switched off
25/01/2013 – 16:55:10
TOT. ENERGY PRODUCTION – Page x/y
Eact = 0 kWh
Ppeak = 0 kW
Date Ppeak : -- / -- / -- 00:00:00
Start rec. : -- / -- / -- 00:00:0 0
Stop rec. : -- / -- / -- 00:00:00
Rec Time : - - Int. Per. : - - - Rec: - -
PAGE SCOPE HARM VECTORS
PARAMETERS CAPTION:
Eact Total active energy produced when starting
recording.
Ppeak Maximum peak of produced active power.
Date Ppeak Date and time in which the peak occurred.
Start rec. Date when recording was started.
Stop rec. Date when recording was stopped.
Rec Time Time elapsed from Rec Start.
Int. Per. Value of the set integration period.
Rec Number of the recording in progress
Fig. 49: Producted energy page
CAUTION
The Total Produced Energy page is shown only if recording parameter “Cogeneration” has been set in the instrument (see § 5.4.2.5) and if general
parameter Total “Active Power & Energy” has been selected (see § 5.4.2.7).
Values will be shown only during or at the end of a recording and zeroed
upon starting a new recording or when the instrument is switched off.
5.2.4.4. Single phase system – Screens sequence
12/09/2006 – 16:55:10
PHASE 1 RMS VALUES – Page x/y
V1N
VNPE
Freq
I1
Patt1
Preatt1
Papp1
Pf1
CosPhi1
PAGE SCOPE HARM VECTORS
=
=
=
=
=
=
=
=
=
0.0 V
0.0 V
0.0 Hz
0.0 A
0.0 W
0.0 VAr
0.0 VA
0.00i
0.00i
PARAMETERS CAPTION:
V1N Phase-Neutral voltage L1 phase
VNPE Neutral-Ground voltage
Freq Frequency
I1
Pact1 Active Power L1 phase
Preact1 Reactive Power L1 phase
Papp1 Apparent Power L1 phase
Pf1 Power factor L1 phase
CosPhi1 Power factor between fundamental of
voltage L1 and current L1
Current on L1 phase
Fig. 50: Page of numerical values
EN - 28
Page 31

SOLAR300 - SOLAR300N
12/09/2006 – 16:55:10
Pst1’ 0.0
Pst
Pst max
Plt
Plt max
Recording Time: 00h – 00min
PAGE SCOPE HARM VECTORS
FLICKER – Page 2/2
V1N
0.0
0.0
0.0
0.0
PARAMETERS CAPTION:
Pst1’ Short term severity after 1minute
Pst Short term severity
Pstmax Maximum short term severity
Plt Long term severity
Pltmax Maximum long term severity
Recording Time Real time duration of recording
expressed in HH:MM
Fig. 51: Page of Flicker values
25/01/2013 – 16:55:10
TOT. ENERGY CONSUMPTION – Page x/y
Eact = 0 kWh
Ppeak = 0 kW
Date Ppeak : -- / -- / -- 00:00:00
Start rec. : -- / -- / -- 00:00:0 0
Stop rec. : -- / -- / -- 00:00:00
Rec. Time : - - Int. Per. : - - - Rec: - -
PAGE SCOPE HARM VECTORS
PARAMETERS CAPTION:
Eact Total active energy consumed when starting
recording.
Ppeak Maximum peak of consumed active power.
Date Ppeak Date and time in which the peak occurred.
Start rec. Date when recording was started.
Stop rec. Date when recording was stopped.
Rec. Time Time elapsed from Rec Start.
Int. Per. Value of the set integration period.
Rec Number of the recording in progress
Fig. 52: Consumed energy page
CAUTION
The Total Consumed Energy page is shown only if the instrument has been
set for the Recording of the General Parameter Total “Active Power &
Energy” (see § 5.4.2.7). Values will be shown only during or at the end of a
recording and zeroed upon starting a new recording or when the instrument
is switched off
25/01/2013 – 16:55:10
TOT. ENERGY PRODUCTION – Page x/y
Eact = 0 kWh
Ppeak = 0 kW
Date Ppeak : -- / -- / -- 00:00:00
Start rec. : -- / -- / -- 00:00:0 0
Stop rec. : -- / -- / -- 00:00:00
Rec Time : - - Int. Per. : - - - Rec: - -
PAGE SCOPE HARM VECTORS
PARAMETERS CAPTION:
Eact Total active energy produced when starting
recording.
Ppeak Maximum peak of produced active power.
Date Ppeak Date and time in which the peak occurred.
Start rec. Date when recording was started.
Stop rec. Date when recording was stopped.
Rec Time Time elapsed from Rec Start.
Int. Per. Value of the set integration period.
Rec Number of the recording in progress
Fig. 53: Producted energy page
CAUTION
The Total Produced Energy page is shown only if recording parameter “Cogeneration” has been set in the instrument (see § 5.4.2.5) and if general
parameter Total “Active Power & Energy” has been selected (see § 5.4.2.7).
Values will be shown only during or at the end of a recording and zeroed
upon starting a new recording or when the instrument is switched off.
EN - 29
Page 32

SOLAR300 - SOLAR300N
5.2.5. SCOPE waveforms screens
Starting from a any page of numerical values it’s possible to select waveforms screens of
the input signals by pressing F2 key (or touch SCOPE at display). By pressing cyclically
F1 key the below screens are shown by meter:
Simultaneous waveforms of voltages V1, V2, V3 and neutral voltage Vn (for three
phase 4-wire system and single phase), with their TRMS values as shown in below
screens:
12/09/2006 – 16:55:10
SCOPE VOLTAGES – Page 1/5
Fs 400.0V
V1 223.4V
V2 228.5V
V3 225.7V
Vn 0.0V
PAGE
Fig. 54: Voltage waveforms screen for 4-wire systems
12/09/2006 – 16:55:10
PAGE
SCOPE VOLTAGES – Page 1/5
Fs 400.0V
V12 378.4V
V23 382.5V
V31 379.4V
Fig. 55: Voltage waveforms screen for 3-wire systems and ARON
12/09/2006 – 16:55:10
PAGE ZOOM I
SCOPE PHASE1 – Page 1/1
Fs 400.0V
V1 228.3V
Vn 0.0V
Fs 20.0A
I1 10.2A
Fig. 56: Voltage/Current waveform screen for Single phase systems
EN - 30
Page 33

SOLAR300 - SOLAR300N
Simultaneous waveforms of currents I1, I2, I3 and neutral current In (for three phase 4-
wire system) with their TRMS values as shown in below screens:
12/09/2006 – 16:55:10
PAGE
SCOPE CURRENTS – Page 2/5
Fs 400.0A
I1 299.4A
I2 302.5A
I3 297.7A
In 97.8 A
Fig. 57: Current waveforms screen for 4-wire systems
12/09/2006 – 16:55:10
PAGE
SCOPE CURRENTS – Page 2/5
Fs 400.0A
I1 299.4A
I2 302.5A
I3 297.7A
Fig. 58: Current waveforms screen for 3-wire systems and ARON
Waveforms of signals on L1 phase, with their TRMS values, as below shown:
12/09/2006 – 16:55:10
SCOPE PHASE1 – Page 3/5
Fs 400.0V
V1 223.4V
Fs 400.0A
I1 299.4A
PAGE ZOOM V
Fig. 59: Voltage/Current waveforms screen L1 phase for 4-wire and 3-wire systems
12/09/2006 – 16:55:10
PAGE ZOOM V
SCOPE PHASE1 – Page 3/5
Fs 400.0V
V12 382.4V
Fs 400.0A
I1 201.5A
Fig. 60: Voltage/Current waveforms screen L1 phase for ARON systems
EN - 31
Page 34

SOLAR300 - SOLAR300N
Waveforms of signals on L2 phase, with their TRMS values, as below shown:
12/09/2006 – 16:55:10
SCOPE PHASE2 – Page 4/5
Fs 400.0V
V2 228.5V
Fs 400.0A
I2 302.5A
PAGE ZOOM V
Fig. 61: Voltage/Current waveforms screen L2 phase for 4-wire systems
12/09/2006 – 16:55:10
SCOPE PHASE2 – Page 4/5
PAGE ZOOM V
Fs 400.0V
V23 389.6V
Fs 400.0A
I2 203.5A
Fig. 62: Voltage/Current waveforms screen L2 phase for 3-wire and ARON systems
Waveforms of signals on L3 phase, with their TRMS values, as below shown:
12/09/2006 – 16:55:10
SCOPE PHASE3 – Page 5/5
Fs 400.0V
V3 228.5V
Fs 400.0A
I3 297.7A
PAGE ZOOM V
Fig. 63: Voltage/Current waveforms screen L3 phase for 4-wire systems
12/09/2006 – 16:55:10
SCOPE PHASE3– Page 5/5
PAGE ZOOM V
Fs 400.0V
V31 386.6V
Fs 400.0A
I3 201.5A
Fig. 64: Voltage/Current waveforms screen L3 phase for 3-wire and ARON systems
In Manual mode inside Advanced Settings (see § 5.3.4.1) a customisation of full scale of
voltage and current graphic is possible in order to improve the resolution on readings. In
this situation pressing arrow keys ZOOM in or ZOOM out for increase or decrease the
value of desired full scale. Press F2 key to change from current full scale to voltage full
scale. Press ESC key (or the smart icon ) to quit waveforms screens and go back to
TRMS real time values screen.
EN - 32
Page 35

SOLAR300 - SOLAR300N
V
V
V
V
V
V
V
V
V
V
V
V
V
V
V
V
5.2.6. HARM analysis screens
Starting from any page of numerical values it’s possible to enter harmonics numerical
values and histogram graphics screens section for voltage and current input signals by
pressing F2 key (or touch HARM at display). By pressing cyclically F1 key the below
screens are shown by meter:
Harmonics values of V1, V2, V3 voltages and neutral voltage Vn (for three phase 4-
wire system), currents I1, I2, I3 and neutral current In with THD% values both with
histogram graphics and with numerical values in percentage or absolute value as below
shown:
12/09/2006 – 16:55:10
TOTAL HARM VOLTAGE – Page 1/5
h 01
Fs 100%
1h
2h
3h
nh
Thd
Thd
Thd
Thd
PAGE HARM I TABLE HARM PAG
12/09/2006 – 16:55:10
TOTAL HARM VOLTAGE – Page 1/5
100.0%
100.0%
100.0%
0.0%
6.5%
5.9%
4.3%
0.0%
PAGE HARM I TABLE HARM PAG
h 01
Fs 400.0V
1h
2h
3h
nh
Thd
Thd
Thd
Thd
228.6V
225.1V
230.7V
0.0V
6.5%
5.9%
4.3%
0.0%
Fig. 65: Harmonic analysis of voltages in percentage/absolute values for 4-wire systems
12/09/2006 – 16:55:10
TOTAL HARM VOLTAGE – Page 1/4
h 01
Fs 100%
12h
23h
31h
Thd
Thd
Thd
PAGE HARM I TABLE HARM PAG
12/09/2006 – 16:55:10
TOTAL HARM VOLTAGE – Page 1/4
100.0%
100.0%
100.0%
6.5%
5.9%
6.5%
PAGE HARM I TABLE HARM PAG
h 01
Fs 400.0V
12h
23h
31h
Thd
Thd
Thd
328.4V
389.6V
386.6V
6.5%
5.9%
4.3%
Fig. 66: Harmonic analysis of voltages in percentage/absolute values for 3-wire and ARON
12/09/2006 – 16:55:10
PHASE1 HARM VOLTAGE – Pag 1/2
h 01
Fs 100%
1h
Thd
PAGE HARM I TABLE HARM PAG
12/09/2006 – 16:55:10
PHASE1 HARM VOLTAGE – Pag 1/2
100.0%
6.5%
PAGE HARM I TABLE HARM PAG
h 01
Fs 400.0V
1h
Thd
228.6V
6.5%
Fig. 67: Harmonic analysis of voltages in percentage/absolute values for Single phase
In all case the full scale of graphs is automatically set from meter depending on measured
values.
EN - 33
Page 36

SOLAR300 - SOLAR300N
Change to currents screens by pressing F2 key (or touch “HARM I” at display). By
pressing F1 key (or the PAGE at display) the screens of total values and each phase
currents I1, I2, I3 and In. The main screens are below shown:
12/09/2006 – 16:55:10
TOTAL HARM CURRENT – Pag 1/5
12/09/2006 – 16:55:10
TOTAL HARM CURRENT – Pag 1/5
h 03
Fs 100%
I1h
I2h
I3h
Inh
Thd
Thd
Thd
Thd
PAGE HARM V TABLE HARM PAG
45.3%
48.7%
37.6%
0.0%
35.5%
32.8%
42.5%
0.0%
PAGE HARM V TABLE HARM PAG
Fig. 68: Harmonic analysis of currents percentage/absolute for 4-wire systems
12/09/2006 – 16:55:10
TOTAL HARM CURRENT – Page 1/4
PAGE HARM V TABLE HARM PAG
h 03
Fs 100%
I1h
I2h
I3h
Thd
Thd
Thd
45.3%
48.7%
37.6%
35.5%
32.8%
42.5%
12/09/2006 – 16:55:10
TOTAL HARM CURRENT – Page 1/4
PAGE HARM V TABLE HARM PAG
h 03
Fs 200.0A
I1h
I2h
I3h
Inh
Thd
Thd
Thd
Thd
h 03
Fs 200.0A
I1h
I2h
I3h
Thd
Thd
Thd
90.6A
97.4A
75.2A
0.0A
35.5%
32.8%
42.5%
0.0%
90.6A
97.4A
75.2A
35.5%
32.8%
42.5%
Fig. 69: Harmonic analysis currents percentage/absolute values for 3-wire and ARON
12/09/2006 – 16:55:10
PHASE1 HARM CURRENT – Page 1/1
h 03
Fs 100%
I1h
Thd
PAGE HARM V TABLE HARM PAG
12/09/2006 – 16:55:10
PHASE1 HARM CURRENT – Page 1/1
45.3%
35.5%
PAGE HARM V TABLE HARM PAG
h 03
Fs 200.0A
I1h
Thd
90.6A
35.5%
Fig. 70: Harmonic analysis of currents percentage/absolute for Single phase systems
Change to screens of numerical values tables of harmonics voltages and currents up to
49st both percentage and absolute value (see § 0) by pressing F3 key (or touch
“TABLE” at display), as shown in below pictures:
EN - 34
Page 37

SOLAR300 - SOLAR300N
12/09/2006 – 16:55:10
h[%] Phase 1 Phase 2 Phase 3 Neutral
Thd% 6.5
DC
h1
h2
h3
h4 0.0 0.0 0.0 0.0
HARM I GRAPHIC HARM PAG
VOLTAGE HARMONICS
5.9 4.3 0.0
0.0 0.0 0.0 0.0
100.0 100.0 100.0 0.0
0.0 0.0 0.0 0.0
1.8 2.3 1.5 0.0
12/09/2006 – 16:55:10
VOLTAGE HARMONICS
h[V] Phase 1 Phase 2 Phase 3 Neutral
Thd% 6.5
DC
h1
h2
h3
h4 0.0 0.0 0.0 0.0
0.0 0.0 0.0 0.0
228.6 225.1 230.7 0.0
0.0 0.0 0.0 0.0
4.2 5.3 3.4 0.0
HARM I GRAPHIC HARM PAG
5.9 4.3 0.0
Fig. 71: Harmonic analysis voltages in percentage/absolute for 4-wire systems
12/09/2006 – 16:55:10
h[%] Phase 1 Phase 2 Phase 3 Neutral
Thd% 35.5
DC
h1
h2
h3
h4 0.0 0.0 0.0
HARM V GRAPHIC HARM PAG
CURRENT HARMONICS
32.8 42.5 0.0
0.0 0.0 0.0 0.0
100.0 100.0 100.0 0.0
0.0 0.0 0.0 0.0
45.3 48.7 37.6 0.0
12/09/2006 – 16:55:10
CURRENT HARMONICS
h[A] Phase 1 Phase 2 Phase 3 Neutral
Thd% 35.5
DC
h1
h2
h3
h4 0.0 0.0 0.0
0.0
0.0 0.0 0.0 0.0
199.7 200.4 197.3 0.0
0.0 0.0 0.0 0.0
90.6 97.4 75.2 0.0
HARM V GRAPHIC HARM PAG
32.8 42.5 0.0
0.0
Fig. 72: Harmonic analysis currents in percentage/absolute for 4-wire systems
12/09/2006 – 16:55:10
VOLTAGE HARMONICS
h[%] Phase 1 Phase 2 Phase 3
Thd% 6.5
DC
h1
h2
h3
0.0 0.0 0.0
100.0 100.0 100.0
0.0 0.0 0.0
1.8 2.3 1.5
5.9 4.3
h4 0.0 0.0 0.0
HARM I GRAPHIC HARM PAG
12/09/2006 – 16:55:10
VOLTAGE HARMONICS
h[V] Phase 1 Phase 2 Phase 3
Thd% 6.5
DC
h1
h2
h3
0.0 0.0 0.0
228.6 225.1 230.7
0.0 0.0 0.0
4.2 5.3 3.4
5.9 4.3
h4 0.0 0.0 0.0
HARM I GRAPHIC HARM PAG
Fig. 73: Harmonic analysis voltages in percentage/absolute for 3-wire and ARON systems
12/09/2006 – 16:55:10
CURRENT HARMONICS
h[%] Phase 1 Phase 2 Phase 3
Thd% 35.5
DC
h1
h2
h3
0.0 0.0 0.0
100.0 100.0 100.0
0.0 0.0 0.0
45.3 48.7 37.6
32.8 42.5
h4 0.0 0.0 0.0
HARM V GRAPHIC HARM PAG
12/09/2006 – 16:55:10
CURRENT HARMONICS
h[A] Phase 1 Phase 2 Phase 3
Thd% 35.5
DC
h1
h2
h3
0.0 0.0 0.0
199.7 200.4 197.3
0.0 0.0 0.0
90.6 97.4 75.2
32.8 42.5
h4 0.0 0.0 0.0
HARM V GRAPHIC HARM PAG
Fig. 74: Harmonic analysis currents in percentage/absolute for 3-wire and ARON systems
EN - 35
Page 38

SOLAR300 - SOLAR300N
V
V
12/09/2006 – 16:55:10
h[%] Phase 1
Thd% 6.5
DC
h1
h2
h3
h4 0.0
HARM I GRAPHIC HARM PAG
VOLTAGE HARMONICS
0.0
100.0
0.0
1.8
12/09/2006 – 16:55:10
VOLTAGE HARMONICS
h[V] Phase 1
Thd% 6.5
DC
h1
h2
h3
h4 0.0
0.0
228.6
0.0
4.2
HARM I GRAPHIC HARM PAG
Fig. 75: Harmonic analysis voltage in percentage/absolute for Single phase system
12/09/2006 – 16:55:10
h[%] Phase 1
Thd% 35.5
DC
h1
h2
h3
h4 0.0
HARM V GRAPHIC HARM PAG
CURRENT HARMONICS
0.0
100.0
0.0
45.3
12/09/2006 – 16:55:10
CURRENT HARMONICS
h[A] Phase 1
Thd% 35.5
DC
h1
h2
h3
h4 0.0
0.0
199.7
0.0
90.6
HARM V GRAPHIC HARM PAG
Fig. 76: Harmonic analysis current in percentage/absolute for Single phase system
Press F3 key to back to graphical screens and F2 key to change voltages’ or currents’
screens. Press F4 key or the up and down arrows (or touch the “HARM PAG” at display)
to show the screens relative to other harmonics orders up to 49st.
Harmonics values of single V1, V2, V3 voltages and neutral voltage Vn and single
currents I1, I2, I3 and neutral current In (for three phase 4-wire system) with THD%
values both with histogram graphics and with numerical values in percentage or
absolute value depending on the desired settings. These values are shown in four
pages selectable by pressing cyclically the F1 key (or touch the “PAGE” at display). As
an example, the situation relative to L1 phase for voltage and current on 4-wire
systems is shown in the next pictures:
12/09/2006 – 16:55:10
PHASE1 HARM VOLTAGE – Pag 2/5
PAGE HARM I TABLE HARM PAG
h 01
Fs 100%
1h
Thd
12/09/2006 – 16:55:10
PHASE1 HARM VOLTAGE – Pag 2/5
100.0%
6.5%
PAGE HARM I TABLE HARM PAG
h 01
Fs
1h
Thd
400.0V
228.6V
6.5%
Fig. 77: Harmonic analysis voltage V1 in percentage/absolute values for 4-wire system
EN - 36
Page 39

SOLAR300 - SOLAR300N
12/09/2006 – 16:55:10
PHASE1 HARM CURRENT – Pag 2/5
h 03
Fs 100%
I1h
Thd
PAGE HARM V TABLE HARM PAG
12/09/2006 – 16:55:10
PHASE1 HARM CURRENT – Pag 2/5
45.3%
35.5%
PAGE HARM V TABLE HARM PAG
h 03
Fs 200.0A
I1h
Thd
90.6A
35.5%
Fig. 78: Harmonic analysis of current I1 in percentage/absolute values for 4-wire system
5.2.7. Vectorial diagrams screens
Starting from a any page of numerical values it’s possible to select the vectorial diagrams
screens of voltage and currents by pressing F4 key (or touch “VECTORS” at display). The
aim of this feature is to show, with numerical and graphical indications, the phase angles,
expressed in degree [°] between the three voltages V1, V2 and V3 and the currents I1, I2
and I3 in order to understand in each moment the inductive or capacitive loads nature of
electrical installations. By pressing cyclically F1 key the below screens are shown by
meter:
Vectorial diagram total of phase angles among V1, V2, V3 and between V1-I1, V2-I2,
V3-I3 more than indication of percentage values of “Rev%” e “Omo%” parameters (see
§ 10.8):
12/09/2006 – 16:55:10
TOTAL DIAGRAM – Seite 1/6
SEITE
Rev 0.0%
Omo
V1^ V2
V2^ V3
V3^ V1
V1^ I1
V2^ I2
V3^ I3
0.0%
120.0°
120.0°
120.0°
60.0°
60.0°
60.0°
Fig. 79: Vectorial diagram total for 4-wire system
12/09/2006 – 16:55:10
TOTAL DIAGRAM – Seite 1/6
SEITE
Rev 0.0%
Omo
V12^ V23
V23^ V31
V31^ V12
V1^ I1
V2^ I2
V3^ I3
0.0%
120.0°
120.0°
120.0°
60.0°
60.0°
60.0°
Fig. 80: Vectorial diagram total for 3-wire and ARON systems
:
EN - 37
Page 40

SOLAR300 - SOLAR300N
V1^ I1
60.0°
12/09/2006 – 16:55:10
PHASE1 DIAGRAM – Page 1/1
PAGE
Fig. 81: Vectorial diagram total for Single phase system
The vectorial diagram of single voltages depending on the type of selected systems as
shown in below screens:
12/09/2006 – 16:55:10
VOLTAGES DIAGRAM – Page 2/6
PAGE
NEG 0.0%
ZERO
V1^ V2
V2^ V3
V3^ V1
0.0%
120.0°
120.0°
120.0°
Fig. 82: Vectorial voltage diagram for 4-wire system
12/09/2006 – 16:55:10
VOLTAGES DIAGRAM – Page 2/6
NEG 0.0%
ZERO
V12^ V23
V23^ V31
V31^ V12
0.0%
120.0°
120.0°
120.0°
PAGE
Fig. 83: Vectorial voltage diagram for 3-wire and ARON systems
The vectorial diagram of currents for 4-wire, 3-wire and ARON systems as shown in
12/09/2006 – 16:55:10
CURRENTS DIAGRAM – Page 3/6
PAGE
I1^ I2
I2^ I3
I3^ I1
120.0°
120.0°
120.0°
Fig. 84: Vectorial currents diagram for 4-wire, 3-wire and ARON systems
EN - 38
Page 41
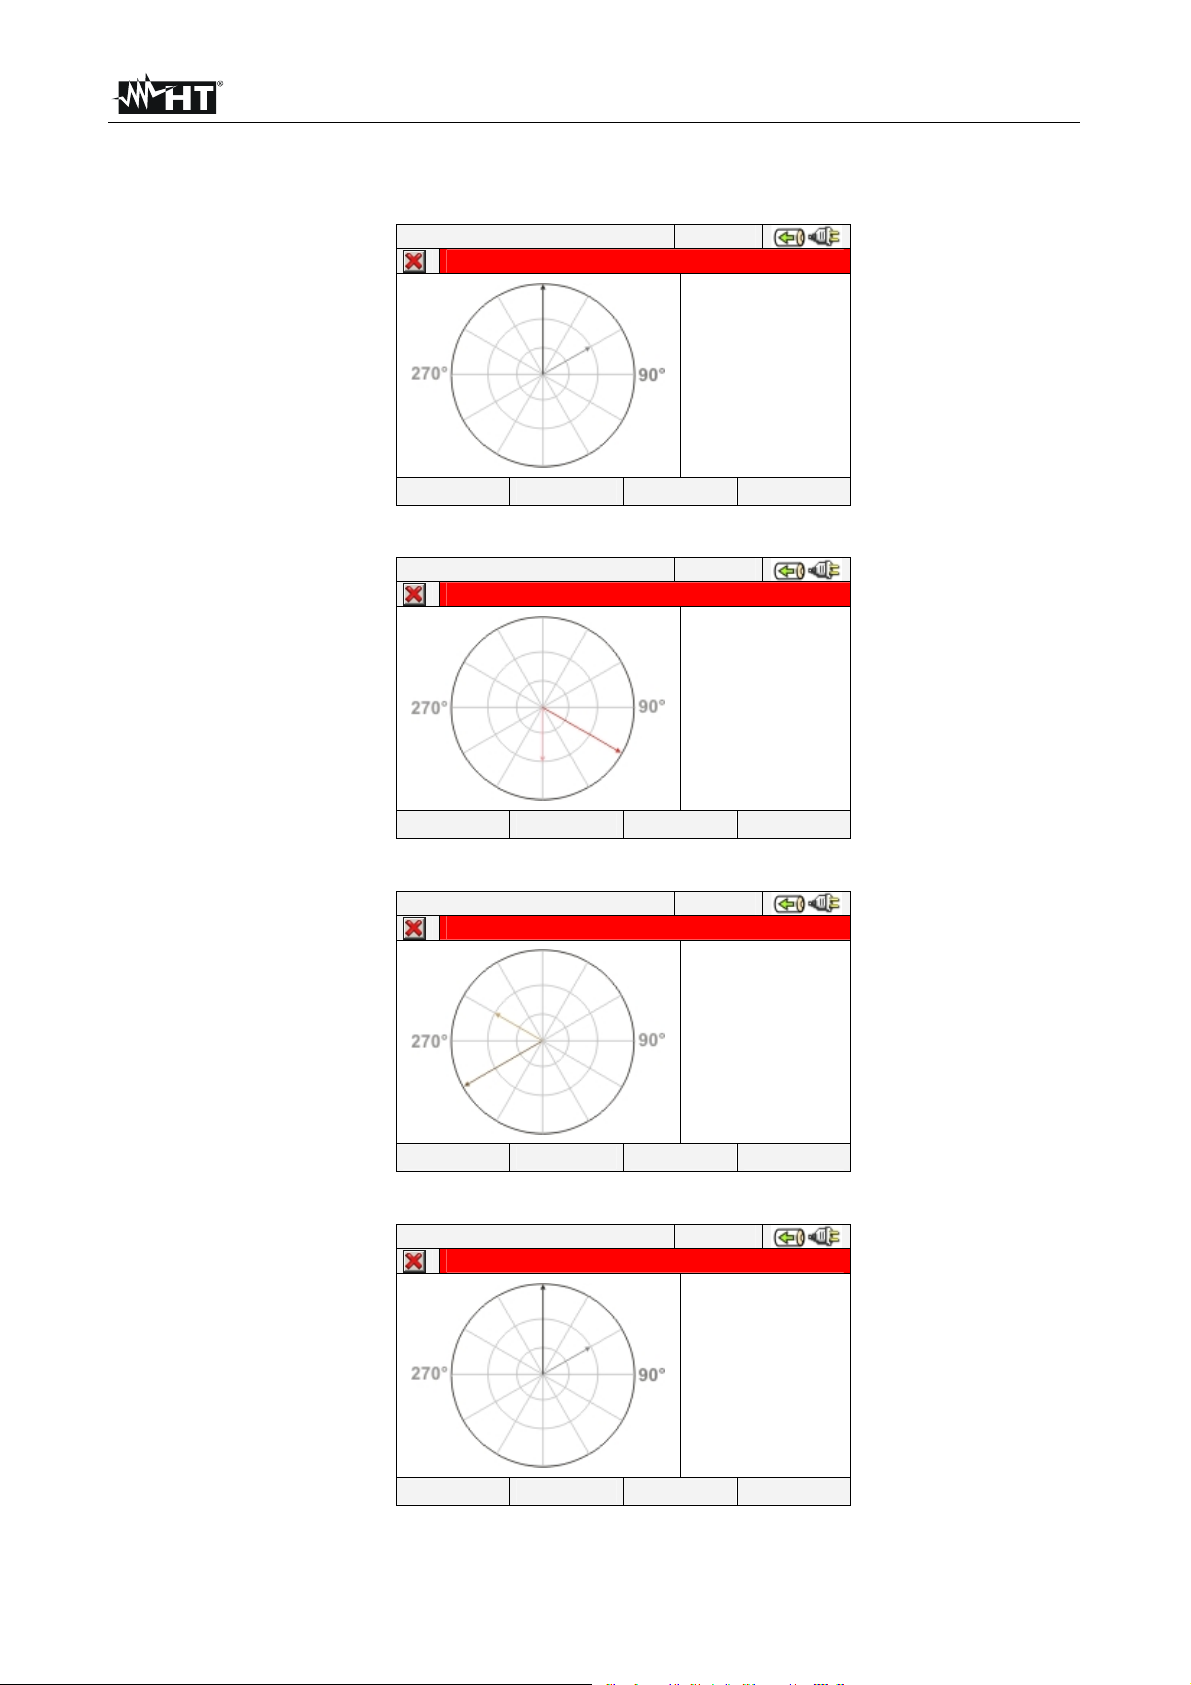
SOLAR300 - SOLAR300N
The vectorial diagram of voltage and current for each phase depending on the type of
system as shown in below screens:
12/09/2006 – 16:55:10
PHASE1 DIAGRAM – Page 4/6
V1^ I1
60.0°
PAGE
Fig. 85: Vectorial voltage-current diagram of L1 phase for 4-wire system
12/09/2006 – 16:55:10
PHASE2 DIAGRAM – Page 5/6
PAGE
V2^ I2
60.0°
Fig. 86: Vectorial diagram voltage-current of L2 phase for 4-wire system
12/09/2006 – 16:55:10
PHASE3 DIAGRAM – Page 6/6
V3^ I3
60.0°
PAGE
Fig. 87: Vectorial diagram voltage-current of L3 phase for 4-wire system
12/09/2006 – 16:55:10
PHASE1 DIAGRAM – Page 4/6
PAGE
V12^ I1
60.0°
Fig. 88: Vectorial diagram voltage-current of L1 phase for 3-wire and ARON systems
EN - 39
Page 42

SOLAR300 - SOLAR300N
12/09/2006 – 16:55:10
PHASE2 DIAGRAM – Page 5/6
V23^ I2
60.0°
PAGE
Fig. 89: Vectorial diagram voltage-current of L2 phase for 3-wire and ARON systems
12/09/2006 – 16:55:10
PHASE3 DIAGRAM – Page 6/6
PAGE
V31^ I3
60.0°
Fig. 90: Vectorial diagram voltage-current of L3 phase for 3-wire and ARON systems
Pressing ESC key (or smart icon at display) to exit from each screen and back to the
previous one.
The vectors of voltages are referred to the external circle on each diagram
CAUTION
and the vectors of current are referred to second circle. The vectors’ sizes
are designed so that the vector of maximum amplitude can touch the circle
and the other vectors are scaled with respect to it proportionally to their
amplitude
The rotation positive reference associated at each vectorial diagram is
clockwise
EN - 40
Page 43
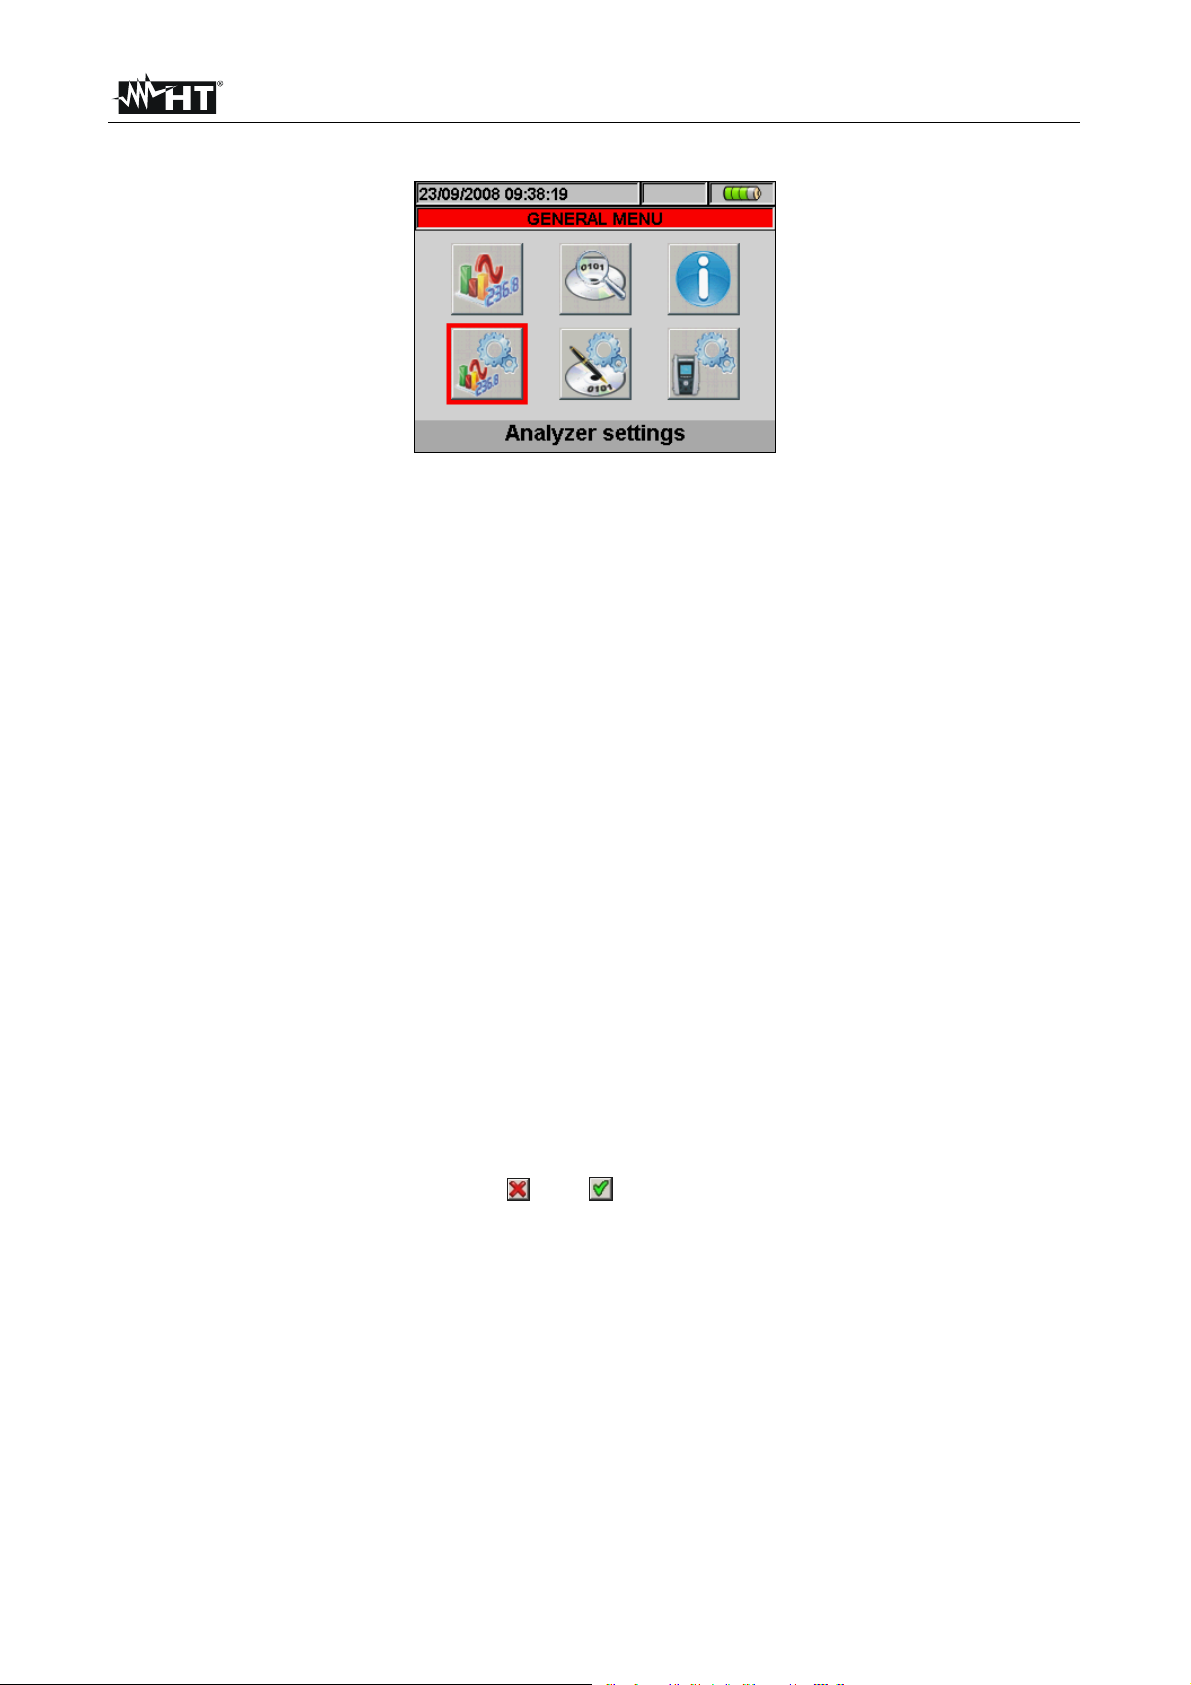
SOLAR300 - SOLAR300N
5.3. ANALYZER SETTINGS
Fig. 91: Analyzer settings screen
In this section, the instrument allows carrying out basic and advanced selections according
to the type of installation being tested. In particular, it is possible to:
For single-phase and three-phase photovoltaic systems (PV):
Select the type of system, the frequency and the full scale of the clamps used
(Photovoltaic configuration)
Set the characteristic parameters of the photovoltaic system being tested such as the
nominal power of the system, the (Gamma) and NOCT coefficients of the panels
used for system construction, the default values for the temperature of the panels and
the environmental temperature at which the panels are, the type of mathematical
relationship to correct the power which can be generated by the panels when the
temperature varies (Parameter Setting) and the number of MPPTs in the concerned
inverter (only together with opt. MPP300 units).
Set the type of remote unit, the coefficient of the pyranometer (sensitivity), the
minimum threshold of irradiance which is considered by meter and the correction k
factor of DC clamp (Advanced Settings).
For single-phase and three-phase non-photovoltaic electrical systems (NPV):
Select the type of system, the frequency, the kind of current clamp, the full scale of
current clamp and the VT ratio of external voltage transformer which can be connected
with meter (Analyser Configuration)
Setting the Manual mode for the customisation of full scale on graphic screen of Real
Time section, the type of harmonic to be shown on screens, the percentage or absolute
values of harmonics, the harmonics zoom, the average calculation of voltages,
currents, active and reactive powers (Advanced Settings)
We suggest the use of smart icons and in order to perform a complete interaction
with the meter.
5.3.1. Analyzer Configuration screen
Inside the “Analyzer configuration” section a screen depending on the type of system
selected by user during the last operation is shown by meter: The instrument is granted for
a correct measurement only in connection with the following electrical systems:
Single-phase photovoltaic system PV-1
Three-phase photovoltaic system PV-3
Single-/Multi-MPPT PV system – single-phase output (via opt. MPP300) MPP-1
Single-/Single-MPPT PV system – three-phase output (via opt. MPP300) MPP-3
Three phase system 4-wire WYE (three phase + neutral + ground)
Three phase system 3-wire DELTA (three phase + ground)
Three phase system 3-wire ARON DELTA (three phase + neutral + ground)
SINGLE phase system (phase + neutral+ ground)
EN - 41
Page 44

SOLAR300 - SOLAR300N
The screen displayed by the instrument for each of the six above-listed situations are
reported below:
Fig. 92: Screen for analyzer configuration for PV-1 system
Fig. 93: Screen for analyzer configuration for PV-3 system
Fig. 94: Analyzer configuration screen for MPP-1 system (opt. MPP300 required)
Fig. 95: Analyzer configuration screen for MPP-3 system (opt. MPP300 required)
EN - 42
Page 45

SOLAR300 - SOLAR300N
12/09/2006 – 16:55:10
ANALYZER CONFIGURATION
1
2
3
N
PE
System
Freq [Hz]
Clamp Type
4WIRE
50
FLEX
Clamp FS [A]
ADVANCED MOD(+) MOD(-)
VT Ratio
3000
1
Fig. 96: Analyzer configuration screen for 4-wire system
12/09/2006 – 16:55:10
ANALYZER CONFIGURATION
ADVANCED MOD(+) MOD(-)
System
Freq [Hz]
Clamp Type
Clamp FS [A]
VT Ratio
3WIRE
50
FLEX
3000
1
Fig. 97: Analyzer Configuration screen for 3-wire system
12/09/2006 – 16:55:10
ANALYZER CONFIGURATION
System
Freq [Hz]
ARON
50
Clamp Type
Clamp FS [A]
VT Ratio
ADVANCED MOD(+) MOD(-)
FLEX
3000
1
Fig. 98: Analyzer Configuration screen for ARON system
12/09/2006 – 16:55:10
ANALYZER CONFIGURATION
ADVANCED MOD(+) MOD(-)
System
Freq [Hz]
Clamp Type
Clamp FS [A]
TV Ratio
SINGLE
50
STD
1000
1
Fig. 99: Analyzer Configuration screen for SINGLE phase system
EN - 43
Page 46
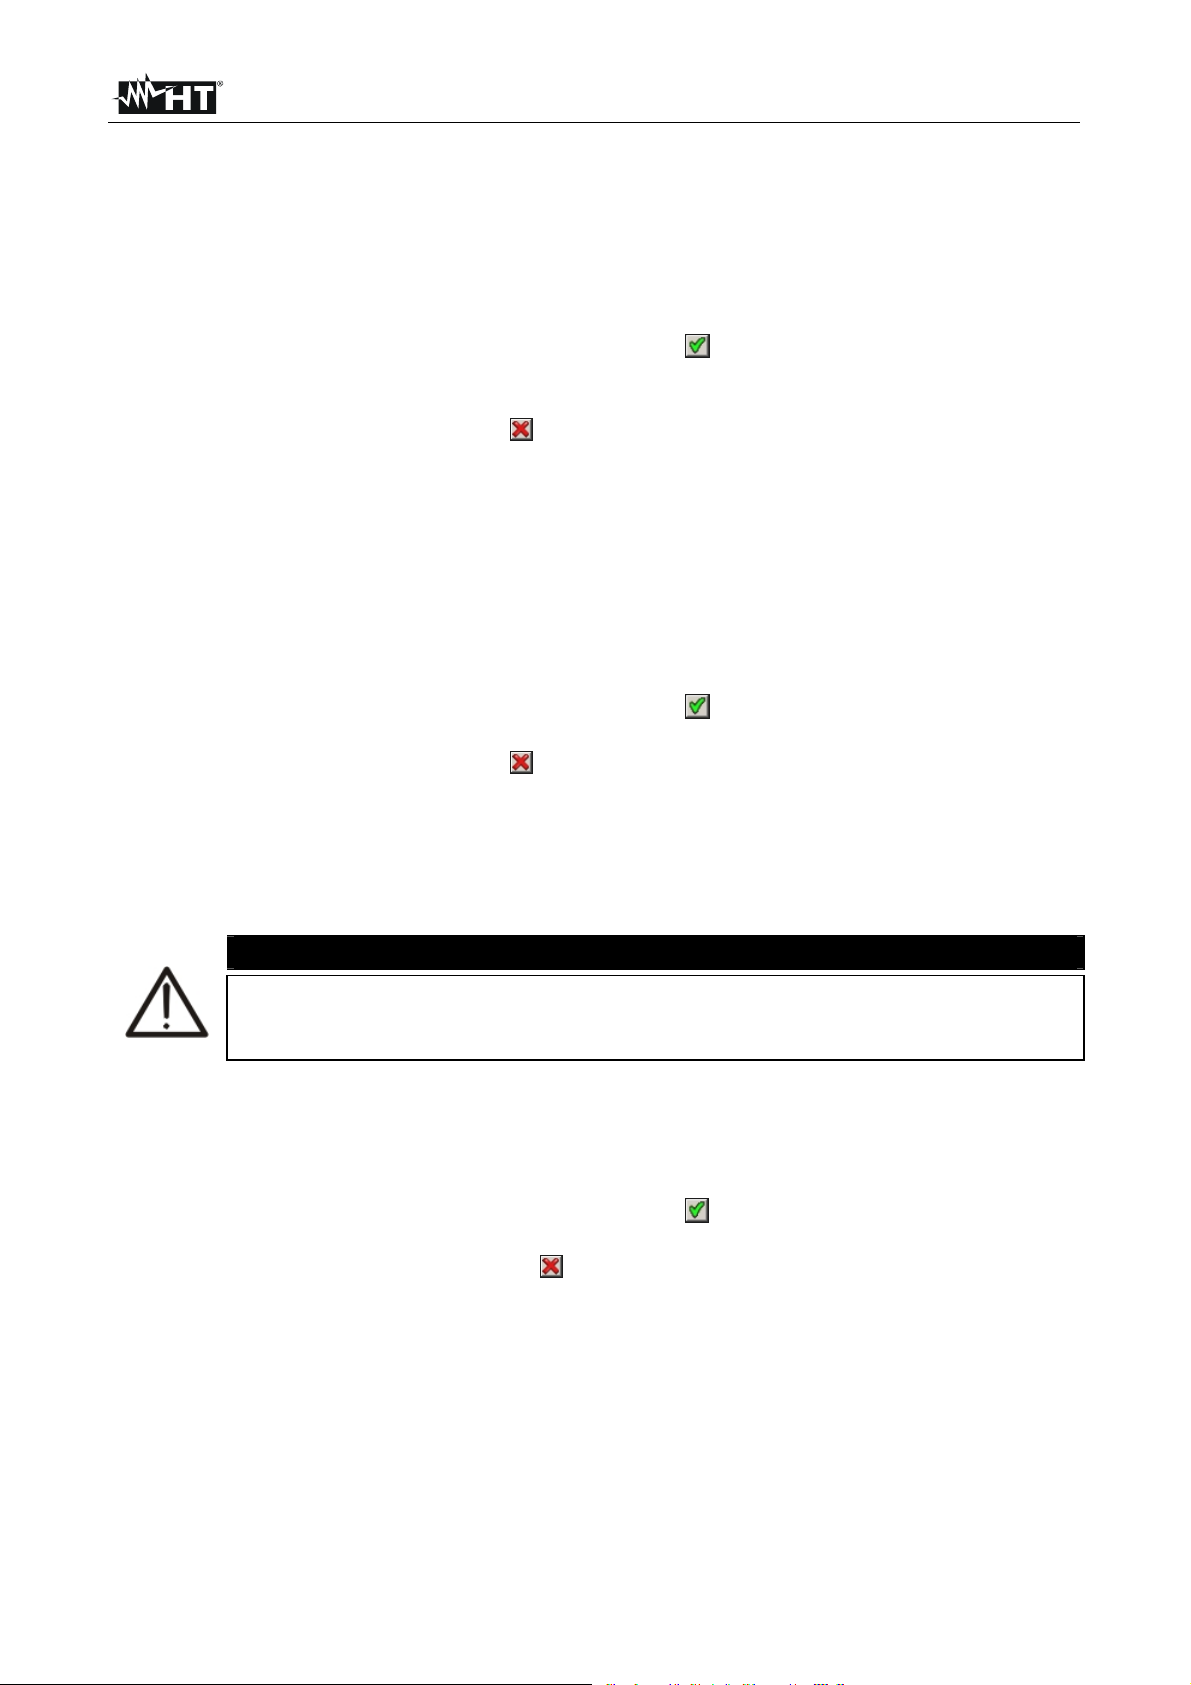
SOLAR300 - SOLAR300N
The connection of input signals to meter are shown in the small synoptic circuit scheme on
the left part of each screen depending on the system. For system selection perform the
below steps:
1. Move the cursor using arrows keys on field relative to “System”, marked with blue
background.
2. Use F3 or F4 keys (alternatively touch MOD(+) o MOD(-)) to select the type of system
choosing among “4-WIRE”, “3-WIRE”, “ARON” or “SINGLE” options.
3. Press SAVE or ENTER keys (or the smart icon ) to save the selected option and
confirm by “Ok”. This selected parameter will be present also after turning off the
meter.
4. Press ESC key (or the smart icon ) to quit without saving any modification.
5.3.1.1. Setting system frequency
1. Move the cursor using arrows keys on field relative to “Freq[Hz]”, marked with blue
background.
2. Use F3 or F4 keys (alternatively touch MOD(+) o MOD(-)) to select the system
frequency choosing between 50Hz or 60Hz options. This parameter is relevant ONLY if
the input voltage not permits to recognize the frequency value (for example, only the
clamps for the current measurement are connected). In this case the instrument
generates an internal synchronism equal to the value of the set frequency.
3. Press SAVE or ENTER keys (or the smart icon ) to save the selected option and
confirm by “Ok”. This selected parameter will be present also after turn off the meter.
4. Press ESC key (or the smart icon ) to quit without saving any modification.
5.3.1.2. Setting clamp type
This parameter must be always set equal to the clamp type used.
Two types of clamps are available:
STD: for Standard clamps or esternal Current Transformer CT
FLEX: for Flexible clamps (Rogowski)
CAUTION
If the PV-1 or PV-3 systems are set on meter the “STD” clamp type is the only
possibility (not modified) both for DC and AC clamps. The FLEX type clamp
NOT BE ok for PV systems
1. Move the cursor using arrows keys on field relative to “Clamp Type”, marked with blue
background.
2. Use F3 or F4 keys (alternatively touch MOD(+) o MOD(-)) to select clamp type
choosing between STD or FLEX options.
3. Press SAVE or ENTER keys (or the smart icon
) to save the selected option and
confirm by “Ok”. This selected parameter will be present also after turn off the meter.
4. Pressing ESC key (or the smart icon ) to quit without saving any modification
EN - 44
Page 47
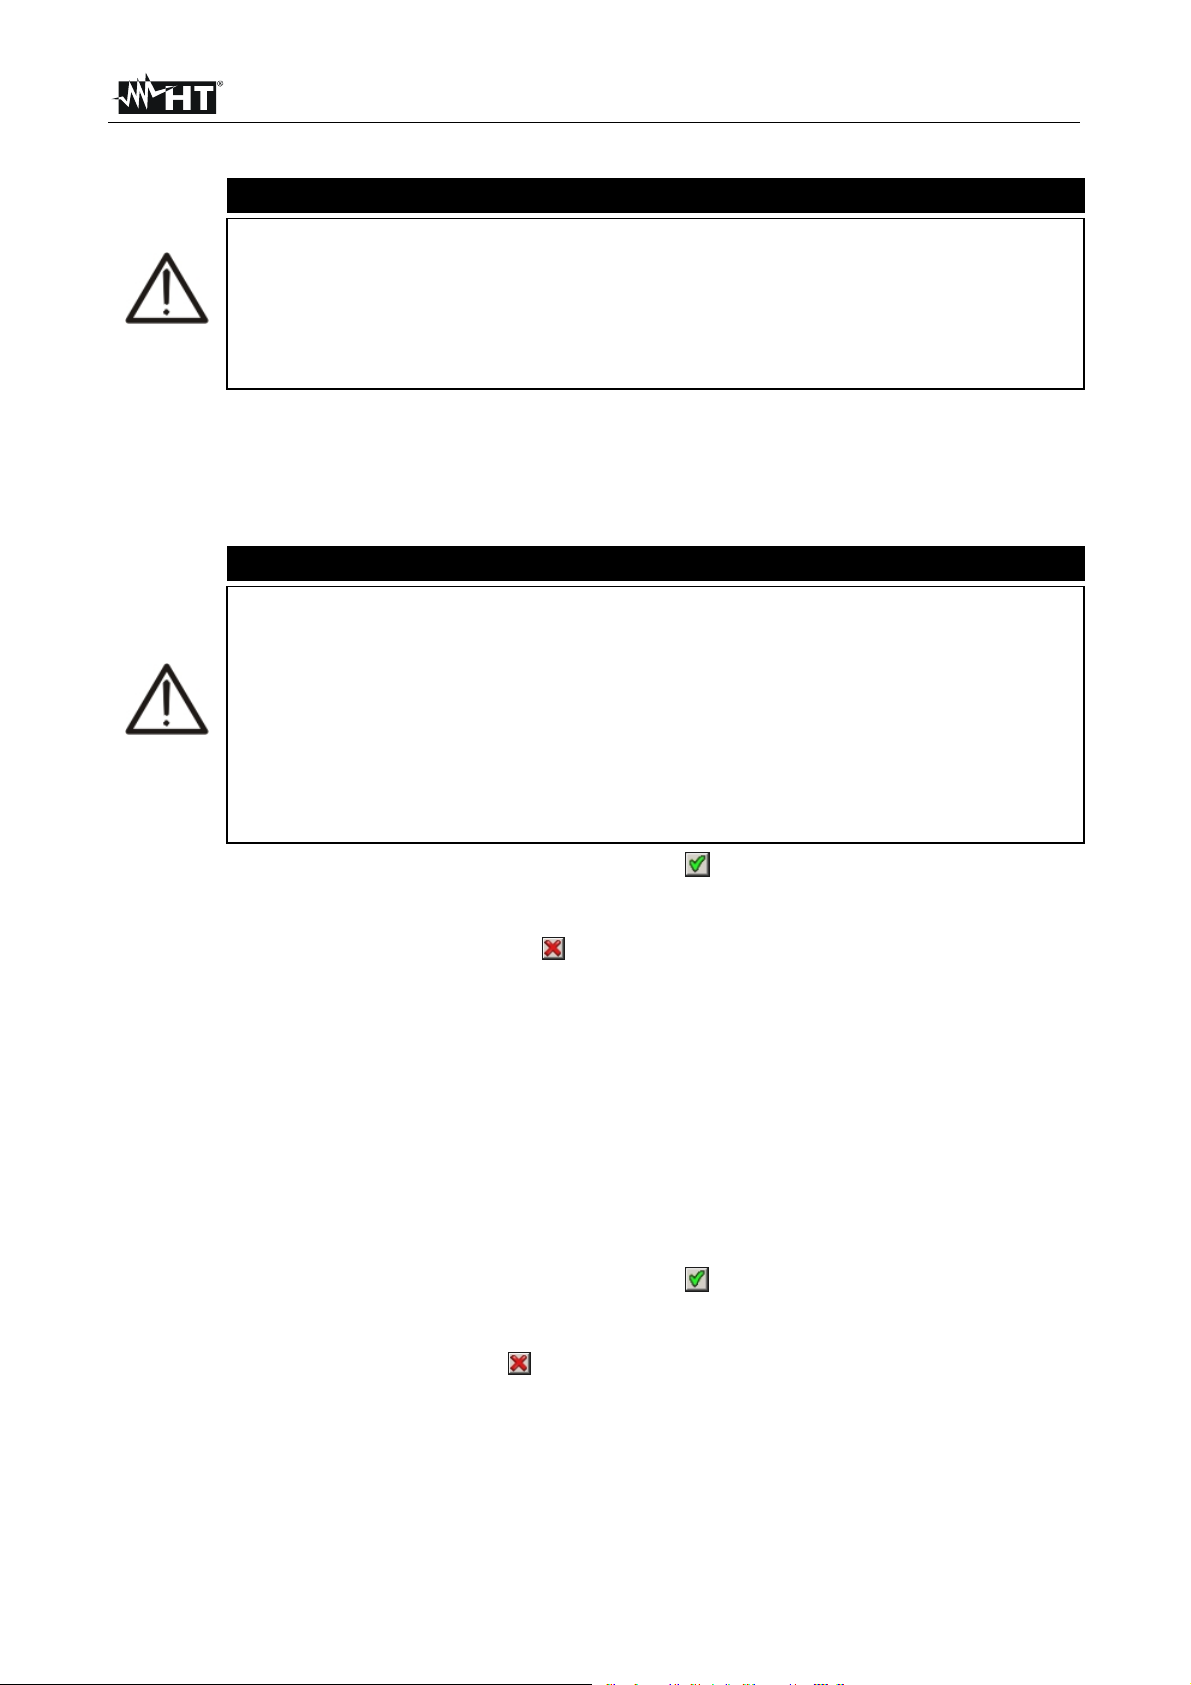
SOLAR300 - SOLAR300N
5.3.1.3. Setting full scale of clamps
CAUTION
The value of this parameter must be always equal to the full scale of the
current clamps used to take the measurement. In case multi-scale clamps
are used, the value of this parameter must be equal to the scale selected on
the clamps
If the type of system set is PV-1 or PV-3, MPP-1, MPP-3 it will be necessary
to set the full scale both for the DC clamps and for the AC clamps
1. By means of the up and down arrow keys, move the cursor on item “AC[A] clamps”
and “DC[A] clamps” for PV systems or on “FS Clamps[A]” for NPV systems, so that it
is highlighted in blue.
2. Use F3 or F4 keys (alternatively touch MOD(+) o MOD(-)) to select the desired full
scale
CAUTION
In case of STD clamps any value can be set by using F3 or F4 keys
(alternatively touch MOD(+) o MOD(-)). In case of FLEX clamp only 300A or
3000A options are possible. In case of MPP-1 or MPP-3 system, for FLEX
clamps only the following values shall be avaibale: 100A and 1000A.
In case of STD clamp measured values of current < 0.1%FS are zeroed
In case FLEX clamps with a capacity of 100A or 300A are used, current values <
1A are zeroed
In case FLEX clamps with a capacity of 1000A or 3000A are used, current
values < 5A are zeroed
3. Press SAVE or ENTER keys (or the smart icon ) to save the selected option and
confirm by “Ok”. This selected parameter will be present also after turning off the
meter.
4. Pressing ESC key (or the smart icon ) to quit without saving any modification
5.3.1.4. Setting VT ratio
For NPV systems the meter can be interfaced also with step-down transformers in the
equipment under test. It can display the value of he voltages present on the primary
winding of these transformers. To do this it will be necessary to set the value of the
transformers’ windings ratio.
1. Move the cursor using arrows keys on field relative to “VT Ratio” , marked it with blue
background.
2. Use F3 or F4 keys (alternatively touch MOD(+) o MOD(-)) for selection of desired value
from 1 to 3000. Leave the default value “1” if no voltage transformer is present on
installation.
3. Press SAVE or ENTER keys (or the smart icon ) to save the selected option and
confirm by “Ok”. This selected parameter will be present also after turning off the
meter.
4. Press ESC key (or the smart icon ) to to quit without saving any modification.
EN - 45
Page 48

SOLAR300 - SOLAR300N
5.3.2. Parameter setting screen – PV systems
Press the F1 key or touch the “PARAM” item on the display. The instrument displays the
following screen:
Fig. 100: Parameter setting screen for PV systems
In this screen it is possible to set the characteristic parameters of the photovoltaic system
being tested such as the nominal power of the system, the and NOCT coefficients of the
panels used for system construction, the default values for the temperature of the panels
and the environmental temperature at which the panels are, the type of mathematical
relationship to correct the power which can be generated by the panels when the
temperature varies (the relationship now in use is displayed on the message bar).
5.3.2.1. Setting the nominal power of the photovoltaic system
This option allows setting the maximum nominal value of the power of the photovoltaic
system (PV).
1. Move the cursor on “Pnom” by means of the up or down arrow keys, so that it is
highlighted in blue
2. By means of the F3 or F4 key (or items MOD(+) or MOD(-) on the display), select the
desired value
3. Press the SAVE or ENTER key (or the smart icon ) to save the selected setting by
confirming with “Ok”. In this way, the settings made will remain valid also after turning
off the instrument
4. To quit the settings made or to exit without saving, press the ESC key (or the smart
icon
)
5.3.2.2. Setting the Gamma parameter of photovoltaic panels
This option allows setting the value of the Gamma parameter (), coefficient of variation
of Power according to Temperature, one of the characteristic parameters of the panels
used for the realization of a PV system, expressed in %°C and tipically negative
1. Move the cursor on “” by means of the up or down arrow keys, so that it is highlighted
in blue.
2. By means of the F3 or F4 key (or items MOD(+) or MOD(-) on the display), select the
desired value within the range -0.01 -1.00.
3. Press the SAVE or ENTER key (or the smart icon
) to save the selected setting by
confirming with “Ok”. In this way, the settings made will remain valid also after turning
off the instrument
4. To quit the settings made or to exit without saving, press the ESC key (or the smart
icon )
EN - 46
Page 49

SOLAR300 - SOLAR300N
5.3.2.3. Setting the NOCT parameter of photovoltaic panels
This option allows setting the value of the NOCT coefficient (nominal working
temperature of a PV cell), one of the characteristic parameters of the panels used for the
realization of a PV system, expressed in °C
1. Move the cursor on “NOCT” by means of the up or down arrow keys, so that it is
highlighted in blue.
2. By means of the F3 or F4 key (or items MOD(+) or MOD(-) on the display), select the
desired value within the range 0 100°C
3. Press the SAVE or ENTER key (or the smart icon ) to save the selected setting by
confirming with “Ok”. In this way, the settings made will remain valid also after turning
off the instrument.
4. To quit the settings made or to exit without saving, press the ESC key (or the smart
icon
).
5.3.2.4. Setting temperatures Tenv and Tpv
This option allows setting the default value of environmental temperature (Tenv) and cell
temperature (Tpv)
CAUTION
The values of Tenv and Tpv set inside this section are used by meter if are not
measured by SOLAR-0x unit as the supplied temperature probe has not been
connected. In this condition the values are marked in blue colour on the real
time value section
1. Move the cursor on “Tenv” or “Tpv by means of the up or down arrow keys, so that it is
highlighted in blue
2. By means of the F3 or F4 key (or items MOD(+) or MOD(-) on the display), select the
desired value within 0 80°C for Tenv and within 0 100°C for Tpv
3. Press the SAVE or ENTER key (or the smart icon ) to save the selected setting by
confirming with “Ok”. In this way, the settings made will remain valid also after turning
off the instrument
4. To quit the settings made or to exit without saving, press the ESC key (or the smart
icon )
5.3.2.5. DC input N setting (only together with opt. MPP300)
This option allows setting the number of MPPTs of the inverter of the PV system being
tested.
CAUTION
It will be possible to set the above-mentioned parameter only if, under
“Analyzer Settings” a system of the “MPP-1” or “MPP-3” type has been
selected.
1. Position the cursor onto item “DC inputs” using the up and down arrow keys in order to
highlight it in blue.
2. Using the F3 or F4 keys (or the items MOD(+) or MOD(-) on the display), select the
desired value.
3. Press the SAVE or ENTER keys (or the smart icon
) to save the selected setting and
confirm with “Ok”. In this case, the settings chosen shall remain valid also after
switching off the instrument.
4. To quit the modifications made or to exit without saving, press the ESC key (or the
smart icon )
EN - 47
Page 50

SOLAR300 - SOLAR300N
5.3.2.6. Selection of the relationship for Temperature effects compensations
This option allows selecting the relationship to be used to correct the measurements
performed according to the modules’ temperature. The following correction modes are
available:
- T.mod.: Correction factor Rfv2 related to PV module Temp. (Italian guideline CEI-82-25)
- T.env: Correction factor Rfv2 related to environment Temp. (Italian guideline CEI-82-25)
- ndc: PRp (Performance ratio for active power) corrected by PV module Temp.
CAUTION
When performing test according to Italian guideline it is recommended to select
“T.env.”
Corr.
Type
T.mod.
T.amb.
Temperature (Tcel) PRp calculation Ref.
asTmodule_MeTcel
R
Irr
20TambTcel NOCT
800
fv2
PRp
40)-(Tcel- 1
Rfv
2
100
P
ca
G
G
p
STC
P
n
C)40Tcel (if 1
C)40Tcel (if
CEI
82-25
25
P
ca
P
- - -
n
G
dc
asTmodule_MeTcel
PRp
G
STC
p
1
T
100
cel
where:
Symbol Description Meas. unit
G
p
G
STC
P
n
P
ca
NOCT
Irradiance on PV module surface
Standard Irradiance = 1000
Nominal Power = sum of all power module (Pmax ) included in the part of PV plant
under test
AC Active Power measured
2Rfv
Thermal Coefficient factor
Absolute value of Pmax thermal coefficient
Normal Operating Cell Temperature (@ 800W/m
2
, 20°C, AM=1.5, Air speed =1m/s).
W/m
W/m
kW
kW
2
2
C%/
C%/
For further details see § 10.1
EN - 48
Page 51

SOLAR300 - SOLAR300N
5.3.3. Advanced setting screen – PV systems
Press the F2 key or touch the “ADVANCED” item on the display. The instrument displays
the following screen:
Selection of rem. U. SOLAR-01 Selection of rem. U. SOLAR-02 Selection of rem. U. MPP300
Fig. 101: Advanced setting screen for PV systems
5.3.3.1. Setting of remote unit
This option allows to set the type of remote unit which can be used with the instrument.
1. By means of the F3 or F4 key (or items MOD(+) or MOD(-) on the display), select the
desired unit SOLAR01 or SOLAR02, MPP300.
CAUTION
The selection of remote unit SOLAR-02 or MPP300 automatically disables the
“Pyranometer” field as the sensitivity of the used irradiance probe (pyranometer
or reference cell) should be set inside the internal menu of SOLAR-02 (see
user manual of SOLAR-02).
The selection of the type of system MPP-1 or MPP-3 (see §5.3.1) shall
automatically force MPP300 as remote unit type.
2. Press the SAVE or ENTER key (or the smart icon ) to save the selected setting by
confirming with “Ok”. In this way, the settings made will remain valid also after turning
off the instrument.
3. To quit the settings made or to exit without saving, press the ESC key (or the smart
icon ).
5.3.3.2. Setting the corrective factor of the pyranometer (only for SOLAR-01 unit)
This option allows setting the characteristic corrective factor (sensitivity) of the supplied
pyranometer
CAUTION
The sensitivity parameter is normally indicated on the labe l of pyranometer
or on the relevant certificate is normally expressed in V/Wm-2 so,
considered the measurement unit on meter [mV/kWm-2] simply set the
value read on label without any unit conversion
A wrong setting of sensitivity parameter on meter means a significative error
on the irradiance measurement and, then, a wrong DC efficiency calculation
1. By means of the F3 or F4 key (or items MOD(+) or MOD(-) on the display), select the
desired value within the range 1.00 100.00
2. Press the SAVE or ENTER key (or the smart icon ) to save the selected setting by
confirming with “Ok”. In this way, the settings made will remain valid also after turning
off the instrument.
3. To quit the settings made or to exit without saving, press the ESC key (or the smart
icon ).
EN - 49
Page 52

SOLAR300 - SOLAR300N
5.3.3.3. Setting of minimum irradiance threshold
This option allow to set the minimum irradiance threshold used by meter as reference
during measurement.
1. By means of the F3 or F4 key (or items MOD(+) or MOD(-) on the display), select the
desired value within the range 400 800 W/m2
2. Press the SAVE or ENTER key (or the smart icon ) to save the selected setting by
confirming with “Ok”. In this way, the settings made will remain valid also after turning
off the instrument
3. To quit the settings made or to exit without saving, press the ESC key (or the smart
icon )
5.3.3.4. Setting of corrective constant of DC clamp
This option allow to set the corrective K factor relative only to the supplied HT4004 DC
clamp which is indicated on the label in the backside of clamp (see Fig. 102)
In case no label is present, set k = 1.000
Fig. 102: Set of corrective constant for DC clamp
CAUTION
For HT4004 DC clamp which do not have the label with the corrective constant
K and for other type of DC clamps do not modify the 1.000 factory value
1. By means of the F3 or F4 key (or items MOD(+) or MOD(-) on the display), select the
desired value within the range 0.950 1.050
2. Press the SAVE or ENTER key (or the smart icon ) to save the selected setting by
confirming with “Ok”. In this way, the settings made will remain valid also after turning
off the instrument
3. To quit the settings made or to exit without saving, press the ESC key (or the smart
icon
)
EN - 50
Page 53

SOLAR300 - SOLAR300N
5.3.4. Advanced Settings screen – NPV systems
By pressing F2 key (or touch the “ADVANCED” at display) in any screen of “Analyzer
Configuration” section, below screen is shown by meter:
12/09/2006 – 16:55:10
Zoom graphics MANUAL
Harm. type ALL
Harm. values ABSOLUTE
Zoom 1st harm YES
Average values NO
ADVANCED SETTINGS
MOD(+) MOD(-)
Fig. 103: Advanced Settings screen
In the above screen is possible to select advanced options which have effect in Real Time
values screens of meter.
5.3.4.1. Zoom graphics option
This option permits to select a customized full scale on each phase of voltage and current
waveforms (see Fig. 59, Fig. 61, Fig. 63) in order to better the resolution of readings.
1. Move the cursor using arrows keys on field relative to “Zoom graphics”, marked wit h
blue background.
2. Use F3 or F4 keys (alternatively touch MOD(+) o MOD(-)) to select one of below
options:
MANUAL: define a customized full scale for waveforms’ visualization choosing
among the available values. A value included from 2.0A to 5000kA it’s set for
current and included from 2.0V to 2000kV it’s set for voltage.
AUTO: the full scale values are automatically modified by the meter.
3. Press SAVE or ENTER keys (or the smart icon
) to save the selected option and
confirm by “Ok”. This selected parameter will be present also the turn off of meter.
4. Press ESC key (or the smart icon
) to quit without saving any modification.
EN - 51
Page 54

SOLAR300 - SOLAR300N
5.3.4.2. Harmonics type option
This option permits to select the type of harmonics which can be shown inside Real Time
values section
1. Move the cursor using arrows keys on field relative to “Harm. type” , marked it with
blue background.
2. Use F3 or F4 keys (alternatively touch MOD(+) o MOD(-)) to select one of below
options:
ALL: the meter shows all the harmonics up to the 49st
EVEN: the meter shows all the even harmonics up to the 49st
ODD: the meter shows all the odd harmonics up to the 49st
3. Press SAVE or ENTER keys (or the smart icon ) to save the selected option and
confirm by “Ok”. This selected parameter will be present also the turn off of meter.
4. Press ESC key (or the smart icon ) to quit without saving any modification.
CAUTION
Not depending on selected harmonics type for the visualization, the meter can
performs the recording of all values in any case.
5.3.4.3. Harmonics values option
This option permits to select the value of harmonics which can be shown inside Real Time
values’ section
1. Move the cursor using arrows keys on field relative to “Harm. values” , marked it with
blue background.
2. Use F3 or F4 keys (alternatively touch MOD(+) o MOD(-)) to select one of below
options:
ABSOLUTE: the meter shows the harmonics in absolute values (in V unit for
voltages and A unit for currents).
PERCENTAGE: the meter shows the harmonics in percentage value respect each
fundamental.
3. Press SAVE or ENTER keys (or the smart icon ) to save the selected option and
confirm by “Ok”. This selected parameter will be present also the turn off of meter.
4. Press ESC key (or the smart icon ) to quit without saving any modification.
CAUTION
Independently of the harmonics value selected for display, the meter can
perform the recording of absolute values anyway.
EN - 52
Page 55

SOLAR300 - SOLAR300N
5.3.4.4. Zoom with respect to the 1st harmonic option
This option permits to show harmonics graphics with a zoom relative to the first harmonic
order (fundamental) or with a zoom relative to the highest amplitude harmonic inside the
Real Time values section. Also in this case the aim is to better the final resolution of
graphics
1. Move the cursor using arrows keys on field relative to “Zoom 1st harm” , marked it
with blue background.
2. Use F3 or F4 keys (alternatively touch MOD(+) o MOD(-)) to select one of below
options:
YES: the meter performs the graphics zoom respect to the first harmonic
NO: the meter performs the graphics zoom respect to the highest amplitude
harmonics except for the first harmonic. This option is active only if the zoom
graphic option (see 5.3.4.1) is set on AUTO mode.
3. Press SAVE or ENTER keys (or the smart icon ) to save the selected option and
confirm by “Ok”. This selected parameter will be present also the turn off of meter.
4. Press ESC key (or the smart icon ) to quit without saving any modification.
5.3.4.5. Average value option
This option, available for 4-wire systems only, permits to display the arithmetic average
of TRMS values of phase voltages V1, V2, V3, phase currents I1, I2, I3, active powers on
each phase P1, P2, P3, absorbed, generated, inductive and capacitive reactive powers on
each phase
The result is shown on Page 9/9 of numerical TRMS value (see Fig. 35).
1. Move the cursor using arrows keys on field relative to “Average values” , marked it
with blue background.
2. Use F3 or F4 keys (alternatively touch MOD(+) o MOD(-)) to select one of below
options:
YES: the meter shows the page 9/9 of average values inside Real Time Values
section only for 4-wire systems.
NO: the meter does not shows the page 8/8 of average values inside Real Time
Values section
3. Press SAVE or ENTER keys (or the smart icon
) to save the selected option and
confirm by “Ok”. This selected parameter will be present also the turn off of meter.
4. Press ESC key (or the smart icon
) to quit without saving any modification.
EN - 53
Page 56

SOLAR300 - SOLAR300N
5.4. RECORDING SETTINGS
12/09/2006 – 16:55:10
GENERAL MENU
Recording settings
Fig. 104: Recording Settings screen selection
In this section the meter permits to define any detail relative to start and stop of recordings,
perform parameters selection for recording, the type of analysis to be carried out very
easily thanks to “touch screen” display. The use of smart icons and is particularly
recommended in this section.
5.4.1. Recorder setting screen – PV systems
This screen is thought on different levels and sub-levels with a tree structure just like that
of the Windows function My Computer, so that the desired options are reached in a very
detailed way. After selecting icon “Recording configuration” of Fig. 104 , the instrument
shows the following screen:
Fig. 105: Example of Recording screen for Photovoltaic systems setting
By using the up and down arrow keys, or directly from the display, it is possible to highlight
the different internal items and to select/deselect the flags inside the check boxes. Next to
the check boxes with the “+” symbol, the group expands, opening a sub-level where it is
possible to carry out new selections. By pressing on the check box with the “-” symbol, you
go back to the upper level. Selection/deselection is visually indicated on the display, as a
help to the user, in the following way:
Grey text and empty check box Completely deselected group
Black text and empty check box Partially selected group
Black text and selected check box Completely selected group
From the display, it is also possible to use the scroll bar located fully on the right. The bar
at the bottom of the display includes the following functions, which correspond to keys F1,
F2, F3, F4:
EN - 54
Page 57

SOLAR300 - SOLAR300N
Function CMP/EXP: used to compress / expand the sub-levels (the left and right arrow
keys have the same function)
Function PRESET: used to open the preset configuration section (see § 5.4.2.14)
Function SEL: used to select/deselect parameters in different levels.
Function MODIFY: used to make any modification inside the levels.
On the bottom of the display, the instrument displays the Recording autonomy in terms
of hours and days, which dynamically updates according to the parameter selections
made.
5.4.1.1. Item Comments
This option allows inserting and/or modifying a comment line on the display, in order to
identify the type of analysis, which will also appear in the print report downloaded onto the
PC by the instrument. A comment can be set both by means of the supplied TopView
software (for information, please refer to the help on line of the software) and interactively
using the virtual keyboard which can be activated by pressing the F4 key (or item MODIFY
on the display). The flag of this voice is always active and cannot be deselected.
5.4.1.2. Use of the virtual keyboard
With the Comments item: highlighted in blue, press the F4 key (or item MODIFY on the
display). The following screen of the virtual keyboard is shown on the display:
Fig. 106: Virtual keyboard screen
The following table reports the description of the keys of the virtual keyboard:
Keys Description
a, b,c,…z
Cap
123
Sb
àž
Standard alphabetic keyboard for typing in the comment
in small letters up to 25 characters
Changes the keyboard to capital letters AZ
Changes the keyboard with numeric characters 09 and
symbols for mathematical operations (+,-,*,/,.,=)
Group of special characters. Press “abc” to go back to
alphabetic display.
Group of special characters with particular accents. Press
“abc” to go back to alphabetic display.
<- Backspace key to delete the digit on the left of the cursor
Table 1: Description of function keys of the virtual keyboard
EN - 55
Page 58

SOLAR300 - SOLAR300N
5.4.1.3. Items Start and Stop
This item determines the activation and deactivation mode of the recordings which can be
made with the instrument (see § 5.6).
For PV systems, the start mode is set to “Manual” (Manu) and cannot be changed:
Recording will therefore started/stopped only manually by pressing the GO/STOP key.
5.4.1.4. Item Integration period
This item allows setting the integration period (see § 10.11.1), that is to say the time
interval between two consecutive recordings in the whole measurement campaign. The
flag of this voice is always active and cannot be deselected.
1. Move the cursor on “Integration period” by means of the up or down arrow keys, so
that it is highlighted in blue.
2. Press the F4 key (or the MODIFY item on the display). At the bottom of the display, the
instrument shows a control bar with the item “Integration period” highlighted.
3. Press the F3 key (MOD(+)) or F4 (MOD(-)) or the up or down arrow keys to set the
desired integration period, choosing between the following values: 1s, 5s, 10s, 30s,
1min, 2min, 5min, 10min, 15min, 30min, 60min.
4. Press the SAVE or ENTER key (or the smart icon ) to save the setting made. The set
integration period is shown on the display.
5.4.1.5. Item General Parameters for use with SOLAR01 or SOLAR02 units
This item allows selecting the desired electrical mains parameters to be recorded. This
level includes different internal sub-levels, in which a detailed definition is possible,
according to the type of electric system (see § 5.3.1).
According to the selections made, the instrument displays the following informations:
Fig. 107: Section General Parameters: no selection
Fig. 98 shows the situation in which the instrument shows the “no parameter selected”
error, although it has highlighted item “General Parameters” on the display.
Note the writing on grey background and the unselected check box.
To exit, press the F3 key (or the “SEL” item on the display).
In this case, a selection flag will appear next to item “General Parameters” and the
previous situation will change to the following screen with text on black ground and
selected check box:
EN - 56
Page 59

SOLAR300 - SOLAR300N
Fig. 108: Section General Parameters: selected parameters
As a consequence of the operation, in the example shown in Fig. 85, 12 electric
parameters have been selected against a total of 251 available and the instrument
automatically provides the recording autonomy with the current settings.
CAUTION
The activation of the flag of item “General Parameters” involves the
automatic selection of the main parameters of the mains, whose number
varies according to the electric system being considered (Voltages,
Currents, Frequency, Power Factors, Active Powers, Active Energies).
Deselection of the item “General Parameters” also involves the automatic
deselection of the above-mentioned items.
EN - 57
Page 60
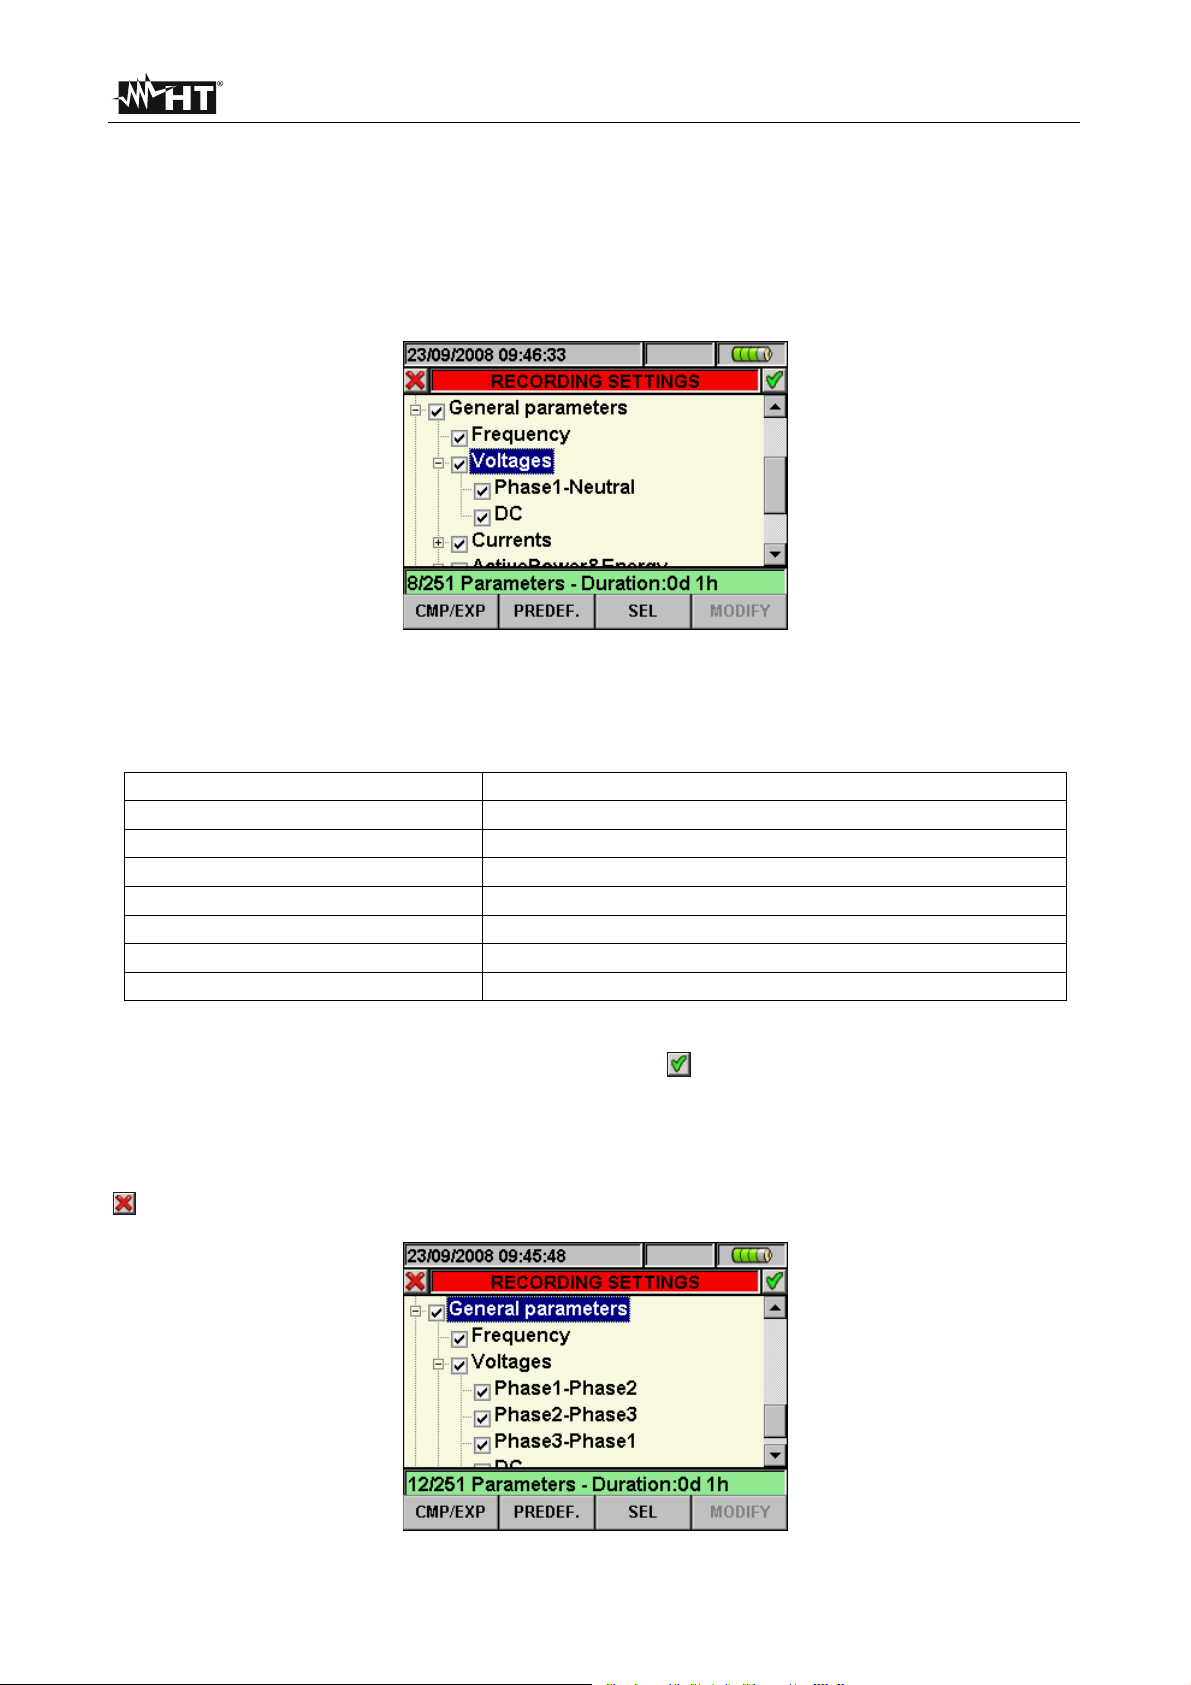
SOLAR300 - SOLAR300N
5.4.1.6. Description of the sub-levels of item General Parameters
Press the F1 key (CMP/EXP on the display) or the right or left arrow keys to expand or
compress the sub-levels. The quantities shown in the sub-levels are closely related to the
type of system considered and selected (see § 5.3.1). In the figures shown below, the
different situations which may occur are shown:
Fig. 109:Sub-level General Parameters – Single-Phase Photovoltaic System
Each parameter can be selected fully independently from the others. The following
quantities are considered for recordings in single-phase photovoltaic systems:
Parameter Description
Frequency Frequency of phase L1
AC voltage TRMS voltage L1-N downstream the inverter
DC voltage DC voltage upstream the inverter
AC current TRMS current of phase L1 downstream the inverter
DC current DC current upstream the inverter
Active power and active energy Active power and active energy DC and on phase L1
Power factor Power factor on phase L1
Table 2: Parameters which can be selected for a single-phase photovoltaic system
Press the SAVE or ENTER key (or the smart icon
) to save each setting made. In this
situation, the instrument shows a window to confirm the saving. Press “Ok” in the window
to confirm. Once the operation is completed, the instrument goes back to the general
menu screen of Fig. 104.
To quit the settings made or to exit without saving, press the ESC key (or the smart icon
).
Fig. 110: Sub-level General Parameters – Three-Phase Photovoltaic System
EN - 58
Page 61
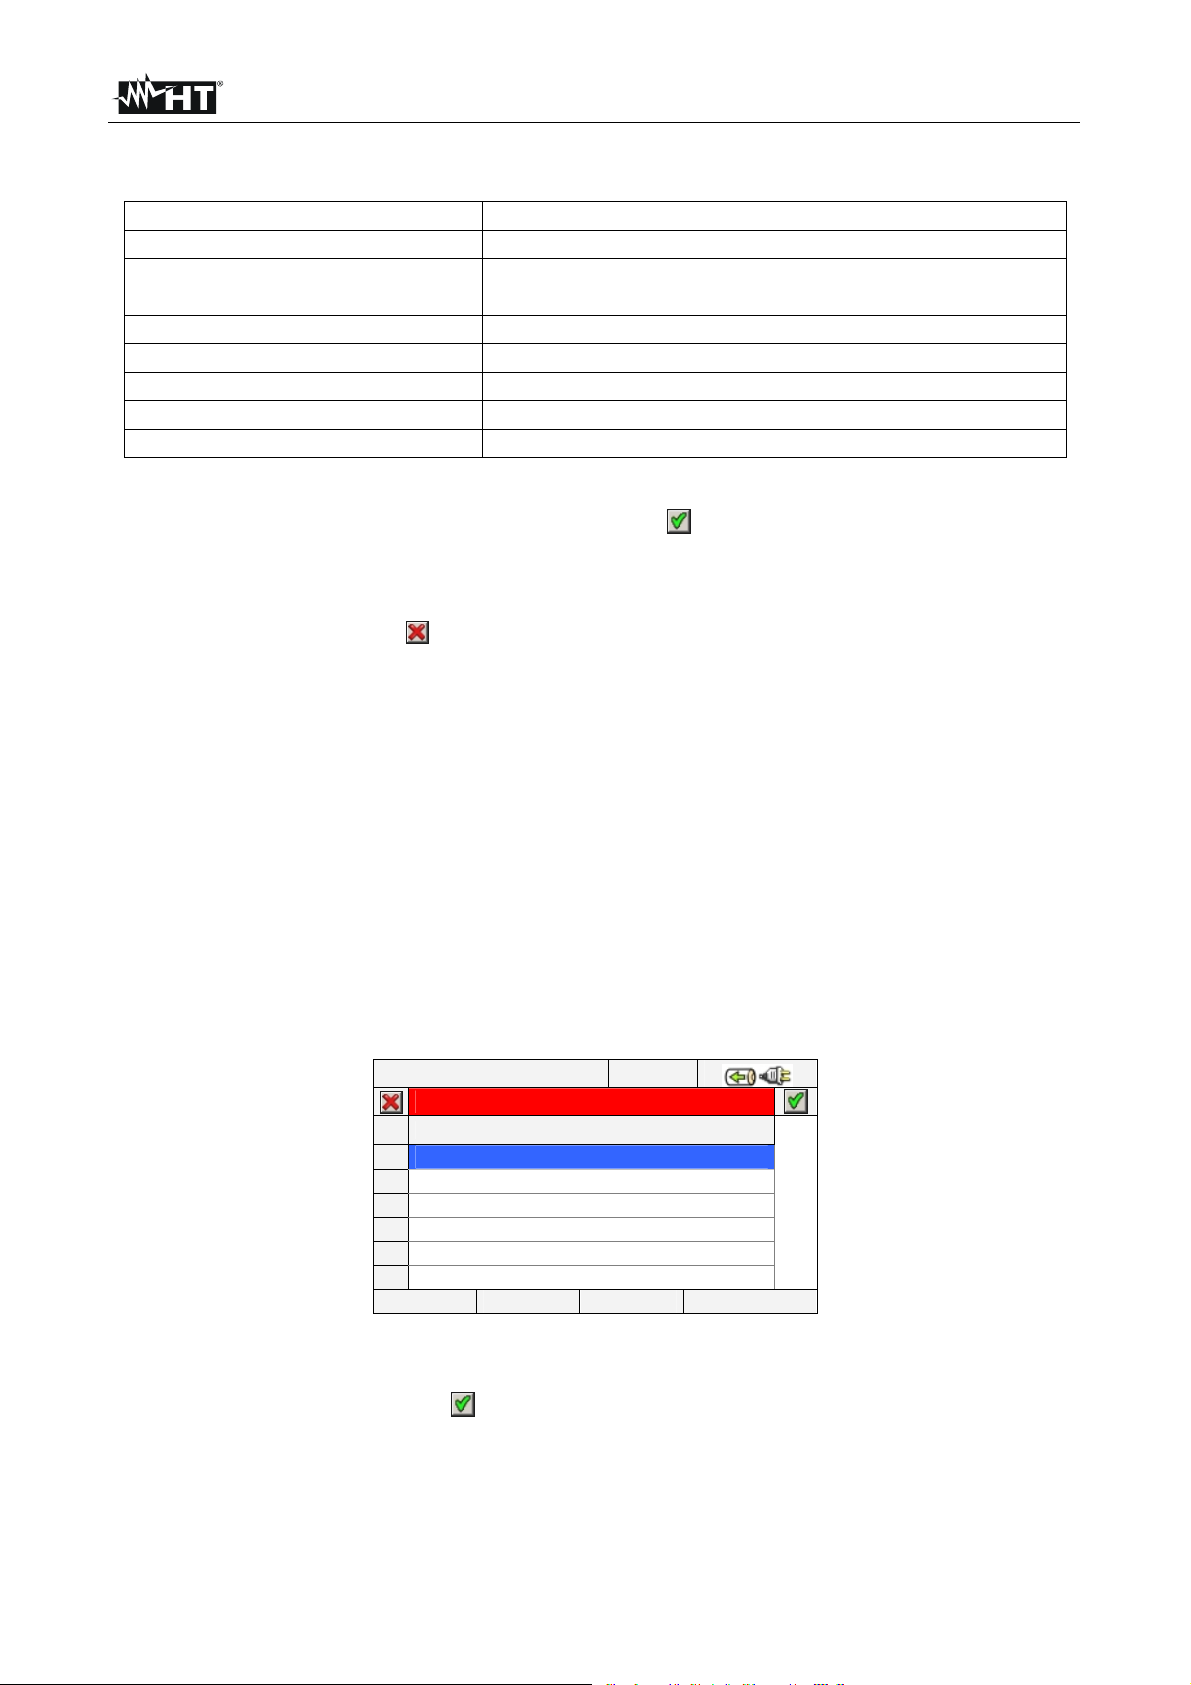
SOLAR300 - SOLAR300N
The following quantities can be selected for recordings in three-phase photovoltaic
systems:
Parameter Description
Frequency Frequency of phases L1, L2, L3
AC voltages
TRMS voltages L1-L2, L2-L3, L3-L1 downstream the
inverter
DC voltage DC voltage upstream the inverter
Current TRMS currents L1, L2, L3 downstream the inverter
DC currents DC current upstream the inverter
Active power and active energy Total DC and AC active power and active energy
Power factor Total power factor
Table 3: Parameters which can be selected for a three-phase photovoltaic system
Press the SAVE or ENTER key (or the smart icon
) to save each setting made. In this
situation, the instrument shows a window to confirm the saving. Press “Ok” in the window
to confirm. Once the operation is completed, the instrument goes back to the general
menu screen of Fig. 104. To quit the settings made or to exit without saving, press the
ESC key (or the smart icon
).
5.4.1.7. Item SOLAR-01 and SOLAR-02
By selecting this item, both by means of the F3 key when the cursor is positioned on item
SOLAR01 or SOLAR02, and directly selecting the flag on the display, inserts the value of
parameters Irradiation, Cell Temperature, Environmental Temperature into the list of
quantities for recording.
5.4.1.8. Default settings
The instrument allows to select the predefined DEFAULT configuration which is always
used during any test on PV installation The instrument allows the user to define up to 16
custom settings, which can be saved and called by the user at all times. The selection of
these settings automatically sets on the instrument only the parameters necessary for
carrying out the recording or the ones selected by the user.
In any screen of section “Recording configuration”, press the F2 key (or select item
PREDEF. on the display). The instrument displays the following screen:
12/09/2006 – 16:55:10
PREDEFINED CONFIGURATIONS
Typical Configuration
DEFAULT
ADD REM
Fig. 111: Default setting screen
Select the desired setting by means of the up or down arrow keys and press the SAVE or
ENTER keys (or the smart icon
) to save the setting. The instrument shows the message
“Do you want to change the recording configuration?”, which must be confirmed with
“Ok”. The instrument automatically selects the parameters and the recording autonomy.
To add a custom default setting, press the F1 key (or item AGG on the display). The
instrument shows the message “Do you want to save current configuration?”, which
must be confirmed with “Ok”, and automatically activates the virtual keyboard (see §
EN - 59
Page 62

SOLAR300 - SOLAR300N
5.4.2.2) in which it is possible to define and save the custom name. Once this operation
has ended, the instrument shows the following screen:
12/09/2006 – 16:55:10
PREDEFINED CONFIGURATIONS
Typical Configuration
DEFAULT
ROSSI SYSTEM
AGG CANC
Fig. 112: Custom setting screen
In the example above, the custom setting “ROSSI SYSTEM” has been created and can be
loaded by pressing the SAVE or ENTER keys (or smart icon ). This setting can be
deleted at all times by pressing the F2 key (or item CANC on the display). The instrument
shows the message “Do you want to change the selected configuration?”, which must
be confirmed with “Ok”, to complete the operation.
To quit the settings made or to exit without saving, press the ESC key (or the smart icon
). The list below contains the parameters selected by the instrument for each typical
configuration:
DEFAULT CONFIGURATION (PV systems)
GENERAL MENU SECTION PARAMETER SETTING
Pnom[W]
Te[°C]
Photovoltaic configuration - Param
Pyranometer [mV/(kW/m2)]
Photovoltaic configuration - Advanced
Recording configuration
General Parameters
Tc[°C]
Y[%°C]
NOCT[°C]
Irr. Min [W/m2]
K Clamp Dc
Comments DEFAULT
Start Manu
Stop Manu
Integration period 5 sec
PV-1 system
PV-3 system
SOLAR-0x
Irradiation, Cell Temperature,
Not modified
Hz, V1N, VDC, I1,
IDC, P1, Ea1, PDC,
EaDC, Pft1
Hz, V12, V23,
V31,VDC, I1, I2, I3,
IDC, Pt, Eat, PDC,
EaDC, Pft
Environmental Temperature
Table 4: Parameters set in DEFAULT configuration
CAUTION
The DEFAULT configuration defines the parameters selected on the
instrument by the manufacturer. Each subsequent modification made and
saved by the user in section “Analyzer setting” changes this configuration
with the new selections, which can differ from the initial ones.
EN - 60
Page 63

SOLAR300 - SOLAR300N
5.4.1.9. Item General Parameters for use with MPP300 unit
After setting MPP300 as remote unit (see § 5.3.3) the instrument will display a selection
tree, in which it will be possible to change only the “comment” fields and the value of the
integration period.
Fig. 113: Section of General Parameters: no selection
The list of the recorded quantities cannot be changed and is only related to the number of
DC inputs set (MPPT) and to the type of electric system at the inverter output (singlephase or three-phase).
PV systems with MPP300
GENERAL MENU SECTION PARAMETER SETTING
Comments (empty)
Start Manu
Stop Manu
Integration period 5 sec .. 60min
Recording configuration
General Parameters
SOLAR-02
MPP300-1
system
MPP300-3
system
Irradiation, Celle Temperature, Environmental
VDCx, IDCx, PDCx,
Hz, V1N, I1, P1, Ea1
VDCx, IDCx, PDCx,PDCtot
Hz, V1N,V2N,V3N,V12,V23,V31,
I1, I2, I3, P1, P2, P3,Ptot, Ea1,
Ea2, Ea2, Eatot
Temperature
x = 1,2,3 according to the number of DC inputs (MPPT) set.
Press the SAVE or ENTER keys (or the smart icon
) to save each selected setting. In
this condition, the instrument shows a window to confirm the saving. In this window,
confirm by pressing “Ok”. Once the operation has been completed, the instrument goes
back to the general menu screen.
To quit the modifications made or to exit without saving, press the ESC key (or the smart
icon ).
EN - 61
Page 64

SOLAR300 - SOLAR300N
5.4.2. Recording settings screen – NPV systems
This screen is designed with some levels and sub-levels as a typical tree Windows
structure in order to reach with extreme details the desired options. After selection of
“Recording settings” icon, the below screen is shown:
Cogenerations
+ General Parameters
85/251 Parameters – Autonomy: 388d 4h
CLP/EXP PREDEF. SEL MODIFY
RECORDING SETTINGS
Comments: GENERIC PLANT
Start:Manu
Stop:Manu
Integration Period:15 min
Fig. 114: Recording settings screen
Using up and down arrows keys or touching directly the items at display the
selection/disable of internal flags inside check box is possible. Clic k on check box with “+”
symbol to cause an expansion of structure with the opening of a new sub-level inside
which new selections are possible. Click on check box with “-” symbol to go back to master
level. The displayed selection/disable of parameters is performed in the following way:
Grey text and empty check box Node completely disabled
Black text and empty check box Node partially selected
Black text and selected check box Node completely selected
The bottom bar of display included the below functions, relative to F1, F2, F3, F4 keys:
CLP/EXP: used to collapse or expand the sub-levels
PREDEF.: used to open the typical configuration section (see § 5.4.2.14)
SEL: used to select or disable parameters inside various levels
MODIFY: used to perform any parameters modify inside various levels
On the bottom of display the number of selected parameters and the recording
autonomy, expressed in days and hours, is shown by meter. These s are dynamically
updated from meter depending on the parameters selection.
5.4.2.1. Comments
These option permits to insert a short comment row at display which will compare also in
print report downloaded from meter to PC. This comment text is set both using standard
TopView software (for any information please refer to software Help on line) and by using
the virtual keyboard on meter which is activated by pressing F4 key (or the MODIFY at
display). The flag of this option is always active and not disabled.
EN - 62
Page 65

SOLAR300 - SOLAR300N
5.4.2.2. Use of virtual keyboard
With the Comments: marked in blue background at display press F4 key (or the MODIFY
at display). The below screen is shown at display:
Fig. 115: Virtual keyboard screen
The keys’ description of the above keyboard is shown in the below table:
Keys Description
a, b,c,…z
Cap
123
Sb
Standard small letters keyboard for digit comments up to
25 characters
Capital letters keyboard AZ is shown
Numerical 09 besides mathematic operation symbols
(+,-,*,/,.,=) keyboard is shown
Special symbols keyboard is shown. By pressing “abc”
key to go back to standard small letter keyboard.
Special symbols with special stress keyboard are shown.
àž
Press “abc” key to go back to standard small letter
keyboard.
<-
Backspace key to cancel character on the left of the
cursor
Table 5: Description of function key of virtual keyboard
5.4.2.3. Start and Stop
These items permits to define the method to enable and disable the recordings with meter
(see § 5.6). The possible options are:
Manu: each recording is enabled/disabled in MANUAL mode by pressing GO/STOP
Auto: each recording is enabled/disabled in AUTOMATIC mode, starting from a setting
and valid date/hour by preliminary pressing of GO/STOP key
The default configuration is always the MANUAL mode and the flags of these s are not
disable. To change from MANUAL mode to AUTO mode performs the below steps:
1. Move the cursor using arrows keys on the field relative to “Start:Manu” or
“Stop:Manu”, marked with blue background
2. Press F4 key (alternatively touch the MODIFY at display). In the bottom of display a
command bar with “Manu” is shown.
3. Press F3 key (MOD(+)) or F4(MOD(-)) and select “Auto”
4. Use left or right arrows keys to moving on date and hour fields. Using the up arrow key
or F3 (MOD(+)) key to increase the value and the down arrow key or F4 (MOD(-)) key
to decrease the value
5. Press SAVE or ENTER keys (or the smart icon ) to save the settings. The Automatic
mode and the set date/hour are shown at display.
EN - 63
Page 66

SOLAR300 - SOLAR300N
5.4.2.4. Integration period
This option permits to set the integration period (see § 10.11.1) which is the time interval
between two sequential recordings within the global duration of measurements. The flag of
this option is always active and not disabled.
1. Move the cursor using arrows keys on field relative to “Integration period” , marked it
with blue background.
2. Press F4 key (alternatively touch the MODIFY at display). In the bottom of display a
command bar with “Integration Period” is shown.
3. Press F3 key (MOD(+)) or F4(MOD(-)) or up and down keys to set the desired
integration period choosing among the below values: 1s, 5s, 10s, 30s, 1min, 2min,
5min, 10min, 15min, 30min, 60min.
4. Press SAVE key or ENTER key (or the smart icon ) to save the settings. The
integration period value is shown at display.
5.4.2.5. Cogenerations
The selection of this , effected both by using up or down arrows keys and directly selecting
the flag at display, enters the values of powers and energies generated (co-generation) in
the list of recorded parameters (see § 10.10.1).
EN - 64
Page 67

SOLAR300 - SOLAR300N
5.4.2.6. General Parameters
This option permits the selection of network parameters for recording operation. This level
included several sub-level for a detailed selection depending on the type of system on test
(see § 5.3.1).
Depending on the selection performed, different error screen can be shown by meter. The
below situations are possible:
12/09/2006 – 16:55:10
+
+
Flicker
Unbalance
Error: no selected parameters
CLP/EXP PREDEF. SEL MODIFY
RECORDING SETTINGS
General Parameters
Harmonics
Voltage Anom.: 230V 6% -10%
Inrush current: 30A 1s fix
Fig. 116: General Parameters section: no selection
Fig. 116 shows the situation which the error due to no parameters selection is performed
also if the “General Parameters” is selected at display. Please note the text on grey
background and the not selected check box. In this situation other type of analysis as
Harmonics, Voltage Anomalies, Flicker, etc.. are not possible. Pressing F3 key (or touch
“SEL” at display) to exit from this error condition. In this order the flag of “General
Parameters” check box it will be selected and the below screen (with black text
background) is shown:
12/09/2006 – 16:55:10
+
+
Flicker
Unbalance
96/251 Parameters – Autonomy: 9d 4h
CLP/EXP PREDEF. SEL MODIFY
RECORDING SETTINGS
General Parameters
Harmonics
Voltage Anom.: 230V 6%-10%
Inrush current: 30A 1s fix
Fig. 117: General Parameters section: selected parameters
In example of the above picture 96 parameters are been selected on total of maximum 251
available and the correspondent autonomy is shown automatically by meter in this case.
CAUTION
The “General Parameters” check box activated flag, automatically select the
main electrical parameters whose number depends on the selected system
(Voltages, Currents, Frequency, Power Factor, Active, Reactive, Apparent
Powers, Active, Reactive, Apparent Energies). The failure to select “General
Parameters” flag automatically doe not select the above parameters.
The opposite situation is the error due to a too many selected parameters. In this case the
below screen is shown:
EN - 65
Page 68

SOLAR300 - SOLAR300N
12/09/2006 – 16:55:10
+
+
Flicker
Unbalance
Error: too many selected parameters 440/251
CLP/EXP PREDEF. SEL MODIFY
RECORDING SETTINGS
General Parameters
Harmonics
Voltage Anom.: 230V 6%-10%
Inrush current: 30A 1s fix
Fig. 118: General Parameters section: too many selected parameters
In the above screen the harmonics' selection brought about too many selected parameters
(more than 251). Not select some parameters to quit this situation.
CAUTION
The choose of a electrical for recording often increase the number of
selected parameters more than one unit only. In particular:
Frequency 1 selected parameter.
Voltage from 1 to 7 selected parameter depend on system.
Current from 1 to 4 selected parameter depend on system.
Powers and Energies from 1 to 8 selected parameter depend on
system and Cogenerations.
Power Factor from 1 to 8 selected parameter depend on system and
Cogeneration.
Harmonics: THD and DC from 1 to 8 selected parameter depend on
system.
Harmonics Odd from 25 to 100 selected parameter depend on
system.
Harmonics Even from 24 to 96 selected parameter depend on
system.
Voltage Anomalies no selected parameters.
Flicker from 1 to 3 selected parameter depend on system.
Unbalance 1 selected parameter.
EN - 66
Page 69

SOLAR300 - SOLAR300N
5.4.2.7. General Parameters: sub-levels description
Press F1 key (or touch CLP/EXP at display) to expand or compress the sub-levels. The
parameters inside sub-levels are strictly depending on type of selected system (see §
5.3.1). Below there are some pictures of different possible situations:
12/09/2006 – 16:55:10
-
+ Currents
+ Active Power&Energy
8/251 Parameters – Autonomy: 109d 0h
CLP/EXP PREDEF. SEL MODIFY
RECORDING SETTINGS
General Parameters
Frequency
-
Voltages
Phase 1-Neutral
Fig. 119: General Parameters sub-level - Single phase system
Each parameter is always selectable independent from others. The below parameters
can be selected for recording in Single phase systems:
Parameter Description
Frequency Frequency of phase L1
Voltages TRMS voltages L1-N and N-PE
Currents TRMS current phase L1
Active Power & Energy Active power and energy of phase L1
Reactive Power & Energy
Reactive (inductive or capacitive) power and energy
of phase L1
Apparent Power & Energy Apparent power and energy of phase L1
Power Factor Power factor of phase L1
CosPhi
Power factor referred to fundamental of voltage and
current of phase L1
Table 6: Selectable parameters for Single phase system
Press SAVE or ENTER keys (or the smart icon ) to save each selection and confirm by
“Ok”. The main screen of is shown by meter at the end of the operation.
Press ESC key (or the smart icon
) to quit without saving and back to previous screens.
12/09/2006 – 16:55:10
-
Phase2-Neutral
Phase3-Neutral
32/250 Parameters – Autonomy: 27d 6h
CLP/EXP PREDEF. SEL MODIFY
RECORDING SETTINGS
General Parameters
Frequency
-
Voltages
Phase1-Neutral
Fig. 120: General Parameters sub-level - Three phase 4-wire system
EN - 67
Page 70
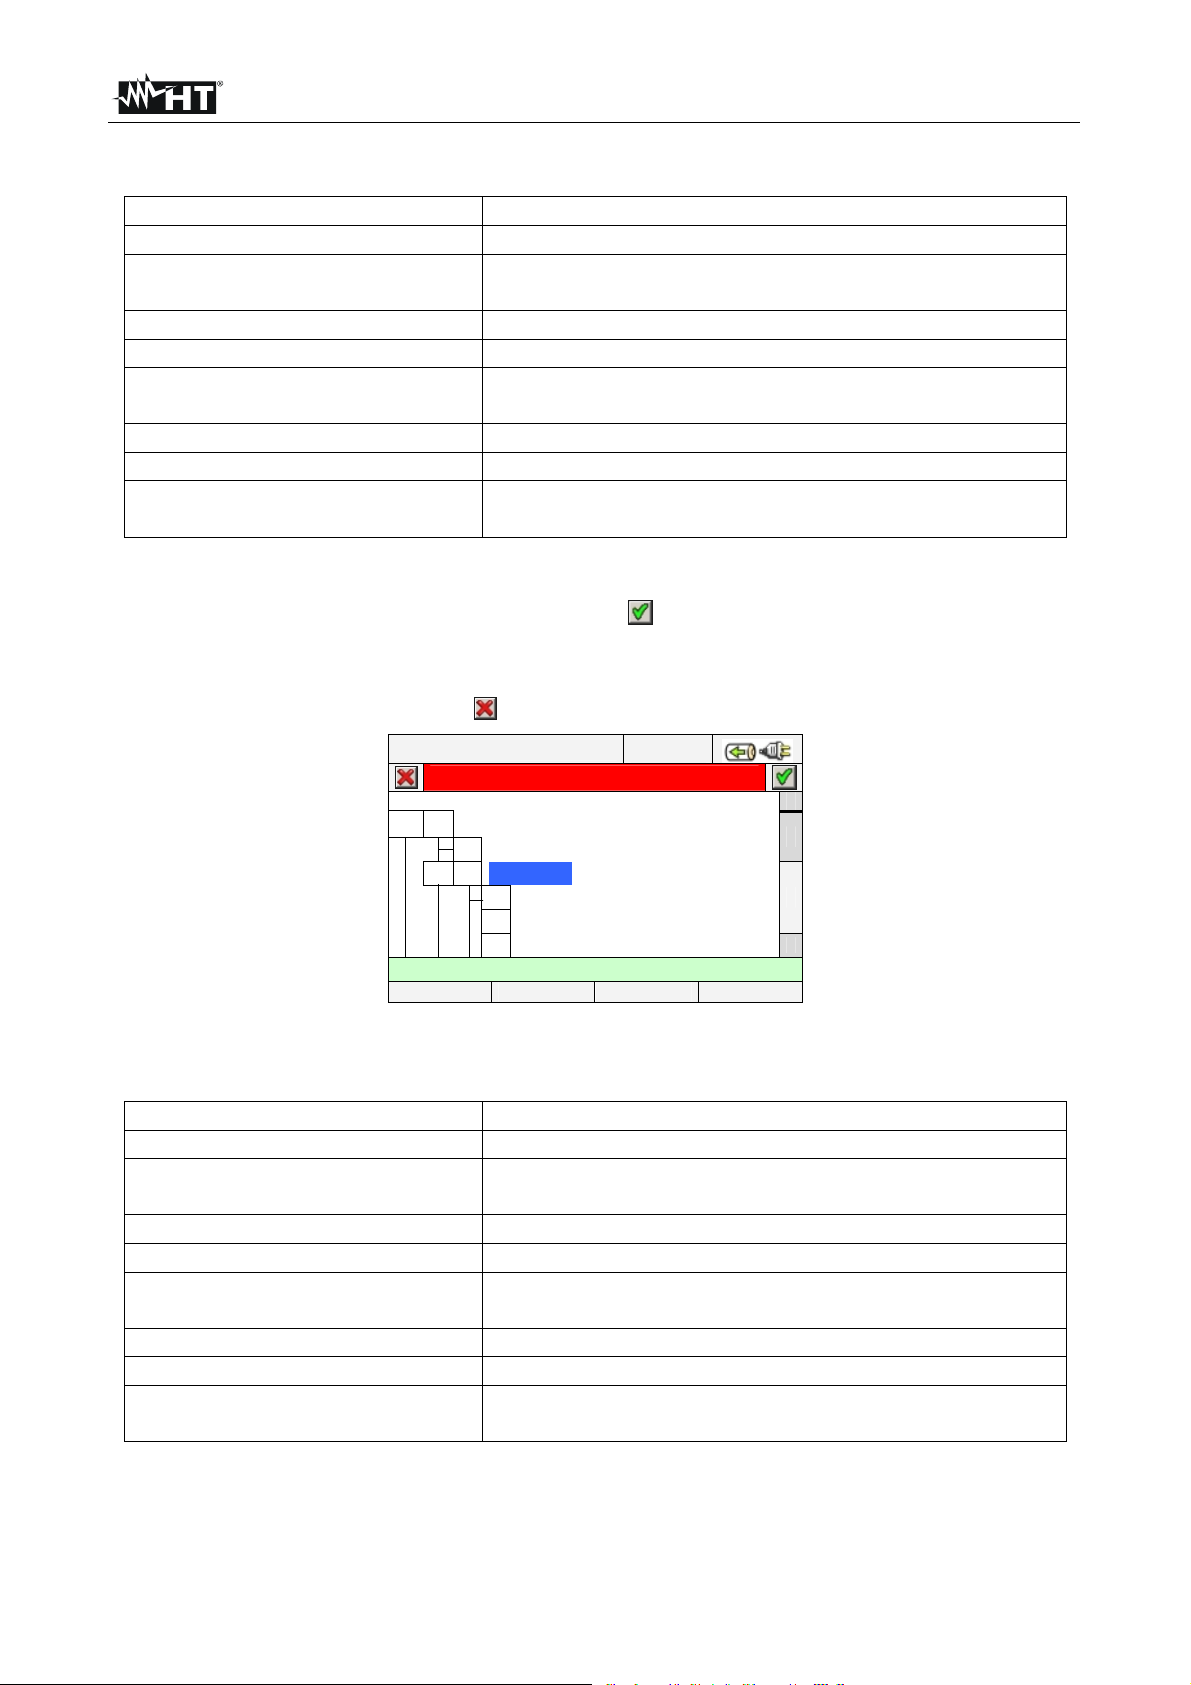
SOLAR300 - SOLAR300N
The below parameters can be selected for recording in Three phase 4-wire systems:
Parameters Description
Frequency Frequency of phases L1, L2, L3
Voltages
TRMS voltages L1-N, L2-N, L3-N, N-PE
TRMS voltages L1-L2, L2-L3, L3-L1
Currents TRMS currents L1, L2, L3, Neutral
Active Power & Energy Active power and energy L1, L2, L3, Total
Reactive Power & Energy
Reactive (inductive or capacitive) power and energy
L1, L2, L3, Total
Apparent Power & Energy Apparent power and energy L1, L2, L3, Total
Power Factor Power factor L1, L2, L3 Total
CosPhi
Power factor referred to fundamental of voltage and
current L1, L2, L3, Total
Table 7: Selectable parameters for Three phase 4-wire system
Press SAVE or ENTER keys (or the smart icon ) to save each selection and confirm by
“Ok” . The main screen of Fig. 104 is shown by meter at the end of the operation.
Press ESC key (or the smart icon ) to quit without saving and back to previous screens.
12/09/2006 – 16:55:10
-
Phase2-PE
Phase3-PE
30/251 Parameters – Autonomy: 28d 13h
CLP/EXP PREDEF. SEL MODIFY
RECORDING SETTINGS
General Parameters
Frequency
-
Voltages
Phase1-PE
Fig. 121: General Parameters sub-level - Three phase 3-wire system
The below parameters can be selected for recording in Three phase 3-wire systems:
Parameters Description
Frequency Frequency of phases L1, L2, L3
Voltages
TRMS voltages L1-PE, L2-PE, L3-PE
TRMS voltages L1-L2, L2-L3, L3-L1
Currents TRMS currents L1, L2, L3
Active Power & Energy Active power and energy L1, L2, L3, Total
Reactive Power & Energy
Reactive (inductive or capacitive) power and energy
L1, L2, L3, Total
Apparent Power & Energy Apparent power and energy L1, L2, L3, Total
Power Factor Power factor L1, L2, L3 Total
CosPhi
Power factor referred to fundamental of voltage and
current L1, L2, L3, Total
Table 8: Selectable parameters for Three phase 3-wire system
EN - 68
Page 71

SOLAR300 - SOLAR300N
Press SAVE or ENTER keys (or the smart icon ) to save each selection and confirm by
“Ok”. The main screen of Fig. 104 is shown by meter at the end of the operation.
Press ESC key (or the smart icon ) to quit without saving and back to previous screens.
12/09/2006 – 16:55:10
-
Phase2-Phase3
Phase3-Phase1
22/251 Parameters – Autonomy: 38d 16h
CLP/EXP PREDEF. SEL MODIFY
RECORDING SETTINGS
General Parameters
Frequency
-
Voltages
Phase1-Phase2
Fig. 122: General Parameters sub-level - Three phase 3-wire ARON system
The below parameters can be selected for recording in Three phase 3-wire ARON
systems:
Parameters Description
Frequency Frequency of phases L1, L2, L3
Voltages TRMS voltages L1-L2, L2-L3, L3-L1
Currents TRMS currents L1, L2, L3
Active Power & Energy Active power and energy L1-L2, L3-L2, Total
Reactive Power & Energy
Reactive (inductive or capacitive) power and energy
L1-L2, L3-L2, Total
Apparent Power & Energy Apparent power and energy L1-L2, L3-L2, Total
Power Factor Power factor L1-L2, L3-L2, Total
CosPhi
Power factor referred to fundamental of voltage and
current L1-L2, L3-L2, Total
Table 9: Selectable parameters for Three phase 3-wire ARON system
Press SAVE or ENTER keys (or the smart icon
) to save each selection and confirm by
Press ESC key (or th“Ok”. The main screen of Fig. 104 is shown by meter at the end of the
operation.e smart icon
) to quit without saving and back to previous screens.
EN - 69
Page 72

SOLAR300 - SOLAR300N
A
5.4.2.8. Harmonics: sub-levels description
Press F1 key (alternatively touch CLP/EXP at display) to expand or compress the
harmonics sub-levels. The parameters inside sub-levels are strictly depending on type of
selected system (see § 5.3.1). Below there are some pictures of different possible
situations:
12/09/2006 – 16:55:10
-
+ Odd
+ Even
162/251 Parameters – Autonomy: 19d 0h
CLP/EXP PREDEF. SEL MODIFY
RECORDING SETTINGS
Harmonics
-
Voltages
THD
DC
Fig. 123: Harmonics sub-levels: initial parameters selection
Inside Harmonics level there is another sub-level where an accurate selection of harmonic
parameters is possible. Move the cursor on “Odd” or “Even” using arrows key and press
F1 key (or touch CLP/EXP at display). The result, referred to Odd harmonics is below
shown:
12/09/2006 – 16:55:10
162/251 Parameters – Autonomy: 19g 0h
CMP/EXP PREDEF. SEL MODIFIC
RECORDING SETTINGS
-
Odd
Harmonic1
Harmonic3
Harmonic5
Harmonic7
Harmonic9
Fig. 124: Harmonics sub-levels: odd harmonics selection
Press F3 key (alternatively touch SEL at display) to select/unselect the desired
parameters. The number of selected and recording autonomy are automatically updated
from meter. The below harmonic parameters can be selected for recording (see § 10.5):
Type of system Selectable parameters
Single phase
Three phase 4-wire
Three phase 3-wire
Three phase 3-wire ARON
THD%, DC, h01
h49 (V1N, VN-PE, I1)
THD%, DC, h01h49 (V1N, V2N, V3N, VN-PE, I1, I2,
I3, IN)
THD%, DC, h01h49 (V12, V23, V31, I1, I2, I3)
THD%, DC, h01h49 (V12, V23, V31, I1, I2, I3)
Table 10: Selectable parameters of harmonic analysis
Press SAVE or ENTER keys (or the smart icon ) to save each selection and confirm by
“Ok”. The main screen of Fig. 104 is shown by meter at the end of the operation.
Press ESC key (or the smart icon ) to quit without saving and back to previous screens.
EN - 70
Page 73

SOLAR300 - SOLAR300N
The selection parameters of harmonic analysis require the preliminary selection of
voltages or currents inside General Parameter sub-level. The below error screen are
shown in these cases:
12/09/2006 – 16:55:10
+ Voltages
+ Currents
Inrush current: 30A 1s fix
Flicker
Error: no selected current
CLP/EXP TYPICAL SEL MODIFY
RECORDING SETTINGS
Harmonics
Voltage Anom.: 230V 6%-10%
Fig. 125: No selected currents error screen
To solve the error situation of above screen select the “Current” inside “General
Parameter” sub-level (see § 5.4.2.7).
12/09/2006 – 16:55:10
+ Voltages
+ Currents
Inrush current: 30A 1s fix
Flicker
Error: no selected voltage
CLP/EXP PREDEF. SEL MODIFY
RECORDING SETTINGS
Harmonics
Voltage Anom.: 230V 6%-10%
Fig. 126: No selected voltages error screen
To solve the error situation of above screen select the “Voltages” inside “General
Parameter” sub-level (see § 5.4.2.7).
EN - 71
Page 74

SOLAR300 - SOLAR300N
5.4.2.9. Voltage Anomalies
This option permits to set the control parameters relative to voltage anomalies (sags,
swell, supply breaks – see § 10.4) recording which is completely independent from
periodic analysis (regulated by integration period). The below screen is shown by meter:
12/09/2006 – 16:55:10
+
+
Flicker
Unbalance
132/251 Parameters – Autonomy: 15d 12h
CLP/EXP PREDEF. SEL MODIFY
RECORDING SETTINGS
General Parameters
Harmonics
Voltage Anom.: 230V 6%-10%
Inrush current: 30A 1s fix
Fig. 127: Voltage Anomalies selection screen
Press F4 key (alternatively touch MODIFYat display) for setting the below voltage
anomalies parameters:
Reference nominal voltage Vref depending on the type of considered system. In
particular Vref = VP-N (Single phase and three phase 4-wire systems), Vref = VP-P
(three phase 3-wire and ARON systems).
The higher threshold percentage of reference nominal voltage, selectable from 1% to
30% for voltage swell detection.
The lower threshold percentage of reference nominal voltage, selectable from 1% to
30% for voltage sags or breaks detection.
12/09/2006 – 16:55:10
+
+
Flicker
Unbalance
Voltage Anom.: 230V 6% 10%
RECORDING SETTINGS
General Parameters
Harmonics
Voltage Anom.: 230V 6%-10%
Inrush current: 30A 1s fix
MOD(+) MOD(-)
Fig. 128: Voltage Anomalies screen - setting control parameters
1. Move the cursor using arrows keys on field relative to “Voltage Anom.” , marked it with
blue background.
2. Use up or down arrow keys or press F3 or F4 keys (alternatively touch the MOD(+) or
MOD(-) s at display) to setting the correspondent value. Pressing and holding of these
keys permits a rapid values setting, while the single pressure increase or decrease on
only unit the value. Use left or right arrow keys to move on various fields.
3. Press SAVE or ENTER keys (or the smart icon ) to save each performed setting.
CAUTION
The nominal reference value should be set depending on the type of
considered system on test and the measured voltage. A message “Wrong
Vref voltage anomalies” at the recording start is shown by meter which do
not permits the recording operation due to this wrong configuration (e.g.: 4wire system and Vref = 400V). Set the correct value in this case.
EN - 72
Page 75
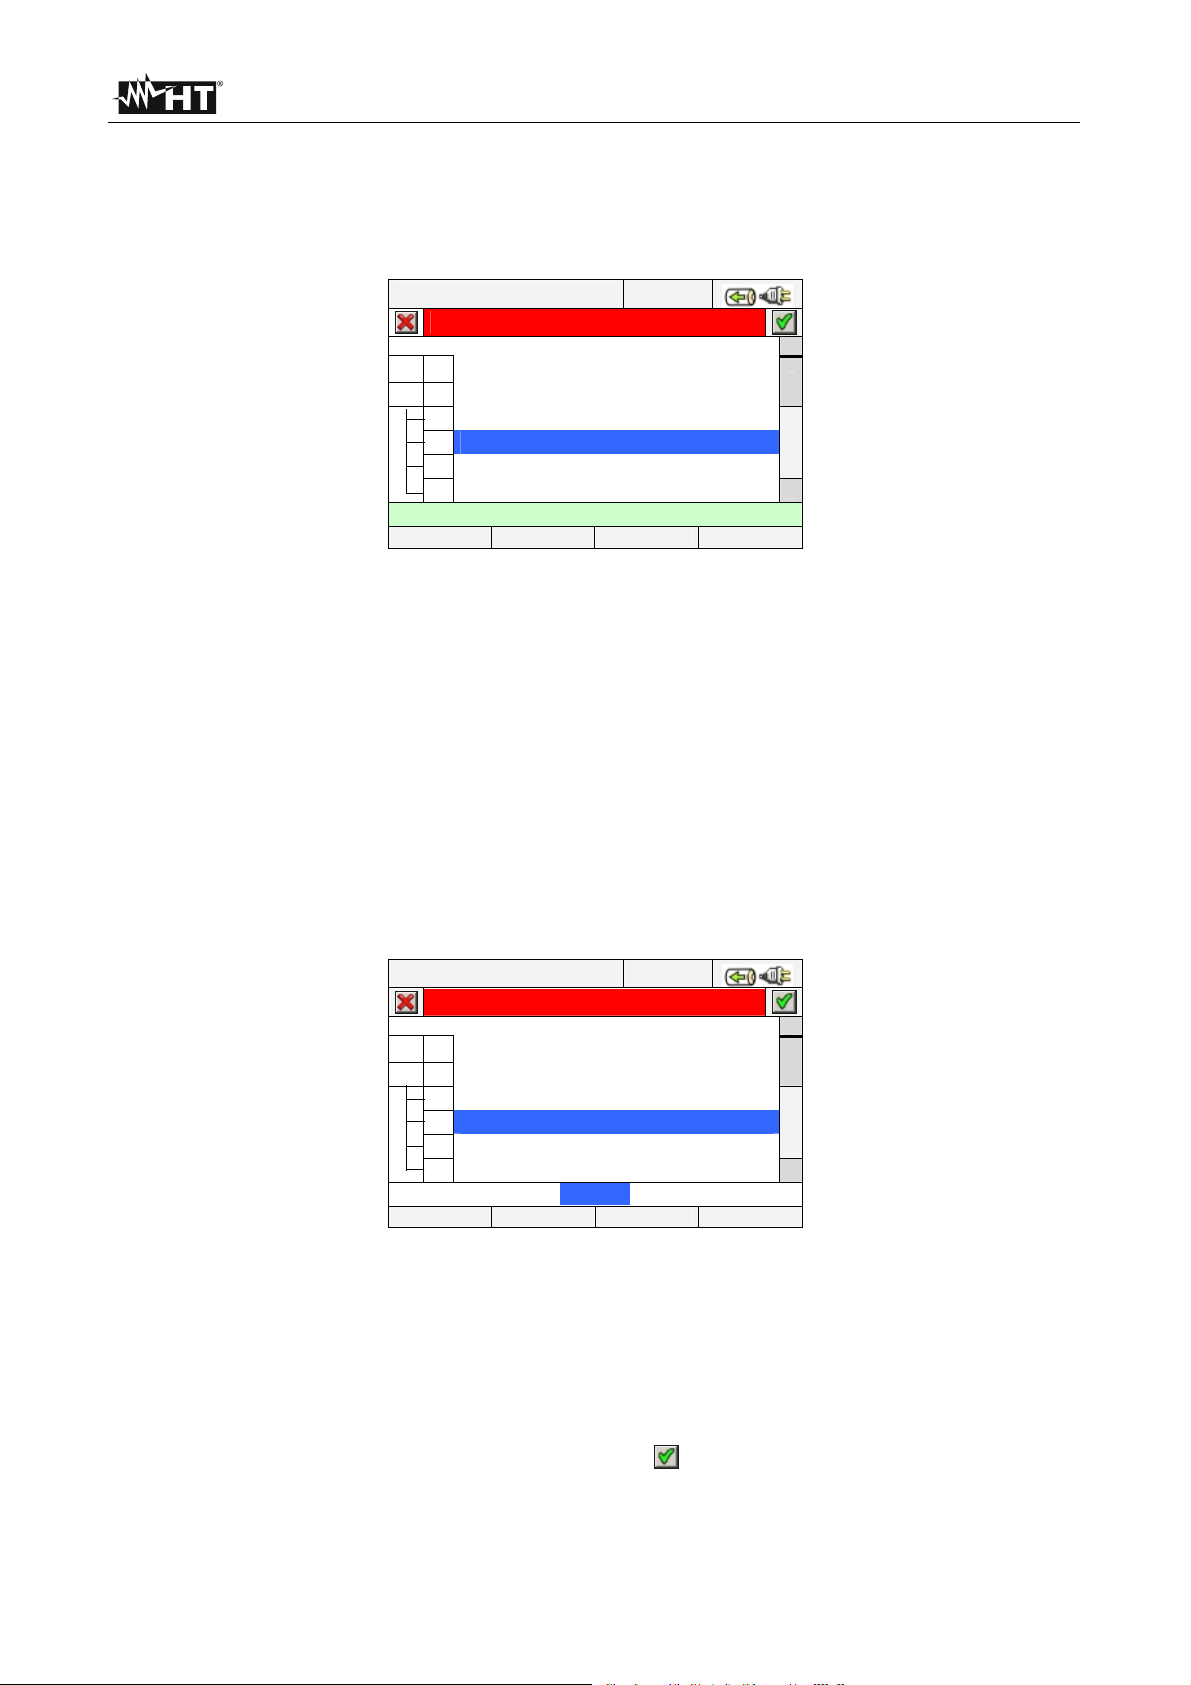
SOLAR300 - SOLAR300N
5.4.2.10. Inrush current
This option permits to set the control parameters relative to recording of inrush current
events (see § 10.6) which is completely independent from periodic analysis (regulated by
integration period). The below screen is shown by meter:
12/09/2006 – 16:55:10
+
+
Flicker
Unbalance
132/251 Parameters – Autonomy: 15d 12h
CLP/EXP PREDEF. SEL MODIFY
RECORDING SETTINGS
General Parameters
Harmonics
Voltage Anom.: 230V 6%-10%
Inrush current: 30A 1s fix
Fig. 129: Inrush currents selection screen
Press F4 key (alternatively touch MODIFY at display) to set the below parameters for
recording of inrush currents:
The value of current threshold which is correspondent to detection and recording of
inrush current event from meter. This value cannot exceeded the full scale which is
selected for the clamp type used for current measurements (see § 5.3.1.3).
The value of the inrush current detection time interval expressed in seconds. Possible
values which can be set are 1s, 2s, 3s and 4s.
The detection type of inrush currents events. The fix mode (the event is detected
whenever the input current value is over the set threshold) or var mode (the event is
detected if the difference between two instantaneous values in a half period exceed the
set threshold) are possible.
12/09/2006 – 16:55:10
+
+
Flicker
Unbalance
Inrush current: 30A 1s fix
RECORDING SETTINGS
General Parameters
Harmonics
Voltage Anom.: 230V 6%-10%
Inrush current: 30A 1s fix
MOD(+) MOD(-)
Fig. 130: Inrush current screen - setting control parameters
1. Move the cursor using arrows keys on field relative to “Inrush current” , marked it with
blue background.
2. Use up or down arrow keys or press F3 or F4 keys (alternatively touch the MOD(+) or
MOD(-) s at display) to set the correspondent value. Pressing and holding these keys
permits a rapid values setting, while the single pressure increases or decreases the
value by one single unit. Use left or right arrow keys to move on various fields.
3. Press SAVE or ENTER keys (or the smart icon ) to save each performed setting
EN - 73
Page 76

SOLAR300 - SOLAR300N
5.4.2.11. Flicker
This option permits to set control parameters relative to flicker value recordings on the
input voltages in compliance to EN 61000-4-15 and EN 50160 standards (see § 10.7). In
particular the below parameters are shown by meter:
Pst1’ = short term severity at 1 min; Pst = short term severity for all recording duration.
Plt = long term severity for all recording duration.
The below screen is shown:
12/09/2006 – 16:55:10
+
+
Unbalance
100/251 Parameters – Autonomy: 21d 0h
CLP/EXP PREDEF. SEL MODIFY
RECORDING SETTINGS
General Parameters
Harmonics
Voltage Anom.: 230V 6%-30%
Inrush current: 30A 1s fix
Flicker
Fig. 131: Flicker setting screen
For flicker recording at least one voltage selection and a correct integration period are
necessary conditions. In particular if no voltage are selected the below screen is shown:
12/09/2006 – 16:55:10
+
+
Unbalance
Error: no selected voltage
CLP/EXP PREDEF. SEL MODIFY
RECORDING SETTINGS
General Parameters
Harmonics
Voltage Anom.: 230V 6%-30%
Inrush current: 30A 1s fix
Flicker
Fig. 132: Flicker setting screen - no selected voltage
See the § 5.4.2.6 to exit from this error situation. In case of integration period setting value
less of 1 minute or higher to 15 minutes the below error screen is shown by meter:
12/09/2006 – 16:55:10
+
+
Unbalance
Error: wrong period for flicker
CLP/EXP PREDEF. SEL MODIFY
RECORDING SETTINGS
General Parameters
Harmonics
Voltage Anom.: 230V 6%-30%
Inrush current: 30A 1s fix
Flicker
Fig. 133: Flicker setting screen - wrong period for flicker
See the § 5.4.2.4 to exit from this error situation. Press SAVE or ENTER keys (or the
smart icon ) to save each selection and confirm by “Ok” . The main screen of Fig. 104 is
shown by meter at the end of the operation.
Press ESC key (or the smart icon ) to quit without saving and go back to previous
screens
EN - 74
Page 77

SOLAR300 - SOLAR300N
5.4.2.12. Unbalance
The selection of this option include on selected parameters list for recording the value of
NEG% and ZERO% s which are index of unbalance of input voltage signal respective to
negative tern and zero term (see § 10.8). “Unbalance” is not shown for single phase
systems.
5.4.2.13. Spike
This option permits to set the control parameters relative to recording of voltage fast
transients (spike) events (see § 10.9) with 5s resolution which is completely independent
from periodic analysis (regulated by integration period). The below screen is shown by
meter:
12/09/2006 – 16:55:10
+
Unbalance
100/251 Parameters – Autonomy: 21d 0h
CLP/EXP PREDEF. SEL MODIFY
RECORDING SETTINGS
Harmonics
Voltage Anom.: 230V 6%-10%
Inrush current: 30A 1s fix
Flicker
Spike: 150V
Fig. 134: Spike setting screen
Press F4 key (alternatively touch MODIFY at display) for setting the parameter for
detection and recording of voltage spikes. In particular is possible to set:
The value of voltage threshold to detection and recording the voltage spike event from
meter. This value s selectable from 100V and 5000V value.
12/09/2006 – 16:55:10
+
Unbalance
Spike: 150
RECORDING SETTINGS
Harmonics
Voltage Anom.: 230V 6%-10%
Inrush current: 30A 1s fix
Flicker
Spike: 150V
MOD(+) MOD(-)
Fig. 135: Spike screen - setting control parameter
1. Move the cursor using arrows keys on field relative to “Spike” , marked it with blue
background.
2. Use up or down arrow keys or press F3 or F4 keys (alternatively touch the MOD(+) or
MOD(-) s at display) to set the correspondent value. Pressing and holding of these
keys permit a rapid values setting, while the single pressure increase or decrease on
only unit the value.
3. Press SAVE or ENTER keys (or the smart icon
) to save each performed setting.
EN - 75
Page 78

SOLAR300 - SOLAR300N
5.4.2.14. Predefined configurations
In order to make the recording start easier the meter includes 3 selectable predefined
configurations which describe typical situation in electrical installations, besides a “Default”
configuration which defines the initial settings from the factory. The meter also permits to
define up to 16 free configuration which can be customized, saved and recalled by user
at any time. The selection of one of these configurations automatically sets only the
necessary parameters for recording operation under that circumstance. The predefined
configurations are:
1. DEFAULT: setting parameters of default configuration from the exit of meter by factory
2. EN50160: Setting parameters for networks quality recording (voltage anomalies,
harmonics, flicker , unbalance and spikes in compliance to EN 50160 standard (see §
10.5.2)
3. VOLTAGE ANOMALIES: configuration of the parameters for mains quality regarding
voltage anomalies (dips, peaks, interruptions – see § 10.4)
4. HARMONICS: configuration of the parameters for voltage and current harmonic
analysis (see § 10.5)
5. INRUSH: Setting parameters inrush current events detection
6. POWER & ENERGY: configuration of the parameters regarding Power and Energy
measurement (see § 10.10)
Pressing F2 key (or touch PREDEF. at display) in any “Recording Settings” screen. The
meter show the below screen:
12/09/2006 – 16:55:10
PREDEFINED CONFIGURATIONS
Typical Configuration
DEFAULT
EN50160
VOLTAGE ANOMALIES
HARMONICS
INRUSH
POWER & ENERGY
ADD REM
Fig. 136: Typical configuration screen
Select the desired typical configuration using up or down arrow keys or touch display.
Press SAVE or ENTER keys (or the smart icon ) to save the desired selection. The
warning message ”Change recording setting?” is shown by meter. Press “Ok” to confirm.
The meter automatically sets the parameters and updated the recording autonomy at
display. To add a predefined customized configuration press the F1 key (or the ADD at
display). The warning message “Add actual configuration” is shown by meter. Press
“Ok” to confirm and activate automatically the virtual keyboard (see § 5.4.2.2) where it’s
possible to define and save the configuration name by user. At the end of these operations
the following screen is shown by meter:
EN - 76
Page 79

SOLAR300 - SOLAR300N
12/09/2006 – 16:55:10
PREDEFINED CONFIGURATIONS
Typical Configuration
DEFAULT
VOLTAGE ANOMALIES
HARMONICS
POWER & ENERGY
GENERIC PLANT
ADD RAM
Fig. 137: Typical customized configuration screen
The typical customized configuration called e.g. “GENERIC PLANT” was defined and can
be loaded by pressing the SAVE or ENTER keys (or the smart icon
). This configuration
cab be removed in any time by pressing F2 key (or the REM at display). The warning
message “Delete selected configuration?” is shown by meter. Press “Ok” to complete
the operation. Please note that the 5 predefined configuration and the DEFAULT
configuration cannot be removable by user.
Press ESC (or the smart icon ) to quit without saving any modify. Below the selected
parameters for each of predefined configuration are shown:
EN - 77
Page 80

SOLAR300 - SOLAR300N
EN50160
MENU GENERAL PARAMETER SETTINGS SYSTEM
System
Freq[Hz]
Analyzer Settings
Analyzer Settings - Advanced
Recording Settings
Clamp Type
FS Clamp[A]
VT Ratio
Zoom Graphics
Harm. Type
Harm. Values
Zoom 1st Harm.
Average Values
Comments EN50160
Start Not modified
Stop Not modified
Integration period 10min
Cogeneration OFF
General Parameters
V1N, V2N, V3N, Average (if
Voltage harmonics THD, DC, h1, h2, h3…h25
Current harmonics OFF
Voltage anomalies ON
Ref. Voltage anomalies
Up threshold anomalies +6%
Low threshold anomalies -10%
Inrush current
Flicker ON
Unbalance
Spike ON (150V) Each system
Not modified Each system
V1N, Hz Single phase
V12,V23, V31, Hz ARON
V1-PE, V2-PE, V3-PE
V12, V23, V31, Hz
activated), Hz
230V Single, 4-wire
400V 3-wire, ARON
OFF
Not available Single phase
ON 3/4-wire, ARON
Each system
3-wire
4-wire
Each system
Each system
Table 11: Selected parameters of EN50160 configuration
EN - 78
Page 81

SOLAR300 - SOLAR300N
VOLTAGE ANOMALIES
MENU GENERAL PARAMETER SETTINGS SYSTEM
System
Freq[Hz]
Analyzer Settings
Analyzer Settings - Advanced
Recording Settings
Clamp Type
FS Clamp[A]
VT Ratio
Zoom Graphics
Harm. Type
Harm. Values
Zoom 1st Harm.
Average Values
Comments VOLTAGE ANOMALIES
Start Not modified
Stop Not modified
Integration period 1min
Cogeneration OFF
General Parameters
Voltage harmonics OFF
Current harmonics OFF
Voltage anomalies ON
Ref. Voltage anomalies
Up threshold anomalies +6%
Low threshold anomalies -10%
Unbalance
Not modified Each system
V1N, VN-PE, Hz Single phase
V12, V23, V31, Hz 3-wire, ARON
V1N, V2N, V3N, VN-PE,
Average (if activated), Hz
230V Single, 4-wire
400V 3-wire, ARON
Not available Single phase
ON 3/4-wire, ARON
Each system
4-wire
Each system
Each system
Table 12: Selected parameters of VOLTAGE ANOMALIES configuration
EN - 79
Page 82

SOLAR300 - SOLAR300N
HARMONICS
MENU GENERAL PARAMETER SETTINGS SYSTEM
System
Freq[Hz]
Analyzer Settings
Analyzer Settings - Advanced
Recording Settings
Clamp Type
FS Clamp[A]
VT Ratio
Zoom Graphics
Harm. Type
Harm. Values
Zoom 1st Harm.
Average Values
Comments HARMONICS
Start Not modified
Stop Not modified
Integration period 10min
Cogeneration OFF
General Parameters
Voltage harmonics THD, DC, h1, h2, h3…h25
Current harmonics THD, DC, h1, h2, h3…h25
Voltage anomalies OFF
Ref. Voltage anomalies
Up threshold anomalies OFF
Low threshold anomalies OFF
Unbalance
Not modified Each system
V1N, VN-PE, I1, Hz Single phase
V1-PE, V2-PE,
V3-PE, V12, V23, V31
I1, I2, I3, Hz
V12, V23, V31
I1, I2, I3, Hz
V1N, V2N, V3N, VN-PE,
I1, I2, I3, IN (only
PQA82x), Hz
OFF Single, 4-wire
OFF 3-wire, ARON
Not available Single phase
OFF 3/4-wire, ARON
Each system
3-wire
ARON
4-wire
Each system
Each system
Table 13: Selected parameters of HARMONICS configuration
EN - 80
Page 83

SOLAR300 - SOLAR300N
INRUSH
MENU GENERAL PARAMETER SETTINGS SYSTEM
System
Freq[Hz]
Analyzer Settings
Analyzer Settings
Advanced
Recording Settings
Clamp Type
FS Clamp[A]
VT Ratio
Zoom Graphics
Harm. Type
Harm. Values
Zoom 1st Harm.
Average Values
Comments INRUSH
Start Not modified
Stop Not modified
Integration period 1s
Cogeneration OFF
I1, I2, I3, IN (only PQA82x), Hz
P1, Q1i, Q1c, S1, Pf1, Cosphi1,
General Parameters
Voltage harmonics THD, DC, h1, h2, h3…h15
Current harmonics THD, DC, h1, h2, h3…h15
Voltage anomalies ON
Ref. Voltage anomalies
Up threshold anomalies +6%
Low threshold anomalies -10%
Inrush current
Flicker
Unbalance
Spike OFF Each system
Pt, P1, P2, P3, Qti, Qti1, Qti2, Qti3,
Qtc, Qtc1, Qtc2, Qtc3, St, S1, S2, S3,
Pft, Pf1, Pf2, Pf3, Cosphit, Cosphi1,
Cosphi2, Cosphi3, Eat,Eat1, Eat2,
Eat3, Erit, Eri1, Eri2, Eri3, Erct, Erc1,
Pt, P12, P32, Qti, Q12i, Q32i, Qtc,
Q12c, Q32c, St, S12, S32, Pft, Pf12,
Pf32, Cospht, Cosphi12, Cosphi32,
Eat, Ea12, Ea32, Erit, Eri12, Eri32,
Not modified Each system
V1N, VN-PE, I1, Hz Single phase
V1-PE, V2-PE,
V3-PE, V12, V23, V31
I1, I2, I3, Hz
V12, V23, V31
I1, I2, I3, Hz
V1N, V2N, V3N, VN-PE
Ea1, Eri1, Erc1
Erc2, Erc3
Erct, Erc12, Erc32
230V Single, 4-wire
400V 3-wire, ARON
ON (10A, 1s, var)
OFF
Not available Single phase
ON 3/4-wire, ARON
Each system
3-wire
ARON
4-wire
Single phase
3-wire, 4-wire
ARON
Each system
Each system
Table 14: Selected parameters of INRUSH configuration
EN - 81
Page 84

SOLAR300 - SOLAR300N
POWER & ENERGY
MENU GENERAL PARAMETER SETTINGS SYSTEM
System
Freq[Hz]
Analyzer Settings
Analyzer Settings
Advanced
Recording
Settings
Clamp Type
FS Clamp[A]
VT Ratio
Zoom Graphics
Harm. Type
Harm. Values
Zoom 1st Harm.
Average Values
Comments POWER & ENERGY
Start Not modified
Stop Not modified
Integration period 15min
Cogeneration ON
V12, V23, V31, I1, I2, I3, Hz
V12, V23, V31, I1, I2, I3, Hz ARON
V1N, V2N, V3N, V12, V23, V31,I1, I2, I3,
P1, Q1i, Q1c, S1, Pf1, Cosphi1, Ea1,
General Parameters
Voltage harmonics OFF
Current harmonics OFF
Voltage anomalies OFF
Ref. Voltage anomalies
Up threshold anomalies OFF
Low threshold anomalies OFF
Unbalance
Pt, P1, P2, P3, Qti, Qti1, Qti2, Qti3, Qtc,
Qtc1, Qtc2, Qtc3, St, S1, S2, S3, Pft,
Pf1, Pf2, Pf3, Cosphit, Cosphi1,
Cosphi2, Cosphi3, Eat,Eat1, Eat2, Eat3,
Erit, Eri1, Eri2, Eri3, Erct, Erc1, Erc2,
Pt, P12, P32, Qti, Q12i, Q32i, Qtc, Q12c,
Q32c, St, S12, S32, Pft, Pf12, Pf32,
Cospht, Cosphi12, Cosphi32, Eat, Ea12,
Ea32, Erit, Eri12, Eri32, Erct, Erc12,
Not modified Each system
V1N, I1 Single phase
V1-PE, V2-PE, V3-PE,
IN (only PQA82x), Hz
Eri1, Erc1
Erc3
Erc32
OFF Single, 4-wire
OFF 3-wire, ARON
Not available Single phase
OFF 3/4-wire, ARON
Each system
3-wire
4-wire
Single phase
3-wire, 4-wire
ARON
Each system
Each system
Table 15: Selected parameters of POWER & ENERGY configuration
EN - 82
Page 85

SOLAR300 - SOLAR300N
DEFAULT CONFIGURATION (NPV systems)
MENU GENERAL PARAMETER SETTINGS
System 4-wire
Freq[Hz] 50
Analyzer Settings
Analyzer Settings
Advanced
Recording Settings
Down threshold anomalies -10%
Clamp Type FLEX
FS Clamp[A] 3000
VT Ratio 1
Zoom Graphics AUTO
Harm. Type ALL
Harm. Values ABSOLUTES
Zoom 1st Harm. YES
Average Values NO
Comments DEFAULT
Start Manu
Stop Manu
Integration period 15min
Cogeneration OFF
V1N,V2N,V3N,VN-PE,V12,V23,V31,
I1, I2, I3, IN (only PQA82x), Hz
Pt, P1,P2,P3, Qti, Qi1, Qi2, Qi3, Qtc, Qc1,
General Parameters
Voltage harmonics THD, DC, h1, h2, h3…h11
Current harmonics THD, DC, h1, h2, h3…h11
Voltage anomalies ON
Ref. Voltage anomalies 230V
Up threshold anomalies +6%
Unbalance ON
Qc2, Qc3, St, S1, S2, S3, Pft, Pft1, Pft2, Pft3,
Cosphit, Cosphi1, Cosphi2, Cosphi3, Eat,
Ea1, Ea2, Ea3, Erit, Eri1, Eri2, Eri3, Erct,
Erc1, Erc2, Erc3
Table 16: Parameters of default configuration
CAUTION
The DEFAULT configuration defines the selection of parameters on meter
from the factory, as shown in Table 16. Each new modification performed
and saved by the user on “Analyser Settings” section replaces this
configuration with new selection which can be different from the default
standard.
EN - 83
Page 86

SOLAR300 - SOLAR300N
5.5. Start a test on PV system
For testing purposes, no setting of the recording parameters is necessary, but only of
those relevant to the configuration of the analyzer (see § 5.3.2).
The test can only be activated by pressing the F1 key (RUN) in GENERAL MENU Real
time values screen. By accessing this screen, the values measured by the instrument will
immediately be displayed in real time. If the SOLAR-0x unit is connected too, the
temperature and irradiation values, measured by means of the external probes connected
to it, will also be available.
Furthermore, the acronym MPPT (Multiple Power Point Tracker) shall indicate the
characteristic of the DC/AC converter (inverter), capable of maximizing the DC power
which can be taken from the photovoltaic field (see the § 10.3 for further details), the
acronym PRp shall indicated the Performance ratio (evaluated on active powers).
Fig. 138: Examples of screens for recording activation on a PV system
After connecting to the SOLAR-0x or MPP300 (optional) unit and pressing the F1 key (see
the test procedure described in par. 7.1 and 7.3), the instrument will enter the stand-by
mode, waiting for recording, and then the recording-in-progress mode. The stand-by and
recording-in-progress modes are signalled by certain icons in the display’s top part, as
shown in the herewith pictures:
Fig. 139: Instrument in stand-by mode
It is recommended to always start recording by connecting the instrument to
the external supply, provided with the instrument, in order not to loose any
data during the whole measurement campaign.
CAUTION
EN - 84
Fig. 140: Recording in progress
Page 87

SOLAR300 - SOLAR300N
The instrument can displays messages when pressing the F1 key:
Message Description
Before start a test, please check
zero reading of DC clamp when
it’s not connected to the plant
Fw SOLAR-01 < 2.02 – Irr.min =
600W/m2
Fw SOLAR-01 < 2.03 – IP=2min
No supply
Wrong phase sequence
Negative powers
Solar 01 connected
Solar 02 connected
SOLAR-01 not connected
SOLAR-02 not connected
SOLAR-0x is not recording. Stop
recording.
Testing in progress
Do you want to stop recording?
Wait for recording start
Wait for data download
Analysis impossible
MPP300 connected
Error in data download from
SOLAR-02
MPP300: low battery
No external power supply for
MPP300. Continue?
MPP300: exchanged AC and DC
voltages
MPP300: negative power
SOLAR-02: not detected. Stop
recording?
SOLAR-02:Firmware not correct Firmware of SOLAR-02 dosen’t match with SOLAR300N Firmware
MPP300:Firmware not correct Firmware of MPP300 dosen’t match with SOLAR300N Firmware
ALWAYS perform at the start of each test the zeroing of the supplied DC clamp connected to
the meter and not to the PV installation by pressing ZERO key on it. The result should be a
“0.000A” on meter but a small current value up to “0.02A” is permitted. After that, connect the
DC clamp to the installation
The minimum irradiance threshold different from 600W/m2 and the internal Fw of SOLAR-01
is < 2.02. The Fw update of SOLAR-01 unit require to send the unit to HT service
The IP > 2min and the internal Fw of SOLAR-01 is < 2.03. In this case the recording is
aborted as the not updated SOLAR-01 can not saving the values in it’s internal memory. The
Fw update of SOLAR-01 unit require to send the unit to HT service
It is recommended to connect the supply provided with the instrument, before starting
testing/recording. Anyway, it is also possible to perform a testing/recording without supply,
using the instrument’s internal battery.
The value of parameter “SEQ” in section Measure display (see § 5.2.4)is different from “123”,
which is correct. Check the sequence value of the phases of Voltages V1, V2, V3.
One or more values of the Active Powers P1, P2, P3 are negative (see § 5.2.4). If necessary,
turn the clamps under current by 180° on the conductors in order to obtain always positive
values (except for cases of co-generation).
Confirms the connection between the instrument and SOLAR-0x. This message MUST
ALWAYS appear when connecting the instrument and SOLAR-0x using the USB cable.
Should this message not appear when connecting, disconnect and connect again the USB
cable to the two units.
Check the connection of SOLAR-0x to the instrument. The error message is displayed when
trying to stop a testing or trying to start/stop recording where item SOLAR-0x is flagged,
while no connection to unit SOLAR-0x has been detected.
This message warns the user that a SOLAR-0x unit with no active recording has been
connected to a instrument unit during the testing/recording phase.
This message is displayed when a testing is being carried out and the GO/STOP key is
pressed. It is not possible to start recording while a test is already being carried out. Stop
testing by pressing the F1 key (FINISH).
Message which asks the user for confirmation before stopping the recording/test currently
being carried out.
This message warns the user that the recording/test will start when reaching the following
minute or when reaching the date and time set for start (only for recordings on NPV
systems).
This message warns the user of the data transferring phase from unit SOLAR-0x to the
instrument. Do not disconnect the USB cable during this phase.
This message warns the user that the data recorded are not compatible with the set
minimum irradiation threshold (see § 5.3.3.3) and it is not possible to provide any result.
This message confirms the connection between the instrument and MPP300. This message
MUST ALWAYS be displayed when connecting the master unit to the MPP300 via USB
cable. If, upon connection, this message should not appear, disconnect the USB cable and
connect it again.
A transmission error has occurred between the SOLAR-02 and SOLAR300N or MPP300
units. Switch off and on again all units and connect them again. The units will try data
transfer again.
The battery of MPP300 is almost flat. Connect the external power supply to MPP300.
This message warns that, in order to carry out very long recordings, it is advisable to connect
the external power supply to MPP300.
An exchange in the connection between DC and AC voltages has been detected. Check the
connections.
One or more Ac negative powers has been measured. This is normally due to a connection
error. Check the connections.
You are trying to stop recording while the SOLAR-02 unit is not connected with the MPP300
unit.
Table 17: Description of error before starting recording
EN - 85
Page 88

SOLAR300 - SOLAR300N
5.5.1. While testing
After starting a test, the instrument allows displaying in real time both the parameters set
and the current state of the operation.
1. Use the arrow keys or select the icon “Saved Data Management” in the GENERAL
MENU.
2. With a recording in progress, press the ENTER key or touch the icon “Saved Data
Management” on the display. The instrument displays the following screen:
Fig. 141: Screen with information about recording in progress with PV system set
3. The screen above contains the following information:
Recording autonomy of the instrument with selections made in Days/Hours
Comments inserted in the relevant comment field of section “Analyzer setting” (see §
5.4.2.1).
Type, data and hour when recording started
Type of recording stop (always manual)
The Integration Period set
The number of integration periods made in real time
The type of photovoltaic system considered
If the parameters of SOLAR-0x (Irradiation, Cell Temperature, Environmental
Temperature) are being recorded
The type of clamp used
The full scale selected for the clamps used
4. Press the ESC key (or smart icon ) to exit the information screen.
Only section “Measure display” is available while testing. The instrument
CAUTION
displays the message “Menu not available while recording” in case of
selection of other sections. Stop testing by pressing the F1 key.
The ON/OFF key is disabled while testing. The instrument shows the
message “Recording in progress. Function not available”. Stop testing by
pressing the F1 key.
EN - 86
Page 89

SOLAR300 - SOLAR300N
5.5.2. Stop a test
To stop a test (after connecting the unit SOLAR-0x or the unit MPP300 to the main unit),
press the F1 key. The icon highlighted in Fig. 140 disappears from the display.
After the automatic data transfer phase, the instrument will automatically display:
The maximum performance outcome (max PRp), according to § 5.3.2.6
or
Will shows the message “Results don't comply with minimal test requirements” if the
Irradiance values were not steady or never reach minimum Irradiance value.
Press:
SAVE: to save the results obtained. Pressing the key will display the virtual keyboard
for typing possible comments. A further pressing of the SAVE key will store
the measure and the typed comments and will go back to the initial screen,
ready for a new measurement. The data will be recorded in a RegPV file and
you’ll have the possibility to view them on the display at all times (see § 5.7.2)
ESC: to delete the detected data and go back to the initial screen, ready for a new
measurement.
EN - 87
Page 90

SOLAR300 - SOLAR300N
5.6. START A RECORDING
The meter is designed to start a recording in MANUAL or AUTOMATIC mode (the
Automatic only for NPV systems - see § 5.4.2.3) by pressing of GO/STOP key. A recording
operation can be started exclusively under the following screens:
GENERAL MENU (with any selected icon)
Real time values (in any internal screen)
12/09/2006 – 16:55:10
GENERAL MENU
12/09/2006 – 16:55:10
SCOPE VOLTAGES – Page 1/5
Fs 400.0V
V1 223.4V
V2 228.5V
V3 225.7V
Vn 0.0V
Meter information
PAGE
Fig. 142: Example of screens for recording starting
Before starting a recording press ESC key (or the smart icon ) until you get a picture as
shown in Fig. 142.This operation can be performed in the below ways:
MANUAL: Recording will start at the following minute after pressing GO/STOP key.
AUTO: Only if the instrument is configured for NPV systems: When pressing the
GO/STOP key (necessary), the instrument remains in stand-by until
reaching the date/time set (see § 5.4.2.2) to start recording.
The waiting and recording run status are marked by meter with dedicated icons which are
present on the top right of display, as shown in below picture:
12/09/2006 – 16:55:10
GENERAL MENU
12/09/2006 – 16:55:10
GENERAL MENU
Meter information
Fig. 143: Meter waiting for recording
Meter information
Fig. 144: Meter in recording run
Press again GO/STOP key to stop the recording run in any time. The icon shown in Fig.
144 disappear.
EN - 88
Page 91

SOLAR300 - SOLAR300N
CAUTION
For recordings ALWAYS use the external power supply even though the
instrument allows the operator to perform a recording using internal
batteries.
After starting a recording a preliminary real time evaluation about the situation on electrical
installation it’s important in order to perform a correct settings, using the predefined
configurations (see § 5.4.2.14) if necessary.
The below warning message can be shown by meter after pressing of GO/STOP key:
Warning
Too many selected parameters
Fig. 145: Warning message of too many selected parameters
In this case of too many parameters were selected it is necessary to disable them inside
“Recordings Settings” section in order to start a correct recording.
After pressing GO/STOP key a possible warning message window is shown by meter.
Inside this window message the internal item can be different as for type and number. This
warning message, which does not block the recording start, is important for user to correct
possible errors performed during meter’s setting:
Warning
Missed external adapter
Wrong phase sequence
Negative active powers
Wrong Vref voltage anomalies
Ok
Cancel
Fig. 146: Warning message errors screen
EN - 89
Page 92

SOLAR300 - SOLAR300N
Below the meaning of the above s of warning windows screen:
Type of error Description
Before start a test, please check
zero reading of DC clamp when
it’s not connected to the plant
Fw SOLAR-01 < 2.02 – Irr.min =
600W/m2
Fw SOLAR-01 < 2.03 – IP=2min
No supply
Wrong phase sequence
Negative active powers
Wrong Vref voltage anomalies
Solar 01 connected
Solar 02 connected
SOLAR-0x not connected
Do you want to stop recording?
Wait for recording start
Analysis impossible
Wait for data download
MPP300 connected
Error in data download from
SOLAR-02
MPP300: low battery
No external power supply for
MPP300. Continue?
MPP300: exchanged AC and DC
voltages
MPP300: negative power
SOLAR-02: not detected. Stop
recording?
SOLAR-02:Firmware not correct Firmware of SOLAR-02 dosen’t match with SOLAR300N Firmware
MPP300:Firmware not correct Firmware of MPP300 dosen’t match with SOLAR300N Firmware
ALWAYS perform at the start of each test the zeroing of the supplied DC clamp connected to
the instrument and not to the PV installation by pressing ZERO key on it. The result should
be a “0.000A” on meter but a small current value up to “0.02A” is permitted. After that,
connect the DC clamp to the installation
The minimum irradiance threshold is different from 600W/m2 and the internal Fw of SOLAR01 is < 2.02. The Fw update of SOLAR-01 unit require to send the unit to HT service
The IP > 2min and the internal Fw of SOLAR-01 is < 2.03. In this case the recording is
aborted as the not updated SOLAR-01 can not saving the values in it’s internal memory. The
Fw update of SOLAR-01 unit require to send the unit to HT service
It is recommended to connect the supply provided with the instrument, before starting
testing/recording. Anyway, it is also possible to perform a testing/recording without supply,
using the instrument’s internal battery.
The value of “SEQ” parameter in Real Time Values section (see § 5.2.1) is different from the
correct “123”. Check the phase sequence value of V1, V2, V3 voltages.
One or more values of P1, P2, P3 Active Powers is negative (see § 5.2.1). Reversing if
necessary the transducer clamps of 180 degrees on phase cables in order to obtain always
positive values (except cogeneration cases).
The nominal reference voltage value for voltage anomalies is not compliance to the type of
selected system (see § 5.4.2.9).
Confirms the connection between the instrument and SOLAR-0x. This message MUST
ALWAYS appear when connecting the instrument and SOLAR-0x using the USB cable.
Should this message not appear when connecting, disconnect and connect again the USB
cable to the two units.
Check the connection of SOLAR-0x to the instrument. The error message is displayed when
trying to start/stop a recording where item SOLAR-0x is flagged, while no connection to unit
SOLAR-0x has been detected.
Message which asks the user for confirmation before stopping the recording currently being
carried out.
This message warns the user that the recording will start when reaching the following minute
or when reaching the date and time set for start (only for recordings on NPV systems).
This message warns the user that the data recorded are not compatible with the set
minimum irradiation threshold (see § 5.3.3.3) and it is not possible to provide any result
This message warns the user of the data transferring phase from unit SOLAR-0x to the
instrument. Do not disconnect the USB cable during this phase.
This message confirms the connection between the instrument and MPP300. This message
MUST ALWAYS be displayed when connecting the master unit to the MPP300 via USB
cable. If, upon connection, this message should not appear, disconnect the USB cable and
connect it again.
A transmission error has occurred between the SOLAR-02 and SOLAR300N or MPP300
units. Switch off and on again all units and connect them again. The units will try data
transfer again.
The battery of MPP300 is almost flat. Connect the external power supply to MPP300.
This message warns that, in order to carry out very long recordings, it is advisable to connect
the external power supply to MPP300.
An exchange in the connection between DC and AC voltages has been detected. Check the
connections.
One or more Ac negative powers has been measured. This is normally due to a connection
error. Check the connections.
You are trying to stop recording while the SOLAR-02 unit is not connected with the MPP300
unit.
Table 18: Description of errors before start a recording
Depending on the type and number of errors, the necessary modifications of setting
parameters should be performed.
EN - 90
Page 93

SOLAR300 - SOLAR300N
Press GO/STOP key again to start recording and verify the possible residual error on
window message.
Confirm with ENTER or press “Ok” or “Cancel” keys to close the warning window message
and start the recording by pressing GO/STOP key anyway.
As the default value of the integration periods is set at 15min (see § 10.11.1) the meter will
store data in the temporary memory for this time. Afterwards the meter will process the
results saved in the temporary memory and will save the first series of values in the
definitive memory. Therefore, if an integration period of 15 minutes has been set, the
recording will continue for about 15 minutes before producing a series of recorded values
CAUTION
Let the meter record for at least one integration period in order to save a
valid value. If the recording is interrupted before the selected integration
period has completely elapsed the data stored in the temporary memory will
not be processed and the corresponding series of values won’t be
transferred to the definitive memory.
5.6.1. Recording settings screen – NPV systems (only for NPV systems)
To start a recording under automatic mode a preliminary definition of a correct starting
Date/Hour, compatible with system date, is needed inside “Recorder Settings” section (see
§ 5.4). The below screen is shown:
12/09/2006 – 16:55:10
Cogeneration
+ General Parameters
Start: Auto 12 / 09 / 06 – 17 : 00 : 00
RECORDING SETTINGS
Comments: POWER & ENERGY
Start:Auto 12/09/2006 – 16:30
Stop:Manu
Integration Period:15 min
MOD(+) MOD(-)
12/09/2006 – 16:55:10
RECORDING SETTINGS
Comments: POWER & ENERGY
Start:Auto 12/09/2006 – 16:30
Stop:Manu
Integration Period:15 min
Cogeneration
+ General Parameters
Error: wrong start date
CMP/EXP PREDEF. SEL MODIFY
Fig. 147: Correct Date/Hour
Fig. 148: Wrong Date/Hour
1. Move the cursor using arrows keys on field relative to “Start” (and or the “Stop” ),
marked them with blue background
2. Press F4 key (alternatively touch the MODIFY at display). In the bottom of display a
command bar with “Manu” is shown. Press F3 key (MOD(+)) or F4(MOD(-)) and select
“Auto”
3. Use left or right arrows keys to move on date and hour fields. Using the up arrow key or
F3 (MOD(+)) key to increase the value and the down arrow key or F4 (MOD(-)) key to
decrease the value. Set a correct Date/Hour as shown in Fig. 147
4. Press SAVE or ENTER keys (or smart icon
) to saving the settings. The screen of
Fig. 148 is shown if a wrong Date/Hour is set. Under this condition the SAVE key does
not have any effect. Repeat the steps 2 and 3 and set corrects values before pressing
SAVE key again
EN - 91
Page 94

SOLAR300 - SOLAR300N
5.6.2. During a recording
After a recording is running, a real time check of parameters’s values and internal status is
shown by meter.
12/09/2006 – 16:55:10
GENERAL MENU
Recording results
Fig. 149: Recording Results screen - Recording running
1. Select “Recording Results” in GENERAL MENU
2. Pressing ENTER or touch the correspondent icon at display.
The below screen is shown (with NPV system set):
12/09/2006 – 16:55:10
Autonomy: 0 days –22 hours
Comments: EN50160
Start: 12/09/2006 16:57:00
Stop: Manual
Integration Period: 5 sec
Num. Periods: 345
Anomalies: 0
MODIFY
INFO RECORDING RUNNING
Fig. 150: Info recording running screen
3. The below information are included in the above screen:
Recording autonomy, in Days/Hours, of meter with the currents selections performed.
Comments included in the relative section (see § 5.4.2.1).
Type, date and time of recording start
Type of recording stop
The Integration Period set
Real time information about integration period performed by meter
Enable of cogeneration
Number of recorded voltage anomalies
Type of selected system
Type of used clamp
Full scale of used clamp
Ratio of eventual external PT used
EN - 92
Page 95

SOLAR300 - SOLAR300N
The instrument displays the following screen (with PV system set):
Fig. 151: Screen with information about recording in progress with PV system set
4. The screen shown in Fig. 151 contains the following information:
Recording autonomy of the instrument with selections made in Days/Hours
Comments inserted in the relevant comment field of section “Analyzer setting” (see §
5.4.2.1).
Type, data and hour when recording started
Type of recording stop
The Integration Period set
The number of integration periods made in real time
The type of photovoltaic system considered
If the parameters of SOLAR-0x (Irradiation, Cell Temperature, Environmental
Temperature) are being recorded
The type of clamp used
The full scale selected for the clamps used
5. Pressing ESC key (or the smart icon ) to quit from the above screen.
Each recording running is stopped and results are automatically saved by meter by
pressing of GO/STOP key or as soon as the date/hour of automatic stop is reached.
The data will be recorded in a Reg file (NPV systems) or RegPV (for PV systems) and
you’ll have the possibility to view them on the display at all times (see par. 5.7.2)
The only “Real Time Values” section is available during a recording
CAUTION
running. The message “Menu not available in recording” is shown by
meter if any section is selected. Stop recording pressing GO/STOP key
before select any section.
ON/OFF key is disabled during a recording running. The message “
Recording running. Not available function” is shown by meter. Stop
recording pressing GO/STOP key before pressing this key.
EN - 93
Page 96

SOLAR300 - SOLAR300N
5.7. SAVED DATA MANAGEMENT SECTION
Fig. 152: GENERAL MENU - Saved Data Management
The “Saved Data Management” section allows the user to check the content of the internal
memory after recording, to delete previous recordings and possibly to copy a recording
(one at a time) on an external USB Pen Driver connected to the instrument. By pressing
the ENTER key or selecting the icon on the display, the instrument shows the following
screen:
Fig. 153: Saved data
The instrument performs the following types of recordings:
Reg type: recordings performed and saved automatically, both in manual and
automatic mode, of each analysis (Periodics, Harmonics, Voltage Anomalies, Flickers,
etc…) by pressing the GO/STOP key.
Istant type: instant samplings of the values displayed (numerical, waveforms,
harmonics, PV tests, etc.) performed by pressing the SAVE key
RegPV type: recordings performed on photovoltaic systems and saved by pressing the
GO/STOP key or tests of photovoltaic system saved by pressing the SAVE key.
RegPV* type: type of data similar to RegPV, but for which the data transferring phase
between SOLAR-0x and the instrument has not been completed. For this type of
recordings NO result will be available.
RegMPP type: recordings/tests of PV systems carried out by means of MPP300 and
automatically saved for each analysis on a photovoltaic system by pressing the
GO/STOP key and at the end of a photovoltaic system test by pressing the SAVE key.
Each line of the “Saved Data Management” screen includes, further to the type of data
saved in the memory, also the information on the starting and stopping date of the event,
respectively “Time1” and “Time2” for Reg and RegFV type recordings, while date and time
are indicated for Istant instant sampling.
EN - 94
Page 97

SOLAR300 - SOLAR300N
The following operations are possible only on the screen in Fig. 153:
1. Use the up and down a rrow keys to highlight (blue background) one of the recordings
on the screen. Press the F1 key (or the INFO item on the display). The instrument
shows the screen containing the main information regarding the recording performed
as described in § 5.7.1.
2. Press the F3 key (or the DEL item on the display) to delete the last saved recording.
The instrument shows the message “Delete last recording?”. Confirm the operation
with “Ok” or “Cancel” to go back to the screen.
3. Press the F4 key (or the DEL ALL item on the display) to delete all recordings in the
memory. The instrument shows the message “Delete all recordings?”. Confirm the
operation with “Ok” or “Cancel” to go back to the previous screen.
5.7.1. Recording analysis (Reg type)
This page shows the analyses which can be performed on the saved data (Reg type).
Fig. 154: Recording analysis (Reg-type data)
1. Use the up and down arrow keys to highlight on blue background one of the analyses
on the screen. Press the F1 or ENTER key (or the OPEN item or the smart icon on
the display) to confirm the type of analysis to be performed.
2. Press the ESC key (or the smart icon ) to exit the function and go back to the “Saved
data” page (Fig. 153).
5.7.1.1. Recording information
This page contains general information about the recording (Reg) file previously selected
in the Saved Data Management MENU.
Fig. 155: Recording info
1. In these conditions, the F1 key (or the MODIFY key on the display) is active and it is
possible to modify and save the comment line by using the virtual keyboard (see §
5.4.2.2).
2. Press the ESC key (or the smart icon ) to exit the function and go back to the
“Recording analysis” page (Fig. 154).
EN - 95
Page 98

SOLAR300 - SOLAR300N
5.7.1.2. Recording graph
By selecting the recording graph option, the following page is accessed, which enables the
user to display the recording trend (ONLY ONE parameter at a time).
Fig. 156: Selecting a parameter
1. Press the F1 key (or the PARAM item on the display ) to access the page containing
the recorded quantities available for the analysis (Fig. 157).
Fig. 157: Parameter selection
The following keys are active on this page:
The up and down arrow keys move the cursor along the quantity tree.
The F1 key (or the CMP/EXP item on the dislay) compresses and expands the tree of
the quantity highlighted by the cursor.
The F2 key (or the SEL item on the dislay) selects or deselects the parameter
highlighted by the cursor.
The ENTER key (or the smart icon on the display) confirms the selection previously
made and displays the graph of the selected parameter (Fig. 158).
The CANC key deselects the parameter previously selected, independently from the
position of the cursor.
The ESC key (or smart icon ) to exit the function and go back to the “Selecting a
parameter” page (Fig. 156).
EN - 96
Page 99

SOLAR300 - SOLAR300N
This page shows the graph, the cursor position (cursor T) and the maximum, minimum and
average RMS values of the parameter selected by the cursor.
Fig. 158: Recording graph
The following keys are active on this page:
F1 key (or PARAM item on the display) to access the page of the selectable parameters
(Fig. 157).
F4 key (or OPTIONS item on the display) to access the page for the activation of the
“Advanced graph” (Fig. 159).
The ESC key (or smart icon ) to exit the function and go back to the “Recording analysis”
page (Fig. 154).
2. Press the F4 key (or the OPTIONS item on the display) to access the page for the activation
of the Advanced graph (Fig. 159).
Fig. 159: Options (Advanced graph)
The following keys are active on this page:
The F3 and F4 keys (or the MOD(+) and MOD(-) items on the display) enable the user to
choose YES or NO for the advanced graph.
The ENTER key (or the smart icon
on the display) confirms the selection previously
made.
The ESC key (or smart icon ) to exit the function and go back to the “Selecting a
parameter” page (Fig. 156).
Example of advanced graph.
Let us take a recording of 2000 pixels into consideration. The SOLAR300N has a display
with a useful resolution of about 200 pixels; therefore, it is not able to distinctly display all
the pixels in our recording. How does it operate then? The first pixel in the graphs of the
curves “Max value”, “Average value” and “Min value” will be the analysis of the 10 first
corresponding pixels of the recording, similarly, the second pixel will be the analysis of the
following 10 pixels, and so on until the whole graph is generated.
3. Press the ESC key (or the smart icon ) to exit the function and go back to the
“Selecting a parameter” page (Fig. 156).
EN - 97
Page 100

SOLAR300 - SOLAR300N
5.7.1.3. Dips ans swells
This page shows a table containing all voltage anomalies occurred during recording.
Fig. 160: Dips ans swells
Column description:
N.: progressive number of the anomaly.
L.: phase in which the anomaly occurred.
Date/Time: date/time at which the anomaly occurred.
Max/Min: maximum/minimum value of the anomaly.
Duration: duration of the anomaly.
Type: type of anomaly (voltage reduction or overvoltage).
The following keys are active on this page:
The up and down arrow keys move the cursor along the voltage anomalies.
The up and down arrow keys move the column display to the right or to the left.
The F1 key (or the PAG item on the display) advances to the following page of voltage
anomalies (to be selected with the F3 or F4 key or through the items MOD (+) or MOD
(-) on the display).
The F2 key (or the PARAM item on the display) accesses the page showing the
settings for voltage anomalies (Fig. 161).
The ESC key (or smart icon
) to exit the function and go back to the “Recording
analysis” page (Fig. 154).
EN - 98
 Loading...