

Page 1

XPWatch and XPSketch Reference Guide
This guide is designed to help you understand and use the XPWatch and XPSketch tools. It describes the functional
capabilities and operational details of XPWatch and XPSketch, and provides some examples of how to use the
tool.
Part Number: T1789-96098
Sixth edition: June 2010
Page 2

Legal and notice information
© Copyright 2010 Hewlett-Packard Development Company, L.P.
Confidential computer software. Valid license from HP required for possession, use or copying. Consistent with FAR 12.211
and 12.212, Commercial Computer Software, Computer Software Documentation, and Technical Data for Commercial Items
are licensed to the U.S. Government under vendor’s standard commercial license.
The information contained herein is subject to change without notice. The only warranties for HP products and services are set
forth in the express warranty statements accompanying such products and services. Nothing herein should be construed as
constituting an additional warranty. HP shall not be liable for technical or editorial errors or omissions contained herein.
Intel, Itanium, Pentium, Intel Inside, and the Intel Inside logo are trademarks or registered trademarks of Intel Corporation or
its subsidiaries in the United States and other countries.
Microsoft ®, MS Windows ®, Windows ® XP, Windows Vista ® are U.S. registered trademarks of Microsoft Corporation.
Java ™ is a US trademark of Sun Microsystems, Inc.
Printed in the US.
Page 3

Contents
1 Introduction to XPWatch ...................................................................... 9
Overview ................................................................................................................................... 9
XPWatch environment ................................................................................................................ 10
Software environment ......................................................................................................... 10
Hardware environment ........................................................................................................ 10
Functional representation ........................................................................................................... 10
2 Installing XPWatch ........................................................................... 13
Prerequisites ............................................................................................................................. 13
Installing XPWatch .................................................................................................................... 13
Uninstalling XPWatch ................................................................................................................ 16
Components ............................................................................................................................ 16
3 Working with XPWatch menus and commands .................................... 17
Commands .............................................................................................................................. 17
Menus ..................................................................................................................................... 18
Array menu ....................................................................................................................... 19
Host groups ....................................................................................................................... 20
Viewing Host groups .................................................................................................... 20
Selecting Host groups ................................................................................................... 20
Clearing Host groups ................................................................................................... 21
Nickname menu ................................................................................................................. 22
Assigning nicknames .................................................................................................... 23
Renaming nicknames ................................................................................................... 24
Deleting nicknames ...................................................................................................... 24
Port menu .......................................................................................................................... 25
Viewing Port menu ....................................................................................................... 26
Pick LDEVs/RAID Groups selection scheme ............................................................................ 27
Viewing Pick LDEVs/RAID Groups selection scheme ......................................................... 27
RAID Group menu .............................................................................................................. 27
Viewing RAID Group menu ........................................................................................... 29
LDEV menu ........................................................................................................................ 29
Viewing LDEV menu ..................................................................................................... 30
Settings menu .................................................................................................................... 30
Menu settings .............................................................................................................. 30
Performance data collection settings ............................................................................... 31
4 Viewing performance metrics in XPWatch ............................................ 33
Collecting performance metrics ................................................................................................... 33
Understanding performance metrics ............................................................................................ 35
Port performance metrics ..................................................................................................... 35
LDEV performance metrics ................................................................................................... 36
RAID Group performance metrics ......................................................................................... 37
CPU performance metrics .................................................................................................... 37
XPWatch and XPSketch Reference Guide 3
Page 4

DKC performance metrics .................................................................................................... 38
5 Introduction to XPSketch .................................................................... 39
Overview ................................................................................................................................. 39
6 Installing XPSketch ............................................................................ 41
Supported Windows platforms ................................................................................................... 41
Installing XPSketch .................................................................................................................... 41
7 Viewing performance metrics in XPSketch ............................................ 45
Loading the Comma seperated file .............................................................................................. 45
Setting the Java heap size value ................................................................................................. 46
Viewing performance metrics in XPSketch ..................................................................................... 46
Understanding performance metrics in XPSketch ........................................................................... 48
8 Working with charts in XPSketch ........................................................ 53
Viewing charts ......................................................................................................................... 53
Modifying chart properties ......................................................................................................... 53
Restoring auto range settings on the chart .................................................................................... 54
Saving and printing the chart ..................................................................................................... 54
A XPWatch use case scenarios ............................................................. 55
Scenario 1: Port I/O spike ......................................................................................................... 55
Business case ..................................................................................................................... 55
Objective .......................................................................................................................... 55
Resolution ......................................................................................................................... 55
Results .............................................................................................................................. 55
Scenario 2: Poor application response ......................................................................................... 55
Business case ..................................................................................................................... 55
Objective .......................................................................................................................... 56
Resolution ......................................................................................................................... 56
Results .............................................................................................................................. 56
B Understanding write ratio in XPWatch ................................................. 57
C Relationship between LDEV I/O response time and Write ratio .............. 59
D Comparing LDEV response time metrics in XP Performance Advisor and
XPWatch ............................................................................................ 61
Maximum values of LDEV response time in XP Performance Advisor and XPWatch ............................. 61
Average values of LDEV response time in XP Performance Advisor and XPWatch ............................... 61
Average read response time ................................................................................................ 61
Average write response time ................................................................................................ 61
9 Support and other resources .............................................................. 63
Contacting HP .......................................................................................................................... 63
Subscription service .................................................................................................................. 63
Documentation feedback ........................................................................................................... 63
HP product documentation survey ............................................................................................... 63
Related information ................................................................................................................... 64
4
Page 5

Document conventions and symbols ............................................................................................. 65
Index ................................................................................................. 67
XPWatch and XPSketch Reference Guide 5
Page 6

Figures
Working of XPWatch ............................................................................................... 111
XP Performance Advisor logon screen ........................................................................ 142
XP Performance Advisor home screen ........................................................................ 143
Table of Contents screen .......................................................................................... 154
XPWatch commands ............................................................................................... 175
XPWatch version ..................................................................................................... 196
Array menu ............................................................................................................ 197
Available Host Groups ............................................................................................ 208
Available Host Groups: One Host Group selected ....................................................... 219
Available Host Groups: Two Host Groups selected ...................................................... 2110
Clearing a Host Group ............................................................................................ 2211
Nickname menu ..................................................................................................... 2312
Nickname menu: Selecting a host group to assign nickname ........................................ 2313
Nickname menu: Entering new nickname ................................................................... 2414
Nickname menu: Displaying new nickname ............................................................... 2415
Port menu .............................................................................................................. 2616
Pick LDEVs/RAID Groups selection scheme ................................................................. 2717
RAID Group menu .................................................................................................. 2818
LDEV menu ............................................................................................................ 2919
Settings menu ......................................................................................................... 3020
Output screen ......................................................................................................... 3521
XP Performance Advisor Logon screen ........................................................................ 4222
XP Performance Advisor Home screen ........................................................................ 4223
Table of Contents screen .......................................................................................... 4324
Error message ........................................................................................................ 4625
Performance report generated using XPSketch ............................................................. 4726
Multiple graphs plotted for multiple metric selection ..................................................... 4827
Metric available, samples available, and samples displayed ........................................ 4828
6
Page 7

Tables
XPWatch software environment ................................................................................. 101
XPWatch hardware environment ............................................................................... 102
Navigation options and their functions ....................................................................... 173
Selection options .................................................................................................... 184
Miscellaneous options ............................................................................................. 185
Array menu — fields ............................................................................................... 196
Host Groups — fields .............................................................................................. 207
Port menu — screen fields ........................................................................................ 268
RAID Group menu — screen fields ............................................................................ 289
LDEV menu — screen fields ...................................................................................... 2910
Menu settings ......................................................................................................... 3011
Performance data collection settings .......................................................................... 3112
Port performance metrics .......................................................................................... 3513
LDEV performance metrics ........................................................................................ 3614
RAID Group performance metrics .............................................................................. 3715
CPU performance metrics ......................................................................................... 3716
DKC performance metrics ........................................................................................ 3817
Port performance metrics .......................................................................................... 4918
LDEV performance metrics ........................................................................................ 4919
RAID Group performance metrics .............................................................................. 4920
CPU performance metrics ......................................................................................... 5021
DKC performance metrics ........................................................................................ 5022
Document conventions ............................................................................................. 6523
XPWatch and XPSketch Reference Guide 7
Page 8

8
Page 9

1 Introduction to XPWatch
This chapter describes the features of XPWatch and the environment required to run it.
Overview
XPWatch is a command-line interface utility provided with HP StorageWorks XP Performance Advisor.
It is designed for focused troubleshooting and can capture data as frequently as every 10 seconds.
XPWatch monitors the performance of the following:
• Ports
• Client-Host Interface Processor (CHIP) or Channel Adapter (CHA)
• Array Control Processors (ACPs) or Disk Adapters (DKAs)
• RAID Groups
• Logical Devices (LDEVs) of XP Arrays
XPWatch can be used to troubleshoot performance issues, such as:
• Hot spots within the Array (hard disk drives or RAID Groups that are over utilized compared to
the rest of the array)
• Front-end congestion (micro processors (mp) ports)
• Back-end issues
• Cache/Shared Memory issues, usage, contention and so on
• Determining true I/O throughput (from the mp port to the hard disk drive)
• Port I/O spikes
• Poor application response
The performance metrics are displayed on the console of the host system. The output data is stored
in a comma separated file (.csv). The .csv file can be loaded in XPSketch to obtain a visual
representation of the output data.
XPWatch offers the following features:
• Focused troubleshooting
• Real-time performance data monitoring and collection for time intervals as low as 10 seconds
• Ability to split data in desired intervals and store them in different files
• Customizable menu size
• Nicknames can be provided to the host groups for easy identification
• Command-line tool with easy-to-use selection menu
• Configuration changes that are reflected with every fresh run
• Small footprint and easy to execute, does not require any special installation
For more information on installing the XP Performance Advisor, see the HP Storage Works XP PA
Installation Guide.
XPWatch and XPSketch Reference Guide 9
Page 10

XPWatch environment
This section describes the software and hardware environment required to run XPWatch.
Software environment
Table 1 lists the XPWatch software environment.
Table 1 XPWatch software environment
Operating system
• Microsoft Windows 2003 Second Edition
• Windows 2003 EE SP1/SP2 [IA 32 bit]
• HP-UX
• HP-UX 11.11 32 bit
• HP-UX 11.23 PA RISC
• HP-UX 11.23 IA 64 bit
• HP-UX 11.31 PI PA RISC
• HP-UX 11.31 PI IA 64 bit
• AIX 5.3 and later
• Microsoft Windows 64 bit ( x64 and IA64)
• Solaris (SPARC)
• Red Hat Enterprise Linux (x32 and x64)
• SuSE Linux Enterprise Server (x32 and x64)
• VMware
Hardware environment
Table 2 lists the XPWatch hardware environment.
Table 2 XPWatch hardware environment
Functional representation
Figure 1 shows the functional representation of XPWatch.
XP Performance Advisor host agent 3.4 and later.Host agent
XP24000/XP20000/XP12000/XP10000/SVS200/XP1024/XP128Array types
Introduction to XPWatch10
Page 11
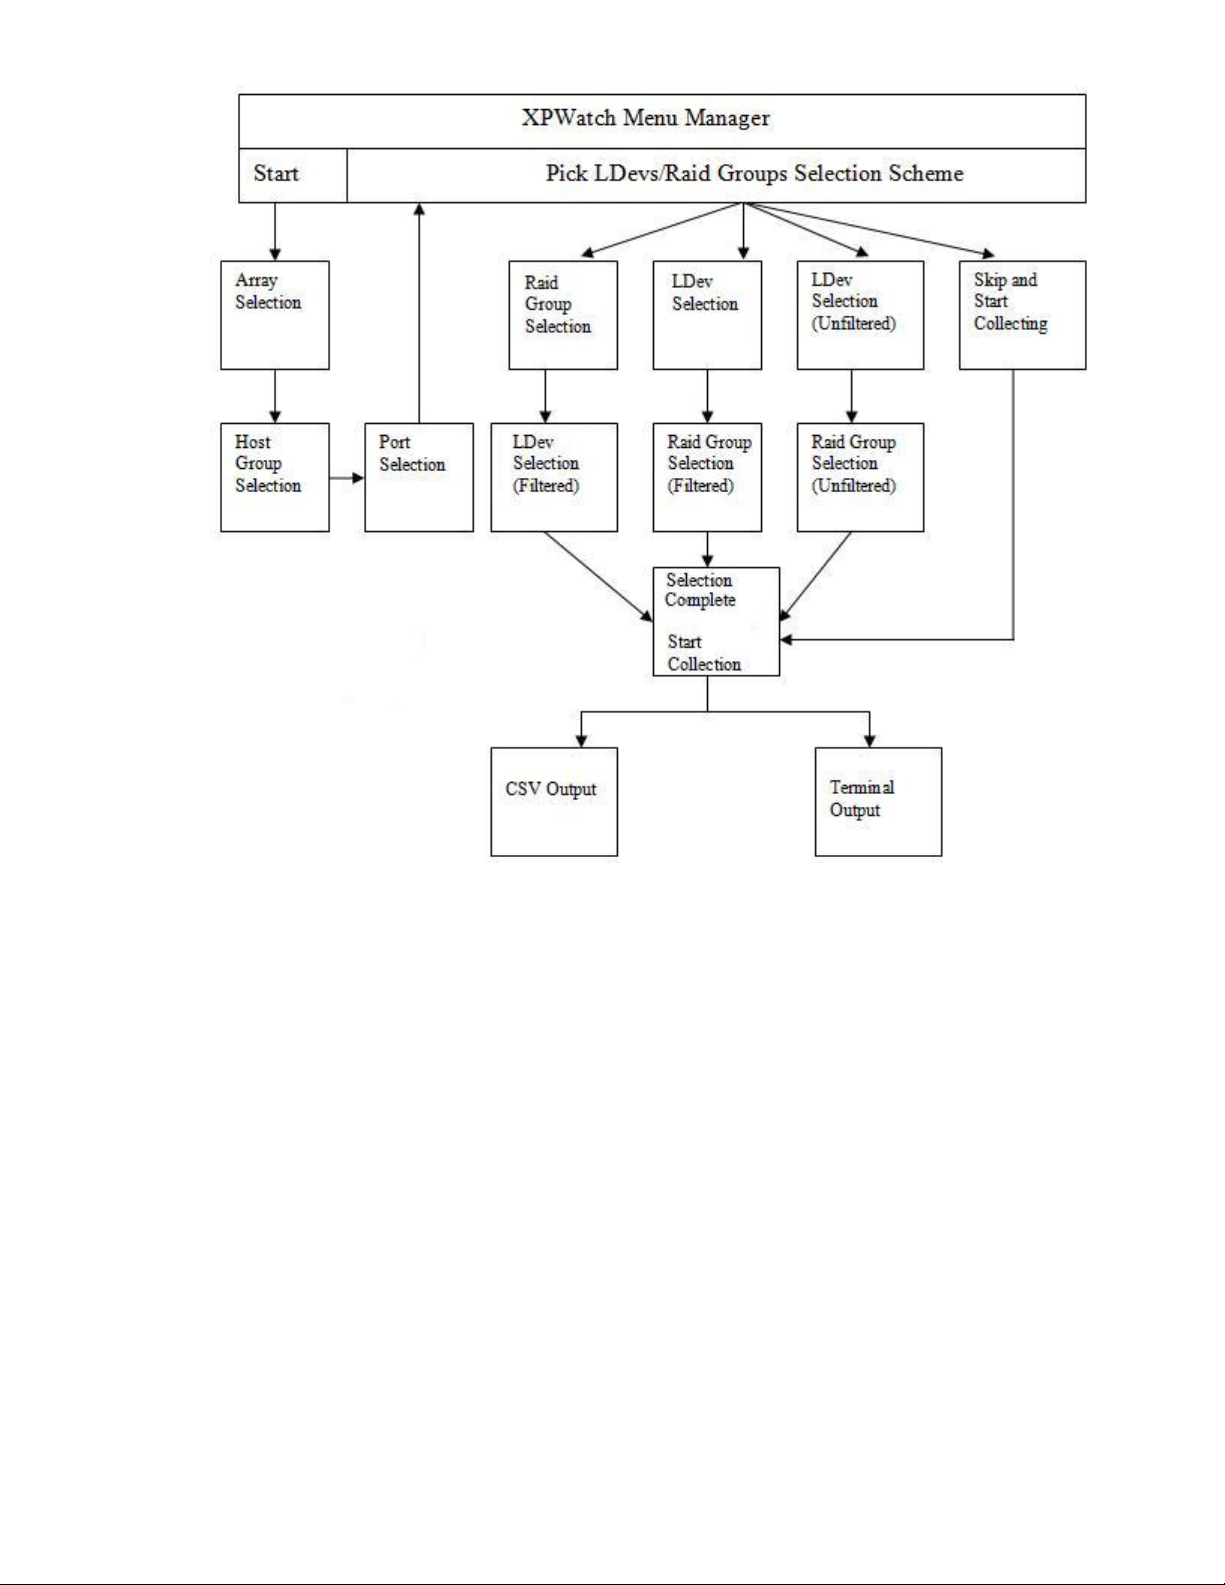
Figure 1 Working of XPWatch
.
XPWatch functions as follows:
1. On starting XPWatch, the Array menu appears.
2. Selecting the desired array displays the list of host groups connected to it.
3. Selecting one or more host groups displays the list of ports connected to them.
4. Selecting the required ports displays the Pick LDEVs/RAID Groups Selection Scheme.
This scheme offers the following options:
• Filter LDEVs by RAID Groups
If you select this option, the RAID Groups menu appears. Select one or more RAID Groups
to view the LDEV menu. The LDEV menu lists all the LDEVs within the selected RAID Groups.
Select the required LDEV to collect and view the performance data.
• Filter RAID Groups by LDEVs
If you select this option, the LDEV menu appears. Select one or more LDEVs to view the RAID
Group menu. The RAID Group menu lists all the RAID Groups within the selected LDEVs. Select
the required RAID Groups to collect and view performance data.
• Manually Add RAID Groups and LDEVs Without Filtering
XPWatch and XPSketch Reference Guide 11
Page 12

If you select this option, all the available LDEVs and RAID Groups are displayed. Select the
desired RAID Groups and LDEVs to collect and view their performance data.
• Skip and Start Collecting
If you select this option, XPWatch skips the LDEV and RAID Group menus, and displays the
port performance data and CPU performance data of all the ports connected to the selected
array.
5. The output appears on the screen, which can be saved in .csv format.
Introduction to XPWatch12
Page 13

2 Installing XPWatch
This section describes installing and uninstalling XPWatch. It also describes the various components
of XPWatch.
Prerequisites
The following are the prerequisites to install XPWatch:
• The XP Performance Advisor host agent (version 3.4 and above) must be installed on your host
system.
• The host must have a command device connected to the array to collect information from the array.
• You need to enable Logical Unit Number (LUN) security on the port of the required array to de-
termine the Host Group paths in XPWatch.
• You should have selected XPWatch bits during XP Performance Advisor installation. For more in-
formation, see the HP StorageWorks XP Performance Advisor Installation Guide.
Installing XPWatch
To install XPWatch, perform the following steps:
1. Open a web browser.
2. In the browser address line, enter your server name followed by /pa. For example, http(s):/
/[server name]/pa.
You can also access XP Performance Advisor over a secure connection: https://[server
name].[domain name]/pa.
If the DNS server cannot locate the management station and open the default XP Performance
Advisor applet, type http(s)://[IP address]/pa.
NOTE:
The XP Performance Advisor URL is case-sensitive.
The XP Performance Advisor logon screen appears.
Figure 2 shows the XP Performance Advisor logon screen.
XPWatch and XPSketch Reference Guide 13
Page 14
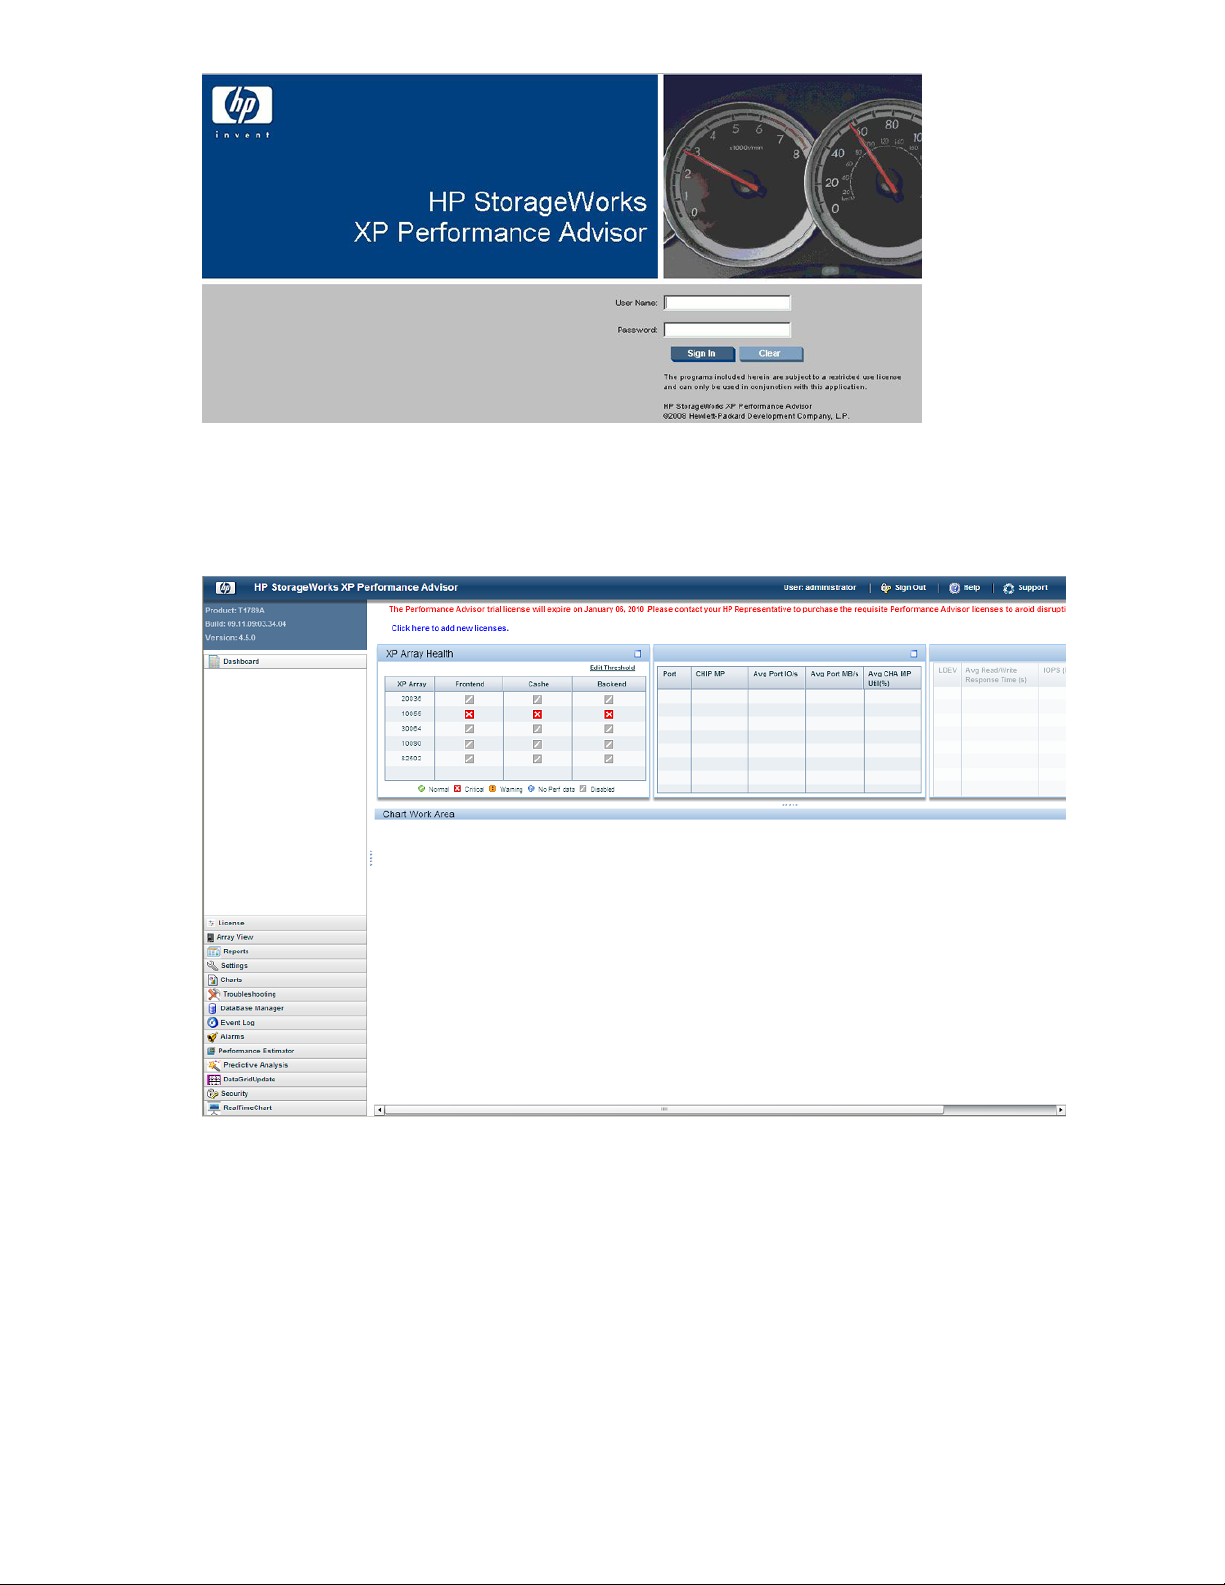
Figure 2 XP Performance Advisor logon screen
.
3. Enter your User Name and Password and click Sign In. The XP Performance Advisor Home screen
appears.
Figure 3 shows the XP Performance Advisor Home screen.
Figure 3 XP Performance Advisor home screen
.
4. On the Header menu, select Support. The screen displaying Table of Contents appears.
Figure 4 shows the Table of Contents screen.
Installing XPWatch14
Page 15
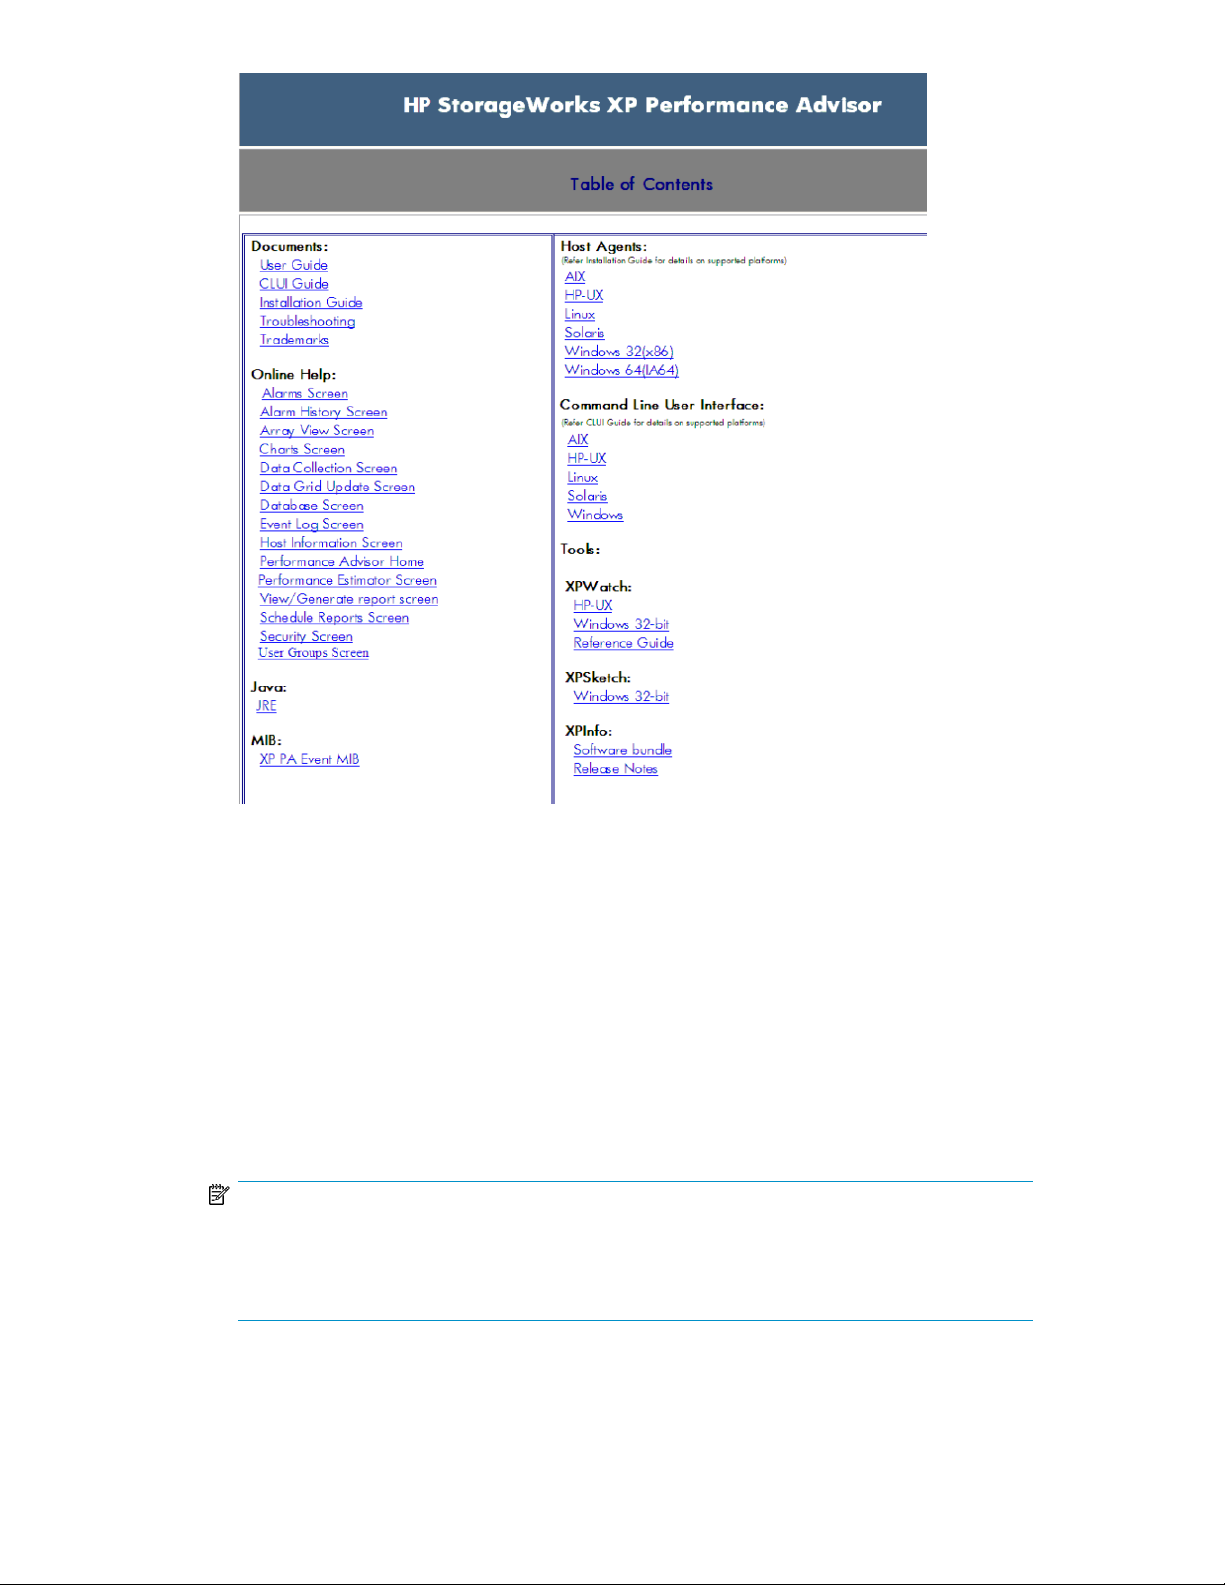
Figure 4 Table of Contents screen
.
5. From the Tools menu, select XPWatch from respective operating system to download the XPWatch
zip file specific to your operating system.
6. Extract the contents of the zip file to a location on your system. The XPWatch.exe and wa-
gent.exe files are extracted.
7. Double-click XPWatch.exe to run XPWatch. You can also run XPWatch using the command
prompt.
For example, c:\XPWatchTool\XPWatch.exe
where, XPWatchTool is the folder containing the XPWatch.exe file.
In your command-prompt window, ensure that you point to the directory where XPWatch is in-
stalled.
NOTE:
• The XPWatch bits are available in the Tools folder on XP Performance Advisor Installation
disk 2.
• At any given point, you can close XPWatch by pressing Ctrl+C.
XPWatch and XPSketch Reference Guide 15
Page 16

Uninstalling XPWatch
To remove XPWatch, delete the folder containing the XPWatch.exe file.
Components
The software components of XPWatch are:
• XPWatch.exe— is an executable file used to launch the XPWatch tool.
• wagent.exe — is an executable file required to operate XPWatch.
• trace.txt — stores information about the execution cycle of XPWatch when the debug mode
is enabled.
• settings.ini — this file contains the default or customized menu settings. It is generated after
the first use of XPWatch.
• .csv file— is the output file that saves performance data.
The output file naming convention is: selected array-dd-mmm-yyyy- hh.min.sec.milliseconds.
For example, 10055-23-OCT-2008-12.40.46.151.csv is the output file name,
where:
• 10055 is the selected array.
• 23-OCT-2008 is the file creation date.
• 12.40.46.151 is the file creation time in (12 hrs, 40 min, 46 sec and 151 milliseconds).
NOTE:
All the above-mentioned software components are saved in one folder.
Installing XPWatch16
Page 17
3 Working with XPWatch menus and commands
This section describes how to use the different commands, menus, and interfaces of XPWatch.
Commands
The XPWatch commands enable you to perform the following tasks:
• Navigate through menus using the Navigation Options.
• Select items, such as ports, host groups, RAID Groups, and LDEVs using the Selection Options.
• Modify the settings using the Miscellaneous Options.
Figure 5 shows the XPWatch commands.
Figure 5 XPWatch commands
.
NOTE:
The Host Groups screen displays all the available navigation options, selection options, and
miscellaneous options. All the other screens have their related options displayed.
Table 3 lists the Navigation options available in the XPWatch interface and their functions.
Table 3 Navigation options and their functions
Command
FunctionOption
To view the previous menu.Backb
XPWatch and XPSketch Reference Guide 17
Page 18

Command
FunctionOption
To view the next menu.
Continuec
NOTE:
Enter c and not C.
Next pagen
Previous pagep
Exite
To view the next set of items, such as host groups, ports, RAID
Groups, and LDEVs.
To view set of items, such as host groups, ports, RAID groups,
and LDEVs displayed on the previous page.
To close XPWatch.
NOTE:
You can also use Ctrl+C to close XPWatch.
Table 4 lists the Selection options available in the XPWatch interface and their functions.
Table 4 Selection options
FunctionOptionCommand
To select all items in a given menu.Select Alla
Select Noner
To clear all the selected items in a given
menu.
Table 5 lists the Miscellaneous options available in the XPWatch interface and their functions.
Table 5 Miscellaneous options
FunctionOptionCommand
Menus
To change the settings of XPWatch.Settingss
To view the Nickname menu.Nickname Menux
NOTE:
XPWatch commands are case-sensitive.
XPWatch enables you to monitor and customize performance data of ports, RAID groups, and LDEVs
through different menus. They are:
• Array menu
• Host groups
• Nickname menu
• Port menu
• Pick LDEVs/RAID Groups selection scheme
• RAID Group menu
Working with XPWatch menus and commands18
Page 19
• LDEV menu
• Settings menu
Array menu
The Array menu appears after you start XPWatch. This menu lists all the arrays that are connected to
the host.
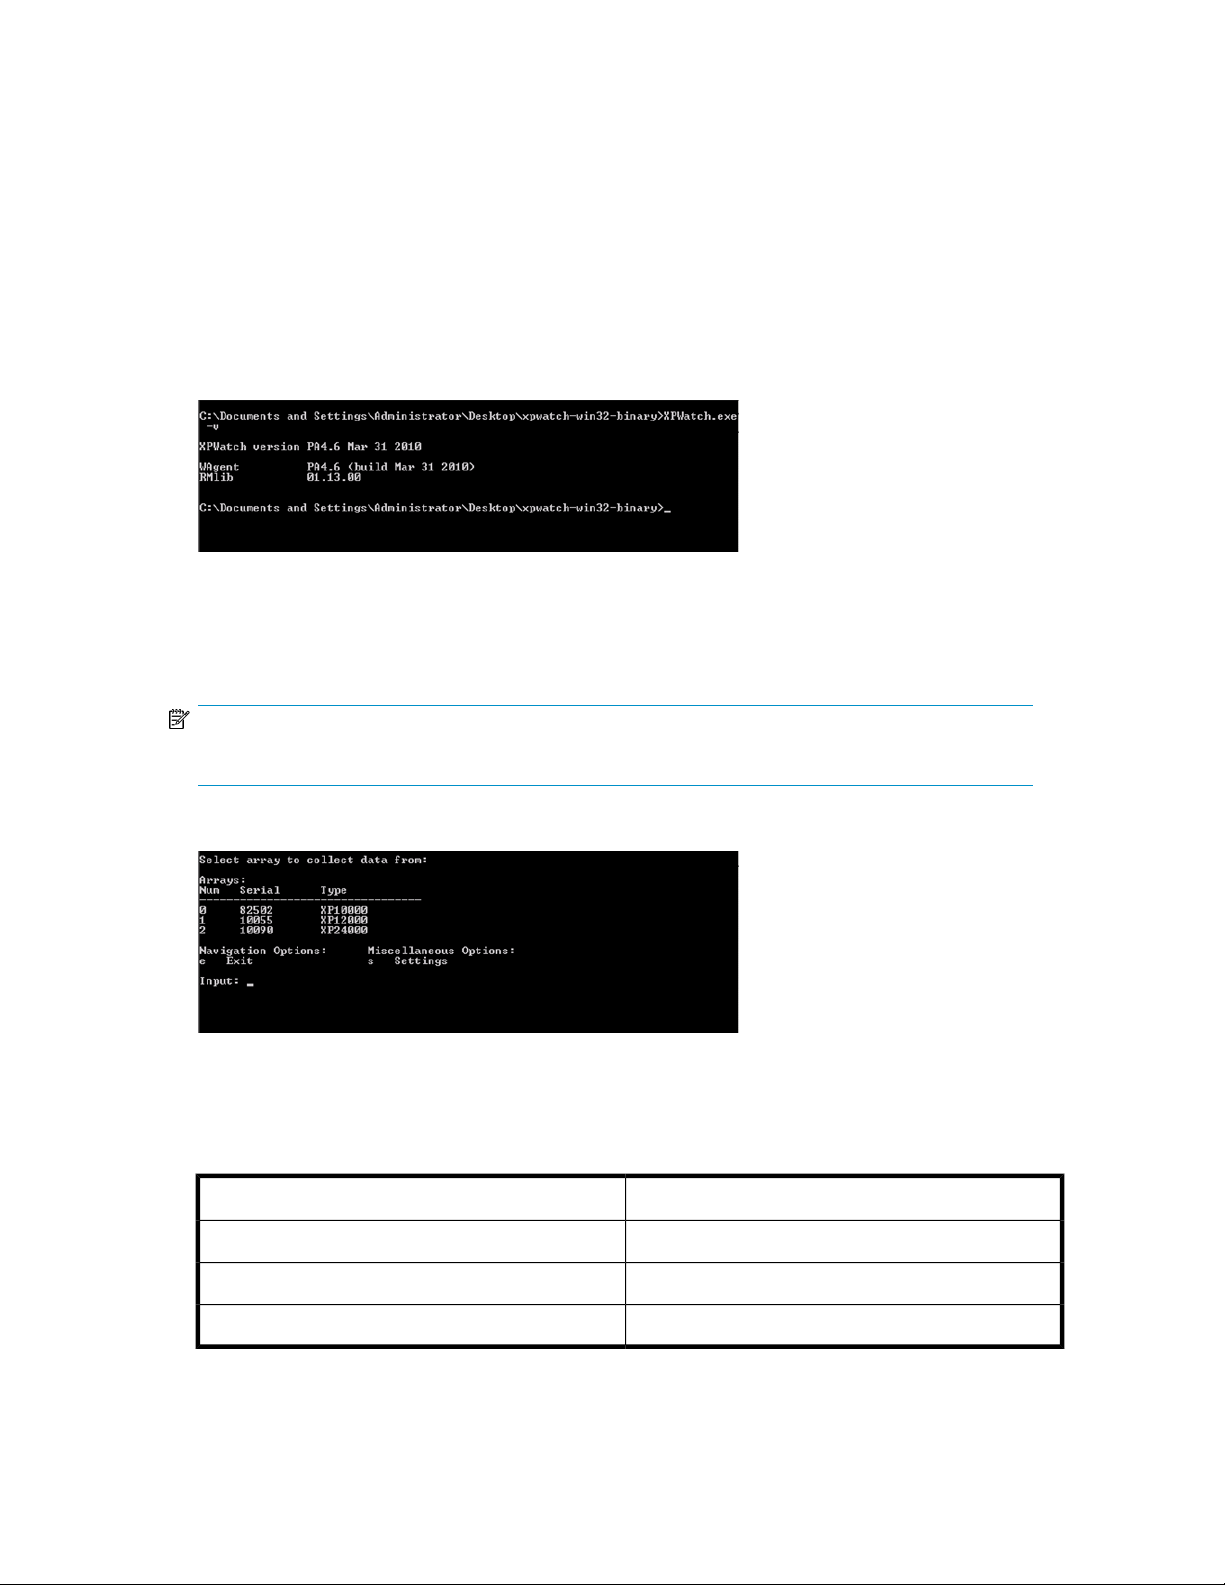
The Array menu also displays the XPWatch version. You can also view the XPWatch version using
the following command in the command prompt:
XPWatch.exe -v
Figure 6 shows the screen that displays the XPWatch version.
Figure 6 XPWatch version
.
To select an array, enter the number (Num) corresponding to it. For example, to select the 10055
array, enter 1.
NOTE:
You can select only one array at a time.
Figure 7 shows the Array menu.
Figure 7 Array menu
.
Table 6 lists the fields of the Array menu.
Table 6 Array menu — fields
DescriptionScreen field
Selection numberNum
Serial number of the arraySerial
Type of the arrayType
XPWatch and XPSketch Reference Guide 19
Page 20
Host groups
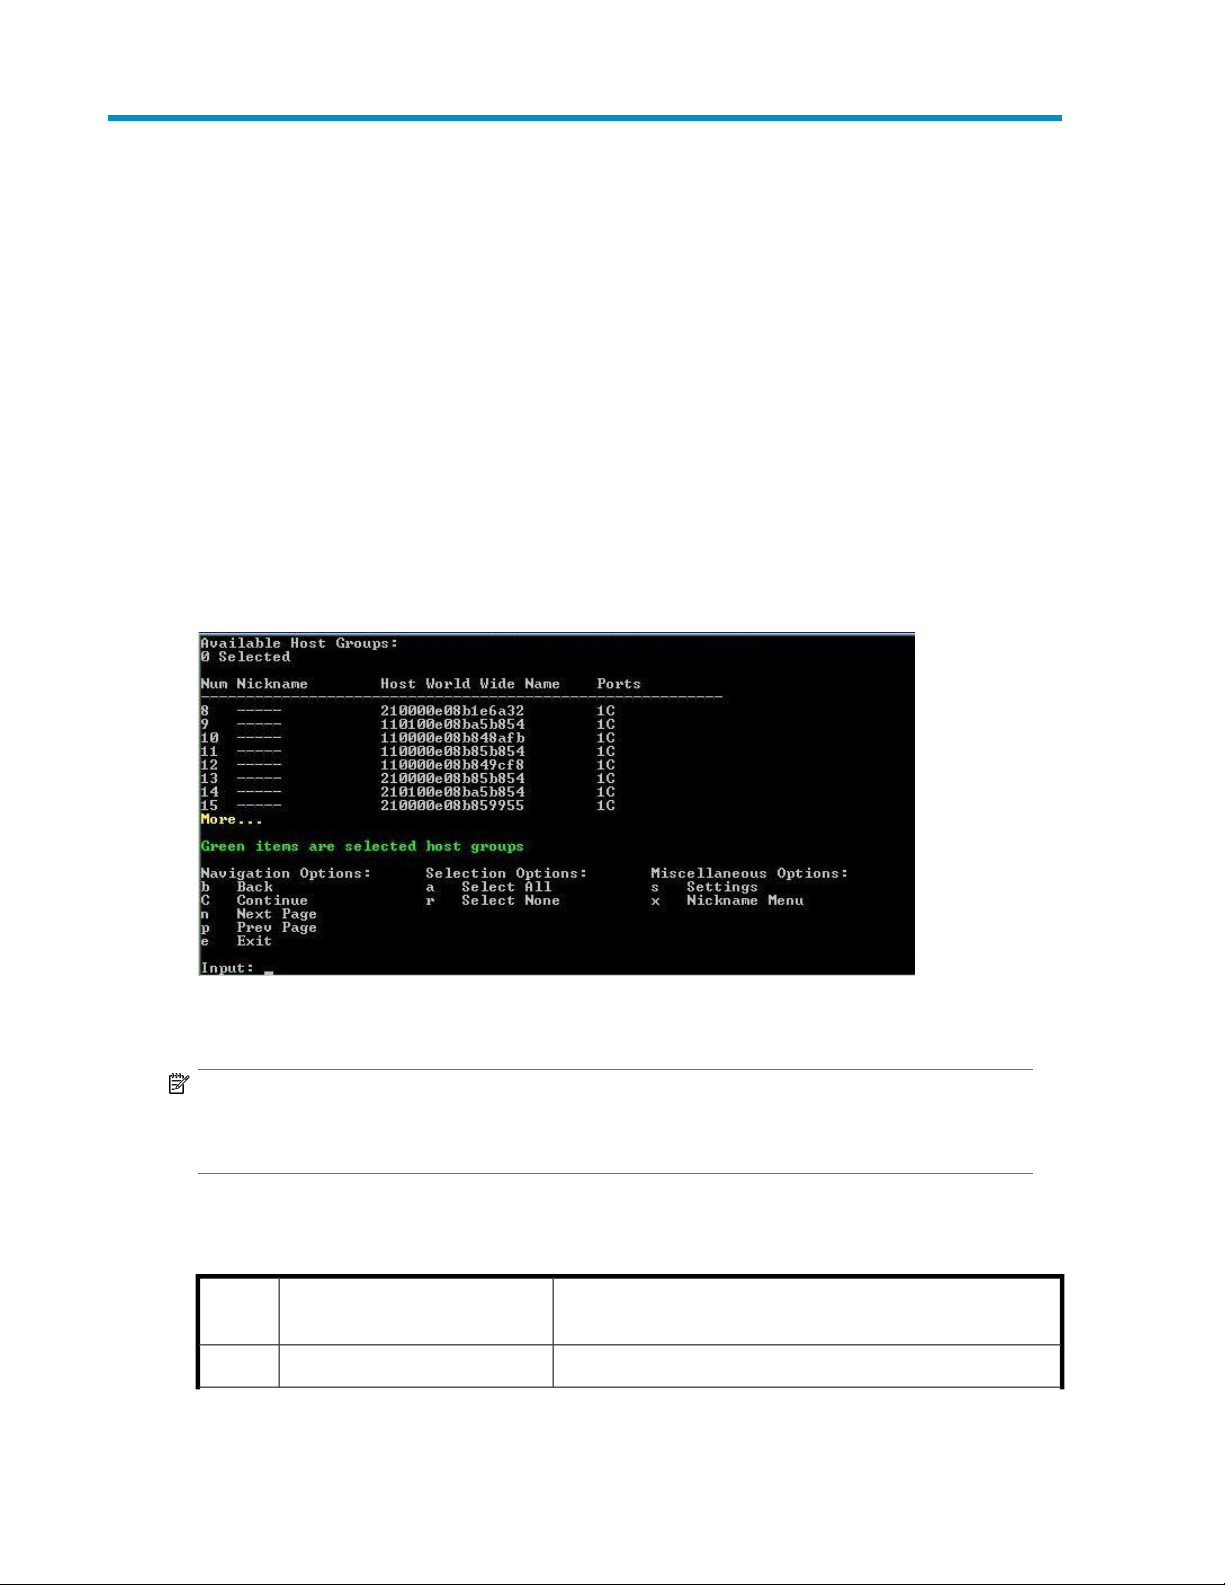
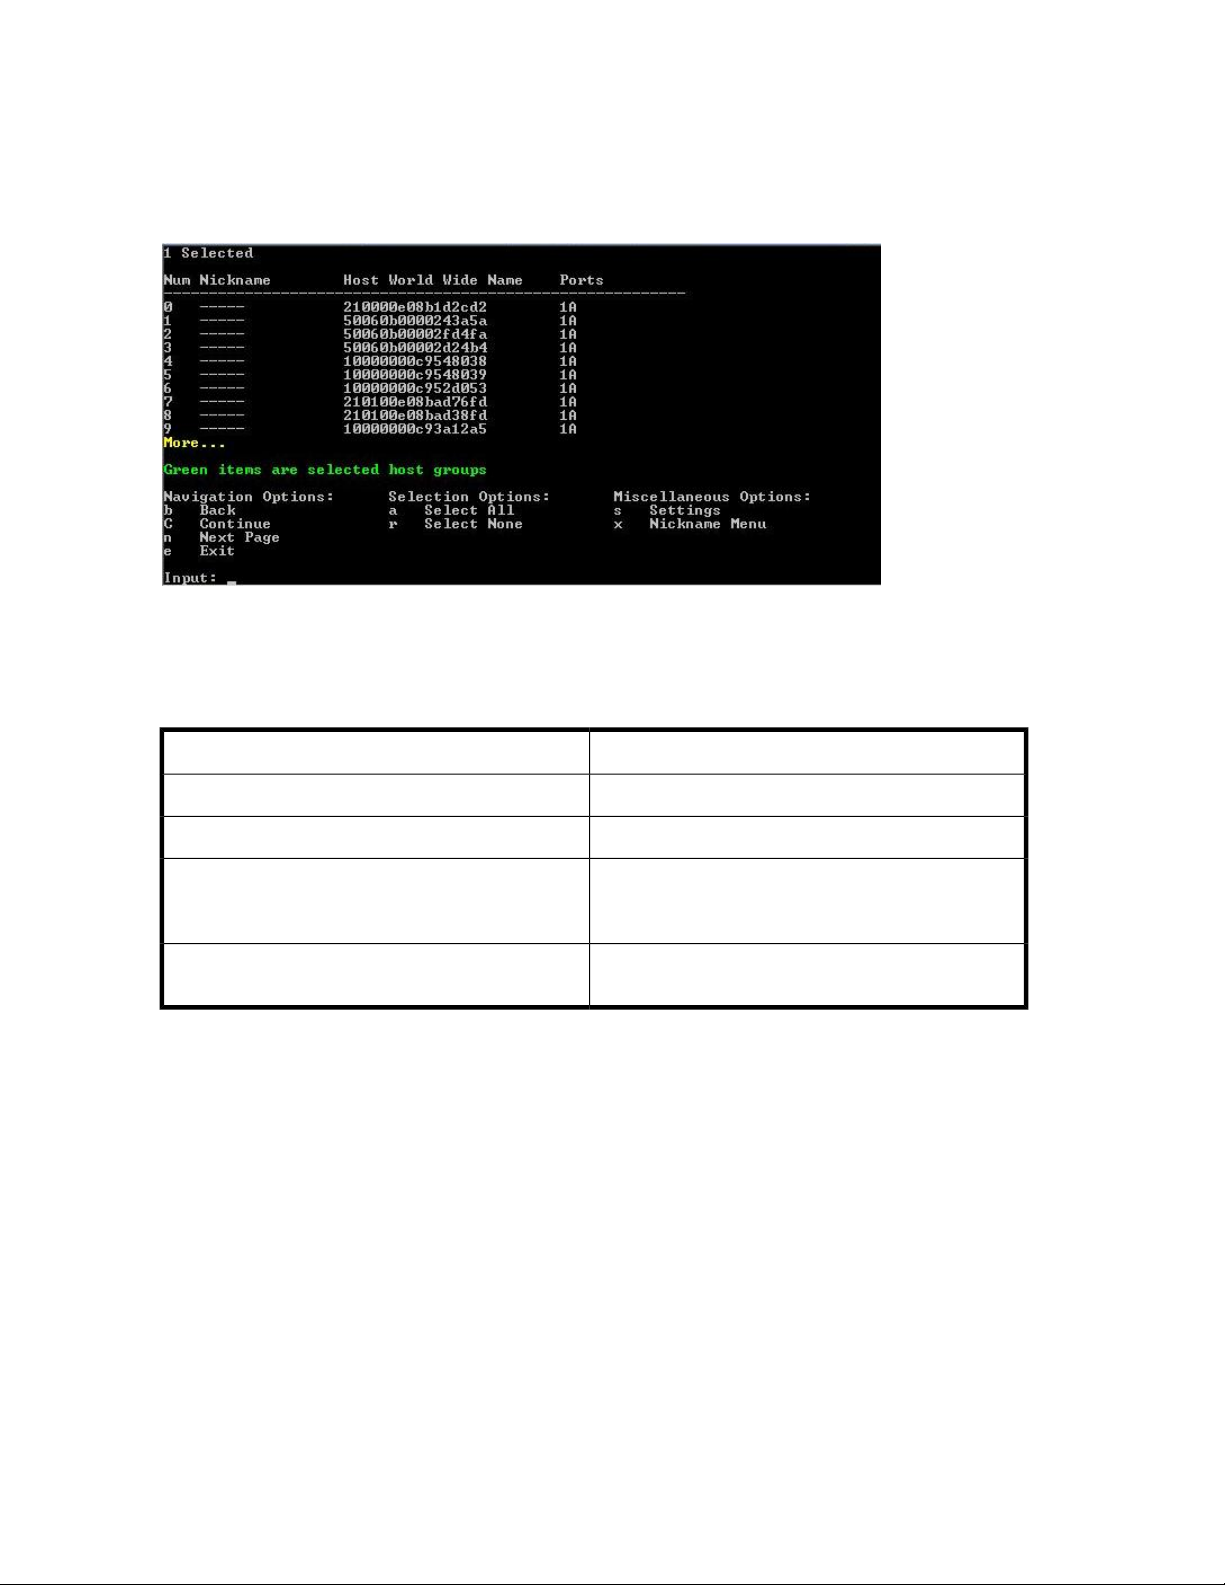
The Host Groups screen lists the available host groups that are connected to the selected array. This
screen also displays all the available Navigation, Selection, and Miscellaneous options.
Figure 8 shows the Available Host Groups.
Figure 8 Available Host Groups
.
Table 7 lists the fields in the Host Groups.
Table 7 Host Groups — fields
Host World Wide Name
Ports
Viewing Host groups
To view the host groups connected to an array, perform the following steps:
1. Start XPWatch. The Array menu appears.
2. Select the array whose performance you want to monitor and press the Enter key. The list of host
groups connected to the array is displayed.
Selecting Host groups
DescriptionScreen field
Selection numberNum
User-friendly names given to the hosts.Nickname
Displays the identification number (WWN) of the Host
Bus Adapter (HBA), which the host uses to establish
communication with the array.
The port used by the array to communicate with the
host.
Select the host whose performance data you want to monitor.
To select a host group, enter the number corresponding to it. For example, to select 50060b00002fd4fa
and 50060b00002d24b4 host groups (see figure Available Host Groups), perform the following
steps:
Working with XPWatch menus and commands20
Page 21
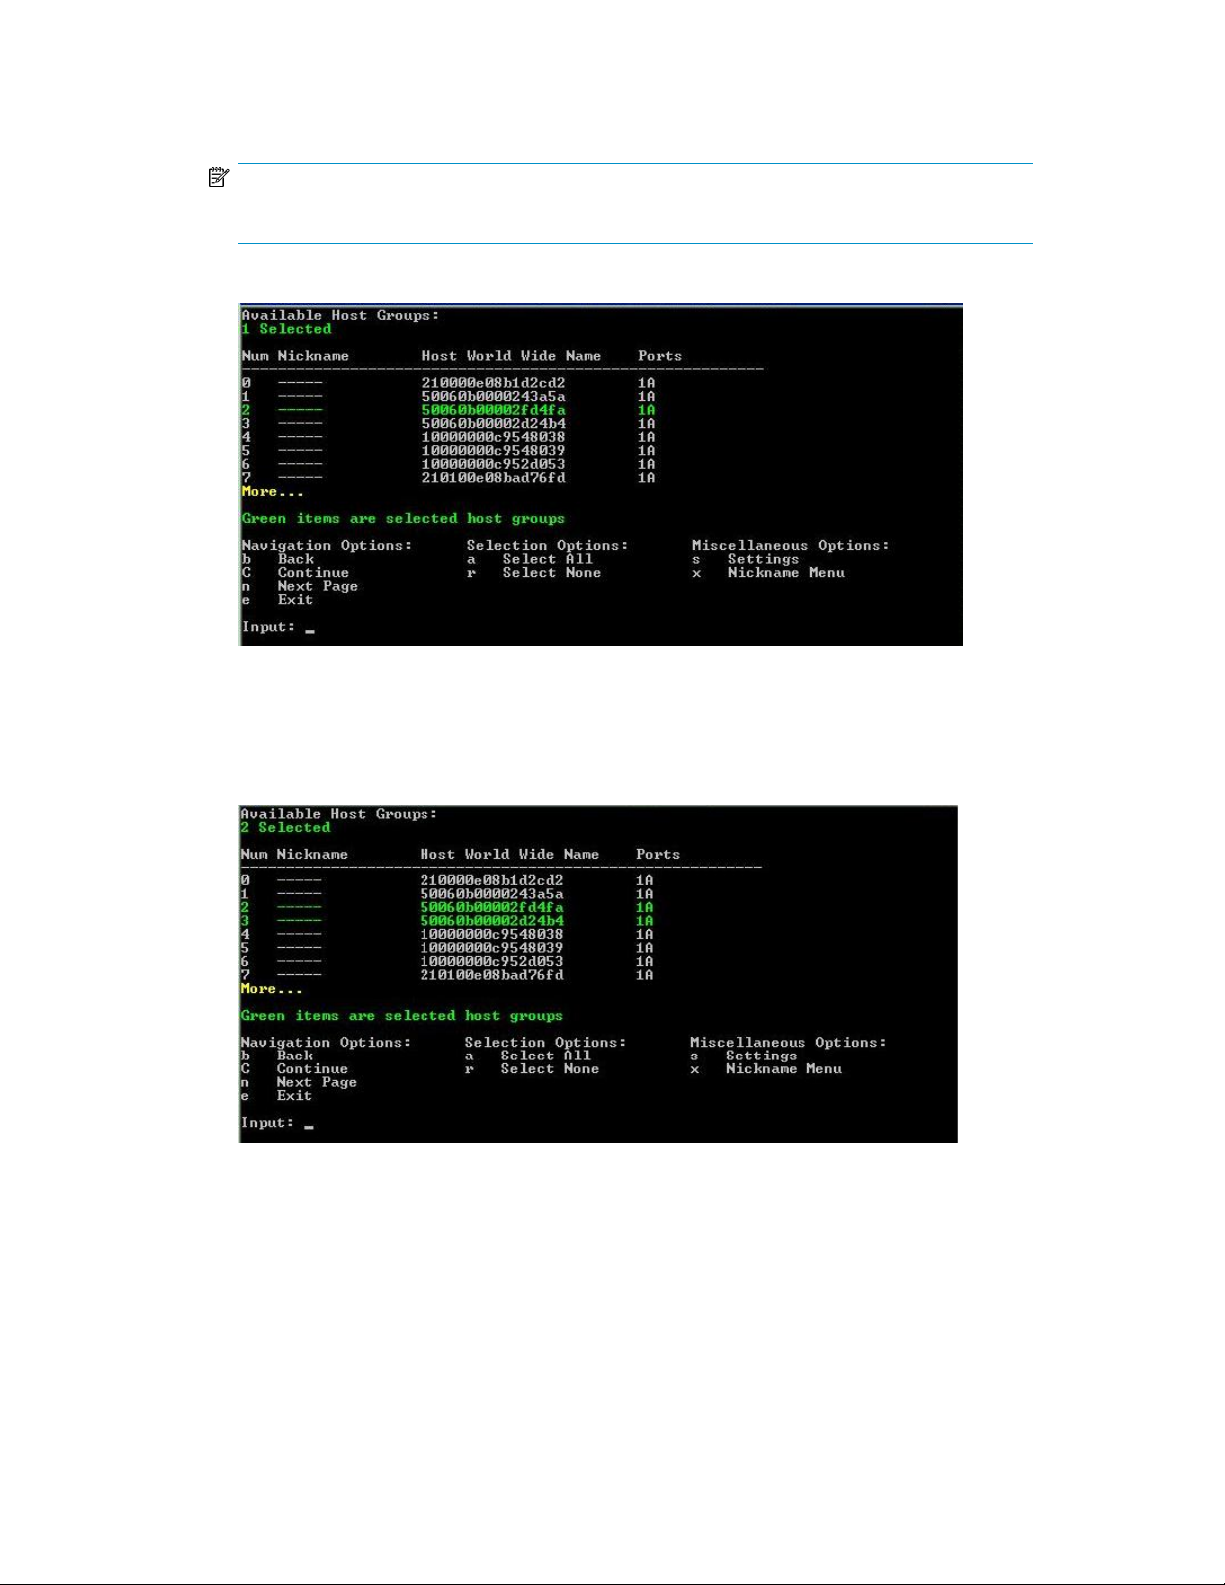
1. Enter 2 and press the Enter key.
The 50060b00002fd4fa host group is selected as shown in the following figure.
NOTE:
The selected host group is highlighted in green.
Figure 9 shows one host group selected from the list of available host groups.
Figure 9 Available Host Groups: One Host Group selected
.
2. Enter 3 and press the Enter key.
The 50060b00002d24b4 host group is selected.
Figure 10 shows two host groups selected from the list of available host groups.
Figure 10 Available Host Groups: Two Host Groups selected
.
Clearing Host groups
To clear a selected host group, enter its corresponding number.
For example, to clear the 50060b00002d24b4 host group, enter 3 and press the Enter key.
The 50060b00002d24b4 host group is cleared.
XPWatch and XPSketch Reference Guide 21
Page 22

Figure 11 shows the screen that appears after clearing the 50060b00002d24b4 host group.
Figure 11 Clearing a Host Group
.
NOTE:
The cleared host groups are not highlighted in green.
Nickname menu
The Nickname menu enables you to provide a nickname to the host to identify the host easily. For
example, you can identify a host that is known by 210000e08b1d2cd2 as “Primary Host”.
NOTE:
• The Nickname menu can be accessed only from the host groups screen.
• The nicknames must be provided when the XPWatch is launched for the first time after installation.
These names will be displayed in all subsequent runs.
Figure 12 shows the Nickname menu.
Working with XPWatch menus and commands22
Page 23

Figure 12 Nickname menu
.
Assigning nicknames
This section describes how to assign nicknames to a host group.
For example, to assign a nickname to the 210000e08b85c955 host group, perform the following
steps:
1. Navigate to the Available Host Groups screen.
2. Type x. The following screen appears.
Figure 13 Nickname menu: Selecting a host group to assign nickname
.
3. Type 2 and press the Enter key.
4. Enter the new nickname. For example, Host 02.
XPWatch and XPSketch Reference Guide 23
Page 24

Figure 14 Nickname menu: Entering new nickname
.
5. Press the Enter key. The following screen, showing nickname as Host 02, appears.
Figure 15 Nickname menu: Displaying new nickname
.
Renaming nicknames
To rename a nickname, perform the following steps:
1. Select the host group whose nickname you want to rename and press the Enter key.
2. Enter the new nickname and press the Enter key.
Deleting nicknames
To delete a nickname, select the host group whose nickname you want to remove and press the Enter
key twice.
For example, to remove the Host 02 nickname, perform the following steps:
1. On the Available Host Groups screen, type 2. The following screen appears.
Working with XPWatch menus and commands24
Page 25

2. Press the Enter key. (Do not enter any new nickname)
Port menu
The Port menu lists all the ports that are connected to the selected host groups. This menu is used to
select the port whose performance needs to be monitored/captured.
Figure 16 shows the Port menu.
The Second Host Nickname is removed and the following screen appears.
XPWatch and XPSketch Reference Guide 25
Page 26

Figure 16 Port menu
.
Table 8 describes the fields that appear in the Port menu.
Table 8 Port menu — screen fields
DescriptionScreen field
Selection numberNum
Port numberPort
Slot numberSlot
Type of port (SCSI, Fibre, ESCON, iSCSI, ENAS)Type
Connection type (N for point-point, NL for FC-AL)Topo
Fabric login (Y/N)FLOGI
Mode
Viewing Port menu
To view the ports connected to a host, perform the following steps:
1. Start XPWatch. The Array menu appears.
2. Select the array whose performance you want to monitor and press the Enter key.
3. The Available Host Groups screen displaying the list of host groups connected to the array is
displayed.
Operating mode of the port (Target, MCU Initiator, RCU Target, e-LUN
initiator)
Security switch (On/Off)Secu
Storage Logical Partition (SLPR) numberSlpr
Count of DKAs associated with LDEVs mapped to portDKA#
Count of RAID Groups mapped to portDg#
Count of LDEVs mapped to portLDEV#
Count of LUSE membersLh#
Working with XPWatch menus and commands26
Page 27

4. Select the required host and enter the c command.
The Port menu showing all ports connected to the hosts is displayed.
Pick LDEVs/RAID Groups selection scheme
Most arrays include a large number of LDEVs and RAID Groups. The Pick LDEVs/RAID Groups Selection
Scheme enables you to sort LDEVs and RAID Groups according to your requirements. This menu
supports the following options:
• Filter LDEVs by RAID Groups
• Filter RAID Groups by LDEVs
• Manually add RAID Groups and LDEVs without Filtering
• Skip and start collecting
Figure 17 shows the Pick LDEVs/RAID Groups selection scheme.
Figure 17 Pick LDEVs/RAID Groups selection scheme
.
Viewing Pick LDEVs/RAID Groups selection scheme
To view this screen, perform the following steps:
1. Start XPWatch. The Array menu appears.
2. Select the array whose performance you want to monitor and press the Enter key.
3. The Available Host Groups screen displaying the list of host groups connected to the array gets
displayed.
4. Select the required host and enter the c command. The Port menu showing all ports connected
to the hosts is displayed.
5. Select the required port and enter the c command. The Pick LDEVs/RAID Groups Selection Scheme
screen appears.
RAID Group menu
The RAID Group menu lists the details of all RAID Groups connected to the selected Host(s).
Figure 18 shows the RAID Group menu.
XPWatch and XPSketch Reference Guide 27
Page 28

Figure 18 RAID Group menu
.
Table 9 describes the fields that appear in the RAID Group menu.
Table 9 RAID Group menu — screen fields
DescriptionScreen field
Selection numberNum
Rg
The Rg column displays the Parent RAID Group if the
RAID Groups are “Concatenated”
RAID levelLevel
RAID typeType
HDD
Drive type of Hard Disk Drives constituting the RAID
Group
Speed of the Hard Disk Drives (in rpm)Rpm
Total number of LDEVs belonging to the RAID GroupLDEV#
Cp#
Hg#
Total number of CHA ports associated with the RAID
Group
Total number of Host Groups associated with the RAID
Group
Count of DKAs associated with LDEVs mapped to portDKA#
Pg
The Pg column displays the entire list of Concatenated
RAID Groups
NOTE:
• If the RAID groups are not configured, the RAID Group menu will display blank screen fields.
• For Non-Concatenated RAID Groups, the Rg and Pg columns display the same data.
Working with XPWatch menus and commands28
Page 29

Viewing RAID Group menu
This screen appears when you select one of the following options from the Viewing Pick LDEVs/RAID
Groups Selection scheme:
• Filter LDEVs by RAID Groups option
• Manually add RAID Groups and LDEVs without Filtering option
LDEV menu
The LDEV menu lists the details of the LDEVs connected to the selected Host(s).
Figure 19 shows the LDEV menu.
Figure 19 LDEV menu
.
Table 10 describes the fields that appear in the LDEV menu.
Table 10 LDEV menu — screen fields
DescriptionScreen field
Selection numberNum
CU: LDEV numberLDEV
RAID groupRG
Emulation typeEmulation
SLPR numberSlpr
Cache Logical Partition (CLPR) numberClpr
DKA or ACP associated with the LDEVDKA
LUSE positionLuseP
Number of ports mapped to LDEVMap#
XPWatch and XPSketch Reference Guide 29
Page 30

Viewing LDEV menu
This screen appears when you select the Filter RAID Groups by LDEVs option from the Viewing Pick
LDEVs/RAID Groups Selection Scheme.
Settings menu
The Settings menu enables you to modify the settings.
This menu includes:
• Menu settings
• Performance data collection settings
Figure 20 shows the Settings menu.
Figure 20 Settings menu
.
Menu settings
Menu settings enable you to modify the settings of the interface.
For example, the Menu settings allow you to modify the appearance of the menus.
Table 11 describes the Menu settings.
Table 11 Menu settings
Debug Mode
Force Cache
Mode
• If this mode is enabled, the program creates a file
trace.txt that stores information about the execution cycle of XPWatch and places in the folder
where XPWatch is placed.
• If this mode is disabled, information about the ex-
ecution cycle of XPWatch is not saved.
Removes any stored information about an array that
is located on the local system.
Valid RangeDefault ValueFunctionsSettings
1-50 lines20 linesChanges the number of items that appear in the menu.Menu Height
NADisabled
NA20 lines
Working with XPWatch menus and commands30
Page 31

Performance data collection settings
Performance data collection settings enable you to modify the settings of the output screen. It also
enables you to modify the time interval for data collection.
Table 12 describes the Performance data collection settings.
Table 12 Performance data collection settings
Splits the data according to the time intervals (in hours) and stores
them in different CSV files. This is used when large amount of data
is collected.
For example: If you have selected the Data Split Time as 1 and
Data Split Time
the Data Collection Time Limit as 12, XPWatch will create 12 new
files, each containing performance data for an hour’s time.
NOTE:
The data splitting activity is performed for the duration set in
the Data Collection Time Limit.
Valid rangeDefault valueFunctionsSettings
1-168 hours24 hours
Data Collection
Time Limit
Real-Time Monitor Size
Collection Update Interval
Enables you to specify the duration for which you want XPWatch
to collect performance data. The program terminates once this time
limit is reached.
Enables you to specify the volume of data to be displayed in the
Output screen for ports, LDEVs, and RAID Groups.
For example, by default the Output screen will display 10 most
active ports, 10 most active LDEVs, and 10 most active RAID
Groups.
Enables you to specify the frequency of performance data collection
from a particular array.
Ports: 10 LDEVs: 10
RAID Groups: 10
1-168 hours24 hours
Ports: 1-50 LDEVs: 1-50
RAID Groups: 1-50
10-300 seconds10 seconds
XPWatch and XPSketch Reference Guide 31
Page 32

Working with XPWatch menus and commands32
Page 33

4 Viewing performance metrics in XPWatch
This section describes how to collect the performance data of HP XP Arrays and view the performance
metrics using XPWatch.
Collecting performance metrics
This section describes how to collect performance data of HP XP Arrays using XPWatch.
The Array menu appears after you invoke XPWatch.
Follow this procedure to collect the performance data on XP Arrays:
1. Start XPWatch.
2. Enter the s command and set the Menu and Performance collection settings. For more information
on setting the Menu and Performance collection settings, see Settings menu.
3. Select the required array. The host groups are displayed.
4. Select one or more host groups.
5. Enter the c command. A list of all the available ports is displayed.
6. Select the required port.
7. Enter the c command. The Pick LDEVs/RAID Groups Selection Scheme is displayed.
• Filtering LDEVs by RAID Groups
Follow this procedure to filter LDEVs by RAID Groups:
a. Enter 1 to select this option. The RAID Groups within the host groups are displayed.
b. Select the required RAID Groups.
c. Enter the c command. The LDEVs within the RAID Groups are displayed.
d. Select the required LDEVs.
e. Enter the c command. The following message appears:
Would you like to archive the performance data collected? (Y/N)
f. Enter Y to save the performance data in .CSV format. The Output screen is displayed.
NOTE:
The Output screen displays performance data of all selected Ports, LDEVs, RAID Groups,
DKCs and processors belonging to the selected array.
g. Enter e or press Ctrl+C to quit XPWatch.
• Filtering RAID Groups by LDEVs
Follow this procedure to filter RAID Groups by LDEVs:
a. Enter 2 to select this option. The LDEVs within the Host Groups are displayed.
b. Select the required LDEVs.
c. Enter the c command. The RAID Groups within the LDEVs are displayed.
XPWatch and XPSketch Reference Guide 33
Page 34

d. Select the required RAID Groups.
e. Enter the c command. The following message appears:
Would you like to archive the performance data collected? (Y/N)
f. Enter Y to save the performance data in .CSV format. The Output screen is displayed.
NOTE:
The Output screen displays performance data of all selected Ports, LDEVs, RAID Groups,
DKCs, and processors belonging to the selected array.
g. Enter e or press Ctrl+C to quit XPWatch.
• Manually Adding RAID Groups and LDEVs without filtering
Follow this procedure to manually add RAID Groups and LDEVs without filtering:
a. Enter 3 to select this option. The RAID Groups are displayed.
b. Select the required RAID Groups.
c. Enter the c command. The LDEVs are displayed.
d. Select the required LDEVs.
e. Enter the c command. The following message appears:
Would you like to archive the performance data collected? (Y/N)
f. Enter Y to save the performance data in .CSV format. The Output screen is displayed.
NOTE:
The Output screen displays performance data of all selected Ports, LDEVs, RAID Groups,
and processors belonging to the selected array.
g. Enter e or press Ctrl+C to quit XPWatch.
• Skip and start collecting
Follow this procedure to skip all the selection process and collect performance data for all
the ports:
a. Enter 4 to select this option. The following message appears:
Would you like to archive the performance data collected? (Y/N)
b. Enter Y to save the performance data in .CSV format. The Output screen is displayed.
NOTE:
The Output screen displays performance data of all selected ports and processors
belonging to the selected array.
c. Enter e or press Ctrl+C to quit XPWatch.
Viewing performance metrics in XPWatch34
Page 35

NOTE:
If you enter N, the performance data is not saved in the .CSV format. However, you can view
the performance data on the output screen.
Understanding performance metrics
The Output screen and the output file (the CSV file) contain performance metrics pertaining to Ports,
LDEVs, RAID Groups, and CPU Utilization of the selected array.
Figure 21 shows the Output screen.
Figure 21 Output screen
.
Port performance metrics
Table 13 describes the Port performance metrics.
Table 13 Port performance metrics
Performance
metrics
DescriptionUnit
Port namestringPort
Slot numberstringSlot
Average I/O rate of the last measurement intervalIO/sCurIO
XPWatch and XPSketch Reference Guide 35
Page 36

Performance
metrics
LDEV performance metrics
Table 14 describes the LDEV performance metrics.
Table 14 LDEV performance metrics
DescriptionUnit
Minimal I/O rate of the last 60 secondsIO/sMinIO
Maximum I/O rate of the last 60 secondsIO/sMaxIO
Average I/O rate of the last 60 secondsIO/sAvgIO
Calculate average I/O size (=avg KB / avgIO)KB/IOKB/IO
Average throughput of the last measurement intervalKB/sCurKb
Minimal throughput of the last 60 secondsKB/sMinKb
Maximum throughput of the last 60 secondsKB/sMaxKb
Average throughput of the last 60 secondsKB/sAvgKb
Performance
metrics
DescriptionUnit
Logical Device namenumberLDEV
RAID Group identifiernumberRG
LDEV spread over number of DKAsnumberDKA
Average Front-end I/OsnumberIOPS
Average Write percentage%Wr%
Average Sequential I/O percentage%Seq%
Average Read Cache Hit percentage%r_H%
Average I/O SizeKB/IOKB/IO
Average ThroughputKB/sKB/s
Average I/O Response timemsms
Front-end I/O Density [IOPS/GB]numberFeD
Back-end/Front-end I/O rationumberBe/Fe
Average LDEV I/O utilization%LD%
Back-end I/OnumberBe
Viewing performance metrics in XPWatch36
Page 37

RAID Group performance metrics
Table 15 describes the RAID Group performance metrics.
Table 15 RAID Group performance metrics
Performance
metrics
DescriptionUnit
RAID Group identifiernumberRG
LDEV identifiernumberLDEV
Average Front-end I/OsnumberIOPS
Average Write percentage%Wr%
Average Sequential I/O percentage%Seq%
Average Read Cache Hit percentage%r_H%
Average I/O sizeKB/IOkB/IO
Average ThroughputKB/sKB/s
Average I/O Response time within back-end arraymsms
Front-end I/O Density [IOPS/GB]numberFeD
Back-end / Front-end I/O rationumberBe/Fe
Average RAID Group I/O utilization%RG%
Back-end I/OnumberBe
CPU performance metrics
Table 16 describes the CPU performance metrics.
Table 16 CPU performance metrics
Performance
metrics
DescriptionUnit
Serial number of the arraynumberSer
CH slot numberstringSlot
CH PCB type (Fibre/SCSI/FICON/DKA)stringType
Minimum CPU utilization on PCB [%]%Min%
Maximum CPU utilization on PCB [%]%Max%
Average CPU utilization on PCB [%]%Avg%
CHA PCB Busy Time for CPU 0 (if installed)numberMP0
XPWatch and XPSketch Reference Guide 37
Page 38

Performance
metrics
DKC performance metrics
Table 17 describes the DKC performance metrics.
Table 17 DKC performance metrics
DescriptionUnit
CHA PCB Busy Time for CPU 1 (if installed)numberMP1
CHA PCB Busy Time for CPU 2 (if installed)numberMP2
CHA PCB Busy Time for CPU 3 (if installed)numberMP3
CHA PCB Busy Time for CPU 4 (if installed)numberMP4
CHA PCB Busy Time for CPU 5 (if installed)numberMP5
CHA PCB Busy Time for CPU 6 (if installed)numberMP6
CHA PCB Busy Time for CPU 7 (if installed)numberMP7
DescriptionUnitPerformance metrics
Serial number of the arraynumberSer
CHA to shared memory bus utilization%SmCha%
DKA to shared memory bus utilization%SmDka%
CHA to cache memory Xbar utilization%CmCha%
DKA to cache memory Xbar utilization%CmDka%
Cache usage [MB] (CLPR0)numberCmUs[MB]
Write cache usage [MB] (CLPR0)numberCmWr[MB]
Side File usage [MB] (CLPR0)numberCmSf[MB]
Cache random read hits (CLPR0)numberCmRdH
Cache utilization [%] (CLPR0)%CmUs%
Write cache utilization [%] (CLPR0), max=70%%CmWr[%]
Viewing performance metrics in XPWatch38
Page 39

5 Introduction to XPSketch
This section gives an overview of XPSketch.
Overview
XPSketch is a tool provided by HP to enable you to view the performance metrics of different
components of an XP array in a graphical format. The performance metrics obtained on monitoring
the selected XP array’s Ports, LDEVs, RAID, CPU, and DKC Groups for a specified duration are stored
in a comma separated file.
The .csv file generated using XPWatch can be opened in XPSketch to view a graphical representation
of the data.
You must load the .csv file in XPSketch, which transforms the metrics into various data points on the
graph. You can also select multiple metrics and view the values plotted on the graph. Using these
graphical representations, you can analyze the performance trend, identify bottlenecks or problems,
and take the necessary corrective actions.
XPWatch and XPSketch Reference Guide 39
Page 40

Introduction to XPSketch40
Page 41

6 Installing XPSketch
This chapter lists the supported environment for XPSketch and describes the installation for XPSketch.
Supported Windows platforms
XPSketch can be installed on the following Windows platforms:
• Windows Server 2003 Standard, Enterprise Edition (IA-32 only) (Service Pack 1, Service Pack 2)
• Windows Server 2003 Standard, Enterprise Edition R2 (IA-32 only) (Service Pack 1, Service Pack
2)
• Windows XP Professional (Service Pack 2)
• Windows Vista (IA-32 only) (Service Pack 1)
• Windows 2008
NOTE:
• Use Microsoft Internet Explorer (IE) 7.0 when using Windows 2008 and IE 6.0 (Service Pack 1)
when using other Windows versions.
• To run the web client on the management station, you must install the Java JRE plug-in separately
on the management station. To download JRE for Windows, see
http://java.sun.com/javase/downloads/index_jdk5.jsp
• For your browser to connect to a management station that uses IPv6 as the communication protocol,
IE version 7.0 and Java version 1.6 are required.
Installing XPSketch
To install XPSketch, complete the following steps:
1. Open a web browser.
2. In the browser address line, enter your server name followed by /pa. For example, http://
java.sun.com/javase/downloads/index_jdk5.jsp
You can also access the XP Performance Advisor over a secure connection using the following
web address: http://java.sun.com/javase/downloads/index_jdk5.jsp
If the DNS server cannot locate the management station and open the default XP Performance
Advisor applet, enter http://java.sun.com/javase/downloads/index_jdk5.jsp
NOTE:
The XP Performance Advisor URL is case-sensitive.
The XP Performance Advisor Logon screen appears.
XPWatch and XPSketch Reference Guide 41
Page 42

Figure 22 shows the XP Performance Advisor Logon screen.
Figure 22 XP Performance Advisor Logon screen
.
3. Enter your user name and password. If you are a valid user on the local system where XP Per-
formance Advisor is installed or on the domain controller, or your name is added to the Users
or Administrators list in the XP Performance Advisor users database, use your local system, domain,
or XP Performance Advisor logon credentials for authentication.
4. The XP Performance Advisor Home screen is displayed. The main menu appears in the left pane.
Figure 23 shows the XP Performance Advisor Home screen.
Figure 23 XP Performance Advisor Home screen
.
5. Click the Support link on the Header menu to view the XP PA Support screen.
Figure 24 shows the Table of Contents screen.
Installing XPSketch42
Page 43

Figure 24 Table of Contents screen
.
6. On the XP PA Support screen, under Tools, click the XPSketch (Windows 32-bit) link to download
the XPSketch.zip file to a XP Performance Advisor server, your local system, or a remote
system. After the download, the XPSketch tool can work independently of XP Performance Advisor.
7. Extract the contents of the zip file to a location of your choice on the designated system.
8. Double-click Run.bat to execute XPSketch.
After executing XPSketch, the window that opens can be used to load the .csv file for viewing
the performance data in a graphical format.
XPWatch and XPSketch Reference Guide 43
Page 44

NOTE:
When you double-click Run.bat, sometimes XPSketch might not start immediately, or might
appear and disappear immediately. This is because the system is searching for the JRE files that
are required to start XPSketch. By default, the JRE path is automatically set. However, to verify
the path, complete the following steps:
a. On your system, right-click My Computer, and select Properties from the pop-up menu that
appears.
b. On the System Properties window, click the Advanced tab.
c. Click the Environment Variables button.
d. In the System Variables section, search for the Variable JAVA_HOME and its corresponding
Value. The Value must point to the directory path and folder that contain the required JRE
files. For example, the Value can be C:\Program Files\Java\jre1.5.0_13\bin.
If the JRE path is not set, complete the following steps to set the path:
a. On your system, right-click My Computer, and select Properties from the pop-up menu that
appears
b. On the System Properties window, click the Advanced tab.
c. Click the Environment Variables button.
d. Click the New button in the System Variables section.
e. On the New System Variable window, enter the Variable name: as JAVA_HOME, and
enter the Variable value: as the path to access the JRE files. For example, the Variable value
can be set as C:\Program Files\Java\jre1.5.0_13\bin.
f. Click OK to save the new configuration.
g. Click OK on the Environment Variables window and the System Properties window to save
the settings and exit.
To start XPSketch, you can also manually copy the XPSketch files into the JRE folder (...\Java\
jre <version>\bin).
Installing XPSketch44
Page 45

7 Viewing performance metrics in XPSketch
This section describes loading the .csv file, setting the Java heap size value, and viewing performance
metrics in XPSketch.
Loading the Comma seperated file
The performance metrics obtained on monitoring the selected XP array’s Ports, LDEVs, RAID, CPU,
and DKC Groups for a specified duration are stored in a comma separated file.
The .csv file generated using XPWatch can be opened in XPSketch to obtain a graphical
representation of the data.
You must load the .csv file in XPSketch, which transforms the metrics into various data points on the
graph. You can also select multiple metrics and view the values plotted on the graph. Using these
graphical representations, you can analyze the performance trend, identify bottlenecks or problems,
and take the necessary corrective actions.
On the File menu, select Load to open the .csv file in XPSketch. If XPSketch is not installed on the
same system as XPWatch, you can still copy the .csv file generated by XPWatch, and load it on the
system (host) where XPSketch is installed.
NOTE:
In XPSketch, you can view only the .csv files that are generated by XPWatch.
If the format of the selected .csv file does not match the input file format that XPSketch requires, an
error message displays stating that the selected file’s format is not supported. The following is a sample
format of a .csv file:
$$$ START COLUMN HEADERS $$$
Sample Time
Metric1
Metric2
.
.
.
$$$ END COLUMN HEADERS $$$
Time in format ’dd-MMM-YYYY hh:mm:ss’, value for Metric1, value for metric2,.....
Time in format ’dd-MMM-YYYY hh:mm:ss’, value for metric1, value for metric2,…
Click File menu, and select Close to close the CSV file in XPSketch.
Click File menu, and select Exit to stop and close XPSketch.
XPWatch and XPSketch Reference Guide 45
Page 46
Setting the Java heap size value
At a time, the number of metrics that can be loaded in XPSketch depends on the minimum and maximum
Java heap size values specified for XPSketch. The default minimum and maximum Java heap size
values are 70 MB and 128 MB respectively.
You can increase the maximum Java heap size value by modifying a property value in run.bat. By
default, when you open run.bat in the Command Prompt window, the following data is displayed:
java -Xms70m —Xmx128m XPSketch
where: -Xms70m refers to the minimum Java heap size value (the minimum system memory that is
required for XPSketch to load a CSV file in XPSketch), and –Xmx128m refers to the maximum Java
heap size value. The maximum Java heap size value refers to the maximum system memory that can
be set based on the memory available in your system and also the metrics collected in the CSV file.
The Java heap size value is directly proportional to the metrics collected in a CSV file, and also the
combination of metrics that you want to view in a graphical format. More the metrics collected, more
is the memory required (Java heap size value) to load the CSV file. More the metrics selected for
viewing, more is the memory required for plotting the numerous data points from the selected metrics.
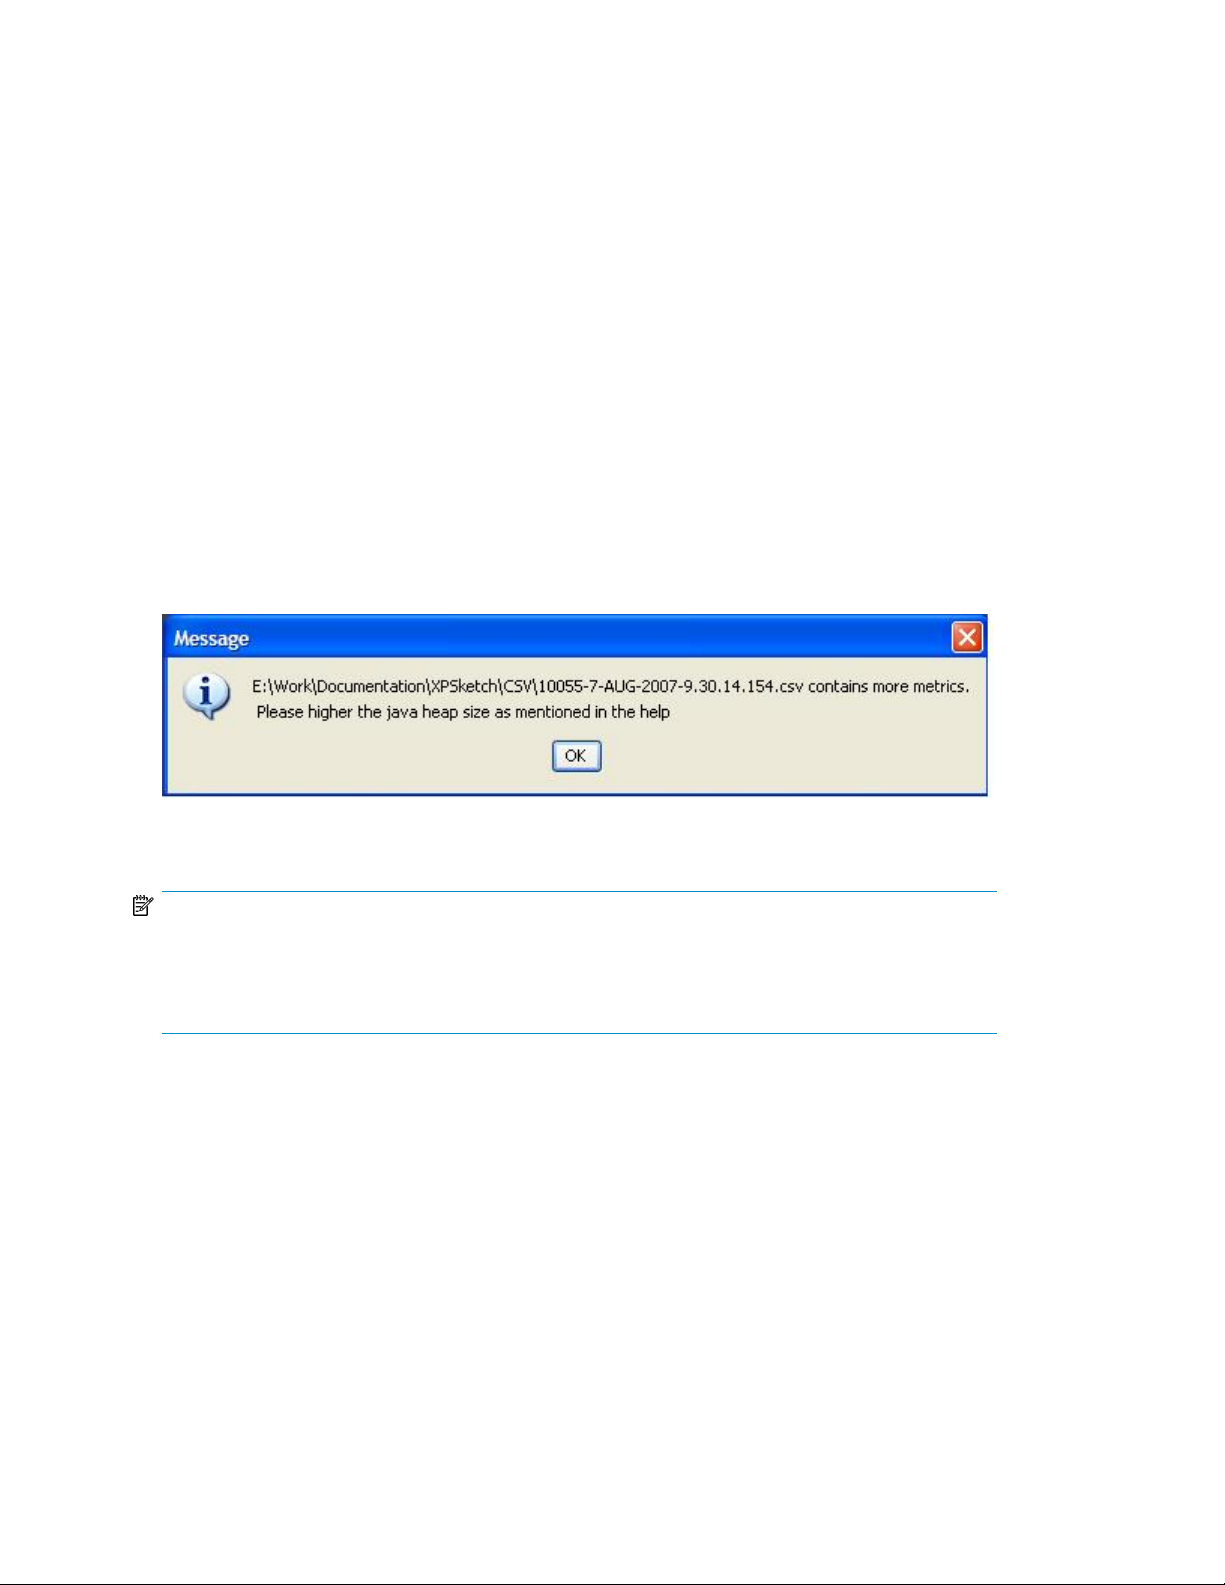
Figure 25 shows the error message that is displayed when the metric count in the CSV file is higher
compared to the Java heap size value specified in run.bat.
Figure 25 Error message
.
NOTE:
• Ensure that the size of the CSV file to be loaded is not more than the configured heap size.
• The maximum Java heap size that can be configured depends on the operating system specification.
For more information, see the Windows operating system documentation.
Viewing performance metrics in XPSketch
After the .csv file is loaded, the performance metrics of different components collected for specified
durations are displayed in the Metrics Pane. By default, the first set of data points collected for the
first metric that appears in the Metrics Pane is automatically plotted in the Graph Area. If the data
collection is more for a metric in a specified time interval and all the data points are not displayed
in the same graph, click the > button to view the plotting of the next set of data points. To view the
first set of data points, click the < button.
Figure 26 shows a performance report generated using XPSketch.
Viewing performance metrics in XPSketch46
Page 47

Figure 26 Performance report generated using XPSketch
.
You can select multiple metrics at a time. Accordingly, multiple graphs are plotted in the Graph Area,
as shown in figure below. This is especially useful when you want to analyze the performance metrics
of components across different time intervals. Different color codes are used to differentiate the various
metrics when they are plotted in the Graph Area. The performance metrics for the selected set of
components are displayed on the Domain Axis (X-axis) against the specified durations, which are
displayed on the Range Axis (Y-axis). The Lower Pane displays the Start Time and End Time of the
samples displayed in the Graph Area. The Status bar displays the location of the CSV file.
Figure 27 shows multiple graphs plotted for multiple metric selection.
XPWatch and XPSketch Reference Guide 47
Page 48

Figure 27 Multiple graphs plotted for multiple metric selection
.
You can also view the Metrics Available, Samples Available, and Samples Displayed data for the
CSV file that is currently loaded in XPSketch. Point to a location on the Metrics label, as shown in
Figure 28.
Figure 28 shows the available metrics and samples displayed on the screen.
Figure 28 Metric available, samples available, and samples displayed
.
A tool tip appears displaying the following data:
• Metrics Available: number of metrics available in the CSV file currently loaded in XPSketch
• Samples Available: total number of data points (samples) available in the CSV file
• Samples Displayed: total number of data points (samples) plotted on the graph(s)
Understanding performance metrics in XPSketch
This section describes the Port, LDEV, RAID, CPU, and DKC Group performance metrics.
Viewing performance metrics in XPSketch48
Page 49

Table 18 describes the Port performance metrics.
Table 18 Port performance metrics
Table 19 describes the LDEV performance metrics.
Table 19 LDEV performance metrics
DescriptionPerformance Metrics
Average I/O rate of the last measurement intervalCurIO
Minimal I/O rate of the last 60 secondsMinIO
Maximum I/O rate of the last 60 secondsMaxIO
Average I/O rate of the last 60 secondsAvgIO
Calculate average I/O size (=avgKB / avgI/O)KB/IO
Average throughput of the last measurement intervalCurKB
Minimal throughput of the last 60 secondsMinKB
Maximum throughput of the last 60 secondsMaxKB
Average throughput of the last 60 secondsAvgKB
DescriptionPerformance Metrics
Average Front-end I/OsIOPS (TotalRd + TotalWr)
Average Write percentageWrite Ratio %
Average Sequential I/O percentageSequential IO ratio %
Average Read Cache Hit percentageRead hits % for LDEV
Average ThroughputThroughput [KB/s]
Average I/O Response TimeIO response time [ms]
Back-end / Front-end I/O ratioBack-end to Front-end IO ratio [%]
Average LDEV I/O utilizationLDEV Utilization % for LDEV
Back-end I/OCache lines staged/destaged [1/s]
Table 20 describes the RAID Group performance metrics.
Table 20 RAID Group performance metrics
DescriptionPerformance Metrics
Average Front-end I/OsIOPS (TotalRd + TotalWr)
Average Write percentageWrite Ratio %
Average Sequential I/O percentageSequential IO ratio %
Average Read Cache Hit percentageRead hits % for LDEV
XPWatch and XPSketch Reference Guide 49
Page 50

Table 21 describes the CPU performance metrics.
Table 21 CPU performance metrics
DescriptionPerformance Metrics
Average ThroughputThroughput [KB/s]
Average I/O Response TimeIO response time [ms]
Back-end / Front-end I/O ratioBack-end to Front-end IO ratio [%]
Back-end I/OCache lines staged/destaged [1/s]
DescriptionPerformance Metrics
Minimum CPU utilization on PCB[%]Minimum Utilization[%]
Maximum CPU utilization on PCB[%]Maximum Utilization[%]
Average CPU utilization on PCB[%]Average Utilization[%]
CHA PCB Busy Time for CPU 0(if installed)Utilization for MP 0 0[1/s]
CHA PCB Busy Time for CPU 1(if installed)Utilization for MP 1 0[1/s]
CHA PCB Busy Time for CPU 2(if installed)Utilization for MP 2 0[1/s]
Table 22 describes the DKC performance metrics.
Table 22 DKC performance metrics
CHA PCB Busy Time for CPU 3(if installed)Utilization for MP 3 0[1/s]
CHA PCB Busy Time for CPU 4(if installed)Utilization for MP 4 0[1/s]
CHA PCB Busy Time for CPU 5(if installed)Utilization for MP 5 0[1/s]
CHA PCB Busy Time for CPU 6(if installed)Utilization for MP 6 0[1/s]
CHA PCB Busy Time for CPU 7(if installed)Utilization for MP 7 0[1/s]
DescriptionPerformance Metrics
CHA to shared memory bus utilization [%]CHA to shared memory utilization [%]
DKA to shared memory bus utilization [%]DKA to shared memory utilization [%]
CHA to cache memory Xbar utilization [%]CHA to cache memory utilization [%]
DKA to cache memory Xbar utilization [%]DKA to cache memory utilization [%]
Cache usage for CLPR0 [MB]Cache usage [MB]
Write cache usage for CLPR0 [MB]Write cache usage [MB]
Side File usage for CLPR0 [MB]Side File usage [MB]
Cache random read hits for CLPR0Cache random read hits
Cache utilization for CLPR0Cache utilization [%]
Viewing performance metrics in XPSketch50
Page 51

DescriptionPerformance Metrics
Write cache utilization [%] for CLPR0, max=70%Write cache utilization [%]
XPWatch and XPSketch Reference Guide 51
Page 52

Viewing performance metrics in XPSketch52
Page 53

8 Working with charts in XPSketch
This section describes viewing, modifying, saving, and printing charts in XPSketch. It also describes
restoring the auto range settings on the chart.
Viewing charts
You can zoom in or zoom out on a chart on either the Domain Axis, Range Axis, or both. To zoom
in, on the Options menu, point to Zoom In and select one of the following options:
• Both— Select this option if you want to zoom in on both Domain Axis and the Range Axis. This
increases the length of both the axes as and when you zoom in on the chart.
• Domain— Select this option if you want to zoom in only on the Domain Axis. This increases the
length of the Domain Axis.
• Range— Select this option if you want to zoom in only on the Range Axis. This increases the length
of the Range Axis.
You can also right-click anywhere on the chart, point to Zoom In on the pop-up menu, and select one
of the above-mentioned options.
To zoom out, on the Options menu, point to Zoom Out and select one of the following options:
• Both— Select this option if you want to zoom out of both Domain Axis and the Range Axis. This
decreases the length of both the axes as and when you zoom out of the chart.
• Domain— Select this option if you want to zoom out only on the Domain Axis. This decreases the
length of the Domain Axis.
• Range— Select this option if you want to zoom out only on the Range Axis. This decreases the
length of the Range Axis
You can also right-click anywhere on the chart, point to Zoom Out on the pop-up menu, and select
one of the above-mentioned options.
Modifying chart properties
You can change the general display settings and the specific settings for a chart. However, you can
modify the specific settings only of the Domain Axis and Range Axis. To modify the chart properties,
complete the following steps:
1. On the Options menu, select Properties.
NOTE:
You can also right-click anywhere the chart, and select Properties from the pop-up menu.
2. On the Chart Properties window, you can modify the following:
• Under the Title tab:
• Change the chart title, font type, and color settings.
XPWatch and XPSketch Reference Guide 53
Page 54

• Clear the Show Title checkbox if you do not want the chart title to be displayed.
• Under the Plot tab:
• Go to Appearance tab to change the appearance and orientation of the chart.
• Go to Domain Axis or Range Axis tabs to:
• Change the other general settings for Domain Axis or Range Axis
• Clear the Show Tick Labels checkbox if you do not want the labels to be displayed on
the Domain Axis or the Range Axis.
• Clear the Show Tick Marks checkbox if you do not want the horizontal or vertical lines
to be displayed towards the Graph Area.
NOTE:
Under the Range tab (available only under Range Axis tab), you can enter the
maximum and minimum range, or select the Auto-adjust Range checkbox for XPSketch
to adjust the maximum and minimum range automatically while plotting the graph.
• Under the Others tab:
• Select Draw Anti-Aliased checkbox to improve the resolution and clarity of the data points
and trends that are displayed on the chart.
• Change the background for the chart.
Restoring auto range settings on the chart
Auto range settings can be restored on the Domain Axis, Range Axis, or both. To restore the auto
range settings, on the Options menu, point to Auto Range and select one of the following based on
the requirement:
• Both — To restore the auto-range calculation on both the axes
• Domain — To restore the auto-range calculation on the Domain Axis
• Range — To restore the auto-range calculation on the Range Axis
Saving and printing the chart
To save the chart in the PNG format, on the Options menu, select Save Chart as…
NOTE:
You can also right-click anywhere on the chart, and select Save Chart as… from the pop-up menu.
To print the chart, on the Options menu, select Print. On the Page Setup window, select the appropriate
settings to print the chart.
NOTE:
You can also right-click anywhere on the chart, and select Print from the pop-up menu.
Working with charts in XPSketch54
Page 55

A XPWatch use case scenarios
Scenario 1: Port I/O spike
Business case
Periodic port I/O spikes are observed in XP Performance Advisor.
Objective
Locate the offending host group/application.
Resolution
XPWatch can be used to find the hot spot by collecting the performance data for very short intervals,
such as, 10 seconds.
Perform the following steps to find the hot spot:
1. Select the affected port (You can find the affected port using XP Performance Advisor).
2. Select all LDEVs attached to the port.
NOTE:
You can use one of the following selection schemes to select the LDEVs:
• Filter LDEVs by RAID Groups
• Filter RAID Groups by LDEVs
• Manually add RAID Groups and LDEVs without Filtering
3. On the output screen, monitor and collect performance data of all the ports.
Results
Using the results displayed by XPWatch, you can identify the application that is causing the
performance issue and can take the corrective action.
Scenario 2: Poor application response
Business case
The XP array is suspected to be the cause of an application’s poor performance.
XPWatch and XPSketch Reference Guide 55
Page 56

Objective
Confirm the observation using XPWatch.
Resolution
In this case, XPWatch can help you to isolate XP array’s performance from the application’s
performance.
Using XPWatch, perform the following steps:
1. Select the host group or server where the application is running. All ports attached to the host
2. Select all ports attached to the host groups.
3. Select all LDEVs and RAID groups attached to the ports.
4. On the output screen, monitor and collect performance data for short time intervals, for example,
Results
By studying the XPWatch metrics, you can analyze the amount of load on the XP array and the
response time for I/Os from the host. This data can be correlated with the application performance.
groups are displayed.
10 seconds.
XPWatch use case scenarios56
Page 57

B Understanding write ratio in XPWatch
The following screen shows the performance of the entire RAID Group 01-03 being collected with the
performance of LDEVs 02:76, 02:77, and 02:78.
The LDEVs in RAID Group 01-03 are exposed only through port 1A. There are no I/O activities or
LDEVs reported on this port because there is no I/O activity in port 1A and these LDEVs are not visible
through any other port.
RAID Group 01-03 shows some activity because it has another LDEV(01:f4) exposed through some
other ports (these LDEVs were not available for selection in XPWatch as we selected only port 1A),
which have I/Os in it.
The average write percentage (Wr%) for the above output can be inferred by the following calculations:
Calculate the I/O per second:
I/O per second (total front-end writes + total front-end reads) = 2
r_H% (cache read hit %)=0 and Be (back-end I/O per second)=0
Because both of the above values are 0, it implies that there are no back-end reads or back-end writes
or front-end reads.
• Total front-end reads = 0
• Total front-end writes = 2
Therefore, Wr% can be calculated as:
Wr% = 100*(total front-end writes / (I/O per second))
XPWatch and XPSketch Reference Guide 57
Page 58

= 100*(2/2)
= 100*1
= 100
The Wr% is 100% because all the front-end I/Os on that RAID group are writes.
NOTE:
We can conclude all the front-end I/Os on the RAID group are writes because the r_H% (cache read
hit %) is 0; that is, there are no front-end reads.
Understanding write ratio in XPWatch58
Page 59

C Relationship between LDEV I/O response time and Write ratio
We cannot establish a relationship between the LDEV I/O response time and Write ratio because:
• LDEV I/O response time is dependent on both front-end reads and front-end writes.
• Write ratio provides only the write percentage in the I/Os.
NOTE:
The LDEV I/O response time shown by XPWatch is the average I/O response time measured in
milliseconds (that is, both reads and writes together are responsible for variations in this value).
The LDEV response time in XPWatch is calculated using the formula:
(front-end read response time over the collection interval * front-end reads + front-end writes * front-end
write response time over the collection interval) / (total front-end I/O)
where:
• front-end reads = front-end random reads + front-end sequential reads
• front-end writes = front-end random writes + front-end sequential writes
• Total front-end I/O = front-end reads + front-end writes
XPWatch and XPSketch Reference Guide 59
Page 60

Relationship between LDEV I/O response time and Write ratio60
Page 61

D Comparing LDEV response time metrics in XP Performance Advisor and XPWatch
Maximum values of LDEV response time in XP Performance Advisor and XPWatch
The maximum values of LDEV response time in XP Performance Advisor cannot be compared with the
response time values in XPWatch because XP Performance Advisor displays the I/O response time
as separate metrics for read and write, respectively.
XP Performance Advisor also displays the maximum and average values for LDEV response time for
reads and writes separately. The maximum values of the read and write response are displayed within
an interval of 30 seconds.
However, XPWatch does not display any related metric for the maximum value of read or write
response.
Average values of LDEV response time in XP Performance Advisor and XPWatch
You can calculate the Average Read Response time and Average Write Response time using the
following formulae:
Average read response time
Front–end read response time over the collection interval / total front–end reads
Average write response time
Front-end write response time over the collection interval / total front–end writes
Because XPWatch displays the cumulative LDEV response time (that is, both reads and writes combined)
a direct comparison of the average values of LDEV response time in XP Performance Advisor and
XPWatch is not allowed.
XPWatch and XPSketch Reference Guide 61
Page 62

Comparing LDEV response time metrics in XP Performance Advisor and XPWatch62
Page 63

9 Support and other resources
Contacting HP
For worldwide technical support information, see the HP support website at:
http://www.hp.com/support
Before contacting HP, collect the following information:
• Product model names and numbers
• Technical support registration number (if applicable)
• Product serial numbers
• Error messages
• Operating system type and revision level
• Detailed questions
Subscription service
HP recommends you register your product at the Subscriber's Choice for Business website at:
http://www.hp.com/go/e-updates
After registering, you receive email notification of product enhancements, new driver versions, firmware
updates, and other product resources.
Documentation feedback
HP welcomes your feedback.
To make comments and suggestions about product documentation, please send a message to
storagedocsFeedback@hp.com. All submissions become the property of HP.
Please take 10 minutes to visit the following website and complete our online survey. This provide us
with valuable information that we use to improve your experience in the future
HP product documentation survey
Are you the person who installs, maintains, or uses this HP storage product? If so, we would like to
know more about your experience using the product documentation. If not, please pass this notice to
the person who is responsible for these activities.
Our goal is to provide you with documentation that makes our storage hardware and software products
easy to install, operate, and maintain. Your feedback is invaluable in letting us know how we can
improve your experience with HP documentation.
Please take 10 minutes to visit the following website and complete our online survey. Provide us with
valuable information that we use to improve your experience in the future.
XPWatch and XPSketch Reference Guide 63
Page 64

http://www.hp.com/support/storagedocsurvey
Thank you for your time and your investment in HP storage products.
Related information
Documents
In addition to this guide, see the following documents for this product:
• HP StorageWorks XP Performance Advisor Software Installation Guide
• HP StorageWorks XP Performance Advisor Software Best Practices Guide
• HP StorageWorks XP Performance Advisor Software Frequently Asked Questions (FAQs)
• HP StorageWorks XP Performance Advisor Software OS Support Matrix
• HP StorageWorks XP Performance Advisor Software Release Notes
The XP Performance Advisor tools related documents are:
• HP StorageWorks XP Performance Advisor Software CLUI Guide
• XPWatch_XPSketch Reference Guide
• XPInfo Release Notes
NOTE:
The content from the
now available as part of the
The XPWatch Reference Guide and the XPSketch help have been consolidated into one document,
titled the
XPWatch_XPSketch Reference Guide
HP StorageWorks XP Performance Advisor Software Troubleshooting Guide
HP StorageWorks XP Performance Advisor Software User Guide
.
is
.
To view these and other HP documents, see the HP website at http://www.hp.com/support.
Accessing XP Performance Advisor documentation The following procedure is to view the
documentation provided for XP Performance Advisor:
1. On the Support & Drivers page, select Storage > Storage Software > Storage Device Management
You can also click Support on any of the XP Performance Advisor screens and download the
above-mentioned documents to your system (except for the HP StorageWorks XP Performance Advisor
Software Best Practices Guide and HP StorageWorks XP Performance Advisor Software Frequently
Asked Questions (FAQs), which are available only at the HP Manuals site). You can access the help
for XP Performance Advisor by clicking the Help link within the XP Performance Advisor user interface.
Websites
For additional information, see the following HP websites:
• http://www.hp.com
• http://www.hp.com/go/storage
• http://www.hp.com/service_locator
• http://www.hp.com/support/manuals
Software > HP StorageWorks XP Device Management Software > HP StorageWorks XP Performance Advisor Software > Manuals. The HP Manuals page for XP Performance Advisor is displayed.
http://www.hp.com/support/manuals
Support and other resources64
Page 65

Document conventions and symbols
Table 23 Document conventions
ElementConvention
Cross-reference links and e-mail addressesBlue text: Table 23
Website addressesBlue, underlined text: http://www.hp.com
• Keys that are pressed
Bold text
Monospace text
• Text typed into a GUI element, such as a box
• GUI elements that are clicked or selected, such as menu
and list items, buttons, tabs, and check boxes
Text emphasisItalic text
• File and directory names
• System output
• Code
• Commands, their arguments, and argument values
Monospace, italic text
Monospace, bold text
• Code variables
• Command variables
Emphasized monospace text
WARNING!
Indicates that failure to follow directions could result in bodily harm or death.
CAUTION:
Indicates that failure to follow directions could result in damage to equipment or data.
IMPORTANT:
Provides clarifying information or specific instructions.
NOTE:
Provides additional information.
TIP:
Provides helpful hints and shortcuts.
XPWatch and XPSketch Reference Guide 65
Page 66

Support and other resources66
Page 67

Index
A
Array menu, 19
Average
read response time, 61
write percentage, 57
write response time, 61
C
Collection Update Interval, 31
conventions
document, 65
text symbols, 65
D
Data Collection Time Limit, 31
Data Split Time, 31
document
conventions, 65
related documentation, 64
documentation
HP website, 64
providing feedback, 63
L
LDEV
average response time in Performance
Advisor and XPWatch,
Filter LDEVs by RAID Groups, 11, 33
LDEV I/O response time and write ratio, 59
manually add LDEV without filtering, 11
manually add LDEVs without filtering, 34
maximum response time in Performance
Advisor and XPWatch,
menu, 29
performance metrics, 36
M
Menus
array menu, 19
host groups, 20
LDEV menu, 29
nickname menu, 22
pick LDEVs/RAID Groups selection scheme,
27
port menu, 25
RAID Group menu, 27
settings menu, 30
H
help
obtaining, 63
Host Groups
clearing host groups, 21
screen, 20
selecting host groups, 20
viewing host groups, 20
HP
technical support, 63
HP Graphical tool
XPSketch, 39, 45
N
Nickname
assigning nicknames, 23
deleting nicknames, 24
menu, 22
renaming nicknames, 24
P
Performance Metrics
load CSV in XPSketch, 45
Performance metrics
CPU performance metrics, 37, 48
DKC performance metrics, 48
LDEV performance metrics, 36, 48
port performance metrics, 35, 48
RAID Group performance metrics, 37
RAID performance metrics, 48
view metrics in XPSketch, 46
XPWatch and XPSketch Reference Guide 67
Page 68

Port
menu, 25
performance metrics, 35
R
RAID Group
Filter RAID Groups by LDEVs, 11
Filtering RAID Groups by LDEVs, 33
menu, 27
performance metrics, 37
Real-Time Monitor Size, 31
related documentation, 64
S
Subscriber's Choice, HP, 63
symbols in text, 65
T
technical support
HP, 63
service locator website, 64
text symbols, 65
XPWatch files
CSV file, 16
settings.ini, 16
trace.txt, 16
wagent.exe, 16
XPWatch.exe, 16
W
websites
HP, 64
HP Subscriber's Choice for Business, 63
product manuals, 64
X
XPSketch
java heap size value, 46
modify chart, 53
multiple metrics selection, 45
print chart, 54
restore auto range settings, 54
save chart, 54
understanding performance metrics, 48
view chart, 53
XPWatch
commands, 17
components, 16
installing, 13
menus, 18
performance metrics, 33
uninstalling, 16
68
 Loading...