

Page 1

HP TopTools for
Hubs & Switches
User Guide
Page 2

a
Page 3

HP TopTools for Hubs & Switches
User Guide
Page 4

© Copyright 1986-2001 Hewlett-Packard Company
All Rights Reserved.
This document contains information which is protected by
copyright. Reproduction, adaptation, or translation without prior
permission is prohibited, except as allowed under the copyright
laws.
Applicable Product
HP TopTools for Hubs & Switches J2569R
September 2001
Trademark Credits
Microsoft Windows®, Windows 95®, Windows 98®, Windows
2000®, Microsoft Windows NT®, Microsoft Internet Explorer®
and MSIE® are U.S. registered trademarks of Microsoft
Corporation.
Ethernet is a registered trademark of Xerox Corporation.
Unicenter and TNG are registered trademarks of Computer
Associates International, Inc.
IBM Tivoli and IBM NetView are registered trademarks of
International Business Machines Corporation.
Disclaimer
The information contained in this document is subject to change
without notice.
HEWLETT-PACKARD COMPANY MAKES NO WARRANTY OF
ANY KIND WITH REGARD TO THIS MATERIAL, INCLUDING,
BUT NOT LIMITED TO, THE IMPLIED WARRANTIES OF
MERCHANTABILITY AND FITNESS FOR A PARTICULAR
PURPOSE. Hewlett-Packard shall not be liable for errors
contained herein or for incidental or consequential damages in
connection with the furnishing, performance, or use of this
material.
Hewlett-Packard assumes no responsibility for the use or
reliability of its software on equipment that is not furnished by
Hewlett-Packard.
U.S. Government Restricted Rights
The software and any accompanying documentation have been
developed entirely at private expense. They are delivered and
licensed as “commercial computer soft ware” as defined in DFARS
252.227-7013 (Oct 1988), DFARS 252.221-7015 (May 1991), or
DFARS 252.227-7014 (Jun 1995), as a “commercial item” as
defined in FAR 2.101(a), or as “Restricted computer software” as
defined in FAR 52.227-19 (Jun 1987)(or any equivalent agency
regulation or contract clause), whichever is applicable. You have
only those rights provided for such Software and any
accompanying documentation by the applicable FAR or DFARS
clause or the HP standard software agreement for the product
involved.
Hewlett-Packard Company
8000 Foothills Boulevard, m/s 5551
Roseville, California 95747-5551
http://www.hp.com/go/procurve
Warranty
A copy of the specific warranty terms applicable to your HewlettPackard products and replacement parts can be obtained from
your HP Sales and Service Office or authorized dealer.
Page 5

Contents
1 Quick Start
Starting HP TopTools for Hubs & Switches . . . . . . . . . . . . . . . . . . . . . 1-1
Getting Around in HP TopTools . . . . . . . . . . . . . . . . . . . . . . . . . . . . . . . 1-2
Viewing Your Network Devices . . . . . . . . . . . . . . . . . . . . . . . . . . . . . . . . . 1-3
Devices . . . . . . . . . . . . . . . . . . . . . . . . . . . . . . . . . . . . . . . . . . . . . . . . . . . . 1-3
Maps . . . . . . . . . . . . . . . . . . . . . . . . . . . . . . . . . . . . . . . . . . . . . . . . . . . . . . 1-3
Policies . . . . . . . . . . . . . . . . . . . . . . . . . . . . . . . . . . . . . . . . . . . . . . . . . . . . . . . 1-4
Quality of Service . . . . . . . . . . . . . . . . . . . . . . . . . . . . . . . . . . . . . . . . . . . 1-4
Configuration Policies . . . . . . . . . . . . . . . . . . . . . . . . . . . . . . . . . . . . . . . 1-5
Examining Alerts . . . . . . . . . . . . . . . . . . . . . . . . . . . . . . . . . . . . . . . . . . . . . . 1-5
Configuring and Monitoring Devices . . . . . . . . . . . . . . . . . . . . . . . . . . . 1-6
Viewing Network Traffic . . . . . . . . . . . . . . . . . . . . . . . . . . . . . . . . . . . . . . . 1-8
Optimizing Your Network . . . . . . . . . . . . . . . . . . . . . . . . . . . . . . . . . . . . . . 1-9
How to Get Support . . . . . . . . . . . . . . . . . . . . . . . . . . . . . . . . . . . . . . . . . . 1-10
2 Introduction
Introduction to HP TopTools . . . . . . . . . . . . . . . . . . . . . . . . . . . . . . . . . . 2-1
HP TopTools for Hubs & Switches . . . . . . . . . . . . . . . . . . . . . . . . . . . . . . 2-2
Network Devices Features . . . . . . . . . . . . . . . . . . . . . . . . . . . . . . . . . . . . . 2-4
Viewing a List of Devices . . . . . . . . . . . . . . . . . . . . . . . . . . . . . . . . . . . . . 2-4
Maps . . . . . . . . . . . . . . . . . . . . . . . . . . . . . . . . . . . . . . . . . . . . . . . . . . . . . . 2-4
Group Policies . . . . . . . . . . . . . . . . . . . . . . . . . . . . . . . . . . . . . . . . . . . . . . 2-5
Network Traffic . . . . . . . . . . . . . . . . . . . . . . . . . . . . . . . . . . . . . . . . . . . . . . . 2-5
Network Growth . . . . . . . . . . . . . . . . . . . . . . . . . . . . . . . . . . . . . . . . . . . . . . 2-5
HP Devices Supported . . . . . . . . . . . . . . . . . . . . . . . . . . . . . . . . . . . . . . . . . 2-5
Learning to Use HP TopTools . . . . . . . . . . . . . . . . . . . . . . . . . . . . . . . . . . 2-8
HP TopTools Technical Product Support . . . . . . . . . . . . . . . . . . . . . . . 2-9
iii
Page 6

3 System Requirements
Hardware and Software Requirements . . . . . . . . . . . . . . . . . . . . . . . . . 3-1
4 Discovering Your Devices
Beginning Discovery . . . . . . . . . . . . . . . . . . . . . . . . . . . . . . . . . . . . . . . . . . . 4-1
Discovery Status . . . . . . . . . . . . . . . . . . . . . . . . . . . . . . . . . . . . . . . . . . . . 4-2
Selecting Networks . . . . . . . . . . . . . . . . . . . . . . . . . . . . . . . . . . . . . . . . . . 4-2
Adding Devices for Discovery . . . . . . . . . . . . . . . . . . . . . . . . . . . . . . . . . 4-3
Configuring Discovery Settings . . . . . . . . . . . . . . . . . . . . . . . . . . . . . . . . 4-4
Troubleshooting Discovery . . . . . . . . . . . . . . . . . . . . . . . . . . . . . . . . . . . . 4-4
Inventory of Devices . . . . . . . . . . . . . . . . . . . . . . . . . . . . . . . . . . . . . . . . . . 4-5
5 Alerts
Interpreting the Alert Log - Automatic Fault Finding . . . . . . . . . . . 5-1
Launching the Device View . . . . . . . . . . . . . . . . . . . . . . . . . . . . . . . . . . . 5-5
Acknowledging Alerts . . . . . . . . . . . . . . . . . . . . . . . . . . . . . . . . . . . . . . . . 5-5
Closing Alerts . . . . . . . . . . . . . . . . . . . . . . . . . . . . . . . . . . . . . . . . . . . . . . . 5-5
Sorting Alerts . . . . . . . . . . . . . . . . . . . . . . . . . . . . . . . . . . . . . . . . . . . . . . . 5-6
Filtering Alerts . . . . . . . . . . . . . . . . . . . . . . . . . . . . . . . . . . . . . . . . . . . . . . . 5-6
Selecting Alert Log Filters . . . . . . . . . . . . . . . . . . . . . . . . . . . . . . . . . . . . 5-6
Selecting Alert Log Filters - Topology . . . . . . . . . . . . . . . . . . . . . . . . . . 5-7
Selecting Alert Log Filters - Custom Groups . . . . . . . . . . . . . . . . . . . . . 5-8
Selecting Alert Log Filters - Search . . . . . . . . . . . . . . . . . . . . . . . . . . . . . 5-8
Configuring Action on Alerts . . . . . . . . . . . . . . . . . . . . . . . . . . . . . . . . . . 5-9
6 Networking Devices
Listing Devices . . . . . . . . . . . . . . . . . . . . . . . . . . . . . . . . . . . . . . . . . . . . . . . . 6-1
Configuring Polling . . . . . . . . . . . . . . . . . . . . . . . . . . . . . . . . . . . . . . . . . . . . 6-2
Selecting Actions for Devices . . . . . . . . . . . . . . . . . . . . . . . . . . . . . . . . . . 6-3
SNMP/Trap Configuration . . . . . . . . . . . . . . . . . . . . . . . . . . . . . . . . . . . . 6-4
Device Topology . . . . . . . . . . . . . . . . . . . . . . . . . . . . . . . . . . . . . . . . . . . . . . 6-5
Node Port Table . . . . . . . . . . . . . . . . . . . . . . . . . . . . . . . . . . . . . . . . . . . . . . . 6-6
iv
Page 7

Custom Groups . . . . . . . . . . . . . . . . . . . . . . . . . . . . . . . . . . . . . . . . . . . . . . . 6-7
Searching for Devices . . . . . . . . . . . . . . . . . . . . . . . . . . . . . . . . . . . . . . . . . 6-8
7 Configuration Policies
Creating Groups . . . . . . . . . . . . . . . . . . . . . . . . . . . . . . . . . . . . . . . . . . . . . . 7-1
Viewing the Devices in a Group . . . . . . . . . . . . . . . . . . . . . . . . . . . . . . . 7-2
Adding a Group . . . . . . . . . . . . . . . . . . . . . . . . . . . . . . . . . . . . . . . . . . . . . 7-3
Modifying a Group . . . . . . . . . . . . . . . . . . . . . . . . . . . . . . . . . . . . . . . . . . . 7-3
Configuring Group Policies . . . . . . . . . . . . . . . . . . . . . . . . . . . . . . . . . . . . 7-6
General Configuration Policies . . . . . . . . . . . . . . . . . . . . . . . . . . . . . . . . 7-7
SNMP System Information . . . . . . . . . . . . . . . . . . . . . . . . . . . . . . . . . . . . 7-7
Checking Firmware Versions . . . . . . . . . . . . . . . . . . . . . . . . . . . . . . . . . . 7-8
Alert Configuration Policies . . . . . . . . . . . . . . . . . . . . . . . . . . . . . . . . . . . 7-8
Setting Fault Sensitivity . . . . . . . . . . . . . . . . . . . . . . . . . . . . . . . . . . . . . . 7-9
Advanced Switch Features . . . . . . . . . . . . . . . . . . . . . . . . . . . . . . . . . . . . 7-10
Automatic Broadcast Control (ABC) . . . . . . . . . . . . . . . . . . . . . . . . . . 7-11
Internet Group Management Protocol (IGMP) . . . . . . . . . . . . . . . . . . 7-13
The Spanning Tree Protocol . . . . . . . . . . . . . . . . . . . . . . . . . . . . . . . . . 7-14
Security Configuration Policies . . . . . . . . . . . . . . . . . . . . . . . . . . . . . . . 7-14
Communities . . . . . . . . . . . . . . . . . . . . . . . . . . . . . . . . . . . . . . . . . . . . . . 7-14
8 Viewing Your Maps
Displaying Maps . . . . . . . . . . . . . . . . . . . . . . . . . . . . . . . . . . . . . . . . . . . . . . . 8-1
Map Server Settings . . . . . . . . . . . . . . . . . . . . . . . . . . . . . . . . . . . . . . . . . 8-2
Launching a Map . . . . . . . . . . . . . . . . . . . . . . . . . . . . . . . . . . . . . . . . . . . . 8-5
Using the Panner . . . . . . . . . . . . . . . . . . . . . . . . . . . . . . . . . . . . . . . . . . . . . . 8-6
Launching the Device View . . . . . . . . . . . . . . . . . . . . . . . . . . . . . . . . . . . . . 8-6
Options for Displaying Maps . . . . . . . . . . . . . . . . . . . . . . . . . . . . . . . . . . . 8-7
Changing Map Views . . . . . . . . . . . . . . . . . . . . . . . . . . . . . . . . . . . . . . . . . 8-8
Locating a Node . . . . . . . . . . . . . . . . . . . . . . . . . . . . . . . . . . . . . . . . . . . . . . . 8-8
v
Page 8

9 Monitoring Network Traffic
Using Traffic Monitor . . . . . . . . . . . . . . . . . . . . . . . . . . . . . . . . . . . . . . . . . 9-1
Reading the Traffic Information Gauges . . . . . . . . . . . . . . . . . . . . . . . . 9-3
Reading the Segment Histogram . . . . . . . . . . . . . . . . . . . . . . . . . . . . . . . 9-3
Selecting Segment Groups and Segments . . . . . . . . . . . . . . . . . . . . . . . 9-4
Setting Thresholds . . . . . . . . . . . . . . . . . . . . . . . . . . . . . . . . . . . . . . . . . . 9-4
Displaying the Network Meter . . . . . . . . . . . . . . . . . . . . . . . . . . . . . . . . . 9-6
Options Button . . . . . . . . . . . . . . . . . . . . . . . . . . . . . . . . . . . . . . . . . . . . . 9-7
Who Are the Top 5 Talkers? . . . . . . . . . . . . . . . . . . . . . . . . . . . . . . . . . . . 9-7
Other Top Talkers Not in Selected Minute . . . . . . . . . . . . . . . . . . . . . . 9-9
Others . . . . . . . . . . . . . . . . . . . . . . . . . . . . . . . . . . . . . . . . . . . . . . . . . . . . 9-10
Top5 View Menu Items . . . . . . . . . . . . . . . . . . . . . . . . . . . . . . . . . . . . . . 9-10
Locating A Segment or End Node . . . . . . . . . . . . . . . . . . . . . . . . . . . . . 9-10
Traffic Data Collector Settings . . . . . . . . . . . . . . . . . . . . . . . . . . . . . . . 9-11
Traffic Data Storage . . . . . . . . . . . . . . . . . . . . . . . . . . . . . . . . . . . . . . . . 9-14
Traffic Data Collector Performance . . . . . . . . . . . . . . . . . . . . . . . . . . . 9-15
Troubleshooting Traffic Monitor . . . . . . . . . . . . . . . . . . . . . . . . . . . . . . 9-16
Connection to Server Lost . . . . . . . . . . . . . . . . . . . . . . . . . . . . . . . . . . . 9-17
10 Planning for Network Growth
Meeting the Challenges . . . . . . . . . . . . . . . . . . . . . . . . . . . . . . . . . . . . . . . 10-1
Using Network Tools . . . . . . . . . . . . . . . . . . . . . . . . . . . . . . . . . . . . . . . 10-2
Planning with the Network Performance Advisor . . . . . . . . . . . . . . 10-2
Starting the Network Performance Advisor . . . . . . . . . . . . . . . . . . . . 10-3
Creating a New Report . . . . . . . . . . . . . . . . . . . . . . . . . . . . . . . . . . . . . . 10-4
Modifying Your Settings . . . . . . . . . . . . . . . . . . . . . . . . . . . . . . . . . . . . . 10-5
Viewing a Report . . . . . . . . . . . . . . . . . . . . . . . . . . . . . . . . . . . . . . . . . . . 10-7
Reorganize Your Current Equipment . . . . . . . . . . . . . . . . . . . . . . . . . . 10-9
Recommendation Details Section . . . . . . . . . . . . . . . . . . . . . . . . . . . . 10-10
Add or Upgrade Equipment . . . . . . . . . . . . . . . . . . . . . . . . . . . . . . . . . . 10-12
Recommendation Details Section . . . . . . . . . . . . . . . . . . . . . . . . . . . . 10-12
Top Conversations . . . . . . . . . . . . . . . . . . . . . . . . . . . . . . . . . . . . . . . . . . 10-15
Inventory of End Nodes . . . . . . . . . . . . . . . . . . . . . . . . . . . . . . . . . . . . . 10-17
vi
Page 9

When There Are No Recommendations . . . . . . . . . . . . . . . . . . . . . . . 10-18
Controlling Data Storage—Administration . . . . . . . . . . . . . . . . . . . 10-18
How the Network Performance Advisor Collects Data . . . . . . . . . 10-19
Understanding HP Sampling . . . . . . . . . . . . . . . . . . . . . . . . . . . . . . . . 10-19
Traffic Data Collector Performance . . . . . . . . . . . . . . . . . . . . . . . . . . 10-20
Potential Problems with Data Collection . . . . . . . . . . . . . . . . . . . . . . 10-21
Segments Excluded from Analysis . . . . . . . . . . . . . . . . . . . . . . . . . . . . 10-22
Segments that do not have Devices with Sampling Capability . . . . 10-22
Segments not Selected for Analysis . . . . . . . . . . . . . . . . . . . . . . . . . . 10-22
11 Quality of Service
Overview . . . . . . . . . . . . . . . . . . . . . . . . . . . . . . . . . . . . . . . . . . . . . . . . . . . . 11-1
Basic Operation . . . . . . . . . . . . . . . . . . . . . . . . . . . . . . . . . . . . . . . . . . . . . . 11-3
Viewing All Currently Configured QoS Policies . . . . . . . . . . . . . . . . 11-4
Configuring QoS for Specific Devices (IP Addresses) . . . . . . . . . . 11-4
Adding a Policy for a Specific IP Address . . . . . . . . . . . . . . . . . . . . . . 11-5
Configuring a QoS Policy for IP Type of Service (ToS) . . . . . . . . . 11-6
ToS Configuration Options . . . . . . . . . . . . . . . . . . . . . . . . . . . . . . . . . . 11-6
How To Configure a ToS Policy . . . . . . . . . . . . . . . . . . . . . . . . . . . . . . 11-8
Configuring a QoS Policy for Specific Protocols . . . . . . . . . . . . . . . . 11-9
Configuring a QoS Policy for a Specific VLAN . . . . . . . . . . . . . . . . . 11-11
12 Accessing Hub Features
Device Management Features . . . . . . . . . . . . . . . . . . . . . . . . . . . . . . . . . 12-1
Viewing Device Identity Information . . . . . . . . . . . . . . . . . . . . . . . . . . 12-2
Interpreting Device Status . . . . . . . . . . . . . . . . . . . . . . . . . . . . . . . . . . . . 12-3
Reading the Performance Gauges . . . . . . . . . . . . . . . . . . . . . . . . . . . . . 12-3
Global Counters . . . . . . . . . . . . . . . . . . . . . . . . . . . . . . . . . . . . . . . . . . . . 12-5
Port Counters . . . . . . . . . . . . . . . . . . . . . . . . . . . . . . . . . . . . . . . . . . . . . . 12-7
Configuring Your Device . . . . . . . . . . . . . . . . . . . . . . . . . . . . . . . . . . . . . . 12-7
Fault Detection . . . . . . . . . . . . . . . . . . . . . . . . . . . . . . . . . . . . . . . . . . . . 12-8
System Information . . . . . . . . . . . . . . . . . . . . . . . . . . . . . . . . . . . . . . . . . 12-9
vii
Page 10

Configuring IP . . . . . . . . . . . . . . . . . . . . . . . . . . . . . . . . . . . . . . . . . . . . . 12-9
Port Configuration . . . . . . . . . . . . . . . . . . . . . . . . . . . . . . . . . . . . . . . . 12-11
Bridge Enable/Disable . . . . . . . . . . . . . . . . . . . . . . . . . . . . . . . . . . . . . 12-12
Backup Links . . . . . . . . . . . . . . . . . . . . . . . . . . . . . . . . . . . . . . . . . . . . . 12-12
Configuring Load Balancing—Switching Hubs . . . . . . . . . . . . . . . . . 12-13
Support URL . . . . . . . . . . . . . . . . . . . . . . . . . . . . . . . . . . . . . . . . . . . . . 12-14
13 Managing Switches
Displaying Switch Status . . . . . . . . . . . . . . . . . . . . . . . . . . . . . . . . . . . . . 13-1
Status - Overview Page . . . . . . . . . . . . . . . . . . . . . . . . . . . . . . . . . . . . . . 13-1
Port Counters . . . . . . . . . . . . . . . . . . . . . . . . . . . . . . . . . . . . . . . . . . . . . . 13-3
Port Status . . . . . . . . . . . . . . . . . . . . . . . . . . . . . . . . . . . . . . . . . . . . . . . . 13-3
Switch Identity Information . . . . . . . . . . . . . . . . . . . . . . . . . . . . . . . . . . 13-5
Configuring Switch Features . . . . . . . . . . . . . . . . . . . . . . . . . . . . . . . . . . 13-6
Device View . . . . . . . . . . . . . . . . . . . . . . . . . . . . . . . . . . . . . . . . . . . . . . . 13-6
Fault Detection . . . . . . . . . . . . . . . . . . . . . . . . . . . . . . . . . . . . . . . . . . . . 13-7
System Information . . . . . . . . . . . . . . . . . . . . . . . . . . . . . . . . . . . . . . . . . 13-8
IP Configuration . . . . . . . . . . . . . . . . . . . . . . . . . . . . . . . . . . . . . . . . . . . 13-8
Port Configuration . . . . . . . . . . . . . . . . . . . . . . . . . . . . . . . . . . . . . . . . . 13-9
Class of Service . . . . . . . . . . . . . . . . . . . . . . . . . . . . . . . . . . . . . . . . . . . 13-10
Steps for Configuring CoS Priority . . . . . . . . . . . . . . . . . . . . . . . . . . . 13-15
Assigning a Monitoring Port . . . . . . . . . . . . . . . . . . . . . . . . . . . . . . . . 13-16
Setting Device Features . . . . . . . . . . . . . . . . . . . . . . . . . . . . . . . . . . . . 13-17
HP ProCurve Stack Management . . . . . . . . . . . . . . . . . . . . . . . . . . . . 13-18
VLAN Configuration . . . . . . . . . . . . . . . . . . . . . . . . . . . . . . . . . . . . . . . 13-20
Support/Management URLs . . . . . . . . . . . . . . . . . . . . . . . . . . . . . . . . . 13-23
viii
14 Setting Up Security for a Device
Device Passwords . . . . . . . . . . . . . . . . . . . . . . . . . . . . . . . . . . . . . . . . . . . . 14-1
Manager/Operator Password Combinations . . . . . . . . . . . . . . . . . . . . 14-2
The Function of Community Names . . . . . . . . . . . . . . . . . . . . . . . . . . . 14-3
Configuring for Community Names . . . . . . . . . . . . . . . . . . . . . . . . . . . 14-5
Hub Port Security . . . . . . . . . . . . . . . . . . . . . . . . . . . . . . . . . . . . . . . . . . . . 14-6
Address Selection . . . . . . . . . . . . . . . . . . . . . . . . . . . . . . . . . . . . . . . . . . 14-7
Page 11

Authorized Address . . . . . . . . . . . . . . . . . . . . . . . . . . . . . . . . . . . . . . . . . 14-8
Eavesdrop Prevention . . . . . . . . . . . . . . . . . . . . . . . . . . . . . . . . . . . . . . 14-8
Send Alarm . . . . . . . . . . . . . . . . . . . . . . . . . . . . . . . . . . . . . . . . . . . . . . . . 14-8
Disable Port . . . . . . . . . . . . . . . . . . . . . . . . . . . . . . . . . . . . . . . . . . . . . . . 14-9
Setting Security Policy for Selected Ports . . . . . . . . . . . . . . . . . . . . . 14-9
The Hub Intrusion Log . . . . . . . . . . . . . . . . . . . . . . . . . . . . . . . . . . . . . . 14-10
Switch Port Security . . . . . . . . . . . . . . . . . . . . . . . . . . . . . . . . . . . . . . . . 14-11
Basic Operation . . . . . . . . . . . . . . . . . . . . . . . . . . . . . . . . . . . . . . . . . . . 14-11
Configuring Port Security—Planning . . . . . . . . . . . . . . . . . . . . . . . . . 14-12
Configuring Authorized IP Managers . . . . . . . . . . . . . . . . . . . . . . . . . 14-14
Overview of IP Mask Operation . . . . . . . . . . . . . . . . . . . . . . . . . . . . . 14-15
Configuring Port Security . . . . . . . . . . . . . . . . . . . . . . . . . . . . . . . . . . . 14-16
Switch Intrusion Log . . . . . . . . . . . . . . . . . . . . . . . . . . . . . . . . . . . . . . . . 14-18
Notice of Security violations . . . . . . . . . . . . . . . . . . . . . . . . . . . . . . . . 14-18
Operating Notes for Port Security . . . . . . . . . . . . . . . . . . . . . . . . . . . . 14-20
Identifying the IP Address of an Intruder . . . . . . . . . . . . . . . . . . . . . . 14-20
Proxy Web Servers . . . . . . . . . . . . . . . . . . . . . . . . . . . . . . . . . . . . . . . . 14-21
Security Violations . . . . . . . . . . . . . . . . . . . . . . . . . . . . . . . . . . . . . . . . 14-21
Intrusion Flag Status for Entries Forced Off of the Intrusion Log . 14-21
15 Performing Diagnostics
Performing a Ping/Link Test . . . . . . . . . . . . . . . . . . . . . . . . . . . . . . . . . . 15-1
Rebooting a Device . . . . . . . . . . . . . . . . . . . . . . . . . . . . . . . . . . . . . . . . . . . 15-2
Resetting a Hub to Factory Default Settings . . . . . . . . . . . . . . . . . . . 15-3
Resetting a Switch . . . . . . . . . . . . . . . . . . . . . . . . . . . . . . . . . . . . . . . . . . . 15-4
Producing a Configuration Report . . . . . . . . . . . . . . . . . . . . . . . . . . . . . 15-5
16 Downloading Software
The Software Update Utility . . . . . . . . . . . . . . . . . . . . . . . . . . . . . . . . . . 16-1
Starting the Software Update Utility . . . . . . . . . . . . . . . . . . . . . . . . . . . 16-2
Viewing the Software Updates Available on the TopTools Server . . 16-7
The HP Download Manager . . . . . . . . . . . . . . . . . . . . . . . . . . . . . . . . . . . 16-9
Obtaining New Software from HP . . . . . . . . . . . . . . . . . . . . . . . . . . . . . 16-9
ix
Page 12

How to Update the Map Files . . . . . . . . . . . . . . . . . . . . . . . . . . . . . . . . 16-12
A Appendix A
Agent Firmware Versions . . . . . . . . . . . . . . . . . . . . . . . . . . . . . . . . . . . . . A-1
Verifying Device Agent Versions . . . . . . . . . . . . . . . . . . . . . . . . . . . . . . A-1
Preparing Network Devices . . . . . . . . . . . . . . . . . . . . . . . . . . . . . . . . . . . A-2
Device Network Addresses . . . . . . . . . . . . . . . . . . . . . . . . . . . . . . . . . . A-2
Globally Assigned IP Network Addresses . . . . . . . . . . . . . . . . . . . . . . A-3
Configuring IP Parameters . . . . . . . . . . . . . . . . . . . . . . . . . . . . . . . . . . . . A-3
Index
x
Page 13

Quick Start
1
This chapter provides a quick overview of important tasks that you can
perform with HP TopTools for Hubs & Switches.
■ Starting HP TopTools for Hubs & Switches
■ Examining Alerts - Find/Fix/Inform
■ Configuring and Monitoring Your Devices
■ Viewing Your Network Traffic
■ Optimizing Your Network
■ How to Get Support
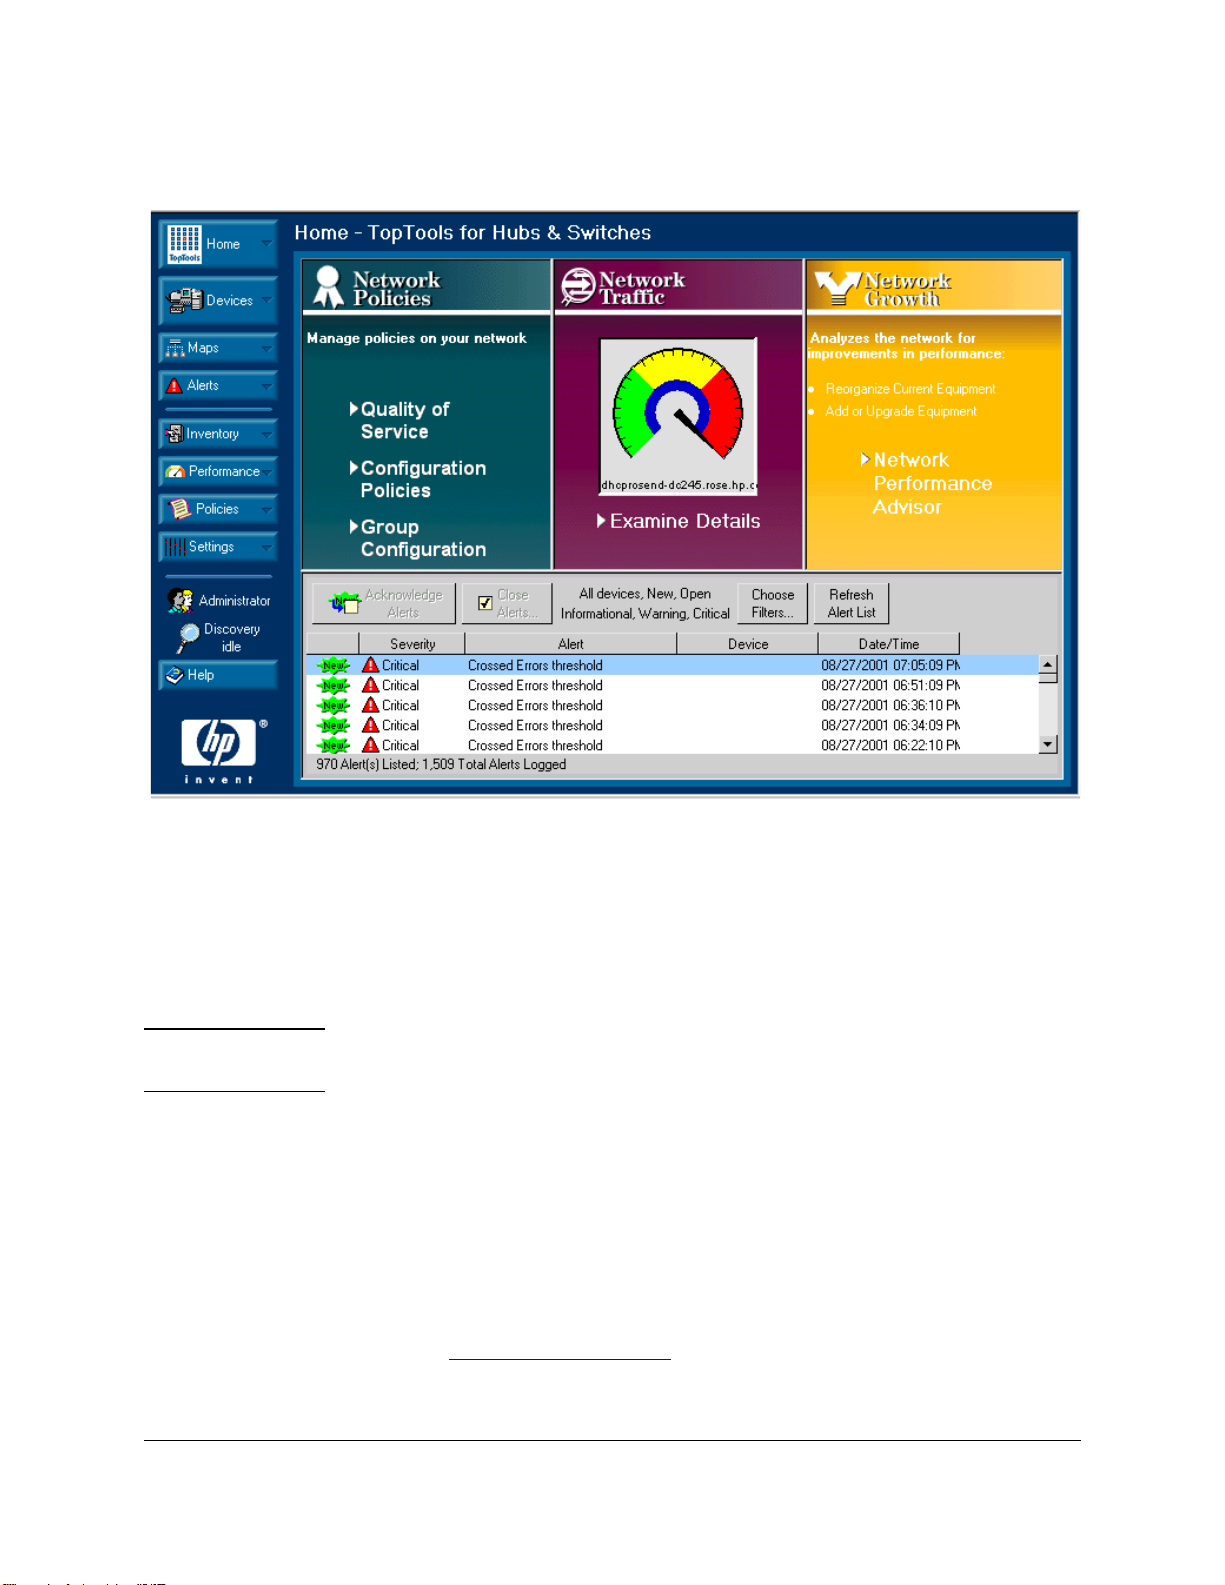
Starting HP TopTools for Hubs & Switches
To start HP TopTools for Hubs & Switches:
1. Click on the HP TopTools icon. Your browser will display the home page of
the TopTools application.
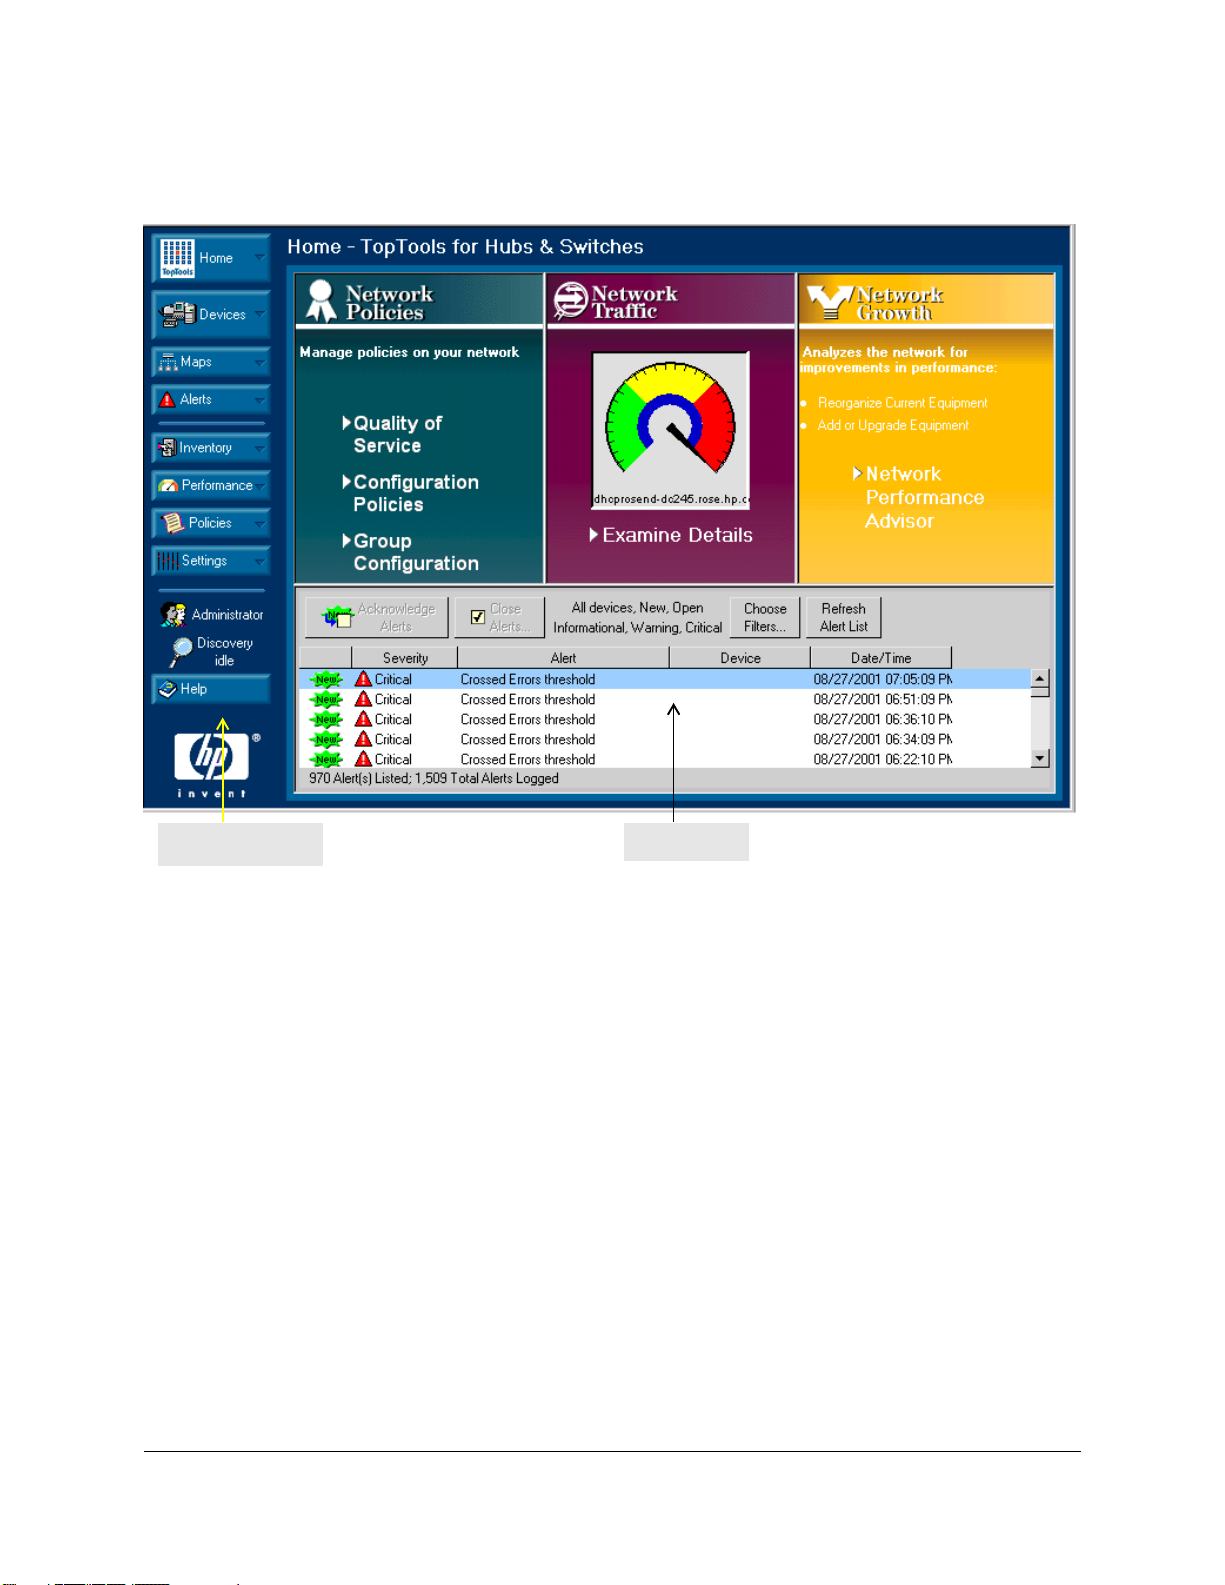
2. In the TopTools home page, click on the Home button in the navigation
frame, or click on the image of the switch.
3. Select Hubs & Switches Home from the Home button menu.
Page 14
Quick Start
Starting HP TopTools for Hubs & Switches
Navigation Frame
Page area
Figure 1-1. Home Page for HP TopTools for Hubs & Switches
Getting Around in HP TopTools
The browser-based tabbed presentation of HP TopTools makes it easy to
access the page you need to perform management tasks. Click on a button in
the navigation frame on the left side of the home page to see a list of tasks and
features, then select a task from the list to open that page in the browser.
To go back to a previous page, click on the back arrow at the top of the browser
window, or right-mouse-click in the page and select back.
Use the tabs or buttons at the top of a page to go quickly from task to task.
Click on the Home button and select Hubs & Switches Home to return to the HP
TopTools for Hubs & Switches home page.
The online help provides detailed information on how to perform HP TopTools
tasks, as well as information about devices that are not manageable with the
browser.
1-2
Page 15

Viewing Your Network Devices
Quick Start
Viewing Your Network Devices
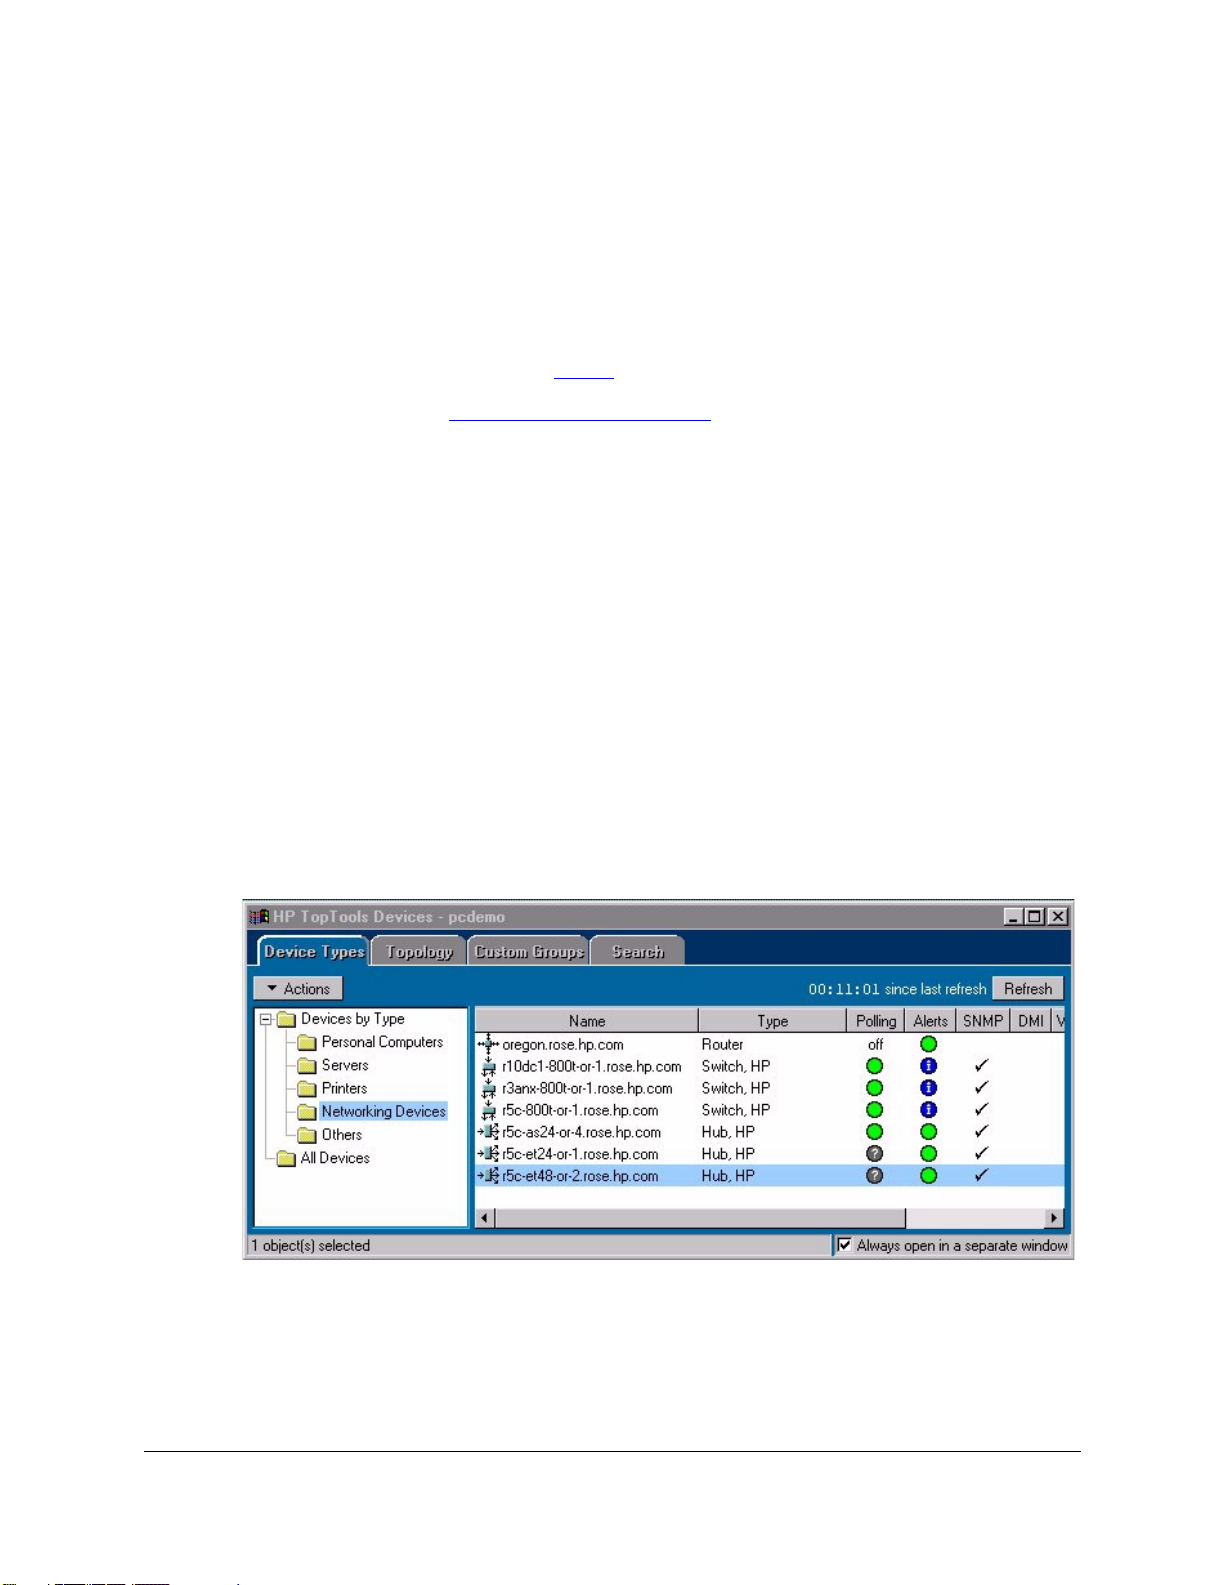
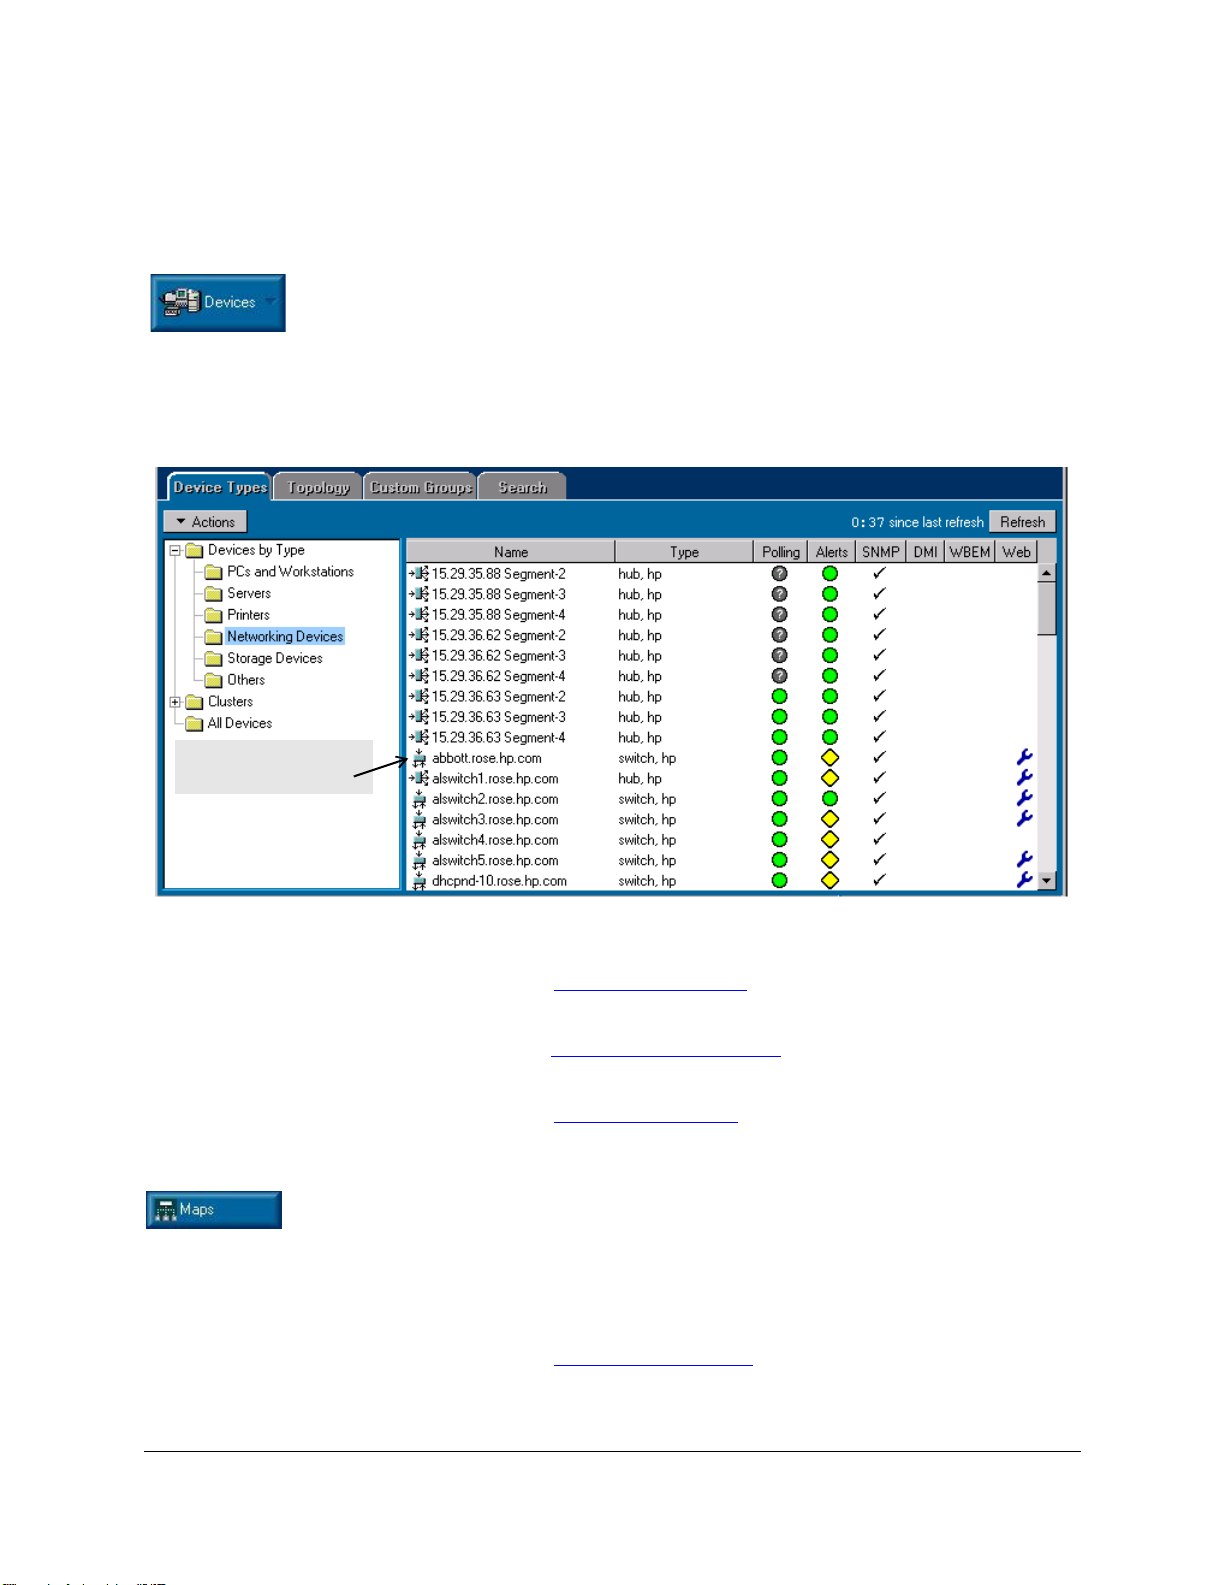
Devices
To view a list of your network devices, click on the Devices button in the
navigation frame and select Devices by Type from the menu. Click on the
Networking Devices folder to display each network device showing its type,
connectivity status, the number of new and open alerts, and its management
capability.
Right-mouse-click o n a hub or switch, and then right-mouse-clic k on Properties
to launch the Device View (formerly the Closeup View). You can perform many
configuration tasks in the Device View.
See the chapter Networking Devices
page.
for more information about the Devices
Maps
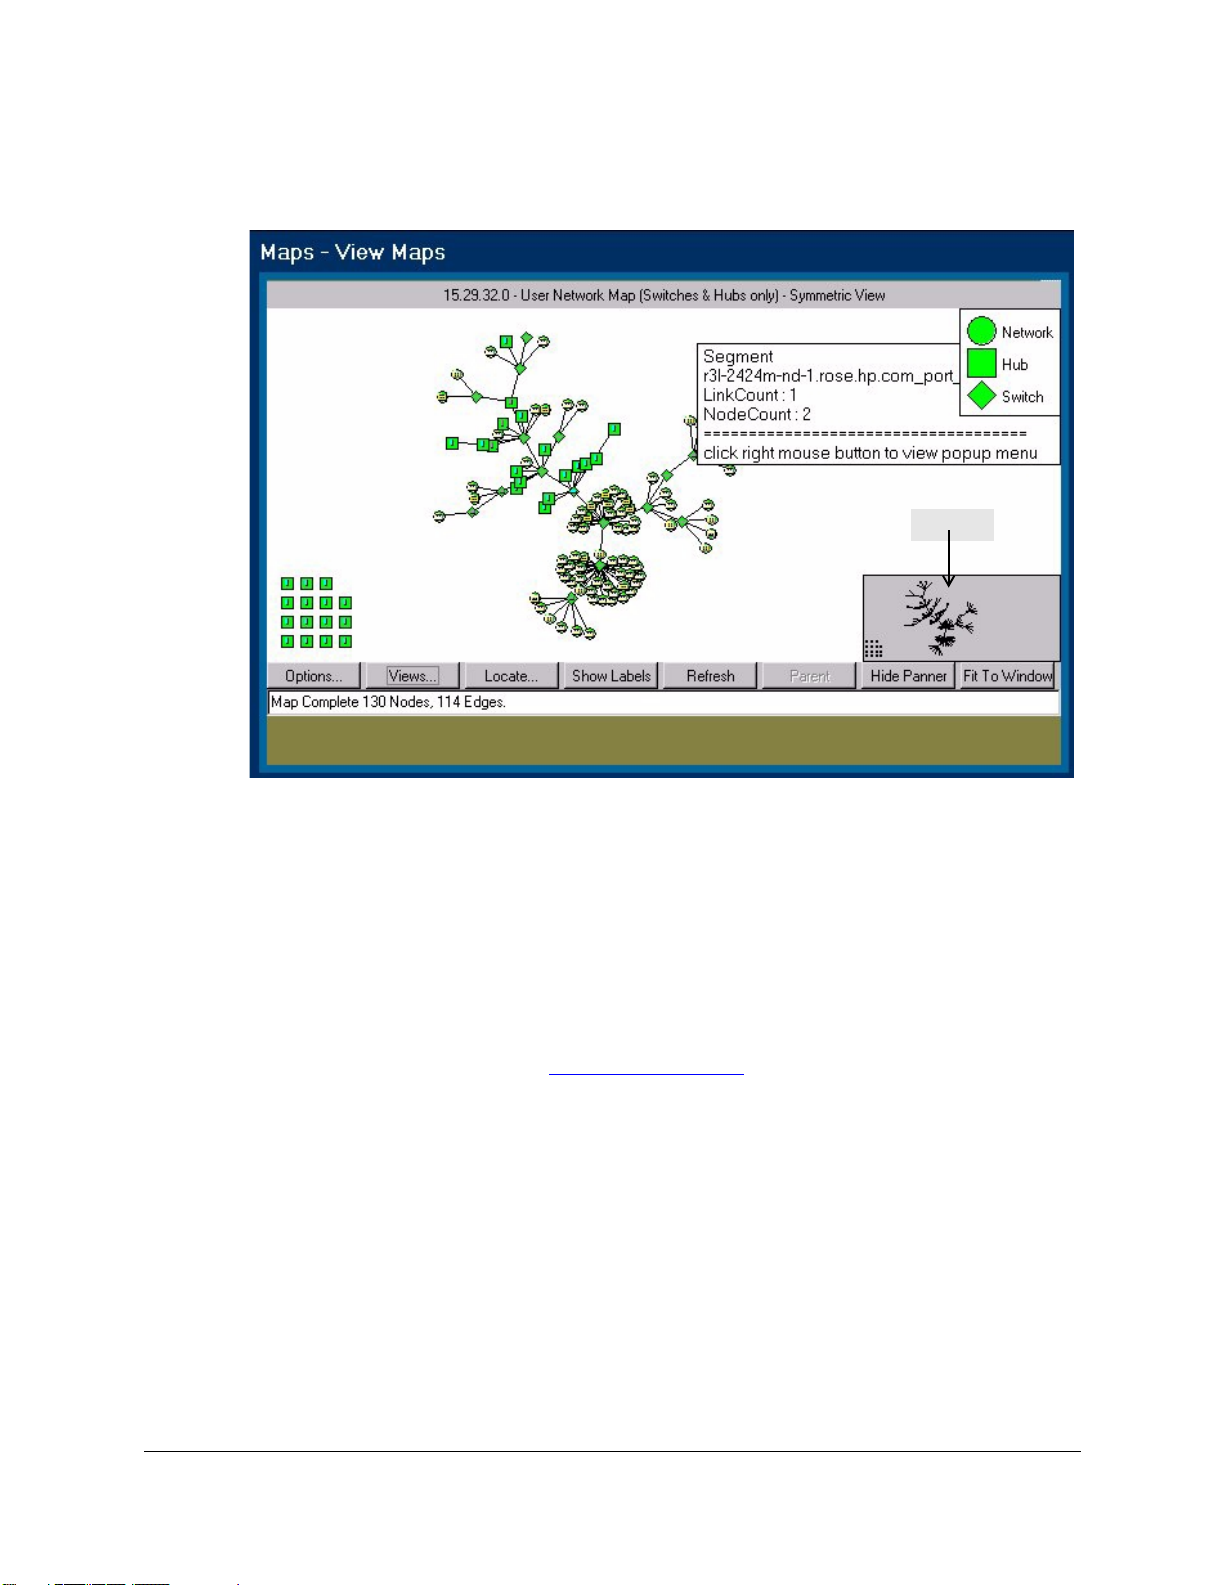
To display a graphical representation of your physical network topology, click
on the Maps button in the navigation frame, then double-click on a network
in the Maps page. The default display is your local network. You can add more
networks to be discovered in the Settings - Discovery
Settings button in the navigation frame and select Discovery.
Double click on a hub or switch icon in the map to display the Device View
where you are able to perform configuration functions.
page. Click on the
,
1-3
Page 16
Quick Start
Policies
Panner
Figure 1-2. An Example of a Subnet Map
Using the Panner
The panner lets you easily focus in on a portion of your map. If it is not already
displayed in the lower right corner of the map, select the Show Panner button
to display the panner. In the Panner window, drag a rectangle around the
portion of your network that you would like enlarged in the map view.
Click on the Fit to Window button to restore the map to its original size.
See the chapter Managing Your Maps
maps.
for more detailed information on using
Policies
Quality of Service
Quality of Service is a method for classifying and prioritizing traffic in a
network. You can establish a traffic priority policy to control and improve the
throughput of data. This allows the more important traffic to move through
the network at acceptable speeds regardless of the bandwidth usage.
1-4
Page 17
Quick Start
Examining Alerts
The Quality of Service feature available in HP TopTools for Hubs & Switches
allows you to set up consistent traffic prioritization policies across the
Procurve switches in your network. The Class of Service features can be
configured on an individual switch using the switch’s console or web browser
interface.
Click on the Policies button in the navigation frame and select Quality of Service
from the menu.
See the chapter Quality of Service
for more detailed information on these
features.
Configuration Policies
Use Configuration Policies to automatically configure several features. To use
Configuration Policies, the devices must be capable of management by a
browser. The automatic management features include:
■ Automatic checking of device firmware versions
■ Sending all alerts to the HP TopTools management station (enabled by
default)
■ Switch Configuration
• Automatic Broadcast Control
• IP Multicasting
• Spanning Tree Protocol
■ Security Configuration by Group
■ Alert Configuration by Group
See the Configuration Policies
chapter for more information.
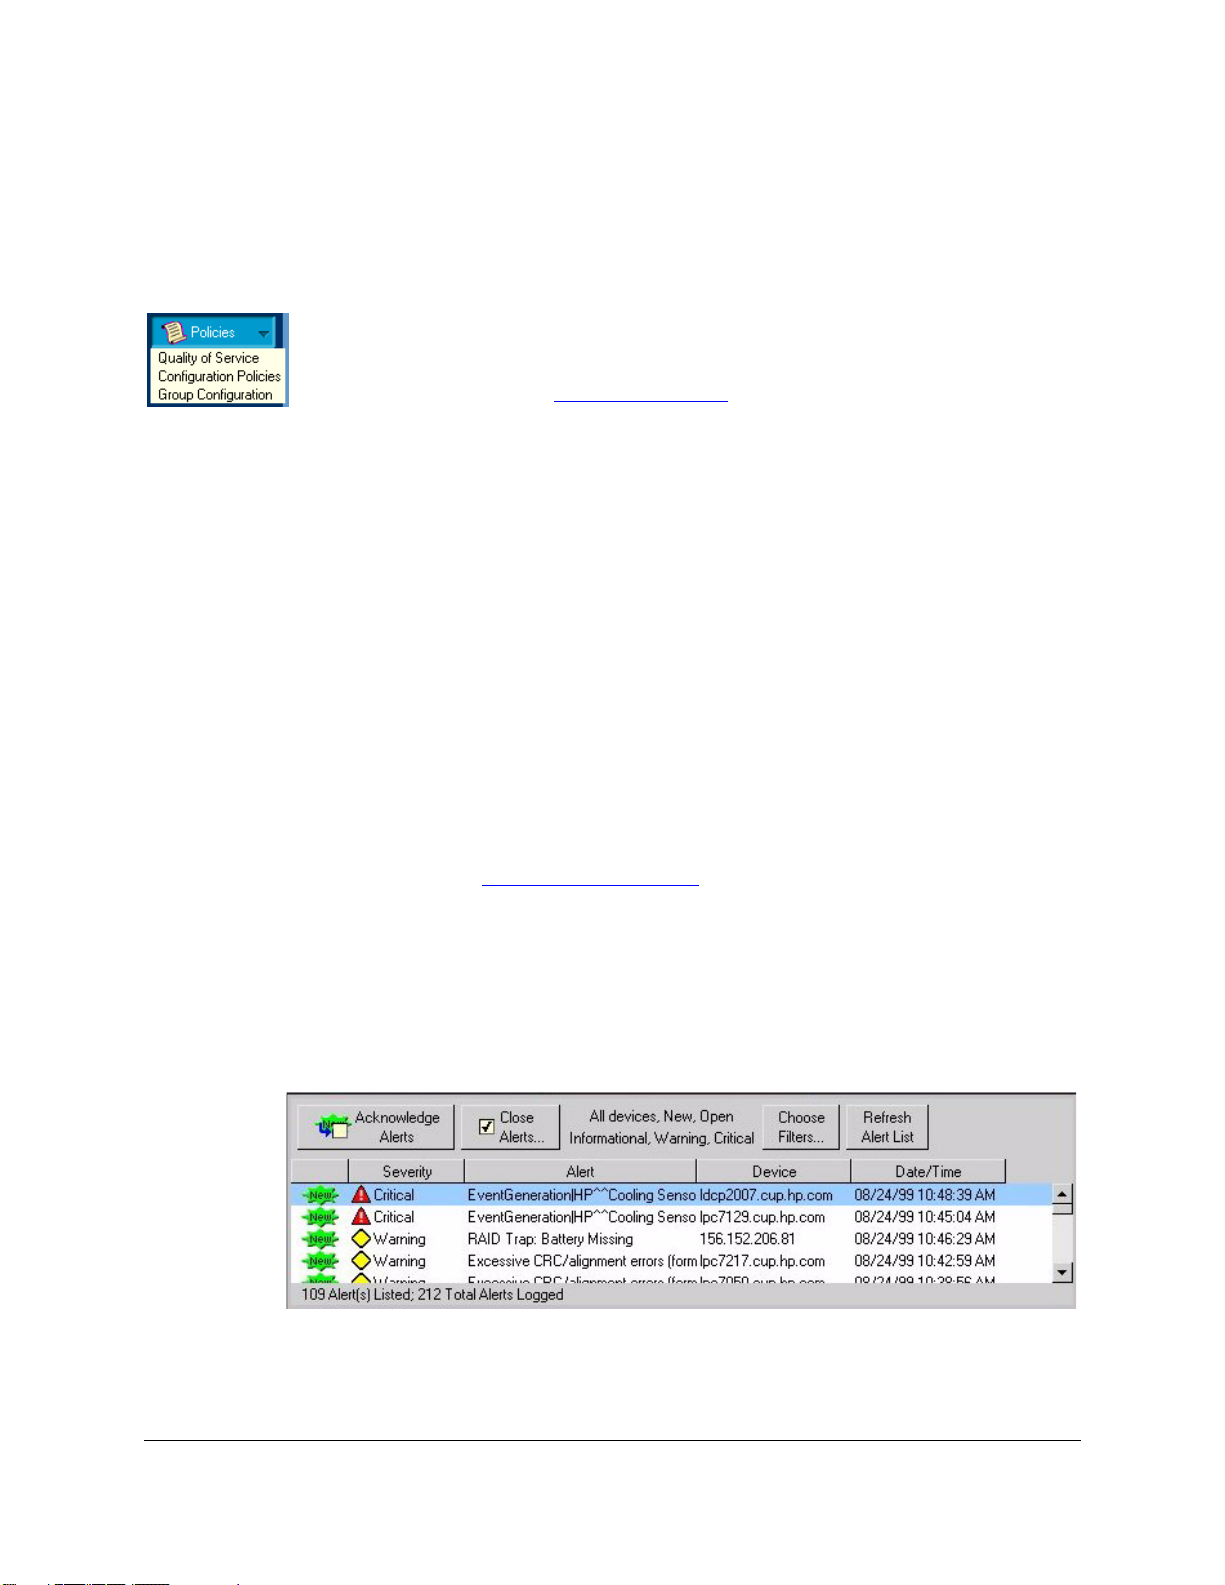
Examining Alerts
The bottom half of the HP TopTools for Hubs & Switches home page displays
the Alert Log.
Figure 1-3. Alert Log
1-5
Page 18
Quick Start
Configuring and Monitoring Devices
The Alert Log’s “Find/ Fix/Inform” capability helps you proactively manage
your network by displaying network traps and problem conditions in one
easily accessible browser page. Click on the Alerts button in the navigation
frame and select View Alerts to open the Alerts page. Click on an alert in the
list at the top of the Alerts page to view more detailed information about that
alert.
See the chapter Alerts
See Configure Action on Alerts
for more detailed information about the Alert page.
for information on configuring actions to
take when certain types of events occur.
Configuring and Monitoring Devices
The Device View displays a graphical representation of a device. The Device
View of an HP hub or switch can be accessed in the following ways:
■ Click on the Devices button in the navigation frame and select Device by
Ty pe . Select Networking Devices. Double-click on a device in the Devices
page.
■ Double-click on a device in the Topology list.
■ Double click on a device in the topology map.
■ Click on a device in the Device page, then select Properties (Device View)
from the Actions menu at the top left of the Devices page.
■ Right-mouse-click on a device in a map and select Properties (Device View)
from the menu.
1-6
Figure 1-4. List of Networking Devices
Page 19
Configuring and Monitoring Devices
Quick Start
Note Double-clicking on a device in the Devices page that is not a hub or switch
will display information about the device’s identity and status.
Note Double-clicking on an HP device that does not support a browser interface
will launch the Closeup View of the device in a separate window if you are at
the management station.
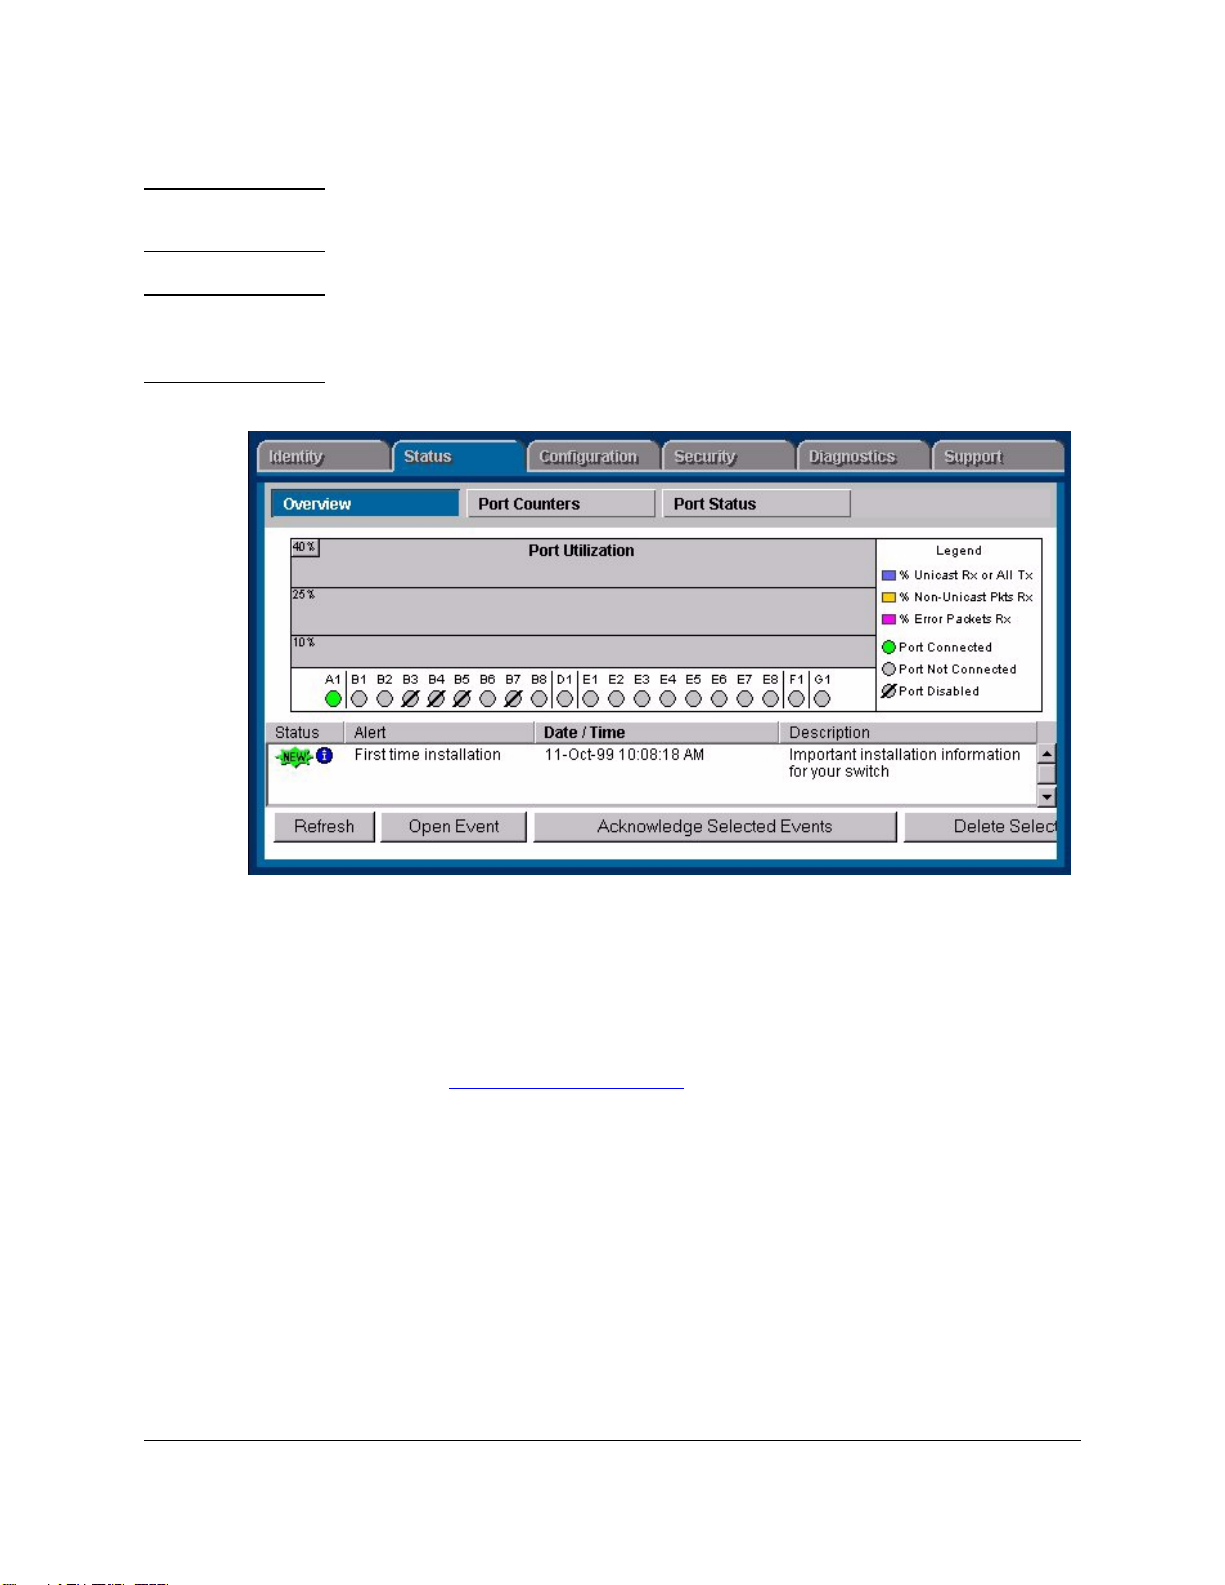
Figure 1-5. Device View - Status Page
The tabs in the Device View page provide access to various configuration
features for the device. You can enable and disable individual ports (click on
the port to select it), or click on the Select All Ports button to enable or disable
all the ports of a device in one step.
See Configuring Your Device
View. To obtain generic SNMP information about devices that cannot be
managed with a browser, select Properties
the Devices page.
Use the online help to obtain more information about configuring devices that
cannot be managed in a browser.
for more information about using the Device
from the Actions menu at the top of
1-7
Page 20
Quick Start
Viewing Network Traffic
Viewing Network Traffic
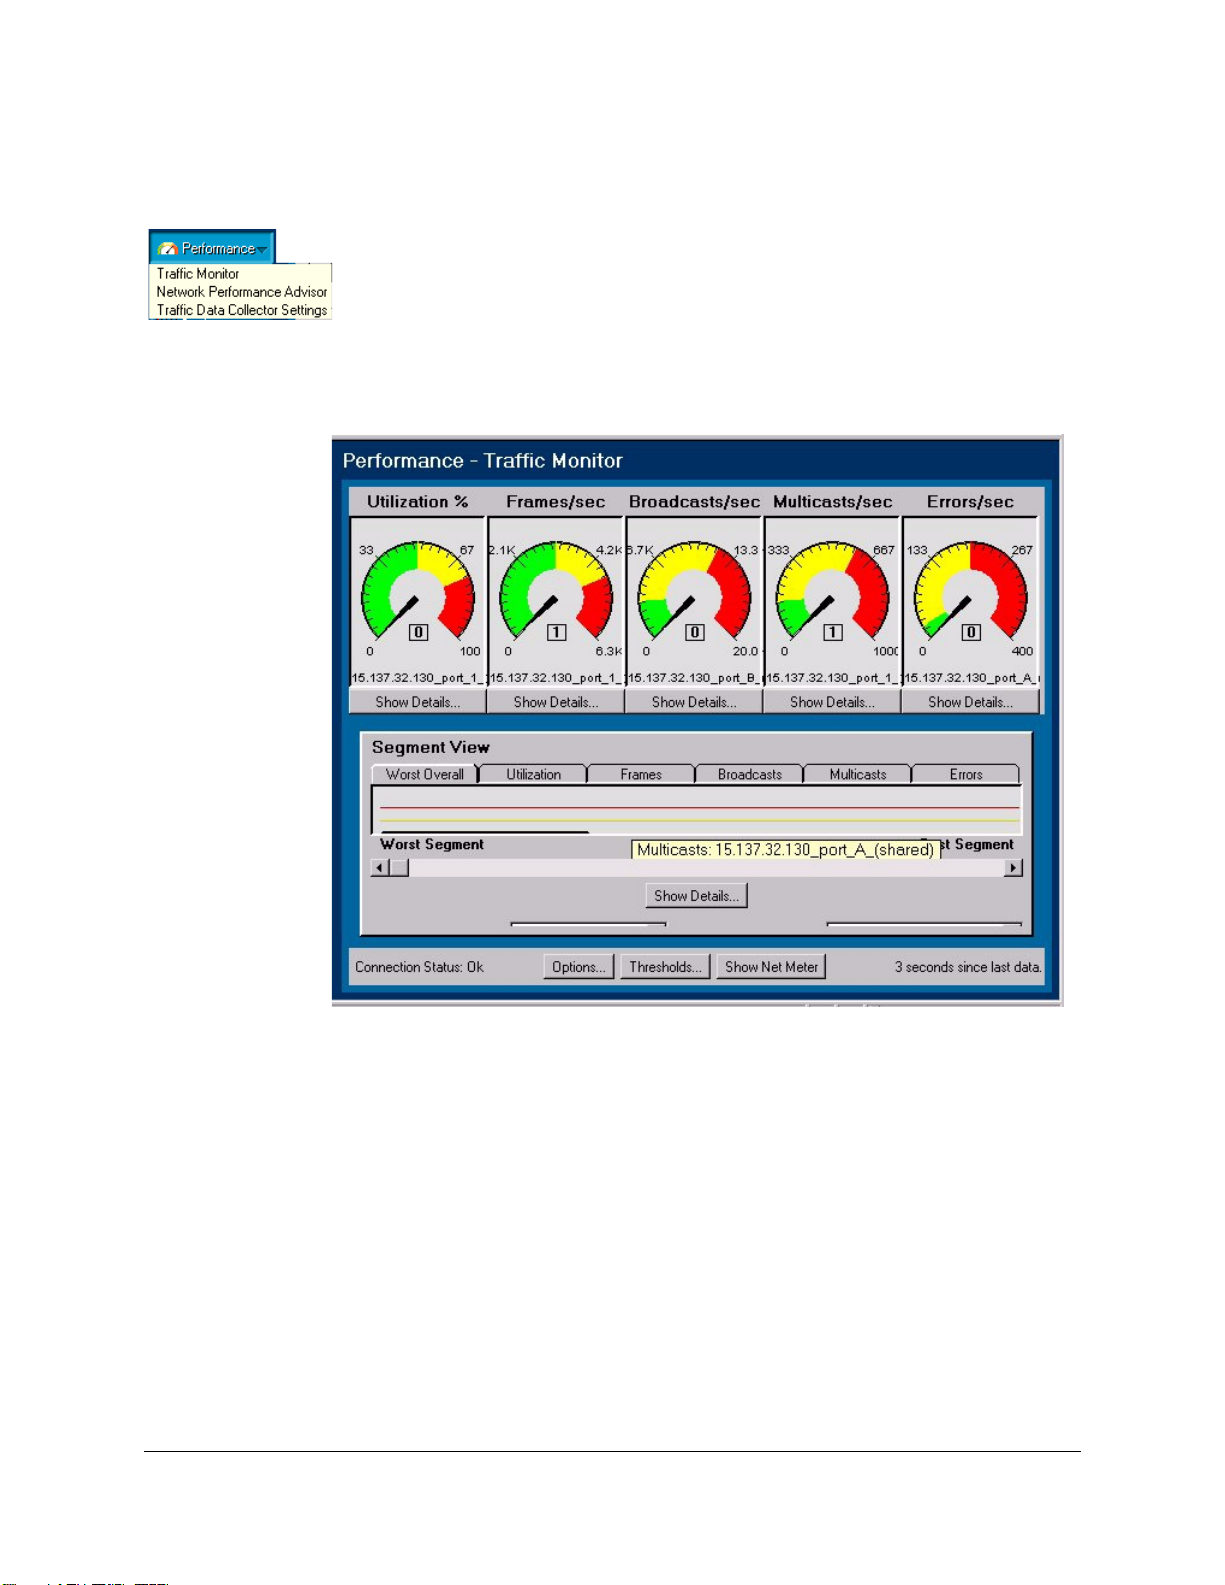
To look at the traffic bottlenecks in your network in real time, click on the
Performance button in the navigation frame and select Traffic Monitor from the
menu.
1-8
Figure 1-6. Traffic Monitor Page
The performance gauges at the top of the page display measurements of five
important attributes affecting the performance of your network for a selected
segment. The histogram below the gauges displays the value of an attribute,
such as broadcasts/sec, for the segments in a selected segment group.
Page 21
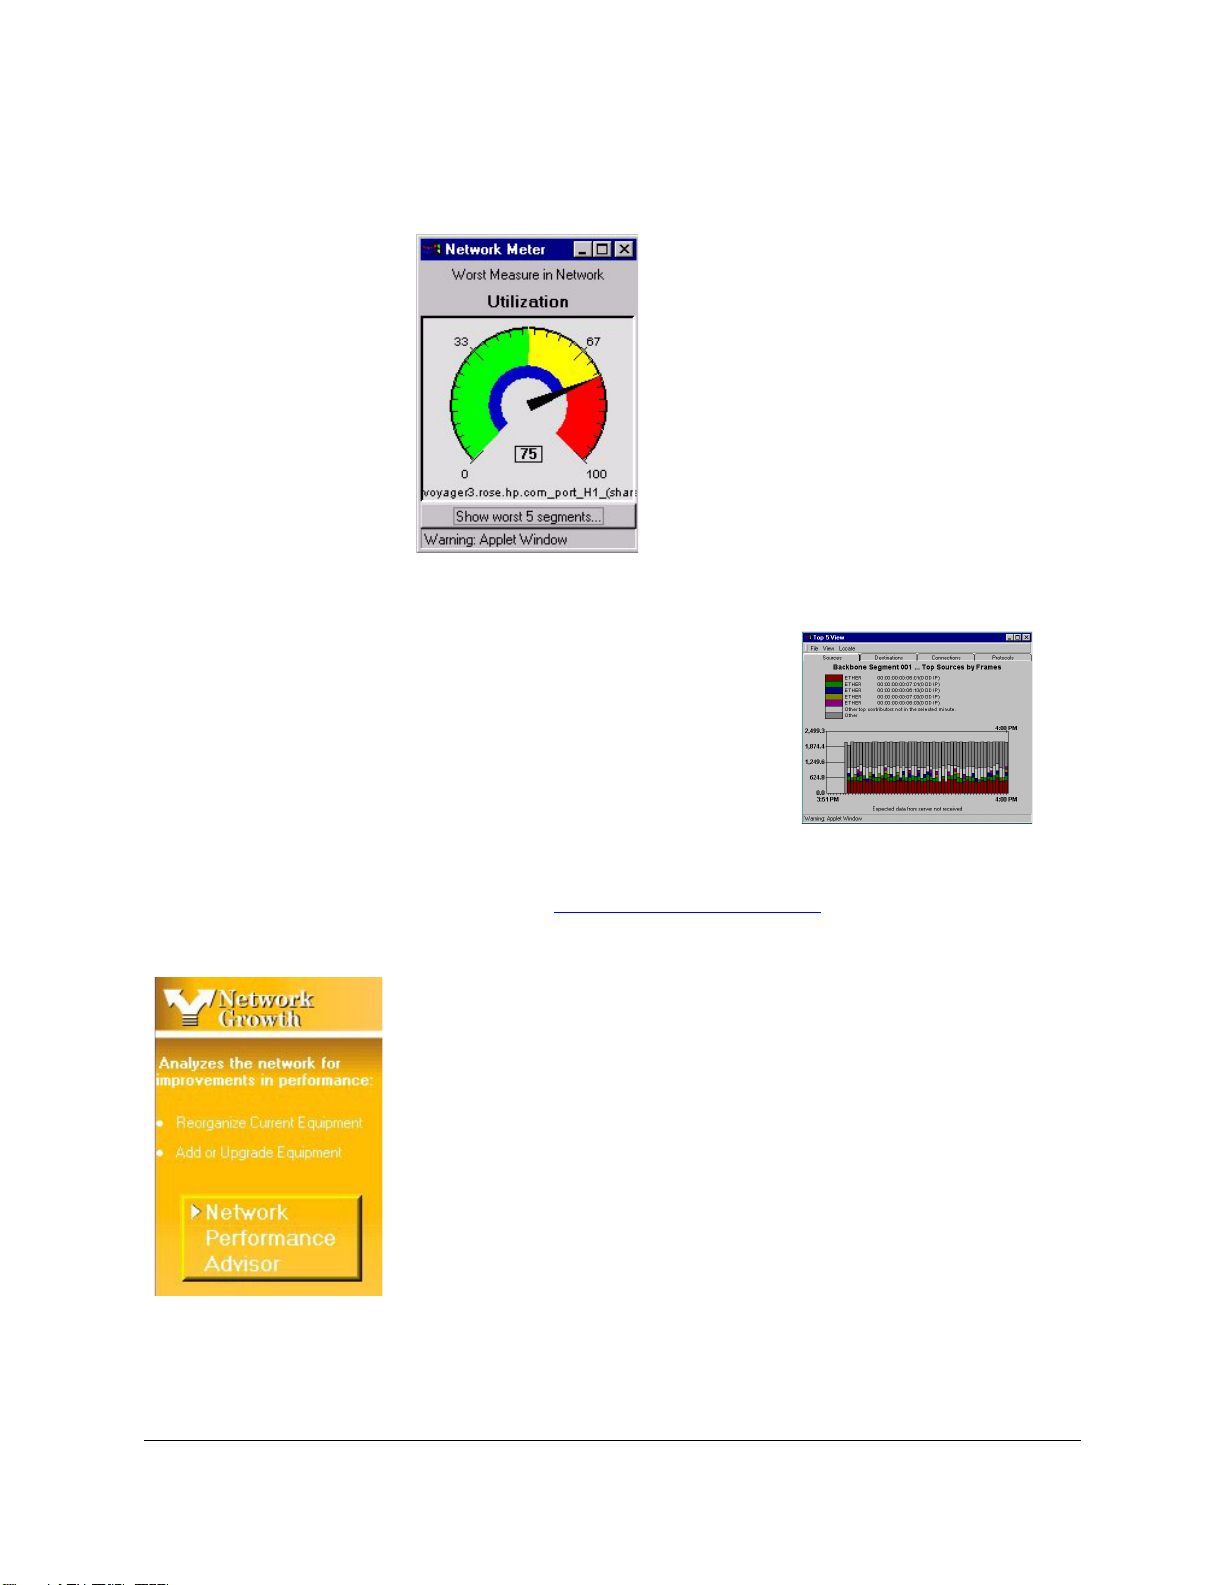
Network Meter
Use the Network Meter to display an “at-a-
glance” look at the most severe traffic problem
on the network being monitored. Click on the
Show Net Meter button at the bottom of the
Traffic Monitor page to start the Network Meter.
You can keep the Network Meter on your PC
desktop to give you a continuous view of the
status of your network traffic. Click on Show
Worst 5 Segments at the bottom of the Network
Meter to see the segments with the most traffic
problems.
Top Talkers
You can quickly determine who the top
talkers are in your network. Click on the
Show Details button below the gauges on
the Traffic Monitor page to display the
Top5 browser window. The graph identifies the top five nodes causing the most
network activity on the segments for the
selected minute. The graph presents realtime information and is updated every minute.
Optimizing Your Network
Quick Start
See the chapter Monitoring Network Traffic
the Traffic Monitor features.
for more information about
Optimizing Your Network
The HP Network Performance Advisor performs automatic traffic analysis
and displays the results in easy-to-understand tables and charts. The reports
make useful recommendations on how to improve network performance. The
Advisor provides proactive analysis of a network, in contrast to the real-time,
reactive analysis provided by Traffic Monitor.
To begin proactive analysis of your network, click on Network Performance
Advisor in the HP TopTools for Hubs & Switches home page.
1-9
Page 22
Quick Start
How to Get Support
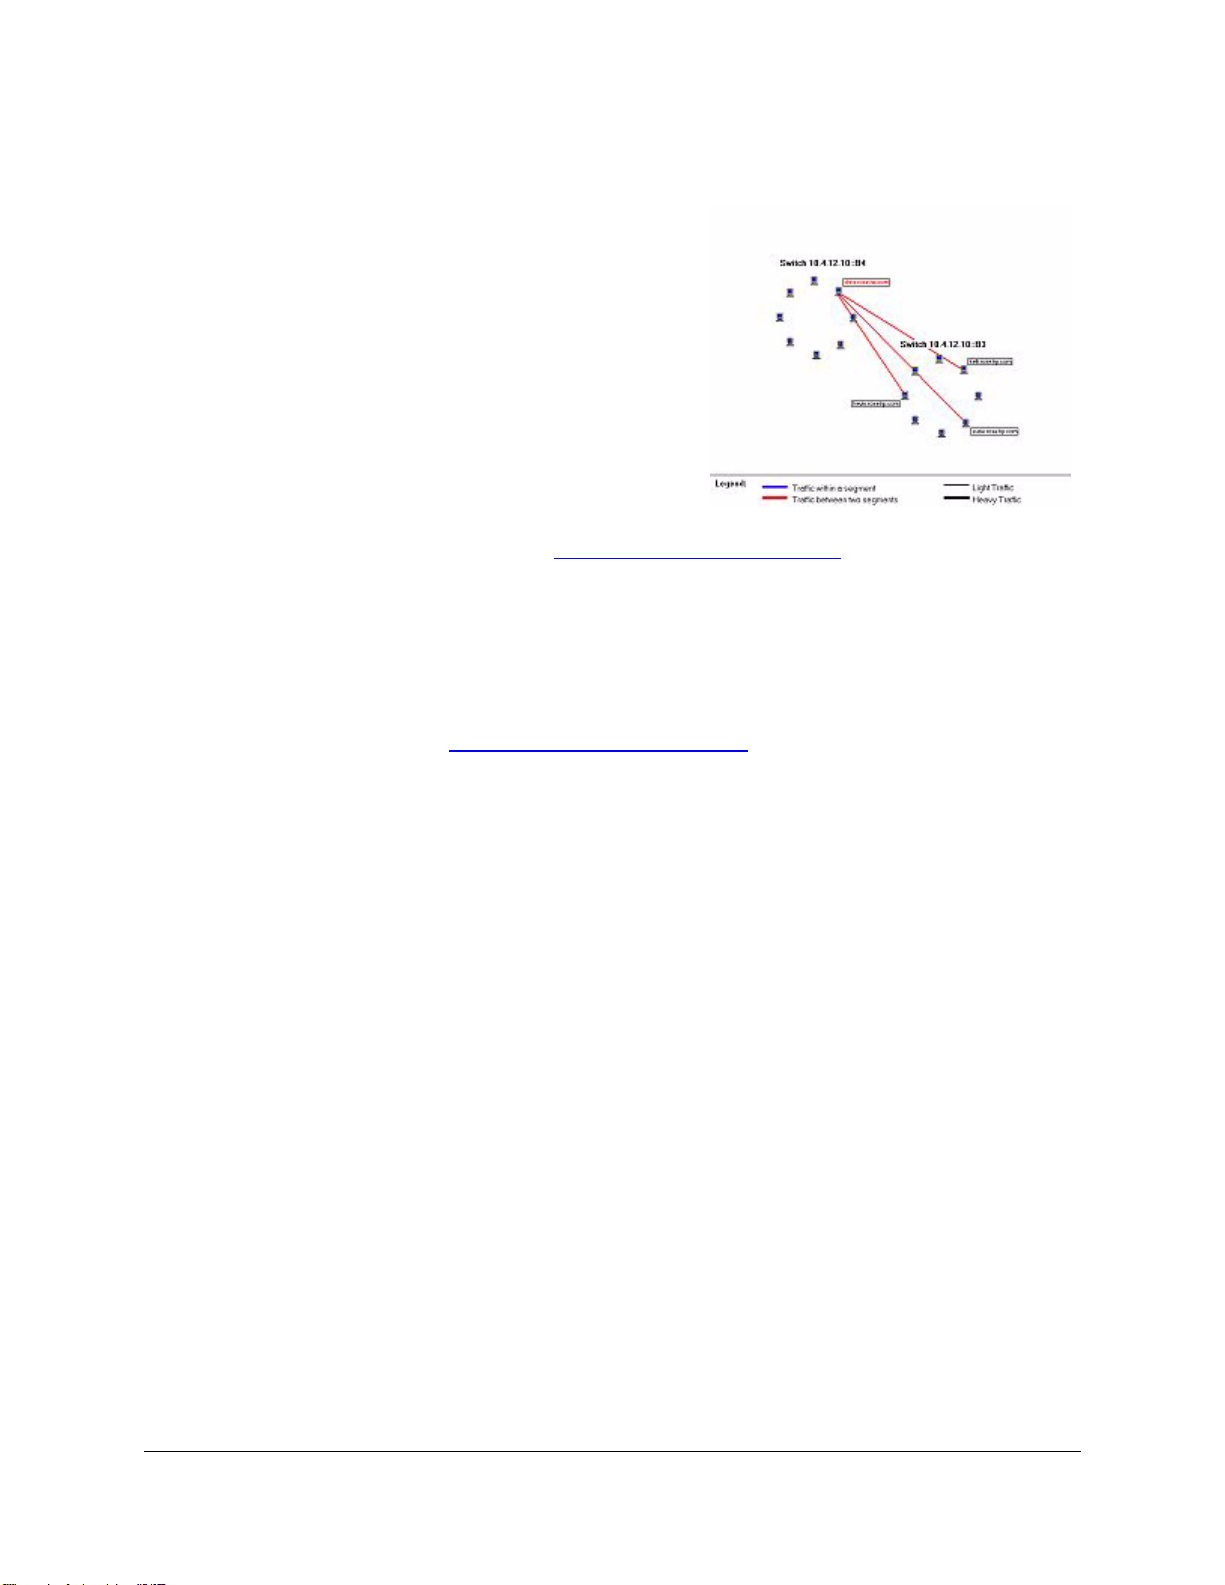
The Welcome page provides
you with a brief description of
the purpose of the three
reports. Select the How to
Improve Performance tab to
begin creating a report.
To view a completed report,
select the Explore Report tab.
Select the report and click on
the View Report button at the
bottom of the page.
See the chapter Planning for Network Growth
for more detailed informa-
tion on planning reports.
How to Get Support
Product support is also available on the World Wide Web. The URL is:
http://www.hp.com/go/procurve
Click on Technical Support. The information available at this site includes:
■ HP network device MIBs
■ HP network device firmware
■ Software updates
■ Frequently asked questions (FAQs)
In addition, you can call your HP Authorized Dealer or the nearest HP Sales
and Support Office.
1-10
Page 23

Introduction
2
Topics covered in this chapter include:
■ Introduction to HP TopTools
■ HP TopTools for Hubs & Switches
■ Network Device Features
■ HP Devices Supported
■ Learning to Use HP TopTools
■ HP TopTools Technical Product Support
Introduction to HP TopTools
By using standards-based management with a browser interface, HP TopTools
provides you with an easy way to manage all your network devices from one
application. HP TopTools diagnoses problems quickly and automatically, then
corrects the problem or gives clear directions on how to fix it.
HP TopTools runs alone or with popular management platforms such as HP
NNM-NT (HP OpenView), CA Unicenter TNG, IBM Tivoli, and IBM NetView,
providing an integrated solution that ranges from small workgroups through
large enterprises.
Page 24

Introduction
HP TopTools for Hubs & Switches
Figure 2-1. HP TopTools Home Page
HP TopTools for Hubs & Switches
HP TopTools for Hubs & Switches is a device management and network
optimization application. You can access the HP TopTools features with a
browser anywhere on the network. HP TopTools gives you the ability to
monitor your network traffic on one workstation while using another workstation to configure devices, examine alert messages or run optimization
reports.
2-2
Page 25
HP TopTools for Hubs & Switches
Introduction
Figure 2-2. HP TopTools for Hubs & Switches Home Page
Browser-based management of devices combines network management with
the simplicity of using a browser to view device performance and configuration information. You can easily access, configure and monitor your network
with devices that support the browser interface. HP TopTools Group Configuration and diagnostic features provide quick solutions to network problems.
Note Your devices must have an IP address in order to be managed by HP TopTools
with a browser. The management station must have an assigned IP address.
This User Guide will help you get started with HP TopTools for Hubs &
Switches. We assume that you have supervisory access to your network
system and devices. Your system should be fully operational. You should know
what an “IP” (Internet Protocol) or “IPX” (Internetwork Packet Exchange
protocol) network is. You should already have the appropriate network software running and know how to use your network utilities.
For more information on other HP TopTools functions, see the online HP
TopTools Administrator’s Guide or online help.
See HP Devices Supported.
2-3
Page 26
Introduction
Network Devices Features
Network Devices Features
Viewing a List of Devices
To view a list of your networking devices, click on Devices, Devices by Type and
select Networking Devices. The Networking Devices folder contains the hubs,
switches and routers discovered in your network. Double click on a device in
the list to launch the Device View for configuring the device.
Double click on a device to
launch the Device View.
Figure 2-3. The Networking Devices List
See the chapter Networking Devices
devices.
See the chapter Accessing Hub Features
hubs.
See the chapter Managing Switches
switches.
for more information on managing
for information about configuring
for information about configuring
Maps
The Maps page displays a graphical representation of the devices in your
network. You can launch the Device View for an HP device by double-clicking
on a device in the map or right-mouse-clicking on a device and selecting
Properties (Device View) from the popup menu.
2-4
See the chapter Managing Your Maps
for more information on maps.
Page 27

Introduction
Network Traffic
Group Policies
Use the Group Policies feature to establish settings for all of your devices at
one time. For example, you can set up Automatic Broadcast Control
your switches.
for
See the chapter G
roup Policies for more information on these features.
Network Traffic
The Tra ff i c Mo n it or presents real-time information about the status of your
network. You can set thresholds for five important measures, which when
exceeded trigger an event that appears in the Alert Log. Use the Top5 View to
determine who the Top Talkers are in a segment.
Network Growth
The HP Network Performance Advisor is an intuitive, intelligent interpretation tool that provides you with information about the entire network. The
Advisor performs automatic traffic analysis and displays the results in easyto-understand tables and charts. The reports created by the Advisor make
useful recommendations on how to improve network performance. The
Advisor also provides inventory information for each segment in the network.
The analysis and data provided by the Advisor assist the system administrator
in making a sound business case for changes to the network.
The Network Performance Advisor creates reports that make recommendations about reducing utilization on the network segments to increase network
performance. It provides proactive analysis of a network, in contrast to the
real-time, reactive analysis provided by Traffic Monitor.
HP Devices Supported
HP TopTools for Hubs & Switches provides Device Views (manageable by
browser) or Closeup Views to fully manage the following HP devices. The
devices that can be managed with a browser are indicated.
Table 2-1. HP Hubs and Bridges Supported
Product Number Description Browser-
manageable
28673A HP 10:10 LAN Bridge No
28674A HP Remote Ethernet Bridge No
2-5
Page 28

Introduction
HP Devices Supported
Product Number Description Browser-
manageable
28674B HP Remote Bridge RB No
28682A HP Fiber-Optic Hub Plus No
28688A/B HP EtherTwist Hub Plus No
28692A HP ThinLAN Hub Plus No
28699A HP EtherTwist Hub Plus/48 No
J2355S HP EtherTwist Hub Plus/24 S No
J2410A
J2413A
J2415A
J2600A
J2601A/B
J2602A/B
J2610A/B
J2611A/B
J2630A
J2631A/B
J2632A/B
J3200A
Note 1
Note 2
Note2
Note 3
Note 3
Note 3
Note 4
Note 4
Note 3
Note 3
Note 3
Note 5
HP AdvanceStack 100VG Hub-15 No
HP AdvanceStack 100VG Hub-7M No
HP AdvanceStack 100VG Hub-14 No
HP AdvanceStack 10Base-T Hub-12 No
HP AdvanceStack 10Base-T Hub-24 No
HP AdvanceStack 10Base-T Hub-48 No
HP AdvanceStack 10Base-T Hub-8U No
HP AdvanceStack 10Base-T Hub-16U No
HP AdvanceStack 10Base-T Hub-12 w/
No
SNMP
HP AdvanceStack 10Base-T Hub-24 w/
No
SNMP
HP AdvanceStack 10Base-T Hub-48 w/
No
SNMP
HP AdvanceStack 10BT S Hub-12R Yes (firmware
A.03.xx)
2-6
J3201A
J3202A
J3203A
Note 5
Note 5
Note 5
HP AdvanceStack 10BT S Hub-12R w/
Mgmt
Yes (firmware
A.03.xx)
HP AdvanceStack 10Base-T S Hub-24R Yes (firmware
A.03.xx)
HP AdvanceStack 10BT S Hub-24R w/
Mgmt
Yes (firmware
A.03.xx)
Page 29

HP Devices Supported
Introduction
Product Number Description Browser-
manageable
Note 5
J3204A
HP AdvanceStack 10Base-T S Hub-24T Yes (firmware
A.03.xx)
Note 5
J3205A
Note 6
J3288A
Note 6
J3289A
Note 6
J3301A
Note6
J3303A
Note 1
Requires J2414A or J2414B HP AdvanceStack 100VG SNMP/Bridge Module.
Note 2
Requires J2414B HP AdvanceStack 100VG SNMP/Bridge Module.
Note 3
Requires J2603A/B HP AdvanceStack 10Base-T SNMP Module. HP
HP AdvanceStack 10Base-T S Hub-24T
w/Mgmt
Yes (firmware
A.03.xx)
HP Procurve 10/100 Hub 12M Yes
HP Procurve 10/100 Hub 24M Yes
HP Procurve 10Base-T Hub 12M Yes
HP Procurve 10Base-T Hub 24M Yes
AdvanceStack 10Base-T hubs provided with SNMP module preinstalled include: HP
J2630A (12-port), HP J2631A/B (24-port), HP J2632A/B (48-port).
Note 4
Requires J2612A/B HP AdvanceStack 10Base-T DMM Module for J2610A and
J2611A.
Requires J3133A HP AdvanceStack 8U/16U SNMP Module for J2610B and J2611B.
Note 5
Requires J3210A HP AdvanceStack 10BT Management Pack. HP AdvanceStack
10Base-T Switching hubs provided with Management. Pack preinstalled include: HP
J3201A (12R), HP J3203A (24R), HP J3204A (24T).
Note 6
No IPX Network Management Support.
Table 2-2. HP Switches Supported
Product Number Description Browser-
manageable
Note 1
J2980A
J3100A/B HP AdvanceStack Switch 2000 Yes (J3100B w/
Note 2
J3125A
Note 2
J3126A
Note 3
J3175A
HP AdvanceStack 10/100 LAN Switch No
firmware
B.04.xx)
HP AdvanceStack Switch 200 No
HP AdvanceStack Switch 100 No
HP AdvanceStack Switch 208T No
2-7
Page 30

Introduction
Learning to Use HP TopTools
Product Number Description Browser-
manageable
Note 3
J3177A
HP AdvanceStack Switch 224T No
J3245A HP AdvanceStack Switch 800T Yes (Firmware
B.04.xx)
J3298A
J3299A
J4093A
Note 2
Note 2
Note 2
HP Procurve Switch 212M Yes
HP Procurve Switch 224M Yes
HP Procurve Switch 2424M Yes
J4120A HP Procurve Switch 1600M Yes
J4110a
J4121A
J4122A
J4138A
J4139A
Note 2
Note 2
Note 2
Note 2
Note 2
HP Procurve Switch 8000M Yes
HP Procurve Switch 4000M Yes
HP Procurve Switch 2400M Yes
HP Procurve Routing Switch 9308M Yes
HP Procurve Routing Switch 9304M Yes
J4840A HP Procurve Routing Switch 6308M-SX Yes
J4841A HP Procurve Routing Switch 6208M-SX Yes
J4812A HP Procurve Switch 2512M Yes
J4813A HP Procurve Switch 2524M Yes
2-8
J4865A HP Procurve Switch 4108gl Yes
Note 1
HP J2980A 10/100 LAN Switch is not supported on IPX networks. To discover this
device on an IP network, the SNMP community name “public” must be configured on the
device.
The J2981A HP 100VG Switch Module and J2984A HP 100TX Switch Module are available
for the HP J2980A.
Note 2
No IPX Network Management Support.
Note 3
Requires J3178A HP AdvanceStack Switch 208/224 Management Module.
Learning to Use HP TopTools
The following information is available for learning HP TopTools for Hubs &
Switches:
Page 31

HP TopTools Technical Product Support
■ This User Guide—helps you become familiar with the application.
■ Online help information—provides information through Help buttons in
Introduction
dialog boxes, and through a table of contents with hypertext links to
procedures and reference information.
HP TopTools Technical Product Support
Product support is also available on the World Wide Web. The URL is:
http://www.hp.com/go/hpprocurve
Click on Technical Support. The information available at this site includes:
■ HP network device MIBs
■ HP network device firmware
■ Software updates
■ Frequently asked questions (FAQs)
Figure 2-4. HP Procurve Switches & Hubs Technical Support Page
In addition, you can call your HP Authorized Dealer or the nearest HP Sales
and Support Office.
2-9
Page 32

Introduction
HP TopTools Technical Product Support
2-10
Page 33

System Requirements
Hardware and Software Requirements
HP TopTools for Hubs & Switches runs on Windows NT and Windows 2000.
The system requirements are listed in the following table.
Table 3-1. System Requirements
Item Requirements
Computer System IBM PC-compatible computer, 266 MHz processor; 400
Minimum RAM 128 Mbytes; 192 Mbytes or higher recommended
Free Disk Space 175 Mbytes
Paging File Size 150 MB
3
MHz or higher recommended
Note: At least 400 MB is needed to install all the required
Microsoft components on a computer that has only the
Windows NT operating system installed.
Disk Drive CD-ROM drive
Hardware Video Monitor and Interface
Card
LAN Adapter Any LAN adapter supported by the system
Other A mouse or other pointing device that is supported by the
Note: Dual-homed or multi-homed PCs are not supported.
DHCP clients are supported. The IP address of the management station cannot be static or dynamic DHCP.
Software Supported Management
Platforms
Browsers Microsoft Internet Explorer (MSIE) 5.0 with Task
Operating System Microsoft® Windows NT version 4.0 with Service Pack 6a
Web Server Windows NT 4.0 Options Pack from Microsoft
SVGA (32,768 colors minimum)
system
TopTools
HP OpenView Network Node Manager
Scheduler, supplied on the TopTools CD-ROM
(workstation or server) or Windows 2000
Page 34

System Requirements
Hardware and Software Requirements
Note Be sure to obtain an assigned IP address for the management station before
installing TopTools. Do not use either a static or dynamic IP address.
3-2
Page 35

Discovering Your Devices
This chapter contains information about:
■ Beginning Discovery
■ The Status Page
■ The Networks Page
■ Adding a Device to a Network
■ The Settings Page
■ Troubleshooting Discovery
■ Device Inventory
Beginning Discovery
Discovery is the process of identifying the devices in your network and
determining how these devices are connected. The discovered devices are
displayed in the Devices page and added to a devices database maintained by
HP TopTools to represent your network. HP TopTools for Hubs & Switches
can discover network devices that have valid IP or IPX addresses. Such
devices include:
■ HP's manageable hubs, bridges and switches that have valid IP or IPX
addresses.
■ Third-party (“multivendor”) devices that have valid IP or IPX addresses
and support SNMP (for example, hubs and bridges from other vendors).
These nodes may not be mapped or managed with HP TopTools.
■ Devices that have IP or IPX addresses, even if they do not support SNMP.
(For example, IPX workstations and fileservers).
■ Other devices, including HP JetDirect printers and plotters (IP or IPX).
4
Note Discovery is a resource-intensive process and may take some time.
To begin discovering the devices in your network, click on the Settings button
in the navigation frame and select Discovery from the menu. The Settings Discovery page displays.
Page 36

Discovering Your Devices
Beginning Discovery
Figure 4-1. Status Page of Settings for Discovery
Discovery Status
The Status page shows the following information about network discovery:
• The date and time the last discovery finished
• The number of network objects that have not been processed yet
• If discovery is scheduled, how often it is set to run, and when
You can manually start discovery by clicking on the Start Discovery button at
the top of the page.
Save your settings by clicking on the Save Settings button.
Selecting Networks
Click on the Networks tab to select the networks whose component devices
you want to add to the device database. You can specify a range of subnets,
for example, 10.4.8.0 - 10.4.15.0. You can also specify a particular network and
subnet mask. The subnet mask is used to determine the range of addresses in
your network.
To select a network, double click on it in the list of Known Networks. The box
to the right will be checked and the network added to the list of networks to
search.
4-2
To remove a network, double click on the network in the Known Networks list.
Page 37

Discovering Your Devices
Beginning Discovery
Figure 4-2. Networks Page of Settings for Discovery
To add a new network to be discovered that does not appear in the Known
Networks list, enter the IP or IPX address of the network and its subnet mask
in the Add One New Network area on the left side of the page. The IP subnet
mask should be the same as the mask you specified when you configured your
TCP/IP protocol stack. HP TopTools uses the subnet mask to calculate the
address range for your network. Click on >> to include it in the Networks list.
Click on the Find More Networks button to discover other networks for which
you do not have the address. The Discovery process needs to know the READ
password for the routers connecting your network to other networks. If the
router is not marked with an asterisk indicating that the password is known
to HP TopTools, double-click on the network and enter its password.
When the list of networks is complete, select the Status tab and click on Start
Discovery.
Adding Devices for Discovery
To add a specific device to a network for discovery, click on the Additional
Devices tab in the Settings - Discovery page. Enter the IP or IPX address and
the Community name of the device. The Community name will default to
“public”. Click on Add Device.
4-3
Page 38

Discovering Your Devices
Beginning Discovery
Configuring Discovery Settings
You can configure the types of protocols and methods of discovery that you
want to use. For example, you may want to discover only IP networks. The
types are:
■ IP—Discovers all IP devices in your network.
• Ping Discovery—Ping packets are sent to discover every device on
the subnet.
• Web Server Discovery—All IP addresses are checked to discover if
the device contains a Web Server. Management Stations are also
discovered.
• WMI (WBEM) Discovery—Checks for PCs that support WMI.
■ IPX—Locates all IPX devices in your network.
■ Segment and Hub Topology—Discovers how the segments are connected
in the network.
4-4
Figure 4-3. Settings Page of Settings - Discovery
Select the Settings tab in the Settings - Discovery page and check the appropriate boxes. Click on Save Settings to save your discovery settings.
Page 39

Discovering Your Devices
Troubleshooting Discovery
Figure 4-4. Additional Community Names
Troubleshooting Discovery
If you do not see certain devices in the Networking Devices list after discovery,
click on the Others folder (Devices - Device Types) to see if the devices are listed
there. If so, perform these steps to have them discovered:
1. Right mouse click on the device or devices with type “unknown” in the
list of devices contained in the Others folder.
2. Select Security -> Set SNMP Passwords (Communities) from the menu.
3. Enter a READ password (twice) for the device.
4. Enter a WRITE password (twice) for the device.
5. In the navigation frame, click on the Actions button and select Update
Discovery.
You must do the Update Discovery so that HP TopTools for Hubs & Switches
will re-read the configuration of the device for which you added the passwords. The device should now appear in the Networking Devices list and the
topology map.
4-5
Page 40

Discovering Your Devices
Inventory of Devices
Inventory of Devices
HP TopTools creates several inventory reports listing basic information about
your devices. Inventory listings for the devices on your local network are the
default. To view the Inventory list, select the Inventory button in the navigation
frame. To add more devices, select the Additional Devices tab in the Settings Discovery page. You can print or email these reports.
See the HP TopTools online help for more detailed information.
4-6
Page 41

Alerts
5
This chapter contains information on:
■ Interpreting the Alert Log
■ Filtering Alerts
■ Configuring Actions on Alerts
Interpreting the Alert Log - Automatic Fault Finding
The Alert Log is displayed in the lower area of the HP TopTools for Hubs &
Switches home page, the Alerts page, and the lower area of the device’s Status
- Overview page. Its “Find/Fix/ Inform” capability helps you proactively
manage your network by displaying network traps and problem conditions in
one easily accessible browser page. It displays messages about events that
have occurred on the device, such as loss of link, a problem cable, or a
broadcast storm. When a new alert occurs, an icon indicating its severity
appears on the Alerts button. The alert is also added to the device description
in the Devices page. You can access the Alert Log by selecting View Alerts from
the Alerts button menu the navigation frame or by clicking on the alert.
To ensure that you are seeing the latest alerts, click on the Refresh Alert List
button.
Closing an alert indicates that it is no longer a problem. Closed alerts are
stored in the alerts database for a time period specified in the Configure
Actions on Alerts page.
Page 42

Alerts
Interpreting the Alert Log - Automatic Fault Finding
Figure 5-1. Alerts Page
The Alerts page displays more information about the alert as well as some
suggestions for fixing the problem. When you have reviewed an alert, the
“New” icon is no longer displayed.
The following table shows the common faults and how they are indicated.
5-2
Page 43

Table 5-1. Common Faults
Fault Description, Cause and Actions
Interpreting the Alert Log - Automatic Fault Finding
Alerts
Too many
undersized/giant
packets
Excessive
jabbering
Excessive CRC/
alignment errors
Description: A device on this port is transmitting packets shorter than 64 bytes or longer than 1518 bytes
(longer than 1522 bytes if tagged), with valid CRCs.
Possible Causes: a misconfigured NIC or a malfunctioning NIC, NIC driver, or transceiver
Actions:
1. Check the NIC for a misconfiguration.
2. Update the NIC driver software.
3. Replace the malfunctioning NIC or transceiver.
4. Check for a short-circuit in the cable patch connected to this port.
Description: A device on this port is continually transmitting packets (jabbering). This is detected as
oversize packets with CRC errors.
Possible causes: A misconfigured NIC, or a malfunctioning NIC or transceiver. It could also be caused by
a short-circuit in the network cable path.
Actions:
1. Check NIC for a misconfiguration.
2. Update the NIC driver software.
3. Replace the NIC or transceiver.
4. Check for a short-circuit in the cable path connected to this port.
Description: A high percentage of data errors was detected on this port.
Possible Causes:
• Faulty cabling or topology
• Half/full duplex mismatch
• Misconfigured NIC
• Malfunctioning NIC, NIC driver or transceiver
Actions:
1. If the port is 100Base-T, make sure the cable, connectors, punch-down blocks, and patch panels
connecting to the port are Category 5 or better. Verify the installation with a Category 5 test device.
2. Check the directly-connected device for mismatches in half/full duplex operation (half duplex on the
switch and full duplex on the connected device, or the reverse).
3. Update the NIC driver software.
4. Verify that the network topology conforms to IEEE 802.3 standards.
5. Replace or relocate the cable.
6. Check the wiring closet components, transceivers, and NICs for proper operation.
5-3
Page 44

Alerts
Interpreting the Alert Log - Automatic Fault Finding
Table 5-1. Common Faults
Fault Description, Cause and Actions
Excessive late
collisions
High collision or
drop rate
Description: Late collisions (collisions detected after transmitting approximately 64 bytes) were detected
on this port.
Possible Causes:
• An overextended LAN topology
• Half/full duplex mismatch
• Misconfigured or faulty device connected to the port
Actions:
1. Verify that the network topol ogy conforms to IEEE 802.3 standards. Insert bridg es or switches, if needed,
to extend the network topology.
2. Check the directly-connected device for mismatches if half/full duplex operation (half duplex on the
switch and full duplex on the connected device).
3. If this port is 100Base-T, make sure the cable connecting to the port is Category 5 or better.
4. Check for faulty cabling, transceivers, and NICs.
Description: A large number of collisions or packet drops have occurred on the port.
Possible Causes:
• an extremely high level of traffic on this port
• Half/full duplex mismatch
• A misconfigured or malfunctioning NIC or transceiver on a device connected to the port
• A topology loop in the network
Actions:
1. Use a network monitoring device or application to determine the traffic levels on the affected segment.
If needed, consider subdividing that segment with switches or bridges, or moving high-traffic devices
to their own switch ports.
2. Check the directly-connected device for mismatches in half/full duplex operation (half duplex on the
switch and full duplex on the connected device).
3. Check for a misconfigured NIC or t ransceiver (for example, a transceiver config ured for “loopback test”
or “SQE test”).
4. Verify that there are no topology loops in your network. If not enabled, you may also enable spanning
tree. See the Switch Configuration menu.
Excessive
broadcasts
5-4
Description: An excessively high rate of broadcast packets were received on the port. This degrades the
performance of all devices connected to this switch.
Possible Causes: This is usually cause d by a network topology loop, but can also be due to a malfuncti oning
device, NIC, NIC driver, or software application.
Actions:
1. Verify that there are no topology loops in your network.
2. Find and correct any malfunctioning devices or NICs on the segment.
3. Find and correct any malfunctioning applications on devices on the segment.
Page 45

Interpreting the Alert Log - Automatic Fault Finding
Alerts
The Find/Fix/Inform function runs continuously in the background at a sensitivity threshold level that you select. Sensitivity threshold settings control the
severity of the alerts that are displayed. The settings internally adjust the
counter thresholds automatically.
Sensitivity settings are selected in the Configuration page for the device. Select
the Fault Detection button. For hubs, you can set the sensitivity for logging
network problems and disabling ports. Switches only have a sensitivity setting
for logging network problems. Switches are more capable than hubs of
isolating problems occurring on a single port.
The sensitivity settings are:
■ High Sensitivity: The device will act when a network problem of any
severity occurs. Network problems are automatically detected and
entered into the Alert Log (located under the Status Tab).
■ Medium Sensitivity: The device will act when serious network problems
occur.
■ Low Sensitivity: the device will act only when severe network problems
occur. These are problems that may bring the network down.
■ Never: The device will never take any actions regardless of the severity
of the problem.
Only serious and persistent problems that impact other users on the network
will cause a hub to disable a port. These problems include:
■ A problem XCVR or NIC
■ A broadcast storm
■ Excessive Auto Partitions
■ A network loop
A warning is entered in the Alert Log shortly before the port is disabled.
Another entry is made indicating that the port has been disabled.
Launching the Device View
Click on the hyperlink “Device Properties” to display a page with Identity and
Status information about the device.
Acknowledging Alerts
Click on the Ackn owledge Alerts button to indicate that you have seen the alert.
Acknowledging an alert changes its state from new to open.
Closing Alerts
To close an alert and remove it from the Alert Log, select the alert and click
on the Close Alerts button. You can set a filter to display closed alerts in the
Alerts page.
5-5
Page 46

Alerts
Filtering Alerts
Sorting Alerts
There are four column title buttons that can be used to sort the alerts:
■ According to severity
■ A description of the alert,
■ The name of the device
■ The date and time of the alert
First Time Installation Information
There will be an entry in the Alert Log for first time installation information
for the device.
Filtering Alerts
Selecting Alert Log Filters
You can choose to display only certain types of alerts in the Alerts page by
setting alert filters. Click on the Choose Filters button in the Alert Log area to
display the Select Alert Log Filters page.
Select the alert
state
View alerts for
only these
devices.
Figure 5-2. Select Alert Log Filters Page
5-6
Page 47

Filtering Alerts
Alerts
Filtering by Alert State
To view only certain alert states in the Alerts page, for instance, only new and
open alerts, check the appropriate boxes in the Filter by Alert State area of
the browser window.
Filtering by Alert Severity
Select an alert severity, for instance, critical, to view only the critical alerts in
the Alerts page.
Filtering by Device
Select one or more devices from the list and click on the >> button to add them
to the Filter by these Devices box. Only the alerts for these devices are displayed
in the Alerts page. If you have also selected an alert state and severity, for
example, New alerts that are Critical, only those alerts are shown for the
selected devices.
To remove a device, select the device in the list and click on the << button. To
clear all the devices from the box, click on the Clear device list button below
the box.
Selecting Alert Log Filters - Topology
You can set filters for an entire segment or network. Select the Topology tab,
then select the segment or network to filter. Click on the >> button to add the
segment or network to the Filter by these Devices box.
Use the Show field at the top of the page to control the display of the folders.
See Device Topology
tion about the Show field.
in the Networking Devices chapter for more informa-
5-7
Page 48

Alerts
Filtering Alerts
Show List
Figure 5-3. Select Alert Log Filters — Topology Page
Selecting Alert Log Filters - Custom Groups
If you have created any Custom Groups of devices, you can apply filter criteria
to these groups.
Selecting Alert Log Filters - Search
You can obtain a list of all of your devices with certain characteristics by using
the Search feature. To find one or more devices, select the parameters, such
as “Ping Status is Critical” or “Device Type is PC”, or any other combination
that is available in the drop down lists. Click on the Start Search button.
Click on the + or - boxes to add or remove search criteria.
5-8
Page 49

Figure 5-4. Search Page
Configuring Action on Alerts
Click on Searches button
and select Save to save
parameters globally.
Alerts
To save your search parameters, select Save from the Searches drop down list
and enter a name for the search. These parameters are saved globally so that
you can use the same parameters again by clicking on the Searches button and
selecting the name you saved.
If you want to rename or delete your saved search parameters, click on the
Searches button and select Manage. Highlight the name that you want to
rename or delete and click the appropriate button.
Configuring Action on Alerts
You may want to have certain actions executed when an event occurs, such
as executing a program. Click on the Alerts button in the navigation frame and
select Configure Action on Alerts from the menu.
Use the Alerts - Configure Actions on the Alerts page to enter the path of the
desired program for each alert severity. You can launch several programs by
using a batch file in this field.
5-9
Page 50

Alerts
Configuring Action on Alerts
Figure 5-5. Configure Actions on Alerts Page
If your program requires information
about the event (for example, device
name and alert severity for inclusion in an e-mail message to you), use one of
the following substitution parameters within the command line:
■ $(dev) - Substitute the name or IP/IPX address of the device that generated
the event. The name is usually the domain name.
■ $(addr) - Address (IP or IPX) of the device that generated the event.
■ $(desc) - Short description text generated for the event that describes the
event.
■ $(xdesc) - Long description text generated for the event that describes the
event.
■ $(stat) - Severity of the event as one of the following strings: “Informa-
tional”, “Warning”, or “Critical”.
■ $(evtid) - Identifier string for the event, for example, the trap OID of an
SNMP trap.
■ $(name) - Name of the event. Event names are assigned to each type of
event as a way to uniquely identify events instead of using event identifiers.
■ $(url) - URL generate for the event.
Click on Save Settings. The program(s) run whenever an alert of the specified
severity is logged to the Alerts page.
5-10
Page 51

Configuring Action on Alerts
Alerts
Deleting Closed Alerts
The field at the bottom of the Configure Actions on Alerts page allows you to
enter the number of days after which you would like closed alerts deleted from
the alerts database.
5-11
Page 52

Alerts
Configuring Action on Alerts
5-12
Page 53

Networking Devices
This chapter contains information on:
■ Listing Devices
■ Configuring Polling
■ Selecting Actions for Devices
■ Device Topology
■ Node Port Table
■ Custom Groups
■ Searching for Devices
See the chapter Group Policies for information on automatic configuration.
Listing Devices
6
The Devices page lists alphabetically all the devices that have been discovered
in your network. The default display is your local network.
To view a list of your network devices, select Devices, Devices by Type in the
navigation frame. Click on the Networking Devices folder to display each
network device in the right frame showing its type, connectivity status, the
number of new and open alerts, and its management capabilities (SNMP and/
or Web browser).
Page 54

Networking Devices
Configuring Polling
Figure 6-1. List of Networking Devices
Check the box at the bottom right to have the page always open in a separate
window.
Note If the device is not manageable by browser, you must launch the Device View
from the Management Station where HP TopTools for Hubs & Switches is
installed.
Configuring Polling
Polling a device involves sending a request to the device and waiting for a
response. If the device does not respond to a request within a certain time
interval, it is considered down and an alert is entered in the Alert page. You
can set a number of polling parameters in the Settings - Device Communication page.
To start configuring polling for devices:
1. Click on the Devices button in the navigation frame.
2. Select Devices by Type from the menu.
6-2
3. Click on a device in the right frame.
4. Click on the Settings button in the navigation frame and select Device
Communication from the list.
Page 55

Networking Devices
Configuring Polling
Figure 6-2. Device Communication Settings
The settings are:
■ Polling State—On or Off for selected devices. Select Do Not Change to keep
the previous settings.
■ Retries—The number of times a device will be polled before entering an
alert in the Alert page.
■ Polling Interval —The amount of time in seconds between requests for a
response.
■ Timeout—The amount of time in seconds that HP TopTools will wait for
a response from a device before sending another request.
■ Management URL—If http discovery has found a management station, its
address will appear in the Management URL field. You can override this
URL if you want to change it.
Click on the Suspend All Polling button to stop polling. The button now reads
Resume Polling. Click on it to start polling again.
6-3
Page 56

Networking Devices
Selecting Actions for Devices
Selecting Actions for Devices
After you select a device, click on the Actions button at the top left of the page
to select an action to perform. Alternatively, right-click on a device in the list
and select an action from the menu. Depending on the device, the Actions
include:
■ View Alerts—Displays the Alerts page with any alerts that have occurred
for the device.
■ Check Connectivity (Ping)—Use ping to test the network connection to
a device.
■ Set Friendly Name—Create an easy-to-remember name for a device.
■ Update Discovery—Re-reads the configuration of the selected network
device or devices to see if changes have occurred.
■ Add to Custom Group—Add a device to a custom group.
■ Delete—Delete the selected device from the devices page.
■ Find in Topology View—Locate a device in the Topology View.
■ Security (Set SNMP Passwords - Communities)—Set up device security
by entering passwords.
■ SNMP/Trap Configuration—Set the thresholds for SNMP traps. Only
appears for switches with browser interfaces.
■ Update Firmware—Download the latest device firmware (see Down-
loading Firmware for instructions).
■ Telnet—Start a telnet session with a device (available only for devices
that support telnet).
■ Node Port Table—View a table showing the devices attached to each port
of the selected device.
■ Management Home Page—Displays the Status page for the selected
device.
■ Properties—Display some generic SNMP information about the device
including the system name, IP/IPX address, uptime, device description
and status.
■ Export—For printing HTML to a spreadsheet (CSV)
6-4
You can perform actions on up to 100 devices at a time. Use Ctrl-click to select
more than one device from the list.
SNMP/Trap Configuration
In order for traps to function, you must set the trap in the Thresholds dialog
box. You must be at the management station to set traps. This menu selection
only appears for switches that are browser-manageable. Do the following:
1. Select SNMP/Trap Configuration from the Actions menu.
2. In the Device Configuration dialog box select the Thresholds tab and set
the thresholds for the traps you are interested in receiving.
Page 57

Networking Devices
Device Topology
• Threshold—the value of the event at which the trap or alarm is
triggered
• Tolerance—the device does not send another event to the manager
until the value goes below the tolerance value and the threshold value
is reached again. The default is 80% of the threshold value.
• Time Interval—the time elapsed while HP TopTools examines speci-
fied traffic for threshold and tolerance violations. If the threshold is
reached with the time interval specified, an event is triggered.
3. Select the Trap Receivers tab and set the management stations that should
receive traps.
4. Select the Authorized Managers tab and set the management stations that
can send and receive SNMP requests for the device.
Figure 6-3. Thresholds Dialog Box
Device Topology
The Topology view displays a hierarchical representation of your network
device connections. If HP TopTools is not able to associate a device with a
segment, the device is listed as unmapped.
6-5
Page 58

Networking Devices
Device Topology
Note Your hubs and switches must have the Community Name “public” set to READ
and WRITE in order for your devices to be mapped.
Figure 6-4. The Topology of Networking Devices
You can choose how to display the topology hierarchy by selecting from the
Show drop down list at the top of the page:
■ Network—Displays folders representing networks. All the devices in the
network are displayed. Double-click on a router to view all the networks
connected to that router.
■ Networks, Segments—Displays folders representing networks. The
network folders contain folders representing segments in the network.
Click on a segment folder to see the devices in that segment.
■ Networks, Segments, Connections—Displays network folders containing
segment folders. Segment folders contain folders representing connections. Connection folders list the devices associated with that connection.
Double-click on a hub or switch in the list to launch the Device View for device
configuration.
6-6
Page 59

Networking Devices
Node Port Table
Node Port Table
To view the devices attached to the ports of a device, right-click on the device
in the networking devices list (Devices, Device Types, Networking Devices).
Select Node Port Table. The Node Port table for the selected device displays.
The table shows the following:
■ Node address
■ Port number of the selected device
■ Type of port, for example, 10Base-T
■ The address of the device connected to the port
■ The port number connected to on the device
Devices that are underlined (linked) have more devices connected to them.
Click on the device address; a new table with that device’s connections
displays.
Figure 6-5. Node Port Table for device 15.37.32.130
When a link has been clicked on, it is no longer blue.
Custom Groups
You may want to perform certain maintenance tasks on a group of devices,
for example, downloading
devices that you want in the Custom group by clicking on the device in the
list, then selecting Add to Custom Group from the Actions menu. You can select
multiple devices at one time by using Ctrl-click on each device that you want
to include. Enter the name of the Custom Group and click OK.
the latest firmware for a type of hub. Select the
6-7
Page 60

Networking Devices
Searching for Devices
Figure 6-6. Custom Groups Page
A quick way to create a Custom Group uses the Search function. Select the
Search tab in the Devices page. Enter the type of device that you want as
members of your group. Save the results of the search, this becomes your
Custom group. You can add and delete devices from the group.
Searching for Devices
You can obtain a list of all of your devices with certain characteristics by using
the Search feature. To find one or more devices, select the parameters, such
as “Ping Status is Critical” or “Device Type is PC”, or any other combination
that is available in the drop down lists. Click on the Start Search button.
6-8
Page 61

Figure 6-7. Search Page
Networking Devices
Searching for Devices
Click on the + or - boxes to add or remove search criteria.
To save your search parameters, select Save from the Searches drop down list
and enter a name for the search. These parameters are saved globally so that
you can use the same parameters again by clicking on the Searches button and
selecting the name you saved.
If you want to rename or delete your saved search parameters, click on the
Searches button and select Manage. Highlight the name that you want to
rename or delete and click the appropriate button.
6-9
Page 62

Networking Devices
Searching for Devices
6-10
Page 63

Group Policies
7
With HP TopTools Group Policies feature, you can specify which devices are
being configured for a particular policy.
This chapter includes information on:
■ Creating Groups
■ General Group Policies
■ Advanced Switch Features
■ Security Configuration Policies
■ Alert Configuration Policies
Creating Groups
You can create up to 30 groups of devices for management by policy. There
are two additional groups already created, “Unconfigured” and “Default”.
To begin creating groups for policy management, click on the Policies button
in the HP TopTools navigation frame and select Group Configuration. The Group
Configuration page displays the groups that have been configured. Initially only
the Unconfigured group and the Default group will be listed.
Page 64

Group Policies
Creating Groups
Figure 7-1. Main Page of Group Configuration
If you check the box labeled Move newly discovered devices into Default group,
your new devices can have policies applied as soon as they are discovered. If
you do not check this box, newly discovered devices are moved to the
Unconfigured group, which does not have any policy settings. The default
setting is to move newly discovered devices to the Default group.
Note Only devices that support Policy Management will be listed for selection as
members of a group.
Viewing the Devices in a Group
To view a list of the devices that are members of a group, select the group and
click on the View Devices button. The View Group Members page lists the
devices in that group. Click on OK to return to the main Group Configuration
page.
7-2
Page 65

Group Policies
Creating Groups
Adding a Group
To create a new group and add it to the group list, click on the Add Group button.
In the Group Configuration - Add Group page, enter a name for the group in
the New Group Name field. Click on OK to add the group. Click on Save Group
Settings in the main Group Configuration page.
Note You must click on Save Group Settings for your changes to take effect.
Figure 7-2. Add Group Page
If there are already 32 groups configured (including the Default and
Unconfigured groups), a message will inform you that the maximum number
of groups has been created.
Modifying a Group
To perform functions such as adding devices to a group, removing devices
from a group, or renaming a group, select a group to be modified and click on
the Modify Selected Group button in the main Group Configuration page. The
Group Configuration - Modify Group page displays the current devices in that
group.
7-3
Page 66

Group Policies
Creating Groups
Figure 7-3. Group Configuration - Modify Group Page
Adding a Device to a Group
To add a device to a group, click on the Add Device button. Select a group from
the Source Group list box. All the devices in that group will be displayed in the
box below. Select a device in the Source Group list box, then click the Add-->
button. The device appears in the Target Group list box. Repeat for as many
devices as you want to move.
Note All the devices displaying the same friendly name but a different IP address
should be added to the same group. For example, if you see two devices with
the friendly name of “Switch1” but one has an IP of 200.1.1.1 and one has an
IP address of 200.1.1.2, they should both go in the same group.
When you are finished with your changes, click the OK button. Click on Save
Group Settings in the main Group Configuration page.
Clicking Cancel removes all your changes.
Note A device can only be a member of one group.
7-4
Page 67

Group Policies
Creating Groups
Figure 7-4. Adding a Device to a Group
Removing a Device from a Group
To remove a device from a group, select a device in the Group ConfigurationModify Group page and click on Remove Device. You will be asked to confirm
the deletion. Select Yes to delete the device from the group. The device is
moved to the Unconfigured group.
Click on Save Group Settings in the main Group Configuration page.
Changing the Group Name
To change a group name, click on the Change Group Name button in the Modify
Group page. Edit the existing group name in the Group Name field and click on
OK. Click on Save Group Settings in the main Group Configuration page.
7-5
Page 68

Group Policies
Configuring Group Policies
Configuring Group Policies
Start configuring Group Policies by clicking on the Policies button in the HP
TopTools navigation frame. Select Configuration Policies from the menu. The
Policies - Automatic Configuration Management of Hubs & Switches page displays
the following buttons:
■ General—Displays SNMP system information and allows modification of
that information
■ Alerts—Allows selection for delivery of alerts to the TopTools server,
removal of trap receivers from a displayed list, and setting fault sensitivity
for alerts
■ Advanced Switch Features—Turn on or off:
• Automatic Broadcast Control (ABC) for a selected protocol
• Multicasting (IGMP)
• Spanning Tree Protocol (STP)
■ Security—Displays and allows addition or modification of community
names and authorized managers
Figure 7-5. Main Configuration Policies Page
Note The devices must have management by browser capability.
7-6
Page 69

General Configuration Policies
Group Policies
General Configuration Policies
SNMP System Information
To configure SNMP Information for a group, click on the General button in the
Configuration Policies main page. The General Polices page for that group
displays.
Three SNMP variables for the selected group are listed in the SNMP System
Information box:
■ sysContact—The person to contact about this group of devices
■ sysLocation—The location of this group of devices.
■ sysName—The name for the group of devices.
If <keep device setting> is selected, the current value stored in the switch is
not modified.
Figure 7-6. General Policies Page Showing SNMP System Information
To modify a field, select the field in the SNMP system Information box, then
check the Enabled check box below if it is not currently checked. Enter the
new information in the field to the right of the Enabled check box and click
7-7
Page 70

Group Policies
Alert Configuration Policies
Update. The new information appears in the box above. Click on OK to return
to the main Configuration Policies page, then click on Apply Policies to save
your changes.
Clicking on Cancel discards all your changes.
Checking Firmware Versions
When TopTools discovers a device in your network, the firmware version of
the device is retrieved and compared against a list to determine if there is a
newer firmware version available. If a newer firmware version is available, a
message is entered in the Alerts page (click on the Alerts button in the
navigation frame). See
Downloading Firmware for instructions on
downloading the newer firmware.
Alert Configuration Policies
To configure group policies for alert notification and fault sensitivity, click on
the Alerts button in the Configuration Policies main page. The Alert Policies page
for that group displays.
Use the Trap Receivers list box to specify the management stations that can
capture traps for web-enabled HP hubs and switches in your network.
Enter the IP addresses of the hosts that should receive traps. The maximum
number of additional trap receivers that you can add is nine. The HP TopTools
management station is a trap receiver by default.
See
SNMP Configuration for information about setting traps.
The device will automatically send traps to the trap receivers entered in the
trap receivers list box. You can configure actions to take when traps occur,
such as paging a network administrator, by using the Configure Actions on
Events feature listed in the Alerts button in the HP TopTools home page.
Traps will be sent for all standard SNMP events, as well as some additional
fixed events. The fixed events for hubs and switches include:
■ coldStart: The device reinitialized itself and its configuration may have
changed.
■ warmStart: The device reinitialized itself but its configuration is not
changed.
■ linkDown: Communication was lost on a device interface.
■ linkUp: Communication was regained on a device interface.
■ authorizationFailure: The device received an SNMP packet that was not
authenticated.
■ entConfigChange: A change, such as the addition of a card, was made to
the device.
■ hpicFaultfinderTrap: A possible error condition was detected by the fault
finder.
7-8
Page 71

Alert Configuration Policies
Group Policies
Sending Alerts to the HP TopTools Management Station
When you check this box, all alerts will be sent to the HP TopTools Server in
addition to any other trap receivers that you have designated. This feature is
enabled by default.
Removing Trap Receivers
If the Remove trap receivers not listed below check box is checked, any trap
receivers configured that are not displayed in the trap receivers list box will
be removed as trap receivers.
Figure 7-7. Alert Policies Page
Setting Fault Sensitivity
The Fault Sensitivity field allows you to set the sensitivity levels for the actions
to be taken when a fault is detected on a port in your network. Switches only
have a sensitivity setting for logging network problems. The sensitivity
settings are:
High Sensitivity: The device will make an entry in the Alert Log (located in the
Status tab of the Device page) when a network problem of any severity occurs.
Medium Sensitivity: The device will make an entry in the Alert Log when
serious network problems occur.
7-9
Page 72

Group Policies
Advanced Switch Features
Low Sensitivity: The device will make an entry in the Alert Log only when
severe network problems occur. These are problems that may bring the
network down.
Off: The device will never make any entries in the Alert Log regardless of the
severity of the problem.
<keep device setting>: The current value stored in the switch is not modified
If you make any changes, you must click on Apply Policies in the main
Configuration Policies page for your changes to take effect.
Advanced Switch Features
To configure Advanced Switch Features for a group, click on the Advanced
Switch Features button in the Configuration Policies main page. The Advanced
Switch Features page for that group displays.
The following features can be set for the selected group of switches:
■ Automatic Broadcast Control (ABC)
■ IP Multicasting (IGMP)
■ Spanning Tree Protocol (STP)
The possible settings are:
■ On - Turns the feature on for all switches in the selected group. On for
ABC has more options:
• On for IP only - Turns on ABC for IP devices only.
• On for IPX only - Turns on ABC for IPX devices only.
• On for IP/IPX - Turns on ABC for IP and IPX devices.
■ Off - Turns the feature off for all switches
■ <keep device setting> - The feature is not on or off. The device conforms
to what has been set in the device console.
7-10
Page 73

Advanced Switch Features
Group Policies
Figure 7-8. Advanced Switch Features Page
The problem of broadcast control is addressed in part by the use of two
features, Automatic Broadcast Control (ABC) and Internet Group
Management Protocol (IGMP).
Automatic Broadcast Control (ABC)
Automatic Broadcast Control (ABC) is a feature that controls broadcasts
through IP/IPX Broadcast Reduction. IP/IPX Broadcast Reduction reduces the
number of broadcasts propagated through the network.
Using ABC, the switch acts as a proxy server, replying to Address Resolution
Protocol (ARP) requests, Nearest Server Query (NSQ) requests, and
GetLocalTarget requests on behalf of the destination node. An ARP cache
(learned address table) is created for each subnet allowing the switch to proxy
reply with the resolved MAC address instead of forwarding the requests out
all ports. This limits the broadcasts within the switching domain. The Service
Advertising Protocol (SAP) table performs the same function in an IPX
network. By using these tables, the switch can resolve addresses for any node
in the network that it already knows about.
7-11
Page 74

Group Policies
Advanced Switch Features
Routing Information Protocol
The switch also intercepts Routing Information Protocol (RIP) and SAP
broadcasts and forwards these only to ports where routers and servers have
been detected. This also reduces the number of broadcasts on the network.
For example, if User A sends out a broadcast message to connect to its server,
the request is sent out of all ports on the switch. When the server responds to
User A, the switch intercepts the response and learns that the server is on that
port. When User B sends a request to the same server, the switch already
knows which port that server is on and sends that information to User B, just
as if the server had responded to the request. User B’s request is not broadcast
out any of the switch ports.
Enabling Broadcast Control for IP
The IP protocol uses Address Resolution Protocol (ARP) packets to find the
MAC address of a node that corresponds to the network layer address. When
Broadcast Control is enabled, the switch intercepts the ARP packet on its way
to the destination node. If this destination is unknown to the switch, the switch
floods the ARP request to all ports. When the destination port responds, the
switch stores information about the source and destination MAC addresses
and layer 3 addresses in its ARP cache. This information allows the switch to
proxy a reply containing the MAC address of a destination to the source of an
ARP request. The source can then send a unicast packet directly to the
destination. The amount of broadcast traffic has been decreased.
Automatic IP RIP Control
To further reduce broadcast traffic, you can check Automatic IP RIP Control.
IP RIP packets are sent out periodically (every 30 seconds) to distribute
routing information. By enabling Automatic IP RIP Control, the switch will
only forward RIP packets out the ports on which RIP packets have been
received. Since routers are the only devices that generate RIP packets, this
ensures that RIP packets are only sent out ports with routers attached to them.
When this feature is not enabled, IP RIP packets are forwarded to all ports.
Enabling Broadcast Control for IPX
The IPX protocol broadcasts all of its known routes and services every minute
by using IPX, RIP and Service Advertising Protocol (SAP) packets. When
servers are booted up, they advertise their services using SAP. These frames
must be forwarded by routers, which maintain a database of this information,
allowing clients on the network to obtain the internetwork addresses of the
servers where they can access services.
7-12
Page 75

Advanced Switch Features
Group Policies
Automatic IPX RIP/SAP Control
To further reduce network traffic, you can check the Automatic IPX RIP/SAP
Control check box. The switch will intercept RIPs and SAPs, broadcasting
them only to ports where IPX routers or servers have been detected, or to
ports that have been configured to transmit RIPs or SAPs. When this feature
is not enabled, IPX RIP/SAP packets are forwarded to all ports.
Automatic IP Gateway Configuration
When Automatic IP Gateway Configuration is enabled, the switch will modify
replies from the DHCP server so that the Default Gateway IP address of client
becomes the client’s own IP address. This is useful in a multinetted
environment (where more than one IP network is configured in a single
broadcast domain).
See
Routing Information Protocol.
Internet Group Management Protocol (IGMP)
Multimedia and email a pplications need the ability to communicate to multiple
destinations efficiently. IP multicasting allows hosts to dynamically register
for sending or receiving multicast traffic.
The Internet Group Management Protocol is a method for automatically
controlling multicast traffic through the network. Using multicasting,
applications can send one copy of a packet addressed to a group of computers
that wish to receive it. This method is more efficient than sending a separate
copy to each node. Other advantages of multicasting include:
■ information delivered in a timely, synchronized manner because all desti-
nation nodes receive the same packet
■ information can be sent to destinations whose addresses are unknown
■ reduces the number of packets on the network because only one multicast
packet is sent.
IGMP uses multicast queriers and hosts that support IGMP to manage
multicast traffic on the network. It specifies how the host informs the network
that it is a member of a multicast group. A set of queriers and hosts that send
and receive data from the same set of sources is a multicast group.
The HP switches have a standards-based IGMP implementation. The switches
process IGMP packets by learning which of the switch’s interfaces are linked
to hosts that are members of multicast groups and multicast routers. It limits
multicast traffic by monitoring the IGMP traffic to learn which hosts are in
which multicast groups, then allowing IP multicast traffic to be sent only to
ports with valid host group members.
When a switch receives an IGMP packet, it updates the internal IP multicast
forwarding table with the IGMP membership read from that packet. The
switch then sends the packet to the ports with members of the destination
multicast group.
7-13
Page 76

Group Policies
Security Configuration Policies
Special multicast routers/queriers communicate by using three message
types - query, report, and leave group. The query message, sent by a querier,
is used to discover which network interfaces belong to a multicast group. Each
host responds to the query message with a report message that tells the querier
the host is a member of the multicast group. The host also can send a report
message to join a group or a leave message to leave a group.
Note Using the console you can designate specific ports to always or never forward
multicast packets.
Forward with High Priority
When Forward with High Priority is checked, any IGMP packets received by the
switch will be forwarded in a prioritized manner, preceding packets with
normal priority.
The Spanning Tree Protocol
The Spanning Tree Protocol (IEEE 802.1d) maintains a loop-free topology in
networks with redundant bridges or switches. The spanning tree devices
determine which devices will be active and which will be backups so that no
two nodes in a network have more than one active path between them at any
time. The Spanning Tree Protocol uses the most efficient path between
segments. If a bridge or switch fails, the other bridges and switches
reconfigure the network automatically. When the problem is repaired, the
bridges and switches automatically return to the original network
configuration.
Security Configuration Policies
To configure Security policies for a group, click on the Security button in the
Configuration Policies main page. The Security Policies page for that group
displays.
Communities
You can create up to five communities for each group. The default community
is “public”.
Caution Do not delete the “public” community.
The Read Access and Write Access choices are:
■ None—Provides access to no tasks in HP TopTools
7-14
Page 77

Security Configuration Policies
■ Discovery—Enables a device to be discovered by HP Toptools for Hubs
Group Policies
and Switches for mapping in a Topology view. The only tasks allowed are
Link Test and Discovery.
■ Restricted—Provides partial access to HP TopTools features (not
Community Name settings or Authorized Managers)
■ User—Provides almost complete access to HP TopTools features
■ Full—Provides complete access to all HP TopTools features
Figure 7-9. Security Policies Page
Adding a Community
To add a community for a group:
1. Click on the Add button. A blank field for the new community name
appears below the Communities box.
2. Enter the name of the new community. Then select the Read Access and
Write Access for that community.
3. Check the Enable Authorized Managers check box if you want to allow the
addition of Authorized Managers to manage this community.
4. Click on OK.
7-15
Page 78

Group Policies
Security Configuration Policies
Modifying a Community
To modify an existing community:
1. Select the community to be modified and click on the Modify button. The
selected name appears in a field below the Communities box. You can
change the name in this field.
2. If desired, change the Read Access and/or Write Access.
3. Check or uncheck the Enable Authorized Managers check box if you want
to change the permission for an Authorized Manager to manage this
community.
4. Click on OK.
5. Click on Apply Policies in the main Configuration Policies page.
If you enable Authorized Managers, this message appears below the check
box: “The TopTools Server will automatically be added as an Authorized
Manager”.
Deleting a Community
To delete a community for a group, select the community and click on the
Delete button. Click on Apply Policies in the main Configuration Policies page.
Configuring Authorized Managers
The Authorized Managers box lists the managers that are authorized to
manage the selected community in the Communities box. You can configure
nine authorized managers; one additional manager is the HP TopTools server
by default.
Adding or Deleting an Authorized Manager
To add an authorized manager for a community:
1. Select the community in the Communities box, then click on the Add button
next to the Authorized Managers box. A blank field appears below the box.
2. Enter the host name or IP address of the new authorized manager in the
field.
3. Click on the OK button.
4. Click on Apply Policies in the main Configuration Policies page.
To delete an authorized manager:
1. Select the community in the Communities box.
7-16
2. Select the authorized manager that you want to delete in the Authorized
Managers box, then click on the Delete button.
3. Click on Apply Policies in the main Configuration Policies page.
Page 79

Viewing Your Maps
This chapter contains information on:
■ Displaying Topology Maps
■ Using the Panner
■ Launching the Device View
■ Options for Map Control
■ Locating a Node
Displaying Maps
When HP TopTools is started, the discovery process discovers the devices on
your network. This information is used by the topology process to create a
network topology and the physical maps. Two maps are created automatically:
■ A map showing just the bridges, switches and segments
■ A map showing the entire network.
8
Note Your hubs and switches must have the Community Name “public” set to READ
and WRITE in order for your devices to be mapped.
Click on the Maps button in the navigation frame to display the Maps-View
Maps page. This page lists the IP subnets that have been discovered by
HP TopTools. The following information is provided for each map:
■ Name—The name of this map
■ Typ e—Either a Network or Segment map
■ Create Date—The date the map was created
■ View—The style of the map, for example, hierarchical
■ Owner—System (default maps created) or the User Id of the person who
created the map
Maps appear in the list only after topology is complete. To display the map in
a separate browser window, check the Map in Separate Window box at the
bottom of the page, then double-click on a map in the list.
Click the Full Network button to generate a map of the entire network.
Select the Delete button to remove a map from the list and the map file on the
server. It may take a minute for the map list to reflect the deletion.
Page 80

Viewing Your Maps
Displaying Maps
Figure 8-1. Network List for Displaying Map Views
Map Server Settings
Click on the Preferences button in the Maps-View Maps page to launch the
Server Settings page. The Server Settings page lets you select the display
characteristics for maps. These settings control how maps appear to all
clients. An individual client can override some of the settings for the map being
displayed by using the View button in the map window.
8-2
Page 81

Viewing Your Maps
Displaying Maps
Figure 8-2. Map Settings
The Map Factory Service generates your topology maps after discovery is
complete. You must stop and restart this service for your new map settings to
take effect. Select the Settings button in the HP TopTools navigation frame and
click on Services.
Automatic Map Generation
Select what devices you would like displayed in your map:
■ Switches—Maps for switches and bridges are automatically created.
■ Switches & Hubs—Maps for switches, bridges and hubs are automatically
created. This is the default.
■ All Nodes—Maps displaying all end nodes are automatically created.
Default View
You can choose the style of map layout that you prefer. The four styles are
shown in the following table.
8-3
Page 82

Viewing Your Maps
Displaying Maps
Table 8-1. Map Styles
Hierarchical—The devices are presented in a treelike structure, from a top-level device such as a
switch, to its connecting hubs and end nodes.
Circular—The network map is displayed with
devices connected in a circular pattern. Segments
connect the circles.
Symmetric—The devices are spaced along an axis on
the page, in a symmetrical fashion.
Orthogonal—The devices are displayed along the x
and y axis. This map resembles a circuit board
layout.
Cluster Size
Use the Cluster Size option to adjust the size of the clusters in your map. The
options are:
■ Enable Max Nodes—Check this box to select a maximum number of
nodes to be displayed in a cluster. Enter the number of nodes in the Max
Nodes field. If a cluster has more nodes than the specified maximum, that
cluster is divided into two clusters of approximately the same size, unless
the resulting cluster has fewer nodes than the specified minimum. This
process continues until all clusters have fewer nodes than the maximum
value, and more nodes than the minimum value.
■ Enable Min Nodes—Check this box to select a minimum number of nodes
to be displayed in a cluster. Enter the number of nodes in the Min Nodes
field. If a cluster has fewer nodes than the specified minimum, that cluster
is merged with a neighboring cluster.
■ Cluster By Degree—The Degree of a node is the number of ports on the
device connected to the node. A node with a degree value greater than or
equal to the value entered in Cluster By Degree will become the starting
node of a new cluster.
8-4
Page 83
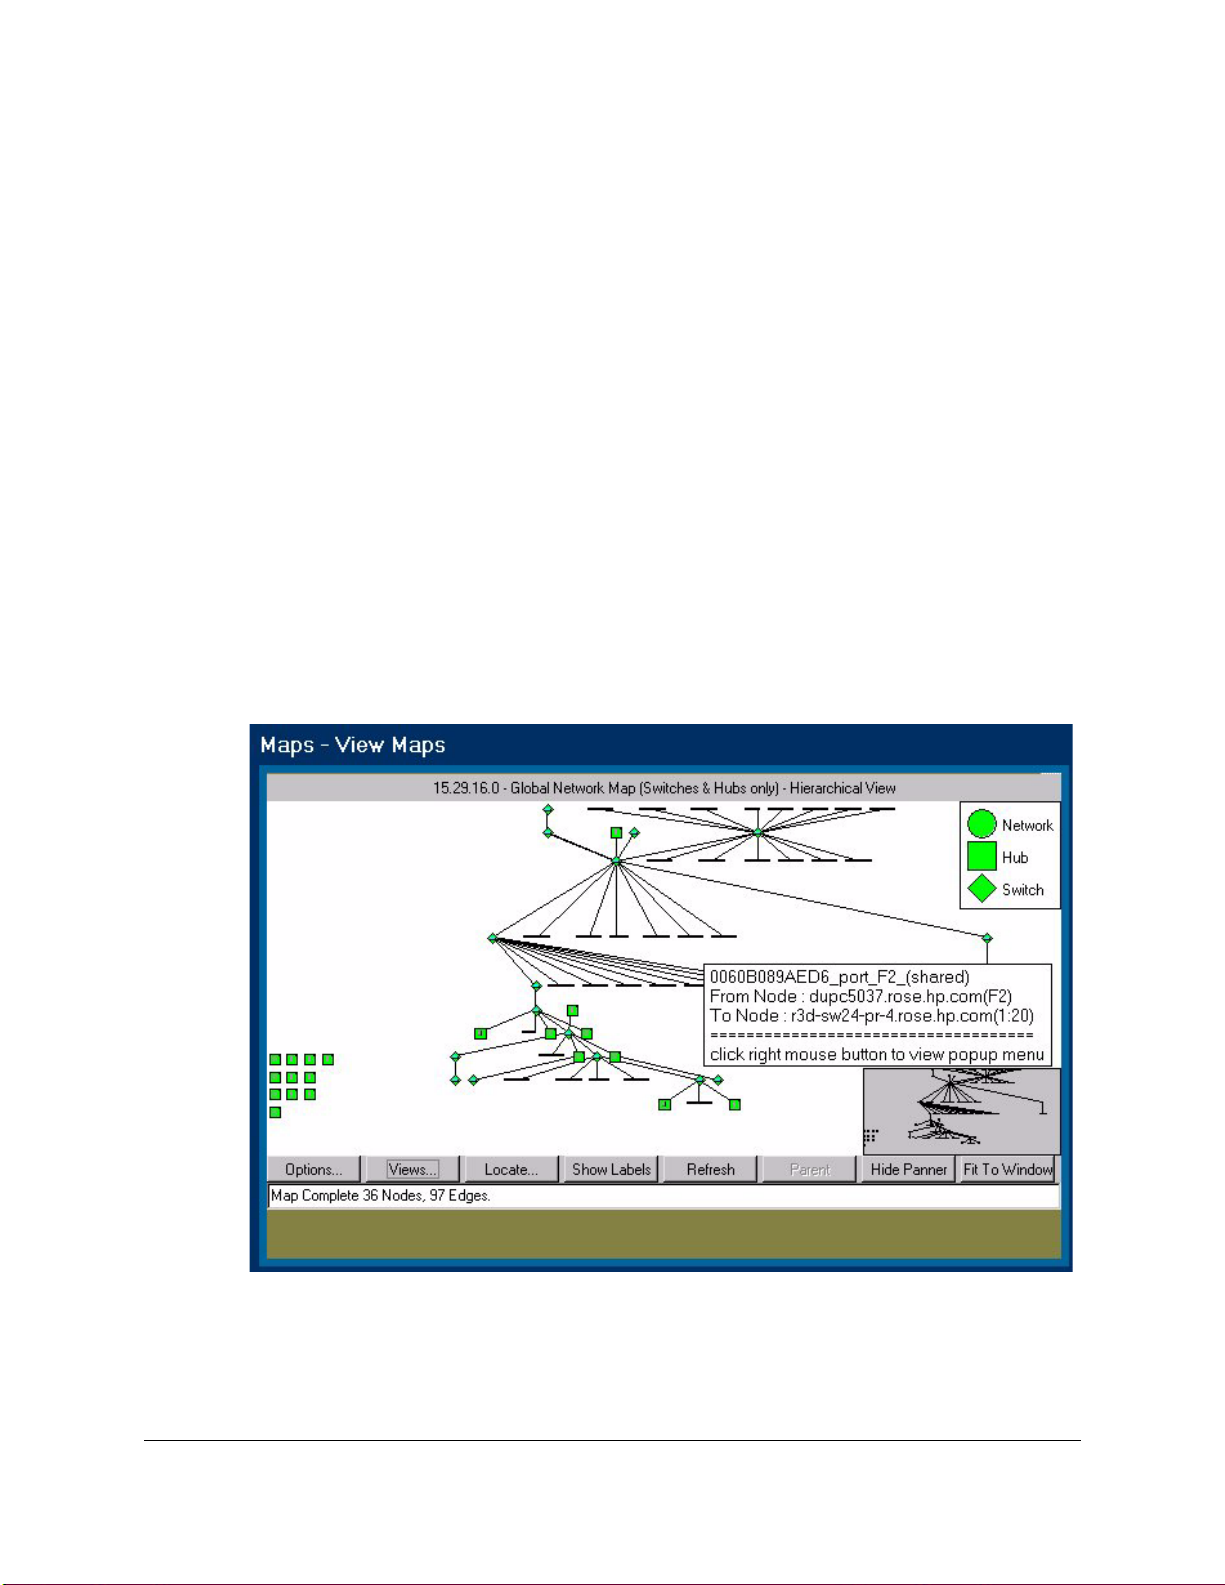
Viewing Your Maps
Displaying Maps
Spacing
Spacing controls the amount of distance between nodes in the topology map
so that they do not overlap each other. There are three spacing options:
Level Frame%—To increase the amount of space between node levels in a
map, increase the percentage. Used in hierarchical map styles.
Level Node%—Sets the amount of space around each node. Increase this value
to increase the amount of space around a node. Decrease this value to pull the
nodes closer to each other. Used in hierarchical map styles.
Node Spacing Multiplier [1.0 - 10.0]—Used to calculate the node spacing
between adjacent nodes in circular clusters. Increase this value to increase
the spacing between adjacent nodes. Decrease this value to decrease the
spacing between adjacent nodes. Used in circular map styles.
Launching a Map
Double-click on a subnet in the Maps-View Maps page to display a map of the
subnet.
Figure 8-3. Subnet Map
8-5
Page 84

Viewing Your Maps
Using the Panner
The IP subnet map shows all the segments and managed routers, switches and
bridges that form the subnet boundaries. IPX managed bridges that are located
in the source IP network are also displayed. To drill down to the end node
level, double-click on a segment.
Move your cursor over a device to display a tooltip with information about the
name, IP address, and status of that device. Right-mouse click on the device
to display the device popup menu. The Properties (Device View) selection
launches the Device View. The SNMP/Trap Configuration menu item lets you
configure traps and trap receivers for the device.
When you right-mouse-click on a segment you can select Show Segment Map.
The buttons at the bottom of the map are:
■ Options—see below for a description of this feature.
■ Views—see below for a description of this feature.
■ Locate—see below for a description of this feature.
■ Show/Hide labels—Displays or hides the address of the represented
device.
■ Refresh—Redraw the map. If new devices have been discovered, they will
appear in the updated map.
■ Parent—Show the map one level above the displayed map (unless you are
already at the network level).
■ Show/Hide Panner—Displays or removes the panner from the map
window.
■ Fit to Window—Displays the entire map view.
You can also access these parameters by right-mouse-clicking on the map
background. The background popup menu also includes menu items for
hiding the legend, disabling the map tool tips, and disabling the panner tool
tips.
Using the Panner
The panner lets you easily focus in on a portion of your map. Click on Show
Panner to display it in the lower right corner of your map. Using your mouse,
drag a rectangle in the panner over the section of the network that you would
like enlarged in your map. To restore the map to its original size, click on Fit
to Window.
Launching the Device View
To configure a device, double-click on the device in the map or right-mouseclick on the device and select Properties (Device View) from the device popup
menu. The Status - Overview page of the device is displayed in the browser.
Use the tabs to view or change device settings, or to display device counters.
8-6
Page 85

Viewing Your Maps
Options for Displaying Maps
Note You must display the Closeup View for older HP devices that do not support
a browser interface from the management station where HP TopTools for
Hubs & Switches is installed. See the online help for specific instructions
about configuring older HP devices.
SNMP/Trap Configuration
See SNMP/Trap Configuration in the Networking Devices chapter for more
information about configuring SNMP thresholds.
Options for Displaying Maps
There are several parameters you can set to control how your map looks and
how often it is refreshed. Click on the Options button at the bottom of the page
displaying a map and make your selections. Click on the Apply button to save
them. To close the window without making any changes, click on OK. The
Cancel button cancels any changes that you have not yet applied.
Options—
Refresh Maps
If you select the
Automatic Map
Refresh option your
map will refresh its
display of devices
automatically for a
selected time period.
If you want your map
to refresh upon
command only,
select the Manual
Map Refresh option.
Options—Labeling
Choose how you would like your device labels to display in the map, by name
or by device address. If you do not want to display labels, uncheck the Show
Label Names box. Check the Show Segment Names box to display the names of
segments in your map. Click on Apply to save your choices.
Note Label options are only applicable when the Show Labels button on the Map is
selected.
8-7
Page 86

Viewing Your Maps
Locating a Node
Options—Legend
Select this option to
display the legend for
the map. Check the box
Show on Map to have the
legend display on the
map. Click on Apply to
save your choices.
Changing Map Views
Click on the Views
button to select the
style of map layout that
you prefer. See Default
View for an explanation
of the four styles.
Locating a Node
To locate a particular end node, click the Locate button at the bottom of the
page displaying a map. In the Locate browser window, select the network that
the node is in, then select the node. Click on the Locate button to locate the
node. A dialog box displays stating that the node has been found and the
appropriate map is opened (if it not open already).
Select Pan in the dialog box to set the panner window so that the located item
is enlarged and centered in the map. If Show labels is turned on, the label under
the located device is displayed in reverse video.
8-8
Page 87

Figure 8-4. Locate a Specific Node in a Map
Viewing Your Maps
Locating a Node
Note You also can locate a specific node from the Top5 browser window in Traffic
Monitor.
8-9
Page 88

Viewing Your Maps
Locating a Node
8-10
Page 89

Monitoring Network Traffic
This chapter describes the tools for monitoring your network using Traffic
Monitor. It contains the following topics:
■ Using Traffic Monitor
■ Reading the Segment Histogram
■ Setting Thresholds
■ Displaying the Network Meter
■ Who Are the Top 5 Talkers?
■ The Traffic Data Collector
■ Troubleshooting Traffic Monitor
Using Traffic Monitor
9
The Traffic Monitor presents real-time information about the status of your
network. When you select Network Traffic, Examine Details from the home page
(or select Traffic Monitor from the Performance button menu), the page displays
five gauges in the top half of the browser window and a histogram in the
bottom half of the window. Each gauge displays the worst measurement in
the entire network for that statistical attribute. The histogram below the
gauges displays the value of an attribute, such as broadcasts/sec, for the
segments in a selected segment group.
Page 90

Monitoring Network Traffic
Using Traffic Monitor
Figure 9-1. Traffic Monitor Main Page
The five statistical attributes sampled by Traffic Monitor are:
Utilization%: Represents the traffic on the selected network or segment as
a percentage of a segment's bandwidth (based on the theoretical maximum
for the type of connection) which is currently being utilized. Monitoring the
utilization gives a measure of how much of the network capacity is being used
on a particular segment. For example, if you are examining a 10 Mbps or a 100
Mbps segment, utilization can tell you how much of the 10 Mbps or 100 Mbps
segment's bandwidth (in percentage such as 20%, 35%, 50%, etc.) is being used
by the devices on the segment.
Frames/sec: Represents the number of frames per second being transmitted
over the network or segment. Each protocol (such as Ethernet, IP, IPX, etc.)
has a different frame or packet specification.
Broadcasts/sec: Represents the number of broadcast packets being
transmitted over the network or segment per second. Broadcast packets are
addressed to, and must be processed by, all nodes on the network. This
indicator gives an estimation of the amount of bulk communications taking
place over the network. In general, this type of activity should be kept to a
minimum as point-to-point messages use bandwidth much more efficiently.
9-2
Page 91

Monitoring Network Traffic
Using Traffic Monitor
Multicasts/sec: Represents the number of multicast packets being
transmitted per second over the network or segment. Multicast packets are
special forms of broadcast packets where copies of the packets are delivered
to a subset of all devices on the network. This indicator gives an estimation
of the amount of bulk communications which are taking place over the
network. As with broadcast packets, this type of activity should be kept to a
minimum as unicast messages use bandwidth much more efficiently.
Errors/sec: Represents the number of errors that have occurred for the
network or segment. The number of errors can help you determine whether
the network is functioning properly.
Reading the Traffic Information Gauges
The gauges display the network traffic information for the current minute. The
colors on the gauges are:
■ green: value for the attribute is within the normal range
■ yellow: value has exceeded the normal range, but is not critical
■ red: value is in the critical range. Corrective action may be needed.
■ blue inner band: The “high water mark”, which shows you the highest
value for that segment in the last hour. This indicator can help you
determine if there are any transient or intermittent problems for the
segment, even though the current minute indicator shows normal activity.
The amount of green, yellow and red displayed in each gauge corresponds to
the threshold settings for that segment. For example, if Segment A is a
10Base-T segment, and the current Threshold settings for Utilization% are as
follows,
green: OK, 0-50% utilization
yellow: warning, 51-75% utilization
red: critical, 76-100% utilization
then the gauge for Utilization% for Segment A would display a green area up
to 50%, a yellow area from 51% to 75%, and a red area from 76% to 100%. Click
on the Thresholds button to set segment thresholds.
The number in the rectangular box below the gauge indicates the attribute
value for the current minute.
Reading the Segment Histogram
Each bar in the histogram represents a segment. The segments are displayed
left to right in worst to best order, the worst segment being the one with traffic
that most exceeds any threshold value for that segment. If there are more than
30 segments to be displayed, a scroll bar will allow you to scroll horizontally
in order to view all the segments.
9-3
Page 92

Monitoring Network Traffic
Using Traffic Monitor
The six tabs across the top of the histogram display the values for the segments
for the selected segment group, or for the entire network if “All Segments” is
selected in the Segment Groups list box. The Worst Overall tab displays in
sorted order left to right the segments that have the most problems in the
selected segment group. For example, if the histogram displays 10 segments
in red, this indicates that these segments have exceeded at least one of the
thresholds set for them. For one segment that might be the Errors threshold,
for another it might be the Utilization% threshold. Holding the mouse over the
segment bar will display a tool tip with the segment name and the
measurement represented, for example, “Utilization: Shared Segment 001”.
Clicking on the segment bar highlights that segment and displays it in the
Selected Segment list box. If you have checked the “Link gauges to selected
segment in histogram” check box (located in the Options button), the gauges
change to reflect the attribute values for that segment.
Comparing Segments Across Different Medias
The yellow warning threshold line and the red critical threshold line are
displayed across the histogram at the same level for all segments. Because the
actual threshold values for various types of media are different, the segment
bar heights are “normalized” to the threshold lines so that they can be
compared visually. For example, if Segment A is a 10Base-T segment, its
warning threshold for Frames/sec might be 3,000 frames/sec. For Segment B,
a 100Base-T segment, the warning threshold for Frames/sec might be 30,000
frames/sec. In order to make a comparison, the height of the segment bar is a
percentage above a threshold value, for example, 50% over the warning
threshold. Both segments can have the same percentage above the warning
threshold settings even though the actual value of Frames/sec is different for
each segment.
9-4
Selecting Segment Groups and Segments
To display the segments for a specific segment group, select the segment group
from the Segment Groups drop-down list at the bottom of the Traffic Monitor
page. The segments for that subnet will be listed in the Selected Segment list
box.
If you want to see the gauges reflect the values of attributes for a particular
segment, click on Options and check Link Gauges to selected segment in
histogram.
Setting Thresholds
When you click on Thresholds at the bottom of the Traffic Monitor page, a
separate Thresholds browser window appears. A set of default thresholds is
provided for each network attribute and is specific to a segment and its type.
The values shown for the Ethernet tab are for a media speed of 10 Mbps. If
your Ethernet is 100 Mbps or Gigabit, or if the segments are trunked, the
threshold values are adjusted automatically. The thresholds for other types
are also adjusted automatically when appropriate, for example, if the
Page 93

Monitoring Network Traffic
Using Traffic Monitor
segments are trunked. This will not be visible in the Thresholds window. For
example, if four ports on a switch are trunked, a 10 Mbps Ethernet segment
would now be four times as fast, or 40 Mbps. The threshold values are adjusted
automatically to be appropriate for this speed. You can still set the threshold
values for a specific segment by selecting that segment from the list in the
Segments tab.
Figure 9-2. Thresholds Window
As a network attribute reaches a certain threshold, a corresponding color
(either green, yellow, or red) is used to indicate the current state (normal,
warning, or critical, respectively.) Changing the threshold ranges to better
represent your network's normal activity will be a relative decision. For
example, a normal threshold range for traffic utilization will vary from
network to network, and segment to segment. It is recommended that you use
the default threshold values first and adjust them to fit the traffic patterns on
your network. By fine tuning the threshold levels, you can find the optimum
operating conditions for each segment on your network, which makes it easier
to see problems as they occur.
9-5
Page 94

Monitoring Network Traffic
Using Traffic Monitor
To change your threshold settings, select a network type such as Ethernet.
The threshold values for the attributes for Ethernet segments are displayed.
You can either move the sliders to the left or right to increase or decrease a
threshold value, or click on the up/down controls underneath the sliders to
fine tune the threshold values. As you move the sliders, these values will
change accordingly. To save your changes, click on Apply at the bottom of the
Threshold window. The changes are applied to all segments of that type, for
example, all Ethernet segments. When you are finished making changes, click
on OK to exit the window.
Note If you click on OK, any changes that you have made and not yet applied will
be applied. If you click on Cancel, any changes that haven't been applied are
not applied. If you have applied changes before clicking on Cancel, those
changes remain applied.
If you want to change the thresholds for a single segment, select the Segments
tab at the top of the window. Select a segment from the list box. The
Thresholds window now reflects the attribute threshold values for that
segment. Click on Apply to save any changes.
Note If you select a different segment from the list box before you have applied
your changes, a message will appear asking you if you want to apply your
changes.
Initially, default values are in effect for all segment types. The Defaults button
returns the threshold values for that segment or segment speed to the original
default values.
Note Traffic Monitor will send a trap to the configured trap receivers when a
threshold has been exceeded. The Traffic Monitor page does not need to be
open for Thresholds traps to be sent.
Displaying the Network Meter
The Network Meter provides an “at-a-glance” look at the most severe traffic
problem on the network being monitored during the current minute. To launch
the Network Meter, click on the Net Meter button below the histogram on the
Traffic Monitor page. Clicking on the Show Worst 5 Segments button displays
a window showing the top five thresholds that have been exceeded and the
associated segments.
9-6
Page 95

Monitoring Network Traffic
Who Are the Top 5 Talkers?
You can keep the Network Meter window
anywhere on your PC desktop. It will continue
to monitor the status of your network while
you use your browser for other tasks. Click on
Hide Net Meter to close the window. When
you close your browser, the Network Met er will
also close.
Options Button
Clicking on the Options button at the bottom of
the Traffic Monitor page displays the Link
Gauges to selected segment in histogram check
box. Clicking on this check box causes the
gauges in the Traffic Monitor page to display statistics for the segment that
you have selected in the histogram.
Note You may see the Network Meter needle indicating a warning or critical
situation when the gauges in the Traffic Monitor page do not. The Network
Meter displays the worst measurement for any segment in the network, but
the gauges in the Traffic Monitor page display the traffic for the segment or
groups of segments that you have selected. If you select All Segments and the
segments are not linked to the gauges (Options), the Network Meter and the
gauges will reflect the same conditions.
Who Are the Top 5 Talkers?
The Top5 View helps answer the question, “Who is causing the problem (who
are the top talkers) on the segment?” by displaying a graph identifying the top
five nodes causing the network activity on the segment for the selected
minute. Click on the Show Details button below the gauges or at the bottom
of the page to display the Top5 View window.
Note If the segment has no devices that are sampling-capable, the Show Details
button below the gauges is grayed out. You can select the segment in the
histogram, then click the Show Details button at the bottom of the page to
launch the Top5 view, but the only data displayed is “Other”.
9-7
Page 96

Monitoring Network Traffic
Who Are the Top 5 Talkers?
Figure 9-3. Top 5 Talkers
You can display graphs for each of the measured attributes showing:
■ Top Sources (default)
■ Top Destinations
■ Top Connections
■ Top Protocols
More than one graph can be displayed at a time, so you can look at the values
for multiple attributes for each segment.
Since Traffic Monitor presents real-time information, the data will be “moving”
on your graph. Data is graphed and updated every minute. The Top5 View
displays up to 60 data points, that is, you can view the most recent hour of
activity.
The right-most bar in the graph represents (up to) the top five nodes for the
latest minute graphed. This bar is selected by default and is indicated with a
black “tick” and the time sampled above it. The color-coded stacked bars
represent the activity for up to the top five nodes and “other” nodes for the
selected attribute and segment. The non-selected bars in the graph show how
these top talkers have behaved over the past hour. This lets you view trends
over the last hour for the five top talkers of the selected minute.
9-8
The yellow and the red horizontal lines on the background of the graph
represent the warning and critical values, respectively, for the selected
segment. These lines only appear when the graph scale is high enough.
Page 97

Monitoring Network Traffic
Who Are the Top 5 Talkers?
The colors are in the same order as they appear in the legend, that is, the node
with the greatest activity is represented by the color at the bottom of the
stacked bar. The white portion of the stacked bar represents the top talkers
in minutes who are not top talkers in the selected minute; the dark gray portion
of the stacked bar represents all other activity. You can visually trace the same
color across the graph to see trends of activity over the past hour.
Information for the top five colors in the legend identifies the source and
destination nodes of the top five connections for every data point on the graph.
The information in the color legend will change as the data points are graphed.
Depending on the parameters you have selected, the information provided by
the legend can include:
■ The layer 3 or layer 2 (MAC) address
■ The network protoc ol or service being used. The highest n etwork protocol
for the communication path is displayed.
■ The direction of data flow (the source and destination nodes)
Here is an example of information that you might see in the legend:
ETHER 00:00:10:44:36:12 (DOD IP)
The first item displayed (ETHER) is the highest (in the network stack)
decoded network protocol used for this destination. The number to the right
(00:00:10:44:36:12) is the IP address of the destination. The last item displayed
in parentheses (DOD IP) is the network service this source node is using to
communicate in this network connection. If the network service is a wellknown service such as telnet or ftp, then the service name appears inside the
parentheses. If the network service is not well-known, then its socket number
is displayed in the parentheses.
Other Top Talkers Not in Selected Minute
You may get more information from the Top5 View by clicking on a stacked
bar that contains a white stack. The white stack represents the top talkers that
occurred in a minute other than the selected minute. For example, if the
selected minute is 2:01, but you notice that there is a tall bar with a large white
portion that occurred at 1:30, you can click on the 1:30 bar to see who the top
talkers were during that minute. The stacked bar and the legend change to
represent the top talkers that occurred at 1:30.
Note If your graph is displaying stacked bars with large portions of white, it is
possible that the selected minute is not displaying the most active nodes.
9-9
Page 98

Monitoring Network Traffic
Who Are the Top 5 Talkers?
Others
The dark gray portion of the stacked bar represents a summation of all of the
other activity that occurred during that minute. There is no additional
information contained in this portion of the bar. It can be a useful indicator of
an overloaded network when what you see on the graph is large areas of dark
gray with no particular user causing a problem.
If your graph displays large portions of gray, selecting another parameter, such
as “Top Destinations”, may show different results. For example, if a large
number of nodes begin backing up to a single server, displaying the Top
Destinations graph would show the server as the “top talker”.
Note If your graph is only displaying “Other” data, there may be a problem with the
data sampler for this segment.
Top5 View Menu Items
The Top5 View has three menu selections. The functions of each are described
in the following table.
Table 9-1. Functions of the Top5 Menu
Menu Item Function
File Close: Closes the Top5 View window
View Displays a new graph for each attribute:
• Utilization%
• Frames/sec
• Broadcasts/sec
• Multicasts/sec
Locate • Locate End Node: Opens the Locate End Node dialog box.
• Locate Segment: Opens a topology map with the selected segment
highlighted.
Locating A Segment or End Node
The Locate menu item lets you select a specific node or segment. Select an
end node or segment from the list or enter the IP address of the node you want
to locate.
9-10
Page 99

Monitoring Network Traffic
Traffic Data Collector Settings
The located end node
or segment will be
highlighted in royal
blue in the topology
map.
Traffic Data Collector Settings
Starting with HP TopTools for Hubs & Switches version 5, you can collect data
from all segments in your network automatically, or collect data from selected
ports of a device (manual mode). With manual selection, you can also choose
the type of data to be collected, for example, Extended RMON (X-RMON) data
or just traffic data.
Setting the Traffic Data Collector to manual mode is advantageous if you have
a large network and don’t want to monitor every segment. You don’t have to
wait for a lengthy Topology process to complete in manual mode; you can
configure the specific segments you want to monitor, up to a total of 2000
segments.
To access the Traffic Data Collector Configuration, click on the Performance
button in the navigation frame. Select Traffic Data Collector Settings from the
menu. The Performance - Traffic Data Collector Settings page appears with
the Configuration tab displayed.
9-11
Page 100

Monitoring Network Traffic
Traffic Data Collector Settings
Figure 9-4. Traffic Data Collector Configuration Page
Nothing is displayed in the Traffic Data Manual Configuration table if Use
Discovery/Topology Data (Automatic) is checked.
Automatic Monitoring
If you want to enable Automatic monitoring, check the radio button labeled
Use Discovery/Topology Data (Automatic). The Traffic Data Manual
Configuration table will be removed and manual selection disabled. The
Traffic Data Collector automatically restarts and retrieves the segments to be
monitored from the information gathered during the Topology process.
Manual Monitoring
To use Traffic Data Collector in manual mode, check the radio button labeled
Use Selected Switch and Hub Ports (Manual). The Traffic Data Collector
automatically restarts and retrieves the segments to monitor from a topologyindependent database. The retrieved segments are displayed in the Traffic
Data Manual Configuration table.
Begin adding devices to the table by clicking on the Add Devices button at the
bottom of the page.
9-12
 Loading...