

Page 1

hp toptools 5.6
user guide
Page 2

toptools user guide
.
Notice Page
The information and specifications contained
in this document are subject to change
Hewlett-Packard makes no warranty of any kind with regard to this material, including, but not
limited to, the implied warranties of merchantability and fitness for a particular purpose.
Hewlett-Packard shall not be liable for errors contained herein or for incidental or consequential damages
in connection with the furnishing, performance, or use of this material.
This document contains proprietary information, which is protected by copyright. All rights are reserved.
No part of this document may be photocopied, reproduced, or translated to another language without the
prior written consent of Hewlett-Packard Company. The information contained in this document is subject
to change without notice.
Microsoft®, Windows®, and Windows NT® are either registered trademarks or trademarks of Microsoft
Corporation in the U.S. and/or other countries.
Pentium® is a registered trademark of Intel Corporation.
IBM and NetFinity are registered trademarks of International Business Machines Corporation.
Compaq and Compaq Insight Manager are registered trademarks of Compaq Computer Corporation.
Netware® and Novell® are registered trademarks of Novell Corporation.
Unicenter® and TNG® are registered trademarks of Computer Associates International, Inc.
SCO Unix® is a registered trademark of The Santa Cruz Operation, Inc.
Other brand and product names are registered trademarks or trademarks of their respective holders.
Hewlett-Packard Company 2002 All Rights Reserved.
Document Version 1.0
Hewlett-Packard Co.
10955 Tantau Ave.
Cupertino, CA 95014 U.S.A.
2
Page 3

toptools user guide
Preface
Toptools is a collection of applications and agents designed to provide device management of Hewlett-Packard
computing products. At the center of the toptools solution is a device management tool (referred to as the Device
Manager) that is designed to help you identify and diagnose network and system problems quickly using a friendly
and intuitive web-based interface. Additional “components” can be installed that provide management functions for
specific device types such as servers or hubs and switches.
This User Guide will provide instructions on the installation and use of toptools. For instructions on using HP
Toptools Enterprise Products, refer to the User Guide for each specific product.
Organization of this Guide
This guide introduces you to toptools and suggests ways in which it can ease your network and system management
tasks. It is organized into the following sections:
• Introduction provides an overview of toptools and describes its features.
• Installation provides a list of prerequisites and step-by-step installation instructions.
• Using Toptools describes how to use toptools to perform typical network management tasks.
• Information and Support provides remedies to common problems and information on how to get support. It
also gives web locations where you can find Hewlett-Packard computing product management-related
information.
• The Glossary provides definitions of common network terms.
New Features
This release contains changes to alerts as well as support for several new device types. For a more complete list of
changes refer to the readme file. (The readme file is available at the root level on the product CD or in the hptt
directory following installation.) Some of the new features are:
New devices and systems supported.
IA-32 Netservers running Windows or Linux
IA-32 Netservers running as “server appliances”
IA-32 Blade Servers running Windows or Linux
IA-64 servers running Windows or Linux
GSP cards on IA-64 and Blade Systems
In addition the latest Hewlett-Packard network switches, workstations, PCs, portable PCs, and blade server
chassis systems are now supported.
• Improved event management. A common setting is used to remove closed and deleted alerts from the alerts
database. The alerts database will now automatically reuse the freed space in the alerts database without the
need to compact the database.
• Training. Self-paced training is available on the HP Toptools CD at \Online Training\start.html or from the
Hewlett-Packard web site at ftp://ftp.hp.com/pub/toptools/Training/start.html
3
Page 4

toptools user guide
4
Page 5

toptools user guide
Table of Contents
Introduction ................................................................................................................... 7
What Can hp toptools Manage?................................................................................................................7
Architecture ...............................................................................................................................................8
Installation ................................................................................................................... 11
Hardware and Software Requirements ................................................................................................... 11
Management Server ......................................................................................................................................11
Recommendations for Managing Large Networks .........................................................................................13
Consoles........................................................................................................................................................13
Managed Nodes ............................................................................................................................................15
Installation Procedure.............................................................................................................................. 17
Using hp toptools........................................................................................................ 33
Navigating the hp toptools Console......................................................................................................... 33
The Navigation Panel.....................................................................................................................................34
The Device Selector.......................................................................................................................................35
The Alert Log .................................................................................................................................................38
Online Help ....................................................................................................................................................39
Applications, Actions and Settings .......................................................................................................... 39
Performing Actions on Devices......................................................................................................................39
Viewing Inventory Reports .............................................................................................................................51
Inventory Data Collection...............................................................................................................................51
Polling ............................................................................................................................................................52
Discovery .......................................................................................................................................................53
Auditing..........................................................................................................................................................53
Actions on Alerts............................................................................................................................................54
Internet & Email Services...............................................................................................................................55
Managing the Drivers/Firmware Version Database .......................................................................................55
Managing the TFTP Server............................................................................................................................56
Managing Toptools Services..........................................................................................................................56
Installing the Toptools MMC Snap-In .............................................................................................................56
Using the System Performance Advisor.................................................................................................. 57
Performance Button.......................................................................................................................................58
System Performance .....................................................................................................................................58
Standard Report ............................................................................................................................................58
Custom Reports.............................................................................................................................................58
Starting Performance Monitoring ...................................................................................................................58
Creating A Custom Group..............................................................................................................................59
Selecting A Group to Monitor.........................................................................................................................59
Configuring the Performance Advisor ............................................................................................................59
Deploying Agents...........................................................................................................................................60
System Prerequisites.....................................................................................................................................62
Performance Reports.....................................................................................................................................63
hp toptools for desktops ..........................................................................................................................68
Locating Personal Computers........................................................................................................................68
Updating Drivers/Firmware ............................................................................................................................69
Preventative Maintenance .............................................................................................................................72
5
Page 6

toptools user guide
hp toptools for servers ............................................................................................................................. 75
Obtaining Operational Status.........................................................................................................................75
Obtaining Software and Driver Information ....................................................................................................75
Finding a Bad Hard Disk Drive Using the Disk Locator Tool..........................................................................77
hp toptools for hubs and switches........................................................................................................... 78
Displaying Topology Maps.............................................................................................................................78
Monitoring Network Traffic Levels..................................................................................................................83
Information and Support ............................................................................................ 89
Online Support and Information ..............................................................................................................89
Telephone Support.................................................................................................................................. 89
hp toptools Documentation and Training.................................................................................................90
Performance and Troubleshooting Tips ..................................................................................................90
Glossary....................................................................................................................... 93
6
Page 7

toptools user guide
Introduction
Toptools is a web-based, device management tool that enables administrators and MIS managers to use a web
browser to obtain information about devices on their network. It provides a common management application for HP
personal computers, Netservers, HP-UX systems, Advancestack and Procurve hubs and switches, and LaserJet
printers as well as products from other vendors.
What Can hp toptools Manage?
Toptools provides critical network and systems management services to both HP and non-HP devices on the
network allowing administrators to quickly and easily determine the health and configuration of their network
resources through the following services:
• Asset Management. Toptools discovers and reports on all devices connected to the network (PCs, servers,
printers, networking devices) using automated discovery and inventory processes that save collected data to an
ODBC compliant database. Users can browse network resources and reports using a web browser to open a
Toptools console session, or a database application like Microsoft Access to merge data into more sophisticated
IS project and asset management databases. In addition, Toptools can be used with HP-UX ServiceControl
Manager (SCM) to provide additional management capabilities for HP-UX systems.
• Fault Management. Toptools receives, logs, displays, and acts on alerts from devices in your network, and
then provides the tools to help troubleshoot and resolve problems when they occur. For example, Hubs &
Switches Automatic Configuration Management can configure your Procurve switches to automatically send a
trap to the Toptools server when a traffic problem occurs. Toptools can be configured to send a page when the
alert is received. When paged, the administrator can log in using a web browser, get more details on the alert,
and then access the switch from the Toptools Device Selector to correct the problem by (e.g.) changing the
configuration of a port.
• Configuration Management. Using Toptools, administrators can directly access the configuration of critical
resources such as printers through HP Web JetAdmin, or distribute software such as drivers or BIOS to HP
personal computers and Netservers.
• Security Management. Toptools allows users to configure access to HP products through actions such as Lock
System for an HP Vectra, or configuring MAC address access to ports on HP networking devices.
• Performance Management. Toptools provides both network and system performance monitoring tools.
Toptools for Hubs & Switches offers the Network Performance Advisor and Traffic Monitor to view and advise
on network traffic. Toptools for Desktops agents provide Resource Monitoring tools that monitor and display
system resource utilization on PCs and generate alerts when thresholds are exceeded. Toptools contains the
System Performance Advisor which monitors systems utilization and generates systems utilization alerts for HP
and non-HP PC and server products at the individual device or group level.
Any device from any vendor can be managed, provided that the device is on a TCP/IP or IPX/SPX network and
running a management agent from one of the following industry standardized protocols: DMI, SNMP, WMI,
HTTP. The amount of management support provided by Toptools is determined by:
• HP Product. Toptools is designed to lower the cost of ownership of HP computing products by accessing the
manageability built into HP products. While Toptools will provide a strong management solution for products
from other vendors, Toptools will provide the most extensive detail on HP products.
• Agent support. Toptools provides the best support to new HP products running current HP management
agents. The more agent standards that are supported by a device the more data Toptools can collect. For nonHP systems, the level of industry standard compliance can also affect the amount of information that Toptools
can access.
7
Page 8
toptools user guide
Toptools provides specific management to the following HP products:
• HP Vectra and Brio Desktops
• HP Kayak and Visualize Workstations
• HP Omnibook Notebooks
• HP Netservers
• HP Blade Servers
• HP Power Bar cabinets
• HP Procurve and Advancestack networking devices
• HP LaserJet and JetDirect products
• HP Jornada PC Companions
• HP SureStore products
• HP Network Attached Storage (NAS) products
• HP-UX systems
Architecture
Toptools collects and then stores information about your network into an ODBC compliant database (MEDS) on a
web server. Toptools uses the web server to authenticate and present the information to Toptools consoles. The
Toptools console, which presents the data to the user (network administrator), can be launched from any station on
your network running a web browser supported by the Toptools application.
The web browser (Toptools console) and the web server use the HTTP protocol, a standard used by the Internet that
provides extensible mechanisms to authenticate a user and offers various encryption options to secure the
communication. The use of a single protocol from the console to the management server simplifies remote
connections through firewalls and minimizes security risks.
Toptools Configuration
Toptools communicates with managed devices using industry standard protocols: TCP/IP, IPX/SPX, DMI, WMI,
SNMP, and HTTP. The protocols used to discover, inventory and manage each device will depend on which
protocols the managed device supports. For example, Toptools will typically use IP, SNMP, and HTTP to
communicate with a Procurve switch, IPX and SNMP to manage a Netserver running Novell NetWare, and IP and
WMI to manage a new Windows 2000 HP Kayak workstation. The Toptools discovery process, one of the several
processes that are part of the Toptools application, automatically detects which protocols are supported and saves
that information to the database.
8
Page 9

toptools user guide
toptools Operating Components
A number of Toptools components run continuously on the management server, gathering data in the background
even if no user is logged on. The following background components operate on a schedule (some schedules are userconfigurable).
• The Toptools Services component is a continuously running process that supports the Toptools
background components. It starts up when the system boots, without any user log-on. Toptools Services
provides the following:
♦ Start up of configured Toptools components when the system boots, including dependency
checking.
♦ Scheduling of components at specific times of day, or at specified time intervals.
♦ An interface which lets you start, stop and pause individual Toptools services (similar to the
Windows NT Services application, servman.exe).
• Discovery services components run as background services to discover network connected devices
(discovery) and their relationships (topology). Discovery services run in one or more processes and are
coordinated by a Discovery Control component, which runs under the Toptools services. In addition, if a
device sends a trap (SNMP) or an alert (DMI or WMI) to the Toptools device manager, the device will
automatically be added to the discovery database if the address is not already present.
• Database Server services automatically maintain the device database.
• Event Monitor/Event Viewer services run continuously to collect, log, and display device events.
• Polling services request responses (ping) from devices to determine operational status. These services
operate on user-configured schedules.
• System Performance Advisor provides monitoring and threshold alerts for CPU, memory, disc I/O, and
storage utilization. This feature, which is available for PCs and servers running Windows operating
systems, requires the installation of Performance agents on managed systems.
• Toptools for Hubs & Switches provides services such as traffic data collector that are also controlled by
the Toptools Services Control. Refer to the HP Toptools for Hubs & Switches User Guide for more
information.
• HP Web JetAdmin. Selected as a component during installation, HP Web JetAdmin may work
independently of Toptools, or integrate with Toptools to manage HP printing products. For more
information, refer to Web JetAdmin user documentation.
As a system administrator, you can stop and restart these services from within Toptools. Online help provides
detailed instructions for these procedures.
9
Page 10

toptools user guide
toptools Databases
• The Device Database (MEDS.mdb). The Managed Elements Data Store (MEDS) provides persistent storage
for information about the managed devices. The discovery and inventory programs put data into or ‘populate’
MEDS, including a list of devices and their attributes (network address, object type, name, etc.). MEDS uses a
Microsoft Access database, and provides read-only access through ODBC.
• The Alert Database (Alerts.mdb). This database is an ODBC-compliant database used to store alerts received
by Toptools.
• The Software Revision Management Database (RMDB.mdb). This database stores information about
software updates for HP personal computers, Netservers, and Procurve networking devices.
• The System Performance Advisor Database (perfmon.mdb). Stores information collected by the System
Performance Advisor to provide trending information.
Toptools for Hubs & Switches creates files that are used to track traffic and topology information collected from HP
Procurve and Advancestack devices.
- NOTE -
IMPORTANT: Do not attempt to modify MEDS or any other Toptools database! This will result in failure of
the Toptools applications. To use Toptools databases for other purposes, make a copy of the database
and modify the duplicate in another location!
10
Page 11

toptools user guide
Installation
This section describes the requirements and installation of Toptools.
- NOTE -
Refer to the Toptools README file for changes or additions
to the installation instructions in this User Guide.
Hardware and Software Requirements
Toptools consists of three main components:
• Management Server
• Consoles
• Managed Nodes
For successful installation and operation of Toptools, you must verify that the station on which you will install the
Toptools server meets or exceeds the minimum requirements as specified below for both the Toptools server and
Toptools consoles.
For best results, managed devices should be configured with management agents prior to installation so that
Toptools can discover them during the first discovery cycle.
Management Server
The Toptools server setup program (installation wizard) performs a thorough check of your system to verify that the
minimum requirements listed in the following tables are met prior to installing Toptools software. For software
requirements, the Toptools installation wizard may prompt you to install missing components, or in some cases, it
may offer to install them for you.
To reduce the amount of time required for installation, you should verify that your system meets the minimum
requirements listed below. Some items, such as an unsupported Operating System type or insufficient system access
privileges, will cause setup.exe to exit without installing Toptools.
Hardware requirements:
Processor Intel Pentium 266MHz or better
Memory
Hard Drive Minimum 2 GB hard disk with 100-400 MB (depending on components
Video Super VGA (16 bit color) or better
Network Adapter Required. Any supported by system
Mouse Required. Any supported by system
• 128 MB RAM or better
• Paging file of 150 MB or better
installed) available before installing Toptools
11
Page 12

toptools user guide
Networking requirements:
Access
• Local Administrator (if installing in a Workgroup environment)
• Domain Administrator if installing into a Windows NT or 2000 Domain.
IP Addressing
IPX Addressing Optional. Microsoft IPX/SPX and Netware Client Services are needed to
Required.
• If using DHCP, IP address for the Toptools server must be ‘reserved’.
• Verify that the IP hostname matches the hostname entry for the IP
address in the DNS server. This may be accomplished by running the
program nslookup.exe.
manage Novell Netware clients and servers that are not running TCP/IP. If
not installed, you may add this component after Toptools installation.
Installing Toptools on a system participating in a Windows domain is recommended because:
• Access through IIS is available through Windows user accounts and may be configured through the domain.
• WMI management security uses Windows user accounts to grant or deny access. The Toptools admin account
in the domain typically has sufficient access to WMI data on systems within the same or trusted domains. If
you install into a workgroup, you will need to explicitly grant access permission to the Toptools admin account
on each WMI based system you wish to manage.
Software requirements:
Operating System
Service Pack
SNMP Required. If not installed, you will be prompted during installation to provide
• Windows NT 4.0 Server or Workstation
• Windows 2000 Professional or Server editions
Required: Windows NT SP 5 or 6a for NT. If neither of these are
installed, the Toptools installation will install SP 6a.
the Operating System installation CD. Windows NT Service Pack 6a will be
reapplied after installation of SNMP.
Web Server
Required: Microsoft Internet Information Server (IIS) or Personal Web
Server.
• Windows NT – included as part of Toptools installation
• Windows 2000 – you will be prompted for the Operating System
installation CD if IIS is not detected.
Most required and optional software is either included in the Operating System (such as WBEM in Windows 2000)
or provided in the Toptools installation such as Microsoft Internet Explorer 5.0, Windows NT Option Pack
components or WBEM (for Windows NT). Only the Windows NT SNMP service and the Windows 2000 SNMP
and IIS services will require that you provide a CD, and you will be prompted by the installation wizard for the CD
if necessary.
The Toptools server system should be configured with a paging file large enough to accommodate the size of the
hard drives, operating system, and web server, plus Toptools applications. Typically, 150 MB paging file is
sufficient. Refer to Windows documentation for more information on optimizing and managing virtual memory.
12
Page 13

toptools user guide
Recommendations for Managing Large Networks
If you are managing large networks (greater than 5000 devices) you should increase the capabilities of the Toptools
server. An Intel Pentium 4 with a processor speed > 1.3 GHz and an additional 256 MB of RAM for every 10,000
nodes (e.g. HP Vectra VL800). The faster the processor and more RAM the better your performance will be.
If you do not require the Hubs and Switches component, do not install it. If you need to install the Hubs and
Switches component, the following is recommended:
Set Traffic Data collection to Manual mode. The traffic monitoring capabilities of the HP TopTools Traffic Monitor
application can require a lot of system resources. Therefore, in large network environments, it is suggested that you
manually select the points at which you would like to collect traffic data. Usually, you will want to collect traffic
data on your network backbone segments and on segments with heavily utilized servers.
Traffic Monitor can use the HP X-RMON functionality built into HP Procurve and HP Advancestack and even HP
Ethertwist network devices to provide detailed information on who is using network segments. It also uses standard
traffic counters to provide basic traffic levels on network segments. Traffic Monitor can realistically monitor up to
200 network segments using the HP X-RMON technology. It can monitor up to 1800 additional segments using
standard traffic counters. You should use the following instructions to turn on Manual traffic data collection and
configure which network segments will be monitored with HP X-RMON and which additional segments will be
monitored using standard traffic counters.
1.
On the Toptools page, select Performance ->Traffic Data Collector Settings
2.
On the Performance – Traffic Data Collector Settings
page select the “User Selected Switch and Hub
Ports (Manual)” setting
Use the Add Device(s) button to add the devices on which you would like to collect Traffic Data 3.
4. On each device, select the ports on which you would like to collect Traffic Data by expanding the device
and then selecting either the Traffic Stats or the HP X-RMON check box for the desired ports.
Consoles
Because Toptools is a web-based application, any system running a supported web browser may act as a Toptools
console. For this reason, it is important to consider security when configuring console access to Toptools.
When installing the Toptools server, the installation wizard will install Microsoft Internet Explorer 5.0 if absent or
an earlier unsupported version is detected. You may use the Microsoft Internet Explorer installation files on the
Toptools CD to install a supported browser on additional systems on your network.
13
Page 14

toptools user guide
The following table provides the console requirements:
Supported Browsers Windows:
Resolution Minimum: 800 X 600 X 256 colors
• Microsoft Internet Explorer 4.01 sp2 (JVM 2436)
• Microsoft Internet Explorer 5.0 (JVM 3167)
• Microsoft Internet Explorer 5.5
• Microsoft Internet Explorer 6.0
• Netscape Navigator 4.61
• Netscape Navigator 4.72
Windows 2000:
• Microsoft Internet Explorer 5.01 (JVM 3234)
• Netscape Navigator 4.72
HP-UX 10.20 and 11.x:
• Netscape Navigator 4.51 (use Sun fonts)
• Netscape Navigator 4.61 (use Sun fonts)
Sun Solaris 2.6:
• Netscape Navigator 4.51
• Microsoft Internet Explorer 5.0
Settings
• Always accept cookies
• Always refresh new page
• Exclude using a proxy to access your Toptools server
Browser settings are extremely important. Set your browser to exclude using a web proxy to access your Toptools
server. This can be done for your entire DNS domain or just for the Toptools server depending on your network
requirements. (Example: For Internet Explorer 4.x go Tools => Internet Options => Connections => LAN
Settings => Bypass proxy box).
Also, be certain that your browsers (consoles) are configured to use the same security mechanisms as the Toptools
server. For example, your browser console must be prepared to use SSL if the web server on the Toptools server is
configured to use Certificate Authentication. If you have enabled Windows NT Challenge Response (Windows NT)
or Integrated Windows Authentication (Windows 2000), the user at the browser must be prepared to supply a valid
Windows user name and password.
When using Netscape, the “afc11.zip” file must be present in the java\classes directory. Toptools will sense the
presence or absence of this file the first time you connect to it via Netscape and walk you through installation of this
file. Do not unzip it.
When Toptools is being accessed from a console running unix:
• replace the HP fonts with Sun fonts by setting the environment variables for the session by typing:
MOZILLA_JAVA_FONT_PROPERTIES=/opt/netscape/java/classes
export MOZILLA_JAVA_FONT_PROPERTIES
• ensure that the "afc11.zip" file resides in the =/opt/netscape/java/classes directory.
If using Netscape Navigator, you must configure the Web server to use Basic Authentication. Refer to the
Application Note “HP Toptools Security” for more information on configuring security for the Toptools application.
During installation of the Toptools server, a shortcut to a console session is placed on the desktop of the Toptools
server.
To start a remote console session from another system, open the following URL:
http://Toptools_Server_Host_Name.company.com/hptt
the valid IP hostname resolved in your DNS for your Topt ols server o
where Toptools_Server_Host_Name.company.com is
-or-
http://#.#.#.#/hptt where #.#.#.# is the IP address of the Toptools server.
14
Page 15

toptools user guide
Managed Nodes
- NOTE -
You must have agents (Toptools, SNMP, DMI, WMI or Webagent)
running on managed devices to provide management information
to Toptools.
Toptools will attempt to discover and identify any devices connected to your network using TCP/IP, IPX/SPX, or
Windows ‘Network Neighborhood’ discovery. While Toptools will make an entry for a device that responds to
discovery, Toptools cannot identify, inventory, or manage devices that do not have a management agent
implemented on them. For the best results, all devices (both HP and non-HP) should have their most recent
management agent installed.
Managing hp computing products
HP computing products support a variety of agents that are provided free-of-charge.
• hp Personal Computers. HP personal computer products (HP Vectra, Kayak, Omnibook, Visualize, and
Brio) must be running a Toptools for Desktops, Toptools for Notebooks, Toptools for Visualize, or
Toptools for Brio agent respectively which provide DMI or WMI support depending on the version of the
agent and model of the product. Once installed, Toptools can identify, inventory, provide detailed property
pages, run management actions, distribute software and automatically receive and process alerts from these
products. Most HP personal computers come equipped with Toptools agents already installed. To check
for update information, refer to http://www.hp.com/go/kayaksupport
http://www.hp.com/go/vectrasupport
. To download agents, visit the Toptools web site at
or
http://www.hp.com/toptools.
• hp jornada PC Companions. These products (also referred to as “Handheld PCs” or “PalmTops”) are
manageable by Toptools when they are docked to an HP personal computer running the Toptools for
Desktops and PC Companion Desktop DMI agents. Upon docking, the PC Companion Desktop DMI agent
downloads an agent to the Jornada called the PC Companion agent. To download the Toptools for
Desktops and PC Companion Desktop DMI agents, go to the download page at the Toptools web site
http://www.hp.com/Toptools.
• hp netservers. To use Toptools to manage HP Netservers, HP Netserver Agents (Toptools for Servers
agents) must be installed on the Netservers. These agents support both SNMP and DMI and enable
Toptools to identify, inventory, poll, manage, and automatically receive and process alerts from HP
Netservers. In addition, HP Netservers are associated with the Toptools Remote Control card accessory if
detected. The Toptools Remote Control card is managed through a firmware agent that uses SNMP and
webagent technology. Instructions for installing HP Netserver (Toptools) agents is provided in the
Toptools for Servers Administration Guide and on the Net Server Navigator CD. The latest information and
downloads can be obtained at http://www.hp.com/toptools
.
• hp procurve and advancestack Hubs and Switches. HP networking devices are managed using both
SNMP and webagent technology provided in the device firmware. This software is included with the
product and enabled during product installation. Additional information is provided in the Toptools for
Hubs & Switches User's Guide and on the Toptools for Hubs & Switches CD. The latest information can be
obtained at http://www.hp.com/rnd/support/support.htm
.
• hp-ux systems. HP-UX systems can be managed using DMI and SNMP technology. Additional
management features are available when Toptools is used together with an HP-UX SCM (Service Control
Manager) Server.
• hp LaserJet Printers. HP LaserJet and JetDirect products are supported through integration with HP Web
JetAdmin which is included on the Toptools CD. To manage HP LaserJet products, the JetDirect interface
must be installed. JetDirect uses SNMP and webagent technology on the firmware of the JetDirect card.
Once enabled and configured, Toptools and Web JetAdmin provide inventory, property page, firmware
update, status monitoring and alert reception functions for HP printing products.
• System Performance Advisor. Toptools provides Performance Agents that may be installed free-of-
15
Page 16

toptools user guide
charge on HP and non-HP systems.
If you want to use the System Performance Advisor to monitor performance on Windows systems, you will need to
install performance monitoring agents on the systems to be monitored. The installation of these agents does not need
to be done before you install Toptools. Refer to the online help topic "Performance Agent Deployment" for
additional information.
Note: The number of devices that you can monitor using the System Performance Advisor will vary depending on
the capabilities of the Toptools server and your network configuration. The performance agents utilize about 2% of
the CPU availability on a typical monitored Pentium-based system.
Other HP products such as HP-UX workstations and server and networked attached storage are also managed by
Toptools. For more information, refer to your product’s documentation.
Managing Non-hp products
Devices must be running agent software provided by their manufacturer (e.g. SNMP support enabled in Cisco
routers) or by another provider (e.g. Microsoft SNMP services installed on a non-HP server or the Intel LanDesk
client installed on a non-HP PC). In all cases, the agent technology must adhere to industry standard DMI, SNMP,
WMI, or HTTP. If a device supports more than one protocol, it will be managed using all protocols supported.
Toptools will attempt to collect and display information using whichever protocol is available. The table below
depicts what level of support is provided to devices supporting each of the listed protocols:
Toptools Services SNMP v.2 (MIB-II) DMI 2.0 WMI HTTP
Discover Yes Yes Yes Yes
Identify Device Type Device Type and OS Device Type and OS No
Polling Yes Yes Yes Yes
Inventory Yes Yes Yes No
Property Pages Yes Yes Yes
Actions Toptools generic
Alert reception (1) (2) (3) N/a
Software Distribution No No No No
Toptools generic plus
Power On (4)
Toptools generic Toptools generic
Link to webagent
page (5)
‘Toptools generic’ refers to non-device specific actions such as Add to Custom Group, Delete, etc.
(1) SNMP traps sent to Toptools will appear with the system object identifier (a number string). Toptools provides a utility that
compiles proprietary SNMP MIBS to load trap definitions into Toptools. Once loaded, SNMP traps from non-HP devices
(such as Compaq servers) or SNMP trap forwarding applications (such as HP ManageX or Microsoft BackOffice) will be
recognized by Toptools and displayed with user friendly descriptions within the Alert Log. In addition, these alerts will be
handled by other Toptools services such as Actions on Alerts and the Most Frequent Alerts Report.
(2) Toptools uses the standard DMI 2.0 mechanism to ‘subscribe’ for DMI alerts. If you have a non-HP PC or server that has a
DMI agent and uses DMI to send alerts, Toptools will automatically receive and process alerts from the PC.
(3) WBEM alert handling has not yet been standardized by the DMTF. Therefore, WMI alert handling is supported for HP PCs
only. Other vendors like IBM may use another protocol (e.g. SNMP) to send alerts. In this case, the system would be
managed using both SNMP and WMI.
(4) Power On will work with systems that support standard Magic Packet technology.
(5) If a device supports a webagent technology and another technology, such as WMI, Toptools will create a link to the
management home page (webagent) and will also generate generic Toptools property pages. Toptools automatically
discovers webagents (or web servers) listening on port 80 (Device Home Page) or ports 280, 411, 2301, or 6500
(Management Home Page). The management URL for a specific device may be manually set using the Device
Communication dialog.
16
Page 17

toptools user guide
Installation Procedure
This section will provide step-by-step instructions on installing a Toptools server on a Windows NT or 2000 system.
- Note -
If you upgrade from a version of Toptools earlier than 5.0, the installation wizard will offer to
uninstall the earlier version for you. If you choose not to uninstall the earlier version, the
installation process will halt.
If you are uninstalling a version earlier than Toptools 5.0 you will lose settings and device
information in the Toptools databases. This means that you must rediscover your network
and reenter any configuration or supplementary information before using Toptools.
If you are upgrading from Toptools 5.0 or higher, you can elect to save database information
during the uninstall process. This information can be restored for use with newer versions
of Toptools. Refer to the uninstallation and installation procedures for more information. If
you do not save information during the uninstall process you will lose configuration and
database information. Check the readme file and the Toptools web site for the latest
information.
You can install the Toptools server from the Toptools CD ROM (run CD:\setup.exe) or from the Toptools web site.
The web site is located at http://www.hp.com/toptools. Go to the download page and follow the directions
provided. The Toptools installation wizard (setup.exe) is an extensive program designed to make the Toptools
installation process friendly and successful. It performs the following basic steps:
1. Checks your system for necessary hardware, operating system and web server components to determine which
if any of these components need to be installed, and then reports on steps that must be completed by the user or
the installation wizard.
2. Prompts the user for desired Toptools components.
3. Installs prerequisite software and Toptools applications while continually displaying status.
The complete installation process including prerequisite software may take up to 45 minutes depending on the
number of components to be installed and the number of reboots necessary. Toptools uses an ‘auto logon’ feature
that automatically logs the user into the system and continues the installation process following a required reboot.
Before running setup.exe, verify the following:
The system meets the minimum hardware and networking requirements as specified in the previous section
and the readme file.
The Operating System is Windows NT 4.0 Workstation or Server, or Windows 2000 Professional, Server,
or Advanced Server edition.
You have a Windows NT Operating System installation CD if installing on a Windows NT system that
does not already have the Microsoft SNMP service installed.
You have a Windows 2000 Operating System installation CD if installing on a Windows 2000 system that
does not already have the Microsoft SNMP service and/or Microsoft IIS already installed.
The following steps show dialogs from a variety of systems. The dialogs you see and the exact procedure you will
follow will vary depending on the operating system, existing software environment, and the components you select.
For information on upgrading Toptools or installing Toptools on non-English versions of Windows, refer to the
readme file.
17
Page 18
toptools user guide
Step 1: Close other applications and run CD:\setup.exe or begin the installation
process from the web site download page.
You will see the following dialog:
Step 2: Click Next.
The Toptools installation wizard will check your system for requirements and installed components and then report
on the results. You may see a screen similar to the following:
This example shows a Windows 2000 Professional Workstation that has met the necessary hardware and networking
requirements, but needs to install both SNMP and IIS services. As shown in the dialog above, the wizard will
indicate which components are needed, whether a CD (or reboot) is required, and the order in which the components
will be installed.
18
Page 19
toptools user guide
Step 3: Select Toptools components and destination directory.
The Toptools Component Selection dialog allows you to choose which Toptools components you would like to
install in addition to Toptools core services such as discovery, inventory, and event management. You may elect to
add components at another time by running install again.
Hubs & Switches Installs Toptools for Hubs & Switches applications like Network Performance
Advisor and topology mapping. These applications manage HP Procurve and
Advancestack products.
Netserver Components Adds software needed to manage HP Netservers and Toptools Remote Control
cards.
Desktop PCs Provides specific management of HP personal computer products. Functions like
software version control and security actions are added to the Toptools console.
Web JetAdmin for Printers By selecting this option, the Toptools installation wizard will either install Web
JetAdmin server on the Toptools server and integrate it with the Toptools console,
or link to a Web JetAdmin server on another system.
At this point if you are not installing on an NTFS formatted drive, the wizard will inform you that the Toptools file
system will not be as secure as possible. You then have the opportunity to select an NTFS drive if you require
additional security. Without NTFS Toptools cannot regulate user roles. On non NTFS installations, all users have
Toptools admin capabilities.
19
Page 20
toptools user guide
Step 4: Integrating web jetadmin.
If you selected Web JetAdmin for Printers in the component selection dialog, Toptools will first check to see if
there is already a Web JetAdmin server installed on the local system. If not, it will prompt you to perform a local
installation or link to a remote Web JetAdmin server on the network.
HP Web JetAdmin supports a number of platforms including Unix. If linking to a remote server, the Toptools
installation wizard will prompt you for the hostname or IP address of the remote server and the port used by Web
JetAdmin. The default port is 8000. If you specified a different port when installing Web JetAdmin, you will need
to enter it.
20
Page 21
toptools user guide
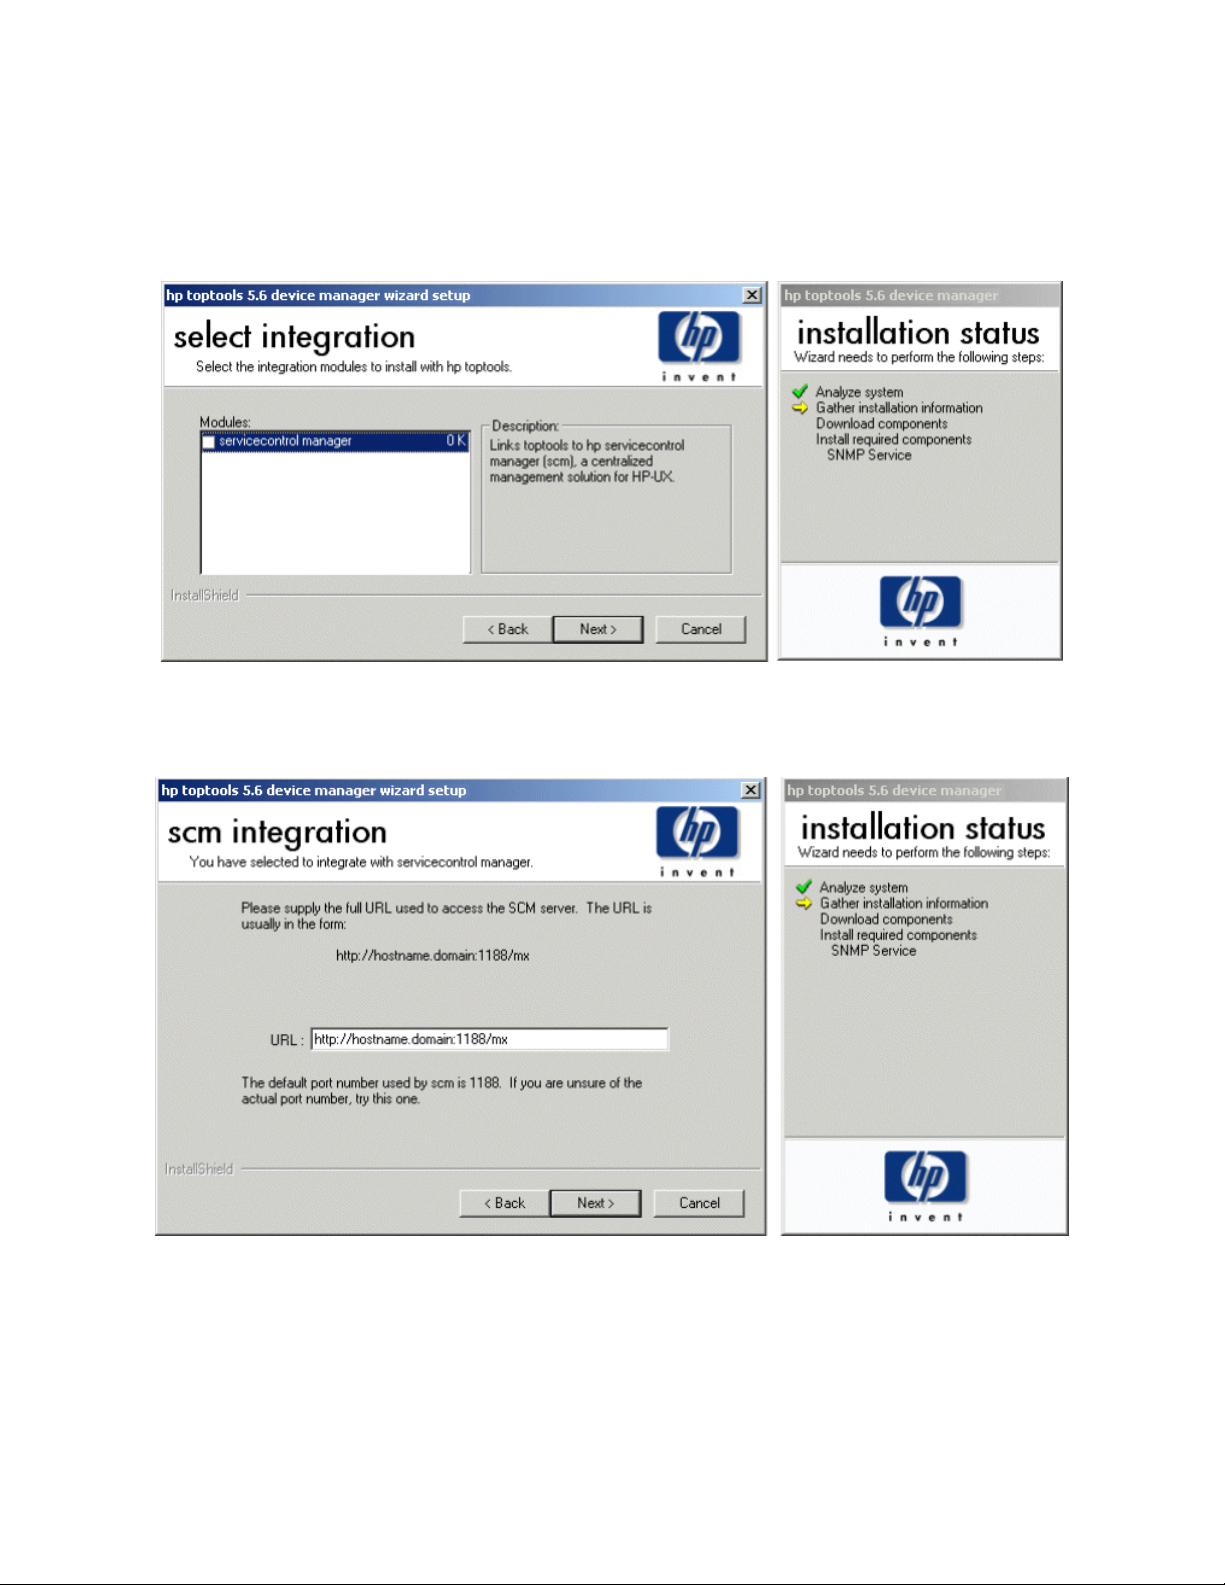
Step 5: Integrating scm.
If you want to link Toptools with a Service Control Manager (SCM) installation you can do so during installlation.
(Note you can also add a link to an SCM server at any time after installation by clicking Settings, and Integration.)
Check the servicecontrol manager box on the Select integration dialog. This will cause the scm integration dialog
to be displayed.
Enter the URL and port (normally 1188) to be used. This will cause a “Launch ServiceControl Manager” action
being added to the action menu for all HP-UX and Linux systems.
21
Page 22
toptools user guide
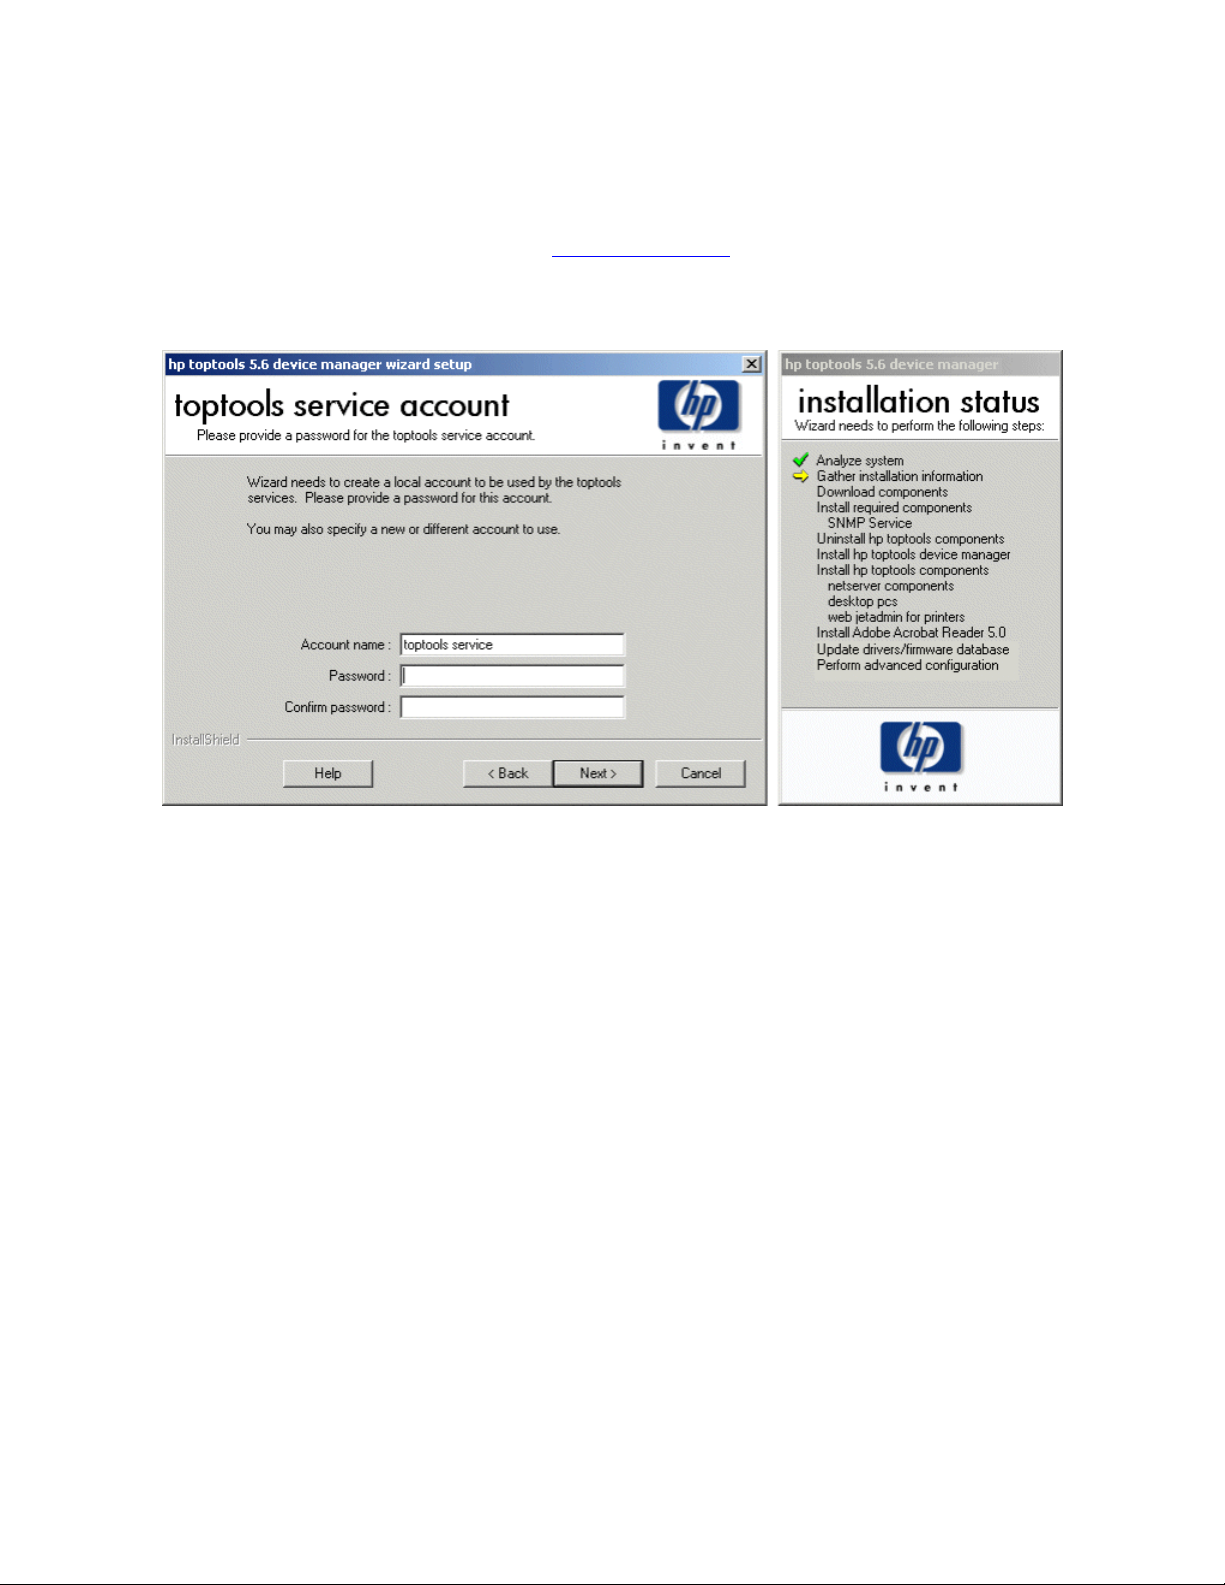
Step 6: Create toptools service account.
Toptools uses a local Windows user account “toptools service” to provide system access to the Toptools services. It
also creates three user groups called “toptools”, “toptools operators” and “toptools admins”. These Windows user
groups are used to control access to the Toptools application when Toptools is installed onto an NTFS partition.
Refer to the White Paper “HP Toptools Security” (www.hp.com/toptools) for more information.
If there was a previous installation of Toptools on the local Windows system you must use the same Toptools
service account password for each installation.
22
Page 23
toptools user guide
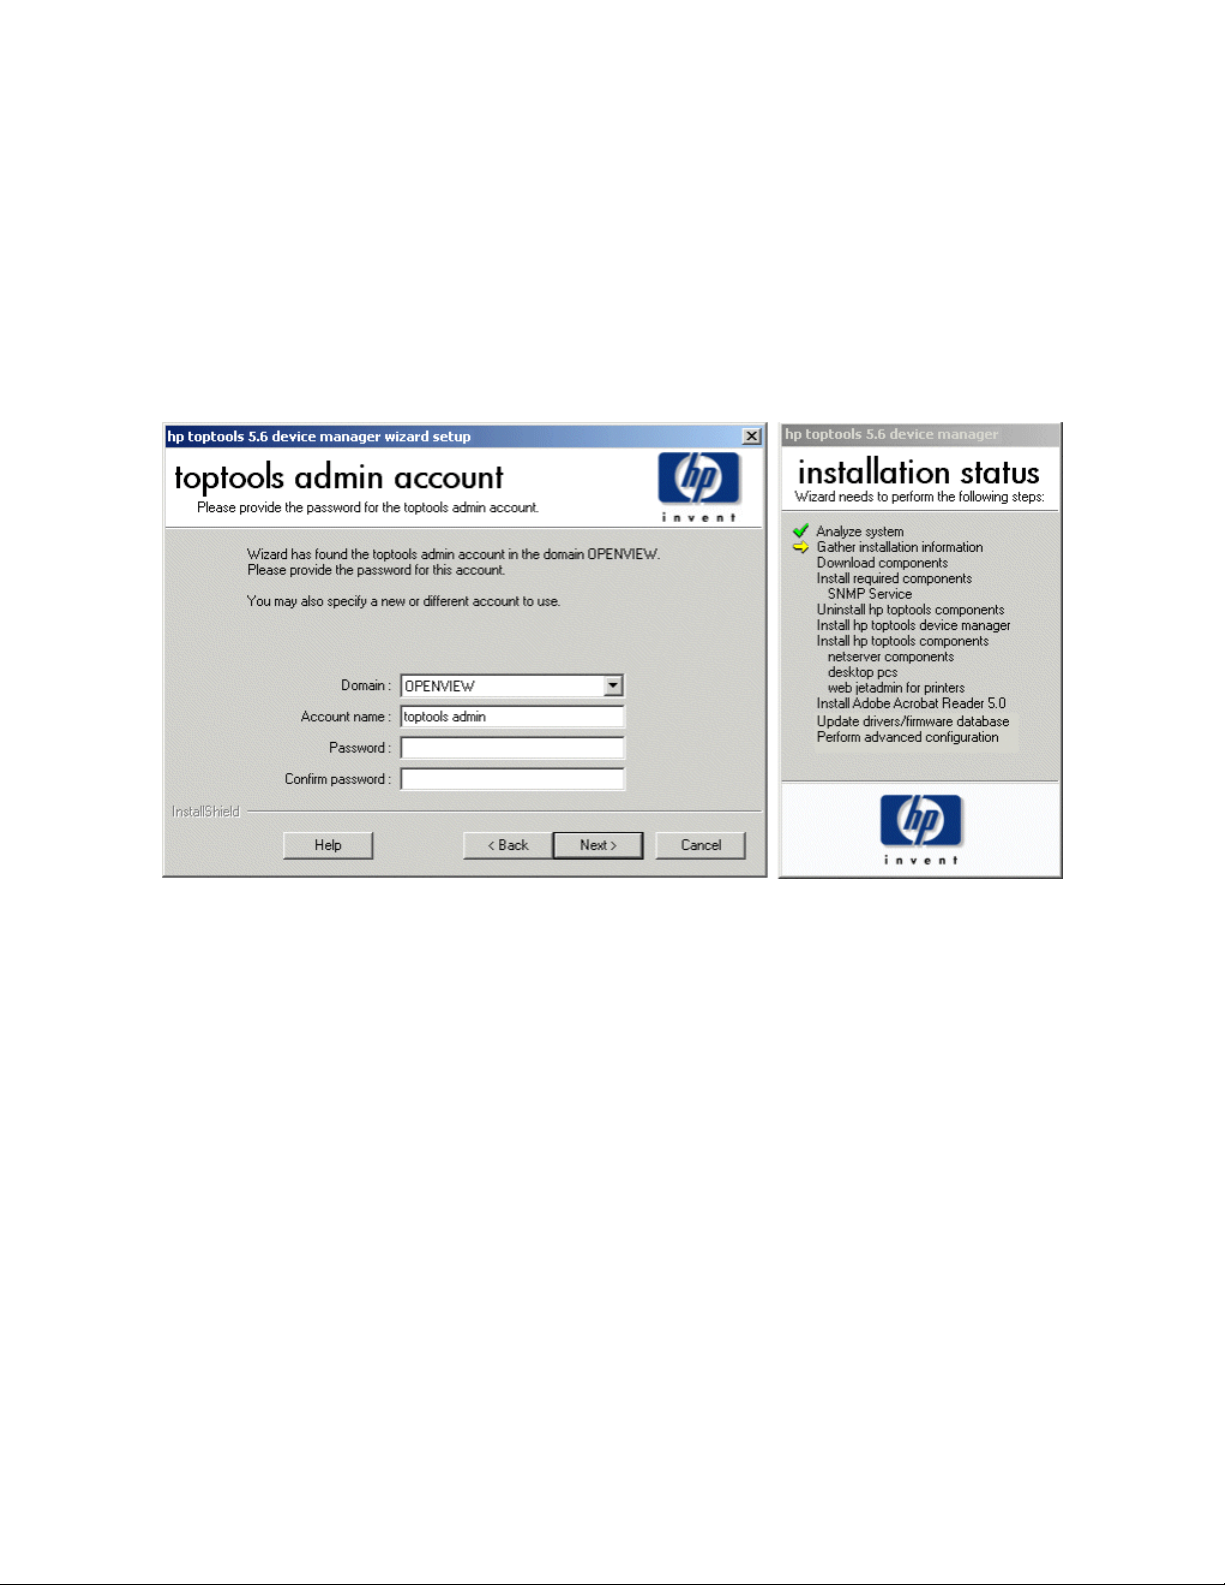
Step 7: Select toptools admin account.
Toptools uses a domain Windows user account “toptools admin” to provide domain access to managed systems. If
the Toptools system is part of a workgroup and is not part of a domain, a local account will be created. If the system
is part of a domain but you do not have domain admin privilages, a domain level admin account and password will
be configured in Toptools, but the domain level “toptools admin” account will not be created. You will not be able
to access all Toptools features until the domain level “toptools admin” account has been created on the domain by
someone with domain admin capabilities. Following installation refer to the Installation help topics for more
information.
If there are previous or multiple installations of Toptools within a the Windows domain you must use the same
toptools admin account password for each installation.
23
Page 24
toptools user guide
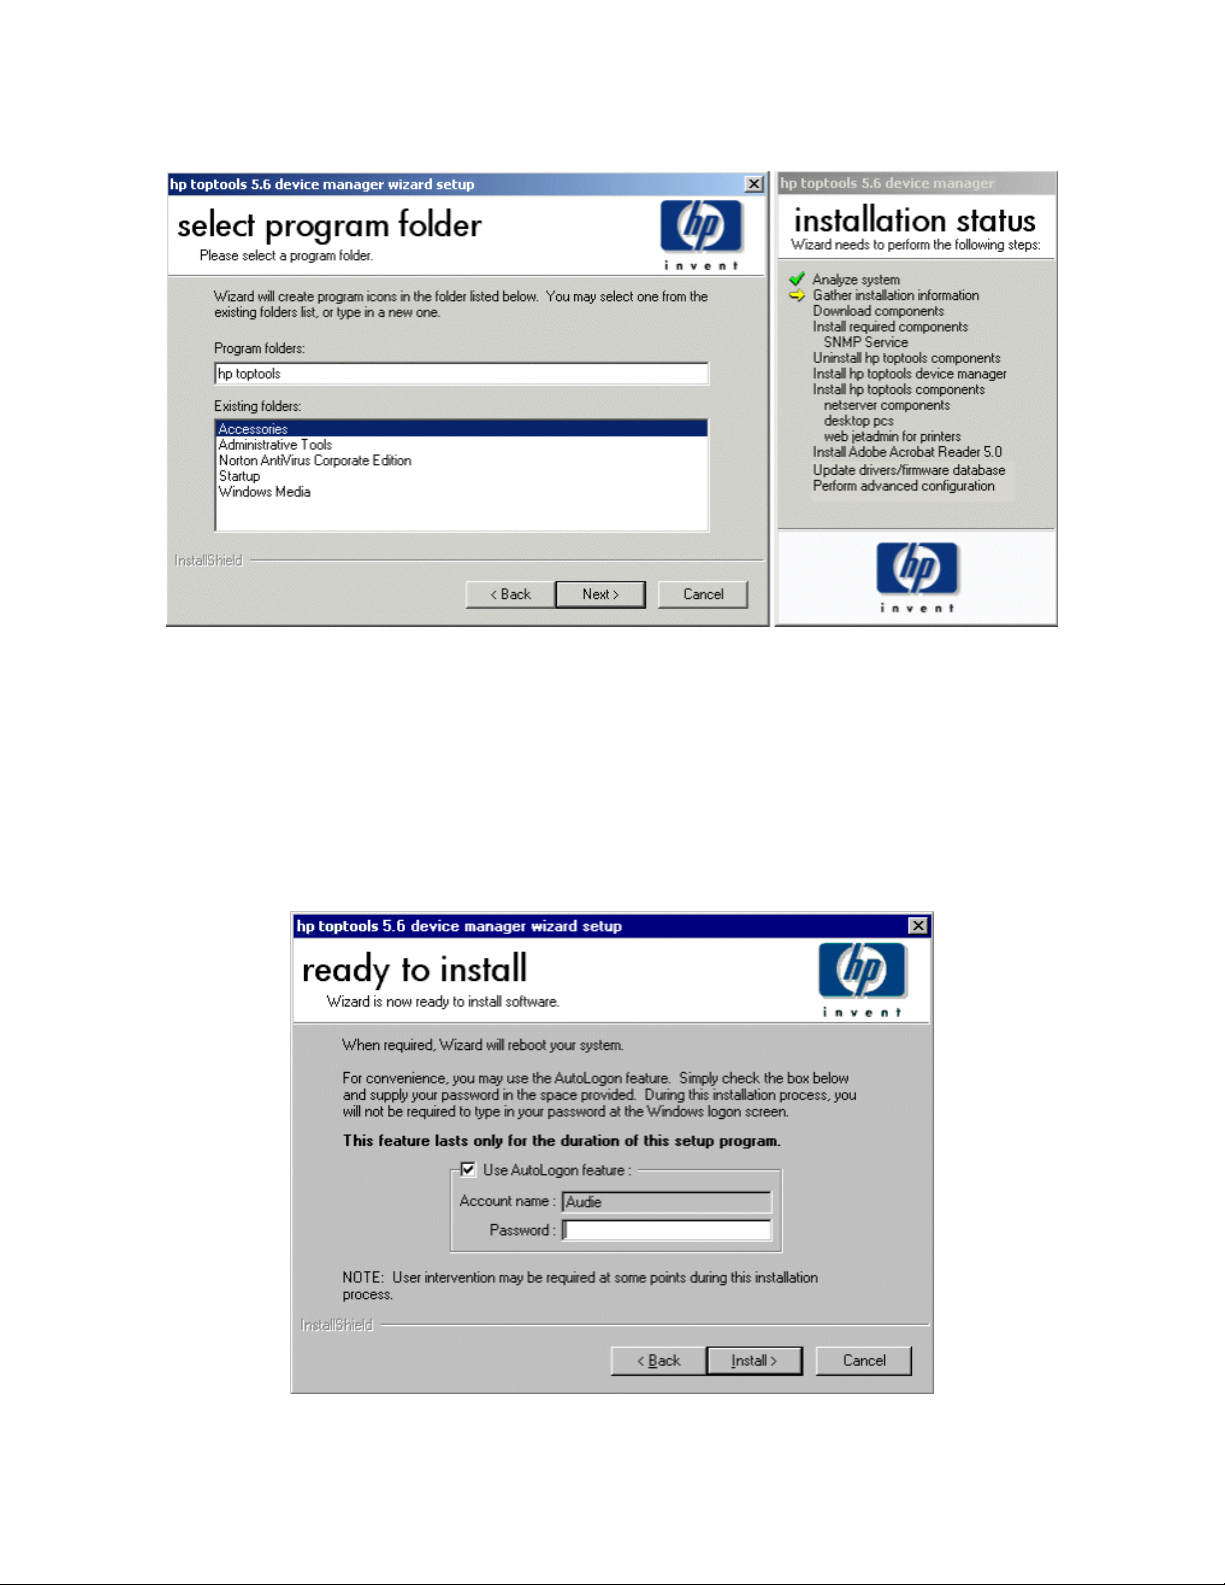
Step 8. Select the hp toptools program folder.
Step 9: License agreement and warranty.
Software license and warranty notices will be displayed. Clicking Yes will indicate that you have read and accept
the terms.
Step 10: Enable auto-logon feature.
The auto-logon feature allows the installation wizard to reduce the amount of interaction required during installation
on NT systems by automatically logging back into the system following a required reboot. This is not required on
Windows 2000 systems.
24
Page 25
toptools user guide
Enter your account information. The account should be the same account used to launch setup.exe (and have
administarative access to system). Account information is temporarily stored in the Windows registry and is
removed when installation is complete to protect the security of your account.
Step 11: Installation wizard installs software and displays progress. Respond to
requests for information or insertion of a CD.
If you are installing from the web, the required components will be downloaded and saved on your hard disk for
installation. A dialog will show you the status of the download process. If you cancel the download, a link to the
Toptools website will be provided to allow you to order a CD.
Once the files have been downloaded or if you are installing from a CD, you will then be guided through any needed
system software installation. The message window on the right shows the status of the installation process. The first
step will be the installation (if required) of Windows components. Once this is complete the Toptools components
that you have selected will be installed.
You may be prompted (depending on your environment and selections) for information or an operating system CD.
For example, on NT systems the Windows Operating System installation you will need the CD for SNMP and/or IIS
if these services have not already been installed.
25
Page 26
toptools user guide
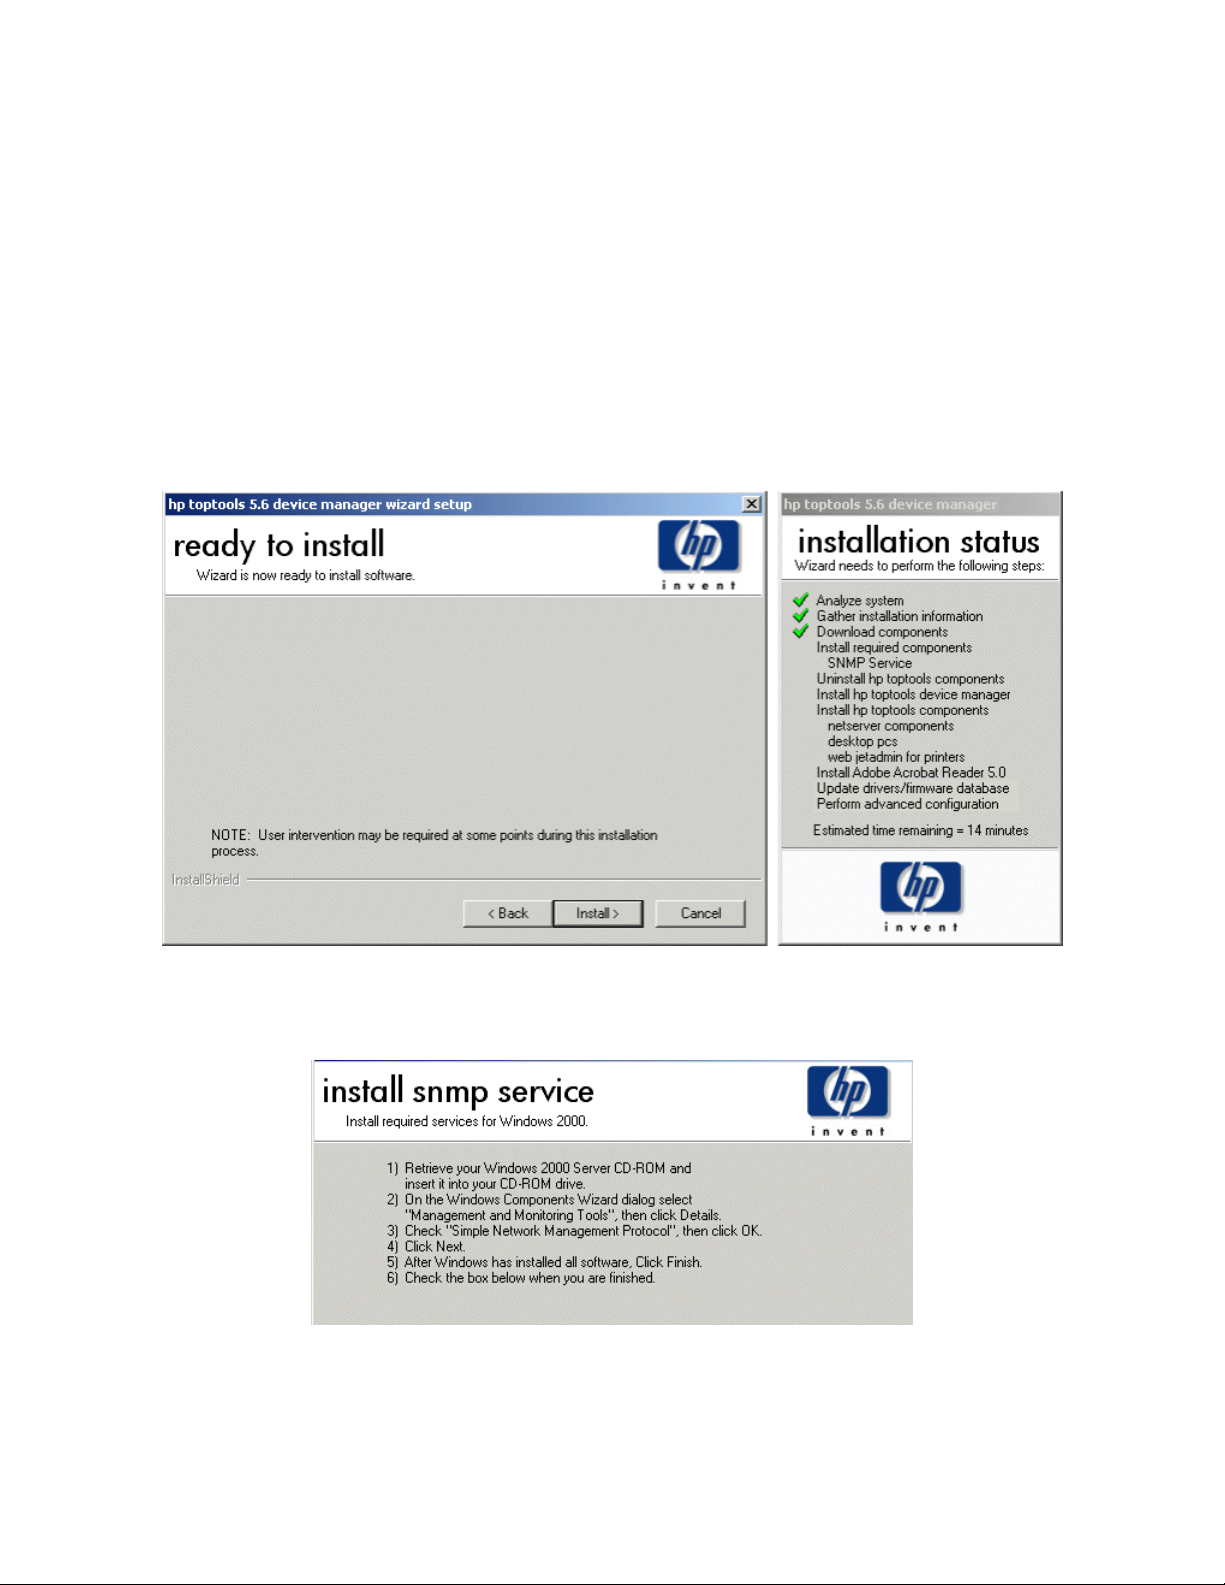
The wizard will provide instructions for installling components. When configuring the SNMP service, it is
important to remember that you are also configuring an SNMP agent that will allow the Toptools server to be
managed. Refer to your Windows documentation for information on configuring the SNMP services.
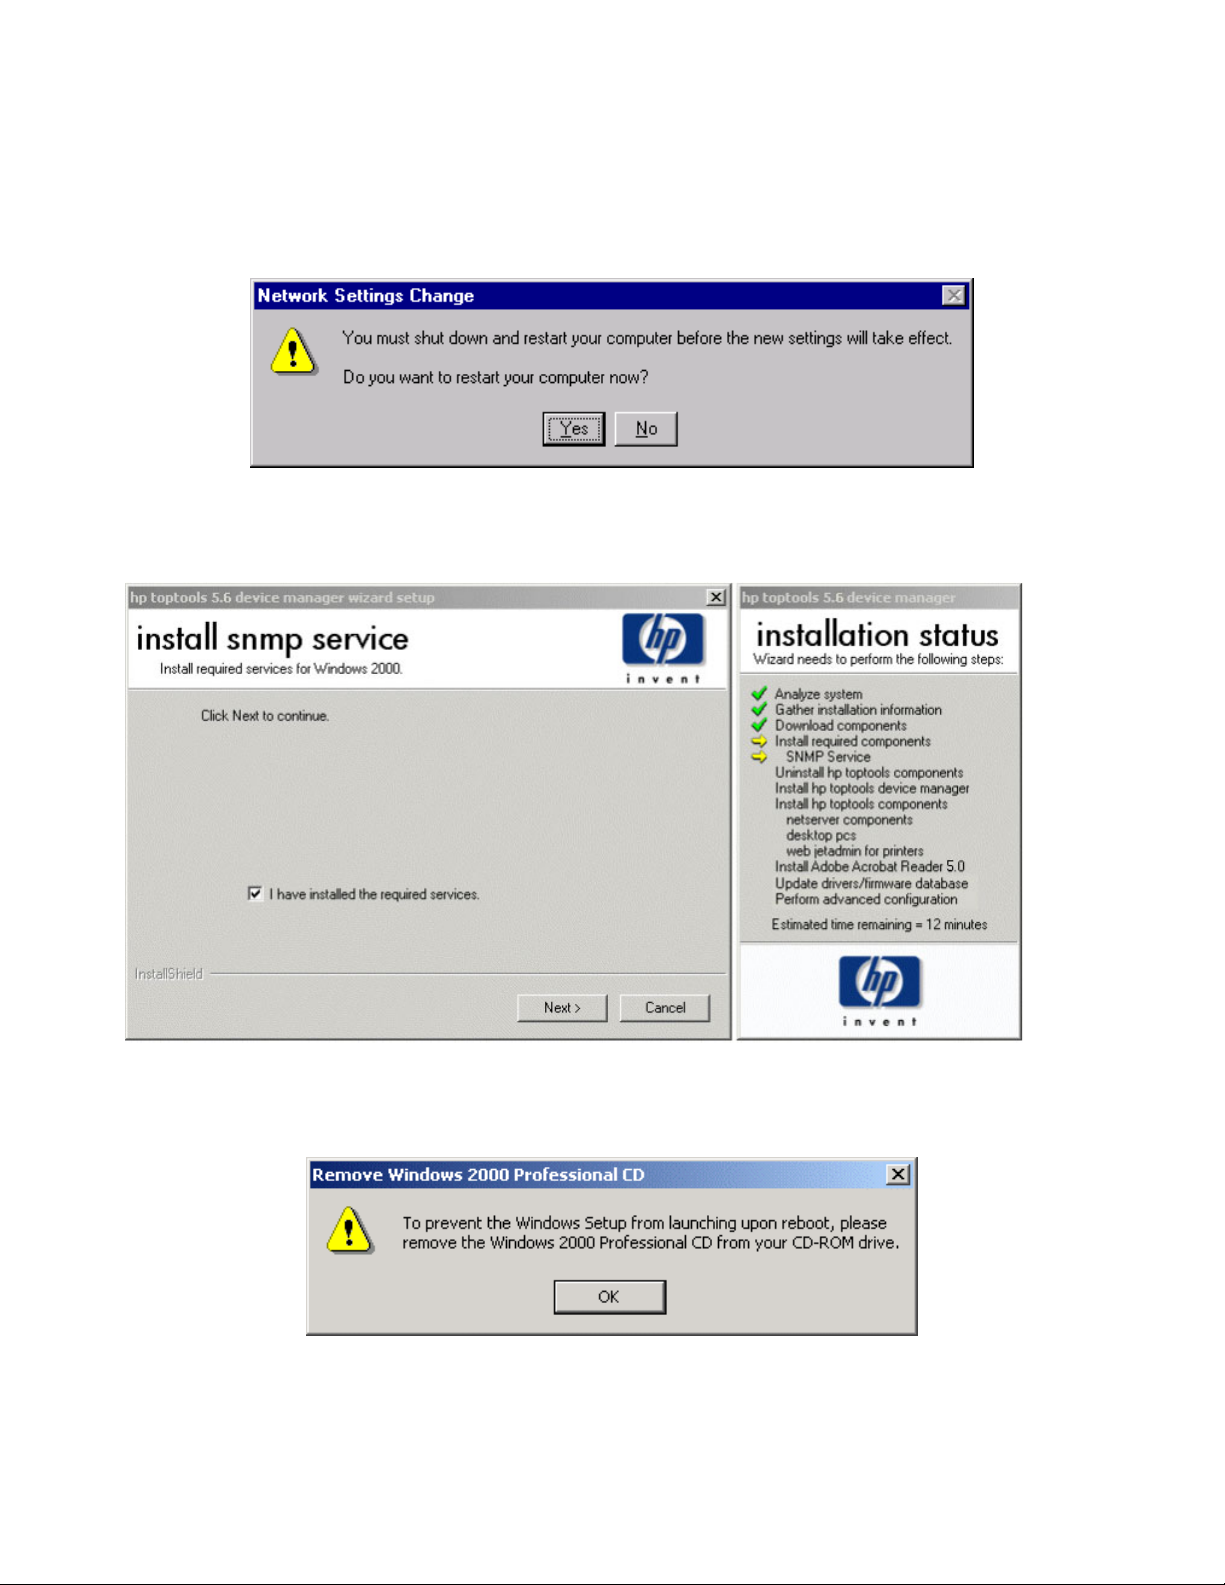
During the installation of SNMP services on an NT system you will be asked if you want to reboot. Answer NO.
The wizard will reboot your system later.
When installing IIS on Windows 2000 systems, you may select multiple IIS services, but only the World Wide Web
Server is required by Toptools.
Upon completion of these tasks, you will need to remove the Operating System CD from the CD drive, check the
confirmation box at the bottom of the dialog (shown above, “I have installed the SNMP & IIS services”), and then
click Next.
26
Page 27
toptools user guide
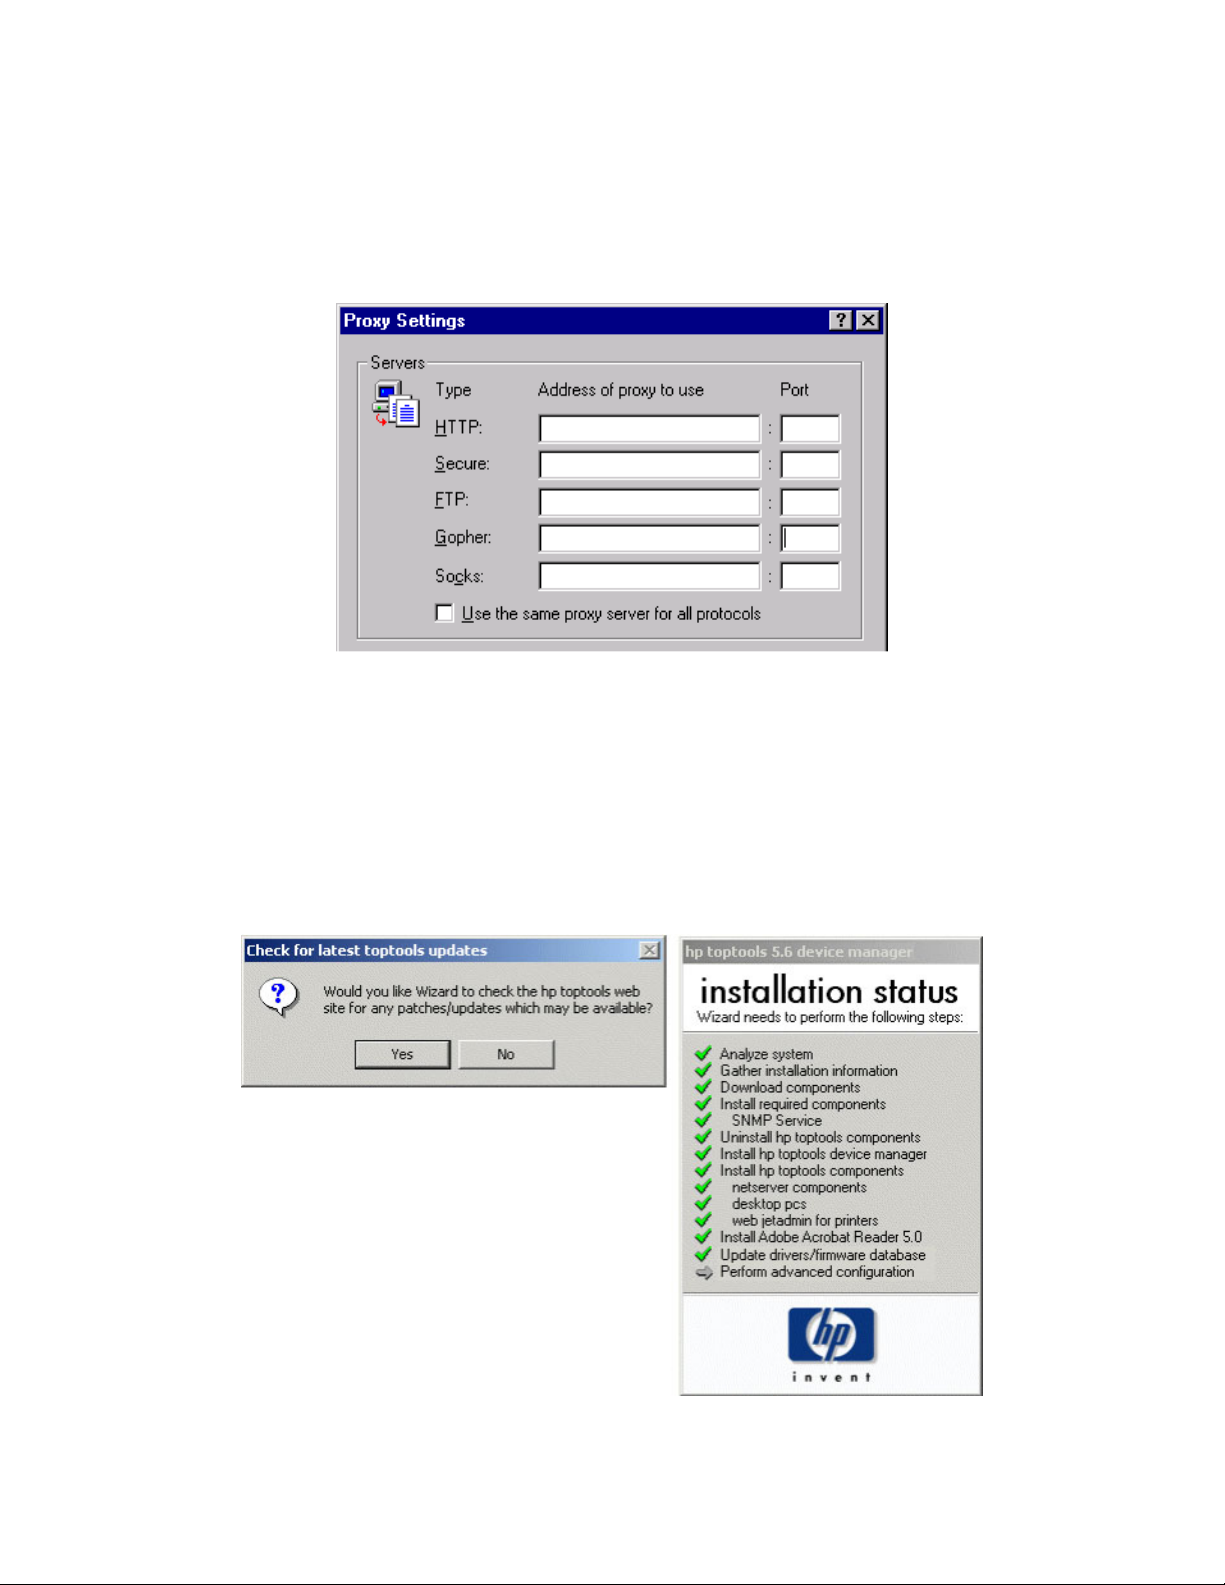
• If you don’t have a browser, or have an installation of Microsoft Internet Explorer older than 4.01 SP2 on the
Toptools server, the wizard will install Internet Explorer version 5.5. If you already have an older version of
Internet Explorer installed, the old proxy settings will be preserved. If you do not have a browser installed and
you are using a gateway or firewall to access the Internet, you must enter the proxy addresses and port numbers
for the HTTP and FTP fields after Toptools installs Internet Explorer. You do not need to make an entry for
Socks.
• Some files may be read-only. This may be because they are in use. Click Yes to overwrite them.
• If you receive a message about Auto Alert, click Continue. (Information about Auto Alert is given in the HP
Toptools for Servers Administrator Guide.)
• If you do not have a copy of Acrobat Reader installed, the installation wizard will install the reader for you.
This is for access to Toptools documentation that is provided in the .pdf format.
• You will be prompted about checking for available patches. If you click Yes, the wizard will check for you.
27
Page 28
toptools user guide
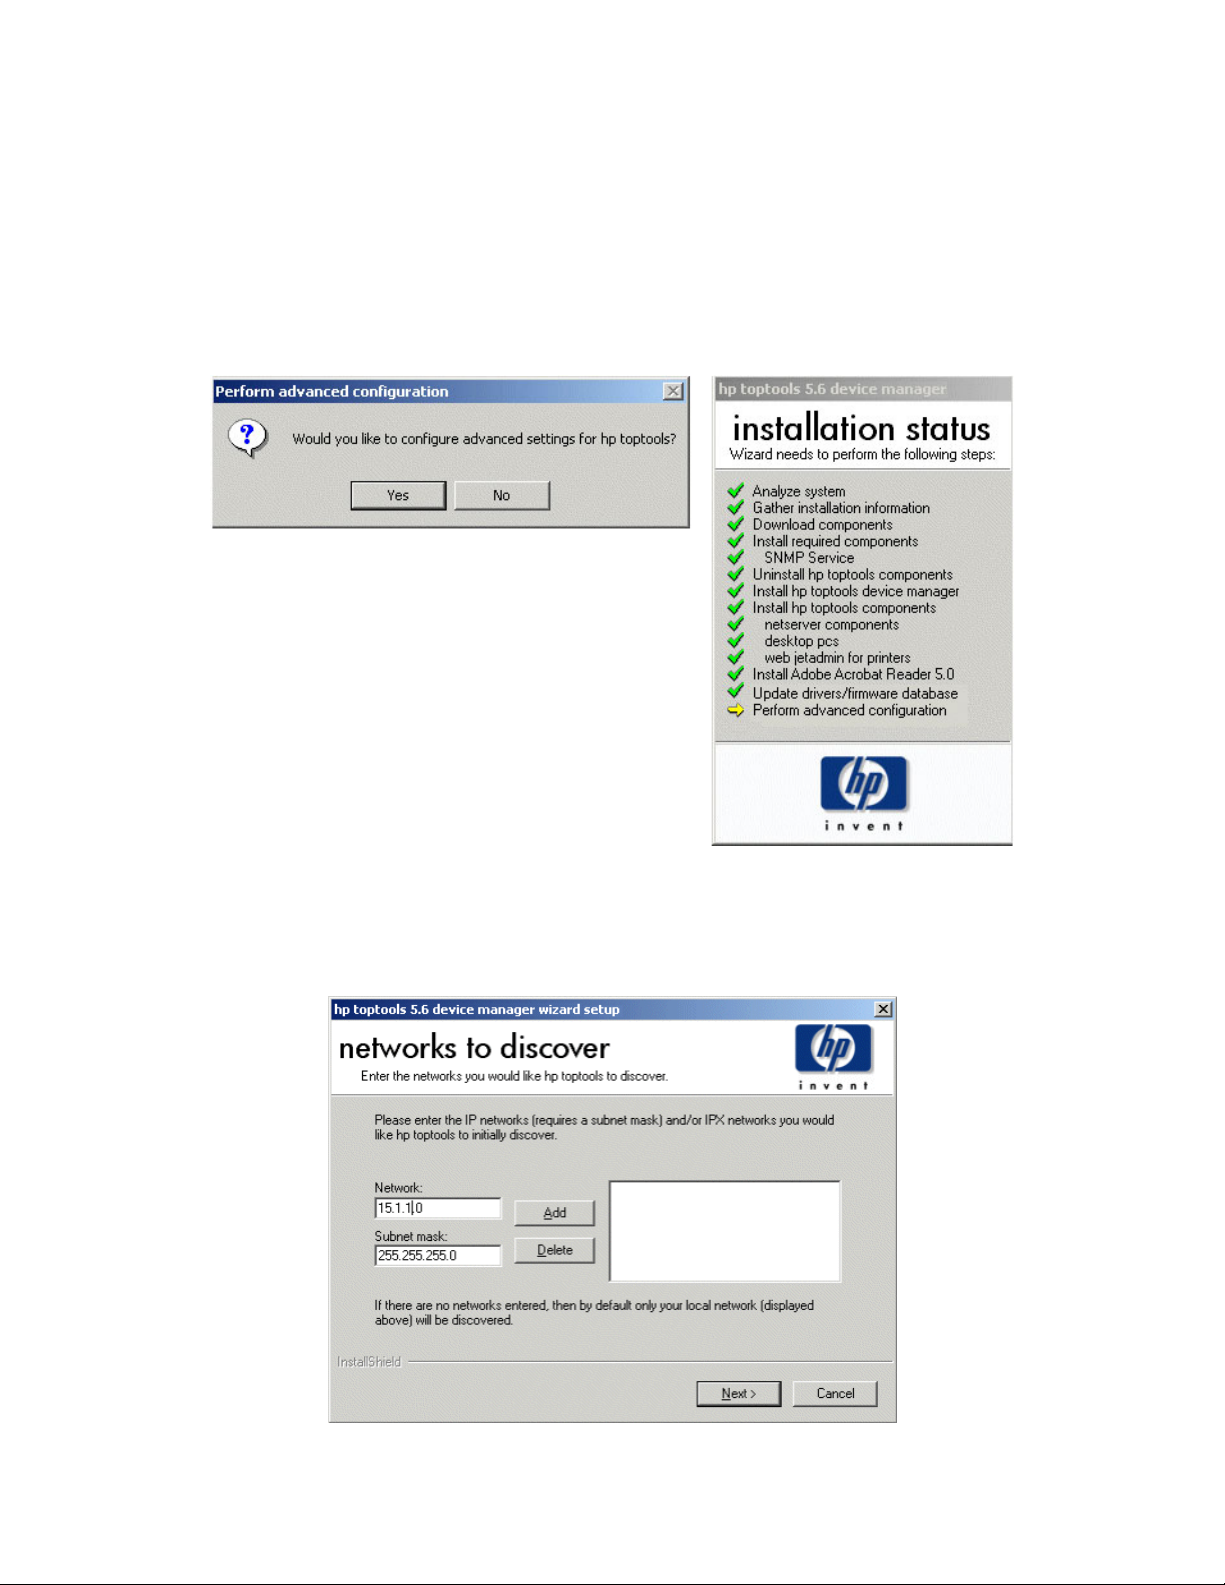
Step 12: Configure Advanced Settings option
When all the selected Toptools components have been installed, you may choose to make advanced configuration
settings for discovery before starting Toptools. Depending on the size of your network, you may want to configure
discovery settings rather than wait for the first discovery cycle to complete.
If you click No, the installation wizard will use the networking configuration of the Toptools server to discover the
local networks that the Toptools server communicates with.
Click Yes to configure the discovery process.
The next graphic shows the first dialog for configuring advanced configuration settings. In this dialog, you can
specify additional networks for Toptools to discover. The first entry is based on the IP network that the Toptools
server resides in. Be certain that the subnet masks specified for IP networks are correct, and that additional IPX
networks are accessible to the Toptools server through the frame type used by the Toptools server or through an IPX
router.
28
Page 29
toptools user guide
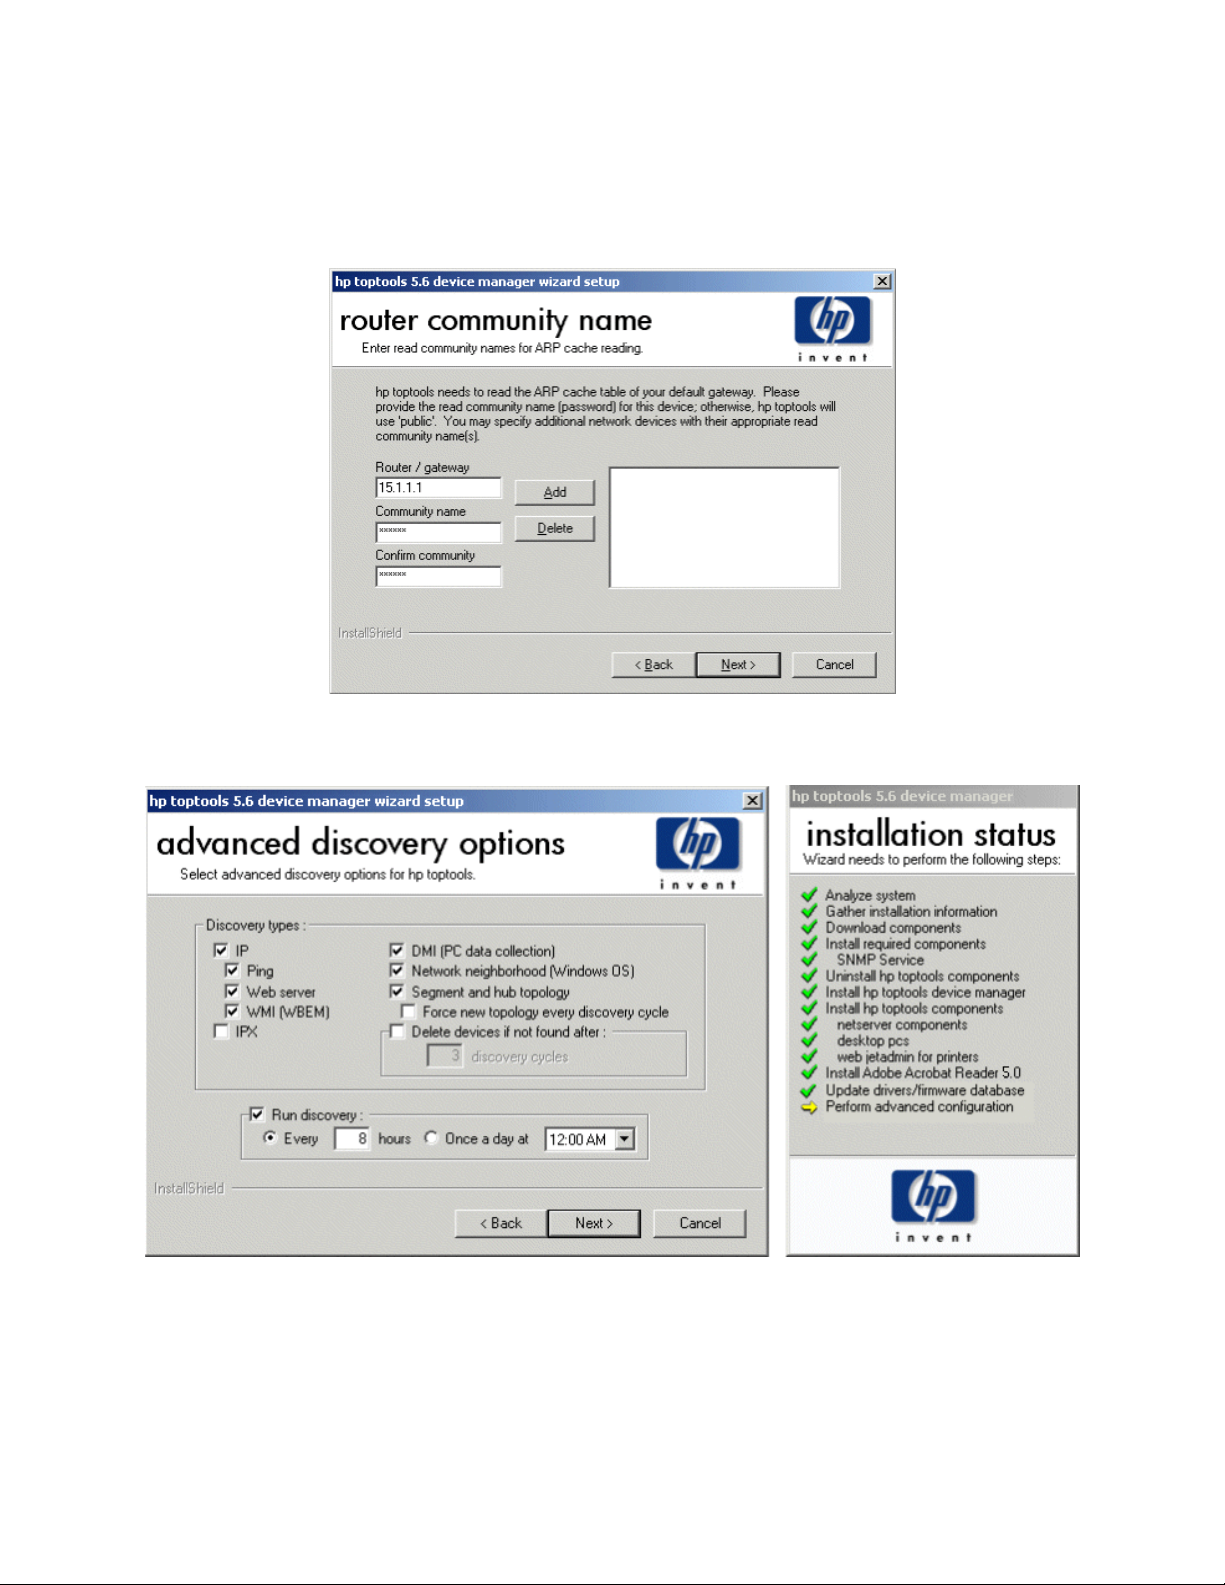
Toptools uses many mechanisms for discovery, including reading the ARP (Address Resolution Protocol) cache on
routers (gateways). To access ARP information from routers, the Toptools server needs the correct SNMP read
community to access the information. By default, the router, or gateway, specified within Windows TCP/IP
properties on the Toptools server is entered. Specify its SNMP read community name, and the address and
corresponding communities of any other routers you would like Toptools to contact for ARP cache discovery.
You will then be asked to select the discovery methods to use and when to schedule discoveries.
This dialog allows you to configure which types of discovery you would like Toptools to run, and on which
schedule. To maximize performance and reduce network traffic, you should only enable discovery types that your
network or environment supports. You must enable either IP or IPX discovery. Schedule discovery for a time when
most PCs are powered on.
29
Page 30

toptools user guide
IP Discovery Discovery using the IP protocol.
Ping Discovery Sends a ping to every address of every network you specified in the previous dialog.
Web Server Discovery Checks ports 80, 280, 411, 2301, and 6500 for the existence of web server
WMI (WBEM) Discovery Enable if you are operating in a Windows 2000 network or if you have devices
IPX Enable if your Toptools server is installed with IPX support and you need to manage
DMI Discovery Enable for identification of systems that use DMI technology in their agents, such as
Network Neighborhood
Discovery
Segment and Hub Topology Uses the standard SNMP bridge MIB and other relationships found by discovery to
Delete devices if not . . . Keeps the Toptools database from becoming populated with obsolete addresses, in
Run Discovery To disable scheduled discovery, uncheck the Run Discovery box. Otherwise,
Without ping discovery, Toptools will rely on information from ARP cache (see
previous dialog description for information). If you do not have a community name
for any routers or devices that support ARP, you will need Ping Discovery enabled to
find IP devices.
applications or webagents.
running agents that use WMI technology (such as the System Performance Advisor).
IPX servers, clients, and networking devices.
HP personal computers with Windows 9x or NT operating systems.
Required for local Windows 2000 discovery. Useful in discovering PCs and servers
that do not currently have an agent, but you would like to deploy a management
agent to using Toptools. This process will discover Windows NT and 2000 systems,
Windows 9x systems with File and Print Sharing enabled, and Netware servers if the
Toptools server has Netware Client services installed. It is required to discover
Windows 2000 systems.
populate the Topology tab within the Toptools server.
particular, within DHCP environments.
configure a discovery schedule that meets your management needs and the traffic
patterns of your network.
Step 13: Scheduled events.
You can set the schedules for automatic inventory and software or firmware updates. When enabled, Toptools will
update inventory data for the devices that have been discovered or check the Toptools website(s) for updated
software and firmware for managed devices.
30
Page 31

toptools user guide
Step 14: Complete installation and reboot.
At this point you can review the readme file (recommended), and have the toptools services started.
If your system requires a final reboot before starting Toptools, you will be prompted. Upon completion of the
installation process, you will need to:
• Add users to the Toptools groups to enable access to the Toptools application.
• Open a Toptools console to verify success using the new shortcut placed on the Desktop. If you configured
Advanced Settings during installation and disabled discovery, you will need to manually start discovery to
populate the database.
• For a quick overview of navigating the Toptools console interface, click “Guided Tour” on the Toptools Home
page.
To open a Toptools console immediately following installation, log into the Toptools server console as a local
Administrator, a Domain Admin, or as the Toptools User (or whichever account you specified during the installation
process). Double-click the Toptools shortcut placed on the desktop.
To setup or enable Toptools console sessions from additional stations in your network, refer to the instructions
provided under Consoles earlier in this section for supported browsers and configurations. For information on
configuring Toptools security, refer to the White Paper “Toptools Security” and the online Help topics Security and
User Roles.
Information about using Toptools applications is provided in the next sections of this guide. You may also refer to
the Toptools online Help that is available from within the Toptools. To access the Toptools online Help system,
click the Help button at the bottom of the Toptools navigation panel.
31
Page 32

toptools user guide
32
Page 33

toptools user guide
Using hp toptools
This chapter describes how to navigate the Toptools console and use its applications and components (Toptools for
Desktops, Toptools for Servers, and Toptools for Hubs & Switches). Specific information for configuring and using
individual applications and dialogs is also provided in the Toptools online Help system. The following
documentation is included on the Toptools CD and provides greater depth on each specific topic:
• HP Toptools Deployment Guide
• HP Toptools for Servers Administrator's Guide
• HP Remote Control Card User Guide
• HP Toptools for Hubs & Switches User's Manual
The Toptools console provides access to the following core management services:
• View managed network assets through browsing or reporting.
• View device or application alerts received by Toptools.
• View and monitor status of your network resources.
• Use tools that allow you to browse and change device configuration or troubleshoot problems.
• Use tools that allow you to update device software such as BIOS and agents.
• Use tools that allow you to monitor network and system utilization.
• Control the configuration of the Toptools server and its services.
To access this information through the Toptools console, you must open a session by launching a browser and
entering a URL to the Toptools application on the Toptools server: http://your_toptools_server/hptt. For information
on supported web browsers and their configuration for use with Toptools, refer to the Consoles section of the
Installation chapter.
Navigating the hp toptools Console
Toptools is designed to help users quickly and easily start browsing and managing their network. The Toptools
console consists of the following main controls or displays:
• The Navigation Panel and main ‘window’.
• The Device Selector
• The Alert Log
• The online Help system
The Device Selector, Alert Log, and online Help system may be accessed through the Navigation Panel.
When the Toptools console opens, it displays the Toptools Home page.
33
Page 34

toptools user guide
Toptools Home Page
The Home page offers an option to view the Guided Tour (a short demonstration of how to click through the
Toptools controls) and displays your current session status.
The Navigation Panel
The Navigation Panel provides Toptools navigational control through a series of buttons that are always displayed
during the session. Each of the buttons displays a specific collection of controls or applications when clicked. For
example clicking on the Devices button displays the following menu:
34
Page 35

toptools user guide
Buttons:
Home Select the Toptools Home page, or pages describing the features of each of the
Devices Display the Device Selector with a specific tab (or page) in focus.
Maps View Topology maps created by HP Toptools for Hubs & Switches.
Alerts View and configure Alert Management.
Inventory Generate and view reports.
installed Toptools components, such as HP Toptools for Hubs & Switches.
Performance View and configure HP Toptools for Hubs & Switches traffic monitoring or System
Policies Configure network policy management using HP Toptools for Hubs & Switches.
Settings Configure Toptools services.
Help Access the online Help system.
Performance Advisor.
When you select actions in Toptools, the resulting dialog or information is usually displayed within the main
window, such as when you display the Home page.
An icon is displayed on the Alerts button to show the highest severity alert within the Alert Log.
The Device Selector
As Toptools discovers your network and its resources, it stores this data in the Toptools database, MEDS. The
Device Selector provides a friendly interface that allows you to take actions on the discovered devices and to view
the data Toptools has gathered about them.
The Device Selector is one of the few tools within the Toptools console that can be displayed in a separate window.
To disable this feature, uncheck the box at the bottom of the dialog “Always open in a separate window”. By
disabling this feature, the Device Selector will appear within the main window.
The Device Selector offers four tabs (pages) that provide different views of the information contained in MEDS.
35
Page 36

toptools user guide
Tabs:
Device Types Displays all devices discovered by Toptools and categorizes them based on their
identified device type. Devices that do not fit one of the categories (Personal
Computers, Servers, Printers, Networking Devices, Storage Devices, Clusters) or do
not have an agent are listed under the “Others” category.
Topology Displays all devices and their network relationships discovered by Toptools topology
Custom
Groups
Search Allows you to specify search criteria to query to Toptools database. You may then
discovery. This view may be sorted by combinations of networks, segments, and
connections.
Displays groups of devices created and maintained by the Toptools console user.
When using the Performance Monitor, these Custom Groups may also become
monitored groups.
take actions upon any devices displayed within the Search results, including adding
the query results to a Custom Group.
Each tab (page) in the Device Selector displays the same columns in the right pane to summarize data about each
device. This information provides a short summary of the device’s type, status, and how Toptools is connecting
with the device to obtain information. It also provides a common method to select devices for each of the functions.
Columns:
Name The name of the computer or device used by the Domain Name Service. This may be
Type Hardware type and model of the device as identified by Toptools.
Polling Displays the results of the last poll sent from Toptools to the managed device. If
Alerts Displays the most critical alert level Toptools has received from the device.
a DNS host name, Windows or Netware name, network address, or user-assigned
“Friendly Name” for the device. Names must be unique.
polling is not enabled for the selected device, the word ‘off’ is displayed.
SNMP Indicates if Toptools has detected an SNMP agent on the device.
DMI Indicates if and what version of DMI has been detected on the device.
WBEM Indicates if WMI has been detected on the device. If the device supports WMI and is
Windows NT, the
2000 or Windows XP system, and
with the HP WMI agent.
Web Indicates if a web server application or webagent has been detected on the device. If
the device responds to an HTTP connection on port 80 the graphic will appear in
the web column.
If the device responds to other ports, or the user configures a management url within
the Device Communication dialog, the graphic will appear.
graphic will appear in this column. A indicates a Windows
indicates a Windows 2000 or Windows XP
You may change the sort order of the list of devices presented by clicking the headings of columns.
36
Page 37

toptools user guide
While browsing devices within the Device Selector, you may wish to obtain more details about the device, or
perform management tasks. To access the menu of options, select the device(s) within the right pane, click the
Actions button located above the left pane, or right-mouse click on the device entry to display the context menu. A
menu such as the following will appear:
The actions available will vary depending on the type and number of devices you have selected. Actions will be
discussed in more detail later in this chapter.
Creating Custom Groups of Devices
In performing your device management tasks, you may find that you spend a significant percentage of time
managing certain devices such as those belonging to a particular department in your organization, or devices of the
same type and model. In these cases, it may be easier to manage and monitor these devices as a permanent group,
rather than searching for and acting on devices one-by-one.
There are two ways to create Custom Groups within the Device Selector:
• Click the Custom Groups tab. Select “Actions” at the top of the left pane and select the menu item “New
Group”. This menu will also allow you to manage existing Custom Groups.
• Select one or more devices from anywhere within the Device Selector and display the Action menu. Select the
option “Add to Custom Group”. The dialog that appears will allow you to specify an existing Custom Group to
add the device(s) to, or allow you to create a new one.
37
Page 38

toptools user guide
The Alert Log
The Alert Log provides you with a quick look at the ‘health’ of your network and its resources. To access the Alert
Log, you may either select a device from within the Device Selector or choose the option “View Alerts” or click the
Alerts button within the Navigation Panel. If you launch “View Alerts” for a selected device, the Alert Log will
launch filtered to show alerts for only the selected device.
When clicking the Alerts button in the Navigation Panel, the following choices appear:
View Alerts Displays the Alert Log within the main window.
Configure Actions on
Alerts
Frequent Alerts Displays the 20 devices having the most critical alerts.
Drivers/Firmware
Update Status
View Audit Events Displays Audit Event Log within the main window.
Provides a utility to configure what actions Toptools should take when it
receives alerts from devices, such as paging or sending email.
Displays a log of driver/firmware update actions that are scheduled or have
occurred for the selected device.
As shown in the picture below, the Alert Log provides a list of alerts including the state of the alert (new,
acknowledged, closed), its severity, a description of the alert, the device that sent it, the time that Toptools received
the event, extended details, and any user entered notes about the alert and/or device.
38
Page 39

toptools user guide
The default display will be all alerts except those that have been closed. To customize your view of the Alert Log,
you can create a filter based on any combination of devices, alert severity and alert state. You may also click on
column headings to change the sort order of the list. To configure how long closed alerts are saved in the log, go to
the Actions on Alerts dialog by clicking the Alerts button in the Navigation Panel.
Online Help
Toptools provides an extensive online Help system designed to provide detailed instructions for Toptools functions
and dialogs.
Toptools offers two options for accessing online Help. You can access the full contents of online Help at any time
by clicking the Help button at the bottom of the Navigation Panel. Help will display with the table of contents in the
left pane, and a topic in the right pane that provides in-context help for the window or dialog you currently have in
focus.
You may also display help for the functions on the current page by clicking on the help icon (
displayed in the upper right corner of the page.
) whenever it is
Applications, Actions and Settings
This section will introduce the actions available for managing devices, Toptools applications like inventory
reporting and software revision management, and tools to manage the Toptools server.
Performing Actions on Devices
You may access Toptools actions for devices through the Device Selector, or from within property pages for HP
devices. This section discusses actions available through the Device Selector.
To access the Actions menu, select a device or collection of devices (Shift + click) within the Device Selector, and
then click on the Actions button on the top left pane of the Device Selector, or right-click on your selections.
The options presented within the displayed menu are context sensitive. This means that the options are appropriate
to all of the devices you have selected. For example, the menu option ‘Power Off’ will only be available for HP
personal computers or Netservers that support it. If your device or collection of devices includes a printer, this
option will not be enabled.
Menu options fit into two categories:
• Actions available for all devices, regardless of type
• Actions available for devices that are dependent on hardware type, management protocol, or model.
39
Page 40

toptools user guide
Actions available for all devices (except PC Companions unless otherwise noted by *):
View Alerts Opens the Alert Log filtered to display alerts for the selected device(s).
Check Connectivity (Ping) Sends a ‘ping’ (ICMP echo request) to the selected device to test network
Set Friendly Name
Update Discovery
Add to Custom Group
Delete
Find in Topology View – orFind Next Occurance
Agent Deployment
Security -> Set SNMP
Passwords (Communities)
Export
connectivity between the Toptools server and the device.
Sets the name used to display the device within the Toptools console. *
Initiates an on-demand discovery of the selected device(s) and updates MEDS with
the information. Click ‘Refresh’ in the Device Selector to update the display. *
Adds the selected device(s) to an existing or new Custom Group. *
Removes the device(s) from the Toptools console and MEDS. *
Opens the Topology tab and displays the selected device within the network
topology.
Deploys an HP Toptools for Desktops agent to the selected device(s).
Stores (in MEDS) the SNMP community strings to be used by Toptools to
communicate with the selected device(s).
Output current display to a file in .HTM or .CSV format.
Some actions are useful for gaining more access to the selected device(s). For example, if you have installed a
management agent on a device following the last Toptools discovery cycle and now want to manage the device but
don’t want to wait for the next discovery to run, you can select Update Discovery to obtain new information on the
selected device immediately.
Toptools discovery uses the default SNMP community string ‘public’ when trying to identify SNMP devices on
your network. For example, if you have configured a different community on your switch, Toptools will not be able
to identify the switch until you enter the correct community for it to use to communicate with the device. Following
the entry of the correct SNMP community, you would want to select that device within the Device Selector, and then
execute the action ‘Update Discovery’.
Actions dependent on hardware type, management protocol, or model:
Power On
Wake on Lan
Power Off
Reboot
Change Support
Information
Personal computers with DMI and HP Netservers with the
HP Toptools Remote Control card installed. Will execute
‘wake on lan’ for any system supporting ‘magic packet’
technology, or use the remote control card to power on a
Netserver.
HP personal computers and HP Netservers with the HP
Toptools Remote Control card installed. Provides the
capability to power off a single or multiple devices. For
PCs includes the option for a conditional or unconditional
power off.
HP personal computers. Will provide the option for a
conditional or unconditional reboot of a single or multiple
PCs.
HP personal computers. Allows the Toptools user to
specify support information such as leasing, software
image, and support URL.
40
Page 41

toptools user guide
Security
Instant Support Settings HP personal computers. Allows you to configure log on, e-
Launch
ServiceControl
Manager
Manage
Drivers/Firmware
Set System Passwords HP personal computers. Sets DMI system passwords and
Change Security Settings HP personal computers. Provides configuration control of
Lock/Unlock System
Protect/Unprotect System HP personal computers. Prevents shutdown via the front
Set ID String
Set Policy
HP UX and Linux systems. Provides a link to an SCM
policies for the managed PC, and also stores the password
in MEDS for use with actions.
the startup sequence and system access to I/O devices.
HP personal computers. Dynamically ‘protects’ the system
and locks the keyboard and mouse of the selected PCs.
panel or through the operating system.
HP personal computers. Sets the asset tag or ‘tatooing
string’ on the selected PCs.
mail address, and proxy information for remote
diagnostics.
HP PC companions. Sets user account information and
policies on the companion.
Server.
HP personal computers and networking products.
Compares the selected device(s) with the software stored
in the Toptools Server’s Driver/Firmware versions available
for upgrades. If the software is not present, it will attempt
to download it. Once stored on the Toptools server, it
offers the option to deploy the software immediately, or on
schedule.
Add Printer
e-Diagtools
NT WebAdmin
Page
Start/Stop
Sending Traps
Remote Control
Related Devices
Update Firmware
SNMP/Trap
Configuration
Configure Settings
Launch e-Diagtools
HP personal computers. Select the shared printer and
driver and deploy settings and driver to managed PCs.
HP personal computers. Configure e-Diagtools such as
Internet settings and PC startup options.
HP personal computers. Launches e-Diagtools, causing a
reboot of the selected device(s).
HP and non-HP systems. Launches to the management
page of Microsoft IIS if enabled and detected by Toptools.
HP Netserver and networking products. Enables/disables
sending of traps on the managed device(s).
HP Netservers with the HP Toptools Remote Control card
installed. Launches the management home page of the
card from which you can control the server’s power,
perform console redirection, and other critical tasks.
HP Netservers. Provides link to associated devices, such
as the HP Toptools Remote Control card.
HP printing and networking products. For printers, must be
launched directly from a console session on the Toptools
server. When selected for networking devices, it displays
the manage Drivers/Firmware dialog.
HP networking products. Only available when launched
directly from the Toptools server console, displays a
windows dialog called ‘Device Configuration’ with options
to configure thresholds and trap destinations.
41
Page 42

toptools user guide
Telnet
Node Port Table
User Maintenance Add
Properties
Device Home
Page
Management
Home Page
View System
Performance
Instant Support
Tuner
PCAnywhere
Delete
Change Password
View Reports
Use remote diagnostic features on HP personal computers
Any device supporting Telnet. Displays telnet.exe on the
station that the browser console was launched from.
HP networking products. Displays the node port table
(device ports and attached systems) for the selected
device.
HP Toptools Remote Control card. Add user accounts for
management control and access to the selected card(s).
HP Toptools Remote Control card. Delete user accounts
for management control and access to the selected
card(s).
HP Toptools Remote Control card. Change account
passwords for management control and access to the
selected card(s).
View a report summarizing user account information on the
selected card(s).
View the Toptools or Web JetAdmin property pages for the
selected device.
View the web server home page for the selected device.
View the management pages (webagent or web
management application) for the selected device.
View the system performance data collected by the
System Performance Advisor.
and servers that have the Instant Support Tuner installed.
Launch a web-based PCAnywhere session to the selected
system.
Many actions, such as the Security options for HP personal computers, or the user account management of the HP
Toptools Remote Control card are also available within the property or management pages of the devices. These
actions are available from the Actions menu to provide quick access, or enable actions against multiple devices,
rather than against a single selected device.
For actions enabled for HP products, the HP management agent must be installed on the HP product to enable the
enhanced management control. (It may be necessary to reboot the device after agent installation.) Without the HP
agent software installed, Toptools will not be able to perform advanced management functions, and will manage the
device as it does other non-HP products.
Toptools property pages (menu item “Properties”) are the most common action executed. When the property pages
are opened, Toptools checks with MEDS to determine the device’s type and supported protocols to display the
correct pages. Toptools attempts to contact the device to provide dynamic information directly supplied by the
device. If the device is inaccessible, Toptools will provide information from data that has been stored in MEDS by
the inventory collection process.
The following sequence of graphics shows Toptools property pages for an HP Vectra PC running Windows 2000
Professional.
42
Page 43

toptools user guide
The Identity page, shown below, displays a short summary of the PCs configuration and location.
43
Page 44

toptools user guide
The Status page provides a collection of buttons and controls to browse device status, including a view of the
Windows Event Log on the managed PC. The Configuration page (shown below) displays detailed statistics and
information about the device's configuration.
44
Page 45

toptools user guide
45
Page 46

toptools user guide
The Security page allows you to modify passwords and security settings such as enabling or disabling floppy drives
or power–on control. The Reports page (below) can display summary or extensive configuration reports of the
device you are browsing.
46
Page 47

toptools user guide
47
Page 48

toptools user guide
The e-Diagtools page (above) provides access to the tools and diagnostic configuration information.
48
Page 49

toptools user guide
The Support page provides information on where to obtain support for the device at HP, and also offers space for
corporate IT departments or resellers to offer support information to users or system administrators.
Property pages or management home pages vary depending on the device type. The examples below show pages for
an HP Procurve switch, an HP Netserver, and the Web JetAdmin property pages for an HP LaserJet printer.
49
Page 50

toptools user guide
The HP Procurve Switch Management Home page is shown above and Toptools property pages for an HP Netserver
are shown below.
50
Page 51

toptools user guide
HP Web JetAdmin property pages are available when the Toptools server has been linked to a Web JetAdmin
server, or when the LaserJet device has a JetDirect interface that supports a webagent.
Viewing Inventory Reports
Toptools collects information about the devices in your network and stores the information into MEDS through the
Inventory Collection process. Once the inventory is collected, you may view the information in pre-configured
inventory reports, or you may create your own reports. To access the reports, click the Inventory button in the
Navigation Panel.
The resulting options will include the ability to create a new report, view reports listed, or configure which reports
are displayed in the drop down menu.
The pre-configured reports offer selections to view your resources by device type, or specialized reports for PCs,
Windows 2000, and Windows XP readiness.
Alternatively, you may make a duplicate of MEDS and save the duplicate to another location. You may use a
program like Microsoft Access to create your own reports.
- NOTE -
Do not attempt to access or modify MEDS directly. This will corrupt your Toptools installation.
Inventory Data Collection
Inventory data collection performs inventory the first time you run discovery on a device, and then on a userconfigurable schedule. To configure the update schedule, click the Settings button in the Navigation Panel, and
select Inventory Data Collection. This dialog will allow you to configure the frequency of collection, and on which
management protocols you wish to collect inventory. For example, if you would like to collect inventory
information for HP personal computers with Windows NT, you would want to enable DMI discovery. To determine
which protocols devices you are interested in supporting, you may display the Device Selector to view your target
systems. Check which protocols are enabled based on what is displayed in the Device Selector columns.
51
Page 52

toptools user guide
Polling
When checking network resource ‘health’, it is important to consider and understand the difference between
monitoring utilization (such as provided by Resource Monitoring, System Performance Advisor, or Traffic
Monitor), receiving alerts sent from devices, and ‘polling’.
Polling is a schedule of network ‘pings’ sent to a device to determine if the polling system (the Toptools server) can
connect with the target system through the network. If the device fails to respond, it may indicate a network
problem between the Toptools server and the device, a problem with the device’s networking configuration, or that
the device is down. Polling is generally used as a quick indicator to determine if the device is ‘up’ (on the network)
or ‘down’ (disconnected from the network).
Whenever a device fails to respond to a poll, Toptools logs an alert for that device which is then displayed in the
Alert Log. The polling status icon for that device within the Device Selector will change to a yellow Warning
symbol (
).
The Device Communication dialog provides controls to select the networks or devices to poll and the frequency of
polling. In addition, you may specify the management URL (management home page) for devices in Toptools.
- NOTE -
If Toptools discovers a different management URL for the device, your entry will be overwritten.
A management URL may be the address and port of the webagent on the device, or the URL for another web-based
management application that manages the device.
To access the Device Communication dialog, click the Settings button in the Navigation Panel and select Device
Communication. The settings for retries and timeout are used by Toptools for all device communications (DMI,
SNMP, WMI, etc.).
52
Page 53

toptools user guide
Discovery
Discovery is the process that Toptools uses to find and identify devices on your network. As discovery locates and
communicates with devices, it stores the information it retrieves in the Toptools database, MEDS.
Using the Settings - Discovery page, you can control, configure and monitor the discovery process, or add new
devices for Toptools to discover. Refer to the Utilities topic in the online help for alternate ways of adding devices
to Toptools. In addition, you can configure database ‘aging’. ‘Aging’, or cleaning, determines how many cycles a
device may be listed in MEDS, but not rediscovered before it is removed from the database. This prevents devices
that have been removed from network from using Toptools resources.
For information about configuring the discovery process, refer to the online Help system, or read the Installation
Procedure section of this User Guide.
Auditing
Auditing tracks the activities of the Toptools server and console users and saves these activities to the Windows
Event Application Log on the Toptools server system.
For example, if a Netserver executed an unplanned reboot, you may want to check the Audit Log (Windows
Application Log) to determine if a console user had initiated the “Reboot” action against the Netserver.
53
Page 54

toptools user guide
To configure auditing, click the Settings button in the Navigation Panel and select Auditing. There are two options
in the dialog:
• Management server changes – This option logs changes to the configuration of the Toptools server, such as
changing the discovery schedule or polling cycles.
• Managed device changes – This option logs actions taken by Toptools on devices it manages.
Check these boxes if you wish to enable either or both auditing functions. If you enable auditing and actively use
Toptools, you may wish to manage the size of the Windows Application Log.
Actions on Alerts
Although the Toptools Alert Log provides you with an extensive list of alerts sent by managed devices as they are
received, you may not be sitting in front of the Alert Log throughout the day ‘waiting for something to happen’. As
an alternative, you can use the Configure Actions on Alerts dialog to configure Toptools to notify you when an alert
is received, or to take action by launching a program. Available actions:
• Send email
• Send a page (via email request)
• Write to the Windows Event Log of the Toptools server station
• Run a program on the Toptools server
In addition, you may use the Configure Actions on Alerts dialog to specify aging of the Alert database by deleting
unacknowledged or closed alerts after a user-configured number of days. To access the Configure Actions on Alerts
dialog, click the Alerts button in the Navigation Panel. For more information on configuring and creating actions,
refer to the instructions provided within online Help.
54
Page 55

toptools user guide
Internet & Email Services
To configure an email action on alert or to download and store software from HP to distribute to managed HP
systems, the Toptools server application must be configured to know how to communicate with these services.
The Internet & Email Settings dialog provides an interface to tell Toptools how to access the Internet and what mail
service to use. To access this dialog, click the Settings button and select Internet & E-mail.
Managing the Drivers/Firmware Version Database
Toptools provides a complete solution for keeping your HP computing product hardware up-to-date with the latest
drivers, BIOS, firmware and agent software packages. When you select a device within the Device Selector, you
have the option to Manage Drivers/Firmware… which identifies the type and model of device you are managing,
informs you of optional updates, and then offers to deploy it to the station… all through a simple wizard approach.
To do this, Toptools maintains a database of the software and firmware available for each device type. It maintains
this database through updates from the HP website. It also keeps track of which packages have been downloaded to
the Toptools server. When you select a device, it runs a comparison of the device type against the information it has
in the database. It then prompts you if you want to deploy the packages it has identified. If you say ‘yes’, and the
package has not yet been downloaded from the HP website, it will download it for you.
To maintain the database, click the Settings button and select Drivers/Firmware. This will display a page that
allows you to update the local database from an HP website immediately or schedule regular automatic updates.
You can select from various device type tabs to view software packages in the local Toptools database available for
downloading.
55
Page 56

toptools user guide
To use this feature, you must configure the Toptools server internet connection by accessing the Internet & E-mail
Settings dialog.
Managing the TFTP Server
To distribute software to HP networking products, a TFTP server is installed on the Toptools server. You may start
and stop this service as needed. To access this dialog, click the Settings button in the Navigation Panel and select
TFTP Server.
Managing Toptools Services
Toptools continuously monitors the network using its management processes: Polling, Discovery, and Alert
monitoring. During routine maintenance of the Toptools server, you may need to turn these processes off or view
their current status.
The Toptools Services page may be accessed through the following:
• By clicking the Settings button in the Navigation Panel and selecting Toptools Services.
• On the Toptools server by going into the Start > Programs > toptools menu and selecting services.
Installing the Toptools MMC Snap-In
With the release of Windows 2000, Toptools now supports a Microsoft Management Console snap-in for use by
administrators who want to work within MMC.
To install the MMC snap-in, go to the Windows 2000 station you wish to access Toptools from. Launch a Toptools
web browser console session and click the Settings button in the Navigation Panel. Select MMC Snap-In and follow
the directions provided on the page.
56
Page 57

toptools user guide
Using the System Performance Advisor
The System Performance Advisor is included in Toptools. The System Performance Advisor can monitor CPU,
memory, disk I/O, and hard disk utilization on computers running Windows NT, Windows 95, Windows 98 or
Windows 2000 operating systems.
Note: Monitored systems must be in the same domain as the Toptools server.
The System Performance Advisor uses agents on the monitored systems to collect information on the computer's
subsystems. Periodically the System Performance Advisor on the Toptools server collects the data obtained by the
agents. The data is then available for display within Toptools. You can set thresholds for critical parameters,
generate alerts when the thresholds are exceeded, and create performance reports.
In order for Toptools to monitor NT or Windows 2000 systems:
• The system must be NT 4.0 SP4 or higher
• The Toptools user must have administrator rights on the system to be monitored.
In order for Toptools to monitor Windows 95 or Windows 98 systems:
• The system must have a DMI agent installed
• Toptools discovery must have identified it as having DMI
• On non-HP systems you must install the HPResMon agent in addition to the systems DMI agent
A summary of group performance information is displayed as a color-coded graphic. The System Performance
Advisor page displays a list of tabs with one tab for each custom group being monitored. You can click on a tab to
select a Custom Group and display the performance of individual devices in the group.
A pie chart indicator shows the percentage of devices in the Normal (Green), Warning (Yellow), Critical (Red), and
Unknown (Gray) states for each group. (A device is considered critical if any of the monitored parameters is above
the critical threshold.)
NOTE: If the Toptools Hubs and Switches component is installed AND the Discovery setting, "Segment and Hub
Topology" is enabled (select Settings, Discovery, Settings tab, and check Segment and Hub Topology) the
Networks tab will be available in the Custom Groups to Display button. In addition, Discovery must have run
to completion in order to display performance information.
Note that for the first 15 minutes after collection is started, the message "Data Unavailable" will be displayed in the
Condition column.
57
Page 58

toptools user guide
Performance Button
Clicking on the Performance button on the Toptools control panel will display the following functions:
• System Performance
• System Performance Standard Report
• System Performance Custom Reports
If the Hubs and Switches component has been installed, the additional features Traffic Monitor, Network
Performance Advisor, and Traffic Data Collector Settings will also be available. Refer to the Hubs and Switches
documentation and the descriptions later in this manual for a description of these features.
System Performance
Selecting System Performance will display the Performance Advisor page. This is the main page for setting up
performance monitoring. From here you can:
• select the groups of devices to display (Custom Groups to Display)
• display summary information for devices in a group (tabs)
• start and stop data collection or uninstall the agent (Actions =>Collection)
• view detailed performance information for a selected device (Actions => View Analysis)
After you have created a custom group of devices you can change the default performance monitor settings
(Settings button, System Performance). Once you have begun monitoring devices and have collected performance
data you can create performance reports.
Standard Report
The Standard Report function generates a summary performance report listing key performance parameters values
for all of the systems in the selected group.
Custom Reports
The Custom Reports function helps you create custom performance reports. You can select the systems, parameters,
and time periods to report. Once you have created a custom report, you can name and save it for reuse.
Starting Performance Monitoring
To use the System Performance Advisor you must:
• Create a custom group of devices
• Deploy performance agents to the devices
Performance monitoring functions are used with custom groups of devices. To start monitoring you must create a
custom group and then turn on monitoring for the group. If a performance agent is not already present on the
systems to be monitored you must deploy or install a performance monitoring agent. On Windows NT, Windows
2000, and XP systems, Toptools will automatically deploy an agent when collection is turned on. You must
manually install the agent on Windows 9x systems. Refer to the online help for detailed instructions for deployment.
58
Page 59

toptools user guide
Creating A Custom Group
1.
Create one or more custom groups containing devices to be monitored. On the Toptools main page, click on
the Devices button and select Custom Groups. This will display the Custom Groups tab of the Devices
dialog.
2.
Click on Actions and New Group. This will display the New Custom Group dialog.
3.
Enter the name for a group to be monitored (example Desktop 9X) and click Create. The new group will be
added to the list of custom groups.
4.
Click on the Devices tab to display the list of network devices.
5.
Select Personal Computers to display available computer systems.
6.
Highlight the systems you want to add to the group and click Actions, Add to Custom Group. This will
display the Add to Custom Group Dialog.
7.
Click on the desired group and click on Add. You can check to see that the systems have been added by
clicking on the Custom Groups tab and then clicking on the new group.
Selecting A Group to Monitor
1.
On the main Toptools window, click on the Performance button and select System Performance. This will
2.
display the System Performance Advisor page.
3.
Click on the Custom Groups to Display button in the upper right of the Performance Advisor page to add
custom groups to the performance display. A "pie" chart will be displayed for the group in the upper half of
the page. It will initially be gray because data has not yet been collected. The systems in the group will be
displayed in the bottom half of the page.
Configuring the Performance Advisor
You can configure alert thresholds for system resources, frequency of data collection, and select the parameters and
time for performance data holding time for each group.
The Thresholds tab on the Performance Settings page displays the System Performance Thresholds page. On
this page you can set threshold levels for CPU, Memory, Disk I/O, and Storage utilization for the selected group of
devices. You can also set the frequency at which performance data will be gathered.
Threshold settings affect:
• Summary pie charts
• Icons in the status column of the list of System Performance Advisor
• Alert generation - an alert will be generated each time a system changes status (NORMAL, WARNING,
CRITICAL)
Thresholds on Windows 95 and Windows 98 systems can only be set for CPU and storage utilization.
59
Page 60

toptools user guide
1.
Click on the Settings button on the Toptools main page. Select System Performance. This will display the
System Performance Settings Page. The Thresholds tab displays the thresholds for the monitored
parameters and the sampling frequency for each group.
2.
Select the custom group to configure. You can make adjustments to the thresholds for the various system
resources by clicking on the red (critical) and yellow (warning) triangle markers and dragging them to the
desired levels.
3.
Position the cursor over the color band for the parameter (CPU, Memory, Disk I/O, or Storage) whose
threshold you want to modify. Triangular settings makers indicate the current threshold settings.
4.
Select the warning (
) marker for the desired system parameter and drag it to the desired % of utilization.
Repeat for the critical ( ) marker. 5.
6.
Repeat the process for each of the thresholds that you want to change.
7.
When you have made your threshold settings, click on the Save Settings button.
The data collection frequency is the rate at which the performance agent on a system samples performance data. For
NT systems this rate can be set to Low (every 60 seconds), Medium (every 30 seconds), or High (every 15 seconds).
For Windows 95 or Windows 98 systems the rate is fixed at Low (every 60 seconds). Data obtained at these
sampling rates can then be displayed for the last hour, day, or month.
Note: Events that occur between samples will not be shown. Thresholds are checked every 15 minutes by
comparing the average utilization for the period with the threshold level. A brief "spike" of usage that exceeds a
threshold will not be reported unless it causes the average for the period to exceed the threshold setting.
1.
Select a custom group
2.
Select the desired data collection frequency High (15 seconds), Medium (30 seconds), or Low (60 seconds)
and click Save Settings.
The Database tab on the Performance Settings page allows you to select the data set and retention time to store
collected data.
1.
Click on the Database tab to select collection of the maximum or minimum set of performance parameters.
(Refer to the online help for the Performance Report for a description of the performance parameters.)
2.
Enter the number of days to retain the performance data. Click on the Save Settings button.
Deploying Agents
The Performance Agent is automatically deployed for Windows NT, 2000, and XP devices when you start data
collection. You must manually install the Performance Agent on devices running Windows 95 or Windows 98.
Refer to the online help for additional information on deploying agents.
Once you have created a Custom Group containing the system(s) you want to monitor and have added the custom
group to the set of custom groups to be displayed on the System Performance Advisor page, You can start the
monitoring process. On the System Performance page (Performance button, System Performance) select the tab
for the group you want to monitor and then select one or more of the devies in the group and right click.. If there is
no agent on a target system, you will see a message on the Toptools console warning you that the target system may
be rebooted. Note that on some systems it may be necessary to manually install the agent on the target system. Refer
to the online help for additional information on agent deployment and data collection. The collection field for the
device(s) will first be set to "Busy" as Toptools checks for the presence of an agent on the target device and if
necessary attempts to deploy an agent. (This may take up to 15 minutes.) If successful the status field will change to
"Collection ON".
Caution: You are not allowed to deploy the performance agent to the Toptools server.
Caution: When you deploy agents or start data collection the device(s) status will be set to "Busy". The status
will remain "Busy" until deployment/start collection is complete or the process times out. Toptools will wait
for approximately 15 minutes before timing out. If the process times out an error message will be displayed in
the device's status column. Do not reboot the Toptools server while the device status is "Busy". If the
Toptools server is rebooted before the deployment/start data collection process has completed or timed out,
the selected device status will be locked as "Busy".
60
Page 61

toptools user guide
It is recommended that deployment be done during off hours when there is a lower level of network traffic and few
critical programs being run. This will minimize the impact of the deployment on the network and on the target
systems.
Toptools discovery must have run in order to identify the operating system on the device as Windows 9X, NT,
2000, or XP. If the operating system has not been fully identified by discovery, you may receive an error message.
During the deployment a warning message will be displayed on the Toptools console. This is to warn you that the
system to be monitored must be rebooted for the agent to begin collecting data. No data will be collected until the
system is rebooted. If an older version of the agent is already present on the system to be monitored, it will be
automatically uninstalled before the new agent is installed. This will require an additional reboot before installation
of the new agent can occur.
If you click OK, another message warning the user of the impending reboot on the target system will be displayed
on the target system. This message states that a reboot will occur automatically following a small delay.
Approximately 60 seconds later Toptools will reboot the target system to complete the agent installation. If a user is
working on the target system they should save any working files during this time.
Note that some programs running on the system where the agent is being deployed may prevent the system from
being rebooted. In this case the agent will not collect data until the system is rebooted.
If you select large (10) numbers of devices for agent deployment, Toptools will deploy the agent to small groups of
devices at a time to prevent overloading system processes. If Toptools is running on an NT Workstation you may
receive the message "Connection Limit Exceeded". If this occurs, you can usually correct the problem by reselecting
the device(s) and clicking on "Start Collection" again. This problem does not occur on NT Servers.
61
Page 62

toptools user guide
System Prerequisites
In order for Toptools to monitor an NT system:
• The system must be NT 4.0 SP4 or higher
• The system must be in the same domain as the Toptools server
• The Toptools user must have administrator rights on the system to be monitored
In order for Toptools to monitor Windows 95 or Windows 98 systems:
• The system must have a DMI agent installed
• Toptools discovery must have identified it as having DMI
• The system must be in the same domain as the Toptools server
• On non-HP systems you must install the HPResMon agent in addition to the system's DMI agent
• The Toptools user must have administrator rights on the system to be monitored
Installing Performance Agents on Non-HP Windows 9X Systems
Non-HP Windows 9X systems require both the manufacturer's DMI agent and the HP Toptools HPResmon.exe
agent.
1.
If the system manufacturer's DMI agent is not already installed on the system to be monitored, install it.
2.
Insert the Toptools CD in the PC running Windows 95 or Windows 98 that you want to monitor and copy
\TT4DAgents\9XPerfAgentsNonHP\HPResMon.exe to a directory on the system to be monitored.
3.
Run HPResMon.exe. It will self-extract into the agent files.
4.
Run the Setup.exe file that is extracted.
5.
Access the Toptools program on the Toptools server using your browser. This can be done at the Toptools
server or any PC on the network.
6.
Run Toptools discovery and make sure that Toptools has discovered the system and has identified the
system as having DMI. (See the DMI column of the Device Type list.)
7.
Make sure the new device has been added to a Custom Group being managed.
8.
Select Performance, System Performance, and Settings.
9.
Select the appropriate Custom Group and the new device(s).
10.
Click on the Start Collection button.
Installing Performance Agents on HP Windows 9X Systems
HP Windows 9X systems require the HP Toptools agent. (You must select the optional Toptools Resource
Monitoring feature.)
1.
Insert the Toptools CD in the PC running Windows 95 or Windows 98 that you want to monitor and copy
\TT4DAgents\v5.0\<device type>\WinNT & Win9x Agent>\<agent.exe> to a directory on the system to be
monitored. (New the agent versions will be released over time.)
2.
Run the agent. It will self-extract into the agent files.
3.
Run the Setup.exe file that is extracted.
4.
Install Toptools selecting the optional "Toptools Resource Monitor" component.
5.
Access the Toptools program on the Toptools server using your browser. This can be done at the Toptools
server or any PC on the network.
6.
Run discovery and make sure that Toptools has discovered the system and has identified the system as
having DMI. (See the DMI column of the Device Type list.)
7.
Make sure the new device has been added to a Custom Group being managed.
8.
Select Performance, System Performance, and Settings.
9.
Select the appropriate Custom Group and the new device(s).
10.
Click on the Start Collection button.
You can also access the agent files on the Toptools server (\program files\hptt\data\packages) and copy them over
your network to the systems to be monitored.
62
Page 63

toptools user guide
Performance Reports
The System Performance Advisor provides the following report formats:
• Standard
• Customized
Standard Report
The System Performance Standard Report provides a summary of the last day's data for all of the systems that
you are monitoring with the System Performance Advisor. The System Performance Advisor provides real-time
monitoring and trend analysis to help you identify system bottlenecks. To generate the Standard Report, click on the
Performance button on the Toptools main page and select System Performance Standard Report.
The report lists the minimum, average, and maximum utilization for each of the monitored system functions. For
detailed information on individual system parameters go to the System Performance Advisor page to select the
desired group and system.
Sample System Performance Report
63
Page 64

toptools user guide
Custom Reports
The System Performance Custom Reports function allows you to create a customized performance report. You
can select the following:
• Device Group
• Parameter set
• Time period
• Data type (average or itemized)
• Data format (min, max, or average)
To access System Performance Custom Reports, click on the Performance button on the Toptools main page and
select System Performance Custom Reports. You can then run a custom performance report that you have
previously save by selecting a report from the list box and clicking Run. To create a new custom report:
1.
Click on the Performance button on the Toptools main page and select System Performance Custom
Reports.
2.
Click New.
3. Select a custom group of devices or all systems.
64
Page 65

toptools user guide
4. Select the parameters for the report.
5. Select the time period for the report.
65
Page 66

toptools user guide
6. Select Average or Detailed data and select a set of Minimum, Maximum, or Average data.
Sample System Performance Report
A sample report will be displayed. If it is what you want, click Display Report. This will display the report
7.
data that you have requested.
66
Page 67

toptools user guide
8. You can click Back to select or create a different report. If you had originally selected to create a New
report you could now name and save the report template by clicking on Save Report Settings.
67
Page 68

toptools user guide
hp toptools for desktops
HP Toptools for Desktops provides extensive management control of your HP personal computers. Through
installation of the standard DMI or WMI based agents, system administrators have access to asset, configuration,
fault, and security management of personal computers from the Toptools console.
This section will provide examples of how to use the Toptools console to:
• Locate PCs within a site
• Update software/firmware on PCs (also available for netservers)
• Perform preventative maintenance
Locating Personal Computers
In this example your company must return 275 leased PCs. You need a report that lists all personal computers with
serial numbers and hardware locations. To generate a personal computer inventory report, follow these steps:
1. In the Toptools navigation panel, click the Inventory button and select PC Asset Location.
2. Toptools generates the PC Asset Location report. To print this report from the browser, right-click on the report
and select print from the popup menu. For best results, print the selected frame in landscape layout.
68
Page 69

toptools user guide
Updating Drivers/Firmware
On occasion, you may need to update the software (BIOS, drivers, agents) of your HP personal computers to support
changes in your hardware or operating systems. Using Toptools you can distribute software to one or more PCs
through a simple wizard displayed within your browser console session.
- NOTE -
The Toptools server must have access to the HP web site on the Internet to support this feature, and be
configured to use this access through the Internet & E-mail Settings dialog.
Toptools handles the complete process. It will download the appropriate software to the Toptools server and install
it on the desktops at the time you specify.
The following example provides instructions on updating the BIOS of a PC.
1. In the Toptools navigation panel, click Devices to display the Device Selector. Select the PC you wish to
update.
2. (Optional) In the Device Selector, click Actions and select Lock/Unlock System to disable keyboard and
mouse activity at the PC to prevent accidental access during BIOS flash.
3. Open the Actions menu and select Manage Drivers/Firmware. If you have selected more than one PC,
Toptools will automatically group the PCs by model to protect you from flashing incorrect software versions.
4. Toptools displays the various classes of software (video driver, BIOS, Toptools agent, etc.) available for the
device family that you selected.
69
Page 70

toptools user guide
5. Click Next. This will display information for the software/firmware selections that you made. The display
shows the current version installed and recommends a newer version (if available) for installation. Details about
the upgrade, and where the package is currently located are also displayed. You can then check the items you
want to install (boxes at far right of display), and click Next to continue the installation process.
6. Click Next. If the package(s) is unavailable on the Toptools server, Toptools will prompt you to download from
the HP web site. When download is complete, click Next.
7. The next display shows which packages can be installed by Toptools and which ones require manual
installation. To automatically install those packages that Toptools can install click Next . You will be prompted
to immediately perform the distribution, or schedule it. If a reboot is required on the target system,you can
select Unconditional or Conditional Reboot which determines whether or not the user at the managed station
has an option to save work before the system is powered off.
70
Page 71

toptools user guide
71
Page 72

toptools user guide
8. After you have made your selections the firmware or drivers installation will take place or be scheduled. The
status of the firmware downloads can be checked by clicking on Report in Manage Drivers/Firmware or in the
View Softwre Update Status page.
Note: Once scheduled, you cannot cancel a scheduled update from within Toptools. You must cancel it from
the task scheduler on the Toptools server.
Preventative Maintenance
Help-desk operations consume a large portion of the MIS budget. Toptools enables you to improve Help-desk
operational efficiency and to reduce device downtime by providing you with the information needed to fix or
prevent problems before they escalate.
In the following example, a user has experienced some ‘slow’ response time from a computer and would now like to
install a new software package. The user would like to know if the PC is ready for installation. To avoid a personal
visit to the PC, use this procedure to verify desktop status and configuration:
1. In the Toptools navigation panel, click the Devices button and select Search. Toptools opens the Device
Selector with the Search tab in focus to allow you to find the device that you need to inspect.
2. On the Search tab, enter the search criteria for the desktop that you wish to update. You could use the system
name, or even the user’s name.
3. From within the query results window, select the computer and right-click to display the Actions menu. Select
Properties.
4. Toptools opens the Property pages for the selected desktop.
72
Page 73

toptools user guide
Browsing through the property pages to check the current configuration and status of the PC:
• Check the Status – Overview page. The first step in identifying a potential PC problem.
• Determine the configuration, the operating system level, the BIOS version, and driver versions displayed in the
Configuration page.
As shown in the Status page above, this desktop seems to have adequate resources to install a new software package,
and doesn’t seem to be currently experiencing a resource load.
Once you have reviewed information presented by the Property Pages, you may wish to view the history of alerts
(and their fixes) for the desktop:
5. In the Device Selector, right-click the device to display the Actions menu and select View Alerts.
6. Toptools displays the Alert Log filtered to show all alerts for the selected desktop.
7. Click any of listed alerts to see details and fix recommendations.
73
Page 74

toptools user guide
As shown here, Toptools has received an alert indicating a possible high average CPU Utilization event. Toptools
provides suggestions on how to follow up with the problem.
Upon resolution or following action taken on this alert, you may wish to close the alert. Before you close the alert,
you can describe your actions in the “Notes” field at the bottom of the alert description. Toptools adds this
information to the alert history. With alert history information, you can identify trends and use this information to
prevent future problems.
You’ve determined that the PC configuration and resources appear to be in good health, but that there may be a CPU
utilization problem. You now have a potential cause of the user’s complaint, and recommendations on how it might
be solved – all accomplished remotely from within a single Toptools console session.
74
Page 75

toptools user guide
hp toptools for servers
HP Toptools for Servers consists of several components:
• The Toptools agent that is installed on the HP Netserver
• The Toptools for Servers component installed on the Toptools server
• HP Toptools Auto Alert
• Instant Toptools for Servers
• HP Toptools Remote Control card
HP Toptools Auto Alert, the HP Toptools Remote Control card and the Instant Toptools for Servers console are not
discussed in this guide. For more information about these solutions, consult the HP Toptools for Servers
Administrator’s Guide and the HP Toptools Remote Control User Guide on the Toptools CD in the manuals
directory.
This section provides examples of how you can use Toptools to aid you in server management:
• Obtain operational status of any server
• Obtain server software and driver information
• Find a failed hard disk drive using the Disk Locator Tool
Obtaining Operational Status
In this example, imagine that you've been told by a group of users that the file server, an HP Netserver, is ‘running
slow’. You want to perform a quick check on the server’s overall health such as CPU utilization, memory usage, and
mass storage status.
Do the following steps:
1. Open a browser console session to Toptools.
2. Click Devices button in the Navigation Panel and select Device Types
3. In the Device Selector’s left pane, click Servers to display a list of all your servers. Then double-click on the
name of the server you wish to view. This will display the property pages for the selected server.
4. When the server's identity page is loaded, click on the Status tab to view server status with at-a-glance
information including CPU and memory utilization, mass storage status, network interface status. For more
information on status alerts, click the Event Log button.
Obtaining Software and Driver Information
The following example describes how you can obtain configuration information about the Netservers in your
network using Inventory Reports, or by drilling down and performing a detailed inventory report on a single server.
In this first example, imagine that you’ve received a Proactive Notification email from Hewlett-Packard describing a
problem that is resolved through installation of a newer BIOS version. You need to check to see which servers need
a BIOS update.
To obtain a quick inventory of your Netservers and their BIOS version:
1. Right click a server in the Device Selector page. Select Properties.
2. Click on the Configuration tab and click on Explore Server. This will gather configuration data for the
server.
75
Page 76

toptools user guide
3. Click on the HP NetServer Revisions MIF item in the left panel and select Driver Revisions. This will
display a report of the driver configuration for the server.
You could also use the Reports tab on the server’s Property page and view a detailed report to get configuration
information.
76
Page 77

toptools user guide
Finding a Bad Hard Disk Drive Using the Disk Locator Tool
In this example, Toptools has notified you that a drive has gone bad in a Netserver located in another building. You
need to identify which drive has failed and tell the on-site technician which drive to hot swap.
1. Open a Toptools console session.
2. Open the Device Selector and double-click on the server with the alert.
3. When the server's identity page is loaded, click on the Status tab. To verify the alert, click the Hard Disk
Status button to see on which drive the alert has occurred.
Upon identifying the failed drive, click on the ALARM link to view the failure message for that drive (see next
figure).
77
Page 78

toptools user guide
The Disk Drive Wizard displays information about the alert and provides tools to solve the problem. To assist the
onsite technician in locating and replacing the correct drive, click the Locate button to access the options to flash the
LEDs of the selected drive.
hp toptools for hubs and switches
HP Toptools for Hubs & Switches is a component installed during installation of the Toptools server that provides
extensive management control of your HP Procurve and Advancestack networking products, and adds network
management applications that help you monitor and plan your network and define network policies.
This section provides examples of how HP Toptools for Hubs & Switches can be used to perform the following
management tasks:
• Display and manage network topology maps
• Monitor network traffic levels
For more information about using HP Toptools for Hubs & Switches, refer to the Hubs and Switches User Guide in
the manuals directory of the Toptools CD.
Displaying Topology Maps
When Toptools is started, the discovery process discovers the devices on your network. This information is used by
the topology process to create network topology maps. Two maps are created automatically:
• A map showing bridges, switches and segments
• A map showing the entire network.
- NOTE -
Your hubs and switches must have their SNMP read and
write communities set to ‘public’ for your devices to be mapped.
78
Page 79

toptools user guide
Click on the Maps button in the Device Selector and select the option View Maps to display the Maps page. The
Maps page lists maps that have been created based on the networks that have been discovered by Toptools. The
following information is provided for each map:
Name Name of the map.
Type Either a ‘Network’ or ‘Segment’ map.
Create Date The date the map was created.
View The style of the map. For example, ‘hierarchical’.
Owner System (default maps created) or the User Id of the person who created the map.
Maps appear in the list only after topology is complete. If you want the map to display in a separate browser
window, check the Map in Separate Window box. When you double-click on a map in the list, a new browser
window opens displaying the map.
Click the Full Network button to generate a map of the entire network.
Select the Delete button to remove a map from the list and the map file on the server. It may take a minute for the
map list to refresh and reflect the deletion.
79
Page 80

toptools user guide
Configuring Map Preferences
Click on the Preferences button in the Network Topology Maps page to launch the Server Settings page. The Server
Settings page lets you select display characteristics for maps. These settings control how maps appear to console
sessions. An individual console session (user) can override some of the map settings using the View button in the
map window.
You can select what devices you would like displayed in your map:
Switches Maps for switches and bridges are automatically created.
Hubs Maps for switches, bridges and hubs are automatically created. This is the default
All Nodes Maps displaying all end nodes are automatically created.
setting.
Using the Server Settings dialog, you may also choose the style of map layout that you prefer (Hierarchical,
Circular, Symmetric, or Orthogonal), cluster size, and spacing.
You must stop and restart services for new map settings to take effect. To start/stop Toptools services, select the
Settings button in the Navigation Panel and click on Toptools Services.
80
Page 81

toptools user guide
Topology Map View
Double-click on a map in the Map list to display a graphical view of the network.
The IP subnet map shown above displays all of the segments and managed routers, switches and bridges that form
the subnet boundaries. IPX managed bridges that are located in the source IP network are also displayed. To drill
down to the end node level, double-click on a segment.
Move your cursor over a device to display a ‘tool tip’ with information about the name, IP address, and status of the
device. Right-click on the device to display the device popup Action menu. The Properties menu item launches
Device View. The SNMP/Trap Configuration menu item launches a dialog that lets you configure thresholds and
trap receivers for the device. This menu item appears only for devices that are manageable by browser and is only
accessible to a console session launched locally on the Toptools server .
When you right-click on a segment you can select Show Segment Map. The buttons at the bottom of the map are:
Options Configures the appearance of the map and refresh rate.
Views Configures map style (hierarchial, etc.)
Locate Allows you to select a device, segment, etc. and find it within the map.
Show/Hide labels Toggles the display of addresses/names on the map.
Refresh Redraw the map. If new devices have been discovered, they will appear in the
Parent Show the map one level above the displayed map (unless you are already at the
Show/Hide Panner Toggles display of the panner in the map window.
Fit to Window Displays the entire map active map within the map window.
updated map.
network level).
81
Page 82

toptools user guide
You can also access these parameters by right-clicking on the map background. The background popup menu also
includes menu items for hiding the legend, disabling the Map tool tips, and disabling the Panner tool tips.
The panner lets you display a portion of your map. Click on Show Panner to display it in the lower right corner of
your map. Using your mouse, drag a rectangle in the panner over the section of the network that you would like
enlarged in your map. To restore the map to its original size, click Fit to Window.
Map Control Options
There are several parameters you can set to control how your map looks and how often it is refreshed. Click on the
Options button at the bottom of the map page to access these options.
When you have completed your selections, click on the Apply button to save them. To close the window without
making any changes, click on OK. The Cancel button cancels any changes that you have not yet applied. Click on
the Views button to select the style of map layout that you prefer.
Locating a Node
To locate a particular end node, click the Locate button at the bottom of the Topology Map browser window. In the
Locate browser window, select the network that the node is in, then select the node. Click on the Locate button to
locate the node. A dialog box displays stating that the node has been found and the appropriate map is opened (if it
is not open already). Select Pan in the dialog box to set the panner window so that the located item is enlarged and
centered in the map. If "Show labels" is turned on, the label under the located device is displayed in reverse video.
82
Page 83

toptools user guide
Monitoring Network Traffic Levels
The Traffic Monitor presents real-time information about the status of your network.
To access the Traffic Monitor, you may either click on the Examine Details button in the “Network Traffic” pane of
the HP Toptools for Hubs & Switches Home page (accessed via the navigation panel by clicking the Home button
and selecting Hubs & Switches home) or by clicking the Performance button in the navigation panel and selecting
Traffic Monitor.
The Traffic Monitor page displays five gauges in the top half of the browser window and a histogram in the bottom
half of the window. Each gauge displays the worst measurement in the entire network of that statistical attribute.
The histogram below the gauges displays the value of an attribute, such as broadcasts/sec, for the segments in a
selected segment group.
83
Page 84

toptools user guide
The five statistical attributes that are sampled by Traffic Monitor are:
Utilization % The traffic on the selected network or segment as a percentage of a segment's bandwidth (based on the
theoretical maximum for the type of connection) currently being utilized. Monitoring utilization gives a
measure of how much of the network capacity is being used on a particular segment. For example, if you
are examining a 10 Mbps or a 100 Mbps segment, utilization can tell you how much of the 10 Mbps or 100
Mbps segment's bandwidth (in percentage such as 20%, 35%, 50%, etc.) is being used by the devices on
the segment.
Frames / sec Represents the number of frames per second being transmitted over the network or segment. Each
protocol (such as Ethernet, IP, IPX, etc.) has a different frame or packet specification.
Broadcasts / sec The number of broadcast packets being transmitted over the network or segment per second. Broadcast
packets are addressed to, and must be processed by, all nodes on the network. This indicator gives an
estimation of the amount of bulk communications taking place over the network. In general, this type of
activity should be kept to a minimum as point-to-point messages use bandwidth much more efficiently.
Multicasts / sec Represents the number of multicast packets being transmitted per second over the network or segment.
Multicast packets are special forms of broadcast packets where copies of the packets are delivered to a
subset of all devices on the network. This indicator gives an estimation of the amount of bulk
communications that are taking place over the network. As with broadcast packets, this type of activity
should be kept to a minimum as unicast messages use bandwidth much more efficiently.
Errors / sec Represents the number of errors that have occurred for the network or segment. The number of errors can
help you determine whether the network is functioning properly.
84
Page 85

toptools user guide
Reading the Performance Gauges
The gauges display the network traffic information for the current minute. The colors on the gauges are:
Green Value for the attribute is within the normal range.
Yellow Value has exceeded the normal range, but is not critical.
Red Value is in the critical range. Corrective action may be needed.
Blue inner band The "high water mark", which shows you the highest value for that segment in the last
hour. This indicator can help you determine if there are any transient or intermittent
problems for the segment, even though the current minute indicator shows normal
activity.
The amount of green, yellow and red displayed in each gauge corresponds to the threshold settings for that segment.
For example, if Segment A is a 10 Base-T segment, and the current Threshold settings for Utilization % are as
follows,
• Green: OK, 0-50% utilization
• Yellow: Warning, 51-75% utilization
• Red: Critical, 76-100% utilization
then the gauge for Utilization % for Segment A would display a green area up to 50%, a yellow area from 51% to
75%, and a red area from 76% to 100%. Click on the Thresholds button to set segment thresholds.
The number in the rectangular box below the gauge indicates the attribute value for the current minute.
Setting Traffic Monitoring Thresholds
When you click on Thresholds at the bottom of the Traffic Monitor page, a separate Thresholds browser window
appears. A set of default thresholds is provided for each network attribute and is specific to a segment and its type.
The values shown for the Ethernet tab are for a media speed of 10 Mbps. If your Ethernet is 100 Mbps or Gigabit, or
if the segments are trunked, the threshold values are adjusted automatically. The thresholds for other types are also
adjusted automatically when appropriate, if for example, the segments are trunked. This will not be visible in the
Thresholds window.
For example, if four ports on a switch are trunked, a 10 Mbps Ethernet segment would now be four times as fast, or
40 Mbps. The threshold values are adjusted automatically to be appropriate for this speed. You can still set the
threshold values for a specific segment by selecting that segment from the list in the Segments tab.
85
Page 86

toptools user guide
As a network attribute reaches a certain threshold, a corresponding color (either green, yellow, or red) is used to
indicate the current state (normal, warning, or critical, respectively.) Changing the threshold ranges to better
represent your network's normal activity will be a relative decision based on trends you’ve identified. For example, a
normal threshold range for traffic utilization will vary from network to network, and segment to segment. It is
recommended that you use the default threshold values first and adjust them to fit the traffic patterns on your
network. By fine tuning the threshold levels, you can find the optimum operating conditions for each segment on
your network, which makes it easier to see problems as they occur.
To change your threshold settings, select a network type such as Ethernet. The threshold values for the attributes for
Ethernet segments are displayed. You can either move the sliders to the left or right to increase or decrease a
threshold value, or click on the up/down controls underneath the sliders to fine tune the threshold values. As you
move the sliders, these values will change accordingly. To save your changes, click on Apply at the bottom of the
Threshold window. The changes are applied to all segments of that type, for example, all Ethernet segments. When
you are finished making changes, click on OK to exit the window.
If you want to change the thresholds for a single segment, select the Segments tab at the top of the window. Select a
segment from the list box. The Thresholds window now reflects the attribute threshold values for that segment.
Click Apply to save any changes.
Initially, default values are in effect for all segment types. The Defaults button returns the threshold values for that
segment or segment speed to the original default values.
Displaying the Network Meter
The Network Meter provides an "at-a-glance" look at the most severe traffic problem on the network being
monitored during the current minute. To launch the Network Meter, click on the Show Net Meter button below the
histogram on the Traffic Monitor page. Clicking the Show Worst 5 Segments button displays a window of the top
five thresholds that have been exceeded and the associated segments.
86
Page 87

toptools user guide
You can keep the Network Meter browser window anywhere on your PC desktop. It will continue to monitor the
status of your network while you use your browser for other tasks. Click Hide Net Meter to close the window.
When you close your browser, the Network Meter will also close.
Who Are the Top 5 Talkers?
The Top 5 View helps to answer the question, "Who is causing the problem (who are the top talkers) on the
segment?" by displaying a graph identifying the top five nodes contributing to network traffic on the segment for the
selected minute. Click the Show Details button on the Traffic Monitor page below the gauges or at the bottom of the
page to display the Top 5 View window.
87
Page 88

toptools user guide
You can display graphs for each of the measured attributes showing:
• Top Sources (default)
• Top Destinations
• Top Connections
• Top Protocols
More than one graph can be displayed at a time, so you can look at the values for multiple attributes for each
segment.
Since Traffic Monitor presents real-time information, the data will be "moving" on your graph. Data is graphed and
updated every minute. The Top 5 View displays up to 60 data points. That is, you can view the most recent hour of
activity.
The bar on the right in the graph represents (up to) the top five nodes for the latest minute graphed. This bar is
selected by default and is indicated with a black "tick" and the time sampled above it. The color-coded stacked bars
represent the activity for up to the top five nodes and "other" nodes for the selected attribute and segment. The nonselected bars in the graph show how these top talkers have behaved over the past hour. This lets you view trends
over the last hour for the five top talkers of the selected minute.
The yellow and the red horizontal lines on the background of the graph represent the warning and critical values,
respectively, for the selected segment. These lines only appear when the graph scale is high enough.
The colors are in the same order as they appear in the legend, that is, the node with the greatest activity is
represented by the color at the bottom of the stacked bar. The white portion of the stacked bar represents the top
talkers in minutes who are not top talkers in the selected minute; the dark gray portion of the stacked bar represents
all other activity. You can visually trace the same color across the graph to see trends of activity over the past hour.
Information for the top five colors in the legend identifies the source and destination nodes of the top five
connections for every data point on the graph. The information in the color legend will change as the data points are
graphed. Depending on the parameters you have selected, the information provided by the legend can include:
• The layer 3 or layer 2 (MAC) address
• The network protocol or service being used. The highest network protocol for the communication path is
displayed.
• The direction of data flow (the source and destination nodes)
88
Page 89

toptools user guide
Information and Support
This section contains information on how to get support and provides important performance and troubleshooting
tips. HP provides both online (website and email) and telephone support for Toptools.
Online Support and Information
• Go to http://www.hp.com/toptools
and online support.
• Use the following websites for specific support information for HP personal computers:
http://www.hp.com/go/vectrasupport
http://www.hp.com/go/kayaksupport
http://www.hp.com/omnibook/support
For more information about managing HP personal computers, visit
http://www.hp.com/desktops/helpmechoose/manageable.
• HP Netserver support is located at http://www.hp.com/Netserver/servsup
Netserver management may be obtained at http://www.hp.com/go/Netserver_mgmt.
• Information and support for HP Procurve products is located at http://www.hp.com/rnd
for information about Toptools applications, downloadable components,
. More information about
.
Telephone Support
Free phone support is available when the Toptools server is installed on an HP Netserver or personal computer
(Vectra, Kayak, or Visualize) that meets the requirements listed in this User Guide and the readme.html document.
When calling for support on Toptools in Europe use the product number Z100D.
A list of telephone numbers is provided in the table below. Additional information and updates are available at
http://www.hp.com/cposupport/mail_support.html
.
89
Page 90

toptools user guide
Region/Country Phone Region/Country Phone
U.S.
Canada
Latin America
Argentina
Brazil
Chile
Mexico
Venezuela
Asia/Pacific
Australia
China
India
Korea
Japan
New Zealand
Taiwan
South East Asia
Hong Kong
Indonesia
Malaysia
Philippines
Singapore
Thailand
Viet Nam
(970) 635-1000
(905) 206-4663
541-778-8380
011-829-6612
800-360-999
800-427-6684
800-47-888
+61-3-8877 8000
+86-10 6564 5959
+91-11 682-6035
+82-2-3270-0700
+81-3-3335-8333
+64-9 356-6640
+886-2-717-0055
+85-2-2802-4098
+62-21-350-3408
+60-3-295-2566
+63-2-867-3551
+65-272-5300
+66-2-661-4000
+84-8-823-4530
Europe
Austria
Belgium
Denmark
Finland
France
Germany
Ireland
Israel
Italy
Netherlands
Norway
Poland
Portugal
Russian Federation
South Africa
Spain
Sweden
Switzerland
Turkey
United Kingdom
+43-6-60-6386
+32-2-626-8806 (Dutch)
+32-2-626-8807 (French)
+45-39-29-4099
+358-203-47-288
+33-1-43-62-3434
+49-180-52-58-143
+353-1-662-5525
+972-9-952-4848
+39-02-264-10350
+31-20-606-8751
+47-22-11-6299
+48-22-865-9999
+351-1-318-0065
+7-095-916-9821
+27-11-806-1030
+34-902-321-123
+46-8-619-2170
+41-848-80-1111
+90-212-224-5925
+44-171-512-5202
hp toptools Documentation and Training
A set of manuals for the Toptools components is provided in the /Manuals directory of the Toptools CD and in the
/Help/Manuals directory on your Toptools server after installation. The manuals are in Adobe Acrobat (.PDF)
format. A copy of Adobe Acrobat Reader is included on the Toptools CD for installation if required. During the
installation of the Toptools server, the installation wizard checks for a copy of Acrobat Reader. If not present, it will
install one on the Toptools server.
Self-paced training for Toptools is available on the Toptools CD at \Online Training\start.html or from the
Hewlett-Packard web site at ftp://ftp.hp.com/pub/toptools/Training/start.html
Performance and Troubleshooting Tips
Description Cause/Remedy
Occasionally, a DMI alert is
not reported to the
management server.
On Toptools server installed
on Windows NT 4.0
Workstation (Personal Web
Server), you see: HPTT
Error 403: Too many users
are connected.
The server was probably down when the alert occurred and the client machine removed
the address of the Toptools server. Discovery will re-establish this link on its next run.
To verify this select the PC in the device selector, select Properties, Configuration tab,
Explore PC, Win32 DMI service layer, SP Indication Subscription, and look for the
IP address of the management server. If the address is not shown this was the cause.
Wait for the next discovery or run discovery immediately (click Settings, Discovery).
The basic Microsoft Windows NT 4.0 Workstation product only supports 10 concurrent
connections. Toptools uses 2 connections for each user. Rapidly changing tabs can
result in temporarily using too many connections.
Close the browser connection and try to re-connect. If you expect to have several
people using the product at the same time, you may want to upgrade to Windows NT 4.0
or Windows 2000 Server with IIS.
90
Page 91

toptools user guide
Description Cause/Remedy
DMI 1.X or 2.X devices that
report N/A in the Identity and
“Reports” Property page.
Some devices do not display
‘all’ Property pages or
actions.
The "Actions" menu will close
if you drag the mouse on the
cascading "Security" menu
enabled for HP personal
computers.
Set SNMP Passwords
(Communities) for SNMP
devices does not change the
community on the device.
This is due to only having the DMI service layer, and not DMI instrumentation software
installed.
Install the latest HP Toptools for Desktops agent or other DMI client software.
The number and type of actions, and the property pages displayed are dependent on
the type of device that is selected, whether or not it is an HP product, and which type
(protocol) and version of agent is installed. New HP Kayak personal computers will
typically have all available actions enabled with all Kayak property pages displayed and
populated.
A router from another vendor that only supports SNMP may have a few generic Toptools
actions and the two generic SNMP property pages displayed.
In some cases, if Toptools is not able to connect to the device’s agent to obtain
information dynamically, a limited set of information may be displayed which is obtained
from the last inventory collection data stored within MEDS.
In addition, when multiple devices are selected, Toptools will display the ‘lowest
common denominator’ of actions supported by all selected devices. That is, each device
selected must support the action in order for it to be enabled within the menu.
This is an AFC defect. Click on "Security" within the menu to bring up the cascade menu
and then make your selection.
This dialog stores (sets) the SNMP communities within the Toptools database to be
used by MEDS during discovery or when obtaining information from a device.
To change the SNMP community strings on a managed SNMP device, go to the
device’s operating system, such as telnet session or using an operating system tool like
the Windows NT Network Properties dialog.
Data is not always updated
when you visit a page.
Netscape crashes periodically
running Toptools. An error
message is displayed stating
"An application error has
occurred and an application
error log is being generated.
Netscape.exe Exception:
access violation …"
Make sure to set your browser to check for newer versions of stored pages on every visit
to the page (Internet Properties, General tab, Settings button).
The Netscape Java JIT compiler fails occasionally. This compiler is not required for
Toptools. If you experience this condition you can disable the Java JIT compiler to
eliminate the problem.
To disable the JIT compiler on Netscape:
1. If you wish to retain the JIT library for possible future use rename it to a different
name (on Windows, the JIT is named "jit3240.dll" and is located in the directory
>Netscape Directory<\Program\Java\Bin.) If you do not need to retain the library file you
can simply delete it.
2. Shut down all copies of your Communicator.
3. Start one copy of your Communicator.
4. Open a Java Console to verify that the JIT compiler is now disabled. (The JIT
compiler displays a message in the Java Console if it is active.)
5. If the JIT is still active, you may need to reboot your system.
91
Page 92

toptools user guide
92
Page 93

toptools user guide
Glossary
Agent
ARP
BIOS
CMOS
DHCP
DMI
DMTF
DDNS
DNS
Domain
Domain
Controller
HTML
HTTP
Internet
Intranet
A software program installed in a device either within firmware or the operating system. ‘Agents’ typically
provide local services such as monitoring for and forwarding events and responding to requests from
management stations to provide information or take action on the local managed system, such as a PC or
printer. Agent programs are specific to the protocol standard and device model or operating system they
support.
Address Resolution Protocol. A procedure by which TCP/IP devices obtain MAC addresses corresponding to
a desired IP address. The originator emits a broadcast requesting the MAC address of a specific IP address,
and the responder returns a packet containing its MAC address. RARP – Reverse Address Resolution
Protocol performs the converse – obtains IP addresses from provided MAC addresses.
Basic Input/Output System. The program or ‘code’ within the computer that controls access to the hardware.
Complementary Metal-Oxide Semiconductor. A part of the computer's memory, the contents of which are
preserved when the computer is turned off. CMOS memory stores information that must be maintained, such
as the computer configuration.
Dynamic Host Configuration Protocol. An open industry standard designed to reduce the complexity of TCP/IP
network administration. DHCP provides methods for dynamic IP addressing of computers on TCP/IP
networks.
Desktop Management Interface. An industry standard that is overseen by the DMTF, it acts as a layer of
abstraction on PCs to allow information retrieval from components. It is made of three parts: Component
Interface (CI), Management Interface (MI), and Service layer (SL). In common usage, it provides asset
information about personal computers and servers through the use of a DMI ‘agent’ or ‘client’ and another
program that acts as a manager, whether on the managed system, or remotely from a program like Toptools.
Desktop Management Task Force. A consortium of 12 companies defining standards to manage network
resources. The DMTF defined a set of APIs to access PC information in a standard way (DMI), and a
description language to standardize the description of manageable objects (MIF). The complete DMI
specifications can be obtained through the DMTF FTP server at: ftp://www
page at: http://www
Dynamic Domain Name Services. Microsoft Windows 2000 DNS services technology that actively updates
records.
Domain Name Services. A process and model by which IP addresses are correlated to a naming convention.
DNS servers typically provide a resolution service providing e.g. an IP address when a requestor supplies a
host name.
There are several uses of the word Domain. Domain may refer to the DNS system. It is also used to describe
Microsoft Networks which consist of Windows Domains. Finally, network and systems management solutions
refer to what is called a ‘management’ domain that describes the scope of management control of a particular
management station.
Windows networks are organized into Domains. A domain defines a relationship between computer
resources and is used to control access to those resources. Windows Domain Controllers provide
authentication and typically browsing services to Windows clients. In Windows NT networks, these services
are provided by the Primary Domain Controller and Backup Domain Controller. Windows 2000 networks
operate with a peer-to-peer relationship between Domain Controllers unless providing emulation services for
Windows NT integration.
HyperText Markup Language. The page description language used to create World Wide Web pages. HTML
consists of plain ASCII text marked by angle-bracketed tags.
HyperText Transfer Protocol. The means by which web browsers on the World Wide Web (WWW)
communicate with (get pages from) web servers.
A cooperative WAN linking computer networks all over the world to share resources through activities such as
exchanging electronic mail, participating in electronic discussion forums (newsgroups), exchanging files with
remote computers via FTP, Gopher or HTTP, and accessing remote session by using programs like Telnet or
Rlogin. The Internet is mainly controlled and created through the standardization, administration and use of
DNS, connections through various telecommunication carriers, and the services of ISP’s.
A company’s or organization’s internal network. Typically behind a firewall and connection to the Internet,
although with use of VPN’s and other services, company Intranets may extend across and use Internet
resources.
.dmtf.org. Recently, the DMTF has assumed oversight of the specification of WBEM.
.dmtf.org or through the DMTF web
93
Page 94

toptools user guide
IIS
IPSEC
IPX/SPX
IS
ISP
IT Information Technology.
Kerberos
LAN
LINUX
MAC
MEDS
MIB
MIF
MIS
NIC
NNM
NT WebAdmin
Page
POST
RDMI
RMON
RPC
RPO
RWU
Microsoft Internet Information Server or Services.
A standard for securing IP transmissions between nodes on an IP network.
Internet Packet eXchange/Sequenced Packet eXchange. Routable Network and Transport layer protocols
primarily used in Novell NetWare solutions.
Information Systems.
Internet Service Provider. An organization or company that offers a POP (point of presence) to computers
attempting to access the Internet.
A method of securing and authenticating a connection through encryption and certificate technologies.
Windows 2000 authentication can now apply Kerberos technology to authenticate Windows client sessions.
Local Area Network. A network that connects computing resources within a site or location.
A freeware version of unix. Also runs on Intel platforms.
Media Access Control. Generally referred to for addressing of network adapters communicating on the OSI
Datalink layer. MAC addresses are designed to be ‘unique’ and contain a code identifying the manufacturer of
the network adapter or interface within the beginning of the address. Because of their unique identifier, MAC
addresses are used by ARP and RARP to identify IP networked devices within a network or segment.
Managed Element Data Store. The Toptools database of discovered devices which is ODBC compliant and
resides on the Toptools server.
Management Information Base. A coded, hierarchical description of the SNMP objects that a device supports.
A MIB is used by the SNMP agent and SNMP manager to communicate. In common usage, SNMP agents
and managers (sometimes referred to as SNMP ‘browsers’) support standardized MIBS that contain
information offered by most managed devices. Vendors like HP then extend the standardized support by
creating proprietary MIBS to offer detailed management control of their products. Both the proprietary agent
and the manager must be aware of the ‘MIB”. Typically, this is referred to as ‘compiling’ a MIB.
Management Information Format. A standard description of management information used by DMI.
Management Information System. A function or department that provides computer and information services
to an organization.
Network Interface Card. Also referred to as a ‘network adapter’, it is typically an expansion card that resides
within a computing or networking device. It provides a physical connection to the network.
HP OpenView Network Node Manager. A network management platform created and distributed by HewlettPackard. HP Toptools for OpenView NNM integrates Toptools with NNM.
HP and non-HP systems. Launches to the management page of Microsoft IIS if enabled and detected by
Toptools.
Power-On Self-Test. A series of tests the computer performs when it is turned on.
Remote Desktop Management Interface. A program designed by HP to enable remote management of DMI
1.1 agents on HP personal computers. Because DMI 2.0 includes remote management support, all recent
and current models of computers sold by HP that support DMI (Toptools for Desktops 3.x and higher) do not
require the use of RDMI.
Remote Monitoring. An extension of the SNMP standard, RMON provides for use of SNMP in monitoring
detailed network traffic information. A network traffic capture utility or network probe typically uses RMON to
collect statistics and packets for later analysis by a central monitoring console. HP Procurve and
Advancestack networking products support and provide Extended RMON within the HP Toptools for Hubs &
Switches applications.
Remote Procedure Call. This facility permits management applications to reside locally (on the managed
desktop) or remotely (on the management platform). RPC is used by DMI 2.0 for remote management.
Remote Power On. A method whereby a PC (which has been powered off) can be powered on by a different
PC on the network. RPO uses Magic Packet technology.
Remote Wake Up. A method whereby a remote PC may wake up another PC on the network which is in
suspension mode. RWU uses Magic Packet technology.
94
Page 95

toptools user guide
SCM
SEMI
SMART
SMS
SNMP
SP
SSL
TCP/IP
TELNET
TFTP
Toptools
URL
USB
UPS
VPN
WAN
WBEM
Webagent
Windows XP
WMI
WWW
Service Control Manager. An HP-UX process which manages multiple HP-UX systems.
Storage element manageability interface, implemented as SNMP mib’s.
Self Monitoring Analysis and Reporting Technology.
Microsoft Systems Management Server. An application that provides asset, software distribution, software
metering, and troubleshooting tools for PCs and servers using Microsoft Windows. HP Toptools for Microsoft
SMS integrates the management capability of Toptools with Microsoft SMS.
Simple Network Management Protocol. A standard protocol whereby network devices respond with statistics
and other current data when queried.
Microsoft Windows Service Pack.
Secure Socket Layer. A technology used to secure transmission between a web browser and web server.
Transmission Control Protocol/Internet Protocol. Routable Network and Transport layer protocols that have
become the defacto standard for the Internet, and most heterogeneous networks.
Telnet provides DEC VT100, DEC VT52, or ANSI emulation interface to many hardware devices
such as Network Hubs, Switches, and Routers. The interfaces uses a connection-based service
of TCP and usually connects via port 23.
Trivial File Transfer Protocol. A simple and unsecured file transfer system. A common use for TFTP is
downloading files to network devices as they boot. In such cases, an administrator typically configures a TFTP
server for read-only access to a single directory.
A collection of software applications and solutions designed to provide HP customers with lower cost of
ownership through extensive management of HP computing products. At the center of this solution is the
Toptools server (also referred to as just ‘Toptools’ or the ‘Device Manager’) that provides a web-based
management console with asset, fault, security, and configuration management services.
Uniform Resource Locator. The address typically used by a web browser to a specific resource’s location (e.g.
a web site).
Universal Serial Bus.
Uninterruptable Power Supply. A power supply that typically uses batteries to continue providing electricity to
a device when primary power has failed (black out). Most UPS products available today also provide power
conditioning to protect against spikes, surges, sags, and brown outs.
Virtual Private Network.
Wide Area Network. A large network, consisting of interconnected smaller networks.
Web-Based Enterprise Management. A new method of managing devices that uses CIM (Common
Information Model) and is overseen by the DMTF.
A common term used to describe a web server application that provides device management information to
remote requesting web browsers. Webagents may reside with a device’s firmware, or as a program running
within the operating system of a computer.
Next generation Windows operating system expected to be released Fall 2001.
Windows Management Interface. The Microsoft Windows implementation of WBEM. WMI support is enabled
within the Windows 2000 operating system.
World Wide Web. An interconnection of servers and applications on the Internet that use HTTP and web
browser applications provide a user-friendly interface to Internet resources and information.
95
Page 96

toptools user guide
96
 Loading...