

Page 1

HP StoreOnce Enterprise Manager version
1.3 User Guide
*TC458-96019*
HP Part Number: TC458-96019
Published: June 2014
Edition: 4
Page 2

© Copyright 2013, 2014 Hewlett-Packard Development Company, L.P.
Confidential computer software. Valid license from HP required for possession, use or copying. Consistent with FAR 12.211 and 12.212, Commercial
Computer Software, Computer Software Documentation, and Technical Data for Commercial Items are licensed to the U.S. Government under
vendor's standard commercial license.
The information contained herein is subject to change without notice. The only warranties for HP products and services are set forth in the express
warranty statements accompanying such products and services. Nothing herein should be construed as constituting an additional warranty. HP shall
not be liable for technical or editorial errors or omissions contained herein.
Microsoft, Windows, Windows XP, and Windows NT are U.S. registered trademarks of Microsoft Corporation.
Adobe, Acrobat, and Flashplayer are registered trademarks of Adobe Systems Incorporated.
Firefox is a registered US trademark of Mozilla Foundation.
UNIX is a registered trademark of The Open Group.
Page 3

Contents
1 Introduction...............................................................................................6
Minimum requirements and compatibility matrix...........................................................................6
2 Getting started ..........................................................................................8
Installing the HP StoreOnce Enterprise Manager...........................................................................8
Upgrading the HP StoreOnce Enterprise Manager .......................................................................9
Launching and logging into the HP StoreOnce Enterprise Manager...............................................10
Identifying regions of the interface............................................................................................11
Understanding administrator-level and user-level permissions........................................................12
3 Configuring the HP StoreOnce Enterprise Manager.......................................13
Adding a device.....................................................................................................................13
Working with orphan service sets.........................................................................................15
Adding new users, administrators, and groups...........................................................................16
Adding users locally...........................................................................................................16
Creating a new group.............................................................................................................16
Importing an AD group...........................................................................................................20
Setting up SMTP for emailed reports.........................................................................................23
Adding an SMTP server for sending emails...........................................................................23
Modifying an SMTP...........................................................................................................24
Removing an SMTP............................................................................................................25
Modifying the data retention period.....................................................................................25
Viewing About Information..................................................................................................25
Configuring a report scheduler.................................................................................................25
Viewing, modifying, or removing a report scheduler...............................................................29
4 Managing devices....................................................................................31
Viewing a group summary.......................................................................................................31
Filtering devices to appear.......................................................................................................32
Launching the device GUI........................................................................................................33
Customizing columns to appear................................................................................................34
Firmware notification..........................................................................................................35
Viewing replication topology....................................................................................................37
Zooming in and out of the replication topology......................................................................38
Filtering the replication topology..........................................................................................38
Refreshing the replication topology.......................................................................................39
Viewing the replication topology legend...............................................................................39
Saving the layout...............................................................................................................40
Managing removed devices.....................................................................................................40
Viewing device details ............................................................................................................42
Accessing the Current Issues screen .....................................................................................42
Viewing current issues.........................................................................................................44
Configuring threshold alerts............................................................................................46
Viewing virtual libraries......................................................................................................49
Viewing virtual library disk usage........................................................................................53
Viewing NAS shares..........................................................................................................55
Viewing NAS shares disk usage..........................................................................................59
Viewing CatalystStores........................................................................................................62
Viewing CatalystStore disk usage.........................................................................................65
Viewing messages..................................................................................................................66
5 Accessing and viewing reports...................................................................68
Viewing the dashboard...........................................................................................................68
Contents 3
Page 4

Viewing the Replication report..................................................................................................69
Viewing replication jobs.....................................................................................................69
Performing duration and size forecasting...............................................................................69
Viewing the Slot Mapping Activity report..............................................................................71
Viewing the Cartridge Activity report....................................................................................73
Viewing actual data transferred for the VTL report..................................................................75
Viewing the CatalystStore Jobs report........................................................................................76
Viewing CatalystStores usage..............................................................................................77
Viewing the Performance report................................................................................................77
Viewing the Service Set Performance report...........................................................................78
Viewing the Library Performance report.................................................................................79
Viewing the Port Performance report.....................................................................................80
Viewing the Drive Performance report...................................................................................81
Viewing the NAS share Performance report...........................................................................82
Viewing the CatalystStores Performance report.......................................................................84
Viewing the Teamed CatalystStores Performance report...........................................................85
Viewing the Storage report......................................................................................................85
Viewing disk usage............................................................................................................85
Viewing the deduplication ratio...........................................................................................86
Viewing forecasting of disk space........................................................................................87
Viewing the Alert Summary report............................................................................................88
Configuring the email notification of alerts............................................................................89
6 Performing administration procedures..........................................................94
Managing the authentication mechanism ..................................................................................94
Configuring LDAP authentication..........................................................................................94
Adding a new LDAP server.............................................................................................94
Reconfiguring an existing LDAP server..............................................................................94
Removing an LDAP server...............................................................................................95
Using user management functions.............................................................................................95
Removing a user or administrator ........................................................................................95
Removing a user from the Active Users tab........................................................................95
Removing a user from the Deactivated Users tab................................................................96
Deactivating a user............................................................................................................96
Activating a user................................................................................................................96
Activating a user (local authentication mechanism)............................................................96
Using group management functions..........................................................................................97
Modifying a group.............................................................................................................97
Moving a library, NAS share, CatalystStore, or Teamed CatalystStore from one group to
another..........................................................................................................................102
Removing a group............................................................................................................107
Performing device management functions.................................................................................107
Modifying the polling interval or IP address of an HP StoreOnce device..................................108
Removing a device...........................................................................................................108
7 Configuring user information....................................................................110
Adding user contact information.............................................................................................110
Modifying a password..........................................................................................................110
8 Managing the history log........................................................................111
9 Backing up and restoring the Enterprise Manager database.........................113
Backing up the Enterprise Manager database..........................................................................113
Restoring the Enterprise Manager database.............................................................................114
10 Using Command Line Interface for Enterprise Manager..............................116
Changing the port used by the Command Line Interface............................................................116
4 Contents
Page 5

Launching the Command Line Interface client............................................................................116
Using Help for the Command Line Interface client.....................................................................117
Listing existing commands......................................................................................................118
Viewing the group summary...................................................................................................119
Viewing owned group details.................................................................................................119
Viewing device details...........................................................................................................120
Viewing the device summary..................................................................................................121
Viewing libraries..................................................................................................................124
Viewing NAS shares.............................................................................................................126
Viewing a list of critical devices..............................................................................................128
Viewing deduplication and disk usage statistics........................................................................129
Viewing replication job statistics.............................................................................................131
Viewing the service set summary (Gen3, multi-node).................................................................134
Exiting the Command Line Interface........................................................................................135
Using the Command Line Interface in a batch file......................................................................135
A Troubleshooting.....................................................................................136
B Support and other resources....................................................................139
Related documentation..........................................................................................................139
HP Technical support.............................................................................................................139
Subscription service..............................................................................................................139
HP websites.........................................................................................................................139
Documentation feedback.......................................................................................................140
Glossary..................................................................................................141
Index.......................................................................................................142
Contents 5
Page 6

1 Introduction
The HP StoreOnce Enterprise Manager is a standalone software application that provides basic
monitoring and management capabilities in a replication environment. It provides an easy way
for customers to manage up to 400 HP StoreOnce devices.
The HP StoreOnce Enterprise Manager provides the following functionality for administrators and
users:
• Create, manage, and remove logical groupings of devices (administrators only).
• Access and manage devices and device groups through Active Directory authentication.
• Manage and monitor replication processes.
• Monitor disk usage and deduplication ratios for the devices for capacity planning.
• Trend analysis of disk capacity changes over a period of time.
• View a graphical display of devices in the topology viewer.
• Send information digests through email with a summary of information about devices.
Minimum requirements and compatibility matrix
When installing the HP StoreOnce Enterprise Manager, observe the following requirements:
Server-side requirements:
• Supported Windows platforms
• Standard LAN connectivity (for web browser-based GUI access)
• Initial 1 GB disk space for installation. (More space is required as the system expands.)
• Internet Explorer v6.0 or later or Mozilla Firefox v3.5 or later
RAM requirements:
• Minimum RAM: 4 GB
• Recommended RAM: 8 GB
Client-side requirements:
• Internet Explorer v6.0 or later, or Mozilla Firefox v3.5 or later
• Adobe Flash plug-in v10.0 or later
• Screen resolution 1024 x 768 or above
HP StoreOnce firmware and software requirements:
• HP StoreOnce 4004i/4009i, firmware v101.751 or later
• HP StoreOnce 4004fc/4009fc, firmware v101.747 or later
• HP StoreOnce 4112, firmware v101.750 or later
• HP StoreOnce 26xx, 42xx, and 44xx firmware v3.6.5 or later
• HP StoreOnce 27xx, 45xx, and 47xx firmware v3.9.0 or later
• HP StoreOnce 49xx, firmware v3.10.0 or later
• HP StoreOnce B6200 systems, v3.6.5 or later
• HP StoreOnce 6500 systems, v3.10.0 or later
• HP StoreOnce VSA version 1.0 or later
6 Introduction
Page 7

The HP StoreOnce Enterprise Manager is compatible with the following hardware:
• HP StoreOnce 250x, 26xx, 27xx, 400x, 41xx, 42xx, 43xx, 44xx, 45xx, 47xx, and 49xx
devices
• HP StoreOnce B6200 and 6500 devices
• HP StoreOnce VSA
NOTE: This guide refers to devices as Gen2 and Gen3 devices. Gen2 devices consist of HP
StoreOnce 250xx, 41xx, and 43xx devices. Gen3 (single node) devices consist of HP StoreOnce
26xx, 27xx, 42xx, 44xx, 45xx, 47xx, and 49xx devices. Gen3 (multi-node) devices consist of
HP StoreOnce B6200 and 6500 devices.
Minimum requirements and compatibility matrix 7
Page 8

2 Getting started
Installing the HP StoreOnce Enterprise Manager
To install the HP StoreOnce Enterprise Manager:
1. Obtain the HP StoreOnce Enterprise Manager code by following the process found on the
customer letter (Read Me First) in the replication License To Use.
2. Log into Software Depot at http://www.software.hp.com/kiosk to download the software.
3. Click StoreOnce Free Software to access the HP StoreOnce Enterprise Manager page to
download the software.
4. Navigate to and click on the TC458-10506.exe file.
The Install Shield starts and displays a welcome message, and then the End User License
Agreement dialog box appears.
NOTE: If the HP StoreOnce Enterprise Manager is installed in the Program Files directory,
HP recommends disabling/lowering the User Account Control (UAC) setting to avoid any
UAC-related issue, or install the HP StoreOnce Enterprise Manager outside of any
UAC-protected folders. For more information on UAC, see http://technet.microsoft.com/en-us/
library/cc709691.aspx.
5. Select the box to accept the terms of the license, and then click Next.
6. Enter the location to install the software.
7. Choose the installation type:
a. If you choose Complete, click Next.
b. If you choose Custom, click Next, and then select the components to install: HP StoreOnce
Enterprise Manager Server, Command Line Client, or both. After selecting installation
components, click Next.
NOTE: HP recommends that you install both components immediately. These features can
be installed or uninstalled at a later date.
8. Choose the http, https, and database service port numbers to run the HP StoreOnce Enterprise
Manager; the defaults are 3095, 3096, and 5432, respectively. Click Next, and then click
Install.
9. After the installation is complete, a check box appears.
10. Select the box, and click OK to launch the HP StoreOnce Enterprise Manager interface.
The application can also be launched from the Start menu by selecting Start→All
Programs→Hewlett-Packard→HP StoreOnce Enterprise Manager.
NOTE:
If the Command Line Interface (CLI) was installed as part of the previous steps, you can access
this feature by either one of these methods:
• Select Start+All Programs→Hewlett-Packard→HP StoreOnce Enterprise
Manager→Command Line Client.
• Access a command prompt window, and then run the semscli command.
11. Log in to the system as hprmsadmin, and then click on Administration in the Navigation tree.
12. Click Apply in the license section, navigate to the location of the license file, select the file,
and click OK.
8 Getting started
Page 9

13. Establish the correct port number settings. The HP StoreOnce Enterprise Manager uses ports
3095 and 3096 to receive client requests. If another application is already using port 3095
or 3096, change one of the application configurations to use another port number. To change
the port numbers in SEM:
a. Access the server.xml file in the [INSTALLDIR]/tomcat/conf folder.
b. Find Connector connectionTimeout="20000" port="3095"
protocol="HTTP/1.1" redirectPort="3096"/, and change the port numbers
3095 and 3096 to some other free port number values.
c. Find Connector SSLEnabled="true" clientAuth="false"
keystoreFile="conf/HP_D2D_RM.bin" keystorePass="iso*help"
maxThreads="150" port="3096" scheme="https" secure="true"
sslProtocol="TLS" truststoreFile="conf/HP_D2D_RM.bin"
truststorePass="iso*help" /, and change the port number 3096 to some other
port number.
d. Ensure that the redirectPort number is the same as the port number given in Step
13.c.
e. Restart the HP StoreOnce Enterprise Manager from the windows services list.
NOTE:
The HP StoreOnce Enterprise Manager process installs the following related items, also accessible
by clicking Start →All Programs→Hewlett-Packard→HP StoreOnce Enterprise Manager:
• Backup the HP StoreOnce Enterprise Manager Database—This utility helps create the backup
of the configurations made in the software.
• Restore the HP StoreOnce Enterprise Manager Database—This utility helps restore the backed
up configuration to the software. Choose any one of the previous backups taken for this restore.
• Readme.html
• Uninstall the HP StoreOnce Enterprise Manager—This utility uninstalls the entire application.
• HP StoreOnce Enterprise Manager User Guide
NOTE: HP StoreOnce systems that are monitored by the HP StoreOnce Enterprise Manager are
referred to as devices. Before adding a device to the HP StoreOnce Enterprise Manager, update
the device firmware to the most recent version.
Upgrading the HP StoreOnce Enterprise Manager
NOTE: Before you upgrade, HP recommends that you close all browser sessions that access the
HP StoreOnce Enterprise Manager. The HP StoreOnce Enterprise Manager version 1.3 supports
upgrading from HP StoreOnce Enterprise Manager versions 1.0 , 1.0.1, and 1.2, and from HP
StoreOnce Replication Manager version 2.2.
1. Follow the procedure described in the section entitled, “Installing the HP StoreOnce Enterprise
Manager” (page 8).
The installer automatically upgrades the software, creates a database backup of the previous
software version, and saves the backup to [INSTALLDIR]\config\dbDump\
DB_Backup_V_[version number].dump.
2. Copy the backup file to a safe location.
IMPORTANT: After an upgrade, it is mandatory that you delete the browser cache to ensure the
proper functioning of the application on the upgraded version.
Upgrading the HP StoreOnce Enterprise Manager 9
Page 10
Launching and logging into the HP StoreOnce Enterprise Manager
1. Launch the HP StoreOnce Enterprise Manager from Start by selecting Start →All
Programs→Hewlett Packard→HP StoreOnce Enterprise Manager or by opening a browser
window and entering the web address, https://<server_ip>:3096/sems, into that
window, where <server_ip> is the IP address or the host name of the system on which the
software is installed.
For security purposes, the HP StoreOnce Enterprise Manager only runs on https which runs
on port number 3096. All requests to http are redirected to https automatically.
The HP StoreOnce Enterprise Manager login screen appears.
NOTE: The operating system allows only one browser window at a time to run the application.
To open the application in a browser window, click Start. After clicking Start, Attempts to
launch a second instance of the application will fail.
Instead, for each additional instance needed, open a new browser window, then enter the
web address, https://<server_ip>:3095/sems, into that window, where
<server_ip> is the IP address or the host name of the system on which the software is
installed. The http request on port 3095 is redirected to port https 3096. Launch an https
instance by using https://x.x.x.x:3096/sems.
2. Select the correct domain name from the drop-down list.
The HP StoreOnce Enterprise Manager supports both authentication methods (local and LDAP)
simultaneously.
NOTE: The default user hprmsadmin is always a local user even if LDAP is selected as the
authentication mechanism.
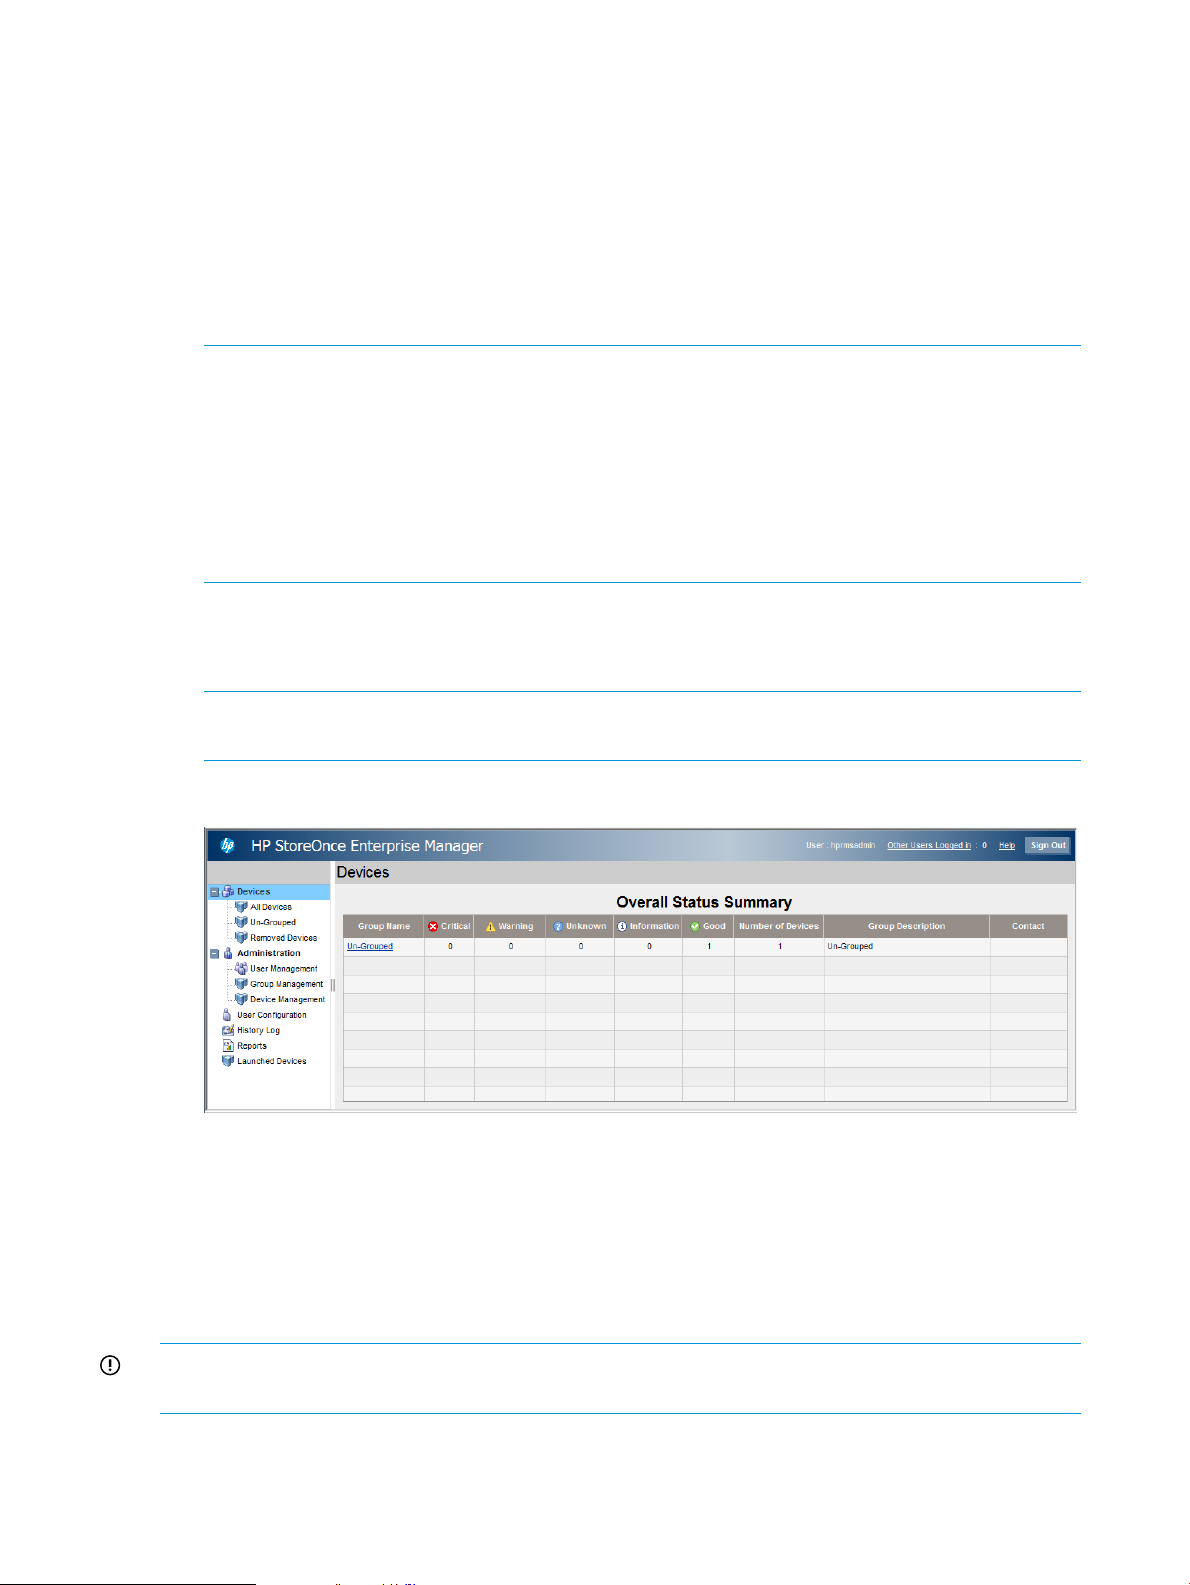
3. After authentication is complete, the Overall Status Summary page is displayed.
At the first login, only the Un-Grouped group appears in the HP StoreOnce Enterprise Manager
Overall Status Summary page. Perform the tasks in “Configuring the HP StoreOnce Enterprise
Manager” (page 13) to populate this window.
At the first login, the Overall Status Summary page contains groups to which you have access.
If you have not been assigned to any groups by the administrator, no groups appear in the
Overall Status Summary page. Contact the administrator to be assigned to the appropriate
group or groups.
IMPORTANT: After the first login as user name hprmsadmin and password hprmsadmin,
change the password.
10 Getting started
Page 11
NOTE: If the HP StoreOnce Enterprise Manager detects that you are already logged in, an error
message appears.
This message is displayed for two reasons:
• After the HP StoreOnce Enterprise Manager browser is refreshed, the system may disconnect
you and require you to log in again.
• If you close the browser, the user session remains active for some time.
In either of these cases, if you try to log in before the previous session times out, you must force
the login.
Click OK to return to the login screen, enter the information again, select the Force Login box, then
click Sign In.
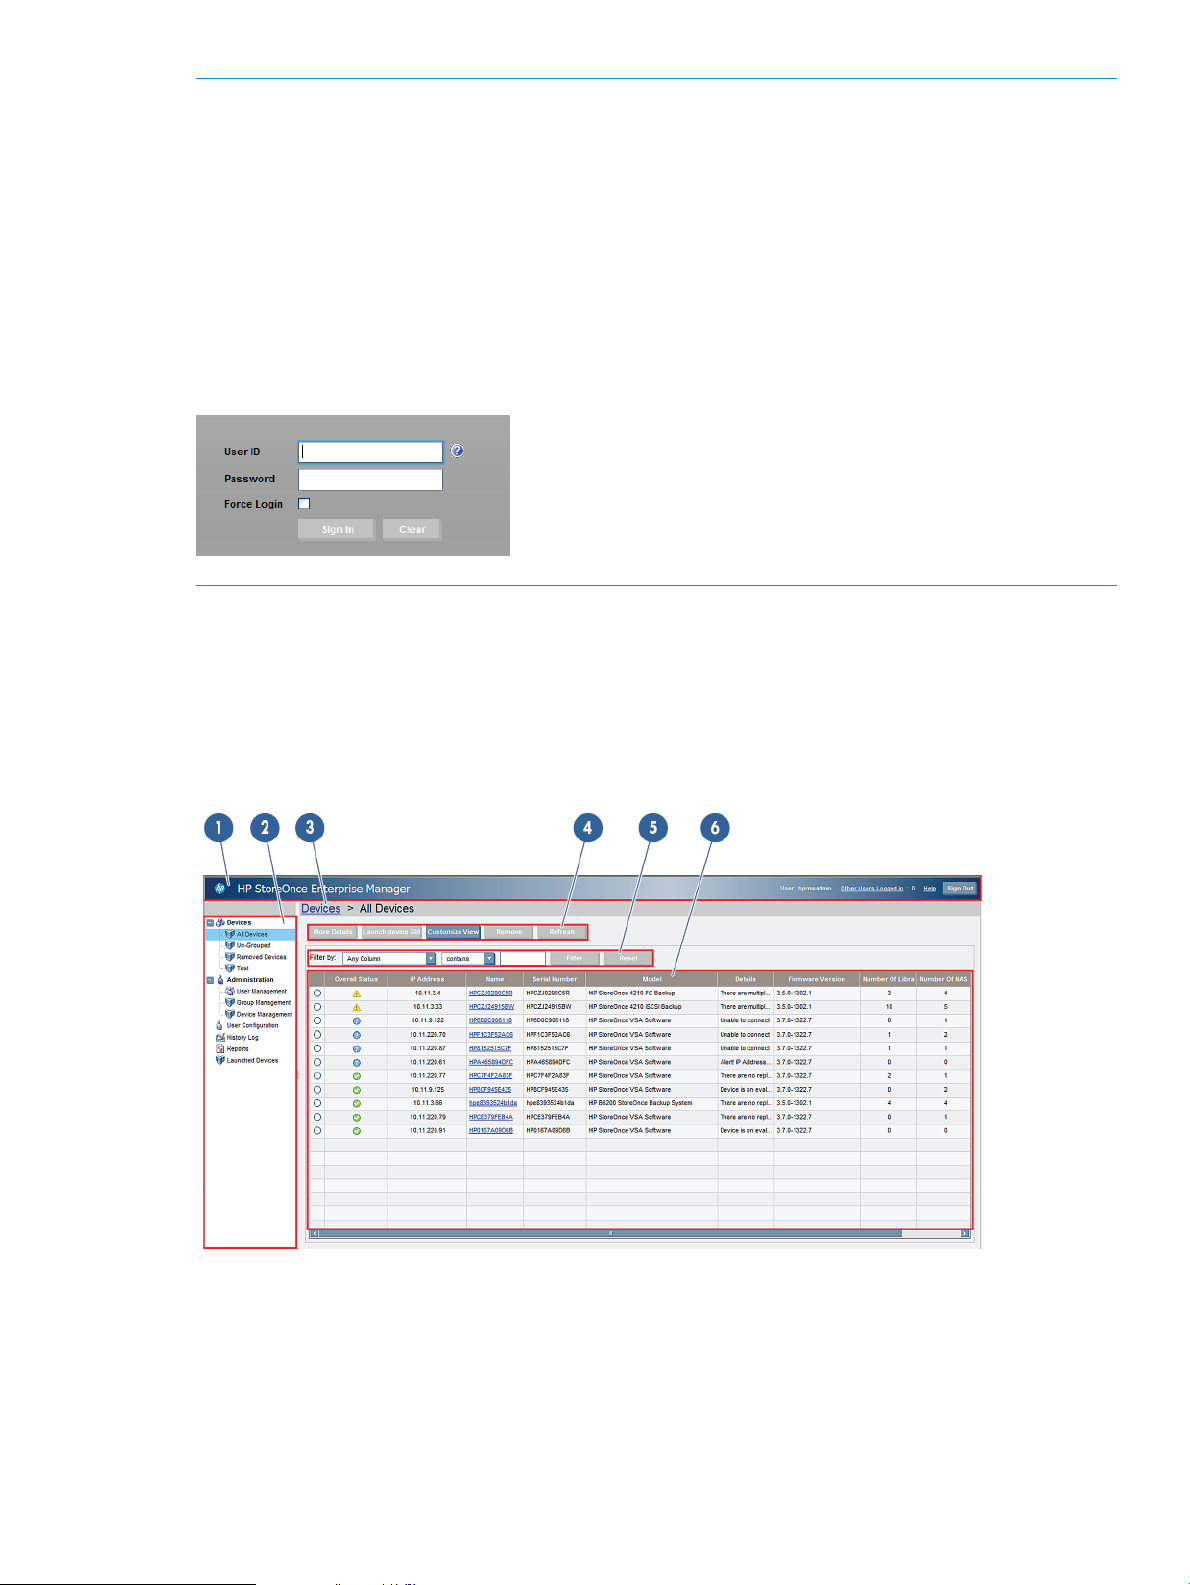
Identifying regions of the interface
Throughout this guide, procedures refer to various regions of the HP StoreOnce Enterprise Manager
interface. See Figure 1 (page 11) to become familiar with these regions. The screen shows a typical
HP StoreOnce Enterprise Manager application with a few devices and groups shown.
Figure 1 Regions of the interface, administrator view
1. Masthead with login information
2. Navigation tree
3. Bread crumbs
4. Context-sensitive action buttons
5. List item filter
6. Content pane
Identifying regions of the interface 11
Page 12
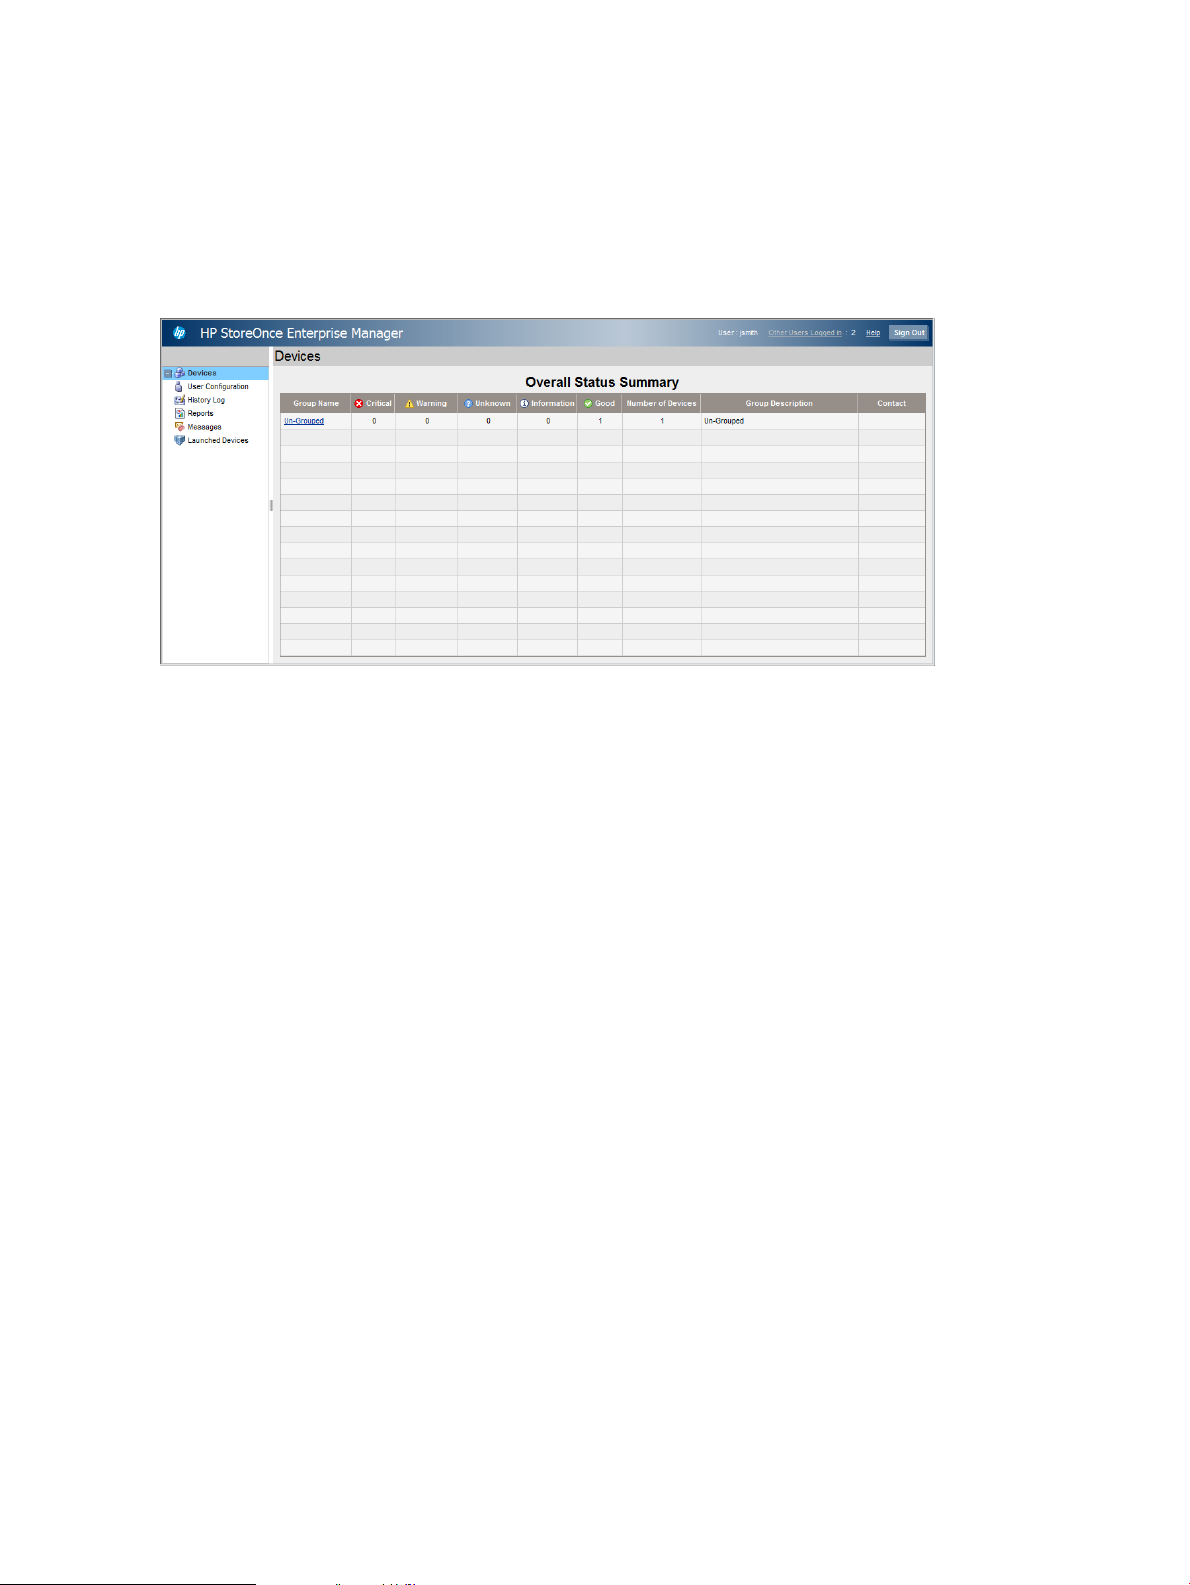
Understanding administrator-level and user-level permissions
Users with administrator-level permissions (administrators) can view all items and perform all actions
in the HP StoreOnce Enterprise Manager.
Users with user-level permissions (users) can only view those items for which they have permissions.
For example, compare the information available in the administrator view (shown in Figure 1 (page
11)) to the information available in the user view (shown in Figure 2 (page 12)).
Figure 2 Regions of the interface, user view
This user guide explains all actions that can be performed by an administrator and by users and
indicates administrator-specific actions.
12 Getting started
Page 13

3 Configuring the HP StoreOnce Enterprise Manager
To start using the HP StoreOnce Enterprise Manager, the administrator must configure it by
performing the following procedures in this order:
1. “Adding a device” (page 13)
2. “Adding new users, administrators, and groups” (page 16)
3. “Creating a new group” (page 16)
Other optional configuration steps include:
• “Importing an AD group” (page 20)
• “Setting up SMTP for emailed reports” (page 23)
• “Configuring a report scheduler” (page 25)
NOTE: Only an administrator can perform these procedures. Users with user-level permissions
cannot add a device, add new users, or create groups.
Adding a device
HP StoreOnce systems monitored by the HP StoreOnce Enterprise Manager are referred to as
devices. Before adding a device to the HP StoreOnce Enterprise Manager, update the device
firmware to the most recent version.
Four types of devices exist:
• Gen2, single node, refers to HP StoreOnce 250x, 41xx, and 43xx series devices.
• Gen3, single node, refers to HP StoreOnce 26xx, 27xx, 42xx, 44xx, 45xx, 47xx, and 49xx
devices.
• Gen3, multi-node, refers to HP StoreOnce B6200 and 6500 devices.
• HP StoreOnce VSA series
The procedure to add devices differs slightly between Gen2 and Gen3 devices.
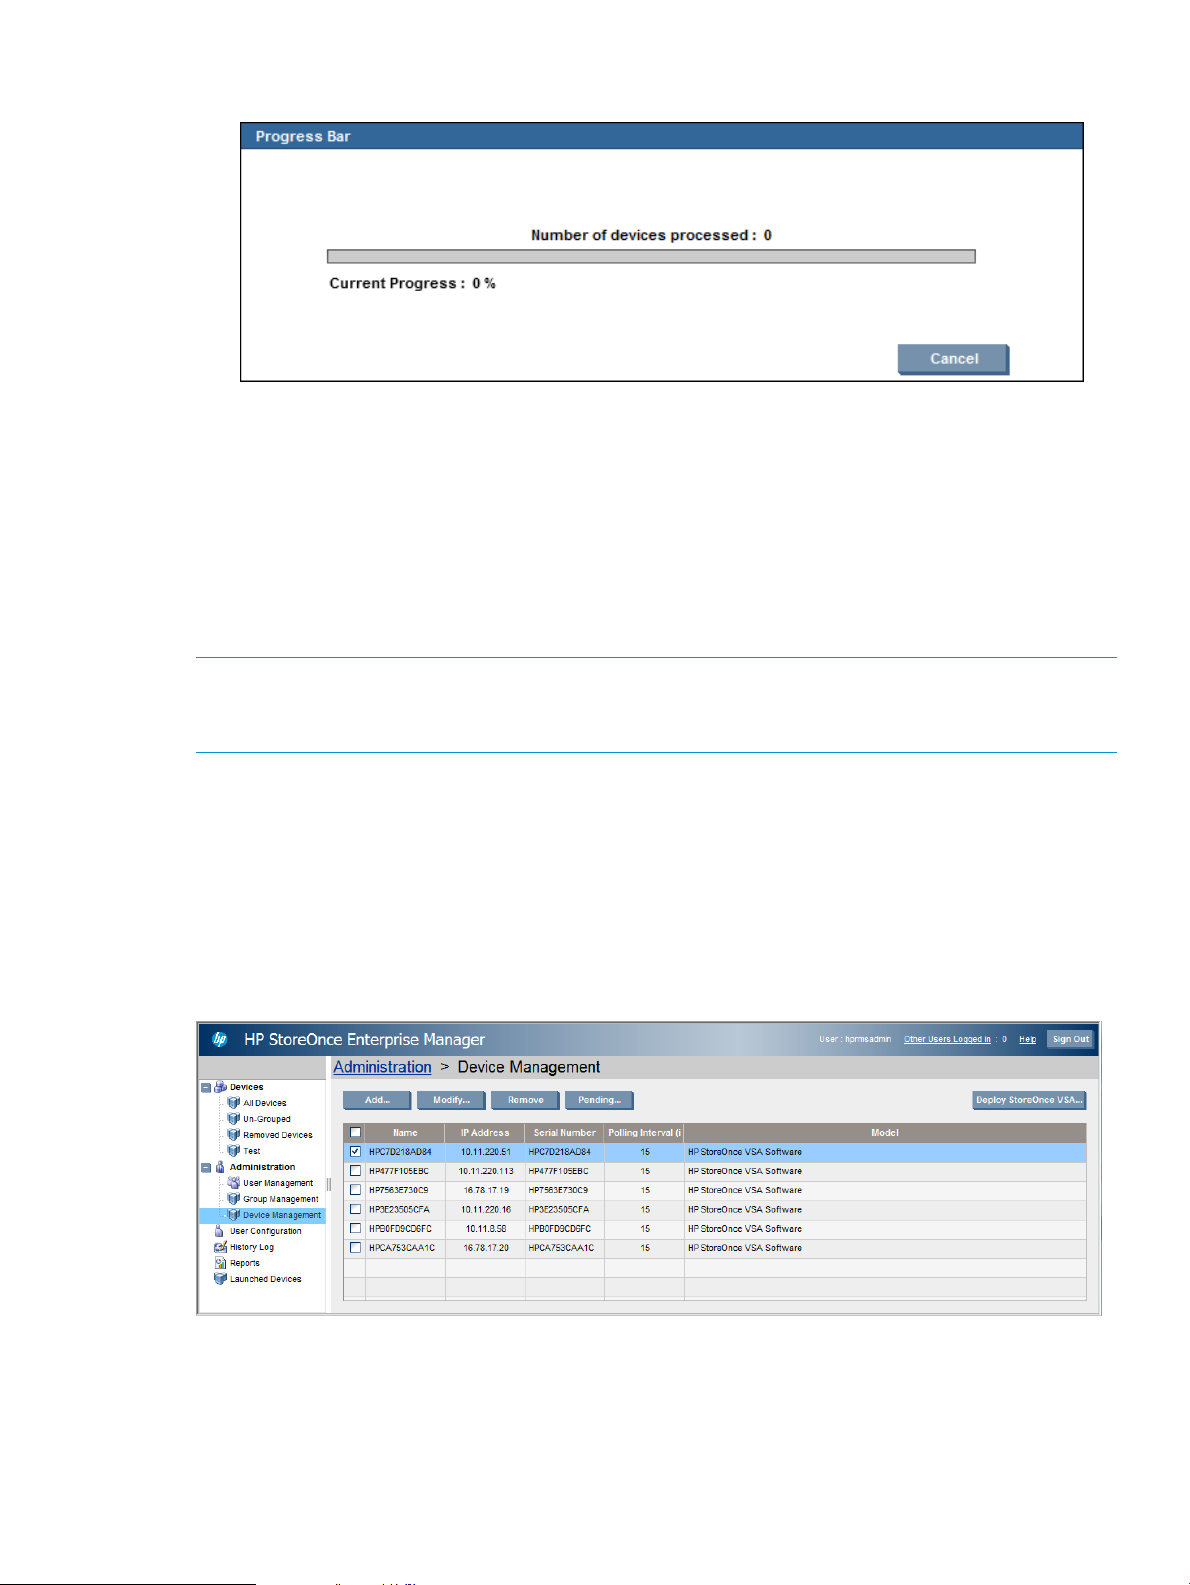
To add devices:
1. From the Administration section of the Navigation tree, select Device Management.
2. Click Add.
The Add Device dialog box appears.
3. Select the appropriate radio button to determine how the HP StoreOnce Enterprise Manager
will locate the device, and then type the correct information into the corresponding field.
Adding a device 13
Page 14

NOTE: After adding a device for an HP StoreOnce device with firmware 3.6.0 or later, you
must enter the user ID and password as authentication.
NOTE: Device additions can be completed by using a file or a Fully Qualified Domain Name
(FQDN) of the StoreOnce IP address also. By using a file, you can add several StoreOnce
devices all at once. To add by files, select Get IP address From File, and click the ... button to
select the file containing IP addresses. To use the FQDN, select Fully Qualified Domain Name.
If you select the option to add a device with its FQDN, ensure the /etc/hosts file in the
host system (HP StoreOnce Enterprise Manager) displays the entry for FQDN of the device to
be added.
If you select the option to get IP addresses from a file, you must create a .txt file with the
IPs of all the devices to be added. The authentication for the devices to be added should be
provided only once.
4. Select the appropriate polling interval from the Polling Interval field.
The polling interval indicates how often the device is surveyed by the HP StoreOnce Enterprise
Manager to determine and record or report its status.
5. Select or clear the box to indicate whether the system is to find the associated target and
source devices.
If this box is selected, the HP StoreOnce Enterprise Manager searches for any target and
source devices connected to the device being added, and also adds them to the system.
6. Select or clear the box to indicate whether the system is to search in the background.
If Search in Background is selected, other operations can be performed while devices are
being added.
If Search in Background is not selected, the Progress Bar window appears until the devices
are added successfully (or if the operation fails). Other operations cannot be performed while
the devices are being added.
14 Configuring the HP StoreOnce Enterprise Manager
Page 15
7. Click OK to continue.
If the operation fails, an error dialog box appears. Click OK to close the dialog box, then
repeat this procedure.
If the device discovery operation fails after multiple attempts, check the network connectivity
between the SEM host and the device to be added. Also, confirm whether the IP address of
the device to be added is valid and that the device is up and running properly.
8. After the operation succeeds and a success dialog box appears, click OK to close the dialog
box.
The newly-added devices are included in the list of devices.
NOTE: If you plan to upgrade a Gen2 system to a Gen3 single node system, you must remove
the device from the HP StoreOnce Enterprise Manager before the upgrade, and add it back to the
HP StoreOnce Enterprise Manager after the upgrade.
Working with orphan service sets
If there is replication between a Gen2 and Gen3 device, or between two Gen3 devices, and you
only add the Gen2 device by finding associated devices, then it is not possible to automatically
find the IP address of the Gen3 device. All the service set/device entries are entered into the
database. Click Device Management->Pending; this displays all the service sets/devices for which
the system cannot automatically find the IP address. Enter the IP address of the 26xx, 27xx, 42xx,
44xx, 45xx, 47xx, 49xx, B6200, or 6500 device corresponding to all the listed service set entries,
and then click OK.
Adding a device 15
Page 16

Adding new users, administrators, and groups
In the HP StoreOnce Enterprise Manager, you can add new users from Active Directory (AD). To
provide access to AD users, you must add the LDAP server information, and then import the AD
group from AD. After a group is imported from AD to the HP StoreOnce Enterprise Manager, all
users of that group can log in to the HP StoreOnce Enterprise Manager. Their information is saved
in the HP StoreOnce Enterprise Manager database.
NOTE: The default authentication mechanism for the HP StoreOnce Enterprise Manager is local.
After the initial configuration, you can change the authentication mechanism from local to LDAP.
Login procedures and procedures for adding users differs based on the authentication mechanism
selected. The following procedures are appropriate for the local authentication mechanism; see
“Configuring LDAP authentication” (page 94) for LDAP information.
Adding users locally
To add new users or administrators, if you are using the local authentication mechanism:
1. From the Navigation tree under Administration, select User Management.
2. On the Active Users tab, click Add.
The Add New User dialog box appears.
3. In the General section, type the appropriate information into each field of the Add New User
dialog box, using the information presented to the right of the fields to ensure the values are
acceptable.
For example, do not include dashes, spaces, or periods in the User Contact Number field.
NOTE: The user ID is not case sensitive.
4. In the Role Selection section, select the appropriate radio button to designate whether the
person being added is an Administrator or a User.
5. If all information is complete, click Submit.
6. The Success dialog box appears.
7. Click OK to exit the dialog box, and return to the User Management screen. The newly-added
user or administrator is included in the list of users.
Creating a new group
An administrator can create a new group by using the following procedure:
1. From the Navigation tree under Administration, select Group Management.
16 Configuring the HP StoreOnce Enterprise Manager
Page 17
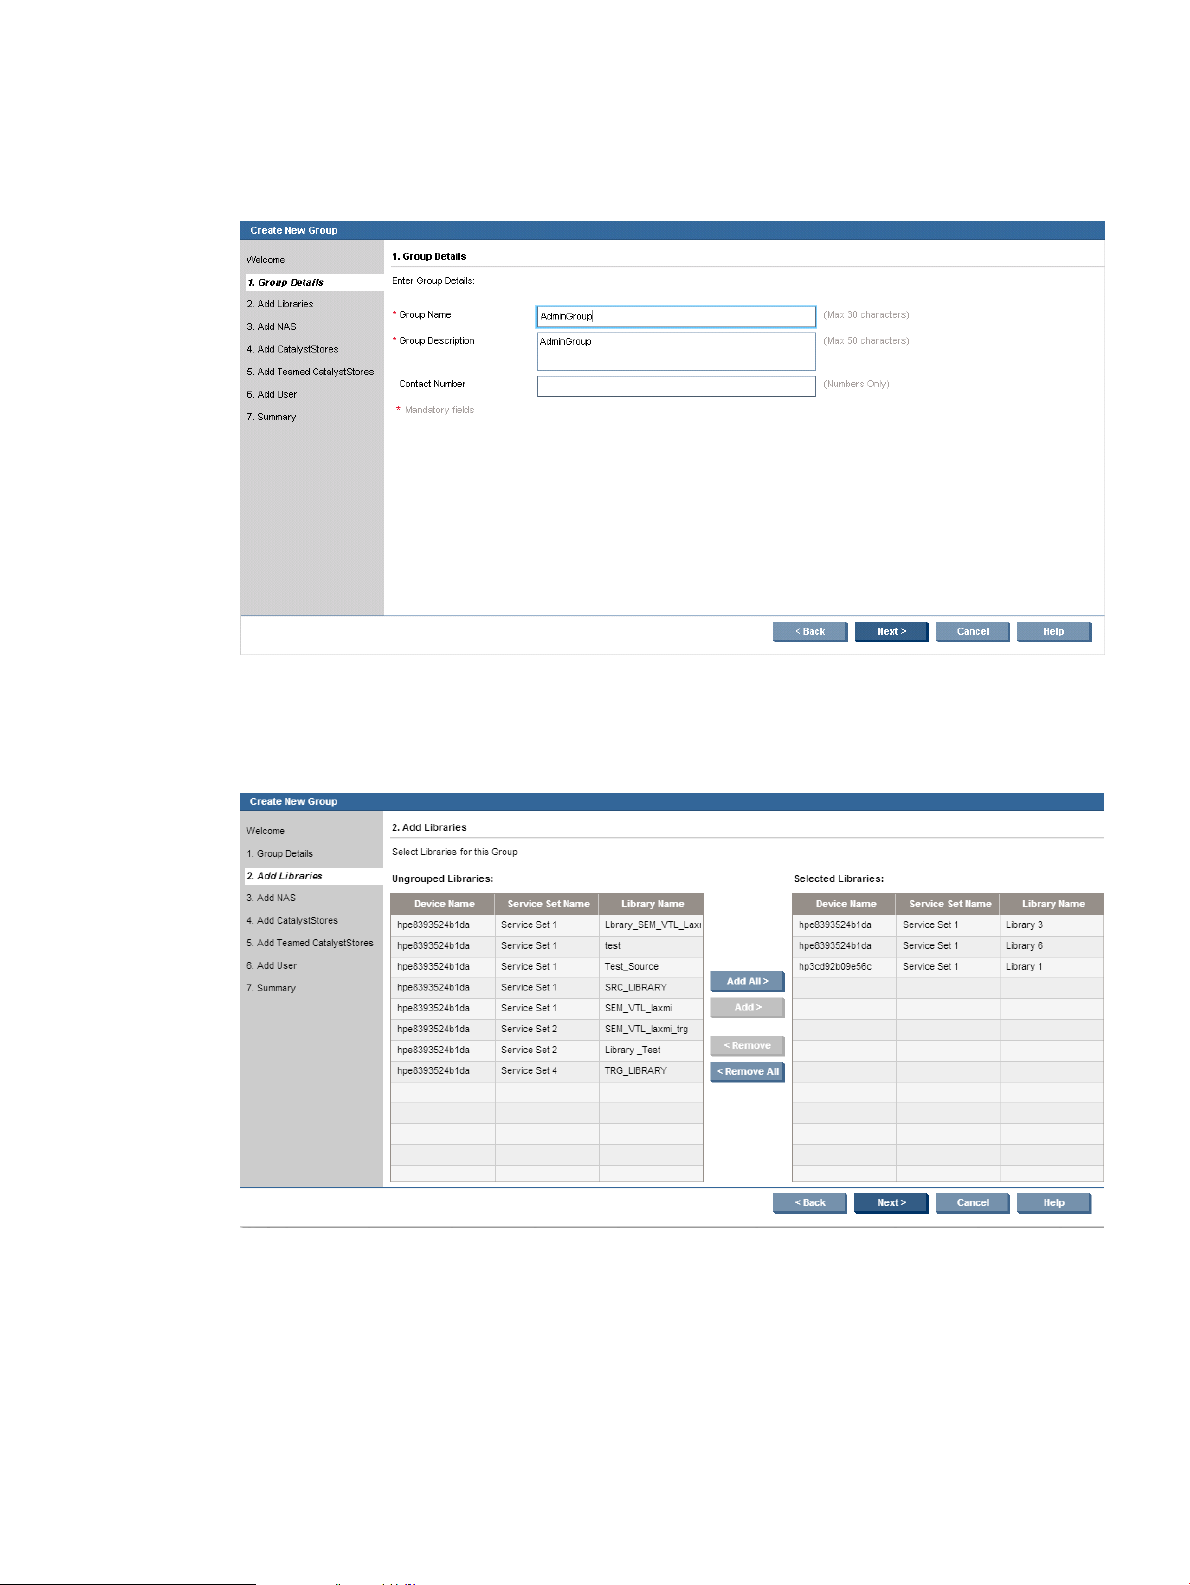
2. Click Create.
The Welcome screen of the Create New Group wizard appears.
3. Click Next to begin.
4. On the Group Details screen, enter the appropriate information into each field.
5. Click Next.
6. On the Add Libraries screen, select a single or multiple libraries from the Un-grouped Libraries
list, and then click Add >. Add all libraries by using Add All > instead.
7. Click Next.
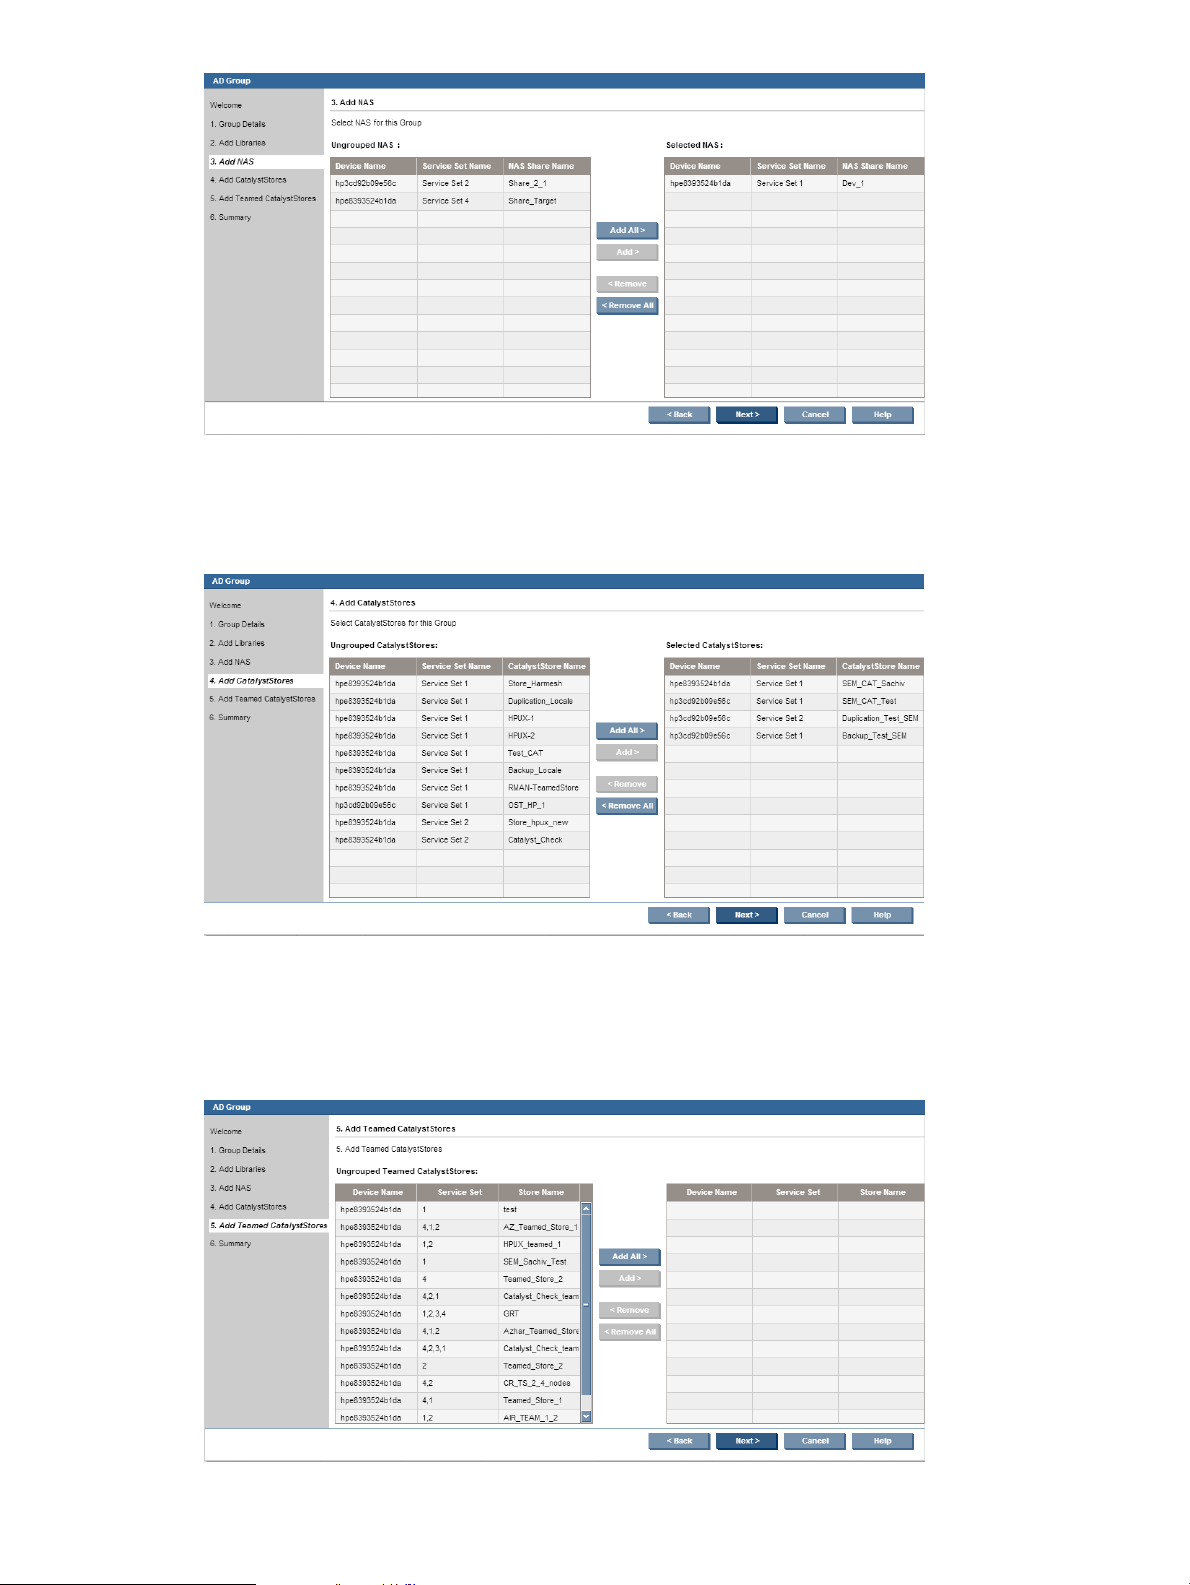
8. On the Add NAS screen, select a single or multiple NAS shares from the Un-Grouped NAS
list, and then click Add >. Add all NAS shares by using Add All > instead.
Creating a new group 17
Page 18
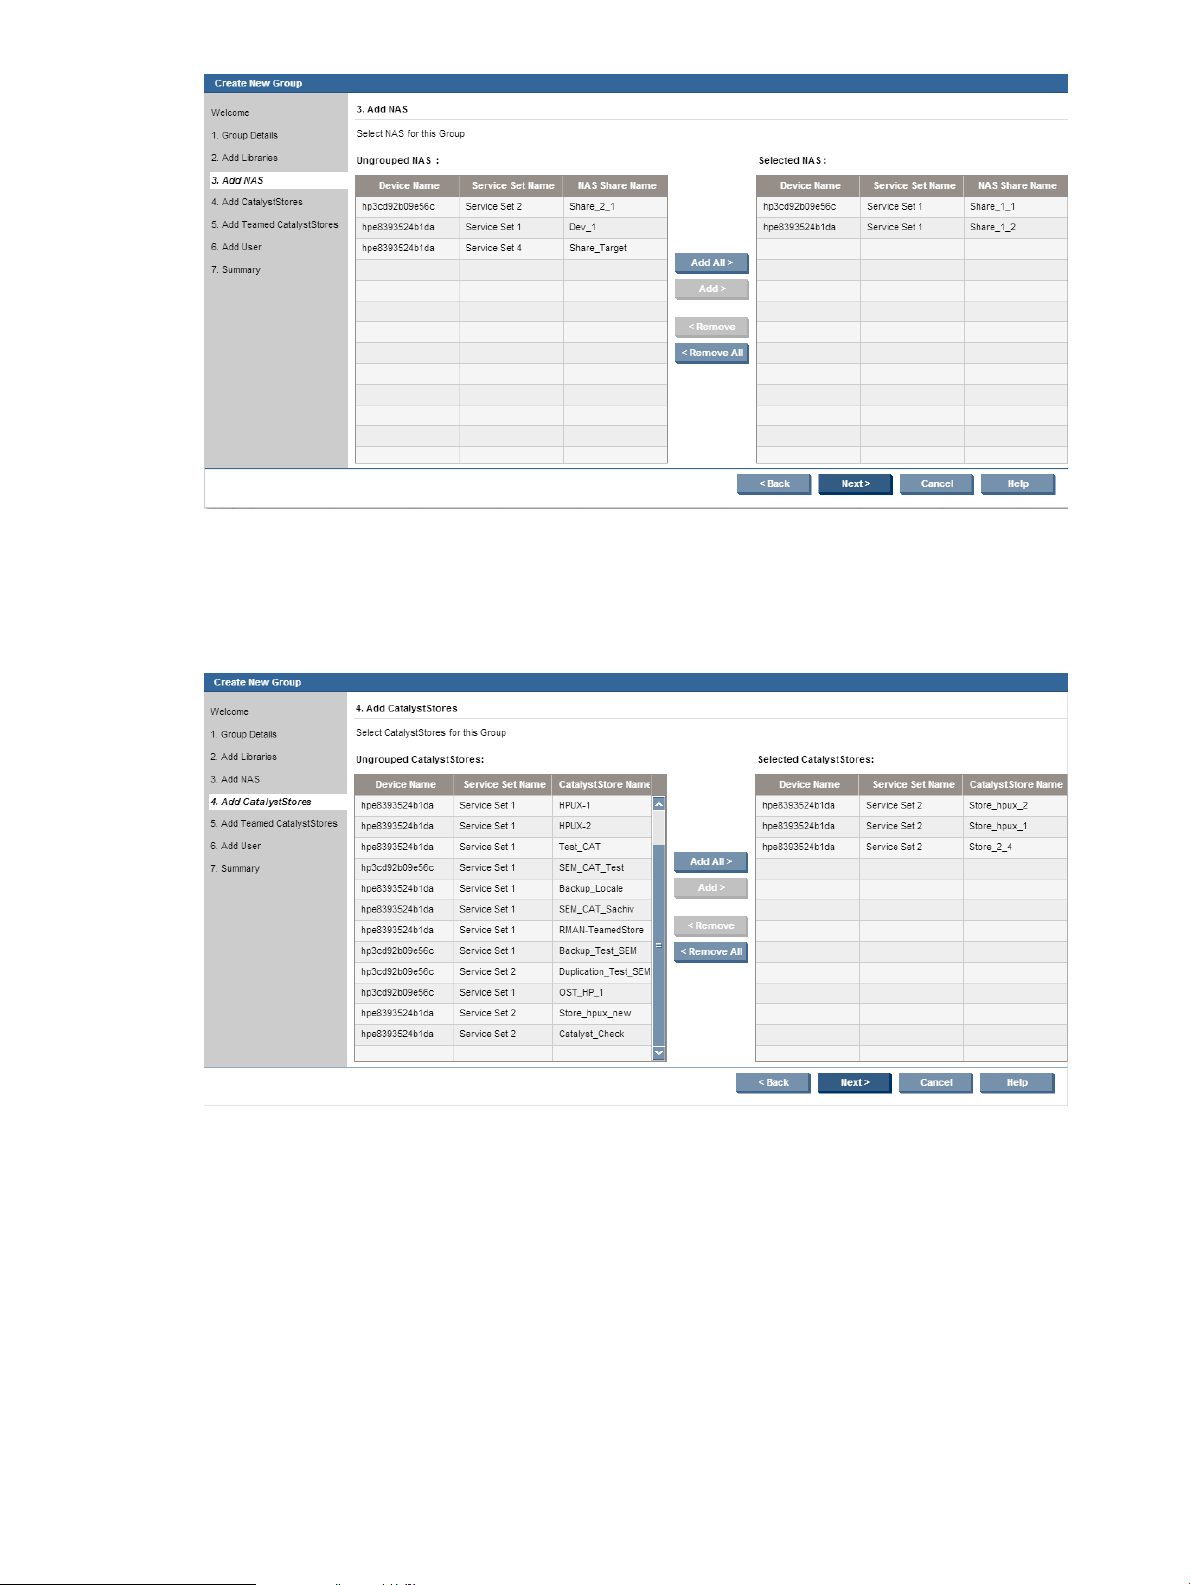
9. Click Next.
10. On the Add CatalystStores screen, select a single or multiple CatalystStores from the
Un-Grouped CatalystStores list, and then click Add >. Add all CatalystStores by using Add
All > instead.
11. Click Next.
12. On the Add Teamed CatalystStores screen, select a single or multiple Teamed CatalystStores
from the Un-Grouped Teamed CatalystStores list, and then click Add >. Add all Teamed
CatalystStores by using Add All > instead.
18 Configuring the HP StoreOnce Enterprise Manager
Page 19
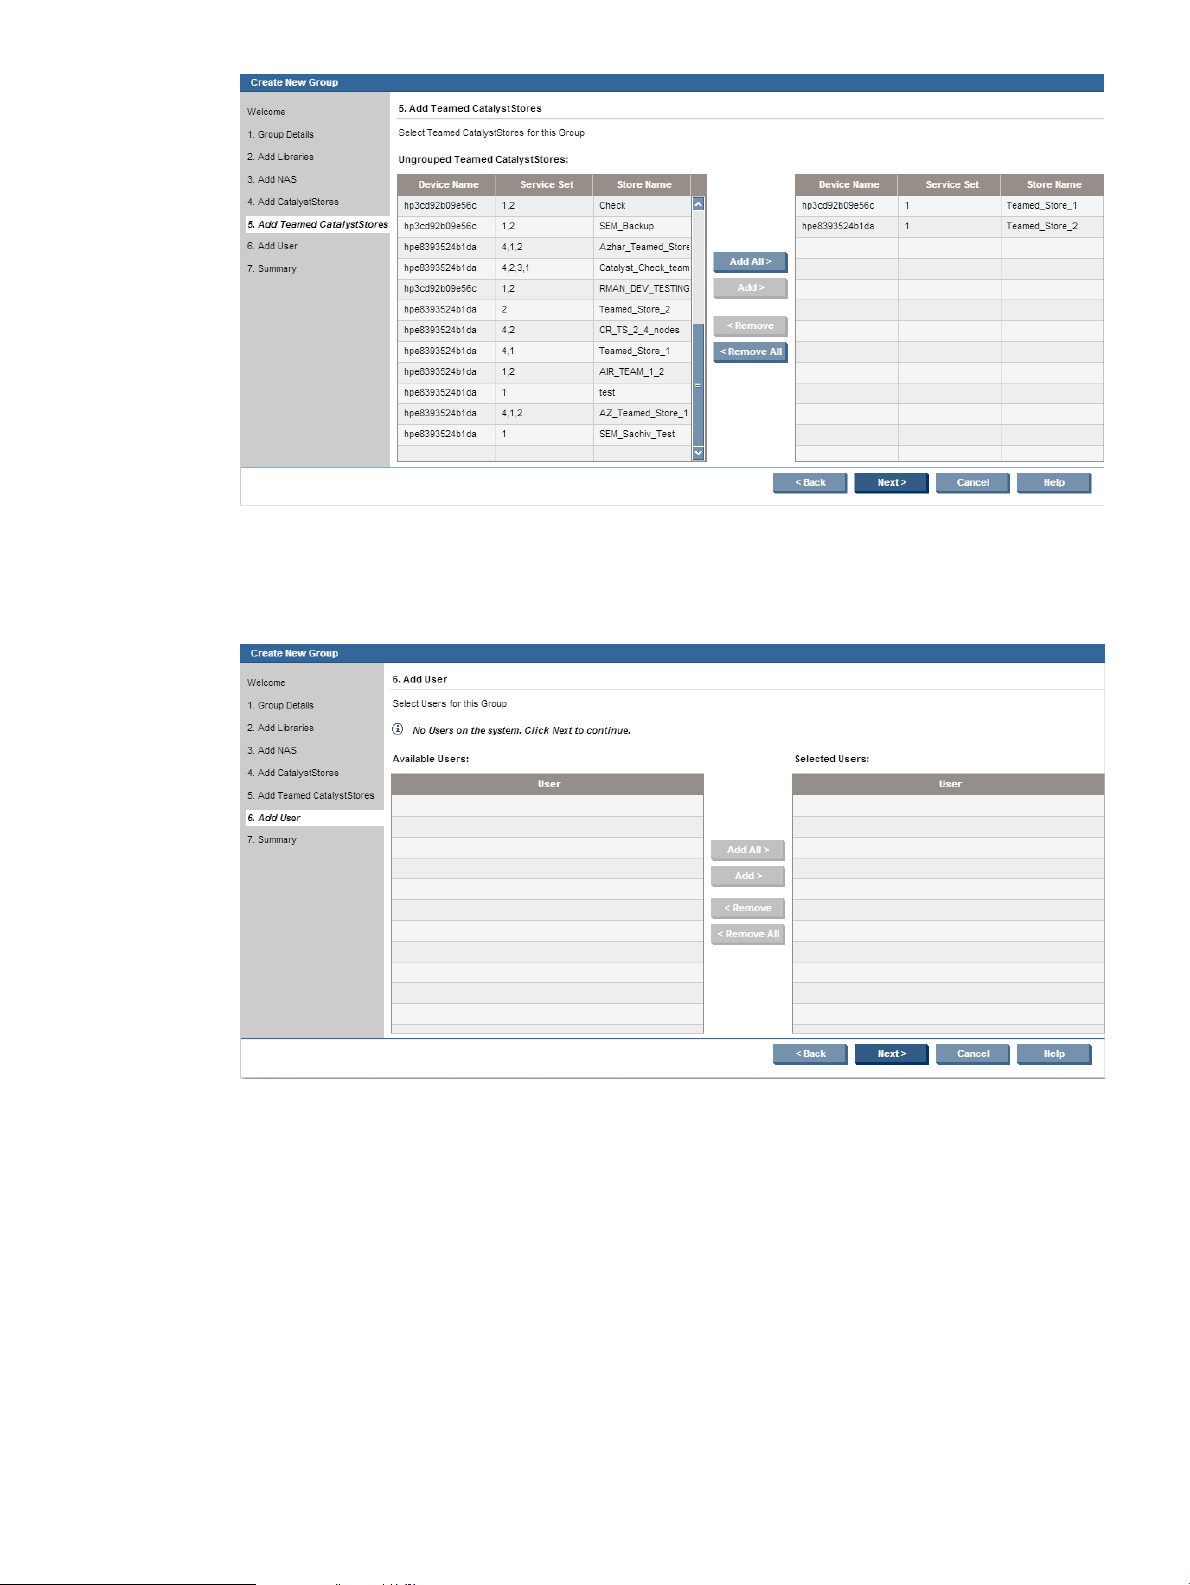
13. Click Next.
14. On the Add User screen, select a single or multiple users from the Available Users list, and
then click Add >. Add all users by using Add All > instead.
15. Click Next.
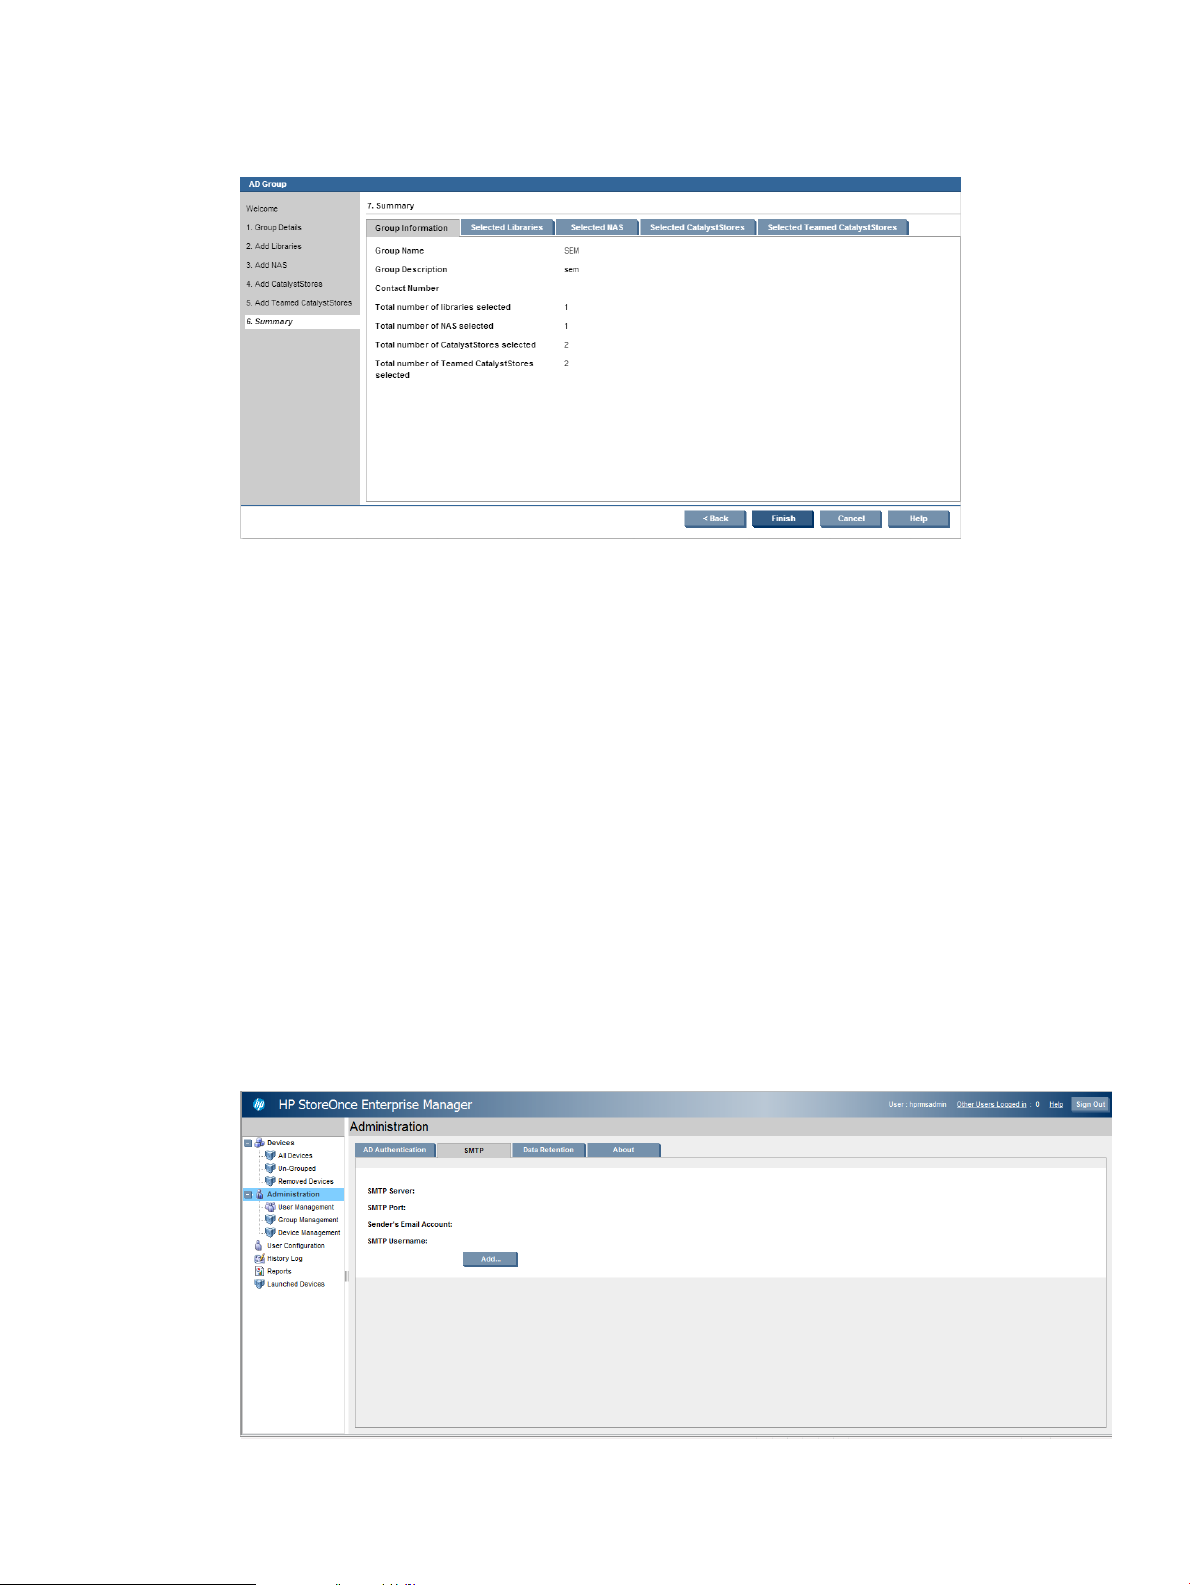
16. On the Summary screen, review the information for each tab.
Creating a new group 19
Page 20

17. If applicable, click Back to make any changes to the information for the new group.
18. If the information is correct, click Finish.
The Success dialog box appears.
19. Click OK to exit the dialog box, and then return to the Group Management screen.
The new group is included in the list of groups.
NOTE: If a new group is created, it takes time before the group will appear in storage and
performance reports. If you do not see a newly created group in the reports, check back later.
NOTE: A group can be created without adding libraries, NAS shares, CatalystStores, or users.
To add to (or modify) this group later, follow the procedure in “Modifying a group” (page 97).
NOTE: This same list of groups can be viewed by selecting Devices from the Navigation tree.
Importing an AD group
An administrator can import an AD group into the HP StoreOnce Enterprise Manager. After an
AD group is imported, all users of that AD group can log into the HP StoreOnce Enterprise Manager,
and see the groups for which they are members.
To import an AD Group to the HP StoreOnce Enterprise Manager:
1. Click Group Management in the Navigation tree.
2. Click Import Group...
The AD wizard opens.
3. Complete the fields as applicable.
20 Configuring the HP StoreOnce Enterprise Manager
Page 21
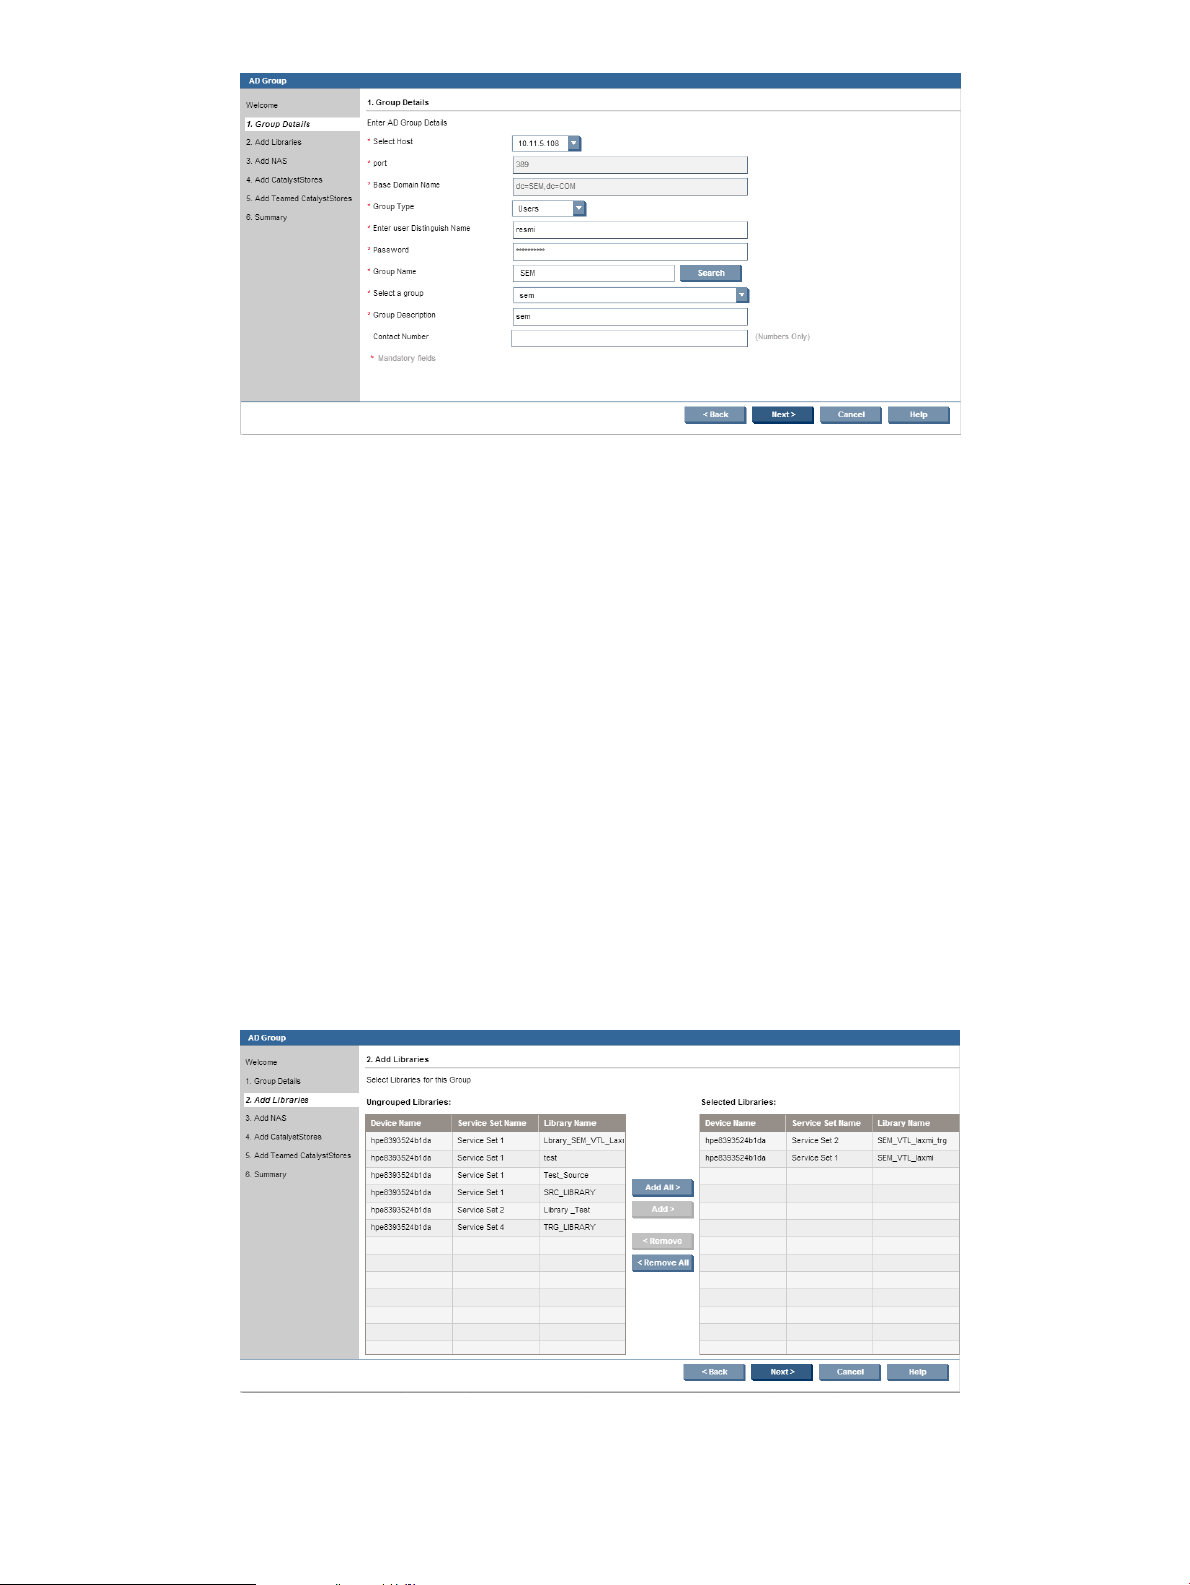
• Host (example: x.x.x.x)
• Port (example: 389)
• Base Domain Name (example: dc=rm,dc=com)
• Group Type (Users/Administrator)
• Enter UserDN (example: cn=john smith,cn=users,dc=xyzad,dc=com)
• Password (user password)
• Group Name: group to search
Enter the first few characters, and then click Search. This populates the Select a group
drop-down box with groups that match.
• Select a group: The LDAP group to import
• Group Description: The description of the group (populates automatically after you select
a group)
• Contact Number: Phone number of the user
4. Click Next.
5. On the Add Libraries screen, select a single or multiple libraries from the Un-Grouped Libraries
list, then click Add >. Add all libraries by using Add All > instead.
6. Click Next.
7. On the Add NAS screen, select a single or multiple NAS shares from the Un-Grouped NAS
list, and then click Add >. Add all NAS shares by using Add All > instead.
Importing an AD group 21
Page 22
8. Click Next.
9. On the Add CatalystStores screen, select single or multiple CatalystStores from the Un-Grouped
CatalystStores list, and then click Add >. Add all CatalystStores by using Add All > instead.
10. Click Next.
11. On the Add Teamed CatalystStores screen, select single or multiple Teamed CatalystStores
from the Un-Grouped Teamed CatalystStores list, and then click Add >. Add all Teamed
CatalystStores by using Add All > instead.
22 Configuring the HP StoreOnce Enterprise Manager
Page 23
12. Click Next.
13. Review the Summary screen and information displayed on each tab. If the information is
correct, click Finish.
After the group is imported, all users of this group can log into the HP StoreOnce Enterprise
Manager by using their LDAP credentials.
Setting up SMTP for emailed reports
The Report Scheduler and replication and CatalystStore copy job alerts email notification features
provide the ability to monitor the status of the various devices and of the replication process between
the devices by way of regular emails.
Before users start receiving emailed reports, an SMTP server must be added for the HP StoreOnce
Enterprise Manager to start sending emails.
Adding an SMTP server for sending emails
Only an administrator can add SMTP server details, which are required for the HP StoreOnce
Enterprise Manager to send emails.
To add a new SMTP server:
1. Select Administration in the Navigation tree.
2. Select the SMTP tab.
3. Click Add….
4. In the SMTP Configuration wizard, enter the SMTP server details.
Setting up SMTP for emailed reports 23
Page 24
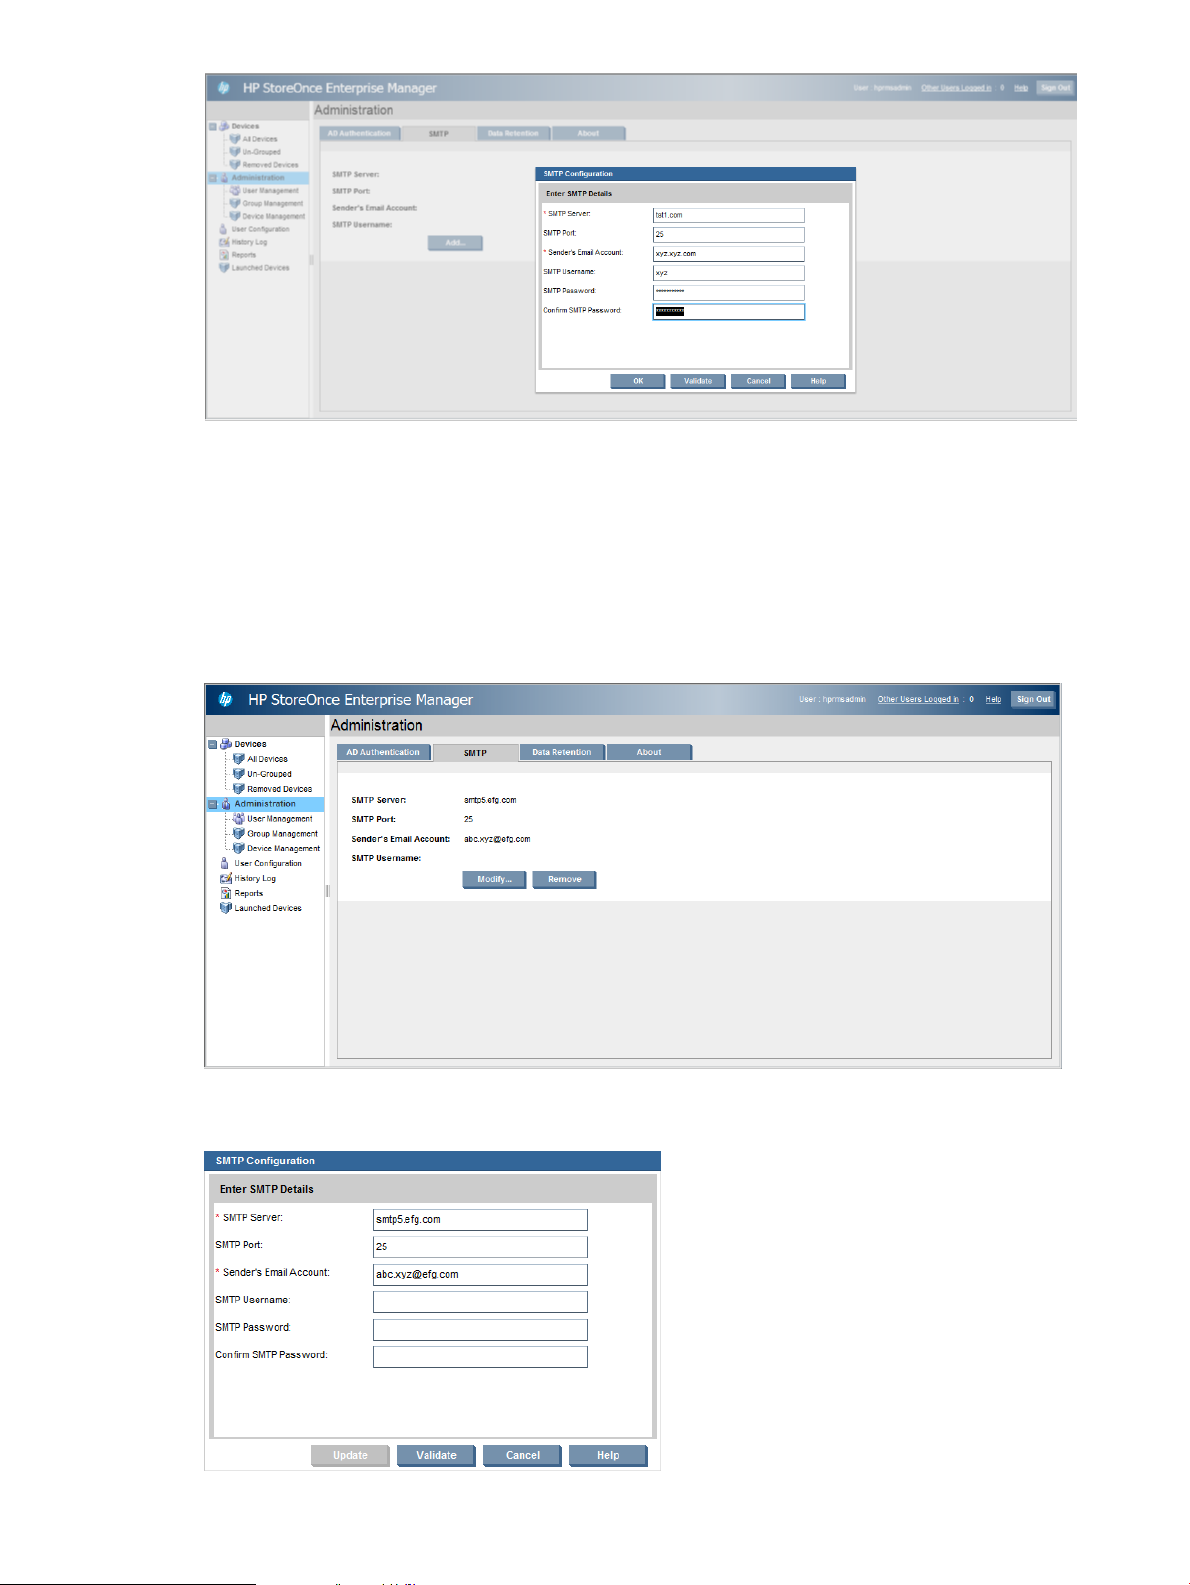
5. Click OK.
Modifying an SMTP
To modify an SMTP you added:
1. Select Administration in the Navigation tree.
2. Select the SMTP tab.
3. Click Modify....
4. Edit SMTP server details, as required.
24 Configuring the HP StoreOnce Enterprise Manager
Page 25

5. Click OK.
Removing an SMTP
To remove an SMTP:
1. Select Administration in the Navigation tree.
2. Select the SMTP tab.
3. Click Remove.
A confirmation window is displayed so you can confirm the deletion before the system removes
the SMTP details.
Modifying the data retention period
Configure the time period for how long to keep the history data in the HP StoreOnce Enterprise
Manager database. Select the Administration tab in the Navigation tree, then select the Data
Retention Tab. The screen displays the default value. Make any changes, and then click Submit.
Viewing About Information
The About tab shows the version and build number of the HP StoreOnce Enterprise Manager and
the installed version of Flash Player on the client side.
Configuring a report scheduler
The Report Scheduler allows you to schedule reports to be received directly as email attachments.
A number of reports can be added to a report scheduler, and each report will be attached as a
Configuring a report scheduler 25
Page 26
separate .csv to the email. After the administrator configures the SMTP server (see “Adding an
SMTP server for sending emails” (page 23)), you can start adding reports to the Report Scheduler.
You can schedule daily, weekly, monthly, quarterly, and yearly reports. This way, you can have
all the reports you want without logging into the HP StoreOnce Enterprise Manager.
The Report Scheduler is available for the following reports:
• Replication Jobs
• Data Transferred
• CatalystStores Jobs
• CatalystStores Usage
• Performance
• Disk Usage and Deduplication Ratio
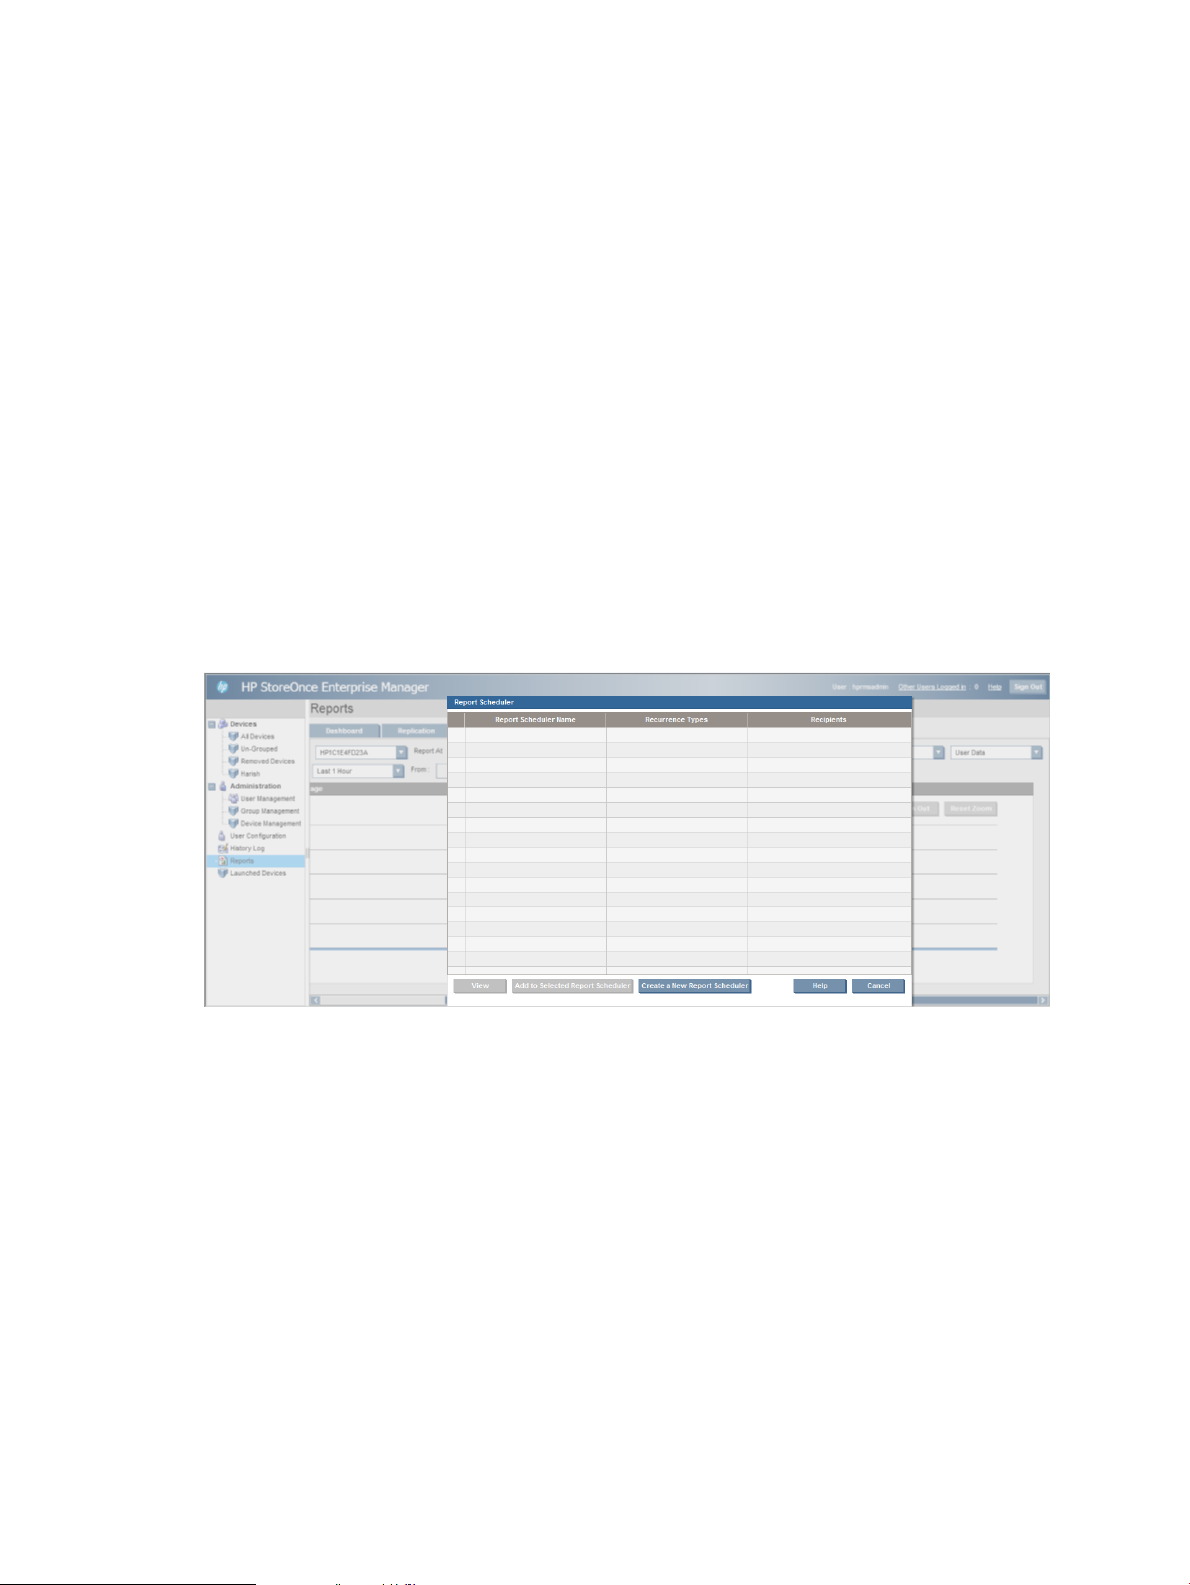
To access the Report Scheduler:
1. Select Reports from the Navigation tree.
2. Select the tab representing the report of interest.
3. Display the report of interest by using the necessary drop-down boxes. (For more information,
see the individual report sections.)
4. Click Schedule an email in the upper right corner of the screen. The Report Scheduler window
appears.
This window provides three options:
• Create a New Report Scheduler
• Add to Selected Report Scheduler
• View (the selected Report Scheduler)
To create a Report Scheduler:
1. Click Create a New Report Scheduler.
2. Click Next to display an overview of the report details.
3. Enter a name for the Report Scheduler.
26 Configuring the HP StoreOnce Enterprise Manager
Page 27
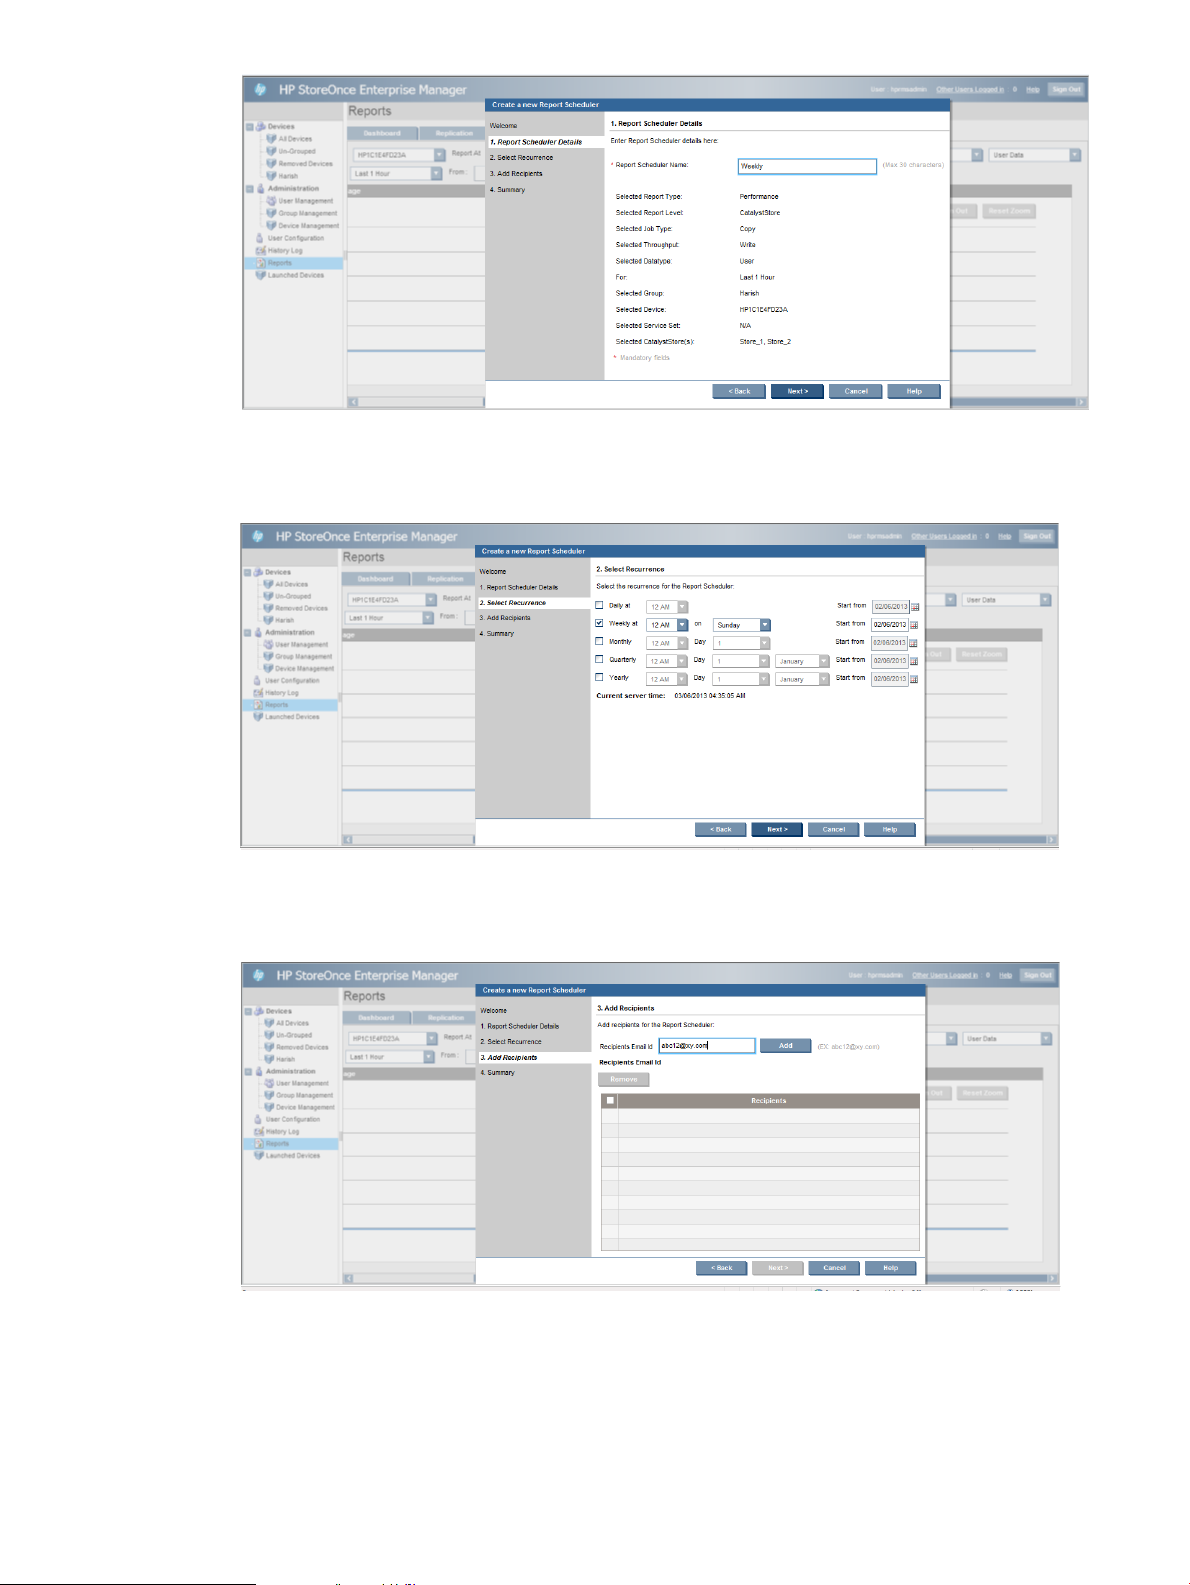
4. Click Next.
5. Select the email interval. See Step 11 in “Setting up SMTP for emailed reports” (page 23).
6. Click Next.
7. Enter a valid recipient email address.
8. Click Add. Add any number of recipients.
9. Click Next.
10. Review the information on the Summary screen.
Configuring a report scheduler 27
Page 28
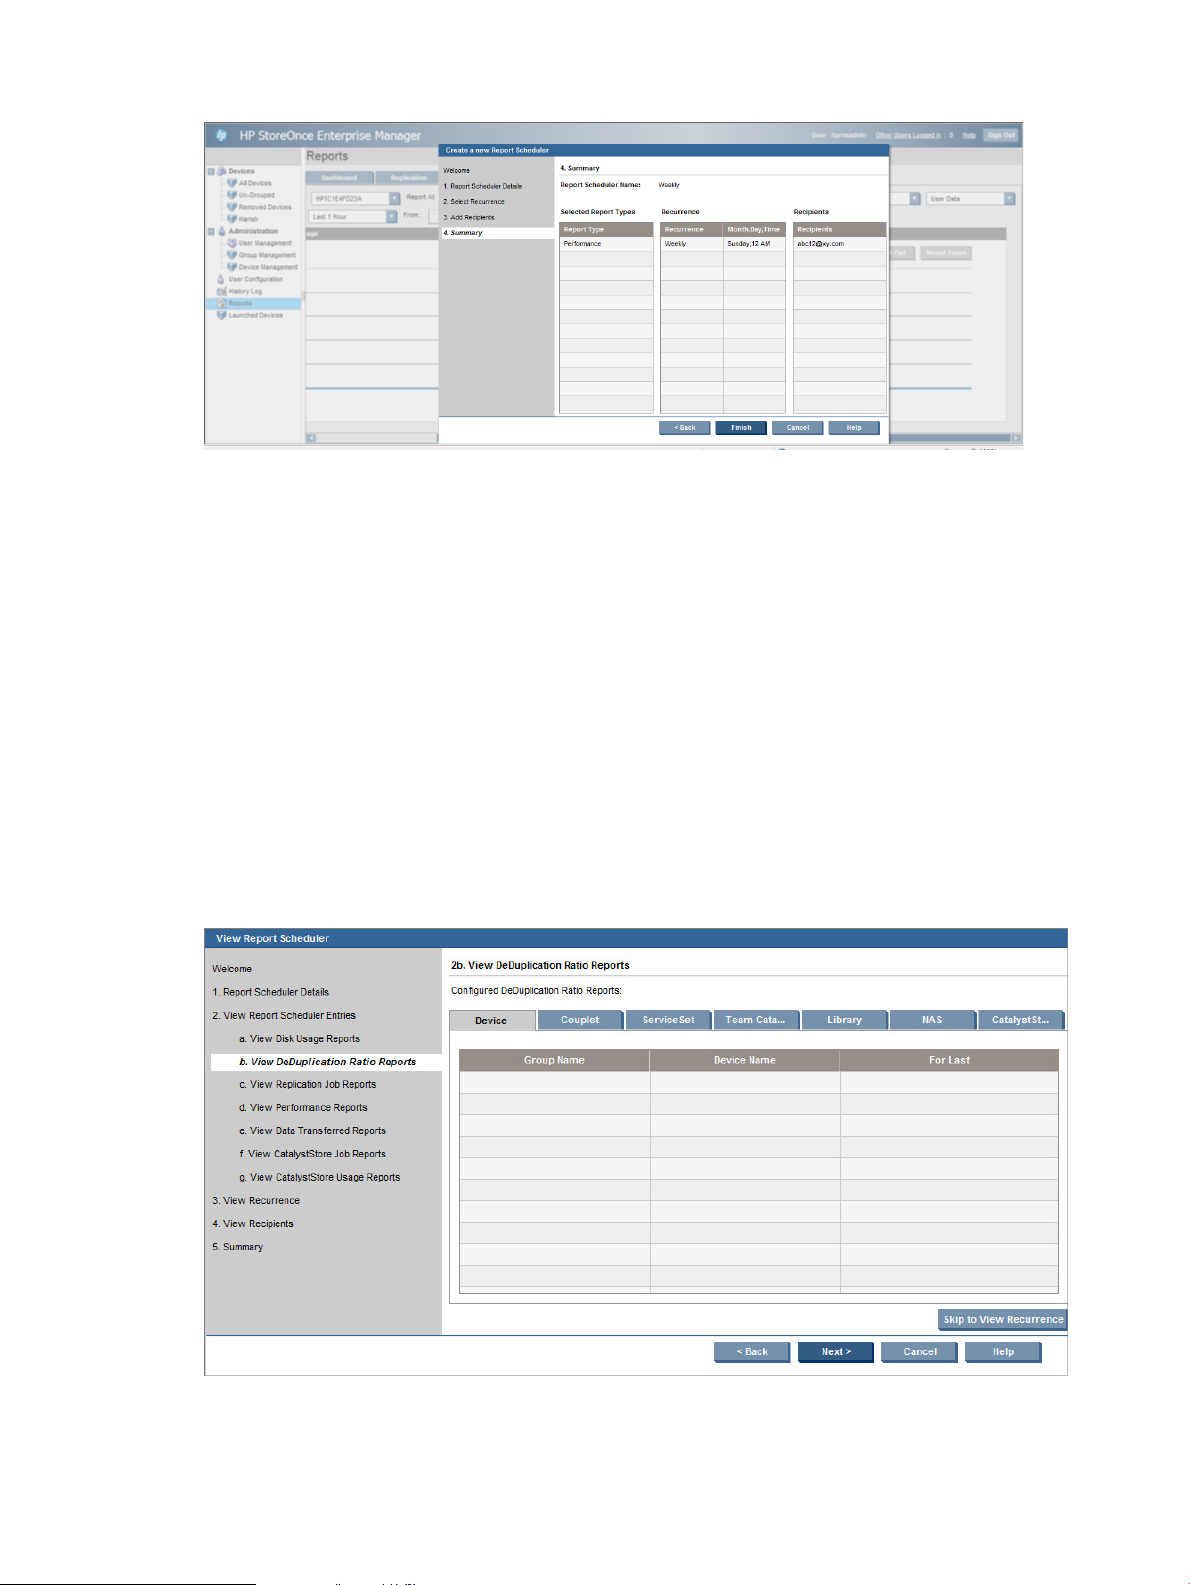
11. Click Finish. The selected report is saved to the new Report Scheduler.
To add a report to an existing Report Scheduler:
1. From the Report Scheduler window, select a Report Scheduler to update with the new report.
2. Click Add to Selected Report Scheduler.
The report is added to the existing Report Scheduler. If the report is already in the selected
Report Scheduler, an error message appears. Add the report to a new or different Report
Scheduler.
To view an existing Report Scheduler:
1. From the Report Scheduler window, select a Report Scheduler to view.
2. Click View.
3. Click Next through the Report Scheduler to see the report types included in that Report
Scheduler.
Within each report type, the screen contains tabs to separate reports by appliance, service
set, library, port, drive, NAS share, and CatalystStore reports. The displayed tabs within each
page depend on the report type.
Click Skip to View Recurrence to bypass the reports, and go directly to the recurrence details.
4. After viewing all the report types, click Next to walk through the email interval, recipients,
and a summary of this Report Scheduler.
28 Configuring the HP StoreOnce Enterprise Manager
Page 29

5. Click OK to close the Report Scheduler window.
View a Report Scheduler from the User Configuration screen.
Viewing, modifying, or removing a report scheduler
1. Go to User Configuration in the Navigation tree.
2. Select the Manage Report Schedulers tab. This screen lists all of the existing Report Schedulers
that you have configured.
3. Select a Report Scheduler.
4. Click View, Modify, or Remove as appropriate.
• View—Shows the Report Scheduler as described in “Configuring a report scheduler”
(page 25).
• Modify—Allows you to modify the Report Scheduler name, recurrence, and recipients,
and to remove any specific report selection from the Report Scheduler. You cannot add
a new report selection to an existing report scheduler by clicking Modify; you can only
do that by clicking Schedule an email on the respective report page.
Configuring a report scheduler 29
Page 30

• Remove—Deletes the Report Scheduler from the HP StoreOnce Enterprise Manager. You
are presented with two confirmation boxes before the Report Scheduler is removed.
30 Configuring the HP StoreOnce Enterprise Manager
Page 31

4 Managing devices
On the Navigation tree, the Devices is available to users and administrators. Those with
administrator-level permissions can view all devices, and those with user-level permissions can only
view devices to which they have access. The following device management procedures can be
performed:
• “Viewing a group summary” (page 31)
• “Filtering devices to appear” (page 32)
• “Launching the device GUI” (page 33)
• “Customizing columns to appear” (page 34)
• “Viewing replication topology” (page 37)
• “Managing removed devices” (page 40)
• “Viewing device details ” (page 42)
• “Viewing messages” (page 66)
Viewing a group summary
The system administrator can view the Overall Status Summary for all groups recognized by the
HP StoreOnce Enterprise Manager. Users can view the Overall Status Summary for all groups
recognized by the HP StoreOnce Enterprise Manager to which they have access. To do so, click
on Devices in the Navigation tree. (The figure below shows the administrator view.)
The Overall Status Summary screen appears and lists for each group:
• The group name
• The number of devices that currently have a status of Critical, Warning, Unknown, Information,
and Good
• The total number of devices
• A description of the group
• Contact information
For additional information about a group, click on the name of the group in the Group Name
column of the content pane or in the Navigation tree. See “Viewing device details ” (page 42).
Viewing a group summary 31
Page 32

Filtering devices to appear
The HP StoreOnce Enterprise Manager allows users and administrators to filter the devices that
appear in the devices group view. Because administrators and users have different permission
levels, users can choose only from the groups to which they have access and administrators can
choose from all groups including all devices and un-grouped devices.
To filter the devices to appear:
1. In the Navigation tree, select a group of devices (for example, a named group, All Devices
or Un-Grouped).
All devices in that group are listed in the content pane. The list item filter fields appear.
2. In the left-most Filter by field, select the column by which to filter or select Any Column.
The following filter options are available:
• Any Column
• Overall Status
• IP Address
• Name
• Serial Number
• Model
• Details
3. In the middle field, select one of the conditions:
• equal to
• not equal to
• contains
These parameters change depending on what you select in the field. For example, if you select
Model as your filter, the parameters to choose from are contains, equal to, or not equal to. If
you select Overall Status as your filter, the parameters to choose from are equal to or not
equal to.
4. In the right-most field, enter or select the appropriate value.
These options also change depending on what is selected in the first two filter fields. For
example, if you select Model as your filter, the parameters to choose from are contains, equal
to, or not equal to, and you must enter the value of the model for which to filter. If you select
Overall Status as your filter, the parameters to choose from are equal to or not equal to, and
the options to choose from are Critical, Warning, Unknown, information, and Good.
32 Managing devices
Page 33

5. After setting up all the filters, click Filter.
The content pane displays only those devices in the group that meet the filter criteria.
6. To view all devices in the group again, click Reset.
Launching the device GUI
As you monitor multiple devices with the HP StoreOnce Enterprise Manager, it might be necessary
to view specific device details. The HP StoreOnce Enterprise Manager provides a way to interact
with a device’s graphical interface through the Launch Devices link in the Navigation tree.
To do so:
1. Select a device to access.
2. Click Launch Device GUI. A link to the device interface login screen is added under Launched
Devices in the Navigation tree.
3. Observe the warning to set browser privacy settings, and then click Yes.
4. Click that link to launch the device's login screen.
Launching the device GUI 33
Page 34

5. Log into the GUI.
Launched devices are not available after you log back in. You can also manually remove a launched
device:
1. Select Launched Devices in the Navigation tree.
2. On the Launched Devices screen, select the device to remove.
3. Click Remove Launched Device(s).
NOTE: The Launched Device GUI works best with the Mozilla Firefox web browser application.
If you are using Microsoft Internet Explorer, you might have a problem logging out of the HP
StoreOnce Enterprise Manager the first time you attempt to launch a device GUI. This is primarily
due to how the browser responds to third-party cookies. Select Force Login after you log in again,
and launching devices will work properly.
Customizing columns to appear
The HP StoreOnce Enterprise Manager allows users and administrators to customize the columns
displayed in many of the device group screens.
To select the columns to appear:
1. In the Navigation tree, select the group of devices.
All devices in that group are listed in the content pane.
34 Managing devices
Page 35

2. Click Customize View.
The Column Selection dialog box appears.
3. From the Available Columns pane on the left of the Column Selection dialog box, click the
column titles you wish to appear, and then click >>.
These column titles are added to the Selected Columns pane on the right of the Column Selection
dialog box.
4. To remove the titles from Selected Columns, click the column titles in that list to be removed,
and then click <<.
Removed column titles are returned to the Available Columns pane.
NOTE: The overall status, IP address, name, serial number, model, and details columns
cannot be removed. After one of these columns are selected, clicking << results in a Warning
dialog box. Click OK to close the dialog box, and continue.
5. To change the order in which columns appear, highlight a selected column, and use the up
or down arrow buttons below the Selected Columns pane.
6. Click OK to save these settings.
NOTE: Click Reset Columns to restore the original columns.
Firmware notification
In the device group view, the Firmware version column shows the firmware version of the managed
HP StoreOnce device. This column is optional; it does not display in the device list page by default.
To display it, change the device list view by clicking Customized View.
In a particular displayed group, the Firmware Version column provides details on whether one of
the managed device has a more recent firmware version available. The column shows the firmware
versions for all managed devices, along with a link to launch the release page where you can
access the latest firmware. This function applies to viewing all devices and also viewing specific
groups.
Customizing columns to appear 35
Page 36

Device list with the default setting and no firmware updates available for any device
Device list with the firmware version column selected in the customized view (regardless of whether
updates are available for any device):
Device list showing firmware version column automatically if a firmware update is available for
any device
36 Managing devices
Page 37

Viewing replication topology
The HP StoreOnce Enterprise Manager allows users to view the replication relationships between
the devices in a graphical format. In the replication topology view, users can see all the replicating
devices that are part of that group. Replication relationships are group-specific (replications can
be seen only if either the source or target library/NAS share is in the current group).
To view the replication topology:
1. From the Navigation tree, select a group of devices to view. The replication topology view is
not available for default system groups, such as all devices and removed devices. All devices
in the selected group appear in the main screen.
2. Click View Replication Topology.
The replication topology view provides the following features:
• Graphical display of islands of devices: After viewing the replication topology of groups, the
graphs are displayed in separate islands, and links are available at the bottom of the page
to navigate through the graphs easily.
• Device status: The status badge on the node indicates the status of that device.
• Replication status: The color of the replication lines indicate the replication status. The replication
line shows the status of replications in a Critical state. (For example, if one replication between
two devices is critical but the rest are good, the replication line will show the critical status.)
Viewing replication topology 37
Page 38

• Replication direction: The arrow in the replication line shows the direction of the replication.
If both the devices connected by an edge are replicating to each other, then a bidirectional
arrow is displayed.
• Node information in tooltip: The tooltip of the device nodes provides more information about
the node.
• Replication status in tooltip: The tooltip of the replication line status provides more information
about the replication status.
• Detailed device information: Details of a specific device. Click on the link in the device node
to view device details. (The link is not available for those devices that are not part of the current
group.)
• Visual rearrangement of replication topology graph: Allows you to manipulate the graph on
the screen, such as dragging the nodes, dragging the entire graph, and centering the graph.
• Page navigation buttons: The buttons at the bottom of the replication topology graph help to
quickly navigate between various pages of the graph.
Zooming in and out of the replication topology
The replication topology viewer allows you to zoom in and zoom out of the graph so you can
concentrate on a specific portion of the graph. Change the zoom screen in the following ways:
• Click the minus (–) button to reduce the zoom level.
• Click the plus (+) button to increase the zoom level.
• Drag the slider to set the zoom to a value of your choice.
• Reset the zoom to the original level by clicking Reset Zoom.
Filtering the replication topology
The replication topology viewer allows you to filter the displayed graph.
38 Managing devices
Page 39

1. In the Filter By drop-down box, select whether to filter by device status or replication status.
2. In the Equal To drop-down box, select the value of the status to view. The choices are Critical,
Warning, Unknown, Information, and Good.
3. Click Filter. The graph is filtered to match the selected criteria.
4. Click Reset to remove all filters on the graph.
Refreshing the replication topology
The replication topology viewer is refreshed automatically. Click Refresh in the replication topology
viewer screen to refresh the graph immediately.
Viewing the replication topology legend
The replication topology viewer has a legend to help you interpret the data being shown in the
replication topology view. To view the legend, click Show Legend in the replication topology
viewer.
Viewing replication topology 39
Page 40

Saving the layout
After you have manipulated the graph into a layout you prefer, save that layout for repeated use
in the replication topology viewer. Click Save Layout to save the current layout of the graph. Each
time you return to the viewer, the saved layout is available for display. This saved layout is specific
to your login; it will not be visible to other users in the same group or a different group.
Managing removed devices
Any devices that are removed using the procedure “Removing a device” (page 108) can be viewed,
restored, or deleted permanently by an administrator. After they are restored or permanently
deleted, they no longer appear in the Removed Devices screen.
To view, restore, or permanently delete removed devices:
40 Managing devices
Page 41

1. In the Navigation tree under Devices, select Removed Devices.
A list of all devices that have been removed, but not restored or permanently deleted, appears
in the content pane.
2. To restore one or more devices:
a. Select the box for each device to be restored.
b. Click Restore, and follow the instructions.
A warning dialog box appears.
c. Click Yes to continue.
Another warning dialog box appears.
d. Click Yes to restore the device.
The restored device is not listed in the Removed Devices screen.
e. On the Navigation tree under Administrator, click Device Management, and verify that
the newly-restored device is listed.
3. To permanently remove one or more devices:
a. Select the box for each device to be permanently removed.
b. Click Remove Permanently, and follow the instructions.
A warning dialog box appears.
c. Click Yes to continue.
A confirmation dialog box appears.
d. Click Yes to permanently remove the device.
A success dialog box appears.
e. Click OK to close the dialog box.
The permanently removed device is not listed in the Removed Devices screen.
NOTE: Although it cannot be restored, the permanently removed device can be added again
as a new device using the procedure “Adding a device” (page 13) .
Managing removed devices 41
Page 42

Viewing device details
You can view certain details about a specific device. Begin by accessing the Current Issues tab
as described below. From this screen, use the tabs at the top to select more options. This sections
provides details about:
• “Accessing the Current Issues screen ” (page 42)
• “Viewing current issues” (page 44)
• “Viewing virtual libraries” (page 49)
• “Viewing virtual library disk usage” (page 53)
• “Viewing NAS shares” (page 55)
• “Viewing NAS shares disk usage” (page 59)
• “Viewing CatalystStores” (page 62)
• “Viewing CatalystStore disk usage” (page 65)
At any time, from the All Devices screen, you can click Refresh, to display the latest device
information.
Accessing the Current Issues screen
1. In the Navigation tree under Devices, select the group that contains the device to be viewed.
The list of devices in the group appears in the main panel.
2. Select the linked name of the device to be viewed.
On Gen2 and Gen3 single node systems, the screen defaults to the Current Issues tab. On
Gen3 multi-node systems, you must first select a service set to access the Current Issues tab.
Gen2 and Gen3 single node
42 Managing devices
Page 43

Gen3 multi-node:
Viewing device details 43
Page 44

3. From the Current Issues tab, click the additional tabs at the top to view additional device
details.
Viewing current issues
Users and administrators can view current issues for the devices to which they have access. Begin
by selecting a device and then clicking More Details (on a Gen3 multi-node system, click the
preferred service set after clicking More Details) See “Accessing the Current Issues screen ”
(page 42).
Gen2 and Gen3 single node systems
On Gen2 and Gen3 single node systems, the Current Issues tab displays the current status of the
device including the status of any virtual libraries, NAS shares, CatalystStores, and Teamed
CatalystStores on the device. It also includes a pie chart of the disk statistics showing used and
free disk space. This screen updates automatically.
44 Managing devices
Page 45

Gen3 multi-node systems
On Gen3 multi-node systems, the device details view displays the device and service set status. It
includes a pie chart of the couplet disk usage showing the couplet's total available space and what
is used by each node. It also shows a table that displays the used space and free space for each
node of the couplet.
From the Gen3 multi-node device status screens, click a service set link to view the Current Issues
tab. The Current Issues tab displays the current status of the device and the status of virtual libraries,
Viewing device details 45
Page 46

NAS shares, and CatalystStores on the selected service set. It also includes a pie chart of service
set statistics showing the space used by the service sets and the remaining space; the remaining
space includes the couplet free space and the StoreOnce bookkeeping data. This screen updates
automatically.
All systems
To see more details, click Launch Devices in the Navigation tree. The HP StoreOnce Management
GUI launches and appears within the HP StoreOnce Enterprise Manager itself. Every launched HP
StoreOnce GUI is automatically added under Launched Devices of the Navigation tree on the left
pane of the HP StoreOnce Enterprise Manager.
NOTE: If necessary, disable pop-up blockers on the web browser so that the new window can
open.
NOTE: To view details for a different device within that group, click on [group name] Devices
in the bread crumbs, and then select the radio button of the device to view.
Configuring threshold alerts
You can change the minimum threshold of disk used space that triggers email alerts for each device
(Gen2 and Gen3 single node systems) or node (Gen3 multi-node systems). If the used space for
the configured device or node reaches the minimum threshold (percent of space used) you selected,
an email is sent to the email addresses provided. You can assign different thresholds to different
email addresses.
46 Managing devices
Page 47

1. On a Gen2 or Gen3 single node system, select Configure Threshold Alerts on the Current
Issues tab.
On a Gen3 multi-node system, select Configure Threshold Alerts on the initial device details
screen.
Gen2 and Gen3 single node systems
Gen3 multi-node systems:
2. On a Gen3 multi-node device, click Select Node(s) to determine which nodes are included in
the email alert at the chosen threshold.
Viewing device details 47
Page 48

3. Use the slider bar to set the minimum threshold from 95 to 45 (percent) in increments of 10.
The email alerts begin at the minimum threshold and continue at each threshold level. For
example, if you set the threshold to 65, the email alerts are sent out after the disk used space
reaches 65, 75, 85, and 95 percent.
4. Enter the email address to receive the alerts.
At this point, you can reset the slider to the default of 95 and clear an entered email address
by clicking Reset.
5. Click Add.
Continue adding email addresses and clicking Add after each entry, or enter multiple addresses
at once by separating them with commas.
6. Click OK.
48 Managing devices
Page 49

7. In the confirmation box, click OK. The email threshold alerts are configured.
The following image is a sample email alert.
8. To change a minimum threshold for an email address, edit the value directly in the Minimum
Threshold column of the table.
9. To remove an email alert, select it from the table, and click Remove. Select the box in the table
heading row to select all email alerts at once.
Viewing virtual libraries
Users and administrators can view details of the devices to which they have access. To do so:
1. Navigate to the Current Issues tab (see “Accessing the Current Issues screen ” (page 42)).
2. Do one of the following:
• On a Gen2 or Gen3 single node device, click the Virtual Library Replication tab.
• On a Gen3 multi-node device, select a service set, and then click the Virtual Library
Replication tab.
The Virtual Library Replication screen appears.
Gen2 and Gen3 single node devices
Viewing device details 49
Page 50

Gen3 multi-node devices
The device and library name, library status, replication status, and details are listed for each
virtual library on the device.
The service set name is applicable only for Gen3 multi-node devices. Hovering the mouse
over the first column indicates that the service set name is applicable only for those devices.
3. To sort the list by a specific column, click the column title once to view by ascending order
and twice to view by descending order.
4. To see a graphical view of the replication relationships of the virtual libraries on this device,
click View Replication Topology. The View Replication Topology helps with the graphical feel
of VTLs present in a device and their replications.
Some of these libraries could behave as source libraries while some could be target libraries.
The Topology Viewer helps in visualizing the islands of replications of the libraries on the
device. The topology graph shown here is similar to the Device Topology view except that
every element in the graph represents a library instead of a device.
50 Managing devices
Page 51

Clicking View Replication Topology in the Virtual Library Replication screen opens the screen
shown below. This is similar to the device topology screen except that every node in this graph
is a library, and the edges indicate the replication link between the libraries. This example
shows a replication between two libraries.
NOTE: View Replication Topology is only enabled after View All is selected for the View By
field. The topology view is not available for filtered views of virtual libraries.
Hovering over the node provides library information, such as which device the library belongs
to, the status of the library, and so forth.
The figures below show the replication between two libraries.
Viewing device details 51
Page 52

5. To filter libraries by type, select the type of libraries to view (all, source, target, or
non-replicating) in the View by field.
The screen refreshes to display only libraries of that type.
NOTE: If there are no libraries of that type, the list appears, but there are no entries.
NOTE: If you are viewing only source libraries, click + next to the library name to display
the associated target library. Source libraries have only one target library.
If you are viewing only target libraries, click + next to the library name to display the associated
source libraries. Target libraries may have more than one source library.
6. To export the library information:
a. Click Export.
b. In the Select location for download [file name] dialog box, navigate to the appropriate
c. Ensure the file name is appropriate.
d. Click Save.
e. Click OK to close the dialog box.
52 Managing devices
folder in which to save the file.
A success dialog box appears.
Page 53

7. To open the library interface, click Launch Device GUI.
The HP StoreOnce Management GUI launches and appears within the HP StoreOnce Enterprise
Manager itself. Every launched HP StoreOnce GUI is automatically added under Launched
Devices of the Navigation tree on the left pane of the HP StoreOnce Enterprise Manager.
NOTE: To view details for a different device within that group, click [group name] Devices in
the bread crumbs, and then select the radio button of the device to view.
Viewing virtual library disk usage
Users and administrators can view details of the virtual library to which they have access. To do
so:
1. Navigate to the Current Issues tab (see “Accessing the Current Issues screen ” (page 42)).
2. On a Gen2 or Gen3 single node system, click Virtual Library Status.
The library and replication status are displayed in a table. In addition, there are two graphs:
• Virtual Library Disk Usage—The used space (includes disk space occupied by virtual
libraries in the current group), others (includes disk space occupied by CatalystStores, if
applicable; NAS; disk space occupied by virtual libraries present in a different group;
and StoreOnce bookkeeping data), and free space.
• Device Disk Usage—The used space, free space, deduplication ratio, and amount of user
data stored on the selected device.
The table to the right of the graphs lists all of the virtual libraries in the current group along
with the physical disk space used, the user data stored, and the deduplication ratio.
Viewing device details 53
Page 54

3. On a Gen3 multi-node system, click a service set link, and then click Virtual Library Status.
The library and replication status are displayed in a table. In addition, there are two graphs:
• Virtual Library Disk Usage—The used space (includes disk space occupied by virtual
libraries in the current service set and current group), others (includes disk space occupied
by the other service set in the same couplet, disk space occupied by NAS and
CatalystStores in the current service set, disk space occupied by virtual libraries in the
current service set but in a different group, and StoreOnce bookkeeping data), and free
space.
• Couplet Disk Usage—The space used by each node, couplet free space, deduplication
ratio, and amount of user data stored on the couplet of the selected service set.
The table to the right of the graphs lists all of the virtual libraries in the current service set and
current group along with the physical disk space used, the user data stored, and the
deduplication ratio.
54 Managing devices
Page 55

Viewing NAS shares
Users and administrators can view details of NAS shares to which they have access. To do so:
1. Navigate to the Current Issues tab (see “Accessing the Current Issues screen ” (page 42)).
2. Do one of the following:
• On Gen2 or Gen3 single node devices, click the NAS Replication tab.
• On Gen3 multi-node devices, select a service set, and then click the NAS Replication tab.
Viewing device details 55
Page 56

The device name, service set and share name, share status, replication status, and details are
listed for each NAS share on the device.
56 Managing devices
Page 57

The service set name is applicable only for Gen3 multi-node devices. Hovering the mouse
over the first column will indicate that service set name is applicable only for those devices.
3. To sort the list by a specific column, click the column title once to view by ascending order
and twice to view by descending order.
4. To see a graphical view of the replication relationships of the NAS shares on this device, click
View Replication Topology.
Some shares behave as source shares while some could be target shares. The Topology Viewer
helps in visualizing the islands of replications of the shares on the device. The topology graph
shown here is similar to the device topology view except that every element in the graph
represents a share instead of a device.
View Replication Topology is only enabled after View All is selected for the View By field. The
topology view is not available for filtered views of NAS shares.
Viewing device details 57
Page 58

Clicking View Replication Topology (if available) opens a screen that shows a graphical
representation NAS shares on the device and their replications.
5. To filter NAS shares by type, select the type of shares to view (all, source, target, or
non-replicating) in the View by field.
The screen refreshes to display only NAS shares of that type.
NOTE: If there are no NAS shares of that type, the list appears but there are no entries.
NOTE: If you are viewing only source shares, click + next to the share name to display the
associated Target Share. Source shares have only one Target Share.
If you are viewing only target shares, click + next to the share name to display the associated
source shares. Target shares may have more than one Source Share.
6. To export the share information:
a. Click Export.
b. In the Select location for download [file name] dialog box, navigate to the appropriate
c. Ensure the file name is appropriate.
d. Click Save.
e. Click OK to close the dialog box.
58 Managing devices
folder in which to save the file.
A success dialog box appears.
Page 59

7. To open the interface of the device on which the selected NAS share resides, click Launch
Device GUI.
The HP StoreOnce Management GUI launches and appears within the HP StoreOnce Enterprise
Manager itself. Every launched HP StoreOnce GUI is automatically added under Launched
Devices of the Navigation tree on the left pane of the HP StoreOnce Enterprise Manager.
NOTE: To view details for a different device within that group, click on [group name] Devices
in the bread crumbs, and then select the radio button of the device to view.
Viewing NAS shares disk usage
Users and administrators can view details of the NAS shares to which they have access. To do so:
1. Navigate to the Current Issues tab (see “Accessing the Current Issues screen ” (page 42)).
2. On a Gen2 or Gen3 single node system, click NAS Status.
The NAS and replication status are displayed in a table. In addition, there are two graphs:
• NAS Disk Usage—The used space (includes disk space occupied by NAS in the current
group), others (includes disk space occupied by CatalystStores, if applicable; virtual
libraries; and disk space occupied by NAS present in a different group; and HP StoreOnce
bookkeeping data), and free space.
• Device Disk Usage—The used space, free space, deduplication ratio, and amount of user
data stored on the selected device.
The table to the right of the graphs lists all NAS in the current group along with the physical
disk space used, the user data stored, and the deduplication ratio.
Viewing device details 59
Page 60

3. On a Gen3 multi-node system, click a service set link, and then click NAS Status.
The library and replication status are displayed in a table. In addition, there are two graphs:
• NAS Disk Usage—The used space (includes disk space occupied by NAS in the current
service set and current group), others (includes disk space occupied by the other service
set in the same couplet, disk space occupied by virtual libraries and CatalystStores in the
current service set, disk space occupied by NAS in the current service set but in a different
group, and StoreOnce bookkeeping data), and free space.
• Couplet Disk Usage—The space used by each node, couplet free space, deduplication
ratio, and amount of user data stored on the couplet of the selected service set.
The table to the right of the graphs lists all of the NAS in the current service set and current
group along with the physical disk space used, the user data stored, and the deduplication
ratio.
60 Managing devices
Page 61

Viewing device details 61
Page 62

Viewing CatalystStores
You can view the CatalystStores that are available within a service set. Along with displaying the
CatalystStore name, this screen shows the health, the number of items in the CatalystStore, and
whether or not the CatalystStore is accessible.
To view the CatalystStores:
1. Navigate to the Current Issues tab (see “Accessing the Current Issues screen ” (page 42)).
2. Do one of the following:
• On HP StoreOnce VSA and Gen3 single node devices, click the CatalystStore tab.
• On Gen3 multi-node devices, select a service set, and then click the CatalystStore tab.
62 Managing devices
Page 63

The device, service set, and CatalystStore name; CatalystStore status; accessibility; and number
of CatalystStore items are listed for each CatalystStore on the device.
3. To export the CatalystStores information:
a. Click Export.
b. In the Select location for download [file name] dialog box, navigate to the appropriate
folder in which to save the file.
c. Ensure the file name is appropriate.
d. Click Save.
A success dialog box appears.
e. Click OK to close the dialog box.
4. To open the interface of the device on which the selected CatalystStore resides, click Launch
Device GUI.
The HP StoreOnce Management GUI launches and appears within the HP StoreOnce Enterprise
Manager itself. Every launched HP StoreOnce GUI is automatically added under Launched
Devices of the Navigation tree on the left pane of the HP StoreOnce Enterprise Manager.
NOTE: To view details for a different device within that group, click on [group name] Devices
in the bread crumbs, then select the radio button of the device to view.
After a Gen3 device is added to the HP StoreOnce Enterprise Manager, it attempts to reach all
the CatalystStores within that device using the default access key which is an empty string. If client
access permissions are disabled or if the store is set as accessible to “All Clients” in the Gen3
device, the Accessible column for that CatalystStore displays Yes. Otherwise, you must enter the
correct client access key. The HP StoreOnce Enterprise Manager then uses that access key to
communicate with CatalystStore. Without the correct access key, the HP StoreOnce Enterprise
Manager cannot retrieve any information related to CatalystStore job statuses.
Viewing device details 63
Page 64

Enter the access key in one of the following ways:
• Click Accessible for the relevant CatalystStore, and enter the access key directly.
• If the same access key needs to be applied to a number of CatalystStores, select all the relevant
CatalystStores, enter the access key in the text box, and click Apply to Selected Stores.
The changes take effect after you click Refresh or navigate to a different page.
64 Managing devices
Page 65

Viewing CatalystStore disk usage
Users and administrators can view details of the CatalystStores to which they have access. To do
so:
1. Navigate to the Current Issues tab (see “Accessing the Current Issues screen ” (page 42)).
2. On HP StoreOnce VSA and Gen3 single node devices, click CatalystStore Status.
The CatalystStore status is displayed. In addition, there are two graphs:
• CatalystStore Disk Usage—The used space (includes disk space occupied by the
CatalystStores in the current group), others (includes disk space occupied by virtual
libraries and NAS, disk space occupied by CatalystStores present in a different group,
and StoreOnce bookkeeping data), and free space.
• Device Disk Usage—The used space, free space, deduplication ratio, and amount of user
data stored on the selected device.
The table to the right of the graphs lists all of the CatalystStores in the current group along
with the physical disk space used, the user data stored, and the deduplication ratio.
Viewing device details 65
Page 66

3. On a Gen3 multi-node device, click a service set link, and then click CatalystStore Status.
The CatalystStore status is displayed. In addition, there are two graphs:
• CatalystStore Disk Usage—The used space (includes disk space occupied by CatalystStores
in the current service set and current group), others (includes disk space occupied by the
other service set in the same couplet, disk space occupied by virtual libraries and NAS
in the current service set, disk space occupied by CatalystStores in the current service set
but in a different group, and StoreOnce bookkeeping data), and couplet free space.
• Couplet Disk Usage—The space used by each node, couplet free space, deduplication
ratio, and amount of user data stored on the couplet of the selected service set.
The table to the right of the graphs lists all of the CatalystStores in the current service set and
current group along with the physical disk space used, the user data stored, and the
deduplication ratio.
Viewing messages
The Messages screen displays the managed and un-managed library, NAS share, CatalystStore,
and Teamed CatalystStore details. The Messages screen is not available to an administrator.
To acknowledge the messages:
66 Managing devices
Page 67

1. Select Messages in the Navigation tree. The screen displays the managed, un-managed,
library, NAS share and Catalyst details.
2. Select specific messages, or check the box in the header row to select all of the messages.
3. Click Acknowledge.
4. Click OK in the two confirmation dialog boxes. A success dialog box appears.
5. Click OK. Selected messages are removed from the list.
Viewing messages 67
Page 68

5 Accessing and viewing reports
The HP StoreOnce Enterprise Manager supports report and trending for the history data. The HP
StoreOnce Enterprise Manager shows a dashboard of overall appliance status, library status, NAS
share status, replication jobs, replication duration and size, object store status, forecast, disk usage,
and disk usage forecasting.
To view the reports, select Reports on the Navigation tree. The Dashboard is displayed by default.
Reports can be exported to a .csv file or a .png image by clicking Export to csv. You can schedule
a report by clicking Schedule an Email (see “Configuring a report scheduler” (page 25)).
In all the reports, the For Last drop-down displays the data as follows:
• For last 24 Hours/1 Day, the report displays hourly aggregated values.
• For last 1 Week or 4 Weeks, the report displays daily aggregated values.
• For last All, the report displays monthly aggregated values.
In addition, in all the reports under Replication tab (Jobs, Slot Mapping Activity, and Cartridge
Activity) the “For Last” also displays the options of “8 Weeks” and “3 months” historic data.
Viewing the dashboard
The Dashboard shows the historical report for a selected time period; the default is one day. Use
the For Last drop-down box to select a different time period.
The Dashboard also shows a summary of the groups and the total number of devices that belong
to each group. It shows the number of devices in the Critical, Warning, Unknown, and Good
statuses; click a number of devices to see more details. If there is a large amount of data displayed,
you can display a subset of data using the filters provided.
68 Accessing and viewing reports
Page 69

NOTE: An unknown device indicates that an unknown status/event was reported by the HP
StoreOnce device during the selected time period. However, this screen only shows the historical
device status. See the device details, “Viewing device details ” (page 42), for the current device
status.
A Good status indicates that the particular device did not report any critical, warning, or unknown
status/events for the selected time period. Therefore, this historical report does not consider whether
the HP StoreOnce Enterprise Manager was able to connect to an HP StoreOnce device.
Viewing the Replication report
The Replication tab presents useful information including replication jobs, slot mapping and cartridge
activity reports, and actual data transferred. It also provides duration and size forecasting.
Viewing replication jobs
Select the Replication tab, and then select the Jobs tab to see replication jobs.
To view the details of a particular device, use the drop-down boxes. Begin with the Group box;
as you make each selection, the next drop-down box populates with the appropriate options. The
service set box is only active for Gen3 multi-node devices. After the selections are made, the screen
displays a graph of the number of jobs with the Critical and Warning status.
Performing duration and size forecasting
Select the Replication tab, and then select the Forecast tab to see the forecasting for a specific
device. The Forecasting tab shows one of two selected graphs: Duration Forecasting and Size
Viewing the Replication report 69
Page 70

Forecasting. Duration forecasting forecasts replication duration. Size forecasting predicts the data
size (in GB) that can be replicated within the user provided time period (Replication window).
Begin by selecting the appropriate values from the Enter Data for Forecast pane (see screen shots
below).
Selections from pre-determined values:
• Replication—Size or Duration forecasting
• Group—Group for which to forecast
• Device—Device for which to forecast
• ServiceSet—Service set for which to forecast
• View By—View forecasting data by target library or NAS share
• Library/NAS Share—Library or NAS share for which to forecast
Numerical inputs:
• History period—Time for which to forecast
• Average rate of change—Percent of data change
• For Next—The time period of the forecast
• Replication Window—The time in which you want the replication to occur
• Current Replication Link Speed—The current link speed available for the StoreOnce device.
• New Replication Link Speed (optional)—A new link speed that could be available for the
StoreOnce device
After completing the selections, click Forecast to generate the graph. The forecast data can be
exported as a .csv file or as a .png file of the graph image by clicking Export to CSV or Export
to PNG. Click Send Mail to receive the graph through email in .csv or .png formats.
The Duration Forecasting Report
70 Accessing and viewing reports
Page 71

The Size Forecasting Report
Viewing the Slot Mapping Activity report
1. Select the Replication tab.
2. Select the SlotMapping Activity tab.
3. Use the drop-down boxes to select the appropriate group, device, service set, and library/NAS
shares.
4. Use the For Last drop-down box to select the time period.
5. Click Show Data to see the details.
The Slot Mapping Activity report is displayed as a list of all slot mappings by time pulled from
the device every day. For example, if you select a time period for the last week, all slot
mappings retrieved daily for the selected week are displayed.
By default, the following fields are displayed:
• Date
• Slot Mapping Name
• Replication Status
• Out of Sync Warning Threshold
• Number of Mapped Slots Out of Sync
• Number of Mapped Slots Out of Sync Warning
• Out of Sync Critical Threshold
Viewing the Replication report 71
Page 72

The following list includes all the fields you can display:
• Date—The date of the Slot Mapping Record
• Slot Mapping Name
• Replication Status—Shows specific values, such as Synchronizing, Pending Synchronized,
and Synchronized
• Out of Sync Warning Threshold—The value of the Warning Threshold that is set on the
device
• Number of Mapped Slots Out of Sync
• Number of Mapped Slots Out of Sync Warning—The number of mapped slots that are
Out of Sync of Warning Threshold
• Out of Sync Critical Threshold—The Critical Threshold value set on the device
• Target Appliance IP
• Target Appliance Name
• Target Appliance Product Class
• Target Appliance Serial Number
• Number of Replicating Slots—The number of replicating slots in the Slot Mapping
• Local Library Role
• Local Library Name
• Target Library Name
• Number of Mapped Slots Out of Sync Critical—The number of mapped slots that are Out
of Sync of Critical Threshold
You can customize the list of fields that are displayed.
By default, report data is displayed in pages. You can browse report data by clicking the page
numbers or First, Last, Previous and Next. You can see all reports at once by clicking View All.
Separate rows are visible for slot map replication for the source and for the target. In most cases
for two individual entries, one for replication from the source and another from the target, the
Change count and Local library columns are the only differences.
72 Accessing and viewing reports
Page 73

After selecting a device and preferred options, you may use the Filter options to:
• Filter results by column or by replication status name
• Add select column headings to be displayed alongside fixed column headings for a customized
view
• Reset filtered results
• Export displayed results into a .csv formatted file by clicking Export to CSV.
Use the Filter By drop-down menu to filter report results by column or by replication status names.
Select Any Column, and enter a column title (for example, Date, Slot Mapping Name, Out of Sync
Warning Threshold, Number of Mapped Slots Out of Sync, Number of Mapped Slots Out of Sync
Warning, or Out of Sync Critical Threshold). To reset entered settings, click Reset.
To select preferred columns to be displayed, click Customize View. The Column Selection dialog
box is displayed. Select one or more headings listed to be added to or remove from the displayed
results, and then either click >> to add column headings to a report or << to remove column
headings from a report. Press the column heading, and hold down the Ctrl key to select multiple
column headings at one time in either pane.
NOTE: Date, SlotMapping Name , Replication status, No. of Mapped Slots Out of Sync, Out of
Sync Warning Threshold, Out of Sync Critical Threshold, and No. of Mapped Slots Out of Sync
Warning are fixed headings that cannot be removed from the displayed results.
Viewing the Cartridge Activity report
1. Select the Replication tab.
2. Select the Cartridge Activity tab.
3. Use the drop-down boxes to select the appropriate group, device, service set, and library.
4. Use the For Last drop-down box to select the time period.
5. Click Show Data to view the Cartridge Activity report.
The Cartridge Data report is displayed as a list of all cartridges by time pulled from the device
every day. For example, if you select a time period for the last week, all cartridges retrieved
daily for the selected week are displayed.
By default, the following fields are displayed:
• Date
• Barcode
Viewing the Replication report 73
Page 74

• Cartridge Size
• Job Status
• Replication Status
• Bandwidth Saving
The following list includes all the fields you can display:
• Date—The date of the Cartridge Activity Record
• Bar Code—The bar code of the cartridge
• Cartridge Size—The size of the cartridge in GB
• Job Status—The status of the job
• Replication Status—The replication status (can have values like Synchronizing, Pending
Synchronized, and Synchronized)
• Sync Start Time—The start time of last synchronization
• Last Sync Time—The last synchronization time
• Cartridge Change Count—The count for cartridge change
• Cartridge Length—The length of the cartridge
• Job Size (GB)—The size of the job in GB
• Out of Sync Duration—The duration for Out of Synchronization
• Pause Cancel Reason—The reason for job cancellation and pausing
• Job Progress (GB)—The job progress in GB
• Job Duration (Min)—The job duration in minutes
• Job Throughput (MB/Second)—The throughput of the job in MB
• Job bandwidth Used (MB)—The bandwidth used by the job in MB
• Bandwidth Saving
You can customize the list of fields that are displayed.
6. Use the Filter by option to filter the data:
a. Select Any column, bar code, or job status from the Filter by drop-down list.
b. Enter the appropriate value in the search box.
c. Click Filter. The content pane displays only the data meeting the filter criteria.
d. Click Reset to clear the filter.
74 Accessing and viewing reports
Page 75

7. Use Customize View to view allowable columns in the displayed report. After selecting
Customize View, select one column heading from the Available Columns pane of the Column
Selection screen, and then click >>. (Hold the Shift key down to select more than one column
heading.) All selected column headings are moved to the Selected Columns pane. To move
any selected heading back to the Available Columns pane, click <<.
By default, report data is displayed in pages. You can browse report data by clicking on the page
numbers or First, Last, Previous, and Next. You can see all report at once by clicking View All.
Click Export to CSV to export the report in .csv format.
Viewing actual data transferred for the VTL report
This report provides a view of the actual data transferred (in MB) and deduplication data transferred
(in MB) for the selected source or target virtual tape library.
The Data Transferred Report can be seen at the VTL level.
1. Select Reports in the Navigation tree.
2. Select the Replication tab.
3. Select the Data Transferred tab.
4. Use the drop-down boxes to select the appropriate group and device.
Viewing the Replication report 75
Page 76

5. Use the drop-down boxes to select a service set and library.
6. Use the drop-down box to select the time period of the report.
You can export the report as a .csv file and export the graph as a .png file. You can also create
an Email Scheduler for the report.
NOTE: The actual data transferred, slot mapping, and cartridge activity reports are only applicable
to Gen3 multi-node, GEN3 single node, and VSA devices.
Viewing the CatalystStore Jobs report
1. Select Reports in the Navigation tree.
2. Select the CatalystStores tab. The Jobs tab opens by default.
3. Use the drop-down boxes to select the appropriate group, device, service set, stores, type,
and time period to display the report.
On HP StoreOnce VSA and Gen3 single node devices, after a device is selected, the Service
Set drop-down box is disabled, and stores are listed. Select stores, type, and time period to
see the report.
Copy jobs can have the status as Completed, Running, Cancelled, Paused, and Pending.
You can export the report as a .csv or .png file by clicking Export... and you can email the
report to a designated recipient by clicking Schedule an email.
76 Accessing and viewing reports
Page 77

Viewing CatalystStores usage
1. Select Reports in the Navigation tree.
2. Select the CatalystStores tab.
3. Select the Usage tab.
4. Use the drop-down boxes to select the appropriate group, device, service set, stores, type,
and time period to see the report.
On HP StoreOnce VSA and Gen3 single node devices, after a device is selected, the Service
Set drop-down box is disabled, and stores will be listed. Select stores, type, and time period
to see the report.
5. By default, inbound copy jobs are displayed. Click Copy Job (OutBound) to see the outbound
copy jobs.
Inbound copy jobs are those received by the selected CatalystStore. Outbound copy jobs are
those initiated by the selected CatalystStore to other target CatalystStores.
You can export the report as a .csv or .png file by clicking Export... and you can email the
report to a designated recipient by clicking Schedule an email.
Viewing the Performance report
The performance reports display throughput values (in MB/sec) for selected service sets, libraries,
ports, drives, NAS shares, CatalystStores, or Teamed CatalystStores. Both read throughput and
write throughput values are graphed for the selected time period.
The throughput values are displayed for every minute. If you select a time period of less than two
months, data is displayed at the minute level. However, if the start date is greater than two months
old, the data is displayed at the hourly level. Administrators can change the polling interval (see
“Modifying the polling interval or IP address of an HP StoreOnce device” (page 108)).
Performance reports can be viewed at the following levels. The specific levels available for each
device depend on the device's configuration:
• Device (VSA or Gen3, single node)
• Service Set (Gen3, multi-node)
• Library
• Port
• Drive
Viewing the Performance report 77
Page 78

• NAS Shares
• CatalystStore
• Teamed CatalystStore
Setting the time period to display
In the View drop-down box, select Hourly, Daily, Weekly, Monthly, Yearly, or Select Range. The
Period drop-down box changes based on the view selection; select the appropriate time period.
If you chose Select Range in the View drop-down box, use the From and To boxes to set the date
range. You can also check the Window box to select the hour range; the data is displayed only
for those hours in the date range. For example, if you select the date range from 04/01/2013 to
04/05/2013 and select the window as 14 to 16, the graph displays data only for two hours,
hour 14 to hour 16, for each day in the range. If you do not select a window, the graph displays
data for the full 24 hours for each days.
NOTE: The data is displayed in the following ways:
• The data displays at the hour level for time periods greater than two months.
• The data displays at the minute level for time periods less than two months.
• The date is refreshed automatically with live data for a time period of last 1 hour.
Viewing the Service Set Performance report
1. Select Reports in the Navigation tree.
2. Select the Performance tab.
3. Use the drop-down boxes to select the appropriate group and device.
4. Use the Report At drop-down box to select the service set level.
5. Click Select ServiceSet to see a list of available service sets.
6. Select one or more service sets.
7. Click OK to close the Available Service Set list.
8. Use the drop-down boxes to select either Read Throughput or Write Throughput.
9. Set the time period to display by using the View and Period or From/To and Window
drop-down boxes.
78 Accessing and viewing reports
Page 79

10. Click Show.
After your mouse device hovers over a particular point on the graph, a tool tip displays the details
of that point.
To zoom into a particular region of the graph, use the mouse device to select the region of interest;
the graph zooms into that area. You can zoom in multiple times until the graph reaches its zoom
limit. Use Zoom Out to step back one level of zoom, or Reset Zoom to return to the graph's original
display state.
The report can be exported to a .csv file or to a .png image file.
Viewing the Library Performance report
1. Select Reports in the Navigation tree.
2. Select the Performance tab.
3. Use the drop-down boxes to select the appropriate group and device.
4. Use the Report At drop-down box to select the library level.
5. Click Select ServiceSet to see a list of available service sets.
6. Select a service set.
7. Click OK to close the Available Service Set list.
Select Interface is now enabled.
8. Click Select Interface to see a list of available libraries.
Viewing the Performance report 79
Page 80

To filter the libraries, enter text into the Available Libraries text box, and click Search. Click
Clear to clear the filter.
9. Select one or more libraries.
10. Click OK to close the Available Library list.
11. Use the drop-down boxes to select either Read Throughput or Write Throughput.
12. Set the time period to display by using the View and Period or From/To and Window
drop-down boxes.
13. Click Show.
The report can be exported to a .csv file or to a .png image file.
Viewing the Port Performance report
1. Select Reports in the Navigation tree.
2. Select the Performance tab.
3. Use the drop-down boxes to select the appropriate group and device.
4. Use the Report At drop-down box to select the port level.
5. Click Select ServiceSet to see a list of available service sets.
6. Select a service set.
7. Click OK to close the Available Service Set list.
Select Interface is now enabled.
80 Accessing and viewing reports
Page 81

8. Click Select Interface to see a list of available ports.
9. Select one or more ports.
10. Click OK to close the Available Ports list.
11. Use the drop-down boxes to select either Read Throughput or Write Throughput.
12. Set the time period to display by using the View and Period or From/To and Window
drop-down boxes.
13. Click Show.
The report can be exported to a .csv file or to a .png image file.
Viewing the Drive Performance report
1. Select Reports in the Navigation tree.
2. Select the Performance tab.
3. Use the drop-down boxes to select the appropriate group and device.
4. Use the Report At drop-down box to select the drive level.
5. Click Select ServiceSet to see a list of available service sets.
6. Select a service set.
7. Click OK to close the Available Service Set list.
Select Interface is now enabled.
Viewing the Performance report 81
Page 82

8. Click Select Interface to see a list of available libraries.
To filter the libraries, enter text into the Available Libraries text box, and click Search. Click
Clear to clear the filter.
9. Select a library.
10. Click OK to close the Available Library list.
Select Drive is now enabled.
11. Click Select Drive to see a list of available drives.
12. Select one or more drives.
13. Use the drop-down boxes to select either Read Throughput or Write Throughput.
14. Set the time period to display by using the View and Period or From/To and Window
drop-down boxes.
15. Click Show.
The report can be exported to a .csv file or to a .png image file.
Viewing the NAS share Performance report
1. Select Reports in the Navigation tree.
2. Select the Performance tab.
82 Accessing and viewing reports
Page 83

3. Use the drop-down boxes to select the appropriate group and device.
4. Use the Report At drop-down box to select the NAS share level.
5. Click Select ServiceSet to see a list of available service sets.
6. Select a service set.
7. Click OK to close the Available Service Set list.
Select Interface is now enabled.
8. Click Select Interface to see a list of available NAS shares.
To filter the NAS shares, enter text into the Available NAS Shares text box, and click Search.
Click Clear to clear the filter.
9. Select one or more NAS shares.
10. Click OK to close the Available NAS Shares list.
11. Use the drop-down boxes to select either Read Throughput or Write Throughput.
12. Set the time period to display by using the View and Period or From/To and Window
drop-down boxes.
13. Click Show.
The report can be exported to a .csv file or to a .png image file.
Viewing the Performance report 83
Page 84

Viewing the CatalystStores Performance report
1. Select Reports in the Navigation tree.
2. Select the Performance tab.
3. Use the drop-down boxes to select the appropriate group and device.
4. Use the Report At drop-down box to select CatalystStores Level.
5. Click Select ServiceSet to see a list of available service sets.
6. Select a service set.
7. Click OK to close the Available Service Set list.
Select Interface is now enabled.
8. Click Select Interface to see a list of available CatalystStores.
To filter the CatalystStores, enter text into the Available CatalystStores text box, and click
Search. Click Clear to clear the filter.
9. Select one or more CatalystStores.
10. Click OK to close the Available CatalystStores list.
11. Use the drop-down boxes to select either Copy Jobs or Data Jobs.
12. Use the drop-down boxes to select either Read Throughput or Write Throughput.
13. Use the drop-down boxes to select either User Data or Actual Data.
14. Set the time period to display using the View and Period or From/To and Window drop-down
boxes.
84 Accessing and viewing reports
Page 85

15. Click Show.
The report can be exported to a .csv file or to a .png image file.
Viewing the Teamed CatalystStores Performance report
1. Select Reports in the Navigation tree.
2. Select the Performance tab.
3. Use the drop-down boxes to select the appropriate group and device.
4. Use the Report At drop-down box to select Teamed CatalystStores Level.
5. Click Select ServiceSet to see a list of available service sets.
6. Select a service set.
7. Click OK to close the Available Service Set list.
Select Interface is now enabled.
8. Click Select Interface to see a list of available Teamed CatalystStores.
To filter the Teamed CatalystStores, enter text into the Available Teamed CatalystStores text
box, and click Search. Click Clear to clear the filter.
9. Select one or more Teamed CatalystStores.
10. Click OK to close the Available Teamed CatalystStores list.
11. Use the drop-down boxes to select either Copy Jobs or Data Jobs.
12. Use the drop-down boxes to select either Read Throughput or Write Throughput.
13. Use the drop-down boxes to select either User Data or Actual Data.
14. Set the time period to display using the View and Period or From/To and Window drop-down
boxes.
15. Click Show.
The report can be exported to a .csv file or to a .png image file.
Viewing the Storage report
The Storage tab provides information about disk usage, the deduplication ratio, and forecasting
disk space.
Viewing disk usage
To display the physical disk usage and user data stored:
1. Select the Storage tab.
Viewing the Storage report 85
Page 86

2. Select the Disk Usage tab.
3. Using the filters at the top of the screen, select from the drop-down boxes:
a. Group and Device
b. Type (based on device type):
• Gen2 will display library, NAS share, and device
• Gen3 multi-node will display library, NAS share, service set, CatalystStore, Teamed
CatalystStore, couplet, and node
• Gen3 single node will display library, NAS share, CatalystStore, and device
c. The specific couplet, service set, or device (based on the selection in the Type drop-down
box)
d. For Last (time period)
The disk usage information is displayed as a graph of user data versus time. The point in time
values of disk usage data (Date and Time, User Data (GB), Physical Disk used (GB), and
Deduplication Ratio) are displayed in a tool tip window if you hover your mouse device over each
data point on the graph.
The legend to the right of the graph displays the following additional disk usage data:
• Appliance Free Space (GB)
• Appliance Total Capacity (GB)
• Couplet Free Space (GB)
• Couplet Total Capacity (GB)
• Total User Data for the selected Device (GB)
• Total Disk Used for the selected Device (GB)
• Deduplication Ratio for the selected Device
Viewing the deduplication ratio
To display the deduplication ratios:
1. Select the Storage tab.
2. Select the Deduplication Ratio tab.
86 Accessing and viewing reports
Page 87

3. Using the filters at the top of the screen, select from the drop-down boxes:
a. Group and Device
b. Type (based on device type):
• Gen2 will display library, NAS share, and device
• Gen3 multi-node will display library, NAS share, service set, CatalystStore, Teamed
CatalystStore, and couplet
• Gen3 single node will display library, NAS share, CatalystStore, and device
c. The specific couplet, service set, library, NAS share, or CatalystStore (based on the
selection in the Type drop-down box)
d. From Last (time period)
Viewing forecasting of disk space
To display the forecasted disk space:
1. Select the Storage tab.
2. Select the Forecast tab.
3. Using the filters at the top of the screen, select from the drop-down boxes:
a. Group and Device
b. Couplet, if applicable to the selected device
c. For Next (time period)
The legend to the right of the graph displays the following additional data:
• Current Disk Usage (GB)
For Gen2 or Gen3 single node system, current disk usage denotes the device disk usage. For
Gen3 multi-node system, current disk usage denotes the couplet disk usage.
• Capacity (GB)
For Gen2 or Gen3 single node system, capacity denotes the device capacity. For Gen3
multi-node system, capacity denotes the couplet capacity.
• Time to reach Threshold (95% of Capacity)
This denotes the time that will take to reach the threshold limit.
NOTE: The threshold limit is 95% of capacity.
Viewing the Storage report 87
Page 88

Viewing the Alert Summary report
The replication and CatalystStore copy job’s alert summary is used to show the details of alert
conditions. The look and feel is similar to previewing mail. To view the replication and copy job
(inbound and outbound) details, click on the Alerts Summary tab in the Reports section.
1. Select Reports in the Navigation tree.
2. Select the Alerts Summary tab. By default, the View tab is displayed showing the Last 1 Day's
report.
3. Use the drop-down box to select a time period to view.
NOTE: If you encounter the message, No data found for the selected duration, in
the Alerts Summary tab and you have administrative privileges, create a user and allow 24 hours
to see results on the Alerts Summary tab.
88 Accessing and viewing reports
Page 89

Configuring the email notification of alerts
After an administrator adds an SMTP server, you can configure the Alerts Summary to send emails
that provide the replication status and the copy job (inbound and outbound) status for the selected
groups at a determined schedule. The alerts emails can display these details:
• Overall status summary
• Device details
• Library details
• NAS Share details
• CatalystStore copy job (inbound and outbound) details
To configure the alerts emails:
1. Select Reportsin the Navigation tree.
2. Select the Alerts Summary tab.
3. Select the Email Notification tab.
4. Click Add....
A welcome screen is displayed.
5. In the wizard, click Next> to begin.
6. Select Groups from the Available Groups list (or click Add All).
7. Click Add.
(You can remove groups by using Remove or Remove All.)
Viewing the Alert Summary report 89
Page 90

8. Click Next>.
9. Select Events for the configuration.
10. Click Next>.
11. Select the email interval:
• Daily
Recipients receive daily emails at the selected time.◦
◦ You can select a Start From date; the system begins sending emails on that date.
◦ Example: Select 1 AM and Start From 08/17/2011. Every day beginning on August
17, 2011, the recipients will get an email at 1 AM.
• Weekly
Recipients receive weekly emails on the selected day and time.◦
◦ You can select a Start From date; the system begins sending emails on that date (or
the first selected day of the week after that date).
◦ Example: Select 12 AM, Sunday, and Start From 08/17/2011 (a Wednesday).
Every Sunday beginning on August 21, 2011, the recipients will receive an email
at 12 AM.
90 Accessing and viewing reports
Page 91

• Monthly
Recipients receive monthly emails on the selected date and time.◦
◦ You can select a Start From date; the system begins sending emails on that date (or
the first selected day of the month after that date).
◦ Example: Select 12 AM, date 25, and Start From 08/17/2011. On the 25th of
every month beginning on August 25, 2011, the recipients will receive an email at
12 AM.
• Quarterly
Recipients receive quarterly emails on the selected date and time.◦
◦ You can select a month for quarter selection.
◦ You can select a Start From date; the system begins sending emails on that date (or
the selected day of the quarter after that date).
◦ Example: Select 12 AM, date 25, January, and Start From 08/17/2011. On the
25th of every quarter beginning on August 25, 2011, the recipients will receive an
email at 12 AM. (Using January marks the quarters: January through March, April
through June, and so forth.)
• Yearly
Recipients receive yearly emails on the selected date and time.◦
◦ You can select a month to receive the yearly email.
◦ You can select a Start From date; the system begins sending emails on that date (or
the selected day of the year after that date).
◦ Example: Select 12 AM, date 25, January, and Start From 08/17/2011. On the
25th of every January beginning on January 25, 2012, the recipients will receive
an email at 12 AM.
12. Click Next>.
13. Enter a valid email address in the Recipients Email Id text box.
Viewing the Alert Summary report 91
Page 92

14. Click Add.
The email address appears in the Recipients list. You can remove an email address by selecting
the appropriate check box and then clicking Remove.
15. Enter as many other email addresses as you need; click Add after each entry.
16. Click Next>.
17. Review the information on the Summary screen.
18. Click Preview if you want to see a preview of an alerts email before confirming the
configuration. Click OK to exit the preview.
92 Accessing and viewing reports
Page 93

Click Send Mail if you want to send a sample email before confirming the configuration. Click
OK in the Success dialog box.
19. Click Finish to save the configuration.
20. Click OK in the Success dialog box to return to the Email Notification tab.
To modify or remove an alerts email:
• To modify, select the alerts email, and click Modify. Click Next> to step through the wizard
and make the changes.
• To remove, select the alerts email, and click Remove. You will be presented with two
confirmation boxes before the email notification is removed.
Viewing the Alert Summary report 93
Page 94

6 Performing administration procedures
On the Navigation tree, administration tasks are available only to administrators. From here, the
administrator can perform a number of important procedures in the following categories:
• “Managing the authentication mechanism ” (page 94)
• “Using user management functions” (page 95)
• “Using group management functions” (page 97)
• “Performing device management functions” (page 107)
NOTE: The Administration tasks are not available to and cannot be seen by anyone with user-level
permissions.
Managing the authentication mechanism
Enterprise Manager supports two types of authentication mechanisms:
• Local authentication—Enterprise Manager stores the authentication information.
• LDAP (Lightweight Directory Access Protocol) authentication—The HP StoreOnce Enterprise
Manager uses the information stored in the LDAP to authenticate users.
Enterprise Manager supports both Authentication types simultaneously; there is no need to switch
between them.
Configuring LDAP authentication
To configure the LDAP authentication, use the following procedures:
• “Adding a new LDAP server” (page 94)
• “Reconfiguring an existing LDAP server” (page 94)
• “Removing an LDAP server” (page 95)
Adding a new LDAP server
IMPORTANT: If you want to configure an LDAP server with the DIGEST-MD5 encryption
mechanism, you must enter a fully-qualified name in the Server field. DIGEST-MD5 does not work
with the Server IP.
To add a new LDAP server:
1. From the Navigation tree, select Administration.
2. On the AD Authentication tab, click Add.
The Add a new LDAP server dialog box appears.
3. Type the appropriate information into each field. After all the information is complete, click
Add.
a. If you cannot connect to the LDAP server, an error message appears. Click OK to close
the dialog box.
b. If the information is correct, a success message appears. Click OK to close the dialog
box.
Reconfiguring an existing LDAP server
The modify option does not allow you to change an existing server to a new server. You can use
either an IP address or a fully-qualified server name, depending on the encryption mechanism.
94 Performing administration procedures
Page 95

IMPORTANT: If you want to modify an LDAP server with the DIGEST-MD5 encryption mechanism,
you must enter a fully-qualified name in the Server field. DIGEST-MD5 does not work with the
Server IP.
To modify an existing LDAP server:
1. From the Navigation tree, select Administration.
2. On the AD Authentication tab, select the LDAP server to modify, and click Modify.
The Modify LDAP server dialog box appears.
3. Modify the appropriate information, and click Modify.
a. If you cannot connect to the LDAP server, an error message appears. Click OK to close
the dialog box.
The following table lists typical error messages and possible causes.
Possible CauseError
Unable to connect to LDAP
Invalid LDAP details
b. If the information is correct, a success message appears, and all the users (except
hprmsadmin) will be logged out. Click OK to close the dialog box.
Removing an LDAP server
To remove an LDAP server:
1. From the Navigation tree, select Administration.
2. On the AD Authentication tab, select the LDAP server to remove, and click Remove.
Two confirmation messages appear.
3. Click Yes twice to confirm removing the LDAP server. After removing the server, all users
(except hprmsadmin) will be logged out.
Using user management functions
• IP Address is incorrect.
• Port Number is incorrect.
• Network Issues.
• Base domain string is incorrect.
• Domain is not correct.
• User name or password is not correct.
An administrator login can perform User Management tasks (under Administration in the Navigation
tree) to remove a user or administrator from Enterprise Manager (see “Removing a user or
administrator ” (page 95)).
Users can be added as described in “Adding new users, administrators, and groups” (page 16)
as part of “Configuring the HP StoreOnce Enterprise Manager” (page 13).
Removing a user or administrator
Administrators can remove a user or another administrator using either the Active Users tab or the
Deactivated Users tab.
Removing a user from the Active Users tab
To remove a user or administrator from the Active Users tab:
1. From the Navigation tree under Administration, select User Management.
2. On the Active Users tab, select the appropriate radio button to select the user to be removed.
Using user management functions 95
Page 96

3. Click Remove.
A warning dialog box appears, to confirm that the user should be removed.
4. Click Yes to confirm the selection.
A confirmation dialog box appears to provide the last chance to keep the selected user.
5. Click Yes to remove the user.
A success dialog box appears to confirm that the user and associated information was removed.
6. Click OK to close the dialog box and return to the Active Users screen.
The user just removed is no longer included in the list of users.
Removing a user from the Deactivated Users tab
To remove a user or administrator:
1. From the Navigation tree under Administration, select User Management.
2. On the Deactivated Users tab, select the appropriate radio button for the user to be removed,
and click Remove.
A warning dialog box appears to confirm that the user should be removed.
3. Click Yes.
A confirmation dialog box appears to confirm the action.
4. Click Yes to remove the user.
A success dialog box appears. The selected user is removed from the list of users.
Deactivating a user
The administrator can deactivate and reactivate users. A deactivated user cannot log into Enterprise
Manager.
To deactivate a user:
1. From the Navigation tree under Administration, select User Management.
2. On the Active Users tab, select the user to be deactivated, and click Deactivate.
A warning dialog box appears.
3. Click Yes to continue.
A confirmation dialog box appears.
4. Click Yes to deactivate the user.
A success dialog box appears.
Activating a user
The administrator can activate a user. The method of activation depends upon the current
authentication mechanism.
Activating a user (local authentication mechanism)
1. From the Navigation tree under Administration, select User Management.
2. On the Deactivated Users tab, select the user to be activated, and click Activate.
A warning dialog box appears, which lists the groups that the user could access before being
deactivated.
3. Click Yes to activate the user.
A success dialog box appears.
96 Performing administration procedures
Page 97

Using group management functions
In Enterprise Manager, a group is a logical collection of libraries, NAS shares, CatalystStores,
and Teamed CatalystStores that the administrator wants to manage and monitor as a collective
set. The administrator can also assign a user or a set of users to a group that provides monitoring
access for the group.
After a new device is added to Enterprise Manager, it is added to the Un-Grouped group. Any
library, NAS share, CatalystStore, and Teamed CatalystStore can only be part of one group at
any time. Because the group works as a collection, an HP StoreOnce device can belong to more
than one group at any time. For example, two libraries from an HP StoreOnce device called,
Archway13, can belong to ‘HR Group’ and two NAS shares from Archway13 can belong to
‘Admin Group,’ so Archway13 belongs to both ‘HR Group’ and ‘Admin Group.’ However,
Archway13 in ‘HR Group’ can monitor only those two libraries. Archway13 in ‘Admin Group’
can monitor only two NAS shares.
Administrators can select Group Management under Administration in the Navigation tree to
perform the following procedures:
• “Creating a new group” (page 16), presented in “Configuring the HP StoreOnce Enterprise
Manager” (page 13)
• “Modifying a group” (page 97)
• “Moving a library, NAS share, CatalystStore, or Teamed CatalystStore from one group to
another” (page 102)
• “Removing a group” (page 107)
Modifying a group
To modify any group other than Un-Grouped:
1. From the Navigation tree under Administration, click Group Management.
2. Select the group to be modified from the list.
3. Click Modify Group.
The Welcome screen of the Modify Group — [group name] wizard appears.
4. Click Next to begin.
5. On the Group Details screen, make the appropriate edits. The group name, group description,
and contact number can be modified.
Using group management functions 97
Page 98

6. Click Next.
7. On the Add Libraries screen, libraries can be added from Un-Grouped libraries. Libraries from
existing groups can be moved back to Un-Grouped libraries.
a. Click on the names of libraries in the Un-Grouped libraries that are to be added to the
group. To select several at a time, hold down the Ctrl key, and click each library to be
added. The libraries are then highlighted in the table.
b. Click Add between the two tables in the wizard. This action moves the highlighted libraries
from the Un-Grouped Libraries table to the Selected Libraries table.
NOTE: To add all Un-Grouped libraries to the group, click the Add All button.
c. To remove libraries from the group, click the names of the libraries in the Selected Libraries
table to be removed. To select several at a time, hold down the Ctrl key, and click each
library to be removed.
d. Click Remove between the two tables in the wizard. This action moves the highlighted
libraries from the Selected Libraries table to the Un-Grouped Libraries table.
NOTE: To remove all libraries from the group, click Remove All.
8. Click Next.
9. On the Add NAS screen, NAS shares can be added from Un-Grouped NAS. Existing shares
from the group can be moved back to Un-Grouped NAS.
98 Performing administration procedures
Page 99

a. Click on the name of the NAS share in the Un-Grouped NAS table to be added to the
group. To select several at a time, hold down the Ctrl key, and click each NAS share to
be added. The NAS shares are then highlighted in the table.
b. Click Add between the two tables in the wizard. This action moves the highlighted shares
from the Un-Grouped NAS table to the Selected NAS table.
NOTE: To add all un-grouped NAS shares to the group, click the Add All button.
c. To remove a NAS share added to the group, click the name of the share in the Selected
NAS table to be removed. To select several at a time, hold down the Ctrl key, and click
each NAS share to be removed.
d. Click Remove between the two tables in the wizard. This action moves the highlighted
shares from the Selected NAS table to the Un-Grouped NAS table.
NOTE: To remove all shares from the group, click Remove All.
10. Click Next.
11. On the Add CatalystStores screen:
Using group management functions 99
Page 100

a. Click on the name of the CatalystStore in the Un-Grouped CatalystStores table. To select
several at a time, hold down the Ctrl key, and click each name to be added. The
CatalystStores are then highlighted in the table.
b. Click Add between the two tables. This action moves the highlighted CatalystStore from
the Un-Grouped CatalystStores table to the Selected CatalystStores table.
NOTE: To add all CatalystStores to the group, click Add All.
c. To remove a CatalystStore added to the group, click it in the Selected CatalystStores
table. To select several at a time, hold down the Ctrl key, and click each one to remove.
d. Click Remove between the two tables. This action moves the highlighted CatalystStores
from the Selected CatalystStores table to the Un-Grouped CatalystStores table.
NOTE: To remove all CatalystStores from the group, click Remove All.
12. Click Next.
13. On the Add Teamed CatalystStores screen:
a. Click on the name of the Teamed CatalystStore in the Un-Grouped Teamed CatalystStores
table. To select several at a time, hold down the Ctrl key, and click each name to be
added. The Teamed CatalystStores are then highlighted in the table.
NOTE: Because Teamed CatalystStore members belong to a group, they are not listed
individually.
b. Click Add between the two tables. This action moves the highlighted Teamed CatalystStore
from the Un-Grouped Teamed CatalystStores table to the Selected Teamed CatalystStores
table.
NOTE: To add all Teamed CatalystStores to the group, click Add All.
c. To remove a Teamed CatalystStore added to the group, click it in the Selected Teamed
CatalystStores table. To select several at a time, hold down the Ctrl key, and click each
one to remove.
100 Performing administration procedures
 Loading...