

Page 1

HPE VAN SDN Controller 2.7 Administrator Guide
Abstract
This guide is intended for network administrators and support personnel involved in:
• Configuring and managing HPE VAN SDN (Virtual Application Network Software-Defined Networking) Controller installations
• Registering and activating HPE VAN SDN Controller licenses
Part Number: 5200-0907
Published: March 2016
Edition: 1
Page 2

© Copyright 2013, 2016 Hewlett Packard Enterprise Development LP
The information contained herein is subject to change without notice. The only warranties for Hewlett Packard Enterprise products and services
are set forth in the express warranty statements accompanying such products and services. Nothing herein should be construed as constituting
an additional warranty. Hewlett Packard Enterprise shall not be liable for technical or editorial errors or omissions contained herein.
Confidential computer software. Valid license from Hewlett Packard Enterprise required for possession, use, or copying. Consistent with FAR
12.211 and 12.212, Commercial Computer Software, Computer Software Documentation, and Technical Data for Commercial Items are licensed
to the U.S. Government under vendor's standard commercial license.
The HPE VAN SDN Controller license text can be found in /opt/sdn/legal/EULA.pdf. The HPE VAN SDN Controller incorporates materials from
several Open Source software projects. Therefore, the use of these materials by the HPE VAN SDN Controller is governed by different Open
Source licenses. Refer to /opt/sdn/legal/HP-SDN-CONTROLLER-OPENSOURCE-LIST.pdf for a complete list of the materials used.
Links to third-party websites take you outside the Hewlett Packard Enterprise website. Hewlett Packard Enterprise has no control over and is not
responsible for information outside the Hewlett Packard Enterprise website.
Acknowledgments
Java® and Oracle® are registered trademarks of Oracle and/or its affiliates.
Open Source Software
For information on licenses for the open source software used by the HPE VAN SDN Controller, see the HPE VAN SDN Controller Open Source
and Third-Party Software License Agreements.
For information on acquiring the open source code for the HPE VAN SDN Controller, send an email to HPN-SDN-Open-Source-Query@hpe.com.
Page 3

Contents
1 Introduction........................................................................................................10
About the HPE VAN SDN Controller...................................................................................................10
The HPE SDN ecosystem..................................................................................................................10
SDN Controller applications and the App Store.................................................................................12
Hewlett Packard Enterprise SDN information library..........................................................................12
Supported switches and OpenFlow compatibility ..............................................................................12
OpenFlow requirements................................................................................................................12
IPv6 traffic......................................................................................................................................13
2 Understanding the controller architecture.........................................................14
List of controller embedded applications............................................................................................15
OpenFlow Link Discovery ..................................................................................................................15
OpenFlow Node Discovery ................................................................................................................16
Path Diagnostics ................................................................................................................................17
Path Daemon......................................................................................................................................17
Topology Manager..............................................................................................................................19
Topology Viewer.................................................................................................................................20
3 Using the SDN controller UI..............................................................................21
Starting the SDN controller console UI...............................................................................................21
Default domain name, user name, and password.........................................................................22
About the user interface......................................................................................................................22
Banner...........................................................................................................................................23
Changing column widths...............................................................................................................23
SDN User window...............................................................................................................................23
User window screen details...........................................................................................................24
Changing the SDN user password................................................................................................24
Changing the background and text colors.....................................................................................25
Expanding the SDN user window..................................................................................................25
Collapsing the SDN user window..................................................................................................25
Logging out of the controller..........................................................................................................25
Navigation menu.................................................................................................................................25
About the navigation menu............................................................................................................25
Expanding or collapsing the navigation menu...............................................................................25
Navigation menu screen details....................................................................................................26
Alerts...................................................................................................................................................27
About alerts...................................................................................................................................27
Alerts screen details......................................................................................................................28
Viewing the alert notification counter.............................................................................................29
Viewing the ten most severe recent active alerts .........................................................................29
Acknowledging an alert.................................................................................................................30
Deleting an alert............................................................................................................................30
Configuring how alerts age out......................................................................................................31
Applications........................................................................................................................................32
About the application manager......................................................................................................32
Prerequisites for installing an application......................................................................................32
Applications screen details............................................................................................................33
Obtaining applications from the Hewlett Packard Enterprise SDN App Store...............................34
Adding or upgrading an application...............................................................................................34
Disabling (stopping) or enabling (starting) an application.............................................................35
Uninstalling an application.............................................................................................................36
Understanding application states and OSGi artifacts....................................................................36
Configuration components..................................................................................................................38
Contents 3
Page 4

Using configuration component keys............................................................................................38
Configurations screen details........................................................................................................39
Basic Configurations view........................................................................................................40
Advanced Configurations view.................................................................................................41
System Configurations view.....................................................................................................43
Apps Configurations view.........................................................................................................45
Modifying a component configuration............................................................................................45
Modifying NTP server or date and time.........................................................................................46
Modifying Network settings............................................................................................................47
Modifying Logger settings..............................................................................................................48
Audit log..............................................................................................................................................49
About the audit log ........................................................................................................................49
Audit log screen details.................................................................................................................50
Deleting an audit log entry.............................................................................................................50
Configuring how audit log data ages out.......................................................................................50
Exporting and archiving audit log data..........................................................................................51
Licenses..............................................................................................................................................52
Licenses screen details.................................................................................................................52
Installing, activating, uninstalling, or transferring licenses.............................................................53
Team...................................................................................................................................................53
Support logs........................................................................................................................................53
About support logs.........................................................................................................................53
Support logs screen details...........................................................................................................54
Configuring the support log queue size ........................................................................................55
Exporting the support logs ............................................................................................................56
Packet listeners..................................................................................................................................56
Packet listeners display details.....................................................................................................57
OpenFlow Monitor..............................................................................................................................58
OpenFlow Monitor screen details..................................................................................................58
Summary for data path view....................................................................................................59
Ports for data path view...........................................................................................................60
Flows for data path view..........................................................................................................60
Groups for data path view........................................................................................................61
OpenFlow topology ............................................................................................................................61
Displaying the network Topology...................................................................................................62
Using keyboard shortcuts to change the display...........................................................................62
Changing switch and host node labeling..................................................................................63
Using the mouse to change the topology display.....................................................................65
Viewing node tooltips...............................................................................................................65
Changing the topology display using the View menu....................................................................65
Using Search............................................................................................................................66
Viewing port labels on switches...............................................................................................67
Viewing details.........................................................................................................................67
Using tools................................................................................................................................67
Using pin, Collapse All, Auto Refresh and Reload...................................................................67
Viewing the shortest path between two nodes .............................................................................68
Follow Flow..............................................................................................................................68
Highlight flow............................................................................................................................69
Viewing flow details for selected nodes.........................................................................................69
Viewing details on packet selection criteria for a data flow...........................................................69
OpenFlow Trace log............................................................................................................................69
About the OpenFlow Trace log......................................................................................................70
OpenFlow Trace screen details.....................................................................................................70
Starting, stopping, or clearing OpenFlow trace ............................................................................71
Displaying trace event details........................................................................................................71
4 Contents
Page 5

Exporting the OpenFlow Trace log................................................................................................72
Filtering the OpenFlow trace log in a CSV file...............................................................................73
Changing the OpenFlow trace interval .........................................................................................74
OpenFlow Classes .............................................................................................................................75
About OpenFlow classes...............................................................................................................75
OpenFlow Classes screen details.................................................................................................76
Controller enforcement levels for OpenFlow classes....................................................................78
Changing the enforcement levels for OpenFlow classes..............................................................78
4 Hybrid mode for controlling packet forwarding..................................................80
Overview.............................................................................................................................................80
Learning more about hybrid mode......................................................................................................80
Viewing and changing the hybrid mode configuration........................................................................80
Coordinating controller hybrid mode and OpenFlow switch settings..................................................82
Supporting hybrid mode on OpenFlow switches...........................................................................82
Configuring controller settings to support hybrid mode.................................................................82
Limitations................................................................................................................................83
Controller packet-forwarding when hybrid mode is disabled..............................................................84
Controller packet forwarding when hybrid mode is enabled...............................................................85
5 License Registration and Activation..................................................................86
Overview of the license registration and activation process...............................................................86
License types, usage, and expiration.................................................................................................86
Preparing for license registration........................................................................................................87
Prerequisites for license registration.............................................................................................87
Identifying the Install ID displayed in the controller UI...................................................................87
Registering and activating a license...................................................................................................87
Registering your license and obtaining a license key.........................................................................88
Viewing your license information...................................................................................................90
Activating a license on the controller..................................................................................................92
Adding and activating a license using the controller UI.................................................................92
Activating a license using a script.................................................................................................93
Managing licenses..............................................................................................................................93
Transferring licenses.....................................................................................................................93
Deactivating licenses to prepare for transfer............................................................................94
Transferring licenses to a new platform...................................................................................95
Using Evaluation Licenses .................................................................................................................98
6 Configuring for High Availability.........................................................................99
High Availability best practices...........................................................................................................99
About teaming for High Availability.....................................................................................................99
Requirements for teaming................................................................................................................100
Team status......................................................................................................................................101
Controller status ...............................................................................................................................101
Manually synchronizing Cassandra database nodes using nodetool repair utility...........................102
Guidelines for running the nodetool repair utility.........................................................................102
Running the Cassandra nodetool repair command.....................................................................102
Configuring controllers to use the same local NTP servers..............................................................103
Viewing your team configuration using the UI..................................................................................104
Viewing team status....................................................................................................................104
Viewing team configuration and controller status........................................................................105
Viewing region configuration.......................................................................................................105
Viewing devices, datapaths, and debug logs..............................................................................106
Methods for configuring HA teaming................................................................................................106
Defining inputs for teaming in a configuration file.............................................................................107
Using a Python script from a controller to configure a team.............................................................109
Contents 5
Page 6

7 Security............................................................................................................110
SDN Controller authentication .........................................................................................................110
Changing the default controller keystore and truststore to use CA signed certificates....................110
SDN Controller keystore and truststore locations and passwords ..................................................112
Encryption ........................................................................................................................................112
Built-in OpenFlow controller..............................................................................................................113
Creating a keystore and truststore for OpenFlow switch communication...................................113
Built-in OpenFlow controller keystore and truststore locations and passwords..........................113
REST authentication.........................................................................................................................114
OpenStack Keystone used for user and token management......................................................115
UUID Authentication....................................................................................................................115
PKI Authentication.......................................................................................................................116
Local vs Remote Keystone..........................................................................................................116
Keystone controller configuration................................................................................................117
Security .......................................................................................................................................117
Role-Based Access Control (RBAC)...........................................................................................118
Assigning a user to a role.......................................................................................................118
API access requires authentication.............................................................................................120
Service and admin tokens ..........................................................................................................120
Controller code verification ..............................................................................................................121
Adding certificates to the jar-signing truststore ..........................................................................121
Running the SDN Controller Without Jar-Signing Validation ......................................................121
Revoking Trust .................................................................................................................................122
Revoking trust via truststore .......................................................................................................122
Revoking trust via CRL ...............................................................................................................122
SDN administrative REST API .........................................................................................................122
Virgo admin UI access via localhost only.........................................................................................123
Virgo console access disabled by default.........................................................................................123
JMX console enabled for local access only......................................................................................123
Creating the Cassandra keystore and truststore..............................................................................124
Cassandra keystore and truststore locations and passwords .........................................................125
Security procedure ...........................................................................................................................125
Security best practices......................................................................................................................126
8 Configuring OpenFlow instances....................................................................128
Configuring OpenFlow Instances with Multiple VLANs ...................................................................128
Configuring OpenFlow Instances with Single VLAN Identifier..........................................................128
Configuring OpenFlow instances to enable MAC group matching...................................................132
MAC group matching...................................................................................................................132
Switches that support MAC group tables and MAC group matching..........................................132
Configuration rules for OpenFlow instances and MAC groups...................................................132
Enabling or disabling MAC group matching on an OpenFlow instance......................................132
Prerequisites..........................................................................................................................132
Enabling MAC groups............................................................................................................133
Disabling MAC groups...........................................................................................................133
9 Backing up and restoring ................................................................................134
Backing up and restoring Best Practices..........................................................................................134
Backing up a controller ....................................................................................................................134
Backup operation ........................................................................................................................135
Backing up a controller ...............................................................................................................136
Downloading a backup from the controller to another location ..................................................136
Recommended backup practices ...............................................................................................137
Restoring a controller from a backup ...............................................................................................137
Restore operation .......................................................................................................................137
System restore requirements .....................................................................................................138
6 Contents
Page 7

Restoring a controller from a backup..........................................................................................138
Distributed (team) backing up and restoring ....................................................................................140
Backing up and restoring the Keystone configuration and database...............................................140
10 Metrics...........................................................................................................141
Viewing metric data..........................................................................................................................141
About metrics...............................................................................................................................141
How metric values are processed..........................................................................................141
Metric identifiers.....................................................................................................................142
Viewing the application IDs for applications that have persisted metrics to disk.........................143
Viewing the metrics persisted by a specific application...............................................................143
Metrics returned by the metrics/apps/app_id command......................................................144
Viewing the primary tags for metrics persisted by an application................................................145
Viewing the secondary tags for metrics persisted by an application...........................................145
Viewing the names of metrics persisted by an application..........................................................146
Viewing information about a persisted metric identified by its UID..............................................147
Viewing the time-series values for a persisted metric identified by its UID.................................147
Viewing all controller JVM metrics....................................................................................................149
Viewing current metric data using a JMX client................................................................................149
Metrics that are viewable using a JMX client..............................................................................149
Prerequisites................................................................................................................................149
Connecting to the JMX server using the JConsole JMX client....................................................150
Selecting and viewing metrics using JConsole JMX...................................................................151
Generating a controller support report..............................................................................................152
11 Troubleshooting.............................................................................................155
REST API request returns HTTP code 401......................................................................................155
Controller not listening on port TCP/8443.........................................................................................155
Packets not received at the end point...............................................................................................156
Session expired message in the UI..................................................................................................156
Error running the config_sdn.py script with date/time/NTP option....................................................156
Licensing...........................................................................................................................................157
Redeem quantity error.................................................................................................................157
Install ID format errors ................................................................................................................157
Install ID errors ...........................................................................................................................157
Applications that use the Cassandra database are experiencing failures........................................158
Controller support log fills disk space, contains multiple “Too many open files” messages.............158
Application management errors........................................................................................................159
Application not starting and in disabled state..............................................................................159
Application in transitive state.......................................................................................................159
Application management exceptions................................................................................................159
Getting IllegalStateException: HTTP code 500...........................................................................159
Getting UnsafeConfigurationException, HTTP code: 403...........................................................160
Getting ApplicationDisableException, HTTP code: 500..............................................................160
Getting ApplicationEnableException, HTTP code: 500...............................................................160
Getting ApplicationInstallException, HTTP code: 500.................................................................161
Getting ApplicationUpgradeException, HTTP code: 500............................................................161
Getting ApplicationUninstallException, HTTP code: 500............................................................161
Getting ApplicationUploadException, HTTP code: 500...............................................................161
Getting ApplicationValidationException, HTTP code: 400...........................................................161
OpenFlow errors...............................................................................................................................162
Host location not learned by controller........................................................................................162
Switches constantly being disconnected and reconnected ........................................................162
Unexpected network or service problems in hybrid mode...........................................................162
Troubleshooting teamed environments............................................................................................163
Controllers dropped from team or unable to form team..............................................................163
Contents 7
Page 8

Teaming framework does not run................................................................................................163
Controller becomes suspended...................................................................................................163
Unable to create team.................................................................................................................164
Controller and application data differs among controllers in a team...........................................165
Application data is not synchronized after a controller rejoins the team.....................................165
12 Support and other resources.........................................................................167
Accessing Hewlett Packard Enterprise Support...............................................................................167
Accessing updates............................................................................................................................167
Websites...........................................................................................................................................167
Customer self repair.........................................................................................................................168
Remote support................................................................................................................................168
Documentation feedback..................................................................................................................169
A curl commands................................................................................................170
About the curl commands in this document......................................................................................170
Getting an authorization token using a curl command.....................................................................171
Export audit log data as a CSV file using curl commands................................................................171
Licensing actions using curl commands...........................................................................................171
Obtaining an install ID.................................................................................................................171
Activating a license on the controller...........................................................................................172
Uninstalling licenses to prepare for transfer................................................................................172
Application manager actions using curl commands.........................................................................174
Listing applications......................................................................................................................174
Listing information about an application......................................................................................175
Getting application health status.................................................................................................175
Uploading an application (new or upgrade).................................................................................176
Installing a new application..........................................................................................................176
Upgrading an application.............................................................................................................177
Disabling an application...............................................................................................................177
Enabling an application...............................................................................................................178
Removing a staged application...................................................................................................178
Deleting an application................................................................................................................179
Viewing metric data using curl commands.......................................................................................179
Managing SNMP keys .....................................................................................................................179
Getting the SNMP keys...............................................................................................................179
Adding SNMP keys......................................................................................................................179
Deleting an SNMP key................................................................................................................180
Managing NETCONF keys ..............................................................................................................180
Getting the NETCONF keys........................................................................................................180
Adding NETCONF keys...............................................................................................................180
Deleting a NETCONF key...........................................................................................................180
Team configuration using curl commands........................................................................................181
Creating a team using curl...........................................................................................................181
Considerations when a controller team is formed using REST..............................................181
Configuring a controller team using curl.................................................................................182
Error log for team configuration ..................................................................................................184
Team alias node.....................................................................................................................186
Cassandra database maintenance in a team.........................................................................186
Disbanding a team using curl......................................................................................................186
Viewing the team configuration using curl...................................................................................187
Creating regions using curl..........................................................................................................188
Regions and device ownership..............................................................................................189
Failover behavior within a region...........................................................................................189
Failback behavior within a region...........................................................................................191
Adding a region using curl...........................................................................................................192
8 Contents
Page 9

Adding a device to a region using curl........................................................................................193
Getting the configuration of all regions using curl.......................................................................193
Getting the configuration of a specific region using curl..............................................................194
Determining whether or not a controller owns a specific device using curl.................................194
Getting the owning controller and devices for a region using curl...............................................194
Getting the status of a specific region using curl.........................................................................195
Getting the status of all regions using curl..................................................................................196
Removing a device from a region using curl...............................................................................198
Removing a region using curl......................................................................................................198
B Scripts.............................................................................................................199
Restoring a controller........................................................................................................................199
Backing up a controller team............................................................................................................201
Restoring a controller team ..............................................................................................................206
C Using an external policy manager..................................................................211
D Performance testing........................................................................................212
E Examples of Metrics........................................................................................213
Index...................................................................................................................228
Contents 9
Page 10

1 Introduction
This document describes the configuration and management of the HPE VAN SDN Controller
in standalone and team modes.
About the HPE VAN SDN Controller
The HPE VAN SDN Controller provides a unified control point in an OpenFlow-enabled network,
simplifying management, provisioning, and orchestration and enabling delivery of a new generation
of application-based network services.
In the Hewlett Packard Enterprise Software Defined Networking (SDN) architecture, the control
and data planes of the network are decoupled from each other, centralizing network intelligence
and abstracting the underlying network infrastructure from applications. Controller software
manages forwarding behavior for physical and virtual switches under its control via the
industry-standard OpenFlow protocol. Network ports, links, and topologies are all directly visible,
enabling centralized policy administration and more effective path selection based on a dynamic,
global view of the network. This dramatically simplifies the orchestration of multi-tenant
environments and the enforcement of network policy for both mobile clients and servers.
The HPE VAN SDN Controller is designed to operate in a variety of computing environments,
including campus, data center, service provider, private cloud, and public cloud. The HPE VAN
SDN Controller features:
• An enterprise-class platform for the delivery of a broad range of network innovations
• An extensible, scalable, and resilient controller architecture
• Compliance with OpenFlow 1.0 and 1.3 protocols
• Support for Hewlett Packard Enterprise and H3C OpenFlow-enabled switches
• Secure authentication using a local or remote Keystone server
• Controller teaming for distributed platform High Availability (HA)
• Embedded applications that provide common network services
• Open APIs enable SDN application developers to deliver innovative solutions that dynamically
link business requirements to network infrastructure using either custom Java programs or
general-purpose RESTful control interfaces, including functions to extend the controller
REST API and UI.
• Integration with HPE Intelligent Management Center (IMC). HPE IMC provides full controller
application life cycle management and monitoring, enhanced reporting and SDN network
visualization.
The HPE SDN ecosystem
SDN architecture separates the network control plane from the forwarding hardware on network
devices. Control can then be centralized, while forwarding remains distributed. SDN is based on
OpenFlow, which is a standards-based protocol allowing for a centralized-control plane in a
separate device (the controller).
OpenFlow is managed by the Open Networking Foundation (ONF). By separating the control
plane from the forwarding plane, SDN makes it possible for the network status and capabilities
to be exposed directly to the business service layer, so that business systems can request
services from the network directly. SDN applications thus provide higher level application direction
to the SDN controller. And freed from the control function, the forwarding plane can then provide
optimized packet processing at very high speeds.
The HPE VAN SDN Controller is the central building block of the HPE SDN ecosystem and
creates a platform for application development.
10 Introduction
Page 11
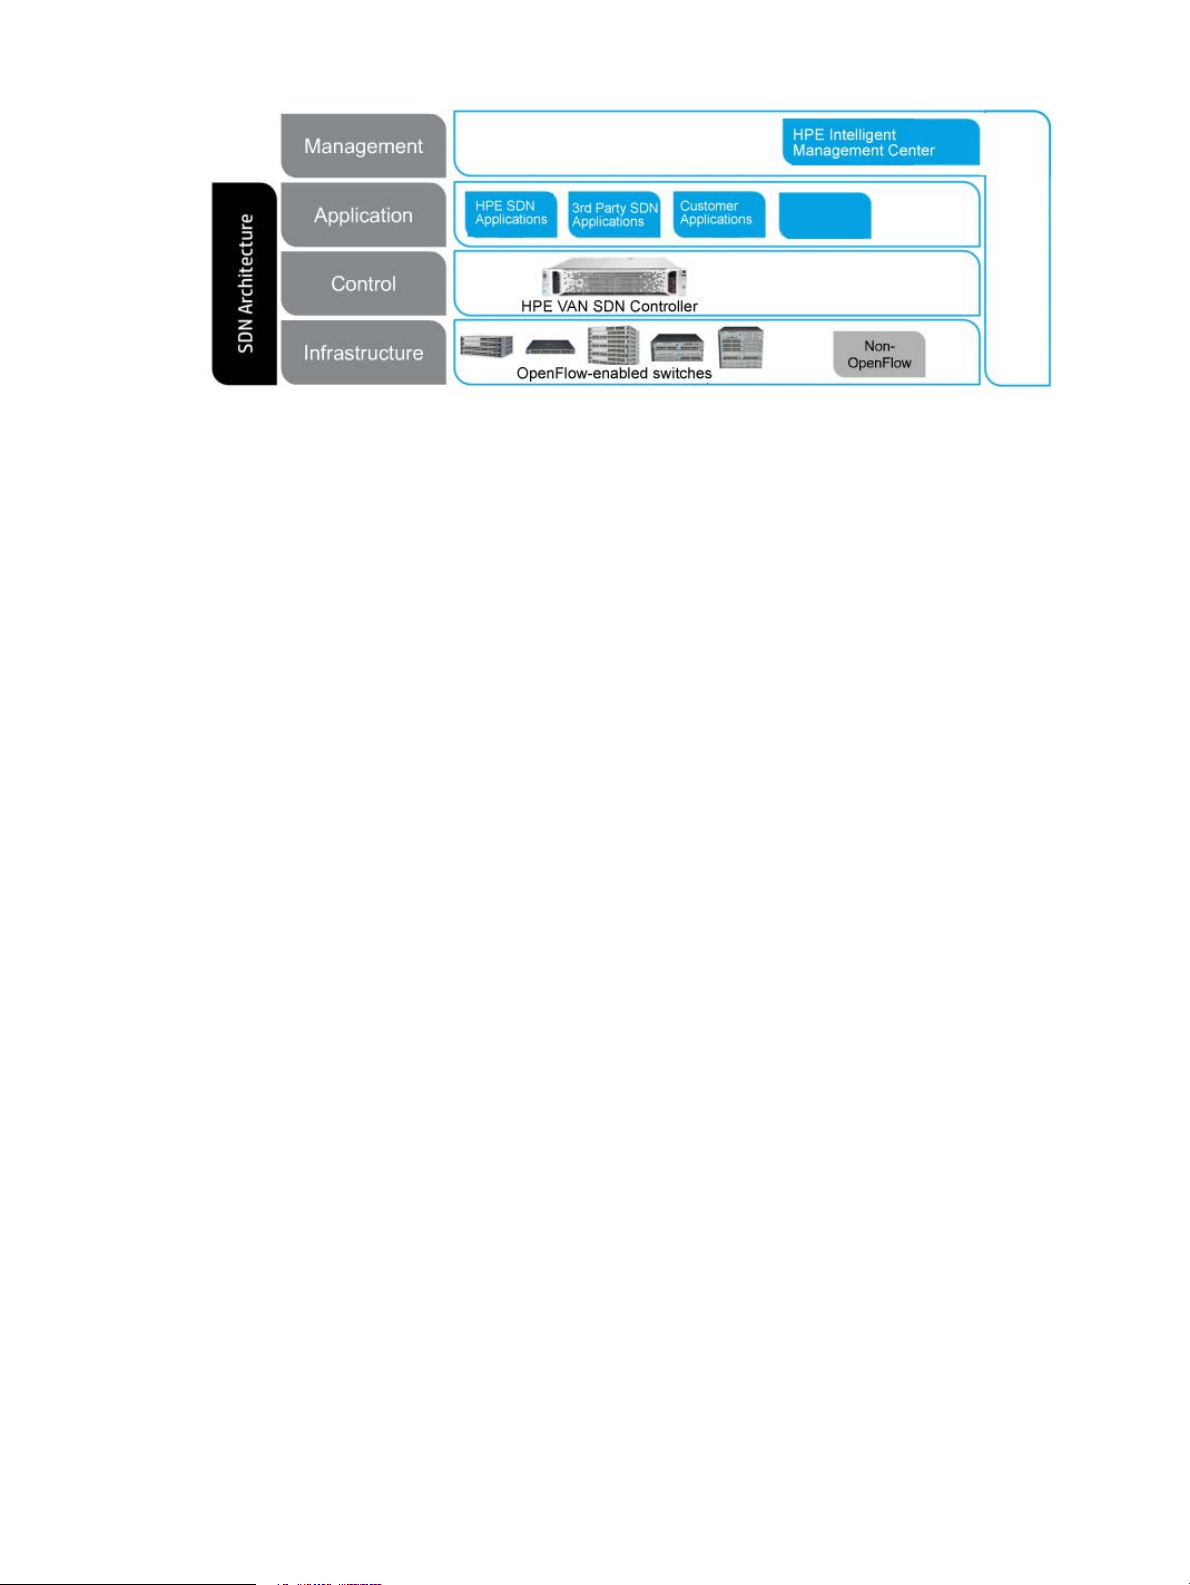
The HPE SDN ecosystem includes the following:
• Infrastructure. The infrastructure layer is made up of network devices, typically but not
exclusively routers and switches. The devices are OpenFlow-enabled. An OpenFlow switch
consists of one or more flow tables and a group table, which perform packet lookups and
forwarding and provide an OpenFlow channel to the HPE VAN SDN Controller. The switch
communicates with the controller and the controller manages the switch via the OpenFlow
protocol. Hewlett Packard Enterprise has more than 50 switch models that are
OpenFlow-enabled.
• Control. HPE VAN SDN Controller provides centralized control and automation for an SDN
network. The controller controls policy and forwarding decisions, which are communicated
to the OpenFlow-enabled switches in the data center or campus network. A variety of Hewlett
Packard Enterprise and third-party SDN applications can leverage the controller to
automatically deliver the necessary business and network service levels.
• Applications. Hewlett Packard Enterprise and third-party SDN applications provide a true
end-to-end service level for network performance, quality of service, and security, which can
be tuned to an applications’ needs. For example, SDN applications can inspect flows, or
perform other network control functions via the HPE VAN SDN Controller. Hewlett Packard
Enterprise SDN applications include: HPE Network Protector SDN Application, HPE Network
Optimizer SDN Application and HPE Network Visualizer SDN Application.
The extensibility and open APIs of the HPE VAN SDN Controller allows new applications to
be created that make requests of the underlying network, without the need to physically
uproot or re-configure the underlying infrastructure. Northbound APIs utilize the REST
architecture and provide easy access to applications that are integrated directly in the
controller or off the controller. Native APIs, provided in Java, deliver support to Network
Control applications that are integrated directly in the controller.
• Management. The HPE Intelligent Management Center (IMC) VAN SDN Manager software
integrates with HPE IMC to provide administrators with a single interface to manage both
the traditional network and the SDN. The IMC VAN SDN Manager Software monitors and
manages all three layers of the SDN architecture: infrastructure, control, and application,
providing comprehensive management—including fault, configuration, accounting, monitoring,
and security for the controller and OpenFlow infrastructure. IMC provides full controller
application life cycle management and monitoring, reporting of network service status and
OpenFlow-related information, and SDN network visualization.
In addition, the HPE VAN SDN Controller provides REST and Java APIs that enable
applications to interact with the controller to receive alerts, to get information about the
network, devices, and controller, and to perform various network management tasks.
The HPE SDN ecosystem 11
Page 12

SDN Controller applications and the App Store
The HPE VAN SDN Controller includes a default set of core network service applications that
are installed as modules with the controller. These embedded applications provide services such
as authentication, data persistence, logging and alerts. For details, see “Understanding the
controller architecture” (page 14).
The HPE VAN SDN Controller also provides a platform for developing and deploying SDN
applications. Several applications have been developed by Hewlett Packard Enterprise including
HPE Network Protector SDN Application, HPE Network Optimizer SDN Application, and HPE
Network Visualizer SDN Application. There are also SDN applications developed by third-party
partners. In addition, you can develop your own SDN applications.
Hewlett Packard Enterprise’s SDN applications as well as third-party SDN applications are
available through the Hewlett Packard Enterprise SDN App Store. Access the App Store at
www.hpe.com/networking/sdnappstore.
The HPE VAN SDN Controller includes an SDK providing the tools needed to develop applications
for the controller. The SDK includes documentation for both the Java and REST APIs as well as
all of the jar files necessary during compilation. A sample application is also included along with
API specifications. For details on how to develop applications for the controller, see the HPE
VAN SDN Controller Programming Guide.
Hewlett Packard Enterprise offers an SDN developer community, as well as forums, events, and
other services, to help developers and partners build and sell SDN applications.
Hewlett Packard Enterprise SDN information library
The following information is provided for the HPE VAN SDN Controller:
• HPE VAN SDN Controller Release Notes
• HPE VAN SDN Controller Installation Guide
• HPE VAN SDN Controller Administrator Guide
• HPE VAN SDN Controller and Applications Support Matrix
• HPE VAN SDN Controller Programming Guide
• HPE VAN SDN Controller REST API Reference
• HPE VAN SDN Controller Troubleshooting Guide
• HPE VAN SDN Controller Open Source and Third-Party Software License Agreements
The most recent versions of these documents are in the Hewlett Packard Enterprise SDN
information library at the following website: www.hpe.com/info/sdn/infolib.
Supported switches and OpenFlow compatibility
For information about supported network switches, OpenFlow versions, and switch configuration
requirements, see the HPE VAN SDN Controller and Applications Support Matrix.
CAUTION: OpenFlow switches in a controller domain should not be connected in a loop
topology with switches outside the domain. Allowing such connections can create broadcast
loops inside the OpenFlow network. For more on packet-forwarding decisions, see “Hybrid mode
for controlling packet forwarding” (page 80).
OpenFlow requirements
The controller must be connected to a network that includes one or more switches configured to
run OpenFlow. Hewlett Packard Enterprise recommends that you plan and implement the switch
OpenFlow configurations before connecting the controller to the network.
12 Introduction
Page 13

NOTE: OpenFlow switches in the network must be configured to allow control by the HPE
VAN SDN Controller. In a controller domain, including a switch that does not support OpenFlow
or allow control by another HPE VAN SDN Controller creates separate clusters of OpenFlow
networks.
NOTE: Running the OpenFlow control mode on a specified switch VLAN disrupts the traffic
on that VLAN until the controller configures the required flow rules in the switch using the
OpenFlow controller API. You should create a separate VLAN for an OpenFlow control plane.
For information on configuring OpenFlow, see the latest OpenFlow Administration Guide for your
switch.
IPv6 traffic
IPv6 traffic running in the data plane of an OpenFlow network is supported when the controller
is operating with hybrid mode set to “true” (the default). In this state the controller is not aware
of the IPv6 traffic. However, with hybrid mode set to false (all packets sent to the controller),
the controller drops IPv6 packets, and they do not reach their destinations.
Supported switches and OpenFlow compatibility 13
Page 14
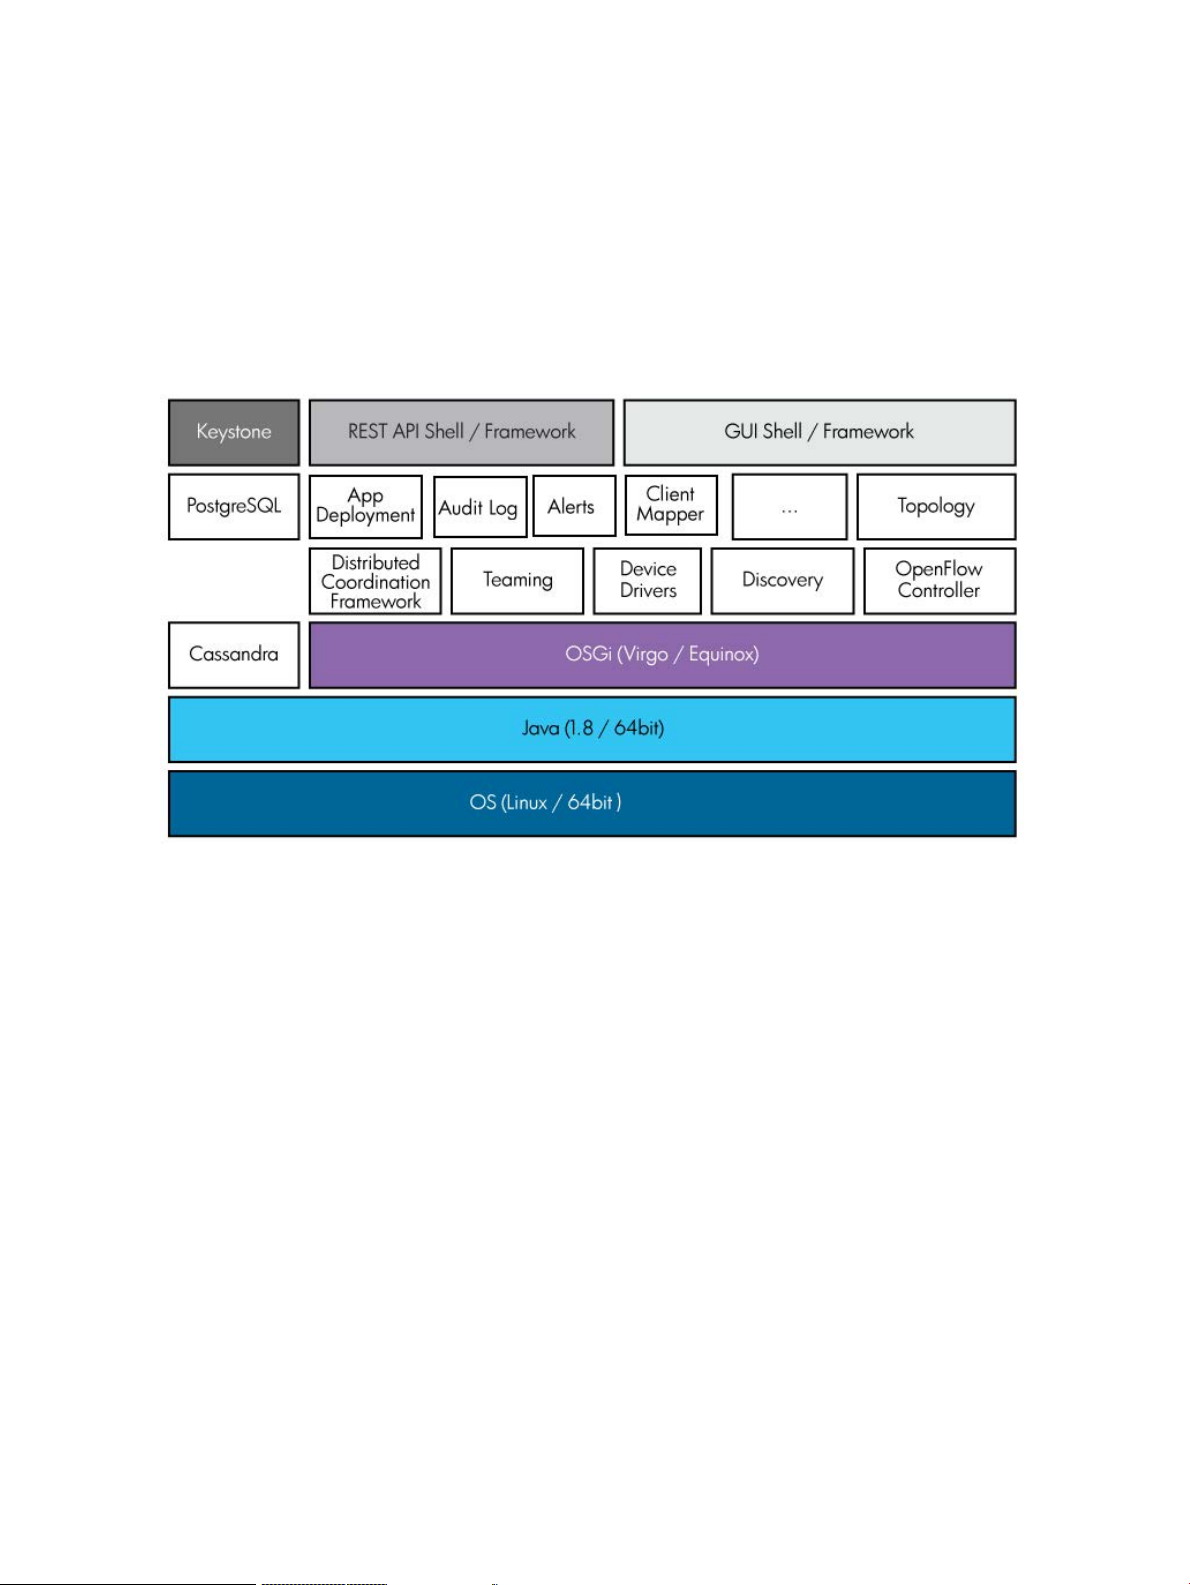
2 Understanding the controller architecture
The HPE VAN SDN Controller software is built upon a Linux OS, Java 1.8, and OSGI (Virgo
stack and Equinox framework) and uses an Apache Cassandra distributed post-relational
database.
Keystone is an external service that provides authentication and high level authorization services.
It supports token-based authentication
REST API and GUI framework are used by SDN application developers for building applications
(RESTful web services and web based UIs).
Figure 1 HPE VAN SDN Controller software stack
The following gives a short description of the controller components:
• The controller Application Manager enables installing, upgrading, enabling (starting), disabling
(stopping), and uninstalling SDN applications on the controller.
• The Audit Log records events related to activities, operations, and configuration changes
initiated by an authorized user. The Audit Log is managed by the controller Audit Log service.
• The Alert Log records information about events that affect controller operation, and in some
cases indicate that some action is needed to correct a condition. Alerts are managed by the
controller Alert service.
• Client Mapper Service combines information known about a network client by the controller,
such as host IP address, host MAC addresses, and the connected datapath and port, with
information about the network client known by an outside policy manager, such as the Aruba
ClearPass policy manager, to provide information about network clients, including user
information, device information, and location information. This information is available via
the REST API only.
• The controller uses the embedded applications Topology Manager and Topology Viewer to
collect and display information about the OpenFlow network.
• The controller provides a framework to back up and restore controller and application state
in a backup file. The backup file can be copied and stored for later use. The stored backup
file can be uploaded to the controller.
14 Understanding the controller architecture
Page 15

• The Distributed Coordination Framework is one of the high-availability features of the
controller. It provides the infrastructure for controller-to-controller communication and
coordination of state information for controllers in a controller team.
• The controller can be configured in a team. The teaming services of the controller keep the
runtime state of each controller in the team (active, unreachable, or suspended) up to date
and is used by other parts of the controller for functions related to high-availability.
• The Device Drivers model the capabilities of the devices and provide APIs for interacting
with different device types.
• The controller uses the embedded applications OpenFlow Link Discovery and OpenFlow
Node Discovery to discover information about the OpenFlow network.
• The OpenFlow controller (also called the core controller) handles the connections from
OpenFlow devices and provides the means for upper layers of software to interact with those
devices.
The HPE VAN SDN Controller includes a default set of core network service applications that
are installed with the controller (see “List of controller embedded applications” (page 15).
List of controller embedded applications
The HPE VAN SDN Controller includes a default set of core network service applications that
are installed as modules on the controller. The following applications are embedded in the
controller and are installed when you install the controller:
• OpenFlow Link Discovery
• OpenFlow Node Discovery
• Path Daemon
• Path Diagnostics
• Topology Manager
• Topology Viewer
OpenFlow Link Discovery
The OpenFlow Link Discovery application is the default OpenFlow link supplier application that
is installed with the controller. This application implements the
com.hp.sdn.supplier.LinkSuppliersBroker interface and uses LinkSupplierService
and LinkService APIs to create and maintain link information for OpenFlow datapaths that
register with the controller.
The OpenFlow Link Discovery application pushes flow-mods to steal discovery packets, injects
discovery packets to all ports on all datapaths, and discovers links on the controlled network by
listening for PACKET_IN messages. It discovers two types of links:
• direct links
• multi-hop links
The OpenFlow Link Discovery application distinguishes the link type by injecting two packets to
each port in an OpenFlow instance. These packets have the same Ethernet type (0x8999), but
are sent to different destination MAC addresses.
The ControllerManager configuration specifies the hybrid mode that has one of the following
values:
• hybrid.mode=true
The OpenFlow Link Discovery application installs a flow rule on every OpenFlow devices to
steal these packets. Packets that match this flow rule are forwarded to the controller from
List of controller embedded applications 15
Page 16

the OpenFlow instance and port where they were received. Using the origin information
contained within the received packet, the controller derives the source and destination of
the link that this packet traversed and records a link between the OpenFlow instances.
The link type is derived from the destination MAC address of the packet (direct or multi-hop).
If a link is direct, it will be discovered as both direct and multi-hop from the reporting OpenFlow
instance, but the type direct has precedence over the type multi-hop, so the link is recorded
as direct.
• hybrid.mode=false
All packets are stolen to the controller by default. Therefore, the OpenFlow Link Discovery
application does not push flow rules to devices.
A controller-generated link discovery packet:
• Uses a non-standard protocol, BDDP, which uses a payload format similar to LLDP.
• Is sent to either a link-local MAC address (to discover direct links) or a multicast MAC address
(to discover multihop links).
The link-local MAC address is: 01:08:c2:00:00:0e
The multicast MAC address used for link discovery is: 01:1B:78:E9:7B:CD.
• Contains the source device and port that introduced the packet to the controlled network.
The OpenFlow Link Discovery application listens for PACKET_IN messages that contain the
BDDP protocol. Each discovery packet has the source device ID embedded within its payload,
and the destination device can be derived from the PACKET_IN message. This design enables
the OpenFlow Link Discovery application to populate the link table with information it learns from
such received packets.
NOTE: Because PACKET_IN messages that contain the BDDP protocol are for
controller-generated link discovery packets, no corresponding PACKET_OUT is sent back to the
device that sent the PACKET_IN.
The OpenFlow Link Discovery application also listens to device and interface events and registers
with the ControllerService API to send OpenFlow packets to datapaths.
If the OpenFlowLinkDiscoveryComponent configuration has age.multihop.links=true,
the OpenFlow Link Discovery application periodically injects discovery packets into the controlled
network to refresh the multihop links. Any multihop links that are not refreshed at the interval
configured for the multihop.poll.interval key are considered to be invalid and are removed
from the link table. Additionally, network events such as a port going down or a device status
change causes relevant links to be removed from the link table, and causes discovery packets
to be sent to all datapaths that are in a ready state.
OpenFlow Node Discovery
The OpenFlow Node Discovery application is the default OpenFlow node supplier application
that is installed with the controller. This application implements the
com.hp.sdn.supplier.NodeSuppliersBroker interface and uses NodeSupplierService
and NodeService APIs to create and maintain node information for OpenFlow datapaths that
register with the controller.
If the ControllerManager configuration has hybrid.mode=false, all packets are implicitly stolen
to the controller and processed by the OpenFlow Node Discovery application. If learn.ip=true,
the node discovery application in this case uses ARP, DHP and IP packets to discover the hosts.
16 Understanding the controller architecture
Page 17

If the ControllerManager configuration has hybrid.mode=true:
• The OpenFlow Node Discovery application pushes flow-mods to controlled devices that
copy ARP packets or DHCP packets to the controller for processing and listens for
PACKET_IN messages that contain the ARP or DHCP protocol.
By default in hybrid mode, IP packets are not sent to controller. Based upon the information
supplied by these copied ARP, DHCP, and IP packets, and if learn.ip=true, the OpenFlow
Node Discovery application registers as a node supplier and supplies updates to the node
table. The controller administrator can configure the timeout value for nodes discovered by
each protocol by setting the value of the age key of the configurable component for that
protocol.
Only when learn.ip=true and some other application has pushed a flow that sends IP
packets to controller. will the controller receive IP packets. By default, in hybrid mode, IP
packets are not sent to controller.
The Node Manager does not update the node table for every PACKET_IN message it
receives. Specifically, PACKET_IN messages are ignored if the connected port is identified
by the Topology Manager as being part of the infrastructure.
NOTE: Because these PACKET_IN messages represent copies of packets that have
already been forwarded by the controlled device, no corresponding PACKET_OUT is sent
back to the device that sent the PACKET_IN.
• If the OfIpDiscoveryComponent configuration has learn.ip=true, the OpenFlow
Node Discovery application also listens for PACKET_IN messages that contain the IP
protocol, but does not explicitly push flow-mods to controlled devices that send IP packets
because doing so would drastically reduce network performance by overwhelming the control
plane.
Path Diagnostics
The Path Diagnostics application determines and verifies the path taken by trace packets from
a source host to a destination host. The application finds an existing flow that matches the
description of the trace packet, clones it with higher priority, and adds an additional action to
instruct the selected switch to send this packet back to the controller for status tally.
The Path Diagnostics application is available when the ControllerManager configuration has
hybrid.mode=false only.
Path Daemon
Path Daemon is a path-paving application that listens for all ARP and IPv4 PACKET_IN messages
and attempts to push flow-mods to datapaths along the forwarding path to ensure that such
packets get forwarded at line-rate. Path Daemon operates only when the entire network is
controlled by the controller (ControllerManager configuration has hybrid.mode=false and
there are no uncontrolled devices). Each PACKET_IN message processed by Path Daemon
results in a PACKET_OUT message and possibly a flow-mod getting pushed to one or more
controlled devices.
By default, the Path Daemon application pushes flow-mods that attempt to forward traffic using
MAC address and incoming port for ARP PACKET_IN messages, and using IPv4 address and
incoming port for IPv4 PACKET_IN messages. These flow-mods are only pushed when the
ControllerManager configuration has hybrid.mode=false. Specifically, the flow-mods will
match all packets that enter a specific switch on a specific port and they will match only packets
with the source MAC or IPv4 address and destination MAC or IPv4 address from the PACKET_IN
message. Any packets that match the flow-mod will be forwarded by the switch to the most
optimal destination port—determined by Path Daemon—for the packet to reach its intended
destination.
Path Diagnostics 17
Page 18

The Path Daemon application is responsible for pushing end-to-end flows for all ARP and IPv4
flow misses that arrive at the controller. By default, Path Daemon is responsible for Layer-2
forwarding only. This component depends on other network service components like the Node
manager and the Path Selection manager.
Path Daemon does the following:
• Registers with the controller as a Director. Directors are allowed to send a packet out.
• Registers for ARP packets and IPv4 packets.
• Uses the Node Manager to get the end hosts corresponding to the source and destination
MAC addresses and the datapaths to which these hosts are connected. It makes use of the
Path Selection manager to get the end-to-end shortest path between the source and
destination hosts. It makes use of the controller to push flows to the datapaths. The flowchart
in Figure 2 provides more details of its operation.
• Path Daemon uses the following match fields when pushing a flow-mod. These match fields
have been chosen so that the flow modules are pushed on hardware tables in both
ProVision-based and Comware-based switches.
◦ Ether type: OFPXMT_OFB_ETH_TYPE
◦ Source MAC or IP address: OFPXMT_OFB_ETH_SRC or OFPXMT_OFB_IPV4_SRC
◦ Destination MAC or IP address: OFPXMT_OFB_ETH_DST or OFPXMT_OFB_IPV4_DST
◦ Input port: OFPXMT_OFB_IN_PORT
• Path Daemon also registers for Port Status Down messages. When such messages are
received, Path Daemon removes all flows configured for the impacted port, thereby causing
the PACKET_IN messages to again come to the controller.
Operational notes
The Path Daemon:
• Does not handle multicast or broadcast traffic
• Does not configure the reverse path along with the forward path
• Drops packets from sources that the controller has not learned
• Floods packets when their destinations are not known
• Does not support fast-failover
• Performance is topology-dependent, recommended for 100-200 node environments, and
can degrade when there is a larger number of nodes
18 Understanding the controller architecture
Page 19
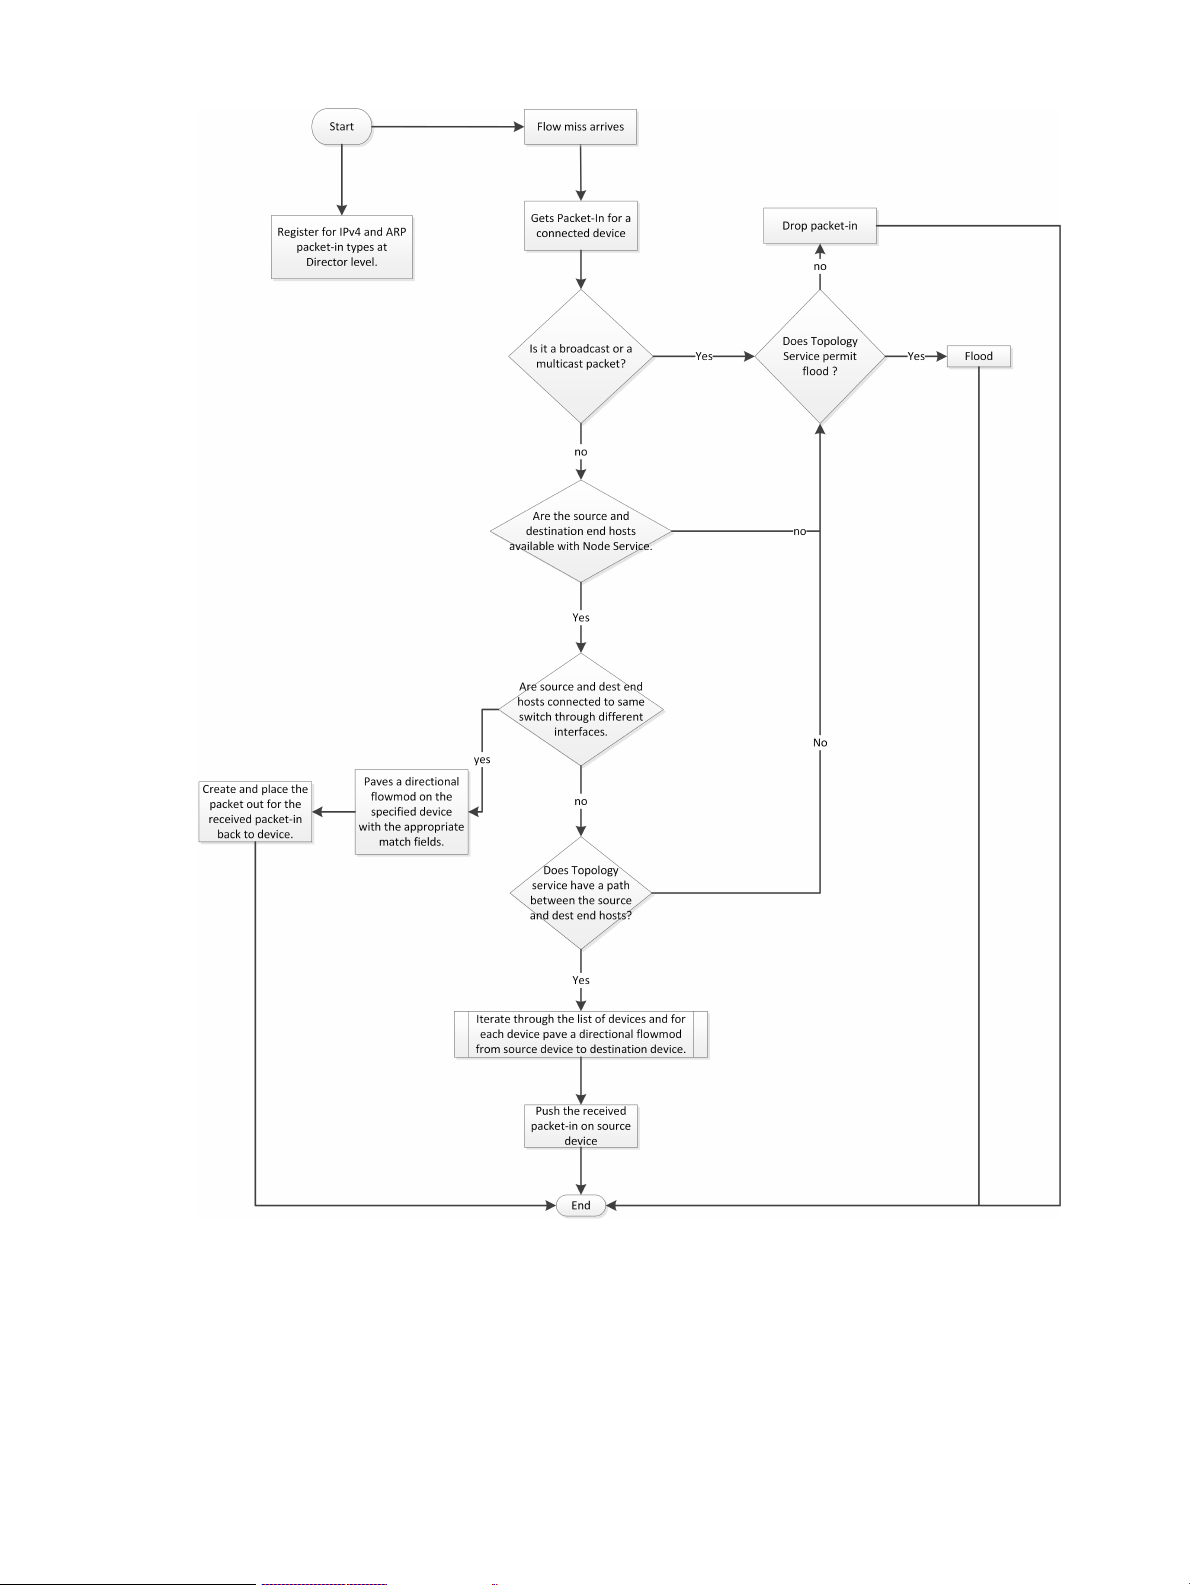
Figure 2 Path Daemon flowchart
Topology Manager
The Topology Manager provides topology information of the control domain. It also facilitates
shortest path traversals through the control domain by computing low cost next-hops or link edge
weight between any two datapaths in the control domain. Topology Manager creates the clusters
and broadcast tree to avoid loops and broadcast storms. The Topology Manager:
• Indicates whether a connection point is part of Infrastructure or is connected to an end host
• Indicates whether ingress broadcast traffic can be allowed through a specified connection
point
Topology Manager 19
Page 20

• Determines if a path exists between two datapaths
• Identifies the shortest path between two datapaths based on hop count or link edge weight
• Provides enumeration of the grouping of datapaths into clusters of strongly connected nodes
• For a given datapath, provides information about the cluster to which the datapath belongs
• Provides information about number of datapaths, number of links, and number of clusters
in the current topology
The Topology Manager provides notifications to subscribed applications about changes in its
broadcast tree and cluster. Applications that subscribe to these notifications can use the
information to respond to changes in topology.
Topology Viewer
The Topology Viewer application creates and updates a network graph for visualizing the network
the controller discovers. In the UI, this graph is displayed in on the OpenFlow Topology screen.
The Topology Viewer uses the services of the Topology Manager and the Link Manager.
20 Understanding the controller architecture
Page 21

3 Using the SDN controller UI
The SDN controller provides a console UI you can use as follows:
• View information such as alerts and logs and view OpenFlow information such as data flow
details, topology of discovered switches and end nodes including shortest path and view
OpenFlow classes that applications have registered.
• Perform actions such as acknowledging an alert, adding or enabling an application, exporting
log data and entering licensing information.
• Configure SDN controller components such as setting key values for alert policies.
The SDN controller also provides REST APIs you can use to program or configure the controller
and develop applications to run on the controller. For details on how to use the REST APIs and
how to develop applications, see the HPE VAN SDN Controller Programming Guide and HPE
VAN SDN Controller REST API Reference.
This chapter includes details on the following:
“Licenses” (page 52)“Starting the SDN controller console UI”
“Team” (page 53)“About the user interface” (page 22)
“Support logs” (page 53)“SDN User window” (page 23)
“Packet listeners” (page 56)“Navigation menu” (page 25)
Starting the SDN controller console UI
Access the SDN controller from a Chrome or Firefox supported browser. A message will be
displayed indicating if you are using an unsupported browser such as Internet Explorer.
1. Using a supported browser, access the controller UI:
https://<SDN_Controller_Address>:8443
Where <SDN_Controller_Address> is the IP address for your controller. The URI is
case sensitive.
For example: https://192.0.2.1:8443
2. Enter the User Name and Password credentials, then select Login.
For Example:
Default user name: sdn
Default password:skyline
“OpenFlow Monitor” (page 58)“Alerts” (page 27)
“OpenFlow topology ” (page 61)“Applications” (page 32)
“OpenFlow Trace log” (page 69)“Configuration components” (page 38)
“OpenFlow Classes ” (page 75)“Audit log” (page 49)
Starting the SDN controller console UI 21
Page 22

3. Once you log in, the main controller screen is displayed. For more information about the
controller console UI, see “About the user interface” (page 22).
The Keystone default timeout is 1 hour. If it is more than 1 hour since you logged in a message
indicating that the session has expired is displayed. You must reload the page and log in again.
For details on changing the Keystone timeout value, see “Session expired message in the UI”
(page 156).
Default domain name, user name, and password
Default domain name: sdn
Default user name: sdn
Default password: skyline
About the user interface
NOTE: Descriptions for common areas, icons, and controls on the UI screen are listed after
the image.
Figure 3 Screen areas and menus
22 Using the SDN controller UI
Page 23
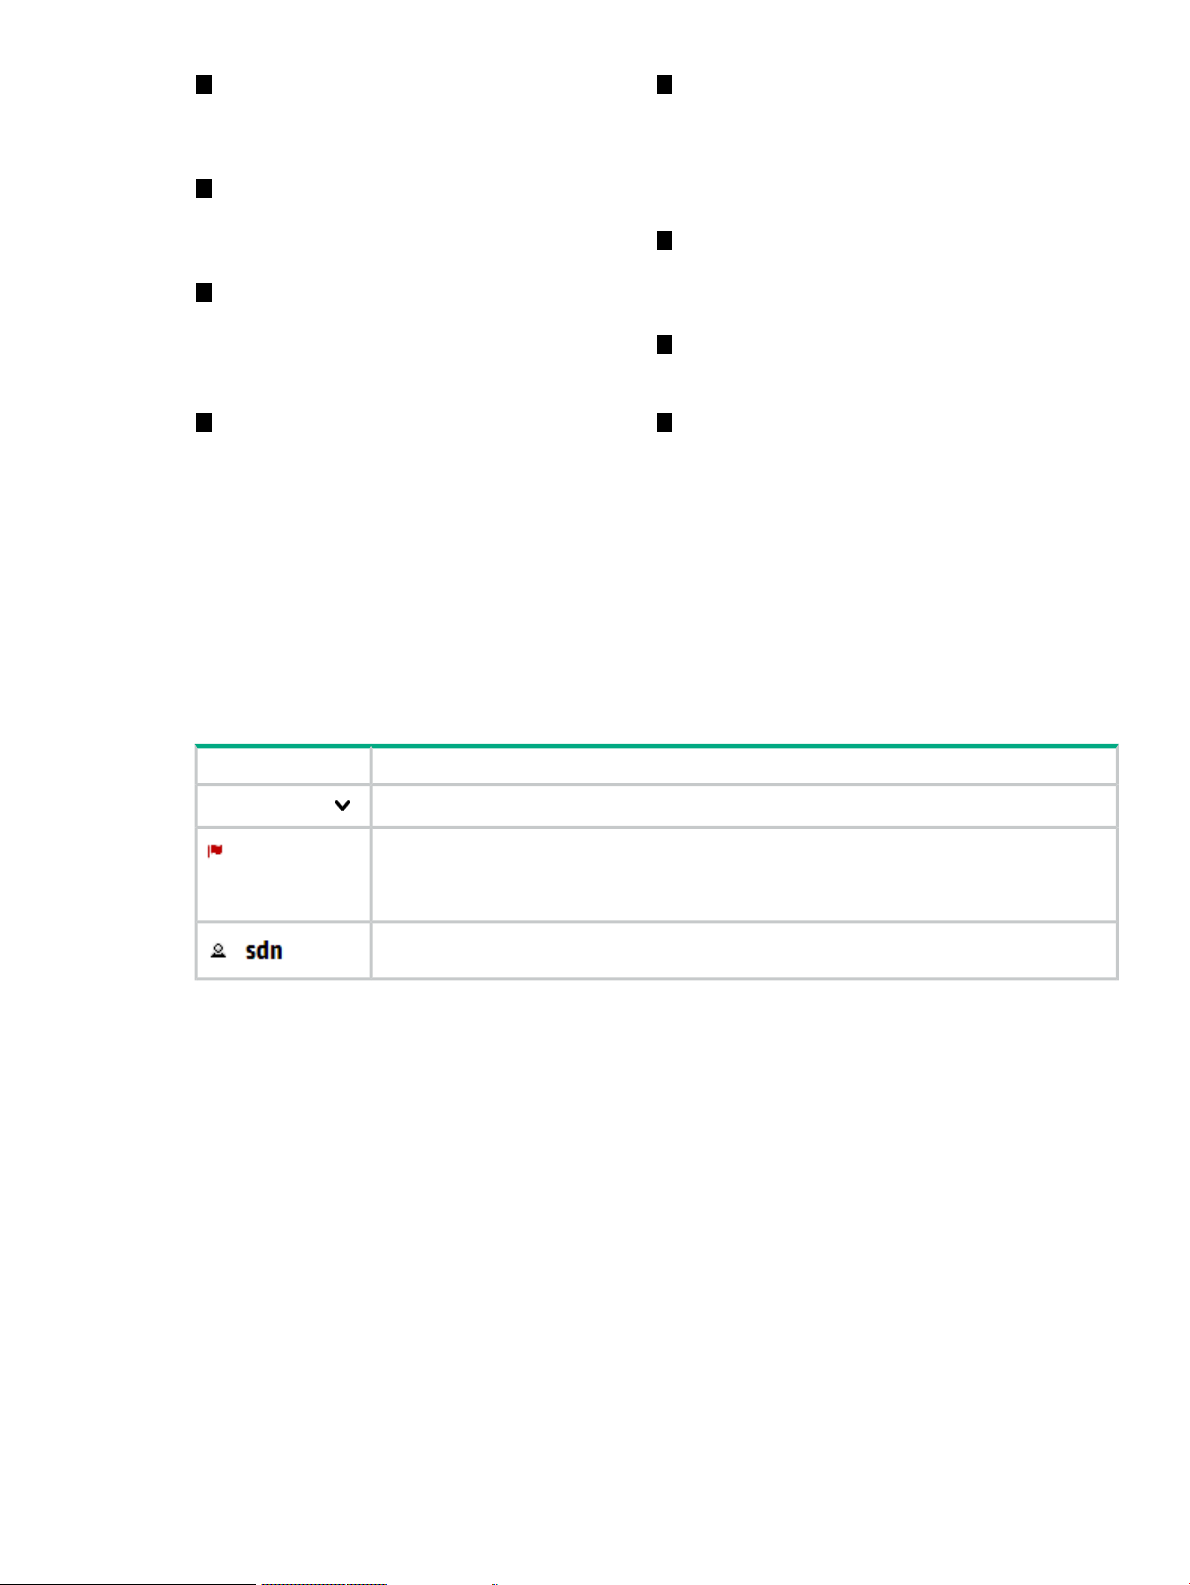
1
Banner: Identifies the user interface.
Contains the alert notification counter and
links to the navigation menu, alert
information, and the SDN User window.
2
Alert notification counter: Displays the
current number of active alerts. Clicking this
icon displays the Alerts as of Today window
box.
3
SDN User window: Enables you to log out
of the controller, link to external websites,
change the theme for the controller, and
identify the version of controller software
currently in use.
4 8
Navigation menu: The primary menu for
navigating to controller and application
5
Navigation tree: Used to select the controller
or application screen to display in the details
pane. General is the controller navigation
tree. Navigation trees for installed
applications are displayed below or to the
right of the General navigation tree.
6
Details pane: Displays the detailed interface
for the controller or application resource
selected in the Navigation menu. When the
controller starts, it displays the Alerts screen.
7
Pagination control: Can appear on screens
that have lists of items. Use these controls to
view the listings page by page.
Listing control: Can appear on screens that
have lists of items. Use these controls to
resources. Contains the controller navigation select the number of items to display in a
tree, labeled General, and can contain single view. The Auto option displays all
additional navigation trees for installed items in a single screen. For listings
applications that integrate with the controller exceeding the length of the screen, you can
UI. Can be displayed as a pane (as shown) use the scroll bar on the right side of the
screen.or as a window that overlays the controller
screen (see “Expanding or collapsing the
navigation menu” (page 25)).
Banner
DescriptionScreen component
SDN Controller
Expands or collapses the “navigation menu” (page 25) as an overlay window.
Expands or collapses the controller “Alerts as of today” (page 29) window.
The number next to the icon is the “alert notification counter” (page 29), which provides a
count of the current active alerts.
Expands or collapses the “SDN User” (page 23) window.
Changing column widths
To change the column widths, drag the column head borders. For example:
• To narrow the Severity column width, click the border to the left of Date/Time and drag it
to the left.
• To change the width of the navigation menu pane, click and drag the divider between the
menu pane and the details pane.
SDN User window
The SDN User window displays as an overlay on the controller screen.
See also:
• “Changing the SDN user password” (page 24)
• “Changing the background and text colors” (page 25)
• “Expanding the SDN user window” (page 25)
SDN User window 23
Page 24
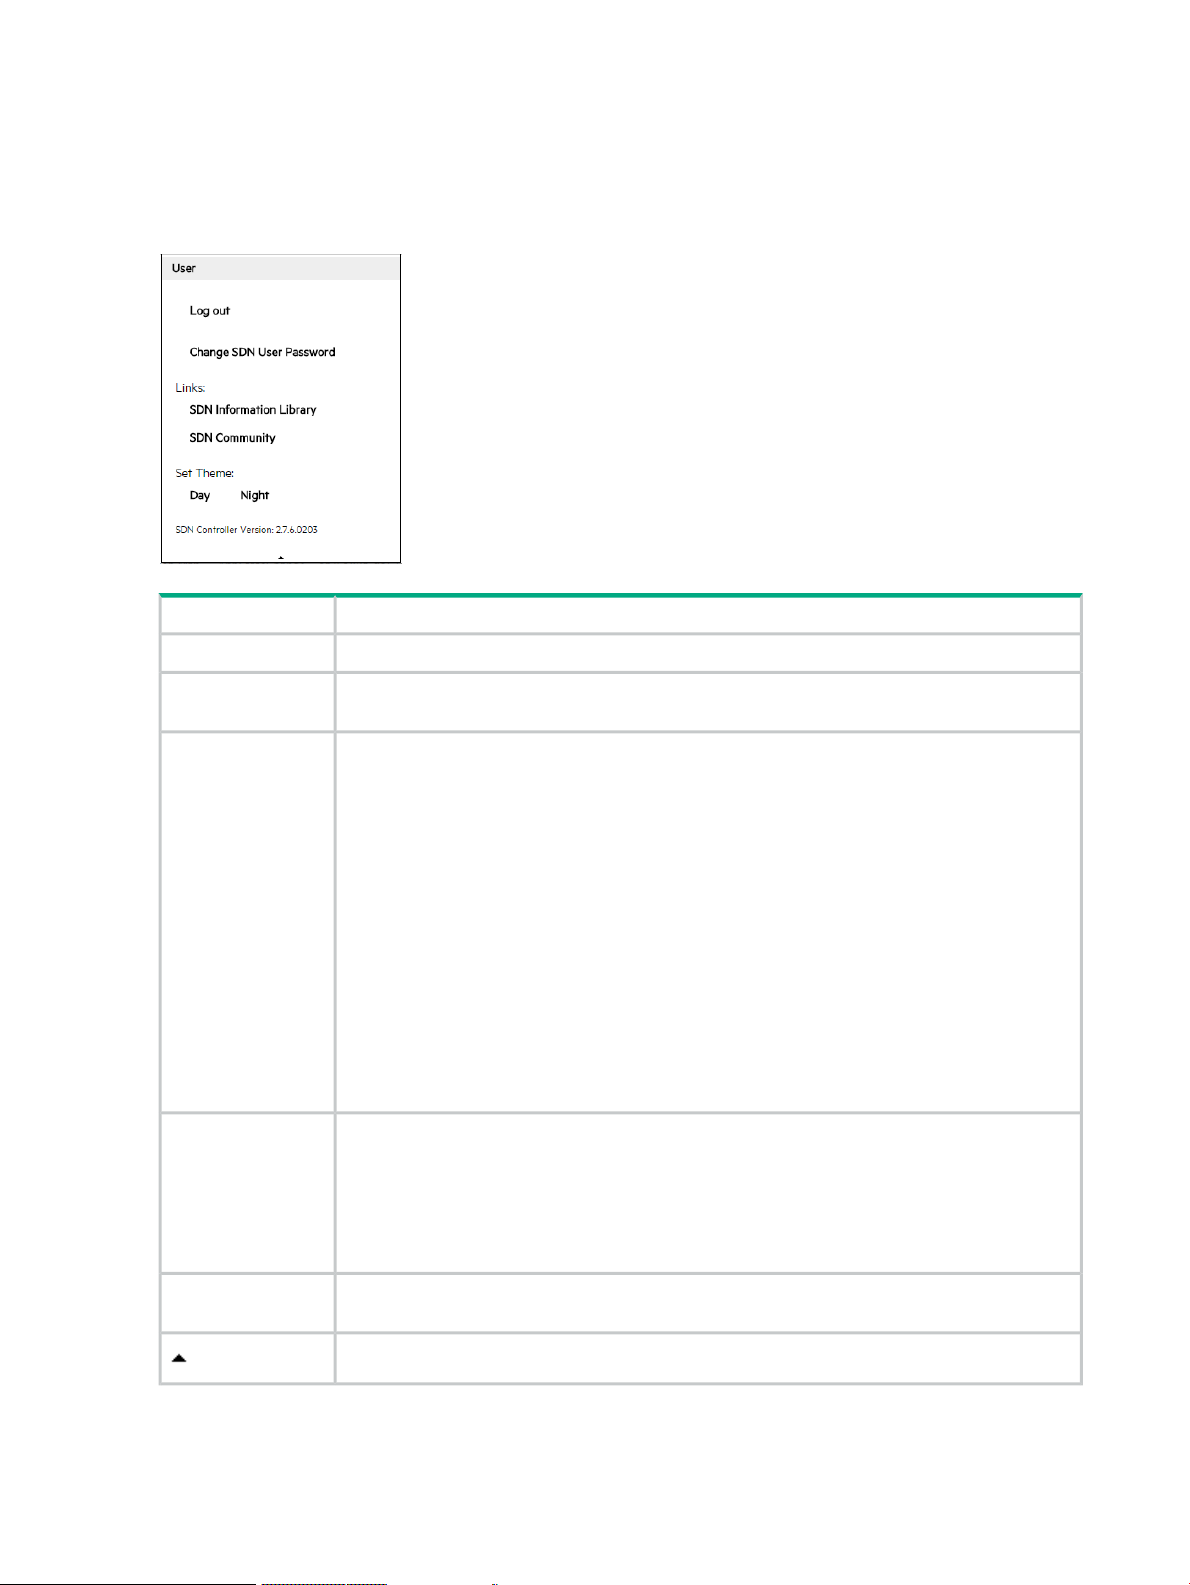
• “Collapsing the SDN user window” (page 25)
• “Logging out of the controller” (page 25)
User window screen details
Figure 4 SDN user window
DescriptionScreen component
Logs the user out of the controller.Log out
Password
Change the SDN user password.Change SDN User
Links to websites outside of the controller:Links:
SDN Information Library
Links to the information library on the Hewlett Packard Enterprise Software-Defined Networking
website. The Hewlett Packard Enterprise Information Library for SDN provides links to the
technical documentation for the HPE VAN SDN Controller and the HP SDN applications. The
Hewlett Packard Enterprise Software-Defined Networking website provides fact sheets, case
studies, white papers, product summaries, technical and business documentation, and other
information to help you identify SDN solutions for your business needs.
SDN Community
Links to the Hewlett Packard Enterprise SDN community discussion forum website within the
HP Enterprise Business Community. This site offers resources such as:
• SDN discussion boards
• SDN development information
• An SDN knowledge base
Changes the theme for the controller UI:Set Theme:
Day
When selected, plain text is black and the background is white.
Night
When selected, plain text is white and the background is black.
Displays the version of the controller software that is running on this system.SDN Controller
Version:
Collapses the window.
Changing the SDN user password
To change the SDN user password:
1. Expand the SDN User window.
24 Using the SDN controller UI
Page 25

2. Select Change SDN User Password.
3. In the Change SDN User Password dialog box, enter the Old Password, New Password,
and Re-enter New Password and click Apply. Or click Cancel to exit without changing the
password.
The SDN user password you can change on this screen is the Keystone user password not the
HPE Linux operating system password.
Changing the background and text colors
The background and text colors are part of the theme of the controller UI. To change the theme:
1. Expand the SDN User window.
2. In Set Theme:, select one of the following options:
• Day
• Night
Expanding the SDN user window
To expand the SDN User window, from the top banner, click .
Collapsing the SDN user window
To collapse the SDN User window, do one of the following:
• In the SDN User window, click .
• From the top banner, click .
Logging out of the controller
To log out of the controller UI:
• From the SDN User window, select Log out.
Navigation menu
About the navigation menu
The navigation menu is the primary menu for navigating to controller resources. The resources
included with the controller are described in this document. Applications installed on controller
might add resources to this menu.
Displays as a pane or an overlay window
You can display the navigation menu in the following ways:
• As a pane on the left side of the controller browser window.
• As a window that overlays part of the main screen of the controller browser window.
Contains one or more navigation trees
The navigation menu contains the General controller navigation tree and can contain additional
navigation trees for installed applications that integrate with the controller UI.
Expanding or collapsing the navigation menu
The navigation menu is displayed as a navigation pane by default. You can display the navigation
menu as a pane on the controller screen or as a window that overlays the controller screen.
Navigation menu 25
Page 26

Expanding or collapsing the navigation menu as an overlay window
To display the navigation menu as an overlay window, from the top banner of the controller
screen, click .
To collapse the navigation window, do one of the following:
• In the window, click
• From the top banner, click HPE VAN SDN Controller.
Expanding or collapsing the navigation menu as a window pane
To expand or collapse the navigation menu as a window pane, click the following icon.
• When the navigation menu is expanded as a window pane, the icon is located on the right
side of the menu.
• When the navigation menu is collapsed, the icon is located in the left margin of the controller
screen.
Navigation menu screen details
General
Alerts
Applications
Configuration
Audit Log
Licenses
Support Logs
DescriptionScreen component
Displays the navigation tree for the resources that are provided with the controller. By
default, the General controller navigation tree is expanded and the Alerts screen is
selected and displayed.
To display the screen for another resource, select the resource in the navigation tree.
Displays the Alerts screen. This screen provides details on alerts and allows you to
acknowledge alerts and unacknowledge alerts back to an active state. For more
information, see “Alerts” (page 27).
Displays the Applications screen. This screen provides details on your controller
applications and allows you to add, upgrade, uninstall, enable and disable these
applications. For more information, see “Applications” (page 32).
Displays the Configurations screen. This screen lists the configurable components of the
controller and allows you to modify key values. For more information, see “Configuration
components” (page 38).
Displays the Audit Log screen. This screen displays audit log records related to activities,
operations and configuration changes initiated by an authorized user, such as, installing
an application. For more information, see “Audit log” (page 49).
Displays the Licenses screen. This screen provides details on licenses and allows you
to enter a license. For more information, see “Licenses” (page 52).
Displays the Team screen. For more information, see “Team” (page 53).Team
Displays the Support Logs screen. This screen displays support log records of internal
controller operations that can be used by a support engineer for troubleshooting an SDN
installation. For more information, see “Support logs” (page 53).
OpenFlow Monitor
OpenFlow Topology
26 Using the SDN controller UI
Displays the OpenFlow Monitor screen. This screen lists the Data Path IDs and descriptive
information for the active switches. For more information, see “OpenFlow Monitor” (page
58).
Displays the OpenFlow Topology. Displays a topology of discovered switches and end
nodes in the controller domain. For more information, see “OpenFlow topology ” (page
61).
Page 27

DescriptionScreen component
OpenFlow Trace
OpenFlow Classes
Packet Listeners
Other navigation menu
items
Alerts
About alerts
Alerts give notification of events that affect controller operation, and in some cases indicate that
some action is needed to correct a condition.
When controllers are operating in a team, alerts generated by any team member are visible in
the Alerts screen for all active team members.
By default, alerts are in an unacknowledged, active state. An alert must be in an active state to
appear in the following places:
Displays the OpenFlow Trace screen. OpenFlow conversations are captured in messages
to and from the controller and the OpenFlow devices it manages and displayed on this
screen. For more information, see “OpenFlow Trace log” (page 69).
Displays the OpenFlow Classes screen. This screen shows the OpenFlow classes that
applications have registered with the controller. For more information, see “OpenFlow
Classes ” (page 75).
Displays the Packet Listeners screen. This screen displays details on the packet listeners
that are currently running on the controllers. For more information, see “Packet listeners”
(page 56).
May include additional navigation trees for installed applications that integrate with the
controller UI.
• The alert notification counter
• The Alerts as of today window
See also:
• “Viewing the alert notification counter” (page 29)
• “Viewing the ten most severe recent active alerts ” (page 29)
• “Acknowledging an alert” (page 30)
• “Deleting an alert” (page 30)
• “Configuring how alerts age out” (page 31)
Alerts 27
Page 28
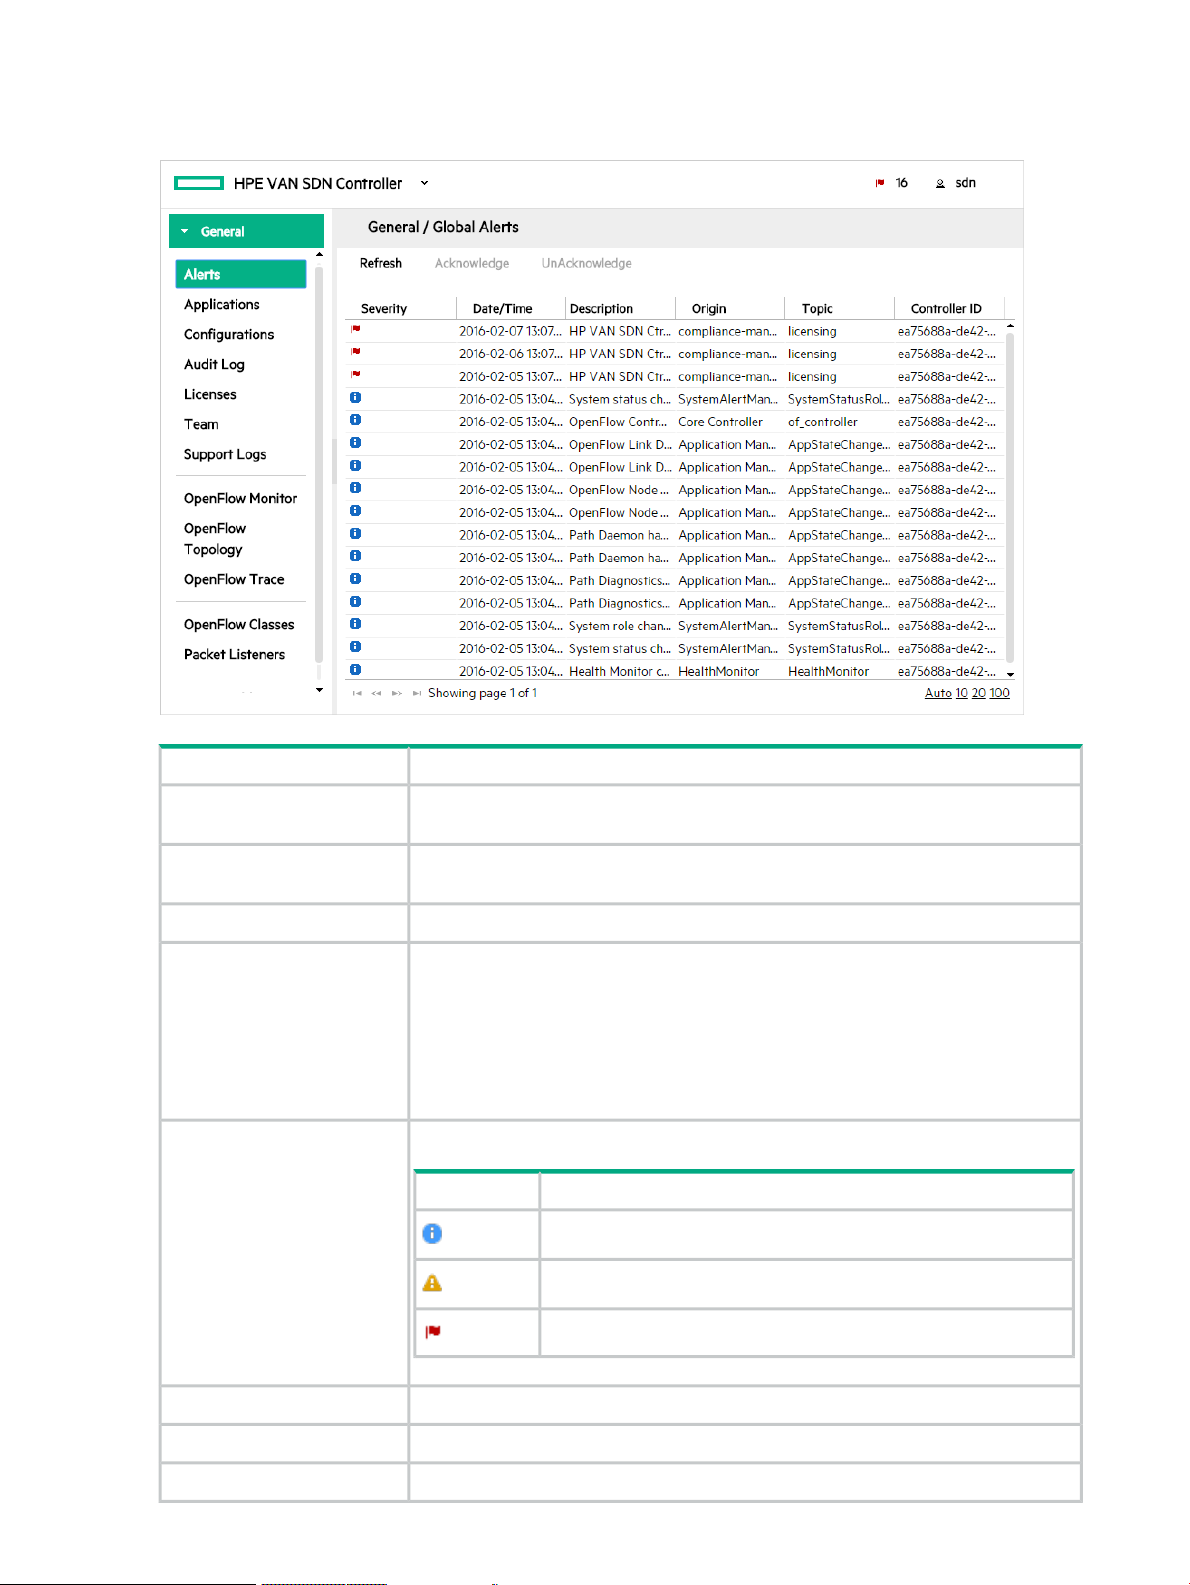
Alerts screen details
Figure 5 Example of global alerts screen
Refresh
Acknowledge
Severity
DescriptionScreen component
Updates the alerts displayed on the screen. The controller does not update the display
as new alerts are generated. Use this action to refresh the display.
Changes the selected alert to an acknowledged state. The controller displays the
alert in gray text. Use this action to indicate that you have read the alert.
Changes the selected alert to an active, unacknowledged state.UnAcknowledge
Indicates the state of the alert:Alert text color
• The controller displays active, unacknowledged alerts the alert in the text color
corresponding to the controller theme. For example, when the controller theme
is daylight, the active alerts appear in black text.
• The controller displays the selected alert in blue text. Click an alert to select it.
• The controller displays acknowledged alerts in gray text.
Indicates the severity of the alert.
DescriptionIcon
Informational
Warning
Critical
28 Using the SDN controller UI
Indicates the date and time the alert was generated.Date/Time
Describes the alert in human readable text.Description
Indicates which component or application generated the alert.Origin
Page 29
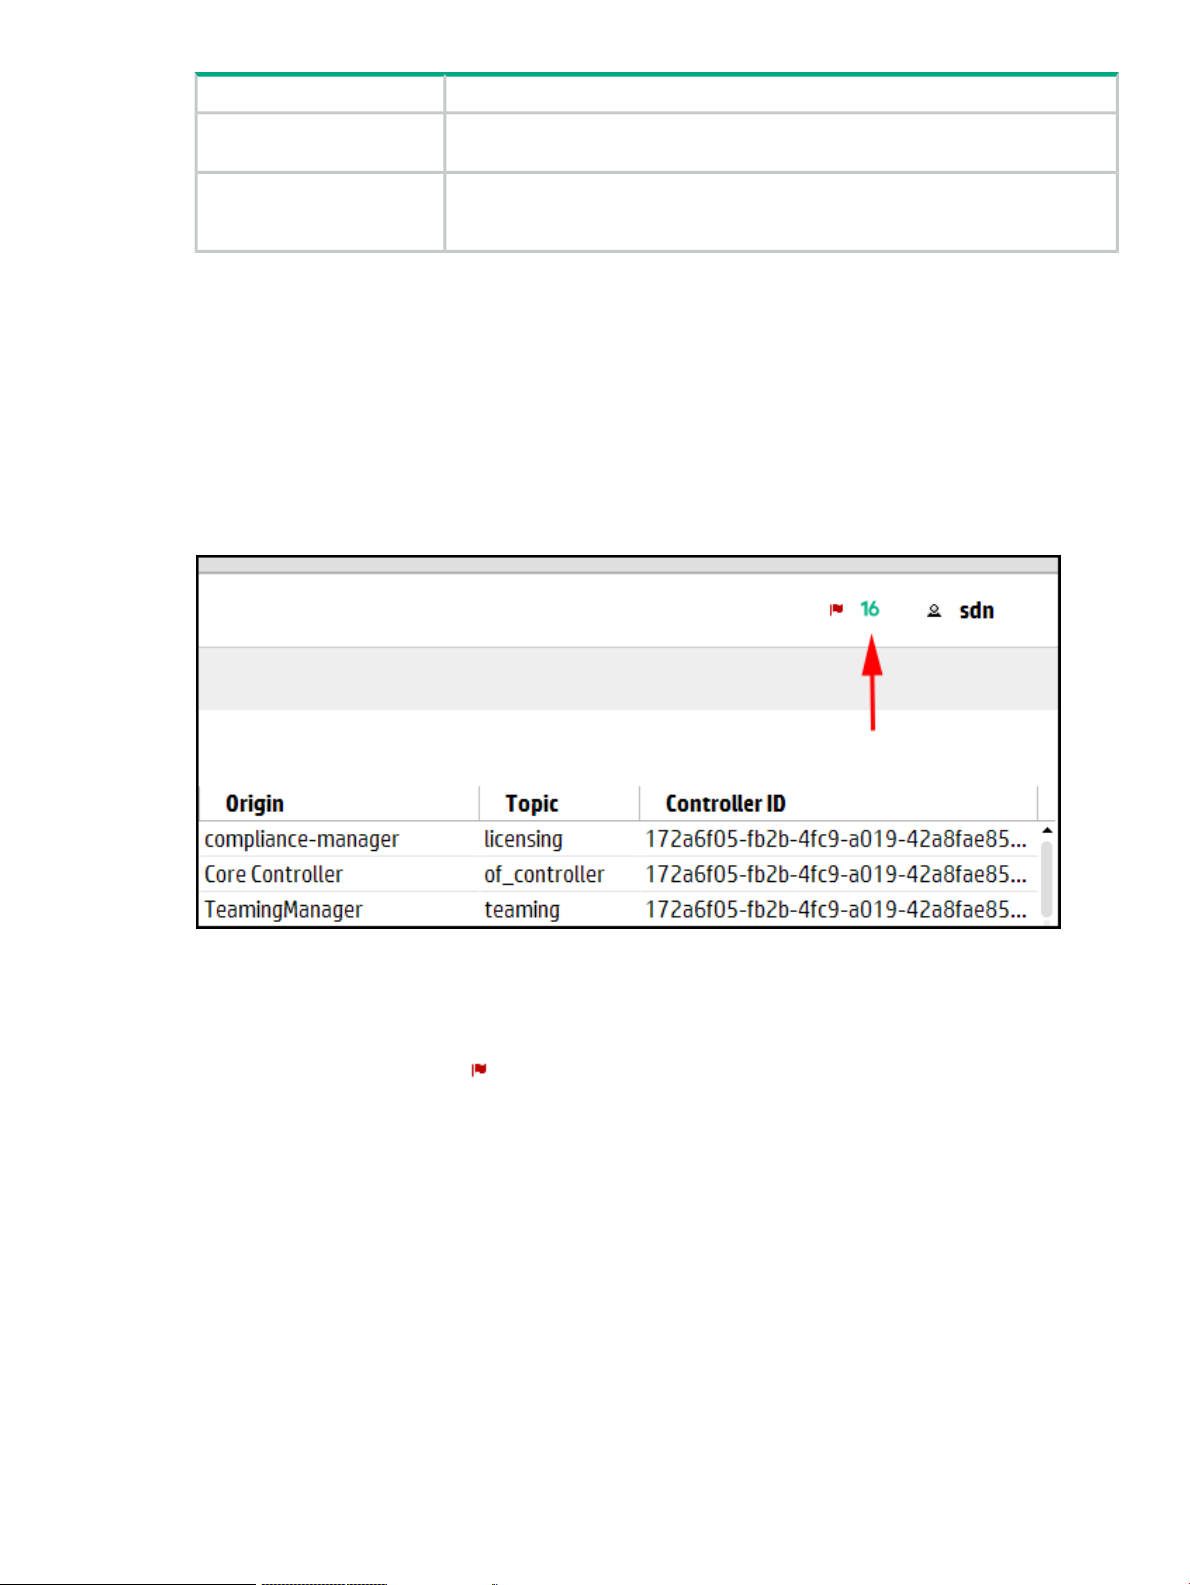
DescriptionScreen component
Topic
Controller ID
Indicates the category for this alert. Multiple origins can contribute alerts to the same
topic.
Identifies the controller that generated the alert. The controller is represented as a
hexadecimal number. When you use controller teaming, this ID enables you to identify
which controller in the team generated the alert.
Viewing the alert notification counter
The alert notification counter is displayed in the top banner and appears on all controller screens.
This counter indicates the number of active alerts:
• The controller increments this counter when each new alert occurs.
• The controller decrements this counter when you acknowledge an alert or when the controller
deletes an alert according to the alert policies set for aging out alerts (for details see,
“Configuring how alerts age out” (page 31).
Figure 6 Alert notification counter
Viewing the ten most severe recent active alerts
To display a summary of up to 10 alerts ranked by severity (highest to lowest) and then by date
and time (newest to oldest):
• In the top banner, click .
The Alerts as of today window is displayed.
Alerts 29
Page 30
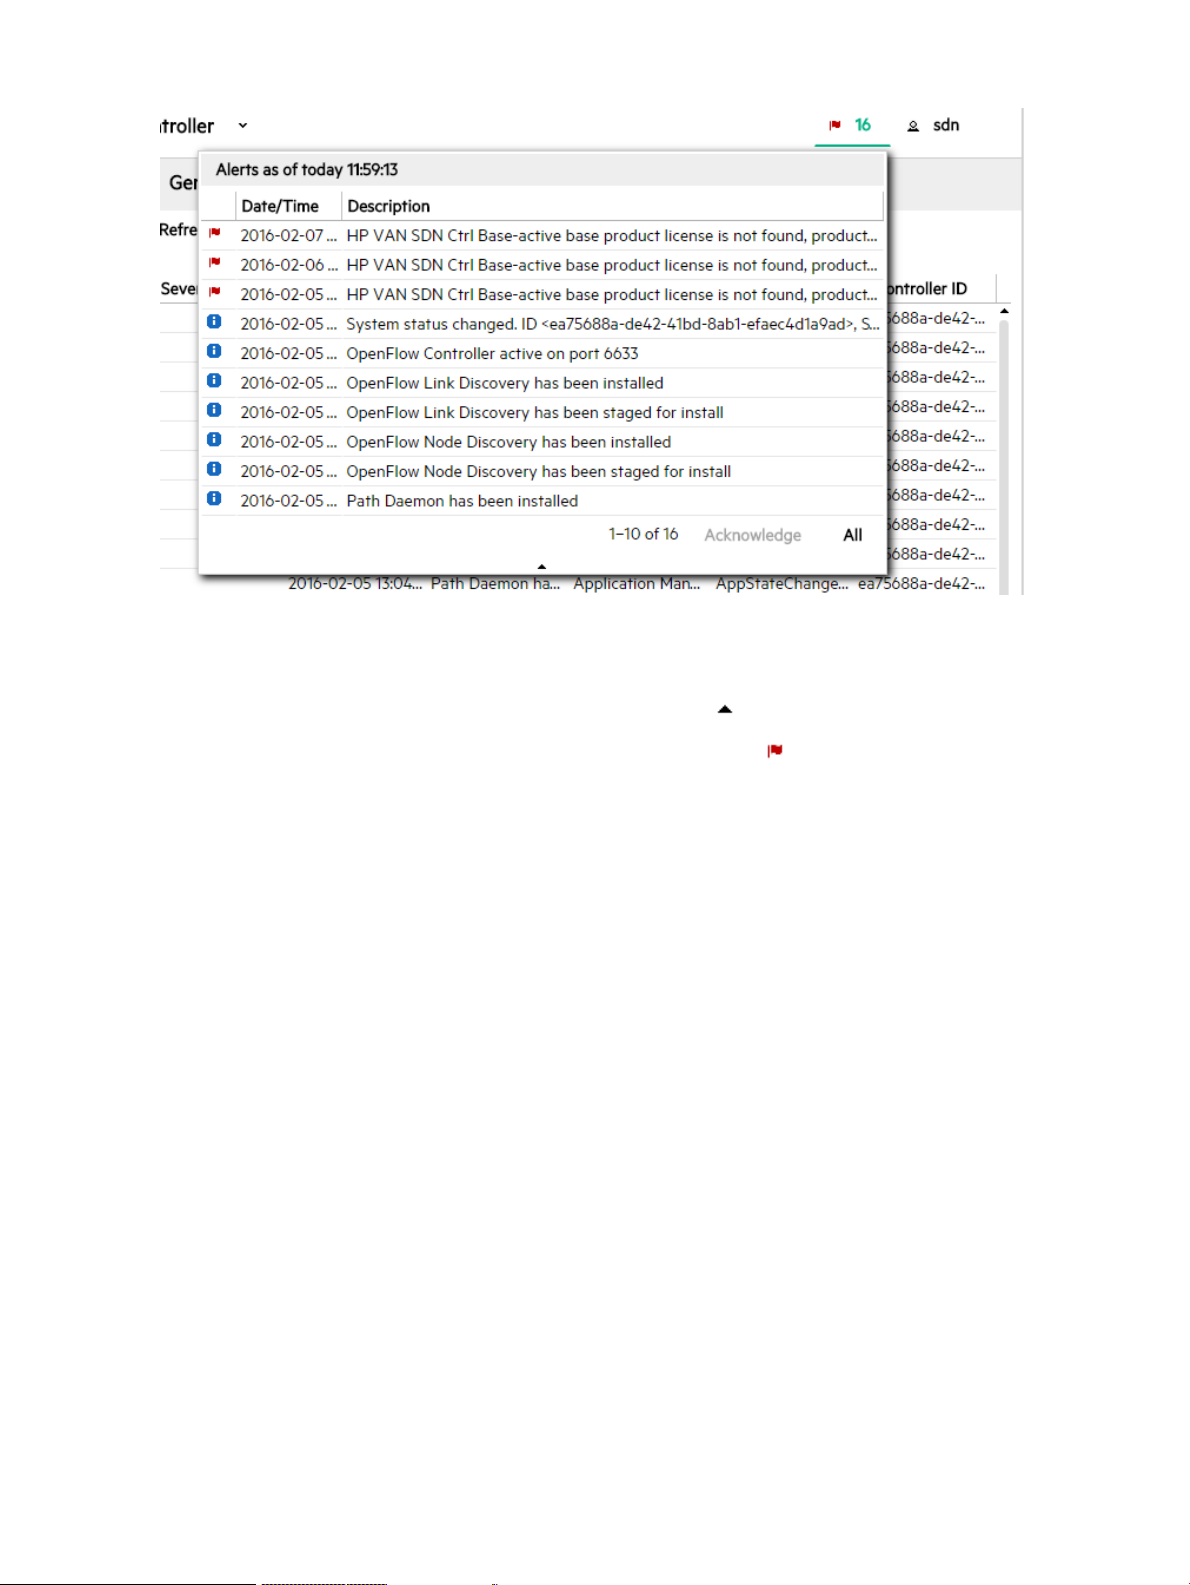
Figure 7 Example of the Alerts as of today window
To close the window, do one of the following:
• To close the window and display the Alerts screen, click All.
• At the bottom of the window, click the collapse icon ( ).
• In the top banner, click either the alert counter number or .
Acknowledging an alert
To acknowledge an alert from the Alerts as of today window:
1. Click the alert to select it.
2. Click Acknowledge.
The controller removes the alert from the Alerts as of today window, displays the alert in
gray text on the Alerts screen, and decrements the alert notification counter by one.
To acknowledge an alert from the Alerts screen:
1. Click the alert to select it.
2. Click Acknowledge.
The controller displays the alert in gray text on the Alerts screen, and decrements the alert
notification counter by one.
Deleting an alert
You can acknowledge an individual alert, but you cannot clear or delete the alert.
The controller deletes alerts according to the configured alert age-out policy. To configure the
age-out policy, see “Configuring how alerts age out” (page 31)
30 Using the SDN controller UI
Page 31

Configuring how alerts age out
You can configure the following key values for alerts to control how alert data ages out. To set
these key values you configure the com.hp.sdn.adm.alert.impl.AlertManager component
using the Configurations screen.
DescriptionKey
trim.alert.age
trim.enabled
trim.frequency
Specifies the number of days an alert remains in persistent storage and remains
displayed on the Alerts screen.
Data type
A number from 1 through 31
Default value
14
When true, specifies that the controller deletes alerts that have exceeded the
trim.alert.age limit.
Default value
true
Specifies how often, in hours, the controller is to delete alerts that have exceeded the
trim.alert.age limit.
Data type
A number from 8 through 168
Default value
24
Example
Enter 8 to specify that the controller delete aged-out alerts every eight hours.
To configure how alerts age out:
1. On the Configurations screen in the System tab, select the
com.hp.sdn.adm.alert.impl.AlertManager component. For more information on
configuration components, see “Configuration components” (page 38).
Figure 8 Select the AlertManager component
Alerts 31
Page 32

2. Click Modify.
The Modify System Configuration dialog box is displayed for the
com.hp.sdn.adm.alert.impl.AlertManager component.
3. Change the values for the keys.
4. Click Apply.
Applications
About the application manager
The Application Manager is a component on the controller that supports default and add-on
network services, and enables installing, upgrading, enabling (starting), disabling (stopping), and
uninstalling SDN applications.
When controllers are operating in a team, actions performed on one controller are propagated
to the other controllers in the team. Actions you select in the Applications screen for one
controller, such as Install, Enable, and Disable, are propagated to the other controllers.
See also:
• “Obtaining applications from the Hewlett Packard Enterprise SDN App Store” (page 34)
• “Adding or upgrading an application” (page 34)
• “Disabling (stopping) or enabling (starting) an application” (page 35)
• “Uninstalling an application” (page 36)
• “Understanding application states and OSGi artifacts” (page 36)
Prerequisites for installing an application
Any application to be installed on the controller must meet the following requirements:
• It must be in a zip format.
• The zip file must be accessible from the browser UI's file manager (or downloadable from
the App Store).
• It must contain an application descriptor file containing key value pairs of the attributes
associated with the application, including all mandatory attributes.
• If jar signing checking is turned on, the application zip files must be signed as well.
Applications you purchase from Hewlett Packard Enterprise or the Hewlett Packard Enterprise
SDN App Store meet these requirements.
For information about developing applications that meet these requirements, see the HPE VAN
SDN Controller Programming Guide.
32 Using the SDN controller UI
Page 33
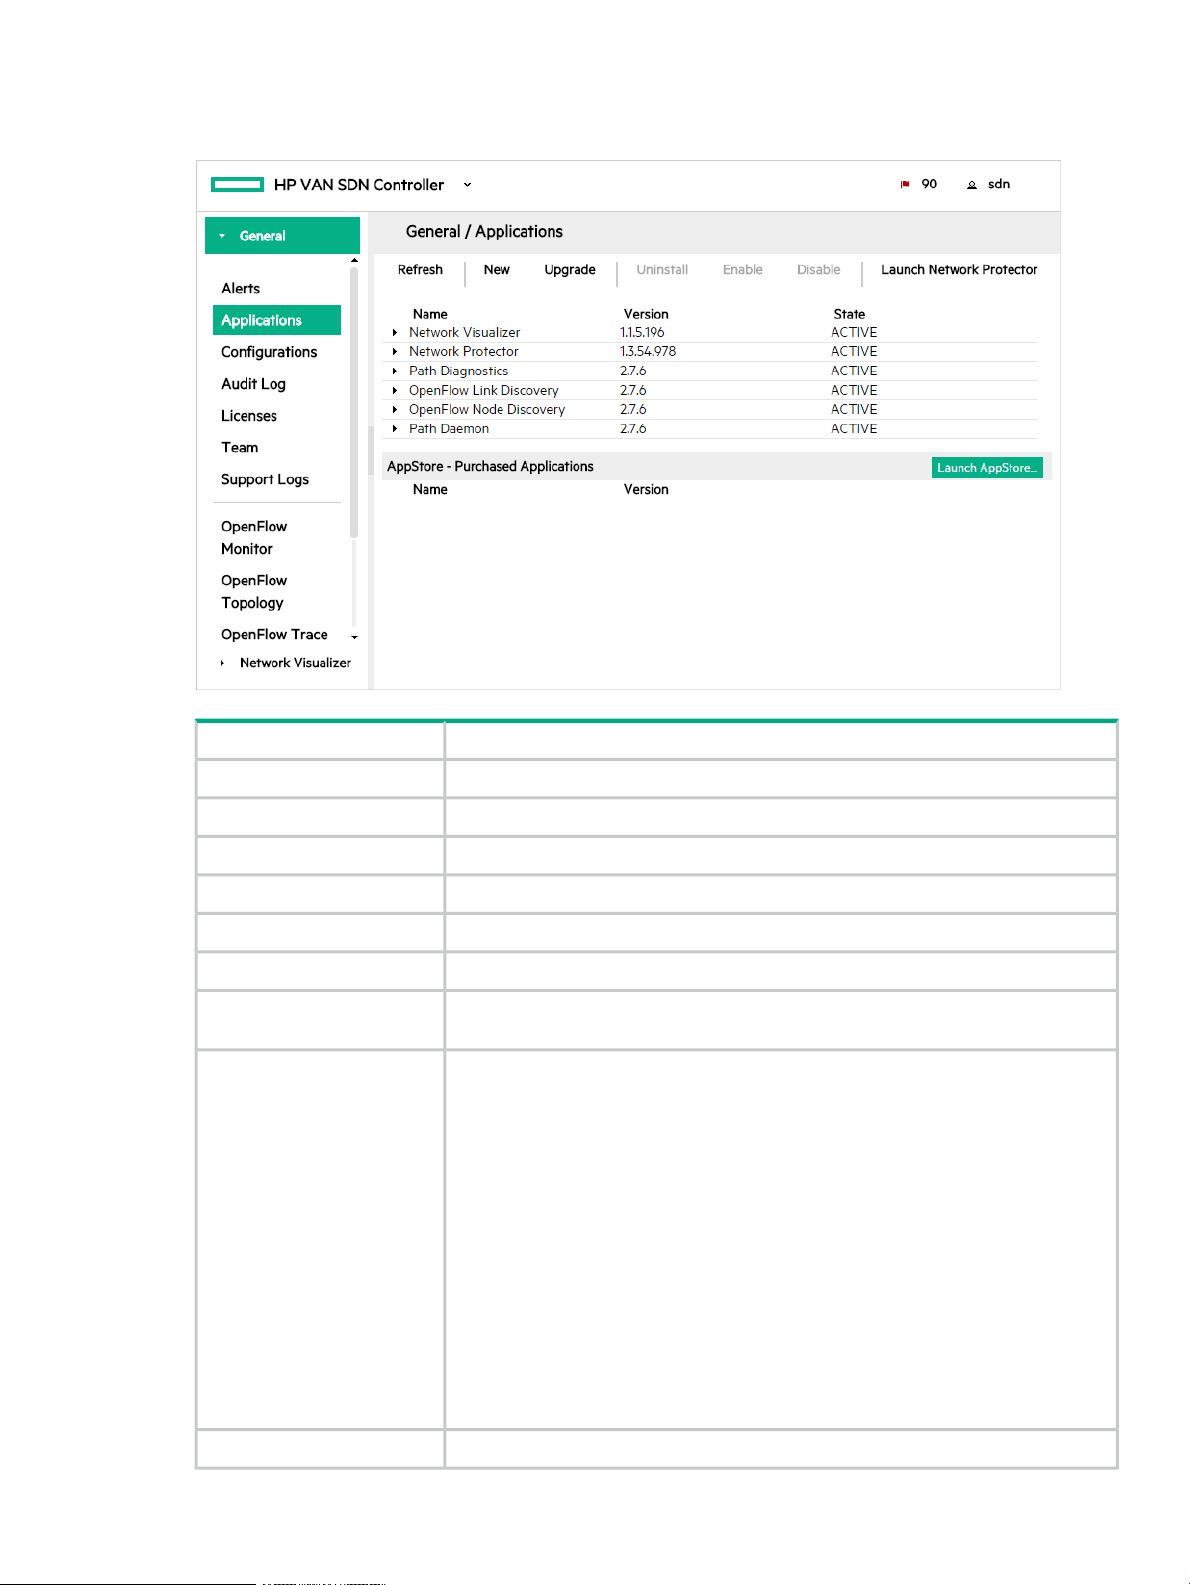
Applications screen details
Figure 9 Applications screen details
Launch Network Protector
DescriptionScreen component
Reloads the view.Refresh
Installs an application on the controller.New
Installs an upgrade to an application that has already been installed on the controller.Upgrade
Removes an application from the controller.Uninstall
Starts or allows an application to continue operations on the controller.Enable
Stops or prevents an application from operating on the controller.Disable
If you have the HPE Network Protector SDN Application installed, this button will be
enabled to allow you to launch the HPE Network Protector application.
The name of the application.Name
The following core embedded applications that come with the controller are listed by
default on the Applications screen:
• Path Diagnostics
• OpenFlow Link Discovery
• OpenFlow Node Discovery
• Path Daemon
These are the only embedded applications you are allowed to manage using the UI.
Other embedded applications are not listed because they should not be disabled or
uninstalled. For information about embedded applications, see “Understanding the
controller architecture” (page 14).
If you have installed any of Hewlett Packard Enterprise’s SDN applications, such as
HPE Network Protector, or any third-party SDN applications these applications will
also be listed.
The version number of the application.Version
Applications 33
Page 34

DescriptionScreen component
The most common states are active, staged and disabled.State
AppStore Purchased
Applications
The name and version number of SDN applications purchase from the Hewlett
Packard Enterprise SDN App Store.
Launches the Hewlett Packard Enterprise SDN App Store website.Launch AppStore
Obtaining applications from the Hewlett Packard Enterprise SDN App Store
From the App Store, you can purchase and download applications for your controller.
In the case of a web proxy, you need a proxy configuration to connect to the App Store portal.
To set the proxy, in the /etc/init/sdnc.conf file, replace c1, c2, c3, and team with the
controller IP addresses and the team IP address (when applicable):
env JAVA_OPTS="-Xms512m -Xmx4096m -XX:MaxPermSize=512m -Dhttps.proxyHost=my-web-proxy
-Dhttps.proxyPort=my-web-proxy-port -Dhttp.nonProxyHosts=127.0.0.1|localhost|c1|c2|c3|team"
Command Example
env JAVA_OPTS="-Xms512m -Xmx4096m -XX:MaxPermSize=512m -Dhttps.proxyHost=web-proxy.test.com -Dhttps.proxyPort=8088
-Dhttp.nonProxyHosts=127.0.0.1|localhost|11.152.121.172|11.152.126.13|11.152.127.5|11.152.123.6"
You must update the /etc/init/sdnc.conf file on each controller and then restart the
controllers for these changes to take effect.
If you are downloading a signed application from the App Store, the JAR signing requires a
trusted certificate in the sdnjar_trust.jks file even if the certificate is trusted in the JAVA
cacerts keystore. For details, see “Adding certificates to the jar-signing truststore ” (page 121)
Adding or upgrading an application
Any application in the proper format can be added to the controller (see “About the application
manager” (page 32)).
To use curl commands and the REST APIs to complete this task, see “curl commands” (page 170).
After you complete this procedure:
• The application is started and in an active state.
• If the controller is in a controller team, the controller propagates the application to all the
controllers in the team automatically.
Use this procedure to install either a new application or a new version of an existing application
on the controller using the UI.
1. Do one of the following:
• To install a new application, click New.
• To upgrade to a new version of an existing application, select the application from the
Name list and click Upgrade.
2. Click Browse to navigate to the location of the application zip file and select the file.
3. Click Upload to upload the file.
Wait for Completed to appear. For example:
34 Using the SDN controller UI
Page 35

4. Click Deploy.
The new application then appears by name on the Applications screen as ACTIVE.
Disabling (stopping) or enabling (starting) an application
This procedure temporarily stops an active application from servicing requests, but retains the
application on the system. The application remains present on the system and can be restarted
when needed. (The application does not automatically restart when the controller restarts.)
To use curl commands and the REST APIs to complete this task, see “curl commands” (page 170).
To disable an application using the UI:
1. In the Applications screen, select the application you want to stop.
2. Click Disable to display the Disable Application dialog box.
3. In the Disable Application dialog box, click Disable.
The Disable Application dialog box closes and the application state is changed to
DISABLED.
To enable an application using the UI:
1. In the Applications screen, select the application you want to enable.
2. Click Enable to display the Enable Application dialog box.
Applications 35
Page 36

3. Click Enable button to activate the application. The application starts or resumes operation
and the application state is changed to ACTIVE.
Uninstalling an application
This procedure completely removes an application from the controller. To later restore the removed
application, see Adding or upgrading an application.
To use curl commands and the REST APIs to complete this task, see “curl commands” (page 170).
Use the following procedure to uninstall an application using the UI.
1. In the Applications screen, select the application you want to uninstall.
2. Click Uninstall.
3. Click the Uninstall button to remove (delete) the application.
Understanding application states and OSGi artifacts
In the default state, or when an application has been started, it is in the ACTIVE state and is
servicing requests. Application states include the following:
Table 1 Application States
DescriptionState
The application is running and servicing requests.ACTIVE
A new application has been downloaded to the controller and is ready to be installed.STAGED
UPGRADE_STAGED
36 Using the SDN controller UI
A new version of an existing running application has been downloaded to the controller and the
new version is ready to be installed (upgrade/downgrade).
A transitive state indicating a new application is in the process of being installed.INSTALLING
Page 37

Table 1 Application States (continued)
DescriptionState
UPGRADING
CANCELING
DISABLED
UNINSTALLING
RESOLVED
A transitive state indicating the existing application is being stopped and a new version of the
application is being installed.
A transitive state indicating a non-installed version of an application is being deleted from the
controller.
A transitive state indicating the application is in the process of being disabled (stopping).DISABLING
The application is disabled (stopped). A disabled application is not automatically started when
the controller restarted.
A transitive state indicating the application is being started.ENABLING
A transitive state indication an application is being stopped and completely removed from the
controller.
The application is stopped and not servicing requests. An application can only be in this state
when it is stopped externally to the SDN Controller (e.g. the virgo console).
Table 2 Error condition management
NEW > STAGED NEW > UPGRADE-STAGED
STAGED > ACTIVE
DescriptionState
If an error condition occurs when staging the application,
then it actually does not exist. (Error conditions in this
stage clean up after themselves.)
If an OSGi deployment exception is encountered, the
application is moved to DISABLED if it fails to deploy as
it is. If a File I/O or URI exception is encountered, the
application remains in the installing state.
UPGRADE-STAGED > ACTIVE
ANY STATE > UNINSTALLED
ANY STATE > DISABLED
DISABLED > ENABLED
If an exception is encountered (OSGi deployment, File
I/O, or URI), rollback attempt is made, as listed below.
(Depending on the original exception, not all options may
be possible).
1. Calls AppStore.deleteStore on the upgraded version
of the application.
2. Attempts to redeploy the original version of the
application.
If any exception is encountered, the application remains
in UNINSTALLING state
If an exception is encountered, remains in DISABLING
state.
If an OSGi deployment exception is encountered, the
application is moved to the DISABLED state if it fails to
deploy as it is. If any other exception is encountered (file
I/O or URI), the application remains in the ENABLING
state.
To access the link to the OSGi artifacts for an application, click on the bullet for the application
in the web GUI. For example, clicking on the bullet for the Path Diagnostics application displays
the link to identity of the associated OSGi artifacts:
Applications 37
Page 38

Figure 10 Links to OSGi artifacts associated with individual applications
Configuration components
The Configurations screen enables access to the configurable components in the controller
which are used to manage the controller and application features. Some examples of when you
might want to make configuration changes include:
• Specify an NTP server or date and time on the controller system using the NTP component
or specify a static IP address using the Network component.
• Specify hybrid mode for controlling packet forwarding by configuring the ControllerManager
component.
• Define how long to keep alerts and how to age out alerts by configuring the AlertManager
component.
• Define how audit log data ages out by configuring the AuditLogManager component.
Adding or removing an SDN application might add or remove additional configuration components.
However, direct addition or removal of configuration components is not supported.
NOTE: When controllers are operating in a team, configuration changes on one active controller
propagate to the other active controllers in the team.
See also:
• “Using configuration component keys” (page 38)
• “Modifying a component configuration” (page 45)
• “Modifying NTP server or date and time” (page 46)
• “Modifying Network settings” (page 47)
• “Modifying Logger settings” (page 48)
Using configuration component keys
Each configuration component contains one or more component keys, each of which identify a
configurable property of the component.
Information about each component key includes the current value, the default value, and a brief
description. Where applicable, the range of suggested values is also included. You can find
information about each component key on the Configurations screen of the controller UI. The
controller Configs REST API is also available for configuring components, excluding Network
38 Using the SDN controller UI
Page 39

and NTP components, and the REST API for Logger configuration can only be done for each
individual module (such as hp.sdn.event) not groups of modules.
CAUTION: Inappropriate changes to key values can result in severely degraded system
performance. For this reason, Hewlett Packard Enterprise strongly recommends that managing
the default key values be done only by experienced network administrators and programmers
who have a strong understanding of SDN controller systems.
Configurations screen details
On the Configurations screen, the configuration components are accessed from the following
four tabs:
• Basic tab provides access to tracing, topology discovery and flow priority configuration (see
“Basic Configurations view” (page 40)).
• Advanced tab provides access to timing, performance tuning and debugging configuration
(see “Advanced Configurations view” (page 41)).
• System tab provides access to platform specific configuration (see “System Configurations
view” (page 43)).
• Apps tab provides access to configuration components for installed SDN applications (see
“Apps Configurations view” (page 45)).
The controls on these screens are the same.
Modify
Component
DescriptionScreen component
Select a component and then click Modify to open the Modify
Configuration dialog box for the selected component.
Click to display a list of the configurable keys for the component.expand icon
The display for each key includes the current value, the default value, and
a brief description. Where applicable, the range of suggested values is
also included.
Click to hide the key and value information for the component.collapse icon
Lists the basic configuration components. The components are described
in the following sections.
Configuration components 39
Page 40

Basic Configurations view
Figure 11 Basic Configurations view
Components in the Basic configurations tab
• com.hp.sdn.ctl.of.impl.ControllerManager
The ControllerManager component provides parameters used in the implementation of the
OpenFlow protocol. You can configure parameters such as hybrid.mode, keystore,
keystore.password, truststore, truststore.password.
• com.hp.sdn.ctl.of.impl.TraceManager
The TraceManager controls OpenFlow trace duration.
◦ Use the record.duration key to specify how long a trace is to run after it starts.
• com.hp.sdn.ctl.path.impl.PathDaemon
The PathDaemon component provides parameters used to perform L2 path calculations
based on IPv4 addresses for IPv4 packets or MAC addresses for ARP packets. You can
set the following flow timeout parameters:
◦ Use the idle.timeout key (default 60 seconds) to configure the idle timeout value
for each flow-mod. The idle timeout value specifies how long the flow-mod will remain
in the device if the flow-mod is not actively being used.
◦ Use the hard.timeout key (default 0, which implies infinite timeout) to configure the
hard timeout value for each flow-mod. The hard timeout value specifies how long the
flow-mod will remain in the datapath (regardless of usage).
40 Using the SDN controller UI
Page 41

• com.hp.sdn.disco.of.node.impl.OfArpDiscoveryComponent
The OpenFlow ARP discovery component of the OpenFlow Node Discovery application is
used for topology host discovery via ARP protocol.
◦ Use the arp.age key to configure the node timeout values.
◦ The listener.altitude key changes the altitude of the
OfArpDiscoveryComponent component. For more information, see “Packet listeners”
(page 56).
• com.hp.sdn.disco.of.node.impl.OfDhcpDiscoveryComponent
The OpenFlow DHCP discovery component of the OpenFlow Node Discovery application
is used for topology host discovery via DHCP protocol.
◦ Use the dhcp.age key to configure the node timeout values.
◦ The listener.altitude key changes the altitude of the
OfDhcpDiscoveryComponent component. For more information, see “Packet listeners”
(page 56).
• com.hp.sdn.disco.of.node.impl.OfIpDiscoveryComponent
The OpenFlow IP discovery component of the OpenFlow Node Discovery application is used
for topology host discovery via IP Protocol.
◦ Use the ip.age key to configure the node timeout values.
◦ The learn.ip key indicates whether the controller should discover nodes from all IP
packets it receives.
◦ The listener.altitude key changes the altitude of the OfIpDiscoveryComponent
component. See “Packet listeners” (page 56).
Advanced Configurations view
Figure 12 Advanced Configurations view
Configuration components 41
Page 42

Components in the Advanced Configurations view.
• com.hp.sdn.adm.mgr.impl.hpws.HpwsInstallManager
The HpwsInstallManager component provides a service for installing applications from the
Hewlett Packard Enterprise SDN App Store, a remote web service.
• com.hp.sdn.api.impl.AlertPostManager
The AlertPostManager component uses the HTTP(s) protocol to send alert data as a JSON
string to registered alert topic listeners.
• com.hp.sdn.cms.impl.ClientMapperServiceProvider
The ClienMapperServiceProvider component provides information about a client by combining
information from Aruba ClearPass log on and log off events and location information from
the controller about the switch and its port connected to the client.
• com.hp.sdn.ctl.diag.impl.PathDiagnosticComponent
The PathDiagnosticComponent provides the ability to send out a diagnostic packet on one
switch and receive it on the next. You can use it to trace a path for debugging link failures
in your network.
• com.hp.sdn.disco.of.link.impl.OpenflowLinkDiscoveryComponent
The OpenflowLinkDiscoveryComponent transmits link discovery packets to the attached
Openflow devices, listens to the responses, and populates the Link Service cache with the
results.
◦ Use the age.multihop.links key to configure the OpenFlow Link Discovery
application to remove multihop links from the link table if the link is not re-discovered in
two poll intervals.
◦ Use the multihop.poll.interval key to configure the polling interval, in seconds,
for multihop links.
• com.hp.sdn.misc.AdminRestComponent
The AdminRestComponent provides parameters for internal communication between SDN
components and the Admin REST API of the controller.
• com.hp.sdn.misc.ServiceRestComponent
The ServiceRestComponent provides parameters for internal communication between SDN
components and the SDN controller Northbound REST API.
• com.hp.sdn.node.impl.NodeCacheComponent
The NodeCacheComponent component serves as an in memory cache of the nodes known
to the controller. It provides add, update, remove, and get methods for its nodes.
◦ The cache.size key allows you to specify a maximum number of nodes that can be
stored by the NodeManager. The default value is 20,000.
• com.hp.sdn.rs.RestPerfProvider
The RestPerfProvider component reports performance data for the REST API. You can
configure the perf.profile key.
42 Using the SDN controller UI
Page 43

System Configurations view
Figure 13 System Configurations view
Components in the System Configurations view.
• NTP
Configure NTP server or set a specific date and time for the controller system. For details,
see “Modifying NTP server or date and time” (page 46).
• Network
Configure networking (Static IP address or DHCP) for the controller system. For details, see
“Modifying Network settings” (page 47).
• Loggers
Configure logging levels (ALL, TRACE, DEBUG, INFO, WARN, ERROR, OFF). For details,
see “Modifying Logger settings” (page 48).
• com.hp.sdn.adm.alert.impl.AlertManager
The AlertManager component controls the quantity of alert data present on the system by
periodically checking for alert data to be deleted based on the configured age-out policy.
For more information about alert log policies, see “Configuring how alerts age out” (page 31).
• com.hp.sdn.adm.auditlog.impl.AuditLogManager
The AuditLogManager component controls the quantity of audit log data present on the
system by periodically checking for audit log data to be deleted based on the configured
age-out policy. For more information about audit log policies, see “Configuring how audit log
data ages out” (page 50).
• com.hp.sdn.adm.auth.impl.AuthenticationManager
The AuthenticationManager component provides for the authentication of external users to
the controller and between the controller and the Keystone server.
• com.hp.sdn.adm.health.impl.HealthManager
The HealthManager component is the Application/Component Health Monitor parameters.
Configuration components 43
Page 44

You must configure the autoShutdown.properties exactly as it is done in the sample
file. The possible health status are critical, unhealthy, healthy, or hung.
• com.hp.sdn.adm.log.impl.LogManager
The LogManager component controls the number of log message rows displayed in the
Support Logs display. For more information on support log queue size, see “Configuring the
support log queue size ” (page 55).
• com.hp.sdn.adm.metric.impl.MetricManagerComponent
The MetricManagerComponent determines how measurement data is maintained by the
controller.
The controller includes a metering framework that internal components and installed
applications can use to collect various types of data. (Data can be persisted on the controller
from sources external to the controller.) Any metric created with the framework might optionally
be persisted over time or directed to the controller JMX facility for viewing. Data persisted
over time can be viewed using the controller REST API, while data sent to JMX can be
viewed using JConsole or another JMX client. The MetricManagerComponent permits
changing default values for certain aspects of the metering framework operation, such as
how long the controller should retain persisted data, at what time of day persisted data that
is too old should be trimmed, and how often persisted metric values should be saved to disk.
(This value can be overridden for any metric when the metric is created).
• com.hp.sdn.dvc.impl.DeviceManager
The DeviceManager component serves as an in memory cache for the persistent devices
known to the controller. It holds information about those devices and whether they are
currently connected to the controller. It provides add, update, remove, and get methods for
its devices.
• com.hp.sdn.link.impl.LinkServiceComponent
The LinkServiceComponent controls the Link Manager service, which serves as an in memory
cache of the links known to the controller. It provides add, update, remove, and get methods
for its links.
◦ The cache.size configurable parameter allows you to specify a maximum number of
links that can be stored by the Link Manager. Default is 20,000.
• com.hp.teaming.imple.CassandraProcessManager
The CassandraProcessManager component controls configuration parameters of the
Cassandra database.
• com.hp.sdn.teaming.impl.TeamConfigurationManager
The TeamConfigurationManager component manages the configuration of team
communication. When one of the components’s keys is modified, the administrator must
wait for the new value to be forwarded to the other members of the team (this can be
confirmed by making sure the change appears in the UI of each controller), and then ALL
controllers must be restarted.
44 Using the SDN controller UI
Page 45

Apps Configurations view
Figure 14 Apps Configurations view
If you have other SDN applications installed, configurable components for these applications are
listed in the Apps Configurations view. For example in the screen shown above the
com.hp.mvisor.adm.topo.impl.NetworkVisualizerTopologyManager component for the HPE
Network Visualizer SDN Application is listed in the Apps Configurations view.
For details on configuring these SDN application specific components see the documentation
for the SDN application.
Modifying a component configuration
1. On the Configurations screen, select the tab that contains the component you want to
modify (Basic, Advanced, System, or Apps).
2. Select the component you want to modify.
3. Click Modify.
A Modify Configuration dialog box is displayed for the component you selected. For example:
4. Enter new values for each of the keys you want to modify.
5. Do one of the following:
• To save your changes and close the dialog box, click Apply.
• To close the dialog box without saving changes, click Cancel.
Configuration components 45
Page 46

Modifying NTP server or date and time
You can configure one NTP server or set a specific date and time for the controller system. It is
recommended that you use an NTP server rather than setting date and time because if you
change network settings, the date/time will be reset to current date/time.
If the controller is in a team and you want to change the NTP server or date and time, the other
two controllers in the team must have the same NTP server or date and time. You can make the
change on an individual controller but will see a message reminding you to check that the NTP
server or date and time is the same on the other controllers in the team.
NOTE: You can also use the python script /opt/sdn/scripts/postinstall/
config_sdn.py to configure NTP servers or the date and time on a controller. For details on
using this script, see the HPE VAN SDN Controller Installation Guide.
IMPORTANT: If you change the NTP server or date and time, after applying the change you
are logged out and you must log on to the UI again.
1. On the Configurations screen in the System tab, select the NTP component. You can use
the expand icon to view the NTP information currently configured.
2. Click Modify.
The Modify System Configuration dialog box is displayed for the NTP component. For
example:
3. Select either NTP Server or Date/Time and make configuration changes as follows.
• Select NTP Server to configure an NTP server for use by the controller system. Enter
either the server IP address or server name. You may only enter one server.
• Select Date/Time to configure the date and time to set for the controller system and
click in the Select a Date field. The calendar view is displayed. You can select Now to
use the current date and time or you can select a date on the calendar and enter the
time in hours and minutes. Then click Done.
46 Using the SDN controller UI
Page 47

4. Do one of the following:
• To save your changes and close the dialog box, click Apply. You will be logged out and
must log in again.
• To close the dialog box without saving changes, click Cancel.
5. Click Yes in the confirmation window showing a message that you will be logged out of the
UI and will need to log back in for authentication. If the controller is in a team the message
will also remind you to check that all controllers in the team have the same NTP server or
date and time.
Modifying Network settings
You can configure Hostname, IP Address and Type (Static or DHCP) of network connection. For
example, if you used DHCP when initially deploying the controller virtual appliance, you can set
a static IP address later from the Configurations screen.
IMPORTANT:
• The configuration is for the eth0 interface only.
• If the controller is in a team you must first disband the team before modifying the network
settings.
• If you make changes to the Network component, the controller will automatically be restarted.
After applying the change, you will be disconnected from the UI and will need to wait for the
controller to restart before logging back in.
When the controller reboots, the date/time is changed to current date/time so it is
recommended that you use an NTP server instead of using the date and time setting (see
“Modifying NTP server or date and time” (page 46)).
1. On the Configurations screen in the System tab, select Network. You can use the expand
icon to view the network information currently configured.
2. Click Modify.
The Modify System Configuration dialog box is displayed for the Network component. For
example:
Configuration components 47
Page 48

3. Enter new values for Host Name, IP Address, Type, and other fields as required. No spaces
are allowed in the Host Name field. If the controller is in a team, you must first disband the
team before modifying the network settings.
If you are configuring a static IP address then you must enter values for Gateway, Netmask,
and Primary DNS fields, Secondary DNS field is optional.
4. Do one of the following:
• To save your changes and close the dialog box, click Apply.
• To close the dialog box without saving changes, click Cancel.
5. Click Yes in the confirmation window showing a message that the controller will automatically
be rebooted.
Modifying Logger settings
You can configure the logging level for each of the logger keys listed for the Loggers component.
For troubleshooting you may want to increase the logging level to generate more information in
the log file for use in debugging a problem. Setting all loggers to a high verbose level of logging
is not recommended because it can lead to a shortage of system storage space very quickly.
NOTE: If the controller is restarted or if the virtual machine is rebooted, the log levels for all
loggers revert back to INFO.
The log levels from most verbose to least verbose are: ALL, TRACE, DEBUG, INFO, WARN,
ERROR, OFF.
For configuration purposes the loggers are grouped into categories listed as keys you can modify.
NOTE: You can also use the python script /opt/sdn/scripts/postinstall/
config_sdn.py to configure logging levels for individual loggers on a controller. For details on
using this script, see the HPE VAN SDN Controller Installation Guide.
1. On the Configurations screen in the System tab, select Loggers. You can use the expand
icon to view the logging levels currently configured.
2. Click Modify.
The Modify System Configuration dialog box is displayed for the Loggers component. For
example:
48 Using the SDN controller UI
Page 49

3. Enter new values for each of the keys you want to modify.
4. Do one of the following:
• To save your changes and close the dialog box, click Apply.
• To close the dialog box without saving changes, click Cancel.
Audit log
About the audit log
The audit log is available through both the controller GUI and the REST API, and records events
related to activities, operations, and configuration changes initiated by an authorized user. This
includes activities such as:
• Installing an application (or starting, stopping, uninstalling an application)
• Modifying the configuration of a controller component
• Installing a license
• Forming a controller team
When controllers are operating in a team, the audit log shows events for all controllers in the
team.
See also:
• “Deleting an audit log entry” (page 50)
• “Configuring how audit log data ages out” (page 50)
• “Exporting and archiving audit log data” (page 51)
Audit log 49
Page 50

Audit log screen details
Figure 15 Viewing the Audit Log
DescriptionScreen component
Refresh
Controller ID
Updates the log entries displayed on the screen. The controller does not update the
display as new entries are generated. Use this action to refresh the display.
The user that performed the operation that triggered the log entryUser
A time stamp (in UTC format) indicating when the controller created the log entry.Occurred
The type of activity that triggered the creation of the log entry.Activity
Detailed information about the log entry.Data
The application or controller component that generated the log entry.Origin
A hexadecimal number that identifies controller that generated the log entry. When
you use controller teaming, this ID enables you to identify which controller in the
team generated the alert.
Deleting an audit log entry
You cannot delete or modify a log entry. The controller deletes entries according to the configured
audit log policies. To configure the audit log policies, see “Configuring how audit log data ages
out” (page 50)
Configuring how audit log data ages out
You can configure the following key values for the audit log to control how audit log data ages
out. To set these key values you configure the
com.hp.sdn.adm.auditlog.impl.AuditLogManager component using the Configurations
screen.
50 Using the SDN controller UI
DescriptionDefault ValueKey
365trim.auditlog.age
truetrim.enabled true Specifies that the controller deletes log entries that have
Specifies the number of days to retain a log entry. Use this key to implement
your record retention policy.
Data type A number from 31 through 1825.
exceeded the trim.auditlog.age limit.
Page 51

DescriptionDefault ValueKey
false Specifies that the controller does not delete log entries
that have exceeded the trim.auditlog.age limit.
24trim.frequency
Specifies how often, in hours, the controller is to delete log entries that have
exceeded the trim.alert.age limit.
Data type A number from 8 through 168
Example Enter 24 to specify that the controller delete aged-out log
entries every 24 hours (once per day).
To configure how audit log data ages out:
1. On the Configurations screen in the System tab, select the
com.hp.sdn.adm.auditlog.impl.AuditLogManager component.
2. Click Modify.
The Modify System Configuration dialog box is displayed for the
com.hp.sdn.adm.auditlog.impl.AuditLogManager component.
3. Change the values for the keys (these keys are described in the table above).
4. Click Apply .
Figure 16 The AuditLogManager Configuration Component Controls Audit Log Policy
Exporting and archiving audit log data
To retain log records for longer than the trim.auditlog.age limit, you must export the audit
log from the controller to a file before the trim.auditlog.age limit is reached. Exporting audit
log data does not remove it from persistent storage.
To export the audit log, you must use the REST APIs since this action cannot be performed in
the UI.
For example, you can use the curl command at “Export audit log data as a CSV file using curl
commands” (page 171).
Audit log 51
Page 52

Licenses
A license is required for the controller. In addition, SDN applications can require licenses that
are separate from the license for the controller. For information on installing, activating, uninstalling
or transferring licenses, see “License Registration and Activation” (page 86).
Licenses screen details
The Licenses screen displays the controller Install ID, and is used to activate new licenses, and
deactivate installed licenses (for transfer to another installation).
Copy Uninstall Key
Serial#
DescriptionScreen component
Updates the screen with the latest license information.Refresh
Adds and activates the specified license key on this controller.Add
Deactivates the selected license.Deactivate
When a license is deactivated, an uninstall key is assigned for license transfer
purposes and you can copy this uninstall key by selecting this button, see
“Transferring licenses” (page 93).
Contains the installation identifier for this controller.Install ID
A sequence/serial/record number given for that license across all licenses generated
for that install ID. The HPE My Networking Portal assigns the serial number while
generating license records.
Name of the application or product for which the license is generated.Product
License metric name. For example, nodes and HA nodes.Licensed For
Quantity of the Licensed For metric based license.Qty
Type of license. For example, PRODUCTION, DEMO, or EVAL.Type
ACTIVE, EXPIRED, or DEACTIVATEDStatus
52 Using the SDN controller UI
Page 53

DescriptionScreen component
Date and time when the license Licensed For expires.Expire By
Uninstall Key
When a license is deactivated, an uninstall key is assigned for license transfer
purposes, see “Transferring licenses” (page 93).
Installing, activating, uninstalling, or transferring licenses
For information about installing, activating, uninstalling, and transferring licenses, see “License
Registration and Activation” (page 86).
Team
The Team screen displays team and region configuration information including:
• Team status (top banner)
• Team configuration and controller status (top section)
• Region configuration (middle section)
• Device owners (bottom section)
For details on viewing information on the Team screen, see “Viewing your team configuration
using the UI” (page 104). For details on configuring High Availability (HA) and teaming, see
“Configuring for High Availability” (page 99).
Figure 17 Team screen
Support logs
About support logs
The support logs maintain an internal record of events of interest from the operations of an active
SDN controller. This information is the type of data a support engineer would request when
troubleshooting an SDN installation.
The log file is configured to have a maximum size of 10 MB and to keep 4 previous versions.
The log.log file is the primary log for controller information. With 4 full previous versions and
the one active log, the core controller logging will consume at most 50 MB of disk space. The
controller allows up to five support logs; one active and four in storage:
• Support logs are stored in the controller /var/log/sdn/virgo/logs directory.
• When the current log reaches 10 MB, the controller copies the log to storage and starts a
new log.
Team 53
Page 54

• When the log file has rolled over four times, the controller purges the oldest log file when it
needs to roll over again. The core controller has at most 5 log files.
• Support logs can be exported to a file.
In a controller team environment:
• Each controller maintains its own support logs.
• Changing the support log queue size on any controller propagates to all active controllers
in the team.
• The Export action gathers the set of support log file data from all active controllers in the
team, and stores the data as a single compressed archive.
See also:
• “Configuring the support log queue size ” (page 55)
• “Exporting the support logs ” (page 56))
Support logs screen details
Figure 18 Selecting the Support Logs screen
Refresh
Export
54 Using the SDN controller UI
DescriptionScreen component
Displays a listing of the most recent log messages, as determined by the currently
configured queue size. For example, with a queue size of 100, Refresh lists the 100
most recent log messages.
Gathers the set of support log file data from the standalone controller or all active
controllers in the team, and stores the data as a single compressed archive.
The severity level for the entry.Level
The logging levels are hierarchical. Messages are logged with the lowest logging
level and above. The lowest level is TRACE, which results in all messages being
logged for the selected logger when the TRACE logging level is specified. INFO is
the logging level In the default configuration.
Page 55

DescriptionScreen component
Severity levels are:
DescriptionValue
ERROR
WARN
DEBUG
TRACE
Using the Virgo Administrator console, you can dynamically change the logging level
for a component that is writing to the support log. For example, you can enable the
DEBUG level logging for just the NodeManager configuration component.
You can also dynamically change the logging level by using the REST API. See HPE
VAN SDN Controller REST API Reference
The module or feature that triggered the logging condition.Logger
The thread that caused the logging condition to occur.Thread
Describes the details of the logging condition.Message
Indicates a problem to investigate. The problem could cause
functional or performance issues with application.
Indicates a problem that you might want to investigate. The
problem could be an early indication of issues that could later
cause an error.
Indicates a normal operational event that requires no action.INFO
Indicates an informational event that is most useful for debugging
applications.
Indicates an informational event that is most useful for debugging
applications. Often used to show program execution details when
DEBUG-level events do not provide enough information
Detailed information about the log entry.Data
Controller ID
A hexadecimal number that identifies controller that generated the log entry. When
you use controller teaming, this ID enables you to identify which controller in the
team generated the alert.
Configuring the support log queue size
The default queue size is 100 lines. To configure a different queue size, change the value for
the max.display.rows key of the com.hp.sdn.adm.log.impl.LogManager component.
1. On the Configurations screen in the System tab, select the
com.hp.sdn.adm.log.impl.LogManager component.
2. Click Modify.
The Modify System Configuration dialog box is displayed for the
com.hp.sdn.adm.log.impl.LogManager component.
3. Change the value for the max.display.rows key.
4. Click Apply.
Support logs 55
Page 56

Figure 19 The LogManager Configuration Component Controls Support Log queue size
Exporting the support logs
The Export operation:
1. Gathers the set of support log file data from the controller, or in a team environment, all
active controllers in the team, and stores the data as a single compressed archive file:
sdn-all-logs.zip
2. Downloads the archive file from the controller to the default download directory specified by
your browser. For example, in Ubuntu installations, this is usually the Downloads directory.
3. Click Export.
The following menu appears in the lower-left corner of the controller console:
Figure 20 Completion of the export operation
4. When the download completes, you can either resume interaction with the controller or
examine the log by selecting an item from the menu, such as:
• Open a window showing the new log zip file.
• Set the default operation to always open the directory containing the log zip file.
• Show the log zip file in the default directory for receiving downloads.
NOTE: The actions resulting from these choices depend on the browser and operating
system, not on the controller.
Packet listeners
The controller applications (and SDN applications) register packet listeners with the controller.
The order of processing an incoming packet is determined by the roles (Advisor, then Director,
then Observer), and then altitudes within a role (in decreasing value, with 0 the lowest altitude).
An incoming packet (PacketListenerRole) is wrapped in a Message Context (which also holds
a Packet-Out reply) which is passed to each packet listener in turn.
56 Using the SDN controller UI
Page 57

Packet listeners display details
The packet listeners screen displays the packet listeners that are currently running on the
controller.
Figure 21 Selecting the Packet listeners screen
Altitude
# Samples
DescriptionScreen component
Refreshes the information on the screen.Refresh
The PacketListener Role is one of the following:PacketListener Role
ADVISOR
Examines the incoming packet. Might add processing hints to the message context,
but does not modify the packet out message.
DIRECTOR
Processes the packet. Might add actions or instructions to the packet-out message.
Can instruct the controller to block the packet, or to send the packet out.
OBSERVER
A passive observer who might examine the incoming packet and any packet-out
response.
Packets are given to packet listeners with role of ADVISOR first, DIRECTOR second,
and OBSERVER third. Every packet listener is guaranteed to see the packet-in
message. Depending on the action taken by higher altitude Directors, a lower altitude
Director might be too late to influence the packet processing.
The weight or priority this packet listener should have relative to other packet listeners
that have the same role. The controller gives packet listeners with higher numbers
priority over packet listeners with lower numbers.
The average time, in milliseconds, that the packet listener spent processing a packet.Average (ms)
The number of packets processed by that packet listener since the packet listener
registered.
Packet listeners 57
Page 58

OpenFlow Monitor
The SDN controller UI includes several screens providing information on OpenFlow enabled
switches:
• “OpenFlow Monitor” (page 58)
• “OpenFlow topology ” (page 61)
• “OpenFlow Trace log” (page 69)
• “OpenFlow Classes ” (page 75)
When the controller is active in an OpenFlow domain, the OpenFlow Monitor enables tracking
of switch traffic summaries, packet traffic per port, and applied flow rules for switches detected
in the controller domain.
For a graphical view of Data Path ID assignments to individual OpenFlow switches, see OpenFlow
topology .
OpenFlow Monitor screen details
The main display lists the Data Path IDs and descriptive information for the active switches and
the options for viewing traffic information. To view information about a specific device, click the
Data Path ID for that device and then select one of these tabs for the view you want to display:
Summary, Ports, Flows, Groups.
Click Refresh to update the display for Topology changes, such as a newly discovered OpenFlow
device or the loss of a device that has been disconnected.
Figure 22 The Main OpenFlow Monitor screen
DescriptionScreen component
58 Using the SDN controller UI
Updates the information displayed on the screen.Refresh
Displays the “Summary for data path view” (page 59) for the selected data path.Summary tab
Displays the “Ports for data path view” (page 60) for the selected data path.Ports tab
Displays the “Flows for data path view” (page 60) for the selected data path.Flows tab
Displays the “Groups for data path view” (page 61) for the selected data path.Groups tab
Page 59

DescriptionScreen component
Data Path ID
Summary for data path view
Figure 23 Summary view for a specific OpenFlow device
Identifies a detected OpenFlow switch. The OpenFlow data path identification for
each detected OpenFlow switch. This ID also appears in the representation of the
switch in the OpenFlow Topology screen.
Identifies the IP address associated with an OpenFlow data path instance.Address
The version of OpenFlow in use with the corresponding data path.Negotiated Version
Manufacturer of the device.Manufacturer
Hardware version of the device.H/W Version
Software version on the device.S/W Version
Serial number on the device.Serial Number
The OpenFlow Monitor→Summary view includes the following details related to the selected
device:
• Manufacturer
• Hardware and software version
• Serial number and device description of the device
• Device identification (Data Path ID) and IP address
• TCP port on the device
• Negotiated OpenFlow version (latest OpenFlow version common to both the controller and
the switch)
• OpenFlow table and buffer information
• OpenFlow capabilities on the device
OpenFlow Monitor 59
Page 60

Ports for data path view
The OpenFlow Monitor→Ports view includes information on the ports used for OpenFlow traffic
on the selected device.
Figure 24 Ports view for a specific OpenFlow device
Flows for data path view
The OpenFlow Monitor→Flows view shows current flows on the selected OpenFlow device.
For a given flow, traffic meeting the requirements specified in the "Matches" field is directed as
specified in the corresponding "Actions/Instructions" field.
Figure 25 Flows view for a specific OpenFlow device
NOTE: The Table ID applies to OpenFlow 1.3 and greater, but not to OpenFlow 1.0.
60 Using the SDN controller UI
Page 61
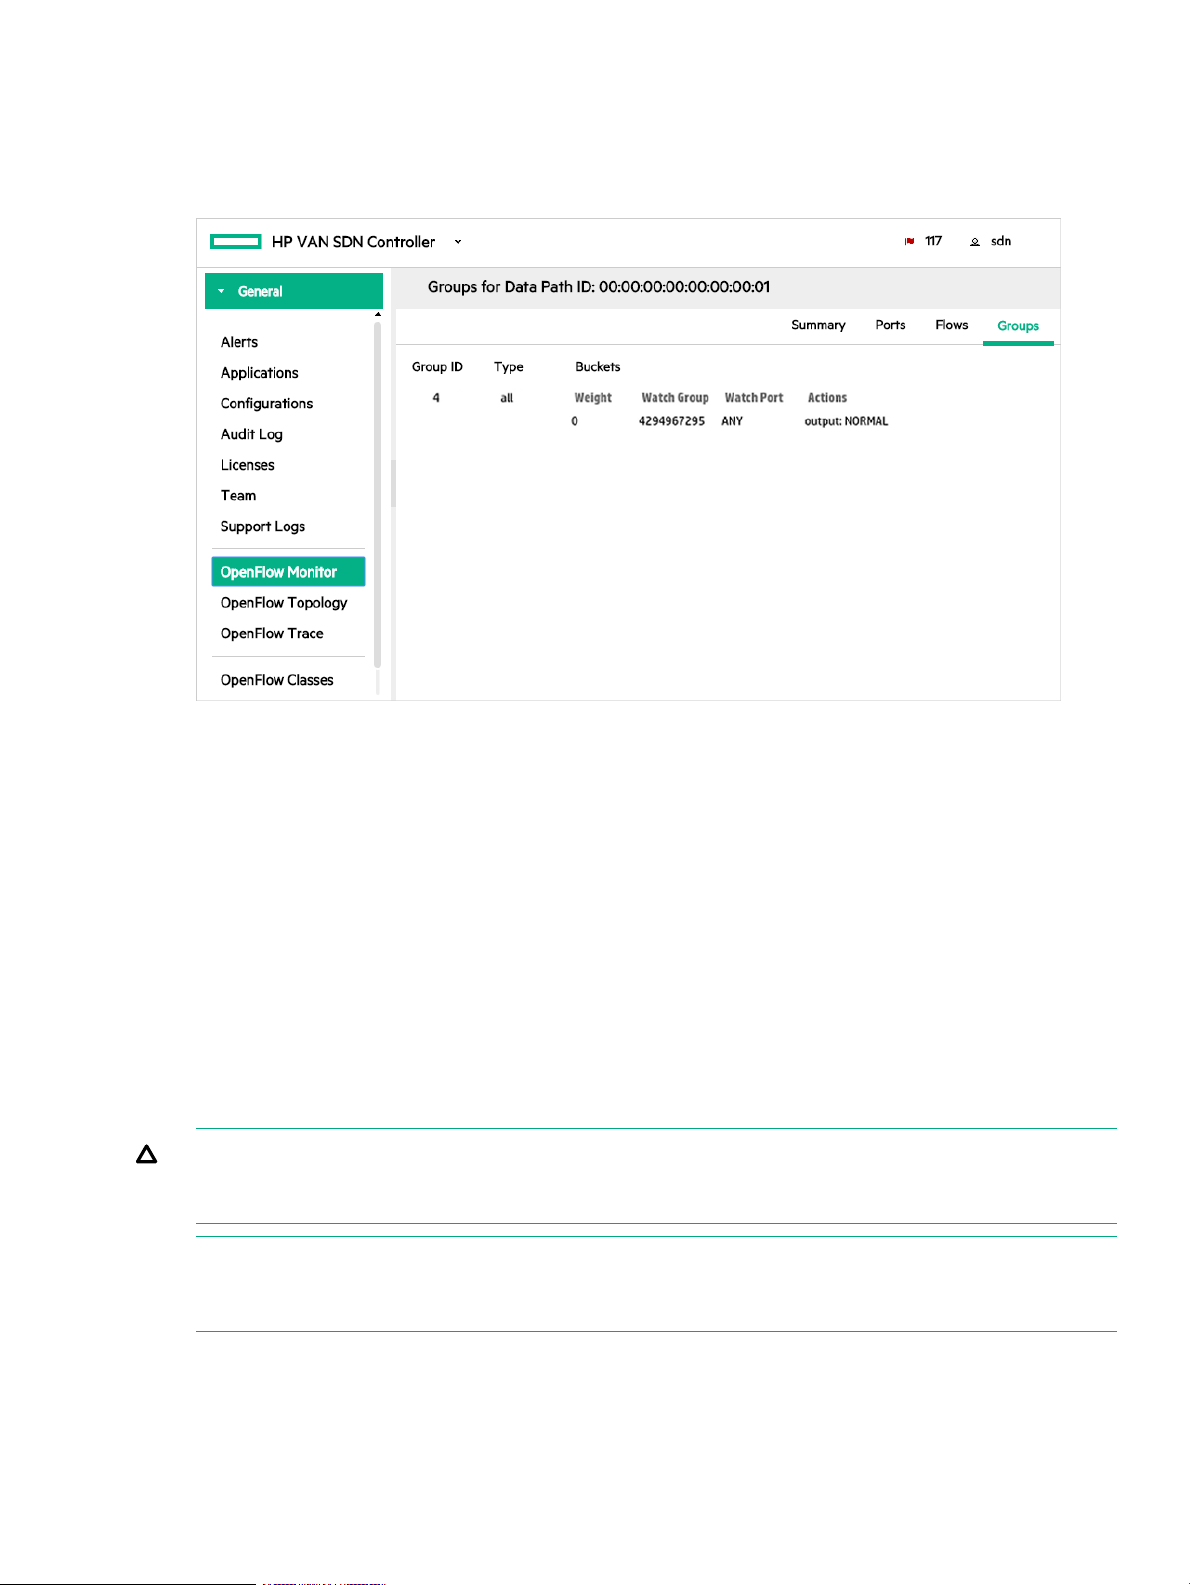
Groups for data path view
The OpenFlow Monitor→Groups view provides information on group actions, if any, defined
for the device. The group actions can assign more specific forwarding actions.
Figure 26 Groups view for a specific OpenFlow device
OpenFlow topology
The OpenFlow Topology screen displays a topology of discovered switches and end nodes in
the controller domain. You can view and change the graphical view of the network, as well as
compute the broadcast tree to avoid loops and broadcast storms. The shortest path is computed
using a Dijkstra graph search algorithm. The OpenFlow topology screen:
• Displays a topology of discovered switches and end nodes.
• Identifies the ports discovered on a given switch. Interface name and OpenFlow numbers
are displayed
• Identifies the shortest path between two nodes.
• Provides node identification options (such as MAC or IP address label).
• Provides a view of switch port identifiers, active flow rules, and a tool for testing flow rule
options.
CAUTION: Do not configure a looped topology in the network between the OpenFlow and
non-OpenFlow portions of your network unless you enable Spanning Tree Protocol on the non
OpenFlow devices operating in the network.
NOTE: In a topology where two or more controlled switches connect to the same uncontrolled
switch, the controller will not learn the location of hosts directly connected to the uncontrolled
switch.
See also:
• “Displaying the network Topology” (page 62)
• “Using keyboard shortcuts to change the display” (page 62)
• “Changing the topology display using the View menu” (page 65)
OpenFlow topology 61
Page 62

• “Viewing the shortest path between two nodes ” (page 68)
• “Viewing flow details for selected nodes” (page 69)
• “Viewing details on packet selection criteria for a data flow” (page 69)
•
Displaying the network Topology
The OpenFlow Topology screen includes the switches and end-nodes in the controller domain.
Figure 27 Topology viewer
The topology legend is show in the top right corner:
• Switch — shown in light green
• Collapsed Switch — shown in dark green
• End Host — shown in orange
Using keyboard shortcuts to change the display
Use the icon to list the keyboard shortcuts you can use to change the display.
To use the keyboard shortcut keys you must first click somewhere in the topology view to bring
it into focus and then you can select a shortcut key. An outline around the topology indicates it
is in focus.
62 Using the SDN controller UI
Page 63

Figure 28 Keyboard shortcuts
See also:
• “Changing switch and host node labeling” (page 63)
• “Using the mouse to change the topology display” (page 65)
• “Viewing node tooltips” (page 65)
Changing switch and host node labeling
You can change how nodes are labeled in the topology using keyboard shortcuts.
To turn on or off ALL node labels, enter the keyboard shortcut L.
To change the host node labeling in the topology, enter the keyboard shortcut H and the display
will cycle through the different node labels each time you enter H.
OpenFlow topology 63
Page 64

Host end-nodes can be labelled with one of the following:
• IP Address (default)
• MAC Address
• No Label
To change the switch node labeling in the topology, enter the keyboard shortcut N and the display
will cycle through the different switch labels each time you enter N.
Switches can be labelled with one of the following:
• System name (default, if the switch does not contain a system name then IP address is
shown instead)
• IP address
• DatapathId
• No label
For example, to change the default display showing System name labels to show the IP addresses
of the switch nodes, click anywhere in the topology display, then press N. The switch IP addresses
appear as labels in the topology diagram:
Figure 29 Switch IP address labeling
Press N again to display the switch datapath IDs as labels in the topology diagram:
Figure 30 Switch datapath IDs as labels
Press N again to display the unlabeled switch view.
64 Using the SDN controller UI
Page 65

And press N again to return to the System Name switch labels.
Using the mouse to change the topology display
Zoom in or out in the topology by using the scroll wheel on the mouse.
To drag the topology to a desired location, place the cursor in the topology and hold the mouse
button down while dragging to move the topology.
Select or deselect a switch or end-node host by clicking the node.
Viewing node tooltips
You can view node tooltips by hovering the mouse-over a node in the topology. Or you can press
O to toggle on and off tooltips.
Mouse-over the switch to display datapath information.
Mouse over the host to display end-node information.
Changing the topology display using the View menu
You can use the View menu to change the topology display.
Figure 31 Topology View Menu
See also:
• “Using Search” (page 66)
• “Viewing port labels on switches” (page 67)
• “Viewing details” (page 67)
• “Using tools” (page 67)
• “Using pin, Collapse All, Auto Refresh and Reload” (page 67)
OpenFlow topology 65
Page 66

Using Search
You can search the topology based on various criteria by using one of the following methods.
• Search using View→Search. Or press the F shortcut key to open the Search dialog box.
• Type the search criteria in Search (regex) box and click Search. This search is across ALL
Search using the Search menu:
1. Select View→Search. Or press the F shortcut key to open the Search dialog box.
2. The Search dialog box is displayed.
3. From the drop down list, select one of the search criteria: Switch IP, Datapath ID, Host IP,
This search is based on any ONE of the following criteria: Switch IP, Datapath ID, Host IP
or Host MAC.
the text including: Switch IP address, Datapath ID, System name, End host IP address and
MAC address.
When the Search dialog box is opened, if one or more nodes are collapsed or highlight path
is enabled, all will be cleared during the search. After the search dialog is closed, the state
of collapse and highlighting will be returned.
Host MAC. Then enter the search value.
4. Click Search. If any match is found the border changes to green. If no match is found the
border changes to red.
To close the dialog box click Close or click Reset to clear the search value and reset the
topology view.
Search using Search (regex):
66 Using the SDN controller UI
Page 67

1. Enter the value you want to search on in the Search(regex) field located in the top right of
the topology view. You can enter a regular expression for more complex searches.
For an exact match, $ should be appended at the end. For example, if there are IP addresses
like 10.10.10.10, 10.10.10.100, 10.10.10.101, 10.10.10.102, etc. and if you want to search
for only 10.10.10.10, you should put the search string as 10.10.10.10$.
2. Click Search or press Enter.
Viewing port labels on switches
You can view port labels on the links between switches and between switches and end nodes.
Port labels can be interface name or OpenFlow numbers.
Select View→Ports to display port labels on switches. Press the P shortcut key to toggle between
displaying OpenFlow port number or port name. Toggling only works when the Ports menu option
is selected.
Viewing details
You can view details for a switch by selecting View→Details. For more information, see “Viewing
flow details for selected nodes” (page 69).
Using tools
After specifying a source and destination data flow you can view details on the packet selection
criteria by selecting View→Tools. For more information, see “Viewing details on packet selection
criteria for a data flow” (page 69).
Using pin, Collapse All, Auto Refresh and Reload
Pin
To pin or unpin the switches and end nodes, press X or select View→Pin All.
When you enable Pin All nodes and Auto Refresh, if any topology updates occur (such as an
end host moved or was removed), then Pin All is automatically removed to update the topology
and then once the topology is updated, the topology is pinned back. However if you had any
customized view then that may be changed during that time. If the number of nodes increases
by more than 500 (both switch and end hosts), Pin All will be enabled and disabled automatically.
Once node count comes down to less than 500, Pin All will be re-enabled.
OpenFlow topology 67
Page 68

Collapse All
Collapse the topology display to show only the number of end nodes connected to each switch,
instead of showing all end nodes (the default) which can present a cluttered display where a
large number of end nodes are connected to the OpenFlow switches. To collapse or expand
end-nodes for a particular switch, double-click the selected switch.
To collapse all end nodes, select View→Collapse All.
Auto Refresh
To automatically refresh the topology, select View→Auto Refresh.
Reload
To reload the whole topology, click the Reload button in the top right of the topology view. When
the topology is reloaded, Highlight, collapse, Collapse All, selection, and node labels will be reset.
Viewing the shortest path between two nodes
You can view the shortest path between two nodes as follows:
1. Select the source node and click Src or press S.
2. Select the destination node and click Dst or press D.
The controller displays the path between the two nodes as a line, see Figure 32 (page 68)).
Features like Collapse all, collapse a single node and highlight a particular node using Ctrl click
are not allowed when a path is selected.
Figure 32 Locating the shortest path between two nodes
To exchange source and destination nodes, press A.
To clear the source and destination flags as well as clearing the path, press Z.
Follow Flow
The Follow Flow option is enabled only when the controller is in pure OpenFow mode, where
hybrid.mode is set to false. The Follow Flow option is disabled when the controller is in
hybrid mode.
When the controller is in pure OpenFlow mode, select Path→Follow Flow.
68 Using the SDN controller UI
Page 69

Highlight flow
The Highlight option is enabled only when a path is selected (either Shortest Path or in Follow
Flow mode). Highlight path is cleared when you toggle between Shortest Path or Follow Flow.
For example, with Shortest Path is enabled you select Highlight path, then you select Follow
Flow, the Highlight path will be cleared and you have to select Highlight path again for Follow
Flow.
Select Path→Highlight.
Viewing flow details for selected nodes
The Switch Details window displays flow details.
Select a switch node and then select View→Details or press I to display the Switch Details
screen.
Figure 33 Flow details for the selected source-destination end nodes
Viewing details on packet selection criteria for a data flow
For a source-destination data flow you can view details on the packet selection criteria used.
Select View→Tools to display the Packet Selection dialog box or press T. The display is read
only.
The Abstract Packet window displays selection criteria for packets moving between the
Source-Destination node pair. MAC addresses and IP addresses are shown based on the source
and destination nodes selected.
Figure 34 Searching for flows for specific packet types
OpenFlow Trace log
This troubleshooting tool logs OpenFlow conversations captured in messages to and from the
controller and the OpenFlow devices it manages.
You can export the captured messages in the trace log to a CSV (Comma-Separated Values)
file that can be opened by applications such as Excel that are designed to accommodate this file
type. This enables you to create a filter to display only the messages from the specific data paths
you want to examine.
OpenFlow Trace log 69
Page 70

About the OpenFlow Trace log
The number of events that can be held in the trace log is limited by system memory. For this
reason, Hewlett Packard Enterprise recommends that you export to a remote storage location
any trace log content you want to retain, and to clear the controller trace log whenever its content
is not needed on the controller itself.
See also:
• “Starting, stopping, or clearing OpenFlow trace ” (page 71)
• “Displaying trace event details” (page 71)
• “Exporting the OpenFlow Trace log” (page 72)
• “Filtering the OpenFlow trace log in a CSV file” (page 73)
• “Changing the OpenFlow trace interval ” (page 74)
OpenFlow Trace screen details
Figure 35 Example of OpenFlow Trace Default Display
70 Using the SDN controller UI
DescriptionScreen component
Starts trace logging.
In the default configuration, the trace stops after ten seconds have passed. (To change the
trace interval, see “Changing the OpenFlow trace interval ” (page 74).)
Stops trace logging before the end of the configured trace interval.
Trace logging stops automatically at the end of the configured trace interval.
Multiple consecutive traces can be held in the trace log. To add additional trace results,
start another trace.
Clears (resets) the current trace log.
To preserve the contents of the trace log before clearing it, see “Exporting the OpenFlow
Trace log” (page 72).
Displays details of the selected trace event.
Page 71

DescriptionScreen component
Export
Copies the trace log into a CSV (comma-separated values) file. See see “Exporting the
OpenFlow Trace log” (page 72).
The time the message event was generated.Time
The event type. For example:Event
CkPt
Indicates a check point in the trace log, such as the starting or stopping of a trace
operation.
Rx
Indicates an OpenFlow message received by the controller (from a datapath).
Tx
Indicates an OpenFlow message sent from the controller (to a datapath).
The Data Path ID of the data path associated with the event.Data Path ID
The trace message.Message
Starting, stopping, or clearing OpenFlow trace
Use the buttons above the Time field to control trace operations (see “OpenFlow Trace screen
details” (page 70)).
Displaying trace event details
1. Select the event you want to examine.
Figure 36 Selecting an event in the OpenFlow Trace log
2. Click . Alternatively, double-click on the event.
The Event Detail dialog box is displayed.
OpenFlow Trace log 71
Page 72

Figure 37 Displaying event details
3. To close the Event Detail window, click Close.
Exporting the OpenFlow Trace log
Exporting an OpenFlow Trace Log places the trace content in a CSV file that is stored in the
default downloads folder specified in your web browser settings.
For more information about CSV files, see RFC 4180.
NOTE: This section shows how to export and access OpenFlow Trace Log files using Google
Chrome. You might experience different results than shown here, depending on your web browser
and its configuration.
1. Click Export. This action places the trace log contents into a CSV file in the default downloads
folder in the system on which the controller is running. Check your web browser for an
indication that the file has been created.
2. To display and filter the CSV file content, see “Filtering the OpenFlow trace log in a CSV
file” (page 73).
72 Using the SDN controller UI
Page 73

Filtering the OpenFlow trace log in a CSV file
1. Open the CSV file in the default folder. For example, using Google Chrome, open the menu
adjacent to the file name (of-trace.csv) and select Show in folder.
Figure 38 Accessing the stored CSV file
In the resulting folder listing, locate the of-trace.csv file and open it using an application,
such as Microsoft Excel, that enables you to read the log messages and configure a filter.
For example, to investigate the messages collected for data path 00.00.00.00.00.00.00.02:
2. Select the DPID (Data Path ID) column.
Figure 39 DPID column
3. Set the filter.
Figure 40 Setting the filter
4. Apply the filter by checking the box for data path 00.00.00.00.00.00.00.02.
OpenFlow Trace log 73
Page 74

Figure 41 Applying the filter
5. In the resulting display, only the data filtered to data path 00:00:00:00:00:00:00:02 appears.
Figure 42 Filtered trace log
Changing the OpenFlow trace interval
The default trace interval is ten seconds. To change the interval, change the value for the
record.duration key of the com.hp.sdn.ctl.of.impl.TraceManager component.:
1. From the navigation menu, select Configurations. Then select the Basic tab.
2. Select the com.hp.sdn.ctl.of.impl.TraceManager component.
74 Using the SDN controller UI
Page 75

3. Click Modify.
The Modify Basic Configuration dialog box is displayed for the
com.hp.sdn.ctl.of.impl.TraceManager component.
4. Change the value for the record.duration key.
5. Click Apply to set the new time span for active trace recording, and return to the OpenFlow
Trace screen.
Figure 43 The TraceManager Configuration Component Controls the OpenFlow trace
interval
OpenFlow Classes
The OpenFlow Classes screen shows the OpenFlow classes that applications have registered
with the controller.
About OpenFlow classes
When multiple applications share the same resource the flow tables of OpenFlow switches how
can their priorities relative to each other be determined and how can their actions be coordinated?
If flow table modification priorities are directly coded into each application, applications can end
up directly competing with other applications for the highest priorities, which can result in conflicts
in general network traffic control and unintended results when you implement a solution that has
multiple SDN applications attempting to act on the same packets. In addition, many environments
make it difficult to trace the origin of flow modification requests installed in switches.
The HPE VAN SDN Controller uses OpenFlow classes to dynamically manage the priorities of
the OpenFlow rules being deployed to the network, thus enabling applications to execute their
business logic in a more orderly fashion.
1. For each class of flow modification message the application can send, the application must
register an OpenFlow class with the controller. The OpenFlow class must specify the types
of match fields, types of actions, and (optionally) the relative position (higher than or lower
than) for this class with respect to other flow classes.
2. The controller adds a unique base cookie to be used with each future flow modification to
be validated against this OpenFlow class, and assigns an actual priority for the OpenFlow
class. This actual priority is based on the logical priorities of all of the OpenFlow classes of
all the applications that are registered with the controller.
3. When the application sends a flow modification message, it must set the match and action
to be the same fields as specified in the OpenFlow class and, instead of providing an actual
OpenFlow Classes 75
Page 76

priority, the application sets the logical priority as assigned by the flow class, and a cookie
that is derived from the base cookie of the OpenFlow class.
4. Before sending the flow table modification message to the switch, the controller evaluates
the requested flow modification against the registered OpenFlow classes and replaces the
logical priority provided by the application with an actual priority.
In addition to enabling the controller to manage priorities for multiple applications, OpenFlow
classes enable the controller to validate flow modifications an application makes against a set
of expected flow modification requests. This capability means that the behavior of an application
must match the intent that the application disclosed when it registered with the controller:
• The flow match must contain exactly the fields and field types that were disclosed when the
application registered with the controller. The controller validates field types but not field
value.
• The action or instruction must fall into the category that was disclosed during registration.
An action is classified into one of the following categories:
FORWARD
DROP
PROCESS
STEAL
COPY
• The upper 16 bits of the flow modification cookie must match the upper 16 bits of the base
cookie that was issued during registration.
OpenFlow Classes screen details
The OpenFlow Classes screen displays the OpenFlow classes that are currently registered with
the controller.
76 Using the SDN controller UI
Page 77

Figure 44 Example of OpenFlow classes screen
Flow Class ID
Cookie
Match Fields
Actions
Description
DescriptionScreen component
Refreshes the list.Refresh
The symbolic name for the flow class. The prefix identifies the application that
registered the class; the suffix uniquely identifies the class.
The actual priority the controller assigns to flows of this class.Priority
The base value of the cookie assigned to this OpenFlow class. The application that
registered this class must use this base cookie when constructing flows that belong
to this class.
The types of match fields that are expected to be specified in flows that belong to
this class.
The general category of the action or instruction a flow that belongs to this class is
expected to include. For a list of categories, see “About OpenFlow classes” (page 75).
Short description of what the OpenFlow class does. The application describes the
OpenFlow class when it registers the class with the controller.
OpenFlow Classes 77
Page 78

Controller enforcement levels for OpenFlow classes
The following table lists the enforcement levels that the controller can use for applications that
send flows to switches.
DescriptionEnforcement level
none
weak
strict
The controller does not manage flow modification priorities or validate flow modification
requests:
• Applications that do not register OpenFlow classes with the controller are permitted
to send flow modifications to switches.
• The controller does not validate flow modifications, even for applications that register
OpenFlow classes with the controller.
• The controller does not replace logical priorities with actual priorities for flow modification
requests from any applications.
(Default) The controller manages flow modification priorities and validates flow modification
requests for applications that register OpenFlow classes:
• Applications that do not register OpenFlow classes with the controller are permitted
to send flow modifications to switches.
• The controller validates flow modifications from registered applications against the
OpenFlow classes that are registered.
• The controller replaces logical priorities with actual priorities for registered applications
only.
The controller manages all flow modification priorities and validates all flow modification
requests:
• Applications that do not register OpenFlow classes with the controller are not permitted
to send flow modifications to switches.
• The controller validates all flow modifications against the OpenFlow classes that are
registered.
• The controller replaces logical priorities with actual priorities for all applications.
Changing the enforcement levels for OpenFlow classes
To change the enforcement level the controller applies to applications sending flows to switches,
change the value for the flow.mod.enforcement key of the
com.hp.sdn.ctl.of.impl.ControllerManager component.
1. From the navigation menu, select Configurations. Then select the Basic tab.
2. Select the com.hp.sdn.ctl.of.impl.ControllerManager component.
3. Click Modify.
The Modify Basic Configuration dialog box is displayed for the
com.hp.sdn.ctl.of.impl.ControllerManager component.
4. Change the value for the flow.mod.enforcement key.
5. Click Apply.
For information about the enforcement levels the controller can apply, see “Controller enforcement
levels for OpenFlow classes” (page 78).
78 Using the SDN controller UI
Page 79

Figure 45 The ControllerManager Configuration Component Controls the enforcement
levels for OpenFlow classes
OpenFlow Classes 79
Page 80

4 Hybrid mode for controlling packet forwarding
Overview
The hybrid mode setting determines which packet-forwarding decisions are made by controlled
OpenFlow switches and which of these decisions are made by the controller itself.
• If hybrid mode is enabled (the default setting), the controller delegates normal packet
forwarding to the controlled switches, but overrides these switches for non-standard
packet-forwarding decisions required by installed applications for specific packet types. In
this mode the controller relies on the controlled switches to resolve loops and determine
forwarding paths by using traditional networking mechanisms (such as STP).
• If hybrid mode is disabled, the controller makes the forwarding decisions for all packets in
the OpenFlow-controlled network. In this state, the controller resolves network loops and
determines forwarding paths.
Managing hybrid mode includes the following:
• “Viewing and changing the hybrid mode configuration” (page 80)
• “Coordinating controller hybrid mode and OpenFlow switch settings” (page 82)
In all cases, the controller only monitors or directs packets within OpenFlow instances. The
controller cannot direct or monitor packets outside of OpenFlow instances.
For information on supported network switches, see the HPE VAN SDN Controller and Applications
Support Matrix.
Learning more about hybrid mode
For more on hybrid mode as it relates to OpenFlow, see the latest OpenFlow Switch Specification
on the Open Networking Foundation website.
For a list of Hewlett Packard Enterprise switches that support OpenFlow operation, see the latest
edition of the HPE VAN SDN Controller and Applications Support Matrix.
Viewing and changing the hybrid mode configuration
To view or change the hybrid mode setting:
1. In the Controller UI, from the navigation menu, select Configurations. Then select the Basic
tab.
2. Select the com.hp.sdn.ctl.of.impl.ControllerManager component. Click to show
the configurable keys for this component and view the current value for hybrid.mode.
80 Hybrid mode for controlling packet forwarding
Page 81

Figure 46 Open the Controller Manager component
Continue with the following steps if you want to change the setting.
3. Click Modify.
The Modify Basic Configuration dialog box is displayed for the
com.hp.sdn.ctl.of.impl.ControllerManager component.
Figure 47 Select the hybrid.mode field
4. Set hybrid.mode to one of the following:
• true (the default): Enables hybrid mode. The controller makes packet-forwarding
decisions only as required by installed applications.
• false: Disables hybrid mode. The controller makes all forwarding decisions. (Release
2.0 of the HPE VAN SDN Controller operates only in this mode – pure OpenFlow mode).
Viewing and changing the hybrid mode configuration 81
Page 82

5. Restart the controller. In a controller team environment, restart all controllers in the team.
In a controller team environment, a configuration change on one controller typically propagates
to the other controllers on the team. However, to implement a hybrid mode configuration
change, it is necessary to restart all the controllers in the team. Make certain that the change
has propagated to all members in the team before restarting the controllers.
a. Close any instance of the web interface in which the controller might be running.
b. At the Linux command prompt (sudo), restart the controller with the following:
~$ sudo service sdnc restart
NOTE: You can also use the REST API to set or reset hybrid mode. See the "configs REST
API" section in the HPE VAN SDN Controller REST API Reference.
Coordinating controller hybrid mode and OpenFlow switch settings
Supporting hybrid mode on OpenFlow switches
The OpenFlow configuration on individual Hewlett Packard Enterprise switches must support
the controller hybrid mode setting. Table 3 (page 82) shows the correspondence between the
hybrid mode configuration on the controller and the per-instance passive/active configuration on
Hewlett Packard Enterprise OpenFlow switches.
Table 3 Hybrid mode support on ProVision switches
ProVision OpenFlow Instance ConfigurationHybrid Mode Settings
passiveEnabled (true)
activeDisabled (false)
For more information on the specific switch, how to configure passive/active mode, and how
these switches behave if they lose their control-plane connection to the controller, see the
OpenFlow documentation.
For a list of switches that are supported in Hybrid and pure OpenFlow mode, see HPE VAN SDN
Controller and Applications Support Matrix.
Configuring controller settings to support hybrid mode
Network-related settings on the controller must agree with the controlled switches. Failure to
achieve agreement between the controller’s network-related settings and the settings in the
controlled switches may result in unpredictable network behavior. Table Table 4 (page 82) lists
the specific network-related controller settings that should agree with managed switches.
For information on limitations in OpenFlow table support, see the HPE VAN SDN Controller and
Applications Support Matrix.
Table 4 Controller settings to support hybrid mode
CommentsKeyController Configurations Component
82 Hybrid mode for controlling packet forwarding
Set to true or false.hybrid.modecom.hp.sdn.ctl.of.impl.ControllerManager
age.multihop.linkscom.hp.sdn.disco.of.link.impl.OpenflowLinkDiscoveryComponent
Set this value to the
refresh rate for multihop
links. A faster refresh
rate will introduce more
link-discovery packets
into the network. A
slower refresh rate will
respond more slowly to
a topology change.
Page 83

Table 4 Controller settings to support hybrid mode (continued)
CommentsKeyController Configurations Component
arp.agecom.hp.sdn.disco.of.node.impl.OfArpDiscoveryComponent
dhcp.agecom.hp.sdn.disco.of.node.impl.OfDhcpDiscoveryComponent
To support ARP-based
host discovery, change
this setting in the
controller to be greater
than or equal to the “ip
arp-age” setting on
controlled switches.
To support DHCP-based
host discovery, change
this setting in the
controller to be greater
than or equal to the
timeout value of the
DHCP server(s) on your
network.
To view or reconfigure any of the above controller configuration components:
1. In the controller UI, select Configurations.
a. Select the Basic tab to view or modify the following components:
• com.hp.sdn.ctl.of.impl.ControllerManager
• com.hp.sdn.disco.of.node.impl.OfArpDiscoveryComponent
• com.hp.sdn.disco.of.node.impl.OfDhcpDiscoveryComponent
b. Select the Advanced tab to view or modify the following component:
2. Click the Modify button. In the Modify Configuration dialog box you can view the current
3. Click Apply to save the changes.
For more information on using the Configurations screen, see “Configurations screen details”
(page 39).
Limitations
For information on limitations in OpenFlow table support, see the HPE VAN SDN Controller and
Applications Support Matrix.
OpenFlow 1.0 is the default version of OpenFlow for Hewlett Packard Enterprise ProVision
switches. OpenFlow does not allow the controller to optimize flow location in hardware tables.
For concerns about line-rate data plane performance, configure all managed switches to use
OpenFlow 1.3. Failure to properly configure the switch in this way may cause packet loss or other
problems associated with high switch CPU utilization.
Uncontrolled switches in an OpenFlow Hybrid network are not visible to or controlled by the HPE
VAN SDN Controller. Uncontrolled switches are either controlled by another controller (outside
the team) or not controlled at all (traditional networking). Traffic by such switches is independently
managed.
The HPE VAN SDN Controller Path Diagnostic Tool is useful only when hybrid mode is disabled.
When hybrid mode is enabled, the controller does not monitor or direct all flows in the network.
As a result, the path diagnostic tool (PathDiagnosticManager) does not have visibility into all
flows on the network, and should not be used.
• com.hp.sdn.disco.of.link.impl.OpenflowLinkDiscoveryComponent
setting for each key for the component and make changes.
Coordinating controller hybrid mode and OpenFlow switch settings 83
Page 84

Controller packet-forwarding when hybrid mode is disabled
Figure 48 Controller operation with hybrid mode disabled
When hybrid mode is disabled (set to "false"), the controller examines and directs the packets
in all flows for the given OpenFlow instance. The controller forwarding decisions for flows in a
given instance are based on the requirements of the installed applications. The forwarding
decision is communicated to controlled switches through OpenFlow. In instances where the
controller has not provided the switch with a rule for how to forward a packet type, the switch
sends the packet to the controller and waits for the controller to provide forwarding instructions.
Hybrid mode is commonly disabled in networks that are either used for experimental OpenFlow
work (such as developing a controller application) or for networks that are completely new and
designed to be fully controlled by OpenFlow.
84 Hybrid mode for controlling packet forwarding
Page 85

Controller packet forwarding when hybrid mode is enabled
Figure 49 Controller operation with hybrid mode enabled
When hybrid mode is enabled (the default), the specific packet types for which the controller
monitors and overrides switch forwarding rules depends on the applications installed and running
in the controller. That is, the controller overrides normal packet forwarding rules in the OpenFlow
switch with application-specific forwarding rules, such as:
• copying ARP request/reply and DHCP offer/ACK packets to the controller so that it can
discover end-hosts
• stealing BDDP packets to the controller so that it can discover inter-switch links
• changing the priority on Microsoft Lync packets to improve instant messaging speed
• monitoring DNS requests to detect dangerous end-host behavior
Packets in flows that the controller does not examine or direct are forwarded through normal
switching operations without controller intervention.
NOTE: Hewlett Packard Enterprise recommends that hybrid mode be enabled when controlling
traditional, established networks where applications-related traffic is responsible for only a subset
of the overall traffic load on the network. Hybrid mode is commonly enabled in established
networks where new applications are installed and running on the controller, creating a need to
override normal switching behavior for specific flows.
Controller packet forwarding when hybrid mode is enabled 85
Page 86

5 License Registration and Activation
A license is required for the controller. In addition, SDN applications can require licenses that
are separate from the license for the controller. Typically, you must have both a license for the
controller and a license for each application. For Hewlett Packard Enterprise SDN applications,
you register the license, obtain the license key, and activate the license on the controller using
the same methods you use to register and activate controller licenses. For information about
obtaining license keys for an application, see the Administrator Guide for the application.
For information on the different types of licenses and how to maintain license registration and
activation after a controller software update, see “License types, usage, and expiration” (page 86).
Overview of the license registration and activation process
After you have downloaded and installed the controller software, as described in the HPE VAN
SDN Controller Installation Guide, you can begin the license registration and activation process.
NOTE: Evaluation licenses are available, for details see “Using Evaluation Licenses ” (page 98).
The basic steps are:
1. “Preparing for license registration” (page 87):
a. “Prerequisites for license registration” (page 87)
b. “Identifying the Install ID displayed in the controller UI” (page 87)
2. “Registering and activating a license” (page 87)
a. “Registering your license and obtaining a license key” (page 88) using the My Networking
portal
b. “Activating a license on the controller” (page 92)
3. “Managing licenses” (page 93)
“Transferring licenses” (page 93)
a. “Deactivating licenses to prepare for transfer” (page 94)
b. “Transferring licenses to a new platform” (page 95)
c. Use new license keys to activate the licenses on the target controller.
License types, usage, and expiration
The following licenses are available for the HPE VAN SDN Controller:
• HPE VAN SDN Ctrl Base SW w/ 50–node E-LTU—The base license for the controller.
• HPE VAN SDN Ctrl 50–node E-LTU—Provides an additional 50–node license.
• HPE VAN SDN Ctrl HA E-LTU—Enables the controller to form a team for high availability.
The following guidelines apply:
◦ The number of team members for an HPE VAN SDN Controller team is three.
◦ When forming a team, only one HPE VAN SDN Controller base license is required,
along with at least two High Availability licenses, all on the same Master controller. Once
86 License Registration and Activation
Page 87

a team is formed, Add Nodes licenses can be added to the team leader for increased
support. In addition, you must:
– Use non-previously licensed controller installations to form the team.
– Use a new hardware platform (or Virtual Machine) with a new installation of the
HPE VAN SDN Controller.
– Run the same software version on all controllers.
• Application Licenses—Licenses for SDN applications. For more information, refer to the
administrator guide for the specific application.
Preparing for license registration
Prerequisites for license registration
Before beginning the license registration and activation process, you must do the following:
• Obtain a Hewlett Packard Enterprise My Networking portal user account.
• Obtain the order number or product registration ID, and e-mail address from your HPE VAN
SDN Controller license order confirmation.
• Install the HPE VAN SDN Controller software and have the controller running, as described
in the HPE VAN SDN Controller Installation Guide.
Identifying the Install ID displayed in the controller UI
Each controller installation generates a unique Install ID that is used for licensing activities.
To view the Install ID using the UI, select Licences from the navigation menu. In the Licenses
screen, the Install ID appears before the list licenses.
To use curl commands and the REST APIs to complete this task, see “curl commands” (page 170).
Figure 50 Default License GUI
Registering and activating a license
Using your Install ID, you must now register your license on the My Networking portal. Doing
this results in a license key, which enables you to activate the license on the controller.
Preparing for license registration 87
Page 88

NOTE: If you are registering licenses in addition to the base controller license, Hewlett Packard
Enterprise recommends you do so in the following order:
1. Register the base controller license.
2. Register any Add Nodes licenses, and then activate the last license key generated.
3. Register any High Availability licenses, and then activate the last license key generated.
4. Register any application licenses you have acquired.
Registering your license and obtaining a license key
To register your license and obtain a license key:
1. Log on to the My Networking portal at http://www.hpe.com/networking/mynetworking.
2. Select My Licenses.
3. In the Order number or Registration ID field, enter your order number or registration ID
and then click Next
• If you enter a registration ID, go to “step 5” (page 88).
• If you enter an order number, the Email field appears.
4. In the Email field, enter either the “Ship to” or “Sold to” e-mail address listed in your sales
order confirmation, and then click Next.
A license selection screen appears, as shown in Figure 51.
Figure 51 Selecting licenses
5. Select the license type, enter the quantity to be registered to your Install ID, and then click
Next.
88 License Registration and Activation
Page 89

NOTE:
• For an HPE VAN SDN Ctrl Base SW w/ 50–node E-LTU license, the quantity must be
1.
• For HPE VAN SDN Ctrl 50–node E-LTU or HPE VAN SDN Ctrl HA E-LTU licenses,
quantity is the number of licenses to be installed with a single Install ID.
• For information on using this process for an application license, see the administrator
guide for that application.
The registration details screen appears, as shown in Figure 52.
Figure 52 Entering the install ID
6. In the Install ID field, enter your Install ID number. (See “Identifying the Install ID displayed
in the controller UI” (page 87).
7. Optional: Enter a Friendly name and Customer notes for this license.
8. Click Next.
The end user software license agreement screen appears.
9. To continue after reading the license agreement, select I accept all of the above terms,
and then click Finish.
The confirmation screen appears, as shown in Figure 53.
Registering your license and obtaining a license key 89
Page 90

Figure 53 Reviewing your registration
10. Review your license registration details, and record the License key listed.
11. Optional: To download the license key file, click Save as, and then save it to your local hard
drive.
12. Optional: To e-mail the registration details:
a. Enter one or more e-mail addresses, separated by a comma or semi-colon in the field
provided.
b. Optional: Enter Comments about this license.
c. Click Send email.
13. Optional: If you want to register additional licenses for this order:
a. Click Register more for this order to return to the license selection screen shown in
Figure 51.
b. Repeat steps “5” (page 88) through 13 until you have registered all licenses.
Viewing your license information
To view your license information:
1. Log on to the My Networking portal at http://www.hpe.com/networking/mynetworking
2. Select My Licenses.
3. Click View Licenses to see a screen similar to the following:
90 License Registration and Activation
Page 91

4. To view the information for the license you just loaded, click the Select button for that license.
You will then see a screen similar to the following:
Figure 54 Viewing your license and other information
Registering your license and obtaining a license key 91
Page 92

5. Record the license key in the above screen for use when you activate the license on the
controller.
Activating a license on the controller
To activate a license on the controller, you must add the license key. If the controller has no
licenses listed, enter the license key for the HPE VAN SDN Ctrl Base SW w/50–node E-LTU
before you add any other license keys.
There are several ways to activate a license on the controller:
• To use the controller UI to activate a license, see “Adding and activating a license using the
controller UI” (page 92)
• To use a Python script on the controller to complete this task, see “Activating a license using
a script” (page 93)
• To use curl commands and the REST APIs to complete this task, see “curl commands”
(page 170).
Adding and activating a license using the controller UI
Use the following procedure to add and activate a license using the controller UI.
1. In the controller UI, from the navigation menu, select Licenses.
2. On the Licenses screen, enter the license key you acquired in “Registering your license
and obtaining a license key” (page 88) in the text box next to the Add button.
Entering the key in the field enables the Add button.
Figure 55 Enter the License Key
92 License Registration and Activation
Page 93

3. To activate the license, click the Add button.
The active license is displayed in the table, below the Install ID, and the Add button is no
longer available.
Figure 56 Active License Displayed on License screen
Activating a license using a script
As an alternative to using the controller UI to activate the license, you can use a post install
configuration script run locally on the controller. For information on other post install configuration
options using the script, see the HPE VAN SDN Controller Installation Guide chapter on post
install configuration.
The post install configuration Python script is run on the local controller machine. The script is
/opt/sdn/scripts/postinstall/config_sdn.py. You can run it interactively or you can
use a configuration file to enter the inputs for activating the license. The default configuration file
is /opt/sdn/scripts/ansible/config_sdn.conf or you can create a custom configuration
file for use with the script.
To run the config_sdn.py script to activate the controller license:
1. To use the script you must ssh to the controller system. For example, ssh sdn@1.1.1.1
(then enter the ssh password).
2. You can run the script either interactively or with a configuration file as follows:
• If you are running the script interactively without a configuration file, enter the option for
add license on the command line: python config_sdn.py -L. You will be prompted
to enter the license key.
• If you are using the configuration file to enter inputs for the script, edit the
config_sdn.conf file or create a custom configuration file. In the [general] section
enter the controller IP, user name and (optionally) password. If you don’t enter a
password in the configuration file, you will be prompted to enter the password when
you run the script. In the [scripts] section set addlicense=true. In the [addlicense]
section enter the license key. Then run the script with the following command:
python config_sdn.py -f ../ansible/config_sdn.conf (or whatever the
custom configuration file name is)
3. Respond to any prompts as the script runs.
Managing licenses
Transferring licenses
You can transfer a license from one controller to another. To do so, you must first deactivate all
licenses from the controller.
Managing licenses 93
Page 94

NOTE: Keeping a license on one controller while transferring one or more other licenses from
the same controller to another controller is not permitted.
When upgrading, no special effort is required to preserve the licenses. Note that the license
transfer mechanism is only required when you want to switch the controller currently running
hardware. You must install the controller on the new hardware and transfer the licenses to that
new hardware before retiring the old hardware.
Before you transfer licenses
Before you transfer licenses, you must first:
• Deactivate all licenses, as described in “Deactivating licenses to prepare for transfer”
(page 94).
• Obtain an Install ID for each destination controller, as described in “Identifying the Install ID
displayed in the controller UI” (page 87).
Deactivating licenses to prepare for transfer
When you deactivate a license to prepare for transfer, the controller generates an Uninstall Key
for that license, which you will need when you transfer the license. Be prepared to record the
Uninstall Key for each license you deactivate. The Uninstall Key is a long text string. For example:
AE2RCLT7CJMDI-MAGAQHS2NBTOB-6VM4QKEQ4HAEZ-3AY4QELRPG4AA-3EMHQELRPGAYQ
To use curl commands and the REST APIs to complete this task, see “curl commands” (page 170).
To deactivate a license using the controller UI, use the following procedure.
1. In the controller UI, from the navigation menu, select Licenses.
2. Select the license to deactivate to prepare for transfer.
Figure 57 Select a License to Transfer
3. Click Deactivate.
Click OK when the deactivation prompt appears:
Figure 58 License Deactivation Prompt
94 License Registration and Activation
Page 95

4. You will see an Uninstall key displayed for that license. Copy the Uninstall key for that license
to the clipboard by clicking Copy Uninstall Key.
5. Repeat the preceding steps for each of the remaining licenses on the controller.
Transferring licenses to a new platform
After you have deactivated all of the licenses for a controller, you can transfer them to another
controller.
To transfer licenses:
1. Log on to the My Networking portal at http://www.hpe.com/networking/mynetworking.
2. From the My Licenses section, select Transfer licenses to a new platform.
3. In the Search field, enter the Install ID for the controller from which you deactivated the
license, and then click Search.
The transfer license screen displays a list of associated licenses, as shown in Figure 59.
Figure 59 Selecting licenses to transfer
4. Click the Select icon next to the license to be transferred.
The license details screen appears, as shown in Figure 60.
Managing licenses 95
Page 96

Figure 60 Reviewing details before transfer
5. Verify that this is the license you want to transfer, and then click Next.
The target Install ID screen is displayed (Figure 61).
Figure 61 Entering target install and uninstall IDs
96 License Registration and Activation
Page 97

6. In the screen in Figure 61, do the following:
a. In the Target Install ID field, enter the Install ID of the controller to which you want to
transfer the license.
b. In each Uninstall field, enter a license uninstall key. (For more on acquiring uninstall
keys, see Section .)
NOTE: In order for the transfer process to succeed, you must enter an Uninstall
value for every registered license.
c. Click the Transfer button in the lower-right corner of the screen.
New license registration information displays on the license transfer confirmation screen
and license details screen, as shown in Figure 62.
Figure 62 Viewing license transfer confirmation and details screens
7. Review the confirmation screen details.
8. For each license you are transferring, record the new license key so that it will be available
when you add and activate the license on the new controller.
9. Optional: To e-mail transferred license details:
a. Enter one or more e-mail addresses, separated by a comma or semi-colon in the field
provided.
b. Optional: Enter Comments about this license transfer.
c. Click Send email.
The license screen displays the status of the original licenses as Transferred, and the new Install
IDs as Active, as shown in Figure 63.
Managing licenses 97
Page 98

Figure 63 Review transferred license status screens
To register the transferred licenses on the new controller, see “Activating a license on the
controller” (page 92).
Using Evaluation Licenses
To use evaluation licenses:
1. Install the HPE VAN SDN Controller and install all the Hewlett Packard Enterprise SDN
applications you would like to evaluate. If you are using the Hewlett Packard Enterprise SDN
App Store, install the Trial Mode SDN applications.
2. Go to the My Networking portal (MNP) at http://www.hpe.com/networking/mynetworking).
3. Under Licenses, select Register License.
4. From the menu on the right of the screen, select SDN Evaluation Licenses.
5. Enter the HPE VAN SDN Controller installation identifier (install-id).
6. The My Networking portal generates every evaluation license possible for that install-id.
7. Apply the relevant evaluation licenses to the controller and applications.
98 License Registration and Activation
Page 99

6 Configuring for High Availability
Standalone controller operation provides management for the OpenFlow switches in a network.
However, it does not provide high availability (HA), with the result that a controller failure leaves
the network in an unmanaged state. Configuring a team of controllers and one or more
corresponding controller regions creates a high availability network with failover capability,
resulting in a continuously managed network in the event that a controller in the team goes down.
You can view your team configuration using the UI, see “Viewing your team configuration using
the UI” (page 104).
High Availability best practices
• Ensure the team and region configuration meets all of the requirements for teaming. For
details, see “Requirements for teaming” (page 100).
• Ensure that IP routing configuration in the controller domain enables the controller team IP
address to be reached from all areas of the domain.
• If any application installed on the controller uses the Cassandra database, run the Cassandra
nodetool repair command every 10 days. For details, see “Manually synchronizing
Cassandra database nodes using nodetool repair utility” (page 102).
• Before you create the team, configure NTP such that all the controllers that will be in the
team use the same local NTP server. Using the same NTP server for all controllers helps
to ensure that the controller clocks remain synchronized. Keeping the system clocks
synchronized is especially important for applications that use the Cassandra database. For
details, see “Configuring controllers to use the same local NTP servers” (page 103).
• Either use the same Keystone server for authentication for all three controllers in the team,
or use a local Keystone server for each controller in the team. For details on security, see
“Security” (page 110).
• To use TLS connections for communications between the switch and the built-in OpenFlow
controller module of the HPE VAN SDN Controller, Hewlett Packard Enterprise recommends
that all controller and device certificates be signed by the same CA. For information about
configuring TLS on a switch, see the documentation for the switch.
• If you are configuring web proxy server settings, ensure that you include the team IP address
and the IP addresses for all three controllers in the team in the /etc/init/sdnc.conf
file. After editing the sdnc.conf file all three controllers will need to be restarted. For details,
see “Obtaining applications from the Hewlett Packard Enterprise SDN App Store” (page 34).
About teaming for High Availability
• Each controller belonging to a team is a team member. To centralize team management
and control, one controller is elected by the team as the team leader.
• Teaming is configured on one controller and is automatically propagated to the other
controllers in the team, regardless of which controller becomes the team leader.
• After a team is configured, any configuration changes will propagate to each controller.
• If the team leader goes down, another active controller becomes the team leader. If a team
leader that failed recovers and rejoins the team, it rejoins the team as a team member and
does not resume team leadership.
• Each controller in the team has its own IP address, which is the IP address of the machine
on which the controller is installed. In addition, the administrator configures a separate IP
address—called the team IP address—to represent the team as a whole. The team IP
address is active on the team leader. If the current team leader goes down, the failover
process includes keeping the team IP address active on the new team leader.
High Availability best practices 99
Page 100

• For the controllers in a team to remain active, they must be part of the team quorum. To be
part of a team quorum, a controller must be connected to at least one other team member
that has a status of active or initializing. If one controller in the team goes offline, controller
operations can continue. However, if two controllers in a team fail, the third controller does
not operate as a standalone controller. Instead, the third controller loses its membership in
the team quorum, and the controller status is changed to suspended.
• A region groups devices together with their controllers. A region must have three controllers
which must be specified in priority order for all devices within the region (master, primary
slave, secondary slave).
• Putting the region configuration in place for a controller team ensures seamless failover and
failback among the configured controllers for the specified network devices in a region. When
a controller experiences a fault, the region configuration ensures that a slave controller
immediately assumes the master role over the groups of network devices for which the failed
controller was master. Once the failed controller recovers and rejoins the team, the rejoining
controller takes back the role for which it was configured with respect to the network devices.
For details on failover and failback, see “Failover behavior within a region” (page 189),
“Failback behavior within a region” (page 191).
• Devices in a region can be expressed as a list of individual IPv4 addresses, a list of IPv4
ranges, or a combination of both. Devices included in a region can connect to the region’s
controllers. OpenFlow 1.3 devices must be configured with the IPs of all three controllers in
a team. This allows one of those controllers to assert itself as the master of a given device.
The device then automatically assigns a role of slave to the other two configured controllers.
This ensures the master knows of all the events happening on the device while the slaves
are kept up to date on a subset of events.
• Applications are stopped when there is a change in the teaming status for a given controller.
For example:
◦ When the controller transitions from stand-alone to a member of a team, all applications
are stopped prior to the creation of the team, and then restarted after the team is formed.
◦ When a teamed controller detects that it is no longer part of the quorum, all applications
are stopped until the controller detects it has rejoined the quorum.
All team members in a teamed environment must be active before you can make configuration,
licensing, application or region changes. Changes attempted when a team member is initializing
or disconnected are not guaranteed to be consistent, such changes are blocked through the
REST API and the GUI. Changes attempted through the REST API result in Forbidden response
(error code 403) and an UnsafeConfigurationException exception.
The team status can be: active, unreachable, or unknown (for details, see “Team status”
(page 101)). You can view team status from the Team screen in the controller UI, see “Viewing
team status” (page 104).
The controller status can be: initializing, active, suspended, or unreachable (for details, see
“Controller status ” (page 101). You can view controller status from the Team screen in the controller
UI, see “Viewing team configuration and controller status” (page 105).
You can view region configuration from the Team screen in the controller UI, see “Viewing region
configuration” (page 105).
Requirements for teaming
• Teaming operation requires the High Availability “Add Controller” license (HPE VAN SDN
Ctrl HA E-LTU). For licensing information, see “License Registration and Activation” (page 86).
• Each controller needs to be able to communicate with all the other controllers on TCP ports
5700, 7001, and 8443.
100 Configuring for High Availability
 Loading...