

Page 1

HP Insight Environmental Observer
Part Number 531668-004
Software User Guide
December 2010 (Fourth Edition)
Page 2

© Copyright 2009, 2010 Hewlett-Packard Development Company, L.P.
The information contained herein is subject to change without notice. The only warranties for HP products and services are set forth in the express
warranty statements accompanying such products and services. Nothing herein should be construed as constituting an additional warranty. HP
shall not be liable for technical or editorial errors or omissions contained herein.
Confidential computer software. Valid license from HP required for possession, use or copying. Consistent with FAR 12.211 and 12.212,
Commercial Computer Software, Computer Software Documentation, and Technical Data for Commercial Items are licensed to the U.S.
Government under vendor’s standard commercial license.
Microsoft, Windows, and Windows Server are U.S. registered trademarks of Microsoft Corporation. Intel, Pentium, and Itanium are trademarks
or registered trademarks of Intel Corporation or its subsidiaries in the United Stated and other countries. UNIX is a registered trademark of The
Open Group. Adobe and Acrobat are registered trademarks of Adobe Systems Incorporated.
Intended audience
This document is for the person who installs, administers, and troubleshoots HP Data Center Environmental Edge systems. HP assumes you are
qualified in the servicing of computer equipment and trained in recognizing hazards in products with hazardous energy levels.
Page 3

Contents
Overview ..................................................................................................................................... 5
About HP Insight Environmental Observer ..................................................................................................... 5
Components ............................................................................................................................................. 5
System requirements .................................................................................................................................. 5
Hardware requirements .................................................................................................................... 5
Software requirements ...................................................................................................................... 6
Client PC requirements ..................................................................................................................... 6
Accessing the HP Insight Environmental Observer .......................................................................................... 6
Secure web access .......................................................................................................................... 7
HP Insight Environmental Observer console interface ........................................................................ 8
Interface components ................................................................................................................................. 8
Menu bars ...................................................................................................................................... 9
Navigation panel ............................................................................................................................ 9
Data View window ........................................................................................................................ 12
Global Information panel ................................................................................................................ 12
System status................................................................................................................................. 13
Changing the appearance of columns ........................................................................................................ 13
Sorting the data in a column ........................................................................................................... 13
Resizing the width of a column ........................................................................................................ 13
Relocating a column ...................................................................................................................... 13
Hiding a column ............................................................................................................................ 14
Printing data ........................................................................................................................................... 14
Resizing the Data View window ................................................................................................................ 14
Closing the Data View window ................................................................................................................. 14
Views ........................................................................................................................................ 15
Data center views .................................................................................................................................... 15
PUE tab .................................................................................................................................................. 15
Accessing the PUE tab .................................................................................................................... 16
Viewing data center PUE information ............................................................................................... 16
Overview tab .......................................................................................................................................... 19
Accessing the Overview tab ............................................................................................................ 19
Viewing data center Overview information ....................................................................................... 20
Viewing zone Overview information ................................................................................................ 21
Detecting disconnected sensors ....................................................................................................... 29
Detecting sensors that require maintenance ....................................................................................... 30
Imaging tab ............................................................................................................................................ 30
Accessing the Imaging tab .............................................................................................................. 30
The Map Legend ........................................................................................................................... 32
Display modes .............................................................................................................................. 32
Pre-Defined Metrics tab ............................................................................................................................ 36
Accessing the Pre-Defined Metrics tab .............................................................................................. 36
Pre-defined metric definitions ........................................................................................................... 37
Custom Metrics tab .................................................................................................................................. 38
Accessing the Custom Metrics tab .................................................................................................... 38
Tabular views ......................................................................................................................................... 41
Contents 3
Page 4

Accessing the Tabular views ........................................................................................................... 41
Sensor object tabs ......................................................................................................................... 41
Alerts ........................................................................................................................................... 50
Exporting tabular data to a .csv file ................................................................................................. 52
Wireless Sensor Network tab .................................................................................................................... 53
Accessing the wireless sensor network .............................................................................................. 53
Menu bar actions ........................................................................................................................ 55
Menu bar options .................................................................................................................................... 55
Reports menu .......................................................................................................................................... 56
Creating a report .......................................................................................................................... 56
Creating custom reports .................................................................................................................. 62
Generating battery reports .............................................................................................................. 65
Base Station F/W reports ............................................................................................................... 66
Exporting report data to .csv file ...................................................................................................... 67
Viewing sensor data for analysis ..................................................................................................... 67
Customizing charts ........................................................................................................................ 68
Alerts menu ............................................................................................................................................ 68
Viewing global active alerts ............................................................................................................ 69
Viewing global alert history ............................................................................................................ 69
Defining a new alert ...................................................................................................................... 70
Managing alerts ............................................................................................................................ 72
Administration menu ................................................................................................................................ 82
Creating user accounts ................................................................................................................... 83
User accounts ............................................................................................................................... 84
Viewing the system log ................................................................................................................... 87
Administrative options .................................................................................................................... 88
My Account menu ................................................................................................................................... 96
Changing your password ............................................................................................................... 96
Changing your preferences ............................................................................................................. 97
Help menu ........................................................................................................................................... 100
Accessing the user guide .............................................................................................................. 100
Viewing version information .......................................................................................................... 100
Maintenance ............................................................................................................................ 102
Battery management .............................................................................................................................. 102
Generating battery reports ............................................................................................................ 102
Replacing batteries ...................................................................................................................... 103
System backup ...................................................................................................................................... 104
System restore ....................................................................................................................................... 105
Troubleshooting ........................................................................................................................ 106
HP Insight Environmental software troubleshooting ..................................................................................... 106
Before you contact HP ............................................................................................................................ 108
HP contact information ........................................................................................................................... 108
Acronyms and abbreviations ...................................................................................................... 109
Index ....................................................................................................................................... 111
Contents 4
Page 5

Overview
About HP Insight Environmental Observer
The HP Insight Environmental Observer is a web-based application that provides visualization of data
center environmental and power data including:
• Rack and/or equipment cabinets temperature and relative humidity
• CRAH/CRAC temperature and relative humidity
• Differential subfloor air pressure
• Chilled water energy values
• Electric power and current values
Users can create customized alerts based on the monitored sensor points.
Observer can monitor a single data center or multiple data centers with a single software installation.
Components
The HP Insight Environmental software includes the following components:
• HP Insight Environmental Application Server
• HP Insight Environmental Observer Console—Visualization and monitoring application
• MySQL Database—Data storage
• HP Insight Environmental Imaging Server—Environmental images created from sensor data
• HP Insight Environmental Device Manager—Subsystem of Observer that provides interfaces to the
managed sensor and data devices
For more information on using HP Insight Environmental software components and its components, see the
HP Insight Environmental Software Installation Guide.
System requirements
Before you install Observer software and related components, the following minimum specifications must
be met.
Hardware requirements
Hardware Requirements
Processor Quad-core processor (Inte®l or AMD®)
Memory 8 GB RAM
Disk space 750 GB (hot swap RAID 1 preferred) with battery-
Overview 5
Page 6

Hardware Requirements
backed caching
Power supply Redundant power (2)
Connectivity Gigabit Ethernet adapter (2)
Software requirements
Software Requirements
Operating system Windows Server® 2008 R2 Standard (64 bit)
Windows Server® 2003 R2 Standard Edition (64 bit)
Windows Server® 2008 Enterprise (32 bit)
Windows Server® 2003 R2 Enterprise Edition (32 bit)
Required software Adobe® Reader
User privileges User with full administrator privileges configured for
installation
Secure access SSL certificate file (if secure access is enabled)
Client PC requirements
Client PC Requirements
Supported
browsers
Flash plug-in Adobe® Flash® Player 9.0.x or later
Internet Explorer 7.0.x or later
Mozilla Firefox 2.0.x or later
Enable cookies in the browser
Accessing the HP Insight Environmental Observer
To install Observer, see the HP Insight Environmental Installation Guide. To access Observer:
1. Launch any supported browser applications.
2. Obtain the server name or IP address and port from the system administrator who configured the
system. The default port is 8080 for non-secure access and 443 for secure access. If you are
accessing Observer from the server where it is installed, substitute localhost for the server name.
3. Browse to one of the following standard non-secure web addresses:
o http://[server name]:[port]/HPIEO, where [server name] is the name of the server and [port] is
the name of the port
o http://[server IP address]:[port]/HPIEO, where [server IP address] is the server IP address and
[port] is the name of the port
o http://localhost:8080/HPIEO when using the server on which Observer is installed.
To set up a secure access using SSL, see Secure web access (on page 7). If you encounter an issue
accessing the web address, contact the system administrator.
The application splash screen appears. If the login screen does not appear within a few seconds,
press Enter, or select Click to enter on the splash screen.
Overview 6
Page 7
4.
Enter a valid username and password in the login window to authenticate the application.
If the authentication is unsuccessful, a message appears, indicating that the login attempt failed.
If the authentication is successful, access is granted, and the HP Insight Environmental Observer console
window appears. A welcome message and instructions for selecting a data center or zone to view and
manage appear.
If you have logged in previously, the window displays an updated view for the data center or zone that
was selected before logging out.
Functionality is accessible or restricted depending on the user role. For more information, see User
accounts (on page 84).
Secure web access
An SSL certificate is required before you can configure the Observer to use a secure web access. Selfcertified or third-party certifications are supported. For more information, see Security options (on page
92).
Overview 7
Page 8
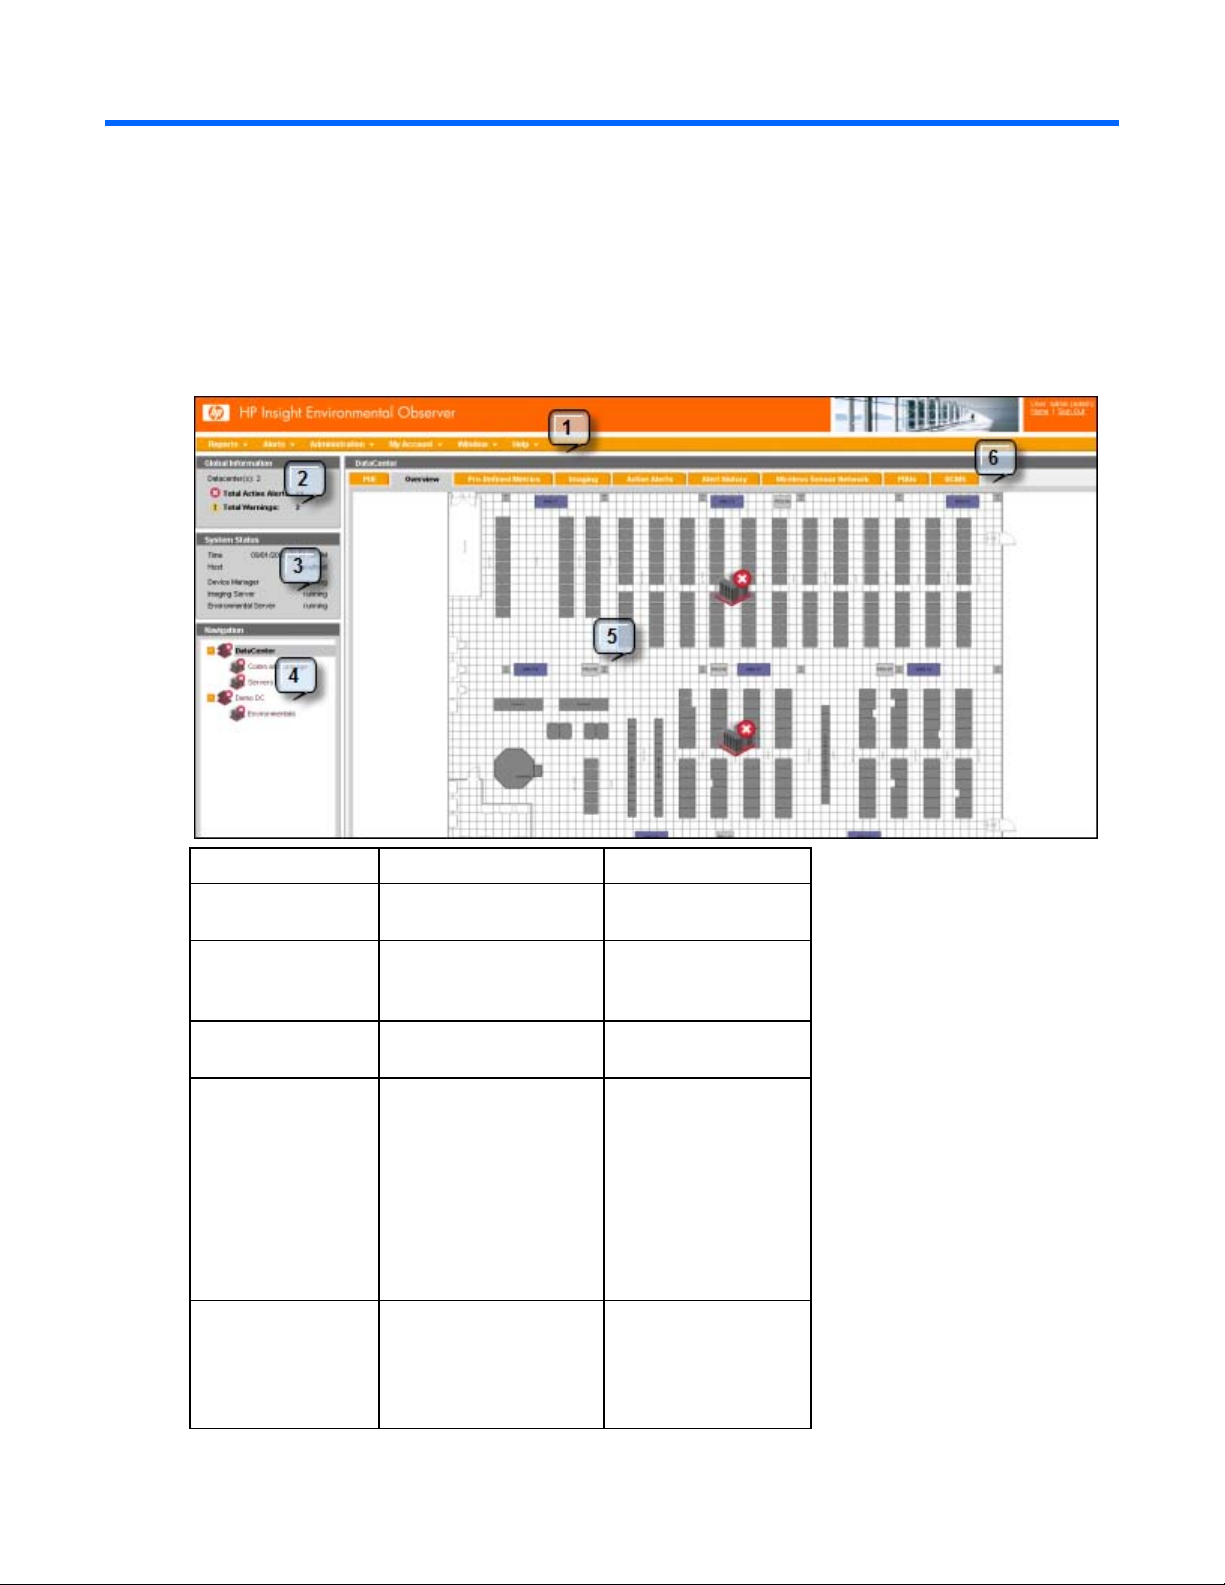
HP Insight Environmental Observer console interface
Interface components
Callout Component Description
1 Menu bar Includes the main task
tabs for the portal.
2 Global information Contains all active alerts
and warnings for all
data centers installed.
3 System status Contains the status of all
installed components.
4 Navigation panel Contains the sensors in
each location configured
at installation by data
center and zone. HP
Insight Environmental
Observer console
displays information
based on additional
user input.
5 Data view window Contains summary and
detailed information
about base stations,
racks, and
CRAH/CRACs.
HP Insight Environmental Observer console interface 8
Page 9
Callout Component Description
•
6 View menu bar Includes tabs for viewing
options.
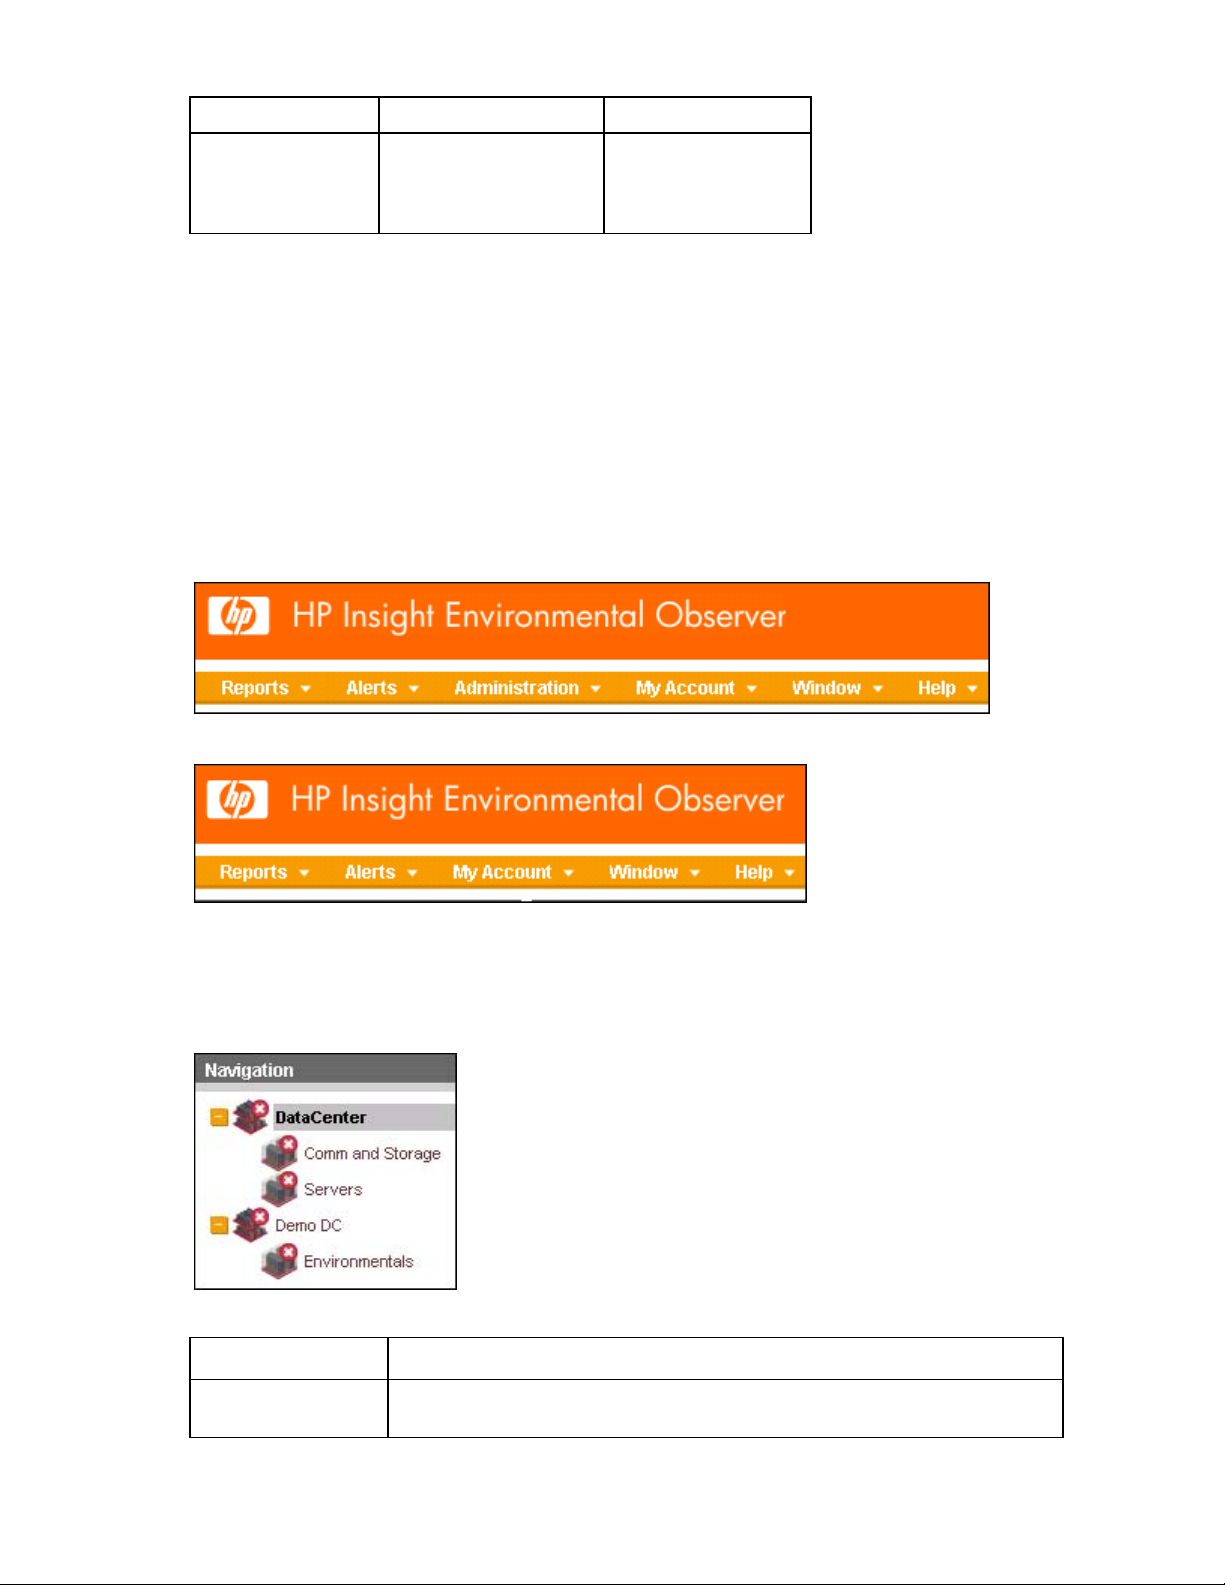
Menu bars
HP Insight Environmental Observer has the following user types:
• Administrator
• Power user
• Standard user
Each user type has a different view that correlates with the functions allowed for that user role. The
primary differences appear in the menu bars.
Administrator menu bar
Power and Standard user menu bar
Navigation panel
The Navigation panel appears to the left of the HP Insight Environmental window. The panel displays a
hierarchical list of the data centers and zones configured at installation.
To choose a data center or zone, select an icon or its corresponding text label.
Icon Description
Data Center The icon and text label represent the data center the user can view.
When the icon and label are red, active alerts are in at least one zone in the
HP Insight Environmental Observer console interface 9
Page 10
Icon Description
•
•
•
data center.
When the icon and label are yellow, warnings are in at least one zone in the
data center.
Data centers are configured at installation.
Zone The icon and text label represent the zone the user can view.
When the icon and label are red, active alerts are in that zone.
When the icon and label are yellow, warnings are in that zone.
Zones are configured at installation.
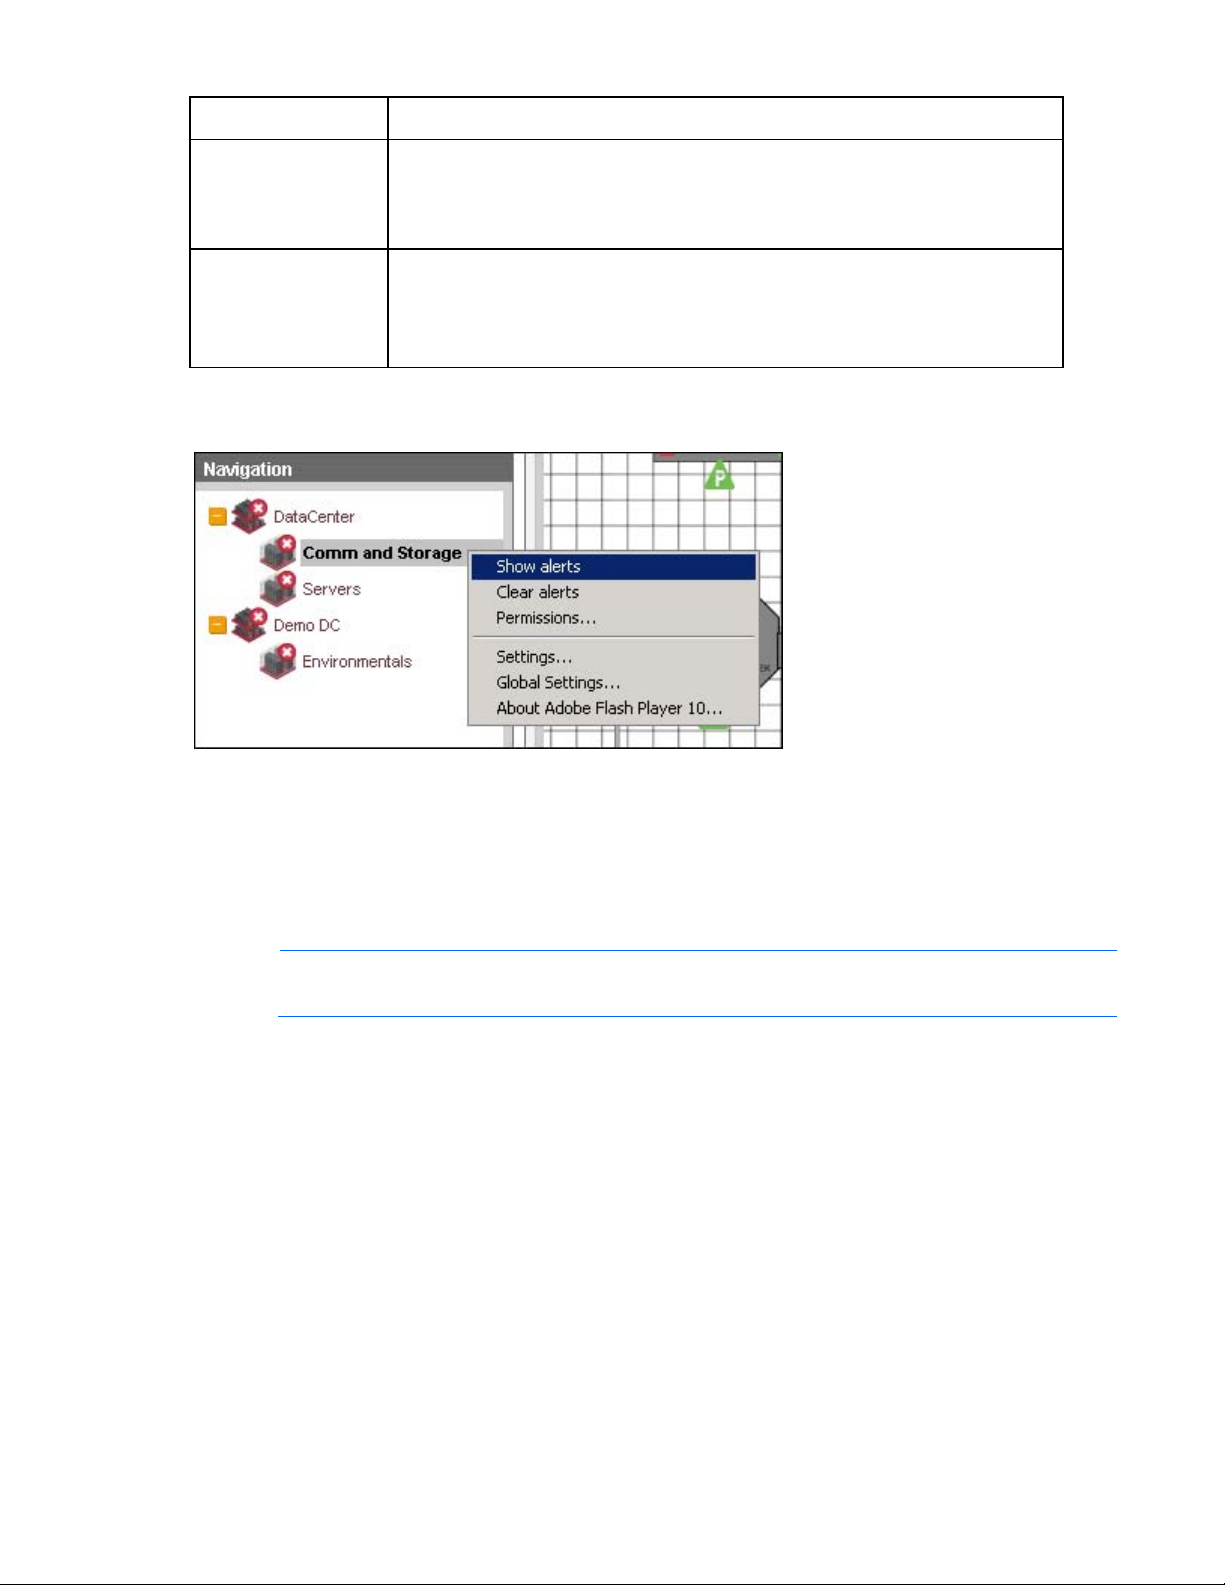
To navigate directly to the Alerts menu, right-click the data center or zone, and select Show alerts. For
more information on alerts, see Alerts menu (on page 68).
The content of the Data View window changes to correspond to the data center and zone selected on the
Navigation panel.
When you log out, the application saves the state of the Navigation panel. The next time you log in, the
Setting permissions
Observer displays that information in the Data View window.
NOTE: Administrators automatically have permission to view all data centers and zones.
As users are added to the system, an administrator must set each standard user's permissions to enable
the user to access monitored data centers and their corresponding zones. The following permission
options are available:
• Data center level only—Provides a high-level view of the monitored data center.
• Data center and corresponding zones—Provides more details of the monitored components within
the data center. For a user to have permission to view a zone, the user must have permission to view
the data center where the zone is located.
Setting the permissions by individual user is the most secure option. However, an administrator can give
every user permission to view a data center or zone, avoiding the requirement to add each new user's
permissions, by adding Everyone.
To set user permissions:
HP Insight Environmental Observer console interface 10
Page 11
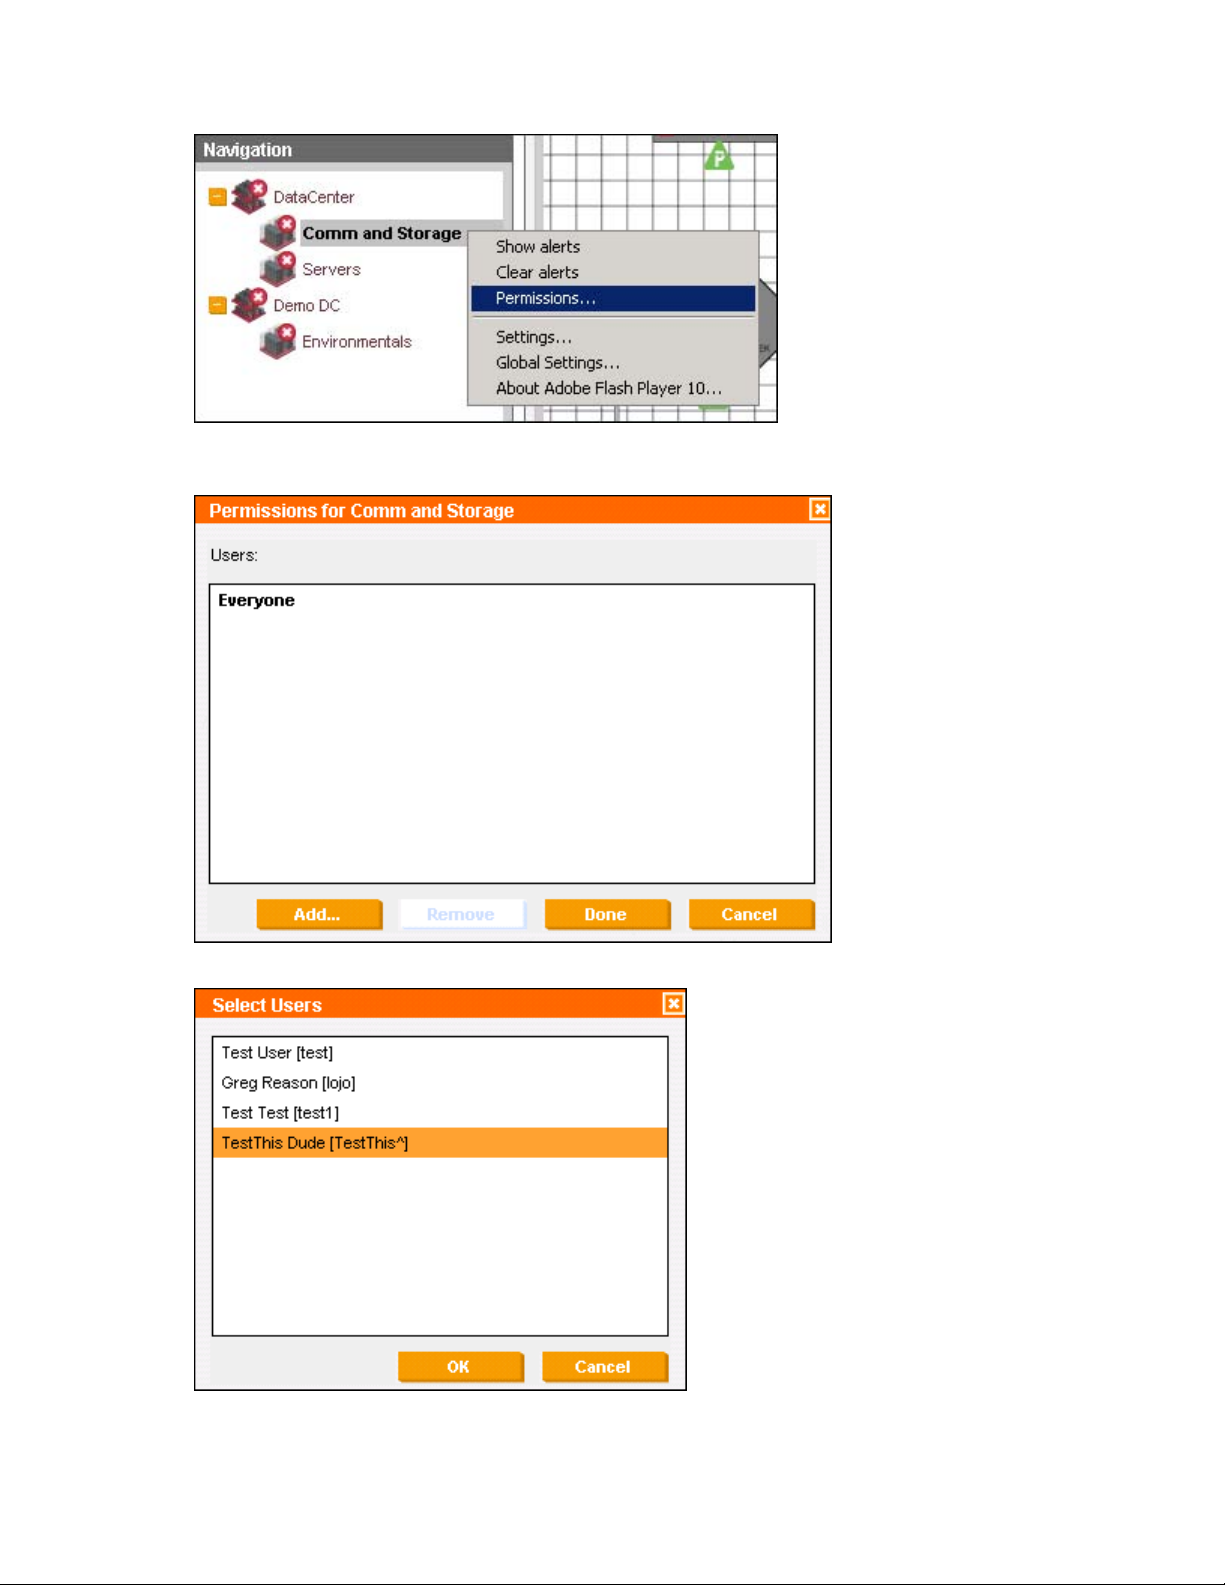
1.
In the Navigation panel, right-click on the data center or zone, and select Permissions.
The Permissions window for the selected data center or zone appears, showing a current list of all
users with access to the selected data center or zone.
2. To give a user permissions to the zone, select Add. The Select Users window appears.
HP Insight Environmental Observer console interface 11
Page 12

o
To give an individual user permission to the data center or zone, highlight the user and select
OK, or select Cancel to close without saving.
o To give all users permission to the data center or zone, highlight Everyone and select OK, or
select Cancel to close without saving.
3. To revoke a user's permissions to the data center or zone, highlight the user, and select Remove.
4. After setting the user permissions, select Done to save the changes and close, or select Cancel to
close without saving the changes.
Data View window
The Data View window is the area of the HP Insight Environmental Observer portal that displays detailed
information, which might include the following tabs:
• Overview
• Metrics
• Imaging
• Active Alerts
• Alert History
• Base Stations
• Pressure Objects
• Racks
• CRAH/CRAC
• Power Meters
Which tab appears is determined by the following:
• The data center or zone that you selected on the Navigation panel
• The menu option that you select
• The tab that you select
Multiple windows might appear simultaneously. However, if more than one window is open, then the
windows overlap completely. Close the visible window to view the window beneath it.
The Data View window can appears on tabbed pages or columns, depending on the view. Click a tab to
go to that page. You can perform operations directly within the columns.
Global Information panel
The Global Information panel appears to the left of the HP Insight Environmental Observer window. It
displays all alerts and warnings for all of the monitored data centers.
HP Insight Environmental Observer console interface 12
Page 13
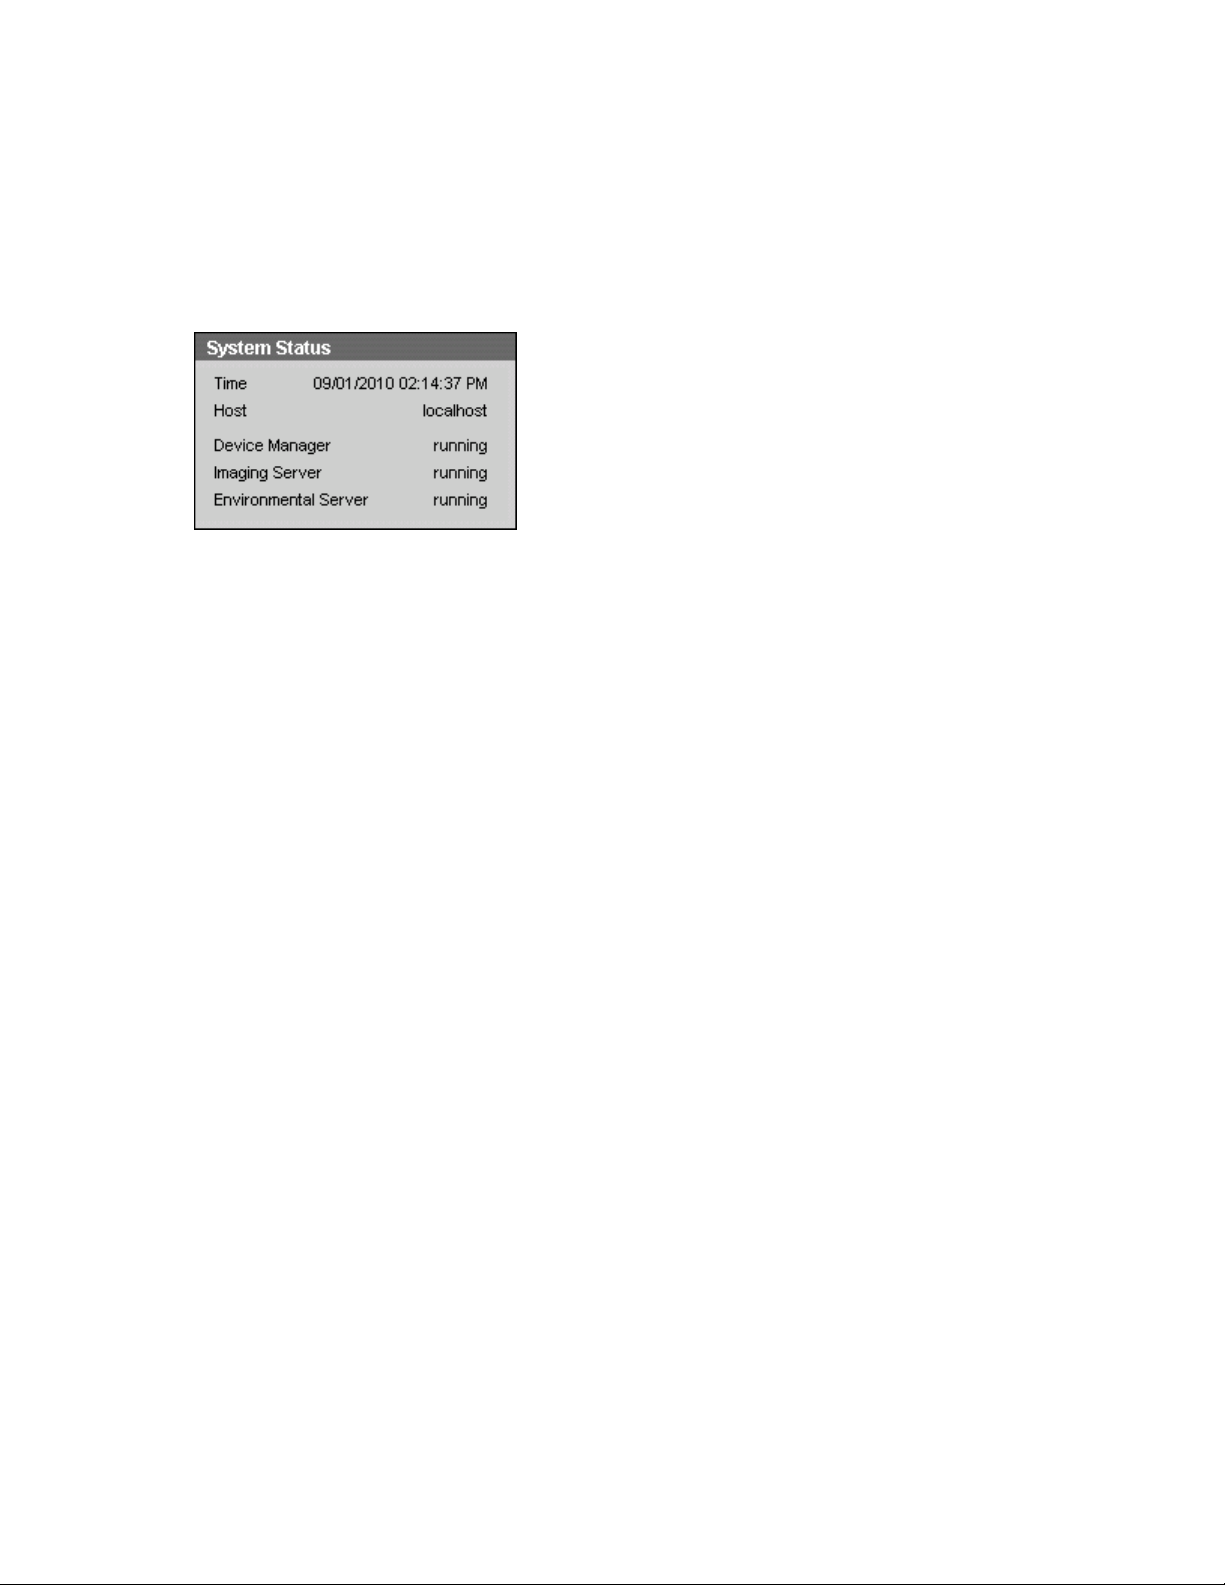
System status
The System Status panel appears to the left of the HP Insight Environmental window. It displays the
following information:
• Date and time
• IP address of the Edge server
• Status of main components
Changing the appearance of columns
There are several ways to change the appearance of the columns in the Data View window:
• Sort the data in the columns (from top to bottom or bottom to top)
• Resize the width of columns
• Relocate the columns to reorder them
Sorting the data in a column
• Hide or show one or more columns
1. Click once in the column heading.
A down arrow appears that indicates that entries are sorted from top to bottom.
2. Click the column heading a second time. An up arrow appears that indicates that the entries are
sorted from bottom to top.
Every time you sort the data in one column, the order of data in other columns changes to
correspond appropriately.
Resizing the width of a column
1. Position the mouse pointer over the headings between that column and the adjacent column until the
pointer becomes a double-headed arrow.
2. Drag the arrow to the left or right until the column is the correct width.
The adjacent column moves but is not resized.
Relocating a column
1. Position the mouse pointer over the heading of the column until the hand pointer appears.
2. Drag the heading to the left or right, and release the mouse button when the moving column appears
over the columns between which you want to relocate it.
HP Insight Environmental Observer console interface 13
Page 14
3.
The other columns shift to accommodate the new column.
Hiding a column
1. Position the mouse pointer over the Plus button (+), above the vertical scroll bar at the right of the
page, until the hand pointer appears.
2. Click the mouse to display a panel with checkboxes for the columns on the page. Check marks
appear for columns that are showing.
3. Choose one of the following options:
o To hide a column, click inside the checkbox to remove the check mark.
o To show a column, click inside the checkbox to display a check mark.
The application shows or hides the columns accordingly.
Printing data
1. Right-click anywhere inside the Tabular rows of data.
2. Select Print table.
Resizing the Data View window
To resize the Data View window, select Maximize/Restore at the upper right corner of the window
To manually resize the Data View window and resize the Navigation panel accordingly:
1. Position the mouse pointer over the middle of the leftmost border of the Data View window until the
hand pointer appears.
2. Drag the border to the left or right, and release the mouse button when the window and panel are
resized as required.
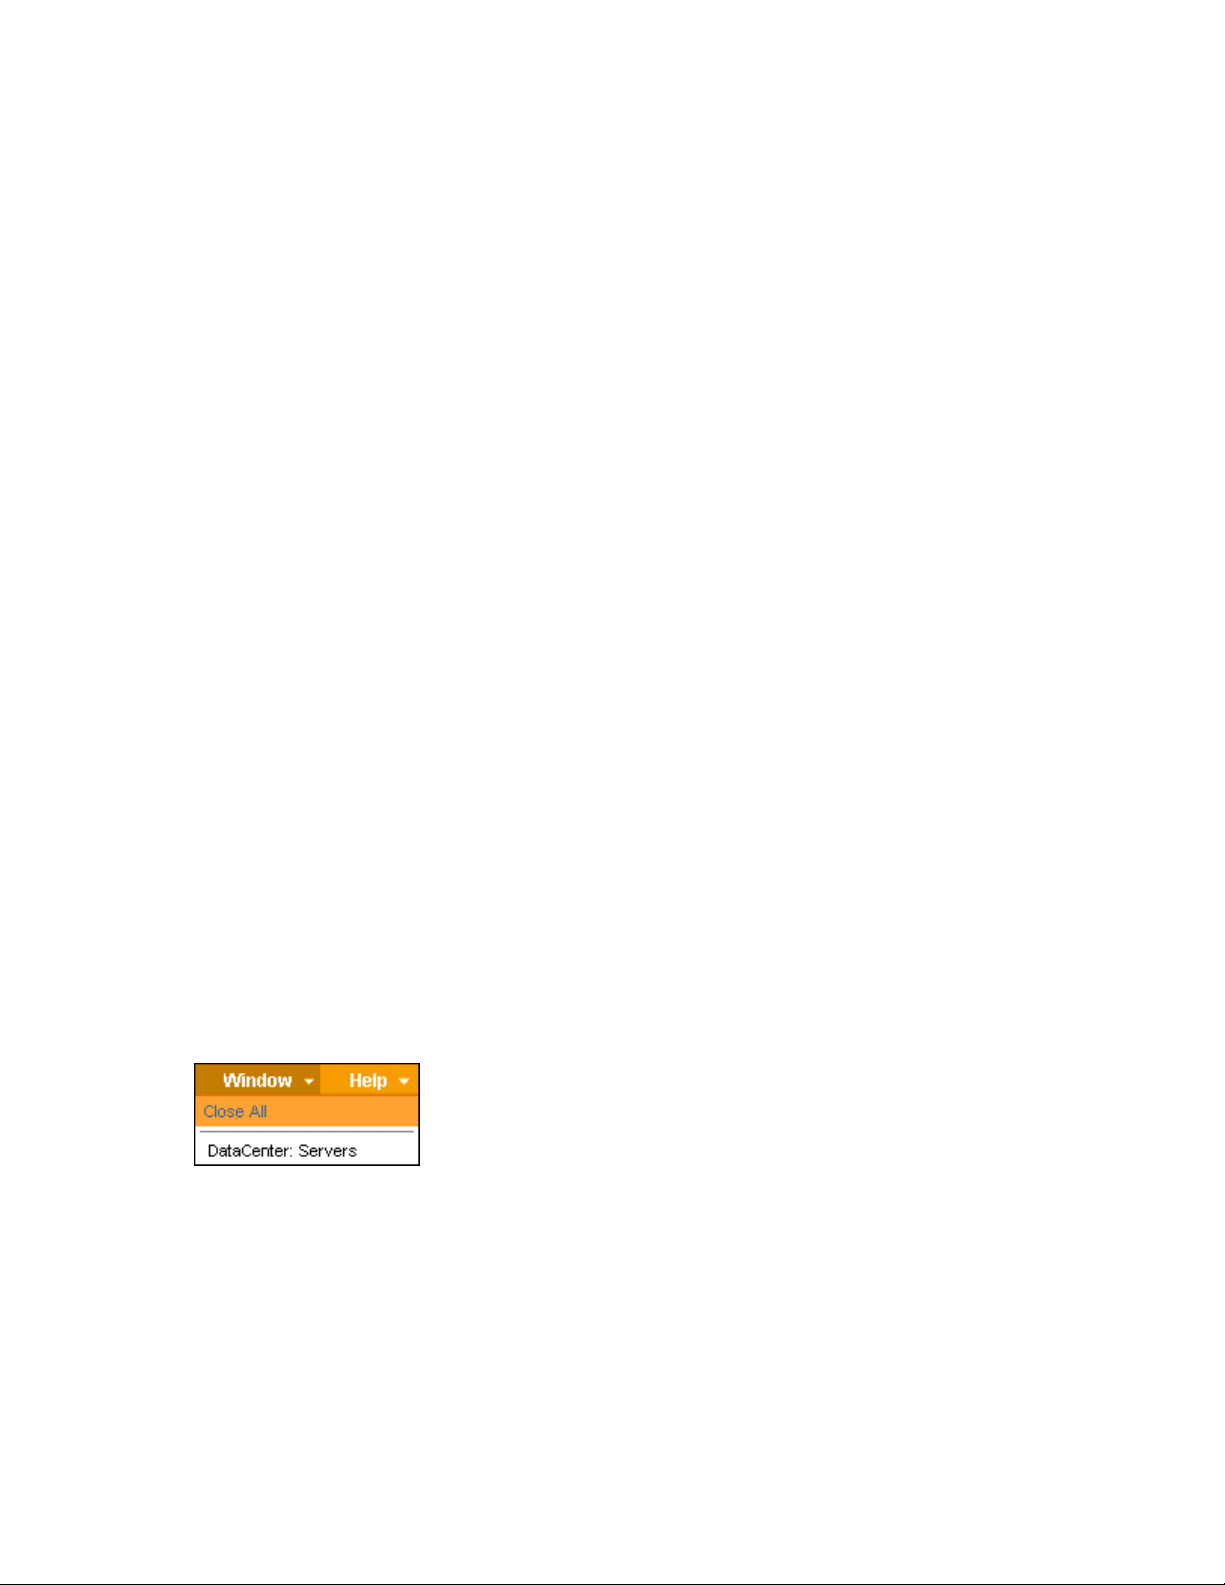
Closing the Data View window
To close a particular Data View window, select Close at the upper right corner of the window.
To close all Data View windows, select Window, and then select Close all.
To begin using the application again, select an icon on the Navigation panel. A view of the selected area
opens on a corresponding Overview tab.
HP Insight Environmental Observer console interface 14
Page 15
Views
Data center views
In the Data View window, users have several different ways to view general and detailed data relating to
sensors, including real-time and historical data. Administrators can perform additional operations.
The HP Insight Environmental Observer provides all users with several different ways to view both highlevel and detailed data relating to all sensors, including real-time data and historical data, in the Data
View window. Administrators have privileges to perform a few additional operations.
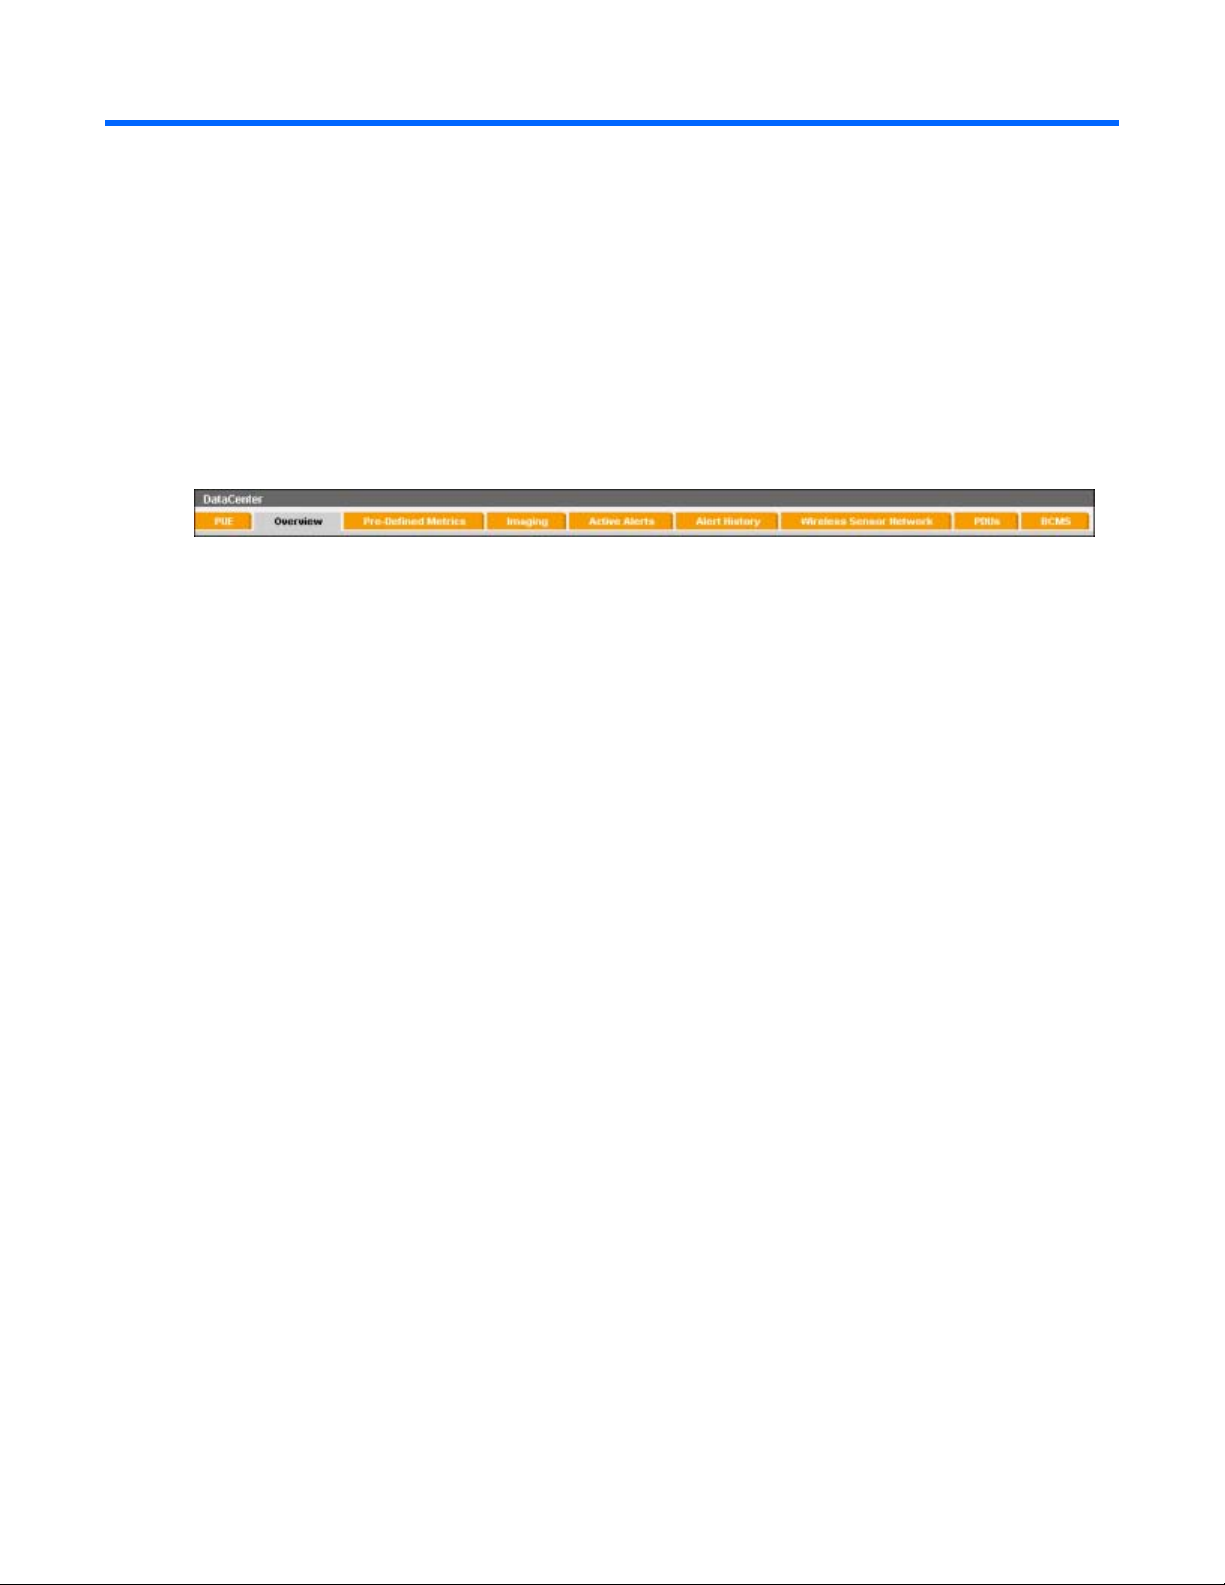
The data center views include:
• PUE View—(Optional) Data center metrics that show current and past power consumption based on
cooling, IT loads, general building lighting, and power loss. This view is only visible if PUE options
are configured.
• Overview—Also known as a floor plan, the virtual map of sensor distribution at either data center or
zone level.
• Pre-Defined Metrics View—Data center metrics that are not sensor data, but use the data collected to
provide visibility of the efficiency of the various aspects of the data center.
• Imaging View—Static or animated images of live and historical sensor reading for either data center
or zone level, overlaid on the Overview tab.
• Active Alerts—A list of active alerts that have not been cleared automatically or manually.
• Alert History—A list of all alerts, including cleared alerts and active alerts.
• Wireless Sensor Network—The communication routes and status information for all wireless devices
installed in the network.
• PDU—A list of all PDUs installed in that zone, and their associated power data.
• BCMS—(Optional) A list of all BCMS devices installed in that data center, and their associated
current, power, and power factor data for each monitored electrical panel.
Within each view, actions performed by the user affect what Observer displays.
PUE tab
The PUE view is an optional view that only displays if energy meters are installed and PUE options are
configured. The view only exists at a data center level, and cannot be viewed from the individual zones.
Power consumption is divided into many categories, such as cooling power, IT power, general lighting,
and power loss through transformers.
Views 15
Page 16
The PUE tab displays power consumption data, gathered from optional energy meters installed in the data
center, in real-time charts and graphs. Collecting PUE data is useful in monitoring power usage and loss,
and determining an ideal power consumption environment.
Accessing the PUE tab
1. From the Navigation panel, select the data center you want to display.
2. Select the PUE tab. The PUE view appears.
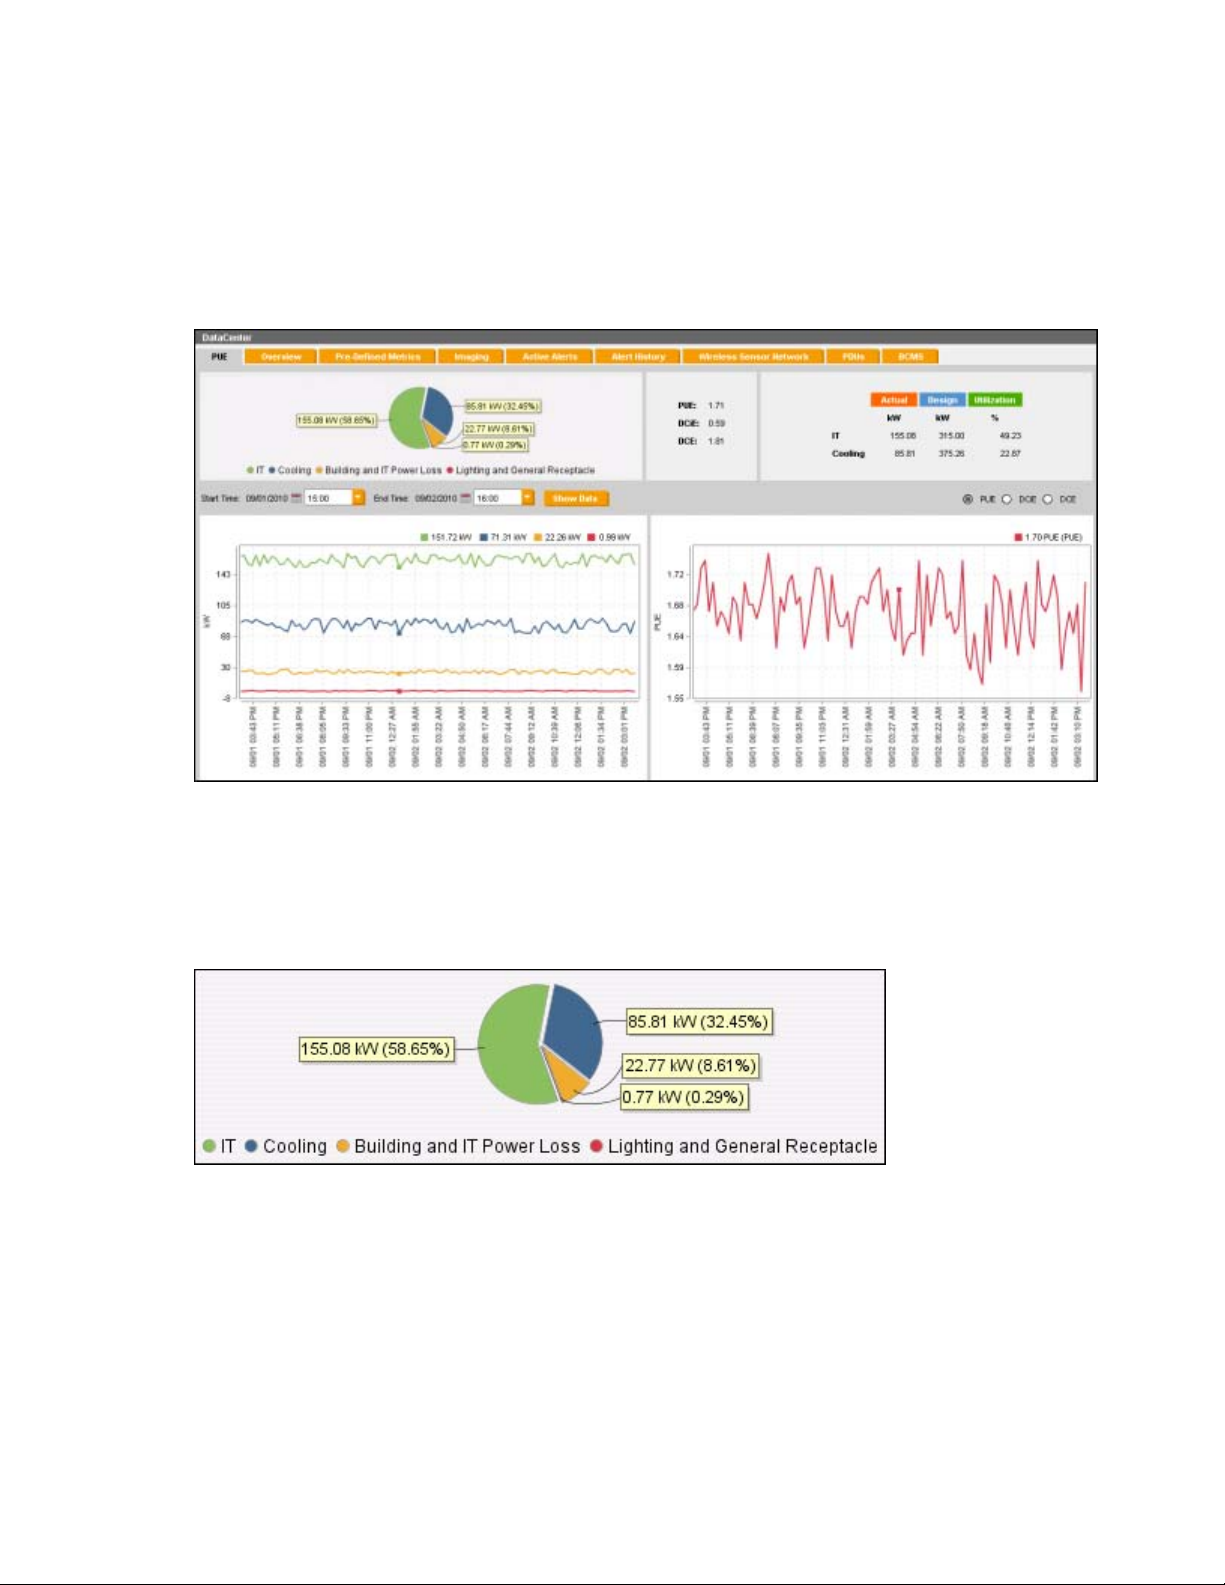
Viewing data center PUE information
The PUE page has five sections:
• Power consumption allocation—A pie chart that displays how much power, in percentages, is used
by different components of the data center.
• Metric definitions—Values of the metrics that appear.
o PUE—The closer the number is to 1, the more efficient the data center power.
o DCiE—The equivalent of a PUE value. The closer the number is to 1, the more efficient the data
center power.
Views 16
Page 17
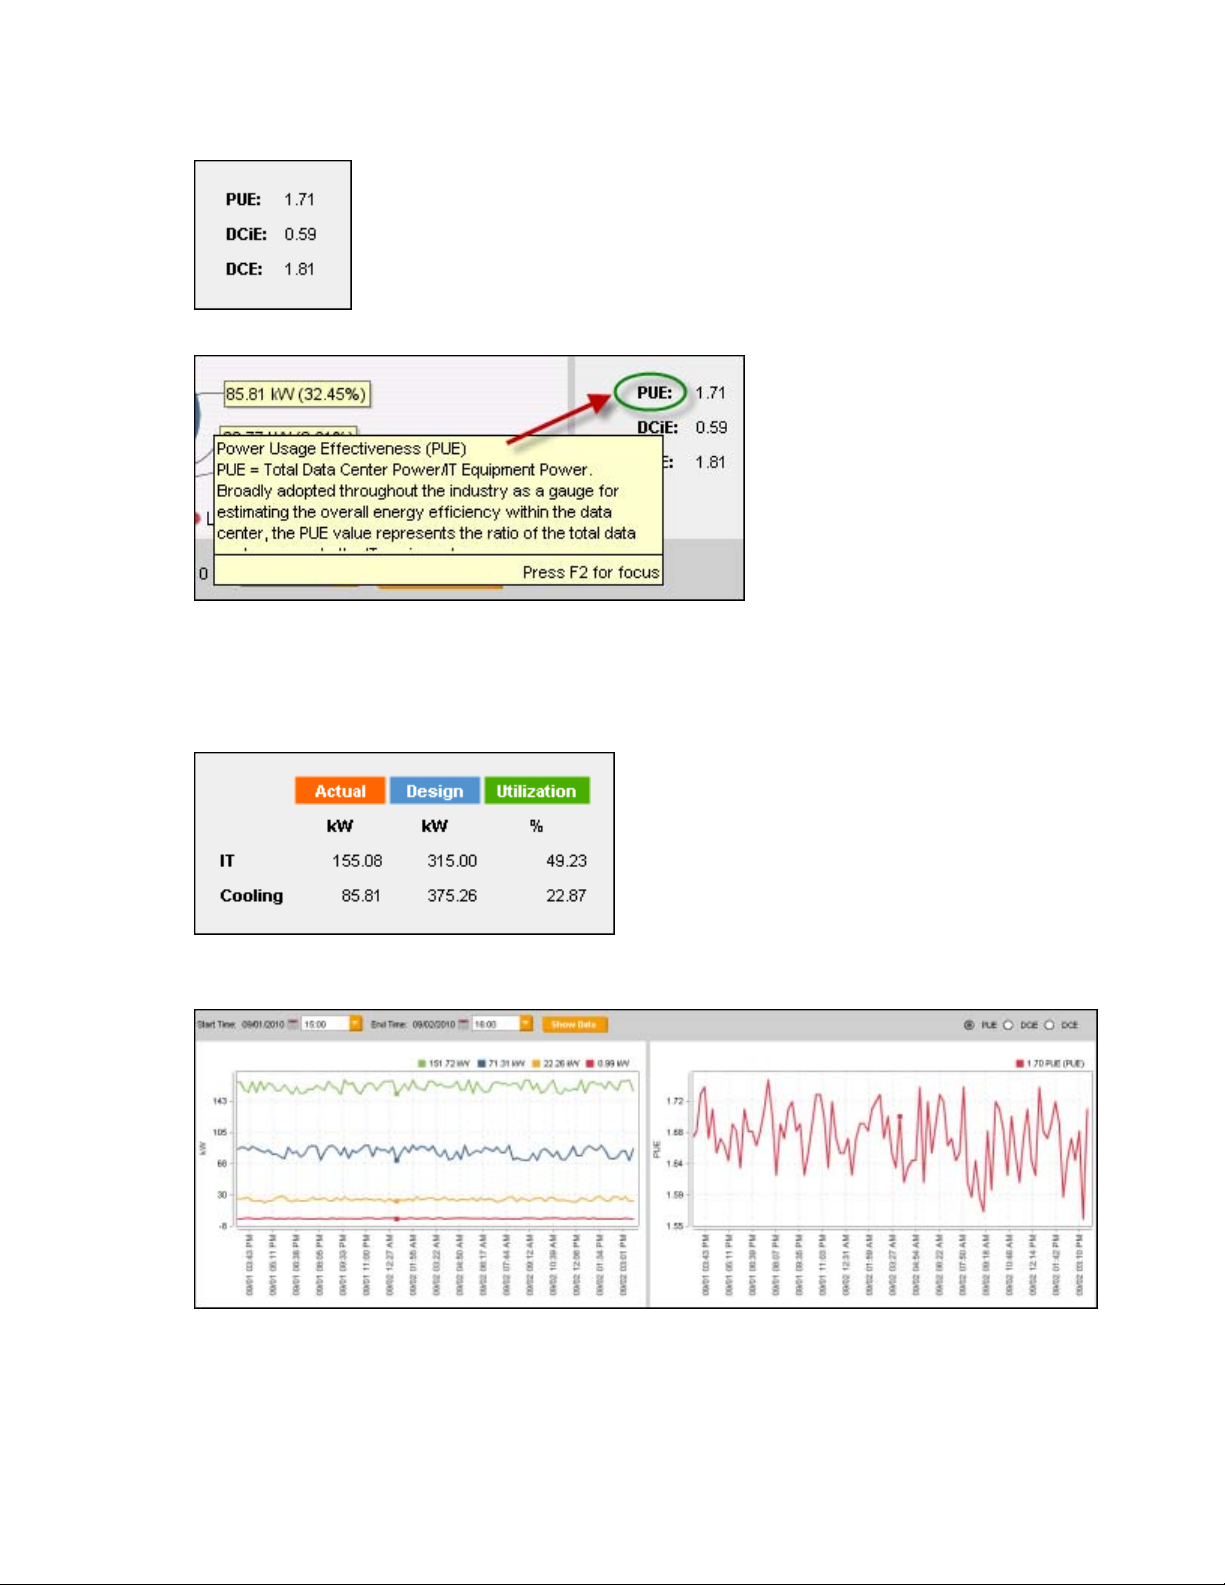
o
DCE—The ratio of IT power over cooling power. The higher the value, the more efficient the data
center power.
Hover the mouse over the metric to display the metric definition.
• IT and cooling power utilization—Values of the IT and cooling power utilization.
o Actual—Actual measurement of power consumption.
o Design—Power capacity limit for the metric.
o Utilization—Percentage of actual consumption, compared to design capacity.
• Power consumption continuous plotting (kW and PUE)—Graphs that continuously plot data and track
historical data.
Adjusting chart and graph options
The charts and graphs plot data continuously as information registers with the system.
Views 17
Page 18
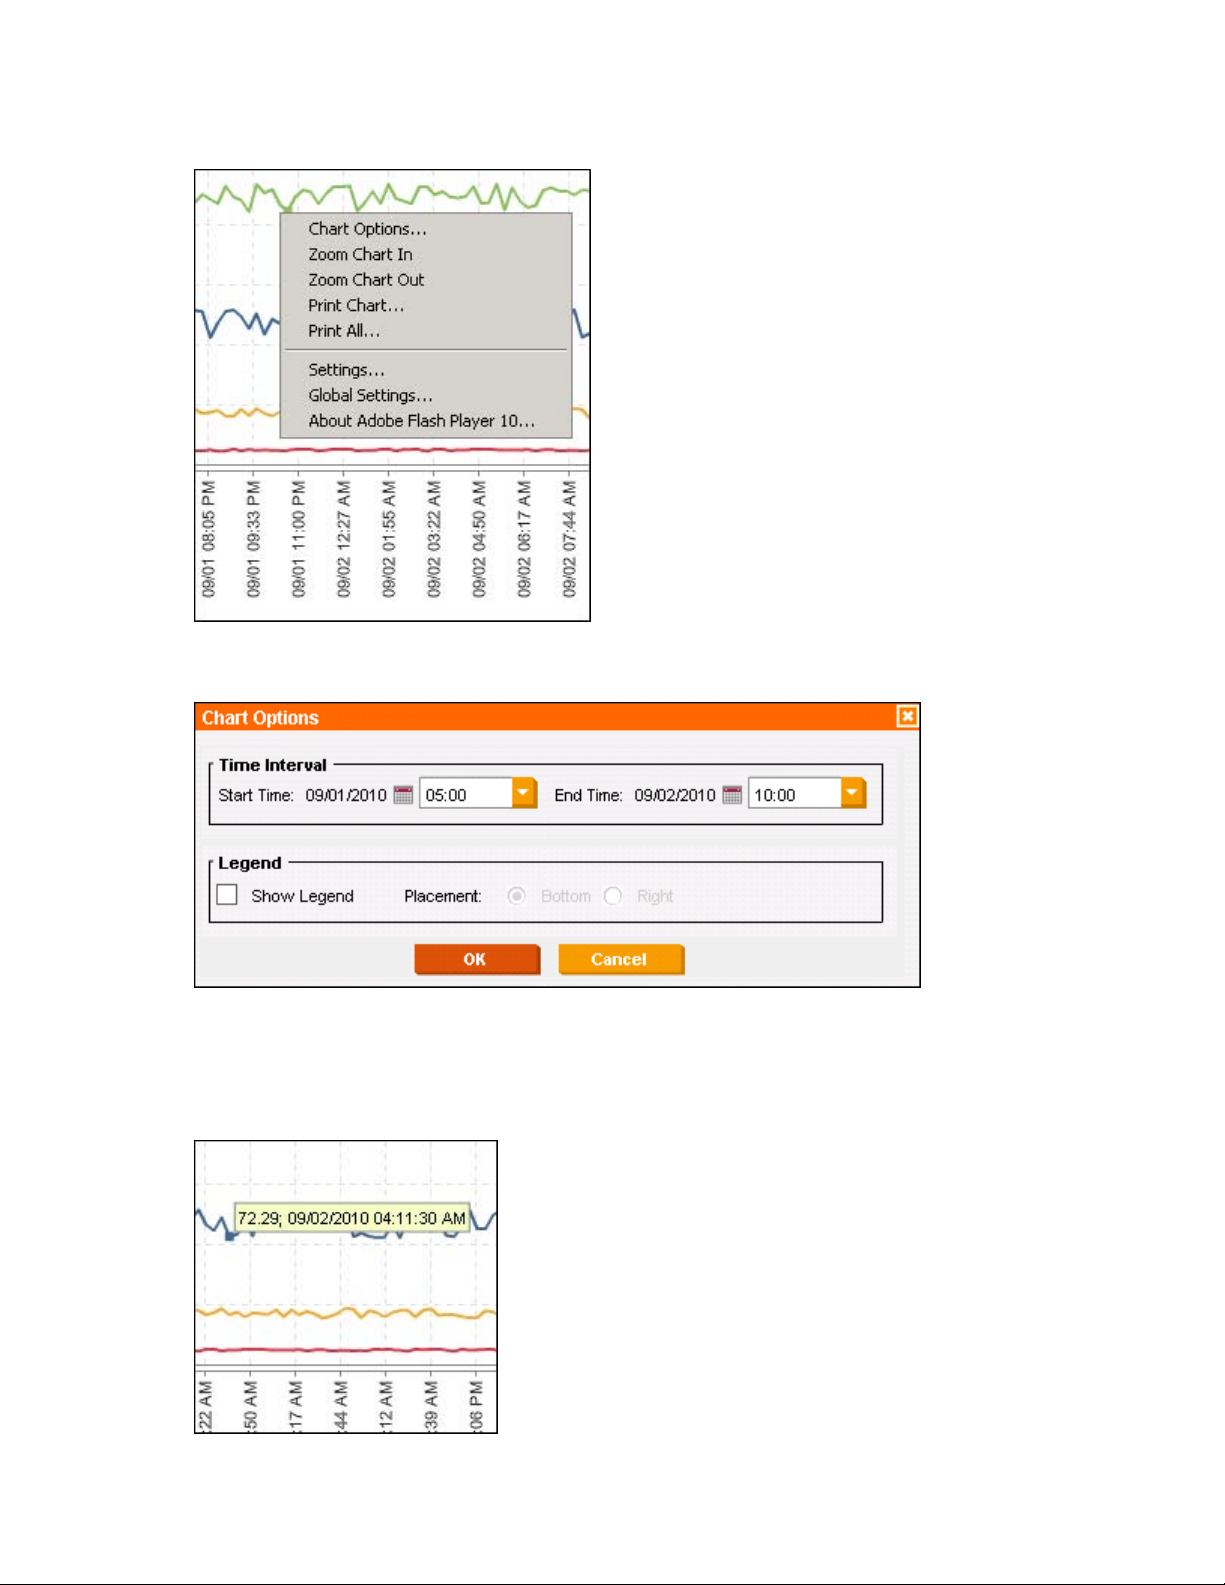
To adjust the information that appears:
1. Right-click inside the chart.
2. Select an option to adjust the view of the chart:
o Chart Options—Displays options for adjusting the time interval and legend visibility.
o Zoom Chart In—Displays a shorter time span on the chart.
o Zoom Chart Out—Displays a greater time span on the chart.
o Print Chart—Displays options for printing the current chart.
To view data at a specific time, move the mouse over the chart plot.
Views 18
Page 19
To adjust the axis line, see The base station toolbar (on page 26).
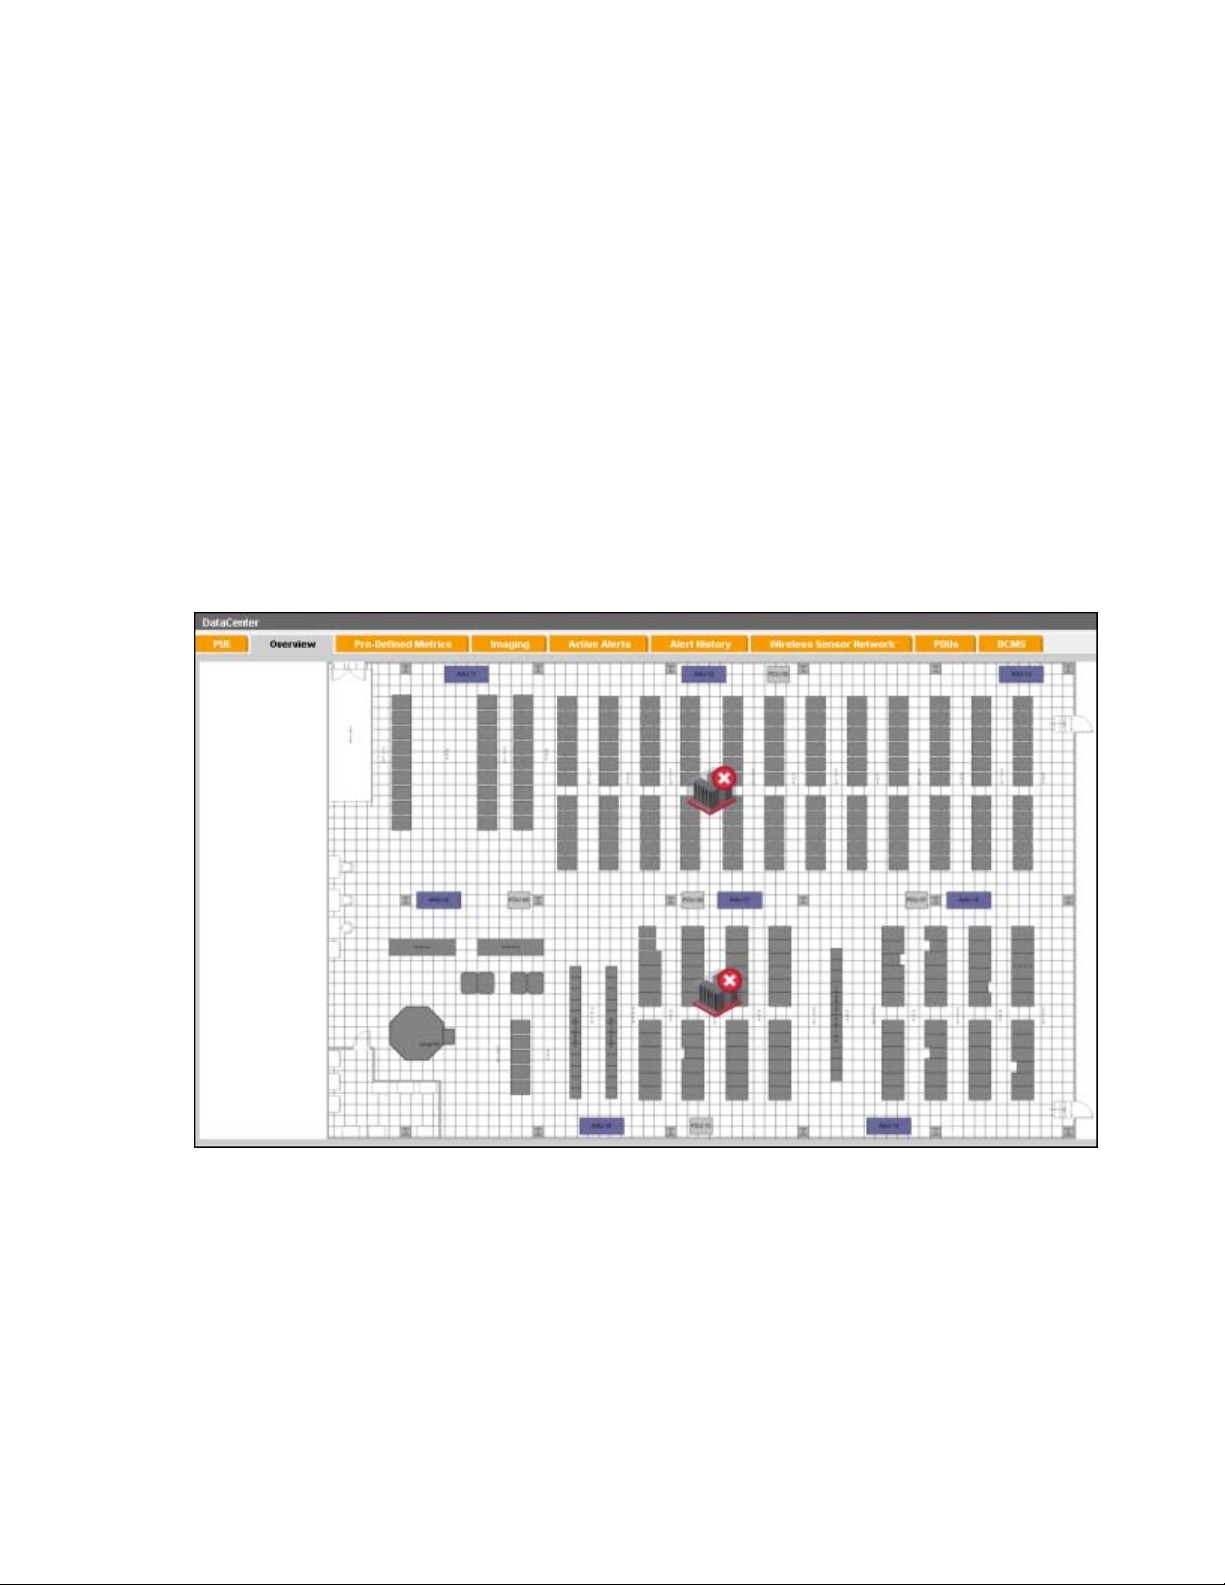
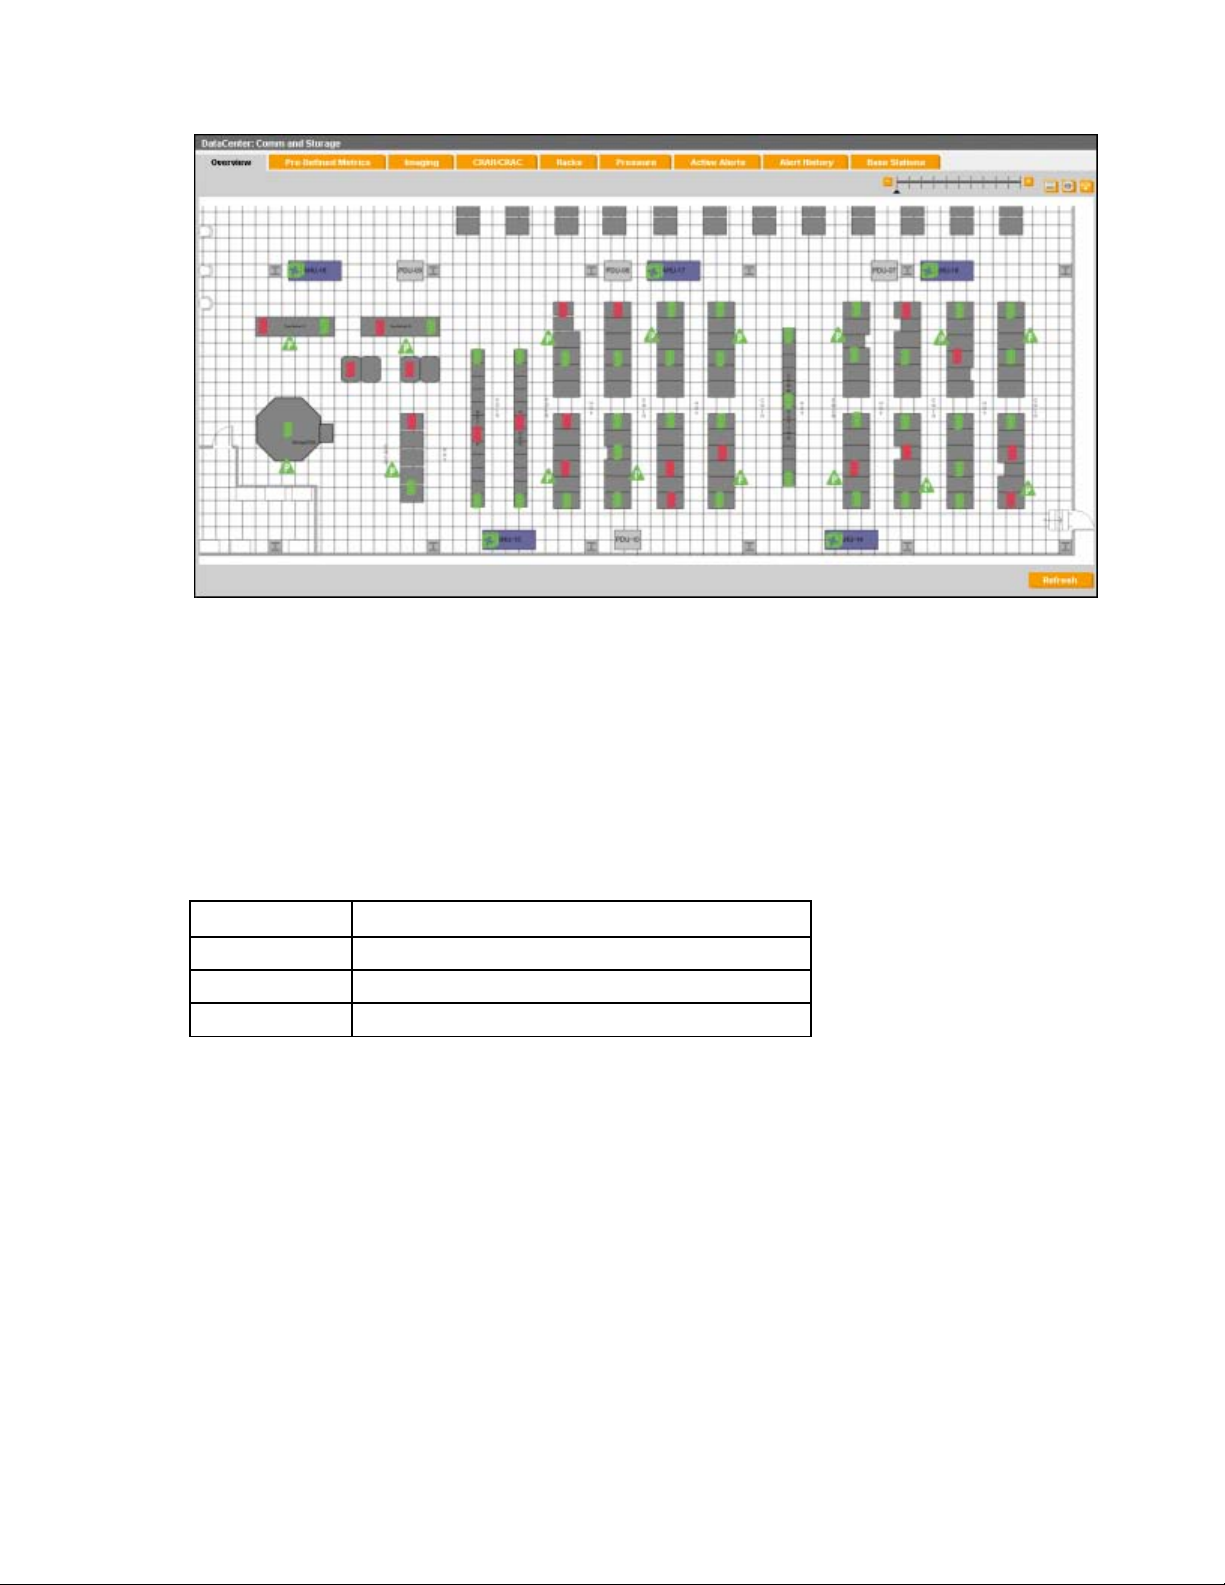
Overview tab
The Observer provides an Overview, or floor plan, of the selected data center. This view is a virtual map
that shows a layout of the zones within a data center, including the CRAHs/CRACs, racks, base stations,
and pressure objects in a zone, and provides access to the corresponding data.
The Overview tab preserves, to scale, the spatial distribution of objects in each zone within each data
Accessing the Overview tab
center.
1. From the Navigation panel, select the data center or zone you want to display.
2. Select the Overview tab, which is the default tab.
The Overview for the selected data center or zone appears. The page displays highlighted areas
corresponding to the physical area covered for each zone in the selected data center.
The following is a data center example.
Views 19
Page 20
The following is a zone example.
By default, the Overview tab displays a solid color background. However, a customized Overview layout
image is configured during installation, providing a spatially accurate site-specific rendering of the layout.
For more information on configuring the background image, see the HP Insight Environmental
Configurator User Guide.
Viewing data center Overview information
On the data center Overview tab, all users can view the layout of all zones in the data center selected on
the Navigation panel and some configuration information about each zone.
Each data center zone is represented by a status icon. The color of the icon indicates the zone status.
Zone color Description
Green Zone has no active alerts. Status is good.
Red Zone has one or more triggered alerts.
Yellow Zone has one or more triggered warnings.
Views 20
Page 21
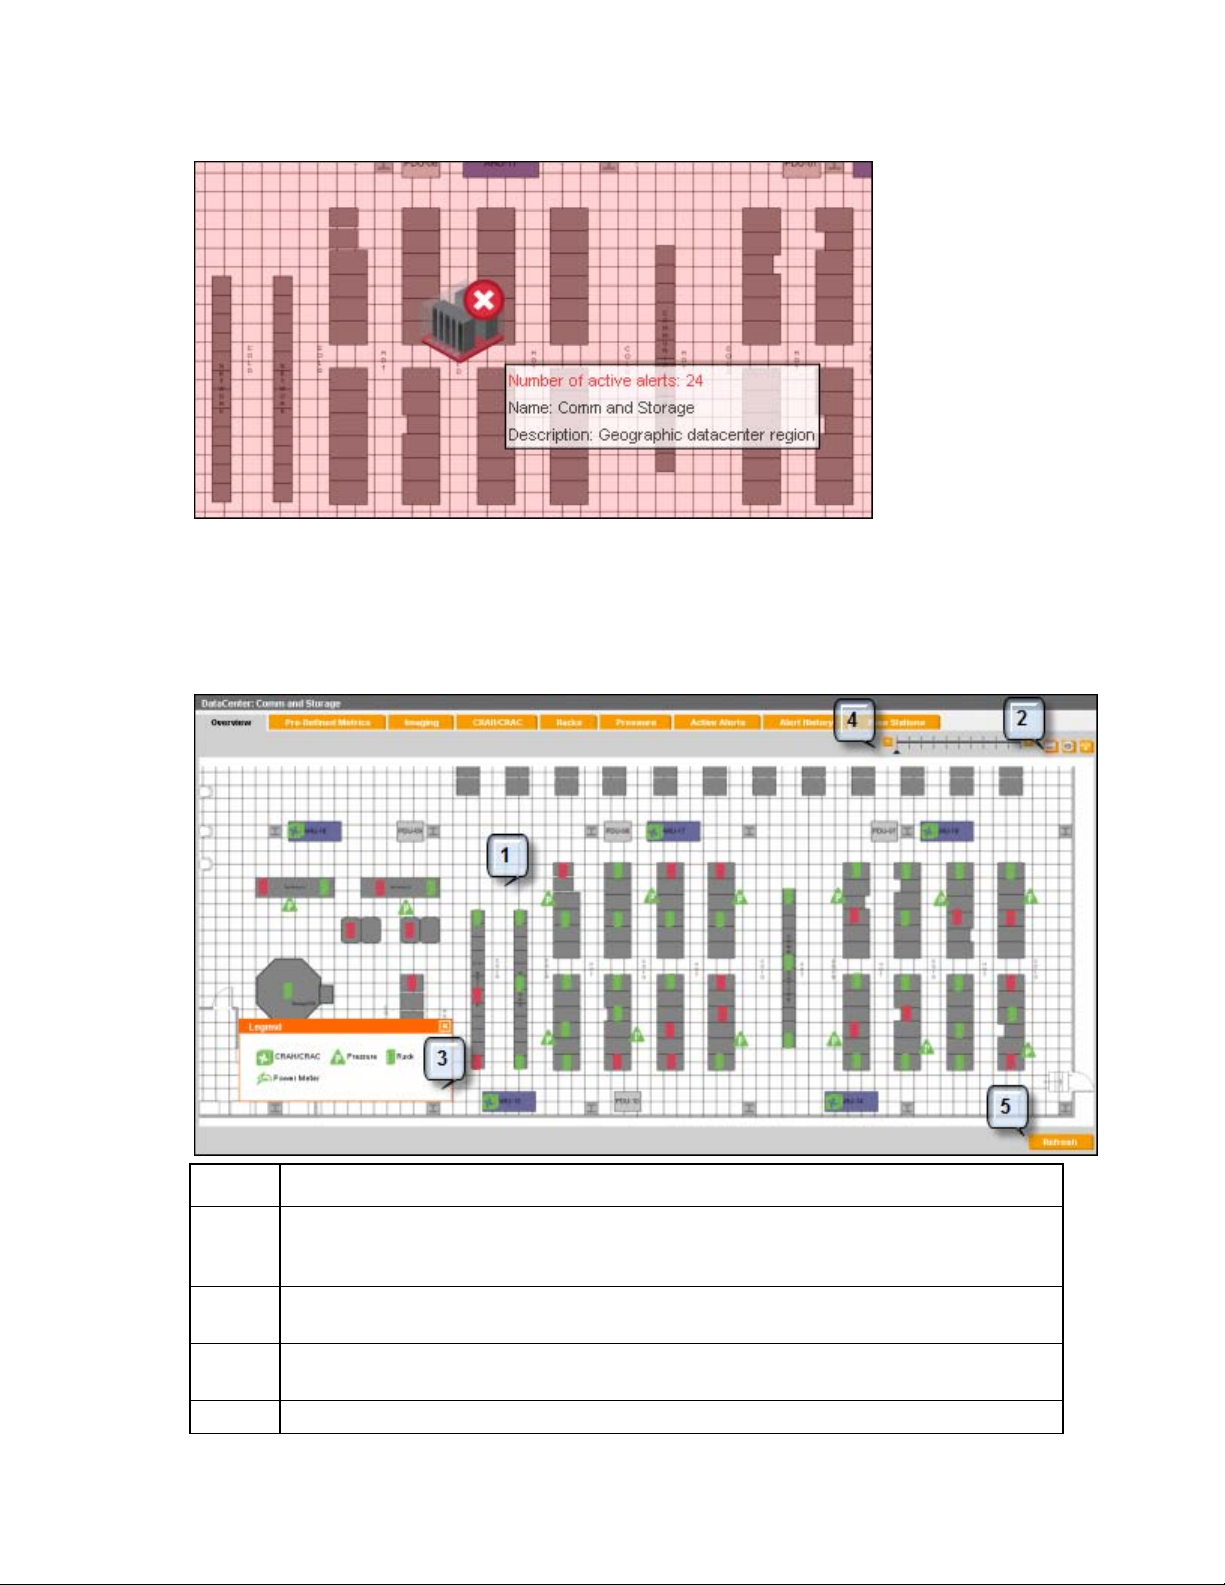
Hovering over any zone icon highlights the entire zone area, and opens a new window that contains
configuration information, including the name and description of the zone.
Viewing zone Overview information
On the Overview tab, you can view the layout and details for base stations, racks, pressure objects, and
CRAH/CRACs in the zone selected on the Navigation panel. For any selected object, you can view
configuration information, real-time data, or historical data.
Callout Description
1 Virtual map of the selected zone. Icons represent CRAH/CRACs, racks, and base stations. You
can access configuration information, real-time data, and historical data for those objects from this
view.
2 Show/Hide and Filter Visible Objects buttons. These buttons enable you to determine what
appears in the window or refresh the data.
3 A moveable and dismissible legend. The panel provides a key to the icons that appear in the zone
Overview and enables you to zoom in or out to change the view level.
4 A zoom slider that enables you to enlarge and shrink the Overview image. The slider also enables
Views 21
Page 22
Callout Description
you to change the details that appear.
5 The Refresh button enables you to refresh the view at any time to show current and updated
information.
The zone Overview controls
These controls consist of a row of buttons at the upper right corner of the zone Overview tab which
provides the user with additional ways to change the appearance of items on this page and a quick way
to navigate.
Button Icon Description
Show/Hide Legend
Filter Visible
Objects
Change Zoom Level
Show/Hide Locater
View
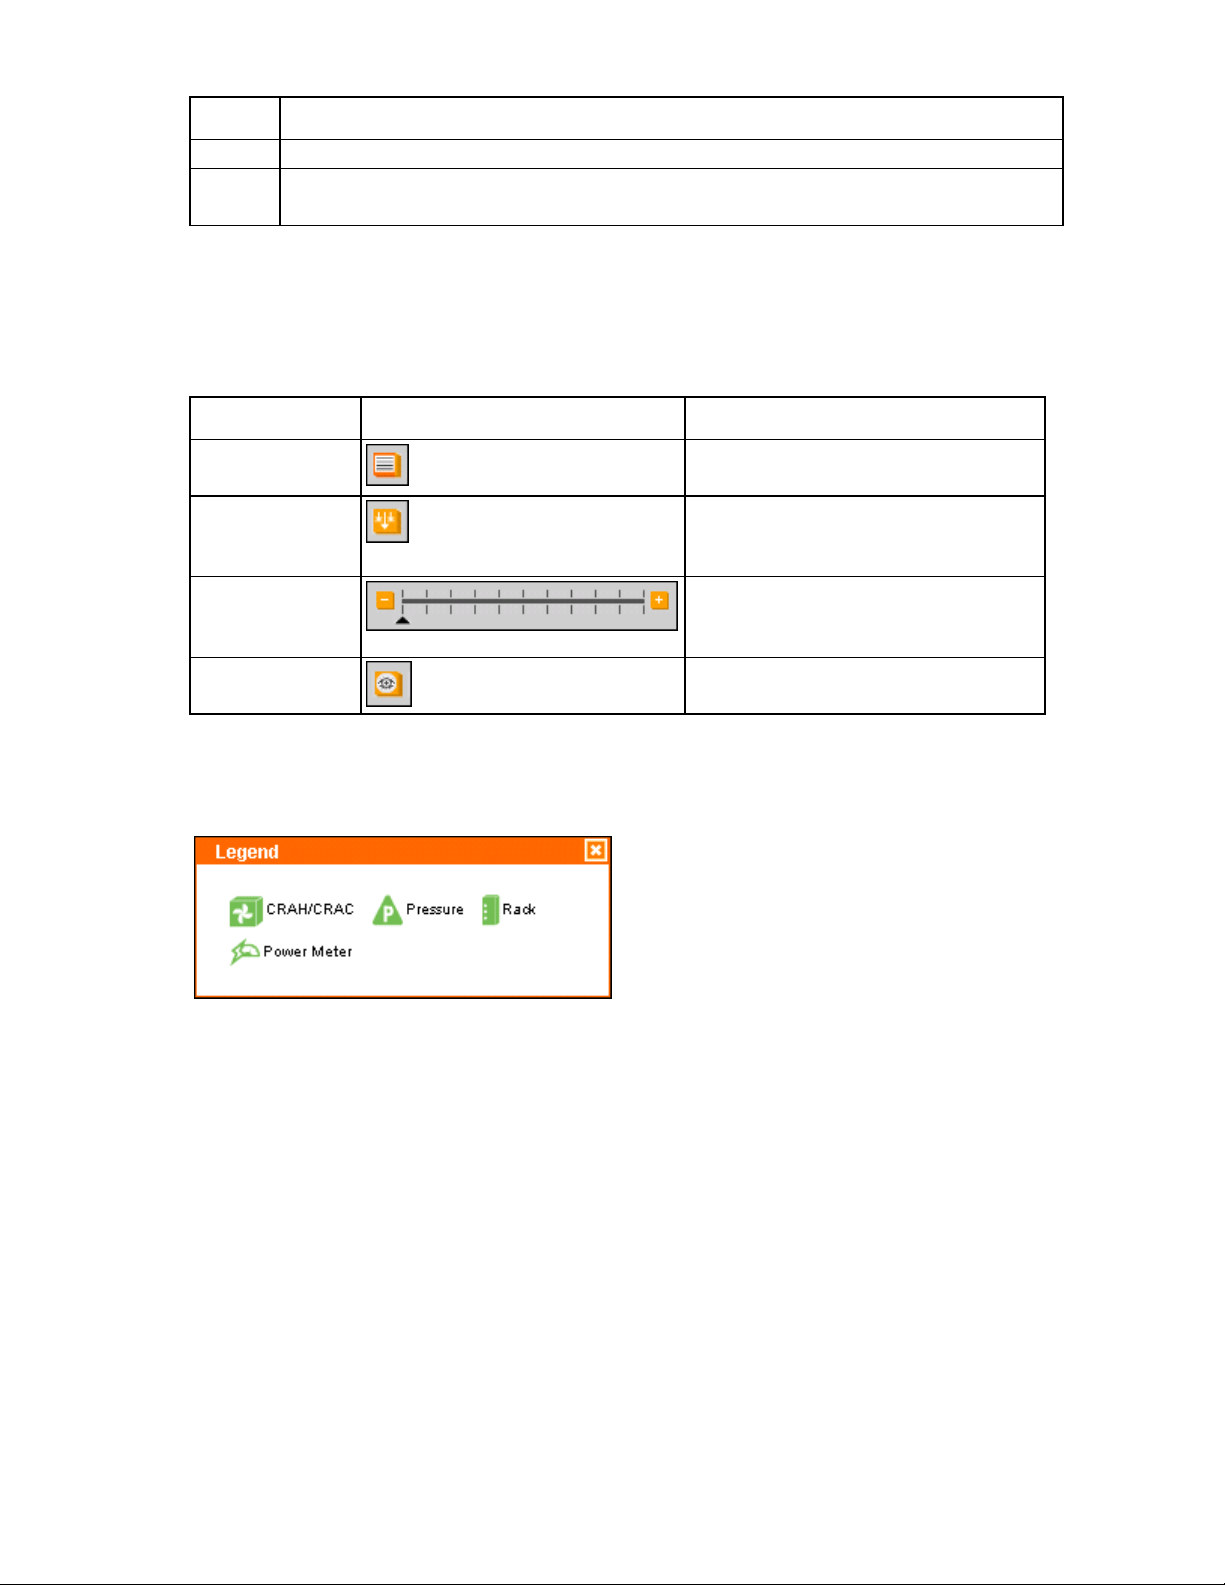
The zone Overview legend
The Legend window provides an explanation about all the icons that appear in the zone Overview.
The color of the icons that appear in the zone Overview also relay the device status:
Enables the user to either show or hide the
Legend window
Enables the user to either show or hide any
object type (base station, CRAH/CRAC,
rack, or power meter) in the zone Overview
Enables the user to zoom in to detailed
areas of the Overview or zoom out to see
the entire Overview
Enables the user to locate the smaller area
they are viewing within a large data center.
• Green—The device does not have any active alerts associated to it.
• Yellow—The device is either not communicating or it has an invalid configuration.
• Red—The device has active alerts.
Filtering visible objects
1. In the upper right corner of the zone Overview, select the Filter Visible Objects icon.
Views 22
Page 23
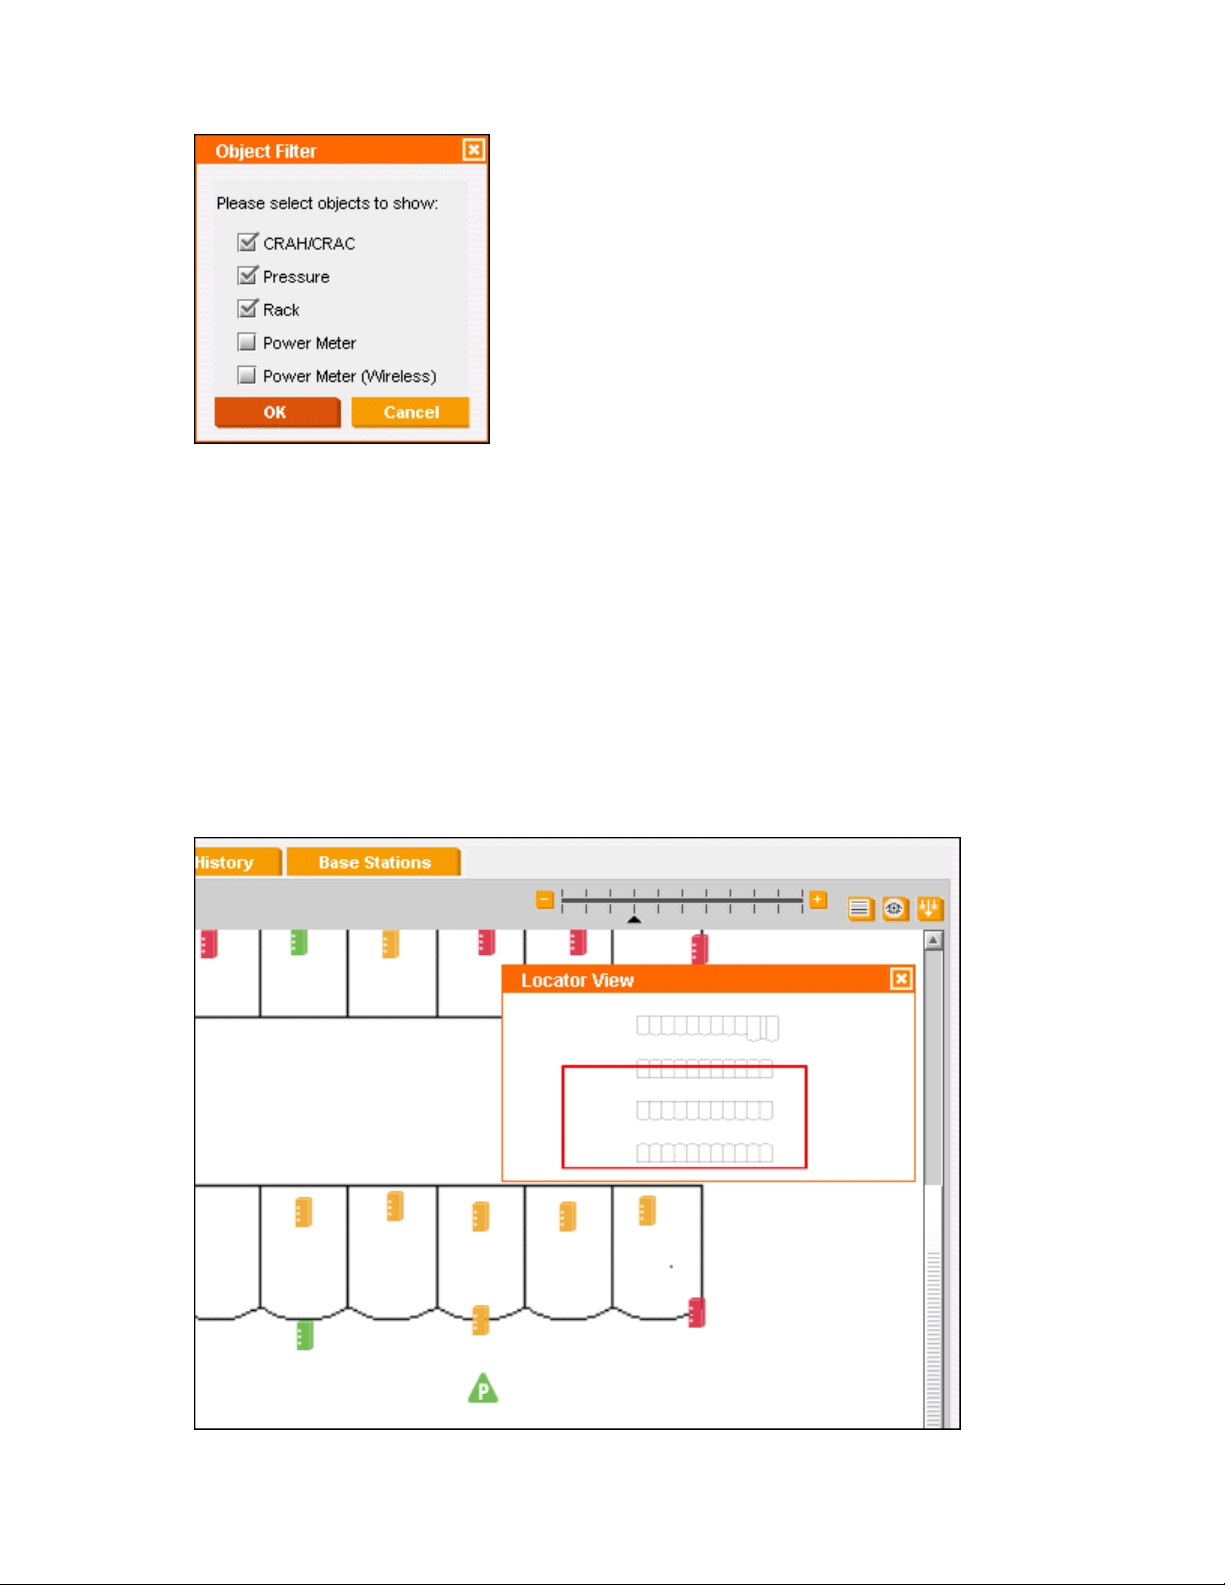
The Object Filter window appears.
2. Select all items you want to display.
3. Clear all items you want to hide.
4. Select OK to save and close.
Locator view
The Locator View is helpful when you have a large data center. It enables you to:
• See which portion of the large data center is visible.
• Zoom into a smaller area within the large data center project.
• Quickly and easily move from one portion of the room to another.
If you show the Locator View, a red rectangle outlines the specific small area you are viewing. You can
drag the rectangle to view a different area.
Views 23
Page 24
To show the Locator View, select the Show/Hide Locator View icon at the top right of the interface.
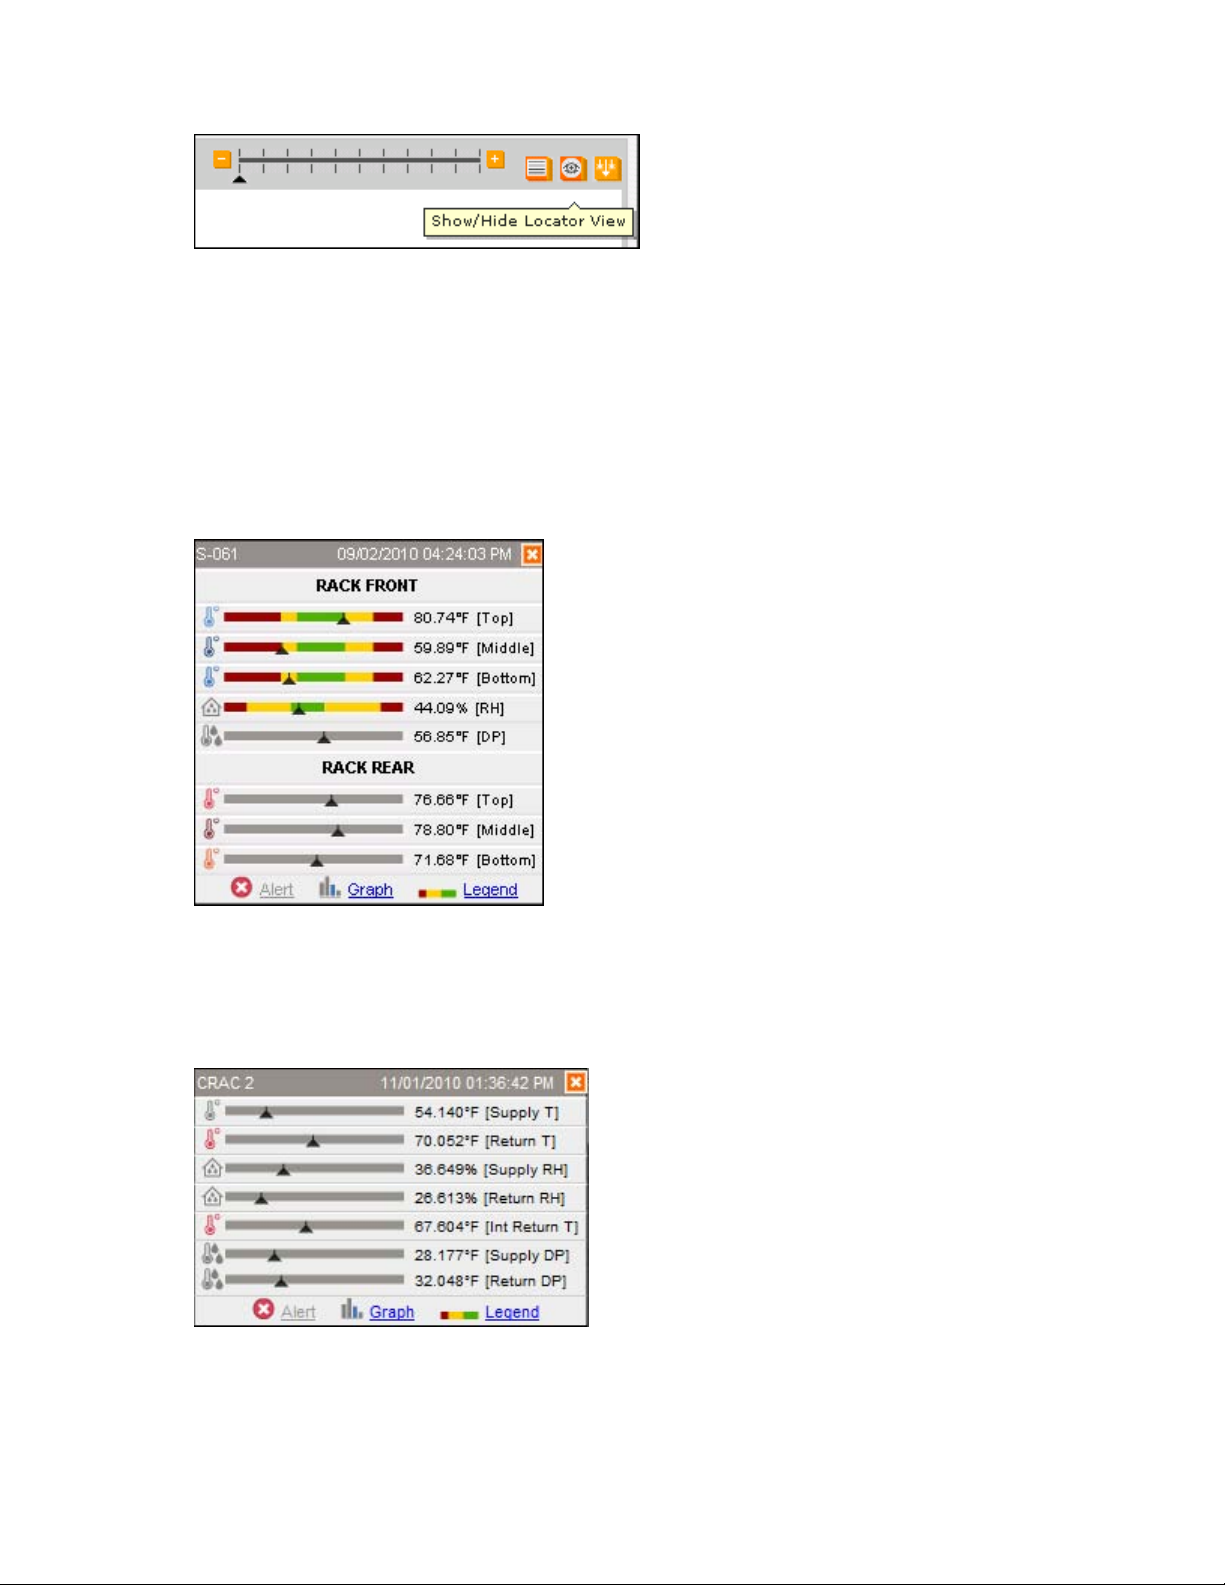
Viewing configuration details for individual components
Rolling the mouse over any icon displays a new window containing configuration information for that
object.
For base stations and racks, the configuration information specifies:
• The name of the base station or rack
• Temperature and humidity data
• Alerts (if any)
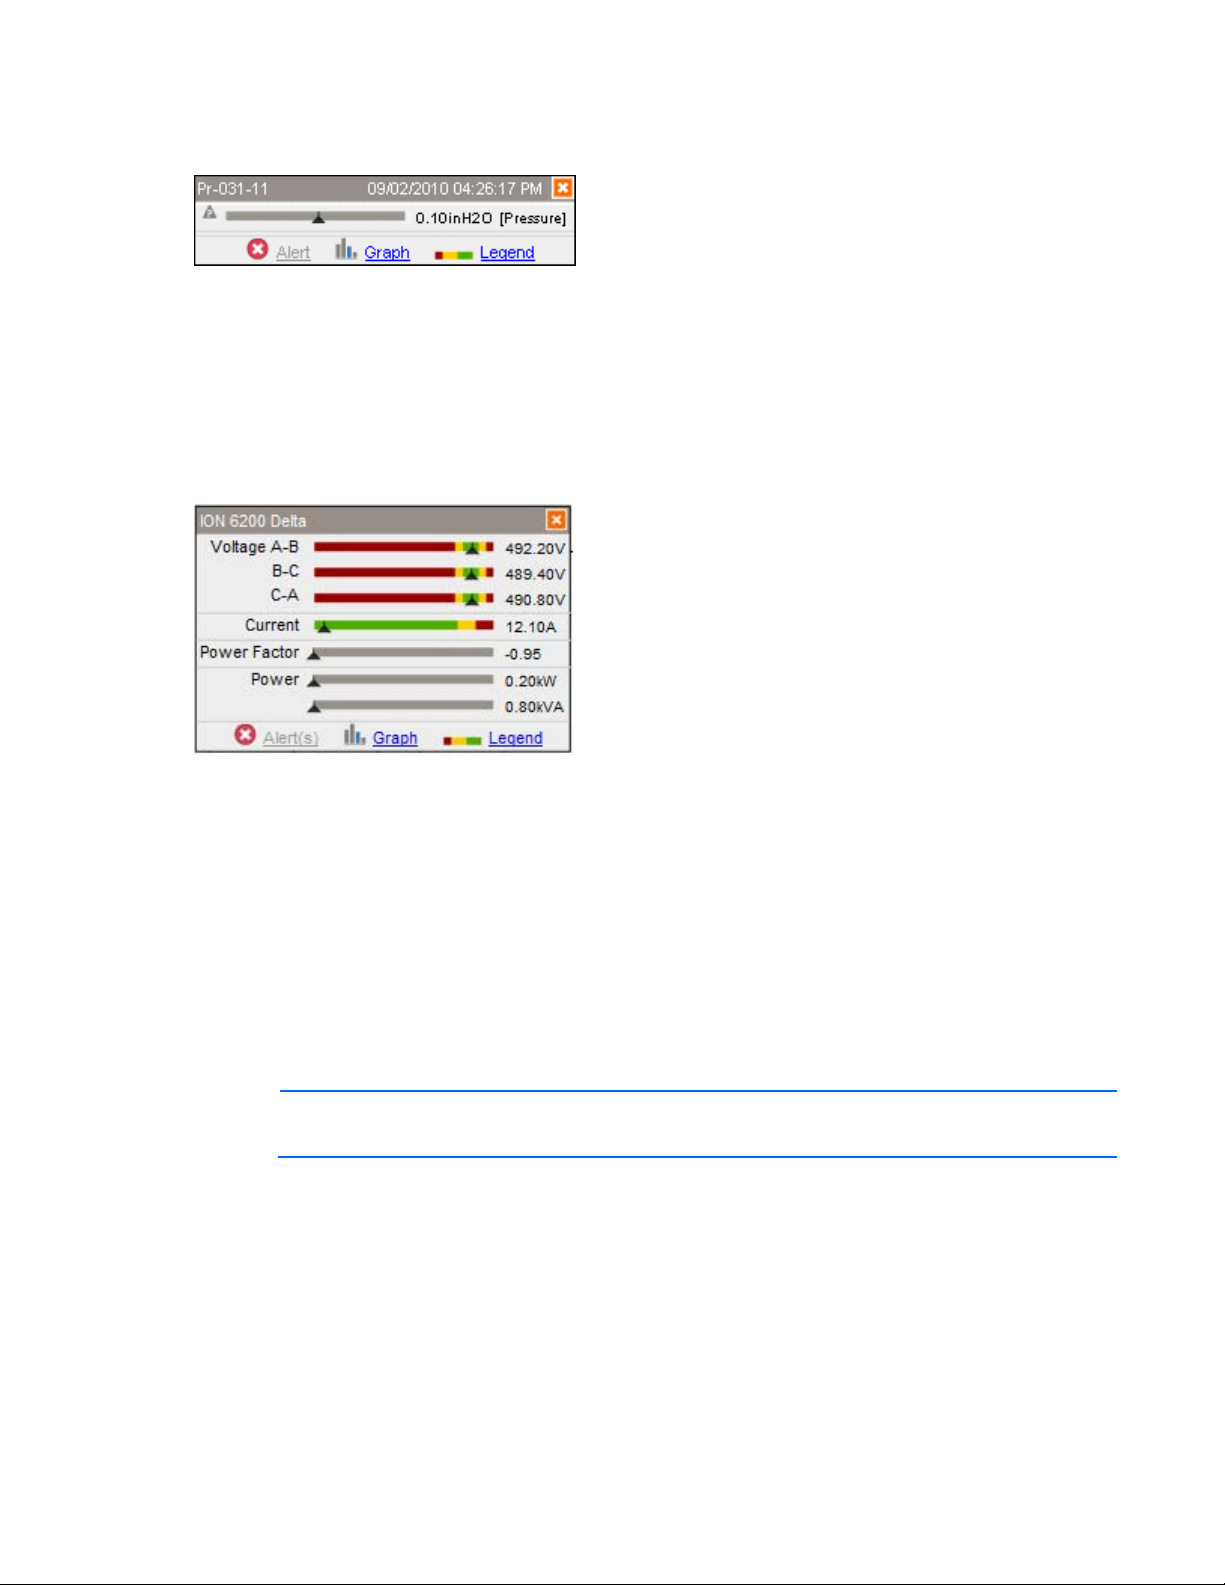
For CRAH/CRACs, the configuration information specifies:
• The name of the CRAH/CRAC
• Temperature data
• Alerts (if any)
For Pressure base stations, the configuration information specifies:
• The name of the pressure base station
Views 24
Page 25
• Pressure data
• Alerts (if any)
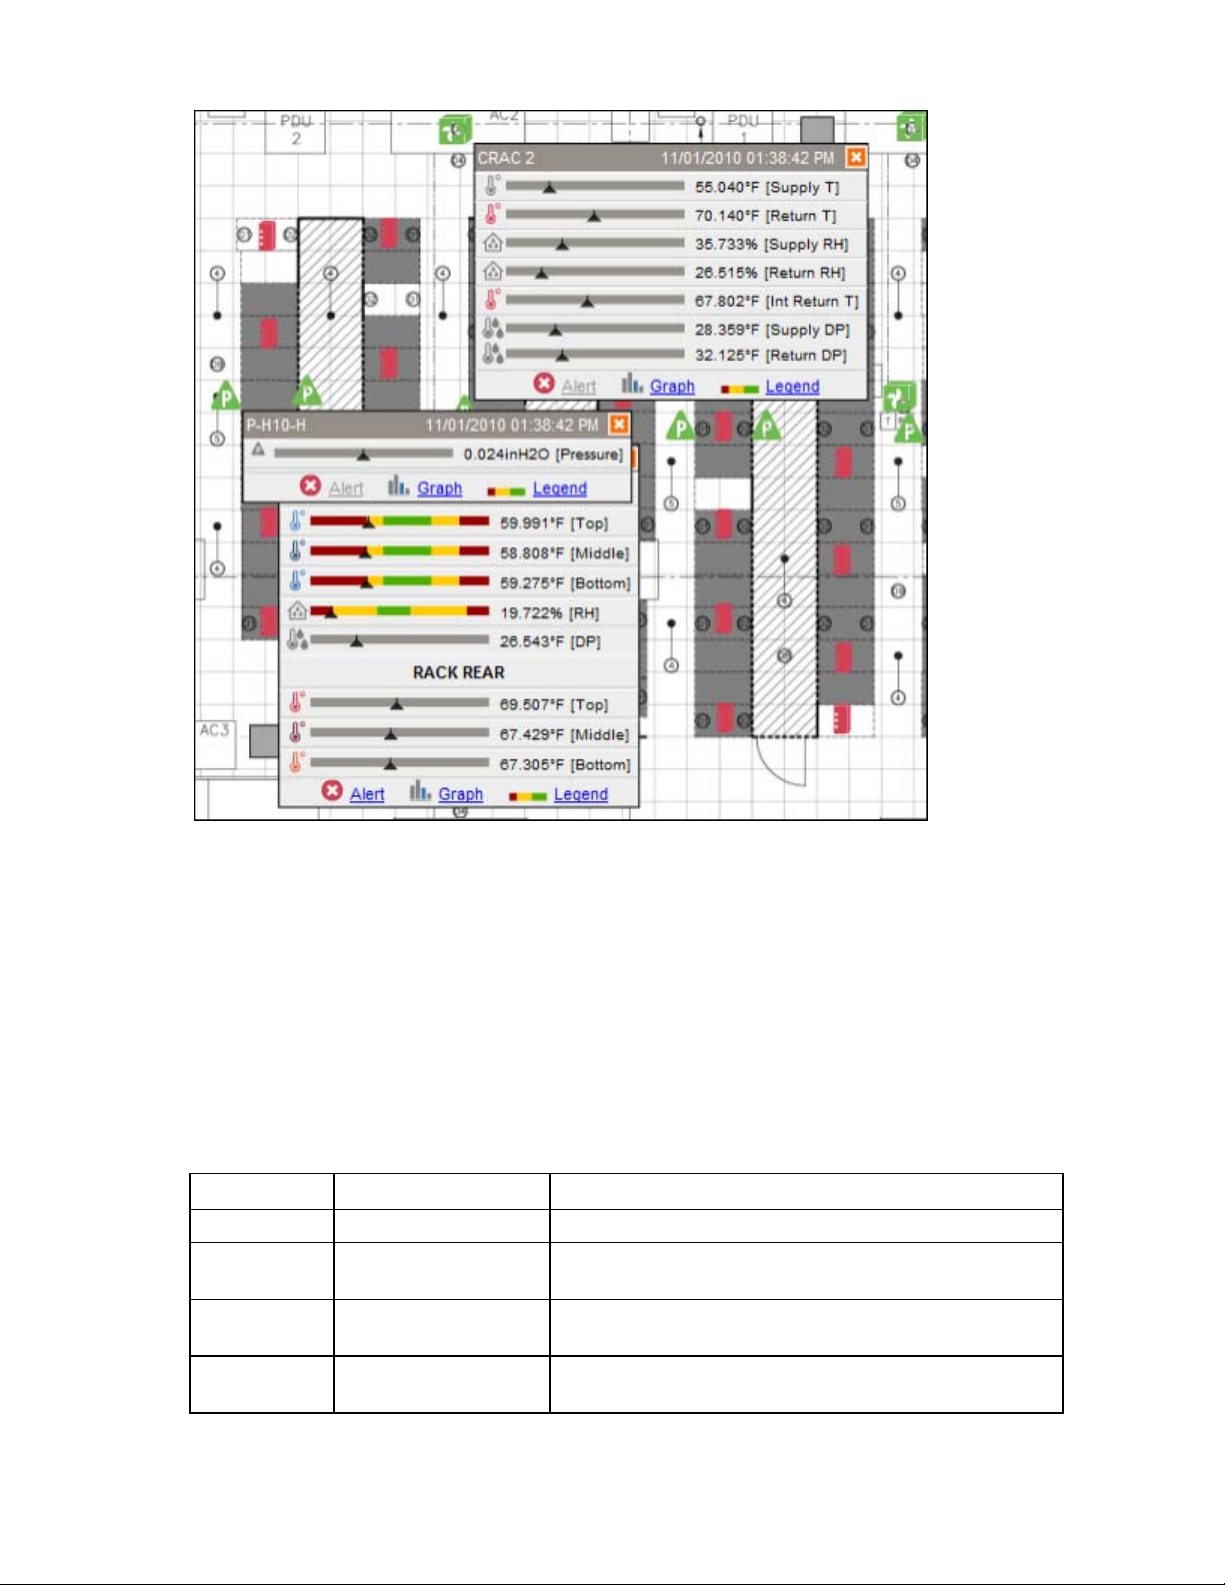
For Power Meters, the configuration information specifies:
• The name of the power meter
• Voltage data
• Current data
• Power data
• Alerts (if any)
Viewing data values
The Observer enables you to view real-time data values for all base stations, racks, pressure objects,
CRAH/CRACs, and supported power meters. The data values shown are current readings for all sensors
associated with a particular object.
To make viewing the values easier, you can show one type of object icon at a time on the Overview tab.
For more information about filtering objects, see Filtering visible objects (on page 22).
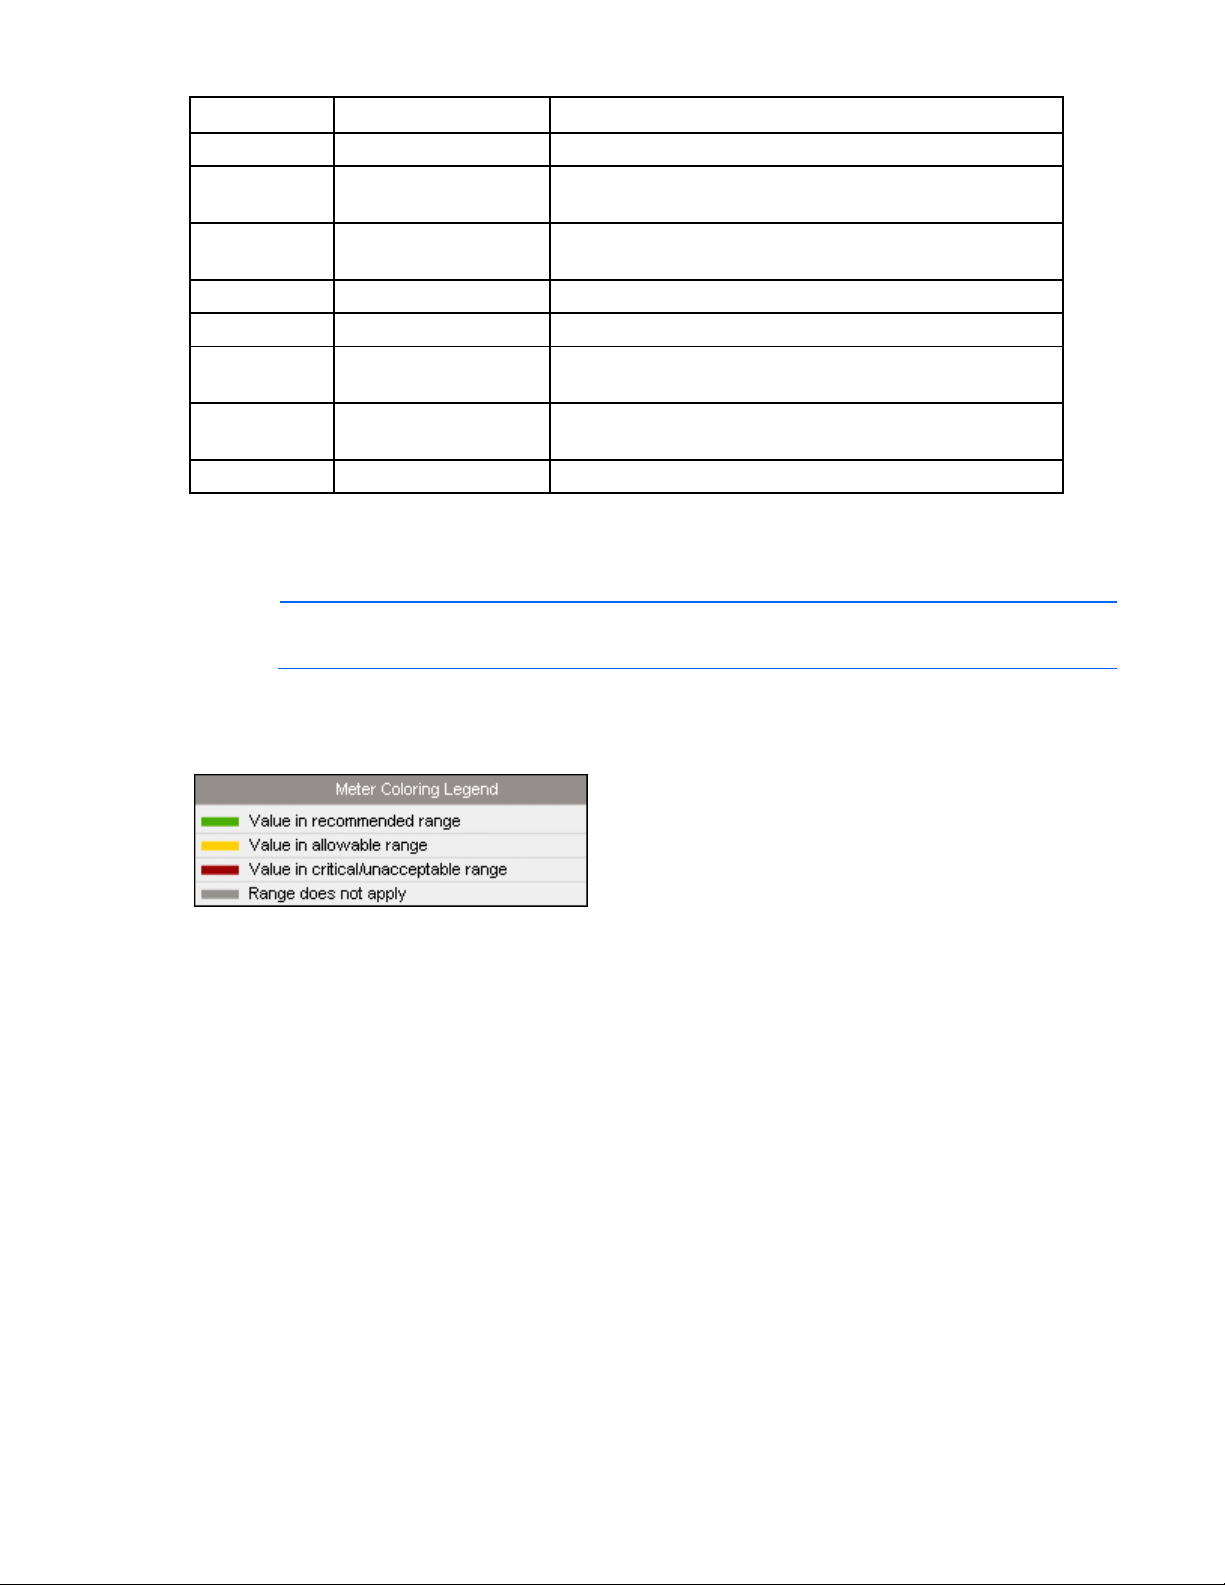
To keep multiple data values visible:
1. Click a sensor icon. The data values window remains open.
2. Continue clicking additional sensor icons to keep multiple data value windows open simultaneously.
NOTE: If you have multiple configuration details open, the most recently clicked sensor moves
to the front.
Views 25
Page 26
3. To briefly the display the data values for objects, move the mouse over other object icons without
clicking.
The title bar of each window bears the name of the base station, rack, or CRAH/CRAC to which the
values are associated, and a date and time stamp appears in the window title. While a data value
window remains open, you can use the mouse to drag it away from and back to the object icon of origin
as needed to adjust the view of other icons and data on the page.
The base station toolbar
The base station toolbar displays real-time and historical data for sensor readings at the selected base
station.
The following table describes the icons on the toolbar.
Sensor object Icon Description
Base station Pending alert An alert is pending on this base station
Base station Temperature The temperature in degrees Fahrenheit or Celsius recorded by
Base station Humidity The relative humidity as a percentage recorded by the sensor
Base station Pressure differential The differential pressure, typically for a subfloor plenum, across
the sensor for the corresponding base station
for this base station
the pressure sensor base station in either inches or Pascals
Views 26
Page 27
Sensor object Icon Description
Base station Historical chart A chart that displays historical data for the base station
Rack Cold side sensor value The temperature and dew point recorded by the sensors at the
front of the rack
Rack Hot side sensor value The temperature and dew point recorded by the sensors at the
rear of the rack
Rack Calculated values The humidity and reference temperature of the rack
Rack Historical chart A chart that displays historical data for the rack
CRAH/CRAC Supply temperature The temperature recorded by the sensor monitoring the air
supply leaving the CRAH/CRAC
CRAH/CRAC Return temperature The temperature recorded by the sensor monitoring the air
supply returning to the CRAH/CRAC
CRAH/CRAC Historical chart A chart that displays historical data for the CRAH/CRAC
Only icons that apply to the selected base station appear. For example, if an alert is active on the
selected base station a Pending alert on appears on the toolbar. Selecting this icon displays the Active
Alerts tab. For more information about active alerts, see Active Alerts tab (on page 51).
NOTE: Before you can delete a base station, you must disassociate any alerts associated with
the base station. To do this, you must use the HP Insight Environmental Configurator software.
Meters with no color bands indicate that there are no existing ASHRAE recommended ranges for those
readings. Base station meters have no color bands. Only rack and CRAC/CRAH object gauges have
color bands, explained by the coloring legend.
Views 27
Page 28
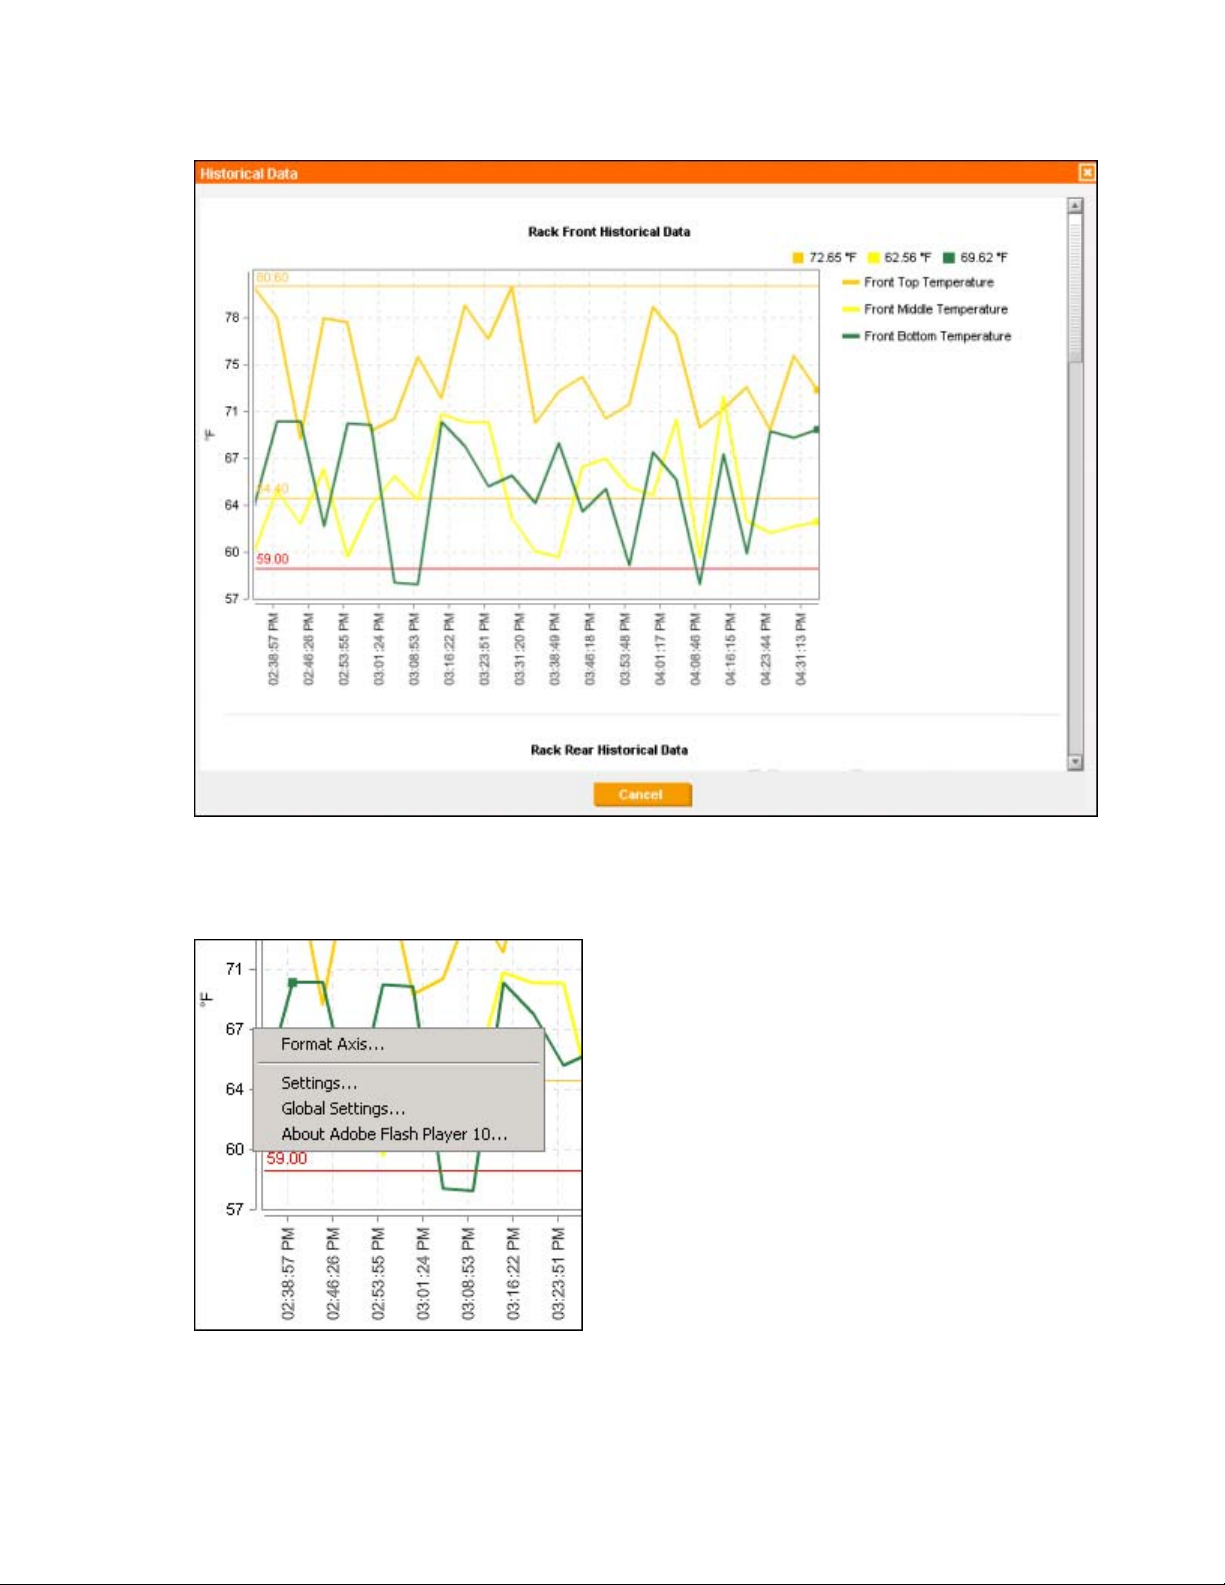
Select Graph to display a chart showing recent history for each sensor associated with the selected base
station.
To display the chart for each sensor, use the scroll bar to the right of the window.
To adjust the chart axis lines:
1. Right-click the axis line.
Views 28
Page 29
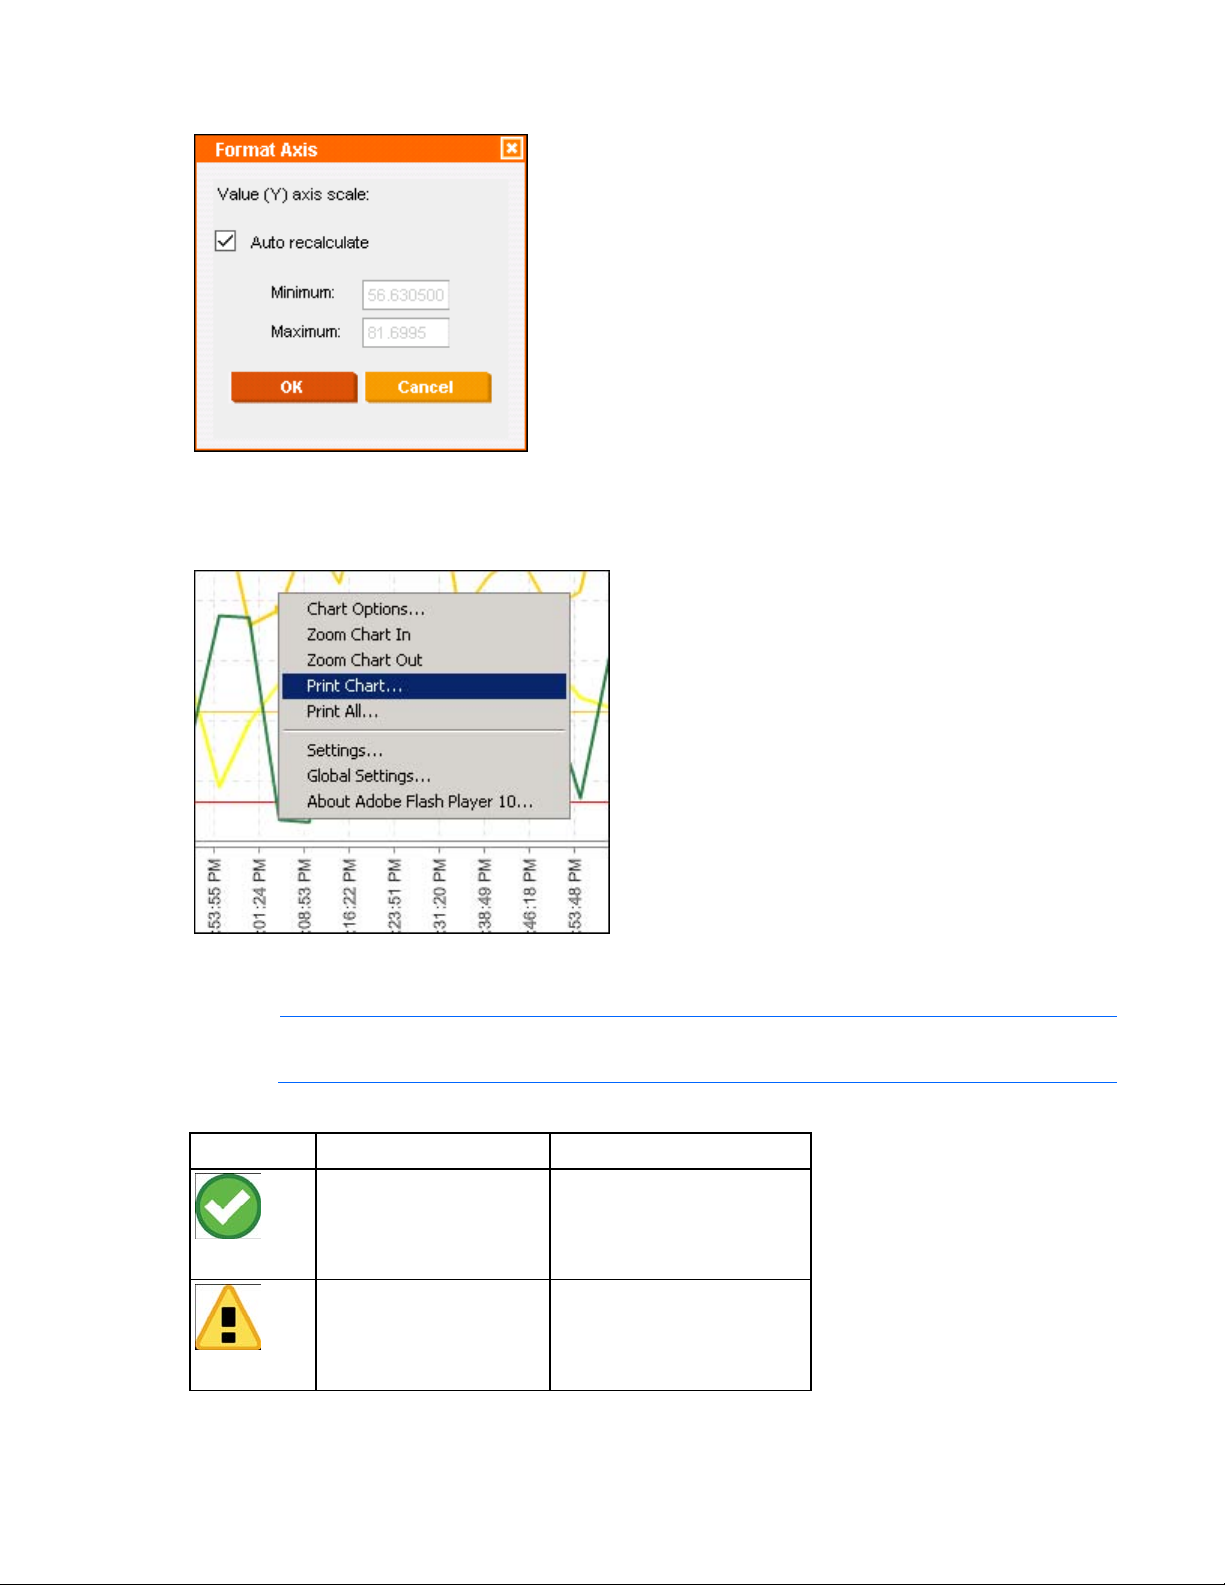
2.
•
•
•
•
Select Format Axis. The Format Axis window appears.
3. Either manually adjust the axis scale or select the Auto Recalculate box.
4. Select OK to save and close, or select Cancel to close without saving.
To print the chart, right-click the chart, and select Print. The chart prints to your default printer.
Detecting disconnected sensors
NOTE: If the base station is attempting to communicate with the gateway, the base station
If external sensors have become disconnected from a sensor object, the following indicators appear.
Icon Status and meaning Location
status might appear green, though the external sensors are disconnected.
Normal—The device
sensors are in normal
operating mode.
Warning—The device
sensors are disconnected or
are not communicating.
The zone in the Navigation
panel
The icon on the Overview
tab
The zone in the Navigation
panel
The icon on the Overview
tab
Views 29
Page 30

Icon Status and meaning Location
•
•
•
Critical—The device sensors
are reporting data values in
critical range.
The zone in the Navigation
panel
The icon on the Overview
tab
The object data value
window
If you notice a disconnected sensor indicated in any location, notify an administrator immediately.
Detecting sensors that require maintenance
Many external sensors require periodic maintenance in accordance with manufacturer guidelines.
If a sensor is disconnected or requires maintenance, a yellow ! appears in the following locations:
• The object data value window
• The zone in the Navigation panel
• The icon on the Overview tab
If you notice a sensor indicates required maintenance in any location, notify an administrator
immediately.
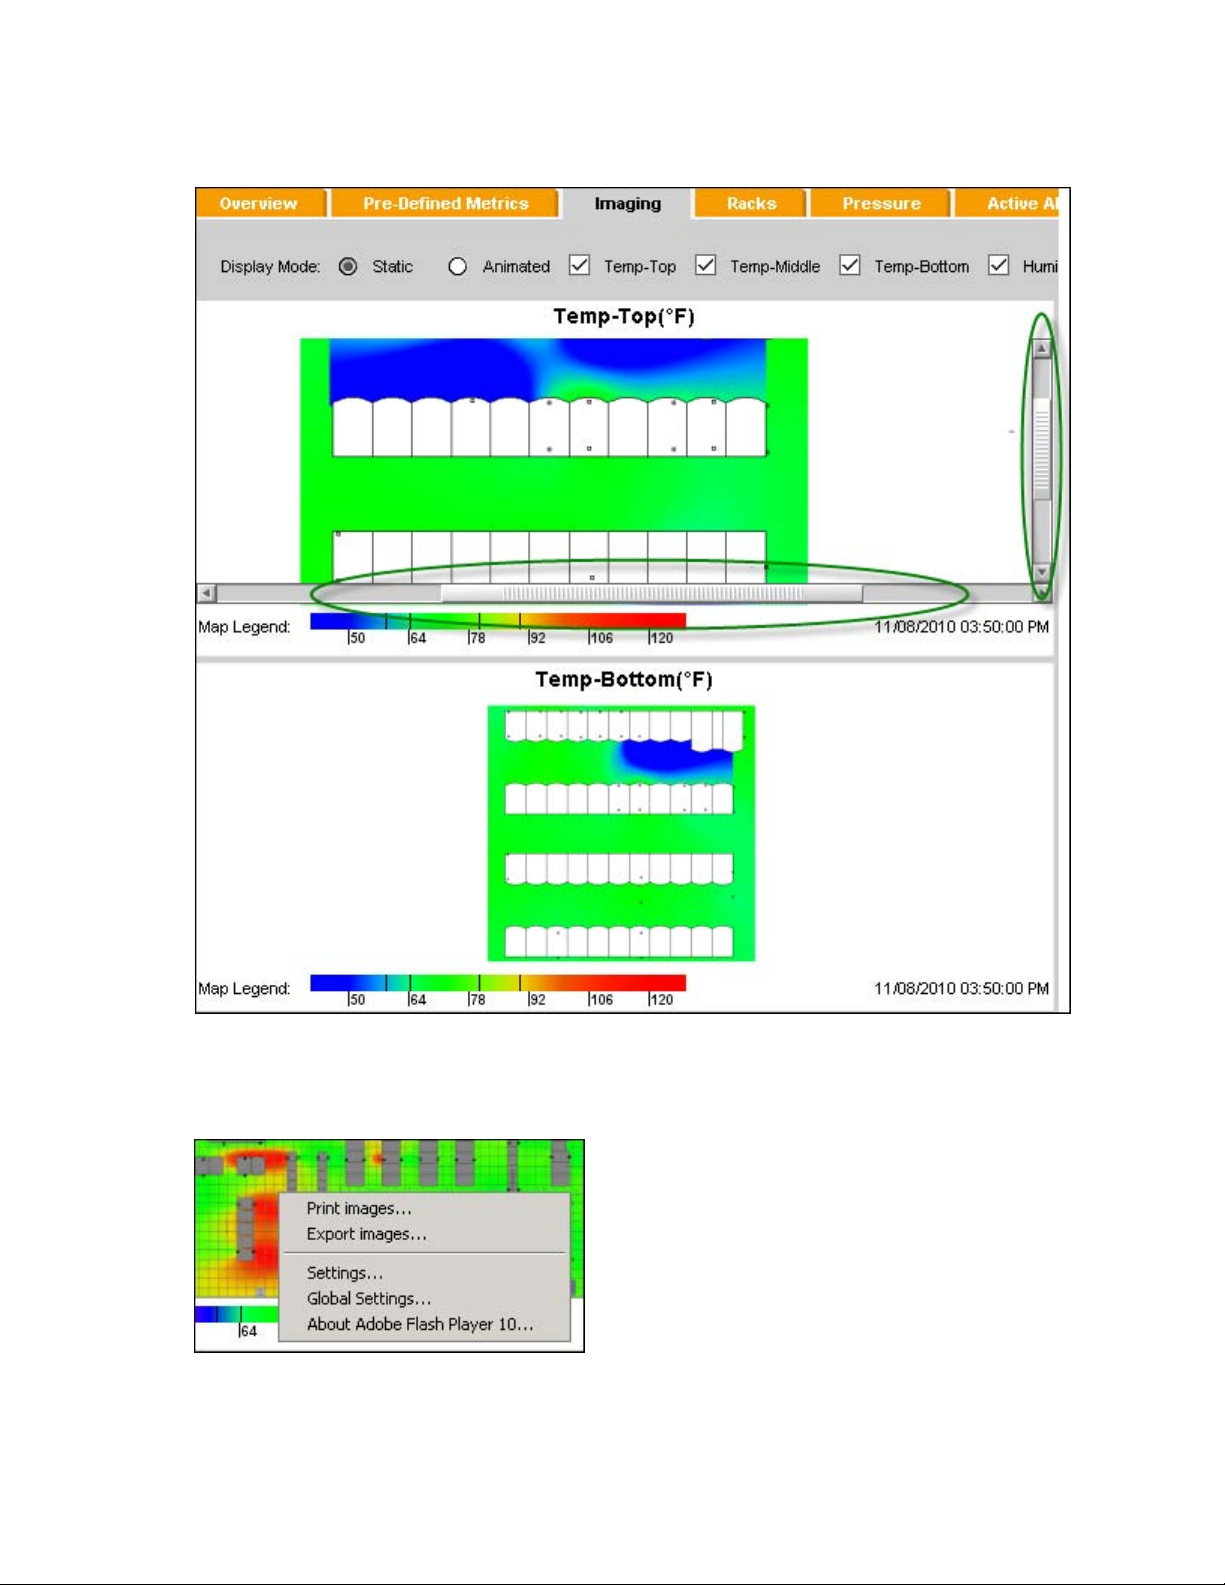
Imaging tab
The Imaging tab provides the following options for viewing zone information:
• Static—A color-coded map of each zone in the data center that depicts the current temperature,
humidity, or air pressure distribution
• Animated—The distribution map that depicts the changes of the specified sensors as a sequenced
flow within a specified date range
Accessing the Imaging tab
1. From the Navigation panel, select the data center or zone you want to display.
Views 30
Page 31

2.
Select the Imaging tab. The Imaging window appears.
Callout Item Description
1 Virtual map Enables you to access real-time and historical
imaging of temperature, humidity, and pressure
distribution.
2 Header Enables you to choose from available options.
Select static or animated imaging and the specific
sensor types and date ranges of data to show.
3 Map legend Enables you to see the status of the zone. The
legend is a color-coded key to the areas shown in
the Imaging tab. The movie bar displays the status
of an animation and enables you to control the
animation.
4 Time stamp Shows the date and time of the static image.
5 Zoom out Enables you to view several sensor static images
simultaneously.
6 Refresh Updates the imaging with the latest time stamp
and corresponding values.
By default, the Imaging tab displays a solid background color. However, a customized Overview layout
image is configured during installation. The image provides a spatially accurate and site-specific
rendering of the layout. For more information on configuring the background image, see the HP Insight
Environmental Configurator User Guide.
You can switch between the static and animated views. The Observer console calculates sensor data to
display in the Imaging tab approximately every 5 minutes.
Views 31
Page 32

The Map Legend
The Observer displays one of three different map legends, depending on what type of sensor the user
selects from the Type list:
• Temperature (Fahrenheit or Celsius)
• Humidity (percentage)
• Pressure (inches of H
The numbers along the bottom indicate the measurements. The colors provide a corresponding visual key.
Display modes
In the Imaging tab, you can view static or animated imaging for the zone selected on the Navigation
panel.
Observer shows the location of base station sensors based on x, y, and z coordinates and provides
readings for all base stations that can be analyzed based on one or more set of coordinates.
Selecting a temperature sensor type enables you to restrict the Imaging criteria and only show the
information for a specific horizontal plane (for example, that of the middle temperature sensor). The
Viewing static information
application renders the imaging only for that plane.
1. Select Static.
0 or Pascals)
2
2. Select the sensor-type you want to appear. A color-coded view of all readings for the sensor-type that
is currently selected appears.
The date and time of the readings from which the image is derived appear in the lower right corner of the
window. Click Refresh to update the image at any time. The image automatically refreshes every 5
minutes.
The available sensor-types are described in the following table.
Sensor-type Description
Temp-Top The temperature readings for sensors in the top position
of the racks within the zone
Views 32
Page 33

Sensor-type Description
Temp-Middle The temperature readings for sensors in the middle
position of the racks within the zone
Temp-Bottom The temperature readings for sensors in the bottom
position of the racks within the zone
Humidity The relative humidity based on readings from the
humidity sensors on racks within the zone
Pressure The differential air pressure, between the supply plenum
and the main floor, based on readings from all pressure
objects within the zone
To view static imaging for a different sensor-type, or to select multiple sensor-types to view at one time,
select the appropriate boxes. Select Refresh to update the view. If more than one sensor-type is selected,
you can select the Zoom out button to view all static images simultaneously.
Views 33
Page 34
If more than one sensor-type is selected and you are zoomed out to view all sensors simultaneously, you
can still zoom in on a single sensor-type. Select the box for that sensor type, and then use the scroll
feature on your mouse to zoom in or out. The scroll bars appear and show the zoom level.
Right-click any image window for available menu options:
• Select Print images to print the image to your default printer.
• Select Export images to export the image to the file-type of your choice.
Views 34
Page 35

Viewing animated information
1. Select Animated.
2. Select the sensor-type you want to appear. A window prompts you to wait while the necessary
images load into the animation.
3. Select the date range (up to 30 days) for your animation. The default date represents the last 24
hours.
a. Open the calendar window for the Start time.
b. Select the month. Use either the forward or back arrows to change the month, or select the month
from the menu.
c. Select the year from the menu.
d. Select the day from the calendar view.
e. Close the calendar window.
f. Repeat the previous steps for the End time.
4. Select Refresh to update the image or to change the animation after changing the sensor-type or
date range.
When loading is complete, the application displays a color animation of the distribution of the current
readings for the selected sensor type within the specified date range.
The animation plays at the rate of one frame per second, and lasts for a maximum of two minutes. A
counter at the lower right provides the currently displayed image, total number of images selected for the
animation, and the number of images available for the selected time period. It also displays the
progression through the images.
Directly below and to the right of the image of the zone, the time stamps for each captured image appear
as that image appears on the screen.
Animation controls appear on the bottom left of the page. As the animation plays, the slider on the
progress bar moves to the right to show the progression of frames. When the animation ends, the slider
returns to its starting position at the far left.
At any time while the animation is playing, or after it ends, the following animation control options are
available:
• Select Play to begin the animation or restart the animation.
• Select Pause to freeze the animation.
• Select either Previous or Next to move forward or backward, respectively, in the animation.
• Select Stop to halt the animation and return to the first frame in the series.
• Position the mouse over the slider on the progress bar to drag the slider to the right or left. Release
the slider to view a particular frame.
• Drag the slider quickly to play the animation quickly.
Views 35
Page 36

Pre-Defined Metrics tab
The Pre-Defined Metrics tab provides detailed data on the current state of the selected zone. These metrics
were developed in conjunction with the United Stated Department of Energy and Lawrence Berkeley
National Labs to reflect the important aspects of the data center and provide information on the efficiency
of the data center operations.
This information can be used to compare the effects of changes and help to improve overall efficiency.
Accessing the Pre-Defined Metrics tab
For more information, see Pre- defined metric definitions ("Pre-defined metric definitions" on page 37).
1. From the Navigation panel, select the data center or zone you want to display.
2. Select the Pre-Defined Metrics tab. A tabular view of all calculated metric information appears in two
categories (Rack and CRAH/CRAC).
Select the + to select all of the columns you want to view for that category.
3. Right-click any metric row. The options window appears.
Views 36
Page 37

4.
Select the operation you want to perform.
o Select Print table to print the entire table to your default printer.
o Select Export to export the information to the file-type of your choice.
o Select Show history to display all metric values calculated within a certain time frame.
The history for a specific metric measurement is shown in a table.
Pre-defined metric definitions
Metric Affected objects Description
Rack Cooling Index
®
Data center racks
HI
Zone racks
The measure of the absence of over-temperatures. 100% means
that no over-temperatures exist. The lower the percentage, the
Views 37
Page 38

Metric Affected objects Description
greater the possibility that the equipment experiences
temperatures above the maximum allowable temperature, as
determined by ASHRAE.
Rack Cooling Index
®
Data center racks
LO
Zone racks
®
/RCI
LO
®
Inlet
Data center racks
Zone racks
Zone racks The average of the top, middle, and bottom rack inlet
RCI
HI
Measurement Count
Average Rack Inlet
Temperature
Average Rack
Zone racks The average of the top, middle, and bottom rack discharge
Discharge
Temperature
Min, Max, Average
Rack Top Inlet Dew
Data center racks
Zone racks
Point
Min, Max, Average
Rack Cold Top Inlet
Data center racks
Zone racks
Air Temp Rate of
Change
Min, Max, Average
CRAC supply
CRAH/CRAC
Zone
temperature
Min, Max, Average
CRAC return
CRAH/CRAC
Zone
temperature
Min, Max, Average
CRAC supply dew
CRAH/CRAC
Zone
point temperature
Min, Max, Average
CRAC return dew
CRAH/CRAC
Zone
point temperature
RCI
TM/SM
is the complement to RCI
LO
TM/SM
to draw attention to
HI
the supply air that is below the minimum recommended
temperature, as determined by ASHRAE.
The number of racks that have RCI
TM/SM
HI
or RCI
LO
TM/SM
measurements
temperature sensors on each rack for each zone
temperature sensors on each rack for each zone
Dew point calculated at the top inlet on each rack for each
zone
Rack top inlet temperature degrees change per hour, for each
zone
Supply temperatures calculated for each zone
Return temperatures calculated for each zone
Dew point temperatures for supply air for each zone
Dew point temperatures for return air for each zone
Custom Metrics tab
The Custom Metrics tab only appears at the data center level, if you have defined and configured custom
calculation inspectors in the HP Insight Environmental Configurator. For more information, see the HP
Insight Environmental Configurator User Guide.
The Custom Metrics tab displays:
• All data inspectors configured for the data center
Accessing the Custom Metrics tab
• Historical data for the monitored calculation groups
1. From the Navigation panel, select the data center you want to display.
Views 38
Page 39

2.
If you have configured custom data inspectors, then select the Custom Metrics tab. The Custom
Metrics window appears.
3. In the Data Inspectors section, click the down arrow to select the filter for the historical data chart.
4. Right-click any row. The options window appears.
5. Select the operation you want to perform.
o Select Print table to print the entire table to your default printer.
o Select Export to export the information to the file-type of your choice.
Views 39
Page 40

6.
In the Historical Data section, click the down arrow to select the time interval for the historical data
graph.
7. Scroll over any point on the graph to display the data.
8. Right-click anywhere in the graph. The options window appears.
o Select Print Chart to print the entire graph.
Views 40
Page 41

9.
Select Refresh at anytime to update the data and graph.
Tabular views
You can view data in tabular form. Columns in the tables show detailed data for all base stations, racks,
pressure objects, and CRAH/CRACs in the zone selected on the Navigation panel. You can sort and edit
Accessing the Tabular views
columns. For more information about columns, see Changing the appearance of columns (on page 13).
1. From the Navigation panel, select the data center or zone you want to display.
2. Select one of the following tabs:
o CRAH/CRAC
o Racks
o Pressure
o Power Meters
o Active Alerts
o Alert History
o Base Stations
The information for the selected data center or zone and the selected tab appears in a tabular or
detailed list format.
Sensor object tabs
The following sensor object tabs might appear in your selected zone, depending on whether the objects
are installed in that zone:
• CRAH/CRAC
• Racks
• Pressure
• Power Meters
• Base Stations
The following table describes the information that appears for each sensor object in the Tabular view.
Column Description
Status icons Icons, in green, yellow, or red indicate the status of the
base station. See Status icons for more information.
Name The name of the sensor object. If the object is not
configured, the device ID appears.
Sensor type Icons representing each sensor type that is connected to
the sensor object.
Values The current reading for sensors connected to the base
station.*
Timestamp The date and time of the latest sensor reading.
Views 41
Page 42
Column Description
Location The location of the sensor object, as entered during
*If an external sensor is disconnected, then a red X appears in the sensor column. If a sensor needs maintenance,
then a yellow X appears in the sensor column.
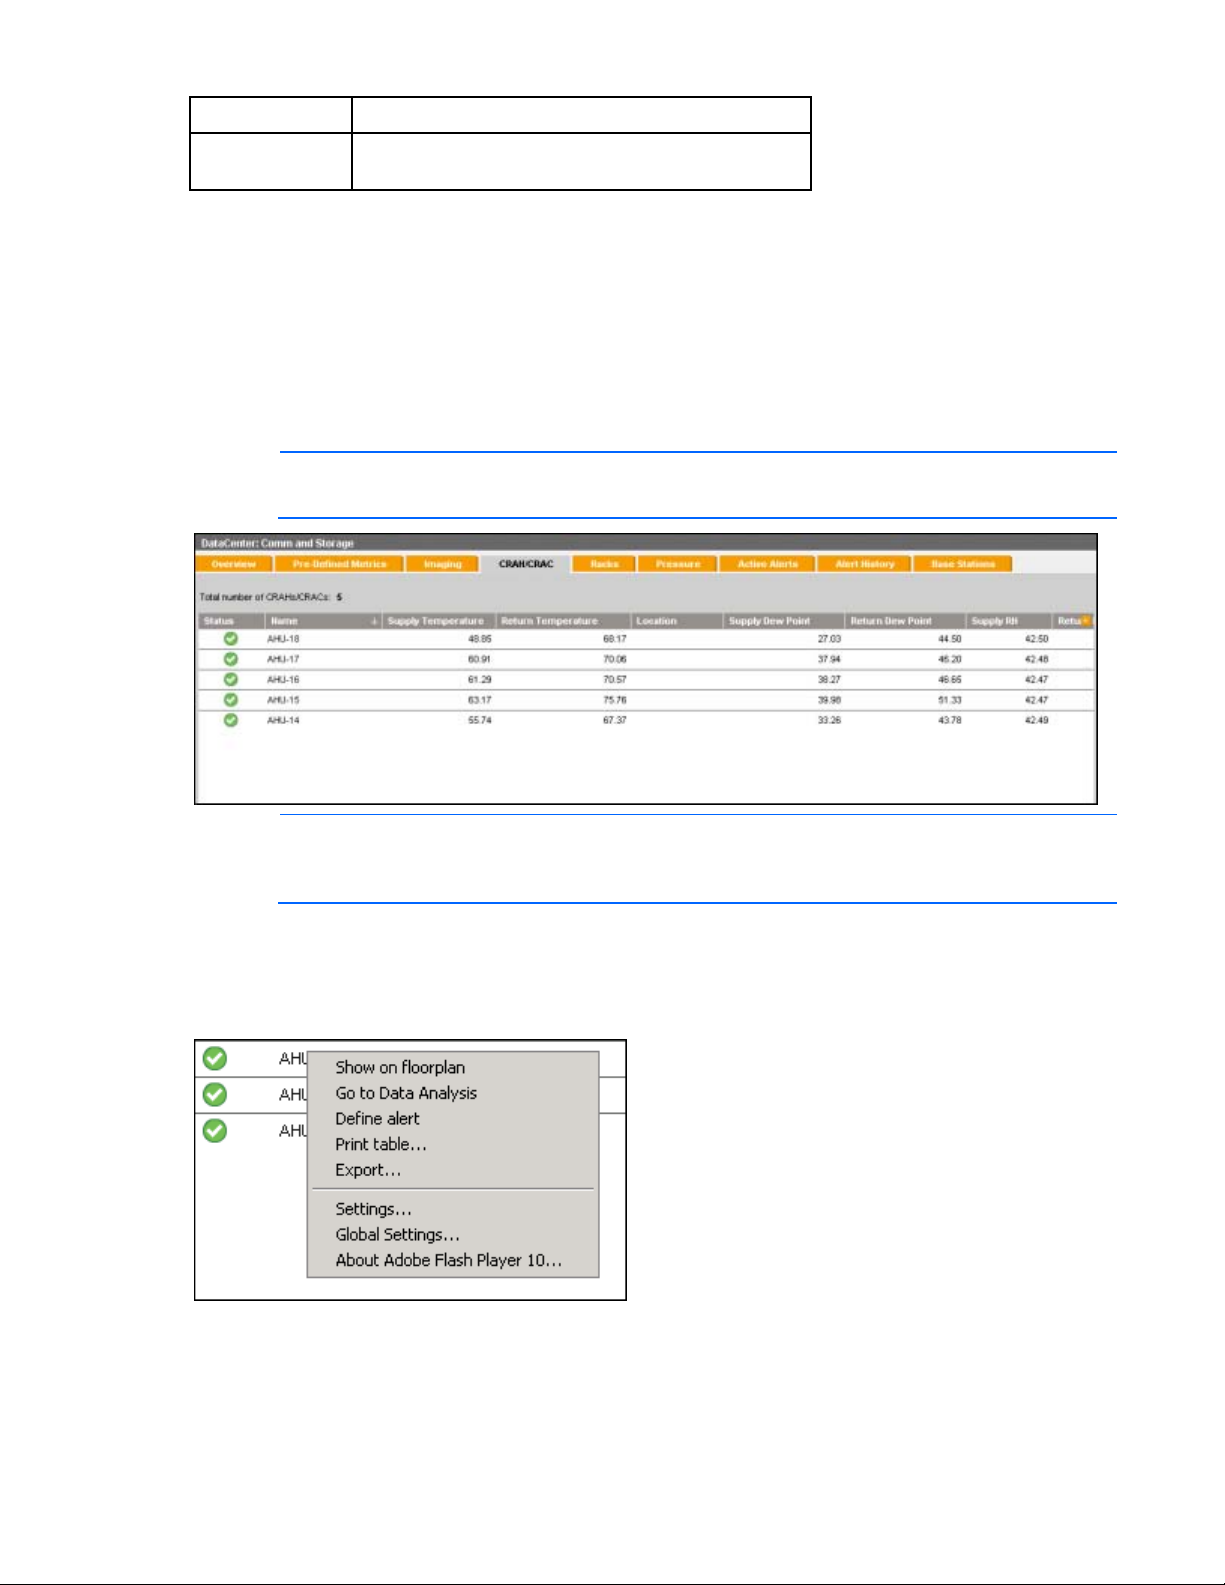
CRAH/CRAC tab
To view the CRAH/CRAC details for a specific zone:
1. From the Navigation panel, select the zone you want to display.
2. Select the CRAH/CRAC tab. The information for all CRAH/CRACs within that zone appears in the
Tabular view.
NOTE: You can sort, resize, move, or hide columns. For more information about the
appearance of columns, see Changing the appearance of columns (on page 13).
configuration.
NOTE: If the system is collecting data from the sensors but cannot calculate a value, the
CRAH/CRAC or rack objects might have a yellow status. This temporary situation is typically
encountered during the installation process.
The header display area specifies the total number of CRAH/CRACs in the zone. The main display
shows data, including status, name, location, and recent readings for each CRAH/CRAC, organized
into columns.
3. Right-click the CRAH/CRAC you want to view. The options window appears.
o Select Show on floorplan to locate the CRAH/CRAC on your zone floorplan view.
o Select Go to Data Analysis to open the Data Analysis window and highlight the selected
CRAH/CRAC for reporting.
Views 42
Page 43

o
Select Define alert to open the Define New Alert window and select the CRAH/CRAC as the
source of the data for the alert.
o Select Print table to print to your default printer.
o Select Export to export the information to the file-type of your choice.
4. Select an individual CRAH/CRAC to display the current and historical data associated with that
CRAH/CRAC.
Racks tab
To view the rack details for a specific zone:
1. From the Navigation panel, select the zone you want to display.
2. Select the Racks tab. The information for all racks within that zone appears in the Tabular view.
NOTE: You can sort, resize, move, or hide columns. For more information about the
appearance of columns, see Changing the appearance of columns (on page 13).
Views 43
Page 44

NOTE: If the system is collecting data from the sensors but cannot calculate a value, the
CRAH/CRAC or rack objects might have a yellow status. This temporary situation is typically
encountered during the installation process.
The header display area specifies the total number of racks in the zone and the number of active
alerts, if any. The main display shows data, including the status, name, location, and recent
readings for each rack, organized into columns.
3. Right-click the rack you want to view. The options window appears.
o Select Show on floorplan to locate the rack on your zone floorplan view.
o Select Go to Data Analysis to open the Data Analysis window and highlight the selected rack for
reporting.
o Select Define alert to open the Define New Alert window and select the rack as the source of
o Select Print table to print to your default printer.
o Select Export to export the information to the file type and location of your choice.
Pressure tab
To view the pressure object details for a specific zone:
1. From the Navigation panel, select the zone you want to display.
2. Select the Pressure tab. The information for all pressure objects within that zone appears in the
Tabular view.
NOTE: You can sort, resize, move, or hide columns. For more information about the
data for the alert.
appearance of columns, see Changing the appearance of columns (on page 13).
Views 44
Page 45

The header display area specifies the total number of pressure sensors in the zone and the number
of active alerts, if any. The main display shows data, including status, name, location, and recent
readings for each pressure object, organized into columns.
3. Right-click the pressure object you want to view. The options window appears.
o Select Show on floorplan to locate the pressure object on your zone floorplan view.
o Select Go to Data Analysis to open the Data Analysis window and highlight the selected pressure
object for reporting.
o Select Define alert to open the Define New Alert window and select the pressure object as the
source of the data for the alert.
o Select Print table to print to your default printer.
o Select Export to export the information to the file-type of your choice.
Power Meters tab
The Power Meters tab only appears if you have a power meter installed and configured in that zone. To
view the power meter object details for a specific zone:
1. From the Navigation panel, select the zone you want to display.
2. Select the Power Meters tab. The information for all power meters within that zone appears in the
Tabular view.
NOTE: You can sort, resize, move, or hide columns. For more information about the
appearance of columns, see Changing the appearance of columns (on page 13).
Views 45
Page 46

The header display area specifies the total number of power meters in the zone and the number of
active alerts, if any. The main display shows data, including the status, name, location, and recent
readings for each power meter, organized into columns.
3. Select any power meter you want to view. The current and historical sensor data appears. The
Current Sensor Data tab is the default.
Views 46
Page 47

4.
Select the Historical Sensor Data tab to view past sensor data.
Views 47
Page 48

5.
Filter sensor data, if desired.
6. Right-click the power meter object. The options window appears.
o Select Show on floorplan to locate the power meter on your zone floorplan view.
o Select Go to Data Analysis to open the Data Analysis window, and highlight the selected power
meter for reporting.
o Select Define Alert to open the Define New Alert window, and select the power meter as the
source of data for the alert.
o Select Print table to print to your default printer.
o Select Export to export the information to the file type and location of your choice.
Views 48
Page 49

Base Station tab
To view the wireless base station details for a specific zone:
1. From the Navigation panel, select the zone you want to display.
2. Select the Base Stations tab. The information for all wireless base stations within that zone appears
in the Tabular view.
NOTE: You can sort, resize, move, or hide columns. For more information about the
appearance of columns, see Changing the appearance of columns (on page 13).
The header display area specifies the total number of wireless base stations in the zone, including all
racks, CRAH/CRAC, and pressure objects. The main display shows data, including status, name (or
device ID), location, and recent readings for each base station, organized in to columns.
3. Move your mouse over a row to highlight it. Select a row to display all sensor information tied to
that wireless base station.
Views 49
Page 50

4.
Right-click the base station you want to view. The options window appears.
o Select Show on floorplan to locate the wireless base station on your zone floorplan view.
o Select Go to Data Analysis to open the Data Analysis window and highlight the selected wireless
base station for reporting.
Alerts
o Select Define alert to open the Define New Alert window and select the wireless base station as
the source of the data for the alert.
o Select Print table to print to your default printer.
o Select Export to export the information to the file-type of your choice.
o Select Send data to have the wireless base station take a reading from its sensors and
immediately send that data to the Observer.
o Select Identify to have the selected wireless base station to flash a yellow LED to identify it within
the data center.
o Select Reset to reset the selected wireless base station. The wireless base station must rejoin the
network and establish connection with the gateway before it can send new data.
o Select Set battery capacity to reset the battery lifetime for the wireless base station, after you
have changed the batteries. For more information about changing batteries, see Changing
batteries ("Replacing batteries" on page 103).
There are two types of alerts:
• System or Global alerts—These alerts are generated by the application for all data centers installed
and are viewable from the Alert menu. For more information, see Alerts menu (on page 68).
• Local alerts—These alerts are generated by the application for a specific data center or zone
installed and are viewable from the Active Alerts tab (on page 51) and Alert History tab (on page
52) within the Tabular view of that data center or zone.
You can view the following local alert options in the Tabular view:
• Active Alerts
• Alert History
Views 50
Page 51

Active Alerts tab
To view active alerts for a specific zone:
1. From the Navigation panel, select the zone you want to display.
2. Select the Active Alerts tab. The information for active alerts within that zone appears in Tabular
view.
The header display area specifies the number of active alerts. Select the + to select the columns you
want to view.
For active alerts, the only action you can perform is to clear them. Select Clear to remove the alert
from the active alerts list. When an alert is cleared, it is removed from the active alerts list, but is not
removed from the Alert History tab.
To clear an alert:
1. Highlight the alert:
o Single alert
o Multiple alerts
2. At the bottom right of the window, select Clear. The Clear Alert window appears.
Views 51
Page 52

You can add a note regarding the alert or reason for clearing it. Any added note appears with the
alert in the Alert History tab.
For more information on clearing alerts, see Alerts menu (on page 68).
Alert History tab
To view the alert history for a specific zone:
1. From the Navigation panel, select the zone you want to display.
2. Select the Alert History tab. The information for historical alert data, including previously dismissed
alerts, within that zone appears in Tabular view.
The header display area specifies the number of alerts in the selected date range. Select the + to
select the columns you want to view.
3. Right-click any alert to export or print the alert information. For more information about exporting
data, see Exporting tabular data to a .csv file (on page 52).
Exporting tabular data to a .csv file
To export the data:
1. Select the object tab in Tabular view.
2. Right-click the object for the data you want to export.
Views 52
Page 53

3.
Select Export. A window appears prompting you to save the file.
If you do not see the download window, you might have pop-ups blocked or may need to add the server
into your trusted zone to allow file downloads. See your browser documentation for enabling pop-ups.
For detailed information on exporting to this format, see Exporting to CSV format ("Exporting report data
to .csv file" on page 67).
Wireless Sensor Network tab
The Wireless Sensor Network tab appears only for administrators who have selected a data center from
the Navigation panel.
The view displays the locations of wireless base stations and the wireless communication status and map
between the base stations and the gateways. Base stations that are not wireless do not appear.
From the Wireless Sensor Network tab, you can view the following items:
• Total base station count—Displays the total number of base stations deployed within the data center.
• Wireless connectivity—Displays all devices connected and communicating with another device. If a
device is shown without a line connected to it, there is no communication for the device.
o Yellow status—The device has a connectivity problem. A warning is issued.
o Green status—The device is communicating to the network.
• Visual wireless hops—Displays the number of hops between base stations and gateways. For
optimal data transmission time, use a maximum of two hops between each base station and its
gateway.
• Wireless traffic balancing—Displays the wireless route lines. Be sure to balance the amount of traffic
Accessing the wireless sensor network
among gateways.
1. From the Navigation panel, select the data center you want to display.
Views 53
Page 54

2.
Select the Wireless Sensor Network tab. The Wireless Sensor Network page appears.
Callout Item Description
1 Virtual map Shows the wireless device location on the
data center and the wireless communication
map.
2 Data center
information
3 Hop level Shows the number of wireless communication
4 Show wireless
routes
5 Zoom slider Enables you to zoom in or out.
6 Network Shows the wireless network PAN selected for
7 Refresh Enables you to refresh the screen and view
Shows all base stations connected to the
wireless network and all warnings for the
wireless network.
hops between the wireless base station and
the gateway.
Enables you to toggle the display of all
wireless routes for all base stations.
the data center.
all current wireless routes.
Views 54
Page 55

Menu bar actions
Menu bar options
HP Insight Environmental Observer has the following user types:
• Administrator
• Power user
• Standard user
Each user type has a different view that correlates with the functions allowed for that user role. The
primary differences appear in the menu bars.
Administrator menu bar
Power and Standard user menu bar
The following table describes the available menu options.
Menu Administrator user options Power user options Standard user options
Reports Create reports
Custom reports
Battery report
Base Station F/W report
Alerts View global active alerts
View global alert history
Define new alert
Alert management
Delete alerts from database
Administration Create account
User accounts
System log
Options
My Account Password
Preferences
Create report
Custom reports
Battery report
View global active alerts
View global alert history
Define new alert
Alert management
None None
Password
Preferences
Create report
Custom reports
Battery report
View global active alerts
View global alert history
Password
Preferences
Menu bar actions 55
Page 56

Menu Administrator user options Power user options Standard user options
Window Close all
Data center
Help User Guide
About
Close all
Data center
User Guide
About
Close all
Data center
User Guide
About
For more information about user types, see Creating user accounts (on page 83).
Reports menu
The Reports menu offers the following options:
• Create reports
• Custom reports
• Battery reports
Creating a report
• Base Station F/W reports
1. From the Reports menu, select Create Reports. The Create Report window appears.
2. Select one of the following;
Menu bar actions 56
Page 57

o
Single-click a zone to view the properties for that zone.
Menu bar actions 57
Page 58

o
Double-click a zone to view all of the objects defined within that zone.
3. Select one or more of the properties listed.
o Highlight the sensors in the Properties list, and then select the > button to select one or more
sensors. The selected sensors appear in the Selected Properties list.
o Select the >> button to select all sensors in the Properties list. All sensors appear in the Selected
Properties list.
4. To remove sensors from the Selected Properties list:
o Highlight the sensors in the Selected Properties list, and then select the < button to remove sensors
from the analysis. The selected sensors reappear in the Properties list.
o Select the << the button to remove all sensors from the analysis. All sensors reappear in the
Properties list.
5. Select one of the following options:
Menu bar actions 58
Page 59

o
Select Tabular to view the report results in a table. The Report Results appear.
If necessary, modify the criteria for the historical data retrieved during data analysis, and then
select Update.
Menu bar actions 59
Page 60

o
Select Chart to view the report results in a table. The Chart Customization window appears.
If necessary, modify the chart customization options, and then select Chart. The Report Results
appear.
Menu bar actions 60
Page 61

Analyzing data
All users can perform an ad hoc report of historical sensor data for each of the following options:
• CRAH/CRAC
• Rack
• Pressure
• Base station
To use the data analysis function:
1. Select an object tab. The information for all sensor objects within that zone appears in the Tabular
view.
2. Move your mouse over a row, and right-click to open the menu.
3. Select Go to Data Analysis.
The Create Report window appears.
4. Continue to create the report ("Creating a report" on page 56).
Menu bar actions 61
Page 62
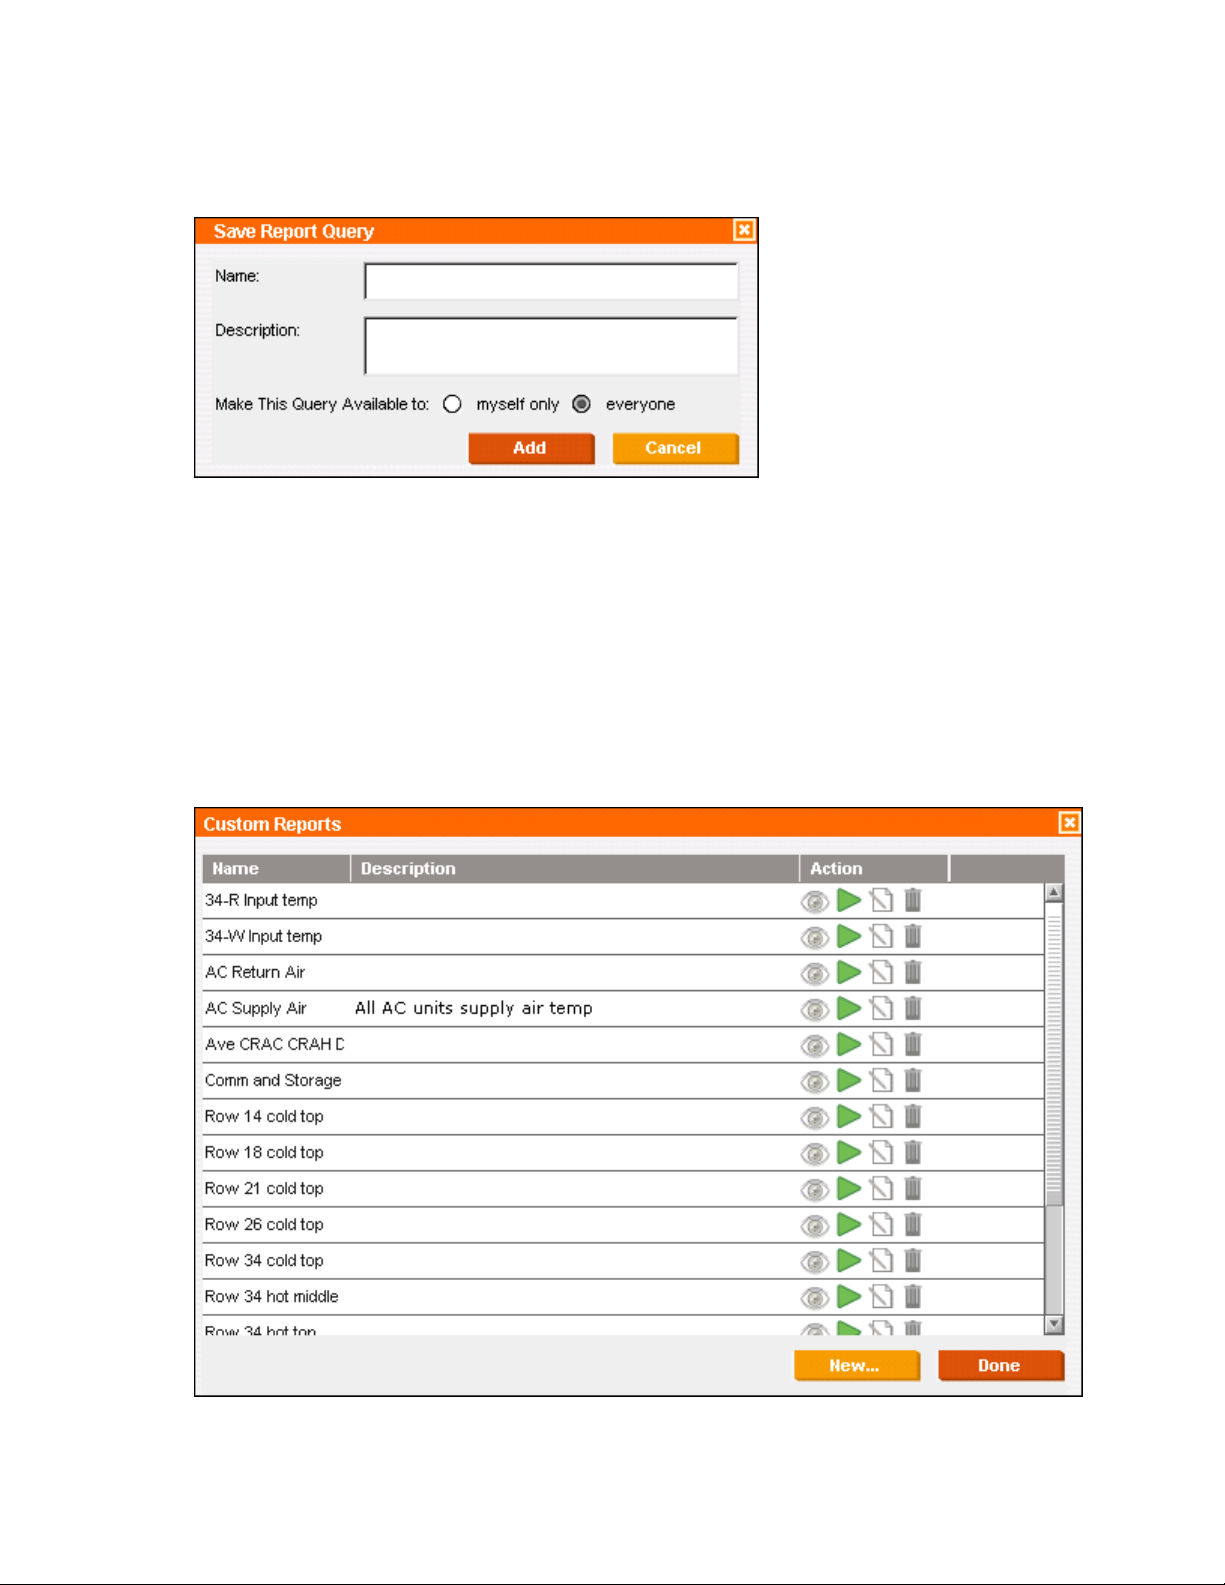
Saving the report
To save the report of the retrieved data for future references:
1. Select Save from the Create Report window. The Save Report Query window appears.
2. Complete the Name and Description fields.
3. Make the query available to:
o Myself only
o Everyone
4. Select Add to save the query.
Creating custom reports
You can view, run, edit, and delete previous custom queries.
1. From the Reports menu, select Custom Reports. The Custom Reports window appears.
Menu bar actions 62
Page 63

The names and descriptions of previous custom queries saved using the Save Report Query window
appear in the columns of the window. The buttons to the right of each column enable the user to
perform additional actions.
Item Action
View Custom Query Selection
Run Custom Query
Edit Custom Query
Delete Custom Query
2. To create a new query, select New. The Create Report window appears.
See Creating a report (on page 56) for more information.
3. Select Save to save any changes and close the window.
Viewing custom queries
1. From the Reports menu, select Custom Reports. The Custom Report window appears.
2. Select the row of the query you want to view.
Menu bar actions 63
Page 64

3.
Select the View Custom Query Selection icon. The Custom Report Details window appears and
displays the names of the objects and sensors used in the previous query.
4. Select Close to close the window and return to the Custom Reports window.
Running custom queries
1. From the Reports menu, select Custom Reports. The Custom Report window appears.
2. Select the row of the query you want to run.
3. Select the Run Custom Query icon. The Data Filter window appears.
4. Select the date/time filters for the current run and specify the export option for the analysis.
o Select Tabular to view the custom query results in a table.
o Select Chart to view the custom query results in a chart.
Editing custom queries
1. From the Reports menu, select Custom Reports. The Custom Report window appears.
2. Select the row of the query you want to run.
3. Select the Edit Custom Query icon. The Create Report window appears.
4. Make all necessary edits, and select Save.
Deleting custom queries
1. From the Reports window, select Custom Reports. The Create Reports window appears.
2. Select the row of the query you want to delete.
Menu bar actions 64
Page 65

3.
Select Delete Custom Query icon. A confirmation window appears.
4. Select OK to delete the custom query. The name of the query and its summary no longer appear in
the Custom Reports window.
Generating battery reports
Battery reports might reflect an inaccurate condition, depending on when you run the report. If you
generate the battery report after a recent installation or deployment, the battery report might show a
depleted battery, due to the wireless device battery being on throughout the installation process.
For the most accurate battery report results, HP recommends waiting a minimum of one week of normal
operation before you generate a battery report.
NOTE: The sensor objects require approved lithium batteries, such as Energizer or Eveready
L91 batteries, not alkaline batteries. When the battery report indicates that a battery is near
1. Select the Reports menu.
end of lifetime, replace the battery immediately.
2. Select Battery Report. The Battery Report window appears.
Menu bar actions 65
Page 66

The report is automatically generated based on sensor readings. It provides estimated battery life for all
object batteries and suggests recommended replacement parameters.
• The scroll bar enables you to see the entire report.
• Right-click a row to access the context menu, and then select from the menu.
Base Station F/W reports
From the Reports menu, select Base Station F/W reports. The Base Station F/W Version Report window
appears.
Menu bar actions 66
Page 67

The report is generated automatically to include each of the base stations information including name,
location, zone, and firmware data.
Exporting report data to .csv file
You can export the sensor data from your reports to a Comma Separated Values (CSV) file format that
can be used with an Excel spreadsheet.
To export the report sensor data:
1. In the Create Report window, create your custom report.
2. Select the Tabular viewing option.
3. Right-click the row of data you want to export.
4. Select Export. A window appears asking you to save the file.
If you do not see the download window, you might have pop-ups blocked or need to add the server to
your trusted zone to allow file downloads. See your browser documentation for enabling pop-ups.
Viewing sensor data for analysis
1. Specify the data you want to compare.
a. Select the aging criteria.
b. Select the first base station and a specific temperature sensor.
c. Select the second base station and a specific temperature sensor.
d. Select the third base station and a specific temperature sensor.
2. Select how you want the data comparison shown. A row of buttons provides access to viewing
options.
o Select Tabular to view the data in a simple detail format.
o Select Chart to plot the retrieved data on a chart and compare sensor trends across a set
timeline. For more information, see Customizing charts (on page 68).
Menu bar actions 67
Page 68

o
Select Save to save the data comparison.
Customizing charts
1. Click Chart to plot the retrieved data on a chart and compare sensor trends across a set timeline.
The Chart Customization window appears.
2. Select the data in the left list and configure it using the following options:
o Style
o Color
o Chart name
o Background color
o Appearance and location of legend
3. Select Chart to create a chart using the selected data.
Alerts menu
The Alerts menu options differ based on the user type.
Administrators can choose from the following options:
• View global active alerts
• View global alert history
• Define new alert
• Alert management
• Delete alerts from database
Menu bar actions 68
Page 69

Power users can choose from the following options:
• View global active alerts
• View global alert history
• Define new alert
• Alert management
Standard users can choose from the following options:
• View global active alerts
• View global alert history
Viewing global active alerts
1. Select the Alerts menu.
2. Select View Global Active Alerts. The Active Alerts window appears, listing all active alerts for all
data centers monitored by the HP Insight Environmental Observer.
Viewing global alert history
1. Select the Alerts menu.
2. Select View Global Alert History. The Alerts History window appears that includes all active and
previously cleared alerts for all data centers monitored by the HP Insight Environmental Observer.
3. Select the Start and End Dates, using the Calendar view for the history you want to view.
4. Select Show Alerts to update the window for the time span selected.
Menu bar actions 69
Page 70

Defining a new alert
To define a new alert or edit existing alert definitions:
1. From the Alerts menu, select Define New Alert. The New Alert window appears with tabbed pages
for each type of alert information to be defined.
2. In the Alert Name tab, enter the basic alert information.
o Alert name—A unique name or identifier for the alert.
o Alert priority—How often and in what order email notifications are sent to the alert recipient.
o Description—Optional location to provide more details about the alert.
3. Select the Message tab, and create the alert notification message.
o Message header—The subject line of the alert notification message
o Message body—The content of the alert notification message
o Macros—Data inserted into the message body that cannot be used in the message header:
— $MESSAGE$—Displays the data type and actual value that triggered the alert.
— $NAME$—Displays the name of the object that triggered the alert.
— $LOCATIONS$—Displays the location of the object that triggered the alert.
— $TIMESTAMP$—Displays the time stamp when the alert was originally triggered.
4. Select the Objects & Conditions tab, and then adjust the types of objects and values you want
evaluated for that alert.
NOTE: Do not create conditions that are mutually exclusive. For example, a top temperature
greater than 80°F and a top temperature less than 50°F. Be careful to select Or rather than
And.
Menu bar actions 70
Page 71

a.
Create a condition.
NOTE: You can evaluate the data values and metrics for rack and CRAH/CRAC objects. You
can evaluate only data values for base station, pressure, and sensor objects.
Object Values available
Base station Temperature
Humidity
Pressure
Voltage
Current
Energy
Liquid flow
Door status
Liquid presence
Remaining battery days
Rack Front top temperature
Front middle temperature
Front bottom temperature
Rear top temperature
Rear middle temperature
Rear bottom temperature
Reference temperature
Humidity
cTROf change
Cold dew point
Pressure objects Pressure
CRAC Supply temperature
Return temperature
Sensor Temperature
Humidity
Pressure
Voltage
Current
Energy
Liquid flow
Door status
b. Select the logical operator and enter the threshold value.
Liquid presence
c. Select the ellipsis button to select all objects to apply the condition. Hold the Ctrl button while
selecting objects to select multiple objects.
d. Select OK to save. The Objects & Conditions window closes, and the New Alert window
appears.
5. Select the Recipients tab, and indicate who receives the alert notification messages when an alert is
triggered.
a. Select the type of alert notification from the menu.
Menu bar actions 71
Page 72

— Email
— SNMP Trap
b. Enter a valid email address.
c. Select the Add (+) button to enter additional recipients. You can enter multiple email addresses
by separating each email address with a semi-colon.
6. At the bottom right of the New Alert window, click Create to save the alert.
Managing alerts
1. From the Alerts menu, select Alert Management. The Manage Alerts window appears.
NOTE: In the Manage Alerts window, any alerts that are grayed out indicate a deactivated
alert. For more information about activating alerts, see Activating an existing alert definition
(on page 79).
Menu bar actions 72
Page 73

Each entry in the alert list contains the following:
o Alert name
o Alert description
o Alert priority
o Edit Alert button
o Activate or Deactivate button
o Delete Alert button
2. Select the alerts you want to view, by selecting All, Active, or Inactive from the menu.
Performing alert actions
From the Manage Alerts window, you can create, edit, activate, deactivate, and delete alerts.
Menu bar actions 73
Page 74

Item Action
Edits alert
Activates alert
Deactivates alert
Deletes alert
Creating an alert definition
Observer has several predefined alerts within the application that cannot be changed or deleted from the
system. The only action items for the predefined alerts is to activate, deactivate, or dismiss the alert. The
following alerts are predefined.
Predefined alert Description
UNKNOWN All errors that are not otherwise defined.
AUDIT Notifies an administrator if any software component is
not running or is configured incorrectly. The default
notification interval is every 5 minutes, though the
interval can be adjusted in HP Insight Environmental
Configurator.
Sensor requires
service
Warning Front
Temperature
Critical Front
Temperature
DAL_ERROR Notifies an administrator of any critical issue with any
Circuit Current
above threshold
Circuit Power above
threshold
Circuit Power Factor
below threshold
Communication
error
Circular
dependency in CRE
rule
A sensor on the HP Rack Sensor Array requires service.
Rack front temperature is outside the recommended
range. The default range is between 18°C and 27°C
(64.4°F and 80.6°F). You can adjust the temperature
range in HP Insight Environmental Configurator.
Rack front temperature is outside the recommended
range. The default range is between 18°C and 27°C
(64.4°F and 80.6°F). You can adjust the temperature
range in HP Insight Environmental Configurator.
software component.
Notifies an administrator if the current of any circuit that
is monitored by BCMS is above the configured
threshold.
Notifies an administrator if the power of any circuit that
is monitored by BCMS is above the configured
threshold.
Notifies an administrator if the power factor of any
circuit that is monitored by BCMS is below the
configured threshold.
Notifies an administrator if one or more data points
cannot be acquired. This alert is generated by wired
plug-ins such as Modbus, SNMP, XML, and web
services that are used in communicating data.
Notifies an administrator when circular dependency is
detected in a CRE rule. This alert is generated if the PUE
calculation graph is configured incorrectly. For more
Menu bar actions 74
Page 75

Predefined alert Description
information about PUE graphs, see the HP Insight
Environmental Configurator User Guide.
To create a new alert definition:
1. From the Alerts menu, select Alert Management. The Manage Alerts window appears.
Menu bar actions 75
Page 76
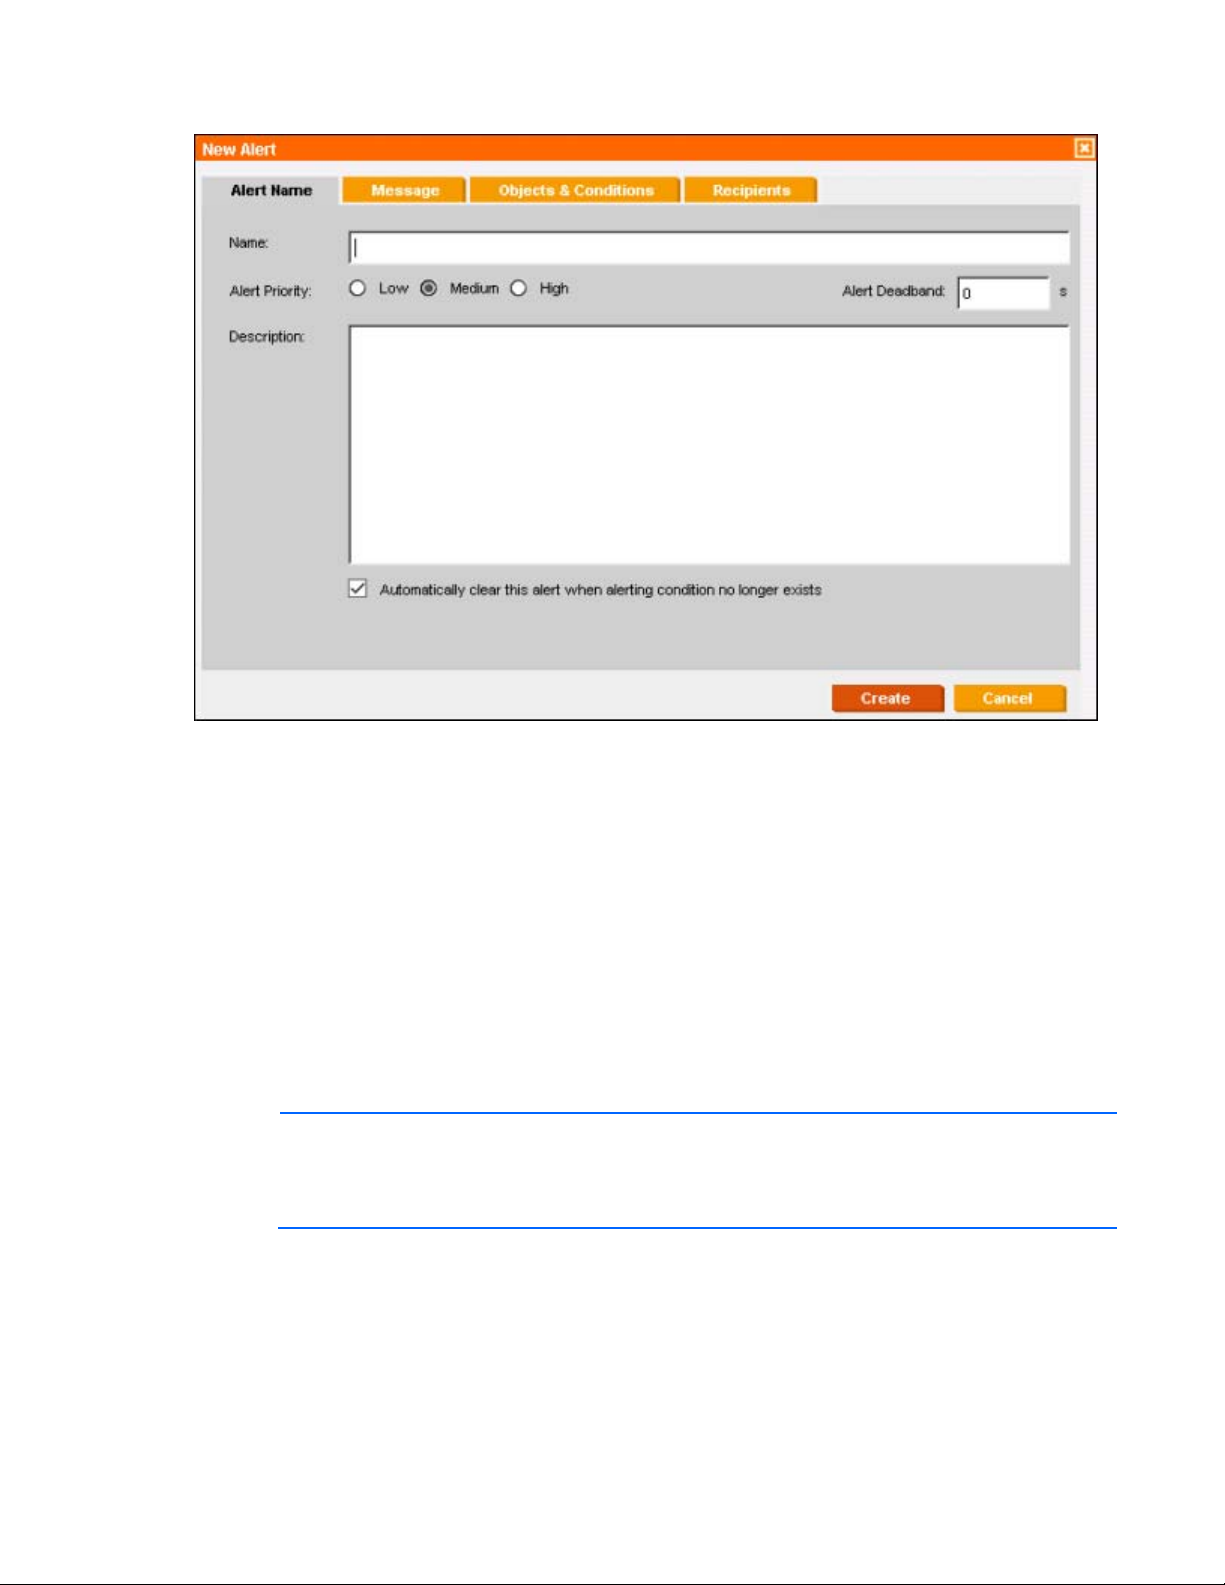
2.
Click Create. The New Alert window appears.
3. Complete the following information:
o Name—Name the new alert
o Alert Priority—Select either Low, Medium, or High priority
o Alert Deadband—Select the deadband in seconds. The deadband value is the amount of time
between the alert condition and the alert. A value of zero triggers an alert immediately during an
alert condition.
o Description—Describe the alert condition.
4. Select the Automatically clear this alert when alerting condition no longer exists box to clear the alert
automatically when the condition no longer exists.
Editing an existing alert definition
5. Select Create to create the alert, save, and close, or select Cancel to close without saving.
NOTE: The system-defined alerts cannot be edited or deleted. You can deactivate the alert, if
you no longer want to receive warning of the alerting condition. All user-defined alerts include
a trash can icon on the Manage Alerts window, and can be edited or deleted at any time with
the appropriate user credentials.
Menu bar actions 76
Page 77

1.
From the Alerts menu, select Alert Management. The Manage Alerts window appears.
2. Select the Edit alert icon for a particular alert. The Edit alert window appears. Fields in this window
are pre-populated with information entered for the associated alert.
Menu bar actions 77
Page 78

If you are editing a user-defined alert, additional tabs appear, enabling you to edit additional
objects and conditions associated to the alert.
3. In this window, an administrator can edit any data relating to the alert definition.
4. Select Update to save edits, close the window, and return to the Manage Alerts window. A message
appears at the lower left of the console window confirming that the alert was successfully updated.
Menu bar actions 78
Page 79

Activating an existing alert definition
1. From the Alerts menu, select Alert Management. The Manage Alerts window appears.
2. Select the Activate alert icon for a particular alert to place the definition in a status where an alert is
evaluated or triggered, based on incoming sensor readings.
A Confirmation window appears prompting you to confirm activating the alert definitions.
o Select OK to close the window and return to the Manage Alerts window. A message appears at
the lower left of the Portal window, informing the administrator that the alert was successfully
activated.
o Select Cancel to close the window and return to the Manage Alerts window without making any
changes.
Menu bar actions 79
Page 80

Deactivating an existing alert definition
1. From the Alerts menu, select Alert Management. The Manage Alerts window appears.
2. Select the Deactivate alert icon for a particular alert to place the definition in a status where an alert
is no longer evaluated or triggered based on incoming sensor readings.
A Confirmation window appears prompting you to confirm deactivating the alert definitions.
o Select OK to close the window and return to the Manage Alerts window. A message appears at
the lower left of the Portal window, informing the administrator that the alert was successfully
deactivated.
Although the deactivated alert definition is no longer available for use, the application saves the
definition for interpretations and historical data, and it can be activated again. Therefore, the
name of the deactivated alert definition cannot be reused, and the administrator should not
create another alert definition with the same name.
o Select Cancel to close the window and return to the Manage Alerts window without making any
changes.
Menu bar actions 80
Page 81

To view all Inactive alerts, select Inactive from the View menu.
Deleting individual alerts
NOTE: The system-defined alerts cannot be edited or deleted. You can deactivate the alert, if
you no longer want to receive warning of the alerting condition. All user-defined alerts include
a trash can icon on the Manage Alerts window, and can be edited or deleted at any time with
the appropriate user credentials.
Before an object can be deleted from the system, any alerts associated with it must be cleared. Therefore
the deletion of the object cannot be accomplished by the software alone. The administrator must remove
the object from any associated alerts.
1. From the Alerts menu, select Alert Management. The Manage Alerts window appears.
Menu bar actions 81
Page 82

2.
Select the Delete alert icon to delete all alert-related data, including conditions and definitions,
regardless of data center or zone. Unlike the clear operation, no historical data that refers to the
deleted alerts is retained.
A Confirmation window appears prompting you to confirm deleting the alert definitions.
o Select OK to close the window and return to the Manage Alerts window. A message appears at
the lower left of the Portal window informing you that the alert was successfully deleted.
o Select Cancel to close the window and return to the Manage Alerts window without making any
changes.
Deleting all alerts from database
If you Delete all alerts from the database, all alert instances are removed from the database. However, the
associated alert definitions remain in the database and will continue to be monitored, unless you
deactivate the alert.
1. From the Alerts menu, select Delete Alerts from Database. The Delete Alerts window appears.
o Select Delete all alerts to clear all the alert instances from the database. A Confirmation window
appears prompting you to confirm deleting all alerts from the database.
— Select OK to permanently remove all alert instances from the system. A message appears at
the lower left of the console window informing you that all alerts are successfully deleted.
— Select Cancel to close the window without making any changes.
o Select Delete alerts older than to select a date to define the alerts you want to delete.
Administration menu
The Administration menu appears on the menu bar only when the administrator logs in to Observer.
The Administration menu offers the following options:
Menu bar actions 82
Page 83

• Create Account
• User Accounts
• System Log
• Options
Creating user accounts
1. From the Administration menu, select Create Account. The Create Account window appears.
2. Select the role of the user account and complete the remaining fields for the user.
o Users given the Administrator role automatically have access to all monitored data centers and
associated zones.
o Users given the Standard User role, by default, do not have access to any monitored data
centers or zones. The access permission for that user must be assigned by an administrator. For
more information about user permissions, see Setting permissions (on page 10).
NOTE: A message appears at the lower left corner of the console window informing you that
the task was successful.
3. Select Add to save and close.
Menu bar actions 83
Page 84

User accounts
1. From the Administration menu, select User Accounts. The Manage Accounts window appears.
o Search for user accounts
o Change user passwords
o Edit or delete a user
Searching for user accounts
An administrator can search for user accounts using the following criteria:
• All users
• First name
• Last name
• Email address
• Username
• User type
To search for a user account:
1. From the Administration menu, select User Accounts. The Manage Accounts window appears.
2. Search for a user account using one of the following methods:
o All user profiles (default)—Select a user account from the list.
Menu bar actions 84
Page 85

o
Search by—Select criteria from the list.
3. If you search using the Search by list, enter the appropriate search criteria, and then select Search. If
any user profile matches the search criteria, the columns are populated with the results.
Changing user passwords
To change the password for any user, you need the user name of the user whose password will be
changed.
1. From the Administration menu, select User Accounts. The Manage Accounts window appears.
2. Search for the user ("Searching for user accounts" on page 84), and then select Edit. The Edit
Account window appears.
3. Check the Change Password box, type in the new password and then confirm the password.
4. Select Update to save and close.
For more information, see Changing your password (on page 96).
Menu bar actions 85
Page 86

Clearing active alerts associated with a user
To delete a user, all active alerts and custom queries associated with that user must be cleared. Either the
user or an administrator can clear the associated alerts and queries.
1. Log in to the Observer as the user.
2. Delete all custom queries ("Deleting individual alerts" on page 81).
3. Dismiss all active alerts ("Active Alerts tab" on page 51).
Editing or deleting users
The default administrator account cannot be deleted. A user cannot be deleted if an active alert or custom
query is associated with that user. For more information, see Clearing active alerts associated with a user
(on page 86).
To edit or delete a user:
1. Search for the user account ("Searching for user accounts" on page 84).
2. Select the user account, and then select either Edit or Delete in the bottom right corner of the
window.
Menu bar actions 86
Page 87

o
If you select Edit, the Edit User window appears. Update all required fields and select Update to
save and close.
o If you select Delete, a confirmation window appears prompting you to confirm deleting the user.
Select OK to delete the user and close.
NOTE: A message appears at the lower left corner of the console window informing you that
the task was successful.
Viewing the system log
The administrator can view the record log for the application, either in its entirety or after applying a data
filter for specific information.
To view the system log:
Menu bar actions 87
Page 88

1.
From the Administrator menu, select System Log. The System Log window appears, detailing a list of
user activities and the corresponding time stamps.
2. To filter the information that appears, select the criteria from the Filter by drop-down menu, and
select Update. The default is Show all activity.
Additional fields might appear, depending on the criteria selected. Enter all appropriate information,
and then select Update.
Administrative options
From the Administration menu, select Options. The Options window appears.
From the Options window, you can define the following options:
• Email
• Auditors
Menu bar actions 88
Page 89

• SNMP
• Security
• Imaging
• Alerts
Email options
To define the email options:
1. From the Administration menu, select Options. The Options window appears.
2. Select the Email tab.
3. Define the following options:
o Server information
o Logon information
o User information
4. To test your new settings, select Test Email. An email is sent to the address defined in the User
information.
5. Select OK to save and close, or select Cancel to close without saving.
Auditors options
To define the auditors options:
1. From the Administration menu, select Options. The Options window appears.
Menu bar actions 89
Page 90

2.
Select the Auditors tab.
3. Define the following options:
o Database auditor
o Device Manager auditor
o Imaging Server auditor
o Observer auditor
4. Select OK to save and close, or select Cancel to close without saving.
SNMP options
To define the SNMP options:
1. From the Administration menu, select Options. The Options window appears.
Menu bar actions 90
Page 91

2.
Select the SNMP tab.
3. Define the following options:
o Source Address
o Destinations
4. To add new destinations, select Add. A new row appears for you to enter the following information:
o Remote IP
o Remote Port
o Write community
o Read community
5. To send a test SNMP trap, highlight a destination, and then select Send.
Menu bar actions 91
Page 92

6.
To edit existing destinations, highlight the existing destination. You can type over the existing
information. Select OK to save and close, or select Cancel to close without saving.
7. To remove existing destinations, highlight the existing destination and select Remove. The destination
is removed from the Destination list.
8. Select OK to save and close, or select Cancel to close without saving.
Security options
To define the security options:
1. From the Administration menu, select Options. The Options window appears.
Menu bar actions 92
Page 93

2.
Select the Security tab.
3. Select the Web access security mode:
o No encryption—(Default) Unsecured HTTP access.
o Authentication only—Secured HTTPS access. During login, the user is authenticated through
HTTPS before they can access the Observer web console. Once authenticated, the
communication between the client browser and the Observer is not encrypted.
o All—Secured HTTPS access and secure communication. During login, the user is authenticated.
Once authenticated, communication between the client browser and the Observer remains
encrypted. This method is the most secure, however, data performance, such as data transfer,
might be affected.
4. To set up the secure Authentication only access, complete the Connector configuration.
a. Specify the connection port, typically 443.
Menu bar actions 93
Page 94

b.
Select Upload to browse to and upload the keystore certificate file on the local machine. The
Upload File window appears.
c. Select Done to save the certificate and close the window.
d. Enter the keystore password that was used to create the keystore.
5. Select OK to save and close, or select Cancel to close without saving.
Imaging options
To define the imaging options:
1. From the Administration menu, select Options. The Options window appears.
Menu bar actions 94
Page 95

2.
Select the Imaging tab.
3. Select the Imaging legend you want to edit from the Legend for menu.
o Select Add to add a new color to the legend. You must define the value range for the color to
represent.
o Select Remove to delete an existing color or value range from the legend.
o Select Restore to ignore all changes made on the Imaging Options page, and restore the
Imaging settings to the previous state.
4. Select OK to save and close, or select Cancel to close without saving.
Alerts options
To define the alerts options:
1. From the Administration menu, select Options. The Options window appears.
Menu bar actions 95
Page 96

2.
The alert system sends one alert notification immediately following the alert condition. If
Select the Alerts tab.
NOTE:
the alert is not acknowledged, the system will send two additional reminder alerts at the time
3. Define the time intervals for high, medium, and low priority alerts. Each alert priority can have an
interval specified.
additional interval configured that will check the alert condition if the alert remains unacknowledged.
4. Define the time interval for the alert to automatically clear when the alert condition has cleared. The
auto clear feature only works if it is enabled in the original alert definition. See Creating an alert
definition (on page 74) for more information.
5. Select OK to save and close, or select Cancel to close without saving.
My Account menu
You can customize your options to suit your viewing preferences. All options are user-specific and remain
the same from session to session.
The My Account menu offers the following options:
• Password
• Preferences
Changing your password
All users can change their own passwords. To change your password:
1. Select the My Account menu.
Menu bar actions 96
Page 97

2.
Select Password. The Change Password window appears.
3. Enter your new password.
4. Repeat the new password.
5. Select OK.
Changing your preferences
All users can set their own preferences. Preferences include:
• Session expiration time
• Data measurement units and decimal places
• Refresh interval
• Date and Timestamp format
• Alert intervals
To change your preferences:
1. Select the My Account menu.
2. Select Preferences. The Preferences window appears.
Changing the general preferences
3. Change your preferences, and select OK to save and close.
From the General tab, you can select the following options:
• Session expiration
• Navigation tree
To change your preferences:
1. From the Preferences menu, select General.
NOTE: The user login session expires after a period of inactivity, The default expiration period
2. Select your preferred session expiration time value from the menu.
is 10 minutes.
o 10 minutes
o 15 minutes
o 20 minutes
o 25 minutes
Menu bar actions 97
Page 98

o
30 minutes
3. Select your preferred Navigation Tree view from the menu.
o Hide single leaves
o Show all
4. Select your preferred animation view. If animation is On, every window fades out after closing. If
animation is Off, every window automatically disappears after closing.
5. Select OK to save and close, or select Cancel to close without saving.
Changing the data display format
From the Data tab, you can select the following options:
• Units
• Decimal places
• Refresh rate
To change your preferences:
1. From the Preferences menu, select Data.
2. Select your preferred units:
o US Standard (default)
o Metric
3. Select the number of decimal places (1, 2, or 3).
Menu bar actions 98
Page 99

4.
Select the refresh rate of the data tables in the application, from 0 to 60 minutes. The refresh rate
refers to how often the data is refreshed on the screen. If you select 0 minutes, the application only
refreshes data when you select the refresh button.
5. Select OK to save and close, or select Cancel to close without saving.
Changing the date format
1. From the Preferences menu, select Date.
2. Select from the following date formats:
o MM/dd/yyyy HH:mm:ss
o yyyy-MM-dd HH:mm:ss
o dd.MM.yyyy H:mm:ss
3. Select OK to save and close, or select Cancel to close without saving.
Changing the language
1. From the Preferences menu, select Language.
Menu bar actions 99
Page 100

2.
Select your preferred language from the menu.
3. Select OK to save and close, or select Cancel to close without saving.
Help menu
The Help menu offers the following options:
• User Guide
• About
Accessing the user guide
To view the HP Insight Environmental Observer User Guide online, save the file to your computer, or print:
1. From the Help menu, select User Guide. A document with the link to the user guide on the web
appears.
2. Download the HP Insight Environmental User Guide PDF, and then use Acrobat® Reader to view,
save, or print the file.
Viewing version information
To view information about the current release of the application:
Menu bar actions 100
 Loading...