

Page 1

April 2001
Compaq Computer
Corporation
Prepared by
ISSG Technology
Communications
ONTENTS
C
Introduction.....................3
Cache Architecture ..........3
The Function of Cache
Memory................................. 3
The Pentium III X eon
Cache Architecture ................ 3
Benchmark Test Results ..4
On-Line Transaction
Processing Testing in a
SQL Server Enviro nment........ 4
SAP Central Server
Running a SQL7
Database...............................7
Microsoft Exchange 2000
Test ......................................9
ServerBench T est ................11
Terminal Serve r Test............13
Conclusions ...................14
Appendix: ServerBench
Disclosure Information ..15
T
ECHNOLOGY
.
.
.
.
.
Performance Comparison of Pentium III
.
.
.
.
.
.
.
Xeon Cache Options
.
.
.
.
.
.
Many factors determine the performance of an industry-standard server, and processor
.
.
.
cache size is one that can have a dramatic effect. However, processors with larger
.
.
.
caches also carry a significantly higher cost, raising the question as to whether the
.
.
.
performance gained will justify the expense. Making sound purchasing decisions requires
.
.
.
.
understanding how much performance gain to expect from an increase in cache size in a
.
.
.
specific computing environment. This paper reports the results of benchmarking tests
.
.
.
performed by Compaq laboratories to determine the effect of cache size on system
.
.
.
.
performance.
.
.
.
.
.
.
.
.
.
.
.
.
.
.
.
.
.
.
.
.
.
.
.
.
.
.
.
.
.
.
.
.
.
.
.
.
.
.
.
.
.
.
.
.
.
.
.
.
.
.
.
.
.
.
.
.
.
.
.
.
.
.
.
.
.
.
.
.
.
.
.
.
.
.
.
.
.
.
.
.
.
.
.
.
.
.
.
.
.
.
.
.
.
.
.
.
.
.
.
.
.
.
.
.
.
.
.
.
Please direct comments regarding this communication to the ISSG Technology Communications Group at this Internet
.
.
.
address: TechCom@compaq.com
.
.
.
.
.
.
.
.
B
RIEF
1
TC010401TB
Page 2

TC010401TB
ECHNOLOGY BRIEF
T
.
.
.
OTICE
N
.
.
.
.
.
The information in this publication is subject to change without notice and is provided “AS IS”
.
.
.
WITHOUT WARRANTY OF ANY KIND. THE ENTIRE RISK ARISING OUT OF T HE USE
.
.
.
OF THIS INFORMATION REMAINS WITH RECIPIENT. IN NO EVENT SHALL COMPAQ
.
.
.
BE LIABLE FOR ANY DIRECT, CONSEQUENTIAL, INCIDENTAL, SPECIAL, PUNITIVE
.
.
.
OR OTHER DAMAGES WHATSOEVER (INCLUDING WITHOUT LIMITATION,
.
.
.
DAMAGES FOR LOSS OF BUSINESS PROFITS, BUSINESS INTERRUPTION OR LOSS OF
.
.
.
BUSINESS INFORMATION), EVEN IF COMPAQ HAS BEEN ADVISED OF THE
.
.
.
POSSIBILITY OF SUCH DAMAGES.
.
.
.
.
.
The limited warranties for Compaq products are exclusively set forth in the documentation
.
.
.
accompanying such products. Nothing herein should be construed as constituting a further or
.
.
.
additional warranty.
.
.
.
.
This publication does not constitute an endorsement of the product or products that were tested.
.
.
.
.
The configuration or configurations tested or described may or may not be the only available
.
.
.
solution. This test is not a determination of product quality or correctness, nor does it ensure
.
.
.
compliance with any federal state or local requirements.
.
.
.
.
Compaq and ProLiant are registered with the United States Patent and Trademark Office.
.
.
.
.
.
Intel and Pentium are registered trademarks and Pentium II Xeon and Pentium III Xeon are
.
.
.
trademarks of Intel Corporation.
.
.
.
.
Other product names mentioned herein may be trademarks and/or registered trademarks of their
.
.
.
respective companies.
.
.
.
.
.
©2001 Compaq Computer Corporation.
.
.
.
.
Printed in the U.S.A.
.
.
.
.
.
.
.
.
.
.
.
.
.
.
.
.
.
.
.
.
.
.
.
.
.
.
.
.
.
.
.
.
.
.
.
.
.
.
.
.
.
.
.
.
.
.
.
.
.
.
.
.
.
.
.
.
.
.
.
.
.
.
.
.
.
.
Performance Comparison of Pentium III Xeon Cache Options
.
.
.
First Edition (April 2001)
.
.
.
TC010401TB
.
.
.
.
.
.
.
2
(cont.)
Page 3

Cache: a relatively small
local memory that stores a
copy of recently used
instructions and data
Coherency:
Maintaining a
consistent relationship
among the contents of
multiple caches,
keeping each cache
informed of any
changes that affect its
data
.
TC010401TB
ECHNOLOGY BRIEF
T
.
.
.
.
NTRODUCTION
I
.
.
.
.
.
.
.
.
.
.
Although for years pro cessor speed ha s been considered the prime indica t or of system
.
.
.
.
.
.
performance, cache size can also dramatically affect system performance in some application
.
.
.
.
.
.
environments. For example, the performance of memory-intensive applications ordinarily benefit
.
.
.
.
.
.
from increased cache memory. While some applications can take advantage of more cache to gain
.
.
.
.
.
.
better performance, others achieve their peak performance from a smaller cache and realize no
.
.
.
.
.
.
improvement from a larger one. Where a choice exists, selecting the optimum cache size for a
.
.
.
.
.
.
given environment gives cust omers the best value for their computi ng dollar.
.
.
.
.
.
.
.
.
This paper reports the results of five benchmark tests performed by Compaq laboratories to
.
.
.
.
.
.
determine the effect of cache size on system performance. These tests represent several types of
.
.
.
.
.
.
.
.
computing environments for which customers often purchase servers. The results of these tests
.
.
.
.
.
.
underscore the importance of understanding the relationship of the cache size to system
.
.
.
.
.
.
performance in specific computing environments and of weighing the trade-offs involved to
.
.
.
.
.
.
determine the best cache solution.
.
.
.
.
.
.
.
.
.
.
.
.
.
.
ACHE ARCHITECTURE
C
.
.
.
.
.
.
.
.
.
.
For those unfamiliar with the basic concepts, some background information on cache memory will
.
.
.
.
.
.
be helpful in understanding the discussion of the test results.
.
.
.
.
.
.
.
.
.
.
.
.
The Function of Cache Memory
.
.
.
.
.
.
.
.
.
.
Cache memory improves system performance by keeping a copy of recently used data in a small,
.
.
.
.
.
.
fast memory near the processor. Since cache memory typically runs at the same speed as the
.
.
.
.
.
.
processor, access to information stored in cache memory is much faster than access to the same
.
.
.
.
.
.
information stored in main memory. Caching is effective because most programs use the same
.
.
.
.
.
.
instructions and data repeatedly, and these repetitions allow a processor to run from its cache most
.
.
.
.
.
.
of the time. The more a processor can run from its cache, the more system performance increases.
.
.
.
.
.
.
In fact, to increase performance, processor designers today include multiple levels of cache
.
.
.
.
.
.
typically, a small primary (level one or L1) cache and a larger secondary (level two or L2) cache.
.
.
.
.
.
.
When requesting data, the processor first accesses the L1 cache. If the requested data is not found
.
.
.
.
.
.
in the L1 cache, the processor then accesses the L2 cache before going to slower main memory.
.
.
.
.
.
.
.
.
Logically, larger caches should improve scalability and performance in multiprocessor systems
.
.
.
.
.
.
.
.
because each processor keeps more data in its local cache, reducing competition with other
.
.
.
.
.
.
processors in the system for access to resources. However, increasing the cache size also increases
.
.
.
.
.
.
the likelihood that another processor will need access to some of the data stored there. Managing
.
.
.
.
.
.
and maintaining coherency between the caches adds system bus traffic, and this overhead is
.
.
.
.
.
.
increased with the use of more processors and larger caches.
.
.
.
.
.
.
.
.
.
.
.
.
The Pentium III Xeon Cache Architecture
.
.
.
.
.
.
.
.
.
.
Intel Pentium III Xeon processors have two levels of cache memory, a relatively small L1 cache
.
.
.
.
.
.
and a much larger L2 cache that varies in size. The L2 cache connects to the processor through a
.
.
.
.
.
.
64-bit dedicated, transaction-oriented bus that supports up to four concurrent cache accesses. The
.
.
.
.
.
.
earliest Pentium III processor (code named Katmai) used an external L2 cache running at half the
.
.
.
.
.
.
processor frequency, but Pentium III Xeon processors use integrated caches that run at the full
.
.
.
.
.
.
speed of the processor bus.
.
.
.
.
.
.
.
.
.
.
.
.
.
.
.
.
.
.
.
.
.
.
.
.
1
.
For more information on the recent history of Intel processors, refer to The Intel Microprocessor
.
.
.
Roadmap at http://www.compaq.com/support/techpubs/whitepapers/tc000808tb.html.
.
3
(cont.)
1
Page 4
Normalized: A method to
simplify comparison of a
set of values, in which the
lowest number divides into
all the numbers. The
lowest number is then
shown as a “normalized”
value of 1.0, while a
number that is twice as
much as the lowest number
is shown as 2.0, and so on.
MB: megabyte
TC010401TB
ECHNOLOGY BRIEF
T
.
.
ENCHMARK TEST RESULTS
B
.
.
.
.
.
Benchmark tests simulate real-world application environments in a controlled and repeatable
.
.
.
fashion. Results of these standardized tests are certifiable by a standards body and therefore
.
.
.
provide a ready means for comparing the performance of different configurations or solutions from
.
.
.
different vendors. Several industry-standard benchmarks exist to evaluate server performance, each
.
.
.
emphasizing different applications or areas of interest. This paper summarizes the results of such
.
.
.
benchmark tests conducted by Compaq engineers to establish the effect of cache size on server
.
.
.
performance.
.
.
.
.
.
.
On-Line Transaction Processing Testing in a SQL Server Environment
.
.
.
.
.
The on-line tr ansaction-pro cessing (OLTP ) test demonstrates how well a system’s throughput
.
.
.
responds to a transaction-processing load. The goal for this test was to compare cache size
.
.
.
performance rather than to obtain certifiable data, so only normalized data is presented here
.
.
.
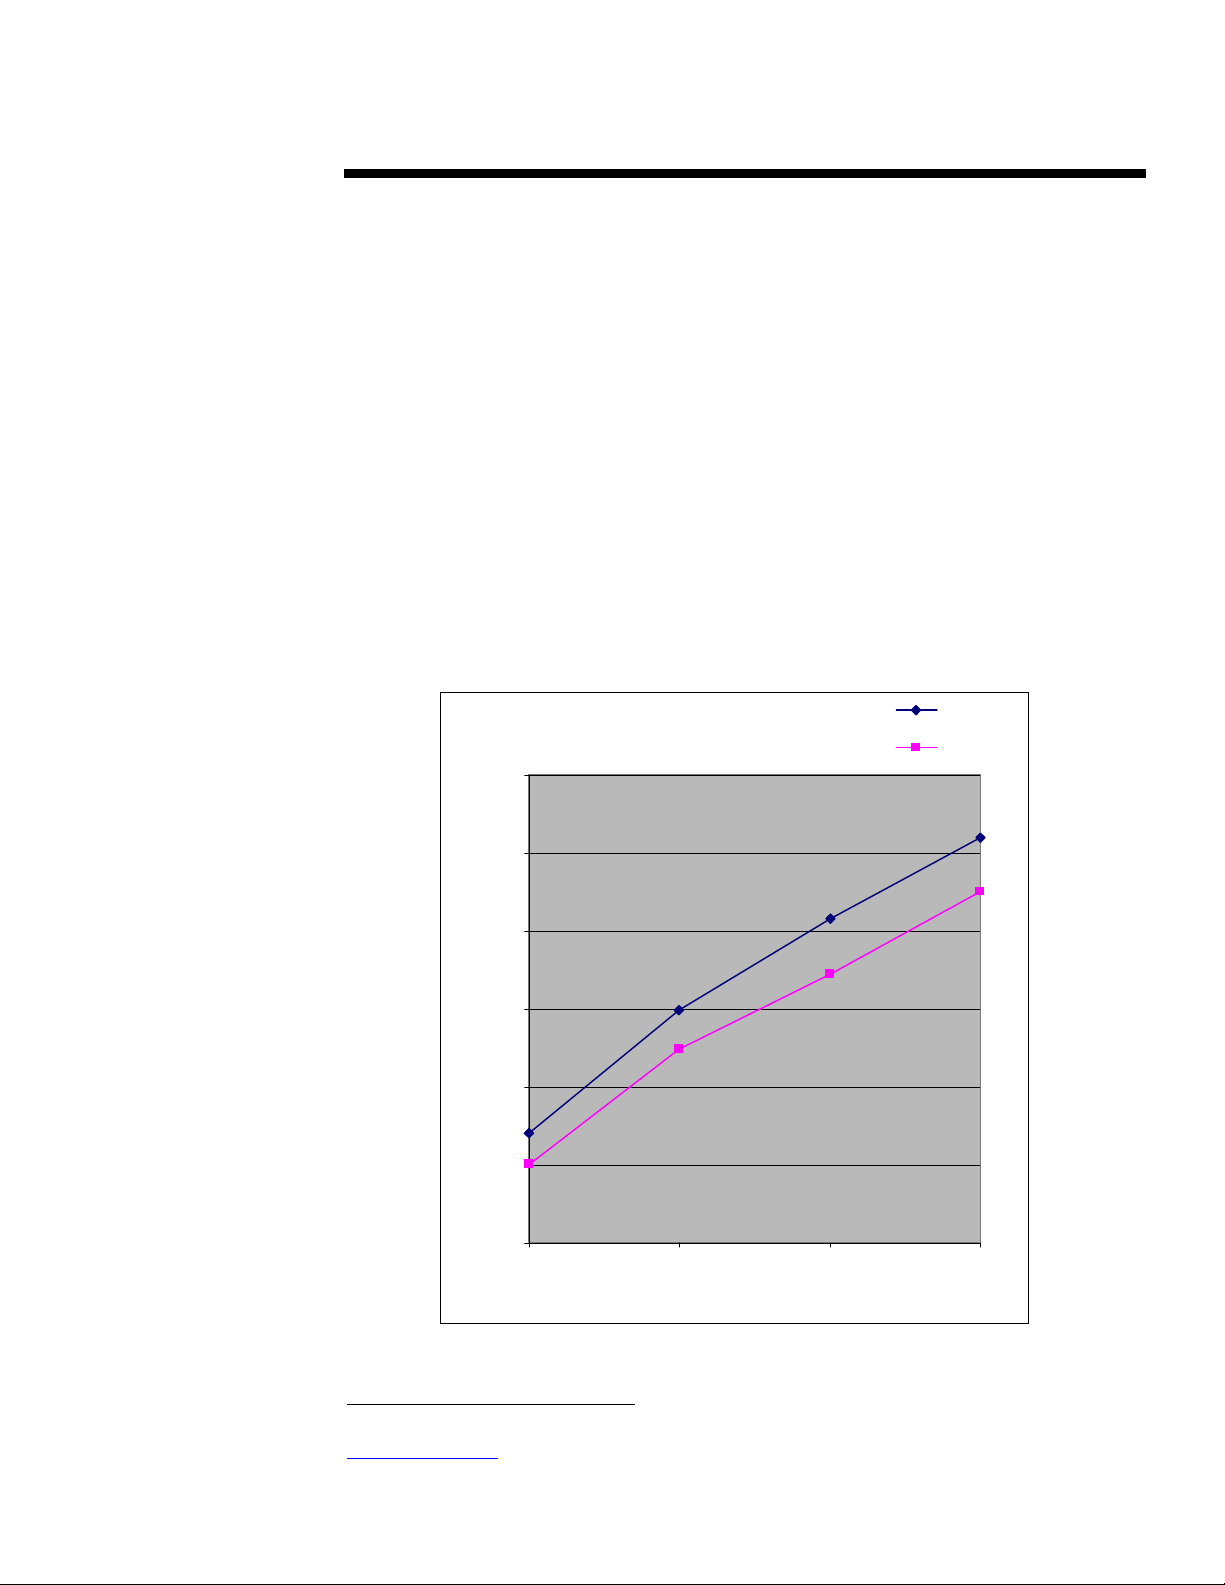
Figure 1 gives the normalized OLTP performance results for a Compaq ProLiant 8500 server using
.
.
.
Pentium III Xeon 700-MHz processors with L2 caches of 1 MB (lower curve) and 2 MB (upper
.
.
.
curve). The load placed on the system affects OLTP test performance, so tuning the load to
.
.
.
optimize the performance of the configuration under test is part of the usual process. In this case,
.
.
.
however, the load was kept constant so meaningful comparisons coul d be made.
.
.
.
.
.
.
.
.
.
.
.
.
.
.
.
.
.
.
.
.
.
.
.
.
.
.
.
.
.
.
.
.
.
.
.
.
.
.
.
.
.
.
.
.
.
.
.
.
.
.
.
.
.
.
.
.
.
.
.
.
.
.
.
.
.
.
.
.
.
.
.
.
.
.
.
.
.
.
.
.
.
.
.
.
.
.
.
.
.
.
.
.
.
.
.
.
2
.
The OLTP test results in this paper were loosely based on TPC benchmark testing. Refer to
.
.
.
http://www.tpc.org
.
.
.
results.
.
4
Normalized Transactions/Second
(cont.)
Relative Performance Scaling
3.50
3.00
2.50
2.00
1.50
1.00
0.50
2468
Number of Processo rs
Figure 1 - OLTP Performance Improvement Between 1-MB
and 2-MB Caches in a ProLiant 8500 Server
to learn more about certified TPC testing and to see Compaq’s published
2 MB ca che
1 MB ca che
2
.
Page 5

TC010401TB
ECHNOLOGY BRIEF
T
.
.
Figure 1 shows that, in each configuration, processors with 2-MB caches provided better system
.
.
.
performance than the processors with 1-MB caches. In addition, it shows that both cache
.
.
.
configurations followed the same non-linear scalability pattern—scalability did not improve with
.
.
.
.
the larger cache. Table 1 summarizes the performance increases measured due to replacing 1-MB
.
.
.
caches with 2-MB caches. Even though the difference in absolute system performance increased
.
.
.
slightly with additional processors, that increase actually declined as a percentage of overall
.
.
.
performance. The larger cache still provides improved performance for the configurations with a
.
.
.
higher number of processors, but not as much improvement as it does for systems with fewer
.
.
.
processors.
.
.
.
.
.
.
.
.
.
.
.
.
.
.
.
.
.
.
.
.
.
.
.
.
.
.
.
.
.
.
.
.
.
.
.
.
.
.
.
.
.
Figure 2 demonstrates the difference larger caches can make in a four-processor OLTP
.
.
.
environment using a Compaq ProLiant ML570 server. A set of 2-MB caches yields a 16 percent
.
.
.
performance improvement over the 1-MB caches, and an even mix of 1-MB and 2-MB caches
.
.
.
yields a performance gain of about half as much. Because Compaq supports mixing of cache sizes
.
.
.
under certain conditions
.
.
.
.
.
.
.
.
.
.
.
.
.
.
.
.
.
.
.
.
.
.
.
.
.
.
.
.
.
.
.
.
.
.
.
.
.
.
.
.
.
.
.
.
.
.
.
.
.
.
.
.
.
.
.
.
.
.
.
.
.
.
.
.
.
.
.
.
.
.
.
.
.
.
.
.
3
.
For details about Compaq support for mixing Intel processo rs in Compaq industry-standard
.
.
.
servers, see http://www.compaq.com/support/techpubs/whitepapers/tc000703tb.html
.
5
Normalized Transactions/Second
(cont.)
Table 1 – OLTP Performance Gain in an 8-Processor System
When 1-MB Caches Are Replaced by 2-MB Caches
Number of
Processors
2 20.1 %
4 14.6 %
6 15.8 %
8 12.8 %
3
, customers have another option for increasing system performance.
1.20
1.15
1.10
1.05
1.00
1.00
0.95
0.90
4 x 1MB 2 x 1MB + 2 x 2MB 4 x 2MB
Number and Cache S ize of Processors
Figure 2 - Cache Performance in a Four-Processo r System
Performance gained
from the larger cache
1.16
1.09
Page 6

TC010401TB
ECHNOLOGY BRIEF
T
.
.
Interestingly, Figure 3 indicates that increasing the system memory from 2GB to 4GB can also
.
.
.
boost performance by 9 or 10 percent. This illustrates the need to address all potential system
.
.
.
bottlenecks in the search for better performance.
.
.
.
.
.
.
.
.
.
.
.
.
.
.
.
.
.
.
.
.
.
.
.
.
.
.
.
.
.
.
.
.
.
.
.
.
.
.
.
.
.
.
.
.
.
.
.
.
.
.
.
.
.
.
.
.
.
.
.
.
.
.
.
.
.
.
.
.
.
.
.
.
.
.
.
.
.
.
.
.
.
Figure 4 is a price/performance chart for six configurations of the Compaq ProLiant ML570 server.
.
.
.
The chart was developed using the pricing information available on the Compaq web site.
.
.
.
Although every installation will have a different overall cost, Figure 4 pro vides examples
.
.
.
representative of the trade-offs in cost and performance. Clearly, a range of options is open to
.
.
.
customers for increasing system performance in an OLTP environment.
.
.
.
.
.
.
.
.
.
.
.
.
.
.
.
.
.
.
.
.
.
.
.
.
.
.
.
.
.
.
.
.
.
.
.
.
.
.
.
.
.
.
.
.
.
.
.
.
.
.
.
.
.
.
.
4
.
http://www.directpluspro.compaq.com/default.asp?page=ctoBases&Product_Line_Id=431&Famil
.
.
.
y_Id=648
.
6
Normalized Transactions/Second
1.30
1.25
1.20
1.15
1.10
1.05
1.00
0.95
0.90
(cont.)
1.26
2GB Memory
4GB Memory
1.09
1.00
4 x 1MB 2 x 1MB + 2 x 2MB 4 x 2MB
Number and Cache Size of Processors
Figure 3 – Memory and Cache Size Comparison
1.09
1.18
1.16
4
Page 7

Write-back transactions:
When a cache line (block of
data) that has been
modified needs to be
replaced with other data,
the modified data must first
be written back to main
memory.
Bus invalidate: the process
by which a line of cache
data is marked as stale by
another processor.
Bus read for ownership:
occurs when a processor
needs to fetch data from the
system bus and at the same
time ensure that no other
cache has a copy of it.
Coherency transactions:
bus activity between
different processors to
ensure that changes to any
data are kept up to date
throughout all caches in the
system.
TC010401TB
ECHNOLOGY BRIEF
T
.
.
.
.
.
.
.
.
.
.
.
.
.
.
.
.
.
.
.
.
.
.
.
.
.
.
.
.
.
.
.
.
.
.
.
.
.
.
.
.
.
.
.
.
.
.
.
.
.
.
.
.
.
.
.
.
.
.
.
.
.
.
.
.
.
.
.
.
.
.
.
.
.
.
.
.
.
.
.
.
.
.
.
.
.
.
.
.
.
.
.
.
.
.
SAP Central Server Running a SQL7 Database
.
.
.
.
.
In an SAP central server configuration, the SAP application and the database both reside on the
.
.
.
same server. This SAP benchmark test was run on an early version of the ProLiant 8500 server
.
.
.
using eight 450-MHz Pentium III Xeon processors with 512-KB, 1-MB, and 2-MB cache sizes.
.
.
.
The SAP Sales and Distribution benchmark module was used to emulate customer orders,
.
.
.
performing a number of steps to process each order. The test adds simulated users to increase the
.
.
.
transaction load until the system response time reaches a threshold of two seconds.
.
.
.
.
.
.
Figure 5 shows that increasing the cache size does yield a performance boost but at a diminishing
.
.
.
rate, probably due to the increasing number of bus coherency transactions needed with larger cache
.
.
.
configurations. Figure 6 gives some evidence for this asser t ion by showing bus transactions that
.
.
.
measure the distribution of bus activity. As expected, the larger L2 cache reduces bus-burst-read
.
.
.
transactions and instruction fetches because the processor does not have to go as often to main
.
.
.
memory to retrieve data or instructions. Likewise, the bus write-back transactions diminish because
.
.
.
the larger cache does not need to write back as many lines to main memory to free up space for new
.
.
.
data. However, bus-invalidate and bus read-for-ownership transactions increase as cache size
.
.
.
.
grows. This interprocessor communication reduces the benefits of larger cache size because it
.
.
.
offsets the reduction in other bus traffic.
.
.
.
.
.
.
.
.
.
.
.
.
.
7
1.30
1.20
1.10
1.00
Normalized Transactions/Second
0.90
(cont.)
2G Memory 4G Memory
4 x 2MB
2 x 1MB
+ 2 x 2MB
4 x 1MB
0.90 1.00 1.10 1.20 1.30
Figure 4 – Price/Performance for Six Configurations of the
Compaq ProLiantML570 Server in an OLTP Environment
4 x 1MB
Price
2 x 1MB
+ 2 x 2MB
4 x 2MB
Page 8

SD User: Sales and
%
Distribution user
module
TC010401TB
ECHNOLOGY BRIEF
T
.
.
.
.
.
.
.
.
.
.
.
.
.
.
.
.
.
.
.
.
.
.
.
.
.
.
.
.
.
.
.
.
.
.
.
.
.
.
.
.
.
.
.
.
.
.
.
.
.
.
.
.
.
.
.
.
.
.
.
.
.
.
.
.
.
.
.
.
.
.
.
.
.
.
.
.
.
.
.
.
.
.
.
.
.
.
.
.
.
.
.
.
.
.
.
.
.
.
.
.
.
.
.
.
.
.
.
.
.
.
.
.
.
.
.
.
.
.
.
.
.
.
.
.
.
.
.
.
.
.
.
.
.
.
.
.
.
.
.
.
.
.
.
.
.
.
.
.
.
.
.
.
.
.
.
.
.
.
.
.
.
8
60
40%
20%
1.18
1.16
1.14
1.12
1.10
1.08
1.06
SD Users (Normalized)
1.04
1.02
1.00
0
% Bus
Burst-Read
Tra n s ac tio n
(cont.)
1.09
1.00
512KB 1MB 1.5MB 2MB
L2 Cache Si z e
Figure 5 – Cache Performance Comparison for SAP Benchmark
512
1MB
2MB
% Bus
Write-b a ck
Tra n s ac tio n
Figure 6 – Distribution of SAP Bus Activity
% Bus
Instru ctio n
Fetches
% Bus
Read for
Ow nership
% Bus
Invalidate
Tra n s ac tio n
1.16
Page 9

MAPI: mail application
program interface - a
message format used by
an application program
to communicate with the
operating system.
POP3: Post Office
Protocol version 3
SMTP: Simple Mail
Transfer Protocol
IMAP4: Internet
Message Access
Protocol version 4
MMB2: Microsoft
MAPI Benchmark-2
(developed by Compaq
in cooperation with
Microsoft)- each MMB2
represents the load of a
heavy corporate mail
user.
Latency: the response
time of the server to
requests made by the
clients; measured in
milliseconds.
TC010401TB
ECHNOLOGY BRIEF
T
.
.
.
Microsoft Exchange 2000 Test
.
.
.
.
.
Microsoft Exchange 2000 Server is a messaging and collaborative application server that runs
.
.
.
under Microsoft Windows 2000 and supplies various messaging clients (such as Outlook MAPI
.
.
.
clients, POP3/SMTP clients, web clients, and IMAP4 clients) with e-mail, calendar, scheduling,
.
.
.
task management, instant messaging, c onferencing, and streaming media storage management.
.
.
.
Benchmark tests conducted by Compaq’s Solutions Engineering Performance Gr oup determined
.
.
.
that using 2-MB caches instead of 1-MB caches with Intel Pentium III Xeon processors could result
.
.
.
in incremental performance gains.
.
.
.
.
The Exchange 2000 MAPI messaging benchmark, MMB2, measures the number of workload units
.
.
.
a server can handle while considering general performance metrics such as response time and send
.
.
.
and disk queues. To facilitate comparison, the test used the same conservative load with both 1-MB
.
.
.
and 2-MB cache sizes, in dual- and quad-processor configurations. The system provided sufficient
.
.
.
bandwidth to prevent other resources (such as memor y, disk, or app l ication constraints) from
.
.
.
becoming a performance bottleneck and skewing the results.
.
.
.
.
.
Figure 7 shows the results for a ProLiant 8500 server with two 700-MHz Pentium III Xeon
.
.
.
processors. For a load of 3,600 MMB2s, a 2-MB cache demonstrated improvements in latency of
.
.
.
about 41 percent when compared to the same load on a 1-MB cache configuration. However, this
.
.
.
result may have been exaggerated by the fact that the CPU utilization reached such a high level (92
.
.
.
percent). The general best practice maximum for Exchange Server CPU utilization is 80 percent,
.
.
.
which also functions as a guideline for ensuring the validity of the other measurements. The latency
.
.
.
results therefore may not be accurate for the 1-MB cache test because the CPU increasingly
.
.
.
becomes a performance bottleneck as its utilization exceeds 80 percent. The Send Queue (the
.
.
.
average number of messages i n the queue) also showed improvement, although the overall number
.
.
.
of threads allocated to the send queue has more effect on this than cache size, and that is the reason
.
.
.
for the smaller difference in this measurement. Overall processor utilization (shown in the chart as
.
.
.
a percentage) improved by 11.5 percent.
.
.
.
.
.
.
.
.
.
.
.
.
.
.
.
.
.
.
.
.
.
.
.
.
.
.
.
.
.
.
.
.
.
.
.
.
.
.
.
.
.
.
.
.
.
.
.
.
.
.
.
.
.
.
.
.
.
.
.
.
.
.
.
.
.
.
.
.
.
.
.
.
.
.
.
.
.
.
9
(cont.)
100
90
80
70
60
50
40
30
20
10
0
Figure 7 – Performance Comparison of 1-MB and 2-MB Caches
with 3600 MMB2 Loads on a Dual-Processor Exchange Server
92
81.4
CPU - Percent
Utilization
1MB Cache 2MB Cache
58.6
34.8
32
Send Queue -
Avg # of
Messages
Latency -
milliseconds
34.7
Page 10

TC010401TB
ECHNOLOGY BRIEF
T
.
.
Figure 8 summarizes the results for the quad-processor configuration of 700-MHz Pentium III
.
.
.
Xeon processors supporting a load of 6,000 MMB2s. The measurements in this test give a better
.
.
.
representation of cache performance than those in the dual-processor test because the CPU
.
.
.
.
utilization stayed in the 80 percent range and the processors did not limit the performance. For the
.
.
.
load and total amount of work performed by the server (for example, the number of messages sent,
.
.
.
received, and users serviced), the use of 2-MB caches improved CPU utilization by 12 percent and
.
.
.
reduced latency by 15 percent over the 1-MB caches. Since the overall CPU utilization for this test
.
.
.
did not exceed testing best practices, the send queue difference was much greater (34 percent).
.
.
.
.
.
.
.
.
.
.
.
.
.
.
.
.
.
.
.
.
.
.
.
.
.
.
.
.
.
.
.
.
.
.
.
.
.
.
.
.
.
.
.
.
.
.
.
.
.
.
.
.
.
.
.
.
.
.
.
.
.
.
.
.
.
.
.
.
.
.
.
.
.
.
.
.
.
.
.
.
.
.
.
.
.
.
.
.
.
.
It is important to note that other factors besides cache size affect the Latency and Send Queue
.
.
.
results. However, processor utilization is directly tied to cache performance. Consequently Co mpaq
.
.
.
test engineers considered the 12 percent gain in processor utilization to be the most important and
.
.
.
representative result for this test.
.
.
.
.
.
.
.
.
.
.
.
.
.
.
.
.
.
.
.
.
.
.
.
.
.
.
.
.
.
.
.
.
.
.
.
.
.
.
10
with 6000 MMB2 Loads on a Quad-Processor Exchange Server Results
(cont.)
90
80
70
60
50
40
30
20
10
0
Figure 8 – Performance Comparison of 1-MB and 2-MB Caches
82
72
CPU - Percent
Utilization
1MB Cache 2MB Cache
39
32
21.2
Send Queue -
Avg # of
Messages
Latency -
milliseconds
33
Page 11

TC010401TB
ECHNOLOGY BRIEF
T
.
.
.
ServerBench Test
.
.
.
.
.
The ServerB ench test, run on a ProLiant 8500 server using 700-MHz Pentium III Xeon processors
.
.
.
and Microsoft Windows 2000, measures the throughput of a system as the number of clients
.
.
.
increases. In this environment, a client is a test file that runs on the system and represents a user
.
.
.
load on the system’s network. Adding clients simply means adding more test files or threads to run
.
.
.
concurrently on the system. Actual user loads are difficult to model because the activity level varies
.
.
.
widely between individuals and depends on how active their application is on the network. One
.
.
.
client in this test can represent anywhere from 10 to 100 actual system users, depending on the
.
.
.
characteristics of the users. Refer to the appendix for the full disclosure on the ServerBench test
.
.
.
setup.
.
.
.
.
Figure 9 shows the system throughput using four processo rs, measured in transactions per sec ond,
.
.
.
and indicates the ability of the system to respond to the client load. When the load is relatively
.
.
.
small, the limiting factors are the number of processors and the size of their caches. Increasing the
.
.
.
number of simultaneously running test files eventually uses more memory than the cache has
.
.
.
available, and the amount of main memory available to the system becomes the next bottleneck.
.
.
.
Adding still more clients will eventually saturate main memory as well and the next limiting factor
.
.
.
becomes the disk drive subsystem. Overall, the performance improvement for the larger cache is
.
.
.
.
greater in a more lightly loaded system, and the gain diminishes with increasing loads.
.
.
.
.
Figure 10 shows a more detailed view of the chart in Figure 9, making it easier to see the difference
.
.
.
in performance in the peak range where the performance is highest and the difference is greatest.
.
.
.
Table 2 summarizes the results for the four system configurations tested. The table shows both the
.
.
.
average performance gain for the entire range of client loads in the test and for the peak range only.
.
.
.
.
.
.
.
.
.
.
.
.
.
.
.
.
.
.
.
.
.
.
.
.
.
.
.
.
.
.
.
.
.
.
.
.
.
.
.
.
.
.
.
.
.
.
.
.
.
.
.
.
.
.
.
.
.
.
.
.
.
.
.
.
.
.
.
.
.
.
.
.
.
.
.
.
.
.
.
.
.
.
.
.
.
.
.
.
.
.
11
4500.00
4000.00
3500.00
3000.00
2500.00
2000.00
1500.00
Throughput (Transaction/sec)
1000.00
500.00
0.00
124681216202836445260
(cont.)
4P - 2MB Cache
4P - 1MB Cache
Number of Clients
Figure 9 – ServerBench Results with Four Processors
Page 12

TC010401TB
ECHNOLOGY BRIEF
T
.
.
.
.
.
.
.
.
3500.00
.
.
.
.
.
3300.00
.
.
.
.
.
3100.00
.
.
.
.
.
2900.00
.
.
.
.
.
2700.00
.
.
.
.
.
2500.00
.
.
.
.
.
2300.00
.
.
.
.
.
2100.00
.
.
.
.
.
1900.00
.
Throughput (Transactions/sec)
.
.
.
.
1700.00
.
.
.
.
.
1500.00
.
.
.
.
.
.
.
.
.
.
.
.
.
.
.
.
.
.
.
.
.
.
.
.
.
.
.
.
.
.
.
.
.
.
.
.
.
.
.
.
.
.
.
.
.
.
.
.
.
.
.
.
.
.
.
.
.
.
.
.
.
.
.
.
.
.
.
.
.
.
.
.
.
.
.
.
.
.
.
.
.
.
.
.
.
.
.
.
.
.
.
.
.
.
.
.
.
.
.
.
.
.
.
12
8 12162028
Table 2 - Throughput Advantage of 2-MB vs. 1-MB Cache in ServerBench Tests
(cont.)
4P - 2MB Cache
4P - 1MB Cache
Number of Clients
Figure 10 – Detail of ServerBench Results in Peak Area
Number of
Processors in
System
2 12.21% 17.31%
4 13.88% 22.62%
6 14.49% 15.95%
8 14.81% 14.94%
Average Improvement
Over the Full
Performance Ra nge
Average Improvement
Over the Peak
Performance Ra nge
Page 13

TC010401TB
ECHNOLOGY BRIEF
T
.
.
.
Terminal Server Test
.
.
.
.
.
Terminal Server is a Microsoft Windows 2000 option that allows multiple users at different
.
.
.
Windows-based terminals to run the same application. The server becomes a centralized, shared-
.
.
.
compute resource that handles data processing, while the clients display only the user interface. The
.
.
.
Terminal Server test had perhaps the most surprising results, as it wa s the only test that showed no
.
.
.
performance advantage in using 2-MB caches.
.
.
.
.
Tests run on a ProLiant 8500 server with 2 GB of main memory and four 700-MHz Pentium III
.
.
.
Xeon processors showed no discernable change in response time for the end user when cache size
.
.
.
was increased from 1 MB to 2 MB . The performance data indicated better kernel and interrupt
.
.
.
handling with the larger cache, but this did not translate into an increase in performance or server
.
.
.
density (the number of users per processor).
.
.
.
.
.
Analysis by the testing lab indicated that the operating system, Microsoft Windows 2000 Advanced
.
.
.
Server using Windows Terminal Service (WTS), was most likely the reason performance did not
.
.
.
improve with the 2-MB cache. Although increased CPU frequency provides modest gains in end-
.
.
.
user response time and density improvements in WTS servers, increasing cache sizes beyond 512
.
.
.
KB has shown little to no improvement in the WTS server space.
.
.
.
.
.
This result emphasizes the need to understand the application environment of any customer
.
.
.
searching for higher performance. Some configurations will not benefit from caches larger than a
.
.
.
certain minimum s ize.
.
.
.
.
.
.
.
.
.
.
.
.
.
.
.
.
.
.
.
.
.
.
.
.
.
.
.
.
.
.
.
.
.
.
.
.
.
.
.
.
.
.
.
.
.
.
.
.
.
.
.
.
.
.
.
.
.
.
.
.
.
.
.
.
.
.
.
.
.
.
.
.
.
.
.
.
.
.
.
.
.
.
.
.
.
.
.
.
.
.
.
.
.
.
.
.
.
13
(cont.)
Page 14

TC010401TB
ECHNOLOGY BRIEF
T
.
.
ONCLUSIONS
C
.
.
.
.
.
In the five benchmark tests conducted in Compaq laboratories, increasing cache size from 1 MB to
.
.
.
2 MB improved system performance in all but the Terminal Server test. Where the tests showed
.
.
.
improvement, the benefit ranged from 10 percent to mo re than 22 percent in the peak range of the
.
.
.
lightly loaded ServerBench test. In the OLTP and ServerBench tests, systems with higher processor
.
.
.
counts did not benefit as much from the larger cache as those with fewer processors did, so
.
.
.
scalability was not improved.
.
.
.
.
According to information available on Compaq’s web site
.
.
.
processor with a 2-MB cache costs about 87 percent more than one with a 1-MB cache does.
.
.
.
However, that amount would usually represent only a small part of the overall cost of a server
.
.
.
.
system. For example, to upgrade half of the processors in a relatively small four-processor system
.
.
.
to a 2-MB cache may represent only about a five percent increase in the hardware cost. Customers
.
.
.
whose application can benefit from the larger cache may consider a potential gain in system
.
.
.
performance of 10 percent or more to be well worth the extra cost.
.
.
.
.
Another aspect to consider is the total cost of ownership for a given system, especially since the
.
.
.
price of many enterprise-edition software packages depends on the number of processors in the
.
.
.
system. When the cost of the software per processor is very high, simply replacing some 1-MB
.
.
.
cache processors with fewer of the 2-MB cache processors to reduce the overall processor count
.
.
.
could provide a price/performance benefit. For example, at the time of this writing Oracle 8i
.
.
.
Enterprise Edition had a listed price per processor of $100 times the Megahertz of the processor.
.
.
.
For that case, each 700-MHz processor wo uld need a license costing $70,000 (minus a volume
.
.
.
discount). For Microsoft SQL Server 2000 Enterprise Edition, the listed processor-licensing fee
.
.
.
was just under $20,000 per processor.
.
.
.
database (Figure 1), choosing six processors with 2-MB caches instead of eight processo rs with 1-
.
.
.
MB caches would decrease the performance by about 6 percent but save about $40,000 in license
.
.
.
fees.
.
.
.
.
.
In summary, the use of larger processor caches is often beneficial to system performance, but not in
.
.
.
all environments. In some cases, a mixed-processor solution would be more cost effective.
.
.
.
Customers need to carefully consider all the trade-offs involved to determine the best cache
.
.
.
solution for their system.
.
.
.
.
.
.
.
.
.
.
.
.
.
.
.
.
.
.
.
.
.
.
.
.
.
.
.
.
.
.
.
.
.
.
.
.
.
.
.
.
.
.
.
.
.
.
.
.
.
.
.
.
.
.
5
.
http://www.directpluspro.compaq.com/default.asp?page=ctoBases&Product_Line_Id=431&Famil
.
.
.
y_Id=648
.
.
6
.
http://oraclestore.oracle.com
.
.
7
.
http://www.microsoft.com/sql/productinfo/pricing.htm
.
14
(cont.)
5
, a 700-MHz Pentium III Xeon
7
For the Compaq b enchmark test of OLTP running on a SQL
6
Page 15

TC010401TB
ECHNOLOGY BRIEF
T
.
.
PPENDIX
A
.
.
.
.
.
.
.
.
Server Configurations Disclosure
.
.
.
DL 570
.
.
.
Number and type of processors
.
.
.
.
Size of hardware CPU cache
.
.
.
Amount of memory
.
.
.
Type of I/O bus
.
.
.
Number and type of hard disk controller
.
.
.
Number and type of hard disks
.
.
.
Disk organization
.
.
.
Disk controller driver version
.
.
.
Number and type of Network Controller
.
.
.
Network controller driver version
.
.
.
Network operating system and version
.
.
.
.
.
.
.
.
.
Testbed Disclosure
.
.
.
Number of clients 4 real clients emulating 120
.
.
.
.
.
.
Network type
.
.
.
Number and types of hubs
.
.
.
Number of clients/segments
.
.
.
Client CPU type and speed
.
.
.
Client network controller
.
.
.
Client network software name and version
.
.
.
Client network software name and version
.
.
.
Size of any client network cache
.
.
.
Disk controller software
.
.
.
.
Network controller software
.
.
.
.
.
.
.
ServerBench Disclosure
.
.
.
ServerBench Version
.
.
.
Description of the test parameter for each mix
.
.
.
in the test
.
.
.
.
.
.
.
.
.
.
.
.
.
.
.
.
.
.
.
.
.
.
.
.
.
.
.
.
.
.
.
.
.
.
.
.
.
.
.
.
.
.
.
.
.
.
.
.
.
.
.
.
15
(cont.)
ERVERBENCH DISCLOSURE INFORMATION
: S
2/4/6/8xPentium III Xeon 700 MHz
1/2 MB
1024MB
PCI
1x SA-5302
7x9GB Fujitsu U3
RAID 0
cpqcissm.sys 5.3.34.0
1xDual-port NC 3131
N100NT5.sys 5.29.4.67
Windows 2000 AS with SP1
ServerBench clients
100 Base-TX
2x Netelligent hubs
60 on each of 2 segments
2x Pentium II 300 MHz
Compaq Netelligent 10/100
Windows 98
Native Win98 drivers, TCP/IP only
N/A
Native Win98 IDE drivers
Native Win98 NIC drivers
4.10
120g_ent.tst
 Loading...