

Page 1
hp StorageWorks
HSG80 Array Controller V8.7
Troubleshooting Reference Guide
Part Number: EK–G80TR–SA. B01
Second Edition (August 2002)
Product Version: 8.7
This guide provides troubleshooting instructions for the HSG80
array controllers running array controller software (ACS) Versions
8.7F, 8.7G, 8.7P, 8.7R, 8.7S and 8.7W. It contains information on
various utilities, software templates, and event reporting codes
Page 2

© Hewlett-Packard Company, 2002. All rights reserved.
Hewlett-Packard Company makes no warranty of any kind with regard to this material, including, but
not limited to, the implied warranties of merchantability and fitness for a particular purpose.
Hewlett-Packard shall not be liable for errors contained herein or for incidental or consequential
damages in connection with the furnishing, performance, or use of this material.
This document contains proprietary information, which is protected by copyright. No part of this
document may be photocopied, reproduced, or translated into another language without the prior
written consent of Hewlett-Packard. The information contained in this document is subject to change
without notice.
Microsoft, MS-DOS, Windows, and Windows NT are trademarks of Microsoft Corporation in the U.S.
and/or other countries.
All other product names mentioned herein may be trademarks of their respective companies.
Hewlett-Packard Company shall not be liable for technical or editorial errors or omissions contained
herein. The information is provided “as is” without warranty of any kind and is subject to change
without notice. The warranties for Hewlett-Packard Company products are set forth in the express
limited warranty statements accompanying such products. Nothing herein should be construed as
constituting an additional warranty.
Printed in the U.S.A.
HSG80 Array Controller V8.7 Troubleshooting Reference Guide
Second Edition (August 2002)
Part Number: EK–G80TR–SA. B01
Page 3

Contents
About this Guide
Document Conventions . . . . . . . . . . . . . . . . . . . . . . . . . . . . . . . . . . . . . . . . . . . . . . . . . . . ix
Symbols in Text . . . . . . . . . . . . . . . . . . . . . . . . . . . . . . . . . . . . . . . . . . . . . . . . . . . . . . . . .ix
Symbols on Equipment . . . . . . . . . . . . . . . . . . . . . . . . . . . . . . . . . . . . . . . . . . . . . . . . . . . x
Rack Stability. . . . . . . . . . . . . . . . . . . . . . . . . . . . . . . . . . . . . . . . . . . . . . . . . . . . . . . . . . . xi
Getting Help. . . . . . . . . . . . . . . . . . . . . . . . . . . . . . . . . . . . . . . . . . . . . . . . . . . . . . . . . . . . xi
StorageWorks Technical Support . . . . . . . . . . . . . . . . . . . . . . . . . . . . . . . . . . . . . . . . xi
StorageWorks Website . . . . . . . . . . . . . . . . . . . . . . . . . . . . . . . . . . . . . . . . . . . . . . . xii
StorageWorks Authorized Reseller . . . . . . . . . . . . . . . . . . . . . . . . . . . . . . . . . . . . . . . . . xii
1 Troubleshooting Information
Typical Installation Troubleshooting Checklist. . . . . . . . . . . . . . . . . . . . . . . . . . . . . . . 1–1
Troubleshooting Table . . . . . . . . . . . . . . . . . . . . . . . . . . . . . . . . . . . . . . . . . . . . . . . . . . 1–3
Significant Event Reporting. . . . . . . . . . . . . . . . . . . . . . . . . . . . . . . . . . . . . . . . . . . . . 1–12
Reporting Events That Cause Controller Operation to Halt . . . . . . . . . . . . . . . . . 1–13
Flashing OCP Pattern Display Reporting . . . . . . . . . . . . . . . . . . . . . . . . . . . . 1–13
Solid OCP Pattern Display Reporting. . . . . . . . . . . . . . . . . . . . . . . . . . . . . . . 1–15
Last Failure Reporting . . . . . . . . . . . . . . . . . . . . . . . . . . . . . . . . . . . . . . . . . . 1–21
Reporting Events That Allow Controller Operation to Continue . . . . . . . . . . . . . 1–21
Spontaneous Event Log . . . . . . . . . . . . . . . . . . . . . . . . . . . . . . . . . . . . . . . . . 1–22
CLI Event Reporting. . . . . . . . . . . . . . . . . . . . . . . . . . . . . . . . . . . . . . . . . . . . 1–22
Running the Controller Diagnostic Test . . . . . . . . . . . . . . . . . . . . . . . . . . . . . . . . . . . 1–23
ECB Charging Diagnostics . . . . . . . . . . . . . . . . . . . . . . . . . . . . . . . . . . . . . . . . . . 1–23
Battery Hysteresis . . . . . . . . . . . . . . . . . . . . . . . . . . . . . . . . . . . . . . . . . . . . . . . . . 1–23
Caching Techniques. . . . . . . . . . . . . . . . . . . . . . . . . . . . . . . . . . . . . . . . . . . . . . . . . . . 1–24
Read Caching. . . . . . . . . . . . . . . . . . . . . . . . . . . . . . . . . . . . . . . . . . . . . . . . . . . . . 1–24
Read-Ahead Caching. . . . . . . . . . . . . . . . . . . . . . . . . . . . . . . . . . . . . . . . . . . . . . . 1–25
Write-Through Caching. . . . . . . . . . . . . . . . . . . . . . . . . . . . . . . . . . . . . . . . . . . . . 1–25
Write-Back Caching . . . . . . . . . . . . . . . . . . . . . . . . . . . . . . . . . . . . . . . . . . . . . . . 1–26
Fault-Tolerance for Write-Back Caching . . . . . . . . . . . . . . . . . . . . . . . . . . . . . . . 1–26
HSG80 Array Controller V8.7 Troubleshooting Reference Guide iii
Page 4

Contents
Nonvolatile Memory . . . . . . . . . . . . . . . . . . . . . . . . . . . . . . . . . . . . . . . . . . . . 1–26
Cache Policies Resulting from Cache Module Failures . . . . . . . . . . . . . . . . . 1–27
Enabling Mirrored Write-Back Cache . . . . . . . . . . . . . . . . . . . . . . . . . . . . . . . . . . 1–32
2 Utilities and Exercisers
Fault Management Utility (FMU) . . . . . . . . . . . . . . . . . . . . . . . . . . . . . . . . . . . . . . . . . 2–1
Displaying Failure Entries . . . . . . . . . . . . . . . . . . . . . . . . . . . . . . . . . . . . . . . . . . . . 2–2
Translating Event Codes . . . . . . . . . . . . . . . . . . . . . . . . . . . . . . . . . . . . . . . . . . . . . 2–3
Controlling the Display of Significant Events and Failures. . . . . . . . . . . . . . . . . . . 2–5
Video Terminal Display (VTDPY) Utility. . . . . . . . . . . . . . . . . . . . . . . . . . . . . . . . . . . 2–7
Restrictions with VTDPY . . . . . . . . . . . . . . . . . . . . . . . . . . . . . . . . . . . . . . . . . . . . 2–7
Running VTDPY . . . . . . . . . . . . . . . . . . . . . . . . . . . . . . . . . . . . . . . . . . . . . . . . . . . 2–8
VTDPY Help . . . . . . . . . . . . . . . . . . . . . . . . . . . . . . . . . . . . . . . . . . . . . . . . . . . . . . 2–9
VTDPY Display Screens . . . . . . . . . . . . . . . . . . . . . . . . . . . . . . . . . . . . . . . . . . . . 2–10
Default Screen . . . . . . . . . . . . . . . . . . . . . . . . . . . . . . . . . . . . . . . . . . . . . . . . . 2–11
Controller Status Screen . . . . . . . . . . . . . . . . . . . . . . . . . . . . . . . . . . . . . . . . . 2–11
Cache Performance Screen . . . . . . . . . . . . . . . . . . . . . . . . . . . . . . . . . . . . . . . 2–12
Device Performance Screen. . . . . . . . . . . . . . . . . . . . . . . . . . . . . . . . . . . . . . . 2–13
Host Ports Statistics Screen. . . . . . . . . . . . . . . . . . . . . . . . . . . . . . . . . . . . . . . 2–15
Resource Statistics Screen. . . . . . . . . . . . . . . . . . . . . . . . . . . . . . . . . . . . . . . . 2–17
Remote Status Screen . . . . . . . . . . . . . . . . . . . . . . . . . . . . . . . . . . . . . . . . . . . 2–17
Interpreting VTDPY Screen Information. . . . . . . . . . . . . . . . . . . . . . . . . . . . . . . . 2–18
Screen Header . . . . . . . . . . . . . . . . . . . . . . . . . . . . . . . . . . . . . . . . . . . . . . . . . 2–19
Common Data Fields. . . . . . . . . . . . . . . . . . . . . . . . . . . . . . . . . . . . . . . . . . . . 2–20
Unit Performance Data Fields . . . . . . . . . . . . . . . . . . . . . . . . . . . . . . . . . . . . . 2–21
Device Performance Data Fields . . . . . . . . . . . . . . . . . . . . . . . . . . . . . . . . . . . 2–23
Device Port Performance Data Fields . . . . . . . . . . . . . . . . . . . . . . . . . . . . . . . 2–25
Host Port Configuration. . . . . . . . . . . . . . . . . . . . . . . . . . . . . . . . . . . . . . . . . . 2–26
TACHYON Chip Status . . . . . . . . . . . . . . . . . . . . . . . . . . . . . . . . . . . . . . . . . 2–28
Runtime Status of Remote Copy Sets . . . . . . . . . . . . . . . . . . . . . . . . . . . . . . . 2–29
Device Port Configuration. . . . . . . . . . . . . . . . . . . . . . . . . . . . . . . . . . . . . . . . 2–31
Controller/Processor Utilization . . . . . . . . . . . . . . . . . . . . . . . . . . . . . . . . . . . 2–32
Resource Performance Statistics . . . . . . . . . . . . . . . . . . . . . . . . . . . . . . . . . . . 2–34
Disk Inline Exerciser (DILX). . . . . . . . . . . . . . . . . . . . . . . . . . . . . . . . . . . . . . . . . . . . 2–35
Checking for Unit Problems. . . . . . . . . . . . . . . . . . . . . . . . . . . . . . . . . . . . . . . . . . 2–35
Finding a Unit in the Subsystem . . . . . . . . . . . . . . . . . . . . . . . . . . . . . . . . . . . 2–35
Testing the Read Capability of a Unit . . . . . . . . . . . . . . . . . . . . . . . . . . . . . . . 2–36
Testing the Read and Write Capabilities of a Unit . . . . . . . . . . . . . . . . . . . . . 2–37
iv HSG80 Array Controller V8.7 Troubleshooting Reference Guide
Page 5

DILX Error Codes . . . . . . . . . . . . . . . . . . . . . . . . . . . . . . . . . . . . . . . . . . . . . . . . . 2–40
Format and Device Code Load Utility (HSUTIL). . . . . . . . . . . . . . . . . . . . . . . . . . . . 2–40
Configuration (CONFIG) Utility . . . . . . . . . . . . . . . . . . . . . . . . . . . . . . . . . . . . . . . . . 2–42
Code Load and Code Patch (CLCP) Utility. . . . . . . . . . . . . . . . . . . . . . . . . . . . . . . . . 2–42
Clone (CLONE) Utility . . . . . . . . . . . . . . . . . . . . . . . . . . . . . . . . . . . . . . . . . . . . . . . . 2–42
Field Replacement Utility (FRUTIL). . . . . . . . . . . . . . . . . . . . . . . . . . . . . . . . . . . . . . 2–43
Change Volume Serial Number (CHVSN) Utility. . . . . . . . . . . . . . . . . . . . . . . . . . . . 2–43
3 Event Reporting Templates
Passthrough Device Reset Event Sense Data Response . . . . . . . . . . . . . . . . . . . . . . . . 3–1
Last Failure Event Sense Data Response (Template 01) . . . . . . . . . . . . . . . . . . . . . . . . 3–2
Multiple-Bus Failover Event Sense Data Response (Template 04). . . . . . . . . . . . . . . . 3–4
Failover Event Sense Data Response (Template 05) . . . . . . . . . . . . . . . . . . . . . . . . . . . 3–5
Nonvolatile Parameter Memory Component Event Sense Data Response (Template 11) .
3–7
Backup Battery Failure Event Sense Data Response (Template 12). . . . . . . . . . . . . . . 3–9
Subsystem Built-In Self-Test Failure Event Sense Data Response (Template 13) . . . 3–10
Memory System Failure Event Sense Data Response (Template 14) . . . . . . . . . . . . . 3–11
Device Services Nontransfer Error Event Sense Data Response (Template 41) . . . . . 3–13
Disk Transfer Error Event Sense Data Response (Template 51). . . . . . . . . . . . . . . . . 3–15
Data Replication Manager Services Event Sense Response (Template 90) . . . . . . . . 3–17
Contents
4 ASC/ASCQ, Repair Action, and Component Identifier Codes
Vendor Specific SCSI ASC/ASCQ Codes. . . . . . . . . . . . . . . . . . . . . . . . . . . . . . . . . . . 4–1
Recommended Repair Action Codes . . . . . . . . . . . . . . . . . . . . . . . . . . . . . . . . . . . . . . . 4–4
Component ID Codes. . . . . . . . . . . . . . . . . . . . . . . . . . . . . . . . . . . . . . . . . . . . . . . . . . 4–11
5 Instance Codes
Instance Code Structure . . . . . . . . . . . . . . . . . . . . . . . . . . . . . . . . . . . . . . . . . . . . . . . . . 5–1
Instance Codes and FMU. . . . . . . . . . . . . . . . . . . . . . . . . . . . . . . . . . . . . . . . . . . . . . . . 5–1
Notification/Recovery Threshold . . . . . . . . . . . . . . . . . . . . . . . . . . . . . . . . . . . . . . 5–2
Repair Action. . . . . . . . . . . . . . . . . . . . . . . . . . . . . . . . . . . . . . . . . . . . . . . . . . . . . . 5–2
Event Number . . . . . . . . . . . . . . . . . . . . . . . . . . . . . . . . . . . . . . . . . . . . . . . . . . . . . 5–2
Component ID . . . . . . . . . . . . . . . . . . . . . . . . . . . . . . . . . . . . . . . . . . . . . . . . . . . . . 5–3
6 Last Failure Codes
Last Failure Code Structure . . . . . . . . . . . . . . . . . . . . . . . . . . . . . . . . . . . . . . . . . . . . . . 6–1
Last Failure Codes and FMU. . . . . . . . . . . . . . . . . . . . . . . . . . . . . . . . . . . . . . . . . . . . . 6–1
HSG80 Array Controller V8.7 Troubleshooting Reference Guide v
Page 6

Contents
Parameter Count. . . . . . . . . . . . . . . . . . . . . . . . . . . . . . . . . . . . . . . . . . . . . . . . . . . . 6–2
Restart Code. . . . . . . . . . . . . . . . . . . . . . . . . . . . . . . . . . . . . . . . . . . . . . . . . . . . . . . 6–2
Hardware/Software Flag . . . . . . . . . . . . . . . . . . . . . . . . . . . . . . . . . . . . . . . . . . . . . 6–2
Repair Action . . . . . . . . . . . . . . . . . . . . . . . . . . . . . . . . . . . . . . . . . . . . . . . . . . . . . . 6–3
Error Number . . . . . . . . . . . . . . . . . . . . . . . . . . . . . . . . . . . . . . . . . . . . . . . . . . . . . . 6–3
Component ID Code . . . . . . . . . . . . . . . . . . . . . . . . . . . . . . . . . . . . . . . . . . . . . . . . 6–3
Glossary
Index
Figures
2–1 VTDPY commands and shortcuts generated from the Help command. . . . . . 2–10
2–2 Sample of the VTDPY default screen . . . . . . . . . . . . . . . . . . . . . . . . . . . . . . . 2–11
2–3 Sample of the VTDPY status screen . . . . . . . . . . . . . . . . . . . . . . . . . . . . . . . . 2–12
2–4 Sample of the VTDPY cache screen . . . . . . . . . . . . . . . . . . . . . . . . . . . . . . . . 2–13
2–5 Sample of regions on the VTDPY device screen . . . . . . . . . . . . . . . . . . . . . . 2–14
2–6 Sample of the VTDPY host screen . . . . . . . . . . . . . . . . . . . . . . . . . . . . . . . . . 2–16
2–7 Sample of the VTDPY resource screen. . . . . . . . . . . . . . . . . . . . . . . . . . . . . . 2–17
2–8 Sample of the VTDPY remote status screen (ACS version 8.7P only). . . . . . 2–18
5–1 Structure of an Instance Code . . . . . . . . . . . . . . . . . . . . . . . . . . . . . . . . . . . . . . 5–1
6–1 Structure of a Last Failure Code . . . . . . . . . . . . . . . . . . . . . . . . . . . . . . . . . . . . 6–1
Tables
1 Document Conventions . . . . . . . . . . . . . . . . . . . . . . . . . . . . . . . . . . . . . . . . . . . . ix
1–1 Troubleshooting Guidelines . . . . . . . . . . . . . . . . . . . . . . . . . . . . . . . . . . . . . . . 1–3
1–2 Flashing OCP Pattern Displays and Repair Actions . . . . . . . . . . . . . . . . . . . . 1–13
1–3 Solid OCP Pattern Displays and Repair Actions. . . . . . . . . . . . . . . . . . . . . . . 1–16
1–4 ECB Capacity Based On Memory Size. . . . . . . . . . . . . . . . . . . . . . . . . . . . . . 1–24
1–5 Cache Policies—Cache Module Status . . . . . . . . . . . . . . . . . . . . . . . . . . . . . . 1–27
1–6 Resulting Cache Policies—ECB Status. . . . . . . . . . . . . . . . . . . . . . . . . . . . . . 1–29
2–1 Event Code Types . . . . . . . . . . . . . . . . . . . . . . . . . . . . . . . . . . . . . . . . . . . . . . . 2–4
2–2 FMU SET Commands . . . . . . . . . . . . . . . . . . . . . . . . . . . . . . . . . . . . . . . . . . . . 2–5
2–3 VTDPY Key Sequences and Commands . . . . . . . . . . . . . . . . . . . . . . . . . . . . . 2–8
2–4 VTDPY—Common Data Fields Column Definitions: Part 1 . . . . . . . . . . . . . 2–20
2–5 VTDPY—Common Data Fields Column Definitions: Part 2 . . . . . . . . . . . . . 2–21
2–6 VTDPY—Unit Performance Data Fields Column Definitions . . . . . . . . . . . . 2–22
2–7 VTDPY—Device Performance Data Fields Column Definitions. . . . . . . . . . 2–24
vi HSG80 Array Controller V8.7 Troubleshooting Reference Guide
Page 7

Contents
2–8 VTDPY—Device Port Performance Data Fields Column Definitions. . . . . . 2–25
2–9 Fibre Channel Host Status Display—Known Host Connections . . . . . . . . . . 2–26
2–10 Fibre Channel Host Status Display—Port Status . . . . . . . . . . . . . . . . . . . . . . 2–26
2–11 Fibre Channel Host Status Display—Link Error Counters. . . . . . . . . . . . . . . 2–27
2–12 First Digit on the TACHYON Chip . . . . . . . . . . . . . . . . . . . . . . . . . . . . . . . . 2–28
2–13 Second Digit on the TACHYON Chip . . . . . . . . . . . . . . . . . . . . . . . . . . . . . . 2–29
2–14 Remote Display Column Definitions— ACS Version 8.7P Only . . . . . . . . . 2–29
2–15 Device Map Column Definitions . . . . . . . . . . . . . . . . . . . . . . . . . . . . . . . . . . 2–31
2–16 Controller/Processor Utilization Definitions . . . . . . . . . . . . . . . . . . . . . . . . . 2–32
2–17 VTDPY Thread Descriptions . . . . . . . . . . . . . . . . . . . . . . . . . . . . . . . . . . . . . 2–33
2–18 Resource Performance Statistics Definitions . . . . . . . . . . . . . . . . . . . . . . . . . 2–34
2–19 DILX Control Sequences . . . . . . . . . . . . . . . . . . . . . . . . . . . . . . . . . . . . . . . . 2–37
2–20 Data Patterns for Phase 1: Write Test. . . . . . . . . . . . . . . . . . . . . . . . . . . . . . . 2–37
2–21 DILX Error Codes. . . . . . . . . . . . . . . . . . . . . . . . . . . . . . . . . . . . . . . . . . . . . . 2–40
2–22 HSUTIL Messages and Inquiries . . . . . . . . . . . . . . . . . . . . . . . . . . . . . . . . . . 2–40
3–1 Passthrough Device Reset Event Sense Data Response Format. . . . . . . . . . . . 3–2
3–2 Template 01—Last Failure Event Sense Data Response Format . . . . . . . . . . . 3–3
3–3 Template 04—Multiple-Bus Failover Event Sense Data Response Format. . . 3–4
3–4 Template 05—Failover Event Sense Data Response Format. . . . . . . . . . . . . . 3–6
3–5 Template 11—Nonvolatile Parameter Memory Component Event Sense Data
Response Format. . . . . . . . . . . . . . . . . . . . . . . . . . . . . . . . . . . . . . . . . . . . . . . . 3–8
3–6 Template 12—Backup Battery Failure Event Sense Data Response Format . . 3–9
3–7 Template 13—Subsystem Built-In Self Test Failure Event Sense Data Response
Format . . . . . . . . . . . . . . . . . . . . . . . . . . . . . . . . . . . . . . . . . . . . . . . . . . . . . . . 3–10
3–8 Template 14—Memory System Failure Event Sense Data Response Format 3–12
3–9 Template 41—Device Services Non-Transfer Error Event Sense Data Response
Format . . . . . . . . . . . . . . . . . . . . . . . . . . . . . . . . . . . . . . . . . . . . . . . . . . . . . . . 3–14
3–10 Template 51—Disk Transfer Error Event Sense Data Response Format. . . . 3–16
3–11 Template 90—Data Replication Manager Services Event Sense Data Response
Format (ACS Version 8.7P Only). . . . . . . . . . . . . . . . . . . . . . . . . . . . . . . . . . 3–18
4–1 ASC and ASCQ Code Descriptions . . . . . . . . . . . . . . . . . . . . . . . . . . . . . . . . . 4–1
4–2 Recommended Repair Action Codes . . . . . . . . . . . . . . . . . . . . . . . . . . . . . . . . 4–4
4–3 Component ID Codes . . . . . . . . . . . . . . . . . . . . . . . . . . . . . . . . . . . . . . . . . . . 4–11
5–1 Instance Code Format . . . . . . . . . . . . . . . . . . . . . . . . . . . . . . . . . . . . . . . . . . . . 5–1
5–2 Event Notification/Recovery (NR) Threshold Classifications . . . . . . . . . . . . . 5–2
5–3 Instance Codes and Repair Action Codes. . . . . . . . . . . . . . . . . . . . . . . . . . . . . 5–4
6–1 Last Failure Code Format . . . . . . . . . . . . . . . . . . . . . . . . . . . . . . . . . . . . . . . . . 6–2
6–2 Controller Restart Codes. . . . . . . . . . . . . . . . . . . . . . . . . . . . . . . . . . . . . . . . . . 6–2
HSG80 Array Controller V8.7 Troubleshooting Reference Guide vii
Page 8

Contents
6–3 Last Failure Codes and Repair Action Codes . . . . . . . . . . . . . . . . . . . . . . . . . . 6–4
viii HSG80 Array Controller V8.7 Troubleshooting Reference Guide
Page 9
Document Conventions
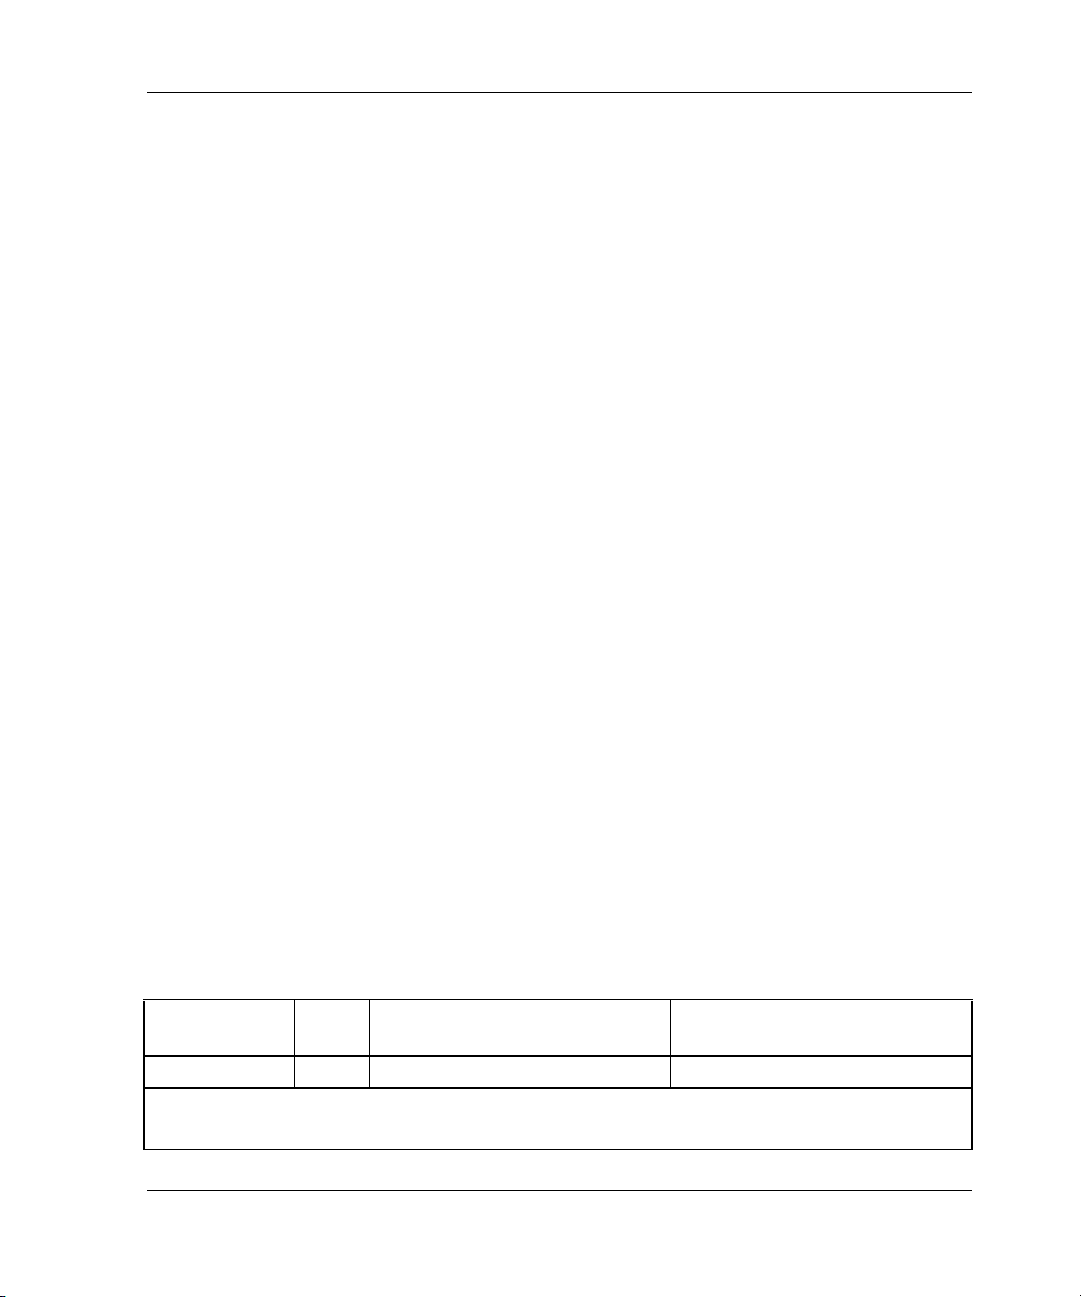
The conventions included in Table 1 apply in most cases.
Table 1: Document Conventions
Element Convention
Key names, menu items, buttons,
and dialog box titles
File names and application names Italics
User input, command names, system
responses (output and messages)
Variables Monospace, italic font
Website addresses Sans serif font (http://www.compaq.com
Symbols in Text
About this Guide
Bold
Monospace font
COMMAND NAMES are uppercase
unless they are case sensitive
)
These symbols may be found in the text of this guide. They have the following
meanings.
WARNING: Text set off in this manner indicates that failure to follow directions
in the warning could result in bodily harm or loss of life.
CAUTION: Text set off in this manner indicates that failure to follow directions could
result in damage to equipment or data.
IMPORTANT: Text set off in this manner presents clarifying information or specific instructions.
HSG80 Array Controller V8.7 Troubleshooting Reference Guide ix
Page 10
About this Guide
NOTE: Text set off in this manner presents commentary, sidelights, or interesting points of
information.
Symbols on Equipment
Any enclosed surface or area of the equipment marked with these
symbols indicates the presence of electrical shock hazards. Enclosed
area contains no operator serviceable parts.
WARNING: To reduce the risk of injury from electrical shock hazards, do
not open this enclosure.
Any RJ-45 receptacle marked with these symbols indicates a network
interface connection.
WARNING: To reduce the risk of electrical shock, fire, or damage to the
equipment, do not plug telephone or telecommunications connectors into
this receptacle.
Any surface or area of the equipment marked with these symbols
indicates the presence of a hot surface or hot component. Contact with
this surface could result in injury.
WARNING: To reduce the risk of injury from a hot component, allow the
surface to cool before touching.
Power supplies or systems marked with these symbols indicate the
presence of multiple sources of power.
WARNING: To reduce the risk of injury from electrical shock,
remove all power cords to completely disconnect power from the
power supplies and systems.
x HSG80 Array Controller V8.7 Troubleshooting Reference Guide
Page 11
Rack Stability
WARNING: To reduce the risk of personal injury or damage to the equipment, be
sure that:
• The leveling jacks are extended to the floor.
• The full weight of the rack rests on the leveling jacks.
• In single rack installations, the stabilizing feet are attached to the rack.
• In multiple rack installations, the racks are coupled.
• Only one rack component is extended at any time. A rack may become
unstable if more than one rack component is extended for any reason.
About this Guide
Any product or assembly marked with these symbols indicates that the
component exceeds the recommended weight for one individual to
handle safely.
WARNING: To reduce the risk of personal injury or damage to the
equipment, observe local occupational health and safety requirements
and guidelines for manually handling material.
Getting Help
If you still have a question after reading this guide, contact service representatives or
visit our website.
StorageWorks Technical Support
In North America, call StorageWorks technical support at 1-800-OK-COMPAQ,
available 24 hours a day, 7 days a week.
NOTE: For continuous quality improvement, calls may be recorded or monitored.
Outside North America, call StorageWorks technical support at the nearest location.
Telephone numbers for worldwide technical support are listed on the StorageWorks
website: http://www.compaq.com
Be sure to have the following information available before calling:
• Technical support registration number (if applicable)
• Product serial numbers
HSG80 Array Controller V8.7 Troubleshooting Reference Guide xi
.
Page 12

About this Guide
• Product model names and numbers
• Applicable error messages
• Operating system type and revision level
• Detailed, specific questions.
StorageWorks Website
The StorageWorks website has the latest information on this product, as well as the
latest drivers. Access the StorageWorks website at: http://www.compaq.com/storage
From this website, select the appropriate product or solution.
StorageWorks Authorized Reseller
For the name of your nearest StorageWorks Authorized Reseller:
• In the United States, call 1-800-345-1518.
• In Canada, call 1-800-263-5868.
• Elsewhere, see the StorageWorks website for locations and telephone numbers.
.
xii HSG80 Array Controller V8.7 Troubleshooting Reference Guide
Page 13

Troubleshooting Information
This chapter provides guidelines for troubleshooting the controller, cache module, and
external cache battery (ECB). See enclosure documentation for information on
troubleshooting enclosure hardware, such as the power supplies, cooling fans, and
environmental monitoring unit (EMU).
Typical Installation Troubleshooting Checklist
The following checklist identifies many of the problems that occur in a typical
installation. After identifying a problem, use Table 1–1 to confirm the diagnosis and
fix the problem.
If an initial diagnosis points to several possible causes, use the tools described in this
chapter and then those in Chapter 2 to further refine the diagnosis. If a problem cannot
be diagnosed using the checklist and tools, contact a StorageWorks authorized service
provider for additional support.
To troubleshoot the controller and supporting modules, complete the following:
1
1. Check the power to the enclosure and enclosure components.
• Are power cords connected properly?
• Is power within specifications?
2. Check the component cables.
• Are bus cables to the controllers connected properly?
• For BA370 enclosures, are ECB cables connected properly?
3. Check each program card to make sure the card is fully seated.
4. Check the operator control panel (OCP) and devices for LED codes.
See “Flashing OCP Pattern Display Reporting” on page 1–13 and “Solid OCP
Pattern Display Reporting” on page 1–15, to interpret the LED codes.
HSG80 Array Controller V8.7 Troubleshooting Reference Guide 1–1
Page 14

Troubleshooting Information
5. Connect a local terminal to the controller and check the controller configuration
with the following command:
SHOW THIS_CONTROLLER FULL
Make sure that the ACS version loaded is correct and that pertinent patches are
installed. Also, check the status of the cache module and the supporting ECB.
In a dual redundant configuration, check the “other controller” with the following
command:
SHOW OTHER_CONTROLLER FULL
6. Use the fault management utility (FMU) to check for Last Failure or “memory
system failure” entries.
Show these codes and translate the Last Failure Codes they contain. See
Chapter 2, “Displaying Failure Entries” and “Translating Event Codes” sections.
If the controller failed to the extent that the controller cannot support a local
terminal for FMU, check the host error log for the Instance or Last Failure Codes.
See Chapter 5 and Chapter 6 to interpret the event codes.
7. Check device status with the following command:
SHOW DEVICES FULL
Look for errors such as “misconfigured device” or “No device at this PTL.” If a
device reports misconfigured or missing, check the device status with the
following command:
SHOW device-name
8. Check storageset status with the following command:
SHOW STORAGESETS FULL
Make sure that all storagesets are normal (or normalizing if the storageset is a
RAIDset or mirrorset). Check again for misconfigured or missing devices using
step 7.
9. Check unit status with the following command:
SHOW UNITS FULL
Make sure that all units are available or online. If the controller reports a unit as
unavailable or offline, recheck the storageset the unit belongs to with the
following command:
SHOW storageset-name
1–2 HSG80 Array Controller V8.7 Troubleshooting Reference Guide
Page 15

Troubleshooting Information
If the controller reports that a unit has lost data or is unwriteable, recheck the
status of the devices that make up the storageset. If the devices are operating
normally, recheck the status of the cache module. If the unit reports a media
format error, recheck the status of the storageset and storageset devices.
Troubleshooting Table
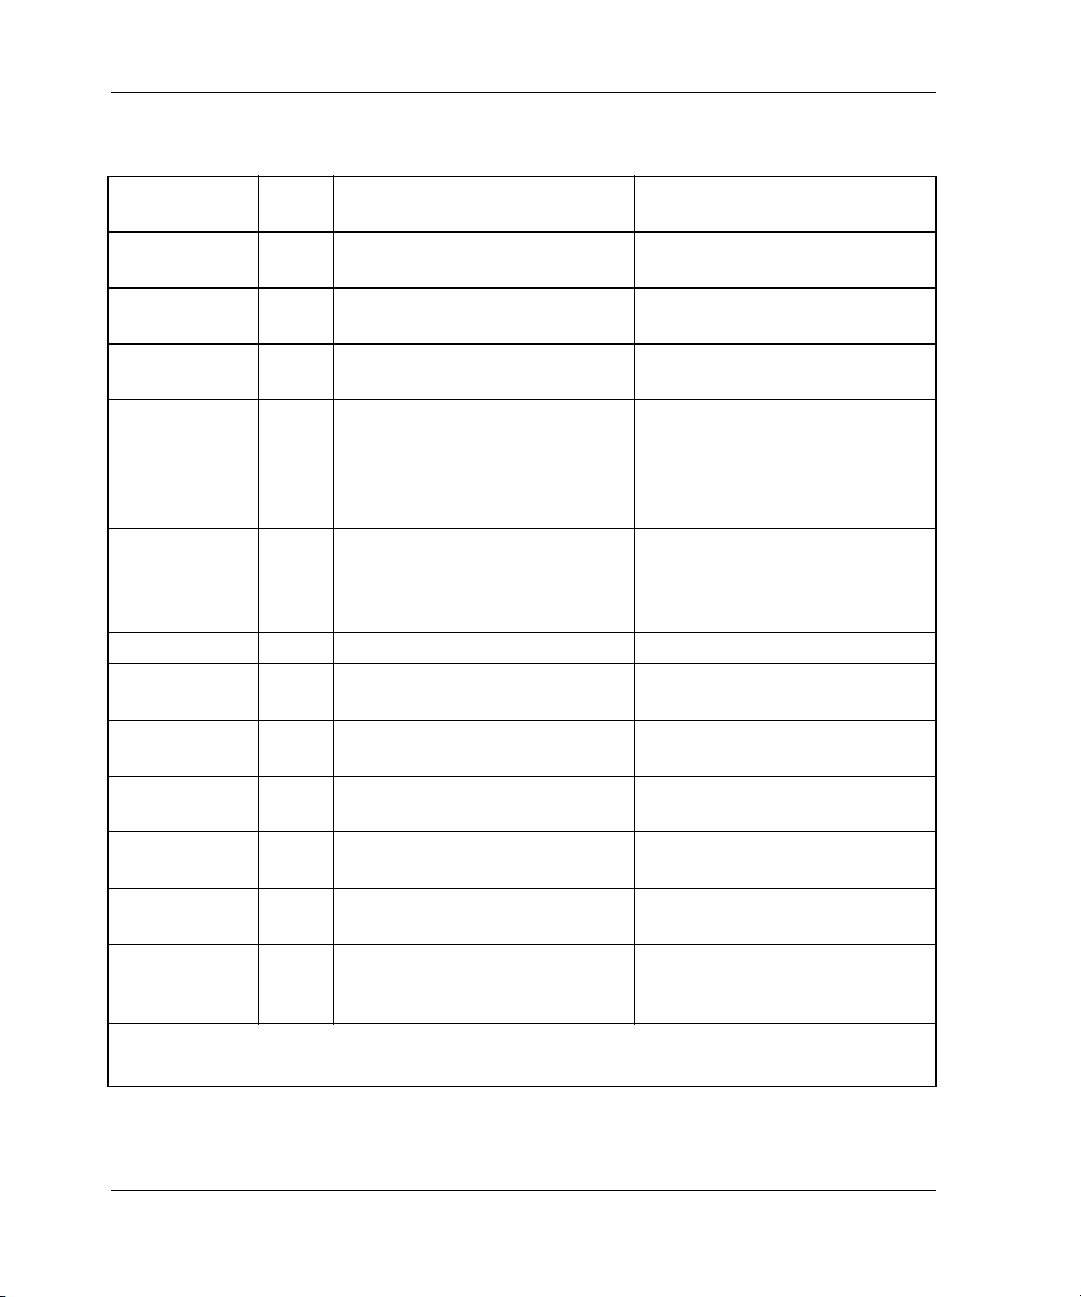
After diagnosing a problem, use Table 1–1 to resolve the problem.
Table 1–1: Troubleshooting Guidelines (Sheet 1 of 10)
Symptom Possible Cause Investigation Remedy
Reset button not lit. No power to
subsystem.
Failed controller. If the previous
Reset button lit
steadily; other
LEDs also lit.
Various. See OCP LED Codes. Follow repair action
Check power to
subsystem and power
supplies on controller
enclosure.
BA370 enclosure
only: Make sure that
all cooling fans are
installed. If one or
more fans are missing
or all are inoperative
for more than 8
minutes, the EMU
shuts down the
subsystem.
BA370 enclosure
only: Determine if the
standby power switch
on the PVA was
pressed for more than
5 seconds.
remedies fail to
resolve the problem,
check OCP LED
codes.
Replace cord or
(BA370 enclosure
only) AC input box.
Turn off power switch
on AC input box.
Replace cooling fan.
Restore power to
subsystem.
Press the alarm
control switch on the
EMU.
Replace controller.
using Table 1–2.
HSG80 Array Controller V8.7 Troubleshooting Reference Guide 1–3
Page 16

Troubleshooting Information
Table 1–1: Troubleshooting Guidelines (Sheet 2 of 10)
Symptom Possible Cause Investigation Remedy
Reset button
FLASHING; other
LEDs also lit.
Device in error or
failedset on
corresponding
SHOW device FULL. Follow repair action
using Table 1–3.
device port with
other LEDs lit.
Cannot set failover
to create
dual-redundant
configuration.
Incorrect command
syntax.
Different software
versions on
controllers.
See the controller CLI
reference guide for
the SET FAILOVER
command.
Check software
versions on both
controllers.
Use the correct
command syntax.
Update one or both
controllers so that
both are using the
same software
version.
Incompatible
hardware.
Check hardware
versions.
Upgrade controllers
so that they are
using compatible
hardware.
Controller
previously set for
failover.
Make sure that
neither controller is
configured for failover.
Use the SET
NOFAILOVER
command on both
controllers, then
reset “this controller”
for failover.
Failed controller. If the previous
remedies fail to
resolve the problem,
Follow repair action
using Table 1–2 or
Table 1–3.
check for OCP LED
codes.
1–4 HSG80 Array Controller V8.7 Troubleshooting Reference Guide
Page 17

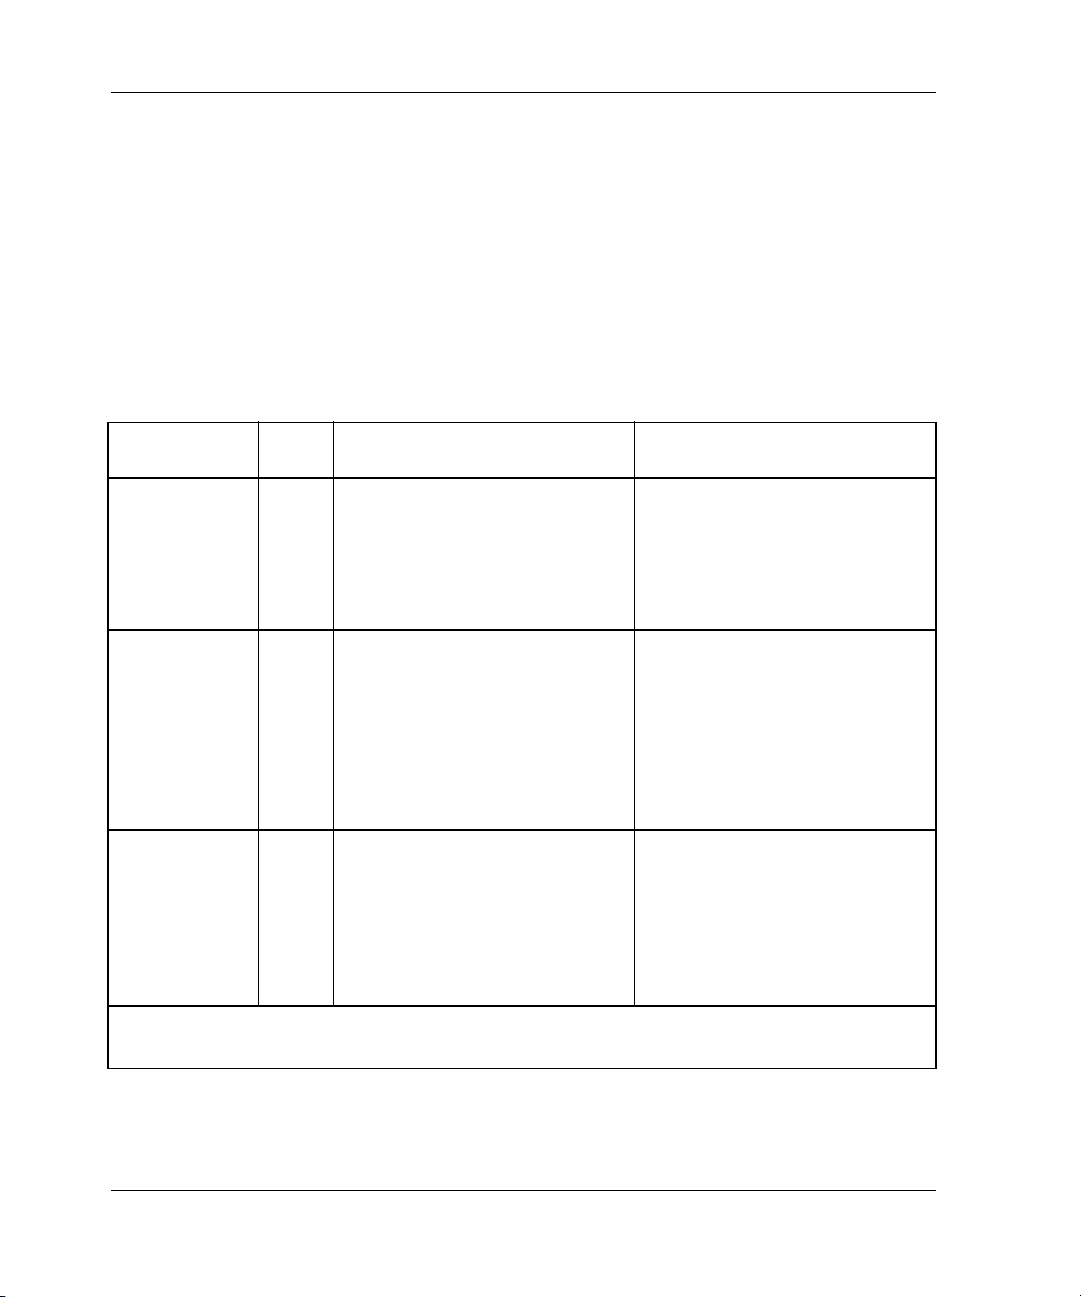
Troubleshooting Information
Table 1–1: Troubleshooting Guidelines (Sheet 3 of 10)
Symptom Possible Cause Investigation Remedy
Node ID is all zeros. SHOW_THIS to see if
node ID is all zeros.
Set node ID using
the node ID (bar
code) that is located
on the frame in
which the controller
sits. See SET
THIS_CONTROLLE
R NODE_ID in the
controller CLI
reference guide.
Also, be sure to copy
in the right direction.
If cabled to the new
controller, use SET
FAILOVER COPY=
OTHER_CONTROL
LER. If cabled to the
old controller, use
SET FAILOVER
COPY=THIS_CONT
ROLLER.
Nonmirrored
cache: controller
reports failed
DIMM in Cache A
or B.
Improperly installed
DIMM.
Remove cache
module and make
sure that the DIMM is
fully seated in the slot.
Failed DIMM. If the previous remedy
Reseat DIMM.
Replace DIMM.
fails to resolve the
problem, check for
OCP LED codes.
Mirrored cache:
“this controller”
reports DIMM 1 or
2 failed in Cache A
or B.
Improperly installed
DIMM in “this
controller” cache
module.
Failed DIMM in “this
controller” cache
module.
Remove cache
module and make
sure that DIMMs are
installed properly.
If the previous remedy
fails to resolve the
problem, check for
Reseat DIMM.
Replace DIMM in
“this controller”
cache module.
OCP LED codes.
HSG80 Array Controller V8.7 Troubleshooting Reference Guide 1–5
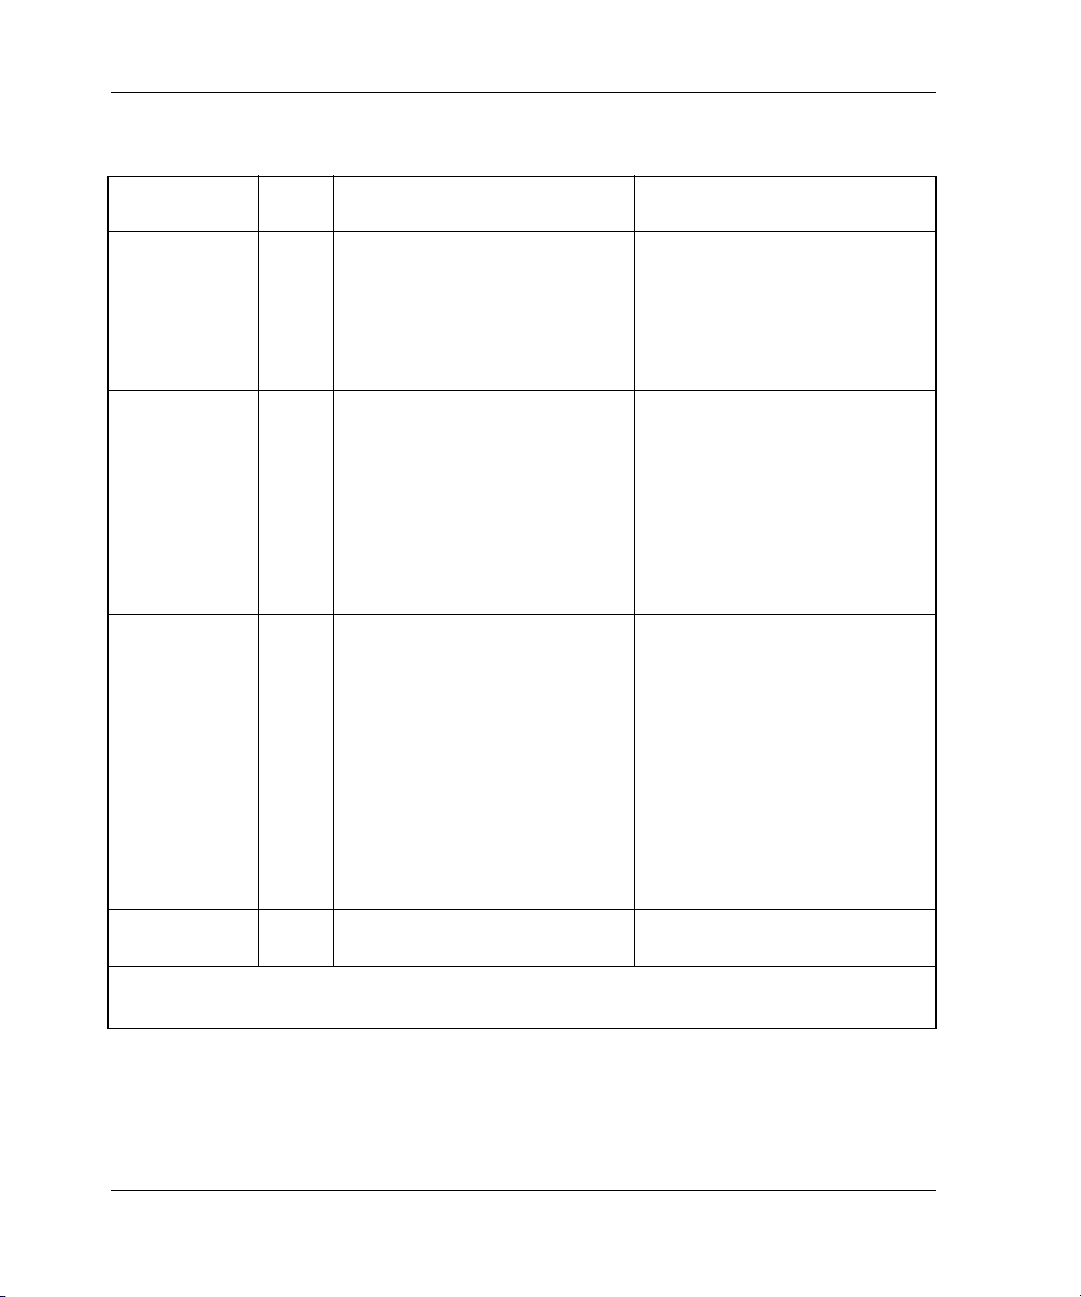
Page 18

Troubleshooting Information
Table 1–1: Troubleshooting Guidelines (Sheet 4 of 10)
Symptom Possible Cause Investigation Remedy
Mirrored cache:
“this controller”
reports DIMM 3 or
4 failed in Cache A
or B.
Improperly installed
DIMM in “other
controller” cache
module.
Failed DIMM in
“other controller”
cache module.
Remove cache
module and make
sure that the DIMMs
are installed properly.
If the previous remedy
fails to resolve the
problem, check for
Reseat DIMM.
Replace DIMM in
“other controller”
cache module.
OCP LED codes.
Mirrored cache:
controller reports
battery not
present.
Memory module
was installed before
the cache module
was connected to
an ECB.
BA370 enclosure:
ECB cable not
connected to cache
module.
Model 2200
enclosure: ECB not
installed or seated
BA370 enclosure:
Connect ECB cable
to cache module,
then restart both
controllers by
pushing their reset
buttons
simultaneously.
properly in backplane.
Model 2200
enclosure: install or
reseat ECB.
Mirrored cache:
controller reports
cache or mirrored
cache has failed.
Primary data and
the mirrored copy
data are not
identical.
SHOW
THIS_CONTROLLER
indicates that the
cache or mirrored
cache has failed.
Spontaneous FMU
message displays:
“Primary cache
declared failed - data
inconsistent with
mirror,” or “Mirrored
cache declared failed
- data inconsistent
Enter the
SHUTDOWN
command on
controllers that
report the problem.
(This command
flushes the cache
contents to
synchronize the
primary and mirrored
data.) Restart the
controllers that were
shut down.
with primary.”
1–6 HSG80 Array Controller V8.7 Troubleshooting Reference Guide
Page 19

Troubleshooting Information
Table 1–1: Troubleshooting Guidelines (Sheet 5 of 10)
Symptom Possible Cause Investigation Remedy
Invalid cache. Mirrored-cache
mode discrepancy.
This discrepancy
might occur after
installing a new
controller. The
existing cache
module is set for
mirrored caching,
but the new
controller is set for
unmirrored caching.
This discrepancy
might also occur if
the new controller is
set for mirrored
SHOW
THIS_CONTROLLER
indicates “invalid
cache.”
Spontaneous FMU
message displays:
“Cache modules
inconsistent with
mirror mode.”
Connect a terminal
to the maintenance
port on the controller
reporting the error
and clear the error
with the following
command—all on
one line:
CLEAR_ERRORS
THIS_CONTROLLE
R INVALID_CACHE
NODESTROY_UNF
LUSHED_ DATA.
See the controller
CLI reference guide
for more information.
caching, but the
existing cache
module is not.
HSG80 Array Controller V8.7 Troubleshooting Reference Guide 1–7
Page 20

Troubleshooting Information
Table 1–1: Troubleshooting Guidelines (Sheet 6 of 10)
Symptom Possible Cause Investigation Remedy
Cache module
might erroneously
contain unflushed
write-back data.
This might occur
after installing a
new controller. The
existing cache
module might
indicate that the
cache module
contains unflushed
write-back data, but
the new controller
expects to find no
data in the existing
SHOW
THIS_CONTROLLER
indicates “invalid
cache.”
No spontaneous FMU
message.
Connect a terminal
to the maintenance
port on the controller
reporting the error,
and clear the error
with the following
command—all on
one line:
CLEAR_ERRORS
THIS_CONTROLLE
R INVALID_CACHE
DESTROY_UNFLUS
HED_ DATA. See the
controller CLI
reference guide for
more information.
cache module.
This error might
also occur if
installing a new
cache module for a
controller that
expects write-back
data in the cache.
1–8 HSG80 Array Controller V8.7 Troubleshooting Reference Guide
Page 21

Troubleshooting Information
Table 1–1: Troubleshooting Guidelines (Sheet 7 of 10)
Symptom Possible Cause Investigation Remedy
Cannot add device. Illegal device. See product-specific
Replace device.
release notes that
accompanied the
software release for
the most recent list of
supported devices.
Device not properly
installed in
Check that the device
is fully seated.
Firmly press the
device into the bay.
enclosure.
Failed device. Check for presence of
device LEDs.
Follow repair action
in the documentation
provided with the
enclosure or device.
Failed power
supplies.
Check for presence of
power supply LEDs.
Follow repair action
in the documentation
provided with the
enclosure or power
supply.
Failed bus to
device.
If the previous
remedies fail to
Replace enclosure.
resolve the problem,
check for OCP LED
codes.
HSG80 Array Controller V8.7 Troubleshooting Reference Guide 1–9
Page 22

Troubleshooting Information
Table 1–1: Troubleshooting Guidelines (Sheet 8 of 10)
Symptom Possible Cause Investigation Remedy
Cannot configure
storagesets.
Incorrect command
syntax.
Exceeded
maximum number
of storagesets.
See the controller CLI
reference guide for
the ADD storageset
command.
Use the SHOW
command to count the
number of
Reconfigure
storageset with
correct command
syntax.
Delete unused
storagesets.
storagesets
configured on the
controller.
Failed battery on
ECB. An ECB or
uninterruptible
power supply (UPS)
Use the SHOW
command to check
the ECB battery
status.
Replace the ECB if
required.
is required for
RAIDsets and
mirrorsets.
Cannot assign unit
number to
storageset.
Unit is available but
not online.
Incorrect command
syntax.
This is normal.
Units are “available”
See the controller CLI
reference guide for
correct syntax.
Reassign the unit
number with the
correct syntax.
None None
until the host
accesses them, at
which point their
status is changed to
“online.”
Host cannot see
device.
Broken cables. Check for broken
cables.
Replace broken
cables.
1–10 HSG80 Array Controller V8.7 Troubleshooting Reference Guide
Page 23

Troubleshooting Information
Table 1–1: Troubleshooting Guidelines (Sheet 9 of 10)
Symptom Possible Cause Investigation Remedy
Host cannot
access unit.
Host files or device
drivers not properly
installed or
configured.
Check for the required
device special files.
Configure device
special files as
described in the
installation and
configuration guide
that accompanied
the software release.
Invalid Cache See the description
for the invalid cache
symptom on page
See the description
for the invalid cache
symptom.
1–7.
Units have lost data. Issue the SHOW
UNITS FULL
command.
Clear these units
with:
CLEAR_ERRORS
unit-number
LOST_DATA.
HSG80 Array Controller V8.7 Troubleshooting Reference Guide 1–11
Page 24

Troubleshooting Information
Table 1–1: Troubleshooting Guidelines (Sheet 10 of 10)
Symptom Possible Cause Investigation Remedy
Host log file or
maintenance
terminal indicates
that a forced error
occurred when the
controller was
reconstructing a
RAIDset or
mirrorset.
Unrecoverable read
errors might have
occurred when the
controller was
reconstructing the
storageset. Errors
occur if another
member fails while
the controller is
reconstructing the
storageset.
Host requested data
from a normalizing
storageset that did
not contain the
data.
Conduct a read scan
of the storageset
using the appropriate
utility from the host
operating system,
such as the “dd” utility
for a TRU64 UNIX
host.
Use the SHOW
storageset-name
command to see if all
storageset members
are “normal.”
Rebuild the
storageset, then
restore storageset
data from a backup
source. While the
controller is
reconstructing the
storageset, monitor
the host error log
activity or
spontaneous event
reports on the
maintenance
terminal for any
unrecoverable
errors. If
unrecoverable errors
persist, note the
device on which they
occurred, and
replace the device
before proceeding.
Wait for normalizing
members to become
normal, then resume
I/O to them.
Significant Event Reporting
Controller fault management software reports information about significant events
that occur. These events are reported by:
• Maintenance terminal displays
• Host error logs
• OCP LEDs
1–12 HSG80 Array Controller V8.7 Troubleshooting Reference Guide
Page 25
Troubleshooting Information
Some events cause controller operation to halt; others allow the controller to remain
operable. Both types of events are detailed in the following sections.
Reporting Events That Cause Controller Operation to Halt
Events that cause the controller to halt operations are reported in three possible ways:
•a
FLASHING OCP pattern display
•a
SOLID OCP pattern display
• Last Failure reporting
Use Table 1–2 to interpret
FLASHING OCP patterns and Table 1–3 to interpret SOLID (ON)
OCP patterns. In the Error column of the solid OCP patterns, there are two separate
descriptions. The first denotes the actual error message that appears on the terminal,
and the second provides a more detailed explanation of the designated error.
Use the following legend to interpret both tables as indicated:
= reset button F
n
o
= reset button O
l
= LED FLASHING (in Table 1–2) or ON (in TABLE 1–3)
m
= LED O
NOTE: If the reset button is FLASHING and an LED is ON, either the devices on the bus that
corresponds to the LED do not match the controller configuration, or an error occurred in one of
the devices on that bus.
Also, a single LED that is turned O
FF
LASHING (in Table 1–2) or ON (in TABLE 1–3)
FF
N indicates a failure of the drive on that bus.
Flashing OCP Pattern Display Reporting
Certain events can cause a FLASHING display of the OCP LEDs. Each event and the
resulting pattern are described in Table 1–2.
IMPORTANT: Remember that a solid black pattern represents a FLASHING display. A white
pattern indicates OFF.
All LEDs F
Table 1–2: FLASHING OCP Pattern Displays and Repair Actions (Sheet 1 of 3)
LASH at the same time and at the same rate.
OCP
Pattern
Code Error Repair Action
nmmmmml 1 Program card EDC error. Replace program card.
Legend:
■ = reset button F
HSG80 Array Controller V8.7 Troubleshooting Reference Guide 1–13
LASHING ❏ = reset button OFF ● = LED FLASHING ❍ = LED OFF
Page 26
Troubleshooting Information
Table 1–2: F
LASHING OCP Pattern Displays and Repair Actions (Sheet 2 of 3)
OCP
Pattern
nmmmlmm 4 Timer zero on the processor is
Code Error Repair Action
Replace controller.
bad.
nmmmlml 5 Timer one on the processor is
Replace controller.
bad.
nmmmllm 6 Processor Guarded Memory
Replace controller.
Unit (GMU) is bad.
nmmlmll B Nonvolatile Journal Memory
(JSRAM) structure is bad
because of a memory error or
an incorrect upgrade
procedure.
nmmllml D One or more bits in the
diagnostic registers did not
match the expected reset
value.
Verify the correct upgrade (see
the controller release notes
and cover letters, if available). If
error continues, replace
controller.
Press the reset button to
restart the controller. If this
does not correct the error,
replace the controller.
nmmlllm E Memory error in the JSRAM. Replace controller.
nmmllll F Wrong image found on
program card.
nmlmmmm 10 Controller Module memory is
Replace program card or
replace controller if needed.
Replace controller.
bad.
nmlmmlm 12 Controller Module memory
Replace controller.
addressing is malfunctioning.
nmlmmll 13 Controller Module memory
Replace controller.
parity is not working.
nmlmlmm 14 Controller Module memory
Replace controller.
controller timer has failed.
nmllmml 15 The Controller Module memory
Replace controller.
controller interrupt handler has
failed.
Legend:
■ = reset button F
LASHING ❏ = reset button OFF ● = LED FLASHING ❍ = LED OFF
1–14 HSG80 Array Controller V8.7 Troubleshooting Reference Guide
Page 27

Troubleshooting Information
Table 1–2: F
LASHING OCP Pattern Displays and Repair Actions (Sheet 3 of 3)
OCP
Pattern
nmllllm 1E During the diagnostic memory
Code Error Repair Action
Replace controller.
test, the Controller Module
memory controller caused an
unexpected Non-Maskable
Interrupt (NMI).
nlmmlmm 24 The card code image changed
Replace controller.
when the contents were copied
to memory.
nllmmmm 30 The JSRAM battery is bad. Replace controller.
nllmmlm 32 First-half diagnostics of the
Replace controller.
Time of Year Clock failed.
nllmmll 33 Second-half diagnostics of the
Replace controller.
Time of Year Clock failed.
nllmlml 35 The processor bus-to-device
Replace controller.
bus bridge chip is bad.
nlllmll 3B An unnecessary interrupt
Replace controller.
pending.
nllllmm 3C An unexpected fault during
Replace controller.
initialization.
nllllml 3D An unexpected maskable
Replace controller.
interrupt during initialization.
nlllllm 3E An unexpected NMI during
Replace controller.
initialization.
nllllll 3F An invalid process ran during
Replace controller.
initialization.
Legend:
■ = reset button F
LASHING ❏ = reset button OFF ● = LED FLASHING ❍ = LED OFF
Solid OCP Pattern Display Reporting
Certain events cause the OCP LEDs to display ON or SOLID. Each event and the resulting
pattern are described in Table 1–3.
HSG80 Array Controller V8.7 Troubleshooting Reference Guide 1–15
Page 28
Troubleshooting Information
Information related to the solid OCP patterns is automatically displayed on the
maintenance terminal (unless disabled with the FMU) using %FLL formatting, as
detailed in the following examples:
%FLL--HSG> --13-MAY-2001 04:39:45 (time not set)-- OCP
Code: 38
Controller operation terminated.
%FLL--HSG> --13-MAY-2001 04:32:26 (time not set)-- OCP
Code: 26
Memory module is missing.
Table 1–3: Solid OCP Pattern Displays and Repair Actions (Sheet 1 of 6)
OCP
Pattern
ommmmmm 0 Catastrophic controller or
nmmmmmm 0 No program card detected or
nlmmlml 25 Recursive Bugcheck detected.
Legend:
■ = reset button O
Code Error Repair Action
Check power. If good, reset
power failure.
controller. If problem persists,
reseat controller module and
reset controller. If problem is
still evident, replace controller
module.
Make sure that the program
kill asserted by other controller.
Controller unable to read
program card.
card is properly seated while
resetting the controller. If the
error persists, try the card with
another controller; or replace
the card. Otherwise, replace
the controller that reported the
error.
Reset the controller. If this fault
The same bugcheck has
occurred three times within 10
minutes, and controller
operation has halted.
pattern is displayed repeatedly,
follow the repair actions
associated with the Last Failure
code that is repeatedly
terminating controller
execution.
N ❏ = reset button OFF ● = LED ON ❍ = LED OFF
1–16 HSG80 Array Controller V8.7 Troubleshooting Reference Guide
Page 29

Troubleshooting Information
Table 1–3: Solid OCP Pattern Displays and Repair Actions (Sheet 2 of 6)
OCP
Pattern
nlmmllm 26 Indicated memory module is
Code Error Repair Action
Insert memory module (cache
missing.
board).
Controller is unable to detect a
particular memory module.
nlmmlll 27 Memory module has
insufficient usable memory.
Replace indicated DIMMs.
This indication is only provided
when Fault LED logging is
enabled.
nlmlmmm 28 An unexpected Machine
Reset the controller.
Fault/NMI occurred during Last
Failure processing.
A machine fault was detected
while a Non-Maskable Interrupt
was processing.
nlmlmml 29 EMU protocol version
incompatible.
The microcode in the EMU and
the software in the controller
are not compatible.
nlmlmlm 2A All enclosure I/O modules are
not of the same type.
Enclosure I/O modules are a
combination of single-ended
Upgrade either the EMU
microcode or the software
(refer to the release notes that
accompanied the controller
software).
Make sure that the I/O modules
in an extended subsystem are
either all single-ended or all
differential, but not both.
and differential.
nlmlmll 2B Jumpers, not terminators,
found on backplane.
One or more SCSI bus
terminators are either missing
from the backplane or broken.
Make sure that enclosure SCSI
bus terminators are installed
and that no jumpers are
installed. Replace the failed
terminator if the problem
continues.
Legend:
■ = reset button O
N ❏ = reset button OFF ● = LED ON ❍ = LED OFF
HSG80 Array Controller V8.7 Troubleshooting Reference Guide 1–17
Page 30
Troubleshooting Information
Table 1–3: Solid OCP Pattern Displays and Repair Actions (Sheet 3 of 6)
OCP
Pattern
nlmllmm 2C Enclosure I/O termination
Code Error Repair Action
Make sure that all of the
power out of range.
Faulty or missing I/O module
causes enclosure I/O
termination power to be out of
enclosure device SCSI buses
have an I/O module. If problem
persists, replace the failed I/O
module.
range.
nlmllml 2D Master enclosure SCSI buses
are not all set to ID 0.
Set the PVA ID to 0 for the
enclosure with the controllers.
If the problem persists, try the
following repair actions:
1. Replace the PVA module.
2. Replace the EMU.
3. Remove all devices.
4. Replace the enclosure.
nlmlllm 2E Multiple enclosures have the
same SCSI ID.
More than one enclosure has
the same SCSI ID.
Reconfigure the PVA ID to
uniquely identify each
enclosure in the subsystem.
The enclosure with the
controllers must be set to PVA
ID 0; additional enclosures
must use PVA IDs 2 and 3. If
the error continues after PVA
settings are unique, replace
each PVA module one at a
time. Check the enclosure if the
problem remains.
nlmllll 2F Memory module has illegal
DIMM configuration.
Verify that DIMMs are installed
correctly.
Legend:
■ = reset button O
N ❏ = reset button OFF ● = LED ON ❍ = LED OFF
1–18 HSG80 Array Controller V8.7 Troubleshooting Reference Guide
Page 31

Troubleshooting Information
Table 1–3: Solid OCP Pattern Displays and Repair Actions (Sheet 4 of 6)
OCP
Pattern
nllmmmm 30 An unexpected bugcheck
Code Error Repair Action
Reinsert controller. If that does
occurred before subsystem
initialization completed.
An unexpected Last Failure
occurred during initialization.
not correct the problem, reset
the controller. If the error
persists, try resetting the
controller again, and replace
the controller if no change
occurs.
nllmmml 31 ILF$INIT unable to allocate
Replace controller.
memory.
Attempt to allocate memory by
ILF$INIT failed.
nllmmlm 32 Code load program card write
Replace program card.
failure.
Attempt to update program
card failed.
nllmmll 33 Nonvolatile program memory
(NVPM) structure revision too
low.
NVPM structure revision
Verify that the program card
contains the latest software
version. If the error persists,
replace controller.
number is lower than can be
handled by the software
version attempting to be
executed.
nllmlml 35 An unexpected bugcheck
Reset controller.
occurred during Last Failure
processing.
Last Failure Processing
interrupted by another Last
Failure event.
nllmllm 36 Hardware-induced controller
Replace controller.
reset expected and failed.
Legend:
■ = reset button O
N ❏ = reset button OFF ● = LED ON ❍ = LED OFF
HSG80 Array Controller V8.7 Troubleshooting Reference Guide 1–19
Page 32

Troubleshooting Information
Table 1–3: Solid OCP Pattern Displays and Repair Actions (Sheet 5 of 6)
OCP
Pattern
nllmlll 37 Software-induced controller
Code Error Repair Action
Replace controller.
reset expected and failed.
nlllmmm 38 Controller operation halted.
Reset controller.
Last Failure event required
termination of controller
operation, for example:
SHUTDOWN via the command
line interface (CLI).
nlllmml 39 NVPM configuration
Replace controller.
inconsistent.
Device configuration within the
NVPM is inconsistent.
nlllmlm 3A An unexpected NMI occurred
Replace controller.
during Last Failure processing.
Last Failure processing
interrupted by a Non-Maskable
Interrupt (NMI).
nlllmll 3B NVPM read loop hang.
Replace controller.
Attempt to read data from
NVPM failed.
nllllmm 3C NVPM write loop hang.
Replace controller.
Attempt to write data to NVPM
failed.
nllllml 3D NVPM structure revision higher
than image.
NVPM structure revision
Replace program card with one
that contains the latest
software version.
number is higher than the one
that can be handled by the
software version attempting to
execute.
Legend:
■ = reset button O
N ❏ = reset button OFF ● = LED ON ❍ = LED OFF
1–20 HSG80 Array Controller V8.7 Troubleshooting Reference Guide
Page 33

Troubleshooting Information
Table 1–3: Solid OCP Pattern Displays and Repair Actions (Sheet 6 of 6)
OCP
Pattern
nllllll 3F DAEMON diagnostic failed
Legend:
■ = reset button O
Code Error Repair Action
Verify that cache module is
hard in non-fault tolerant mode.
DAEMON diagnostic detected
critical hardware component
failure; controller can no longer
operate.
N ❏ = reset button OFF ● = LED ON ❍ = LED OFF
present. If the error persists,
replace controller.
Last Failure Reporting
Last failures are automatically displayed on the maintenance terminal (unless disabled
via the FMU) using %LFL formatting. The example below shows a Last Failure
report:
%LFL--HSG> --13-MAY-2001 04:39:45 (time not set)-- Last Failure Code:
20090010
Power On Time: 0. Years, 14. Days, 19. Hours, 58. Minutes, 42. Seconds
Controller Model: HSG80
Serial Number: AA12345678 Hardware Version: 0000(00)
Software Version: V087P(FF)
Informational Report
Instance Code: 0102030A
Last Failure Code: 20090010 (No Last Failure Parameters)
Additional information is available in Last Failure Entry: 1.
In addition, Last Failures are reported to the host error log using Template 01,
following a restart of the controller. See Chapter 4 for a more detailed explanation of
this template.
Reporting Events That Allow Controller Operation to Continue
Events that do not cause controller operation to halt are displayed in one of two ways:
• Spontaneous event log
• CLI event reporting
HSG80 Array Controller V8.7 Troubleshooting Reference Guide 1–21
Page 34

Troubleshooting Information
Spontaneous Event Log
Spontaneous event logs are automatically displayed on the maintenance terminal
(unless disabled with the FMU) using %EVL formatting, as illustrated in the
following examples:
%EVL--HSG> --13-OCT-2000 04:32:47 (time not set)-- Instance Code: 0102030A (not yet
reported to host)
Template: 1.(01)
Power On Time: 0. Years, 14. Days, 19. Hours, 58. Minutes, 43. Seconds
Controller Model: HSG80
Serial Number: AA12345678 Hardware Version: 0000(00)
Software Version: V087P(FF)
Informational Report
Instance Code: 0102030A
Last Failure Code: 011C0011
Last Failure Parameter[0.] 0000003F
%EVL--HSG> --13-OCT-2000 04:32:47 (time not set)-- Instance Code: 82042002 (not yet
reported to host)
Template: 13.(13)
Power On Time: 0. Years, 14. Days, 19. Hours, 58. Minutes, 43. Seconds
Controller Model: HSG80
Serial Number: AA12345678 Hardware Version: 0000(00)
Software Version: V087P(FF)
Header type: 00 Header flags: 00
Test entity number: 0F Test number Demand/Failure: F8 Command: 01
Error Code: 0008 Return Code: 0005 Address of Error: A0000000
Expected Error Data: 44FCFCFC Actual Error Data: FFFF01BB
Extra Status(1): 00000000 Extra Status(2): 00000000 Extra Status(3): 00000000
Instance Code: 82042002
HSG>
Spontaneous event logs are reported to the host error log using SCSI Sense Data
Templates 01, 04, 05, 11, 12, 13, 14, 41, 51, and 90. See Chapter 3 for a more detailed
explanation of templates.
CLI Event Reporting
CLI event reports are automatically displayed on the maintenance terminal (unless
disabled with the FMU) using %CER formatting, as shown in the following example:
%CER--HSG> --13-OCT-2000 04:32:20 (time not set)-- Previous controlleroperation stopped with display of solid fault code, OCP Code: 3F
HSG>
1–22 HSG80 Array Controller V8.7 Troubleshooting Reference Guide
Page 35

Running the Controller Diagnostic Test
During startup, the controller automatically tests the device ports, host ports, cache
module, and value-added functions. If intermittent problems occur with one of these
components, run the controller diagnostic test in a continuous loop rather than
restarting the controller repeatedly.
Use the following steps to run the controller diagnostic test:
1. Connect a terminal to the controller maintenance port.
2. Start the self-test with one of the following commands:
SELFTEST THIS_CONTROLLER
SELFTEST OTHER_CONTROLLER
NOTE: The self-test runs until an error is detected or until the controller reset button is pressed.
If the self-test detects an error, the self-test saves information about the error and
produces an OCP LED code for a “daemon hard error.” Restart the controller to write
the error information to the host error log, then check the host error log for a “built-in
self-test failure” event report. This report will contain an instance code, located at
offset 32 through 35, that can be used to determine the cause of the error. See
Chapter 2, “Translating Event Codes” for help translating instance codes.
Troubleshooting Information
ECB Charging Diagnostics
Whenever restarting the controller, the diagnostic routines automatically check the
charge of each ECB battery. If the battery is fully charged, the controller reports the
battery as good and rechecks the battery every 24 hours. If the battery is charging, the
controller rechecks the battery every 4 minutes. A battery is reported as being either
above or below 50 percent capacity. A battery below 50 percent capacity is referred to
as low.
The 4-minute polling continues for the maximum allowable time to recharge the
battery—up to 10 hours for a BA370 enclosure, or 3.5 hours for a Model 2200
enclosure. If the battery does not charge sufficiently after the allotted time, the
controller declares the battery as failed.
Battery Hysteresis
When charging an ECB battery, write-back caching is allowed as long as a previous
downtime did not drain more than 50 percent battery capacity. When an ECB battery
is operating below 50 percent capacity, the battery is considered to be low and
write-back caching is disabled.
HSG80 Array Controller V8.7 Troubleshooting Reference Guide 1–23
Page 36
Troubleshooting Information
ECB battery capacity depends on the size of the cache module memory configuration
as shown in Table 1–4. For example, when the batteries are fully charged, an ECB can
preserve 512 MB of cache memory for 24 hours (1 day).
Table 1–4: ECB Capacity Based On Memory Size
Size
128 MB Four, 32 MB each 96 (4)
128 MB One, 128 MB each 96 (4)
256 MB Two, 128 MB each 48 (2)
512 MB Four, 128 MB each 24 (1)
CAUTION: StorageWorks recommends replacing the ECB every 2 years to prevent
battery failure.
NOTE: If a UPS is used for backup power and set to DATACENTER_WIDE, the controller does
not check the battery. See the controller configuration planning guide, controller installation and
configuration guide and controller CLI reference guide for information about the UPS switches.
DIMM
Combinations
Capacity in Hours
(Days)
Caching Techniques
The cache module supports the following caching techniques to increase subsystem
read and write performance:
• Read caching
• Read-ahead caching
• Write-through caching
• Write-back caching
Read Caching
When the controller receives a read request from the host, the controller reads the data
from the disk drives, delivers the data to the host, and stores the data in the supporting
cache module. Subsequent reads for the same data will take this data from the
supporting cache module rather than access the data from the disk drives. This process
is called read caching.
1–24 HSG80 Array Controller V8.7 Troubleshooting Reference Guide
Page 37

Read caching can decrease the subsystem response time to many host read requests. If
the host requests some or all of the cached data, the controller satisfies the request
from the supporting cache module rather than from the disk drives. Read caching is
enabled by default for all storage units.
For more details, refer to the following CLI commands in the controller CLI reference
guide:
SET unit-number MAXIMUM_CACHED_TRANSFER=nn
SET unit-number MAX_READ_CACHED_TRANSFER_SIZE=nn
SET unit-number READ_CACHE
Read-Ahead Caching
Read-ahead caching begins when the controller has already processed a read request
and the controller receives a subsequent read request from the host. If the controller
does not find the data in the cache memory, the controller reads the data from the disk
drives and sends this data to the cache memory.
During read-ahead caching, the controller anticipates subsequent read requests and
begins to prefetch the next blocks of data from the disk drives as the controller sends
the requested read data to the host. These are parallel actions. The controller notifies
the host of the read completion, and subsequent sequential read requests are satisfied
from the cache memory. Read-ahead caching is enabled by default for all disk units.
Troubleshooting Information
Write-Through Caching
When the controller receives a write request from the host, the controller places the
data in the supporting cache module, writes the data to the disk drives, then notifies
the host when the write operation is complete. This process is called write-through
caching because the data actually passes through—and is stored in—the cache
memory along the way to the disk drives.
If read-caching is enabled for a storage unit, write-through caching is automatically
enabled.
HSG80 Array Controller V8.7 Troubleshooting Reference Guide 1–25
Page 38

Troubleshooting Information
Write-Back Caching
Write-back caching improves the subsystem response time to write requests by
allowing the controller to declare the write operation “complete” as soon as the data
reaches the supporting cache memory. The controller performs the slower operation of
writing the data to the disk drives at a later time. For more details, refer to the
following CLI commands in the controller CLI reference guide:
SET unit-number MAXIMUM_CACHED_TRANSFER=nn
SET unit-number MAX_WRITE_CACHED_TRANSFER_SIZE=nn
SET unit-number WRITEBACK_CACHE
Write-back caching is enabled by default for all units. The controller will only provide
write-back caching to a unit if the cache memory is nonvolatile, as described in the
next section.
By default, the controller expects to use an ECB as the backup power source for the
cache module. However, if the subsystem is protected by a UPS, use one of the
following CLI commands to instruct the controller to use the UPS:
SET controller UPS=NODE_ONLY
or
SET controller UPS=DATACENTER_WIDE
Fault-Tolerance for Write-Back Caching
The cache module supports nonvolatile memory and dynamic cache policies to protect
the availability of cache module unwritten (write-back) data.
Nonvolatile Memory
The controller provides write-back caching for storage units as long as the controller
cache memory is connected to a nonvolatile backup power source, such as an ECB.
The cache module must be nonvolatile to preserve unwritten cache data during a
power failure. If the cache memory is not connected to a backup power supply, this
unwritten data will be lost during a power failure.
NOTE: Disaster-tolerant mirrorsets are not subject to this requirement.
By default, the controller expects to use an ECB as the backup power source for the
supporting cache module. However, if the subsystem is backed up using a UPS, two
options are available that tell the controller to use the UPS:
• For BA370 enclosures only: use both the ECB and the UPS together with the
following command:
SET controller UPS=NODE_ONLY
1–26 HSG80 Array Controller V8.7 Troubleshooting Reference Guide
Page 39

• Use only the UPS as the backup power source with the following command:
SET controller UPS=DATACENTER_WIDE
NOTE: See the controller CLI reference guide for detailed descriptions of these commands.
Cache Policies Resulting from Cache Module Failures
If the controller detects a full or partial failure of the supporting cache module or ECB,
the controller automatically reacts to preserve the unwritten data in the supporting
cache module. Depending upon the severity of the failure, the controller chooses an
interim caching technique—also called the cache policy—until the cache module or
ECB is repaired or replaced.
Table 1–5 shows the cache policies resulting from a full or partial failure of cache
module A (Cache A) in a dual-redundant controller configuration. The consequences
shown in Table 1–5 are the same for Cache B failures.
Table 1–6 on page 1–29 shows the cache policies resulting from a full or partial failure
of the ECB connected to Cache A in a dual-redundant controller configuration. The
consequences shown in Table 1–6 are the opposite for an ECB failure connected to
Cache B.
• If the ECB is at least 50% charged, the ECB is still good and is charging.
Troubleshooting Information
• If the ECB is less than 50% charged, the ECB is low but still charging.
Table 1–5: Cache Policies—Cache Module Status (Sheet 1 of 3)
Cache Module
Status Cache Policy
Cache A Cache B Unmirrored Cache Mirrored Cache
Good. Good. Data loss: None
Cache policy: Both controllers
support write-back caching.
Failover: None
Multibit
cache
memory
failure.
HSG80 Array Controller V8.7 Troubleshooting Reference Guide 1–27
Good. Data loss: Forced error and
loss of write-back data for
which the multibit error
occurred. Controller A detects
and reports the lost blocks.
Cache policy: Both controllers
support write-back caching.
Failover: None
Data loss: None
Cache policy: Both controllers
support write-back caching.
Failover: None
Data loss: None. Controller A
recovers lost write-back data
from the mirrored copy on Cache
B.
Cache policy: Both controllers
support write-back caching.
Failover: None
Page 40

Troubleshooting Information
Table 1–5: Cache Policies—Cache Module Status (Sheet 2 of 3)
Cache Module
Status Cache Policy
Cache A Cache B Unmirrored Cache Mirrored Cache
DIMM or
cache
memory
controller
chip
failure.
Good. Data loss: Write-back data that
was not written to media when
failure occurred was not
recovered.
Cache policy: Controller A
supports write-through caching
only; Controller B supports
write-back caching.
Failover: In transparent failover,
all units fail over to Controller B.
In multiple-bus failover with
host-assist, only those units
that use write-back caching,
such as RAIDsets and
mirrorsets, fail over to Controller
Data loss: Controller A recovers
all of write-back data from the
mirrored copy on Cache B.
Cache policy: Controller A
supports write-through caching
only; Controller B supports
write-back caching.
Failover: In transparent failover,
all units fail over to Controller B
and operate normally. In
multiple-bus failover with
host-assist, only those units that
use write-back caching, such as
RAIDsets and mirrorsets, fail
over to Controller B.
B. All units with lost data
become inoperative until they
are cleared using the CLEAR
unit-number LOST_DATA
command. Units that did not
lose data operate normally on
Controller B.
In single-controller
configurations, RAIDsets,
mirrorsets, and all units with
lost data become inoperative.
Although lost data errors can
be cleared on some units,
RAIDsets and mirrorsets
remain inoperative until the
memory on Cache A is repaired
or replaced.
1–28 HSG80 Array Controller V8.7 Troubleshooting Reference Guide
Page 41

Troubleshooting Information
Table 1–5: Cache Policies—Cache Module Status (Sheet 3 of 3)
Cache Module
Status Cache Policy
Cache A Cache B Unmirrored Cache Mirrored Cache
Cache
Board
Failure.
Good. Same as for DIMM failure. Data loss: Controller A recovers
all of write-back data from the
mirrored copy on Cache B.
Cache policy: Both controllers
support write-through caching
only. Controller B cannot execute
mirrored writes because Cache
A cannot mirror Controller B
unwritten data.
Failover: None
Table 1–6: Resulting Cache Policies—ECB Status (Sheet 1 of 4)
Cache Module
Status Cache Policy
Cache A Cache B Unmirrored Cache Mirrored Cache
At least
50%
charged.
At least
50%
charged.
Data loss: None
Cache policy: Both controllers
continue to support write-back
caching.
Failover: None
Data loss: None
Cache policy: Both controllers
continue to support write-back
caching.
Failover: None
HSG80 Array Controller V8.7 Troubleshooting Reference Guide 1–29
Page 42

Troubleshooting Information
Table 1–6: Resulting Cache Policies—ECB Status (Sheet 2 of 4)
Cache Module
Status Cache Policy
Cache A Cache B Unmirrored Cache Mirrored Cache
Less
than
50%
charged.
At least
50%
charged.
Data loss: None
Cache policy: Controller A
supports write-through caching
only; Controller B supports
write-back caching.
Data loss: None
Cache policy: Both controllers
continue to support write-back
caching.
Failover: None
Failover: In transparent failover,
all units fail over to Controller B.
In multiple-bus failover with
host-assist, only those units
that use write-back caching,
such as RAIDsets and
mirrorsets, fail over to Controller
B.
In single-controller
configurations, the controller
only provides write-through
caching to the units.
1–30 HSG80 Array Controller V8.7 Troubleshooting Reference Guide
Page 43

Troubleshooting Information
Table 1–6: Resulting Cache Policies—ECB Status (Sheet 3 of 4)
Cache Module
Status Cache Policy
Cache A Cache B Unmirrored Cache Mirrored Cache
Failed. At least
50%
charged.
Data loss: None
Cache policy: Controller A
supports write-through caching
only; Controller B supports
write-back caching.
Data loss: None
Cache policy: Both controllers
continue to support write-back
caching.
Failover: None
Failover: In transparent failover,
all units fail over to Controller B
and operate normally.
In multiple-bus failover with
host-assist, only those units
that use write-back caching,
such as RAIDsets and
mirrorsets, fail over to Controller
B.
In single-controller
configurations, the controller
only provides write-through
caching to the units.
Less
than
50%
charged.
Less
than 50%
charged.
Data loss: None
Cache policy: Both controllers
support write-through caching
only.
Failover: None
Data loss: None
Cache policy: Both controllers
support write-through caching
only.
Failover: None
HSG80 Array Controller V8.7 Troubleshooting Reference Guide 1–31
Page 44

Troubleshooting Information
Table 1–6: Resulting Cache Policies—ECB Status (Sheet 4 of 4)
Cache Module
Status Cache Policy
Cache A Cache B Unmirrored Cache Mirrored Cache
Failed. Less
than 50%
charged.
Failed. Failed. Data loss: None
Data loss: None
Cache policy: Both controllers
support write-through caching
only.
Failover: In transparent failover,
all units fail over to Controller B
and operate normally.
In multiple-bus failover with
host-assist, only those units
that use write-back caching,
such as RAIDsets and
mirrorsets, fail over to Controller
B.
In single-controller
configurations, the controller
only provides write-through
caching to the units.
Cache policy: Both controllers
support write-through caching
only.
Failover: None. RAIDsets and
mirrorsets become inoperative.
Other units that use write-back
caching operate with
write-through caching only.
Data loss: None
Cache policy: Both controllers
support write-through caching
only.
Failover: None
Data loss: None
Cache policy: Both controllers
support write-through caching
only.
Failover: None. RAIDsets and
mirrorsets become inoperative.
Other units that use write-back
caching operate with
write-through caching only.
Enabling Mirrored Write-Back Cache
Before configuring dual-redundant controllers and enabling mirroring, make sure the
following conditions are met:
• Each cache module is configured with the same size cache, 128 MB, 256 MB, or
512 MB.
1–32 HSG80 Array Controller V8.7 Troubleshooting Reference Guide
Page 45

Troubleshooting Information
• Diagnostics indicate that both caches are good.
• Both cache modules have an ECB connected and the UPS switch is set by the
following command:
SET controller NOUPS (no UPS is connected)
• Both cache modules either:
— Have an ECB connected, and the UPS switch is set by one of the following
commands:
SET controller NOUPS (no UPS is connected)
BA370 enclosure only: SET controller UPS=NODE_ONLY (a UPS is
connected)
— Do not have an ECB connected, and the UPS switch is set by the following
command:
SET controller UPS=DATACENTER_WIDE
NOTE: No unit errors are outstanding (for example, lost data or data that cannot be written to
devices).
• Both controllers are started and configured in failover mode.
For important considerations when configuring a subsystem for mirrored caching, see
the controller installation and configuration guide. To add or replace DIMMs in a
mirrored cache configuration, see the controller maintenance and service guide.
HSG80 Array Controller V8.7 Troubleshooting Reference Guide 1–33
Page 46

Page 47

2
Utilities and Exercisers
This chapter describes the utilities and exercisers available to help troubleshoot and
maintain the controllers, cache modules, and ECBs. These utilities and exercisers
include:
• Fault Management Utility (FMU)
• Video Terminal Display (VTDPY) Utility
• Disk Inline Exerciser (DILX)
• Format and Device Code Load Utility (HSUTIL)
• Configuration (CONFIG) Utility
• Code Load and Code Patch (CLCP) Utility
• Clone (CLONE) Utility
• Field Replacement Utility (FRUTIL)
• Change Volume Serial Number (CHVSN) Utility
Fault Management Utility (FMU)
The FMU provides a limited interface to the controller fault management software.
Use FMU to:
• Display the last failure and memory-system failure entries that the fault
management software stores in the controller nonvolatile memory.
• Translate many of the code values contained in event messages. For example,
entries might contain code values that indicate the cause of the event, the software
component that reported the event, or the repair action.
• Display the Instance Codes that identify and accompany significant events that do
not cause the controller to halt operation.
HSG80 Array Controller V8.7 Troubleshooting Reference Guide 2–1
Page 48

Utilities and Exercisers
• Display the Last Failure Codes that identify and accompany failure events that
cause the controller to halt operations. Last Failure Codes are sent to the host only
after the affected controller is restarted.
• Control the display characteristics of significant events and failures that the fault
management system displays on the maintenance terminal. See “Controlling the
Display of Significant Events and Failures” on page 2–5 for specific details on this
feature.
Displaying Failure Entries
The controller stores the 16 most recent last failure reports as entries in its nonvolatile
memory. The occurrence of any failure event halts operation of the controller on
which it occurred.
NOTE: Memory system failures are reported through the last failure mechanism but can be
displayed separately.
Use the following steps to display the last failure entries:
1. Connect a PC or a local terminal to the controller maintenance port.
2. Start FMU with the following command:
RUN FMU
3. Show one or more of the entries with the following command:
SHOW event_type entry# FULL
where:
• event-type is LAST_FAILURE or MEMORY_SYSTEM_FAILURE
• entry# is ALL, MOST_RECENT, or 1 through 16
• FULL displays additional information, such as the Intel i960 stack and
hardware component register sets (for example, the memory controller, FX,
host port, device ports, and so forth).
4. Exit FMU with the following command:
EXIT
The following example shows a last failure entry. The Informational Report—the
lower half of the entry—contains the last failure code, reporting component, and so
forth, that can be translated with FMU to learn more about the event.
2–2 HSG80 Array Controller V8.7 Troubleshooting Reference Guide
Page 49

Utilities and Exercisers
Last Failure Entry: 4. Flags: 006FF300
Template: 1.(01) Description: Last Failure Event
Occurred on 28-OCT-2000 at 15:29:28
Power On Time: 0. Years, 14. Days, 19. Hours, 51. Minutes, 31. Seconds
Controller Model: HSG80
Serial Number: AA12345678 Hardware Version: 0000(00)
Software Version: V087P(FF)
Informational Report
Instance Code: 0102030A Description:
An unrecoverable software inconsistency was detected or an intentional
restart or shutdown of controller operation was requested.
Reporting Component: 1.(01) Description:
Executive Services
Reporting component's event number: 2.(02)
Event Threshold: 10.(0A) Classification:
SOFT. An unexpected condition detected by a controller software component
(e.g., protocol violations, host buffer access errors, internal
inconsistencies, uninterpreted device errors, etc.) or an intentional
restart or shutdown of controller operation is indicated.
Last Failure Code: 20090010 (No Last Failure Parameters)
Last Failure Code: 20090010 Description:
This controller requested this controller to shutdown.
Reporting Component: 32.(20) Description:
Command Line interface
Reporting component's event number: 9.(09)
Restart Type: 1.(01) Description: No restart
Translating Event Codes
To translate the event codes in the fault management reports for spontaneous events
and failures, complete the following:
1. Connect a PC or a local terminal to the controller maintenance port.
2. Start FMU with the following command:
RUN FMU
3. Show one or more of the entries with the following command:
DESCRIBE code_type code#
where:
• code_type is one of those listed in Table 2–1
• code# is the alphanumeric value displayed in the entry
HSG80 Array Controller V8.7 Troubleshooting Reference Guide 2–3
Page 50

Utilities and Exercisers
• code types marked with an asterisk (*) require multiple code numbers
(see Chapter 3 for types codes used in the various templates, Chapter 4 for
ASC, ASCQ, Repair Action, and Component ID codes, Chapter 5 for Instance
Codes, and Chapter 6 for Last Failure Codes)
Table 2–1: Event Code Types
Event Code Type Event Code Type
ASC_ASCQ_CODE*
COMPONENT_CODE
CONTROLLER_UNIQUE_ASC_AS
CQ_CODE*
DEVICE_TYPE_CODE
EVENT _THRESHOLD_CODE
INSTANCE_CODE
LAST_FAILURE_CODE
The following examples show the FMU translation of a last failure code and an
instance code.
FMU>DESCRIBE LAST_FAILURE_CODE 206C0020
Last Failure Code: 206C0020
Description: Controller was forced to restart in order for new controller
code image to take effect.
Reporting Component: 32.(20)
Description: Command Line interface
Reporting component's event number: 108.(6C)
Restart Type: 2.(02)
Description: Automatic hardware restart
REPAIR_ACTION_CODE
RESTART_TYPE
SCSI_COMMAND_OPERATION_CODE*
SENSE_DATA_QUALIFIERS*
SENSE_KEY_CODE
TEMPLATE_CODE
FMU>DESCRIBE INSTANCE 026e0001
Instance Code: 026E0001
Description: The device specified in the Device Locator field has been
reduced from the Mirrorset associated with the logical unit. The nominal
number of members in the mirrorset has been decreased by one. The reduced
device is now available for use.
Reporting Component: 2.(02)
Description: Value Added Services
Reporting component's event number: 110.(6E)
Event Threshold: 1.(01) Classification:
IMMEDIATE. Failure or potential failure of a component critical to proper
controller operation is indicated; immediate attention is required.
2–4 HSG80 Array Controller V8.7 Troubleshooting Reference Guide
Page 51

Utilities and Exercisers
Controlling the Display of Significant Events and Failures
Use the SET command to control how the fault management software displays
significant events and failures.
Table 2–2 describes various SET commands that can be entered while running FMU.
These commands remain in effect only as long as the current FMU session remains
active, unless the PERMANENT qualifier is entered (the last entry in the table).
Table 2–2: FMU SET Commands (Sheet 1 of 3)
Command Result
SET EVENT_LOGGING
SET
NOEVENT_LOGGING
SET LAST_FAILURE
LOGGING
SET NOLAST_FAILURE
LOGGING
SET log_type
REPAIR_ACTION
SET log_type
NOREPAIR_ACTION
Enable and disable the spontaneous display of significant
events to the local terminal; preceded by “%EVL” (see
example in Chapter 1). By default, logging is enabled (SET
EVENT_LOGGING).
When logging is enabled, the controller spontaneously
displays information about the events on the local terminal.
Spontaneous event logging is suspended during the
execution of CLI commands and operation of utilities on a
local terminal. Because these events are spontaneous, logs
are not stored by the controller.
Enable and disable the spontaneous display of last failure
events; preceded by “%LFL” (see example in Chapter 1). By
default, logging is enabled (SET LAST_FAILURE LOGGING).
The controller spontaneously displays information relevant to
the sudden termination of controller operation.
In cases of automatic hardware reset (for example, power
failure or pressing the controller reset button), the fault LED
log display is inhibited because automatic resets do not allow
sufficient time to complete the log display.
Enable and disable the inclusion of repair action information
for event logging or last failure logging. By default, repair
actions are not displayed for these log types (SET log_type
NOREPAIR_ACTION). If the display of repair actions is
enabled, the controller displays any of the recommended
repair actions associated with the event.
HSG80 Array Controller V8.7 Troubleshooting Reference Guide 2–5
Page 52

Utilities and Exercisers
Table 2–2: FMU SET Commands (Sheet 2 of 3)
Command Result
SET log_type VERBOSE
SET log_type
NOVERBOSE
Enable and disable the automatic translation of event codes
that are contained in event logs or last failure logs. By default,
this descriptive text is not displayed (SET log_type
NOVERBOSE). See “Translating Event Codes” on page 2–3
for instructions to translate these codes manually.
SET PROMPT
SET NOPROMPT
Enable and disable the display of the CLI prompt string
following the log identifier “%EVL,” or “%LFL,” or “%FLL.” This
command is useful if the CLI prompt string is used to identify
the controllers in a dual-redundant configuration (see the
controller CLI reference guide for instructions to set the CLI
command string for a controller). If enabled, the CLI prompt
will be able to identify which controller sent the log to the local
terminal. By default, the prompt is set (SET PROMPT).
SET TIMESTAMP
SET NOTIMESTAMP
Enable and disable the display of the current date and time in
the first line of an event or last failure log. By default, the
timestamp is set (SET TIMESTAMP).
SET
FMU_REPAIR_ACTION
SET
FMU_NOREPAIR_ACTION
Enable and disable the inclusion of repair actions with SHOW
LAST_FAILURE and SHOW MEMORY_SYSTEM_FAILURE
commands. By default, the repair actions are not shown (SET
FMU_NOREPAIR_ACTION). If repair actions are enabled,
the command outputs display all of the recommended repair
actions associated with the instance or last failure codes
used to describe an event.
SET FMU_VERBOSE
SET FMU_NOVERBOSE
Enable and disable the inclusion of instance and last failure
code descriptive text with SHOW LAST_FAILURE and
SHOW MEMORY_SYSTEM_ FAILURE commands. By
default, this descriptive text is not displayed (SET
FMU_NOVERBOSE). If the descriptive text is enabled, it
identifies the fields and their numeric content that comprise
an event or last failure entry.
SET
CLI_EVENT_REPORTING
SET
NOCLI_EVENT_REPORTI
NG
Enable and disable the asynchronous errors reported at the
CLI prompt (for example, “swap signals disabled” or “shelf
(enclosure) has a bad power supply”); preceded by “%CER”
(see example in Chapter 1). By default, these errors are
reported (SET CLI_EVENT_REPORTING). These errors are
cleared with the CLEAR ERRORS_CLI command.
2–6 HSG80 Array Controller V8.7 Troubleshooting Reference Guide
Page 53

Utilities and Exercisers
Table 2–2: FMU SET Commands (Sheet 3 of 3)
Command Result
SET
FAULT_LED_LOGGING
SET
NOFAULT_LED_LOGGING
SHOW PARAMETERS Displays the current settings associated with the SET
SET command
PERMANENT
Enable and disable the solid fault LED event log display on
the local terminal. Preceded by “%FLL.” By default, logging is
enabled (SET FAULT_LED_LOGGING).
When enabled, and a solid fault pattern is displayed in the
OCP LEDs, the fault pattern and its meaning are displayed on
the maintenance terminal. For many of the patterns,
additional information is also displayed to aid in problem
diagnosis.
In cases of automatic hardware reset (for example, power
failure or pressing the controller reset button), the fault LED
log display is inhibited because automatic resets do not allow
sufficient time to complete the log display.
command.
Preserves the SET command across controller resets.
Video Terminal Display (VTDPY) Utility
The VTDPY utility, through various screens, displays configuration and performance
information for the HSG80 storage subsystem and is used to check the subsystem for
communication problems. Information displayed includes:
• Processor utilization
• Virtual storage unit activity and configuration
• Cache performance
• Device activity and configuration
• Host port activity and configuration
• Local and remote controller activity in a Data Replication Manager configuration
NOTE: All VTDPY screen displays are 132 characters wide. However, for readability purposes,
the sample screens in this section are not complete screens as viewed on the terminal.
Restrictions with VTDPY
The following restrictions apply when using VTDPY:
HSG80 Array Controller V8.7 Troubleshooting Reference Guide 2–7
Page 54

Utilities and Exercisers
• The VTDPY utility requires a serial maintenance terminal that supports ANSI
control sequences or a graphics display that emulates an ANSI-compatible
terminal.
• Only one VTDPY session can be run on a controller at a time.
• VTDPY does not display information for passthrough devices.
Running VTDPY
Use the following steps to run VTDPY:
1. Connect a serial maintenance terminal to the controller maintenance port.
IMPORTANT: The terminal must support ANSI control sequences.
2. Set the terminal to NOWRAP mode to prevent the top line of the display from
scrolling off of the screen.
3. Press Enter/Return to display the CLI prompt (CLI>).
4. Start VTDPY with the following command:
RUN VTDPY
Use the key sequences and commands listed in Table 2–3 to control VTDPY.
Table 2–3: VTDPY Key Sequences and Commands (Sheet 1 of 2)
Command Action
Ctrl/C Enables command mode; after entering Ctrl/C, enter one of the
following commands and press Enter/Return:
CLEAR
DISPLAY CACHE
DISPLAY DEFAULT
DISPLAY DEVICE
DISPLAY HOST
DISPLAY REMOTE (ACS version 8.7P only)
DISPLAY RESOURCE
DISPLAY STATUS
EXIT or QUIT
HELP
INTERVAL seconds (to change update interval)
REFRESH or UPDATE
2–8 HSG80 Array Controller V8.7 Troubleshooting Reference Guide
Page 55

Table 2–3: VTDPY Key Sequences and Commands (Sheet 2 of 2)
Command Action
Ctrl/G Updates screen
Ctrl/O Pauses (and resumes) screen updates
Ctrl/R Refreshes the current screen display
Ctrl/W Refreshes the current screen display
Ctrl/Y Exits VTDPY
Commands can be abbreviated to the minimum number of characters necessary to
identify the command. Enter a question mark (?) after a partial command to see the
values that can follow the supplied command.
For example: if DISP ? (DISP<space>?) is entered, the utility will list CACHE,
DEFAULT, and other possibilities.
Upon successfully executing a command—other than HELP—VTDPY exits
command mode. Pressing Enter/Return without a command also causes VTDPY to
exit command mode.
VTDPY Help
Utilities and Exercisers
Entering HELP at the VTDPY prompt (VTDPY>) displays information about
VTDPY commands and keyboard shortcuts. See Figure 2–1 below:
NOTE: The ^ symbol denotes the Ctrl key on the keyboard.
HSG80 Array Controller V8.7 Troubleshooting Reference Guide 2–9
Page 56

Utilities and Exercisers
VTDPY> HELP
Available VTDPY commands:
^C - Prompt for commands
^G or ^Z - Update screen
^O - Pause/Resume screen updates
^Y - Terminate program
^R or ^W - refresh screen
DISPLAY CACHE - Use 132 column unit caching statistics display
DISPLAY DEFAULT - Use 132 column system performance display
DISPLAY DEVICE - Use 132 column device performance display
DISPLAY HOST - Use 132 column Host Ports statistics display
DISPLAY REMOTE - Use 132 column controller status display
DISPLAY RESOURCE - Use 132 column controller status display
DISPLAY STATUS - Use 132 column controller status display
CLEAR - Clears the host port event counters
EXIT - Terminate program (same as QUIT)
INTERVAL <seconds> - Change update interval
HELP - Display this help message
REFRESH - Refresh the current display
QUIT - Terminate program (same as EXIT)
UPDATE - Update Screen Display
Figure 2–1: VTDPY commands and shortcuts generated from the Help command
VTDPY Display Screens
VTDPY displays storage subsystem information using the following display screens:
• Default Screen
• Controller Status Screen
• Cache Performance Screen
• Device Performance Screen
• Host Ports Statistics Screen
• Resource Statistics Screen
• Remote Status Screen
Choose any of the screens by entering DISPLAY at the VTDPY prompt, followed by
the screen name. For example: enter the following command at the VTDPY prompt:
DISPLAY CACHE
Each display screen is shown in the following sections. Screen interpretations are
presented following the various screens.
2–10 HSG80 Array Controller V8.7 Troubleshooting Reference Guide
Page 57

Default Screen
The DEFAULT screen, shown in Figure 2–2 (the display for ACS version 8.7P differs
slightly), consists of the following sections and subsections:
• Screen header, which includes:
— Controller ID data
— Subsystem performance
— Controller uptime
• Controller/processor utilization
• Host port 1 and 2 packet data brief
• Full unit performance
VTDPY> DISPLAY DEFAULT
HSG80 S/N: ZG92712820 SW: V87P-0 HW: E-01
0.0% Idle 0 KB/S 0 Rq/S Up: 0
Pr Name Stk/
0NULL 0/
Max
Typ Sta CPU% Target Unit ASWCKB/SRd%
0
Rn 0.0 111111 D0001 x
Utilities and Exercisers
22:10.03
a
00
Figure 2–2: Sample of the VTDPY default screen
Controller Status Screen
The STATUS screen, shown in Figure 2–3, consists of the following sections:
• Screen header, which includes:
— Controller ID data
— Subsystem performance
— Controller uptime
• Controller/processor utilization
• Device port configuration
• Host port configuration
• Brief unit performance
HSG80 Array Controller V8.7 Troubleshooting Reference Guide 2–11
Page 58

Utilities and Exercisers
NOTE: Figure 2–3 applies to “this controller” only. To see “other controller” connections, run
VTDPY again on the “other controller.”
VTDPY>DISPLAY STATUS
HSG80 S/N: ZG92712934 SW: V87P-0 HW: E-01
0.0% Idle 18093 KB/S 3165 Rq/S Up: 19 5:02:22
Pr Name Stk/
Max
0 NULL 0/
Typ Sta CPU% Unit ASWCKB/S Unit ASWC KB/S
Rn 100.0 D0000o^ a658 D0112x a 0
0
D0001o^ a683 D0113x a 0
D0002o^ a237 D0114x a 0
D0006o^ a237 D0115x a 0
D0007o^ a696 D0116x a 0
D0008o^ a2993 D0117x a 0
D0009o^ a2351
D0010o^ a2830
D0011o^ a2031
D0012o^ a2793
D0013o^ a2579
Figure 2–3: Sample of the VTDPY status screen
Cache Performance Screen
The CACHE screen, shown in Figure 2–4, consists of the following sections:
• Screen header, which includes:
— Controller ID data
— Subsystem performance
— Controller uptime
2–12 HSG80 Array Controller V8.7 Troubleshooting Reference Guide
Page 59

•Unit status
• Unit I/O activity
VTDPY>DISPLAY CACHE
Utilities and Exercisers
HSG
80
58.1% Idle 878 KB/S 787 Rq/S Up: 0 22:10:28
UnitASWC KB/S Rd%Wr% Cm%Ht%Ph%MS%PurgeBlChdBlHi
P0300o000
D0303o^ b 0
D03
04
P04
00
P04
01
D0402x^ b 0
S/N: ZG92712820 SW: V87P-0 HW: E-01
0
0
0
Figure 2–4: Sample of the VTDPY cache screen
Device Performance Screen
The DEVICE screen, shown in Figure 2–5, consists of the following sections:
• Screen header, which includes:
t
000
0000
0
0
0
0
0
0
0000
0
0000
0
0000
0
0000
0
0000
000
000
000
000
000
— Controller ID data
— Subsystem performance
— Controller uptime
• Device port configuration (upper left)
• Device performance (upper right)
• Device port performance (lower left)
HSG80 Array Controller V8.7 Troubleshooting Reference Guide 2–13
Page 60

Utilities and Exercisers
VTDPY>DISPLAY DEVICE
HSG80 S/N: ZG92712820 SW: V87P-0 HW: E-01
Target P TL ASWFRq/SRdKB/SWrKB/SQ
0123456789012345 D1130 A^ 0 0 0 0 0 0 0
P1 hH PDD D1140 A^ 0 0 0 0 0 0 0
o2 hH DDD D2120 A^ 0 0 0 0 0 0 0
r3 ????hH D2130 A^ 0 0 0 0 0 0 0
t4 hH DDD D2140 a^ 0 0 0 0 0 0 0
5 P hH ?3020 ^
6D hH ?3030 ^
99.9% Idle 0 KB/S 0
Rq/S
111111 P1120 A^ 0 0 0 0 0 0 0
0000000
F
0000000
F
?3040 ^
?3050 ^
D4090 A^ 0 0 0 0 0 0 0
D4100 A^ 0 0 0 0 0 0 0
D4110 A^ 0 0 0 0 0 0 0
P5030 A^ 0 0 0 0 0 0 0
D6010 A^ 0 0 0 0 0 0 0
0000000
F
0000000
F
Up: 0 22:08:21
TgBRE
u
e
R
PortR
10 0 0000
20 0 0000
30 0 0000
40 0 0000
50 0 0000
60 0 0000
RdKB/SWrKB/SCRBRT
q
/
S
R
Figure 2–5: Sample of regions on the VTDPY device screen
2–14 HSG80 Array Controller V8.7 Troubleshooting Reference Guide
Page 61

Host Ports Statistics Screen
The HOST screen, shown in Figure 2–6, consists of the following sections:
• Screen header, which includes:
— Controller ID data
— Subsystem performance
— Controller uptime
• Known hosts
• Host port 1 configuration and link error counters
• Host port 2 configuration and link error counters
NOTE: Figure 2–6 applies to “this controller” only. To see “other controller” connections, run
VTDPY again on the “other controller.”
Utilities and Exercisers
HSG80 Array Controller V8.7 Troubleshooting Reference Guide 2–15
Page 62

Utilities and Exercisers
VTDPY>DISPLAY HOST
********* KNOWN HOSTS
**********
##NAME BBF
r
S
z
00BONK2P272
0
4
8
10!NEWCO
N35
11DADRA1172
12BONK1P172
72
0
4
8
0
4
8
0
4
8
FIBRE CHANNEL HOST STATUS DISPLAY
******* PORT 1 ******* ******* PORT 2 *******
ID/ALPAP S Topology : FAB
RIC
2101132 N Current Status : FAB
RIC
2102132 N Current ID/ALPA : 210
313
2102131 N Tachyon Status : ff Tachyon Status : ff
2101131 N Queue Depth : 6 Queue Depth : 0
Busy/QFull Rsp : 0 Busy/QFull Rsp : 0
LINK ERROR COUNTERS LINK ERROR COUNTERS
Link Downs : 1 Link Downs : 1
Soft Inits : 0 Soft Inits : 0
Hard Inits : 0 Hard Inits : 0
Loss of Signals : 0 Loss of Signals : 0
Bad Rx Chars : 3 Bad Rx Chars : 3
Loss of Syncs : 0 Loss of Syncs : 0
Link Fails : 0 Link Fails : 0
Received EOFa : 0 Received EOFa : 0
Generated EOFa : 0 Generated EOFa : 0
Bad CRCs : 0 Bad CRCs : 0
Protocol Errors : 0 Protocol Errors : 0
Elastic Errors : 0 Elastic Errors : 1
Topology : FAB
RIC
Current Status : FAB
RIC
Current ID/ALPA : 210
413
Figure 2–6: Sample of the VTDPY host screen
2–16 HSG80 Array Controller V8.7 Troubleshooting Reference Guide
Page 63

Resource Statistics Screen
The RESOURCE screen, shown in Figure 2–7, consists of the following sections:
• Screen header, which includes:
— Controller ID data
— Subsystem performance
— Controller uptime
• Physical resource name fields
• Cache memory requirement fields (Free, Need, and Wait)
• Full unit performance
• Resource status fields (Wait Flush, wait FX, Nodes, Dirty, and Flush)
VTDPY>DISPLAY RESOURCE
HSG80 S/N: ZG92712934 SW: V87P-0 HW: E-01
0.0% Idle 18574 KB/S 3276 Rq/S Up: 19 5:01:43
Resource Name Free Need Wait Unit ASWC KB/S Rd% Wr% Cm% HT%
------------- ------ ---- ---- D0000 o^ a 614 50 49 0 100
Buffers 307739 0 0 D0001 o^ a 609 50 50 0 100
VAXDs 302 0 0 D0002 o^ a 259 0 100 0 0
WARPs 68 0 0 D0006 o^ a 743 100 0 0 99
RMDs 180 0 0 D0007 o^ a 613 50 49 0 100
XBUFs 306 0 0 D0008 o^ a 2924 0 100 0 0
ZBUFs 106 0 0 D0009 o^ a 2551 0 100 0 0
Disk Read DWDs 291 0 0 D0010 o^ a 2709 0 100 0 0
Disk Write DWDs 196 0 0 D0011 o^ a 2463 0 100 0 0
DPCX Read DWDs 144 0 0 D0012 o^ a 2665 0 100 0 0
DPCX Write DWDs 138 0 0 D0013 o^ a 2420 0 100 0 0
DDs 243 0 0 D0100 x a 0 0 0 0 0
Wait Flush: 0 (DDs) 0 (blocks)
Wait FX: 0 (wait) 1 (queue)
Nodes: 0 (cache) 0 (strip)
Dirty: 12295 (blocks) 23721 (nodes)
Flush: 77328 (blocks) 610 (nodes)
Utilities and Exercisers
Figure 2–7: Sample of the VTDPY resource screen
Remote Status Screen
The REMOTE screen (ACS version 8.7P only), shown in Figure 2–8, consists of the
following sections:
HSG80 Array Controller V8.7 Troubleshooting Reference Guide 2–17
Page 64

Utilities and Exercisers
• Remote copy set name
• Runtime status
VTDPY>DISPLAY REMOTE
U=Kb/
LO
G
==
==
==
ASSOC
SET
========
=
IT
==
==
U=Kb
/S
==
COPY
SET
======
===
RCS2 G213_TAR/D52DD2 o 920ASC1 D98o *****LG 6
RCS3 G213_TAR/D0D D3 x *****ASC2 D99x ******* ***%***%**
RCS4 G213_TAR/D0D D4 x *****ASC3 D97x ******* ***%***%**
RCS5 NO TARGETS * D5 x ******************x ******* ***%***%**
RCS7 G213_TAR/D57DD7 o 714ASC4 D96o336LG 4
RCS8 G213_TAR/D0D D8 x *****ASC2 D99x ******* ***%***%**
TARGET
==========
===
C=IN
LS==%L
S
===
==
%M
RG
OG
==
==
==
==
7% 0%100%
9% 0%100%
%C
PY
==
==
*%
*%
*%
*%
Figure 2–8: Sample of the VTDPY remote status screen (ACS version 8.7P only)
Interpreting VTDPY Screen Information
Refer to the sample VTDPY screens in the previous section as needed while the
various sections of these screens are interpreted in this section. The VTDPY screens
display information in the following screen subsections:
• Screen Header
• Common Data Fields
• Unit Performance Data Fields
• Device Performance Data Fields
• Device Port Performance Data Fields
• Host Port Configuration
• TACHYON Chip Status
• Runtime Status of Remote Copy Sets
2–18 HSG80 Array Controller V8.7 Troubleshooting Reference Guide
Page 65

• Device Port Configuration
• Controller/Processor Utilization
Each screen subsection is described in the following sections.
Screen Header
The screen header is the first line of data on every display screen. The header shows
information about the overall performance of the HSG80 storage subsystem and is
further divided into the following four subsections:
• Controller ID data
• Subsystem performance data
• Controller uptime data
• Current date and time
The controller ID data appears as follows:
HSG80 S/N: xxxxxxxxxxxx SW: xxxxxxx HW: xx-xx
where:
— HSG80: string represents the controller model name and number.
Utilities and Exercisers
— S/N: depicts an alphanumeric serial number.
— SW: depicts a software version number.
— HW: depicts a hardware revision number.
The subsystem performance data appears as follows:
xxx.x% Idle xxxxxx KB/S xxxxx RQ/S
where:
— xxx.x% Idle displays the controller policy processor uptime.
— KB/S displays cumulative data transfer rate in kilobytes per second.
— RQ/S displays cumulative unit request rate in requests per second.
The controller uptime data shows the uptime of the HSG80 controller in days, hours
and minutes in the following format:
Up: days hh:mm:ss
HSG80 Array Controller V8.7 Troubleshooting Reference Guide 2–19
Page 66

Utilities and Exercisers
Common Data Fields
Some VTDPY displays contain common data fields, such as the DEFAULT, STATUS,
and DEVICE screens. Table 2–4 provides a description of common data fields on
DEFAULT and STATUS screens.
Table 2–4: VTDPY—Common Data Fields Column Definitions: Part 1
Column Contents
Pr Thread priority
Name Thread name or NULL (idle)
Stk/Max Allocated stack size in 512 byte pages and maximum number of
stack pages actually used
Typ Thread type:
FNC= functional thread
DUP= device utility/exerciser (DUP) local program threads
Sta Status:
Bl = waiting for completion of a process currently running
Io = waiting for input or output
Rn = actively running
CPU% Percentage of central processing unit resource consumption
Other common VTDPY data fields in the DEFAULT and DEVICE screens are
described in Table 2–5.
2–20 HSG80 Array Controller V8.7 Troubleshooting Reference Guide
Page 67

Table 2–5: VTDPY—Common Data Fields Column Definitions: Part 2
Column Contents
Port SCSI ports 1 through 6.
Target SCSI targets 0 through 15. Single controllers occupy 7;
dual-redundant controllers occupy 6 and 7.
D = disk drive or CD-ROM drive
F = foreign device
H = this controller
h = other controller in dual-redundant configurations
P = passthrough device
? = unknown device type
space = no device at this port/target location
Unit Performance Data Fields
VTDPY displays virtual storage unit performance information in a block of tabular
data in the DEFAULT, STATUS, CACHE, and RESOURCE screens only. Each of
these screens displays the unit performance data in a different format, as follows:
Utilities and Exercisers
• DEFAULT screen uses the full format (see Figure 2–2).
• STATUS screen uses a brief format (see Figure 2–3).
• CACHE screen uses the maximum format (see Figure 2–4).
• RESOURCE screen also uses a brief format (see Figure 2–7).
Although these displays show unit performance in three different formats, the displays
share common data fields, with the brief format displaying the least information, the
full format supplying more information, and the maximum format displaying the
maximum amount of available information. See Table 2–6 for a description of each
field on these screens.
HSG80 Array Controller V8.7 Troubleshooting Reference Guide 2–21
Page 68

Utilities and Exercisers
Table 2–6: VTDPY—Unit Performance Data Fields Column Definitions (Sheet 1 of 2)
Column Contents
Unit Kind of unit and unit number. Unit types include:
A Availability of the unit:
S State of a virtual storage unit:
W Write-protection state of the virtual storage device
D = disk drive or CD-ROM drive
I = invisible device
P = passthrough device
? = unknown device type
a = available to “other controller”
d = offline, unit disabled for servicing
e = online, unit mounted for exclusive access by a user
f = offline, media format error
i = offline, unit inoperative
m = offline, maintenance mode for diagnostic purposes
o = online, Host can access this unit through “this controller”
r = offline, rundown set with the SET NORUN command
v = offline, no volume mounted due to lack of media
x = online, Host can access this unit through “other controller”
z = currently not accessible to host due to a remote copy
condition (ACS version 8.7P only)
space = unknown availability
^ = disk device spinning at correct speed
> = disk device spinning up
< = disk device spinning down
v = disk device stopped spinning
space = unknown spindle state or device is not a disk unit
W = for disk drives, indicating the device is hardware
write-protected
space = device is not a disk unit
2–22 HSG80 Array Controller V8.7 Troubleshooting Reference Guide
Page 69
Utilities and Exercisers
Table 2–6: VTDPY—Unit Performance Data Fields Column Definitions (Sheet 2
of 2)
Column Contents
C Caching state of the device:
a = read, write-back, and read-ahead caching enabled
b = read and write-back caching enabled
c = read and read-ahead caching enabled
p = read-ahead caching enabled
r = read caching only
w = write-back caching is enabled
space = caching disabled
KB/S Average amount of data transferred to and from the unit during the last
update interval in kilobyte increments per second.
Rd% Percentage of data transferred between the host and the unit that was
read from the unit.
Wr% Percentage of data transferred between the host and the unit that was
written to the unit.
Cm% Percentage of data transferred between the host and the unit that was
compared. A compare operation can accompany a read or a write
operation, so this column is not the sum of columns Rd% and Wr%.
Ht% Cache-hit percentage for data transferred between the host and the
unit.
Ph% Partial cache hit percentage of data transferred between the host and
the unit.
MS% Cache miss percentage of data transferred between the host and the
unit.
Purge Number of blocks purged from the write-back cache during the last
update interval.
BlChd Number of blocks added to the cache during the last update interval.
BlHit Number of cached data blocks hit during the last update interval.
Device Performance Data Fields
VTDPY displays up to 42 devices in the device performance region (see Figure 2–5,
upper right) of the DEVICE screen only. See Table 2–7 for a description of each field.
HSG80 Array Controller V8.7 Troubleshooting Reference Guide 2–23
Page 70

Utilities and Exercisers
Table 2–7: VTDPY—Device Performance Data Fields Column Definitions (Sheet 1 of 2)
Column Contents
PTL Type of device and the device port-target-LUN (PTL) address:
A Allocation state. Availability of the device:
S State of the device:
W Write-protection state of the device
F Fault status of a device
Rq/S Average I/O request rate for the device during the last update interval.
RdKB/S Average read data transfer rate to the device in KB/s during the
D = disk drive
P = passthrough device
? = unknown device type
= (space) no device configured at this location
a = available to “other controller”
A = available to “this controller”
u = unavailable, but configured on “other controller”
U = unavailable, but configured on “this controller”
space = unknown allocation state
^ = disk device spinning at correct speed
> = disk device spinning up
< = disk device spinning down
v = disk device stopped spinning
space = unknown spindle state
W = for disk drives, indicating the device is hardware
write-protected
space = other device type
F = unrecoverable device fault. Device fault LED is O
N.
space = no fault detected
Requests can be up to 32 KB and generated by host requests or cache
flush activity.
previous update interval.
2–24 HSG80 Array Controller V8.7 Troubleshooting Reference Guide
Page 71

Table 2–7: VTDPY—Device Performance Data Fields Column Definitions (Sheet
2 of 2)
Column Contents
WrKB/S Average write data transfer rate to the device in KB/s during the
previous update interval.
Que Maximum number of transfer requests waiting to be transferred to the
device during the last screen update interval.
Tg Maximum number of requests queued to the device during the last
screen update interval. If the device does not support tagged queuing,
the maximum value is 1.
BR Number of SCSI bus resets that occurred since VTDPY was started.
ER Number of SCSI errors received. If the device is swapped or deleted,
then the value clears and resets to 0.
Device Port Performance Data Fields
VTDPY displays a device port performance region (see Figure 2–5, lower left) on the
DEVICE screen only. See Table 2–8 for a description of each field.
Table 2–8: VTDPY—Device Port Performance Data Fields Column Definitions
Column Contents
Port SCSI device ports 1 through 6.
Rq/S Average I/O request rate for the device during the last update
interval. Requests can be up to 32 KB and generated by host
requests or cache flush activity.
RdKB/S Average read data transfer rate to the device in KB/s during the
previous update interval.
WrKB/S Average write data transfer rate to the device in KB/s during the
previous update interval.
CR Number of SCSI command resets that occurred since VTDPY was
started.
BR Number of SCSI bus resets that occurred since VTDPY was
started.
TR Number of SCSI target resets that occurred since VTDPY was
started.
Utilities and Exercisers
HSG80 Array Controller V8.7 Troubleshooting Reference Guide 2–25
Page 72

Utilities and Exercisers
Host Port Configuration
VTDPY displays host port configuration information in a block of tabular data in the
HOST screen only. The data is displayed for both host Port 1 and host Port 2
independently, although the format is the same for both.
Use the VTDPY>CLEAR command to clear the host display link error counters.
Table 2–9 outlines the “Known Hosts” portion of the Fibre Channel Host Status
Display. For a more detailed explanation of certain field labels and their definitions,
consult The Fibre Channel Physical and Signaling Interface Standard (also known as
the FC-PH specification).
Table 2–9: Fibre Channel Host Status Display—Known Host Connections
Field
Label Description
## Internal ID
NAME Refer to the SHOW CONNECTIONS command in controller CLI
reference guide.
BB Buffer-to-buffer credit
FrSz Frame size
ID/ALPA Host ID
P Port number (1 or 2)
S Status:
N = online
F = offline
The following tables detail the remaining portions of the Fibre Channel Host Status
Display. Table 2–10 includes the labels that report the status of ports one and two, and
Table 2–11 describes the Link Error Counters.
Table 2–10: Fibre Channel Host Status Display—Port Status (Sheet 1 of 2)
Field
Label Description
Topology FABRIC, LOOP, or OFFLNE
Current
Status
Current
ID/ALPA
2–26 HSG80 Array Controller V8.7 Troubleshooting Reference Guide
FABRIC, LOOP, DOWN, STNDBY, or OFFLNE
Controller ID
Page 73

Utilities and Exercisers
Table 2–10: Fibre Channel Host Status Display—Port Status (Sheet 2 of 2)
Field
Label Description
TACHYO
N Status
This denotes the current state of the TACHYON or Fibre Channel
control chip. See “TACHYON Chip Status” on page 2–28 for more
detail.
Queue
Depth
Busy/QFu
ll Rsp
Table 2–11: Fibre Channel Host Status Display—Link Error Counters (Sheet 1 of
Queue depth shows the instantaneous number of commands at
the controller port.
This field represents the total number of QFull/Busy responses
sent by the port.
2)
Field
Label Description
Link
This field refers to the total number of link down/up transitions.
Downs
Soft Inits Soft initializations are the number of loop initializations caused by
this port.
Hard Inits Hard initializations indicate the number of TACHYON chip resets.
Loss of
Signals
Bad Rx
Chars
Loss of signals show the number of times the Frame Manager
detected a low-to-high transition on the lnk_unuse signal.
This field represents the number of times the 8B/10B decode
detected an invalid 10-bit code. FC-PH denotes this value as
“Invalid Transmission Word during frame reception.” This field may
be non-zero after initialization. After initialization, the host should
read this value to determine the correct starting value for this error
count.
Loss of
Syncs
Loss of Sync denotes the number of times the loss of sync is
greater than RT_TOV.
Link Fails This field indicates the number of times the Frame Manager
detected a NOS or other initialization protocol failure that caused a
transition to the Link Failure state.
Received
EOFa
Received EOFa refers to the number of frames containing an
EOFa delimiter that the TACHYON chip has received.
HSG80 Array Controller V8.7 Troubleshooting Reference Guide 2–27
Page 74

Utilities and Exercisers
Table 2–11: Fibre Channel Host Status Display—Link Error Counters (Sheet 2 of
2)
Field
Label Description
Generate
d EOFa
Bad
CRCs
Protocol
Errors
Elastic
Errors
This field reveals the number of problem frames that the
TACHYON chip has received that caused the Frame Manager to
attach an EOFa delimiter. Frames that the TACHYON chip
discarded due to internal FIFO overflow are not included in this or
any other statistic.
Bad CRCs denotes the number of bad CRC frames that the
TACHYON chip has received.
This field indicates the number of protocol errors that the Frame
Manager has detected.
Elastic errors reveal the timing difference between the receive and
transmit clocks and usually indicate cable pulls.
TACHYON Chip Status
The number that appears in the TACHYON Status field represents the current state of
the TACHYON or Fibre Channel control chip. It consists of a two-digit hexadecimal
number, the first of which is explained in Table 2–12. The second digit is outlined in
Table 2–13. Refer to the Hewlett-Packard TACHYON user manual for a more detailed
explanation of the TACHYON chip definitions.
Table 2–12: First Digit on the TACHYON Chip
State Definition State Definition
0 MONITORING 8 INITIALIZING
1 ARBITRATING 9 O_I INIT FINISH
2 ARBITRATION WON a O_I PROTOCOL
3 OPEN b O_I LIP RECEIVED
4 OPENED c HOST CONTROL
5 XMITTED CL0SE d LOOP FAIL
6 RECEIVED CLOSE f OLD PORT
7TRANSFER
2–28 HSG80 Array Controller V8.7 Troubleshooting Reference Guide
Page 75

Table 2–13: Second Digit on the TACHYON Chip
State Definition State Definition
0OFFLINE 6LR2
1OL1 7LR3
2OL2 9LF1
3OL3 aLF2
5 LR1 f ACTIVE
Runtime Status of Remote Copy Sets
Use the REMOTE screen to check the runtime status of all remote copy sets.
Table 2–14 provides a description of the REMOTE screen column headings and
possible entries under each column.
NOTE: This feature is only supported in ACS version 8.7P.
Table 2–14: Remote Display Column Definitions— ACS Version 8.7P Only (Sheet 1 of 3)
Column Contents
COPY
SET
TARGET Target connection name and target unit number
C Connection status:
INIT Initiator unit number
Remote copy set name
U = connection Up (online)
D = connection Down (offline)
Utilities and Exercisers
HSG80 Array Controller V8.7 Troubleshooting Reference Guide 2–29
Page 76

Utilities and Exercisers
Table 2–14: Remote Display Column Definitions— ACS Version 8.7P Only
(Sheet 2 of 3)
Column Contents
U Availability of the unit:
Kb/S Total initiator unit bandwidth in Kb per second
ASSOC
SET
LOG Write history log unit number
U Log unit status: uses the same codes as “U - Availability of the unit”
Kb/S Total log unit bandwidth in Kb per second
LS Log State:
%LOG Percentage of the write history log unit available for use / remaining
%MRG Percentage of merge process completed
a = available to “other controller”
d = disabled for servicing, offline
e = mounted for exclusive access by a user
f = media format error
i = inoperative
m = maintenance mode for diagnostic purposes
o = online. Host can access this unit through “this
controller”.
r = rundown with the SET NORUN command
v = no volume mounted due to lack of media
x = online. Host can access this unit through “other
controller”.
z = currently not accessible to host due to a remote copy
condition
= (space) unknown availability
Association set name
LG = logging
MG = merging
CP = copying
NR = normal
NZ = normalizing
2–30 HSG80 Array Controller V8.7 Troubleshooting Reference Guide
Page 77

Table 2–14: Remote Display Column Definitions— ACS Version 8.7P Only
(Sheet 3 of 3)
Column Contents
%CPY Percent of copy process completed
Device Port Configuration
VTDPY displays device port configuration information in a block of tabular data in
the DEFAULT and DEVICE screens only. The information is arranged in a grid with
the port numbers listed along the vertical axis and the targets on each port listed along
the horizontal axis. The word “Port” is spelled out vertically to denote the port
numbers. The screen shows the usage of each port/target combination with a code in
the array as shown below. Field information is explained Table 2–15.
Target
111111
123456789012345
P1DDDD Hh
o2DDDD Hh
r3DDDD Hh
t4DDDD Hh
5DDDD Hh
6DDDD Hh
Utilities and Exercisers
Table 2–15: Device Map Column Definitions
Column Contents
Port SCSI ports 1 through 6.
Target SCSI targets 0 through 15. Single controllers occupy 7;
dual-redundant controllers occupy 6 and 7.
D = disk drive or CD-ROM drive
F = foreign device
H = “this controller”
h = “other controller” in dual-redundant configurations
P = passthrough device
? = unknown device type
= (space) no device at this port/target location
HSG80 Array Controller V8.7 Troubleshooting Reference Guide 2–31
Page 78

Utilities and Exercisers
Controller/Processor Utilization
VTDPY displays information on policy processor threads using a block of tabular data
in the DEFAULT and STATUS screens only. Thread data is located on the left side of
both screens (see Figure 2–2 and Figure 2–3) and contains fields described in
Table 2–16 and Table 2–17.
Table 2–16: Controller/Processor Utilization Definitions
Column Contents
Pr Thread priority. The higher the number, the higher the priority.
Name Thread name. For DUP Local Program threads, use the name in the
Name field to invoke the program.
Stk/Max Allocated stack size in 512-byte pages. The Max column lists the
number of stack pages actually used.
Typ Thread type:
FNC = Functional thread. Those threads that are started
when the controller boots and never exits.
DUP = DUP local program threads. Those threads that are
only active when run either from a DUP connection or
through the command line interface RUN command.
NULL = a special type of thread that only executes when no
other thread is executable.
Sta Current thread state:
Bl = The thread is blocked waiting for timer expiration,
resources, or a synchronization event.
Io = A DUP local program is blocked waiting for terminal
I/O completion.
Rn = The thread is currently executable.
CPU% Shows the percentage of execution time credited to each thread
since the last screen update. The values might not total 100% due
to rounding errors and the fact that there might not be enough room
to display all of the threads. An unexpected amount of time can be
credited to some threads because the controller firmware
architecture allows code from one thread to execute in the context
of another thread without a context switch.
2–32 HSG80 Array Controller V8.7 Troubleshooting Reference Guide
Page 79

Utilities and Exercisers
Table 2–17: VTDPY Thread Descriptions (Sheet 1 of 2)
Thread Description
CLI A local program that provides an interface to the controller
command line interface thread.
CLIMAIN Command line interface (CLI).
CONFIG A local program that locates and adds devices to a configuration.
DILX A local program that exercises disk devices.
DIRECT A local program that returns a listing of available local programs.
DS_0 A device error recovery management thread.
DS_1 The thread that handles successful completion of physical device
requests.
DS_HB The thread that manages the device and controller error indicator
lights and port reset buttons.
DUART The console terminal interface thread.
DUP The DUP protocol thread.
FMTHRD The thread that performs error log formatting and fault reporting
for the controller.
FOC The thread that manages communication between the controllers
in a dual controller configuration.
HP_MAIN Host port work queue handler. Handles all work from the host port
such as new I/O and completion of I/O.
MDATA The thread that processes metadata for nontransportable disks.
NULL The process that is scheduled when no other process can be run.
NVFOC The thread that initiates state change requests for the other
controller in a dual controller configuration.
REMOTE The thread that manages state changes initiated by the other
controller in a dual controller configuration.
RMGR The thread that manages the data buffer pool.
RECON The thread that rebuilds the parity blocks on RAID 5 storagesets
when needed and manages mirrorset copy operations when
necessary.
VA The thread that provides logical unit services independent of the
host protocol.
HSG80 Array Controller V8.7 Troubleshooting Reference Guide 2–33
Page 80

Utilities and Exercisers
Table 2–17: VTDPY Thread Descriptions (Sheet 2 of 2)
Thread Description
VTDPY A local program that provides a dynamic display of controller
configuration and performance information.
Resource Performance Statistics
VTDPY displays resource performance statistics using a block of tabular data in the
RESOURCE screen only. Resource name and statistical data is located along the left
side of the screen (see Figure 2–7). Table 2–18 defines the resource name and
statistical fields.
Table 2–18: Resource Performance Statistics Definitions (Sheet 1 of 2)
Column Contents
Resource
Name
Free Current resources not being used
Need Number of resources required for the specific transaction
Wait Number of transactions waiting to be accomplished
Buffers Number of cache data buffers available for holding data
VAXDs Number of value-added transfer descriptors that manage the
WARPs Number of write algorithm request packets that manage data for
RMDs Number of RAID member data descriptors that manage data for
XBUFs Number of XOR buffers used by the FX chip for XOR operations
ZBUFs Number of zeroed XBUFs used by the FX chip for XOR
Disk
Read
DWDs
Disk
Write
DWDs
Name of the physical resource
actual device I/O operations within the controller
RAID level 5 writes
RAID level 5 writes
operations
Number of device work descriptors that process work requests for
disk reads
Number of device work descriptors that process work requests for
disk writes
2–34 HSG80 Array Controller V8.7 Troubleshooting Reference Guide
Page 81

Utilities and Exercisers
Table 2–18: Resource Performance Statistics Definitions (Sheet 2 of 2)
Column Contents
DPCX
Read
DWDs
DPCX
Write
DWDs
DDs Number of device work descriptors that maintain context for
Wait
Flush
Wait FX Number of transactions waiting for the FX chip to be available
Nodes Number of cache nodes that are available for use
Dirty Amount of data buffers in cache memory that needs to be written
Flush Number of dirty data buffers pending flush or currently flushing
Number of device work descriptors that process work requests for
tape reads
Number of device work descriptors that process work requests for
tape writes
transfers between the host and controller
Number of host write data queued for caching, pending the
flushing of dirty data already cached
from cache memory
Disk Inline Exerciser (DILX)
Use DILX to check the data transfer capability of a unit (which may be composed of
one or more disk drives).
Checking for Unit Problems
DILX generates intense read/write loads to the unit while monitoring drive
performance and status. Run DILX on as many units as desired, but since this utility
creates substantial I/O loads on the controller, StorageWorks recommends stopping
host-based I/O activity during the test.
IMPORTANT: DILX cannot be run on snapshot units (ACS versions 8.7S and 8.7P) or remote
copy sets (ACS version 8.7P only).
Finding a Unit in the Subsystem
Use the following steps to find a unit or device in the subsystem:
1. Connect a PC or a terminal to the controller maintenance port.
HSG80 Array Controller V8.7 Troubleshooting Reference Guide 2–35
Page 82

Utilities and Exercisers
2. Show the devices that are configured on the controller with the following
command:
SHOW UNITS
3. Find the specific device in the enclosure with the following command:
LOCATE unit-number
This command causes the device fault LED to FLASH continuously.
4. Enter the following command to turn off the LED:
LOCATE CANCEL
Testing the Read Capability of a Unit
Use the following steps to test the read capability of a unit:
1. From a host console, dismount the logical unit that contains the unit being tested.
2. Connect a terminal to the controller maintenance port that accesses the unit being
tested.
3. Run DILX with the following command:
RUN DILX
IMPORTANT: Use the auto-configure option to test the read and write capabilities of every unit
in the subsystem.
4. Enter N(o) to decline the auto-configure option and to allow testing of a specific
unit.
5. Enter Y(es) to accept the default test settings and to run the test in read-only
mode.
6. Enter the unit number of the specific unit to test.
For example: to test D107, enter the number 107.
7. To test more than one unit, enter the appropriate unit numbers when prompted.
Otherwise, enter N(o) to start the test.
NOTE: Use the control sequences listed in Table 2–19 to control DILX during the test.
2–36 HSG80 Array Controller V8.7 Troubleshooting Reference Guide
Page 83
Table 2–19: DILX Control Sequences
Command Action
Ctrl/C Stops the test.
Ctrl/G Displays the performance summary for the current test and
continues testing.
Ctrl/Y Stops the test and exits DILX.
Testing the Read and Write Capabilities of a Unit
Run a DILX basic function test to test the read and write capability of a unit. During
the basic function test, DILX runs the following four tests.
NOTE: DILX repeats the last three tests until the time entered in step 6 on page 2-39 expires.
• Write test. Writes specific patterns of data to the unit (see Table 2–20). DILX
does not repeat this test.
• Random I/O test. Simulates typical I/O activity by issuing read, write, access,
and erase commands to randomly-chosen LBNs. The ratio of these commands can
be manually set, as well as the percentage of read and write data that is compared
throughout this test. This test takes 6 minutes.
• Data-transfer test. Tests throughput by starting at an LBN and transferring data
to the next unwritten LBN. This test takes 2 minutes.
Utilities and Exercisers
• Seek test. Stimulates head motion on the unit by issuing single-sector erase and
access commands. Each I/O uses a different track on each subsequent transfer.
The ratio of access and erase commands can be manually set. This test takes 2
minutes.
Table 2–20: Data Patterns for Phase 1: Write Test (Sheet 1 of 2)
Pattern Pattern in Hexadecimal Numbers
1 0000
28B8B
3 3333
4 3091
5 0001, 0003, 0007, 000F, 001F, 003F, 007F, 00FF, 01FF, 03FF, 07FF, 0FFF,
1FFF, 3FFF, 7FFF
6 FIE, FFFC, FFFC, FFFC, FFE0, FFE0, FFE0, FFE0, FE00, FC00, F800, F000,
F000, C000, 8000, 0000
HSG80 Array Controller V8.7 Troubleshooting Reference Guide 2–37
Page 84

Utilities and Exercisers
Table 2–20: Data Patterns for Phase 1: Write Test (Sheet 2 of 2)
Pattern Pattern in Hexadecimal Numbers
7 0000, 0000, 0000, FFFF, FFFF, FFFF, 0000, 0000, FFFF, FFFF, 0000, FFFF,
0000, FFFF, 0000, FFFF
8B6D9
9 5555, 5555, 5555, AAAA, AAAA, AAAA, 5555, 5555, AAAA, AAAA, 5555,
AAAA, 5555, AAAA, 5555, AAAA, 5555
10 DB6C
11 2D2D, 2D2D, 2D2D, D2D2, D2D2, D2D2, 2D2D, 2D2D, D2D2, D2D2, 2D2D,
D2D2, 2D2D, D2D2, 2D2D, D2D2
12 DB6D, B6DB, 6DB6, DB6D, B6DB, 6DB6, DB6D, B6DB, 6DB6, DB6D, B6DB,
6DB6, DB6D
13, ripple 10001, 0002, 0004, 0008, 0010, 0020, 0040, 0080, 0100, 0200, 0400, 0800,
1000, 2000, 4000, 8000
14, ripple 0FIE, FFFD, FFFB, FFF7, FFEF, FFDF, FFBF, FF7F, FEFF, FDFF, FBFF, F7FF,
EFFF, BFFF, DFFF, 7FFF
15 DB6D, B6DB, 6DB6, DB6D, B6DB, 6DB6, DB6D, B6DB, 6DB6, DB6D, B6DB,
6DB6, DB6D
16 3333, 3333, 3333, 1999, 9999, 9999, B6D9, B6D9, B6D9, B6D9, FFFF, FFFF,
0000, 0000, DB6C, DB6C
17 9999, 1999, 699C, E99C, 9921, 9921, 1921, 699C, 699C, 0747, 0747, 0747,
699C, E99C, 9999, 9999
18 FFFF
Use the following steps to test the read and write capabilities of a specific unit:
CAUTION: Running this test on the unit will erase all data on the unit. Make sure that
the units used do not contain customer data.
1. From a host console, dismount the logical unit that contains the unit that needs
testing.
2. Connect a terminal to the controller maintenance port that accesses the unit being
tested.
3. Run DILX with the following command:
RUN DILX
2–38 HSG80 Array Controller V8.7 Troubleshooting Reference Guide
Page 85

Utilities and Exercisers
IMPORTANT: Use the auto-configure option to test the read and write capabilities of every unit
in the subsystem.
4. Enter N(o) to decline the auto-configure option and to allow testing of a specific
unit.
5. Enter N(o) to decline the default settings.
NOTE: To ensure that DILX accesses the entire unit space, enter 120 minutes or more in the
next step. The default setting is 10 minutes.
6. Enter the number of minutes desired for running the test.
7. Enter the number of minutes between the display of performance summaries.
8. Enter Y(es) to include performance statistics in the summary.
9. Enter Y(es) to display both hard and soft errors.
10. Enter Y(es) to display the hex dump.
11. Press Enter/Return to accept the hard-error limit default.
12. Press Enter/Return to accept the soft-error limit default.
13. Press Enter/Return to accept the queue depth default.
14. Enter 1 to run the basic function test option.
15. Enter Y(es) to enable phase 1, the write test.
16. Enter Y(es) to accept the default percentage of requests that DILX issues as read
requests during phase 2, the random I/O test.
DILX issues the balance as write requests.
17. Enter 0 to select ALL for the data patterns that DILX issues for write requests.
18. Enter Y(es) to perform the initial write pass.
19. Enter Y(es) to allow DILX to compare the read and write data.
20. Press Enter/Return to accept the default percentage of reads and writes that
DILX compares.
21. Enter the unit number of the specific unit to be tested.
For example: to test D107, enter the number 107.
22. To test more than one unit, enter the appropriate unit numbers when prompted.
Otherwise, enter N(o) to start the test.
HSG80 Array Controller V8.7 Troubleshooting Reference Guide 2–39
Page 86

Utilities and Exercisers
NOTE: Use the command sequences shown in Table 2–19 to control the test.
DILX Error Codes
Table 2–21 explains the error codes that DILX might display during and after testing.
Table 2–21: DILX Error Codes
Error
Code Message and Explanation
1
2
3
4
Illegal Data Pattern Number found in data pattern header.
Explanation: DILX read data from the unit and discovered that the
data did not conform to the pattern that DILX had previously
written.
No write buffers correspond to data pattern.
Explanation: DILX read a legal data pattern from the unit, but
because no write buffers correspond to the pattern, the data must
be considered corrupt.
Read data does not match write buffer.
Explanation: DILX compared the read and write data and
discovered that they did not correspond.
Compare host data should have reported a compare error but did
not.
Explanation: A compare host data compare was issued in a way
that DILX expected to receive a compare error, but no error was
received.
Format and Device Code Load Utility (HSUTIL)
Use the HSUTIL utility to upgrade the firmware on disk drives in the subsystem and
to format disk drives. While formatting disk drives or installing new firmware,
HSUTIL might produce one or more of the messages shown in Table 2–22 (many of
the self-explanatory messages have been omitted from the table).
Table 2–22: HSUTIL Messages and Inquiries (Sheet 1 of 3)
Message Description
Insufficient resources. HSUTIL cannot find or perform the operation because internal
controller resources are not available.
2–40 HSG80 Array Controller V8.7 Troubleshooting Reference Guide
Page 87

Utilities and Exercisers
Table 2–22: HSUTIL Messages and Inquiries (Sheet 2 of 3)
Message Description
Unable to change
operation mode to
HSUTIL was unable to put the source single-disk drive unit into
maintenance mode to enable formatting or code load.
maintenance for unit.
Unit successfully
allocated.
HSUTIL has allocated the single-disk drive unit for code load
operation. At this point, the unit and the associated device are not
available for other subsystem operations.
Unable to allocate unit. HSUTIL could not allocate the single-disk drive unit. An
accompanying message explains the reason.
Unit is owned by
another sysop.
Unit is in maintenance
mode.
Exclusive access is
Device cannot be allocated because the device is being used by
another subsystem function or local program.
Device cannot be formatted or code loaded because the device is
being used by another subsystem function or local program.
Another subsystem function has reserved the unit shown.
declared for unit.
The other controller
has exclusive access
The companion controller has locked out this controller from
accessing the unit shown.
declared for unit.
The
RUNSTOP_SWITCH
The RUN\NORUN unit indicator for the unit shown is set to
NORUN; the disk cannot spin up.
is set to
RUN_DISABLED for
unit.
What BUFFER SIZE
(in BYTES) does the
drive require (2048,
4096, 8192) [8192]?
HSUTIL detects that an unsupported device has been selected as
the target device and the firmware image requires multiple SCSI
Write Buffer commands. Specify the number of bytes to be sent in
each Write Buffer command. The default buffer size is 8192 bytes.
A firmware image of 256 K, for example, can be code loaded in 32
Write Buffer commands, each transferring 8192 bytes.
What is the TOTAL
SIZE of the code
image in BYTES
HSUTIL detects that an unsupported device has been selected as
the target device. Enter the total number of bytes of data to be
sent in the code load operation.
[device default]?
Does the target device
support only the
download microcode
HSUTIL detects that an unsupported device has been selected as
the target device. Specify whether the device supports the SCSI
Write Buffer command download and save function.
and save?
HSG80 Array Controller V8.7 Troubleshooting Reference Guide 2–41
Page 88

Utilities and Exercisers
Table 2–22: HSUTIL Messages and Inquiries (Sheet 3 of 3)
Message Description
Should the code be
downloaded with a
single write buffer
command?
HSUTIL detects that an unsupported device has been selected as
the target device. Indicate whether to download the firmware
image to the device in one or more contiguous blocks, each
corresponding to one SCSI Write Buffer command.
Configuration (CONFIG) Utility
Use the CONFIG utility to add one or more storage devices to the subsystem. This
utility checks the device ports for new disk drives, adds them to the controller
configuration, and automatically names them. Refer to the controller installation and
configuration guide for more information about using the CONFIG utility.
Code Load and Code Patch (CLCP) Utility
Use the CLCP utility to upgrade the controller software and the EMU software. Also
use CLCP to patch the controller software. To successfully install a new controller, the
correct (or current) software version and patch numbers must be available. See the
controller maintenance and service guide for more information about using this utility
during a replacement or upgrade process.
NOTE: Only StorageWorks authorized service providers are allowed to upload EMU microcode
updates. Contact the Customer Service Center (CSC) for directions to obtain the appropriate
EMU microcode and installation guide.
Clone (CLONE) Utility
Use the CLONE utility to duplicate the data on any unpartitioned single-disk unit,
stripeset, mirrorset, or striped mirrorset. Back up the cloned data while the actual
storageset remains online. When the cloning operation is done, back up the clones
rather than the storageset or single-disk unit, which can continue to service the I/O
load. When cloning a mirrorset, the CLONE utility does not need to create a
temporary mirrorset. Instead, the CLONE utility adds a temporary member to the
mirrorset and copies the data onto this new member.
The CLONE utility creates a temporary, two-member mirrorset for each member in a
single-disk unit or stripeset. Each temporary mirrorset contains one disk drive from
the unit being cloned and one disk drive onto which the CLONE utility copies the
data. During the copy operation, the unit remains online and active so the clones
contain the most up-to-date data.
2–42 HSG80 Array Controller V8.7 Troubleshooting Reference Guide
Page 89

Utilities and Exercisers
After the CLONE utility copies the data from the members to the clones, the CLONE
utility restores the unit to the original configuration and creates a clone unit for backup
purposes.
Field Replacement Utility (FRUTIL)
Use FRUTIL to replace a failed controller, cache module, or ECB, in a dual-redundant
controller configuration, without shutting down the subsystem. See the controller
maintenance and service guide for a more detailed explanation of how FRUTIL is
used during the replacement process.
IMPORTANT: FRUTIL cannot run in remote copy set environments while I/O is in progress to
the target side due to host write and normalization (ACS version 8.7P only).
Change Volume Serial Number (CHVSN) Utility
The CHVSN utility generates a new volume serial number (called VSN) for the
specified device and writes the VSN on the media. The CHVSN utility is used to
eliminate duplicate volume serial numbers and to rename duplicates with different
volume serial numbers.
NOTE: Only StorageWorks authorized service providers can use this utility.
HSG80 Array Controller V8.7 Troubleshooting Reference Guide 2–43
Page 90

Page 91

Event Reporting Templates
This chapter describes the event codes that the fault management software provides
for spontaneous events and last failure events.
The HSG80 controller uses various codes to report different types of events, and these
codes are presented in template displays.
• Instance codes are unique codes that identify events, additional sense codes (ASC)
• Additional sense code qualifier (ASCQ) codes explain the cause of the events
• Last failure codes describe unrecoverable conditions that might occur with the
controller.
NOTE: The error log messages in this chapter are used for all StorageWorks controller devices;
therefore, some of the events reported in this chapter might not be applicable to the HSG80
controller.
Passthrough Device Reset Event Sense Data Response
3
Events reported by passthrough devices during host/device operations are conveyed
directly to the host system without intervention or interpretation by the HSG80
controller, with the exception of device sense data that is truncated to 160 bytes when
it exceeds 160 bytes.
Events that are related to passthrough device recognition, initialization, and SCSI bus
communication events, result in a reset of a passthrough device by the HSG80
controller. These events are reported using standard SCSI Sense Data (see Table 3–1).
For all other events, refer to the templates contained within this section.
• ASC and ASCQ codes (byte offsets 12 and 13) are detailed in Chapter 4.
• Instance codes (byte offsets 8–11) are detailed in Chapter 5.
HSG80 Array Controller V8.7 Troubleshooting Reference Guide 3–1
Page 92

Event Reporting Templates
Table 3–1: Passthrough Device Reset Event Sense Data Response Format
↓
bit
offset
0 Valid Error Code
1Segment
2 FM EOM ILI Reserv
3–6 Information
7 Additional Sense Length
8–11 Instance Code
12 Additional Sense Code (ASC)
13 Additional Sense Code Qualifier (ASCQ)
14 Field Replaceable Unit Code
15 SKSV Sense Key Specific
16 Sense Key Specific
17 Sense Key Specific
→ 76543210
Sense Key
ed
Last Failure Event Sense Data Response (Template 01)
Unrecoverable conditions detected by either software or hardware, and certain
operator-initiated conditions, terminate controller operation. In most cases, following
such a termination, the controller attempts to restart with hardware components and
software data structures initialized to the states necessary to perform normal
operations (see Table 3–2). Following a successful restart, the condition that caused
controller operation to terminate is signaled to all host systems on all logical units.
NOTE: For ACS version 8.7P configurations, last failure events generated by the target will not
be signaled to any host unless the host has a direct connection to the target—which is not
through the initiator. In addition, these events might not appear on the initiator.
• ASC and ASCQ codes (byte offsets 12 and 13) are detailed in Chapter 4.
• Instance codes (byte offsets 32–35) are detailed in Chapter 5.
• Last failure codes (byte offsets 104–107) are detailed in Chapter 6.
3–2 HSG80 Array Controller V8.7 Troubleshooting Reference Guide
Page 93

Event Reporting Templates
Table 3–2: Template 01—Last Failure Event Sense Data Response Format
↓
bit
offset
→ 76543210
0 Unused Error Code
1Unused
2 Unused Sense Key
3–6 Unused
7 Additional Sense Length
8–11 Unused
12 Additional Sense Code (ASC)
13 Additional Sense Code Qualifier (ASCQ)
14 Unused
15–17 Unused
18–31 Reserved
32–35 Instance Code
36 Template
37 Template Flags
38–53 Reserved
54–69 Controller Board Serial Number
70–73 Controller Software Revision Level
74 Reserved or Patch Version (TM2)
75 Reserved
76 LUN Status
77–103 Reserved
104–107 Last Failure Code
108–111 Last Failure Parameter [0]
112–115 Last Failure Parameter [1]
116–119 Last Failure Parameter [2]
120–123 Last Failure Parameter [3]
124–127 Last Failure Parameter [4]
128–131 Last Failure Parameter [5]
132–135 Last Failure Parameter [6]
136–139 Last Failure Parameter [7]
140–159 Reserved
HSG80 Array Controller V8.7 Troubleshooting Reference Guide 3–3
Page 94

Event Reporting Templates
Multiple-Bus Failover Event Sense Data Response
(Template 04)
The controller SCSI Host Interconnect Services software component reports
Multiple-Bus Failover events via the Multiple-Bus Failover Event Sense Data
Response (see Table 3–3). The error or condition is signaled to all host systems on all
logical units.
• ASC and ASCQ codes (byte offsets 12 and 13) are detailed in Chapter 4.
• Instance codes (byte offsets 32–35) are detailed in Chapter 5.
Table 3–3: Template 04—Multiple-Bus Failover Event Sense Data Response Format (Sheet 1 of 2)
↓
bit
offset
0 Unused Error Code
1Unused
2 Unused Sense Key
3–6 Unused
7 Additional Sense Length
8–11 Unused
12 Additional Sense Code (ASC)
13 Additional Sense Code Qualifier (ASCQ)
14 Unused
15–17 Unused
18–26 Reserved
27 Failed Controller Target Number
28–31 Affected LUNs
32–35 Instance Code
36 Template
37 Template Flags
38–53 Other Controller Board Serial Number
54–69 Controller Board Serial Number
70–73 Controller Software Revision Level
74 Reserved or Patch Version (TM2)
75 Reserved
76 LUN Status
→ 76543210
3–4 HSG80 Array Controller V8.7 Troubleshooting Reference Guide
Page 95

Event Reporting Templates
Table 3–3: Template 04—Multiple-Bus Failover Event Sense Data Response
Format (Sheet 2 of 2)
↓
bit
offset
77–103 Reserved
104–131 Affected LUNs Extension (TM0)
132–159 Reserved
→ 76543210
Failover Event Sense Data Response (Template 05)
The controller Failover Control software component reports errors and other
conditions encountered during redundant controller communications and failover
operation via the Failover Event Sense Data Response (see Table 3–4). The error or
condition is signaled to all host systems on all logical units.
• ASC and ASCQ codes (byte offsets 12 and 13) are detailed in Chapter 4.
• Instance codes (byte offsets 32–35) are detailed in Chapter 5.
• Last failure codes (byte offsets 104–107) are detailed in Chapter 6.
HSG80 Array Controller V8.7 Troubleshooting Reference Guide 3–5
Page 96
Event Reporting Templates
Table 3–4: Template 05—Failover Event Sense Data Response Format
↓
bit
offset
→ 7 6543210
0 Unused Error Code
1Unused
2 Unused Sense Key
3–6 Unused
7 Additional Sense Length
8–11 Unused
12 Additional Sense Code (ASC)
13 Additional Sense Code Qualifier (ASCQ)
14 Unused
15–17 Unused
18–31 Reserved
32–35 Instance Code
36 Template
37 Template Flags
38–53 Reserved
54–69 Controller Board Serial Number
70–73 Controller Software Revision Level
74 Reserved or Patch Version (TM2)
75 Reserved
76 LUN Status
77–103 Reserved
104–107 Last Failure Code
108–111 Last Failure Parameter [0]
112–115 Last Failure Parameter [1]
116–119 Last Failure Parameter [2]
120–123 Last Failure Parameter [3]
124–127 Last Failure Parameter [4]
128–131 Last Failure Parameter [5]
132–135 Last Failure Parameter [6]
136–139 Last Failure Parameter [7]
140–159 Reserved
3–6 HSG80 Array Controller V8.7 Troubleshooting Reference Guide
Page 97

Event Reporting Templates
Nonvolatile Parameter Memory Component Event
Sense Data Response (Template 11)
The controller executive software component reports errors detected while accessing a
nonvolatile parameter memory component via the Nonvolatile Parameter Memory
Component Event Sense Data Response (see Table 3–5). Errors are signaled to all host
systems on all logical units.
• ASC and ASCQ codes (byte offsets 12 and 13) are detailed in Chapter 4.
• Instance codes (byte offsets 32–35) are detailed in Chapter 5.
HSG80 Array Controller V8.7 Troubleshooting Reference Guide 3–7
Page 98
Event Reporting Templates
Table 3–5: Template 11—Nonvolatile Parameter Memory Component Event
Sense Data Response Format
↓
bit
offset
→ 7 6543210
0 Unused Error Code
1Unused
2 Unused Sense Key
3–6 Unused
7 Additional Sense Length
8–11 Unused
12 Additional Sense Code (ASC)
13 Additional Sense Code Qualifier (ASCQ)
14 Unused
15–17 Unused
18–31 Reserved
32–35 Instance Code
36 Template
37 Template Flags
38–53 Reserved
54–69 Controller Board Serial Number
70–73 Controller Software Revision Level
74 Reserved or Patch Version (TM2)
75 Reserved
76 LUN Status
77–103 Reserved
104–107 Memory Address
108–111 Byte Count
112–114 Number of Times Written
115 Undefined
116–159 Reserved
3–8 HSG80 Array Controller V8.7 Troubleshooting Reference Guide
Page 99
Event Reporting Templates
Backup Battery Failure Event Sense Data Response
(Template 12)
The controller Value Added Services software component reports backup battery
failure conditions for the various hardware components that use a battery to maintain
state during power failures via the Backup Battery Failure Event Sense Data Response
(see Table 3–6). The failure condition is signaled to all host systems on all logical
units.
• ASC and ASCQ codes (byte offsets 12 and 13) are detailed in Chapter 4.
• Instance codes (byte offsets 32–35) are detailed in Chapter 5.
Table 3–6: Template 12—Backup Battery Failure Event Sense Data Response Format (Sheet 1 of 2)
↓
bit
offset
0 Unused Error Code
1Unused
2 Unused Sense Key
3–6 Unused
7 Additional Sense Length
8–11 Unused
12 Additional Sense Code (ASC)
13 Additional Sense Code Qualifier (ASCQ)
14 Unused
15–17 Unused
18–31 Reserved
32–35 Instance Code
36 Template
37 Template Flags
38–53 Reserved
54–69 Controller Board Serial Number
70–73 Controller Software Revision Level
74 Reserved or Patch Version (TM2)
75 Reserved
76 LUN Status
77–103 Reserved
→ 7 6543210
HSG80 Array Controller V8.7 Troubleshooting Reference Guide 3–9
Page 100

Event Reporting Templates
Table 3–6: Template 12—Backup Battery Failure Event Sense Data Response
Format (Sheet 2 of 2)
↓
bit
offset
104–107 Memory Address
108–159 Reserved
→ 7 6543210
Subsystem Built-In Self-Test Failure Event Sense Data
Response (Template 13)
The controller Subsystem Built-In Self-Test software component reports errors
detected during test execution via the Subsystem Built-In Self-Test Failure Event
Sense Data Response (see Table 3–7). Errors are signaled to all host systems on all
logical units.
• ASC and ASCQ codes (byte offsets 12 and 13) are detailed in Chapter 4.
• Instance codes (byte offsets 32–35) are detailed in Chapter 5.
Table 3–7: Template 13—Subsystem Built-In Self Test Failure Event Sense Data
Response Format (Sheet 1 of 2)
↓
bit
offset
0 Unused Error Code
1Unused
2 Unused Sense Key
3–6 Unused
7 Additional Sense Length
8–11 Unused
12 Additional Sense Code (ASC)
13 Additional Sense Code Qualifier (ASCQ)
14 Unused
15–17 Unused
18–31 Reserved
32–35 Instance Code
36 Template
37 Template Flags
38–53 Reserved
→ 7 6543210
3–10 HSG80 Array Controller V8.7 Troubleshooting Reference Guide
 Loading...