

Page 1

application notes
hp OpenView
storage management appliance
software
event code definitions
Product Version: 2.0
First Edition (December 2002)
Part Number: AA-RTDKA-TE
This document describes the event codes used in notification messages generated by the HP OpenView Storage
Management Appliance software V2.0.
Additional information and other HP OpenView documentation are available at:
http://h18000.www1.hp.com/products/sanworks/managemen ta pp li ance.
Page 2

© Hewlett-Packard Company, 2002. All rights reserved.
Hewlett-Packard Company makes no warranty of any kind with regard to this material, including, but not limited
to, the implied warranties of merchantability and fitness for a particular purpose. Hewlett-Packard shall not be
liable for errors contained herein or for incidental or consequential damages in connection with the furnishing,
performance, or use of this material.
This document contains proprietary information, which is protected by copyright. No part of this document may
be photocopied, reproduced, or translated into another language without the prior written consent of
Hewlett-Packard. The information contained in this document is subject to change without notice.
Compaq Computer Corporation is a wholly-owned subsidiary of Hewlett-Packard Company.
All product names mentioned herein may be trademarks of their respective companies.
Hewlett-Packard Company shall not be liable for technical or editorial errors or omissions contained herein. The
information is provided “as is” without warranty of any kind and is subject to change without notice. The
warranties for Hewlett-Packard Company products are set forth in the express limited warranty statements
accompanying such products. Nothing herein should be construed as constituting an additional warranty.
Printed in the U.S.A.
Storage Management Appliance Software
Event Code Definitions Application Notes
First Edition (December 2002)
Part Number: AA-RTDKA-TE
2 Storage Management Appliance Software Event Code Definitions Application Notes
Page 3

Application Notes Contents
These Application Notes provide listings of the various event codes displayed by the HP
OpenView Storage Management Appliance. The event codes are defined and discussed in the
following sections:
■ Introduction, page 4
■ Storage Management Appliance Event Codes, page 5
■ Storage Management Appliance Audit Codes, page 6
■ NetApp Filers Event Codes, page 9
■ HP StorageWorks and McData Switch Event Codes, page 11
■ HP StorageWorks SAN and Brocade Switch Event Codes, page 13
■ HSG Element Manager Event Codes, page 15
■ HSV Element Manager Event Codes, page 21
Intended Audience
This document is intended for customers who purchase the Storage Management Appliance
software V2.0. It has been developed for use by storage and system administrators who are
experienced with:
Application Notes Contents
■ Managing storage area networks (SANs).
■ Running a Storage Management Appliance.
Related Storage Management Appliance Software V2.0 Documentation
The following list includes documentation related to the Storage Management Appliance
software V2.0:
■ HP OpenView Storage Management Appliance Software V2.0 Update Installation Card
■ HP OpenView Storage Management Appliance Software V2.0 User Guide
■ HP OpenView Storage Management Appliance Software V2.0 Release Notes
■ HP OpenView Storage Management Appliance Software V2.0 Installing Antivirus and
Backup Software Application Notes
■ HP OpenView Storage Management Appliance Software V2.0 Online Help
■ HP OpenView Automation Manager Script Development Guide
■ HP StorageWorks HSG Element Manager User Guide
■ HP StorageWorks HSV Element Manager User Guide
■ HP StorageWorks SAN Design Reference Guide
Additional documentation, including white papers and best practices documents, is available
from the HP website at:
http://h18000.www1.hp.com/products/sanworks/manage m e n tappliance/
documentation
.
3Storage Management Appliance Software Event Code Definitions Application Notes
Page 4
Introduction
Introduction
The Storage Management Appliance can generate notification messages to any number of
users in response to events. A notification message, including the source of the event, date,
time, event code, and event description, can be sent to a standard e-mail address or to an e-mail
pager address. This document provides a complete list of the events logged by the Storage
Management Appliance.
The lists of events are presented in tables with one table for each application or vendor.
Each table contains the following columns:
■ Event ID—Numeric code used to identify the event specific to the event’s source.
■ Event Code—Hexadecimal code used to identify an event type in notification messages
and in the Storage Management Appliance Event Log or Audit Log.
■ Severity—Single digit code indicating the event severity or potential impact on Storage
Management Appliance operations (see Table 1 for more information).
■ Description—Text describing the event. Event details are provided by the source of the
event. In this document, event details are expressed as %1, %2, etc.
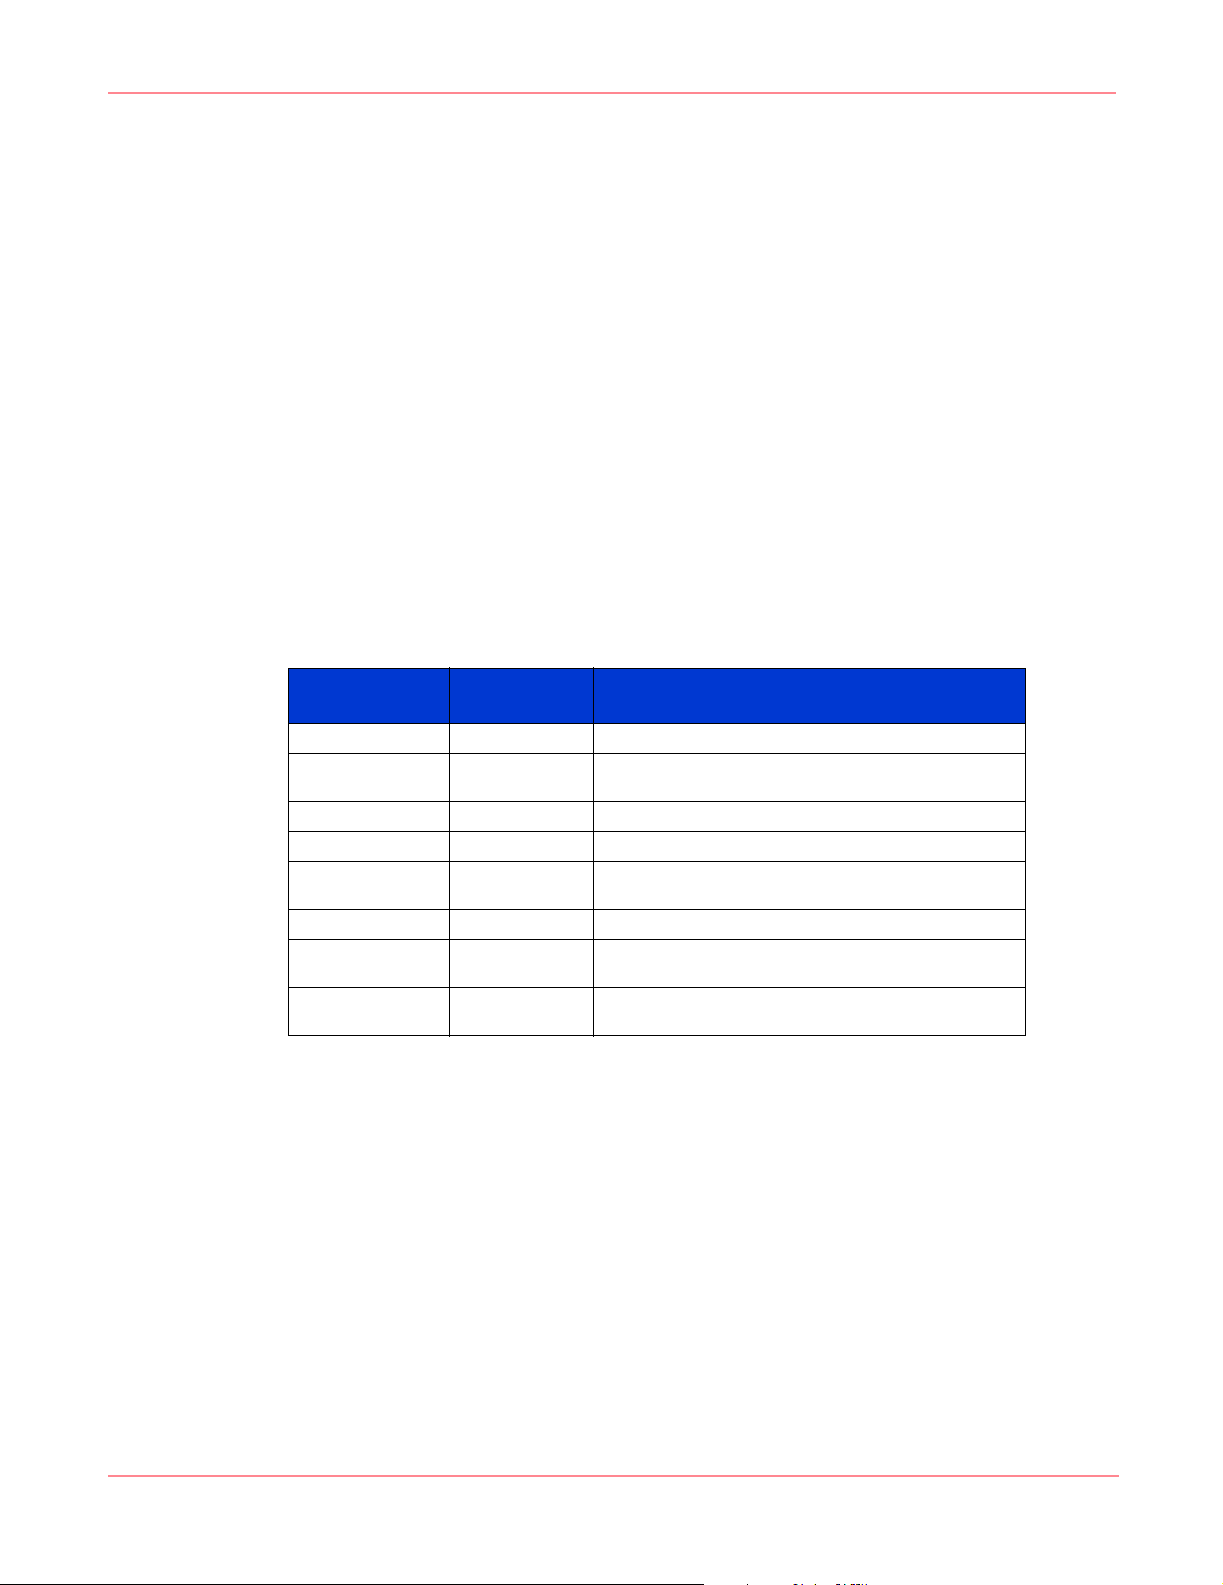
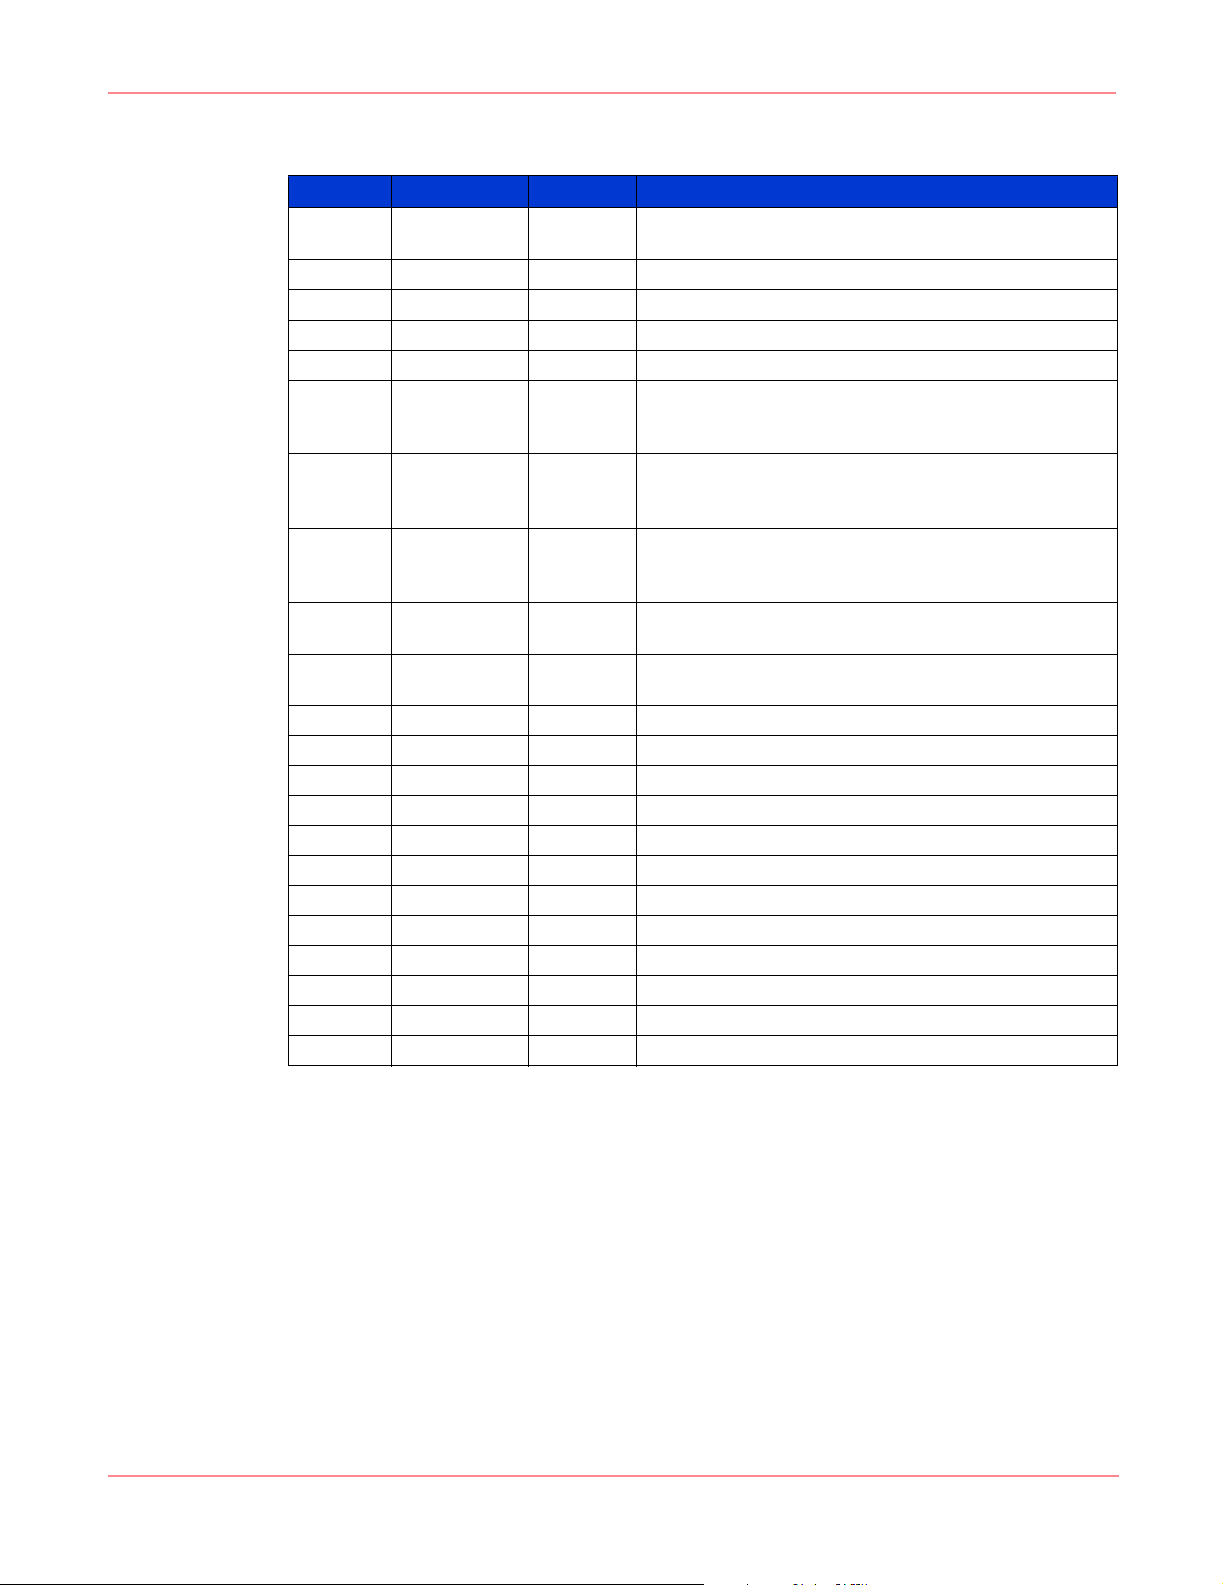
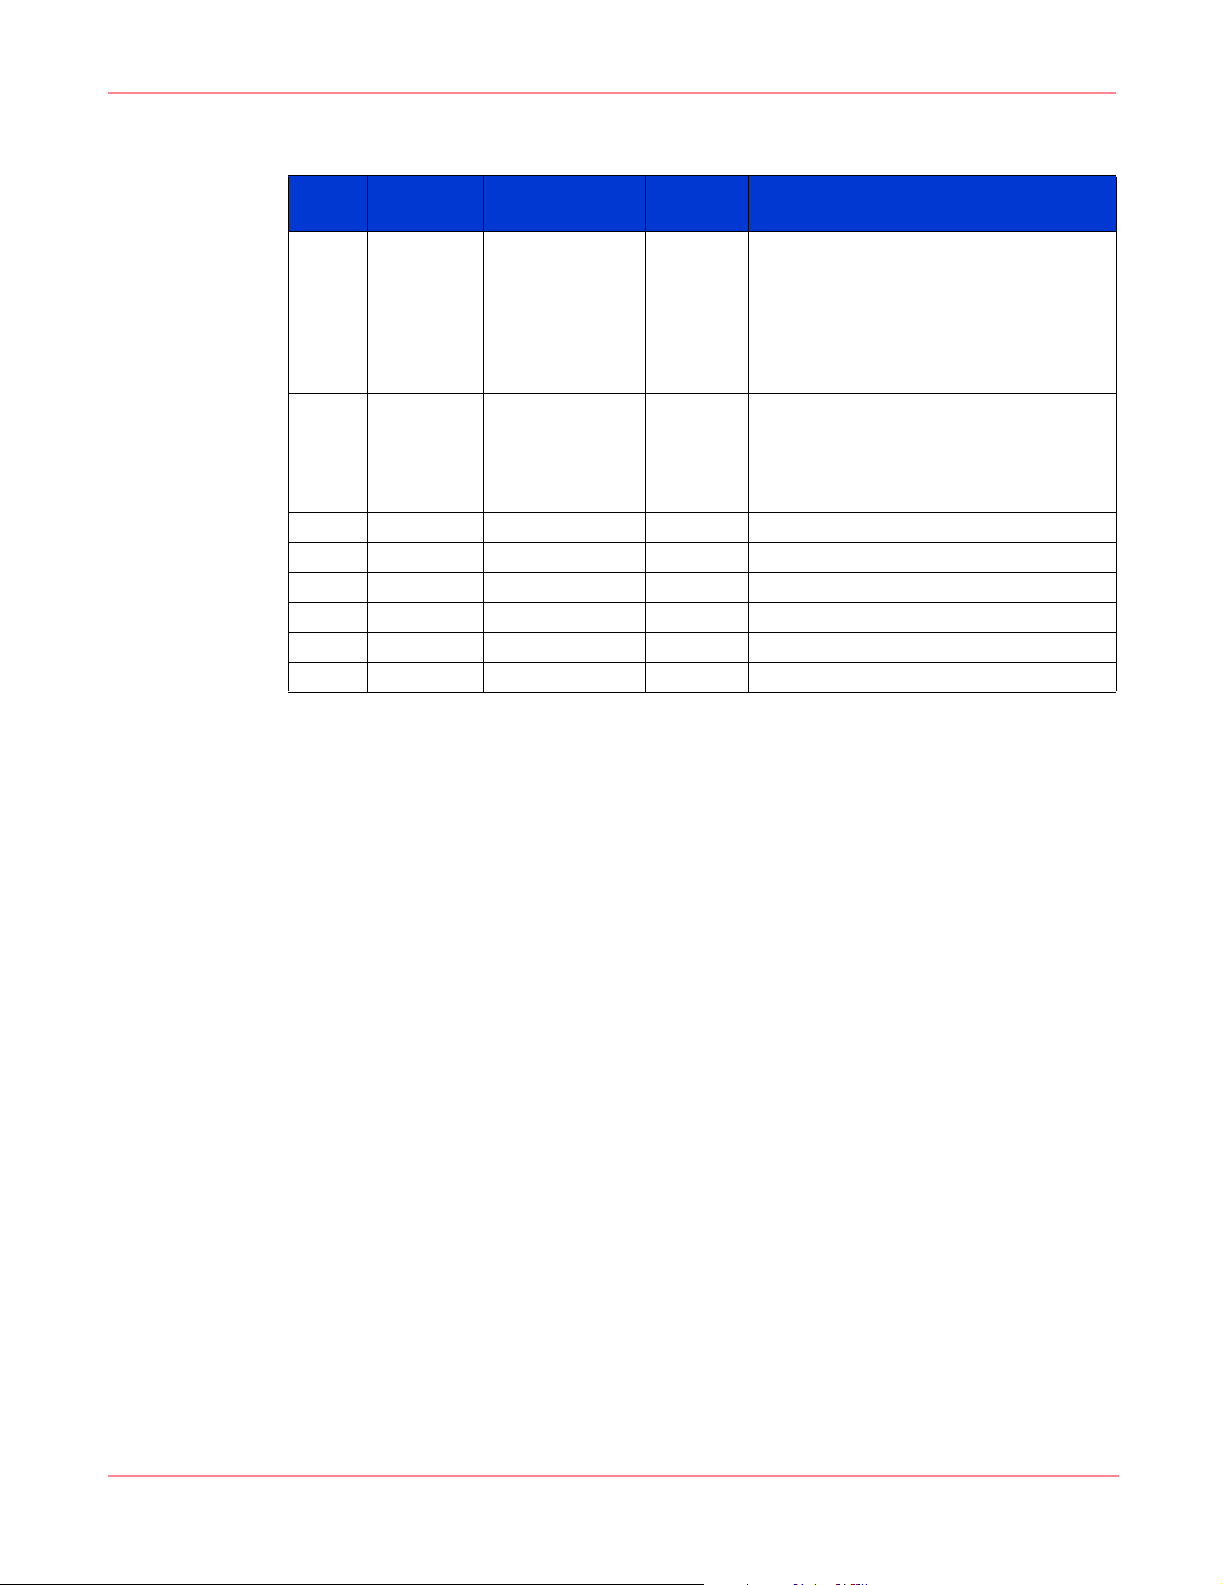
Table 1 describes the severity codes used for event codes.
Table 1: Severity Codes
Event Severity
Code
0 Unknown Severity cannot be determined.
1 Other Can be one of several possible severity conditions.
2 Information Event is generally part of normal operation.
3 Warning Further action is optional
4 Minor Further action is required but the situation is not
5 Major Action should be taken immediately.
6 Critical Action required to avoid a significant impact on
7 Fatal An error occurred and no action can be taken to avoid
Name Description
Refer to the event code description for details.
considered serious.
operations.
or mitigate the immediate impact.
4 Storage Management Appliance Software Event Code Definitions Application Notes
Page 5
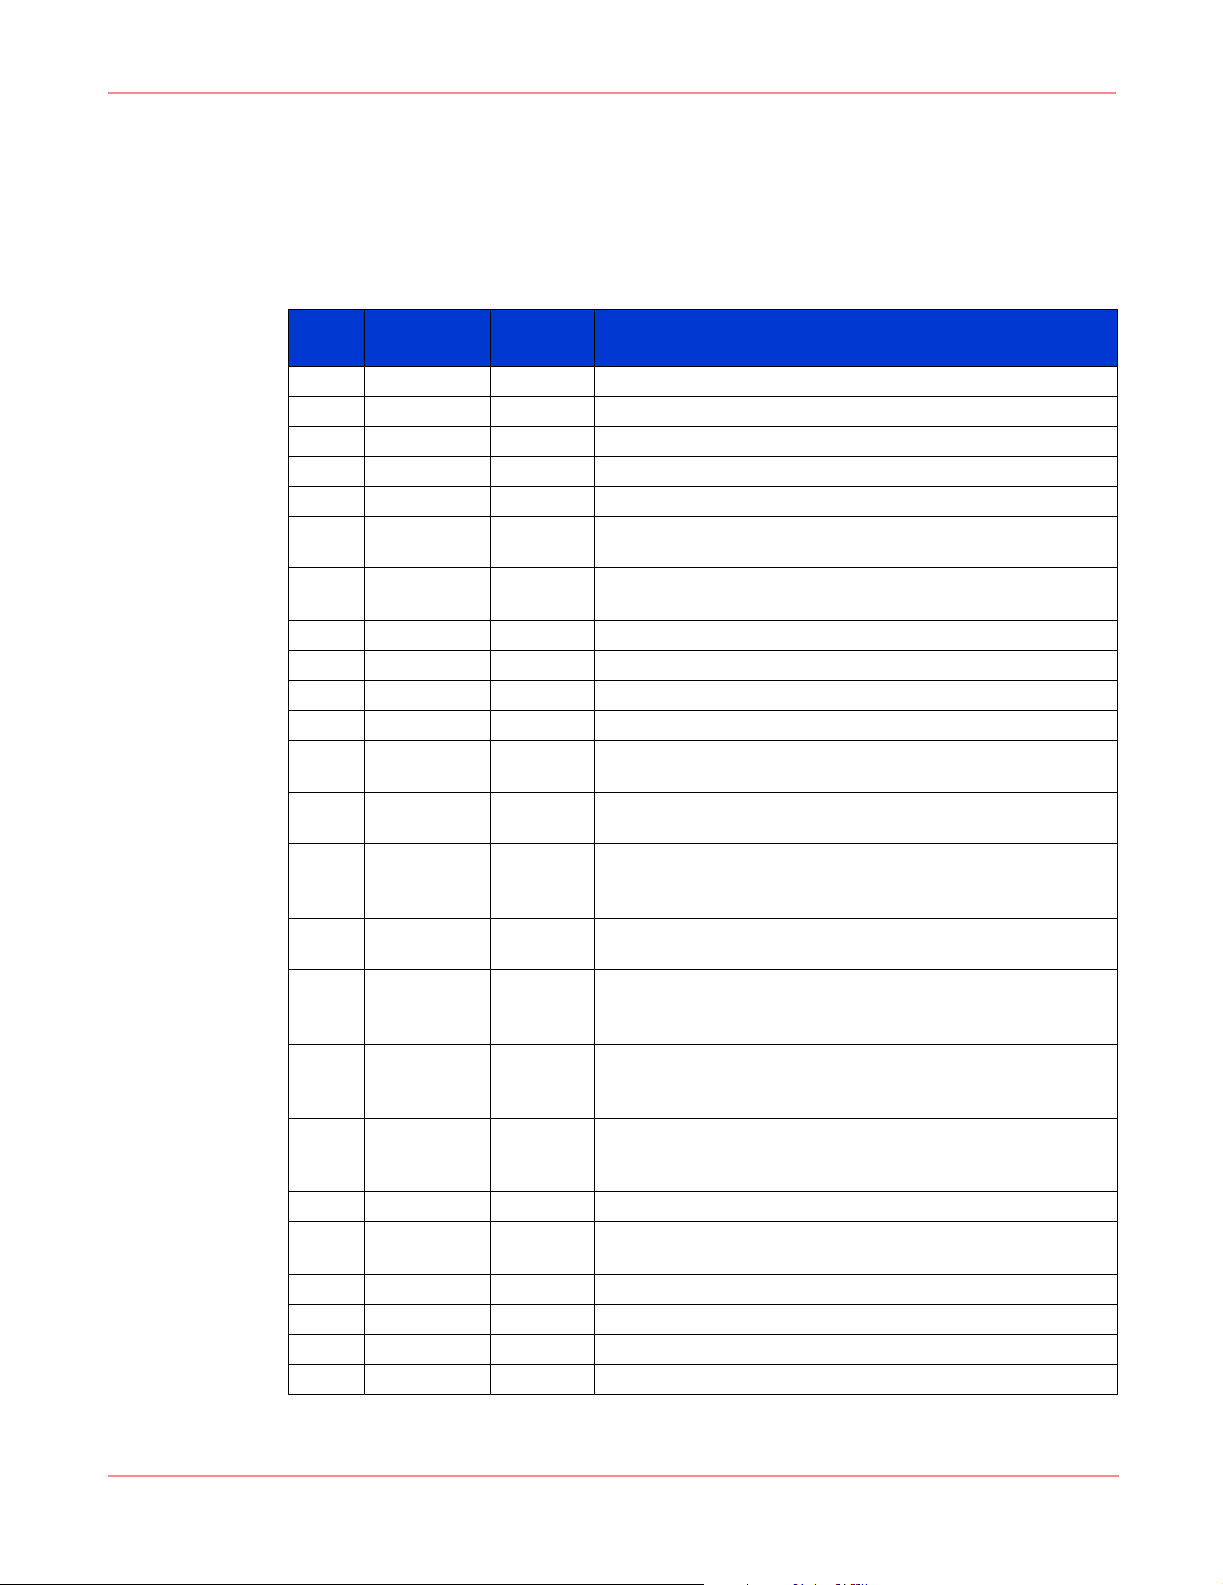
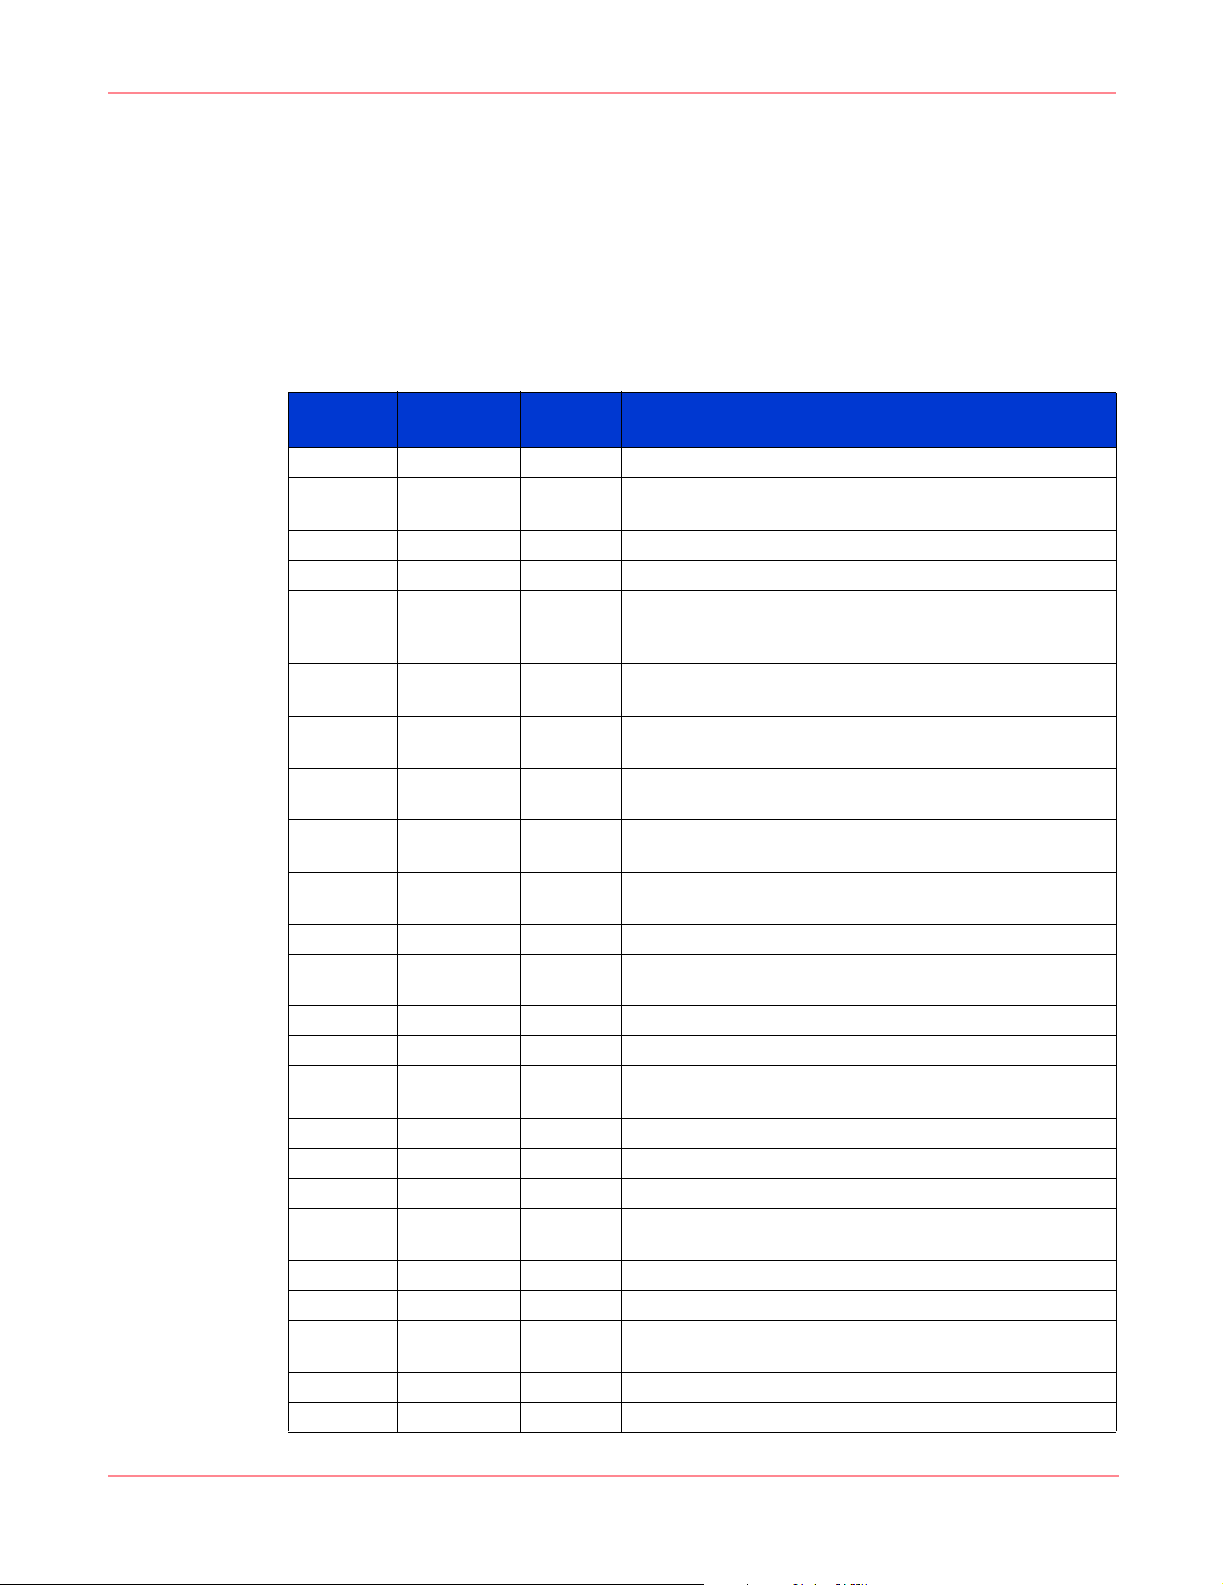
Storage Management Appliance Event Codes
The Storage Management Appliance’s core services—discovery, event notification, and
automation—generate the events listed below. The system records these events in the Storage
Management Appliance Event Log.
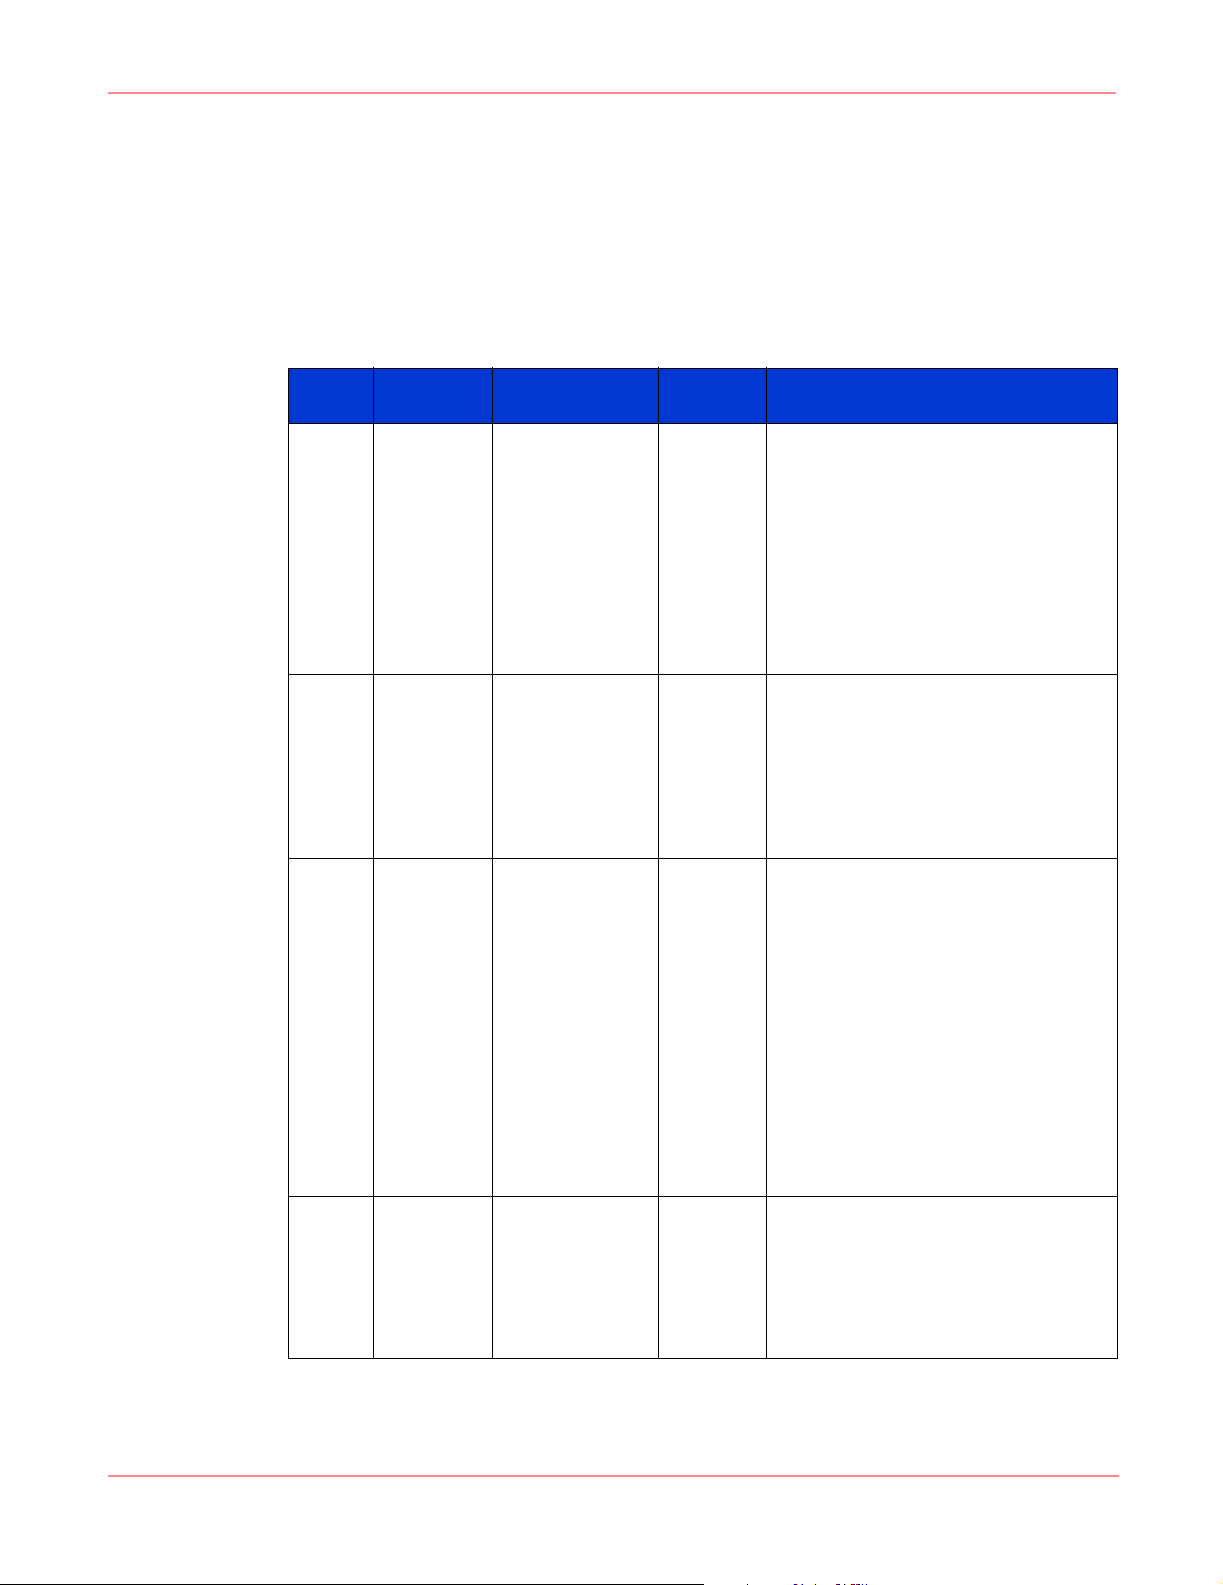
Table 2: Storage Management Appliance Event Codes
Storage Management Appliance Event Codes
Event
ID
202 880A00CA 2 Discovery %1 started.
203 880A00CB 2 Discovery %1 completed.
204 880A00CC 2 New device found: %1.
205 880A00CD 2 Device %1 unreachable for %2 day(s).
206 880A00CE 2 Device %1 unreachable for %2 week(s).
408 880A0198 3 Notification for user %1 has been disabled. This user was the sole
700 880A02BC 2 Received a SNMP Trap from %1. The enterprise OID is %2,
701 880A02BD 3 The Management Appliance event log is 80% full.
702 880A02BE 6 The Management Appliance event log is full.
703 880A02BF 3 The Management Appliance audit log is 80% full.
704 880A02C0 6 The Management Appliance audit log is full.
800 880A0320 7 Automation Manager experienced the following abnormal
801 880A0321 7 Automation Manager experienced the following database failure:
802 880A0322 2 Event process %1 ran in policy %2 on Management Appliance %3
803 880A0323 2 Event process %1 ran in policy %2 triggered on an event %3
804 880A0324 3 Event process %1 ran in policy %2 on Management Appliance %3
805 880A0325 2 Action process %1 ran in policy %2 on Management Appliance %3
806 880A0326 3 Action process %1 ran in policy %2 on Management Appliance %3
807 880A0327 2 %1 policy has been submitted successfully.
808 880A0328 2 Event process %1 in policy %2 was satisfied when the %3 value of
1014 880A03F6 2 %1 service started.
1015 880A03F7 2 %1 service stopped.
1016 880A03F8 2 %1 service: Handler not installed.
1017 880A03F9 2 %1 service: Bad service request.
Event
Code
Severity Description
recipient of event notifications from %2.
GenericTrap is %3, SpecificTrap is %4.
operation: %1
%1
completed with state %4. Process started on %5 and ended on %6
with %7 return code. Policy finished with status: %8
logged by %4.
completed with state %4. Process started on %5 and ended on %6
with %7 return code. Policy finished with status: %8
completed with state %4. Process started on %5 and ended on %6
with %7 return code. Policy finished with status: %8
completed with state %4. Process started on %5 and ended on %6
with %7 return code. Policy finished with status: %8
enterprise OID %4 was received in a SNMP Trap.
5Storage Management Appliance Software Event Code Definitions Application Notes
Page 6
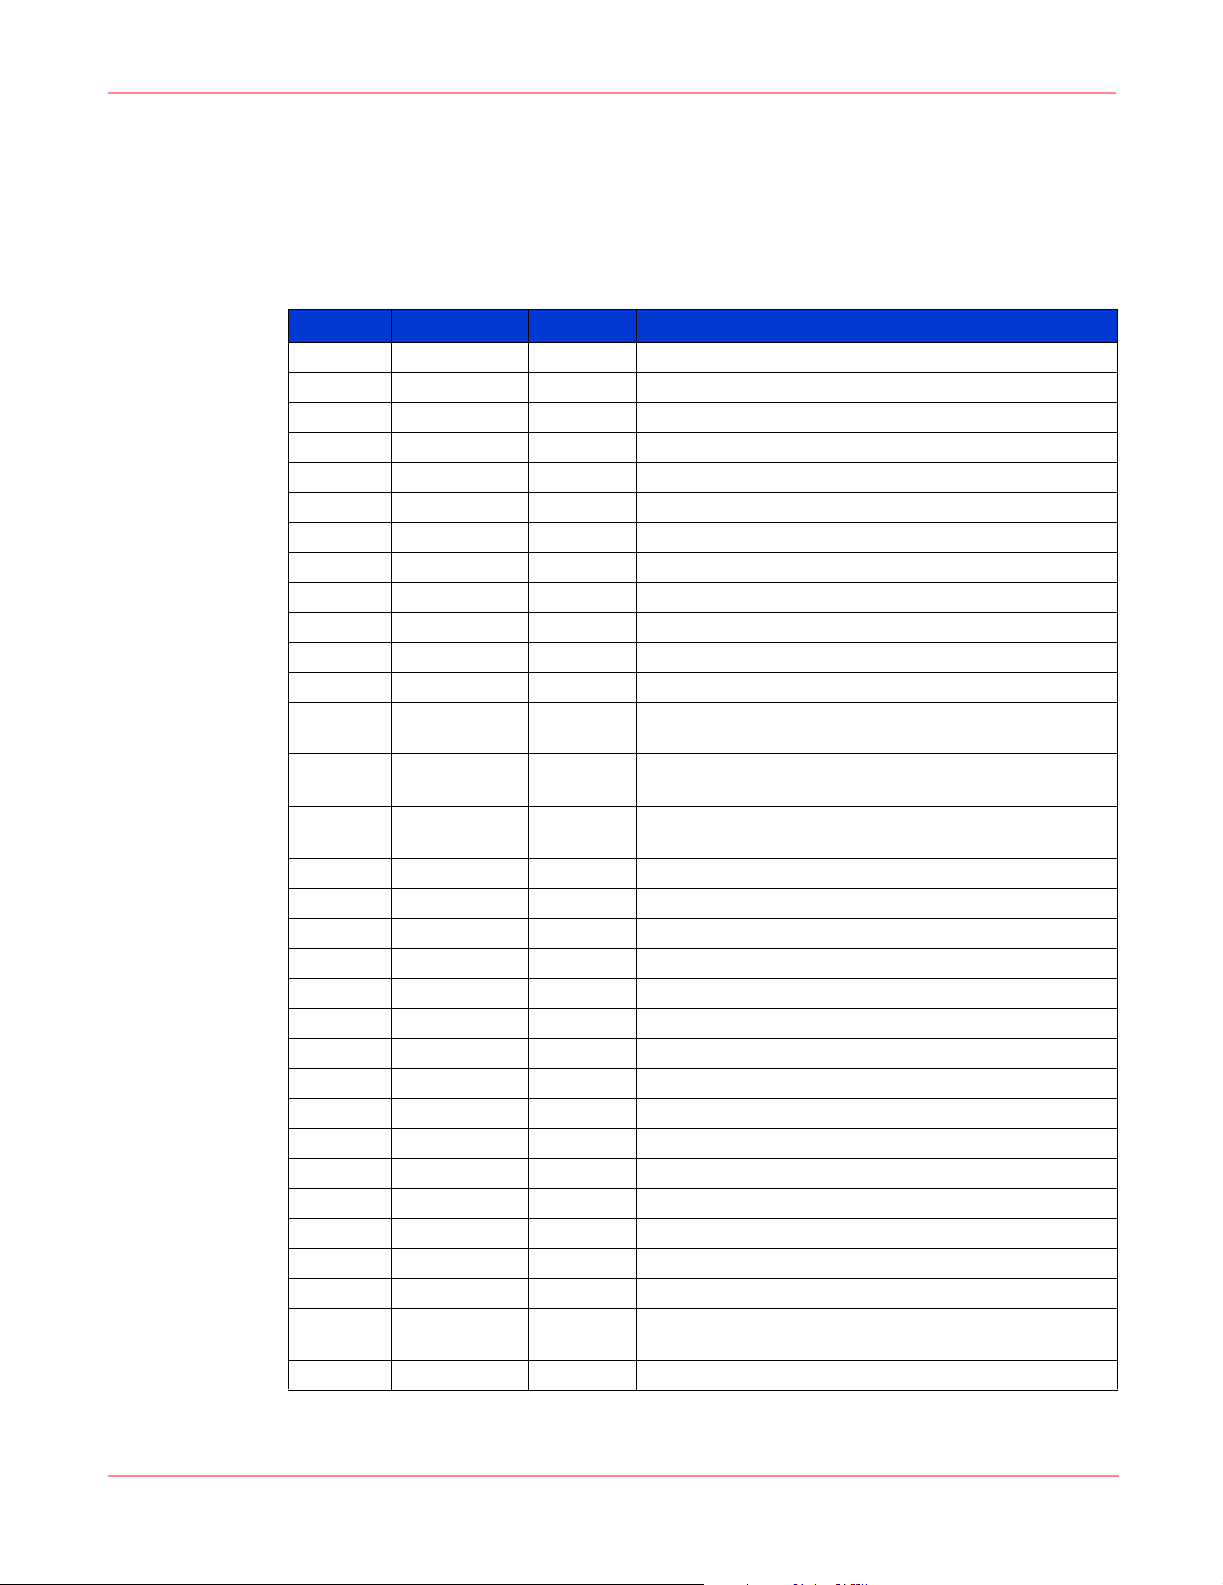
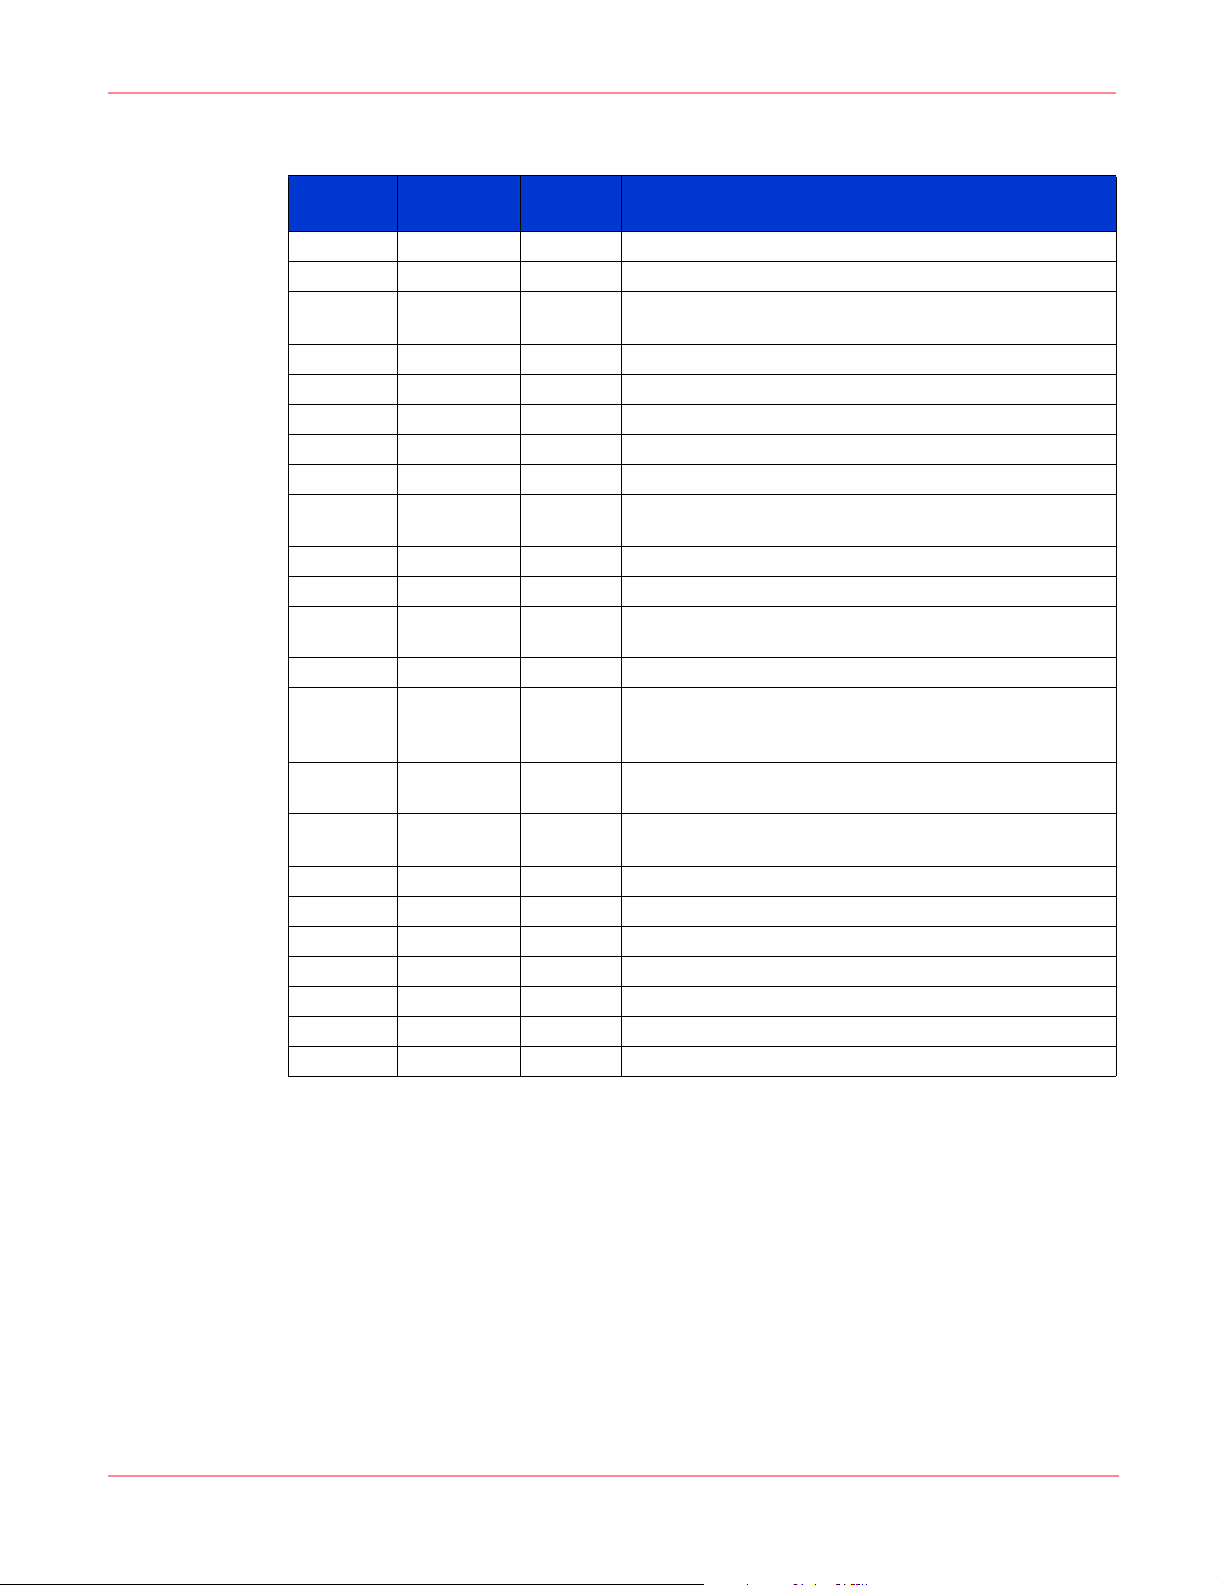
Storage Management Appliance Audit Codes
Storage Management Appliance Audit Codes
The Storage Management Appliance generates audits in response to most user-initiated
operations. Activities such as creating or running a discovery generate audits that are recorded
in the Storage Management Appliance Audit Log.
Table 3: Storage Management Appliance Audit Codes
Event ID Event Code Severity Description
100 8C0A0064 2 Installation of %1 on appliance %2.
101 8C0A0065 2 Removal of %1 from appliance %2.
150 8C0A0096 2 Deletion of %1 device.
151 8C0A0097 2 Launch of %1 URL.
152 8C0A0098 2 Modification of %1 device.
207 8C0A00CF 2 Creation of discovery named %1.
208 8C0A00D0 2 Deletion of discovery named %1.
209 8C0A00D1 2 Modification of discovery named %1.
210 8C0A00D2 2 Enabling of schedule for discovery named %1.
211 8C0A00D3 2 Disabling of schedule for discovery named %1.
212 8C0A00D4 2 Discovery named %1 requested to start.
213 8C0A00D5 2 Discovery named %1 requested to stop.
300 8C0A012C 2 Creation of remote access entry for Host: %1, Application:
%2, Domain Name: %3, Username: %4.
301 8C0A012D 2 Modification of remote access entry for Host: %1,
Application: %2, Domain Name: %3, Username: %4.
302 8C0A012E 2 Deletion of remote access entry for Host: %1, Application:
%2, Domain Name: %3, Username: %4.
303 8C0A012F 2 Modification of %1 license.
304 8C0A0130 2 Creation of %1 license.
305 8C0A0131 2 Deletion of %1 license.
306 8C0A0132 2 Modification of %1 license.
307 8C0A0133 2 Download of %1 license.
308 8C0A0134 2 Clearing of %1 license.
309 8C0A0135 2 Download of event log.
310 8C0A0136 2 Clearing of event log.
311 8C0A0137 2 Modification of event log properties.
312 8C0A0138 2 Acknowledgement of events in the event log.
400 8C0A0190 2 Deletion of user %1.
401 8C0A0191 2 Importing of user %1.
402 8C0A0192 2 Creation of user %1.
403 8C0A0193 2 Changing password for user %1.
404 8C0A0194 2 Modification of user %1 properties.
405 8C0A0195 2 Modification of user %1 notification properties for the
following devices: %2.
406 8C0A0196 2 Transfer of user %1 notification settings to user %2.
6 Storage Management Appliance Software Event Code Definitions Application Notes
Page 7
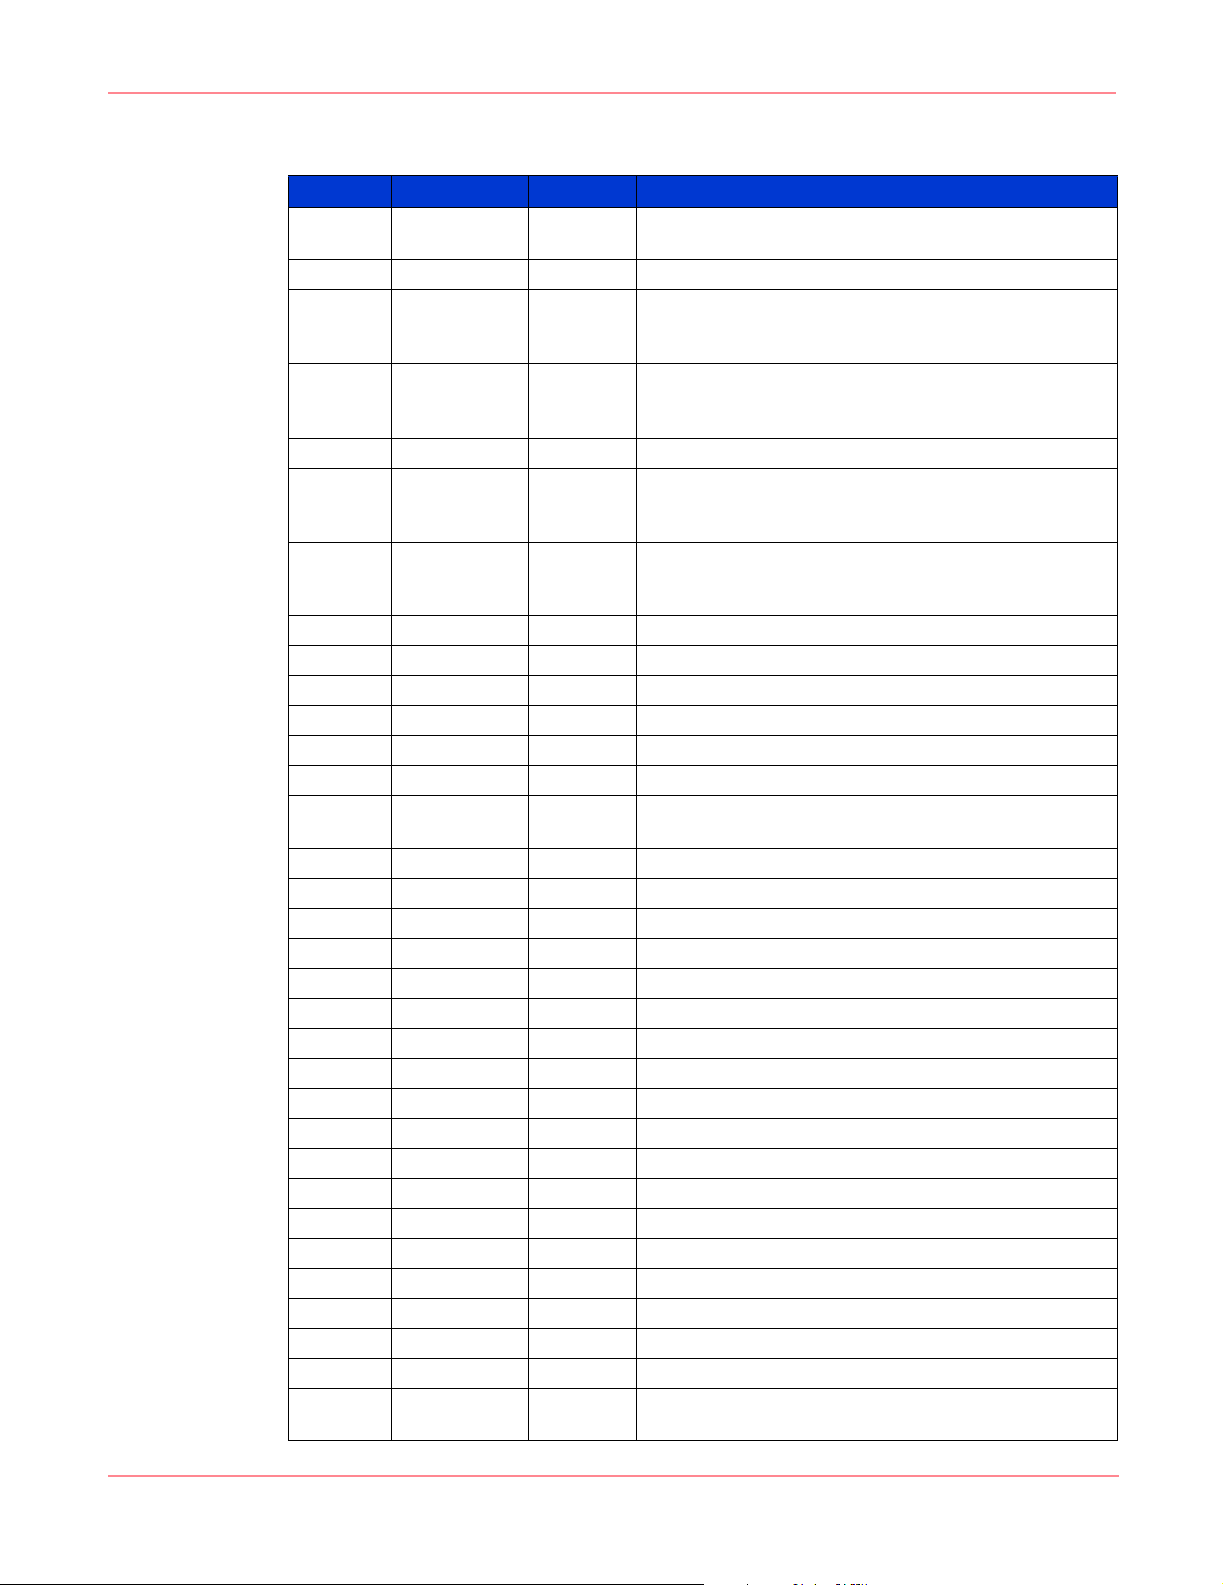
Storage Management Appliance Audit Codes
Table 3: Storage Management Appliance Audit Codes (Continued)
Event ID Event Code Severity Description
407 8C0A0197 2 Deletion of notification settings from user %1 and transferred
to user %2.
500 8C0A01F4 2 Starting backup to network share %1.
501 8C0A01F5 2 Completion of backup operation that was started to network
share %1. See %2 file on Management Appliance %3 for
details.
502 8C0A01F6 2 Cancellation of backup operation that was started to network
share %1. See %2 file on Management Appliance %3 for
details.
600 8C0A0258 2 Starting restore operation from network share %1.
601 8C0A0259 2 Completion of restore operation that was started to network
share %1. See %2 file on Management Appliance %3 for
details.
602 8C0A025A 2 Cancellation of restore operation that was started from
network share %1. See %2 file on Management Appliance
%3 for details.
603 8C0A025B 2 Clearing of backup log %1.
604 8C0A025C 2 Clearing of restore log %1.
900 8C0A0384 2 Starting %1.
901 8C0A0385 2 Stopping %1.
904 8C0A0388 2 Changing date/time to %1.
905 8C0A0389 2 Changing time zone to %1.
906 8C0A038A 2 Modification of SNTP time server - Enabled: %1, Server:%2,
Frequency:%3.
950 8C0A03B6 2 Launching of HSV element manager.
951 8C0A03B7 2 Launching of HSG Element Manager.
952 8C0A03B8 2 Launching of VersaStor.
953 8C0A03B9 2 Launching of Automation.
954 8C0A03BA 2 Launching of Management Agents.
960 8C0A03C0 2 Launching of Network View.
961 8C0A03C1 2 Launching of Secure Path Manager.
962 8C0A03C2 2 Launching of Data Replication Manager.
963 8C0A03C3 2 Launching of Enterprise Volume Manager.
964 8C0A03C4 2 Launching of Storage Allocation Reporter.
965 8C0A03C5 2 Launching of Storage Provisioner.
970 8C0A03CA 2 Modification of IP address configuration.
971 8C0A03CB 2 Modification of DNS server configuration.
972 8C0A03CC 2 Modification of WINS server configuration.
980 8C0A03D4 2 Modification of Administration Web Site properties.
981 8C0A03D5 2 Modification of Global Network settings.
982 8C0A03D6 2 Modification of Telnet Administration configuration.
1000 8C0A03E8 2 Changing Management Appliance name to %1.
1001 8C0A03E9 2 Changing Management Appliance membership to
workgroup %1.
7Storage Management Appliance Software Event Code Definitions Application Notes
Page 8
Storage Management Appliance Audit Codes
Table 3: Storage Management Appliance Audit Codes (Continued)
Event ID Event Code Severity Description
1002 8C0A03EA 2 Changing Management Appliance membership to domain
1003 8C0A03EB 2 Shutdown of Management Appliance.
1004 8C0A03EC 2 Changing domain/workgroup membership.
1005 8C0A03ED 2 Restarting Management Appliance.
1006 8C0A03EE 2 Scheduling Management Appliance for %1.
1010 8C0A03F2 2 Configuration of Management Appliance as the first domain
1011 8C0A03F3 2 Configuration of Management Appliance as the first domain
1012 8C0A03F4 2 Configuration of Management Appliance as the first domain
1013 8C0A03F5 2 Configuration of Management Appliance as an additional
1020 8C0A03FC 2 Modification of notification properties for event code %1 on
1021 8C0A03FD 2 Configuration of notification for the following devices: %1.
1022 8C0A03FE 2 Clearing of notification settings for the following devices: %1.
1030 8C0A0406 2 Download of audit log.
1031 8C0A0407 2 Clearing of audit log.
1032 8C0A0408 2 Modification of audit log properties.
1033 8C0A0409 2 Acknowledgement of audits in the audit log.
1040 8C0A0410 2 Adding of trap recipient %1.
1041 8C0A0411 2 Removal of trap recipient %1.
1042 8C0A0412 2 Modification of trap recipient %1.
1050 8C0A041A 2 Setting SMTP server to %1 with IP address: %2.
1055 8C0A041F 2 Logging in of user.
1056 8C0A0420 2 Logging out of user.
%1.
controller in the new forest, %1. The new domain name is
%2.
controller in a new domain tree. The name of the new
domain is %1 and has trust link with %2.
controller in a new domain. The name of the new domain is
%1 and is created in %2 domain.
domain controller for the domain %1.
%2.
8 Storage Management Appliance Software Event Code Definitions Application Notes
Page 9
NetApp Filers Event Codes
The following events are generated by NetApp Filer devices and are recorded in the Storage
Management Appliance Event Log. A number of these events are associated with user-defined
traps and most indicate a condition that is likely to have a negative impact on operations. A
small number of events mark a return to normal operation after some period of abnormal
operation.
The Storage Management Appliance supports the NetApp MIB version 1.2.
Table 4: NetApp Filer Event Codes
Event
Event ID
100 880E0064 2 An unknown trap event was received.
101 880E0065 3 A polling-style trap built by the user using the SNMP traps
102 880E0066 5 Disk Health Monitor reported a Disk Degraded-I/O Event.
103 880E0067 4 Disk Health Monitor reported a Disk Predictive-Failure Event.
104 880E0068 7 A user-defined trap indicating an extremely urgent situation,
105 880E0069 5 A user-defined trap indicating a condition that should be
106 880E006A 6 A user-defined trap indicating a critical condition, such as a
107 880E006B 5 A user-defined trap indicating an error condition, such as a
108 880E006C 4 A user-defined trap indicating a condition which is not an error,
109 880E006D 2 A user-defined trap meant to provide information, such as an
110 880E006E 1 A user-defined trap used for debugging purposes.
111 880E006F 7 System is shutting down because the system has been running
112 880E0070 5 One or more disks failed.
113 880E0071 2 The failed disks have been repaired.
114 880E0072 7 Critical chassis or cpu fans have failed and the system is
115 880E0073 5 One or more chassis fans failed.
116 880E0074 3 One or more chassis or cpu fans are in warning state.
117 880E0075 2 All fans are repaired.
118 880E0076 7 Critical power supplies or power rails failed and the system is
119 880E0077 5 One or more redundant power supplies failed.
120 880E0078 3 One or more power supplies or power rails in warning state.
121 880E0079 2 Previously-failed power supplies or power rails have been
122 880E007A 4 CPU utilization exceeds 90 percent.
123 880E007B 2 CPU utilization has dropped back below 90 percent.
Code
NetApp Filers Event Codes
Severity Description
command on the filer.
usually indicating that the system has failed and is shutting
down.
corrected immediately, such as a failed disk.
hard device error.
mistake in a configuration file.
but which may require special handling.
hourly uptime message.
in degraded mode for 24 hours.
shutting down.
shutting down.
repaired.
9Storage Management Appliance Software Event Code Definitions Application Notes
Page 10
NetApp Filers Event Codes
Table 4: NetApp Filer Event Codes (Continued)
Event
Event ID
124 880E007C 5 The NVRAM battery is fully discharged.
125 880E007D 4 The charge in the NVRAM battery is low.
126 880E007E 5 A node in a Cluster FailOver configuration failed. Its partner
127 880E007F 5 The partner has taken over for a failed cluster node.
128 880E0080 2 A cluster node has resumed operation.
129 880E0081 5 At least one volume is more than 98 percent full.
130 880E0082 4 At least one volume is more than 95 percent full.
131 880E0083 2 All volumes are now under 95 percent full.
132 880E0084 7 System temperature is too high to continue operating. The
133 880E0085 4 System temperature is too high and in the warning level.
134 880E0086 2 System temperature has returned to an acceptable value.
135 880E0087 5 A disk storage shelf reported a fault, probably due to a
136 880E0088 2 A previously-reported shelf fault is now corrected.
137 880E0089 7 The appliance’s overall status changed to ‘nonRecoverable’,
138 880E008A 6 The appliance’s overall status changed to ‘critical’, indicating a
139 880E008B 4 The appliance’s overall status changed to ‘nonCritical’,
140 880E008C 2 The appliance’s overall status returned to normal.
141 880E008D 2 Cold Start.
142 880E008E 2 Warm Start.
143 880E008F 2 Link Down: %1
144 880E0090 2 Link Up: %1
145 880E0091 2 Authorization failure.
146 880e0092 2 EGP Peer down: %1
Code
Severity Description
will assume service for the failed node.
system is shutting down.
problem with drive placement, fans, power, or temperature.
indicating a problem so severe that the appliance is shutting
down.
problem that needs immediate attention.
indicating a problem that needs attention.
10 Storage Management Appliance Software Event Code Definitions Application Notes
Page 11
HP StorageWorks and McData Switch Event Codes
HP StorageWorks and McData Switch Event Codes
The following events are generated by HP StorageWorks switches and McData switches and
are recorded in the Storage Management Appliance Event Log. Many of these event types
have several possible states and each state has an appropriate severity code.
The Storage Management Appliance supports the following StorageWorks and McData MIB
versions:
■ V1.9 for the ED-5000 series
■ V1.10 for the EF-6000 series
■ V1.0 for the ES-1000 series
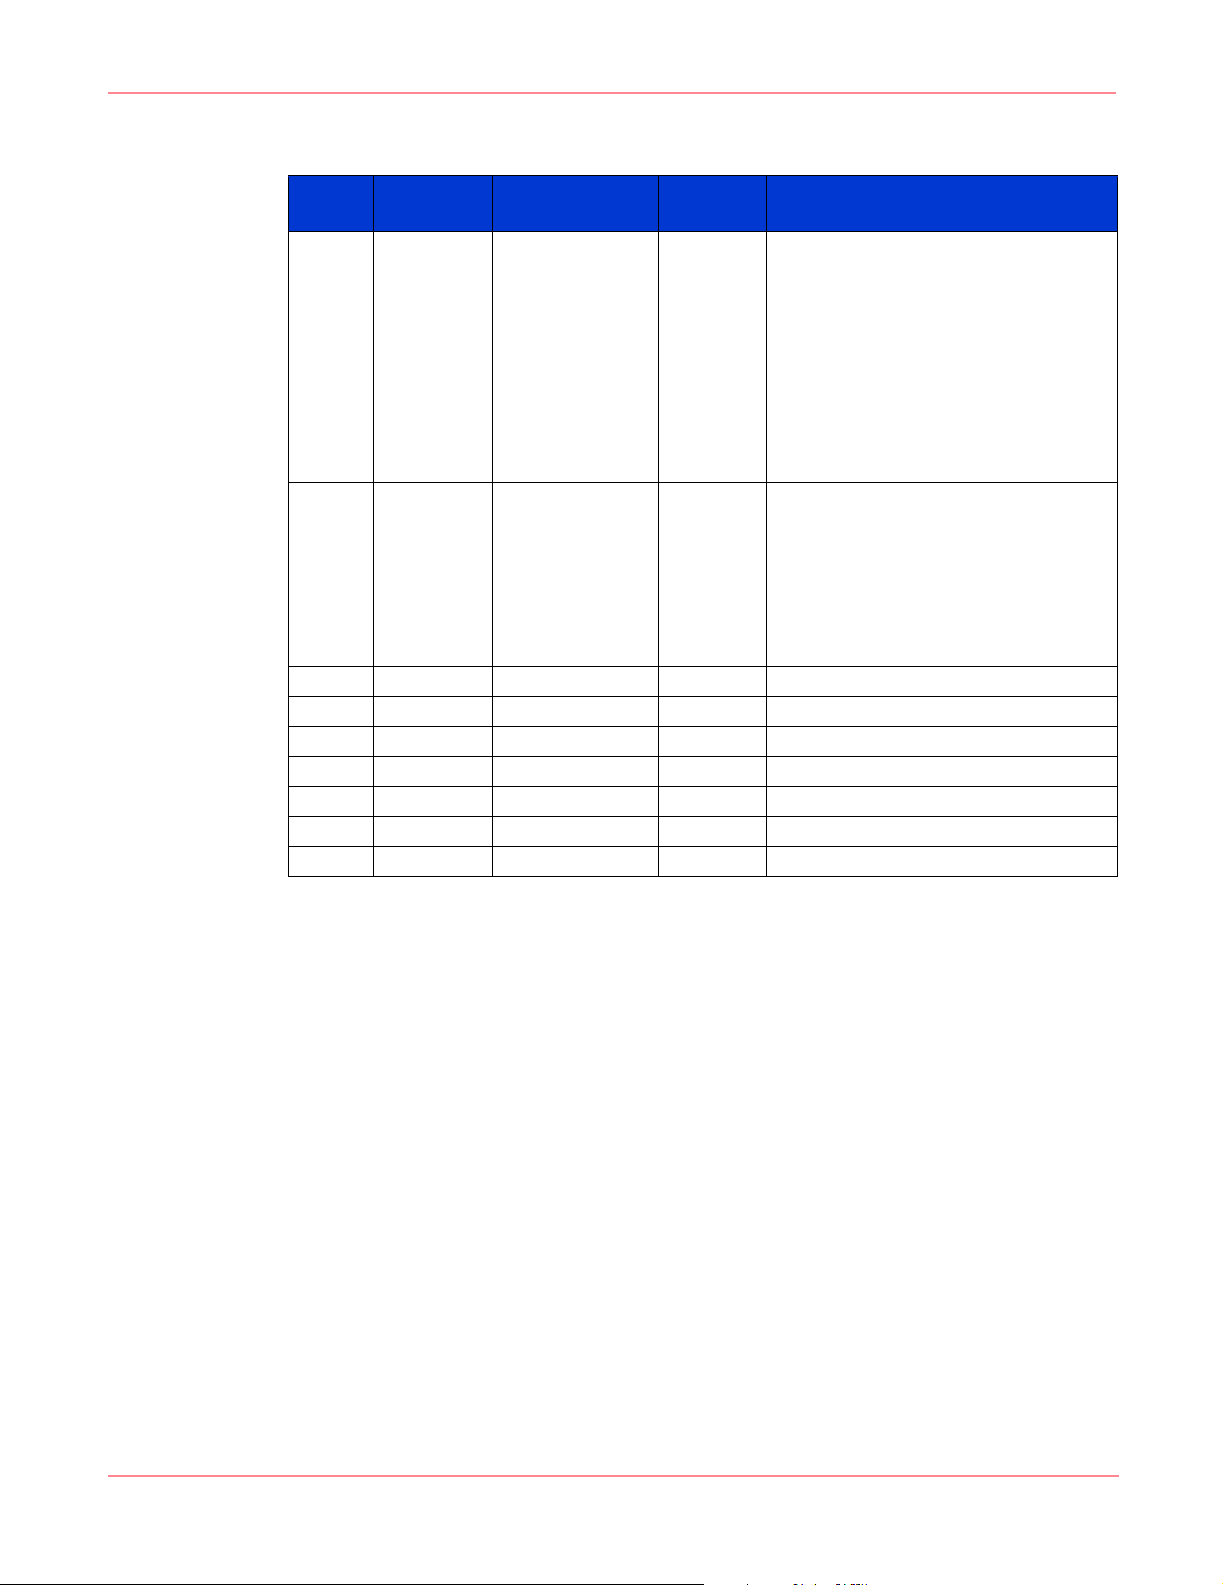
Table 5: HP StorageWorks and McData Event Codes
Event
ID
100 880C0064 N/A 2 An unknown trap event was received.
101 880C0065 online
102 880C0066 online
103 880C0067 active
104 880C0068 online
105 880C0069 active
106 880C006A online
107 880C006B active
Event
Code
Possible States Severity Description
offline
testing
faulty
unknown
offline
testing
faulty
unknown
updatebusy
failed
unknown
offline
testing
faulty
unknown
backup
updatebusy
failed
unknown
offline
testing
faulty
unknown
backup
updatebusy
failed
unknown
2
5
2
7
0
2
5
2
7
0
2
2
7
0
2
5
2
7
0
2
3
2
7
0
2
5
2
7
0
2
3
2
7
0
B_Port Index %2 changed state to %1.%n
A es1000PortBportScn is generated whenever
a B_Port changes its operational state.
H_Port Index %2 changed state to %1.%n
A es1000PortHportScn is generated whenever
a H_Port changes its operational state
Component Code %2 has changed state to
%1.%n
A es1000CompScn is generated whenever a
COMPONENT status changes its operational
state.
Port Index %2 changed state to %1.%n
An ed5000PortScn(1) is generated whenever
a Fc_Port changes its operational state.
FRU Code %2 has changed state to %1.%n
An ed5000FruScn(2) is generated whenever a
FRU status changes its operational state.
Port Index %2 changed state to %1.%n
An ef6000PortScn(1) is generated whenever a
Fc_Port changes its operational state.
FRU Code %2 has changed state to %1.%n
An ef6000FruScn(2) is generated whenever a
FRU status changes its operational state.
11Storage Management Appliance Software Event Code Definitions Application Notes
Page 12
HP StorageWorks and McData Switch Event Codes
Table 5: HP StorageWorks and McData Event Codes (Continued)
Event
ID
108 880C006C N/A 2 Device WWN: %1 currently attached to Port
109 880C006D N/A 2 Threshold Alert.%n
113 880C0071 informational 2 Cold Start.
115 880C0073 informational 2 Warm Start.
117 880C0075 warning 3 Link Down: %1.
119 880C0077 informational 2 Link Up: %1.
121 880C0079 warning 3 Authorization failure.
123 880C007B warning 3 EGP Peer down: %1.
Event
Code
Possible States Severity Description
%2 has either successfully connected or is
currently being rejected due to a Port Binding
violation.%n
An ef6000PortBindingViolation(3) is
generated whenever the switch detects that a
port binding violation occurs.
ef6000PortIndex: %1%n
ef6000TAIndex: %2%n
An ef6000ThresholdAlert(4) is generated
whenever a threshold alert occurs.
12 Storage Management Appliance Software Event Code Definitions Application Notes
Page 13
HP StorageWorks SAN and Brocade Switch Event Codes
HP StorageWorks SAN and Brocade Switch Event Codes
The following events are generated by HP StorageWorks SAN switches and Brocade switches
and are recorded in the Storage Management Appliance Event Log. Many of these event types
have several possible states and each state has an appropriate severity code.
The Storage Management Appliance supports the StorageWorks SAN and Brocade MIB
version 4.0.
Table 6: StorageWorks SAN and Brocade Switch Event Codes
Event
ID
105 88020069 unknown
101 88020065 ok
103 88020067 unknown
107 8802006B critical
Event
Code
Possible States Severity Description
online
offline
testing
faulty
faulty
unknown
faulty
below minimum
normal
above maximum
absent
error
warning
informational
debug
0
2
5
2
7
2
5
0
0
5
7
2
5
2
5
5
3
2
2
Port Index %2 changed state to %1%n
SSN: %3%n
GroupName: %3%n
GroupType: %5%n
Group MemPosition: %6%n
A swFCPortScn(3) is generated whenever
an FC_Port changes its operational state.
For instance, the FC_Port goes from on-line
to offline. The VarBind in the Trap Data Unit
shall contain the corresponding instance of
the FC_Port's operational status and index.
Switch is faulty.
Faulty reason: %1%n
SSN: %2%n
GroupName: %3%n
GroupType: %4%n
Group MemPosition: %5%n
A swFault(1) is generated whenever the
diagnostics detects a fault with the switch.
%5 is currently in state %1%n
SSN: %7%n
GroupName: %3%n
GroupType: %8%n
Group MemPosition: %9%n
A swSensorScn(2) is generated whenever
an environment sensor changes its
operational state. For instance, a fan stops
working. The VarBind in the Trap Data Unit
shall contain the corresponding instance of
the sensor status, sensor index, sensor type,
sensor value (reading) and sensor
information. Note that the sensor
information contains the type of sensor and
its number in textual format.
Event %1: %2 (severity level %3) - %5%n
SSN: %6%n
GroupName: %7%n
GroupType: %8%n
GroupMemPosition: %9%n
This trap is generated when an event whose
level at or below swEventTrapLevel occurs.
13Storage Management Appliance Software Event Code Definitions Application Notes
Page 14
HP StorageWorks SAN and Brocade Switch Event Codes
Table 6: StorageWorks SAN and Brocade Switch Event Codes (Continued)
Event
ID
109 8802006D informational
111 8802006F informational 2 A track change has generated a trap.
100 88020064 informational 2 An unknown trap event was received.
113 88020071 informational 2 Cold Start.
115 88020073 informational 2 Warm Start.
117 88020075 warning 3 Link Down: %1.
119 88020077 informational 2 Link Up: %1.
121 88020079 informational 3 Authorization failure.
123 8802007B informational 3 EGP Peer down: %1.
Event
Code
Possible States Severity Description
normal
faulty
2
2
7
Fabric Watch has generated an event.%n
Threshold %3 in Class/Area %1 at index
%2 has generated event %7 with %5 on
%6.%n
This event is %8%n
SSN: %9%n
GroupName: %10%n
GroupType: %11%n
GroupMemPosition: %12%n
Trap sent by Fabric Watch to notify of an
event.
%1%n.
SSN: %2
GroupName: %3
GroupType: %4
GroupMemPosition: %5%n
Trap sent for tracking login/logout/config
changes.
14 Storage Management Appliance Software Event Code Definitions Application Notes
Page 15
HSG Element Manager Event Codes
The HSG Element Manager is an application provided with the Storage Management
Appliance and used to configure and monitor HSG80/60 storage elements. The HSG Element
Manager generates events that help a user understand the status of both the manager
application and the storage elements. The system records these events in the Storage
Management Appliance Event Log.
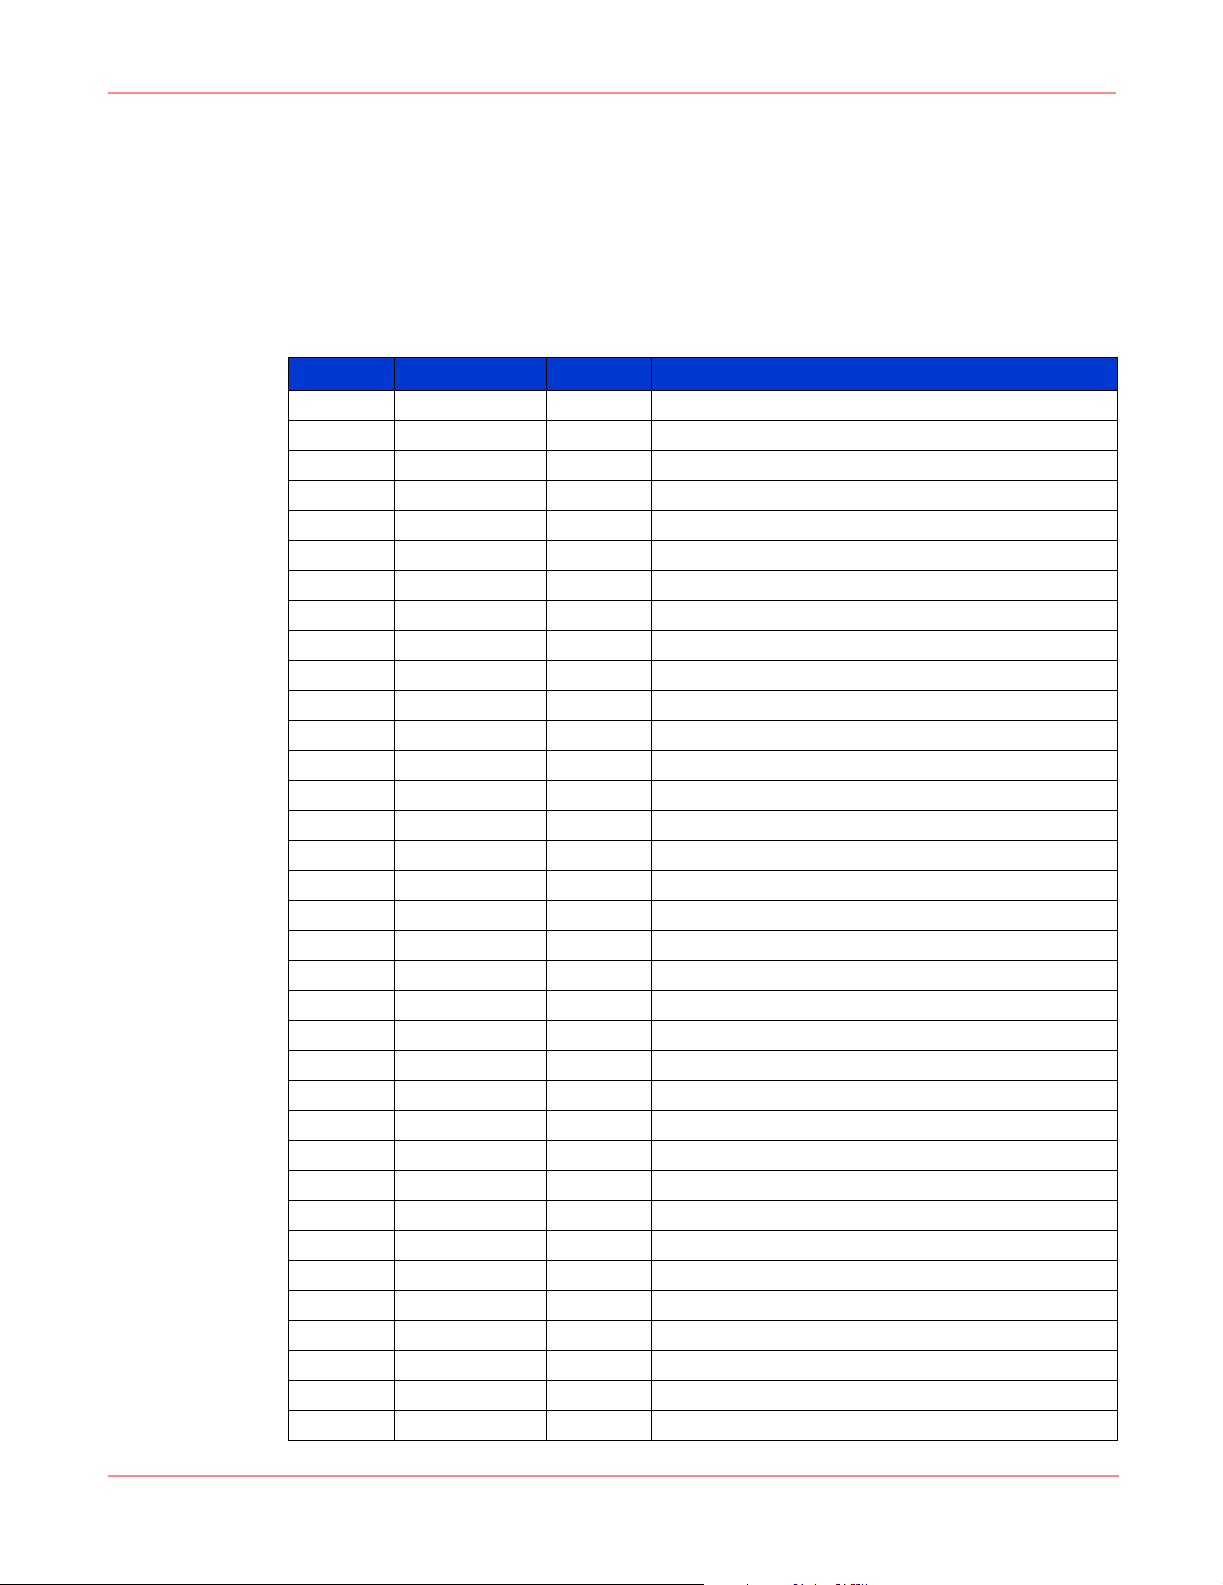
Table 7: HSG Element Manager Event Codes
Event ID Event Code Severity Description
6001 88011771 2 HSGSubsystem object created.
6002 88011772 2 Sense Data found.
6003 88011773 2 %1 state changed to online
6004 88011774 5 %1 state changed to offline
6005 88011775 2 %1 container state changed to good
6006 88011776 5 %1 container state changed to failed
6007 88011777 2 %1 container state changed to Reconstructing
6008 88011778 2 %1 container state changed to Initializing
6009 88011779 3 %1 container state changed to Reduced
6010 8801177A 2 %1 state changed to good. %2
6011 8801177B 5 %1 state changed to failed. %2
6012 8801177C 7 No controllers found
6013 8801177D 3 New controller %1 found
6014 8801177E 4 Other controller %1 unreachable
6015 8801177F 3 Other controller %1 reachable
6016 88011780 2 Controller %1 Cache Battery state changed to good
6017 88011781 3 Controller %1 Cache Battery state changed to low
6018 88011782 5 Controller %1 Cache Battery state changed to bad
6019 88011783 2 Controller %1 Cache state changed to good
6020 88011784 5 Controller %1 Cache state changed to bad
6021 88011785 5 Controller %1 Cache state changed to invalid
6022 88011786 4 Failed to refresh HSGSubsystem
6023 88011787 4 Failed to refresh Virtual Disks
6024 88011788 4 Failed to refresh Storage Sets
6025 88011789 4 Failed to refresh Devices
6026 8801178A 4 Failed to refresh Host Connections
6027 8801178B 4 Failed to rescan HSGSubsystem
6028 8801178C 7 Striped Mirror set modification. Members do not match
6029 8801178D 7 Too few mirrorset members for striped mirror set
6030 8801178E 7 Mirrorset already a member
6031 8801178F 7 STL Exception generated. %1
6032 88011790 7 Unknown system Exception generated. %1
6033 88011791 7 HSG Exception generated. %1
6034 88011792 7 Invalid Controller Pointer
6035 88011793 7 Invalid Container Pointer. %1
HSG Element Manager Event Codes
15Storage Management Appliance Software Event Code Definitions Application Notes
Page 16

HSG Element Manager Event Codes
Table 7: HSG Element Manager Event Codes (Continued)
Event ID Event Code Severity Description
6036 88011794 3 Device not found. %1
6037 88011795 3 %1 not found
6038 88011796 3 Storage Set not found
6039 88011797 3 Host Connection not found
6040 88011798 4 Test Unit Ready failed
6041 88011799 2 Virtual Disk %1 deleted
6042 8801179A 2 Virtual Disk %1 created
6043 8801179B 2 Device %1 added
6044 8801179C 2 Device %1 deleted
6045 8801179D 3 Host Connection %1 went offline
6046 8801179E 2 Host Connection %1 went online
6047 8801179F 3 Invalid parameter was found in request. %1
6048 880117A0 7 Invalid Storage Set type found. %1
6049 880117A1 4 Attempt to create virtual disk failed. %1
6050 880117A2 4 Attempt to modify virtual disk failed. %1
6051 880117A3 4 Attempt to delete virtual disk failed. %1
6052 880117A4 4 Attempt to modify device failed. %1
6053 880117A5 4 Attempt to modify Controller failed. %1
6054 880117A6 4 Attempt to modify Host Connection failed. %1
6055 880117A7 4 Attempt to delete Host Connection failed. %1
6056 880117A8 4 Attempt to rename Host Connection failed. %1
6057 880117A9 4 Snapshot: %1 not created.
6058 880117AA 2 Snapshot: %1 created.
6059 880117AB 2 Virtual Disk modified. %1
6060 880117AC 2 %1 modified
6061 880117AD 2 Controller modified. %1
6062 880117AE 2 Host Connection %1 modified
6063 880117AF 2 Host connection %1 has been renamed to %2
6064 880117B0 2 Host Connection %1 deleted
6065 880117B1 4 Attempt to rescan storage failed. %1
6066 880117B2 4 Attempt to Delete Storage Set failed. %1
6067 880117B3 4 Attempt to Delete Device failed. %1
6068 880117B4 2 Virtual disk: %1, %2 member removed.
6069 880117B5 4 Attempt to remove a member from a Virtual Disk failed. %1
6070 880117B6 7 Invalid Device Pointer. %1
6071 880117B7 4 Attempt to remove Failed Set member failed. %1
6072 880117B8 4 Attempt to add member to Spare Set failed. %1
6073 880117B9 4 Attempt to remove member from Spare Set failed. %1
6074 880117BA 6 EMU state now invalid. %1
6075 880117BB 2 EMU state now valid. %1
6076 880117BC 6 Power supply has gone bad. %1
16 Storage Management Appliance Software Event Code Definitions Application Notes
Page 17
HSG Element Manager Event Codes
Table 7: HSG Element Manager Event Codes (Continued)
Event ID Event Code Severity Description
6077 880117BD 2 Power supply is now good. %1
6078 880117BE 6 Fan has gone bad. %1
6079 880117BF 2 Fan is now good. %1
6080 880117C0 6 High Temperature detected. %1
6081 880117C1 2 Temperature is within optimal range. %1
6082 880117C2 6 Airflow is bad. %1
6083 880117C3 2 Airflow is now good. %1
6084 880117C4 2 EMU is present
6085 880117C5 6 EMU is no longer present
6086 880117C6 7 Cabinet %1 went offline
6087 880117C7 2 Cabinet %1 went online
6088 880117C8 6 Master cabinet has no controller installed. %1
6089 880117C9 2 Master cabinet has controller installed. %1
6090 880117CA 2 Controller present but present in slave cabinet. %1
6091 880117CB 2 Master cabinet has controller installed. %1
6092 880117CC 6 UPS has gone bad. %1
6093 880117CD 2 UPS is now good. %1
6094 880117CE 6 Shelf is bad. %1
6095 880117CF 2 Shelf is good. %1
6096 880117D0 6 Voltage has gone bad. %1
6097 880117D1 2 Voltage is now good. %1
6098 880117D2 3 Other controller failed
6099 880117D3 2 Other controller now good
6100 880117D4 6 Communication with subsystem has gone down. %1
6101 880117D5 2 Regained communication to subsystem
6102 880117D6 4 Attempt to create Remote Copy Set failed. %1
6103 880117D7 2 Remote copy set: %1 created.
6104 880117D8 4 Attempt to Delete Remote Copy Set failed. %1
6105 880117D9 2 RCS: %1 deleted.
6106 880117DA 4 Attempt to modify Remote Copy Set failed. %1
6107 880117DB 2 %1 RCS has been modified.
6108 880117DC 3 No Modifications were made. %1
6109 880117DD 3 Attempt to set failsafe on Remote Copy Set failed. %1
6110 880117DE 4 Attempt to Delete Association failed. %1
6111 880117DF 4 Attempt to create Association failed. %1
6112 880117E0 2 Association: %1 created.
6113 880117E1 2 Association: %1 not deleted.
6114 880117E2 4 Attempt to modify Association failed. %1
6115 880117E3 2 %1 Association has been modified.
6116 880117E4 2 Name is in use
6117 880117E5 4 %1 unable to add to spare set
17Storage Management Appliance Software Event Code Definitions Application Notes
Page 18

HSG Element Manager Event Codes
Table 7: HSG Element Manager Event Codes (Continued)
Event ID Event Code Severity Description
6118 880117E6 2 Item is already used
6119 880117E7 2 Device %1 added to Spare Set
6120 880117E8 2 Device %1 removed from Spare Set
6121 880117E9 2 Device removed from Failed Set
6122 880117EA 4 Attempt to expand Virtual Disk failed. %1
6123 880117EB 2 Virtual Disk expanded
6124 880117EC 2 %1 Virtual Disk not expandable
6125 880117ED 4 Incomplete Concatset modify: %1
6126 880117EE 2 Storage Set modified
6127 880117EF 4 Attempt to modify Chunksize failed
6128 880117F0 7 HSGSubsystem Assertion
6129 880117F1 4 Codeload failed. %1
6130 880117F2 3 Codeload Error. %1
6131 880117F3 2 Top Controller is rebooting
6132 880117F4 2 Bottom Controller is rebooting
6133 880117F5 2 Both Controllers are rebooting
6134 880117F6 4 Could not locate top controller
6135 880117F7 4 Could not locate bottom controller
6136 880117F8 2 Operating state is normal. %1
6137 880117F9 6 Operating state is failed. %1
6138 880117FA 4 Operating state is impaired. %1
6139 880117FB 2 Top controller is done rebooting
6140 880117FC 2 Bottom controller is done rebooting
6141 880117FD 2 Both controllers are done rebooting
6142 880117FE 4 Reboot of controller failed. %1
6143 880117FF 2 SCSI command did not complete. %1
6144 88011800 2 EMU modified
6145 88011801 4 EMU modify failed
6146 88011802 2 Unit is an Association Log Device
6147 88011803 2 Unit is an RCS Initiator
6148 88011804 2 Unit has been expanded
6149 88011805 2 Unit has no preferred path
6150 88011806 2 Unit is transportable
6151 88011807 2 Unit is a Snapshot
6152 88011808 2 Unit writeback cache is disabled
6153 88011809 2 Unit storage container is partitioned
6154 8801180A 2 Incompatible storage container type
6155 8801180B 2 No peer to peer configuration
6156 8801180C 2 Unit is in Failed state
6157 8801180D 2 Unit has too few devices
6158 8801180E 2 Unit not in correct state
18 Storage Management Appliance Software Event Code Definitions Application Notes
Page 19
HSG Element Manager Event Codes
Table 7: HSG Element Manager Event Codes (Continued)
Event ID Event Code Severity Description
6159 8801180F 2 Unit is used by another configuration
6160 88011810 2 Unit is a Snapshot source
6161 88011811 2 Subsystem firmware does not support snapshots
6162 88011812 2 Subsystem does not have peer to peer support enabled
6163 88011813 2 HSGSubsystem Miscellaneous info
6164 88011814 2 Mirror cache is not enabled
6165 88011815 2 Controller cache size is too small
6166 88011816 3 HSGSubsystem Unknown Status
6167 88011817 3 Subsystem has the maximum number of snapshots
6168 88011818 4 Not enough available physical disks or unused stripes
6169 88011819 3 Reached maximum physical disk count
6170 8801181A 4 Virtual Disk is a target
6171 8801181B 2 Initialize container failed. %1
6172 8801181C 2 Initialized container successfully. %1
6173 8801181D 4 No available containers
6174 8801181E 2 Reservation mutex check failed
6175 8801181F 7 Container not found. %1
6176 88011820 2 %1 Used by name list
6177 88011821 2 Unable to disable the PPRCMode
6178 88011822 4 Add VD member failed. %1
6179 88011823 2 Virtual Disk: %1, added member %2 successfully
6180 88011824 2 Check VirtualDisk not in REDUCE state or Replacement
6181 88011825 2 Rejected because of reservation. %1
6182 88011826 4 Need ACS firmware revision 8.7 for management
6183 88011827 2 Virtual disk %1 has been reserved by %2
6184 88011828 2 A virtual disk has been unreserved. %1
6185 88011829 2 Virtual disk reservation failure. %1
6186 8801182A 2 Management lock down change. %1
6187 8801182B 2 No available disks
6188 8801182C 2 Maximum number of members
6189 8801182D 2 Replacement policy must be NOPOLICY
6190 8801182E 2 Raidset must be in reduced state
6191 8801182F 2 Code patch %1-%2 is Succesfully loaded on %3 controller
7001 88011B59 6 HSGSubsystem API has lost comm to Subsystem. %1
7002 88011B5A 4 HSGSubsystem API has returned controller error text. %1
7003 88011B5B 4 HSGSubsystem API has received Invalid show this output
7004 88011B5C 4 HSGAPI::getAllControllers: Invalid SHOW OTHER output
7005 88011B5D 4 Invalid SHOW UNIT output %1
7006 88011B5E 4 HSGSubsystem API has received Invalid show storage
policy not NONE or not available physical disks
lockdown
output. %1
19Storage Management Appliance Software Event Code Definitions Application Notes
Page 20

HSG Element Manager Event Codes
Table 7: HSG Element Manager Event Codes (Continued)
Event ID Event Code Severity Description
7007 88011B5F 4 Invalid SHOW DEV FULL output
7008 88011B60 4 HSGSubsystem API has received Invalid show connection
7009 88011B61 3 HSGSubsystem API received modification request but no
7010 88011B62 3 HSGSubsystem API received delete request but no changes
7011 88011B63 3 HSGSubsystem API invalid CLI syntax or incomplete CLI
7012 88011B64 2 HSGSubsystem API has returned controller warning text
7013 88011B65 2 HSGSubsystem API This controller rebooting
7014 88011B66 2 HSGSubsystem API Other controller rebooting
7015 88011B67 2 HSGSubsystem API Both controllers rebooting
7016 88011B68 4 HSGAPI::getAllAssociations: Invalid SHOW AllAssociations
7017 88011B69 4 HSGSubsystem API has received Invalid show Remote Copy.
7018 88011B6A 4 HSGSubsystem API Setting Host connection failure
7019 88011B6B 4 HSGAPI::getAutospare, Invalid SHOW FAILEDSET output
7020 88011B6C 3 Comm path switched. %1
7021 88011B6D 3 Unable to switch comm path. %1
7022 88011B6E 3 Last Status
8204 8801200C 7 A spurious interrupt was detected during the execution of a
8205 8801200D 7 An unrecoverable error was detected during execution of
8206 8801200E 7 An unrecoverable error was detected during execution of
8207 8801200F 7 An unrecoverable error was detected during execution of
8301 8801206D 7 An unrecoverable error was detected during execution of
8302 8801206E 7 An unrecoverable error was detected during execution of
8303 8801206F 7 Deletion of component failed.
8304 88012070 2 A component location has been updated.
8305 88012071 2 A component name has been updated.
8306 88012072 6 HSG not communicating.
8307 88012073 2 HSG is communicating.
8308 88012074 3 Log approaching max size, prior entries removed.
8309 88012075 2 New HSG found.
output. %1
changes were found. %1
were found. %1
command error (Last Status). %1
output %1
%1
Subsystem Built-In Self Test
the HOST PORT Subsystem Test. The system will not be able
to communicate with the host.
the UART/DUART Subsystem Test. This will cause the
console to be unusable. This will cause failover
communications to fail.
the FX Subsystem Test.
the PCI9060ES Test.
the Device Port Subsystem Built-In Self Test. One or more of
the device ports on the controller module has failed;
some/all of the attached storage is no longer accessible via
this controller.
20 Storage Management Appliance Software Event Code Definitions Application Notes
Page 21
HSV Element Manager Event Codes
The HSV Element Manager is an application provided with the Storage Management
Appliance that is used to configure and monitor HSV110 Array Controllers. The HSV
Element Manager generates controller events and management agent events that help users
understand the status of both the manager application and the storage elements.
The Storage Management Appliance supports the HSV MIB version 2.0.
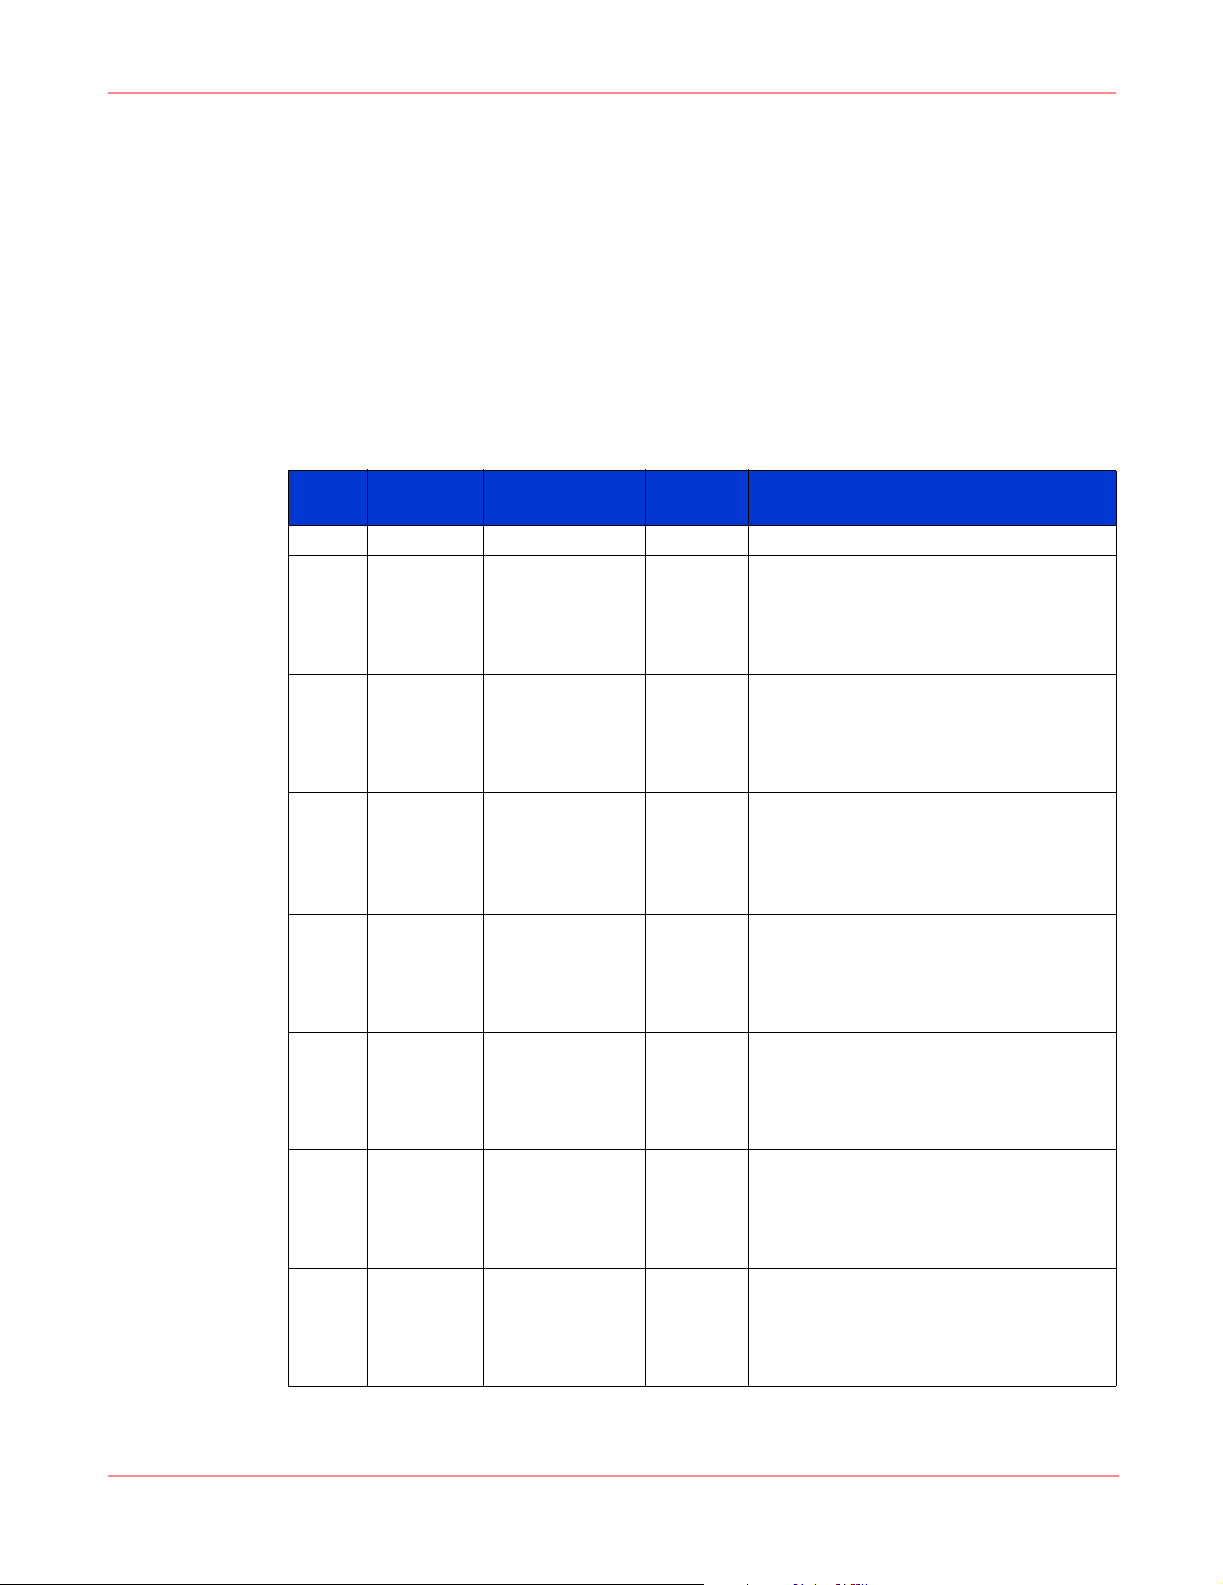
Controller Events
Table 8 shows events generated by the HSV Controller, which are logged in the Storage
Management Appliance Event Log. The Software Component ID (SWC ID) and Event
Number (Evt. No.) codes can be used to correlate events recorded in the Controller Event Log
of the HSV Element Manager with the events logged in the Storage Management Appliance
Event Log.
Table 8: HSV Element Manager Event Codes: Controller Events
HSV Element Manager Event Codes
Event
ID
100 88030064 3 0 0 Storage Cell: %1 Event Code: %2 Description: recognized Controller event
256 88030100 2 1 0 Storage Cell: %1 Event Code: %2 Description: During Executive Services
257 88030101 2 1 1 Storage Cell: %1 Event Code: %2 Description: The system time value was set to
768 88030300 2 3 0 Storage Cell: %1 Event Code: %2 Description: The HSV110 controller identified
769 88030301 6 3 1 Storage Cell: %1 Event Code: %2 Description: The physical disk drive identified
770 88030302 3 3 2 Storage Cell: %1 Event Code: %2 Description: The physical disk drive identified
Event
Code
Severity
SWC IDEvt.
No. Description
generated.
initialization the system time value was set to the value contained in the time field.
The action field contains one of the following codes which describes the condition
that caused the time value to be: 0 = TOY clock unavailable; time reset to default
date and time. 1 = TOY clock time value was less than or equal to the last known
time value previously stored in nonvolatile memory; time reset to default date and
time. 2 = EDC was bad for last known time value previously stored in nonvolatile
memory; time reset to default date and time. 3 = TOY clock not running; time
reset to default date and time. 4 = TOY clock time value believed to be accurate;
time set to TOY clock time value.
the value contained in the time field by a call to the EXEC$SET_TIME service. As
part of setting the time in a dual HSV110 controller configuration, the times are
synchronized. The action field contains one of the following codes which
describes the action taken: 0 = The time was set to the time value on this HSV110
controller. 1 = The master HSV110 controller requested the slave HSV110
controller to set it’s time to the time value. 2 = The slave HSV110 controller set the
local time to the time value. 3 = The HSV110 controller’s TOY clock was set to the
time value.
in the node_name field has failed in communicating with the Cabinet (Rack) Bus
Interface Controller.
by the device field has been rendered inoperable. If the flags.quorum_disk flag is
nonzero, the physical disk drive is the Storage System Quorum disk identified in
the quorum_sequence field. If the flags.inq_state flag is nonzero, the content of
the inq_data and capacity fields is valid. If the rss_flags.member_abnormal flag
is nonzero, the content of the member_state field is valid. The rack_num field will
not be valid until a future release.
in the node_name field will not be used because the maximum number of
physical disk drives already exist in the current Storage System.
21Storage Management Appliance Software Event Code Definitions Application Notes
Page 22
HSV Element Manager Event Codes
Table 8: HSV Element Manager Event Codes: Controller Events (Continued)
Event
ID
771 88030303 2 3 3 Storage Cell: %1 Event Code: %2 Description: The HSV110 controller has
772 88030304 2 3 4 Storage Cell: %1 Event Code: %2 Description: The HSV110 controller, identified
773 88030305 2 3 5 Storage Cell: %1 Event Code: %2 Description: The HSV110 controller identified
774 88030306 2 3 6 Storage Cell: %1 Event Code: %2 Description: The HSV110 controller identified
775 88030307 2 3 7 Storage Cell: %1 Event Code: %2 Description: The HSV110 controller identified
776 88030308 2 3 8 Storage Cell: %1 Event Code: %2 Description: The HSV110 controller identified
1024 88030400 6 4 0 Storage Cell: %1 Event Code: %2 Description: HSV110 controller operation was
1025 88030401 6 4 1 Storage Cell: %1 Event Code: %2 Description: The HSV110 controller identified
1026 88030402 6 4 2 Storage Cell: %1 Event Code: %2 Description: A machine check occurred while
Event
Code
Severity
SWC IDEvt.
No.
Description
begun booting.
in the node_name field, has finished the process of bringing the Storage System,
identified in the cell_tag fields, online.
in the node_name field has been joined into the Storage System.
in the node_name field has been ousted from the Storage System, identified in
the cell_tag fields
in the node_name field is now the Storage System master, identified in the
cell_tag fields, master
in the node_name field has been brought into the Storage System, identified in
the cell_tag fields.
terminated due to an unrecoverable event detected by either software or
hardware or due to an action initiated via the Storage System Management
Interface.
in the lter.terminating_ctrlr field sent a last gasp message prior to terminating
operation.
a termination event was being processed. The post-termination operation being
performed at the time the event occurred can be derived from the
lter.reuea_index field.
Note: The lteihd and lter fields may not describe the event that caused the
HSV110 controller to terminate operation depending on how far termination
processing got before the machine check occurred.
22 Storage Management Appliance Software Event Code Definitions Application Notes
Page 23
Table 8: HSV Element Manager Event Codes: Controller Events (Continued)
HSV Element Manager Event Codes
Event
ID
1027 88030403 6 4 3 Storage Cell: %1 Event Code: %2 Description: An unexpected event occurred
1028 88030404 2 4 4 Storage Cell: %1 Event Code: %2 Description: The Storage System Event Log
Event
Code
Severity
SWC IDEvt.
No.
Description
while a termination event was being processed. The value contained in the
uei.type field describes the event as follows: 0 = Unrecognized Unexpected Event
code. 1 = Power failure before initialization could complete. 2 = Recursive
termination before initialization could complete. 3 = Terminated during the first
part post-termination preparation. 4 = Terminated during the load of the G3
Glue registers. 5 = Terminated during the second part post-termination
preparation. 6 = Terminated during event report block load. 7 = Terminated
during initialization of all hardware components and software data structures in
preparation for restart. 8 = Terminated during execution of an unrecognized
post-termination operation (premature). 9 = Power failure during execution of a
post-termination operation. A = No good entries found in Termination Event
Array. B = The EDC of one or more Termination Event Array entries is bad. C =
Terminatio n Event Array entry control block revision is different. D = Termination
Event Array entry information block revision is different. E = Termination Event
Array entry up time value is greater than the system’s up time value. F =
Termination Event Array entry up time value is less than the previous entry’s up
time value. 10= Termination Event Array entry sequence number value is less
than the previous entry’s sequence number value. 11= Detected an unrecognized
dump/restart control code. 12= Failed to terminate the entity dump loop. 13=
Unexpected dump entity size. 14= Unexpected Event Log Packet processing stage
code. 15= Number of Termination Parameters supplied not equal to maximum
allowed as required. The post-termination operation being performed at the time
the unexpected event occurred is contained in the uei.pto field.
Note: The lteihd and lter fields may not describe the event that caused the
HSV110 controller to terminate operation depending on how far t ermination
processing got before the unexpected event occurred.
validation completed successfully. The content of the cinfo.scelcbi.status field, the
cinfo.scelcbi structure, and the minfo.scelmi structure show the validated state of
the Storage System Event Log. The meaning of the status value contained in the
cinfo.scelcbi.status field is as follows: 0 = No problems found.
Note: The content of the ainfo fields, cinfo.sctelcbi structure, and minfo.sctelmi
structure is undefined.
23Storage Management Appliance Software Event Code Definitions Application Notes
Page 24
HSV Element Manager Event Codes
Table 8: HSV Element Manager Event Codes: Controller Events (Continued)
Event
ID
1029 88030405 2 4 5 Storage Cell: %1 Event Code: %2 Description: The Storage System Event Log
1030 88030406 6 4 6 Storage Cell: %1 Event Code: %2 Description: Event reports were lost due to an
1031 88030407 6 4 7 Storage Cell: %1 Event Code: %2 Description: Event reports were lost due to an
1032 88030408 2 4 8 Storage Cell: %1 Event Code: %2 Description: The Storage System Termination
Event
Code
Severity
SWC IDEvt.
No.
Description
validation failed. The content of the cinfo.scelcbi.status field, the cinfo.scelcbi
structure, and the minfo.scelmi structure show the state of the Storage System
Event Log at the time of the failure. The content and state of the Storage System
Event Log have been initialized to their initial operational settings. The meaning
of the status value contained in the cinfo.scelcbi.status field is as follows: 1 =
Cookie value is not as expected. 2 = Event data overflows the buffer. 3 = Event
data size is not a multiple of 4 bytes, is less than the minimum, or is greater than
the maximum. 4 = Event Information Packet type is greater than the maximum. 5
= Event information size is not a multiple of 4 bytes, is less than the minimum, is
greater than the maximum, doesn’t match the Event Information Packet type size,
or when combined with the entry header size doesn’t equal the entry size. 6 =
Event code is zero. 7 = Event is out of sequence. 8 = Dead space area at the end
of a partially packed buffer contains a nonzero value. 9 = An event data block
containing a nonzero value was found after end of event data was detected. A =
Sequence number reset flag not set as expected. B = The event log contains no
entries. C = Event data block read failed during maintenance verification. D =
Event data block read failed during maintenance completion. E = Event data
block erase failed during maintenance completion. F = Control block read failed
during maintenance verification.
Note: The content of the ainfo fields, cinfo.sctelcbi structure, and minfo.sctelmi
structure is undefined.
insufficient supply of Event Log Packets on the HSV110 controller that is the
Storage System Master. The ainfo.events_not_reported field shows the number of
event reports lost.
Note: The content of the ainfo.quiesce_type field, ainfo.remote_event field
cinfo.sctelcbi structure, and minfo.sctelmi structure is undefined.
insufficient supply of Event Log Packets on the HSV110 controller that is not the
Storage System Master. The ainfo.events_not_reported field shows the number of
event reports lost.
Note: The content of the ainfo.quiesce_type field, ainfo.remote_event field
cinfo.sctelcbi structure, and minfo.sctelmi structure is undefined.
Event Log has become inaccessible. The content of the cinfo.sctelcbi.status field,
the cinfo.sctelcbi structure, and the minfo.sctelmi structure show the current state
of the Storage System Termination Event Log. The meaning of the status value
contained in the cinfo.sctelcbi.status field is as follows: F = Control block read
failed during maintenance verification. 10= Control block read failed during
maintenance verification. 11= Event data block write failed during maintenance
update. 12= Control block write failed during maintenance completion. 13=
Storage System Termination Event Log related send was unsuccessful or the
master found that the Storage System Termination Event Log is inaccessible. 16=
Event data block read failed during retrieval request.
Note: The content of the ainfo fields, cinfo.scelcbi structure, and minfo.scelmi
structure is undefined.
24 Storage Management Appliance Software Event Code Definitions Application Notes
Page 25

Table 8: HSV Element Manager Event Codes: Controller Events (Continued)
HSV Element Manager Event Codes
Event
ID
1033 88030409 2 4 9 Storage Cell: %1 Event Code: %2 Description: The Storage System Termination
1034 8803040a 2 4 a Storage Cell: %1 Event Code: %2 Description: The Storage System Termination
1035 8803040b 2 4 b Storage Cell: %1 Event Code: %2 Description: The Storage System Termination
1036 8803040c 6 4 c Storage Cell: %1 Event Code: %2 Description: The Fault Manager on the
1037 8803040d 2 4 d Storage Cell: %1 Event Code: %2 Description: The Fault Manager operation
1038 8803040e 6 4 e Storage Cell: %1 Event Code: %2 Description: An HSV110 controller sent a last
Event
Code
Severity
SWC IDEvt.
No.
Description
Event Log validation completed successfully. The content of the
cinfo.sctelcbi.status field, the cinfo.sctelcbi structure, and the minfo.sctelmi
structure show the validated state of the Storage System Termination Event Log.
The meaning of the status value contained in the cinfo.sctelcbi.status field is as
follows: 0 = No problems found.
Note: The content of the ainfo fields, cinfo.scelcbi structure, and minfo.scelmi
structure is undefined.
Event Log validation failed. The content of the cinfo.sctelcbi.status field, the
cinfo.sctelcbi structure, and the minfo.sctelmi structure show the state of the
Storage System Termination Event Log at the time of the failure. The meaning of
the status value contained in the cinfo.sctelcbi.status field is as follows: F =
Control block read failed during maintenance verification. 10= Control block
read failed during maintenance verification. 11= Event data block write failed
during maintenance update. 12= Control block write failed during maintenance
completion. 13= Storage System Termination Event Log related send was
unsuccessful or the master found that the Storage System Termination Event Log is
inaccessible. 16= Event data block read failed during retrieval request.
Note: The content of the ainfo fields, cinfo.scelcbi structure, and minfo.scelmi
structure is undefined.
Event Log has been updated with the termination event information obtained
from the HSV110 controller that is not the Storage System Master. The content of
the cinfo.sctelcbi.status field, the cinfo.sctelcbi structure, and the minfo.sctelmi
structure show the updated state of the Storage System Termination Event Log.
The meaning of the status value contained in the cinfo.sctelcbi.status field is as
follows: 0 = No problems found.
Note: The content of the ainfo fields, cinfo.scelcbi structure, and minfo.scelmi
structure is undefined.
Storage System Master received an invalid Event Information Packet from the
remote Fault Manager. The header information from the invalid Event Information
packet is contained in the ainfo.remote_event field.
Note: The content of the ainfo.quiesce_type field, ainfo.events_not_reported field,
cinfo.scelcbi structure, cinfo.sctelcbi structure, minfo.scelmi structure, and
minfo.sctelmi structure is undefined.
was made quiescent. If the ainfo.quiesce_type field is equal to 0, the operation
was performed on both HSV110 controllers. If the ainfo.quiesce_type field is
equal to 1, the operation was performed only on the HSV110 controller that is
not the Storage System Master.
Note: The content of the ainfo.events_not_reported field, cinfo.scelcbi structure,
cinfo.sctelcbi structure, minfo.scelmi structure, and minfo.sctelmi structure is
undefined.
gasp message prior to terminating operation with an indication that the HSV110
controller identified in the lter.terminating_ctrlr field should also terminate
operation.
25Storage Management Appliance Software Event Code Definitions Application Notes
Page 26

HSV Element Manager Event Codes
Table 8: HSV Element Manager Event Codes: Controller Events (Continued)
Event
ID
1536 88030600 6 6 0 Storage Cell: %1 Event Code: %2 Description: A physical disk drive has
1537 88030601 3 6 1 Storage Cell: %1 Event Code: %2 Description: A Fibre Channel port on the
1538 88030602 2 6 2 Storage Cell: %1 Event Code: %2 Description: A physical disk drive has
Event
Code
Severity
SWC IDEvt.
No.
Description
reported that it has exceeded its failure prediction threshold. The identity of the
physical disk drive is contained in the device field. The Fibre Channel port used
to communicate with the physical disk drive is contained in the cerp_id field. The
HSV110 controller internal Fibre Channel port number used to communicate with
the physical disk drive is contained in the port field. The arbitrated loop physical
address of the physical disk drive is contained in the al_pa field. If the bay field
contains a value other than zero, the location of the physical disk drive is
contained in the rack_num, dencl_num, and bay fields. If the bay field contains
a zero, the location of the physical disk drive is unknown and the content of the
rack_num and dencl_num fields is undefined. The rack_num field will not be
valid until a future release. The Fibre Channel Exchange Descriptor class is
contained in the fed_class field. The command issued to the physical disk drive is
contained in t he cmd field. The sense data obtained from the physical disk drive
as a result of the failure prediction threshold exceeded error is contained in the
error field.
HSV110 controller has failed to respond. The identity of the affected Fibre
Channel port is contained in the cerp_id field. The HSV110 controller internal
Fibre Channel port number of the affected Fibre Channel port is contained in the
port field. The peb array contains the port event block information. The
peq_frz_prod_index field contains the index to the port event block in use when
the Tachyon chip entered the frozen state. The peq_prod_index field contains the
index to the next port event block. The peq_cons_index field contains the index
to the next port event block to be acted upon. The failure_cause field contains the
internal routing.
reported a check condition error. The identity of the physical disk drive is
contained in the device field. The Fibre Channel port used to communicate with
the physical disk drive is contained in the cerp_id field. The HSV110 controller
internal Fibre Channel port number used to communicate with the physical disk
drive is contained in the port field. The arbitrated loop physical address of the
physical disk drive is contained in the al_pa field. If the bay field contains a
value other than zero, the location of the physical disk drive is contained in the
rack_num, dencl_num, and bay fields. If the bay field contains a zero, the
location of the physical disk drive is unknown and the content of the rack_num
and dencl_num fields is undefined. The rack_num field will not be valid until a
future release. The Fibre Channel Exchange Descriptor class is contained in the
fed_class field. The command issued to the physical disk drive is contained in the
cmd field. The sense data obt ained from the physical disk drive as a result of the
check condition error is contained in the error field.
26 Storage Management Appliance Software Event Code Definitions Application Notes
Page 27

Table 8: HSV Element Manager Event Codes: Controller Events (Continued)
HSV Element Manager Event Codes
Event
ID
1539 88030603 3 6 3 Storage Cell: %1 Event Code: %2 Description: A frame sent to a physical disk
1540 88030604 3 6 4 Storage Cell: %1 Event Code: %2 Description: Work was unexpectedly sent to
1541 88030605 3 6 5 Storage Cell: %1 Event Code: %2 Description: Work has been sent to a physical
Event
Code
Severity
SWC IDEvt.
No.
Description
drive or another HSV110 controller via the mirror port or a Drive Enclosure
Environmental Monitoring Unit has timed out. The identity of the intended
recipient is contained in the device field. The Fibre Channel port over which the
frame was sent is identified in the cerp_id field. The HSV110 controller internal
Fibre Channel port number over which the frame was sent is contained in the
port field. The arbitrated loop physical address of the intended recipient is
contained in the al_pa field. If the bay field contains a value other than zero, the
intended recipient was the physical disk drive located as indicated by the content
of the rack_num, dencl_num, and bay fields. If the bay field contains a zero, the
location of the intended recipient is unknown and the content of the rack_num
and dencl_num fields is undefined. The rack_num field will not be valid until a
future release. The number of timeouts detected is contained in the num_times
field.
this HSV110 controller by a physical disk drive or another HSV110 controller.
This HSV110 controller did not originate the work. The identity of the sender is
contained in the device field. The Fibre Channel port over which the unexpected
work was received is identified in the cerp_id field. The HSV110 controller
internal Fibre Channel port number over which the unexpected work was
received is contained in the port field. The arbitrated loop physical address of
the sender is contained in the al_pa field. If the bay field contains a value other
than zero, the sender was the physical disk drive located as indicated by the
content of the rack_num, dencl_num, and bay fields. If the bay field contains a
zero, the location of the sender is unknown and the content of the rack_num and
dencl_num fields is undefined. The rack_num field will not be valid until a future
release. The hdr_cdb field contains the command descriptor block and Fibre
Channel header information associated with the unexpected work.
disk drive or another HSV110 controller via the mirror port but it did not
respond. The identity of the intended target is contained in the device field. The
Fibre Channel port over which the work was sent is identified in the cerp_id field.
The HSV110 controller internal Fibre Channel port over which the work was sent
is contained in the port field. The arbitrated loop physical address of the
intended target is contained in the al_pa field. If the bay field contains a value
other than zero, the intended target was the physical disk drive located as
indicated by the content of the rack_num, dencl_num, and bay fields. If the bay
field contains a zero, the location of the intended target is unknown and the
content of the rack_num and dencl_num fields is undefined. The rack_num field
will not be valid until a future release. The Fibre Channel Exchange Descriptor
class is contained in the fed_class field. The command issued to the intended
target is contained in the c md field. Note that in this case the content of the
error field is undefined.
27Storage Management Appliance Software Event Code Definitions Application Notes
Page 28

HSV Element Manager Event Codes
Table 8: HSV Element Manager Event Codes: Controller Events (Continued)
Event
ID
1543 88030607 3 6 7 Storage Cell: %1 Event Code: %2 Description: A Target Discovery Service
1544 88030608 2 6 8 Storage Cell: %1 Event Code: %2 Description: An excessive number of link
1545 88030609 6 6 9 Storage Cell: %1 Event Code: %2 Description: A physical disk drive has
Event
Code
Severity
SWC IDEvt.
No.
Description
Descriptor frame sent to a physical disk drive has timed out. The identity of the
physical disk drive is contained in the device field. The Fibre Channel port used
to communicate with the physical disk drive is contained in the cerp_id field. The
HSV110 controller internal Fibre Channel port number used to communicate with
the physical disk drive is contained in the port field. The arbitrated loop physical
address of the physical disk drive is contained in the al_pa field. If the bay field
contains a value other than zero, the location of the physical disk drive is
contained in the rack_num, dencl_num, and bay fields. If the bay field contains
a zero, the location of the physical disk drive is unknown and the content of the
rack_num and dencl_num fields is undefined. The rack_num field will not be
valid until a future release. The Fibre Channel Exchange Descriptor class is
contained in the fed_class field. The command issued to the physical disk drive is
contained in th e cmd field. Note that in this case the content of the error field is
undefined.
errors were detected on a HSV110 controller’s Fibre Channel port. The identity
of the affected Fibre Channel port is contained in the cerp_id field. The HSV110
controller internal Fibre Channel port number of the affected Fibre Channel port
is contained in the port field. This is an informational event triggered by the
occurrence of an excessive number of Tachyon chip link status errors detected
within a particular link status error type. The number of occurrences of each link
status error type is contained in a separate type-specific field (e.g.,
loss_of_signal, bad_rx_char, etc.). The HSV110 controller checks each of its
Fibre Channel port’s for excessive link status errors periodicaly.
reported numerous failure prediction threshold exceeded errors. The identity of
the physical disk drive is contained in the device field. The Fibre Channel port
used to communicate with the physical disk drive is contained in the cerp_id field.
The HSV110 controller internal Fibre Channel port number used to communicate
with the physical disk drive is contained in the port field. The arbitrated loop
physical address of the physical disk drive is contained in the al_pa field. If the
bay field contains a value other than zero, the location of the physical disk drive
is contained in the rack_num, dencl_num, and bay fields. If the bay field contains
a zero, the location of the physical disk drive is unknown and the content of the
rack_num and dencl_num fields is undefined. The rack_num field will not be
valid until a future release. The Fibre Channel Exchange Descriptor class is
contained in the fed_class field. The num_times field is the number of failure
prediction threshol d exceeded errors reported by the physical disk drive in the
previous minute.
28 Storage Management Appliance Software Event Code Definitions Application Notes
Page 29

Table 8: HSV Element Manager Event Codes: Controller Events (Continued)
HSV Element Manager Event Codes
Event
ID
1546 8803060a 2 6 a Storage Cell: %1 Event Code: %2 Description: A physical disk drive has
1547 8803060b 3 6 b Storage Cell: %1 Event Code: %2 Description: A non-data exchange frame sent
1548 8803060c 2 6 c Storage Cell: %1 Event Code: %2 Description: A loop switch has been detected
1549 8803060d 2 6 d Storage Cell: %1 Event Code: %2 Description: The location of a physical disk
Event
Code
Severity
SWC IDEvt.
No.
Description
reported numerous check condition errors. The identity of the physical disk drive
is contained in the device field. The Fibre Channel port used to communicate
with the physical disk drive is contained in the cerp_id field. The HSV110
controller internal Fibre Channel port number used to communicate with the
physical disk drive is contained in the port field. The arbitrated loop physical
address of the physical disk drive is contained in the al_pa field. If the bay field
contains a value other than zero, the location of the physical disk drive is
contained in the rack_num, dencl_num, and bay fields. If the bay field contains
a zero, the location of the physical disk drive is unknown and the content of the
rack_num and dencl_num fields is undefined. The rack_num field will not be
valid until a future release. The Fibre Channel Exchange Descriptor class is
contained in the fed_class field. The num_times field is the number of check
condition errors reported by the physical disk drive in the previous minute.
to a physical disk drive has timed out. The identity of the physical disk drive is
contained in the device field. The Fibre Channel port used to communicate with
the physical disk drive is contained in the cerp_id field. The HSV110 controller
internal Fibre Channel port number used to communicate with the physical disk
drive is contained in the port field. The arbitrated loop physical address of the
physical disk drive is contained in the al_pa field. If the bay field contains a
value other than zero, the location of the physical disk drive is contained in the
rack_num, dencl_num, and bay fields. If the bay field contains a zero, the
location of the physical disk drive is unknown and the content of the rack_num
and dencl_num fields is undefined. The rack_num field will not be valid until a
future release. The Fibre Channel Exchange Descriptor class is contained in the
fed_class field. The command issued to the physical disk drive is contained in the
cmd field. Note that in this case the content of the error field is undefined.
on a Fibre Channel port. The identity of the Fibre Channel port is contained in
the cerp_id field. The HSV110 controller internal Fibre Channel port number is
contained in the port field. Note that in this case the device, al_pa, rack_num,
dencl_num, bay, fed_class and num_times fields are undefined.
drive previously reported as unknown is now known. The identity of the physical
disk drive is contained in the device field. The Fibre Channel port used to
communicate with the physical disk drive is contained in the cerp_id field. The
HSV110 controller internal Fibre Channel port number used to communicate with
the physical disk drive is contained in the port field. The arbitrated loop physical
address of the physical disk drive is contained in the al_pa field. The location of
the physical disk drive is contained in the rack_num, dencl_num, and bay fields.
The rack_num field will not be valid until a future release. Note that in this case
the content of the fed_class and num_times fields is undefined.
29Storage Management Appliance Software Event Code Definitions Application Notes
Page 30

HSV Element Manager Event Codes
Table 8: HSV Element Manager Event Codes: Controller Events (Continued)
Event
ID
1550 8803060e 6 6 e Storage Cell: %1 Event Code: %2 Description: A Drive Enclosure Environmental
1551 8803060f 6 6 f Storage Cell: %1 Event Code: %2 Description: The Drive Enclosure
1552 88030610 6 6 10 Storage Cell: %1 Event Code: %2 Description: The Drive Enclosure
Event
Code
Severity
SWC IDEvt.
No.
Description
Monitoring Unit requested a code update but the code update could not be
found, so the update was not performed. The identity of the affected Drive
Enclosure Environmental Monitoring Unit is contained in the device field. The
Fibre Channel port used to communicate with the Drive Enclosure Environmental
Monitoring Unit is contained in the cerp_id field. The HSV110 controller internal
Fibre Channel port number used to communicate with the Drive Enclosure
Environmental Monitoring Unit is contained in the port field. The location of the
Drive Enclosure Environmental Monitoring Unit is contained in the rack_num and
dencl_num fields. The rack_num field will not be valid until a future release.
Note that in this case the content of the al_pa, bay, fed_class and num_times
field is undefined.
Environmental Monitoring Unit is able to communicate with a physical disk drive
but this HSV110 controller is unable to communicate with that physical disk drive
on the Fibre Channel bus. The identity of the Drive Enclosure Environmental
Monitoring Unit is contained in the device field. The Fibre Channel port used to
communicate with the physical disk drive is contained in the cerp_id field. The
HSV110 controller internal Fibre Channel port number used to communicate with
the physical disk drive is contained in the port field. The location of the physical
disk drive is contained in the rack_num, dencl_num, and bay fields. The
rack_num field will not be valid until a future release. Note that in this case the
content of the al_pa, fed_class and num_times fields is undefined.
Environmental Monitoring Unit is unable to communicate with this HSV110
controller. The Drive Enclosure Environmental Monitoring Unit has either stopped
communicating with the HSV110 controller, or is not connected to the rack. If the
Drive Enclosure Environmental Monitoring Unit is not connected to the rack, then
the location of the Drive Enclosure Environmental Monitoring Unit is unknown. If
the bay field contains a value other than zero, the identity of the Drive Enclosure
Environmental Monitoring Unit is contained in the device field. If the bay field
contains a zero, the content of the device field is undefined. The Fibre Channel
port used to communicate with the Drive Enclosure Environmental Monitoring
Unit is contained in the cerp_id field. The HSV110 controller internal Fibre
Channel port number used to communicate with the Drive Enclosure
Environmental Monitoring Unit is contained in the port field. If the bay field
contains a value other than zero, the location of the Dr ive Enclosure
Environmental Monitoring Unit is contained in the rack_num and dencl_num
fields. If the bay field contains a zero, the location of the Drive Enclosure
Environmental Monitoring Unit is unknown and the content of the rack_num and
dencl_num fields is undefined. The rack_num field will not be valid until a future
release. Note that in this case the content of the al_pa, fed_class and num_times
fields is undefined.
30 Storage Management Appliance Software Event Code Definitions Application Notes
Page 31

Table 8: HSV Element Manager Event Codes: Controller Events (Continued)
HSV Element Manager Event Codes
Event
ID
1554 88030612 2 6 12 Storage Cell: %1 Event Code: %2 Description: The retry count for a task
1555 88030613 2 6 13 Storage Cell: %1 Event Code: %2 Description: A Drive Enclosure Environmental
1556 88030614 6 6 14 Storage Cell: %1 Event Code: %2 Description: There are too many drive
1557 88030615 6 6 15 Storage Cell: %1 Event Code: %2 Description: The cable connected to the I/O
1558 88030616 6 6 16 Storage Cell: %1 Event Code: %2 Description: A HSV110 controller does not
1559 88030617 6 6 17 Storage Cell: %1 Event Code: %2 Description: A Drive Enclosure Environmental
Event
Code
Severity
SWC IDEvt.
No.
Description
assigned to a Drive Enclosure Environmental Monitoring Unit has been
exhausted. The Fibre Channel port used to communicate with the physical disk
drive is contained in the cerp_id field. The HSV110 controller internal Fibre
Channel port number used to communicate with the physical disk drive is
contained in the port field. The peb array contains the task list that was intended
to be sent to the Drive Enclosure Environmental Monitoring Unit. The
peq_frz_prod_index field contains the task that was being retried. The
peq_prod_index field contains the drive enclosure where the physical disk drive
used to communicate with the Drive Enclosure Environmental Monitoring Unit is
located. The peq_cons_index field identifies the Fibre Channel loop pair (0 =
Loop A, 1 = Loop B) used to communicate with the physical disk drive that was
used to communicate with the Drive Enclosure Environmental Monitoring Unit.
The failure_cause field contains the bay where the physical disk drive used to
communicate with the
Monitoring Unit is able to communicate with this HSV110 controller. The identity
of the Drive Enclosure Environmental Monitoring Unit is contained in the device
field. The Fibre Channel port used to communicate with the Drive Enclosure
Environmental Monitoring Unit is contained in the cerp_id field. The HSV110
controller internal Fibre Channel port number used to communicate with the
Drive Enclosure Environmental Monitoring Unit is contained in the port field. The
location of the Drive Enclosure Environmental Monitoring Unit is contained in the
rack_num and dencl_num fields. The rack_num field will not be valid until a
future release. Note that in this case the content of the bay, fed_class and
num_times fields is undefined.
enclosures. The Fibre Channel port with too many drive enclosures attached to
the HSV110 controller is contained in the cerp_id field. Note that in this case the
content of the bay, fed_class, rack_num, dencl_num and num_times fields is
undefined.
module is attached to the wrong Fibre Channel port. The Fibre Channel port
incorrectly attached to the HSV110 controller is contained in the cerp_id field.
Note that in this case the content of the bay, fed_class, rack_num, dencl_num
and num_times fields is undefined.
have an address on the enclosure address bus. The HSV110 controller location
cannot be identified. Note that in this case the content of the bay, fed_class,
rack_num, dencl_num, alpa, device, cerp_id, port, and num_times fields are
undefined.
Monitoring Unit has detected a physical disk drive that was preventing proper
loop operation. The physical disk drive has been bypassed and is ready for
replacement. The location of this physical disk drive is specified by the
rack_num, bay, and dencl_num fields. The rack_num field will not be valid until
a future release. The identity of the Drive Enclosure Environmental Monitoring
Unit is contained in the device field. The UUID of the specific physical disk drive
is not identifiable. Check the fault lights of the enclosure associated with this Drive
Enclosure Environmental Monitoring Unit. Note that in this case the content of
the fed_class, alpa, and num_times fields are undefined.
31Storage Management Appliance Software Event Code Definitions Application Notes
Page 32

HSV Element Manager Event Codes
Table 8: HSV Element Manager Event Codes: Controller Events (Continued)
Event
ID
1560 88030618 2 6 18 Storage Cell: %1 Event Code: %2 Description: A Drive Enclosure Environmental
1561 88030619 2 6 19 Storage Cell: %1 Event Code: %2 Description: A Drive Enclosure Environmental
1562 8803061a 6 6 1a Storage Cell: %1 Event Code: %2 Description: A physical disk drive has
1563 8803061b 2 6 1b Storage Cell: %1 Event Code: %2 Description: A HSV110 controller now has an
Event
Code
Severity
SWC IDEvt.
No.
Description
Monitoring Unit has begun updating its code. Do not power down this drive
enclosure until the code update has completed. The identity of the Drive Enclosure
Environmental Monitoring Unit is contained in the device field. The Fibre
Channel port used to communicate with the Drive Enclosure Environmental
Monitoring Unit is contained in the cerp_id field. The HSV110 controller internal
Fibre Channel port number used to communicate with the Drive Enclosure
Environmental Monitoring Unit is contained in the port field. The location of the
Drive Enclosure Environmental Monitoring Unit is contained in the rack_num and
dencl_num fields. The rack_num field will not be valid until a future release.
Note that in this case the content of the fed_class, alpa, and num_times fields are
undefined.
Monitoring Unit has completed updating its code. It is now safe to power down
this drive enclosure. The identity of the Drive Enclosure Environmental Monitoring
Unit is contained in the device field. The Fibre Channel port used to
communicate with the Drive Enclosure Environmental Monitoring Unit is
contained in the cerp_id field. The HSV110 controller internal Fibre Channel
port number used to communicate with the Drive Enclosure Environmental
Monitoring Unit is contained in the port field. The location of the Drive Enclosure
Environmental Monitoring Unit is contained in the rack_num and dencl_num
fields. The rack_num field will not be valid until a future release. Note that in this
case the content of the fed_class, alpa, and num_times fields are undefined.
exceeded its soft error threshold. The identity of the physical disk drive is
contained in the device field. The Fibre Channel port used to communicate with
the physical disk drive is contained in the cerp_id field. The HSV110 controller
internal Fibre Channel port number used to communicate with the physical disk
drive is contained in the port field. The arbitrated loop physical address of the
physical disk drive is contained in the al_pa field. If the bay field contains a
value other than zero, the location of the physical disk drive is contained in the
rack_num, dencl_num, and bay fields. If the bay field contains a zero, the
location of the physical disk drive is unknown and the content of the rack_num
and dencl_num fields is undefined. The rack_num field will not be valid until a
future release. Note that in this case the content of the fed_class, cdb, and
sense_data fields are undefined.
address on the enclosure address bus. The HSV110 controller location has been
identified. The location of the HSV110 controller is contained in the rack_num
and dencl_num fields. The rack_num field will not be valid until a future release.
Note that in this case the content of the bay, fed_class, alpa, cerp_id, port, and
num_times fields are undefined.
32 Storage Management Appliance Software Event Code Definitions Application Notes
Page 33

Table 8: HSV Element Manager Event Codes: Controller Events (Continued)
HSV Element Manager Event Codes
Event
ID
1564 8803061c 3 6 1c Storage Cell: %1 Event Code: %2 Description: A non-data exchange frame sent
2305 88030901 2 9 1 Storage Cell: %1 Event Code: %2 Description: The state of the Physical Disk
2306 88030902 2 9 2 Storage Cell: %1 Event Code: %2 Description: The state of the Volume identified
2307 88030903 2 9 3 Storage Cell: %1 Event Code: %2 Description: The state of The internal Logical
2308 88030904 2 9 4 Storage Cell: %1 Event Code: %2 Description: The state of the HSV110
2309 88030905 2 9 5 Storage Cell: %1 Event Code: %2 Description: The state of a battery assembly
2310 88030906 6 9 6 Storage Cell: %1 Event Code: %2 Description: The state of the Volume identified
Event
Code
Severity
SWC IDEvt.
No.
Description
to a physical disk drive has timed out. The identity of the physical disk drive is
contained in the device field. The Fibre Channel port used to communicate with
the physical disk drive is contained in the cerp_id field. The HSV110 controller
internal Fibre Channel port number used to communicate with the physical disk
drive is contained in the port field. The arbitrated loop physical address of the
physical disk drive is contained in the al_pa field. If the bay field contains a
value other than zero, the location of the physical disk drive is contained in the
rack_num, dencl_num, and bay fields. If the bay field contains a zero, the
location of the physical disk drive is unknown and the content of the rack_num
and dencl_num fields is undefined. The rack_num field will not be valid until a
future release. The Fibre Channel Exchange Descriptor class is contained in the
fed_class field. The command issued to the physical disk drive is contained in the
cmd field. Note that in this case the content of the error field is undefined.
Drive identified in the handle field has transitioned to the NORMAL state. The
value.ul1 field contains the new state: 1 (NORMAL). The value.ul2 field contains
the old state. The state values that may be in the value.ul2 field are as follows: 2
= Degraded 3 = Failed 4 = Not present
in the handle field has changed. The value.ul1 field contains the new state. The
value.ul2 field contains the old state. The state values that may be found in the
value.ul1 and value.ul2 fields are as follows: 1 = Normal 2 = Migrating 3 =
Missing 4 = Reconstructing 5 = Completing 6 = Reverting 7 = Failed
Disk associated with the Virtual Disk identified in the handle field has changed.
The value.ul1 field contains the new state. The value.ul2 field contains the old
state. The state values that may be found in the value.ul1 and value.ul2 fields are
as follows: 1 = Normal 2 = Replacement delay in progress 3 = Redundancy lost,
restore in progress 4 = Redundancy lost, restore stalled 5 = Failed 6 = Creation in
progress 7 = Snapshot is inoperative due to lack of snapshot space 8 = Deletion
in progress 9 = Capacity change in progress 10 = Inoperative due to data lost
controller identified in the handle field has transitioned to the NORMAL state. The
value.ul1 field contains the new state: 1 (NORMAL). The value.ul2 field contains
the old state: 3 (FAILED).
within the HSV110 controller identified in the handle field has changed. The
value.ul1 field contains the new state. The value.ul2 field contains the old state.
The state values that may be found in the value.ul1 and value.ul2 fields are as
follows: 1 = Battery System Hold-up Time is greater than 96 hours 3 = Battery
System Hold-up Time is greater than 0 and less than 96 hours 5 = Battery System
Hold-up Time is zero hours
in the handle field has transitioned to the MISSING state. The value.ul1 field
contains the new state: 3 (MISSING). The value.ul2 field contains the old state.
The state values that may be found in the value.ul2 field are as follows: 1 =
Normal 2 = Migrating 4 = Reconstructing 5 = Completing 6 = Reverting 7 =
Failed
33Storage Management Appliance Software Event Code Definitions Application Notes
Page 34

HSV Element Manager Event Codes
Table 8: HSV Element Manager Event Codes: Controller Events (Continued)
Event
ID
2311 88030907 2 9 7 Storage Cell: %1 Event Code: %2 Description: The state of the Fibre Channel
2312 88030908 3 9 8 Storage Cell: %1 Event Code: %2 Description: The Occupancy Alarm Level
2313 88030909 2 9 9 Storage Cell: %1 Event Code: %2 Description: The Resource Availability state of
2314 8803090a 2 9 a Storage Cell: %1 Event Code: %2 Description: The Data Availability state of the
2316 8803090c 2 9 c Storage Cell: %1 Event Code: %2 Description: The Snapclone Logical Disk
2317 8803090d 2 9 d Storage Cell: %1 Event Code: %2 Description: The state of the Quorum Disk flag
2318 8803090e 3 9 e Storage Cell: %1 Event Code: %2 Description: The temperature trip point for a
2319 8803090f 3 9 f Storage Cell: %1 Event Code: %2 Description: A temperature sensor located
2321 88030911 2 9 11 Storage Cell: %1 Event Code: %2 Description: The Blower Present flag for the ‘1’
2322 88030912 6 9 12 Storage Cell: %1 Event Code: %2 Description: The ‘1’ blower located within the
2323 88030913 2 9 13 Storage Cell: %1 Event Code: %2 Description: One of the voltage sensors
Event
Code
Severity
SWC IDEvt.
No.
Description
port identified in the attribute.value.str field and located on the rear panel of the
HSV110 controller identified in the handle field has transitioned to the NORMAL
state. The attribute.type field contains the value 4. The value.ul1 field contains the
new state: 1 (NORMAL). The value.ul2 field contains the old state: 2 (FAILED).
Note that the HSV110 controller’s internal identity of the affected Fibre Channel
port is contained in the secondary_id field.
threshold has been reached for the Disk Group identified in the handle field.
the Volume identified in the handle field has transitioned to the SUFFICIENT state.
The value.ul1 field contains the new state: 0 (SUFFICIENT). The value.ul2 field
contains the old state: 1 (INSUFFICIENT).
Logical Disk identified in the handle field has transitioned to the NORMAL state.
The value.ul1 field contains the new state: 0 (NORMAL). The value.ul2 field
contains the old state: 1 (DATA LOST).
identified in the handle field has completed the unsharing operation.
for the Volume identified in the handle field has changed. The value.ul1 field
contains the new state of the Quorum Disk flag. The value.ul2 field contains the
old state of the Quorum Disk flag. The state values that may be found in the
value.ul1 and value.ul2 fields are as follows: 0 = FALSE 1 = TRUE
temperature sensor located within the HSV110 controller identified in the handle
field has been reached.
within the HSV110 controller identified in the handle field is approaching its trip
point. The value.ul1 field contains the current temperature reading from that
sensor in Celsius. The secondary_id field contains the temperature trip point in
Celsius.
blower assembly located within the HSV110 controller identified in the handle
field has transitioned from the NOT PRESENT to PRESENT state indicating that
the blower has been reinstalled. The secondary_id field contains the ‘1’ blower
assembly internal identifier value: 1. The value.ul1 field contains the new state of
the Blower Present flag: 1 (PRESENT). The value.ul2 field contains the old state of
the Blower Present flag: 0 (NOT PRESENT).
HSV110 controller identified in the handle field is running slower than the lowest
acceptable speed. The secondary_id field contains the ‘1’ blower assembly
internal identifier value: 1. The value.ul1 field contains the current speed of the
‘1’ blower. The value.ul2 field contains the lowest acceptable speed for the ‘1’
blower.
located within the HSV110 controller identified in the handle field has reported a
voltage that is out of range. The value.ul1 field contains the out of range voltage
value. The secondary_id field contains the specific voltage threshold value (i.e.,
12V, 5V, 3.3V, 2.5V or 2V). Note that the voltages are expressed in
millivolts--e.g.,12.5V is expressed as 12500.
34 Storage Management Appliance Software Event Code Definitions Application Notes
Page 35

Table 8: HSV Element Manager Event Codes: Controller Events (Continued)
HSV Element Manager Event Codes
Event
ID
2324 88030914 6 9 14 Storage Cell: %1 Event Code: %2 Description: The state of the Volume identified
2325 88030915 6 9 15 Storage Cell: %1 Event Code: %2 Description: The state of the HSV110
2327 88030917 6 9 17 Storage Cell: %1 Event Code: %2 Description: The Battery Present flag for
2328 88030918 2 9 18 Storage Cell: %1 Event Code: %2 Description: The Battery In Use flag for battery
2329 88030919 2 9 19 Storage Cell: %1 Event Code: %2 Description: One of the voltage sensors
2330 8803091a 3 9 1a Storage Cell: %1 Event Code: %2 Description: The battery assembly voltage
2331 8803091b 2 9 1b Storage Cell: %1 Event Code: %2 Description: The state of the Disk Group
2332 8803091c 2 9 1c Storage Cell: %1 Event Code: %2 Description: The Occupancy Alarm Level for
Event
Code
Severity
SWC IDEvt.
No.
Description
in the handle field has transitioned to the FAILED state. The value.ul1 field
contains the new state: 7 (FAILED). The value.ul2 field contains the old state. The
state values that may be found in the value.ul2 fields are as follows: 1 = Normal
2 = Migrating 3 = Missing 4 = Reconstructing 5 = Completing 6 = Reverting
controller identified in the handle field has transitioned to the FAILED state. The
value.ul1 field contains the new state: 3 (FAILED). The value.ul2 field contains the
old state: 1 (NORMAL).
battery assembly ‘1’ located within the HSV110 controller identified in the
handle field has changed from PRESENT to NOT PRESENT indicating that the
battery assembly was removed. The secondary_id field contains the battery
assembly ‘1’ internal identifier value: 1. The value.ul1 field contains the new state
of the Battery Present flag: 0 (NOT PRESENT). The value.ul2 field contains the old
state of the Battery Present flag: 1 (PRESENT).
assembly ‘1’ located within the HSV110 controller identified in the handle field
has transitioned from the NOT IN USE to IN USE state indicating that the battery
assembly is functioning properly. The secondary_id field contains the battery
assembly ‘1’ internal identifier value: 1. The value.ul1 field contains the new state
of the Battery In Use flag: 1 (IN USE). The value.ul2 field contains the old state of
the Battery In Use flag: 0 (NOT IN USE).
located within the HSV110 controller identified in the handle field has reported a
voltage that indicates that a voltage that was previously out of range has returned
to the normal range. The value.ul1 field contains the normal range voltage
value. The secondary_id field contains the voltage threshold value (i.e., 12V, 5V,
3.3V, 2.5V or 2V). Note that the voltages are expressed in thousands--e.g.,
12.5V is expressed as 12500.
regulator located within the HSV110 controller identified in the handle field is
offline.
identified in the handle field has transitioned to the NORMAL state. The value.ul1
field contains the new Disk Group state: 1 (NORMAL). The value.ul2 field
contains the old Disk Group state. The state values that may be found in the
value.ul2 field are as follows: 2 = Disk Group with no redundancy is inoperative
3 = Disk Group with parity redundancy is inoperative 4 = Disk Group with
mirrored redundancy is inoperative 5 = Disk Group with no redundancy is
inoperative, marked for re-use 6 = Disk Group with parity redundancy is
inoperative, marked for re-use 7 = Disk Group with mirrored redundancy is
inoperative, marked for re-use
the Disk Group identified in the handle field has returned to the normal range.
35Storage Management Appliance Software Event Code Definitions Application Notes
Page 36

HSV Element Manager Event Codes
Table 8: HSV Element Manager Event Codes: Controller Events (Continued)
Event
ID
2333 8803091d 6 9 1d Storage Cell: %1 Event Code: %2 Description: The Battery In Use flag for battery
2334 8803091e 2 9 1e Storage Cell: %1 Event Code: %2 Description: The Battery Present flag for
2335 8803091f 6 9 1f Storage Cell: %1 Event Code: %2 Description: The Battery Present flag for
2336 88030920 2 9 20 Storage Cell: %1 Event Code: %2 Description: The Battery Present flag for
2337 88030921 2 9 21 Storage Cell: %1 Event Code: %2 Description: The Battery In Use flag for battery
2338 88030922 6 9 22 Storage Cell: %1 Event Code: %2 Description: The Battery In Use flag for battery
2339 88030923 6 9 23 Storage Cell: %1 Event Code: %2 Description: The Blower Present flag for the ‘2’
Event
Code
Severity
SWC IDEvt.
No.
Description
assembly ‘1’ located within the HSV110 controller identified in the handle field
has transitioned from the IN USE to NOT IN USE state indicating that the battery
assembly has malfunctioned. The secondary_id field contains the battery
assembly ‘1’ internal identifier value: 1. The value.ul1 field contains the new state
of the Battery In Use flag: 0 (NOT IN USE). The value.ul2 field contains the old
state of the Battery In Use flag: 1 (IN USE).
battery assembly ‘1’ located within the HSV110 controller identified in the
handle field has changed from NOT PRESENT to PRESENT indicating that the
battery assembly was reinstalled. The secondary_id field contains the battery
assembly ‘1’ internal identifier value: 1. The value.ul1 field contains the new state
of the Battery Present flag: 1 (PRESENT). The value.ul2 field contains the old state
of the Battery Present flag: 0 (NOT PRESENT).
battery assembly ‘2’ located within the HSV110 controller identified in the
handle field has changed from PRESENT to NOT PRESENT indicating that the
battery assembly was removed. The secondary_id field contains the battery
assembly ‘2’ internal identifier value: 2. The value.ul1 field contains the new state
of the Battery Present flag: 0 (NOT PRESENT). The value.ul2 field contains the old
state of the Battery Present flag: 1 (PRESENT).
battery assembly ‘2’ located within the HSV110 controller identified in the
handle field has changed from NOT PRESENT to PRESENT indicating that the
battery assembly was reinstalled. The secondary_id field contains the battery
assembly ‘2’ internal identifier value: 2. The value.ul1 field contains the new state
of the Battery Present flag: 1 (PRESENT). The value.ul2 field contains the old state
of the Battery Present flag: 0 (NOT PRESENT).
assembly ‘2’ located within the HSV110 controller identified in the handle field
has transitioned from the NOT IN USE to IN USE state indicating that the battery
assembly is functioning properly. The secondary_id field contains the battery
assembly ‘2’ internal identifier value: 2. The value.ul1 field contains the new state
of the Battery In Use flag: 1 (IN USE). The value.ul2 field contains the old state of
the Battery In Use flag: 0 (NOT IN USE).
assembly ‘2’ located within the HSV110 controller identified in the handle field
has transitioned from the IN USE to NOT IN USE state indicating that the battery
assembly has malfunctioned. The secondary_id field contains the battery
assembly ‘2’ internal identifier value: 2. The value.ul1 field contains the new state
of the Battery In Use flag: 0 (NOT IN USE). The value.ul2 field contains the old
state of the Battery In Use flag: 1 (IN USE).
blower assembly located within the HSV110 controller identified in the handle
field has transitioned from the PRESENT to NOT PRESENT state indicating that
the blower has been removed. The secondary_id field contains the ‘2’ blower
assembly internal identifier value: 2. The value.ul1 field contains the new state of
the Blower Present flag: 0 (NOT PRESENT). The value.ul2 field contains the old
state of the Blower Present flag: 1 (PRESENT).
36 Storage Management Appliance Software Event Code Definitions Application Notes
Page 37

Table 8: HSV Element Manager Event Codes: Controller Events (Continued)
HSV Element Manager Event Codes
Event
ID
2340 88030924 2 9 24 Storage Cell: %1 Event Code: %2 Description: The Blower Present flag for the ‘2’
2341 88030925 6 9 25 Storage Cell: %1 Event Code: %2 Description: The ‘2’ blower located within the
2342 88030926 6 9 26 Storage Cell: %1 Event Code: %2 Description: The Blower/Power Supply Present
2343 88030927 2 9 27 Storage Cell: %1 Event Code: %2 Description: The Blower/Power Supply Present
2344 88030928 6 9 28 Storage Cell: %1 Event Code: %2 Description: The Blower/Power Supply Present
2345 88030929 2 9 29 Storage Cell: %1 Event Code: %2 Description: The Blower/Power Supply Present
2346 8803092a 6 9 2a Storage Cell: %1 Event Code: %2 Description: The ‘1’ blower/power supply
Event
Code
Severity
SWC IDEvt.
No.
Description
blower assembly located within the HSV110 controller identified in the handle
field has transitioned from the NOT PRESENT to PRESENT state indicating that
the blower has been reinstalled. The secondary_id field contains the ‘2’ blower
assembly internal identifier value: 2. The value.ul1 field contains the new state of
the Blower Present flag: 1 (PRESENT). The value.ul2 field contains the old state of
the Blower Present flag: 0 (NOT PRESENT).
HSV110 controller identified in the handle field is running slower than the lowest
acceptable speed. The secondary_id field contains the ‘2’ blower assembly
internal identifier value: 2. The value.ul1 field contains the current speed of the
‘2’ blower. The value.ul2 field contains the lowest acceptable speed for the ‘2’
blower.
flag for the ‘1’ blower/power supply assembly located within the HSV110
controller identified in the handle field has transitioned from the PRESENT to
NOT PRESENT state indicating that the blower/power supply has been removed.
The secondary_id field contains the ‘1’ blower/power supply assembly internal
identifier value: 1. The value.ul1 field contains the new state of the Blower/Power
Supply Present flag: 0 (NOT PRESENT). The value.ul2 field contains the old state
of the Blower/Power Supply Present flag: 1 (PRESENT).
flag for the ‘1’ blower/power supply assembly located within the HSV110
controller identified in the handle field has transitioned from the NOT PRESENT
to PRESENT state indicating that the blower/power supply has been reinstalled.
The secondary_id field contains the ‘1’ blower/power supply assembly internal
identifier value: 1. The value.ul1 field contains the new state of the Blower/Power
Supply Present flag: 1 (PRESENT). The value.ul2 field contains the old state of the
Blower/Power Supply Present flag: 0 (NOT PRESENT).
flag for the ‘2’ blower/power supply assembly located within the HSV110
controller identified in the handle field has transitioned from the PRESENT to
NOT PRESENT state indicating that the blower/power supply has been removed.
The secondary_id field contains the ‘2’ blower/power supply assembly internal
identifier value: 2. The value.ul1 field contains the new state of the Blower/Power
Supply Present flag: 0 (NOT PRESENT). The value.ul2 field contains the old state
of the Blower/Power Supply Present flag: 1 (PRESENT).
flag for the ‘2’ blower/power supply assembly located within the HSV110
controller identified in the handle field has transitioned from the NOT PRESENT
to PRESENT state indicating that the blower/power supply has been reinstalled.
The secondary_id field contains the ‘2’ blower/power supply assembly internal
identifier value: 2. The value.ul1 field contains the new state of the Blower/Power
Supply Present flag: 1 (PRESENT). The value.ul2 field contains the old state of the
Blower/Power Supply Present flag: 0 (NOT PRESENT).
located within the HSV110 controller identified in the handle field is running
slower than the lowest acceptable speed. The secondary_id field contains the ‘1’
blower/power supply assembly internal identifier value: 1. The value.ul1 field
contains the current speed of the ‘1’ blower/power supply. The value.ul2 field
contains the lowest acceptable speed for the ‘1’ blower/power supply.
37Storage Management Appliance Software Event Code Definitions Application Notes
Page 38

HSV Element Manager Event Codes
Table 8: HSV Element Manager Event Codes: Controller Events (Continued)
Event
ID
2347 8803092b 6 9 2b Storage Cell: %1 Event Code: %2 Description: The ‘2’ blower/power supply
2348 8803092c 3 9 2c Storage Cell: %1 Event Code: %2 Description: The state of a battery assembly
2349 8803092d 6 9 2d Storage Cell: %1 Event Code: %2 Description: The Resource Availability state of
2350 8803092e 2 9 2e Storage Cell: %1 Event Code: %2 Description: The HSV110 controller identified
2351 8803092f 2 9 2f Storage Cell: %1 Event Code: %2 Description: The HSV110 controller identified
2352 88030930 2 9 30 Storage Cell: %1 Event Code: %2 Description: The HSV110 controller identified
2353 88030931 6 9 31 Storage Cell: %1 Event Code: %2 Description: The state of the Physical Disk
2354 88030932 6 9 32 Storage Cell: %1 Event Code: %2 Description: The state of the Physical Disk
2355 88030933 2 9 33 Storage Cell: %1 Event Code: %2 Description: The Derived Unit identified in the
2356 88030934 2 9 34 Storage Cell: %1 Event Code: %2 Description: The internal Logical Disk
Event
Code
Severity
SWC IDEvt.
No.
Description
located within the HSV110 controller identified in the handle field is running
slower than the lowest acceptable speed. The secondary_id field contains the ‘2’
blower/power supply assembly internal identifier value: 2. The value.ul1 field
contains the current speed of the ‘2’ blower/power supply. The value.ul2 field
contains the lowest acceptable speed for the ‘2’ blower/power supply.
within the HSV110 controller identified in the handle field has transitioned to the
Battery System Hold-up Time is zero hours state. The value.ul1 field contains the
new state 3: (Battery System Hold-up Time is zero hours). The value.ul2 field
contains the old state. The state values that may be found in the value.ul2 field
are as follows: 1 = Battery System Hold-up Time is greater than 96 hours 3 =
Battery System Hold-up Time is greater than 0 and less than 96 hours
the Volume identified in the handle field has transitioned to the INSUFFICIENT
state. The value.ul1 field contains the new state: 1 (INSUFFICIENT). The value.ul2
field contains the old state: 0 (SUFFICIENT).
in the handle field rejected a login attempt. The value.ul1 and value.ul2 fields
contain words [0] and [1], respectively, of the World Wide Name of the host
adapter that originated the rejected login attempt. The secondary_id field
contains the reason for the rejection as follows: 50 = The host is already logged
in 101 = Maximum number of logins is exceeded 102 = Invalid cookie was sent
106 = The password is not set on the HSV110 controller
in the handle field processed a StorageCell Management Interface command
with the result of non-success return code. The value.ul1 field contains the
command type. The value.ul2 field contains the return code.
in the handle field has updated the physical disk drive map for the loop pair
identified in the secondary_id field. The value.ul1 field contains the new internal
map generation number. The value.ul2 field contains the old internal map
generation number.
Drive identified in the handle field has transitioned to the DEGRADED state. The
value.ul1 field contains the new state: 2 (DEGRADED). The value.ul2 field
contains the old state. The state values that may be in the value.ul2 field are as
follows: 1 = Normal 3 = Failed 4 = Not present
Drive identified in the handle field has transitioned to the FAILED state. The
value.ul1 field contains the new state: 3 (FAILED). The value.ul2 field contains the
old state. The state values that may be in the value.ul2 field are as follows: 1 =
Normal 2 = Degraded 4 = Not present
handle field was created. The add_handle field contains the identity of the
Storage System Virtual Disk that is associated with that Derived Unit. The
atribute.value.obj field contains the identity of the Virtual Disk associated with
that Derived Unit.
associated with the Virtual Disk identified in the handle field was created.
38 Storage Management Appliance Software Event Code Definitions Application Notes
Page 39

Table 8: HSV Element Manager Event Codes: Controller Events (Continued)
HSV Element Manager Event Codes
Event
ID
2357 88030935 2 9 35 Storage Cell: %1 Event Code: %2 Description: The Disk Group identified in the
2358 88030936 2 9 36 Storage Cell: %1 Event Code: %2 Description: The Physical Disk Drive identified
2359 88030937 2 9 37 Storage Cell: %1 Event Code: %2 Description: The Presented Unit identified in
2360 88030938 2 9 38 Storage Cell: %1 Event Code: %2 Description: The Storage System Host path
2361 88030939 2 9 39 Storage Cell: %1 Event Code: %2 Description: The Storage System Virtual Disk
2362 8803093a 2 9 3a Storage Cell: %1 Event Code: %2 Description: The Volume identified in the
2363 8803093b 2 9 3b Storage Cell: %1 Event Code: %2 Description: The Derived Unit identified in the
2364 8803093c 2 9 3c Storage Cell: %1 Event Code: %2 Description: The internal Logical Disk
2365 8803093d 2 9 3d Storage Cell: %1 Event Code: %2 Description: The Disk Group identified in the
2366 8803093e 6 9 3e Storage Cell: %1 Event Code: %2 Description: The Physical Disk Drive identified
2367 8803093f 2 9 3f Storage Cell: %1 Event Code: %2 Description: The Presented Unit identified in
2368 88030940 2 9 40 Storage Cell: %1 Event Code: %2 Description: The Storage System Host path
2369 88030941 2 9 41 Storage Cell: %1 Event Code: %2 Description: The Storage System Virtual Disk
2370 88030942 6 9 42 Storage Cell: %1 Event Code: %2 Description: The Snapshot Logical Disk
Event
Code
Severity
SWC IDEvt.
No.
Description
handle field was created.
in the handle field was discovered. The enclosure number and bay number where
the Physical Disk Drive is located are contained in the attribute.value.u32[0] and
attribute.value.u32[1] fields, respectively. The attribute.type field contains the
value 1.
the handle field was created. The add_handle field contains the identity of the
Storage System Virtual Disk that is associated with the Presented Unit. This
Presented Unit is associated with the Virtual Disk identified in the
attribute.value.obj.handle field.
identified in the handle field was created.
identified in the handle field was created.
handle field was created. The add_handle field contains the identity of the
Physical Disk Drive that is associated with the Volume.
handle field was deleted. The add_handle field contains the identity of the
Storage System Virtual Disk that was associated with the Derived Unit. This
Derived Unit is associated with the Virtual Disk identified in the
attribute.value.obj.handle field.
associated with the Virtual Disk identified in the handle field was deleted.
handle field was deleted.
in the handle field has disappeared. The enclosure number and bay number
where the Physical Disk Drive was located are contained in the
attribute.value.u32[0] and attribute.value.u32[1] fields, respectively. The
attribute.type field contains the value 1.
the handle field was deleted. The add_handle field contains the identity of the
Storage System Virtual Disk that was associated with the Presented Unit. This
Presented Unit is associated with the Virtual Disk identified in the
attribute.value.obj.handle field.
identified in the handle field was deleted.
identified in the handle field was deleted. The Storage System Virtual Disk is
associated with the Virtual Disk identified in the add_handle field.
identified in the handle field has been marked inoperative due to the Disk Group
being out of space for additional storage allocation.
39Storage Management Appliance Software Event Code Definitions Application Notes
Page 40

HSV Element Manager Event Codes
Table 8: HSV Element Manager Event Codes: Controller Events (Continued)
Event
ID
2371 88030943 2 9 43 Storage Cell: %1 Event Code: %2 Description: The HSV110 controller identified
2372 88030944 6 9 44 Storage Cell: %1 Event Code: %2 Description: The HSV110 controller identified
2373 88030945 2 9 45 Storage Cell: %1 Event Code: %2 Description: The Storage System identified by
2405 88030965 2 9 65 Storage Cell: %1 Event Code: %2 Description: The Host Operating System mode
2406 88030966 2 9 66 Storage Cell: %1 Event Code: %2 Description: Time was set on the Storage
2407 88030967 2 9 67 Storage Cell: %1 Event Code: %2 Description: The LUN of the Presented Unit
2408 88030968 2 9 68 Storage Cell: %1 Event Code: %2 Description: The Device Addition Policy of the
2409 88030969 2 9 69 Storage Cell: %1 Event Code: %2 Description: The Quiescent state of the
Event
Code
Severity
SWC IDEvt.
No.
Description
in the handle field has joined the Storage System. If the handle field is zero, the
HSV110 controller identity could not be obtained due to an unexpected state
transition.
in the handle field has left the Storage System. If the handle field is zero, the
HSV110 controller identity could not be obtained due to an unexpected state
transition.
the handle field was deleted by the HSV110 controller identified in the
add_handle field. If the handle field or add_handle field is zero, the
corresponding identity could not be obtained due to an unexpected state
transition.
of the Storage System Host identified in the handle field has changed. The
old_attr.type and new_attr.type fields contain the value 1. The
old_attr.value.u32[0] field contains the old Host Operating System mode. The
new_attr.value.u32[0] field contains the new Host Operating System mode. The
values that may be found in the old_attr.value.u32[0] and new_attr.value.u32[0]
fields are as follows: 0 = Unknown 1 = User defined 2 = Unused 3 = WINNT
with SecurePath 4 = VMS 5 = TRU64 UNIX 6 = Sun UNIX 7 = NetWare 8 = HP
9 = IBM 10 = LINUX 11 = SCO UNIX
System identified in the handle field.
identified in the handle field has changed. The old_attr.type field and the
new_attr.type fields contain the value 1. The old_attr.value.u32[0..1] fields
contain the value of the old LUN. The new_attr.value.u32[0..1] fields contain the
value of the new LUN. The secondary_id field contains the noid portion of the
handle for the Storage System Virtual Disk associated with the Presented Unit.
This Presented Unit is associated with the Virtual Disk identified in the
add_handle field.
Storage System identified in the handle field has changed. The old_attr.type field
and the new_attr.type fields contain the value 1. The old_attr.value.u32[0] field
contains the old Device Addition Policy. The new_attr.value.u32[0] field contains
the new Device Addition Policy. The policy values that may be found in the
old_attr.value.u32[0] and new_attr.value.u32[0] fields are as follows: 1 =
Manual policy 2 = Automatic policy
Storage System Virtual Disk identified in the handle field has changed. The
old_attr.type field and the new_attr.type fields contain the value 1. The
old_attr.value.u32[0] field contains the old Quiescent state. The
new_attr.value.u32[0] field contains the new Quiescent state. The state values
that may be found in the old_attr.value.u32[0] and new_attr.value.u32[0] fields
are as follows: 0 = FALSE 1 = TRUE This Storage System Virtual Disk is associated
with the Virtual Disk identified in the add_handle field.
40 Storage Management Appliance Software Event Code Definitions Application Notes
Page 41

Table 8: HSV Element Manager Event Codes: Controller Events (Continued)
HSV Element Manager Event Codes
Event
ID
2410 8803096a 2 9 6a Storage Cell: %1 Event Code: %2 Description: The Enabled/Disabled state of
2411 8803096b 2 9 6b Storage Cell: %1 Event Code: %2 Description: The Cache Policy of the Storage
2412 8803096c 2 9 6c Storage Cell: %1 Event Code: %2 Description: The Usage state of the Volume
2413 8803096d 2 9 6d Storage Cell: %1 Event Code: %2 Description: The Disk Failure Protection Level
2414 8803096e 2 9 6e Storage Cell: %1 Event Code: %2 Description: The Write Protected state of the
2416 88030970 3 9 70 Storage Cell: %1 Event Code: %2 Description: The Physical Disk Drive identified
Event
Code
Severity
SWC IDEvt.
No.
Description
the Storage System Virtual Disk identified in the handle field has changed. The
old_attr.type field and the new_attr.type fields contain the value 1. The
old_attr.value.u32[0] field contains the old Enabled/Disabled state. The
new_attr.value.u32[0] field contains the new Enabled/Disabled state. The state
values that may be found in the old_attr.value.u32[0] and new_attr.value.u32[0]
fields are as follows: 1 = Disabled 2 = Enabled This Storage System Virtual Disk
is associated with the Virtual Disk identified in the add_handle field.
System Virtual Disk identified in the handle field has changed. The old_attr.type
field and the new_attr.type fields contain the value 1. The old_attr.value.u32[0]
field contains the old Write Cache Policy. The new_attr.value.u32[0] field
contains the new Write Cache Policy. The policy values that may be found in the
old_attr.value.u32[0] and new_attr.value.u32[0] fields are as follows: 1 =
Writethrough 2 = Writeback The old_attr.value.u32[1] field contains the old
Read Cache Policy. The new_attr.value.u32[1] field contains the new Read Cache
Policy. The policy values that may be found in the old_attr.value.u32[1] and
new_attr.value.u32[1] fields are as follows: 1 = Read cache on 2 = Read cache
off The old_attr.value.u32[2] field contains the old Cache Mirroring Policy. The
new_attr.value.u32[2] field contains the new Cache Mirroring Policy. The policy
values that may be found in the old_attr.value.u32[2] and new_attr.value.u32[ 2]
fields are as follows: 1 = Mirror 2 = No mirror This Storage System Virtual Disk is
associated with the Virtual Disk identified in the add_handle field.
identified in the handle field has changed. The old_attr.value.u32[0] field
contains the old Usage state. The new_attr.value.u32[0] field contains the new
Usage state. The Usage state values that may be found in the
old_attr.value.u32[0] and new_attr.value.u32[0] fields are as follows: 1 = Disk
Group 2 = Reserved
of the Disk Group identified in the handle field has changed. The old_attr.type
and new_attr.type fields contain the value 1. The old_attr.value.u32[0] field
contains the old number of physical disk drives available for use. The
new_attr.value.u32[0] field contains the new number of physical disk drives
available for use.
Derived Unit identified in the handle field has changed. The secondary_id field
contains the noid portion of the handle for the Storage System Virtual Disk
associated with the Derived Unit. The old_attr.type field and the new_attr.type
fields contain the value 1. The old_attr.value.u32[0] field contains the old Write
Protected state. The new_attr.value.u32[0] field contains the new Write Protected
state. The Write Protected state values that may be found in the
old_attr.value.u32[0] and new_attr.value.u32[0] fields are as follows: 0 = Write
protect off 1 = Write protect on This Derived Unit is associated with the Virtual
Disk identified in the add_handle field.
in the handle field has experienced numerous communication failures on a
particular Fibre Channel port.
41Storage Management Appliance Software Event Code Definitions Application Notes
Page 42

HSV Element Manager Event Codes
Table 8: HSV Element Manager Event Codes: Controller Events (Continued)
Event
ID
2417 88030971 2 9 71 Storage Cell: %1 Event Code: %2 Description: The HSV110 controller identified
2418 88030972 2 9 72 Storage Cell: %1 Event Code: %2 Description: The HSV110 controller identified
2504 880309c8 6 9 c8 Storage Cell: %1 Event Code: %2 Description: The Data Availability state of the
2505 880309c9 6 9 c9 Storage Cell: %1 Event Code: %2 Description: The state of the Disk Group
Event
Code
Severity
SWC IDEvt.
No.
Description
in the handle field received a request to shutdown. The old_attr.type field and the
new_attr.type fields contain the value 1. The old_attr.value.u32[0] field indicates
the type of restart that was requested as follows: 0 = None -- no restart 1 =
Regular -- full restart, host system connectivity is lost until the controller returns to
normal operation 2 = Fast -- resynchronization, restart of the controller in a
manner that has little or no impact on host system connectivity The
old_attr.value.u32[1] field indicates whether the other HSV110 controller of the
pair was requested to remain operational or to also shutdown as follows: 0 =
Remain operational 1 = Coupled shutdown The old_attr.value.u32[2] field
indicates whether the HSV110 controller was requested to remain in the power
on state or power itself off as follows: 0 = Remain in the power on state 1 =
Power itself off The old_attr.value.u32[3] field value indicates whether the
Physical Disk Drive enclosure(s) was requested to remain in the power on state or
to be powered off as follows: 0 = Remain in the power on state 1 = Powered off
The old_attr.value.u32[4] field value indicates whether the battery assemblies
located within the HSV110 controller were requested to be enabled or disabled
as follows: 0 = Enabled 1 = Disabled The old_attr.value.u32[5] field contains the
number of seconds the shutdown operation was requested to be delayed.
in the handle field has completed its shutdown preparations. The old_attr.type
field and the new_attr.type fields contain the value 1. The old_attr.value.u32[0]
field value indicates the result of the HSV110 controller Cache Memory shutdown
operation as follows: 1 = Success 2 = Failure 3 = Not applicable The
old_attr.value.u32[1] field contains the internal Storage System Management
Interface cache shutdown status code. The old_attr.value.u32[2] field value
indicates the result of the Physical Disk Drive enclosure(s) power off operation as
follows: 1 = Success 2 = Failure 3 = Not applicable The old_attr.value.u32[3]
field contains the internal Storage System Management Interface Physical Disk
Drive enclosure(s) power off status code. The old_attr.value.u32[4] field value
indicates the result of the battery assemblies disable operation as follows: 1 =
Success 2 = Failure 3 = Not applicable <P > The old_attr.value.u32[5] field value
indicates the battery assemblies disable operation failure mode as follows: 0 =
No failure indicated. 1 = Failed only on the HSV110 controller identified in the
handle field. 2 = Failed only on the other HSV110 controller of the pair. 3 =
Failed on both HSV110 controllers.
internal Logical Disk associated with the Virtual Disk identified in the handle field
has has transitioned to the DATA LOST state. The value.ul1 field contains the new
state: 1 (DATA LOST). The value.ul2 field contains the old state: 0 (NORMAL).
identified in the handle field has transitioned to an INOPERATIVE state. The
value.ul1 field contains the new Disk Group state. The value.ul2 field contains the
old Disk Group state. The state values that may be found in the value.ul1 and
value.ul2 fields are as follows: 1 = Normal 2 = Disk Group with no redundancy
is inoperative 3 = Disk Group with parity redundancy is inoperative 4 = Disk
Group with mirrored redundancy is inoperative 5 = Disk Group with no
redundancy is inoperative, marked for re-use 6 = Disk Group with parity
redundancy is inoperative, marked for re-use 7 = Disk Group with mirrored
redundancy is inoperative, marked for re-use
42 Storage Management Appliance Software Event Code Definitions Application Notes
Page 43

Table 8: HSV Element Manager Event Codes: Controller Events (Continued)
HSV Element Manager Event Codes
Event
ID
2506 880309ca 6 9 ca Storage Cell: %1 Event Code: %2 Description: The state of the internal Logical
2507 880309cb 6 9 cb Storage Cell: %1 Event Code: %2 Description: The state of the internal Logical
2508 880309cc 6 9 cc Storage Cell: %1 Event Code: %2 Description: The state of the internal Logical
2509 880309cd 6 9 cd Storage Cell: %1 Event Code: %2 Description: The state of the Fibre Channel
2510 880309ce 2 9 ce Storage Cell: %1 Event Code: %2 Description: The state of the Disk Group
2511 880309cf 3 9 cf Storage Cell: %1 Event Code: %2 Description: The state of the Physical Disk
2512 880309d0 2 9 d0 Storage Cell: %1 Event Code: %2 Description: The HSV110 controller identified
Event
Code
Severity
SWC IDEvt.
No.
Description
Disk associated with the Virtual Disk identified in the handle field has transitioned
to the FAILED state. The value.ul1 field contains the new state: 5 (FAILED). The
value.ul2 field contains the old state. The state values that may be found in the
value.ul2 field are as follows: 1 = Normal 2 = Replacement delay in progress 3 =
Redundancy lost, restore in progress 4 = Redundancy lost, restore stalled 6 =
Creation in progress 7 = Snapshot is inoperative due to lack of snapshot space 8
= Deletion in progress 9 = Capacity change in progress 10 = Inoperative due to
data lost
Disk associated with the Virtual Disk identified in the handle field has transitioned
to the SNAPSHOT OVERCOMMIT state. The value.ul1 field contains the new
state: 7 (SNAPSHOT OVERCOMMIT). The value.ul2 field contains the old state.
The state values that may be found in the value.ul2 field are as follows: 1 =
Normal 2 = Replacement delay in progress 3 = Redundancy lost, restore in
progress 4 = Redundancy lost, restore stalled 5 = Failed 6 = Creation in progress
8 = Deletion in progress 9 = Capacity change in progress 10 = Inoperative due
to device data lost
Disk associated with the Virtual Disk identified in the handle field has transitioned
to the DEVICE DATA LOST state. The value.ul1 field contains the new state: 10
(DEVICE DATA LOST). The value.ul2 field contains the old state. The state values
that may be found in the value.ul2 field are as follows: 1 = Normal 2 =
Replacement delay in progress 3 = Redundancy lost restore, in progress 4 =
Redundancy lost restore, stalled 5 = Failed 6 = Creation in progress 7 =
Snapshot is inoperative due to lack of snapshot space 8 = Deletion in progress 9
= Capacity change in progress
port identified in the attribute.value.str field and located on the rear panel of the
HSV110 controller identified in the handle field has transitioned to the FAILED
state. The attribute.type field contains the value 4. The value.ul1 field contains
the new state: 2 (FAILED). The value.ul2 field contains the old state: 1
(NORMAL). Note that the HSV110 controller’s internal identity of the affected
Fibre Channel port is contained in the secondary_id field.
identified in the handle field has transitioned to an INOPERATIVE MARKED state.
The value.ul1 field contains the new Disk Group state. The value.ul2 field
contains the old Disk Group state. The state values that may be found in the
value.ul1 and value.ul2 fields are as follows: 1 = Normal 2 = Disk Group with no
redundancy is inoperative 3 = Disk Group with parity redundancy is inoperative
4 = Disk Group with mirrored redundancy is inoperative 5 = Disk Group with no
redundancy is inoperative, marked for re-use 6 = Disk Group with parity
redundancy is inoperative, marked for re-use 7 = Disk Group with mirrored
redundancy is inoperative, marked for re-use
Drive identified in the handle field has transitioned to the NOT PRESENT state.
The value.ul1 field contains the new state: 4 (NOT PRESENT). The value.ul2 field
contains the old state. The state values that may be in the value.ul2 field are as
follows: 1 = Normal 2 = Degraded 3 = Failed
in the handle field no longer needs attention.
43Storage Management Appliance Software Event Code Definitions Application Notes
Page 44

HSV Element Manager Event Codes
Table 8: HSV Element Manager Event Codes: Controller Events (Continued)
Event
ID
2513 880309d1 6 9 d1 Storage Cell: %1 Event Code: %2 Description: The HSV110 controller identified
2514 880309d2 6 9 d2 Storage Cell: %1 Event Code: %2 Description: The Blower Present flag for the ‘1’
2816 88030b00 2 b 0 Storage Cell: %1 Event Code: %2 Description: The HSV110 controller identified
3072 88030c00 2 c 0 Storage Cell: %1 Event Code: %2 Description: The specified destination virtual
3073 88030c01 6 c 1 Storage Cell: %1 Event Code: %2 Description: The specified source virtual disk
3074 88030c02 6 c 2 Storage Cell: %1 Event Code: %2 Description: The specified source virtual disk
3076 88030c04 6 c 4 Storage Cell: %1 Event Code: %2 Description: The specified source virtual disk
3077 88030c05 6 c 5 Storage Cell: %1 Event Code: %2 Description: The specified source virtual disk
3078 88030c06 6 c 6 Storage Cell: %1 Event Code: %2 Description: An unrecoverable read error
3079 88030c07 6 c 7 Storage Cell: %1 Event Code: %2 Description: A full copy terminated prior to
3080 88030c08 6 c 8 Storage Cell: %1 Event Code: %2 Description: A full copy terminated prior to
3081 88030c09 6 c 9 Storage Cell: %1 Event Code: %2 Description: The specified log logical disk has
Event
Code
Severity
SWC IDEvt.
No.
Description
in the handle field needs attention.
blower assembly located within the HSV110 controller identified in the handle
field has transitioned from the PRESENT to NOT PRESENT state indicating that
the blower has been removed. The secondary_id field contains the ‘1’ blower
assembly internal identifier value: 1. The value.ul1 field contains the new state of
the Blower Present flag: 0 (NOT PRESENT). The value.ul2 field contains the old
state of the Blower Present flag: 1 (PRESENT).
by the node_name field has begun a resynchronization operation (i.e., a restart
of the controllers in a manner that has little or no impact on host system
connectivity). The information.pc field contains the program counter of
resynchronization operation initiator. The information.flags field contains reboot
flags value. The information.code field contains the resynchronization operation
event code value.
disk has successfully completed a full copy. The following fields are not valid:
status, blocks, vda.
has transitioned to the logging state, because the alternate site is not accessible
or the DRM group is suspended. The following fields are not valid: status, blocks,
vda, port, side.
has transitioned to the logging state, because the destination virtual disk is not
accessible. The following fields are not valid: status, blocks, vda, port, side.
has been forced inoperative due to a failsafe locked condition. Either the
destination is not accessible or a member virtual disk in the group has gone
inoperative. The following fields are not valid: status, blocks, vda, port, side.
has been forced inoperative due to a failsafe locked condition. Either the
destination is not accessible or a member virtual disk in the group has gone
inoperative. The following fields are not valid: status, blocks, vda, port, side.
occurred on the specified source virtual disk during the full copy. The virtual disk
address (vda) specified indicates the first block in error. The full copy was
terminated.
completion. A remote copy error occurred, due to an inaccessible alternate site.
The virtual disk address specified indicates the first block in error. The full copy
will continue when the destination is restored.
completion. A remote copy error occurred, due to an inaccessible destination
virtual disk. The virtual disk address specified indicates the first block in error.
The full copy will continue when the destination is restored.
been reset due to insufficient storage space. The destination has been marked
for a full copy. The following fields are not valid: status, blocks, vda, port, side.
44 Storage Management Appliance Software Event Code Definitions Application Notes
Page 45

Table 8: HSV Element Manager Event Codes: Controller Events (Continued)
HSV Element Manager Event Codes
Event
ID
3082 88030c0a 2 c a Storage Cell: %1 Event Code: %2 Description: The specified log logical disk has
3084 88030c0c 2 c c Storage Cell: %1 Event Code: %2 Description: The specified destination virtual
3087 88030c0f 2 c f Storage Cell: %1 Event Code: %2 Description: The specified virtual disk is no
3088 88030c10 2 c 10 Storage Cell: %1 Event Code: %2 Description: The specified destination virtual
3089 88030c11 2 c 11 Storage Cell: %1 Event Code: %2 Description: This site has just discovered that a
3090 88030c12 2 c 12 Storage Cell: %1 Event Code: %2 Description: This site has just discovered that a
3092 88030c14 6 c 14 Storage Cell: %1 Event Code: %2 Description: The specified destination DRM
3328 88030d00 6 d 0 Storage Cell: %1 Event Code: %2 Description: Unrecognized event reported by
3329 88030d01 6 d 1 Storage Cell: %1 Event Code: %2 Description: A physical disk drive that is not
3330 88030d02 3 d 2 Storage Cell: %1 Event Code: %2 Description: A physical disk drive is
3331 88030d03 3 d 3 Storage Cell: %1 Event Code: %2 Description: A physical disk drive was
Event
Code
Severity
SWC IDEvt.
No.
Description
been reset due to site failover. The following fields are not valid: status, blocks,
vda.
disk has successfully completed a merge. The following fields are not valid:
status, blocks, vda.
longer failsafe locked. The following fields are not valid: status, blocks, vda, port,
side.
disk has been marked for a full copy. The following fields are not valid: status,
blocks, vda.
site failover has taken place. This group is transitioning from a source role to a
destination role. The following fields are not valid: status, blocks, vda.
site failover has taken place. This group is transitioning from a destination role to
a source role. The following fields are not valid: status, blocks, vda.
group was not found. The destination group appears to have been deleted by
the user after a site failover, therefore this dangling DRM source group should
likewise be deleted.
a Drive Enclosure Environmental Monitoring Unit. The event was reported by the
Drive Enclosure Environmental Monitoring Unit located in the drive enclosure
identified in the dencl_num field within the rack identified in the rack_num field.
The rack_num field will not be valid until a future release. The content of the
alarm_error_code field could not be translated into a known event.
Fibre Channel compatible or cannot operate at the link rate established by the
drive enclosure I/O modules was detected. This problem was detected by the
Drive Enclosure Environmental Monitoring Unit located in the drive enclosure
identified in the dencl_num field within the rack identified in the rack_num field
during spin up of the physical disk drive installed in the drive enclosure bay
identified in the alarm_error_code.field.en field. The rack_num field will not be
valid until a future release.
improperly installed or missing. This could affect the drive enclosure air flow and
cause an over temperature condition. This problem was detected by the Drive
Enclosure Environmental Monitoring Unit located in the drive enclosure identified
in the dencl_num field within the rack identified in the rack_num field. The
rack_num field will not be valid until a future release. The affected drive enclosure
bay is identified in the alarm_error_code.field.en field.
removed while software-activated drive locking was enabled on a drive enclosure
that does not support drive locking. This problem was detected by the Drive
Enclosure Environmental Monitoring Unit located in the drive enclosure identified
in the dencl_num field within the rack identified in the rack_num field. The
rack_num field will not be valid until a future release. The affected drive enclosure
bay is identified in the alarm_error_code.field.en field.
45Storage Management Appliance Software Event Code Definitions Application Notes
Page 46

HSV Element Manager Event Codes
Table 8: HSV Element Manager Event Codes: Controller Events (Continued)
Event
ID
3332 88030d04 6 d 4 Storage Cell: %1 Event Code: %2 Description: A physical disk drive that is
3379 88030d33 3 d 33 Storage Cell: %1 Event Code: %2 Description: The AC input to a drive enclosure
3380 88030d34 6 d 34 Storage Cell: %1 Event Code: %2 Description: A drive enclosure power supply is
3381 88030d35 6 d 35 Storage Cell: %1 Event Code: %2 Description: A drive enclosure power supply
Event
Code
Severity
SWC IDEvt.
No.
Description
capable of operating at the loop link rate established by the drive enclosure I/O
module was found to be running at a different rate. This problem was detected
by the Drive Enclosure Environmental Monitoring Unit located in the drive
enclosure identified in the dencl_num field within the rack identified in the
rack_num field. The rack_num field will not be valid until a future release. The
affected physical disk drive is installed in the drive enclosure bay identified in the
alarm_error_code.field.en field. The Fibre Channel loop on which the problem
was detected is identified by the content of the alarm_error_code.field.ec field as
follows: 4 = loop A 5 = loop B
power supply has been lost. This makes the remaining power supply a single
point of failure. This problem was detected by the Drive Enclosure Environmental
Monitoring Unit located in the drive enclosure identified in the dencl_num field
within the rack identified in the rack_num field. The rack_num field will not be
valid until a future release. The location of the affected power supply (1 or 2) is
identified in the alarm_error_code.field.en field.
improperly installed or missing. This could affect the drive enclosure air flow and
cause an over temperature condition. The operational power supply will
automatically shut down after a short period of time, thereby disabling the drive
enclosure. This condition remains active until either the problem is corrected, or
the operational power supply shuts down, whichever occurs first. This problem
was detected by the Drive Enclosure Environmental Monitoring Unit located in the
drive enclosure identified in the dencl_num field within the rack identified in the
rack_num field. The rack_num field will not be valid until a future release. The
location of the affected power supply (1 or 2) is identified in the
alarm_error_code.field.en field.
component has failed. This problem was detected by the Drive Enclosure
Environmental Monitoring Unit located in the drive enclosure identified in the
dencl_num field within the rack identified in the rack_num field. The rack_num
field will not be valid until a future release. The location of the affected power
supply (1 or 2) is identified in the alarm_error_code.field.en field.
46 Storage Management Appliance Software Event Code Definitions Application Notes
Page 47

Table 8: HSV Element Manager Event Codes: Controller Events (Continued)
HSV Element Manager Event Codes
Event
ID
3399 88030d47 6 d 47 Storage Cell: %1 Event Code: %2 Description: A drive enclosure blower is not
3403 88030d4b 6 d 4b Storage Cell: %1 Event Code: %2 Description: A drive enclosure blower is
3404 88030d4c 6 d 4c Storage Cell: %1 Event Code: %2 Description: Both drive enclosure blowers are
Event
Code
Severity
SWC IDEvt.
No.
Description
operating properly. This could affect the drive enclosure air flow and cause an
over temperature condition. This problem was detected by the Drive Enclosure
Environmental Monitoring Unit located in the drive enclosure identified in the
dencl_num field within the rack identified in the rack_num field.The rack_num
field will not be valid until a future release. The location of the affected blower (1
or 2) is identified in the alarm_error_code.field.en field. The cause of the
improper operation is described by the content of the alarm_error_code.field.ec
field as follows: 1 = The blower is operating at a speed that is outside of the Drive
Enclosure Environmental Monitoring Unit specified range, possibly because of a
bearing problem. 2 = The blower is operating at a speed that is significantly
outside of the Drive Enclosure Environmental Monitoring Unit specified range,
possibly because of a bearing problem. 3 = The blower has stopped.
NOTE: The other blower (if operational) now operates at high speed and is a
single point of failure. A single blower operating at high speed can provide
sufficient air flow to cool an enclosure and the elements for up to 100 hours.
However, operating an enclosure at temperatures approaching an overheating
threshold can damage elements and may reduce the MTBF of a specific element.
Compaq therefore recommends immediate replacement of the defective blower.
4 = The power supply reported an internal blower error.
improperly installed or missing. This affects the drive enclosure air flow and can
cause an over temperature condition. This problem was detected by the Drive
Enclosure Environmental Monitoring Unit located in the drive enclosure identified
in the dencl_num field within the rack identified in the rack_num field. The
rack_num field will not be valid until a future release. The location of the affected
blower (1 or 2) is identified in the alarm_error_code.field.en field.
missing. This severely affects the drive enclosure air flow and can cause an over
temperature condition. The operational power supply(s) will automatically shut
down after a short period of time, thereby disabling the drive enclosure. This
condition remains active until either the problem is corrected, or the operational
power supply(s) shut down, whichever occurs first. This problem was detected by
the Drive Enclosure Environmental Monitoring Unit located in the drive enclosure
identified in the dencl_num field within the rack identified in the rack_num field.
The rack_num field will not be valid until a future release. Note that this event is
preceded by a ‘drive enclosure blower is improperly installed or missing’ event
that identifies the location of the first missing blower. The location of the second
missing blower (1 or 2) is identified in the alarm_error_code.field.en field of this
event.
47Storage Management Appliance Software Event Code Definitions Application Notes
Page 48

HSV Element Manager Event Codes
Table 8: HSV Element Manager Event Codes: Controller Events (Continued)
Event
ID
3419 88030d5b 3 d 5b Storage Cell: %1 Event Code: %2 Description: A drive enclosure temperature
3423 88030d5f 6 d 5f Storage Cell: %1 Event Code: %2 Description: The average temperature of two
3439 88030d6f 3 d 6f Storage Cell: %1 Event Code: %2 Description: An internal Drive Enclosure
Event
Code
Severity
SWC IDEvt.
No.
Description
sensor out of range condition has been reported by one of the drive enclosure
elements. This problem was detected by the Drive Enclosure Environmental
Monitoring Unit located in the drive enclosure identified in the dencl_num field
within the rack identified in the rack_num field. The rack_num field will not be
valid until a future release. The location of the temperature sensor (1 through 11)
is identified in the alarm_error_code.field.en field as follows: 1 = Power Supply 1
Exhaust 2 = Power Supply 2 Exhaust 3 = Drive Enclosure Environmental
Monitoring Unit 4 = Drive Bay 1 5 = Drive Bay 2 6 = Drive Bay 3 7 = Drive
Bay 4 8 = Drive Bay 5 9 = Drive Bay 6 A = Drive Bay 7 B = Drive Bay 8 C =
Drive Bay 9 D = Drive Bay 10 E = Drive Bay 11 F = Drive Bay 12 10 = Drive
Bay 13 11 = Drive Bay 14 The temperature sensor out of range condition is
described by the content of the alarm_error_code.fie ld.ec field as follows: 1 =
The element temperature is approaching, but has not reached, the high
temperature CRITICAL threshold. Continued operation under these conditions
may result in a CRITICAL condition and may reduce an element’s MTBF. 2 = The
element temperature is above the high temperature CRITICAL threshold.
Continued operation under these conditions may result in element failure. 3 =
The element temperature is approaching, but has not reached, the low
temperature CRITICAL threshold. Continued operation under these conditions
may result in a CRITICAL condition and may reduce an element’s MTBF. 4 = The
element temperature has reached the low temperature CRITICAL threshold.
Continued operation under these conditions may result in element failure. The
actual temperature threshold values can be found in the HSV element manager
GUI.
of the three temperature sensor groups (i.e., Drive Enclosure Environmental
Monitoring Unit, Disk Drives, and Power Supplies) exceeds the CRITICAL level.
The operational power supply(s) will automatically shut down after a short period
of time, thereby disabling the drive enclosure. This condition remains active until
either the problem is corrected, or the operational power supply(s) shut down,
whichever occurs first. This problem was detected by the Drive Enclosure
Environmental Monitoring Unit located in the drive enclosure identified in the
dencl_num field within the rack identified in the rack_num field. The rack_num
field will not be valid until a future release. Note that in this case the content of
the alarm_error_code.field.en field is undefined. The actual temperature
threshold values can be found in the HSV element manager GUI.
Environmental Monitoring Unit error has occurred. This problem was detected by
the Drive Enclosure Environmental Monitoring Unit located in the drive enclosure
identified in the dencl_num field within the rack identified in the rack_num field.
The rack_num field will not be valid until a future release. The
alarm_error_code.field.en field contains the value 1 signifying that the Drive
Enclosure Environmental Monitoring Unit is the affected element. The cause of
the improper operation is described by the content of the
alarm_error_code.field.ec field as follows: 1 = An internal Drive Enclosure
Environmental Monitoring Unit clock error has occurred. 2 = The Inter-IC (I2C)
bus is not processing data and the Drive Enclosure Environmental Monitoring
Unit is unable to monitor or report the status of the elements or enclosures. 5 = A
Backplane NVRAM error has occurred.
48 Storage Management Appliance Software Event Code Definitions Application Notes
Page 49

Table 8: HSV Element Manager Event Codes: Controller Events (Continued)
HSV Element Manager Event Codes
Event
ID
3441 88030d71 2 d 71 Storage Cell: %1 Event Code: %2 Description: An internal Drive Enclosure
3442 88030d72 3 d 72 Storage Cell: %1 Event Code: %2 Description: A Drive Enclosure Environmental
3454 88030d7e 3 d 7e Storage Cell: %1 Event Code: %2 Description: Invalid data was read from a
3455 88030d7f 3 d 7f Storage Cell: %1 Event Code: %2 Description: An internal Drive Enclosure
3458 88030d82 3 d 82 Storage Cell: %1 Event Code: %2 Description: A drive enclosure’s address is
Event
Code
Severity
SWC IDEvt.
No.
Description
Environmental Monitoring Unit error has occurred. This problem was detected by
the Drive Enclosure Environmental Monitoring Unit located in the drive enclosure
identified in the dencl_num field within the rack identified in the rack_num field.
The rack_num field will not be valid until a future release. The
alarm_error_code.field.en field contains the value 1 signifying that the Drive
Enclosure Environmental Monitoring Unit is the affected element. The cause of
the improper operation is described by the content of the
alarm_error_code.field.ec field as follows: 3 = A drive enclosure power supply
was shut down. 16 = The Drive Enclosure Environmental Monitoring Unit ESI data
has been corrupted.
Monitoring Unit is unable to collect data for the SCSI-3 Engineering Services
(SES) page. This problem was detected by the Drive Enclosure Environmental
Monitoring Unit located in the drive enclosure identified in the dencl_num field
within the rack identified in the rack_num field. The rack_num field will not be
valid until a future release. The alarm_error_code.field.en field contains the value
1 signifying that the Drive Enclosure Environmental Monitoring Unit is the
affected element.
Drive Enclosure Environmental Monitoring Unit NVRAM. This problem was
detected by the Drive Enclosure Environmental Monitoring Unit located in the
drive enclosure identified in the dencl_num field within the rack identified in the
rack_num field. The rack_num field will not be valid until a future release. The
alarm_error_code.field.en field contains the value 1 signifying that the Drive
Enclosure Environmental Monitoring Unit is the affected element.
Environmental Monitoring Unit error has occurred. This problem was detected by
the Drive Enclosure Environmental Monitoring Unit located in the drive enclosure
identified in the dencl_num field within the rack identified in the rack_num field.
The rack_num field will not be valid until a future release. The
alarm_error_code.field.en field contains the value 1 signifying that the Drive
Enclosure Environmental Monitoring Unit is the affected element. The cause of
the improper operation is described by the content of the
alarm_error_code.field.ec field as follows: 11 = The Drive Enclosure
Environmental Monitoring Unit cannot write data to the NVRAM. 12 = The Drive
Enclosure Environmental Monitoring Unit cannot read data from the NVRAM. 13
= The Field Programmable Gate Array (FPGA) that controls the ESI bus failed to
load information required for Drive Enclosure Environmental Monitoring Unit
operation.
incorrect or the enclosure has no address. This problem was detected by the
Drive Enclosure Environmental Monitoring Unit located in the drive enclosure
identified in the dencl_num field within the rack identified in the rack_num field.
The rack_num field will not be valid until a future release. The
alarm_error_code.field.en field contains the value 1 signifying that the Drive
Enclosure Environmental Monitoring Unit is the affected element.
49Storage Management Appliance Software Event Code Definitions Application Notes
Page 50

HSV Element Manager Event Codes
Table 8: HSV Element Manager Event Codes: Controller Events (Continued)
Event
ID
3459 88030d83 6 d 83 Storage Cell: %1 Event Code: %2 Description: A Drive Enclosure Environmental
3461 88030d85 3 d 85 Storage Cell: %1 Event Code: %2 Description: A drive enclosure power supply
3469 88030d8d 6 d 8d Storage Cell: %1 Event Code: %2 Description: A drive enclosure transceiver
3489 88030da1 6 d a1 Storage Cell: %1 Event Code: %2 Description: A drive enclosure power supply
Event
Code
Severity
SWC IDEvt.
No.
Description
Monitoring Unit has experienced a hardware failure. This problem was detected
by the Drive Enclosure Environmental Monitoring Unit located in the drive
enclosure identified in the dencl_num field within the rack identified in the
rack_num field. The rack_num field will not be valid until a future release. The
alarm_error_code.field.en field contains the value 1 signifying that the Drive
Enclosure Environmental Monitoring Unit is the affected element.
failed to respond to a shut down command. This problem was detected by the
Drive Enclosure Environmental Monitoring Unit located in the drive enclosure
identified in the dencl_num field within the rack identified in the rack_num field.
The rack_num field will not be valid until a future release. The
alarm_error_code.field.en field contains the value 1 signifying that the Drive
Enclosure Environmental Monitoring Unit is the affected element.
error has been detected. This problem was detected by the Drive Enclosure
Environmental Monitoring Unit located in the drive enclosure identified in the
dencl_num field within the rack identified in the rack_num field. The rack_num
field will not be valid until a future release. The location of the transceiver (1
through 4) is identified in the alarm_error_code.field.en field as follows: 1 =
Transceiver 01 2 = Transceiver 02 3 = Transceiver 03 4 = Transceiver 04 The
transceiver error condition is described by the content of the
alarm_error_code.field.ec field as follows: 1 = The transceivers on this link are
not the same type or they are incompatible with the drive enclosure I/O module.
This error prevents the controller from establishing a link with the enclosure drives
and eliminates the enclosure dual-loop capability. 2 = The transceiver can no
longer detect a data signal. This error prevents the controller from transferring
data on a loop and eliminates the enclosure dual-loop capability. 3 = The
system has detected an FC-AL bus fault involving a transceiver. This error prevents
the controller from transferring data on a loop and eliminates the enclosure
dual-loop capability.
voltage sensor out of range condition has been reported. This problem was
detected by the Drive Enclosure Environmental Monitoring Unit located in the
drive enclosure identified in the dencl_num field within the rack identified in the
rack_num field. The rack_num field will not be valid until a future release. The
location of the voltage sensor (1 through 4) is identified in the
alarm_error_code.field.en field as follows: 1 = Power Supply 1 +5 VDC 2 =
Power Supply 1 +12 VDC 3 = Power Supply 2 +5 VDC 4 = Power Supply 2 +12
VDC The voltage sensor out of range condition is described by the content of the
alarm_error_code.field.ec field as follows: 1 = The element voltage is
approaching, but has not reached, the high voltage CRITICAL threshold.
Continued operation under these conditions may result in a CRITICAL condition.
2 = The element voltage is above the high voltage CRITICAL threshold. 3 = The
element voltage is approaching, but h as not reached, the low voltage CRITICAL
threshold. Continued operation under these conditions may result in a CRITICAL
condition. 4 = The element voltage has reached the low voltage CRITICAL
threshold.
50 Storage Management Appliance Software Event Code Definitions Application Notes
Page 51

Table 8: HSV Element Manager Event Codes: Controller Events (Continued)
HSV Element Manager Event Codes
Event
ID
3509 88030db5 6 d b5 Storage Cell: %1 Event Code: %2 Description: A drive enclosure power supply
3544 88030dd8 3 d d8 Storage Cell: %1 Event Code: %2 Description: A drive enclosure backplane
3545 88030dd9 6 d d9 Storage Cell: %1 Event Code: %2 Description: A drive enclosure backplane
3549 88030ddd 6 d dd Storage Cell: %1 Event Code: %2 Description: A drive enclosure I/O module
3550 88030dde 3 d de Storage Cell: %1 Event Code: %2 Description: A drive enclosure I/O module is
Event
Code
Severity
SWC IDEvt.
No.
Description
current sensor out of range condition has been reported. This problem was
detected by the Drive Enclosure Environmental Monitoring Unit located in the
drive enclosure identified in the dencl_num field within the rack identified in the
rack_num field. The rack_num field will not be valid until a future release. The
location of the current sensor (1 through 4) is identified in the
alarm_error_code.field.en field as follows: 1 = Power Supply 1 +5 VDC 2 =
Power Supply 1 +12 VDC 3 = Power Supply 2 +5 VDC 4 = Power Supply 2 +12
VDC The current sensor out of range condition is described by the content of the
alarm_error_code.field.ec field as follows: 1 = The element current is
approaching, but has not reached, the high current CRITICAL threshold.
Continued operation under these conditions may result in a CRITICAL condition.
2 = The element current is above the high current CRITICAL threshold.
invalid NVRAM read error has occurred. This problem was detected by the Drive
Enclosure Environmental Monitoring Unit located in the drive enclosure identified
in the dencl_num field within the rack identified in the rack_num field. The
rack_num field will not be valid until a future release. The
alarm_error_code.field.en field contains the value 1 signifying that the drive
enclosure is the affected element.
error has occurred. This problem was detected by the Drive Enclosure
Environmental Monitoring Unit located in the drive enclosure identified in the
dencl_num field within the rack identified in the rack_num field. The rack_num
field will not be valid until a future release. The alarm_error_code.field.en field
contains the value 1 signifying that the drive enclosure is the affected element.
The cause of the improper operation is described by the content of the
alarm_error_code.field.ec field as follows: 11 = Unable to write data to the
NVRAM. This problem prevents communication between elements in the
enclosure. 12 = Unable to read data from the NVRAM. This problem prevents
communication between elements in the enclosure. 13 = NVRAM has not been
initialized properly. This is a manufacturing error.
error has occurred. This problem was detected by the Drive Enclosure
Environmental Monitoring Unit located in the drive enclosure identified in the
dencl_num field within the rack identified in the rack_num field. The rack_num
field will not be valid until a future release. The location of the I/O module (A
(01) and B (02)) is identified in the alarm_error_code.field.en field. The cause of
the improper operation is described by the content of the
alarm_error_code.field.ec field as follows: 1 = The I/O module’s Fibre Channel
link speed is not supported by the backplane. This error prevents the controller
from establishing a link with enclosure drives and eliminates the enclosure
dual-loop capability. 11 = Unable to write data to the I/O module NVRAM. 12
= Unable to read data from the I/O module NVRAM.
unable to communicate with the Drive Enclosure Environmental Monitoring Unit.
This problem was detected by the Drive Enclosure Environmental Monitoring Unit
located in the drive enclosure identified in the dencl_num field within the rack
identified in the rack_num field. The rack_num field will not be valid until a future
release. The location of the I/O module (A (01) and B (02)) is identified in the
alarm_error_code.field.en field.
51Storage Management Appliance Software Event Code Definitions Application Notes
Page 52

HSV Element Manager Event Codes
Table 8: HSV Element Manager Event Codes: Controller Events (Continued)
Event
ID
3564 88030dec 3 d ec Storage Cell: %1 Event Code: %2 Description: A drive enclosure I/O module
3568 88030df0 2 d f0 Storage Cell: %1 Event Code: %2 Description: The status has changed on one or
16896 88034200 2 42 0 Storage Cell: %1 Event Code: %2 Description: Indicated Host Fibre Channel
16897 88034201 2 42 1 Storage Cell: %1 Event Code: %2 Description: Indicated Host Fibre Channel
16899 88034203 2 42 3 Storage Cell: %1 Event Code: %2 Description: An excessive number of link
16900 88034204 3 42 4 Storage Cell: %1 Event Code: %2 Description: A Fibre Channel port on the
33536 88038300 6 83 0 Storage Cell: %1 Event Code: %2 Description: A failure was detected during the
Event
Code
Severity
SWC IDEvt.
No.
Description
invalid NVRAM read error has occurred. This problem was detected by the Drive
Enclosure Environmental Monitoring Unit located in the drive enclosure identified
in the dencl_num field within the rack identified in the rack_num field. The
rack_num field will not be valid until a future release. The location of the I/O
module (A (01) or B (02)) is identified in the alarm_error_code.field.en field.
more of the drive enclosures. This is an informational event triggered by the
occurrence of a change in the status of a drive enclosure. The content of the
alarm_error_code field, drive enclosure, and rack number have no meaning for
this event.
port transitioned to link down.
port transitioned to link failed.
errors were detected on a Fibre Channel port. The error counters are checked
every hour. This is an informational event that reports all link status errors
detected by the Tachyon chip, triggered by an excessive number detected in one
category.
HSV110 controller has failed to respond. The evt_peq.peb field contains port
event information. The evt_peq.peq_frz_prod_index field contains the index to
the port event block that points to when the Tachyon chip entered the frozen state.
The evt_peq.peq_prod_index field contains the index to the next port event block.
The evt_peq.peq_cons_index field contains the index to the next port event block
to be acted upon.
execution of this HSV110 controller’s on board diagnostics.
52 Storage Management Appliance Software Event Code Definitions Application Notes
Page 53

Management Agent Events
Table 9 shows events generated by the HSV Management Agent, which are logged in the
Storage Management Appliance Event Log. The Event Number (Evt. No.) codes can be used
to correlate events recorded in the Management Agent Event Log of the HSV Element
Manager with the events logged in the Storage Management Appliance Event Log.
Table 9: HSV Element Manager Event Codes: Management Agent Events
HSV Element Manager Event Codes
Event
ID
20000 88034e20 3 0 Storage Cell: %1 Unhandled Management event generated. Event Code: %2
20001 88034e21 2 1 Storage Cell: %1 SCMI Object Already Exists Event Code: %2 Description: %3
20002 88034e22 2 2 Storage Cell: %1 SCMI Supplied Buffer Too Small Event Code: %2 Description: %3
20003 88034e23 2 3 Storage Cell: %1 SCMI Object Already Assigned Event Code: %2 Description: %3
20004 88034e24 6 4 Storage Cell: %1 SCMI Insufficient Available Data Storage Event Code: %2
20005 88034e25 3 5 Storage Cell: %1 SCMI Internal Error Event Code: %2 Description: %3
20006 88034e26 2 6 Storage Cell: %1 SCMI Invalid Cell Status for Logical Disk Event Code: %2 Description:
20007 88034e27 2 7 Storage Cell: %1 SCMI Invalid Class Event Code: %2 Description: %3
20008 88034e28 2 8 Storage Cell: %1 SCMI Invalid Function Event Code: %2 Description: %3
20009 88034e29 2 9 Storage Cell: %1 SCMI Invalid Logical Disk Block State Event Code: %2 Description:
20010 88034e2a 2 10 Storage Cell: %1 SCMI Invalid Loop Configuration Event Code: %2 Description: %3
20011 88034e2b 2 11 Storage Cell: %1 SCMI Invalid Parameter Event Code: %2 Description: %3
20012 88034e2c 2 12 Storage Cell: %1 SCmi Invalid Parameter handle Event Code: %2 Description: %3
20013 88034e2d 2 13 Storage Cell: %1 SCMI Invalid Parameter Id Event Code: %2 Description: %3
20014 88034e2e 2 14 Storage Cell: %1 SCMI Invalid Quorum Configuration Event Code: %2 Description: %3
20015 88034e2f 2 15 Storage Cell: %1 SCMI Invalid Target Handle Event Code: %2 Description: %3
20016 88034e30 2 16 Storage Cell: %1 SCMI Invalid Target Id Event Code: %2 Description: %3
20017 88034e31 2 17 Storage Cell: %1 SCMI Invalid Time Event Code: %2 Description: %3
20018 88034e32 3 18 Storage Cell: %1 SCMI Media is Inaccessible Event Code: %2 Description: %3
20019 88034e33 3 19 Storage Cell: %1 SCMI No Fibre Channel Port Event Code: %2 Description: %3
20020 88034e34 2 20 Storage Cell: %1 SCMI No Image Event Code: %2 Description: %3
20021 88034e35 2 21 Storage Cell: %1 SCMI No Permission Event Code: %2 Description: %3
20022 88034e36 2 22 Storage Cell: %1 SCMI Storage system not initialized Event Code: %2 Description: %3
20023 88034e37 2 23 Storage Cell: %1 SCMI Not a Loop Port Event Code: %2 Description: %3
20024 88034e38 2 24 Storage Cell: %1 SCMI Not a Participating Controller Event Code: %2 Description: %3
20025 88034e39 2 25 Storage Cell: %1 SCMI Object is in Use Event Code: %2 Description: %3
20026 88034e3a 2 26 Storage Cell: %1 SCMI Parameter Object Does Not Exist Event Code: %2 Description:
20027 88034e3b 2 27 Storage Cell: %1 SCMI Target Object Does Not Exist Event Code: %2 Description: %3
20028 88034e3c 2 28 Storage Cell: %1 SCMI Timeout Event Code: %2 Description: %3
20029 88034e3d 2 29 Storage Cell: %1 SCMI Unknown Id Event Code: %2 Description: %3
20030 88034e3e 2 30 Storage Cell: %1 SCMI Unknown Parameter Handle Event Code: %2 Description: %3
Event
Code
Severity
Evt.
No. Description
Description: %3
Description: %3
%3
%3
%3
53Storage Management Appliance Software Event Code Definitions Application Notes
Page 54

HSV Element Manager Event Codes
Table 9: HSV Element Manager Event Codes: Management Agent Events (Continued)
Event
ID
20031 88034e3f 2 31 Storage Cell: %1 SCMI Unrecoverable Media Error Event Code: %2 Description: %3
20032 88034e40 2 32 Storage Cell: %1 SCMI Invalid State Event Code: %2 Description: %3
20033 88034e41 3 33 Storage Cell: %1 SCMI Transport Error Event Code: %2 Description: %3
20034 88034e42 3 34 Storage Cell: %1 SCMI Volume is Missing Event Code: %2 Description: %3
20035 88034e43 2 35 Storage Cell: %1 SCMI Invalid Cursor Event Code: %2 Description: %3
20036 88034e44 2 36 Storage Cell: %1 SCMI Invalid Target Logical Disk Event Code: %2 Description: %3
20037 88034e45 2 37 Storage Cell: %1 SCMI No More Events Event Code: %2 Description: %3
20038 88034e46 2 38 Storage Cell: %1 SCMI Lock Busy Event Code: %2 Description: %3
20039 88034e47 2 39 Storage Cell: %1 SCMI Time Not Set Event Code: %2 Description: %3
20040 88034e48 2 40 Storage Cell: %1 SCMI Not a Supported Version Event Code: %2 Description: %3
20041 88034e49 2 41 Storage Cell: %1 SCMI No Logical Disk for StorageCell Virtual Disk Event Code: %2
20042 88034e4a 2 42 Storage Cell: %1 SCMI Logical disk Presented Event Code: %2 Description: %3
20043 88034e4b 3 43 Storage Cell: %1 SCMI Operation Denied On Slave Event Code: %2 Description: %3
20044 88034e4c 2 44 Storage Cell: %1 SCMI Not DRM Licensed Event Code: %2 Description: %3
20045 88034e4d 2 45 Storage Cell: %1 SCMI Not DRM Member Event Code: %2 Description: %3
20046 88034e4e 2 46 Storage Cell: %1 SCMI Invalid DRM Mode Event Code: %2 Description: %3
20047 88034e4f 2 47 Storage Cell: %1 SCMI Invalid DRM State Event Code: %2 Description: %3
20048 88034e50 2 48 Storage Cell: %1 Security credentials needed. Please update your system’s ID and
20049 88034e51 2 49 Storage Cell: %1 Security credentials supplied were invalid. Please update your system’s
20050 88034e52 2 50 Storage Cell: %1 SCMI Already Logged In Event Code: %2 Description: %3
20051 88034e53 3 51 Storage Cell: %1 SCMI Cell Connection Down Event Code: %2 Description: %3
20052 88034e54 2 52 Storage Cell: %1 SCMI DRM Group Empty Event Code: %2 Description: %3
20053 88034e55 2 53 Storage Cell: %1 SCMI Incompatible Attribute Event Code: %2 Description: %3
20054 88034e56 2 54 Storage Cell: %1 SCMI Is Drm Member Event Code: %2 Description: %3
20055 88034e57 2 55 Storage Cell: %1 SCMI Is Log Unit Event Code: %2 Description: %3
20056 88034e58 2 56 Storage Cell: %1 SCMI No Destination DRM Group Specified Event Code: %2
20057 88034e59 2 57 Storage Cell: %1 SCMI Not Presented Event Code: %2 Description: %3
20058 88034e5a 3 58 Storage Cell: %1 SCMI Other Nsc Failed Event Code: %2 Description: %3
20059 88034e5b 2 59 Storage Cell: %1 SCMI Max Objects Event Code: %2 Description: %3
20060 88034e5c 2 60 Storage Cell: %1 SCMI Max Size Event Code: %2 Description: %3
20061 88034e5d 2 61 Storage Cell: %1 SCMI Password Mismatch Event Code: %2 Description: %3
20062 88034e5e 2 62 Storage Cell: %1 SCMI Is Merging Event Code: %2 Description: %3
20063 88034e5f 2 63 Storage Cell: %1 SCMI Is Logging Event Code: %2 Description: %3
20064 88034e60 2 64 Storage Cell: %1 SCMI Is Suspended Event Code: %2 Description: %3
20065 88034e61 2 65 Storage Cell: %1 SCMI Bad Image Header Event Code: %2 Description: %3
20066 88034e62 2 66 Storage Cell: %1 SCMI Bad Image Event Code: %2 Description: %3
20067 88034e63 2 67 Storage Cell: %1 SCMI Image Too Large Event Code: %2 Description: %3
Event
Code
Severity
Evt.
No.
Description
Description: %3
password in the Storage System Access menu. Event Code: %2 Description: %3
ID and password in the Storage System Access menu. Event Code: %2 Description: %3
Description: %3
54 Storage Management Appliance Software Event Code Definitions Application Notes
Page 55

Table 9: HSV Element Manager Event Codes: Management Agent Events (Continued)
HSV Element Manager Event Codes
Event
ID
20068 88034e64 2 68 Storage Cell: %1 SCMI EMU Not Available Event Code: %2 Description: %3
20069 88034e65 2 69 Storage Cell: %1 SCMI EMU Indefinite Delay Event Code: %2 Description: %3
20070 88034e66 2 70 Storage Cell: %1 SCMI Image Incompatible Event Code: %2 Description: %3
20071 88034e67 2 71 Storage Cell: %1 SCMI Bad Image Segment Event Code: %2 Description: %3
20072 88034e68 2 72 Storage Cell: %1 SCMI Image Already Loaded Event Code: %2 Description: %3
20073 88034e69 2 73 Storage Cell: %1 SCMI Image Write Error Event Code: %2 Description: %3
20074 88034e6a 2 74 Storage Cell: %1 SCMI Logical Disk Sharing Event Code: %2 Description: %3
20075 88034e6b 2 75 Storage Cell: %1 SCMI Bad Image Size Event Code: %2 Description: %3
20076 88034e6c 2 76 Storage Cell: %1 SCMI Image Load Busy Event Code: %2 Description: %3
20077 88034e6d 6 77 Storage Cell: %1 SCMI Volume Failure Predicted Event Code: %2 Description: %3
20078 88034e6e 2 78 Storage Cell: %1 SCMI Invalid Object Condition Event Code: %2 Description: %3
20079 88034e6f 2 79 Storage Cell: %1 SCMI Invalid Predecessor Virtual Disk Condition Event Code: %2
20080 88034e70 2 80 Storage Cell: %1 SCMI Invalid Volume Usage Event Code: %2 Description: %3
20081 88034e71 2 81 Storage Cell: %1 SCMI Minimum Volumes In Disk Group Event Code: %2 Description:
20082 88034e72 2 82 Storage Cell: %1 SCMI Shutdown In Progress Event Code: %2 Description: %3
20083 88034e73 2 83 Storage Cell: %1 SCMI Not Ready Event Code: %2 Description: %3
20084 88034e74 2 84 Storage Cell: %1 SCMI Is Snapshot Event Code: %2 Description: %3
20085 88034e75 2 85 Storage Cell: %1 SCMI Incompatible Mirror Policy Event Code: %2 Description: %3
20086 88034e76 2 86 Storage Cell: %1 SCMI Inoperative Event Code: %2 Description: %3
20087 88034e77 3 87 Storage Cell: %1 SCMI Disk group inoperative or less than 8 disks in group Event
20088 88034e78 6 88 Storage Cell: %1 SCMI StorageCell Inoperative Event Code: %2 Description: %3
20089 88034e79 2 89 Storage Cell: %1 SCMI Failsafe Locked Event Code: %2 Description: %3
20090 88034e7a 3 90 Storage Cell: %1 SCMI Data Flush Incomplete Event Code: %2 Description: %3
20091 88034e7b 2 91 Storage Cell: %1 SCMI Redundancy Mirrored Inoperative Event Code: %2 Description:
20092 88034e7c 2 92 Storage Cell: %1 SCMI Duplicate LUN Event Code: %2 Description: %3
20093 88034e7d 3 93 Storage Cell: %1 SCMI Other Remote NSC Failed Event Code: %2 Description: %3
20094 88034e7e 2 94 Storage Cell: %1 SCMI Unknown Remote Unit Event Code: %2 Description: %3
20095 88034e7f 2 95 Storage Cell: %1 SCMI Unknown Remote DRM Group Event Code: %2 Description: %3
20096 88034e80 6 96 Storage Cell: %1 SCMI PLDMC Failed Event Code: %2 Description: %3
20097 88034e81 6 97 Storage Cell: %1 SCMI Lock Failed Event Code: %2 Description: %3
20098 88034e82 2 98 Storage Cell: %1 SCMI Remote SCS Error Event Code: %2 Description: %3
20099 88034e83 2 99 Storage Cell: %1 Scmi Cell Connection Up Event Code: %2 Description: %3
20100 88034e84 2 100 Storage Cell: %1 Scmi Login Needed - Password Changed Event Code: %2
20101 88034e85 2 101 Storage Cell: %1 Scmi Max Logins Reached Event Code: %2 Description: %3
20102 88034e86 2 102 Storage Cell: %1 Scmi Invalid Cookie Event Code: %2 Description: %3
20103 88034e87 2 103 Storage Cell: %1 Scmi Login Timed Out Event Code: %2 Description: %3
Event
Code
Severity
Evt.
No.
Description
Description: %3
%3
Code: %2 Description: %3
%3
Description: %3
55Storage Management Appliance Software Event Code Definitions Application Notes
Page 56

HSV Element Manager Event Codes
Table 9: HSV Element Manager Event Codes: Management Agent Events (Continued)
Event
ID
20104 88034e88 2 104 Storage Cell: %1 Scmi Max Snapshot Depth Reached Event Code: %2 Description: %3
20105 88034e89 2 105 Storage Cell: %1 Scmi Attribute Mismatch Event Code: %2 Description: %3
20106 88034e8a 2 106 Storage Cell: %1 Scmi Password Not Set Event Code: %2 Description: %3
20107 88034e8b 2 107 Storage Cell: %1 Scmi Not Host Port Event Code: %2 Description: %3
20108 88034e8c 2 108 Storage Cell: %1 Scmi Duplicate Lun WWID Event Code: %2 Description: %3
20109 88034e8d 2 109 Storage Cell: %1 Scmi System Inoperative Event Code: %2 Description: %3
20110 88034e8e 2 110 Storage Cell: %1 Scmi SnapClone Active Event Code: %2 Description: %3
20111 88034e8f 2 111 Storage Cell: %1 Scmi Emu Load Busy Event Code: %2 Description: %3
20112 88034e90 2 112 Storage Cell: %1 Scmi Duplicate User Name Event Code: %2 Description: %3
20113 88034e91 2 113 Storage Cell: %1 Scmi Drive Reserved For Code Load Event Code: %2 Description: %3
20114 88034e92 2 114 Storage Cell: %1 Scmi Already Presented Event Code: %2 Description: %3
20115 88034e93 2 115 Storage Cell: %1 Scmi Invalid Remote Scell Event Code: %2 Description: %3
20116 88034e94 2 116 Storage Cell: %1 Scmi No Scmi Lock Event Code: %2 Description: %3
21000 88035208 2 1000 Storage Cell: %1 Logical Disk Condition Change Event Code: %2 Description: %3
21001 88035209 6 1001 Storage Cell: %1 Storage system is FULL **critical** Event Code: %2 Description: %3
21002 8803520a 3 1002 Storage Cell: %1 Storage system is almost FULL. Disk group at or above maximum
21003 8803520b 2 1003 Storage Cell: %1 NSC Cache Battery Condition Change Event Code: %2 Description:
21004 8803520c 2 1004 Storage Cell: %1 NSC Cache Condition Change Event Code: %2 Description: %3
21005 8803520d 2 1005 Storage Cell: %1 NSC Condition Change Event Code: %2 Description: %3
21006 8803520e 2 1006 Storage Cell: %1 NSC FC Port Condition Change Event Code: %2 Description: %3
21007 8803520f 2 1007 Storage Cell: %1 Physical Device Condition Change Event Code: %2 Description: %3
21008 88035210 2 1008 Storage Cell: %1 Physical Store Condition Change Event Code: %2 Description: %3
21009 88035211 2 1009 Storage Cell: %1 Host condition change Event Code: %2 Description: %3
21010 88035212 2 1010 Storage Cell: %1 Storage system time has been set Event Code: %2 Description: %3
21011 88035213 2 1011 Storage Cell: %1 Volume Condition change Event Code: %2 Description: %3
21012 88035214 2 1012 Storage Cell: %1 Volume insufficient_resources condition change Event Code: %2
21013 88035215 2 1013 Storage Cell: %1 Volume Quorum Disk change Event Code: %2 Description: %3
21014 88035216 2 1014 Storage Cell: %1 The state of an object in the system has changed. View adjacent events
22001 880355f1 6 2001 Storage Cell: %1 Startup Failed Event Code: %2 Description: %3
22002 880355f2 2 2002 Storage Cell: %1 Management agent event log cleared successfully Event Code: %2
22003 880355f3 3 2003 Storage Cell: %1 Invalid name specified for storage system Event Code: %2
22004 880355f4 2 2004 Storage Cell: %1 Storage system is not initialized Event Code: %2 Description: %3
22005 880355f5 3 2005 Storage Cell: %1 Duplicate name for virtual disk found Event Code: %2 Description:
22006 880355f6 3 2006 Storage Cell: %1 Invalid name specified for virtual disk Event Code: %2 Description:
Event
Code
Severity
Evt.
No.
Description
capacity warning level. Event Code: %2 Description: %3
%3
Description: %3
for more detail. Event Code: %2 Description: %3
Description: %3
Description: %3
%3
%3
56 Storage Management Appliance Software Event Code Definitions Application Notes
Page 57

Table 9: HSV Element Manager Event Codes: Management Agent Events (Continued)
HSV Element Manager Event Codes
Event
ID
22007 880355f7 3 2007 Storage Cell: %1 Virtual disk name exceeds maximum length Event Code: %2
22008 880355f8 3 2008 Storage Cell: %1 Invalid parameter specified for virtual disk Event Code: %2
22009 880355f9 3 2009 Storage Cell: %1 No virtual disk found Event Code: %2 Description: %3
22010 880355fa 3 2010 Storage Cell: %1 Specified virtual disk size exceeds available size Event Code: %2
22011 880355fb 2 2011 Storage Cell: %1 There are not enough disk drives to create a disk group Event Code:
22012 880355fc 3 2012 Storage Cell: %1 Specified number of device exceeds available number of disk Event
22013 880355fd 3 2013 Storage Cell: %1 Specified number of device is below the minimum number of disk to
22014 880355fe 3 2014 Storage Cell: %1 No available volumes to complete the request Event Code: %2
22015 880355ff 3 2015 Storage Cell: %1 Specified spare count exceeds maximum count Event Code: %2
22016 88035600 3 2016 Storage Cell: %1 Completed unpresenting virutal disk to host Event Code: %2
22017 88035601 3 2017 Storage Cell: %1 Negative value for device count is invalid Event Code: %2
22018 88035602 3 2018 Storage Cell: %1 Specified spare count is below minimum count Event Code: %2
22019 88035603 3 2019 Storage Cell: %1 Specified device count is below minimum count Event Code: %2
22020 88035604 3 2020 Storage Cell: %1 Requested device count exceeds available physical store Event Code:
22021 88035605 3 2021 Storage Cell: %1 Invalid refresh interval value. Should be numeric and non-negative.
22022 88035606 3 2022 Storage Cell: %1 Invalid security message. Should not be blank. Event Code: %2
22023 88035607 2 2023 Storage Cell: %1 Virtual Disk Create Complete Event Code: %2 Description: %3
22024 88035608 2 2024 Storage Cell: %1 Storage system uninitialized Event Code: %2 Description: %3
22025 88035609 2 2025 Storage Cell: %1 Storage system successfully initialized Event Code: %2 Description:
22026 8803560a 2 2026 Storage Cell: %1 Device Added Successfully Event Code: %2 Description: %3
22027 8803560b 2 2027 Storage Cell: %1 Storage system successfully renamed Event Code: %2 Description: %3
22028 8803560c 2 2028 Storage Cell: %1 Virtual Disk Delete Complete Event Code: %2 Description: %3
22029 8803560d 2 2029 Storage Cell: %1 Virtual Disk Renamed - Complete Event Code: %2 Description: %3
22030 8803560e 2 2030 Storage Cell: %1 Refresh Interval Changed Event Code: %2 Description: %3
22031 8803560f 2 2031 Storage Cell: %1 Security Message Changed Event Code: %2 Description: %3
22032 88035610 2 2032 Storage Cell: %1 Present Virtual Disk to a Host - Complete Event Code: %2
22033 88035611 2 2033 Storage Cell: %1 Control Startup Complete Event Code: %2 Description: %3
Event
Code
Severity
Evt.
No.
Description
Description: %3
Description: %3
Description: %3
%2 Description: %3
Code: %2 Description: %3
create a disk group (minimum 8) Event Code: %2 Description: %3
Description: %3
Description: %3
Description: %3
Description: %3
Description: %3
Description: %3
%2 Description: %3
Event Code: %2 Description: %3
Description: %3
%3
Description: %3
57Storage Management Appliance Software Event Code Definitions Application Notes
Page 58

HSV Element Manager Event Codes
Table 9: HSV Element Manager Event Codes: Management Agent Events (Continued)
Event
ID
22034 88035612 2 2034 Storage Cell: %1 Change Device Usage Complete Event Code: %2 Description: %3
22035 88035613 2 2035 Storage Cell: %1 Control Shutdown - Complete Event Code: %2 Description: %3
22036 88035614 2 2036 Storage Cell: %1 Nsc Shutdown - Complete Event Code: %2 Description: %3
22037 88035615 2 2037 Storage Cell: %1 Nsc Crash - Complete Event Code: %2 Description: %3
22038 88035616 6 2038 Storage Cell: %1 Control Memory Allocation Failure Event Code: %2 Description: %3
22039 88035617 2 2039 Storage Cell: %1 There must be at least 5 member devices to create Raid 5 VD Event
22040 88035618 2 2040 Storage Cell: %1 Access level denied or session activity timeout. Please log in again.
22041 88035619 2 2041 Storage Cell: %1 Virtual Disk Snapshot - Completed Event Code: %2 Description: %3
22042 8803561a 2 2042 Storage Cell: %1 Virtual Disk Snapclone - Completed Event Code: %2 Description: %3
22043 8803561b 2 2043 Storage Cell: %1 Virtual Disk Snapshot - Failed Event Code: %2 Description: %3
22044 8803561c 2 2044 Storage Cell: %1 Virtual Disk Snapclone - Failed Event Code: %2 Description: %3
22045 8803561d 2 2045 Storage Cell: %1 Restore Device - Completed Event Code: %2 Description: %3
22046 8803561e 6 2046 Storage Cell: %1 Device Failed Event Code: %2 Description: %3
22047 8803561f 2 2047 Storage Cell: %1 Host record added successfully Event Code: %2 Description: %3
22048 88035620 2 2048 Storage Cell: %1 Nsa object discarded successfully Event Code: %2 Description: %3
22049 88035621 2 2049 Storage Cell: %1 Invalid host adapter ID Event Code: %2 Description: %3
22050 88035622 2 2050 Storage Cell: %1 Specified device is already a member of the system Event Code: %2
22051 88035623 2 2051 Storage Cell: %1 Create Folder - Completed Event Code: %2 Description: %3
22052 88035624 2 2052 Storage Cell: %1 Change Object Properties - Completed Event Code: %2 Description:
22053 88035625 2 2053 Storage Cell: %1 Comments exceed maximum size Event Code: %2 Description: %3
22057 88035629 2 2057 Storage Cell: %1 Completed disk group creation Event Code: %2 Description: %3
22058 8803562a 2 2058 Storage Cell: %1 Added host port Event Code: %2 Description: %3
22059 8803562b 2 2059 Storage Cell: %1 Discarded host port Event Code: %2 Description: %3
22060 8803562c 2 2060 Storage Cell: %1 EMU/Shelf code load complete Event Code: %2 Description: %3
22061 8803562d 2 2061 Storage Cell: %1 Operation will exceed the available capacity of the disk group Event
22062 8803562e 2 2062 Storage Cell: %1 Controller(s) code load complete Event Code: %2 Description: %3
22063 8803562f 2 2063 Storage Cell: %1 The target device is not in the right condition to perform the operation
22064 88035630 2 2064 Storage Cell: %1 Storage system Device Addition Policy changed successfully Event
22065 88035631 2 2065 Storage Cell: %1 Maximum number of disk groups exceeded Event Code: %2
22066 88035632 3 2066 Storage Cell: %1 Nsa object discard failed. Event Code: %2 Description: %3
22067 88035633 3 2067 Storage Cell: %1 There are not enough disks to meet the minimum number requirement
22068 88035634 2 2068 Storage Cell: %1 Entry added successfully in the password file Event Code: %2
Event
Code
Severity
Evt.
No.
Description
Code: %2 Description: %3
Event Code: %2 Description: %3
Description: %3
%3
Code: %2 Description: %3
Event Code: %2 Description: %3
Code: %2 Description: %3
Description: %3
Event Code: %2 Description: %3
Description: %3
58 Storage Management Appliance Software Event Code Definitions Application Notes
Page 59

Table 9: HSV Element Manager Event Codes: Management Agent Events (Continued)
HSV Element Manager Event Codes
Event
ID
22069 88035635 2 2069 Storage Cell: %1 Entry updated successfully in the password file Event Code: %2
22070 88035636 2 2070 Storage Cell: %1 Entry discarded successfully in the password file Event Code: %2
22071 88035637 2 2071 Storage Cell: %1 Storage system is in an unknown state. Communications error or
22072 88035638 2 2072 Storage Cell: %1 Object not found. Operation on this object is completed Event Code:
22073 88035639 2 2073 Storage Cell: %1 There is no more available space to create a virtual disk Event Code:
22074 8803563a 2 2074 Storage Cell: %1 Name or comments contains invalid characters Event Code: %2
22075 8803563b 2 2075 Storage Cell: %1 Duplicate - Another object with the same name is found Event Code:
22076 8803563c 2 2076 Storage Cell: %1 Error - No healthy disk group(s) to create a unit. Resolve any abnormal
22077 8803563d 2 2077 Storage Cell: %1 Error - Operating System ID must be a valid number. Event Code: %2
22078 8803563e 2 2078 Storage Cell: %1 Watchdog successfully started Event Code: %2 Description: %3
22079 8803563f 2 2079 Storage Cell: %1 Watchdog successfully stopped Event Code: %2 Description: %3
22080 88035640 3 2080 Storage Cell: %1 Delete Event Config List failed Event Code: %2 Description: %3
22081 88035641 2 2081 Storage Cell: %1 Disk group meltdown repaired successfully. Event Code: %2
22082 88035642 2 2082 Storage Cell: %1 There are no available LUNs to present this unit. Event Code: %2
22083 88035643 2 2083 Storage Cell: %1 Controller time synchronization turned on. Event Code: %2
22084 88035644 2 2084 Storage Cell: %1 Controller time synchronization turned off. Event Code: %2
22085 88035645 2 2085 Storage Cell: %1 System login failed. Invalid password. Event Code: %2 Description:
22086 88035646 2 2086 Storage Cell: %1 System is not set for password validation. Event Code: %2
22087 88035647 2 2087 Storage Cell: %1 Agent is already logged in to this system. Event Code: %2
22088 88035648 2 2088 Storage Cell: %1 StorageCell time set to custom time. Controller time syncronization
22089 88035649 2 2089 Storage Cell: %1 StorageCell time set to SAN appliance time. Event Code: %2
22090 8803564a 2 2090 Storage Cell: %1 StorageCell time set to browser time. Controller time syncronization
22091 8803564b 2 2091 Storage Cell: %1 StorageCell time set to controller time. Controller time syncronization
23001 880359d9 2 3001 Storage Cell: %1 Event Manager Offline Event Code: %2 Description: %3
23002 880359da 2 3002 Storage Cell: %1 Event Manager Online Event Code: %2 Description: %3
Event
Code
Severity
Evt.
No.
Description
Description: %3
Description: %3
unresponsive controller. Event Code: %2 Description: %3
%2 Description: %3
%2 Description: %3
Description: %3
%2 Description: %3
conditions in the disk group first. Event Code: %2 Description: %3
Description: %3
Description: %3
Description: %3
Description: %3
Description: %3
%3
Description: %3
Description: %3
automatically turned off. Event Code: %2 Description: %3
Description: %3
automatically turned off. Event Code: %2 Description: %3
automatically turned off. Event Code: %2 Description: %3
59Storage Management Appliance Software Event Code Definitions Application Notes
Page 60

HSV Element Manager Event Codes
Table 9: HSV Element Manager Event Codes: Management Agent Events (Continued)
Event
ID
23003 880359db 6 3003 Storage Cell: %1 Event Manager - Startup Failed Event Code: %2 Description: %3
23004 880359dc 2 3004 Storage Cell: %1 Event Manager - Startup Complete Event Code: %2 Description: %3
23005 880359dd 3 3005 Storage Cell: %1 Event Manager - Abnormal Startup Event Code: %2 Description: %3
23006 880359de 3 3006 Storage Cell: %1 Event Manager - Shutdown Failed Event Code: %2 Description: %3
23007 880359df 2 3007 Storage Cell: %1 Event Manager - Shutdown Complete Event Code: %2 Description:
23008 880359e0 3 3008 Storage Cell: %1 Event Manager - Abnormal Shutdown Event Code: %2 Description:
23009 880359e1 3 3009 Storage Cell: %1 Unable to open NSA Local Event Log File Event Code: %2
23010 880359e2 3 3010 Storage Cell: %1 Unable to open NSA Debug File Event Code: %2 Description: %3
23011 880359e3 3 3011 Storage Cell: %1 EM: Agent event file on SC MLD unavailable - trying local event file.
23012 880359e4 3 3012 Storage Cell: %1 Unable to open Local Temp Event File - possibly no initialized SC
23013 880359e5 3 3013 Storage Cell: %1 Unable to clear NSA Local Event Log File Event Code: %2
23014 880359e6 3 3014 Storage Cell: %1 Unable to clear NSA Debug File Event Code: %2 Description: %3
23015 880359e7 3 3015 Storage Cell: %1 Unable to clear NSA Event Log File Event Code: %2 Description: %3
23016 880359e8 3 3016 Storage Cell: %1 Local log file found on startup Event Code: %2 Description: %3
23017 880359e9 3 3017 Storage Cell: %1 Event Queue Flush Error Event Code: %2 Description: %3
23018 880359ea 6 3018 Storage Cell: %1 Log Event Action Failed Event Code: %2 Description: %3
23019 880359eb 2 3019 Storage Cell: %1 EM File Manager Online Event Code: %2 Description: %3
23020 880359ec 2 3020 Storage Cell: %1 EM File Manager Offline Event Code: %2 Description: %3
23021 880359ed 2 3021 Storage Cell: %1 EM Log Manager Online Event Code: %2 Description: %3
23022 880359ee 2 3022 Storage Cell: %1 EM Log Manager Offline Event Code: %2 Description: %3
23023 880359ef 2 3023 Storage Cell: %1 Startup Complete Event Code: %2 Description: %3
23024 880359f0 2 3024 Storage Cell: %1 Local NSA logfile is empty Event Code: %2 Description: %3
23025 880359f1 2 3025 Storage Cell: %1 Event Queue Online Event Code: %2 Description: %3
23026 880359f2 2 3026 Storage Cell: %1 Event Queue Offline Event Code: %2 Description: %3
23027 880359f3 2 3027 Storage Cell: %1 Event Queue is full Event Code: %2 Description: %3
23028 880359f4 3 3028 Storage Cell: %1 Status Descriptions Unavailable Event Code: %2 Description: %3
23029 880359f5 2 3029 Storage Cell: %1 EM Description Mngr Online Event Code: %2 Description: %3
23030 880359f6 2 3030 Storage Cell: %1 EM: User Defined Status Description File Initialized Event Code: %2
23031 880359f7 3 3031 Storage Cell: %1 EM Description Mngr Start Failed Event Code: %2 Description: %3
23032 880359f8 3 3032 Storage Cell: %1 EM Log Mngr Start Failed Event Code: %2 Description: %3
23033 880359f9 3 3033 Storage Cell: %1 EM File Mngr Start Failed Event Code: %2 Description: %3
23034 880359fa 3 3034 Storage Cell: %1 EM Event Queue Start Failed Event Code: %2 Description: %3
23035 880359fb 3 3035 Storage Cell: %1 EM: NSA log file unavailable Event Code: %2 Description: %3
23036 880359fc 6 3036 Storage Cell: %1 EM Memory Allocation Error Event Code: %2 Description: %3
Event
Code
Severity
Evt.
No.
Description
%3
%3
Description: %3
Event Code: %2 Description: %3
Event Code: %2 Description: %3
Description: %3
Description: %3
60 Storage Management Appliance Software Event Code Definitions Application Notes
Page 61

Table 9: HSV Element Manager Event Codes: Management Agent Events (Continued)
HSV Element Manager Event Codes
Event
ID
23037 880359fd 3 3037 Storage Cell: %1 EM: Local Event Configuration File Unavailable Event Code: %2
23038 880359fe 3 3038 Storage Cell: %1 EM: MLD Notification File Unavailable - retrieving local backup copy
23039 880359ff 3 3039 Storage Cell: %1 EM: Local Notification Host List File Unavailable Event Code: %2
23040 88035a00 2 3040 Storage Cell: %1 EM: SCMI returns zero SC Events but reports additional events Event
23041 88035a01 2 3041 Storage Cell: %1 Undefined Status Code Event Code: %2 Description: %3
23042 88035a02 2 3042 Storage Cell: %1 Status Code Not Found Event Code: %2 Description: %3
23043 88035a03 2 3043 Storage Cell: %1 EM Failed SC Init - couldn’t retrieve SC Event Event Code: %2
23044 88035a04 2 3044 Storage Cell: %1 Override this description with missing filename Event Code: %2
23045 88035a05 2 3045 Storage Cell: %1 Invalid storage system event sequence number - can’t retrieve event
23046 88035a06 2 3046 Storage Cell: %1 Invalid SC termination event sequence number - can’t retrieve event
23047 88035a07 3 3047 Storage Cell: %1 EM: Event config file unavailable from MLD - retrieving local backup
23048 88035a08 2 3048 Storage Cell: %1 EM: Local user defined event state file unavailable Event Code: %2
23049 88035a09 2 3049 Storage Cell: %1 EM: EMU event monitoring thread unable to start Event Code: %2
23050 88035a0a 6 3050 Storage Cell: %1 EM: EMU event - this description will be overwritten Event Code: %2
23051 88035a0b 3 3051 Storage Cell: %1 EM: Failed to write Event Config file to MLD Event Code: %2
23052 88035a0c 3 3052 Storage Cell: %1 EM: Failed to write Notification Host List to MLD Event Code: %2
23053 88035a0d 2 3053 Storage Cell: %1 EM: Event Configiguration Filename Error or File empty Event Code:
23054 88035a0e 2 3054 Storage Cell: %1 EM: Notification Hostlist Filename Error or File empty Event Code: %2
23055 88035a0f 3 3055 Storage Cell: %1 EM: Event Config List Object Reference Error Event Code: %2
23056 88035a10 2 3056 Storage Cell: %1 EM: SC Parse File successfully uploaded Event Code: %2 Description:
23057 88035a11 2 3057 Storage Cell: %1 EM: SC Parse File upload failed Event Code: %2 Description: %3
23058 88035a12 3 3058 Storage Cell: %1 EM: Contents of the uploaded parse file invalid - unexpected contents
23059 88035a13 3 3059 Storage Cell: %1 EM: Parse file is empty Event Code: %2 Description: %3
23060 88035a14 6 3060 Storage Cell: %1 Storage system being shutdown due to a command failure. Event
23061 88035a15 2 3061 Storage Cell: %1 EM: Could not retrieve a storage system event Event Code: %2
Event
Code
Severity
Evt.
No.
Description
Description: %3
Event Code: %2 Description: %3
Description: %3
Code: %2 Description: %3
Description: %3
Description: %3
Event Code: %2 Description: %3
Event Code: %2 Description: %3
copy Event Code: %2 Description: %3
Description: %3
Description: %3
Description: %3
Description: %3
Description: %3
%2 Description: %3
Description: %3
Description: %3
%3
Event Code: %2 Description: %3
Code: %2 Description: %3
Description: %3
61Storage Management Appliance Software Event Code Definitions Application Notes
Page 62

HSV Element Manager Event Codes
Table 9: HSV Element Manager Event Codes: Management Agent Events (Continued)
Event
ID
23062 88035a16 2 3062 Storage Cell: %1 EM: Init SC Event config list failed Event Code: %2 Description: %3
23063 88035a17 3 3063 Storage Cell: %1 Could not initialize Comm infrastructure for event logging to system log
23064 88035a18 6 3064 Storage Cell: %1 EM: Storage system pointer is NULL! Event Code: %2 Description: %3
23065 88035a19 6 3065 Storage Cell: %1 EM: Failed to log event to the Appliance event log: check if log is full
23066 88035a1a 3 3066 Storage Cell: %1 EM: Description Mngr Init StorageCell Failed Event Code: %2
23067 88035a1b 3 3067 Storage Cell: %1 EM: Description file too small. File read problem Or Incomplete file.
23068 88035a1c 6 3068 Storage Cell: %1 EM: Can’t init NT Event object pointer Event Code: %2 Description:
23069 88035a1d 6 3069 Storage Cell: %1 EM: Can’t init NT Notification object pointer Event Code: %2
23070 88035a1e 6 3070 Storage Cell: %1 EM: Appliance Event Logging Failure - log may be full Event Code:
23071 88035a1f 3 3071 Storage Cell: %1 EM: SCMI returned bad additional events number Event Code: %2
23072 88035a20 3 3072 Storage Cell: %1 EM: SCMI returned zero sized SC Event Event Code: %2 Description:
23073 88035a21 6 3073 Storage Cell: %1 EM: Local event file Size exceeds max size - event logging shutdown
23074 88035a22 3 3074 Storage Cell: %1 EM: Local event file exceeded max size limit - truncating file Event
23075 88035a23 2 3075 Storage Cell: %1 EventQueue index passed is out of bounds Event Code: %2
23076 88035a24 3 3076 Storage Cell: %1 EM: An abnormal number of duplicate events logged - dropping
23077 88035a25 2 3077 Storage Cell: %1 EM: Update of the MLD Status Description file failed Event Code: %2
23078 88035a26 2 3078 Storage Cell: %1 EM: NsaStatusDescriptions.txt open file error Event Code: %2
23079 88035a27 2 3079 Storage Cell: %1 EM: NsaStatusDescriptions.txt file error - file size discrepency from mld
23080 88035a28 6 3080 Storage Cell: %1 SC Event Log has been cleared and restarted. Possible RAID1
23081 88035a29 2 3081 Storage Cell: %1 Invalid logType parameter Event Code: %2 Description: %3
23082 88035a2a 2 3082 Storage Cell: %1 Unsupported version Event Code: %2 Description: %3
23083 88035a2b 2 3083 Storage Cell: %1 Log file is empty Event Code: %2 Description: %3
23084 88035a2c 2 3084 Storage Cell: %1 Storage System with this WWN is not visible to this agent or the
23085 88035a2d 6 3085 Storage Cell: %1 Pointer to Event Manager is NULL Event Code: %2 Description: %3
23086 88035a2e 2 3086 Storage Cell: %1 Parsefile for current firmware version not found. Upload correct parse
Event
Code
Severity
Evt.
No.
Description
Event Code: %2 Description: %3
Event Code: %2 Description: %3
Description: %3
Event Code: %2 Description: %3
%3
Description: %3
%2 Description: %3
Description: %3
%3
Event Code: %2 Description: %3
Code: %2 Description: %3
Description: %3
duplicates Event Code: %2 Description: %3
Description: %3
Description: %3
list Event Code: %2 Description: %3
Meltdown. Event Code: %2 Description: %3
WWN is invalid Event Code: %2 Description: %3
file. Event Code: %2 Description: %3
62 Storage Management Appliance Software Event Code Definitions Application Notes
Page 63

Table 9: HSV Element Manager Event Codes: Management Agent Events (Continued)
HSV Element Manager Event Codes
Event
ID
23090 88035a32 2 3090 Storage Cell: %1 The contents of this file appear to be invalid Event Code: %2
23091 88035a33 2 3091 Storage Cell: %1 The MIB failed to build due to a missing parse file. Event Code: %2
24000 88035dc0 2 4000 Storage Cell: %1 MLD Manager Subsystem Error Event Code: %2 Description: %3
24001 88035dc1 2 4001 Storage Cell: %1 MLD Manager Offline Event Code: %2 Description: %3
24002 88035dc2 2 4002 Storage Cell: %1 MLD Manager Online Event Code: %2 Description: %3
24003 88035dc3 2 4003 Storage Cell: %1 MLD Manager Startup Failed Event Code: %2 Description: %3
24004 88035dc4 2 4004 Storage Cell: %1 MLD Manager Startup Complete Event Code: %2 Description: %3
24005 88035dc5 2 4005 Storage Cell: %1 MLD Manager Abnormal Startup Event Code: %2 Description: %3
24006 88035dc6 2 4006 Storage Cell: %1 MLD Manager Shutdown Failed Event Code: %2 Description: %3
24007 88035dc7 2 4007 Storage Cell: %1 MLD Manager Shutdown Complete Event Code: %2 Description: %3
24008 88035dc8 2 4008 Storage Cell: %1 MLD Manager Abnormal Shutdown Event Code: %2 Description: %3
24009 88035dc9 2 4009 Storage Cell: %1 Unable to startup WSA during MldMgr:init Event Code: %2
24010 88035dca 2 4010 Storage Cell: %1 Unable to get Server Host Name during MldMgr:init Event Code: %2
24011 88035dcb 2 4011 Storage Cell: %1 Invalid Host IP Address specified Event Code: %2 Description: %3
24012 88035dcc 2 4012 Storage Cell: %1 Unable to open the NsaMldMgr.dat file for Write Event Code: %2
24013 88035dcd 2 4013 Storage Cell: %1 Unable to open the NsaMldMgr.dat file for Read Event Code: %2
24014 88035dce 2 4014 Storage Cell: %1 Agent Uid does not exist Event Code: %2 Description: %3
24015 88035dcf 2 4015 Storage Cell: %1 Unable to find Object Event Code: %2 Description: %3
24016 88035dd0 2 4016 Storage Cell: %1 Unable to store Object Event Code: %2 Description: %3
24017 88035dd1 2 4017 Storage Cell: %1 Unable to find Object Cell Event Code: %2 Description: %3
24018 88035dd2 2 4018 Storage Cell: %1 Unable to create MLD Event Code: %2 Description: %3
24019 88035dd3 2 4019 Storage Cell: %1 lastSafeChoiceDelay Expired Event Code: %2 Description: %3
24020 88035dd4 2 4020 Storage Cell: %1 lastSafeChoiceDelay Expired Event Code: %2 Description: %3
24021 88035dd5 2 4021 Storage Cell: %1 crashDetectDelay Expired Event Code: %2 Description: %3
24022 88035dd6 2 4022 Storage Cell: %1 retSCCBNum not an SCCB Num Event Code: %2 Description: %3
24023 88035dd7 2 4023 Storage Cell: %1 Unable to read Copy1 of MLD Event Code: %2 Description: %3
24024 88035dd8 2 4024 Storage Cell: %1 Copy 1 of MLD Invalid Event Code: %2 Description: %3
24025 88035dd9 2 4025 Storage Cell: %1 Invalid Copy block of MLD Event Code: %2 Description: %3
24026 88035dda 2 4026 Storage Cell: %1 Copy 2 of MLD Invalid Event Code: %2 Description: %3
24027 88035ddb 2 4027 Storage Cell: %1 MLD database capacity not equal to true MLD capacity Event Code:
24028 88035ddc 2 4028 Storage Cell: %1 Backup range out of bounds of copy 1 range Event Code: %2
24029 88035ddd 2 4029 Storage Cell: %1 MLD Manager Lock Crash DetectDelay has expired, just taking lock!
24030 88035dde 2 4030 Storage Cell: %1 MLD Copy 1 Restored Event Code: %2 Description: %3
Event
Code
Severity
Evt.
No.
Description
Description: %3
Description: %3
Description: %3
Description: %3
Description: %3
Description: %3
%2 Description: %3
Description: %3
Event Code: %2 Description: %3
63Storage Management Appliance Software Event Code Definitions Application Notes
Page 64

HSV Element Manager Event Codes
Table 9: HSV Element Manager Event Codes: Management Agent Events (Continued)
Event
ID
24031 88035ddf 2 4031 Storage Cell: %1 MLD Copy 2 Restored Event Code: %2 Description: %3
24032 88035de0 2 4032 Storage Cell: %1 Unable to find UidAssoc Object Event Code: %2 Description: %3
24033 88035de1 2 4033 Storage Cell: %1 Unable to store UID Association Object Event Code: %2 Description:
24034 88035de2 2 4034 Storage Cell: %1 Unable to find UidAssoc Object Event Code: %2 Description: %3
24035 88035de3 2 4035 Storage Cell: %1 Unable to read last Fusion event read Event Code: %2 Description:
24036 88035de4 2 4036 Storage Cell: %1 MLD Notification Queue Empty Event Code: %2 Description: %3
24037 88035de5 2 4037 Storage Cell: %1 Unable to find Notification Object Event Code: %2 Description: %3
24038 88035de6 2 4038 Storage Cell: %1 Unable to store Notification Object Event Code: %2 Description: %3
24039 88035de7 2 4039 Storage Cell: %1 Unable to find Notification Object Event Code: %2 Description: %3
24040 88035de8 2 4040 Storage Cell: %1 Unable to read Event Log Pointer Event Code: %2 Description: %3
24041 88035de9 2 4041 Storage Cell: %1 Unable to read Event Log Event Code: %2 Description: %3
24042 88035dea 2 4042 Storage Cell: %1 Unable to store Event Log Event Code: %2 Description: %3
24043 88035deb 2 4043 Storage Cell: %1 Unable to read Event Log Event Code: %2 Description: %3
24044 88035dec 2 4044 Storage Cell: %1 Unable to read Event Log and free Lock Event Code: %2 Description:
24045 88035ded 2 4045 Storage Cell: %1 Unable to store Event Log and free Lock Event Code: %2 Description:
24046 88035dee 2 4046 Storage Cell: %1 Unable to read Event Log and free Lock Event Code: %2 Description:
24047 88035def 2 4047 Storage Cell: %1 Previously Read Object Properties do not Match Event Code: %2
24048 88035df0 2 4048 Storage Cell: %1 Previously Read Object Properties do not Match Event Code: %2
24049 88035df1 2 4049 Storage Cell: %1 Unable to read Notification Host List Event Code: %2 Description:
24050 88035df2 2 4050 Storage Cell: %1 Unable to store Notification Host List Event Code: %2 Description: %3
24051 88035df3 2 4051 Storage Cell: %1 Unable to store Notification Host List and free Lock Event Code: %2
24052 88035df4 2 4052 Storage Cell: %1 Unable to read Event Configuration List Event Code: %2 Description:
24053 88035df5 2 4053 Storage Cell: %1 Unable to store Event Configuration List Event Code: %2 Description:
24054 88035df6 2 4054 Storage Cell: %1 Unable to store Event Configuration List and free Lock Event Code: %2
24055 88035df7 2 4055 Storage Cell: %1 MLD roll up buffer full Event Code: %2 Description: %3
24056 88035df8 2 4056 Storage Cell: %1 MLD roll up list read error Event Code: %2 Description: %3
24057 88035df9 2 4057 Storage Cell: %1 MLD Monitor Lock error Event Code: %2 Description: %3
24058 88035dfa 2 4058 Storage Cell: %1 MLD Manager Mutex Timeout error Event Code: %2 Description: %3
24059 88035dfb 2 4059 Storage Cell: %1 MLD Manager list is empty Event Code: %2 Description: %3
25001 880361a9 2 5001 Storage Cell: %1 Monitor Startup Complete Event Code: %2 Description: %3
25002 880361aa 2 5002 Storage Cell: %1 Monitor Startup Failed Event Code: %2 Description: %3
Event
Code
Severity
Evt.
No.
Description
%3
%3
%3
%3
%3
Description: %3
Description: %3
%3
Description: %3
%3
%3
Description: %3
64 Storage Management Appliance Software Event Code Definitions Application Notes
Page 65

Table 9: HSV Element Manager Event Codes: Management Agent Events (Continued)
HSV Element Manager Event Codes
Event
ID
25003 880361ab 2 5003 Storage Cell: %1 Monitor ShutDown Complete Event Code: %2 Description: %3
25004 880361ac 6 5004 Storage Cell: %1 Monitor Memory Allocation Failure Event Code: %2 Description: %3
25005 880361ad 2 5005 Storage Cell: %1 Monitor Mark Agent as Inactive Event Code: %2 Description: %3
25006 880361ae 2 5006 Storage Cell: %1 Monitor create thread error Event Code: %2 Description: %3
25007 880361af 2 5007 Storage Cell: %1 Monitor create timer error Event Code: %2 Description: %3
25008 880361b0 2 5008 Storage Cell: %1 Monitor agent registration - Complete Event Code: %2 Description:
25009 880361b1 2 5009 Storage Cell: %1 Monitor controller rediscovery - Complete Event Code: %2
25010 880361b2 2 5010 Storage Cell: %1 Monitor initiated a storage system shutdown because of controller
25011 880361b3 2 5011 Storage Cell: %1 Unknown storage system rediscovery complete Event Code: %2
25012 880361b4 2 5012 Storage Cell: %1 Start monitoring thread for storage system - Complete Event Code: %2
25013 880361b5 2 5013 Storage Cell: %1 Start monitoring thread for storage system - Fail Event Code: %2
25014 880361b6 2 5014 Storage Cell: %1 Monitoring thread for storage system terminated Event Code: %2
25015 880361b7 2 5015 Storage Cell: %1 Rediscover unknown storage system - Error Event Code: %2
25016 880361b8 2 5016 Storage Cell: %1 Controller time synchronized to appliance time. Event Code: %2
25017 880361b9 2 5017 Storage Cell: %1 Appliance and controller time checked for synchronization. Event
25018 880361ba 2 5018 Storage Cell: %1 Controller and appliance time are the same. No need to synchronize.
25019 880361bb 2 5019 Storage Cell: %1 Exception caught in monitoring process. Event Code: %2 Description:
26001 88036591 2 6001 Storage Cell: %1 Nsc Manager Ready Event Code: %2 Description: %3
26002 88036592 2 6002 Storage Cell: %1 Nsc Manager Index Out of Range Event Code: %2 Description: %3
26003 88036593 6 6003 Storage Cell: %1 Cannot access storage system. Communications error. Event Code:
26004 88036594 2 6004 Storage Cell: %1 Nsc Manager No NSCs Found Event Code: %2 Description: %3
26005 88036595 2 6005 Storage Cell: %1 Nsc Manager Invalid Index Event Code: %2 Description: %3
26006 88036596 6 6006 Storage Cell: %1 Nsc Manager Memory Allocation Failure Event Code: %2
26007 88036597 2 6007 Storage Cell: %1 Nsc Manager No Physical Stores Found Event Code: %2 Description:
26008 88036598 2 6008 Storage Cell: %1 Nsc Manager No Storage Cell Found Event Code: %2 Description:
26009 88036599 2 6009 Storage Cell: %1 Nsc Manager No disk group Found Event Code: %2 Description: %3
26010 8803659a 2 6010 Storage Cell: %1 Nsc Manager too many disk groups Event Code: %2 Description: %3
26011 8803659b 2 6011 Storage Cell: %1 Nsc Manager No Volumes Found Event Code: %2 Description: %3
Event
Code
Severity
Evt.
No.
Description
%3
Description: %3
failure Event Code: %2 Description: %3
Description: %3
Description: %3
Description: %3
Description: %3
Description: %3
Description: %3
Code: %2 Description: %3
Event Code: %2 Description: %3
%3
%2 Description: %3
Description: %3
%3
%3
65Storage Management Appliance Software Event Code Definitions Application Notes
Page 66

HSV Element Manager Event Codes
Table 9: HSV Element Manager Event Codes: Management Agent Events (Continued)
Event
ID
26012 8803659c 2 6012 Storage Cell: %1 Nsc Manager No Logical Disks Found Event Code: %2 Description:
26013 8803659d 2 6013 Storage Cell: %1 Nsc Manager Context Id Changed During Operation Event Code: %2
26014 8803659e 2 6014 Storage Cell: %1 Nsc Manager No Name Event Code: %2 Description: %3
26015 8803659f 2 6015 Storage Cell: %1 Nsc Manager Name Size Exceeded Event Code: %2 Description: %3
26016 880365a0 2 6016 Storage Cell: %1 Nsc Manager Shutdown Complete Event Code: %2 Description: %3
26017 880365a1 2 6017 Storage Cell: %1 Nsc Manager Mutex Creation Failure Event Code: %2 Description:
26018 880365a2 2 6018 Storage Cell: %1 Nsc Manager Mutex Timeout Event Code: %2 Description: %3
26019 880365a3 2 6019 Storage Cell: %1 Nsc Manager No MLD Handle Set Event Code: %2 Description: %3
26020 880365a4 2 6020 Storage Cell: %1 Nsc Manager Failed Transport Layer Communication - No Such Id
26021 880365a5 2 6021 Storage Cell: %1 Nsc Manager Failed Transport Layer Communication - TimeOut Event
26022 880365a6 2 6022 Storage Cell: %1 Nsc Manager No Storage Cell Objects Found Event Code: %2
26023 880365a7 2 6023 Storage Cell: %1 Nsc Manager No Attached Port Found Event Code: %2 Description:
26024 880365a8 2 6024 Storage Cell: %1 Nsc Manager Failed to get SCMI Object Handle Event Code: %2
26025 880365a9 2 6025 Storage Cell: %1 Shutdown Both Restart And Power Off Requested Event Code: %2
26026 880365aa 2 6026 Storage Cell: %1 Shutdown Drive Shelf Power Off But No Enclosure Power Off Requested
26027 880365ab 2 6027 Storage Cell: %1 Shutdown Disable Battery But No Enclosure Power Off Requested
26028 880365ac 2 6028 Storage Cell: %1 Shutdown Disable Battery But Shutdown Unconditional Requested
26029 880365ad 2 6029 Storage Cell: %1 Shutdown Delay Out Of Range Event Code: %2 Description: %3
26030 880365ae 2 6030 Storage Cell: %1 Cache Write Failure Event Code: %2 Description: %3
26031 880365af 2 6031 Storage Cell: %1 Battery Disable Failure Event Code: %2 Description: %3
26032 880365b0 2 6032 Storage Cell: %1 Drive Shelf Disable Failure Event Code: %2 Description: %3
26033 880365b1 2 6033 Storage Cell: %1 Battery Disable Failed on Both Controllers Batteries Event Code: %2
26034 880365b2 2 6034 Storage Cell: %1 Battery Disable Failed on This Controllers Battery Event Code: %2
26035 880365b3 2 6035 Storage Cell: %1 Battery Disable Failed on the Other Controllers Battery Event Code:
26036 880365b4 2 6036 Storage Cell: %1 Requested disk failure protection level is set. Actual level will change
26037 880365b5 2 6037 Storage Cell: %1 Physical Store Contains Stale or Foreign Volume Information. Event
26038 880365b6 2 6038 Storage Cell: %1 Controller Resynchronization or Reboot Occurred. Context Error Event
Event
Code
Severity
Evt.
No.
Description
%3
Description: %3
%3
Event Code: %2 Description: %3
Code: %2 Description: %3
Description: %3
%3
Description: %3
Description: %3
Event Code: %2 Description: %3
Event Code: %2 Description: %3
Event Code: %2 Description: %3
Description: %3
Description: %3
%2 Description: %3
when sufficient disk space is available. Event Code: %2 Description: %3
Code: %2 Description: %3
Code: %2 Description: %3
66 Storage Management Appliance Software Event Code Definitions Application Notes
Page 67

Table 9: HSV Element Manager Event Codes: Management Agent Events (Continued)
HSV Element Manager Event Codes
Event
ID
26039 880365b7 2 6039 Storage Cell: %1 Bad Command Or Response Cookie Event Code: %2 Description: %3
27001 88036979 2 7001 Storage Cell: %1 More than one storage system found Event Code: %2 Description: %3
27002 8803697a 2 7002 Storage Cell: %1 Storage system already exists Event Code: %2 Description: %3
27003 8803697b 2 7003 Storage Cell: %1 Storage System is not initialized Event Code: %2 Description: %3
27004 8803697c 2 7004 Storage Cell: %1 Storage Object Mngr Ready Event Code: %2 Description: %3
27005 8803697d 2 7005 Storage Cell: %1 Storage Object Mngr Shutdown Complete Event Code: %2
27006 8803697e 2 7006 Storage Cell: %1 Storage system name too long Event Code: %2 Description: %3
28001 88036d61 2 8001 Storage Cell: %1 Invalid Operation Event Code: %2 Description: %3
28002 88036d62 2 8002 Storage Cell: %1 Storage system already created Event Code: %2 Description: %3
28003 88036d63 2 8003 Storage Cell: %1 Controller already part of storage system configuration Event Code:
28004 88036d64 2 8004 Storage Cell: %1 Physical Store Count Below Minimum Event Code: %2 Description:
28005 88036d65 2 8005 Storage Cell: %1 Controller not part of storage system configuration Event Code: %2
28006 88036d66 2 8006 Storage Cell: %1 Failed to uninitialize storage system Event Code: %2 Description: %3
28007 88036d67 3 8007 Storage Cell: %1 Storage system File Open Error Event Code: %2 Description: %3
28008 88036d68 3 8008 Storage Cell: %1 Storage system File Write Error Event Code: %2 Description: %3
28009 88036d69 3 8009 Storage Cell: %1 Storage system File Read Error Event Code: %2 Description: %3
28010 88036d6a 2 8010 Storage Cell: %1 Name too long Event Code: %2 Description: %3
28011 88036d6b 2 8011 Storage Cell: %1 No String Error Event Code: %2 Description: %3
28012 88036d6c 2 8012 Storage Cell: %1 No MLD Handle Found Event Code: %2 Description: %3
28013 88036d6d 2 8013 Storage Cell: %1 No Controllers Found Event Code: %2 Description: %3
28014 88036d6e 2 8014 Storage Cell: %1 Controller Not Found On Loop Event Code: %2 Description: %3
28015 88036d6f 2 8015 Storage Cell: %1 No Disk Groups Found Event Code: %2 Description: %3
28016 88036d70 2 8016 Storage Cell: %1 No Volumes Found Event Code: %2 Description: %3
28017 88036d71 2 8017 Storage Cell: %1 No Physical Stores Found Event Code: %2 Description: %3
28018 88036d72 2 8018 Storage Cell: %1 No Virtual Disks Found Event Code: %2 Description: %3
28019 88036d73 2 8019 Storage Cell: %1 No Hosts Found Event Code: %2 Description: %3
28020 88036d74 2 8020 Storage Cell: %1 Name already exists Event Code: %2 Description: %3
28021 88036d75 2 8021 Storage Cell: %1 Folder is not empty Event Code: %2 Description: %3
28022 88036d76 2 8022 Storage Cell: %1 Spares goal could not be met Event Code: %2 Description: %3
28023 88036d77 2 8023 Storage Cell: %1 Storage system object found Event Code: %2 Description: %3
28024 88036d78 2 8024 Storage Cell: %1 Storage system object not found Event Code: %2 Description: %3
28025 88036d79 2 8025 Storage Cell: %1 New Physical Store Detected But Not Found In Physical Store List Event
28026 88036d7a 3 8026 Storage Cell: %1 MldManager Handle is NULL Event Code: %2 Description: %3
28027 88036d7b 3 8027 Storage Cell: %1 NscMngrInterface Handle is NULL Event Code: %2 Description: %3
28028 88036d7c 3 8028 Storage Cell: %1 ScLockMngr Handle is NULL Event Code: %2 Description: %3
28029 88036d7d 6 8029 Storage Cell: %1 Storage system initialization failed Event Code: %2 Description: %3
Event
Code
Severity
Evt.
No.
Description
Description: %3
%2 Description: %3
%3
Description: %3
Code: %2 Description: %3
67Storage Management Appliance Software Event Code Definitions Application Notes
Page 68

HSV Element Manager Event Codes
Table 9: HSV Element Manager Event Codes: Management Agent Events (Continued)
Event
ID
28030 88036d7e 3 8030 Storage Cell: %1 MldMngr, NscMngrInterfaceMngr, or ScLockMngr Handle is NULL
28031 88036d7f 6 8031 Storage Cell: %1 Storage system initilization failed Event Code: %2 Description: %3
28032 88036d80 3 8032 Storage Cell: %1 Storage system discovery failed Event Code: %2 Description: %3
28033 88036d81 2 8033 Storage Cell: %1 Storage system already uninitialized or does not exist Event Code: %2
28034 88036d82 3 8034 Storage Cell: %1 Get Total Storage Failed Event Code: %2 Description: %3
28035 88036d83 2 8035 Storage Cell: %1 Storage system is uninitialized Event Code: %2 Description: %3
28036 88036d84 3 8036 Storage Cell: %1 Get Total Storage Available Failed Event Code: %2 Description: %3
28037 88036d85 3 8037 Storage Cell: %1 Get Total Storage Occupied Failed Event Code: %2 Description: %3
28038 88036d86 3 8038 Storage Cell: %1 Get Total Storage Free Failed Event Code: %2 Description: %3
28039 88036d87 3 8039 Storage Cell: %1 Get Disk Group Failed Event Code: %2 Description: %3
28040 88036d88 3 8040 Storage Cell: %1 Get Disk Group List Failed Event Code: %2 Description: %3
28041 88036d89 3 8041 Storage Cell: %1 Get Disk Group Count Failed Event Code: %2 Description: %3
28042 88036d8a 3 8042 Storage Cell: %1 Create Volume Failed Event Code: %2 Description: %3
28043 88036d8b 3 8043 Storage Cell: %1 Get Volume Failed Event Code: %2 Description: %3
28044 88036d8c 3 8044 Storage Cell: %1 Get Volumes Failed Event Code: %2 Description: %3
28045 88036d8d 3 8045 Storage Cell: %1 Get Volumes Count Failed Event Code: %2 Description: %3
28046 88036d8e 3 8046 Storage Cell: %1 Get Virtual Disk Failed Event Code: %2 Description: %3
28047 88036d8f 3 8047 Storage Cell: %1 Get Virtual Disk List Failed Event Code: %2 Description: %3
28048 88036d90 3 8048 Storage Cell: %1 Get Physical Store Failed Event Code: %2 Description: %3
28049 88036d91 3 8049 Storage Cell: %1 Get Physical Stores Failed Event Code: %2 Description: %3
28050 88036d92 3 8050 Storage Cell: %1 Get Physical Stores Count Failed Event Code: %2 Description: %3
28051 88036d93 3 8051 Storage Cell: %1 Create Virtual Disk Failed Event Code: %2 Description: %3
28052 88036d94 3 8052 Storage Cell: %1 Delete Virtual Disk Failed Event Code: %2 Description: %3
28053 88036d95 3 8053 Storage Cell: %1 Get Device Addition Policy Failed Event Code: %2 Description: %3
28054 88036d96 3 8054 Storage Cell: %1 Get Spares Current Failed Event Code: %2 Description: %3
28055 88036d97 3 8055 Storage Cell: %1 Get Spares Goal Failed Event Code: %2 Description: %3
28056 88036d98 3 8056 Storage Cell: %1 Get storage system events failed Event Code: %2 Description: %3
28057 88036d99 3 8057 Storage Cell: %1 Get Volume Replacement Delay Failed Event Code: %2 Description:
28058 88036d9a 3 8058 Storage Cell: %1 Set Device Addition Policy Failed Event Code: %2 Description: %3
28059 88036d9b 3 8059 Storage Cell: %1 Set Spares Goal Failed Event Code: %2 Description: %3
28060 88036d9c 3 8060 Storage Cell: %1 Set Volume Replacement Delay Failed Event Code: %2 Description:
28061 88036d9d 3 8061 Storage Cell: %1 Create NSC Failed Event Code: %2 Description: %3
28062 88036d9e 3 8062 Storage Cell: %1 Update NSC Failed Event Code: %2 Description: %3
28063 88036d9f 3 8063 Storage Cell: %1 Create Host Failed Event Code: %2 Description: %3
28064 88036da0 3 8064 Storage Cell: %1 Discard Host Failed Event Code: %2 Description: %3
28065 88036da1 3 8065 Storage Cell: %1 Get Host Failed Event Code: %2 Description: %3
28066 88036da2 3 8066 Storage Cell: %1 Get Host List Failed Event Code: %2 Description: %3
Event
Code
Severity
Evt.
No.
Description
Event Code: %2 Description: %3
Description: %3
%3
%3
68 Storage Management Appliance Software Event Code Definitions Application Notes
Page 69

Table 9: HSV Element Manager Event Codes: Management Agent Events (Continued)
HSV Element Manager Event Codes
Event
ID
28067 88036da3 3 8067 Storage Cell: %1 Get Host Count Failed Event Code: %2 Description: %3
28068 88036da4 3 8068 Storage Cell: %1 Get Presented Unit List Failed Event Code: %2 Description: %3
28069 88036da5 3 8069 Storage Cell: %1 Get Presented Unit Count Failed Event Code: %2 Description: %3
28070 88036da6 3 8070 Storage Cell: %1 Free View Failed Event Code: %2 Description: %3
28071 88036da7 3 8071 Storage Cell: %1 Storage system shutdown Failed Event Code: %2 Description: %3
28072 88036da8 3 8072 Storage Cell: %1 StorageCell Virtual Disk Count Does Not Match Logical Disk Count
28073 88036da9 3 8073 Storage Cell: %1 Get Derived Unit List Failed Event Code: %2 Description: %3
28074 88036daa 3 8074 Storage Cell: %1 Get Derived Unit Count Failed Event Code: %2 Description: %3
28075 88036dab 3 8075 Storage Cell: %1 Get StorageCell Virtual Disk List Failed Event Code: %2 Description:
28076 88036dac 3 8076 Storage Cell: %1 Get StorageCell Virtual Disk Count Failed Event Code: %2
28077 88036dad 3 8077 Storage Cell: %1 Error while building virtual disk root view Event Code: %2
28078 88036dae 3 8078 Storage Cell: %1 Error while building host root view Event Code: %2 Description: %3
28079 88036daf 3 8079 Storage Cell: %1 Error while uilding disk group root view Event Code: %2 Description:
28080 88036db0 3 8080 Storage Cell: %1 Error while building hardware root view Event Code: %2 Description:
28081 88036db1 3 8081 Storage Cell: %1 Specified time format is incorrect Event Code: %2 Description: %3
28082 88036db2 3 8082 Storage Cell: %1 Error creating/opening time syncronization file. Event Code: %2
28083 88036db3 3 8083 Storage Cell: %1 StorageCell NscList Reordered. Event Code: %2 Description: %3
28084 88036db4 3 8084 Storage Cell: %1 StorageCell NscList Mutex Get Error Event Code: %2 Description: %3
29001 88037149 3 9001 Storage Cell: %1 Virtual disk File Open Error Event Code: %2 Description: %3
29002 8803714a 3 9002 Storage Cell: %1 Virtual disk File Write Error Event Code: %2 Description: %3
29003 8803714b 3 9003 Storage Cell: %1 Virtual disk File Read Error Event Code: %2 Description: %3
29004 8803714c 2 9004 Storage Cell: %1 Virtual disk name too long Event Code: %2 Description: %3
29005 8803714d 2 9005 Storage Cell: %1 Virtual disk No String Error Event Code: %2 Description: %3
29006 8803714e 2 9006 Storage Cell: %1 Virtual disk No Object Error Event Code: %2 Description: %3
29007 8803714f 2 9007 Storage Cell: %1 Virtual disk still exists Event Code: %2 Description: %3
29008 88037150 2 9008 Storage Cell: %1 Virtual disk Invalid Value Event Code: %2 Description: %3
29009 88037151 2 9009 Storage Cell: %1 An outstanding command is still in progress for the virtual disk Event
29010 88037152 2 9010 Storage Cell: %1 Requested virtual disk size exceeds the available size Event Code: %2
29011 88037153 2 9011 Storage Cell: %1 Virtual disk size may be expanded but not reduced Event Code: %2
29012 88037154 2 9012 Storage Cell: %1 Operation on a fast virtual disk deletion completed Event Code: %2
29013 88037155 2 9013 Storage Cell: %1 Operation on a fast virtual disk creation completed Event Code: %2
Event
Code
Severity
Evt.
No.
Description
Event Code: %2 Description: %3
%3
Description: %3
Description: %3
%3
%3
Description: %3
Code: %2 Description: %3
Description: %3
Description: %3
Description: %3
Description: %3
69Storage Management Appliance Software Event Code Definitions Application Notes
Page 70

HSV Element Manager Event Codes
Table 9: HSV Element Manager Event Codes: Management Agent Events (Continued)
Event
ID
29014 88037156 2 9014 Storage Cell: %1 Operation on a fast virtual disk size expansion completed Event
29015 88037157 2 9015 Storage Cell: %1 Virtual disk cache data lost error Event Code: %2 Description: %3
29016 88037158 2 9016 Storage Cell: %1 Virtual disk data lost error resolved Event Code: %2 Description: %3
29017 88037159 2 9017 Storage Cell: %1 Operation rejected - The virtual disk has a sharing relationship with
29018 8803715a 2 9018 Storage Cell: %1 Operation on this virtual disk was rejected due to the unit’s not normal
29019 8803715b 2 9019 Storage Cell: %1 Operation on this virtual disk could only be performed if unit is
29020 8803715c 2 9020 Storage Cell: %1 Cache policies cannot be modified if unit is presented to a host Event
29021 8803715d 2 9021 Storage Cell: %1 Allowed property changes successful. (Cache policy changes not
29022 8803715e 2 9022 Storage Cell: %1 Requested redundancy type cannot be implemented with the current
29023 8803715f 2 9023 Storage Cell: %1 Your unit was created but cannot be presented at this time. Continue to
29024 88037160 2 9024 Storage Cell: %1 Operation would exceed the maximum allowable presented units.
29025 88037161 2 9025 Storage Cell: %1 Virtual Disk Device Data Lost Error Event Code: %2 Description: %3
29026 88037162 2 9026 Storage Cell: %1 The Most Significant Hex Character in a World Wide LUN Name must
29027 88037163 2 9027 Storage Cell: %1 Virtual disk cache and inoperative data lost error Event Code: %2
29028 88037164 2 9028 Storage Cell: %1 Virtual disk inoperative data lost error Event Code: %2 Description:
29029 88037165 2 9029 Storage Cell: %1 Virtual disk condition failed because of an inoperative data lost error.
30001 88037531 2 10001 Storage Cell: %1 Storage Object Broker Ready Event Code: %2 Description: %3
30002 88037532 3 10002 Storage Cell: %1 Storage Object Startup Failed Event Code: %2 Description: %3
30003 88037533 2 10003 Storage Cell: %1 Invalid storage system name Event Code: %2 Description: %3
30004 88037534 2 10004 Storage Cell: %1 Storage system is not Initialized Event Code: %2 Description: %3
30005 88037535 2 10005 Storage Cell: %1 Failed to set storage system name Event Code: %2 Description: %3
30006 88037536 6 10006 Storage Cell: %1 SOB Memory Allocation Failure Event Code: %2 Description: %3
30007 88037537 2 10007 Storage Cell: %1 Failed to find virtual disk from list Event Code: %2 Description: %3
30008 88037538 2 10008 Storage Cell: %1 Failed to find host from list Event Code: %2 Description: %3
30009 88037539 2 10009 Storage Cell: %1 The Lun specified for this Host is already in use Event Code: %2
30010 8803753a 2 10010 Storage Cell: %1 Your initialized system must have at least one disk group Event Code:
30011 8803753b 2 10011 Storage Cell: %1 Cannot talk to all available NSCs Event Code: %2 Description: %3
Event
Code
Severity
Evt.
No.
Description
Code: %2 Description: %3
another object Event Code: %2 Description: %3
condition Event Code: %2 Description: %3
presented to a host Event Code: %2 Description: %3
Code: %2 Description: %3
allowed, while virtual disk is presented to a host.) Event Code: %2 Description: %3
disk group condition. Event Code: %2 Description: %3
check your unit and present it later when it is fully allocated. Event Code: %2
Description: %3
Event Code: %2 Description: %3
be a 6 Event Code: %2 Description: %3
Description: %3
%3
Event Code: %2 Description: %3
Description: %3
%2 Description: %3
70 Storage Management Appliance Software Event Code Definitions Application Notes
Page 71

Table 9: HSV Element Manager Event Codes: Management Agent Events (Continued)
HSV Element Manager Event Codes
Event
ID
30012 8803753c 2 10012 Storage Cell: %1 Command rejected - Folder is not empty Event Code: %2 Description:
30013 8803753d 2 10013 Storage Cell: %1 Command rejected - There are virtual disk(s) attached to this disk
30014 8803753e 2 10014 Storage Cell: %1 Command rejected - There are virtual disk(s) presented to this host
30015 8803753f 2 10015 Storage Cell: %1 Command rejected - The virtual disk has a sharing relationship with
30016 88037540 2 10016 Storage Cell: %1 Target storage system is currently being used by another process Event
30017 88037541 2 10017 Storage Cell: %1 Command rejected - Number of disk groups will exceed the maximum
30018 88037542 2 10018 Storage Cell: %1 Cannot access the password file Event Code: %2 Description: %3
30019 88037543 2 10019 Storage Cell: %1 Enterprise Login - Complete Event Code: %2 Description: %3
30020 88037544 2 10020 Storage Cell: %1 Operation rejected - Storage system should conform with the number
30021 88037545 2 10021 Storage Cell: %1 Rediscovery of controllers - Complete Event Code: %2 Description:
30022 88037546 2 10022 Storage Cell: %1 Unable to establish communication with controller, check all
30023 88037547 2 10023 Storage Cell: %1 Disk Group Data Lost Error Resolution Sequence 3 - Disk Group
30024 88037548 2 10024 Storage Cell: %1 Disk Group Data Lost Error Resolution Sequence 1 - Marked Event
30025 88037549 2 10025 Storage Cell: %1 Disk Group Data Lost Error Resolution Sequence 2 - Affected Units
30026 8803754a 2 10026 Storage Cell: %1 Disk Group Data Lost Error Resolution Sequence 3 - Disk Group
30027 8803754b 2 10027 Storage Cell: %1 Error - Creating the virtual disk would exceed the maximum allowable
30028 8803754c 2 10028 Storage Cell: %1 Volume Insufficient Resources Event Code: %2 Description: %3
30029 8803754d 2 10029 Storage Cell: %1 Process mutex is locked Event Code: %2 Description: %3
30030 8803754e 2 10030 Storage Cell: %1 Invalid URL request type Event Code: %2 Description: %3
30031 8803754f 2 10031 Storage Cell: %1 Invalid URL object type Event Code: %2 Description: %3
31001 88037919 2 11001 Storage Cell: %1 Agent Startup Complete Event Code: %2 Description: %3
31002 8803791a 2 11002 Storage Cell: %1 AgentShutdown Complete Event Code: %2 Description: %3
31003 8803791b 6 11003 Storage Cell: %1 Insufficient memory to create a new object, Heap may be full! Event
31004 8803791c 6 11004 Storage Cell: %1 Agent Startup Failed Event Code: %2 Description: %3
32000 88037d00 2 12000 Storage Cell: %1 Nsc Manager Interface First Status Event Code: %2 Description: %3
32001 88037d01 2 12001 Storage Cell: %1 Nsc Manager Interface No NSCs Found Event Code: %2 Description:
32002 88037d02 2 12002 Storage Cell: %1 Nsc Manager Interface Index Out Of Range Event Code: %2
Event
Code
Severity
Evt.
No.
Description
%3
group Event Code: %2 Description: %3
Event Code: %2 Description: %3
another object Event Code: %2 Description: %3
Code: %2 Description: %3
allowable number Event Code: %2 Description: %3
of minimum member devices. Event Code: %2 Description: %3
%3
connections. Event Code: %2 Description: %3
Resolved to Normal Event Code: %2 Description: %3
Code: %2 Description: %3
Deleted Event Code: %2 Description: %3
Deleted Event Code: %2 Description: %3
count Event Code: %2 Description: %3
Code: %2 Description: %3
%3
Description: %3
71Storage Management Appliance Software Event Code Definitions Application Notes
Page 72

HSV Element Manager Event Codes
Table 9: HSV Element Manager Event Codes: Management Agent Events (Continued)
Event
ID
32003 88037d03 2 12003 Storage Cell: %1 Unable to process command at this time. Retry the command or check
32004 88037d04 2 12004 Storage Cell: %1 Nsc Manager Interface Initialization Complete Event Code: %2
32005 88037d05 2 12005 Storage Cell: %1 Nsc Manager Interface Initialization Failed Event Code: %2
32007 88037d07 2 12007 Storage Cell: %1 Lock description not null but failed to get context ID Event Code: %2
32008 88037d08 2 12008 Storage Cell: %1 No Disk Groups Available For Access Event Code: %2 Description:
33001 880380e9 2 13001 Storage Cell: %1 NM Good Status Event Code: %2 Description: %3
33002 880380ea 2 13002 Storage Cell: %1 Notification Mngr Online Event Code: %2 Description: %3
33003 880380eb 2 13003 Storage Cell: %1 Notification Mngr Offline Event Code: %2 Description: %3
33004 880380ec 2 13004 Storage Cell: %1 NM Startup Complete Event Code: %2 Description: %3
33005 880380ed 6 13005 Storage Cell: %1 NM Startup Failed Event Code: %2 Description: %3
33006 880380ee 2 13006 Storage Cell: %1 Notification Succeeded Event Code: %2 Description: %3
33007 880380ef 6 13007 Storage Cell: %1 Notification Failed Event Code: %2 Description: %3
33008 880380f0 6 13008 Storage Cell: %1 Notification Failed - MLD Error Event Code: %2 Description: %3
33009 880380f1 6 13009 Storage Cell: %1 Notification Failed - Network Error Event Code: %2 Description: %3
33010 880380f2 2 13010 Storage Cell: %1 NM Shutdown Complete Event Code: %2 Description: %3
33011 880380f3 3 13011 Storage Cell: %1 NM Shutdown Failed Event Code: %2 Description: %3
33012 880380f4 2 13012 Storage Cell: %1 NM Prev Failed Notification Successfully Notified Event Code: %2
33013 880380f5 2 13013 Storage Cell: %1 NM SNMP Manager Online Event Code: %2 Description: %3
33014 880380f6 2 13014 Storage Cell: %1 NM SNMP Packet Sent Event Code: %2 Description: %3
33015 880380f7 6 13015 Storage Cell: %1 NM SNMP Packet Failed Event Code: %2 Description: %3
33016 880380f8 2 13016 Storage Cell: %1 NM SNMP Manager Offline Event Code: %2 Description: %3
33017 880380f9 6 13017 Storage Cell: %1 NM Memory Allocation Error Event Code: %2 Description: %3
34001 880384d1 2 14001 Storage Cell: %1 View Already Exists Event Code: %2 Description: %3
34002 880384d2 2 14002 Storage Cell: %1 View Is Not Set Event Code: %2 Description: %3
34003 880384d3 2 14003 Storage Cell: %1 No View Object(s) Found Event Code: %2 Description: %3
34004 880384d4 2 14004 Storage Cell: %1 View Index Is Out Of Range Event Code: %2 Description: %3
34005 880384d5 2 14005 Storage Cell: %1 View Object - Invalid Object Condition Event Code: %2 Description:
34006 880384d6 2 14006 Storage Cell: %1 View Object - Invalid Object Type Event Code: %2 Description: %3
34007 880384d7 3 14007 Storage Cell: %1 View List Pointer is NULL Event Code: %2 Description: %3
34008 880384d8 3 14008 Storage Cell: %1 View Object Pointer is NULL Event Code: %2 Description: %3
34009 880384d9 2 14009 Storage Cell: %1 Building View List Object - Complete Event Code: %2 Description: %3
34010 880384da 2 14010 Storage Cell: %1 Building View List Object - Failed Event Code: %2 Description: %3
34011 880384db 2 14011 Storage Cell: %1 View Size is Zero Event Code: %2 Description: %3
34012 880384dc 2 14012 Storage Cell: %1 View Find by UID Failed Event Code: %2 Description: %3
34013 880384dd 2 14013 Storage Cell: %1 View Find by Type Failed Event Code: %2 Description: %3
Event
Code
Severity
Evt.
No.
Description
all connections. Event Code: %2 Description: %3
Description: %3
Description: %3
Description: %3
%3
Description: %3
%3
72 Storage Management Appliance Software Event Code Definitions Application Notes
Page 73

Table 9: HSV Element Manager Event Codes: Management Agent Events (Continued)
HSV Element Manager Event Codes
Event
ID
34014 880384de 2 14014 Storage Cell: %1 View Find by Index Failed Event Code: %2 Description: %3
34015 880384df 2 14015 Storage Cell: %1 View Find by Name Failed Event Code: %2 Description: %3
34016 880384e0 2 14016 Storage Cell: %1 View Find by WWN Failed Event Code: %2 Description: %3
34017 880384e1 2 14017 Storage Cell: %1 View Find by Type by Name Failed Event Code: %2 Description: %3
34018 880384e2 2 14018 Storage Cell: %1 View Find by Name by Type Failed Event Code: %2 Description: %3
35001 880388b9 2 15001 Storage Cell: %1 Tree View Symbol Not Found Event Code: %2 Description: %3
35002 880388ba 2 15002 Storage Cell: %1 Tree View Id Symbol Not Found Event Code: %2 Description: %3
35003 880388bb 2 15003 Storage Cell: %1 Tree Cursor Symbol Not Found Event Code: %2 Description: %3
35004 880388bc 2 15004 Storage Cell: %1 Tree Cursor Id Symbol Not Found Event Code: %2 Description: %3
35005 880388bd 2 15005 Storage Cell: %1 Tree Sibling Symbol Not Found Event Code: %2 Description: %3
35006 880388be 2 15006 Storage Cell: %1 Tree Total Children Symbol Not Found Event Code: %2 Description:
35007 880388bf 2 15007 Storage Cell: %1 Tree Expansion Symbol Not Found Event Code: %2 Description: %3
35008 880388c0 2 15008 Storage Cell: %1 Tree Contraction Symbol Not Found Event Code: %2 Description: %3
35009 880388c1 2 15009 Storage Cell: %1 Tree Invalid Descriptor String Event Code: %2 Description: %3
36001 88038ca1 2 16001 Storage Cell: %1 Ema Short Status - Reissue Command Event Code: %2 Description:
36002 88038ca2 2 16002 Storage Cell: %1 Ema EMU Could Not Read ALPA Event Code: %2 Description: %3
36003 88038ca3 2 16003 Storage Cell: %1 Ema Invalid Request Event Code: %2 Description: %3
36004 88038ca4 2 16004 Storage Cell: %1 Ema Invalid Handle Set In Request Packet Event Code: %2
36005 88038ca5 2 16005 Storage Cell: %1 Ema No Pstore At Referenced Location Event Code: %2 Description:
36006 88038ca6 2 16006 Storage Cell: %1 Ema No Primary EMU Selected Event Code: %2 Description: %3
36007 88038ca7 2 16007 Storage Cell: %1 Ema Invalid SubEnclosure ID Specified Event Code: %2 Description:
36008 88038ca8 2 16008 Storage Cell: %1 Ema No Device Found Event Code: %2 Description: %3
36009 88038ca9 2 16009 Storage Cell: %1 Ema Request Packet Missing Parameter Event Code: %2 Description:
36010 88038caa 2 16010 Storage Cell: %1 Ema Could Not Find SubEnclosure in Configuration List Event Code:
36011 88038cab 2 16011 Storage Cell: %1 Ema EMU Alarm Or Status Event Information Event Code: %2
36012 88038cac 2 16012 Storage Cell: %1 Ema Non-specific error occurred Event Code: %2 Description: %3
36013 88038cad 2 16013 Storage Cell: %1 Ema Shelf WWN Could Not Be Accessed Through A Drive Event
36014 88038cae 2 16014 Storage Cell: %1 Ema EMU Failed To Enter Primary Mode Event Code: %2
36015 88038caf 2 16015 Storage Cell: %1 Ema EMU Failed To Exit Primary Mode Event Code: %2 Description:
36016 88038cb0 2 16016 Storage Cell: %1 Ema Downloaded File Does Not Contain Valid Fibre Channel Loader
Event
Code
Severity
Evt.
No.
Description
%3
%3
Description: %3
%3
%3
%3
%2 Description: %3
Description: %3
Code: %2 Description: %3
Description: %3
%3
[status:1] Event Code: %2 Description: %3
73Storage Management Appliance Software Event Code Definitions Application Notes
Page 74

HSV Element Manager Event Codes
Table 9: HSV Element Manager Event Codes: Management Agent Events (Continued)
Event
ID
36017 88038cb1 2 16017 Storage Cell: %1 Ema Downloaded File Format Is Not Recognized [status:2] Event
36018 88038cb2 2 16018 Storage Cell: %1 Ema Incorrect Firmware In Downloaded File [status:3] Event Code: %2
36019 88038cb3 2 16019 Storage Cell: %1 Ema Downloaded Loader is Too Large [status:4] Event Code: %2
36020 88038cb4 2 16020 Storage Cell: %1 Ema Invalid Checksum [status:5] Event Code: %2 Description: %3
36021 88038cb5 2 16021 Storage Cell: %1 Ema Previous Offset Plus Previous Length Not Equal To Current Offset
36022 88038cb6 2 16022 Storage Cell: %1 Ema Downloaded Loader Terminated Incorrectly [status:7] Event
36023 88038cb7 2 16023 Storage Cell: %1 Ema EMU Out Of Memory [status:8] Event Code: %2 Description:
36024 88038cb8 2 16024 Storage Cell: %1 Ema EMU CDB Timeout -- Download Aborted [status:9] Event Code:
36025 88038cb9 2 16025 Storage Cell: %1 Ema EMU Internal State Machine Error [status:10] Event Code: %2
36026 88038cba 2 16026 Storage Cell: %1 Ema EMU Flash Erasure Failure [status:11] Event Code: %2
36027 88038cbb 2 16027 Storage Cell: %1 Ema EMU In Primary Mode - Cannot Download To Primary EMU
36028 88038cbc 2 16028 Storage Cell: %1 Ema Previous Offset Plus Previous Length Greater Than Total Size
36029 88038cbd 2 16029 Storage Cell: %1 Ema Current Total Size Different From Previous Total Size [status:14]
36030 88038cbe 2 16030 Storage Cell: %1 Ema Could Not Restore Reporting Group Number. Final Download
36031 88038cbf 2 16031 Storage Cell: %1 Ema Could Not Recovery From Invop. Invop Retries Exhausted Event
36032 88038cc0 2 16032 Storage Cell: %1 Ema Requested WWN Does Not Match Enclosure WWN Event
36033 88038cc1 6 16033 Storage Cell: %1 Ema EMU Enclosure Services Error Occurred. EMU May Be
36034 88038cc2 2 16034 Storage Cell: %1 Ema SCSI Error Occurred While Trying To Communicate With EMU
36035 88038cc3 2 16035 Storage Cell: %1 Ema Could Not Open EMU Firmware File Event Code: %2
36036 88038cc4 2 16036 Storage Cell: %1 Ema EMU Firmware File Name Is Null Event Code: %2 Description:
36037 88038cc5 2 16037 Storage Cell: %1 Ema EMU Firmware Download Retries Exhausted. Manual Download
36038 88038cc6 2 16038 Storage Cell: %1 Ema EMU Current Firmware Version Matches Upgrade Firmware
36039 88038cc7 2 16039 Storage Cell: %1 Ema EMU Firmware Upgrade Success Event Code: %2 Description:
Event
Code
Severity
Evt.
No.
Description
Code: %2 Description: %3
Description: %3
Description: %3
[status:6] Event Code: %2 Description: %3
Code: %2 Description: %3
%3
%2 Description: %3
Description: %3
Description: %3
[status:12] Event Code: %2 Description: %3
[status:13] Event Code: %2 Description: %3
Event Code: %2 Description: %3
Record Error Event Code: %2 Description: %3
Code: %2 Description: %3
Code: %2 Description: %3
Unavailable or Not Installed Event Code: %2 Description: %3
Event Code: %2 Description: %3
Description: %3
%3
May Be Required Event Code: %2 Description: %3
Version. No Upgrade Will Be Performed. Event Code: %2 Description: %3
%3
74 Storage Management Appliance Software Event Code Definitions Application Notes
Page 75

Table 9: HSV Element Manager Event Codes: Management Agent Events (Continued)
HSV Element Manager Event Codes
Event
ID
36040 88038cc8 2 16040 Storage Cell: %1 Ema EMU In Load State. Do Not Power Off. Reload EMU Firmware
37001 88039089 2 17001 Storage Cell: %1 Drive Code Load Descriptor File Open Error Event Code: %2
37002 8803908a 2 17002 Storage Cell: %1 Drive Code Load Descriptor File Parsing Error - Invalid Line Event
37003 8803908b 2 17003 Storage Cell: %1 Drive Code Load Image File Open Error, Event Code: %2
37004 8803908c 2 17004 Storage Cell: %1 Drive Code Load Image File Error Getting File Size Event Code: %2
37005 8803908d 2 17005 Storage Cell: %1 Drive Code Load Image File Buffer Allocation Error Event Code: %2
37006 8803908e 2 17006 Storage Cell: %1 Drive Code Load Image File Read Error Event Code: %2 Description:
37007 8803908f 6 17007 Storage Cell: %1 Drive Code Load Drive Firmware Update Failed Event Code: %2
37008 88039090 3 17008 Storage Cell: %1 Drive Code Load Drive Inquiry Failed Event Code: %2 Description:
37009 88039091 3 17009 Storage Cell: %1 Drive Code Load Format Command Failed Event Code: %2
37010 88039092 3 17010 Storage Cell: %1 Drive Code Load Format Failed Event Code: %2 Description: %3
37011 88039093 3 17011 Storage Cell: %1 Drive Code Load Restore Volume Failed Event Code: %2 Description:
37012 88039094 2 17012 Storage Cell: %1 Drive Code Load Get Physical Store Condition Failed Event Code: %2
37013 88039095 2 17013 Storage Cell: %1 Drive Code Load Get Volume Condition Failed Event Code: %2
37014 88039096 3 17014 Storage Cell: %1 Drive Code Load Drive Spin Up Error Event Code: %2 Description:
37015 88039097 2 17015 Storage Cell: %1 Drive Code Load - Complete Event Code: %2 Description: %3
37016 88039098 2 17016 Storage Cell: %1 Drive Code Load Disk Group Migration In Progress Event Code: %2
37017 88039099 2 17017 Storage Cell: %1 Drive Code Load Unable To Code Load Disks Part Of A Group Event
38001 88039471 2 18001 Storage Cell: %1 Api Created Element Success Event Code: %2 Description: %3
38002 88039472 2 18002 Storage Cell: %1 Api Created Storage Success Event Code: %2 Description: %3
38003 88039473 2 18003 Storage Cell: %1 Api Created Storage Client Success Event Code: %2 Description: %3
38004 88039474 2 18004 Storage Cell: %1 Api Set Storage Success Event Code: %2 Description: %3
38005 88039475 2 18005 Storage Cell: %1 Api Set Element Success Event Code: %2 Description: %3
38006 88039476 2 18006 Storage Cell: %1 Api Deleted Element Success Event Code: %2 Description: %3
38007 88039477 2 18007 Storage Cell: %1 Api Deleted Storage Success Event Code: %2 Description: %3
38008 88039478 2 18008 Storage Cell: %1 Api Deleted Storage Client Success Event Code: %2 Description: %3
38009 88039479 2 18009 Storage Cell: %1 Api Created Snapshot Success
38010 8803947a 2 18010 Storage Cell: %1 Api Created Clone Success Event Code: %2 Description: %3
Event
Code
Severity
Evt.
No.
Description
Event Code: %2 Description: %3
Description: %3
Code: %2 Description: %3
Description: %3
Description: %3
Description: %3
%3
Description: %3
%3
Description: %3
%3
Description: %3
Description: %3
%3
Description: %3
Code: %2 Description: %3
75Storage Management Appliance Software Event Code Definitions Application Notes
Page 76

HSV Element Manager Event Codes
Table 9: HSV Element Manager Event Codes: Management Agent Events (Continued)
Event
ID
38018 88039482 2 18018 Storage Cell: %1 Api Unable To Get The Lock Event Code: %2 Description: %3
38019 88039483 2 18019 Storage Cell: %1 Api Created PresentedUnit Success Event Code: %2 Description: %3
38022 88039486 2 18022 Storage Cell: %1 Api Create DiskGroup Success Event Code: %2 Description: %3
38024 88039488 2 18024 Storage Cell: %1 Api Create Folder Success Event Code: %2 Description: %3
38025 88039489 2 18025 Storage Cell: %1 Api Delete Folder Success Event Code: %2 Description: %3
38028 8803948c 2 18028 Storage Cell: %1 Api Set Folder Success Event Code: %2 Description: %3
38034 88039492 2 18034 Storage Cell: %1 Api Invalid User Name Or Password Error Event Code: %2
38036 88039494 2 18036 Storage Cell: %1 Api Delete Presented Unit Success Event Code: %2 Description: %3
38038 88039496 2 18038 Storage Cell: %1 Api Set Diskgroup Success Event Code: %2
38039 88039497 2 18039 Storage Cell: %1 Api Set Disk Success Event Code: %2 Description: %3
38040 88039498 2 18040 Storage Cell: %1 Api Delete Storage Family Success Event Code: %2 Description: %3
38041 88039499 2 18041 Storage Cell: %1 Api Set Storage Family Success Event Code: %2 Description: %3
38042 8803949a 2 18042 Storage Cell: %1 Api Control Memory Allocation Failure Event Code: %2 Description:
38045 8803949d 2 18045 Storage Cell: %1 Api Element Codeload Success Event Code: %2 Description: %3
38047 8803949f 2 18047 Storage Cell: %1 Api Disk Codeload Success Event Code: %2 Description: %3
38048 880394a0 2 18048 Storage Cell: %1 Api Monitor Codeload Success Event Code: %2 Description: %3
38049 880394a1 2 18049 Storage Cell: %1 Api Added Port WwID Success Event Code: %2 Description: %3
38050 880394a2 2 18050 Storage Cell: %1 Api Set Storage Client Success Event Code: %2 Description: %3
38051 880394a3 2 18051 Storage Cell: %1 Api Invalid Operation Event Code: %2 Description: %3
38052 880394a4 2 18052 Storage Cell: %1 Api Deleted Port WwID Success Event Code: %2 Description: %3
38059 880394ab 2 18059 Storage Cell: %1 Api Set Power Success Event Code: %2 Description: %3
38060 880394ac 2 18060 Storage Cell: %1 Api Element Is Not Initialized Event Code: %2 Description: %3
38063 880394af 2 18063 Storage Cell: %1 Api Error trying to delete a disk group Event Code: %2 Description:
38065 880394b1 2 18065 Storage Cell: %1 Api A storage (virtual disk) operation is in progress. Try again later.
38066 880394b2 2 18066 Storage Cell: %1 Api The storage (virtual disk) condition is invalid. The storage may be
38067 880394b3 2 18067 Storage Cell: %1 Api Error calling get virtual disk condition. Virtual disk may be deleted.
38068 880394b4 2 18068 Storage Cell: %1 Api Invalid initialization of the API. Cannot start monitoring process
38070 880394b6 2 18070 Storage Cell: %1 Api A command is currently under execution from another API call. Try
38071 880394b7 2 18071 Storage Cell: %1 Api The server has not completed initialization, cannot process the
38073 880394b9 2 18073 Storage Cell: %1 Api Removing of disk from disk group successfull Event Code: %2
38074 880394ba 2 18074 Storage Cell: %1 Api Adding of disk(s) to disk group successfull Event Code: %2
Event
Code
Severity
Evt.
No.
Description
Description: %3
Description: %3
%3
%3
Event Code: %2 Description: %3
in error. Try again later. Event Code: %2 Description: %3
Try again later. Event Code: %2 Description: %3
which limits storage cell actions. Event Code: %2 Description: %3
again later. Event Code: %2 Description: %3
request. Event Code: %2 Description: %3
Description: %3
Description: %3
76 Storage Management Appliance Software Event Code Definitions Application Notes
Page 77

Table 9: HSV Element Manager Event Codes: Management Agent Events (Continued)
HSV Element Manager Event Codes
Event
ID
38075 880394bb 2 18075 Storage Cell: %1 Api Modify monitor properties successfull Event Code: %2
38076 880394bc 2 18076 Storage Cell: %1 Api Element name too long. Maximum is 20 characters. Event Code:
38079 880394bf 2 18079 Storage Cell: %1 Api The basic license cannot be validated. Either the license key has
38080 880394c0 2 18080 Storage Cell: %1 Api The snapshot/Snapclone license cannot be validated. Either the
38081 880394c1 2 18081 Storage Cell: %1 Api The folder operation is not valid for the specified folder. Either the
38082 880394c2 2 18082 Storage Cell: %1 Api Cannot create the clone copy because the target storage is not
39001 88039859 3 19001 Storage Cell: %1 Storage Cell Lock Error Event Code: %2 Description: %3
39002 8803985a 2 19002 Storage Cell: %1 Storage Cell Deleted Event Code: %2 Description: %3
39003 8803985b 2 19003 Storage Cell: %1 An outstanding command is in-progress for the selected storage
39004 8803985c 2 19004 Storage Cell: %1 Lock Wait Time too large Event Code: %2 Description: %3
39005 8803985d 2 19005 Storage Cell: %1 Place Request In Q Failed Event Code: %2 Description: %3
39006 8803985e 2 19006 Storage Cell: %1 No Match for Q Found Event Code: %2 Description: %3
39007 8803985f 2 19007 Storage Cell: %1 Agent Wait Timeout Event Code: %2 Description: %3
39008 88039860 3 19008 Storage Cell: %1 Free Lock Unsuccessful Event Code: %2 Description: %3
39009 88039861 3 19009 Storage Cell: %1 Lock Manager Mutex Timeout Error Event Code: %2 Description: %3
39010 88039862 6 19010 Storage Cell: %1 Lock Queue Memory Allocation Failure Event Code: %2 Description:
40001 88039c41 6 20001 Storage Cell: %1 LicMngr Memory Allocation Failure Event Code: %2 Description: %3
40002 88039c42 2 20002 Storage Cell: %1 LicMngr Startup Complete Event Code: %2 Description: %3
40003 88039c43 6 20003 Storage Cell: %1 LicMngr Startup Failed Event Code: %2 Description: %3
40004 88039c44 2 20004 Storage Cell: %1 License successfully checked out Event Code: %2 Description: %3
40005 88039c45 3 20005 Storage Cell: %1 License checkout failed Event Code: %2 Description: %3
40011 88039c4b 3 20011 Storage Cell: %1 License Line has an incorrect format Event Code: %2 Description: %3
40012 88039c4c 3 20012 Storage Cell: %1 License file with this Node WWID is missing Event Code: %2
40013 88039c4d 6 20013 Storage Cell: %1 License Library runtime error Event Code: %2 Description: %3
40014 88039c4e 6 20014 Storage Cell: %1 New License Job invocation failed Event Code: %2 Description: %3
40015 88039c4f 3 20015 Storage Cell: %1 Failed to retrieve Node WWN from storage system Event Code: %2
40016 88039c50 3 20016 Storage Cell: %1 Failed to retrieve license list from MLD Event Code: %2 Description:
40017 88039c51 3 20017 Storage Cell: %1 Failed to write license list to MLD Event Code: %2 Description: %3
40018 88039c52 3 20018 Storage Cell: %1 This license line appears to be invalid Event Code: %2 Description:
Event
Code
Severity
Evt.
No.
Description
Description: %3
%2 Description: %3
not been entered, or there is a system communication failure. Event Code: %2
Description: %3
license key has not been entered, or there is a system communication failure. Event
Code: %2 Description: %3
folder is a root folder and cannot be modified, or it is a disk group folder for which you
should use ‘set group’ command. Event Code: %2 Description: %3
presented. Event Code: %2 Description: %3
system. Please try again later. Event Code: %2 Description: %3
%3
Description: %3
Description: %3
%3
%3
77Storage Management Appliance Software Event Code Definitions Application Notes
Page 78

HSV Element Manager Event Codes
Table 9: HSV Element Manager Event Codes: Management Agent Events (Continued)
Event
ID
40019 88039c53 3 20019 Storage Cell: %1 MLD Manager Handle is NULL - unable to update MLD License List
40020 88039c54 6 20020 Storage Cell: %1 LicMngr: StorageCell Handle is NULL Event Code: %2 Description:
40021 88039c55 2 20021 Storage Cell: %1 The license you entered is a valid license but not for the Node WWN
40022 88039c56 2 20022 Storage Cell: %1 Function name string is null or in an incorrect format Event Code: %2
40023 88039c57 2 20023 Storage Cell: %1 Version string is null or in an incorrect format Event Code: %2
41001 8803a029 2 21001 Storage Cell: %1 HSV Upgrade Manager Image File Open Error Event Code: %2
41002 8803a02a 2 21002 Storage Cell: %1 HSV Upgrade Manager Image File Buffer Allocation Error Event
41003 8803a02b 2 21003 Storage Cell: %1 HSV Upgrade Manager Image File Read Error Event Code: %2
41004 8803a02c 2 21004 Storage Cell: %1 HSV Upgrade Manager Event File Write Error Event Code: %2
41005 8803a02d 2 21005 Storage Cell: %1 HSV Upgrade Manager Drive Firmware Update Failed Event Code:
41006 8803a02e 2 21006 Storage Cell: %1 HSV Upgrade Manager Global Header Edc Compute Error Event
41007 8803a02f 2 21007 Storage Cell: %1 HSV Upgrade Manager Image Header Edc Compute Error Event
41008 8803a030 2 21008 Storage Cell: %1 HSV Upgrade Manager Image Type Exceeds Max Image Count Event
41009 8803a031 2 21009 Storage Cell: %1 HSV Upgrade Manager Image Type Not Controller Image Event
41010 8803a032 2 21010 Storage Cell: %1 HSV Upgrade Manager Image Size Exceeded Event Code: %2
41011 8803a033 2 21011 Storage Cell: %1 HSV Upgrade Manager Event File Open Error Event Code: %2
41012 8803a034 2 21012 Storage Cell: %1 HSV Upgrade Manager Image Edc Compute Error Event Code: %2
41013 8803a035 2 21013 Storage Cell: %1 HSV Upgrade Manager Begin Text Not Found Event Code: %2
41014 8803a036 2 21014 Storage Cell: %1 HSV Upgrade Manager After Text Not Found Event Code: %2
41015 8803a037 2 21015 Storage Cell: %1 HSV Upgrade Manager File Format Version Mismatch Event Code:
41016 8803a038 2 21016 Storage Cell: %1 HSV Upgrade Manager Global Header Format Version Mismatch
41017 8803a039 2 21017 Storage Cell: %1 HSV Upgrade Manager Product Information Was Not Found Event
42001 8803a411 3 22001 Storage Cell: %1 Trace: Unable to write managment agent trace file Event Code: %2
Event
Code
Severity
Evt.
No.
Description
Event Code: %2 Description: %3
%3
on this controller pair Event Code: %2 Description: %3
Description: %3
Description: %3
Description: %3
Code: %2 Description: %3
Description: %3
Description: %3
%2 Description: %3
Code: %2 Description: %3
Code: %2 Description: %3
Code: %2 Description: %3
Code: %2 Description: %3
Description: %3
Description: %3
Description: %3
Description: %3
Description: %3
%2 Description: %3
Event Code: %2 Description: %3
Code: %2 Description: %3
Description: %3
78 Storage Management Appliance Software Event Code Definitions Application Notes
Page 79

Table 9: HSV Element Manager Event Codes: Management Agent Events (Continued)
HSV Element Manager Event Codes
Event
ID
42002 8803a412 2 22002 Storage Cell: %1 Trace: file write succeeded Event Code: %2 Description: %3
43002 8803a7fa 3 23002 Storage Cell: %1 Diagnostic The view list has errors Event Code: %2 Description: %3
43003 8803a7fb 6 23003 Storage Cell: %1 Diagnostic Memory allocation failure Event Code: %2 Description:
Event
Code
Severity
Evt.
No.
Description
%3
79Storage Management Appliance Software Event Code Definitions Application Notes
Page 80

HSV Element Manager Event Codes
80 Storage Management Appliance Software Event Code Definitions Application Notes
 Loading...