

Page 1

hp StorageWorks
edge switch 2/16
service manual
Part Number: A7284-96002/AA-RS2JA-TE
First Edition (August 2002)
This manual describes the hp StorageWorks edge switch 2/16
and attached hp StorageWorks ha-fabric manager (HAFM)
application. For service representatives, it describes diagnostic
procedures, repair procedures, and the removal and replacement
procedures for field-replaceable units (FRUs). An illustrated parts
breakdown is included for all FRUs.
Page 2

© Hewlett-Packard Company, 2002. All rights reserved.
Hewlett-Packard Company makes no warranty of any kind with regard to this material, including,
but not limited to, the implied warranties of merchantability and fitness for a particular purpose.
Hewlett-Packard shall not be liable for errors contained herein or for incidental or consequential
damages in connection with the furnishing, performance, or use of this material.
This document contains proprietary information, which is protected by copyright. No part of this
document may be photocopied, reproduced, or translated into another language without the prior
written consent of Hewlett-Packard. The information contained in this document is subject to change
without notice.
Microsoft, MS-DOS, and Windows are trademarks of Microsoft Corporation in the U.S. and/or
other countries.
All other product names mentioned herein may be trademarks of their respective companies.
Hewlett-Packard Company shall not be liable for technical or editorial errors or omissions contained
herein. The information is provided “as is” without warranty of any kind and is subject to change
without notice. The warranties for Hewlett-Packard Company products are set forth in the express
limited warranty statements accompanying such products. Nothing herein should be construed as
constituting an additional warranty.
Printed in the U.S.A.
edge switch 2/16 service manual
First Edition (August 2002)
Part Number: A7284-96002/AA-RS2JA-TE
Page 3

Contents
About this Guide
Intended Audience . . . . . . . . . . . . . . . . . . . . . . . . . . . . . . . . . . . . . . . . . . . . . . . . . . . . . .xiii
Related Documentation . . . . . . . . . . . . . . . . . . . . . . . . . . . . . . . . . . . . . . . . . . . . . . . . . .xiii
Document Conventions . . . . . . . . . . . . . . . . . . . . . . . . . . . . . . . . . . . . . . . . . . . . . . . . . . xiv
Symbols in Text . . . . . . . . . . . . . . . . . . . . . . . . . . . . . . . . . . . . . . . . . . . . . . . . . . . . . . . . xv
Symbols on Equipment . . . . . . . . . . . . . . . . . . . . . . . . . . . . . . . . . . . . . . . . . . . . . . . . . . xv
Rack Stability. . . . . . . . . . . . . . . . . . . . . . . . . . . . . . . . . . . . . . . . . . . . . . . . . . . . . . . . . .xvi
Getting Help. . . . . . . . . . . . . . . . . . . . . . . . . . . . . . . . . . . . . . . . . . . . . . . . . . . . . . . . . . xvii
HP Technical Support . . . . . . . . . . . . . . . . . . . . . . . . . . . . . . . . . . . . . . . . . . . . . . . xvii
HP Website . . . . . . . . . . . . . . . . . . . . . . . . . . . . . . . . . . . . . . . . . . . . . . . . . . . . . . . xvii
HP Authorized Reseller . . . . . . . . . . . . . . . . . . . . . . . . . . . . . . . . . . . . . . . . . . . . . . . . . xvii
General InformationI
Switch Description. . . . . . . . . . . . . . . . . . . . . . . . . . . . . . . . . . . . . . . . . . . . . . . . . . . . . 1–1
Switch Management . . . . . . . . . . . . . . . . . . . . . . . . . . . . . . . . . . . . . . . . . . . . . . . . 1–3
Error-Detection, Reporting, and Serviceability Features . . . . . . . . . . . . . . . . . . . . 1–5
Zoning Feature. . . . . . . . . . . . . . . . . . . . . . . . . . . . . . . . . . . . . . . . . . . . . . . . . . . . . 1–7
Multi-Switch Fabrics. . . . . . . . . . . . . . . . . . . . . . . . . . . . . . . . . . . . . . . . . . . . . . . . 1–8
Switch Specifications. . . . . . . . . . . . . . . . . . . . . . . . . . . . . . . . . . . . . . . . . . . . . . . . . . . 1–9
Physical Characteristics . . . . . . . . . . . . . . . . . . . . . . . . . . . . . . . . . . . . . . . . . . 1–9
HAFM Server Description. . . . . . . . . . . . . . . . . . . . . . . . . . . . . . . . . . . . . . . . . . . . . . 1–11
HAFM Server Specifications. . . . . . . . . . . . . . . . . . . . . . . . . . . . . . . . . . . . . . . . . 1–12
Ethernet Hub . . . . . . . . . . . . . . . . . . . . . . . . . . . . . . . . . . . . . . . . . . . . . . . . . . . . . 1–13
Embedded Web Server Interface. . . . . . . . . . . . . . . . . . . . . . . . . . . . . . . . . . . . . . 1–13
Maintenance Approach . . . . . . . . . . . . . . . . . . . . . . . . . . . . . . . . . . . . . . . . . . . . . . . . 1–13
Remote Workstation Configurations . . . . . . . . . . . . . . . . . . . . . . . . . . . . . . . . . . . . . . 1–14
Minimum Remote Console Hardware Specifications . . . . . . . . . . . . . . . . . . . . . . 1–16
Field Replaceable Units . . . . . . . . . . . . . . . . . . . . . . . . . . . . . . . . . . . . . . . . . . . . . . . . 1–17
SFP Transceivers. . . . . . . . . . . . . . . . . . . . . . . . . . . . . . . . . . . . . . . . . . . . . . . . . . 1–19
Cooling Fans . . . . . . . . . . . . . . . . . . . . . . . . . . . . . . . . . . . . . . . . . . . . . . . . . . . . . 1–19
edge switch 2/16 installation guide iii
Page 4

Contents
Power Supplies. . . . . . . . . . . . . . . . . . . . . . . . . . . . . . . . . . . . . . . . . . . . . . . . . . . . 1–19
Connectors and Indicators . . . . . . . . . . . . . . . . . . . . . . . . . . . . . . . . . . . . . . . . . . . 1–19
Initial Machine Load Button . . . . . . . . . . . . . . . . . . . . . . . . . . . . . . . . . . . . . . . . . 1–20
Ethernet LAN Connector . . . . . . . . . . . . . . . . . . . . . . . . . . . . . . . . . . . . . . . . . . . . 1–20
Power and System Error LEDs . . . . . . . . . . . . . . . . . . . . . . . . . . . . . . . . . . . . . . . 1–20
FRU Status LEDs. . . . . . . . . . . . . . . . . . . . . . . . . . . . . . . . . . . . . . . . . . . . . . . . . . 1–21
Maintenance Port . . . . . . . . . . . . . . . . . . . . . . . . . . . . . . . . . . . . . . . . . . . . . . . . . . 1–21
Software Diagnostic Features. . . . . . . . . . . . . . . . . . . . . . . . . . . . . . . . . . . . . . . . . . . . 1–21
HAFM Diagnostics . . . . . . . . . . . . . . . . . . . . . . . . . . . . . . . . . . . . . . . . . . . . . . . . 1–22
HAFM Status Symbols . . . . . . . . . . . . . . . . . . . . . . . . . . . . . . . . . . . . . . . . . . 1–23
Hardware View Layout and Function . . . . . . . . . . . . . . . . . . . . . . . . . . . . . . . . . . 1–24
Menu Bar . . . . . . . . . . . . . . . . . . . . . . . . . . . . . . . . . . . . . . . . . . . . . . . . . . . . . 1–24
Product Manager Diagnostics . . . . . . . . . . . . . . . . . . . . . . . . . . . . . . . . . . . . . . . . 1–25
Hardware View . . . . . . . . . . . . . . . . . . . . . . . . . . . . . . . . . . . . . . . . . . . . . . . . 1–25
Status Table . . . . . . . . . . . . . . . . . . . . . . . . . . . . . . . . . . . . . . . . . . . . . . . . . . . 1–26
LED Emulation . . . . . . . . . . . . . . . . . . . . . . . . . . . . . . . . . . . . . . . . . . . . . . . . 1–27
Product Manager Status Symbols . . . . . . . . . . . . . . . . . . . . . . . . . . . . . . . . . . 1–27
View Tabs . . . . . . . . . . . . . . . . . . . . . . . . . . . . . . . . . . . . . . . . . . . . . . . . . . . . 1–28
View Panel. . . . . . . . . . . . . . . . . . . . . . . . . . . . . . . . . . . . . . . . . . . . . . . . . . . . 1–28
Status Bar. . . . . . . . . . . . . . . . . . . . . . . . . . . . . . . . . . . . . . . . . . . . . . . . . . . . . 1–35
Topology Tab. . . . . . . . . . . . . . . . . . . . . . . . . . . . . . . . . . . . . . . . . . . . . . . . . . . . . 1–37
Zone Set Tab . . . . . . . . . . . . . . . . . . . . . . . . . . . . . . . . . . . . . . . . . . . . . . . . . . . . . 1–38
HAFM Services Application . . . . . . . . . . . . . . . . . . . . . . . . . . . . . . . . . . . . . . . . . 1–38
Event Table . . . . . . . . . . . . . . . . . . . . . . . . . . . . . . . . . . . . . . . . . . . . . . . . . . . 1–39
Status Line. . . . . . . . . . . . . . . . . . . . . . . . . . . . . . . . . . . . . . . . . . . . . . . . . . . . 1–40
Embedded Web Server Diagnostics. . . . . . . . . . . . . . . . . . . . . . . . . . . . . . . . . . . . 1–41
SNMP Trap Message Support . . . . . . . . . . . . . . . . . . . . . . . . . . . . . . . . . . . . . . . . 1–42
E-Mail and Call-Home Support . . . . . . . . . . . . . . . . . . . . . . . . . . . . . . . . . . . . . . . 1–43
Tools and Test Equipment . . . . . . . . . . . . . . . . . . . . . . . . . . . . . . . . . . . . . . . . . . . . . . 1–43
Tools Supplied with the Switch . . . . . . . . . . . . . . . . . . . . . . . . . . . . . . . . . . . . . . . 1–43
Tools Supplied by Service Personnel. . . . . . . . . . . . . . . . . . . . . . . . . . . . . . . . . . . 1–44
Diagnostics
Maintenance Analysis Procedures . . . . . . . . . . . . . . . . . . . . . . . . . . . . . . . . . . . . . . . . . 2–1
Factory Defaults. . . . . . . . . . . . . . . . . . . . . . . . . . . . . . . . . . . . . . . . . . . . . . . . . . . . 2–1
Quick Start . . . . . . . . . . . . . . . . . . . . . . . . . . . . . . . . . . . . . . . . . . . . . . . . . . . . . . . . 2–1
MAP 0000: Start MAP . . . . . . . . . . . . . . . . . . . . . . . . . . . . . . . . . . . . . . . . . . . . . . . . . . 2–7
MAP 0100: Power Distribution Analysis. . . . . . . . . . . . . . . . . . . . . . . . . . . . . . . . . . . 2–26
iv edge switch 2/16 installation guide
Page 5

MAP 0200: POST, Reset, or IPL Failure Analysis . . . . . . . . . . . . . . . . . . . . . . . . . . . 2–32
MAP 0300: Console Application Problem Determination . . . . . . . . . . . . . . . . . . . . . 2–33
MAP 0400: Loss of Console Communication. . . . . . . . . . . . . . . . . . . . . . . . . . . . . . . 2–39
MAP 0500: Fan and CTP Failure Analysis . . . . . . . . . . . . . . . . . . . . . . . . . . . . . . . . . 2–58
MAP 0600: Port Failure and Link Incident Analysis. . . . . . . . . . . . . . . . . . . . . . . . . . 2–63
MAP 0700: Fabric, ISL, and Segmented Port Problem Determination. . . . . . . . . . . . 2–79
MAP 0800: Console PC Problem Determination . . . . . . . . . . . . . . . . . . . . . . . . . . . . 2–90
Repair Information
Factory Defaults. . . . . . . . . . . . . . . . . . . . . . . . . . . . . . . . . . . . . . . . . . . . . . . . . . . . . . . 3–2
Procedural Notes . . . . . . . . . . . . . . . . . . . . . . . . . . . . . . . . . . . . . . . . . . . . . . . . . . . . . . 3–2
Using Log Information. . . . . . . . . . . . . . . . . . . . . . . . . . . . . . . . . . . . . . . . . . . . . . . . . . 3–3
HAFM Audit Log . . . . . . . . . . . . . . . . . . . . . . . . . . . . . . . . . . . . . . . . . . . . . . . . . . 3–3
HAFM Event Log . . . . . . . . . . . . . . . . . . . . . . . . . . . . . . . . . . . . . . . . . . . . . . . . . . 3–3
Session Log . . . . . . . . . . . . . . . . . . . . . . . . . . . . . . . . . . . . . . . . . . . . . . . . . . . . . . . 3–4
Product Status Log. . . . . . . . . . . . . . . . . . . . . . . . . . . . . . . . . . . . . . . . . . . . . . . . . . 3–5
Fabric Log . . . . . . . . . . . . . . . . . . . . . . . . . . . . . . . . . . . . . . . . . . . . . . . . . . . . . . . . 3–5
Audit Log. . . . . . . . . . . . . . . . . . . . . . . . . . . . . . . . . . . . . . . . . . . . . . . . . . . . . . . . . 3–6
Event Log . . . . . . . . . . . . . . . . . . . . . . . . . . . . . . . . . . . . . . . . . . . . . . . . . . . . . . . . 3–6
Refresh the Event Log. . . . . . . . . . . . . . . . . . . . . . . . . . . . . . . . . . . . . . . . . . . . 3–7
Clear the Event Log . . . . . . . . . . . . . . . . . . . . . . . . . . . . . . . . . . . . . . . . . . . . . 3–7
Hardware Log . . . . . . . . . . . . . . . . . . . . . . . . . . . . . . . . . . . . . . . . . . . . . . . . . . . . . 3–7
Link Incident Log . . . . . . . . . . . . . . . . . . . . . . . . . . . . . . . . . . . . . . . . . . . . . . . . . . 3–9
Refresh the Link Incident Log . . . . . . . . . . . . . . . . . . . . . . . . . . . . . . . . . . . . 3–10
Clear the Link Incident Log . . . . . . . . . . . . . . . . . . . . . . . . . . . . . . . . . . . . . . 3–10
Threshold Alert Log . . . . . . . . . . . . . . . . . . . . . . . . . . . . . . . . . . . . . . . . . . . . . . . 3–10
Using Views. . . . . . . . . . . . . . . . . . . . . . . . . . . . . . . . . . . . . . . . . . . . . . . . . . . . . . . . . 3–12
Port List View . . . . . . . . . . . . . . . . . . . . . . . . . . . . . . . . . . . . . . . . . . . . . . . . . . . . 3–12
FRU List View. . . . . . . . . . . . . . . . . . . . . . . . . . . . . . . . . . . . . . . . . . . . . . . . . . . . 3–14
Node List View . . . . . . . . . . . . . . . . . . . . . . . . . . . . . . . . . . . . . . . . . . . . . . . . . . . 3–16
Performance View . . . . . . . . . . . . . . . . . . . . . . . . . . . . . . . . . . . . . . . . . . . . . . . . . 3–17
Zone Set View . . . . . . . . . . . . . . . . . . . . . . . . . . . . . . . . . . . . . . . . . . . . . . . . . . . . 3–17
Performing Port Diagnostics . . . . . . . . . . . . . . . . . . . . . . . . . . . . . . . . . . . . . . . . . . . . 3–19
Port LEDs . . . . . . . . . . . . . . . . . . . . . . . . . . . . . . . . . . . . . . . . . . . . . . . . . . . . . . . 3–19
Hardware View . . . . . . . . . . . . . . . . . . . . . . . . . . . . . . . . . . . . . . . . . . . . . . . . . . . 3–20
Performance View . . . . . . . . . . . . . . . . . . . . . . . . . . . . . . . . . . . . . . . . . . . . . . . . . 3–24
Perform Loopback Tests . . . . . . . . . . . . . . . . . . . . . . . . . . . . . . . . . . . . . . . . . . . . 3–26
Internal Loopback Test . . . . . . . . . . . . . . . . . . . . . . . . . . . . . . . . . . . . . . . . . . 3–26
Contents
edge switch 2/16 installation guide v
Page 6

Contents
External Loopback Test. . . . . . . . . . . . . . . . . . . . . . . . . . . . . . . . . . . . . . . . . . 3–28
Perform Channel Wrap Test. . . . . . . . . . . . . . . . . . . . . . . . . . . . . . . . . . . . . . . . . . 3–29
Swapping Ports . . . . . . . . . . . . . . . . . . . . . . . . . . . . . . . . . . . . . . . . . . . . . . . . . . . . . . . 3–30
Collecting Maintenance Data . . . . . . . . . . . . . . . . . . . . . . . . . . . . . . . . . . . . . . . . . . . . 3–31
Clean Fiber-Optic Components . . . . . . . . . . . . . . . . . . . . . . . . . . . . . . . . . . . . . . . . . . 3–33
Power-On Procedure. . . . . . . . . . . . . . . . . . . . . . . . . . . . . . . . . . . . . . . . . . . . . . . . . . . 3–34
Power-Off Procedure . . . . . . . . . . . . . . . . . . . . . . . . . . . . . . . . . . . . . . . . . . . . . . . . . . 3–35
Reset or IPL the Switch . . . . . . . . . . . . . . . . . . . . . . . . . . . . . . . . . . . . . . . . . . . . . . . . 3–35
Reset the Switch. . . . . . . . . . . . . . . . . . . . . . . . . . . . . . . . . . . . . . . . . . . . . . . . . . . 3–36
IPL the Switch . . . . . . . . . . . . . . . . . . . . . . . . . . . . . . . . . . . . . . . . . . . . . . . . . . . . 3–36
Set the Switch Online or Offline . . . . . . . . . . . . . . . . . . . . . . . . . . . . . . . . . . . . . . . . . 3–37
Set Online State . . . . . . . . . . . . . . . . . . . . . . . . . . . . . . . . . . . . . . . . . . . . . . . . . . . 3–37
Set Offline State . . . . . . . . . . . . . . . . . . . . . . . . . . . . . . . . . . . . . . . . . . . . . . . . . . . 3–38
Block and Unblock Ports . . . . . . . . . . . . . . . . . . . . . . . . . . . . . . . . . . . . . . . . . . . . . . . 3–39
Block a Port . . . . . . . . . . . . . . . . . . . . . . . . . . . . . . . . . . . . . . . . . . . . . . . . . . . . . . 3–39
Unblock a Port . . . . . . . . . . . . . . . . . . . . . . . . . . . . . . . . . . . . . . . . . . . . . . . . . . . . 3–39
Manage Firmware Versions . . . . . . . . . . . . . . . . . . . . . . . . . . . . . . . . . . . . . . . . . . . . . 3–40
Determine a Switch Firmware Version . . . . . . . . . . . . . . . . . . . . . . . . . . . . . . . . . 3–40
Add a Firmware Version . . . . . . . . . . . . . . . . . . . . . . . . . . . . . . . . . . . . . . . . . . . . 3–41
Modify a Firmware Version Description . . . . . . . . . . . . . . . . . . . . . . . . . . . . . . . . 3–44
Delete a Firmware Version . . . . . . . . . . . . . . . . . . . . . . . . . . . . . . . . . . . . . . . 3–45
Download a Firmware Version to a Switch. . . . . . . . . . . . . . . . . . . . . . . . . . . . . . 3–45
Manage Configuration Data . . . . . . . . . . . . . . . . . . . . . . . . . . . . . . . . . . . . . . . . . . . . . 3–48
Back Up the Configuration . . . . . . . . . . . . . . . . . . . . . . . . . . . . . . . . . . . . . . . . . . 3–48
Restore the Configuration . . . . . . . . . . . . . . . . . . . . . . . . . . . . . . . . . . . . . . . . . . . 3–49
Reset Configuration Data. . . . . . . . . . . . . . . . . . . . . . . . . . . . . . . . . . . . . . . . . . . . 3–50
Install or Upgrade Software . . . . . . . . . . . . . . . . . . . . . . . . . . . . . . . . . . . . . . . . . . . . . 3–51
FRU Removal and Replacement
Remove and Replace FRUs . . . . . . . . . . . . . . . . . . . . . . . . . . . . . . . . . . . . . . . . . . . . . . 4–1
FRUs . . . . . . . . . . . . . . . . . . . . . . . . . . . . . . . . . . . . . . . . . . . . . . . . . . . . . . . . . . . . 4–1
Procedural Notes . . . . . . . . . . . . . . . . . . . . . . . . . . . . . . . . . . . . . . . . . . . . . . . . . . . 4–2
RRP: SFP Transceiver . . . . . . . . . . . . . . . . . . . . . . . . . . . . . . . . . . . . . . . . . . . . . . . . . . 4–2
Removal . . . . . . . . . . . . . . . . . . . . . . . . . . . . . . . . . . . . . . . . . . . . . . . . . . . . . . . . . . 4–2
Replacement. . . . . . . . . . . . . . . . . . . . . . . . . . . . . . . . . . . . . . . . . . . . . . . . . . . . . . . 4–3
RRP: Power Supply . . . . . . . . . . . . . . . . . . . . . . . . . . . . . . . . . . . . . . . . . . . . . . . . . . . . 4–4
Removal . . . . . . . . . . . . . . . . . . . . . . . . . . . . . . . . . . . . . . . . . . . . . . . . . . . . . . . . . . 4–4
Replacement. . . . . . . . . . . . . . . . . . . . . . . . . . . . . . . . . . . . . . . . . . . . . . . . . . . . . . . 4–5
vi edge switch 2/16 installation guide
Page 7

RRP: Cooling Fan . . . . . . . . . . . . . . . . . . . . . . . . . . . . . . . . . . . . . . . . . . . . . . . . . . . . . 4–6
Removal. . . . . . . . . . . . . . . . . . . . . . . . . . . . . . . . . . . . . . . . . . . . . . . . . . . . . . . . . . 4–6
Replacement . . . . . . . . . . . . . . . . . . . . . . . . . . . . . . . . . . . . . . . . . . . . . . . . . . . . . . 4–7
RRP: CTP Card - Switch Replacement . . . . . . . . . . . . . . . . . . . . . . . . . . . . . . . . . . . . . 4–8
Replacing a Failed Switch . . . . . . . . . . . . . . . . . . . . . . . . . . . . . . . . . . . . . . . . . . . . 4–8
Illustrated Parts Breakdown
Front-Accessible FRUs . . . . . . . . . . . . . . . . . . . . . . . . . . . . . . . . . . . . . . . . . . . . . . . . . 5–1
Rear-Accessible FRUs . . . . . . . . . . . . . . . . . . . . . . . . . . . . . . . . . . . . . . . . . . . . . . . . . . 5–2
Miscellaneous Parts . . . . . . . . . . . . . . . . . . . . . . . . . . . . . . . . . . . . . . . . . . . . . . . . . . . . 5–3
Messages
HAFM Application Messages . . . . . . . . . . . . . . . . . . . . . . . . . . . . . . . . . . . . . . . . . . . . A–1
Edge-16 Switch Product Manager Messages. . . . . . . . . . . . . . . . . . . . . . . . . . . . . . . . A–18
Event Codes
System Events (000 through 199) . . . . . . . . . . . . . . . . . . . . . . . . . . . . . . . . . . . . . . . . . B–3
Power Supply Events (200 through 299) . . . . . . . . . . . . . . . . . . . . . . . . . . . . . . . . . . . B–11
Fan Module Events (300 through 399) . . . . . . . . . . . . . . . . . . . . . . . . . . . . . . . . . . . . B–15
CTP2 Card Events (400 through 499) . . . . . . . . . . . . . . . . . . . . . . . . . . . . . . . . . . . . . B–21
Port Events (500 through 599). . . . . . . . . . . . . . . . . . . . . . . . . . . . . . . . . . . . . . . . . . . B–29
SBAR Events (600 through 699) . . . . . . . . . . . . . . . . . . . . . . . . . . . . . . . . . . . . . . . . . B–34
Thermal Events (800 through 899) . . . . . . . . . . . . . . . . . . . . . . . . . . . . . . . . . . . . . . . B–35
Contents
Glossary
Index
Figures
1–1 Switch, HAFM server, and Ethernet Hub. . . . . . . . . . . . . . . . . . . . . . . . . . . . . 1–2
1–2 Out-of-Band Product Management. . . . . . . . . . . . . . . . . . . . . . . . . . . . . . . . . . 1–4
1–3 Inband Product Management . . . . . . . . . . . . . . . . . . . . . . . . . . . . . . . . . . . . . . 1–5
1–4 HAFM Server . . . . . . . . . . . . . . . . . . . . . . . . . . . . . . . . . . . . . . . . . . . . . . . . . 1–12
1–5 12-Port Ethernet Hub . . . . . . . . . . . . . . . . . . . . . . . . . . . . . . . . . . . . . . . . . . . 1–13
1–6 Typical Network Configuration (One Ethernet Connection) . . . . . . . . . . . . . 1–15
1–7 Typical Network Configuration (Two Ethernet Connections) . . . . . . . . . . . . 1–16
1–8 Edge Switch 2/16 (front view) . . . . . . . . . . . . . . . . . . . . . . . . . . . . . . . . . . . . 1–18
1–9 Edge Switch 2/16 (rear view) . . . . . . . . . . . . . . . . . . . . . . . . . . . . . . . . . . . . . 1–18
edge switch 2/16 installation guide vii
Page 8

1–10 Product View. . . . . . . . . . . . . . . . . . . . . . . . . . . . . . . . . . . . . . . . . . . . . . . . . . 1–23
1–11 Hardware View . . . . . . . . . . . . . . . . . . . . . . . . . . . . . . . . . . . . . . . . . . . . . . . . 1–25
1–12 Hardware View . . . . . . . . . . . . . . . . . . . . . . . . . . . . . . . . . . . . . . . . . . . . . . . . 1–29
1–13 Port List View . . . . . . . . . . . . . . . . . . . . . . . . . . . . . . . . . . . . . . . . . . . . . . . . . 1–31
1–14 FRU List View. . . . . . . . . . . . . . . . . . . . . . . . . . . . . . . . . . . . . . . . . . . . . . . . . 1–32
1–15 Node List View . . . . . . . . . . . . . . . . . . . . . . . . . . . . . . . . . . . . . . . . . . . . . . . . 1–33
1–16 Performance View . . . . . . . . . . . . . . . . . . . . . . . . . . . . . . . . . . . . . . . . . . . . . . 1–34
1–17 Fabrics View - Topology Tab . . . . . . . . . . . . . . . . . . . . . . . . . . . . . . . . . . . . . 1–37
1–18 Fabrics View - Zone Sets Tab . . . . . . . . . . . . . . . . . . . . . . . . . . . . . . . . . . . . . 1–38
1–19 HAFM Services Window . . . . . . . . . . . . . . . . . . . . . . . . . . . . . . . . . . . . . . . . 1–39
1–20 Multi-mode and Single-mode Loopback Plugs. . . . . . . . . . . . . . . . . . . . . . . . 1–43
1–21 Fiber-Optic Protective Plug. . . . . . . . . . . . . . . . . . . . . . . . . . . . . . . . . . . . . . . 1–44
1–22 Null Modem Cable . . . . . . . . . . . . . . . . . . . . . . . . . . . . . . . . . . . . . . . . . . . . . 1–44
3–1 HAFM Event Log . . . . . . . . . . . . . . . . . . . . . . . . . . . . . . . . . . . . . . . . . . . . . . . 3–4
3–2 Product Status Log. . . . . . . . . . . . . . . . . . . . . . . . . . . . . . . . . . . . . . . . . . . . . . . 3–5
3–3 Switch Event Log . . . . . . . . . . . . . . . . . . . . . . . . . . . . . . . . . . . . . . . . . . . . . . . 3–6
3–4 Hardware Log . . . . . . . . . . . . . . . . . . . . . . . . . . . . . . . . . . . . . . . . . . . . . . . . . . 3–8
3–5 Link Incident Log . . . . . . . . . . . . . . . . . . . . . . . . . . . . . . . . . . . . . . . . . . . . . . . 3–9
3–6 Threshold Alert Log . . . . . . . . . . . . . . . . . . . . . . . . . . . . . . . . . . . . . . . . . . . . 3–11
3–7 Port List View . . . . . . . . . . . . . . . . . . . . . . . . . . . . . . . . . . . . . . . . . . . . . . . . . 3–13
3–8 FRU List View. . . . . . . . . . . . . . . . . . . . . . . . . . . . . . . . . . . . . . . . . . . . . . . . . 3–15
3–9 Node List View . . . . . . . . . . . . . . . . . . . . . . . . . . . . . . . . . . . . . . . . . . . . . . . . 3–16
3–10 Zone Sets View . . . . . . . . . . . . . . . . . . . . . . . . . . . . . . . . . . . . . . . . . . . . . . . . 3–18
3–11 Hardware View . . . . . . . . . . . . . . . . . . . . . . . . . . . . . . . . . . . . . . . . . . . . . . . . 3–20
3–12 Port Properties Dialog Box . . . . . . . . . . . . . . . . . . . . . . . . . . . . . . . . . . . . . . . 3–21
3–13 Performance View . . . . . . . . . . . . . . . . . . . . . . . . . . . . . . . . . . . . . . . . . . . . . . 3–24
3–14 Port Diagnostics Dialog Box. . . . . . . . . . . . . . . . . . . . . . . . . . . . . . . . . . . . . . 3–27
3–15 Channel Wrap On for Port n Dialog Box . . . . . . . . . . . . . . . . . . . . . . . . . . . . 3–30
3–16 Swap Ports Dialog Box . . . . . . . . . . . . . . . . . . . . . . . . . . . . . . . . . . . . . . . . . . 3–31
3–17 Save Data Collection Dialog Box . . . . . . . . . . . . . . . . . . . . . . . . . . . . . . . . . . 3–32
3–18 Data Collection Dialog Box . . . . . . . . . . . . . . . . . . . . . . . . . . . . . . . . . . . . . . 3–33
3–19 Clean Fiber-Optic Components. . . . . . . . . . . . . . . . . . . . . . . . . . . . . . . . . . . . 3–34
5–1 Front-Accessible FRUs . . . . . . . . . . . . . . . . . . . . . . . . . . . . . . . . . . . . . . . . . . . 5–1
5–2 Rear-Accessible FRUs. . . . . . . . . . . . . . . . . . . . . . . . . . . . . . . . . . . . . . . . . . . . 5–3
Page 9

Tables
1–1 Status Symbols . . . . . . . . . . . . . . . . . . . . . . . . . . . . . . . . . . . . . . . . . . . . . . . . 1–24
1–2 Operating Status - Status Bar and Switch Status Table . . . . . . . . . . . . . . . . . 1–36
1–3 HAFM Services Status Symbols. . . . . . . . . . . . . . . . . . . . . . . . . . . . . . . . . . . 1–40
2–1 Factory-Set Defaults . . . . . . . . . . . . . . . . . . . . . . . . . . . . . . . . . . . . . . . . . . . . . 2–1
2–2 MAP Summary . . . . . . . . . . . . . . . . . . . . . . . . . . . . . . . . . . . . . . . . . . . . . . . . . 2–2
2–3 Event Codes versus Maintenance Action . . . . . . . . . . . . . . . . . . . . . . . . . . . . . 2–2
3–1 Factory-Set Defaults . . . . . . . . . . . . . . . . . . . . . . . . . . . . . . . . . . . . . . . . . . . . . 3–2
4–1 ESD Requirements . . . . . . . . . . . . . . . . . . . . . . . . . . . . . . . . . . . . . . . . . . . . . . 4–1
5–1 Front-Accessible FRU Parts List . . . . . . . . . . . . . . . . . . . . . . . . . . . . . . . . . . . 5–2
5–2 Rear-Accessible FRU Parts List . . . . . . . . . . . . . . . . . . . . . . . . . . . . . . . . . . . . 5–3
5–3 Miscellaneous Parts. . . . . . . . . . . . . . . . . . . . . . . . . . . . . . . . . . . . . . . . . . . . . . 5–3
Contents
edge switch 2/16 installation guide ix
Page 10

Page 11

This manual describes the service procedures for the hp StorageWorks edge
switch 2/16.
Intended Audience
This publication is intended for service personnel, and any individuals who monitor,
configure, and repair the edge switch 2/16.
Related Documentation
In addition to this guide, HP provides corresponding information:
• hp StorageWorks product in a SAN environment - planning guide for director
2/64, edge switch 2/16, and edge switch 2/32, A6534-96025/AA-RS2DA-TE
• hp StorageWorks SNMP reference guide for director 2/64, edge switch 2/16, and
edge switch 2/32, A6534-96026/AA-RQ7BB-TE
• hp StorageWorks CLI reference guide for director 2/64, edge switch 2/16, and
edge switch 2/32, A6534-96027/AA-RQ7AB-TE
About this Guide
• hp StorageWorks edge switch 2/32 installation guide,
A7283-96001/AA-RSTZA-TE
• hp StorageWorks edge switch 2/32 service manual, A7283-96002/AA-RS2GA-TE
• hp StorageWorks edge switch 2/32 product manager user guide,
A7283-96003/AA-RS2HA-TE
• hp StorageWorks edge switch 2/32 release notes, A7283-96004/AV-RSU0A-TE
• hp StorageWorks edge switch 2/32 flexport upgrade instructions,
A7290-96001/AA-RS33A-TE
• hp StorageWorks edge switch 2/16 installation guide,
A7284-96001/AA-RSU2A-TE
xiiiedge switch 2/16 service manual
Page 12

About this Guide
• hp StorageWorks edge switch 2/16 product manager user guide,
A7284-96003/AA-RS2KA-TE
• hp StorageWorks edge switch 2/16 release notes, A7284-96004/AV-RSU3A-TE
• hp StorageWorks edge switch rack mount installation instructions,
A7283-96004/AA-RT4MA-TE
• hp StorageWorks HAFM server installation guide, A6582-96001/AA-RT4KA-TE
• hp StorageWorks ha-fabric manager user guide, A6534-96024/AA-RS2CA-TE
• hp StorageWorks ha-fabric manager release notes, A6575-96004/AV-RQZJC-TE
• hp StorageWorks SFP transceiver installation instructions,
A6534-96030/AA-RSS3A-TE
Document Conventions
The conventions included in Table 1 apply.
Table 1: Document Conventions
Element Convention
Cross-reference links Blue text: Figure 1
Key names, menu items, buttons, and
dialog box titles
File names, application names, and text
emphasis
User input, command names, system
responses (output and messages)
Variables
Website addresses Sans serif font (http://thenew.hp.com)
Bold
Italics
Monospace font
COMMAND NAMES
unless they are case sensitive
Monospace, italic font
are uppercase
xiv edge switch 2/16 service manual
Page 13

Symbols in Text
These symbols may be found in the text of this manual. They have the following
meanings.
WARNING: Text set off in this manner indicates that failure to follow directions
in the warning could result in bodily harm or loss of life.
CAUTION: Text set off in this manner indicates that failure to follow directions could
result in damage to equipment or data.
IMPORTANT: Text set off in this manner presents clarifying information or specific instructions.
NOTE: Text set off in this manner presents commentary, sidelights, or interesting points of
information.
Symbols on Equipment
About this Guide
Any enclosed surface or area of the equipment marked with these
symbols indicates the presence of electrical shock hazards. Enclosed
area contains no operator serviceable parts.
WARNING: To reduce the risk of injury from electrical shock hazards, do
not open this enclosure.
Any RJ-45 receptacle marked with these symbols indicates a network
interface connection.
WARNING: To reduce the risk of electrical shock, fire, or damage to the
equipment, do not plug telephone or telecommunications connectors into
this receptacle.
xvedge switch 2/16 service manual
Page 14
About this Guide
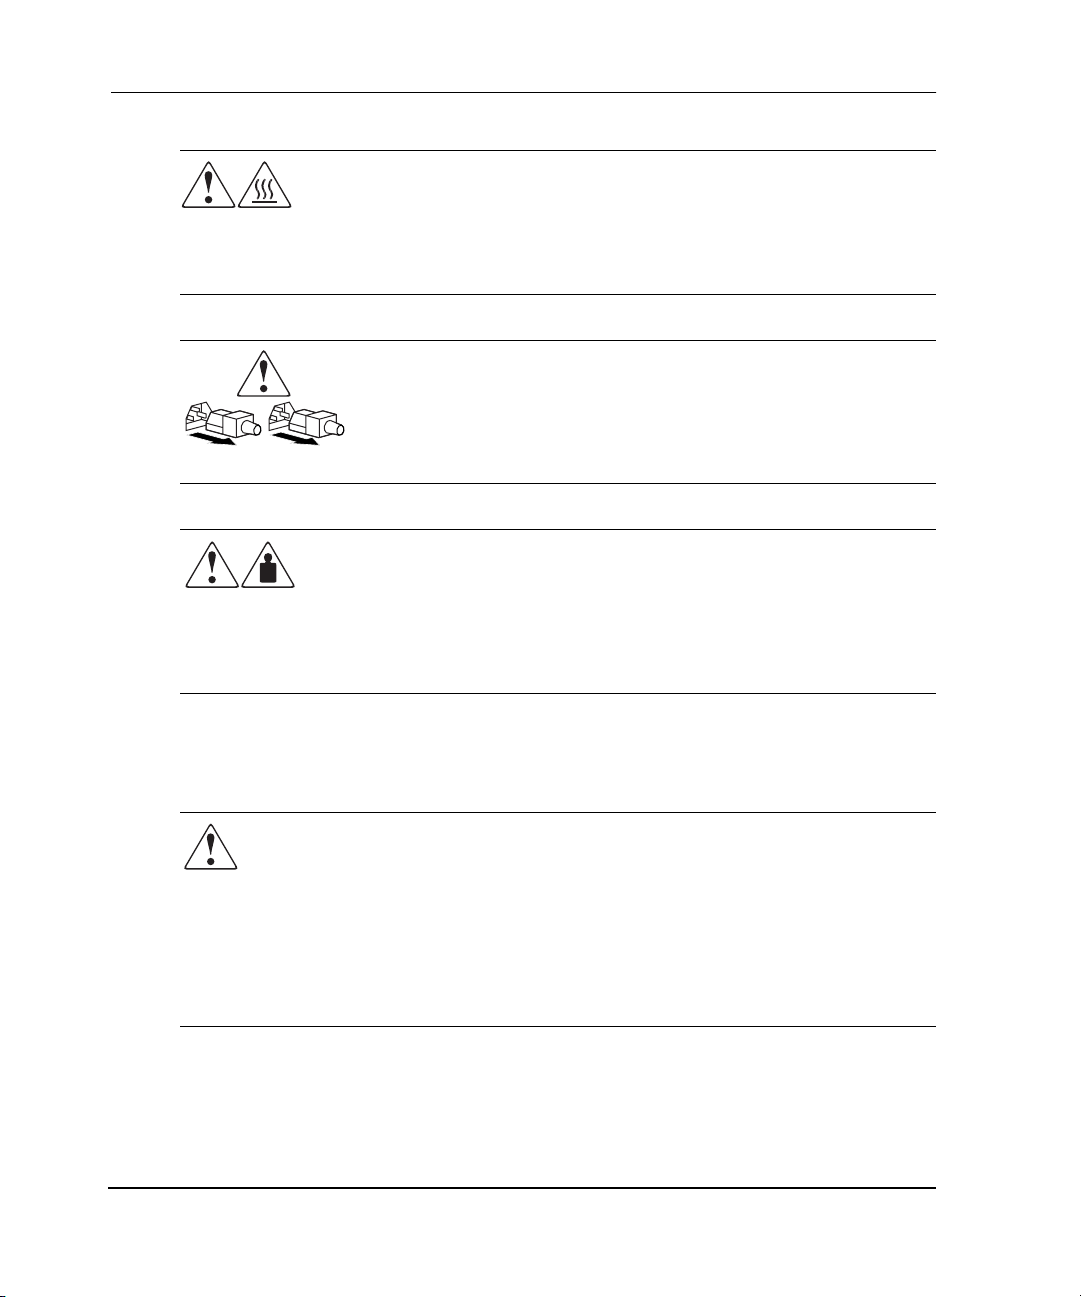
Any surface or area of the equipment marked with these symbols
indicates the presence of a hot surface or hot component. Contact with
this surface could result in injury.
WARNING: To reduce the risk of injury from a hot component, allow the
surface to cool before touching.
Power supplies or systems marked with these symbols indicate the
presence of multiple sources of power.
WARNING: To reduce the risk of injury from electrical shock,
remove all power cords to completely disconnect power from the
power supplies and systems.
Any product or assembly marked with these symbols indicates that the
component exceeds the recommended weight for one individual to
handle safely.
WARNING: To reduce the risk of personal injury or damage to the
equipment, observe local occupational health and safety requirements
and guidelines for manually handling material.
Rack Stability
WARNING: To reduce the risk of personal injury or damage to the equipment, be
sure that:
• The leveling jacks are extended to the floor.
• The full weight of the rack rests on the leveling jacks.
• In single rack installations, the stabilizing feet are attached to the rack.
• In multiple rack installations, the racks are coupled.
• Only one rack component is extended at any time. A rack may become
unstable if more than one rack component is extended for any reason.
xvi edge switch 2/16 service manual
Page 15

Getting Help
If you still have a question after reading this manual, contact an HP authorized service
provider or access our website: http://thenew.hp.com.
HP Technical Support
In North America, call technical support at 1-800-652-6672, available 24 hours a day,
7 days a week.
NOTE: For continuous quality improvement, calls may be recorded or monitored.
Outside North America, call technical support at the nearest location. Telephone
numbers for worldwide technical support are listed on the HP website under support:
http://thenew.hp.com/country/us/eng/support.html
Be sure to have the following information available before calling:
• Technical support registration number (if applicable)
• Product serial numbers
• Product model names and numbers
About this Guide
.
• Applicable error messages
• Operating system type and revision level
• Detailed, specific questions
HP Website
The HP website has the latest information on this product, as well as the latest drivers.
Access storage at: http://thenew.hp.com/country/us/eng/prodserv/storage.html
website, select the appropriate product or solution.
HP Authorized Reseller
For the name of your nearest HP Authorized Reseller:
• In the United States, call 1-800-345-1518
• In Canada, call 1-800-263-5868
• Elsewhere, see the HP website for locations and telephone numbers:
http://thenew.hp.com.
. From this
xviiedge switch 2/16 service manual
Page 16

Page 17

1
General InformationI
The hp StorageWorks edge switch 2/16 provides dynamic switched connections
between Fibre Channel servers and devices in a storage area network (SAN)
environment. SANs introduce the concept of server-to-device networking and
multi-switch fabrics, eliminate requirements for dedicated connections, and enable the
enterprise to become data centric.
A SAN provides speed, high capacity, and flexibility for the enterprise, and is
primarily based upon Fibre Channel architecture. The switch implements Fibre
Channel technology that provides a bandwidth of 2.125 gigabits per second,
redundant switched data paths, a scalable number of active ports, and long
transmission distances (up to 35 kilometers).
This chapter describes the switch and attached hp StorageWorks ha-fabric manager
(HAFM) server. The chapter specifically discusses:
• Switch management, error-detection and reporting features, serviceability
features, zoning, multi-switch fabrics, and specifications.
• The HAFM server and minimum hardware specifications.
• Remote workstation configurations and hardware specifications.
• Maintenance approach.
• Field-replaceable units (FRUs).
• Connectors and indicators.
• Software diagnostic features.
• Tools and test equipment.
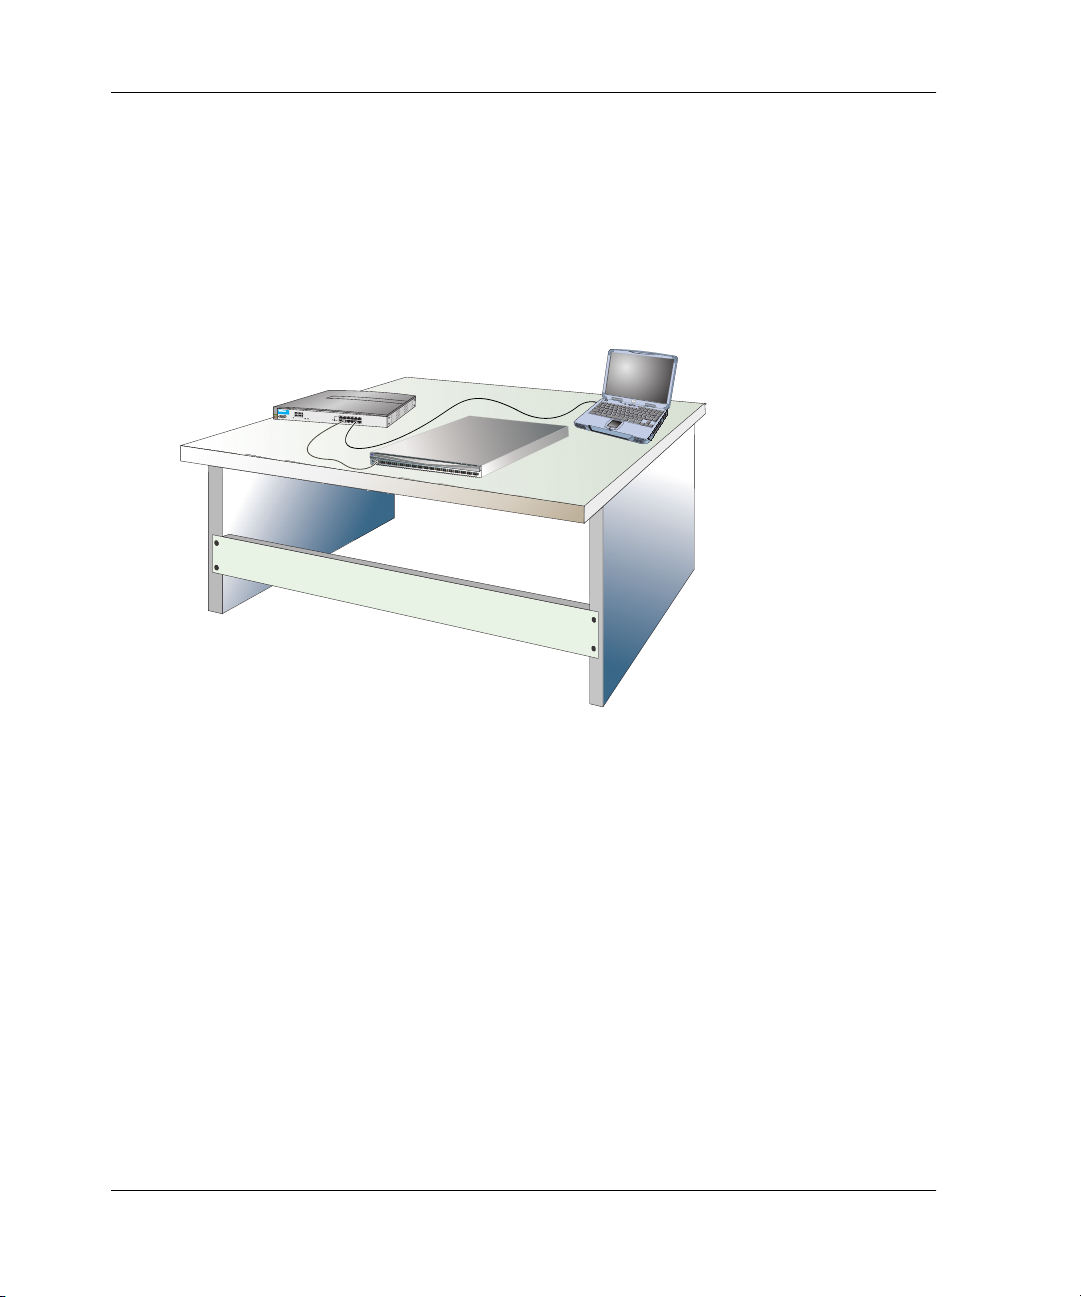
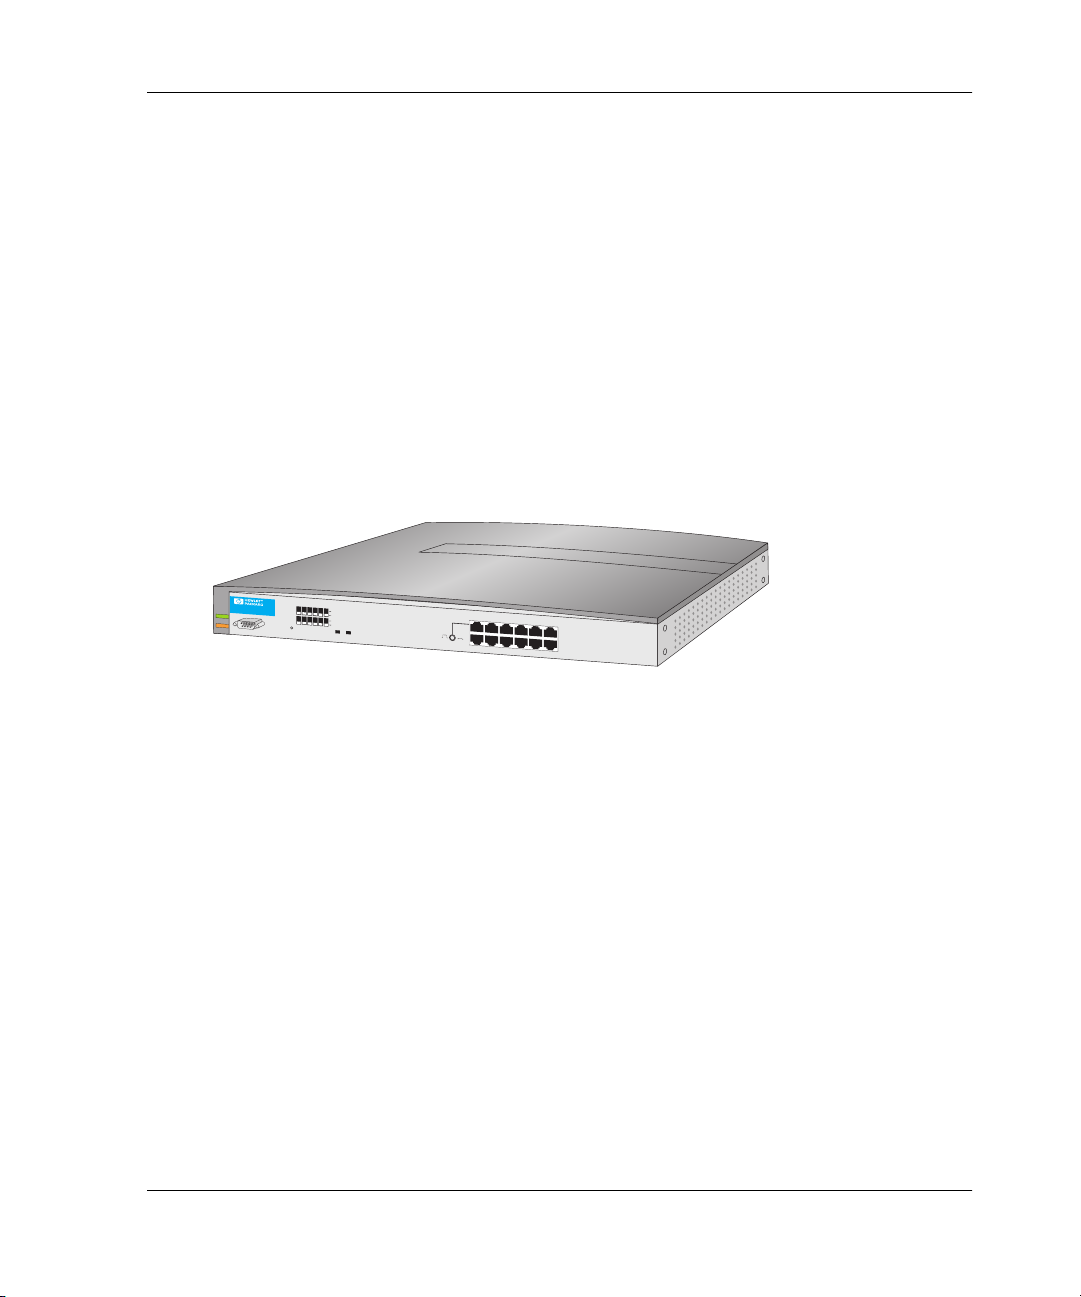
Switch Description
The switch can be installed on a table or desk top, or mounted in an equipment cabinet
or in any standard equipment rack.
edge switch 2/16 service manual 1–1
Page 18
General InformationI
Multiple switches and the HAFM server communicate on a local area network (LAN)
through one or more 10/100Base-T Ethernet hubs. One or more 12-port Ethernet hubs
are optional and can be ordered with the switch. Up to three hubs are daisy-chained as
required to provide additional Ethernet connections as more switches (or other
Hewlett Packard managed products) are installed on a customer network.
Figure 1–1 illustrates the switch, HAFM server, and Ethernet hub.
P
W
R
E
R
R
Switch
HAFM Server
HP Hub
P
ro
C
u
rv
e
10
1
/
100H
2
u
b1
2
H
P
J
3
2
9
4
A
7
8
P
o
we
r
Fault
Re
s
et
3
4
5
6
Lin
k
100
1
9
2
10
X
11
12
3X
Po
Link
r
t
1
O
n
l
y
4X
5X
6
X
100
A
c
tCol
M
DI-X
MDI
(out
)(in)
7
X
8X
9X
10X
11
X
12X
S
t
o
r
a
g
e
W
o
r
k
s
d
i
r
e
c
t
o
r
2
/
6
4
1
0
/
1
0
0
R
S
T
Figure 1–1: Switch, HAFM server, and Ethernet Hub
The switch provides dynamic switched connections for servers and devices, supports
mainframe and open-systems interconnection (OSI) computing environments, and
provides data transmission and flow control between device node ports (N_Ports) as
dictated by the Fibre Channel Physical and Signaling Interface (FC-PH 4.3). Through
interswitch links (ISLs), the switch can connect additional switches to form a Fibre
Channel multi-switch fabric.
The switch provides connectivity for devices manufactured by multiple original
equipment manufacturers (OEMs). To determine if an OEM product can communicate
through connections provided by the switch, or if communication restrictions apply,
refer to the supporting publications for the product or contact your Hewlett Packard
marketing representative
1–2 edge switch 2/16 service manual
Page 19

Switch Management
Out-of-band (non-Fibre Channel) management access to HP products is provided
through an Ethernet LAN connection to a switch front panel. The following
out-of-band management access methods are provided:
• Management through the HAFM application. The HAFM application includes the
edge switch 2/16 Product Manager application. This GUI resides on the HAFM
server and provides a single point of management for all directors and switches.
Operators at remote workstations can connect to the HAFM server through the
local HAFM application and associated Product Manager applications to manage
and monitor switches controlled by the HAFM server. A maximum of nine
concurrent users (including a local user) can log in to the HAFM application.
• Management using simple network management protocol (SNMP). An SNMP
agent is implemented through the HAFM application that allows administrators
on SNMP management workstations to access product management information
using any standard network management tool. Administrators can assign Internet
Protocol (IP) addresses and corresponding community names for up to six SNMP
workstations functioning as SNMP trap message recipients.
• Management through the Internet using the EWS interface installed on the switch.
This interface supports configuration, statistics monitoring, and basic operation of
the product, but does not offer all the capabilities of the corresponding Product
Manager application. Administrators launch the web server interface from a
remote PC by entering the product’s IP address as the Internet uniform resource
locator (URL), then entering a user name and password at a login screen. The PC
browser then becomes a management console.
General InformationI
• Management through a customer-supplied remote workstation communicating
with the HAFM server through a corporate intranet.
• Management through the command line interface (CLI). The CLI allows you to
access many HAFM and Product Manager applications while entering commands
during a telnet session with the switch. The primary purpose of the CLI is to
automate management of a large number of switches using scripts. The CLI is not
an interactive interface; no checking is done for pre-existing conditions and no
prompts display to guide users through tasks. Refer to the hp StorageWorks CLI
reference guide for director 2/64, edge switch 2/16, and edge switch 2/32
(A6534-96027/AA-RQ7AB-TE).
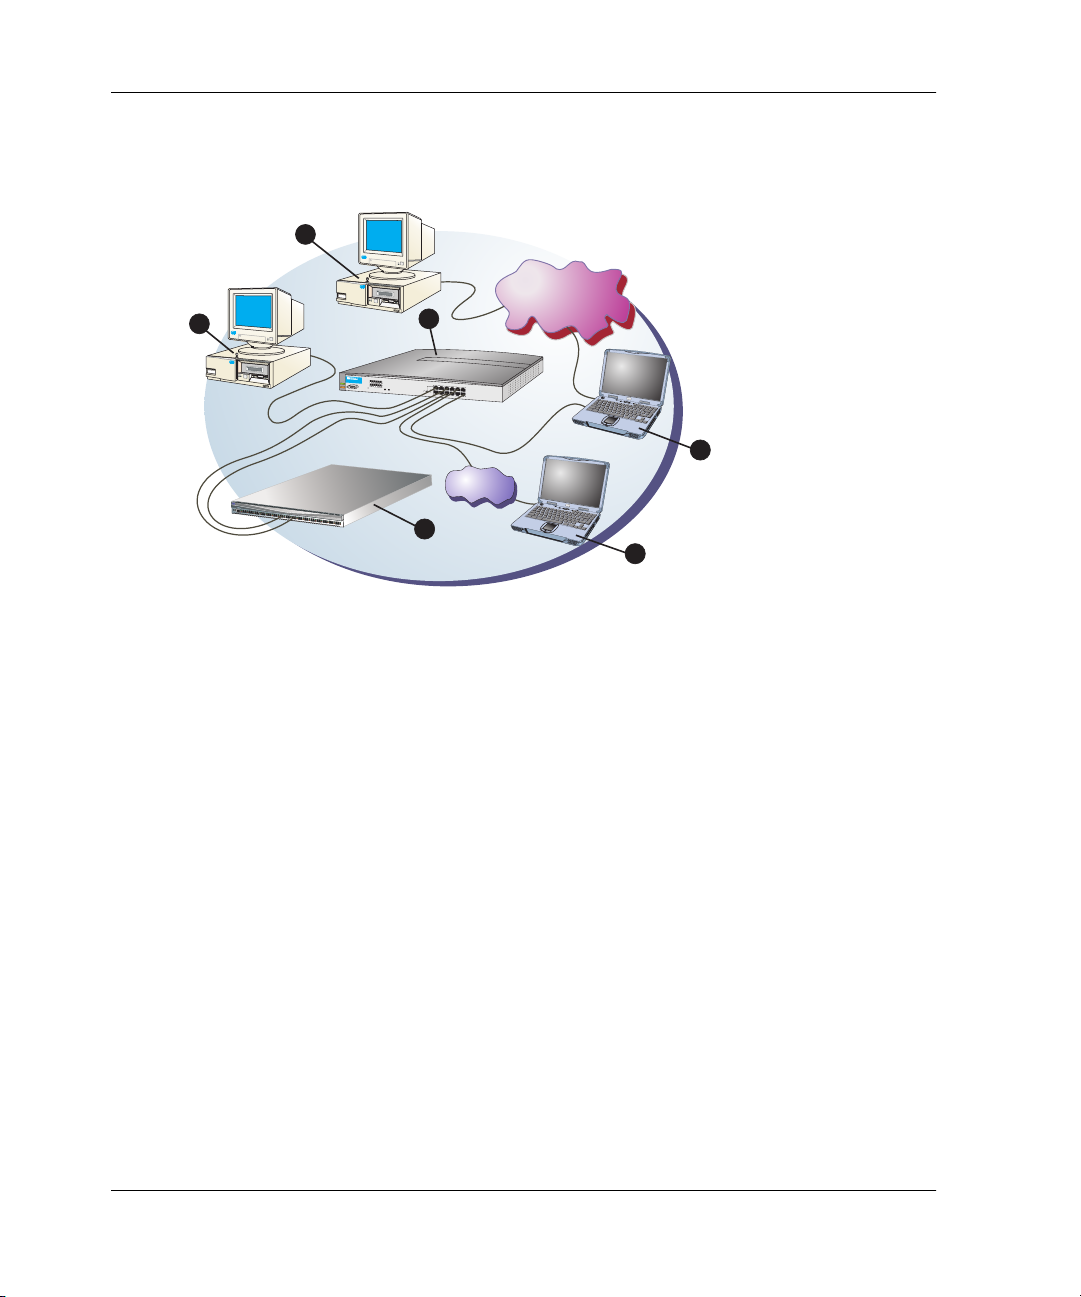
Figure 1–2 illustrates an example of out-of-band product management. In the figure,
the managed product is an edge switch 2/16.
edge switch 2/16 service manual 1–3
Page 20
General InformationI
1
S
t
o
ra
g
e
W
o
rk
s
d
ir
e
c
t
o
r
2
/
6
4
1
0/100
R
S
T
2
10/100 Mbps
10/100 Mbps
Corporate LAN
5X
6X
11X
12X
Corporate LAN
3
ProCurve
1
1
0/100
2
3
H
ub
4
1
2
5
HPJ3
6
2
94A
Link
100
7
8
9
Power
Fault
Reset
1
10
11
1
2
2X
3X
Port
L
ink
1
O
nly
100
Act
C
ol
4X
MDI-X
MDI
(out)
(in)
7X
8X
9X
10X
4
Internet
Connection
P
W
R
E
R
R
6
5
SHR-2314d
1 SNMP management
workstation
2 Remote user workstation
4 HAFM server
5 Web browser
6 Edge switch 2/16
3 HP Ethernet hub
Figure 1–2: Out-of-Band Product Management
The following inband management access methods are provided as options:
• Management through the product’s open-system management server (OSMS) that
communicates with an application client. The application resides on an
open-systems interconnection (OSI) device attached to a switch port, and
communicates using Fibre Channel common transport (FC-CT) protocol. Product
operation, port connectivity, zoning, and fabric control are managed through a
device-attached console.
• Management through the product’s Fibre Connection (FICON) management
server (FMS) that communicates with the IBM System Automation for OS/390
(SA OS/390) operating system. The operating system resides on an IBM
System/390
or zSeries 900 Parallel Enterprise Server attached to a director or
switch port, and communicates through a FICON channel. Control of connectivity
and statistical product monitoring are provided through a host-attached console.
1–4 edge switch 2/16 service manual
Page 21
General InformationI
PWR
ERR
10
12
14
16
18
20
22
24
26
28
30
13
15
17
19
21
23
25
27
29
31
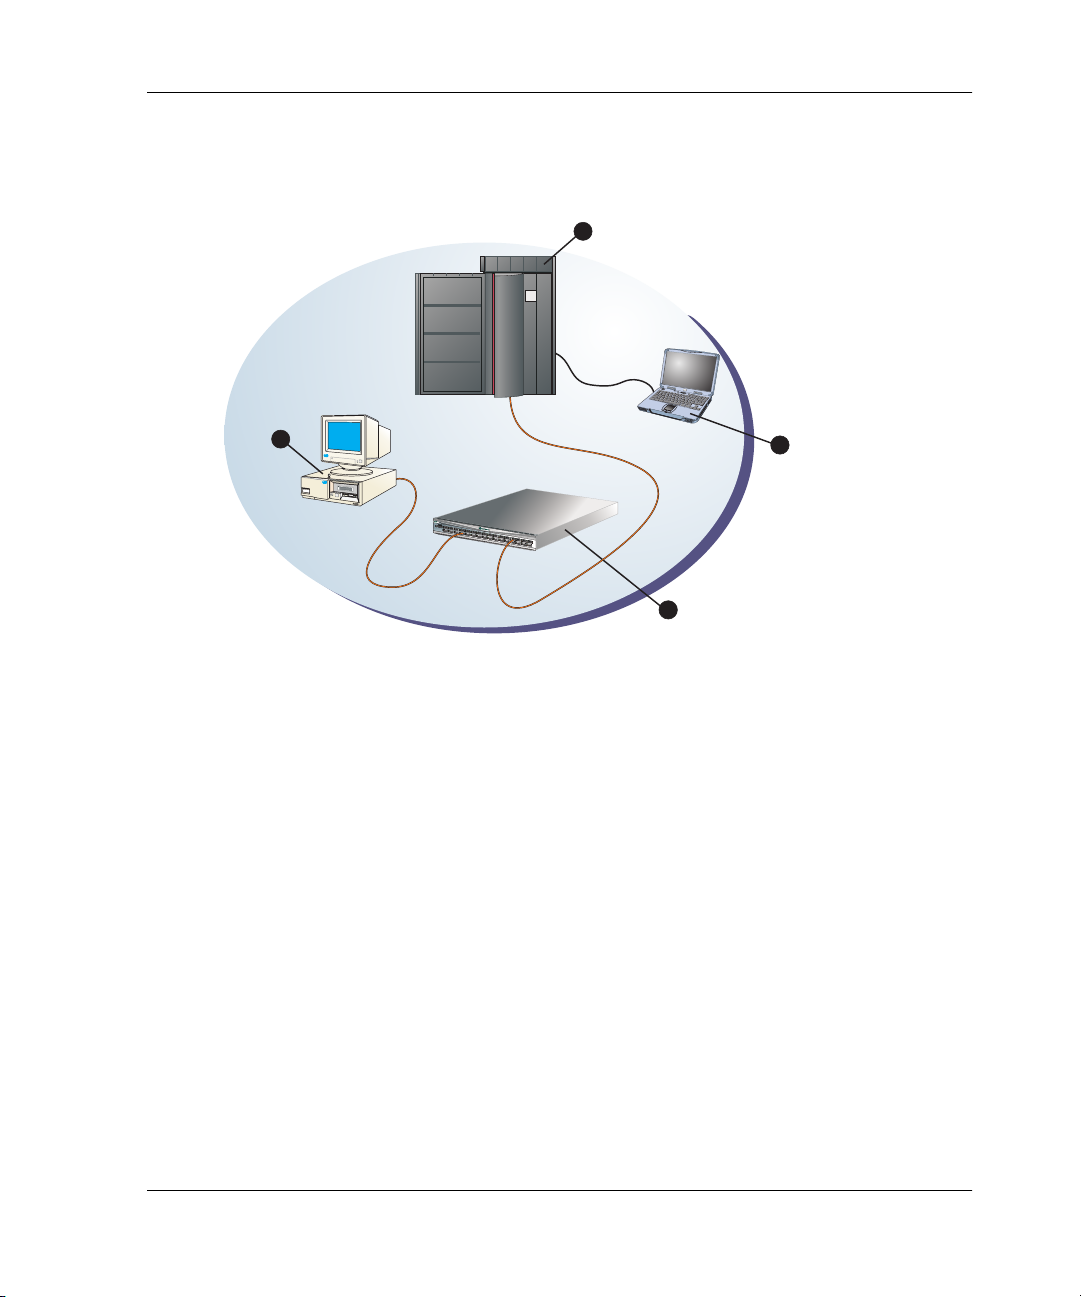
Figure 1–3 on page 1-5 illustrates inband product management. In the figure, the
managed product is an edge switch 2/16. The figure shows the following elements:
1
4
Fibre Channel
Connection
FICON
Channel
3
1
2
9
2
7
2
5
2
3
T
M
2
1
1
9
3
0
1
7
2
8
1
5
2
6
3
2
4
111
2
2
9
2
0
7
1
8
1
6
35
1
4
1
1
2
0
P
W
R
81
E
R
6
R
24
0
2
3
SHR-2364b
1 S/390 or zSeries 900 parallel
Enterprise Server
3 Edge switch 2/16
4 OSI server
2 Host-attached console
Figure 1–3: Inband Product Management
Error-Detection, Reporting, and Serviceability Features
The switch provides the following error-detection, reporting, and serviceability
features:
• Light-emitting diodes (LEDs) on switch FRUs and adjacent to Fibre Channel
ports that provide visual indicators of hardware status or malfunctions.
• System and threshold alerts, event logs, audit logs, link incident logs, threshold
alert logs, and hardware logs that display switch, Ethernet link, and Fibre Channel
link status at the HAFM server or on a remote workstation.
edge switch 2/16 service manual 1–5
Page 22

General InformationI
• Diagnostic software that performs power-on self-tests (POSTs) and port
diagnostics (internal loopback, external loopback, and Fibre Channel (FC) wrap
tests). The FC wrap test applies only when the switch is configured to operate in
S/390 mode.
• Automatic notification of significant system events (to support personnel or
administrators) through e-mail messages or the call-home feature.
• An internal modem in the HAFM server for HP call-home support
NOTE: For directors and switches installed in some legacy environments, call-home
notification requires installation of HP Proactive Service software. This service is offered at no
additional charge for subsystems covered under an on-site warranty or on-site storage
hardware support contract. To register or order Proactive Service software, contact your HP
customer service representative.
• An RS-232 maintenance port at the rear of the switch (port access is password
protected) that enables installation or service personnel to change the switch’s
internet protocol (IP) address, subnet mask, and gateway address; or to run
diagnostics and isolate system problems through a local or remote terminal.
• Redundant FRUs; (small form factor pluggable (SFP)) optical transceivers, power
supplies, and cooling fans that are removed or replaced without disrupting switch
or Fibre Channel link operation.
• A modular design that enables quick removal and replacement of FRUs without
tools or equipment.
• Concurrent port maintenance. SFPs and Fiber-optic cables are removed and
attached to ports without interrupting other ports or switch operation.
• Beaconing to assist service personnel in locating a specific port or switch. When
port beaconing is enabled, the amber LED associated with the port flashes. When
unit beaconing is enabled, the system error indicator on the front panel flashes.
Beaconing does not affect port or switch operation.
• Data collection through the product manager application to help isolate system
problems. The data includes a memory dump file and audit, hardware, and
engineering logs.
• Status monitoring of redundant FRUs and alternate Fibre Channel data paths to
ensure continued switch availability in case of failover. The HAFM application
queries the status of each backup FRU daily. A backup FRU failure is indicated by
an illuminated amber LED.
1–6 edge switch 2/16 service manual
Page 23

• Simple network management protocol (SNMP) management using the Fibre
Alliance MIB that runs on the HAFM server. Up to 12 authorized management
workstations can be configured through the HAFM application to receive
unsolicited SNMP trap messages. The trap messages indicate operational state
changes and failure conditions.
• SNMP management using the Fibre Channel Fabric Element MIB, transmission
control protocol/internet protocol (TCP/IP) MIB-II definition (RFC 1213), and a
product-specific MIB, all of which run on each switch. Up to 12 authorized
management workstations can be configured through the product manager
application to receive unsolicited SNMP trap messages. The trap messages
indicate switch operational state changes and failure conditions.
NOTE: For more information about SNMP support provided by Hewlett Packard products, refer
to the hp StorageWorks SNMP reference guide for director 2/64, edge switch 2/16, and edge
switch 2/32 (A6534-96026/AA-RQ7BB-TE).
Zoning Feature
The switch supports a name server zoning feature that partitions attached devices into
restricted-access groups called zones. Devices in the same zone can recognize and
communicate with each other through switched port-to-port connections. Devices in
separate zones cannot communicate with each other.
General InformationI
Zoning is configured by authorizing or restricting access to name server information
associated with device N_Ports that attach to switch fabric ports (F_Ports). A zone
member is specified by the port number to which a device is attached, or by the
eight-byte (16-digit) worldwide name (WWN) assigned to the host bus adapter (HBA)
or Fibre Channel interface installed in a device. A device can belong to multiple
zones.
CAUTION: If zoning is implemented by port number, a change to the switch fiber-optic
cable configuration disrupts zone operation and may incorrectly include or exclude a
device from a zone.
If zoning is implemented by WWN, removal and replacement of a device HBA or Fibre
Channel interface (thereby changing the device WWN) disrupts zone operation and
may incorrectly include or exclude a device from a zone.
In Open Fabric mode, only zoning by WWN is supported. Zoning by port numbers is
not.
Zones are grouped into zone sets. A zone set is a group of zones that is enabled
(activated) or disabled across all switches in a multi-switch fabric. Only one zone set
per fabric can be enabled at one time.
edge switch 2/16 service manual 1–7
Page 24

General InformationI
Multi-Switch Fabrics
A Fibre Channel topology that consists of one or more interconnected switches or
switch elements is called a fabric. Operational software provides the ability to
interconnect switches (through expansion port (E_Port) connections) to form a
multi-switch fabric. The data transmission path through the fabric is typically
determined by fabric elements and is user-transparent. Subject to zoning restrictions,
devices attached to any interconnected switch can communicate with each other
through the fabric.
Because a multi-switch fabric is typically complex, maintenance personnel should be
aware that several factors can degrade fabric performance or cause connectivity
failures. These factors include:
• Domain ID assignment - Each switch in a fabric is identified by a unique domain
ID that ranges from 1 through 31. A domain ID of 0 is invalid. If two operational
fabrics join, they determine if any domain ID conflicts exist between the fabrics.
If one or more conflicts exist, the E_Ports that form the interswitch link (ISL)
segment to prevent the fabrics from joining.
• Zoning - In a multi-switch fabric, zoning is configured on a fabric-wide basis, and
any change to the zoning configuration is applied to all switches in the fabric. To
ensure zoning is consistent across a fabric, the following rules are enforced when
two fabrics (zoned or unzoned) join:
— Fabric A unzoned and Fabric B unzoned - The fabrics join successfully,
and the resulting fabric remains unzoned.
— Fabric A zoned and Fabric B unzoned - The fabrics join successfully, and
fabric B automatically inherits the zoning configuration from fabric A.
— Fabric A unzoned and Fabric B zoned - The fabrics join successfully, and
fabric A automatically inherits the zoning configuration from fabric B.
— Fabric A zoned and Fabric B zoned - The fabrics join successfully only if
the zone configurations can be merged. If the fabrics cannot join, the
connecting ports segment and the fabrics remain independent.
Zone configurations for two fabrics are compatible (the zones can join) if the
active zone set name is identical for each fabric, and if zones with the same name
have identical elements.
• Port segmentation - When an ISL activates, the switches exchange operating
parameters to determine if they are compatible and can join to form a single
fabric. If incompatible, the connecting E_Port at each switch segments to prevent
1–8 edge switch 2/16 service manual
Page 25

General InformationI
the creation of a single fabric. A segmented link transmits only Class F traffic; the
link does not transmit Class 2 or Class 3 traffic. The following conditions cause
ports to segment:
— Incompatible operating parameters - either the resource allocation time-out
value (R_A_TOV) or error-detect time-out value (E_D_TOV) is inconsistent
between switches. To prevent port segmentation, the same E_D_TOV and
R_A_TOV must be specified for each switch.
— Duplicate domain IDs - one or more domain ID conflicts are detected.
— Incompatible zoning configurations - zoning configurations for the
switches are not compatible.
— Build fabric protocol error - a protocol error is detected during the process
of forming the fabric.
— No principal switch - no switch in the fabric is capable of becoming the
principal switch.
NOTE: At least one director or switch in a multi-switch fabric must be set to either principal or
default, making it capable of becoming principal switch. If all directors and switches are set to
never principal, all ISLs will segment (Reason code 05).
— Unresponsive switch - Each switch in a fabric periodically verifies operation
of all attached switches. An ISL segments if the attached switch does not
respond to a verification request.
— ELP retransmission failure timeout-a switch that exhibits a hardware
failure or connectivity problem cannot transmit or receive Class F frames. The
switch did not receive a response to multiple exchange link protocol (ELP)
frames, did not receive a fabric login (FLOGI) frame, and cannot join an
operational fabric.
Switch Specifications
This section lists the physical characteristics, storage and shipping environment,
operating environment, and service clearances for the switch.
Physical Characteristics
Dimensions:
Height: 1.7 inches (4.3 centimeters)
Width: 17.5 inches (44.5 centimeters)
Depth: 25 inches (63.5 centimeters)
edge switch 2/16 service manual 1–9
Page 26

General InformationI
Weight: 26 pounds (11.8 kilograms)
Power Requirements:
Input voltage: 100 to 230 VAC
Input Frequency: 47 to 63 Hz
Plan for single phase or phase-to-phase connections and 5-ampere dedicated
service
Airflow Clearance in Rack:
Sides: None
Top and Bottom: None
Front and Rear: 3.0 inches (7.6 centimeters)
Heat Dissipation:
410 BTU/Hr
Shock and Vibration Tolerance:
60 Gs for 10 milliseconds without nonrecoverable errors
Acoustical Noise:
70 dB “A” scale
Inclination:
°
10
maximum
Storage and Shipping Environment
Protective packaging must be provided to protect the switch under all shipping
methods (domestic and international).
Shipping temperature:
°
F to 140° F (-40° C to 60° C)
-40
Storage temperature:
°
F to 140° F (1° C to 60° C)
34
Shipping relative humidity:
5% to 100%
Storage relative humidity:
1–10 edge switch 2/16 service manual
Page 27

5% to 80%
Maximum wet-bulb temperature:
°
F (29° C)
84
Altitude:
40,000 feet (12,192 meters)
Operating Environment
Temperature:
°
F to 104° F (4° C to 40° C)
40
Relative humidity:
8% to 80%
Maximum wet-bulb temperature:
°
F (27° C)
81
Altitude:
10,000 feet (3,048 meters)
General InformationI
HAFM Server Description
The HAFM server (Figure 1–1) is a notebook personal computer (PC) that provides a
central point of control for up to 48 LAN-connected directors or edge switches.
edge switch 2/16 service manual 1–11
Page 28

General InformationI
Figure 1–4: HAFM Server
The server is mounted in a slide-out drawer in an HP-supplied equipment rack. The
HAFM server or Internet access to the embedded web server interface is required to
install, configure, and manage the switch.
Although a configured switch operates normally without HAFM server intervention,
an attached server should operate at all times to monitor switch operation, log events
and configuration changes, and report failures.
The HAFM server provides an auto-detecting 10/100 Mbps LAN connection,
provided by an internal Ethernet adapter card. This LAN port attaches to the
customer’s public intranet to allow access from remote user workstations. An optional
Ethernet adapter card (not supplied by HP) can be installed in the personal computer
memory card international association (PCMCIA) slot to provide a connection to a
private LAN segment for dedicated switch communication.
HAFM Server Specifications
The following list summarizes hardware specifications for the HAFM server notebook
platform. Current platforms may ship with more enhanced hardware, such as a faster
processor, additional random- access memory (RAM), or a higher-capacity hard drive
or removable disk drive.
• HP Omnibook 6200 PC with color monitor, keyboard, keyboard-mounted
trackpad (mouse), and U. S. power cord.
•Intel
1–12 edge switch 2/16 service manual
®
Pentium III™ processor with an 800 megahertz (MHz) or greater clock
speed, running the Microsoft Windows 2000 operating system.
Page 29
• Eighteen gigabyte (GB) or greater internal hard drive.
• 160 megabyte (MB) or greater RAM.
• Removable DVD/CD-ROM drive.
• Removable 100 MB disk (Zip
• 56K internal modem.
• One internal 10/100 Mbps Ethernet adapter with RJ-45 connector (provides public
LAN interface to switches and remote clients).
Ethernet Hub
The HAFM Server and managed switches connect through a rack- mounted 10/100
Base-T Ethernet hub. Figure 1–5 illustrates the optional 12-port hub.
ProCurve
1
1
0/100
H
ub
1
2
H
P
J
3
2
9
4
A
Power
Fault
7
Reset
General InformationI
®
) drive.
2
3
4
5
6
Link
100
8
9
10
11
12
Link
100
Act
Col
1
2X
3X
Port1
O
nly
4X
5X
MDI-X
MDI
(out)
(in)
7X
6X
8X
9X
10X
11X
12X
Figure 1–5: 12-Port Ethernet Hub
Embedded Web Server Interface
Administrators or operators with a browser-capable PC and an Internet connection can
monitor and manage the switch through an embedded web server interface. The
application provides a graphical user interface (GUI) similar to the product manager
application, and supports switch configuration, statistics monitoring, and basic
operation.
Maintenance Approach
Whenever possible, the maintenance approach instructs service personnel to perform
fault isolation and repair procedures without degrading or interrupting operation of the
switch, attached devices, or associated applications. Switch fault isolation begins
when one or more of the following occur:
edge switch 2/16 service manual 1–13
Page 30

General InformationI
• System event information displays at the attached HAFM server, a remote
workstation communicating with the HAFM server, or the embedded web server
interface.
• LEDs on the switch front panel or FRUs illuminate to indicate a hardware
malfunction.
• An unsolicited SNMP trap message is received at a management workstation,
indicating an operational state change or failure.
• Notification of a significant system event is received at a designated support
center through an e-mail message or the call-home feature.
System events can be related to a:
• Switch or HAFM server failure (hardware or software).
• Ethernet LAN communication failure between the switch and HAFM server
• Link failure between a port and attached device.
• ISL failure or segmentation of an E_port.
Fault isolation and service procedures vary depending on the system event
information provided. Fault isolation and related service information is provided
through maintenance analysis procedures (MAPs) documented in Chapter 3. MAPs
consist of step-by-step procedures that prompt service personnel for information or
describe a specific action to be performed. MAPs provide information to interpret
system event information, isolate a switch failure to a single FRU, remove and replace
the failed FRU, and verify switch operation. The fault isolation process normally
begins with "
MAP 0000: Start MAP" on page 2-7.
Ensure the correct switch is selected for service (if the HAFM server manages
multiple switches or other Hewlett Packard products) by enabling unit beaconing at
the failed switch. The amber system error LED on the switch front panel blinks when
beaconing is enabled. Instructions to enable beaconing are incorporated into MAP
steps.
Remote Workstation Configurations
Using a standard web browser, the HAFM and product manager applications can be
downloaded and installed on remote user workstations that are LAN-attached to the
HAFM server. Operators at these workstations can manage and monitor switches
controlled by the HAFM server. A maximum of nine concurrent users (including a
local user) can log in to the HAFM application.
1–14 edge switch 2/16 service manual
Page 31

General InformationI
Each remote workstation must have access to the LAN segment on which the HAFM
server is installed. Switch administrative functions are accessed through the LAN and
HAFM server. The LAN interface can be:
• Part of the customer’s public 10/100 Mbps LAN segment that provides access to
managed switches. This switch-to-HAFM server LAN connection is part of the
equipment rack installation and is required. Connection of remote workstations
through the hub is optional. This type of network configuration using one Ethernet
connection through the HAFM server is shown in Figure 1–6.
This single-Ethernet connection is supported by HP, is Open View-Storage Node
Manager (OV-SNM) compatible, and is the recommended configuration for a
typical HP installation at a customer site. LAN security is provided by restricting
password access and disabling the SNMP agent, embedded Web server interface,
and command line interface (telnet access) for each managed switch.
NOTE: The Ethernet adapter in the HAFM server provides an auto-detecting 10/100 Mbps
connection. Depending on speed restrictions imposed by other LAN-attached devices, the LAN
segment that connects the HAFM server to manage directors and switches operates at either
ten or 100 Mbps.
Switch HAFM Server
S
t
o
r
a
g
e
W
o
r
k
s
d
i
r
e
c
t
o
r
2
/
6
4
1
0
/1
0
0
R
S
T
S
t
o
r
a
g
e
W
o
r
k
s
d
i
r
e
c
t
o
r
2
/
6
4
1
0
/
1
0
0
R
S
T
PW
R
E
R
R
Customer Intranet
Customer Intranet
(10/100 Mbps)
(10/100 Mbps)
PWR
E
R
R
Switch
Remote
Workstation
Figure 1–6: Typical Network Configuration (One Ethernet Connection)
edge switch 2/16 service manual 1–15
Page 32

General InformationI
• Part of a second HAFM server interface that connects to a customer’s private
intranet and allows operation of the product manager application from remote user
PCs or workstations. Connection to this LAN segment is optional and depends on
customer requirements. A network configuration using both Ethernet connections
is shown in Figure 1–7.
1
0
/
1
0
0
3
1
RS
T
2
9
2
7
2
5
T
M
2
3
2
1
1
9
1
7
1
5
1
3
3
0
1
2
8
2
6
2
4
5791
2
2
2
0
1
8
1
6
1
4
1
2
0
4681
Pro
C
urve
1
1
0
/100
2
3
H
ub
4
1
2
5
HP
6
J32
94
Link
A
100
7
8
9
1
0
Pow
11
e
1
r
2
Port
Link
1O
nl
y
100
F
a
u
l
t
Reset
A
ct Col
MDI-X
MD
I
(out)
(in)
HP Hub
1
0
/
1
0
0
3
1
R
S
T
2
9
2
7
2
5
T
M
2
3
2
1
1
9
1
7
1
5
3
3
0
2
8
2
6
2
4
2
2
2
0
1
8
1
6
1
4
1
2
1
0
Figure 1–7: Typical Network Configuration (Two Ethernet Connections)
Remote
3
1
P
W
R
E
R
R
02
Switch
1
2
X
3X
4X
5
X
6X
7X
8X
9
X
10X
11X
12X
3579111
1
P
W
R
E
R
R
02468
Switch
HAFM
Server
Workstation
Customer Intranet
Customer Intranet
(10/100 Mbps)
(10/100 Mbps)
Remote
Workstation
• Although this dual Ethernet connection is supported by HP, it is not OV-SNM
compatible, requires installation of an additional PCMCIA LAN adapter card (not
supplied by HP), and is not the recommended configuration for a typical new HP
installation at a customer site.
Refer to the hp StorageWorks product in a SAN environment: planning guide for
director 2/64, edge switch 2/16, and edge switch 2/32
(A6534-96025/AA-RS2DA-TE) for additional information about network
configurations.
CAUTION: Prior to servicing a switch or HAFM server, determine the Ethernet LAN
configuration. Installation of switches and the HAFM server on a public customer
intranet can complicate problem determination and fault isolation.
Minimum Remote Console Hardware Specifications
Client HAFM and product manager applications download and install to remote
workstations (from the HAFM server) using a standard web browser. The applications
operate on platforms that meet the following minimum system requirements:
1–16 edge switch 2/16 service manual
Page 33

General InformationI
• Desktop or notebook PC with color monitor, keyboard, and mouse, using an Intel
Pentium
Microsoft Windows
®
processor with a 400 MHz or greater clock speed, and using the
®
95, Windows® 98, Windows® 2000, Windows XP, or Linux
2.2 operating system.
• UNIX workstation with color monitor, keyboard, and mouse, using a:
— Hewlett-Packard
speed, using the HP-UX
—Sun
®
Microsystems UltraSPARC™-II processor with a 400 MHz or greater
®
HA PA-RISC® processor with a 400 MHz or greater clock
®
11 or higher operating system.
clock speed, using the SunOS™ version 5.5.1 or higher operating system, or
Solaris™ version 2.5.1 or higher operating system.
—IBM PowerPC
®
microprocessor with a 400 MHz or greater clock speed, or
POWER3™ microprocessor with a 400 MHz or greater clock speed, using the
AIX version 4.3.3 or higher operating system.
• At least 24 MB available on the internal hard drive.
• 128 MB or greater RAM.
• Video card supporting 256 colors at 800 x 600 pixel resolution.
• Ethernet network adapter.
• Java™-enabled Internet browser, such as Microsoft
4.0 or later) or Netscape Navigator
®
(version 4.0 or later).
®
Internet Explorer (version
Field Replaceable Units
The switch provides a modular design that enables quick removal and replacement of
FRUs small form factor pluggable SFP optical transceivers, power supplies, and fans.
Figure 1–8 illustrates the front of the switch. The switch front panel includes:
edge switch 2/16 service manual 1–17
Page 34

General InformationI
StorageWorks edge switch 2/16
IM
L
PWR
ERR
1
5 Initial machine load (IML) button
6 Ethernet LAN connector
7 SFP fiber optic connectors
2
3
8 Port LEDs
9 Error LED (amber)
10 Power LED (green)
Figure 1–8: Edge Switch 2/16 (front view)
2
3
2
1
1 Cooling fan (4)
2 Power supply (2)
3 Power switches on power supplies (2)
4 RS-232 maintenance port
Figure 1–9: Edge Switch 2/16 (rear view)
4
6
5
3
4
Figure 1–9 illustrates the rear of the switch. The FRUs on the rear panel include two
power supplies and three individual cooling fan FRUs with each fan FRU comprised
of two individual fans.
1–18 edge switch 2/16 service manual
Page 35

SFP Transceivers
A single-mode or multi-mode fiber-optic cable attaches to a port through a pluggable
small form factor (SFP) transceiver. The SFP provides a duplex LC interface, and can
be detached from the switch port for easy replacement. Two fiber-optic transceiver
types are available:
• Shortwave laser—Shortwave laser SFPs provide short-distance connections (2 to
500 meters) through 50-micron or 62.5-micron multi-mode fiber.
• Longwave laser—Longwave laser SFPs provide long-distance connections (up to
10 kilometers) through 9-micron single-mode fiber.
• Extended reach laser—Extended reach laser SFPs provide long-distance
connections (up to 35 kilometers) through 9-micron single-mode fiber.
Cooling Fans
Three 2-fan FRUs (a total of six fans) provide cooling for the switch power supplies
and the control processor (CTP) card, as well as redundancy for continued operation if
a single fan fails.
Each fan FRU can be replaced while the switch is operating.
General InformationI
Power Supplies
Redundant, load-sharing power supplies step down and rectify facility input power to
provide 3.3 volts direct current (VDC), 5 VDC, and 12 VDC to the CTP card. The
power supplies also provide input filtering, overvoltage protection, and overcurrent
protection. Either power supply can be replaced while the switch is operational.
Each power supply has a separate CTP card connection to allow for independent AC
power sources. The power supplies are input-rated at 100 to 230 volts alternating
current (VAC).
Connectors and Indicators
Connectors and indicators include the:
• Initial machine load (IML) button.
• Ethernet LAN connector.
• Green power (PWR) and amber system error (ERR) LEDs.
• Green and amber status LEDs associated with FRUs.
edge switch 2/16 service manual 1–19
Page 36

General InformationI
• RS-232 maintenance port.
Initial Machine Load Button
When the IML button (Figure 1–8) is pressed and held for three seconds, the switch
performs an IML that takes approximately 30 seconds and resets the:
• Microprocessor and functional logic for the CTP card and loads firmware from
FLASH memory.
• Ethernet LAN interface, causing the connection to the HAFM server to drop
momentarily until the connection automatically recovers.
• Ports, causing all Fibre Channel connections to drop momentarily until the
connections automatically recover.
An IML should only be performed if a CTP card failure is indicated. Do not IML the
switch unless directed to do so by a procedural step or the next level of support. As a
precaution, the IML button is flush mounted to protect against accidental activation.
Ethernet LAN Connector
The front panel provides a 10/100 megabit per second (Mbps) RJ-45 twisted-pair
connector (Figure 1–8) that attaches to an Ethernet LAN to provide communication
with the HAFM server or an SNMP management workstation. Two green LEDs are
associated with the LAN connector. When illuminated, the left LED indicates LAN
operation at 10 Mbps, and the right LED indicates LAN operation at 100 Mbps.
Power and System Error LEDs
The PWR LED (Figure 1–8) illuminates when the switch is connected to facility AC
power and powered on. If the LED extinguishes, a facility power source, power cord,
or power distribution failure is indicated.
The ERR LED (Figure 1–8) illuminates when the switch detects an event requiring
immediate operator attention, such as a FRU failure. The LED remains illuminated as
long as an event is active. The LED extinguishes when the Clear System Error Light
function is selected from the product manager application. The LED blinks if unit
beaconing is enabled. An illuminated ERR LED (indicating a failure) takes
precedence over unit beaconing.
1–20 edge switch 2/16 service manual
Page 37

FRU Status LEDs
Amber and green LEDs associated with switch FRUs provide status information as
follows:
• Port SFP - Amber and green LEDs to the left of the port (Figure 1–8) illuminate,
extinguish, or blink to indicate various port states (operational with active Fibre
Channel traffic, operational but not communicating, beaconing, blocked, failed,
inactive, or running diagnostics).
• Fan - An amber LED at the upper left corner of each fan FRU (Figure 1–9)
illuminates if the fan fails or rotates too slowly.
• Power Supply - A green LED on each power supply (Figure 1–9) illuminates if
the power supply is operational and receiving AC power.
Maintenance Port
The rear panel provides a 9-pin RS-232 maintenance port (Figure 1–9) that provides a
connection for a local terminal or dial-in connection for a remote terminal. Although
the port is typically used by authorized maintenance personnel, operations personnel
can use the port to configure switch network addresses.
General InformationI
Software Diagnostic Features
The switch provides the following diagnostic software features that aid in fault
isolation and repair of problems:
• FRUs provide on-board diagnostic and monitoring circuits that continuously
report FRU status to the HAFM and product manager applications. These
applications provide system alerts and logs that display failure and diagnostic
information at the HAFM server or a remote workstation communicating with the
HAFM server.
• The HAFM Services application that runs as a Windows 2000 service and
provides an additional user interface to display operational status.
• The embedded web server interface that provides Internet access to isolate
problems for a single switch.
• Unsolicited SNMP trap messages that indicate operational state changes or
failures can be transmitted to up to 12 authorized management workstations.
edge switch 2/16 service manual 1–21
Page 38

General InformationI
• E-mail messages or call-home reports from the HAFM server provide automatic
notification of significant system events to designated support personnel or
administrators.
HAFM Diagnostics
The HAFM application provides a Java-based GUI to manage, monitor, and isolate
problems for multiple switches and multi-switch fabrics. The user interface operates
locally on the HAFM server, or through an Ethernet LAN connection from a remote
user workstation. The application starts automatically when the HAFM server is
powered on or rebooted, and the default display is the main HAFM window, or
Product View (Figure 1–10). If you are using a remote user workstation, see Log Into
the HAFM in the hp StorageWorks edge switch 2/16 product manager user guide
(A7284-96003/AA-RS2KA-TE). Managed products (including switches) appear as
icons in the window, and a set of view tabs appear at the top of the window. A status
bar displays below the view area of the screen.
Figures containing HAFM and product manager screens in this manual are included
for illustration purposed only. These illustrations may not match exactly what you see
through your server or workstation. Title bars have been removed from the
illustrations, and fields in the illustrations may contain different data than the screens
displayed on your system.
NOTE: Icons shown in the
fabric being represented.
The HAFM application is independent from the switch or other products managed by
the HAFM server. Service personnel can perform the following maintenance and
diagnostic functions:
Product View
will vary, based on what is installed in the particular
• Display the operational status for each managed product.
• Display logs that provide service and diagnostic-related information.
• Open a product manager application to monitor or fault-isolate a specific switch.
• Select the Products tab to view hardware, node list, port list, performance, and
FRU list views and to configure and diagnose hardware problems.
• Select the Fabrics tab to monitor or fault-isolate multi-switch fabric problems.
1–22 edge switch 2/16 service manual
Page 39

Figure 1–10: Product View
General InformationI
HAFM Status Symbols
A status bar at the bottom of the Product View displays a colored symbol that
indicates the worst-case status of any managed product in the Product View, that
fabrics are persisted in the Fabrics View (double-click the Fabrics tab), and the status
of the HAFM server.
Table 1–1
symbols. If a switch is degraded but all other managed products are fully operational,
a yellow triangle displays in the status bar, and adjacent to the icon representing the
degraded switch. The remaining icons have a green circle adjacent to them. By
double-clicking an icon or selecting from the View menu, service personnel can open
a specific product manager application.
edge switch 2/16 service manual 1–23
illustrates and explains the meaning of the status
Page 40

General InformationI
A label below each icon identifies the switch by its configured name or IP address,
and a colored status symbol beside each icon indicates the operational status of the
switch.
Table 1–1: Status Symbols
Alert Symbol Meaning
Green circle Status Bar: All managed products are fully operational and
no failures are indicated.
Next to Icon: The switch is fully operational and no failures are
indicated.
Yellow
triangle
Red diamond
(with yellow
background)
Grey square Status Bar: The status of at least one managed product is
Status Bar: At least one managed product is operating in
degraded mode.
Next to Icon: A redundant component failed or the switch is
operating in degraded mode. Service is required.
Status Bar: At least one managed product is not operational.
Next to Icon: A critical failure occurred and the switch is not
operational. Immediate service is required.
unknown.
Next to Icon: The switch status is unknown because of a network
connection failure between the switch and HAFM server.
Hardware View Layout and Function
Double-click a switch icon on the Product View to open the product manager for that
switch. When the application opens, the default display is the Hardware View
(Figure 1–11). The main product manager window (Hardware View) is divided into
five main areas as shown in Figure 1–11 menu bar, view tabs, status table, view panel,
and status bar. Use features in these panels to configure switch operation, monitor
performance, and access maintenance features.
Menu Bar
The menu bar on the product manager window displays tabs for the following menus:
•Product
• Configure
•Logs
• Maintenance
1–24 edge switch 2/16 service manual
Page 41

•Help
Click one of the tabs to display a list of menu options. Click an option to open a dialog
box that allows you to perform configuration and maintenance tasks and view logs. If
a menu option contains a check box, click in the box to add a check mark and enable a
function. Click a check box containing a check mark to remove the check mark and
disable the function.
Product Manager Diagnostics
The product manager application provides a Java-based GUI to manage, monitor, and
isolate problems for a specific switch. The application operates locally on the HAFM
server, or through an Ethernet LAN connection from a remote user workstation.
Hardware View
The hardware view (Figure 1–11)illustrates the following elements:
General InformationI
1 Menu Bar
2 View Tabs
Figure 1–11: Hardware View
3 View Panel
4 Status Bar
Service personnel can perform the following maintenance and diagnostic functions
from the application:
edge switch 2/16 service manual 1–25
Page 42

General InformationI
• Observe the operational status and state, name, description, and location for the
selected switch at the status table at the top of the Hardware View.
• Observe green and amber LEDs that illuminate on graphical FRUs. These LEDs
emulate LED operation on corresponding switch FRUs.
• Observe graphical FRUs that emulate the hardware configuration and operational
status of the corresponding switch. Colored symbols appear on graphical FRUs to
represent failed or degraded status. The colors and shapes are consistent with
other status displays.
• Select a view tab to perform maintenance functions or display logs that provide
service and diagnostic-related information.
• Select graphical FRUs with the mouse to display maintenance-related dialog
boxes or perform maintenance functions.
Status Table
The switch status table displays the selected switch operational status, operational
state, port state, name, description, and location. The Status field shows one of the
following:
• Fully Operational - all switch FRUs and ports are fully operational, and no
failures are indicated.
• Redundant Failure - a redundant FRU failed (power supply or fan FRU) and the
switch is operational. In addition to the text message, the Status and State fields
change to a yellow background (refer to Figure 1–12, Hardware View).
• Minor Failure - a failure occurred that decreased the operational capability of the
switch (port SFP failure), but has not affected normal switching operations. In
addition to the text message, the Status and State fields change to a yellow
background (refer to Figure 1–12).
• Not Operational - the switch failed, is not operational, and requires immediate
service. In addition to the text message, the Status and State fields change to a
yellow background (refer to Figure 1–12).
• No Link - if the switch-to-HAFM server link is down, No Link appears in the
Status field, the Status and State fields change to a yellow background, the Name,
Description, and Location fields do not display, and the State field changes to a
Reason field with a brief description of the link loss condition. For a description
of link loss conditions, refer to MAP 0400: Loss of Console Communication on
page 2–39.
The State field shows one of the following:
1–26 edge switch 2/16 service manual
Page 43

• Online - when the switch is set online, an unblocked port and all unbypassed ports
are awaiting device login and are able to attach to a device. This state is
configured through the Set Online State dialog box or following an IML.
• Offline - when the switch is set offline, all ports are offline and cannot accept a
login from an attached device that requires a switch connection. This state is
configured through the Set Online State dialog box.
• Coming online - this is a transitional state that occurs just prior to the switch
going online. Unless a problem occurs, this state appears only briefly. The switch
automatically transitions through this state after a power-up or reset procedure.
• Going offline - this is a transitional state that occurs just prior to the switch going
offline. Unless a problem occurs, this state appears only briefly.
LED Emulation
At the Hardware View for the selected switch, simulated LEDs illuminate on FRUs
and adjacent to port SFPs to emulate the operation of LEDs on the corresponding
hardware. Simulated PWR and ERR LEDs also illuminate to emulate the operation of
LEDs on the corresponding switch front panel. For an explanation of LED operation,
refer to FRU Status LEDs.
General InformationI
Product Manager Status Symbols
A status bar at the bottom of the window displays a colored symbol (green circle,
yellow triangle, red diamond with yellow background, or grey square) that indicates
the worst-case status of the selected switch. The meaning of the status symbol is
consistent with the icon explanations in
As an example, for a single SFP, fan, or power supply failure, a blinking red and
yellow diamond displays at the FRU illustration in the Hardware View. However, the
status bar displays a yellow triangle to indicate degraded operation. If a blinking red
and yellow diamond displays over multiple FRUs, the status bar displays a red and
yellow diamond, indicating a critical failure and the switch is not operational.
The following colored symbols overlay graphical FRUs to represent failed or
degraded status for the corresponding switch FRU.
• Failed FRU indicator - a blinking (color reversing) red and yellow diamond
overlaying a FRU indicates the FRU failed and immediate service is required.
edge switch 2/16 service manual 1–27
Table 1–1.
Page 44

General InformationI
• Attention indicator - a yellow triangle overlaying the top of a port SFP indicates
the port is in a nonstandard mode or configuration, but did not actually fail. The
indicator appears for any port having a state other than online, failed, blocked,
bypassed, or loss of light. The indicator also appears to indicate a link incident
(LIN) alert or a segmented port.
View Tabs
Click one of the view tabs across the top of the product manager window to display
the following views in the View panel.
• Hardware
•Node List
•Port List
• Performance
•FRU List
View Panel
Views, selected from the view tabs, display in the view panel.
Hardware View
The Hardware View is the default view that displays in the view panel when you open
the switch product manager. To return to this view from another view, click the
Hardware view tab. Refer to Figure 1–12 for an example of this view.
1–28 edge switch 2/16 service manual
Page 45

General InformationI
Figure 1–12: Hardware View
In the Hardware View, colored indicators reflect the status of actual LEDs on the
switch FRUs. The status bar displays a symbol to represent the most degraded status
currently reported by any of the switch FRUs. For example, for a port failure,
indicated by a blinking red and yellow diamond on a port, a yellow triangle displays
on the status bar to indicate a degraded condition. However, if a blinking red and
yellow diamond displays over both power supplies, the status bar displays a blinking
red and yellow diamond, which indicates a failure requiring immediate attention. For
an explanation of the different status symbols and the reasons they display in the
Hardware View or Port List View, refer to
Table 1–1
.
Switch Menu
Double-click the switch graphic away from a FRU to display the Switch Properties
dialog box. Right-click a hardware graphic away from a FRU to display the following
options:
• Switch Properties
• Enable Unit Beaconing
• Clear System Error Light
• IPL Switch
• Set Switch Date and Time
• Set Switch Online State
edge switch 2/16 service manual 1–29
Page 46

General InformationI
Port Menu
Double-click a port to display the Port Properties dialog box. Right-click a port to
display the following options:
• Node Properties
• Port Technology
• Block Port
• Enable Beaconing
• Channel Wrap (S/390 mode only)
• Swap Ports (S/390 mode only)
• Port Diagnostics
• Clear Link Incident Alert(s)
•Reset Port
• Port Binding
• Clear Threshold Alert(s)
Note that these same options are available when you click a port on the Hardware
View and select the port secondary menu from the Product menu on the menu bar.
NOTE: For Node Properties, if a node is not logged in a message box displays indicating that
node information is not available.
Port List View
Select the Port List view tab. A table listing the port number, port name, port address
(S/390 mode only), the block/unblock configuration, operating state, port type,
operating speed, and alert condition displays in the view panel. Figure 1–13 shows an
example of the Port List View.
1–30 edge switch 2/16 service manual
Page 47

General InformationI
Figure 1–13: Port List View
The Port List View displays information about all ports installed in the switch. All data
is dynamic and updates automatically. Double-click any row in this view to display
the Port Properties dialog box for the port.
Right-click a port row to display the same menu options that display when you
right-click a port in the Hardware View or a port’s bar graph in the Performance View.
These include:
• Port Properties
• Node Properties
• Port Technology
•Block Port
• Enable Beaconing
• Port Diagnostics
• Channel Wrap (S/390 mode only)
• Swap Ports (S/390 mode only)
• Clear Link Incident Alert(s)
•Reset Port
• Port Binding
• Clear Threshold Alert(s)
edge switch 2/16 service manual 1–31
Page 48

General InformationI
Note that these options are also available when you click a port row and select the Port
secondary menu from the Product menu on the menu bar.
FRU List View
Select the FRU List view tab. A table with information about each of the FRUs
installed in the switch displays in the view panel. All data is dynamic and updates
automatically. Figure 1–14 shows an example of the FRU List View.
Figure 1–14: FRU List View
Node List View
Select Node List from view tabs. Figure 1–15 on page 1-33 shows an example of the
Node List View. This view displays a table with information about all node
attachments or N_Ports that have logged into existing F_Ports on the switch. Only
N_Ports display in the Node List View after nodes have logged in to the fabric. The
1–32 edge switch 2/16 service manual
Page 49

General InformationI
columns that display in the table include: port number where the node is attached, the
port’s address (S/390 mode only), node type, WWN of the attached node (device), and
BB_Credit used by the attached node.
Double-click a port row to highlight it and display the Node Properties dialog box for
that port.
Right-click a port row to display the following menu options:
• Node Properties: Displays the Node Properties dialog box.
• Port Properties: Displays the Port Properties dialog box.
• Define Nickname. Displays the Define Nickname dialog box, where you can
define a nickname to display for the attached device instead of the device's 8-byte
WWN.
• Display options. Allows you to display attached devices listed under the Port
WWN column in the Node List View by the device’s nickname configured through
the Define Nickname menu option or the device's WWN.
Figure 1–15: Node List View
Note that these options are also available when you click a port row, then select the
Port secondary menu from the Product tab on the menu bar.
edge switch 2/16 service manual 1–33
Page 50

General InformationI
Performance View
Select the Performance view tab from the menu. Figure 1–16 shows an example of the
Performance View. This view provides a graphical display of performance for all 16
ports. The top portion of the Performance View displays bar graphs that show the level
of transmit/receive activity for each port. This information updates every five seconds.
Each bar graph also shows the percentage link utilization for the port. A red arrow
marks the highest utilization level reached since the Performance View was opened. If
the system detects activity on a port, it represents minimal activity with at least one
bar.
When an end device (node) is logged into a port, moving the cursor over the port’s bar
graph in the Performance View highlights the graph and displays a message with the
world-wide name of the connected node. If the connected node has more than one
port, this is the world-wide name of the specific port on the node. When a port is
functioning as an expansion port (E_Port), the message is “E_Port.” When a port is
not logged into an end-device (not functioning as an F_Port) or to another switch (not
functioning as an E_Port), the message is the port’s current online state.
Figure 1–16: Performance View
Right-click a bar graph to display a menu of port-related actions. The options
available on this menu are the same as those that are available when you right-click a
port in the Hardware View or right-click a row in the Port List View. These include:
1–34 edge switch 2/16 service manual
Page 51

General InformationI
• Port Properties
• Node Properties
• Port Technology
•Block Port
• Enable Beaconing
• Port Diagnostics
• Channel Wrap (S/390 mode only)
• Swap Ports (S/390 mode only)
• Clear Link Incident Alert(s)
•Reset Port
•Port Binding
• Clear Threshold Alert(s)
Note that these same options are also available when you click a port’s graph, then
select the Port secondary menu from the Product menu on the menu bar.
The bottom portion of the Performance View displays cumulative statistical
information for the port selected in the bar graph. Click the Refresh button to update
the data with current data from the port.
Click the Clear button to clear all of the counters to zero for the selected port and to
place an entry in the audit log indicating that statistics for the port have been cleared.
NOTE: Clearing the counters clears the statistics for all users.
Status Bar
The status bar is located along the bottom of the product manager window. This
includes a symbol that displays at the left side of the bar and messages that display in
the panel to the right of the symbol. The symbol indicates the current operating status
of the switch and the messages display to provide more description of menu options as
you move the cursor over the options under menu bar menus. Refer to
meaning of these status symbols and of the corresponding alert text that displays in the
Edge-16 Status table at the top of the Hardware View in the view panel.
If a gray square displays in the status bar (no Ethernet connection), a reason for the
status displays in the Status table at the top of the Hardware View.
edge switch 2/16 service manual 1–35
Table 1–2 for the
Page 52

General InformationI
Table 1–2: Operating Status - Status Bar and Switch Status Table
SymbolStatus
Bar
Green
Circle
Yellow
Triangle
Blinking
Red and
Yellow
Diamond
Gray
Square
Switch Status
Table Text Meaning
Fully Operational All components and installed
ports are operational; no
failures.
Redundant Failure A redundant component has
failed, such as a power supply,
and the backup component
has taken over operation.
Minor Failure A failure occurred which has
decreased the switch
operational ability. Normal
switching operations are not
affected.
One or more ports failed, but
at least one port is still
operational.
A fan has failed or is not
rotating sufficiently.
NOT
OPERATIONAL
A critical failure prevents the
switch from performing
fundamental switching
operations.
All fans failed.
All installed ports failed.
Both power supplies failed.
Never Connected
Link Timeout
Protocol Mismatch
Duplicate Session
Unknown Network
Switch status is unknown. This
occurs if the Ethernet network
connection between the
HAFM server and the switch
cannot be established or if the
CTP fails.
Address
Incorrect Product
Type
1–36 edge switch 2/16 service manual
Page 53

General InformationI
Messages display to the right of the status symbol as you move the cursor over options
under the menu bar menus. These messages provide additional details about tasks that
you can perform through the menu option.
Fabrics View
Access the Fabrics View by clicking the Fabrics tab on the HAFM application
window. The left panel of this view is the Fabric Tree, which is the expandable list of
fabrics, products in fabrics, and nodes connected to products. The view area for the tab
is to the right of the Fabric Tree.
Click the Topology and Zone Set tabs at the bottom of the view area to change the
views. The Topology tab (default) is illustrated in Figure 1–17 and the Zone Sets tab is
illustrated in Figure 1–18.
Figure 1–17: Fabrics View - Topology Tab
Topology Tab
The view area of the Topology tab provides details on all fabrics known to the HAFM
server and HAFM application. This area displays product icons like those in the
Products view, each representing switches and directors in fabrics that you select from
a Fabric Tree on left panel of the view. Interswitch links (ISLs) display between the
product icons as black lines. Fabrics are initially listed in the Fabric Tree by the world
edge switch 2/16 service manual 1–37
Page 54

General InformationI
wide name (WWN) of the fabric’s principal switch, but if the fabric is “persisted,”
they could have various names configured by the user. The selected fabric’s name
displays above the icons at the top of the tab.
Zone Set Tab
This tab displays the currently active zone set for fabrics that you select from the left
side of the view. The zones and zone members that make up the zone set display in a
scrollable tree structure below the name of the active zone set. Menu options available
in this tab allow you to quickly determine fabric zoning structure (zone sets, zones,
and zone members), determine logged in and logged out zone members, save active
zones under another name, determine the default zone members, deactivate/activate
zone sets, and change the default zone
.
Figure 1–18: Fabrics View - Zone Sets Tab
HAFM Services Application
The hp StorageWorks ha-fabric manager (HAFM) Services application provides both
a central control point and server-side functionality (in a client-server environment)
for all Hewlett Packard managed products. The application runs as a Windows 2000
service and starts automatically when the HAFM server is powered on.
1–38 edge switch 2/16 service manual
Page 55

General InformationI
The user interface consists of the HAFM Services window (Figure 1–19), which
provides HAFM application status and diagnostic information. The HAFM Services
window consists of:
• An event table that displays HAFM Services events that occurred since the
HAFM application was started.
• A status line at the bottom of the panel that provides a status indicator and
message area.
Figure 1–19: HAFM Services Window
Event Table
The event table displays the last ten events that occurred since the HAFM application
was started. Events that occurred during a prior instance of the application do not
display. If a new event occurs while ten events display, the oldest event is discarded. A
deeper event history is maintained in the form of a log file viewed through the HAFM
application.
The events are internal error conditions detected by the HAFM application, and are
not related to product-specific events reported by a switch. Events typically relate to
HAFM audit log and file corruption, invalid product definition and firmware files,
missing product services class, or missing version information.
The event table contains the following columns:
edge switch 2/16 service manual 1–39
Page 56

General InformationI
• Viewed - this column provides a check box associated with each event. Each
check box allows service personnel to mark an event as viewed (acknowledged
with appropriate action taken).
• Date/Time - the date and time the event was reported to the HAFM server.
• Product - the product associated with the event. Some events are associated with
the HAFM application, while others are associated with a specific instance of the
product manager application. In the latter case, the switch and configured name
(or IP address) associated with the instance are displayed.
• Event - the numeric event code and a brief description of the event.
Status Line
The status line provides a status indicator and message area. HAFM status symbols
are explained in Table 1–3.
The HAFM application icon (upper left corner of the window) is dynamic and
matches the status indicator. This feature allows users and service personnel to
observe the status when the application is minimized to the Windows 2000 task bar.
The message area briefly displays messages during HAFM application startup to
indicate the progress of startup activities.
Table 1–3: HAFM Services Status Symbols
Alert Symbol Meaning
Blank The status indicator is blank during HAFM
application initialization.
Green circle All events are viewed (acknowledged with
appropriate action taken).
Yellow
triangle
Red diamond
(with yellow
background)
1–40 edge switch 2/16 service manual
One or more nonfatal events have not
been viewed.
A fatal error occurred.
Page 57

Embedded Web Server Diagnostics
If the hp StorageWorks ha-fabric manager (HAFM) server access is not available, the
embedded web server interface provides a GUI accessed through the Internet (locally
or remotely) to manage, monitor, and isolate problems for a single switch. This
interface is available with switch firmware Version 1.2 (or later) installed, and does
not replace nor offer the full management capability of the HAFM and switch product
manager applications.
General InformationI
The embedded web server interface can be opened from a standard web browser
running Netscape Navigator
®
4.6 or higher or Microsoft Internet Explorer 4.0 or
higher. At the browser, enter the IP address of the switch as the Internet uniform
resource locator (URL). When prompted at a login screen, enter a user name and
password. When the interface opens, the default display is the View panel. Service
personnel can perform the monitoring, configuration, maintenance and diagnostic
functions as follows:
• View panel - quickly inspect and determine the operational status of the switch,
and inspect switch properties and operating parameters, FRU properties, and Fibre
Channel port properties.
• Configure panel - configure or change:
— Switch ports.
— Switch identification, date and time, operating parameters, and network
addresses.
— SNMP trap message recipients.
— User passwords.
• Monitor panel - inspect and monitor:
— Fibre Channel ports and port performance statistics.
— The active zone set.
— Event log entries, and clear the IML LED at the front panel.
— Information about attached devices (nodes).
• Operations panel - perform the following operations and maintenance tasks:
— Enable port beaconing and perform port diagnostics (internal and external
loopback tests).
— Reset Fibre Channel ports.
— Set the switch online state.
edge switch 2/16 service manual 1–41
Page 58

General InformationI
— Upgrade switch firmware.
General tasks performed through the web server interface are similar in form and
function to tasks performed through the HAFM and product manager applications,
and are therefore not documented in this publication. For task information and
descriptions, open the online user documentation (Help selection) that supports the
interface.
This publication provides instructions for switch installation and fault isolation using
the embedded web server interface. Refer to the hp StorageWorks edge switch 2/16
installation guide, (A7284-96001/AA-RSU2A-TE) for installation and configuration
tasks. Refer to Chapter 2 for fault isolation tasks.
SNMP Trap Message Support
Unsolicited SNMP trap messages that indicate switch operational state changes or
failure conditions can be customer-configured to be transmitted to up to 12
management workstations. If installed on a dedicated Ethernet LAN, the workstations
communicate directly with each switch. If installed on a customer intranet, the
workstations communicate with switches through the HAFM server.
SNMP data and trap messages are defined in the Fibre Channel FE-MIB definition, a
subset of the TCP/IP MIB-II definition (RFC1213), and a custom, switch-specific
MIB. Customers can install these MIBs (in standard ASN.1 format) on any SNMP
management workstation.
Although SNMP trap messages are typically transmitted to customer personnel only,
the messages may be provided to service personnel as initial notification of a switch
problem or as information included in the fault isolation process. Generic SNMP traps
include:
• coldStart - reports that the SNMP agent is reinitializing due to a switch reset.
• warmStart - reports that the SNMP agent is reinitializing due to a switch IPL.
• authorizationFailure - reports access by an unauthorized SNMP manager. This
trap is configurable, and is disabled by default.
Switch-specific SNMP traps specified in the custom MIB include Fibre Channel port
operational state changes and FRU operational state changes.
If authorized through the Configure SNMP dialog box in the product manager
application, users at SNMP management workstations can modify MIB variables.
Switch modifications performed through SNMP management work stations are
recorded in the associated switch Audit Log and are available through the product
manager application.
1–42 edge switch 2/16 service manual
Page 59

For additional information, refer to the hp StorageWorks SNMP reference guide for
director 2/64, edge switch 2/16, and edge switch 2/32
(A6534-96026/AA-RQ7BB-TE).
E-Mail and Call-Home Support
If e-mail notification and call-home support are configured for the switch as part of
the customer support process, service personnel may be:
• Notified of a switch problem by e-mail message, either directly or through a
system administrator at the customer site or call center.
• Assigned a service call from call center personnel upon receipt and confirmation
of a switch call-home event.
Tools and Test Equipment
This section describes tools and test equipment that may be required to install, test,
service, and verify operation of the switch and attached HAFM server.
Tools Supplied with the Switch
General InformationI
The following tools are supplied with the switch. Use of the tools may be required to
perform one or more installation, test, service, or verification tasks. These tools are
supplied with the switch or must be supplied by service personnel.
• Fiber-optic loopback plug - An SFP multi-mode (shortwave laser) or single-mode
(longwave laser) loopback plug is required to perform port loopback diagnostic
tests. One loopback plug is shipped with the switch, depending on the type of port
transceivers installed. Both plugs are shipped if shortwave laser and longwave
laser transceivers are installed. The plug is shown in Figure 1–20.
Figure 1–20: Multi-mode and Single-mode Loopback Plugs
edge switch 2/16 service manual 1–43
Page 60

General InformationI
• Fiber-optic protective plug - For safety and port transceiver protection,
fiber-optic protective plugs must be inserted in all port SFPs without fiber-optic
cables attached. The switch is shipped with protective plugs installed in all ports.
A protective plug is shown in Figure 1–21.
Figure 1–21: Fiber-Optic Protective Plug
• Null modem cable - An asynchronous RS-232 null modem cable is required to
configure switch network addresses and acquire event log information through the
maintenance port. The cable has nine conductors and DB-9 male and female
connectors. A null modem cable is not a standard (straight-through) RS-232
cable. Refer to Figure 1–22.
Figure 1–22: Null Modem Cable
Tools Supplied by Service Personnel
The following tools are expected to be supplied by service personnel performing
switch installation and maintenance actions. Use of the tools may be required to
perform one or more installation, test, service, or verification tasks.
• Scissors or pocket knife - A sharp cutting edge (scissors or knife blade) may be
required to cut the protective strapping when unpacking the switch, HAFM server,
Ethernet hub, or replacement FRUs.
1–44 edge switch 2/16 service manual
Page 61

General InformationI
• Standard flat-tip and cross-tip (Phillips) screwdrivers - Screwdrivers are
required to remove, replace, adjust or tighten various connector or chassis
components, and to remove and replace power supplies.
• Maintenance terminal (desktop or notebook PC) - the PC is required to
configure switch network addresses and acquire event log information through the
maintenance port. The PC must have:
— The Microsoft Windows 98, Windows
2000, or Windows Millennium Edition
operating system installed.
— RS-232 serial communication software (such as ProComm Plus™ or
HyperTerminal) installed. HyperTerminal is provided with Windows
operating systems.
• Fiber-optic cleaning kit - The kit contains tools and instructions to clean
fiber-optic cable, connectors, loopback plugs, and protective plugs.
edge switch 2/16 service manual 1–45
Page 62

Page 63

This chapter describes diagnostic procedures used by service representatives to isolate
hp StorageWorks edge switch 2/16 (edge switch 2/16) problems or failures to the
field-replaceable unit (FRU) level. The chapter specifically describes how to perform
maintenance analysis procedures (MAPs).
Maintenance Analysis Procedures
The MAPs provide fault isolation and related service procedures. They are
step-by-step procedures that prompt service personnel for information and describe a
maintenance action. They provide information to interpret system events, isolate a
switch failure to a single FRU, remove and replace the failed FRU, and verify switch
operation.
Factory Defaults
Table 2–1 lists the defaults for the passwords, and IP, subnet, and gateway addresses.
Table 2–1: Factory-Set Defaults
2
Diagnostics
Item Default
Customer password password
Maintenance password level-2
IP address 10.1.1.10
Subnet mask 255.0.0.0
Gateway address 0.0.0.0
Quick Start
Table 2–2 lists the MAPs in this chapter. Fault isolation normally begins at "MAP 0000:
Start MAP
edge switch 2/16 service manual 2–1
" on page 2-7.
Page 64
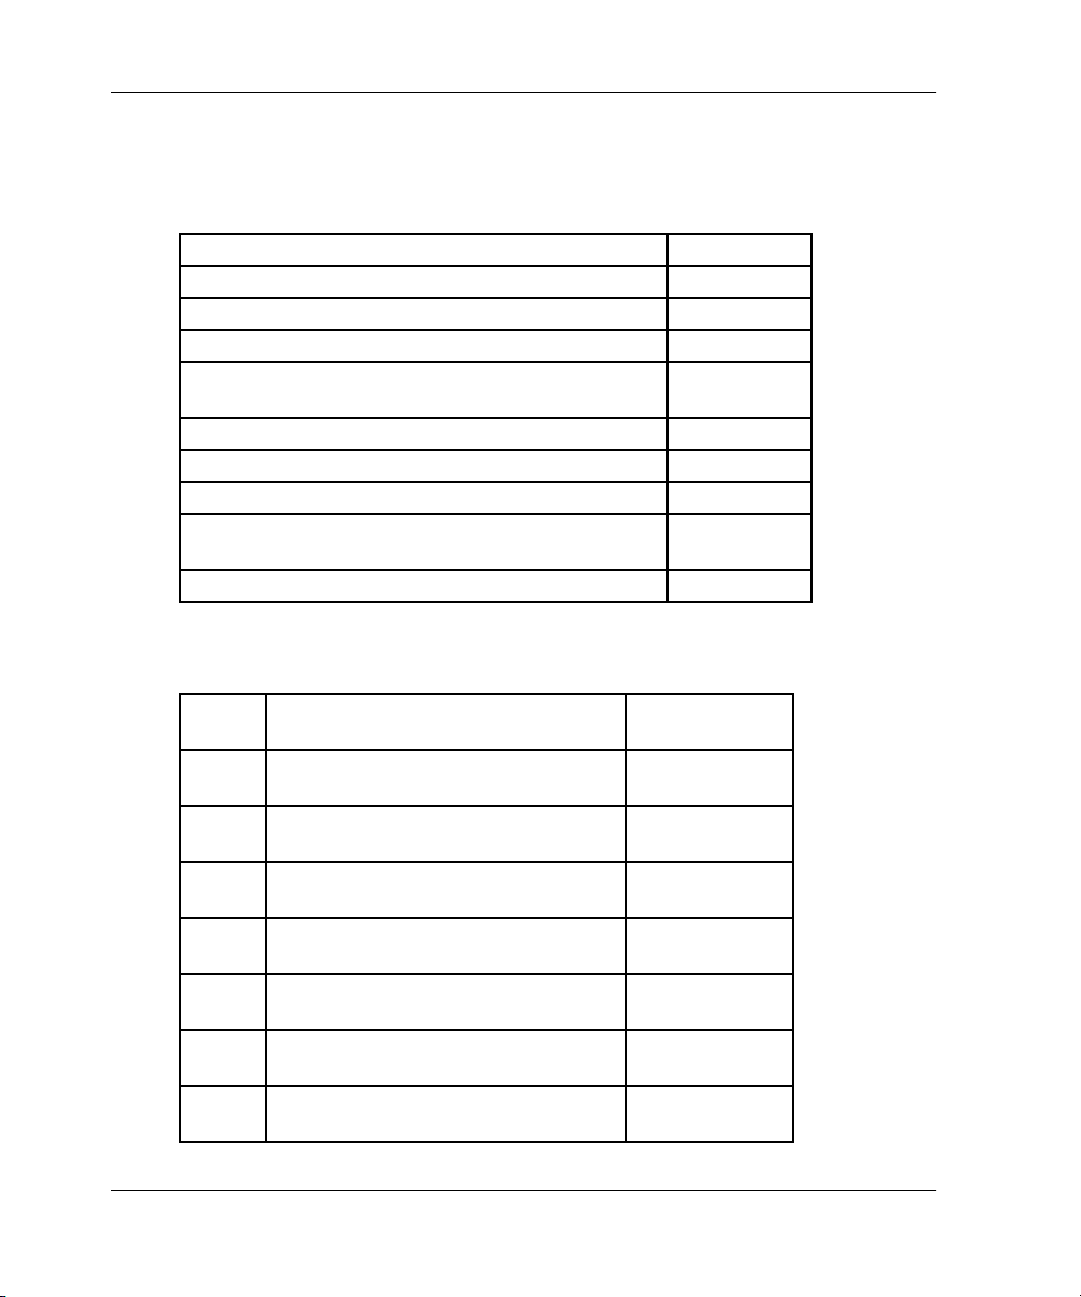
Diagnostics
However, Table 2–3 lists the event codes and the corresponding MAPs. It is a quick
start, if an event code is readily available.
Table 2–2: MAP Summary
MAP Page
MAP 0000: Start MAP page 2–7
MAP 0100: Power Distribution Analysis page 2–26
MAP 0200: POST, Reset, or IPL Failure Analysis page 2–32
MAP 0300: Console Application Problem
page 2–33
Determination
MAP 0400: Loss of Console Communication page 2–39
MAP 0500: Fan and CTP Failure Analysis page 2–58
MAP 0600: Port Failure and Link Incident Analysis page 2–63
MAP 0700: Fabric, ISL, and Segmented Port
page 2–79
Problem Determination
MAP 0800: Console PC Problem Determination page 2–90
Table 2–3: Event Codes versus Maintenance Action
Event
Code Explanation Action
001 System power-down. Power on
switch.
011 Login server database invalid. Go to
021 Name server database invalid. Go to
031 SNMP request received from
unauthorized community.
051 Management server database invalid. Go to
052 Management server internal error. Go to
061 Fabric controller database invalid. Go to
2–2 edge switch 2/16 service manual
MAP
.
0700
MAP
.
0700
Add community
name.
MAP
.
0700
MAP
.
0700
MAP
.
0700
Page 65

Table 2–3: Event Codes versus Maintenance Action (Continued)
Event
Code Explanation Action
062 Maximum interswitch hop count
exceeded.
070 E_Port is segmented. Go to
071 Switch is isolated. Go to
072 E_Port connected to an unsupported
switch.
080 Unauthorized world wide name Go to
200 Power supply ac voltage failure. Go to
201 Power supply DC voltage failure. Go to
202 Power supply thermal failure. Go to
Go to
0700
0700
0700
Go to
0700
0100
0100
0100
MAP
.
MAP
.
MAP
.
MAP
.
MAP 0600
MAP
.
MAP
.
MAP
.
203 Power supply ac voltage recovery. No action
required.
204 Power supply DC voltage recovery. No action
required.
206 Power supply removed. Replace FRU.
207 Power supply installed. No action
required.
208 Power supply false shutdown. Go to
300 First cooling fan failed. Go to
301 Second cooling fan failed. Go to
302 Third cooling fan failed. Go to
303 Fourth cooling fan failed. Go to
0100
0500
0500
0500
0500
MAP
.
MAP
.
MAP
.
MAP
.
MAP
.
Diagnostics
edge switch 2/16 service manual 2–3
Page 66

Diagnostics
Table 2–3: Event Codes versus Maintenance Action (Continued)
Event
Code Explanation Action
304 Fifth cooling fan failed. Go to
305 Sixth cooling fan failed. Go to
0500.
0500
MAP
MAP
.
310 First cooling fan recovered. No action
required.
311 Second cooling fan recovered. No action
required.
312 Third cooling fan recovered. No action
required.
313 Fourth cooling fan recovered. No action
required.
314 Fifth cooling fan recovered . No action
required.
315 Sixth cooling fan recovered. No action
required
400 Power-up diagnostic failure. Go to
0200
MAP
.
410 CTP card reset. No action
required.
411 Firmware fault occurred. Go to
0200
MAP
.
421 Firmware download complete. No action
required.
423 CTP firmware download initiated. No action
required.
430 Excessive Ethernet transmit errors. Go to
431 Excessive Ethernet receive errors. Go to
432 Ethernet adapter reset. Go to
0400
0400
0400
MAP
.
MAP
.
MAP
.
2–4 edge switch 2/16 service manual
Page 67

Table 2–3: Event Codes versus Maintenance Action (Continued)
Event
Code Explanation Action
433 Non-recoverable Ethernet fault. Go to
440 Embedded port hardware failure. Go to
0400
0600
MAP
.
MAP
.
502 Port module anomaly detected. No action
required.
504 Port module failure - error threshold
exceeded.
Go to
0600
MAP
.
505 Port module revision not supported. No action
required.
506 Fibre Channel port failure. Go to
507 Loopback diagnostics port failure. Go to
508 Fibre Channel port anomaly detected. Go to
0600
0600
0600
MAP
.
MAP
.
MAP
.
510 SFP hot-insertion initiated. No action
required.
512 SFP nonfatal error. Go to
0600
MAP
.
513 SFP hot-removal completed. No action
required.
514 SFP failure. Go to
581 Implicit incident. Go to
582 Bit-error threshold exceeded. Go to
583 Loss of signal or loss of
synchronization.
584 Not operational primitive sequence
(NOS) received.
0600
0600
0600
Go to
0600
Go to
0600
MAP
.
MAP
.
MAP
.
MAP
.
MAP
.
Diagnostics
edge switch 2/16 service manual 2–5
Page 68

Diagnostics
Table 2–3: Event Codes versus Maintenance Action (Continued)
Event
Code Explanation Action
585 Primitive sequence timeout. Go to
586 Invalid primitive sequence received
for link state.
0600
Go to
0600
MAP
.
MAP
.
602 SBAR module anomaly detected. No action
required.
604 SBAR module failure. Go to
605 SBAR module revision not supported. Go to
800 High-temperature warning (port
module thermal sensor).
801 Critically hot temperature warning
(port module thermal sensor).
802 Port module shutdown due to thermal
violations.
805 High-temperature warning (SBAR
module thermal sensor).
806 Critically hot temperature warning
(SBAR module thermal sensor).
807 SBAR module shutdown due to
thermal violations.
810 High-temperature warning (CTP
thermal sensor).
811 Critically hot temperature warning
(CTP thermal sensor).
812 CTP shutdown due to thermal
violations.
850 System shutdown due to CTP thermal
violations.
0600
0600
Go to
0500
Go to
0500
Go to
0500
Go to
0500
Go to
0500.
Go to
0500
Go to
0500.
Go to
0500
Go to
0500
Go to
0500
MAP
.
MAP
.
MAP
.
MAP
.
MAP
.
MAP
.
MAP
MAP
.
MAP
MAP
.
MAP
.
MAP
.
2–6 edge switch 2/16 service manual
Page 69

MAP 0000: Start MAP
This MAP describes initial fault isolation for the switch. Fault isolation begins at the
hp StorageWorks ha-fabric manager (HAFM) server, failed switch, or
Internet-connected personal computer (PC) running the embedded web server
interface.
1
Prior to fault isolation, acquire the following information from the customer:
• A system configuration drawing or planning worksheet that includes the HAFM
server, switches, other Hewlett Packard products, and device connections.
• The location of the HAFM server and all switches.
• The internet protocol (IP) address, gateway address, and subnet mask for the
switch reporting the problem.
• If performing fault isolation using the HAFM server:
— The Windows 2000 user name and password. These are required when
prompted during any MAP or repair procedure that directs the HAFM server
to be rebooted.
— The user name, maintenance password, and HAFM server name. All are
case sensitive and required when prompted at the HAFMHAFM Login dialog
box.
• If performing fault isolation using the embedded web server interface, the switch
user name and password. Both are case sensitive and required when prompted
at the Username and Password Required dialog box.
Diagnostics
Continue.
2
Are you at the HAFM server?
YES NO
↓
Go to step 24.
3
Did the HAFM server lock up or crash and:
• Display an application warning or error message, or
• Not display an application warning or error message, or
edge switch 2/16 service manual 2–7
Page 70

Diagnostics
NO YES
4
Did the HAFM server crash and display a blue screen with the system dump file in
hexadecimal format (blue screen of death)?
NO YES
5
Is the HAFM application active?
NO YES
• Display a Dr. Watson for Windows 2000 dialog box?
An HAFM server application problem is indicated. Event codes are not
↓
recorded. Go to "
page 2-33.
An HAFM server application problem is indicated. Event codes are not
↓
recorded. Go to "
page 2-33.
↓
Go to step 7.
MAP 0300: Console Application Problem Determination
MAP 0300: Console Application Problem Determination
" on
" on
6
Reboot the HAFM server PC.
a. Click the Windows Start button. The Windows Workstation menu displays.
b. At the Windows Workstation menu, select Shut Down. The Shut Down Windows
dialog box appears.
c. At the Shut Down Windows dialog box, select Shut down the Computer and click
Yes to power off the PC.
d. Wait approximately 30 seconds and power on the PC. After POSTs complete, the
Begin Logon dialog box displays.
e. Simultaneously press Ctrl, Alt, and Delete to display the Logon Information dialog
box. Type a user name and password (obtained in step 1) and click OK. The
HAFM Services and HAFM applications start, and the HAFM Login dialog box
displays.
2–8 edge switch 2/16 service manual
Page 71

Diagnostics
f. At the HAFM Login dialog box, type a user name, password, and HAFM server
name (obtained in step 1, and all are case sensitive), and click Login. The
application opens and the Product View displays.
Did the Product View display and does the HAFM application appear operational?
YES NO
An HAFM server hardware problem is indicated. Event codes are not
↓
recorded. Go to "
MAP 0800: Console PC Problem Determination
" on page 2-90.
7
Inspect the alert panel at the lower left corner of the Product View. The indicator
shows the status of managed switches or the status of the link between the HAFM
server and managed switches as follows:
• A green circle indicates all switches are operational.
• A yellow triangle indicates at least one switch is operating in degraded mode.
• A red diamond with yellow background indicates at least one switch is not
operational.
• A grey square indicates the status of at least one switch is unknown
The grey square indicates the HAFM server cannot communicate with the switch
because:
edge switch 2/16 service manual 2–9
Page 72

Diagnostics
Does a grey square appear at the alert panel and as the background to the icon
representing the switch reporting the problem?
YES NO
8
At the switch reporting the problem, ensure the power switch is set to the Power On
(1) position. Inspect the switch for indications of being powered on, such as:
Does the switch appear powered on?
YES NO
• The switch-to-HAFM server Ethernet link failed.
• Ac power distribution in the switch failed.
• The control processor (CTP) card failed. Because the CTP card is not a FRU,
CTP failure requires replacing the switch.
↓
Go to step 10.
• At the front panel, an illuminated PWR or ERR indicator.
• Green LEDs illuminated on the power supplies.
• Audio emanations and airflow from fans.
A power distribution problem is indicated. Go to step 23 to obtain event codes.
↓
If no event codes are found, go to "
page 2-26.
MAP 0100: Power Distribution Analysis
" on
9
Either a switch-to-HAFM server Ethernet link failure or CTP card failure is indicated.
Go to step 23 to obtain event codes. If no event codes are found:
a. Fault isolate the least severe failure indicated (Ethernet link problem). Go to
"
MAP 0400: Loss of Console Communication
b. If MAP 400 does not isolate the problem, fault isolate the CTP card problem. Go
to "
MAP 0200: POST, Reset, or IPL Failure Analysis
" on page 2-39.
" on page 2-32.
10
Does a red diamond with yellow background (failure indicator) appear at the alert
panel and as the background to the icon representing the switch reporting the
problem?
YES NO
2–10 edge switch 2/16 service manual
Page 73

Diagnostics
↓
Go to step 14.
11
Click the icon representing the switch reporting the problem. The Hardware View
displays. At the Hardware View:
• Observe whether the edge switch 2/16 Status table is yellow and switch status is
NOT OPERATIONAL.
• Inspect FRUs for a blinking red and yellow diamond (failed FRU indicator) that
overlays a FRU graphic.
Does a blinking red and yellow diamond overlay a Fibre Channel port graphic?
NO YES
A port SFP failure is indicated. Go to step 23 to obtain event codes. If no
↓
event codes are found, go to "
on page 2-63.
MAP 0600: Port Failure and Link Incident Analysis
12
Does a blinking red and yellow diamond overlay a fan graphic?
NO YES
"
A fan failure is indicated. Go to step 23 to obtain event codes. If no event
↓
codes are found, go to "
MAP 0500: Fan and CTP Failure Analysis
" on page 2-58.
13
A blinking red and yellow diamond overlays a power supply graphic.
A power supply failure is indicated. Go to step 23 to obtain event codes. If no event
codes are found, go to "
MAP 0100: Power Distribution Analysis
" on page 2-26.
14
Does a yellow triangle (attention indicator) appear at the alert panel and as the
background to the icon representing the switch reporting the problem?
YES NO
↓
Go to step 18.
15
Click the icon representing the switch reporting the problem. The Hardware View
displays. At the Hardware View:
edge switch 2/16 service manual 2–11
Page 74

Diagnostics
Does a blinking red and yellow diamond overlay a Fibre Channel port graphic?
NO YES
16
Does a blinking red and yellow diamond overlay a fan graphic?
NO YES
17
A blinking red and yellow diamond overlays a power supply graphic.
• Observe whether the edge switch 2/16 Status table is yellow and switch status is
Minor Failure or Not Installed.
• Inspect FRUs for a blinking red and yellow diamond (failed FRU indicator) that
overlays the FRU graphic.
A port SFP failure is indicated. Go to step 23 to obtain event codes. If no
↓
event codes are found, go to "
on page 2-63.
A fan failure is indicated. Go to step 23 to obtain event codes. If no event
↓
codes are found, go to "
MAP 0600: Port Failure and Link Incident Analysis
MAP 0500: Fan and CTP Failure Analysis
" on page 2-58.
"
A power supply failure is indicated. Go to step 23 to obtain event codes. If no event
codes are found, go to "
MAP 0100: Power Distribution Analysis
" on page 2-26.
18
A green circle appears at the alert panel and as the background to the icon
representing the switch reporting the problem. Although the switch is operational, a
minor problem may exist.
Click the icon representing the switch reporting the problem. The Hardware View
displays. At the Hardware View, inspect ports for a yellow triangle (attention indicator)
that overlays a port graphic.
Does a yellow triangle overlay the port graphic?
YES NO
↓
Go to step 22.
19
Inspect the port state and LED status for all ports with an attention indicator.
2–12 edge switch 2/16 service manual
Page 75

Diagnostics
a. At the Hardware View, click the port graphic with the attention indicator. The Port
Properties dialog box displays.
b. Inspect the Beaconing and Operational State fields.
Does the Operational State field display a Beaconing message and the Beaconing
field display an On message?
YES NO
↓
Go to step 21.
20
Port beaconing is enabled.
a. Consult with the customer and next level of support to determine the reason port
beaconing is enabled.
b. Disable port beaconing:
1. At the Hardware View, right-click the port graphic. A pop-up menu appears.
2. Click Enable Beaconing. The check mark disappears from the box adjacent to
the option, and port beaconing is disabled.
Was port beaconing enabled because port failure or degradation was suspected?
YES NO
The switch appears operational.
↓
edge switch 2/16 service manual 2–13
Page 76

Diagnostics
Go to step 2.
21
At the Port Properties dialog box, does the Operational State field display a
Segmented E_Port message?
NO YES
A message displays indicating a link incident or port problem. Go to step 23 to obtain
event codes. If no event codes are found, go to "
Incident Analysis
22
A link incident may have occurred, but the LIN alerts option is not enabled for the port
and the attention indicator does not appear.
At the Hardware View, select Link Incident Log from the Logs menu on the navigation
control panel. The Link Incident Log displays.
E_Port segmentation is indicated. Go to step 23 to obtain event codes. If no
↓
event codes are found, go to "
Problem Determination
" on page 2-63.
" on page 2-79.
MAP 0700: Fabric, ISL, and Segmented Port
MAP 0600: Port Failure and Link
If a link incident occurred, the affected port number is listed with one of the following
messages.
Link interface incident - implicit incident.
2–14 edge switch 2/16 service manual
Page 77

Diagnostics
Link interface incident - bit-error threshold exceeded.
Link failure - loss of signal or loss of synchronization.
Link failure - not-operational primitive sequence (NOS) received.
Link failure - primitive sequence timeout.
Link failure - invalid primitive sequence received for the current link state.
Did one of the listed messages appear in the Link Incident Log?
YES NO
The switch appears operational.
↓
A link incident problem is indicated. Go to step 23 to obtain event codes. If no event
codes are found, go to "
MAP 0600: Port Failure and Link Incident Analysis
" on page 2-63.
23
Obtain event codes from the switch Event Log.
NOTE: If multiple event codes are found, note all codes and associated severity levels. Record
the date, time, and listed sequence, and determine if the codes are related to the reported
problem. Begin fault isolation with the most recent event code with the highest severity level.
Other codes may accompany this event code, or may indicate a normal indication after a
problem is recovered.
a. At the Hardware View, select Event Log from the Logs menu on the navigation
control panel. The Event Log displays.
b. Record the event code, date, time, and severity (Informational, Minor, Major, or
Severe).
c. Record all event codes that may relate to the reported problem.
Were one or more event codes found?
NO YES
↓
Go to Table 2–3 on page 2-2.
Return to the MAP step that sent you here.
edge switch 2/16 service manual 2–15
Page 78

Diagnostics
24
Are you at the switch reporting the problem?
YES NO
25
Is the PWR LED at the switch front panel illuminated?
NO YES
26
Is the power switch set to the Power On (1) position?
NO YES
27
Power on the switch. Inspect the switch for indications of being powered on, such as:
↓
↓
↓
Go to step 36.
Go to step 30.
Go to step 29.
• At the front panel, an illuminated PWR or ERR indicator.
• Green LEDs illuminated on the power supplies.
• Audio emanations and airflow from fans.
Does the switch appear powered on?
YES NO
A power distribution problem is indicated. Go to step 23 to obtain event
↓
codes. If no event codes are found, go to "
Analysis
" on page 2-26.
MAP 0100: Power Distribution
28
Is the PWR LED at the switch front panel illuminated?
NO YES
↓
Go to step 30.
A faulty PWR LED is indicated, but Fibre Channel port operation is not disrupted.
2–16 edge switch 2/16 service manual
Page 79

Diagnostics
a. If continued operation without benefit of the PWR LED is acceptable to the
customer, do not perform any repair action.
b. If continued operation without benefit of the PWR LED is not acceptable to the
customer, remove and replace the switch.
29
Inspect the switch for indications of being powered on, such as:
• At the front panel, an illuminated PWR or ERR indicator.
• Green LEDs illuminated on the power supplies.
• Audio emanations and airflow from fans.
Does the switch appear powered on?
YES NO
A power distribution problem is indicated. Go to step 23 to obtain event
↓
codes. If no event codes are found, go to "
Analysis
A faulty PWR LED is indicated, but Fibre Channel port operation is not disrupted.
a. If continued operation without benefit of the PWR LED is acceptable to the
customer, do not perform any repair action.
b. If continued operation without benefit of the PWR LED is not acceptable to the
customer, remove and replace the switch.
Exit MAP.
" on page 2-26.
MAP 0100: Power Distribution
30
Is the ERR LED blinking?
YES NO
↓
Go to step 32.
31
Unit beaconing is enabled for the switch.
a. Consult the customer and next level of support to determine the reason unit
beaconing is enabled.
b. Disable unit beaconing.
1. At the Hardware View, right-click the front bezel graphic (away from a FRU). A
pop-up menu appears.
edge switch 2/16 service manual 2–17
Page 80

Diagnostics
Was unit beaconing enabled because an switch failure or degradation was
suspected?
YES NO
Go to step 25.
32
Is the ERR LED illuminated?
YES NO
33
Check FRUs (port SFPs, fans, power supplies) for failure symptoms.
Is the amber LED adjacent to a port SFP illuminated?
NO YES
2. Click Enable Unit Beaconing. The check mark disappears from the box
adjacent to the option, and unit beaconing is disabled.
The switch appears operational.
↓
The switch appears operational. Verify operation at the HAFM server. Go to
↓
step 3.
A port SFP failure is indicated. Go to step 23 to obtain event codes. If no
↓
event codes are found, go to "
on page 2-63.
MAP 0600: Port Failure and Link Incident Analysis
"
34
Is the amber LED at the lower left corner of a fan illuminated?
NO YES
A fan failure is indicated. Go to step 23 to obtain event codes. If no event
↓
codes are found, go to "
MAP 0500: Fan and CTP Failure Analysis
" on page 2-58.
35
Is the green LED on a power supply extinguished?
NO YES
A power supply failure is indicated. Go to step 23 to obtain event codes. If no
↓
event codes are found, go to "
2-26.
2–18 edge switch 2/16 service manual
MAP 0100: Power Distribution Analysis
" on page
Page 81

Diagnostics
The switch appears operational.
36
Are you at a PC with a web browser (such as Netscape Navigator or Microsoft Internet
Explorer) and an Internet connection to the switch reporting the problem.
YES NO
↓
Go to step 52.
37
Is the web browser PC powered on and communicating with the switch through the
Internet connection?
NO YES
↓
Go to step 39.
38
Boot the web browser PC.
a. Power on the PC in accordance with the instructions delivered with the PC. The
Windows desktop appears.
b. Launch the PC browser application by double-clicking the appropriate icon at the
Windows desktop.
c. At the Netsite field (Netscape Navigator) or Address field (Internet Explorer), type
http://xxx.xxx.xxx.xxx, where xxx.xxx.xxx.xxx is the IP address of the switch
(obtained in step 1). The Username and Password Required dialog box appears.
d. Type the user name and password obtained in step 1, and click OK. The
embedded web server interface opens with the View panel (Switch tab)
displayed.
Continue.
edge switch 2/16 service manual 2–19
Page 82

Diagnostics
39
Does the embedded web server interface appear operational with the view panel
displayed?
NO YES
↓
Go to step 44.
40
A Page cannot be found, Unable to locate the server, HTTP 404 - file not found,
or other similar message appears. The message indicates the web browser PC
cannot communicate with the switch because:
• The switch-to-PC Internet link could not be established.
• AC power distribution in the switch failed, or AC power was disconnected.
• The switch’s CTP failed. Because the CTP card is not a FRU, CTP failure
requires replacing the switch.
Continue.
41
Inspect the switch for indications of being powered on, such as:
• At the front panel, an illuminated PWR or ERR indicator.
• Green LEDs illuminated on the power supplies.
• Audio emanations and airflow from fans.
2–20 edge switch 2/16 service manual
Page 83

Diagnostics
Does the switch appear powered on?
YES NO
A power distribution problem is indicated. Go to "
↓
Analysis
" on page 2-26.
MAP 0100: Power Distribution
42
Either a switch-to-PC Internet link problem (Internet too busy or IP address typed
incorrectly) or a CTP card failure is indicated.
a. Wait approximately five minutes, then attempt to login to the switch again.
b. At the Netsite field (Netscape Navigator) or Address field (Internet Explorer), type
http://xxx.xxx.xxx.xxx, where xxx.xxx.xxx.xxx is the IP address of the switch
(obtained in step 1). The Username and Password Required dialog box appears.
c. Type the user name and password obtained in step 1, and click OK. If the View
panel does not display, wait another five minutes and perform this step again.
Does the embedded web server interface appear operational with the View panel
displayed?
YES NO
A CTP card failure is indicated. Go to "
↓
Analysis
" on page 2-32.
MAP 0200: POST, Reset, or IPL Failure
43
At the View panel, inspect the Status field.
Does the switch status indicate Operational?
NO YES
The switch appears operational.
↓
44
Inspect the port operational state.
a. At the View panel, click the Port Properties tab. The View panel (Port Properties
tab) displays.
b. Inspect the Beaconing and Operational State fields.
edge switch 2/16 service manual 2–21
Page 84

Diagnostics
Does the Operational State field display a Beaconing message and the Beaconing
field display an On message?
YES NO
↓
Go to step 46.
45
Port beaconing is enabled.
a. Consult the customer and next level of support to determine the reason port
beaconing is enabled.
b. Disable port beaconing:
1. At the View panel, select Operations at the left side of the panel. The
Operations panel opens with the Port Beaconing page displayed.
2. Click the Beaconing State check box for the port. The check mark disappears
from the box and port beaconing is disabled.
2–22 edge switch 2/16 service manual
Page 85

Diagnostics
3. Return to the View panel (Port Properties tab).
Continue.
46
At the View panel, does the Operational State field display a Segmented message?
NO YES
Port segmentation is indicated. Go to step 51 to obtain event codes. If no
↓
event codes are found, go to "
Problem Determination
" on page 2-79.
MAP 0700: Fabric, ISL, and Segmented Port
47
At the View panel, does the Operational State field display a message indicating a link
incident or port problem?
NO YES
A port problem is indicated. Go to step 51 to obtain event codes. If no event
↓
codes are found, go to "
page 2-63.
MAP 0600: Port Failure and Link Incident Analysis
" on
48
Repeat step 44 through step 47 for each remaining port.
Is a link incident or port problem indicated for any of the ports?
NO YES
A link incident problem or port SFP failure is indicated. Go to step 51 to obtain
↓
event codes. If no event codes are found, go to "
Link Incident Analysis
" on page 2-63.
MAP 0600: Port Failure and
49
Inspect the power supply operational states.
a. At the View panel, click the Component Properties tab. The View panel
(Component Properties tab) displays.
Inspect the
b.
edge switch 2/16 service manual 2–23
fields for both power supplies.
State
Page 86

Diagnostics
Does the State field display a Failed message for either power supply?
NO YES
A power supply failure is indicated. Go to step 51 to obtain event codes. If no
↓
event codes are found, go to "
2-26.
MAP 0100: Power Distribution Analysis
" on page
50
Inspect the State fields for Fan 0, and Fan 1 through Fan 3 (fans).
Does the State field display a Failed or Not Installed message for any of the fans?
YES NO
The switch appears operational.
↓
A fan failure is indicated. Continue to the next step to obtain event codes. If no event
codes are found, go to "
MAP 0500: Fan and CTP Failure Analysis
" on page 2-58.
51
Obtain event codes from the embedded web server event log.
NOTE: If multiple event codes are found, note all codes and associated severity levels. Record
the date, time, and listed sequence, and determine if the codes are related to the reported
problem. Begin fault isolation with the most recent event code with the highest severity level.
Other codes may accompany this event code, or may indicate a normal indication after a
problem is recovered.
2–24 edge switch 2/16 service manual
Page 87

Diagnostics
a. At the View panel, select Monitor at the left side of the panel. The Monitor panel
opens with the Status page displayed.
b. At the Monitor panel, click the Log tab. The Monitor panel (Log tab) displays.
c. Record the event code, date, time, and severity (Informational, Minor, Major, or
Severe).
d. Record all event codes that may relate to the reported problem.
Were one or more event codes found?
YES NO
Return to the MAP step that sent you here.
↓
Go to Table 2–3 on page 2-2.
52
The link incident record provides the attached switch port number(s) and one or more
of the following event codes and messages. Record all event codes that may relate to
the reported problem.
581 - Link interface incident - implicit incident.
582 - Link interface incident - bit-error threshold exceeded.
583 - Link failure - loss of signal or loss of synchronization.
edge switch 2/16 service manual 2–25
Page 88

Diagnostics
584 - Link failure - not-operational primitive sequence (NOS) received.
585 - Link failure - primitive sequence timeout.
586 - Link failure - invalid primitive sequence received for the current link state.
Were one or more event codes found?
YES NO
Perform switch fault isolation at the HAFM server.
↓
Go to step 3.
Go to Table 2–3 on page 2-2.
MAP 0100: Power Distribution Analysis
This MAP describes fault isolation for the switch power distribution system, including
defective AC power cords or power supplies.
1
Was an event code 200, 201, 202, or 208 observed at the switch Event Log (HAFM
server) or at the embedded web server event log?
YES NO
↓
Go to step 3.
2
The following table lists event codes, brief explanations of the codes, and the
associated steps that describe fault isolation procedures.
Event
Code Explanation Action
200 Power supply AC voltage failure. Go to step 6.
201 Power supply DC voltage failure. Go to step 10.
202 Power supply thermal failure. Go to step 10.
208 Power supply false shutdown. Go to step 6.
3
Is remote fault isolation being performed at the HAFM server?
YES NO
2–26 edge switch 2/16 service manual
Page 89

Diagnostics
Remote fault isolation is being performed through the embedded web server
↓
interface. Go to step 20.
4
Does inspection of a power supply indicate a failure (green LED extinguished)?
NO YES
↓
Go to step 6.
5
Does a blinking red and yellow diamond (failed FRU indicator) appear to overlay a
power supply graphic at the HAFM server Hardware View?
YES NO
↓
Go to step 11.
6
A redundant power supply is disconnected from facility AC power, not properly
installed, or has failed.
Verify the indicated power supply is connected to facility power.
Ensure the AC power cord (PS0 or PS1) is connected to the rear of the switch and a
facility power receptacle. If not, connect the cord as directed by the customer.
a. Ensure the associated facility circuit breaker is on. If not, ask the customer set
the circuit breaker on.
b. Ensure the AC power cord is not damaged. If damaged, replace the cord.
Was a corrective action performed?
YES NO
↓
Go to step 8.
7
Verify power supply operation.
a. Inspect the power supply and ensure the green LED illuminates.
b. At the Hardware View, observe the graphic representing the power supply and
ensure a failure symbol (blinking red and yellow diamond) does not appear.
Is a failure indicated?
YES NO
edge switch 2/16 service manual 2–27
Page 90

Diagnostics
8
Ensure the power supply is correctly installed and seated in the CTP card. If required,
partially remove and reseat the power supply.
Was a corrective action performed?
YES NO
9
Verify power supply operation.
Is a failure indicated?
YES NO
The switch appears operational.
↓
↓
Go to step 10.
a. Inspect the power supply and ensure the green LED illuminates.
b. At the Hardware View, observe the graphic representing the power supply and
ensure a failure symbol (blinking red and yellow diamond) does not appear.
The switch appears operational.
↓
10
A redundant power supply failed and must be removed and replaced. (RRP: Power
Supply on page 4-4).
• This procedure is concurrent and can be performed while the switch is powered
on.
• Perform the data collection procedure after FRU removal and replacement.
Did power supply replacement solve the problem?
NO YES
The switch appears operational.
↓
Contact the next level of support.
11
At the Product View, does a grey square appear at the alert panel and as the
background to the icon representing the switch reporting the problem?
The grey square indicates the HAFM server cannot communicate with the switch
because:
2–28 edge switch 2/16 service manual
Page 91

Diagnostics
• The switch-to-HAFM server Ethernet link failed.
• AC power distribution in the switch failed, or AC power was disconnected.
• The switch’s CTP failed. Because the CTP card is not a FRU, CTP failure
requires replacing the switch.
YES NO
The switch appears operational.
↓
12
Ensure the power switch is set to the Power On (1) position. Inspect the switch for
indications of being powered on, such as:
• At the front panel, an illuminated PWR or ERR indicator.
• Green LEDs illuminated on the power supplies.
• Audio emanations and airflow from fans.
Does the switch appear powered on?
NO YES
Analysis for an Ethernet link or CTP card failure is not described in this MAP.
↓
Go to "
step, contact the next level of support.
MAP 0000: Start MAP
" on page 2-7. If this is the second time at this
13
Verify facility AC power connections.
a. Ensure both AC power cords (PS0 and PS1) are connected to the rear of the
switch and to facility power receptacles. If not, connect the cords as directed by
the customer.
b. Ensure associated facility circuit breakers are on. If not, ask the customer set the
circuit breakers on.
c. Ensure the AC power cords are not damaged. If damaged, replace the cords.
Was a corrective action performed?
YES NO
↓
Go to step 15.
14
Verify operation of both power supplies.
edge switch 2/16 service manual 2–29
Page 92

Diagnostics
Is a failure indicated?
YES NO
15
Ensure both power supplies are correctly installed and seated in the CTP card. If
required, partially remove and reseat the power supplies.
Was a corrective action performed?
YES NO
16
Verify operation of both power supplies.
a. Inspect the power supplies and ensure the green LEDs illuminate.
b. At the Hardware View, observe the graphics representing the power supplies and
ensure a failure symbol (blinking red and yellow diamond) does not appear.
The switch appears operational.
↓
↓
Go to step 17.
a. Inspect the power supplies and ensure the green LEDs illuminate.
b. At the Hardware View, observe the graphics representing the power supplies and
ensure a failure symbol (blinking red and yellow diamond) does not appear.
Is a failure indicated?
YES NO
The switch appears operational.
↓
17
Inspect the switch for indications the power supplies are operational, but the switch is
not receiving DC power. Indications include:
• Green LEDs illuminated on one or both power supplies.
• PWR and ERR LEDS extinguished at the switch front panel.
• All green and amber port LEDs extinguished.
Does the switch appear powered off while the power supplies appear operational (one
or both power supply LEDs illuminated)?
NO YES
↓
Go to step 19.
2–30 edge switch 2/16 service manual
Page 93

Diagnostics
18
Both power supplies failed and must be removed and replaced (RRP: Power Supply
on page 4-4). Perform the data collection procedure after FRU removal and
replacement.
Did replacement of both power supplies solve the problem?
NO YES
The switch appears operational.
↓
Contact the next level of support.
19
One or both power supplies appear operational, but the CTP card is not receiving DC
power. An in-card circuit breaker may have tripped due to a power surge or the CTP
card failed.
Reset the switch ("
Did a switch reset solve the problem?
NO YES
The switch appears operational.
↓
A CTP card failure is indicated. Because the CTP card is not a FRU, replace the
switch
Reset the Switch
" on page 3-36).
20
Does the embedded web server interface appear operational?
NO YES
↓
Go to step 22.
21
A Page cannot be found, Unable to locate the server, HTTP 404 - file not found,
or other similar message appears. The message indicates the web browser PC
cannot communicate with the switch because:
• The switch-to-PC Internet (Ethernet) link could not be established.
• AC power distribution in the switch failed, or AC power was disconnected.
• The switch CTP card failed.
Go to step 12.
edge switch 2/16 service manual 2–31
Page 94

Diagnostics
22
Inspect the power supply operational states at the embedded web server interface.
a. At the View panel, click the Component Properties tab. The View panel
(Component Properties tab) displays.
b. Inspect the State fields for Power Supply 0 and Power Supply 1.
Does the State field display a Failed or Not Installed message for either power
supply?
NO YES
A redundant power supply failure is indicated. Go to step 6.
↓
The switch appears operational.
MAP 0200: POST, Reset, or IPL Failure Analysis
When the switch is powered on, it performs a series of power-on self-tests (POSTs).
When POSTs complete, the switch performs an initial program load (IPL) that loads
firmware and brings the unit online. This MAP describes fault isolation for problems
that may occur during the POST/IPL process.
If an error is detected, the POST/IPL process continues in an attempt to initialize the
switch and bring it online. But an event code 400 displays when the switch completes
the POST/IPL process.
1
Was an event code 400 or 411 observed at the switch Event Log (HAFM server) or at
the embedded web server event log?
YES NO
Analysis for the failure is not described in this MAP. Go to "
↓
" on page 2-7.
MAP
2–32 edge switch 2/16 service manual
MAP 0000: Start
Page 95

Diagnostics
2
The following table lists event codes, brief explanations of the codes, and the
associated steps that describe fault isolation procedures.
Event
Code Explanation Action
400 Power-up diagnostic failure. Go to step 3.
411 Firmware fault occurred. Go to step 4.
3
POST/IPL diagnostics detected a CTP card failure as indicated by an event code 400
with supplementary bytes of event data.
• Byte 0 is a FRU code (02) that indicates a failed CTP card.
• Byte 1 is the slot number (00) for the CTP card.
Because the CTP card is not a FRU, replace the switch.
4
POST/IPL diagnostics detected a firmware failure (as indicated by event code 411)
and performed an online dump. All Fibre Channel ports reset after the failure and
attached devices momentarily logout, login, and resume operation.
Perform the data collection procedure and return the Zip disk to Hewlett Packard
support personnel.
MAP 0300: Console Application Problem Determination
This map describes isolation of HAFM server application problems, including
problems associated with the Windows operating system and HAFM and switch
product manager.
1
Did the HAFM server lock up or crash without displaying a warning or error message?
YES NO
edge switch 2/16 service manual 2–33
Page 96

Diagnostics
2
An application or operating system problem is indicated. Close the HAFM application.
Continue.
3
Attempt to clear the problem by rebooting the HAFM server PC.
↓
Go to step 4.
a. Simultaneously press Ctrl, Alt, and Delete. The Windows Security dialog box
displays.
b. At the Windows Security dialog box, click Task Manager. The Windows Task
Manager dialog box displays with the Applications page open.
c. Select (highlight) the hp StorageWorks ha-fabric manager (HAFM) application
entry and click End Task. The HAFM application closes.
a. Click the Windows Start button. The Windows Workstation menu displays.
b. At the Windows Workstation menu, select Shut Down. The Shut Down Windows
dialog box displays.
c. At the Shut Down Windows dialog box, select Shut down the Computer and click
Yes to power off the PC.
d. Wait approximately 30 seconds and power on the PC. After POSTs complete, the
Begin Logon dialog box displays.
e. Simultaneously press Ctrl, Alt, and Delete to display the Logon Information dialog
box. Type a user name and password (obtained in "
page 2-7) and click OK. The HAFM application starts and the HAFM Login dialog
box displays.
MAP 0000: Start MAP
" on
2–34 edge switch 2/16 service manual
Page 97

Diagnostics
f. At the HAFM Login dialog box, type a user name, password, and HAFM server
name (obtained in "
application opens and the Product View displays.
MAP 0000: Start MAP
" on page 2-7) and click Login. The
Did the Product View display and does the HAFM application appear operational?
NO YES
The problem is transient and the HAFM server appears operational.
↓
Contact the next level of support.
4
Did the HAFM application display a dialog box with the message Connection to
HAFM server lost - click OK to exit application or HAFM error n (where n is an
error message number 1 through 8 inclusive)?
NO YES
An HAFM application error occurred. Click OK to close the dialog box and
↓
close the HAFM application. Go to step 3.
edge switch 2/16 service manual 2–35
Page 98

Diagnostics
5
Did the HAFM application display a dialog box with the message The software
version on this HAFM server is not compatible with the version on the remote
HAFM server?
YES NO
6
The HAFM applications running on the HAFM server and client workstation are not at
compatible release levels. Recommend to the customer that the downlevel version be
upgraded.
Does the customer want the HAFM application upgraded?
YES NO
7
Upgrade the downlevel HAFM application ("
↓
Go to step 8.
Power off the client workstation.
↓
Install or Upgrade Software
" on page 3-51).
Did the software upgrade solve the problem?
NO YES
The HAFM server appears operational
↓
Contact the next level of support.
8
Did the product manager application display a dialog box with the message Product
Manager error 5001 or Product Manager error 5002?
NO YES
A product manager application error occurred. Click OK to close the dialog
↓
box and close the HAFM and product manager applications. Go to step 3.
9
Did the product manager application display a dialog box with the message Send
firmware failed?
YES NO
↓
Go to step 11.
2–36 edge switch 2/16 service manual
Page 99

Diagnostics
10
An attempt to download a firmware version from the HAFM server hard drive to the
switch failed. Retry the operation ("
Did the firmware version download to the switch?
NO YES
The HAFM server appears operational.
↓
Manage Firmware Versions
" on page 3-40).
A CTP card failure is suspected. Go to "
the problem.
MAP 0000: Start MAP
" on page 2-7 to isolate
11
Did the product manager application display a dialog box with the message The data
collection process failed?
YES NO
↓
Go to step 13.
12
The data collection process failed. Retry the process using a new Zip disk("
Maintenance Data
Did the data collection process complete?
NO YES
↓
Exit MAP.
Contact the next level of support.
" on page 3-31).
Collecting
13
Did the HAFM server lock up or crash and display a Dr. Watson for Windows dialog
box?
edge switch 2/16 service manual 2–37
Page 100

Diagnostics
NO YES
14
Did the HAFM server crash and display a blue screen with the system dump file in
hexadecimal format (blue screen of death)?
YES NO
15
Attempt to clear the problem by power cycling the HAFM server PC.
A Windows operating system or HAFM application error occurred. Click
↓
Cancel to close the dialog box and HAFM application. Go to step 3.
The HAFM server appears operational.
↓
a. Power off the PC.
b. Wait approximately 30 seconds and power on the PC. After POSTs complete, the
Begin Logon dialog box displays.
c. Simultaneously press Ctrl, Alt, and Delete to display the Logon Information dialog
box. Type a user name and password (obtained in "
page 2-7) and click OK. The HAFM application starts and the HAFM Login dialog
box displays.
MAP 0000: Start MAP
" on
d. At the HAFM Login dialog box, type a user name, password, and HAFM server
name (obtained in "
application opens and the Product View displays.
2–38 edge switch 2/16 service manual
MAP 0000: Start MAP
" on page 2-7), and click Login. The
 Loading...