

Page 1
HP 783Xx Series and HP 788Xx Series
Service Manual’- Volume 1
Patient Monitors and Neonatal Monitors
HEWLETT
Ea
HP Part No. 78354-90008
Printed in Germany
PACKARD
Edition 8
March 1993
Page 2

Notice
The information contained in this document is subject to change without notice.
Hewlett-Packard makes no warranty of any kind with regard to this material, including, but
not limited to, the implied warranties of merchantability and fitness for a particular purpose.
Hewlett-Packard shall not be liable for errors contained herein or for incidental or
consequential damages in connection with the furnishing, performance, or use of this material.
Hewlett-Packard assumes no responsibility for the use or reliability of its software on
equipment that is not furnished by Hewlett- Packard.
This document contains proprietary information, which is protected by copyright. All rights
are reserved. No part of this document may be photocopied, reproduced or translated to
another language without the prior written consent of Hewlett-Packard Company. The
information contained in this document is subject to change without notice.
Hewlett-Packard Company
Medical Products Group (Europe)
Schickardstrasse 4
7030 Boeblingen
Federal Republic
of Germany
@ Copyright Hewlett-Packard Company, 1991. All rights reserved.
Page 3
Printing History
New editions are complete revisions of the manual. Update packages, which are issued
between editions, contain additional and replacement pages to be merged into the manual by
the customer. The dates on the title page change only when a new edition or a new update is
published.
Preface
This manual covers the following models:
w MODELS 78352A/78352C/78353A/78353B/78354A/78354C PATIENT MONITORS
w MODELS 78832A/78833A/78833B/78834A/78834C NEONATAL MONITORS
w MODEL 78356A GAS MONITOR
The contents of this manual (Volume One) apply to HP Models 78352A/C, 78353A, 78353B,
78354A and 78354C series, 78832A, 78833A, 78833B, 78834A/C series, and 78356A with the
following serial numbers prefixed:
MODELS
78352A
78352C
78353A
78353B
78354A
78354C
78356A
PREFIX
2640G
First Issue
2348G
2612G
2613G
First Issue
2717G
MODEL
78832A
78833A
78833B
78834A
78834C
PREFIX
2412G
2413G
2610G
2611G
First Issue
Instruments with higher serial numbers may contain production changes. In such cases refer
to the Manual Change sheets and Publication Change Notices enclosed with this manual.
Hewlett-Packard reserves the right to make changes in its products without notice in order to
improve design or performance characteristics. Hewlett-Packard products are sold on the basis
of the specifications valid on the day of purchase. Hewlett-Packard is not obliged to update
instruments which have already been retailed.
. . .
III
Page 4
CONTENTS OVERVIEW
This manual contains service information for the Hewlett-Packard 78352/3/4, 78832/3/4 and
78356A monitors. The information is divided into two sections:
n
Chapter 1 - Theory of Operation
n
Chapter 2 - Maintenance Checks
q
Chapter 2a - Performance Assurance Checks
q
Chapter 2b - Specification Checks
q
Chapter 2c - Technical Specifications for all Monitors
Further sections covering disassembly and reassembly of the monitor, switch programming and
adjustments, schematic diagrams and replaceable parts lists, are contained in Volume 2 of the
manual (part number 78354-90010).
Documentation relating to these monitors:
Instrument Document Part Number
Note
78352A
78353B/4A
78352C/4C
78352A/2C/3B/4A/4C
78833B/4A
78834C
78833B/4A/4C
78356A
78356A
783528 )
78362C 3 monitors are
783638 ) referred to
783538 ) in text es
783548 3 783Xx Series
78354C
3
Operating Guide
Operating Guide
Operating Guide
Installation Guide
Operating Guide
Operating Guide
Installation Guide
Operating Guide
Installation Guide
end 788328 3 monitors are
78833A 1 referred to
708338 3 in text as
788348 3 788Xx Series
78334C
78352-90001
78354-90001
78354-92001
78354-90011
78834-91001
78834-92001
78834-90011
78356-90001
78356-90011
3
iv
Page 5
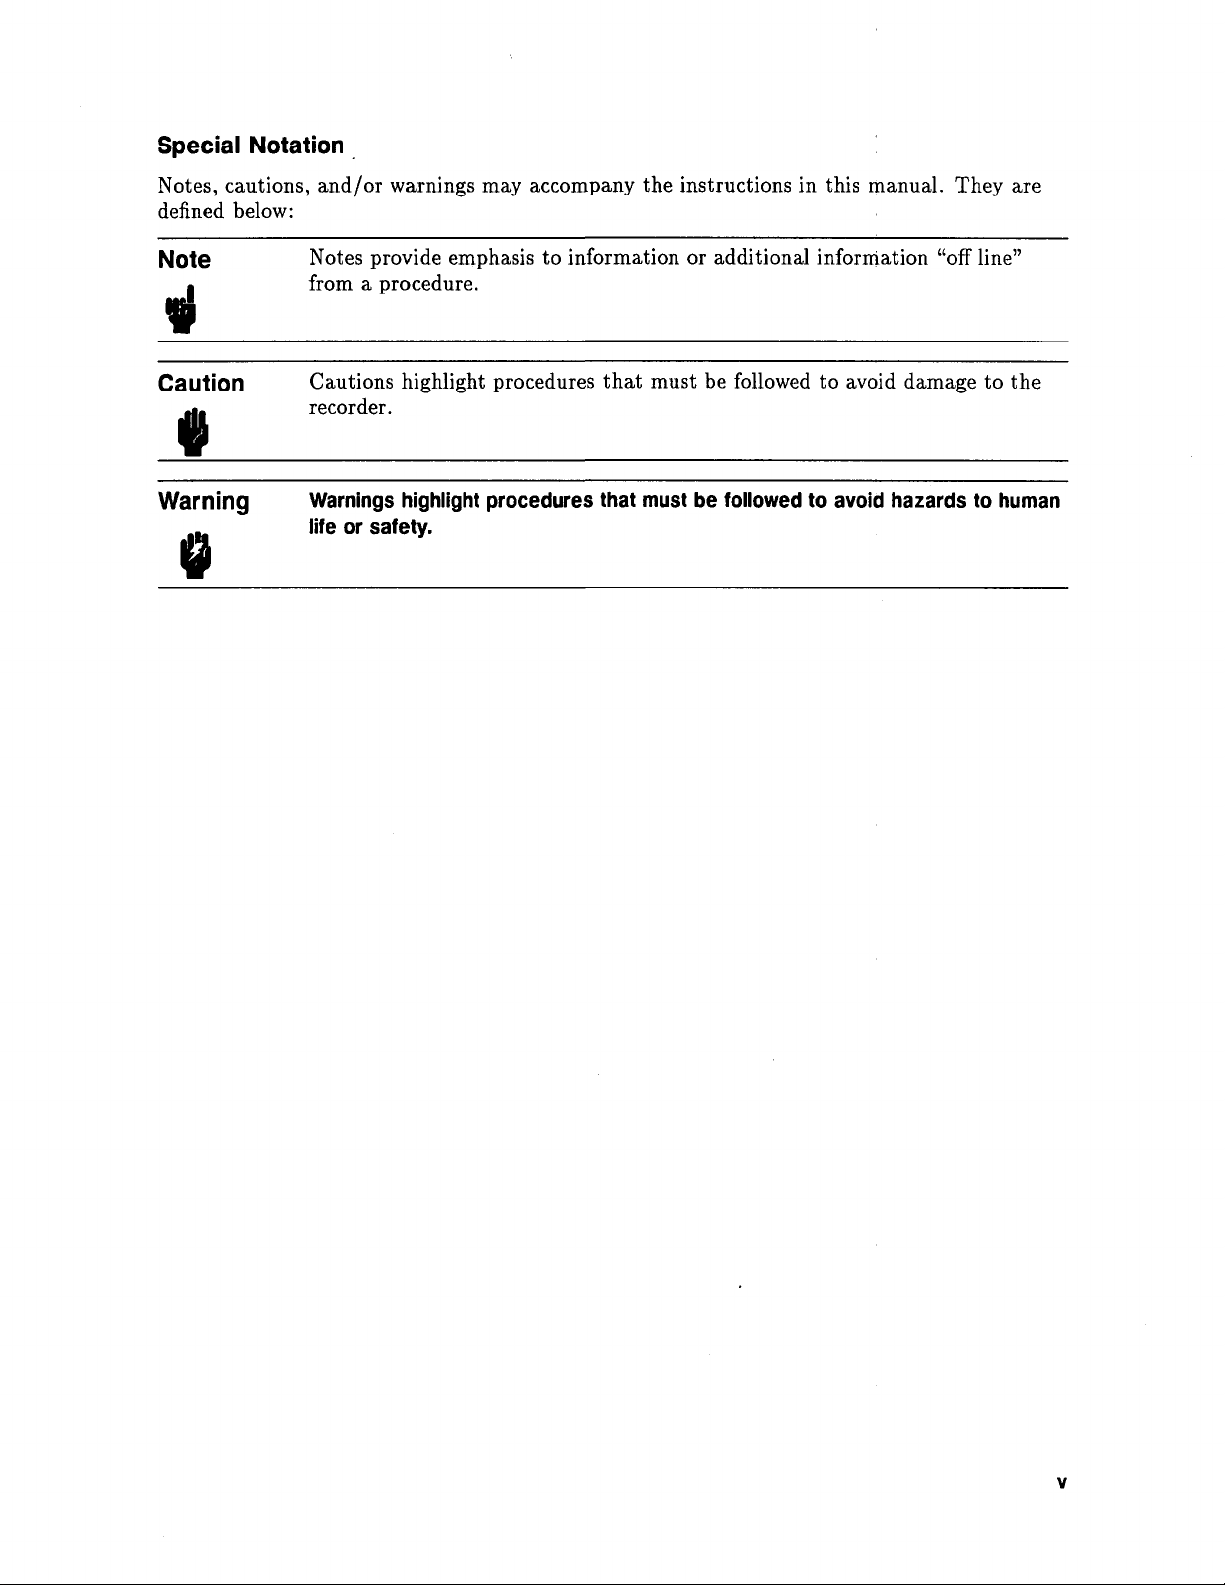
Special Notation
Notes, cautions, and/or warnings may accompany the
defined below:
Note
I
VI!
Caution
Warning
Notes provide emphasis to information or additional inforniation “off line”
from a procedure.
Cautions highlight procedures that must be followed to avoid damage to the
recorder.
Warnings highlight procedures that must be followed to avoid hazards to human
life or safety.
instructions in this manual. They are
Page 6
Contents
1. Theory Of Operation
Introduction
Functional description
Shared Memory and Data Transfer
General
Power Fail
Time Slices
Mother Board 78353-66501 and 78354-66501
Video Amplifier
Horizontal Deflection Circuit
Vertical Deflection Circuit
High Voltage Circuits
Power-On Reset
5 V Buffering.
Extender Board
Display UP Boards 78353-66502 (16K byte), 78354-66502 (40K byte)
78354-66602 and 78354-66702 (48K byte)
Character Generation
Slow/fast Sync. Signal Generation
Clock Generation
2 ms Interrupt Signal Generation
Alarm Trigger Generation
Power Fail Circuit
Display Software
Single Channel Interpolation Board 78352-66503
D-A Convertor and Sample and Hold Circuits
Shuffle Mux ............................
Video Pulse Generator
Ramp Generator
Raster Line Control
Erase Bar Latch
Wave Length Latch
Start-up Delay
Three-Channel Interpolation Board 78353-66503
Power Supply Board 78351-66506
+5 V DC Supply
f12 V DC Supplies
t17V DC Supply
Audio Board 78353-66512
Battery Board 78832-66519
Battery Charge Circuit
Alarm Lamp Drive Circuit
..............................
.............................
........................
.............................
...........................
......................
........................
..........................
...........................
..........................
........................
..........................
......................
.........................
..........................
........................
..........................
..........................
..........................
.........................
...........................
..........................
.........................
..........................
.......................
......................
.......................
......................
...................
..................
.....................
..................
...................
....................
...............
...............
.............
.............
.............
1-1
1-1
1-2
1-2
1-2
1-2
1-5
1-5
1-5
1-5
1-6
1-6
1-6
1-6
1-8
1-8
1-9
1-9
1-9
1-9
1-10
1-10
1-13
1-13
1-13
1-13
1-14
1-14
1-14
1-14
1-14
1-16
1-18
1-18
1-18
1-18
1-19
1-21
1-21
1-21
Contents-1
Page 7
ECG Board (Full Lead) 78354-66522(42) and 78354-66722(42)
Floating Input Circuit
Right-Leg Drive
INOP Detection Circuit
Lead Selector Circuit
Grounded Input Circuit
Digital Circuits
...........................
ECG Parameter Software
........................
..........................
.......................
........................
.......................
......................
ECG Board (3 Lead) 78832-66522 (50 Hz) and 78832-66542 (60 Hz)
Floating Input Circuit
Right-Leg Drive
INOP Detection Circuit
Lead Selector Circuit
Grounded Input Circuit
Digital Circuits
...........................
ECG Parameter Software
........................
..........................
.......................
........................
.......................
......................
........
.....
Pressure Board 78353-66532 (Single Channel) and 78353-66534 (Dual Channel)
Transducer Excitation Circuits
Transducer Signal Demodulation Circuits
Analog to Digital Conversion
Transducer Disconnected Detection
Zero, Calibration and Test Functions
Digital Circuits
...........................
Pressure Parameter Software
Non-Invasive Blood Pressure (NIBP) Board 78352-66535
General Principle of Operation
NIBP Parameter Board 78352-66535
Pressure Transducer
........................
Amplification and Filtering
Analog to Digital Conversion
Digital Circuit
..........................
Safety and Valve/Pump Control
NIBP Parameter Software
Non-Invasive Blood Pressure (NIBP) Board 78352-66358
Specifications
Patient Modes
Measurement Principle
............................
...........................
.......................
General Principle of Operation
NIBP Parameter Board 78352-66538
The Analog Board-Hardware Description
Pressure Transducers and Input Amplifier
Oscillation Channel
........................
Multiplexer and A/D Conversion
EEPROM and Latch
Hardware Description
Valve Drivers
Pump Motor
...........................
...........................
.......................
........................
The Digital Board-Hardware Description
Partial CO2 Pressure Board 78354-66540 and 78356-66540
General Principle of Operation
CO2 Parameter Board 78354-66540 and 78356-66540
....................
...............
.....................
..................
.................
.....................
..........
....................
.................
.....................
....................
..................
.....................
..........
....................
.................
...............
..............
..................
...............
.........
....................
..........
1-22
1-22
1-22
1-22
1-22
1-23
1-23
1-24
1-26
1-26
1-26
1-26
1-27
1-27
1-28
1-28
1-30
1-30
1-30
1-30
1-31
1-31
1-31
1-32
1-35
1-35
1-37
1-37
1-37
1-37
1-37
1-38
1-38
1-41
1-41
1-41
1-42
1-43
1-44
1-44
1-44
1-44
1-44
1-45
1-45
1-45
1-45
1-46
1-49
1-49
1-50
Contents-2
Page 8
Motor Circuit
Temperature Control Circuit
Preamplifier
Analog to Digital Conversion
Digital Circuits
Oxygen Board 78354-66541 and 78356-66541
General Principle of Operation
Preamplifier Circuit
Temp/Pleth/Aux Board 78353-66552 and 78354-66552
Pleth Floating Input Circuit
Test Function Generator
INOP Detection Circuit
Pleth Sensor Circuit
Temperature Floating Input Circuit
Temperature Grounded Circuit
Aux Input Circuit
Digital Circuits
Temp/Pleth/Aux Parameter Software
Temperature Board 78832-66552 and 78834-66552
Input Circuits
Signal Rectification and A/D Conversion
Digital Circuits
Temperature Parameter Software
..........................
....................
...........................
....................
..........................
...............
....................
.........................
...........
.....................
.......................
.......................
.........................
..................
....................
...................
...........................
.................
.............
...........................
................
...........................
...................
Dual Temperature Board 78353-66554 and 78354-66554
Input Circuits
Signal Rectification and A/D Conversion
Digital Circuits
Temperature Parameter Software
Respiration Board 78832-66562
Input Circuits
INOP Detection
Respiration Wave Signal Circuits
Feedback Loop Operation
A/D Conversion
A. Initial conditions
B. Patient impedence increases to 1.5 kohm + 10
C. Summing point again at zero volts
...........................
................
...........................
...................
.....................
...........................
..........................
...................
......................
..........................
........................
...........
................
Test Signals ............................
Digital Circuits
Respiration Parameter Software
...........................
....................
Transcutaneous Partial CO2 and O2 Board 78834-66572
Transducer Recognition
tcpCO2 Input
...........................
.......................
tcpO2 Input ............................
Polarization Voltage
Heater Circuit
Temperature Control
Analog Multiplexer
Analog to Pulse Width Conversion
Repolarization
Floating Power Supply
.........................
...........................
........................
.........................
..................
...........................
.......................
..........
..........
:
......
1-50
1-50
1-53
1-53
1-53
1-54
1-54
1-54
1-57
1-57
1-57
1-57
1-57
1-57
1-57
1-58
1-58
1-58
1-60
1-60
1-60
1-60
1-60
1-63
1-63
1-63
1-63
1-63
1-67
1-67
1-67
1-67
1-67
1-68
1-68
1-68
1-68
1-69
1-69
1-69
1-73
1-73
1-73
1-73
1-73
1-74
1-74
1-74
1-75
1-76
1-76
Contents-3
Page 9
Digital Circuits
Clock ..............................
Watchdog Circuit
EAROM
Barometer Board Information
Parameter Software
Barometer Board 78834-66573
Circuit Operation
Oxygen Saturation/Pleth (SPO2) Board 78354-66510/520
Floating Section
ESU Rejection ..........................
Ambient Light Rejection
Amplification
Compensation for Ambient Light ..................
The Transducer ..........................
Multiplexer ...........................
LEDs ..............................
Selftest .............................
Grounded Section
780 System Interface (Non-Annotating) 78353-66590
Input Circuits
Beat-to-beat Heart Rate
Average Heart Rate
System Control Signals
Status byte ...........................
ECG Wave.
Respiration Wave
780 Interface Board (Annotating) 78353-66592
Digital Circuits
Analog Circuits
System Board Software
SDN Board 78353-66595
Microprocessor Interface Circuit and I/O RAM
System Interface Controller (SIC)
Data Synchronization Circuit
Control Logic
Signature RAM
RS-232C Interface Board 78354-66598 ..................
General Principle of Operation
ROM/RAM
Counter-timer Circuit
Serial Interface ...........................
Watchdog Circuit
...........................
.........................
.............................
....................
.........................
.....................
..........................
..........................
......................
.................
..........................
...........
...........................
.......................
.........................
.......................
............................
..........................
..............
...........................
...........................
.......................
........................
.............
...................
.....................
............................
...........................
....................
............................
........................
..........................
.........
: .........
1-76
1-76
1-77
1-77
1-77
1-78
1-80
1-80
1-83
1-83
1-84
1-84
1-84
1-84
1-85
1-85
1-85
1-85
1-86
1-89
1-89
1-89
1-89
1-90
1-90
1-90
1-90
1-92
1-92
1-92
1-92
1-97
1-97
1-97
1-97
1-98
1-98
1-100
1-100
1-100
1-101
1-101
1-101
Contents-4
Page 10
2. Maintenance Checks
Introduction . . . . . . . . . . . . . . . . . . . . . . . . . . . . .
2a. Performance Assurance Checks
Introduction
General ..............................
Test equipment
General checks
Monitor Service Test Mode
Display Intensity
Checks in ECG Setup Mode
Filter/Diagnostic Mode Check
Parameter Set-up Keys
Pressure Channel Check and Calibration
CO2 and O2 Calibration and Adjustments
Temperature Channel Checks
Plethysmograph Channel Checks
Barometer Board Checks
tcpCO2/tcpO2 Channel Checks and Transducer
HP 15210A Calibration Unit
Installation
Description
Unpacking the Instrument
Initial Inspection
Claims For Damage
Repacking for Shipment or Storage
Instrument Identification
Specification
Operating Environment
Operating Information
Fitting the Gas Cylinders
Storage of Gas Cylinders
Disposal of Used Gas Cylinders
Routine Maintenance
Changing the Gas Cylinders
Care and Cleaning
Theory of Operation
Gas Flow Performance Checks
Test Procedure
Disassembly
Parts List
Transducer Troubleshooting
SpO2 Channel Checks
.............................
............................
...........................
......................
..........................
.....................
...................
.......................
................
...............
.....................
...................
.......................
.............
......................
.............................
.............................
......................
.........................
........................
.................
.......................
............................
.......................
........................
......................
.......................
....................
.........................
.....................
.........................
.........................
.....................
...........................
.............................
..............................
......................
........................
2-1
2a-1
2a-1
2a-2
2a-2
2a-2
2a-4
2a-4
2a-5
2a-6
2a-7
2a-9
2a-10
2a-11
2a-11
2a-11
2a-15
2a-15
2a- 15
2a-15
2a-15
2a-15
2a-16
2a-16
2a-16
2a-17
2a-17
2a-17
2a-17
2a-17
2a-18
2a-18
2a-18
2a-19
2a-20
2a-20
2a-22
2a-25
2a-26
2a-30
Contents-5
Page 11
2b. Specification Checks
Introduction
Specification Checks Test Equipment
ECG Channel
Pressure Channel
Transformer Test Settings for Pressure Output Linearity
Plethysmograph channel
Respiration Channel
NIBP Calibration and Adjustments
NIBP Calibration and Adjustments (HP7xxxC Only)
RS 232C Interface Checks
Barometer Board Adjustment
TcpCO2 /tcpO2 Channel
SpO2 Board
2c. Technical Specifications for all Monitors
Introduction
Technical Specifications 78352A/C
General ..............................
Patient safety
Power requirements:
Environment:
Display
Superaster video display:
ECG Channel (Full lead)
ECG Amplifier
Patient Safety:
Cardiotach
Digital cardiotach
Analog output
ECG wave on phone-jack.
Alarms
Test/Calibration
ST Segment Monitoring (78354-66722)
Noninvasive Blood Pressure (NIBP)
General
Modes
Alarms .............................
Temperature Channel
Trend.. .............................
General .............................
ECG Channel
Pressure Channel
Dual Temperature Channel
System Interface
System outputs
SpO2 /Pleth
Alarms
Pleth Amplifier
Cardiotach
Graticule lines
.............................
...........................
..........................
.......................
.........................
......................
....................
.......................
............................
.............................
...................
..........................
........................
...........................
..............................
......................
......................
..........................
..........................
............................
.........................
..........................
.....................
.............................
.........................
.............................
..............................
........................
..........................
.........................
.....................
..........................
..........................
............................
.............................
..........................
............................
..........................
.................
..................
................
..................
........
..........
2b-1
2b-1
2b-1
2b-9
2b-11
2b-12
2b-12
2b-14
2b-17
2b-18
2b-20
2b-21
2b-21
2c-1
2c-1
2c-1
2c-1
2c- 1
2c-1
2c-2
2c-2
2c-2
2c-2
2c-2
2c-2
2c-2
2c-3
2c-3
2c-3
2c-3
2c-3
2c-4
2c-4
2c-5
2c-5
2c-5
2c-6
2c-6
2c-6
2c-6
2c-6
2c-6
2c-6
2c-7
2c-7
2c-7
2c-7
2c-8
Contents-6
Page 12
...............................
Test
Technical Specifications 78353A
General
Patient safety:
Power requirements:
Environmental:
Display
ECG Channel (3 lead)
ECG Amplifier
Cardiotach ............................
Analog Output
Alarms
Test
Plethysmograph Channel
Pleth. amplifier
Cardiotach. ............................
Graticule lines
Test
Alarms .............................
Pressure Channel
Pressure amplifier
Auto zero
Pressure wave display
Alarms .............................
Calibration/test signal
Rear panel output
Temperature Channel
Auxiliary Input Channel
General .............................
Auxiliary input -
Graticule line labelling and resolution
Auxiliary input - 47210 Capnometer
System 780 Annotating Interface
General .............................
ECG System Outputs
Pressure system outputs
Plethysmograph system outputs
Temperature system output
System 780 Non-Annotating Interface
ECG Wave.
Heart Rate
Control Signals
Alarm Relay (only loaded on request)
Technical Specifications - 78353B and 78354A/C
..............................
..........................
........................
..........................
..............................
........................
..........................
..........................
.............................
...............................
...........................
..........................
...............................
..........................
.........................
............................
........................
........................
78205D Pressure module
Auxiliary signals and parameters
Selectable channels for external recorder
Wave .............................
Wave (All the following voltages are f 50 mV.)
Wave .............................
DC output (HR)
DC output ...........................
...........................
............................
........................
..........................
.....................
......................
.......................
.......................
.......................
................
.................
...................
.................
.......................
......................
..................
....................
.................
................
..............
..............
...........
.............
2c-8
2c-9
2c-9
2c-9
2c-9
2c-9
2c-9
2c-10
2c-10
2c-10
2c-10
2c-11
2c-11
2c-11
2c-11
2c-11
2c-12
2c-12
2c-12
2c-12
2c-12
2c-12
2c-13
2c-13
2c-13
2c-13
2c-14
2c-14
2c-14
2c-14
2c-15
2c-15
2c-16
2c-16
2c-16
2c-16
2c-16
2c-16
2c-16
2c-16
2c-17
2c-17
2c-17
2c-17
2c-17
2c-18
2c-18
2c-18
2c-18
2c-18
2c-19
Contents-7
Page 13
General ..............................
Patient safety ..........................
Power requirements ........................
Enviromental ...........................
Display ..............................
ECG Channel (Full lead)
ECG Amplifier ..........................
Cardiotach
Analog output ..........................
Alarms
Test/Calibration .........................
ST Segment Monitoring (78354-66722)
Plethysmograph Channel
Pleth. amplifier ..........................
Cardiotach
Graticule lines ..........................
Autofix
Test ...............................
Alarms
Pressure Channel
Pressure amplifier .........................
Auto zero
Pressure wave display .......................
Graticule line labelling and resolution:
Pulse Rate
Alarms .............................
Test/calibration .........................
Noninvasive Blood Pressure (NIBP)
General
Modes ..............................
Alarms
Alarm Limit Adjustments (78354C):
Respiration Channel
Respiration amplifier .......................
Respiration trigger ........................
Alarms .............................
Fractional Inspired Oxygen
Alarms
Carbon Dioxide
General
Instantaneous CO2 Wave Display
End Tidal CO2 Numerical Display
Respiration Rate Numerical Display
Alarms .............................
Temperature Channel
Auxiliary Input Channel
General .............................
Auxiliary input - 78205D Pressure module
Graticule line labelling and resolution.
Auxiliary input - 47210 Capnometer
SpO2 / Pleth ............................
............................
..............................
............................
.............................
.............................
..........................
............................
............................
.............................
.............................
.........................
.............................
...........................
.............................
......................
......................
..................
......................
..................
........................
.......................
................
................
.................
.................
.................
..............
................
.................
2c-19
2c-19
2c-19
2c-19
2c-20
2c-20
2c-20
2c-20
2c-21
2c-21
2c-21
2c-21
2c-22
2c-22
2c-22
2c-23
2c-23
2c-23
2c-23
2c-23
2c-23
2c-23
2c-24
2c-24
2c-24
2c-24
2c-24
2c-25
2c-25
2c-25
2c-25
2c-25
2c-26
2c-26
2c-26
2c-26
2c-26
2c-27
2c-27
2c-27
2c-27
2c-27
2c-28
2c-28
2c-29
2c-29
2c-29
2c-29
2c-29
2c-30
2c-30
Contents-8
Page 14
Alarms
Pleth Amplifier
Cardiotach
Graticule lines
Test
.............................
........................... 2c-30
............................
..........................
...............................
Alarms .............................
System Interface
General (Opt. J11 only)
ECG system outputs
Pressure system outputs
..........................
......................
.......................
......................
Respiration system output
Plethysmograph system outputs
Temperature system output
Trend..
General
ECG Channel
Respiration Channel
Pressure Channel
Pleth Channel
AUX Channel
.............................
.............................
..........................
........................
.........................
..........................
..........................
Single Temperature Channel
Dual Temperature Channel
Oxygen Channel
Carbon Dioxide Channel
SpO2 Channel (78354C)
.........................
......................
......................
Technical Specifications - 78832A
General
Patient safety
Power Requirements
Environmental
Display
Superaster video display
ECG Channel
ECG Amplifier
Patient Safety:
Cardiotach
Analog Output
Alarms
Test/Calibration
Temperature Channel
Respiration Channel
Respiration amplifier
Respiration trigger
Respiration alarms
780 Annotating Interface
General
ECG System Outputs
.............................. 2c-36
........................... 2c-36
........................ 2c-36
..........................
.............................. 2c-36
...................... 2c-36
........................... 2c-37
.......................... 2c-37
.......................... 2c-37
............................ 2c-37
.......................... 2c-37
.............................
.........................
........................
.........................
.......................
........................
........................
.......................
.............................
.......................
Respiration-system output
Temperature - system output
Trend..
General
.............................
.............................
.....................
..................
....................
....................
.....................
....................
.....................
....................
2c-30
2c-31
2c-31
2c-31
2c-31
2c-31
2c-31
2c-31
2c-32
2c-32
2c-32
2c-32
2c-33
2c-33
2c-33
2c-33
2c-33
2c-33
2c-34
2c-34
2c-34
2c-34
2c-34
2c-35
2c-36
2c-36
2c-37
2c-38
2c-38
2c-38
2c-38
2c-39
2c-39
2c-39
2c-39
2c-39
2c-40
2c-40
2c-40
2c-40
Contents-9
Page 15
ECG Channel
Respiration Channel ........................
Technical Specifications - 78833A
General
Patient safety ..........................
Power Requirements ........................
Environmental ..........................
Display
Superaster video display ......................
ECG Channel ...........................
ECG Amplifier ..........................
Patient Safety: ..........................
Cardiotach ............................
Analog Output ..........................
Alarms .............................
Test/Calibration .........................
Respiration Channel
Respiration amplifier .......................
Respiration trigger ........................
Respiration alarms ........................
Pressure Channel
Pressure amplifier .........................
Auto zero ............................
Pressure wave display .......................
Pulse rate ............................
Graticule line labelling and resolution: ................
Alarms .............................
Test/calibration .........................
780 Annotating Interface
General .............................
ECG System Outputs .......................
Respiration-system output .....................
Pressure system output (P1 only) ..................
Trend..
General .............................
ECG Channel
Respiration Channel ........................
Pressure Channel .........................
Technical Specifications - 78833B and 78834A/C .............
General
Patient safety
Power requirements ........................
Environmental ..........................
Display
ECG Channel ...........................
ECG Amplifier ..........................
Cardiotach ............................
Analog output
Alarms
Test/Calibration
Temperature Channel
..............................
..............................
.............................
..............................
..............................
.............................
..........................
....................
.........................
..........................
.......................
..........................
..........................
..........................
.........................
........................
2c-40
2c-41
2c-42
2c-42
2c-42
2c-42
2c-42
2c-42
2c-42
2c-43
2c-43
2c-43
2c-43
2c-43
2c-43
2c-44
2c-44
2c-44
2c-44
2c-45
2c-45
2c-45
2c-45
2c-45
2c-45
2c-46
2c-46
2c-46
2c-47
2c-47
2c-47
2c-47
2c-47
2c-48
2c-48
2c-48
2c-48
2c-48
2c-49
2c-49
2c-49
2c-49
2c-49
2c-50
2c-50
2c-50
2c-51
2c-51
2c-51
2c-51
2c-52
Contents-10
Page 16
Respiration Channel
Respiration amplifier
Respiration trigger
Respiration alarms
Pressure Channel
Pressure amplifier
Auto zero
............................
Pressure wave display
Graticule line labelling and resolution:
Pulse Rate
Alarms
............................
.............................
.........................
.......................
........................
........................
..........................
.........................
.......................
................
Test/calibration
Transcutaneous O2 and CO2 Channel (tcpO2 and tcpCO2) : : : : : : : :
General
Transducer Heating
.............................
........................
Alarms .............................
Test Signal:
780 Annotating Interface
General
ECG system outputs
Respiration system output
Temperature system output
Pressure system output
tcpO2 and tcpCO2 system output
Plethysmograph system outputs (78834C)
Oxygen system output (78834C)
Carbon Dioxide system output (78834C)
Trend..
General
ECG Channel
Pressure Channel
Respiration Channel
Dual Temperature Channel
tcpO2 and tcpCO2 Channel
Pleth Channel (78834C)
Oxygen Channel (78834C)
Carbon Dioxide Channel (78834C)
SpO2 Channel (78834C)
SpO2 / Pleth (78834C)
Alarms
Pleth Amplifier
Cardiotach
Graticule lines
...........................
.......................
.............................
.......................
.....................
....................
......................
..................
..............
..................
...............
.............................
.............................
..........................
.........................
........................
.....................
....................
......................
.....................
.................
......................
......................
.............................
..........................
............................
..........................
Autofix .............................
...............................
Test
Pulse rate alarm limits
Noninvasive Blood Pressure (NIBP)
General
Modes
...................
..............................
......................
..................
. .........
Alarms .............................
Alarm Limit Adjustments:
.....................
2c-52
2c-52
2c-52
2c-52
2c-53
2c-53
2c-53
2c-53
2c-53
2c-54
2c-54
2c-54
2c-55
2c-55
2c-55
2c-55
2c-56
2c-56
2c-56
2c-56
2c-56
2c-56
2c-57
2c-57
2c-57
2c-57
2c-57
2c-58
2c-58
2c-58
2c-58
2c-58
2c-58
2c-59
2c-59
2c-59
2c-59
2c-59
2c-60
2c-60
2c-60
2c-60
2c-60
2c-60
2c-61
2c-61
2c-61
2c-61
2c-61
2c-62
2c-62
Contents-11
Page 17
Fractional Inspired Oxygen (78834C)
Alarms
Carbon Dioxide (78834C) : : : : : : : : : : : : : : :
General
Instantaneous CO2 Wave Display
End Tidal CO2 Numerical Display
Respiration Rate Numerical Display
Alarms
Graticule Line Labelling and Resolution:
Technical Specifications - 78356A
General
Patient safety
Power requirements
Environment ....................
Display
Inspired Oxygen
Carbon Dioxide
General
Instantaneous CO2 Wave Display
End Tidal and Inspired Minimum CO2 Numerical Display
Respiration Rate Numerical Display
Alarms
Trend
General ......................
Oxygen Channel
Carbon Dioxide Channel
System Interface
General (Opt. J11 only)
Instantaneous CO2
End Tidal CO2
Respiration Rate
02 ........................
......................
......................
.............
.......................
...................
.................
.......................
...................
....................
......................
......................
........................
..................
...............
...................
...............
.................
...................
..................
..........
...........
..........
..........
.......
...........
..........
.......
.......
.......
.......
.......
.......
.......
.......
.......
.......
.......
.......
.......
.......
.......
.......
.......
.......
.......
.......
.......
.......
.......
.......
.......
.......
.......
.......
.......
.......
.......
.......
2c-62
2c-62
2c-62
2c-62
2c-63
2c-63
2c-63
2c-63
2c-64
2c-65
2c-65
2c-65
2c-65
2c-65
2c-65
2c-66
2c-66
2c-66
2c-67
2c-67
2c-67
2c-67
2c-68
2c-68
2c-68
2c-68
2c-68
2c-68
2c-69
2c-69
2c-69
2c-69
A. Ordering Information
Main Sales and Support Offices
United States of America
Other International Areas
Contents-12
..............
...............
...............
.......
.......
.......
A-1
A-1
A-2
Page 18
Figures
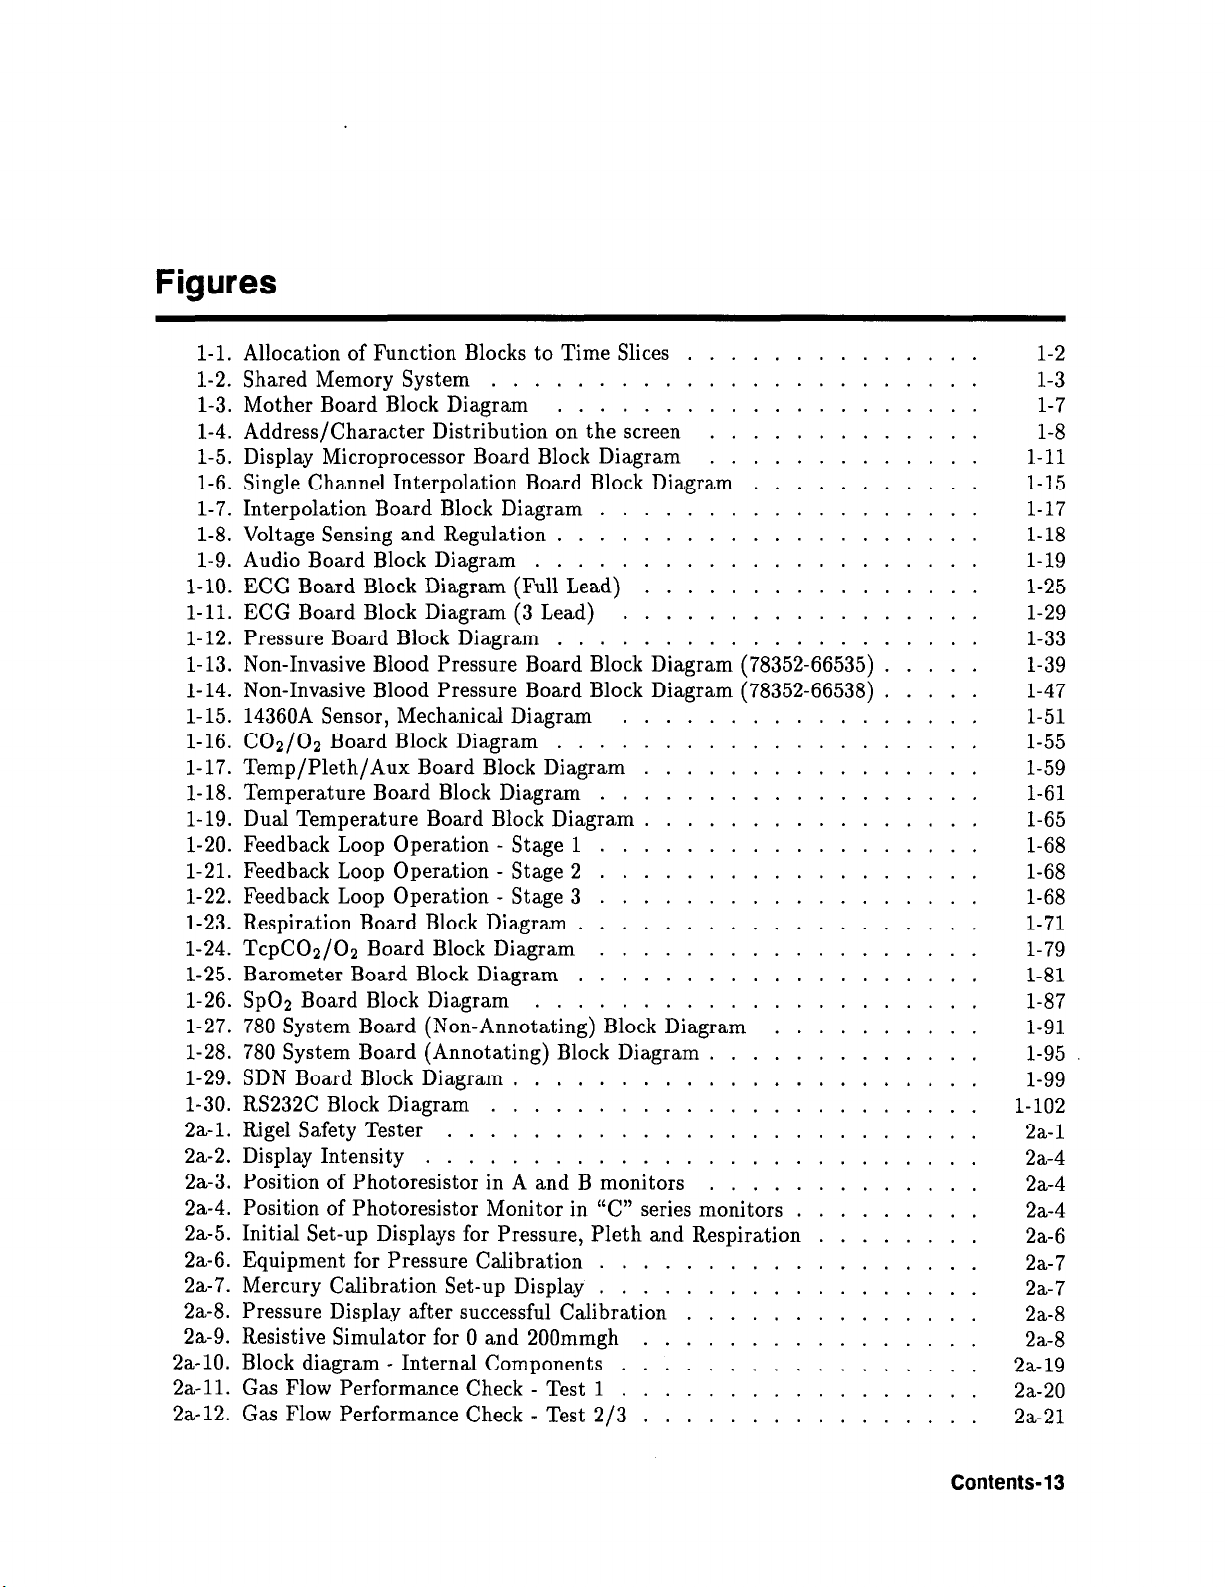
1-1. Allocation of Function Blocks to Time Slices
1-2. Shared Memory System
1-3. Mother Board Block Diagram
1-4. Address/Character Distribution on the screen
1-5. Display Microprocessor Board Block Diagram
1-6. Single Channel Interpolation Board Block Diagram
1-7. Interpolation Board Block Diagram
1-8. Voltage Sensing and Regulation
1-9. Audio Board Block Diagram
1-10. ECG Board Block Diagram (Full Lead)
1-11. ECG Board Block Diagram (3 Lead)
1-12. Pressure Board Block Diagram
1-13. Non-Invasive Blood Pressure Board Block Diagram (78352-66535)
1-14. Non-Invasive Blood Pressure Board Block Diagram (78352-66538)
1-15. 14360A Sensor, Mechanical Diagram
1-16. CO2/02 Board Block Diagram
1-17. Temp/Pleth/Aux Board Block Diagram
1-18. Temperature Board Block Diagram
1-19. Dual Temperature Board Block Diagram
1-20. Feedback Loop Operation - Stage 1
1-21. Feedback Loop Operation - Stage 2
1-22. Feedback Loop Operation - Stage 3
1-23. Respiration Board Block Diagram
1-24. TcpCOz/Oz Board Block Diagram
1-25. Barometer Board Block Diagram
1-26. SpOn Board Block Diagram
1-27. 780 System Board (Non-Annotating) Block Diagram
1-28. 780 System Board (Annotating) Block Diagram
1-29. SDN Board Block Diagram
1-30. RS232C Block Diagram
2a-1. Rigel Safety Tester
2a-2. Display Intensity
2a-3. Position of Photoresistor in A and B monitors
2a-4. Position of Photoresistor Monitor in “C” series monitors
2a-5. Initial Set-up Displays for Pressure, Pleth and Respiration
2a-6. Equipment for Pressure Calibration
2a-7. Mercury Calibration Set-up Display
2a-8. Pressure Display after successful Calibration
2a-9. Resistive Simulator for 0 and 200mmgh
2a-10. Block diagram - Internal Components
2a-11. Gas Flow Performance Check - Test 1
2a-12. Gas Flow Performance Check - Test 2/3
..........................
.......................
....................
..................
....................
.....................
.................
....................
.................
....................
..................
..................
..................
..................
...................
..................
...................
.....................
......................
.......................
.........................
..................
..................
.................
.................
..............
.............
.............
...........
................
................
................
..........
.............
.............
.........
........
..............
................
................
.....
.....
1-2
1-3
1-7
1-8
1-11
1-15
1-17
1-18
1-19
1-25
1-29
1-33
1-39
1-47
1-51
1-55
1-59
1-61
1-65
1-68
1-68
1-68
1-71
1-79
1-81
1-87
1-91
1-95
1-99
1-102
2a-1
2a-4
2a-4
2a-4
2a-6
2a-7
2a-7
2a-8
2a-8
2a-19
2a-20
2a-21
Contents-13
Page 19
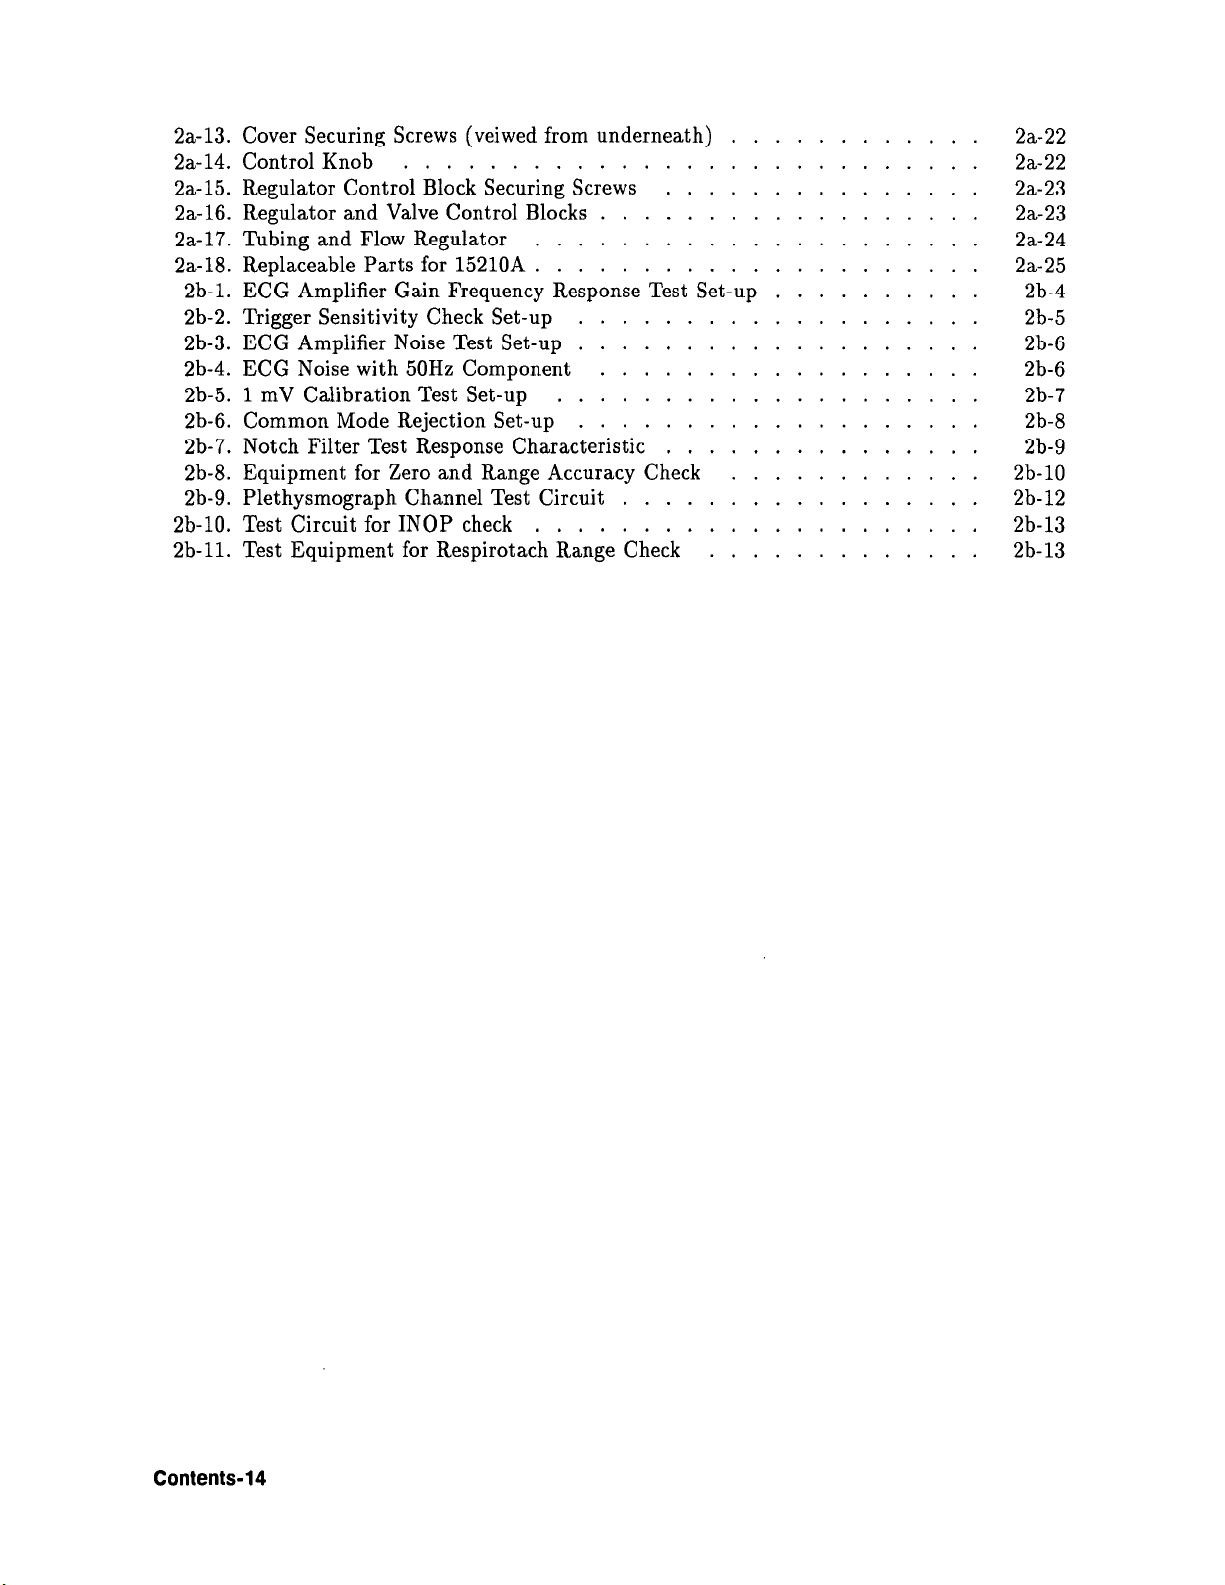
2a-13. Cover Securing Screws (veiwed from underneath)
2a-14. Control Knob
2a-15. Regulator Control Block Securing Screws
2a-16. Regulator and Valve Control Blocks
2a-17. Tubing and Flow Regulator
2a-18. Replaceable Parts for 15210A
2b-1. ECG Amplifier Gain Frequency Response Test Set-up
2b-2. Trigger Sensitivity Check Set-up
2b-3. ECG Amplifier Noise Test Set-up
2b-4. ECG Noise with 50Hz Component
2b-5. 1 mV Calibration Test Set-up
2b-6. Common Mode Rejection Set-up
2b-7. Notch Filter Test Response Characteristic
2b-8. Equipment for Zero and Range Accuracy Check
2b-9. Plethysmograph Channel Test Circuit
2b-10. Test Circuit for INOP check
2b-11. Test Equipment for Respirotach Range Check
...........................
...............
..................
.....................
.....................
...................
...................
..................
....................
...................
...............
.................
.....................
.............
............
..........
............
2a-22
2a-22
2a-23
2a-23
2a-24
2a-25
2b-4
2b-5
2b-6
2b-6
2b-7
2b-8
2b-9
2b-10
2b-12
2b-13
2b-13
Contents-14
Page 20
Tables
1-1. Test Signals and Results
1-2. System Output Configurations
2b-1. Test Equipment Requirements for Specification Checks
2b-2. mmHg Test
............................
.......................
....................
1-69
1-93
......... 2b-3
2b-11
Contents-15
Page 21
1
Theory Of Operation
Introduction
This section contains an overall functional description of the following monitors:
n
78352A,78352C,78353A,78353B,78354A,78354C series of adult monitors
n
78832A,78833A,78833B,78834A,78354C series of neonatal monitors
n
78356A gas monitor
Also, more detailed descriptions of the individual sub-assemblies are contained in this section.
Functional description
The measured physiological signals are routed directly to the parameter board, where
they are amplified and then A/D converted. The digital information is processed by the
parameter board microprocessor. The digital section of the Parameter Board contains the
microprocessor, the ROM storing the parameter program and a general purpose memory
(RAM).
The results of the parameter processing are transferred to the shared memory. Here they are
accessed by the display microprocessor for further processing. The shared memory, which is
located on the Display UP Board, is used to store all parameter and waveform information.
This information is used by the display microprocessor to update the wave RAM and the
numerics RAM.
The wave information is routed from the display microprocessor through a D/A converter
to the Interpolation Board. At the same time, alphanumeric information from the numerics
RAM (character generator) is parallel-serial converted. The video driver on the Mother Board
combines these two signals to drive the CRT. The CRT controller on the Display UP Board
triggers the driver circuits on the Mother Board.
Data entered via the keyboard (e.g. alarm limits, lead configuration) is passed via the display
microprocessor and stored in the shared memory, where it is accessed by the parameter
board for appropriate action. When the parameter board reports back that the action has
been carried out, the data is passed to the Display Board microprocessor, which initiates the
appropriate display.
Theory Of Operation l-l
Page 22
Shared Memory and Data Transfer
General
Data transfer in the 783Xx series, the 788Xx series and the 78356A is carried out via a
common memory area, to which all function blocks have access. This common memory is the
Shared Memory chip U40 on A2 Display UP board. The local bus systems are separated from
the main shared memory bus by tri-state buffers.
Power Fail
In the event of power fail the configuration of the instrument at the time of power fail is held
in the shared memory for 15 seconds.
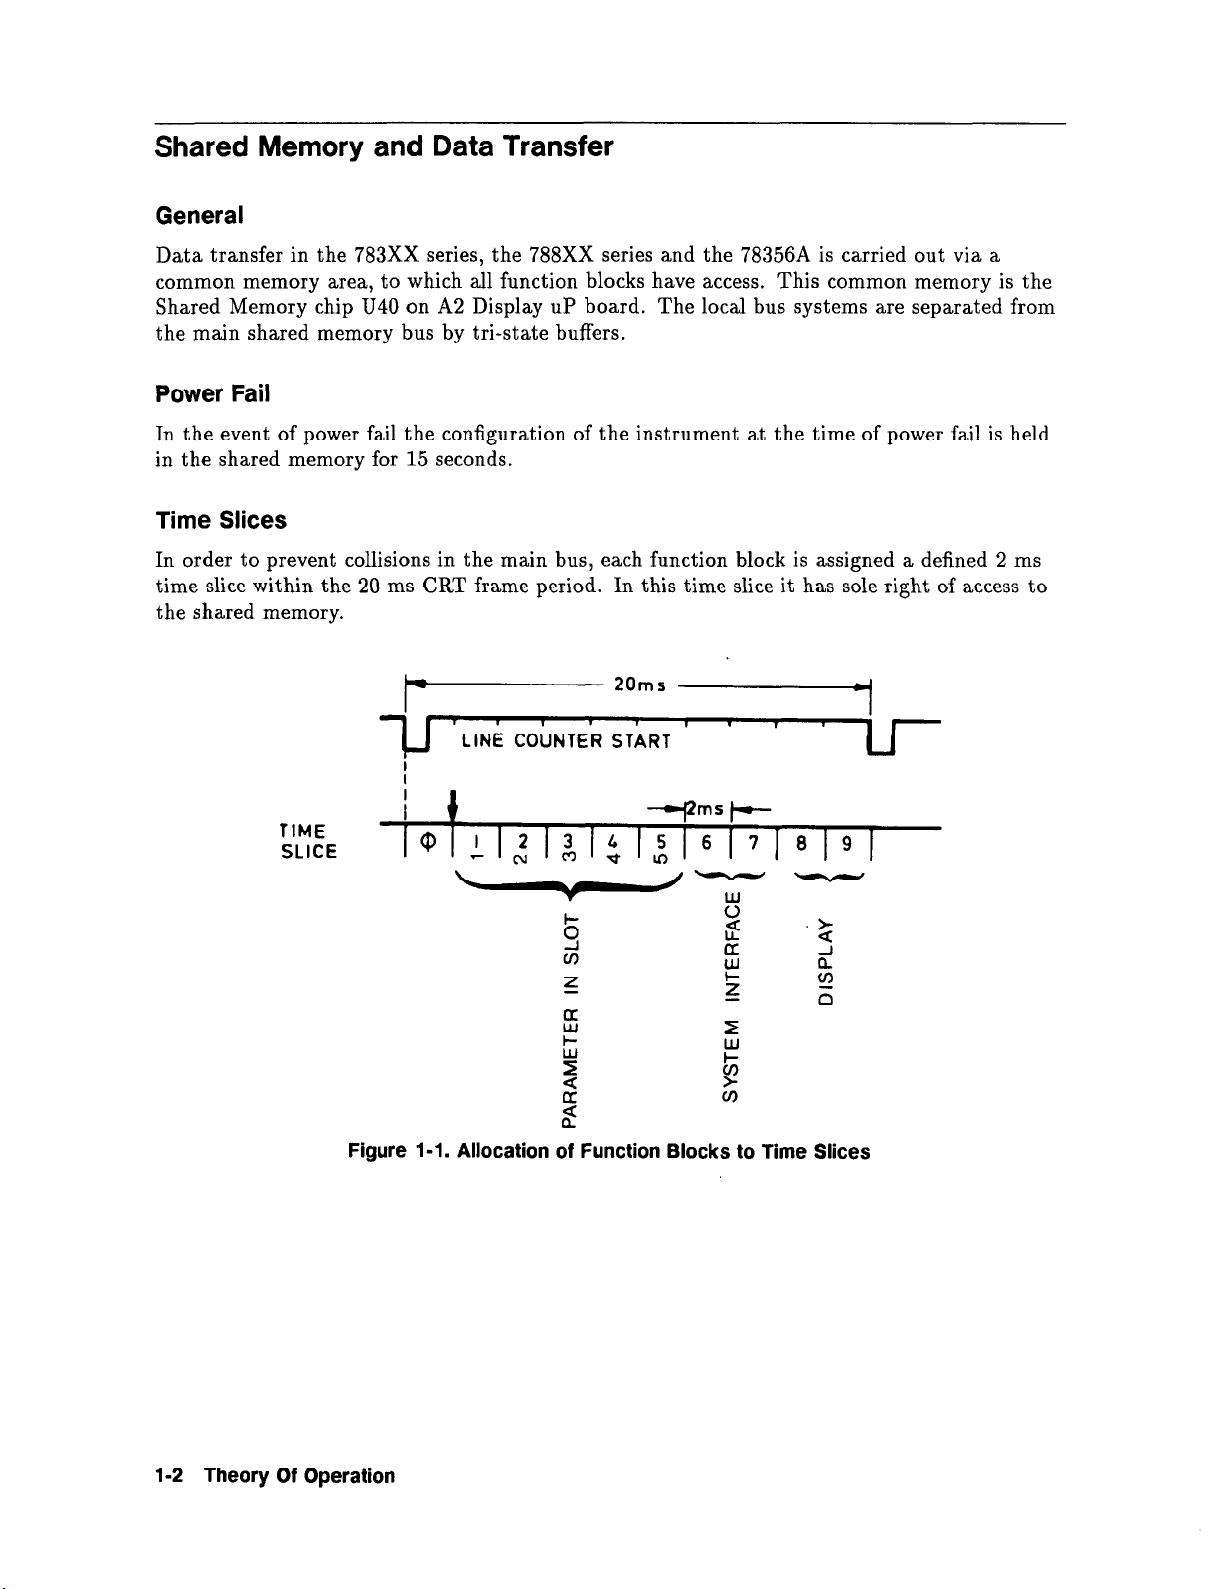
Time Slices
In order to prevent collisions in the main bus, each function block is assigned a defined 2 ms
time slice within the 20 ms CRT frame period. In this time slice it has sole right of access to
the shared memory.
/_ 20,ms
LINE COUNTER START
Figure l-l. Allocation of Function Blocks to Time Slices
1-2 Theory Of Operation
Page 23

Blatt von alte Seite l-3 hier horizontal einfiigen
Figure 1-2. Shared Memory System
Theory Of Operation 1-3
Page 24

. . . . . . . .
. . .
1-4 Theory Of Operation
Page 25
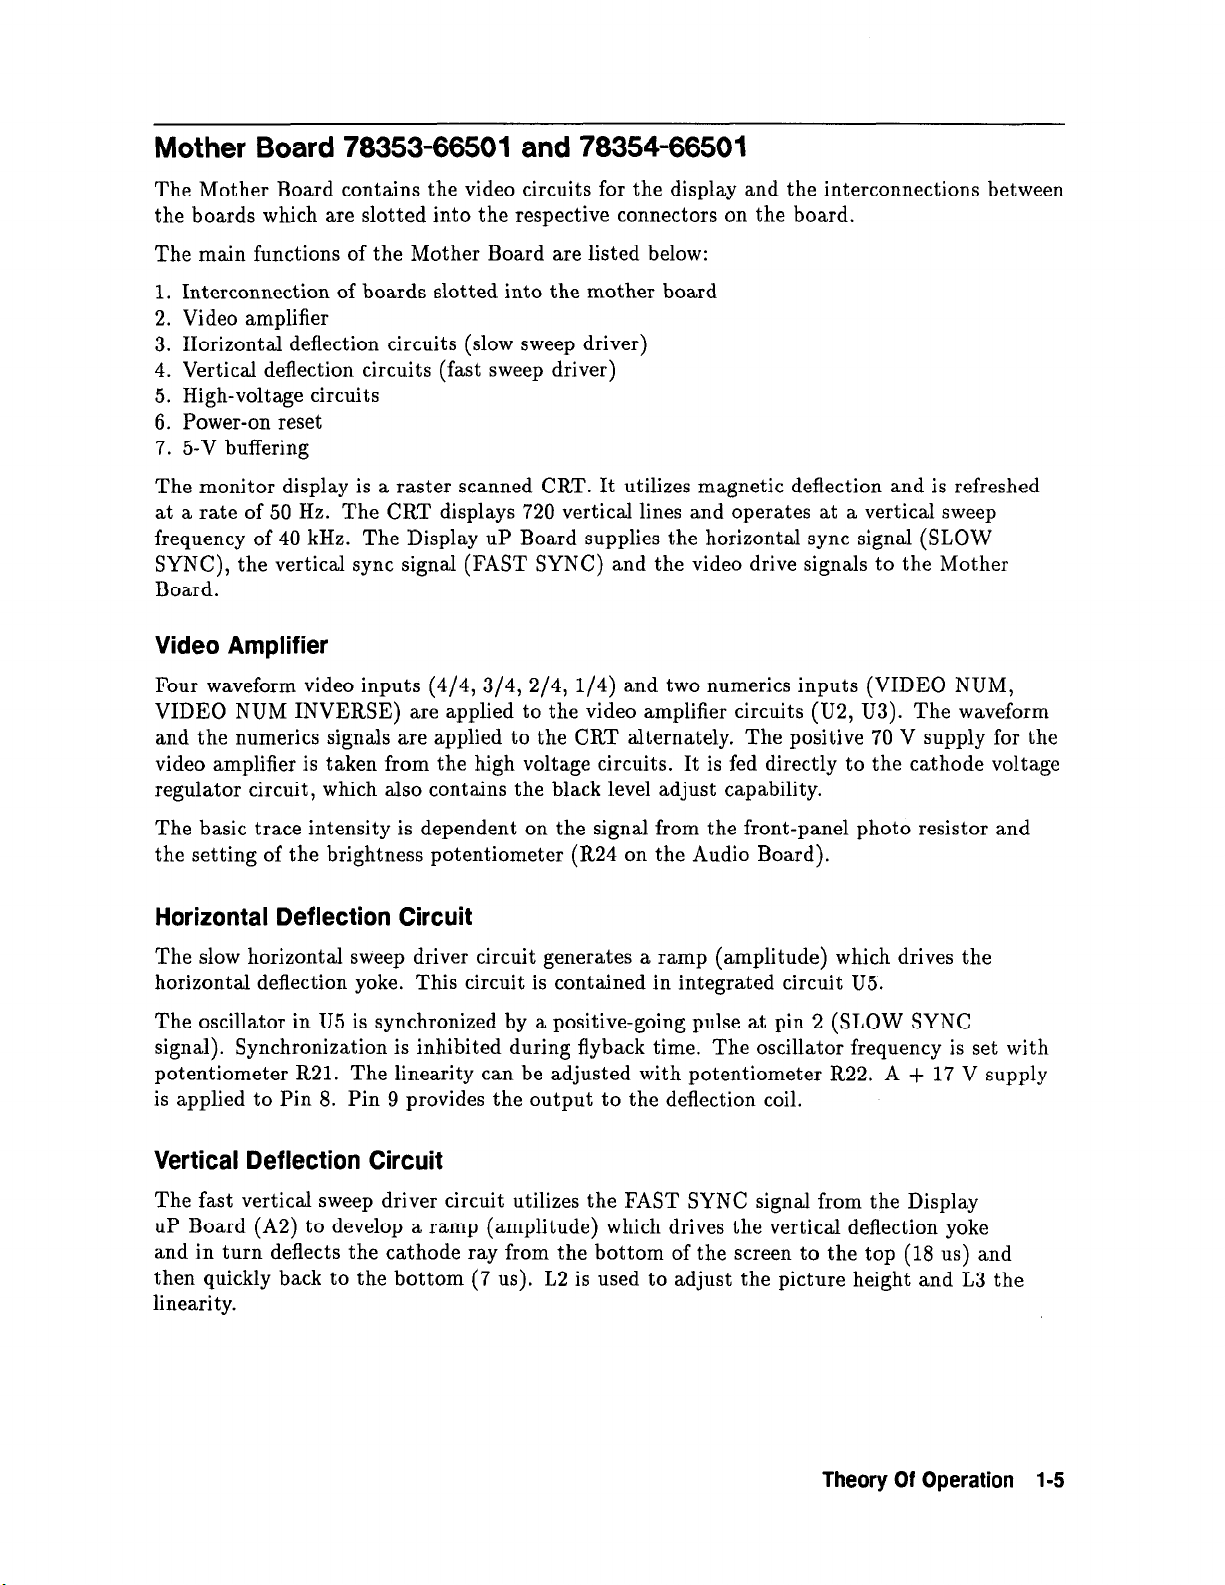
Mother Board 78353-66501 and 78354-66501
The Mother Board contains the video circuits for the display and the interconnections between
the boards which are slotted into the respective connectors on the board.
The main functions of the Mother Board are listed below:
1. Interconnection of boards slotted into the mother board
2. Video amplifier
3. Horizontal deflection circuits (slow sweep driver)
4. Vertical deflection circuits (fast sweep driver)
5. High-voltage circuits
6. Power-on reset
7. 5-V buffering
The monitor display is a raster scanned CRT. It utilizes magnetic deflection and is refreshed
at a rate of 50 Hz. The CRT displays 720 vertical lines and operates at a vertical sweep
frequency of 40 kHz. The Display UP Board supplies the horizontal sync signal (SLOW
SYNC), the vertical sync signal (FAST SYNC)
Board.
Video Amplifier
Four waveform video inputs (4/4, 3/4, 2/4, l/4) and two numerics inputs (VIDEO NUM,
VIDEO NUM INVERSE)
and the numerics signals are applied to the CRT alternately. The positive 70 V supply for the
video amplifier is taken from the high voltage circuits. It is fed directly to the cathode voltage
regulator circuit, which also contains the black level adjust capability.
are applied to the video amplifier circuits (U2, U3). The waveform
and the video drive signals to the Mother
The basic trace intensity is dependent on the signal from the front-panel photo resistor and
the setting of the brightness potentiometer (R24 on the Audio Board).
Horizontal Deflection Circuit
The slow horizontal sweep driver circuit generates a ramp (amplitude) which drives the
horizontal deflection yoke. This circuit is contained in integrated circuit U5.
The oscillator in U5 is synchronized by a positive-going pulse at pin 2 (SLOW SYNC
signal). Synchronization is inhibited during flyback time. The oscillator frequency is set with
potentiometer R21. The linearity can be adjusted with potentiometer R22. A + 17 V supply
is applied to Pin 8. Pin 9 provides the output to the deflection coil.
Vertical Deflection Circuit
The fast vertical sweep driver circuit utilizes the FAST SYNC signal from the Display
UP Board (A2) to develop a ramp (amplitude) which drives the vertical deflection yoke
and in turn deflects the cathode ray from the bottom of the screen to the top (18 us) and
then quickly back to the bottom (7 us). L2 is used to adjust the picture height and L3 the
linearity.
Theory Of Operation l-5
Page 26
High Voltage Circuits
The flyback transformer Tl is used to generate the high voltages required by the CRT and the
video amplifier.
The five supplies are:
1. A positive voltage of 10 kV for electron acceleration. This is the anode voltage.
2. A positive 100, V supply for grid G2 of the CRT.
3. A positive 300 V supply for grid G4 of the CRT (focus).
4. A supply of virtual 0 V for grid Gl of the CRT.
5. A positive 70 V supply for the video amplifier.
Control of the focus and black level is obtained by dividing the supply down with resistor
chains. Both of these chains have potentiometers in them so that adjustments can be made.
(R38 for focus and R55 for black level).
Power-On Reset
A power-on reset signal is generated from the + 5 V supply via UlOA, B and associated
components. It is used to reset all CPUs in the instrument.
5 V Buffering
The power-on reset signal and +5 V are applied to transistors Qll and &lo, respectively, to
generate the buffered + 5 V for use on the Display UP Board (A2) This is used in the event of
power fail to save stored data for approximately 15 s.
Extender Board
The extender board (78354-66504)
instrument is connected to the mother board with ribbon cables, and supports additional
parameters.
in the full modules 78354A/C and 78834A/C, the
1-6 Theory Of Operation
Page 27

Blatt von alte Seite l-5 hier einfiigen
Figure 1-3. Mother Board Block Diagram
Theory Of Operation 1-7
Page 28
Display UP Boards 78353066502 (16K byte), 78354-66502 (40K byte)
78354-66602 and 78354966702 (48K byte)
The Display UP Board is the heart of the instrument. It contains the following functions:
1. Shared memory
2. Character generation (numerics)
3. Slow/fast sync. signal generation
4. Clock generation
5. 20 ms and 2 ms interrupt signal generation
6. Alarm trigger generation
7. Power fail circuit
8. Keyboard handling
The shared memory and data transfer are already described in “Shared Memory and Data
Transfer”.
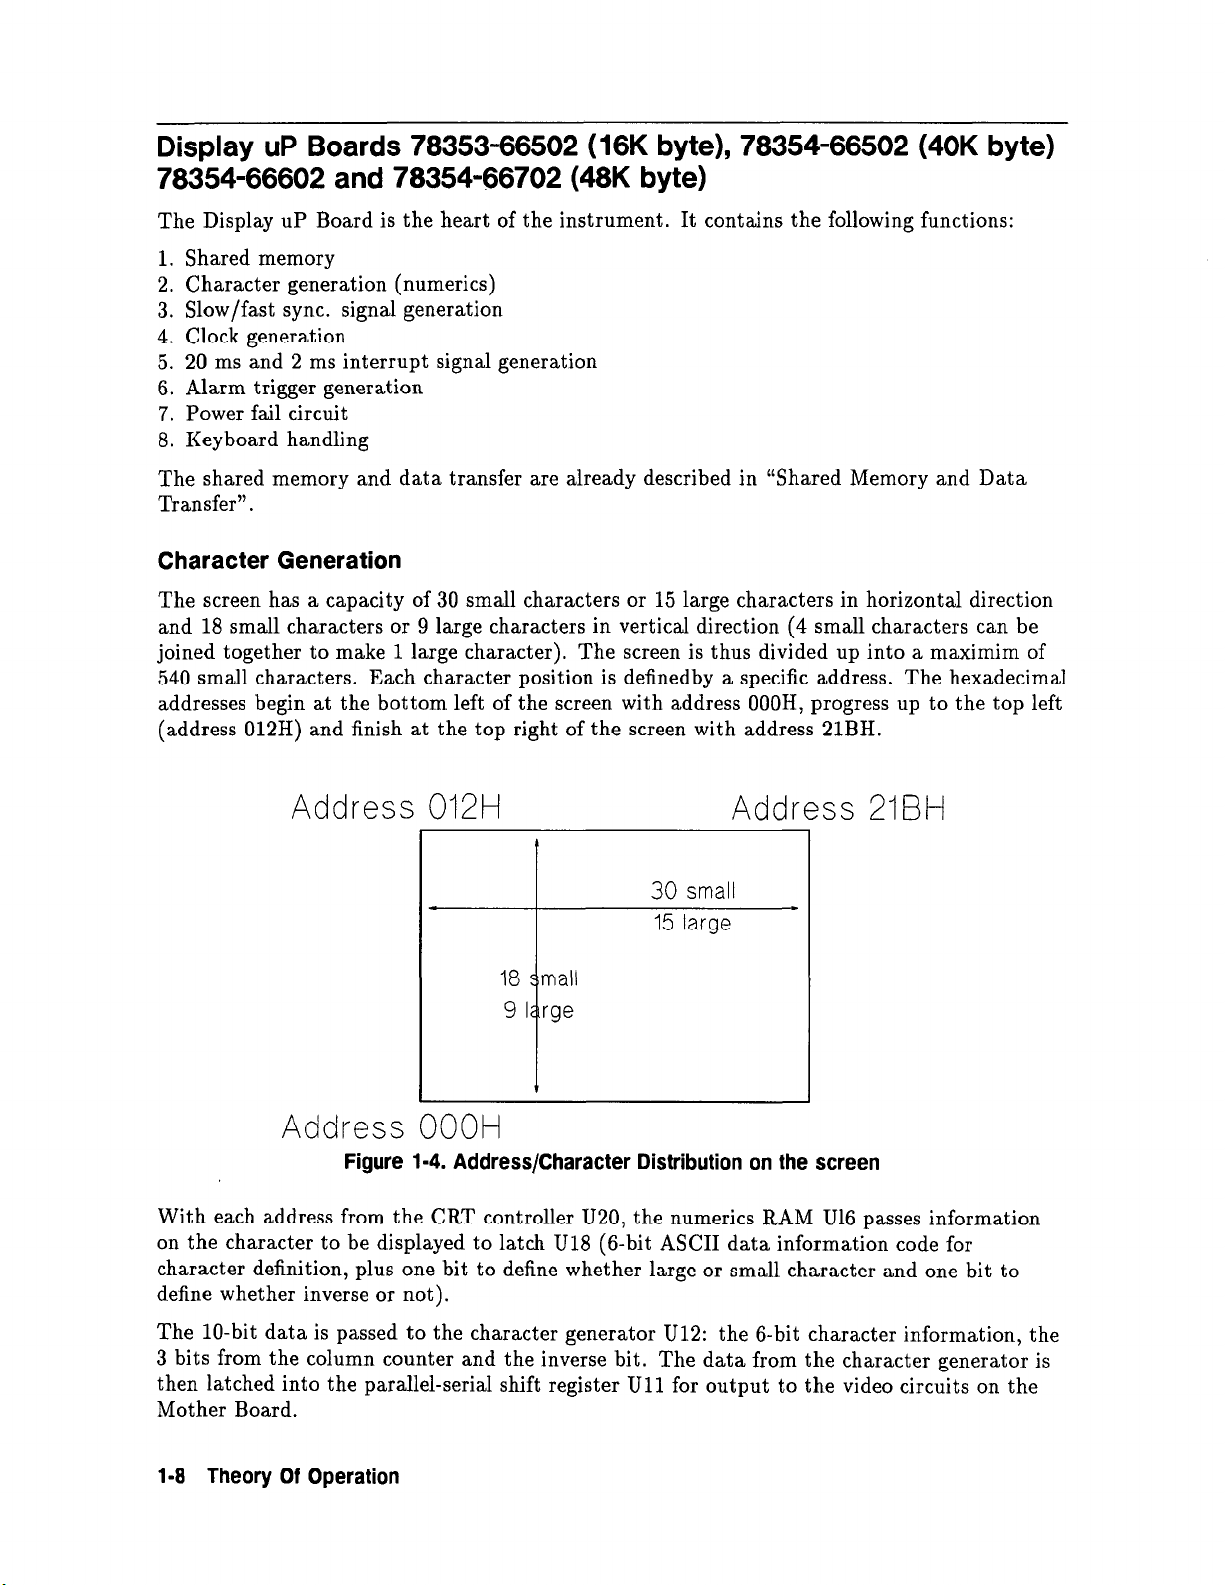
Character Generation
The screen has a capacity of 30 small characters or 15 large characters in horizontal direction
and 18 small characters or 9 large characters in vertical direction (4 small characters can be
joined together to make 1 large character). The screen is thus divided up into a maximim of
540 small characters. Each character position is definedby a specific address. The hexadecimal
addresses begin at the bottom left of the screen with address OOOH, progress up to the top left
(address 012H) and finish at the top right of the screen with address 21BH.
Address 012H
30
15 large
Address 21BH
small
Address OOOH
Figure 1-4. Address/Character Distribution on the screen
With each address from the CRT controller U20, the numerics RAM U16 passes information
on the character to be displayed to latch U18 (6-bit ASCII data information code for
character definition, plus one bit to define whether large or small character and one bit to
define whether inverse or not).
The lo-bit data is passed to the character generator U12: the 6-bit character information, the
3 bits from the column counter and the inverse bit. The data from the character generator is
then latched into the parallel-serial shift register Ull for output to the video circuits on the
Mother Board.
1-8 Theory Of Operation
Page 29
The sweep is delayed by two clock signals so that it does not start until the character
information has reached the parallel-serial shift register Ull; i.e. with one clock pulse, address
1 data is latched into the parallel-serial register, address 2 data is latched into U18 and
address 3 data presented to the numerics RAM from the CRT controller.
The CRT controller U20 is programmed to provide 24 fast sweeps per row of addresses. The
character size information is passed to column counter U14 to determine the number of fast
sweeps per column. With an 8x8 dot matrix per small character, this gives 3 fast sweeps for
every column for a small character, and 6 fast sweeps for every column for a large character.
The character size information is also passed to the load and clock multiplexer. The shift rate
for small characters is twice as high as the shift rate for the large characters. In the wave area
the characters are smaller than in the numeric area, 4x6 dot matrix instead of 5x7 dot matrix.
All characters in the wave area and the inverse characters in the numeric area are displayed
with half intensity.
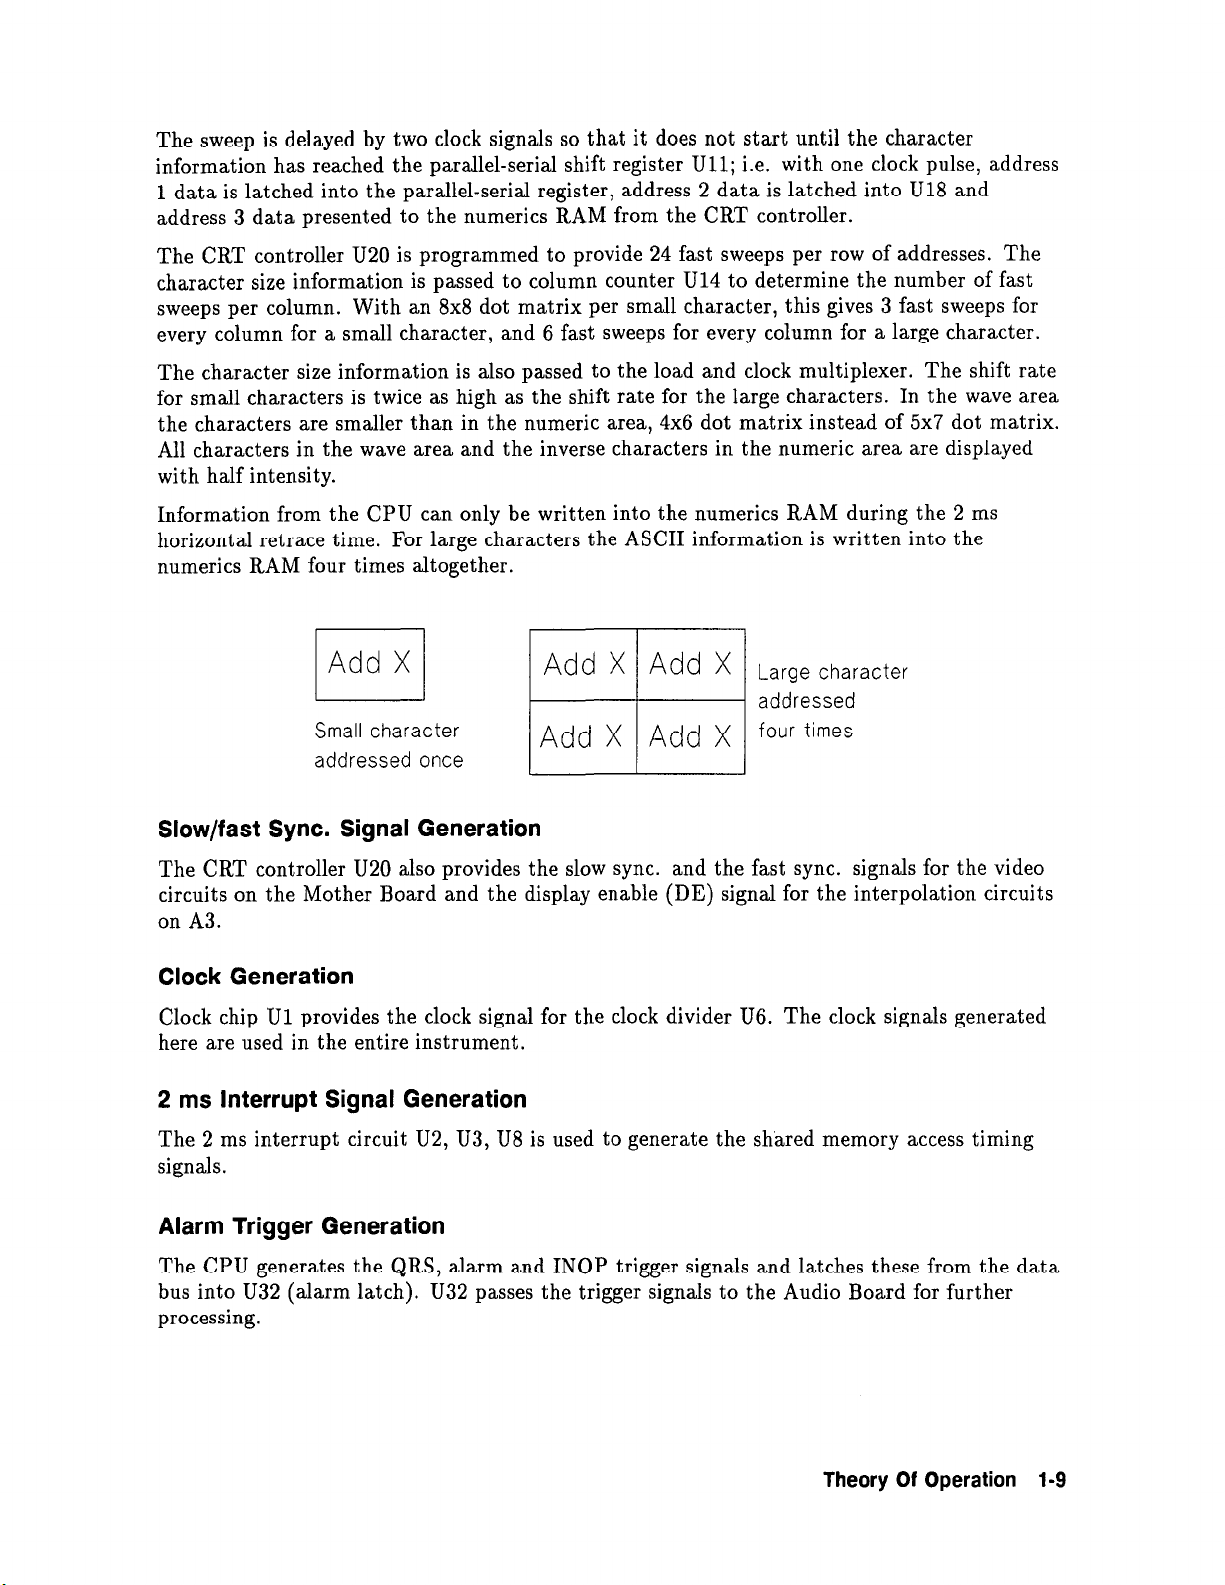
Information from the CPU can only be written into the numerics RAM during the 2 ms
horizontal retrace time. For large characters the ASCII information is written into the
numerics RAM four times altogether.
Add X
I I
Small character
addressed once
Slow/fast Sync. Signal Generation
The CRT controller U20 also provides the slow sync. and the fast sync. signals for the video
circuits on the Mother Board and the display enable (DE) signal for the interpolation circuits
on A3.
Clock Generation
Clock chip Ul provides the clock signal for the clock divider U6. The clock signals generated
here are used in the entire instrument.
2 ms Interrupt Signal Generation
The 2 ms interrupt circuit U2, U3, U8 is used to generate the shared memory access timing
signals.
Alarm Trigger Generation
Add X Add X Large character
addressed
Add X Add x four times
4-l
The CPU generates the QRS, alarm and INOP trigger signals and latches these from the data
bus into U32 (alarm latch). U32 passes the trigger signals to the Audio Board for further
processing.
Theory Of Operation 1-9
Page 30
Power Fail Circuit
In the event of power fail, the shared memory, U40, is buffered for at least 15 s. If power
returns after these 15 s, the power fail signal is delayed (30 ms after the reset signal). This
creates a power-on reset, i.e. instrument set-up is reconfigured. If power returns before the
15 s are up, the instrument set-up is maintained.
Display Software
The Display software contains the following modules:
n
Initialisation of CRT controller
n
Self tests (ROM/RAMS/
n
Service tests (CRT adjust, wave interpolation check)
n
Keyboard handling
n
Soft key labeling
n
Display editing
n
Processing and issuing of alarms
H Wave handling (wave addressing, wave RAM loading, erase
n
bar control)
n
Communication with the parameter software via the common shared memory
The display software is contained in one 32K x 8 EPROM (U26), and in one 8K x 8 EPROM
(U50) on board 78354-66502, in one 16K EPROM (U50) on boards 78354-66602 and
78354-66702.
sounds test) and error handling
Note
I
lb
78353-66502 Board U26 is 16K x 8,
U47,U52,U54 and U55)
)
<ON RESET
) not included
l-10 Theory Of Operation
Page 31

Faltblatt von alte Seite l-9 hier einfiigen
Figure l-5. Display Microprocessor Board Block Diagram
Theory Of Operation
l-1 1
Page 32

. . . . . . . .
. . .
1-12 Theory Of Operation
Page 33

Single Channel Interpolation Board 78352-66503
The Interpolation Board contains most of the control circuit for generating the video pulses
for the waveform display.
The Monitor display uses a vertical raster format of 720 vertical lines with a vertical raster
frequently of 40 kHz and a frame frequency of 50 Hz. To eliminate the quantitization of
sampled data, the Interpolation Board utilizes a smoothing algorithm. The smoothing
algorithm interpolates four consecutive waveform samples.
of the four samples, the intensity of the CRT beam is modulated to produce a continuous
waveform with a constant line width.
The main functions of the Interpolation Board are listed below:
1. D-A converter
2. Sample and hold
3. Shuffle mux
4. Video pulse generator
5. Ramp generator
6. Raster line control
7. Erase bar latch
8. Wave length latch
9. Start-up delay
10. RAM for A2 display board (RAM 1)
Depending on the relative values
D-A Convertor and Sample and Hold Circuits
The waveform is stored in digital form in the wave RAM 1 (U35). It is converted in U5 into
an analog voltage in order to perform the smoothing algorithm. The smoothing algorithm
uses four waveform samples. Analog multiplexer A (U8) acts as a 4 PST switch rotating one
position in between every raster line. The sample and hold circuit (UlO), therefore, holds the
dc level of the present and previous 3 waveform samples.
Shuffle MUX
Analog multiplexer B (Ull, Ul2) makes alternately available to the video pulse generator the
four stored dc levels, in the correct time relationship.
Video Pulse Generator
The weighted comparators (U14, U15, U16, U17) generate a series of pulses in response to the
waveform samples. The video pulse generator circuit translates the pulses from the weighted
comparators into video pulses that are used by the video circuits on the Mother Board (Al).
Theory Of Operation 1-13
Page 34

Ramp Generator
The ramp generator (U28, Ql, Q2) g
ramp signals are used by the weighted comparators for each sample that is displayed. The
output combinational logic within the video pulse generator logically combines these pulses so
as to produce four digital outputs corresponding to four levels of CRT beam intensity.
enerates a ramp for each raster line (fast sweep). The
Raster Line Control
During data input to the DA converter U5, the raster line control (UlA, UlB) sends a WAIT
signal back to the Display UP Board, in order to synchronize the CPU, which operates as a
line counter. This status is reversed by the display enable signal.
Erase Bar Latch
The erase bar latch (U4A) provides waveform blanking (fading effect of erase bar) by using
Data DO information.
Wave Length Latch
The wave length latch (U3A)
have been displayed.
is used to blank the wave after a defined number of raster lines
Start-up Delay
The start-up delay (U7, U3B)
and ensures that the wave is blanked until all four samples are stored for the next frame.
d rives MUX A decoder (U9A, U32) and MUX B decoder (U2)
1-14 Theory Of Operation
Page 35

Faltblatt von alte Seite l-11 hier einfiigen
Figure 1-6. Single Channel Interpolation Board Block Diagram
Theory Of Operation 1-15
Page 36

Three-Channel Interpolation Board 78353-66503
The Interpolation Board (78353-66503)
pulses for the waveform display.
The main functions of the Interpolation Board are listed below:
1. D-A conversion
2. Waveform smoothing
3. Load Control
4. Load Timing
5. Video Pulse generation
6. Ramp generation
7. Ramp timing
8. Erase bar latch
The 783Xx and 788Xx monitor series use a vertical raster format of 720 vertical lines
with a vertical raster frequency of 40 kHz and a frame frequency of 50 Hz. To eliminate
the quantization of sampled data, the Interpolation Board uses a smoothing algorithm.
The smoothing algorithm interpolates four consecutive waveform samples, and is carried
out separately for each of the three channels. Depending on the relative values of the four
samples, the intensity of the CRT beam is modulated to produce a continuous waveform with
a constant line width.
The waveform is stored in digital form in the wave RAM
2 or 3 into an analog voltage, in order to perform the smoothing algorithm. The smoothing
algorithm uses four waveform samples.
contains the control circuit for generating the video
(U14).
It is converted in DAC
1,
In the Hybrid circuits the dc levels of the four waveform samples are compared with
the output signals of the ramp generators, resulting in a series of pulses. The output
combinational logic within the video intensity logic circuits logically combines these pulses
so as to produce four digital outputs corresponding to four levels of CRT beam intensity.
These video pulses are transferred to the video circuits on the mother board (to the 2 axis
amplifier).
Data input and output from the DAC stage is controlled by the load-control circuit which also
supplies a waveform-blanking signal for each channel, to the erase bar latch.
The load timing circuit controls the timing and sequence of signals into, and out of, the
Hybrid circuits. The load timing circuit also provides a wave-blanking signal, to blank all
waves, direct to the video intensity logic circuits.
The erase bar latch provides selective waveform blanking (fading effect of erase bar).
1-16 Theory Of Operation
Page 37

Blatt von alte Seite 1-13 verkleinern and horizontal hier einfiigen
Figure 1-7. Interpolation Board Block Diagram
Theory Of Operation 1-17
Page 38

Power Supply Board 78351-66506
+5 V DC Supply
In order to increase the efficiency of the analog dc power circuit (5 V), two unregulated dc
voltages (8.2 V and 6 V) are provided. The 6 V dc supply is connected to the sensing circuit;
if ever it falls below a threshold of 5.5 V, the 8.2 V dc is connected instead and remains
connected until the 6 V dc returns to a value higher than 5.5 V.
8.2 V
uMo. DC
m!,!: DC
5VDC
ov
1
I
I
I
I
I
I
!
I
- 5.5 v 7HRLSHOLD
Figure 1-6. Voltage Sensing and Regulation
The unregulated 8.2 V dc is applied to transistor Q4 and the unregulated 6 V dc to transistor
Q5. The unregulated 6 V is divided by R15/R16 and applied to sensing amplifier U6A. The
-4 V ref is applied to 1:l amplifier U6B, which alters the polarity of the signal to give a
constant +4 V at the base of transistor Q7.
If the unregulated 6 V is higher than the 5.5 V threshold, CR12 conducts, setting the output
of U6A to 3.4 V. Since the base potential of QS is now lower than that of Q7, Q7 is rendered
conductive. This causes driver transistor Q5 to conduct, letting the +6 V pass to provide the
+5 V. If the unregulated 6V is lower than the 5.5 V threshold, CR12 is reverse-biased and
CR11 conducts. the output of U6A is now at 4.6V which means that the base potential of QS
is higher than that of Q7. QS and Q4 are rendered conductive, letting the unregulated 8.2 V
pass.
U6D is the current-sensing circuit and U6C the voltage sensing circuit for the f5 V supply.
Qll is the switch for the battery mode. The -4 V ref is generated by U3 and associated
components. It is used as the reference power source for the +5 V and the i-40 V power
supplies.
f12 V DC Supplies
Ul and U2 are linear power regulators with internal current limiting. They provide the +12 V
and -12 V dc supplies, respectively.
+17V DC Supply
U5 is an adjustable power regulator with internal current limiting and overload protection. It
provides the i-17 V dc supply.
1-18 Theory Of Operation
Page 39

Audio Board 78353-665 12
r--- ----------- -----.----- .-----~
I
I
I
L ____ ---------~~----------~.~
ECG WAVE OUTPUT
OEFlERlLLATOR 1
INTERFACE
ClRculT
I
Figure 1-9. Audio Board Block Diagram
The Audio Board receives three signals (QRS, 1
a arm, INOP) from the Display UP Board.
Amplifier U3B creates the QRS tone, whereby appropriate jumpering (Sl on Al Mother
Board) can provide a differentiation between the standard and the Japanese QRS tones.
Divider Ul divides the 62.5 kHz signal to provide two signals (976 Hz and 488 Hz). These are
used in conjunction with the alarm signal and the INOP signal, respectively. Gates U2A, U2B
are used to select the signal to be amplified by U3A. Potentiometers are provided for QRS
volume adjustment (R22) and alarm volume adjustment (R23).
Theory Of Operation 1-19
Page 40

All three signals are applied to audio amplifier U3C where they are amplified and applied
directly to the loudspeaker. The Audio Board also contains the external brightness
potentiometer R24 and houses the input jack (auxiliary inputs 2 and
Defibrillator Interface circuit (78353-66511 only) - the defibrillator interface circuit is located
on the Audio Board. When the defibrillator senses an ECG wave from either the tip or the
ring of the phone jack, it sends back to the tip of the phone jack a marker pulse which is
detected by the Marker Detector Circuit. The marker is indicated as a vertical line on the
trace of the ECG wave.
21).
Note
3
The Audio board 78353-66509 does not include this circuit.
l-20 Theory Of Operation
,
Page 41

Battery Board 78832-66519
Battery Charge Circuit
When the unit is switched on, battery BTl is charged via U3C and U3D. In this situation the
j-5 V supply to the parameter boards is supplied via Q2. The power-on signal at the base of
Ql causes Ql, and hence Q2, to conduct. U3B is switched on and acts as a diode bringing the
base of U3A to +5 V. Hence U3A is reverse-biased and not conducting. So the i-5 V supply is
routed from the input connector via Q2 to the parameter boards.
When the power is switched off, Q2 is also switched off and the battery discharges power via
U3A to the parameter boards.
Alarm Lamp Drive Circuit
The alarm lamp signal and 20 ms SYNC signal are combined at gate UlA. When the alarm
lamp signal is low at the same time that the SYNC signal is low, the flip-flops (U2A, U2B) are
cleared and the lamps are off.
When there is one rising edge on the alarm lamp signal between SYNC pulses, the output of
U2B goes high and lamp Ll is switched on. When there are two rising edges the output of
U2A goes high and lamp L2 is switched on.
Theory Of Operation 1-21
Page 42

ECG Board (Full Lead) 78354-66522(42)and 78354-66722(42)
The ECG Board contains the entire circuit required for ECG signal processing. It consists of
an analog section containing:
1. Floating input circuit
2. Right leg drive
3. INOP detection circuit
4. Lead selector circuit
5. Grounded input circuity with bandpass and notch filters
6. A-D converter
and a digital section containing:
7. Microprocessor
8. ROM
9. RAM
Floating Input Circuit
The ECG input signals (C, LL, LA, RA)
to input amplifiers Ul, U2 which provide a gain of 1. The signals are then routed to lead
selector switch U4, U3. The amplified (U6) ECG ‘g 1
AC voltage is transferred to the grounded section by transformer T2.
are applied, via the overvoltage protection circuits,
sr na is fed to modulator U6. The resulting
Right-Leg Drive
The common-mode error signal that serves as input to the right leg drive circuit is derived
from the signals summed through R16 and R17. This common-mode error signal drives the
right-leg drive amplifier U9A. The output of the right-leg drive amplifier returns to the patient
through the patient cable, serving to prevent 50/60 Hz power line interference. Gates UlOA,
B, C switch this signal to the LL, LA or RA input (Ql, Q2, Q3, respectively) according to
which lead is selected (I, II, III) for the other lead positions, connection via RL is used.
INOP Detection Circuit
If any of the leads are disconnected, right-leg drive amplifier U5A generates an INOP signal
(logic high). This signal
U6. It is transferred to the grounded circuit and once again detected (U15). From latch U21,
it is transferred to the digital ECG circuits.
is p assed to INOP comparator U9B, and then switched to modulator
Lead Selector Circuit
U24 receives lead information from the microprocessor U27 via the data bus. The serial
output from U24 drives the opto-coupler U39 via Q13, to transmit information to the floating
circuit. U8 receives this incoming serial data and transmits parallel output to the lead
switches U4, U3 and to the gates U7 and UlO.
1-22 Theory Of Operation
Page 43

Grounded Input Circuit
Demodulator Ull provides the demodulated ECG signal. From here the signal is routed to
the bandpass filter U12, U14, which functions in conjunction with the FILTER/DIAGnostic
switching capability. When the FILTER (
filtered, giving a bandwidth of 0.5 Hz to 30 Hz.
Pace Pulse Rejection: the demodulated signal is directed to the pace pulse hybrid circuit
which detects pace pulses and transmits this information to UP via Latch U21. This signal is
then transferred to the instrument’s shared memory.
The notch filter removes AC line frequency artifacts and the results of AC line rectification
from the waveform display during electrosurgery. The notch filter is bypassed in the
DIAGnostic mode.
After these two filter stages, the ECG signal is A/D converted via DAC (lo-bit) U16 and
comparator U17 on the basis of successive approximation. In operation, the microprocessor
first guesses a number, then U16 converts this to an analog signal and U17 compares it with
the input voltage. The output of the comparator returns to the microprocessor for further
processing.
monitoring) mode is selected, the ECG signal is
Digital Circuits
The A/D converted ECG information is processed by the microprocessor U27 in the digital
circuit and the results passed to the shared memory on the Display UP Board (A2). The
digital circuit also processes data from the shared memory.
Theory Of Operation 1-23
Page 44

ECG Parameter Software
The
ECG
parameter software contains the following modules:
n
ECG wave processing
q
A/D conversion
0 Pace pulse rejection
q
Digital filtering
q
Autofix/Autogain for the display
q
Beat detector
q
Trend*
•I Fibrillation and Noise detection
n
Heart rate calculation
n
Alarm derivation
q
Leads-off alarm
q
Asystole alarm
q
High rate alarm
0 Low rate alarm
n
Keyboard handling
n
Communication with shared memory
n
Selftest and error handling
The ECG parameter software is contained in one 16K x 8 EPROM (U28) located on the ECG
Board.
*Trend capability: The ECG trend times and display update times are listed below
Trend Time
20 min
60 min
2h 18.7 s
4h 37.4 s
8h
24 h
1 Update Time
I
3.1 s
9.4 s
1.25 min
3.74 min
1-24 Theory Of Operation
Page 45

Faltblatt von alte Seite 1-21 hier einfiigen
Figure l-10. ECG Board Block Diagram (Full Lead)
Theory Of Operation 1-25
Page 46

ECG Board (3 Lead) 78832966522 (50 Hz) and 78832-66542 (60 Hz)
The ECG Board contains the entire circuitry required for ECG signal processing. It consists
of an analog section containing:
1. Floating input circuit
2. Right leg drive
3. INOP detection circuit
4. Lead selector circuit
5. Grounded input circuit with bandpass and notch filters
6. A-D converter
and a digital section containing:
7. Microprocessor
8. ROM
9. 2 RAMS
Floating Input Circuit
The ECG input signals (LL, LA, RA)
input amplifiers Ul, U2, U3, which provide a gain of approximately 15. The signals are then
routed to lead selector switch U4. The amplified ECG signal is fed to modulator U6. The
resulting AC voltage is transferred to the grounded section by transformer T2.
are applied, via the overvoltage protection circuits, to
Right-Leg Drive
The common-mode error signal that serves as input to the right leg drive circuit is derived
from the signals summed through R21 and R22. This common-mode error signal drives the
right-leg drive amplifier U5A. The output of the right-leg drive amplifier returns to the patient
through the patient cable, serving to prevent 50/60 Hz power line interference. Gates UlOA,
B, C switch this signal to the LL, LA or RA input (Ql, Q2, Q3, respectively) according to
which lead is selected.
INOP Detection Circuit
If any of the leads are disconnected, right-leg drive amplifier U5A generates an INOP signal
(logic high).
U6. It is transferred to the grounded circuit and once again detected (U15). From latch U21,
it is transferred to the digital ECG circuits.
Th is signal is passed to INOP comparator U5B, and then switched to modulator
1-26 Theory Of Operation
Page 47

Lead Selector Circuit
Frequency selector U18, U19 is clocked by the 1 MHz signal from clock divider U30. It also
receives lead select data (DO to D3) from latch U22. The frequency selector is used for lead
select coding:
45.46 kHz
31.25 kHz
38.47 kHz
25 kHz TEST Signal (low)
18.52 kHz TEST Signal (high)
The signal is then sent to power driver QS, Q7 and passed via transformer Tl to the floating
circuit. The floating lead select logic consists of monostable multivibrators U7A, U7B, counter
U8 and latch U9. The output signals are applied to lead selector U4 and right-leg drive gates
UlOA, B, C.
= Lead I
= Lead II
= Lead III
Grounded Input Circuit
Demodulator Ull provides the demodulated ECG signal. From here the signal is routed to
the bandpass filter U12, U14, which functions in conjunction with the FILTER/DIAGnostic
switching capability. When the FILTER (
filtered, giving a bandwidth of 0.5 Hz to 30 Hz.
The notch filter removes AC line frequency artifacts and the results of AC line rectification
from the waveform display during electrosurgery. The notch filter is bypassed in the
DIAGnostic mode.
After these two filter stages, the ECG signal is A/D converted via DAC (lo-bit) U16 and
comparator U17 on the basis of successive approximation. In operation, the microprocessor
first guesses a number, then U16 converts this to an analog signal and U17 compares it with
the input voltage. The output of the comparator returns to the microprocessor for further
processing.
monitoring) mode is selected, the ECG signal is
Theory Of Operation 1-27
Page 48

Digital Circuits
The A/D converted ECG information is processed by the microprocessor U27 in the digital
circuit and the results passed to the shared memory on the Display UP Board (A2). The
digital circuit also processes data from the shared memory.
ECG Parameter Software
The ECG parameter software contains the following modules:
n
ECG wave processing
q
A/D conversion
q
Digital filtering
q
Autofix gain for the display
q
Beat detector
n
Heart rate calculation
w Alarm derivation
q
Leads-off alarm
o Asystole alarm
q
High rate alarm
0 Low rate alarm
n
Keyboard handling
m Communication with shared memory
n
Selftest and error handling
The ECG parameter software is contained in one 8K x 8 EPROM (U28) located on the ECG
Board.
1-28 Theory Of Operation
Page 49

Faltblatt von alte Seite l-25 hier einfiigen
Figure l-11. ECG Board Block Diagram (3 Lead)
Theory Of Operation 1-29
Page 50

Pressure Board 78353-66532 (Single Channel) and 78353-66534
(Dual Channel)
Note
I
!b
The pressure board contains all the circuits required for processing two pressure signals. The
board supplies an excitation voltage to the transducers, and processes the resulting transducer
output signals for display and system use.
Where block functions are repeated in both pressure channels, only channel 1
is described.
Transducer Excitation Circuits
Frequency divider (U19, UlO, Ull) divides down a 1 MHz square-wave input to give a 2400
Hz square-wave output. This is filtered to give a sine wave which is input to the push-pull
amplifier stage (Ql, Q2). This stage provides the excitation voltage and current to the
transducer across transformer T3.
Transducer Signal Demodulation Circuits
The input signal from the transducer is transferred across transformer Tl to input-amplifier
Ul. This amplifier has a proportional gain of Xl or X8 for 40 UV or 5 UV transducers
respectively. When a 5 UV transducer is used, pins 5 of the front panel connector are shorted
together causing a light emitting diode to conduct, activating a light sensitive transistor
(U17). This transistor conduct switching FET Q7 on. With Q7 conducting Rl is connected to
ground thus increasing the gain of the amplifier (Ul) by a factor of 8.
After amplification the signal is filtered (U2) before demodulation. The synchronous
demodulator (U2, U3) rectifies the signal using an operational amplifier which has alternately
an inverting gain and non-inverting gain. The excitation-voltage signal is used to switch the
amplifier between inverting gain and non-inverting gain.
A 12 Hz low-pass filter (U7) then removes the excitation frequency to leave the dc pressure
signal. This signal goes via amplifier U19A to the system output, and also via the selector
switch (U12) to the analog to digital (A/D) conversion stage.
Analog to Digital Conversion
The analog to digital conversion uses a DAC (U14) and comparator (U13) in a method based
on successive approximations. In this method the microprocessor supplies a number, then U14
converts this to an analog signal and U13 compares it with the input voltage. The output of
the comparator returns to the microprocessor for further processing.
l-30 Theory Of Operation
Page 51

Transducer Disconnected Detection
If the transducer is not connected, a change in load current is sensed by resistor R22 in the
push-pull amplifier stage (Q2, Q3). Th is resistor is connected to a differential amplifier
(U19B), which amplifies the voltage across the resistor. Hence when the current in R22
changes, as the result of transducer disconnection, the output of the amplifier (U19B) will also
change. This output voltage goes to the selector switch and then to the A/D conversion stage.
Here it is converted into a digital signal for use in the digital circuits, to generate an INOP
signal when necessary, and for storage in the shared memory to initiate pressure signal display.
Zero, Calibration and Test Functions
A DAC (U8) and amplifier (U5) are used to provide calibration and test functions to the
input amplifier (Ul). The same circuits also provide zero compensation for the transducer.
When testing the board the input from the transducer to the input amplifier (Ul) is grounded
using a signal applied from latch U24, on the digital section of the board. The alternative test
and calibration inputs are provided by the DAC (U8)
from the microprocessor.
as a result of the digital inputs to U8
Digital Circuits
The A/D converted pressure information and transducer disconnected signal are processed
by the microprocessor (U27) in the digital circuits and the results are passed to the shared
memory on the display microprocessor board (A2). The digital circuits also process
information from the shared memory for use in the pressure parameter circuit.
The additional EAROM in the digital circuits is used as a RAM and ROM facility for
accurate storage and recall of the gain constant used by the internal software for the pressure
signal display and output.
The watchdog timer (U29, U26, U15) is a counter (U15) which has a 2 ms input and is reset
by a regular pulse via gate U29. If the microprocessor is not working correctly the pulse
to U29 does not occur regularly and the counter is not reset. The output from the counter
overflows via gate U26 to cause a reset in the microprocessor program, back to the initial
power on sequence etc.
Theory Of Operation 1-31
Page 52

Pressure Parameter Software
The pressure parameter software contains the following modules:
n
Pressure signal processing
q
Systolic/diastolic/mean detection and calculation
q
A/D conversion
q
gain fixing and storage, for output and display
n
Alarm derivation
n
Communication with the shared memory
n
Self-test and error handling
n
“Watchdog” timer
0 CPU reset
n
Auto zero
n
Trend l:
q
78353B
q
78833A, 78833B
The pressure parameter software is contained in a 16K X8 EPROM (U28).
and
78354A/C:
trend times 20 min, 60 min, 2 h, 4 h, 8 h, 24 h
and 78834A/C: trend times 2 min, 20 min, 60 min, 2 h, 4 h, 8 h, 24 h
Note
’ Trend capability: the pressure trend curve is the average values of mean,
diastolic and systolic pressures.
The trend information is updated at specified
times dictated by the trend time selected - see table;
I
lkend Time
2 min
20 min
60
2h
4h
8h
24
min
h
! 1
Update Time
-
12.5 s
37.4 s
1.25
min
2.5 min
5 min
15 min
I
The screen is divided into 384 points and each trend data sample requires 4 points, therefore
the update time is calculated from: (trend time / 384) x 4
1-32 Theory Of Operation
Page 53

Faltblatt von alte Seite l-29 hier einfiigen
Figure 1-12. Pressure Board Block Diagram
Theory Of Operation 1-33
Page 54

, . . .
. . .
1-34 Theory Of Operation
Page 55

Non-Invasive Blood Pressure (NIBP) Board 78352-66535
For the new NIBP board 78352-66538 used on 78xxxC monitors see “Non-Invasive Blood
Pressure (NIBP) Board 78352-66358”.
General Principle of Operation
The measurement of blood pressure is based on the oscillometric method in which an inflated
cuff around the patient’s limb partially occludes the artery. The pulsatile arterial flow causes
oscillations superimposed on the cuff pressure, the amplitude of which can be analysed to
obtain the systolic, diastolic and mean pressure values. The procedure is microprocessor
controlled and summarized as follows;
Cuff inflation
Arterial occlusion
Pressure decrements
Cuff pressure and oscillations
On instruction from the operator, via the keyboard, the
microprocessor instructs the pump to inflate the cuff to about
180 mmHg pressure. The pressure in the cuff is measured by
a piezo-resistive transducer. Signals from the transducer are
sent to the microprocessor which’switches off the pump when
the required pressure is reached.
At cuff pressures of about 180 mmHg the artery is occluded
(no blood flow) and th
e p ressure transducer detects only the
cuff pressure.
The pressure in the cuff is released in steps of about 7 mmHg
until the pressure partially occludes the artery. At this point
the, artery pressure oscillations are seen superimposed on
the cuff pressure.(Below cuff pressure of 30 mmHg the steps
reduce to 2 mmHg).
As the pressure in the cuff is progressively released the
magnitude of the oscillation as a function of the cuff pressure
increases until the arterial mean pressure is reached. When
the cuff pressure falls below the arterial mean pressure the
oscillation magnitude decreases as illustrated in the following
diagram:
pressure
Note
air pressure in cuff
maximum oscillation
/
arterial
. mean
pressure
\ arterial pressure curve
time
This is a schematic representation only to demonstrate that the maximum
oscillation is reached as the arterial mean pressure is approached. The
microprocessor waits for two pressure cycles before decrementing to the next
step, see Oscillations paragraph.
Theory Of Operation 1-35
Page 56

Oscillations
The pressure transducer detects both the cuff baseline
pressure and pressure oscillation. These signals are amplified
and filtered to separate the cuff baseline pressure and the
pressure oscillations. The micro processor compares successive
pressure oscillation magnitudes until it detects two oscillations
of similar amplitude. By checking two subsequent oscillations
it is possible to reject artefact due to patient movement. The
baseline cuff pressure and oscillation magnitudes are stored
in the memory and the cuff pressure is further decremented.
Subsequent oscillation magnitudes will show decreases until no
significant oscillations are seen.
Results
Note
3
Safety circuit
The microprocessor displays the arterial mean pressure
together with the systolic and diastolic pressures. The cuff is
completely deflated and depending on the selected cycle time
is inflated to when the next measurement is to be made
There are still some oscillations present above and below the systolic and
diastolic values)
If the cuff pressure exceeds 315mmHg f10, the safety circuit
cuts in to release the pressure via the release valve, and an
error message is displayed. (The circuit is essentially a bellows
which expands under pressure and trips a microswitch opening
the release valve.)
The block diagram below illustrates the general principle of the
non-invasive blood pressure.
Blatt von alte Seite 1-31 hier einfiigen
1-36 Theory Of Operation
Page 57

NIBP Parameter Board 78352-66535
The NIBP parameter board is located on the extended mother board, of the full module
78354A. The board contains the pressure transducer, release valve, and all the circuitry
necessary to operate the pressure pump and process the pressure signals. A safety circuit
prevents the cuff from overpressurizing and is also mounted on the parameter board.
Pressure Transducer
The pressure transducer is of the piezo-resistive type and supplied with 1OV dc from amplifier
(Ul). Pressure applied to the transducer causes a change in resistance and the output signal
ranges between O-70 mV.
Amplification and Filtering
The pressure transducer’s output signal is amplified by (76-152) at U3. Cut-off frequency at
U3 is 100 Hz. The amplified signal is sent to switch U8 directly and via the band pass filter
network. The signal arriving directly at U8 contains information on cuff pressure (baseline
cuff pressure and oscillation pressure) but the signal arriving from the band pass filter network
contains only oscillation pressure information. The band pass filter network comprises of a
2nd order LP filter (fc =
network from U13 latch is included to obtain a fast decrease time for improved oscillation
pressure detection. Switch U8 switches alternately at a rate determined by software,
depending on the presence of oscillations.
10 Hz) and a 1st order filter (fc = 1 Hz). The switch in the filter
Analog to Digital Conversion
The analog to digital conversion uses a 12 bit DAC and comparator (U5 & US). The method
used is successive approximation under the control of the uP.(In order to suppress noise
the supply to the DAC includes the accurate -8 V from the reference supply (U7). The UP
loads a value into the DAC which is compared to the voltage to be converted (i.e. pin 18).
The output of the comparator (U6) indicates to the UP if the value on the data bus is the
equivalent of the unknown input analog voltage.
Digital Circuit
The A/D converted pressure signals are sent to the Z8OL microprocessor (U21) and after
processing to the shared memory. ROM (U25) having 16K and RAM (U26) with 2K memory
provide the necessary storage and recall of cuff/oscillation pressure information. The ROM
contains the program for the control of the measurement process.
Clock divider U17A provides the microprocessor with a 2 MHz pulse. The watchdog timer
circuit includes counter (U19) and receives the same 2 ms input as the microprocessor. If the
microprocessor does not reset, the watchdog timer interrupts with a reset signal.
Theory Of Operation 1-37
Page 58

Digital Circuit
The purpose of this circuit is to release the pressure in the cuff if it exceeds 315 mmHg and
also to provide the control signals for the valve and pump. The overpressure safety circuit has
five connections on the pressure valve and the valve is held closed via a 5 V relay switch. If
the pressure in the cuff exceeds 315 mmHg a metal bellows expands and cuts out the circuit
holding the valve closed. If the power fails the safety valve opens automatically to release any
cuff pressure.
NIBP Parameter Software
The software contains the following modules;
n
A/D conversion in U5,
n
systolic/diastolic/mean pressure detection & calculation,
n
alarm determination,
w communication with shared memory,
n
Watchdog timer - to reset CPU,
n
overpressure circuit controlled by CPU,
m Trend*
NIBP parameter software contained in 16K ROM (U25)
*NIBP Trend Times are:
Trend Tie Update Time
20 min 12.5 s
60 min 37.4 s
2h 1.25 min
4h 2.5 min
8h 5 min
24 h 15 min
1-38 Theory Of Operation
Page 59

Faltblatt von alte Seite l-33 hier einfiigen
Figure 1-13. Non-Invasive Blood Pressure Board Block Diagram (78352-66535)
Theory Of Operation 1-39
Page 60

. . . . . . . . . .
l-40 Theory Of Operation
Page 61

Non-Invasive Blood Pressure (NIBP) Board 78352066358
The new NIBP board 78352-96538 is used in the HP78352C, HP78354C Adult and HP78834C
Neonatal Monitors. It is designed to be used with adult, pediatric and neonatal patients in
either an OR or ICU environment.
This new NIBP board uses surface-mounted technology (SMT). This does not allow repairs to
be carried out in the field.
Specifications
Safety
Cuff Pressure
Range
Cuff Inflation
Rate
Auto Mode
Repitition (ICU)
STAT Mode
Cycle Time
Measurement
Time
Typical at HR greater than 60 bpm.
Cuff Pressure
Accuracy 10°C to 35°C f3 mmHg (fO.G% or reading).
Complies with UL544, IEC 601-1, CSA C22.2 No. 125. Patient leakage
current < 10uA at lOOV/60Hz a.c.
Protected against damage from defibrillation and electrosurgery.
0 to 280 mmHg (0 to 37 kPa).
less than 10 s (typical for normal adult cuff).
2, 5, 10, 15, 30 and 60 minutes. Time Defaults: 5 minutes (OR), 15 minutes
5 minutes.
Auto/Manual: 35 s (adult), 20 s (neonatal)
STAT: 17 s
15°C to 25°C f3 mmHg.
0°C to 55OC f3 mmHg (f1.7% or reading)
Display
Update
INOP Alarms
Auto/Manual/STAT: < 2 s after end of measurement.
Trigger if a static pressure, an overpressure or an overlong measurement time
is detected.
Patient Modes
The new NIBP board 78352-66538 is designed to be used with adult, pedatric and neonatal
patients. The Measurement Ranges, Limit Alarms and Overpressure Safety Limits are listed
for each patient mode in turn.
Adult Mode
Measurement Ranges and
Limit Alarms
Systolic: 30 to 270 mmHg (4 to 36 kPa).
Diastolic: 10 to 245 mmHg (1.5 to 32 kPa).
Mean: 20 to 255 mmHg (2.5 to 34 kPa)
Theory Of Operation 1-41
Page 62

Limit Alarm Adjustment
5 mmHg (1 kPa) steps
2 mmHg (0.5 kPa) steps for 10 to 30 mmHg range.
Overpressure Safety Limits
Pediatric Mode
Measurement Ranges and
Limit Alarms
Limit Alarm Adjustment:
Overpressure Safety Limits
Neonatal Mode
Measurement Ranges and
Limit Alarms
Limit Alarm Adjustment:
Overpressure Safety Limits
Measurement Principle
Oscillometric
Measurement
The measurement of the blood pressure is based on the ocillometric method
in which an inflated cuff around the patients limb partially occludes the
artery. The pulsitile arterial flow causes oscillations superimposed on the
cuff pressure, the amplitude of which can be analyzed to obtain the systolic,
diastolic and mean pressure values. The procedure is microprocessor
controlled.
maximum 330 mmHg (44 kPa).
Systolic: 30 to 180 mmHg (4 to 24 kPa).
Diastolic: 10 to 150 mmHg (1.5 to 20 kPa)
Mean: 20 to 160 mmHg (2.5 to 22 kPa)
5 mmHg (1 kPa) steps,
2 mmHg (0.5 kPa) steps for 10 to 30 mmHg range.
maximum 220 mmHg (30 kPa).
Systolic: 30 to 130 mmHg (4 to 17 kPa)
Diastolic: 10 to 100 mmHg (1.5 to 13 kPa)
Mean: 20 to 120 mmHg (2.5 to 16 kPa)
5 mmHg (1 kPa) steps,
2 mmHg (0.5 kPa) steps for 10 to 30 mmHg range.
maximum 165 mmHg (22 kPa).
Measurement
Method
The board offers an adult, pediatric or neonatal mode. The board also offers
three methods of obtaining the non-invasive blood pressure.
n
Manual: This method takes one measurement of systolic, diastolic and
mean, on each request.
n
Auto: This method takes repeated blood pressure measurements of systolic,
diastolic and mean, at specific user-selected time intervals.
n
STAT: This method imediately takes repeated blood pressure measurements
of systolic, diastolic and mean, over a period of five minutes. This method
uses a faster measurement procedure.
Related Literature
n
Hewlett-Packard Application Note: Systolic Pressure Monitoring, A Comparison of the
Oscillometric, Auscultatory and Invasive Techniques; 5954-2388.
n
The Direct and Indirect Measuring Of The Blood Pressure - Geddas L.A. Chicago: Year
Book Medical Publishers 1970; 104-5.
1-42 Theory Of Operation
Page 63

General Principle of Operation
Cuff Inflation
Arterial Occlusion
Pressure Decrements
Oscillations
The cuff around the patients limb is connected to the board via
a single tube. The cuff is inflated by the pressure pump once or
repeatedly (depending on the measurement method used) to a cuff
pressure above the patients systolic pressure.
For the first measurement, the cuff inflates to approximately 165
mmHg (Adult), 125 mmHg (Pedi) or 100 mmHg (Neo). For futher
measurements the cuff inflates to approximately 20 mmHg above the
previously measured systolic pressure.
When the cuff is greater than the systolic pressure then the artery is
occluded and the pressure sensor only detects the cuff pressure.
Cuff Deflation \ The pressure in the cuff is automatically released
by the deflation system on the board. The deflation occurs in
steps of approximately 7 mmHg until the cuff pressure is partially
occluding the artery. At this point the arterial pressure oscillations
are superimposed on the sensed pressure and are extracted by the
bandpass filter for measurement purposes.
As the cuff is deflated, that is the pressure is progressively released,
the magnitude of the oscillations as a function of the cuff pressure
increases until the mean arterial pressure is reached. The minimum
cuff baseline pressure which allows maximum amplitude of arterial
pressure oscillations is identical to the mean arterial pressure. When
the cuff pressure falls below the mean arterial pressure the oscillation
magnitude decreases.
are deducted from the oscillometric signal by extrapolation, resulting
in empirical values. For the extrapolation the attenuation rate of the
signal on both sides of the maximum readings are used.
The systolic and diastolic blood pressure values
Safe Monitoring
The board has the following maximum limits which ensure the safety
of the patient:
1. A maximum measurement time of: 120 seconds (Adult and
Pediatrics Modes), 60 seconds (Neonatal Mode).
2. A maximum time of 120 seconds for a cuff pressure greater than
15 mmHg for adults and pediatric modes or 60 seconds for a cuff
pressure greater than 5 mmHg for neonatal mode.
3. An overpressure system with the following limits:
a. 330 mmHg maximum (for adult mode)
b. 220 mmHg maximum (for pediatric mode)
c. 165 mmHg maximum (for neonatal mode)
Theory Of Operation 1-43
Page 64

NIBP Parameter Board 78352-66538
The Analog Board-Hardware Description
Pressure Transducers and Input Amplifier
The static inflation pressure of the cuff is measured by two identical solid-state transducers
(sensor 1 and 2). These transducers are mounted on either side of the input connector so that
the same pressure is measured by both. The transducers are duplicated for safety reasons so
that there is always a backup if one fails. If one channel produces a false value, the second
channel provides a reference signal by means of which the error can be detected.
The transducers use a bridge circuit to measure the pressure of the cuff. Two amplifiers
(Ul,U2 or U4,U5) supply the bridge excitation voltage of i-5 V (Ul) and -5 V (U2).
The excitation voltage is symmetrical so that a single-ended output is generated for A/D
conversion.
The voltage on the voltage divider (R6, R7/8) is -1.875 V at zero pressure with no offset.
The amplifier U2 adjusts the supply voltage for the transducer so that the voltage on the
output pin 4 (sensor output) is equal to the offset voltage from R38,R39 (f5 mV). The other
output of the transducer (pin 2) is amplified by U3 which has a gain of 111.
Oscillation Channel
An oscillation channel filters and amplifies the oscillations superimposed on the static cuff
pressure. The signal first passes through a low pass filter (U7B with R25,R26,C23,C24) with
a cutoff frequency of 3.5 Hz. The dc voltage is removed by two software-controlled high pass
filters (C25,R27 and C27,R34) with
a cutoff frequency of 0.4 Hz. The recovered oscillation
signal is amplified by U7A, and output to the multiplexer U9.
Transistor Ql increases the gain of U7A for neonatal blood pressure monitoring. Increased
gain is needed when measuring neonatal blood pressure because of the smaller oscillations.
Switches U8A and U8C switch the time constant of the high pass filter to achieve rapid
baseline recovery each time the cuff is deflated. This is required because each time the
deflation valve opens, a strong signal is produced that creates an unwanted peak.
Multiplexer and A/D Conversion
The software-controlled multiplexer (U9) selects one of the following input signals for output
to the A/D converter (Ull):
n
Static pressure channel 1 (Output from U3)
n
Static pressure channel 2 (Output from US)
n
Oscillation channel
n
Reference voltage (t3.8 V)
n
Referen’ce voltage (t1.5 V)
w Reference voltage (t5.0 mV)
The reference voltages are used for test purposes to ensure that the calibration is valid.
The output from the multiplexer (pin 8) is buffered by the amplifier (UlOA) before it is input
to the A/D converter (U11). A/D
conversion is made by the type 7548 12-bit DAC (Ull) and
comparator (U12), by means of a successive approximation algorithm.
1-44 Theory Of Operation
Page 65

A reference voltage for the DAC of -6 V is produced by UlOB. The reference element (U13)
delivers a stable +5 V reference.
EEPROM and Latch
An EEPROM (U350) t
required by the software. This non-volatile memory has a capacity of 128 8-bit words. Data
is loaded and read serially by the 80C88A microprocessor (U26) on the digital board. The
contents of the EEPROM are not lost when the module is unplugged.
The module is factory-calibrated by applying an accurate pressure of 220 mmHg to the
sensors. The values produced are stored in the EEPROM and used for future reference.
A type ‘574 latch (UlOO)
(U9), and switch (U8). It also transmits the signals to start the pump motor and close Valve
1.
s ores the factory calibration values for the sensors and other values
is connected to the data bus and stores the switch settings for MUX
Hardware Description
Note
Valve Drivers
Two valves are used to inflate and deflate the different types of cuff. Valve 1 is normally open
(the valve for the adult cuff), and Valve 2 is normally closed (the valve for the neonatal cuff).
Valve 2 has two switches (Q3, Q4, Q9) and Valve 1 has only one switch (Q2, QS). There are
two switches to open and close Valve 2 to save power. A relatively high current is needed to
change the state of the switch but a very low current is required to hold the selected state.
Latch U310 on the Analog Board supplies the VALVE-2 signal. The valve is then held closed
with a reduced current from transistor Q3 limited by resistors R53, R54 and R55.
No opto-couplers are required on this board because the board is grounded.
It is not necessary to use the same power conservation technique for Valve 1 because it is
activated very rarely in comparison with the adult valve. When it is activated, Valve 1 is
opened only for a very short period.
Diodes CR8, CR3 and CR4, CR5 are protection diodes to limit the induction voltage if the
valves are switched off.
Pump Motor
The pump motor is controlled by U12A, Q5, and the current limiting resistor R73, R74, R75,
R76. The pump is activated when a +5 V signal (PUMP) is received from latch UlOO at the
non-inverting input of U12B. When the motor is switched on, the inrush current is limited to
about 700 mA. When the motor is running, the current is reduced to between 300 and 400
mA depending on the load.
Diode CR9, CR2 protects the transistors from the back emf generated when the motor is
switched off.
Theory Of Operation 1-45
Page 66

The Digital Board-Hardware Description
The Digital Board is based around one microprocessor; an 8OC88 (U250). This processing
power is needed to generate an NIBP reading
The 8OC88 processes the signals from the analog board and runs the NIBP algorithm.
Application software is stored on the 128 k x 8 EPROM (U320), and the 32 k x 8 RAM
(U360).
The address decoder (U330) g
latches UlOO, U310, U340, U400, U410.
A Watchdog ASIC (U240) supervises the processor. If either the time interval is too long, or
the data bits are wrong, the ASIC sends a reset signal to restart the microprocessor.
enerates the chip select signals for the DAC (U210), and the
1-46 Theory Of Operation
Page 67

Bitte Faltblatt von alter Seite 2-50a (VOLUME 2) hier einfiigen
Figure l-14. Non-Invasive Blood Pressure Board Block Diagram (78352-88538)
Theory Of Operation 1-47
Page 68

. . . . . . . . .
1-48 Theory Of Operation
Page 69

Partial CO2 Pressure Board 78354-66540 and 78356-66540
General Principle of Operation
The concentration of carbon dioxide (CO ) 2 is measured directly and continuously from the
patient’s expired gases. Light arriving from an infra-red source passes successively through the
expired (or inspired) gas, a filter wheel and an optical interference filter and is then detected
by the photoresistor detector. The detector output is processed by the CO2 parameter board.
The transducer is maintained at a constant temperature of 45OC to prevent condensation
developing at the windows of the Airway Adapter (the transducer clips onto this). This also
produces stable conditions for the optical filter inside the transducer to operate in. This is
controlled by the temperature control circuit.
The CO2 measurement technique is based on the absorbtion of infra-red energy by Con. A
rotating filter wheel chops the in-coming light to produce a series of pulses. These pulses are
used to calculate the value of CO2 present in the expired gas using algorithms.
The chopping filter wheel forms the rotor of the dc motor. Four permanent magnets are
placed symmetrically around the wheel to provide the magnetic attraction and repulsion
from a drive-coil pair mounted on the surrounding stator. A properly-phased drive signal is
obtained from the motor drive circuits by integrating and amplifying the voltage from a pair
of sensing coils, also located on the stator. The relationship of the drive coils, sense coils and
magnets are shown in the figure opposite. The motor is started by magnetically positioning a
permanent magnet over one sense coil, then pulsing the drive coils.
The filter wheel contains 2 sealed chambers, one filled with CO:! which is used as a reference
absorbtion and other chamber filled with N2 which does not absorb infra-red light. An
additional empty chamber in the filter wheel gives information on CO2 enclosed in the
transducer. The resulting analog signal at output of transducer’s preamplifier is shown below;
Theory Of Operation 1-49
Page 70

CO2 Parameter Board 78354-66540 and 78356-66540
The CO2 parameter boards 78354-66540 and 78356-66540 contains the following main circuits:
H Motor and Temperature circuit,
n
Preamplifier,
n
Analog to Digital conversion,
n
Digital circuits necessary to process data and transmit data to the instrument‘s shared
memory.
Motor Circuit
When a transducer is connected to an instrument, pin C on Jl is connected to ground which
in turn forces pin 11 on microcomputer U2 also to ground. The microcomputer recognizes the
presence of a transducer and sends a pulse to the start up pulse generator (U3/Ql) via port
10 (pin 13) of U2. The start up pulse generator sends a pulse to power the sense coils of the
transducer and start the filter wheel rotating. (If filter wheel start-up is not successful the
start up pulse generator repeats with a second pulse 2 s later until motor runs). When the
filter wheel rotates a sine wave voltage appears on the sense coils and the sine wave will be
phase shifted by integrator UlB and amplified by variable gain stage U5/Ul. The variable
gain amplifier drives power amplifier Q2 and Q3 to power motor drive coils in the transducer.
To control the motor speed the zero crossing at TPl (output UlB) is detected by Schmitt
trigger U3D, which gives the microcomputer data about actual speed of the motor. An
internal algorithm of the microcomputer controls the gain of U5 to the achieve correct motor
speed of 40 Hz. When the start-up pulse is generated the gain of U5 is 0, but in normal
operation when the motor is running the gain is between 0 and 1 to compensate for variations
in motor speed. To achieve a symmetrical Motor Drive voltage (UMD) around zero the
integrator UlD corrects the dc part of UMD by giving an offset to the flux integrator UlB (dc
restoring).
Temperature‘Control Circuit
The sense thermistor of the transducer is part of a resistance bridge and its differential voltage
is amplified by UlA and then Analog to Digital converted by U4. The microcomputer U2 uses
an algorithm to filter the temperature data and provide a pulse width modulated signal at
P21. Q4 and associated components make a flyback converter to provide a dc voltage to the
heater thermistor in the transducer. The thermistor is only supplied with power when the
motor runs. While the correct transducer operating temperature is being reached the message
sensor warm up appears on the display.
l-50 Theory Of Operation
Page 71

Faltblatt von alte Seite l-35 hier einfiigen
Figure 1-15. 14360A Sensor, Mechanical Diagram
Theory Of Operation 1-51
Page 72

l-52 Theory Of Operation
Page 73

Preamplifier
The preamplifier U8A converts the incoming signal current from the biased photoresistor
detector to obtain the CO:! voltage signal. U8B and U15 build a variable gain stage
to generate enough dynamic range for the A to D conversion. U15 is contolled by the
microprocessor U13. Microcomputer U2 derives an auto zero (AZ) signal from the incoming
motorphase. During this zero signal the output of U8 will be integrated by U9 and output U9
controls the current source made up by QS, Q9 and QlO which in turn loads capacitor C6 to
a voltage that gives the correct current (93 uA) to the photoresistor detector. This current
source is supplied by 80 V derived by the circuit around Tl.
Analog to Digital Conversion
The values of the four samples, VR , VH, VS and VZ are measured by a dual slope
integrating technique.
Comparator Ull detects the zero crossing of the (integrating) slopes. This information is used
by the internal timer of the microprocessor U13 to determine the relative value of the four
samples.
This A/D converter is also used to measure the analog 02 voltage from the 02 board by
switching S2 and S3 of U16.
Digital Circuits
The digital part of the CO2 parameter board builds a UP system which consists of
microprocessor U13, 16K EPROM U28, 2K RAM U26, NOVRAM U27, address decoder U25,
input latch U23 and shared memory buffers U20, U21 and U22. The clock U32, counter U29
and the shift registers U30 and U31 are used to provide the necessary clock and timing signals
for the UP U13. The input latch U23 reads slotcode SCO, SC1 and SC2, the powerfail signal
(PF), 20 ms clock, option switches (SlA for kPa or mmHg and SlB for respiration from COZ)
and by Xl Calstick position (out or in).
*Trend capability: The trend times and display update times are listed below
Trend Time Update Time
20 min 3.1 s
60 min 9.4 s
2h 18.7 s
4h 37.4 s
8h 1.25 min
24h
3.74
min
Theory Of Operation 1-53
Page 74

Oxygen Board 78354-66541 and 78356-66541
General Principle of Operation
The 02 transducer measures oxygen concentrations in ambient or inspired air, operating on
the polarographic principle.
Preamplifier Circuit
A battery on the 02 parameter board supplies a reference voltage to the anode of the
transducer which, after a warm-up time, causes the transducer to produce current when it is
exposed to oxygen.
The current flows from the transducer to the 02 parameter board (78354-66541 or
78356-66541), h
the non-floating part of the 02 board by modulator U5, transformer Tl and demodulator U4.
After this signal has been filtered by R8 and Cl it passes to the the CO2 board (78354-66540
or 78356-66540), h
memory. The Oxygen value is displayed on the screen as a percentage.
w ere it is amplified and converted to a voltage. This 02 signal is transferred to
w ere it is A/D converted and transmitted to the instrument shared
1-54 Theory Of Operation
Page 75

Faltblatt von alte Seite l-37 hier einfiigen
Figure 1-16. C02/02 Board Block Diagram
Theory Of Operation l-55
Page 76

. . . . . .
l-56 Theory Of Operation
Page 77

Temp/Pleth/Aux Board 78353-66552 and 78354-66552
Pleth Floating Input Circuit
The Pleth input signal is applied, via diode clamp protection, to the Pleth pre-amplifier (UlA,
UlC) which is an active-feedback amplifier giving a band-pass characteristic. The signal is
then used in modulator (UlB, Ql), which provides a current directly proportional to the input
Pleth signal. This current is detected on the grounded side of the transformer (Tl) by means
of a sensing resistor. The transformer also provides the power to drive a constant-current
source (U36, U3, Q2) which supplies the lamp.
Test Function Generator
The frequency at the transformer is normally 250 kHz, but for test purposes a 125 kHz
frequency is applied. This stimulates the test generator to output a square wave of 101.7 bpm,
which is input as a test signal to the Pleth preamplifier.
INOP Detection Circuit
If the Pleth transducer is not connected the instrument can not operate. When the transducer
is disconnected the current to the lamp does not flow. This is detected as a change in load by
the INOP detector U18 with 78353-66552 board (U8 with 78354-66552), which generates an
INOP signal. From latch U21 this signal is transferred to the digital Pleth circuits.
Pleth Sensor Circuit
The signal detected across the sensing resistor in the grounded section is demodulated by
the Pleth Sensor and passed through a bandpass filter (UlO). The signal is then routed via
a selector switch (U15) to the A/D conversion stage. The signal is A/D converted by DAC
U16 (12 bit) and comparator U17 on the basis of successive approximation. This same A/D
conversion stage is also used for Temperature and Auxiliary signals.
Temperature Floating Input Circuit
The temperature measurement is based on the change in resistance of the transducer with
changing temperature. This resistance is transformed across T2 to the grounded section.
Two reference values (representing 40°C and 25°C) are also available at the input stage
for calibration checks, which are carried out periodically by the microprocessor. The
microprocessor checks for offset and drift errors, and removes the necessity for on-board
adjustments.
Temperature Grounded Circuit
The resistance transformed across from the floating section provides damping for the resonant
circuit (Tl, C26, R63). As the amount of damping changes with temperature, the voltage
across the resonant circuit also changes. This voltage signal is routed via a driver stage to a
full wave rectifier and filter. The output is a dc level proportional to the input temperature
signal. This dc signal is offset to make optimum use of the temperature range and then routed
to the A/D conversion stage via selector switch U15.
Theory Of Operation 1-57
Page 78

Aux Input Circuit
The Aux parameter signal is routed, via selector switch U13, to the Aux buffer. This selector
switch can also give a zero signal for calibration purposes and allows software recognition of
the parameter cable which is connected, by identifying the particular series resistor in that
cable. The output signal from the detection circuit is then fed, via selector switch U15, to the
A/D conversion stage.
Digital Circuits
The A/D converted parameter information is processed by the microprocessor U27 in the
digital circuit and the results passed to the shared memory on the Display microprocessor
board. The digital circuits also processes information from the shared memory.
Temp/Pleth/Aux Parameter Software
The software contains the following modules:
n
Pleth:
q
Autofix gain
q
Manual gain
q
Peak finding
q
Heart rate processing
q
INOP detection
q
Trend (78354-66552 BD)
w Temp:
q
Calibration checks
q
INOP detection
n
Aux:
q
Auto zero
q
Parameter identification
0 Scaling
The PAT parameter software is contained in one 16K x 8EPROM (U28).
TREND: 8K x 8 RAM (U32) loaded. NO TREND: 2K x 8 RAM (U32) loaded. Trend times
are as follows:
‘&end Time Update Time
20
60
24 h
min
min
2h
4h
8h
3.1 s
9.4
18.7 s
37.4 s
1.25
3.74
s
min
min
1-58 Theory Of Operation
Page 79

Faltblatt von alte Seite l-39 hier einfiigen
Figure 1-17. Temp/Pleth/Aux Board Block Diagram
Theory Of Operation 1-59
Page 80

Temperature Board 78832-66552 and 78834-66552
The temperature measurement is based on the change in resistance of the transducer with
changing temperature. This signal, in the form of a voltage, is rectified and then A/D
converted.
Input Circuits
Two reference resistors and two temperature inputs (in the form of resistances) are available
at the input section of the board. The microprocessor, through relays (K1,2,3) and transistor
switches (U7),
The two reference values (representing 40°C and 25OC) are used for periodic calibration checks
when the microprocessor checks for offset and drift errors.
Signal Rectification and A/D Conversion
The resistance transformed across Tl provides damping for the resonant circuit (Tl, Cl). The
excitation frequency for the resonant circuit is supplied via frequently divider U3 and amplifier
U4. The voltage across the resonant circuit changes, as the amount of damping changes,
with temperature. This voltage signal is half-wave rectified (Ul) giving an output dc level
proportional to the input temperature signal. This signal is then dual slope A/D converted
(U8) and goes to the respiration board digital circuits.
controls which of the resistances is transformed across Tl to the next stage.
Digital Circuits
The A/D converted temperature information is processed by the microprocessor U13 in the
digital circuits and the results passed to the shared memory on the display microprocessor
board.
Temperature Parameter Software
The software controls hardware functions (relays, switches etc.) and A/D conversion.
Software also checks calibration using the reference resistors and detects INOP conditions.
l-80 Theory Of Operation
Page 81

Blatt von alte Seite 1-41 verkleinern und horizontal hier einfiigen
Figure 1-18. Temperature Board Block Diagram
Theory Of Operation l-81
Page 82

1-62 Theory Of Operation
Page 83

Dual Temperature Board 78353-66554 and 78354-66554
The temperature measurement is based on the change in resistance of the transducer with
changing temperature. This signal, in the form of a voltage, is rectified and then A/D
converted.
Input Circuits
Two reference resistors and two temperature inputs (in the form of resistances) are available
at the input section of the board. The microprocessor, through relays (Kl, 2, 3) and transistor
switches (Ql, 2, 3),
stage. The two reference values (representing 40°C and 25°C) are used for periodic calibration
checks when the microprocessor checks for offset and drift errors.
Signal Rectification and A/D Conversion
The resistance transformed across Tl provides damping for the resonant circuit (Tl, C3).
The excitation frequency for the resonant circuit is supplied via frequency divider UlO and
amplifier U5. The voltage across the resonant circuit changes, as the amount of damping
changes, with temperature. This voltage signal is full-wave rectified (U6) giving an output dc
level proportional to the input temperature signal. This signal is then A/D converted and
goes to the digital circuits.
controls which of the reiistances is transformed across Tl to the next
Digital Circuits
The A/D converted temperature information is processed by the microprocessor U27 in the
digital circuits and the results passed to the shared memory on the display microprocessor
board.
Temperature Parameter Software
The software controls hardware functions (relays, switches etc.) and A/D conversion.
Software also checks calibration using the reference resistors and detects INOP conditions.
n
Board 78353-66554 contains 1K x 8 RAM and 8K x 8 EPROM
n
Board 78354-66554 contains 2K x 8 RAM and 8K x 8 EPROM
Theory Of Operation 1-63
Page 84

Trend: Board 78354-66554 has trend capability. The trend times and display update times for
single and dual temperature are shown in table.
Trend Time Update Time Update Time
20 min
60
min
Tl T2
3.6 s 24.9 s 3.1 s
10.7 s
1.25
Single Temp
min 9.4 s
Note
I
I(cT
2h
4h
8h 1.42
24
h 4.27 min 30.0 min 3.74 min
21.4 s 2.5
42.7 s 5.0
min
10.0
min
min
18.7 s
37.4 s
min 1.25 min
Single temperature - each data sample requires 1 point of screen, Dual
temperature - T2 is updated every eighth point with respect to Tl.
1-64 Theory Of Operation
Page 85

Blatt von alte Seite l-43 verkleinern und horizontal hier einfiigen
Figure 1-19. Dual Temperature Board Block Diagram
Theory Of Operation l-85
Page 86

1-66 Theory Of Operation
Page 87

Respiration Board 78832-66562
The changing impedance, during respiration, between two ECG electrodes (RL & LL) is
measured and the signal processed to give a high resolution respiration signal output.
Input Circuits
The voltage across the two leads is transferred to the grounded section across transformer
Tl. In the grounded section the transformer forms part of a bridge network to which a 62.5
kHz sinusoidal signal is applied. This signal is derived from a 1 MHz square wave, which
is first divided (Ul) and then filtered to give an approximate sine shape at 62.5 kHz. The
changing voltage across the bridge, which is proportional to the changing impedance across
the electrodes, is input to the differential voltage amplifier (Q2, 3, 4, 5). The differential
signal is then rectified using a synchronous demodulator (U4). The output signal from the
demodulator is integrated (U5) and filtered to remove the excitation frequency and give a dc
respiration signal.
INOP Detection
This respiration signal is applied to a clamping amplifier (UlO) to limit the voltage to the
0 - 2 V range necessary for the analog to digital (A/D)
derived from the input of the synchronous demodulator, this absolute value of the respiration
signal is used to check whether an INOP condition exists (patient impedance > 2 kohms or
patient cable disconnected).
converter. Together with a voltage
Respiration Wave Signal Circuits
The dc respiration signal is also applied to the summing point (R30, R31). Amplifiers U9 and
U6 form a feedback compensation loop and when the analog switch (Q7, 8, 9) is closed, the
feedback loop works to bring the summing point to zero. When the analog switch is open, the
voltage at the output of the integrator (U6) is fixed. The clamping amplifier (Ull) has a gain
of 33 and provides the input to the A/D converter. Ull also clamps the signal to the 0 to 2 V
range.
Feedback Loop Operation
As an example, assume that the voltage at the output of U8 is +3 V (i.e. 1.5 kohm patient
impedance). In this case the voltage at the output of integrator U6 is -3 V and at the
summing point 0 V (see Figure l-20). The resulting range for the A/D converter via Ull is
from 1500-10 ohms to 1500-l-10 ohms. If the input impedance (i.e. patient impedance) exceeds
1500+10 ohms the microprocessor closes the analog switch (via FET driver) for approximately
3 ms. During this time the feedback loop via U9 and R40 is closed. This results in a fast
change of the integrator output voltage until the voltage at the summing point is zero. This
process takes approximately lms (see Figure 1-21).
The microprocessor now opens the analog switch and the voltage at the integrator output is
again fixed. The new range in the example (Figure l-22) is 1510-10 ohms to 1510-l-10 ohms.
Theory Of Operation 1-67
Page 88

Note
All values are only used as examples and are not actual values.
3
A/D Conversion
The A/D converter has eight input channels, two of which are internally connected to the
reference voltage and the input ground pin. The microprocessor controls the A/D converter
via the ramp start pin (RS) and the address pins AO, Al, A2. If the RS pin is low the
capacitor Cl5 is charged to the voltage at the selected input channel. If the RS pin goes high,
Cl5 is discharged via a constant current source in the A/D converter. The output of the A/D
converter is a pulse-width-modulated signal, where the pulse-width is proportional to the
input voltage.
A. Initial conditions
- AMPL\FIER -
+-
p&Lg u9
Figure l-20. Feedback Loop Operation - Stage 1
B. Patient impedence increases to 1.5 kohm +lO
-,” INTEGRATOR +U6
,g.N.&L~~ u9
Figure 1-21. Feedback Loop Operation - Stage 2
C. Summing
point again at zero volts
CLAMPING ‘
.I
AMPLIFIER+
CLAMPING
AMPL!!IER -
.I
AMPLIFIER
Figure l-22. Feedback Loop Operation - Stage 3
1-68 Theory Of Operation
Page 89

Test Signals
Test signals Tl and T2 are applied to switch U2, bringing to ground one or both points across
which the differential voltage is measured. The combinations of test signals and functions are
shown in Table l-l.
Table l-l. Test Signals and Results
Key: 0 = CMOS low level, 1 = CMOS high level
Digital Circuits
The A/D converted respiration and INOP signals are processed by the microprocessor
(U13) in the digital circuits and the results are passed to the shared memory on the display
microprocessor board (A2). The digital circuits also process information from the shared
memory for use in the respiration parameter board.
Channel 1 of timer U16 is reset regularly during normal operation by a pulse from the
microprocessor, forming a watchdog function. If the microprocessor is not working correctly
it will not reset the timer. The timer then overflows and causes a hard reset of the
microprocessor. The program makes an internal check and then begins a warm start to
recover from the failure.
Respiration Parameter Software
The respiration parameter software has the following functions:
n
Control Hardware functions and ADC
w Prepare ADC-reading for display
w Respiration Trigger
n
Derive Alarm conditions
n
Evaluate Trends
n
Communicate with shared memory
n
Internal Selftest
n
Trend
Theory Of Operation 1-69
Page 90

Trend times are shown below:
* Trend Time Update Time 78353B/44
2 min
20 min
60 min
-
3.1 s
9.4 s
2h
4h
8h
24 h
18.7 s
37.4 s
1.25 min
3.75 min
l-70 Theory Of Operation
Page 91

Faltblatt von alte Seite 1-47 hier einfiigen
Figure l-23. Respiration Board Block Diagram
Theory Of Operation 1-71
Page 92

1-72 Theory Of Operation
Page 93

Transcutaneous Partial CO2 and 02 Board 78834-66572
The tcpC02/tcp02 (transcutaneous partial) pressure parameter board A72 is used in
conjunction with transducers 15204A and 15205A on neonatal instruments 78833A and
78834A. It can process signals from either the 15204A tcpOz transducer or the 15205A
tcpCOz transducer. With certain monitor configurations (78834A neonatal monitor) it is
possible to have two of these parameter boards in the same instrument which enables the
simultaneous measurement of tcpCO2 and tcpOz.
Barometer board 78834-66573 provides the transcutaneous parameter boards with
atmospheric pressure information for calibration purposes and is secured to the parameter
board with clips. Only one barometer board is necessary even if the Monitor is configured to
monitor both tcpC0, and tcp02.
The floating and non-floating circuits of the board are separated by opto-couplers and a
transformer.
Transducer Recognition
The 15204A and 15205A transducers each have a coding resistor which enables the Monitor
to recognize whether a CO2 or 02 transducer is connected. The coding resistor forms part of
a voltage divider and the resulting voltage produced when the transducer is connected to an
instrument is fed to channel 8 of the analog mutiplexer U520.
tcpC02 Input
+12 V, -12 V are fed from the parameter board to the 15205A tcpC0, transducer for the
internal amplifier supply. The tcpC02 input amplifier U5OlC amplifies the output voltage
from the amplifier situated inside the 15205A tcpCOz transducer. The output of U5OlC is fed
to channel 3 of multiplexer U520.
tcp02 Input
The tcp02 input amplifiers U502 and U501D converts the current produced by the 15204A
tcpOz transducer into an analog voltage which is fed to channel 4 of analog multiplexer U520.
L
Polarization Voltage
The 15204A tcpOz transducer requires a polarization voltage for operation. This polarization
voltage of -745 mV is fed to the cathode of the transducer, and is also required when the
monitor is switched off and the transducer is still connected, allowing it to remain polarized
and ready for use. This polarization voltage produced by the 2.5 V dc supply and associated
circuitry is backed up by a rechargeable battery BT501. The output of the battery is fed to
channel 7 of multiplexer U520 for monitoring the battery voltage.
Theory Of Operation 1-73
Page 94

Heater Circuit
Both the 15204A and 15205A transducers contain a heating coil. When in operation the
heating coil heats up the patients skin to enhance the diffusion of gases through the skin.
The temperature of the skin and therefore of the heating coils must be carefully kept within
specified limits of the selected temperature (heating coil temperature can be selected using
softkeys; choice of 37°C or in the range 42OC to 45OC in steps of 1/2OC).
The microprocessor U6 provides a pulse width modulated heat signal which is transferred
from the non-floating to the floating circuits via opto-coupler U23. The heating coil circuit
U510B produces a dc heating voltage which is fed to the heating coil. This signal is also used
for the synchronisation of data transfer.
Temperature Control
Transducers 15204A and 15205A each have two internal thermistors which form part of a
bridge circuit. Tl thermistor with U504 and associated components and T2 with U505 with
associated components. The output of the thermistor bridges are fed to channel 5 and channel
6 of multiplexer U520. This information is used by the UP to feedback the required pulse
width modulated signal to maintain the selected temperature. Two comparators U506A and
U506B monitor the output of Tl bridge U504. If upper or lower specified temperature limits
are outside the defined temperature limits the comparators switch off the heating coil (this is
for patient safety).
Analog Multiplexer
The analog multiplexer U510 has eight analog inputs;
n
Channel 1 - floating ground
w Channel 2 - t2.5 V reference voltage
n
Channel 3 - tcpCO2 input
n
Channel 4 - tcpOz input
n
Channel 5 - Temp input Tl
n
Channel 6 - Temp input T2
n
Channel 7 - Battery voltage
w Channel 8 - Transducer recognition
The multiplexer is controlled by counter U519. The output of the multiplexer is clamped
between + and -3.2 V by diodes CR505 and CR506. Thisoutput is then given an offset by
U508B to produce only positive voltages. These analog voltages are then fed, in sequence, to
the analog pulse width conversion circuit U508A and U509.
1-74 Theory Of Operation
Page 95

Analog to Pulse Width Conversion
The analog to pulse width conversion operates as follows:
On the rising edge of the incoming heating pulse the output of flip-flop U523B is set high and
switch S (CR 508)
integrator output increases until the VA analog input voltage has been reached. At this time
the comparator U509A resets the flip-flop U523B, so the output goes low and the switch S is
closed to reset the integrator. The output Q of flip-flop U509A is therefore the pulse width
modulated signal
is opened. This starts the integration of flV input of the integrator. The
Y-----
The integrator output increases until the VA analog input voltage level has been reached, and
the integrator is reset (Sl closed *) The output of comparator U509A is therefore the pulse
20ms ,-I
I
Theory Of Operation 1-75
Page 96

width modulated signal having widths tx, ty . . .
voltages.
The 8 bit pulse width modulated signals, corresponding to the 8 analog voltages at
multiplexer U520, and a 9th synchronization pulse is transmitted serially and represents a
measurement cycle every 180 ms.
Heat
Pulse
and is proportional to the incoming analog
-l--L
l-l --- - - -----
cc
GND
Each pulse width signal is proportional to the input signals to multiplexer U520. The pulse
width modulated signals are then measured and the resulting information is processed by UP
U6.
FIEF pco2 ~02 Tl T2
Batt
Sensor
Repolarization
The 15204A tcp0z transducer can be electrically cleaned by repolarization. The UP U6
initiates, via softkey, a repolarization signal which is routed from the non-floating to floating
circuit of the parameter board through relay Kl. The repolarization signal reverses the
polarization voltage applied to the 15204A tcp0z sensor’s cathode and electrically removes
deposits.
Floating Power Supply
The floating power supply consists of an alternator on the non-floating section of the
parameter board (Tl, T2, Ql, &2), T2 transforms the dc voltage from the non-floating to the
floating section of the board. On the floating side 7 different dc voltages are produced: +12
V, -12 V, LV+, LV-, i-5 V, j-2.5 Vref. and +l Vref.
Digital Circuits
The pulse width modulated signals received by the UP U6 are processed by the firmware
(EPROM US) and the results are passed onto the monitors shared memory on the display UP
board A2. Ul,U2 and U3 are buffers for communication with the shared memory.
Clock
The 16 MHz clock U12 and divider circuit UlO produce a 4 MHz clock frequency for the 6303
UP system and a 250 kHz frequency for driving the floating power supply circuit.
1-76 Theory Of Operation
Page 97

Watchdog Circuit
Watchdog circuit provides reset information to the UP, if an error condition is present in the
system for more than 400 ms.
EAROM
The additional EAROM in the digital circuits is used to store offset voltages of the floating
hardware.
Barometer Board Information
The 8 bit data word from the Barometer board latch (Ul on A73) is fed directly onto the data
bus. Bits BO (feedback for successive approximately A/D conversion on the barometer board)
and BI (barometer board recognition) are interfaced to the data bus via buffer U15.
*Trend capability: The trend times and display update times are listed below
Trend time Trend time Update Time
2 min -
2 min
20 min 3.1 s
20 min
60 min
60 min
9.4 s 9.4 s
2h 2h
4h 4h
8h 1.25 min
8h
24
h 3.74 min
24
h
18.7 s
37.4 s
Theory Of Operation 1-77
Page 98

Parameter Software
The tcpOa/CO, software can be divided into 2 main blocks. These consist of the main
program that takes care of processing tcpOz/tcpCOz values and an interrupt program which
looks after timing tasks such as A/D conversion, temperature control of the sensors and
communication with the shared memory. Communication with the shared memory takes place
every 20 ms.
Software Block Diagram
Power On
I
-------------
I
I
I
I
------------- ---
I
I
Test l
Routines I
Initialize
Routines l
I
I
I
I
I Background
I
task
I
I
Control
I
I
I
l---l
I
I
I
I
I
I
I
I
I
I
I
I
I
I
I
I
I
I
I
I
I
I
I
I
-------------
I
I
I
I
I
--------------
I
Key
I
Processing
--------------
I Error
I Processing
--------------
I Alarm
Processing
--------------
I
Transducer
---I
---I Processing
Recognition
--------------
I
po2
--------------
I
PC02
---I
Processing
--------------
I
Heating,
---I Power
I
Processing
--------------
I
Barometer,
---I
---I Processing
Pressure
I
Processing
--------------
I
Trend
-----------me-
Interrupt (20ms)
I
---------
I
I
I
I
I
I
I
I
I
I
1 Task I________
I
Control I
---------
------------
I A/D
I
Conversion l-----l
I I
----- -------
I
Temperature
I
Control
------------
I
Shared I l
I
Memory
I
Communicat . I
------------
I
-----
I I
I----- I
I
I
I
I
I
I
I
I
I
I
I
I
I
I
t
1-78 Theory Of Operation
Page 99

Faltblatt von alte Seite l-53 hier einfiigen
Figure l-24. TcpC02/02 Board Block Diagram
Theory Of Operation 1-79
Page 100

Barometer Board 78834-66573
The Barometer Board (78834-66573)
board and supplies atmospheric pressure information, via connection Xl, to this tcpCOz/Oz
board. Atmospheric pressure (room air pressure) is measured for calibration purposes.
is secured and electrically connected to the tcpC0z/02
Circuit Operation
The barometer board consists of a pressure transducer U7 (bridge network) and appropriate
circuit to provide the microprocessor U6 on the transcutaneous gas parameter board with an
8 bit digital word proportional to the barometric pressure. The temperature compensated
pressure transducer elements are arranged in a bridge circuit and powered by a dc voltage
supply of 10.0 V generated by U5A and U6. Leg 2 of the bridge circuit is held at zero by zero
driver U6 and barometer adjustment is made via potentiometer Rll. The pressure output
signal is amplified at U4 and its voltage output, which is proportional to the atmospheric
pressure, is fed to the feedback input of digital to analog converter U2.
The analog output of U2 is input to Schmitt trigger circuit U3 and this in turn is output (BO)
to the microprocessor on the tcpCOz/Oz parameter board, A72.
U2 is an 8 bit DAC which is used as an analog to digital converter via successive
approximation as follows:
The microprocessor U6 initiates an 8 bit digital signal equal to l/2 of the full scale output of
U2 and the analog signal produced by U2 is internally compared with the feedback voltage
from U4. The comparator (U3)
or lower than the initial l/2 fullscale first guess value. On the basis of this, output BO is fed
back to the microprocessor U6 and the most significant bit of the 8 bit word is set High or
Low. The same then occurs for the next bit, bit 2, and this continues until 8 comparisons
have been made. The digital signal then present at the input of Ul and therefore at the input
of U2, is equal to the digitized voltage value from output of U4.
switches depending on whether the feedback voltage is higher
i-5 V, +12 V and -12 V are also fed from the parameter board to the barometer via connector
Xl.
A -4 Vref. signal is fed from the mother board via the parameter board where it is required
for A/D conversion, DAC U2 and generation of the transducer bridge voltage at U5A.
The barometric range is between 500 mmHg and 800 mmHg pressure which is equal to a
signal output at U4 of between 0.04 mV and 38.71 mV.
l-80 Theory Of Operation
 Loading...