

Page 1
Page 2

ThinPrep® Imaging System
Review Scope
Operator’s Manual
HOLOGIC, INC.
250 C
AMPUS DRIVE
MARLBOROUGH, MA 01752 USA
T
EL: 1-800-442-9892
1-508-263-2900
F
AX: 1-508-229-2795
W
EB: WWW.HOLOGIC.COM
For Use With Version 6.x.y Software
MAN-03352-001
Page 3

The ThinPrep® Imaging System is a PC-based and automated review system for use with ThinPrep.
.
cervical cytology sample slides. The ThinPrep
Imaging System is intended to help a cytotechnologist
or pathologist highlight areas of a slide for further manual review. The Product is not a replacement
for manual review. Determination of slide adequacy and patient diagnosis is at the sole discretion of
.
the cytotechnologists and pathologists trained by Hologic to evaluate ThinPrep
and only if it is finally determined by a court of competent jurisdiction that the Product sold to Cus
prepared slides. If
tomer thereunder was defective in design or contained a manufacturing defect and that such defect
was solely responsible for an error in diagnosis that caused harm to a patient, Hologic shall indem
nify Customer for the compensatory damages paid by Customer to discharge the personal injury
judgment with respect to Product.
Caution: Federal law restricts this device to sale by or on the order of a physician, or any other practitioner licensed by the law of the State in which the practitioner practices to use or order the use of
the device and are trained and experienced in the use of the ThinPrep Imaging System.
© Hologic, Inc., 2017. All rights reserved. No part of this publication may be reproduced, transmitted, transcribed, stored in a retrieval system, or translated into any language or computer language,
in any form, or by any means, electronic, mechanical, magnetic, optical, chemical, manual, or other
wise, without the prior written permission of Hologic, 250 Campus Drive, Marlborough, Massachusetts, 01752, United States of America.
Although this guide has been prepared with every precaution to ensure accuracy, Hologic assumes no
liability for any errors or omissions, nor for any damages resulting from the application or use of this
information.
This product may be covered by one or more U.S. patents identified at
http://www.hologic.com/patentinformation/
Hologic, PreservCyt and ThinPrep are registered trademarks in the United States and other countries. All other trademarks are the property of their respective companies.
Changes or modifications to this unit not expressly approved by the party responsible for compliance could void the user’s authority to operate the equipment.
Document Number: AW-09293-001 Rev. 005
Page 4

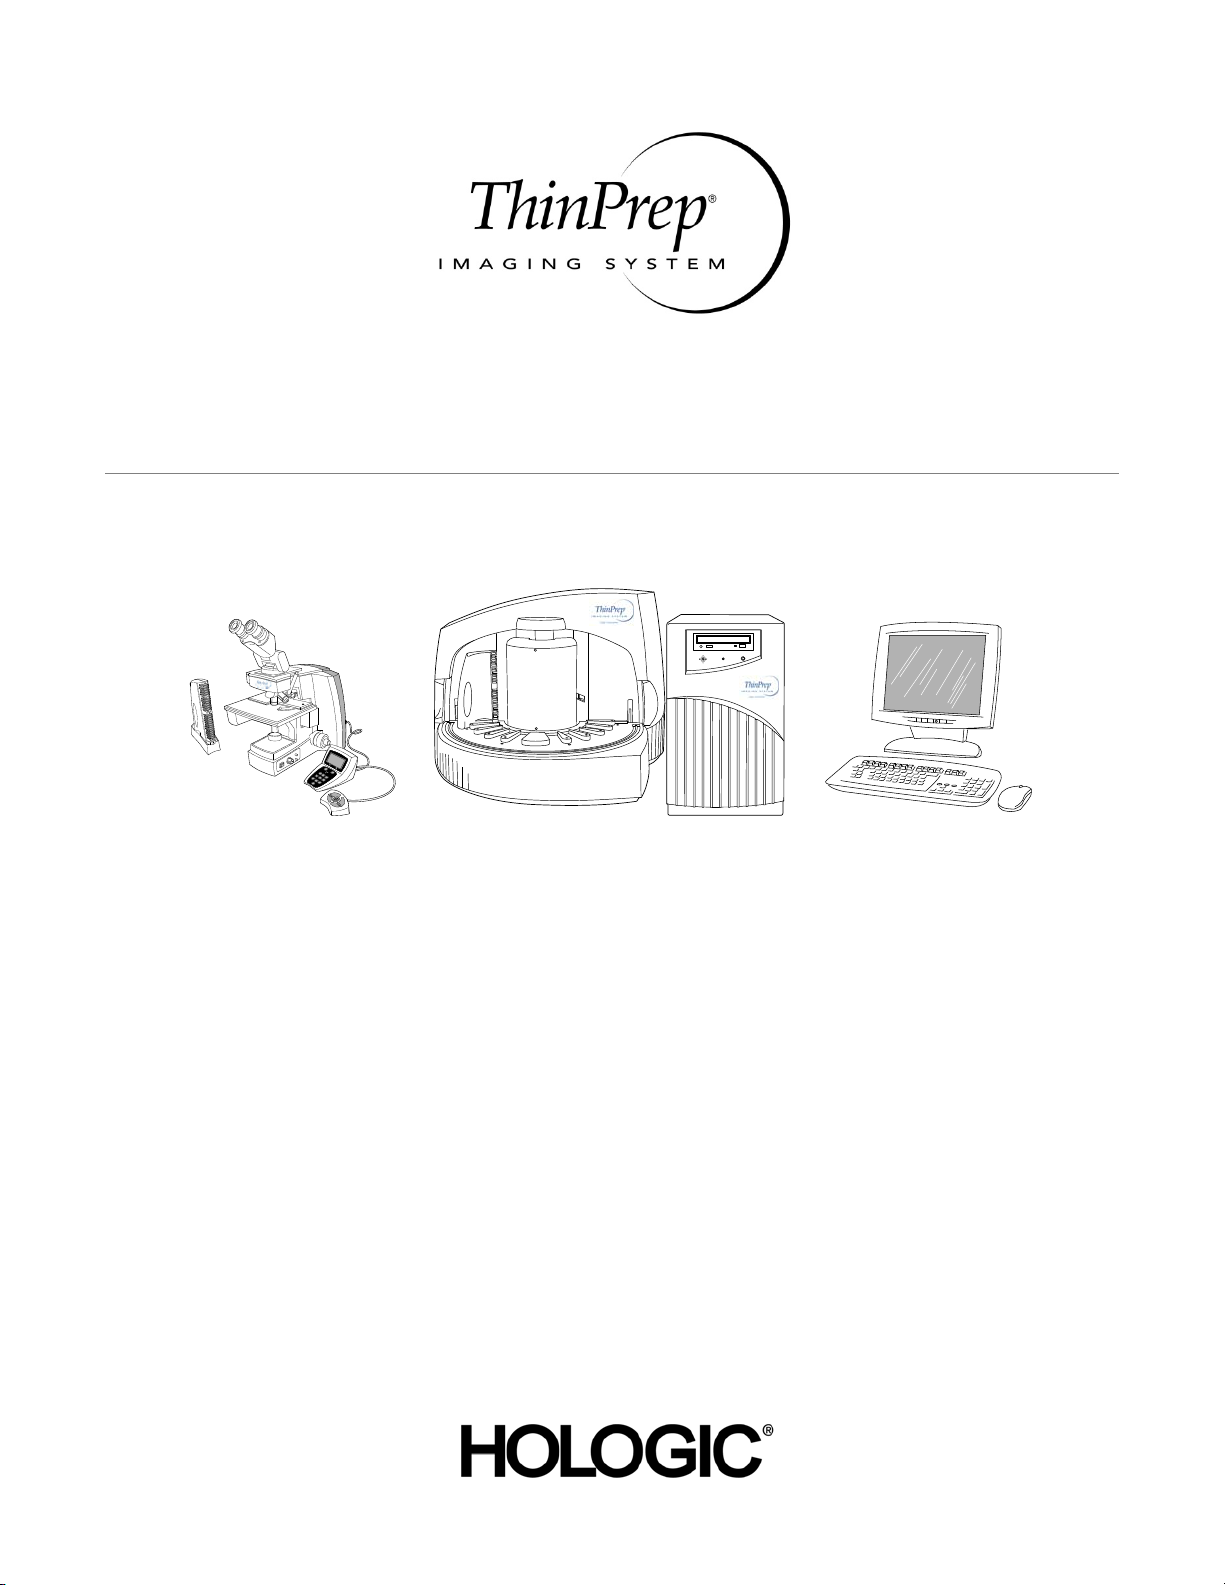
Imaging System
The ThinPrep
®
®
The ThinPrep
Imaging System
Page 5
Operation Summary and Clinical Information
The ThinPrep® Imaging System
Page 6

A. INTENDED USE
The Hologic ThinPrep® Imaging System (Imager) is a device that uses computer imaging
technology to assist in primary cervical cancer screening of ThinPrep Pap Test slides for the
presence of atypical cells, cervical neoplasia, including its precur sor lesio ns (Low Grade Sq uamou s
Intraepithelial Lesions, High Grade Squamous Intraepithelial Lesions), and carcinoma as well as all
other cytologic criteria as defi ned by 2001 B et hesda Sy stem : Term inol ogy for Rep orti ng Re sults of
Cervical Cytology
1
.
B. SUMMARY AND EXPLANATION OF THE SYSTEM
The ThinPrep Imaging System is an automated imaging and review system for use with ThinPrep
Pap Test slides. It combines imaging technology to identify microscopic fields of diagnostic interest
with automated stage movement of a microscope in order to locate these fields. In routine use, the
ThinPrep Imaging System selects 22 fields of view for a Cytotechnologist to review. Following
review of these fields, the Cytotechnologist will either complete the diagnosis if no abnormalities
are identified or review the entire slide if any abnormalities are identified. The ThinPrep Imaging
System also allows the physical marking of locations of interest for the Cytopathologist.
C. PRINCIPLES OF OPERATION
The ThinPrep Imaging System consists of an Image Processor and one, or more, Review Scopes.
The system makes use of computer imaging to select fields of view for presentation to a
Cytotechnologist on a Review Scope. Slides used with this system must first be prepared on a
ThinPrep 2000 or 3000 Processor, and stained with ThinPr ep Stain.
The Imaging Processor acquires and processes image data from the slides to identify diagnostically
relevant cells or cell groups based on an imaging algorithm that considers cellular features and
nuclear darkness. During slide imaging, the alphanumeric slide accession identifier is recorded and
the x and y coordinates of 22 fields of interest are stored in the computer database. This computer
also coordinates the communication of information between the Image Processor and the Review
Scopes.
After image processing, slides are distributed to Cytotechnologists for review utilizing the Review
Scopes. The Review Scope is a microscope with an automated stage to facilitate the locating of the
22 fields containing the cells of interest. Additionally, the Review Scope provides a method for
automated marking of objects for further review. Slides are individually loaded onto the Review
Scope stage, the alphanumeric slide accession identifier is automatically scanned and the stored x
and y coordinates representing fields of interest for that slide are electronically downloaded from
the computer to the Review Scope. The Cytotechnologist then uses a keypad to step through each
of the fields of interest (Autolocate). If the Cytotechnologist identifies any of these fields as
containing abnormal objects, that field may be marked electronically. The Review Scope will guide
the Cytotechnologist to conduct a review of the entire cell spot for any slide that h as had fields
electronically marked (Autoscan). The Cytotechnologist determines specimen adequacy and the
presence of infections during the review of the 22 fields of view presented by the ThinPrep Imaging
System. Either of two method s can be used to determine specimen adequacy. The first method is to
count cells and determine the average number of cells in the 22 fields of view presented by the
Imager. The second method is to count and determine the average number of cells in 10 fields of
view across the diameter of the cell spot. Either method will enable the Cytotechnologist to
determine if the minimum cells, as recommended by Bethesda System 2001 criteria, are present on
the slide. At the conclusion of the slide review electronically marked objects are automatically ink
marked. Any x and y coordinates representing marked locations al ong with a slide com pletion status
are then electronically transmitted back to the computer for storage.
MAN-03938-001 Rev. 002 page 2 of 23
Page 7

D. LIMITATIONS
Only pers onnel who ha ve bee n approp riately traine d should operat e the ThinPrep® Imaging System
Image Processor or Review Scope.
All slides that undergo primary automated screening with the Image Processor require manual
rescreening of the selected fields of view by a Cytotechnologist using a Review Scope.
The ThinPrep Imaging System is only indicated for use with the ThinPrep Pap Test.
The laboratory Technical Supervisor should establish individual workload limits for personnel using the
ThinPrep Imaging System. The maximum daily limit specified is only an upper limit and should never be used
as an expectation for daily productivity or as a performance target.
The ThinPre p Im aging Sy ste m has n ot bee n pro ven t o be safe or effective at workload levels which
exceed product labeling.
ThinPrep slides with fiducial marks must be used.
Slides must be stained using the ThinPrep Stain according to the applicable ThinPrep Imaging
System slide staining protocol.
Slides should be clean and free of debris before being placed on the system.
The slide coverslip should be dry and located correctly.
Slides that are broken or poorly coverslipped should not be used.
Slides used with the ThinPrep Imaging System must contain properly formatted accession number
identification information as described in the operator’s manual.
Slides once successfully imag ed on the Image Processor cannot be imaged again.
The performance of the ThinPrep Imaging System using slides prepared from reprocessed sample
vials has not been evaluated; therefore it is recommended that these slides be manually reviewed.
E. WARNINGS
The Imager generates, uses, and can radiate radio frequency energy and may cause interference to
radio communications.
A Hologic authorized service representative must install the ThinPrep Imaging System.
F. PRECAUTIONS
Caution should be used when loading and unloading glass slides on the ThinPrep Imaging System
to prevent slide breakage and/or injury.
Care should be taken to assure that slides are correctly oriented in the ThinPrep Imaging System
cassettes to prevent rejection by the system.
Partially processed slide cassettes should not be removed from the Image Processor, as data m ay be
lost.
The Image Processor should be place d on a flat, sturdy surface away from any vibrating machinery
to assure proper operation.
MAN-03938-001 Rev. 002 page 3 of 23
Page 8

G. PERFORMANCE CHARACTERISTICS
A multi-center, two-armed clinical study was performed over an eleven (11) month period at four
(4) cytology laboratory sites within the United States. The objective of the study entitled “MultiCenter Trial Evaluating the Primary Screening Capability of the ThinPrep
to show that routine screening of ThinPrep Pap Test slides using the ThinPrep Imaging System is
equivalent to a manual review of ThinPrep slides for all categories used for cytologic diagnosis
(specimen adequacy and descriptiv e diagnosis) as defined by the Bethesda System criteria
The two-arm study approach allowed a comparison of the cytologic interpretation (descriptive
diagnosis and specimen adequacy) from a single ThinPrep prepared slide, screened first using
standard laboratory cervical cytology practices (Manual Review) and then after a 48 day time lag
were screened with the assistance of the ThinPrep Imaging System (Imager Review). A subset of
slides from the study were reviewed and adjudicated by a panel of three (3) independent
Cytopathologists to determine a consensus diagnosis. The consensus diagnosis was used as a “gold
standard” for truth to evaluate the results of the study.
G.1 LABORATORY AND PATIENT CHARACTERISTICS
Of the 10,359 subjects in the study, 9,550 met the requirements for inclusion in the descriptive
diagnosis analysis. During the study, 7.1% (732/10,359) slides could not be read on the Imager and
required a manual review during the Imager Review arm. Excessive number of air bubbles on the
slides was the leading contributor. Additional factors included focus pr oblems, slide density, slide
identification read failures, slides detected out of position, multip le slides seated within a cassette
slot and slides that had already been imaged. The cytology laboratories participating in the study
were comprised of four centers. All sites selected had extensive experience in the processing and
evaluation of gynecologic ThinPrep slides, and were trained in the use of the ThinPrep Imaging
System. The study population represented diverse geographic region s and subject populations of
women who would undergo cervical screening with the ThinPrep Imaging System in normal clinical
use. These sites included both women being routinely screened (screening population) and patients
with a recent previous cervical abnormality (referral population) . The characteristics of the study
sites are summarized in Table 1.
Table 1: Site Characteristics
®
Imaging System” was
2
.
Site 1 2 3 4
Low Risk Population
High Risk Population
HSIL+ prevalence
ThinPrep Pap Tests Per Year
Number of Cytotechnologists
Number of Cytotechnologists in Study
Number of Cytopathologists
Number of Cytopathologists in Study
88% 82% 90% 94%
12% 18% 10% 6%
1.1% 0.7% 0.4% 0.6%
120,000 70,200 280,000 105,000
14 9 32 11
2 2 2 2
6 5 6 14
1 2 1 2
MAN-03938-001 Rev. 002 page 4 of 23
Page 9

G.2 DESCRIPTIVE DIAGNOSIS SENSITIVITY AND SPECIFICITY ESTIMATES
A panel of three independent Cytopathologists adjudicated slides from all discordant (one-grade or
higher cytologic difference) descriptive diagnosis cases (639), all concordant positive cases (355)
and a random 5% subset of the 8550 negative concordant cases (428). The Cytopathologists on the
adjudication panel were board-certified, all of whom had a subspecialty certification in
Cytopathology. Their experience levels in Cytopathology ranged from 6 to 12 years. Two of the
adjudicators were from university practices and one adjudicator was from a private medical center.
The volumes for the adjudicator’s institutions ranged from 12,0 00 to 30,000 ThinPrep
annually.
A consensus diagnosis was defi ned as agreement by at least 2 of 3 Cytopathologists. All sli des sent
to the panel of Cytopathologists were not identified by site nor ordered in any fashion. When a
consensus diagnosis could not be obtained by at least 2 of 3 Cytopathologists, the full panel of
Cytopathologists reviewed each case simul taneously usin g a mult i-headed mi croscope to determ ine
a consensus diagnosis.
The adjudicated results were used as a “gold standard” to define the following major “true”
descriptive diagnosis classifications of the Bethesda System: Negative, ASCUS, AGUS, LSIL,
HSIL, Squamous Cell Carcinoma (SQ CA) and Glandular Cell Carcinoma (GL CA). Estimates of
sensitivity and specificity together with 95% confidence intervals were calculated for the Manual
Review and Imager Review arms of the study. The differences in sensitivity and specificity between
the two arms, together with their 95% confidence intervals were also calcu lated. Among the random
5% subset of 8,550 cases (428 slides) that were found to be negative by both arms and adjudicated,
there were 425 “true” negative and 3 “true” ASCUS slides. A multiple imputation technique was
used to adjust the numbers of true positives and true negatives for the 8,550 negative concord ant
cases based on the 5% of cases that were adjudicated
3
.
®
Pap Tests
Tables 2-4 below summarize the descriptive diagnosis sensitivity and specificity estimates with 95%
confidence intervals for each of the four sites and all sites combined for “true” ASCUS+, LSIL+
and HSIL+.
Table 2: Adjudicated Review Versus Imager And Manual Reviews ASCUS+
Descriptive Diagnosis Summary.
Sensitivity is a percent of “true” ASCUS+ (combined ASCUS, AGUS, LSIL, HSIL, SQ CA and GL CA) slides
classified in either study arm as ASCUS+ and specificity is a percent of “true” Negative slides classified in either
study arm as Negative.
Sensitivity Specificity
Site/
Number
Cases
Site 1
180
Site 2
230
Site 3
103
Site 4
179
All
692
Numbers in parentheses represent 95% confidence intervals.
Manual Imager Difference
77.2%
(70.4, 83.1)
63.1%
(56.5, 69.3)
80.6%
(71.6, 87.7)
87.2%
(81.4, 91.7)
75.6%
(72.2, 78.8)
78.3%
(71.6, 84.1)
77.5%
(71.4, 82.6)
94.2%
(87.8, 97.8)
84.4%
(78.2, 89.4)
82.0%
(78.8, 84.8)
+1.1%
(-5.8, 8.0)
+14.4%
(8.2, 20.5)
+13.6%
(4.3, 22.9)
-2.8%
(-10.6, 5.0)
+6.4%
(2.6, 10.0)
Site/
Number
Cases
Site 1
2132
Site 2
2210
Site 3
2196
Site 4
2313
All
8851
Manual Imager Difference
98.7%
(98.1, 99.1)
95.8%
(94.9, 96.6)
98.5%
(97.9, 99.0)
97.3%
(96.6, 97.9)
97.6%
(97.2, 97.9)
99.2%
(98.7, 99.5)
96.1%
(95.2, 96.9)
98.8%
(98.3, 99.2)
97.0%
(96.2, 97.7)
97.8%
(97.4, 98.1)
+0.4%
(-0.1, 1.0)
+0.3%
(-0.7, 1.3)
+0.4%
(-0.3, 1.0)
-0.3%
(-1.1, 0.5)
+0.2%
(-0.2, 0.6)
The results presented in Table 2 show that for ASCUS+, the increase in sensitivity of the Imager
Review over the Manual Review was statistically significant with the lower limit of the 95%
confidence interval being 2.6% for all sites combined. The observed difference between sensitivities
for ASCUS+ varied among the sites from –2.8% with a 95% confi dence int erval of (–10.6%; 5.0%)
to +14.4% with a 95% confidence interval of (8.2%; 20.5%) . The difference in specificity results
between the Imager Review and the Manual Review was not statistically significant with a 95%
confidence interval of -0.2% to +0.6%. The observed differences between specificities varied am ong
the sites from –0.3% to +0.4%.
MAN-03938-001 Rev. 002 page 5 of 23
Page 10

Table 3: Adjudicated Review Versus Imager Review LSIL+ Descriptive Diagnosis
Summary for Each Site and All Sites Combined.
Sensitivity is a percent of “true” LSIL+ (combined LSIL, HSIL, SQ CA and GL CA) slides classified in either study
arm as LSIL+ and specificity is a percent of “true” Non-LSIL+ (combined Negative, ASCUS, AGUS) slides classified
in either study arm as Non-LSIL+.
Sensitivity Specificity
Site/
Number
Cases
Site 1
104
Site 2
98
Site 3
62
Site 4
111
All
375
Numbers in parentheses represent 95% confidence intervals.
Manual Imager Difference
84.6%
(76.2, 90.9)
70.4%
(60.3, 79.2)
77.4%
(65.0, 87.1)
84.7%
(98.1, 99.1)
79.7%
(75.3, 83.7)
82.7%
(74.0, 89.4)
72.4%
(62.5, 81.0)
85.5%
(74.2, 93.1)
78.4%
(76.6, 90.8)
79.2%
(74.7, 83.2)
-1.9%
(-9.5, 5.6)
+2.0%
(-6.9, 11.0)
+8.1%
(-4.0, 20.1)
-6.3%
(-14.7, 2.1)
-0.5%
(-5.0, 4.0)
Site/
Number
Cases
Site 1
2208
Site 2
2342
Site 3
2237
Site 4
2381
All
9168
Manual Imager Difference
98.7%
(98.1, 99.1)
99.3%
(98.8, 99.6)
99.2%
(98.7, 99.5)
98.7%
(98.2, .99.2)
99.0%
(98.8, 99.2)
99.3%
(98.9, 99.6)
98.9%
(98.4, 99.3)
99.5%
(99.1, 99.8)
98.7%
(98.1, 99.1)
99.1%
(98.9, 99.3)
+0.6%
(0.1, 1.0)
-0.4%
(-0.8, .001)
+0.3%
(-0.1, 0.6)
-0.08%
(-0.6, 0.4)
+0.09%
(-0.1, 0.3)
The results presented in Table 3 show that the difference between sensitivities of the Imager Review
and Manual Review arms for LSIL+ for all sites co mbined was not statistically significant with a
95% confidence interval of –5.0% to +4.0%. The observed difference between sensitivities for
LSIL+ varied among the sites from –6.3% with a 95% confidence interval of (–14.7%; 2.1%) to
+8.1% with a 95% confidence interval of (–4.0%; 20.1%). The difference in specificity results
between the Imager Review and the Manual Review was not statistically significant with a 95%
confidence interval of -0.1% to +0.3%. The observed differences between specificities varied am ong
the sites from –0.4% to +0.6%.
Table 4: Adjudicated Review Versus Imager Review HSIL+ Descriptive Diagnosis
Summary for Each Site and All Sites Combined.
Sensitivity is a percent of “true” HSIL+ (combined HSIL, SQ CA and GL CA) slides classified in either study arm as
HSIL+ and specificity is a percent of “true” Non-HSIL+ (combined Negative, ASCUS, AGUS, LSIL) slides classified
in either study arm as Non-HSIL+.
Sensitivity Specificity
Site/
Number
Cases
Site 1
38
Site 2
40
Site 3
22
Site 4
39
All
139
Numbers in parentheses represent 95% confidence intervals.
Manual Imager Difference
89.5%
(75.2, 97.1)
72.5%
(56.1, 85.4)
72.7%
(49.8, 89.3)
61.5%
(44.6, 76.6)
74.1%
(66.0, 81.2)
92.1%
(78.6, 98.3)
70.0%
(53.4, 83.4)
86.4%
(65.1, 97.1)
74.4%
(57.9, 87.0)
79.9%
(72.2, 86.2)
2.6%
(-8.9, 14.1)
-2.5%
(-15.4, 10.4)
+13.6%
(-0.7, 28.0)
+12.8%
(-1.7, 27.4)
+5.8%
(-1.1, 12.6)
Site/
Number
Cases
Site 1
2274
Site 2
2400
Site 3
2277
Site 4
2453
All
9404
Manual Imager Difference
98.8%
(98.3, 99.2)
99.8%
(99.5, 99.9)
99.7%
(99.4, 99.9)
99.5%
(99.2, 99.8)
99.4 %
(99.2, 99.6)
99.5%
(99.1, 99.8)
99.6%
(99.2, 99.8)
99.7%
(99.4, 99.9)
99.8%
(99.5, 99.9)
99.6%
(99.5, 99.7)
+0.7%
(0.2, 1.2)
-0.1%
(-0.3, .09)
0%
(-0.2, 0.2)
+0.3%
(-0.003, 0.6)
+0.2%
(0.06, 0.4)
MAN-03938-001 Rev. 002 page 6 of 23
Page 11

The results presented in Table 4 show that the difference between sensitivities of the Imager Review
and Manual Review arms for HSIL+ for all sites combined was not statistically significan t with a
95% confidence interval of -1.1% to +12.6%. The observed difference between sensitivities for
HSIL+ varied among the sites from –2.5% with a 95% confidence interval of (–15.4%; 10.4%) to
+13.6% with a 95% confidence interval of (–0.7%; 28.0%). The increase in specificity of the Imager
Review over the Manual Review was statistically significant with a 95% confidence interval of
+0.06% to +0.4%. The observed differences between specificities varied among the sites from –
0.1% to +0.7%.
Tables 5-9 show the performance of the Imager Review and Manual Review compared to the final
consensus diagnosis made by the adjudication panel (truth) for the following major descriptive
diagnosis classifications of the Bethesda System: Negative, ASCUS, AGUS, LSIL, HSIL, Cancer*
(CA)
*Includes SQ CA and GL CA.
Abbreviations for Diagnoses: NEG = Normal or negative, ASCUS = Atypical Squamous Cells of Undetermined Significance,
AGUS = Atypical Glandular Cells of Undetermined Significance, LSIL = Low-grade Squamous Intraepithelial Lesion, HSIL
= High-grade Squamous Intraepithelial Lesion, SQ CA = Squamous Cell Carcinoma, GL CA = Glandular Cell
Adenocarcinoma.
All 786 Cases Determined To Be Negative By Adjudication
Table 5: 6x6 “True Negative” Contingency Table For All Sites Combined
Unadjudicated Manual Review Arm Diagnosis
NEG ASCUS AGUS LSIL HSIL CA TOTAL
NEG 425 138 6 10 6 2 587
ASCUS 130 39 1 3 - - 173
AGUS 5 - - - - - 5
LSIL 9 5 - 2 - - 16
HSIL 1 1 - - 3 - 5
CA - - - - - - 0
Unadjudicated Imager
Review Arm Diagnosis
TOTAL 570 183 7 15 9 2 786
Among the 786 cases determined by the adjudication panel to be Negative, 587 (74.7%) cases in the
Imager Review arm and 570 (72.5%) cases in the Manual Review arm were diagnosed as Negative
and 21 (2.7%) cases in the Imager Review arm and 26 (3.3%) cases in the Manual Review arm were
diagnosed as LSIL+.
Table 6: 6x6 “True ASCUS” Contingency Table For All Sites Combined
All 251 Cases Determined To Be ASCUS By Adjudication
Unadjudicated Manual Review Arm Diagnosis
NEG ASCUS AGUS LSIL HSIL CA TOTAL
NEG 3 32 - 7 3 - 45
ASCUS 70 47 1 20 4 - 142
AGUS 1 - - - - - 1
LSIL 6 21 - 16 7 - 50
HSIL 2 3 - 5 1 1 12
CA 1 - - - - - 1
Unadjudicated Imager
Review Arm Diagnosis
TOTAL 83 103 1 48 15 1 251
Among the 251 cases determi ned by the adjudication panel to be ASCUS, 142 (56.6%) cases in the
Imager Review arm and 103 (41.0%) cases in the Manual Review arm were diagnosed as ASCUS
and 45 (17.9%) cases in the Imager Review arm and 83 (33.1%) cases in the Manual Review arm
were diagnosed as Negative.
MAN-03938-001 Rev. 002 page 7 of 23
Page 12

Table 7: 6x6 “True AGUS” Contingency Table For All Sites Combined
All 10 Cases Determined To Be AGUS By Adjudication
Unadjudicated Manual Review Arm Diagnosis
NEG ASCUS AGUS LSIL HSIL CA TOTAL
NEG - 2 1 - 1 - 4
ASCUS - - 1 - - - 1
AGUS 2 - 1 - - 1 4
LSIL - - - - - - 0
HSIL - - - - - - 0
CA - - - - - 1 1
Unadjudicated Imager
Review Arm Diagnosis
TOTAL 2 2 3 0 1 2 10
Among the 10 cases determined by the adjudication panel to be AGUS, 4 (40.0%) cases in the
Imager Review arm and 3 (30.0%) cases in the Manual Review arm were diagnosed as AGUS and
4 (40.0%) cases in the Imager Review arm and 2 (20.0%) cases in the Manual Review arm were
diagnosed as Negative.
Table 8: 6x6 “True LSIL” Contingency Table For All Sites Combined
All 236 Cases Determined To Be LSIL By Adjudication
Unadjudicated Manual Review Arm Diagnosis
NEG ASCUS AGUS LSIL HSIL CA TOTAL
NEG - 4 - 12 1 - 17
ASCUS 13 16 - 20 1 - 50
AGUS - - - - - - 0
LSIL 8 20 - 115 12 - 155
HSIL - - - 5 9 - 14
CA - - - - - - 0
Unadjudicated Imager
Review Arm Diagnosis
TOTAL 21 40 0 152 23 0 236
Among the 236 cases determined by the adjudication panel to be LSIL, 155 (65.6%) cases in the
Imager Review arm and 152 (64.4%) cases in the Manual Review arm were diagnosed as LSIL and
17 (7.2%) cases in the Imager Review arm and 21 (8.9%) cases in the Manual Review arm were
diagnosed as Negative.
Table 9: 6x6 “True HSIL” Contingency Table For All Sites Combined
All 138 Cases Determined To Be HSIL By Adjudication
Unadjudicated Manual Review Arm Diagnosis
NEG ASCUS AGUS LSIL HSIL CA TOTAL
NEG - 1 - - 1 - 2
ASCUS 2 4 - 2 1 - 9
AGUS - - - - - - 0
LSIL 1 - - 10 6 - 17
HSIL 3 3 1 9 91 1 108
CA - - - - 1 1 2
Unadjudicated Imager
Review Arm Diagnosis
TOTAL 6 8 1 21 100 2 138
MAN-03938-001 Rev. 002 page 8 of 23
Page 13

Among the 138 cases determined by the adjudication panel to be HSIL, 108 (78.3%) cases in the
Imager Review arm and 100 (72.5%) cases in the Manual Review arm were diagnosed as HSIL and
2 (1.4%) cases in the Imager Review arm and 6 (4.3%) cases in the Manual Review arm were
diagnosed as Negative.
There was one (1) squamous cell carcinoma (SQ CA) case resulting from adjudication. It was
diagnosed as HSIL in the Imager Review arm and SQ CA in the Manual Review arm.
Table 10 shows the study subjects unadjudicated descriptive diagnosis marginal frequencies for
benign cellular changes for all sites combined.
Table 10: Unadjudicated Marginal Frequencies Summary of Descriptive Diagnosis
for Benign Cellular Changes – All Sites Combined.
Manual Review Imager Review
Number of Patients: 9550 9550
Descriptive Diagnosis N % N %
Benign Cellular Changes:
Infection:
Trichomonas Vaginalis 8 0.1 8 0.1
Fungal organisms consistent with Candida spp. 47 0.5 31 0.3
Predominance of coccobacilli 71 0.7 60 0.6
Bacteria consistent with Actinomyces spp. 1 0.0 1 0.0
Cellular Changes associated with Herpes virus 1 0.0 1 0.0
Other Infection 1 0.0 0 0.0
Reactive Cellular Changes Associated with:
Inflammation 218 2.3 156 1.6
Atrophic with inflammation (atrophic vaginitis) 68 0.7 46 0.5
Radiation 0 0.0 0 0.0
Intrauterine contraceptive device (IUD) 0 0.0 0 0.0
Other Reactive Cellular Change 34 0.4 14 0.1
Note: Some patients had more than one diagnostic subcategory.
405 4.2 293 3.1
The Manual Review showed a higher rate of Benign Cellular Changes (405) than the Imager
Review cases (293).
G.3 ANALYTICAL PERFORMANCE OF THINPREP IMAGING SYSTEM FOR
DETECTION OF CERVICAL CANCER USING THINPREP
®
PAP TEST SLIDES
FRESHLY PREPARED FROM ARCHIVAL SAMPLES
This analytical study was conducted to compare the Bethesda System 2001 results, obtained by a
Cytotechnologist and a Cytopathologist, when their review was limited to 22 fields that were selected
by the ThinPrep Imaging System, to their diagnostic results obtained from their independent blinded
review of the entire cell spot on the ThinPrep Pap Test slides. All of the reviews were performed in an
independent and blinded manner. The test materials consisted of 33 archival PreservCyt-preserved
cervical samples that had been previously diagnose d a s AG US o r cancer . One ThinPrep Pap Test slide
was freshly prepared from each of the 33 original PreservCyt vials. All of the ThinPrep slides used in
the study were made on the TP-2000 processor and stained with ThinPrep Stain. Based on the cur rent
cervical cancer prevalence rate in the United States, 33 cases of cervical cancer would represent the
number of invasive cervical cancer cases in a population of approximately 275,000 women
4
.
Initially, a board-certified Cytopathologist manually reviewed all of the fields on the ThinPrep Pap Test
slides and identified and recorded the number of individual cancer cells and clusters of cancer cells that
were present. For this part of the study, the Cytopathologist was not required to record any other cells
with other Bethesda System 2001 diagnoses. The 33 cases included slides that represented both rare
numbers of cancer cells (5-20 per slide), and numerous cancer cells (>20/slide). Cancer cells were
categorized according to Bethesda System 2001 criteria for Glandular Cancer, Ade nocarcinom a-in-situ
and Squamous Cell Cancer. Each slide was then processed on a ThinPrep Imaging System. The
Cytotechnologist then reviewed only the 22 fields of view presented by the Autolocate mode of the
Review Scope. No review outside of the selected 22 fields of view was permitted. For each field of
view, the Cytotechnologist counted and recorded all abnormal cell types based on the following seven
Bethesda System classifications: ASCUS, LSIL, HSIL, AGUS, Glandular Cancer, Squamous Cell
Carcinoma and Adenocarcinoma-In-Situ.
MAN-03938-001 Rev. 002 page 9 of 23
Page 14

Finally, the same Cytopathologist who had conducted the manual review of the entire ThinPrep
®
Pap
Test slide, independently re-reviewed the slides using the identical method used by the
Cytotechnologists. The Cytopathologist was blinded from the original manual review results. For each
of the 22 fields of view selected by the ThinPrep Imaging System, the Cytopathologist verified and
recorded the number of individual cancer cells, clusters of cancer cells, and any other abnormalities
present. Table 11 summarizes the results from this study:
Table 11: Summary of Results From Restricted Analytical Cancer Study
Cytopathologist Full Manual
Review
10 Glandular Cancer
1 Adenocarcinoma In-situ 1 Adenocarcinoma In-Situ 1 Adenocarcinoma In-Situ
22 Squamous Cell Carcinoma
Total = 33 Total = 33 Total = 33
Cytotechnologist Review of Imager
Identified 22 Fields of View *
5 Glandular Carcinoma
1 Squamous Cell Carcinoma
1 Adenocarcinoma In-situ
2 HSIL/AGUS
1 ASC-H/ASC-US
3 Glandular Carcinoma
12 Squamous Cell Carcinoma
1 Squamous/Glandular Carcinoma
2 Adenocarcinoma In-situ
4 HSIL
Cytopathologist Review of
Imager Identified 22 Fields
of View **
7 Glandular Carcinoma
1 Squamous Cell Carcinoma
1 AGUS
1 HSIL
21 Squamous Cell Carcinoma
1 Adenocarcinoma In-situ
* In the intended use of the ThinPrep Imaging System (Imager), the Cytotechnologist would perform a full manual slide review
of each of these cases and pass them on to a Cytopathologist for further review.
* *In the intended use of the ThinPrep Imaging System (Imager), the Cytopathologist would perform a full manual slide review of
each of these cases.
The results in Table 11 demonstrate the ability of the ThinPrep Imaging System to successfully identify
abnormalities in the 22 fields of view presented during the Autolocate mode of slide review. In all 33
cases in this study, the ThinPrep Imaging System identified and presented cells among the 22 fields of
view that were categorized as Cancer, HSIL, AGUS or ASCUS. In addition, the Cytopathologists’
confirming review of the identical 22 fields of view showed consistent, but slightly improved results
with all cases being categorized as Cancer, HSIL or AGUS. Consistent with the intended use of the
ThinPrep Imaging System, the Cytotechnologists’ diagnoses in every one of these 33 cas es would have
invoked the full slide Autoscan mode that would require a Cytotechnologist to screen the entire slide
before making a final diagnosis. The results of this study indicate that ThinPrep Imaging System will
accurately lead to a full manual slide review for the detection of cervical cancer or its precursor lesi ons.
G.4 SPECIMEN ADEQUACY STUDY
Of the 10,359 subjects in the study, 9627 met the requirements for inclusion in the specimen adequ acy
analysis.
MAN-03938-001 Rev. 002 page 10 of 23
Page 15

Table 12: Unadjudicated Marginal Frequencies Summary of Specimen Adequacy
Results – All Sites Combined.
Manual Review Imager Review
Number of Patients:
Descriptive Diagnosis N % N %
Satisfactory for Evaluation
Satisfactory but Limited by
Endocervical Component Absent 1196 12.4 1397 14.5
Scant Squamous Epithelial Component 92 1.0 102 1.1
Obscuring Blood 45 0.5 17 0.2
Obscuring Inflammation 69 0.7 68 0.7
No Clinical History 982 10.2 933 9.7
Cytolysis 4 0.0 2 0.0
Other 6 0.1 33 0.3
Unsatisfactory for Evaluation
Endocervical Component Absent 6 0.1 0 0.0
Scant Squamous Epithelial Component 35 0.4 22 0.2
Obscuring Blood 17 0.2 2 0.0
Obscuring Inflammation 8 0.1 5 0.1
No Clinical History 2 0.0 2 0.0
Cytolysis 0 0.0 0 0.0
Other 2 0.0 0 0.0
Note: Some patients had more than one diagnostic subcategory.
9627 9627
7375 76.6 7346 76.3
2186 22.7 2252 23.4
66 0.7 29 0.3
For SAT cases, there was agreement between the Manual Review cases (7375) and the Imager
Review cases (7346). For SBLB cases, there is agreement between the Manual Review cases (2186)
and the Imager Review cases (2252). Unsatisfactory cases were greater in the Manual Review cases
(66) versus the Imager Review cases (29).
The adjudicated results were used as a “gold standard” to define “true” specimen adequacy
classifications of the Bethesda System: SAT/SBLB and UNSAT. There were 58 “true” UNSAT
cases and 9569 “true” SAT/SBLB cases.
Table 13 below summarizes specimen adequacy performance for the Imager Review and Manual
Review arms for all four sites and all sites combined using the Bethesda System 1991 criteria.
Table 13: Adjudicated Review Versus Imager Review Specimen Adequacy
Summary for All Sites and All Sites Combined.
Sensitivity is a percent of “true” UNSAT slides classified in either study arm as UNSAT and specificity is a percent of
“true” SAT/SBLB slides classified in either study arm as SAT/SBLB.
Sensitivity Specificity
Site/
Number
Cases
Site 1
21
Site 2
6
Site 3
5
Site 4
26
All
58
CI*
*95% Confidence Interval
Manual Imager Difference
0%
(0/21)
100%
(6/6)
80.0%
(4/5)
30.8%
(8/26)
29.3%
(17/58)
(18.1, 42.7)
0%
(0/21)
16.7%
(1/6)
60.0%
(3/5)
19.2%
(5/26)
13.8%
(8/58)
(6.1, 25.4)
0.0%
(0/21)
-83.3%
(-5/6)
-20.0%
(-1/5)
-11.5%
(-3/26)
-15.5%
(-9/58)
(-25.9, -5.0)
All ThinPrep
®
slides that produced discordant unsatisfactory determinations (Manual Review arm
Site/
Number
Cases
Site 1
2292
Site 2
2476
Site 3
2323
Site 4
2478
All
9569
CI*
Manual Imager Difference
100%
(2292/2292)
98.9%
(2449/2476)
99.2%
(2304/2323)
99.9%
(2475/2478)
99.5%
(9520/9569)
(99.3, 99.6)
100%
(2292/2292)
99.6%
(2465/2476)
99.7%
(2315/2323)
99.9%
(2476/2478)
99.8%
(9548/9569)
(99.7, 99.9)
0.0%
(0/2292)
+0.6%
(16/2476)
+0.5%
(11/2323)
+0.04%
(1/2478)
+0.3%
(28/9569)
(0.2, 0.4)
MAN-03938-001 Rev. 002 page 11 of 23
Page 16

vs. Imager Review arm) during the clinical study were assessed in an additional clinical support
study to compare the method used for specimen adequacy in the clinical study with a control cell
count of the slides and 3 differ ent methods as foll ows: (1) Manual assessment of specim en adequacy
on the entire microscope slide based on ThinPrep Bethesda System 1991 criteria; (2) Using the
“diameter” method of Bethesda Syst em 2001, which requi res that t he Cyt otechn ologi st c ounts cel ls
in 10 fields of view along the diameter of the cell spot and calculate the number of cells on the slide;
(3) Having the Cytotechnologist count the cells in the 22 fields o f view pre sented by t he system and
calculate the number of cells on the slide.
This additional support study demonstrated that the Bethesda System 1991 estimation methods,
including the method used in the clinical study, do not generate similar specimen adequacy
determinations when compared against each other or with the control method. Therefore, the
recommended methods for determining specimen adequacy on the ThinPrep Imaging System are
(1) the Bethesda System 2001 count of fields along a diagonal of the cell spot or (2) counting the
cells in the 22 fields-of-view selected by the ThinPrep Imager System. Refer to the ThinPrep
Imaging System Review Scope Operator’s Manual for instructions on the proper use of these
methods.
G.5 CYTOTECHNOLOGIST SCREENING RATES
Daily Cytotechnologist screening rates were recorded throughout the duration of the clinical study.
The study was conducted in a manner designed to reproduce actual clinical conditions. Eight (8)
Cytotechnologists participated in the study; two (2) at each clinical site. The experience levels of
the Cytotechnologists ranged from 5 to 23 y ears. During the study the Cytotechnologist’s screening
times for the Imager Review arm included automated screening of the 22 fields of view with
subsequent full side review of abnormal slides. A full slide review co nsists of approximately 120
fields of view. The number of hours each Cytotechnologist screened slides per day varied due to
logistical issues and scheduling. With the ThinPrep Imaging System, Cytotechnologist screening
rates were uniformly faster than the Manual Review method.
Table 14 summarizes the Cytotechnologist screening rates for both the Imager Review and the
Manual Review methods. The total number of slides reviewed in the study and the average number
of hours screened per day are presented for each Cytotechnologist and site. Screening rates
(extrapolated to an 8 hour wo rkday) are pres ented as the low, average and high daily screening rates
achieved by each Cytotechnologist and site. The low and high daily rates were selected from the
lowest and highest daily hourly rates, respectively, and are extrapolated to 8 hours.
MAN-03938-001 Rev. 002 page 12 of 23
Page 17

Table 14: Cytotechnologist Screening Rates
Site/CT
Review
Methods
Site 1 Manual 2568 7.4 49 69 94
1-1 Manual 1284 7.5 49 60 72
1-2 Manual 1284 7.3 70 78 94
Site 2 Manual 2686 7.7 40 68 80
2-1 Manual 1348 7.6 40 71 80
2-2 Manual 1338 7.8 55 66 75
Site 3 Manual 2738 7.9 20 80 101
3-1 Manual 1368 7.9 63 82 91
3-2 Manual 1370 7.8 20 78 101
Site 4 Manual 2612 7.6 42 69 94
4-1 Manual 1305 8.2 59 75 84
4-2 Manual 1307 6.9 42 63 94
Table 15 summarizes the Manual Review versus the Imager Review for ASCUS+ and HSIL+
sensitivity and specificity by site. The table also presents the prevalence of ASCUS+, LSIL+, and
HSIL+ among the reviewed slides and the respective screening daily rates of each review method.
The daily screening rates are extrapolated to an 8-hour workday and are presented as the low,
average and high daily screening rates by site.
Table 15: Screening Rates, Prevalence of ASCUS+, LSIL+, HSIL+, and Respective
Performance for ASCUS+ and HSIL+.
Site % of
ASCUS+
Site 1 7.7% 4.5% 1.6%
Site2 9.2% 4.0% 1.6%
Site 3
Site 4 7.2% 4.5% 1.6%
4.4% 2.7% 1.0%
% of
LSIL+
% of
HSIL+
Total
Number of
Slides
Evaluated
Average
Number of
Hours
Screened Per
Extrapolated Daily Rates
(8-hour workday)
Low
Day
Average
Day
High
Day
Day
Imager 2297 6.0 107 153 206
Imager 1168 6.1 117 153 182
Imager 1129 5.9 107 154 206
Imager 2665 7.8 69 109 131
Imager 1309 7.9 97 110 118
Imager 1356 7.7 69 109 131
Imager 2726 4.5 148 204 320
Imager 1460 4.2 167 230 320
Imager 1266 4.7 148 178 212
Imager 2524 5.1 86 138 198
Imager 1252 5.1 86 150 190
Imager 1272 5.0 109 126 198
Review
Methods
Manual 49 69 94 77.2%
Imager 107 153 206 78.3% 99.2% 92.1% 99.5%
Manual 40 68 80 63.1%
Imager 69 109 131 77.7% 96.1% 70.0% 99.6%
Manual 20 80 101 80.6%
Imager 148 204 320 94.2% 98.8% 78.6% 99.7%
Manual 42 69 94 87.2%
Imager 86 138 198 84.4% 97.0% 74.4% 99.8%
Extrapolated Daily Rates
(8-hour workday)
Low
Day
Average
Day
High
Day
Performance for
ASCUS+
Sensitivity Specificity Sensitivity Specificity
98.7%
+1.1%
+14.4%
+13.6%
-2.8%
95.8%
98.5%
97.3%
+0.4%
+0.3%
+0.4%
-0.3%
89.5%
72.5%
64.3%
61.5%
Performance for
HSIL+
98.8%
+2.6%
99.8%
-2.5%
99.7%
+13.6%
99.5%
+12.8%
+0.7%
-0.1%
0%
+0.3%
The clinical study data show that the screening rates achieved with the ThinPrep® Imaging System
resulted in sensitivity or specificity values that fall within acceptable limits.
MAN-03938-001 Rev. 002 page 13 of 23
Page 18

Laboratorians should use the following method when calculating workload:
All slides with Fields of View (FOV) only review count as 0.5 or ½ slide
All slides with full manual review (FMR) using the Autoscan feature count as 1 slide (as mandated by CLIA’88 for
manual screening)
Then, slides with both FOV and FMR count as 1.5 or 1½ slides
Use these values to count workload, not exceeding the CLIA maximum limit of 100 slides in no less than an 8-hour
day.
FMR = 1 slide
FOV = 0.5 slide
FMR + FOV = 1.5 slides
Upper Limit = 100 slides
The ThinPrep
Screening 22 Fields of View
Full manual slide review using the Autoscan feature
Review clinical history
Record results and triage appropriately
An example of workload scenario for ThinPrep Pap slides using the ThinPrep Imaging System:
100 FOV review only = 50 slides (100 x 0.5 = 50)
30 FOV review + FMR = 45 slides (30 x 1.5 = 45)
Total number of slides screened = 95 (50 FOV only and 45 FOV + FMR)
Note: ALL laboratories should have a clear standard operation procedure for documentation of their method of workload
counting and for establishing workload limits.
It is the responsibility of the Technical Supervisor to evaluate and set workload limits for individual cytotechnologists
based on laboratory clinical performance.
According to CLIA ’88, these workload limits should be reassessed every six months.
®
Imaging System limit of 100 slides in an 8-hour workday includes the following:
For less than an 8-hour workday, the following formula must be applied to determine the
maximum number of slides to be reviewed during that workday:
The manual workload limit does not supercede the CLIA requirement of 100 slides in a 24-hour
period in no less than an 8-hour day. Manual review includes the following types of slides:
Slides reviewed on the ThinPrep Imaging System using the Autoscan feature
Slides reviewed without the ThinPrep Imaging System
Non–gynecologic slides.
When conducting manual review, refer to the CLIA requirements for calculating workload limits.
G.6 THINPREP IMAGING SYSTEM USE WITH THINPREP 5000 PROCESSOR
A study was conducted to estimate the Positive Percent Agreement (PPA) and Negative Percent
Agreement (NPA) for Imager-assisted review as compared with manual review of specimens
processed on the ThinPrep 5000 processor.
8
100
MAN-03938-001 Rev. 002 page 14 of 23
Page 19

Clinical Study Design
The study was a prospective, multi-center, blinded evaluation of ThinPrep slides of known
diagnoses generated from residual cytological specimens which were prepared, reviewed and
adjudicated in a previous study.
One thousand two hundred sixty (1260) slides were prepared on a ThinPrep 5000 processor and
were reviewed independently by a Cytotechnologist and confirmed by a Pathologist. All cytologic
diagnoses were determined in accordance with the Bethesda System 2001 c riteria for all slides
study was conducted at Hologic, Inc., Marlborough, MA and at two external laboratories in the
United States.
Table 16: Laboratory Imager-Assisted Review Diagnosis vs. Laboratory Manual Review
Diagnosis by one Pair of Cytotechnologist/Pathologist (Combined Sites)
Lab
ImagerAssisted
Review
Diagnosis
UNSAT 30 10 2 0 1 0 0 0 43
NILM 10 620 36 1 5 5 3 1 681
ASC-US 3 40 35 10 8 1 2 0 99
AGUS 0 10 28 127 8 0 8 0 181
LSIL 0 4 9 4 14 2 13 0 46
ASC-H 2 2 1 0 1 3 1 2 12
HSIL 1 3 6 15 24 2 111 5 167
Cancer 1 0 0 0 1 1 7 21 31
Total 47 689 117 157 62 14 145 29 1260
UNSAT NILM ASC-US AGUS LSIL ASC-H HSIL Cancer Total
Lab Manual Review Diagnosis
1
. The
Reference Diagnosis by Adjudication Review
All slides were subject to an adjudication review. Adjudication was done at a facility that was not
one of the study sites conducting the study. Slides for adjudication were even ly divided between
three (3) adjudication panels each consisting of one (1) Cytotechnologist and three (3) independent
Pathologists. Each adjudicatio n pa nel was bli nde d t o the ori ginal revi ew di agn osis for al l slides a nd
each independent Pathologist within each panel was also blinded to other adjudicator’s diagnoses
for all slides. Adjudication consensus agreement was obtained for each slide reviewed. Consensus
agreement was achieved when at least two (2) of the three (3) Pathologists from a panel rendered an
identical diagnosis. In cases where consensus agreement was not achieved the panel members were
brought together at a multi-head microscope to review the slides together and come to a consensus
diagnosis.
In the study, there were 18 Cancer, 92 HSIL, 37 ASC-H, 180 LSI L, 18 AGUS, 122 ASC-US, 770
NILM, and 23 UNSAT specimens. Clinical sensitivity and specificity (e.g., with reference to a
histological diagnosis) cannot be measured in this study which relied on cytological examination
alone. Instead, laboratory positive and negative diagnoses by both methods, Imager-assisted and
manual review, for the specimens with Reference Diagnosis of ASC-US+ (combined ASC-US,
AGUS, LSIL, ASC-H, HSIL, and Cancer), LSIL+ (combined LSIL, ASC-H, HSIL, and Cancer),
ASC-H+ (combined ASC-H, HSIL, and Cancer) and HSIL+ (combined HSIL and Cancer) were
compared.
MAN-03938-001 Rev. 002 page 15 of 23
Page 20

Clinical Study Results
Tables 17 through 20 present the comparison of Laboratory true positive and negative rates for
ASC-US+, LSIL+, ASC-H+, and HSIL+.
Table 17: Laboratory Imager-Assisted Review Results vs. Laboratory Manual Review Results
for the Specimens with Reference Diagnosis of ASC-US+
In the study, there were 467 specimens with Reference Diagnosis of ASC-US+ (combined ASC-US, AGUS, LSIL, ASC-H,
HSIL, and Cancer) and 770 specimens with Reference Diagnosis of NILM.
In this table, “Positive” means ASC-US+ or UNSAT, and “Negative” means NILM. All percentages are rounded to the
nearest 0.1%.
ASC-US+ Positive Percent Agreement Negative Percent Agreement
Lab CT/
Pathologist
#1
#2
#3
Combined
Imager-Assisted Manual Difference Imager-Assisted Manual Difference
(95% CI) (95% CI) (95% CI) (95% CI) (95% CI) (95% CI)
93.8% 95.1% -1.3% 84.4% 81.9% 2.5%
(287/306) (291/306) (-4/306) (434/514) (421/514) (13/514)
(90.5% to 96.0%) (92.1% to 97.0%) (-4.2% to 1.5%) (81.0% to 87.3%) (78.3% to 85.0%) (-0.2% to 5.3%)
91.6% 92.3% -0.6% 84.8% 85.2% -0.4%
(428/467) (431/467) (-3/467) (653/770) (656/770) (-3/770)
(88.8% to 93.8%) (89.5% to 94.4%) (-3.3% to 1.9%) (82.1% to 87.2%) (82.5% to 87.5%) (-2.9% to 2.1%)
91.9% 91.4% 0.4% 83.0% 83.4% -0.4%
(429/467) (427/467) (2/467) (639/770) (642/770) (-3/770)
(89.0% to 94.0%) (88.5% to 93.6%) (-2.1% to 3.0%) (80.2% to 85.5%) (80.6% to 85.8%) (-2.9% to 2.1%)
92.3% 92.7% -0.4% 84.0% 83.7% 0.3%
(1144/1240) (1149/1240) (-5/1240) (1726/2054) (1719/2054) (7/2054)
(90.6% to 93.6%) (91.1% to 94.0%) (-1.9% to 1.1%) (82.4% to 85.6%) (82.0% to 85.2%) (-1.1% to 1.8%)
MAN-03938-001 Rev. 002 page 16 of 23
Page 21

Table 18: Laboratory Imager-Assisted Review Results vs. Laboratory Manual Review Results
for the Specimens with Reference Diagnosis of LSIL+
In the study, there were 327 specimens with Reference Diagnosis of LSIL+ (combined LSIL, ASC-H, HSIL, and Cancer)
and 910 specimens with Reference Diagnosis of (combined NILM, ASC-US, and AGUS).
In this table, “Positive” means LSIL+ or UNSAT, and “Negative” means NILM or ASC-US/AGUS. All percentages are
rounded to the nearest 0.1%.
LSIL+
Lab CT/
Pathologist
#1
#2
#3
Combined
Imager-Assisted Manual Difference Imager-Assisted Manual Difference
(95% CI) (95% CI) (95% CI) (95% CI) (95% CI) (95% CI)
93.9% 90.0% 3.9% 86.1% 85.3% 0.8%
(215/229) (206/229) (9/229) (509/591) (504/591) (5/591)
(90.0% to 96.3%) (85.4% to 93.2%) (-0.5% to 8.5%) (83.1% to 88.7%) (82.2% to 87.9%) (-1.7% to 3.5%)
85.0% 88.1% -3.1% 87.4% 87.7% -0.3%
(278/327) (288/327) (-10/327) (795/910) (798/910) (-3/910)
(80.7% to 88.5%) (84.1% to 91.2%) (-7.0% to 0.8%) (85.0% to 89.4%) (85.4% to 89.7%) (-2.3% to 1.6%)
93.9% 87.5% 6.4% 84.3% 84.6% -0.3%
(307/327) (286/327) (21/327) (767/910) (770/910) (-3/910)
(90.7% to 96.0%) (83.4% to 90.6%) (3.2% to 10.0%) (81.8% to 86.5%) (82.1% to 86.8%) (-2.4% to 1.7%)
90.6% 88.3% 2.3% 85.9% 85.9% 0.0%
(800/883) (780/883) (20/883) (2071/2411) (2072/2411) (-1/2411)
(88.5% to 92.4%) (86.0% to 90.3%) (0.1% to 4.5%) (84.5% to 87.2%) (84.5% to 87.3%) (-1.3% to 1.2%)
Positive Percent Agreement Negative Percent Agreement
MAN-03938-001 Rev. 002 page 17 of 23
Page 22

Table 19: Laboratory Imager-Assisted Review Results vs. Laboratory Manual Review Results
for the Specimens with Reference Diagnosis of ASC-H+
In the study, there were 147 specimens with Reference Diagnosis of ASC-H+ (combined ASC-H, HSIL, and Cancer) and
1,090 specimens with Reference Diagnosis of (combined NILM, ASC-US/AGUS, and LSIL).
In this table, “Positive” means ASC-H+ or UNSAT, and “Negative” means NILM, ASC-US/AGUS, or LSIL. All
percentages are rounded to the nearest 0.1%.
ASC-H+
Lab CT/
Pathologist
#1
#2
#3
Combined
Imaged Manual Difference Imaged Manual Difference
(95% CI) (95% CI) (95% CI) (95% CI) (95% CI) (95% CI)
93.7% 88.3% 5.4% 86.7% 86.7% 0.0%
(104/111) (98/111) (6/111) (615/709) (615/709) (0/709)
(87.6% to 96.9%) (81.0% to 93.0%) (-0.6% to 12.0%) (84.0% to 89.0%) (84.0% to 89.0%) (-2.2% to 2.2%)
86.4% 86.4% 0.0% 89.4% 89.4% -0.1%
(127/147) (127/147) (0/147) (974/1090) (975/1090) (-1/1090)
(79.9% to 91.0%) (79.9% to 91.0%) (-6.8% to 6.8%) (87.4% to 91.1%) (87.5% to 91.1%) (-1.8% to 1.6%)
95.2% 89.8% 5.4% 88.2% 87.4% 0.7%
(140/147) (132/147) (8/147) (961/1090) (953/1090) (8/1090)
(90.5% to 97.7%) (83.8% to 93.7%) (-0.1% to 11.4%) (86.1% to 90.0%) (85.3% to 89.3%) (-1.0% to 2.5%)
91.6% 88.1% 3.5% 88.3% 88.0% 0.2%
(371/405) (357/405) (14/405) (2550/2889) (2543/2889) (7/2889)
(88.5% to 93.9%) (84.6% to 90.9%) (0.0% to 7.0%) (87.0% to 89.4%) (86.8% to 89.2%) (-0.8% to 1.3%)
Positive Percent Agreement Negative Percent Agreement
MAN-03938-001 Rev. 002 page 18 of 23
Page 23

HSIL+
Lab CT/
Pathologist
#1
#2
#3
Combined
Table 20: Laboratory Imager-Assisted Review Results vs. Laboratory Manual Review Results
for the Specimens with Reference Diagnosis of HSIL+
In the study, there were 110 specimens with Reference Diagnosis of HSIL+ (combined HSIL and Cancer) and 1,127
specimens with Reference Diagnosis of (combined NILM, ASC-US/AGUS, LSIL, and ASC-H).
In this table, “Positive” means HSIL+ or UNSAT, and “Negative” means NILM, ASC-US/AGUS, LSIL, or ASC-H. All
percentages are rounded to the nearest 0.1%.
Positive Percent Agreement Negative Percent Agreement
Imaged Manual Difference Imaged Manual Difference
(95% CI) (95% CI) (95% CI) (95% CI) (95% CI) (95% CI)
90.7% 80.2% 10.5% 86.8% 89.1% -2.3%
(78/86) (69/86) (9/86) (637/734) (654/734) (-17/734)
(82.7% to 95.2%) (70.6% to 87.3%) (2.9% to 18.8%) (84.1% to 89.0%) (86.6% to 91.2%) (-4.6% to -0.1%)
80.9% 74.5% 6.4% 92.1% 92.3% -0.2%
(89/110) (82/110) (7/110) (1038/1127) (1040/1127) (-2/1127)
(72.6% to 87.2%) (65.7% to 81.8%) (-2.0% to 14.7%) (90.4% to 93.5%) (90.6% to 93.7%) (-1.7% to 1.4%)
90.9% 82.7% 8.2% 89.0% 89.7% -0.7%
(100/110) (91/110) (9/110) (1003/1127) (1011/1127) (-8/1127)
(84.1% to 95.0%) (74.6% to 88.7%) (0.7% to 16.0%) (87.0% to 90.7%) (87.8% to 91.3%) (-2.4% to 0.9%)
87.3% 79.1% 8.2% 89.6% 90.5% -0.9%
(267/306) (242/306) (25/306) (2678/2988) (2705/2988) (-27/2988)
(83.1% to 90.5%) (74.2% to 83.3%) (3.7% to 12.7%) (88.5% to 90.7%) (89.4% to 91.5%) (-1.9% to 0.1%)
In the study, there were 1.83% (23/1260) ThinPrep 5000 slides with UNSAT results by
Adjudication.
MAN-03938-001 Rev. 002 page 19 of 23
Page 24

ImagerAssisted
Review
Three lab
CTs have
read the
same slide
Agreement among Laboratory Cytotechnologists/Pathologists
The following tables indicate the extent to which the laboratory Cytotechnologists/Pathologists at a
given site agreed amongst t hemselves on the diagno sis, comparing the Im ager-assisted review to the
manual review. Tables are provided for ASC-US+ and ASC-H+. Note that since one site had only
two CT/Pathologist pairs, the three-way agreement analysis is available for just two sites, with 840
total specimens.
In Table 21 for ASC-H+, the number of specimens is shown for which various levels of agreement
among the CTs occurred. Either all three CTs rated the slide as positive (ASC-H+), two out of three
rated it positive, one out of three, or none of them.
Table 21: Laboratory Cytotechnologist/Pathologist Agreement, All Results, ASC-H+
ASC-H+
Three CTs had
ASC-H+
Two CTs had ASC-H+
and one had <ASC-H
One CT had ASC-H+
and two had <ASC-H
Three lab CTs have read the same slide
Three CTs
had
ASC-H+
91 23 8 0 122
12 21 7 8 48
3 12 16 11 42
Manual Review
Two CTs had
ASC-H+
& one had
<ASC-H
One CT had
ASC-H+
& two had
<ASC-H
Three
CTs had
<ASC-H
Totals
Three CTs had
<ASC-H
Totals
ASC-H+
ImagerAssisted
Review
Three lab
CTs have
read the
same slide
Three or two CTs had
ASC-H+
Three or two CTs had
<ASC-H
Totals
0 2 22 604 628
106 58 53 623 840
Manual Review
Three lab CTs have read the same slide
Three or two CTs
had ASC-H+
147 23 170
17 653 670
164 676 840
Three or two CTs
had <ASC-H
Totals
MAN-03938-001 Rev. 002 page 20 of 23
Page 25
The rate of agreement between the Imager-assisted review result an d the m anual revi ew result from
the previous table is presented below. PPA is the positive percent agreement, percent of specimens
of ASC-H+ diagnosis with Imager-assisted review by a majority of laboratory CT/Pathologists
among all specimens of ASC-H+ diagnosis with manual review by a majority of laboratory
CT/Pathologists. NPA is the negative percent agreement, percent of specimens of <ASC-H
diagnosis with Imager-assisted review by a majority of laboratory CT/Pathologists among all
specimens of <ASC-H diagnosis with manual review by a majority of laboratory CT/Pathologists.
Table 22: Rate of CT/Pathologist Agreement, ASC-H+
ASC-H+
PPA
NPA
89.0% (147/164) (83.3% to 92.9%)
96.6%
(653/676)
(95.0% to 97.7%)
In Table 23 for ASCUS+, the number of specimens is shown for which various levels of agreement
among the CTs occurred. Either all three CTs rated the slide as positive (ASCUS+), two out of three
rated it positive, one out of three, or none of them.
Table 23: CT Agreement, All Results, ASCUS+
Manual Review
Two CTs had
ASCUS+ &
one had
<ASCUS
One CT had
ASCUS+ &
two had
<ASCUS
ImagerAssisted
Review
Three lab CTs
have read the
same slide
ASCUS+
Three CTs had
ASCUS+
Two CTs had
ASCUS+ and one had
<ASCUS
One CT had ASCUS+
and two had <ASCUS
Three CTs had
<ASCUS
Three lab CTs have read the same slide
Three CTs
had
ASCUS+
272 22 8 0 302
15 16 6 7 44
7 10 24 38 79
0 5 28 382 415
Three CTs
had
<ASCUS
Totals
Totals
ASCUS+
ImagerAssisted
Review
Three lab
CTs have
read the
same slide
Three or two CTs had
ASCUS+
Three or two CTs had
<ASCUS
Totals 347 493 840
294 53 66 427 840
Manual Review
Three lab CTs have read the same slide
Three or two CTs
had ASCUS+
325 21 346
472 494
22
Three or two CTs
had <ASCUS
MAN-03938-001 Rev. 002 page 21 of 23
Totals
Page 26

The rate of agreement between the Imager-assisted review result an d the m anual revi ew result from
the previous table is presented below. PPA is the positive percent agreement, percent of specimens
of ASCUS+ diagnosis with Imager-assisted review by a majority of laboratory CT/Pathologists
among all specimens of ASCUS+ diagnosis with manual review by a majority of laboratory
CT/Pathologists. NPA is the negative percent agreement, percent of specimens of <ASCUS
diagnosis with Imager-assisted review by a majority of laboratory CT/Pathologists among all
specimens of <ASCUS diagnosis with manual review by a majority of laboratory CT/Pathologists.
Table 24: Rate of CT Agreement, ASCUS+
ASCUS+
PPA
NPA
93.7% (325/347) (90.6% to 95.8%)
95.7% (472/493) (93.6% to 97.2%)
H. Clinical Investigation Conclusions
For all sites combined for ASCUS+, the improvement in sensitivity of the Imager Review
method over the Manual Review method is statistically significant. This increase is 6.4%
with a 95% confidence interval of 2.6% to 10.0% for all sites combined. The differences
in sensitivity varied among the sites from –2.8% to +14.4%. For LSIL+ and HSIL+ the
sensitivity of the Imager Review method is equivalent to the Manual Review method.
For all sites combined for HSIL+, the improvement in specificity of the Imager Review
method over the Manual Review method is statistically significant. This increase is 0.2%
with a 95% confidence interval of 0.06% to 0.4% for all sites combined. The differences
in specificity varied among the sites from –0.1% to +0.7%. For ASCUS+ and LSIL+ the
specificity of the Imager Review method is equivalent to the Manual Review method.
Specimen adequacy can be determined using the method described in Bethesda System
2001 or by having the Cytotechnologist count the cells in the 22 fields of view presented
by the Imager.
The workload limit for the ThinPrep Imaging System has be en est a bl is hed at 200 slides in
no less than an 8-hour workday. This workload limit of 200 slides includes the time spent
for manual review of slides that is not to exceed 100 slides in an 8 hour workday.
For these clinical sites and these study populations, the data from the clinical trial and clinical
support studies demonstrate that the use of the ThinPrep Imaging System to assist during primary
screening of ThinPrep Pap Test slides for all cytologic interpretations, as defined by the Bethesda
System, is safe and effective for the detection of cervical abnormalities.
Performance may vary from site to site as a result of differences in patient populations and reading
practices. As a result each laboratory using t his device s houl d employ qualit y assurance a nd contr ol
systems to ensure proper use and selection of appropriate workload limits.
MAN-03938-001 Rev. 002 page 22 of 23
Page 27

I. Bibliography
1. Solomon D., Davey D, Kurman R, Moriarty A, O’Connor D, Prey M, Raab S, Sherman M, Wilbur
D, Wright T, Young N, for the Forum Group Members and the 2001 Bethesda Workshop. The
2001 Bethesda System Terminology for Reporting Results of Cervical Cancer. JAMA.
2002;287:2114-2119.
2. Kurman RJ, Solomon D. The Bethesda System for Reporting Cervical/Vagin al Cytologic
Diagnoses. Springer-Verlag 1994.
3. Schafer, J.L. Multiple imputation: a primer. Statistical Methods in Medical Research, 1999, 8:3-
15.
4. Nationa l Cancer Institute. SEER Cancer Statistics Review 1973-1998. Available at:
http://www.seer.cancer.gov. Accessed February 2002.
Hologic, Inc.
250 Campus Drive
Marlborough, MA 01752 USA
1-800- 442-9892
www. hologic.com
© 2015 Hologic, Inc. All rights reserved.
MAN-03938-001 Rev. 002 page 23 of 23
AW-12515-001 Rev. 001
Page 28

Table of Contents
Table of Contents
Page 29

Table of Contents
Chapter One
INTRODUCTION
SECTION A:
SECTION B:
SECTION C:
SECTION D:
SECTION E:
SECTION F:
SECTION G:
Chapter Two
INSTALLATION
SECTION A:
SECTION B:
SECTION C:
SECTION D:
SECTION E:
SECTION F:
SECTION G:
Overview and Function of the Review Scope 1.1
The ThinPrep® Imaging System Process 1.4
Specimen Preparation and Processing 1.6
Review Scope Technical Specifications 1.6
Internal Quality Control 1.13
Review Scope Hazards 1.13
Disposal 1.18
General 2.1
Action Upon Delivery 2.1
Preparation Prior to Installation 2.1
Moving the Review Scope 2.2
Connecting Review Scope Components 2.3
Power On the Review Scope 2.7
Storage and Handling - Post Installation 2.10
Chapter Three
OPERATION OF THE REVIEW SCOPE
SECTION A:
SECTION B:
SECTION C:
SECTION D:
SECTION E:
SECTION F:
Overview 3.1
Materials Required Prior to Operation 3.5
Auto Review 3.6
Subsequent Review 3.16
Manual Slide Review 3.18
Shutting Down the Review Scope 3.24
Review Scope Operator’s Manual
i
Page 30

Chapter Four
OPERATION OF THE SOFTWARE MENU
SECTION A:
SECTION B:
SECTION C:
SECTION D:
SECTION E:
SECTION F:
SECTION G:
Introduction 4.1
Menu Option 1 Login/Logout 4.3
Menu Option 2 Joystick Calibration 4.4
Menu Option 3 Setup Marker 4.6
Menu Option 4 Preferences 4.13
Menu Option 5 Open Error Log 4.27
Menu Option 6 Usage Count 4.28
ThinPrep Review Scope Preferences Worksheet
Chapter Five
REVIEW SCOPE MAINTENANCE
SECTION A:
SECTION B:
SECTION C:
SECTION D:
SECTION E:
Daily 5.1
General Cleaning 5.1
Replacing the Illuminator Light Bulb 5.2
Replacing the Fuses 5.5
Koehler Alignment 5.8
Chapter Six
TROUBLESHOOTING
SECTION A:
SECTION B:
SECTION C:
SECTION D:
Chapter Seven
DEFINITIONS AND ABBREVIATIONS 7.1
Chapter Eight
SERVICE INFORMATION 8.1
Chapter Nine
ORDERING INFORMATION 9.1
INDEX
ii
Review Scope Operator’s Manual
Operation Errors 6.1
User-Correctable Errors 6.4
Recoverable System Errors 6.13
Miscellaneous 6.13
Page 31

1. Introduction
1. Introduction
Page 32

INTRODUCTION
SECTION
A
1
Chapter One
Introduction
OVERVIEW AND FUNCTION OF THE REVIEW SCOPE
The Review Scope is an automated microscope to be used by a cytotechnologist (CT) to screen ThinPrep® Pap Test slides that have been imaged by a ThinPrep Image Processor. The microscope uses stan-
dard microscope optics enhanced with automated features that facilitate review of the slide. The CT
views the slide and by means of automatic stage movement, is presented with fields of view containing
objects of interest identified by the Imaging System. A motorized nosepiece allows the CT to change
magnification via a pod device, without interrupting visual observation of the slide. An automated
slide marking system allows the CT to mark objects for further review by a pathologist. The Review
Scope is networked to the imaging system and slide data is retrieved from and later updated and
returned to a slide database maintained by the imaging system.
Review Scope Operator’s Manual
1.1
Page 33

INTRODUCTION
1
1.2
Review Scope Operator’s Manual
Figure 1-1 Review Scope
Page 34
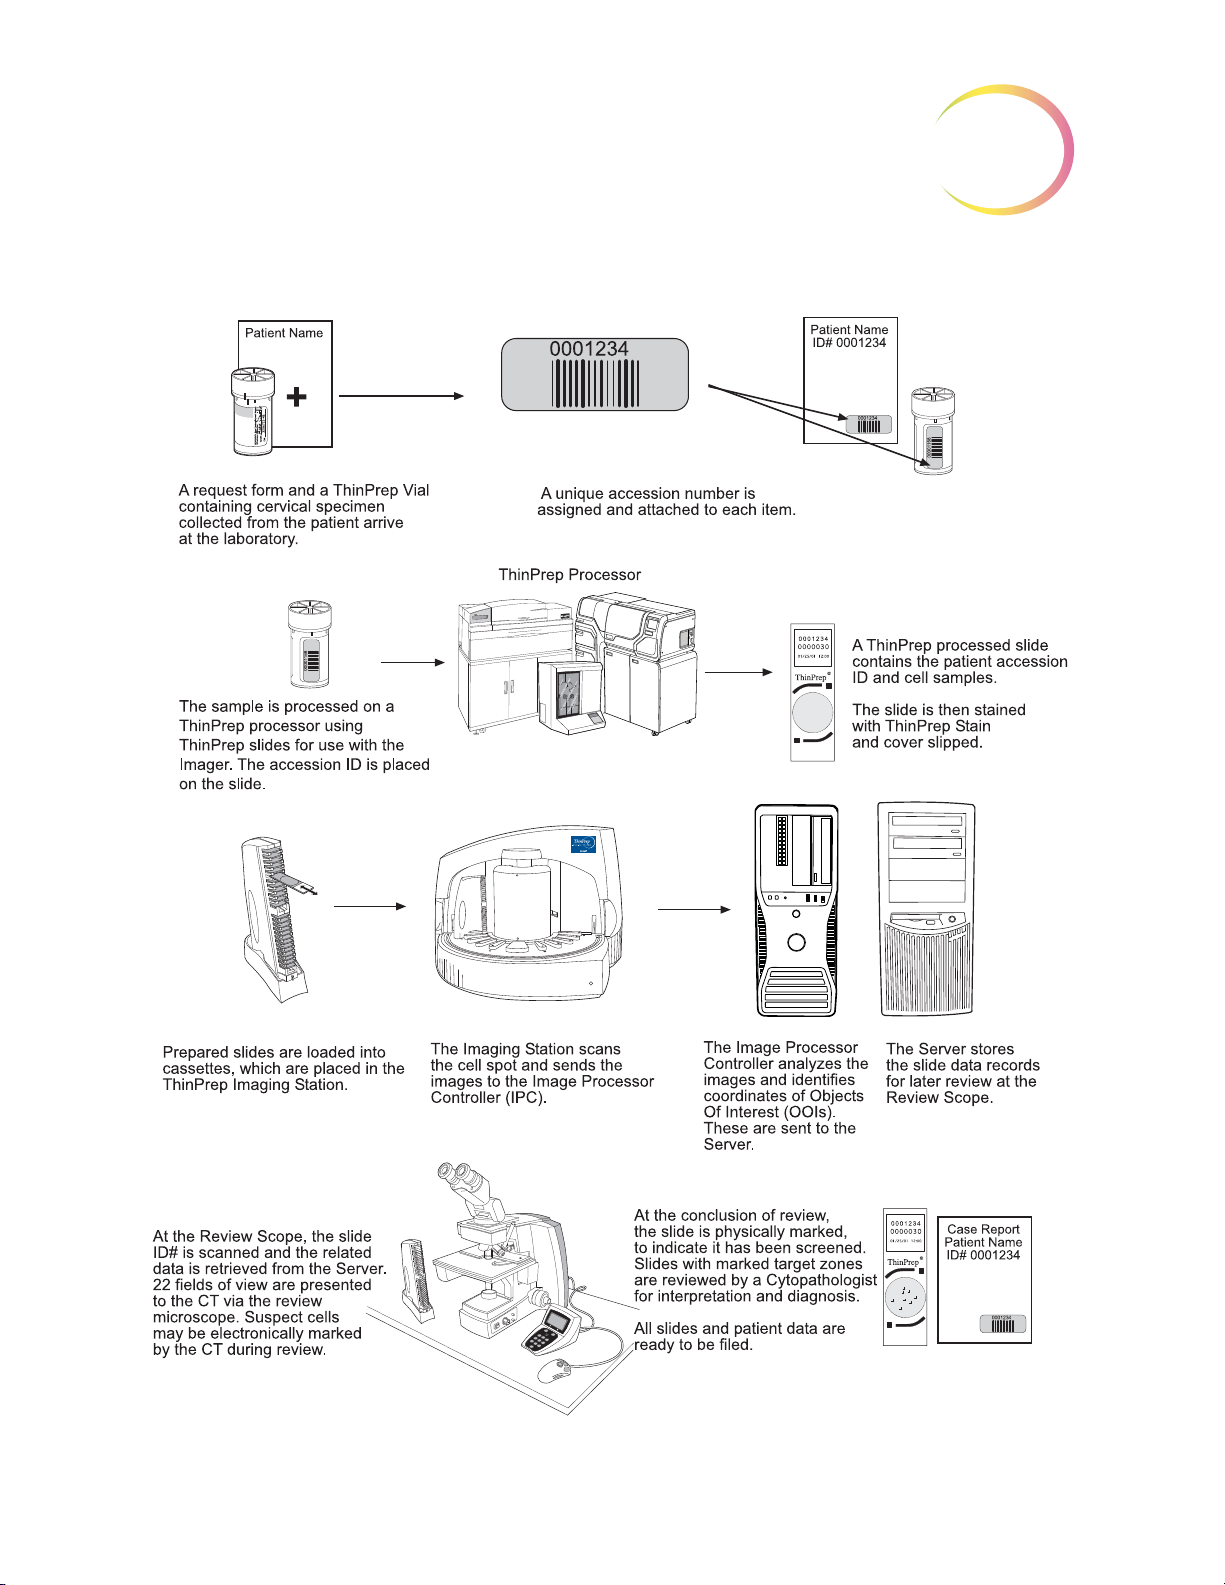
ThinPrep® Imaging System: Laboratory Flow
INTRODUCTION
1
Figure 1-2 Lab Flow
Review Scope Operator’s Manual
1.3
Page 35

INTRODUCTION
1
SECTION
B
THE THINPREP® IMAGING SYSTEM PROCESS
Slides that have been prepared for screening are loaded into cassettes which are placed into the
Imaging Station. The operator uses a PC keyboard, mouse and monitor to interact with the instru
ment via a graphic, menu driven interface.
A slide ID reader scans the slide accession ID and then the Imaging Station scans the entire ThinPrep
cell spot. The system identifies objects of interest found on the slide, based on integrated optical den
sity. (Refer to Figure 1-3, ThinPrep Imaging Process.) The coordinates of 22 of those objects are
recorded and the slide is returned to its cassette. Following processing of each cassette of slides, the
numeric slide ID and associated data record are sent to the Server.
The Server acts as the central data manager for the ThinPrep® Imaging System. As slides are imaged
by the Image Processor and reviewed at the Review Scope, the Server stores, retrieves and transmits
information based on the slide ID.
-
-
The Cytotechnologist (CT) reviews slides at the Review Scope (RS). The RS consists of elements of a
standard microscope, augmented with automated capabilities for viewing and marking the micro
scope slides. The RS contains an optical scanner which reads the slide ID when a slide is loaded on
the stage. When a valid slide accession ID has been identified at the RS, the Server sends the object of
interest coordinates for that ID and the CT is presented with the 22 fields of view determined for that
slide. It is required that the CT review each of these fields of view before completing a slide review.
As each field of view is being reviewed, the CT has the option to electronically mark the contents of
the field for subsequent physical marking at completion of the slide review. The CT always has the
option to control the position of the stage/slide manually, which provides complete freedom to move
any portion of the ThinPrep cell spot into the field of view for examination.
Note:
Before completing the review, the CT may revisit any locations and mark or unmark fields of view, as
desired. At the conclusion of electronically marking the slide, physical marks are applied at those
locations with a semi-permanent translucent marker. A “slide reviewed” mark is placed on the slide
at the end of the review, whether or not any physical marks were placed.
The object of interest is typically placed in the center of the field of view, however the CT
screen the entire field of each of the 22 fields of view presented.
-
must
1.4
Review Scope Operator’s Manual
Page 36

INTRODUCTION
1
Figure 1-3 ThinPrep® Imaging Process
Review Scope Operator’s Manual
1.5
Page 37

INTRODUCTION
1
SECTION
C
SECTION
D
SPECIMEN PREPARATION AND PROCESSING
Specimens for the ThinPrep® Pap Test cytology slide are collected by a clinician, then immersed and
®
rinsed in a PreservCyt
ratory equipped with a ThinPrep Processor. The samples are processed on ThinPrep Imaging System
slides. After being processed, the slides are stained with ThinPrep Stain.
Please refer to the Operator’s Manuals of these instruments and stain for more information regarding
preparation and processing of ThinPrep slides.
Specimen Handling and Stability
The ThinPrep slides are stored, transported and handled the same as conventional cytology slides.
Please refer to your laboratory guidelines for specimen handling.
Solution sample vial. The sample is then capped, labeled, and sent to a labo-
REVIEW SCOPE TECHNICAL SPECIFICATIONS
Overview of Components
Refer to Figure 1-4 to Figure 1-8 for information regarding components and specifications.
1.6
Review Scope Operator’s Manual
Page 38

INTRODUCTION
Motorized Object Marker Mechanism
Motorized Nosepiece
Binoculars
Object Marker Pen
Network Connection (on
rear of Scope)
Model/Rating Label (on
rear of Scope)
Power Cord;
On/Off Switch
(on rear of Scope)
Coarse Focus
Fine Focus (on both
sides of Scope)
10X/40X Objectives
Motorized
Nosepiece
Motorized Stage
Condenser
(Aperture) Lens
(underneath stage)
Collector (Field)
Lens
Illuminator Assembly
(underneath)
Lamp On/Off Switch
Lamp Intensity Adjustment
Console
Navigator Pod
White & Green
Mark Indicator
Intensity
Adjustments
(4-Button Pod) or ( 5-Button Pod)
Note: only one pod is used
Focus Knob
for Condenser
Lens
Note:
Certain models of the
ThinPrep Review Scope
(model numbers 70669-001,
70669-002, and 70669-003)
require a different pen and
special setup instructions. See
"MENU OPTION 3 SETUP
MARKER" on page 4.6.
1
Figure 1-4 Review Scope Components
Review Scope Operator’s Manual
1.7
Page 39
1
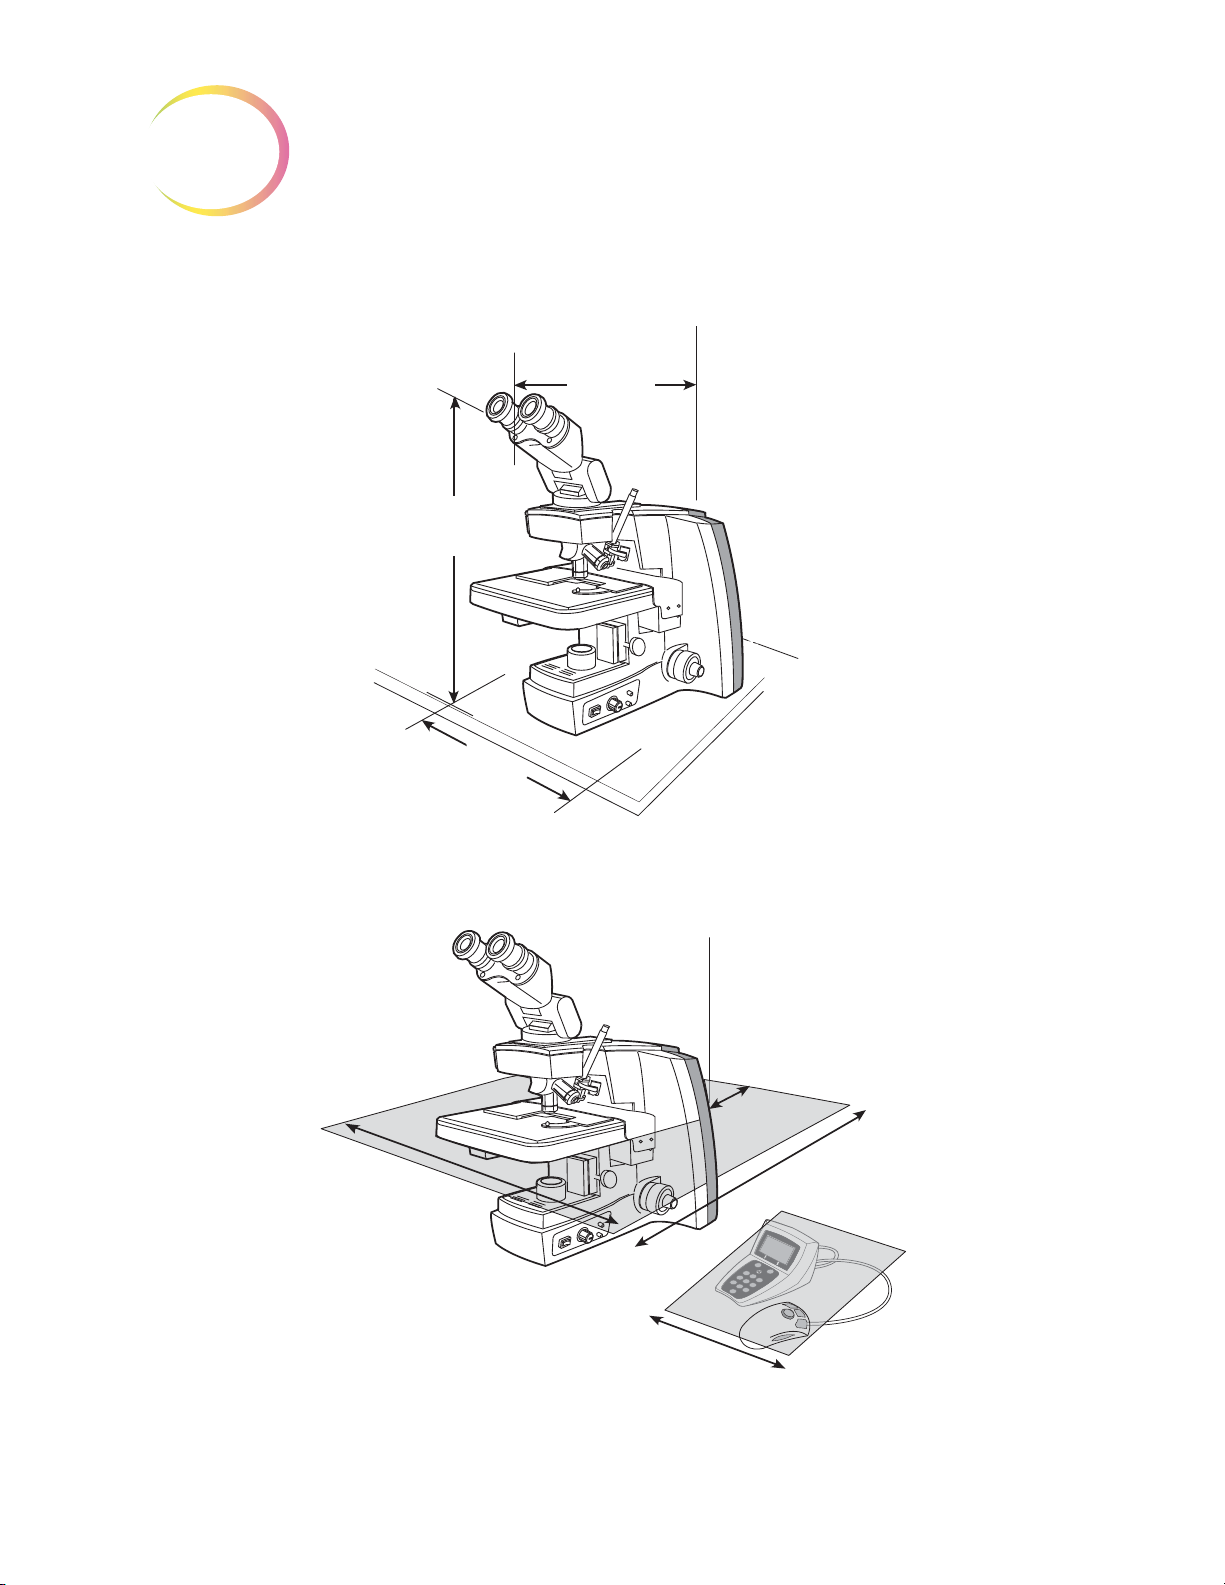
Dimensions
12
(304 mm)
Wide
21
(533 mm)
High
23
(584 mm)
Deep
Approximate Weight: 38 lbs (17.24 kg)
4
(101 mm)
Rear
27
(610 mm)
Deep
32
(813 mm)
Wide
12
(305 mm)
Wide
INTRODUCTION
Figure 1-5 Review Scope Dimensions
Figure 1-6 Recommended Clearances
1.8
Review Scope Operator’s Manual
Page 40

INTRODUCTION
5.5
(140 mm)
7
(178 mm)
3
(76 mm)
1
(25 mm)
4
(102 mm)
3
(76 mm)
4.75
(121 mm)
1.5
(38 mm)
Console
(Display and Keypad)
Approximate Weight:
3.3 oz (95 g)
Approximate Weight:
13.4 oz (380 g)
4-Button Pod
5-Button Pod
Note: (only one pod is used)
Approximate Weight:
4.3 oz (122g)
1
Figure 1-7 Console and Navigator Pod
Review Scope Operator’s Manual
1.9
Page 41

INTRODUCTION
1
14-digit numeric accession ID
(OCR label format shown)
Fiducial Mark
Fiducial Mark
Frosted portion of the slide
Cell spot - contains patient
sample cells
Fiducial Mark
ThinPrep® Microscope Slide for Use with the Imaging System
The ThinPrep microscope slide is used by the ThinPrep Processor in preparing the patient slide. The
slide utilizes fiducial marks, or fixed reference points, which are permanently printed features on the
slide that are used to register the slide position on the stage. A coordinate system is based on the fidu
cial marks, for locating objects of interest on the cell spot.
-
Slide Labeling Formats
The formats that the optical scanner on the Review Scope can read for the accession ID on the slide
label are configured on the Imaging System server. Refer to the Image Processor Operator’s Manual
for specifications for slide label formats.
Environmental
Operating Temperature Range:
16°C to 32°C
Non-Operating Temperature Range:
-28°C to 50°C
Operating Humidity Range:
20 to 80% relative humidity, non-condensing
Non-Operating Humidity Range:
15 to 95% relative humidity, non-condensing
Pollution Degree II
Figure 1-8 ThinPrep Microscope Slide
(the Review Scope is plugged in and turned on.)
(the Review Scope is plugged in but not turned on)
, in accordance with IEC 60664.
1.10
Review Scope Operator’s Manual
Page 42

INTRODUCTION
1
Category II
ronment.
Altitude:
Atmospheric Pressure:
. The ThinPrep Review Scope is for indoor use only in an office or a clean laboratory envi-
0 meters (sea level) to 2000 meters
Power
Voltage:
100-120 / 200-240~ (Volts alternating current, no selection required)
Mains supply voltage not to exceed ± 10% of the nominal voltage
Frequency:
50-60 Hz
Power:
2A maximum
Heat Generated:
Approximately 600 BTU/HR (176W)
Fusing:
1100 millibar to 500 millibar
Two T2.5A, 250V, 5 x 20 mm, glass, time delay, low break capacity
F1 - 2.5A fused AC to 12V supply, located on Illumination Control Board
Protective Temperature Coefficient Devices
This unit contains protective temperature coefficient (PTC) devices intended for protection against
occasional overcurrent or overtemperature fault conditions. These devices automatically reset after
the overcurrent or overtemperature condition has been removed.
The PTCs locations and functions are as follows:
System Hardware Electromechanical Processor (SHEMP)
F1 - 1A PTC - 5V sensor power to sensor ports J4 and J5
F2 - 1A PTC - 5V sensor power to sensor ports J2 and J3
F3 - 1A PTC - Isolated 5V for the CAN BUS
F4 - 500ma PTC - 24V line to protect against motor or drive failure
Servo Interface Module (SERVIM)
R21 - 1.85A PTC - 24V line to protect FETS and motors
Review Scope Operator’s Manual
1.11
Page 43

INTRODUCTION
1
Dimensions and Weight (Approximate)
Review Scope:
21” (533mm) H x 12” (304mm) W x 23” (584mm) D
38 lbs (17 kg)
Console:
3.5” (89mm) H x 5.5” (140mm) W x 7” (178mm) D
13.4 oz (380 g)
Navigator Pod:
4-button pod:
1” (25mm) H x 4” (102mm) W x 3” (76mm) D
3.3 oz (95 g)
5-button pod:
4.75” (121mm) H x 3” (76mm) W x 1.5” (38mm) D
4.3 oz (122 g)
Review Scope Standards
The ThinPrep® Review Scope
Laboratory (NRTL) to comply with current Safety, Electro-Magnetic Interference (EMI) and Elec
tro-Magnetic Compatibility (EMC) standards. Refer to the product label, located on the rear of
the instrument, to see the safety certification markings.
Do not use this device in close proximity to sources of strong electromagnetic radiation (e.g.,
unshielded intentional RF sources), as these may interfere with proper operation.
has been tested and certified by a U.S. nationally recognized testing
-
This product is in vitro diagnostic (IVD) medical equipment.
This product contains a device classified per EN 60825-1: 1994, Issue 2, June 1997 as a Class 1 LED
Product.
1.12
Review Scope Operator’s Manual
Page 44

INTRODUCTION
SECTION
E
SECTION
F
1
INTERNAL QUALITY CONTROL
Power On Self Test
When the Review Scope is powered on (refer to Power On the Review Scope page 2.7), the instrument goes through a self-diagnostic test. Electrical, mechanical and software systems are tested to
confirm each functions properly. Network communication is tested at the time the user Logs In for an
Auto Review session. The operator is alerted to any malfunction via a message on the console dis
play.
If the system does not function, or there are persistent errors, contact Hologic Technical Support.
(Refer to
Service Information, Chapter 8.)
-
REVIEW SCOPE HAZARDS
The Review Scope is intended to be operated in the manner specified in this manual. Be sure to
review and understand the information listed below in order to avoid harm to operators and/or
damage to the instrument.
If this equipment is used in a manner not specified by the manufacturer, then the protection provided
by the equipment may be impaired.
Warnings, Cautions and Notes
The terms WARNING, CAUTION and Note have specific meanings in this manual.
• A
WARNING
injury or death.
• A
CAUTION
inaccurate data or invalidate a procedure, although personal injury is unlikely.
• A
Note
provides useful information within the context of the instructions being provided.
advises against certain actions or situations that could result in personal
advises against actions or situations that could damage equipment, produce
Review Scope Operator’s Manual
1.13
Page 45

INTRODUCTION
1
Symbols Used on the Instrument
The following is an explanation of the symbols that may appear on your product:
Symbol Title Description Standard information
Caution Indicates the need for th e user
to consult the instructions for
use for important cautionary
information such as warnings
and precautions that cannot,
for a variety of reasons, be
presented on the medical
device itself.
In vitro diagnostic
medical device
Authorized
Representative in the
European Community
Serial number Indicates the manufacturer’s
Indicates a medical device that
is intended to used as an in
vitro diagnostic medical device
Indicates the Authorized
Representative in the
European Community
serial number so that a specific
medical device can be
identified
ISO 15223-1 Medical
devices—Symbols to be used
with medical device labeling
and information to be supplied,
Section 5.4.4
ISO 15223-1 Medical
devices—Symbols to be used
with medical device labeling
and information to be supplied,
Section 5.5.1
ISO 15223-1 Medical
devices—Symbols to be used
with medical device labeling
and information to be supplied,
Section 5.1.2
ISO 15223-1 Medical
devices—Symbols to be used
with medical device labeling
and information to be supplied,
Section 5.1.7
Catalogue
Number
Manufacturer Indicates the medical device
Fuse To identify fuse boxes or their
1.14
Review Scope Operator’s Manual
Indicates the manufacturer's
catalogue number so that the
medical device can be
identified
manufacturer, as defined in the
EU Directives 90/385/EEC, 93/
42/EEC and 98/79/EC
location.
ISO 15223-1 Medical
devices—Symbols to be used
with medical device labeling
and information to be supplied,
Section 5.1.6
ISO 15223-1 Medical
devices—Symbols to be used
with medical device labeling
and information to be supplied,
Section 5.1.1
IEC 60417 Graphical symbols
for use on equipment, symbol
5016
Page 46

INTRODUCTION
1
Symbol Title Description Standard information
Caution, hot surface To indicate that the marked
item can be hot and should not
be touched without taking care
Caution, risk of
electric shock
Protective earth;
protective ground
Figure 1-9 Symbols used on the instrument
The Review Scope has symbols placed on it specifically to advise the operator to refer to the Operator’s Manual. (Refer to Figure 1-10.) Be sure to review and understand the warnings listed below in
order to avoid damage to the instrument and any harm to operators. One or more of the warnings
may be pertinent to the area marked.
To identify equipment that has
risk of electric shock
To identify any terminal which
is intended for connection to an
external conductor for
protection against electric
shock in case of a fault, or the
terminal of a protective earth
(ground) electrode
IEC 60417 Graphical symbols
for use on equipment, symbol
5041
IEC 60417 Graphical symbols
for use on equipment, symbol
5042
IEC 60417 Graphical symbols
for use on equipment, symbol
5019
The instrument model/rating label and the serial number label are also located on the Review Scope.
Review Scope Operator’s Manual
1.15
Page 47

INTRODUCTION
1
Motorized Stage
Crushing/Pinch Point
Moving Parts
Glass
Rear Of Scope
External Connections
Fusing
Grounded Outlet
Bottom, Interior of Scope
Hot Surfaces (the lightbulb
itself may be hot)
Bottom, Exterior of Scope
Operator Access
Model/Rating Label
Serial Number Label
Review Scope
ThinPrep Imaging System
®
CYTYC
corporation
85 Swanson Road
Boxborough, MA
USA 01719
90-264V~ 4A 47-63 Hz
2 X T6.3AL 250V 5x20 mm
Part Number Label
WEEE Label
Location of Labels on the Instrument
1.16
Review Scope Operator’s Manual
Figure 1-10 Label Locations
Page 48

INTRODUCTION
Warnings Used in this Manual:
WARNING
Service Installation Only
This instrument is to be installed by trained Hologic® personnel only.
WARNING
Instrument Fusing
For continued protection against fire, replace only with fuses of the specified type and current rating.
Refer to the
Refer to Ordering Information for fuse specification and ordering.
Review Scope Maintenance chapter for instructions on replacing user accessible fuses.
1
WARNING
Moving Parts
The instrument contains moving parts. Keep hands, hair, loose clothing, jewelry, etc., clear.
WARNING
Grounded Outlet
To ensure safe operation of the instrument, use a three-wire grounded outlet.
WARNING
Glass
The instrument uses microscope slides, which have sharp edges. In addition, the slides may be broken in their storage packaging or on the instrument. Use caution when handling glass slides and
when cleaning the instrument.
Review Scope Operator’s Manual
1.17
Page 49

INTRODUCTION
1
SECTION
G
WARNING
Hot Surfaces
The microscope contains hot surfaces. Use extreme caution when handling items near these surfaces.
Allow hot surfaces to cool before handling. The light bulb contained in the collector housing may be
hot.
DISPOSAL
Disposal of Consumables
Marking Pens. No special instructions; used marking pens may be disposed of in your laboratory
refuse.
Halogen light bulbs. No special instructions; used light bulbs may be disposed of in your laboratory
refuse.
Instrument fuses. No special instructions; used fuses may be disposed of in your laboratory refuse.
Disposal of the Device
Please contact Hologic Service (refer to Service Information, Chapter 8).
Do not dispose in municipal waste.
Please contact Hologic Technical Support.
Hologic, Inc.
250 Campus Drive
Marlborough, MA 01752 USA
Tel: 1-800-442-9892
1-508-263-2900
Fax: 1-508-229-2795
Web: www.hologic.com
1.18
Review Scope Operator’s Manual
Page 50

2. Installation
2. Installation
Page 51

Chapter Two
SECTION
A
SECTION
B
SECTION
C
Installation
INSTALLATION
2
WARNING:
Service Installation Only
GENERAL
The ThinPrep® Review Scope must be installed by Hologic Service Personnel. When installation is
complete, Hologic personnel trains the operator(s), using the Operator’s Manual as the training
guide.
ACTION UPON DELIVERY
Remove and read the
Inspect the packing cartons for damage. Report any damage immediately to the shipper and/or
Hologic Technical Support as soon as possible. (Refer to
Leave the instrument in the packing cartons for Hologic Service installation.
Store the instrument in a suitable environment until installation (cool, dry, vibration-free area).
Operating Instructions Prior to Installation
Service Information, Chapter 8.)
sheet attached to the packing carton.
PREPARATION PRIOR TO INSTALLATION
Pre-Installation Site Assessment
A pre-installation site assessment is performed by Hologic Service Personnel. Be sure to have prepared any and all site configuration requirements as instructed by the Service personnel.
Location And Configuration
Review Scopes connected to the Server may be local or up to 200 meters (656 feet) away. Room for the
console and Navigator Pod that accompany each review scope should be accommodated, as well as a
comfortable amount of desk space for placing slide cassettes, flats or other slide containers. (Refer to
Figure 2-1.)
Review Scope Operator’s Manual
2.1
Page 52

INSTALLATION
2
SECTION
D
CAUTION:
over, or disconnecting cabling, do not place cabling near foot traffic.
The Review Scope is sensitive to vibrations. It should be placed on a flat, sturdy surface away from
any vibrating equipment.
Route connections carefully to avoid pinching the cables. To avoid tripping
Figure 2-1 A Typical Review Scope
MOVING THE REVIEW SCOPE
The Review Scope is a precision instrument and should be handled with care. If the microscope must
be moved, it should be grasped and lifted by the frame housing. (Refer to
instrument by the motorized stage will cause damage to the microscope and may render it inoperable.
If the Review Scope is to be shipped to a new location, please contact Hologic Technical Support.
(Refer to
CAUTION:
Do not rest the stage against your body, as this may misalign the stage.
2.2
Service Information, Chapter 8.)
Do not lift or handle the Review Scope by the stage.
Review Scope Operator’s Manual
Figure 2-2.) Lifting the
Page 53

INSTALLATION
SECTION
E
Figure 2-2 Moving the Review Scope
CONNECTING REVIEW SCOPE COMPONENTS
2
The Review Scope provides electrical and software interface for the display console and the control
pod. The microscope is connected to the Server via an ethernet cable to receive and transmit slide
data, user preferences and other data for report generation.
The power cord (refer to Figure 2-3) provides electrical power to the Review Scope. It must be
plugged into a 3-prong grounded outlet. Disconnection from the power supply source is by removal
of the power cord.
• The network connection (refer to Figure 2-3) connects the Review Scope to the hub, enabling
communication to the Server located in the Image Processor Controller.
• The console connection is used to interface the console and pod to the Review Scope. The
operator interfaces with the Review Scope via these peripheral devices.
• The service port (refer to Figure 2-3) is to be used only by trained Hologic personnel for ser-
vice and diagnostic purposes.
Review Scope Operator’s Manual
2.3
Page 54

INSTALLATION
2
Network
connection
Interconnection to
RS Console
(Bottom - Service
Port for Hologic
use only)
Fusing
On
Off
Power Cord
Console Contrast Adjustment Knob
(Turn the knob to adjust the contrast of the
console display.)
Interconnection Cable to Navigator Pod
Cable to Review Scope
Console and Navigator Pod
Connect the console unit to the Review Scope by plugging the end of the serial cable into the middle
right port on the rear of the microscope. Plug the other end of the cable into the rear of the console.
The console and pod may be placed on either side of the microscope, depending on user preference.
The connection cord between them is short, so they must be located together.
The network connection cable from the Server snaps into an available port on the hub or switch.
Another cable goes from the hub to the Review Scope, snapping into the connection jack at the top
port on the rear of the Scope. (Refer to
CAUTION:
Review Scope.
2.4
Review Scope Operator’s Manual
Only the optional accessories listed in Table 9.2 may be used with the
Figure 2-3 Review Scope, Rear
Figure 2-4 Console, Rear
Figure 2-3.)
Page 55
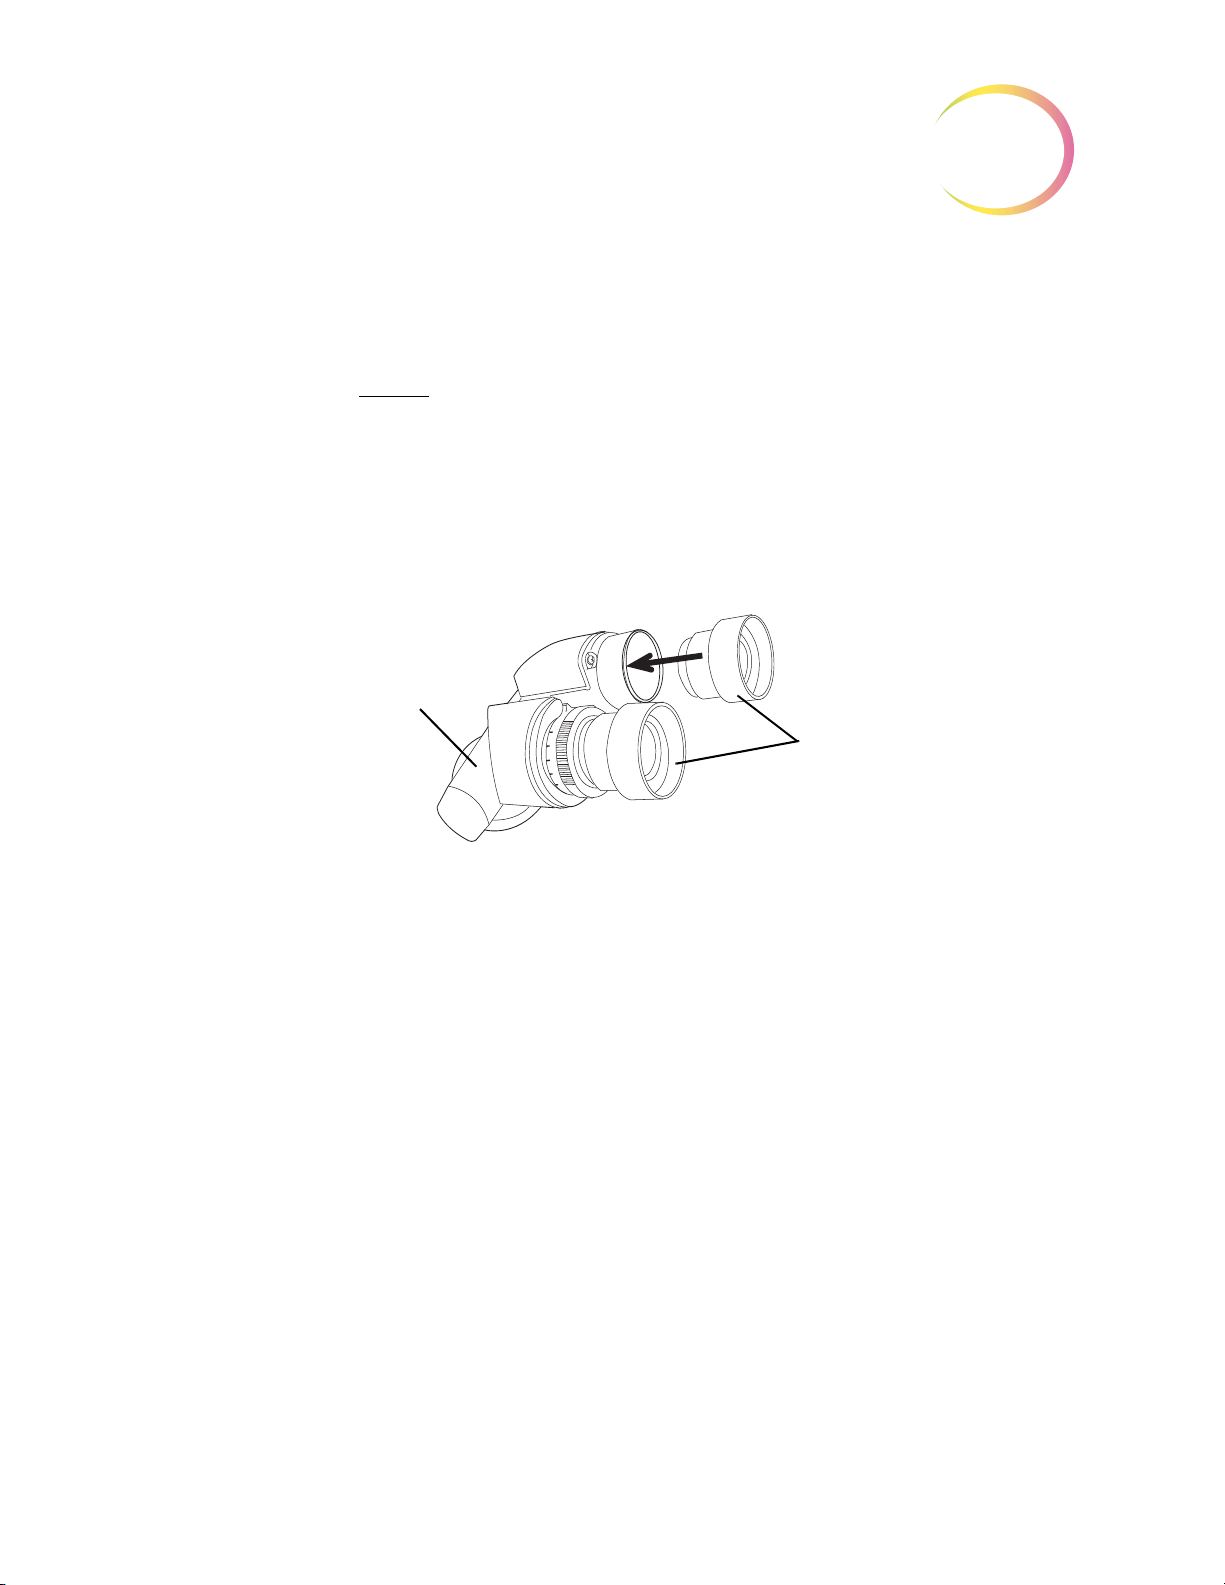
INSTALLATION
Eyepieces
Binocular Head
Binocular Head
The Review Scope is supplied with a standard, tilting binocular head. (Refer to Figure 2-5.)
Hologic has evaluated the use of an optional riser and an optional telescoping binocular head with
the Review Scope. The
Hologic Technical Support for more information on the installation of these items.
specific riser and head that may be used are listed in Table 9.1. Contact
2
CAUTION:
tute eyepieces or lenses.
Eyepieces
The 10X eyepieces slide into their mounting holes in the binoculars. (Refer to Figure 2-5.)
Objectives
The 10X and 40X objective lenses are mounted in the motorized nosepiece on the microscope at the
factory.
If an objective must be replaced, an optical alignment is required. Please contact Hologic Technical
Support.
Only use Hologic supplied eyepieces and objective lenses. DO NOT substi-
Figure 2-5 Binocular Head With Eyepieces
Review Scope Operator’s Manual
2.5
Page 56

INSTALLATION
2
Marking Pen
CAUTION:
Marker function via the software menu.
Certain models of the ThinPrep Review Scope (model numbers 70669-001, 70669-002, and 70669-003)
require a different pen and special setup instructions.
The marking pen for some models of the ThinPrep Review Scope is a Sharpie® Ultra Fine Point
marking pen. Only use this specified marker for ThinPrep Review Scope model numbers 70575-001,
70575-003, 71062-001, and 71062-002. (Refer to
The marking pen should ONLY be loaded by performing the Calibrate
Figure 2-6.)
Figure 2-6 Sharpie® Marking Pen
The marking pen for the other models of the ThinPrep Review Scope is a Pilot Extra Fine Point marking pen. Only use this specified marker for ThinPrep Review Scope model numbers 70669-001,
70669-002, and 70669-003. (Refer to
The marking pen must be present for physical marking of the slide at the conclusion of a review.
Loading the marking pen should
Scope software menu. (Refer to Marker Calibration on
Focus Knob Covers
Rubber knob covers for the fine focus knobs are available. They are placed over the focus knob and
remain in place via a friction fit. (Refer to
them.
Figure 2-7.)
Figure 2-7 Pilot Marking Pen
only
be done by executing “Calibrate Marker” from the Review
page 4.8.)
Figure 2-8.) Contact Hologic Technical Support to request
2.6
Review Scope Operator’s Manual
Page 57

Figure 2-8 Focus Knob Covers
SECTION
F
INSTALLATION
2
POWER ON THE REVIEW SCOPE
The Review Scope power On/Off switch is located at the rear of the microscope. Confirm that it is in
the Off position and plug the receptacle end of the power cord into the socket. Plug the other end of
the power cord into a wall outlet. To ensure safe operation of the microscope, a three wire grounded
outlet must be used. (Refer to
WARNING:
Instrument Fusing
Do not power on or operate if equipment has been damaged.
To ensure network communication necessary to operate the automated Review Scope for auto
review, the server must be powered on and initialized. The Review Scope may be turned on at any
time. Entering a valid Login ID will make a network connection if the server is available.
Power on the Review Scope by pressing the rocker switch on the rear of the scope to On. An audible
beep will be heard as the unit powers up. It takes less than a minute for the microscope to become
ready for use.
Note:
Disconnection from power supply source is by removal of the power cord.
Grounded Outlet
Figure 2-9.)
Review Scope Operator’s Manual
2.7
Page 58
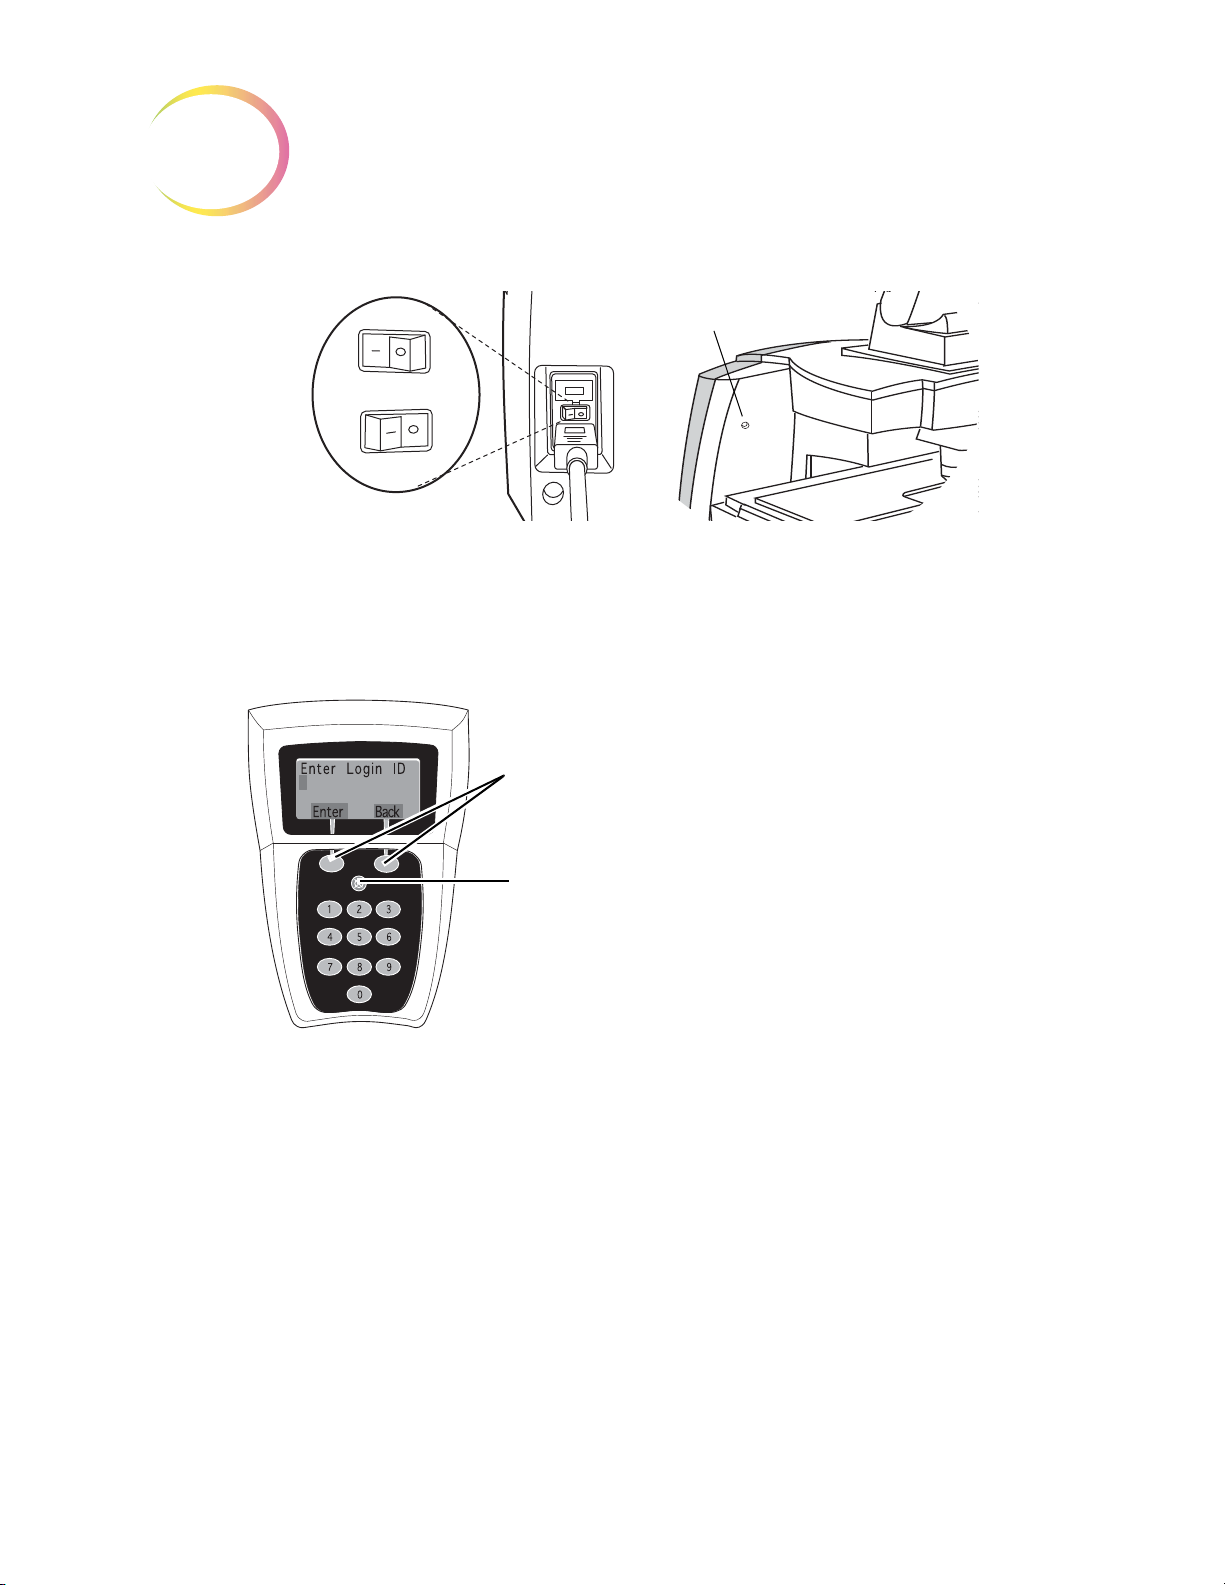
INSTALLATION
2
On
Off
Power On LED
Soft keys
(software definable) will
implement user selections or
actions, associated with the labels
on the display directly above the
key. Soft key functions and availability will change depending on
the current software operational
state or mode.
Cancel
key will abort the current
operation. Use the Cancel key to
back out of submenus or to terminate the slide review.
SOFT KEYS
CANCEL KEY
Figure 2-9 Power Entry Module and On/Off Switch
Allow the microscope to initialize. The instrument is ready for operation when the display on the
console shows
Enter Login ID
[Offline]. (Refer to Figure 2-10.)
Figure 2-10 Console Keypad and Display
The Navigator Pod connects to the Review Scope, through the console. The pod is ready for use as
soon as
Next
Previous
Objective
2.8
Load Slide
Review Scope Operator’s Manual
is displayed on the console.
Figure 2-11 Pod (Default Button Configuration)
used to advance through functions
used to pause /resume stage motion during scan
used to adjust user preference settings
used to return to fields of view during review
used to adjust user preference settings
used to toggle between 10x and 40x magnification
Page 59

INSTALLATION
OBJECTIVE
(10X / 40X)
both sides
MARK
JOYSTICK
PREVIOUS
NEXT
NEXT
PREVIOUS
OBJECTIVE
(10X / 40X)
MARK
JOYSTICK
4-BUTTON POD
5-BUTTON POD
Note: Only one pod is used.
2
Mark
Joystick
Note:
At the control panel on right side of the microscope, turn the lamp power rocker switch to the “on”
position. Adjust the illumination to the desired intensity by turning the lamp intensity adjustment
dial.
The white and green mark indicator intensities may be set individually by turning their respective
adjustment knobs. (Refer to
Koehler illumination may be adjusted using the condenser and collector assemblies. Instructions for
making this adjustment may be found in the Koehler Alignment section on
The Navigator Pod button functions are illustrated showing the default configuration. The
Next, Previous, Objective and Mark functions can be assigned by the user. Refer to
Button Setup.
used to electronically mark or unmark cells for dotting by the marking pen
used for directional and velocity control of the motorized stage during slide review
used to increase or decrease stage speed during autoscan
page 4.24,
Figure 2-12.)
page 5.8.
Review Scope Operator’s Manual
2.9
Page 60

INSTALLATION
2
Lamp On/Off
Lamp Intensity
Adjustment
White & Green Mark Indicator
Intensity Adjustments
Focus Knob (on
left & right sides,
both)
Fine Focus
Coarse Focus
Condenser
(Aperture)
Adjustment
Thumbscrews
Condenser
(Aperture) Focus
Knob
SECTION
G
The Review Scope may be stored in the location where it was installed. When it is not in use, the
power should be turned off. Cover the instrument with the microscope dust cover.
Figure 2-12 Illumination Control Panel
STORAGE AND HANDLING - POST INSTALLATION
2.10
Review Scope Operator’s Manual
Page 61

3. Operation
3. Operation
Page 62

OPERATION OF THE REVIEW SCOPE
SECTION
A
3
Chapter Three
Operation of the Review Scope
OVERVIEW
ThinPrep® Pap Test cervical cytology sample slides processed by the ThinPrep Imaging System are
reviewed at the Review Scope (RS). Slide review by a cytotechnologist is assisted by automated fea
tures. (Refer to Figure 3-1 for typical slide review process.)
Auto Review
In this manual, Auto Review refers to a slide review in which the RS
-
• scans the ID number from the slide
• communicates with the server for appropriate slide data record
• makes use of the Autolocate function (where the 22 fields of view identified by the Image Pro-
cessor are presented to the cytotechnologist, CT)
• makes use of the Autoscan function, as required or desired
• uploads slide data record to the server at conclusion of slide review
Subsequent Review
A slide that has undergone Auto Review may be reviewed again, making use of the Autolocate,
review and Autoscan functions. Further marks may be added (to a maximum of 30 marks on a slide),
but no previous marks may be removed. The slide data record will be revised at the Server at the con
clusion of the review.
Note:
Slides previously screened either via auto review or manually may always be examined again
in manual mode.
-
Review Scope Operator’s Manual
3.1
Page 63

OPERATION OF THE REVIEW SCOPE
3
Manual Review
Manual Review refers to a slide review in which
• patient slide data is not retrieved from or communicated to the server
• a scan of the entire cell spot is conducted by the operator initiating each movement of the
stage
• marks may be made (up to 30), but no record is stored on the server
(Refer to Figure 3-1 for a graphical representation of the typical slide review process.)
Important Operational Notes
CAUTION
Moving the Review Scope.)
Calibrate the 4-button pod Joystick and the Object Marker once a day, in that order. (Refer to page 4.4
and page 4.6, respectively.)
: Never lift or handle the Review Scope by the stage. (Refer to Figure 2-2‚
Calibrate the 5-button pod joystick upon installation of the pod, or if the pod has been removed and
then reinstalled on a Review Scope. (Refer to
Load the slide properly, seated fully against the back and left guides, to ensure a successful slide ID
scan and accurate positioning of Object of Interest coordinates sent from the Server. (Refer to
3-2.)
Always examine the
entire
Field of View. Mark if you see any suspect object and then do Autoscan.
page 4.4.)
Figure
3.2
Review Scope Operator’s Manual
Page 64

OPERATION OF THE REVIEW SCOPE
Daily Cytotechnologist Screening Rates
Laboratorians should use the following method when calculating workload:
• All slides with Fields of View (FOV) only review count as 0.5 or ½ slide
• All slides with full manual review (FMR) using the Autoscan feature count as 1 slide (as man-
dated by CLIA’88 for manual screening)
3
• Then, slides with
• Use these values to count workload, not exceeding the CLIA maximum limit of 100 slides in
no less than an 8-hour day.
•
Note:
ALL laboratories should have a clear standard operation procedure for documentation
of their method of workload counting and for establishing workload limits.
• It is the responsibility of the Technical Supervisor to evaluate and set workload limits for indi-
vidual cytotechnologists based on laboratory clinical performance. According to CLIA ‘88,
these workload limits should be reassessed every six months.
For less than an 8-hour workday, the following formula must be applied to determine the maximum
number of slides to be reviewed during that workday:
The ThinPrep Imaging System limit of 100 slides in an 8-hour workday includes the following:
• Screening 22 Fields of View
both
FOV and FMR count as 1.5 or 1½ slides
FMR = 1 slide
FOV = 0.5 slide
FMR + FOV = 1.5 slides
Upper Limit = 100 slides
Number of hours examining slides X 100
8
• Full manual slide review using the Autoscan feature
• Review clinical history
• Record results and triage appropriately
The manual workload limit does not supersede the CLIA requirement of 100 slides in no less than an
8-hour day. Manual review includes the following types of slides:
• Slides reviewed on the ThinPrep Imaging System using the Autoscan
feature
• Slides reviewed without the ThinPrep Imaging System
• Non–gynecologic slides.
When conducting manual review, refer to the CLIA requirements for calculating workload limits.
Review Scope Operator’s Manual
3.3
Page 65

3
Power On
User Login
Load Slide
Register Slide
Autolocate
Review Marked
Fields
Autoscan
Mark Slide
Check
Registration
Unload Slide
Manual Scan
Review Marked
Fields
Mark Slide
User LogOut
Power Off
(Optional)
Check
Registration
OR
Online
Offline
OR
Register Slide
(Optional)
OR
OR
(Manual Review Mode)
(Auto Review Mode)
Unload Slide
(if negative)
(if negative)
Verify Marks
Verify Marks
Calibrate
Marker (Daily)
Calibrate
Joystick (Daily)
Autoscan
Overlap (choose)
Mark Indicator
(on/off)
(4-button pod)
OPERATION OF THE REVIEW SCOPE
3.4
Review Scope Operator’s Manual
Figure 3-1 Typical Slide Review Process
Page 66

OPERATION OF THE REVIEW SCOPE
SECTION
B
3
MATERIALS REQUIRED PRIOR TO OPERATION
ThinPrep® Pap Test slides imaged by the Image Processor are necessary to begin slide review.
A Sharpie® Ultra Fine Point marking pen or a Pilot Extra Fine point marking pen is used for physically marking the slides, depending on the model of ThinPrep Review Scope you have. If a pen is not
already installed, refer to instructions on
instrument installation.)
page 4.6 for installing the pen. (A box of pens is provided at
Review Scope Operator’s Manual
3.5
Page 67

OPERATION OF THE REVIEW SCOPE
3
SECTION
C
Enter Login ID
Enter Back
1 Min Overlap
2 Medium Overlap
3 Max Overlap
Test Save
AUTO REVIEW
Login
To login, enter the three-digit User Login ID via the console keypad. Press the
Pressing the
cancel the Login process.
Each cytotechnologist (CT) must use a unique Login ID. That ID becomes part of the slide data
record for each slide screened by the CT. Each Login ID is associated with the CT’s RS options prefer
ences. The preferences are downloaded from the Server to any RS the CT logs onto. (Refer to setting
preferences on
Back
soft key will perform a backspace/delete function. The
page 4.13.)
Enter
Cancel
soft key to Login.
console key will
-
Note:
Scan Overlap
An autoscan overlap must be selected. This sets how much the fields of view overlap from row to
row during autoscan of the cell spot.
Select the scan overlap:
See your lab administrator for any issues regarding Login ID’s. Also, refer to the ThinPrep
Image Processor’s Operator ’s Manual.
• minimum
• medium
• maximum
3.6
Review Scope Operator’s Manual
Page 68

OPERATION OF THE REVIEW SCOPE
Autolocate
1
Mark Always ON
2 Mark Turns OFF
Save
Load Slide
Press Next
Manual Menu
The Manual soft key will activate the
manual review mode. Refer to page
3.2 for manual review.
The Menu soft key will display page
1 of the RS software menu.
AUTO REVIEW (continued)
3
Mark Indicator
The white mark indicator may be turned off during autolocate, scan or review mode, when fields of
interest are presented to the CT.
If it is preferred that the mark indicator always be visible during slide review, select
ON
. Press 1 on the keypad and then press the
If it is preferred that the mark indicator is not visible during slide review, select
2
Press
the operator moves the joystick or presses the Mark button.
Note:
on the keypad and the press the
the green mark indicator is unaffected by the preference setting.
Save
softkey.
Mark Turns OFF
Save
softkey. The white mark indicator will remain off until
Load Slide
WARNING:
Moving Parts
The Load Slide display will appear on the console.
Glass
Mark Always
.
To proceed with Auto Review, load a slide into the slide holder on the stage by rotating the slide
clamp arm open far enough to allow placement of a slide in the holder. The slide should have the ID
label face up, to the left. Gently release the arm against the slide.
Make sure the left and back edges of the slide are firmly positioned against the guides of the slide
holder. (Refer to
CAUTION:
Confirm it is a clean, properly labeled ThinPrep® Pap Test slide.
Check for any damage. Do not load a slide onto the stage upside down.
Figure 3-2‚ Loading a Slide.)
Inspect the slide before loading.
Review Scope Operator’s Manual
3.7
Page 69

OPERATION OF THE REVIEW SCOPE
3
Slide Orientation:
Frosted Side Up,
Label to the Left
Slide Clamp Arm
Align 1st Mark
Press Next
AUTO REVIEW (continued)
Figure 3-2 Loading a Slide
Press the
ID has been scanned.
Note:
Register the Slide Fiducial Marks
The stage will move the slide to present the first fiducial mark in the field of view. The display on the
console prompts to align the first mark.
Using the joystick on the Navigator Pod, manipulate the view of the slide fiducial mark to align it
against the inner edge of the illuminated mark indicator. The left and bottom edges of the fiducial
mark should register with the inside of the ‘L’ mark. Bring the fiducial mark into sharp focus. (Refer
to
Figure 3-3.)
Next
button on the pod. A flash of red light and a beep will indicate that the slide accession
If the slide reader cannot read the numeric slide ID, you may have to manually enter the slide
ID number or manually review the slide. (Refer to
page 6.1.)
"Text Messages on the Console Display" on
3.8
Review Scope Operator’s Manual
Page 70

OPERATION OF THE REVIEW SCOPE
Slide Fiducial Mark
Illuminated
Mark Indicator
Good Alignment
Poor Alignment:
Fiducial Mark is on
top of Illuminated
Mark Indicator
Poor Alignment:
Fiducial Mark is too far
away from Illuminated
Mark Indicator
Align 2nd Mark
Press Next/Prev
Align 3rd Mark
Press Next/Prev
AUTO REVIEW (continued)
Figure 3-3 Align the Fiducial Mark and the Mark Indicator
3
When the fiducial mark is aligned with the mark indicator, press the
stage presents the second mark and the display prompts the user to align the second fiducial mark.
Using the joystick control, align the second fiducial mark with the illuminated mark indicator, as necessary. (Pressing the
was made.) Press the
The third fiducial mark is presented and the display prompts the user to align the third mark.
Using the joystick control, align the third fiducial mark with the illuminated mark indicator, as necessary. Press the
Prev
button will allow re-alignment of the first fiducial mark, in case a mistake
Next
button on the pod when satisfied with the alignment.
Next
button on the pod.
Next
button on the pod. The
Review Scope Operator’s Manual
3.9
Page 71

OPERATION OF THE REVIEW SCOPE
3
Autolocate
1 of 22
Press Next
AUTO REVIEW (continued)
Autolocate - Viewing the Slide
The stage moves to present the first field of view to the operator.
Note:
Focus as needed using the focus knobs on either side of the Review Scope.
CAUTION:
Visually scan the entire field of view
the field of view, yet the entire field must be examined.
The system does not determine specimen adequacy; use your standard lab protocol. To estimate the
cellularity of the preparation in scantly cellular specimens, a specimen adequacy check can be per
formed during a review of the 22 fields of view. This is done by counting the cells presented in each
of the 22 fields of view presented by the ThinPrep
requirements for the average number of cells in each field dependent upon the microscope objective
used:
The intensity of the mark indicator may be adjusted by using the knobs on the illumination
control panel. The upper knob adjusts the intensity of the white light and the lower knob
adjusts the intensity of the green light. (Refer to
Scan the entire field of view.
. The coordinates of the Object of Interest place it in the center of
FN 22 Eyepiece/
10X Objective
PREP
DIAM
mm AREA
Total
Number of
Fields
Number of
Cells per
Field for
5,000 Total
"Illumination Control Panel" on page 2.10.)
®
Imaging System. The chart below lists the
FN 22 Eyepiece/
40X Objective
Number of
Total
Number of
Fields
Cells per
Field for
5,000 Total
-
20 314.2 82.6 60.5 1322 3.8
Autolocate presents in geographic order the 22 fields of interest as identified by the Image Processor
to the CT for review. During review, the operator may:
• Focus, as necessary
3.10
• Move among the fields of view by pressing the
• Move the field of view by manipulating the joystick
• Change the objective magnification by using the
• Add and remove electronic marks by using the
• Press the
Review Scope Operator’s Manual
Cancel
key to cancel review at any time
Next
and
Objective
Mark
button
Previous
button
buttons on the pod
Page 72

OPERATION OF THE REVIEW SCOPE
Autolocate
22 of 22
Complete
Review Scan
Autolocate
22 of 22
Complete
Scan Finish
This is displayed if one or
more electronic marks were
made. Proceed with the
next section.
This is displayed if no electronic
marks were made. (Scan of the
cell spot is optional.) Proceed with
Check Slide Registration.
AUTO REVIEW (continued)
3
To proceed to the next field of view, press the
pod to go back to the previous field of view (unless you are at the first one). If the objective is at 40X
when the
ceeding.
The object(s) of interest are not necessarily presented in the exact center of the field of view. The joystick can be used to move the stage for viewing and to position an abnormality in the target zone of
the mark indicator for electronic marking.
Note:
Press the
Press the
sion of slide review. The mark indicator highlight will turn from white to green when it has been
selected. Pressing the
white and the electronic mark to be removed.
Note:
When all 22 fields have been viewed, an audible beep will sound. The console display indicates the
Autolocate function is complete.
Next
or
Prev
button is pressed, the objective will automatically return to 10X before pro-
Be sure to position the object so that the physical mark will not obscure it.
Objective
Mark
Electronic marking can only be done while at 10X. The mark indicator is not visible at 40X.
button on the pod to toggle between 10X and 40X magnification.
button on the pod to electronically ‘tag’ an area for physical marking at the conclu-
Mark
button a second time will cause the mark indicator to turn from green to
Next
button on the pod. Press the
Screen the entire field of view!
Prev
button on the
After all 22 fields of view have been presented, the stage will position the field of view at the top
edge of the cell spot.
Review Scope Operator’s Manual
3.11
Page 73

OPERATION OF THE REVIEW SCOPE
3
Review
1 of 3
Press Next
Scan
Finish
AUTO REVIEW (continued)
To estimate the cellularity of the preparation in scantly cellular specimens, a specimen adequacy
1
check can be also performed. In accordance with Bethesda 2001 criteria
should be counted along a diameter of the cell spot that includes the center. Dependent upon the
microscope objective used, use the chart below and count the average number of cells in each field. If
this step is necessary, use the joystick to traverse the cell spot.
, a minimum of 10 fields
FN 22 Eyepiece/
10X Objective
PREP
DIAM
mm AREA
20 314.2 82.6 60.5 1322 3.8
1
The Bethesda System For Reporting Cervical Cytology, Second Edition, 2004, 1994 Spring Science and Business Media, LLC.
Total
Number of
Fields
Number of
Cells per
Field for
5,000 Total
FN 22 Eyepiece/
40X Objective
Total
Number of
Fields
Number of
Cells per
Field for
5,000 Total
Review Marked Fields
If areas on the slide were electronically marked, they may be reviewed prior to scanning the slide.
This function is optional and does not have to be done to complete the slide review procedure. To
review marks, press the
Review
soft key.
The display lists how many electronic marks were made. Similar to operation of the Autolocate function, the Review Marks function allows the operator to:
• Move among electronic marks using the
• Move the field of view by manipulating the joystick
• Change the objective magnification by pressing the
• Add and remove electronic marks by using the
All marks are presented at 10X magnification. The objective will be returned to 10X prior to advancing to the next location. When the desired marks have been reviewed, press the
ceed to slide scanning.
3.12
Review Scope Operator’s Manual
Next
and
Mark
Prev
buttons on the pod
Objective
button
button
Scan
soft key to pro-
Page 74

Slide Scanning
Scan Paused
0% Complete
Press Next
Review
Scan Paused
29% Complete
Press Next/Prev.
Reset Review
CAUTION:
Autoscan must be done if any electronic marks have been made.
OPERATION OF THE REVIEW SCOPE
AUTO REVIEW (continued)
3
The slide may be scanned whether any electronic marks have been made or not.
must
marks have been made, the entire slide
tion, enabling scan coverage of the entire cell spot. User preferences regarding method of scan, direction of scan and speed of scan may be customized in the preference menu. Preferences for scan mode
must be set up ahead of time, in the user preference menu. (Refer to setting preferences on
Slide scanning must be performed to complete slide review if electronic marks have been made.
To proceed with Autoscan, press the
entire cell spot in a defined path at 10X objective.
For Automatic Continuous or Automatic Start/Stop scan modes, to pause while scanning the slide,
press the
Next
button on the pod. The stage motion will cease.
Next
be scanned
button on the pod. The motorized stage will present the
. The Review Scope has an Autoscan func-
If any electronic
page 4.13.)
The operator may:
• Press the
deleted)
• Press the
• Press the
Start/Stop option; only goes back one field of view)
CAUTION:
bration should be performed. Refer to page 4.4.
•
During scan
(The speed remains until the scan ends, or the joystick is moved again.)
•
During pause
Review
Reset
Prev
If the stage drifts (movement without touching the joystick), a joystick cali-
soft key to review electronic marks, (electronic marks may be added or
soft key to start the scan at the beginning
button on the pod to go back to the previous field of view (only on Automatic
, move the joystick left to slow the scan speed, right to increase the scan speed.
, move the joystick to view a different area of the slide
Review Scope Operator’s Manual
3.13
Page 75

OPERATION OF THE REVIEW SCOPE
3
Scan Paused
100% Complete
Finish
Creating Marks
1 of 3
Mark Verify
1 of 3
Press Next
Reject
Good Poor
Mark Rejected
Erase Marks
Continue
Slide Review
Cancelled
Continue
Confirm Reject
Yes No
AUTO REVIEW (continued)
• Press the
off)
An audible beep indicates the completion of scanning. The display shows Scan Paused, 100% Complete.
Physical Marking of the Slide
Press the
marker pen. The display indicates marking activity (the number of marks depends on how many
were electronically marked during review):
Finish
Next
button on the pod to resume scanning (from the location where the scan left
soft key. Any electronic marks will be physically marked on the cover slip with the
When the physical marks have been made, they are presented for final approval. This is to ensure
that the physical marks coincide with the electronic marks.
If the physical mark is acceptable, press the
If the mark is not acceptable, press the
to erase pen marks on the slide. Review of the slide is canceled.
3.14
Review Scope Operator’s Manual
Reject
Next
button on the pod to continue.
soft key. The display prompts to confirm the reject and
Page 76

OPERATION OF THE REVIEW SCOPE
Confirm 1st Mark
Press Next
Reject
Confirm 2nd Mark
Press Next
Reject
Mark Rejected
Erase Marks
Continue
Slide Review
Cancelled
Continue
Creating Slide
Reviewed Mark
Please Wait ...
Slide Reviewed Mark
(Auto Review Location)
AUTO REVIEW (continued)
Check the Slide Registration
If all of the physical marks have been accepted, the stage positions the slide to show the first fiducial
mark. The slide registration is checked to confirm that there has been no slide movement or loss of
stage position during slide review.
3
If the fiducial mark is aligned with the illuminated mark indicator, press the
Next
If the second fiducial mark is properly aligned, press the
If the fiducial mark is not aligned, press the
on the slide and the review of the slide is canceled.
Creating the Slide Reviewed Mark
If the slide registration is acceptable, upon pressing the
to the Server, including the serial number of the review station, operator ID, date/time of the slide
review, slide-review-complete status, coordinates of any marks that were made.
The stage positions the slide to receive the Slide Reviewed Mark. The marker pen is uncapped and a
small double line is marked on the coverslip, located near the top arc of the slide. This indicates that
a slide has completed the entire Auto Review process.
Reject
soft key. The display prompts to erase pen marks
Next
.
button.
button on the pod, the slide data is sent
Next
button on the pod.
Review Scope Operator’s Manual
3.15
Page 77

OPERATION OF THE REVIEW SCOPE
3
Review Complete
Unload Slide
Load Slide
Press Next
Manual Menu
SECTION
D
Slide Already
Reviewed
Continue
If you do not wish to
do a Subsequent
Review, press the
Cancel
soft key on
the console.
An audible beep indicates the mark has been created. The display indicates slide review is complete.
The slide may be removed from the slide holder. The Load Slide screen is displayed and the Review
Scope is ready for another slide review.
Logout When Finished
When finished reviewing slides, logout to save your preferences settings. (Refer to Menu Option 1
Login/Logout,
page 4.3.)
SUBSEQUENT REVIEW
A slide that has undergone Auto Review may be reviewed again.
• More marks may be added (up to a total of 30 marks on any slide)
• No previous marks can be eliminated
• Up to 10 subsequent reviews may be performed
To conduct a subsequent review:
Power On
User Login
Load Slide
slide data record in the server database indicates a previous review has taken place.
- same as Auto Review.
- same as Auto Review.
- same as Auto Review. A “Slide Already Reviewed” message will display, because the
Press the
Register Slide - same as Auto Review.
3.16
Continue
Review Scope Operator’s Manual
soft key.
Page 78

OPERATION OF THE REVIEW SCOPE
Autolocate
4 of 22
Press Next/Prev
Review Finish
Review
1 of 3
Press Next
Scan
Finish
SUBSEQUENT REVIEW (continued)
3
Autolocate
Because the entire slide has been screened previously [at least once], you may skip to review or finish
at any time. If scanning the slide is desired, press the
Review Marked Fields
If additional electronic marks are made, the display will increase the tally to show total number of
electronic marks associated with that slide. Any newly marked fields will be presented first, then
marked fields from the previous review(s).
- same as Auto Review. Notice that the soft keys are
Review
- same as Auto Review
soft key.
Review
and
Finish
.
Autoscan
Physically Marking the Slide
Verify Marks
marks are rejected.
Check Registration
the fiducial mark alignment is rejected.
Creating Slide Reviewed Mark
reviewed mark.
Unload Slide
Logout When Finished
When finished reviewing slides, logout to save your preferences settings. (Refer to Menu Option 1
Login/Logout,
- same as Auto Review.
- same as Auto Review. Only new marks are made on the slide.
- same as Auto Review, EXCEPT you will not be prompted to erase marks if the
- same as Auto Review, EXCEPT you will not be prompted to erase marks if
- Not performed. Only the initial slide review will create the slide
- same as Auto Review.
page 4.3.)
Review Scope Operator’s Manual
3.17
Page 79

OPERATION OF THE REVIEW SCOPE
3
SECTION
E
Load Slide
Press Next
Manual Menu
Enter Login ID
Offline
At the Login ID display, press the
Offline soft key.
From the Load Slide display, press
the Manual soft key.
Load Slide
Offline
Manual Menu
Display
when there
is no interaction with
Server
(offline)
Display when
interacting
with Server
(on line)
MANUAL SLIDE REVIEW
ThinPrep slides may be manually reviewed and marked at the Review Scope. Manual Review is
always an available option. It will be required in certain conditions, which include:
• Slide not imaged (the slide has not been imaged by the Image Processor)
• “Slide Data Error” message (the slide was imaged but there is an error in the data that makes
it unavailable for Auto Review)
• Slide rejected by the Image Processor during imaging (too dense, too scant, too many bubbles,
etc.)
• No communication with the server is available
• Other problems such as a slide physical defect, incorrect labeling or incorrect coverslipping
Accessing Manual Review Mode
Manual Review mode may be accessed at Login display (via the menu) or at the start of a new slide
review during Auto Review.
Press the
menu)
3.18
Offline
Or
Review Scope Operator’s Manual
soft key when the Enter Login display appears (either at power up, or via the
Page 80

OPERATION OF THE REVIEW SCOPE
Align Cell Spot
With Indicator
Press Next
Align Cell Spot
With Indicator
Press Next
MANUAL REVIEW (continued)
3
At the Load Slide display, press the
Note:
Load a slide onto the stage. (Refer to Figure 3-2.)
Register the Slide (Align Cell Spot)
Press the
Manual Review cannot make use of the fiducial marks that are printed on the ThinPrep® Microscope
Slides. In order to create a reference coordinate for physically dotting the slide at the end of review,
the operator must align two edges of the cell spot with the mark indicator.
Look through the eyepieces and using the joystick, move the cell spot up or down to align the
tom edge
movement is allowed on the joystick. (Refer to
When working offline, all user preferences will be set to default values. Refer to Preferences,
page 4.13, to temporarily set preferences for an offline screening session.
Manual
of the cell spot with the inner surface of the illuminated ‘L’ indicator mark. Only vertical
soft key and the following screen will display.
Manual
soft key.
bot-
Figure 3-4‚ Align Cell Spot.)
Note:
Press the
Next, the second alignment is made. Look through the eyepieces and using the joystick, move the cell
spot left or right to align the
indicator mark. Only horizontal movement is allowed on the joystick. (Refer to
Spot.)
It is important to try to align along the
may be easily recognized later.
Next
button on the pod when satisfied with the first alignment.
left edge
of the cell spot with the inner surface of the illuminated ‘L’
edge
of the cell spot, rather than at a group of cells that
Figure 3-4‚ Align Cell
Review Scope Operator’s Manual
3.19
Page 81

OPERATION OF THE REVIEW SCOPE
3
Align the cell spot ‘edge’ with the mark indicator.
Align 1st
Align 2nd
View 1st Alignment View 2nd Alignment
Scan Paused
0% Complete
Press Next
MANUAL REVIEW (continued)
Press the
Manual Scan/Review of the Cell Spot
To proceed with the scan, press the
entire cell spot in a defined path at 10X magnification. The
to advance the stage movement. The console display shows the progress of the cell spot scan in 1%
increments.
Next
button on the pod when satisfied with the second alignment.
Figure 3-4 Align Cell Spot
Next
button on the pod. The motorized stage will present the
Next
button on the pod must be pressed
3.20
Review Scope Operator’s Manual
Page 82

The operator may:
Scan Paused
29% Complete
Press Next/Prev.
Reset Review
‘Review’ soft key
appears the first time
you electronically
mark.
Scan Paused
100% Complete
FinishReview
Creating Marks
1 of 3
OPERATION OF THE REVIEW SCOPE
MANUAL REVIEW (continued)
3
• Press the
• Move the joystick to view a different area of the slide
• Press the
• Press the
Note:
An audible beep indicates the completion of scanning. The display shows Scan Complete.
Press the
Be sure to position the object so that the physical mark will not obscure it.
• Press the
deleted)
• Press the
• Press the
Review
Next
button on the pod to move to the next location
Object
Mark
Review
Reset
Prev
button on the pod to change magnification
button on the pod to electronically mark or unmark cells for physical marking
soft key to review electronic marks (electronic marks may be added or
soft key to restart the scan at the beginning
button on the pod to go back to the previous field of view
soft key to review electronic marks.
Press the
Physical Marking of the Slide
If any areas were electronically marked for physical marking, the pen dots the slide now. The number
of marks count up until all marks are complete.
Finish
soft key to finish manual slide review.
Review Scope Operator’s Manual
3.21
Page 83

OPERATION OF THE REVIEW SCOPE
3
Mark Verify
1 of 3
Press Next
Reject
Good Poor
Confirm 1st Mark
Press Next
Reject
Confirm 2nd Mark
Press Next
Reject
MANUAL REVIEW (continued)
When the physical marks have been made, they are presented for final approval. This is to ensure
that the physical marks coincide with the electronic marks.
The pen mark should align within the illuminated ‘L’ shape of the Mark Indicator. If the physical
marks are acceptable, press the
Next
button on the pod to continue.
If the marks are not acceptable, press the
Note
: If the marks are rejected, the slide may be reviewed again at the Review Scope (the entire pro-
cess is repeated). The marks from the marking pen should be removed before viewing the
slide again.
Check the Slide Registration
If all the marks have been accepted, the stage positions the slide exactly at the first cell spot alignment location. The slide registration is checked to confirm that there has been no slide movement or
loss of stage position during slide review.
If the edge of the cell spot aligns with the illuminated mark indicator, press the
pod. The stage moves to the second cell spot edge position.
Reject
soft key. The review of the slide is cancelled.
Next
button on the
If the alignment is acceptable press the
If either of the positions do not align with the mark indicator, press the
review will be cancelled. Any marks should be removed.
3.22
Review Scope Operator’s Manual
Next
button.
Reject
soft key. The slide
Page 84

OPERATION OF THE REVIEW SCOPE
Slide Review
Cancelled
Continue
Creating Slide
Reviewed Mark
Please Wait ...
Slide Reviewed Mark
(Manual Review Location)
Review Complete
Unload Slide
Load Slide
Offline
Manual Menu
MANUAL REVIEW (continued)
When the cell spot alignment has been confirmed, the stage positions the slide to receive the Slide
Reviewed Mark. The marker pen is uncapped and a small double line is marked on the coverslip,
located on the bottom arc of the slide. This indicates that a slide has completed an entire manual
review process.
3
An audible beep indicates the mark has been created. Slide review is complete and the slide may be
unloaded from the slide holder. The display transitions to the “Load Slide” screen.
Another slide may be loaded for manual review.
Review Scope Operator’s Manual
3.23
Page 85

OPERATION OF THE REVIEW SCOPE
3
SECTION
F
Illuminator Lamp Switch
Review Scope Power Switch
SHUTTING DOWN THE REVIEW SCOPE
Normal Shut Down
When you are finished screening slides, the Review Scope may be shut off.
Make sure there are no slides left on the stage. Turn off the illuminator lamp switch. Turn off the
Review Scope power switch. (Refer to
The Review Scope may be covered with the dust cover provided with it.
Figure 3-5.)
Figure 3-5 Review Scope Lamp Switch and Power Switch
Taking the Instrument Out of Service (Extended Shut Down)
If the Review Scope is to be removed from service, or shut down for an extended time, follow the
steps for normal shut down and unplug the instrument.
3.24
Review Scope Operator’s Manual
Page 86

4. Software Menu
4. Software Menu
Page 87

OPERATION OF THE SOFTWARE MENU
SECTION
A
4
Chapter Four
Operation of the Software Menu
INTRODUCTION
A User accessible software menu is available for calibration of the Review Scope components and to
select user preferences. Refer to
on the console keypad and the joystick and buttons on the pod. The display on the console provides
visual user interface. An audible beep function is also used to indicate completion of some software
tasks.
Figure 4-1‚ Review Scope On-line Menus. User input is via the keys
User preferences for joystick button setup and movement speed, autoscan type, speed and direction,
autolocate speed and audible beep volume may be selected, saved or changed. A preference setting
profile is associated with each User Login ID and is retrieved from the Server at the time of Login.
Regardless of which RS one logs onto, the last saved configuration will be enabled at the time of User
Login. Preferences may be changed at any time. Factory default settings may be restored from this
menu.
Review Scope Operator’s Manual
4.1
Page 88

OPERATION OF THE SOFTWARE MENU
4
1 Left/Right
2 Up/Down
1 Continuous
2 Auto ST/SP
3 Manual ST/SP
Reset Defaults
Beep Volume Setting
Configure Pod Buttons
1 Min Overlap
2 Medium Overlap
3 Max Overlap
Autolo. Speed
Mark Indicator
Frame of Reference
1 User Based
2 Slide Based
Speed Setting
1 Logout / Login
2 Joystick Cal.
3 Setup Marker
(Marker Setup)
(Marker Cal.)
4 Preferences
5 Open Error Log
6 Usage Count
Menu
1 Scan Dir.
2 Scan Type
3 Scan Overlap
4 Autolocate
5 Joystick Setup
6 Beep Volume
7 Button Setup
8 Reset Defaults
Preferences
Load Slide
Press Next
Manual Menu
1 Logout
2 Joystick Cal.
3 Setup Marker
More
4 Preferences
5 Open Error Log
6 Usage Count
Back
To access the menus, at the Load Slide display, press the
The menu list appears as two ‘pages’ of options, both of which are shown here.
To select an option, press the corresponding number key on the console keypad. Press the
Back
4.2
Figure 4-1 Review Scope On-line Menus
soft keys to move from page to page of the menu.
Review Scope Operator’s Manual
Menu
soft key on the console.
More
or
Page 89

OPERATION OF THE SOFTWARE MENU
SECTION
B
Enter Login ID
Enter Back
Confirm Logout
Yes No
1 Logout
2 Joystick Cal.
3 Setup Marker
More
MENU OPTION 1 LOGIN/LOGOUT
4
If the RS is offline (not communicating with the server), the menu option reads
online, the menu option reads
Login
is used to enter the three-digit operator ID at the start of a screening session at the review
scope. As soon as the numbers are entered, the RS queries the server to confirm that the ID is valid. If
any user preferences have been saved for that ID, they are immediately activated on the RS.
Note:
Logout
the Server.
The operator ID is setup via the User Interface at the Image Processor or server. Consult your
lab manager or the Image Processor Operator’s Manual to address any operator ID issues.
is only available if user Login was successful and the Review Scope is actively connected to
• Logout is used to log out of the current session at the Review Scope.
• Logout is used to save preferences associated with a user Login ID. If any preferences have
been selected, they are not saved on the server until Logout has been performed.
Logout
.
Login
; if the RS is
The menu options must be visible on the console display to activate a particular selection. Press 1 on
the key pad to logout.
A display prompting confirmation of user logout appears. Press the
logout is desired.
Yes
soft key on the console if
Review Scope Operator’s Manual
4.3
Page 90

OPERATION OF THE SOFTWARE MENU
4
Enter Login ID
Offline
Load Slide
Press Next
Manual Menu
SECTION
C
Joystick Cal.
Move to extents
then center
and wait
The Enter Login ID display will appear if logout was successful.
If the user does not wish to logout, press the No soft key on the console. The software will display the
Load Slide screen.
MENU OPTION 2 JOYSTICK CALIBRATION
The joystick is calibrated by the operator via the system menu.
4-button pod: calibration is recommended once daily or at the start of each shift.
5-button pod: calibration is necessary upon installation of the pod, or if the pod has been removed
and then reinstalled on a Review Scope.
Note:
To calibrate the joystick, from the menu select
The display prompts for the joystick to be moved so that it reaches its furthest point of travel in all
directions. This is necessary for calculating the calibration. To calibrate the joystick:
1. Place your finger in the center of the joystick. Deflect the button outward to the farthest possible
If drifting of the stage is noticed, calibrate the joystick.
2, Joystick Cal
extent.
.
4.4
Review Scope Operator’s Manual
Page 91

OPERATION OF THE SOFTWARE MENU
Joystick
Deflect and circle
2 or 3 times
Joystick Cal.
Complete
Continue
Joystick Cal.
Failed
Continue
2. While maintaining full deflection, roll your finger in a circle 2 or 3 times to move the joystick in
the widest possible circles.
3. Return the joystick to the center and let go.
4. Do not touch the joystick while calibration calculations are being performed.
Figure 4-2 Calibrate the Joystick
4
In a few seconds, the calibration is complete. An audible beep will sound and the display indicates
the calibration is complete.
Press the
If calibration fails, retry it several times. If calibration continues to fail, contact Hologic Technical
Support.
Continue
soft key on the key pad to return to the Load Slide screen.
Review Scope Operator’s Manual
4.5
Page 92

OPERATION OF THE SOFTWARE MENU
4
SECTION
D
1 Marker Setup
2 Marker Cal.
Back
Load Blank Slide
Press Next
MENU OPTION 3 SETUP MARKER
Two object marker adjustments are available in this menu: Marker Setup, which adjusts the proximity of the pen tip to the slide for marking, and Marker Calibration, which calibrates the marker.
Marker Setup
Marker Setup adjusts the pen tip nearer to or further from the microscope slide when the pen is lowered for marking. Indications that adjustment is needed include:
• The pen mark is too wide (too close to the slide)
• The pen drags on the slide between marks (too close to the slide)
• Scant or no mark on the slide (too far from the slide)
Before changing the Marker Setup, confirm the pen is seated correctly in the holder. Do a Marker Calibration.
From the menu, select
A prompt to load a blank slide appears.
Load a blank ThinPrep slide into the slide holder on the stage. Press the
1, Marker Setup.
Next
button on the pod.
4.6
Review Scope Operator’s Manual
Page 93

OPERATION OF THE SOFTWARE MENU
Marker Setup
Focus
Continue
®
Focus
Marker Setup
Load Marker
Skip Done
Marker Setup
Next - Lower Pen
Prev - Raise Pen
Save
Next Button
Prev Button
Figure 4-3 Focus on the Painted Arc
Looking through the eyepieces, focus the microscope on the top arc of the frosted area. (Refer to Figure 4-3.) Press the
Continue
soft key when ready.
4
If a marking pen is already in the object marker holder, press the
If there is no pen present or you are replacing a pen, take a new pen, uncap it and prime the marker
by gently dragging the tip across a piece of lint free tissue. Load the pen into the holder.
• For ThinPrep Review Scopes that use the Sharpie marking pen, push the pen into the guide,
making sure it is seated against the holder. Then press the locking arm to the right until it
firmly grips the pen.
• For ThinPrep Review Scopes that use the Pilot marking pen, push the pen into the guide.
Loosen your hold on the pen and notice that it moves up slightly. Gently hold the pen there
and press the locking arm to the right until it firmly grips the pen. Because the pen is thinner
than the holder, it may be helpful to hold the pen at a 15° angle (approximately the 1 o’clock
position on a clock face) in the guide, while pressing the locking arm.
Press the
Press the
Observe the movement of the pen as either button is repeatedly pressed.
Done
softkey. (Refer to Figure 4-5.)
Next
or
Prev
buttons on the pod to step the pen closer to or away from the slide surface.
Skip
soft key.
Review Scope Operator’s Manual
4.7
Page 94

OPERATION OF THE SOFTWARE MENU
4
Load Blank Slide
Press Next
If the pen is too close to the slide (leaving wide marks or bent pen tip), click on the
move the pen away from the slide. If the pen is not close enough to the slide, click on the
to bring the pen tip closer to the slide.
Click on
WARNING:
Moving Parts
Save
to save the position.
Glass
Prev
button to
Next
button
Marker Calibration
Calibration of the pen used for physically marking the slide positions the pen so that the ink mark is
within the ‘L’ shape of the mark indicator. Minimally, calibration should be performed:
• Daily
• Every time a new marker is installed
• After a mark is rejected while verifying marks
Note:
Note:
The object marker on ThinPrep Review Scope model numbers 70575-001, 70575-003, 71062001, and 71062-002 uses an ultra fine tip Sharpie
ThinPrep Review Scope model numbers 70669-001, 70669-002, and 70669-003 uses a Pilot
extra fine marking pen. These pens are widely used for marking slides.
If using a 4-button pod, joystick calibration should be done before marker calibration.
®
marking pen. The object marker on
To calibrate the object marker, the Review Scope must be powered On. The lamp illuminator should
be on and the white mark indicator lamp intensity should be turned up to a brightness for normal
viewing.
From the menu, select option
Load a blank ThinPrep® microscope slide into the slide holder on the stage. Press the
the pod.
4.8
Review Scope Operator’s Manual
3, Setup Marker
, and then select option
2, Marker Cal.
Next
button on
Page 95

OPERATION OF THE SOFTWARE MENU
®
Marker Cal.
Focus
Continue
Focus
Marker Cal
Load Marker
Skip Done
Figure 4-4 Focus on the Painted Arc
Looking through the eyepieces, focus the microscope on the top arc of the frosted area. (Refer to Figure 4-4.) Press the
Continue
soft key when ready.
4
If you are doing the routine calibration of the marker and a marking pen is already in the object
marker holder, press the
If you are replacing the pen with a new one, remove the pen now.
CAUTION:
ing, the control arm moves it to a position that allows for the best access, and ensures
that it seats most securely against the seal diaphragm.
Take a new pen, uncap it and prime the marker by gently dragging the tip across a piece of lint free
tissue. Load the pen into the holder.
• For ThinPrep Review Scopes that use the Sharpie marking pen, push the pen into the guide,
making sure it is seated against the holder. Then press the locking arm to the right until it
firmly grips the pen. (Refer to
Do not load the Sharpie marking pen until prompted to do so. During load-
Skip
soft key.
Figure 4-5.)
Review Scope Operator’s Manual
4.9
Page 96

OPERATION OF THE SOFTWARE MENU
4
Lock
Unlock
Poor
Good
12
9
6
3
Lock
Unlock
Poor Good
Creating Mark
Please Wait...
Center Mark
Press Next
Figure 4-5 Load the Sharpie® Object Marker Pen
• For ThinPrep Review Scopes that use the Pilot marking pen, push the pen into the guide.
Loosen your hold on the pen and notice that it moves up slightly. Gently hold the pen there
and press the locking arm to the right until it firmly grips the pen. Because the pen is thinner
than the holder, it may be helpful to hold the pen at a 15° angle (approximately the 1 o’clock
position on a clock face) in the guide, while pressing the locking arm.
Press the
4.10
Review Scope Operator’s Manual
Done
Figure 4-6 Load the Pilot Object Marker Pen
soft key when the pen is loaded. A test mark will be made on the slide.
Page 97

OPERATION OF THE SOFTWARE MENU
Correct
Incorrect
Marker
Calibration
Complete
Continue
Load Blank Slide
Press Next
The software prompts the user to center the mark in the illuminated mark indicator. Using the joystick, move the mark until it aligns within the boundaries of the ‘L’ shape of the mark indicator.
(Refer to
Figure 4-7.)
Figure 4-7 Align the Pen Mark Within the Mark Indicator
4
Press the
An audible beep indicates the marker calibration is complete. Press the
the Load Slide display. Unload the slide from the slide holder.
Prime the Object Marker
For Review Scopes that use the Pilot pen as the object marker, priming the pen may improve the flow of
ink to the slide. Prime the pen after the marker has been set up and after the marker has been calibrated.
Use the first several steps of the Marker Calibration process to uncap the marker.
From the menu, select option
Next
button on the pod when ready.
3, Setup Marker,
and then select option
Continue
2, Marker Cal.
soft key to return to
Load a blank ThinPrep® microscope slide into the slide holder on the stage. Press the
the pod.
Next
button on
Review Scope Operator’s Manual
4.11
Page 98
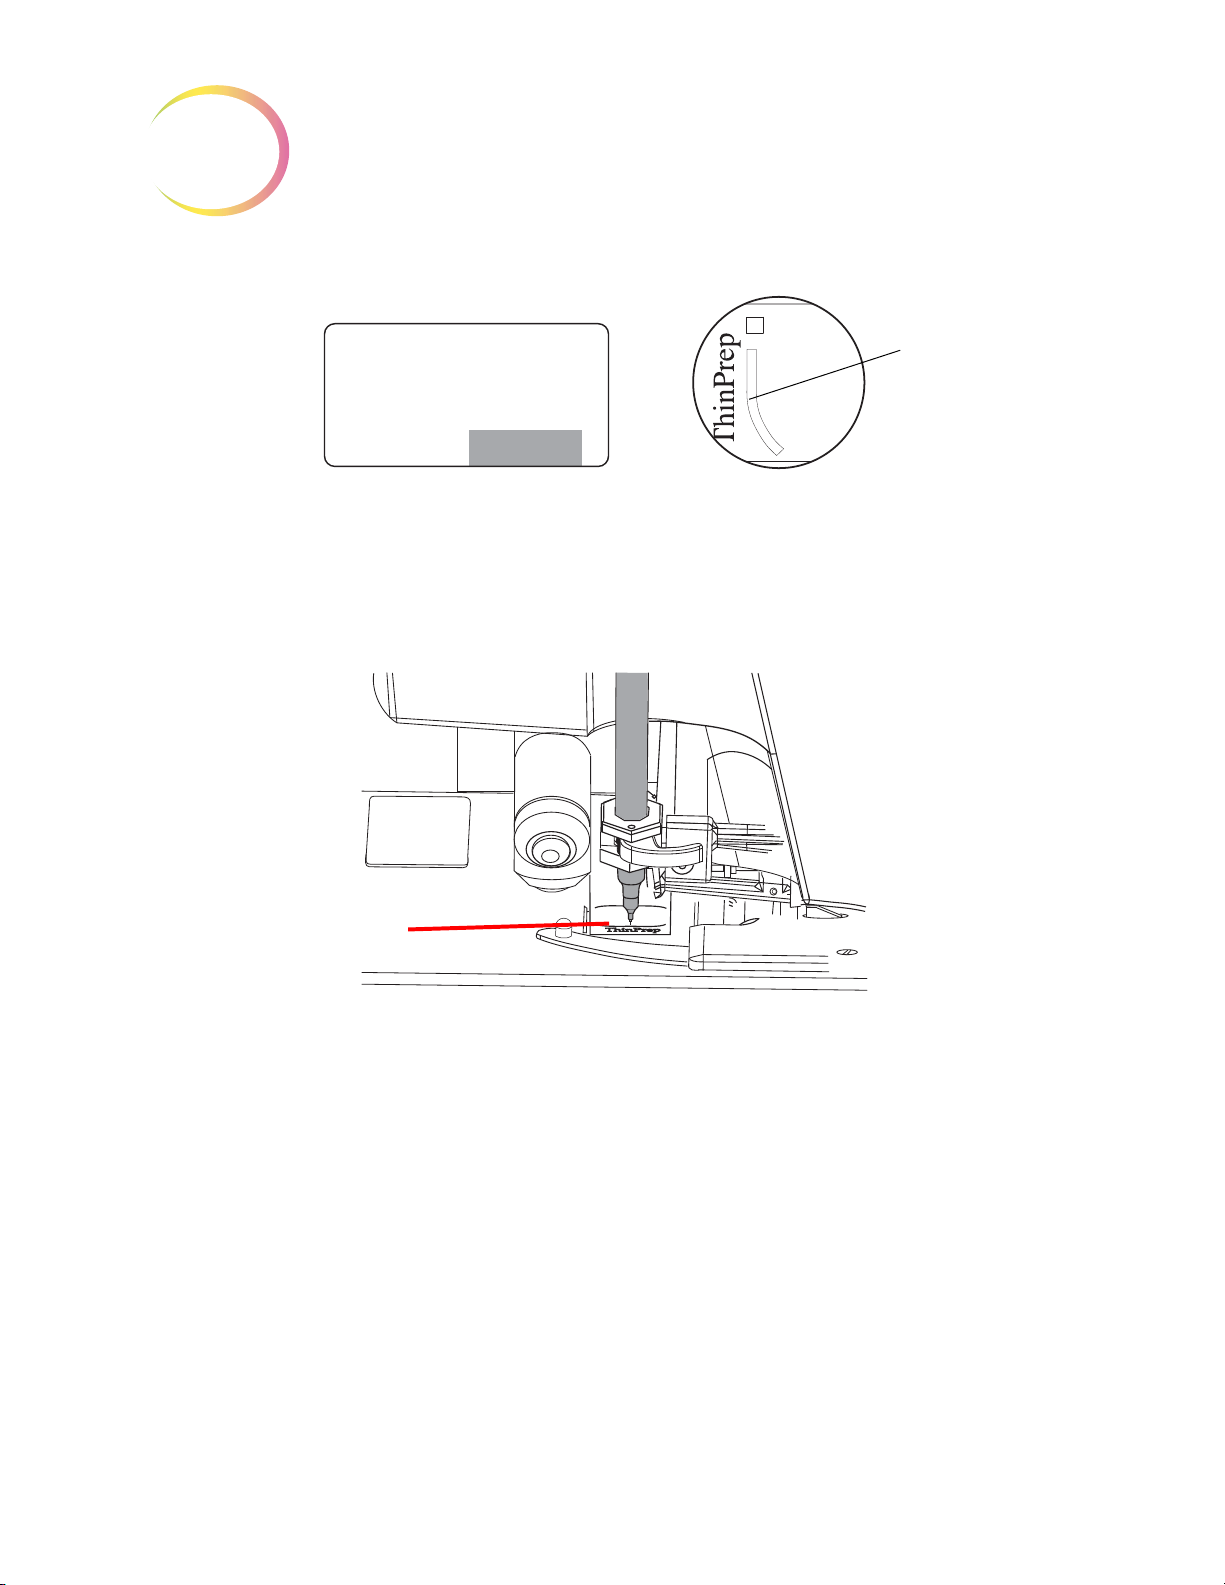
OPERATION OF THE SOFTWARE MENU
4
®
Marker Cal.
Focus
Continue
Focus
Slide a lint-free wipe
under the pen tip.
Figure 4-8 Focus on the Painted Arc
Looking through the eyepieces, focus the microscope on the top arc of the frosted area. (Refer to Figure 4-8.) Press the
Slide a lint-free wipe between the pen tip and the slide
Continue
soft key when ready.
Figure 4-9 Prime the pen
Lift up the lint-free wipe so that it touches the pen top. When ink from the pen starts to flow freely to
the lint-free wipe, the pen is primed and ready to use.
Press the cancel key
Load Slide display. Remove and discard the lint-free wipe.
Note:
4.12
Alternatively, you can prime the Pilot marking pen by hand. Remove the pen from the holder,
and press the pen against a lint-free wipe. In this case, the Marker Setup and Marker Calibra
tion processes must be done after the pen is primed.
Review Scope Operator’s Manual
⊗
to omit the remaining steps in the Marker Calibration process and return to the
-
Page 99

OPERATION OF THE SOFTWARE MENU
SECTION
E
1 Scan Dir.
2 Scan Type
3 Scan Overlap
More
4 Autolocate
5 Joystick Setup
6 Beep Volume
Back More
7 Button Setup
8 Reset Defaults
Back
1 Left/Right
2 Up/Down
Save
4
MENU OPTION 4 PREFERENCES
Preferences allows the setting of user preferences including Autoscan settings and maximum speed
for Autolocate. For each user-selectable preference, the console display shows the current setting of
the parameter. Use the pod buttons to change the setting to the desired value. The setting is stored
locally (in RS memory) until the user preferences are updated on the Server during user Logout.
Note:
From the main menu, select option
select an option, press the corresponding number key on the console keypad. Press the
soft keys to move from page to page of the menu.
Note:
Preferences 1 Scan Direction
The direction of the stage movement during autoscan can be selected. From the preferences menu,
select
time to exit out of menus.
Preferences are not saved until Logout. At the next Login, the preferences for that User ID will
be uploaded.
4, Preferences
Refer to the preferences worksheet at the end of this chapter, when evaluating and recording
preference settings.
1, Scan Dir
. The direction options are Left/Right or Up/Down. Press the cancel key
. All three ‘pages’ of the menu are shown below. To
More
or
Back
⊗ at any
On the console keypad press the number key corresponding to your choice. The selected direction
Save
will have a highlighted box around it. Press the
tion setting will now be used during this login session and will be saved to the user preferences profile at logout.
soft key to save that preference. The scan direc-
Review Scope Operator’s Manual
4.13
Page 100

OPERATION OF THE SOFTWARE MENU
4
Preferences 2 Scan Type
The autoscan function presents the entire cell spot in a defined path at 10X magnification. Three
types of scan motion are selectable:
•
Automatic Continuous
across the cellular region, with each pass overlapping the previous scan. The user may speed
up or slow down the movement by moving the joystick to the
left
for a slower scan. Scan motion may be paused and resumed (from where the scan was
interrupted) by pressing the
•
Automatic Start Stop
overlapping fields of view, including a pause at each view. The user may increase or decrease
the duration of each pause by moving the joystick to the
for a slower scan. Scan motion may be paused and resumed (from where the scan was interrupted) by pressing the
•
Manual Start Stop
which is a series of discrete, overlapping fields of view (identical to the Auto Start-Stop pat
tern). The autoscan is paused after each field of view and remains there until the user presses
Next
the
button again.
- Scan motion is initiated by the RS and consists of steady movement
right
for a faster scan and to the
Next
button on the pod.
- Scan motion is initiated by the RS and consists of a series of discrete,
right
for a faster scan and to the
Next
button on the pod.
- Using the
Next
button on the pod, the user initiates the scan motion,
left
-
To set the preferred scan type, select option
Note:
In order to have a visual reference during the speed and direction test functions, load a test
slide in the stage slide holder prior to selecting the preferences. If a slide is not present, the
display will prompt you to load one.
2, Scan Type
.
4.14
Review Scope Operator’s Manual
 Loading...