

Page 1
Understanding
R2 ImageChecker
Software Versions 8.5– 8.7
MAN-01049 Rev 001
®
Page 2

Page 3

Screen-Film Mammography
Understanding
R2 ImageChecker
Software Versions 8.5–8.7
PN MAN-01049 Rev 001
®
Page 4

Technical Support
For support in North America contact:
Toll Free: +1 866.243.2533 (866.CHECKED)
Email: techsupport@r2tech.com
Hours: Monday – Friday, 6:00 AM – 5:00 PM, PT (GMT –8:00)
Website: www.hologic.com
For support in Europe, South America, or Asia, contact your local dealer or distributor.
© 2008, Hologic, Inc. All rights reserved. Duplication or distribution without written permission
is prohibited. Hologic reserves the right to revise this manual. Issued August 2008.
Protected by one or more of the following U.S. Patents: 5133020, 5452367, 5491627, 5537485,
5622171, 5657362, 5673332, 5729620, 5732697, 5740268, 5815591, 5828774, 5832103,
5917929, 6014452, 6035056, 6075879, 6078680, 6185320, 6198838, 6263092, 6266435,
6301378, 6404908, 6434262, 6477262, 6574357, 6580818, 6640001, 6628815, 6909795,
7054473, 7072498, 7146031, 7174515
Hologic, the Hologic logo, Cenova, CheckMate, DigitalNow, EmphaSize, ImageChecker, Malc,
Mammolux, R2, R2 Technology, SecurView
trademarks of Hologic in the USA. MergeCOM-3 is a trademark of Merge Healthcare.
, and Selenia are trademarks or registered
DX
Hologic Inc.
35 Crosby Drive
Bedford, MA 01730-1401 USA
Tel: +1.781.999.7300
Sales: +1.781.999.7453
Fax: +1.781.280.0668
Asia Pacific
Room 302, Hung Kei Building
5-8 Queen Victoria Street
Central, Hong Kong
Tel: +852.3102.9200
Hologic N.V.
Authorized Representative
Leuvensesteenweg 250A
1800 Vilvoorde, Belgium
Tel: +32.2.711.4680
Fax: +32.2.725.2087
MergeCOM-3 Advanced Integrator’s
Tool Kit is a product of Merge
Healthcare.
ii Understanding R2 ImageChecker 8.5–8.7 – PN MAN-01049 Rev 001
Page 5

Contents
Part 1: Introduction....................................................... 1
1.1. Intended Use......................................................... 1
1.2. Resources Available ................................................... 2
1.3. Warnings and Precautions .............................................. 3
1.4. Overview of ImageChecker CAD.......................................... 5
1.5. Benefits of ImageChecker CAD........................................... 6
1.6. Devices Used with ImageChecker CAD .................................... 7
1.7. ImageChecker Features ................................................ 8
RightOn CAD Marks................................................... 8
EmphaSize........................................................... 8
PeerView and PeerView Digital ........................................... 8
Operating Points ...................................................... 9
Part 2: Data Inputs and Outputs ......................................... 11
2.1. Film-Based CAD with DigitalNow........................................ 11
2.2. CAD Inputs and Supported Views ....................................... 13
View Modifiers ...................................................... 14
Images with Breast Implants ............................................ 14
2.3. Image and Case Processing ............................................ 15
Selecting Images for Case Processing ...................................... 16
2.4. System Outputs ..................................................... 18
CAD Results Report .................................................. 19
Part 3: Algorithm Description ............................................ 21
3.1. ImageChecker CAD Algorithm .......................................... 21
3.2. RightOn CAD Marks .................................................. 22
Limiting the Number of Marks .......................................... 22
3.3. EmphaSize Marks .................................................... 23
3.4. PeerView and PeerView Digital ......................................... 24
3.5. What the Algorithm Detects............................................ 25
Calcifications........................................................ 25
Masses/Architectural Distortions......................................... 26
Understanding R2 ImageChecker 8.5–8.7 – PN MAN-01049 Rev 001 iii
Page 6

Contents
3.6. Detecting Calcifications ............................................... 28
Image Processing for Calcifications ....................................... 28
Case Processing for Calcifications ........................................ 29
3.7. Detecting Masses .................................................... 30
Image Processing for Masses ............................................ 30
Case Processing for Masses ............................................. 31
3.8. CAD Operating Points................................................. 32
Index .................................................................. 35
iv Understanding R2 ImageChecker 8.5–8.7 – PN MAN-01049 Rev 001
Page 7

Part 1: Introduction
f 1.1. Intended Use
f
1.2. Resources Available
f
1.3. Warnings and Precautions
f
1.4. Overview of ImageChecker CAD
f
1.5. Benefits of ImageChecker CAD
f
1.6. Devices Used with ImageChecker CAD
f
1.7. ImageChecker Features
R2 ImageChecker® is a software application used for analyzing mammography
images. This manual describes R2 ImageChecker software versions 8.5, 8.6, and 8.7,
which were developed to provide the ImageChecker software as a licensed option
with these Hologic film scanning systems:
• R2 DMax System
• R2 LS System
• R2 DM System
These systems support a second application, R2 DigitalNow™, which the systems use
to create archivable digital mammography image files from the original films.
R2 ImageChecker 8.7 is available as a software upgrade for customers that have
previous versions. For customers using full-field digital mammography (FFDM)
systems, the ImageChecker software is also available as a licensed option with
Hologic’s R2 Cenova digital mammography server. For more information, contact
your Hologic customer representative.
The information in this manual is intended to serve as a reference for radiologists and
clinic personnel who need to understand how ImageChecker computer-aided
detection (CAD) can be integrated into their practice.
1.1. Intended Use
ImageChecker is a software application intended to identify and mark regions of
interest on routine screening and diagnostic mammograms to bring them to the
attention of the radiologist after the initial reading has been completed.
ImageChecker assists the radiologist in minimizing observational oversights by
identifying areas on the original mammogram that may warrant a second review.
Understanding R2 ImageChecker 8.5–8.7 – PN MAN-01049 Rev 001 1
Page 8

Part 1: Introduction
1.2. Resources Available
In addition to this manual, the following resources are available to assist you:
•
R2 Member Center: This website provides quick access to electronic (pdf) versions
of Hologic manuals and training materials. You can find the R2 Member Center by
visiting the Hologic website (
accompanies this product for instructions on accessing the R2 Member Center.
•
Manuals: The manuals for the R2 film scanning systems are listed below:
– Understanding R2 ImageChecker
– R2 DMax User Manual
– R2 DM User Manual
– R2 LS User Manual
– R2 DMax/DM/DX/LS Service Manual
– R2 DMax/DM/DX/LS Release Notes
– R2 DMax/DM/DX/LS DICOM Conformance Statement
You can obtain additional copies of printed manuals through your Hologic
Account Manager. The DICOM Conformance Statement is available at
www.hologic.com.
www.hologic.com). See the R2U flyer that
•
Training: The Hologic Applications team is available to train your staff, should you
feel they need additional training. To purchase additional personalized instruction,
contact your Hologic Account Manager.
•
Technical Support and Service: For support in North America contact:
Toll Free: +1.866.243.2533 (+1.866.CHECKED)
Email: r2support@hologic.com
Hours: Monday – Friday, 6:00 AM – 5:00 PM, PT (GMT –8:00)
Website: www.hologic.com
For support in Europe, South America, or Asia, contact your local dealer or
distributor.
2 Understanding R2 ImageChecker 8.5–8.7 – PN MAN-01049 Rev 001
Page 9

1.3. Warnings and Precautions
Note: For Warnings and Cautions related to the installation, operation, and
maintenance of the R2 film scanning system, refer to the user manual accompanying the
product.
• The radiologist should base interpretation only on original diagnostic-quality
images and not depend on ImageChecker CAD marks for interpretation.
• The device is a detection aid, not an interpretative aid. ImageChecker CAD marks
should be activated only after the first reading.
• The device does not enhance what the user sees; rather it helps to identify regions
on mammograms that should be re-examined.
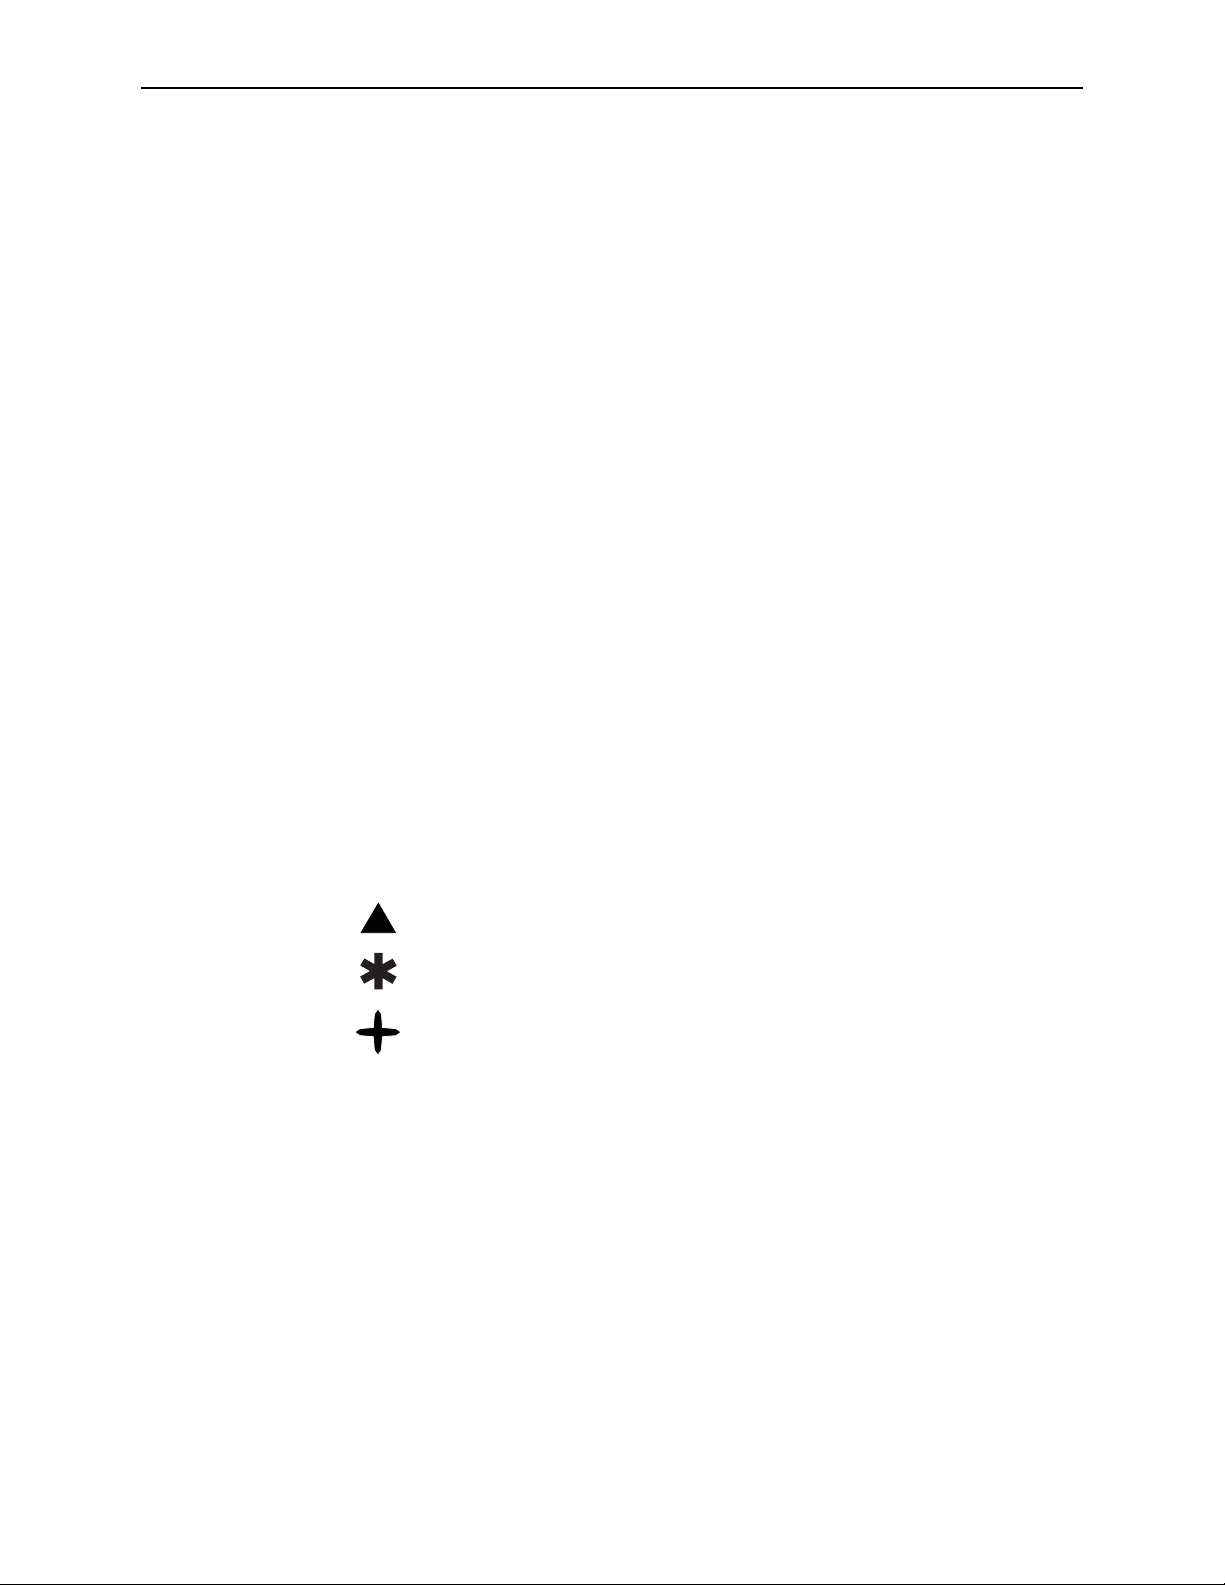
• The ImageChecker software marks calcification features with triangles (Calc
marks) and mass features with asterisks (Mass marks). The software marks mass
and calcification features that occur at the same location on the image with
pointed crosses (Malc marks). These features may not represent cancer, and the
skill of the user is still required for proper interpretation of the marked areas.
• EmphaSize (variable-size) marks – Sites may choose to display prominence detail,
in which case the size of a Calc, Mass, or Malc mark is proportional to the ranking
of the feature by the algorithm. The marked features may not represent cancer,
and the skill of the user is still required for proper interpretation of areas marked
by the device.
1.3. Warnings and Precautions
• For proper system operation, the technical quality of the original films or images
(e.g., contrast) should meet relevant MQSA standards (or the appropriate national
standards) and be acceptable to the mammographer.
• The use of digitized images (scanned film images) for primary reading has not
been approved by MQSA. Digitized film images retrieved from archive should be
used only for the purpose of comparison with digital images meeting the current
standard.
• During routine interpretation of mammograms and results produced by
ImageChecker CAD, Hologic recommends use of a mammography workstation
that has been FDA-approved, recently calibrated, and employs a CAD marking
schema authorized by Hologic.
• ImageChecker software does not identify all areas that are suspicious for cancer.
– The software does not mark all lesions and a user should not be dissuaded from
working up a finding if the software fails to mark that site.
– The software is not designed to detect changes from prior mammograms.
– The software is not designed to detect skin thickening or nipple retractions.
– Conditions of the breast that diminish mammographic sensitivity, such as
density of normal tissue, also diminish the sensitivity of the software.
– The software is more sensitive for detection of calcifications than masses, and the
sensitivity depends on the site-specific operating points chosen. For sensitivity
values, see ‘
algorithm has a lower sensitivity for masses greater than 2.5 cm in diameter.
3.8. CAD Operating Points’. In addition to not marking all masses, the
Understanding R2 ImageChecker 8.5–8.7 – PN MAN-01049 Rev 001 3
Page 10

Part 1: Introduction
– Individual practice patterns may influence results obtained when using
ImageChecker CAD. Therefore, each facility and radiologist should carefully
monitor the results that the software has on their practice of mammography in
order to optimize its effectiveness.
• The performance of the system has not been characterized for mammograms from
patients with:
– Breast implants. Process only Implant-Displaced Views with less than 2.5 cm (1
in) of the breast implant appearing on the image.
– Special diagnostic views (e.g., magnified views or spot-compressed views).
Process only full-view diagnostic images.
– Segmented views of the breast (e.g., ‘mosaic’ views) with no clear breast border.
Process only views with breast borders.
4 Understanding R2 ImageChecker 8.5–8.7 – PN MAN-01049 Rev 001
Page 11
1.4. Overview of ImageChecker CAD
Systems configured with R2 ImageChecker 8.5–8.7 analyze digitized film
mammography images with a software algorithm that identifies regions of interest,
which can include clusters of bright spots (suggestive of calcification clusters), and
dense regions with or without radiating lines (suggestive of masses or architectural
distortions). The systems generate results that include ImageChecker CAD marks
identifying the regions of interest. The results produced are either image files,
Mammography CAD SR (Structured Report) objects, or both.
After making an initial interpretation from the original mammograms, the radiologist
displays the ImageChecker results and chooses whether or not to reinspect the
marked regions on the original mammogram. The ImageChecker algorithm marks
visually perceptible structures that have some of the generally accepted geometric
characteristics of calcifications or masses. The marked areas may be something other
than an actual abnormality, which the radiologist generally recognizes upon a second
review of the original mammogram.
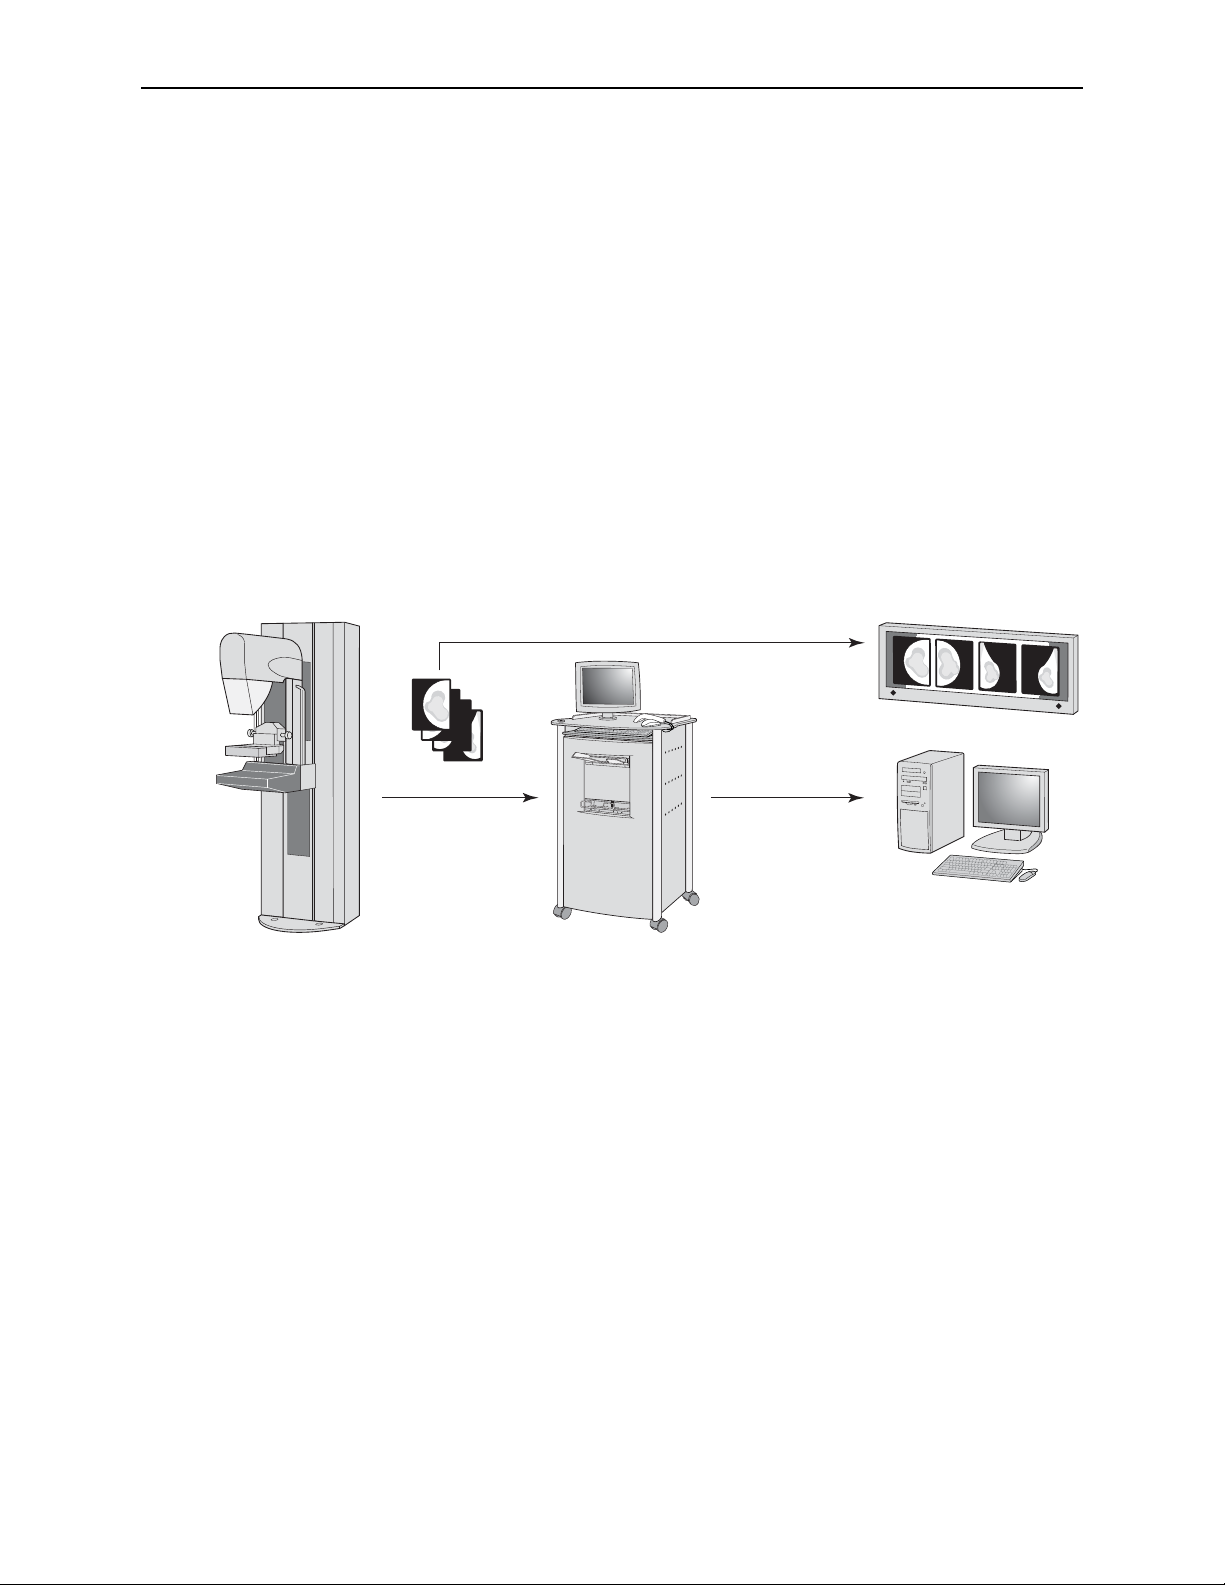
1.4. Overview of ImageChecker CAD
Examination is
Performed
Films
CAD Results
ImageChecker
Analyzes the Images
ImageChecker Workflow
Radiologist
Reviews Films
and CAD Results
Understanding R2 ImageChecker 8.5–8.7 – PN MAN-01049 Rev 001 5
Page 12

Part 1: Introduction
1.5. Benefits of ImageChecker CAD
The interpretation of mammograms is challenging. Normal breast tissue varies widely
among women, even for the same woman over time or at different times of the
month. The radiologist also has to balance the need for accurate detection of breast
cancer with the need to limit the number of unnecessary procedures. The
combination of viewing a large number of cases, radiologist fatigue, the complex
image of the breast structure, and the subtle nature of certain observable
characteristics of the disease can result in false-negative readings. In fact, studies show
that half of undetected cancers are missed due to observational oversights. The
prevalence of observational oversights is not strongly related to experience and may
be inevitable with human observers.
R2 ImageChecker functions like a spellchecker for medical images. It is designed to
help radiologists in reducing the number of false-negative readings due to
observational oversight by drawing their attention to areas that may warrant a second
review. Use of ImageChecker CAD can result in earlier detection of up to 23.4% of
the cancers currently detected with screening mammography in those women who
had a prior screening mammogram 9–24 months earlier. Early detection is the key to
higher survival rates, better prognosis, and lower treatment costs.
6 Understanding R2 ImageChecker 8.5–8.7 – PN MAN-01049 Rev 001
Page 13

1.6. Devices Used with ImageChecker CAD
All systems with R2 ImageChecker 8.5–8.7 include a film scanner for scanning
mammography X-ray films and a processing unit computer configured with the R2
image-processing software. There are three models:
• R2 DMax System
• R2 LS System
• R2 DM System
Facilities must also have an output device in order to review or store the CAD results.
These devices may include any of the following:
• R2 CheckMate Ultra™ display unit
• Postscript printer
1.6. Devices Used with ImageChecker CAD
• Diagnostic mammography review workstation (such as Hologic’s SecurView
dx
)
• PACS (Picture Archiving and Communication System)
The system devices are connected by a computer network and can be in the same
room, different rooms, the same building, different buildings, or even different cities.
The R2 processing unit can send results to several different output devices.
The R2 DMax, LS, and DM systems are designed to:
• Scan mammography X-ray films and convert them into digital image files
• Allow users to review the scanned images, and to reorient, label, and reprocess the
images as needed.
• Analyze the images using the R2 ImageChecker algorithm to detect regions of
interest.
• Transmit the study results so they can be viewed on an output device such as the
R2 CheckMate Ultra display unit, printer, diagnostic review workstation (or to a
PACS for archiving).
Understanding R2 ImageChecker 8.5–8.7 – PN MAN-01049 Rev 001 7
Page 14
Part 1: Introduction
1.7. ImageChecker Features
R2 ImageChecker provides the following features, which are discussed below:
f RightOn CAD Marks
f
EmphaSize
f
PeerView and PeerView Digital
f
Operating Points
Upon installation, the Hologic field service engineer will configure the software based
on the preferences of site personnel. Thereafter, your Hologic representative can help
you add a new license (such as DigitalNow) and enable or disable features as needed.
For more information on ImageChecker features, see ‘
Important! Display of results from each ImageChecker feature depends upon several
factors, in particular:
• The feature must be licensed and enabled on the R2 processing unit.
• The review workstation must be equipped with software that can interpret the output
produced by the processing unit.
Some workstations can interpret only a subset of ImageChecker features. Consult with
your workstation vendor concerning availability and integration of ImageChecker features
with your workstation.
RightOn CAD Marks
The ImageChecker software provides three types of RightOn™ CAD marks (Mass,
Calc, and Malc) that can appear in the results. You can choose to display any or all of
the three types of marks. Each mark identifies a region of interest for the radiologist
to review.
Part 3: Algorithm Description’.
Calc – Marks regions suggestive of calcifications.
Mass – Marks regions suggestive of masses or architectural distortions.
Malc – Marks regions where Calc and Mass marks are coincident.
EmphaSize
The processing unit is configured by default to convert the CAD marks to
EmphaSize™ marks, which can be viewed on some diagnostic review workstations, as
well as the R2 output devices (R2 CheckMate Ultra and postscript printer).
EmphaSize produces CAD marks of variable size that correlate to feature significance.
When the algorithm determines that a region is more significant, the CAD mark
appears larger, indicating that the region should receive more emphasis from the
radiologist. EmphaSize marks can be disabled if clinic staff choose not to use them.
For more information see ‘
3.3. EmphaSize Marks’.
PeerView and PeerView Digital
PeerView™ and PeerView Digital are optional features that help radiologists better
understand why a region of interest was marked. PeerView and PeerView Digital
8 Understanding R2 ImageChecker 8.5–8.7 – PN MAN-01049 Rev 001
Page 15

1.7. ImageChecker Features
display a close-up, high-resolution section of the image and highlight physical
features found by the algorithm, facilitating the radiologist’s reassessment of the
mammograms.
• PeerView is licensed on CheckMate Ultra display units and Mammolux motorized
viewers. When licensed, PeerView asks the R2 DMax system to send the additional
high-resolution CAD information to the display unit.
• PeerView Digital is licensed on the DMax system. When licensed, PeerView Digital
creates extra CAD information in the Mammography CAD SR output, viewable on
some softcopy review workstations. It displays a close-up, high-resolution section
of the image, highlights physical features found by the algorithm, and produces
measurements of the physical features.
Operating Points
For more information see ‘
3.4. PeerView and PeerView Digital’.
The ImageChecker algorithm offers three operating points (i.e., CAD algorithm
thresholds) to accommodate differing radiologist preferences: operating point 0,
which emphasizes specificity (a low false-mark rate), operating point 1, which is a
balanced intermediate point, and operating point 2, which emphasizes sensitivity.
The algorithm performance for each of the operating points is summarized below:
Operating Point 0 1 2
Calcification Sensitivity 95% 96% 97%
Mass Sensitivity 83% 88% 90%
False Marks per Case 1.0 1.5 2.0
When your system is installed, the R2 processing unit is configured to use operating
point 1 for masses and operating point 2 for calcifications. You can choose other
settings, or your service representative can change the operating points at a later time.
For new customers, Hologic recommends using the default settings for the first four
to six weeks to allow you to become familiar with the R2 marks and algorithm
behavior.
The ImageChecker algorithm provides the medical-imaging industry’s highest
sensitivity at any given false-mark rate. ImageChecker was the first computer-aided
detection software approved by the FDA for full-view diagnostic and screening
mammograms. Since that first approval, the ImageChecker software has been refined
many times, resulting in an algorithm that is highly sensitive with few false marks. For
more information, see ‘
3.8. CAD Operating Points’.
Understanding R2 ImageChecker 8.5–8.7 – PN MAN-01049 Rev 001 9
Page 16

Part 1: Introduction
10 Understanding R2 ImageChecker 8.5–8.7 – PN MAN-01049 Rev 001
Page 17

Part 2: Data Inputs and Outputs
f 2.1. Film-Based CAD with DigitalNow
f
2.2. CAD Inputs and Supported Views
f
2.3. Image and Case Processing
f
2.4. System Outputs
Part 2 explains how information flows through systems with ImageChecker CAD, the
supported mammography views, and the result formats.
ImageChecker 8.5–8.7 runs on Hologic’s film-scan systems (R2 DMax, DX, DM, and
LS). Facilities can also run ImageChecker on images produced by full-field digital
mammography (FFDM) systems such as Hologic’s Selenia. Digital CAD requires a
different processing computer, the R2 Cenova server, and a different ImageChecker
version (9.0 or greater). For further information, see the corresponding manual,
Understanding ImageChecker, for the appropriate software version (9.0 or greater).
2.1. Film-Based CAD with DigitalNow
With the R2 DMax, DM, DX, and LS systems, scanned X-ray films can be analyzed
using ImageChecker CAD, or they can be converted to archivable digital images using
R2 DigitalNow. The flow of data through the systems is as follows (see diagram on the
next page).
Films
Film priors are fed into the processing unit with film scanner, which scans (digitizes)
the films and processes the resulting images.
Note: Every time films are rescanned, the image created is subtly different. This
difference is of no consequence to a human observer, but slight rotation, shift, and
electronic noise differences will cause some CAD marks to vary with each rescan. This
behavior is expected. Also, CAD marks may vary if the ImageChecker software has been
upgraded to a newer revision since the mammography films were first processed.
Processing Unit with Film Scanner
The R2 processing unit with film scanner is used to scan and digitize the films,
analyze the images using ImageChecker, and then send the resulting images and/or
CAD output to a review workstation, PACS, or printer.
Patient Database Connectivity
When scanning films for digital archiving, sites need the ability to retrieve patient
information in order to add the required identification information to the resulting
Digital Mammography X-Ray images. Sites can retrieve patient data by querying a
PACS or RIS (Radiology Information System). As an alternative, sites can enter
patient data manually by using the R2 Patient ID feature.
Understanding R2 ImageChecker 8.5–8.7 – PN MAN-01049 Rev 001 11
Page 18

Part 2: Data Inputs and Outputs
Diagnostic Review Workstation, PACS and Printer
Users can review or archive the results on a variety of devices. The form of the results
depends upon the capabilities of the output device.
Image Acquisition
System(s)
Films
Mammography CAD SR,
Mammography CAD SC, and/or
DigitalNow For Presentation Image
R2 Processing Unit
with Film Scanner
R2 Auto
Image
Postscript
Image
SecurView
(or other diagnostic
workstations)
CheckMate Ultra
Display Unit
DX
PACS
ImageChecker and DigitalNow
12 Understanding R2 ImageChecker 8.5–8.7 – PN MAN-01049 Rev 001
Printer
Page 19

2.2. CAD Inputs and Supported Views
If your system has the ImageChecker license, all images are CAD-processed if the
views are supported by the software. The four ‘standard views’ processed
automatically by the ImageChecker software are:
2.2. CAD Inputs and Supported Views
• RCC – Right Cranio-Caudal
• LCC – Left Cranio-Caudal
The Four Standard Views
• RMLO – Right Medio-Lateral Oblique
• LMLO – Left Medio-Lateral Oblique
The following table lists the views supported by the ImageChecker software:
ImageChecker Supported Views
and View Modifiers
Screening Views Cranio-Caudal CC
Medio-Lateral Oblique MLO
Equivalent Views Medio-Lateral ML
Cranio-Caudal Exaggerated XCC
Cranio-Caudal Exaggerated Laterally XCCL
Cranio-Caudal Exaggerated Medially XCCM
Reversed Equivalent
Views**
Cranial-Caudal From Below FB
Superolateral to Inferomedial Oblique SIO
Latero-Medial LM
Latero-Medial Oblique LMO
ACR MQCM*
View Label
*American College of Radiology Mammography Quality Control Manual 1999
**CAD results for Reversed Equivalent views are supported with the Mammography CAD
SR format only. These views are not supported with the Mammography CAD SC format, on
the R2 CheckMate Ultra display unit, or on the postscript printout.
Understanding R2 ImageChecker 8.5–8.7 – PN MAN-01049 Rev 001 13
Page 20

Part 2: Data Inputs and Outputs
View Modifiers
View modifiers can be added to describe any supported view. However, some
modifiers are not supported for CAD processing. Using a non-supported modifier
will prevent CAD processing a supported view. The following table lists the DICOM
view modifiers and indicates which are supported for CAD processing.
View Modifier Label View Modified CAD Support
Axillary Tail AT MLO z
Cleavage CV CC
Implant Displaced* ID Any z
Implant Present (none) Any
Magnification M… Any
Partial View (none) Any
Rolled Lateral …RL Any z
Rolled Medial …RM Any z
Rolled Inferior …RI Any z
Rolled Superior …RS Any z
Spot Compression S Any
Tangential TAN Any z
* Implant-displaced views with a maximum of 2.5 cm (1 in) of implant imaged.
Images with Breast Implants
The ImageChecker software does attempt to process images with breast implants. For
images with breast implants, send only Implant Displaced views to the system. Images
with more than 2.5 cm (1 in) of the breast implant appearing on the image may not
be processed correctly.
Note: The Implant Present and Partial View modifier labels are NOT added to the view
description, but are present in the DICOM header of the DigitalNow image.
14 Understanding R2 ImageChecker 8.5–8.7 – PN MAN-01049 Rev 001
Page 21

2.3. Image and Case Processing
During processing, the ImageChecker software analyzes each received image, as long
as the view is supported by the software. The algorithm searches for patterns
suggestive of calcification clusters and masses or architectural distortions,
characterizes each suspected lesion, and finally determines the location and numbers
of CAD marks for the image. This initial analysis is known as image processing.
The R2 processing unit groups successive images from a single patient into a study,
with up to 24 images per study. For most patients, a study consists of the four
screening views:
2.3. Image and Case Processing
• RCC – Right Cranio-Caudal
• LCC – Left Cranio-Caudal
• RMLO – Right Medio-Lateral Oblique
• LMLO – Left Medio-Lateral Oblique
As an additional step when a study includes two or more views, the ImageChecker
algorithm selects up to four views and compares the images to each other in a process
known as case processing. By checking for similarities and differences between the
images, the algorithm can further refine its findings for the four selected views. When
case processing is complete, the ImageChecker provides results for both the case
processing images and the remaining images.
As a result of the case processing analyses, ImageChecker may produce a different set
of CAD marks for an individual image than when the image is part of a case. When
ImageChecker applies the more sophisticated case processing rules it may add or
discard marks. For example:
• Some large masses are marked only when the image is part of the bilateral
asymmetry analysis used for case processing.
• Some marks may be discarded when the image is subjected to the mark capping
limitations used for case processing. For more information, see ‘
Number of Marks
’ in ‘3.2. RightOn CAD Marks’.
For more information about image and case processing, see ‘
Calcifications
’ and ‘3.7. Detecting Masses’.
Limiting the
3.6. Detecting
Understanding R2 ImageChecker 8.5–8.7 – PN MAN-01049 Rev 001 15
Page 22

Part 2: Data Inputs and Outputs
Selecting Images for Case Processing
The ImageChecker algorithm uses the following criteria to determine which images
will be case-processed:
• If a study includes one image for each of the four screening views or their
equivalents, then all images are case-processed.
• When a study includes multiple images of the same view and laterality (e.g., two
RCC views), case processing is performed on the last scanned film for each of the
four screening views or their equivalents. (Refer to the diagram on the following
page.)
• If a study does not include one or more of the four screening views, then the
equivalent views (or the reversed equivalent views) are case-processed, if they are
present. Screening views are given preference over equivalent views, which in turn
are given preference over reversed equivalent views.
• The view modifiers, if present, do not affect which images are selected for case
processing.
• When a study includes multiple equivalent (or reversed equivalent) views, the
views selected for case processing are based on the following preference order:
Preference
Order
1 CC MLO
2 FB* ML
3 XCC LM*
4 XCCL LMO*
5 XCCM SIO*
*Indicates a reversed view, not available for display units,
printouts, or CAD SC output.
CC Equivalent MLO Equivalent
16 Understanding R2 ImageChecker 8.5–8.7 – PN MAN-01049 Rev 001
Page 23

2.3. Image and Case Processing
For example, if a study includes the four screening views plus two additional RMLO
images (as is shown in the figure below), all the images are image-processed
separately. However, when selecting images for case processing, the ImageChecker
algorithm includes only the last RMLO image acquired by the scanner (along with the
other three screening views). As is shown below, the algorithm would select the
RMLO 3 image for case processing.
Acquisition Time
LMLORMLO 1 RMLO 2 RMLO 3 LCCRCC
Image
Processing
Image and Case Processing
Image plus Case
Processing
ImageChecker
Results
As a further example, for a study with segmented breast views including multiple CC
images, you may choose to image the anterior (ductal) region of the breast last in the
sequence to ensure that that image is case-processed.
Understanding R2 ImageChecker 8.5–8.7 – PN MAN-01049 Rev 001 17
Page 24

Part 2: Data Inputs and Outputs
2.4. System Outputs
The R2 processing unit can be configured to send results in one or more of the
following formats:
•
R2 Auto is the format used to display the four screening views with CAD results on
a CheckMate Ultra display unit or Mammolux motorized viewer. With this
format, the CAD results appear over a montage of low-resolution images.
Normally, the four screening views appear, although it is also possible to produce
CAD results from films that show Equivalent Views.
•
Mammography CAD SC is a Secondary Capture image that provides the same low-
resolution images and CAD results as appear in the R2 Auto format. This format is
useful for PACS that do not support CAD SR.
•
Postscript files, suitable for printing on a postscript printer, provide the same low-
resolution images and CAD results as appear in the R2 Auto format. For an
example, see the
•
Mammography CAD SR 8.x results are derived from the latest version of the
ImageChecker algorithm. This is the DICOM standard format for CAD results.
Mammography CAD SR objects are generally useful only when viewed with the
images on an advanced diagnostic review workstation.
CAD results report on page 19.
•
Mammography CAD SR 5.x provides backward compatibility with previous
releases of ImageChecker 5.x products. The 5.x format provides RightOn Calc and
Mass marks but not EmphaSize or PeerView.
•
DigitalNow is a traditional DICOM Digital Mammography X-Ray For
Presentation image where the image is comprised of Natural Pixel Values, the
values actually created by the film scanner. These can be created as 50- or 100micron image files. DigitalNow images do not include CAD results.
Note: CAD results for Reversed Equivalent views are supported with the
Mammography CAD SR format only. These views are not supported with the
Mammography CAD SC format, the R2 Auto format, or the postscript printout.
The Mammography CAD SR format is the DICOM standard format for CAD results.
For more information, refer to the R2 DMax/DX/DM/LS DICOM Conformance
Statement.
If the results are not archived, they can be recreated at a later time if the films are still
available. In most cases, the same ImageChecker results should be generated each
time the images are reprocessed.
18 Understanding R2 ImageChecker 8.5–8.7 – PN MAN-01049 Rev 001
Page 25

CAD Results Report
If the Hologic service engineer has configured the system to print CAD results, the
results are automatically printed when processing is complete. The following is an
example of a printed CAD results report:
2.4. System Outputs
Understanding R2 ImageChecker 8.5–8.7 – PN MAN-01049 Rev 001 19
Page 26

Part 2: Data Inputs and Outputs
20 Understanding R2 ImageChecker 8.5–8.7 – PN MAN-01049 Rev 001
Page 27

Part 3: Algorithm Description
f 3.1. ImageChecker CAD Algorithm
f
3.2. RightOn CAD Marks
f
3.3. EmphaSize Marks
f
3.4. PeerView and PeerView Digital
f
3.5. What the Algorithm Detects
f
3.6. Detecting Calcifications
f
3.7. Detecting Masses
f
3.8. CAD Operating Points
Part 3 describes the algorithm used by the ImageChecker software when analyzing
mammography images.
3.1. ImageChecker CAD Algorithm
R2 Technology’s ImageChecker algorithm looks for characteristics commonly
associated with cancer – specifically, calcifications and masses (including architectural
distortions). The algorithm ranks its findings by likelihood, places marks on those
regions above a fixed threshold of likelihood (operating point), and then sends the
results to the review workstation.
ImageChecker provides the medical-imaging industry’s highest sensitivity at any
given false-mark rate. The algorithm offers three operating points to accommodate
differing radiologist preferences. For more information, see ‘
Points
’.
3.8. CAD Operating
Understanding R2 ImageChecker 8.5–8.7 – PN MAN-01049 Rev 001 21
Page 28

Part 3: Algorithm Description
3.2. RightOn CAD Marks
ImageChecker provides three types of CAD marks. Each RightOn™ mark indicates a
region of interest for the radiologist to review. There are two basic types of marks plus
one composite mark, as summarized below.
Calc – Marks regions suggestive of calcifications.
Mass – Marks regions suggestive of masses or architectural distortions.
Malc – Marks regions where Calc and Mass marks are coincident.
Note: Not all mammography workstations can display Malc marks. Consult with your
workstation vendor concerning availability and integration of ImageChecker features with
your workstation.
Limiting the Number of Marks
The software limits or ‘caps’ the number of CAD marks for each image and case. The
actual number of CAD marks produced depends upon the individual case and the
operating point selected for the CAD algorithm.
Views Per Image Limit Per Case Limit
Screening views
(RCC, LCC, RMLO, LMLO)
Extra views
*For cases with more than four views, the maximum number of marks per case
depends upon the number of images in the case.
When ImageChecker processes an individual image, it may show a set of CAD marks
different from the marks reported when the image is part of a case. The differences
are due to the fact that ImageChecker first processes the images individually before
analyzing the case. When ImageChecker applies the more sophisticated case
processing rules (such as bilateral asymmetry analysis), it may discard marks for
regions that are less suspicious. For more information, see ‘
Processing
’.
ImageChecker CAD Marks
3 Calc marks
2 Mass marks
2 Malc marks
3 Calc marks
2 Mass marks
2 Malc marks
8 Calc marks
4 Mass marks
4 Malc marks
Dependent upon the
number of images*
2.3. Image and Case
22 Understanding R2 ImageChecker 8.5–8.7 – PN MAN-01049 Rev 001
Page 29

3.3. EmphaSize Marks
EmphaSize is an optional feature that provides variable-size CAD marks that scale
according to feature significance. When the ImageChecker algorithm considers a
region to be more significant, it increases the size of the EmphaSize CAD mark. The
size of the mark does not correlate to the size of the lesion.
As the algorithm evaluates regions of interest, each region is given a ranking. This
ranking along with the selected algorithm operating point determines whether or not
the region of interest is marked with a CAD mark.
The system normally displays all CAD marks at the same size regardless of ranking. If
your site has enabled the EmphaSize feature and configured the review workstation to
use it, the ImageChecker algorithm adjusts the size of each mark according to its
ranking. The EmphaSize feature can be disabled if you do not want to use it.
3.3. EmphaSize Marks
CAD without EmphaSize CAD with EmphaSize
• Calcifications: The size of a suspected lesion is of variable significance, since small
lesions may be highly significant and large lesions may be nonactionable.
However, there are other key characteristics. For calcifications, the algorithm looks
at characteristics such as signal intensity, number of calcifications in a cluster,
shape of the calcifications (i.e., pleomorphism), and other important features to
determine lesion significance.
•
Masses: For masses, the algorithm looks at characteristics such as degree of
spiculation, lesion shape, contrast to surrounding tissue, and other important
features which help determine lesion significance.
•
Masses with Calcifications (Malc Marks): Regions containing both a mass and
calcifications are suspicious and should be carefully evaluated.
Note: Not all mammography workstations can display EmphaSize marks. Consult
with your workstation vendor concerning availability and integration of ImageChecker
features with your workstation.
Understanding R2 ImageChecker 8.5–8.7 – PN MAN-01049 Rev 001 23
Page 30

Part 3: Algorithm Description
3.4. PeerView and PeerView Digital
PeerView and PeerView Digital are optional licensed features designed to help
radiologists better understand why a region of interest was marked. When licensed,
PeerView (or PeerView Digital) provides a high-resolution graphical image of the
region of interest, which is intended to assist the radiologist in reassessing the
mammograms.
•
Calcifications: PeerView highlights individual calcifications in the cluster marked
by the algorithm. PeerView may not highlight all calcifications in a cluster, and it
may show features suggestive of calcifications that are not calcifications.
•
Masses: PeerView defines and outlines the central density of the mass so the
radiologist can evaluate the margin, shape, and interior characteristics of the CADdetected mass or distortion. The outline does not generally include spiculations
associated with the mass, although the shape of the central density may lead the
eye to larger spicules.
•
Masses with Calcifications: For composite Malc marks, which indicate that one or
more Mass and Calc marks occur at the same location on the image, PeerView
highlights the calcifications and outlines the central density of the mass and/or
distortion found in the CAD analysis. The same region is shown with and without
a PeerView Malc mark (mass with calcifications).
PeerView is licensed on Hologic’s CheckMate Ultra display units. When licensed, the
CheckMate Ultra accepts the additional high-resolution CAD information from the
processing unit (R2 DMax, DM, DX, or LS) so it can be shown on the display unit.
PeerView Digital is licensed on the R2 DMax processing unit. When licensed,
PeerView Digital adds graphical information to the Mammography CAD SR output.
At the review workstation, the radiologist can use PeerView Digital to highlight
regions of interest detected by the ImageChecker algorithm.
Note: Not all mammography workstations can display PeerView Digital highlights.
Consult your workstation vendor concerning availability and integration of ImageChecker
features with your workstation.
24 Understanding R2 ImageChecker 8.5–8.7 – PN MAN-01049 Rev 001
Page 31

3.5. What the Algorithm Detects
The ImageChecker algorithm searches an image for clusters of bright spots that are
suggestive of calcification clusters, for patterns of dense regions, and for dense regions
with radiating lines suggestive of masses or architectural distortions.
Calcifications
The algorithm marks:
• Clusters with three or more elements
• Elements that are at or within 3 mm of each other
• Where each element is at least 150 microns in size
The algorithm does not mark:
• Clusters with fewer than three elements*
• Clusters where each element is separated by more than 3 mm
• Elements it considers to be of benign morphology
• Low-contrast elements
3.5. What the Algorithm Detects
• Lead skin markers or clips
*Note: The algorithm marks two elements if the elements have significant contrast or
shape, as defined by the cluster filter. See ‘
The algorithm occasionally marks:
• Calcified arteries
• Cluster or rim benign calcifications
• Crossing linear tissues
Calcified Artery
Benign Calcifications
To be considered a cluster, elements need only be at or within 3 mm of another
element within the cluster, as shown next:
3.6. Detecting Calcifications’.
Cluster or Rim
Crossing Linear
Tissues
≤ 3 mm square Each element is
at or within 3 mm
Understanding R2 ImageChecker 8.5–8.7 – PN MAN-01049 Rev 001 25
Page 32

Part 3: Algorithm Description
When features in the mammogram meet the ImageChecker criteria, the algorithm
places a triangular CAD mark over the center of that region (not over a particular
element), as is shown next:
Masses/Architectural Distortions
To detect masses, the ImageChecker algorithm searches the image in a progressive
manner looking for circular, dense regions and lines radiating from a common
center. The algorithm marks:
• Regions suggestive of masses/architectural distortions
• Dense regions
• Regions with radiating lines
Less pronounced radiating lines but
with a central mass
No central mass but pronounced
radiating lines
The algorithm occasionally marks:
• Ducts and tissue radiating from the nipple
• Inadvertent crossing of parenchymal tissue
• Well circumscribed masses
• Lymph nodes
• Vague opacities, skin thickening, or nipple retraction
Ducts and tissue
radiating from nipple
Inadvertent crossing of
parenchymal tissue
26 Understanding R2 ImageChecker 8.5–8.7 – PN MAN-01049 Rev 001
Page 33

3.5. What the Algorithm Detects
The likelihood of a mass/architectural distortion being marked is affected by:
• Margin of the mass (the greater the spiculation, the more likely)
• Degree of density (the higher the density, the more likely)
• Presence of left/right breast asymmetry
Lobulated Ill-Defined Slightly
Spiculated
Increasing Likelihood
Low Density Medium Density High Density
Mostly
Spiculated
Spiculated
When the algorithm finds patterns associated with masses, it places an asterisk at the
point of maximum convergence on the image.
Understanding R2 ImageChecker 8.5–8.7 – PN MAN-01049 Rev 001 27
Page 34

Part 3: Algorithm Description
3.6. Detecting Calcifications
To detect calcifications, the ImageChecker algorithm performs a series of analyses.
DICOM For Processing
Mammography Image
Information From Other Images
(Similarity/Asymmetry)*
*For case processing the four
screening views or their equivalents
Breast Area
Segmentation
Calcification Detection
(SIANN)
Calcification Cluster
Detection
Statistical Pattern Recognition
(Combining/Ranking)
Case Processing
Results
Mark Number
Limit Applied
Image Processing
Results
Image Processing for Calcifications
For each image, the algorithm uses two filters (artificial neural networks) to identify
calcifications and their features:
• First, it runs each image through a Shift-Invariant Neural Network (SIANN), a
calcification detection filter that has been optimized using R2 Technology’s large
training database. SIANN is a patented technology developed through more than
10 years of research at the University of Chicago.
• Then, it analyzes the resulting calcifications using a cluster filter that weights over
a dozen different features, including contrast, shape, and size.
In addition, the algorithm segments the breast and identifies the location of the
cluster within the breast.
Mammography
CAD SR
Operating Point Applied
Results Display
on Workstation
28 Understanding R2 ImageChecker 8.5–8.7 – PN MAN-01049 Rev 001
Page 35

Case Processing for Calcifications
In addition to processing images individually, the ImageChecker algorithm selects up
to four images that represent the screening views – RCC, LCC, RMLO, and LMLO (or
their equivalents). The algorithm reviews the findings from each image and looks for
similarities in the findings by comparing complementary orthogonal views (for
example, LMLO and LCC):
3.6. Detecting Calcifications
Similarity
It also looks for asymmetries between views from each side, for example, LMLO and
RMLO:
Asymmetry
The algorithm combines the results of these various analyses, analyzes the resulting
cluster and context data, and employs statistical pattern recognition against the
training database to determine the ranking for each of the possible clusters. It then
selects the Calc marks that best meet the algorithm criteria (mark capping), and
applies the selected operating point, thereby limiting the number of marked features.
Finally, if the algorithm determines that a selected Calc mark is coincident with a
Mass mark, then the marks are converted into a Malc mark.
For more information see ‘
2.3. Image and Case Processing’.
Understanding R2 ImageChecker 8.5–8.7 – PN MAN-01049 Rev 001 29
Page 36

Part 3: Algorithm Description
3.7. Detecting Masses
To detect masses, the ImageChecker algorithm performs a series of analyses.
DICOM For Processing
Mammography Image
Information From Other Images
(Similarity/Asymmetry)*
*For case processing the four
screening views or their equivalents
Breast Area
Segmentation
Mass Detection
Statistical Pattern Recognition
(Combining/Ranking)
Case Processing
Mark Number
Limit Applied
Results
Radiating Line
Detection
Image Processing
Results
Image Processing for Masses
For each image, the algorithm uses patented technology to segment the breast. It then
identifies masses by evaluating structures based on their density, shape, and margin
characteristics. It also searches for structures appearing as radiating lines, and, if they
are present, the degree of spiculation.
Mammography
CAD SR
Operating Point Applied
Results Display
on Workstation
30 Understanding R2 ImageChecker 8.5–8.7 – PN MAN-01049 Rev 001
Page 37

Case Processing for Masses
In addition to processing images individually, the ImageChecker algorithm selects up
to four images that represent the screening views – RCC, LCC, RMLO, and LMLO (or
their equivalents). The algorithm reviews the findings from each image and looks for
similarities in the findings by comparing complementary orthogonal views (for
example, LMLO and LCC):
3.7.T TDetecting Masses
Similarity
It also looks for asymmetries between views from each side, for example, LMLO and
RMLO:
Asymmetry
The algorithm then runs the resulting data against the training database to determine
the ranking for each of the possible masses. Finally, the algorithm either marks or
does not mark the masses, based on the ranking and operating point.
The algorithm combines the results of these various analyses, analyzes the resulting
cluster and context data, and employs statistical pattern recognition against the
training database to determine the ranking for each of the possible clusters. It then
selects the Calc marks that best meet the algorithm criteria (mark capping), and
applies the selected operating point, thereby limiting the number of marked features.
Finally, if the algorithm determines that a selected Mass mark is coincident with a
Calc mark, then the marks are converted into a Malc mark.
For more information see ‘
Understanding R2 ImageChecker 8.5–8.7 – PN MAN-01049 Rev 001 31
2.3. Image and Case Processing’.
Page 38

Part 3: Algorithm Description
3.8. CAD Operating Points
ImageChecker allows each site to choose between three different operating points
(i.e., CAD algorithm thresholds). You can choose a different operating point for
calcifications than for masses, which provides a total of nine options for operating
point combinations. The operating points are summarized below:
Operating point 0 trades off a lower false-mark rate for a lower overall sensitivity.
•
This operating point is suited for sites that prefer the system to display the fewest
false marks.
•
Operating point 1 represents a balanced intermediate point. Improvements in the
algorithm have allowed points 0 and 2 to be set quite far apart, and some sites may
want balanced behavior from the CAD algorithm.
•
Operating point 2 focuses on sensitivity. It gives the best performance for marking
regions of interest (i.e., CAD sensitivity), with a higher false-mark rate. It is suited
for sites that want the system to be as sensitive as possible, regardless of the higher
false-positive mark rate.
For example, if you want high sensitivity for calcifications but a moderate balance
between sensitivity and false positives for masses, choose operating point 2 for
calcifications and operating point 1 for masses.
Each system is shipped with a default set of operating points for both masses and
calcifications. You can discuss the choices that are right for your site with your
Applications Specialist or, if you would like to change configurations, contact your
Hologic Technical Service Representative.
32 Understanding R2 ImageChecker 8.5–8.7 – PN MAN-01049 Rev 001
Page 39

3.8. CAD Operating Points
The table below gives the sensitivity and false-mark rate values for the three operating
points for ImageChecker software versions 8.5–8.7, as measured on Hologic’s large
film test database of biopsy-proven malignancies and confirmed normal cases for the
four screening views (RCC, LCC, RMLO, and LMLO).
Operating Point: 0 1 2
Calcification Cases (n = 588)
Mean Sensitivity1
95% Confidence Interval
95%
93.1–96.7%
96%
94.0–97.2%
97%
95.5–98.3%
Mass Cases (n = 767)
Mean Sensitivity
95% Confidence Interval
Overall (n = 1355)
Mean Sensitivity
95% Confidence Interval
False-Positive Marks2
Calcification FP/Image
Mass FP/Image
Total False-Positive Marks/Case
Specificity2
95% Confidence Interval
1
1
83%
79.8–85.2%
88%
86.2–90.0%
0.09
0.17
1.0
48.3%
43.7–53.0%
88%
85.6–90.2%
91%
89.7–92.7%
0.12
0.25
1.5
35.1%
30.6–39.5%
90%
87.7–92.0%
93%
91.5–94.3%
0.16
0.35
2.0
24.5%
20.5–28.5%
1. ‘Sensitivity’ refers only to the sensitivity of the CAD algorithm, not to the sensitivity of the
radiologist using the device.
2. ‘False-Positive’ and ‘Specificity’ data were developed from a review of 445 confirmed
normal cases (defined as those with a subsequent normal screening study). ‘FP/Image’
refers to the average number of false-positive marks per image measured on normal cases.
‘Specificity’ refers to the percentage of normal cases that, when processed, show no CAD
marks.
Note: Earlier versions of the ImageChecker algorithm (before version 8.0) produce
slightly different performance results. For further information, see the manuals provided
with those systems.
To determine false-mark rates, Hologic processes normal screening cases (defined as
those with a subsequent normal screening study) through the ImageChecker software
and measures the number of false marks per image. More extraordinary screening
cases, such as those with additional views or those from diagnostic studies, may have
a very different make-up of images and, as such, may produce results that fall outside
the measured normal case mark rate. Since the mark rate is measured per image, a
larger number of images in a case should correspond on average with a higher total
mark count for that case. While clinical experience demonstrates some variation in
mark rates, Hologic has not found the false-mark rate to vary dramatically when
averaged over a large number of cases.
Understanding R2 ImageChecker 8.5–8.7 – PN MAN-01049 Rev 001 33
Page 40

Part 3: Algorithm Description
The following graphs shows plots of algorithm sensitivity vs. false-mark rate based on
cases with the four screening views, with data points for each of the three operating
points.
98
96
2
1
94
92
90
Algorithm Sensitivity (%)
88
86
0.0 0.1 0.2 0.3 0.4 0.5 0.6 0.7 0.8 0.9 1.0
0
False Mark Rate
(False Positives/Case)
Calcification Performance
91
90
89
88
87
1
2
86
85
84
Algorithm Sensitivity (%)
83
82
81
0.0 0.5 1.0 1.5 2.0
0
False Mark Rate
(False Positives/Case)
Mass Performance
34 Understanding R2 ImageChecker 8.5–8.7 – PN MAN-01049 Rev 001
Page 41

Index
A
algorithm, ImageChecker, 9, 21–34
operating points, 32–34
what is detected by, 25
architectural distortions. See masses
with PeerView, 24
C
CAD marks, 5, 8, See also
ImageChecker
archiving, 18
EmphaSize (variable-size), 3, 8, 23
maximum number of, 22
overlapping, 24
types, 22
Calc marks, 22
maximum number of, 22
variable-size, 23
with EmphaSize, 23
with PeerView, 24
calcifications, 22
analysis by algorithm, 28
case processing for, 29
image processing for, 28
what the algorithm detects, 25
case processing, 15–17
for calcifications, 29
for masses, 31
Cenova. See R2 Cenova server
CheckMate Ultra display unit, 7, 8, 12,
13, 18
customer support resources, 2
D
DICOM, 18
conformance statement, 18
digital review workstation. See review
workstation
DigitalNow, 1, 8, 11, 12, 18
E
EmphaSize, 23
overview, 8
precautions, 3
F
false-mark rate, 9, 32–34
films, processing, 11
I
image processing, 15–17
for calcifications, 28
for masses, 30
ImageChecker. See also CAD marks
algorithm, 21–34
benefits of, 6
case and image processing, 15–17
intended use, 1
overview, 5
overview of features, 8–9
performance specifications, 32–34
printed report, 19
result formats, 18
supported view modifiers, 14
supported views, 13
warnings and precautions, 3–4
implants, breast, 4, 14
M
Malc marks, 22
identification of, 29, 31
maximum number of, 22
variable-size, 23
with EmphaSize, 23
with PeerView, 24
Mammography CAD SR, 15, 18, 24
Mammolux motorized viewer, 18
Mass marks, 22
maximum number of, 22
variable-size, 23
with EmphaSize, 23
Understanding R2 ImageChecker 8.5–8.7 – PN MAN-01049 Rev 001 35
Page 42

Index
with PeerView, 24
masses, 22
analysis by algorithm, 30
case processing for, 31
image processing for, 30
images selected for case processing,
15–17
review workstation, 5, 7, 12, 18
requirements for ImageChecker, 8
RightOn CAD marks. See CAD marks
what the algorithm detects, 26
S
O
operating points, 9, 32–34
screening views, 15, 33
SecurViewdx diagnostic review
workstation, 7, 12
P
PACS, 7, 12, 18
sensitivity, 9, 32–34
specificity, 9, 33
PeerView and PeerView Digital
described, 24
overview, 9
precautions, 3–4
printout, postscript, 7, 8, 12, 13, 18
T
thresholds, algorithm. See operating
points
training, 2
example of, 19
V
R
R2 Cenova server, 1
R2 DM system, 1, 7
R2 DMax system, 1, 7
R2 LS system, 1, 7
variable-size marks. See EmphaSize
views
modifiers, 14
screening, 15, 33
supported by ImageChecker, 13
R2 Patient ID, 11
results
formats, 18
W
warnings, 3–4
workstation. See review workstation
36 Understanding R2 ImageChecker 8.5–8.7 – PN MAN-01049 Rev 001
Page 43

Page 44

 Loading...