

Page 1
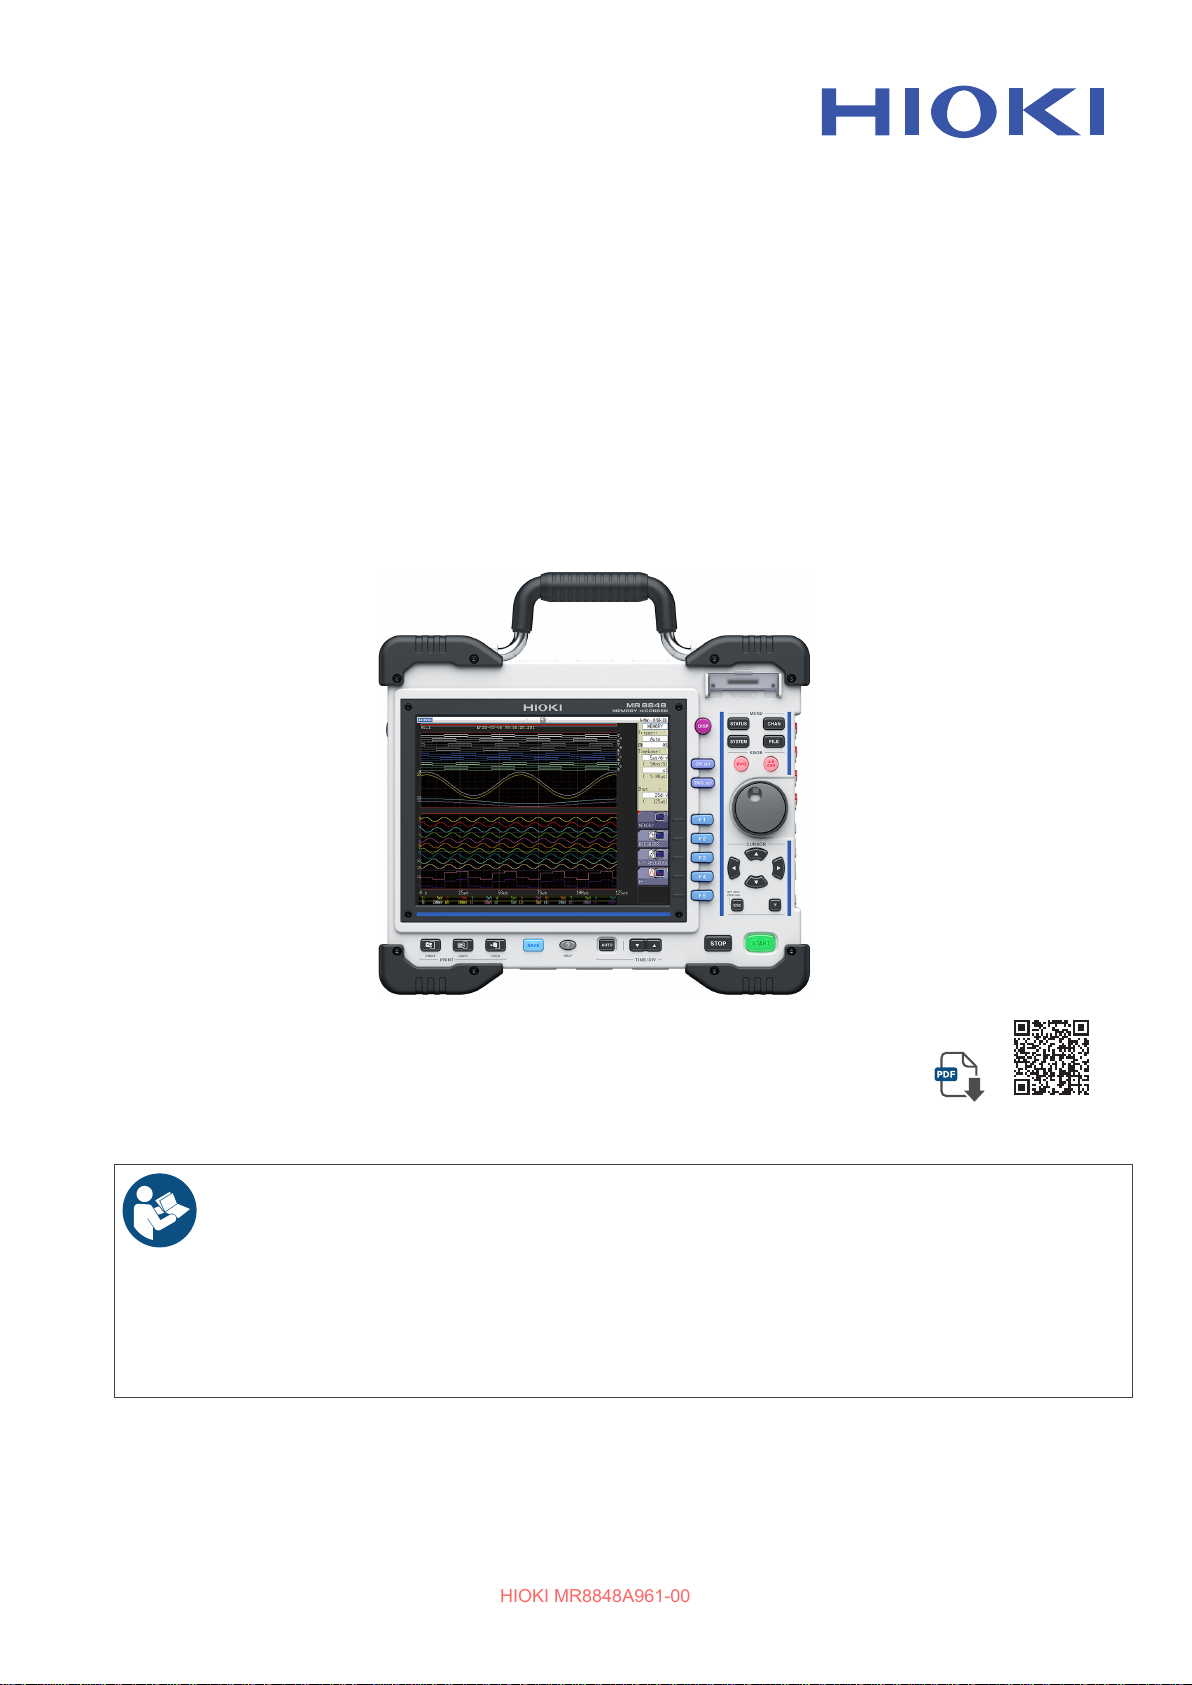
MR8848
HIOKI MR8848A961-00
Instruction Manual
MEMORY HiCORDER
Read carefully before use.
Keep for future reference.
Safety Information
Part Names and Functions
Measurement
June 2025 Edition 1
MR8848A961-00
Check for the latest edition and
other language versions.
p.14 Maintenance and Service p.431
p.26 Error Messages
p.65
[600666850]
p.438
EN
Page 2

HIOKI MR8848A961-00
Page 3

Contents
HIOKI MR8848A961-00
Usage Index
Introduction
Inspecting Package Contents
Notation
Safety Information
Operation Precautions
......................................................9
......................................................10
....................... 11
............................................................12
..........................................14
...................................15
1 Overview 25
1.1 Product Overview
1.2 Part Names and Functions
1.3 ScreensConguration
Display
.....................................................30
1.4 Basic Key Operation
Using the HELP key
Using mouse to enable key operation
.................................25
.................26
.........................29
............................31
..................................32
........33
2 Preparing for
Measurement
2.1 Installing and Removing Units
Channelconguration
2.2 Attaching Connection Cords
Measuring voltage
Measuring frequency, number of
rotations, and count
Measuring temperature
Measuring vibration or displacement
with a strain gauge transducer
Measuring current
Measuring acceleration
Measuring logic signals
Measuring voltage with a high degree of
accuracy (digital voltmeter)
Measuring high voltage
Outputting waveforms
Outputting a pulse waveform
2.3 Preparing Storage Devices
Available storage devices (inserting an
SDcardandaUSBashdrive)
Formatting storage devices
2.4 Loading Recording Paper (When
U8351 Printer Unit is Installed)
2.5 Supplying Power
Connecting the power cord
Connecting an earthing wire to the GND
terminal (functional earth terminal)
Turningonandotheinstrument
2.6 Setting the Clock
2.7 Adjusting the Zero Position (ZeroAdjustment)
...........................................63
35
............36
...............................37
...............39
....................................39
..................................41
.............................42
...................43
.....................................46
.............................49
.............................51
.......................52
.............................53
...............................54
.....................55
.................56
.................56
.......................58
...........59
...................................60
.......................60
............60
..............61
..................................62
2.8 Performing Calibration (When
MR8990 is Installed)
............................64
3 Measurement 65
3.1 Measurement Procedure
3.2 Inspecting the Instrument Before
Measurement
........................................67
3.3 Setting Measurement Conditions
Measurement functions
Timebase and sampling rate
Recording length (number of divisions)
Screen layout
...........................................76
3.4 ConguringInputChannelsSettings
Channel setting procedure
Analog channel settings
Logic channel settings
Display sheet
............................................85
3.5 Starting and Stopping Measurement
3.6 Measurement in Automatic Range
Setting (Auto-Range Function)
.....................65
.......68
.............................68
.....................70
......73
.77
........................78
............................80
..............................84
.86
...........89
4 X-Y Recorder 91
4.1 Measurement Procedure
4.2 Setting Measurement Conditions
4.3 Starting and Stopping Measurement
4.4 Observing X-Y Composite Curves
Saving and printing waveforms
.....................92
.......93
.94
.....95
..................95
5 Saving/Loading Data
and Managing Files
5.1 Data That Can be Saved and
Loaded
5.2 Saving Data
Save types and setting procedure
Automatically saving waveforms
Saving waveforms in real time (option)
Saving data selectively (SAVE key)
Saving waveform output data to a
storage device
5.3 Loading Data
5.4 Automatically Loading Settings
(Auto-setup Function)
5.5 Managing Files
Saving data
Checking the contents in a folder
(opening a folder)
Creatinglesandfolders
...................................................99
.........................................101
........................................119
.......................................120
........................123
...................................124
............................................125
....................................127
.........................127
97
...........101
..............102
....108
.........113
MR8848A961-00
3
Page 4

Contents
HIOKI MR8848A961-00
Deletinglesandfolders
Sortingles
Renaminglesandfolders
Copyingaleintoaspeciedfolder
Printingtheletable
............................................129
.........................128
......................130
........131
...............................132
6 Printing Data (When
U8351 Printer Unit is
Installed)
6.1 Print Type and Procedure
6.2 Setting Auto-printing
6.3 Manually Printing Data by
Pressing the PRINT Key (Selection
.....................................................137
Print)
6.4 Setting the Print Density of the
Waveform
6.5 ConguringthePrinterSettings
6.6 Advanced Print Functions
Printing a screenshot
Printing reports (A4 size)
Printing a list
Printing the text comments
133
..................134
...........................135
............................................139
.......140
.................143
..............................143
.........................143
...........................................144
......................144
7 Monitoring and
Analyzing Waveforms
on the Waveform
Screen
7.1 Reading Measured Values (Using
Cursors A and B)
7.2 Specifying the Waveform Range
(Cursors A and B)
7.3 Moving the Waveform Display
Position
Display position
Scrolling the waveforms with the jog dial
and shuttle ring
Changing position (jump function)
7.4 Plotting X-Y Composite Curves
7.5 Magnifying and Demagnifying
Waveforms
Magnifying and demagnifying
waveforms horizontally
(in the time axis direction)
Zoom function {horizontally magnifying
a part of waveforms
(in the time axis direction)}
145
................................146
...............................151
................................................152
......................................152
.......................................152
...........153
........154
..........................................156
.......................156
......................157
Magnifying/Demagnifying the
waveforms vertically
(in the voltage axis direction)
...................159
7.6 Monitoring Input Levels (Level
Monitor)
Level monitor
Numerical value monitor
................................................160
..........................................160
.........................161
7.7 Switching the Waveform Screen
Display (Display Menu)
Displaying upper and lower limits on the
waveform screen
Displaying comments on the waveform
screen
....................................................162
Switching the waveform display width
Switching channel information (U8975,
U8977, and U8978 only)
Switching the sheet to be displayed
....................................162
......................162
......162
.........................163
.........163
7.8 Viewing Waveforms Divided Into
Blocks
...................................................164
8 Advanced Functions 165
8.1 Adding Comments
Adding, displaying, and printing the title
comment
Adding, displaying, and printing the
channel comments
Entering alphanumeric characters
................................................166
8.2 Displaying Waveforms
Simultaneously
During Writing to the Memory (Roll
Mode)
...................................................173
8.3 Overlaying New Waveforms with
Past Waveforms
8.4 Setting Channels to be Used
(Extending the Recording Length)
8.5 Converting Input Values (Scaling
Function)
Example of scaling settings
..............................................177
8.6 Setting the Waveform Position
(Variable Function)
8.7 Fine-Adjusting Input Values
(Vernier Function)
8.8 Inverting the Waveform (Invert
Function)
..............................................188
8.9 Copying Settings to Other
Channels (Copy Function)
8.10 Setting Details of Units
Settingtheanti-aliasinglter(A.A.F)
Setting the probe voltage dividing ratio
..............................166
..................................167
...........169
.................................174
...176
.....................180
.............................184
...............................187
................189
......................190
........192
....192
4
Page 5

Contents
HIOKI MR8848A961-00
Setting the 8967 Temp Unit
Setting the 8969 and U8969 Strain Units
Setting the 8970 Freq Unit
Setting the 8971 Current Unit
Setting the 8972 DC/RMS Unit
Setting the MR8990 Digital Voltmeter
Unit
........................................................199
Setting the U8974 High Voltage Unit
Setting U8977 3CH Current Unit
Setting U8979 Charge Unit
Setting the MR8790 Waveform
Generator Unit
Setting the MR8791 Pulse Generator
Unit
........................................................207
Setting the U8793 Arbitrary Waveform
Generator Unit
........................................205
........................................209
.....................193
......................195
..................198
................198
........200
.............201
.....................202
8.11 Registering Waveforms in the
U8793 Arbitrary Waveform
Generator Unit
....................................212
8.12 Saving Waveforms Registered in
the U8793 onto a Storage Device
8.13 Setting Output Waveform
Parameters on the Waveform
Screen
..................................................215
.194
....215
9.11 Searching the Measured Data
Using the
Trigger Settings
...................................238
10 Numerical Calculation
Function
10.1 Numerical Calculation Procedure
10.2 Setting the Numerical Value
Calculation
Displaying the numerical calculation
results
....................................................248
10.3 Judging the Calculation Results
Displaying the judgment results and
outputting the signals
10.4 Saving the Numerical Calculation
Results
10.5 Printing the Numerical Calculation
Results
10.6 Numerical Calculation Types and
Descriptions
241
....242
...........................................244
.......249
..............................251
.................................................252
.................................................254
.........................................255
9 Setting the Trigger 217
9.1 Setting Procedure
9.2 Setting the Trigger Mode
9.3 Triggering the Instrument Using
Analog Signals
9.4 Triggering the Instrument Using
Logic Signals (Logic Trigger)
9.5 Triggering the Instrument at the
SpeciedTimeoratRegular
Intervals (Timer Trigger)
9.6 Triggering the Instrument
Externally (External Trigger)
9.7 Triggering the Instrument Manually
(Manual Trigger)
9.8 Setting the Pre-trigger
Setting the trigger start point (pre-trigger)
Setting the trigger acceptance (trigger
priority)
...................................................234
9.9 Setting the Trigger Timing
9.10 Setting the Trigger Logical
Connective (AND/OR) Among the
Trigger Sources
...............................218
...................219
....................................220
............226
....................228
.............231
.................................231
........................232
232
.................235
..................................237
11 Waveform Calculation
Function
11.1 WaveformCalculationWorkow
11.2 Waveform Calculation Settings
Displaying the waveform calculation
results
....................................................263
Setting constants
Changing the display method for
calculated waveforms
11.3 Waveform Calculation Operators
and Results
259
......260
........262
....................................265
.............................266
.........................................268
12 Memory Division
Function
12.1 ConguringtheRecordingSettings
12.2 ConguringtheDisplaySettings
271
.273
......274
13 FFT Function 277
13.1 Overview and Features
13.2 OperationWorkow
13.3 Setting the FFT Analysis Conditions
Selecting the FFT function
.....................277
............................278
279
......................279
5
Page 6

Contents
HIOKI MR8848A961-00
Setting the data source for analysis
(reference data)
Setting the frequency range and number
of analysis points
Decimating and calculating data
Setting the window function
Conguringtheanalysisresultpeak
value setting
Averaging analysis results (waveform
averaging)
Highlighting analysis results (phase
spectra only)
Conguringtheanalysismodesettings
Setting the display range of the vertical
axis (scaling)
Setting and changing analysis
conditions on the waveform screen
13.4 ConguringtheChannelSettings
......................................280
....................................281
..............283
.....................284
...........................................285
..............................................286
...........................................289
....290
..........................................294
.........295
....296
13.5 ConguringtheScreenDisplay
Settings
Displaying the running spectrum
13.6 Saving Analysis Results
13.7 Printing Analysis Results
................................................298
.............300
....................303
...................304
13.8 Analyzing Waveforms on the
Waveform Screen
Calculating after specifying the
calculation starting point
13.9 FFT Analysis Mode
Analysis modes and display examples
Analysis mode functions
...............................305
..........................305
.............................307
.....307
.........................325
14 Waveform Judgment
Function
14.1 Evaluating Waveforms and Giving
GO/NG Judgments (MEM, FFT
Function)
14.2 Setting the Evaluation Area
Loading the previously created
evaluation area
Creating a new evaluation area
14.3 ConguringtheWaveform
Evaluation Setting
14.4 Setting the Waveform Evaluation
Stopping Conditions
14.5 Create the Evaluation Area
14.6 Details About the Editor Commands
327
.............................................327
...............330
.......................................330
...............331
..............................332
...........................333
...............335
336
15 Setting the System
Environment
341
16 Connecting the
Instrument to a PC
16.1 Setting LAN and Connecting
the Instrument to the LAN
Network (Before Using FTP/
Internet Browser/Command
Communications)
ConguringtheLANsettingswiththe
instrument
Connecting the instrument to the PC
with the LAN cable
..............................................346
16.2 Controlling the Instrument
Remotely (Using an Internet
Browser)
ConguringtheHTTPsettingswiththe
instrument
Connecting the PC to the instrument
with the Internet browser
Operating the instrument with the
Internet browser
..............................................351
..............................................351
16.3 Accessing Files on the Instrument
from the PC (Using the FTP)
ConguringtheFTPsettingswiththe
instrument
Connecting the PC to the instrument
andmanaginglesusingtheFTP
..............................................358
16.4 Sending Data to a PC Using the
FTP Client Function
ConguringtheFTPserversettingswith
the PC
....................................................361
ConguringtheFTPclientsettingswith
the instrument
16.5 Transferring Data to the PC Using
a USB Cable
16.6 Wave Viewer (Wv)
16.7 ConguringtheUSBSettingsand
Connecting the Instrument to the
Computer (Before Performing
Command Communications)
ConguringtheUSBsettingswiththe
instrument
Connecting the instrument to the PC
..............................................370
16.8 Controlling the Instrument with
Command Communications (LAN/
.....................................................371
USB)
................................346
..................................349
......................................353
...........................360
.........................................366
.......................................368
..............................369
345
.........................352
............357
...........359
............370
.......370
6
Page 7

Contents
HIOKI MR8848A961-00
Setting the instrument
.............................372
16.9 Operating the Instrument Remotely
and Acquiring Data Using 9333
LAN Communicator
...........................373
17 Controlling the
Instrument Externally
17.1 Connection of the External Control
Terminals
17.2 External I/O
External input (START/IN1) (STOP/IN2)
(PRINT/IN3)
External output (GO/OUT1) (NG/OUT2)
External sampling (EXT.SMPL)
Trigger output (TRIG. OUT)
External trigger terminal (EXT.TRIG)
.............................................376
.........................................378
............................................378
.....................383
375
..380
...............381
.......384
18 Specications 385
18.1 GeneralSpecicationsofthe
Instrument
18.2 Common Functions
18.3 Measurement Functions
Memory function
Recorder function
X-Y recorder function
FFT function
18.4 Other Functions
18.5 File
........................................................399
18.6 SpecicationsofModules
8966 Analog Unit
8967 Temp Unit
8968 High Resolution Unit
8969 Strain Unit, U8969 Strain Unit
8970 Freq Unit
8971 Current Unit
8972 DC/RMS Unit
8973 Logic Unit
MR8990 Digital Voltmeter Unit
U8974 High Voltage Unit
U8979 Charge Unit
U8793 Arbitrary Waveform Generator
Unit
........................................................418
MR8790 Waveform Generator Unit
MR8791 Pulse Generator Unit
U8975 4CH Analog Unit
U8977 3CH Current Unit
U8978 4CH Analog Unit
............................................385
............................389
....................391
.....................................391
...................................392
..............................393
...........................................393
..................................394
.................401
....................................401
......................................402
.......................404
.........406
........................................407
...................................409
.................................410
.......................................412
.................412
.........................413
.................................415
..........421
.................422
..........................425
.........................426
..........................428
19 Maintenance and
Service
19.1 Troubleshooting
19.2 Resetting the Instrument
Resetting system settings
Resetting waveform data
19.3 Error Messages
19.4 Self-Test (Self-Diagnostics)
ROM/RAM check
Printer check (when U8351 Printer Unit
is installed)
Display check
Key check
Systemcongurationcheck
19.5 Cleaning
Cleaning the print head (When U8351
Printer Unit is installed)
To clean the instrument and units
19.6 Disposing of the Instrument
(Removing Lithium Battery)
Appendix 451
Appx. 1 Default Values for Major
Settings
Appx. 2 For Reference
Waveformlesize
Referencesofthelesize
Calculationmethodofwaveformlesize
Filesizesofsettingsandimageles
Timebase and maximum recordable time
Maximum recording length and number
of divisions (memory division function)
Scaling method for strain gauges
Appx. 3 Options
Options
9783 Carrying Case
9784 DC Power Unit
Appx.4 FFTDenitions
Appx. 5 Open source software
Index 483
431
..................................433
...................436
.......................436
.........................437
..................................438
...............443
....................................443
.............................................444
.........................................444
...............................................445
.....................446
...............................................447
...........................447
............448
..............449
.........................................451
..............................452
...................................452
.......................452
.454
........455
456
.....458
............459
..........................................461
...................................................461
................................467
...............................468
............................470
................482
7
Page 8

Contents
HIOKI MR8848A961-00
8
Page 9
Usage Index
HIOKI MR8848A961-00
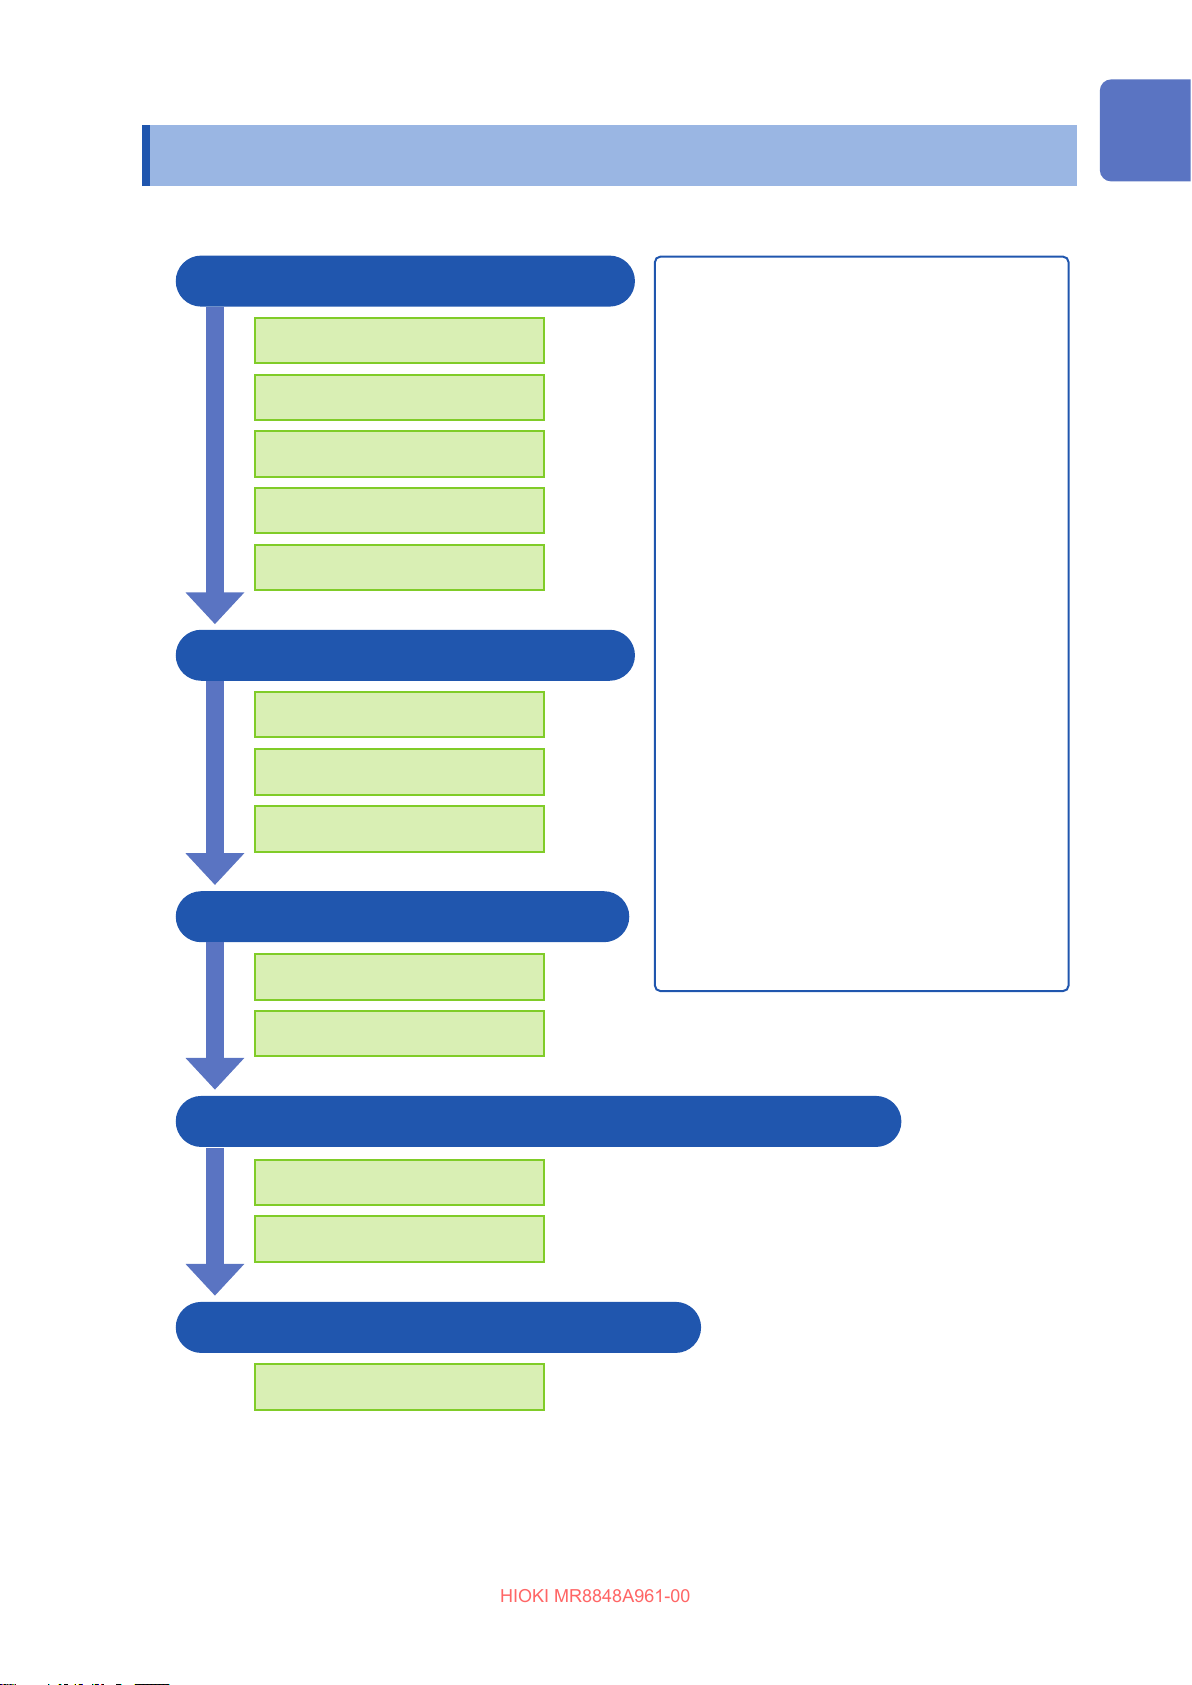
Basic measurement procedure
Usage Index
1 Installing the instrument (p. 35)
Installing the instrument
Installing modules
Connecting cords
Loading the recording paper*
Turning on the Instrument
1
2 Setting the instrument (p. 65)
Selecting a function
Setting measurement
settings
Setting input channels
Performing measurement in the automatic
range setting (p. 89)
Monitoring changes in input signals (p. 217)
Manually triggering the instrument (p. 231)
Entering comments (p. 166)
Freely setting the waveform display (p. 77)
Converting input values (p. 177)
Copying settings to other channels (p. 189)
Eliminating noise (Low-pass lter) (p. 83)
Plotting X-Y composite curves (p. 154)
Locking the operation keys (p. 27)
Formatting an SD Card (p. 58)
Scaling measured values obtained with
3 Measuring input signals (p. 86)
Starting measuring input
signals
Completing the measurement
4
Analyzing (p. 145), saving (p. 97) and printing data (p. 133)
Performing analysis
Saving/printing results
(optionally)*
1
current clamp sensors (p. 180)
5 Completing the measurement (p. 61)
Turning o the instrument
*1. When the U8351 Printer Unit is installed.
9
Page 10
Introduction
HIOKI MR8848A961-00
Introduction
Thank you for choosing the Hioki MR8848 Memory HiCorder. To ensure you get the most out of
this instrument over the long term, please read this manual carefully and keep it available for future
reference.
Information on download site
For details on the product application, the update le for the instrument, and the
instruction manual, please check Hioki’s website:
https://cloud.gennect.net/dl
Request for product user registration
This product may be upgraded for improvements or specication changes. We kindly
request that you visit the following link to register your product to receive critical
updates and information about the product:
https://www.hioki.com/global/support/myhioki/registration/
The optional clamps (p. 461) collectively mean “clamp sensors”.
The following instruction manuals are available for this instrument. Refer to the relevant manual as
usage. Please review the separate Operating Precautions before using this instrument.
Name of instruction manual Explanation Supply form
Startup Guide
Instruction Manual
Communication Command
Instruction Manual
U8793, MR8790, MR8791
Instruction Manual
Operation Precautions Information to safely use this instrument Print
Information regarding the safe use of this
instrument and specications (excerpts)
Contains details and specications regarding the
functions and operations of this instrument.
Contains a list of the communication commands
and their explanations to control the instrument
with a computer.
Contains specications and explanations of
functions/operations of the U8793 Arbitrary
Waveform Generator Unit, MR8790 Waveform
Generator Unit, MR8791 Pulse Generator Unit,
and SF8000 Waveform Maker.
Print
PDF
(Download)
HTML
(Download)
PDF
(Download)
Target audience
This manual has been written for use by individuals who use the product or provide information
about how to use the product.
In explaining how to use the product, it assumes electrical knowledge (equivalent of the knowledge
possessed by a graduate of an electrical program at a technical high school).
Trademarks
Excel, Microsoft Edge, and Windows are trademarks of the Microsoft group of companies.
10
Page 11
Inspecting Package Contents
HIOKI MR8848A961-00
Inspecting Package Contents
Upon receiving the product, inspect it for any damage or anomalies. If you discover any damage
or nd that the product does not perform as indicated in the specications, please contact your
authorized Hioki distributor or reseller.
Instrument and accessories
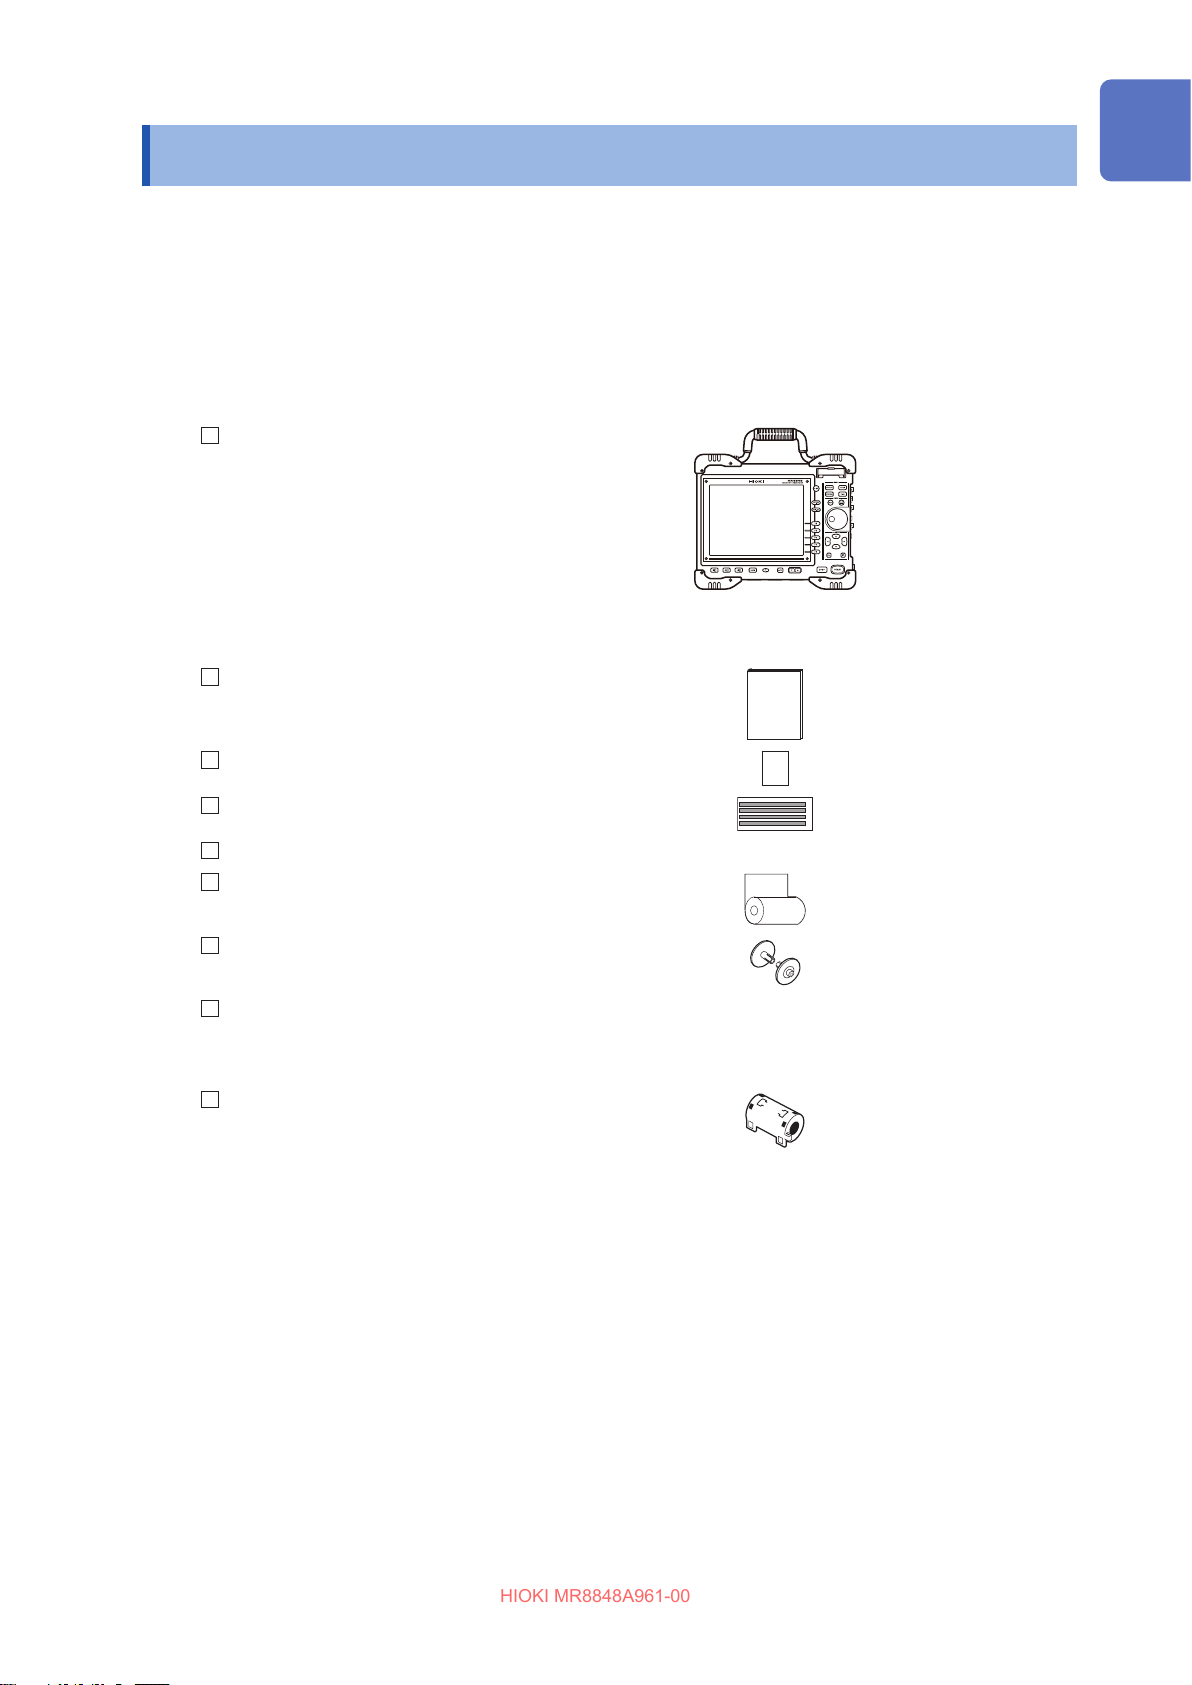
Conrm that you received the following items:
Instrument
MR8848 Memory HiCorder
Accessories
Startup Guide
Operating Precautions (0990A903)
Input cord label
Power cord
9231 Recording Paper
(When the U8351 Printer Unit is installed.)
Paper Roll Axle
1 pair (When the U8351 Printer Unit is installed.)
Other options as specied in your order
Refer to “Options” (p. 461).
When the 8967 Temp Unit is installed in the instrument
Ferrite clamp-on choke (small)
(2 pieces per unit)
11
Page 12
Notation
HIOKI MR8848A961-00
Notation
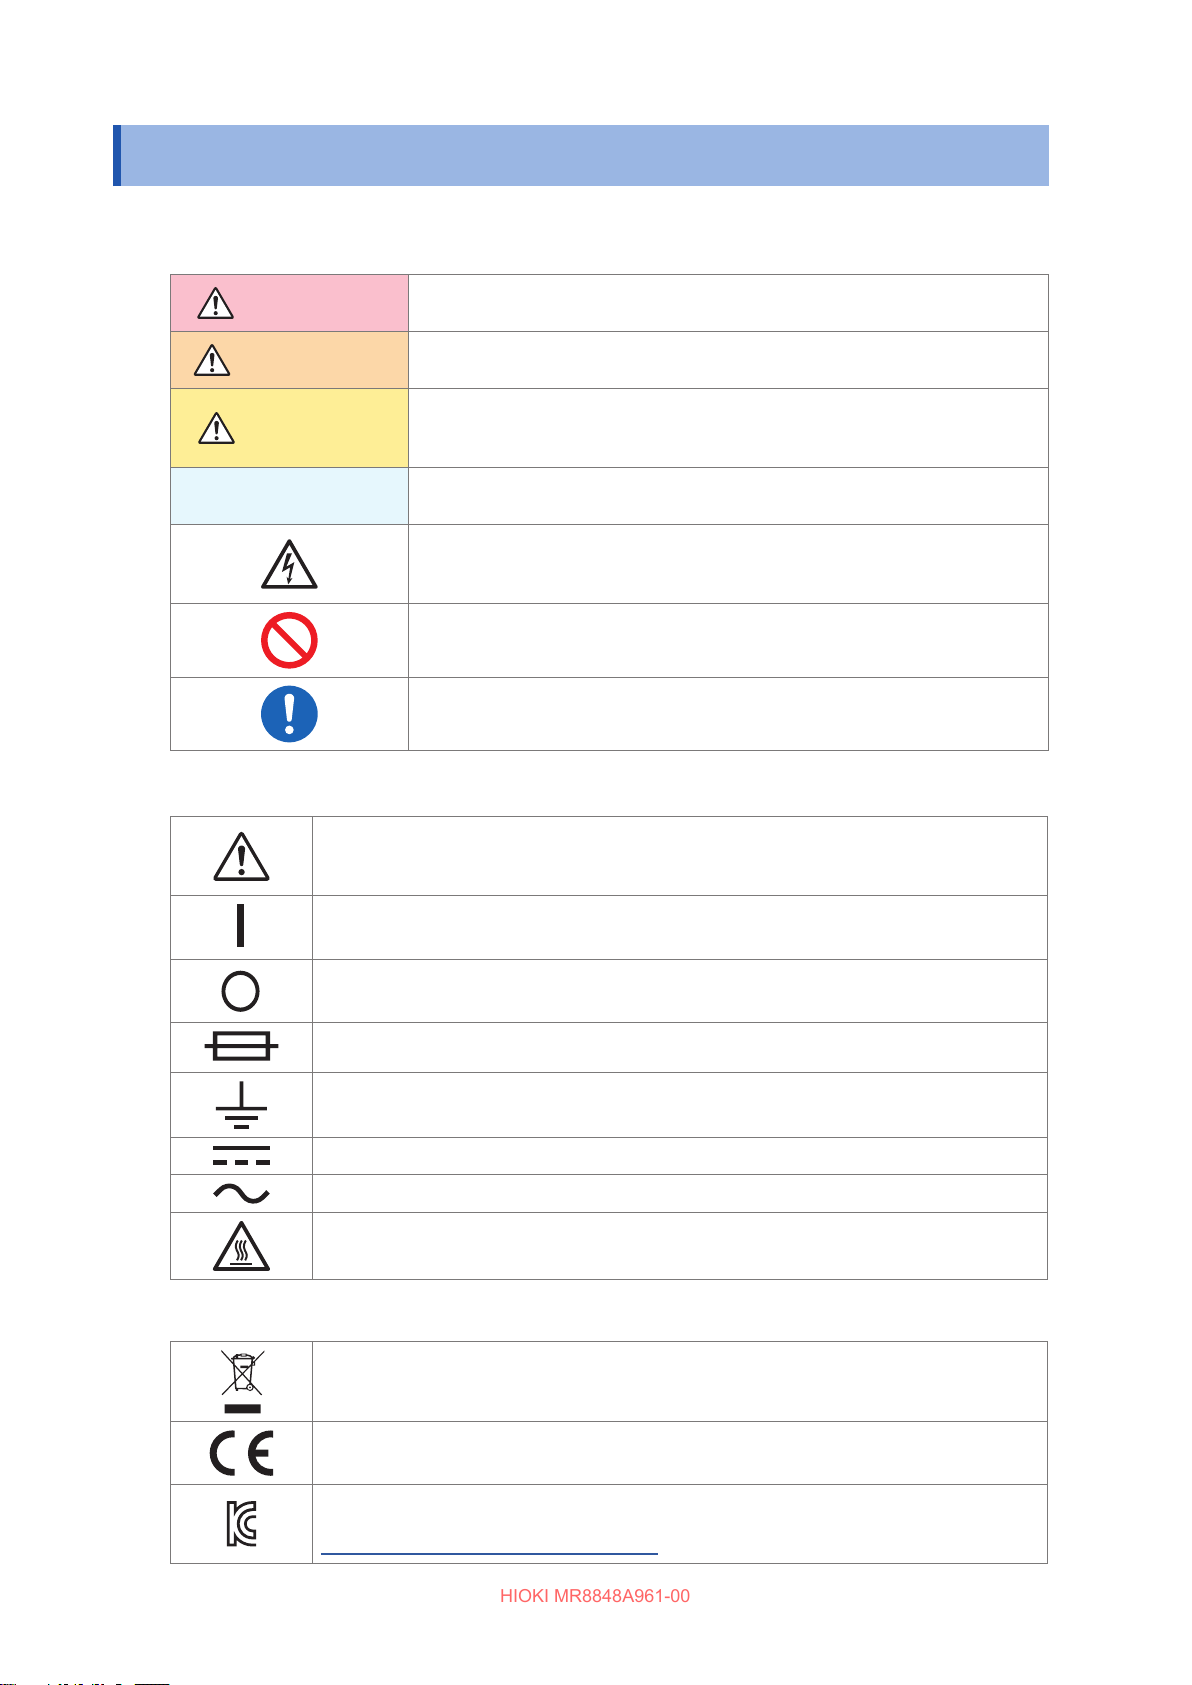
Safety notations
This manual classies the seriousness of risks and hazard levels as described below.
DANGER
WARNING
CAUTION
IMPORTANT
Indicates an imminently hazardous situation that, if not avoided, will result in
death or serious injury.
Indicates a potentially hazardous situation that, if not avoided, could result in
death or serious injury.
Indicates a potentially hazardous situation that, if not avoided, could result in
minor or moderate injury or potential risks of damage to the supported product
(or to other property).
Indicates information related to the operation of the instrument or maintenance
tasks with which the operators must be fully familiar.
Indicates a high voltage hazard.
Failure to verify safety or improper handling of the product will result in an
electric shock, a burn, or injury, potentially leading to death.
Indicates prohibited actions.
Indicates mandatory actions.
Symbols axed to the instrument
Indicates the presence of a potential hazard. See “Operation Precautions” (p. 15) and
warning messages listed at the beginning of each operating instruction in the instruction
manual, as well as the accompanying document entitled Operating Precautions.
Indicates the On side of the power switch.
Indicates the O side of the power switch.
Indicates a fuse.
Indicates a grounding terminal.
Indicates DC (Direct Current).
Indicates AC (Alternating Current).
Indicates a burn hazard if touched directly.
Standards symbols
Indicates that the product is covered by the Directive on Waste Electrical and Electronic
Equipment (WEEE) in EU member nations. Dispose of the product by local regulations.
Indicates that the product conforms to regulations set out by the EU Directive.
Indicates that the product conforms to Korean regulations.
Declarer: HIOKI KOREA CO., LTD.
http://www.rra.go.kr/selform/HKO-MR8848
12
Page 13
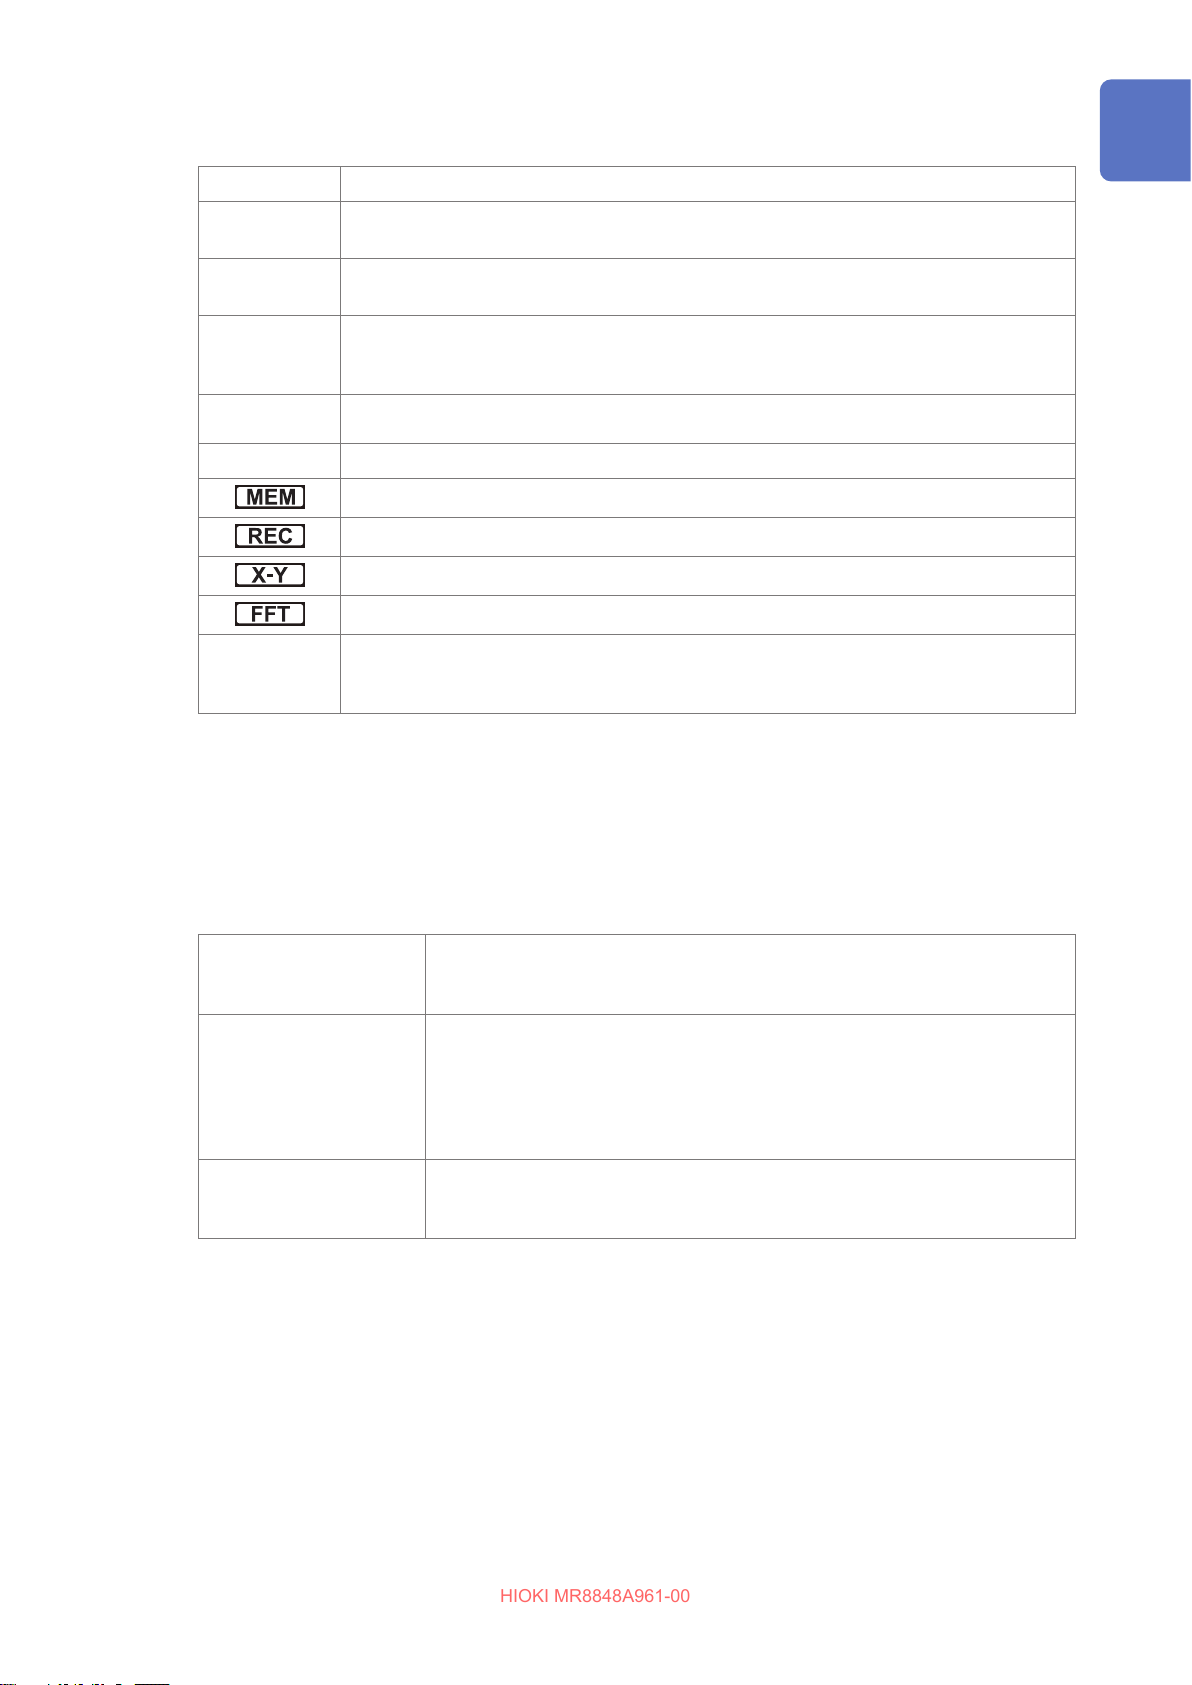
Other symbols
HIOKI MR8848A961-00
(p. ) Indicates the page number to reference.
Notation
CURSOR
(Bold-faced)
Windows
S/s
*
[ ] Indicates the names of user interface elements on the screen.
Indicates the names of the control buttons.
Unless otherwise specied, “Windows” represents Windows 7, Windows 8, Windows 10, or
Windows 11.
For this product, the number of times the analog input signal is digitized is indicated in
samples per second (S/s).
For example, 20 MS/s (20 megasamples per second) signies 20
Indicates that additional information is described below.
Indicates that the memory function supports the function.
Indicates that the recorder function supports the function.
Indicates that the X-Y recorder function supports the function.
Indicates that the FFT recorder function supports the function.
Click: Press and quickly release the left button of the mouse.
Right-click: Press and quickly release the right button of the mouse.
Double-click: Quickly click the left button of the mouse twice.
106 samples per second.
×
Accuracy labeling
The accuracy of the measuring instrument is expressed using a combination of the formats shown
below:
• By dening limit values for errors using the same units as measured values.
• By dening limit values for errors as a percentage of the reading, a percentage of the full scale,
and a percentage of the setting.
Reading (display value) Indicates the value displayed on the measuring instrument. Limit values for
reading errors are expressed as a percentage of the reading (% of reading or
% rdg).
f.s. (maximum display
value)
Setting (set value) Indicates the set value, such as voltage and current, that the measuring
Indicates the maximum display value for each range. The maximum display
value for each range is obtained by multiplying the measurement range by 20,
which is the number of divisions on the vertical axis. Limit values for full-scale
errors are expressed as a percentage of the full scale (% of full scale or % f.s.).
Example: For a 1 V/div. range
(Maximum display value) = 1 V/div.
instrument has been congured to output. Limit values for setting errors are
expressed as a percentage of the setting (% of setting).
20 div. = 20 V
×
13
Page 14
Safety Information
HIOKI MR8848A961-00
Safety Information
The instrument and unit have been designed in accordance with the IEC 61010 safety standard
and has undergone rigorous safety testing prior to shipment. However, using the instrument in a
way not specied in this manual may compromise its safety features.
Before using the instrument, be certain to carefully read the following safety notes:
DANGER
Mishandling during use could result in injury or death, as well as damage to the
instrument. Be certain that you understand the instructions and precautions in
the manual before use.
WARNING
With regard to the electricity supply, there are risks of electric shock, heat
generation, re, and arc discharge due to short circuits. Individuals using an
electrical measuring instrument for the rst time should be supervised by a
technician who has experience in electrical measurement.
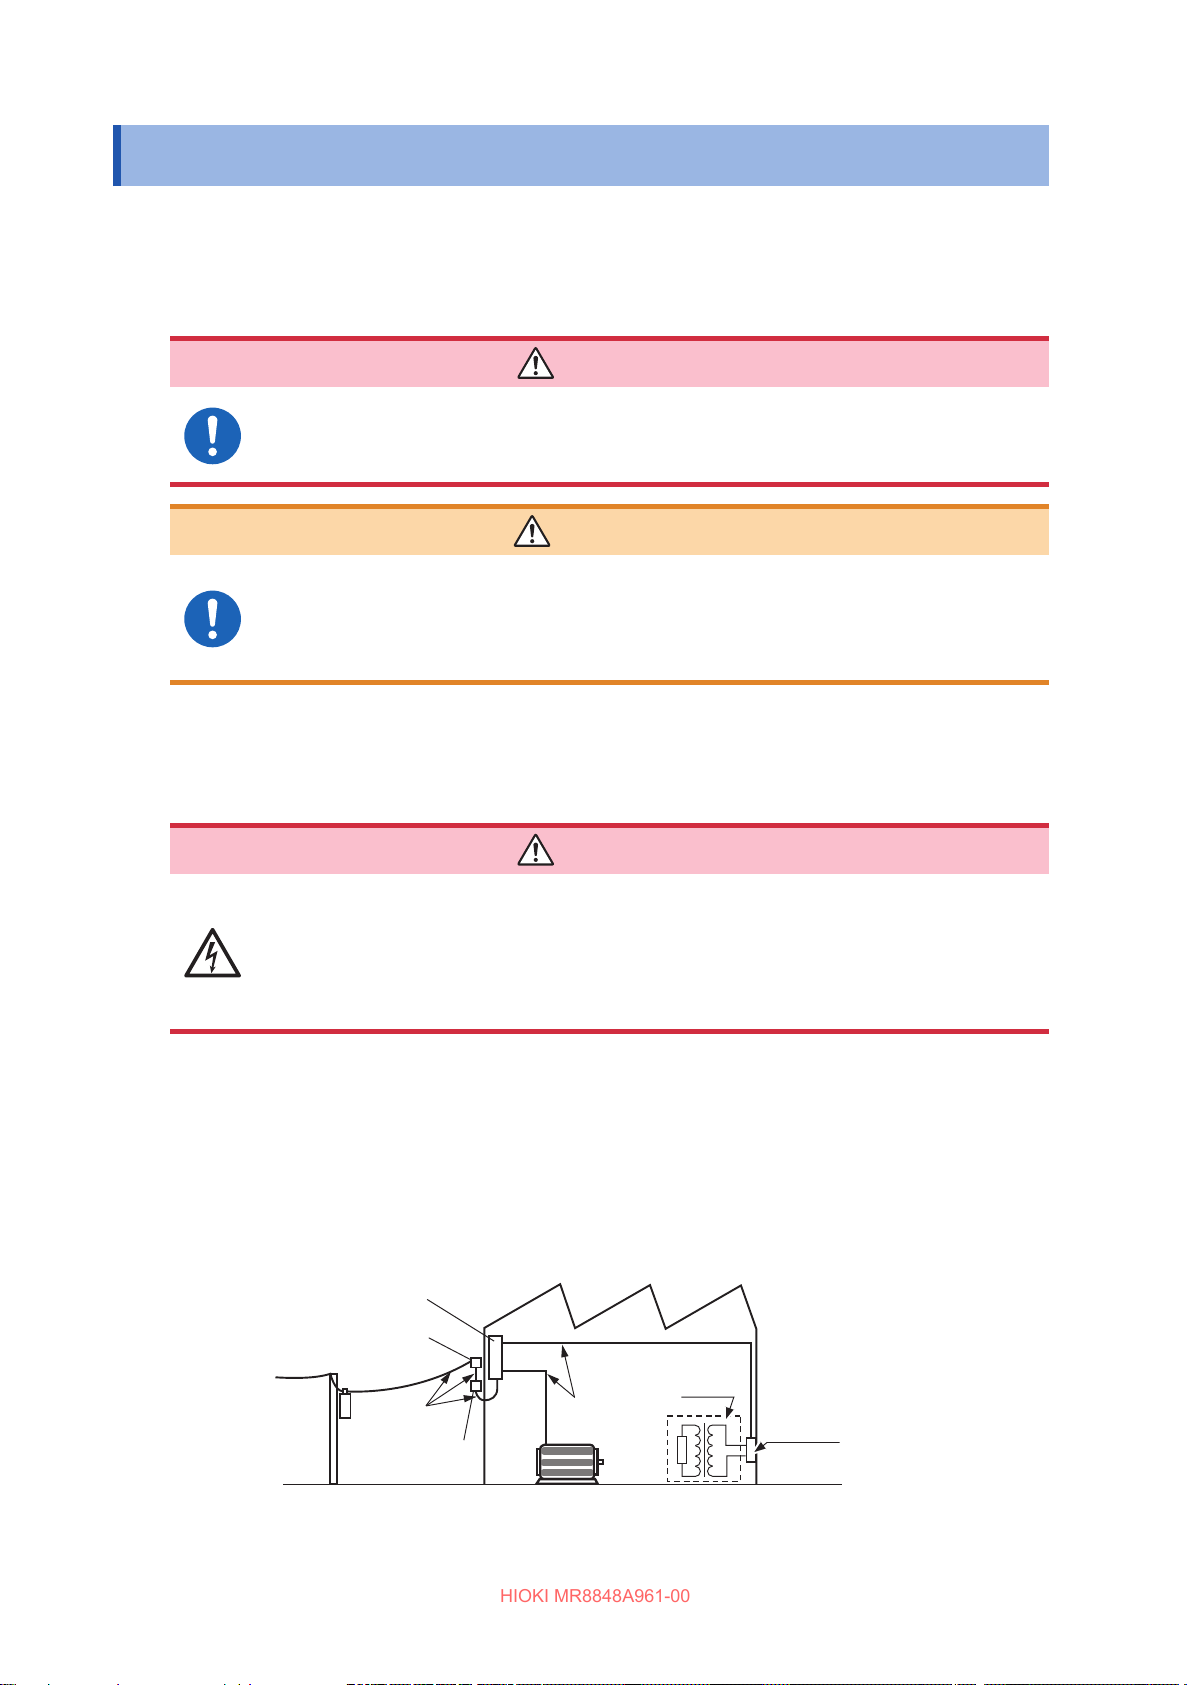
Measurement categories
To ensure safe operation of measuring instruments, IEC 61010 establishes safety standards for
various electrical environments, categorized as CAT II to CAT IV, and called measurement categories.
DANGER
• Using a measuring instrument in an environment designated with a higher-
numbered category than that for which the instrument is rated could result in a
severe accident, and must be carefully avoided.
• Never use a measuring instrument that lacks category labeling in a CAT II to
CAT IV measurement environment. Doing so could result in a serious accident.
CAT II: When directly measuring the electrical outlet receptacles of the primary electrical
circuits in equipment connected to an AC electrical outlet with a power cord (portable
tools, household appliances, etc.)
CAT III: When measuring the primary electrical circuits of heavy equipment (xed installations)
connected directly to the distribution panel, and feeders from the distribution panel to
outlets
CAT IV: When measuring the circuit from the service drop to the service entrance, and to the
power meter and primary overcurrent protection device (distribution panel)
Distribution Panel
The applicable measurement category is determined based on the unit being used.
Refer to “18.6 Specications of Modules” (p. 401).
14
Service Entrance
Service Drop
CAT IV
Power Meter
Internal Wiring
CAT III
Fixed Installation
CAT II
T
Outlet
Page 15
Operation Precautions
HIOKI MR8848A961-00
Operation Precautions
Before use
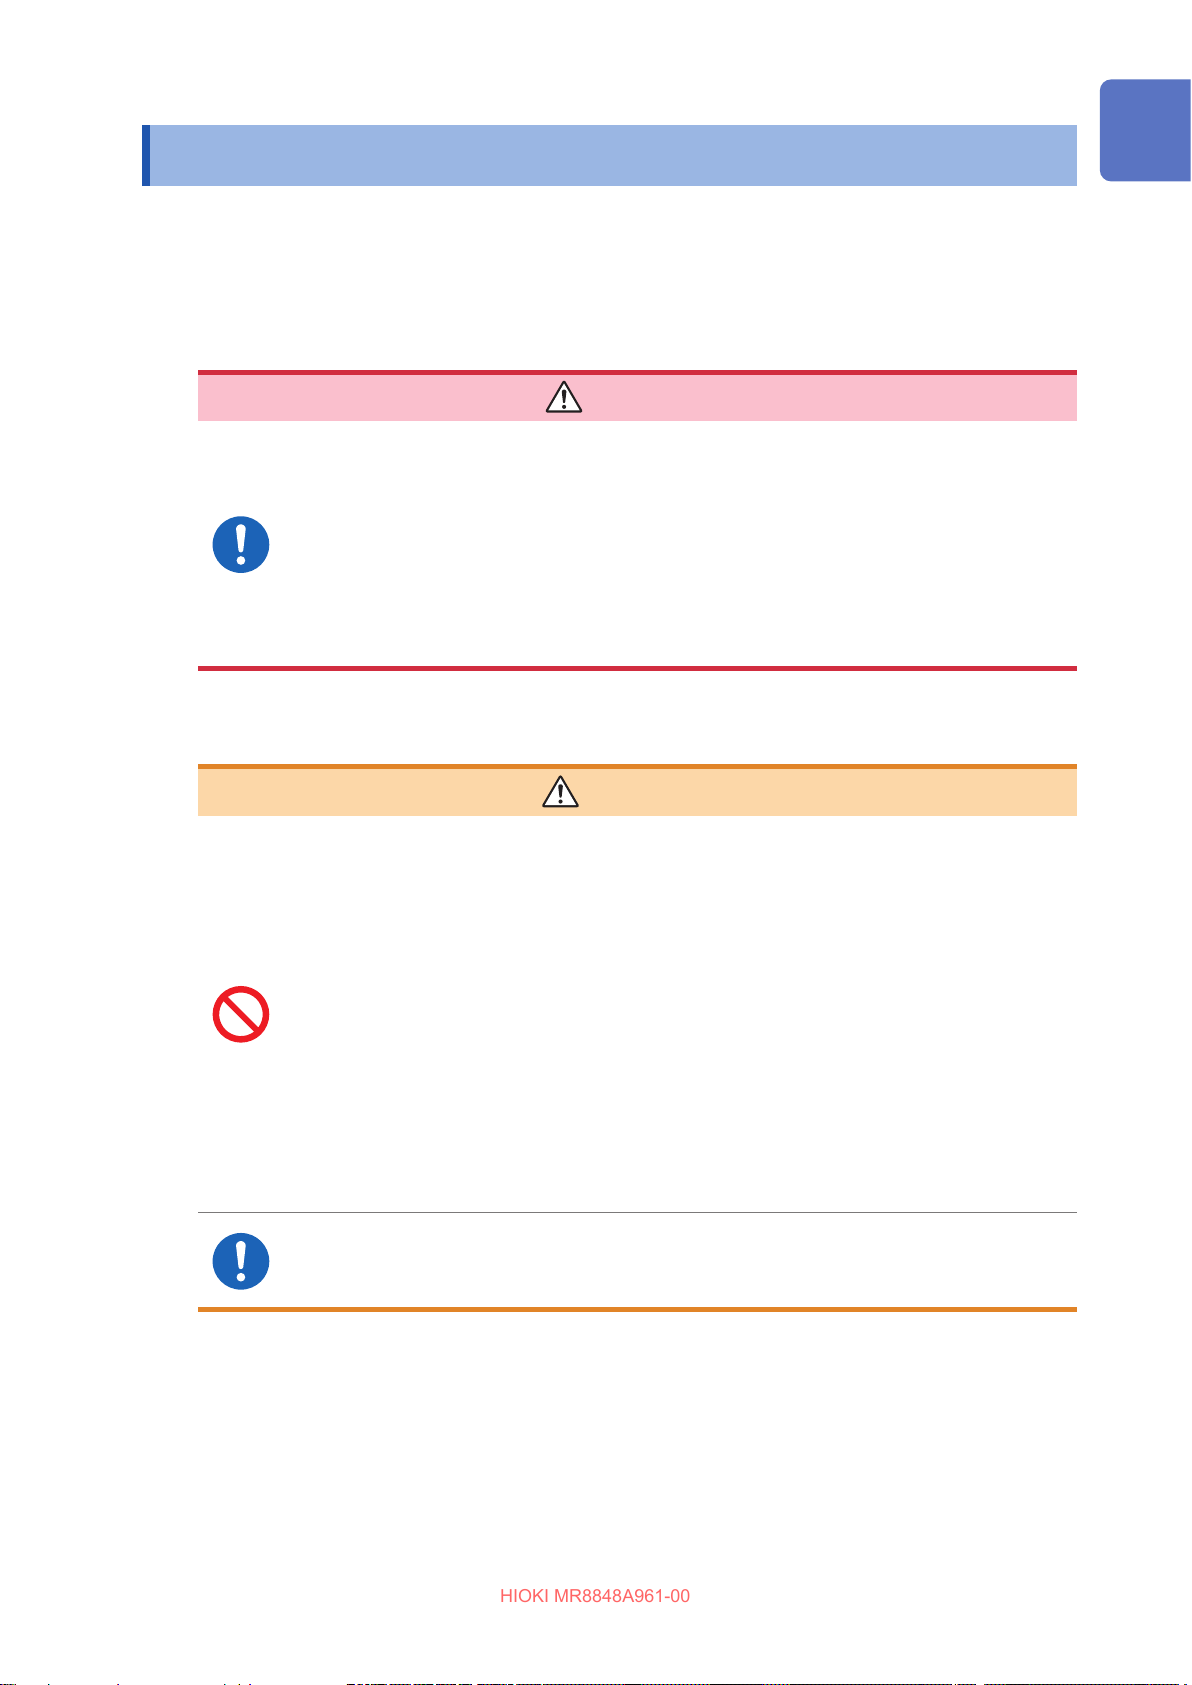
Follow these precautions to ensure safe operation and to obtain the full benets of the various
functions.
Ensure that the use of the instrument conforms not only to its specications but also to the
specications of all products to be used, including accessories and optional equipment.
DANGER
If the connection cords or the instrument are damaged, there is a risk of an
electric shock. Perform the following inspection before using the instrument:
• Before using the instrument, check that the coatings of the connection cords
are neither ripped nor torn and that no metal parts are exposed. Replace the
connection cords with those specied by our company.
• Verify that it operates normally to ensure that no damage occurred during
storage or shipping. If you nd any damage, contact your authorized Hioki
distributor or reseller.
Installing the instrument and units
Installing the instrument and units in inappropriate locations may cause a
malfunction of the instrument or may give rise to an accident. Avoid the following
locations:
• Exposed to direct sunlight or high temperatures
• Exposed to corrosive or combustible gases
• Exposed to a strong electromagnetic eld or electrostatic charge
• Near induction heating systems (such as high-frequency induction heating
systems and IH cooking equipment)
• Susceptible to vibration
• Exposed to water, oil, chemicals, or solvents
• Exposed to high humidity or condensation
• Exposed to high quantities of dust particles
• Where it would be unstable or inclined
Ensure enough space for operation around the instrument so that the power
supply can be immediately cut o by pulling out the plug of the power cord in
case of emergency.
WARNING
15
Page 16
Operation Precautions
HIOKI MR8848A961-00
Installing the instrument
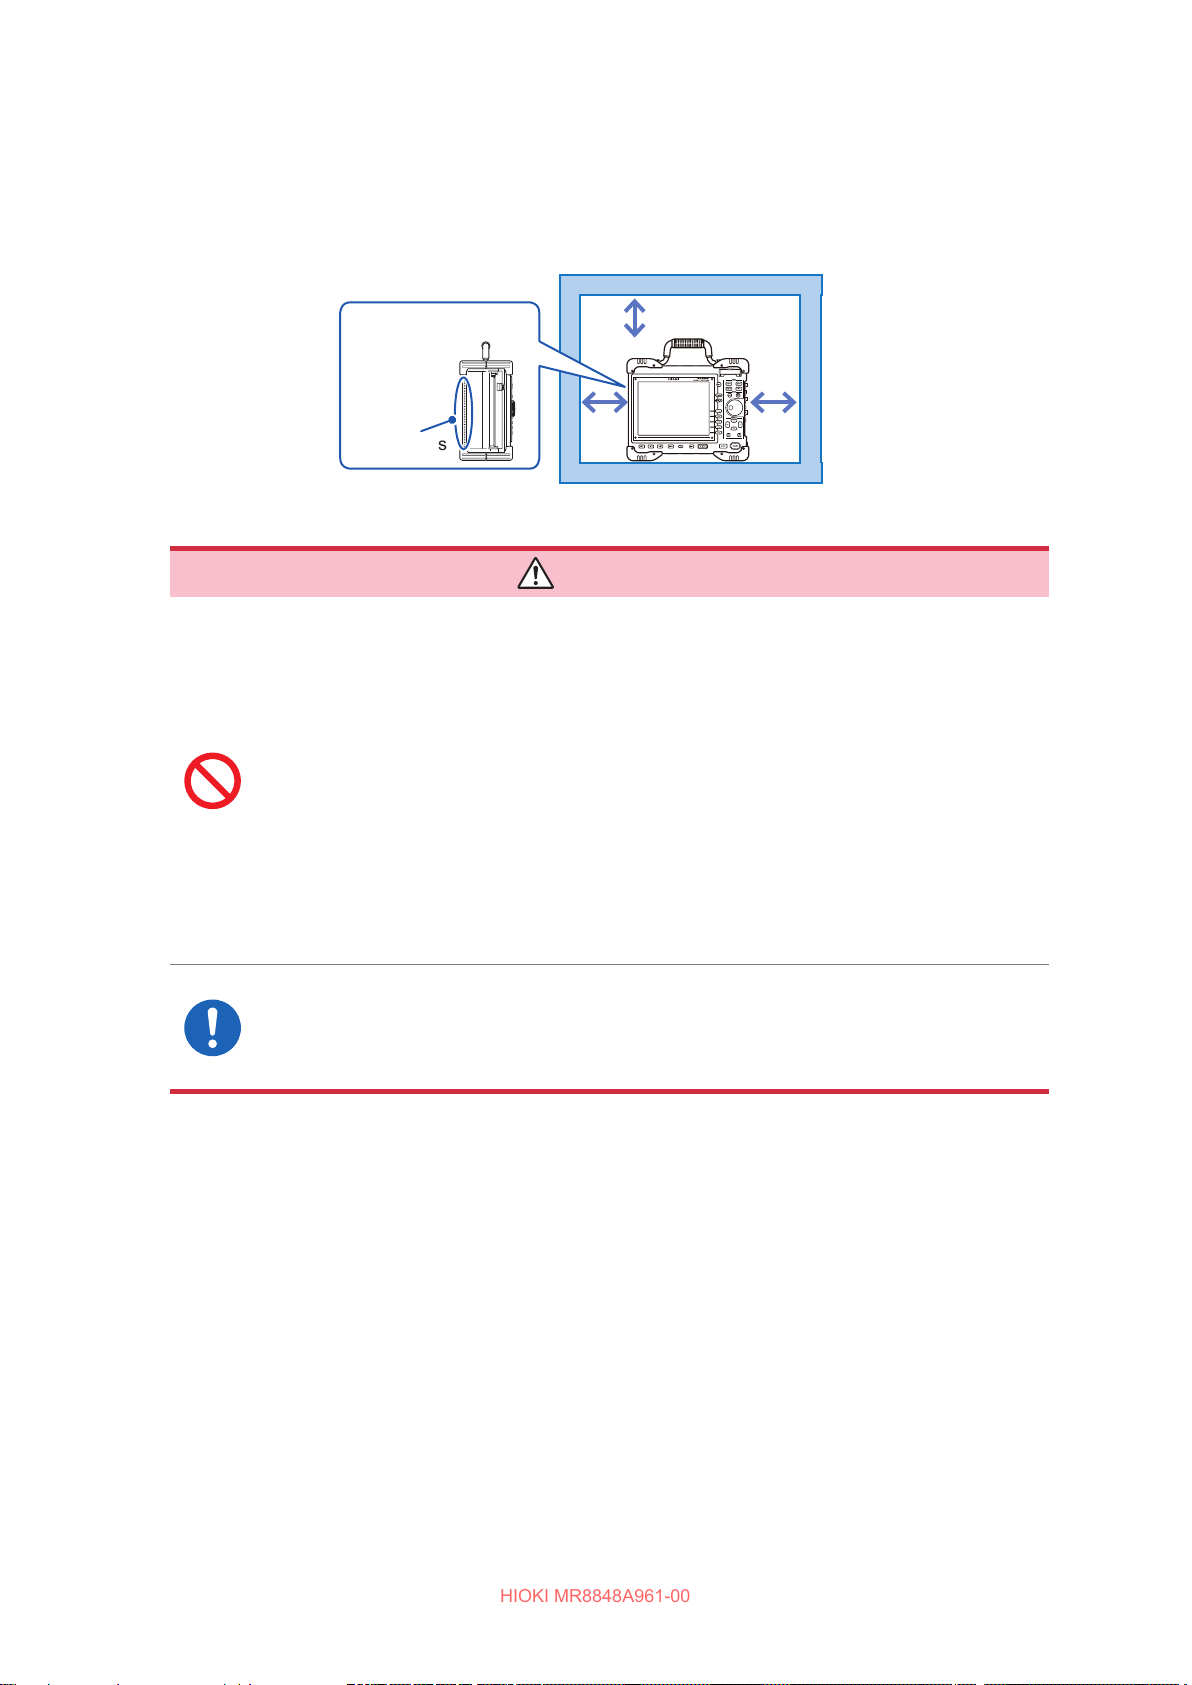
To prevent overheating, be sure to leave the specied clearances around the instrument.
• The instrument should be operated only with the bottom or rear side downwards.
• Do not block any vents.
• Do not install the instrument at an angle.
Left side
Vents
Handling the instrument and units
• Do not use the units or the cords with circuits that exceed those ratings or
specications.
Doing so may damage the instrument or cause it to become hot, resulting in bodily
injury.
Even including any devices, such as an attenuator, in the input terminal will
never increase the maximum rated line-to-ground voltage. Take care of the
connection not to allow any input voltage to exceed the maximum rated line-to-
ground voltage.
• To avoid an electric shock, do not remove the instrument’s cover and the units’
cases.
The internal components of the instrument carry high voltages and may
become very hot during operation.
At least 5 cm
on all sides
DANGER
• It is recommended to measure the secondary side of a distribution panel with
the U8974 High Voltage Unit. Do not connect the connection cords on the
primary side of the distribution panel because an unrestricted current ow can
damage the connection cords and facilities if a short-circuit occurs.
16
Page 17
Operation Precautions
HIOKI MR8848A961-00
WARNING
• Each channel of the U8979 Charge Unit has the BNC terminal and miniature
connector terminal with the common ground. Do not connect cords with each
of the terminals simultaneously to avoid a short-circuit.
• To avoid an electric shock, before removing or replacing an input unit,
conrm that the instrument is turned o and that the connection cords are
disconnected.
• To avoid the danger of an electric shock, never operate the instrument with an
input unit removed. To use the instrument with a unit removed, install a blank
panel over the opening of the removed unit.
• To prevent the instrument damage or an electric shock, use only the screws
that are originally installed for securing the unit in place.
If you have lost any screws or nd that any screws are damaged, please contact
your Hioki distributor for a replacement.
• Setting the measurement mode to [PreAmp] allows the U8979 Charge Unit to
constantly provide power (3.0 mA, 22 V) to sensors. Set any measurement
mode other than [PreAmp] or tum o the instrument before connecting a
sensor or probe with a BNC terminal to avoid an electric shock or damage to
the measurement target.
CAUTION
• To avoid damaging units, do not touch the connectors, installed in the instrument, to
which the units are connected.
• The U8979 Charge Unit has miniature connectors with the maximum input charge
of ±500 pC (for six higher-sensitivity range) or ±50,000 pC (for six lower-sensitivity
range). Inputting a charge that exceeds these value causes damage to the instrument.
• Use an acceleration sensor with a built-in pre-amplier that conforms to the
specication of the U8979 (3.0 mA, 22 V). Using a inapplicable sensor may cause
damaging itself.
• To avoid damage to the instrument, protect it from physical shock when transporting
and handling it. Be especially careful to avoid physical shock due to dropping it.
• The mounting screws must be rmly tightened or the unit may not perform to
specications, or may even fail.
• Before carrying the instrument, disconnect all cords and remove the SD card, USB ash drive,
and the recording paper.
• Displayed waveforms can frequently uctuate due to induction potential even when no voltage is
applied. This, however, is not a malfunction.
• The instrument is classied as a Class A device under the EN 61326 standard.
Use of the instrument in a residential setting such as a neighborhood could interfere with
reception of radio and television broadcasts. If this occurs, take appropriate steps to counteract
the issue.
17
Page 18
Operation Precautions
HIOKI MR8848A961-00
Handling the printer and the recording paper
WARNING
The print head and surrounding metal parts can become hot. Be careful to avoid
touching these parts.
CAUTION
Be careful not to cut yourself with the paper cutter.
• Please use only the specied recording paper. Using non-specied paper may not only result in
faulty printing, but printing may become impossible.
• If the recording paper is skewed on the roller, paper jams may result.
• Always use the paper cutter to cut the printed paper. Excessive paper dust can accumulate on
the roller if the paper is cut with the print head, which may result in paper jams or white streaks in
the printing.
Storing data recordings
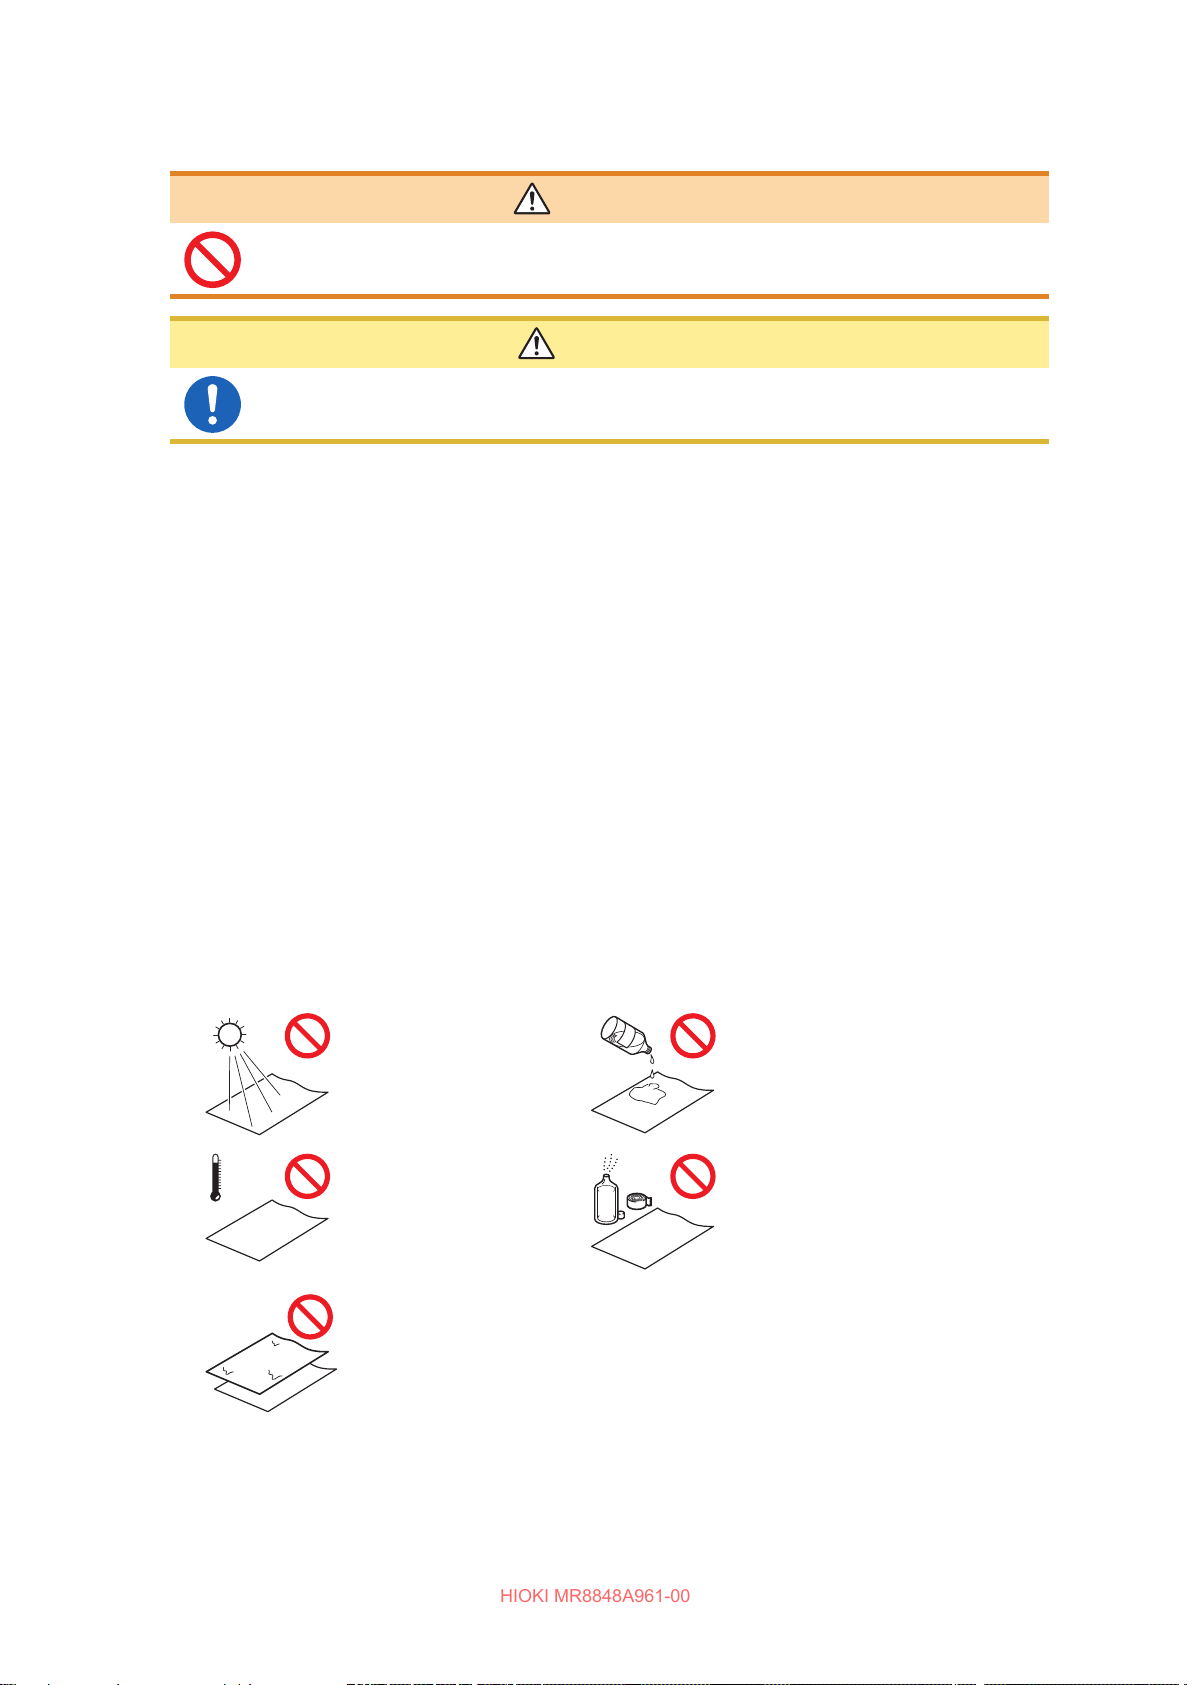
The recording paper is thermally sensitive. Observe the following precautions to avoid paper
discoloration and fading.
• To avoid paper discoloration, do not expose it to direct sunlight. Store the paper at no more than
C and 90% RH.
40
°
• Store the paper away from dew and damp places.
• Make photocopies of recording printouts that are to be handled or stored for legal purposes.
• If the thermal paper is exposed to an organic solvent such as alcohol or ketone, it may no longer
develop properly, and recorded data may fade. Keep the printer papers away from exible PVC
lms and pressure sensitive tapes including scotch tapes because they contain organic solvents.
• Also, the thermal recording paper is ruined by contact with wet diazo copy paper.
Avoid exposure to direct
sunlight.
Do not store the paper at
more than 40
and 90% RH.
C (104°F)
°
Avoid exposure to volatile
organic solvents like
alcohol, ethers, and
ketones.
Avoid contact with exible
PVC lms or adhesive
tapes such as scotch
tapes.
Storing recording paper
• Store thermal paper where its temperature will not exceed 40
• The paper will deteriorate if exposed to light for a long time; thus, do not remove the wrapping
18
Avoid stacking with wet
Diazo copy paper.
paper from the roll until it is ready to be used.
C.
°
Page 19
Handling storage devices
HIOKI MR8848A961-00
• Do
not remove the storage device while it is being accessed by the instrument (while
the SAVE key is lit in blue). Data saved on the device could be lost.
• Do not turn o the instrument while it is accessing the storage device (while the SAVE
key is lit up in blue). Data saved on the device could be lost.
•
Do not carry the instrument with a USB ash drive left connected. Damage could
result.
•
Exercise care when using such products because static electricity could damage the
storage device or cause a malfunction of the instrument.
•
Do not subject the SSD to extreme
damaged.
IMPORTANT
• No compensation is available for loss of data stored on the built-in drive (SSD) or a removable
storage device, regardless of the content or cause of damage or loss. Be sure to back up any
important data saved on the built-in drive (SSD) or the removable storage device.
• Use only the SD cards or USB ash drive sold by Hioki.
Compatibility and performance are not guaranteed for SD cards or USB ash drive made by
other manufacturers. You may be unable to read from or save data to such cards.
Hioki optional SD cards and USB ash drive
Z4003 SD Memory Card 8 GB, Z4001 SD Memory Card 2 GB
Z4006 USB Drive 16 GB
Operation Precautions
CAUTION
shock or vibration. Shock can cause it to be
• Turn on the instrument before inserting the external storage device. With some external storage
device, the instrument may not start up if it is turned on while the external storage device is
inserted.
• The instrument does not support particular kind of USB ash drives, such as those that require
ngerprint authentication or a password.
• When saving or loading data, insert the storage device before selecting data to be saved. When
the storage device is not inserted, no devices are not displayed in the le list.
• All storage devices {built-in drive (SSD), USB ash drive, and SD card} have a limited service
life. After extensive use for a long period, saving and loading data may be disabled. In that case,
replace the device with a new one.
• The built-in drive (SSD) is a consumable part. When the saved data reaches the capacity (about
60 TB), no further data can be recorded. In such a case, the SSD should be replaced with a new
one.
• When the instrument is left powered o for a one year or more, the data saved on the built-in
drive (SSD) may be lost. Be sure to back up the data if the instrument is left powered o for a
long time.
• Devices the automatic data saving supports are the built-in drive (SSD), a USB ash drive, and
an SD card.
• SD Memory Cards, which use ash memory, have a service life. After extensive use for a long
period, saving and loading data may be disabled. In that case, replace the device with a new one.
19
Page 20
Operation Precautions
HIOKI MR8848A961-00
Before connecting cords
When measuring power line voltage
• Do not short-circuit two wires to be measured by bringing the connection cords
into contact with them. Arcs or such grave accidents are likely to occur.
• To avoid a short-circuit or an electric shock, do not touch the metal parts of the
connecting cord clips.
• To avoid electrical shock, be careful to avoid shorting live lines with the
connection cord chips.
• Connect the connecting cords to only the secondary side of a breaker. Even
if a short-circuit occurs on the secondary side of the breaker, the breaker will
interrupt a short-circuit current. Do not connect them to the primary side of the
breaker because an unrestricted current ow could damage the instrument and
facilities if a short circuit occurs.
• To prevent an electrical shock and a bodily injury, do not touch any input
terminals on the VT (PT), CT or the instrument when they are in operation.
• Do not leave the measurement cables connected to the instrument in an
environment where voltage surges exceeding the maximum input voltage may
occur. Subjecting the instrument to such a voltage may result in damage to the
instrument or a serious accident.
DANGER
WARNING
To prevent an electric shock, conrm that the white or red portion (insulation layer)
inside the cable is not exposed. If a color inside the cable is exposed, do not use
the cable.
• To avoid an electric shock and a short-circuit accident, use only the specied
test leads to connect the instrument input terminals to the circuit to be tested.
• To avoid an electric shock, do not exceed the lower of the ratings shown on the
instrument and connection cords.
CAUTION
To prevent cord damage, do not step on cords or pinch them between other objects. Do
not bend or pull on cords at their base.
• The cable is hardened in the freezing temperatures. Do not bend or pull it to avoid
tearing its shield or cutting cable.
• Connecting cables to the BNC terminals on units
Do not use any cable terminated with a metal BNC connector. If you connect a metal
BNC cable to an insulated BNC connector, the insulated BNC connector and the
instrument may be damaged.
20
IMPORTANT
• Use only the specied connection cords. Use of any cord not specied by our company does
not allow safe measurements due to poor connection or other reasons.
• For detailed precautions and instructions regarding connections, refer to the instruction
manuals for your units, connection cords, etc.
Page 21
Before connecting a logic probe to the measurement object
HIOKI MR8848A961-00
DANGER
To avoid an electric shock, a short-circuit, and damage to the instrument, observe
the following precautions:
• The ground pin in the logic connector (plug) of the 9320-01 Logic Probe and
the 9327 Logic Probe are not isolated from the instrument’s ground (common
ground).
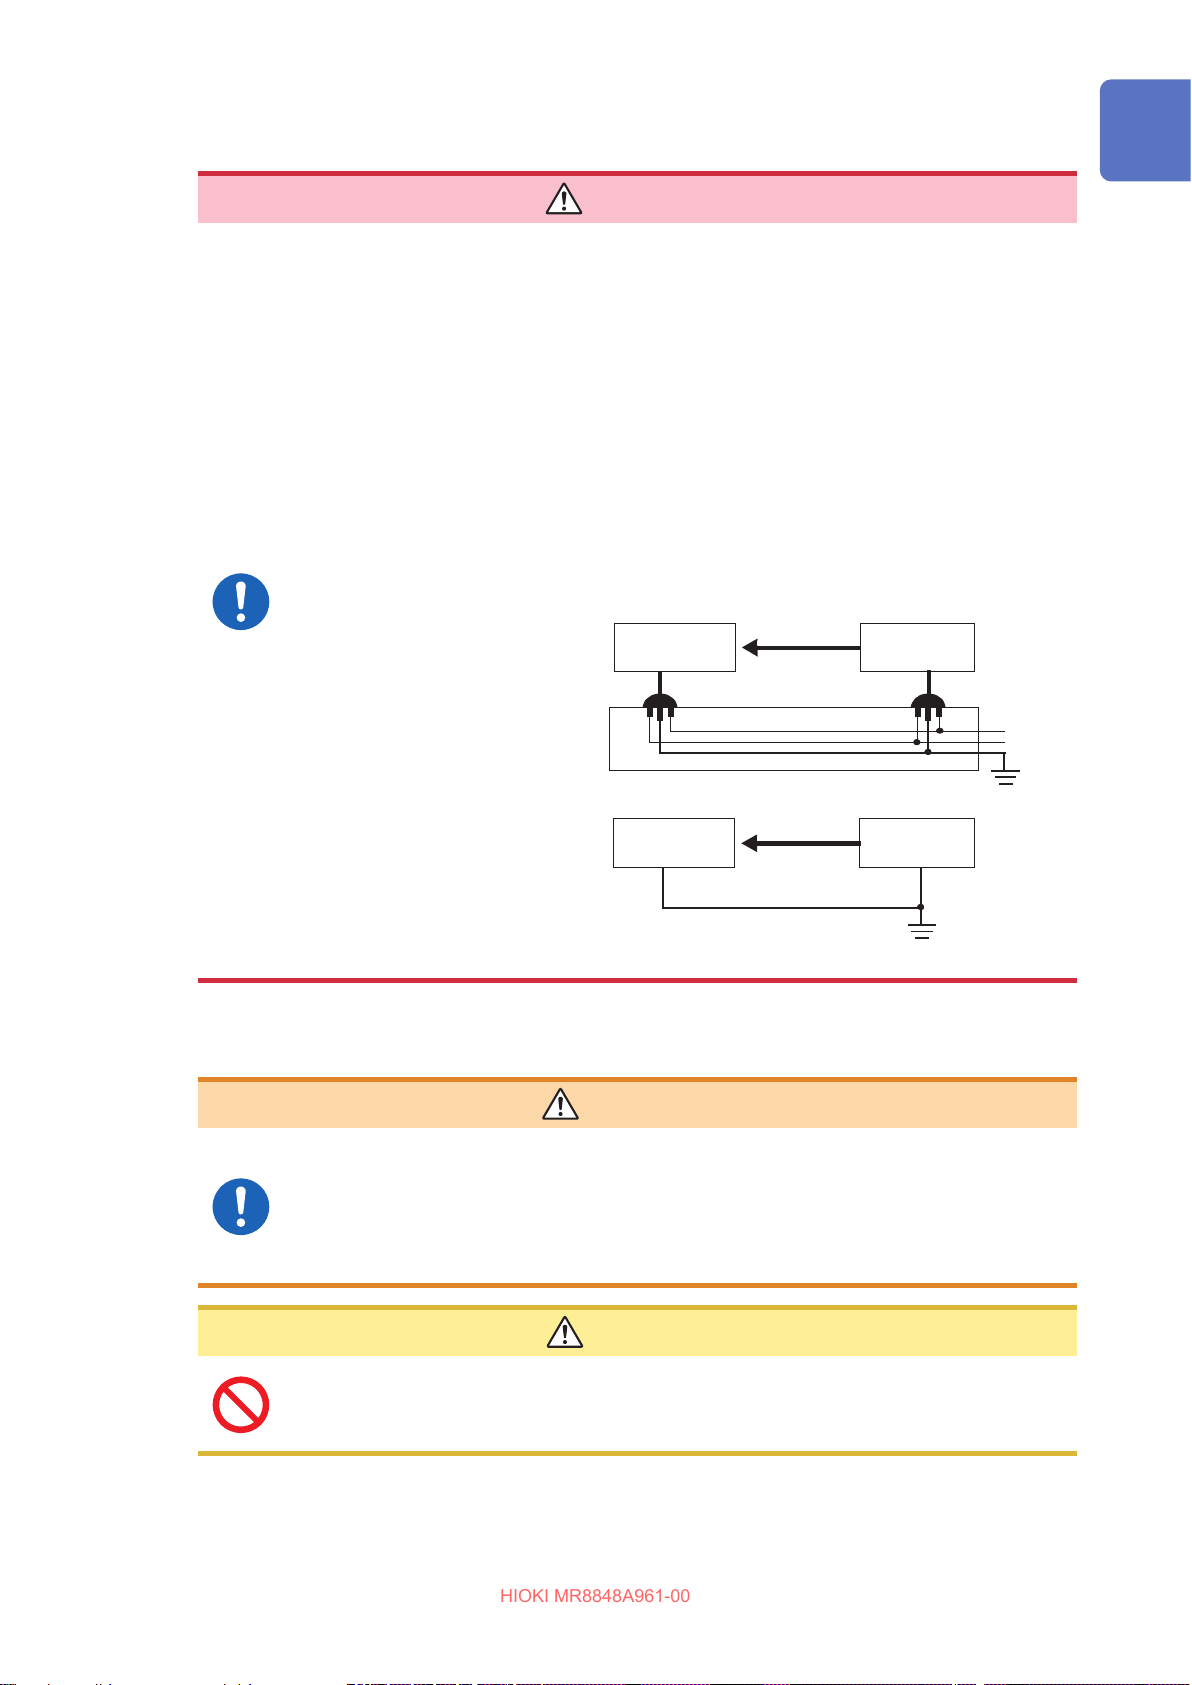
Supply power to the instrument with the provided power cord and measurement
objects from a single mains circuit.
Connecting the instrument and a measurement object to dierent mains circuits
from one another or using a non-grounding power cord may cause damage to
the measurement object or the instrument because of current owing through
the logic probes resulting from the potential dierence between the grounds of
the dierent wiring systems.
To avoid that, we recommend the following connection procedure:
Connect the provided power cord
to the instrument and supply
power from the same outlet as the
measurement object.
Measurement
Object
Logic
Probe
Operation Precautions
Instrument
Connect the measurement object’s
ground to the GND terminal
(functional earth terminal) of the
instrument.
(Always supply power from the
single mains circuit.)
Refer to
to the GND terminal (functional earth
terminal)” (p. 60).
“Connecting an earthing wire
Before turning on the instrument
• To avoid electrical accidents and to maintain the safety specications of this
instrument, connect the power cord provided only to an outlet.
• Before turning the instrument on, make sure the supply voltage matches that
indicated on its power connector. Connection to an improper supply voltage
may damage the instrument and present an electrical hazard.
Measurement
Object
GND
WARNING
CAUTION
Logic
Probe
Instrument
Functional
Earth Terminals
Avoid using an uninterruptible power supply (UPS), DC/AC inverter with rectangular-
wave or pseudo-sine-wave output to power the instrument. Doing so may damage the
instrument.
21
Page 22
Operation Precautions
HIOKI MR8848A961-00
Before connecting the instrument to an external device
DANGER
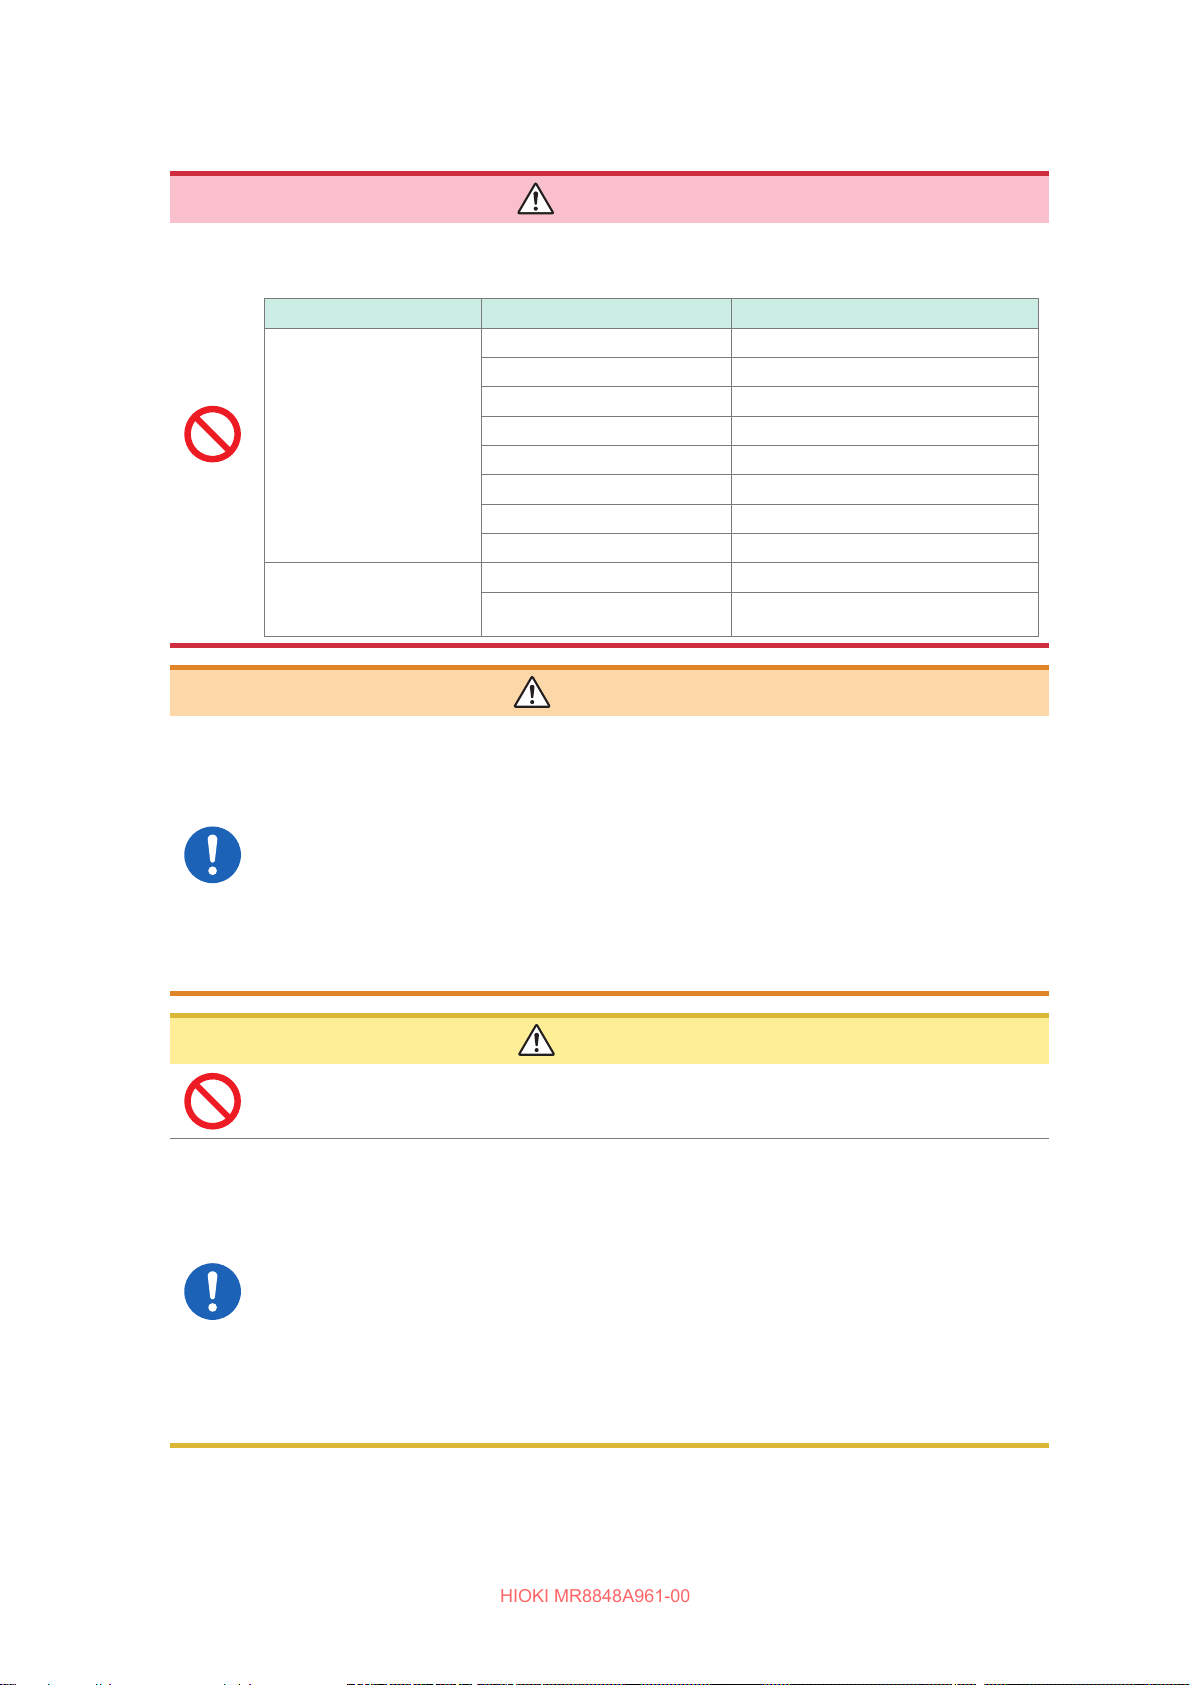
To avoid electrical hazards and damage to the instrument, do not apply voltage
exceeding the rated maximum to the external control terminals.
I/O terminals Maximum input voltage
Instrument START/IN1 −0.5 V to 7 V DC
STOP/IN2 −0.5 V to 7 V DC
PRINT/IN3 −0.5 V to 7 V DC
GO/OUT1 50 V DC 50 mA 200 mW
NG/OUT2 50 V DC 50 mA 200 mW
EXT.SMPL −0.5 V to 7 V DC
TRIG.OUT 50 V DC 50 mA 200 mW
EXT.TRIG −0.5 V to 7 V DC
U8793
Arbitrary Waveform
Generator Unit
IN −0.5 V to 7 V DC
OUT 30 V DC 50 mA
WARNING
To avoid an electric shock or damage to the equipment, always observe the
following precautions when connecting the cables to external control terminals.
• Always turn o the instrument and any devices to be connected before making
connections.
• Be careful to avoid exceeding the ratings of the external control terminals and
the external connectors.
• The external control terminals use the same GND as the instrument. Ensure
that devices and systems to be connected to the external control terminals are
isolated from one another as required.
CAUTION
To avoid equipment failure, do not disconnect the USB cable while communications are
in progress.
• Use a common ground for both the instrument and the connection equipment. Using
dierent ground circuits will result in a potential dierence between the instrument’s
ground and the connected equipment’s ground. If the cable is connected while such a
potential dierence exists, it may result in equipment malfunction or failure.
• Before connecting or disconnecting any cable, always turn o the instrument and
the device to be connected. Failure to do so may result in equipment malfunction or
damage.
• After connecting the communications cable, tighten the screws on the connector
securely. Failure to secure the connector could result in equipment malfunction or
damage.
22
Page 23

Operation Precautions
HIOKI MR8848A961-00
When the instrument is not used for a long period
• To avoid straining some parts of the printer, and to prevent dirt adhering to the print head, close
the printer cover.
• Perform test prints (printer check) three or four times before using the printer that has been in
storage and has left unused for a long period.
Precautions during shipment
Store the packaging materials after unpacking the instrument. Use the original packaging materials
when shipping the instrument.
23
Page 24

Operation Precautions
HIOKI MR8848A961-00
24
Page 25
1
HIOKI MR8848A961-00
Overview
1.1 Product Overview
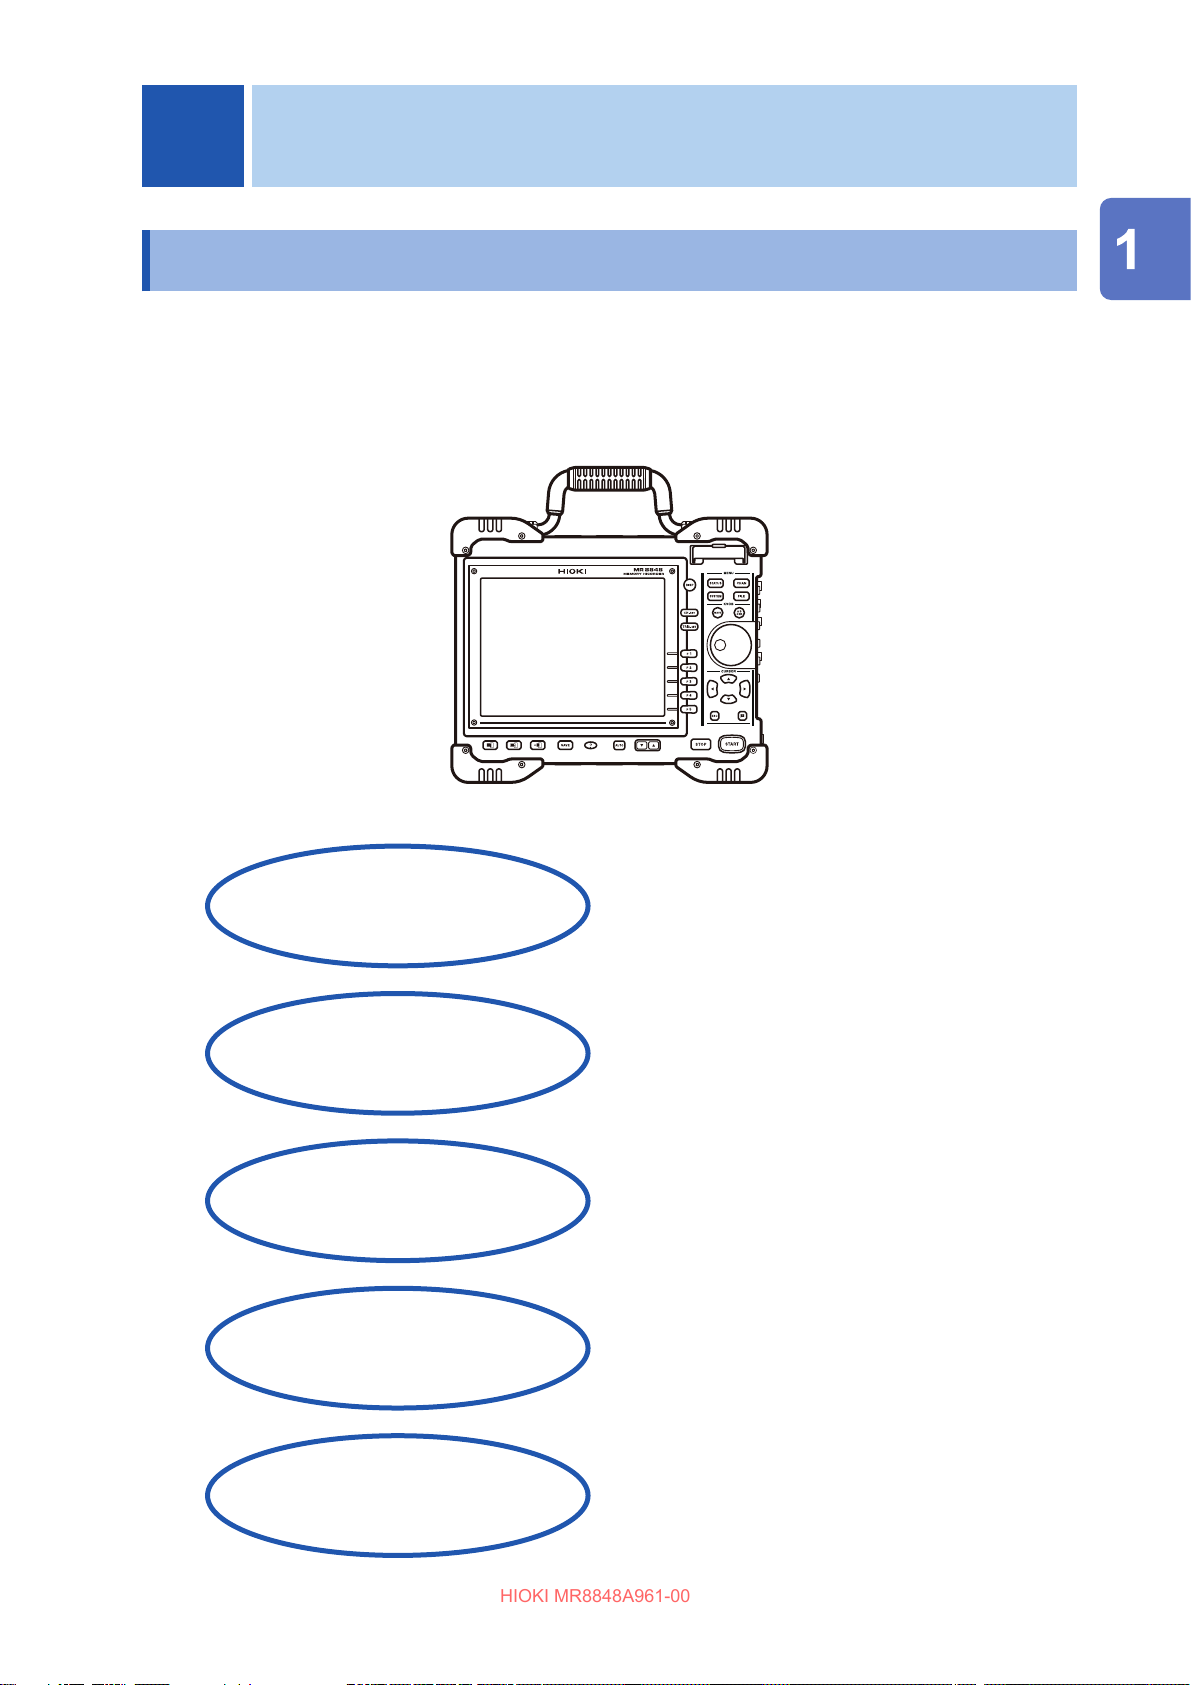
This instrument enables you to measure and analyze various waveforms promptly with simple
methods.
You can use this instrument mainly for facility diagnosis, preventive maintenance, and
troubleshooting.
Sturdy body with
easy-to-grasp handle
installed
You can install this portable instrument anywhere.
Overview
Logic units can measure
signals input on
64 channels
Easy loading of recording paper
High-speed printing
High-speed sampling
20 MS/s
Arbitrary Waveform
Generator Unit can output
waveforms simulating
measured signals
You can take multiple measurements
simultaneously.
(When the U8351 Printer Unit is installed.)
You can load the recording paper through one-
touch operation.
You can conduct reliable response evaluation.
You can have the instrument output realistically
simulated waveforms.
25
Page 26
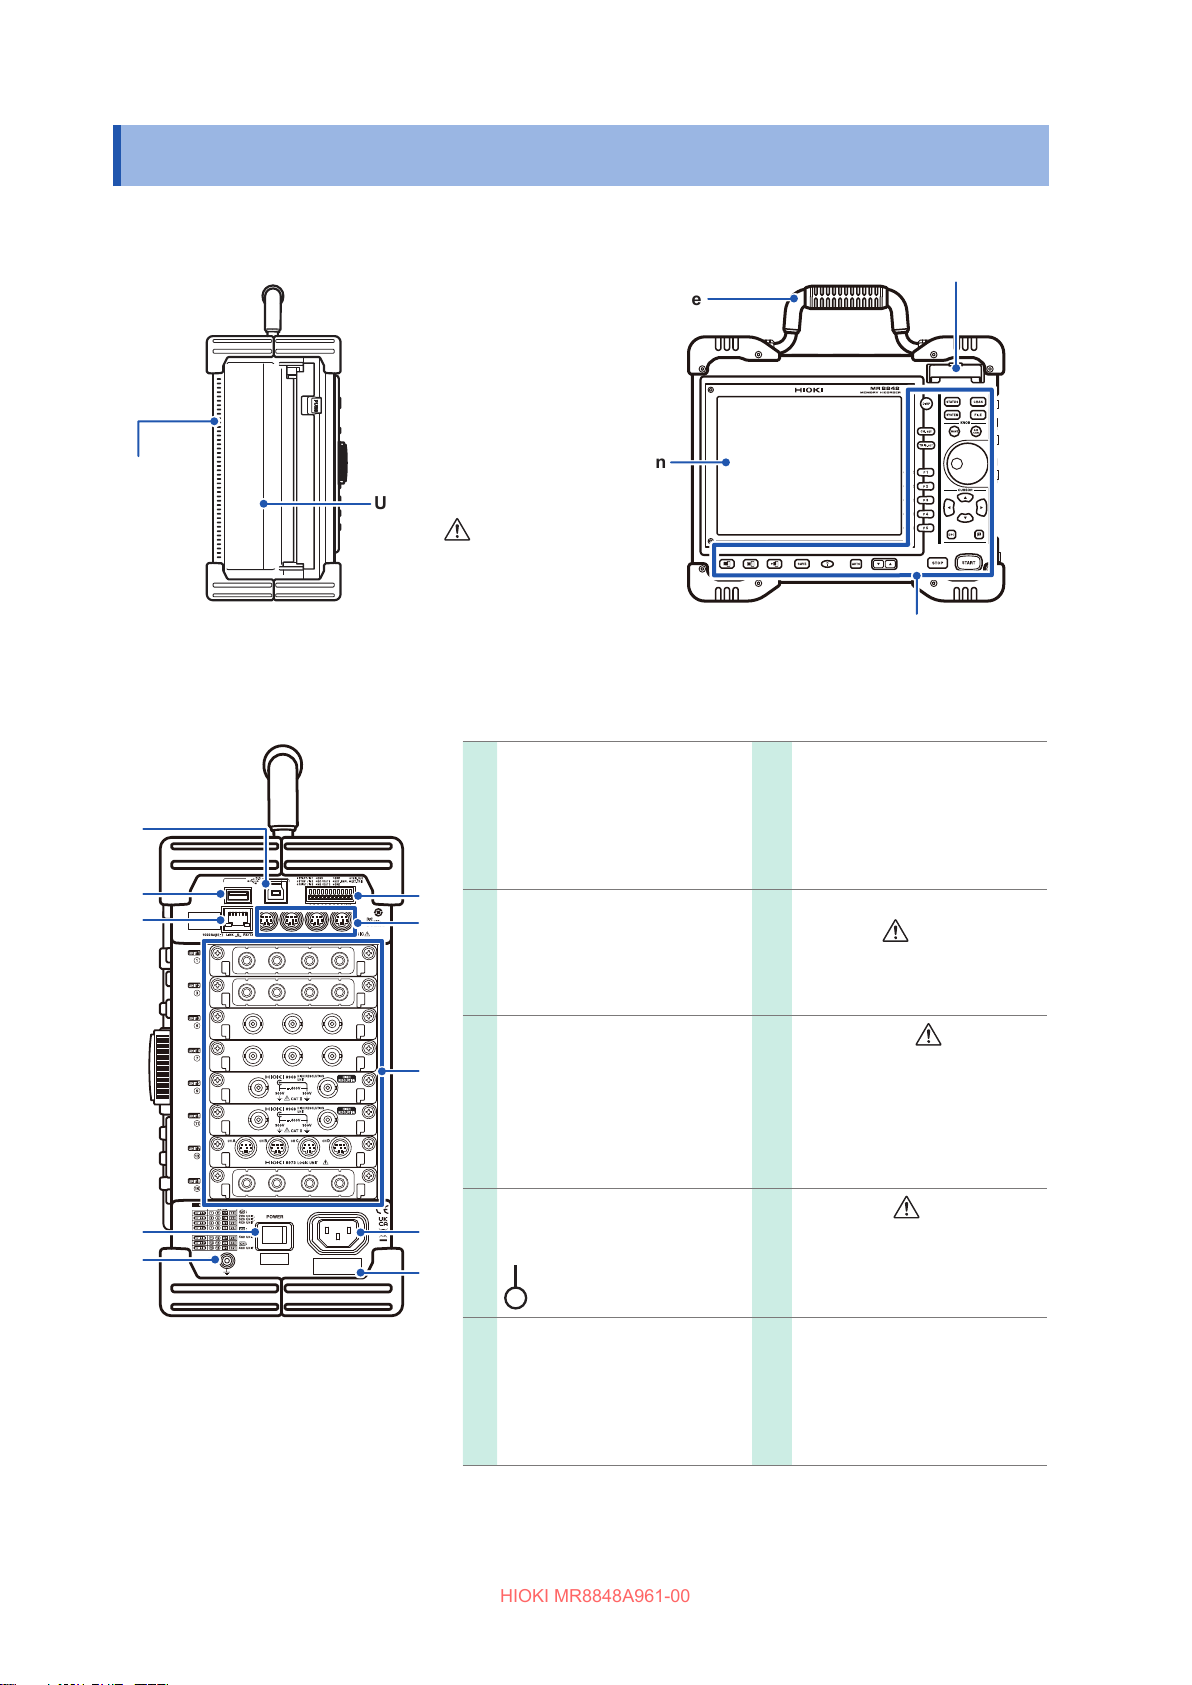
Part Names and Functions
HIOKI MR8848A961-00
1.2 Part Names and Functions
Left side
Vents
Right side
U8351 Printer Unit
(Option)
(p. 18)
USB connector (Type B)
Used to connect the PC.
(p. 370)
Front side
SD card slot
Handle
Screen
Operation keys (p. 27)
External control terminals
Input an external sampling
signal. (p. 375)
Connect signal cables to
operate the instrument
externally.
USB connector (Type A)
Connect a USB ash drive or
a mouse. (p. 56)
1000BASE-T connector
Connect a LAN cable.
(p. 345)
Power switch (p. 61)
Flip the switch to turn on and
o the instrument.
: Power-on
: Power-o
GND terminal (Functional
earth terminal)
Connect a grounded
conductor.
(p. 60)
Standard LOGIC
terminals
Connect optional Hioki logic
probes.
(p. 39)
Various units
(p. 36, p. 39)
For more details, see
“8.10 Setting Details of
Units” (p. 190) or “18.6
Specications of Modules”
(p. 401).
Power inlet
Connect the provided power
cord. (p. 60)
Serial number
For the latest information,
check Hioki’s website.
Do not remove this sticker
because the number is
required for product tracking.
26
Page 27
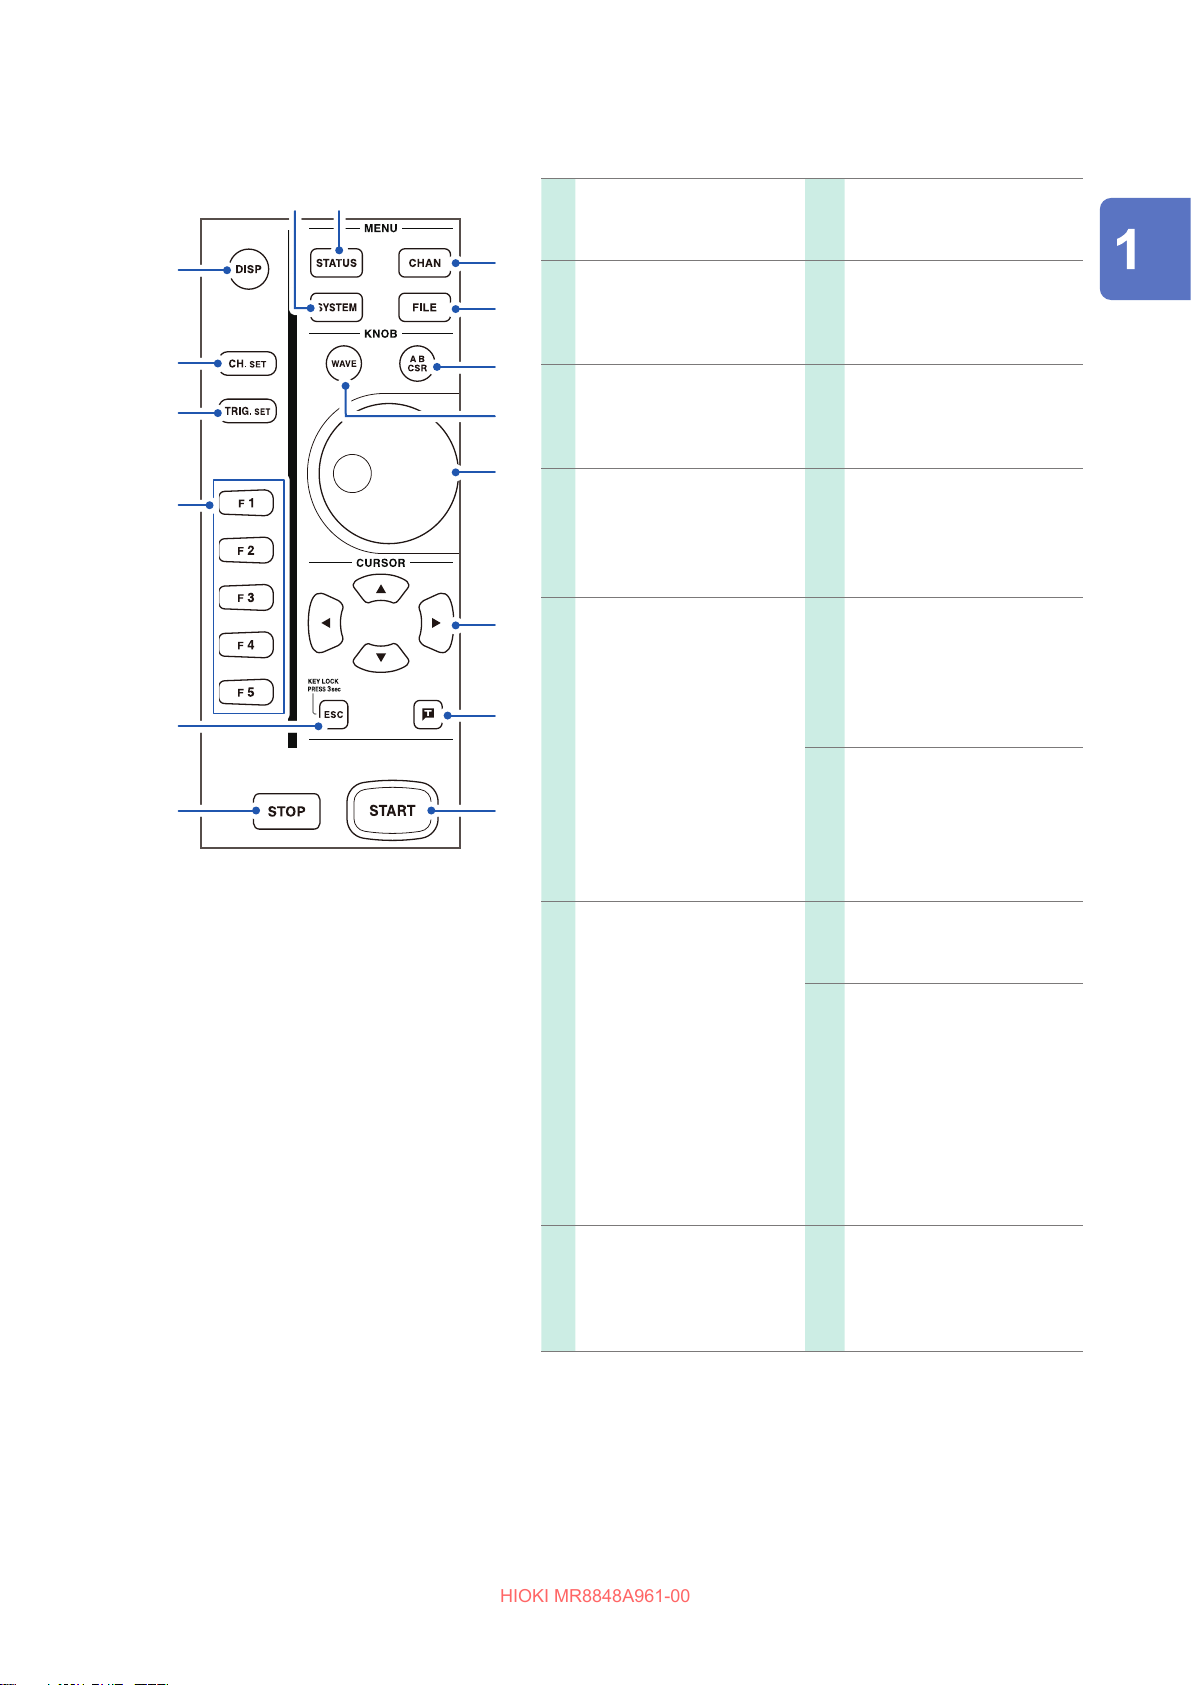
Operation keys
HIOKI MR8848A961-00
Part Names and Functions
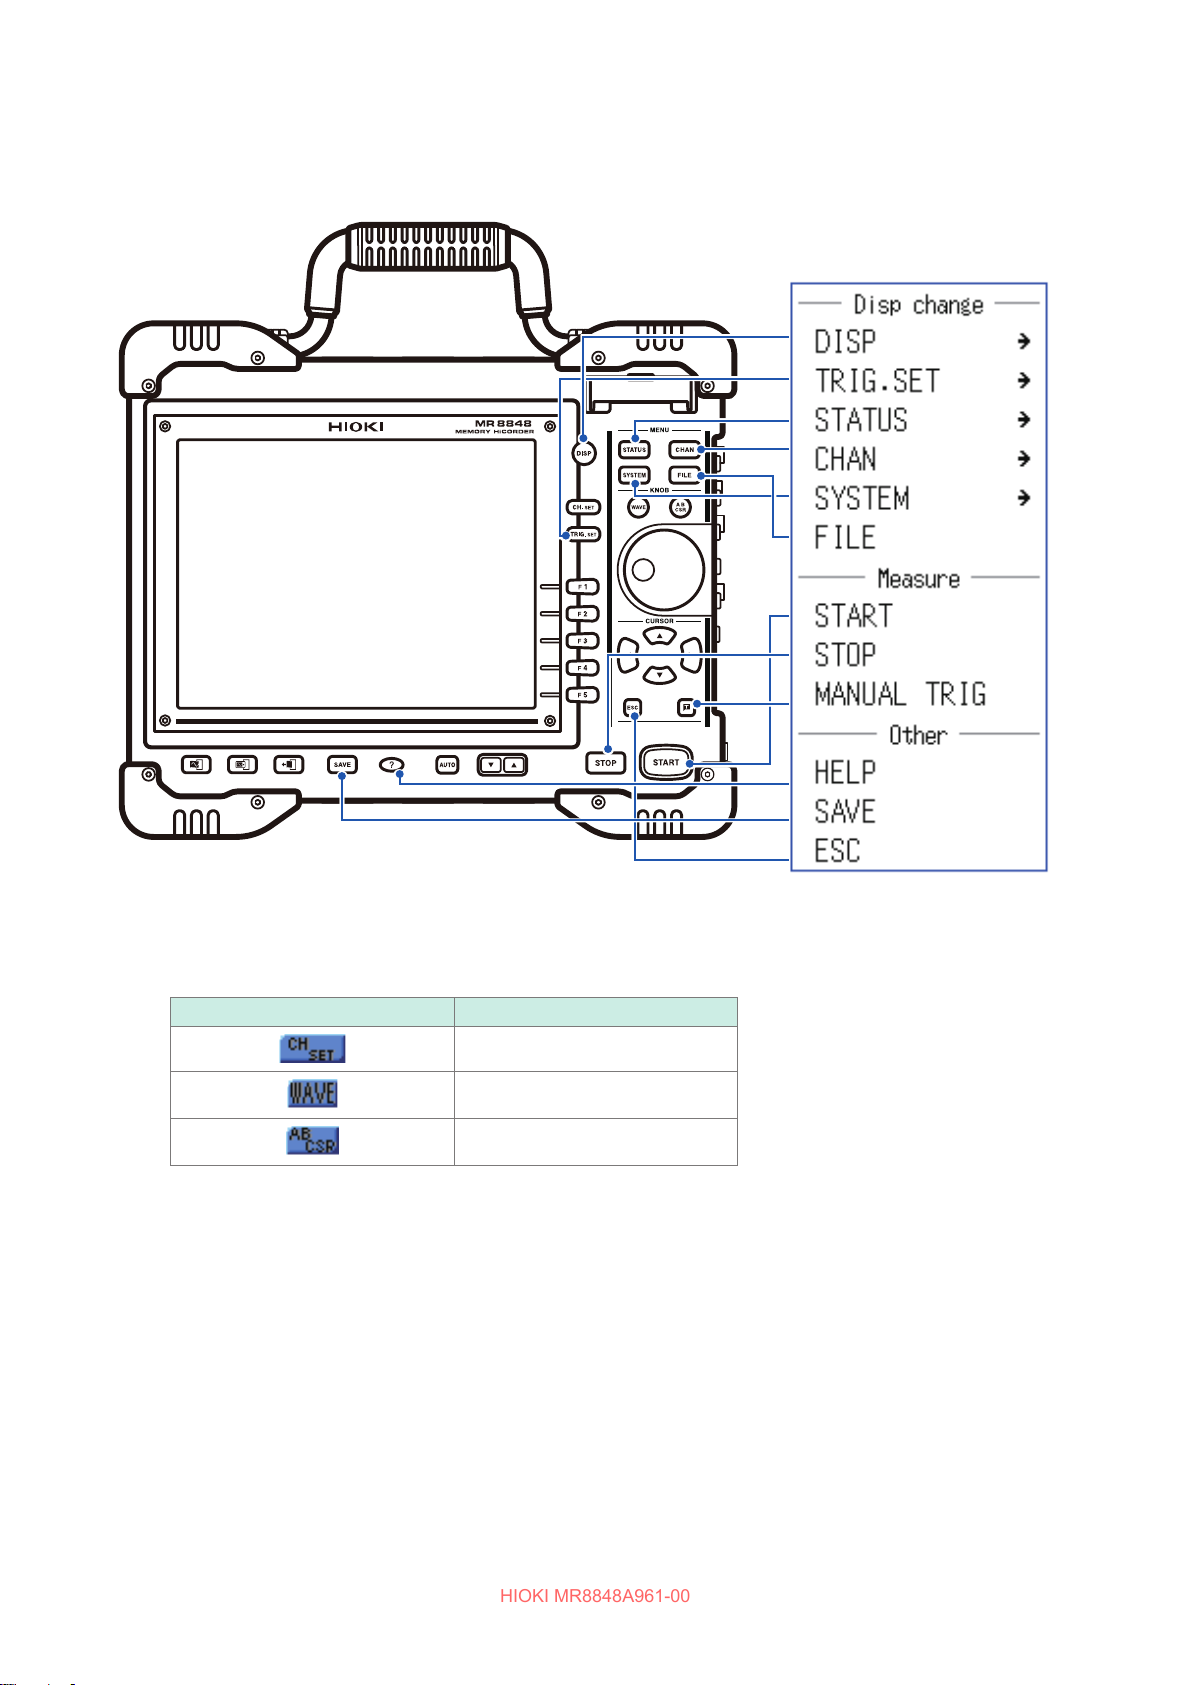
DISP key
Displays the waveform
screen.
CH.SET key
Displays the channel
settings window on the
waveform screen. (p. 77)
TRIG.SET key
Displays the trigger settings
window on the waveform
screen. (p. 217)
F key
Selects setting items.
ESC key
Cancels the last action.
Closes the displayed dialog
and window.
KEY LOCK:
Press and hold the ESC
key for 3 seconds to
engage the key lock
function, which prevents
accidental operation.
Press and hold this key for
3 seconds to disengage
the key lock function.
STATUS key
Displays the status screen.
CHAN key
Displays the channel
screen.
FILE key
Displays the File screen.
(p. 124)
AB CSR key
(Lights up in red when
selected.)
Sets Cursors A and B.
(p. 146)
WAVE key
(Lights up in red when
selected.)
Assigns waveform scrolling
to the jog dial and shuttle
ring. (p. 152)
Inner: Jog dial
Outer: Shuttle ring
Scrolls waveforms display.
(p. 152)
Increases and decreases a
setting value.
(p. 31)
Overview
STOP key
Stops the measurement in
progress.
Press the key once:
Stops the measurement
in progress after the
instrument records the
specied recording
length of waveforms.
Press the key twice:
Immediately stops
the measurement in
progress.
(p. 341)
SYSTEM key
Displays the system
screen.
(p. 341)
CURSOR key
Moves the cursor up, down,
left, and right on the screen.
Manual trigger key
Manually trigger the
instrument.
(p. 231)
START key
Starts measurement.
(Lights up in green during
measurement.)
(p. 341)
27
Page 28
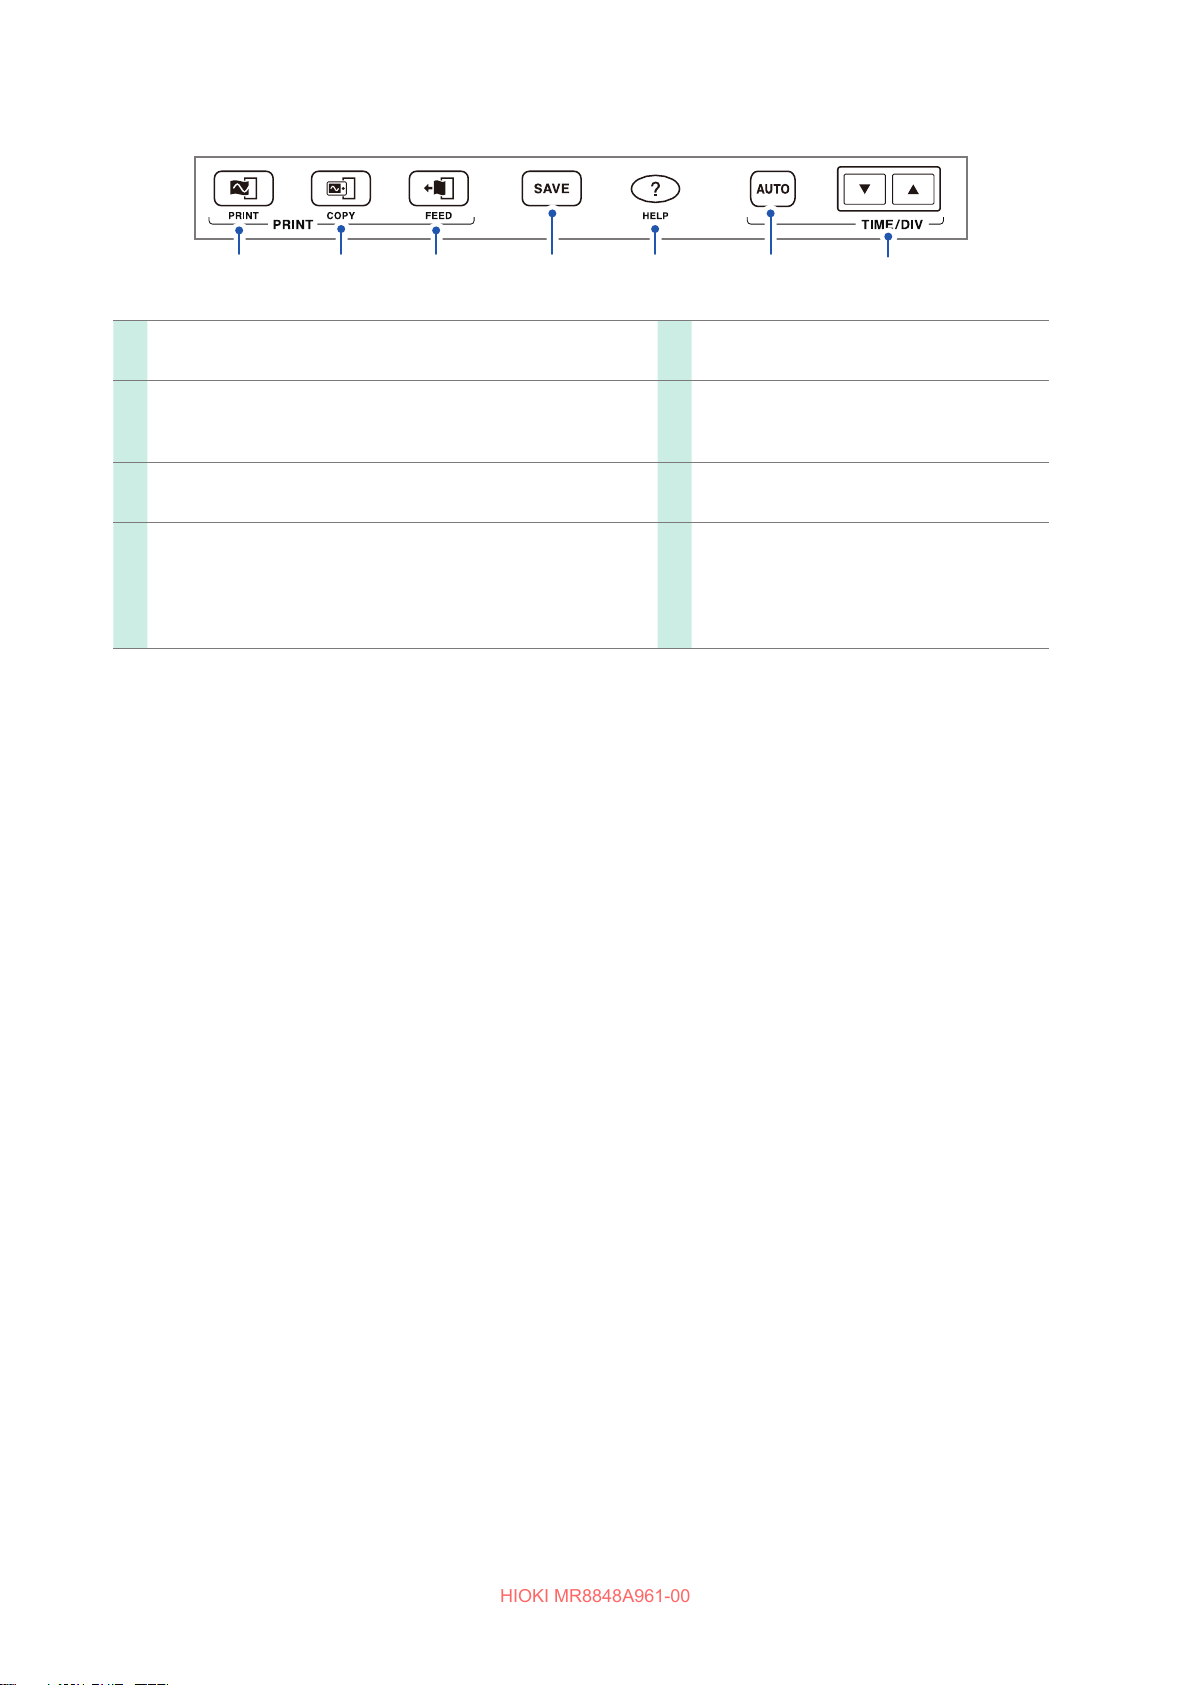
Part Names and Functions
HIOKI MR8848A961-00
PRINT key
Prints waveforms, le tables, and lists. (p. 133)
COPY key
Prints a screenshot. (p. 143)
FEED key
Feeds paper.
SAVE key (Lights up in blue while the instrument is
accessing a storage device.)
Saves data to a storage device. (p. 97)
The dialog box can be switched between visible and invisible
during auto-saving.
HELP key
Displays help information. (p. 32)
AUTO key
Starts measurement in the auto-range
setting. (p. 89)
TIME/DIV key
Sets the timebase.
28
Page 29
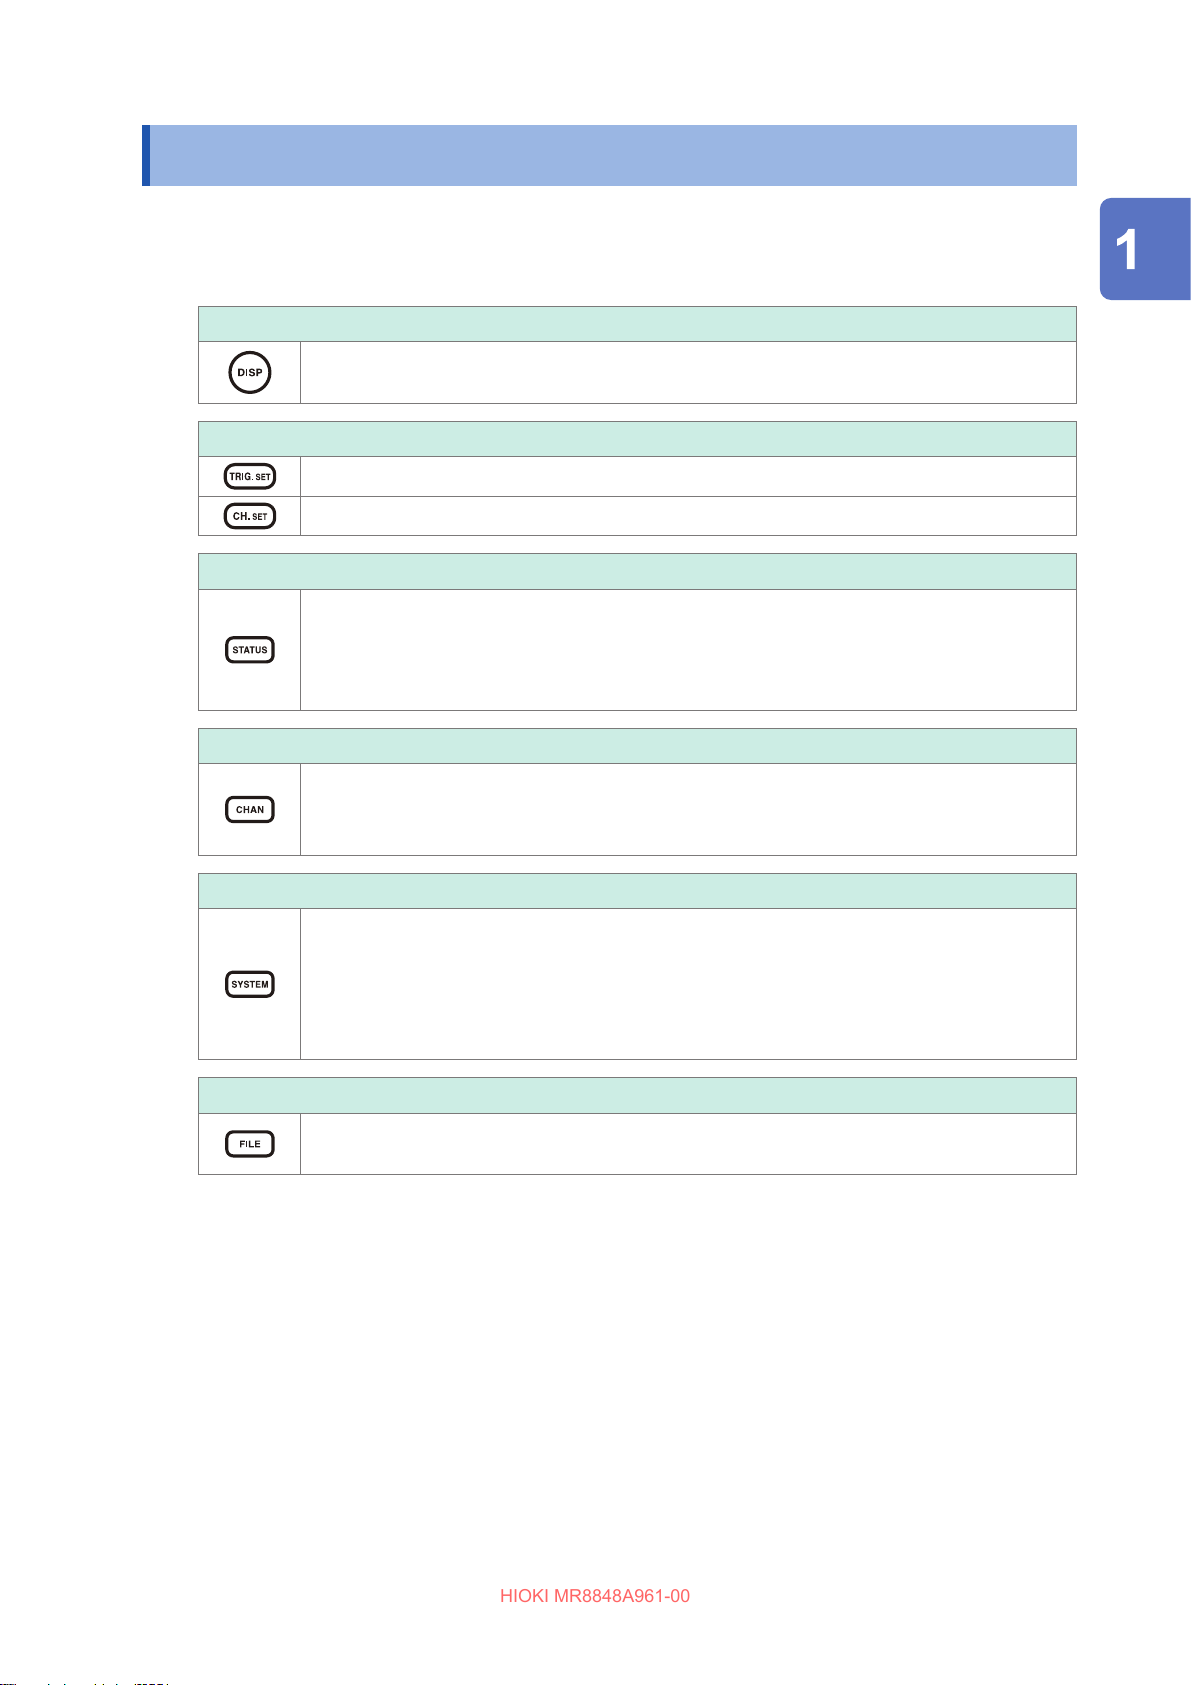
Screens Conguration
HIOKI MR8848A961-00
1.3 Screens Conguration
The screens are congured as listed below. Pressing each of the keys listed below displays a
corresponding screen or window.
The waveform screen can display the trigger settings window, and the channel settings window.
Waveform screen
The display used to observe waveforms.
Congure measurement conditions using the settings window on the right.
Trigger settings window, channel settings window
The display used to congure the trigger settings.
The display used to congure the settings of analog channels and logic channels.
Status screen
The window used to congure the measurement methods and numerical calculation
settings.
The sheet changes every time the STATUS key is pressed.
[Status] sheet, [Num Calc] sheet, [Memory Div] sheet, and [Wave Calc] sheet.
Overview
Channel screen
The screen used to congure the channel, the scaling, and the comment settings.
Pressing the CHAN key switches the sheet between the following modes:
[Unit List] sheet, [Each Ch] sheet, [Scaling] sheet, and [Comment] sheet.
System screen
The screen used to congure the environment, the le saving, the le printing, and the
interface settings, and to initialize data.
Pressing the SYSTEM key switches the sheets to be displayed in the following order:
[Environment] sheet, [File Save] sheet, [Printer] sheet, [Interface] sheet,
and [Init] sheet.
File screen
The screen used to view saved data les in storage devices (an SD card, the built-in
drive, a USB ash drive, the internal memory).
29
Page 30
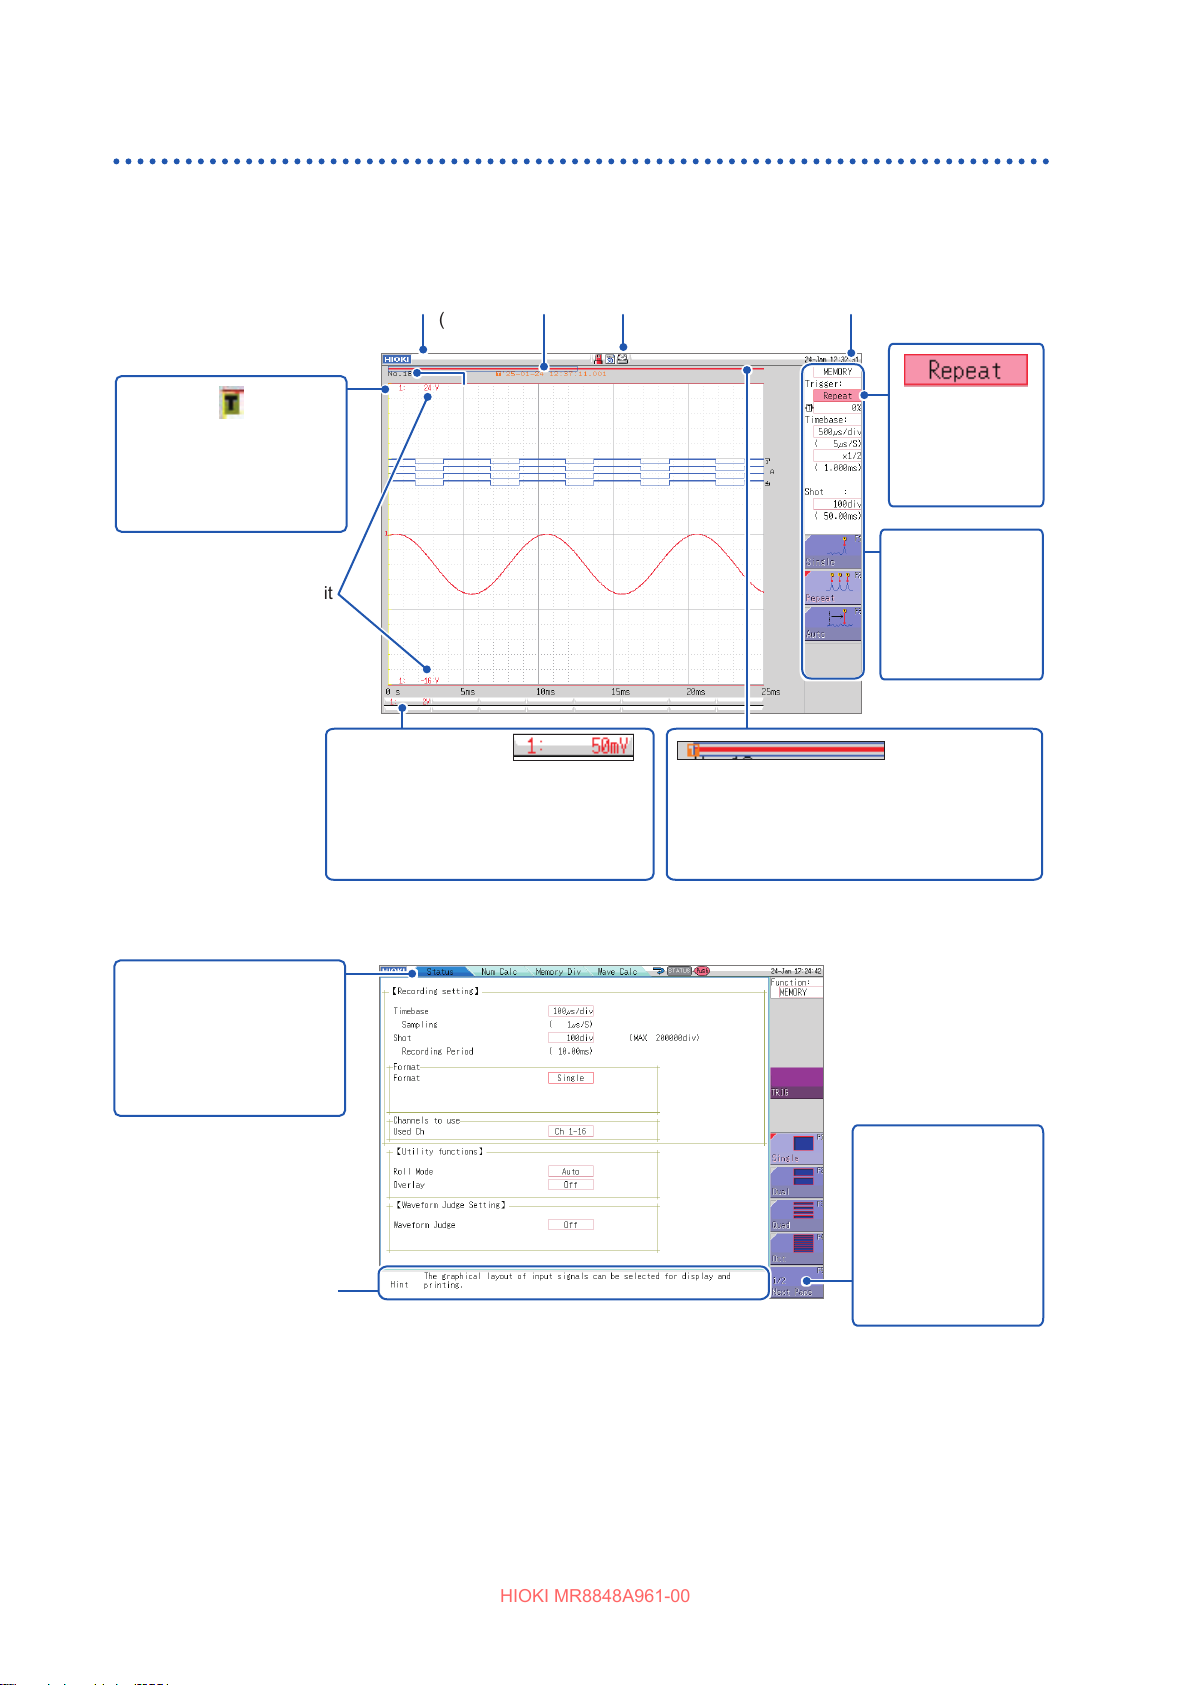
Screens Conguration
HIOKI MR8848A961-00
Display
Waveform screen
Title comment
Shows a previously
entered title
comment. (p. 166)
Trigger time
Shows the date
and time when the
instrument triggered.
(p. 217)
Storage device icon
Displays the status of
storage devices.
(p. 56)
Current date and time
Shows the current date and
time in the manner previously
congured. (p. 62)
Storage counter
Shows the number of times the
Trigger marker
Indicates the point when
the instrument triggered.
(p. 217)
Limit Value
The upper and lower limit
values for each channel
(p. 162)
Vertical axis display
Shows a value per division for each
channel linked to the range settings
of the vertical axis (voltage axis).
(
p. 80
)
instrument triggered. (p. 87)
Logic waveform (p. 84)
Analog waveform(p. 80)
Scroll bar
The red bar indicates the waveform range
written in the memory. The blue frame indicates
the displayed waveform range.
Items common to the status, channel, system, and le screens
Settings cursor
The present
cursor position
ashes.
Settings window
The window
used to congure
measurement
conditions.
(p. 68)
(
p. 152
)
Sheet tabs
Shows names of sheets
that can be selected.
Pressing each of the
MENU keys switches a
sheet to another.
Hint
Shows details about the item at the present settings cursor
position.
Messages and error messages also appear here.
Next Page
Appears when more
than ve setting
items are available.
Pressing this button
switches other
groups of items to be
displayed.
30
Page 31
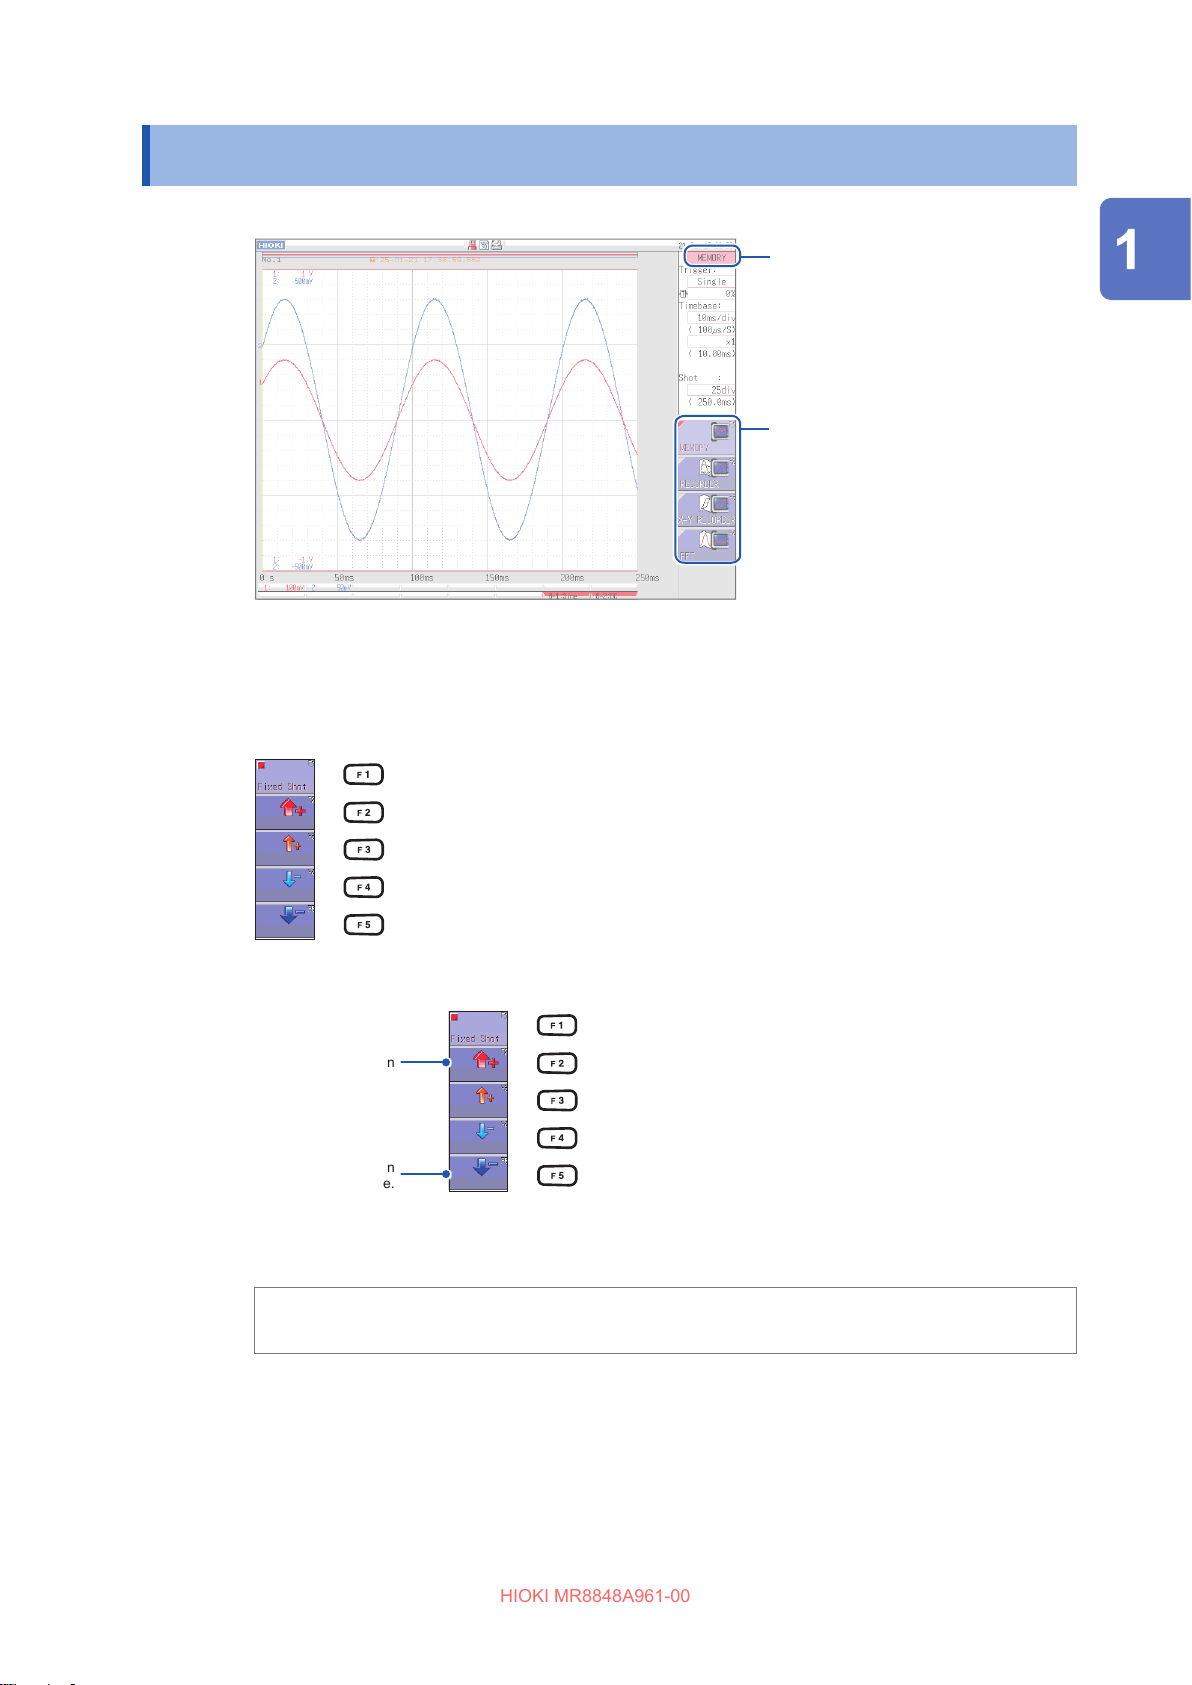
1.4 Basic Key Operation
HIOKI MR8848A961-00
Press the CURSOR key and move the cursor to an item to be changed.
1
Basic Key Operation
Cursor
Overview
GUI
2
Check the illustrations on the GUI and press the function key (F key) to change the
settings.
The function assigned to the F key varies depending on the setting items.
To select an item to be set
Press the F key to change settings.
When there are more than ve setting items, press
the F5 [Next Page] key to switch to the next page.
To increase and decrease a setting value
Press the F key to change the setting value.
numerical value at an
Increases a
accelerated rate.
Decreases a
numerical value at an
accelerated rate.
(Turning the jog dial or shuttle ring enables you to
change values.)
3
For some settings, press the CH.SET key to select [Exec], and press the TRIG.SET key
to select [Cancel].
To enter characters and numbers
Refer to “Entering alphanumeric characters” (p. 169).
31
Page 32
Basic Key Operation
HIOKI MR8848A961-00
Using the HELP key
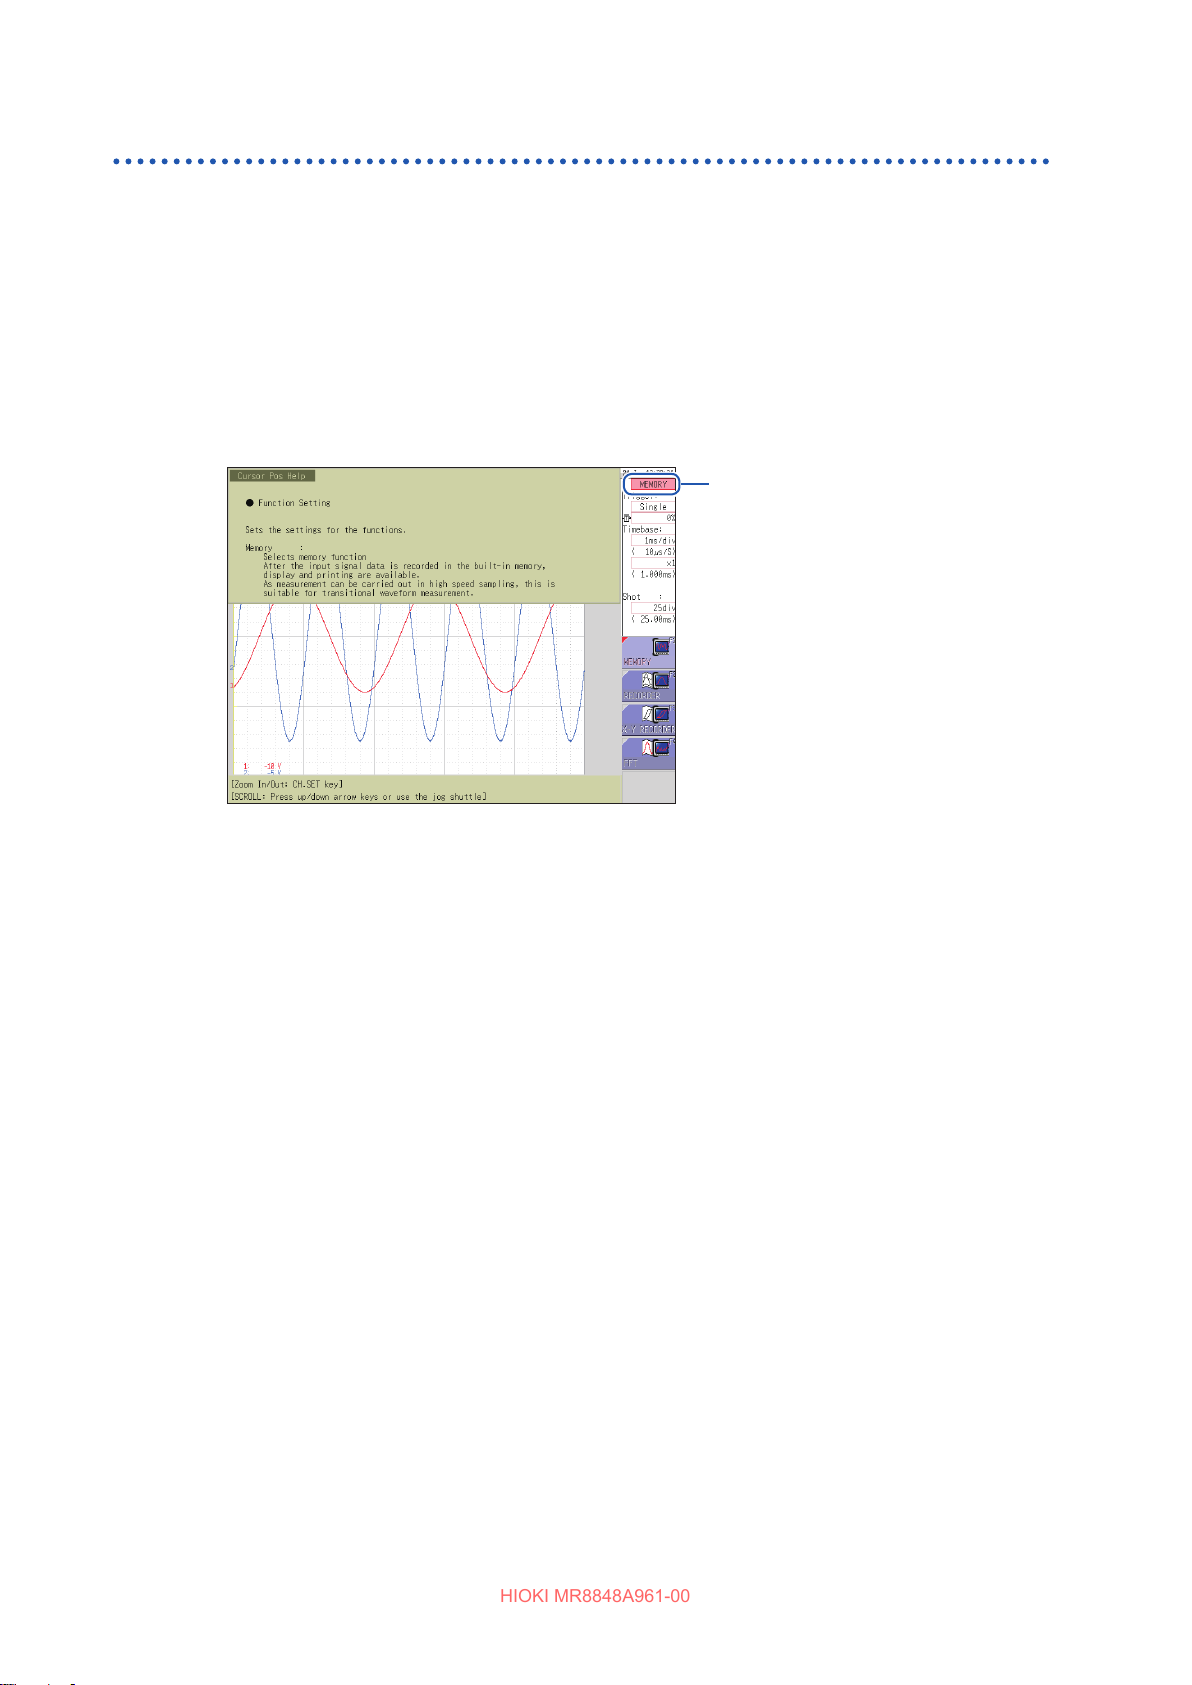
Pressing the HELP key displays a simple explanation of the item at the cursor position. You can
also search the help messages for the information for which you are looking.
Cursor position help
Move the cursor to the item for which you want to display a help message.
1
Press the HELP key. The [Cursor Pos Help] sheet that contains the help message of
2
the cursor position appears.
Pressing the CURSOR up and down keys or turning the Jog dial scrolls the information.
Cursor
• Pressing the CH.SET key switches the display mode of the [Cursor Pos Help] sheet between the
following modes: The full-screen display, the upper-half display, and the lower-half display. The gure
above illustrates the upper-half display mode.
• The sheet changes every time the HELP key is pressed. (Cursor Pos Help, Help SERCH, and Help
display o)
32
Page 33
Basic Key Operation
HIOKI MR8848A961-00
Using mouse to enable key operation
Using a commercially available USB mouse enables you to operate the instrument in the manner
similar to that with the keys on the instrument.
• The instrument may not support some types of mouses.
• Do not connect any type of device other than a mouse or a USB ash drive to the USB connector
of the instrument.
• Operating the instrument with a mouse may cause temporary operating delay or abnormal screen
display.
• While operating the instrument with a mouse, do not change the interface on the system screen
to anything other than “LAN”. Operating the instrument with a mouse is disabled while USB
communications are in progress.
• External noise may cause the instrument to malfunction while it is operated with a mouse. Keep
the mouse and mouse cable as far away as possible from sources of noise.
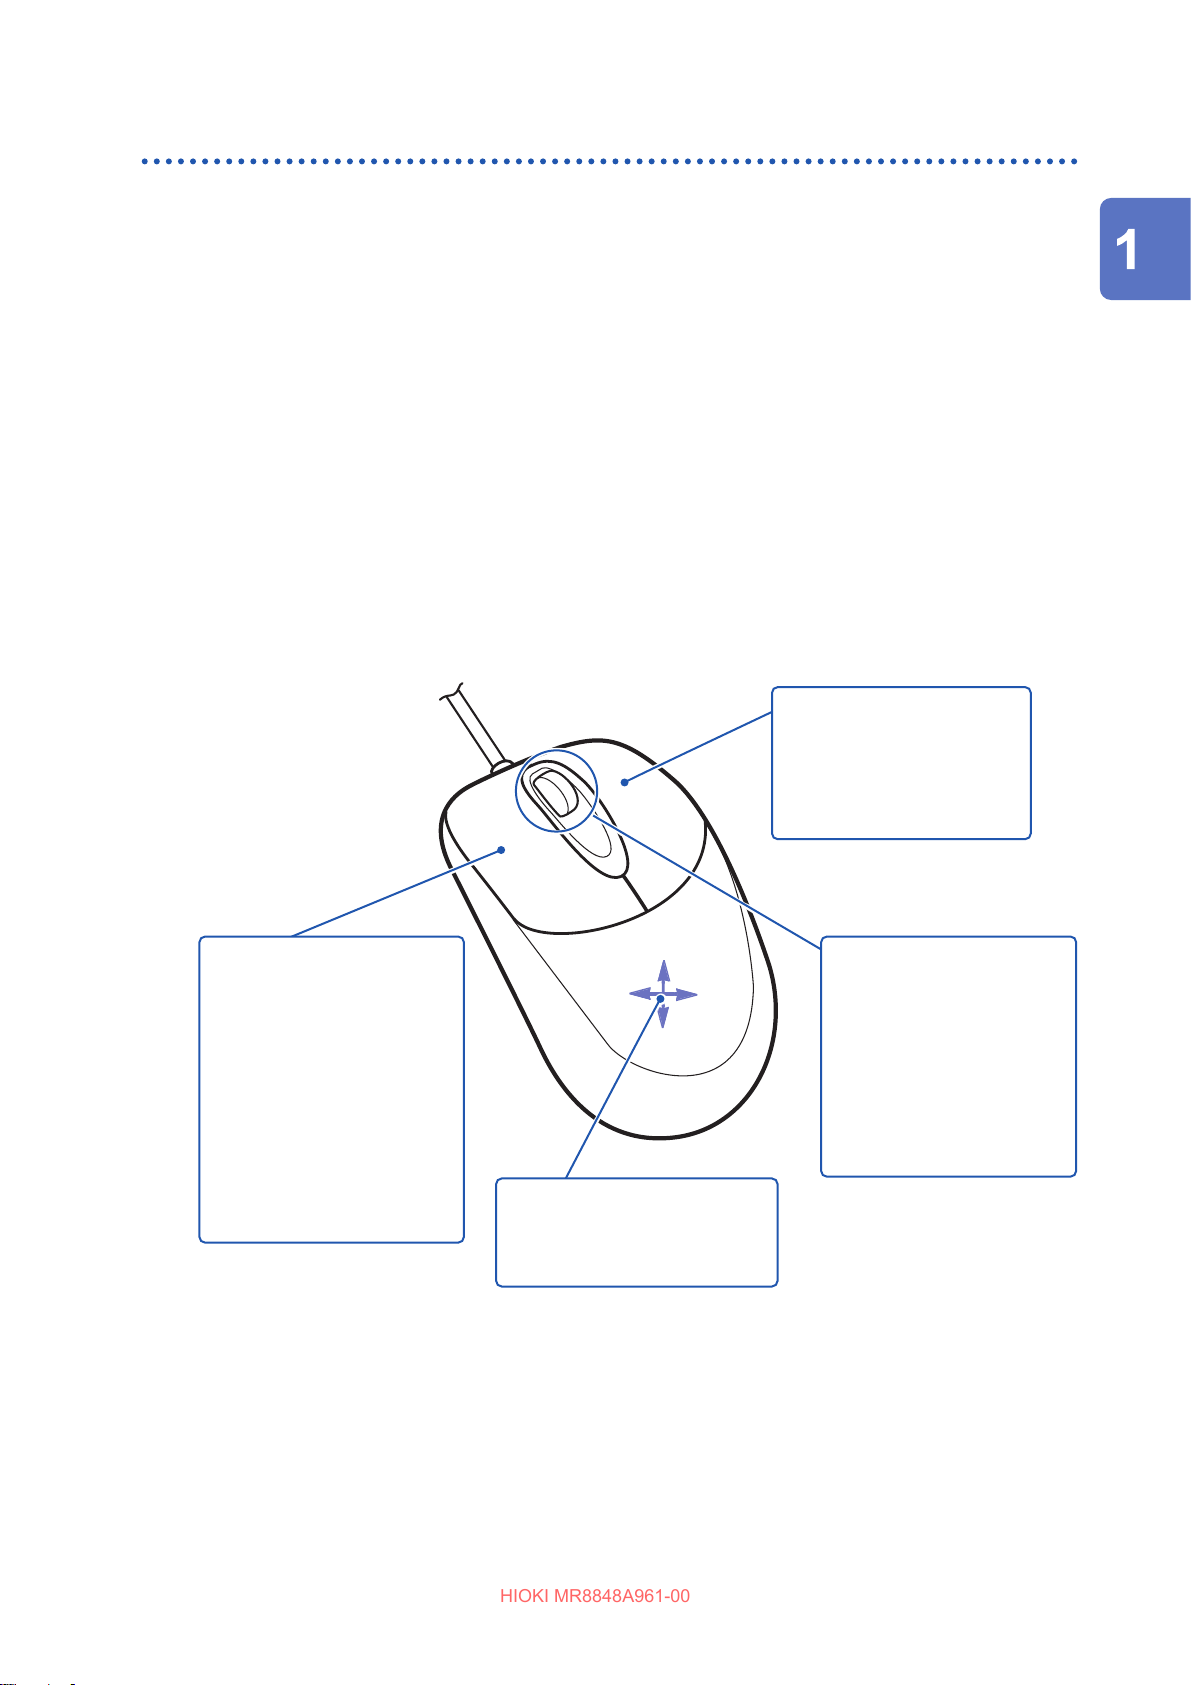
The gure below illustrates the basic operation of the instrument with a mouse.
Overview
Clicking the left button
(click)
Selects a menu or executes
a selected item. During
measurement with the
memory division engaged,
you can change blocks to be
displayed by double-clicking
the left button.
Click the current path shown
on the File screen to move to
the upper folder in the folder
hierarchy.
Clicking the right button
(right-click)
Displays a menu with a list of
screens.
Dimmed screen items are
unavailable.
Clicking the center wheel
Changes an item to be
selected.
On the File screen, clicking
the center wheel changes
a le to be selected. During
measurement with the
memory division engaged,
you can change blocks to be
displayed.
Move the mouse forward/
backward/leftward/rightward
Moves the mouse cursor on the
screen.
33
Page 34
Basic Key Operation
HIOKI MR8848A961-00
The operation keys of the instrument and the shortcut menu relate to each other as follows.
To operate the functions assigned to the CH.SET, WAVE, and AB CSR keys and to congure those
settings, click the icons displayed while a mouse is connected to the instrument.
Icon Operation key
CH.SET key
WAVE key
AB CSR key
Useful functionality
Dragging the right button of the mouse (hold down the button, moving the mouse rightward,
leftward, or forward, and then release the button) performs the same function as when pressing the
following keys:
Rightward: START
Leftward: STOP
Upward: ESC
34
Page 35
2
HIOKI MR8848A961-00
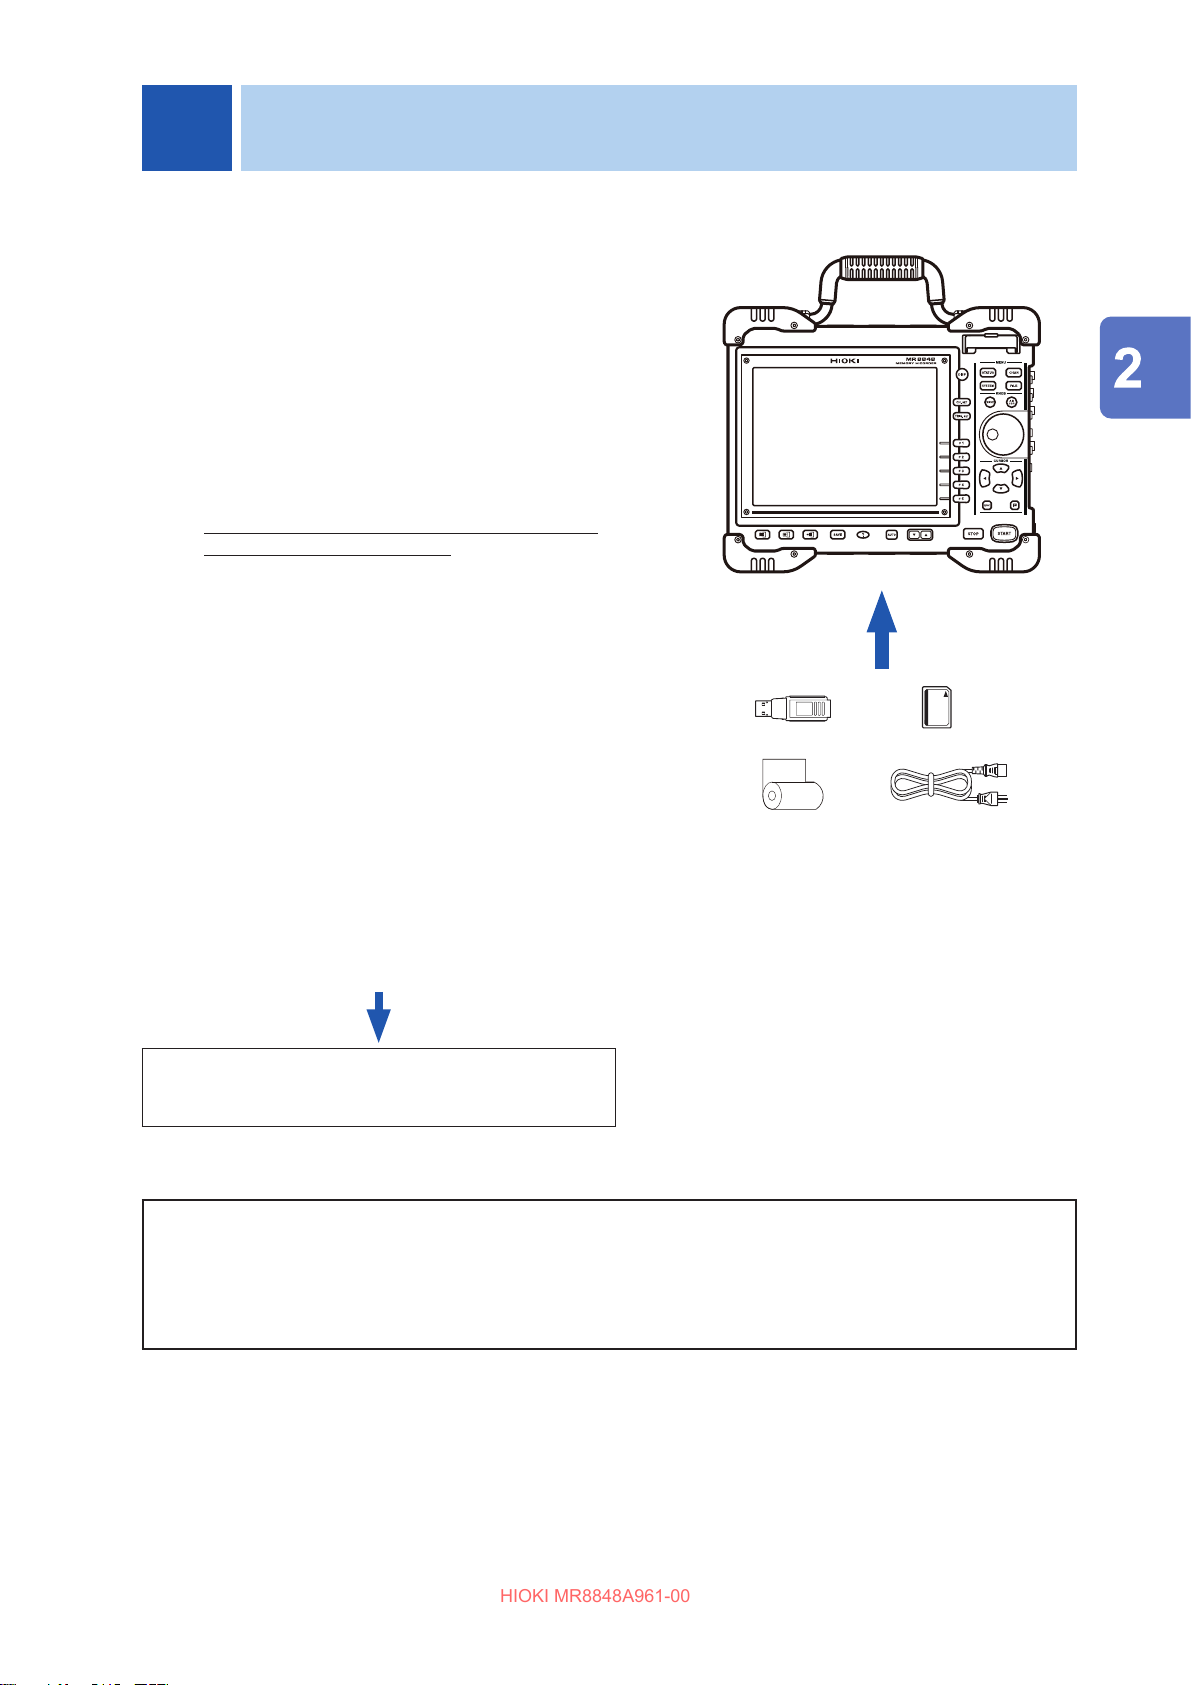
Procedure
Preparing for Measurement
Install the instrument.
1
Install or remove units.
2
(When adding or replacing units)
Connect logic probes to the LOGIC
3
terminals.
(When measuring logic signals)
Connect connection cords to the units.
4
(When measuring analog signals)
Probes and cords dier depending on the type of
measurement to be performed.
Insert a storage device (SD card, USB
5
ash drive).
Load a roll of recording paper.
6
Connect the power cord.
7
Connect an earthing wire to the GND
8
terminal (functional earth terminal).
(When performing measurement in noisy
environments)
Turn on the instrument.
9
Set the clock.
10
Perform zero-adjustment.
11
Perform calibration.
(For the instrument with the MR8990 installed)
(p. 15)
(p. 36)
(p. 51)
Preparing for Measurement
(p. 39)
(p. 56)
(p. 59)
(p. 60)
(p. 60)
(p. 61)
(p. 62)
(p. 63)
(p. 64)
To operate the instrument with a computer
To control the instrument externally
After preparation terminates, start
measurement. (p. 65)
Refer to “16 Connecting the Instrument to a PC” (p. 345).
Refer to “17 Controlling the Instrument Externally” (p. 375).
35
Page 36
Installing and Removing Units
HIOKI MR8848A961-00
2.1 Installing and Removing Units
Read “Handling the instrument and units” (p. 16) carefully.
Units ordered with the instrument has already been installed in the instrument. Follow the
procedures below to add, replace, or remove units from the instrument.
• Up to three logic units can be installed. The instrument ignores the fourth logic unit and later units
that are installed in the instrument.
• For information on the analog channel resolution when logic channels are used, refer to “8.10
Setting Details of Units” (p. 190).
The installation of the U8977 3CH Current Unit and the 8971 Current Unit is restricted as follows:
• If three U8977 units are installed: 8971 cannot be installed.
• If two U8977 units are installed: Only one 8971 unit can be installed.
• If one U8977 unit is installed: Up to three 8971 units can be installed.
• If no U8977 units are installed: Up to four 8971 units can be installed.
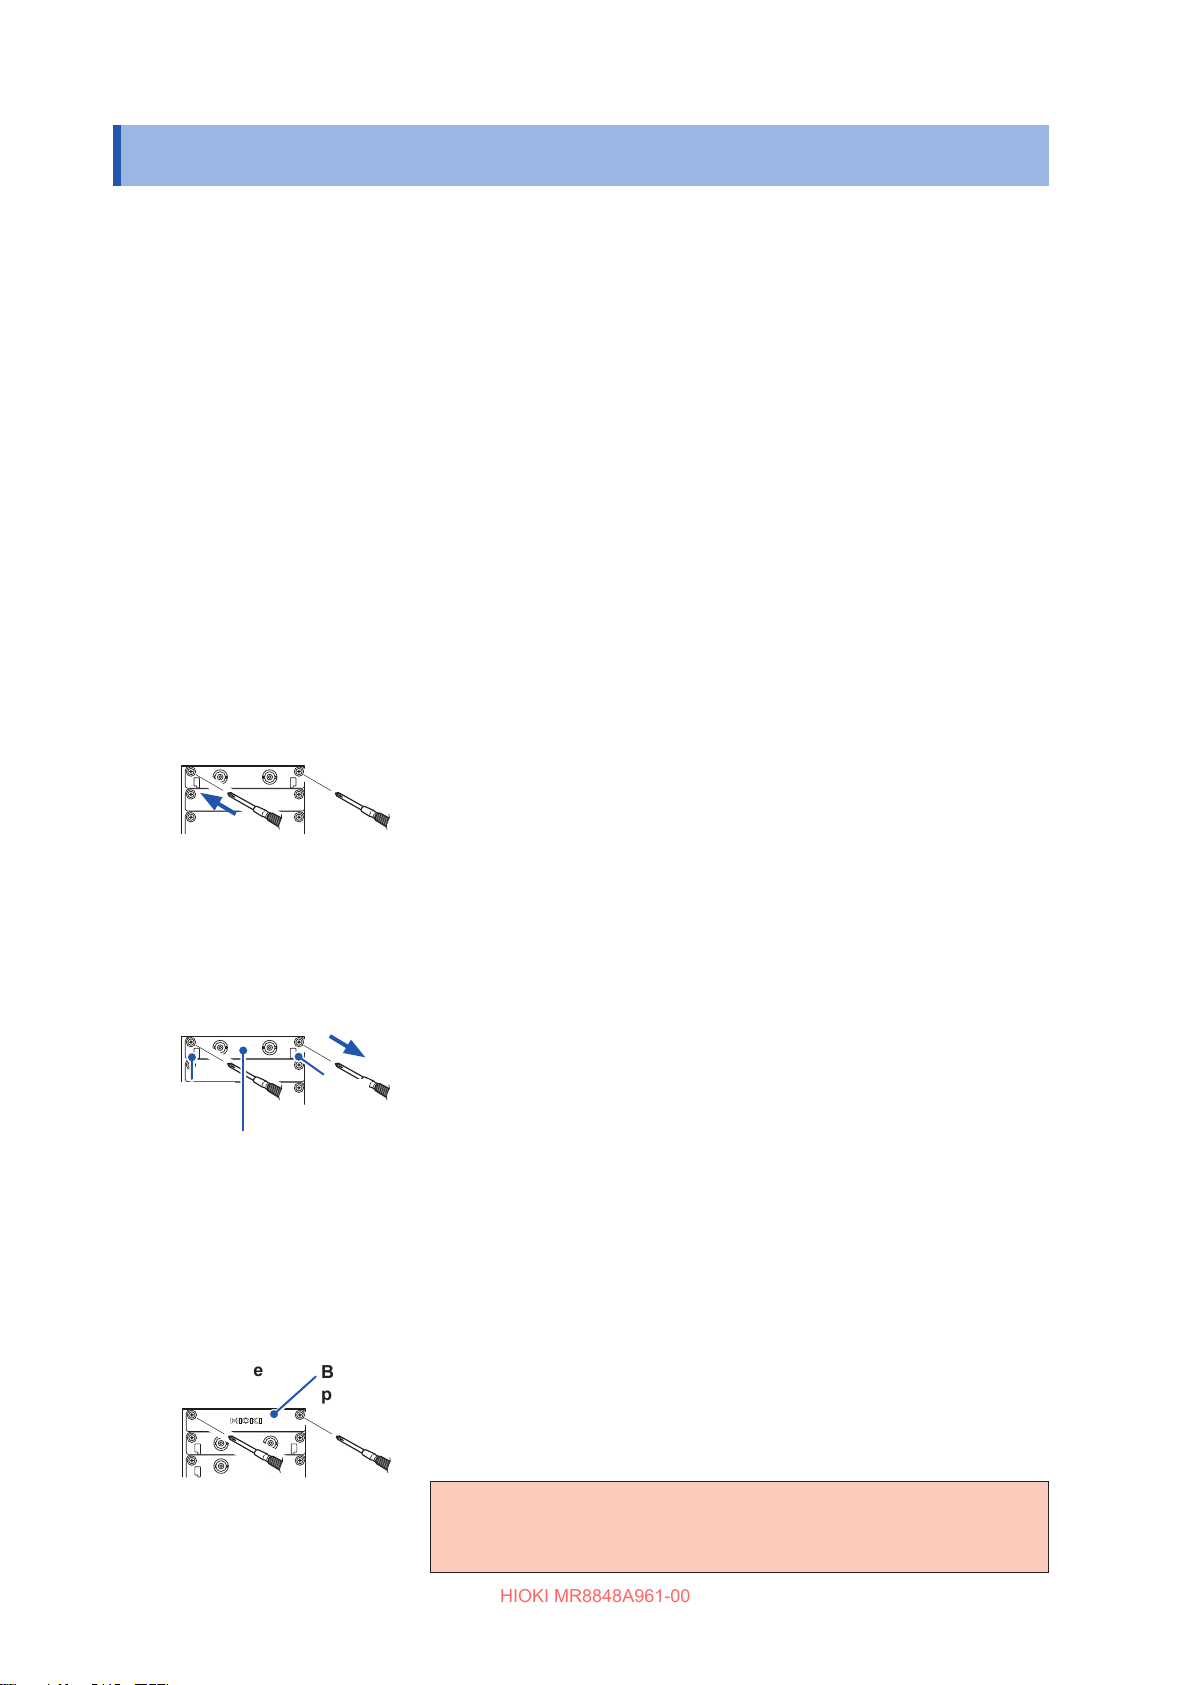
Installing a unit
Right side
Removing a unit
Knob
(Example: 8966)
Knob
Required items: Phillips-head screwdriver (No. 2)
Turn o the instrument.
1
Orient the unit and insert it all the way into the instrument.
2
Make certain that the unit is installed in such a way that the
characters printed on the unit’s panel are right side up about
those printed on the instrument.
Tighten the two unit mounting screws with a Phillips-head
3
screwdriver.
Required items: Phillips-head screwdriver (No. 2)
Turn o the instrument.
1
Remove all connection cords and thermocouples
2
connected to the unit.
Remove the power cord.
3
Loosen the two unit mounting screws with a Phillips-head
4
screwdriver.
When not installing another unit after removal
Right side
36
Blank
panel
Pinch the knobs and pull out the unit.
5
Place a blank panel.
1
Tighten the two unit mounting screws with a Phillips-
2
head screwdriver.
If measurement is performed with the instrument without
a blank panel installed, the instrument may fail to meet
specications because of temperature instability within units.
Page 37
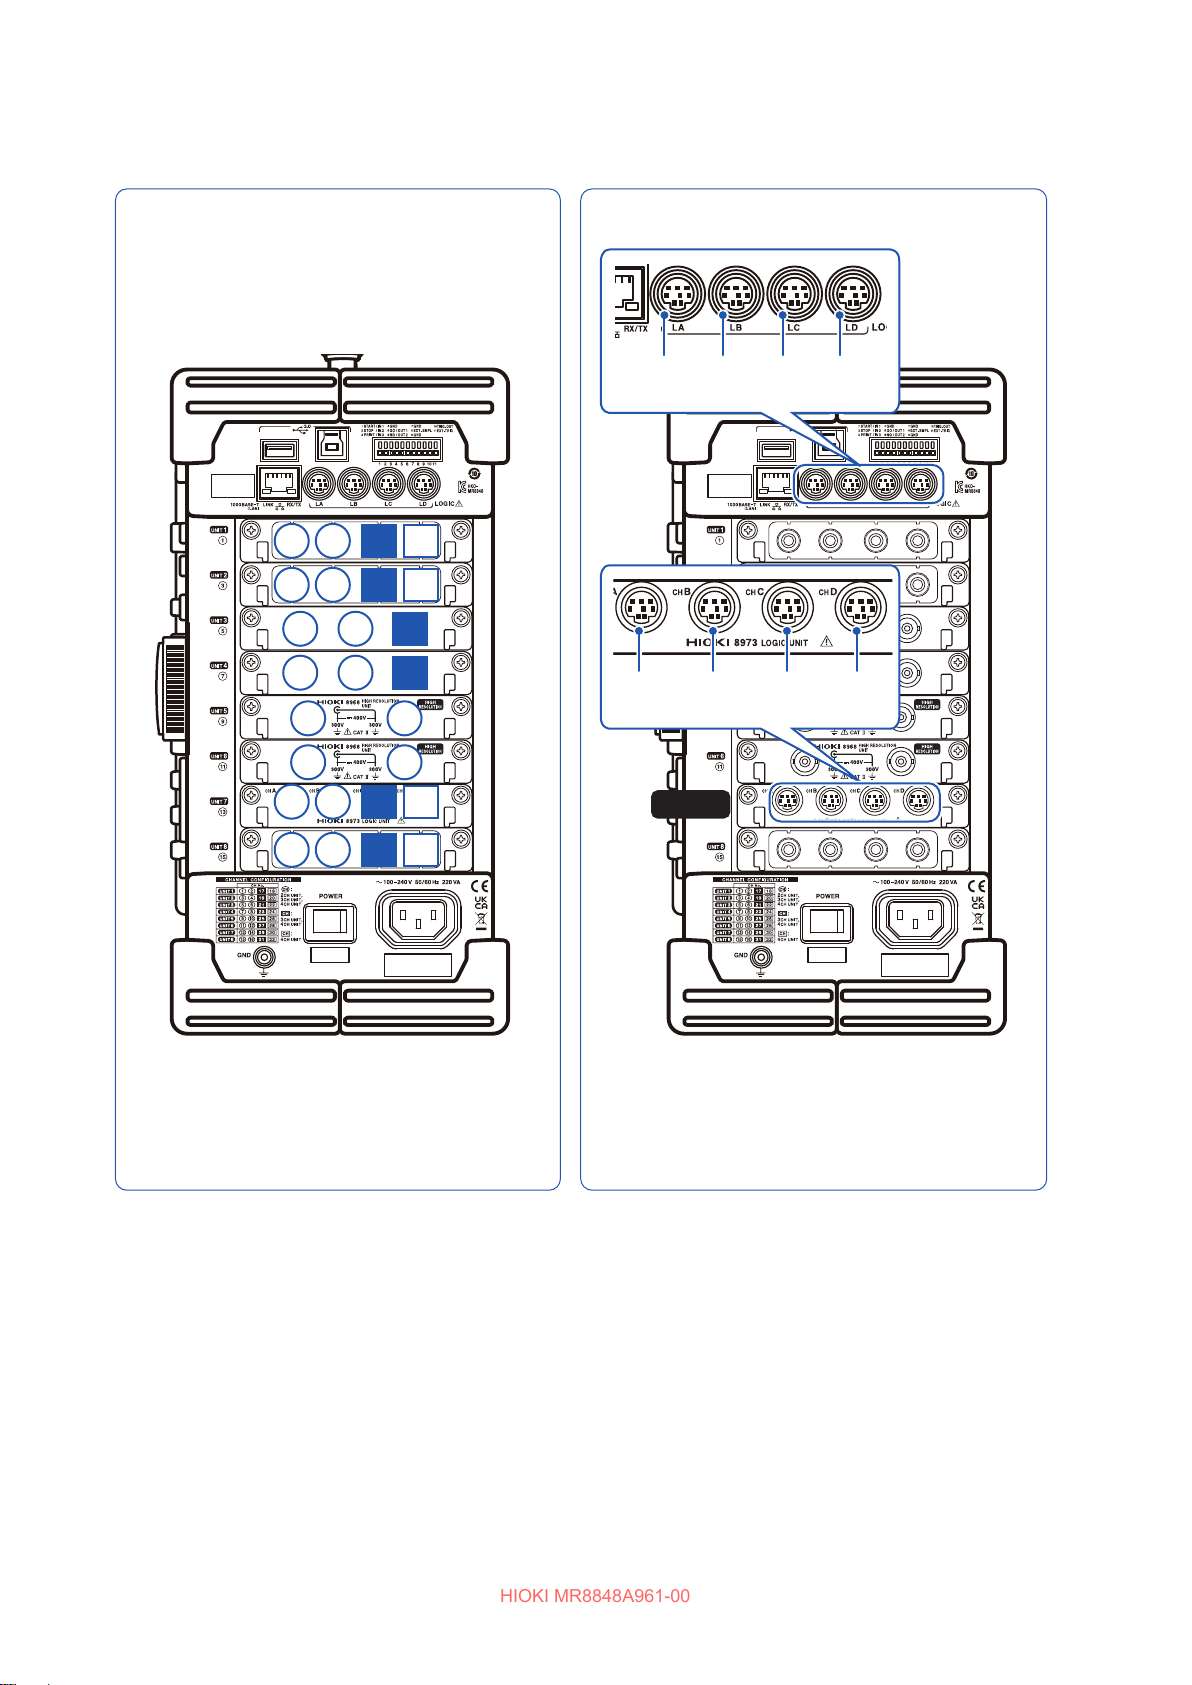
Channel conguration
HIOKI MR8848A961-00
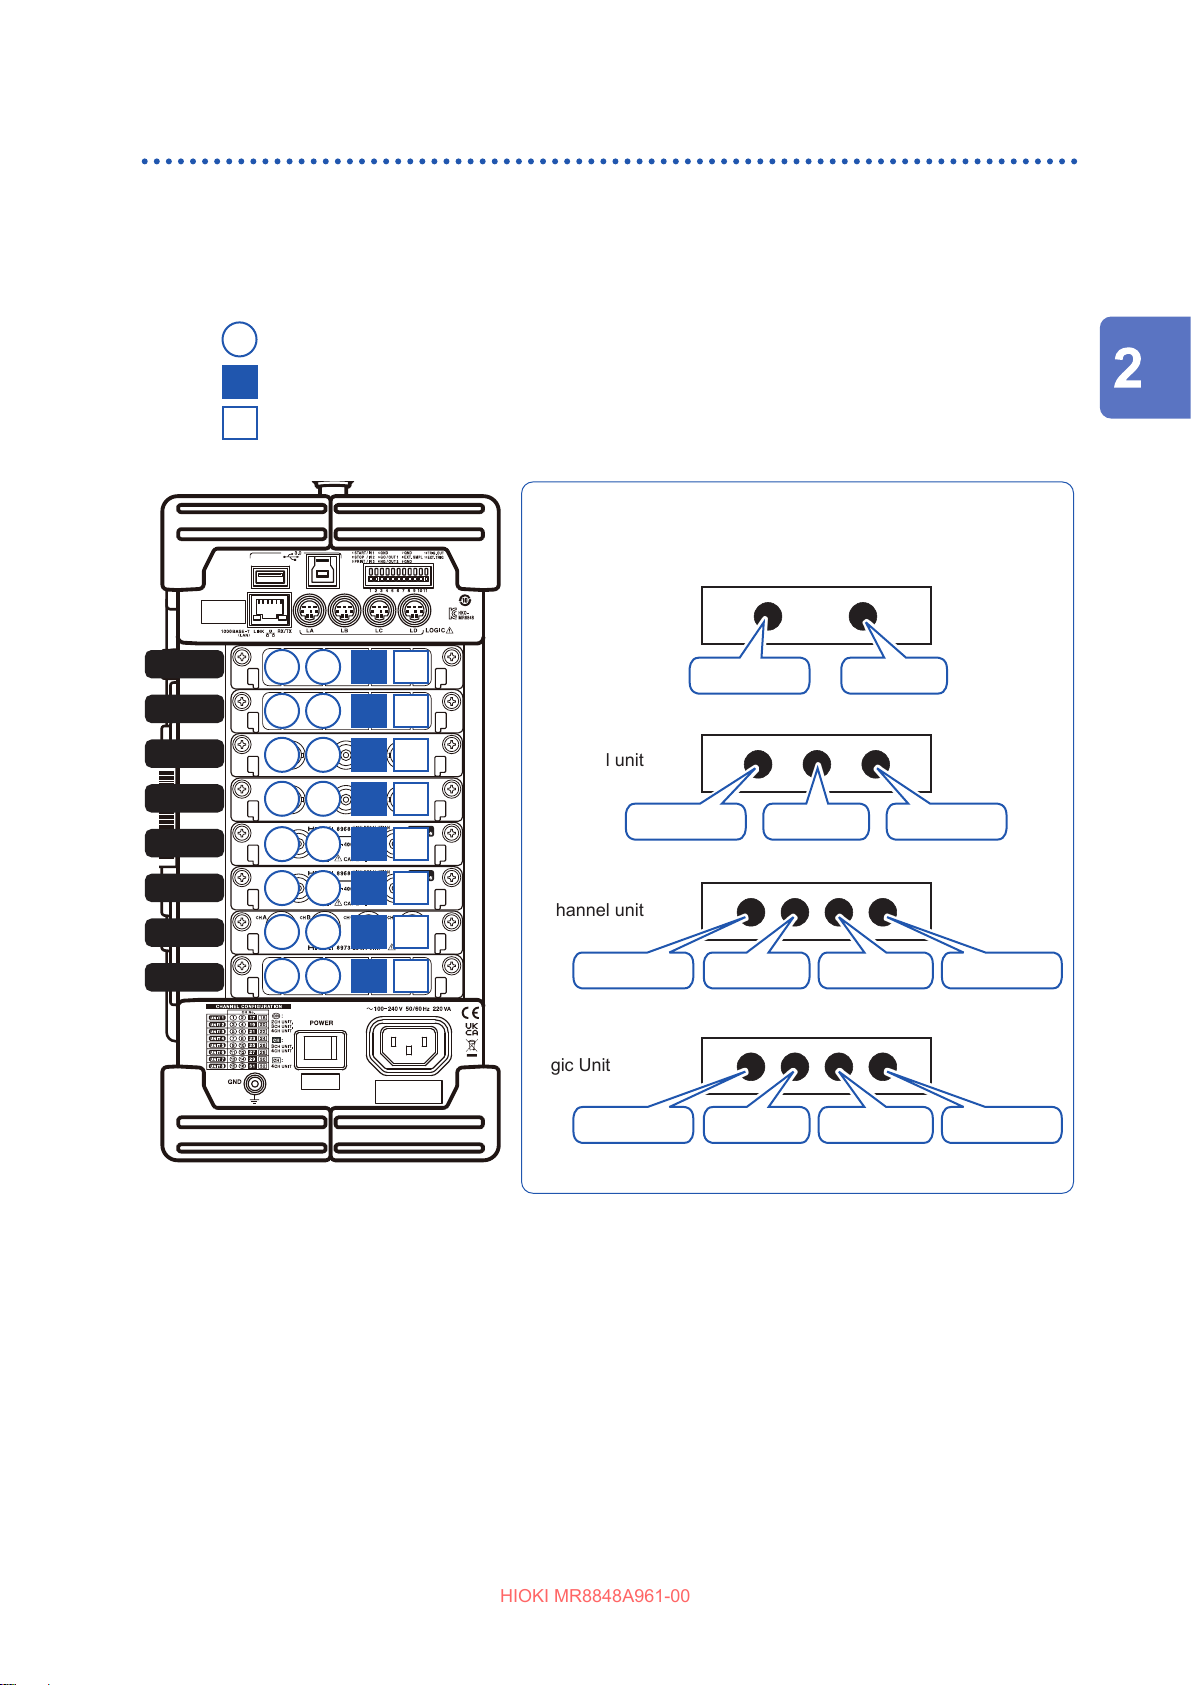
• Units are numbered as Unit 1, Unit 2 , Unit 8, beginning at the top.
• Channels are numbered as CH1, CH2 , beginning at the left of Unit 1.
Channel No.
: 2-channel unit, 3-channel unit, 4-channel unit
: 3-channel unit, 4-channel unit
Installing and Removing Units
UNIT 1
UNIT 2
UNIT 3
UNIT 4
UNIT 5
UNIT 6
UNIT 7
UNIT 8
: 4-channel unit
1 2
3 4
5 6
7 8
9 10
11 12
13 14
15 16
17
19
21
23
25
27
29
31
18
20
22
24
26
28
30
32
Preparing for Measurement
Channel No. (CH1 to CH32)
n = Unit No. (1 to 8)
2-channel unit
CH (2n−1) CH (2n)
3-channel unit
CH (2n−1) CH (2n) CH (2n+15)
4-channel unit
CH (2n−1) CH (2n) CH (2n+16) CH (2n+15)
Logic Unit
LnA [1:4] LnB [1:4] LnD [1:4] LnC [1:4]
You can nd out information about the units installed in the instrument in the System Information
(p. 446).
37
Page 38
Installing and Removing Units
HIOKI MR8848A961-00
Example channel numbers
When no logic probe is used
1 2
3 4
5 6
7 8
9 10
11 12
17
19
18
20
21
23
When the logic probes only are used
LA
[1:4]LB[1:4]LC[1:4]LD[1:4]
L7A
[1:4]
L7B
[1:4]
L7C
[1:4]
L7D
[1:4]
13 14
15 16
Example channel numbers
• Unit 1/2: 4-channel unit
• Unit 3/4: 3-channel unit
• Unit 5/6: 2-channel unit
• Unit 7/8: 4-channel unit
29
31
30
32
UNIT 7
Example channel numbers
When a logic unit has been installed as
Unit 7
38
Page 39
Attaching Connection Cords
HIOKI MR8848A961-00
2.2 Attaching Connection Cords
Read “Before connecting cords” (p. 20) carefully.
For detailed precautions and instructions regarding connections, refer to the instruction manuals for
your units, connection cords, etc.
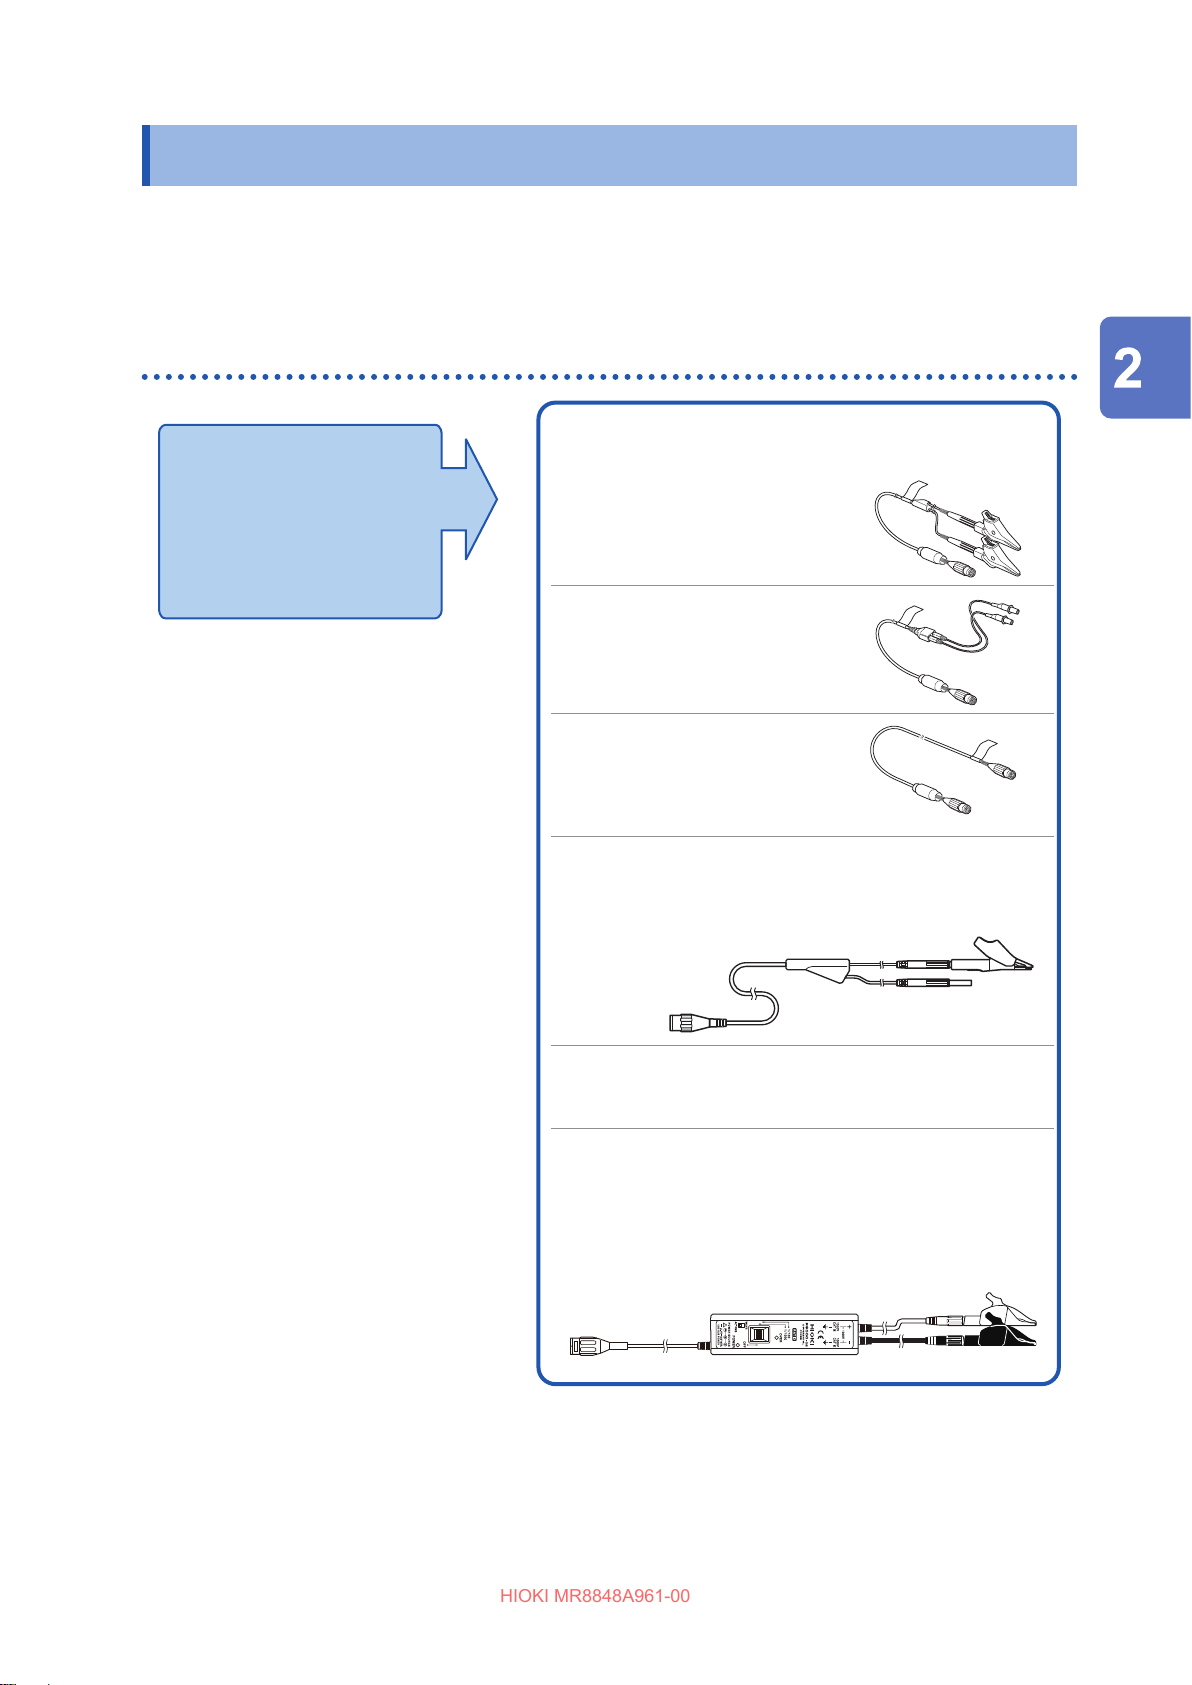
Measuring voltage
Applicable units
• 8966 Analog Unit
• U8975 4CH Analog Unit
• U8978 4CH Analog Unit
• 8968 High Resolution Unit
• 8972 DC/RMS Unit
• U8979 Charge Unit
Connect cables to BNC female
connectors on units.
The following connection cords can be
connected to the units.
• L9197 Connection Cord
(Maximum rated input voltage:
600 V)
Large alligator clip set type
• L9198 Connection Cord
(Maximum rated input voltage:
300 V)
Small alligator clip set type
• L9217 Connection Cord
(Maximum rated input voltage:
300 V)
For measuring output signal
from a BNC connector
• L9790 Connection Cord
(Maximum rated input voltage: 600 V)
Terminal type: Alligator, contact, grabber
Example: Terminal type:
Alligator
Preparing for Measurement
*1. An optional power cord or AC
*2. An optional AC adapter or a
adapter is required.
commercially available USB cable
is required.
• 9166 Connection Cord
(Maximum rated input voltage: 30 V AC, 60 V DC)
Electrical clips
When a voltage to be measured exceeds
rating of a unit being used
• 9322 Dierential Probe*1
• 9665 10:1 Probe
• 9666 100:1 Probe
• P9000-01/-02 Dierential Probe*2
Example: P9000-02 Dierential Probe
a
maximum input
39
Page 40
Attaching Connection Cords
HIOKI MR8848A961-00
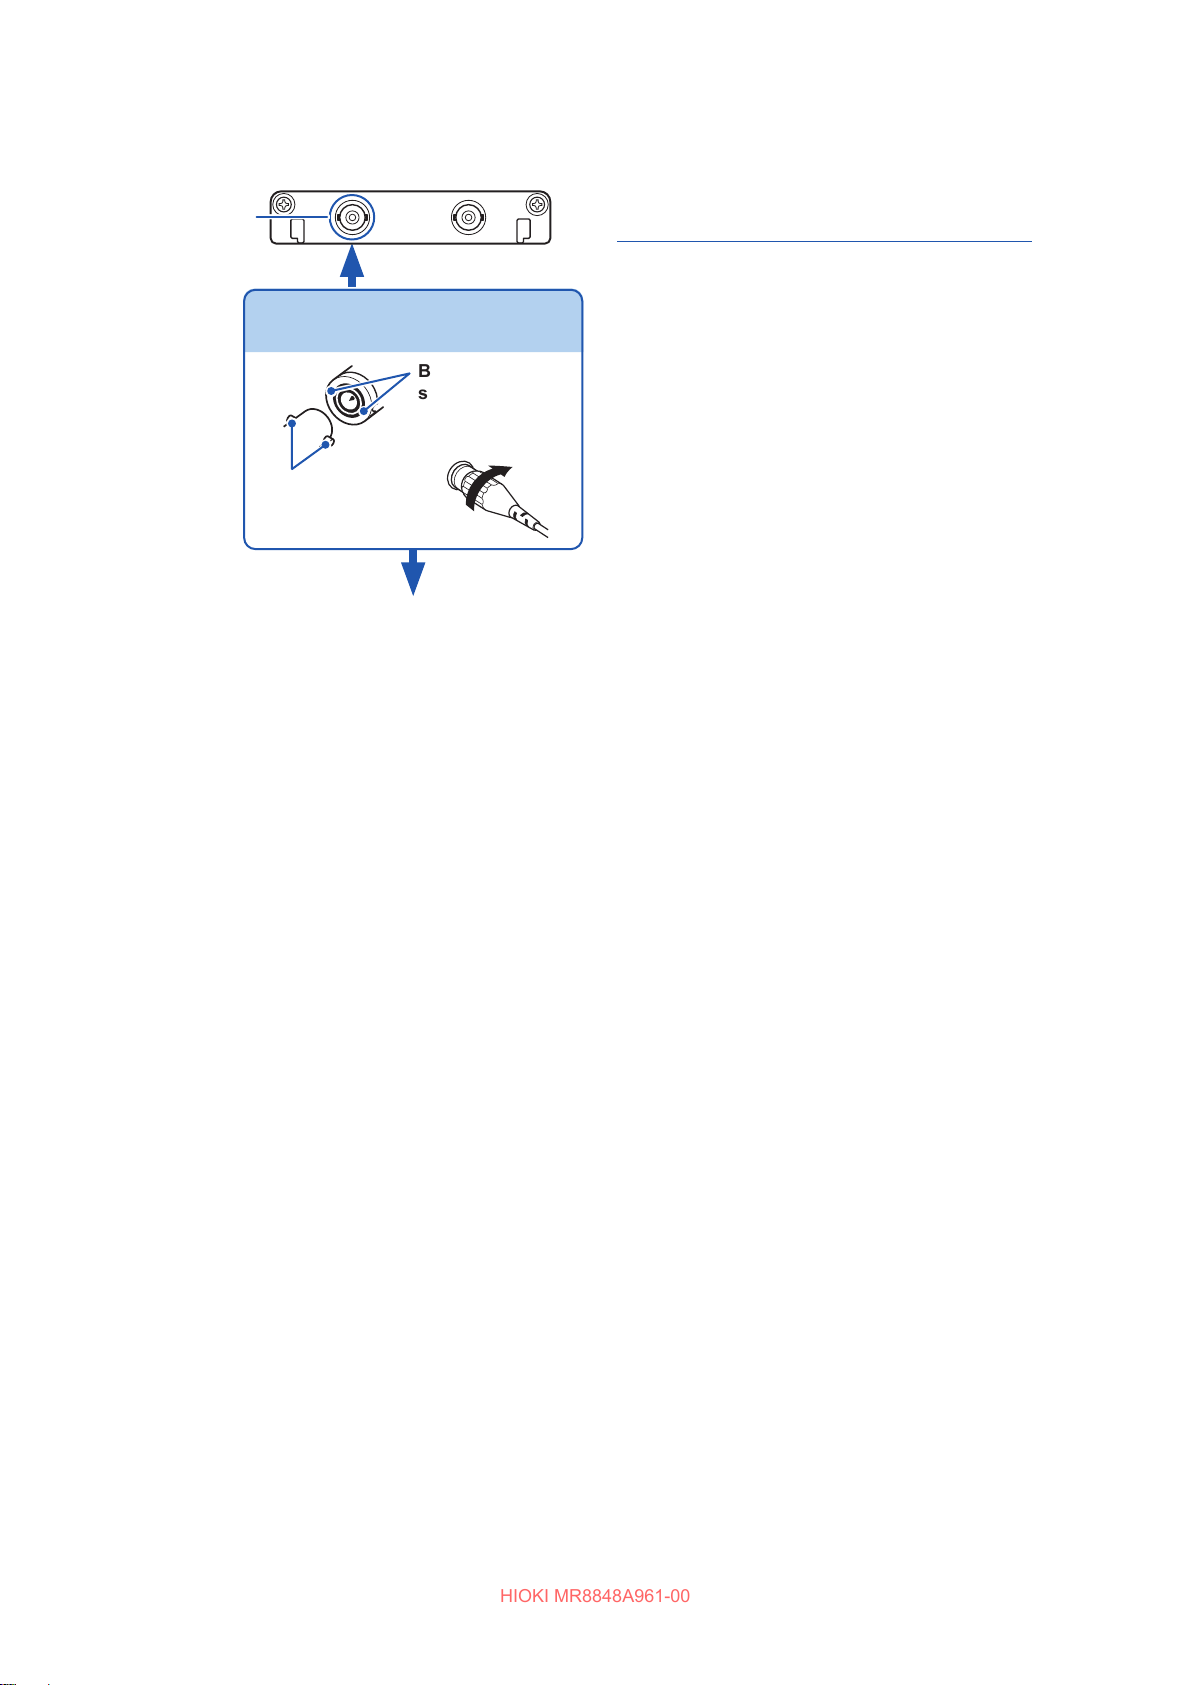
Connecting cables to the BNC female terminals on units
Example: 8966 Analog Unit
BNC female
connector
Connecting the cord
BNC connector
slots
Lock
Locking studs of
unit side
Connect the logic probe to a
measurement object.
Required item: Connection cord
Connect the BNC male connector of
1
the cord to a BNC female connector
on the unit.
Align the slots in the BNC male
2
connector with the bayonet lugs on
the BNC female connector on the
unit, then attach the male connector
while turning it clockwise until it
locks.
Connect the cord clips to a
3
measurement object.
To disconnect the connection cable from
the BNC female connector
Turn the BNC male connector
counterclockwise, then pull it out.
40
Page 41
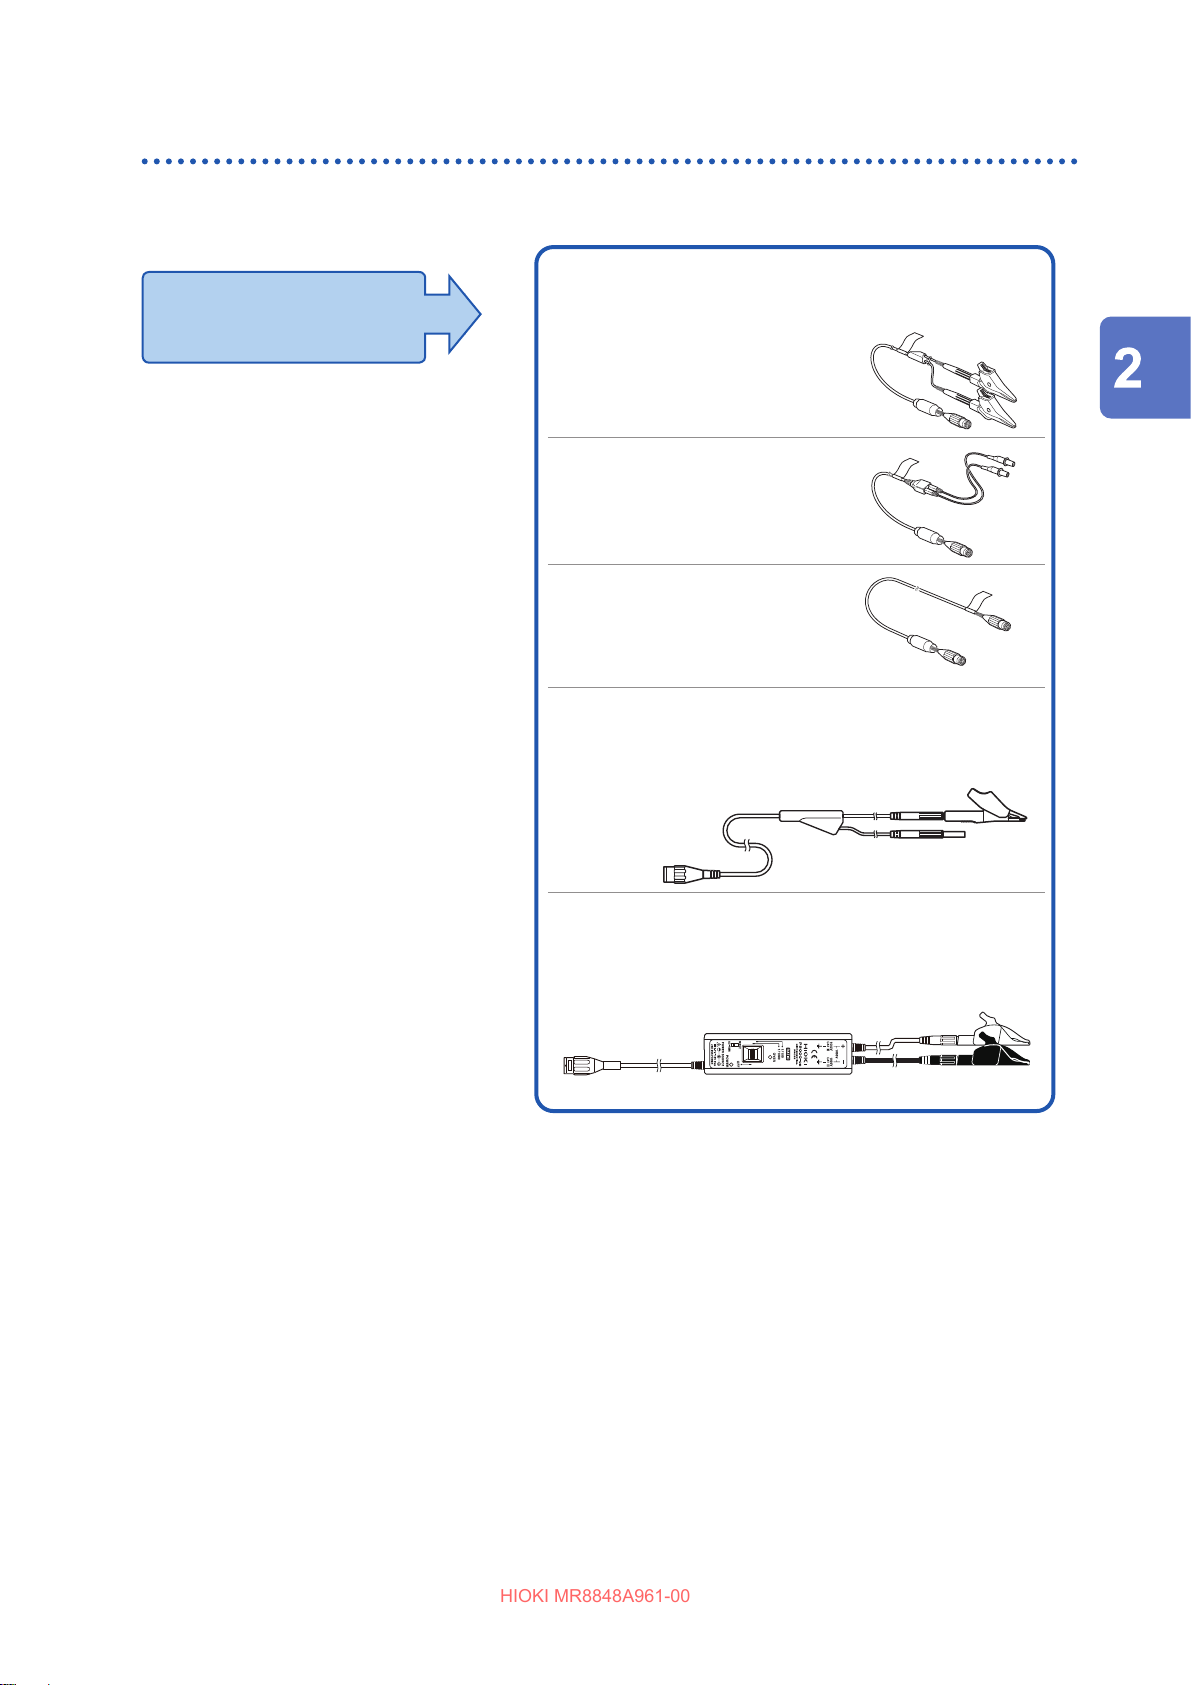
Attaching Connection Cords
HIOKI MR8848A961-00
Measuring frequency, number of rotations, and count
Refer to (p. 40) for details about connecting a cable to the BNC female terminal.
Applicable unit
• 8970 Freq Unit
Connect cables to BNC female
connectors on units.
The following connection cords can be
connected to the units.
• L9197 Connection Cord
(Maximum rated input voltage:
600 V)
Large alligator clip set type
Preparing for Measurement
• L9198 Connection Cord
(Maximum rated input voltage:
300 V)
Small alligator clip set type
• L9217 Connection Cord
(Maximum rated input voltage:
300 V)
For measuring output signal
from a BNC connector
• L9790 Connection Cord
(Maximum rated input voltage: 600 V)
Terminal type: Alligator, contact, grabber
Example: Terminal type:
Alligator
*1. An optional power cord or AC
adapter is required.
*2. An optional AC adapter or a
commercially available USB cable is
required.
When a voltage to be measured exceeds
rating of a unit being used
• 9322 Dierential Probe*1
• P9000-01/-02 Dierential Probe*2
Example: P9000-02 Dierential Probe
a
maximum input
41
Page 42
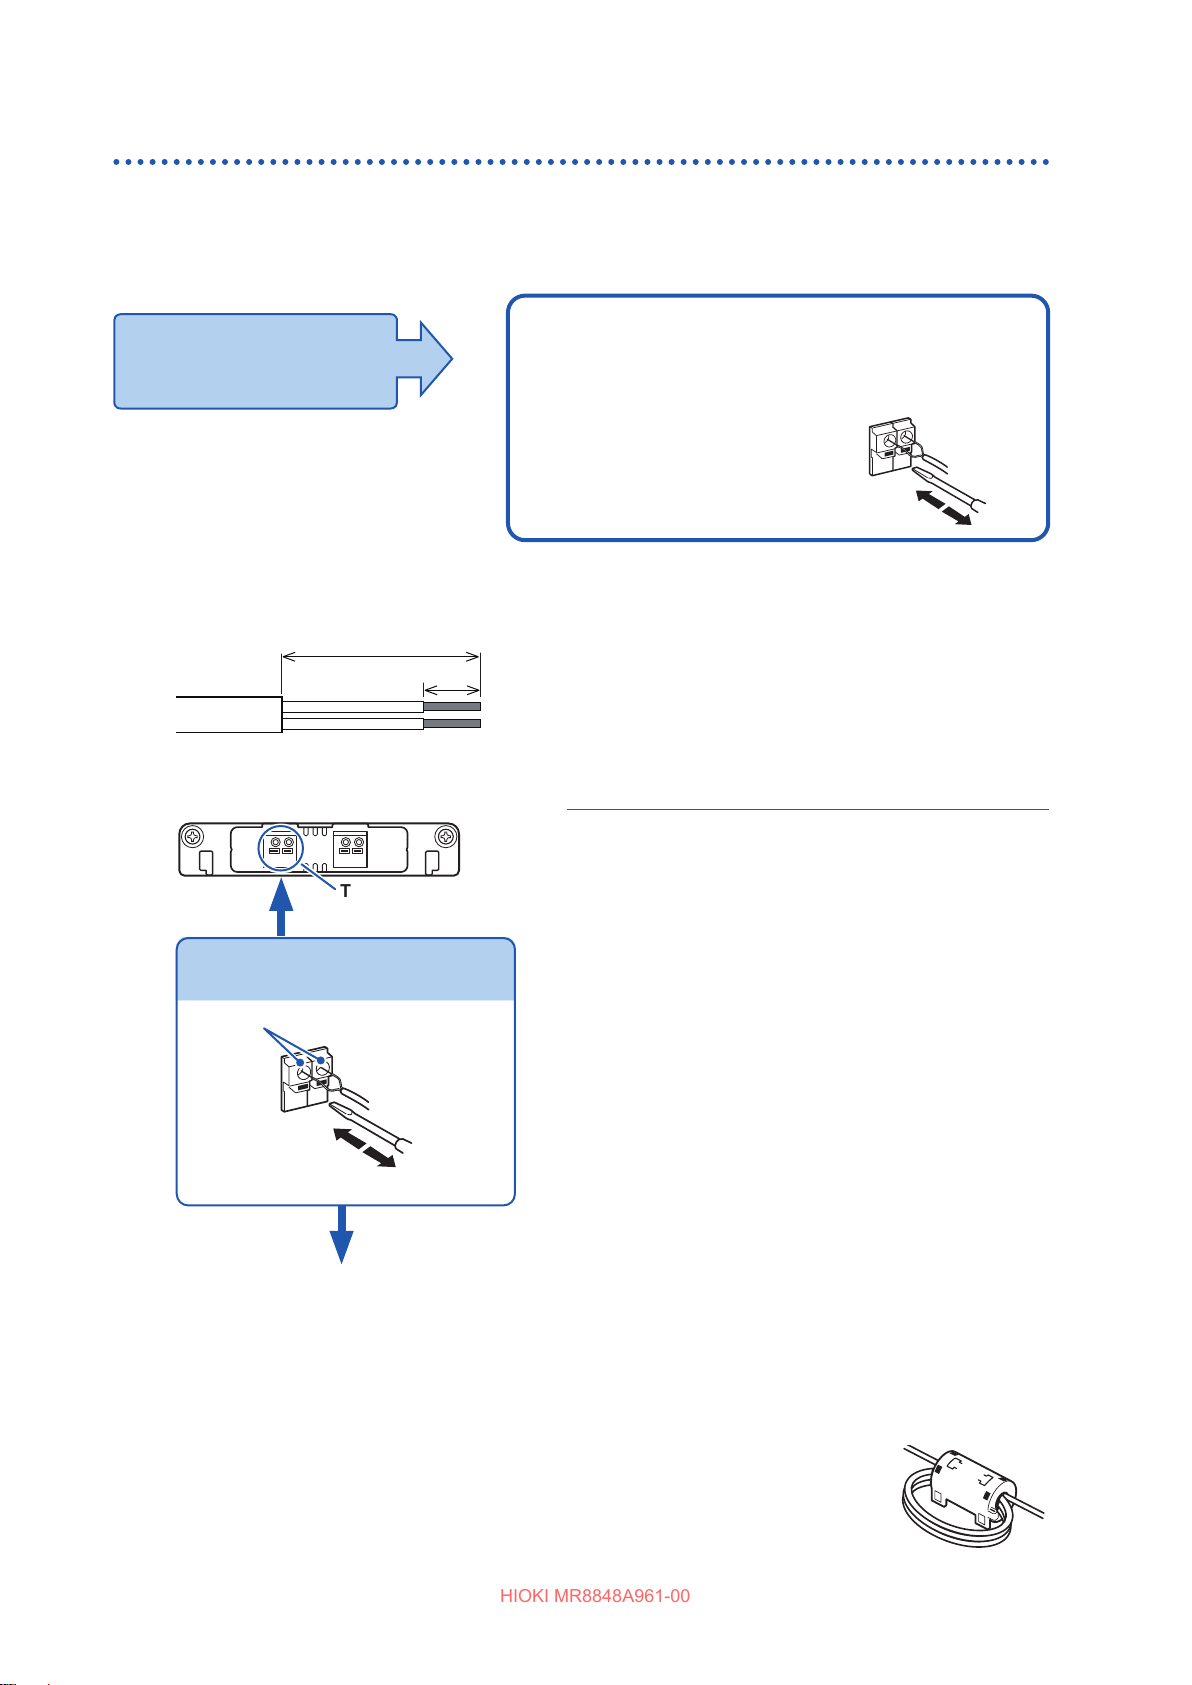
Attaching Connection Cords
HIOKI MR8848A961-00
Measuring temperature
K and E thermocouples exhibit a phenomenon known as short range ordering. This prevents
accurate measurement at temperatures from 250°C to 600°C.
Consult your thermocouple manufacturer to choose appropriate sensors.
Applicable unit
• 8967 Temp Unit
Thermocouple
(Compatible wire: from 0.4 mm to
1.2 mm in diameter)
Connect a thermocouple to the terminal
block on the unit.
The following thermocouple can be
Connecting thermocouples to the terminal blocks
Required items:
Thermocouple, at-blade screwdriver (2.6 mm blade)
Recommended wire:
Compatible wire: Thermocouple element wires from
0.4 mm to 1.2 mm in diameter
Strip length: 10 mm
Strip the insulation of the thermocouple
1
wires as shown on the left.
Length: Approx. 10 mm
Outer
insulation
25 mm
Inner
insulation
Terminal block
10 mm
1
Thermocouple
element wire1
connected to the unit.
Connect thermocouple
to terminal block
Depress the button on the terminal block
2
Connecting a thermocouple
Connection holes
3
2
4
Connect the thermocouple to a
5
measurement object
• If there are noise eects from/on surrounding equipment, wind the
thermocouple around the ferrite clamp-on choke, which is an accessory of
8967, several times (as seen in the right diagram).
• When connecting the thermocouple that is more than 3 meters long, the
measurement may be aected by EMC environments including external noise.
on the unit with the at-blade screwdriver.
Insert each thermocouple wire into the
3
appropriate terminal hole while depressing
the button.
The color of the cable insulation varies
depending on the country and manufacturer.
Check the insulation color before connecting.
Release the screwdriver from the button.
4
The thermocouple is connected to the terminal
block.
Connect the thermocouple to a
5
measurement object.
To remove the thermocouple
Pull the thermocouple wire while depressing the button.
42
Page 43
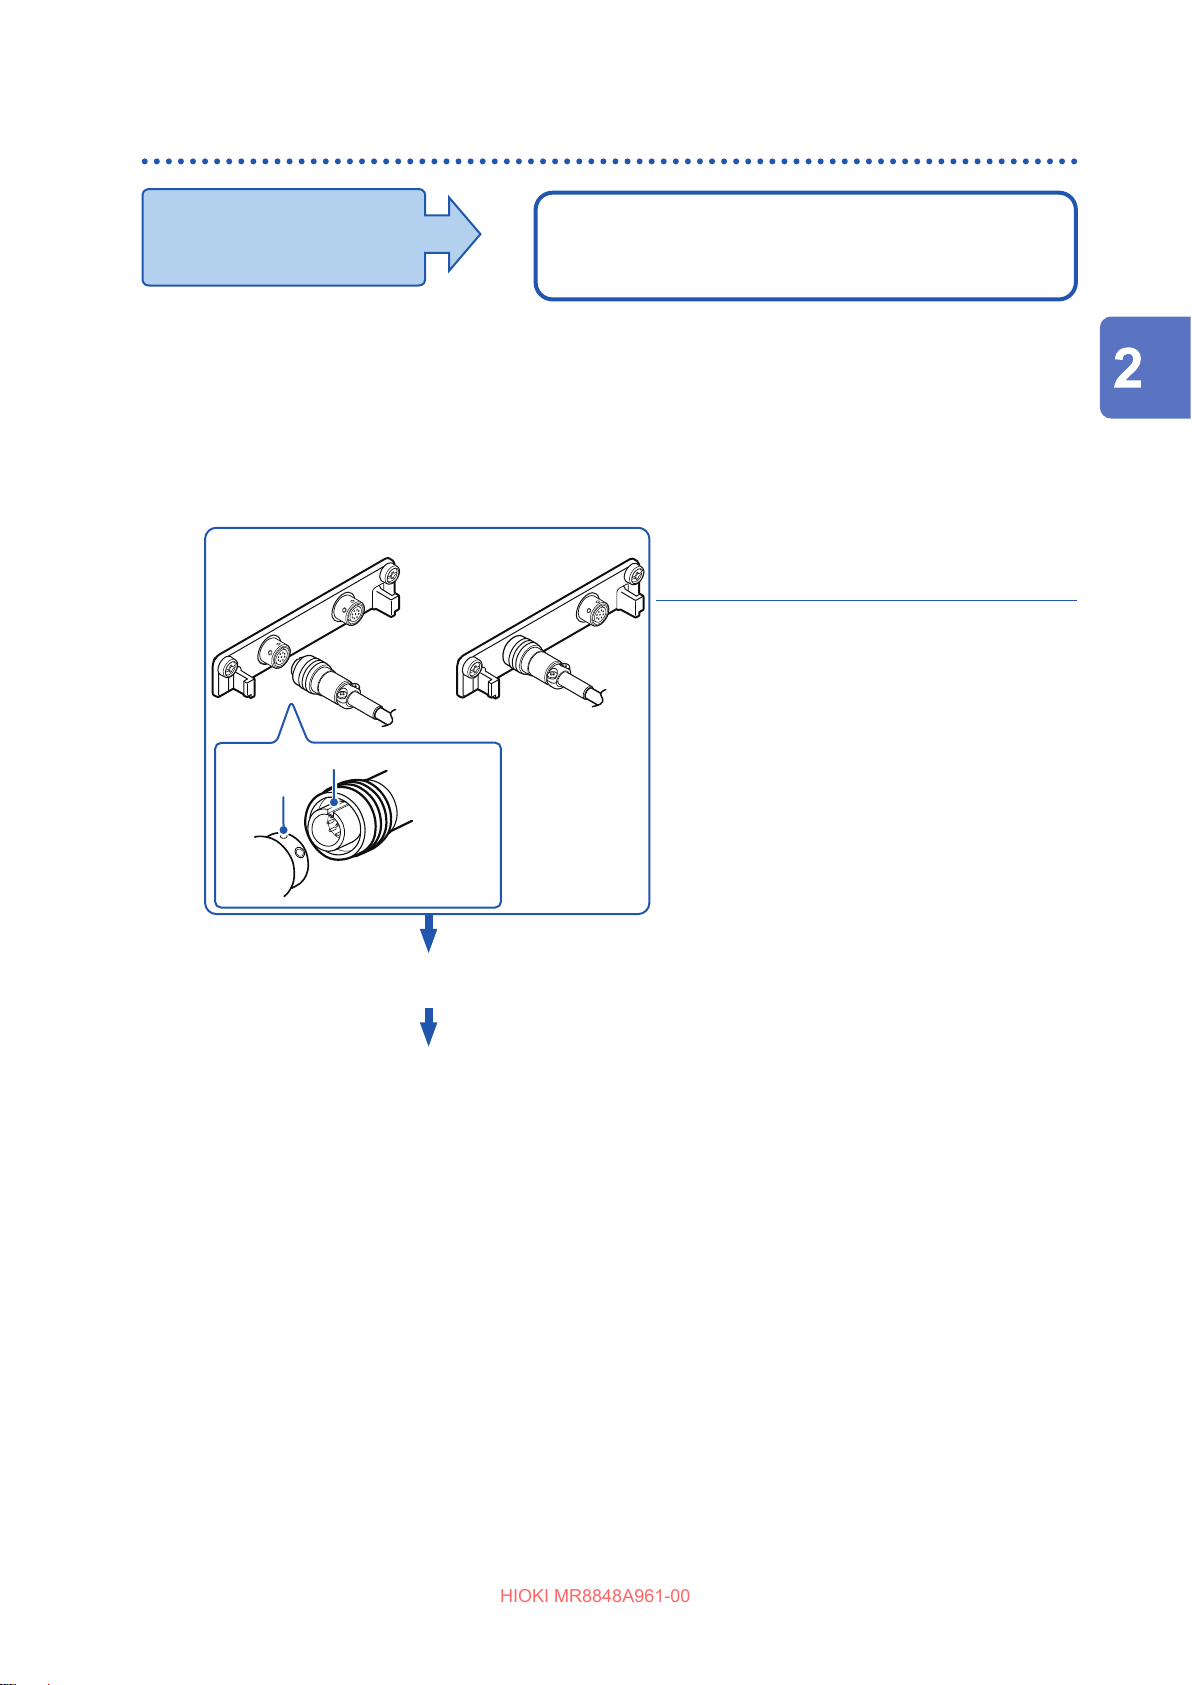
Attaching Connection Cords
HIOKI MR8848A961-00
Measuring vibration or displacement with a strain gauge transducer
Applicable units
• U8969 Strain Unit
• 8969 Strain Unit
Connect a strain gauge transducer to a connector on the U8969 Strain Unit via the L9769
Conversion Cable; the 8969 Strain Unit via the 9769 Conversion Cable.
The following device can be connected to the unit.
Strain gauge transducer (Not available from Hioki)
Connect L9769 or 9769 Conversion Cable to the strain gauge
transducer.
Connecting the strain gauge transducer to a unit’s connector
Example: Connecting the strain gauge transducer to the U8969 Strain Unit via the L9769
Conversion Cable
Required items:
L9769 Conversion Cable, strain gauge
transducer
Insert the L9769 into a connector of
1
the U8969 with the slot of the plug
aligned with the outward indentation
of the connector.
Insert the plug into the connector
2
until they are locked together.
Connect the L9769 to the strain
3
gauge transducer.
Connector’s
indentation
U8969 Strain Unit
1
Connect the L9769.
Plug’s slot
2
Preparing for Measurement
Connect the L9769 to the strain gauge
3
transducer.
Connect the strain gauge transducer to
4
a measurement object.
The instrument describes the U8969 as “8969”.
Connect the strain gauge transducer
4
to a measurement object.
How to disconnect the L9769
Pull the sleeve of the plug gently,
releasing the plug, and disconnect the
cable.
43
Page 44
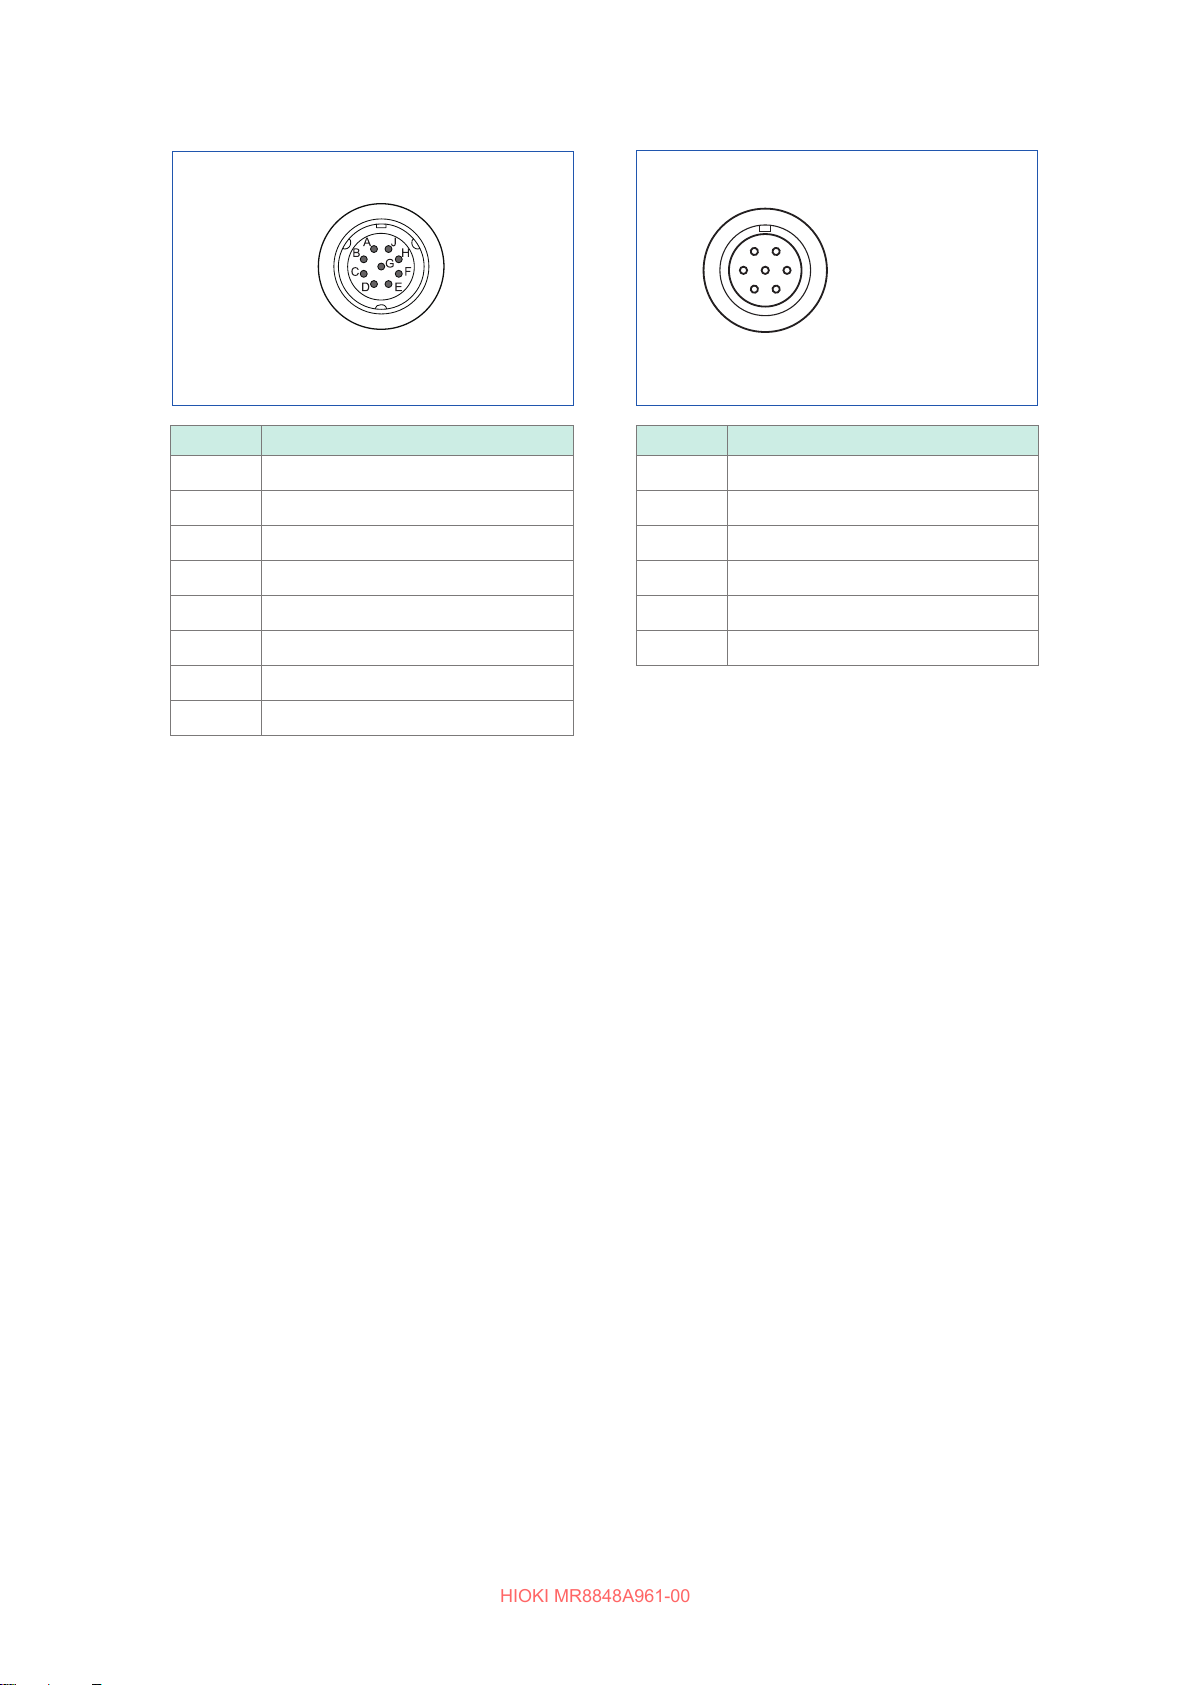
Attaching Connection Cords
HIOKI MR8848A961-00
Connector pin-out
U8969 Strain Unit
The metal shell is connected to the GND
of the instrument.
Pin mark Description
A BRIDGE+
B INPUT-
C BRIDGE-
D INPUT+
E
F SENSE+
G SENSE-
H, J N.C.
FLOATING COMMON
L9769 Conversion Cable
(Strain gauge transducer end)
A F
G
B
C D
The metal shell is connected to the GND
of the instrument.
Pin mark Description
A BRIDGE+, SENSE+
B INPUT-
C BRIDGE-, SENSE-
D INPUT+
E
F, G N.C.
Applied voltage:
E
bridge voltage of 2 V
FLOATING COMMON
Connection of the L9769
• Pin F of the unit end is connected with Pin A of the strain gauge transducer end.
• Pin G of the unit end is connected with Pin C of the strain gauge transducer end.
44
Page 45
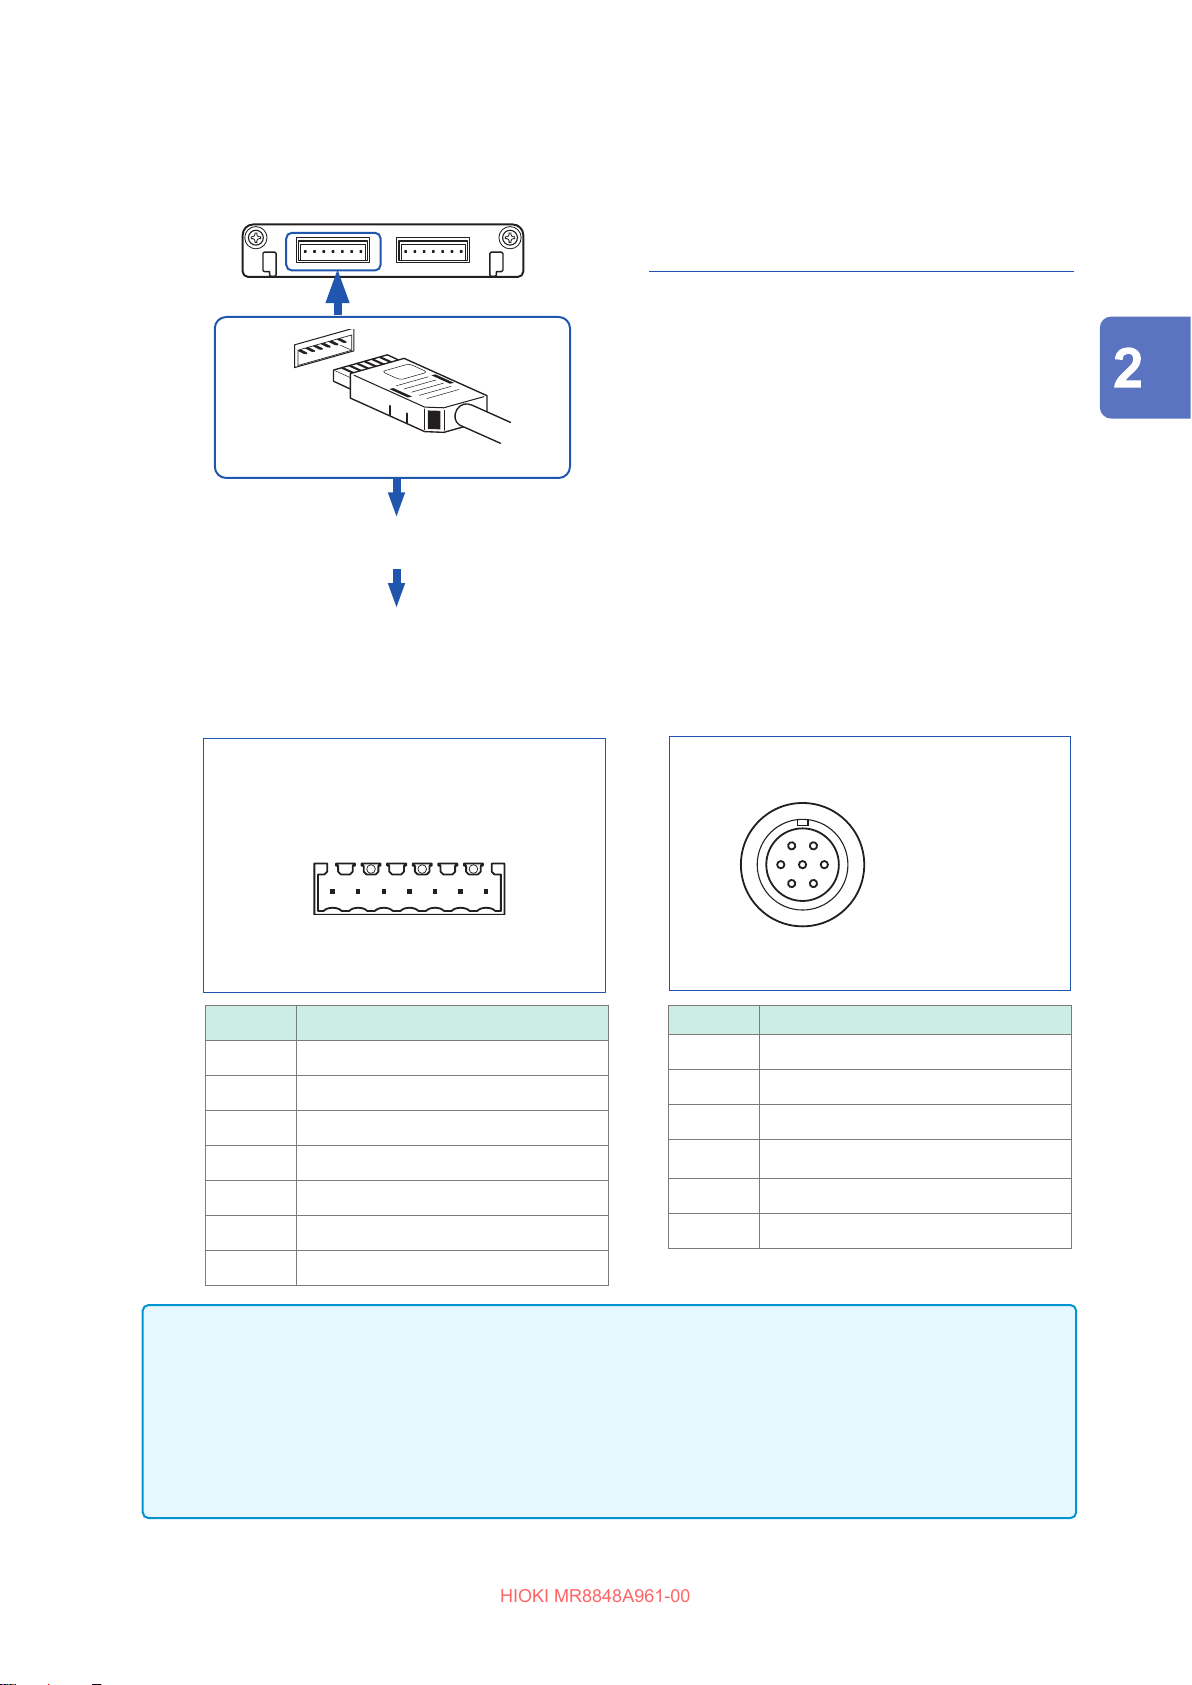
Attaching Connection Cords
HIOKI MR8848A961-00
Example: Connecting the strain gauge transducer to the 8969 Strain Unit via the 9769 Conversion
Cable
8969 Strain Unit Required items:
9769 Conversion Cable, strain gauge
transducer
Connect the 9769 to a connector on
1
the unit.
1
Connect the 9769.
Insert the connector of the 9769 with the
orange part facing upward.
Connect the 9769 to the strain gauge
2
transducer.
Connect the strain gauge transducer
3
to a measurement object.
Connect the L9769 to the strain
2
gauge transducer.
Connect the strain gauge
3
transducer to a measurement
object.
Preparing for Measurement
Connector pin-out
(Pin 1 is on the left when the
unit’s top side is on the up)
Pin No. Description
1 BRIDGE+
2 SENSE+
3 INPUT+
4 INPUT-
5 BRIDGE-
6 SENSE-
7
8969 Strain Unit
1 2 3 4 5 6 7
FLOATING COMMON
9769 Conversion Cable
(Strain gauge transducer end)
A F
G
B
C D
The metal shell is connected to the GND
Pin mark Description
A BRIDGE+, SENSE+
B INPUT-
C BRIDGE-, SENSE-
D INPUT+
E
F, G N.C.
Applied voltage:
E
bridge voltage of 2 V
of the 8969.
FLOATING COMMON
IMPORTANT
• Preforming measurement with a strain gauge requires a bridge box. Use a strain gauge and bridge
box both of which are commercially available.
• The bridge box may be susceptible to the eect of noise. In this case, connect an earthing wire to the
bridge box to reduce the eect of noise. For more information about how to ground the bridge box,
refer to its instruction manual or contact the manufacturer of the bridge box.
• Do not excessively bend the cable and the base between cable and connector, pull on them, nor twist
them. Doing so may cause the conversion cable to break.
45
Page 46
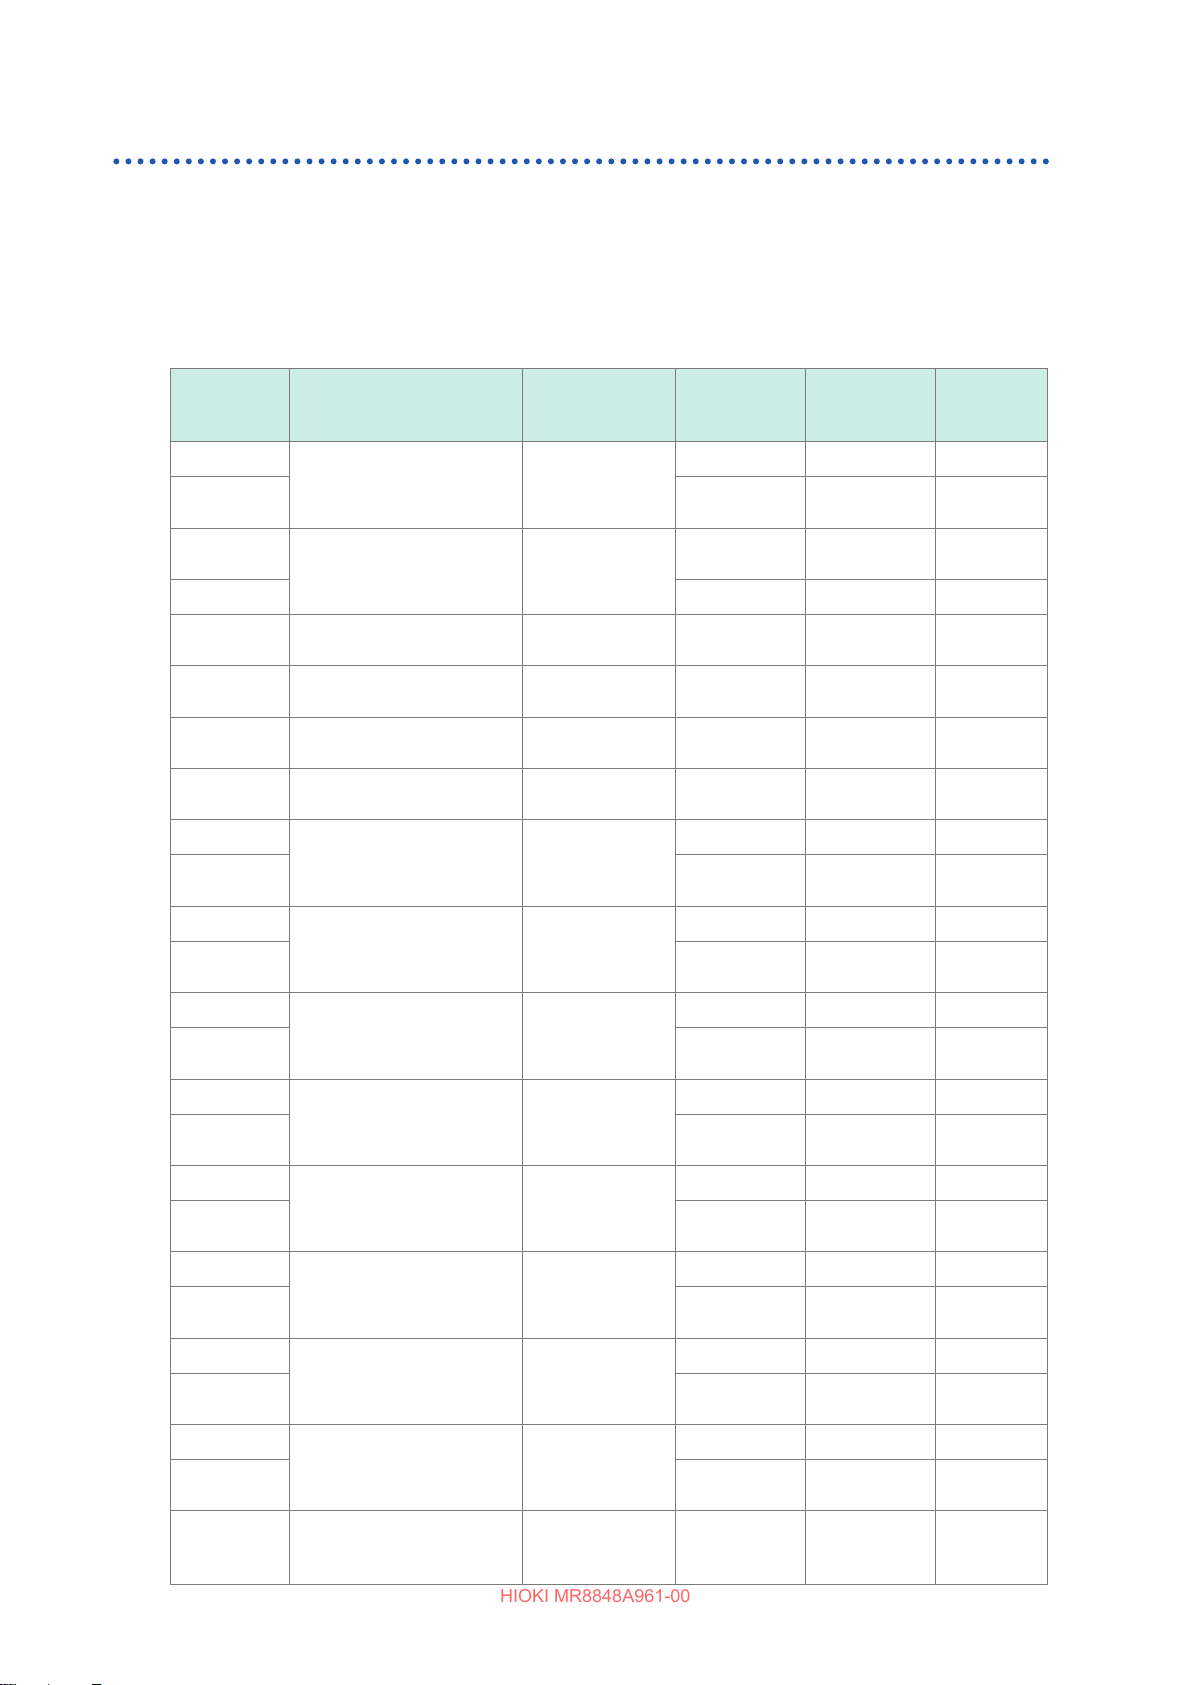
Attaching Connection Cords
HIOKI MR8848A961-00
Measuring current
There is a limitation on the number of Current Units that can be installed.
Refer to “2.1 Installing and Removing Units” (p. 36).
Current sensors that can be connected to current units
The following current sensors can be connected to the U8977 3CH Current Unit and the 8971
Current Unit. Use of conversion cables may be required depending on sensors and units.
: Directly connectible
Model
number
9709
9709-05
9272-05
9272-10 CT9900 9318 Plastic
CT6830 AC/DC Current Probe
CT6831 AC/DC Current Probe
CT6833
CT6833-01
CT6834
CT6834-01
CT6841
CT6841-05
CT6841A
CT6843
CT6843-05
CT6843A
CT6844
CT6844-05
CT6844A
CT6845
CT6845-05
CT6845A
CT6846
CT6846-05
CT6846A
CT6862
CT6862-05
CT6863
CT6863-05
CT6865
CT6865-05
CT6875
CT6875A
CT6875A-1
Model name
AC/DC Current Sensor
Clamp on Sensor
AC/DC Current Probe
AC/DC Current Probe
AC/DC Current Probe
AC/DC Current Probe
AC/DC Current Probe
AC/DC Current Probe
AC/DC Current Probe
AC/DC Current Sensor
AC/DC Current Sensor
AC/DC Current Sensor
AC/DC Current Sensor
Maximum
input current /
Frequency
500 A
DC to 100 kHz
20 A/200 A
1 Hz to 100 kHz
2 A
DC to 100 kHz
20 A
DC to 100 kHz
200 A
DC to 50 kHz
500 A
DC to 50 kHz
20 A
DC to 1 MHz
200 A
DC to 500 kHz
500 A
DC to 200 kHz
500 A
DC to 100 kHz
1000 A
DC to 20 kHz
50 A
DC to 1 MHz
200 A
DC to 500 kHz
1000 A
DC to 20 kHz
500 A
DC to 2 MHz
Conversion
cable for
U8977
CT9900 9318 Plastic
CT9900 9318 Plastic
CT9900 9318 Plastic
CT9900 9318 Plastic
CT9900 9318 Plastic
CT9900 9318 Plastic
CT9900 9318 Plastic
CT9900 9318 Plastic
CT9900 9318 Plastic
Conversion
cable for 8971
CT9901
+ 9318
CT9901
+ 9318
Not
connectible
Not
connectible
CT9901
+ 9318
CT9901
+ 9318
CT9901
+ 9318
CT9901
+ 9318
CT9901
+ 9318
CT9901
+ 9318
CT9901
+ 9318
CT9901
+ 9318
CT9901
+ 9318
CT9901
+ 9318
CT9901
+ 9318
Connector*
Metal
Metal
Metal
Metal
Metal
Metal
Metal
Metal
Metal
Metal
Metal
Metal
Metal
Metal
Metal
1
46
Page 47
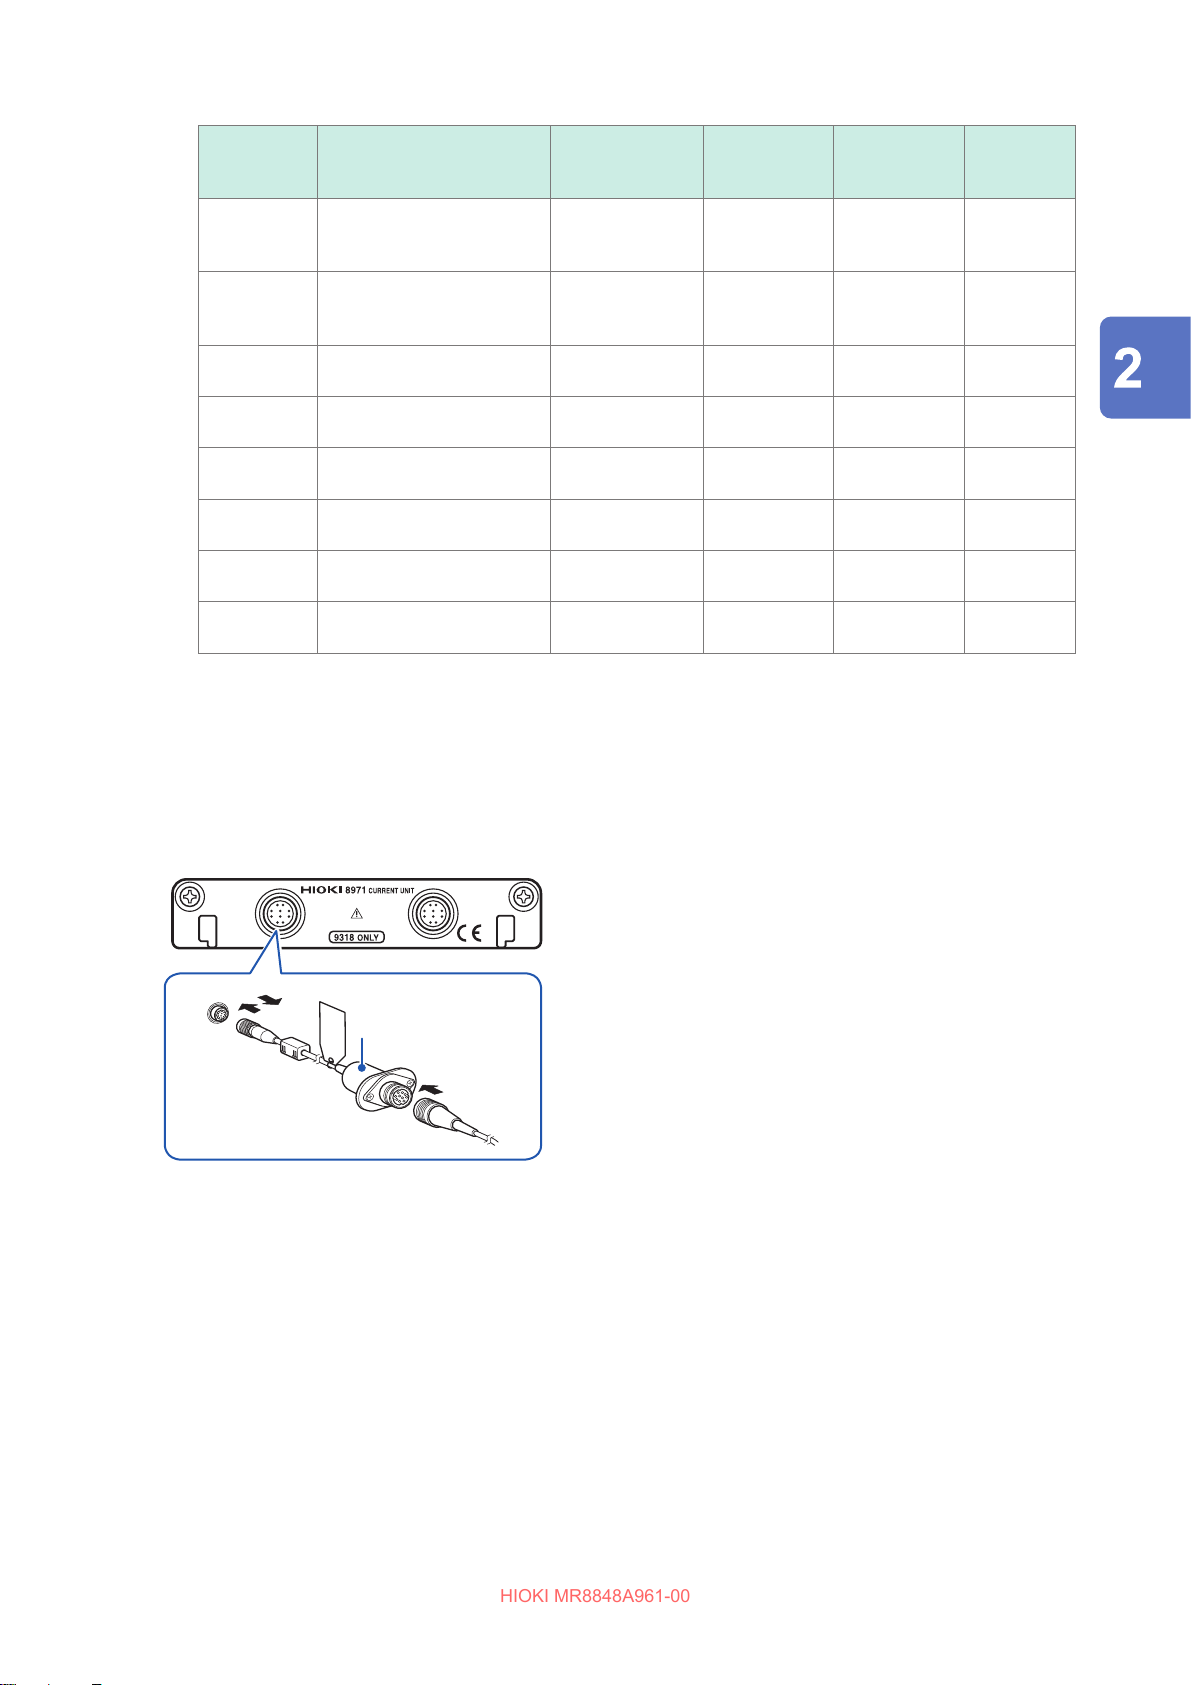
Attaching Connection Cords
HIOKI MR8848A961-00
Model
number
CT6876
CT6876A
CT6876A-1
CT6877
CT6877A
CT6877A-1
CT6872
CT6872-01
CT6873
CT6873-01
CT6904A AC/DC Current Sensor
CT6904A-1 AC/DC Current Sensor
CT6904A-2 AC/DC Current Sensor
CT6904A-3 AC/DC Current Sensor
*1. Metal connector (ME15W), plastic connector (PL23)
Model name
AC/DC Current Sensor
AC/DC Current Sensor
AC/DC Current Sensor
AC/DC Current Sensor
Maximum
input current /
Frequency
1000 A
DC to 1.5 MHz
2000 A
DC to 1 MHz
50 A
DC to 10 MHz
200 A
DC to 10 MHz
500 A
DC to 4 MHz
500 A
DC to 2 MHz
800 A
DC to 4 MHz
800 A
DC to 2 MHz
Conversion
cable for
U8977
Conversion
cable for 8971
CT9901
+ 9318
Not
connectible
CT9901
+ 9318
CT9901
+ 9318
CT9901
+ 9318
CT9901
+ 9318
CT9901
+ 9318
CT9901
+ 9318
Connector*
Metal
Metal
Metal
Metal
Metal
Metal
Metal
Metal
1
Preparing for Measurement
Connecting current sensors to the 8971 Current Unit
Current sensors with a black resin connector (PL23), can be connected to the 8971 using the
optional 9318 Conversion Cable*.
*: The 9318 Conversion Cable is an accessory of the 8971 Current Unit.
8971 Current Unit
9318 Conversion
Cable
Aligning the guides of the conversion cable
1
with those of the sensor connector on the unit,
and straightly insert the plug until it locks.
Align the guides of the current sensor to be used
2
with those of the conversion cable connector,
and straightly insert the plug until it locks.
The instrument automatically recognizes the model of
the current sensor.
Clamp the current sensor around a line of a
3
measurement target.
How to disconnect the current sensor
Hold and pull the plastic collar of the
1
conversion cable, which releases the lock, and
the remove the connector.
When measuring current with the 9018-50 Clamp on Probe
Hold and pull the plastic collar of the current
2
sensor, which releases the lock, and the
remove the connector.
Using the 9018-50 enables voltage measurement units such as the 8966 Analog Unit to measure current.
For more information about how to congure the instrument for use in this type of application, refer
to “Example of scaling settings” (p. 180).
47
Page 48
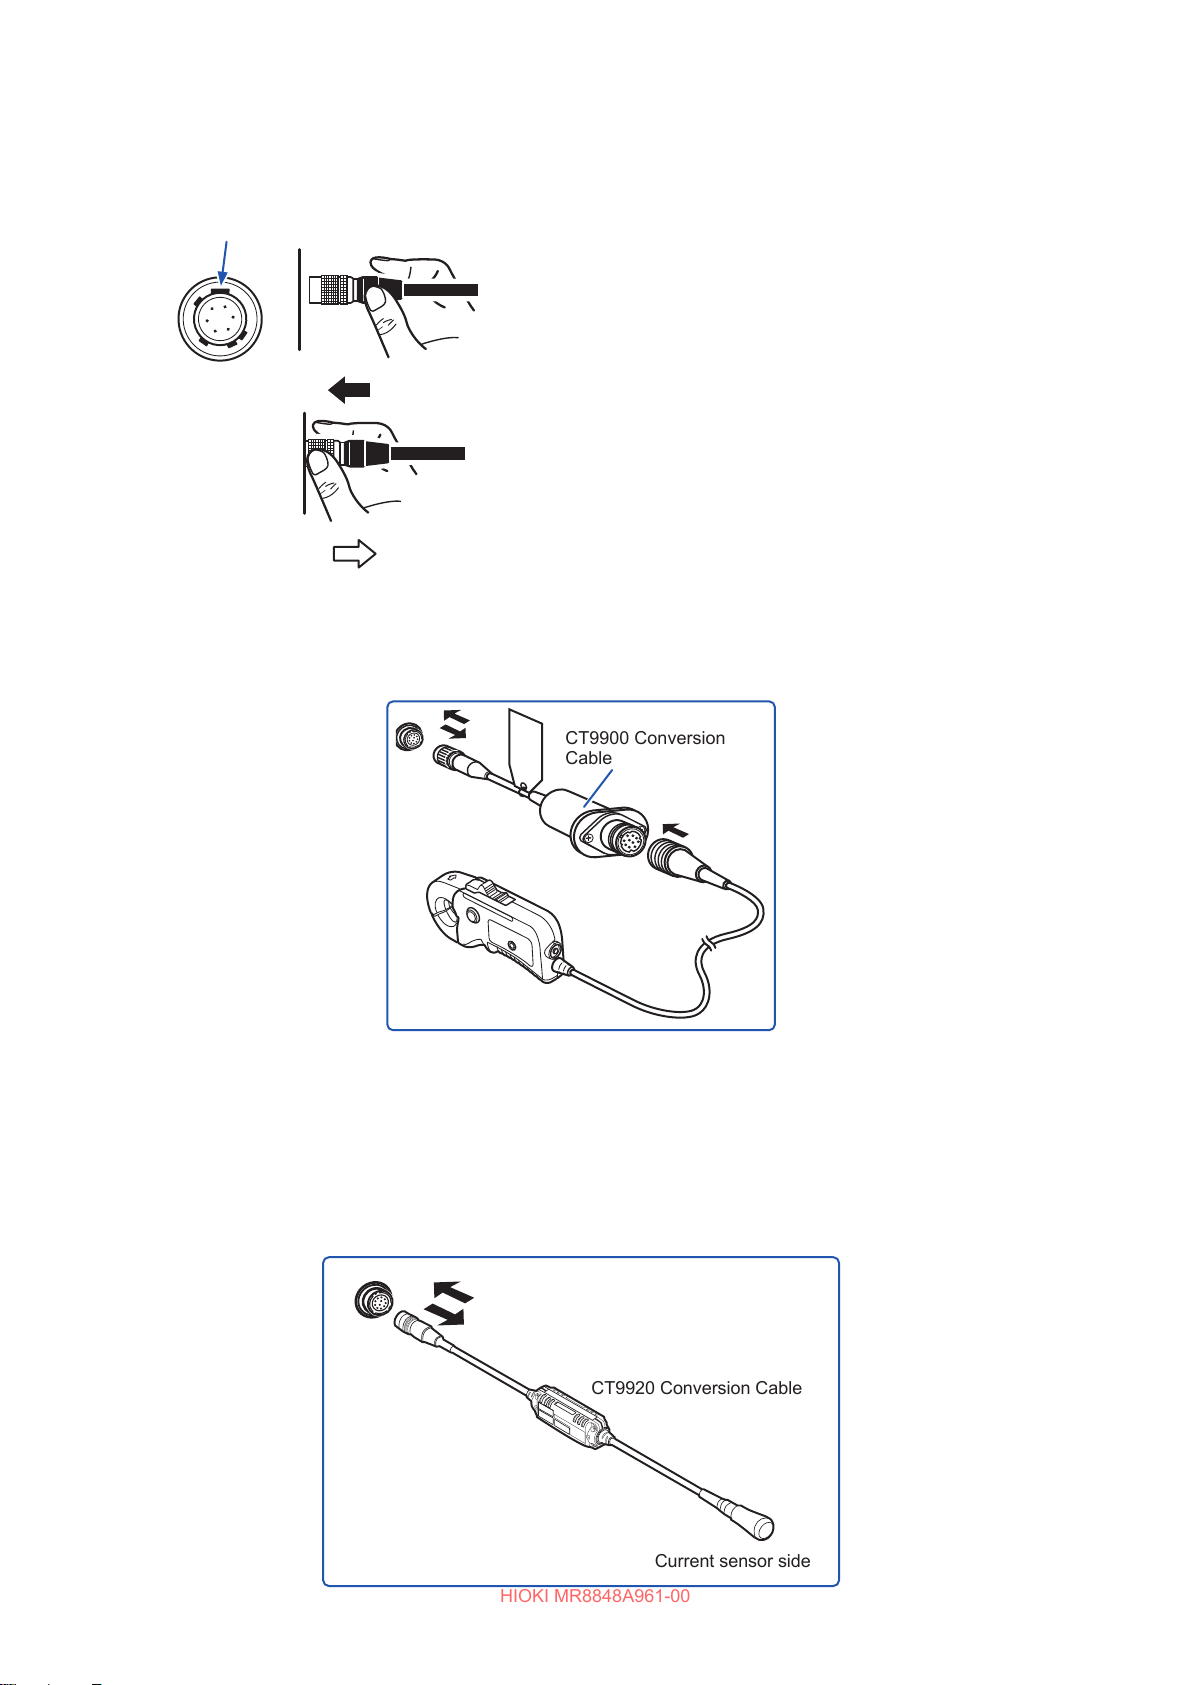
Attaching Connection Cords
HIOKI MR8848A961-00
Connecting current sensors to the U8977 3CH Current Unit
Current sensors with metal connectors (ME15W) can be connected directly.
Orient so that the wide ridge is
positioned at the top of the instrument.
Grip the metal part
of the connector.
Current sensors with a black resin connector (PL23) can be connected to the U8977 using the
optional CT9900 Conversion Cable.
Align the connector guides.
1
Push the connector straight in until it locks.
2
Grip the connector by the non-metal part and push it in.
The instrument automatically recognizes the model of
the current sensor.
How to disconnect the current sensor
Grip the connector’s metal part and slide it
1
towards you to disengage the lock.
Pull the connector towards you.
2
CT9900 Conversion
Cable
If the CT6846 or CT6865 (1000 A rating) is connected using the CT9900 Conversion Cable, it will be
recognized as a 500 A AC/DC sensor. Set the CT ratio to 2.00.
Current sensors in the CT7000 series can be connected to the U8977 3CH Current Unit using
the optional CT9920 Conversion Cable. When using the CT9920, sensors will not be recognized
automatically.
Select the supported mode on the settings screen.
Supported models:
48
CT7631, CT7636, CT7642, CT7731, CT7736, CT7742, CT7044, CT7045, CT7046
CT9920 Conversion Cable
Current sensor side
Page 49
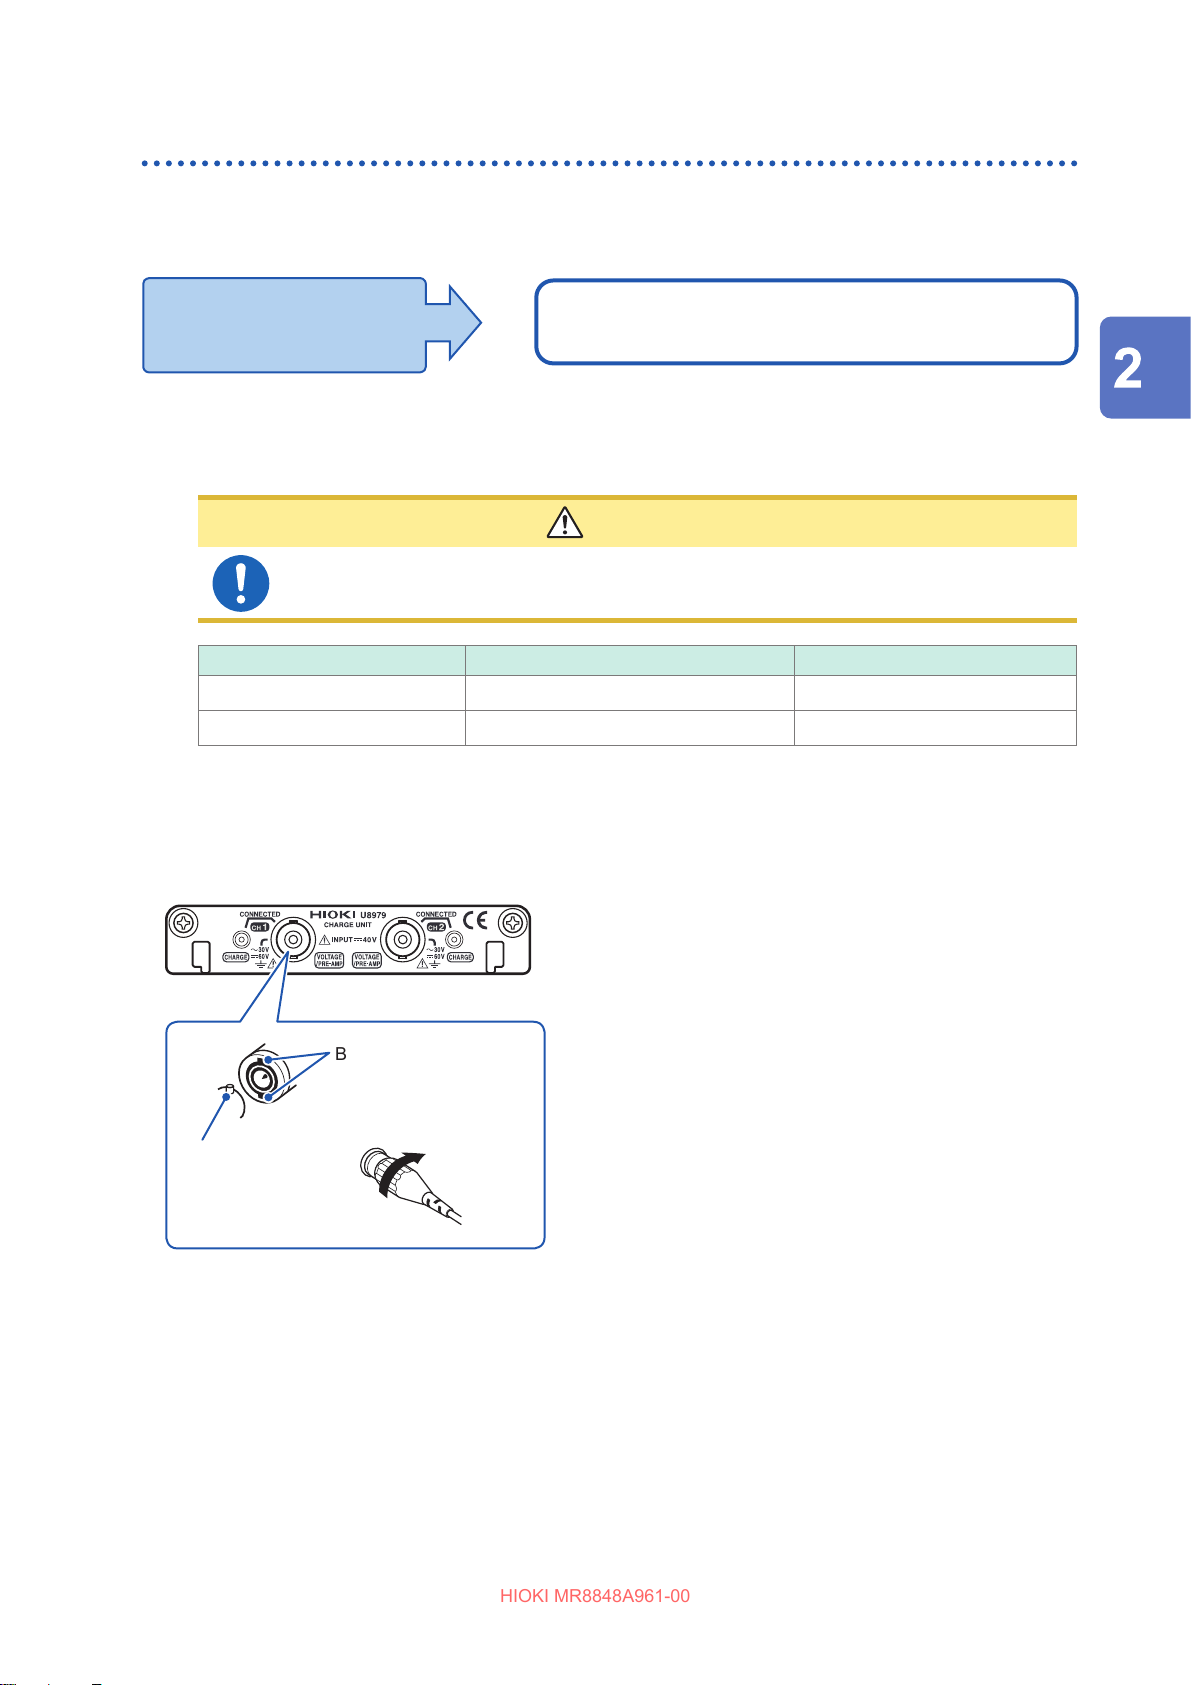
Attaching Connection Cords
HIOKI MR8848A961-00
Measuring acceleration
Familiarize yourself with “Handling the instrument and units” (p. 16) before connecting a current
sensor.
Applicable unit
• U8979 Charge Unit
Connect a acceleration sensor to the U8979 Charge Unit.
The following device can be connected to the unit.
Acceleration sensor (Not available from Hioki)
Acceleration sensor connectable with the U8979
CAUTION
Use an acceleration sensor with a built-in pre-amplier that conforms to the specication
of the U8979 Charge Unit. Using a inapplicable sensor may cause damaging itself.
Acceleration sensor type Terminal the sensor is connected to Note
With a built-in pre-amplier BNC connector Drive power: 3.0 mA, 22 V
Charge output Miniature connector (#10-32) –
Connecting an acceleration sensor with a built-in pre-amplier
Connecting a BNC-output acceleration sensor with a built-in pre-amplier
Preparing for Measurement
U8979 Charge Unit
BNC connector slots
Lock
Locking studs of
unit side
Connecting an acceleration sensor other than a sensor with a built-in pre-amplier
Convert the output connector into the BNC connector using a commercially available conversion
connector or conversion cable to connect the sensor.
Align the slots in the BNC connector of an
1
acceleration sensor with the locking studs of
a BNC connector on the unit, and insert the
connector.
Turn the BNC connector of the acceleration
2
sensor clockwise until it locks.
Attach the acceleration sensor with the built-in
3
pre-amplier to a measurement target.
How to disconnect the acceleration sensor
Turn the BNC connector of the acceleration sensor
counter-clockwise to release the lock and remove the
connector.
49
Page 50
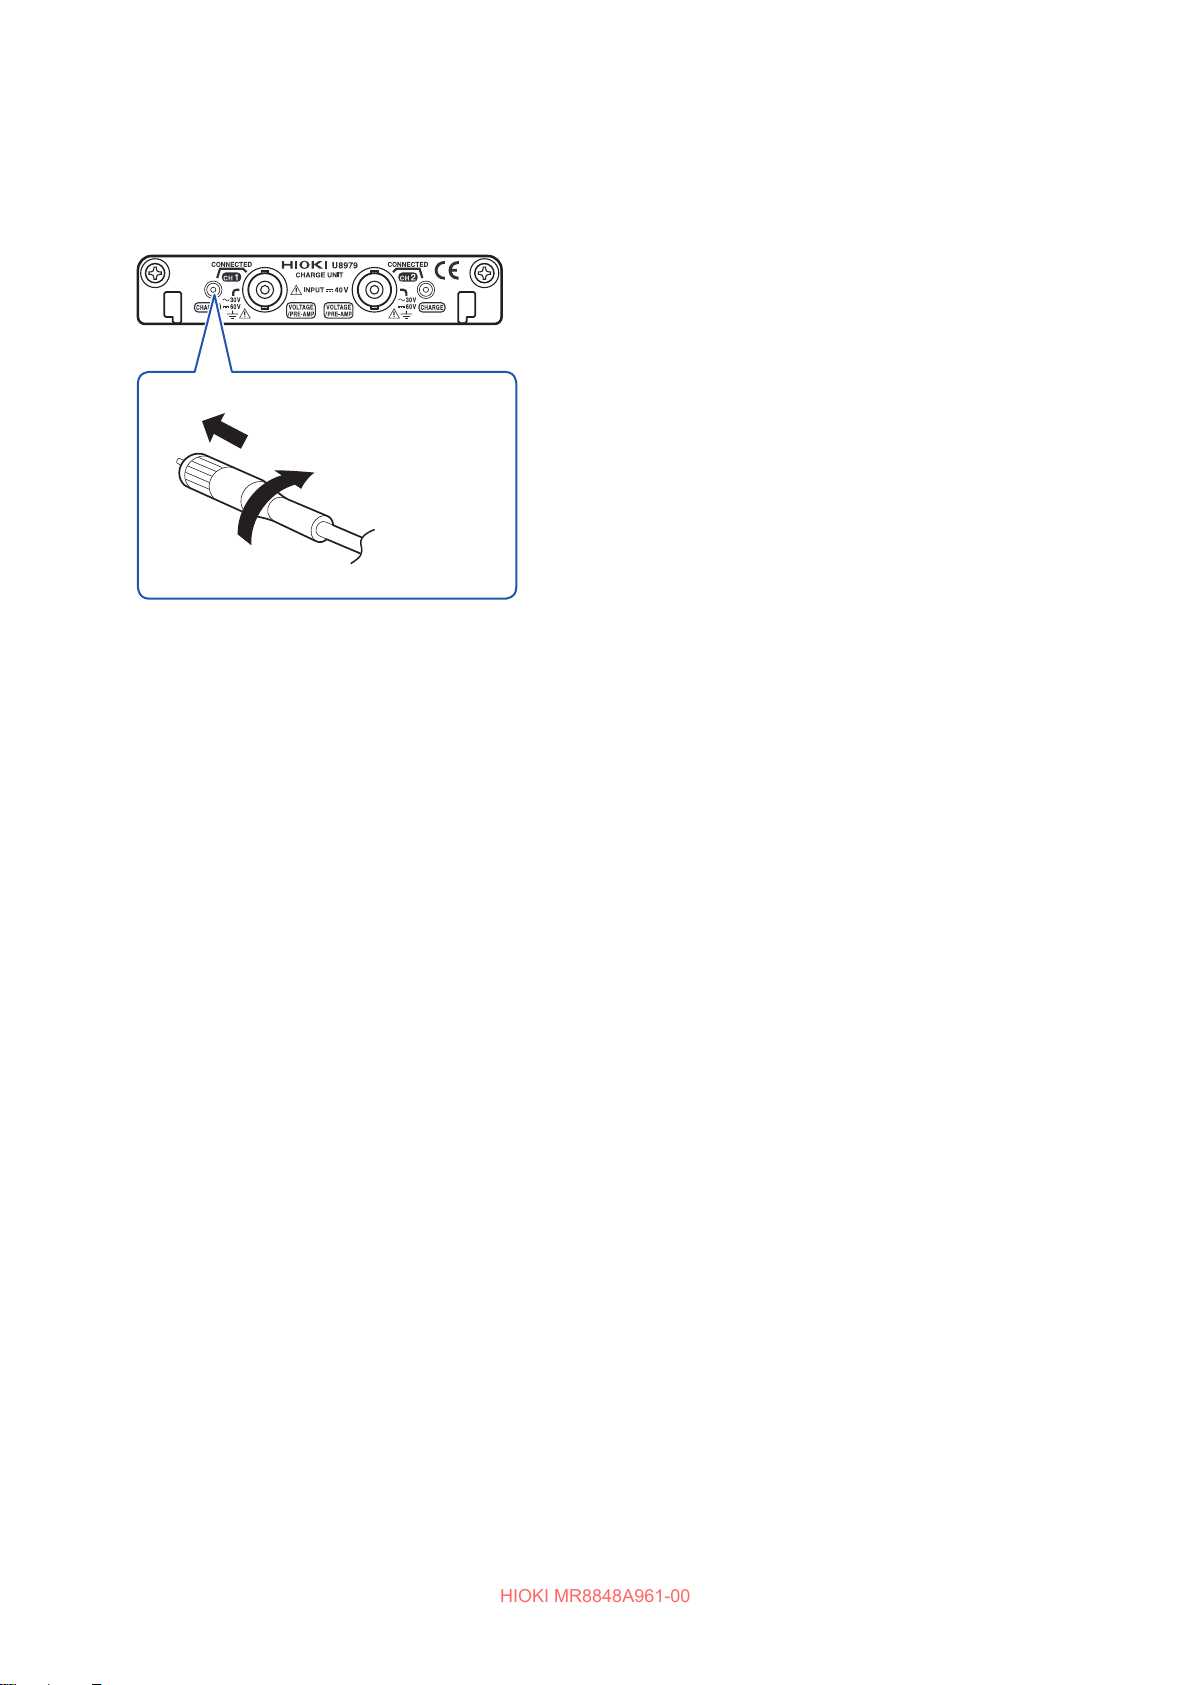
Attaching Connection Cords
HIOKI MR8848A961-00
Connecting a charge-output acceleration sensor
Connecting a charge-output acceleration sensor equipped with the miniature connector
(#10-32)
U8979 Charge Unit
Tighten the screw.
Connecting a charge-output acceleration sensor equipped with a connector other than a
miniature connector (#10-32)
Convert the output connector into the miniature connector (#10-32) using a commercially available
conversion connector or conversion cable to connect the sensor.
Align the screw of the miniature connector, and
1
turn the connector clockwise to tighten it.
Attach the charge-output acceleration sensor
2
to a measurement target.
How to disconnect the charge-output acceleration
sensor
Turn the miniature connector counterclockwise, and then
pull out the connector.
50
Page 51
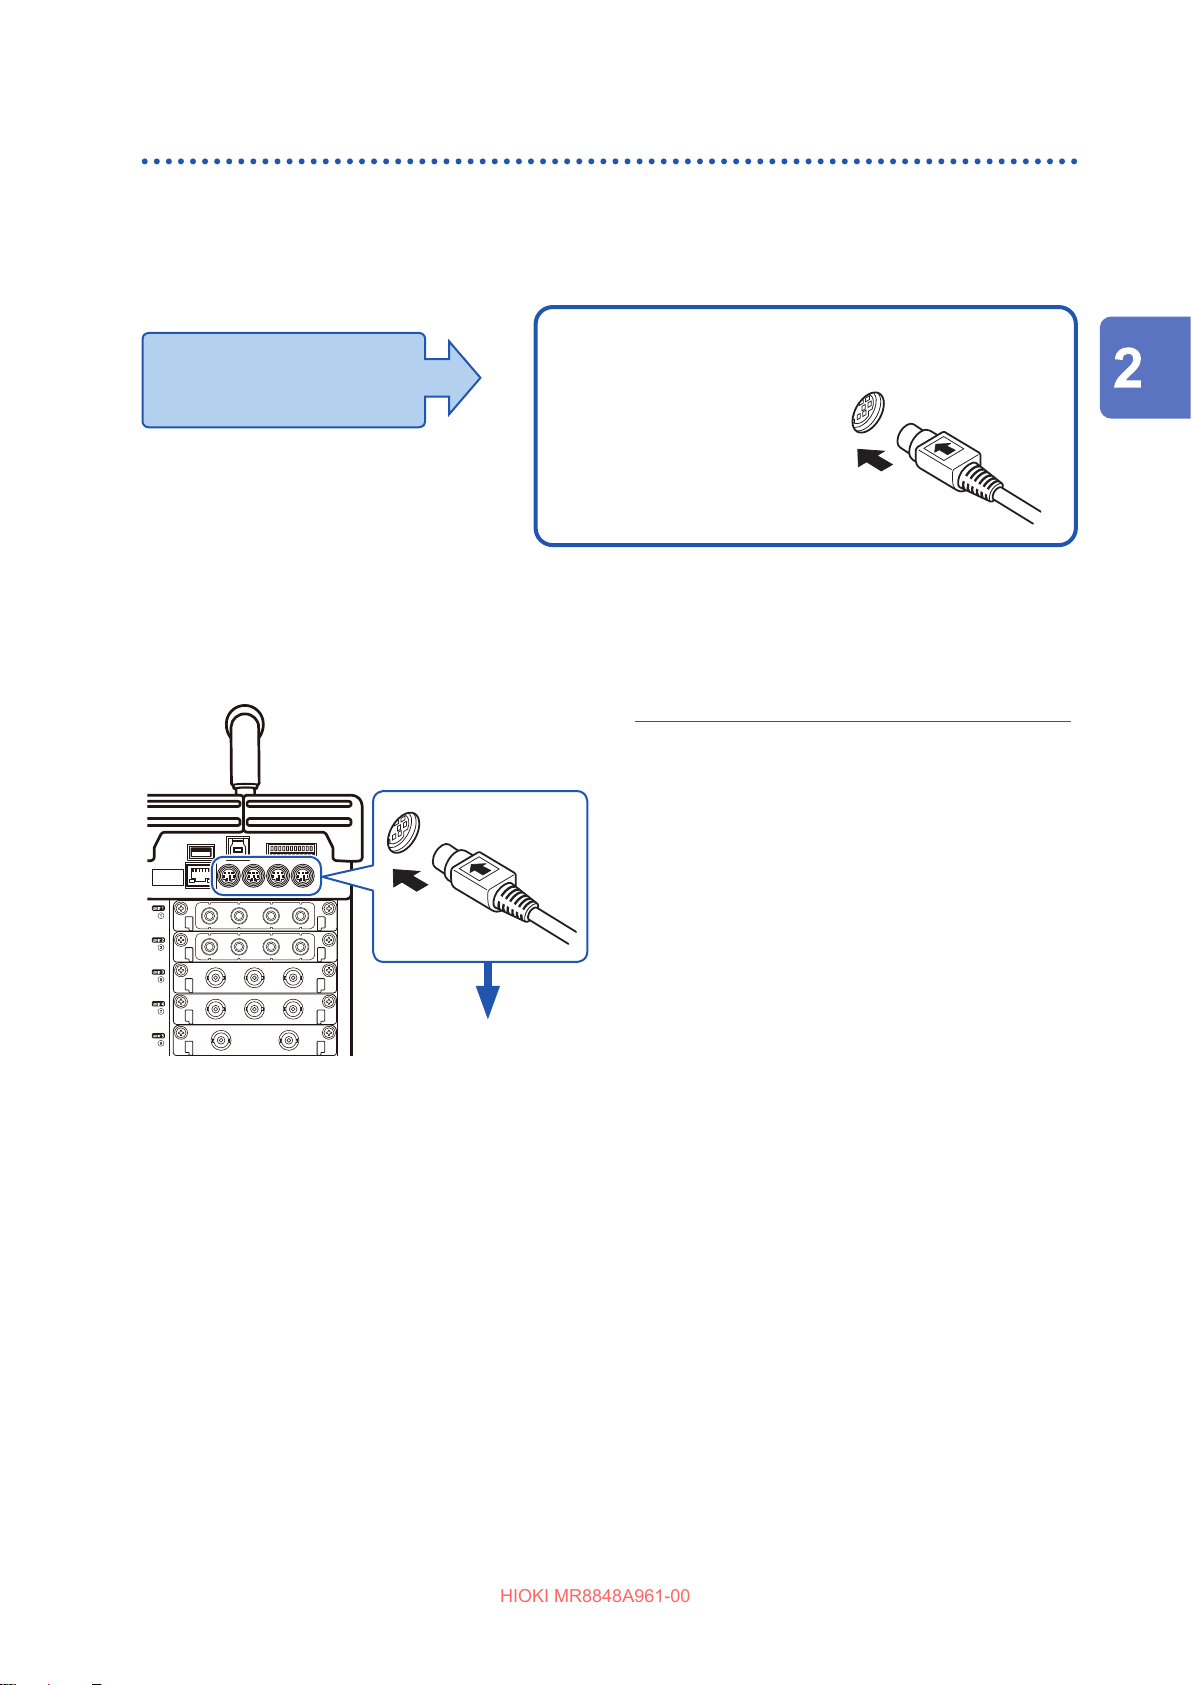
Attaching Connection Cords
HIOKI MR8848A961-00
Measuring logic signals
Read “Before connecting a logic probe to the measurement object” (p. 21) carefully.
For more information about logic probe specications, refer to the instruction manual of your logic
probe.
Applicable unit
• 8973 Logic Unit
• 9320-01 Logic Probe
• MR9321-01 Logic Probe
• 9327 Logic Probe
The logic channels LA through LD are
installed in the instrument.
The following logic probes can be
Connecting logic probes to the logic terminals
Example: Connecting the 9327 Logic Probe
Right side
Required items:
9327 Logic Probe
1
LOGIC terminals
2
1
connected to the unit.
LOGIC terminals
Preparing for Measurement
Aligning the plug slots of the logic
probe with a logic terminal, insert the
logic probe plug.
Connect the logic probe to a
measurement object.
Connect the
2
logic probes to
measurement objects.
51
Page 52
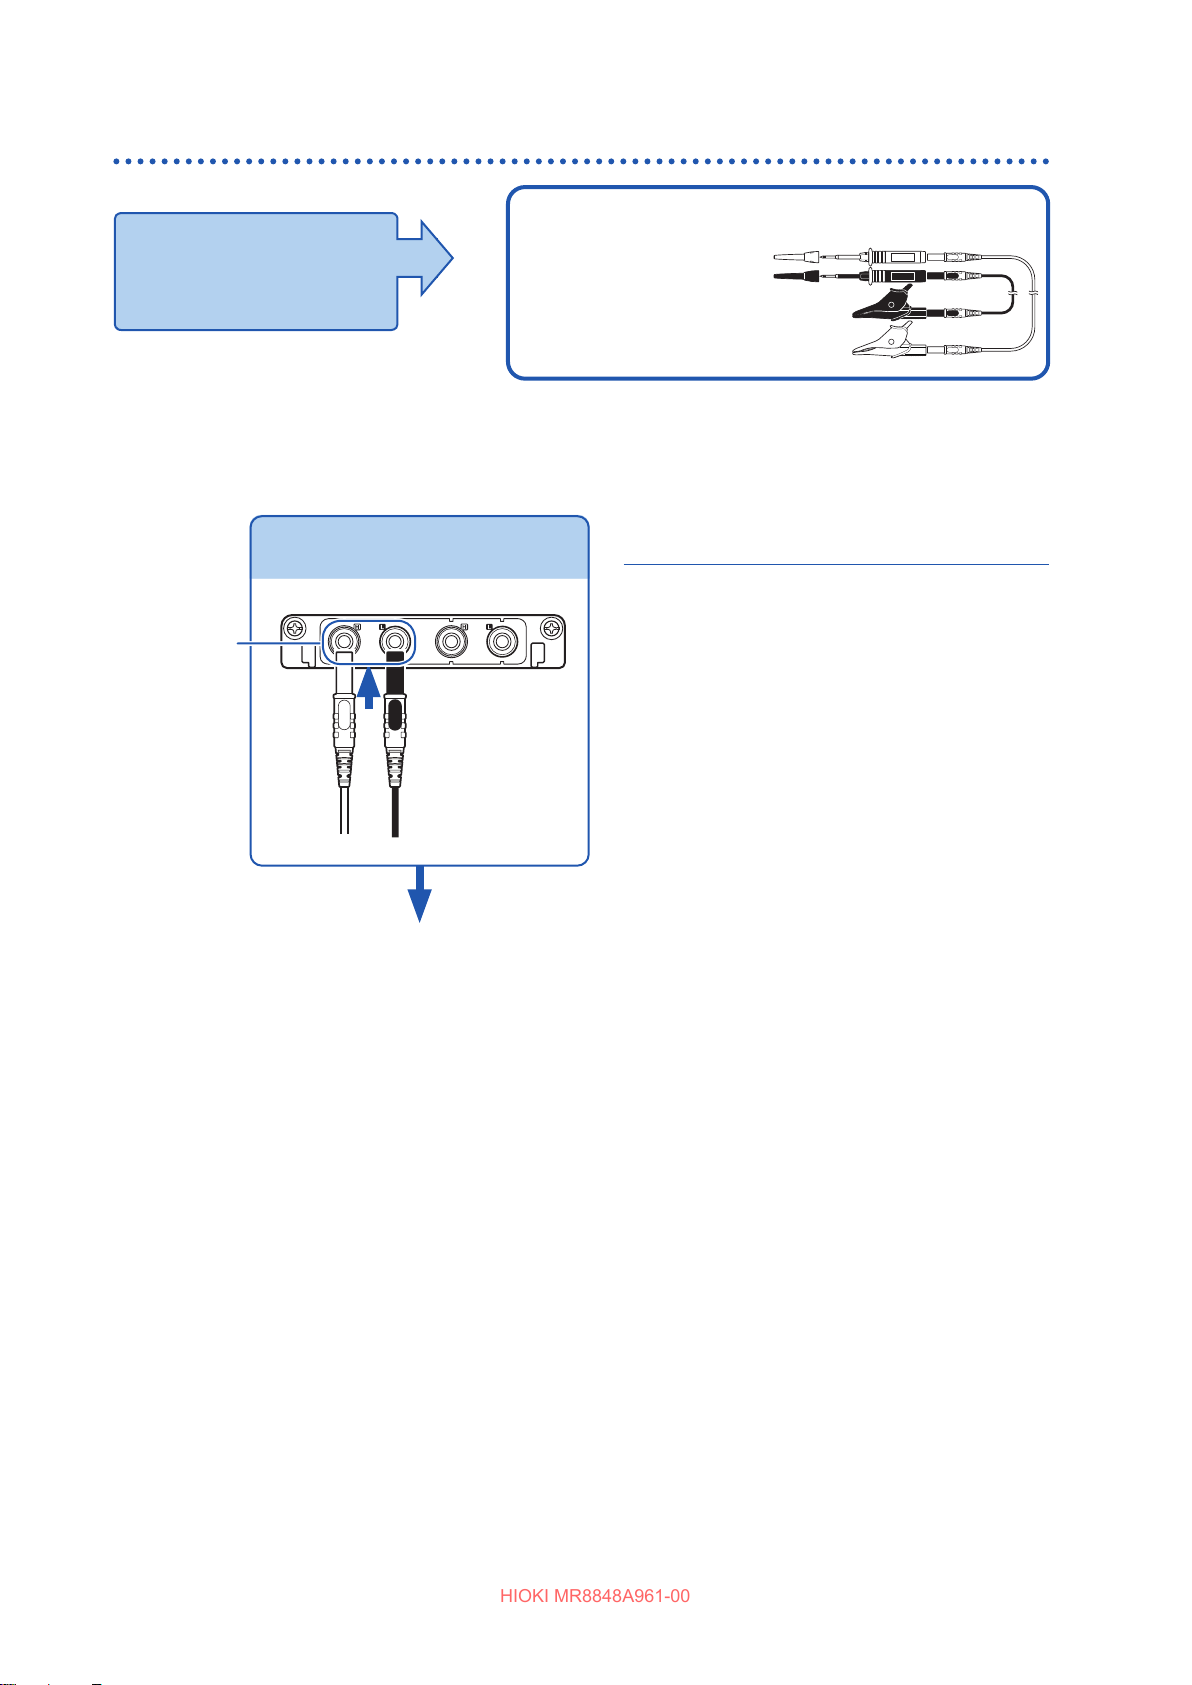
Attaching Connection Cords
HIOKI MR8848A961-00
Measuring voltage with a high degree of accuracy (digital voltmeter)
Applicable unit
• MR8990 Digital
Voltmeter Unit
Connect the test lead to the banana
terminals on the unit.
The following lead can be connected to the unit.
• L2200 Test Lead
(Maximum rated input
voltage: 1000 V)
Connecting test leads to the banana terminals
Connect the test leads
Banana
terminals
1
BlackRed
Required items: Test leads mentioned
above
Connect the test leads to the banana
1
terminals on the unit.
Connect the black lead to the L terminal;
and the red lead to the H terminal. Make
sure the test lead plugs are fully inserted
in the terminals.
Connect the test lead to a
2
measurement object.
Connect the test leads to a
2
measurement object.
52
Page 53
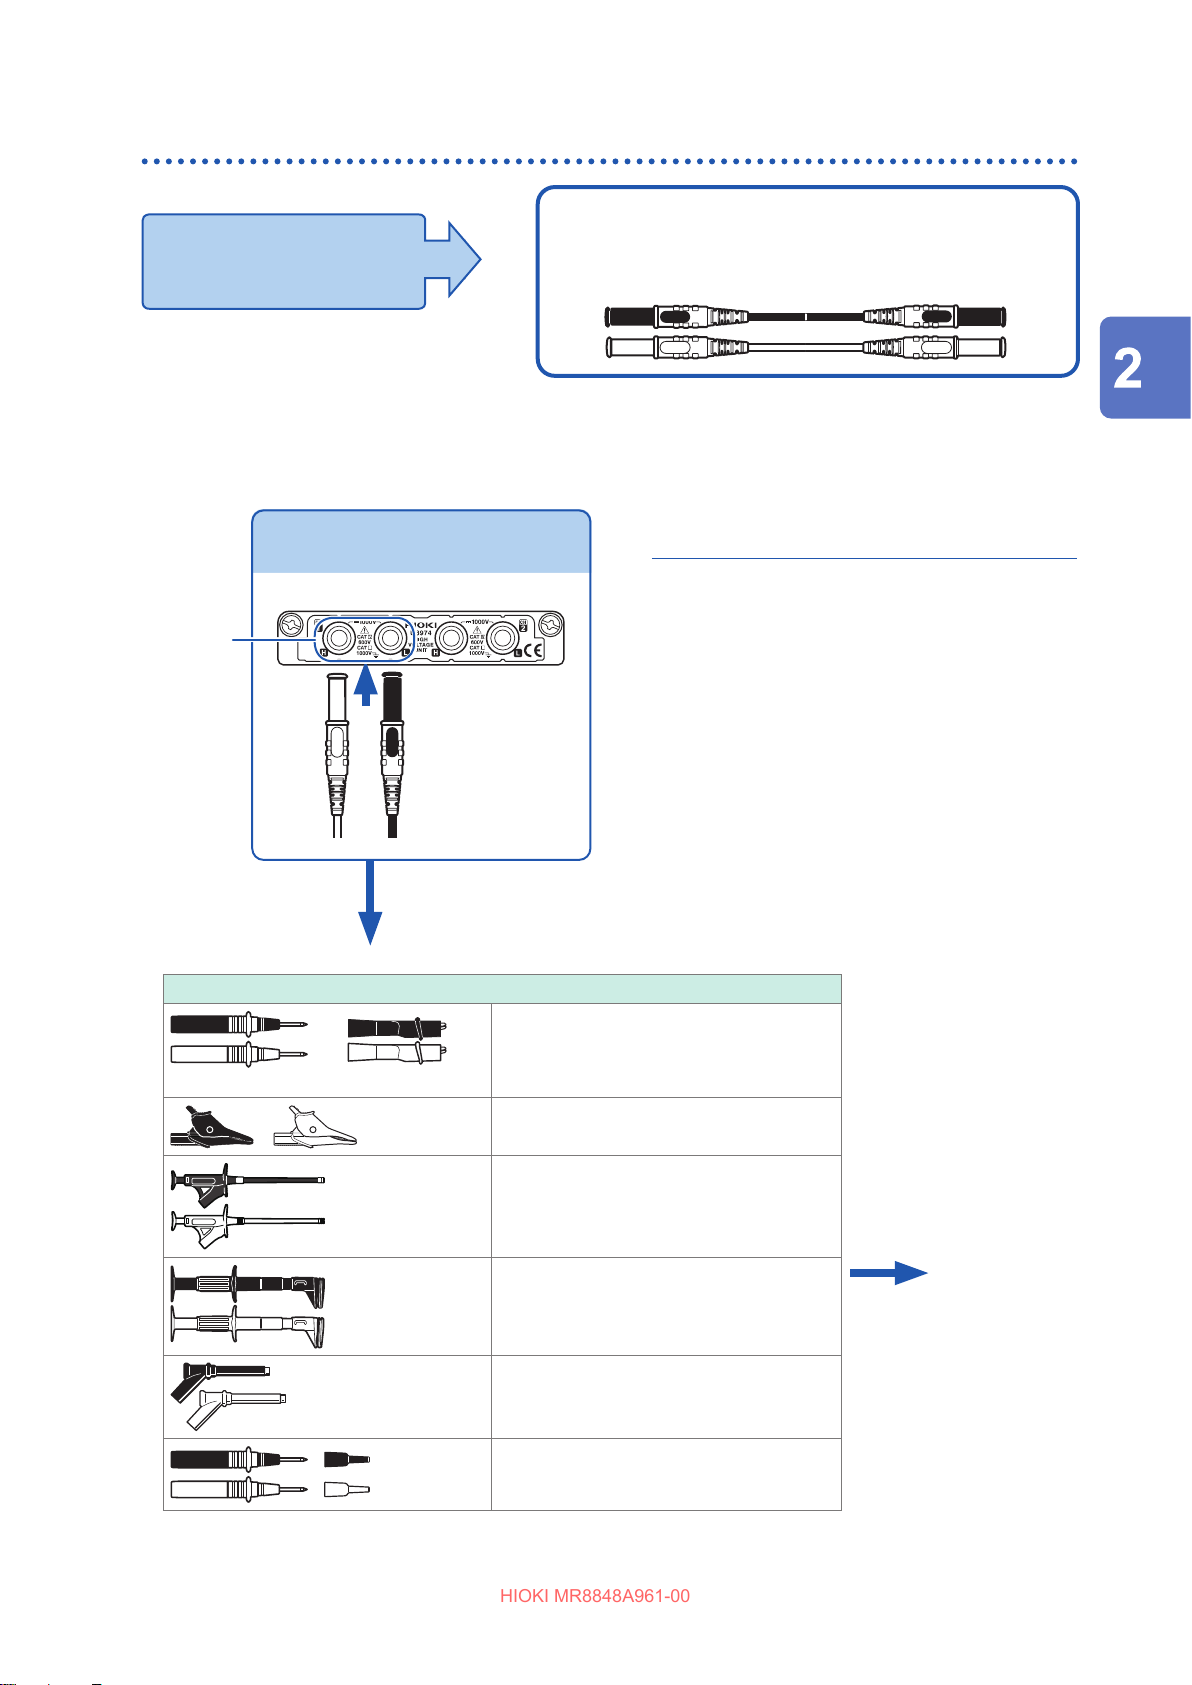
Measuring high voltage
HIOKI MR8848A961-00
The following cables can be connected to the unit.
Applicable unit
• U8974 High Voltage Unit
Connect the connection cable to the
banana terminals on the unit.
Connecting connection cables to the banana terminals
Connect the connection cable
Banana
terminals
• L4940 Connection Cable Set
(Maximum input voltage: 1000 V)
Required items: L4940 Connection Cable
Set
Connect the plugs of the connection
1
cord to banana terminals on the unit.
Connect each of the plugs to the banana
terminal in the same color.
Attaching Connection Cords
Preparing for Measurement
+
1
BlackRed
Connect the clips.
2
Accessory clips
L4934L4932
Insert accessory clips into another
2
side of the cord.
Connect the cord clips to a
3
measurement object.
1
L4934*
*1. The L4932 is required to use the
L4935 Alligator Clip Set
L9243 Grabber Clip
L4936 Bus Bar Clip Set
Small Alligator Clip Set
L4934.
Connect the clips
3
to a measurement
object.
L4937 Magnetic Adapter Set
L4932 Test Pin Set
53
Page 54
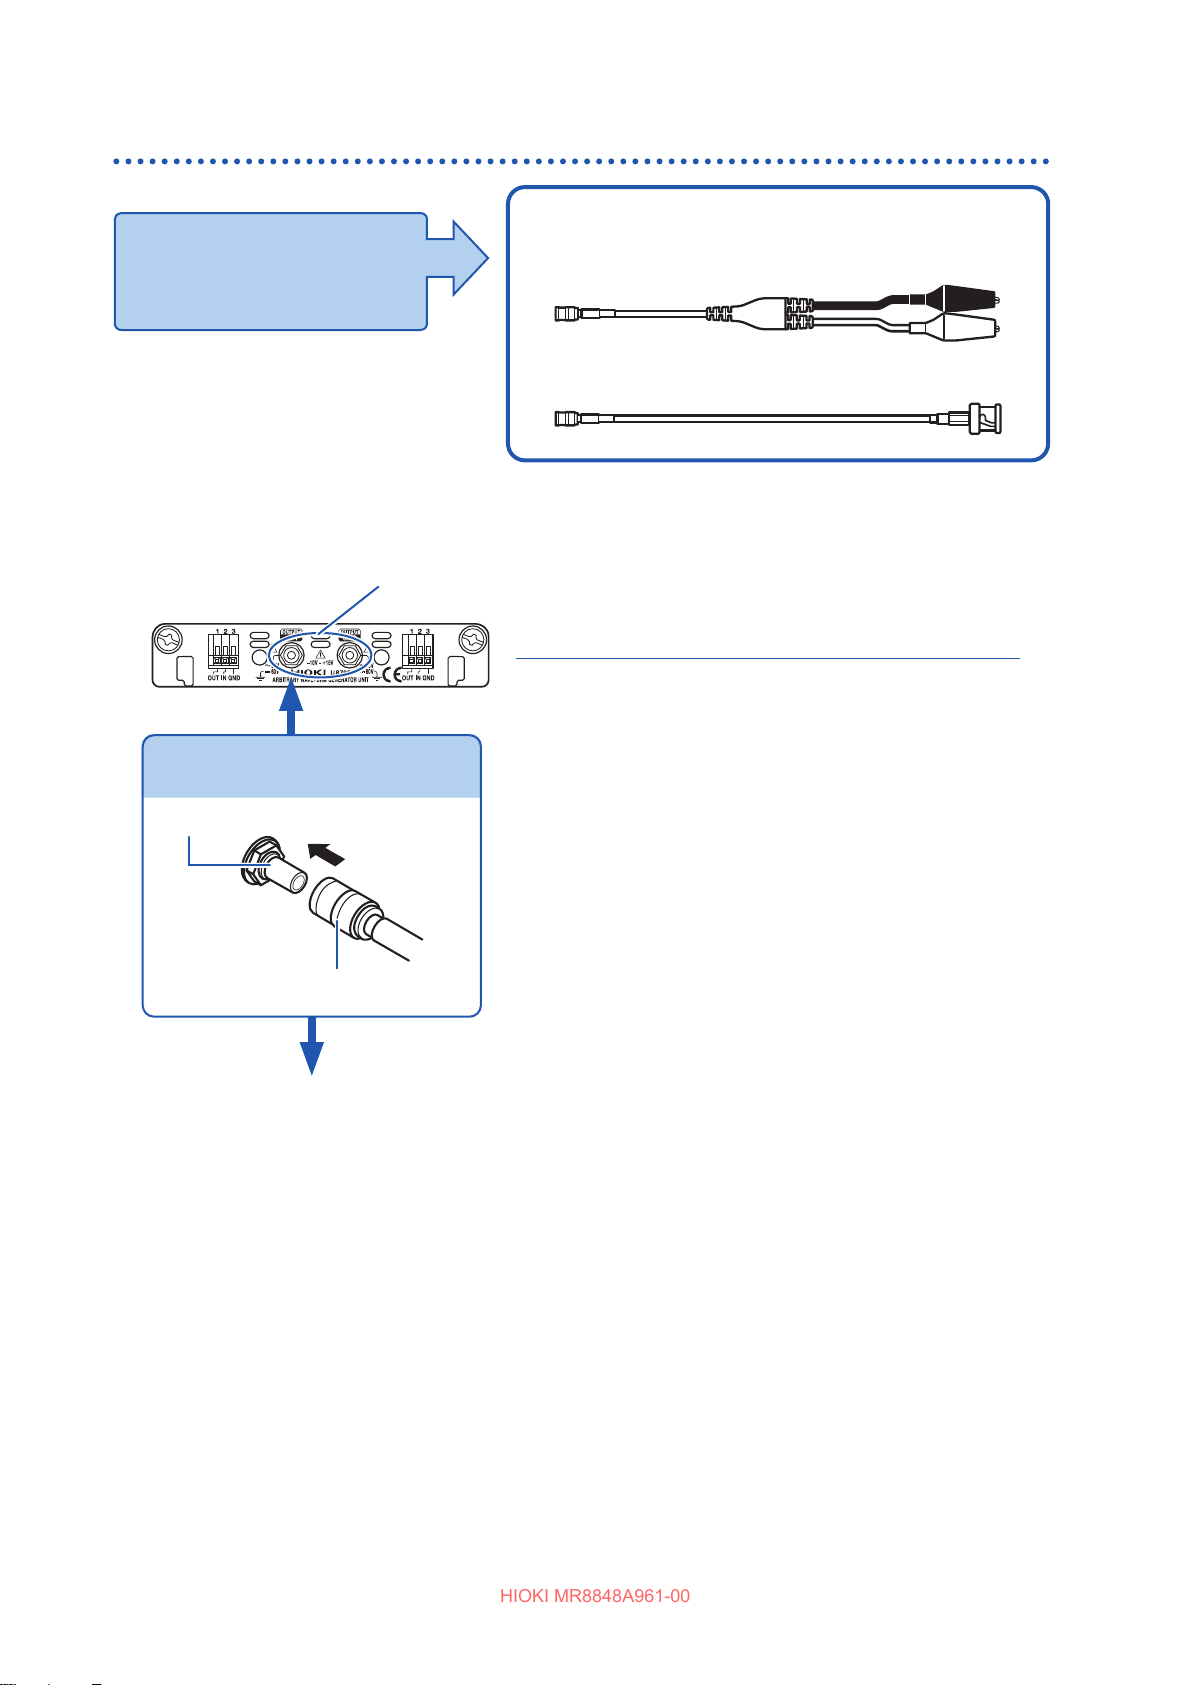
Attaching Connection Cords
HIOKI MR8848A961-00
Outputting waveforms
Applicable units
• U8793 Arbitrary Waveform
Generator Unit
• MR8790 Waveform Generator Unit
Connect the connection cable to the SMB
terminal of a unit.
The following cables can be connected to the unit.
• L9795-01 Connection Cable (Electrical clips)
• L9795-02 Connection Cable (BNC output)
Connecting a connection cable to the output terminals
Example: U8793
Output terminal
Required item: Connection cable mentioned above
Insert the SMB connector of connection cable
1
in the output terminal of the unit until it clicks.
Connect the cable clips to an object to which
2
Connect the connection cable
the instrument applies the waveform.
Output terminal
SMB connector
Connect the connection cable to
2
an object to which the instrument
applies the waveform.
1
To disconnect output connectors
Firmly pinch the head of the SMB connector (other than
the cable), and pull it out.
54
Page 55
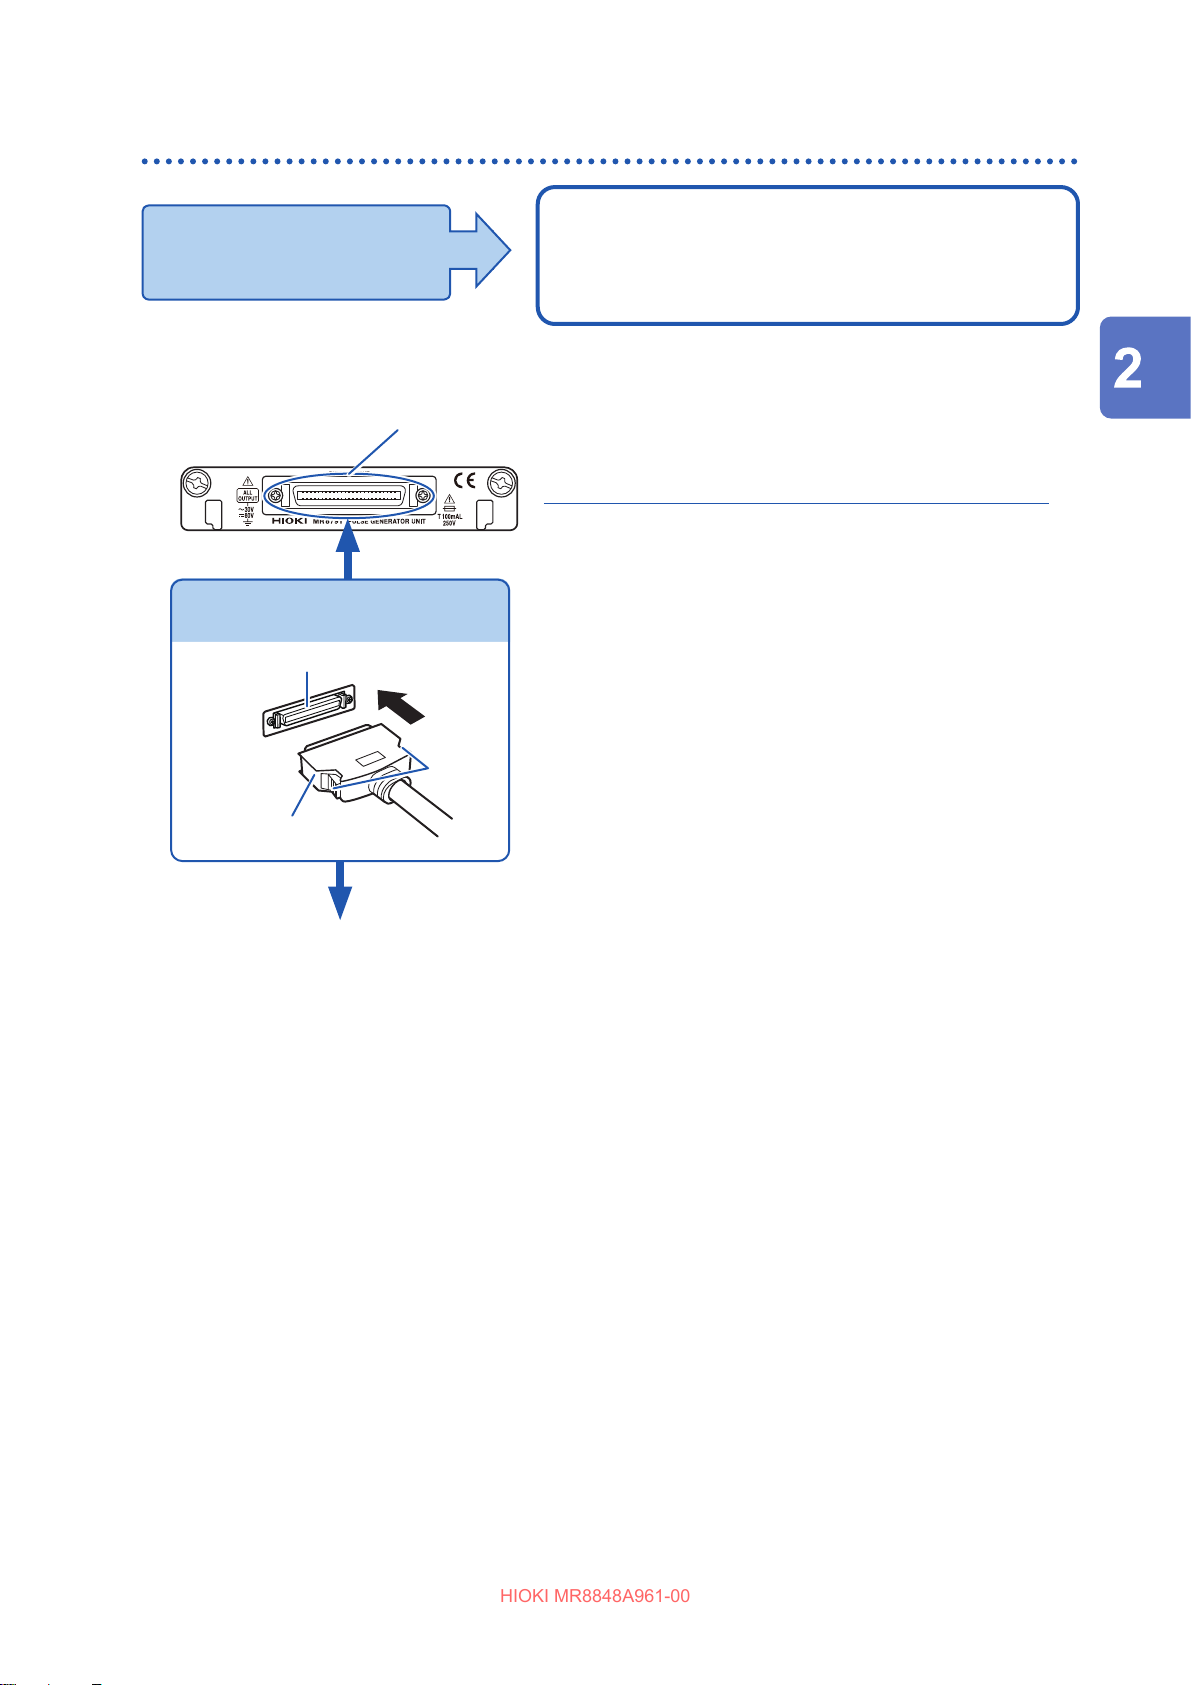
Outputting a pulse waveform
HIOKI MR8848A961-00
Attaching Connection Cords
Applicable unit
• MR8791 Pulse Generator Unit
The following cable can be connected to the unit.
Commercially available cable
(Half-pitch 50 pins)
Connecting a connection cable to the output connector
Output connector
Required items: Commercially available cable
Connect the connection cable to the output
1
connector of the unite.
Connect the connection cable to the object to
2
Connect the connection cable
Output connector
1
Buttons
which the instrument applies the waveform.
To disconnect output connectors
Pull the connector while depressing the buttons of the
connection cable.
Preparing for Measurement
Connection cable connector
Connect the connection cable to
2
an object to which the instrument
applies the waveform.
Output connector
10250-52A2PL: Sumitomo 3M products (SCSI-2 connector), (Centronics half-pitch 50 pins socket-
contact)
Refer to “Specications of output connector” (p. 424).
• The metal shell of the connector 10250-52A2PL has the same potential as the ground of the
instrument (frame ground).
• Use a lock-type connector for connecting a wire harness and the connector.
55
Page 56
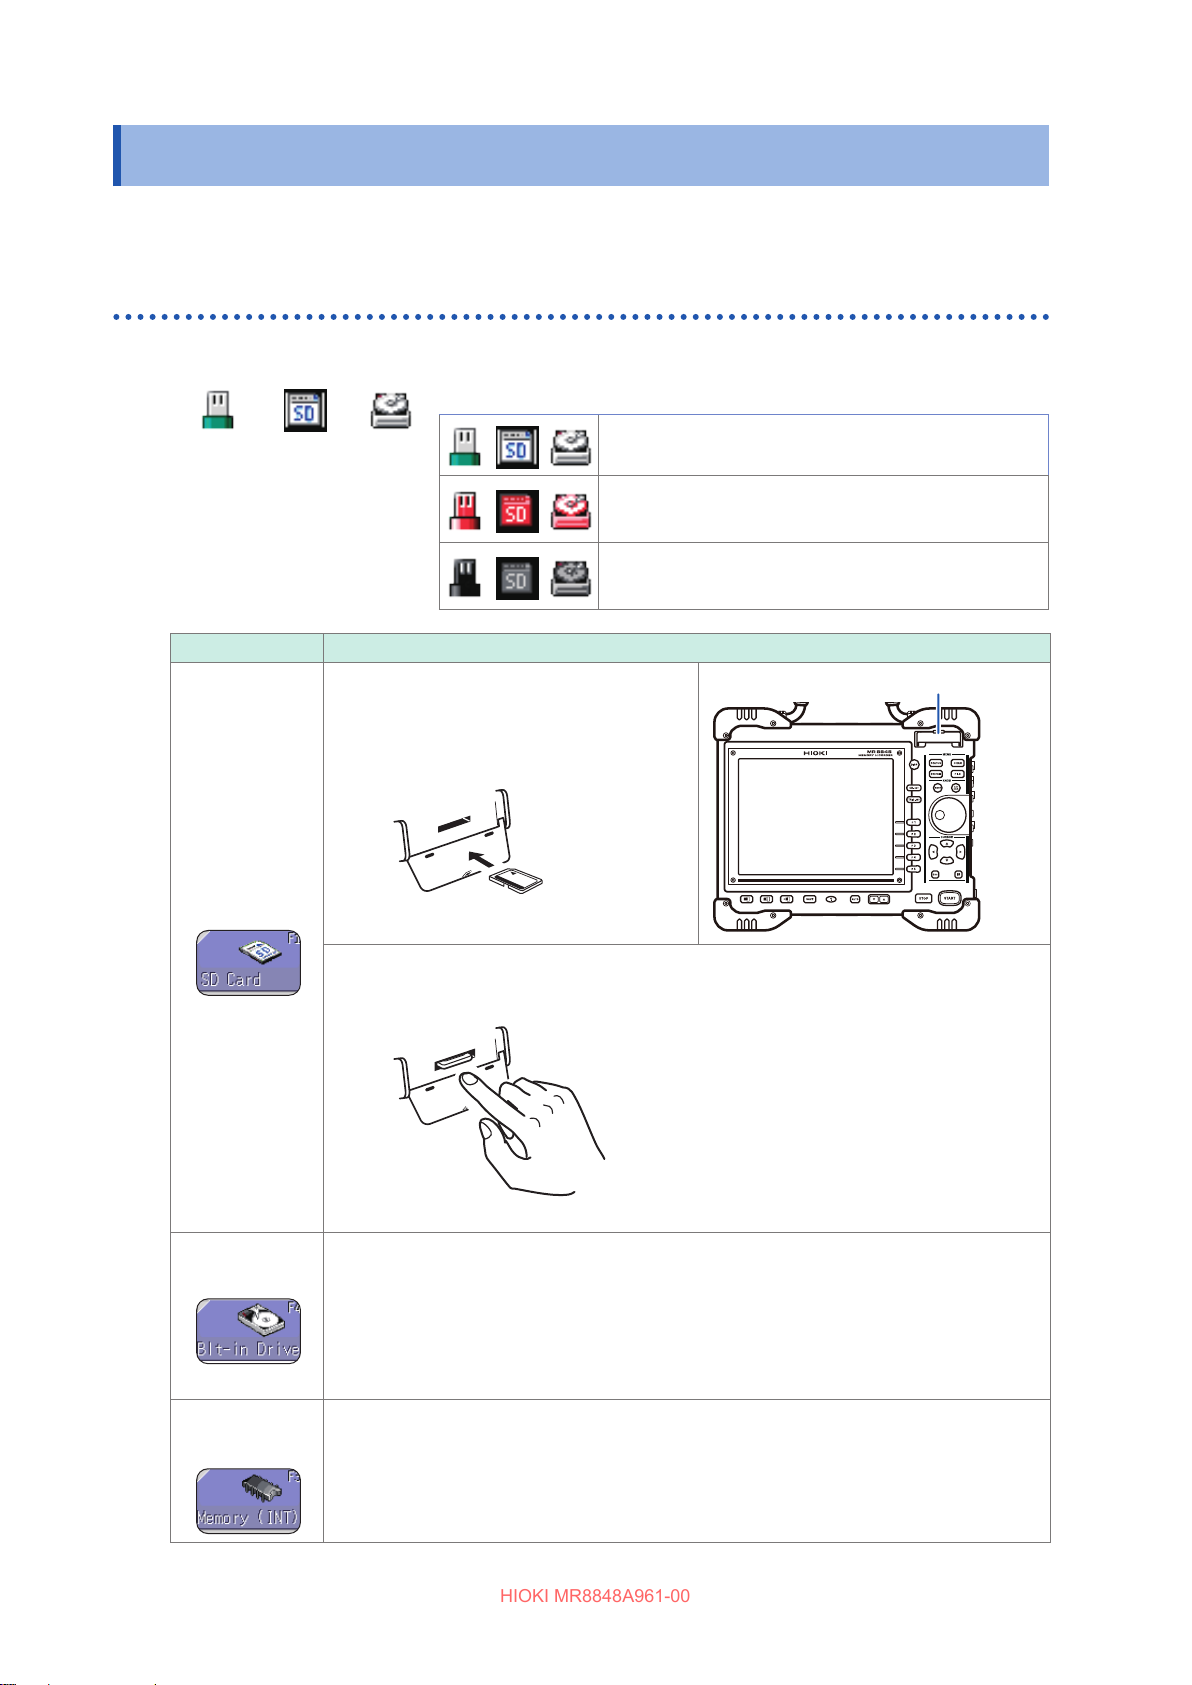
Preparing Storage Devices
HIOKI MR8848A961-00
2.3 Preparing Storage Devices
Read “Handling storage devices” (p. 19) carefully.
Available storage devices (inserting an SD card and a USB ash drive)
Storage device icon
The icons indicating the status of storage devices always appear at
the top of the screen.
USB
ash
drive
SD card Built-in
drive
Storage devices are inserted.
Storage devices are inserted and selected as the
save destination. (Shown in red)
Storage devices are not inserted, however, they are
selected as the save destination. (Shown in black)
Storage device How to insert devices, notes
Insert an SD card
Fully insert an SD card with the top facing
upward and the mark (p) pointing toward
the slot.
SD card
SD card slotFront side
Built-in drive
Memory (INT)
(RAM)
To remove the SD card
Fully insert the SD card. When the SD card pops out of the slot, pull it out.
U8334 Internal Storage (storage capacity: 1 TB*, 1 TB = 1,000,000,000,000 bytes)
* After formatting the drive, its capacity is decreased to less than 1 TB, which is an
actually available capacity.
The optional U8334 Internal Storage (factory option) is required.
The hard disk has been formatted to the factory-default settings during the production
process.
• The memory installed in the instrument is available. Only settings les can be written in
the memory.
• Automatic writing of data is not possible.
56
Page 57
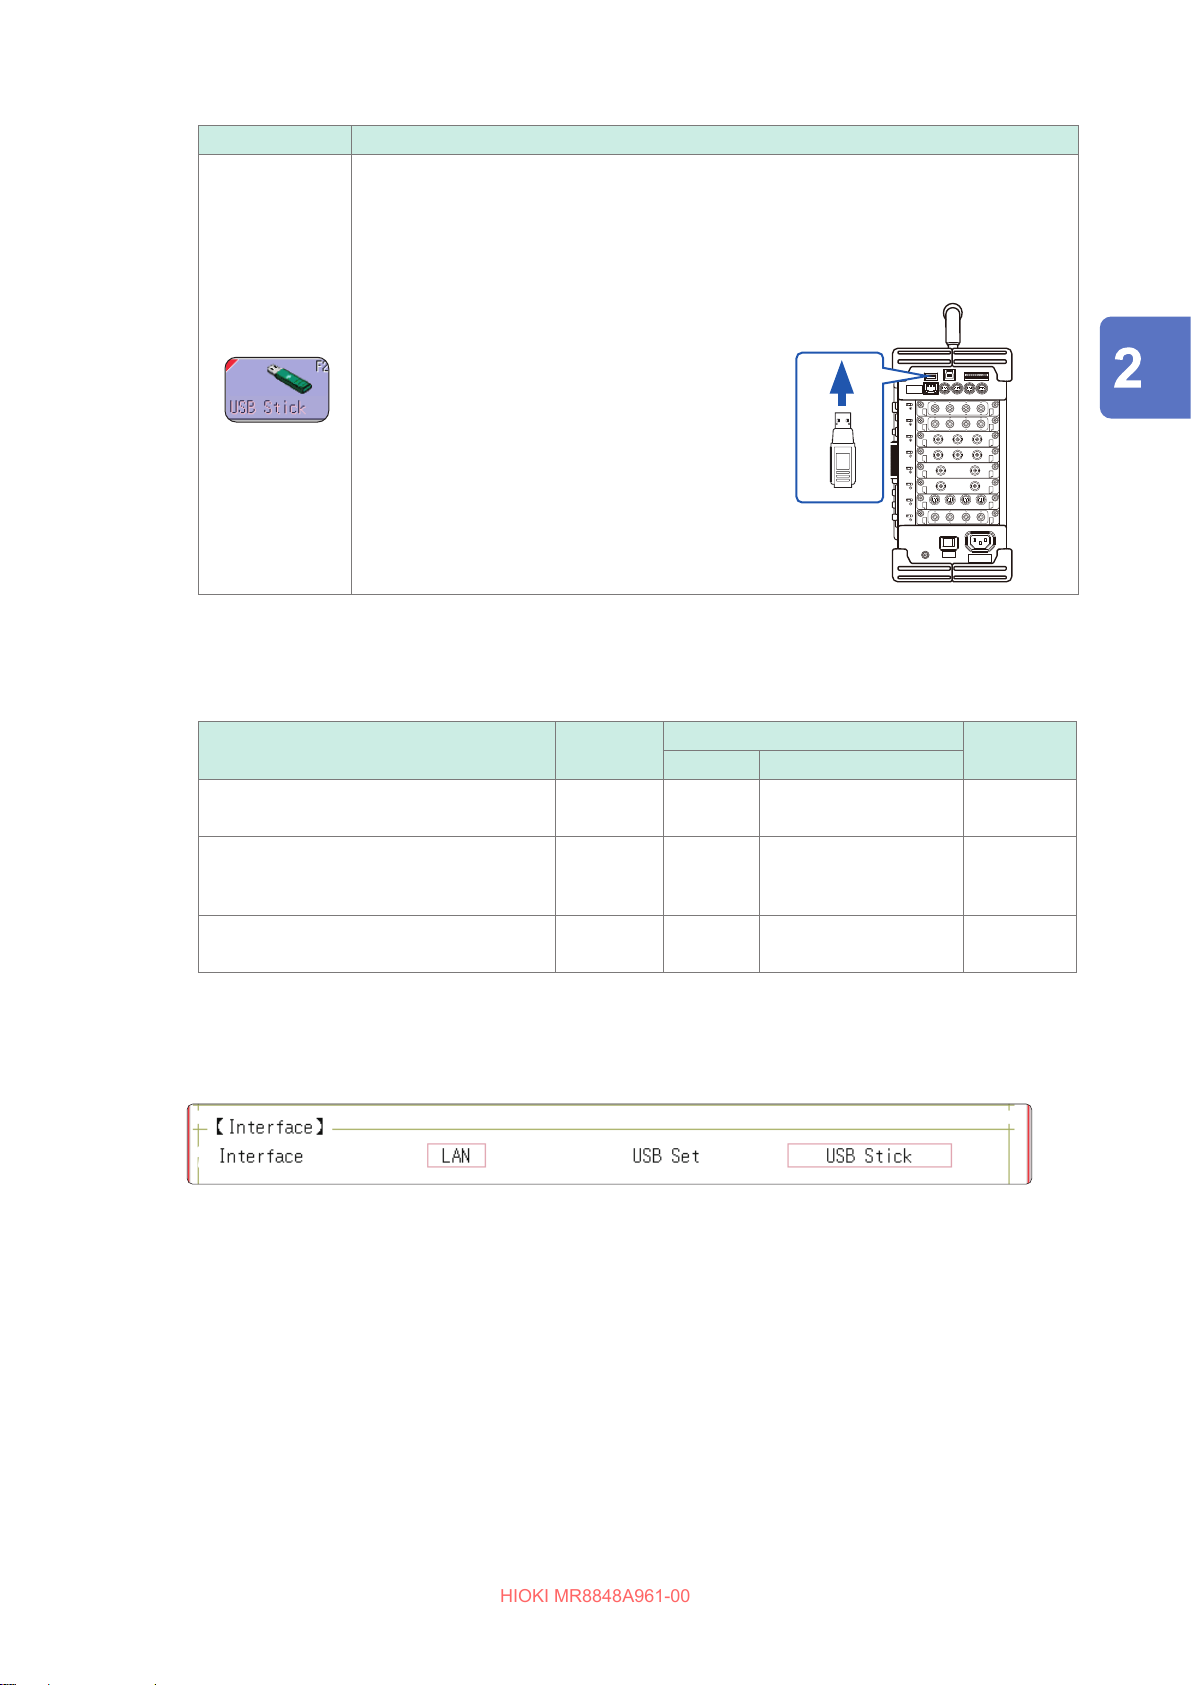
Storage device How to insert devices, notes
HIOKI MR8848A961-00
• Do not connect any devices other than USB ash drives.
• The instrument does not support all commercially available USB ash drives.
• To use a USB ash drive, you have to congure the setting on the instrument. See the
procedure described on the following page.
Preparing Storage Devices
Inserting a USB ash drive
Orient the USB ash drive and insert it all the
way into the connector.
USB Stick
Removing the USB ash drive
Make sure that the instrument is not
accessing the USB ash drive (for saving
or loading data, etc.), and then remove the
USB ash drive.
No operation is required on the instrument.
Right side
USB connector
(Type A)
Depending on the intended use of the USB ash drive, connector types and settings on the
instrument dier.
USB usage
Using a USB ash drive Type A LAN USB ash drive “Procedure”
Connector
Instrument settings
Interface USB setting
Reference
information
(p. 57)
Preparing for Measurement
Retrieving les saved on an SD card or
the built-in drive with a computer (via a
USB cable)
Operating the instrument from a computer
(via a USB cable)
Type B LAN Mass storage SSD,
Mass storage SD
Type B USB Interface p. 370
p. 368
Procedure
To display the screen: Press the SYSTEM key several times to display the [Interface] sheet on the system screen.
1 2
Move the cursor to the [Interface] box, and select [LAN].
1
Move the cursor to the [USB Set] box, and then select [USB Stick].
2
57
Page 58
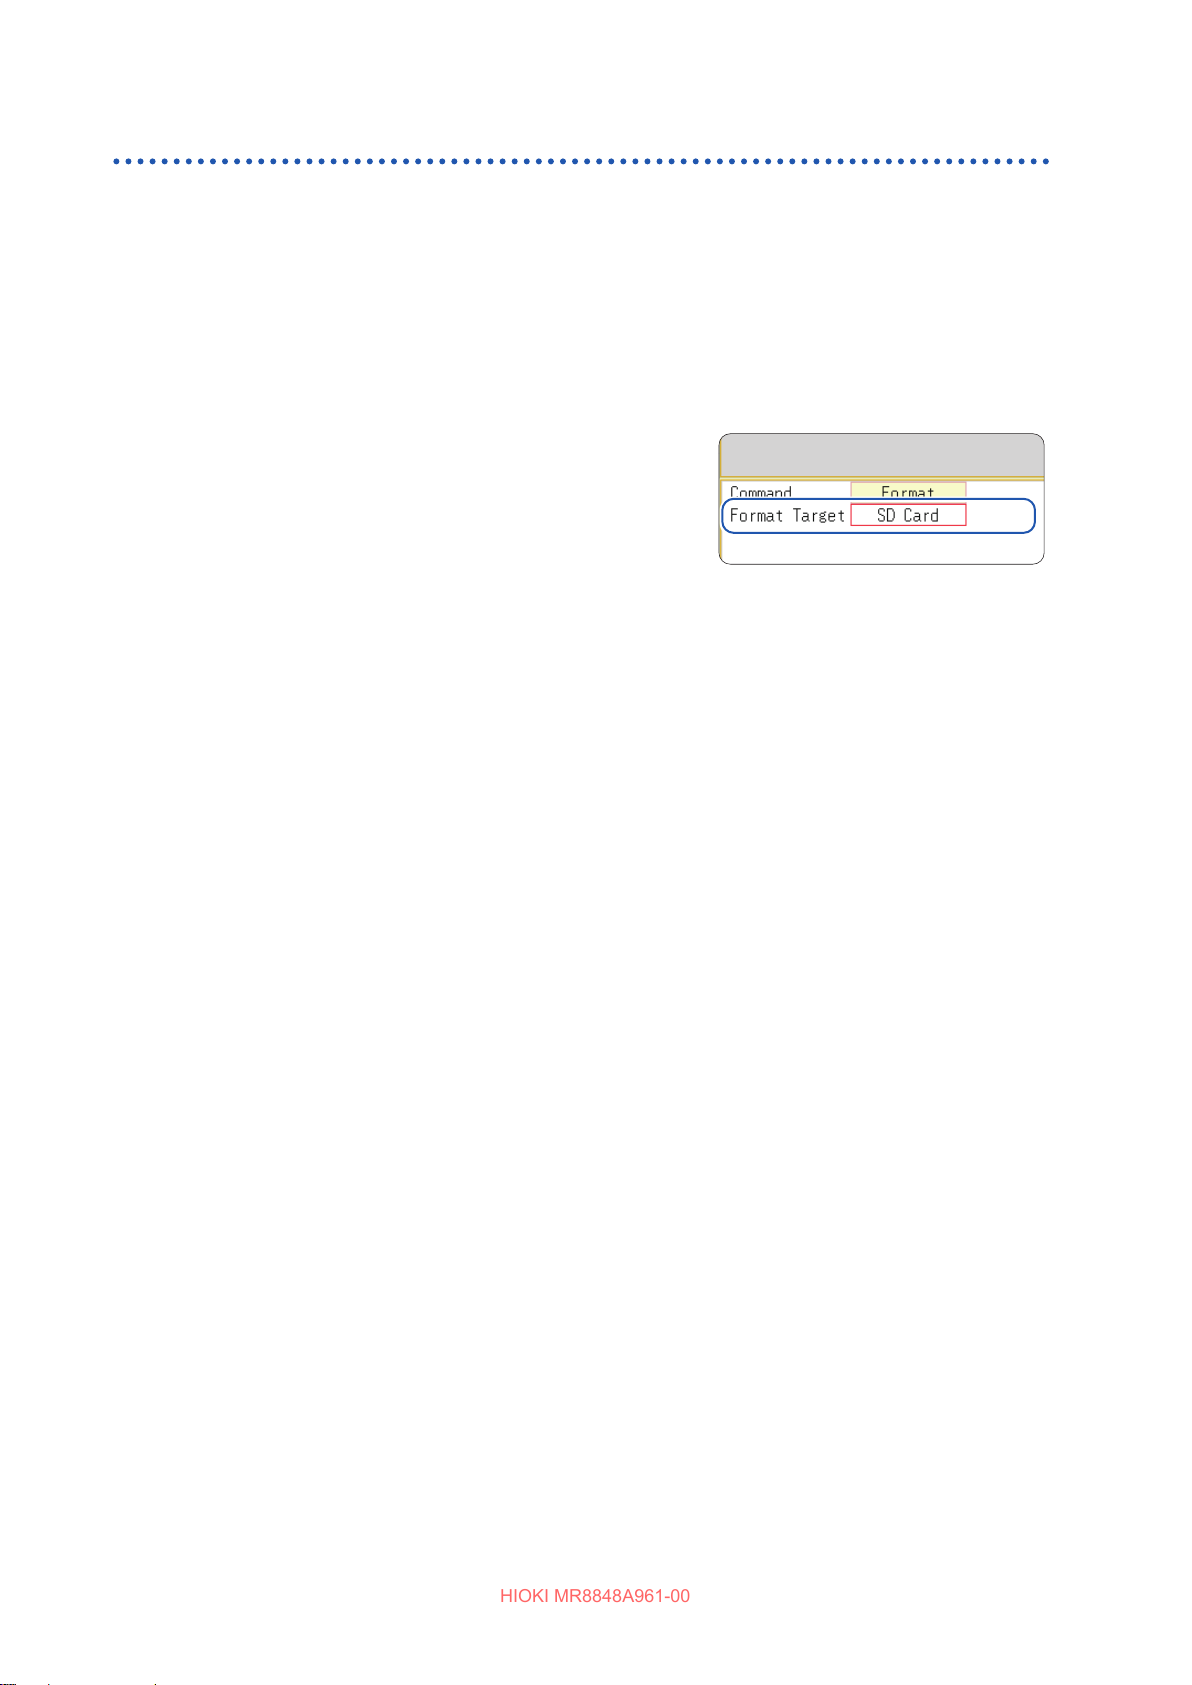
Preparing Storage Devices
HIOKI MR8848A961-00
Formatting storage devices
The instrument can format SD cards, USB ash drives, the built-in drive, and the internal memory.
Once they are formatted, the [HIOKI_MR8848] folder is created.
Note that formatting a storage device deletes all the information on the storage device, and the
deleted information is unrecoverable.
Procedure
To display the screen: Press the FILE key to display the le screen.
Insert a storage device.
1
Select [Next Page].
2
Select [Format].
The cursor is placed on the [Format Target] box.
Select a storage device to be formatted, and then select
3
[Exec].
The specied storage device is formatted.
A conrmation window is displayed. Select [YES] to proceed
the formatting action.
Select [No] to cancel the formatting action.
58
Page 59
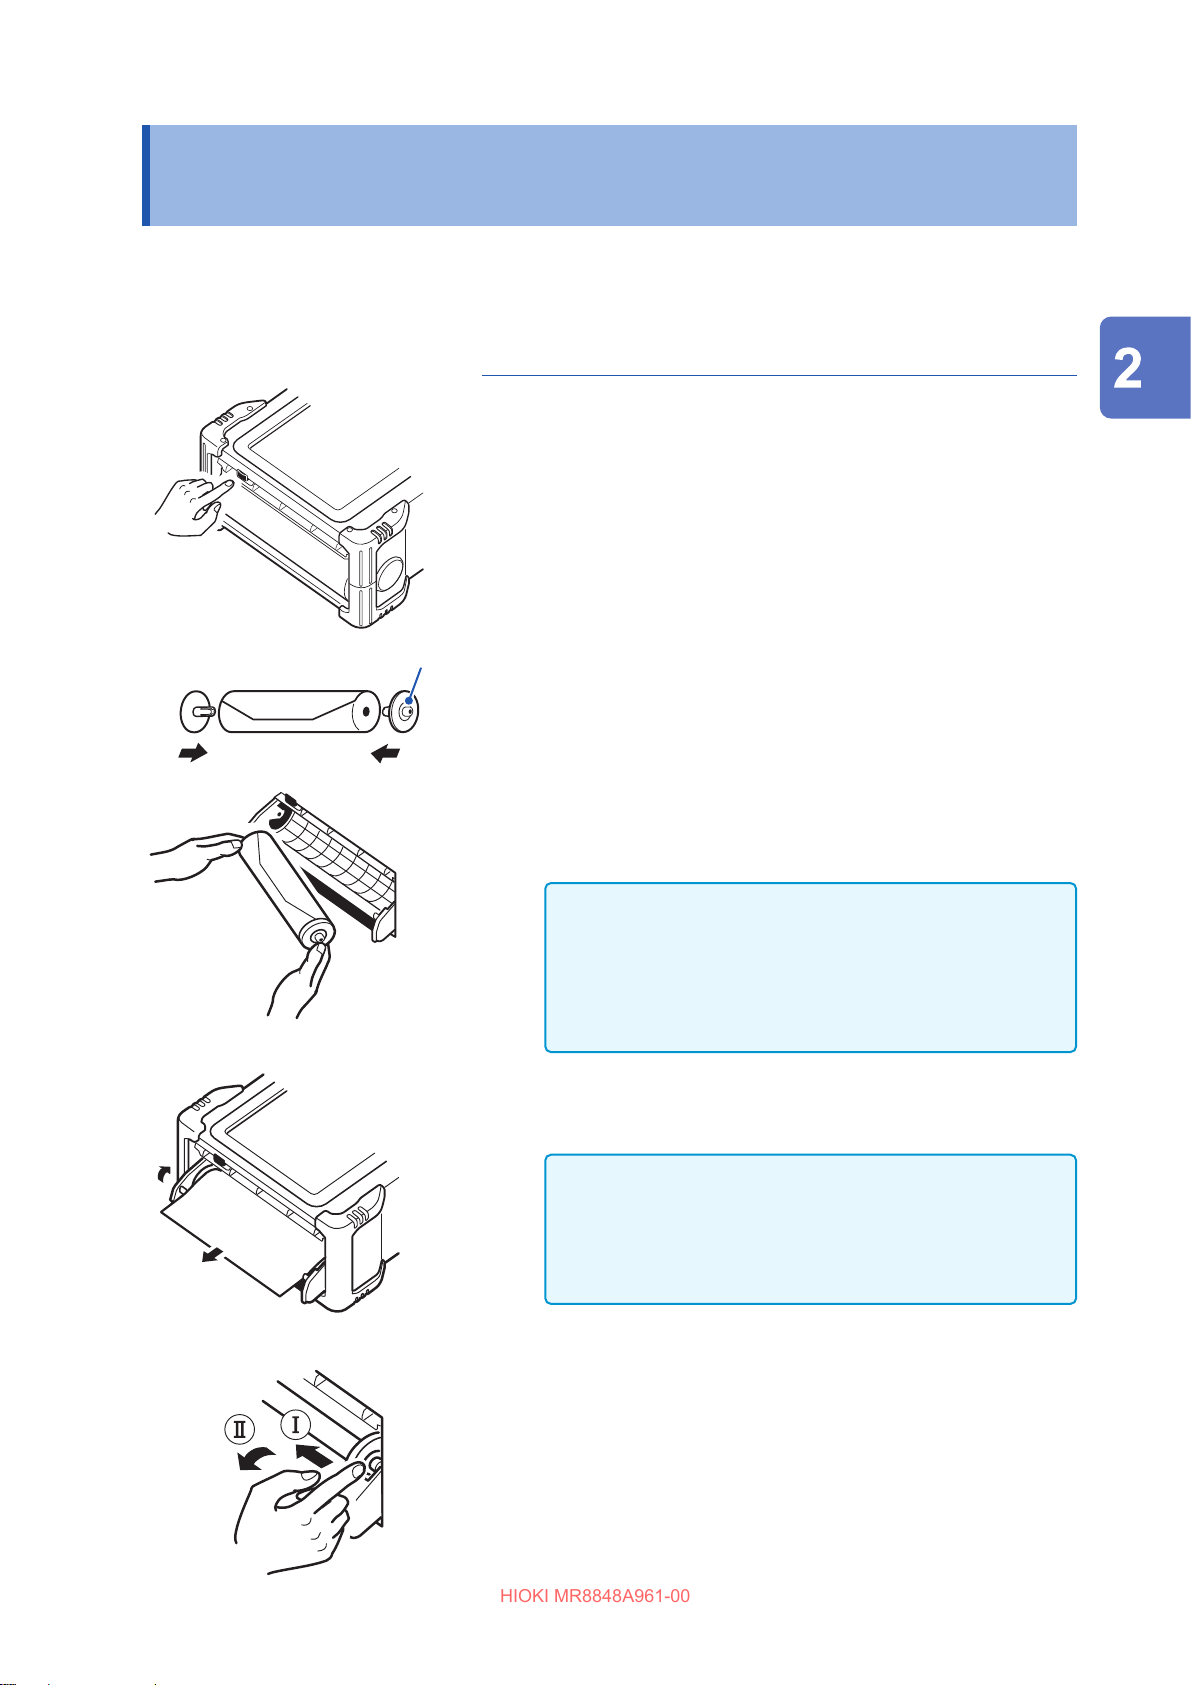
Loading Recording Paper (When U8351 Printer Unit is Installed)
HIOKI MR8848A961-00
2.4 Loading Recording Paper (When U8351 Printer Unit is Installed)
Read “Handling the printer and the recording paper” (p. 18) carefully.
Procedure
Required items: 9231 Recording Paper, Paper roll axles
(accessory)
Press the button to open the printer cover.
1
Preparing for Measurement
Paper roll axle
Insert the paper roll axles into the core of the 9231
2
Recording Paper.
Put the paper into the holder.
3
Insert rst the left side of the paper into the holder, and then, until
the holder clicks, put the paper into the holder while pressing the
paper leftward.
Face the print side of the paper upward. Printing is not
possible if the front and back of the recording paper are
reversed.
If the recording paper is put in the holder without the
paper roll axle installed, the printer cover cannot be open,
resulting in damage to the printer.
Pull out the edge of the paper toward yourself, and
4
close the printer cover while applying the face of the
paper to the cover’s side surface.
The surface of the paper may become sticky due to the
residue left behind by the adhesive tape, with the result
that the printing on that area becomes unprintable. Unroll
approximately the rst 200 mm of paper before inserting it
into the printer.
How to withdraw the recording paper
As shown in the left gure, withdraw the paper while pressing the
paper roll axle leftward.
59
Page 60
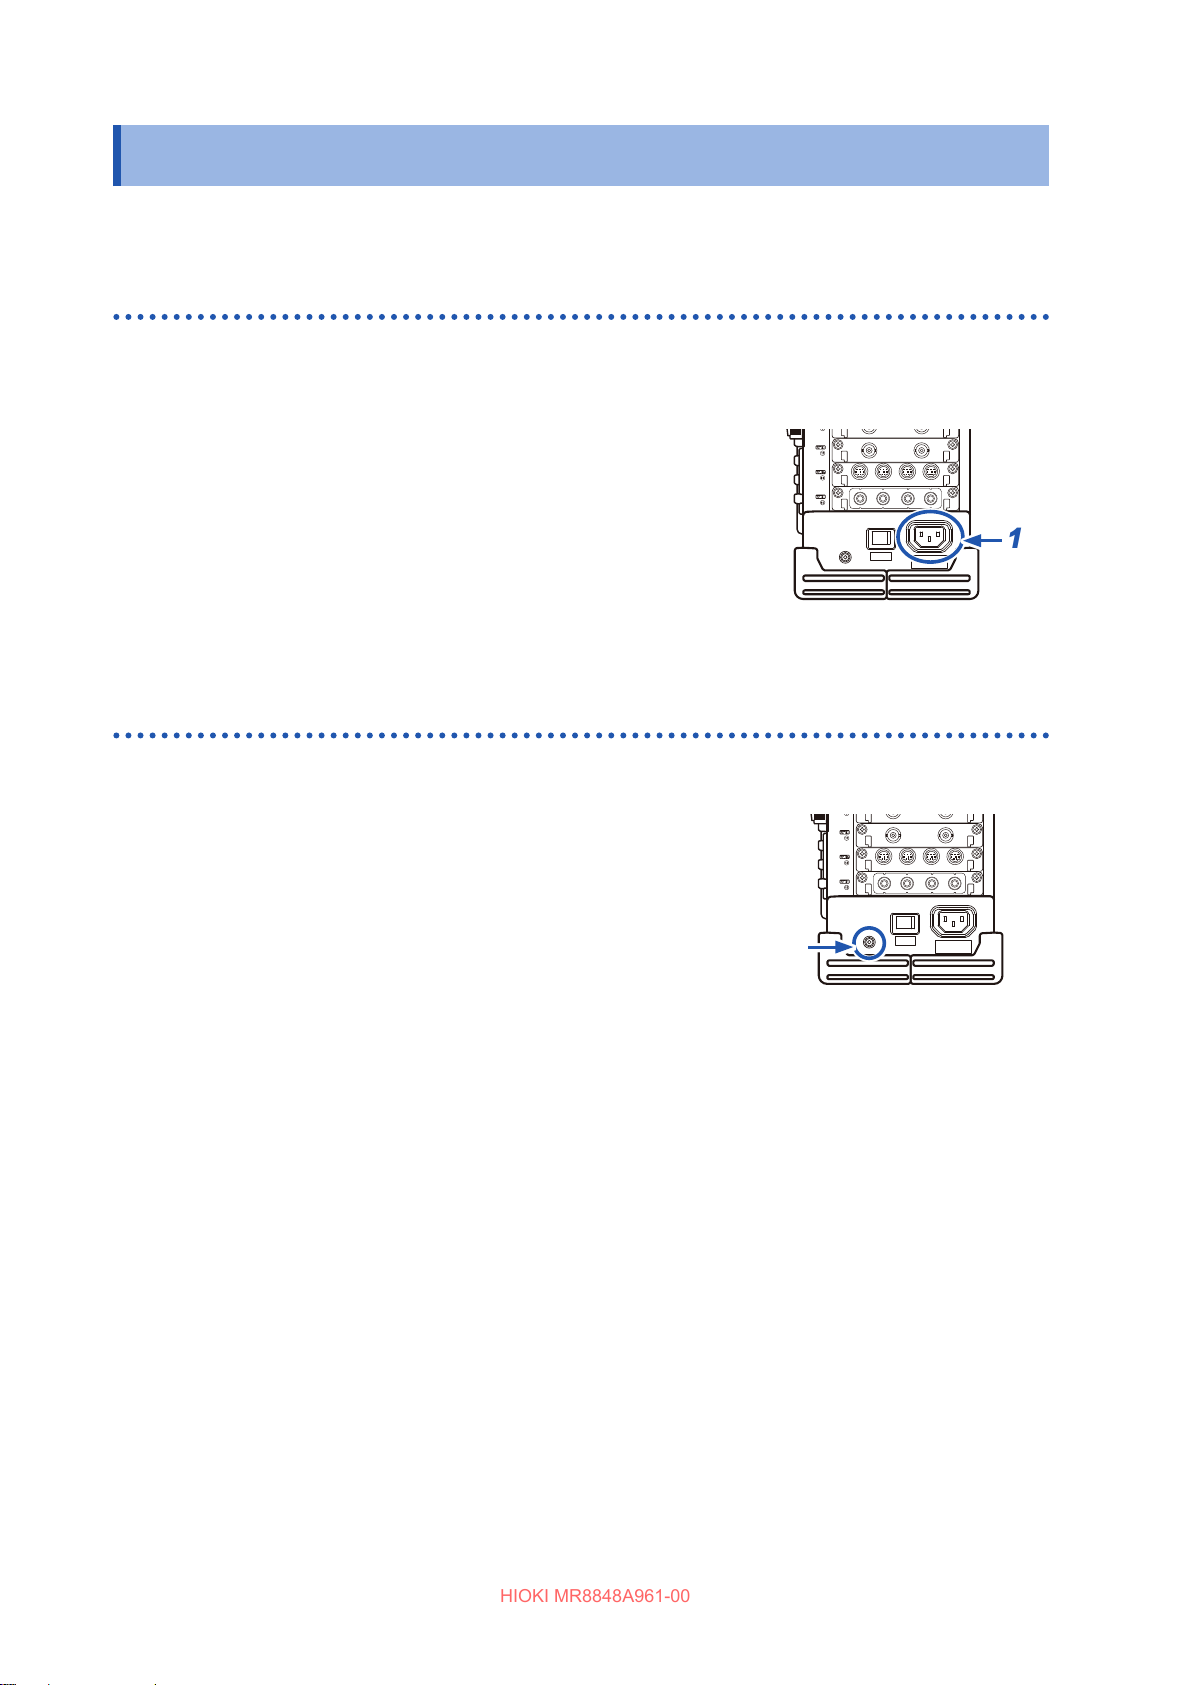
Supplying Power
HIOKI MR8848A961-00
2.5 Supplying Power
Read “Before turning on the instrument” (p. 21) carefully.
Connecting the power cord
Procedure
Connect the power cord to the power inlet on the instrument.
1
Plug the power cord into the mains outlet.
2
Right side
1
Connecting an earthing wire to the GND terminal (functional earth terminal)
When performing measurement in a noisy environment, you can
improve the noise immunity by connecting an earthing wire to the GND
terminal (functional earth terminal).
When using a potential transformer (PT) for AC power line measurement
or others, connect an earthing wire to the GND terminal of the PT.
Right side
60
Page 61
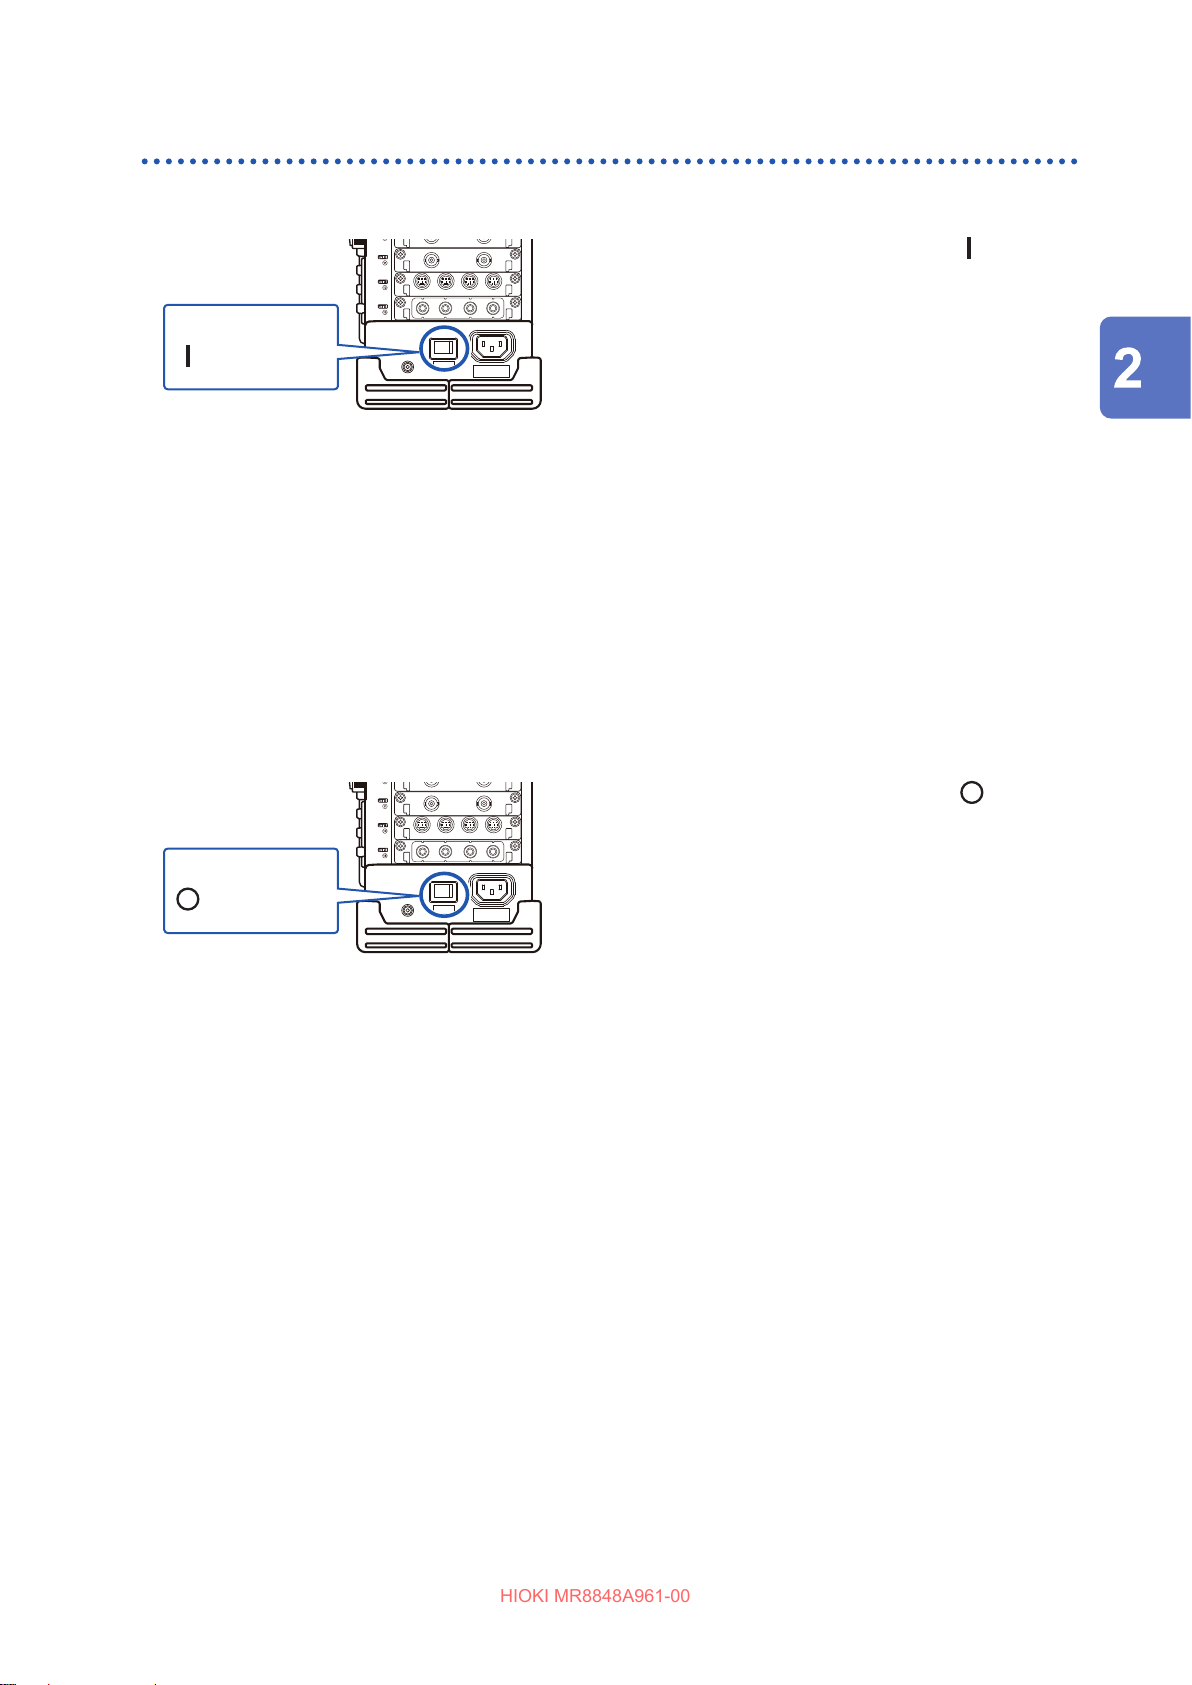
Turning on and o the instrument
HIOKI MR8848A961-00
Turning on the Instrument
Supplying Power
Right side
Power switch
: On
Before starting measurement
To perform precise measurement, warm up the instrument about 30 minutes after turning on the
instrument to stabilize the internal temperature of the units. After warm-up, perform zero adjustment
before performing measurement.
Set the power switch in the on position ( ).
The splash screen is displayed rst, and then the
waveform screen is displayed.
Turning o the instrument
Before turning o the instrument
When the instrument is turned o, data recorded in the internal memory is deleted. When you do
not want to lose recorded data, save it rst to an SD card or an external storage device.
Refer to “5 Saving/Loading Data and Managing Files” (p. 97).
Right side
Set the power switch in the o position ( ).
Preparing for Measurement
Power switch
: O
The instrument is turned o.
After the instrument is turned on again, the display is
displayed with the same settings as when the instrument
was turned o last time.
When the auto-setup function is enabled, settings are
read and congured automatically. (p. 123)
61
Page 62
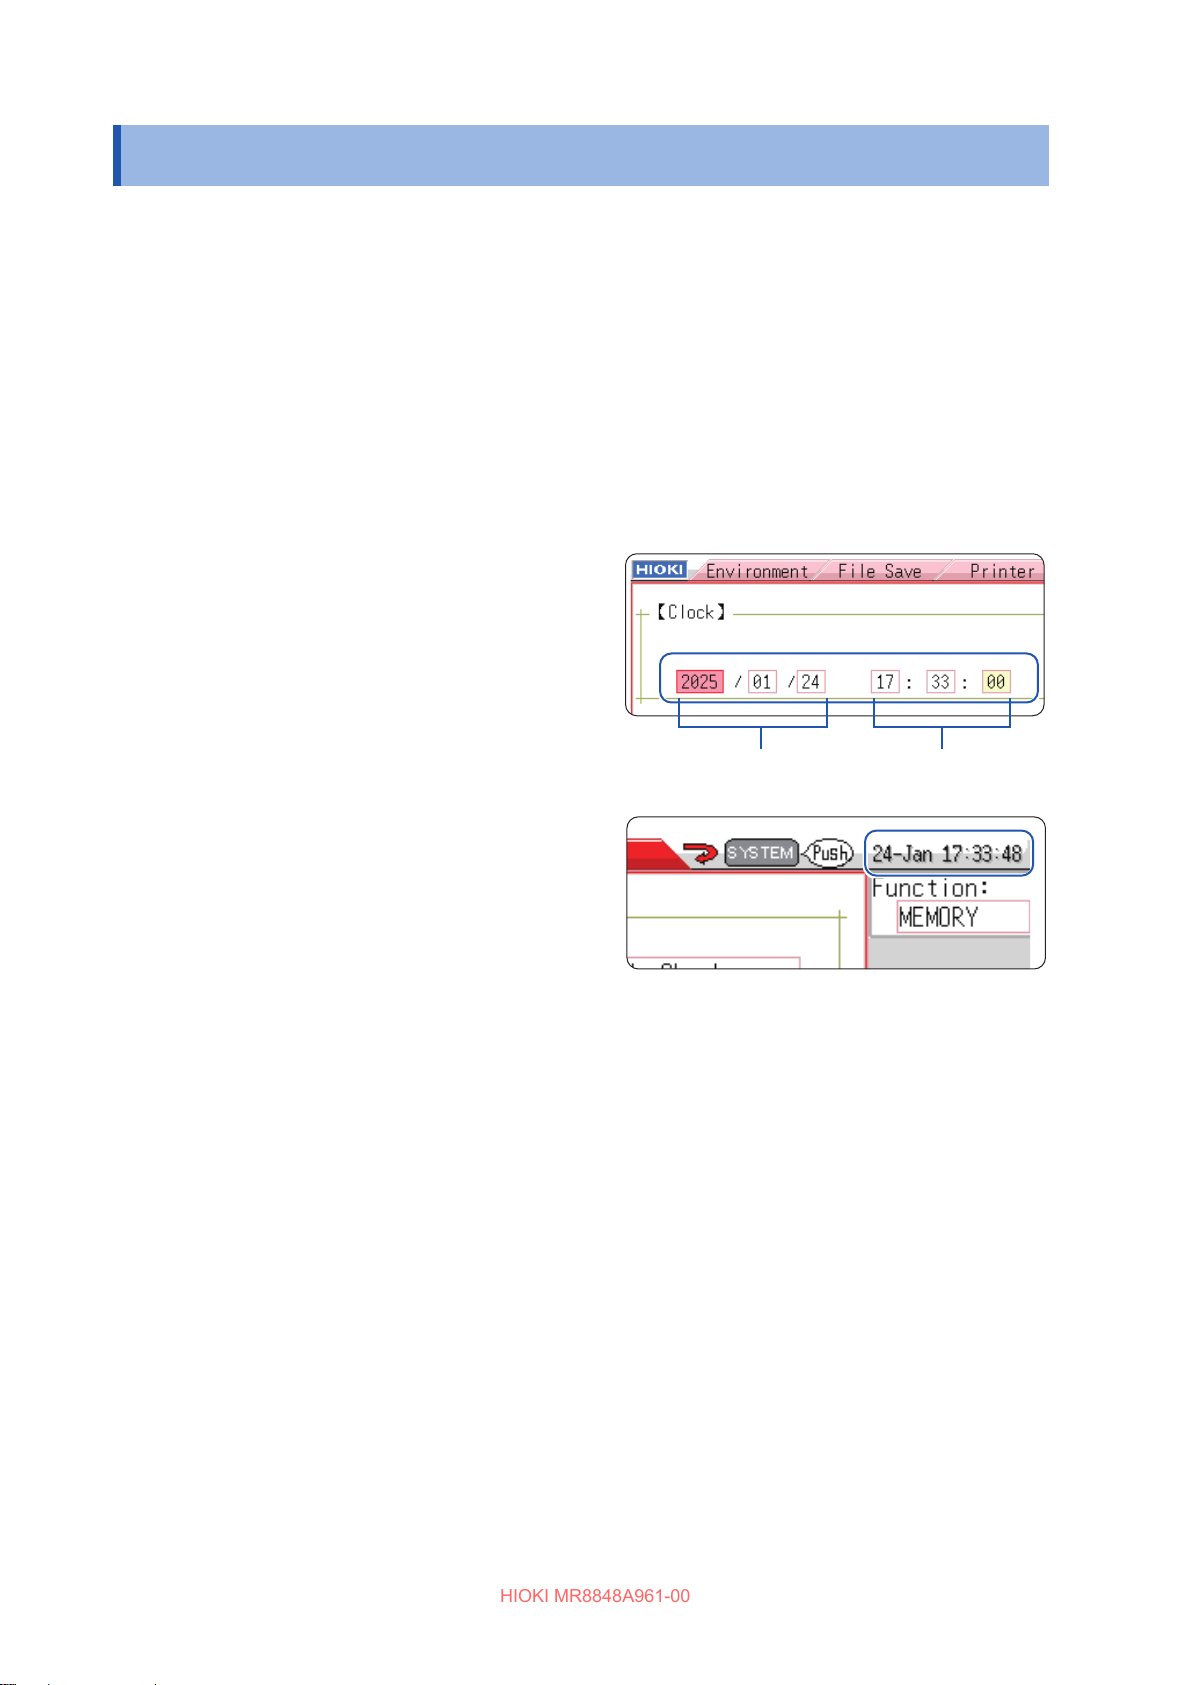
Setting the Clock
HIOKI MR8848A961-00
2.6 Setting the Clock
Set date and time for the built-in clock as follows.
The clock has an automatic calendar with leap year correction and 24-hour format.
The functions listed below make use of the clock. Ensure that the clock is set correctly before using
these functions.
• Performing measurement with timer-based trigger enabled
• Printing data including times of trigger events
• Saving measured data
Procedure
To display the screen: Press the SYSTEM key several times to display the [Init] sheet on the system screen.
Move the cursor to the [Clock] box.
1
Select the digits to change and set the
2
numeric values.
While the cursor is placed on one of the
3
[Clock] settings, select [SET].
The date and time settings are accepted.
The date and time are displayed at the top
right of the screen.
Date setting
(Year, month, day)
Time setting
(Hour, minute, second)
62
Page 63
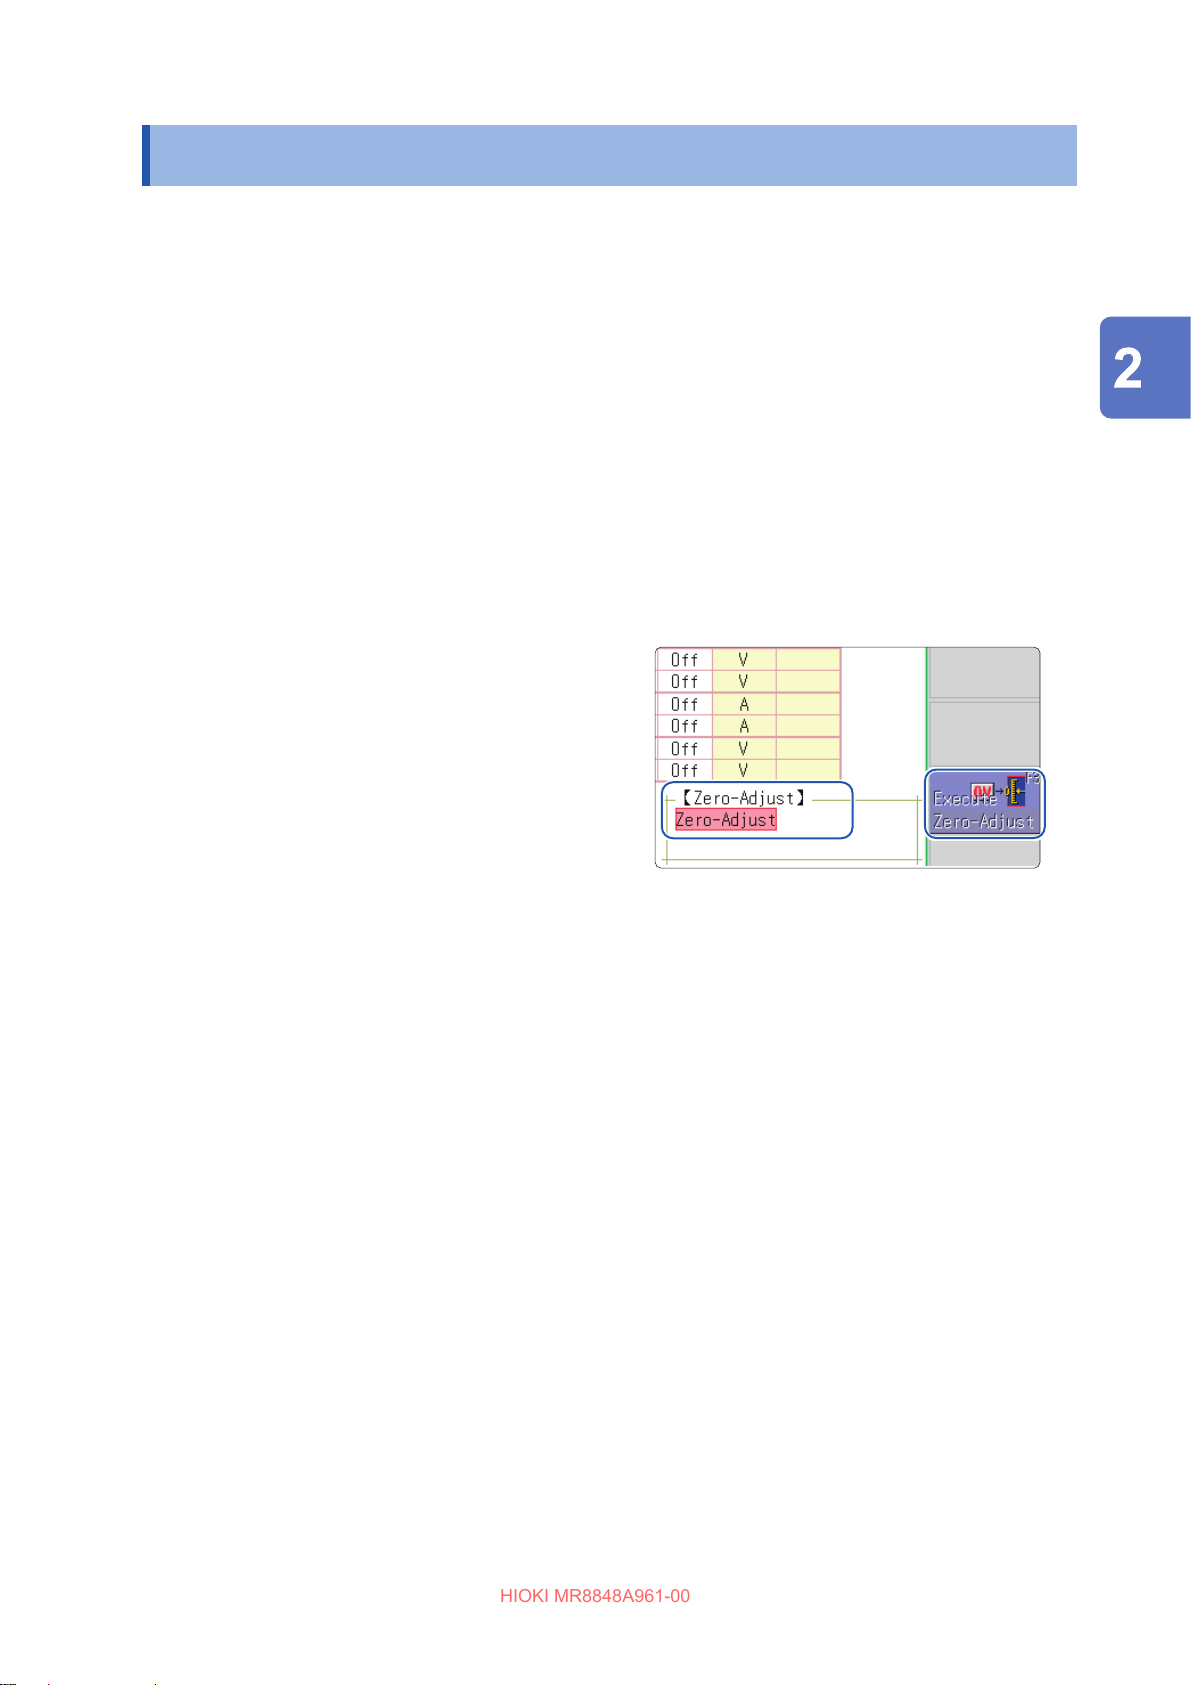
Adjusting the Zero Position (Zero-Adjustment)
HIOKI MR8848A961-00
2.7 Adjusting the Zero Position (Zero-Adjustment)
This operation compensates potential deection of units and sets the reference potential of the
instrument to 0 V.
The compensation operation is performed for all channels and ranges.
Before performing zero-adjustment
• Warm up the instrument for about 30 minutes after the power-on to stabilize the internal
temperature of the units, and then perform zero-adjustment.
• Note that zero-adjustment cannot be performed during measurement.
• Key operation is not accepted during zero-adjustment.
• The time required for zero-adjustment varies depending on types and the number of units
installed in the instrument. (The operation may take several seconds.)
Procedure
To display the screen: Press the CHAN key several times to display the [Unit List] sheet on the channel screen.
Preparing for Measurement
Move the cursor to the [Zero-Adjust] box.
1
Select [Execute Zero-Adjust].
2
The zero-adjustment is executed.
Zero-adjustment has no eect on the 8969 and U8969 Strain Unit.
Adjust the zero position using the auto-balance. (p. 194)
Perform zero-adjustment in the following cases.
• When a unit has been replaced
• When the instrument has been cycled
• When settings has been initialized (system reset)
• When measurement mode has been switched between DC and RMS on the 8971 Current Unit,
8972 DC/RMS Unit, or U8974 High Voltage Unit
• When measurement mode has been switched on the U8979 Charge Unit
• When the ambient temperature has changed signicantly
1
• The zero-position drift*
may occur.
*1. Drift: A spurious output caused by a shift in an operating point of an operational amplier. Drift
can occur due to changes in temperature and due to component aging over a period of
use.
63
Page 64
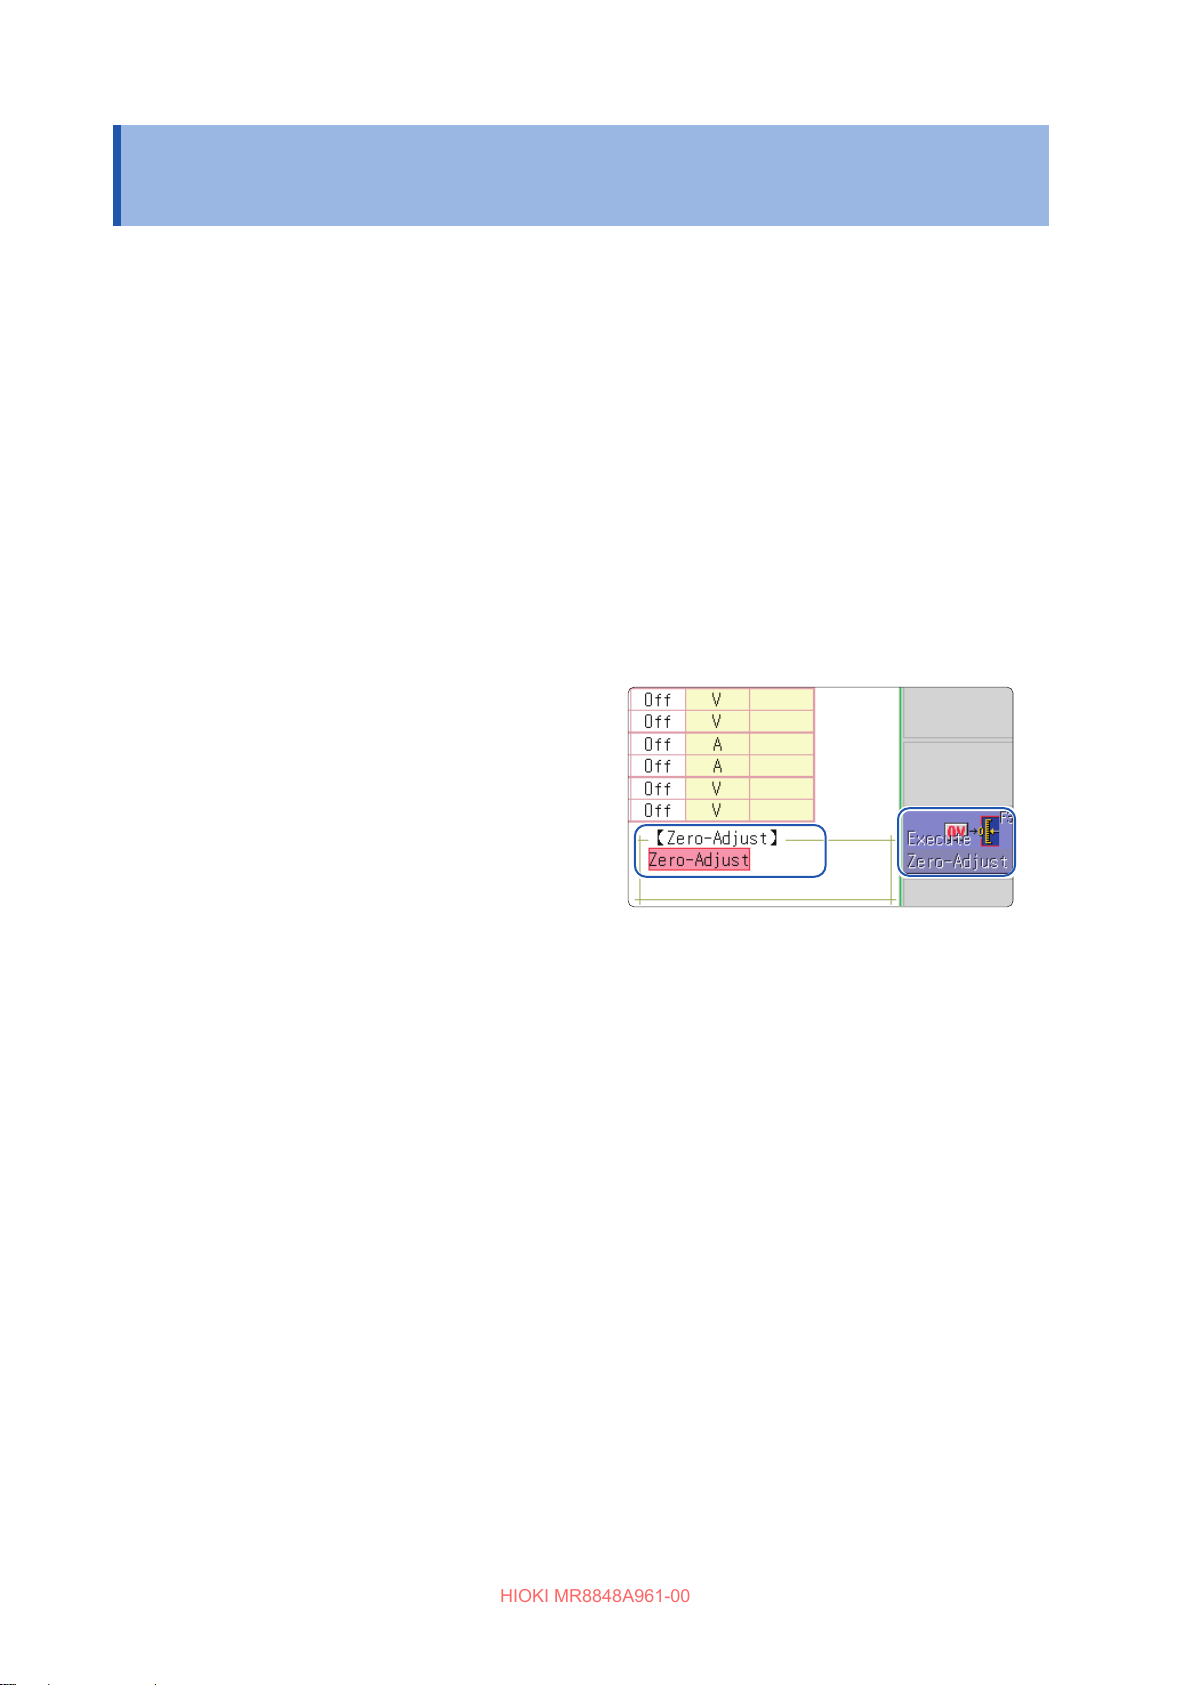
Performing Calibration (When MR8990 is Installed)
HIOKI MR8848A961-00
2.8 Performing Calibration (When MR8990 is Installed)
This operation calibrates the scale of MR8990 Digital Voltmeter Unit.
The compensation operation is performed for all channels and ranges.
Before performing calibration
• Warm up the instrument for about 30 minutes after the power-on to stabilize the internal
temperature of the units, and then perform zero-adjustment.
• Note that calibration cannot be performed during measurement. However, when the calibration
setting is set to on, calibration is performed at the start of measurement.
• Key operation is not accepted during calibration.
• The time required for calibration varies depending on types and number of units installed in the
instrument. (The operation may take several seconds.)
Procedure
To display the screen: Press the CHAN key several times to display the [Unit List] sheet on the channel screen.
Move the cursor to the [Zero-Adjust] box.
1
Select [Execute Zero-Adjust].
2
Calibration is executed.
In the following cases, calibration should be executed again.
• When a unit has been replaced
• When the instrument has been cycled
• When settings has been initialized (system reset)
• When the ambient temperature has changed signicantly
64
Page 65
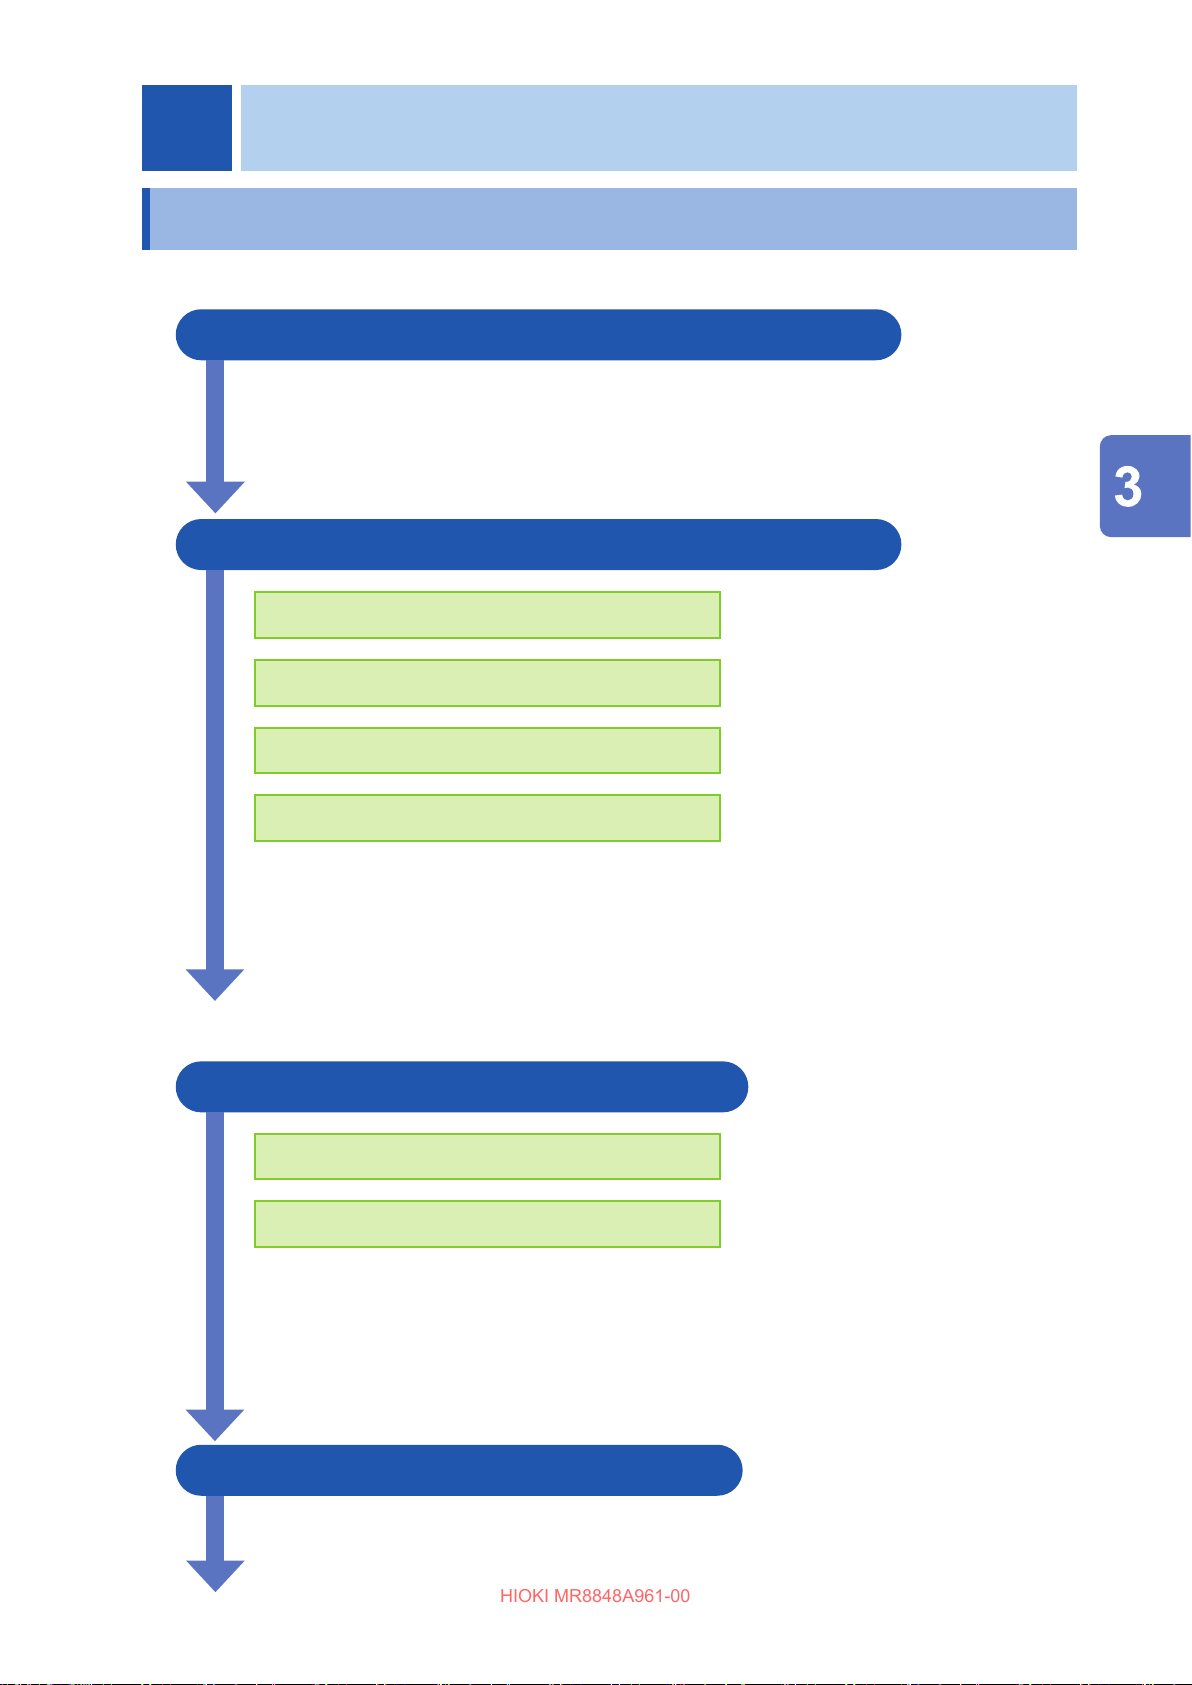
3
HIOKI MR8848A961-00
Measurement
3.1 Measurement Procedure
1 Inspecting the instrument before measurement
Refer to
“3.2 Inspecting the Instrument Before Measurement” (p. 67).
2 Conguring the basic measurement settings
Refer to the following pages:
Select a suitable recording method for an object
to be measured
Set the sampling rate
Set the recording length
Set the waveform display format and printing
format
Advanced settings
Refer to the following pages:
“7.4 Plotting X-Y Composite Curves” (p. 154)
“8.2 Displaying Waveforms Simultaneously
During Writing to the Memory (Roll Mode)” (p. 173)
“8.3 Overlaying New Waveforms with Past Waveforms” (p. 174)
“10 Numerical Calculation
Function” (p. 241)
“Measurement functions” (p. 68)
“Timebase and sampling rate” (p. 70)
“Recording length (number of divisions)”
(p. 73)
“Screen layout” (p. 76)
3 Conguring Input Channels Settings
Refer to the following pages:
Congure the analog channel settings
“Analog channel settings” (p. 80)
Measurement
Congure the logic channel settings
Advanced settings
Refer to the following pages:
“8.1 Adding Comments” (p. 166)
“8.5 Converting Input Values (Scaling Function)” (p. 177)
“8.6 Setting the Waveform Position (Variable Function)” (p. 184)
“8.7 Fine-Adjusting Input Values (Vernier Function)” (p. 187)
“8.8 Inverting the Waveform (Invert Function)” (p. 188)
4 Conguring the trigger settings
Refer to
“9 Setting the Trigger” (p. 217).
“Logic channel settings” (p. 84)
65
Page 66
Measurement Procedure
HIOKI MR8848A961-00
5 Starting measurement
Refer to the following pages:
“3.5 Starting and Stopping Measurement” (p. 86)
“5 Saving/Loading Data and Managing Files” (p. 97)
“6 Printing Data (When U8351 Printer Unit is Installed)” (p. 133)
“7.1 Reading Measured Values (Using Cursors A and B)” (p. 146)
“Scrolling the waveforms with the jog dial and shuttle ring” (p. 152)
“7.5 Magnifying and Demagnifying Waveforms” (p. 156)
6 Completing the measurement
Refer to
“3.5 Starting and Stopping Measurement” (p. 86).
To observe the input signal
Pressing the AUTO key congures the timebase of the input waveform, vertical axis (voltage
axis) range, and zero-adjust settings automatically and then starts measurement.
Refer to “3.6 Measurement in Automatic Range Setting (Auto-Range Function)” (p. 89).
To load previously saved settings
Load the settings le using the le screen.
Saving the settings with respect to each measurement object and each application enables you
to perform measurement more convenient.
Refer to “5.3 Loading Data” (p. 120).
To automatically load previously saved settings at power-on
Previously saved measurement settings can be automatically loaded from a le when the
instrument is turned on. Simply insert an SD card containing an auto-settings le before turning
on the instrument.
Refer to “5.4 Automatically Loading Settings (Auto-setup Function)” (p. 123).
Make sure that the [HIOKI_MR8848] folder of the SD card contains the le.
To initialize the instrument (restoring the basic default settings)
From the system screen, select the [Init] sheet to reset the instrument to the factory default
settings.
After initialized, the instrument is set up to perform simple measurement easily.
If the operation of the instrument seems unusual or overly complex, initialize the instrument.
Refer to “19.2 Resetting the Instrument” (p. 436).
66
Page 67
Inspecting the Instrument Before Measurement
HIOKI MR8848A961-00
3.2 Inspecting the Instrument Before Measurement
Verify that it operates normally to ensure that no damage occurred during storage or shipping. If
you nd any damage, contact your authorized Hioki distributor or reseller.
(1) Inspecting products used with the instrument
When using probes and connection cords
Insulation of a probe or connection
cord to be used is damaged, or bare
metal is not exposed.
No metal exposed
Go to Step (2)
When using clamp sensors
Any clamp is not cracked or
damaged.
Go to Step (2)
No
(2) Inspecting the instrument and units
There is no visible damage to the
instrument or units.
No
When turning on the instrument
Metal exposed
There is an
abnormality.
There is an
abnormality.
Do not use them if damage is present, as you
could receive an electric shock.
Request repairs.
Do not use them if damage is present, as you
could receive an electric shock.
Request repairs.
If damage is evident, request repairs.
Measurement
The Hioki logo appears on the
screen.
Yes
The waveform screen appears.
Yes
Inspection terminates.
No
Nothing
appears, or
the display is
abnormal.
The power cord may be damaged, or the
instrument may be damaged. Request repairs.
The instrument may be damaged. Request
repairs.
67
Page 68
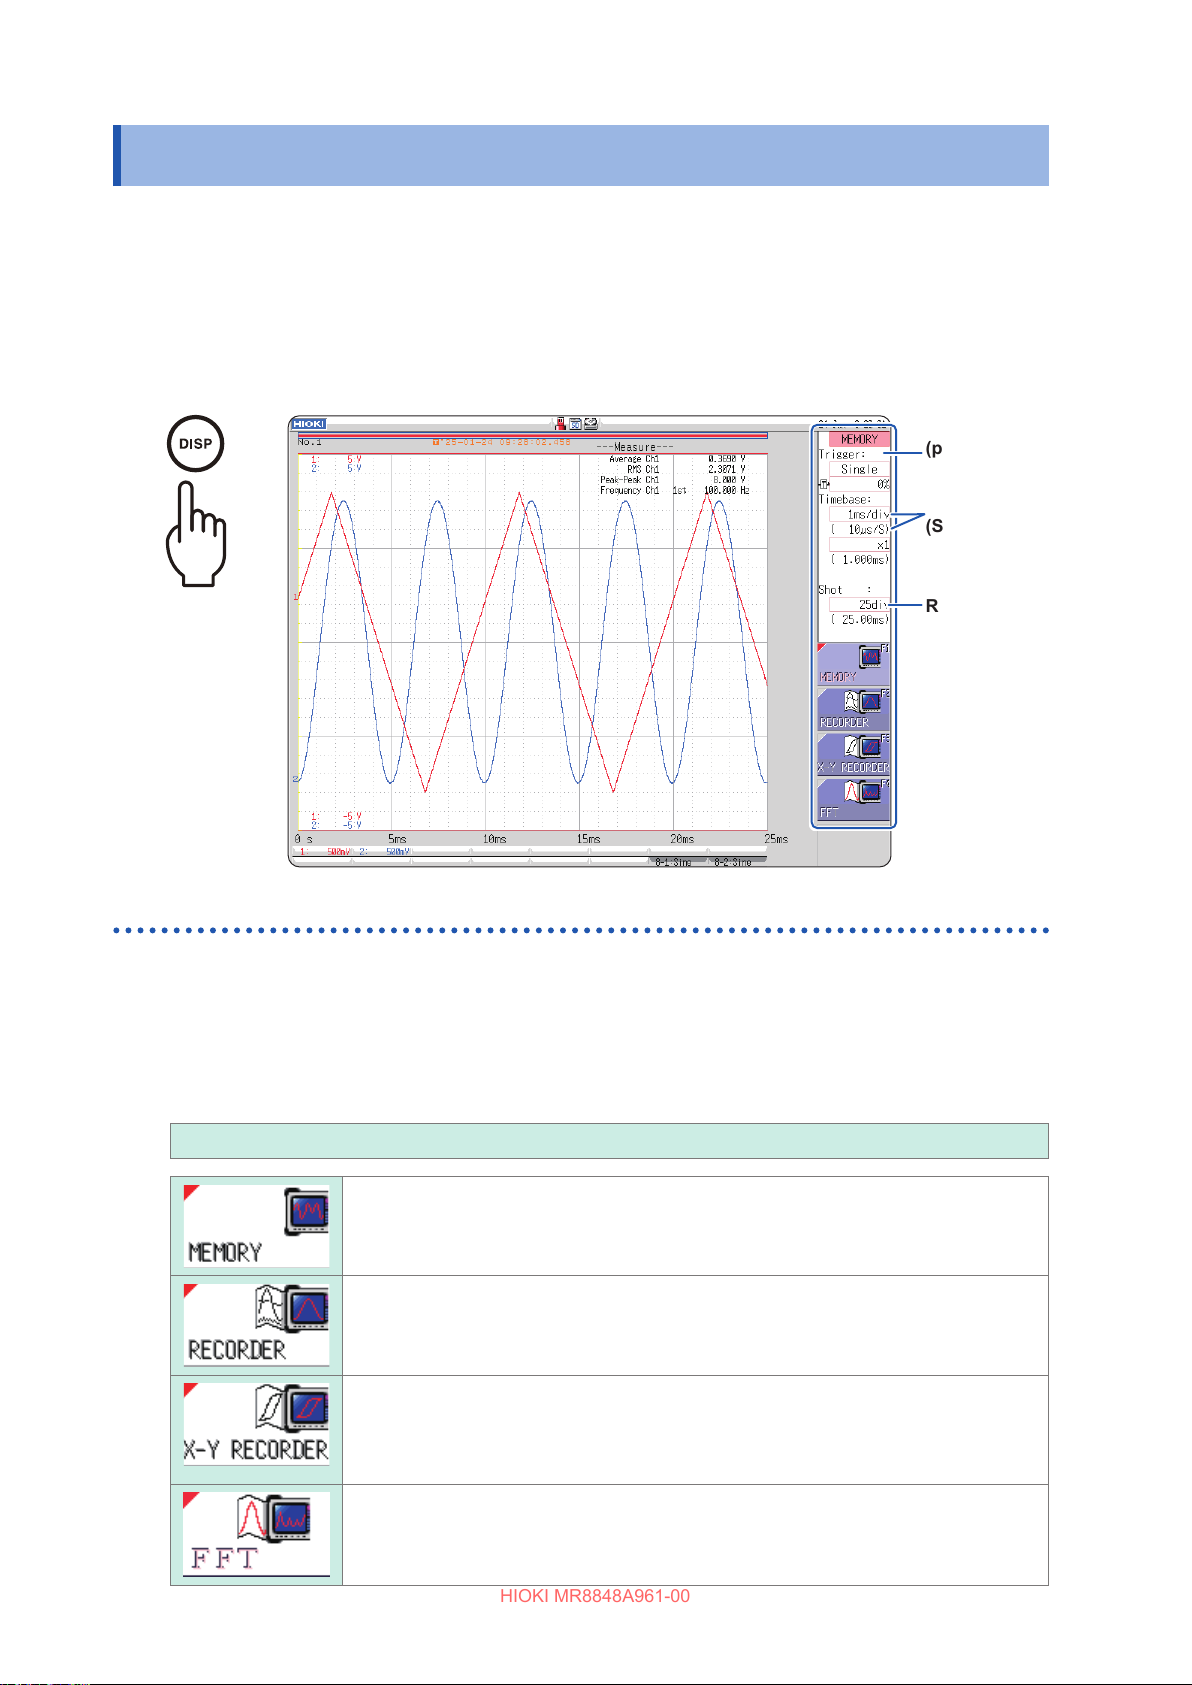
Setting Measurement Conditions
HIOKI MR8848A961-00
3.3 Setting Measurement Conditions
This section describes how to set measurement conditions.
The settings window displayed on the Waveform display enables you to congure basic settings
conveniently while you are observing waveforms. The basic settings can also be congured on the
[Status] sheet of the status screen.
How to open the settings window
Settings
window
(p. 68)
Timebase
(Sampling
rate) (p. 70)
Press
the [DISP] key.
Measurement functions
Select a function depending on a type of measurement.
Procedure
To display the screen: Press the DISP key to open the waveform screen.
Move the cursor to the function box (the uppermost column of the settings window).
MEMORY (Default setting), RECORDER, X-Y RECORDER, FFT
Recording
length
(Number of
divisions)
(p. 73)
68
Used to measure instantaneous waveforms and transient phenomenon.
You can use the trigger and calculation functions.
Used to observe and record uctuations of phenomenon changing
slowly.
You can print data in real time.
Used to observe signals endlessly in X-Y curve format.
You can set the X-Y composite curves plotting setting to on/o in the same manner as
the pen raising/lowering setting installed in typical X-Y pen recorders.
Refer to “4 X-Y Recorder” (p. 91).
Used to analyze frequencies.
You can conduct various types of the spectrum and octave analyses.
Refer to “13 START key” (p. 278).
Page 69
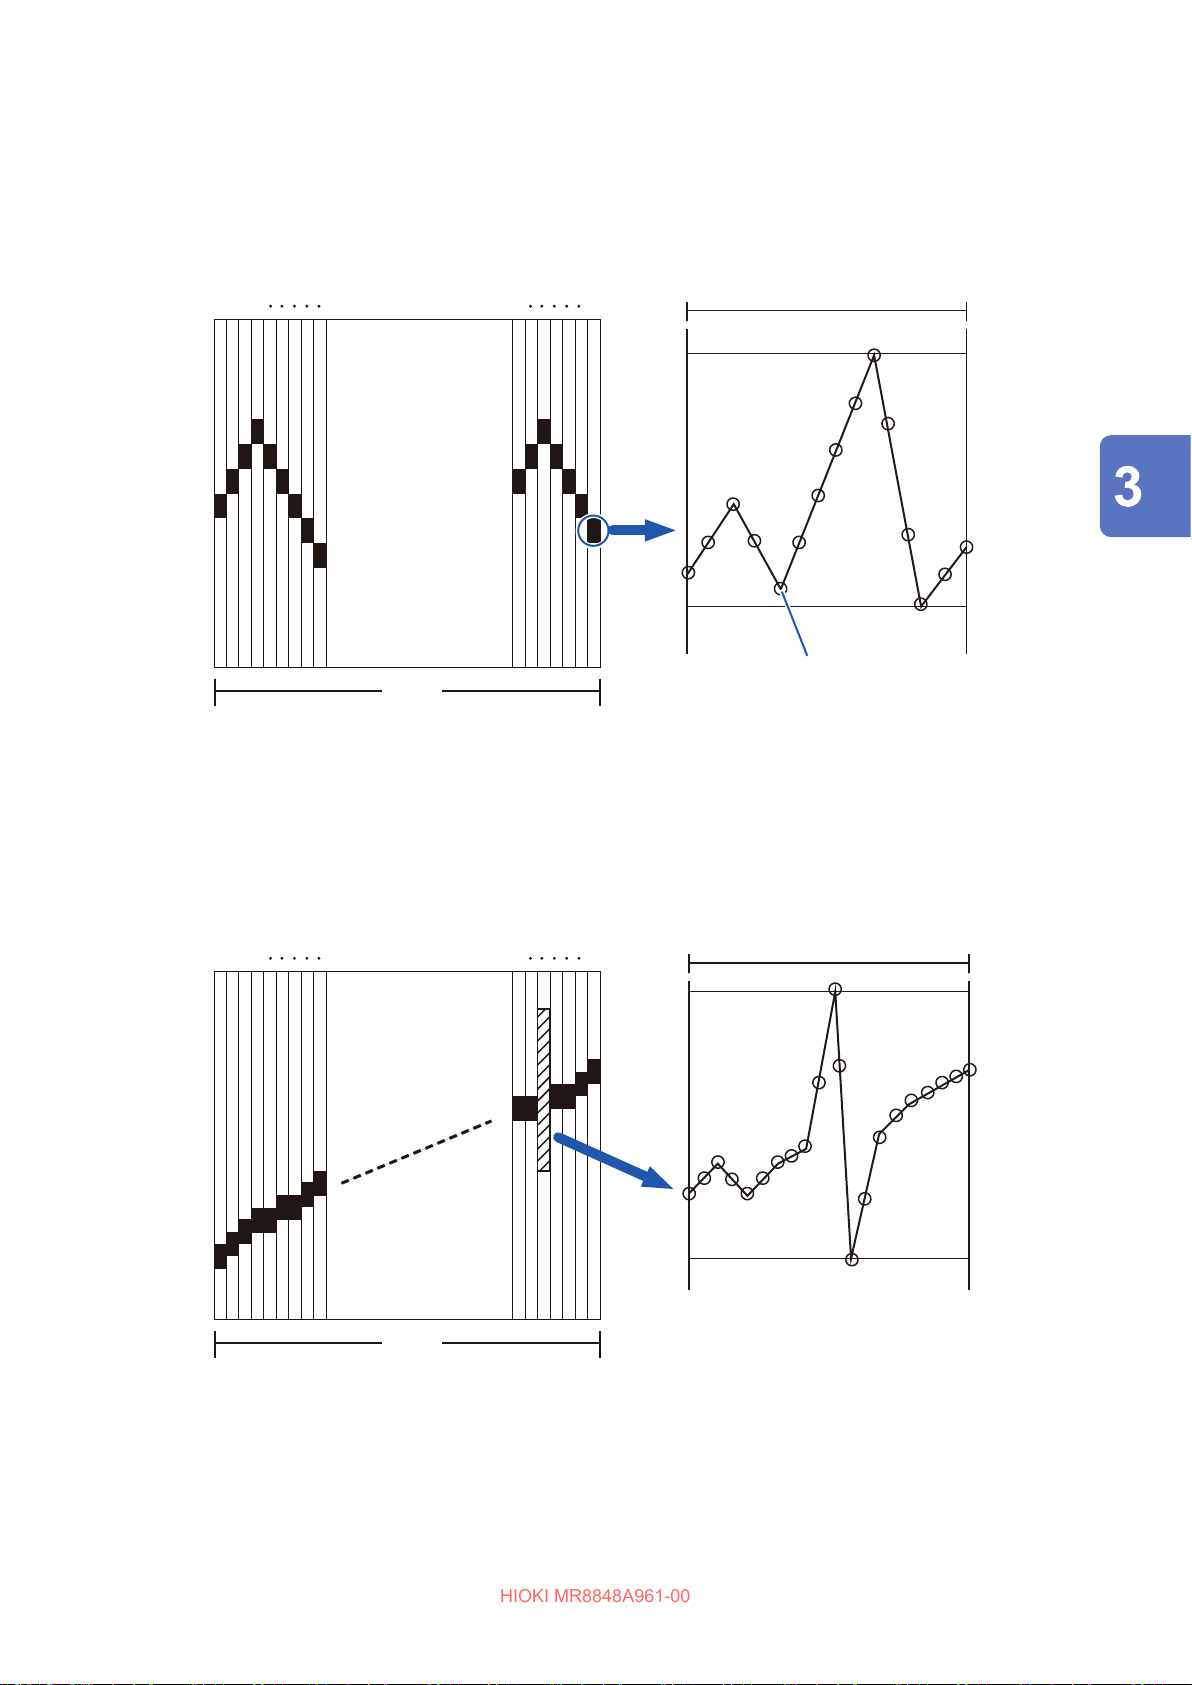
Setting Measurement Conditions
HIOKI MR8848A961-00
Values obtained by the recorder function
While the recorder function is being used, the instrument obtains measured values at a previously
set sampling rate and lets both the maximum and minimum values be a sampling data value during
each of the sampling data periods. Thus, every sampling data value ranges in amplitude.
1 2 3 4 100
One sampling data
Maximum
value
Minimum
value
Data acquired at the specied sampling rate
1 div
If the input waveform uctuates widely due to noise even though usually it uctuates slightly, the
dierence between the maximum and minimum values obtained with the instrument at the sampling
rate that is relatively faster can be inordinately large.
Set the sampling rate to a slower setting to prevent this phenomenon from being observed.
Measurement
1 2 3 4 100
1 div
One sampling data
Maximum
value
Minimum
value
When the sampling rate is fast
69
Page 70
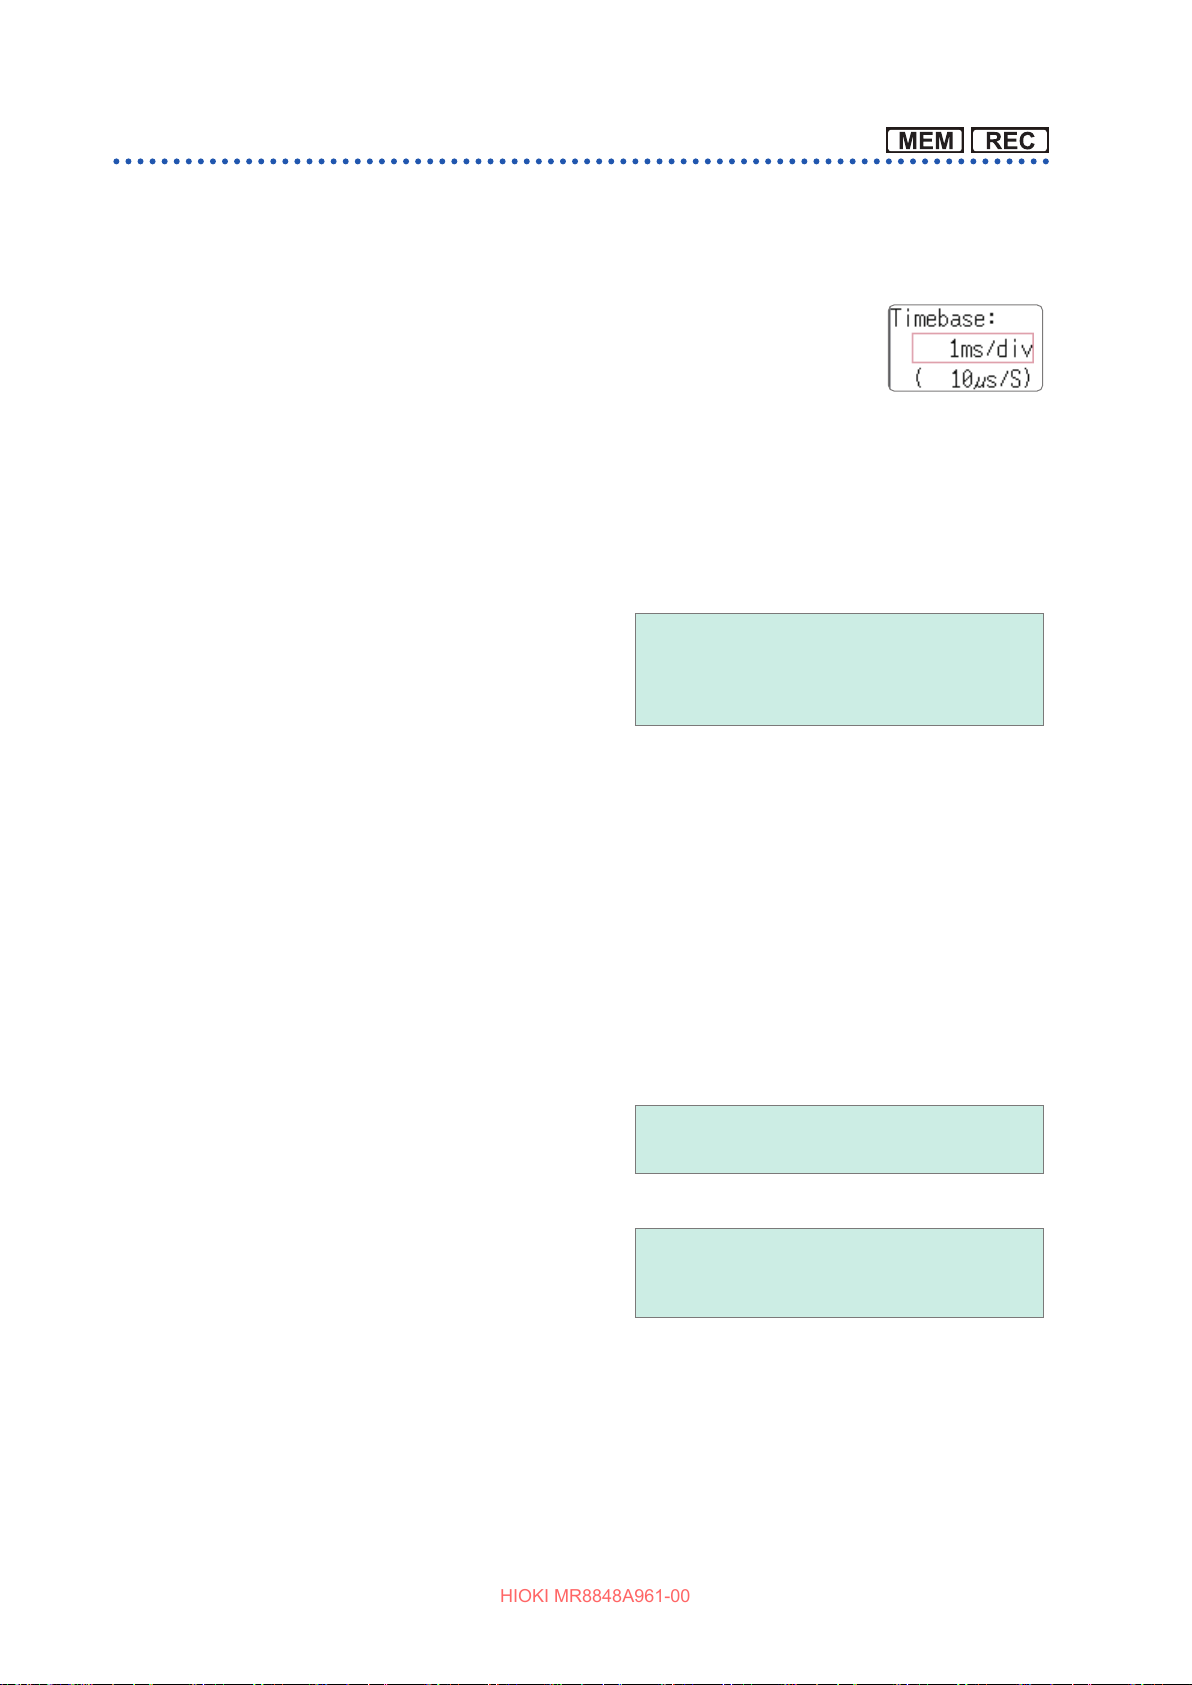
Setting Measurement Conditions
HIOKI MR8848A961-00
Timebase and sampling rate
The timebase refers to a speed for sampling the input signal waveform. The timebase setting
denes a time length per division of the horizontal axis (time/div).
The sampling setting denes an interval at which the instrument samples waveforms.
While the memory function is being used, the sampling rate appears, enclosed
in parentheses, under the timebase box (as shown on the right). The displayed
sampling rate changes along with the timebase.
Procedure
To display the screen: Press the DISP key to open the waveform screen.
For the memory function
Move the cursor to the [Timebase] box.
1
5 (Default setting), 10, 20, 50, 100, 200, 500 µs/
Set the time per division on the horizontal axis
2
(time axis).
div
1, 2, 5, 10, 20, 50, 100, 200, 500 ms/div
1, 2, 5, 10, 30, 50 s/div, 1 min/div, 100 s/div
2, 5 min/div
To control the sampling rate using an external signal, select [External] and input the signal to the
external sampling terminal. To set back the setting to the internal sampling, select [Internal] and
set the time.
When the external sampling is used, the settable number of sampling per division can range from
10 S/div to 1000 S/div.
Refer to “External sampling (EXT.SMPL)” (p. 381).
If using the U8975, U8977, or U8978, the 5 µs/div range will not be available (the default setting
will be 10 µs/div).
For the recorder function
Move the cursor to the [Timebase] box.
1
Set the time per division on the horizontal axis
2
(time axis).
Move the cursor to the [Sampling] box.
3
Set the sampling rate.
4
10(Default setting), 20, 50, 100, 200, 500 ms/div
1, 2, 5, 10, 30, 50 s/div, 1 min/div, 100 s/div
2, 5, 10, 30 min/div, 1 h/div
1(Default setting), 10, 100 µs
1, 10, 100 ms
(Select a sampling rate from among the options
that are 1/100 of the timebase or less)
The selectable range varies depending on the timebase setting.
The higher the sampling rate is, the better you can observe minute changes.
70
Page 71
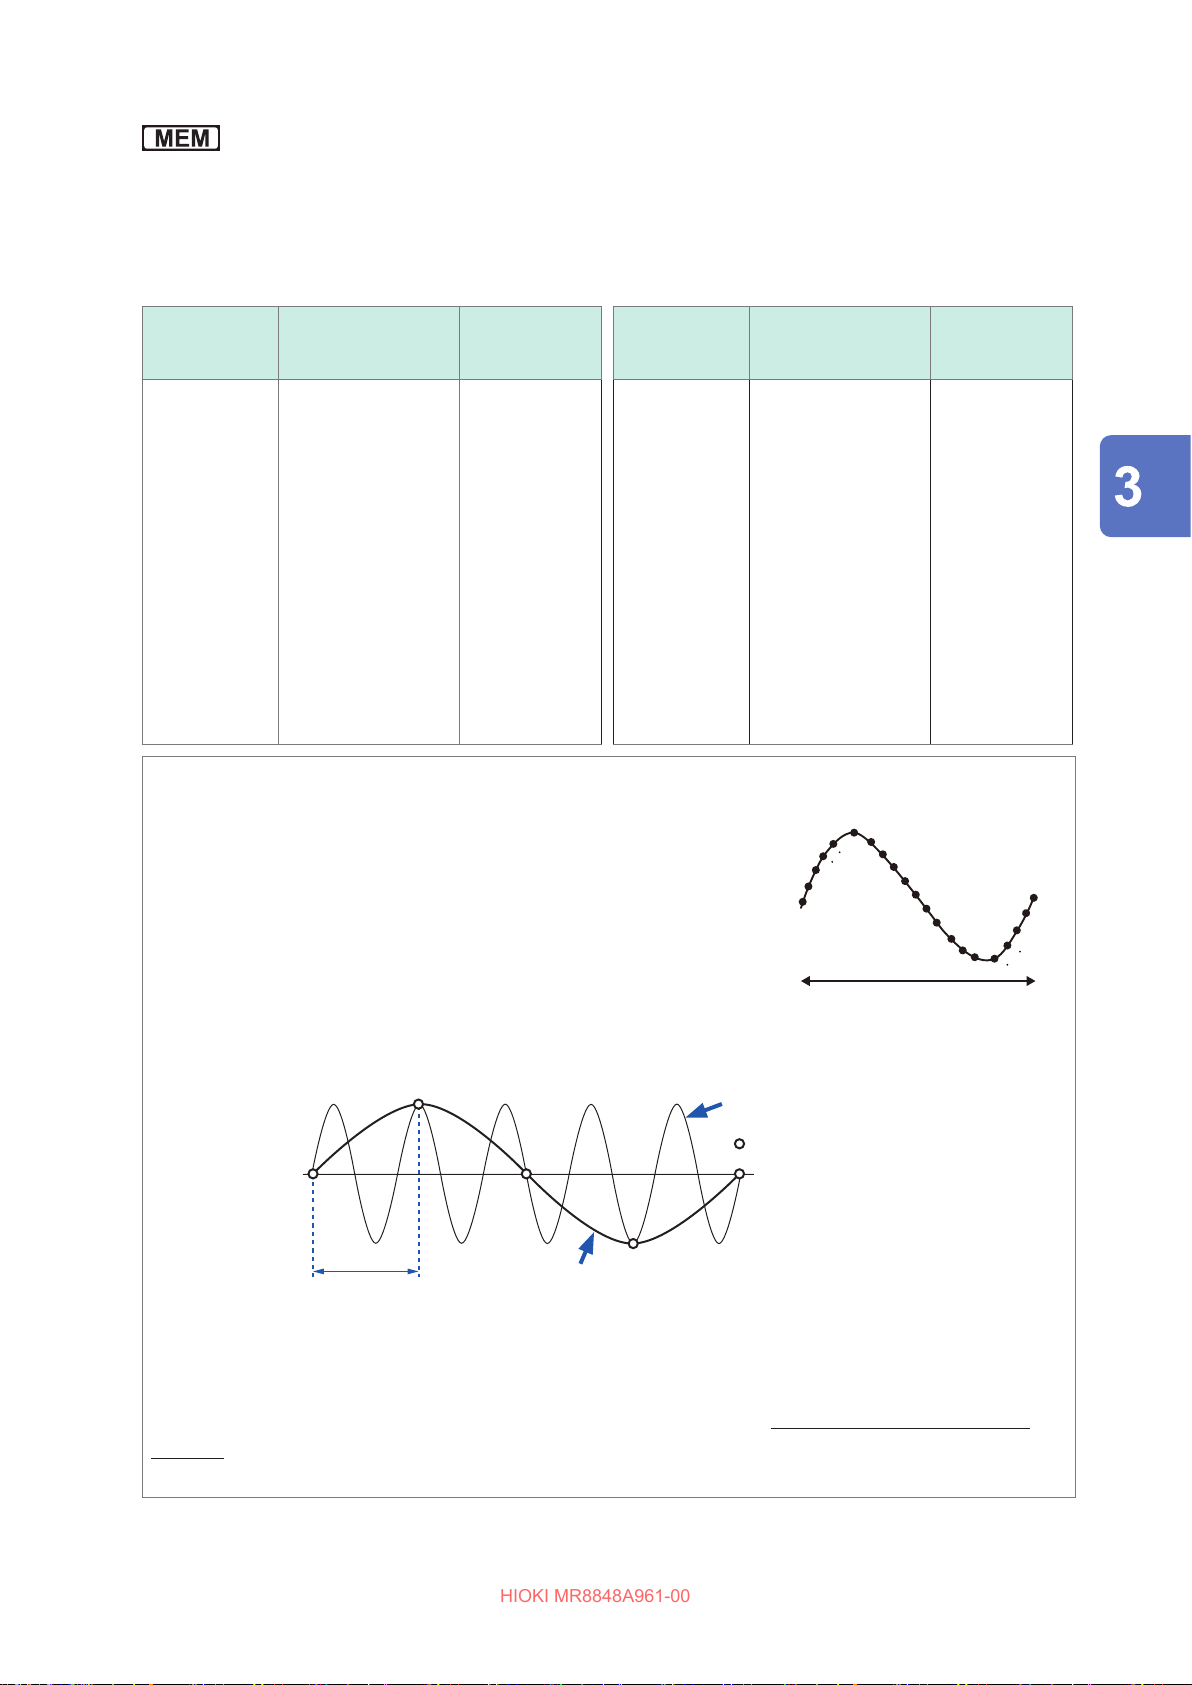
Setting Measurement Conditions
HIOKI MR8848A961-00
How to select the timebase
Refer to the table below to set the timebase.
For example, to measure a waveform with a frequency of 100 kHz, a maximum display frequency
of between 200 kHz and 800 kHz should be selected according to the following table. When you
want to set the maximum display frequency to 400 kHz, the timebase should be set to 10 µs/div.
Maximum
Timebase Sampling rate
5 µs/div
10 µs/div
20 µs/div
50 µs/div
100 µs/div
200 µs/div
500 µs/div
1 ms/div
2 ms/div
5 ms/div
10 ms/div
20 ms/div
50 ms/div
100 ms/div
200 ms/div
500 ms/div
50 ns (20 MS/s)
100 ns (10 MS/s)
200 ns (5 MS/s)
500 ns (2 MS/s)
1 µs (1 MS/s)
2 µs (500 kS/s)
5 µs (200 kS/s)
10 µs (100 kS/s)
20 µs (50 kS/s)
50 µs (20 kS/s)
100 µs (10 kS/s)
200 µs (5 kS/s)
500 µs (2 kS/s)
1 ms (1 kS/s)
2 ms (500 S/s)
5 ms (200 S/s)
display
frequency
800 kHz
400 kHz
200 kHz
80 kHz
40 kHz
20 kHz
8 kHz
4 kHz
2 kHz
800 Hz
400 Hz
200 Hz
80 Hz
40 Hz
20 Hz
8 Hz
Timebase Sampling rate
1 s/div
2 s/div
5 s/div
10 s/div
30 s/div
50 s/div
1 min/div
100 s/div
2 min/div
5 min/div
10 ms (100 S/s)
20 ms (50 S/s)
50 ms (20 S/s)
100 ms (10 S/s)
300 ms (3.33 S/s)
500 ms (2 S/s)
600 ms (1.67 S/s)
1 s (1 S/s)
1.2 s (0.83 S/s)
3 s (0.33 S/s)
Maximum
display
frequency
4 Hz
2 Hz
0.8 Hz
0.4 Hz
0.13 Hz
0.08 Hz
0.04 Hz
0.067 Hz
0.033 Hz
0.013 Hz
Measurement
What is the maximum display frequency?
To plot sine waves that allow you to observe those peaks on the LCD,
the instrument needs to sample the waveforms at least 25 points
per cycle. The maximum display frequency varies depending on the
timebase setting.
If instrument plots non-existent waveforms (aliasing)
If a measured signal uctuates at a higher frequency compared to
the specied sampling speed, the instrument can probably plot nonexistent waveforms uctuating at a lower frequency than that of
realistic signal when the signal frequency reaches a certain level. This
eect is called aliasing.
Actual input signal
Sampling rate
Observer waveform
Aliasing occurs because the sampling rate is slower
than the cycle of the input signal.
3
2
1
One signal period
Sampling points
25
24
23
For the memory function, because the sampling rate can signicantly vary according to the timebase
setting, select the timebase setting carefully to avoid aliasing from occurring. Since the timebase setting
determines the maximum display frequency, perform measurement at as fast a timebase setting as
possible.
When recording signals repeatedly, the auto-range function (p. 89) is useful.
71
Page 72
Setting Measurement Conditions
HIOKI MR8848A961-00
The sampling rate is automatically set to 1/100 of the selected timebase.
When the MR8990 Digital Voltmeter Unit is installed, the sampling rate of its channels is automatically set
to 1/50 of the selected timebase.
Example: When the 8966 is installed as Unit 1 (CH1 and CH2) and MR8990 as Unit 2 (CH3 and
CH4), then the timebase is set to 1 s/div.
Sampling rate of Unit 1 (8966): 10 ms
Sampling rate of Unit 2 (MR8990): 20 ms
To automatically set the timebase
Pressing the AUTO key selects a suitable timebase for an input signal and starts measurement.
This function can be used in the memory function only.
Refer to “3.6 Measurement in Automatic Range Setting (Auto-Range Function)” (p. 89).
• The timebase and sampling rate can be set independently. The sampling rate is selected
depending on the timebase setting.
• As mentioned below, when the former timebase settings are selected, the instrument displays
waveforms that are demagnied horizontally (in the time axis direction) at the latter scale size.
20 ms/div,
1/2; 10 ms/div, ×1/5
×
To perform measurement minimizing the eect of noise
While measuring a waveform that usually uctuates only slightly, with a fast sampling rate set, a
dierence between the maximum and minimum values may become large if the amplitude of the
waveform changes sharply. To prevent this eect, select a slower sampling rate or enable the
unit’s low-pass lter (p. 80).
Note common to
The data refresh rate is not allowed to exceed the maximum sampling rate of the unit.
During the period while data is being not updated, the same data is measured, with the result that
stair-like waveforms are plotted.
Even when a single signal is sampled simultaneously by two units, the data may dier with one
another due to dierences in the sampling rate, frequency bandwidth, and frequency response.
72
Page 73
Data refresh rate for various units
HIOKI MR8848A961-00
Setting Measurement Conditions
Unit Max. timebase
8966, 8973 5 µs/div 50 ns (20 MS/s) –
8967 Depends on data refresh setting Depends on data refresh setting p. 193
8968 100 µs/div 1 µs (1 MS/s) –
8969, U8969, U8979 500 µs/div 5 µs (200 kS/s) –
8970 Depends on setting Depends on setting p. 195
8971 100 µs/div 1 µs (1 MS/s) p. 198
8972 Depends on response setting Depends on response setting p. 198
U8975, U8977, U8978 20 µs/div 200 ns (5 MS/s) –
MR8990 Depends on NPLC setting Depends on NPLC setting –
U8974 100 µs/div Depends on response setting p. 200
Recording length (number of divisions)
Set the recording length (number of divisions) of each data acquisition.
Procedure
To display the screen: Press the DISP key to open the Waveform screen.
Max. sampling rate or
data refresh rate
Reference
information
Measurement
For the memory function
Move the cursor to the [Shot] box.
1
Select the type.
2
User Shot Select the length from among the xed values.
Fixed Shot Freely specify a value in one division increments.
Set the recording length.
3
(Fixed Shot)
25, 50, 100, 200, 500, 1,000, 2,000, 5,000, 10,000, 20,000, 50,000, 100,000 div
200,000 div (in 2-, 4-, 8-, 16-ch mode), 500,000 div (in 2-, 4-, 8-ch mode)
1,000,000 div (in 2-, 4-ch mode), 2,000,000 div (in 2-ch mode)
(User Shot)
1 to 160,000 div (in 32-ch mode*
1 to 640,000 div (in 8-ch mode), 1 to 1,280,000 div (in 4-ch mode)
1 div to 2,560,000 div (in 2-ch mode)
*1. If using the U8975, U8977, or U8978
For the recorder function
1
), 1 to 320,000 div (in 16-ch mode)
1
2
Move the cursor to the [Shot] box.
Select the type.
User Shot Select the length from among the xed values.
Fixed Shot Freely specify a value in one division increments.
73
Page 74

Setting Measurement Conditions
HIOKI MR8848A961-00
Set the recording length.
3
(Fixed Shot)
Cont
On-O
25,50,100,200,500,1,000,2,000,5,000,10,000,20,000,50,000 div,100,000 div*
*1. If not using the U8975, U8977, or U8978
(User Shot)
1 div to 80,000 div
1 div to 160,000 div*
*1. If not using the U8975, U8977, or U8978
When [On] is selected, the instrument performs measurement while continuously overwriting
the data in the memory. You can save and print the data obtained during the period from the
measurement was stopped until the recording reached its maximum record length.
1
1
74
Page 75
Setting Measurement Conditions
HIOKI MR8848A961-00
Recording length and the number of samples
Every division of the recording length includes 100 samples. The total number of samples in a
specied recording length is: Set recording length (divisions)
However, when the MR8990 Digital Voltmeter Unit is installed, the number of samples is as follows:
• When only the MR8990 is installed
Number of samples in a division: 50 samples
Total number of samples in the recording length: Set recording length (divisions)
50 samples + 1
×
• When both the MR8990 and other units are installed
Channels for the MR8990
Number of samples in a division: 50 samples
Total number of samples in the recording length: Set recording length (divisions)
50 samples + 1
×
Channels for other units
Number of samples in a division: 100 samples
Total number of samples in the recording length: Set recording length (divisions)
100 samples + 2
×
100 samples + 1.
×
Measurement
Each recording length division includes 100 samples, each of which consists of two values: the
maximum and minimum values.
Using the recorder function causes the MR8990 to acquire data with a resolution of 16 bits.
When recording length is set to [Cont.]
• The instrument saves data that is obtained during the period that lasts until the measurement
terminates and has the following maximum recording lengths.
• 160,000 div (if using the U8975, U8977, or U8978: 80,000 div)
• For the range settings of from 10 ms/div to 200 ms/div, the instrument does not perform the real-
time print even when the printer setting (real-time print) is set to on. Perform printing manually
after measurement terminates (p. 137)
• When the auto-saving is set to on, the instrument does not save any data during the
measurement. When the measurement terminates, the data presently written in the internal
memory is saved.
When the recording length is changed during measurement
Measured data already acquired in the memory is discarded, and measurement is started using the
newly set recording length.
75
Page 76
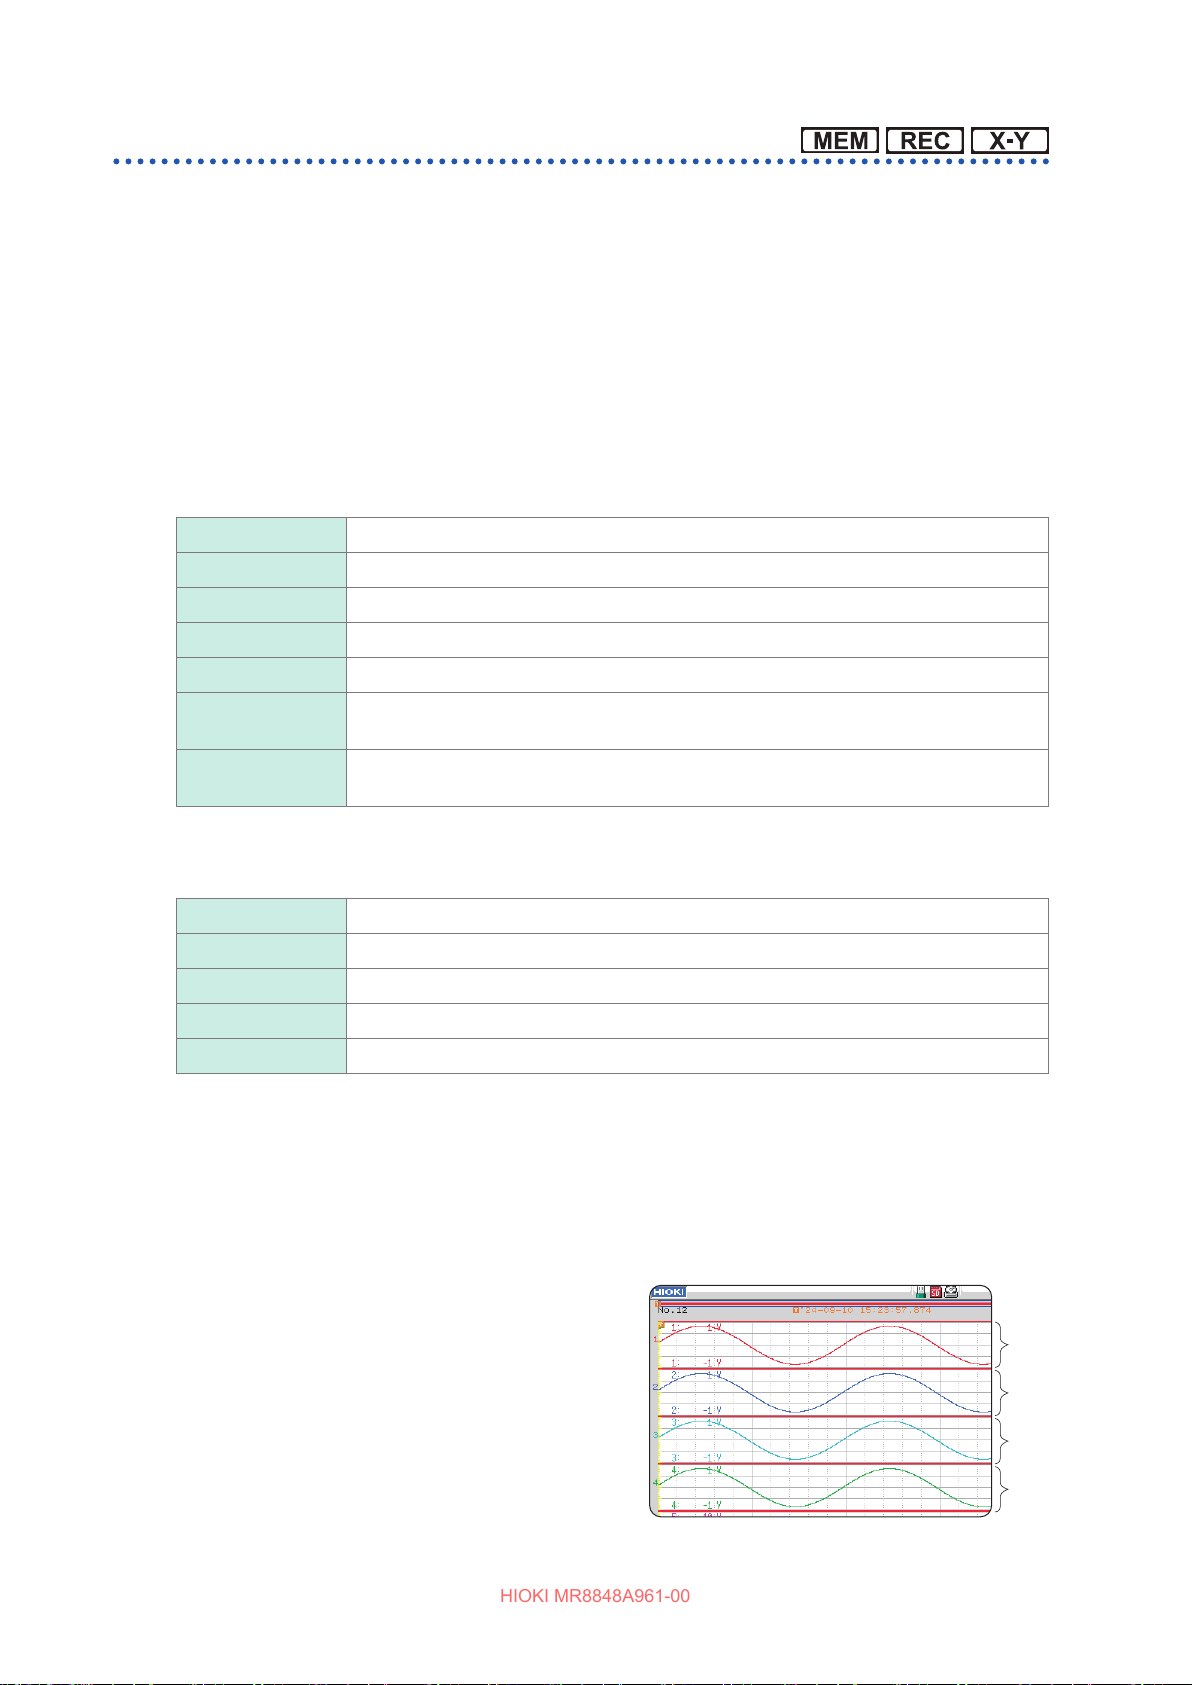
Setting Measurement Conditions
HIOKI MR8848A961-00
Screen layout
You can lay out waveform displays of input signals on the waveform screen.
This setting also applies to the printing setting.
Selecting X-Y Single mode or X-Y Quad mode plots X-Y composite curves.
This function can be used in the memory and X-Y recorder functions.
Refer to “7.4 Plotting X-Y Composite Curves” (p. 154).
Procedure
To display the screen: Press the STATUS key several times to display the [Status] sheet on the status screen.
For the memory function
Move the cursor to the [Format] box.
Single Displays and records waveforms in a graph. (Default setting)
Dual Displays and records waveforms in two graphs.
Quad Displays and records waveforms in four graphs.
Oct Displays and records waveforms in eight graphs.
Hex Displays and records waveforms in sixteen graphs.
X-Y Single Plots and records curves that illustrate correlations between them assigning multiple
input signals to the X and Y axes in a graph.
X-Y Quad Plots and records curves that illustrate correlations between them assigning multiple
input signals to the X and Y axes in four graphs.
For the recorder function
Move the cursor to the [Format] box.
Single Displays and records waveforms in a graph. (Default setting)
Dual Displays and records waveforms in two graphs.
Quad Displays and records waveforms in four graphs.
Oct Displays and records waveforms in eight graphs.
Hex Displays and records waveforms in sixteen graphs.
Analog channel assignment
In Dual, Quad, Oct, and Hex mode, you can freely assign analog channels to the dierent graphs.
Procedure
To display the screen: Press the CHAN key several times to display the [Unit List] sheet on the channel screen.
Move the cursor to the [Graph] box.
1
Example screen after assigning channels
Select the display screen with respect to
2
each channel.
The graphs are numbered beginning from
the top like Gr1, Gr2, Gr3.
76
Gr1
Gr2
Gr3
Gr4
Page 77
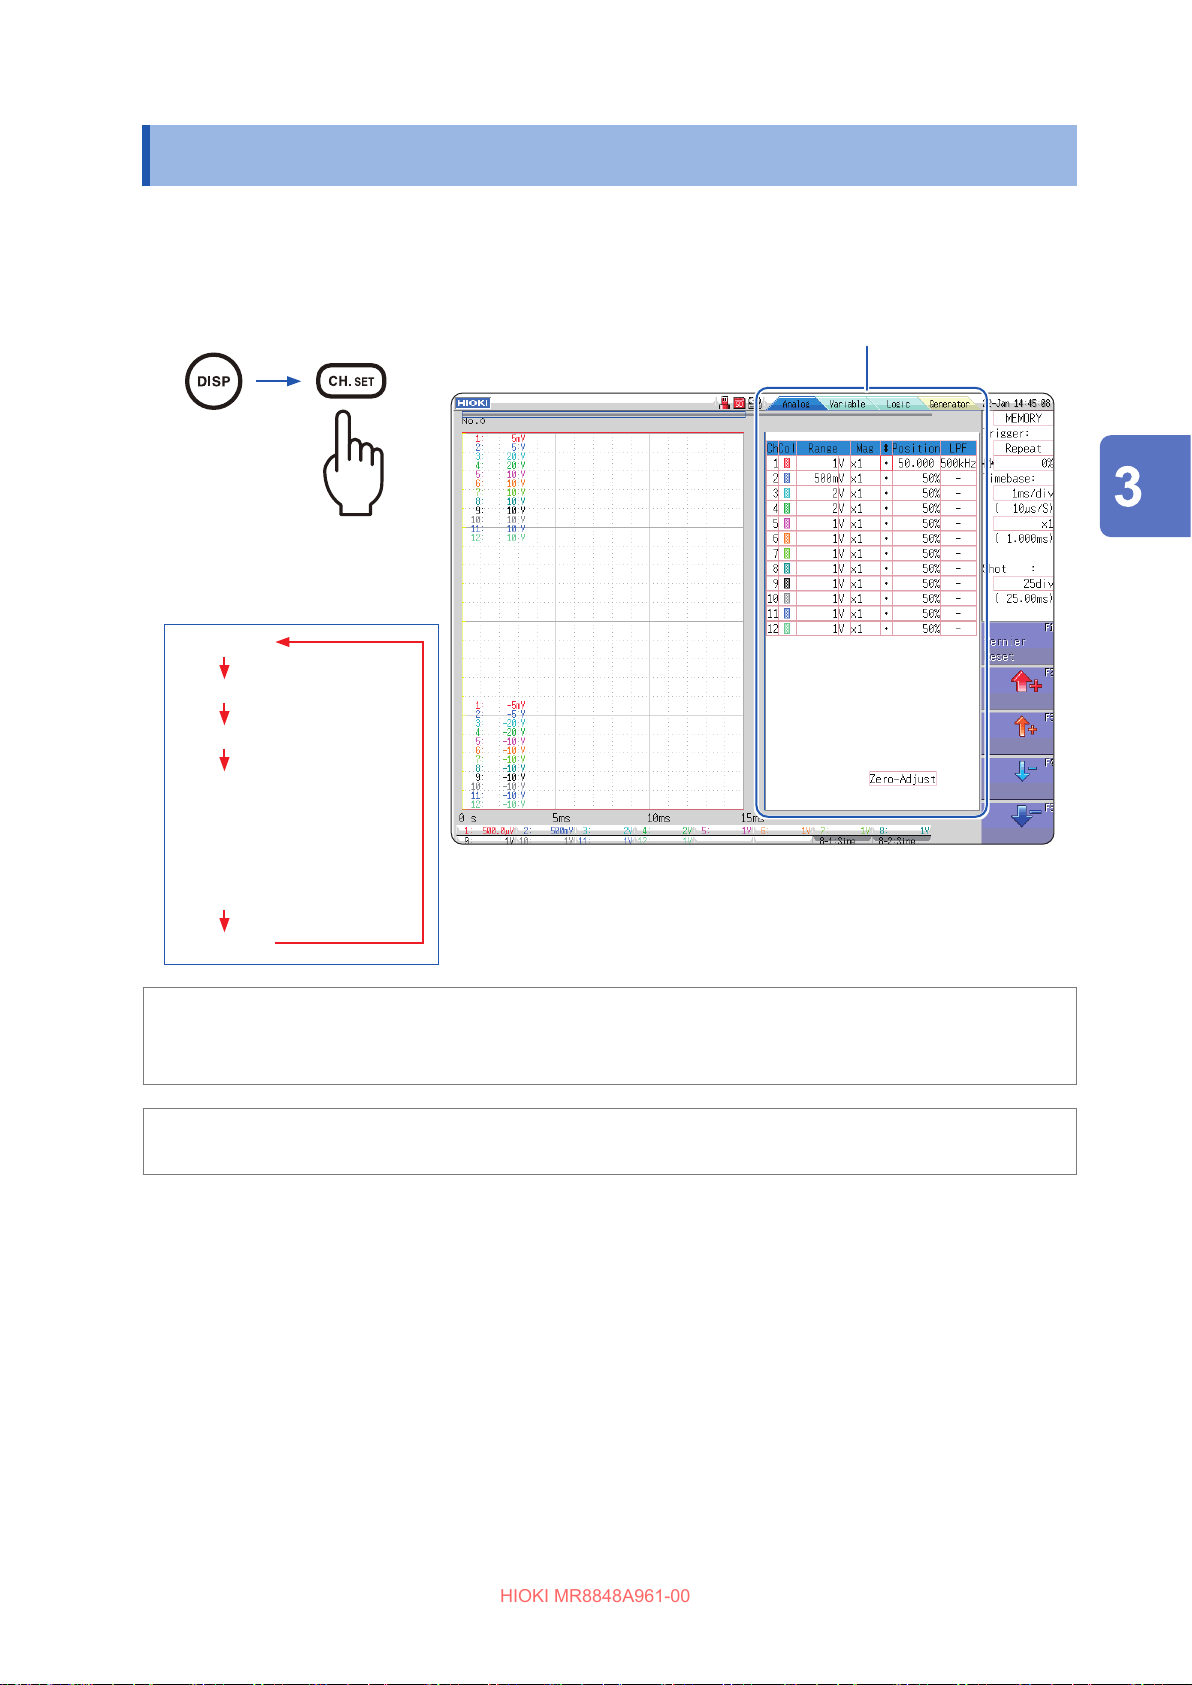
Conguring Input Channels Settings
HIOKI MR8848A961-00
3.4 Conguring Input Channels Settings
Conguring analog and logic channels settings.
To open the channel settings window
Refer to “Setting the variable function while the waveforms obtained
through all of the channels are being displayed” (p. 186).
The sheet changes every time the
CH.SET key is pressed.
[Analog]
[Variable]
[Logic]
[Wave Calc](when [Wave
Calculation] is set to on)
or
[Generator](when a waveform
generator unit is
installed)
No display
If the channel setting screen is hard to be observed due to
waveforms overlay, reduce the waveform display width to separate
the waveform display screen from trigger settings screen.
Refer to “Switching the waveform display width” (p. 162).
To reduce the number of displayed waveforms
Set the waveform display color setting on the Channel setting window to o.
Refer to “1. Waveform display color” (p. 80).
Measurement
To apply a channel setting to another channel
Refer to “8.9 Copying Settings to Other Channels (Copy Function)” (p. 189).
77
Page 78
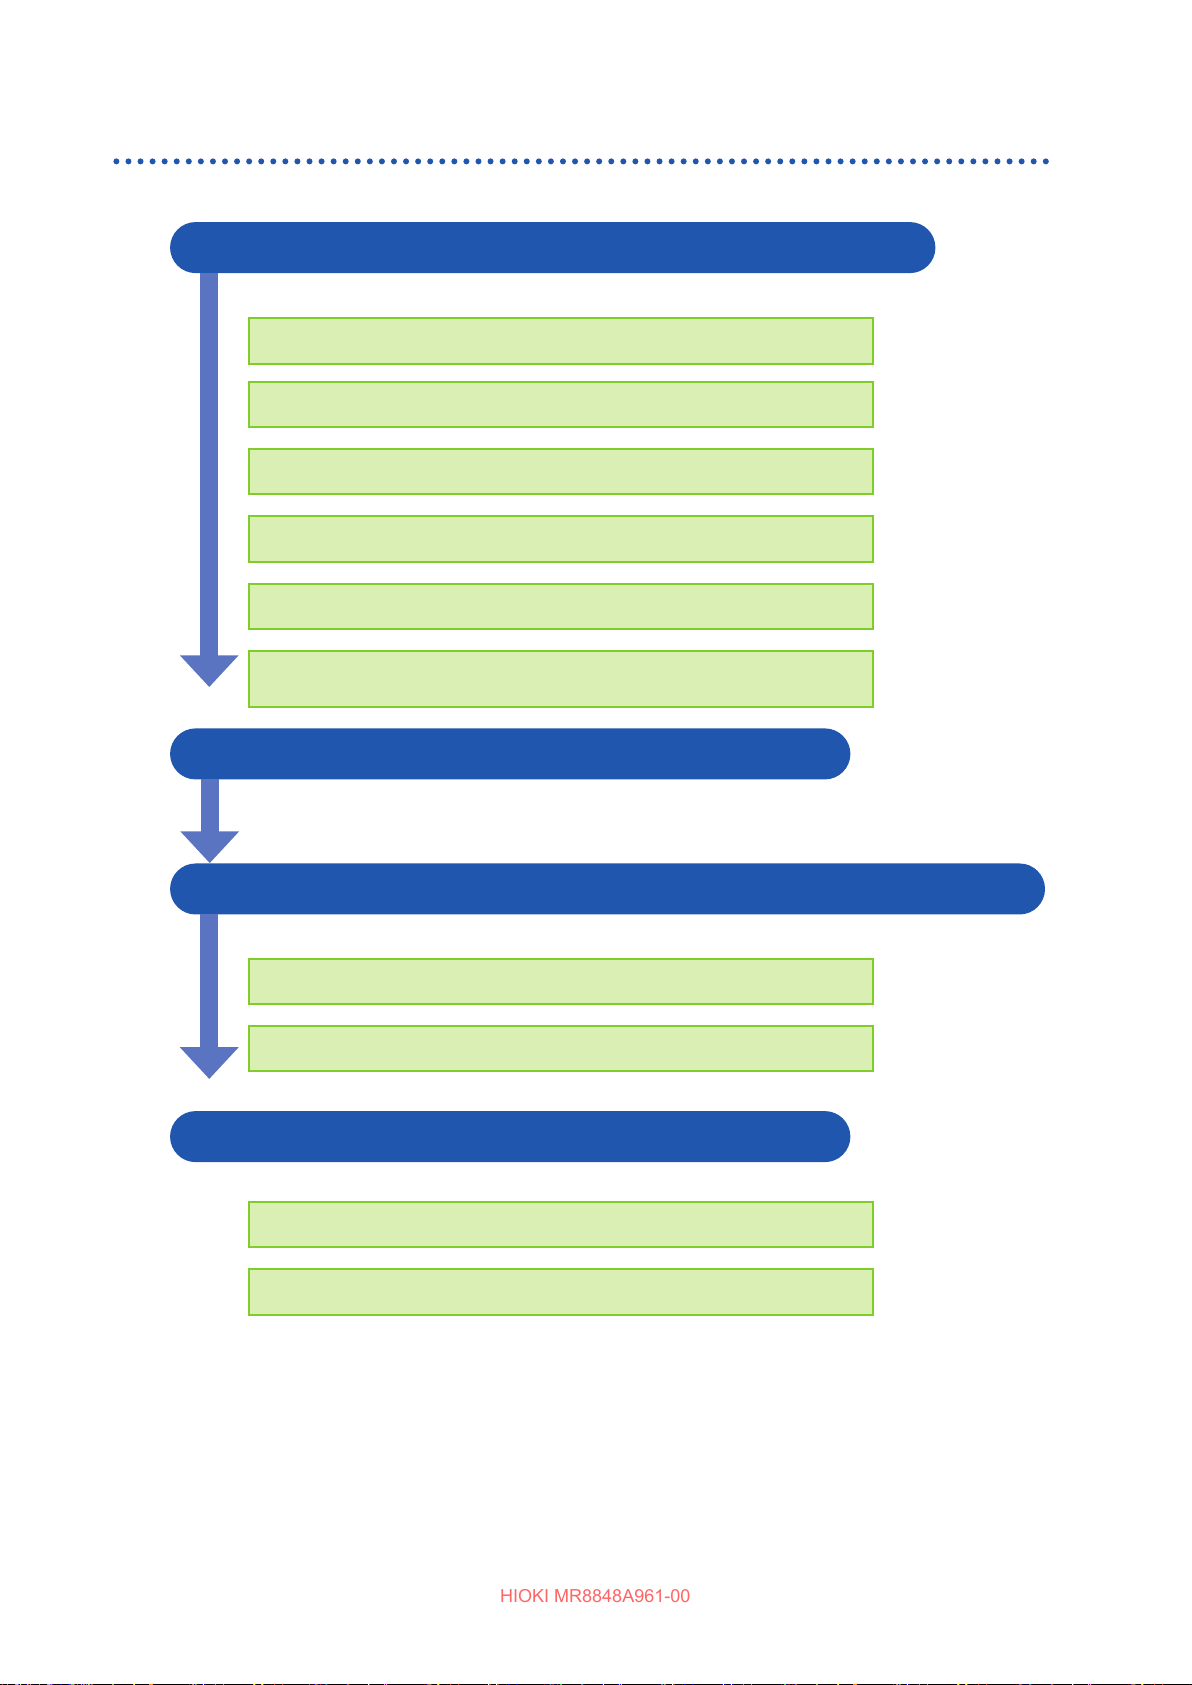
Conguring Input Channels Settings
HIOKI MR8848A961-00
Channel setting procedure
The procedure below shows how to congure the analog channels (CH1 through CH16) settings.
1 Conguring the settings of input and screen display
Refer to the following
pages:
Conguring the input coupling setting
Selecting an appropriate range for the input signal
Scaling the input value (As needed)
Conguring the lter setting (If performed in noisy environment)
Finely adjust the waveform amplitude (As needed)
Magnify/demagnify the waveform vertically (in the voltage-axis
direction) (As needed)
(p. 81)
(p. 80)
(p. 177)
(p. 83)
(p. 81)
(p. 81)
2 Conguring the trigger settings (as needed)
Refer to
(p. 217).
3
Conguring the settings of waveform display colors and positions
Refer to the
following pages:
Setting the waveform display color
(p. 80)
Setting the display position and magnication ratio (As needed)
(p. 184)
4 Conguring the graph display settings
Refer to the following
pages:
In Single, Dual, Quad, Oct, and Hex mode
In X-Y Single and X-Y Quad mode
• Setting the input coupling set to GND disables the range settings because the waveforms seem
to have no amplitude.
• Filter attenuation may inuence correct range settings.
• When choosing trigger settings, set the vertical axis (voltage axis) range rst. When you change
the range after specifying the trigger, the trigger setting is changed.
• When using the variable function, set the vertical axis (voltage axis) range rst. When you change
the range setting after applying the variable function, observation of waveforms with sucient
precision may not be possible.
(p. 76)
(p. 155)
78
Page 79
Conguring Input Channels Settings
HIOKI MR8848A961-00
• When using the variable and scaling functions together, enable the scaling function rst. When
you enable the scaling function after enabling the variable function, an unintended display may be
displayed.
This section describes the setting procedure for logic channels (standard logic terminals: LA
through LD, expansion logic terminals: L1A through L8D).
1 Conguring the display settings
Refer to
Conguring the logic recording width settings
(p. 84).
2 Conguring the settings of waveform display colors and positions
Refer to the following
pages:
Setting the waveform display positions
(p. 84)
Measurement
Setting the waveform display color
• The waveform display positions can be specied in one percent point increments.
• No logic waveforms are displayed in X-Y Single and X-Y Quad modes
• Up to three logic units can be installed. The instrument ignores the fourth logic unit and later units
that are installed in the instrument.
(p. 84)
79
Page 80
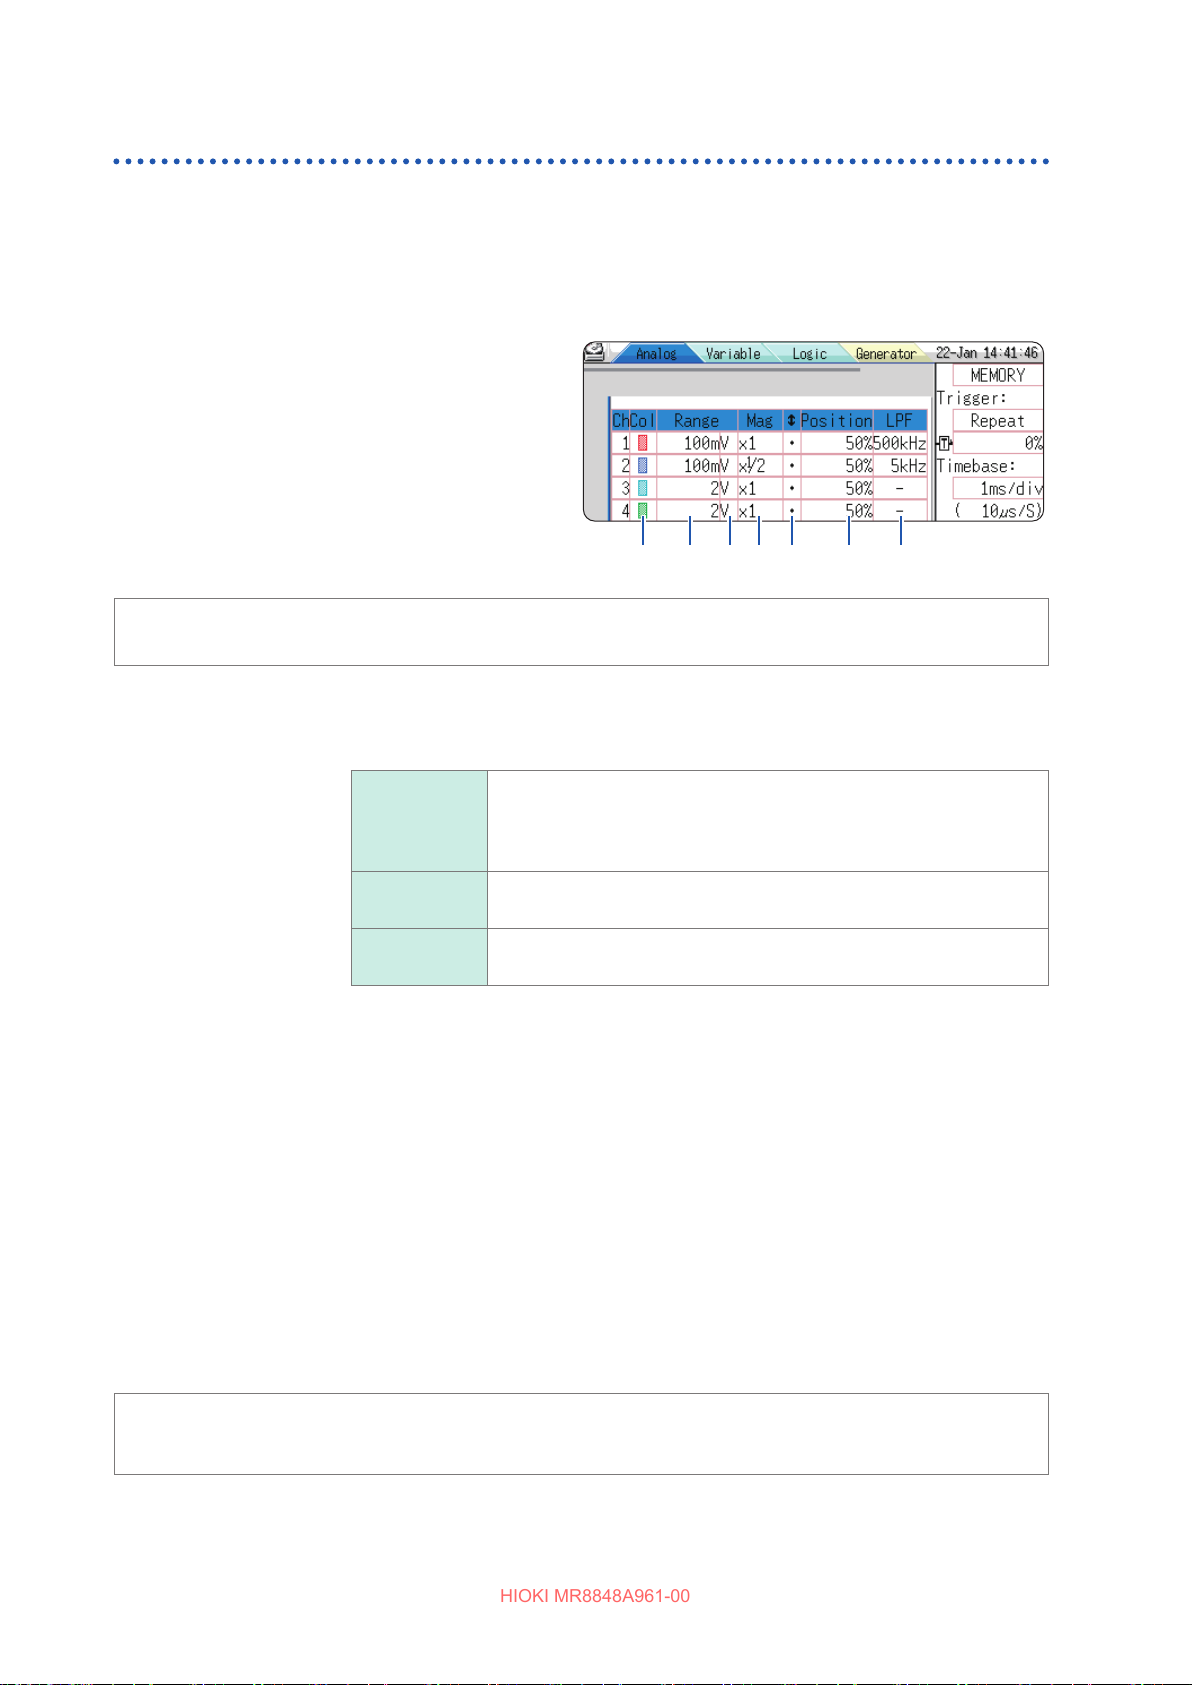
Conguring Input Channels Settings
HIOKI MR8848A961-00
Analog channel settings
For information about specic settings for each unit, refer to “8.10 Setting Details of Units” (p. 190).
Procedure
To display the screen: Press the DISP key to display the waveform screen, and then press the CH.SET key to open
the channel settings window ([Analog] sheet).
Move the cursor to the channel for which
1
you want to change the settings.
Select settings by pressing the F key.
2
1. 2. 3. 4. 5. 6. 7.
To apply the settings to another channel
Refer to “8.9 Copying Settings to Other Channels (Copy Function)” (p. 189).
1. Waveform
display color
2. Vertical axis
(voltage axis)
range
Sets the color of the waveform of the selected channel. You can also select
the same color as other lines.
O Displays no waveform. When [Save Channel] of the auto-saving
setting is set to [Disp Ch], the instrument does not save any data of
this channel.
Refer to “Select the channels to be saved.” (p. 104).
On Displays the waveform. To select the display color, press [↑] and [↓]
in the F keys.
All On-O You can switch the waveforms display between on and o for entire
channels.
Sets the vertical axis (voltage axis) range with respect to each channel.
You can set the vertical axis range in terms of voltages per division.
When the variable auto-correction is set to [O
is set to [On], the size of the waveform displayed on the screen is xed
regardless of the vertical axis (voltage axis) ranges.
Full-scale
value
Full-scale value = {Vertical axis (voltage axis) range}
Example: When the vertical axis (voltage axis) range is set at
1 V/div, the full-scale value is calculated as
1 V/div × 20 = 20 V.
As the full-scale value is 20 V, the measurable range is
20 V.
±
] and the variable function
20 div
×
If a waveform amplitude falls outside of the range
80
Changes the vertical axis (voltage axis) range to a lower sensitivity setting.
Page 81
Conguring Input Channels Settings
HIOKI MR8848A961-00
3. Input coupling
4. Vertical axis
(voltage axis)
magnication
ratio
You can set the input signal coupling method. Typically, select the DC coupling.
DC (V, –) Measures the input signals including both DC components and AC
components. (Default setting)
AC (
GND (
V
, )
)
Measures the input signal, including AC components only. DC
components are rejected.
Measures the input signals short-circuiting the input signal to the
ground. This enables you to check the zero position of the signal.
You can set the magnication ratio of waveforms in the vertical axis (voltage
axis) direction for displaying and printing waveforms respect to each channel.
Magnifying waveforms are performed based on the zero position. Magnifying
waveforms does not inuence the measurement resolution.
Refer to “Magnifying/Demagnifying the waveforms vertically
(in the voltage axis direction)” (p. 159).
To display waveforms magnied in user-dened magnication ratios, enables
the variable function.
When signs of displayed waveforms are reversed, you can ip the
waveforms vertically.
Refer to “8.6 Setting the Waveform Position (Variable Function)” (p. 184).
Refer to “8.8 Inverting the Waveform (Invert Function)” (p. 188).
Measurement
5. Vernier
6. Zero position
You can nely adjust input voltage amplitudes freely on the waveform screen
(This ne adjustment changes waveforms shape only seemingly).
When recording physical values such as noise, temperature, and acceleration
with sensors, you can adjust those amplitudes, facilitating calibration.
Refer to “8.7 Fine-Adjusting Input Values (Vernier Function)” (p. 187).
You can set the zero-volt level display position. If the zero-volt input level is
displaced, perform the zero-adjust.
Refer to “2.7 Adjusting the Zero Position (Zero-Adjustment)” (p. 63).
Refer to “2.8 Performing Calibration (When MR8990 is Installed)” (p. 64).
To move the zero positions of entire channels at a time, press [Preset].
Ascending order
(3%→96%)
Descending order
(96%→3%)
All Ch 0% Moves the zero position of entire channels to the 0% level of the
All Ch 50% Moves the zero position of entire channels to the 50% level of
Moves the zero position of CH1 to the 10% level of the vertical
axis and those of the following channels, through CH16, to each
position that increases in 5 percentage points increments.
Moves the zero position of CH1 to the 90% level of the vertical
axis and those of the following channels, through CH16, to each
position that decreases in 5 percentage points increments.
vertical axis.
the vertical axis.
If the zero position of the waveform obtained with the 8969 or U8969 Strain
Unit is displaced, perform the auto-balance.
Refer to “Setting the 8969 and U8969 Strain Units” (p. 194).
• The zero position setting merely change waveform positions, not applying any osets to inputs
signals.
• The vertical axis (voltage axis) magnication/demagnication of waveforms is performed based
on the zero position.
• The zero position adjustment and the vertical axis (voltage axis) magnication/demagnication
merely change displayable voltage ranges on the waveform screen. No actual measurement
ranges are not changed.
81
Page 82
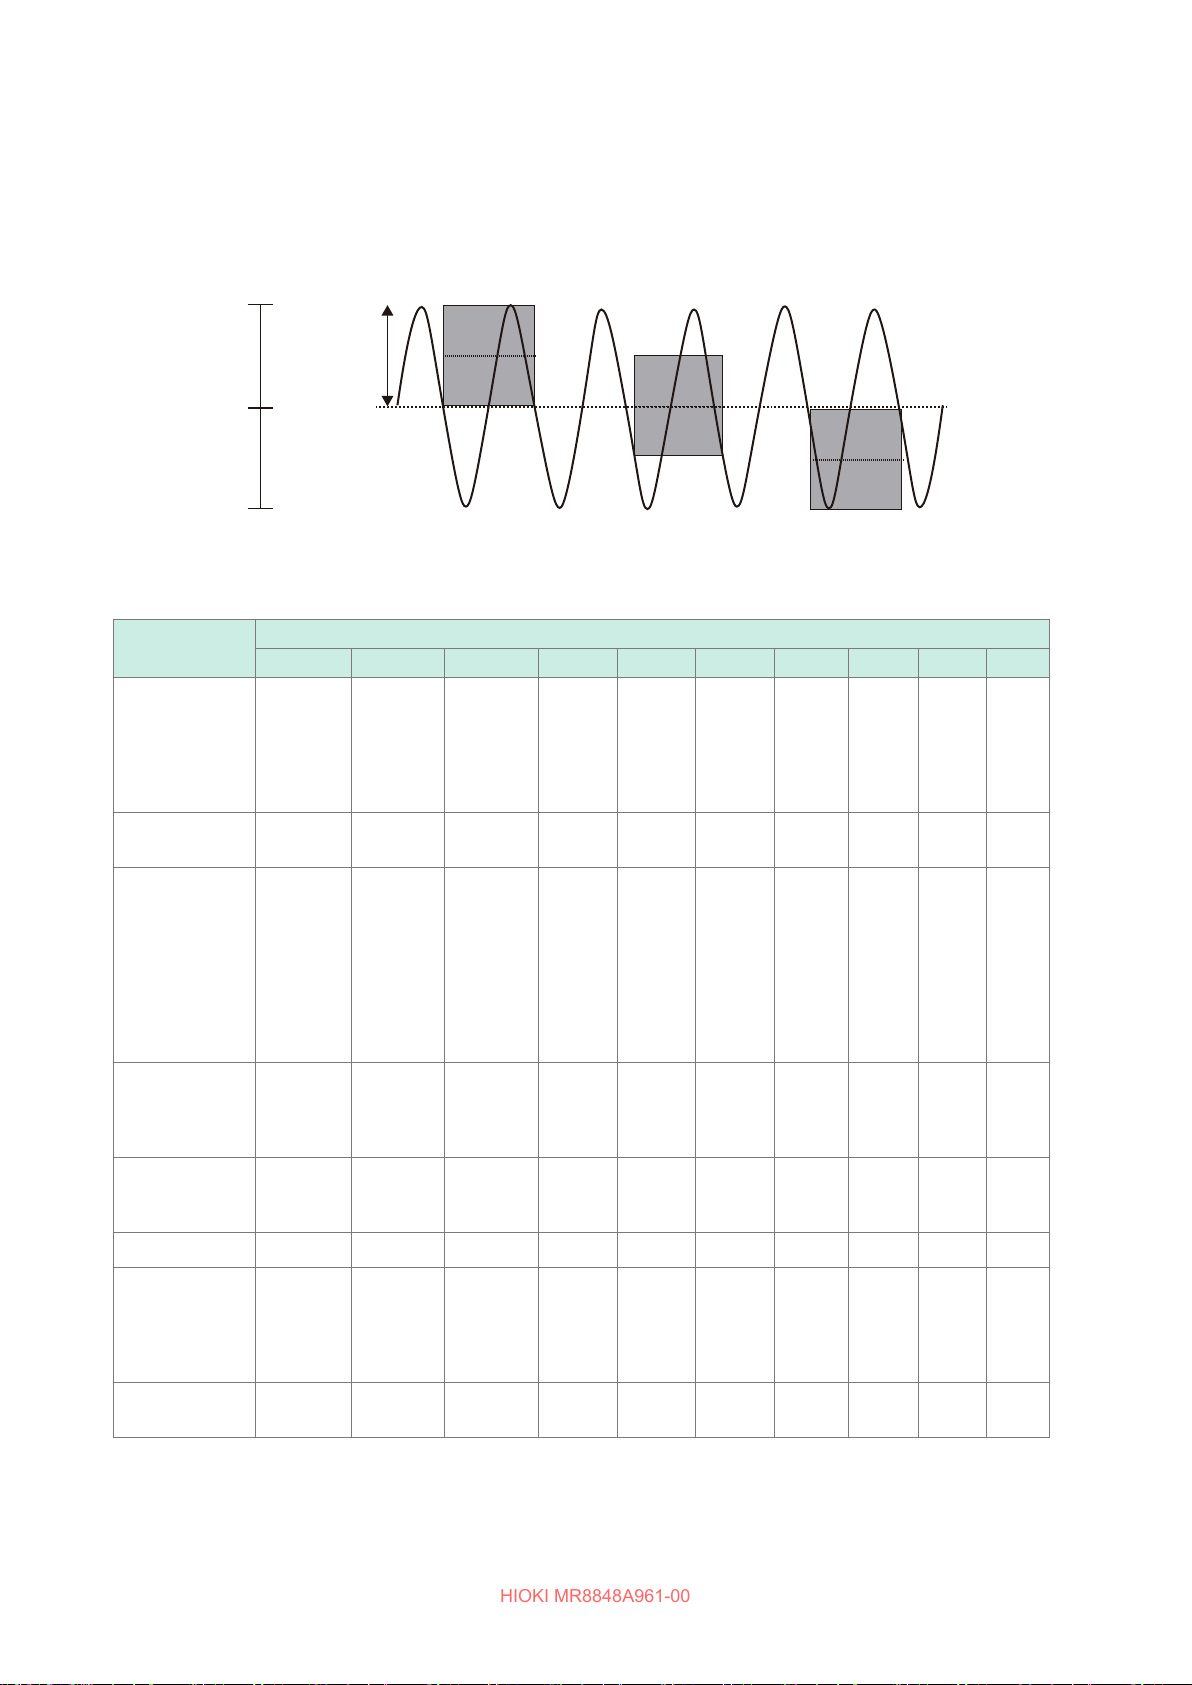
Conguring Input Channels Settings
HIOKI MR8848A961-00
The zero positions are moved as shown in the illustration below.
Example: 8966 Analog Unit
Zoom factor
A/D data
2047
1
×
2000 LSB
Displayed area
(Zero position: 0%)
100 %
50 %
Displayed area
(Zero position: 50%)
Displayed area
(Zero position: 100%)
0 0 V
A/D data
−2047
0 %
Resolution of each unit in screen display range (LSB)
Unit
8966
(Analog)
8971
(Current)
8972
(DC/RMS)
8967
(Temperature)*
8968
(High
resolution)
U8974
(High voltage)
U8975, U8978
(4CH analog)
U8977
(3CH current)
1/10
×
20000
(4000)
200000 100000 40000 20000 10000 4000 2000 1000 400 200
320000
(64000)
1/5
×
10000
(4000)
160000
(64000)
1/2
×
4000 2000 1000 400 200 100 40 20
64000 32000 16000 6400 3200 1600 640 320
Magnication ratio
1
×
2
×
5
×
10
×
20
×
50×100
×
8969, U8969
(Strain)
U8979
(Charge)
8970
(Power
frequency)
8970 (Count) 400000 200000 80000 40000 20000 8000 4000 2000 800 400
8970
(
Excluding
power
frequency and
count
)
MR8990
(DVM)
The magnication ratios enclosed in the brackets represent ranges of valid data.
*: For the 8967 Temp Unit, the valid range varies depending on thermocouples. For information about the
minimum resolution, see the specications of the 8967 Temp Unit.
82
250000
(64000)
20000 10000 4000 2000 1000 400 200 100 40 20
100000 50000 20000 10000 5000 2000 1000 500 200 100
10000000
(1200000)
125000
(64000)
5000000
(1200000)
50000 25000 12500 5000 2500 1250 500 250
2000000
(1200000)
1000000
500000 200000 100000 50000 20000 10000
Page 83
Conguring Input Channels Settings
HIOKI MR8848A961-00
7. Low-pass lter
You can set the low-pass lter installed in the unit. Enabling this function
can eliminate unwanted high-frequency components.
Settable lter types varies depending on units. Select a suitable setting
according to an input signal characteristics.
Measurement
83
Page 84
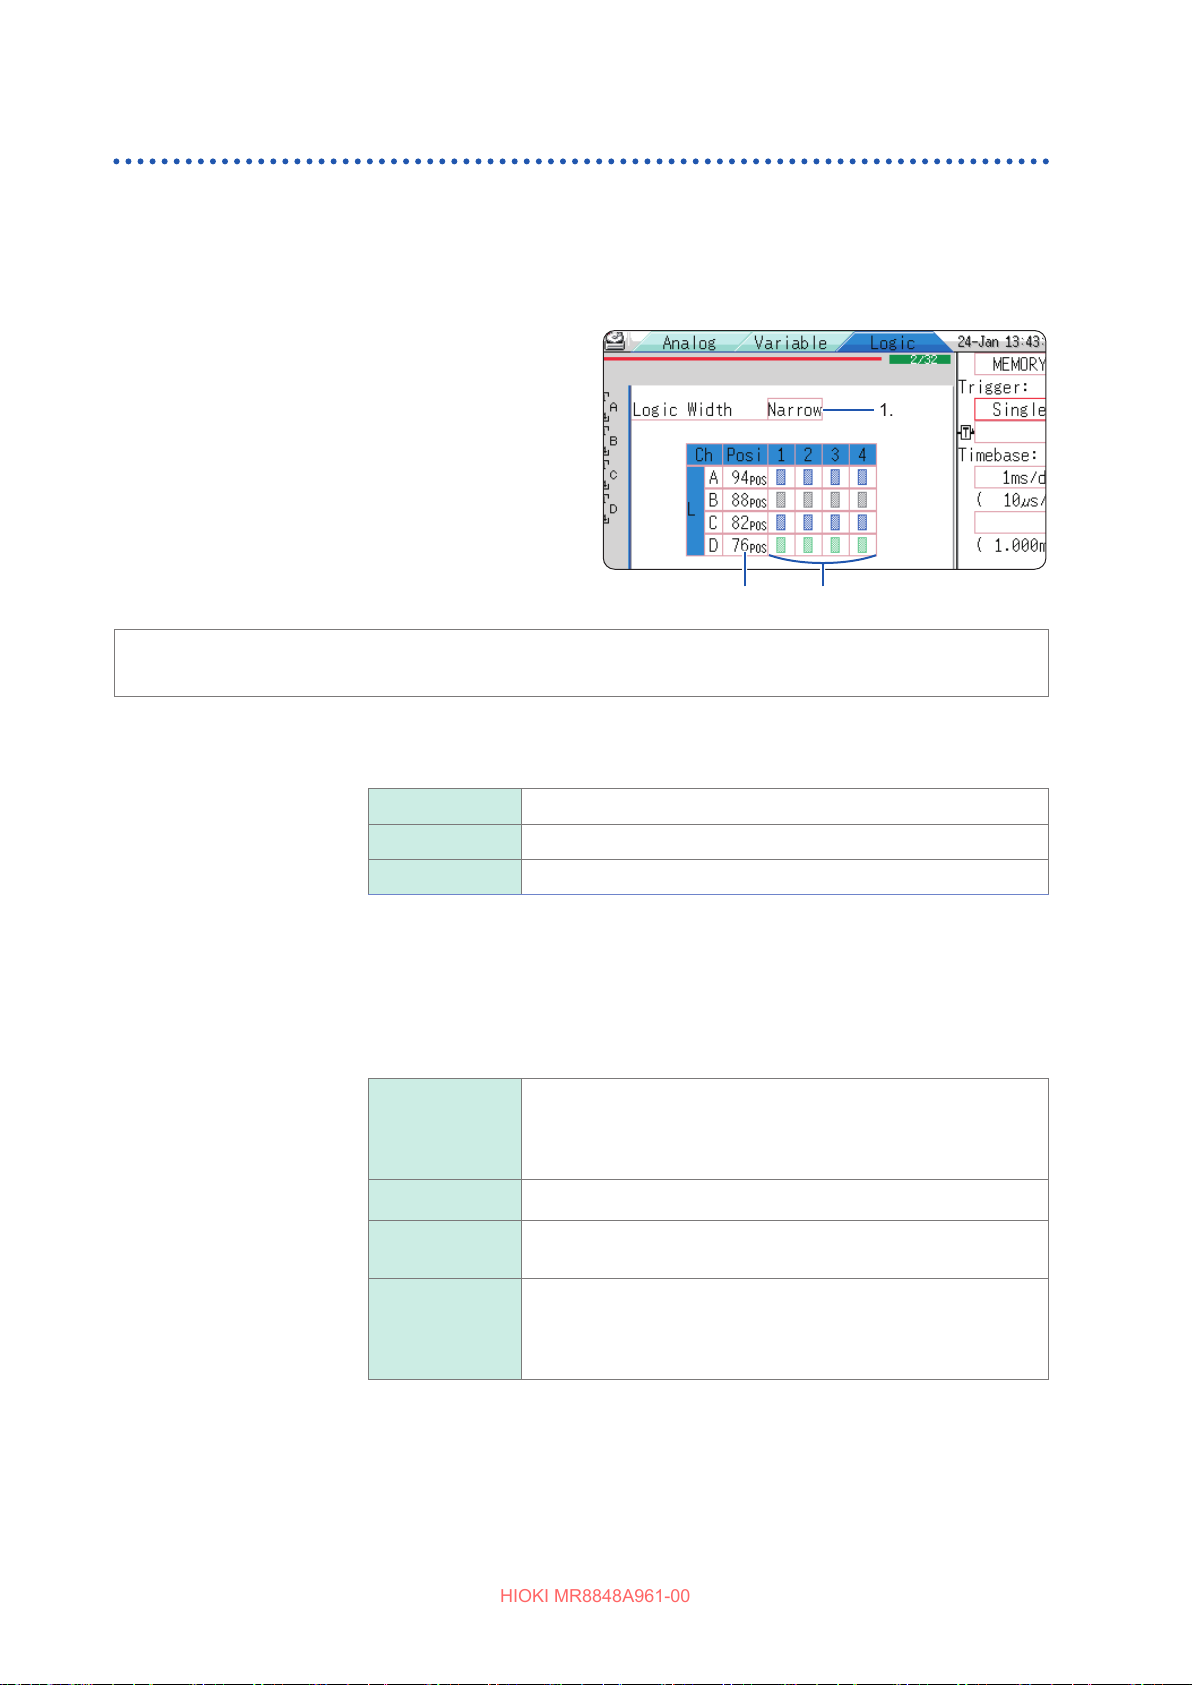
Conguring Input Channels Settings
HIOKI MR8848A961-00
Logic channel settings
The [Logic] sheet appears in Single, Dual, Quad, Oct, and Hex mode.
Procedure
To display the screen: Press the DISP key to display the waveform screen, and then press the CH.SET key to open
the channel settings window ([Logic] sheet).
Move the cursor to the channel for which
1
you want to change the settings.
Select settings by pressing the F key.
2
2. 3.
1.
To apply the settings to another channel
Refer to “8.9 Copying Settings to Other Channels (Copy Function)” (p. 189).
1. Logic width
2. Waveform
display position
3. Waveform
display color
You can change the display width of the logic waveform.
Making waveforms narrower can enhance the readability of the display
containing a large number of waveforms.
Wide Displays waveforms at expanded width.
Normal Displays waveform at the normal width.
Narrow Displays waveform at reduced width. (Default setting)
You can set the logic waveforms positions.
You can freely move the positions of the logic waveforms within the range
of the display.
Sets the color of the waveform of the selected channel. You can also select
the same color as other lines.
For logic unit, either each unit or each channel can have a dierent color
setting.
O Displays no waveform. When [Save Channel] of the auto-
saving setting is set to [Disp Ch], the instrument does not save
any data of this channel.
Refer to “Select the channels to be saved.” (p. 104).
On Displays the waveform. Press the F key to set the display colors.
Setting the standard logic (LA, LB, LC, and LD) display setting to [On] disables the 8970 Freq Units
installed in Unit 1 and Unit 2 positions. Furthermore, it deteriorates the resolutions of the 8967
Temp Unit, 8968 High Resolution Unit, 8969 Strain Unit, U8969 Strain Unit, U8974 High Voltage
Unit, and U8979 Charge Unit from 16 bits to 12 bits. Installing the MR8990 Digital Voltmeter Unit,
U8793 Arbitrary Waveform Generator Unit, MR8790 Waveform Generator Unit, or MR8791 Pulse
Generator Unit installed in Unit 1 and Unit 2 positions disables the standard logic terminals.
84
Probe On-O Switches the waveform display between on and o at a time for
those obtained with a single probe.
All On-O Switches the entire logic waveform display between on and o
at a time.
This setting is selectable when the cursor is placed on any item
of the waveform display position box.
Page 85
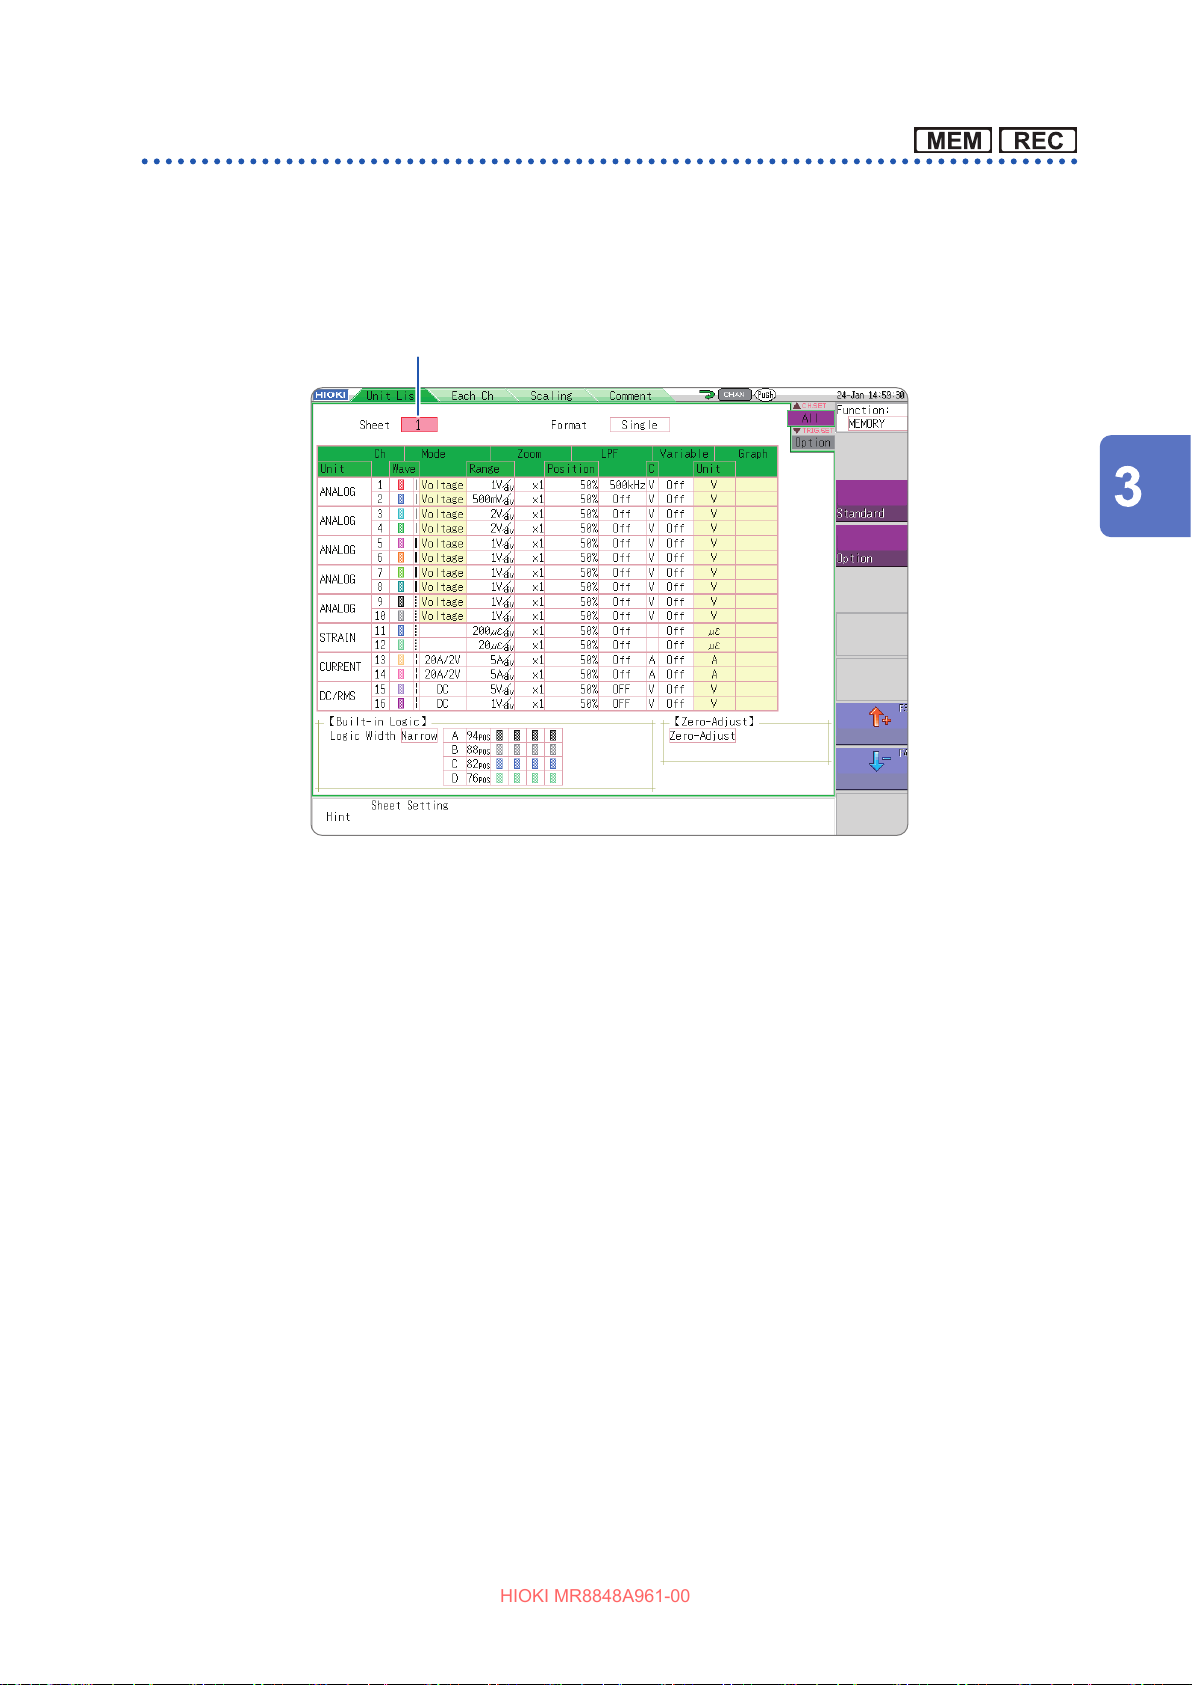
Conguring Input Channels Settings
HIOKI MR8848A961-00
Display sheet
The input channel settings can be set with respect to each display sheet. Up to four sheets are
available.
You can assign waveforms to be displayed to each display sheets and switch a display sheet to
another.
Switching sheets (1 through 4)
Measurement
• You can set the following display-related settings only with respect to each display sheet.
Analog waveform: Display on/o, waveform color, magnication ratio, zero position, graph,
variable (on/o, upper and lower limits)
Logic waveform: Display on/o, waveform color, display position, logic width
X-Y waveform: Display on/o, display color, X ch, Y ch, waveform calculation (X ch, Y ch)
Common setting: Display format
• The measurement-related settings other than above are common to all displayed sheets.
• When a range is changed, the ranges of entire display sheets are changed.
• Saving settings les operation saves the settings of all displayed sheets.
• Saving waveform les operation saves the waveforms in the setting of the sheet displayed at
the time of saving. When you try to load a waveform le, only the sheet displayed at the time of
saving can be loaded because other sheets were not saved.
You can congure the waveform calculation settings using the channel setting window.
Refer to “3.4 Conguring Input Channels Settings” (p. 77).
85
Page 86
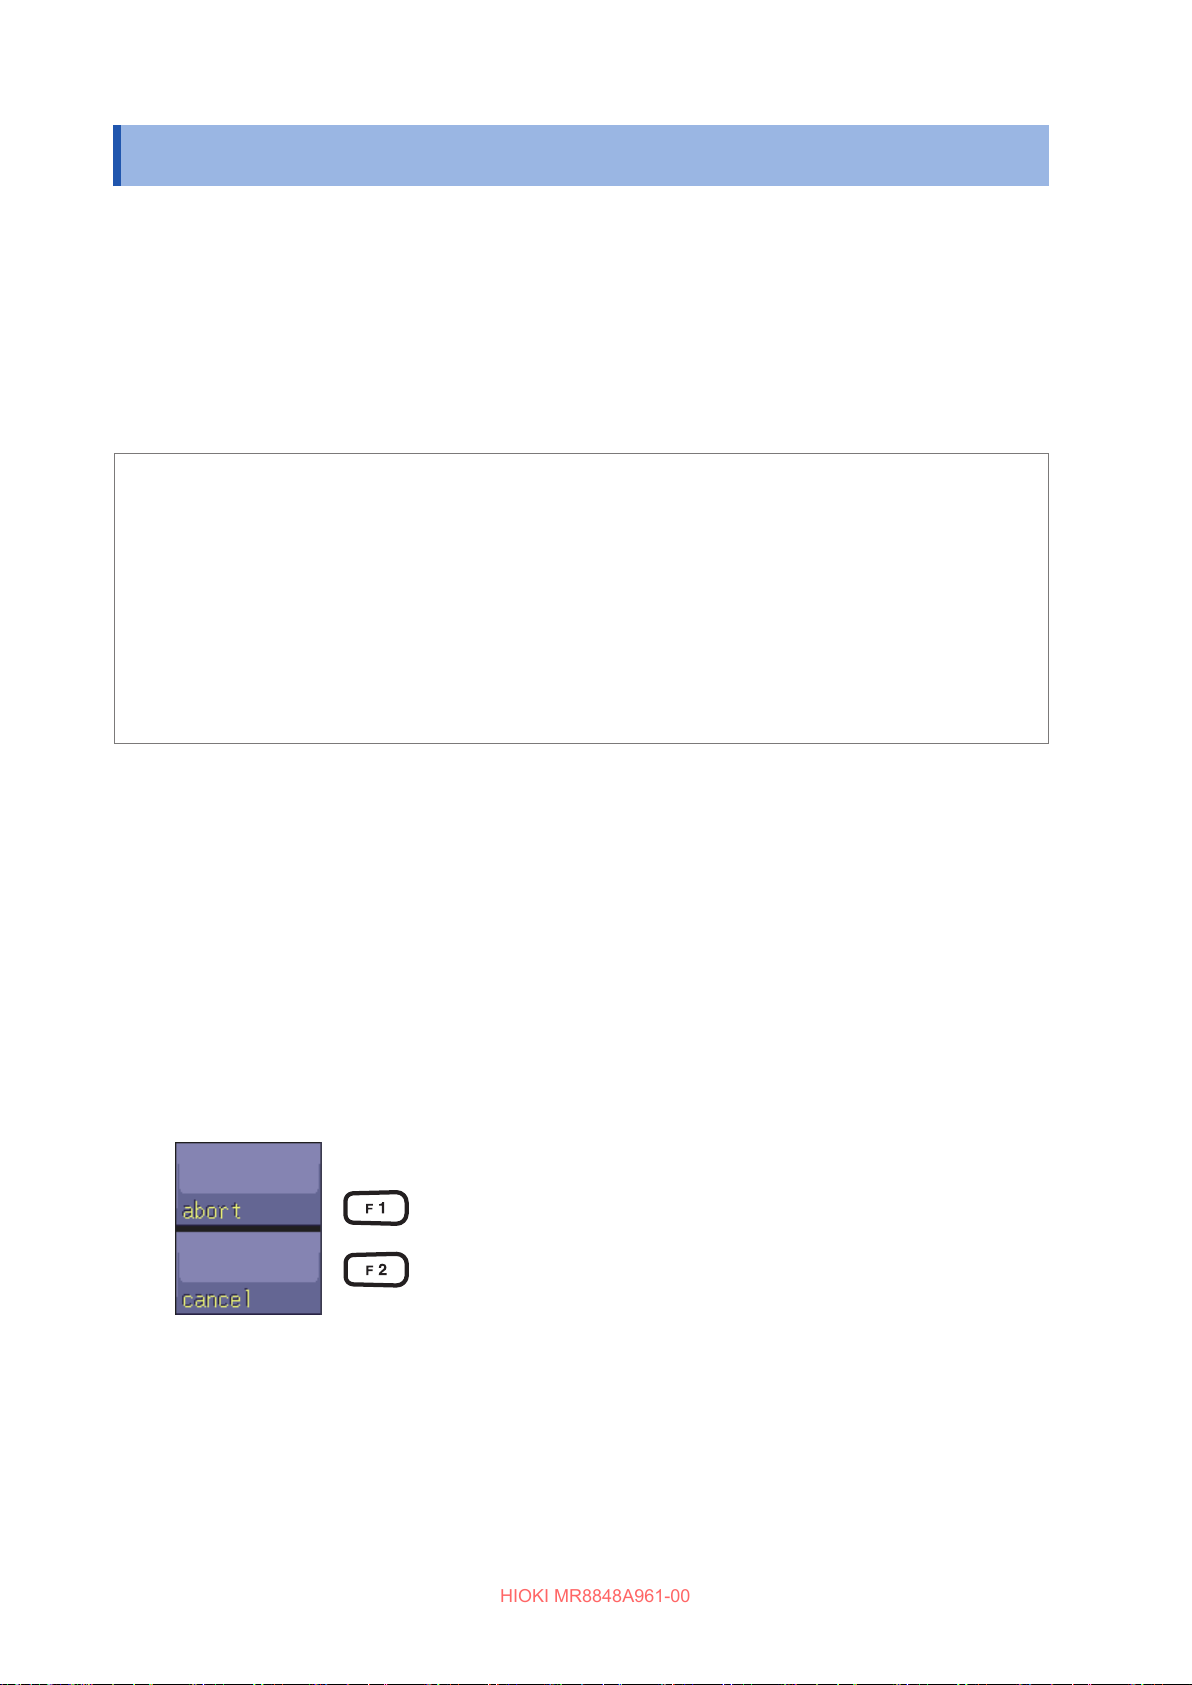
Starting and Stopping Measurement
HIOKI MR8848A961-00
3.5 Starting and Stopping Measurement
Procedure
To display the screen: Press the DISP key to open the waveform screen.
To start measurement
Press the START key to start measurement.
• When measurement is started, waveform data displayed on the screen is cleared.
• Applying a signal to the external control terminal can start measurement.
Refer to “17 Controlling the Instrument Externally” (p. 375).
To prevent starting measurement unintentionally
To prevent the instrument from starting measurement unintentionally due to operation mistakes,
you can change the START key operation method.
Refer to START key acceptance conditions (p. 341).
To automatically save data during measurement
Refer to “Automatically saving waveforms” (p. 102).
To print waveforms
Refer to “6 Printing Data (When U8351 Printer Unit is Installed)” (p. 133).
To stop the measurement in progress
Press the STOP key once to stop the measurement in progress after the specied recording length
expires.
Press the STOP key once again to stop the measurement in progress immediately.
You can change key acceptance conditions for the START and STOP keys.
Refer to “15 Setting the System Environment” (p. 341).
Pressing the STOP key may display the following GUI on screen.
Stops the measurement in progress immediately.
(the same behavior as that when pressing the STOP key twice)
Cancels the stopping action and continue the measurement in progress.
When no keys are operated during this status, the measurement is terminated after the specied
recording length expires, and the display returns to the previous screen.
86
Page 87
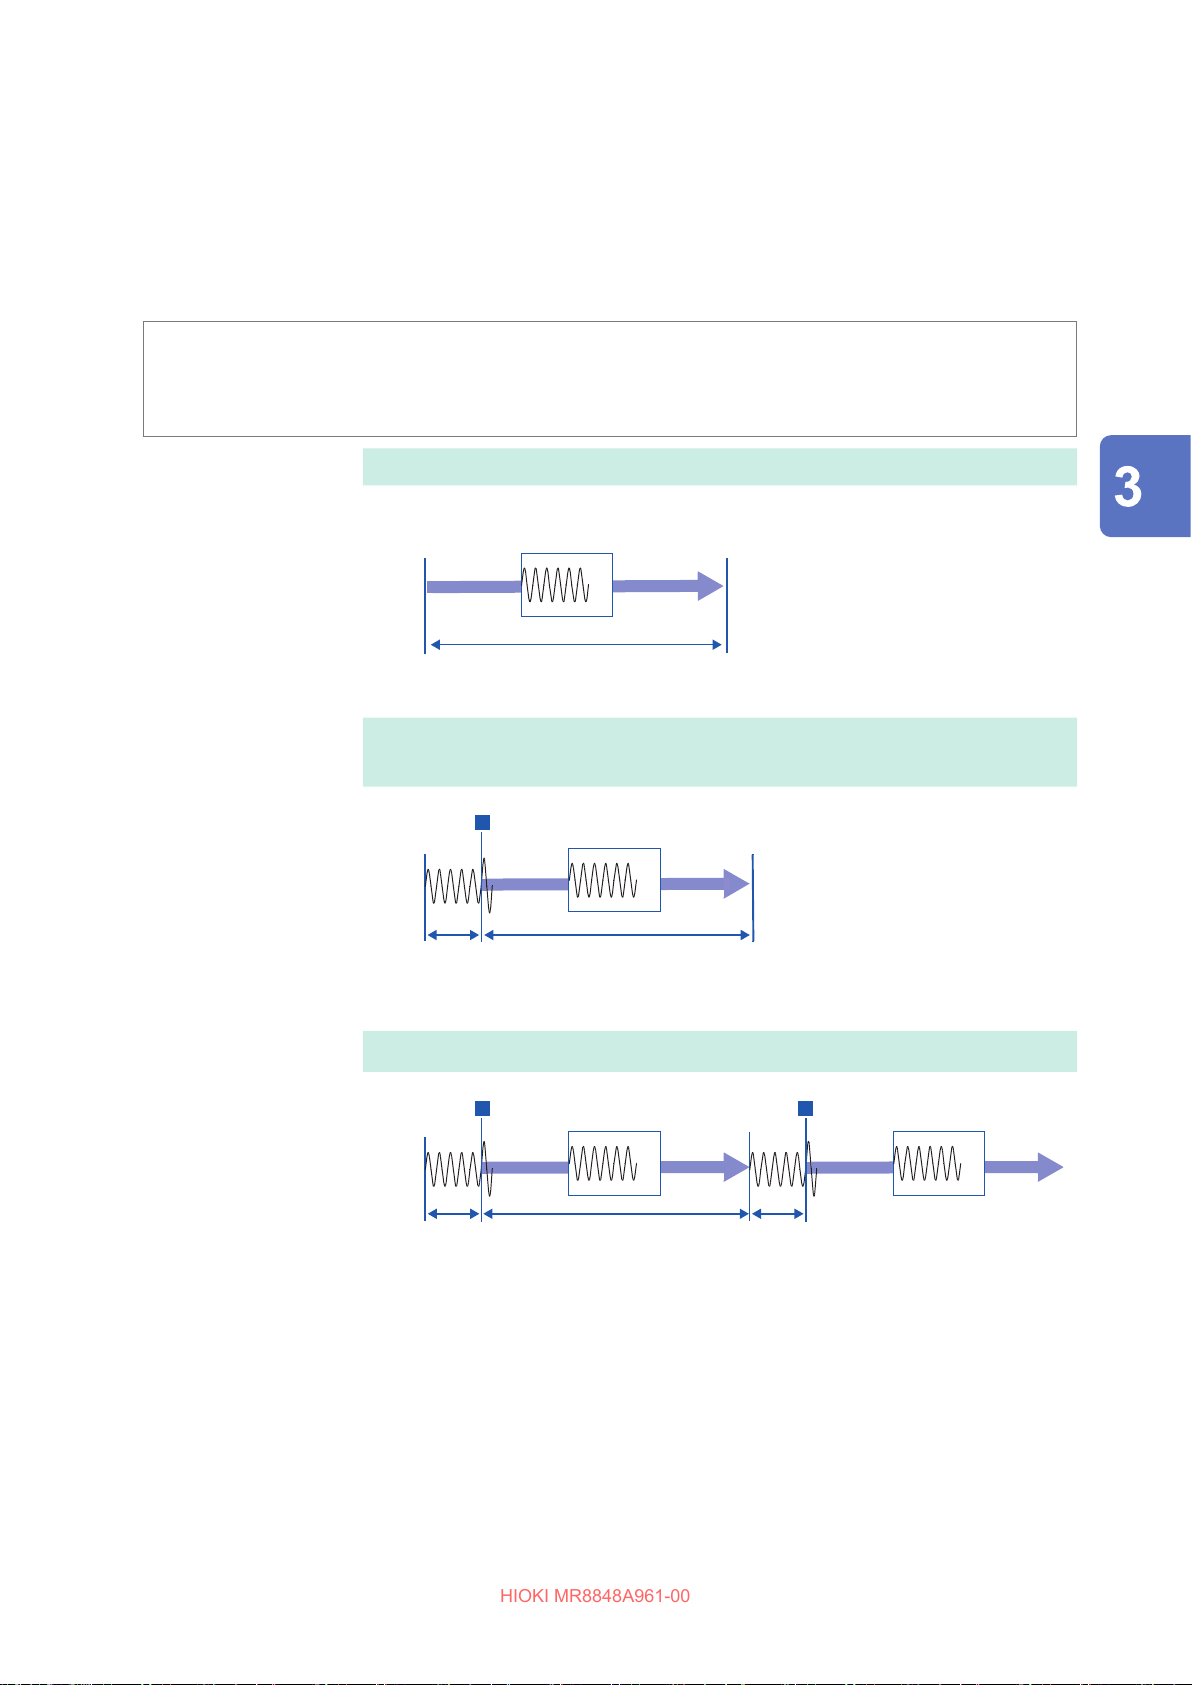
Starting and Stopping Measurement
HIOKI MR8848A961-00
Measurement and internal operations
Two options of the measurement methods available: the normal measurement (starts measuring
and recording waveforms at once) and trigger measurement (starts recording waveforms when
trigger conditions are satised). In this manual, “Start of measurement” indicates the time when you
press the START key, and “start of acquisition” indicates a start time of waveform acquisition on the
waveform screen.
To trigger the instrument once or repeatedly
Select the trigger mode. (p. 219)
To observe data acquired preceding the trigger point
Set a pre-trigger. (p. 232)
Typical
measurement
Triggered
measurement
Trigger mode:
[Single]
With the pre-trigger
not enabled
Without trigger setting
Start
measurement
START key
Recording starts
The recording terminates after the recording length expires.
Recording End of measurement
Recording stops
[Now Storing] Storing Finished
[ ]: Status bar display
Triggering the instrument once
Start
measurement
START key
[Trigger wait]
A trigger event starts recording, and the recording terminates after the recording length
of the data is acquired.
T
Recording End of measurement
Recording stopsRecording starts
[Now Storing] Storing Finished
Measurement
Trigger mode:
[Repeat]
With the pre-trigger
not enabled
Triggering the instrument repeatedly
Start
measurement
START key
[Trigger wait]
A trigger event starts recording, and the recording terminates after the recording length
of the data is acquired, setting the instrument to wait for another trigger.
T T
Recording End of measurement
STOP key
Recording stopsRecording starts
[Now Storing] [Trigger wait]
Recording starts
87
Page 88
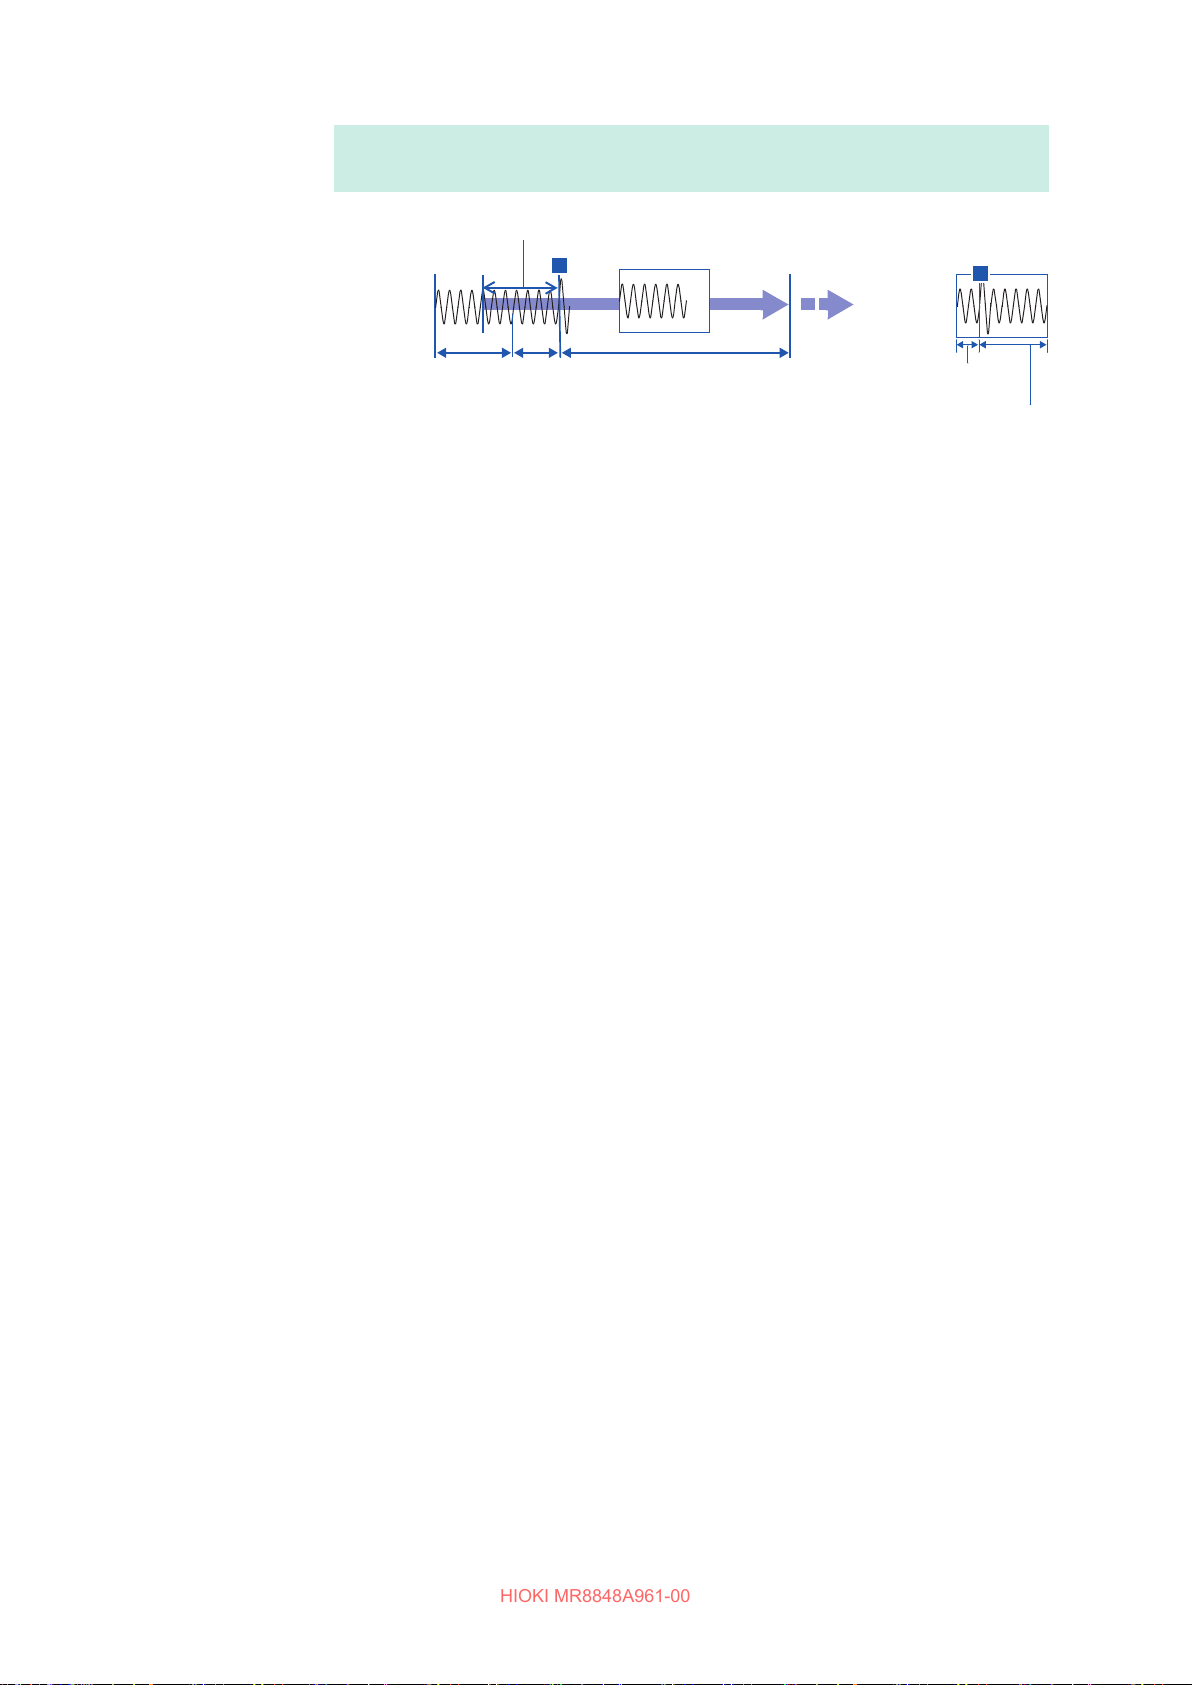
Starting and Stopping Measurement
HIOKI MR8848A961-00
Triggering the instrument repeatedly and recording phenomena before
each trigger event
Trigger mode:
[Repeat]
With the pre-trigger
enabled
Start
The specied pre-trigger wait period is recorded before each trigger event.
measurement
START key
Recording starts
[Pre-Trigger wait]
After starting measurement and internally acquiring data for the
specied pre-trigger period, the [Trigger Wait] state is activated.
T
[Trigger wait]
Recording End of measurement
Recording stops
[Now Storing]
Storing Finished
Operation is
repeated from
pre-triggering
stage.
Wave for m during
specied pre-trigger
period
T
Post-trigger
waveform
The data before a trigger event (for the pre-trigger period) is acquired.
When the trigger mode is set to [Repeat] or [Auto] (the memory function
only), the number of trigger events is displayed at the top of the screen. (Storage
counter)
Refer to “Display” (p. 30).
88
Page 89
Measurement in Automatic Range Setting (Auto-Range Function)
HIOKI MR8848A961-00
3.6 Measurement in Automatic Range Setting (Auto-Range Function)
This function is enabled only for measurement with the analog units with the memory function enabled.
When you press the AUTO key after inputting signals to an analog unit and select [Auto Range],
the horizontal axis range (timebase), vertical axis (voltage axis) range, and zero position are
selected automatically, and then measurement is started.
The timebase is set to the lowest numbered channel of the channels with those waveform display
setting set to on. In addition, it is set automatically so that waveforms with a length of from one
cycle to 2.5 cycles in 25 divisions are recorded.
Setting the auto-range function set to on changes the following items.
Unit-related conditions (For all channels)
Vertical axis (voltage axis) range
Zero position
Vertical axis (voltage axis) magnication ratio×1
Low-pass lter O
Input coupling DC
Automatically-set value
Measurement
Trigger conditions (For a single channel only)
Trigger Mode Auto
Logical operation between trigger sources OR
Pre-trigger 20%
Set to on is only the lowest numbered channel of channels
Internal trigger
Trigger type
Condition of [Status] sheet on the status screen
Timebase Automatically-set value (time axis magnication ratio:
with those waveform display setting. (If the dierence
between maximum and minimum value is eight divisions or
less, the second lowest numbered channel is turned on.)
Level trigger: Slope, Rising
Trigger level: Automatically-set value
Filter: O
1)
×
• When measurement is started in the auto-range setting, the trigger output signal is output from
the external control terminal block’s TRIG OUT terminal. Keep this in mind when performing autorange measurement while using the trigger output terminal.
• The auto-range function automatically selects settings for an input signal when the function is
enabled. After supplying an input signal (waveform), start auto-range measurement.
• If the input signal of the lowest numbered channel with the waveform display setting set to on
have extremely low amplitude, the timebase is set according to the input signal of the next lowest
numbered channel.
• If the range cannot be set for any channels with waveform display setting set to on, a warning
message is displayed, with the result that the measurement in progress is interrupted.
• The auto-range measurement disables the auto-saving and auto-printing functions.
• For a low-frequency signal of less than 10 Hz, the optimal ranges cannot be selected
automatically. Set the ranges manually.
• Using the following units disables the auto-range function:
8967 Temp Unit, 8969 Strain Unit, U8969 Strain Unit, 8970 Freq Unit, MR8990 Digital Voltmeter
Unit
89
Page 90

Measurement in Automatic Range Setting (Auto-Range Function)
HIOKI MR8848A961-00
90
Page 91
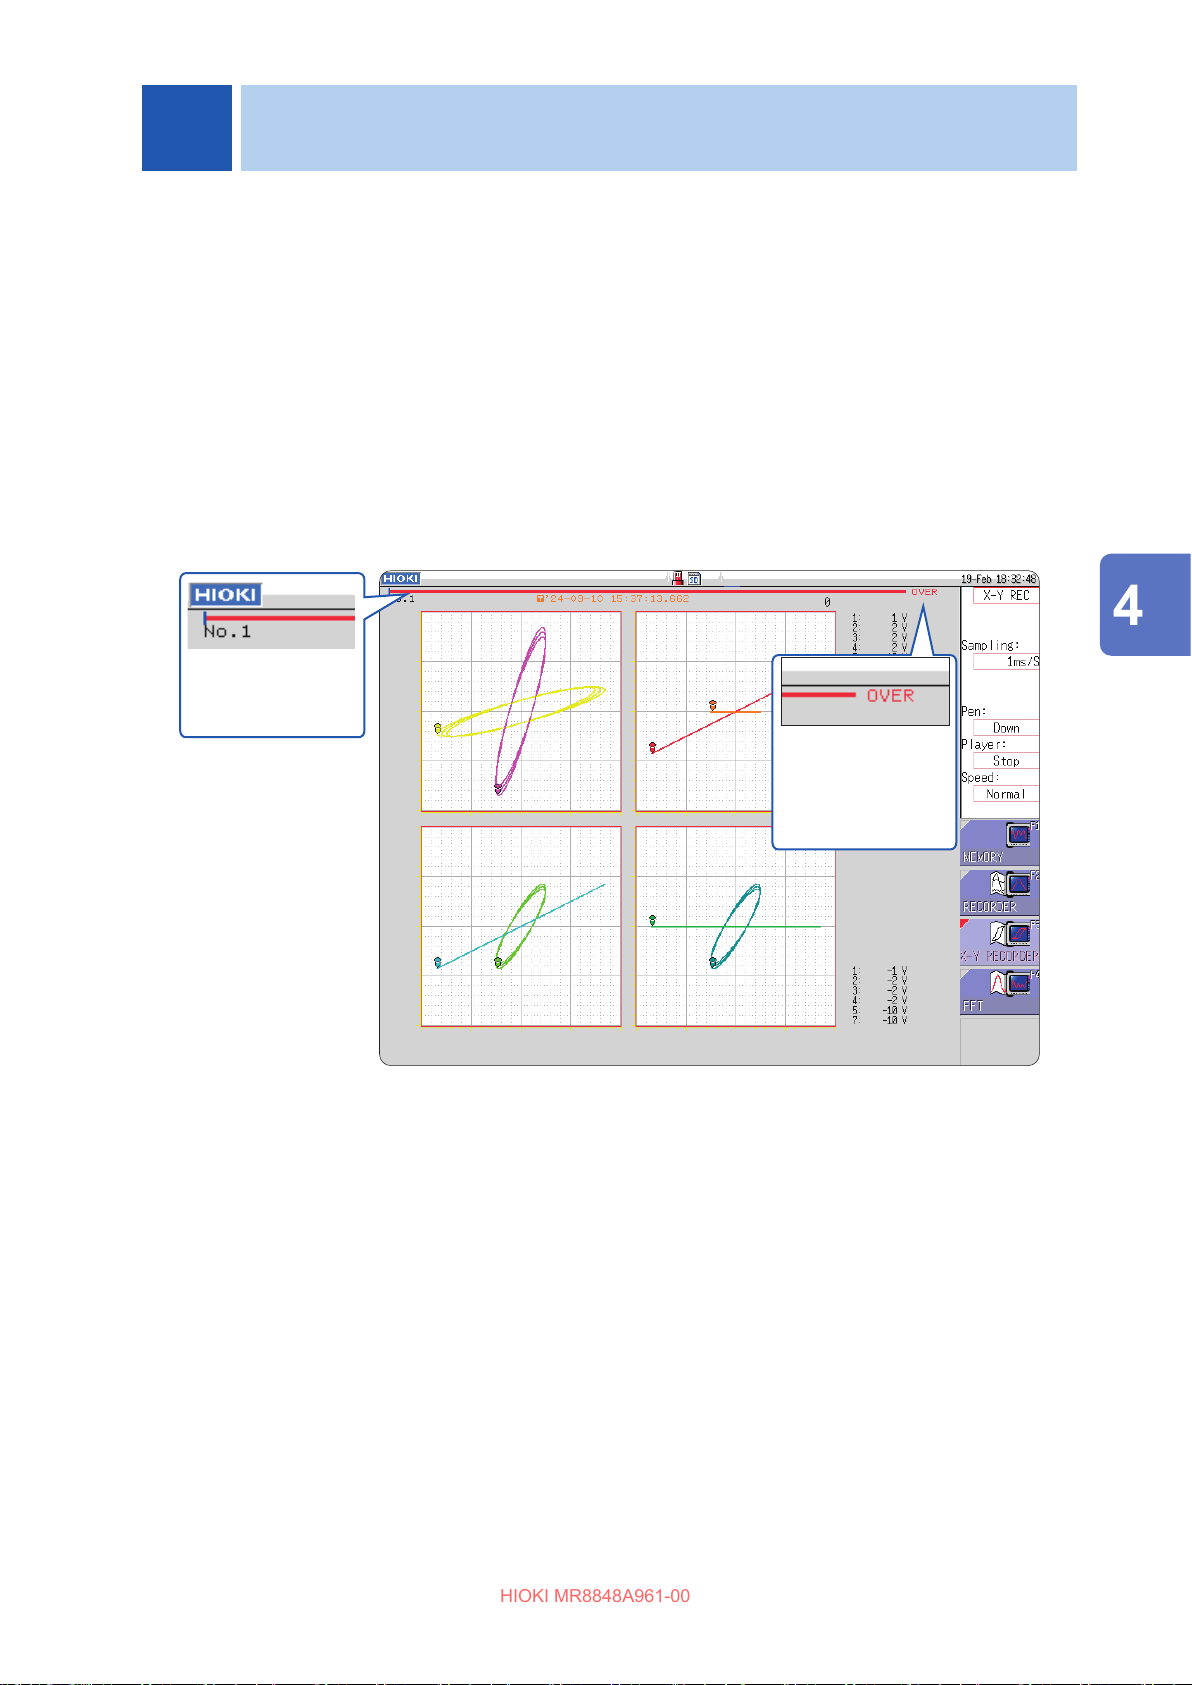
4
HIOKI MR8848A961-00
X-Y Recorder
• You can plot X-Y composite curves each of which presents the relationship between an input
signal and another in real time.
• Since the instrument writes the data of plotted curves in the memory, it can save the data as les
as well as print the curves.
• You can set the waveforms plotting setting to on and o in the same manner as the pen raising
and lowering setting installed in typical X-Y pen recorders.
• You can observe up to eight X-Y composite curves simultaneously.
• Since the instrument writes X-Y composite curves in the memory, it can redraw the X-Y composite
curves in other display settings after measurement.
Example of X-Y recorder waveform screen (in X-Y4 mode)
The bar indicates
the amount of
occupied memory.
X-Y Recorder
[OVER] appears
when the memory
is lled with the
waveforms to
capacity.
91
Page 92
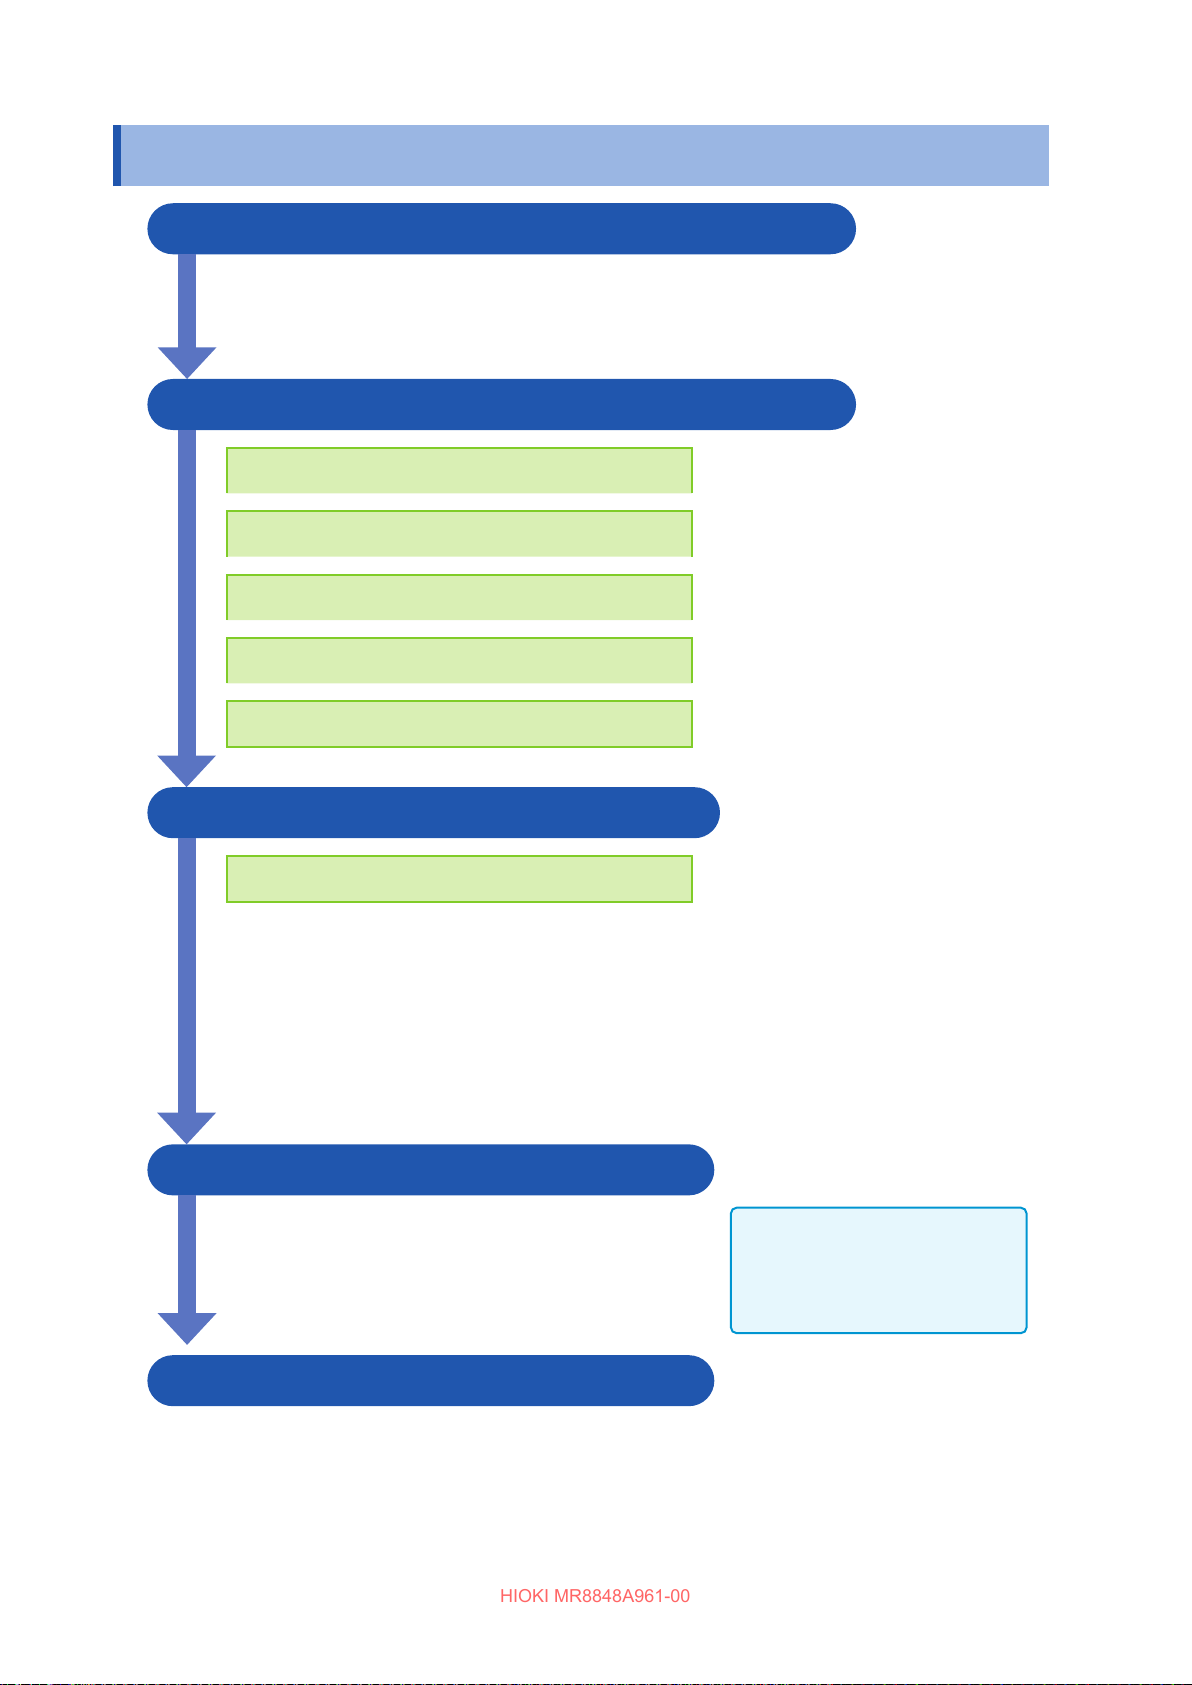
Measurement Procedure
HIOKI MR8848A961-00
4.1 Measurement Procedure
1 Inspecting the instrument before measurement
Refer to
“3.2 Inspecting the Instrument Before Measurement” (p. 67).
2 Conguring the basic measurement settings
Setting the measurement function to the X-Y
recorder
Refer to the following pages:
“Measurement functions” (p. 93)
Setting the sampling rate
Setting the X-Y composite curve display mode
Specify whether to perform X-Y composite curve
interpolation
Specify whether to clear previous X-Y composite
curve data
3 Conguring input channel settings
Congure the analog channel settings
Logic channels cannot be used.
Advanced settings
Refer to the following pages:
“8.6 Setting the Waveform Position (Variable Function)” (p. 184)
“8.7 Fine-Adjusting Input Values (Vernier Function)” (p. 187)
“8.1 Adding Comments” (p. 166)
“8.5 Converting Input Values (Scaling Function)” (p. 177)
“Sampling” (p. 93)
“Format” (p. 93)
“Dots-Line (interpolation)” (p. 93)
“Disp Clear” (p. 93)
Refer to
“Analog channel settings” (p. 80)
4 Starting measurement
5 Completing the measurement
92
Refer to the following pages:
“4.3 Starting and Stopping Measurement” (p. 94)
“7.1 Reading Measured Values (Using Cursors A and B)”
(p. 146)
Refer to the following pages:
“4.3 Starting and Stopping Measurement” (p. 94)
“4 Redraw X-Y composite curves” (p. 94)
“Saving data selectively (SAVE key)” (p. 113)
“6.3 Manually Printing Data by Pressing the PRINT Key (Selection Print)” (p. 137)
The X-Y recorder function does not
support the following operations:
• Trigger setting
• Auto-saving
• Auto-printing
Page 93
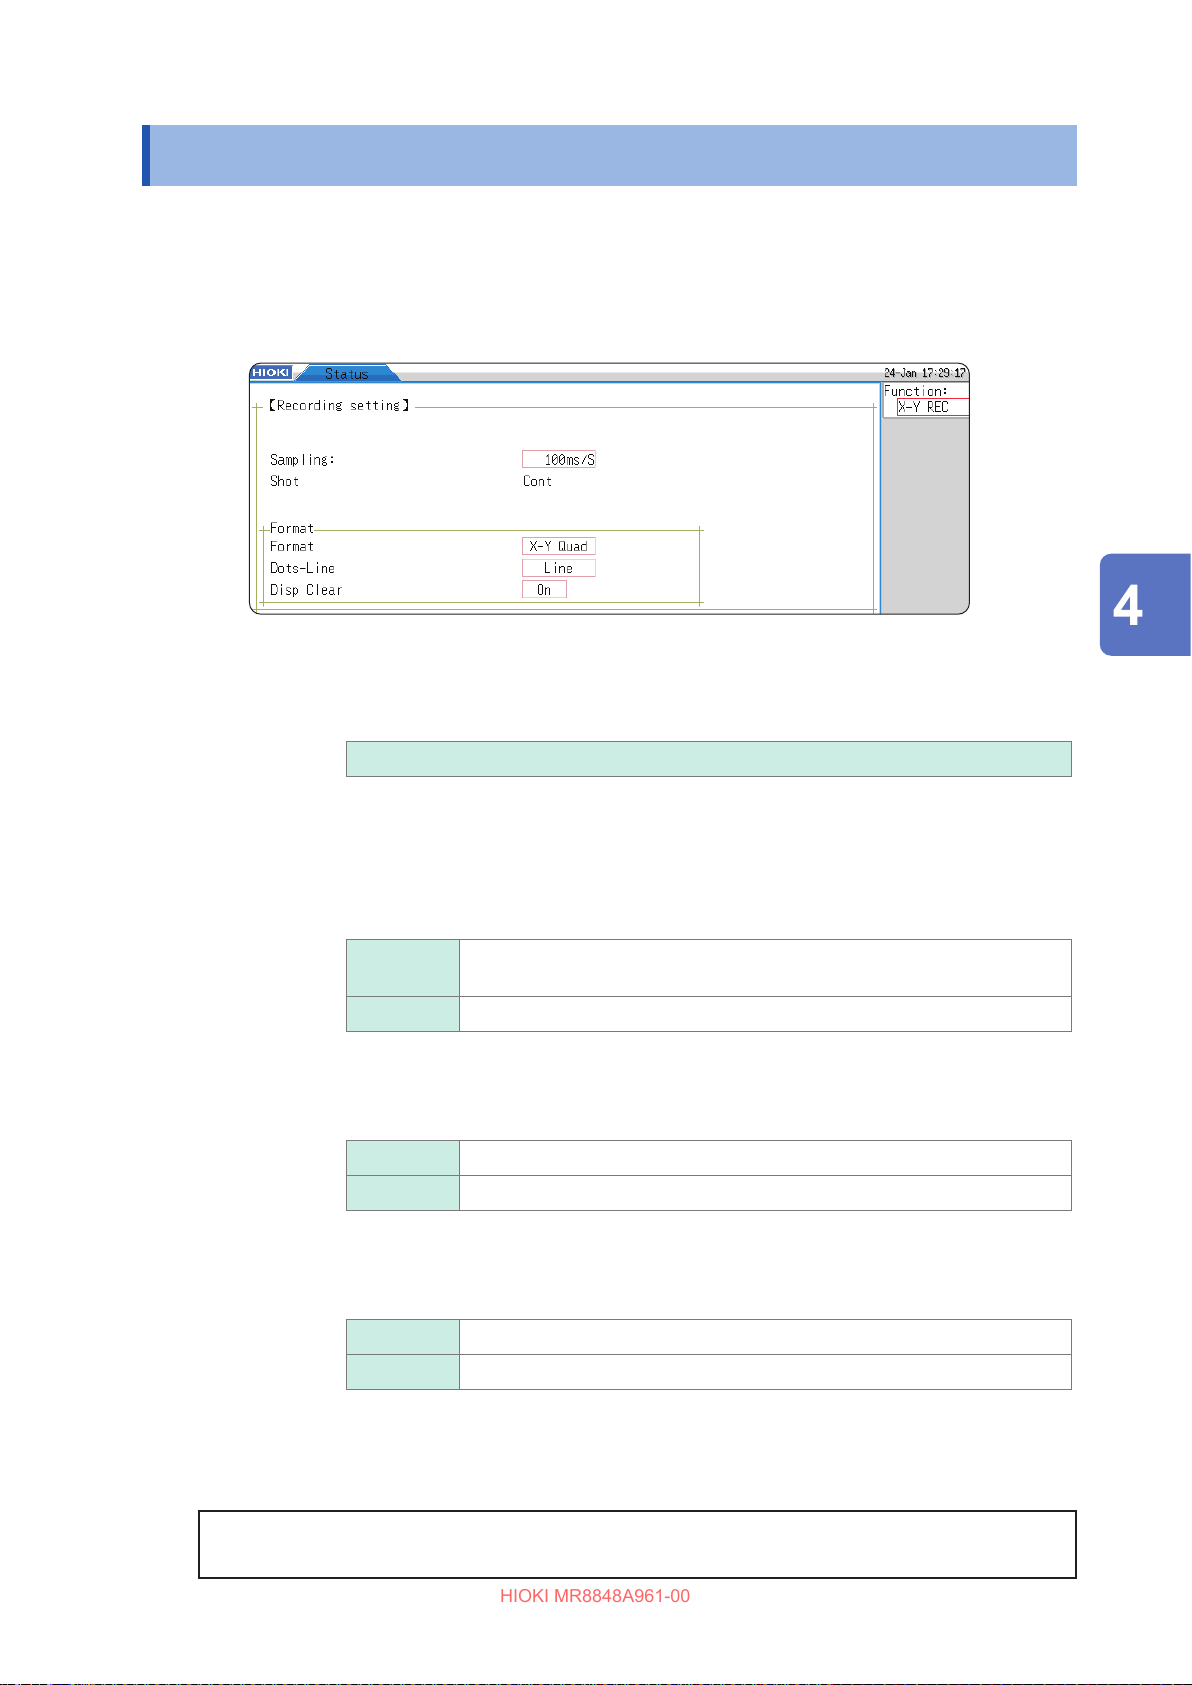
Setting Measurement Conditions
HIOKI MR8848A961-00
4.2 Setting Measurement Conditions
To set the measurement conditions, press the STATUS key to display the status screen, and then
select the [Status] sheet. (The measurement functions and sampling rates can also be set on the
waveform screen.)
Setting items
Measurement
functions
Sampling Set the sampling rate.
Format Select the graph format for the waveform screen display or printout of the input
Dots-Line
(interpolation)
Disp Clear When previously plotted X-Y composite curves remain at the start of
Set the measurement function to [X-Y REC].
1 MS/s, 10 MS/s, 100 MS/s (Default setting)
The setting [1 ms] can be set only when the [Dots-Line] is set to [Dots].
signal. Up to eight phenomena can be observed simultaneously.
X-Y Single Displays and records the waveforms of graphs 1 through 8 in Single mode.
(Default setting)
X-Y Quad Displays and records the waveforms of graphs 1 through 8 in Quad mode.
Select whether to display and print the input waveform (sampling data) as dots
(sampling points) or perform the linear interpolation. Dot display allows faster
sampling.
Dots Displays and prints sampling data as dots.
Line Displays and prints linearly interpolated sampling data. (Default setting)
measurement, you can choose between leaving them and clearing them. When
you choose to leave them, the new waveforms are displayed as an overlay.
X-Y Recorder
O Overlays new waveforms with the existing waveforms.
On Clears the previously plotted waveforms. (Default setting)
Setting measurement conditions terminates.
Next, congure the analog channel settings.
For details, refer to “Analog channel settings” (p. 80).
To choose channels used to plot X-Y composite curves
Refer to “7.4 Plotting X-Y Composite Curves” (p. 154).
93
Page 94
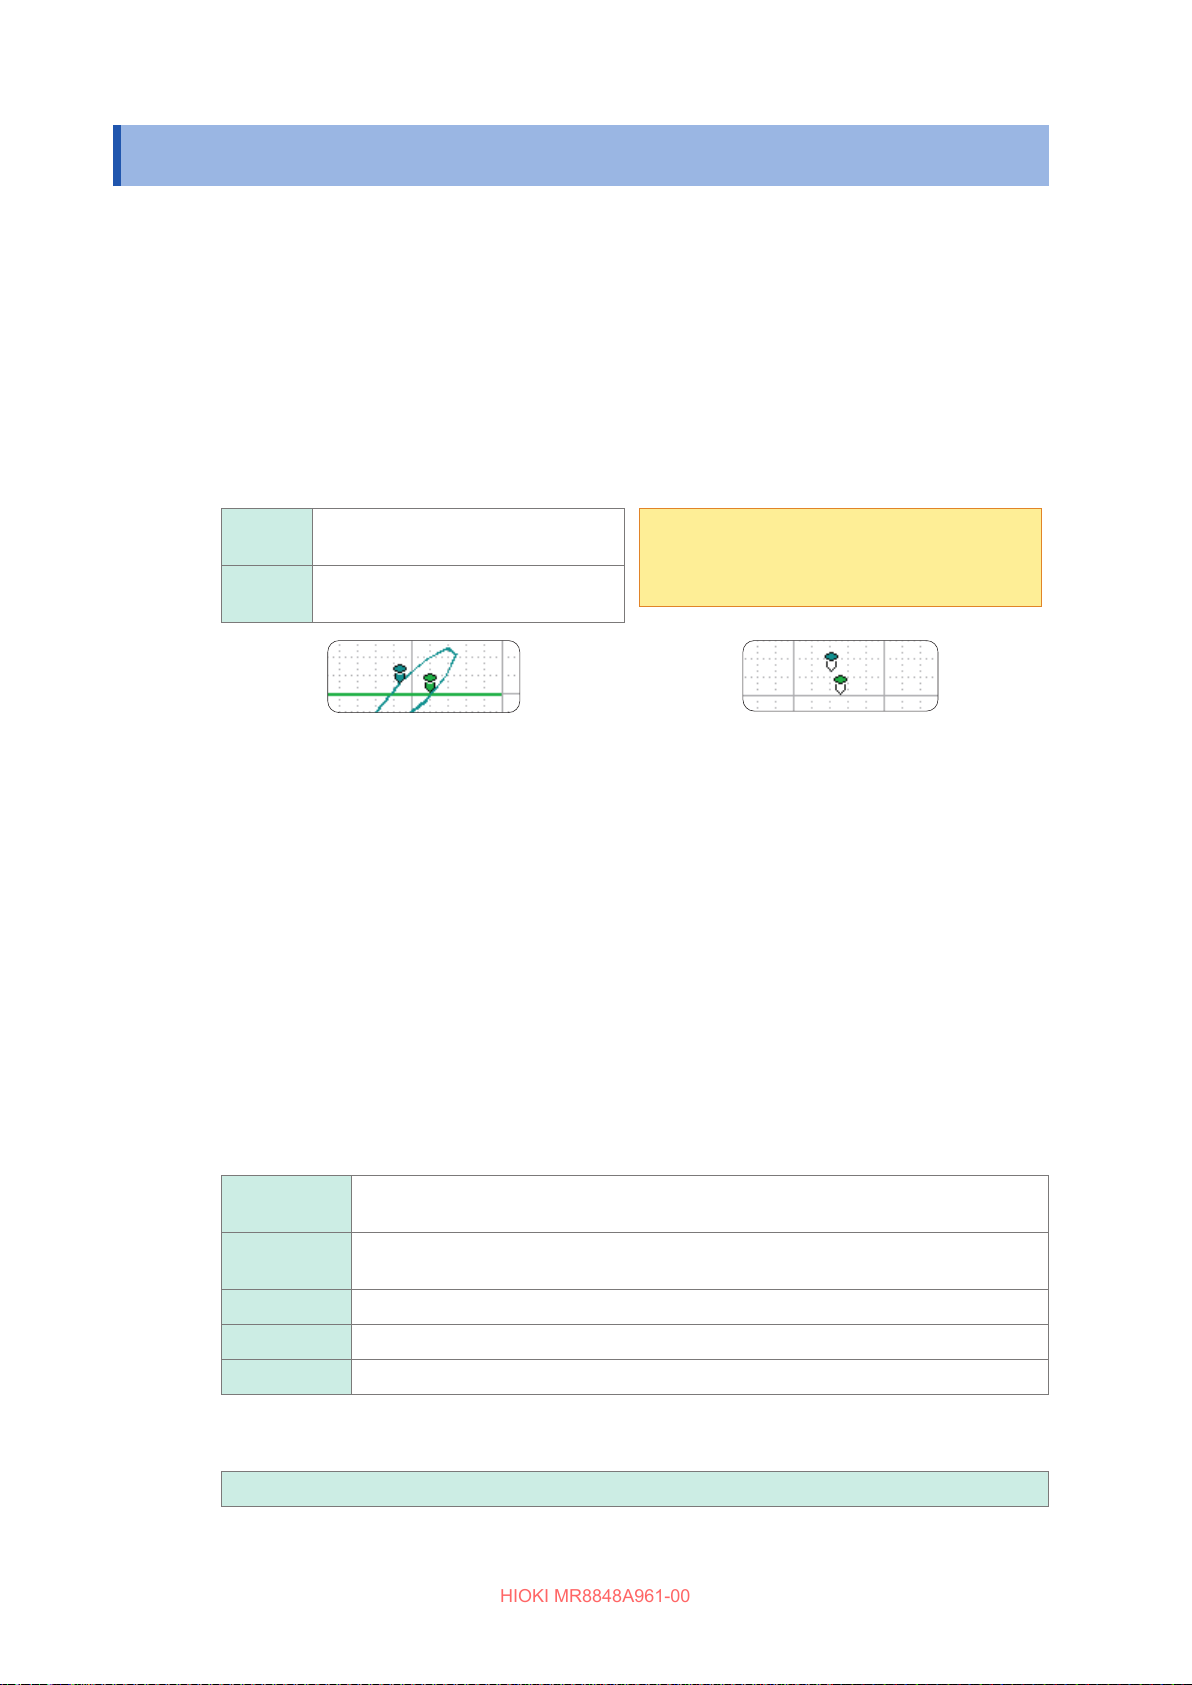
Starting and Stopping Measurement
HIOKI MR8848A961-00
4.3 Starting and Stopping Measurement
Press the DISP key to go to the waveform screen.
Start measurement.
1
Press the START key to start measurement.
Set the X-Y composite curves plotting to on and o (make the pen setting to up and
2
down).
You can choose this setting both before and during measurement. Setting the pen setting to Down
enables the X-Y composite curve plotting function. Setting the pen setting to Up disables the X-Y
composite curve plotting function. This setting applies to all channels.
Move the cursor to the [Pen] box to change the setting.
Up Disable the X-Y composite curve
plotting function.
Down Enable X-Y composite curves to be
plotted.
Setting the pens in the Down position
The pens are shown in colors and curves are
plotted.
Stop the measurement in progress.
3
Press the STOP key to stop the measurement in progress.
Redraw X-Y composite curves
4
The instrument plots the X-Y composite curves that start from any specied sampling point and consists
of 4,000,000 (if using the U8975, U8977, or U8978: 2,000,000) samples of the data recorded before the
measurement terminated, playing back the X-Y composite curve plotting in the same manner as video
recorders.
This setting applies to all channels. You can specify the playback speed. (You can also change it during
playback.)
X-Y composite curves are only played back on the screen, not aecting the printout data. To print the
same X-Y composite curves as shown on the screen, use the screenshot function (p. 143).
Pressing the TRIG.SET key or the Manual
Trigger key can switch the [Pen] setting
between up and down as well.
Setting the pens in the Up position
The pens are shown in white, and no X-Y
composite curves are plotted.
Inputting signals to the external control terminal can start and stop measurement and switch the
[Pen] setting between up and down as well. (p. 378)
94
Move the cursor to the [Player] box.
Disp Clear Clears only the displayed X-Y composite curves.
(The instrument does not discard the waveform data written in the memory.)
Redraw Redraws the X-Y composite curves. The X-Y composite curve display conditions can
also be changed for plotting the curves again.
First Moves the pens to the start points of the X-Y composite curves.
Last Moves the pens to the end points of the X-Y composite curves.
Play/Stop Starts and stops the X-Y composite curve playback.
Move the cursor to the [Speed] box.
In the [Normal] setting, plays back the X-Y composite curves at the same speed as at which they recorded.
Very Fast
,
Fast, Normal (Default setting), Slow, Very Slow
Page 95
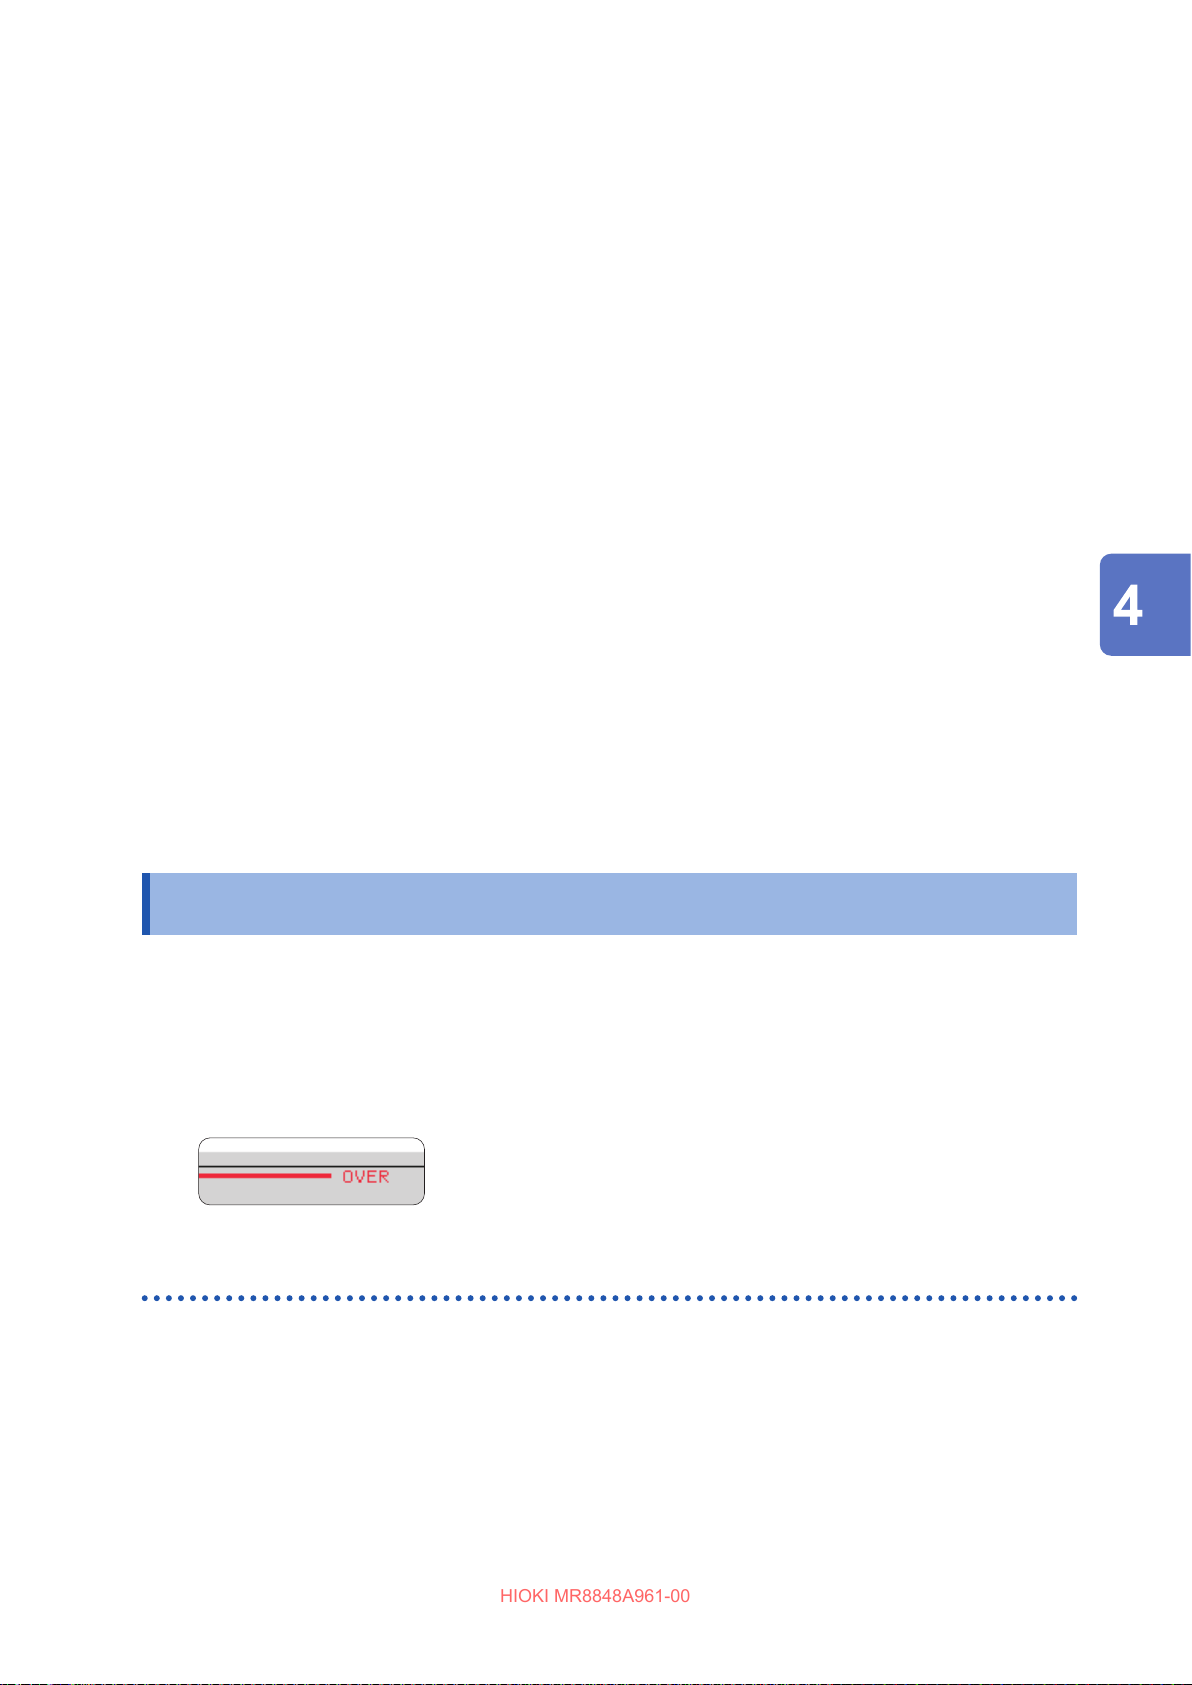
Observing X-Y Composite Curves
HIOKI MR8848A961-00
To redraw the X-Y composite curves in dierent X-Y composite curve display
settings
• Even after the X-Y composite curve display is cleared, the waveform data is still retained in
the memory. This makes it possible to redraw the X-Y composite curves in dierent settings,
which include the display format, display color, channels used for plotting the curves, channel
magnication ratio, and channel oset, from those previously set. (Select [Redraw])
Executing [Redraw] update the screen and printout data.
Until [Redraw] is not executed, the screen and print data are not updated, even if the settings are
changed.
• The X-Y composite curves can also be redrawn by operating the jog dial and shuttle ring.
Jog dial Plots the X-Y composite curves and plays back the plotting of the curves inversely
in one sample increments.
Shuttle ring Plots the X-Y composite curves and plays back the plotting of the curves inversely
at speed proportional to the rotation angle.
• To play back the plotting of the X-Y composite curves inversely, plot curves in the direction of
earlier data. Erasing the X-Y composite curves is not possible.
• If the measured data exceeds 4,000,000 (if using the U8975, U8977, or U8978: 2,000,000)
samples, it is only possible to redraw up to 4,000,000 (if using the U8975, U8977, or U8978:
2,000,000) samples in the past, counting backward from the point when measurement terminated.
The instrument discards waveform data obtained earlier.
• Redrawing the X-Y composite curves with the jog dial and shuttle ring aects the X-Y composite
curves displayed on the screen only and does not aect the printout data. To print the same X-Y
composite curves as shown on the screen, use the screenshot function (p. 143).
X-Y Recorder
4.4 Observing X-Y Composite Curves
Up to 4,000,000 samples of waveform data are written in the memory, and you can observe those
measured values using Cursors A and B. (p. 146)
The bar at the top of the screen indicates the amount of the occupied memory.
When the number of samples reaches 4 million, the sign [OVER] appears next to the screen bar at
the top.
Saving and printing waveforms
Saving X-Y
composite
curves
Printing X-Y
composite
curves
Pressing the SAVE key or executing the saving command using the le screen
saves the waveform data written in the memory as a le.
Refer to “Saving data selectively (SAVE key)” (p. 113).
Pressing the PRINT key prints out the X-Y composite curves.
Refer to “6.3 Manually Printing Data by Pressing the PRINT Key (Selection
Print)” (p. 137).
The data saved in this way as a le can be loaded into the instrument, however, it cannot be loaded
into PCs.
95
Page 96

Observing X-Y Composite Curves
HIOKI MR8848A961-00
96
Page 97
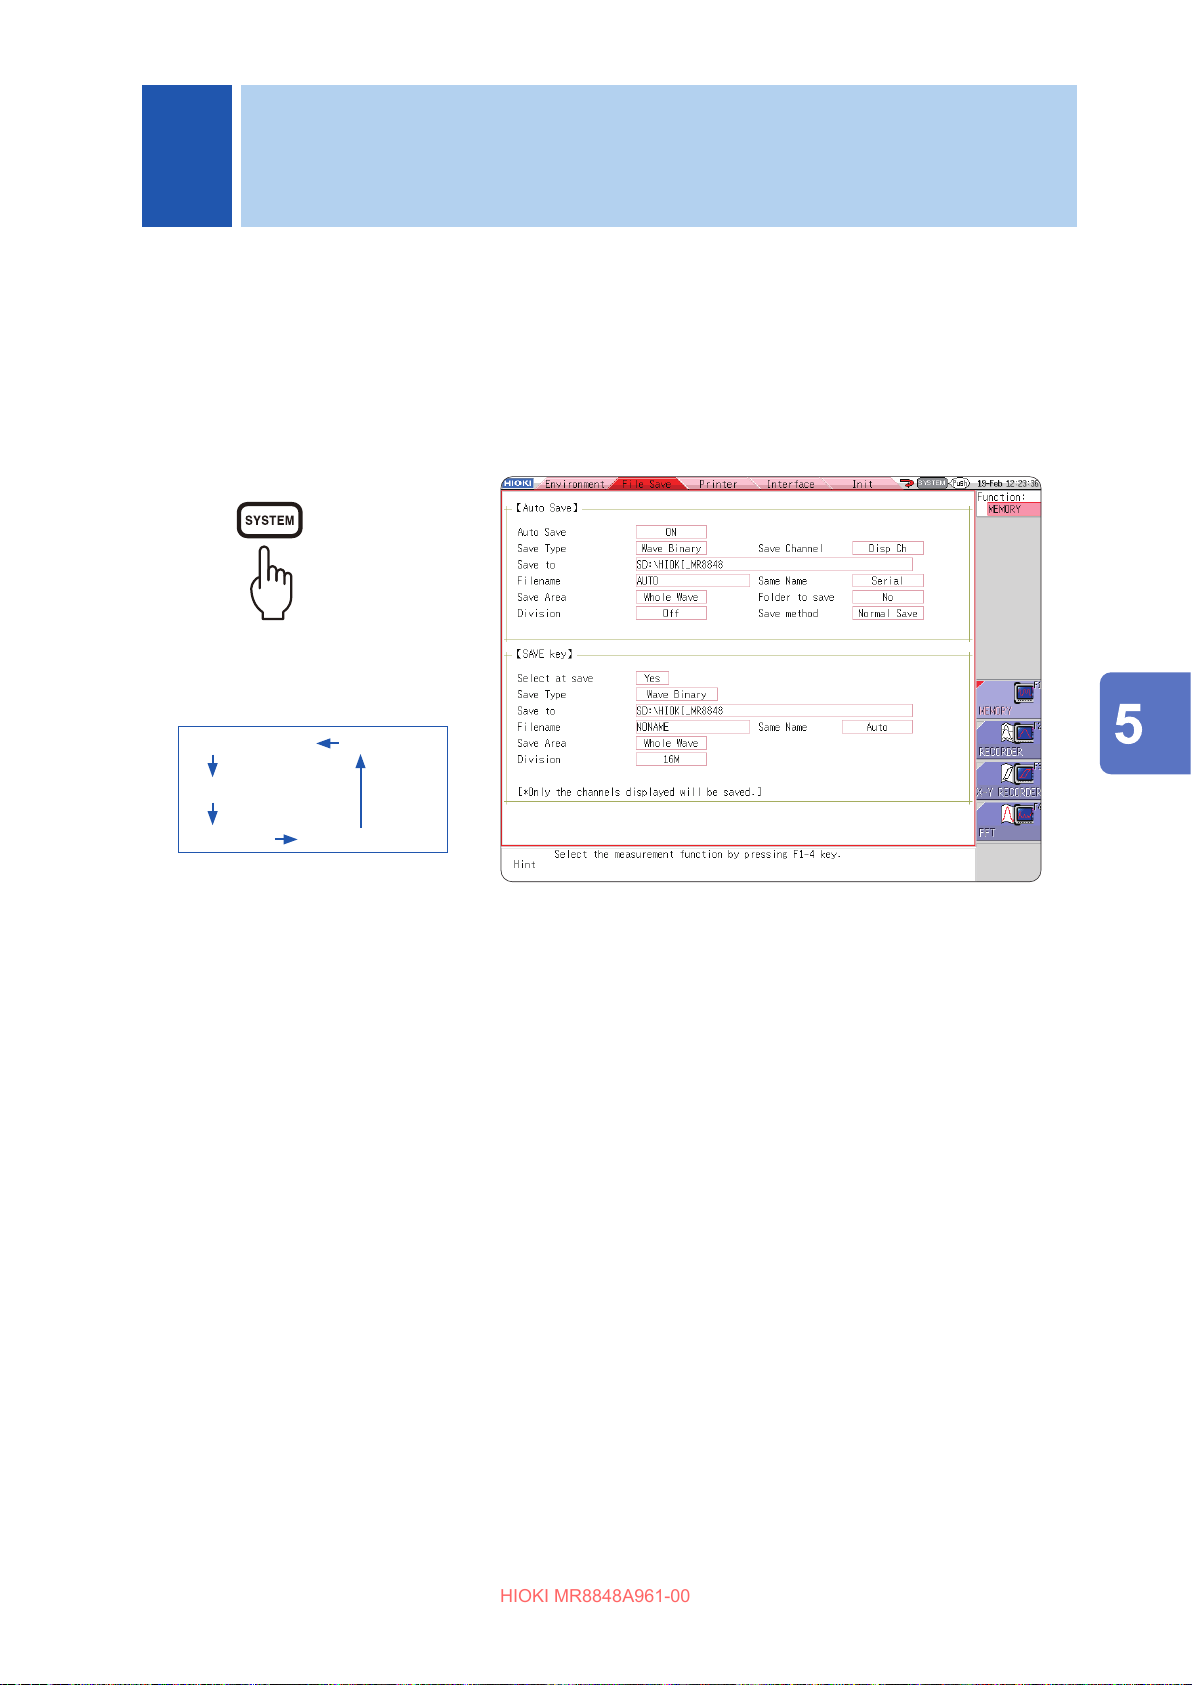
Saving/Loading Data
HIOKI MR8848A961-00
5
and Managing Files
This chapter explains how to save and load data and manage les.
Before saving data, congure the save settings on the [File Save] sheet of the system screen.
The File screen allows you to load data and manage les.
To display the [File Save] sheet
The sheet changes every time
the SYSTEM key is pressed.
[Interface]
[Init]
[Environment]
[File Save]
[Printer]
Operations available on the [File Save] sheet
The following settings are available on the [File Save] sheet. (Refer to p. 101.)
Auto-saving settings
Setting the method of the auto-saving of waveform data.
SAVE key settings
Setting the method of saving the data when pressing the SAVE key.
Saving/Loading Data and Managing Files
97
Page 98
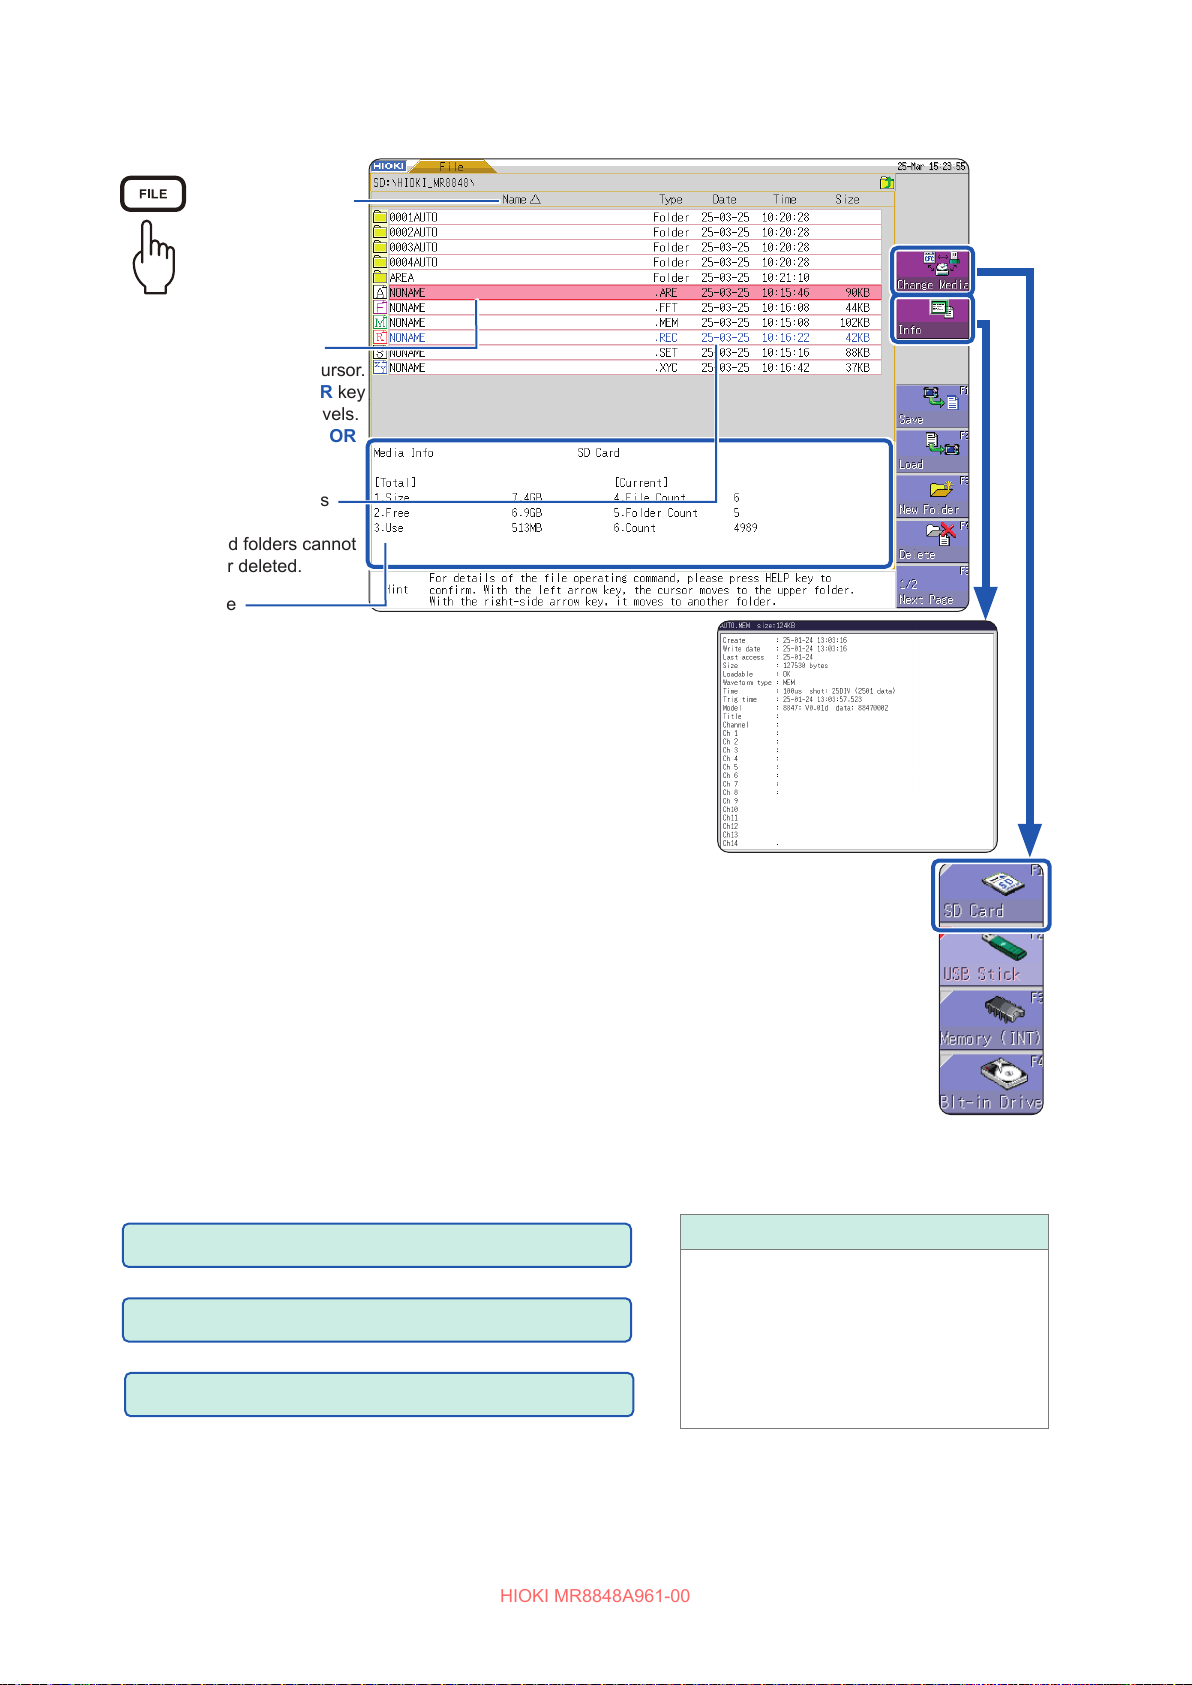
HIOKI MR8848A961-00
To display the le screen
Indicates the order
in which the les
are sorted.
Ascending order
:
Descending order
:
Press the [FILE] key.
The selected le is
indicated by the ashing cursor.
Press Left/Right CURSOR key
to move between folder levels.
Press the Up/down CURSOR
keys to select les.
Read-only les and folders
are shown in blue.
These les and folders cannot
be renamed or deleted.
Storage device
information
Shows information about the selected storage device.
File Count: Displays the number of les saved in the selected folder.
Dir Count: Displays the number of folders in the selected folder.
Count: Displays the number of les and folders you can create
at the selected folder level.
When the storage device is not displayed, and you cannot
perform any operations, choose a setting option other than
[Mass storage SSD] or [Mass storage SD] in the [USB Set]
box.
To change storage devices
1
Refer to “2.3 Preparing Storage Devices” (p. 56).
Select [Change Media] and select a storage device type.
2
The les saved on the selected storage device appears on the le list.
Operations available from the le screen
Formatting storage devices (p. 58)
Loading data (p. 120)
Saving and loading auto-setting les (p. 123)
Displays the information of
the selected le.
Managing les (p. 101)
• Saving data (p. 125)
• Creating a new folder (p. 127)
• Copying a le (p. 131)
• Sorting les (p. 129)
• Deleting a le (p. 128)
• Renaming a le (p. 130)
• Printing a le table (p. 132)
98
Page 99
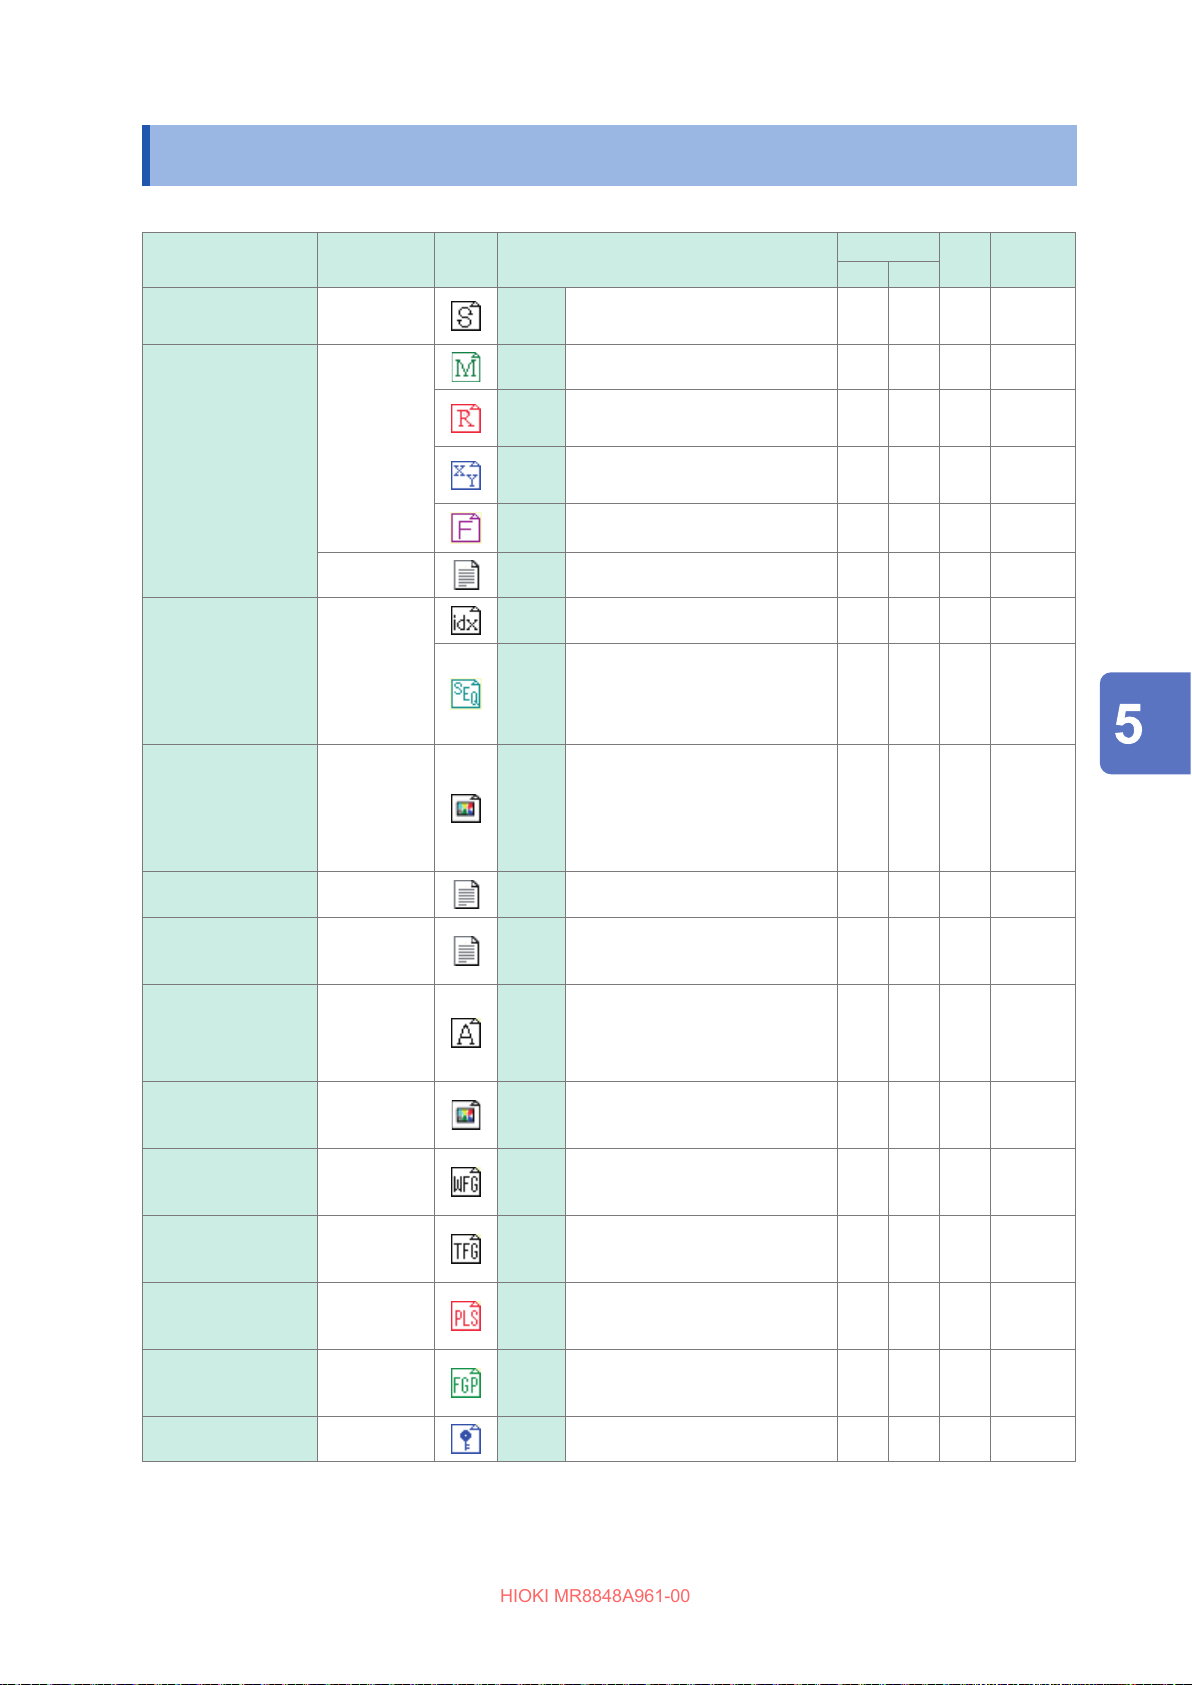
Data That Can be Saved and Loaded
HIOKI MR8848A961-00
5.1 Data That Can be Saved and Loaded
File type
Settings data*
1
Waveform data*
The entire length
of the waveforms
or the portion of
waveforms within
the range between
Cursors A and B
(acquired in the
instrument)
2
File
format
Binary SET
Binary
Text
Icon File extension and description
MEM Memory function waveform data
REC
XYC
FFT FFT function data
CSV Text data
Settings data (measurement
conditions)
Recorder function waveform
data
X-Y recorder function X-Y curve
data
Save
Auto
Manual
‒
‒
Load
‒
: Yes, ‒: No
PC-
readable
‒
4
‒ *
4
‒ *
‒
‒
Waveform
management
3
data*
(memory division /
division save)
Captured screen
images (Display/
Waveform
screens)
Calc Result
Comments for
printing
Waveform
evaluation setting
data
Waveform
evaluation area
Arbitrary
waveform data
IDX Index data for division save
(Index le)
SEQ
5
BMP*
Text CSV Text data
Text TXT Text data ‒ ‒
Binary ARE
BMP BMP
Binary WFG
BMP Image data ‒
Index data for memory division
(automatically created during
batch saving)
Settings data
(Measurement conditions +
waveform evaluation areas)
Waveform evaluation area
image data
User-dened waveform data
(For U8793)
‒
‒
‒
‒
‒
6
*
‒
‒
Saving/Loading Data and Managing Files
‒
‒
Arbitrary
waveform data
Pulse pattern
data
Generation
program data
License key
Text TFG
Binary PLS
Program FGP
Text key Data for adding functions ‒ ‒
User-dened waveform data
(For U8793)
Pulse pattern data
(For MR8791)
Generation program data
(For U8793)
‒ ‒
‒
‒
‒
‒
‒
99
Page 100
Data That Can be Saved and Loaded
HIOKI MR8848A961-00
*1. Multiple les can be registered in the instrument and loaded selectively. Automatic loading at power-on is also
possible. (p. 123)
*2. To load the data onto the instrument
Save the data in binary format. The waveform data and a part of the measurement settings data are saved.
To load the data onto the PC: Save the data in text format. (p. 101)
To save a portion of the waveform: Specify the range to be saved with Cursors A and B. (p. 146, p. 151)
*3. To load the data, which is saved with the memory division enabled, of entire blocks at once
Save measured data in the [ALL BLOCK] setting. A directory including waveform data for each block and index
data (SEQ) is automatically created. Load this index data.
To load waveform data that is saved using division save: Load the IDX index data.
*4. Load les with Wave Viewer (Wv).
*5. This is a standard Windows graphics format. Many graphics programs can open les in this format.
*6. You can print out text les created on a PC along with loaded waveforms. Other processing operations are not
available.
Files that exceed 2 GB cannot be saved.
Data that cannot be loaded onto the instrument
• Data saved by other instruments
• Image les other than waveform evaluation areas (
• Files displayed with the icon .
)
100
 Loading...