

Page 1
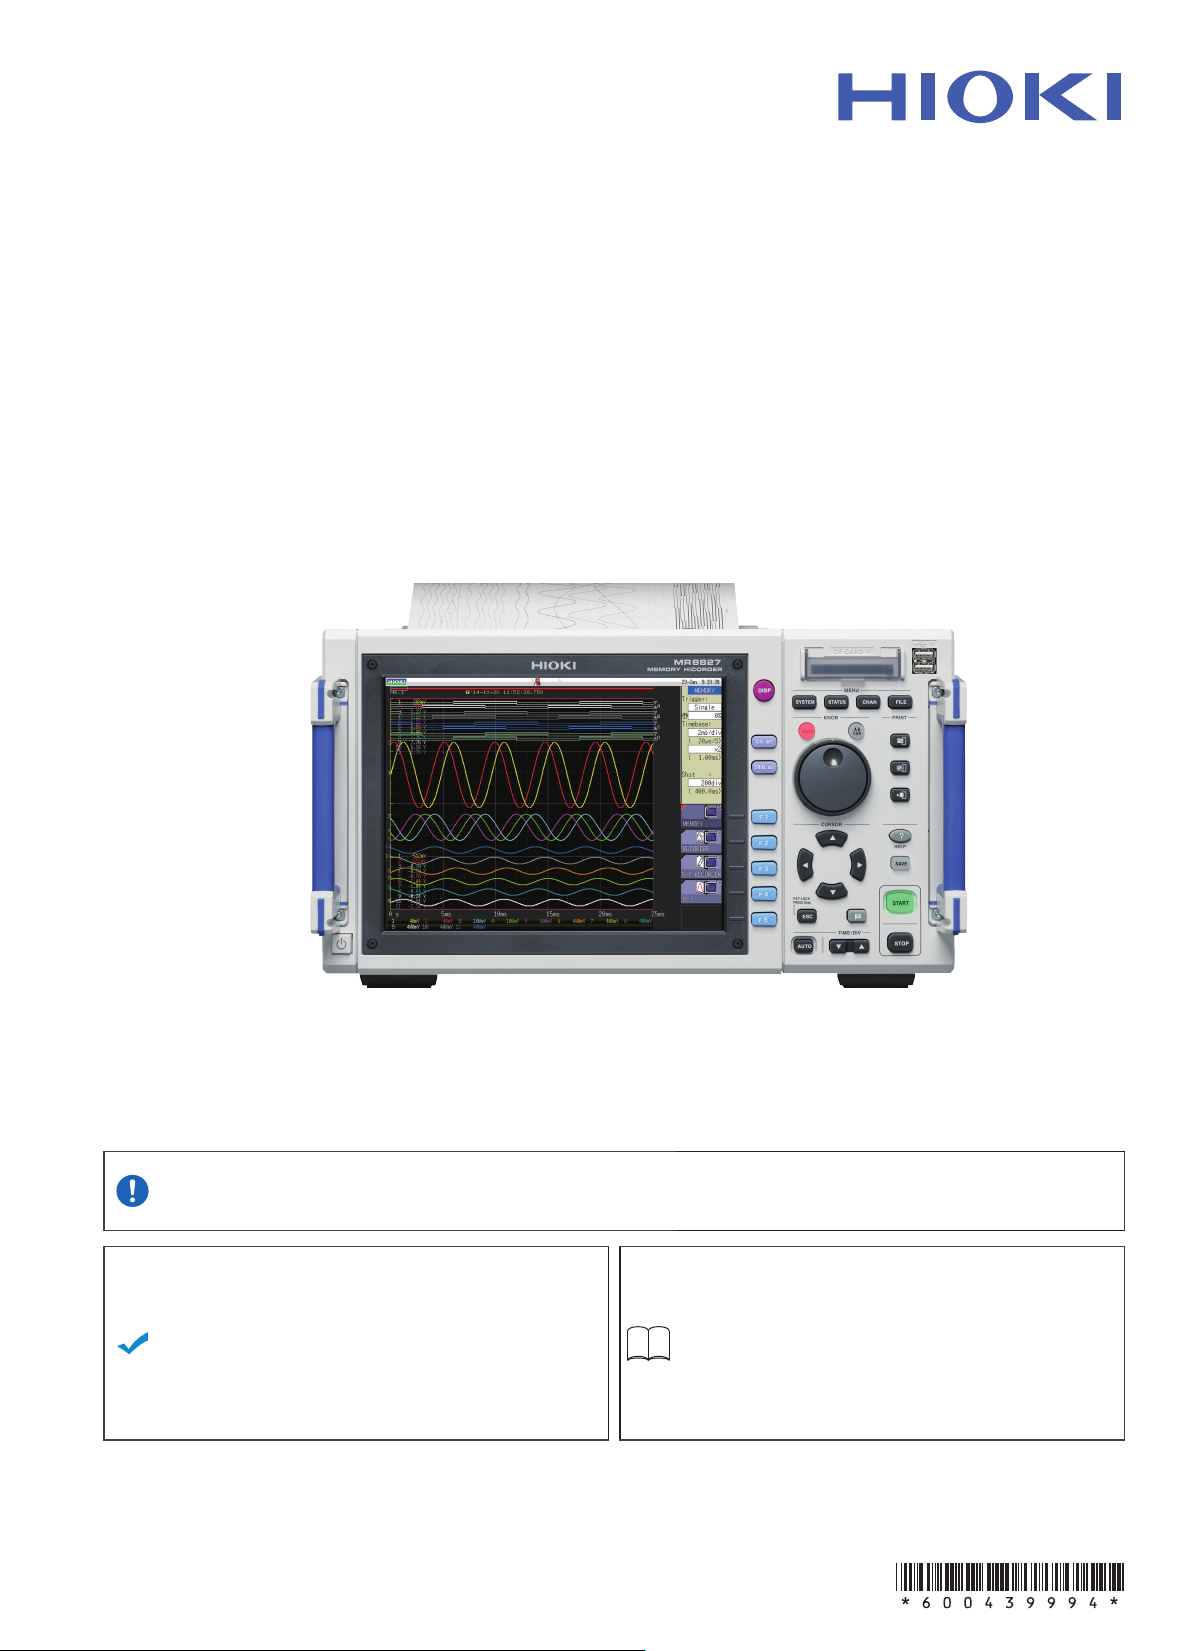
MR8827
Instruction Manual
MEMORY HiCORDER
Be sure to read this manual
before using the instrument.
When using the instrument
for the rst time
Part Names and Functions
Measurement Preparation
Revised edition 4Oct. 2018
18-10HMR8827A981-04
Safety Information
Troubleshooting
p.16 Maintenance and Service
p.25 Error Messages
p.3
p.383
p.389
EN
Page 2

Contents
Contents
Usage Index ............................................... 1
Introduction ................................................ 2
Package Contents ..................................... 2
Safety Information ..................................... 3
Operation Precautions .............................. 6
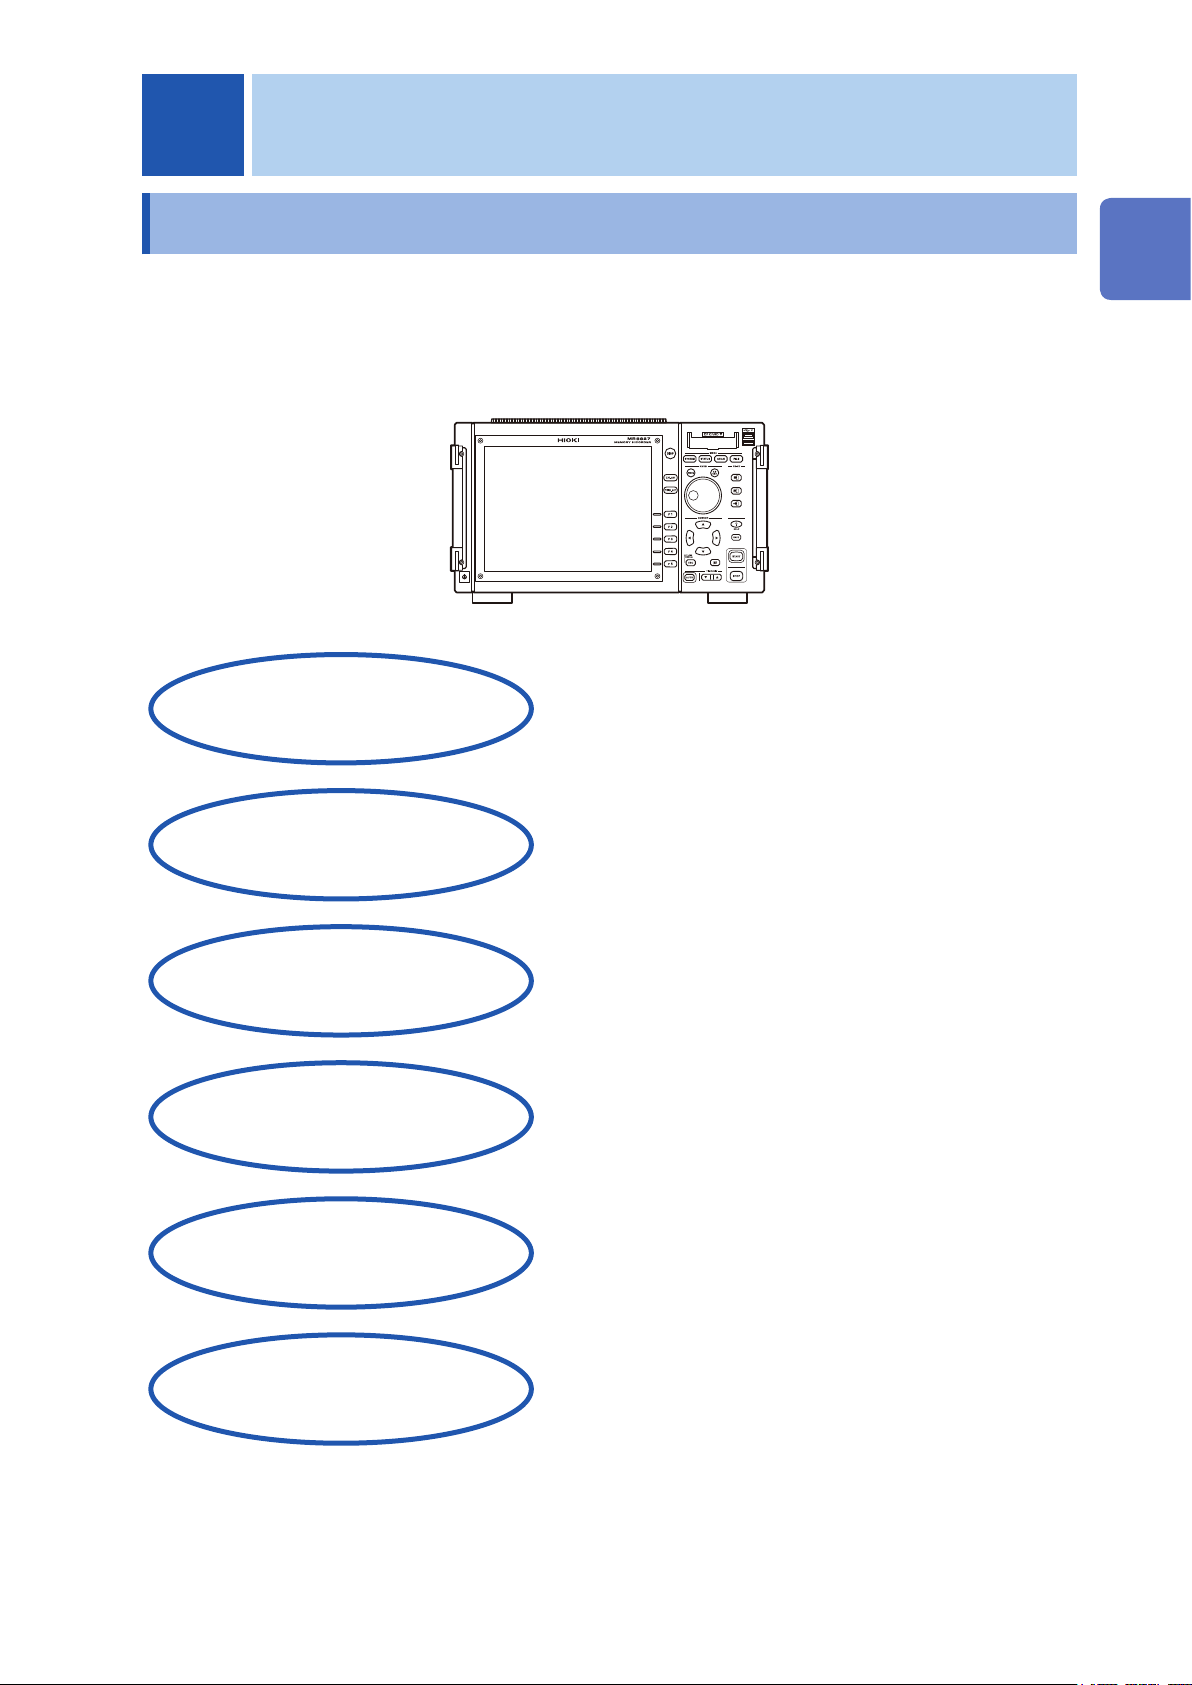
1 Overview 15
1.1 Product Overview ........................... 15
1.2 Part Names and Functions ............ 16
1.3 Screen Organization ...................... 19
Explanation of Screen Contents .................20
1.4 Basic Key Operations .................... 21
1.4.1 Using the HELP Key .................................... 22
1.4.2 Use a Mouse to Perform Key Operations ..... 23
2 Measurement
Preparation 25
2.1 Install or Remove Modules ............ 26
Channel Allocation ......................................27
2.2 Connection Cables ......................... 28
2.3 Prepare Storage Media .................. 40
2.3.1 Storage Media (Inserting a CF Card and
USB Memory Stick) .....................................40
2.3.2 To Format Storage Media ............................ 42
2.4 Load Instrument With Recording
Paper (When Model U8350
Printer Unit is installed) ................. 43
2.5 Power Supply ................................. 44
2.5.1 Connect the Power Cord .............................44
2.5.2 Ground the Functional Earth of This
Instrument ...................................................44
2.5.3 Turn the Power On and Off .......................... 45
2.6 Set the Clock .................................. 46
2.7 Adjust the Zero Position
(Zero-Adjust) ................................... 47
2.8 Perform Calibration (When
Model MR8990 is installed) ........... 48
3 Measurement 49
3.1 MeasurementWorkow ................. 49
3.2 Pre-measurement Inspection ........ 51
3.3 MeasurementConguration ......... 52
3.3.1 Measurement Function ................................52
3.3.2 Timebase and Sampling Rate ......................54
3.3.3 Recording Length (Number of Divisions) ...... 57
3.3.4 Screen Layout ............................................. 59
3.4 Select Input Channels .................... 60
3.4.1 ChannelSettingWorkow ............................ 61
3.4.2 Choose Analog Channel Settings ................. 63
3.4.3 Logic Channel Settings ................................66
3.4.4 Displayed Sheet...........................................67
3.5 Start and Stop Measurement ........ 68
3.6 Measurement With Automatic
Range Setting (Auto-ranging
Function) ......................................... 70
4 X-Y Recorder Function 71
4.1 MeasurementWorkow ................. 72
4.2 MeasurementConguration ......... 73
4.3 Start and Stop Measurement ........ 74
4.4 Waveform Observation .................. 75
4.4.1 To Save and Print Waveforms......................75
5 Save/Load Data and
Manage Files 77
5.1 Data That Can Be Saved and
Loaded ............................................ 79
5.2 Save Data ........................................ 81
5.2.1 SaveTypesandWorkow ........................... 81
5.2.2 Automatically Save Waveforms ...................82
5.2.3 Save Data Selectively (SAVE Key) .............. 88
5.2.4 Save Waveform Output Data to the Media ... 92
5.3 Load Data ........................................ 93
5.4 Automatically Load Settings
(Auto-setup Function) .................... 96
5.5 Manage Files ................................... 97
5.5.1 Save Data ...................................................98
5.5.2 Check the Contents of a Folder (Open a
Folder) ....................................................... 100
5.5.3 Create New Folders ................................... 100
5.5.4 Delete Files and Folders ............................ 101
5.5.5 Sort Files ................................................... 102
5.5.6 Rename Files and Folders ......................... 103
5.5.7 CopyaFileIntoaSpeciedFolder ............ 104
5.5.8 Print the File List ........................................ 105
6 Printing (When Model
U8350 Printer Unit is
installed) 107
6.1 PrintTypeandWorkow ............. 108
6.2 Auto-print Settings ....................... 109
6.3 Manual Printing With the PRINT
Key (Selective Printing) ................112
6.4 Setting the Print Density of the
Waveform .......................................114
6.5 Printer Settings .............................115
6.6 Miscellaneous Printing
Functions .......................................118
6.6.1 Screen Hard Copy ......................................118
6.6.2 Report Print (A4 Size Print) .........................118
6.6.3 List Print .....................................................119
6.6.4 Text Comment Printing ................................119
1
2
3
4
5
6
7
8
8
8
9
9
10
10
Appendix
Appx.
Index
Index
MR8827A981-04
i
Page 3

Contents
7 Waveform Screen
Monitoring and
Analysis 121
7.1 Read Measurement Values
(Using the AB Cursors) ................ 122
7.2 Specify a Waveform Range
(AB Cursor) ................................... 125
7.3 Move the Waveform Display
Position ......................................... 126
7.3.1 About the Display Position ......................... 126
7.3.2 Scroll With Jog and Shuttle Knobs (Scroll) . 126
7.3.3 Change Position (Jump Function) .............. 127
7.4 Perform Waveform X-Y
Synthesis ...................................... 128
7.5 Magnify and Compress
Waveforms .................................... 130
7.5.1 Magnify and Compress Horizontal Axis
(Time Axis)................................................. 130
7.5.2 Zoom Function
(Magnifying a Section of the Horizontal
Axis [Time Axis]) ........................................ 131
7.5.3 VerticalAxis(VoltageAxis)Magnication ... 132
7.6 Monitor Input Levels
(Level Monitor) ............................. 133
7.6.1 Level Monitor ............................................. 133
7.6.2 Numerical Value Monitor ............................ 134
7.7 Switch the Waveform Screen
Display (Display Menu) ................ 135
7.7.1 Show Upper/Lower Limit on Waveform
Screen ....................................................... 136
7.7.2 Show Comments on Waveform Screen ..... 136
7.7.3 Switch the Waveform Display Width...........136
7.7.4 Switch the Channel Range Information
Display ...................................................... 136
7.7.5 Switch the Displayed Sheet ....................... 136
7.8 View Block Waveforms ................ 137
8 Utility Functions 139
8.1 Add Comments ............................. 140
8.1.1 Add a Title Comment ................................. 140
8.1.2 Add a Channel Comment ........................... 141
8.1.3 Alphanumeric Input .................................... 143
8.2 Display Waveforms During
Recording (Roll Mode) ................. 147
8.3 Display New Waveforms Over
Past Waveforms (Overlay) ........... 148
8.4 Setting Channels to Use
(Extending the Recording Length)
8.5 Convert Input Values
(Scaling Function) ........................ 151
8.5.1 Scaling Examples ...................................... 153
150
8.6 Set the Waveform Position
(Variable Function) ....................... 158
8.7 Fine Adjustment of Input Values
(Vernier Function) ........................ 161
8.8 Invert the Waveform
(Invert Function) ........................... 162
8.9 Copy Settings to Other
Channels (Copy Function) .......... 163
8.10 Detailed Settings for Modules ..... 164
8.10.1 Settings for the Anti-Aliasing Filter (A.A.F.)
(Model 8968 High Resolution Unit) ............. 166
8.10.2 Probe Attenuation Selection ....................... 166
8.10.3 Setting Model 8967 Temp Unit ................... 167
8.10.4 Setting Model 8969 and U8969 Strain Unit . 168
8.10.5 Setting Model 8970 Freq Unit ..................... 169
8.10.6 Setting Model 8971 Current Unit ................ 172
8.10.7 Setting Model 8972 DC/RMS Unit .............. 172
8.10.8 Setting Model MR8990 Digital Voltmeter
Unit ............................................................ 173
8.10.9 Setting Model U8974 High Voltage Unit ...... 174
8.10.10 Setting Model MR8790 Waveform
Generator Unit ........................................... 175
8.10.11 Setting Model MR8791 Pulse Generator
Unit ............................................................ 177
8.10.12 Setting Model U8793 Arbitrary
Waveform Generator Unit .......................... 179
8.11 Register the Waveform in the
U8793 ArbitraryWaveform
Generator Unit .............................. 182
8.12 Save the Waveforms Registered
in the Model U8793 in the Media . 185
8.13 Setting Output Waveform
Parameters .................................... 185
9 Trigger Settings 187
9.1 SettingWorkow .......................... 188
9.2 Set the Trigger Mode .................... 189
9.3 Analog Signal Triggers ................ 190
9.4 Logic Signal Triggers
(Logic Trigger) .............................. 195
9.5 Trigger by Timer or Time
Interval (Timer Trigger) ................ 197
9.6 Apply an External Trigger
(External Trigger) ......................... 200
Trigger Manually (Manual Trigger)
9.7
9.8 Pre-trigger Settings ...................... 201
9.8.1 Set the Trigger Start Point (Pre-trigger) ...... 201
9.8.2 Set Trigger Acceptance (Trigger Priority) .... 203
9.9 Set Trigger Timing ........................ 204
Combined Trigger Logic (AND/OR)
9.10
for Multiple Trigger Sources
9.11 Use Trigger Settings to Search
Measurement Data ....................... 207
........... 206
200
12
13
14
15
16
17
18
19
9
10
ii
Page 4

Contents
10 Numerical Calculation
Functions 209
10.1 NumericalCalculationWorkow 210
10.2 Numerical Value Calculation
Settings ......................................... 212
10.2.1 Display Numerical Calculation Results ....... 215
10.3 Calculation Result Judgment ...... 216
10.3.1 Display Judgment Results and Signal
Output ....................................................... 218
10.4 Save Numerical Calculation
Results .......................................... 219
10.5 Print Numerical Calculation
Results .......................................... 221
10.6 Numerical Calculation Type and
Description ................................... 222
11 Waveform Calculation
Functions 225
11.1 WaveformCalculationWorkow 226
11.2 Waveform Calculation Settings .. 228
11.2.1 Display the Trigger Settings to Search
Measurement Data .................................... 229
11.2.2 Setting Constants ...................................... 231
11.2.3 Change the Display Method for
Calculated Waveforms ............................... 232
11.3 Waveform Calculation
Operators and Results ................. 234
12 Memory Division
Function 237
12.1 Recording Settings ...................... 239
12.2 Display Settings ........................... 240
13.3.8 Emphasize Analysis Results (Phase
Spectra Only) ............................................255
13.3.9 Analysis Mode Settings ..............................256
13.3.10
13.3.11 Set and Change Analysis Conditions on
13.4 Select Channels ........................... 262
13.5 Screen Display Settings .............. 263
13.5.1 Display Running Spectrums ....................... 265
13.6 Save Analysis Results ................. 268
13.7 Print Analysis Results ................. 269
13.8 Analysis With the Waveform
13.8.1 Analyze After Specifying an Analysis
13.9 FFT Analysis Modes ..................... 272
13.9.1 Analysis Modes and Display Examples ...... 272
13.9.2 Analysis Mode Functions ........................... 289
Set the Display Range of the Vertical Axis
(Scaling) ....................................................260
the Waveform Screen ................................ 261
Screen ........................................... 270
Starting Point ............................................. 270
14 Waveform Evaluation
Function 291
14.1 Waveform GO/NG Evaluation
(MEM, FFT Function) .................... 291
14.2 Set the Waveform Area ................ 294
14.3 Set the Waveform Evaluation
Mode .............................................. 296
14.4 Set Waveform Evaluation Stop
Mode .............................................. 297
14.5 Create the Evaluation Area .......... 299
14.6 Editor Command Details ............. 300
15 System Environment
Settings 305
11
12
13
14
15
16
17
18
13 FFT Function 243
13.1 Overview and Features ................ 243
13.2 OperationWorkow
(Reference Data) ........................... 244
13.3 FFT Analysis Condition Settings 245
13.3.1 Select the FFT Function ............................. 245
13.3.2 Select the Data Source for Analysis
(Reference Data) ....................................... 246
13.3.3 Set the Frequency Range and Number of
Analysis Points ..........................................247
13.3.4 Thin Out and Calculating Data ...................249
13.3.5 Window Function Settings .......................... 250
13.3.6 Analysis Result Peak Value Settings .......... 251
13.3.7 Average Analysis Results (Waveform
Averaging) ................................................. 252
16 Connect to a PC 309
16.1 LAN Connection and Settings
(Before Using FTP/
Internet Browser/Command
Communications) ......................... 310
16.1.1 LAN Settings on the Instrument ................. 310
16.1.2 Connect the Instrument to a PC With a
LAN Cable ................................................. 313
16.2 Perform Remote Operations on
the Instrument
(Use an Internet Browser) ........... 315
16.2.1 HTTP Settings on the Instrument ............... 315
16.2.2 Connect to the Instrument With an
Internet Browser ........................................ 316
iii
9
19
10
Appx.
Index
Page 5

Contents
16.2.3 Operate the Instrument With an Internet
Browser ..................................................... 317
16.3 Access Files on the Instrument
From a PC (Using FTP) ................ 322
16.3.1 FTP Settings at the Instrument ................... 323
16.3.2 Use FTP to Connect to the Instrument ....... 324
16.3.3 Use FTP for File Operations.......................325
16.4 Transferring Data to the PC ......... 326
16.5 Wave Viewer (Wv) ......................... 327
16.6 USB Connection and Settings
(Before Command Communication)
16.6.1 USB Settings on the Instrument ................. 328
16.6.2 Install the USB Driver ................................. 328
328
16.7 Controlling the Instrument with
Command Communications
(LAN/USB) ..................................... 333
16.7.1 Settings on the Instrument ......................... 333
16.8 Operate the Instrument
Remotely and Acquire Data
Using the Model 9333 LAN
Communicator .............................. 334
17 External Control 335
17.1 Connect to External Control
Terminals....................................... 337
17.2 External I/O ................................... 338
17.2.1 External Input (START/IN1) (STOP/IN2)
(S AVE/IN3) ................................................ 338
17.2.2 External Output (GO/OUT1) (NG/OUT2) .... 340
17.2.3 External Sampling (EXT.SMPL) ..................342
17.2.4 Trigger Output (TRIG OUT) ........................ 343
17.2.5 External Trigger Terminal (EXT.TRIG) ........344
18.6.8 Model 8973 Logic Unit ............................... 370
18.6.9 Model MR8990 Digital Voltmeter Unit ......... 371
18.6.10 Model U8974 High Voltage Unit ................ 373
18.6.11 U8793 Arbitrary Waveform Generator Unit . 375
18.6.12 MR8790 Waveform Generator Unit ..........378
18.6.13 MR8791 Pulse Generator Unit .................. 380
19 Maintenance and
Service 383
19.1 Trouble Shooting .......................... 385
19.2 Reset the Instrument ................... 388
19.2.1 Reset System Settings ..............................388
19.2.2 Reset Waveform Data ...............................388
19.3 Error Messages ............................ 389
19.4 Self-Test (Self Diagnostics) ......... 393
19.4.1 ROM/RAM Check ...................................... 393
19.4.2 Printer Check (When Model U8350
Printer Unit is Installed) .............................. 394
19.4.3 Display Check ............................................ 394
19.4.4 Key Check ................................................. 395
19.4.5SystemCongurationCheck ...................... 395
19.5 Cleaning ........................................ 396
19.6 Dispose of the Instrument
(Lithium Battery Removal) .......... 398
Appendix A1
Appx. 1 Default Values for Major
Settings .....................................A1
Appx. 2 For Reference ...........................A2
Appx. 3 About Options .......................... A9
Appx.4 FFTDenitions .......................A13
18 Specications 345
18.1 GeneralSpecicationsofthe
Unit ................................................ 345
18.2 Common Functions ..................... 348
18.3 Measurement Functions .............. 350
18.3.1 Memory Function ....................................... 350
18.3.2 Recorder Function ..................................... 351
18.3.3 X-Y Recorder Function .............................. 352
18.3.4 FFT Function ............................................. 352
18.4 Other Functions ........................... 353
18.5 File ................................................. 358
18.6 ModuleSpecications ................. 360
18.6.1 Model 8966 Analog Unit ............................. 360
18.6.2 Model 8967 Temp Unit ............................... 361
18.6.3 Model 8968 High Resolution Unit ............... 363
18.6.4 Model 8969 Strain Unit, U8969 Strain Unit . 364
18.6.5 Model 8970 Freq Unit ................................ 365
18.6.6 Model 8971 Current Unit ............................ 367
18.6.7 Model 8972 DC/RMS Unit .......................... 368
iv
Index Ind.1
Page 6
Usage Index
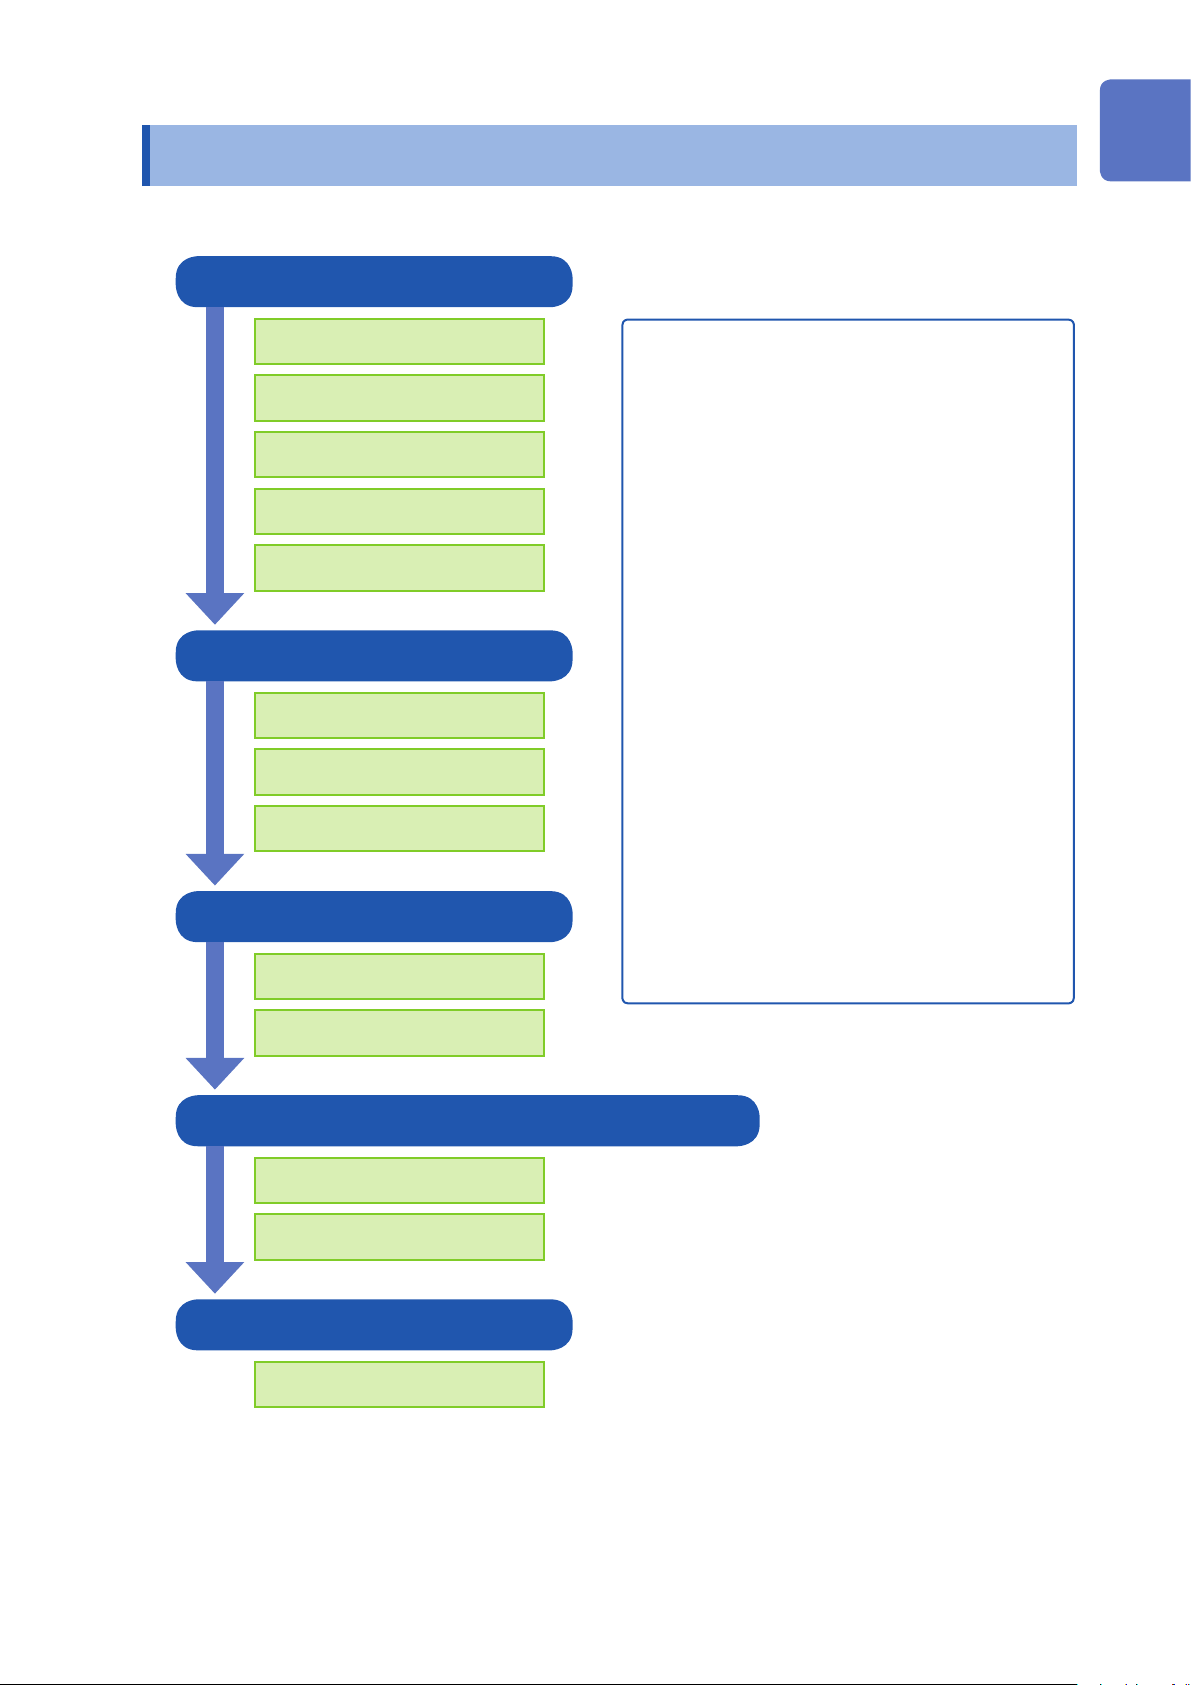
Basic Measurement Workow
1 Install (p. 25)
Usage Index
1
Install this instrument
To install a module
Connect cables
Insert recording paper*
Turn Power On
2 Set (p. 49)
Select a function
Select measurement settings
Select input channels
3 Measure (p. 68)
Measuring with automatic range setting
(p. 70)
Catching Changes in Input Signals (p. 187)
Applying a Manual Trigger (p. 200)
Adding Comments (p. 140)
Freely Setting the Waveform Display (p. 60)
Converting Input Values (p. 151)
Copying Settings to Other Channels (p. 163)
Suppressing Noise (Low-pass lter) (p. 65)
Composing X-Y Waveforms (p. 128)
Locking the Keys (KEY LOCK) (p. 17)
Initializing a CF card (p. 42)
2
3
4
5
6
Scaling During Measurement Using a Current
Start recording
Stop recording
4
Analyze (p. 121), Save (p. 77), Print * (p. 107)
Perform analysis
Save and/or print* (optional)
5 Finish (p. 45)
Turn power Off
* When Model U8350 Printer Unit is installed
Camp Sensor (p. 153)
7
8
9
10
Appx.
Index
1
Page 7
Introduction
Introduction
Thank you for purchasing the HIOKI MR8827 Memory HiCorder. To obtain optimal performance from this
instrument, please read this manual and keep it handy for future reference.
The optional clamps (p. A9) are called by a generic name of “clamp sensor.”
Trademarks
• Microsoft and Windows are either registered trademarks or trademarks of Microsoft Corporation in the
United States, Japan, and other countries
• CompactFlash is a registered trademark of Sandisk Corporation (USA).
• Sun, Sun Microsystems, Java, and any logos containing Sun or Java are trademarks or registered
trademarks of Oracle Corporation in the United States and other countries.
• Microsoft Excel and Internet Explorer are either registered trademarks or trademarks of Microsoft
Corporation in the United States and other countries.
Package Contents
When you receive your Memory HiCorder, inspect it carefully to ensure that no damage occurred during
shipping. Please pay particular attention when checking the accessories, panel keys and switches, and
connectors. If you nd damage, or your HiCorder fails to operate according to specications, contact your
authorized Hioki distributor or reseller.
Keep the packing material used for the shipping of the instrument because you need to use it when
transporting the instrument in the future.
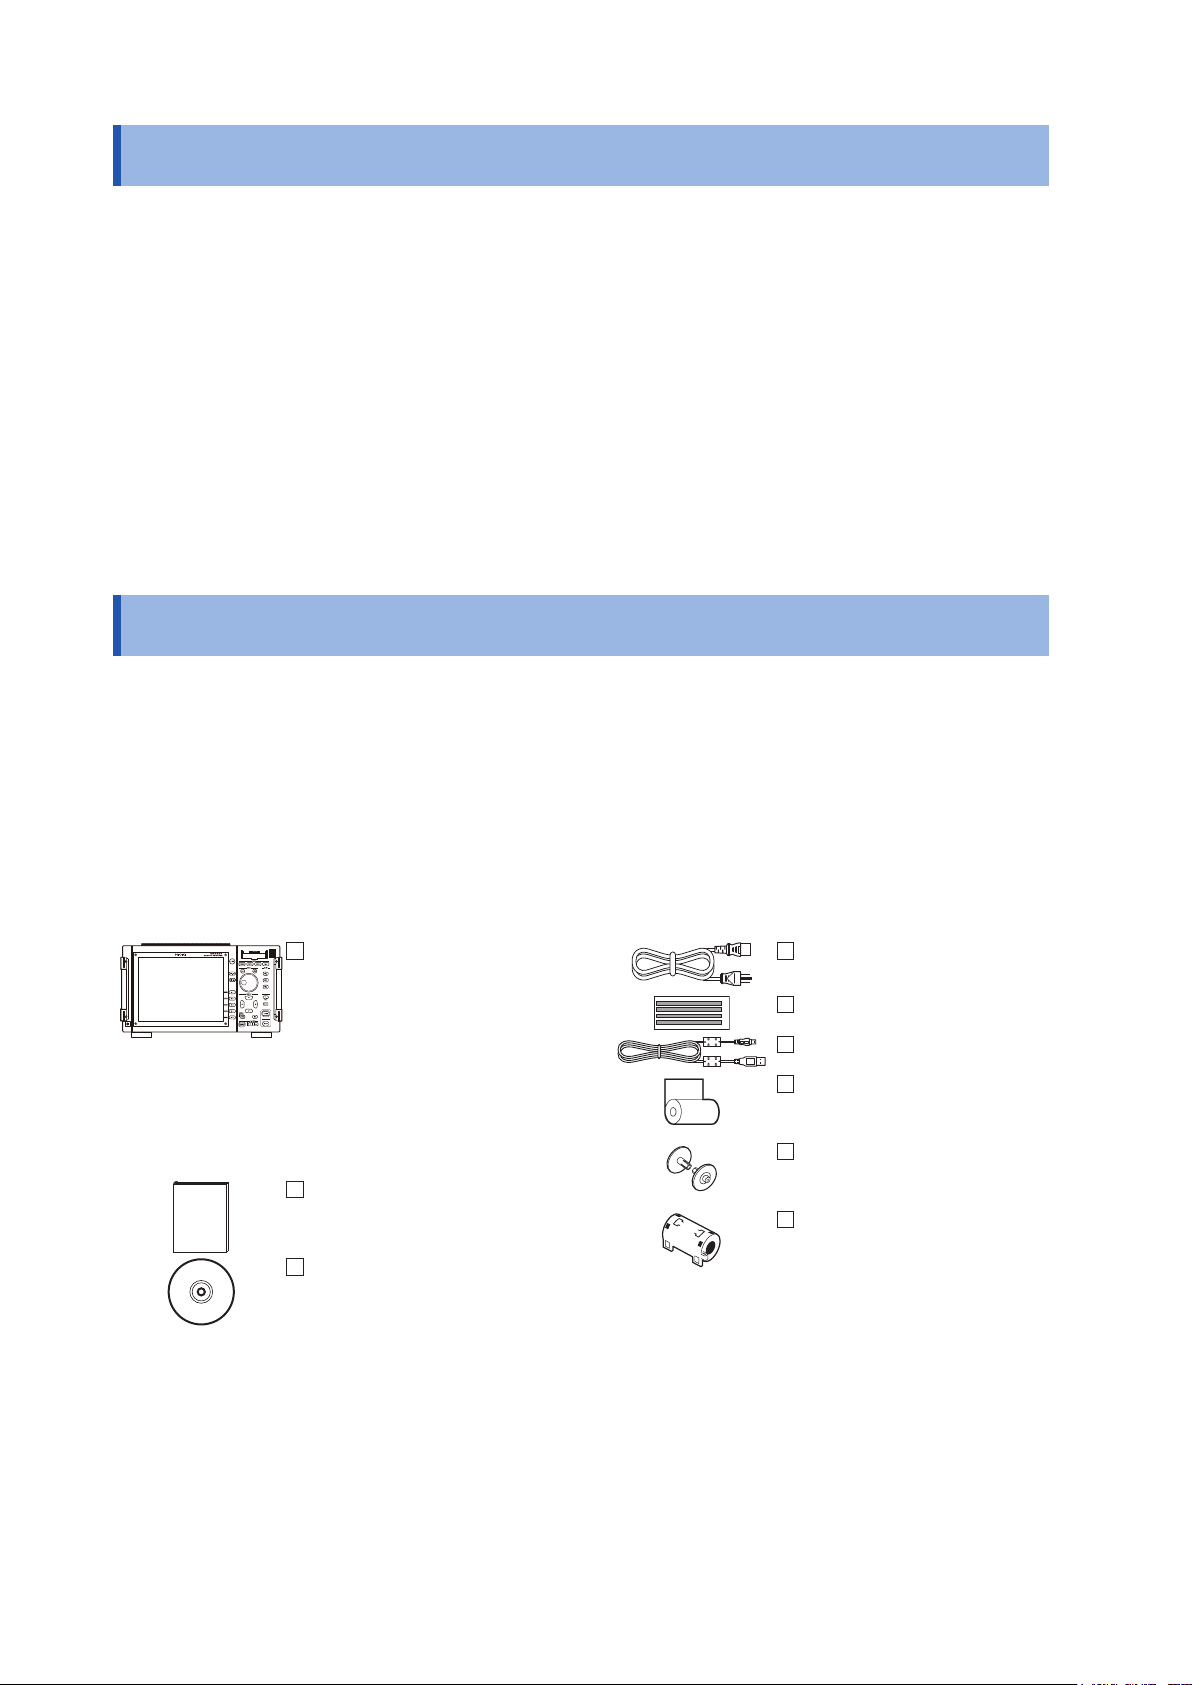
Unit and Accessories
Conrm that you received the following items: (One each)
MR8827 Memory HiCorder
Accessories
Instruction Manual
Application disc (CD)*2
(p. 327)
• SF8000 Waveform Maker
• Wave Viewer (WV)
• Communication Command
Instruction Manual
• U8793, MR8790, MR8791
Instruction Manual
*1: If one or more Model 8967 Temp Units are installed in the instrument, two ferrite clamp-on chokes
(small) will be supplied per module.
*2:The latest version can be downloaded from our website.
Power cord
Input cable labels
USB cable
9231 Recording Paper
(When Model U8350 Printer
Unit is installed)
Paper Roll Axle
(When Model U8350 Printer
Unit is installed)
Ferrite clamp-on choke
(For LAN/USB Cable)
Other options as specied in
your order
Refer to “Appendix 3.1
Options” (p. A9).
*1
2
Page 8
Safety Information
Safety Information
This instrument is designed to conform to IEC 61010 Safety Standards, and has been thoroughly tested
for safety prior to shipment. However, using the instrument in a way not described in this manual may
negate the provided safety features.
Before using this instrument, read and understand the following safety notes.
DANGER
Mishandling during use could result in injury or death, as well as damage to the
instrument. Be certain that you understand the instructions and precautions in
the manual before use.
1
2
WARNING
Electricity presents risks of electric shock, heat generation, re, and arc
discharge due to short circuits. If anyone who is unfamiliar with electrical
measuring instruments will use the instrument, a person familiar with such
instruments must supervise operations.
Protective gear
WARNING
This instrument is measured on a live line. To prevent electric shock, use
appropriate protective insulation and adhere to applicable laws and regulations.
Notation
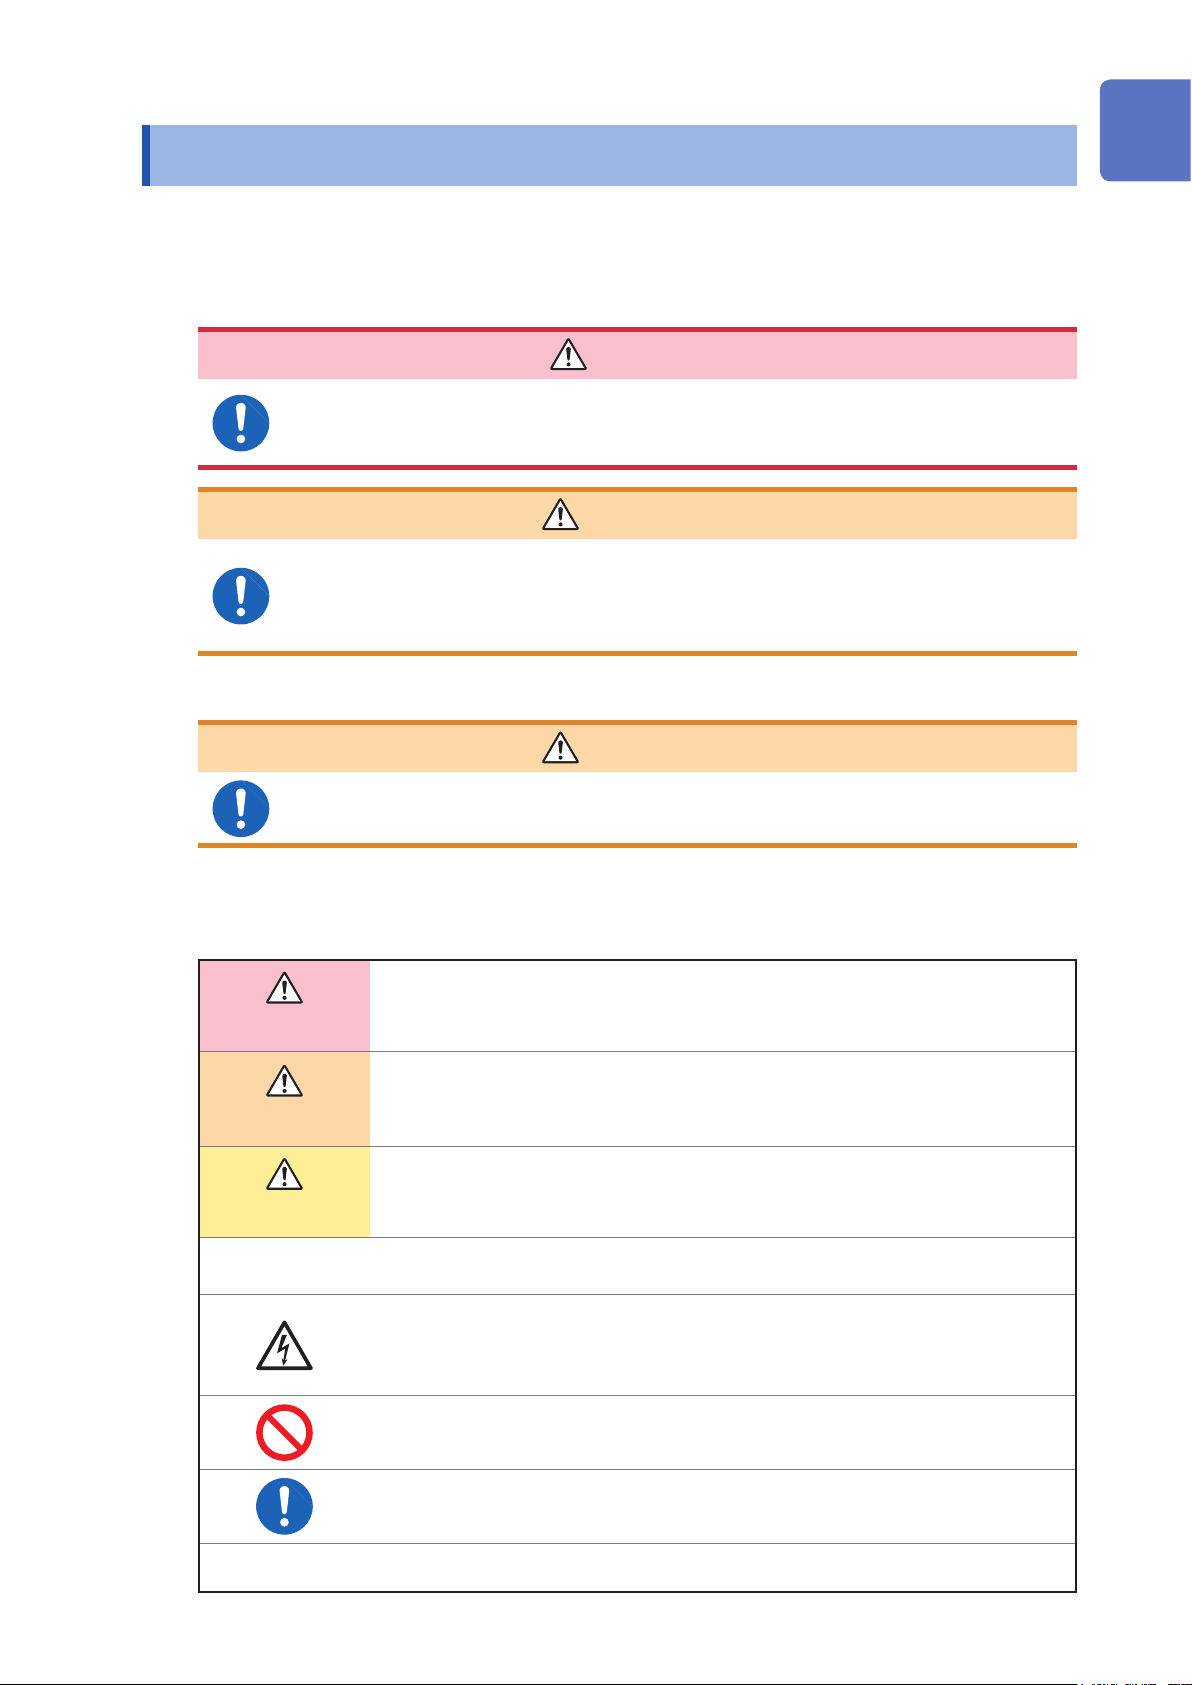
In this manual, the seriousness of risks and hazard levels are classied as follows.
Indicates an imminently hazardous situation that will result in death or serious injury to
DANGER
the operator.
3
4
5
6
7
WARNING
CAUTION
IMPORTANT
*
Indicates a potentially hazardous situation that may result in death or serious injury to
the operator.
Indicates a potentially hazardous situation that may result in minor or moderate injury
to the operator or damage to or malfunction of the instrument.
Indicates information related to the operation of the instrument or maintenance tasks
with which the operators must be fully familiar.
Indicates a high voltage hazard.
If a particular safety check is not performed or the instrument is mishandled, this may
give rise to a hazardous situation; the operator may receive an electric shock, be
burned or even be fatally injured.
Indicates prohibited actions.
Indicates actions which must be performed.
Additional information is presented below.
8
9
10
Appx.
Index
3
Page 9
Safety Information
Symbols Afxed to the Instrument
Indicates cautions and hazards. When this symbol is printed on the instrument, refer to
the corresponding topic in this Instruction Manual.
Indicates the ON or OFF side of the power switch.
Indicates a grounding terminal.
Indicates AC (Alternating Current).
Indicates a burn hazard if touched directly.
Standards Symbols
This symbol indicates that the electrical and electronic appliance was put on the EU
market after August 13, 2005, and producers of the Member States are required to display
it on the appliance under Article 11.2 of Directive 2002/96/EC (WEEE).
This symbol indicates that the product conforms to regulations set out by the EU Directive.
Other Symbols
This manual uses the following symbols to indicate specic information for operating the instrument.
(p. ) Indicates the location of reference information.
CURSOR
(Bold text)
[ ]
Names of settings, buttons, and other screen elements are written in bold blue text.
Unless otherwise specied, “Windows” refers to Windows Vista, Windows 7, and
Windows 8.
IE is an acronym for Internet Explorer.
Menus, commands, dialogs, buttons in a dialog, and other items on the screen and keys
are enclosed in brackets.
Indicates Memory function support.
Indicates Recorder function support.
Indicates X-Y Recorder function support.
Indicates FFT Recorder function support.
Click: Press and quickly release the left button of the mouse.
Right click: Press and quickly release the right button of the mouse.
Double click: Quickly click the left button of the mouse twice.
4
Page 10
Accuracy
We dene measurement tolerances in terms of f.s. (full scale), rdg. (reading) and setting values,
with the following meanings:
Safety Information
f.s. (maximum display value
or scale length)
rdg. (display value) The value currently being measured and indicated on the measuring
setting Indicates the value set as the output voltage, current, or other quantity.
Measurement Categories
To ensure safe operation of measuring instruments, IEC 61010 establishes safety standards for
various electrical environments, categorized as CAT II to CAT IV, called measurement categories.
The maximum displayable value or scale length.
For this instrument, the maximum displayable value is the range (V/div)
times the number of divisions (20) on the vertical axis.
Example: When range is 1 V/div, f.s. = 20 V
instrument.
DANGER
• Using a measuring instrument in an environment designated with a higher-
numbered category than that for which the instrument is rated could result in
severe accidents, and must be carefully avoided.
• Using a measuring instrument that has no category rating in an environment
designated with the CAT II to CAT IV category could result in severe accidents,
and must be carefully avoided.
1
2
3
4
5
CAT II: When directly measuring the electrical outlet receptacles of the primary electrical circuits in
equipment connected to an AC electrical outlet by a power cord (portable tools, household
appliances, etc.)
CAT III: When measuring the primary electrical circuits of heavy equipment (xed installations)
connected directly to the distribution panel, and feeders from the distribution panel to
outlets
CAT IV: When measuring the circuit from the service drop to the service entrance, and to the power
meter and primary overcurrent protection device (distribution panel).
Service Entrance
Service Drop
CAT IV
Power Meter
The applicable measurement category is determined by the module being used.
Refer to “18.6 Module Specications” (p. 360).
Distribution panel
Fixed Installation
Internal Wiring
CAT III
CAT II
T
Outlet
6
7
8
9
10
Appx.
5
Index
Page 11
Operation Precautions
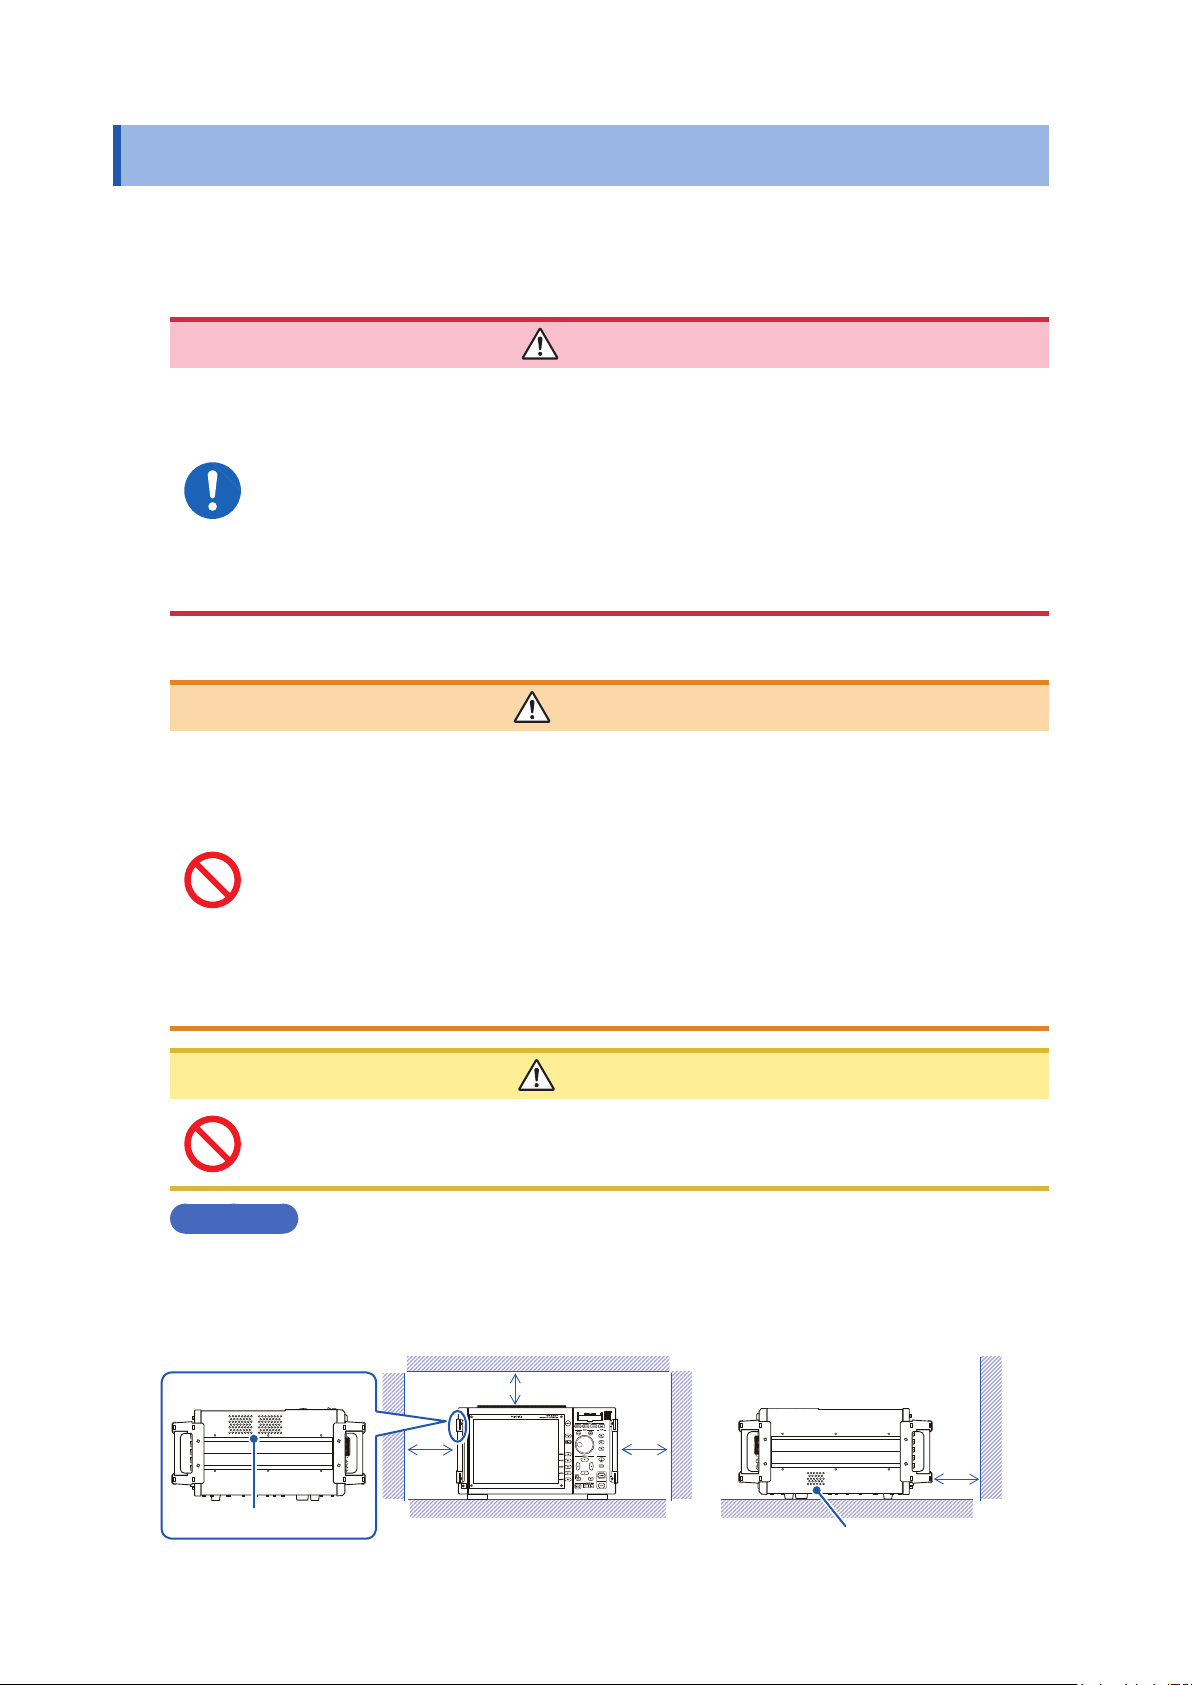
At least 5 cm
At least 5 cm on all sides
Operation Precautions
Before Use
Follow these precautions to ensure safe operation and to obtain the full benets of the various
functions.
DANGER
If connection cables or instrument are damaged, there is a risk of electric shock.
Before using the instrument, perform the following inspection.
• Before using the instrument, check that the insulation of the connection cables
is not damaged and that no metal parts are exposed. Using the instrument
under such conditions could result in electric shock. Replace the connection
cable with those specied by our company.
• Verify that the instrument operates normally to ensure that no damage occurred
during storage or shipping. If you nd any damage, contact your authorized
Hioki distributor or reseller.
Instrument Installation
To avoid accidents or damage to the instrument, do not install the instrument in
locations that are:
• Exposed to direct sunlight or high temperature
• Exposed to corrosive or combustible gases
• Exposed to a strong electromagnetic eld or electrostatic charge
• Near induction heating systems (such as high-frequency induction heating
systems and IH cooking equipment)
• Susceptible to vibration
• Exposed to water, oil, chemicals, or solvents
• Exposed to high humidity or condensation
• Exposed to high quantities of dust particles
Do not place the instrument in a location that is unstable or inclined. Do not place the
unit on another unit. Knocking-over or dropping the instrument can cause injury or
damage to the instrument.
Installation
WARNING
CAUTION
Be sure to keep the specied clearances around the instrument to prevent overheating.
• Do not install the instrument with any side except the bottom facing down.
• Do not obstruct vents.
• Do not install the instrument at an angle.
Left side
Vents
At least 5 cm on all sides
Right side
6
Vents
At least 5 cm
Page 12
Handling the Instrument and Modules
• Do not exceed the range of the specications and the rated value of the cable
or the module.
Otherwise, the instrument may be damaged or may produce heat, resulting in
personal injury.
The maximum rated voltage to earth does not change when an attenuator or
similar is used at the input. Take the connection method into consideration and
make sure that the rating is not exceeded.
• To avoid electric shock, ddo not remove the instrument’s cover and the module
case.
The internal components of the instrument carry high voltages and may
become very hot during operation.
•
To avoid electric shocks, conrm that the module is turned off and the
connection cables are disconnected before removing or replacing a module.
•
To avoid electric shocks, never operate the instrument with a module removed.
To use the instrument after removing a module, install a blank panel over the
opening of the removed module.
•
To prevent instrument damage or electric shocks, use only the screws for
securing the module in place that shipped with the instrument.
If you lose any screw or nd that any screws are damaged, please contact your
Hioki distributor for a replacement.
Operation Precautions
DANGER
1
2
3
WARNING
4
5
CAUTION
• To avoid damage to the instrument, protect it from physical shock during transport and
handling. Be especially careful to avoid physical shock from dropping.
• The mounting screws must be rmly tightened or the module may not perform as
specied or may fail.
• To avoid damaging modules, do not touch the module connectors on this instrument.
• Before transporting the instrument, disconnect all cables and remove any CF cards, USB memory sticks,
and recording paper.
• When there is no input, the waveform might be unstable due to the induced voltage, but this is not an
error.
• This instrument may cause interference if used in residential areas. Such use must be avoided unless the
user takes special measures to reduce electromagnetic emissions to prevent interference to the reception
of radio and television broadcasts.
6
7
8
9
10
Appx.
7
Index
Page 13
Operation Precautions
Handling the Printer and Recording Paper
WARNING
The print head and surrounding metal parts can become hot. Be careful to avoid
touching these parts.
CAUTION
Be careful not to cut yourself with the paper cutter.
• Please use only the specied recording paper. Using non-specied paper may not only result in
faulty printing, but printing may become impossible.
• If the recording paper is skewed on the roller, paper jams may result.
• Always use the paper cutter to cut the printed paper. Excessive paper dust can accumulate on the roller
if the paper is cut by the print head, which may result in paper jams or white streaks in the printing.
Storing Data Recordings
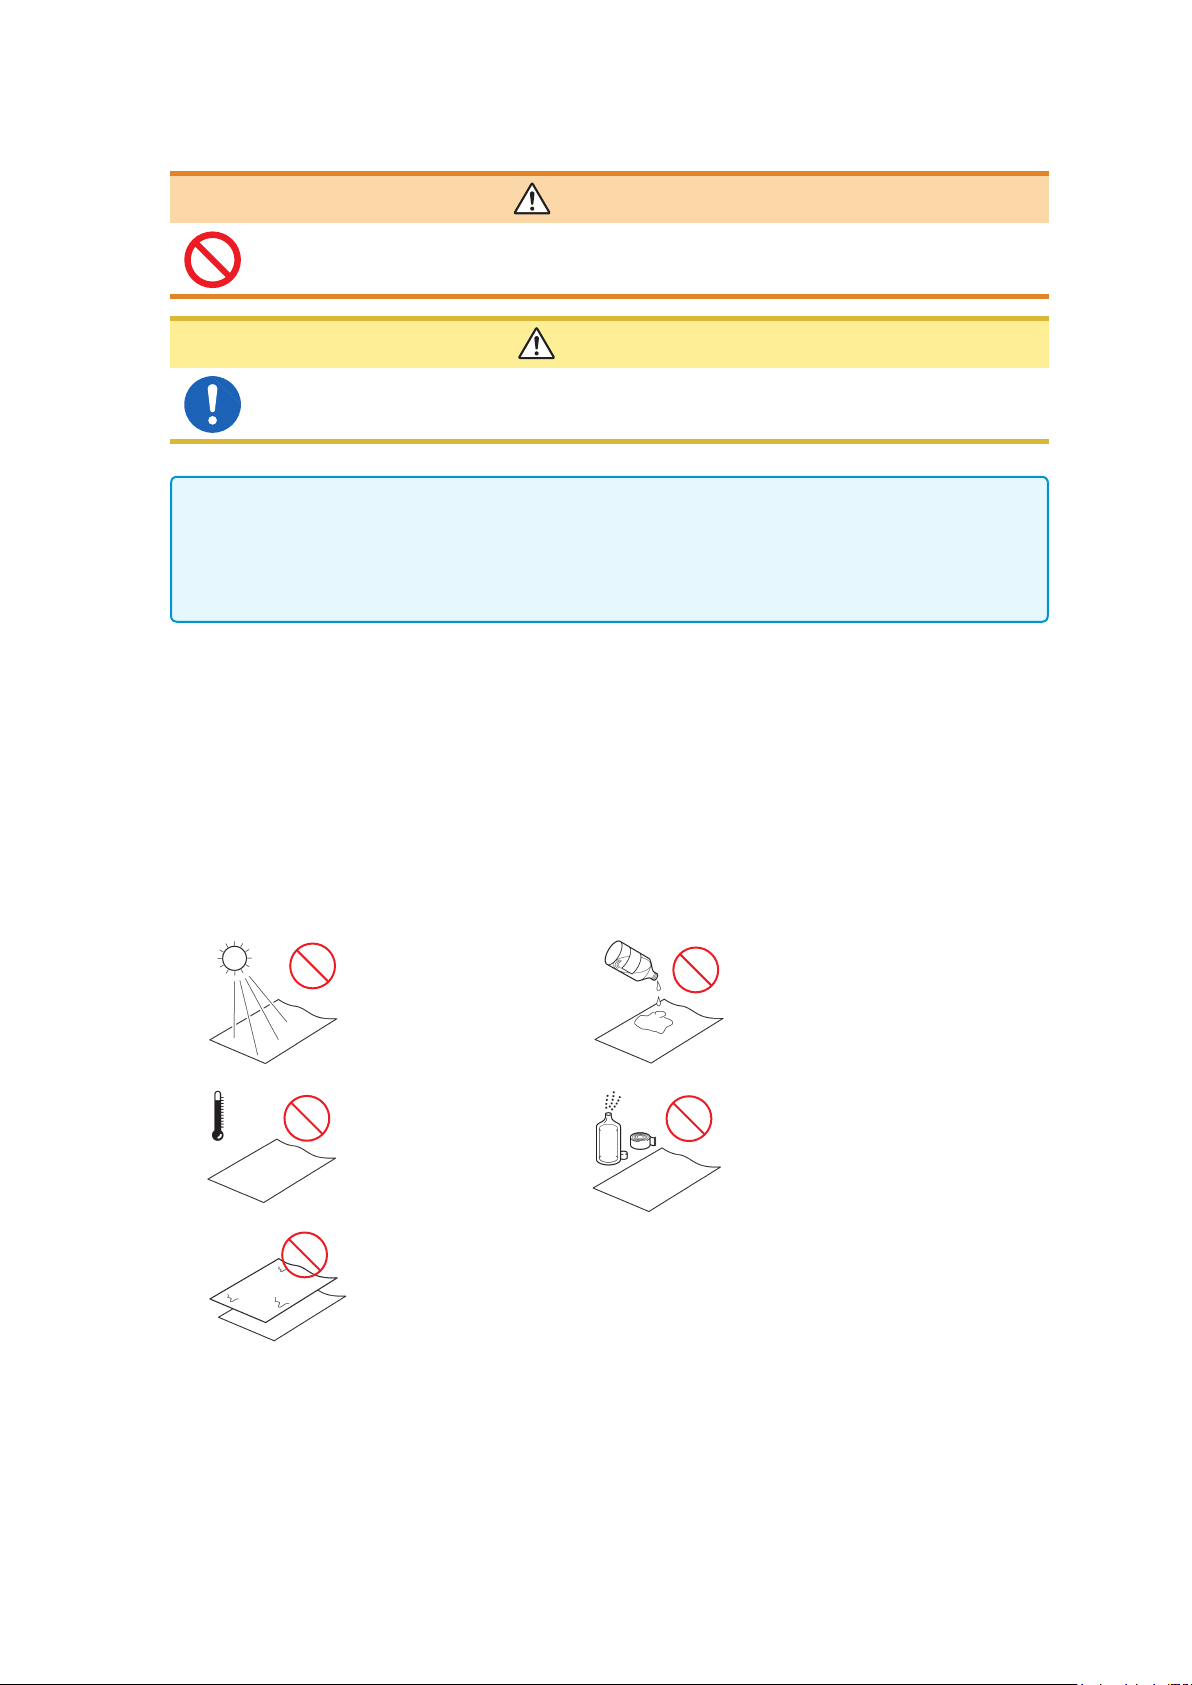
The recording paper is thermally and chemically sensitized. Observe the following precautions to
avoid paper discoloration and fading.
• To avoid discoloration, do not expose it to direct sunlight. Store below 40°C (104°F) and 90% RH.
• Store away from dew and damp places.
• Make photocopies of recording printouts that are to be handled or stored for legal purposes.
• If the thermal paper is exposed to an organic solvent such as alcohol or ketone, it may no longer
develop properly, and recorded data may fade. Pressure sensitive tapes such as exible PVC
lms and scotch tapes must be handled with care as they contain organic solvents.
• Also, the thermal recording paper is ruined by contact with wet Daizo copy paper.
Avoid exposure to direct
sunlight.
Do not store thermal paper
above 40°C and 90% RH.
Avoid stacking with wet
Diazo copy paper.
Avoid exposure to volatile
organic solvents like
alcohol, ethers, and
ketones.
Avoid contact with
adhesive tapes like
soft vinyl chloride and
cellophane tape.
Storing Recording Paper
• Store thermal paper where its temperature will not exceed 40°C (104°F).
• The paper will deteriorate if exposed to light for a long time, so do not remove rolls from their
wrappers until ready to use.Handling Media
8
Page 14
Handling Media
Operation Precautions
CAUTION
• Do not remove the media while it is being accessed by the instrument (while the
key is lit in blue). Data on the media could be lost.
• Do not turn off the power to the instrument while the media is being accessed by the
instrument (while the
• Do not transport the instrument while a USB ash drive is connected. Damage could
result.
• Exercise care when using such products because static electricity could damage the
external media or cause a malfunction of the instrument.
• Do not subject the SSD to extreme shock or vibration. Doing so may damage the hard
disk.
IMPORTANT
• No compensation is available for loss of data stored on the built-in drive (SSD) or removable
media, regardless of the content or cause of damage or loss. Be sure to back up any important
data stored on the built-in drive (SSD) or removable media.
• Use only CF Cards sold by Hioki. (No adapter will be required when the card is inserted into
the instrument.)
• Compatibility and performance are not guaranteed for PC cards made by other manufacturers.
You may be unable to read from or save data to such cards.
■Hioki optional CF cards (The CF card includes an adapter.)
Model 9728 PC Card 512M, Model 9729 PC Card 1G, Model 9830 PC Card 2G
key is lit in blue). Data on the media could be lost.
SAVE
SAVE
1
2
3
4
5
• With some external media, the instrument may not start up if power is turned on while the external
media is inserted. In such a case, turn power on rst, and then insert the external media. Prior
testing is recommended.
• Unusual USB ash drives, such as those that require ngerprint authentication or a password,
cannot be used.
• When saving or loading data, insert the storage media before selecting it. If the media is not
inserted, the le list display will not appear.
• All media (built-in drive, USB memory stick and CF card) have a limited service life. After
extensive use over a long period, data retention and readout may become stop working. In
such cases, you should procure new media.
• The built-in drive (SSD) is a consumable part. When the written data reaches the capacity (about
60 TB), no more data can be recorded. In such a case, the SSD should be replaced with a new
one.
• When the instrument is turned off for a long time (more than one year), the data stored on the
built-in drive (SSD) may be lost. Be sure to back up the data if the instrument is left turned off
for a long time.
• Automatic saving of data is possible only on built-in drive (SSD), USB memory stick and CF
card media.
• Data can also be saved to a USB ash drive in real time, but for data protection we recommend
using Hioki’s optional CF card instead.
6
7
8
9
10
Appx.
9
Index
Page 15
Operation Precautions
Before Connecting Cables
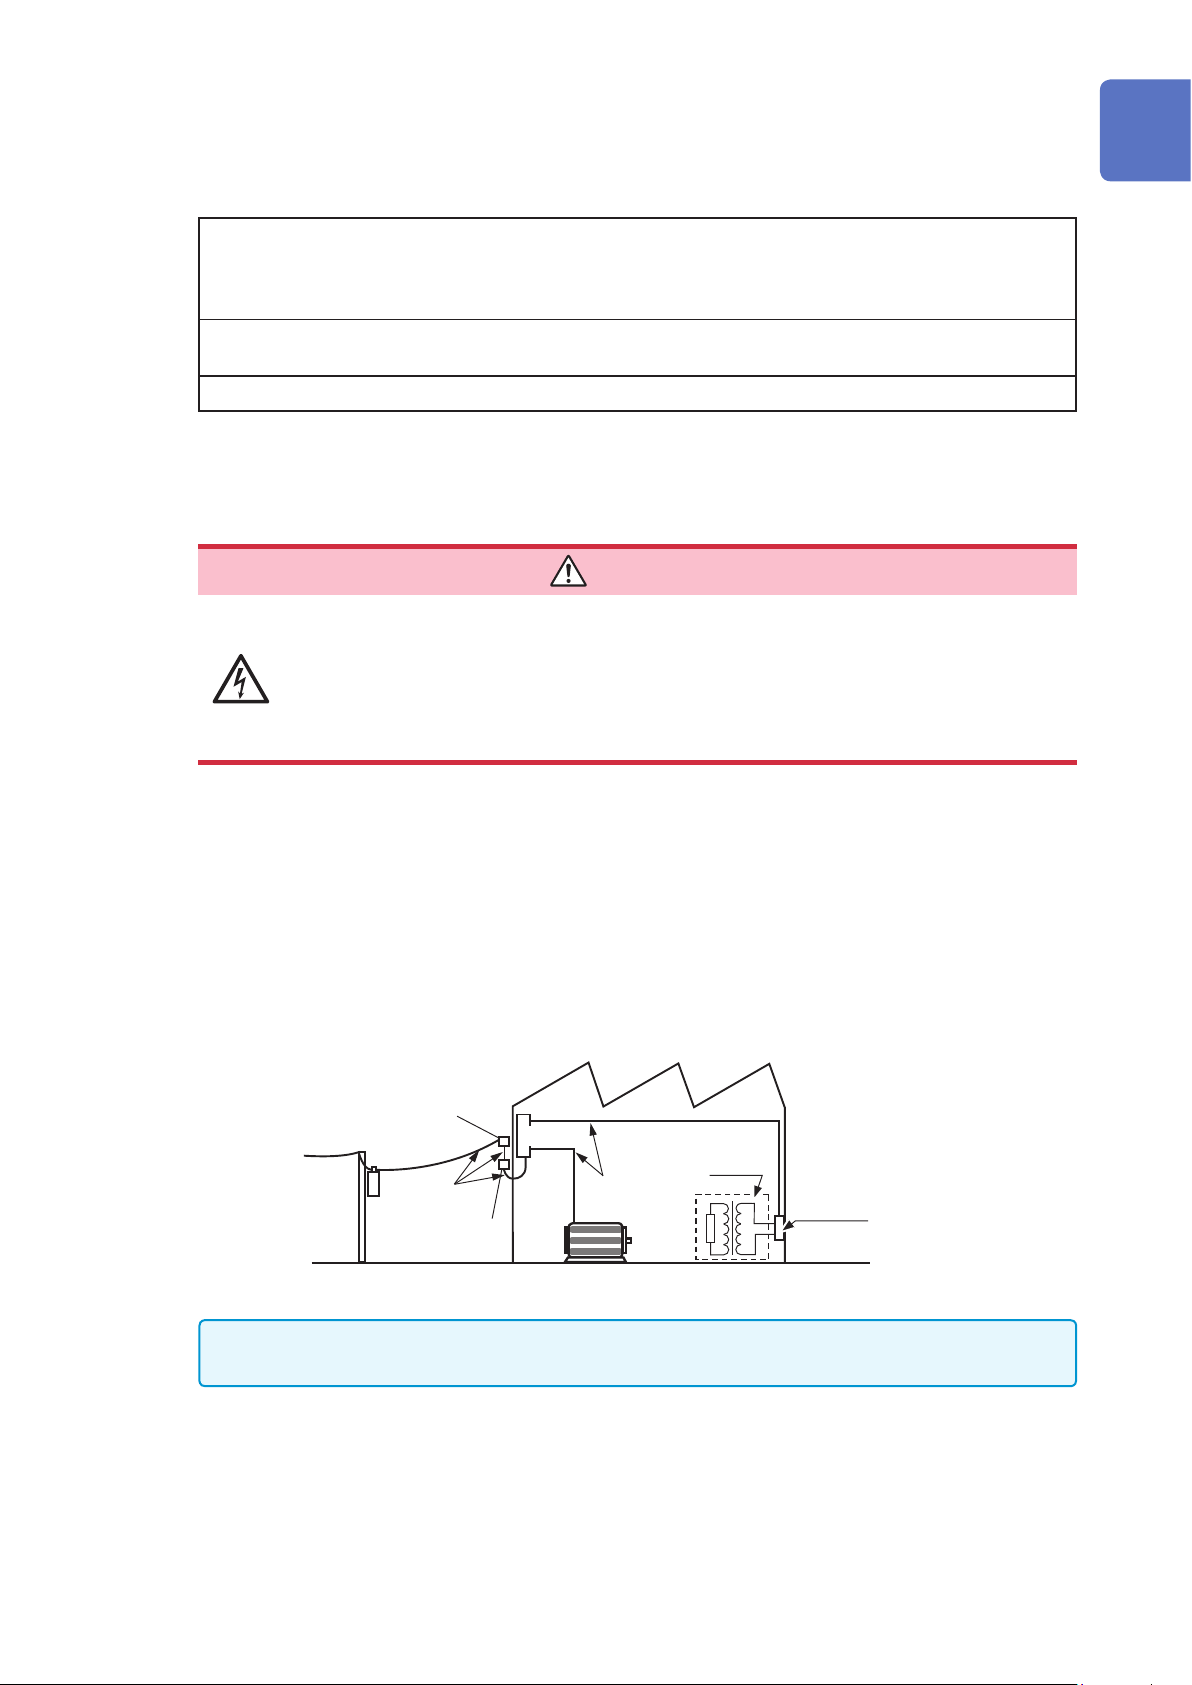
When measuring power line voltage
• Connecting cables should only be connected to the secondary side of a breaker
Even if there is a short circuit on the secondary side of the breaker, the breaker
cuts off the electric supply. Do not connect to the primary side of a breaker
because unrestricted current ow could damage the instrument and facilities if
a short circuit occurs.
• To prevent electrical shocks and personal injury, do not touch any input
terminals on the VT (PT), CT or the instrument when they are in operation.
• Do not permanently connect the instrument in an environment where voltage
surges exceeding the maximum input voltage may occur. Failure to observe
this precaution could result in damage to the instrument or personal injury.
• Do not short-circuit two wires to be measured by bringing the connection cables
into contact with them. Arcs or such grave accidents are likely to occur.
• To avoid short circuit or electric shock, do not touch the metal parts of the
connecting cable clips.
• To avoid electrical shocks, be careful to avoid shorting live lines with the
connection cables.
DANGER
WARNING
• To avoid electric shock and short-circuit accidents, use only the specied test
leads to connect the instrument input terminals to the circuit to be tested.
• To avoid electric shock, do not exceed the lower of the ratings shown on the
instrument and connection cords.
To prevent an electric shock accident, conrm that the white or red portion
(insulation layer) inside the cable is not exposed. If a color inside the cable is
exposed, do not use the cable.
CAUTION
• The cable is hardened under the 0°C (32°F) or colder environment. Do not bend or
pull cables in such environments to avoid tearing insulation or breaking the cable.
• Connecting to the BNC jacks on modules
Do not use a metal BNC connector. If you connect a metal BNC cable to an insulated
BNC connector, the insulated BNC connector can be damaged and the instrument
may be damaged.
• To prevent cable damage, do not step on cables or pinch them between other objects.
Do not bend or pull on cables at their base.
IMPORTANT
• Use only the specied connection cables. Using a non-specied cable may satisfy the
specication requirements due to poor connection or other reasons.
• For detailed precautions and instructions regarding connections, refer to the instruction
manuals for your modules, connection cables, etc.
10
Page 16

Before Connecting a Logic Probe to the Measurement Object
Functional Earth
DANGER
To avoid electric shock and short circuit accidents or damage to the instrument,
conrm the following:
• The ground pin in the LOGIC connector (plug) of Models 9320-01 and 9327
Logic Probes is not isolated from the instrument’s ground (common ground).
Use grounding-type polarized power cords for the measurement object and this
instrument, and obtain power from the same mains circuit.
Connecting to different mains circuits or using a non-grounding power cord
may cause damage to the measurement object or this instrument because
of current ow through the logic probes resulting from potential difference
between the grounds of the different wiring systems.
To avoid these problems, we recommend the following connection procedure:
Connect this instrument to the
same outlet as the measurement
object using the (supplied)
grounding polarized power cord.
Measurement
Object
Logic probe
Operation Precautions
1
2
3
Memory
HiCorder
4
Connect the measurement object’s
ground to the GND terminal
(functional earth terminal) of this
instrument.
(Always obtain power from the
same mains circuit.)
See “2.5.2 Ground the Functional
Earth of This Instrument” (page
44)
Before Turning the Power Supply On
• To avoid electrical accidents and to maintain the safety specications of this
instrument, only connect the provided power cord to an outlet.
• Before turning the instrument on, make sure the supply voltage matches that
indicated on its power connector. Connection to an improper supply voltage
may damage the instrument and present an electrical hazard.
Avoid using an uninterruptible power supply (UPS), DC/AC inverter with rectangular
wave or pseudo-sine-wave output to power the instrument. Doing so may damage the
instrument.
Measurement
Object
GND
WARNING
CAUTION
Logic probe
Memory
HiCorder
Terminals
5
6
7
8
9
To avoid damaging the power cord, grasp the plug, not the cord, when unplugging it
from the power outlet.
Turn off the power before connecting or disconnecting the power cord.
10
Appx.
Index
11
Page 17
Operation Precautions
Before Connecting to an External Device
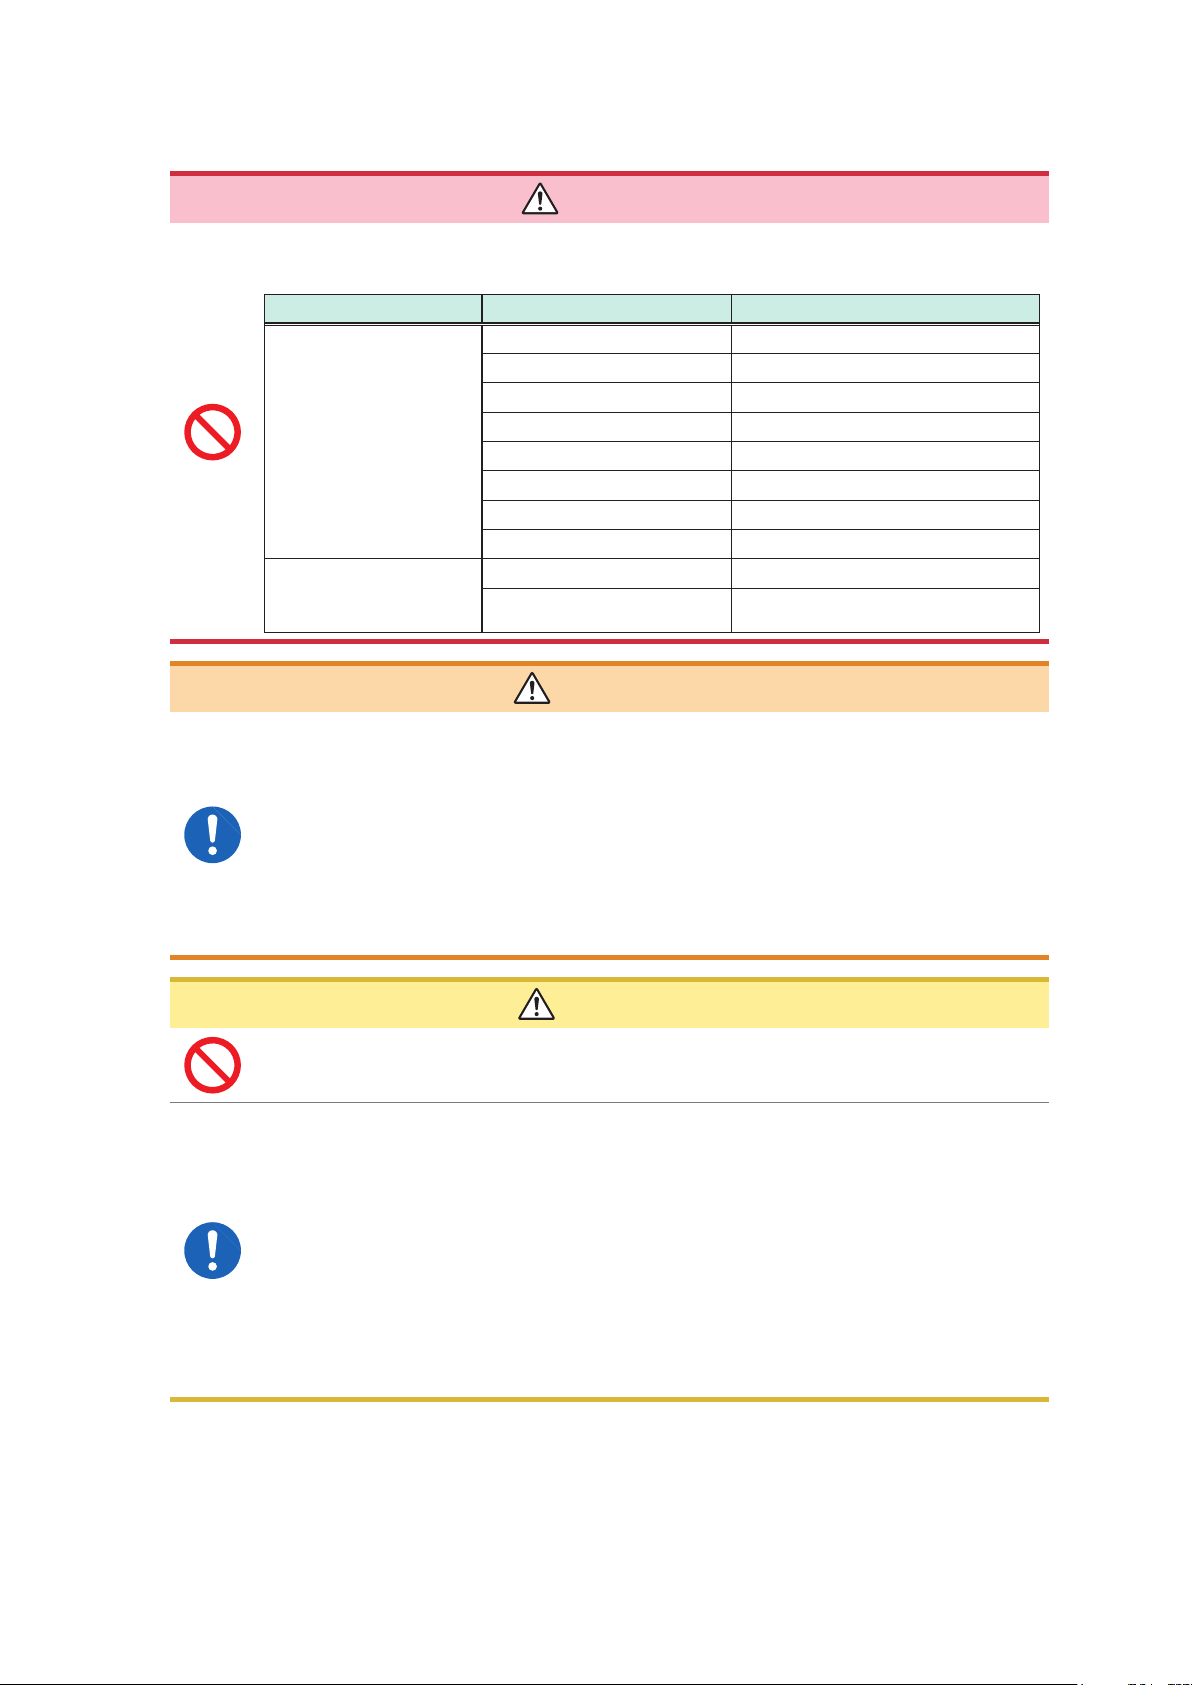
DANGER
To avoid electrical hazards and damage to the instrument, do not apply voltage
that exceeds the maximum input voltage to the external control terminals.
I/O terminals Maximum input voltage
Instrument START/.IN1 -0.5 V to 7 V DC
STOP/IN2 -0.5 V to 7 V DC
PRINT/.IN3 -0.5 V to 7 V DC
GO/OUT1 50 V DC, 50 mA DC, 200 mW
NG/OUT2 50 V DC, 50 mA DC, 200 mW
EXT.SMPL -0.5 V to 7 V DC
TRIG OUT 50 V DC, 50 mA DC, 200 mW
EXT.TRIG -0.5 V to 7 V DC
U8793
Arbitrary Waveform
Generator Unit
IN -0.5 V to 7 V DC
OUT 30 V DC, 50 mA DC
WARNING
To avoid electric shock or damage to the equipment, always observe the
following precautions when connecting to external control terminals or external
connectors.
• Always turn off the power to the instrument and to any devices to be connected
before making connections.
• Be careful to avoid exceeding the ratings of external control terminals and
external connectors.
• Ensure that devices and systems to be connected to the external control
terminals are properly isolated.
CAUTION
To avoid equipment failure, do not disconnect the USB cable while communication is in
progress.
• Use a common ground for both the instrument and the connection equipment.
Use of different ground circuits will result in a potential difference between the
instrument's ground and the connected equipment's ground. If the communications
cable is connected while such a potential difference exists, it may result in equipment
malfunction or failure.
• While connecting or disconnecting the communication cables, ensure that the power
supply of the instrument and the device to be connected is cut off. This may cause
damage or malfunctioning.
• After connecting the communications cable, tighten the screws on the connector
securely. Failure to secure the connector could result in equipment malfunction or
damage.
12
Page 18

CD Precautions
• Keep the recorded side of discs free of dirt and scratches. When writing text on a disc’s label, use
a pen or marker with a soft tip.
• Keep discs inside a protective case and do not expose to direct sunlight, high temperatures, or
high humidity.
• Hioki is not liable for any issues your computer system experiences in the course of using this
disc.
When the Instrument is Not Used for a Long Period
• To avoid straining some parts of the printer, and to prevent dirt adhering to the print head, close
the printer cover.
• Perform three or four test prints (printer check) before using a printer that has been in storage for
a long period.
Operation Precautions
1
2
Precautions During Shipment
Keep the packing material that was used for shipping this instrument because you may need to use
it when transporting the instrument in the future.
3
4
5
6
7
13
8
9
10
Appx.
Index
Page 19

Operation Precautions
14
Page 20
1
Overview
1.1 Product Overview
The MR8827 Memory HiCorder is an instrument that allows simultaneous measurement
of multiple signals. The MR8827 is easy to operate and allows quick and efficient
measurement and analysis.
Its major uses are monitoring, facility diagnosis and various tests.
1
Overview
Isolated 32 analog channels
Measurement possible using
up to 28 analog channels and
64 logic channels
Selectable module according to
the measurement details
High-speed sampling:
20 MS/s
Easy loading of recording paper
High-speed printing
The unit is electrically isolated from the channels.
All channels can be measured simultaneously.
Modules can be selected from more than eight types.
Reliable response evaluation is possible.
One-touch insertion allows quick and trouble-free
operation.
Arbitrary Waveform Generator Unit
can output the measured data
(When Model U8350 Printer Unit is installed)
You can simulate actual waveforms.
15
Page 21
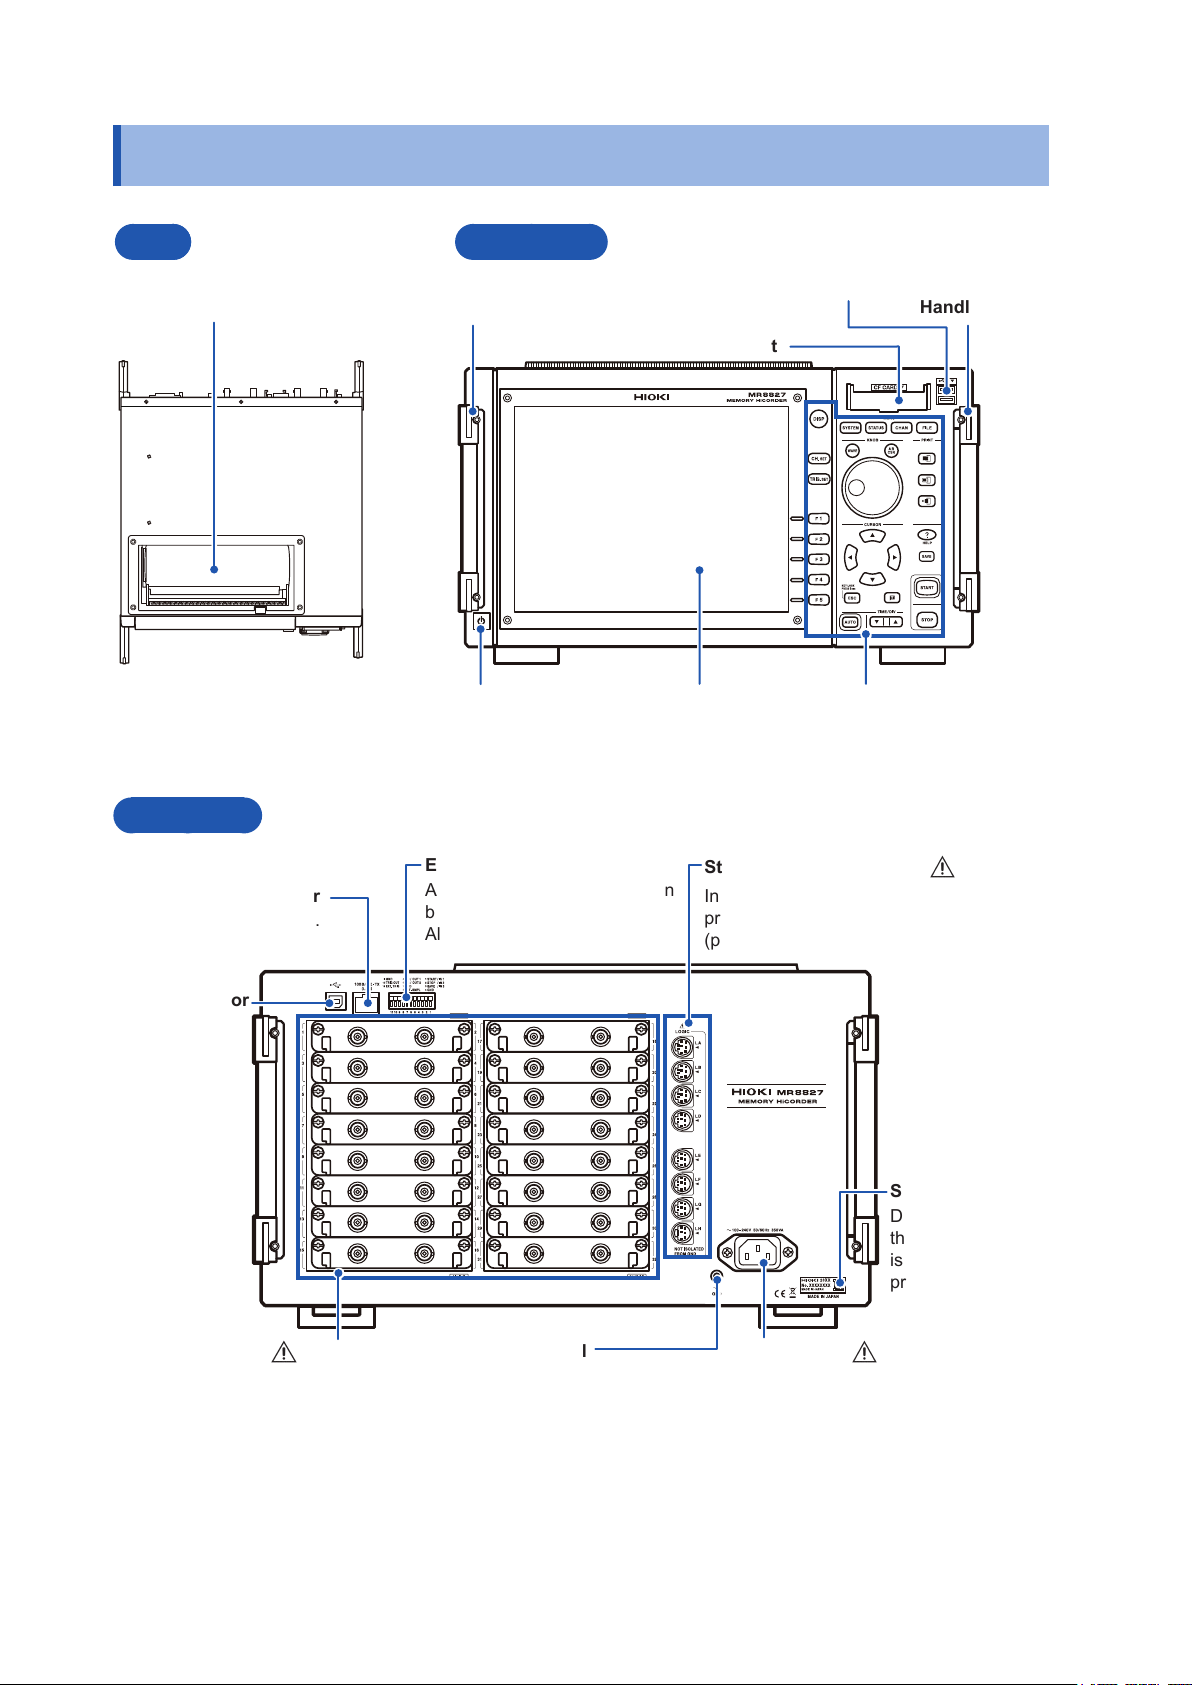
Part Names and Functions
1.2 Part Names and Functions
Top
Model U8350 Printer Unit
(Optional)
Back Side
Front Side
Handle Handle
POWER switch (p. 45)
USB connector (Type A)
Connect USB memory stick and
USB mouse here. (p. 40)
CF card slot
Display
Operation key (p. 17)
100BASE-TX connector
Connect LAN cable here.
(p. 309)
USB connector
(Type B)
Connect to the
computer (PC)
with the USB
cable.
(p. 328)
Various modules
(For details, see the instruction manual
of the respective module.)
(p. 26), (p. 28)
External control terminals
An external sampling signal can
be connected here. (p. 335)
Allows control of the unit.
GND terminal
(Functional earth terminal)
Connect to Earth ground. (p. 44)
Standard LOGIC terminals
Input connectors for optional
proprietary logic probes.
(p. 28)
Serial No.
Do not remove
this label, as it
is required for
product support.
Power inlet
Connect the supplied power
cord here. (p. 44)
16
Page 22
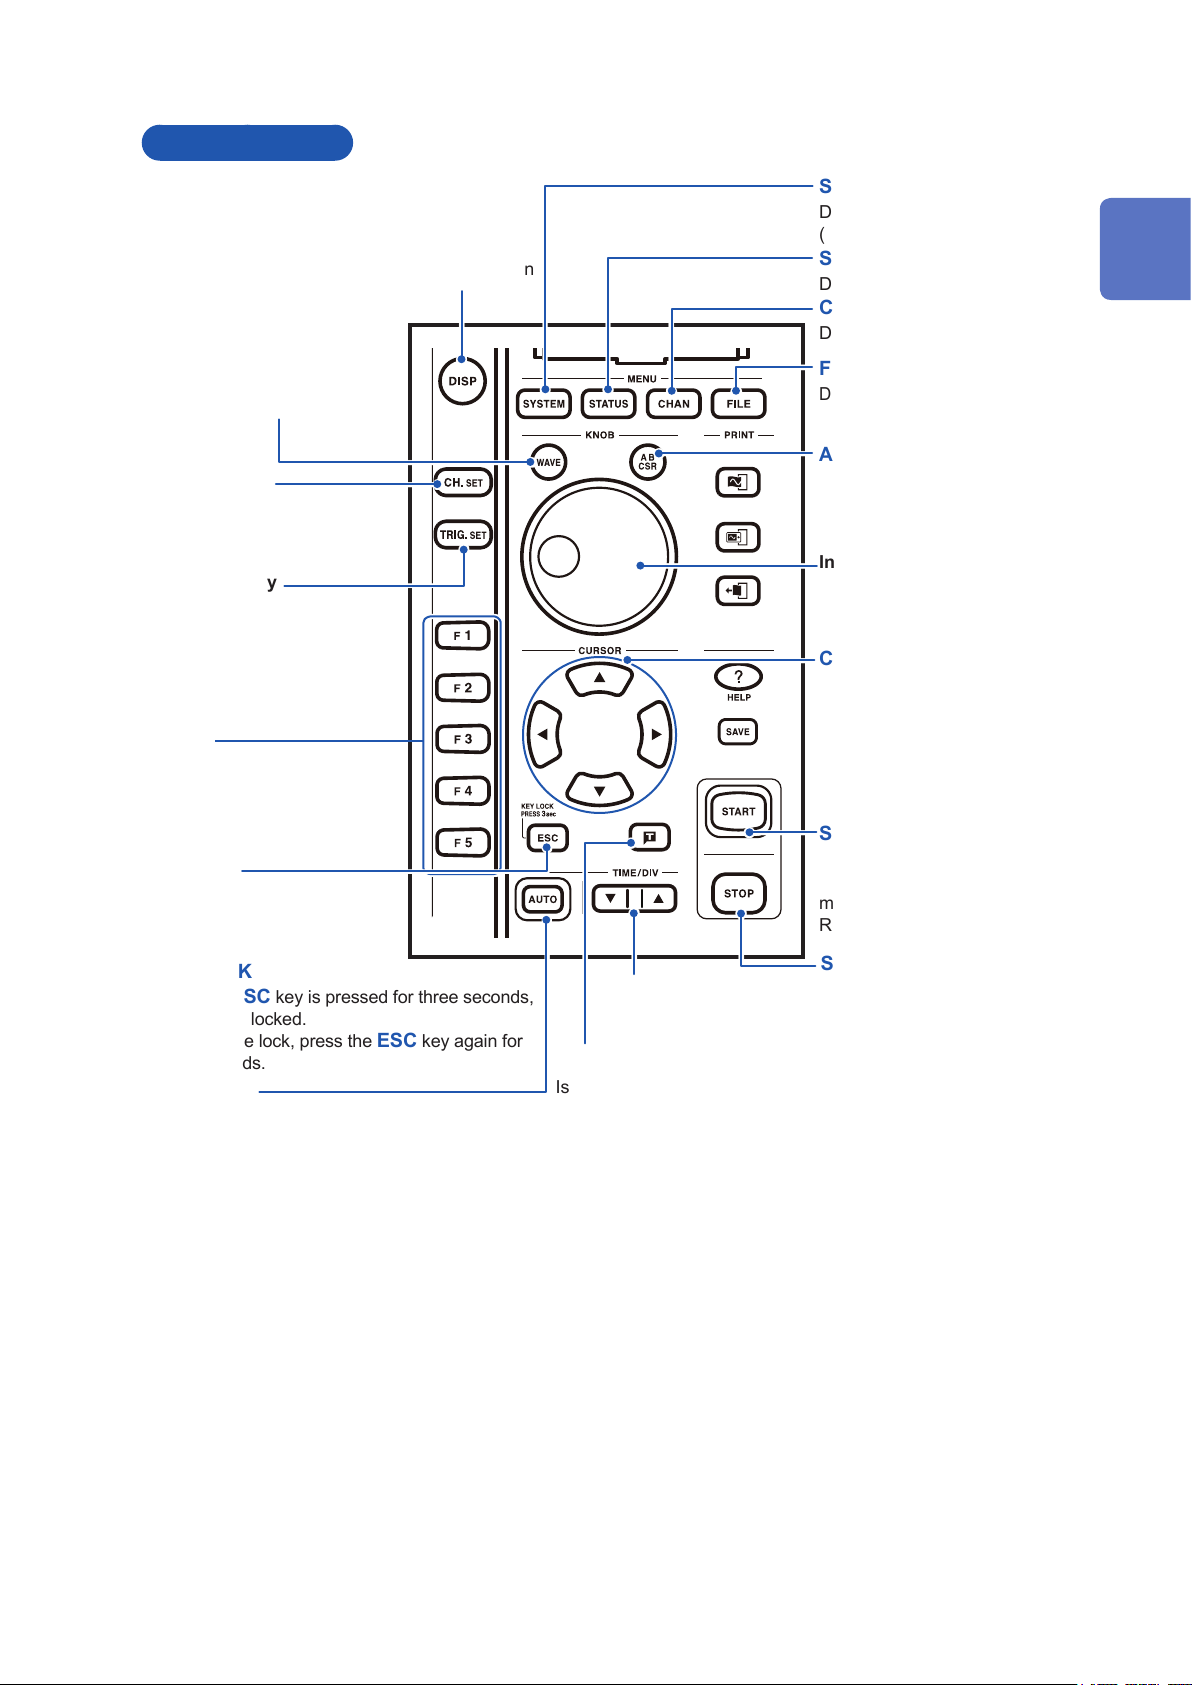
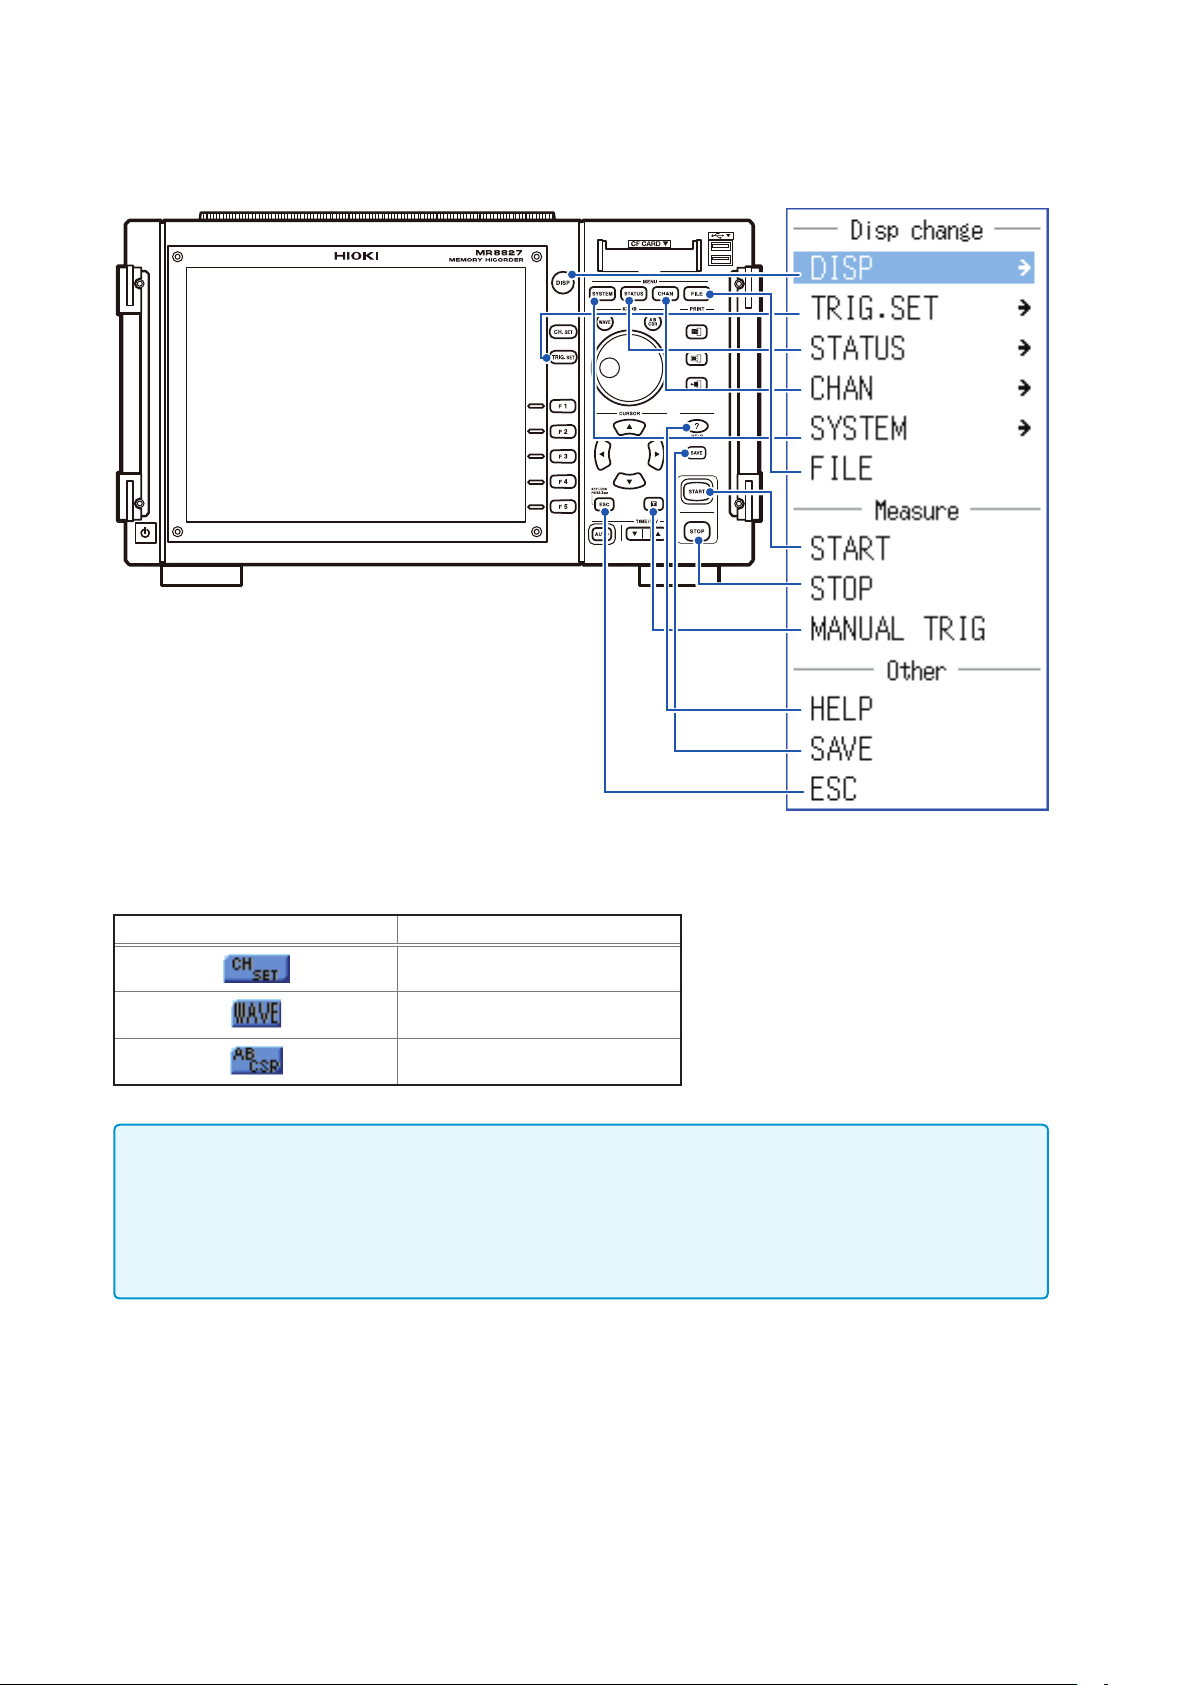
Operation Keys
Part Names and Functions
key
DISP
Displays the Waveform screen
WAVE
key
(Lights up in red when
selected)
Assigns the jog and shuttle
knobs to waveform scrolling.
(p. 126)
CH.SET
Displays the channel settings
window on the Waveform
screen. (p. 60)
TRIG.SET
Displays the trigger settings
window on the Waveform
screen. (p. 187)
F
Select setting items
key
key
key
SYSTEM
Displays the System screen
(p. 305)
STATUS
Displays the Status screen
CHAN
Displays the Channel screen
FILE
Displays the File screen (p. 97)
AB CSR
(Lights up in red when selected)
Sets AB cursors (p. 122)
Inner:
Outer:
Scrolls waveforms (p. 126)
CURSOR
Moves the cursor up, down, left
and right on the screen.
key
key
key
key
key
Jog
Shuttle
key
1
Overview
key
ESC
Cancels an operation.
Removes the displayed dialog
and window.
KEY LOCK
When the
the keys are locked.
To cancel the lock, press the
three seconds.
AUTO
Starts auto-range measurement
(p. 70)
key is pressed for three seconds,
ESC
ESC
key
key again for
TIME/DIV
Sets the time axis.
Manual Trigger
Issues a manual trigger event.
(p. 200)
key
key
START
Starts Measurement
Lights up green during
measurement.
Refer to (p. 307).
STOP
Stops Measurement
Press once:
Measurement stops after the
set recording length
Press twice:
Stop measurement
Refer to (p. 307).
key
key
17
Page 23
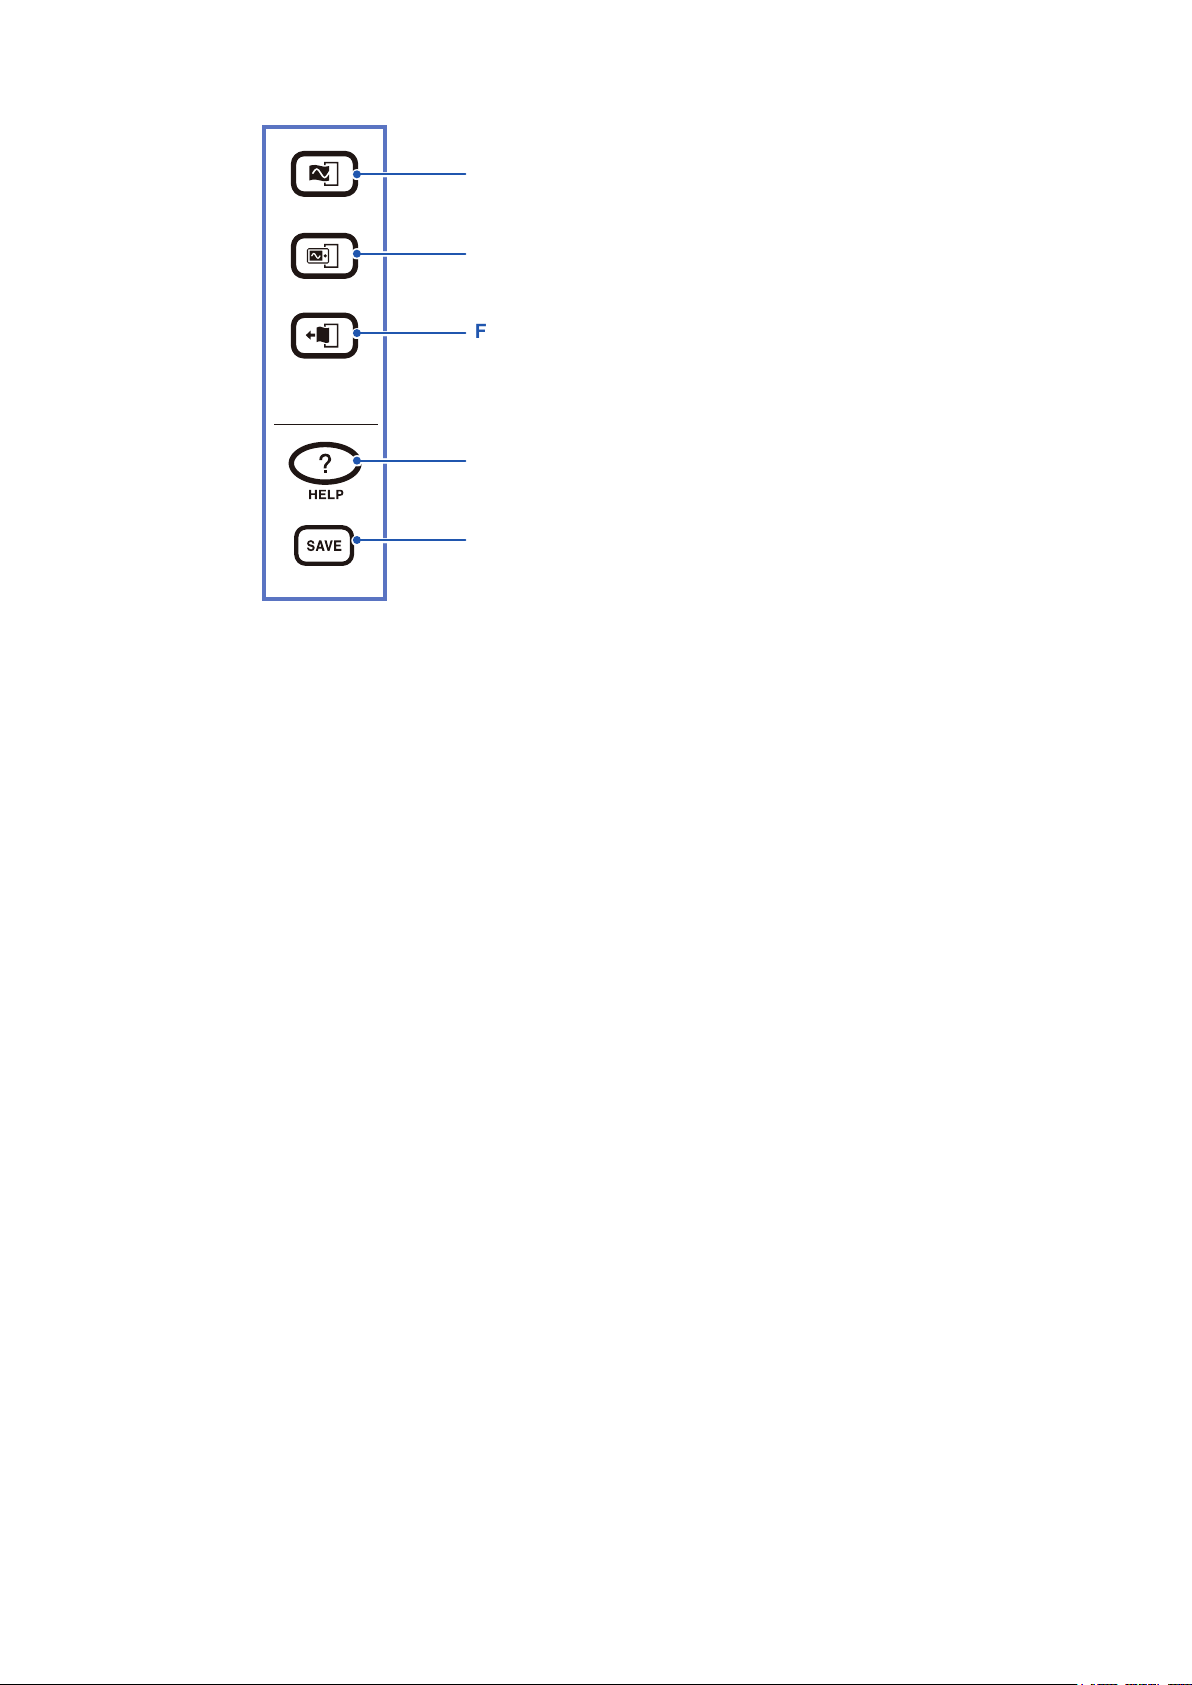
Part Names and Functions
PRINT
Prints waveforms and lists (p. 107)
COPY
Prints a hard copy of the display screen (p. 118)
FEED
Feeds paper
HELP
Opens help information (p. 22)
SAVE
(Lights up in blue while media is being accessed.)
Saves data to storage media. (p. 77)
Turns dialog box display during auto-save on or off.
key
key
key
key
key
18
Page 24
Screen Organization
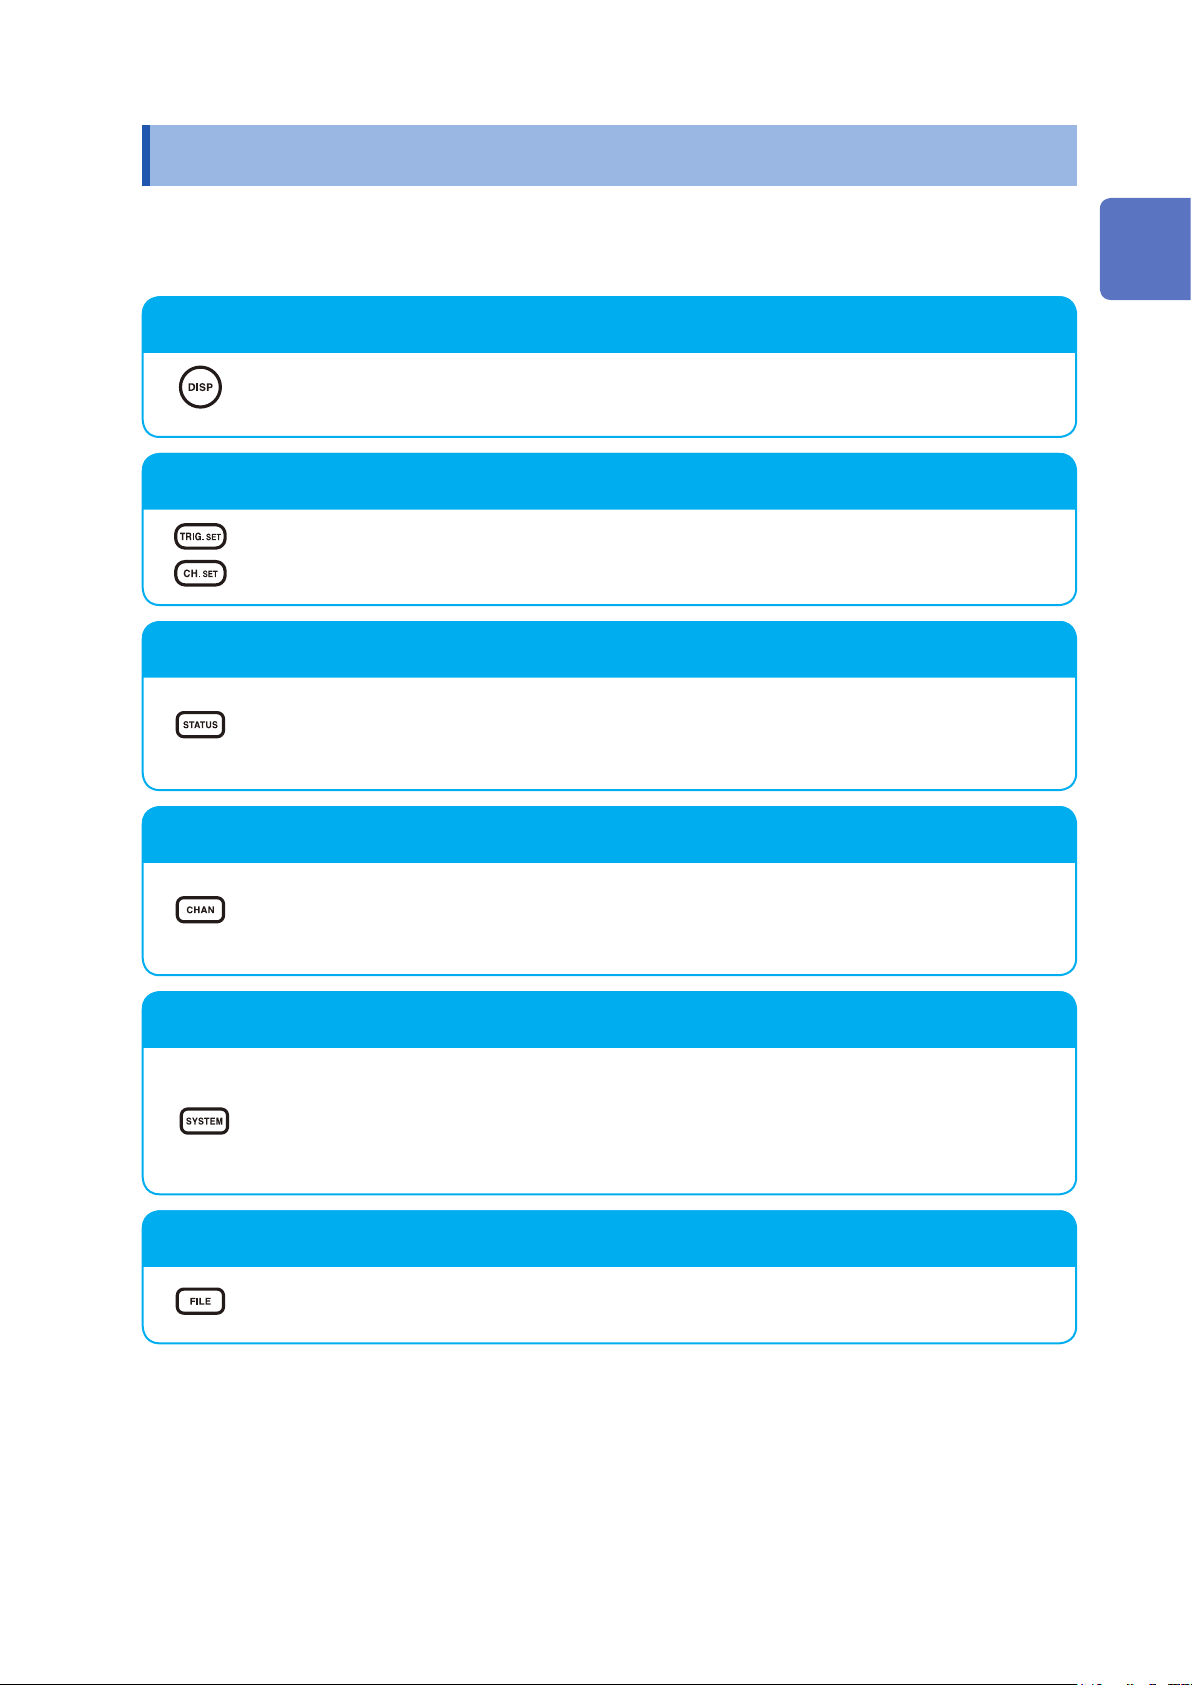
1.3 Screen Organization
The screen conguration is as listed below. Each screen or window appears when the listed key is
pressed.
The trigger settings window and channel settings window can be brought up on the Waveform screen.
Waveform Screen
Use this screen to view the waveform.
The settings window on the right displays the current measurement parameters.
Trigger Settings Window, Channel Settings Window
View the trigger settings.
View the analog channel and logic channel settings.
1
Overview
Status Screen
View and update measurement and calculation settings.
Each push of the
[Status]
Channel Screen
View and update channel, scaling, and comment settings.
Each push of the
[Unit List]
System Screen
View and update environment settings, save and print les, choose interface settings, and
perform data initialization.
Each push of the
[Environment]
sheet.
sheet,
sheet,
STATUS
key cycles through the following sheets:
[Num Calc]
CHAN
key cycles through the following sheets:
[Each Ch]
SYSTEM
sheet,
key cycles through the following sheets:
[File Save]
sheet,
sheet,
[Memory Div]
[Scaling]
sheet,
sheet,
[Printer]
sheet,
[Wave Calc]
[Comment]
sheet,
sheet.
[Interface]
sheet.
sheet,
[Init]
File Screen
View saved data les (CompactFlash cards, built-in drive, USB memory stick, internal
memory).
19
Page 25
Screen Organization
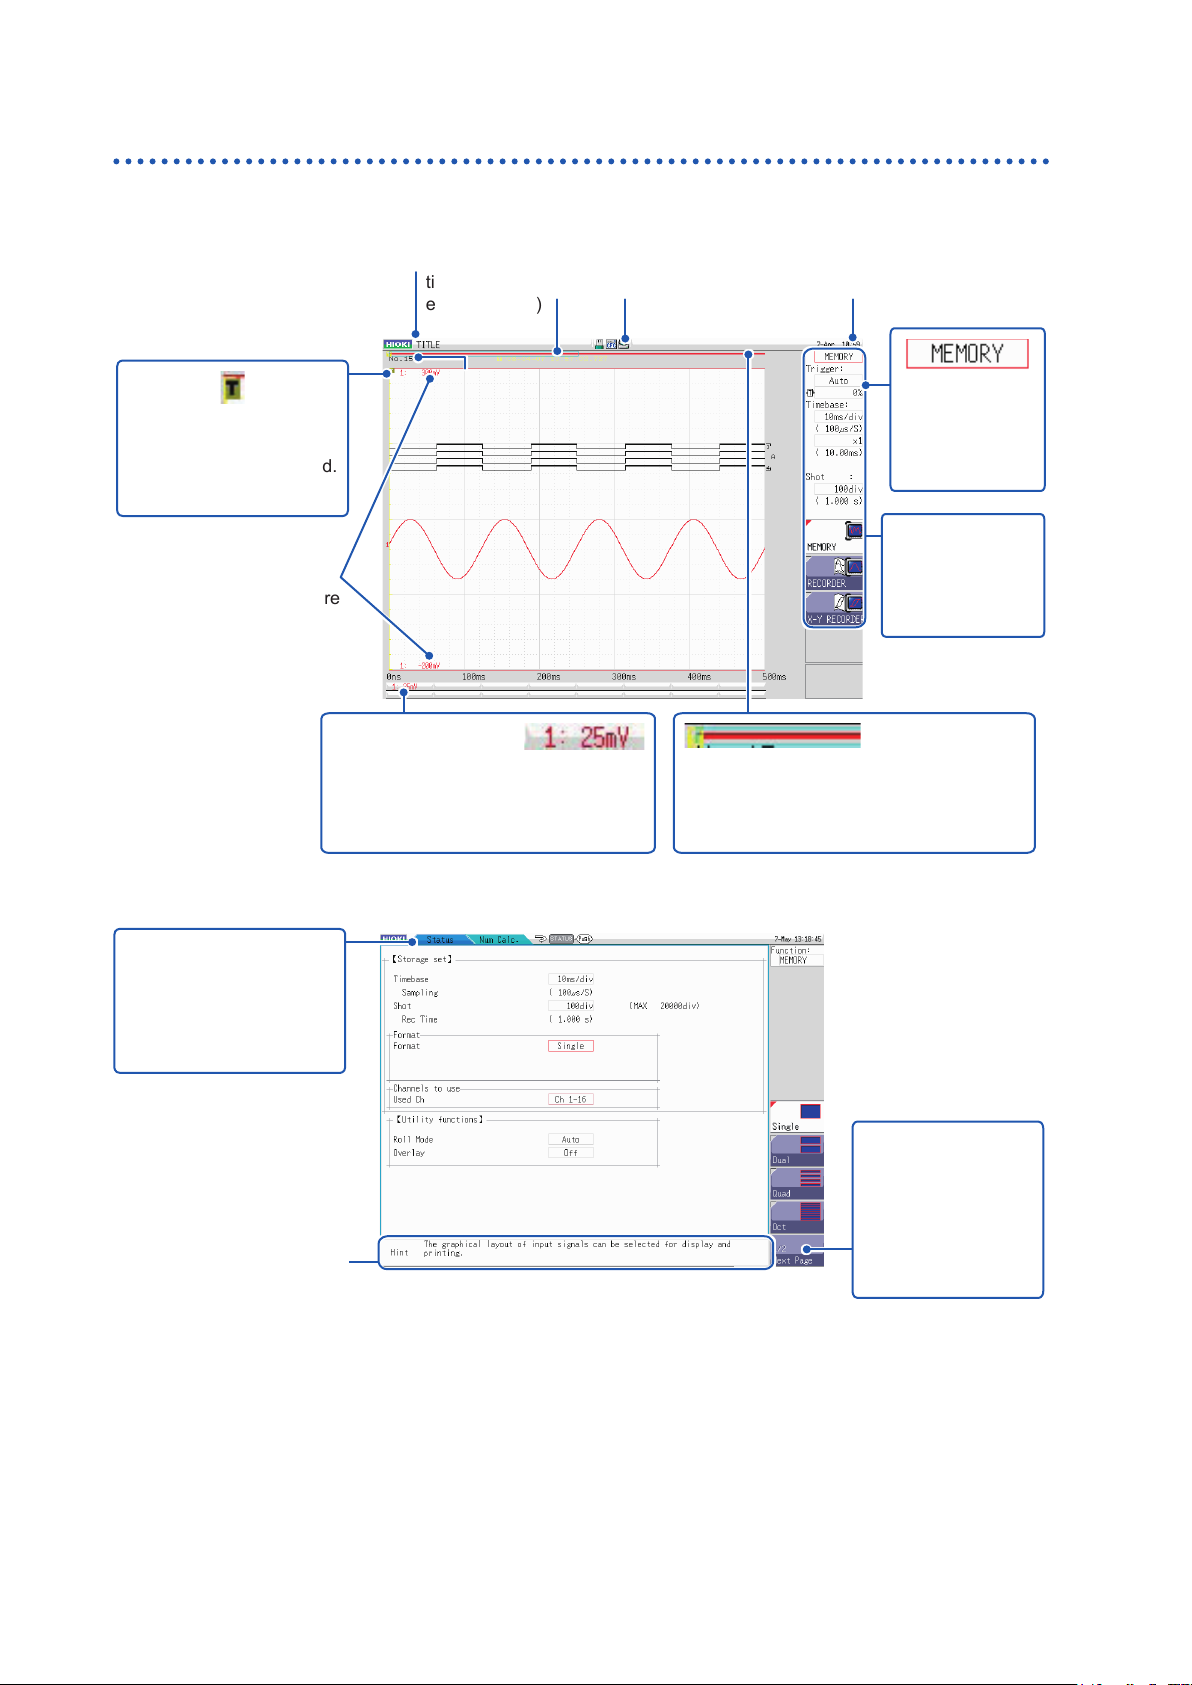
Explanation of Screen Contents
Waveform Screen
Title comment
Shows the specied
title comment.
(p. 140)
Trigger marker
Shows the point where
the trigger event occurred.
(p. 187)
Upper and lower limits
The upper and lower limit
values for each channel are
shown here. (p. 136)
Trigger time
Shows the date and
time of the last trigger
event. (p. 187)
Storage counter
Shows how many trigger
events occurred. (p. 69)
Logic waveform (p. 66)
Analog waveform (p. 63)
Media icon
Shows the media
status. (p. 40)
Vertical axis display
Shows the value per increment for each
channel. This is linked to the range
setting. (p. 63)
Current date and time
Shows the internal clock
date and time. (p. 46)
Settings cursor
The current
cursor location
ashes.
Settings window
Set measurement
conditions as
follows. (p. 52)
Scroll bar
Stored waveforms are indicated by red
bars. The displayed waveform is indicated
by a blue frame. (p. 126)
Elements Common to the Status, Channel, System, and File Screens
Sheet tab
Shows names of sheets
that can be selected.
Use the
switch between sheets.
MENU
keys to
Hint
Shows details about the item at the current settings cursor position.
Messages such as “Online,” “Key Lock active.” and error messages
are also shown here.
Next page
This is displayed if
there are more than
ve setting items.
This button brings
up the next group of
items.
20
Page 26
1.4 Basic Key Operations
Basic Key Operations
1
2
Press the
Check the interface and press the function key (F key) for the setting you want to
change.
The assignment of the F keys is different for each item.
Selecting a Setting Item
CURSOR
key and move the cursor to the item you want to change.
Cursor
GUI
Press the
key to change the setting item.
F
1
Overview
3
Increasing or Decreasing a Setting Value
Increase value quickly
Decrease value quickly
For some setting items, the
selects
To enter text or numbers
[Cancel]
Refer to “8.1.3 Alphanumeric Input” (p. 143).
.
CH.SET
When there are more than ve setting items,
press
F5 [Next Page]
next page.
Press the F keys to change the setting value.
key selects
[Exec]
and the
key to switch to the
TRIG.SET
key
21
Page 27
Basic Key Operations
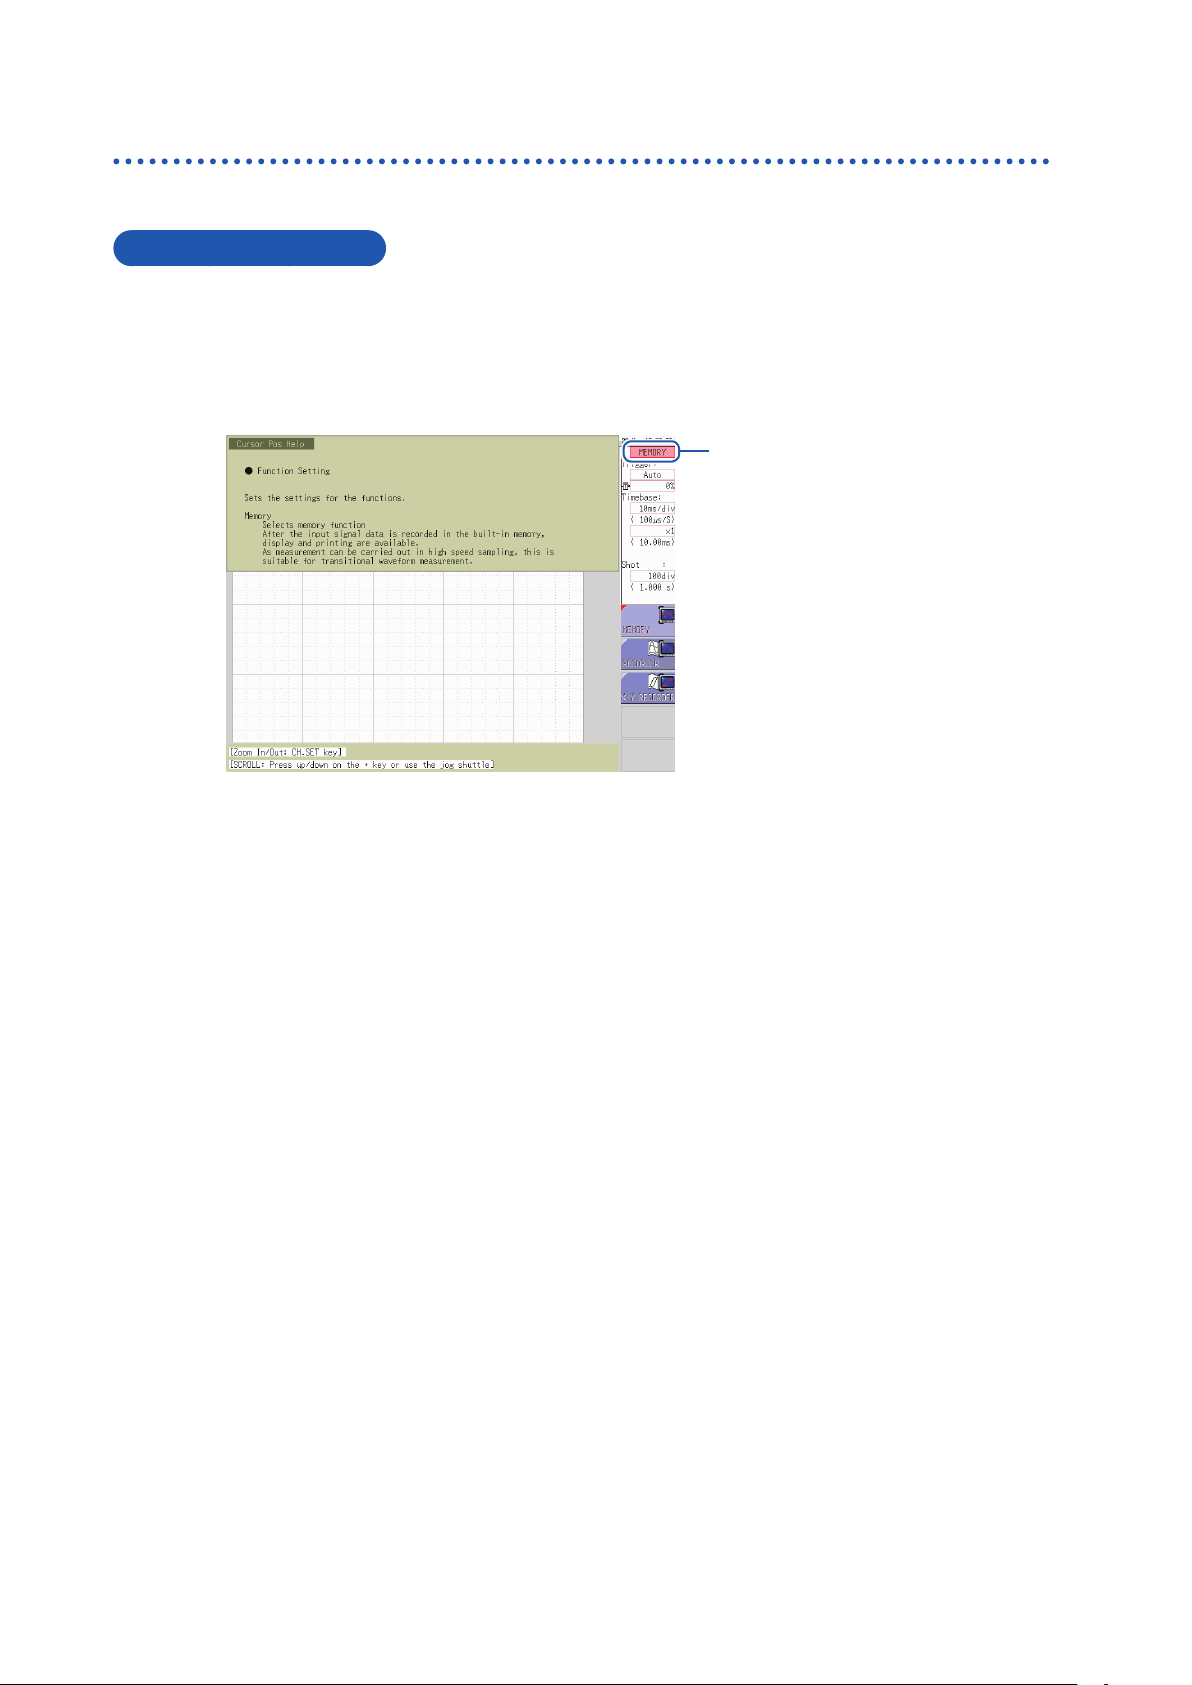
1.4.1 Using the HELP Key
When you press the Help key a simple explanation will appear at the cursor position.
Cursor Position Help
Move the cursor to the item for which you want to display help.
1
2
Press the
You can scroll the information using the
• You can change the size of the Help sheet with the
and bottom half. The example above is for top half.
• Pressing the
HELP
key. A
HELP
[Cursor Pos Help]
key toggles Cursor Position Help, on and off.
CURSOR
sheet is displayed at the cursor position.
up/down keys or the jog knob.
Cursor
CH.SET
key. Available settings are full, top half,
22
Page 28
Basic Key Operations
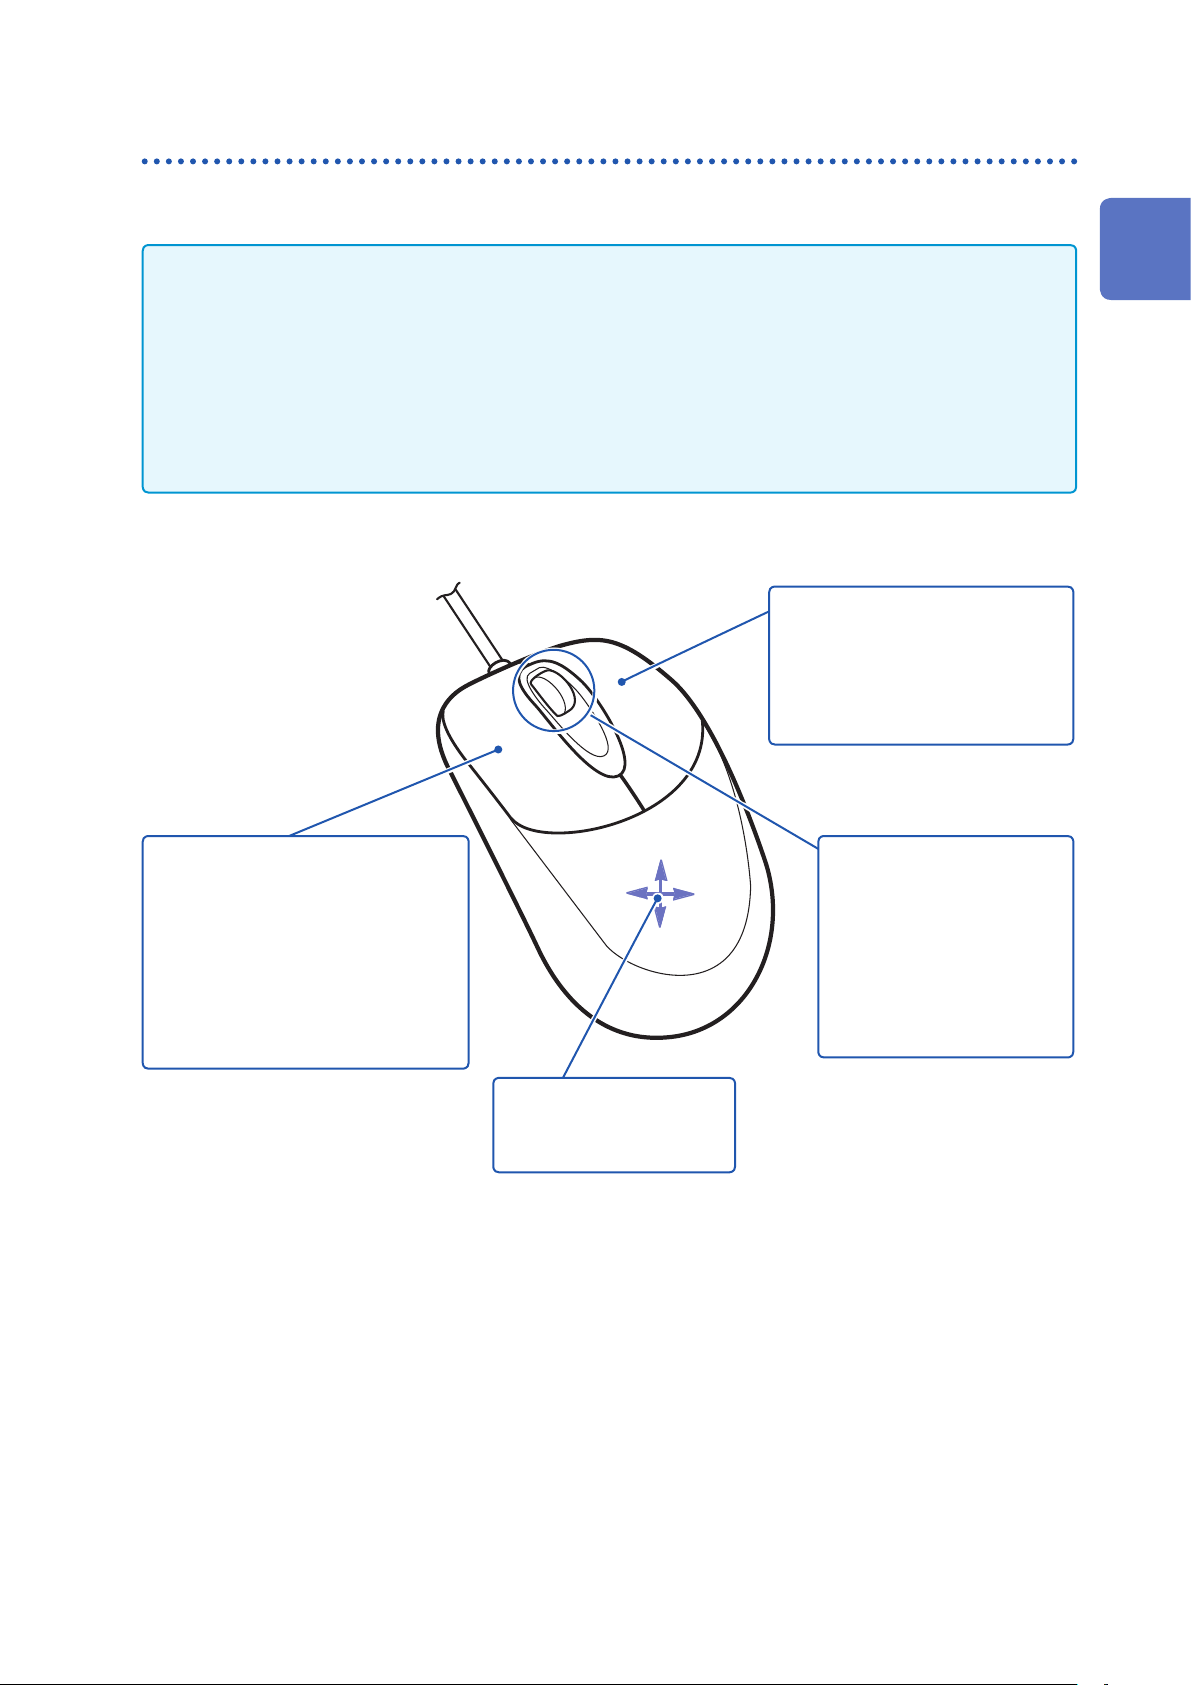
1.4.2 Use a Mouse to Perform Key Operations
You can use a commercially available USB mouse to perform the same operations as the keys on the
instrument.
• There are a variety of mice available, and not all devices will work with the instrument.
• The instrument's USB ports are designed exclusively for use with mice and USB memory sticks. Do
not connect any other type of device.
• When operating the instrument with the mouse, you may experience temporary delayed operation or
corrupted screen display.
• When using a mouse, do not change the interface on the System screen to anything other than “LAN.”
You may not be able to use the mouse while USB communications are in progress.
• External interference may cause the mouse to malfunction. Keep the mouse and mouse cable as far
away as possible from sources of interference.
To perform operations with a mouse:
Right click
Displays a menu with a list of
screens.
Screens displayed in gray cannot
be selected.
1
Overview
Left-click
Left-click to select menus and menu
items. When measuring with memory
segmentation, you can change the
displayed block by double-clicking the
left button.
Click the current path shown on the
File screen to move to one level up in
the folder hierarchy.
Center wheel
Changes the selected item.
On the File screen, you
can use the center wheel
to change the selected
le. While measuring with
memory segmentation, you
can use the center wheel to
change the displayed block.
Up/Down/Left/Right
Moves the mouse cursor
on the screen
23
Page 29
Basic Key Operations
The operation keys of the instrument and the menu displayed when you right-click the mouse are related
as follows:
To operate and carry out settings for CH.SET, WAVE, and AB CSR click the icons displayed when a
mouse is connected. The operation keys and icons are related as follows.
Icon Operation key
CH.SET
WAVE
AB CSR
Useful function
Dragging the right button of the mouse (Holding down the button, moving the mouse rightward,
leftward, or upward, and then releasing the button) works the same as the following keys:
Rightward: START
Leftward: STOP
Upward: ESC
key
key
key
24
Page 30
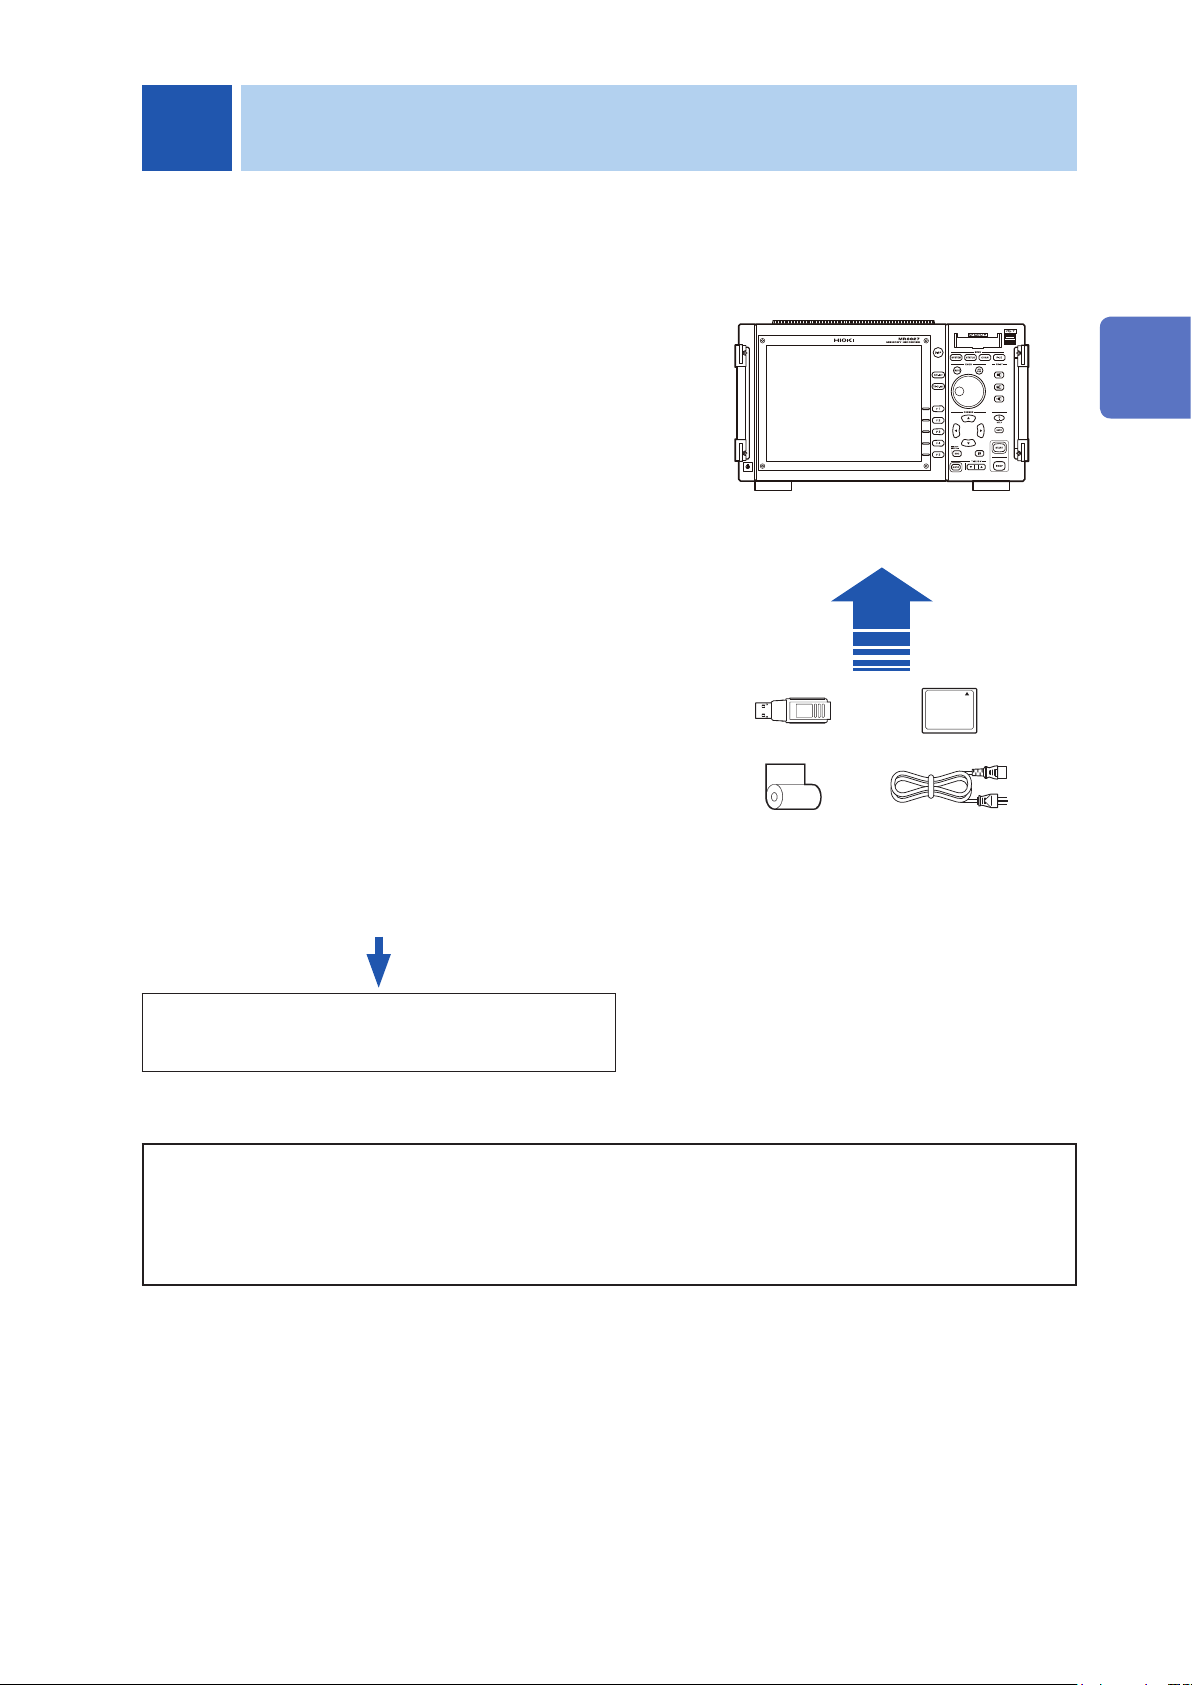
2
Procedure
Measurement Preparation
Install this instrument
1
Install or remove modules
2
(When adding or replacing modules)
Connect logic probes to the Standard
3
LOGIC terminals
(When measuring logic signals)
Connect connection cables to the module
4
(When measuring analog signals)
Probes and cables will differ depending on the type of
measurement being performed.
Insert media (CF card, USB memory stick)
5
Load recording paper
6
Connect the power cord
7
Connect the GND terminal (functional
8
earth terminal).
(When measuring in noise-prone environments)
Turn Power On
9
Set the clock
10
Perform zero-adjust
11
Perform calibration
(When using Model MR8990)
(p. 6)
(p. 26)
2
(p. 28)
Measurement Preparation
(p. 28)
(p. 40)
(p. 43)
(p. 44)
(p. 44)
(p. 45)
(p. 46)
(p. 47)
(p. 48)
When preparation is complete, start
measurement. (p. 49)
To use communication functions
Refer to “16 Connect to a PC” (p. 309).
To use external control functions
Refer to “17 External Control” (p. 335).
25
Page 31

Install or Remove Modules
2.1 Install or Remove Modules
Read “Handling the Instrument and Modules” (p. 7) carefully.
Modules specied when the instrument is ordered are supplied preinstalled. Use the following procedures
to add, replace, or remove modules from the instrument.
• Up to two logic units can be installed as units 1 to 8. Logic units installed as the other units
cannot be used. Other logic units being installed will be disabled.
• For information on the analog channel resolution when logic channels are used, refer to “8.10
Detailed Settings for Modules” (p. 164).
To Install a Module
Back side
Required items: One Phillips-head screwdriver (No. 2)
Turn off the power to the instrument.
1
Correctly orient the module and insert it rmly all the way in.
2
Make certain that the labels on the module's panel face the same
direction as the labels on the back side of the instrument.
Using a Phillips screwdriver, tighten the two module mounting
3
screws (M3 × 7.5 mm).
To Remove a Module
Back side
Handle
(Example: 8966)
Handle
Required items: One Phillips-head screwdriver (No. 2)
Turn off the power to the instrument.
1
Remove any connection cables or thermocouples connected to
2
the module.
Remove the power cord.
3
Using a Phillips screwdriver, loosen the two module mounting
4
screws (M3 × 7.5 mm).
Grasp the handles and pull the module out.
5
If not Installing Another Module After Removal
Back side
26
Blank
panel
Install a blank panel.
1
Using a Phillips screwdriver, tighten the two mounting screws
2
(M3 × 7.5 mm).
Measurements made without a blank panel installed may fail to meet
specications because of temperature instability within the module.
Page 32

Install or Remove Modules
Channel Allocation
Module number one is at the top, and channel number one is at the top left.
Information about the modules installed in the instrument can be veried in the System Conguration list.
(p. 395)
Module 1
Module 2
Module 3
Module 4
Module 5
Module 6
Module 7
Module 8
CH1
CH3
CH15 CH31
L7A
[1:4]
L7B
[1:4]
L7C
[1:4]
CH2
CH4
CH16 CH32
L7D
[1:4]
CH17
CH19
Module 9
Module 10
Module 11
Module 12
Module 13
Module 14
Module 15
Module 16
Analog channels only
Mixed analog and logic units
CH18
CH20
LA
[1:4]
LB
[1:4]
LC
[1:4]
LD
[1:4]
LE
[1:4]
LF
[1:4]
LG
[1:4]
LH
[1:4]
2
Measurement Preparation
27
Page 33

Connection Cables
2.2 Connection Cables
Measuring voltage
Read Refer to “Before Connecting Cables” (p. 10). carefully.
For detailed precautions and instructions regarding connections, refer to the instruction manuals for your
modules, connection cables, etc.
Applicable Modules
• Model 8966 Analog Unit
• Model 8968 High Resolution Unit
• Model 8972 DC/RMS Unit
Connect to the BNC jack on a module.
*1 An optional power cord or AC
adapter may be required.
*2 An optional AC adapter or a
commercially available USB cable
is required.
Connect with: connection cables
• Model L9197 Connection Cord
(Maximum input voltage: 600 V)
Large alligator clip type
• Model L9198 Connection Cord
(Maximum input voltage: 300 V)
Small alligator clip type
• Model L9217 Connection Cord
(Maximum input voltage: 300 V)
For measuring BNC output
• Model L9790 Connection Cord
(Maximum input voltage: 600 V)
Terminal type: Alligator, contact, grabber
Example: Terminal type: Alligator
To Connect to a BNC Terminal
Example: Model 8966 Analog Unit
BNC jack
Connecting the cable
BNC plug slots
Module connector
guide pins
Connect to the measurement object
28
If the voltage to be measured exceeds the maximum input rating of
the module being used
• Model 9322 Differential Probe*
• Model 9665 10:1 Probe
• Model 9666 100:1 Probe
• Model P9000-01/-02 Differential Probe*
Example: Model P9000-02 Differential Probe
1
2
Required tools: One of the above cables
Connect the BNC plug on the cable
1
to a BNC jack on the module.
Align the slots in the BNC plug with
2
the guide pins on the jack on the
module, then push in and twist the
plug clockwise until it locks.
Lock
Connect the cable clips to the
3
measurement object.
To disconnect BNC connectors
Push the BNC plug, twist it counterclockwise,
then pull it out.
Page 34

Measuring Frequency, Number of Rotations and Count
Refer to p. 28 for details about connecting to BNC terminals.
Connection Cables
Applicable Modules
• Model 8970 Freq Unit
Connect to the BNC jack on a module.
*1 An optional power cord or AC
adapter may be required.
*2 An optional AC adapter or a
commercially available USB cable
is required.
Connect with: connection cables
• Model L9197 Connection Cord
(Maximum input voltage: 600 V)
Large alligator clip type
• Model L9198 Connection Cord
(Maximum input voltage: 300 V)
Small alligator clip type
• Model L9217 Connection Cord
(Maximum input voltage: 300 V)
For measuring BNC output
• Model L9790 Connection Cable
(Maximum input voltage: 600 V)
Terminal type: Alligator, contact, grabber
Example: Terminal type: Alligator
2
Measurement Preparation
If the voltage to be measured exceeds the maximum input rating of
the module being used
• Model 9322 Differential Probe*
• Model P9000-01/-02 Differential Probe*
Example: Model P9000-02 Differential Probe
1
2
29
Page 35

Connection Cables
Measuring temperature
Applicable Modules
• Model 8967 Temp Unit
Connect to the terminal block on the
module.
To Connect to the Terminal Block
25 mm
10 mm
Outer Insulation
Inner insulation
Thermocouple
element wires
Terminal Block
Connect with: thermocouples
Thermocouple
(Compatible wire: 0.4 mm to
1.2 mm diameter)
Required device and tool:
Thermocouple, at-blade screwdriver (2.6-mm
blade)
1
Recommended wire:
Compatible wire: Thermocouple element
wires of from 0.4 mm to 1.2 mm in diameter
Stripped length: 10 mm
Strip insulation from the
1
thermocouple wires as shown at the
left.
Stripped length: approx. 10 mm
Connect to terminal block
Push the blade of a at screwdriver
Connecting a Thermocouple
Connection
Holes
3
2
4
Connect to the measurement object
5
• If surrounding equipment is affected by noise, coil the thermocouple several
times and then attach the included ferrite clamp-on choke (as seen in the
diagram to the right).
• When connecting a thermocouple using a wire run of more than 3 meters,
take into consideration the EMC environment including possible inuence of
external noise.
2
into the button on the terminal block
of the module.
Insert each thermocouple wire into
3
the appropriate terminal hole while
pressing the button. Conrm proper
polarity.
Release the button.
4
The thermocouple is connected.
Connect to the measurement object.
5
To remove a thermocouple
Hold the button while pulling the thermocouple
wire out.
30
Page 36

Connection Cables
Measuring vibration or displacement with a strain gauge transducer
Applicable Module
• Model U8969 Strain Unit
• Model 8969 Strain Unit
Connect a strain gauge transducer to a connector on Model U8969 Strain Unit via Model L9769
Conversion Cable; Model 8969 Strain Unit via Model 9769 Conversion Cable.
The following device can be connected to the module.
• Strain gauge transducer (Not available from Hioki)
Connect L9769 or 9769 Conversion Cable to the strain gauge
transducer.
Connecting the strain gauge transducer to a module’s connector
Example: Connecting the strain gauge transducer to Model U8969 Strain Unit via Model L9769
Conversion Cable
Required items:
Model L9769 Conversion Cable, strain gauge
transducer
Insert Model L9769 into a connector
1
of Model U8969 with the slot of
the plug aligned with the outward
indentation of the connector.
Insert the plug into the connector
2
until they are locked together.
Connect Model L9769 to the strain
3
gauge transducer.
Connector’s
indentation
U8969 Strain Unit
1
Connect the L9769.
Plug’s slot
2
2
Measurement Preparation
Connect Model L9769 to the strain
3
gauge transducer.
Connect the strain gauge transducer to
4
a measurement object.
Connect the strain gauge transducer
4
to a measurement object.
How to disconnect Model L9769
Pull the sleeve of the plug gently,
releasing the plug, and disconnect the
cable.
The instrument describes Model U8969 as “8969.”
31
Page 37

Connection Cables
Connector pin-out
Model U8969 Strain Unit
The metal shell is connected to
the GND of the instrument.
Pin mark Description
A BRIDGE+
B INPUT−
C BRIDGE−
D INPUT+
E
F SENSE+
G SENSE−
H, J N.C.
FLOATING COMMON
Model L9769 Conversion Cable
(Strain gauge transducer end)
A F
G
B
C D
The metal shell is connected to
the GND of the instrument.
Pin mark Description
A BRIDGE+, SENSE+
B INPUT−
C BRIDGE−, SENSE−
D INPUT+
E
F, G N.C.
Applied voltage:
E
bridge voltage of
FLOATING COMMON
2 V
Connection of Model L9769
• Pin F of the module end is connected with Pin A of the strain gauge transducer end.
• Pin G of the module end is connected with Pin C of the strain gauge transducer end.
32
Page 38

Connection Cables
Example: Connecting the strain gauge transducer to Model 8969 Strain Unit via Model 9769
Conversion Cable
1
Connect a strain gauge transducer to
2
Connect the strain gauge transducer to
3
a measurement object.
Connector pin-out
Model 8969 Strain Unit
8969 Strain Unit
Connect the 9769.
Model 9769.
Required items:
Model 9769 Conversion Cable, strain gauge
transducer
Connect Model 9769 to a connector
1
on the module.
Insert the connector of Model 9769 with
the orange part facing upward.
Connect the Model 9769 to the strain
2
gauge transducer.
Connect the strain gauge transducer
3
to a measurement object.
Model 9769 Conversion Cable
(Strain gauge transducer end)
2
Measurement Preparation
(Pin 1 is on the left when the module’s
top side is on the up)
1 2 3 4 5 6 7
Pin No. Description
1 BRIDGE+
2 SENSE+
3 INPUT+
4 INPUT−
5 BRIDGE−
6 SENSE−
7 FLOATING COMMON
IMPORTANT
• Preforming measurement with a strain gauge requires a bridge box. Use a strain gauge and bridge
box both of which are commercially available.
• The bridge box may be susceptible to the effect of noise. For more information about how to ground
the bridge box, refer to its instruction manual or contact the manufacturer of the bridge box.
A F
G
B
C D
The metal shell is connected to
the GND of Model 8969.
Pin mark Description
A BRIDGE+
B INPUT−
C BRIDGE−
D INPUT+
E FLOATING COMMON
F, G N.C.
Applied voltage:
E
bridge voltage of 2V
IMPORTANT
Do not excessively bend the cable and the base between cable and connector, pull on them, nor twist
them. Doing so may cause the conversion cable to break.
33
Page 39

Connection Cables
Measuring current
Applicable Modules
• Model 8971 Current Unit
Connect Model 9318 Conversion Cable to
the module jack.
• Model 9272-10
Clamp on Sensor
• Models 9709, CT6862,
CT6863, CT6865
AC/DC Current Sensor
• Models CT6841, CT6843,
CT6844, CT6845
AC/DC Current Probe
Connect with: Clamp sensors
To Connect to the Module's Terminals
Example: When connecting Model 9272-10 Clamp on Sensor
Sensor connector
Connect the 9318 Conversion Cable
and clamp sensor
Conversion cable plug
1
Conversion Cable
Connector
Required tools:
Model 9318 Conversion Cable, Model 9272-10
Clamp on Sensor
Align the grooves of the module’s sensor
1
connector and the conversion cable plug.
Insert the plug until it locks.
Align the grooves of the conversion cable
2
connector and the plug of the clamp
sensor to be used. Insert the plug until it
locks.
Example:
Model 9272-10 + Model 9318
Connect the clamp sensor to the item to
3
be measured.
To disconnect the conversion cable
Slide the plug to release the lock and then unplug
the cable.
Clamp sensor
plug
Model 9272-10
Connect to the measurement
3
object
2
When Measuring Current With Model 9018-50 Clamp on Probe
When using Model 9018-50 you can use a voltage measurement unit such as Model 8966 Analog Unit to
make current measurements.
For more information about how to congure the instrument for use in this type of application, refer to the
example settings in “8.5.1 Scaling Examples” (p. 153).
34
Page 40

Connection Cables
Measuring logic signals
Read “Before Connecting a Logic Probe to the Measurement Object” (p. 11) carefully.
For more information about logic probe specications, see the instruction manual that came with the logic
probe you plan to use.
Applicable Modules
• Model 8973 Logic Unit
LA to LH are supplied as standard
equipment with the unit.
To Connect to Logic Terminals
Example: Connecting the 9327 Logic Probe
Back Side
Logic terminals
Connect with: Logic Probes
• Model 9320-01 Logic Probe
• Model MR9321-01 Logic Probe
• Model 9327 Logic Probe
Required tools:
Model 9327 Logic Probe
Connect the logic probe by aligning
1
the grooves on the plug and Logic
terminal.
Connect to the measurement object.
2
1
LOGIC terminals
2
Measurement Preparation
Connect to the
2
measurement object
35
Page 41

Connection Cables
Measuring voltage with a high degree of accuracy (Digital Voltmeter)
Applicable Modules
• Model MR8990 Digital
Voltmeter Unit
Connect to the banana jacks on a module.
To Connect to Banana Jacks
Connect the test leads
Banana
jacks
1
BlackRed
Connect with: Model L2200 Test Leads
• Model L2200 Test Lead
(Maximum input voltage:
1000 V)
Required tools: Test leads above
Connect the test leads to the banana
1
jacks on the module.
Connect the black lead to the L jack,
and the red lead to the H jack. Make
sure the test lead plugs are fully
inserted into the jacks.
Connect the test leads to the object
to be measured.
Connect to the measurement object
2
36
Page 42

Measuring high voltage
Applicable Module
• Model U8974 High Voltage
Unit
Connect to the banana jacks on a module.
Connection Cables
Required item: Model L4940 Connection Cable Set
• Model L4940 Connection Cable Set:
(Maximum input voltage: 1000 V)
2
To Connect to Banana Jacks
Connect the Connection cable
Banana jacks
1
BlackRed
2
Accessory clips
+
Model L4934
Required items:
Model L4940 Connection Cable Set
Connect the plug of the connection
1
cable to the banana jacks on the
module.
Connect the terminal and the plug of the
same color.
Insert the accessory clip into cable
2
clips.
Connect the cable clips to the
3
measurement object.
Connect the clip.
Model L4934 Small Alligator Clip Set
* Model L4932 is required when using
Model L4934.
Measurement Preparation
Model L4935 Alligator Clip Set
Model 9243 Grabber Clip
Model L4936 Bus Bar Clip Set
Model L4937 Magnetic Adapter Set
Model L4932 Test Pin Set
Connect to the
3
measurement
object.
37
Page 43

Connection Cables
Output Waveform
Applicable Modules
• Model U8793 Arbitrary
Waveform Generator Unit
• Model MR8790 Waveform
Generator Unit
Connect to the SMB jack on a module.
To Connect to Output Terminals
Example: Model U8793
Output terminal
Connect the Connection cable
Output terminal
1
Required item: Model L9795-01 /
L9795-02 Connection Cable
• Model L9795-01 Connection Cable (Electrical clips)
• Model L9795-02 Connection Cable (BNC output)
Required items: Connection cable mentioned
above
Insert the SMB connector of connection cable
1
in the output terminal of the module until you
hear a click.
Connect the cable clips to the object to which
2
the waveform is being applied.
SMB connector
Connect to the object to which
2
the waveform is being applied.
To disconnect output connectors
Grip the head of the SMB connector (not the cable),
and pull it out.
38
Page 44

Output Pulse Waveform
Connection Cables
Applicable Module
• Model MR8791 Pulse Generator
Unit
To Connect to Output Connector
Output connector
Connect the Connection cable
Output connector
1
Button
Required items: Commercially available cable
(Half-pitch 50 pins)
Required items: Commercially available cable
Connect the connection cable to Output
1
Connector of module.
Connect the connection cable to the object to
2
which the waveform is being applied.
To disconnect output connectors
Hold the button of connection cable while pulling the
connector.
2
Measurement Preparation
Connection cable connector
Connect to the object to which
2
the waveform is being applied.
Output connector
10250-52A2PL: 3M products (SCSI-2 connector), (Centronics half-pitch 50 pin socket-contact)
Refer to: “Output Connector Specications” (p. 33)
• Metal shell of the connector 10250-52A2PL is the same as GND of the instrument (frame GND).
• Use lock type connectors for connecting the harness and the connector.
39
Page 45

Prepare Storage Media
2.3 Prepare Storage Media
Read “Handling Media” (p. 9) carefully.
2.3.1 Storage Media (Inserting a CF Card and USB Memory Stick)
Media icons
Icons indicating the status of storage media are always shown at the top
of the screen.
USB
Memory
CF card Built-in
drive
: Media is inserted
: Media is inserted and selected as save target
(Icon is red)
: Media is not inserted but is selected as save target
(Icon is black)
Storage media Insertion procedure and notes
To insert a CF card
With the Front mark (p) pointing toward the slot, fully
insert the card in the direction of the arrow.
When the Eject button has popped out, press it
down rst before inserting the CF card all the way
in. Inserting the CF card when the Eject button is not
pressed down may cause damage to the instrument.
If the CF card cannot go all the way in, do not force it
in. Press the Eject button so it pops out, then press it
down again before fully inserting in the CF card.
CF Card
Front side
Insert
CF card slot
Built-in drive
RAM (Internal
memory)
To remove a CF card
Press the Eject button. Press the Eject button. When
the button pops out, press it again to eject the CF
card.
Model U8330 SSD Unit (capacity: 128 GB, 1 GB=1,000,000,000 bytes)
The optional Model U8330 SSD Unit (factory option) is required.
The hard disk is formatted at the factory.
• Memory integrated in the unit is used. Only settings les can be saved.
• Automatic saving of data is not possible.
Remove
Eject button
40
Page 46

Storage media Insertion procedure and notes
• Do not connect any devices other than USB memory sticks.
• Not all commonly available USB memory sticks are supported.
• To use a USB memory stick, suitable unit settings must be made, as described next page.
Prepare Storage Media
USB Memory
Depending on the intended use of the USB memory stick, connector types and settings on the instrument
will differ.
USB memory stick Type A LAN USB Memory See procedure
To retrieve CF card or built-in drive les
from a computer (PC) (using a USB cable)
For communication with a PC (using a USB
cable)
To insert a USB memory stick
Ensure correct orientation of the USB memory stick
and push it all the way into the connector.
To remove a USB memory stick
Verify that the instrument is not accessing the USB
memory stick (for saving or loading data, etc.). Then
pull the USB memory stick out.
(No special steps are required on the instrument.)
USB use
Connector
Type B LAN Mass storage HDD,
Type B USB Interface “16.6.1” (p. 328)
Instrument settings
Interface USB setting
Front side
USB Connector
(Type A)
Reference
information
below
“16.4” (p. 326)
mass storage CF
2
Measurement Preparation
Even when the built-in drive is SSD, it is recognized as HDD.
Procedure
Press the SYSTEM key to open the System screen, and then select the [Interface] sheet.
Move the cursor to [Interface], and select [LAN].
1
Move the cursor to [USB Set], and select [USB Stick].
2
41
Page 47

Prepare Storage Media
2.3.2 To Format Storage Media
Possible targets for formatting are CF card, USB memory stick, built-in drive, and internal memory. During
the formatting process, a folder named “HIOKI_MR8827” will be created.
Note that formatting storage media deletes all the information on the storage media and deleted
information is unrecoverable.
Procedure
Press the FILE key to open the File screen.
Insert the storage media.
1
Select [Next Page].
2
Select [Format].
The cursor moves to the [Format Target] item.
Select the storage media to format, and select [Exec].
3
The specied storage media will be formatted.
A conrmation window will be displayed. Select [Yes] to
proceed, or [No] to cancel.
42
Page 48

Load Instrument With Recording Paper (When Model U8350 Printer Unit is installed)
2.4 Load Instrument With Recording Paper (When Model U8350 Printer Unit is installed)
Read “Handling the Printer and Recording Paper” (p. 8) carefully.
Procedure
Paper roll axle
Required items: Model MR9231 Recording Paper, Paper
roll axle (Supplied with the instrument)
Press the button to open the printer cover.
1
Insert the paper roll axles into the core of Model 9321
2
Recording Paper.
Load the instrument with the paper, putting it into the
3
holder.
Put the right side of the paper rst into the holder, and then
press its left side until it clicks, pressing it rightward.
Face the print side of the paper frontward. Putting the
paper in the holder without the paper roll axle installed
will make the printer cover impossible to be opened,
resulting in damage to the printer.
2
Measurement Preparation
Pull out the edge of the paper toward the other side,
4
and close the printer cover, pressing the edge face of
the paper against the cover’s side surface.
The surface of the paper may become sticky from the
residue left behind by the adhesive tape and cause
the printing on that area to become unreadable. Unroll
approximately the rst 200 mm of paper before inserting
it into the printer.
How to withdraw the recording paper
As shown in the left gure, withdraw the paper, pressing the
paper roll axle rightward.
43
Page 49

Power Supply
2.5 Power Supply
Read “Before Turning the Power Supply On” (p. 11) carefully.
2.5.1 Connect the Power Cord
Procedure
Connect the power cord to the power inlet on the instrument.
1
Plug the power cord into the mains outlet.
2
Back side
1
2.5.2 Ground the Functional Earth of This Instrument
When measuring in a noisy environment, you can improve the noise immunity
by connecting the GND terminal (functional earth terminal).
When using a potential transformer (PT) for AC power line measurements or
similar, the GND terminal of the PT must also be grounded.
Back side
2
44
Page 50

2.5.3 Turn the Power On and Off
Turn Power On
Power Supply
Front side
Power switch
ON
Before Starting Measurement
To obtain precise measurements, allow about 30 minutes for warm-up after turning power
on to allow the internal temperature of the modules to stabilize. After warm-up, perform zero
adjustment before taking measurements.
Turn Power Off
Press the power switch.
The startup screen appears rst, then the Waveform screen is
displayed.
2
Measurement Preparation
Before Turning Power Off
When the power switch is turned off, data recorded in the internal memory is erased. If you do
not want to lose recorded data, save it rst to a CF card or external storage media.
Refer to “5 Save/Load Data and Manage Files” (p. 77).
Front side
Power switch
OFF
Press the power switch.
The instrument is turned off.
When power is turned on again, the display appears with the
same settings as when power was last turned off.
When the auto-setup function is enabled, settings will be loaded
and established automatically. (p. 96)
45
Page 51

Set the Clock
2.6 Set the Clock
Set date and time for the built-in clock as follows.
The clock has an automatic calendar with leap year correction and 24-hour format.
The functions listed below make use of the clock. Ensure that the clock is set correctly before using these
functions.
• Measurement with timer-based trigger
• Printout of data including count of trigger events
• Saving measurement data
Procedure
Press the SYSTEM key to open the System screen, and then select the [init] sheet.
Move the cursor to the [Clock] item.
1
Select the digit to change and set the numeric
2
value.
Select [Apply] while the cursor is on one of
3
the [Clock] items
The clock is set to the current date and time
values.
The date and time indication is shown at the top
right of the screen.
Date setting
(Year, Month, Day)
Time setting
(Hour, Minutes, Seconds)
46
Page 52

Adjust the Zero Position (Zero-Adjust)
2.7 Adjust the Zero Position (Zero-Adjust)
This procedure compensates for module differences and sets the reference potential of the instrument to
0 V.
The compensation procedure is performed for all channels and ranges.
Before Performing Zero-Adjust
• Before performing this procedure, allow the equipment to warm up for about 30 minutes after the power
is turned on so the internal temperature of the modules can stabilize.
• Note that zero-adjust cannot be performed during measurement.
• Key operations are not accepted during zero-adjust.
• The time required for zero-adjust varies depending on the type and number of modules installed in the
instrument. (The procedure may take several seconds.)
Procedure
Press the CHAN key to open the Channel screen, and then select the [Unit List] sheet.
Move the cursor to [Zero-Adjust].
1
2
Measurement Preparation
Select [Exec Zero-Adjust].
2
The zero-adjust procedure is carried out.
Zero-adjustment has no effect on the 8969 and U8969 Strain Unit.
(Perform zero-adjust using auto-balance. (p. 168))
Perform zero-adjust in the following cases.
• When a module was changed.
• When power was turned off and on again.
• When settings were initialized (system reset).
• When DC/RMS is switched at the 8971 Current Unit and the 8972 DC/RMS Unit
• When the ambient temperature has changed signicantly.
Zero-position drift* may occur.
* Drift:
This refers to spurious output caused by a shift in the operating point of an operational amplier. Drift can
occur due to changes in temperature and due to component aging over a period of use.
47
Page 53

Perform Calibration (When Model MR8990 is installed)
2.8 Perform Calibration (When Model MR8990 is installed)
This procedure compensates for MR8990 Digital Voltmeter Unit differences.
The compensation procedure is performed for all channels and ranges.
Before Performing Calibration
• Before performing this procedure, allow the equipment to warm up for about 30 minutes after the power
is turned on so the internal temperature of the modules can stabilize.
• Note that calibration cannot be performed during measurement. However, if the calibration setting is set
to ON, calibration is performed at the start of measurement.
• Key operations are not accepted during calibration.
• The time required for calibration varies depending on the type and number of modules installed in the
instrument. (The procedure may take several seconds.)
Procedure
Press the CHAN key to open the Channel screen, and then select the [Unit List] sheet.
Move the cursor to [Zero-Adjust].
1
Select [Exec Zero-Adjust].
2
Calibration will be performed.
In the following cases, calibration should be executed again.
• When a module was changed.
• When power was turned off and on again.
• When settings were initialized (system reset).
• When the ambient temperature has changed signicantly.
48
Page 54

3
Measurement
3.1 Measurement Workow
1 Pre-measurement Inspection
Refer to “3.2 Pre-measurement Inspection” (p. 51).
2 Basic Measurement Settings
Select a suitable recording method for the
measurement target
Set sampling rate
Set recording length
Set waveform display format
and printing format
Application examples
Refer to...
“7.4 Perform Waveform X-Y Synthesis” (p. 128)
“8.2 Display Waveforms During Recording (Roll Mode)” (p. 147)
“8.3 Display New Waveforms Over Past Waveforms (Overlay)” (p. 148)
“10 Numerical Calculation Functions” (p. 209)
3 Input Channel Settings
Choose analog channel settings
Refer to...
“3.3.1 Measurement Function” (p. 52)
“3.3.2 Timebase and Sampling Rate”
(p. 54)
“3.3.3 Recording Length (Number of
Divisions)” (p. 57)
“3.3.4 Screen Layout” (p. 59)
Refer to...
“3.4.2 Choose Analog Channel Settings”
(p. 63)
3
Measurement
Choose logic channel settings
Application examples
Refer to...
“8.1 Add Comments” (p. 140)
“8.5 Convert Input Values (Scaling Function)” (p. 151)
“8.6 Set the Waveform Position (Variable Function)” (p. 158)
“8.7 Fine Adjustment of Input Values (Vernier Function)” (p. 161)
“8.8 Invert the Waveform (Invert Function)” (p. 162)
4 Trigger Settings
Refer to “9 Trigger Settings” (p. 187).
“3.4.3 Logic Channel Settings” (p. 66)
49
Page 55

Measurement Workow
5 Start Measurement
Refer to...
“3.5 Start and Stop Measurement” (p. 68)
“5 Save/Load Data and Manage Files” (p. 77)
“6 Printing (When Model U8350 Printer Unit is installed)” (p. 107)
“7.1 Read Measurement Values (Using the AB Cursors)” (p. 122)
“7.3.2 Scroll With Jog and Shuttle Knobs (Scroll)” (p. 126)
“7.5 Magnify and Compress Waveforms” (p. 130)
6 Stop Measurement
Refer to “3.5 Start and Stop Measurement” (p. 68).
To check the input signal
Press the
zero-adjust performed and measurement started, all automatically.
AUTO
“3.6 Measurement With Automatic Range Setting (Auto-ranging Function)” (p. 70)
key. Input waveform timebase and vertical axis (voltage axis) range will be selected,
To reuse previously stored settings
Load the settings le from the File screen.
Saving the settings for different measurement targets or applications makes operation more convenient.
Refer to “5.3 Load Data” (p. 93).
To automatically restore previous settings at power-up
Stored measurement settings can be automatically loaded from a le when the unit is turned on. Simply
insert a CF card with an auto-settings le before turning the unit on.
Refer to “5.4 Automatically Load Settings (Auto-setup Function)” (p. 96).
Make sure that the le is stored in the “HIOKI_MR8827” folder of the CF card.
To return settings to their original (basic default) state
From the System screen, select the
In this condition, the unit is set up to easily perform simple measurements.
If operation of the instrument seems unusual or overly complex, reinitialize the instrument.
Refer to “19.2 Reset the Instrument” (p. 388).
sheet to return the unit to the factory default settings.
[Init]
50
Page 56

Pre-measurement Inspection
3.2 Pre-measurement Inspection
Verify that the instrument operates normally to ensure that no damage occurred during storage or
shipping. If you nd any damage, contact your authorized Hioki distributor or reseller.
(1) Peripheral Device Inspection
When using probes and connection cables
Is the insulation of the probe or connection
cable to be used damaged, or is bare metal
exposed?
No Metal Exposed
When using a clamp sensor
Is the clamp cracked or damaged?
Metal Exposed
Go to Step (2)
Yes
No
Do not use if damage is present, as
you could receive an electric shock.
Request repairs.
3
Measurement
(2) Instrument and Module Inspection
Is there any visible damage to the instrument
or modules?
No
When turning power on
Do the fans turn and the Hioki logo appear on
the screen?
Yes
Does the Waveform screen appear?
Yes
Inspection complete
Go to Step (2)
Yes
No
Nothing appears,
or the display is
abnormal
If damage is evident, request repairs.
The power cord may be damaged,
or the instrument may be damaged
internally. Request repairs.
The instrument may be damaged
internally. Request repairs.
51
Page 57

Measurement Conguration
3.3 Measurement Conguration
Set measurement conditions as follows.
You can immediately verify the effect of settings on the waveform by calling up the Waveform screen
and using the Settings window to make basic settings. Basic settings can also be made by calling up the
Status screen and selecting the
[Status]
Open the Settings Window
Press this key.
sheet.
“Settings
window”
(p. 52)
“Timebase
setting
(Sampling rate)”
(p. 54)
“Recording
Length (Number
of divisions)”
(p. 57)
3.3.1 Measurement Function
Select the function according to the target and type of measurement.
Procedure
Press the
Move the cursor to the function item (the upper most column of
the Settings window).
key to open the Waveform screen.
DISP
Measure an instantaneous waveform or a transient phenomenon.
Trigger and calculation functions can be used.
Record the variation and monitoring data of a slow phenomenon.
Data can be printed in real time.
An endless X-Y waveform can be displayed.
Pen up/down operation as in an X-Y pen recorder is possible.
Refer to “4 X-Y Recorder Function” (p. 71).
MEMORY (
RECORDER/ X-Y RECORDER/ FFT
Default setting
)/
52
Analyze the frequency.
Perform various types of spectrum and octave analysis.
Refer to “13 FFT Function” (p. 243).
Page 58

Measurement Conguration
Recorder Function Values
With the Recorder function, each data sample consists of the maximum and minimum values acquired in
the specied sampling rate. This means that each data sample has its own amplitude breadth.
1 2 3 4........... ....100
1 div
When input waveform variation is slight, the difference between maximum and minimum values can be
inordinately large if the sampling rate is short and severe uctuations are present due to noise.
This may be prevented by setting a longer sampling rate.
1 2 3 4........... ....100
1 div
One Sample
Maximum value
Minimum value
Data acquired within the specied sampling rate
One Sample
Maximum value
Minimum value
When the sampling rate is short (fast)
3
Measurement
53
Page 59

Measurement Conguration
3.3.2 Timebase and Sampling Rate
The timebase setting establishes the rate of input signal waveform acquisition, specied as time-per-
division on the horizontal axis (time/div).
The sampling setting species the interval from one sample to the next.
(The sampling rate is shown in brackets under the timebase for the Memory function
(see illustration at right). The displayed sampling rate changes as the time axis range
changes.)
Procedure
Press the
With the Memory Function
Move the cursor to the [Timebase] item.
1
key to open the Waveform screen.
DISP
Set the time per division on the horizontal axis
2
(time axis).
To control sampling with an external signal, select
external sampling terminal. To reset the setting to the internal sampling, select
the time.
When external sampling is selected, the number of samples per division can be set in the range
from 10 - 1000 S/div.
“17.2.3 External Sampling (EXT.SMPL)” (p. 342).
With the Recorder Function
Move the cursor to the [Timebase] item.
1
Set the time per division on the horizontal axis
2
(time axis).
Move the cursor to the [Sampling] item.
3
Set the sampling rate.
4
5 (
Default setting
div
1, 2, 5, 10, 20, 50, 100, 200, 500 ms/div
1, 2, 5, 10, 30, 50 s/div, 1 min/div, 100 s/div
2, 5 min/div
[External]
10 (
Default setting
1, 2, 5, 10, 30, 50 s/div, 1 min/div, 100 s/div
2, 5, 10, 30 min/div, 1 h/div
1 (
Default setting
1, 10, 100 ms
(Select a sampling rate less than 1/100 of the time
base)
), 10, 20, 50, 100, 200, 500 μs/
and input the signal from the
[Internal]
), 20, 50, 100, 200, 500 ms/div
), 10, 100 μs
and set
54
The range of choices depends on the selected timebase.
The higher the sampling rate, the more detailed the changes that can be observed.
Page 60

Measurement Conguration
To select the timebase
Refer to the table below when setting the timebase.
For example, to measure a 100 kHz waveform, the maximum display frequency setting range according
to the table is 200 kHz - 800 kHz. If the maximum display frequency is set to 400 kHz, setting the time
axis range to 10 μs/div is recommended.
Timebase Sampling rate (Speed)
5 µs/div
10 µs/div
20 µs/div
50 µs/div
100 µs/div
200 µs/div
500 µs/div
1 ms/div
2 ms/div
5 ms/div
10 ms/div
20 ms/div
50 ms/div
100 ms/div
200 ms/div
500 ms/div
1 s/div
2 s/div
5 s/div
10 s/div
30 s/div
50 s/div
1 min/div
100 s/div
2 min/div
5 min/div
50 ns (20 MS/s)
100 ns (10 MS/s)
200 ns (5 MS/s)
500 ns (2 MS/s)
1 µs (1 MS/s)
2 µs (500 kS/s)
5 µs (200 kS/s)
10 µs (100 kS/s)
20 µs (50 kS/s)
50 µs (20 kS/s)
100 µs (10 kS/s)
200 µs (5 kS/s)
500 µs (2 kS/s)
1 ms (1 kS/s)
2 ms (500 S/s)
5 ms (200 S/s)
10 ms (100 S/s)
20 ms (50 S/s)
50 ms (20 S/s)
100 ms (10 S/s)
300 ms (3.33 S/s)
500 ms (2 S/s)
600 ms (1.67 S/s)
1 s (1 S/s)
1.2 s (0.83 S/s)
3 s (0.33 S/s)
Maximum display
frequency
800 kHz
400 kHz
200 kHz
80 kHz
40 kHz
20 kHz
8 kHz
4 kHz
2 kHz
800 Hz
400 Hz
200 Hz
80 Hz
40 Hz
20 Hz
8 Hz
4 Hz
2 Hz
0.8 Hz
0.4 Hz
0.13 Hz
0.08 Hz
0.04 Hz
0.067 Hz
0.033 Hz
0.013 Hz
S/s = Number of samplings / second
3
Measurement
What is the maximum display frequency?
Displaying waveforms by their sampled values with adequate resolution of
characteristics such as sine wave peaks requires a minimum of about 25
samples per waveform period.
Maximum display frequency is determined by the timebase.
What is aliasing (recording of non-existent waveforms)?
If the signal to be measured changes too fast relative to the sampling rate,
beginning at a certain frequency, non-existent slow signal uctuations are recorded. This phenomena is aliasing.
Actual Input Signal
Sampling Rate
Measured Waveform
Aliasing occurs when the sampling rate is longer
than half of the input signal period.
With the Memory function, the sampling rate can be signicantly affected by the timebase setting, so
care is necessary to avoid aliasing when selecting the timebase. Because the timebase determines the
maximum display frequency, the fastest possible timebase setting should be used.
When the signal can be recorded repeatedly, the auto-ranging function (p. 70) may be used to select
the optimum timebase.
Sampling Points
55
Page 61

Measurement Conguration
The sampling rate is automatically set to 1/100 of the selected timebase.
If MR8990 Digital Voltmeter Unit is installed, that channel's sampling rate is automatically set to 1/50 of
the selected timebase.
Example: When 8966 is installed as unit 1 (CH1 and CH2) and MR8990 as unit 2 (CH3 and CH4), and
the timebase is set to 1 s/div
Sampling rate of unit 1 (8966): 10 ms
Sampling rate of unit 2 (MR8990): 20 ms
To automatically set the timebase
When you press the
AUTO
key, a suitable timebase for the input signal is selected and
measurement starts. (This applies only to the Memory Function.)
Refer to “3.6 Measurement With Automatic Range Setting (Auto-ranging Function)” (p. 70).
• The timebase and sampling rate can be set independently. The sampling rate is selected depending on
the timebase setting.
• When the following timebase values are selected, displayed waveforms are compressed in the
horizontal (time axis) direction as shown.
20 ms/div → ×1/2,
10 ms/div → ×1/5
To minimize noise during measurement
If the sampling rate is too fast and the input waveform amplitude is small, the difference between
maximum and minimum values may become quite large as a result of sudden uctuations, such
as those caused by noise. To prevent this, select a slower sampling rate or enable the module's
lowpass lter (p. 63).
Common
The data refresh rate is not allowed to exceed the maximum sampling rate of the module.
During the period when data is not updated, the same data is measured, resulting in a stair-shaped
waveform.
Even when the same signal is sampled simultaneously by two modules, the data may differ due to
differences in sampling rate, frequency bandwidth, and frequency response.
Data refresh rate for various modules
Module Max. timebase Max. sampling rate Reference
Model 8966 5 µs/div 50 ns (20 MS/s) -
Model 8967 Dependent on data refresh
setting
Model 8968 100 µs/div 1 µs (1 MS/s) -
Model 8969
Model U8969
500 µs/div 5 µs (200 kS/s) -
Dependent on data refresh
setting
Refer to “8.10.3” (p. 167).
56
Model 8970 Dependent on setting Dependent on setting Refer to “8.10.5” (p. 169).
Model 8971 100 µs/div 1 µs (1 MS/s) Refer to “8.10.6” (p. 172).
Model 8972 Dependent on response
setting
Model 8973 5 µs/div 50 ns (20 MS/s) -
Model MR8990
Model U8974 100 µs/div
Dependent on NPLC setting Dependent on NPLC setting
Dependent on response
setting
1 µs (1 MS/s)
Refer to “8.10.7” (p. 172).
Refer to “8.10.8” (p. 173).
Refer to “8.10.9” (p. 174).
Page 62

3.3.3 Recording Length (Number of Divisions)
Set the length (number of divisions) to record each time data is acquired.
Procedure
Press the
With the Memory Function
Move the cursor to [Shot].
1
Select the type.
2
key to open the Waveform screen.
DISP
Fixed Shot Select from a range of preset values.
User Shot Freely specify any value in 1-division units.
Measurement Conguration
Set the recording length.
3
With the Recorder Function
Move the cursor to [Shot].
1
Select the type.
2
Set the recording length.
3
(Fixed Shot)
25, 50, 100, 200, 500, 1,000, 2,000, 5,000, 10,000, 20,000,
50,000, 100,000 div
200,000 div (in 4/8/16 ch mode)
500,000 div (in 4/8 ch mode)
1,000,000 div (in 4 ch mode)
(User Shot)
1 to 160,000 div (in 32 ch mode)
1 to 320,000 div (in 16 ch mode)
1 to 640,000 div (in 8 ch mode)
1 to 1,280,000 div (in 4 ch mode)
Fixed Shot Select from a range of preset values.
User Shot Freely specify any value in 1-division units.
(Fixed Shot)
3
Measurement
Cont.
On-Off
25, 50, 100, 200, 500, 1,000, 2,000, 5,000, 10,000, 20,000,
50,000 div
(User Shot)
1 to 80,000 div
When
carried out while continuously overwriting the
data in memory.
measurement was stopped back to the maximum
recording length can be saved or printed.
is selected, measurement is
[On]
Data from the point at which
57
Page 63

Measurement Conguration
Recording Length and Data Samples
Each division of the recording length consists of 100 data samples. The total number of data samples for
a specied recording length is: Set recording length (divisions) × 100 + 1.
However, if the MR8990 Digital Voltmeter Unit is installed, the number of data samples is as follows.
• When only MR8990 is installed
Number of data samples for each division: 50 data samples
Total number of data samples for recording length: Set recording length (divisions) × 50 + 1
• When a mix of MR8990 and other modules are installed
Channels for MR8990 units
Number of data samples for each division: 50 data samples
Total number of data samples for recording length: Set recording length (divisions) × 50 + 1
Channels for other modules
Number of data samples for each division: 100 data samples
Total number of data samples for recording length: Set recording length (divisions) × 100 + 2
Each recording length division consists of 100 pairs of data points, with each pair composed of two
values: the maximum and minimum measured values within each sampling period. The MR8990 data
measured by the recorder function has a resolution of 16 bits.
When recording length is set to
• The instrument stores the maximum recording length of data back from the point at which measurement
was stopped in its internal memory (80,000 divisions).
• For range settings of 10 ms/div to 200 ms/div, when the printer setting (real-time print) is On, the realtime print is not performed. Perform printing manually after measurement is completed. (p. 112)
• When Auto-saving is On, the saving is not performed during the measurement. When measurement is
stopped, the data currently stored in the internal memory is saved.
When recording length is changed during measurement
Measurement data already stored in memory is discarded and measurement starts with the
newly set recording length.
[Cont.]
58
Page 64

Measurement Conguration
3.3.4 Screen Layout
You can specify the format in which the input signal is shown on the Waveform screen.
This setting will also affect how the waveform will be printed.
Selecting X-Y1 screen or X-Y4 screen allows waveform X-Y synthesis.
(This applies to the Memory and X-Y Recorder functions.)
Refer to “7.4 Perform Waveform X-Y Synthesis” (p. 128).
Procedure
Press the
With the Memory Function
STATUS
key to open the Status screen, and then select the
[Status]
sheet
Move the cursor to
Single Display and record using 1 graph. (
Dual Display and record using 2 graphs.
Quad Display and record using 4 graphs.
Oct Display and record using 8 graphs.
Hex Display and record using 16 graphs.
X-Y Single Set input signal to X-Y and display and record the correlation using 1
X-Y Quad Set input signal to X-Y and display and record the correlation using 4
With the Recorder Function
Move the cursor to
Single Display and record using 1 graph. (
Dual Display and record using 2 graphs.
Quad Display and record using 4 graphs.
Oct Display and record using 8 graphs.
[Format]
graph.
graph.
[Format]
.
Default setting
.
Default setting
)
)
3
Measurement
Hex Display and record using 16 graphs.
Analog Channel Assignment
With 2, 4, 8 or 16 screens, analog channels can be freely assigned to the different graphs.
Procedure
Press the
Move the cursor to [Graph].
1
Select the display screen for each
2
channel.
The graphs are numbered Gr1, Gr2, Gr3,
etc. starting from the top.
CHAN
key to open the Channel screen, and then select the
<Sample screen after assigning channels>
[Unit List]
sheet.
Gr1
Gr2
Gr3
Gr4
59
Page 65

Select Input Channels
3.4 Select Input Channels
Set which channels are analog and logic.
To Open the Channel Settings Window
Refer to “Variable Function Settings for All Channels”
(p. 160).
Pressing
cycles through the available
sheets.
[Analog]
[Variable]
[Logic]
[WaveCalc]
(When [Wave Calculation] is
[On])
or
[Generator]
waveform generator module
is installed)
No display
CH.SET
repeatedly
(When a
If the channel setting screen is hard to see due to waveform overlap, narrow
the waveform display width to divide the waveform display screen and trigger
settings screen.
Refer to “7.7.3 Switch the Waveform Display Width” (p. 136).
To perform waveform interpolation
Set the waveform display color in the channel setting window to Off.
Refer to “1. Waveform Display Color” (p. 63).
To copy the settings of one channel to another
Refer to “8.9 Copy Settings to Other Channels (Copy Function)” (p. 163).
60
Page 66

3.4.1 Channel Setting Workow
The workow below shows how to choose settings for analog channels (CH1 to CH32).
1
Input and screen display related settings
Refer to...
Select input coupling
(p. 63)
Select Input Channels
Match range to measurement target input value
Convert input value (As needed)
Choose lter settings (When there is noise)
Fine-tune waveform amplitude (As needed)
Set zoom on vertical axis (voltage axis)
(As needed)
2 Trigger settings (As needed)
3
Waveform display color and position settings
Set waveform display color
(p. 63)
(
(p. 151)
(p. 65)
(p. 64)
(p. 64)
Refer to (p. 187).
Refer to...
(p. 63)
3
Measurement
Set display position and scaling (As needed)
4 Graph display settings
For 1, 2, 4, 8, or 16 screens
For X-Y1 or X-Y4 screens
(p. 158)
Refer to...
(p. 59)
(p. 129)
61
Page 67

Select Input Channels
• When input coupling is set to GND, the waveform will have no amplitude and you cannot set the
range.
• Due to the inuence of lter attenuation, correct range setting may not be possible.
• When choosing trigger settings, set the vertical axis (voltage axis) range rst. If the range is changed
after specifying the trigger, the trigger setting may change.
• When using the Variable function, set the vertical axis (voltage axis) range rst. If you change the
range setting after applying the variable function observation with sufcient precision may not be
possible.
• When using the Variable and Scaling functions together, apply the Scaling function rst. If you apply
the Scaling function after the Variable function, you may not get the intended display result.
The setting workow for logic channels (standard LOGIC terminals LA - LH, expansion LOGIC terminals
L1A to L8D) is explained below.
1 Select screen display related settings
Refer to...
Set logic recording width
(p. 66)
2
Waveform display color and position settings
Refer to...
Set waveform display position
Set waveform display color
• Waveform display position can be specied in 1% increments.
• Not displayed for X-Y1 and X-Y4 screens.
• Up to two logic units can be installed as units 1 to 8. Logic units installed in other positions cannot be
used.
(p. 66)
(p. 66)
62
Page 68

Select Input Channels
3.4.2 Choose Analog Channel Settings
For information about specic settings for Model 8967 Temp Units, 8969 Strain Unit, U8969 Strain Unit,
8970 Freq Unit, 8971 Current Unit, 8972 DC/RMS Unit, MR8990 Digital Voltmeter Unit, and U8974 High
Voltage Unit, refer to “8.10 Detailed Settings for Modules” (p. 164).
Procedure
Press the
window (
Move the cursor to the channel for which
1
you want to change the settings.
Select settings with the F keys.
2
key to open the Waveform screen, and the press the
DISP
[Analog]
sheet)
CH.SET
1. 2. 3. 4. 5. 6. 7.
key to open the channel settings
3
Measurement
To copy the setting to another channel
Refer to “8.9 Copy Settings to Other Channels (Copy Function)” (p. 163).
1. Waveform
Display Color
2. Vertical Axis
(Voltage Axis)
Range
Species the color in which the waveform of the selected channel is
displayed. You can also select the same color as other channels.
Off The waveform is not displayed. If the auto-save setting for
.
is
[Disp Ch]
[On]
Channel]
Refer to “Select the channels to save.” (p. 84).
On The waveform is displayed. Select the display color with the
[↑], [↓]
All On-Off Switches the waveform display of all channels to all On or all OFF
Sets the vertical axis (voltage axis) range for each channel. The value set
here is the voltage of one increment on the vertical axis.
For information on the full-scale value for various modules, refer to the table
in the section “6. Zero Position” (p. 64).
When the Variable function is
size of the waveform on the screen will not change even if the vertical axis
(voltage) range is changed.
, data for this channel will not be saved.
but variable auto-adjustment is
When an over-range condition has occurred
Change the vertical axis (voltage axis) range to a lower sensitivity setting.
[Save
F
[Off]
keys
, the
3. Coupling
Set the input signal coupling method. Normally, DC coupling should be
selected.
DC (V) Both DC components and AC components of the input signal will be
AC (V )
GND (
measured. (
Only AC components of the input signal will be measured. DC
components will be blocked.
)
Input is shorted to ground. (Allows checking the zero position.)
Default setting
)
63
Page 69

Select Input Channels
4. Vertical Axis
(Voltage Axis)
Zoom
5. Vernier
6. Zero Position
Vertical axis (voltage axis) zoom-up or zoom-down settings can be selected
separately for each channel. These settings will be used for display and printout.
Zoom is based on the zero position. The measurement resolution does not change.
Refer to “7.5.3 Vertical Axis (Voltage Axis) Magnication” (p. 132).
Use the Variable function for user-specied zoom.
The waveform can be inverted by reversing plus/minus.
Refer to “8.6 Set the Waveform Position (Variable Function)” (p. 158).
Refer to “8.8 Invert the Waveform (Invert Function)” (p. 162).
Fine adjustment of input voltage can be performed arbitrarily on the
Waveform screen (display only).
When recording physical values such as noise, temperature and acceleration
using sensors, amplitude can be adjusted to facilitate calibration.
Refer to “8.7 Fine Adjustment of Input Values (Vernier Function)” (p. 161).
Sets the 0 V level display position. If the 0 V input level has shifted, perform
zero-adjust.
Refer to “2.7 Adjust the Zero Position (Zero-Adjust)” (p. 47).
Refer to “2.8 Perform Calibration (When Model MR8990 is installed)” (p. 48).
The zero position of all channels can be changed at the same time using the
zero position preset (press
Ascending
(3%→96%)
The zero position of CH1 is set to 3% and the following channels
up to CH32 are increased by 3% each.
[Preset]
).
Descending
(96%→3%)
All Ch 0% The zero position of all channels is set to 0%.
All Ch 50% The zero position of all channels is set to 50%.
The zero position of CH1 is set to 96% and the following channels
up to CH32 are decreased by 3% each.
If the zero position of the waveform obtained with Model 8969 or U8969
Strain Unit is displaced, perform the auto-balance.
Refer to “8.10.4 Setting Model 8969 and U8969 Strain Unit” (p. 168).
• Only the display position is shifted. No offset is applied to the input.
• Vertical axis (voltage axis) zooming is based on the zero position.
• Zero position adjustment and vertical axis (voltage axis) zooming only change the voltage range as
displayed on the Waveform screen. The actual measurement range does not change.
The zero position is as shown in the illustration below. (Example: 8966 Analog Unit)
Zoom factor ×1
A/D Data
2047
2000 LSB
0 0 V
Display screen
(Zero position: 0%)
100 %
50 %
0 %
Display screen
(Zero position: 50%)
Display screen
(Zero position: 100%)
A/D Data
−2047
Full-scale resolution for modules at various vertical axis zoom factors (LSB)
64
Page 70

Select Input Channels
Module
Model 8966
(Analog)
Model 8971
(Current)
Model 8972
(DC/RMS)
Model 8967
(Temperature)*
Model 8968
(High
resolution)
Model U8974
(High voltage)
Model 8969
Model U8969
(Strain)
Model 8970
(Power
Frequency)
Model 8970
(Count)
Zoom factor
×1/10 ×1/5 ×1/2 ×1 ×2 ×5 ×10 ×20 ×50 ×100
20000
(4000)
200000 100000 40000 20000 10000 4000 2000 1000 400 200
320000
(64000)
250000
(64000)
20000 10000 4000 2000 1000 400 200 100 40 20
400000 200000 80000 40000 20000 8000 4000 2000 800 400
10000
(4000)
160000
(64000)
125000
(64000)
4000 2000 1000 400 200 100 40 20
64000 32000 16000 6400 3200 1600 640 320
50000 25000 12500 5000 2500 1250 500 250
3
Measurement
Model 8970
(Excluding
power
frequency and
count)
Model MR8990
(DVM)
The brackets for the zoom factor indicate valid data ranges.
*: With Model 8967 Temp Unit, the valid range differs depending on the thermocouple. For minimum resolution
information, see the specications of Model 8967 Temp Unit.
7. Low-Pass Filter
100000 50000 20000 10000 5000 2000 1000 500 200 100
1200000 1200000 1200000 1000000
500000 200000 100000 50000 20000 10000
Select settings for the module's low-pass lter. This is useful for eliminating
unwanted high-frequency components.
The lter type depends on the module. Choose setting according to the
input characteristics.
65
Page 71

Select Input Channels
3.4.3 Logic Channel Settings
The channel settings window (Logic sheet) is shown when the display format is 1, 2, 4, 8 or 16 screens.
Procedure
Press the
window (
Move the cursor to the channel for which
1
you want to change the settings.
Select settings with the F keys.
2
To copy the setting to another channel
Refer to “8.9 Copy Settings to Other Channels (Copy Function)” (p. 163).
key to open the Waveform screen, and then press the
DISP
[Logic]
sheet).
CH.SET
key to open the channel settings
1.
2. 3.
1. Logic Width
2. Waveform Display
Position
3. Waveform
Display Color
Change the display width of the logic waveform.
Making waveforms narrower can enhance the readability of the display
when there are a high number of waveforms.
Wide Make the waveform wider.
Normal Display the waveform at normal width.
Narrow Make the waveform narrower. (
Determines where on the screen the logic waveform is displayed.
The position can be freely moved within the range of the display.
Species the color in which the waveform of the selected channel is
displayed. You can also select the same color as other channels.
For logic units, the color can be specied for each units and each channel
separately.
Off The waveform is not displayed. If the auto-save setting for
Channel]
Refer to “Select the channels to save.” (p. 84).
On The waveform is displayed. Select the color with the
Probe On-Off
Switches the waveform display of the same probes to ON or OFF simultaneously.
is
[Disp Ch]
Default setting
, data for this channel will not be saved.
)
[Save
keys.
F
All On-Off
• When the standard logic display (LA, LB, LC, LD, LE, LF, LG, and LH) is
installed as unit 1, 2, 9, or 10 cannot be used. Furthermore, the 16-bit resolution 8967 Temp Unit, 8968
High Resolution Unit, 8969 Strain Unit, U8969 Strain Unit, and U8974 High Voltage Unit have their
resolutions reduced to 12 bits. When Model MR8990 Digital Voltmeter Unit is installed as unit 1, 2, 9, or
10, the standard logic display cannot be used.
• Install logic units as units 1 to 8. Logic units installed as units 9 and above cannot be used.
Switches the display of all logic waveforms to ON or OFF simultaneously.
This can be selected when the cursor is on the waveform display position item.
, 8970 Freq Units
[On]
66
Page 72

Select Input Channels
3.4.4 Displayed Sheet
The input channel settings can be set differently for each displayed sheet. Up to four sheets can be set.
You can set desired waveforms for displaying to different sheets and switch them.
Sheet switching (1 to 4)
3
Measurement
• Only the following display-related settings can be set to each displayed sheet.
Analog waveform: Display ON/OFF, waveform color, magnication, zero position, vernier, invert,
graph variable (ON/OFF, upper/lower limits)
Logic waveform: Display ON/OFF, waveform color, display position, logic width
X-Y waveform: Display ON/OFF, display color, X ch/Y ch waveform calculation (X ch, Y ch)
Waveform calculation: Display ON/OFF, waveform color, scale setting, upper/lower limits, graph
Common setting: Display format
• The measurement-related settings other than above will be common to all displayed sheets.
When the range is changed, the change is applied to all displayed sheets.
• When a settings le is saved, the settings of all displayed sheets are saved.
• A waveform le is saved based on the setting of the sheet displayed at the time of saving. When a
waveform le is loaded, only the sheet displayed at the time of saving can be loaded because other
sheets were not saved.
67
Page 73

Start and Stop Measurement
3.5 Start and Stop Measurement
Procedure
Press the
To Start Measurement
Press the
• When a measurement is started, waveform data displayed on the screen is cleared.
• Measurement can also be started by applying a signal to the external control terminal.
Refer to “17 External Control” (p. 335).
To prevent inadvertently starting measurement
To prevent operation mistakes from unintentionally starting measurement, the
method can be changed.
Refer to “Start Action” (p. 307).
To automatically save data during measurement
Refer to “5.2.2 Automatically Save Waveforms” (p. 82).
key to open the Waveform screen.
DISP
START
key to start measurement.
START
key operation
To print the waveform
Refer to “6 Printing (When Model U8350 Printer Unit is installed)” (p. 107).
To Stop Measurement
Press the
Press the
The operation conditions for the
Refer to “15 System Environment Settings” (p. 305).
When
STOP
key once to stop recording at the end of the specied recording length.
STOP
key again to stop recording immediately.
STOP
START
is pressed, the following indication may appear on the screen.
Measurement will stop at the point where the key is pressed.
(Pressing the
The stopping procedure will be canceled and measurement will continue.
and
STOP
STOP
keys can be changed.
key twice has the same effect.)
When no key operation is made in this status, the measurement will stop at the end of the specied
recording length and the display returns to the previous screen.
68
Page 74

Start and Stop Measurement
End of Measurement
[Storing Finished]
[ ]: Status Bar Display
RecordingStart Measurement
End of Measurement
[Trigger Wait]
T
Start Measurement
[Storing Finished]
Recording
Stop Measurement
[Trigger Wait]
Recording
Starts
T
Recording
Stops
[Now Storing]
Start Measurement Recording
[Trigger Wait]
T
Recording
Starts
START key STOP key
[Pre-Trigger Wait]
The specified pre-trigger wait period is recorded before each trigger event
Post-trigger waveform
Measurement and Internal Operations
Measurement methods are normal measurement (start recording when measurement starts) and trigger
measurement (start recording when trigger criteria are satised). In this manual, “Measurement start”
means when you press the
START
waveform screen.
• To record on either single or repeating trigger events
Select the Trigger mode. (p. 189)
• To capture data measured prior to trigger events
Enable pre-triggering.
key and “Recording start” means when recording begins on the
(p. 201)
Normal
Measurement
Trigger
Measurement
Trigger modes:
[Single]
Pre-triggering not
enabled
Trigger modes:
[Repeat]
Pre-triggering not
enabled
Without triggering
START key
Recording
Starts
[Now Storing]
Terminates when measurement up to the recording length has made.
Recording
Stops
Single triggering
START key
Recording
Starts
[Now Storing]
Recording starts when a trigger event occurs and continues for the specied recording
length.
Recording
Stops
Repeated triggering
3
Measurement
Recording starts when a trigger event occurs, continues for the specied recording length,
and returns to the Trigger Wait state.
Repeated triggering and recording of phenomena before each event
Trigger modes:
[Repeat]
Pre-triggering
Start Measurement
START key
T
enabled
Recording
Starts
[Trigger Wait]
After starting measurement and internally acquiring data for the
specified pre-trigger period, the Trigger Wait state is activated.
The data before a trigger event (for the pre-trigger period) is recorded.
When the trigger mode is set to
number of trigger events is shown in the top part of the screen (Storage Counter).
Refer to “Explanation of Screen Contents” (p. 20).
Recording
[Now Storing]
[Repeat]
End of Measurement
Recording
Stops
[Storing Finished]
or
[Auto]
(Memory function only), the
Operation is
repeated from
pre-triggering
stage.
Waveform during
specified pre-trigger
period
T
69
Page 75

Measurement With Automatic Range Setting (Auto-ranging Function)
3.6 Measurement With Automatic Range Setting (Auto-ranging Function)
This applies only to the Memory function and analog modules.
When you press the
AUTO
key after inputting a signal to an analog unit, and select
[Auto Range]
, the
horizontal axis range (timebase), vertical axis (voltage axis) range, and zero position will be selected and
measurement started, all automatically.
The timebase will be set according to the lowest numbered channel among the channels where waveform
display is on. It will be set automatically to record 1 to 2.5 cycles in 25 divisions.
When measuring using the auto-ranging function, the following items are adjusted.
Module-Related Conditions (For all channels)
Vertical axis (Voltage axis) Range
Zero Position
Vertical axis (Voltage axis) magnication ×1
Low-pass lter Off
Input coupling DC
Trigger Criteria (For a single channel only)
Trigger modes Auto
Trigger source AND/OR OR
Pre-Trigger 20%
Internal Trigger
Auto-setup value
Only the lowest numbered channel for which waveform display is On
will be On. (If the difference between maximum and minimum value is 8
divisions or less the next lowest numbered channel will be used)
Level trigger: Slope, Rising
Trigger type
Status Screen -
Timebase Auto-setting value (time axis magnication: × 1)
[Status]
Sheet Conditions
Trigger level: Auto-setup value
Filter: Off
• When measurement is started with the auto-ranging setting, the trigger output signal is output to the
external control terminal block's TRIG OUT terminal. Keep this in mind when performing auto-range
measurement while using the trigger output terminal.
• The auto-ranging function automatically selects settings for the input signal that is present when the
function is enabled. Start auto-ranging measurement after supplying the input signal (waveform).
• If the input signal of the lowest numbered channel selected for waveform display is extremely small,
the timebase will be set according to the input signal of the next lowest channel.
• If range could not be set for any channel where waveform display is On, a warning message will
appear and measurement will be interrupted.
• The auto-save and auto-print functions cannot be used when measuring with the auto-ranging
function.
• For low-frequency signals of less than 10 Hz, the optimal range cannot be selected automatically. Set
the range manually.
• Using the following modules disables the auto-range function:
Models 8967 Temp Unit, 8969 Strain Unit, U8969 Strain Unit, 8970 Freq Unit, MR8990 Digital
Voltmeter Unit.
70
Page 76

4
• The X-Y waveform generated from the input signal is displayed in real time.
• By saving the displayed data in memory, data can be stored as well as printed.
• Similar to an X-Y pen recorder, waveform drawing can be controlled by simulated pen up/down
operation.
• Simultaneous observation of up to 8 X-Y phenomena is possible.
• Because waveform information is stored in memory, settings can be changed after measurement for
repeated synthesis.
X-Y Recorder Waveform Screen Example (X-Y4 screen)
Memory usage is
indicated by the bar.
X-Y Recorder Function
[OVER]
when the memory
capacity is reached.
appears
4
X-Y Recorder Function
71
Page 77

Measurement Workow
4.1 Measurement Workow
1 Pre-measurement Inspection
Refer to “3.2 Pre-measurement Inspection” (p. 51).
2 Basic Measurement Settings
Select X-Y recorder as measurement function
Refer to...
“Function” (p. 73)
Set sampling rate
Determine screen layout format
Determine whether to perform waveform
interpolation
Determine whether to clear previous
waveform data
3 Input Channel Settings
Choose analog channel settings
Logic channels cannot be used.
Application examples
Refer to...
“8.6 Set the Waveform Position (Variable Function)” (p. 158)
“8.7 Fine Adjustment of Input Values (Vernier Function)” (p. 161)
“8.1 Add Comments” (p. 140)
“8.5 Convert Input Values (Scaling Function)” (p. 151)
“Sampling” (p. 73)
“Format” (p. 73)
“Setting Descriptions” (p. 73)
“Disp Clear” (p. 73)
Refer to
Settings” (p. 63).
“3.4.2 Choose Analog Channel
4 Start Measurement
Refer to...
“4.3 Start and Stop Measurement” (p. 74)
“7.1 Read Measurement Values (Using the AB Cursors)”
(p. 122)
5 Stop Measurement
Refer to...
“4.3 Start and Stop Measurement” (p. 74)
“4 Redraw waveforms” (p. 74)
“5.2.3 Save Data Selectively (SAVE Key)” (p. 88)
“6.3 Manual Printing With the PRINT Key (Selective Printing)” (p. 112)
72
With the X-Y recorder function, the
following operations are not available:
• Trigger setting
• Auto-saving
• Auto-printing
Page 78

4.2 Measurement Conguration
Measurement Conguration
To set measurement parameters, press the
the
[Status]
Waveform screen.)
Setting Descriptions
Function Set the measurement function to X-Y recorder.
Sampling Set the sampling rate.
[1 ms]
sheet. (Settings for measurement function and sampling rate can also be made on the
1 ms / 10 ms / 100 ms
can only be selected when
STATUS
(Default setting)
[Dots-Line]
key to bring up the Status screen and select
is set to
[Dots]
.
4
X-Y Recorder Function
Format Select the graph format for Waveform screen display or printout of the input
signal. Up to 8 phenomena can be observed simultaneously.
X-Y Single The waveforms of graphs 1 - 8 are shown and recorded on a single
screen.
X-Y Quad The waveforms of graphs 1 - 8 are shown and recorded on four screens.
Dots-Line
(interpolation)
Disp Clear If past waveforms remain at the start of measurement, you can either clear or
Determines whether to display and print the input waveform (sampling data) as
dots (sampling points) or perform linear interpolation. Dot display allows faster
sampling.
Dots Display and print sampling data as dots.
Line Display and print sampling data using linear interpolation.
keep them. If you keep them, the new waveforms will be displayed as an overlay.
Off Overlay on existing waveforms
On Clear existing waveforms
(Default setting)
(Default setting)
(Default setting)
This completes the measurement conguration settings.
Next, choose analog channel settings.
For details, refer to “3.4.2 Choose Analog Channel Settings” (p. 63).
To set the channels for X-Y synthesis
Refer to “7.4 Perform Waveform X-Y Synthesis” (p. 128).
73
Page 79

Start and Stop Measurement
4.3 Start and Stop Measurement
Press the
1
2
key to go to the Waveform screen.
DISP
Start measurement.
Press the
Set the pen to Up/Down.
This setting can be chosen before or during measurement. When the pen is set to Down, the waveform
is being drawn. When the pen is set to Up, the waveform is not drawn. This setting applies to all
channels.
Move the cursor to
Up Waveform is not drawn.
Down Waveform is drawn.
Pen in Down position
Pen is shown in color and waveform is drawn.
START
key to start measurement.
to change the setting.
[Pen]
Up/Down operation is also possible
using the TRIG.SET key or the Manual
Trigger key.
Pen in Up position
Pen is shown in white and waveform is not drawn.
Stop measurement
3
Press the
Redraw waveforms
4
When measurement is stopped, waveform data for up to 16,000,000 samples before the current point can
be played back (redrawn) by the pen, similar to using a video recorder, starting from any specied point.
This setting applies to all channels. The playback speed can be specied. (It can also be changed during playback.)
Waveform is only played back on the screen and will not affect the printout data. To print the same
waveforms as shown on the screen, use the hard copy function (p. 118).
Move the cursor to
Move the cursor to
With the
occurs at the same speed as recording.
key to stop measurement.
STOP
[Player]
[Speed]
[Normal]
setting, playback
.
.
Clear Clear only waveform display.
(Waveform data will not be cleared.)
Redraw Redraw measurement data. Measurement
settings can also be changed for redrawing.
First Move pen to start of waveform.
Last Move pen to end of waveform.
Play/Stop Start/stop waveform playback.
Very Fast/ Fast /Normal
(Default setting)
/ Slow/Very Slow
Measurement start/stop and pen up/down can be controlled via the external control terminal. (p. 338)
74
Page 80

Waveform Observation
To Redraw With Different Waveform Display Settings
• After clearing the waveform display, waveform data is still retained by the unit. This makes it
possible to change the settings for display format, display color, synthesis channels, channel
zoom and offset before redrawing the waveform by selecting
executed, the screen and printout data will be renewed.
(As long as
settings are changed.)
• The jog and shuttle knobs can also be used for redrawing.
Move back and forth in the redrawing process in increments of 1 sample.
Jog
Shuttle
rotation angle.
• When moving backwards, the waveform will be drawn in the direction of earlier data.
Erasing the waveform is not possible.
• If the measurement exceeds 16,000,000 samples, it is only possible to redraw up to 16,000,000
samples in the past, counting backwards from the point where measurement was stopped. Earlier
waveform data is lost.
• Redrawing with the jog-shuttle is only reected on the screen and will not affect the printout data. To
print the same waveforms as shown on the screen, use the hard copy function (p. 118).
[Redraw]
Move back and forth in the redrawing process at a speed corresponding to the
is not run, the screen and print data are not refreshed, even if the
[Redraw]
. When
[Redraw]
is
4
X-Y Recorder Function
4.4 Waveform Observation
Waveform data for up to 16,000,000 samples is stored in memory, and an A/B cursor pair can be used to
trace measurement values. (p. 122)
The amount of memory used is indicated by the bar at the top of the screen.
When the number of samples exceeds 16,000,000, the indication
[OVER]
4.4.1 To Save and Print Waveforms
Saving The
Data stored as a le this way can be reloaded into the instrument, but cannot be read by a PC.
Printing The
appears at the top of the screen.
key or the controls on the File screen can be used to save waveform data
SAVE
stored in memory as a le.
Refer to “5.2.3 Save Data Selectively (SAVE Key)” (p. 88).
PRINT
Refer to “6.3 Manual Printing With the PRINT Key (Selective Printing)” (p. 112).
key can be used to print out waveforms.
75
Page 81

Start and Stop Measurement
76
Page 82

Save/Load Data and Manage
5
Files
This chapter explains how to save and load data and manage les on your Hioki Memory HiCorder.
Before saving data, congure the save settings on the [File Save] sheet.
You can load data and manage les from the File screen.
To Open the [File Save] Sheet
Press this key repeatedly to
display the various sheets.
[Environment] [Init]
[File Save]
[Printer] [Interface]
Operations available from the [File Save] sheet
The following settings are available on the [File Save] sheet. (p. 81)
Auto-save settings
Set the method of automatic saving of waveform data.
SAVE key settings
Set the method of saving when the SAVE key is pressed.
5
Save/Load Data and Manage Files
77
Page 83

To Open the File Screen
Indicated the order in which
the les are displayed.
: Ascending order
r
: Descending order
s
Press this key.
The selected le is indicated
by a ashing cursor.
Use the Right/left CURSOR keys
to move between folder levels.
Use the Up/down CURSOR
keys to select les.
Read-only les and folders
are shown in blue.
These les and folders cannot
be renamed or deleted.
Storage Media information
Shows information about the selected storage media.
Count: Displays the number of les in the selected folder.
Dir Count: Shows the number of folders in the selected folder.
Count: Shows the number of les and folders that can be
created in the selected folder level.
When Media is not displayed and you cannot perform any
operations n the file screen, choose a setting other than
[Mass storage HDD] or [Mass storage CF] for [USB Set].
To Change Media
Verify that storage media is inserted.
1
Refer to “2.3 Prepare Storage Media” (p. 40).
Select [Change Media] and select a storage media type.
2
The les on the selected storage media will be displayed in the le list.
Operations available from the File screen
Format storage media (p. 42)
Load data (p. 93)
Save/load an auto-settings le (p. 96)
Manage les (p. 81)
• Save data (p. 98)
• Create new folders (p. 100)
• Copy les (p. 104)
• Sort les (p. 102)
• Delete les (p. 101)
• Rename les (p. 103)
• Print the File List (p. 105)
Information is displayed for
the selected le.
78
Page 84

Data That Can Be Saved and Loaded
5.1 Data That Can Be Saved and Loaded
File type
Settings data
Waveform data
Entire waveform
acquired by the
instrument or a
section of the
waveform specied
with the A and B
cursors.
*1
*2
File
format
Binary SET
Binary
Text
Icon File extension and description
MEM
REC
XYC
FFT FFT Function data
CSV Text Data
Settings data (Measurement
Conguration)
Memory Function waveform data
Recorder Function waveform data
X-Y Recorder Function
waveform data
: Possible, —: Not possible
Save
Auto
—
—
Manual
Load
—
PC readable
—
—
—
*4
*4
—
—
Waveform
Management
*3
Data
(Divided Saving)
Captured Screen
Image (Display/
Waveform screens)
Numerical
Calculation Results
Comments for
Printing
Waveform
evaluation setting
data
Waveform
evaluation area
Arbitrary
waveform data
Arbitrary
waveform data
IDX Index data for divided saving
(Index
le)
*5
BMP
Text CSV Text Data
Text TXT Text Data — —
Binary ARE
BMP BMP
Binary
Text
SEQ
BMP Image Data —
WFG
TFG
Index data for memory division
(automatically created during
batch saving)
Settings data
(Measurement conditions +
waveform evaluation areas)
Waveform evaluation area
image data
Arbitrary waveform data
(For U8793)
Arbitrary waveform data
(For U8793)
—
—
—
— —
—
—
*6
—
—
5
Save/Load Data and Manage Files
—
—
Pulse pattern
data
Generation
program data
*1: Multiple data can be saved in the instrument, and loaded selectively. Automatic loading at power-on is also
possible. (p. 96)
*2: When data is to be reloaded on the instrument, save it in binary format. Waveforms and some measurement
settings can be saved for reloading.
When the data is to be loaded on a PC, save it in text format. (p. 81)
When saving a section of a waveform, use the A and B cursors to set the section to be saved. (p. 122), (p. 125)
*3: When you want to use memory division and load all blocks at the same time:
Save measurement data using [All blocks]. A directory will be created automatically and waveform data for
each block and index data (SEQ) will be created. When loading, load this index data.
When loading waveform data from divided saving, import the IDX index data.
*4: Loading is possible with Wave Viewer (Wv).
Binary
Program
PLS
FGP
Pulse pattern data
(For MR8791)
Generation program data
(For U8793)
—
—
—
—
79
Page 85

Data That Can Be Saved and Loaded
*5: This is a standard Windows
*6: It is possible to print out loaded waveforms with text les created on a PC. Other processing operations are not
available.
®
graphics format. Files in this format can be handled by many graphics programs.
Files larger than 2 GB cannot be saved.
Data That Cannot Be Loaded on the Instrument
• Data saved by other instruments.
• Image les other than waveform evaluation areas (
•
Files displayed with this icon.
)
80
Page 86

5.2 Save Data
5.2.1 Save Types and Workow
There are basically three types of save operations.
Save Data
To automatically save data
during measurement (p. 82)
Auto-save
Acquires measurement data for
the recording length then saves
it automatically. Select the save
location and data type before
measurement. (p. 82)
Data is saved to an HDD or CF card.
After installation and connection, turn the power on.
Insert the storage media.
Set the measurement conguration.
[File Save] sheet
Set [Auto Save] to [On].
Use this function to save multiple
times or to quickly save data
during monitoring. Specify the
save location and data, then press
the SAVE key. (p. 88)
After installation and connection, turn the power on.
To save data manually with the SAVE key (p. 88)
Save data immediately Select data and save
Quick Save
Insert the storage media.
[File Save] sheet [File Save] sheet
Set [Select at save] to [No].
Selection Save
(Default setting)
Press the SAVE key and then
specify the data to be saved. Save
settings can be made from any
screen without choosing settings
on the [File Save] sheet. (p. 88)
After installation and connection, turn the power on.
Insert the storage media.
5
Set [Select at save] to [Yes].
Press the SAVE key
Save/Load Data and Manage Files
Select the save destination.
Set the data to save.
• Waveform data
• Numerical calculation
results*
Measurement
Auto-save
Check before saving:
Select the save destination.
Set the data to save.
Data to save:
• Settings data
• Waveform data
• Display screen
• Waveform screen
• Numerical Calculation Results
• Waveform evaluation setting data
• Waveform evaluation area
• Pulse pattern data
• Arbitrary waveform data
• Program data
Press the SAVE key
Save
•Is the storage media inserted and initialized? (p. 40),
(p. 42)
•
Is the save location specified correctly?
•
Is auto-save set to
[On]
? (For auto-saving)
Dialogue
Select the save destination.
Set the data to save.
Data to save:
• Settings data
• Waveform data
• Display screen
• Waveform screen
• Numerical Calculation Results
• Waveform evaluation setting data
• Waveform evaluation area
• Pulse pattern data
• Arbitrary waveform data
• Program data
Select [Exec]
Save
* To save numerical calculation
results
Refer to “10.4 Save Numerical
Calculation Results” (p. 219).
81
Page 87

Save Data
5.2.2 Automatically Save Waveforms
This function acquires measurement data for the recording length then saves the waveform data
automatically. The save location and data to be saved must be selected before measurement starts.
Procedure
Press the SYSTEM key to open the System screen. → [File Save] sheet
Enable auto-save.
1
Move the cursor to [Auto Save], and select [On].
Default setting: Off (no automatic saving)
Set the data to be saved.
2
Move the cursor to [Save Type].
1
2
3
4
Wave
Binary
Wave
Text
Set the save destination.
3
Save waveform data in binary format.
(Data saved in binary format can only be
loaded on this instrument.)
Save waveform data in text format.
The data can be thinned out then saved.
(This data can be opened by a PC editor
or spreadsheet software, but it cannot be
reloaded on this instrument.)
Move the cursor to [Save To], and select [Edit].
The Browse folders dialog box appears (at bottom right).
Move the cursor to the storage media you want
to save the data to and conrm the setting with
[Conrm].
HDD Automatically save the waveform data on the
built-in drive.
(When Model U8330 SSD Unit is installed)
CF Automatically save the waveform data on a CF
card.
USB Automatically save the waveform data on a USB
memory stick.
LAN Automatically save the waveform data on a PC
connected via LAN.
Model 9333 LAN Communicator required.
When the root directory (topmost folder on the storage
media) is selected, a folder named “HIOKI_MR8827” will be
created automatically. (If the media was formatted by the
instrument, the folder will already have been created.) This
folder is then used as the save location.
To create a new folder to use as the save target,
select [New Folder]. When [LAN] is set as the save
destination, [New Folder] is ignored and a folder
named with the current date will be created.
Select media:
Open next lower
folder level:
Up/down CURSOR
Right CURSOR
*
• To save the waveform data on a
PC connected via LAN
The 9333 LAN Communicator must be
installed on the PC on which the data
is to be saved. For more information
about how to operate and congure
the Model 9333 LAN Communicator,
as well as install it on a PC, refer to the
instruction manual of Model 9333 LAN
Communicator.
• When setting the save destination
to [LAN]
You must rst set the IP addresses of the
unit and the PC connected via LAN. For
more information about how to set the IP
addresses, refer to (p. 310).
82
Page 88

Save Data
Set the le name.
4
Move the cursor to [Save Name], and enter a le name.
Refer to “8.1.3 Alphanumeric Input” (p. 143).
When [LAN] is set as the save destination, [Save Name] is ignored and the les will be named in
the previously-determined format.
Refer to “Save Operations (When Setting the Save Destination to [LAN])” (p. 87).
File name
The maximum number of characters for [Save Name] is 123. The maximum path length including le
name is 255 characters.
Specify the action if a le with the same name
5
exists in the target folder.
Move the cursor to [Same Name].
Auto If no les with the same name exist, saves the
le with the designated name. Otherwise, a
4-digit number is automatically added to the
eginning of the le name (default setting).
If the rst character of the le name is a
numeral, the added number will continue
sequentially from that number.
Serial Unconditionally, a 4-digit number is
automatically added to the beginning of the
le name. If a le with the same name exists,
saves the le, adding the 4-digit number that
is increased by 1.
5
Save/Load Data and Manage Files
Set the save area.
6
Move the cursor to [Save Area].
Whole
Wave
A-B
Wave
(When the selected save type is [Wave Binary])
7
Select whether to save divided les.
Move the cursor to [Division].
Off Files are not divided when saved.
16M,
32M,
64M
Save all recorded data. (
Save the data between the A and B cursors.
If only cursor A is set, all data after the cursor
will be saved.
To specify the AB cursors (p. 122)
Select the size for Divided Save.
Default setting
)
83
Page 89

Save Data
(When [Wave Text] is selected as the save type)
Set the data thinning amount.
Move the cursor to [Save Thin].
Off No data thinning (sub-sampling).
1/2 to
1/1000
Set the thinning amount (the fraction of the
total data to retain).
About divided saving
• Large quantities of waveform data can be divided and saved as multiple les.
• Saving divided data automatically makes a folder then creates one or more waveform les and an
index (IDX) le in that folder. The IDX le can be used to load the data in the waveform le(s) as a
batch.
• When divided saving is selected, delete save (p. 76) is not available.
• Automatic divided saving is not possible when using the memory division function.
Refer to “Divided les are loaded together.” (p. 95) or “12 Memory Division Function” (p. 237).
Thinning
A large amount of space is required to save les in the text format. Data thinning reduced the le size.
Example: When [1/2] is set, every second data item is saved.
The number of data items is reduced to 1/2 the original amount.
Save destination
Data can also be saved to a USB ash drive in real time, but for data protection we recommend using
Hioki’s optional CF card instead.
Select the channels to save.
8
Move the cursor to [Save Ch].
Disp Ch Saves the channels of all sheets for which
waveform display is set to [On]. (
setting
)
All Ch Saves all measured channels (When using
the memory function, saves channels which
have been set as [Used Ch] on the Status
settings screen).
Saves the channels for which waveform
display is set to [Off].
Set whether to create folders.
9
Move the cursor to [Folder to save].
No A folder is not created when measurement
starts.
Yes A folder is created automatically when
measurement starts and les are saved in this
folder.
When [LAN] is set as the save destination, [New
Folder] is ignored and a folder named with the
current date will be created.
Default
8
9
10
84
Page 90

Set the save method for when the storage media
10
runs out of space.
Move the cursor to [Save method].
Save Data
Normal
Save
Delete
Save
When [LAN] is set as the save destination, this
setting is ignored and the save method becomes
[Normal Save].
Conrm the measurement conguration then start
11
measurement.
Press the START key.
After the data is acquired, the screen image is saved
automatically to the specied storage media.
• Maximum number of les per folder
The combined maximum for les and folders created in one folder is 5,000.
Refer to “Auto-save Operations (When Setting the Save Destination to Storage Media)” (p. 86).
• [Preparing les] display
Sometimes [Preparing les] is displayed after measurement starts. This indicates that the instrument
is checking the status of the destination where the le will be saved. The more the les exist in the
destination folder, the longer the preparation takes.
When printing is attempted simultaneously with saving, the printing may override the saving and
[Preparing les] may be displayed longer.
Automatic saving stops when the storage
media is full.
Old les are deleted and automatic saving
is continues when the storage media is full.
(Waveform les only.)
5
Save/Load Data and Manage Files
To clear the Auto Save dialog box
Press the SAVE key to toggle dialog box display.
85
Page 91

Save Data
(A new folder will be created automatically when 5,000
files have been saved in the TEST folder.)
(A new folder will be created automatically when 5,000
files have been saved in the AUTO014530 folder.)
0000AUTO.MEM
0001AUTO.MEM
Auto-save Operations (When Setting the Save Destination to Storage Media)
Example 1 Saving Files to the Topmost Directory of the Storage Media (A folder named “HIOKI_MR8827” will
be created and les saved there)
Save to CF:¥HIOKI_
MR8827
Save method Normal Save
Folder to save Off
When the storage media is full:
Automatic saving stop.
Example 2 Saving Files to a Folder on Storage Media
CF
HIOKI_MR8827
File name will be
“4-digit number + file name.”
0001HIOKI_MR8827
(A new folder will be created automatically when 5,000
les have been saved in the HIOKI_MR8827 folder.)
0000AUTO.MEM
0001AUTO.MEM
Up to 5,000 files
0000AUTO.MEM
Save to CF:¥HIOKI_
MR8827¥TEST
Save method Normal Save
Folder to save Off
(Create a folder named “TEST” on the CF card
beforehand.)
HIOKI_MR8827
TEST
The automatically created folder will be named
“4-digit number + folder name.”
0001TEST
0000AUTO.MEM
0001AUTO.MEM
Up to 5,000 files
0000AUTO.MEM
When the storage media is full:
Automatic saving stop.
Example 3 Create a folder on storage media automatically and save data there
Save to CF:¥HIOKI_
MR8827
Save method Normal Save
Folder to save On
HIOKI_MR8827
AUTO014530
“AUTO + hours/minutes/seconds”
is createdautomatically. (Example: 1:45:30)
Folder name created next will be
“4-digit number + folder name.”
0001AUTO014530
0000AUTO.MEM
0001AUTO.MEM
Up to 5,000 files
0000AUTO.MEM
When the storage media is full:
Automatic saving stop.
Example 4 Using Delete/Save to Automatically Save Data
Save to CF:¥HIOKI_
MR88 27 or a
specied folder
in the HIOKI_
MR8827 folder
Save method Delete Save
Folder to save Off
When the number of les in the folder has reached 5,000, or when the storage media is full, les in the AUTO014530
folder (or specied folder) will automatically be deleted in sequence, starting from the oldest le, and replaced by
new les.
Only waveform les will be deleted.
86
HIOKI_MR8827
AUTO014530
Folder name will be
“AUTO + hours/minutes/seconds.”
(Example: 1:45:30)
Up to 5,000 files
Page 92

Example 5 Saving data in an existing folder on the media using divided saving
(A new folder will be created automatically when 5,000
folders have been saved in the TEST folder.)
(A new folder will be created automatically when 5,000 folders
have been saved in the AUTO014530 folder.)
Save Data
Save to CF:¥HIOKI_
MR8827¥TEST
Save method Normal Save
Folder to save Off
(Create a folder named “TEST” on the CF card
beforehand.)
HIOKI_MR8827
TEST
The automatically created folder will be
named “4-digit number + folder name.”
0001TEST
0000AUTO
0001AUTO
Up to 5,000 folders
0000AUTO
0000AUTO.IDX
0000AUTO.MEM
0001AUTO.MEM
Up to 5,000 files
0000AUTO.IDX
0000AUTO.MEM
When the storage media is full:
Automatic saving stop.
Example 6 Saving data in an automatically created folder on storage media using divided saving
Save to CF:¥HIOKI_
MR8827
Save method Normal Save
Folder to save On
HIOKI_MR8827
AUTO014530
“AUTO + hours/minutes/seconds”
is
created automatically. (Example: 1:45:30)
Folder name created next will be
“4-digit number + folder name.”
0001AUTO014530
0000AUTO
0001AUTO
Up to 5,000 folders
0000AUTO
0000AUTO.IDX
0000AUTO.MEM
0001AUTO.MEM
Up to 5,000 files
0000AUTO.IDX
0000AUTO.MEM
When the storage media is full:
Automatic saving stop.
Save Operations (When Setting the Save Destination to [LAN])
5
Save/Load Data and Manage Files
The le is saved according to the method (on the
right gure) specied under [Save Settings] using
the 9333 LAN Communicator.
For more information about how to congure save
settings, refer to the instruction manual for the 9333
LAN Communicator.
The destination folders and les are named in the
previously-determined formats and saved as follows:
Waveform files
Specified folder
HIOKI 9333
192.168.1.1 14-01-10
Folder name
will be Model
MR8827 IP
address.
14-01-11
Folder names
will be
“YY-MM-DD.”
14-01-20
14-01-21
WAVE123015.MEM
WAVE123245.MEM
WAVE123245.TXT
File names will be
“WAVE + hours/
minutes/seconds.”
Numerical calculation files
PARAMETER.TXT
PARAMETER_1.TXT
File names will be
“PRAMETER_ +
number.”
WAVE124012.BMP
File names will be
“WAVE + hours/
minutes/seconds.”
87
Page 93

Save Data
5.2.3 Save Data Selectively (SAVE Key)
To use the SAVE key for quick saving, you rst need to set the saving conditions.
The following types of data can be saved: setting data, waveform data, display screens, waveform screen,
and numerical calculation results.
Procedure
Press the SYSTEM key to open the System screen, and then select the [File Save] sheet.
Set the save method for when the SAVE key is pressed.
1
Move the cursor to the [Select at save] item, and
select [No].
1
Yes After pressing the SAVE key, a dialog box
will appear to select data before saving.
(Default setting)
Refer to “Selection Save” (p. 81).
No The preset data is saved when you press
the SAVE key.
Refer to “Quick Save” (p. 81).
When [Yes] is selected, the following setting determines
which dialog box appears when you press the SAVE key.
(Middle screen at right)
This does not apply when other dialogs such as the
“Folder Reference Dialog” are being displayed.
Set the save destination.
2
Move the cursor to [Save To], and select [Edit].
The Browse folders dialog box appears (at bottom right).
Move the cursor to the storage media you want to save
the data to and conrm the setting with [Conrm].
HDD Automatically save the waveform data on the
built-in drive.
(When Model U8330 SSD Unit is installed)
2
3
Select
media:
Open next
lower folder
level:
Up/down
CURSOR
Right CURSOR
88
CF Automatically save the waveform data on a CF
card.
USB Automatically save the waveform data on a
USB memory stick.
LAN Automatically save the waveform data on a PC
connected via LAN.
Model 9333 LAN Communicator required.
When the root directory (topmost folder on the storage
media) is selected, a folder named “HIOKI_MR8827” will
be created automatically. (If the media was formatted by
the instrument, the folder will already have been created.)
This folder is then used as the save location.
To create a new folder to use as the save target,
select [New Folder]. When [LAN] is set as the
save destination, [New Folder] is ignored and a
folder named with the current date will be created.
Page 94

Save Data
Set the le name.
3
Move the cursor to [Save Name], and enter a le name.
Refer to “8.1.3 Alphanumeric Input” (p. 143).
When [LAN] is set as the save destination, [Save Name] is ignored and the les will be named in
the previously-determined format.
Refer to “Save Operations (When Setting the Save Destination to [LAN])” (p. 87).
File Name
The maximum number of characters for [Save Name] is 123. The maximum path length including le name is 255
characters.
Specify the action if a le with the same name
4
exists in the target folder.
Move the cursor to [Same Name].
Auto If no les with the same name exist, saves
the le with the designated name.
Otherwise, a 4-digit number is automatically
added to the beginning of the le name
(default setting).
If the rst character of the le name is a
numeral, the added number will continue
sequentially from that number.
Serial Unconditionally, a 4-digit number is
utomatically added to the beginning of
the le name. If a le with the same name
exists, saves the le, adding the 4-digit
number that is increased by 1.
5
Save/Load Data and Manage Files
89
Page 95

Save Data
Set to save.
5
Move the cursor to [Save Type].
5
6
Set Save the settings data.
Wave Binary Save waveform data in binary format.
Select this to be able to reload the waveform on the instrument.
Wave Text Save waveform data in text format.
Select this to use the waveform data on a PC. (Memory/Recorder/FFT
Function only)
Wave
ALLWave Bin
Wave ALLWave Txt Save waveform data in text format. (When the memory division setting is
Save data for all blocks in binary format. (Only when the memory division
setting is [On].)
[On])
Screen Copy Save screen display data as a BMP le.
Data saved in BMP format can be displayed on a PC with image viewing
software.
Wave Image Save printer output data as a BMP le.
Data saved in BMP format can be displayed on a PC with image viewing
software.
Numerical Calculation Results Save numerical calculation results. (Memory Function only)
Waveform evaluation settings Save settings data and waveform evaluation areas.
Waveform evaluation area Save evaluation areas created with the waveform evaluation function as
black-and-white BMP les. Saved data can be edited on a PC and loaded
back into the instrument.
Edit images in black and white only.
Pulse pattern Saves pulse patterns registerd in the MR8791.
Arbitrary waveform Saves arbitrary waveforms registered in the U8793.
Program Saves program data registered in the U8793.
(When Wave Binary or Wave Text has been selected)
6
Move the cursor to [Save Area].
Whole Wave Save all recorded data. (
Default setting
)
90
A-B Wave Save the data between the A and B cursors. If only cursor A is set, all
data after the cursor will be saved.
Refer to “7.2 Specify a Waveform Range (AB Cursor)” (p. 125).
The channel displayed on the screen will be saved.
Page 96

Advanced settings
7
Available settings will differ depending on the save type.
Save
types
Setting - Wave
Binary
Wave
Text
Screen
Copy
(Hard
copy
of the
display)
Wave
Image
(Print
image)
Calc
Result
Settings Description
Division
Save
Thin
Image
Color
Image
size
Save
GUI
Output
File
Wave
Image
Shot
Folder
to save
(Off, 16 M, 32 M, 64 M)
Select this to divide large les into
several les when saving.
A folder with the specied name
will be created and data saved as
multiple les in that folder.
(Off, 1/2 to 1/1000)
Select this to use thinning (subsampling) when saving text data.
Set the thinning amount (the fraction
of the total data to retain).
(Color, Gray, Mono, Mono [Rev])
Species the color palette of the
created image le.
(UnCompressed, Compressed)
Determines whether the image le is
compressed.
(Yes, No)
Determines whether the GUI will be
saved in the image.
(All, 1 to 250)
Species the number of les to save.
To specify a range, open the [Printer]
sheet from the System screen and
set the printing area to [A-B Wave].
(Memory/Recorder Function only)
(1 to 60 div)
Species the amount of data per le.
If the amount of measurement
data is lower than the entered
number of divisions, only the actual
measurement data amount will be
saved. (Memory/Recorder Function
only)
(New File, Existing File)
Determines whether data is saved
under a new le name every time (with
automatically incremented number
if the same le name exists), or
appended to the same le.
Save Data
5
Save/Load Data and Manage Files
(For memory function)
8
When using the memory division function
Select the blocks to be saved
Move the cursor to [Save Block].
All Blks Saves all blocks with waveforms.
Start-End Saves all used blocks beginning from the
start block.
This completes the data save settings.
These settings will be used whenever the SAVE key
is pressed.
If “Image size” is used when saving a display image le, the image may not be viewable with some
image viewer applications.
91
Page 97

Save Data
5.2.4 Save Waveform Output Data to the Media
The pulse pattern data registered in Model MR8791, arbitrary waveform data registered in Model U8793,
or program data is saved in the media.
Before attempting to save the data, make sure that the storage media is inserted and the loading target is
correctly specied.
Procedure
To open the screen: press the FILE key to display the [File] sheet.
5
2
3
4
1
Press [Next Page].
1
Select [Pulse Patt], [Arb Waveform], or [Program].
2
Enter a [Save Name].
3
Register a [Unit No], a [Channel No], and a [Name] of the MR8791 or the U8793.
4
Press [Exec].
5
The data registered in the module is saved to the media.
Refer to the instruction manual of Models U8793, MR8790, and MR8791 regarding each detailed save
settings.
92
Page 98

Load Data
5.3 Load Data
Data saved on storage media or in the internal memory of the instrument can be reloaded.
Load Data Workow
Before attempting to load data, make sure that the storage media is inserted and the loading target is
correctly specied.
Only settings and measurement data saved in binary format can be loaded on the instrument.
Waveform data
Insert the storage media.
Select data to be loaded.
(Extension: .MEM, .REC, .FFT,
.XYC, .IDX, .SEQ)
Select [Load]
Select [Exec]
Load
Waveform evaluation area
Insert the storage media.
Settings data
Insert the storage media.
Select data to be loaded.
(Extension: .SET)
Select [Load]
Select [Exec]
Load
Waveform output data
Insert the storage media.
Text comment
On Printer sheet,
set [Text Comment] to
[Before Wave] (or [After Wave]).
Insert the storage media.
Select data to be loaded.
(Extension: .TXT)
Select [Load]
Select [Exec]
Load
5
Save/Load Data and Manage Files
Select data to be loaded.
(Extension: .ARE, .BMP)
Select [Load]
Select [Exec]
Load
Refer to See “8.11 Register the Waveform in the U8793 ArbitraryWaveform Generator Unit” (page 182),
or the instruction manual of Models U8793, MR8790, and MR8791 regarding the detailed settings for
loading (registration) of pulse pattern data, arbitrary waveform data, program data.
Select data to be loaded.
(Extension: .WFG, .TFG,
.PLS, .FGP)
Select [Load]
Specify the module and channel of
the loading target.
Select [Exec]
Load
93
Page 99

Load Data
Procedure
Press the FILE key to open the File screen.
To load a text comment
1
Press the SYSTEM key and bring up the [Printer]
sheet.
Move the cursor to [Text Comment], and select
[Before Wave] (or [After Wave]).
Select a le.
2
Use the CURSOR keys to select the le to load.
(The le type is indicated by the extension)
Refer to “(Extension)” in the “Load Data Workow”
(p. 93).
Select a file.
2.
Carry out the loading operation.
3
Select [Exec]. The le will be loaded.
The name of the loaded le will appear on the screen.
To cancel loading, select [Cancel].
When loading data from the sources other than the internal memory/built-in drive
Insert the storage media before selecting the media.
Other limitations
• Data saved with Memory HiCorders other than the MR8827 cannot be loaded.
• When loading waveform data, the settings for the unit will change to the same settings as when
the data was saved. To reset the unit settings, carry out [Clear Wave Data] (p. 388) or start
measurement.
94
Page 100

Load Data
Batch Load of Waveform Data
When the following index les are loaded, waveform data can be loaded as a batch. With the following
settings, index les are created along with waveform les.
Extension
IDX Divided les are loaded together.
(To create index les, use [Division] on the [File Save] sheet of the System screen to set the
dividing size before saving. Note: If [Save type] is not [Wave Binary], index les will not be
created)
Refer to “5.2.2 Automatically Save Waveforms” (p. 82) or “5.2.3 Save Data Selectively (SAVE Key)”
(p. 88).
SEQ (When using the memory division function of the memory function)
Waveform data of all blocks is loaded together.
(To create index les, set [Memory Div] to [On] on the [Memory Div] sheet of the Status Screen,
and then, set [Save Type] to [ALL-Wave Bin] on the [File Save] sheet of the System Screen.)
Refer to “12.1 Recording Settings” (p. 239) or “5.2.3 Save Data Selectively (SAVE Key)” (p. 88).
Explanation
Load a Waveform Evaluation Area
Files with the following two extensions can be loaded:
Extension
ARE Loads waveform evaluation areas and settings data
(Files saved by selecting [Area settings] when saving the data).
BMP Loads waveform evaluation areas.
(Files saved by selecting [Area image] when saving the data can be edited on a PC and then loaded
back into the instrument.)
Explanation
5
Save/Load Data and Manage Files
Data Loading for Waveform Generation (Registration)
You can load data for generated modules.
Data loading is performed on Signal generator sheet of Channel screen (CHAN key) or FILE screen (FILE
key).
For details, see the instruction manual of Models U8793, MR8790, and MR8791.
Extension
WFG,
TFG
PLS The data for pulse pattern generation is loaded in channels of a specied arbitrary wave
FGP The waveform generation program le is loaded in channels of a specied arbitrary waveform generator
Loads waveform evaluation areas and settings data
(Files saved by selecting [Area settings] when saving the data).
Refer to “8.11 Register the Waveform in the U8793 ArbitraryWaveform Generator Unit” (p. 182)
generator module.
The pulse pattern waveform loaded (registered) is output from Model MR8791 Pulse Generator
Unit.
module.
Explanation
95
 Loading...