

Page 1

LR8450
LR8450-01
Instruction Manual
MEMORY HiLOGGER
Feb. 2020 Edition 1
LR8450A964-00 20-02H
EN
Page 2

Page 3

Contents
Introduction
AbouttheNotationsUsedinThisManual
How to Use This Manual
........................................................1
.....2
.................................4
1 Settings and Operation 5
1.1 Performing Basic Operations
Instructions
Value entry method
Text entry method
1.2 Setting Measurement Conditions
Measurement module data refresh
intervals
1.3 ConguringInputChannels
Measuring voltage
Measuring temperature
(with thermocouples)
Measuring temperature
(with resistance temperature detectors)
Measuring humidity
Measuring resistance
Measuring strain
Integrating pulses
Measuring rotational speed
Measuring logic signals
Treatment of data that exceeds the
measurable range
1.4 ConguringtheWaveformDisplay
Conguringthedisplayofthevertical
axis
..........................................................36
Other display settings
1.5 Using the Scaling Function
1.6 Entering Comments
Title comments
Channel comments
Moduleidentiers
1.7 ConguringChannelsinaList
Copying channel settings
Conguringchannelsettingsatonce
1.8 Performing Zero Adjustment
1.9 Checking Input Signals
(Monitor Function)
1.10 Starting and Stopping
Measurement
1.11 Observing Waveforms
Waveform display
Gage (scale) display
Numericalvaluedisplay
Moving waveforms (scrolling)
Scroll bar (waveform display position)
Enlarging and shrinking the waveform
horizontally
Waveform search
Jump function (changing the display
position)
.................................................6
.....................................7
.......................................8
....................................................13
....................................19
.................................21
...................................25
................................26
.......................................27
.....................................29
.............................34
.....................................35
...............................40
.............................47
.........................................47
...................................48
......................................49
..........................55
................................58
........................................59
.........................60
.....................................62
.................................65
............................66
...............................................71
......................................72
...................................................74
................6
.......10
................16
.....24
.......................31
....36
.................42
............50
.........56
...............57
....................69
........71
1.12 Using the A/B Cursors
Reading values from the waveforms
Specifying a waveform range
1.13 CongurationNavigator
(Quick Set)
Strain gage connection diagram
External control terminal pin names
.............................................78
.........................75
..........75
....................77
................78
...........79
2 Trigger Function 81
2.1 Trigger Meanings
2.2 Enabling the Trigger Function
Shared settings
2.3 Analog Triggers, Pulse Triggers,
Waveform Calculation Triggers
(Level, Window)
Level triggers
Window triggers
2.4 Logic Triggers (Patterns)
2.5 Applying Triggers Based on
External Sources
2.6 Activating a Trigger at a Set Interval
Interval triggers
2.7 Example Trigger Settings
..................................83
.............84
.........................................84
....................................87
............................................89
........................................91
.....................92
..................................94
..95
.........................................95
....................97
3 Saving and Loading
Data
3.1 Data That Can Be Saved and
Loaded
3.2 Formatting Media
3.3 Saving Data
Auto save (real-time save)
Manual saving (selective saving,
immediate saving)
Selective save operation
3.4 Loading Data
3.5 Managing Data
Switching media (drives)
Moving between levels (folders)
Deleting data
Renaminglesandfolders
Copying data
Sortingles
3.6 Acquiring Data with a Computer
(PC)
Connecting the USB cable
Activating USB drive mode
Canceling USB drive mode
99
.................................................100
................................103
.........................................105
.....................106
...................................112
......................... 114
....................................... 117
...................................119
.........................119
..............120
..........................................121
......................122
..........................................123
............................................124
......................................................125
......................125
......................126
.....................127
1
2
3
4
5
6
7
8
9
10
Index
LR8450A964-00
i
Page 4

Contents
4 Alarm (Alarm Output) 129
4.1 ConguringAlarms
Setting shared alarm conditions for all
channels
Conguringchannel-specicalarm
settings
.................................................130
...................................................133
4.2 Checking Alarms
.............................130
.................................137
5 Marking Functionality 139
5.1 Assigning Event Marks during
Measurement
......................................140
5.2 Assigning Event Marks with an
External Signal
....................................141
5.3 Assigning Event Marks When
Alarms Occur
5.4 Searching for Event Marks
5.5 Reviewing Events in CSV Data
......................................142
................143
........144
6 Numerical and
Waveform Calculations
6.1 PerformingNumericalCalculations
Conguringnumericalcalculations
Real-time numerical calculations
(automatic calculations)
Numericalcalculationsafter
measurement (manual calculations)
Partial numerical calculations
Numericalcalculationformulas
6.2 Performing Waveform Calculations
Conguringcalculationsonthe
calculation list screen
Copying calculation formulas
Conguringwaveformcalculation
settings at once
......................................162
..........................150
..................152
................153
..............................160
...................161
145
.146
..........147
........151
.155
7 Conguring System
Settings
7.1 ConguringSettings
7.2 Controlling the System
Setting the time
Synchronizing the time
Initializing (resetting) the system
Systemconguration
Performing a self-check
163
...........................164
.......................167
.......................................167
............................168
.............169
..............................170
..........................171
8 External Control
(EXT. I/O)
8.1 ConguringVoltageOutput
(VOUTPUT)
8.2 ConguringAlarmOutput
(ALARM)
8.3 ConguringExternalInput/Output
(I/O) Terminals
External trigger input
Trigger output
Simultaneously starting measurement
using external triggers
173
.........................................174
..............................................175
....................................177
...............................179
.........................................180
.............................182
9 Communicating with a
Computer (PC)
9.1 Using the Logger Utility
9.2 ConguringandEstablishing
a USB Connection
Installing the USB driver
Connecting the instrument to the
computer with a USB cable
9.3 ConguringandEstablishing
aLANConnection
Conguringthecomputer’snetwork
settings
Conguringtheinstrument’sLAN
settings
Connecting the instrument to a
computerwithaLANcable
9.4 Exporting Acquired Data to a
ComputerOverWirelessLAN
ConguringandEstablishingaWireless
LANConnection(LR8450-01only)
9.5 Performing Remote Measurement
with the HTTP Server
Connecting to the HTTP server
Remote control using a browser
Starting and stopping measurement
Entering comments
9.6 Acquiring Data Using the FTP
Server
9.7 Sending Data Using the FTP Client
Example computer FTP server settings
Conguringautomaticsendingofdata
Sendingatestle
Checking FTP communications status
9.8 Controlling the Instrument with
Communication Commands
...................................................191
...................................................192
...................................................206
...................................227
183
.....................185
..............................186
..........................186
.....................188
..............................189
.....................196
..........199
..........199
.........................201
...............201
..............203
........204
.................................205
.....225
.....228
.............229
.210
...211
ii
Page 5

Contents
10 Specications 231
10.1 BasicSpecications
LR8450/LR8450-01 Memory HiLogger
10.2 Plug-inModuleSpecications
U8550 Voltage/Temp Unit
U8551 Universal Unit
U8552 Voltage/Temp Unit
U8553 High Speed Voltage Unit
U8554 Strain Unit
...........................231
....231
..........243
........................243
..............................249
........................255
..............262
...................................265
11 Knowledge and
Information
11.1 Measuring Temperature
11.2 Measuring Strain
Tension and compression on a single
axis
........................................................270
Bending stress
Torsional stress
Converting values to stress
Auto-balancing
Correcting for wiring resistance
Correcting for gage factor
11.3 Digitalltercharacteristics
11.4 NoiseCountermeasures
Noisecontaminationmechanisms
Example noise countermeasures
11.5 Scan Timing
U8550, U8551, LR8530, and LR8531
U8552 and LR8532
U8553 and LR8533
11.6 Filenames
11.7 Text Format
11.8 File Size
11.9 Settings after Initialization
(System Reset)
11.10 Maximum Recording Times
11.11 Application Measurement
Recording instrumentation signals
(4-20 mA)
Measuring power consumption using
pulse output from a watt-hour meter
11.12 Input Circuit Schematics
11.13 Data Handling
11.14DisplayingtheCertication
Number
............................................286
...............................................289
...............................................293
................................................304
269
.....................269
................................270
........................................271
.......................................272
.....................273
........................................273
...............274
........................274
................275
....................276
...........276
.............278
.........................................282
......283
.................................284
.................................285
.........................................287
...................................290
..............292
..................293
........296
....................299
.....................................302
11
2
3
4
5
6
7
8
9
10
Index 305
Index
iii
Page 6

Contents
iv
Page 7

Introduction
Introduction
Thank you for purchasing the Hioki LR8450/LR8450-01 Memory HiLogger. To ensure your ability to
get the most out of the instrument over the long term, please read this manual carefully and keep it
available for future reference.
The LR8450-01 Memory HiLogger adds wireless LAN functionality to the LR8450.
The instrument comes with the following documentation. Please refer to these resources as
necessary in light of your specic application. Please review the separate “Operating Precautions”
before using the instrument.
Type Manual contents
Operating Precautions Information to ensure safe use of the instrument
Precautions Concerning Use
of Equipment That Emits
Radio Waves
Quick Start Manual
Instruction Manual (this
manual)
Logger Utility*
User Manual
Communications
Commands*
*1: For information about how to install and use the Logger Utility computer application, see “Logger Utility
User Manual” on the included CD (application disc).
*2: The instrument can be controlled by a LAN- or USB-connected computer (PC).
For more information about the communications commands used to control the instrument, see
“Communications Commands User Manual” on the included CD (application disc).
1
2
User Manual
Precautions relating to use of equipment that
emits radio waves, countries in which the
instrument has been certied, etc.
Basic connection and operating instructions for
the instrument
Detailed information about the instrument and
specications
Information about how to install and use the
computer application
Explanation of communications commands for
controlling the instrument
Printed
edition
–
–
–
CD edition
–
–
Intended audience
This manual has been written for use by individuals who use the product or provide information
about how to use the product.
In explaining how to use the product, it assumes electrical knowledge (equivalent of the knowledge
possessed by a graduate of an electrical program at a technical high school).
Trademarks
• Microsoft, Windows, Excel, Internet Explorer, and Visual Basic are the registered trademarks or
trademarks of Microsoft Corporation in the U.S., Japan, and other countries.
• Other products and company names are the trade names, registered trademarks or trademarks
of their respective owners.
Screen font
• The typefaces included herein are solely developed by DynaComware Taiwan Inc.
1
Page 8

About the Notations Used in This Manual
About the Notations Used in This Manual
Safety notations
This manual classies seriousness of risks and hazard levels as described below.
DANGER
WARNING
CAUTION
NOTICE
IMPORTANT
Symbols on equipment
Indicates an imminently hazardous situation that, if not avoided, will result in
death of or serious injury to the operator.
Indicates a potentially hazardous situation that, if not avoided, could result in
death of or serious injury to the operator.
Indicates a potentially hazardous situation that, if not avoided, could result in
minor or moderate injury to the operator.
Indicates the possibility of equipment damage.
Indicates information or content that is particularly important from the standpoint
of operating or maintaining the instrument.
Indicates a high-voltage hazard. Failure to verify safety or improper handling of
the instrument could lead to electric shock, burns, or death.
Indicates an action that must not be performed.
Indicates action that must be performed.
Indicates the need for caution or the presence of a hazard. For more information
about locations where this symbol appears on instrument components, see “Operating
Precautions” in the Quick Start Manual, warning messages listed at the beginning of
operating instructions, and the document entitled “Operating Precautions” that comes
with the instrument.
Indicates an instrument that has been protected throughout by double insulation or
reinforced insulation.
Indicates whether the power is on or o.
Indicates the ground terminal.
Indicates direct current (DC).
Indicates alternating current (AC).
2
Page 9

Notations related to standards compliance
Indicates compliance with the Waste Electrical and Electronic Equipment (WEEE)
Directive in EU member nations.
Indicates that the instrument is targeted for recycling under the Act on the Promotion of
Eective Utilization of Resources.
Li-ion
Indicates that the instrument complies with standards imposed by EU directives.
Other notations
Indicates useful advice concerning instrument performance and operation.
About the Notations Used in This Manual
*
(p. ) Indicates the page number to reference.
Bold The names of control keys are printed in bold.
[ ]
Windows
S/s
Instructs the reader to see below for additional information.
Indicates the default setting. When initialized, the instrument will revert to this value.
The names of user interface elements on the screen are enclosed in brackets ([ ]).
Unless otherwise noted, the term “Windows” is used generically to refer to Windows 7,
Windows 8, and Windows 10.
For the instrument, the number of times the analog input signal is digitized is indicated
in samples per second (S/s).
Example: 20 MS/s (20 megasamples per second) signies 20×10
second.
Accuracy
Hioki denes tolerances for measured values in terms of f.s. (full scale), as indicated below.
Maximum display value, scale magnitude
f.s.
Indicates the maximum display value or scale magnitude. Generally speaking, the f.s.
gure indicates the range in current use.
Example: f.s. for the 1 V range = 1 V
6
samples per
3
Page 10

How to Use This Manual
How to Use This Manual
How to open screens
: SET key
: Main tab
: Sub tab
Step number
Numbers are the same as those
used in the instructions.
Selections and explanations
Indicates the selections that
can be made by pressing the
ENTER key and explains them.
Indicates the default setting.
4
Page 11

1.1 Performing Basic Operations ..............................................p. 6
1.2 Setting Measurement Conditions .......................................p. 10
1.3 Conguring Input Channels ................................................p. 16
1.4 Conguring the Waveform Display .....................................p. 36
1.5 Using the Scaling Function .................................................p. 42
1.6 Entering Comments .............................................................p. 47
1.7 Conguring Channels in a List ...........................................p. 50
1.8 Performing Zero Adjustment ...............................................p. 57
1.9 Checking Input Signals (Monitor Function) .......................p. 58
1.10 Starting and Stopping Measurement ................................p. 59
1.11 Observing Waveforms ........................................................p. 60
1.12 Using the A/B Cursors .......................................................p. 75
1.13 Conguration Navigator (Quick Set) ................................p. 78
1
Settings and Operation
This chapter introduces basic settings and instrument
operation.
Before starting measurement, you must set measurement
conditions such as recording interval and range. You must
also congure input channel settings such as input signal
types and ranges.
1
Settings and Operation
Unit Measure Channel Trigger Alarm Calculation System
5
Page 12

Performing Basic Operations
1.1 Performing Basic Operations
Instructions
>
>
)
: main tab;
22
33
Press the SET key to display the settings screen.
1
: sub tab)
In this manual, the active
item is said to have
“focus.” The background
of the selected item will
turn yellow.
Select the main tab you wish to congure with the Left Arrow and Right Arrow keys.
2
Unit Measure Channel Trigger Alarm Calculation System
You can also switch among the main tabs using the SET key.
You can move the focus among sub tabs by pressing the ENTER key.
You can return the focus to the main tab by pressing the ESC key.
Select the sub tab whose settings you wish to congure with the Up Arrow and Down Arrow
3
keys
You can move the focus to the settings area by pressing the ENTER key.
You can return the focus to the sub tab by pressing the ESC key.
Select the setting you wish to congure with the Left Arrow, Right Arrow, Up Arrow, and
4
Down Arrow keys and then press the ENTER key.
The available settings will be displayed.
Select an option with the Up Arrow and Down Arrow keys and then press the ENTER key.
5
The setting will be accepted.
IMPORTANT
Unless otherwise directed, do not press multiple keys simultaneously. The instrument could
exhibit unintended behavior.
You can prevent accidental or unintended operation by enabling the key lock feature to disable
key operation.
See “Key lock (disabling keys)” in the Quick Start Manual.
6
Page 13

Value entry method
This section describes how to enter values.
Performing Basic Operations
Numerical value entry window
11
Clear Clears the value.
1
Settings and Operation
22
33
BS Deletes one digit (backspace).
← Moves left one digit.
→ Moves right one digit.
OK Accepts the value.
Cancel Closes the window without entering a value.
Select the desired value with the Left Arrow, Right Arrow, Up Arrow, and Down Arrow keys
1
and then press the ENTER key.
The selected value will be entered.
Select the SI prex.
2
P, T, G, M, k,
The open box “
Press the ENTER key while [OK] is selected. Alternatively, press the START key.
3
The window will close, and the value will be entered.
␣
, m, µ, n, p, f
␣
” indicates a blank space.
Unit Measure Channel Trigger Alarm Calculation System
7
Page 14

Performing Basic Operations
Text entry method
This section describes how to enter comments and lenames.
You can enter single-byte alphanumeric and characters only.
Text entry window
11
22
22
Select a character with the Left Arrow, Right Arrow, Up Arrow, and Down Arrow keys and
1
press the ENTER key.
Press the START key (OK). Alternatively, or press the ENTER key while [OK] is selected.
2
The text entry window will close.
When saved in text format, some characters are saved using alternative characters as follows:
Character
used on the
instrument
2
3
μ
Ω
Saved
character
^2
^3
~
u
~
o
8
Page 15

Performing Basic Operations
Text entry
You can perform the operations listed below by choosing the operation on the screen and pressing
the ENTER key.
You can also use the corresponding key to perform the same operation.
Operation on screen Corresponding key Description
OK START Accepts the character.
Cancel ESC Closes the window without entering any text.
Clear FILE Deletes all entered text.
BS
DEL
<<
>>
Deletes the previous character (backspace).
Deletes the next character (delete).
Moves the cursor to the left.
Moves the cursor to the right.
1
Settings and Operation
Unit Measure Channel Trigger Alarm Calculation System
9
Page 16

Setting Measurement Conditions
1.2 Setting Measurement Conditions
This section describes how to congure settings such as the recording interval and recording time.
Settings cannot be changed while measurement is in progress. Stop measurement and then
change the settings.
You can select the recording method.
Sets the recording time setting to [Continuous].
Continuous recording
Time-specied recording
Repeat recording
Recording will continue until you press the STOP key. Recording can
be stopped with a trigger.
See “Stop triggers” (p. 84).
Sets the recording time setting to [Specied time].
The setting indicates the amount of time for which to record (the
recording length). Recording will stop once the set time has elapsed.
Recording can be stopped before the set time elapses with the STOP
key or a trigger.
Sets the repeat recording setting to [ON].
Recording will resume after stopping (due to stop trigger conditions or
the completion of recording for the set recording time). Recording will
repeat until you press the STOP key. If the repeat recording setting is
[OFF], recording will stop after one iteration.
10
Page 17

> >
11
22
33
44
55
66
Setting Measurement Conditions
1
Settings and Operation
Enter a title comment in the [Title comment] eld (optional).
1
See “Title comments” (p. 47).
Under [Recording mode], select type of recording.
2
Normal
The setting cannot be changed from [Normal]. Hioki plans to add new functionality in the future.
Under [Recording interval], select the data capture interval.
3
Example: Choosing [10 ms] will cause data to be captured at a 10 ms interval (100 times per
1 ms
1 s, 2 s, 5 s, 10 s, 20 s, 30 s,
1 min, 2 min, 5 min, 10 min, 20 min, 30 min,
1 h
*1: Setting available only when using a module with data refresh intervals including 1 ms. (when there is at
Under [Repetitive recording], choose whether to repeat recording operation.
4
OFF
ON Repeats recording operation.
second).
*1, 2 ms*1, 5 ms*1, 10 ms, 20 ms, 50 ms, 100 ms, 200 ms, 500 ms,
least one U8553, U8554, LR8533, or LR8534 module for which measurement is enabled).
Data is recorded in synchronization with the internal clock.
Stops recording after one iteration.
Measurement will stop when you press the STOP key.
Unit Measure Channel Trigger Alarm Calculation System
11
Page 18

Setting Measurement Conditions
Under [Recording time], set the amount (length) of time for which you wish to record data.
5
Specied time Records for the set amount of time. (Max. 500 days)
Days, hours, minutes, seconds
Continuous
If you select [Specied time], the maximum time and data count will be displayed. The maximum amount of
time that you can record varies with the number of channels in use and the recording interval.
If you select [Continuous], measurement will continue while deleting past data from the internal buer
memory if the maximum capacity of the internal buer memory is exceeded. It is recommended to use auto
saving since deleted data cannot be restored.
See “Auto save (real-time save)” (p. 106).
Under [Alarm source], choose whether to record the alarm source channel during alarms.
6
Recording will continue until you press the STOP key.
Measurement can also be stopped with a trigger.
See “Stop triggers” (p. 84).
Set to [ON] when you’re using an alarm and you wish to save data for the alarm source channel.
Set as necessary as the amount of data will increase.
OFF
, ON
When the recording time is set to [Specied time] and repeat recording is set to
[ON]
Internal processing will take some time (downtime) between the time that recording stops after the
specied amount of time has elapsed and the start of the next recording operation. Recording is not
performed during this time.
Downtime
Recording
You can record without any downtime by setting the recording time to [Continuous] and enabling
auto saving and le segmentation. Saved data les can be segmented using the desired time
segment.
12
Page 19

Setting Measurement Conditions
Measurement module data refresh intervals
This section describes how to set the data refresh interval for each measurement module
separately from the instrument’s recording interval.
Data refresh interval
Recording interval
>
Interval at which measurement modules refresh measurement data
Interval at which the instrument captures data from measurement
modules
A list of connected modules will be displayed.
• [Unit 1] to [Unit 4]: Plug-in modules
• [Remote 1] to [Remote 7]: Wireless modules
1
Settings and Operation
11 22
Under [Update], select the data refresh interval.
1
Auto
, 1 ms, 2 ms, 5 ms, 10 ms, 20 ms, 50 ms, 100 ms, 200 ms, 500 ms, 1 s, 2 s, 5 s, 10 s
Ordinarily, this setting should be set to [Auto]. When you choose [Auto], the shortest data refresh interval will
be set for each module based on the recording interval.
The available data refresh interval settings vary with the modules in use and the wire break detection setting.
Wire break detection
OFF From 10 ms*
ON From 20 ms*
*1: Settings start at 100 ms when using a Pt1000 with the U8551 or LR8531.
*2: When using 15 or fewer channels, the 10 ms setting is available.
*3: When using 15 or fewer channels, the 20 ms setting is available.
*4: No wire break detection function is available.
• When the data refresh interval is set to a value other than [Auto], it is recommended to use
longer times.
This will allow you to reduce the digital lter’s cuto frequency to eliminate low-frequency noise.
• You can eliminate power supply frequency noise by setting the data refresh interval so that the
[Filter] setting is 50 Hz or 60 Hz.
U8550, U8551,
LR8530, LR8531
1
1
U8552, LR8532
From 20 ms*
From 50 ms*
2
3
U8553, U8554,
LR8533, LR8534
From 1 ms*
4
Unit Measure Channel Trigger Alarm Calculation System
13
Page 20

Setting Measurement Conditions
Under [Filter], check the lter’s cuto frequency.
2
The lter’s cuto frequency will change depending on the data refresh interval setting.
Check the cuto frequency that is displayed for each module.
Relationship between the data refresh interval and the recording interval
• Measurement modules send data to the instrument once each data refresh interval.
• The instrument receives data from measurement modules once each recording interval.
• Even if a measurement module’s data refresh interval is short, it will not be possible to record
waveform peaks if the instrument’s recording interval is long.
Data refresh interval Recording interval
Short Long Short Long
Strength of the power
supply frequency lter
Data volume – – More data Less data
Weak Strong – –
Waveform peaks Easier to capture* More dicult to
capture
*: If the data refresh interval and recording interval are short.
Easier to capture* More dicult to
capture
• For the U8550 to U8553 and LR8530 to LR8533 modules, the longer the data refresh interval,
the lower the digital lter cuto frequency, yielding more eective noise rejection. For more
information about cuto frequencies, see the section about each module’s digital lter in “10.2
Plug-in Module Specications” (p. 243).
• To maximize the eectiveness of the digital lter, congure the [Power frequency lter] setting
according to the power supply frequency in the region where the instrument is being used.
See “7.1 Conguring Settings” (p. 164).
• For modules whose data refresh interval is longer than the recording interval, the rst two data
points will be continuous, and there will be a delay.
Dierences in measurement data caused by data refresh intervals and recording intervals
: Point in measurement data
Module
Data refresh interval: 1 s
Peak
1 s
LR8450/LR8450-1
Recording interval: 2 s
Unable to capture peak
2 s
Module
Data refresh interval: 1 s
1 s
14
Peak
LR8450/LR8450-1
Recording interval: 1 s
Able to capture peak
1 s
Page 21

Setting Measurement Conditions
Example setting
What you want to do Data refresh interval Recording interval
Record a signal that’s changing quickly
(electrical signal, etc.)
Record a signal that’s changing slowly
(temperature, etc.)
Record fast and slow signals at the same time Shorter for modules used to
Since you can set the data refresh interval separately for each module, the instrument can be used
as follows:
• For module 1, set the data refresh interval to 2 s so that you can eliminate power supply noise
and reduce the eects of noise when performing temperature measurement using thermocouples.
• For module 2, set the data refresh interval to 10 ms so that you can record battery voltage
uctuations.
• For module 3, set the data refresh interval to 1 ms so that you can record changes in control
signals at the maximum speed.
• Set the instrument’s recording interval to 1 ms, reecting the shortest data refresh interval.
The instrument will record data from modules 1 through 3 every 1 ms.
Shorter Shorter
Longer Longer
Shorter
measure fast signals
Longer for modules used to
measure slow signals
1
Settings and Operation
If the instrument’s recording interval is shorter than a module’s data refresh interval, the same value
will be recorded for that module’s data.
Example: If the recording interval is 1 ms and the data refresh interval is 1 s, 1000 pieces of data all
of which have the same value will be recorded.
For more information about the module identier, see “Module identiers” (p. 49); about the lter
of U8554 and LR8534 Strain Unit, “Measuring strain” (p. 27).
Data refresh interval of pulses
Pulse data will be refreshed at the data refresh intervals.
The data refresh interval of pulses will automatically be set depending on input types.
Input type Data refresh interval
Integration 1 ms
Rotational speed r/s or r/min (Smoothing: 1 s) 10 ms
r/min (Smoothing: 2 s to 60 s) 50 ms
• The data refresh interval setting does not aect pulse counting processes.
• Even if the data refresh interval of pulses is equal to that for the measurement module, these data
will not simultaneously be refreshed when the recording interval is shorter than the data refresh
interval.
Unit Measure Channel Trigger Alarm Calculation System
15
Page 22

Conguring Input Channels
1.3 Conguring Input Channels
Congure input channels for voltage measurement, temperature measurement, etc.
Un-m
Channel
The letters n and m represent a module number and a channel
number, respectively.
Input
Range
Set the waveform color, scaling, and comments as necessary.
These settings can be congured either on each channel’s individual settings screen or on the
settings list screen for multiple channels.
Selects the type of measurement target.
Voltage, thermocouple, humidity, etc.
Sets the magnitude of the input signal.
Setting method
Set the main tab to [Channel].
1
Select the settings screen on the sub tab.
2
• [Individual]
Congure the settings on the individual settings screen for each channel.
• [Unit n] (n = 1, 2, . . .)
Congure the settings on the settings list screen for each module.
• [Pulse]
Congure the settings on the settings list screen.
Press the ENTER key.
3
The focus will move to the settings area.
You can return the focus to the sub tab by pressing the ESC key.
Select the setting you wish to congure with the Left Arrow, Right Arrow, Up Arrow, and
4
Down Arrow keys.
Press the ENTER key.
5
The available settings will be displayed.
Select the desired setting with the Up Arrow and Down Arrow keys and then press the
6
ENTER key.
The setting will be accepted.
16
Page 23

Conguring Input Channels
Individual settings screen
A settings screen will be displayed for each channel.
Under [Channel], select the module and channel to congure.
Congure the range and display for the selected channel.
A waveform monitor is shown on the left side of the screen. You can also switch the display format
to show numerical values.
1
Settings and Operation
Unit Measure Channel Trigger Alarm Calculation System
17
Page 24

Conguring Input Channels
Settings list screen
This screen displays a list of settings for each module.
For more information about the settings list screen, see “1.7 Conguring Channels in a List” (p. 50).
The following settings can be congured on the settings list screen:
• Measurement on/o
• Waveform display colors
• Input, display, scaling, comment, and numerical value calculation settings (Available settings
depend on the type of module.)
• Zero-adjustment (U8554 and LR8534: auto balancing)
Select a channel number and press the ENTER key to display the individual settings window.
You can also congure settings on the individual settings window.
Individual settings window (close with the ESC key)
18
Page 25

Conguring Input Channels
Measuring voltage
This section describes how to congure settings on the individual settings screen when measuring
voltage.
You can use [Input] on the settings list screen to congure the settings. (See p. 50.)
Applicable modules: U8550, U8551, U8552, U8553, U8554, LR8530, LR8531, LR8532, LR8533,
LR8534
> >
1
Settings and Operation
11
22
33
44
Select the module (Unit) and channel to congure and select the checkbox.
1
Measurement will not be performed for channels whose checkboxes are not selected.
Select the waveform display color.
2
× (OFF), 24 colors
Select [×] if you wish to measure the channel but not to display its waveform or numerical values on the
screen.
Set the input type to [Voltage].
3
For the U8553 and LR8533, the setting cannot be changed from [Voltage].
Under [Range], select the measurement range as appropriate for the measurement target.
4
(For the U8550, U8551, U8552, LR8530, LR8531, or LR8532)
10 mV
(For the U8553 or LR8533 High Speed Voltage Unit)
100 mV
(For the U8554 or LR8534 Strain Unit)
1 mV
, 20 mV, 100 mV, 200 mV, 1 V, 2 V, 10 V, 20 V, 100 V, 1 to 5 V
, 200 mV, 1 V, 2 V, 10 V, 20 V, 100 V, 1 to 5 V
, 2 mV, 5 mV, 10 mV, 20 mV, 50 mV, 100 mV, 200 mV
Unit Measure Channel Trigger Alarm Calculation System
19
Page 26

Conguring Input Channels
(For the U8554 or LR8534 Strain Unit)
5
Under [Filter], select the cuto frequency.
Auto
, 120 Hz, 60 Hz, 30 Hz, 15 Hz, 8 Hz, 4 Hz
See the table in “Measuring strain” (p. 27) for a list of cuto frequencies when [Auto] is selected.
When measuring instrumentation devices
• When measuring a 4-20 mA current, connect a 250 Ω resistor between the positive and negative
input terminals.
See “Connecting voltage cables and thermocouples” in the Quick Start Manual.
• The [1-5 V] range is convenient when measuring output from 4-20 mA instrumentation devices.
• The [1-5 V] range is a range in which the lower and upper limits of the [10 V] range’s display
range are automatically set to 1 V and 5 V, respectively. If you wish to change the upper and
lower limit values, use the [10 V] range.
• The Strain Unit does not support 4-20 mA current measurement.
You can use the scaling function to convert measured voltage values to the desired values.
See “1.5 Using the Scaling Function” (p. 42).
20
Page 27

Conguring Input Channels
Measuring temperature (with thermocouples)
This section describes how to congure settings on the individual settings screen when measuring
temperature using thermocouples.
You can use [Input] on the settings list screen to congure the settings. (See p. 50.)
Applicable modules: U8550, U8551, U8552, LR8530, LR8531, LR8532
> >
1
Settings and Operation
11
33
44
22
55
66
77
Select the module (Unit) and channel to congure and select the checkbox.
1
Measurement will not be performed for channels whose checkboxes are not selected.
Select the waveform display color.
2
× (OFF), 24 colors
Select [×] if you wish to measure the channel but not to display its waveform or numerical values on the
screen.
Set the input type to [Tc].
3
Under [Range], select the measurement range as appropriate for the temperature being
4
measured.
100°C
B thermocouples cannot be selected for the 100°C and 500C° ranges.
When using B thermocouples, set the range to 2000°C rst.
Under [Type], select the type of thermocouple you’re using.
5
K
*:[B] can be selected when using the 2000°C range.
See “Measurable temperature range” (p. 22).
, 500°C, 2000°C
, J, E, T, N, R, S, B*, C
Unit Measure Channel Trigger Alarm Calculation System
21
Page 28

Conguring Input Channels
Under [Burn out], select whether you wish to detect wire breaks.
6
OFF
ON Detects thermocouple wire breaks when measuring temperature using thermocouples.
Under [RJC], select the type of reference junction compensation to use.
7
INT
EXT Does not perform reference junction compensation inside the measurement module.
Does not detect thermocouple wire breaks.
Values will vary when a thermocouple experiences a wire break.
The numerical value display and cursor value will be indicated as [BURNOUT] when a
wire break occurs. Calculated values and saved data are treated as 327.66°C (100°C
f.s. range), 1638.3°C (500°C f.s. range), or 3276.6°C (2000°C f.s. range).
There are limits on the data refresh interval that can be set.
See “Thermocouple wire break detection” (p. 23).
Performs reference junction compensation inside the measurement module.
Use this setting when the thermocouple (or compensation lead wire) is connected
directly to the instrument.
The measurement accuracy is determined by adding the temperature measurement
accuracy to the reference junction compensation accuracy.
Use this setting when connecting an external zero junction compensation device (0°C
ice water, etc.).
The measurement accuracy is dened by the temperature measurement accuracy
alone.
Measurable temperature range
The measurable temperature range depends on the type of thermocouple being used.
Thermocouple Measurable temperature range
K −200°C to 1350°C
J −200°C to 1200°C
E −200°C to 1000°C
T −200°C to 400°C
N −200°C to 1300°C
R 0°C to 1700°C
S 0°C to 1700°C
B* 400°C to 1800°C
C 0°C to 2000°C
*: [B] can be selected when using the 2000°C range. Temperatures from 0°C to 400°C will be displayed even
if [B] is selected, but accuracy will not be guaranteed.
22
Page 29

Thermocouple wire break detection
• The system checks for wire breaks by applying a minuscule current each date refresh interval
when measuring temperature using thermocouples.
• Measured values are not aected since wire breaks are detected when measurement is not being
performed.
• If the data refresh intervals are the same, setting [Burn out] to [ON] will result in less eective
noise rejection since it results in a cuto frequency that is higher than the [OFF] setting.
Check “Digital lter” of each module in “10.2 Plug-in Module Specications” (p. 243) for the cuto
frequency.
• If the thermocouple resistance exceeds roughly the next value, the system will determine that a
wire break has occurred.
Conguring Input Channels
1
Settings and Operation
Thermocouple
K 260
J 470
E 1530
T 220
N 520
R 50
S 50
B – – 2090
C 220
When using a long thermocouple with [Burn out] set to [ON], use a thick-diameter wire to avoid false wire
break detection.
100°C f.s. 500°C f.s. 2000°C f.s.
Ω
Ω
Ω
Ω
Ω
Ω
Ω
Ω
Range
5400
4150
5970
5440
1470
40
80
910
Ω
Ω
Ω
Ω
Ω
Ω
Ω
2940
200
9290
5440
590
890
1300
Ω
Ω
Ω
Ω
Ω
Ω
Ω
Ω
Ω
3090
Ω
Unit Measure Channel Trigger Alarm Calculation System
23
Page 30

Conguring Input Channels
Measuring temperature (with resistance temperature detectors)
This section describes how to congure settings on the individual settings screen when measuring
temperature using resistance temperature detectors.
You can use [Input] on the settings list screen to congure the settings. (See p. 50.)
Applicable modules: U8551, LR8531
> >
11
22
33
55
Select the module (Unit) and channel to congure and select the checkbox.
1
Measurement will not be performed for channels whose checkboxes are not selected.
Select the waveform display color.
2
× (OFF), 24 colors
44
66
Select [×] if you wish to measure the channel but not to display its waveform or numerical values on the
screen.
Set the input type to [RTD].
3
Under [Type], select the type of resistance temperature detector you’re using.
4
Pt100
When [Pt1000] is selected, the [10 ms], [20 ms], and [50 ms] data refresh interval settings will not be
available.
Under [Range], select the measurement range as appropriate for the temperature being
5
measured.
100°C
Under [Wiring method], select a the wiring method of the resistance temperature detector.
6
3-wire
4-wire 4-wire resistance temperature detector.
, JPt100, Pt1000
, 500°C, 2000°C
3-wire resistance temperature detector.
24
Page 31
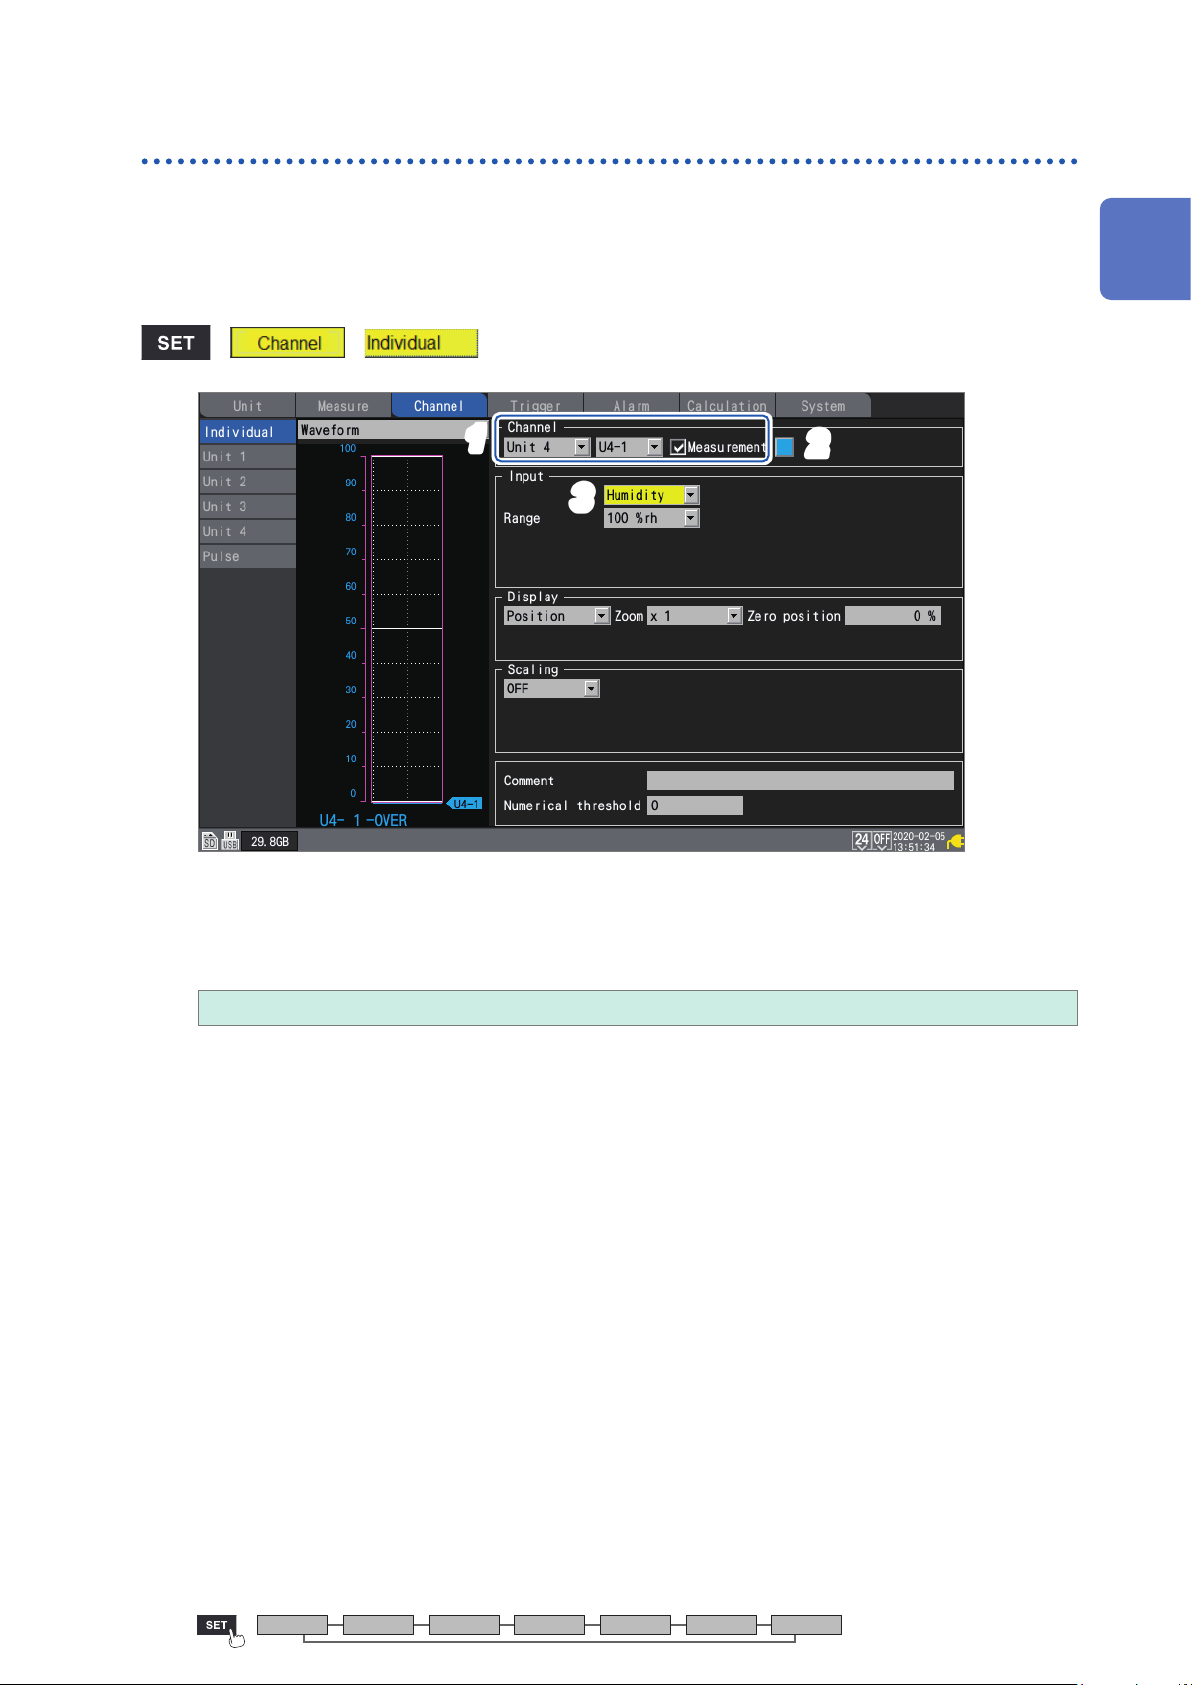
Conguring Input Channels
Measuring humidity
This section describes how to congure settings on the individual settings screen when measuring
humidity with the optional Humidity Sensor.
You can use [Input] on the settings list screen to congure the settings. (See p. 50.)
Applicable modules: U8550, U8551, U8552, LR8531
Applicable sensor: Z2000 Humidity Sensor
> >
1
Settings and Operation
11
22
33
Select the module (Unit) and channel to congure and select the checkbox.
1
Measurement will not be performed for channels whose checkboxes are not selected.
Select the waveform display color.
2
× (OFF), 24 colors
Select [×] if you wish to measure the channel but not to display its waveform or numerical values on the
screen.
Set the input type to [Humidity].
3
There is no range setting (the setting cannot be changed from the 100% RH range).
Unit Measure Channel Trigger Alarm Calculation System
25
Page 32
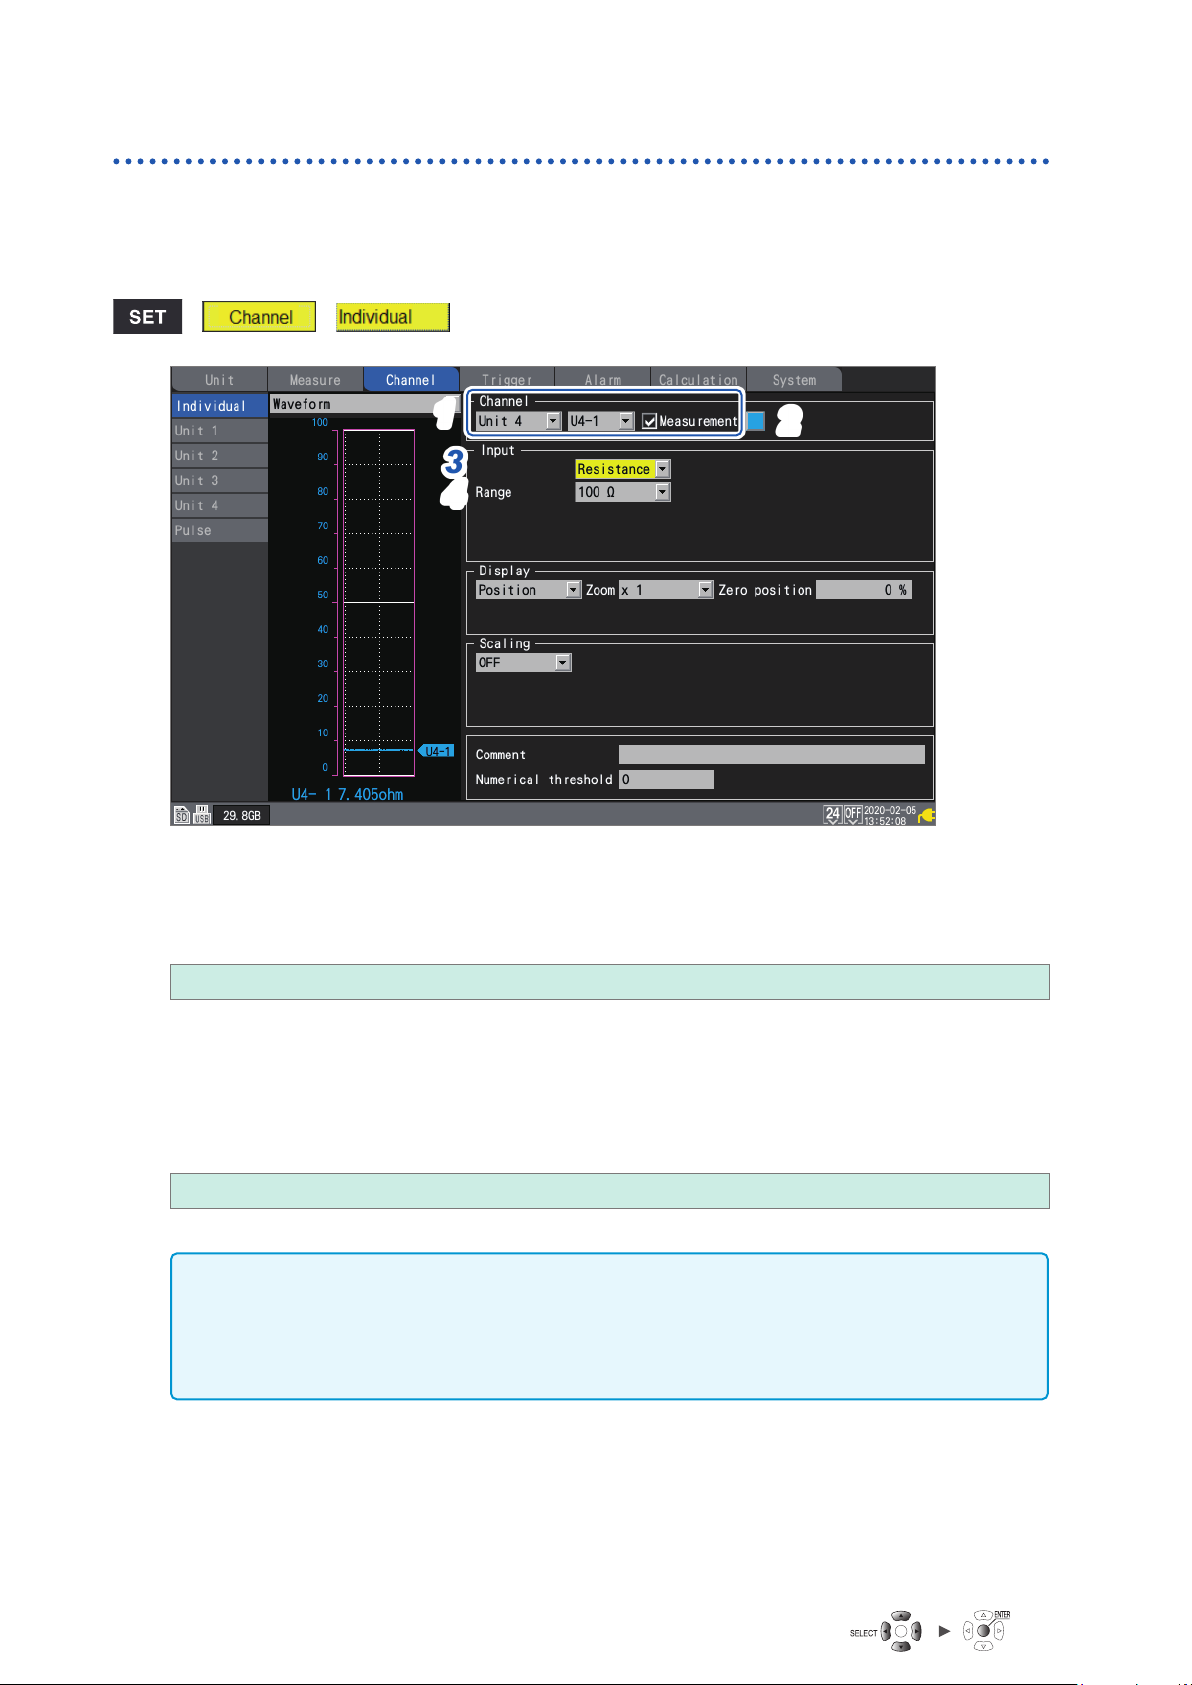
Conguring Input Channels
Measuring resistance
This section describes how to congure settings on the individual settings screen when measuring
resistance.
You can use [Input] on the settings list screen to congure the settings. (See p. 50.)
Applicable modules: U8551, LR8531
> >
11
22
33
44
Select the module (Unit) and channel to congure and select the checkbox.
1
Measurement will not be performed for channels whose checkboxes are not selected.
Select the waveform display color.
2
× (OFF), 24 colors
Select [×] if you wish to measure the channel but not to display its waveform or numerical values on the
screen.
Set the input type to [Resistance].
3
Under [Range], select the measurement range as appropriate for the resistance being
4
measured.
10
, 20 Ω, 100 Ω, 200
Ω
IMPORTANT
When measuring an inductive load such as winding resistance, the instrument’s response may
not be able to keep up, preventing accurate measurement. If you encounter this issue, increase
the data refresh interval. As a general rule, inductors of up to 100 mH can be measured with a
data refresh interval of 100 ms.
Ω
26
Page 33
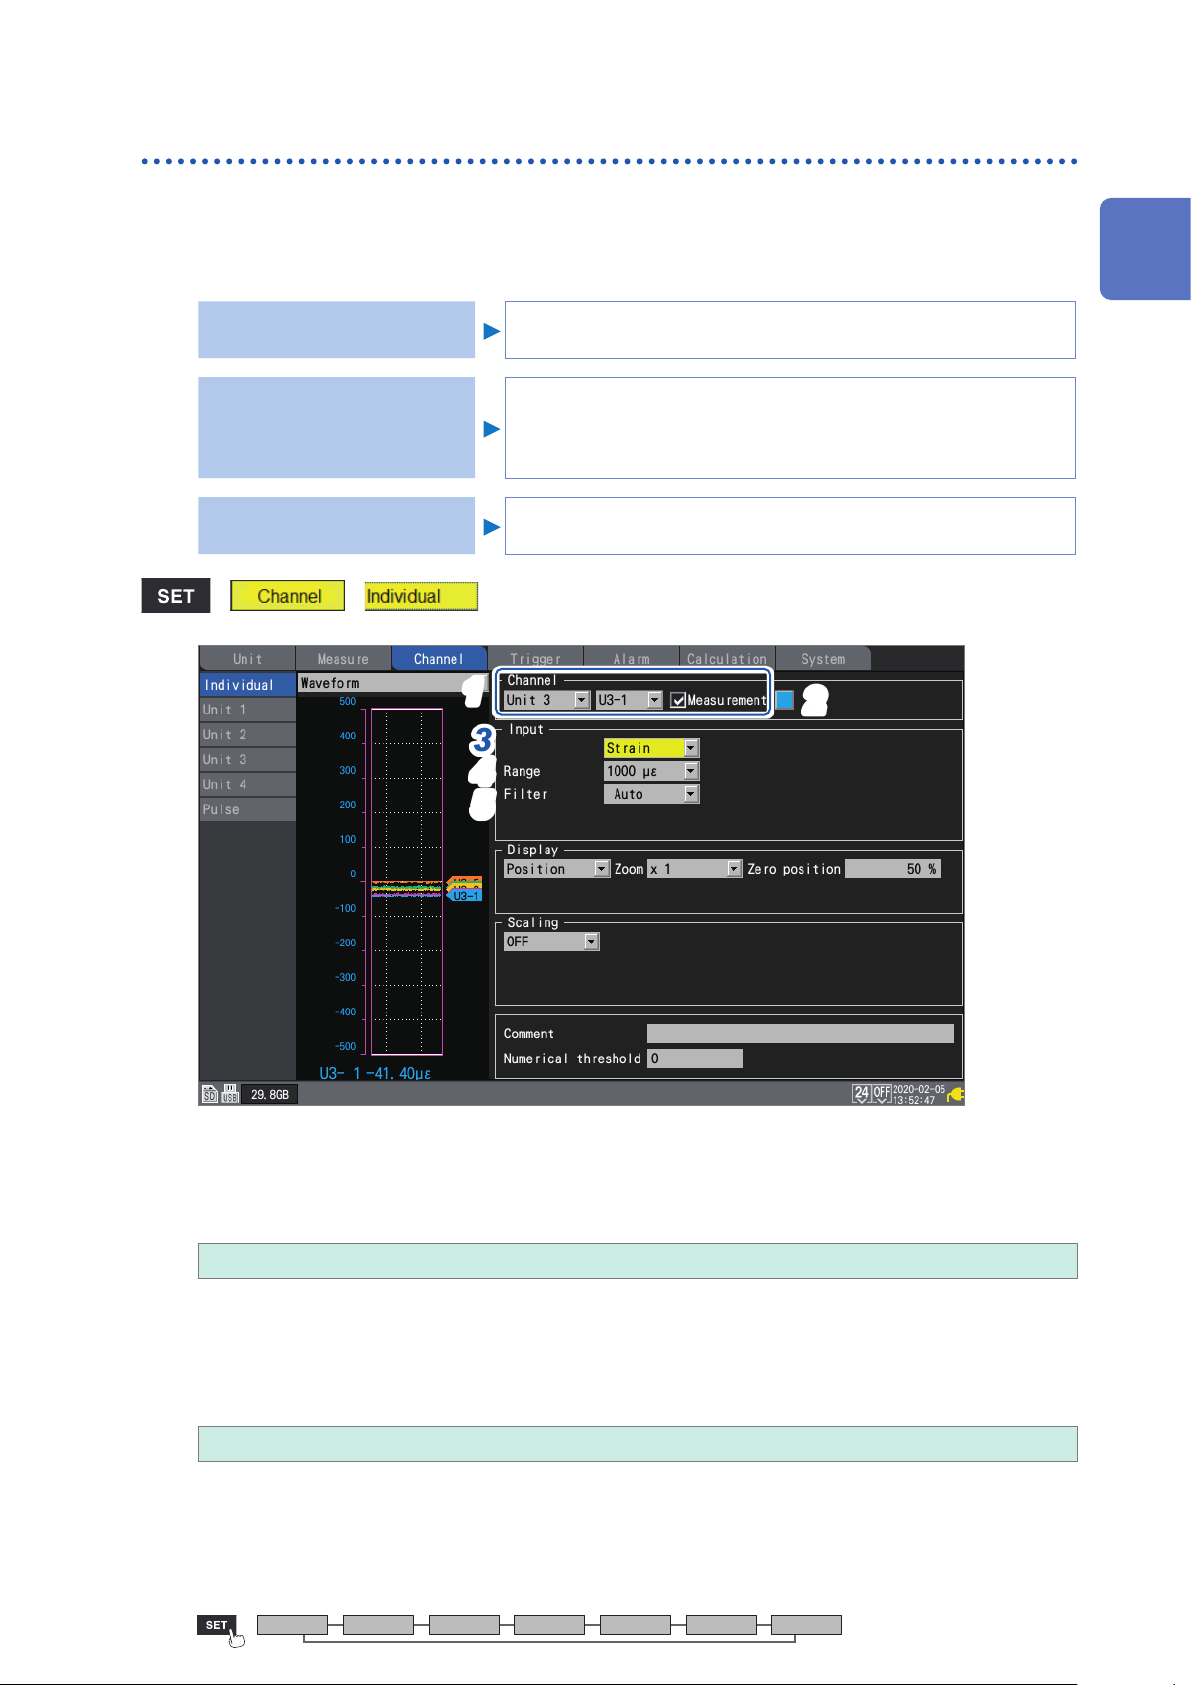
Conguring Input Channels
Measuring strain
This section describes how to congure settings on the individual settings screen when measuring
strain or vibration with a strain gage or strain gage-type converter.
You can use [Input] on the settings list screen to congure the settings. (See p. 50.)
Applicable modules: U8554, LR8534
Measuring strain
Converting measured values
using scaling based on the
gage factor or a strain gage-
type converter’s rated value
See “11.2 Measuring Strain” (p. 270).
See “1.5 Using the Scaling Function” (p. 42).
1
Settings and Operation
Connecting a strain gage or
strain gage-type converter
> >
See “Connecting a strain gage or strain gage-type converter” in the
Quick Start Manual.
11
22
33
44
55
Select the module (Unit) and channel to congure and select the checkbox.
1
Measurement will not be performed for channels whose checkboxes are not selected.
Select the waveform display color.
2
× (OFF), 24 colors
Select [×] if you wish to measure the channel but not to display its waveform or numerical values on the
screen.
Set the input type to [Strain].
3
Under [Range], select the measurement range as appropriate for the measurement target.
4
1000 µε
The instrument expresses strain in terms of micro epsilon (με).
, 2000 µε, 5000 µε , 10000 µε, 20000 µε, 50000 µε , 100000 µε, 200000 µε
Unit Measure Channel Trigger Alarm Calculation System
27
Page 34
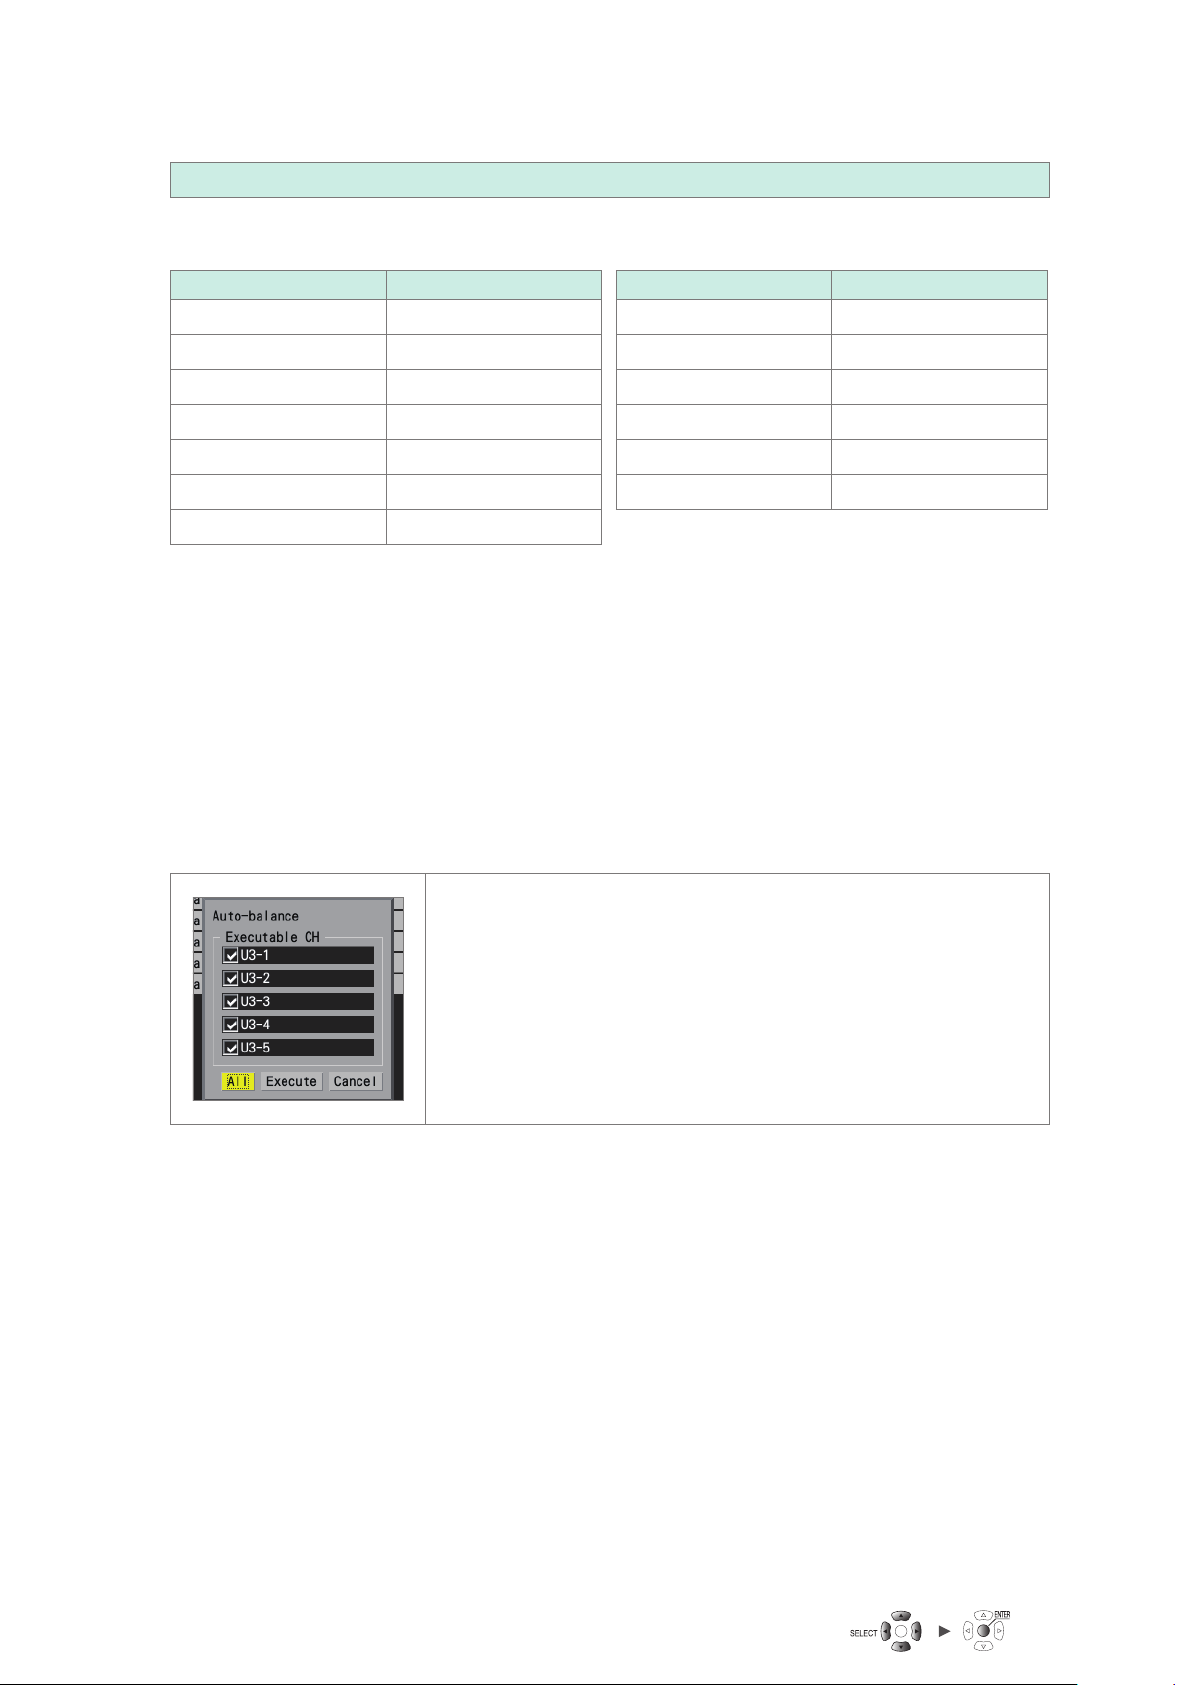
Conguring Input Channels
Under [Filter], select the cuto frequency.
5
Auto
, 120 Hz, 60 Hz, 30 Hz, 15 Hz, 8 Hz, 4 Hz
When [Auto] is selected, the low-pass lter’s cuto frequency will automatically be set as described
in the following table based on the set data refresh interval:
Data refresh interval Cuto frequency Data refresh interval Cuto frequency
1 ms 120 Hz 200 ms 4 Hz
2 ms 60 Hz 500 ms 4 Hz
5 ms 30 Hz 1 s 4 Hz
10 ms 15 Hz 2 s 4 Hz
20 ms 8 Hz 5 s 4 Hz
50 ms 4 Hz 10 s 4 Hz
100 ms 4 Hz
On the [Wave+Set] screen, press the ENTER key while [Auto-bal] is selected on the bottom
6
right of the screen.
Auto-balancing will be performed for all channels of the Strain Unit.
Perform this step under the following conditions:
• Turn on the instrument and wait 30 minutes.
• Connect a strain gage or strain gage-type converter to the module; however, do not apply any
loads, including vibration.
• Connect the B and D inputs terminals with one another when measuring voltage.
Auto-balancing cannot be performed while measurement is in progress.
Key operations are ignored while auto-balancing is in progress.
Auto-balancing can also be performed using the [Auto-balance]
button on the top right of the channel list screen. Press the ENTER
key to display the settings window.
Select the checkboxes for the channels for which you wish to
perform auto-balancing. Then press the ENTER key while [Execute]
is selected.
Press the ENTER key while [All] is selected to select or cancel
auto-balancing for all channels at once.
See “1.7 Conguring Channels in a List” (p. 50).
Perform auto-balancing again in the following circumstances:
• When the input types have changed
• When the range has changed
• When module connections have changed
• When the strain gage or strain gage-type converter has changed
• When the instrument’s power has been cycled
• When the instrument’s settings have been initialized
• When the ambient temperature has changed abruptly (when the zero position may have drifted)
If auto-balancing fails, check the following:
• Is the strain gage or strain gage-type converter in a no-load state?
• Is the strain gage or strain gage-type converter connected properly?
28
Page 35
Conguring Input Channels
Integrating pulses
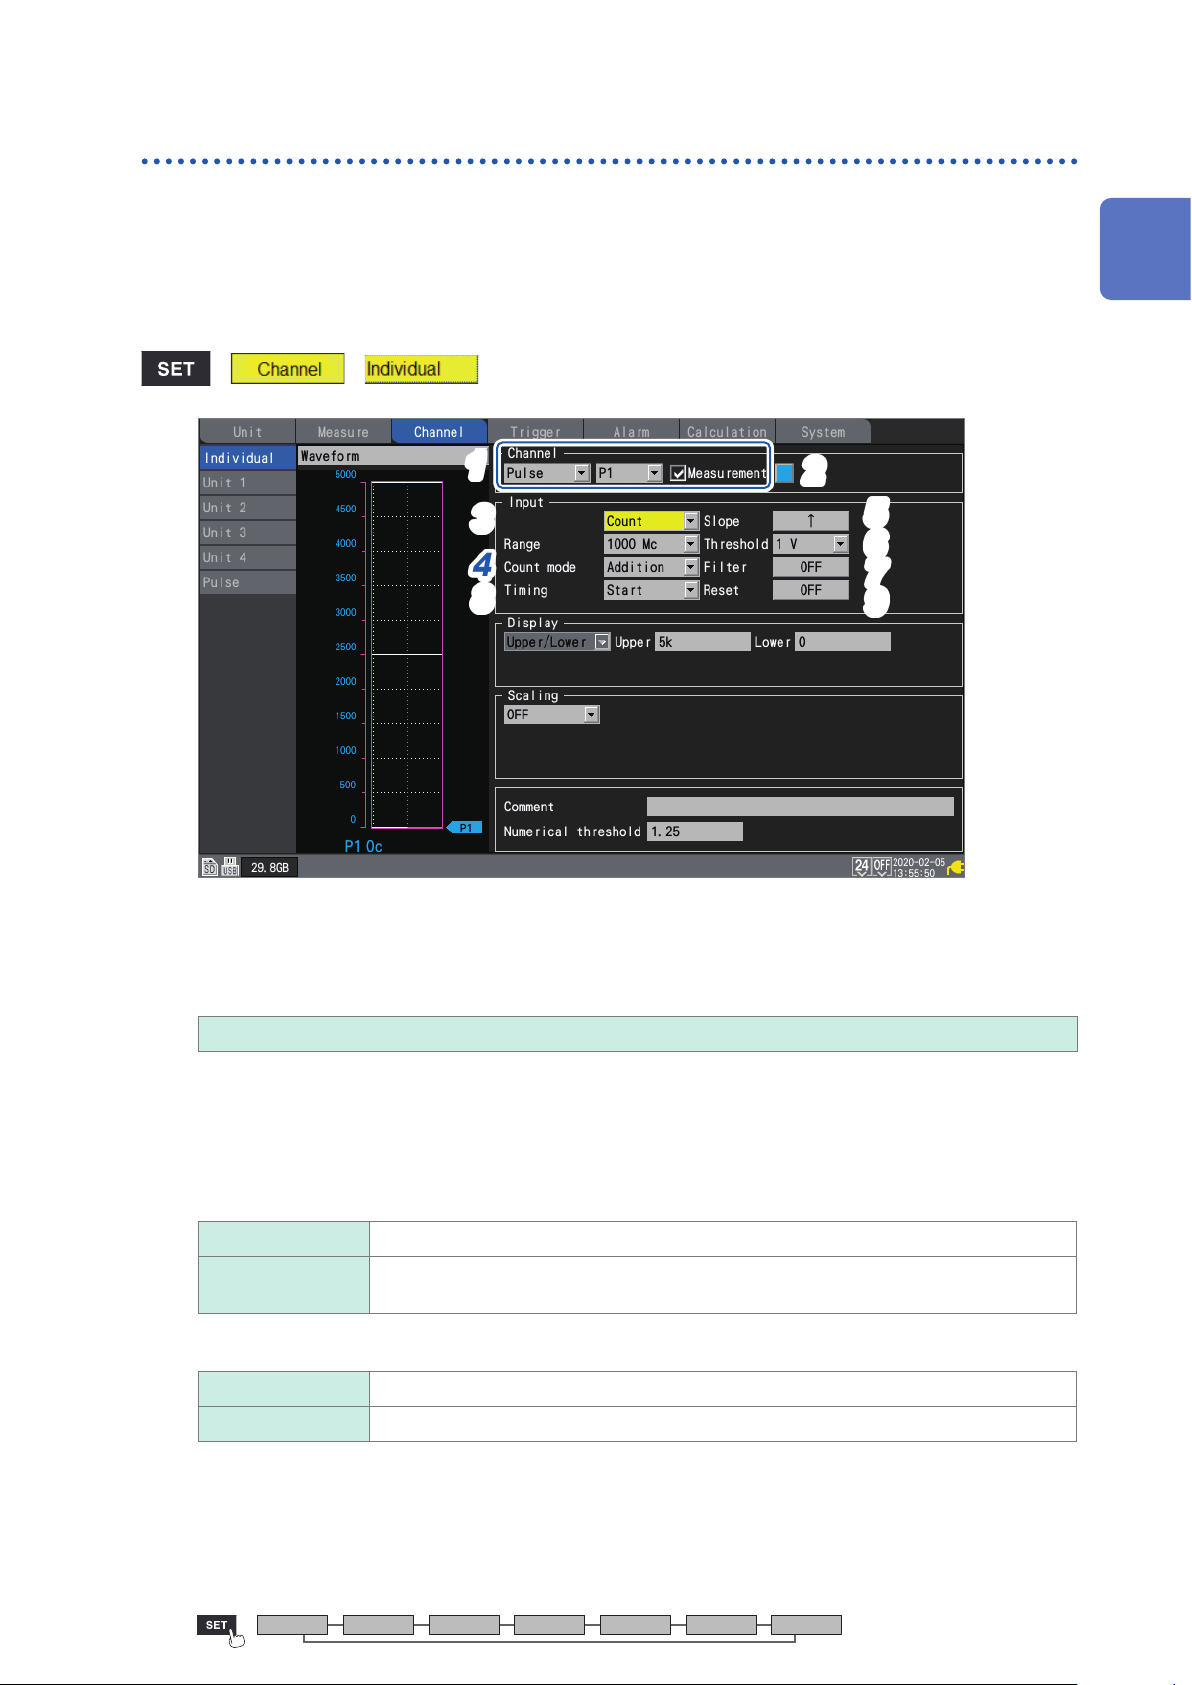
You can perform measurement by integrating the pulse count from an integrating wattmeter, ow
meter, or similar device.
This section describes how to congure settings on the individual settings screen when performing
integration measurement.
You can use the settings list screen to congure the settings. See p. 52.
External control terminals: Pulse input terminals P1 to P8
> >
1
Settings and Operation
11
22
33
44
88
Select [Pulse], and choose a channel from [P1] to [P8].
1
Measurement will not be performed for channels whose checkboxes are not selected.
Select the waveform display color.
2
× (OFF), 24 colors
55
66
77
99
Select [×] if you wish to measure the channel but not to display its waveform or numerical values on the
screen.
Set the input type to [Count].
3
The range cannot be changed from 1000 Mc.
Under [Count mode], select the integration method.
4
Addition
Instant Measures the number of pulses inputted to the instrument during the recording interval.
Under [Slope], select the slope to count.
5
↑
↓ Integrates the number of times the pulse switches from high level to low level (falling).
Unit Measure Channel Trigger Alarm Calculation System
Measures the integrated value for the number of pulses from the start of measurement.
The pulse count will be reset for each recording interval.
Integrates the number of times the pulse switches from low level to high level (rising).
29
Page 36
Conguring Input Channels
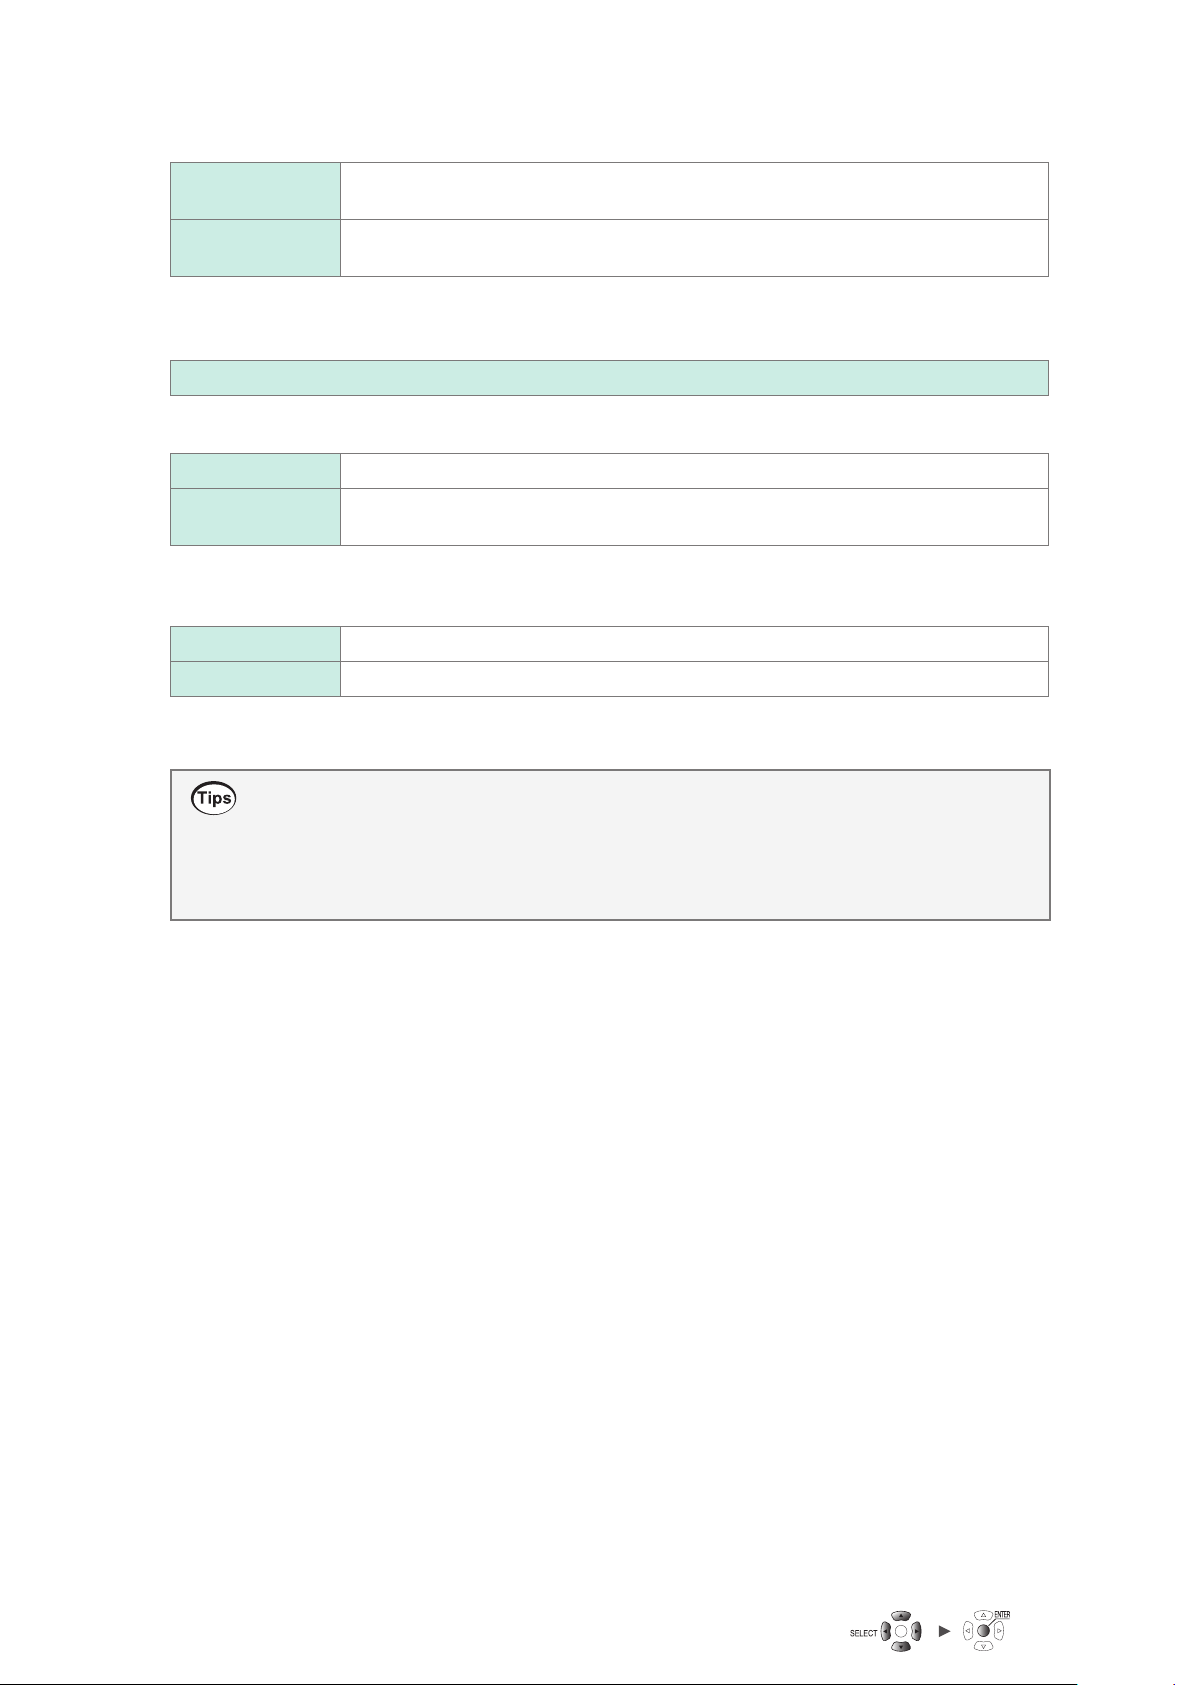
Under [Threshold], select the level used for counting.
6
1 V
4 V Treats voltages that are greater than or equal to 4.0 V as high level and voltages that
Under [Filter], select whether to use the chatter prevention lter.
7
Treats voltages that are greater than or equal to 1.0 V as high level and voltages that
are greater than or equal to 0 V but less than 0.5 V as low level.
are greater than or equal to 0 V but less than 1.5 V as low level.
Set to [ON] to prevent false counting due to chatter in mechanical contact (relay) output.
OFF
, ON
Under [Timing], select when to reset counting.
8
Start
Trigger Resets the count to zero at the start of measurement and at which a trigger activates.
Under [Reset], select the operation to perform when the integrated value overows.
9
OFF
Resets the count to zero at the start of measurement.
The values acquired before the reset are recorded for the trigger point.
Stops counting.
ON Resets the count value and resumes counting from zero.
• You can use the scaling function to convert the integrated pulse count into the measurement
target’s physical properties (Wh, VA, etc.) and display the result.
See “1.5 Using the Scaling Function” (p. 42).
• The upper limit that can be measured is 1,000,000,000 pulses. If the possibility exists that this
limit may be exceeded, it is recommended to perform measurement using the instantaneous
integration mode and integrate the pulses later using Excel
®
or other software.
30
Page 37
Conguring Input Channels
Measuring rotational speed
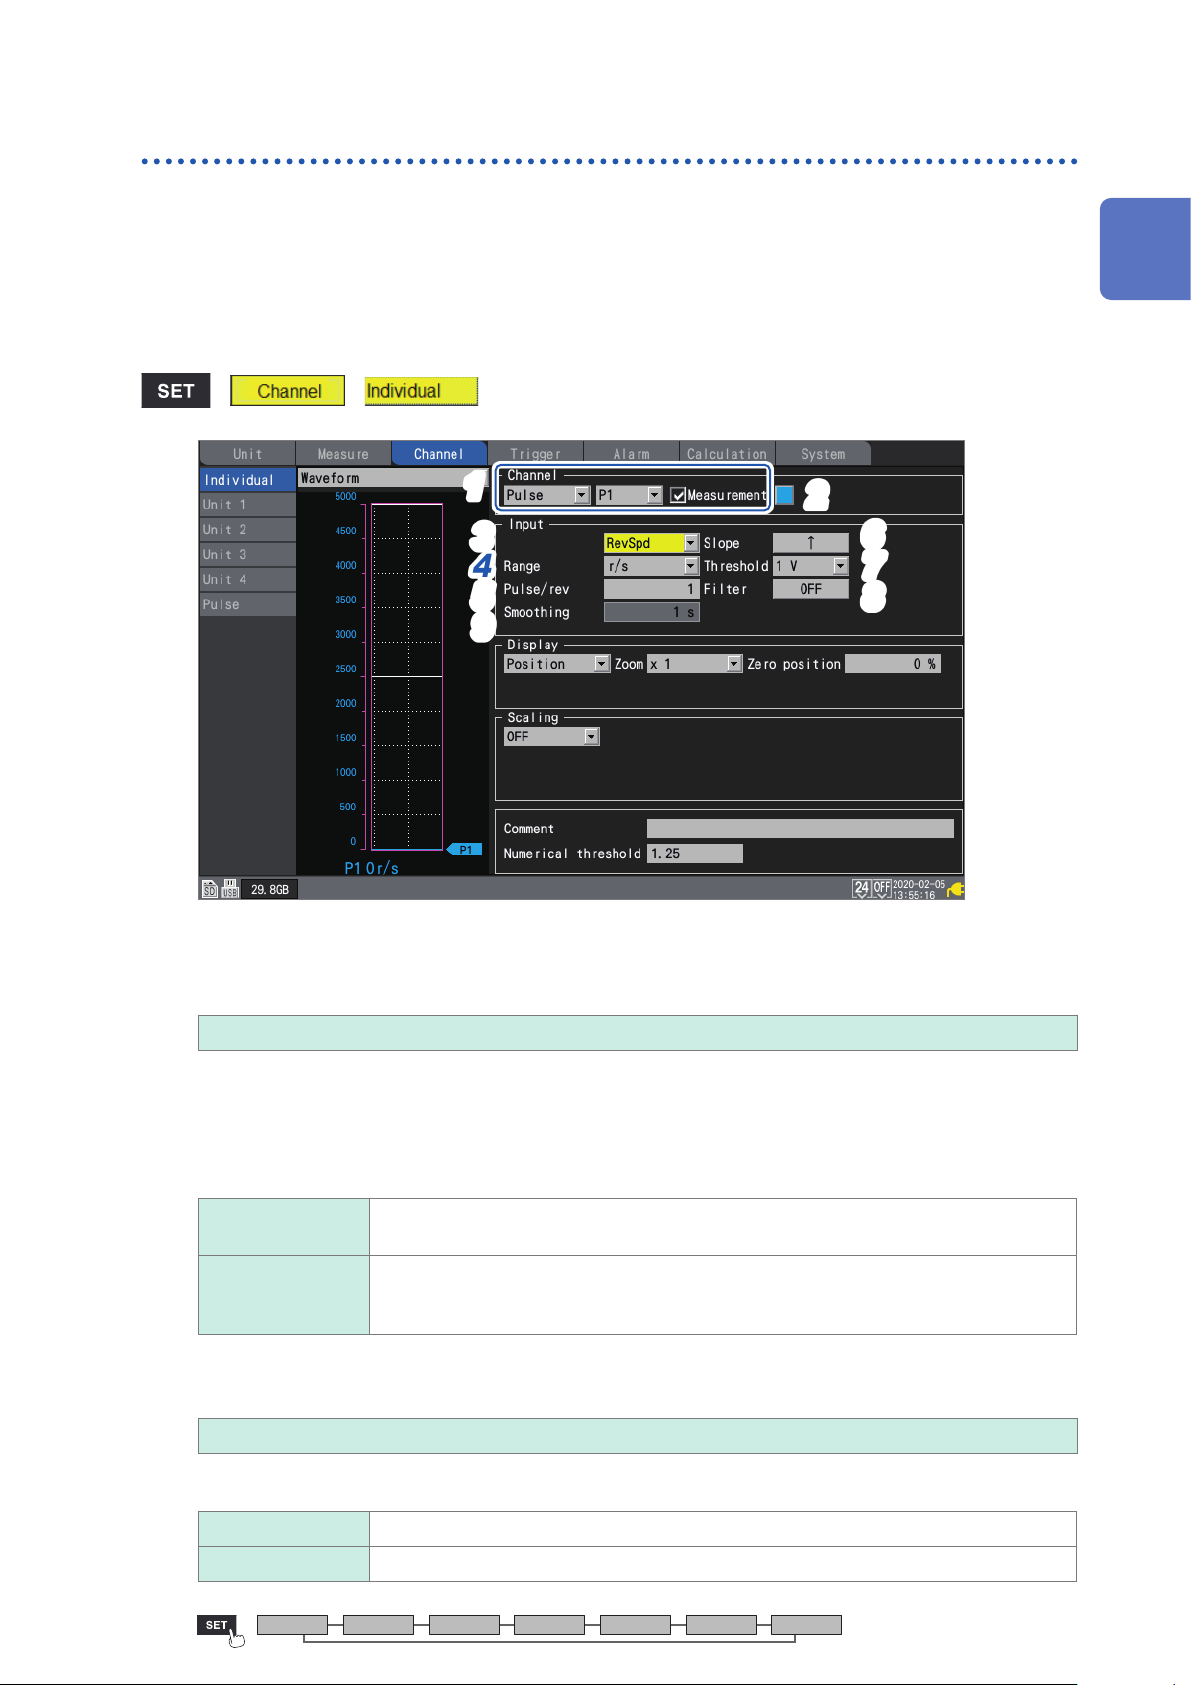
This section describes how to measure the pulses output by a rotary encoder, tachometer, or
similar device.
The instrument counts the number of pulses per second and calculates the rotational speed.
This section describes how to congure settings on the individual settings screen when measuring
rotational speed.
You can use the settings list screen to congure the settings. (See p. 52.)
External control terminals: Pulse input terminals P1 to P8
> >
1
Settings and Operation
11
22
33
44
55
99
Select [Pulse], and choose a channel from [P1] to [P8].
1
Measurement will not be performed for channels whose checkboxes are not selected.
Select the waveform display color.
2
× (OFF), 24 colors
66
77
88
Select [×] if you wish to measure the channel but not to display its waveform or numerical values on the
screen.
Set the input type to [RevSpd].
3
Under [Range], select the count base time.
4
r/s
r/min Counts the number of pulses per module of time specied with the [Smoothing]
Under [Pulse/rev], enter the number of pulses per revolution output by the encoder or
5
tachometer.
1
to 1000
Under [Slope], select the slope to count.
6
↑
↓ Integrates the number of times the pulse switches from high level to low level (falling).
Unit Measure Channel Trigger Alarm Calculation System
Counts the number of pulses per second and calculates the rotational speed. (Number
of revolutions per second)
setting and calculates the rotational speed.
(Number of revolutions per minute)
Integrates the number of times the pulse switches from low level to high level (rising).
31
Page 38
Conguring Input Channels
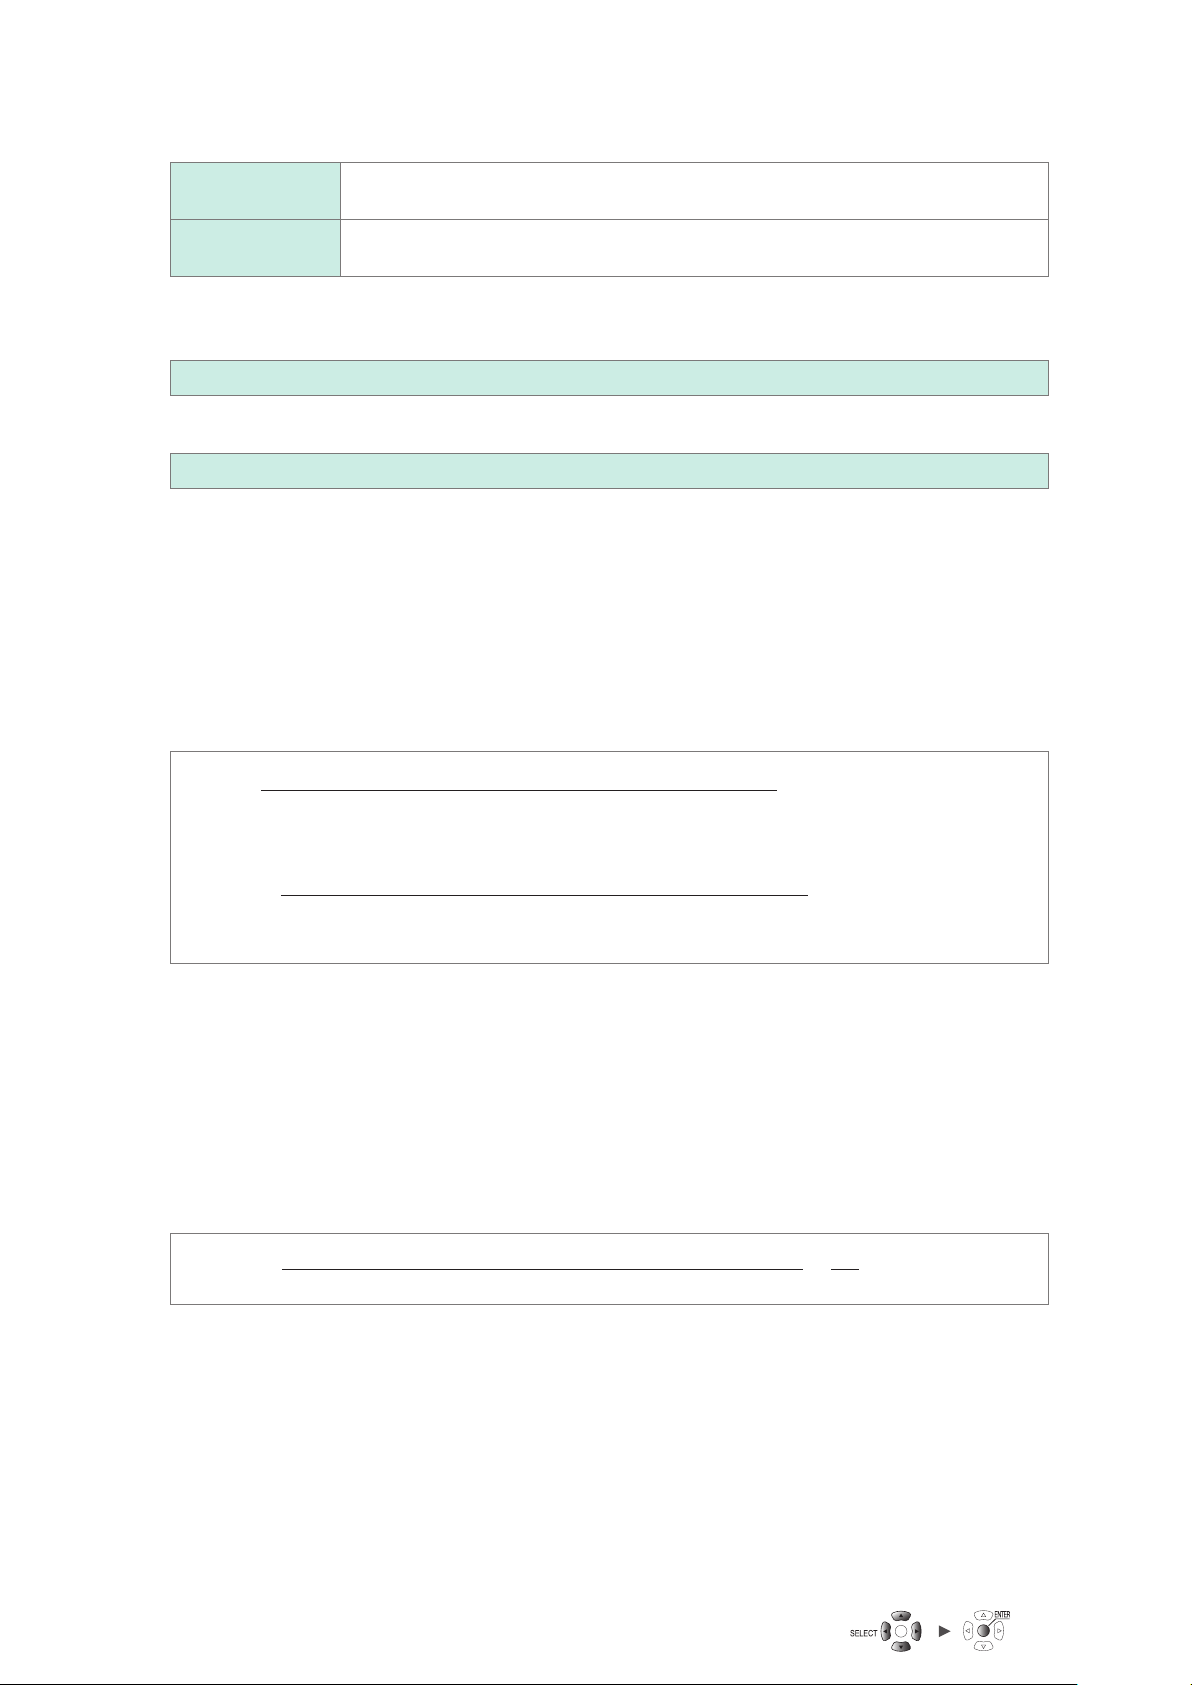
Under [Threshold], select the level to count.
7
1 V
4 V Treats voltages that are greater than or equal to 4.0 V as high level and voltages that
Under [Filter], select whether to use the chatter prevention lter.
8
Treats voltages that are greater than or equal to 1.0 V as high level and voltages that
are greater than or equal to 0 V but less than 0.5 V as low level.
are greater than or equal to 0 V but less than 1.5 V as low level.
Set to [ON] to prevent false counting due to chatter in mechanical contact (relay) output.
OFF
, ON
Under [Smoothing], enter the smoothing processing time (when [Range] is set to [r/min]).
9
1 s
to 60 s
Principal of rotational speed measurement
Under the following conditions, the integration pulse count is internally updated at a data refresh
interval of 10 ms:
• When the range is [r/s]
• When the range is [r/min] and smoothing is set to [1 s]
The rotational speed at time t [s] is calculated by dividing the pulse count from (t - 1) to t [s] by the
number of pulses per revolution.
Integrated pulse count at t [s] − integrated pulse count at (t − 1) [s]
(r/s) =
r
r/s: Rotational speed per second
Integrated pulse count at t [s] − integrated pulse count at (t − 1) [s]
r (r/min) =
r/min: Rotational speed per minute (with smoothing set to [1 s])
Number of pulses per revolution
Number of pulses per revolution
× 60
Example: Number of pulses per revolution = 4
Integrated pulse count at 1 s = P1 = 1000 c
Integrated pulse count at 2 s = P2 = 2000 c
The rotation speed at t = 2 s (r
r
= (2000 - 1000) / 4 = 250 r/s
t=2
When the range is set to [r/min] and smoothing is set to t
) can be calculated as follows:
t=2
[s], the integrated pulse count is
0
internally updated at a data refresh rate of 50 ms.
The rotational speed at time t [s] is calculated by dividing the pulse count from (t - t0) to t [s] by the
number of pulses per revolution and multiplying the result by 60.
r (r/min) =
Integrated pulse count at t [s] − integrated pulse count at (t − t
Number of pulses per revolution
) [s]
0
60
×
t
0
32
Page 39
Conguring Input Channels
When the range is [r/min]
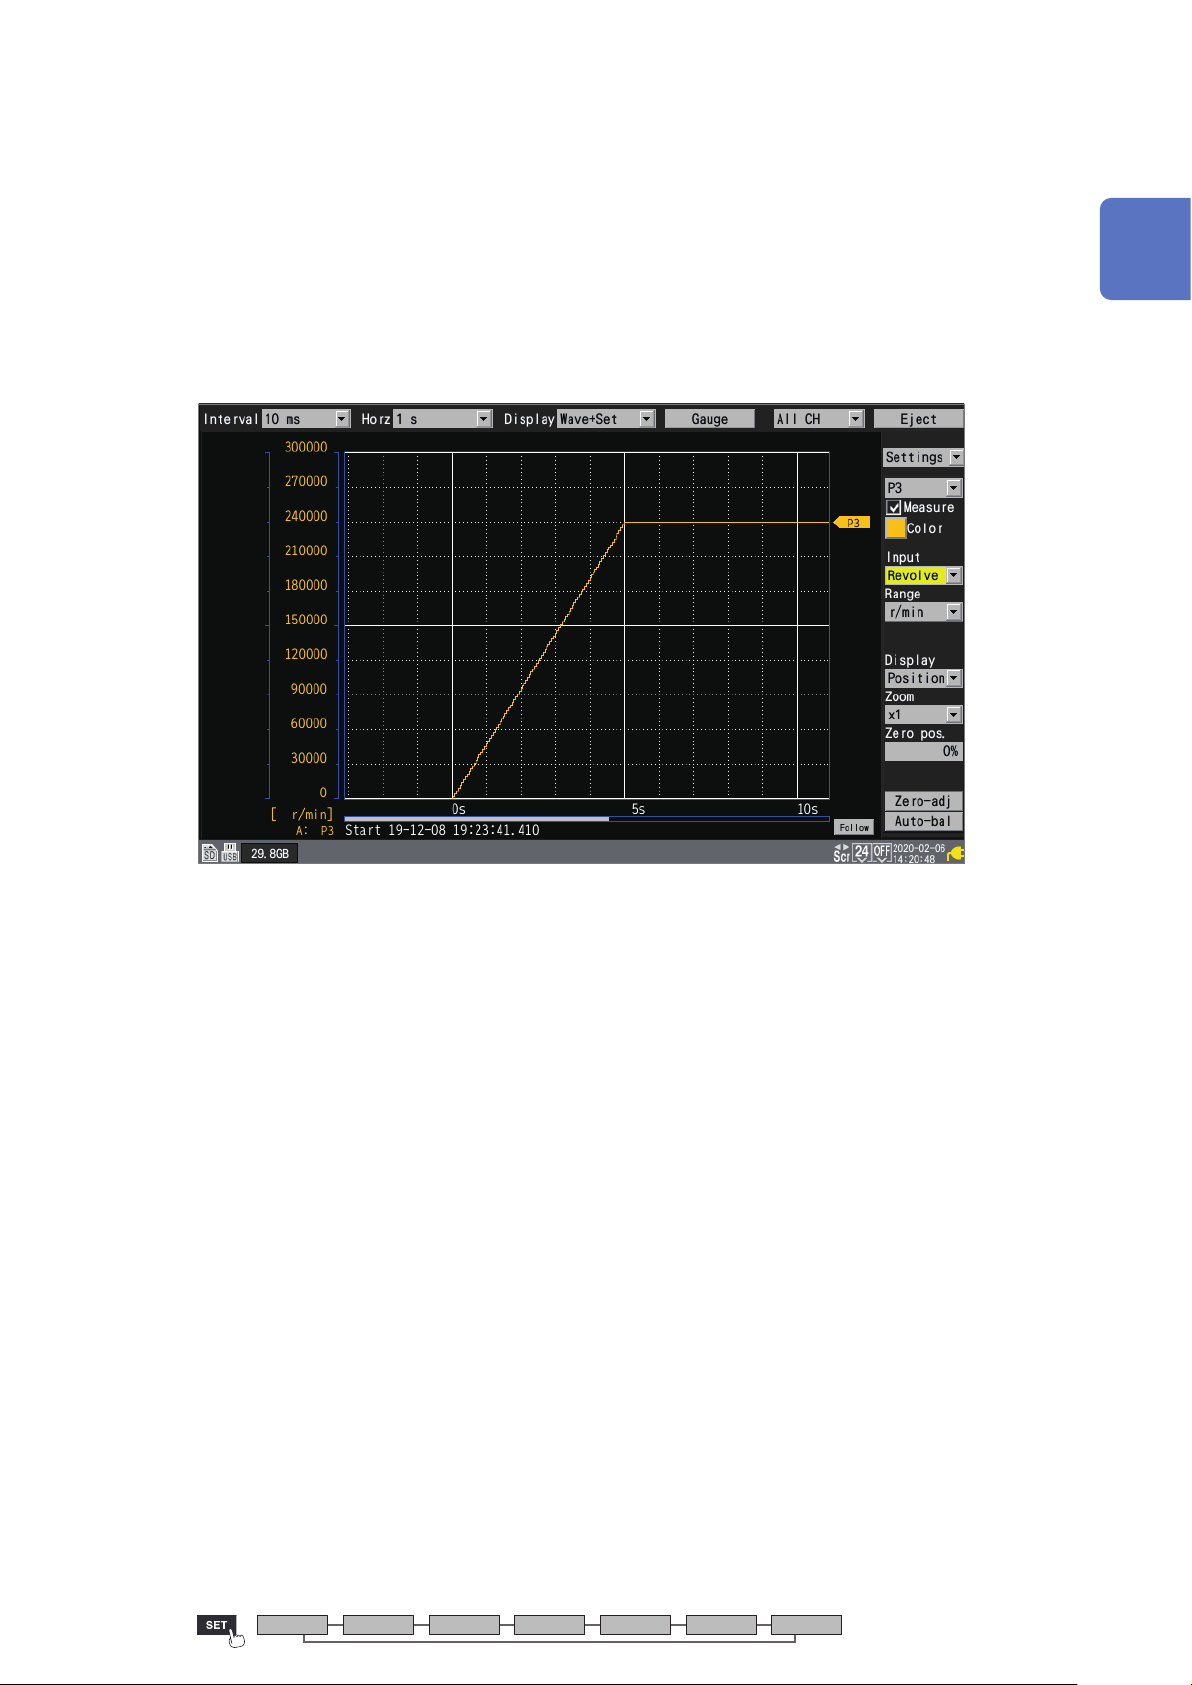
If the time t [s] is less than t0 (time specied with the smoothing), the displayed rotational speed will
be the actual rotational speed. (however, t0 is equal to or more than 2 s).
If an unintentional trigger activates, set the smoothing time at 1 s.
Example when t0 = 5 s
The rotational speed recorded value will spend t
Even if the inputted rotational speed remains constant, the smoothing process will cause the
recorded data to show an increase after the start of measurement until t0 [s].
[s] from the start of measurement to increase.
0
1
Settings and Operation
Unit Measure Channel Trigger Alarm Calculation System
33
Page 40
Conguring Input Channels
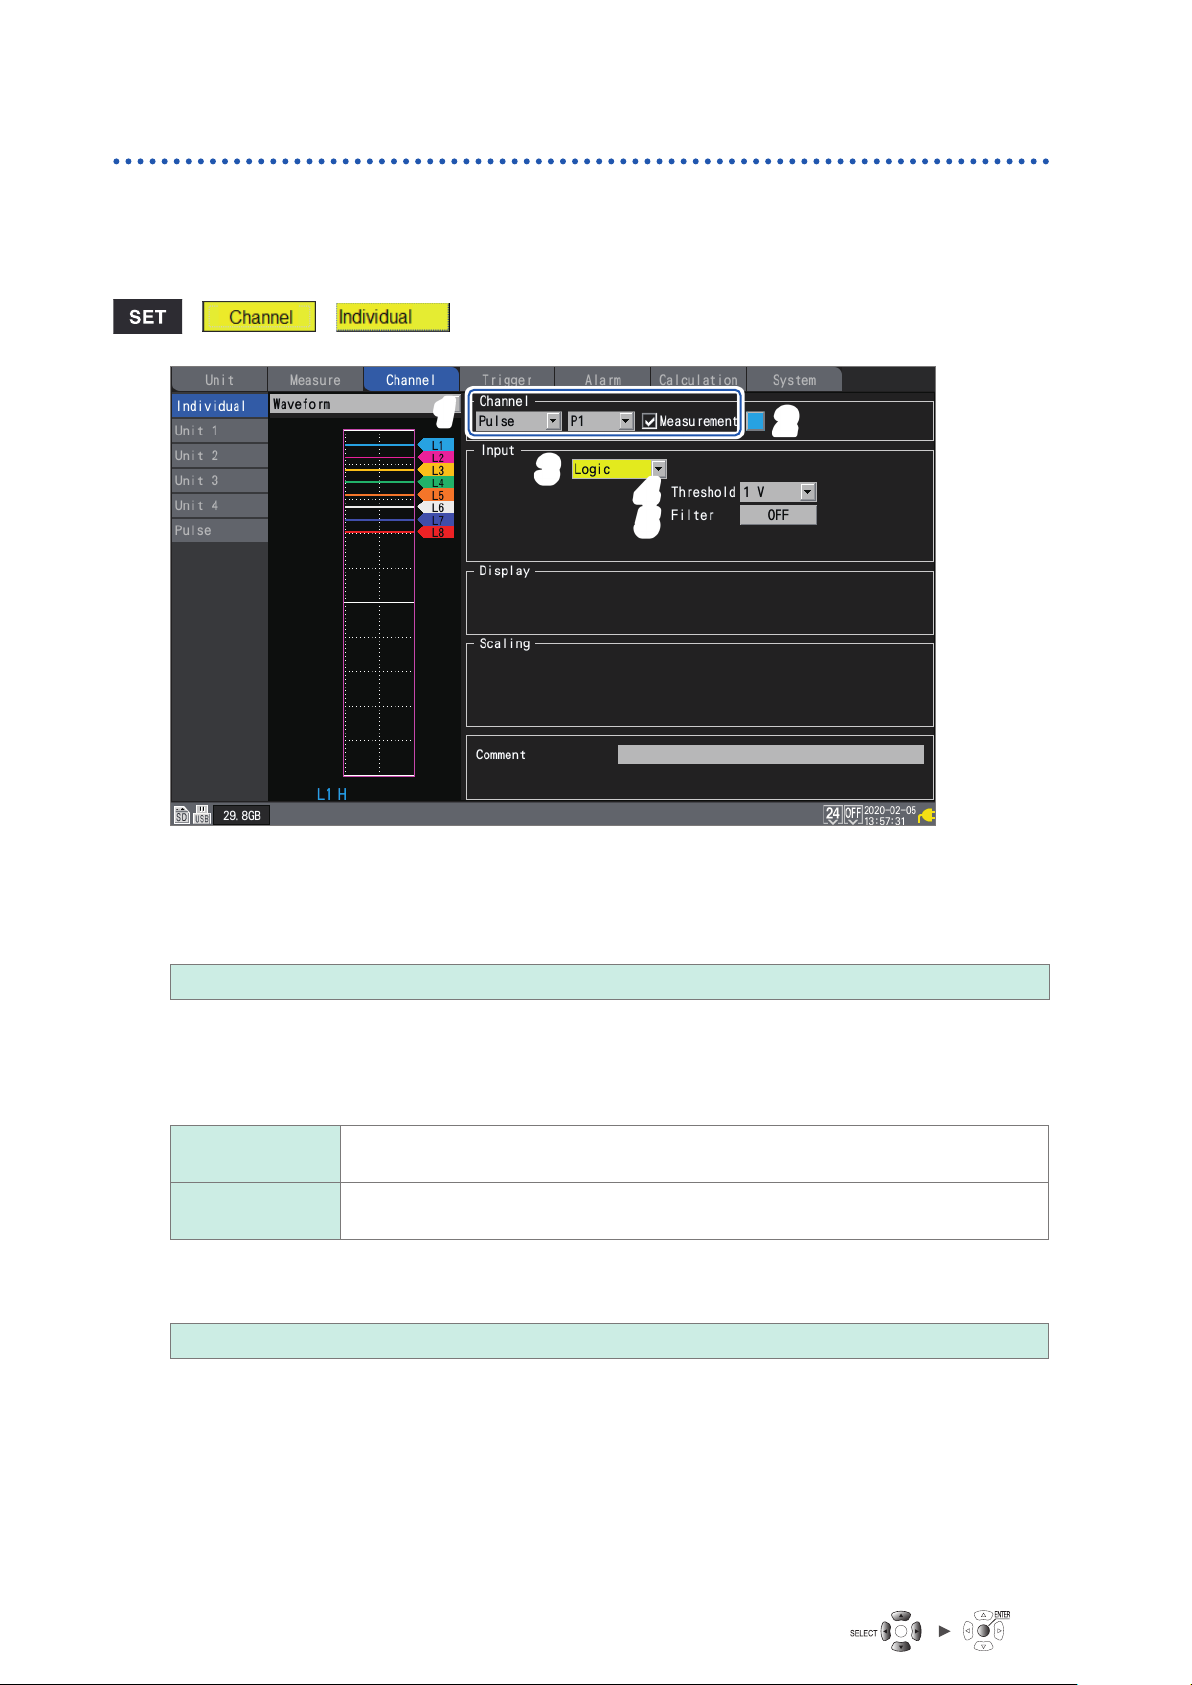
Measuring logic signals
This section describes how to congure settings on the individual settings screen when measuring
logic signals.
You can use the settings list screen to congure the settings. (See p. 52.)
External control terminals: Pulse input terminals P1 to P8
> >
11
22
33
44
55
Select [Pulse], and choose a channel from [P1] to [P8],
1
Measurement will not be performed for channels whose checkboxes are not selected.
Select the waveform display color.
2
× (OFF), 24 colors
Select [×] if you wish to measure the channel but not to display its waveform on the screen.
Set the input type to [Logic].
3
Under [Threshold], select the level to count.
4
1 V
4 V Treats voltages that are greater than or equal to 4.0 V as high level and voltages that
Under [Filter], select whether to use the chatter prevention lter.
5
Set to [ON] to prevent false counting due to chatter in mechanical contact (relay) output.
OFF
, ON
Treats voltages that are greater than or equal to 1.0 V as high level and voltages that
are greater than or equal to 0 V but less than 0.5 V as low level.
are greater than or equal to 0 V but less than 1.5 V as low level.
34
Page 41
Conguring Input Channels
Treatment of data that exceeds the measurable range
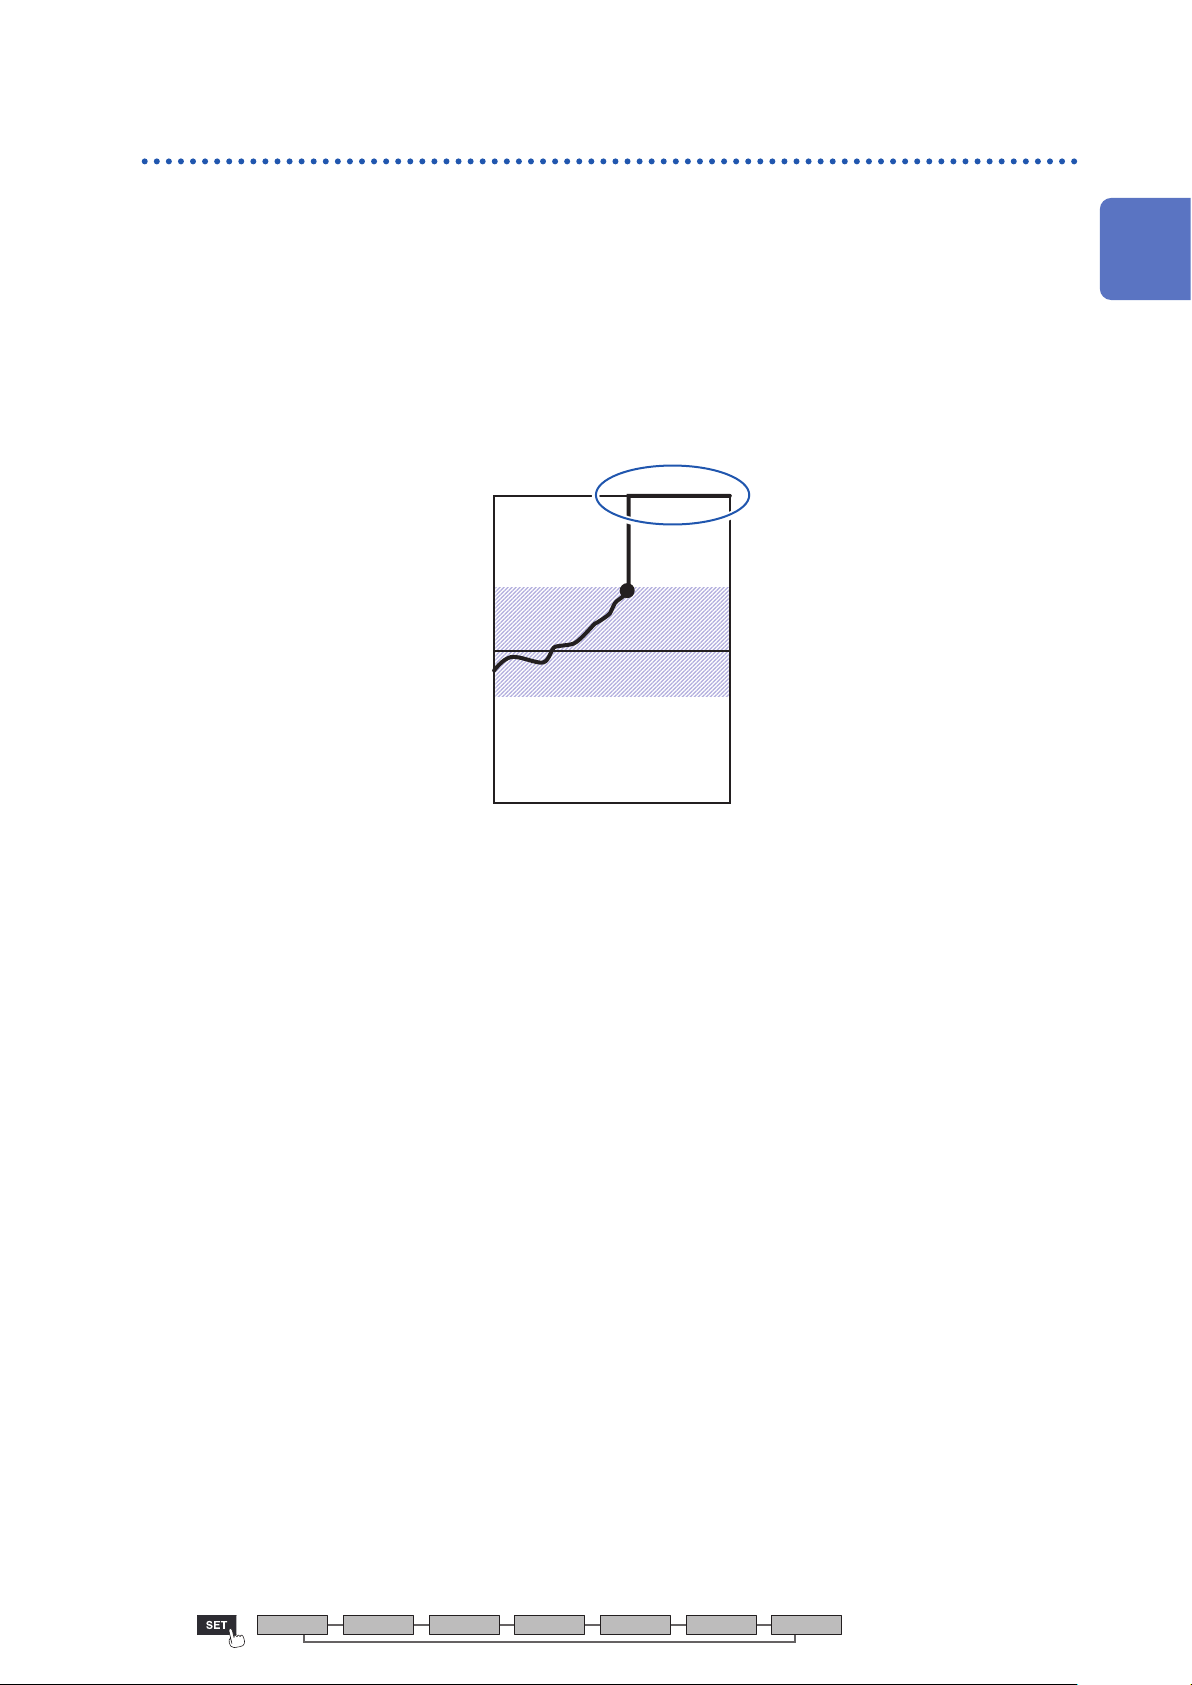
Regardless of the measurement target, measured values that exceed the measurable range are
treated as over-range values, resulting in a display of either [+OVER] or [-OVER] on the numerical
value display and for A/B cursor values.
1
Treatment of such values in saved data and calculation results is described in “11.13 Data
Handling” (p. 302).
The screen will display a waveform saturated by the value described in “11.13 Data Handling”
(p. 302).
(°C)
1000
400
0
- 200
- 1000
When using wire break detection in thermocouple measurement, values are treated as follows:
• When there is a wire break or the thermocouple’s measurable range is exceeded in the positive
direction, the value is treated as a wire break (BURNOUT).
• When the thermocouple’s measurable range is exceeded in the negative direction, the value is
treated as (-OVER).
Settings and Operation
Unit Measure Channel Trigger Alarm Calculation System
35
Page 42
Conguring the Waveform Display
1.4 Conguring the Waveform Display
This section describes how to set how waveforms are displayed (display color, display position,
zoom factor, etc.).
Conguring the display of the vertical axis
This section describes how to congure the display in the vertical axis direction.
You can set the waveform display position and zoom factor for each channel on the individual
settings screen.
You can use [Display] on the settings list screen to congure the settings. (See p. 50.)
There are two methods for setting the display position:
• Setting the zoom factor and zero position
• Setting upper and lower limit values
Setting the zoom factor and zero position
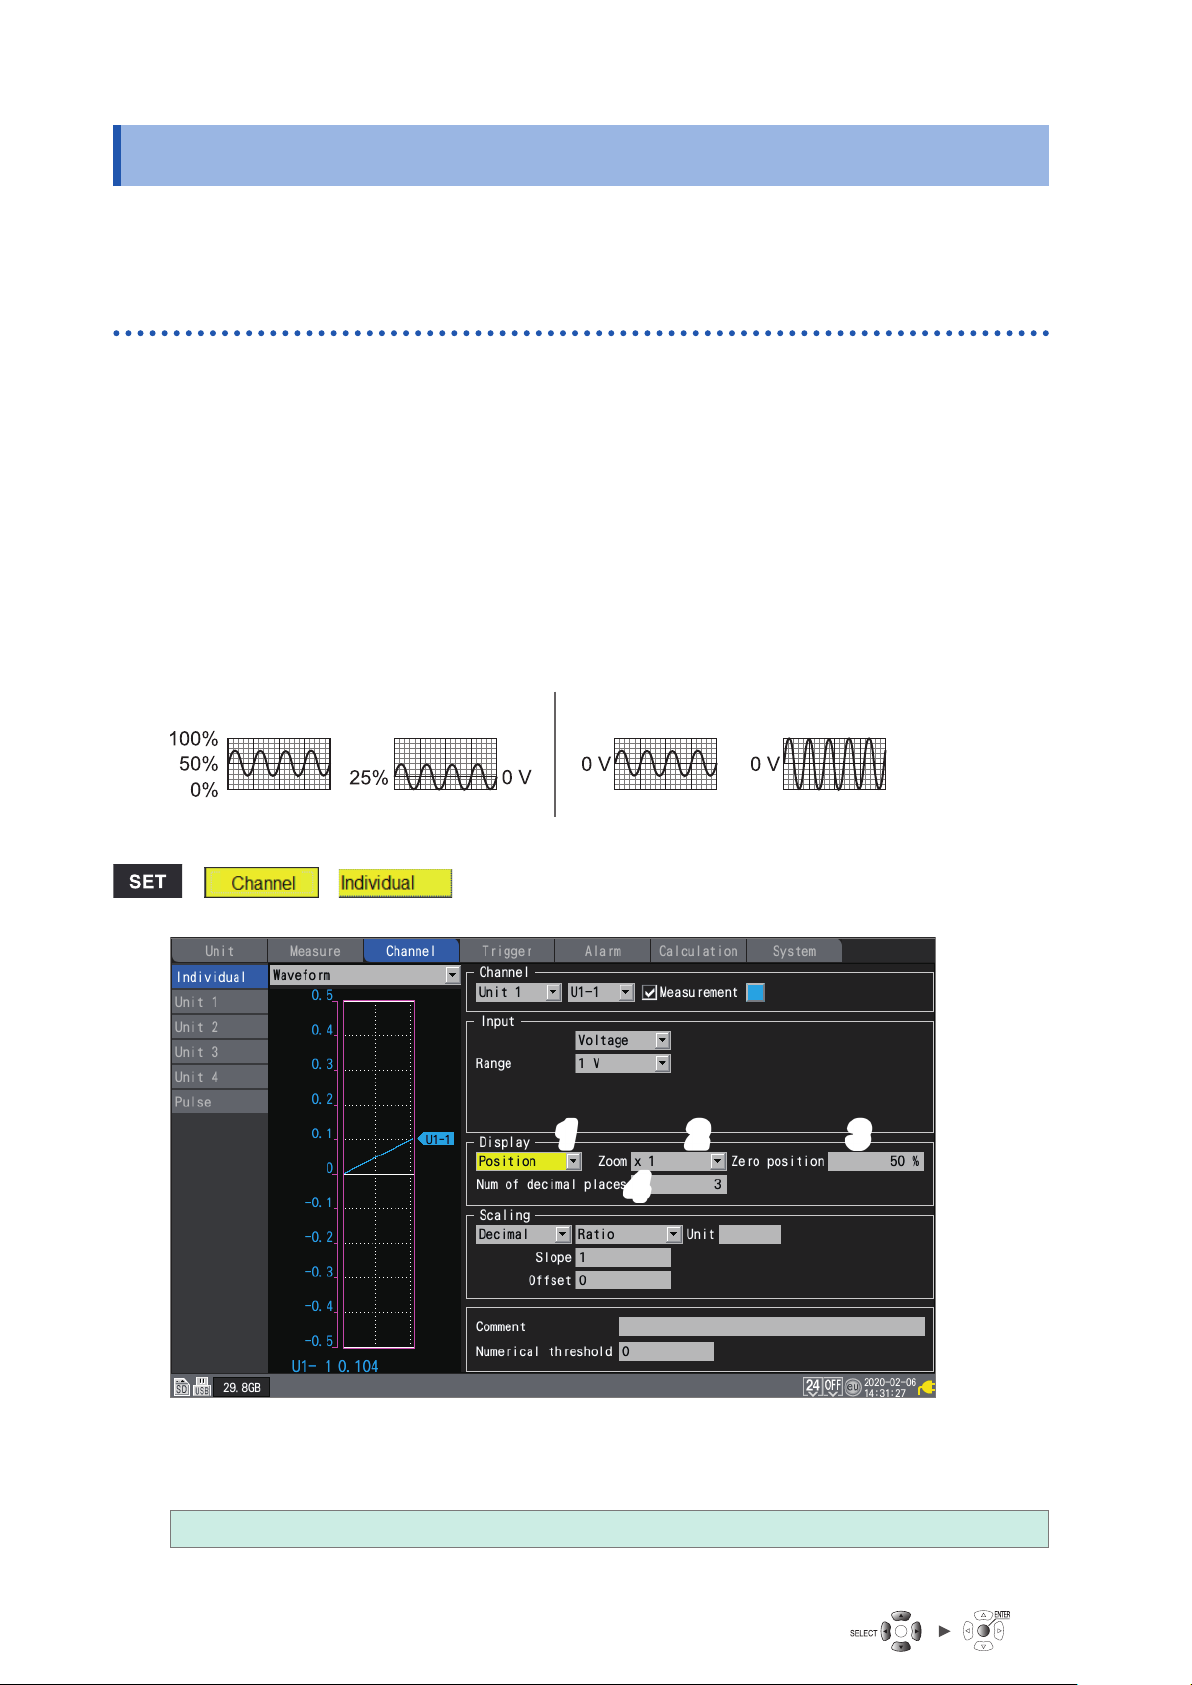
Set the waveform display position by specifying the zoom factor and zero position (position of 0 V
that serves as the reference).
The zoom factor will be increased and decreased based on the zero position.
Vertical display range and 0 V display position
Zero position: 50% Zoom factor: 1×
>
>
Zero position: 25% Zoom factor: 2×
When setting the display range with the zoom factor
(enlarge/shrink)
11 22 33
44
Select [Position] in the display settings.
1
Under [Zoom], select the waveform display zoom factor.
2
×1/2, ×1
When the zoom factor is [×1], the screen’s vertical axis display range will be the same as full scale.
, ×2, ×5, ×10, ×20, ×50, ×100
36
Page 43
Conguring the Waveform Display
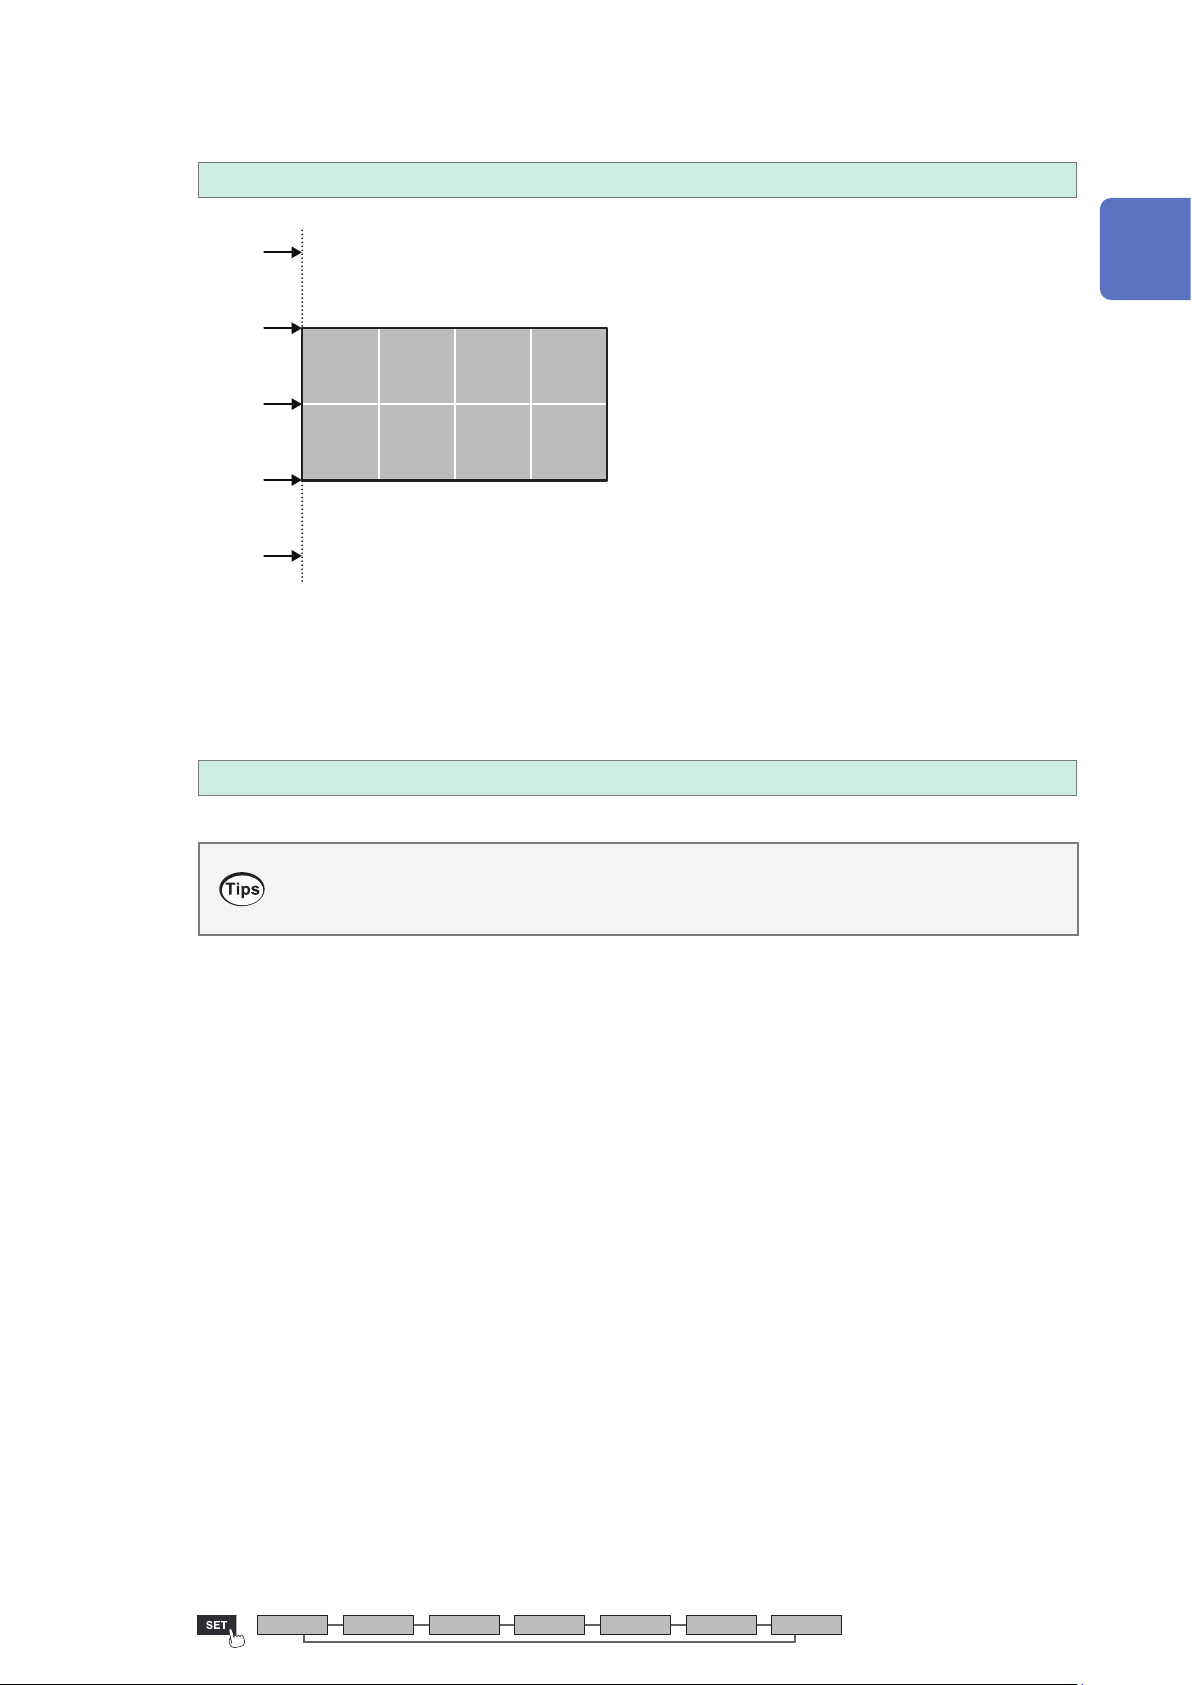
Under [Zero position], set where to place the waveform’s zero point (0 V, 0°C, etc.).
3
−50% to 150% (×1
)
150%
100%
50%
0%
−50%
You can set o-screen values.
With a vertical axis zoom factor of 1×: Up to 150%
Top edge of screen: 100%
Center of screen: 50%
Bottom edge of screen: 0%
You can set o-screen values.
With a vertical axis zoom factor of 1×: Down to −50%
Screen
Screen
The range of available zero position settings will depend on the zoom factor.
(When using scaling, or when [Number display format] is set to a value other than [Standard])
4
Under [Num of decimal places], set the number of decimal places to use for measured
values.
0, 1, 2, 3
, 4, 5, 6, 7, 8, 9, 10
1
Settings and Operation
When using scaling, a large number of decimal places, for example 5, may be used. If you wish
to reduce the number of decimal places, set [Num of decimal places] to a small value.
Example: 1.23456 mV → 1.23 mV (when [Num of decimal places] is set to [2])
Unit Measure Channel Trigger Alarm Calculation System
37
Page 44
Conguring the Waveform Display
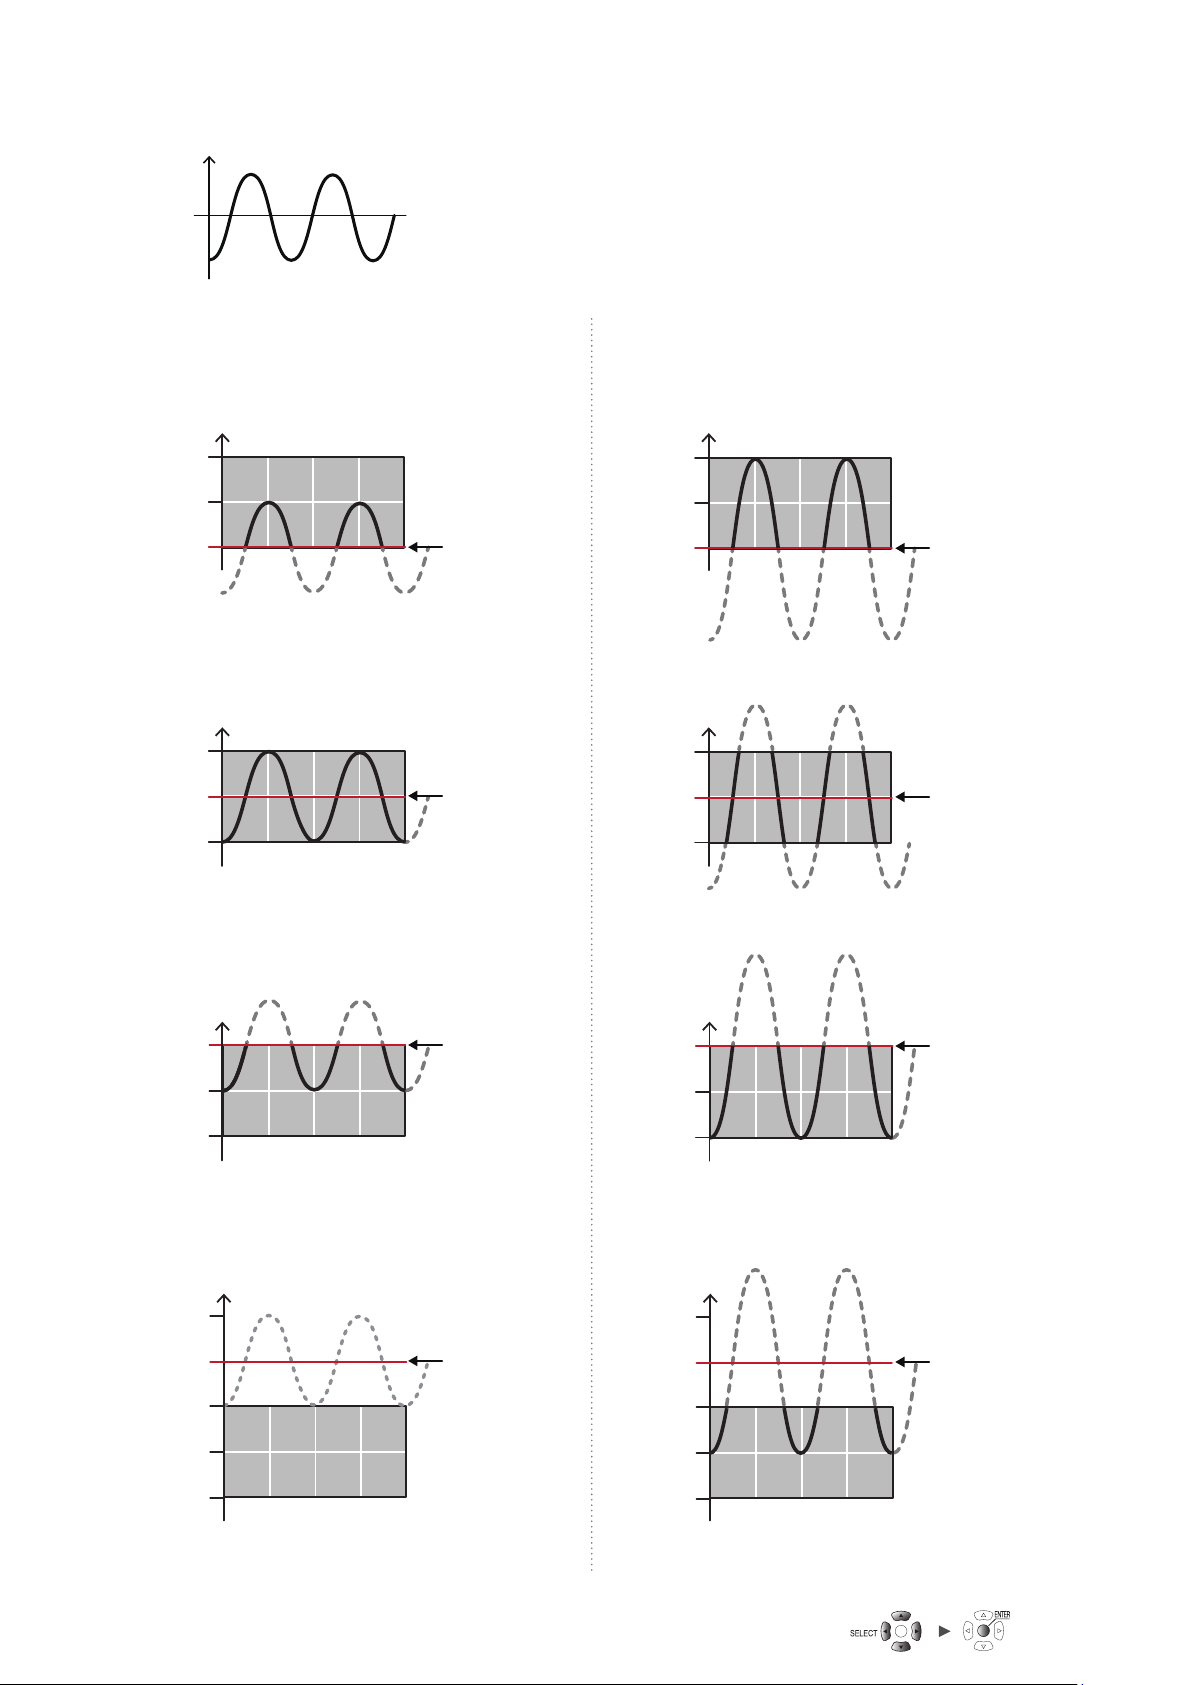
Example: Waveform from −5 V to +5 V
5 V
0 V
−5 V
With voltage axis zoom factor of 1×
Zero position setting range: −50% to 150%
With zero position of 0% With zero position of 0%
10 V
1×
5 V
Screen
0 V
5 V
0 V
−5 V
With zero position of 50% With zero position of 50%
1×
0%
O screen
Screen Screen
50%
With voltage axis zoom factor of 2×
Zero position setting range: −150% to 250%
5 V
2×
2.5 V
Screen
0 V
2.5 V
0 V
−2.5 V
2×
0%
O screen
O screen
50%
O screen
5 V
0 V
−5 V
−10 V
5 V
0 V
−5 V
−10 V
−15 V
With zero position of 100% With zero position of 100%
O screen
2.5 V
100%
1×
With zero position of 150% With zero position of 150%
1×
Screen
O screen O screen
150%
Screen
0 V
−2.5 V
−5 V
2.5 V
0 V
−2.5 V
−5 V
−7.5 V
2×
2×
Screen
Screen
O screen
100%
150%
38
Page 45
Conguring the Waveform Display
Setting upper and lower limit values
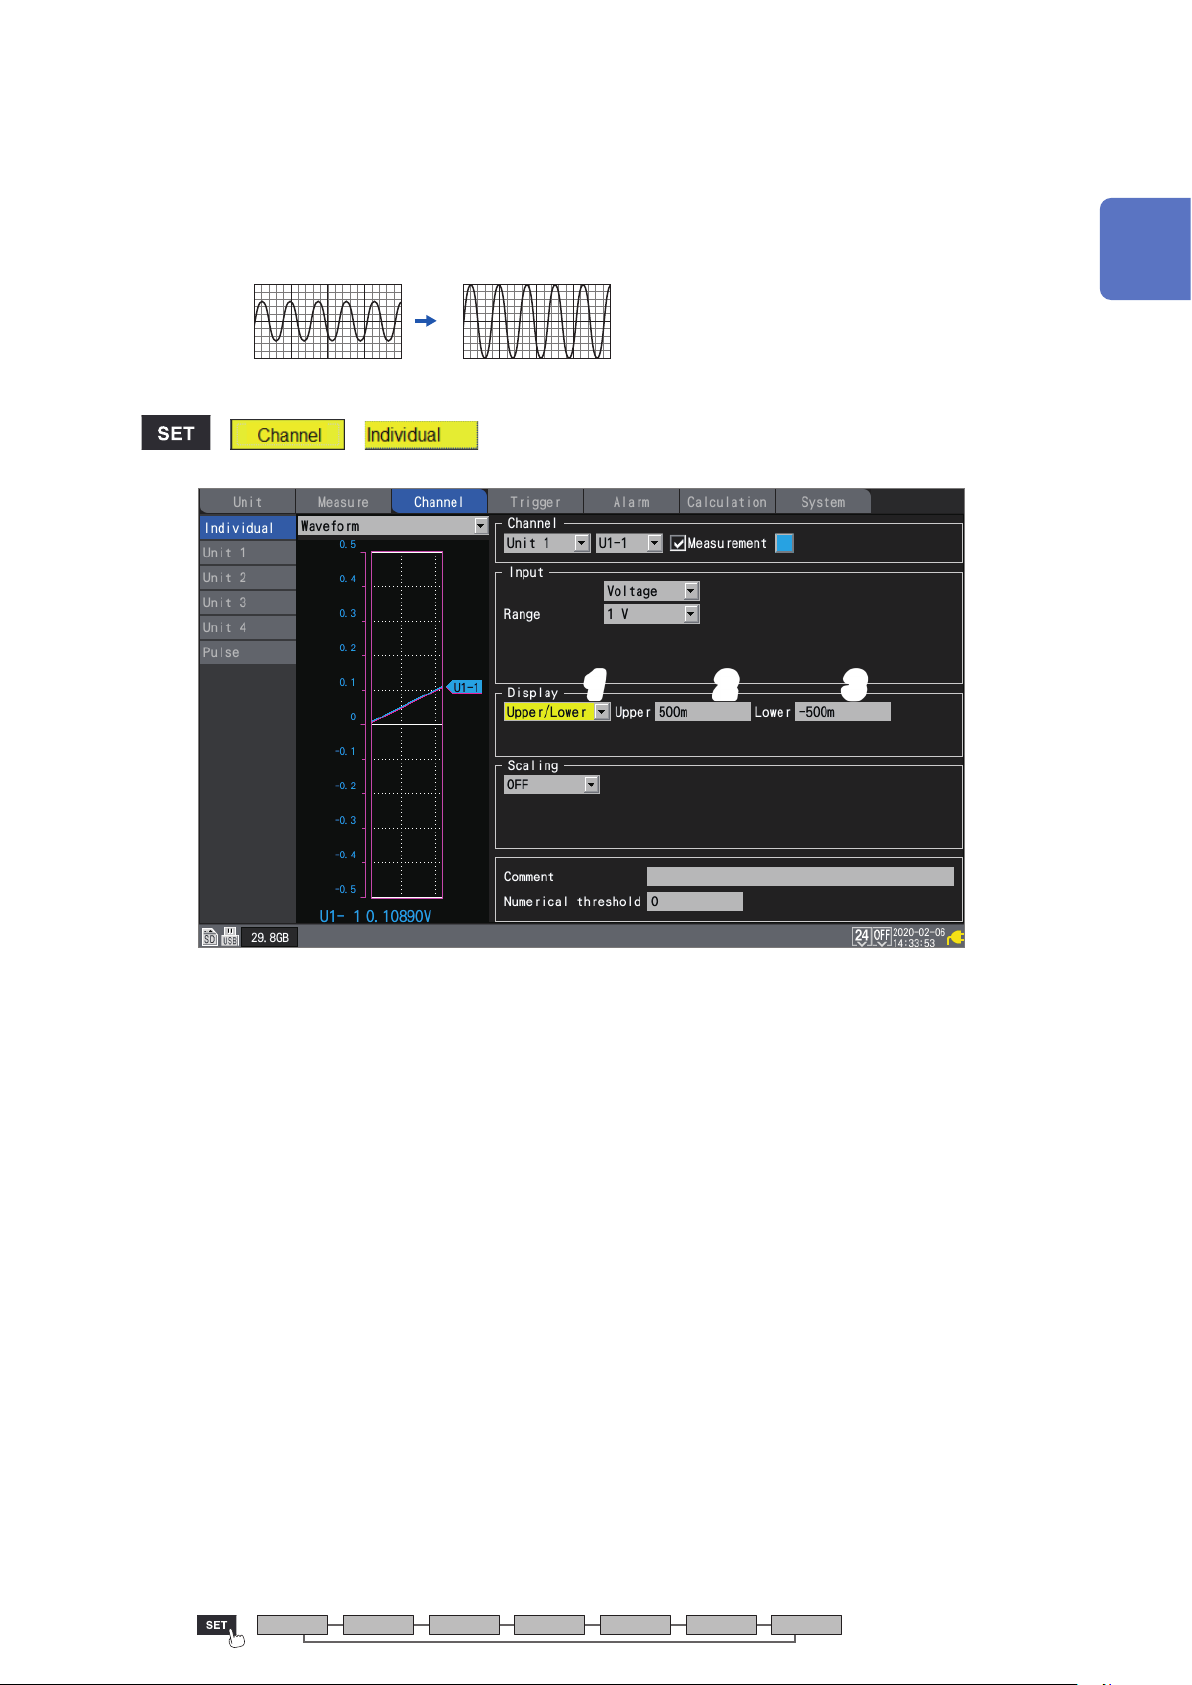
You can set the waveform’s display range by specifying upper and lower limit values for the screen.
Since you can specify any desired range, you can enlarge the waveform to show only the
necessary portion.
Setting upper and lower limit values is also useful when using the scaling function.
10
0
5
0
1
Settings and Operation
−10
> >
−5
11 22 33
Select [Upper/Lower] in the display settings.
1
Set the screen’s upper limit value in [Upper].
2
See “Value entry method” (p. 7).
Set the screen’s lower limit value in [Lower].
3
See “Value entry method” (p. 7).
Unit Measure Channel Trigger Alarm Calculation System
39
Page 46
Conguring the Waveform Display
Other display settings
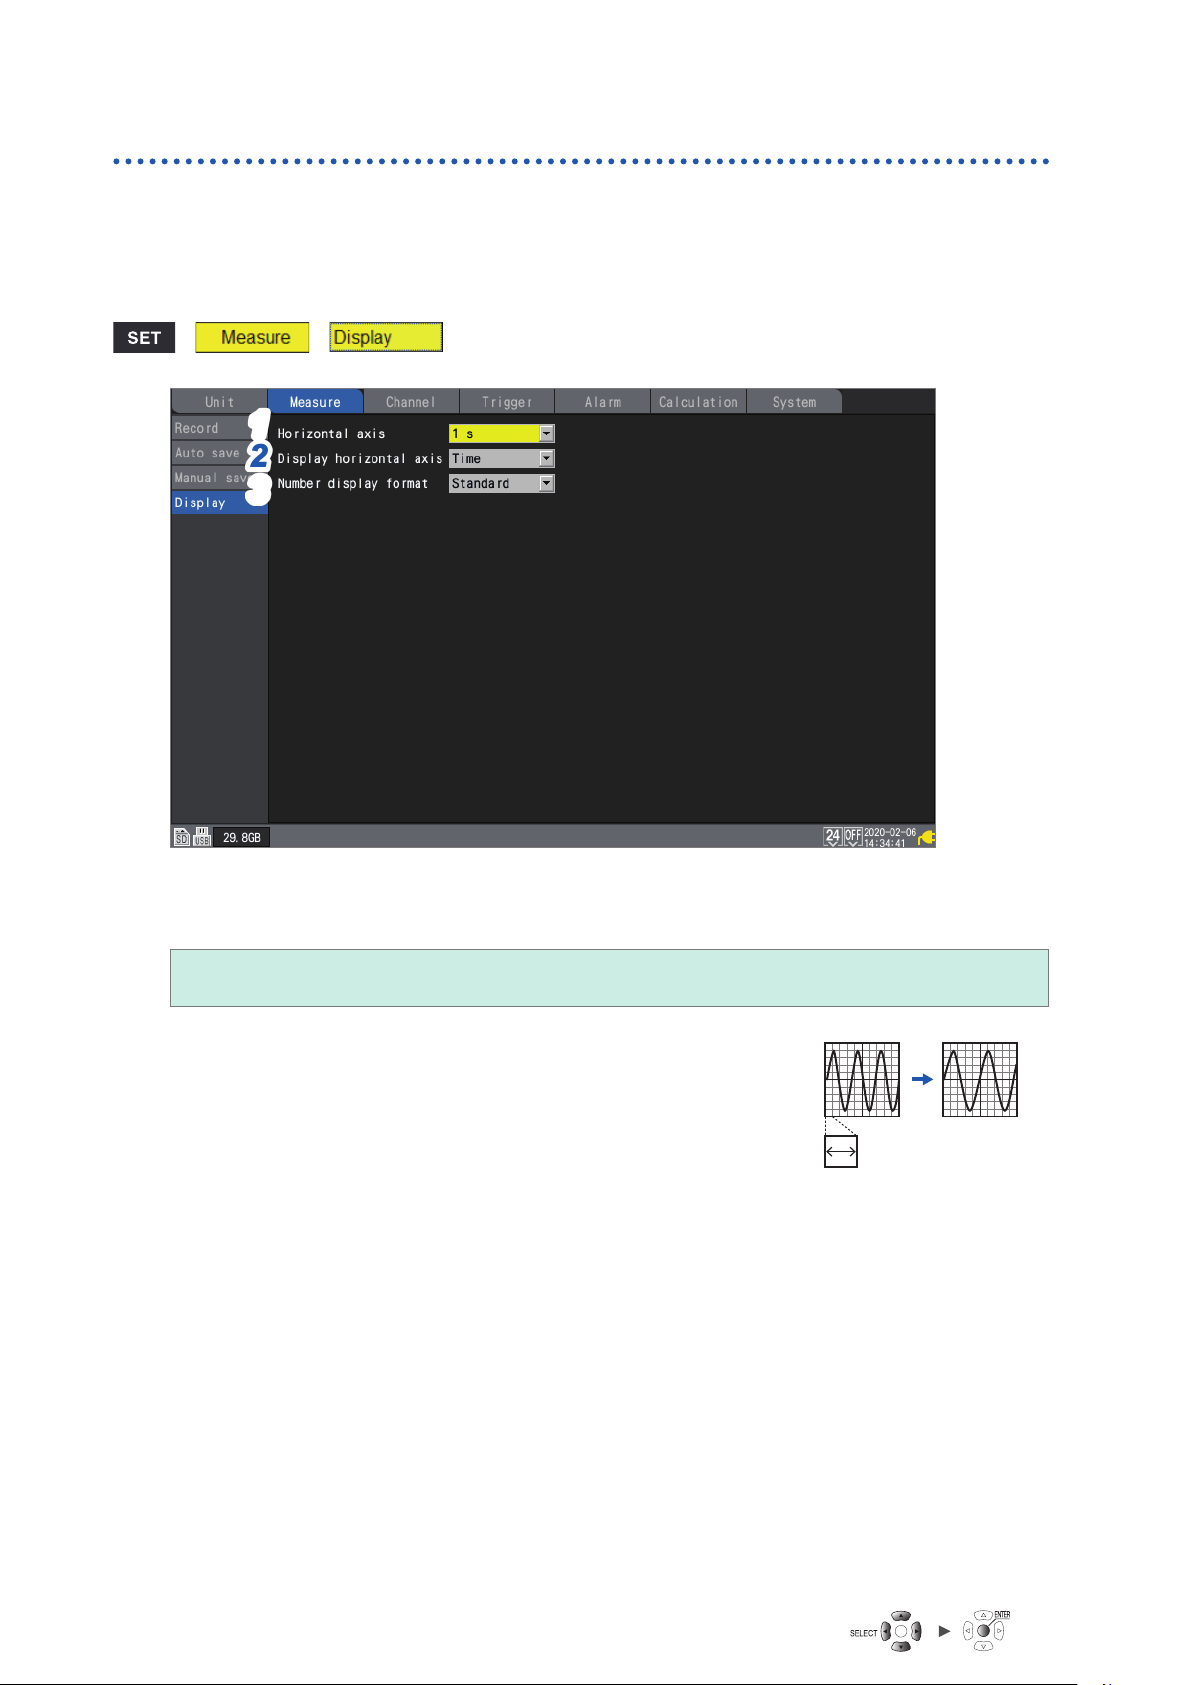
This section describes how to change the display’s zoom factor in the horizontal axis direction.
This feature allows you to view ne-grained changes by enlarging the waveform or check the
overall state by shrinking the waveform.
You can congure the horizontal axis display and set the method used to display vertical axis
values.
> >
11
22
33
Under [Horizontal axis], select the time per division.
1
You can select any time settings longer than the recording interval.
2 ms, 5 ms, 10 ms, 20 ms, 50 ms, 100 ms, 200 ms, 500 ms, 1 s
1 min, 2 min, 5 min, 10 min, 20 min, 30 min, 1 h, 2 h, 5 h, 10 h, 12 h, 1 d
Setting a shorter time enlarges the waveform.
Setting a longer time shrinks the waveform.
Since the time assigned to 1 division is a display setting, the recording
interval and data refresh interval are unaected.
Restrictions during measurement
During measurement, the time per division setting has the upper limit according to the recording
interval.
• Recording interval of 1 ms to 5 ms: Settings up to 10 min. will be available.
If you start measurement after selecting a setting of 20 min. or greater, the setting will be changed
to 10 min.
• Recording interval of 10 ms to 50 ms: Settings up to 1 h will be available.
If you start measurement after selecting a setting of 2 h or greater, the setting will be changed to
1 h.
• Recording interval of 100 ms to 500 ms: Settings up to 10 h will be available.
If you start measurement after selecting a setting of 12 h or greater, the setting will be changed to
10 h.
, 2 s, 5 s, 10 s, 20 s, 30 s,
1 division
40
Page 47
Conguring the Waveform Display
Under [Display horizontal axis], select the display format to use for time values (horizontal-
2
axis values) displayed on the screen.
Time
Date Displays the actual time (date and time) every 10 divisions.
Data points Displays the number of data points since the start of measurement.
This setting also applies when displaying time values for waveform data saved in the CSV format.
Under [Number display format], select the display format to use for measured values
3
(vertical-axis values).
Displays the time elapsed since the start of measurement.
When using a trigger, the time elapsed since the trigger activation time will be
displayed.
When using a trigger, the number of data points from the trigger activation time will be
displayed.
1
Settings and Operation
Standard
Decimal Displays measured values as decimals.
Exponent Displays measured values as exponents.
Prex Displays measured values using an SI prex.
Displays measured values using the same SI prex as the range.
Example: 0.01234V (when using the 1 V range)
Example: 0.012V (when the number of decimal places is set to 3)
Example: 1.234E-02V (when the number of decimal places is set to 3)
Example: 12.345mV (when the number of decimal places is set to 3)
When setting the horizontal axis on the waveform screen
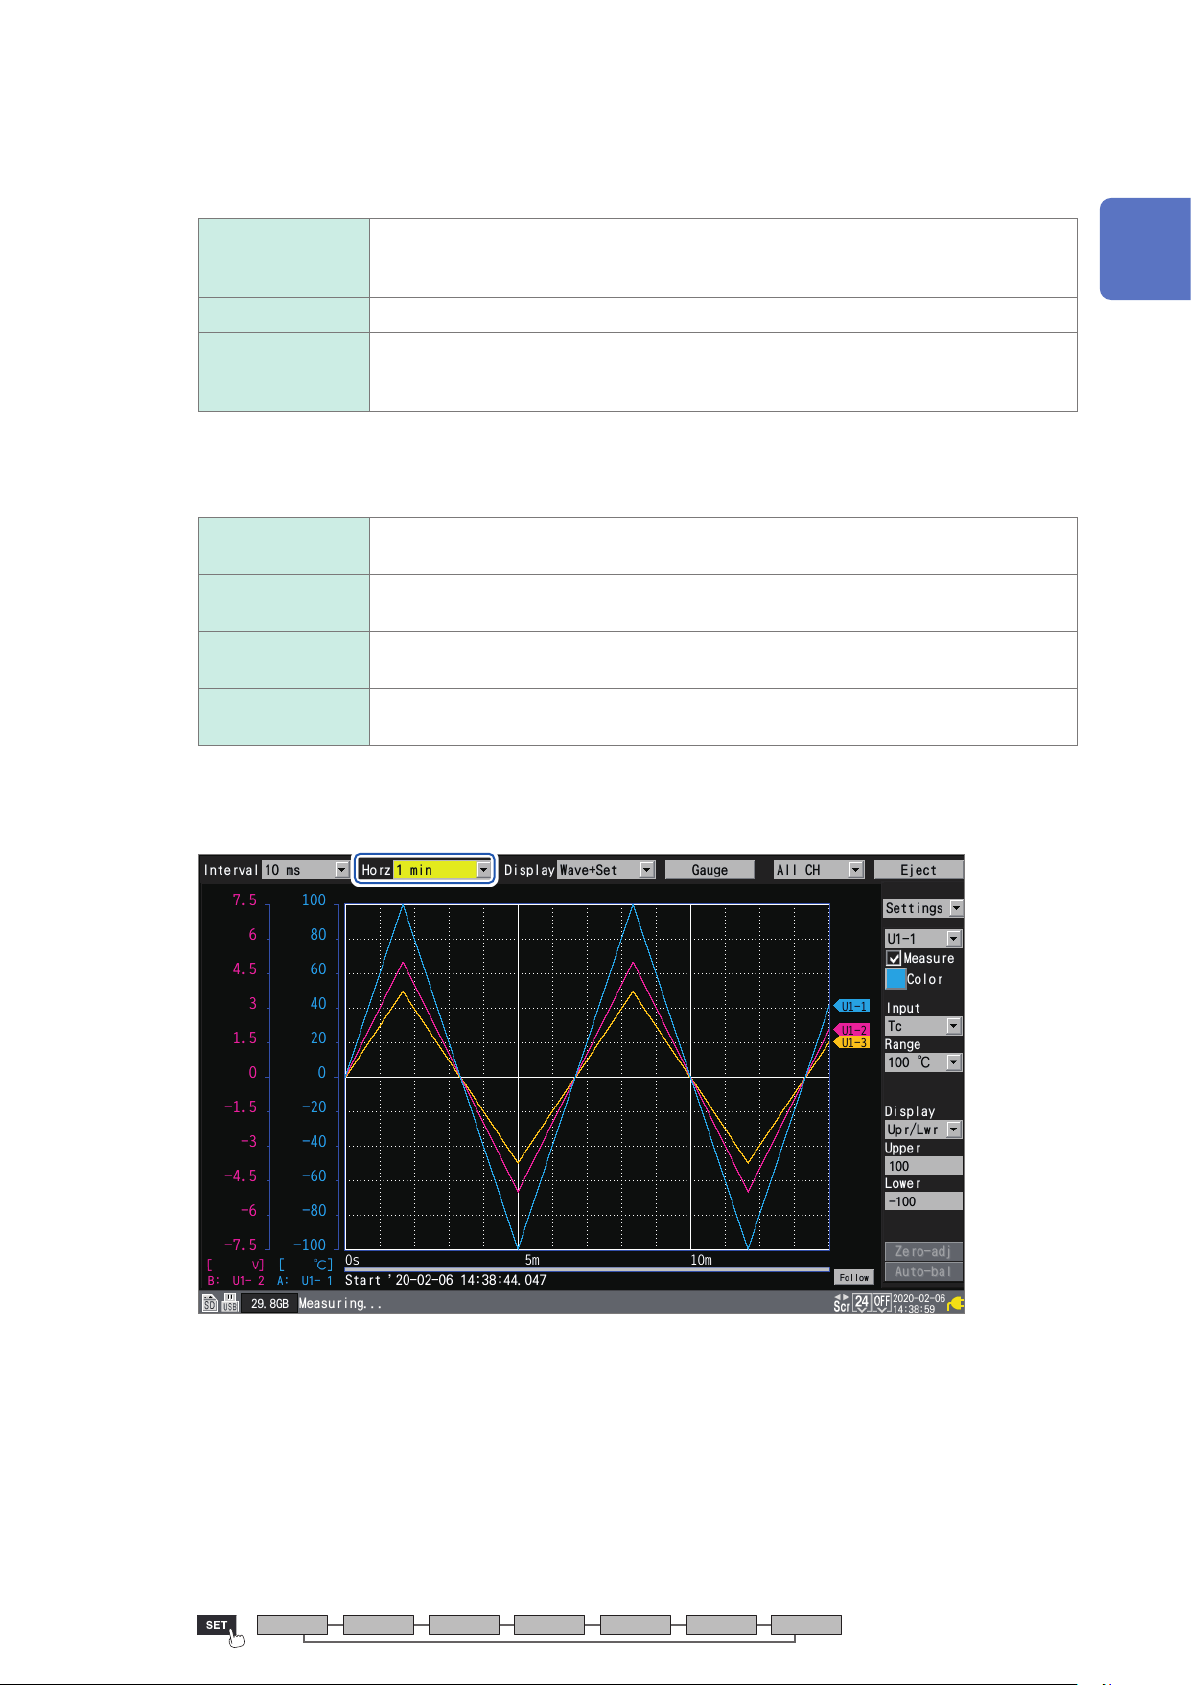
Under [Horz], you can select the time per division. This setting can be changed while measurement
is in progress.
Unit Measure Channel Trigger Alarm Calculation System
41
Page 48
Using the Scaling Function
1.5 Using the Scaling Function
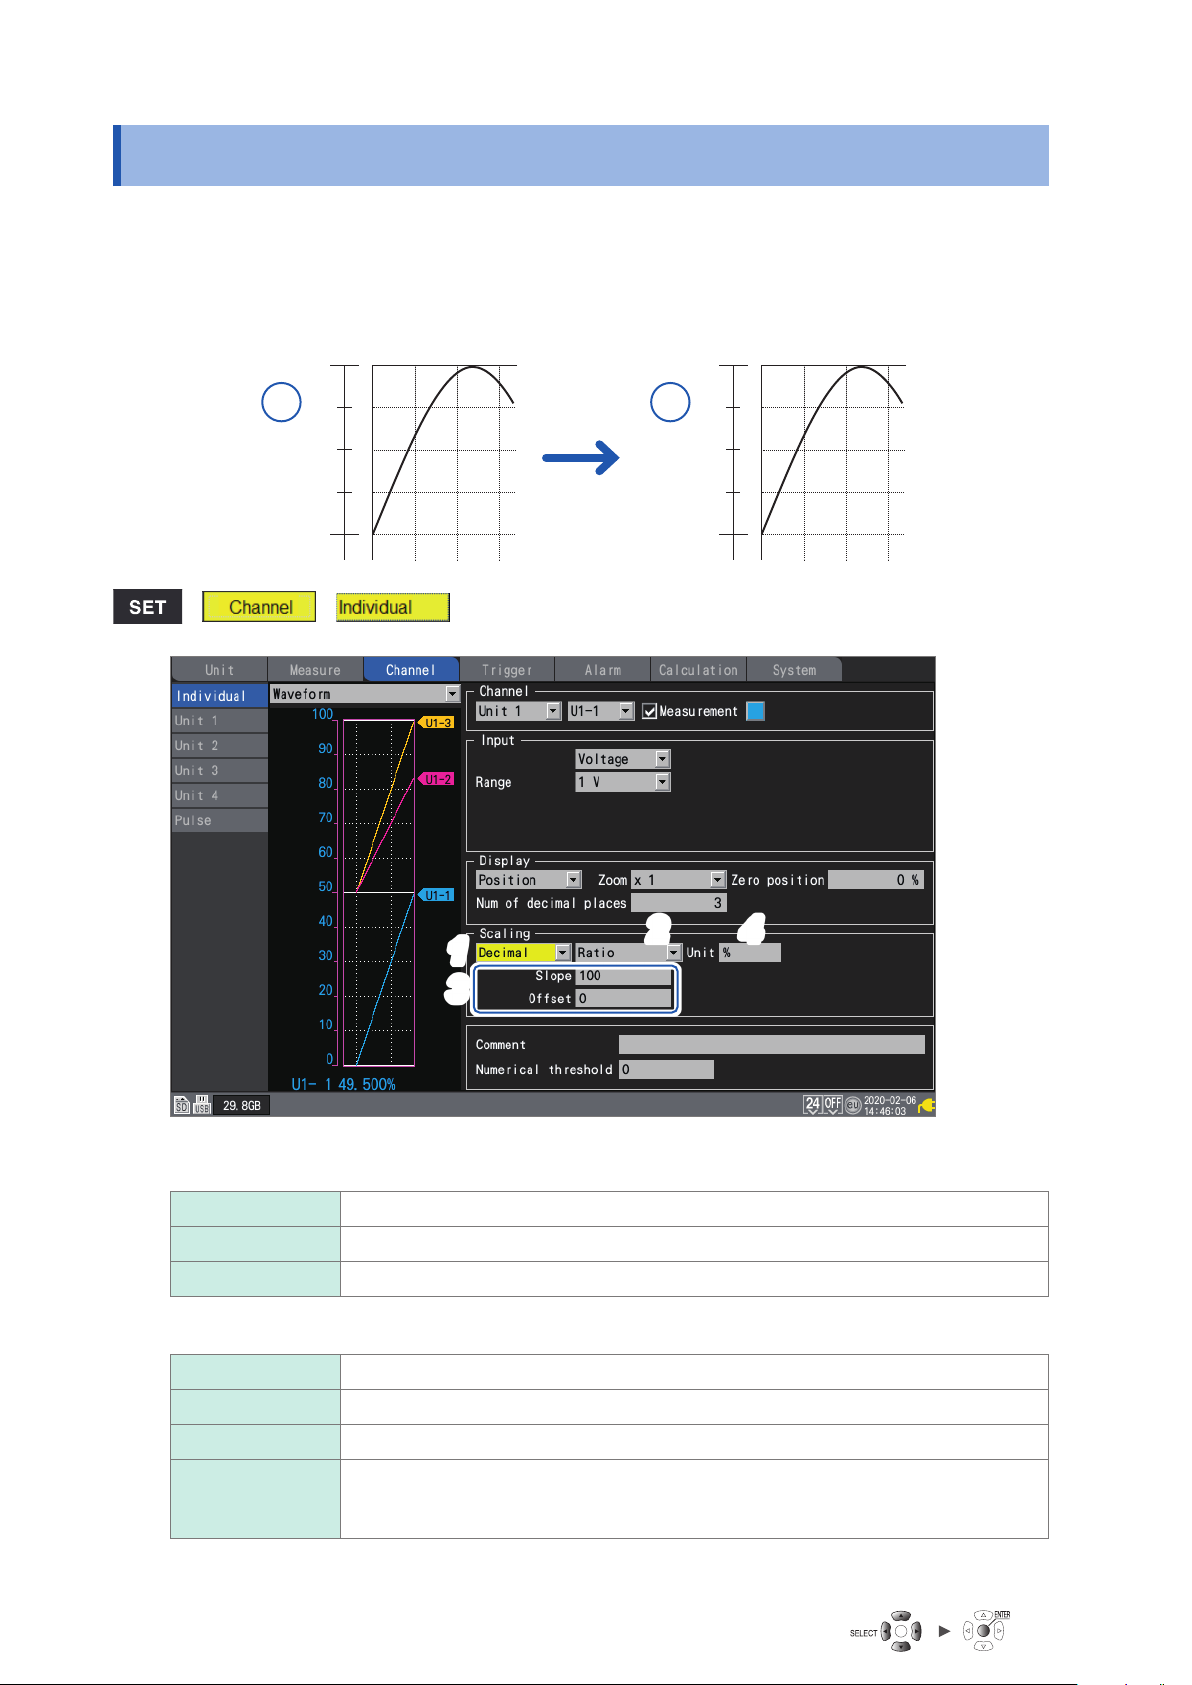
This section describes how to use the scaling function to convert voltage values measured by the
instrument into the measurement target’s physical properties (current, temperature, etc.) and then
display or record them.
Converted values can be displayed using decimal or scientic notation.
Before scaling After scaling
0.2
[V] [A]
10
0.1
0
> >
11
33
22
5.0
0
44
Select the scaling display method.
1
OFF
Decimal Displays converted values as decimals.
Exponent Displays converted values as exponents.
Select the scaling conversion method.
2
Ratio
2-point Sets converted values for two input signal voltage values.
Sensitivity Sets the sensitivity constant for a heat ow sensor or actinometer.
Rating Sets the rated capacity and rated output according to values in the inspection results
The conversion method cannot be selected for pulse integration measurement.
See “Scaling settings during integration measurement” (p. 45).
Does not use the scaling function.
Sets the physical quantity (conversion ratio) per 1 V of input signal and the oset.
sheet for the strain gage-type converter.
(Setting available when using the U8554/LR8534 Strain Unit)
42
Page 49
Using the Scaling Function
(When the scaling conversion method is set to [Ratio])
3
Enter the slope and the oset in [Slope] and [Oset], respectively.
Select the numerical value entry item and press the ENTER key to display the numerical value
setting window.
See “Value entry method” (p. 7).
−9.9999e+09 to +9.9999e+09
Example setting
Make measurements using a strain* acceleration sensor with a calibration coecient of
0.001442G /1 × 10
(G) (*: 10-6 strain = με):
Unit G
Slope 0.001442 (G) (displayed as 1.442 m)
Oset 0
Enter the post-conversion unit in [Unit] (up to 7 single-byte characters).
4
See “Text entry method” (p. 8).
(When the scaling conversion method is set to [2-point])
5
Enter the pre- and post-conversion values in [Convert 1] and [Convert 2], respectively.
Select the numerical value entry item and press the ENTER key to display the numerical value
setting window.
−6
and display waveform data as values expressed in units of gees
1
Settings and Operation
−9.9999e+29 to +9.9999e+29
Example setting
Convert 4-20 mA output from a sensor into 0 to 100 mm.
The 4-20 mA output is measured as 1 V to 5 V using a 250
Convert a range of 1 V to 5 V into that of 0 mm to 100 mm.
Unit mm
Convert 1
Convert 2
(When the scaling conversion method is set to [Sensitivity])
6
Enter the sensitivity value in [Sensitivity].
Select the numerical value entry item and press the ENTER key to display the numerical value
setting window.
−1.0000e+09 to +1.0000e+09
Example setting
Make measurements using a heat ow sensor with a sensitivity constant of 0.02421 mV/W•m
display waveform data as values expressed in units of watts per square meter (W/m2):
Unit W/m
Convert 1 into 0 (1 V into 0 mm).
Convert 5 into 100 (5 V into 100 mm).
2
shunt resistor.
Ω
-2
and
Sensitivity 0.02421 m (displayed as 24.21 μ)
Oset 0
Unit Measure Channel Trigger Alarm Calculation System
43
Page 50
Using the Scaling Function
(When the scaling conversion method is set to [Rating])
7
(Available only when U8554 or LR8534 Strain Unit is used)
Enter the rated capacity and rated output in [Capacity] and [Output], respectively.
Set the rated capacity and rated output (μV/V) according to values in the inspection results sheet
for the strain gage-type converter.
Enter the rated capacitance unit as the unit.
Select the numerical value entry item and press the ENTER key to display the numerical value
setting window.
+1.0000e−09 to +9.9999e+09
Example setting
If you wish to display measured results obtained using an acceleration sensor with a rated capacity
of 20 G and rated output of 1000 μV/V as values expressed in units of gees (G):
Unit G
Capacity 20
Output 1000 (displayed as 1k)
You can use [Scaling] on the settings list screen to congure the settings.
See “1.7 Conguring Channels in a List” (p. 50).
• Setting the display position (upper and lower limit values)
When using the scaling function, congure scaling before setting the upper and lower limit
values.
See “Setting upper and lower limit values” (p. 39).
• Setting of the number of display digits
You can set the number of display digits when the scaling display setting is set to [Decimal].
(Default setting: three decimal places)
See “Conguring the display of the vertical axis” (p. 36).
• Reviewing pre-conversion waveforms
When you save waveform data in the binary format, raw data (data prior to the scaling
conversion) and scaling settings are recorded. Loading waveform data allows waveforms after
the scaling conversion to be displayed. You can review the pre-conversion waveforms if you
turn o the scaling setting.
44
Page 51
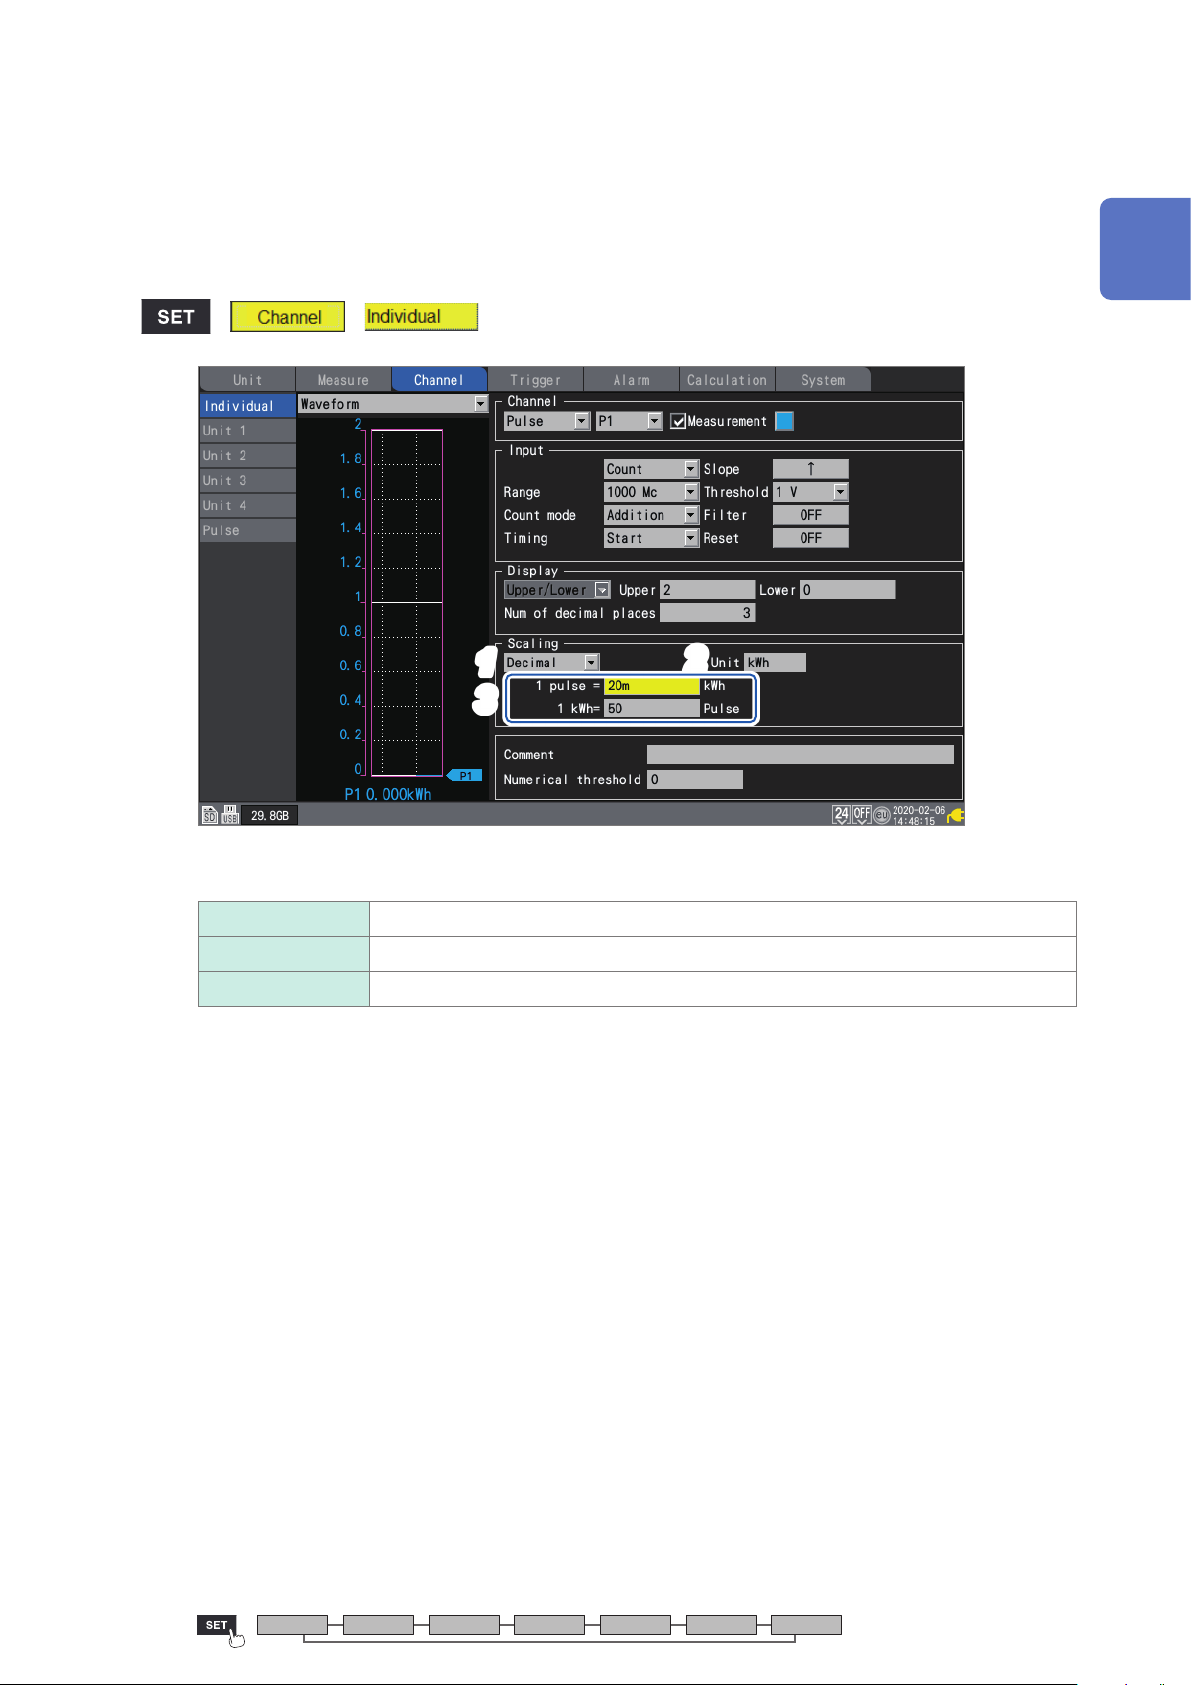
Using the Scaling Function
Scaling settings during integration measurement
You can use the scaling function to convert the integrated pulse count to the measurement target’s
physical properties (watt hours, volt-amperes, etc.) and then display or record the result.
The pulse output device will have predetermined physical quantity that corresponds to 1 pulse or
a number of pulses that corresponds to a value of one in the basic units (for example, 1 kWh, 1 L,
1 m3).
> >
1
Settings and Operation
11
22
33
Select the scaling display method.
1
OFF
Decimal Displays converted values as decimals.
Exponent Displays converted values as exponents.
Enter the post-conversion unit (up to 7 single-byte characters).
2
See “Text entry method” (p. 8).
Does not use the scaling function.
Unit Measure Channel Trigger Alarm Calculation System
45
Page 52
Using the Scaling Function
Enter physical quantity per pulse or the number of pulses (example: 1 c = 1 pulse) that
3
corresponds to a value of one in the basic units.
Select the numerical value entry item and press the ENTER key to display the numerical value
setting window.
The settings that dene the physical property per pulse and the number of pulses corresponding to
a value of one in the basic units are linked.
Example setting
When connecting a watt-meter with 50,000 pulses per kWh and integrating its output
Scaling Decimal
Unit kWh
1 kWh 50000 (number of pulses per kWh)
When connecting a owmeter with 10 L per pulse and integrating its output
Scaling Decimal
Unit L
1 pulse 10 (ow rate [L] per pulse)
46
Page 53
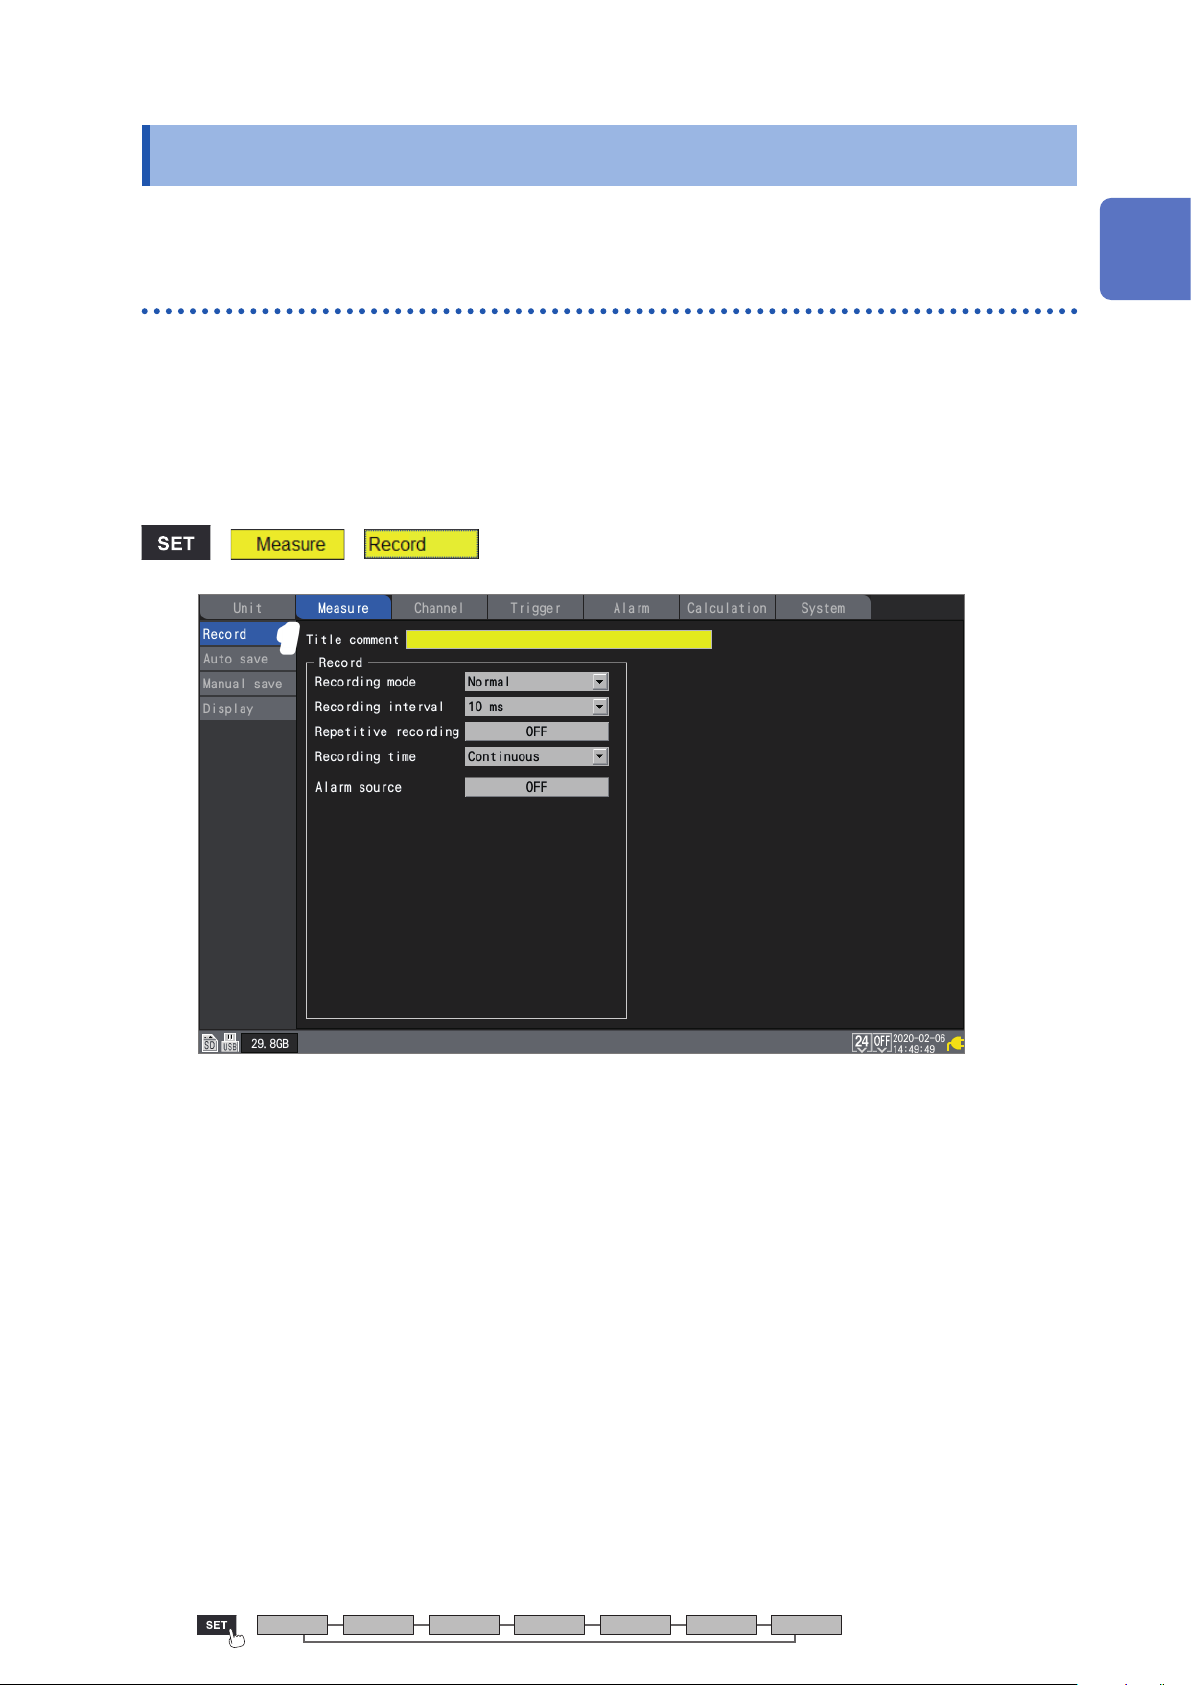
Entering Comments
1.6 Entering Comments
This section describes how to enter measurement titles, channel comments, and module identiers.
Title comments
This section describes how to enter a string of text to serve as the measurement title. (Up to 40
single-byte characters)
See “Text entry method” (p. 8).
Title comments are displayed at the top of the waveform screen.
You can use title comments to identify measurement based on image data when display
screenshots are saved.
> >
1
Settings and Operation
11
Select [Title comment] with the Left Arrow, Right Arrow, Up Arrow, and Down Arrow keys
1
and press the ENTER key.
The text entry window will open.
See “Text entry method” (p. 8).
Enter text and press the ENTER key.
2
The entered text will be accepted.
Unit Measure Channel Trigger Alarm Calculation System
47
Page 54
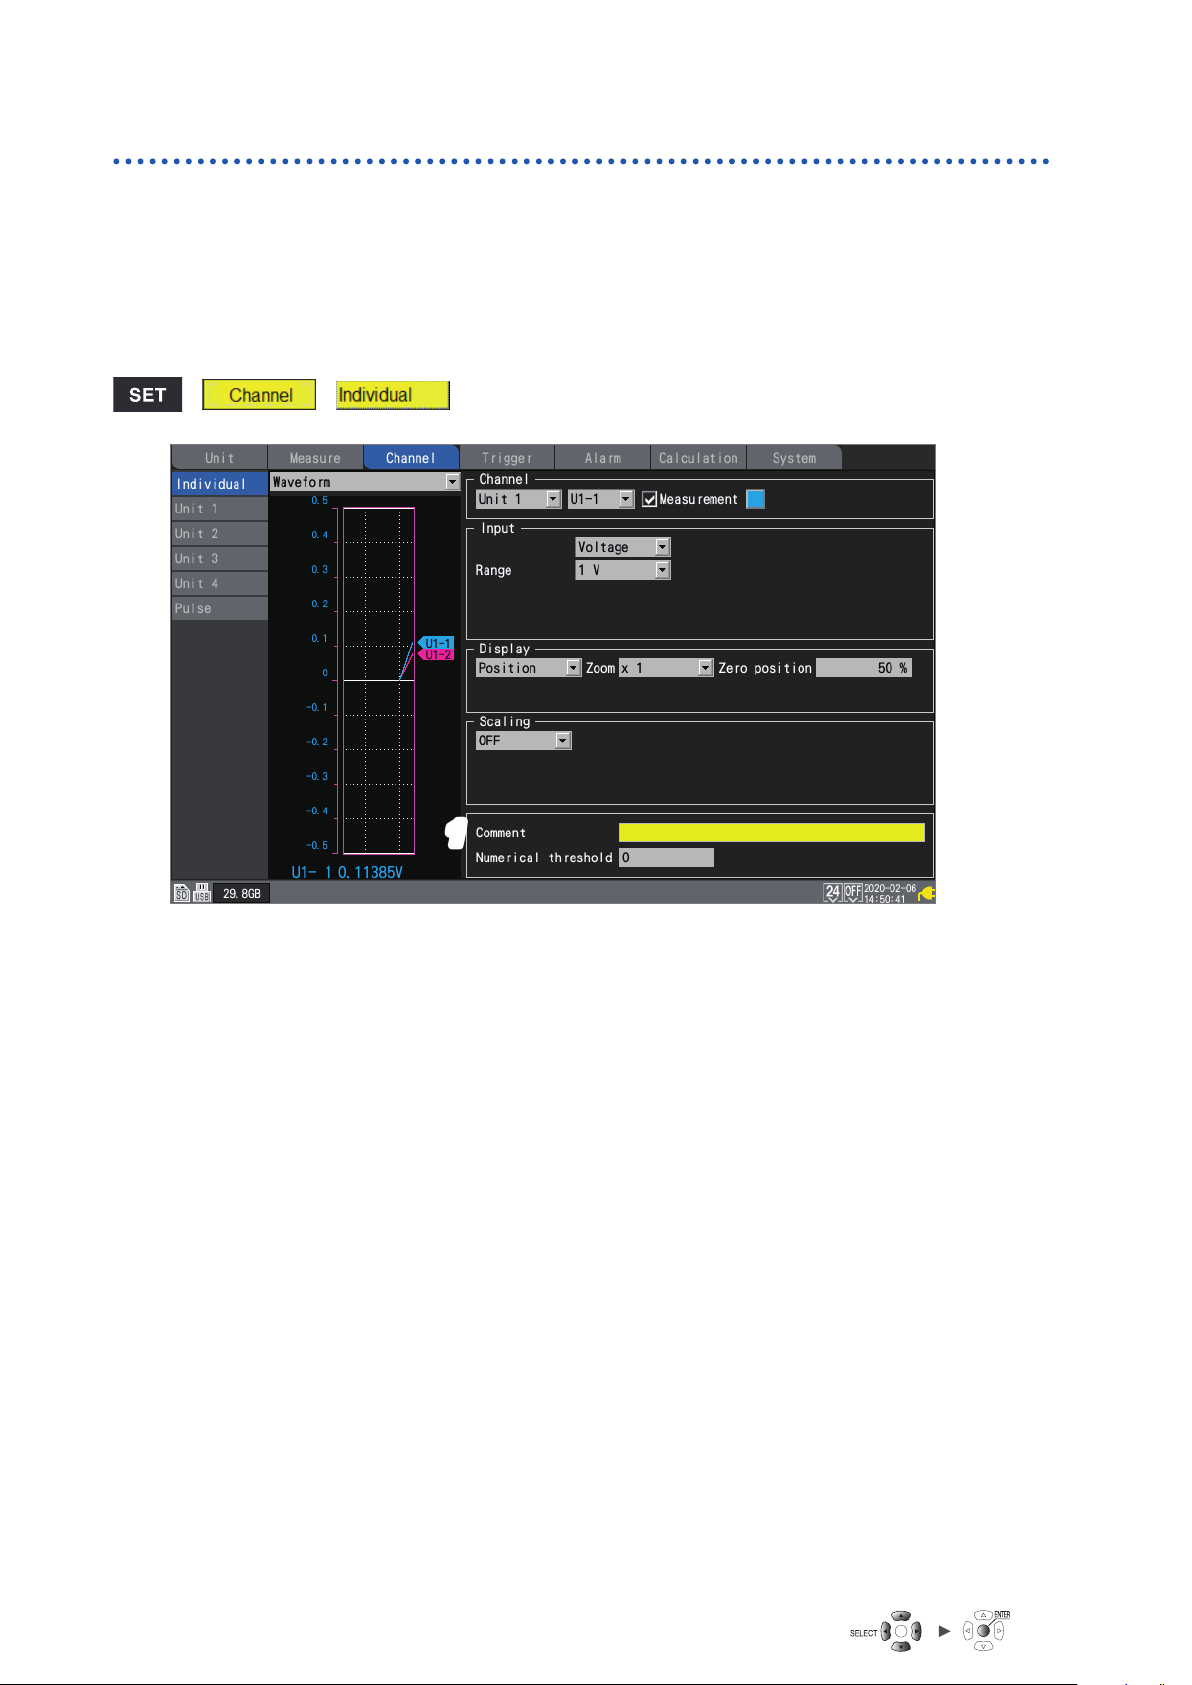
Entering Comments
Channel comments
This section describes how to enter a string of text for each channel. (Up to 40 single-byte
characters)
See “Text entry method” (p. 8).
Channel comments are displayed on the screen when the waveform screen is set to [Wave+Value].
Channel comments allow you to identify channels when measuring numerous channels.
> >
11
Select [Comment] with the Left Arrow, Right Arrow, Up Arrow, and Down Arrow keys and
1
press the ENTER key.
The text entry window will open.
See “Text entry method” (p. 8).
Enter text and press the ENTER key.
2
The entered text will be accepted.
You can use [Comment] on the settings list screen to enter channel comments.
See “1.7 Conguring Channels in a List” (p. 50).
48
Page 55
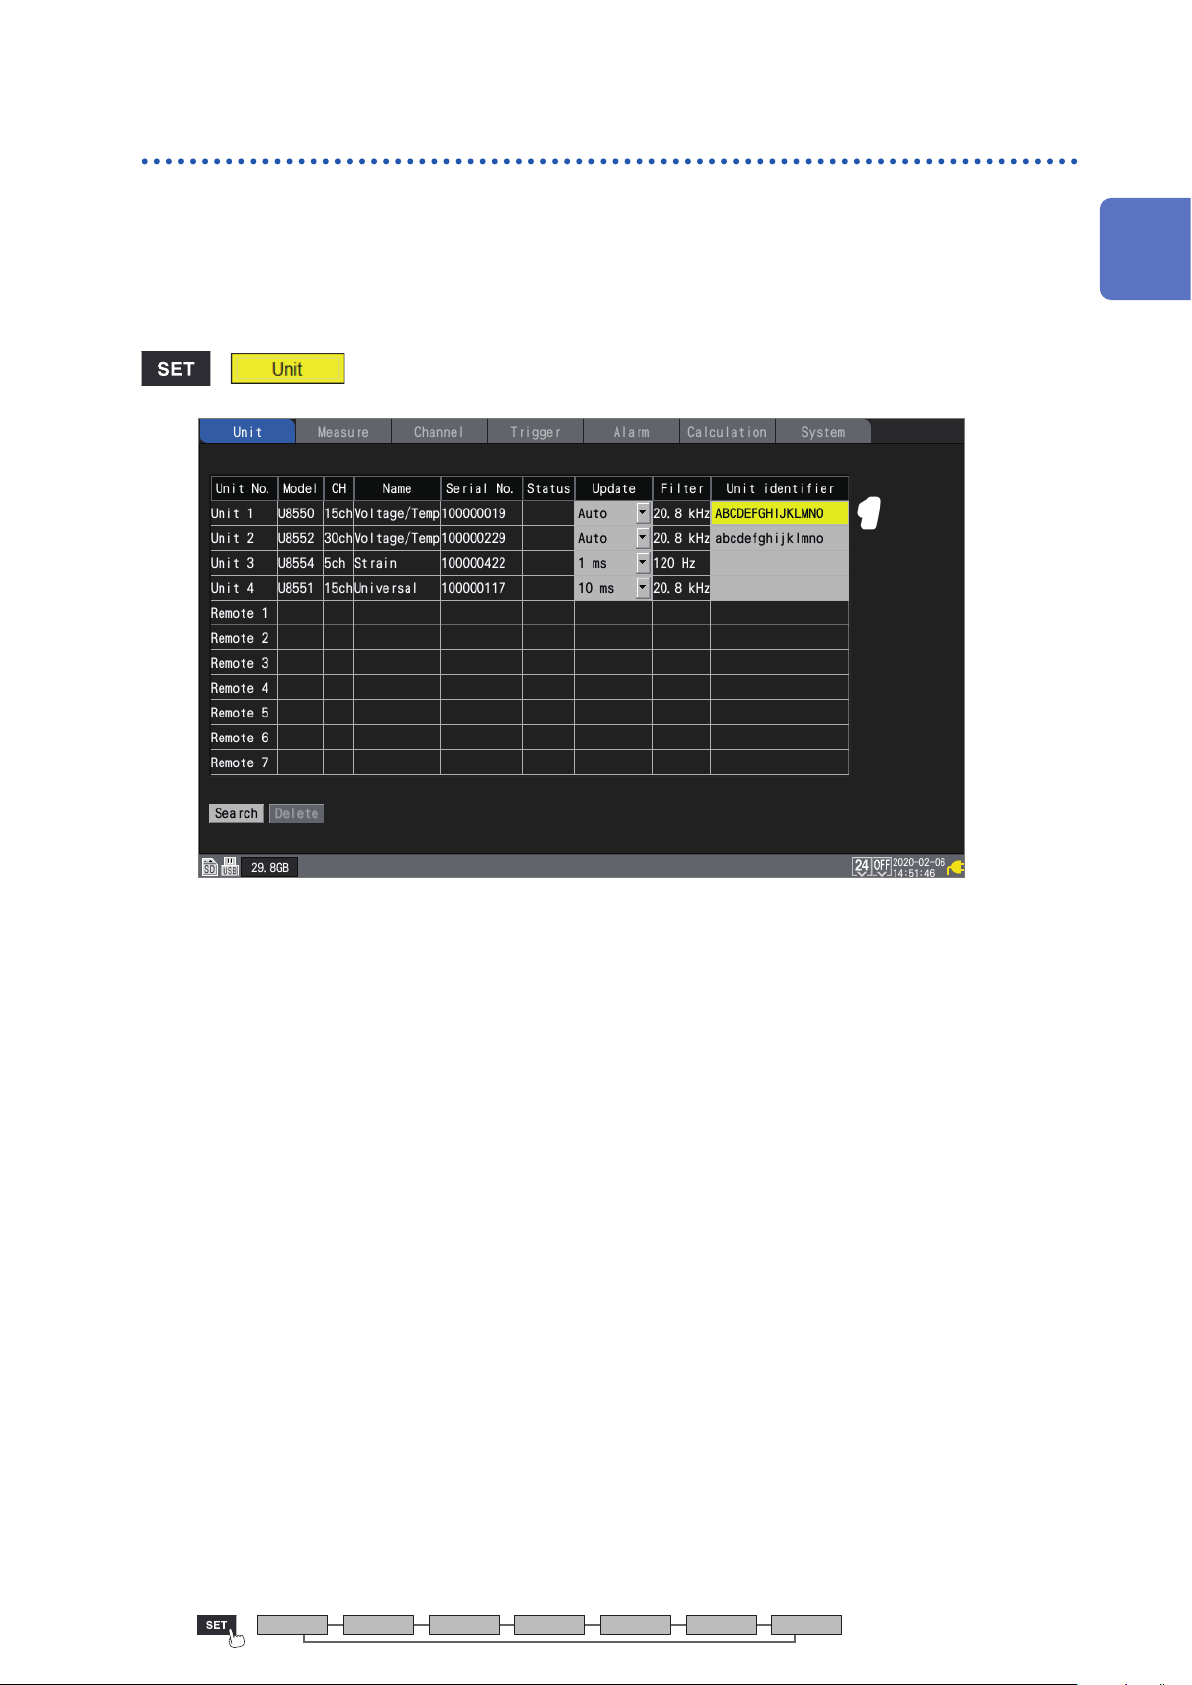
Entering Comments
Module identiers
This section describes how to enter an identier (string of text) for each module. (Up to 8 doublebyte or 16 single-byte characters)
See “Text entry method” (p. 8).
1
You can use module identiers to identify modules when using multiple modules.
>
11
Settings and Operation
Select [Unit identier] with the Left Arrow, Right Arrow, Up Arrow, and Down Arrow keys and
1
press the ENTER key.
The text entry window will open.
See “Text entry method” (p. 8).
Enter text and press the ENTER key.
2
The entered text will be accepted.
Unit Measure Channel Trigger Alarm Calculation System
49
Page 56
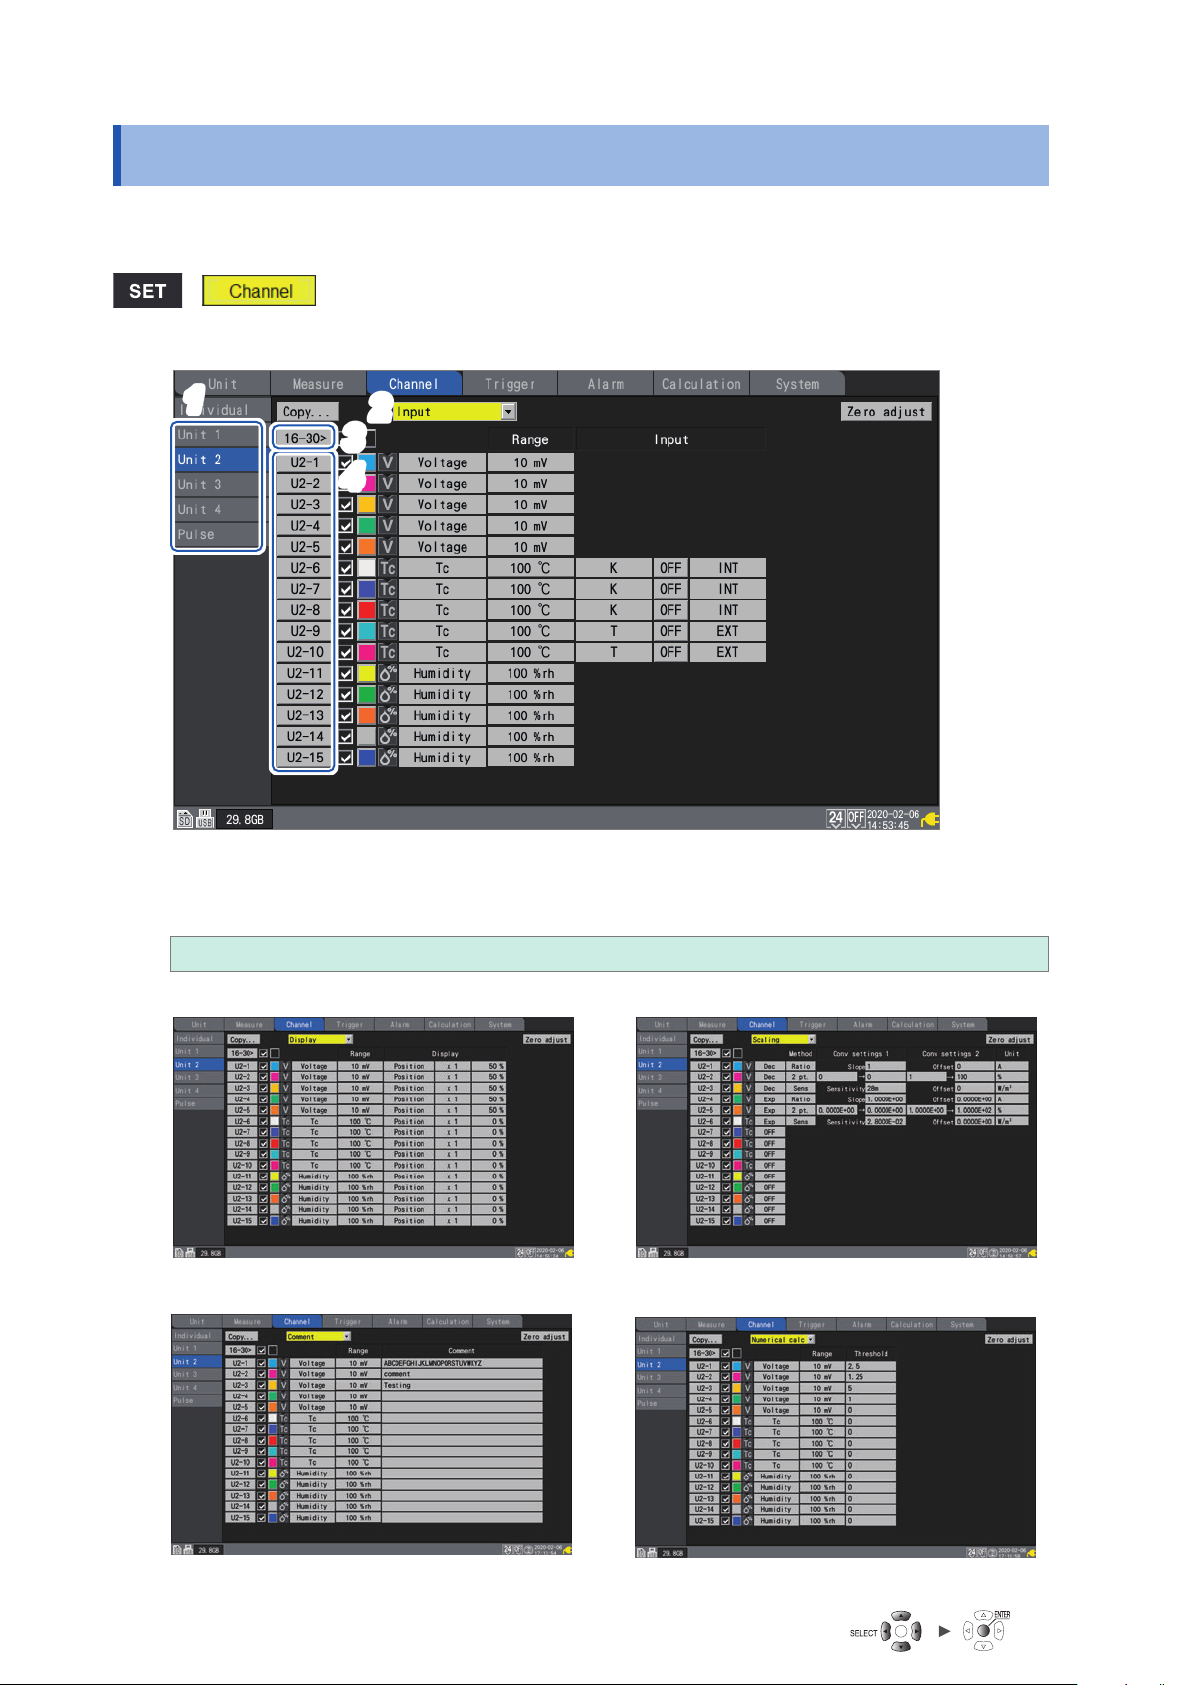
Conguring Channels in a List
1.7 Conguring Channels in a List
This section describes how to review module settings on the list.
> > [Unit n] (n = 1, 2, . . .)
Settings list screen: [Input]
11
22
33
44
On the sub tab, select the module whose settings you wish to display in the list.
1
Select the item to display.
2
Input
, Display, Scaling, Comment, Numerical calc
Settings list screen: [Display]
See “1.4 Conguring the Waveform Display” (p. 36).
Settings list screen: [Comment]
See “1.6 Entering Comments” (p. 47).
Settings list screen: [Scaling]
See “1.5 Using the Scaling Function” (p. 42).
Settings list screen: [Numerical calc]
See “Conguring numerical calculations” (p. 147).
50
Page 57
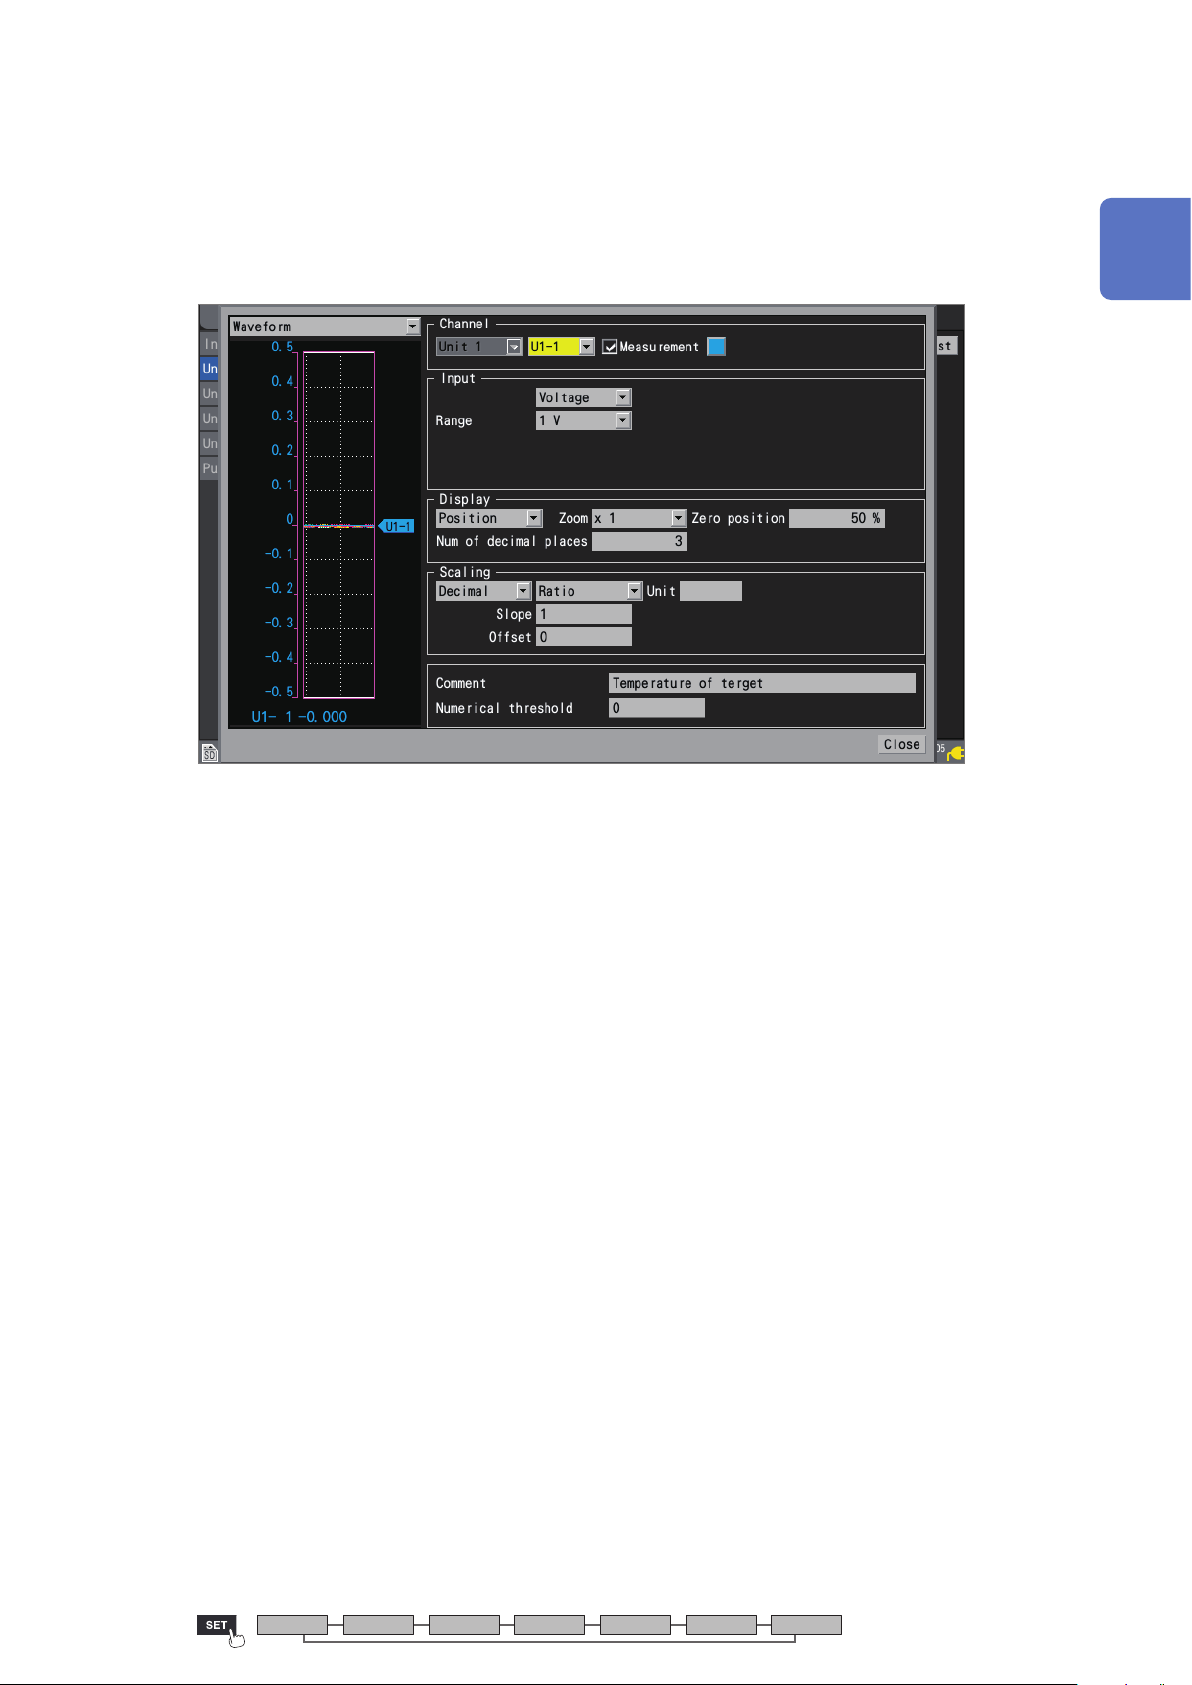
(U8552, LR8532)
3
• Press the ENTER key while [16-30>] is selected to display CH16 to CH30.
• Press the ENTER key while [1-15>] is selected to display CH1 to CH15.
Select a channel number and press the ENTER key.
4
The individual settings window will open, allowing you to congure the settings.
Press the ESC key to close the window.
Conguring Channels in a List
1
Settings and Operation
See “1.3 Conguring Input Channels” (p. 16).
Unit Measure Channel Trigger Alarm Calculation System
51
Page 58
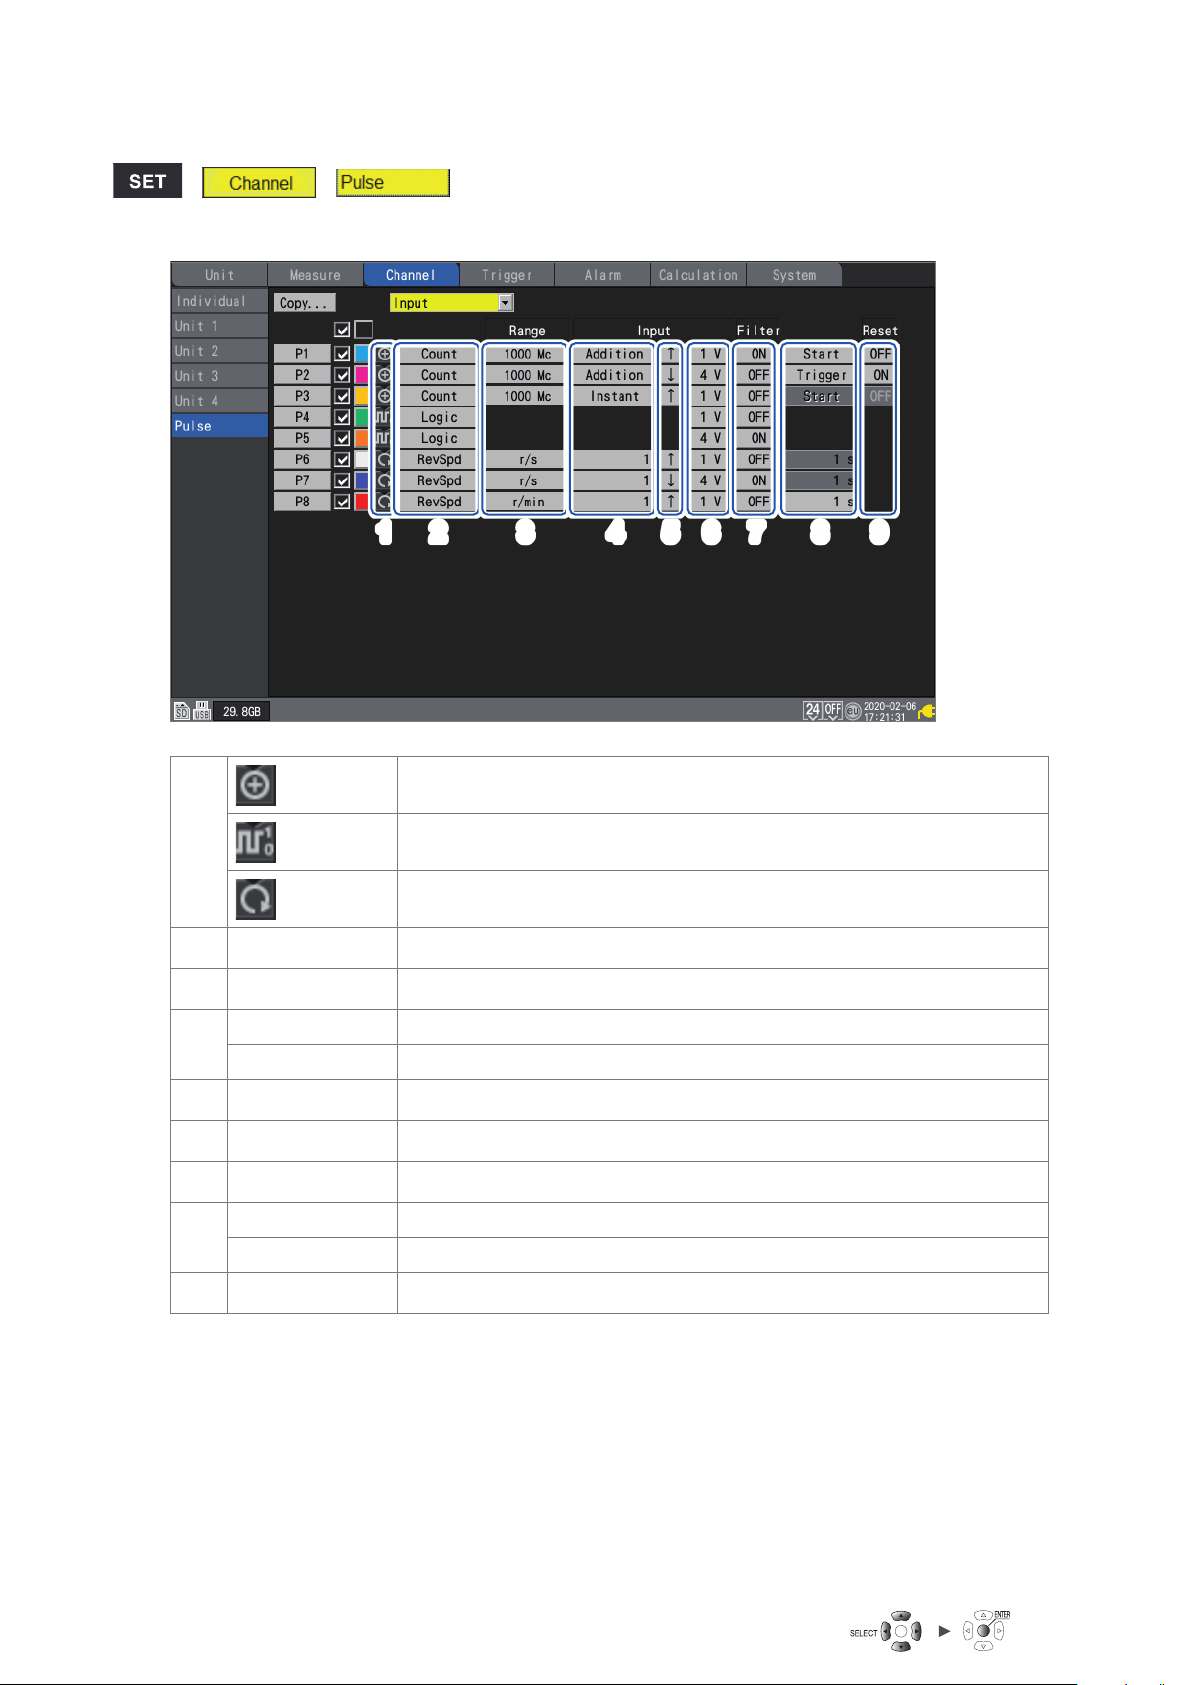
Conguring Channels in a List
Pulse settings list screen
> >
Settings list screen: [Input]
11 22 33 44 55 66 77 88 99
11
Input type Input type
22
Range When the input type is [RevSpd]: Count reference time
33
Integration mode When the input type is [Count]: Integration method
44
Pulse count When the input type is [RevSpd]: Number of pulses per revolution
Slope Slope at which to count
55
Threshold value Level at which to count
66
Filter Chatter prevention lter
77
Timing When the input type is [Count]: Timing at which to start counting
88
Smoothing When the input type is [RevSpd]: Processing period for smoothing
Reset Operation to perform when the integrated value overows
99
Input type: Integration
Input type: Logic
Input type: Rotational speed
52
Page 59
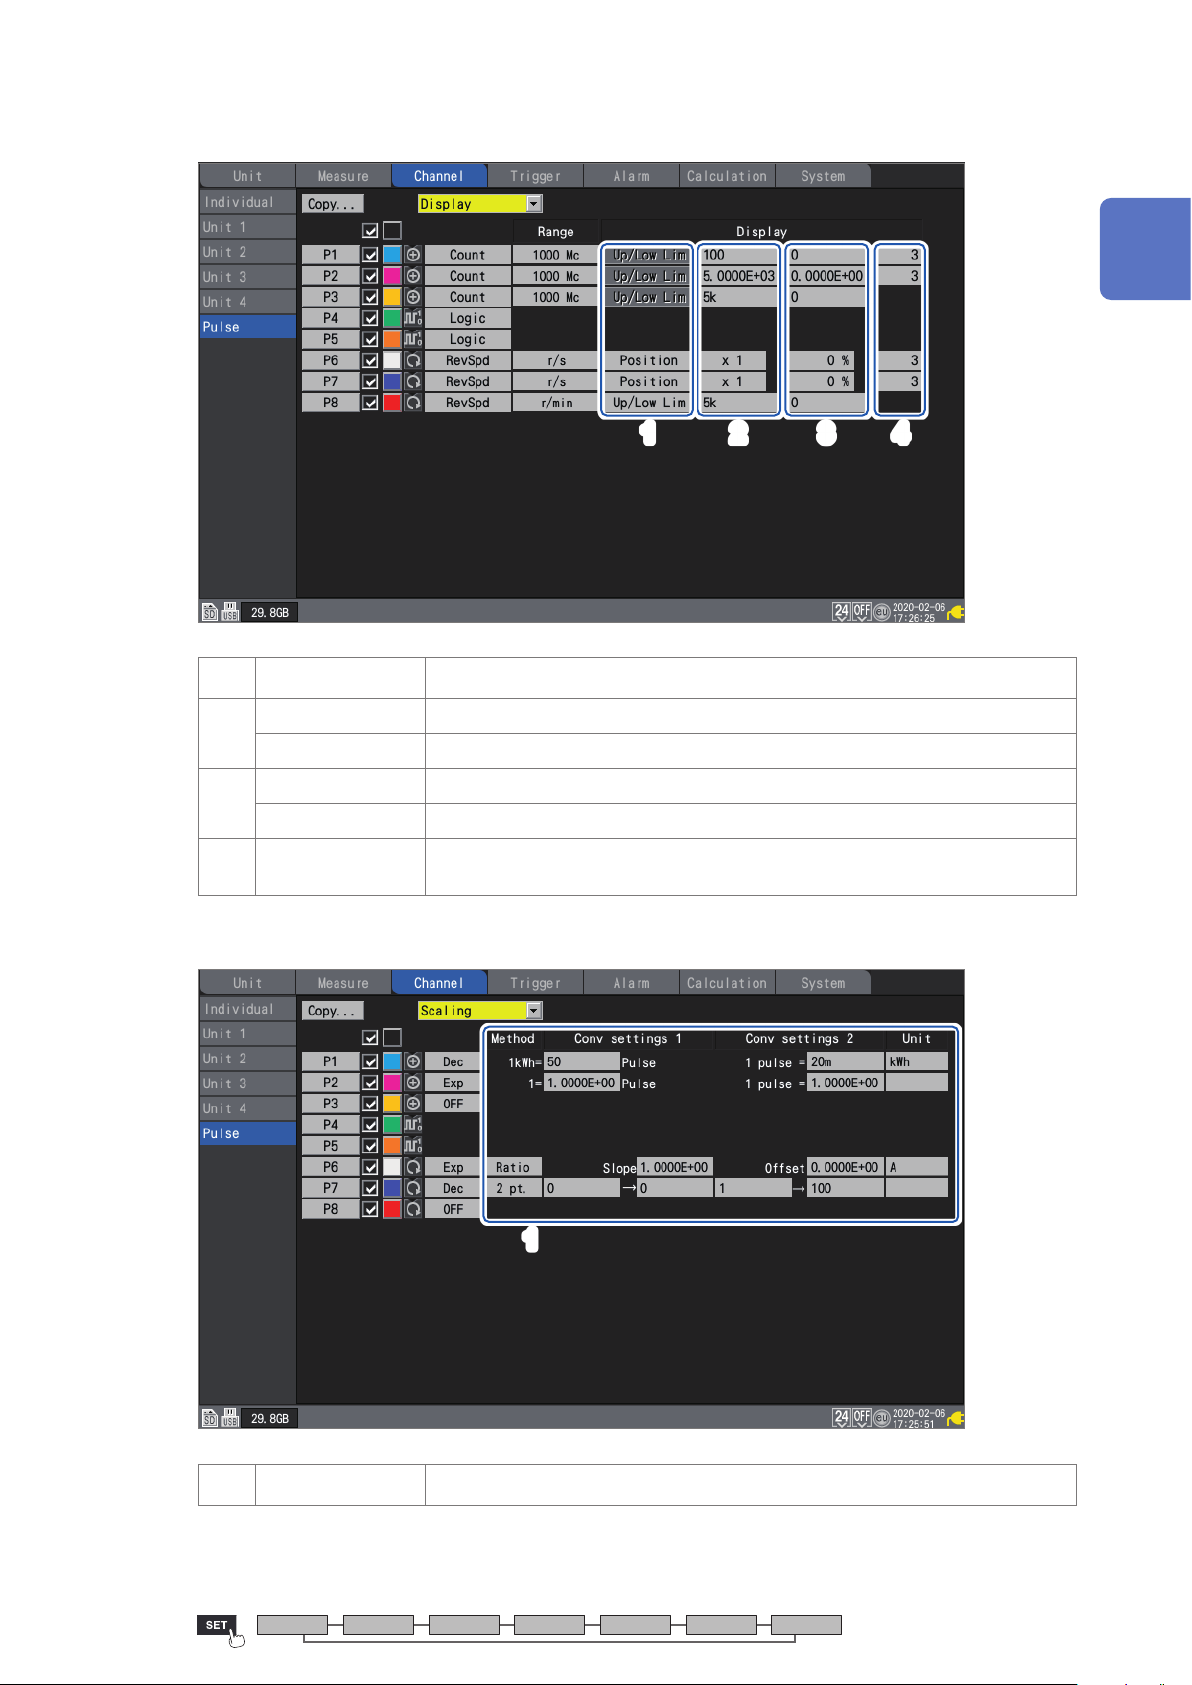
Settings list screen: [Display]
Conguring Channels in a List
1
Settings and Operation
2211 4433
Display settings Displays setting method
11
Zoom factor When the display setting is [Position]: Waveform display zoom factor
22
Upper limit value When the display setting is [Up/Low Lim]: Screen upper limit value
Zero position When the display setting is [Position]: Waveform zero position (0 V, 0°C, etc.)
33
Lower limit value When the display setting is [Up/Low Lim]: Screen lower limit value
Number of
44
decimal places
Settings list screen: [Scaling]
Number of decimal places for measured values
11
Scaling Scaling settings
11
Unit Measure Channel Trigger Alarm Calculation System
53
Page 60
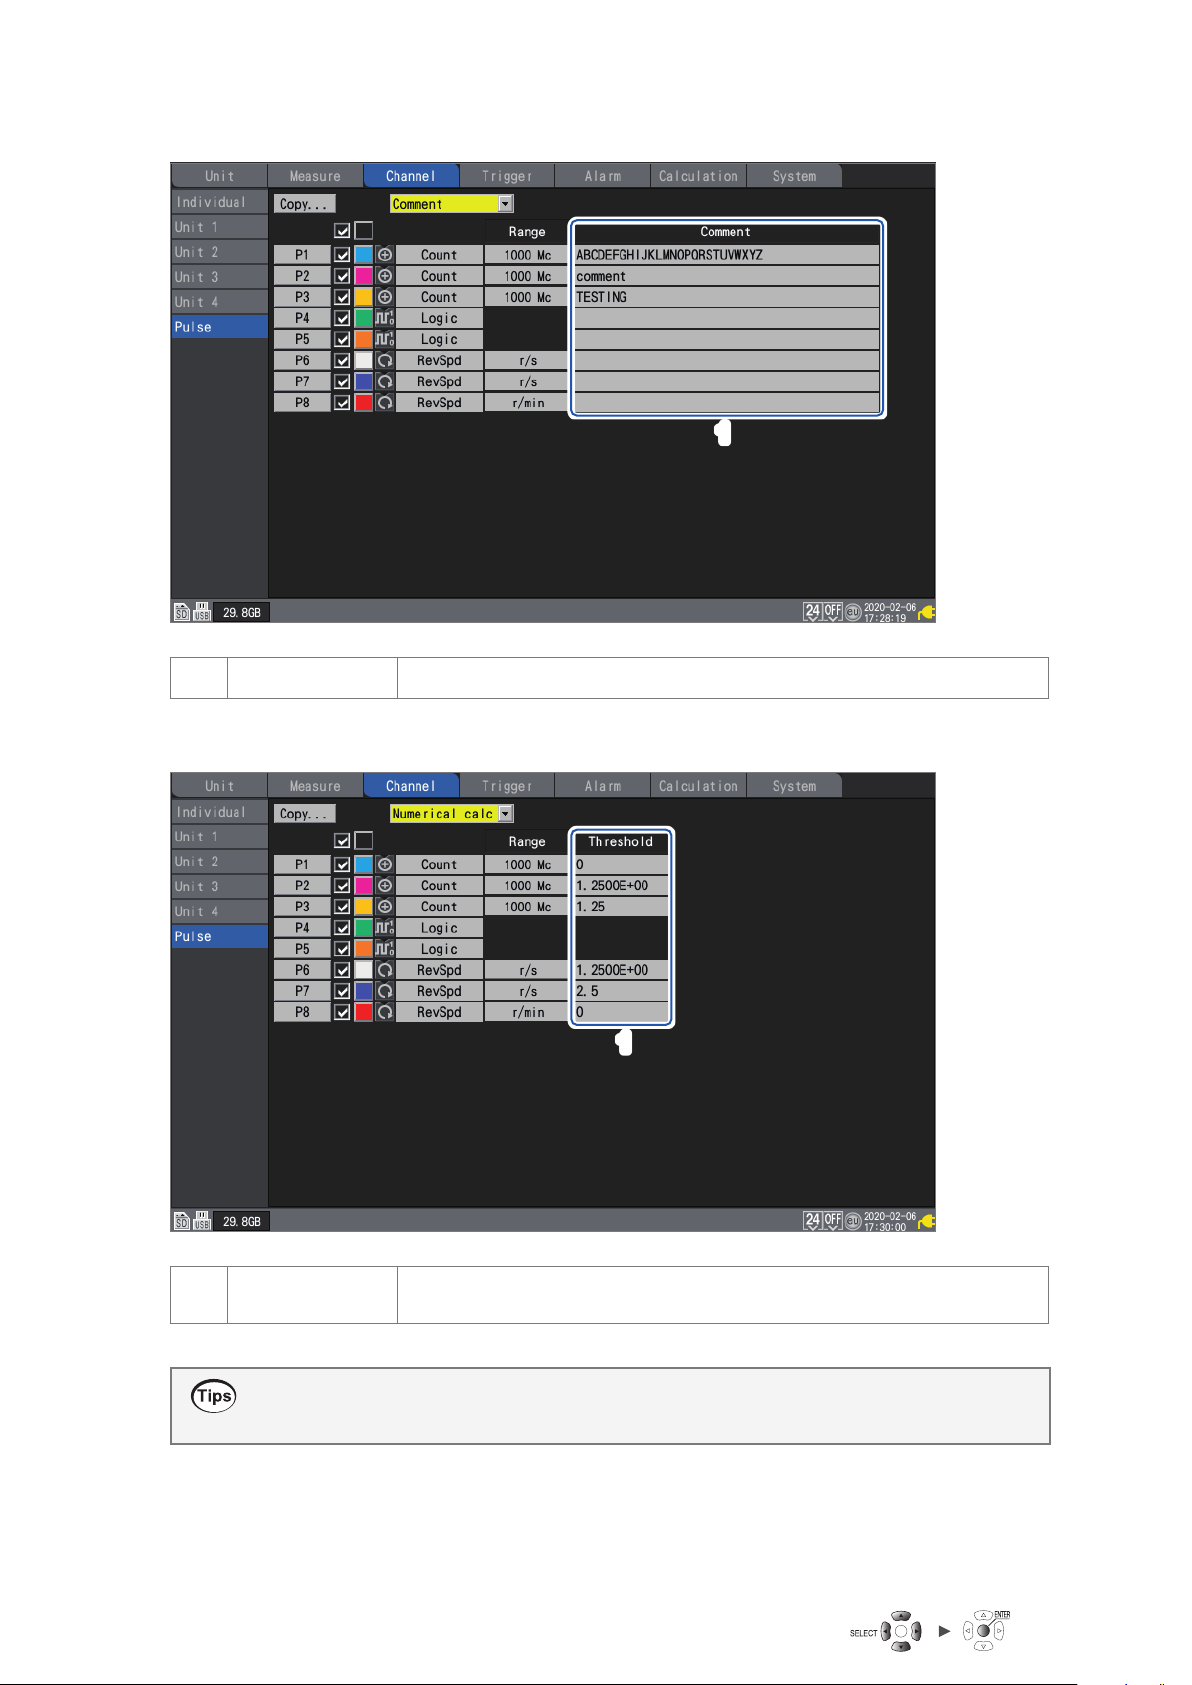
Conguring Channels in a List
Settings list screen: [Comment]
11
Comment Comments for individual channels
11
Settings list screen: [Numerical calc]
11
54
Threshold value Threshold value for numerical calculations
11
Threshold values will be used for numerical calculations. For more information about threshold
values, see “Conguring numerical calculations” (p. 147).
(Availability, ON time, OFF time, ON count, OFF count)
Page 61
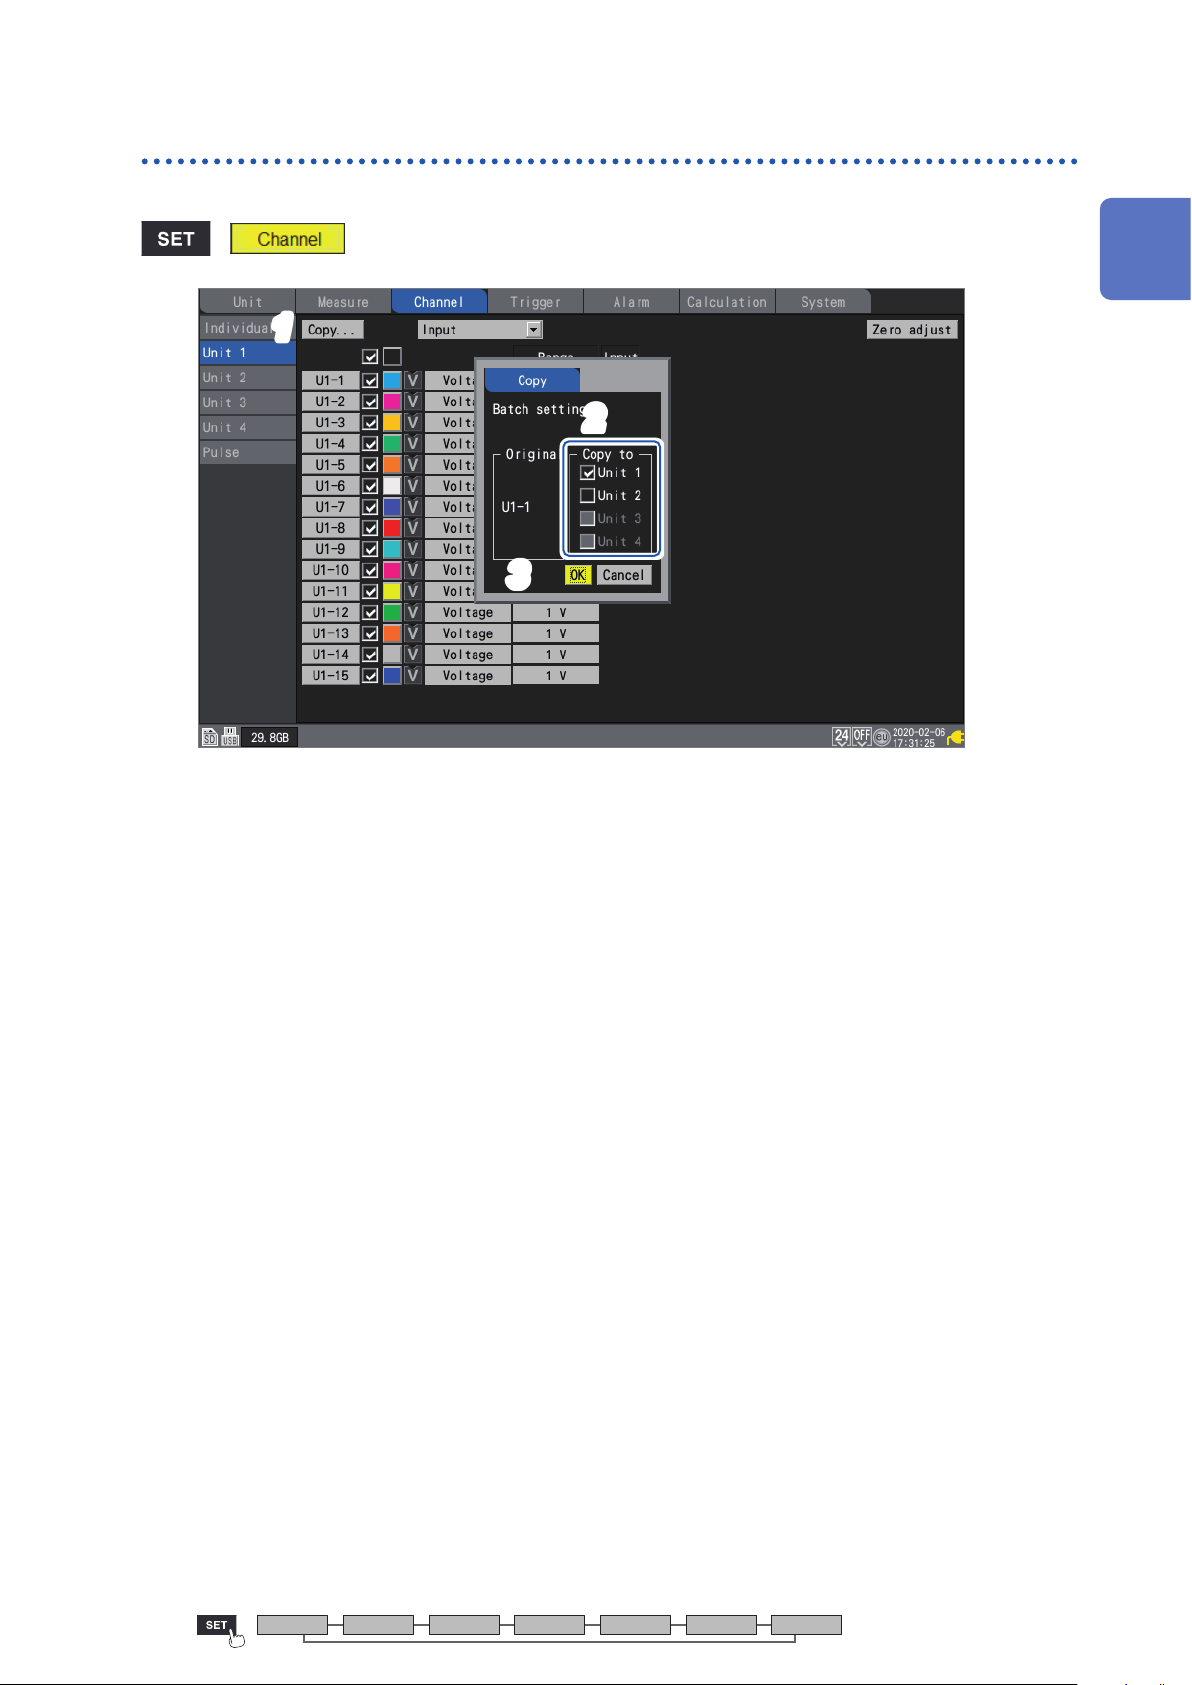
Copying channel settings
This section describes how to copy one module’s settings to another module.
> > [Unit n] (n = 1, 2, . . .)
11
22
33
Conguring Channels in a List
1
Settings and Operation
Press the ENTER key while [Copy...] is selected.
1
The settings window will open.
Select the checkbox for the module to which you wish to copy the settings (the target
2
module).
The source module cannot be changed from [Un-1]. (n = 1, 2, . . .)
Select [OK] and press the ENTER key.
3
The settings will be copied.
Pressing the ENTER key while [Cancel] is selected to cancel the copy operation.
Unit Measure Channel Trigger Alarm Calculation System
55
Page 62
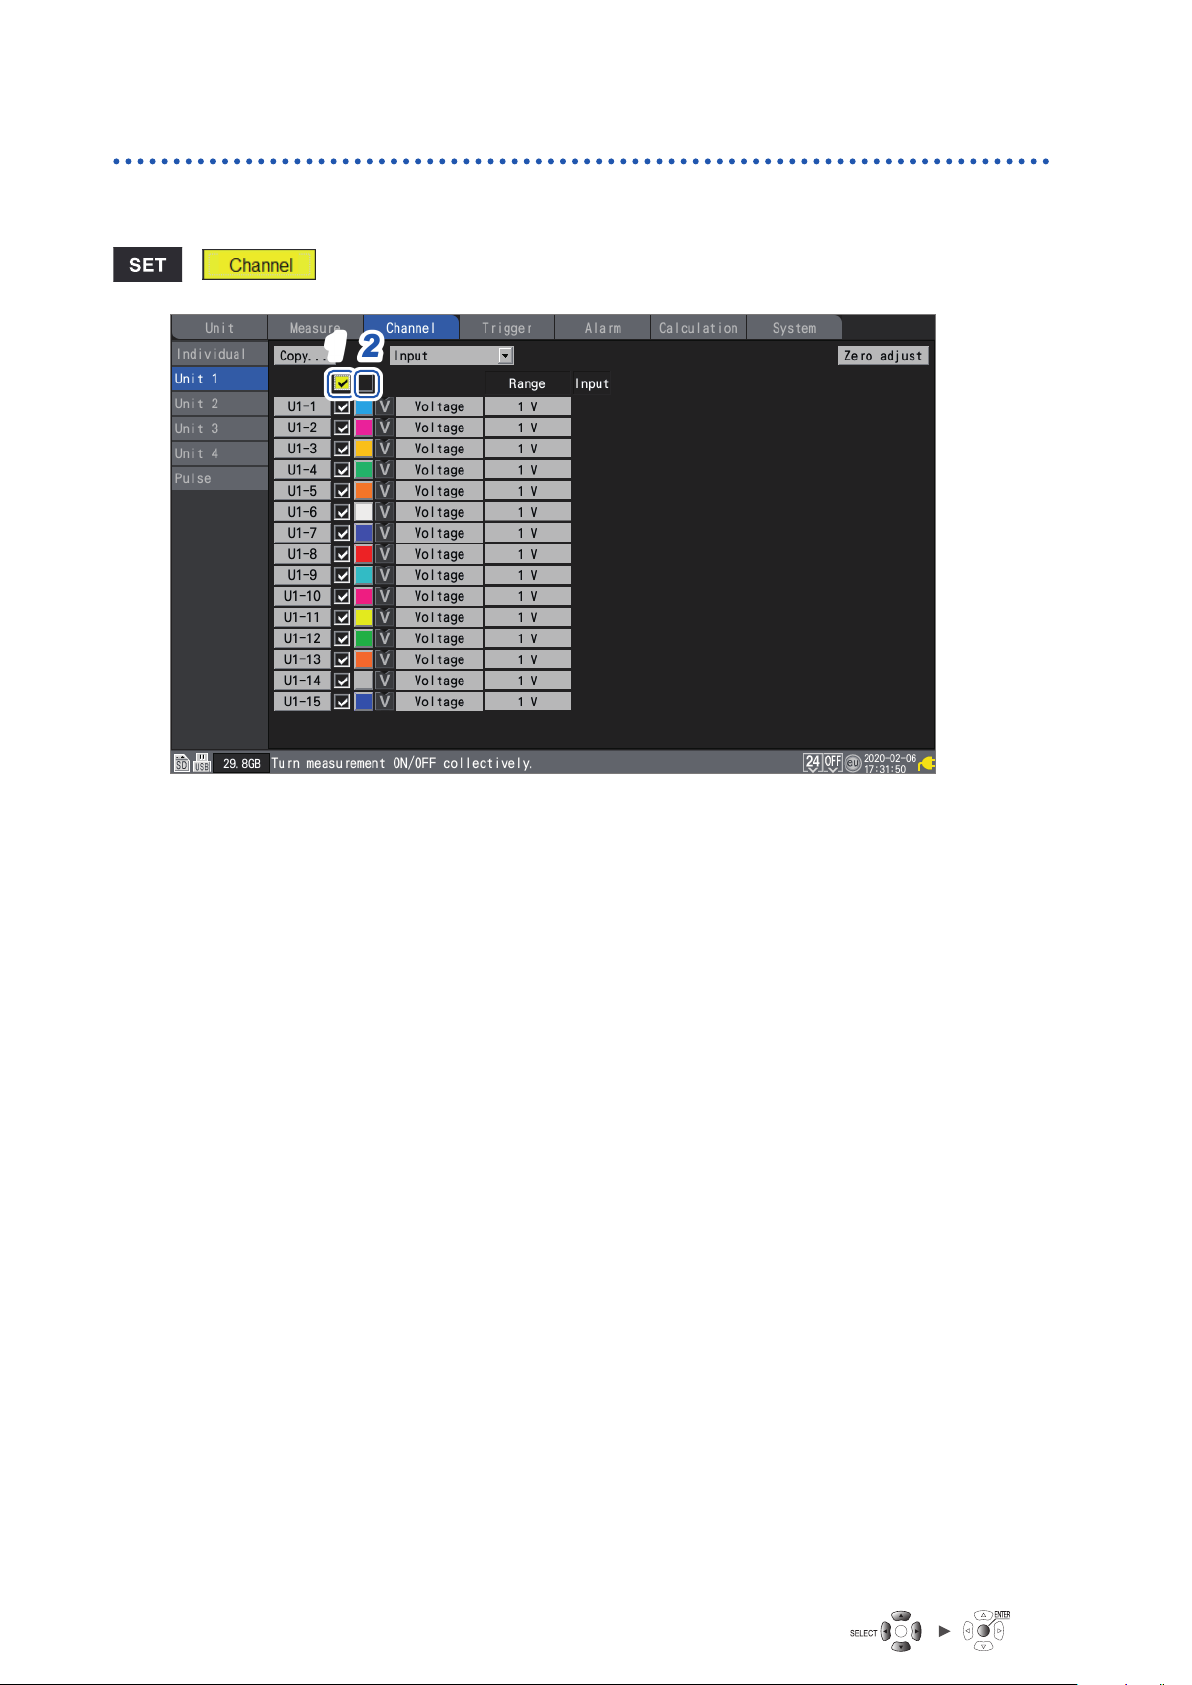
Conguring Channels in a List
Conguring channel settings at once
This section describes how to turn the measurement on or o and congure the waveform display
color settings for all channels on a module.
> > [Unit n] (n = 1, 2, . . .)
2211
Select the measurement ON/OFF checkbox and press the ENTER key.
1
Each time you press the ENTER key, the measurement setting for all channels will toggle between
ON and OFF.
Select the measurement display color checkbox and press the ENTER key.
2
Each time you press the ENTER key, the display setting for all channels will toggle between ON
and OFF.
56
Page 63
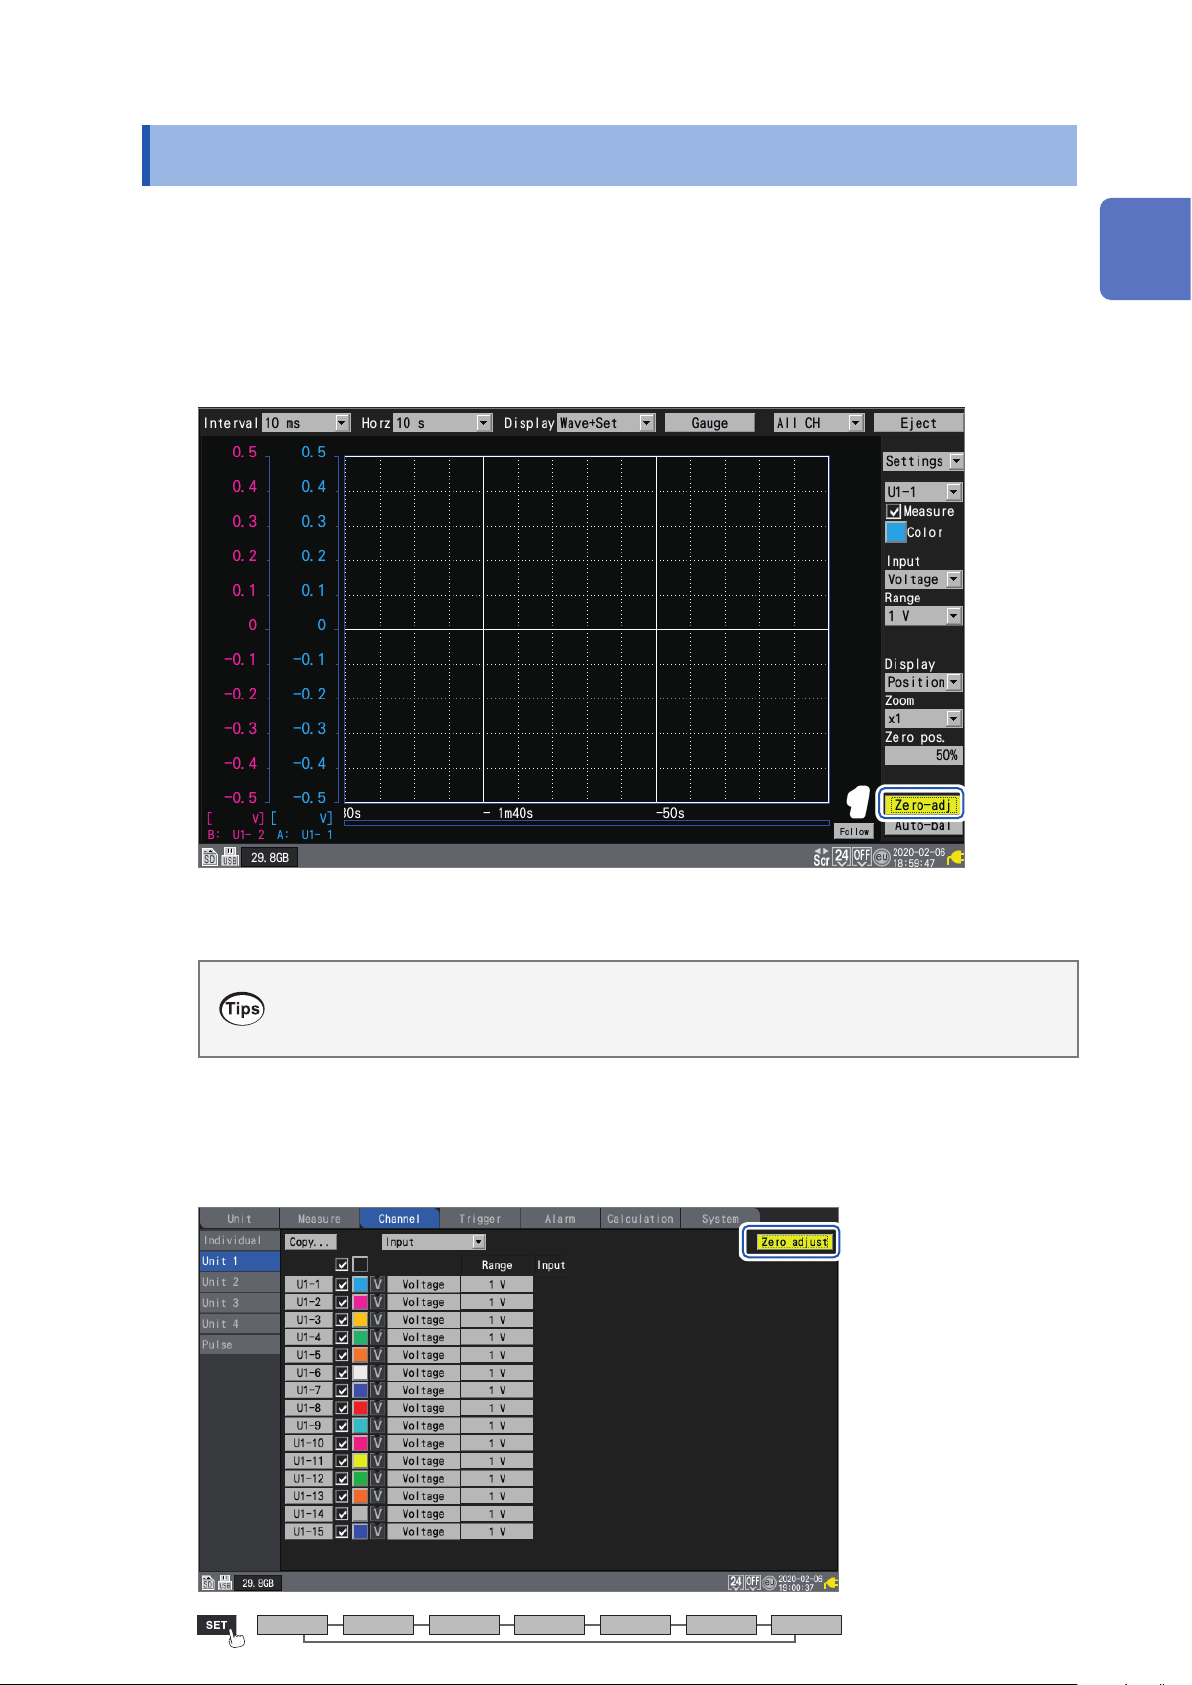
Performing Zero Adjustment
1.8 Performing Zero Adjustment
This section describes how to correct misalignment of inputs and set the instrument’s reference
voltage to 0 V.
Perform zero adjustment if the reference voltage is not 0 V with a pair of input terminals short-
circuited.
Zero adjustment is performed as follows:
Press the ENTER key while [Zero-adj] is selected on the waveform screen.
1
1
Settings and Operation
Zero adjust
performed while meas
The zero adjustment function is disabled for Strain Units (U8554, LR8534).
To adjust the zero position of Strain Units, use the auto-balancing function.
For more information about auto-balancing, see “Measuring strain” (p. 27).
Zero adjustment can also be performed on the settings list screen.
ment values are reset when a system reset is performed. Zero adjustment cannot be
urement is in progress.
The internal temperature of the instrument and modules will stabilize once at least 30 minutes
has elapsed since they were turned on. Temporal variation can be limited by performing zero
adjustment in this state.
11
Unit Measure Channel Trigger Alarm Calculation System
57
Page 64
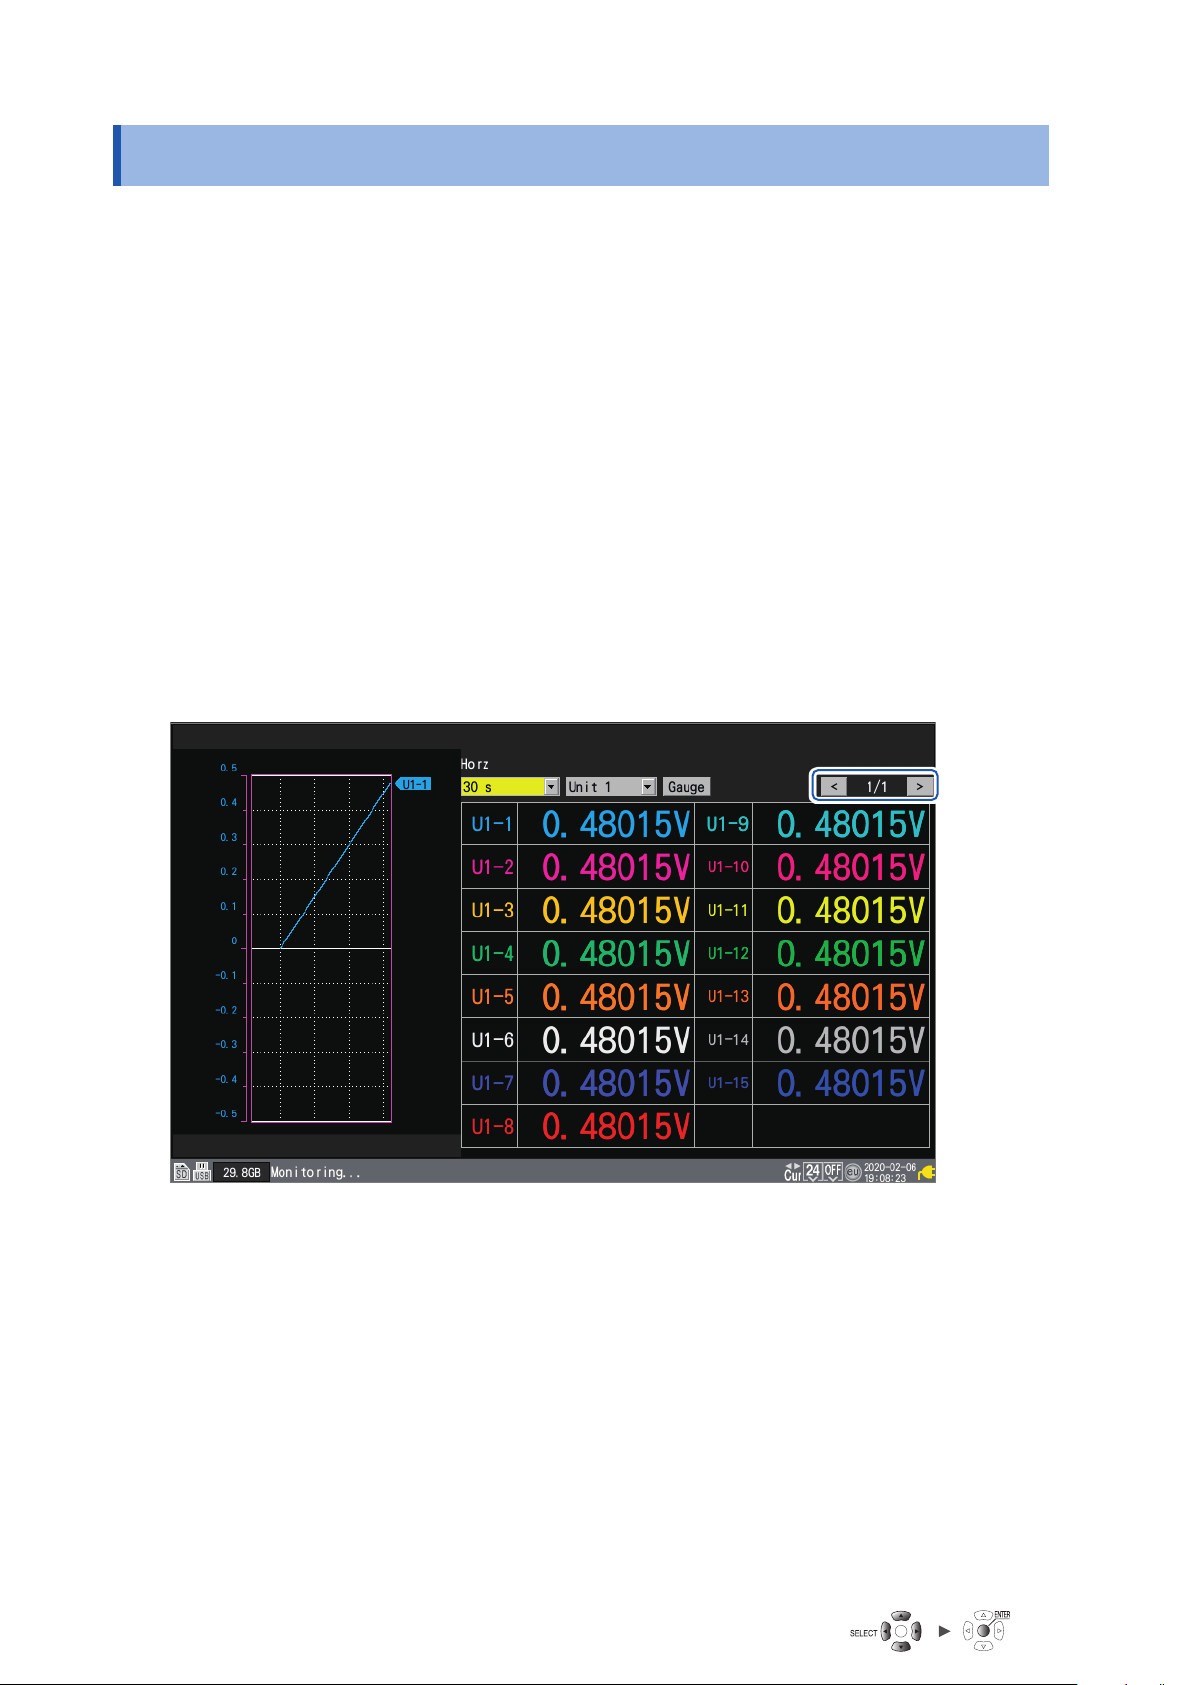
Checking Input Signals (Monitor Function)
1.9 Checking Input Signals (Monitor Function)
This section describes how to check input waveforms to verify that settings such as the range and
display range have properly been congured before starting measurement.
Press the MONITOR key to display waveforms and values on the monitor screen.
Data will be displayed on the screen but not saved in the instrument’s internal buer memory or on
storage media.
(1) Setting the time per division
See “Under [Horizontal axis], select the time per division.” (p. 40).
(2) Selecting the module to display
Waveforms for up to 166 channels can be displayed.
(Maximum number of channels: 120 analog, 8 pulse, 8 alarm, and 30 waveform calculation)
(3) Turning the gage on or o
You can choose the channels for which to display a gage.
(4) Switching the channels to display (for modules with 16 channels or more)
Values can be displayed for up to 15 channels on one screen.
(1)(1) (2)(2) (4)(4)(3)(3)
The monitor function will terminate when you change the screen display or start measurement.
58
• The monitor function cannot be used while measurement is in progress.
• For channels with more than 14 characters, text will be shown in a smaller size.
Page 65
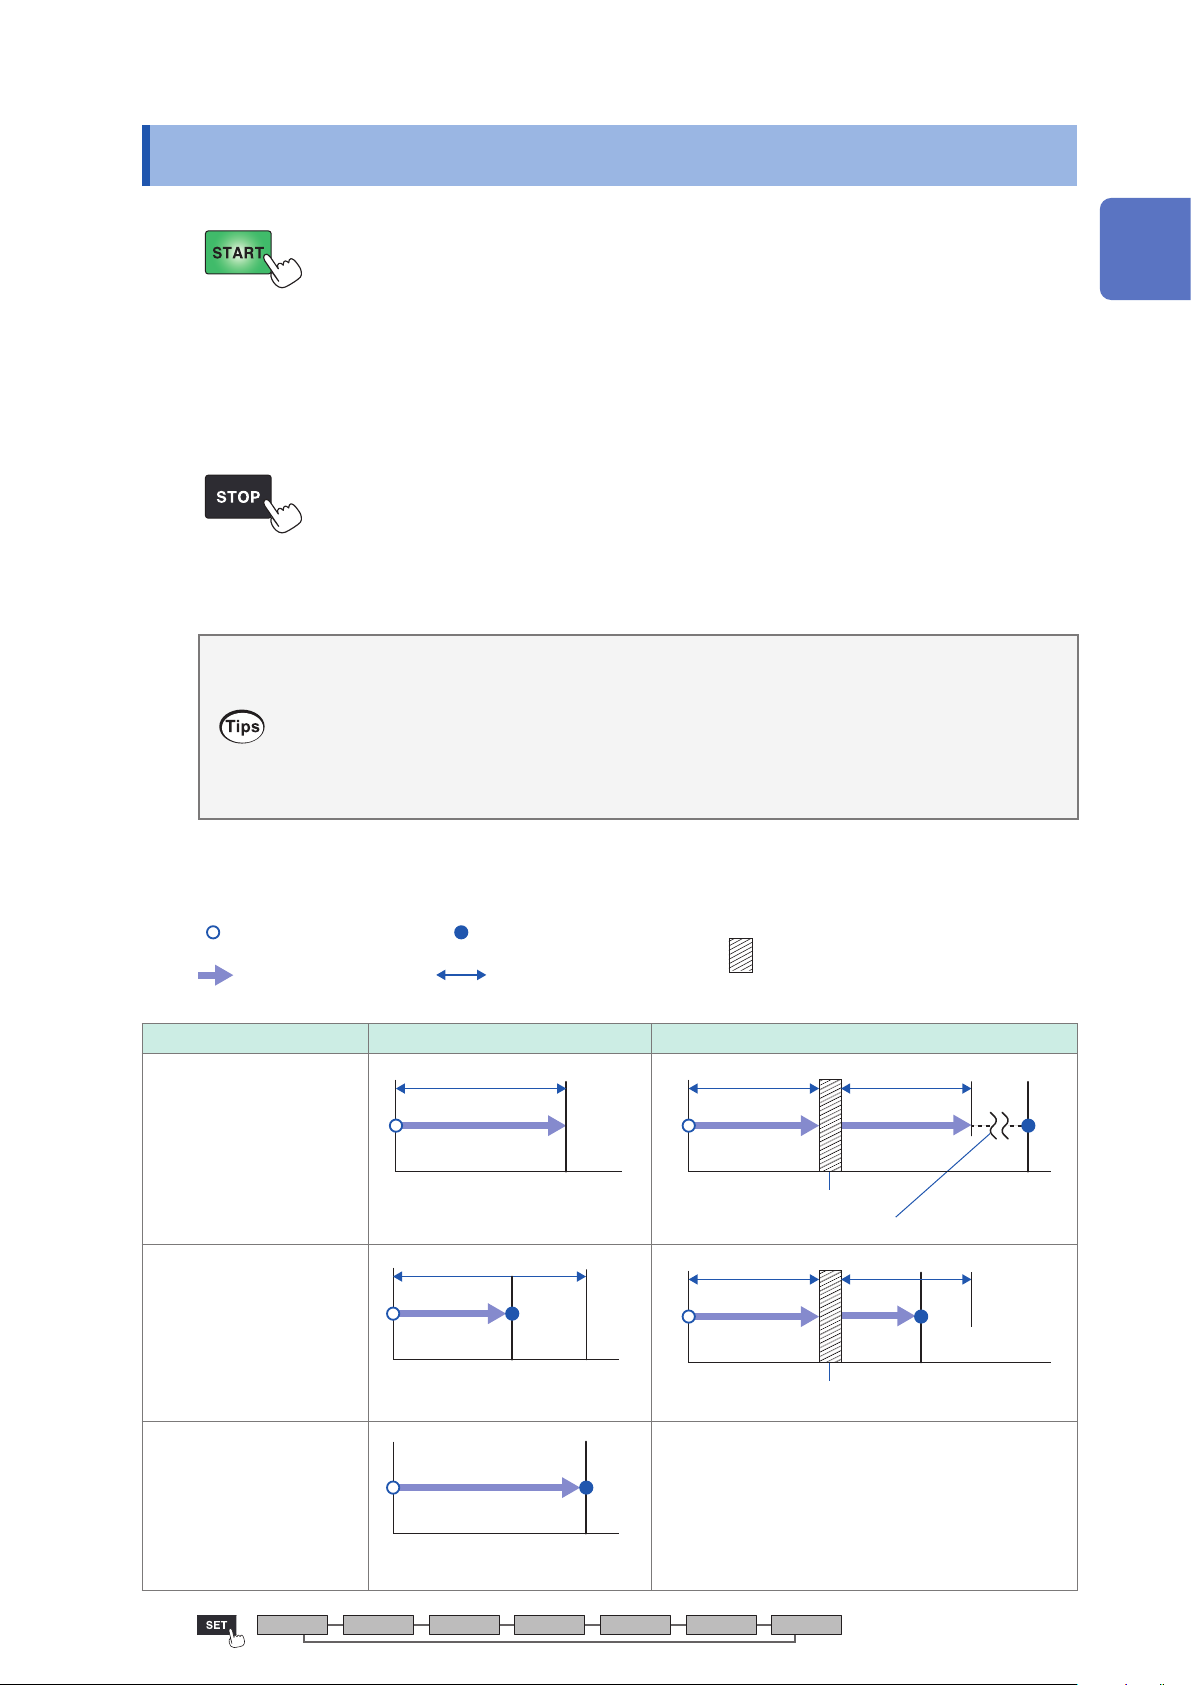
Starting and Stopping Measurement
1.10 Starting and Stopping Measurement
Press the START key to start measurement.
When the [System] > [Operation error prevention] setting is [ON], an operation conrmation
window will be displayed. Press the ENTER key while [Yes] is selected to start measurement.
Starting measurement after stopping it will cause the measurement data in the instrument’s internal
buer memory to be deleted. Save important data on an SD Memory Card or USB Drive before
starting measurement again.
Press the STOP key to stop measurement.
When the [System] > [Operation error prevention] setting is [ON], an operation conrmation
window will be displayed. Press the ENTER key while [Yes] is selected to stop measurement.
• Measurement can also be stopped automatically at the set recording time.
See “1.2 Setting Measurement Conditions” (p. 10).
• You can prevent misoperation of the START and STOP keys.
See “7.1 Conguring Settings” (p. 164).
• You can start recording operation when specic conditions occur. This functionality is
convenient when you wish to monitor conditions for anomalies.
See “2 Trigger Function” (p. 81).
1
Settings and Operation
Measurement operation
Press the START key. Press the STOP key.
Downtime
Measurement
Recording time Repeat recording: OFF Repeat recording: ON
Recording time
Time specied
(STOP key not pressed)
Time specied
(If the STOP key
is pressed while
measurement is in
progress)
Measurement
Measurement
start
Recording time
Measurement
Measurement
start
Set recording time
Measurement
stop
Measurement
stop
Recording time
Measurement
Measurement start
Downtime
Repeats processes until measurement stop.
Recording time
Measurement
Measurement start Measurement stop
Downtime
Measurement
stop
Continuous recording
Unit Measure Channel Trigger Alarm Calculation System
Measurement
Measurement
start
(Same as when repeat recording is OFF)
Measurement
stop
59
Page 66
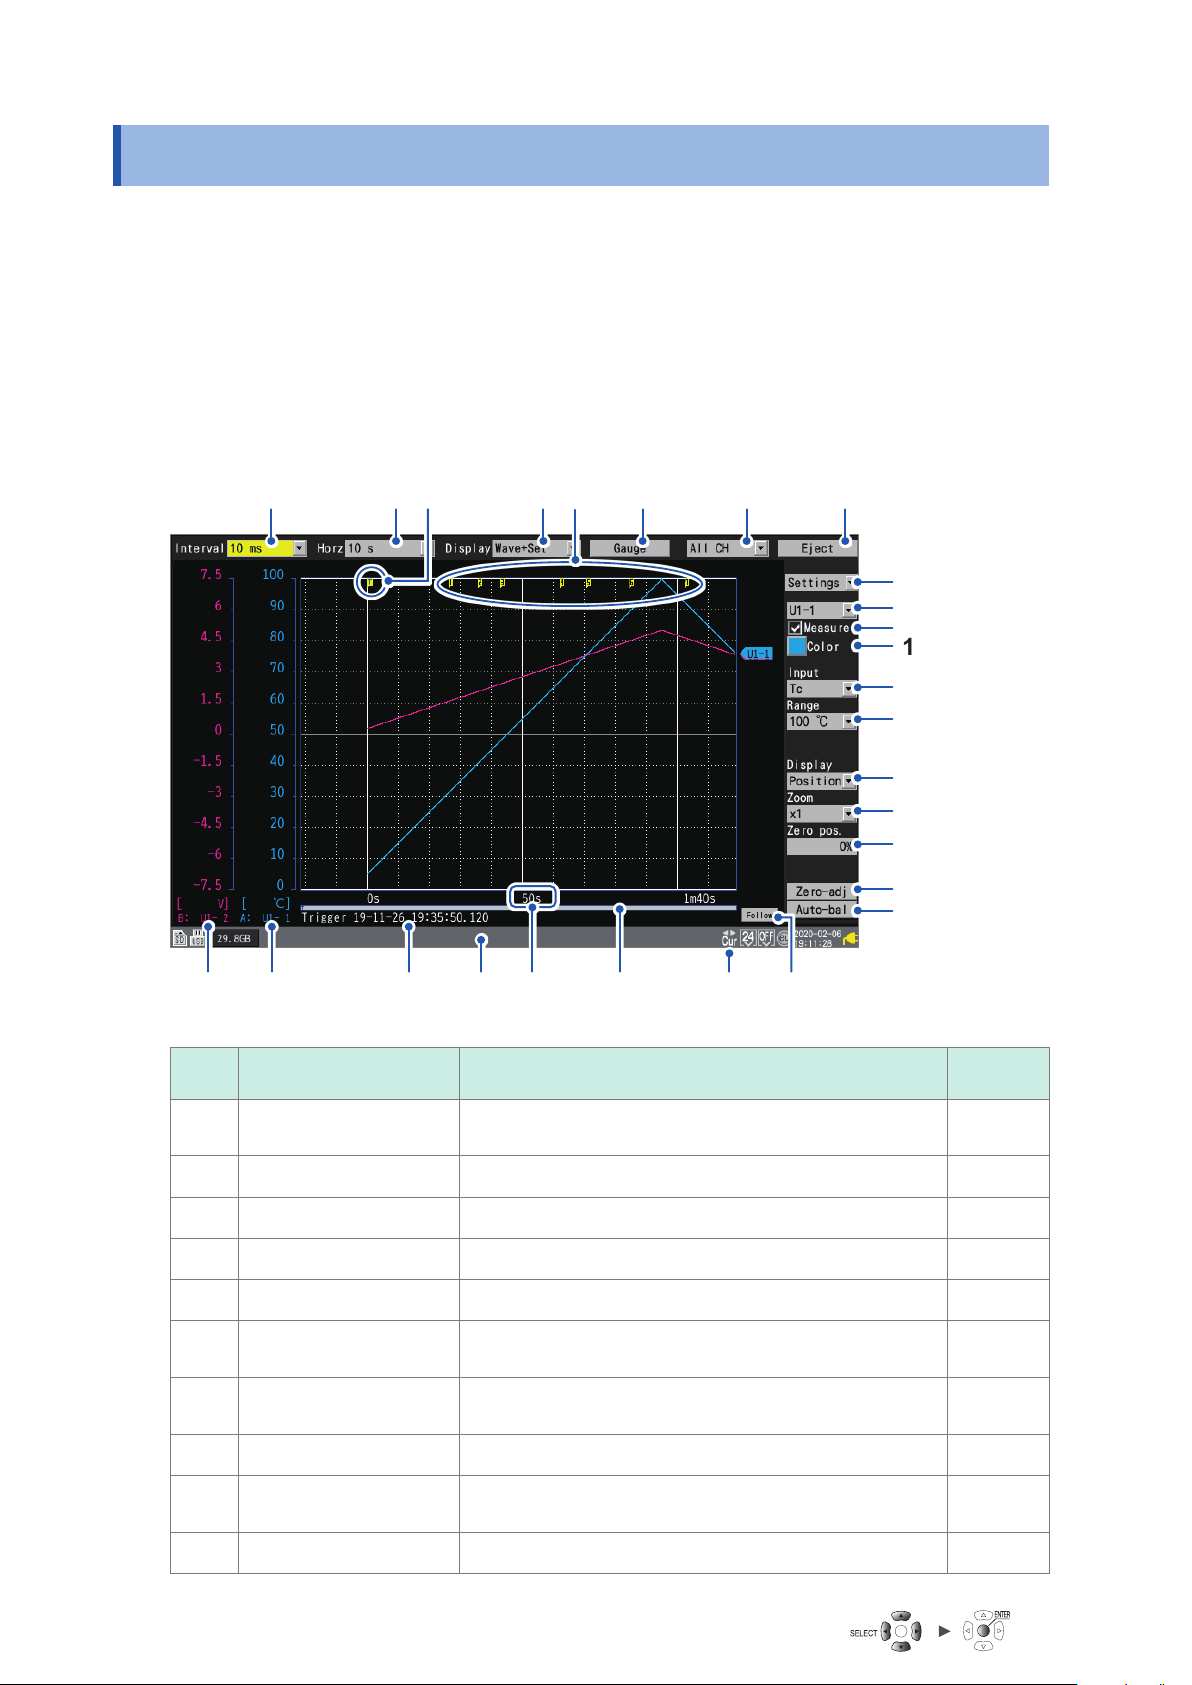
Observing Waveforms
1.11 Observing Waveforms
Press the WAVE key to display the waveform screen. The waveform screen is displayed at all times
while measurement is in progress.
The screen provides the following functionality:
• Moving (scrolling) waveforms
• Moving waveforms while measurement is in progress (to check past waveform data)
• Enlarging and shrinking waveforms
• Reading values from waveforms with the A/B cursors
• Displaying a gage (scale) on the left side of the screen
• Displaying comments on the right side of the screen
11 22 4433 66 77
2020 2121 2222 2424 2525 2626
No. Name Description
Recording interval Allows you to select the interval at which the instrument
11
captures data from the measurement module.
55
27272323
88
99
1010
1111
1212
1313
1414
1515
1616
1717
1818
1919
Reference
page
p. 11
60
Horizontal axis Allows you to select the horizontal axis (time per division). p. 40
22
Trigger mark Indicates the trigger points. p. 81
33
Screen Allows you to select the waveform display method. p. 62
44
Event mark Displays the event number. p. 140
55
Gage Allows you to congure the gage (scale) displayed on the
66
Display selection Allows you to select the waveforms displayed on the
77
Eject Allows you to eject external media. p. 111
88
Setting selection Allows you to select the settings displayed on the right side
99
Channel selection Allows you to select the channel to congure. –
1010
left side of the screen.
screen (sheet).
of the screen.
p. 65
–
–
Page 67
Observing Waveforms
No. Name Description
Measurement Allows you to turn measurement on or o. p. 19
1111
Waveform color Allows you to select the waveform display color. p. 19
1212
Input type Allows you to select the type of input. p. 16
1313
Range Allows you to select the range. p. 16
1414
Display position Allows you to select the waveform display position. p. 36
1515
Zoom factor Allows you to select the zoom factor in the voltage axis
1616
Zero position Allows you to set the waveform's display position (zero
1717
Zero adjustment Allows you to perform zero adjustment. p. 57
1818
Auto-balancing Allows you to perform auto-balancing (Strain Units only). p. 28
1919
Gage B Indicates the channels and modules displayed using gage
2020
Gage A Indicates the channels and modules displayed using gage
2121
Trigger time Indicates the time and date at which the trigger was
2222
Status bar Displays the time and date, messages, icons*
2323
Time value Displays the time from the measurement start.*
2424
direction.
position).
B.
A.
activated.
information.
1
, and other
2
Reference
page
1
Settings and Operation
p. 36
p. 36
p. 65
p. 65
–
–
–
Scroll bar Indicates the displayed waveform’s range and position. p. 71
2525
Scroll icon
2626
Cursor icon
Follow The most recent waveform is always displayed using the
2727
*1: For more information about icons other than the scroll and cursor icons, see “Screen and icons” in “1.2 Part
Names and Functions; Screens” in the Quick Start Manual.
*2: The waveform screen, value screen, and warning screen of the instrument express minute, a unit of time,
in terms of the letter m instead of min.
The waveform is moved using the SCROLL/CURSOR
keys.
The A/B cursors are moved using the SCROLL/CURSOR
keys.
auto-scroll function.
p. 69
p. 75
–
Unit Measure Channel Trigger Alarm Calculation System
61
Page 68
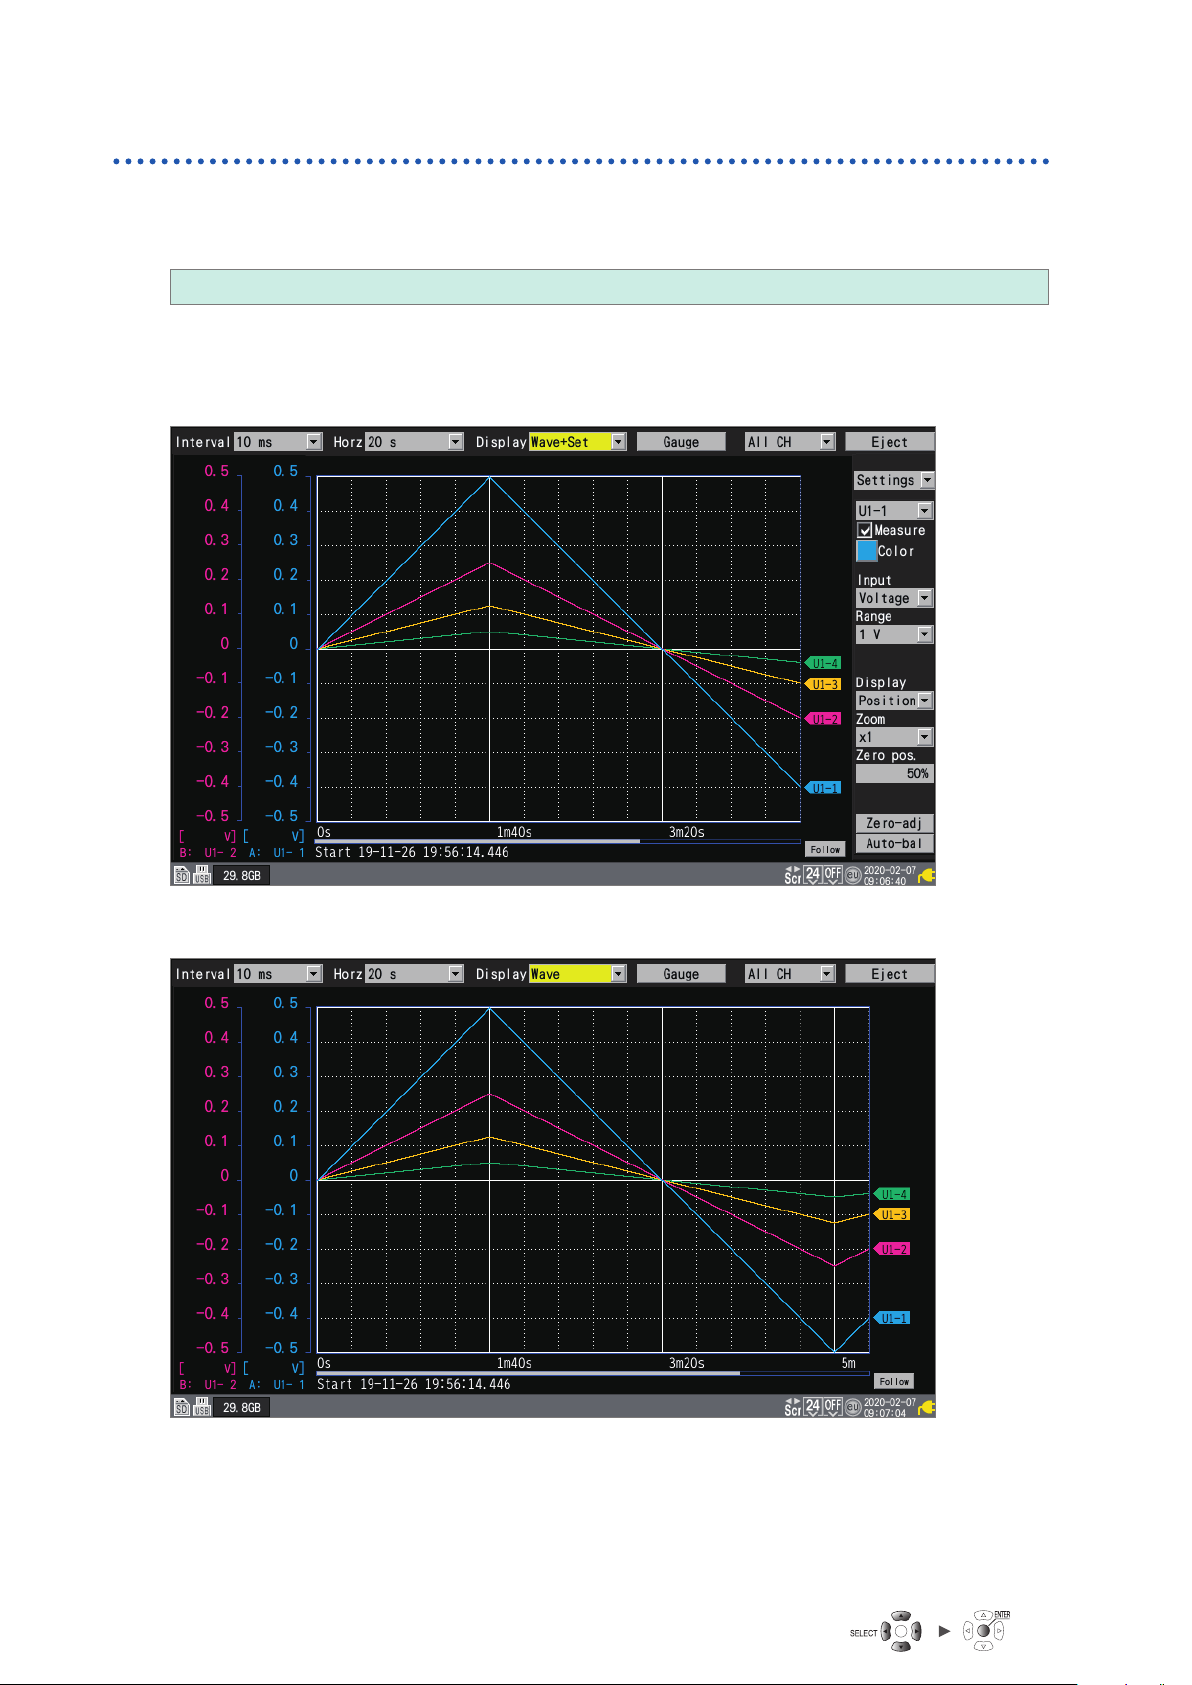
Observing Waveforms
Waveform display
This section describes how to change the method used to display measured waveforms.
Under [Display], select the waveform display method.
Wave+Set, Wave, Wave+Value, Value, Alarm
You can also select the display method with the WAVE key.
Each time you press the WAVE key, the display will cycle to the next display method.
[Wave+Set]
[Wave]
62
Page 69
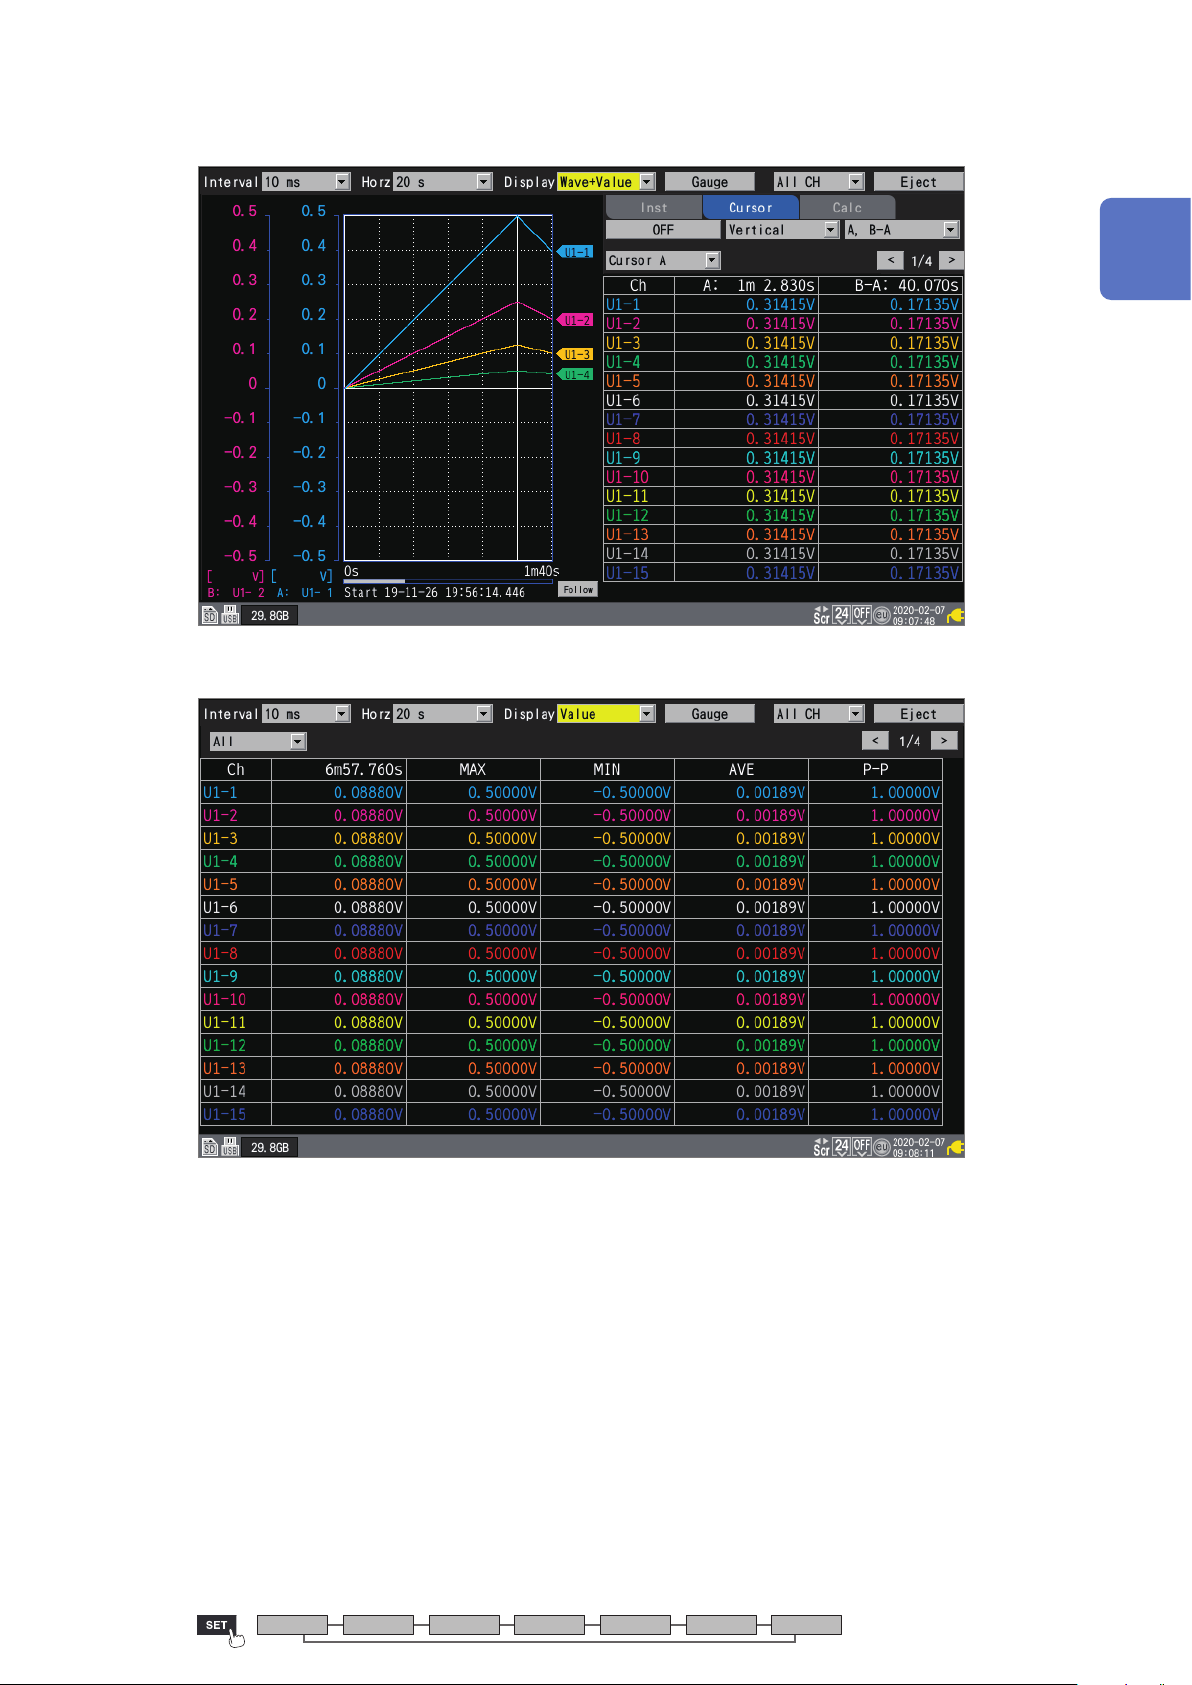
[Wave+Value]
Observing Waveforms
1
Settings and Operation
[Value]
Unit Measure Channel Trigger Alarm Calculation System
63
Page 70
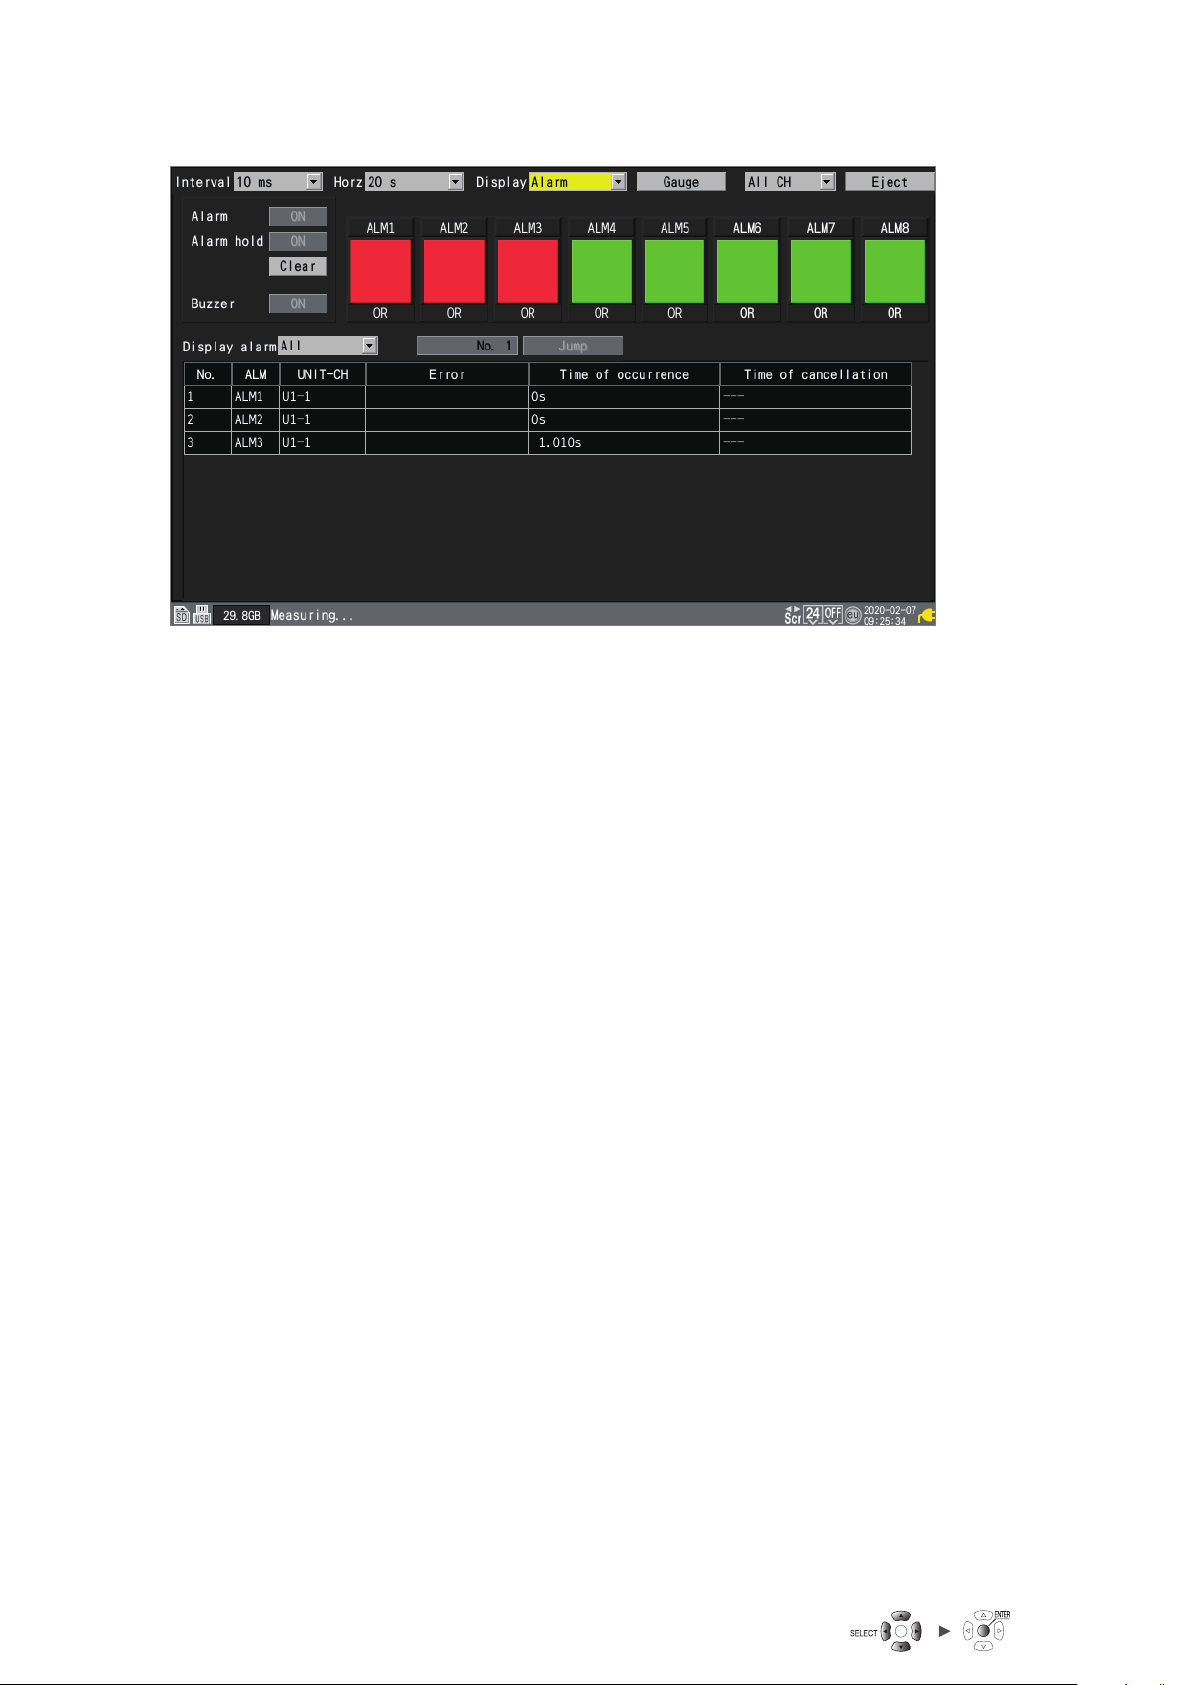
Observing Waveforms
[Alarm]
64
Page 71
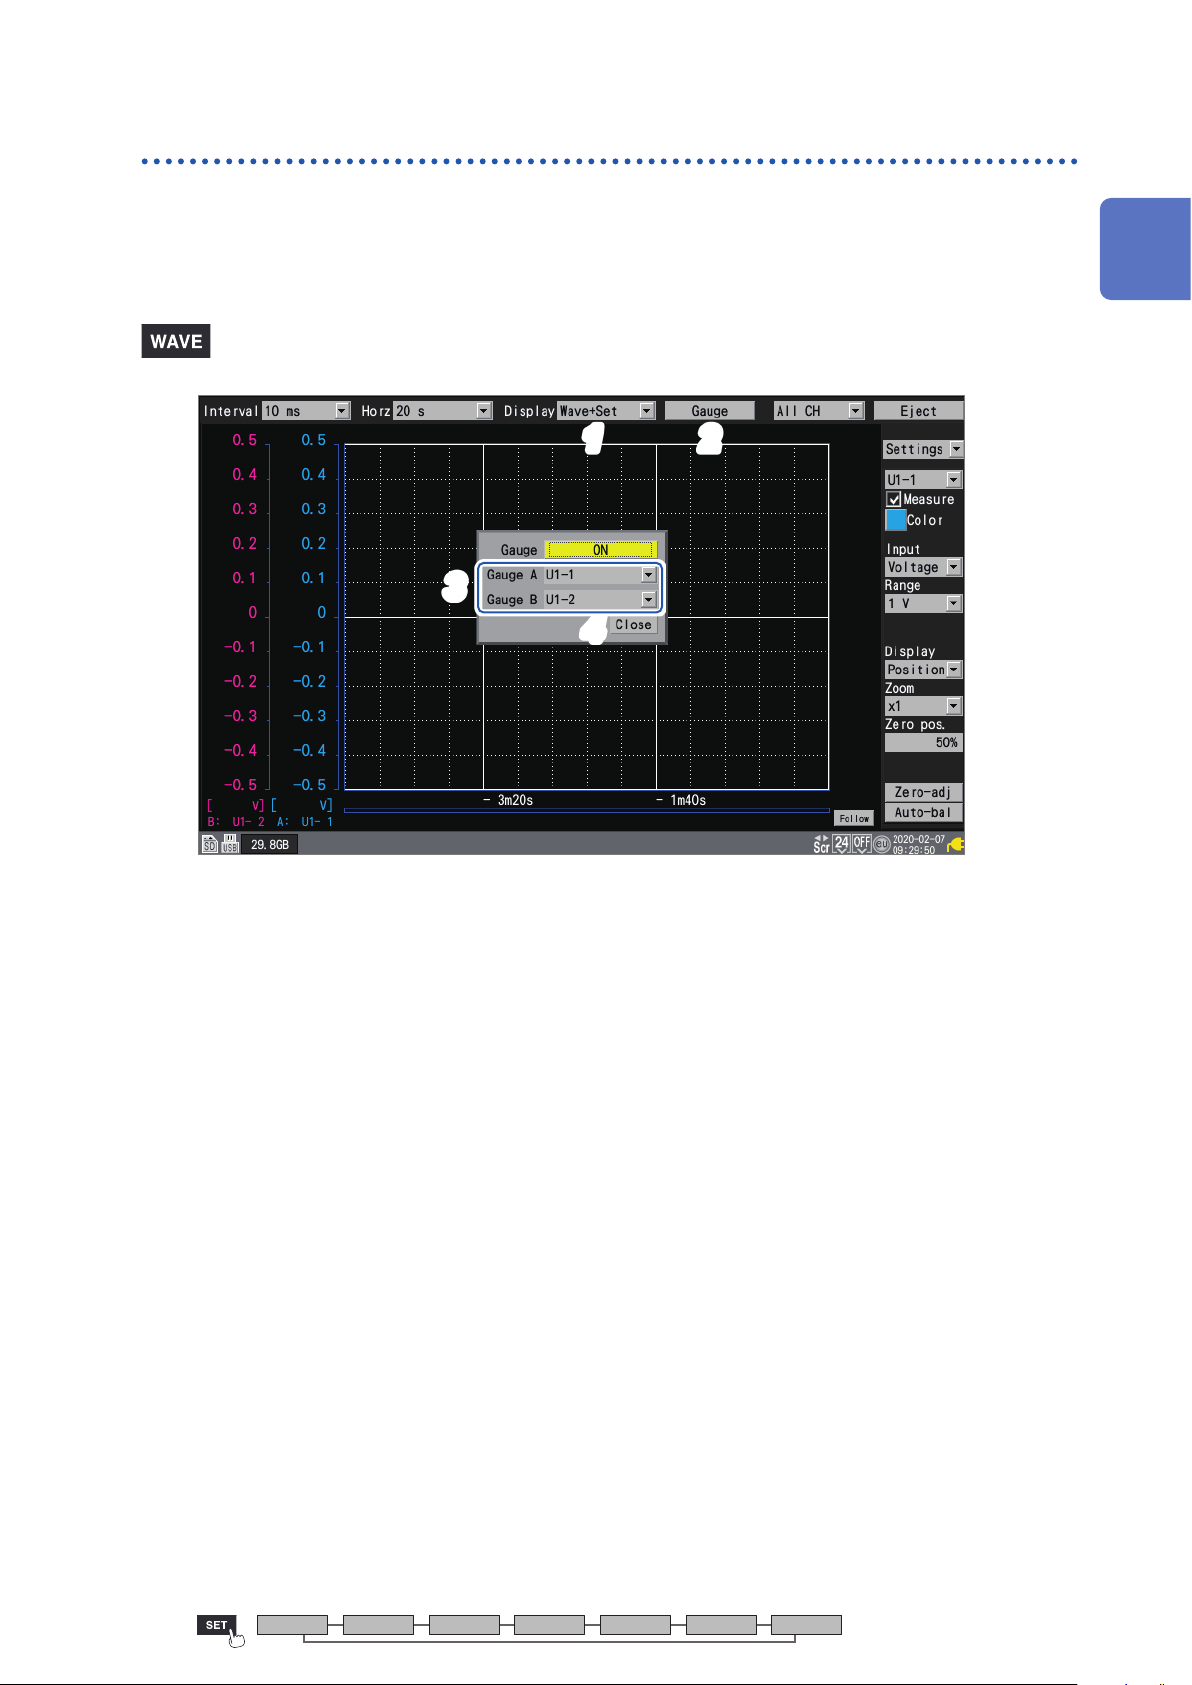
Observing Waveforms
Gage (scale) display
This section describes how to display a gage (scale) for any channel on the left side of the screen.
The gage can be used to check the waveform and its values.
Two gages (A and B) can be displayed.
You can choose the channels for which to display a gage. The gage will be shown in the same color
as the selected channel.
1
Settings and Operation
11
22
33
44
Under [Display], set the display to [Wave+Set], [Wave], or [Wave+Value].
1
Press the ENTER key while [Gauge] is selected.
2
The gage window will open.
Select the channels for gage A and gage B.
3
To cancel the settings, press the ESC key.
Press the ENTER key while [Close] is selected.
4
The window will close.
Unit Measure Channel Trigger Alarm Calculation System
65
Page 72
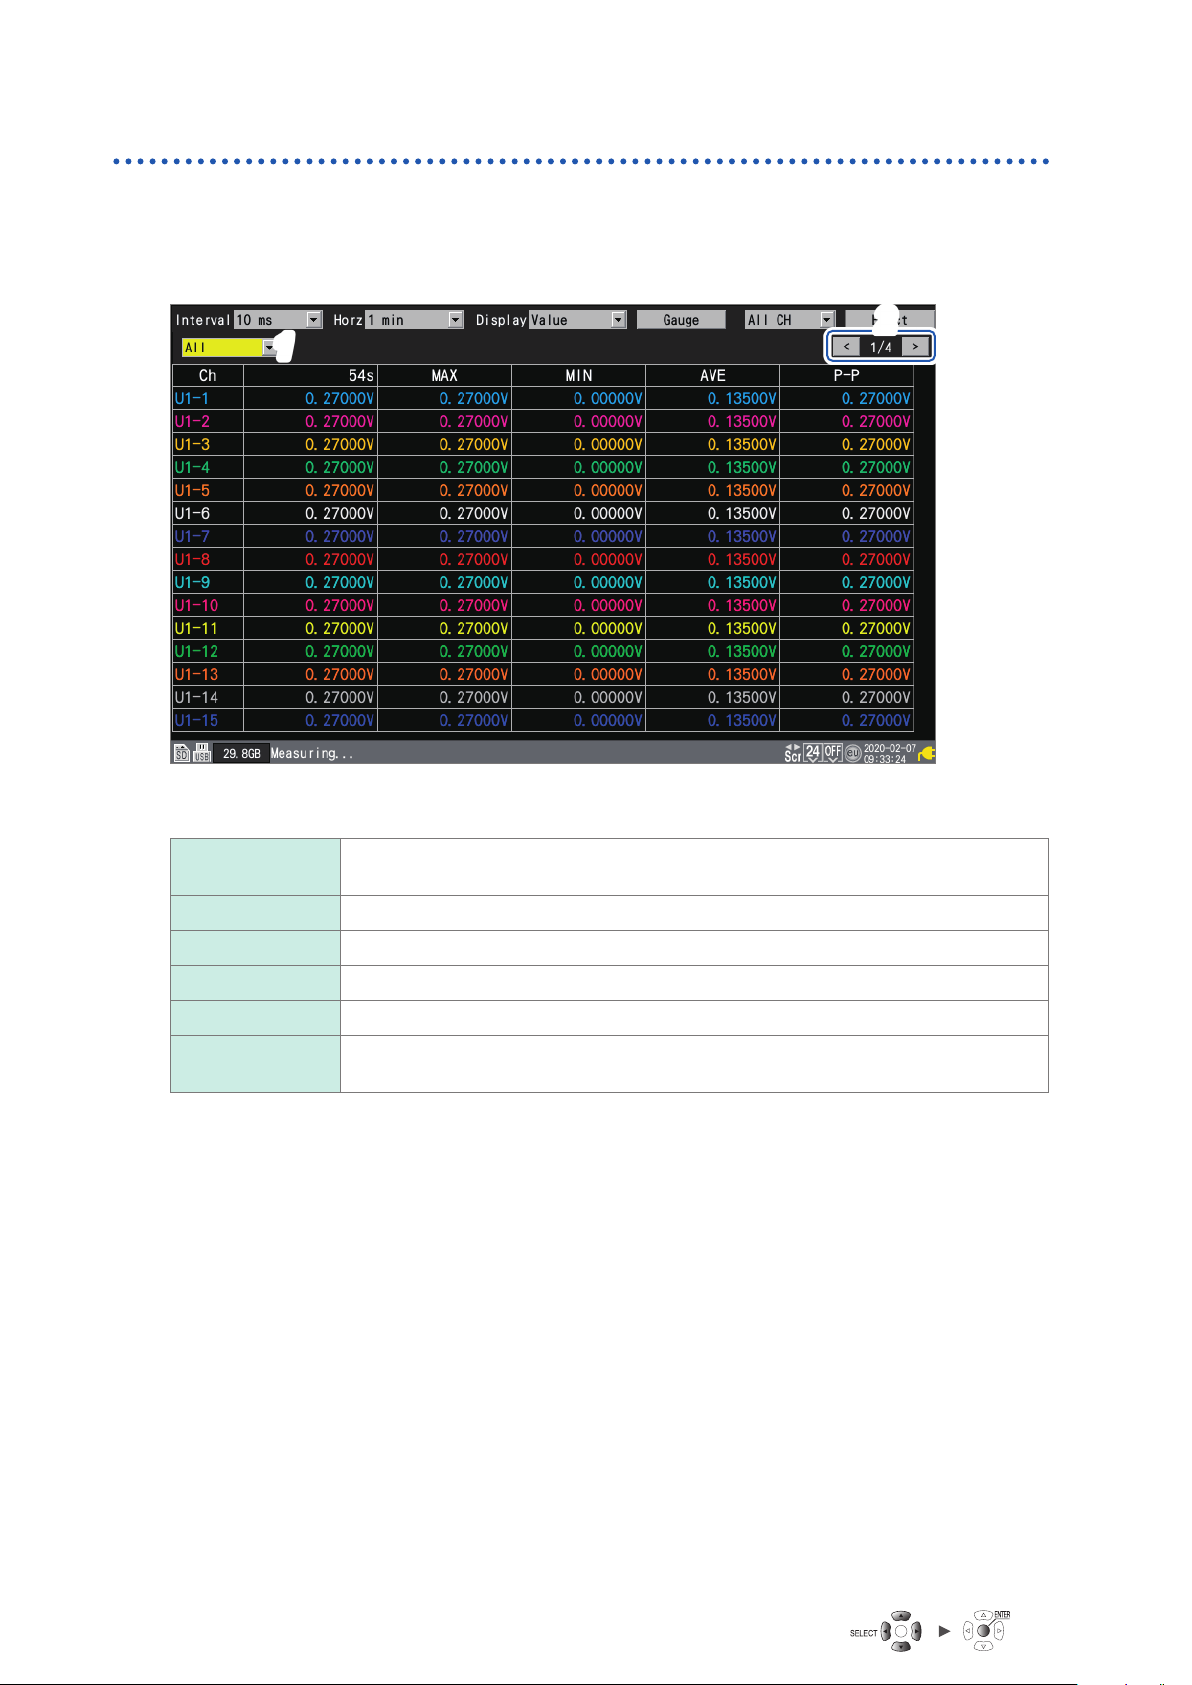
Observing Waveforms
Numerical value display
This section describes how to select the numerical value display method.
[Value] screen
This screen displays only numerical values.
11
22
Select the value to display.
1
All Instantaneous values, maximum values, minimum values, average values, and peak-
to-peak values
Instant Most recent measured value (INST)
Maximum Maximum value (MAX) from the start of measurement to the current time
Minimum Minimum value (MIN) from the start of measurement to the current time
Average Average value (AVE) from the start of measurement to the current time
P-P Dierence between maximum and minimum value (peak-to-peak value) from the start
of measurement to the current time
You can also select the value with the SELECT key.
To choose a setting other than [All], press and hold the SELECT key to display comments.
Change the channel to display (as necessary) using the [<] and [>] keys on the top right of
2
the screen.
66
Page 73
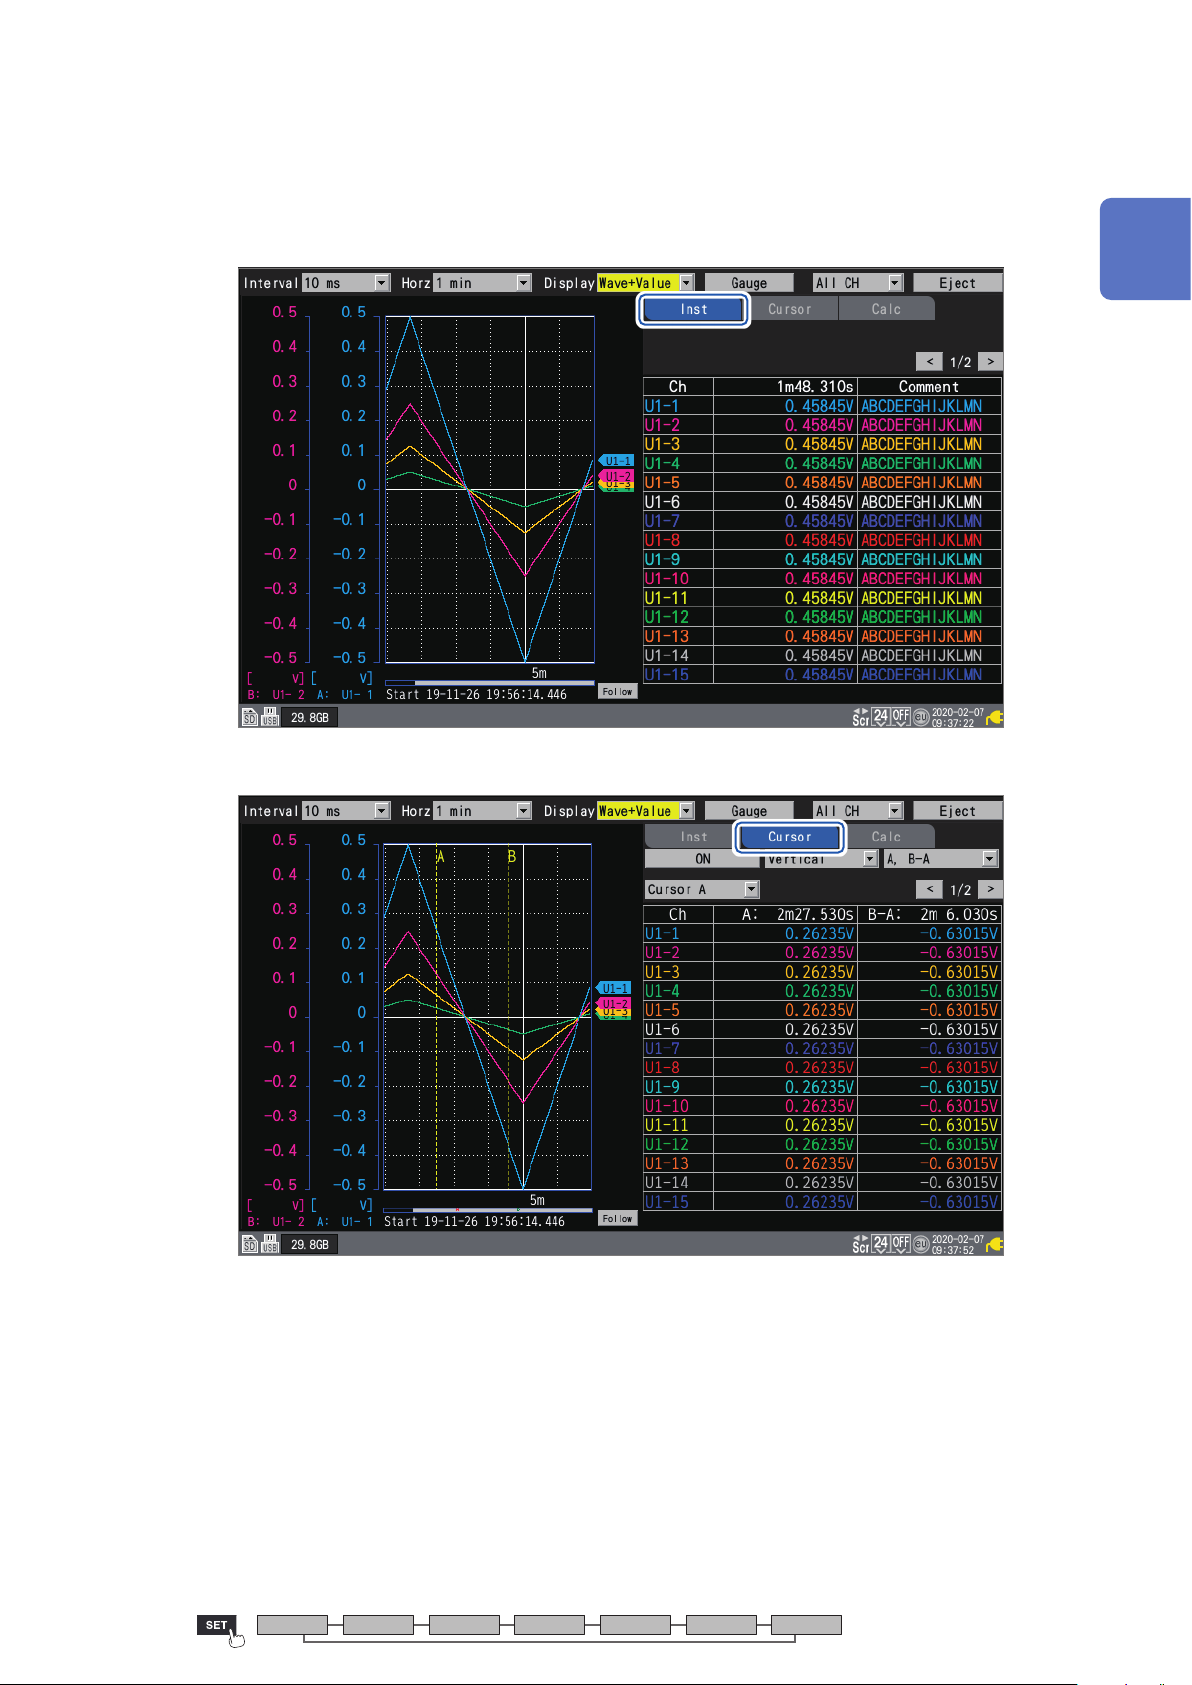
Observing Waveforms
[Wave+Value] screen
You can choose any of three types of information to display on the right side of the screen.
(1) Instantaneous: Measured values most recently obtained or shown on the right portion of the
waveform screen
1
Settings and Operation
(2) Cursor: A/B cursor values
Unit Measure Channel Trigger Alarm Calculation System
67
Page 74
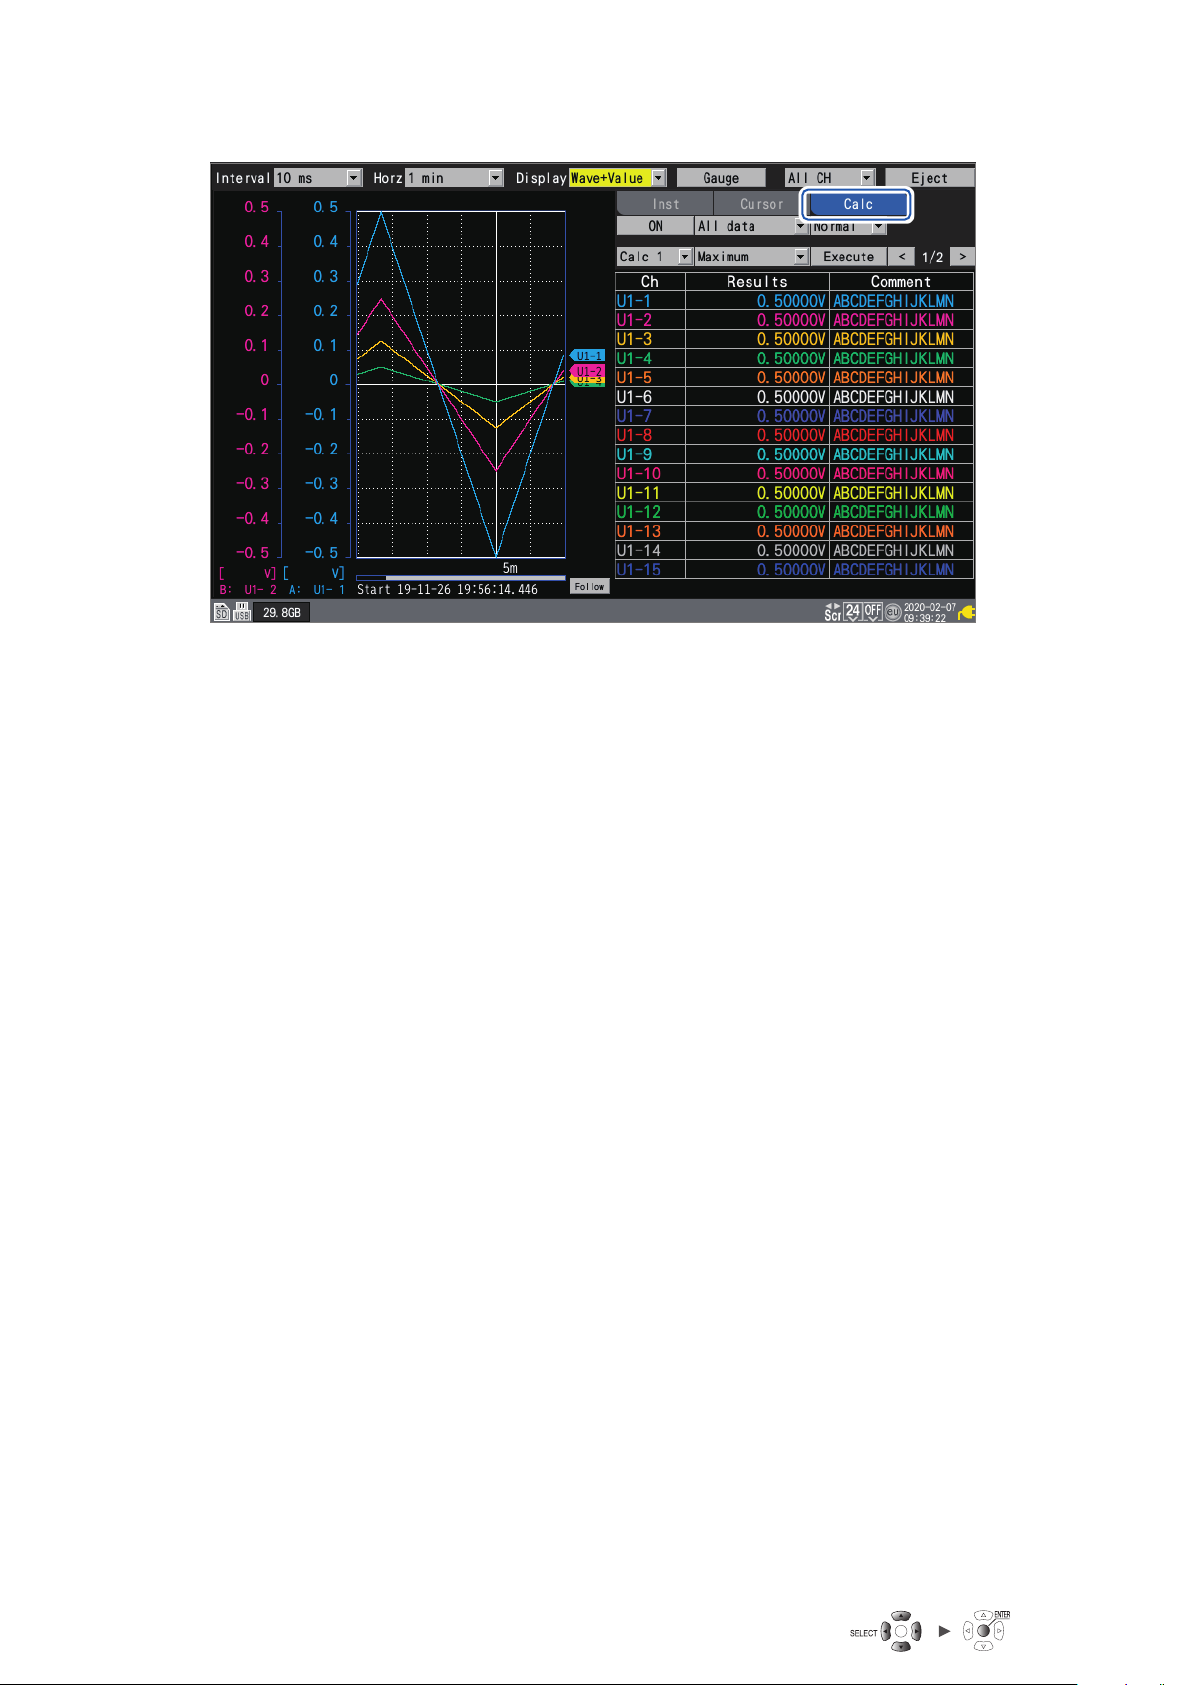
Observing Waveforms
(3) Numerical calculation: Numerical calculation results
68
Page 75
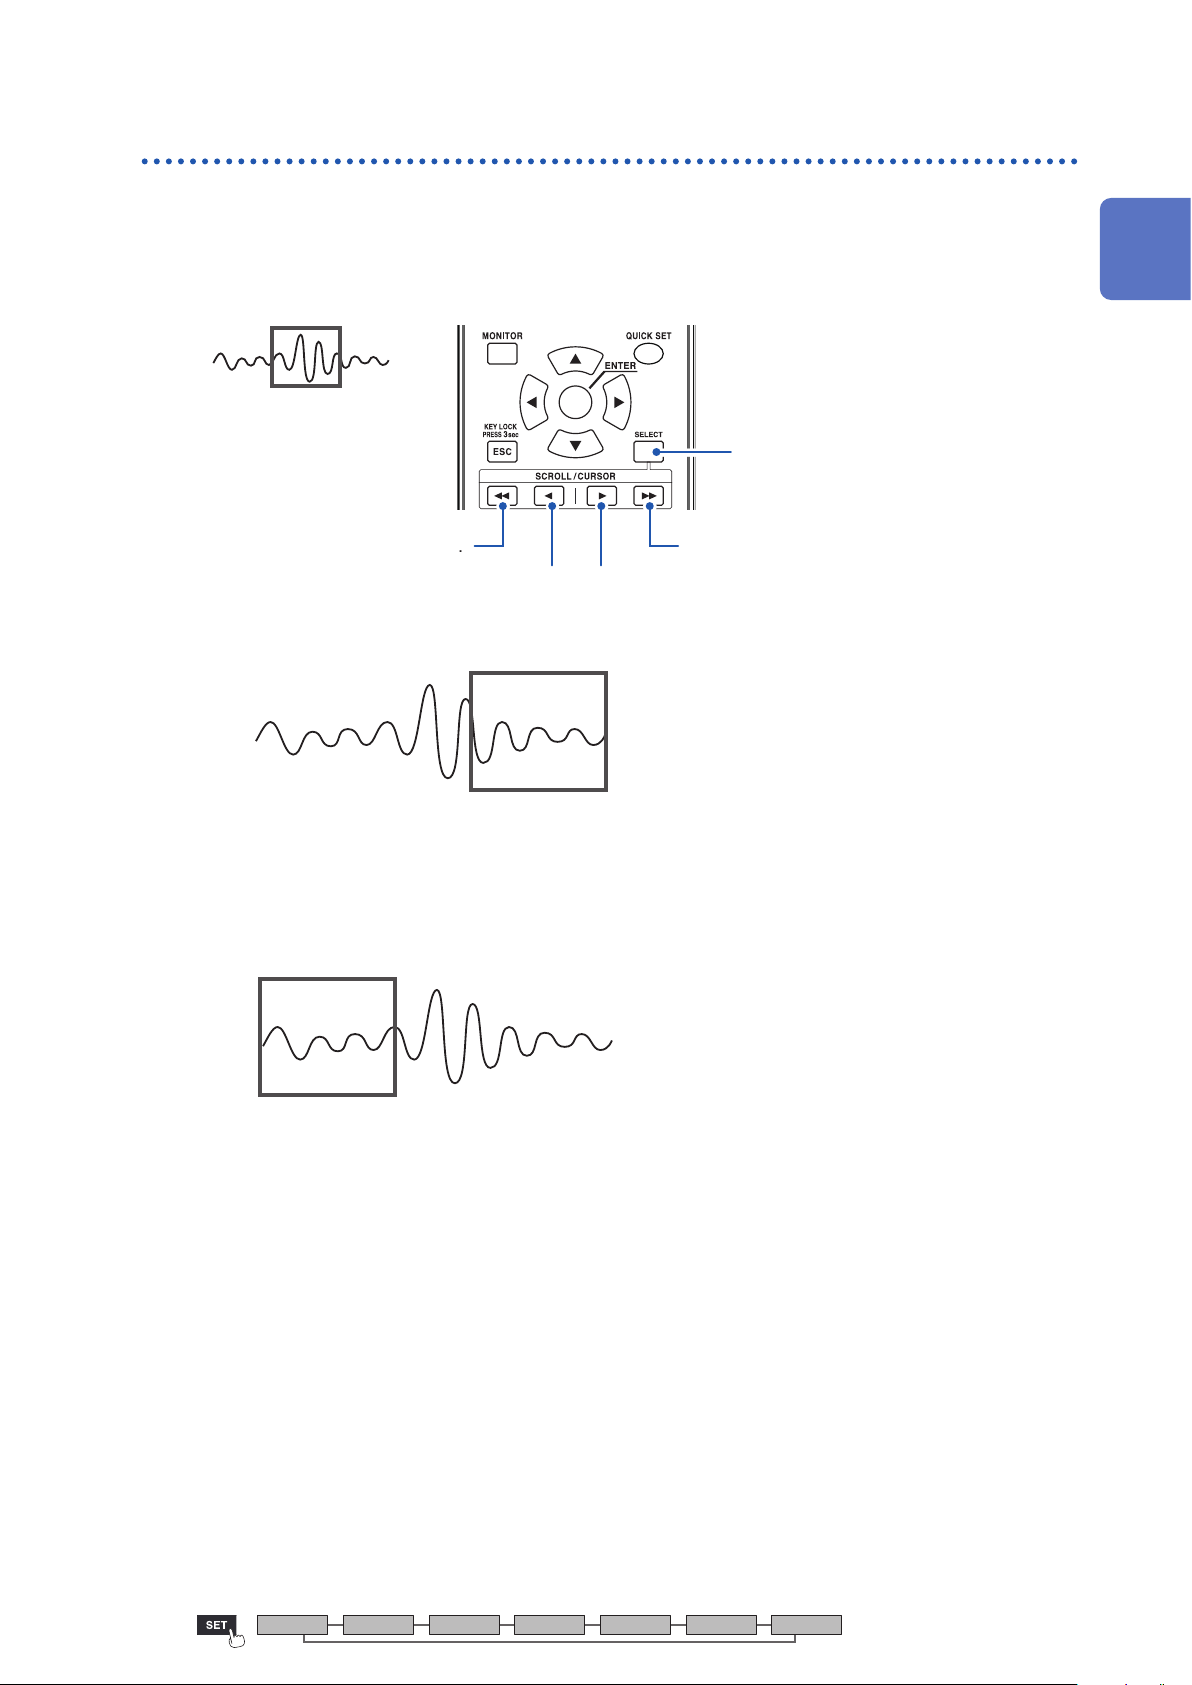
Observing Waveforms
Moving waveforms (scrolling)
This section describes how to move (scroll) the measured waveform horizontally (along the time
axis).
Since waveforms can also be moved while measurement is in progress, you can check past
waveforms during measurement.
1
Settings and Operation
Past Most
Scrolls quickly toward past data.
Screen
recent
Switches the SCROLL/CURSOR keys
function
(waveform movement or A/B cursor
movement).
Scrolls quickly toward the most
recent data.
Scrolls toward the most recent data.Scrolls toward past data.
If you wish to move to the most recent waveform
Past Most recent
Screen
During measurement, press the ENTER key while [Follow] (on the bottom right of the screen) is
selected or use the jump function to move to the end of the waveform.
See “Jump function (changing the display position)” (p. 74).
If you wish to move to the beginning of the waveform
Past Most recent
Screen
Use the jump function to move to the beginning of the waveform.
See “Jump function (changing the display position)” (p. 74).
Unit Measure Channel Trigger Alarm Calculation System
69
Page 76
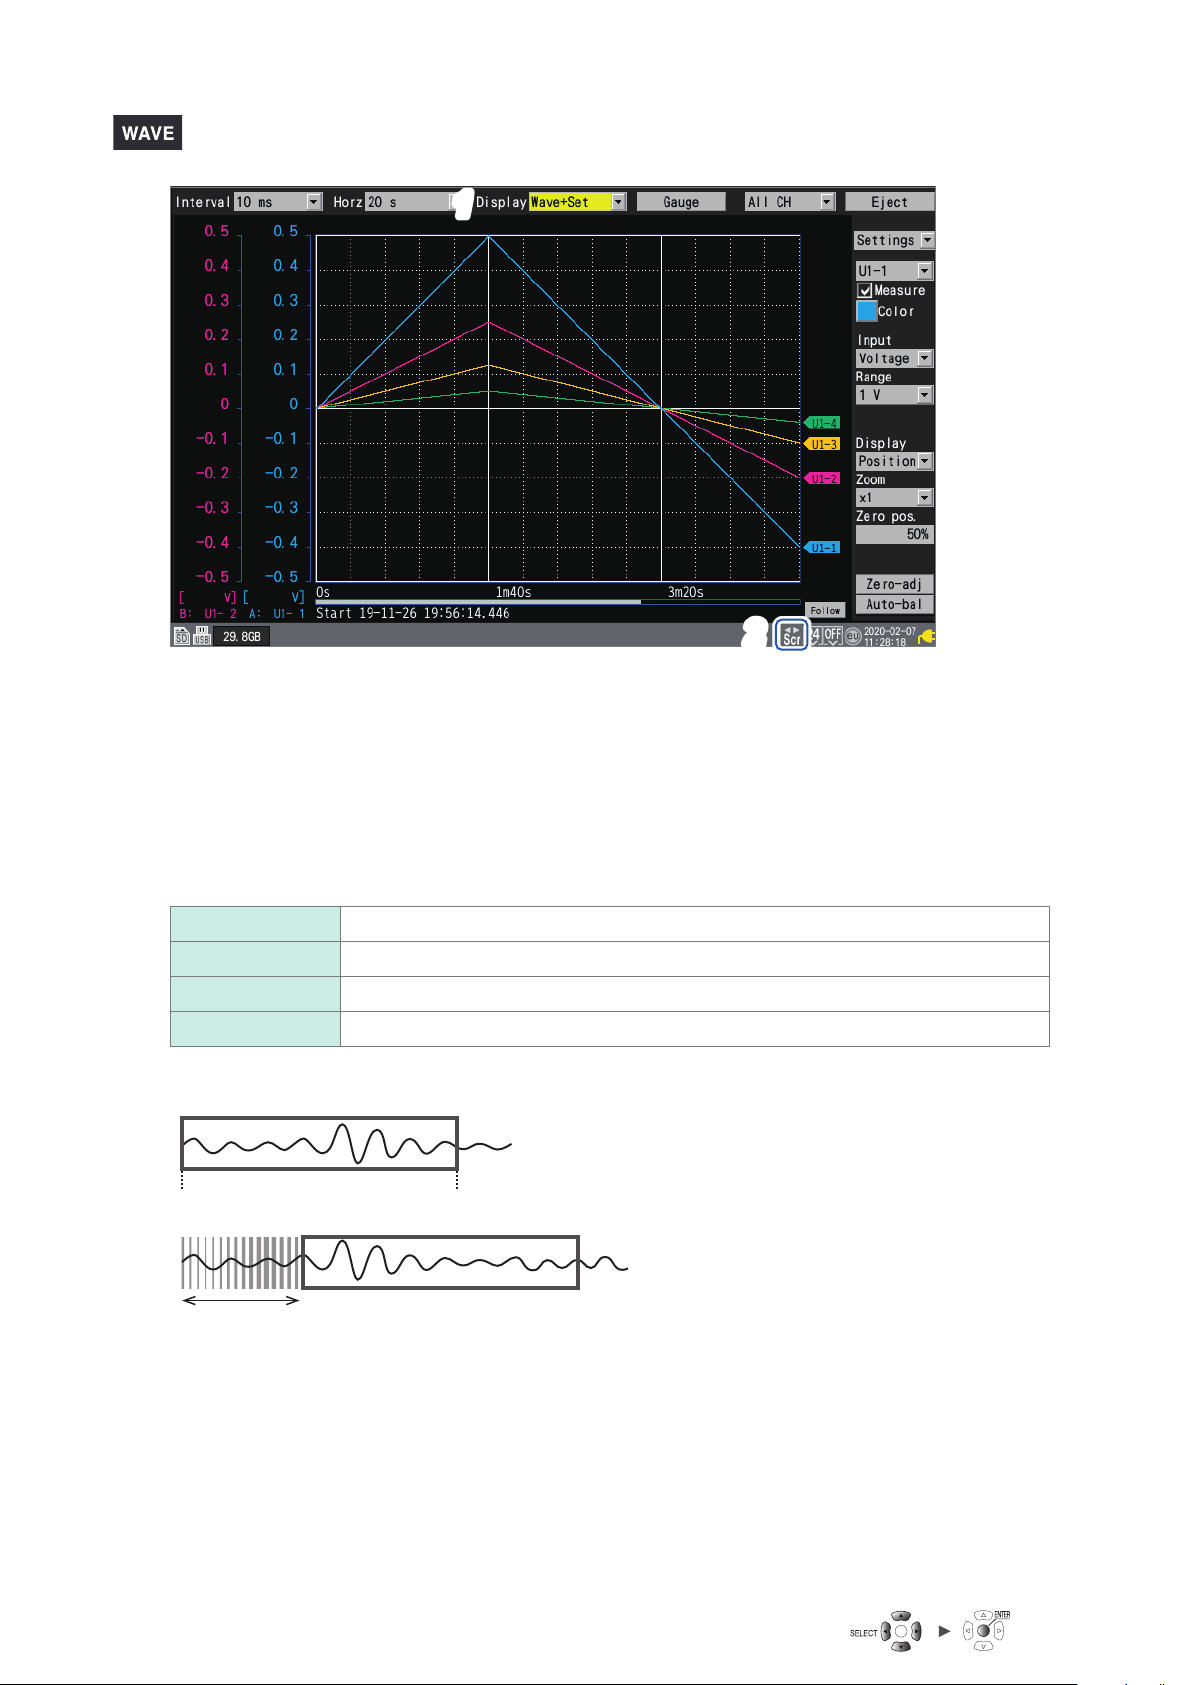
Observing Waveforms
11
22
Under [Display], set the display to [Wave+Set], [Wave+Set], or [Wave+Value].
1
Press the SELECT key to display the Scroll icon.
2
Each time you press the SELECT key, the display will switch between the Cursor icon (A/B cursor
movement) and the Scroll icon (waveform movement).
For more information about the Scroll icon, see “1.11 Observing Waveforms” (p. 60).
Press the SCROLL/CURSOR keys to move the waveform.
3
Key operation
If the waveform is less than one screen long, you will not be able to move it.
Internal buer memory (maximum recording time): Displayable range on screen
Moves the waveform left a large amount (10 divisions at a time).
Moves the waveform right a large amount (10 divisions at a time).
Moves the waveform left a small amount (1 division at a time).
Moves the waveform right a small amount (1 division at a time).
70
Data deletion
Page 77
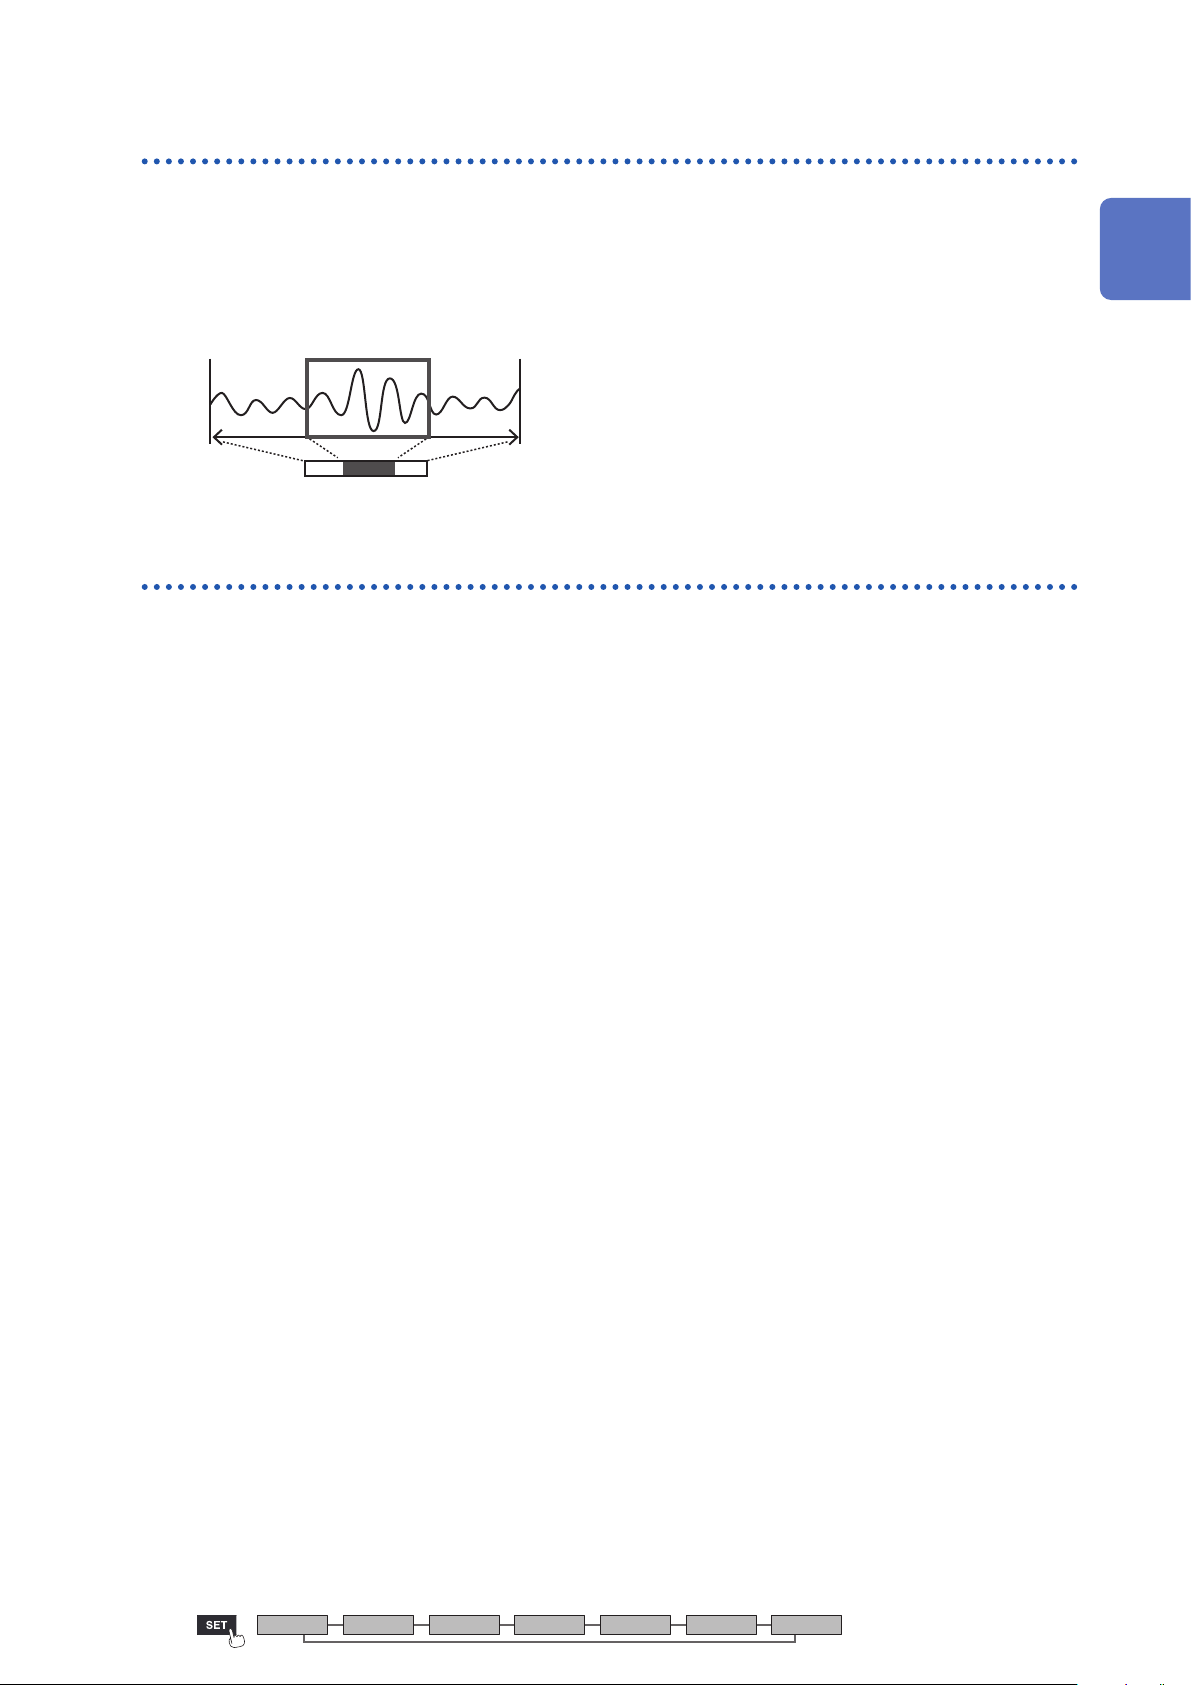
Scroll bar (waveform display position)
A scroll bar is displayed on the bottom of the screen.
You can use the scroll bar to check which part of the entire waveform is being displayed.
The width shown on the scroll bar varies with the recording time and horizontal axis display
settings.
Overall waveform
Screen display range
Enlarging and shrinking the waveform horizontally
You can enlarge and shrink the waveform using the horizontal axis display settings.
See “Other display settings” (p. 40).
Observing Waveforms
1
Settings and Operation
When you enlarge the waveform, you can observe detailed variations.
When you shrink the waveform, you can quickly ascertain overall variations.
Unit Measure Channel Trigger Alarm Calculation System
71
Page 78
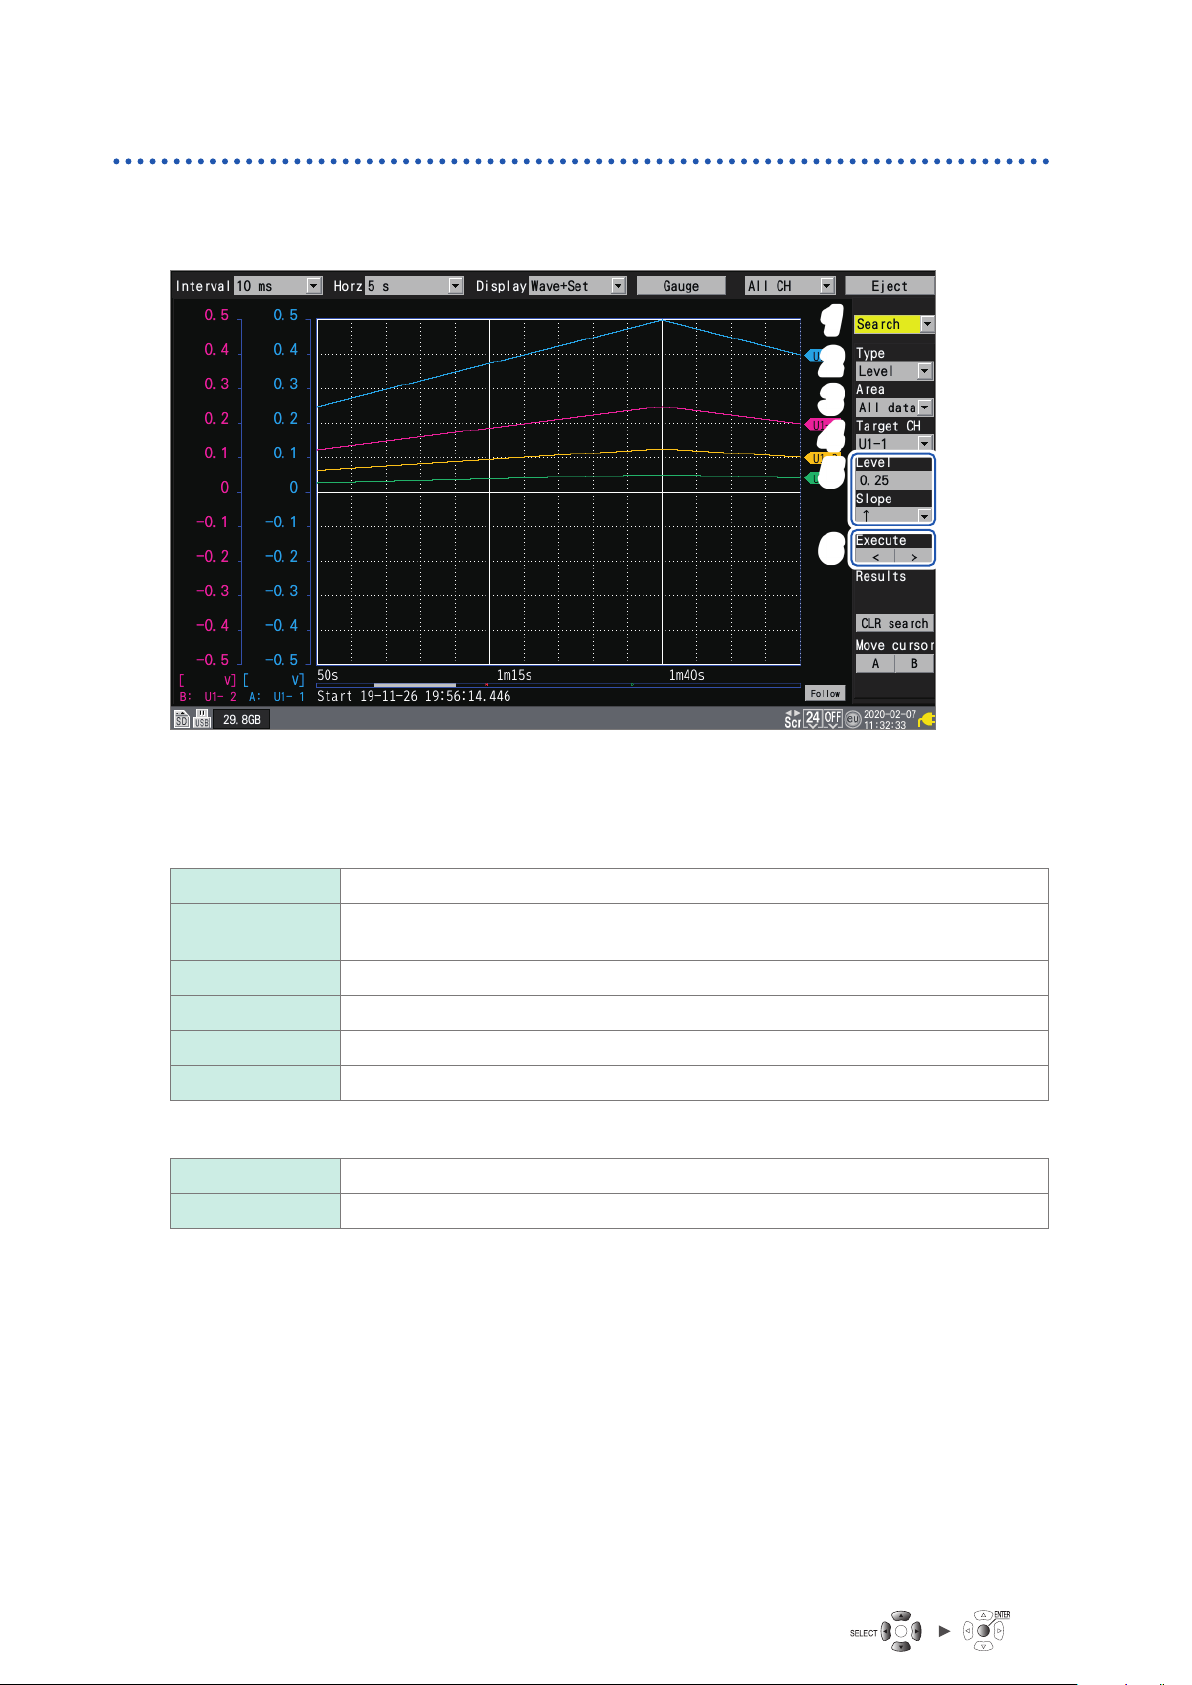
Observing Waveforms
Waveform search
This section describes how to search a measured waveform for a specic point of interest.
This function cannot be used while measurement is in progress.
11
22
33
44
55
66
Under [Settings], select [Search].
1
A number of search-related settings will be displayed.
Under [Type], select the search method.
2
Level Searches for points that cross the specied level.
Window Searches for points that lie inside or outside the window dened by the specied upper
and lower limit values.
Maximum Searches for the point at which the maximum value occurs.
Minimum Searches for the point at which the minimum value occurs.
Maximal Searches for points at which local maximums occur.
Minimal Searches for points at which local minimums occur.
Under [Area], select the search range.
3
All data Searches all measured waveforms.
A-B Searches the range specied with the A/B cursors.
Under [Target CH], select the channel to search.
4
(When [Type] is set to [Level])
5
Under [Level], specify the level to search for.
Under [Slope], select the slope (direction in which the waveform crosses the specied level)
to search for.
(When [Type] is set to [Window])
Under [Upr/Lwr], specify the upper and lower limit values.
Under [IN/OUT], select the direction in which to search (whether the waveform enters [IN] or
exits [OUT] the area dened by the upper and lower limit values).
72
Page 79
Observing Waveforms
(When [Type] is set to [Level], [Window], [Maximal], or [Minimal])
6
Press the ENTER key while either [<] or [>] under [Execute] is selected.
The search will be performed. If the search returns multiple points, you can move to the next point
with [>] or to the previous point with [<].
(When [Type] is set to [Maximum] or [Minimum])
Press the ENTER key while [Search] is selected.
The search will be performed.
An “S” mark will appear at points returned by the search.
You can delete the search results by pressing the ENTER key while [CLR search] is selected.
You can move the A cursor or B cursor position to an “S” mark position by pressing the ENTER key
while [A] or [B] under [Move cursor] is selected. The screen will switch to the cursor display on
the [Wave+Value] screen.
See “(2) Cursor: A/B cursor values” (p. 67).
You can search logic waveforms according to the [Level] setting.
• With [Slope] set to [↑], searches for points that rise from the Low level to the High level.
• With [Slope] set to [↓], searches for points that fall from the High level to the Low level.
1
Settings and Operation
Unit Measure Channel Trigger Alarm Calculation System
73
Page 80
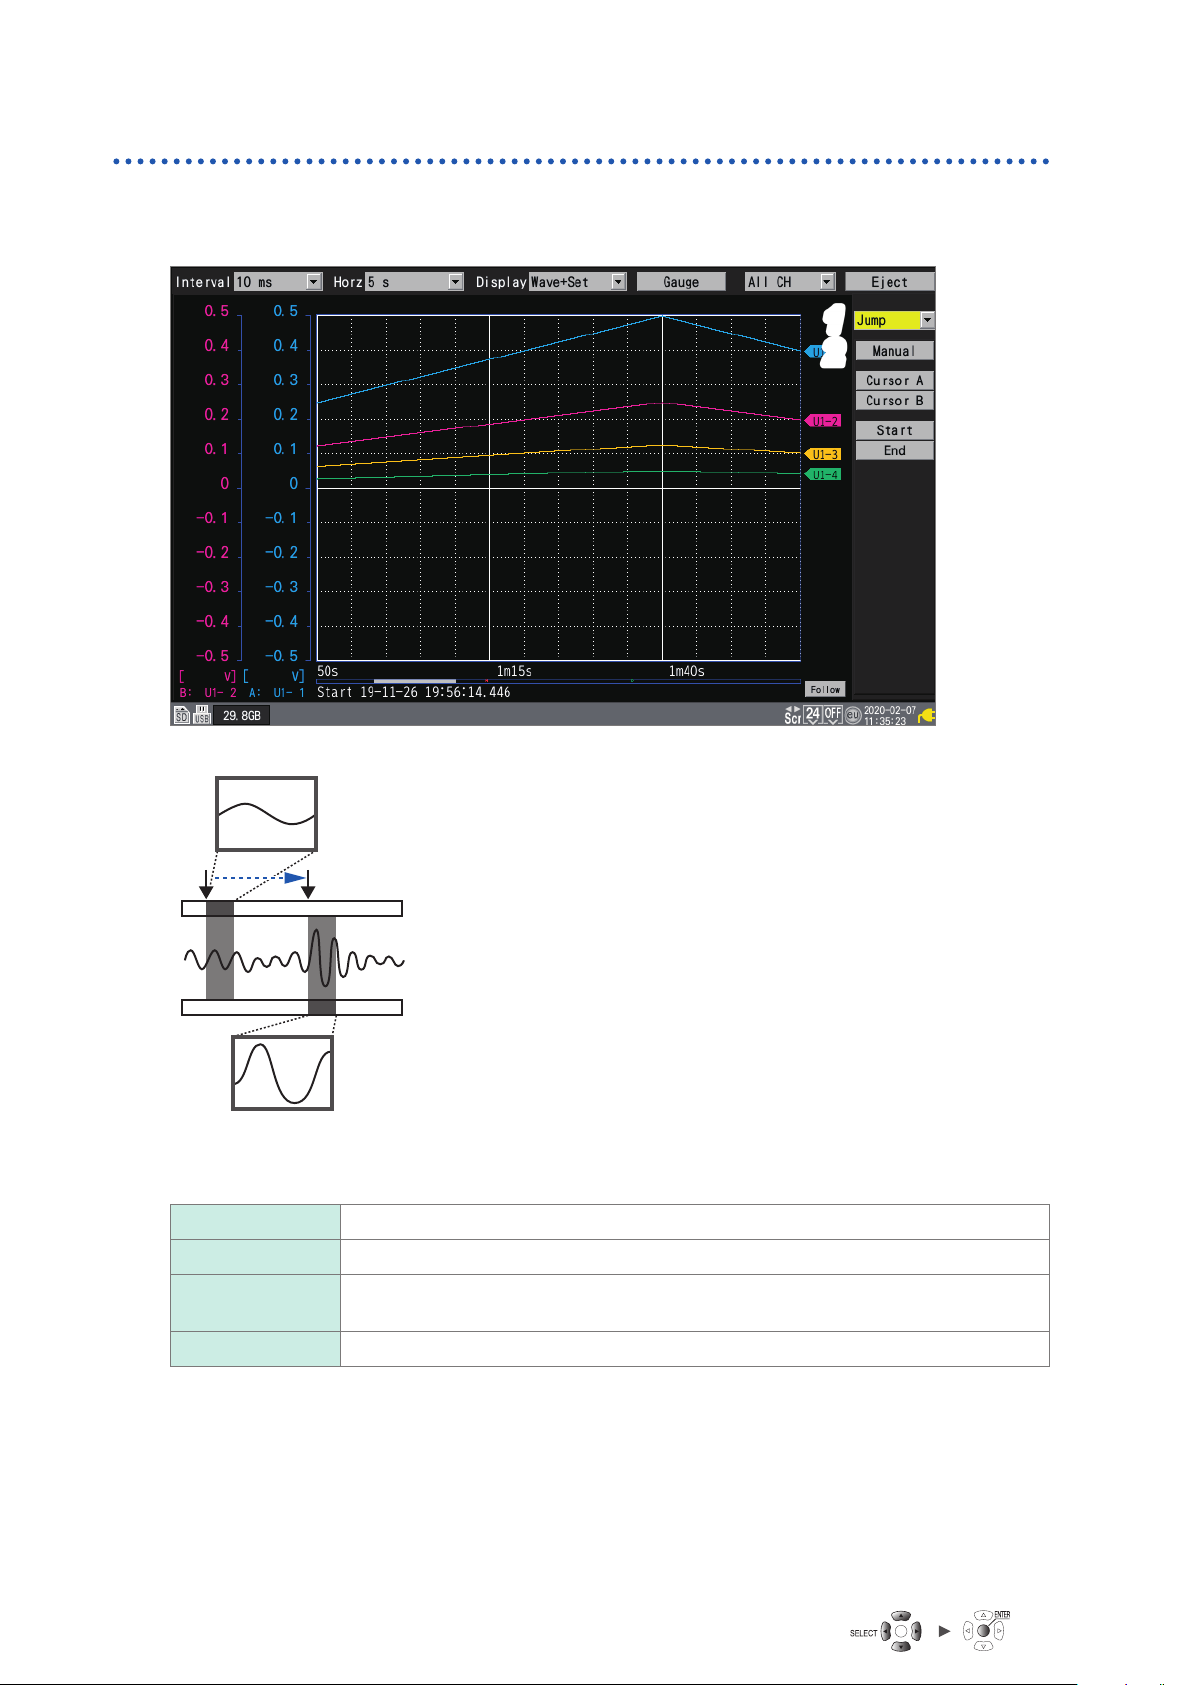
Observing Waveforms
Jump function (changing the display position)
This section describes how to use the scroll bar to change the waveform’s display position (jump
function).
11
22
Under [Settings], select [Jump].
1
The jump-related settings will be displayed.
Press the ENTER key while [Manual] is selected.
2
33
An arrow (↓) will indicate the current display position on the
scroll bar.
Move the arrow to the position you wish to display using
3
the Left Arrow and Right Arrow keys.
Press the ENTER key.
4
The display will move to the specied location.
44
You can also change the display position directly without selecting [Manual].
Cursor A Moves the display to the position of cursor A.
Cursor B Moves the display to the position of cursor B.
Start Moves the display to the beginning of the waveform (the measurement start point or
the start of data in the internal buer memory).
End Moves the display to the end of the waveform (the measurement stop point).
74
Page 81
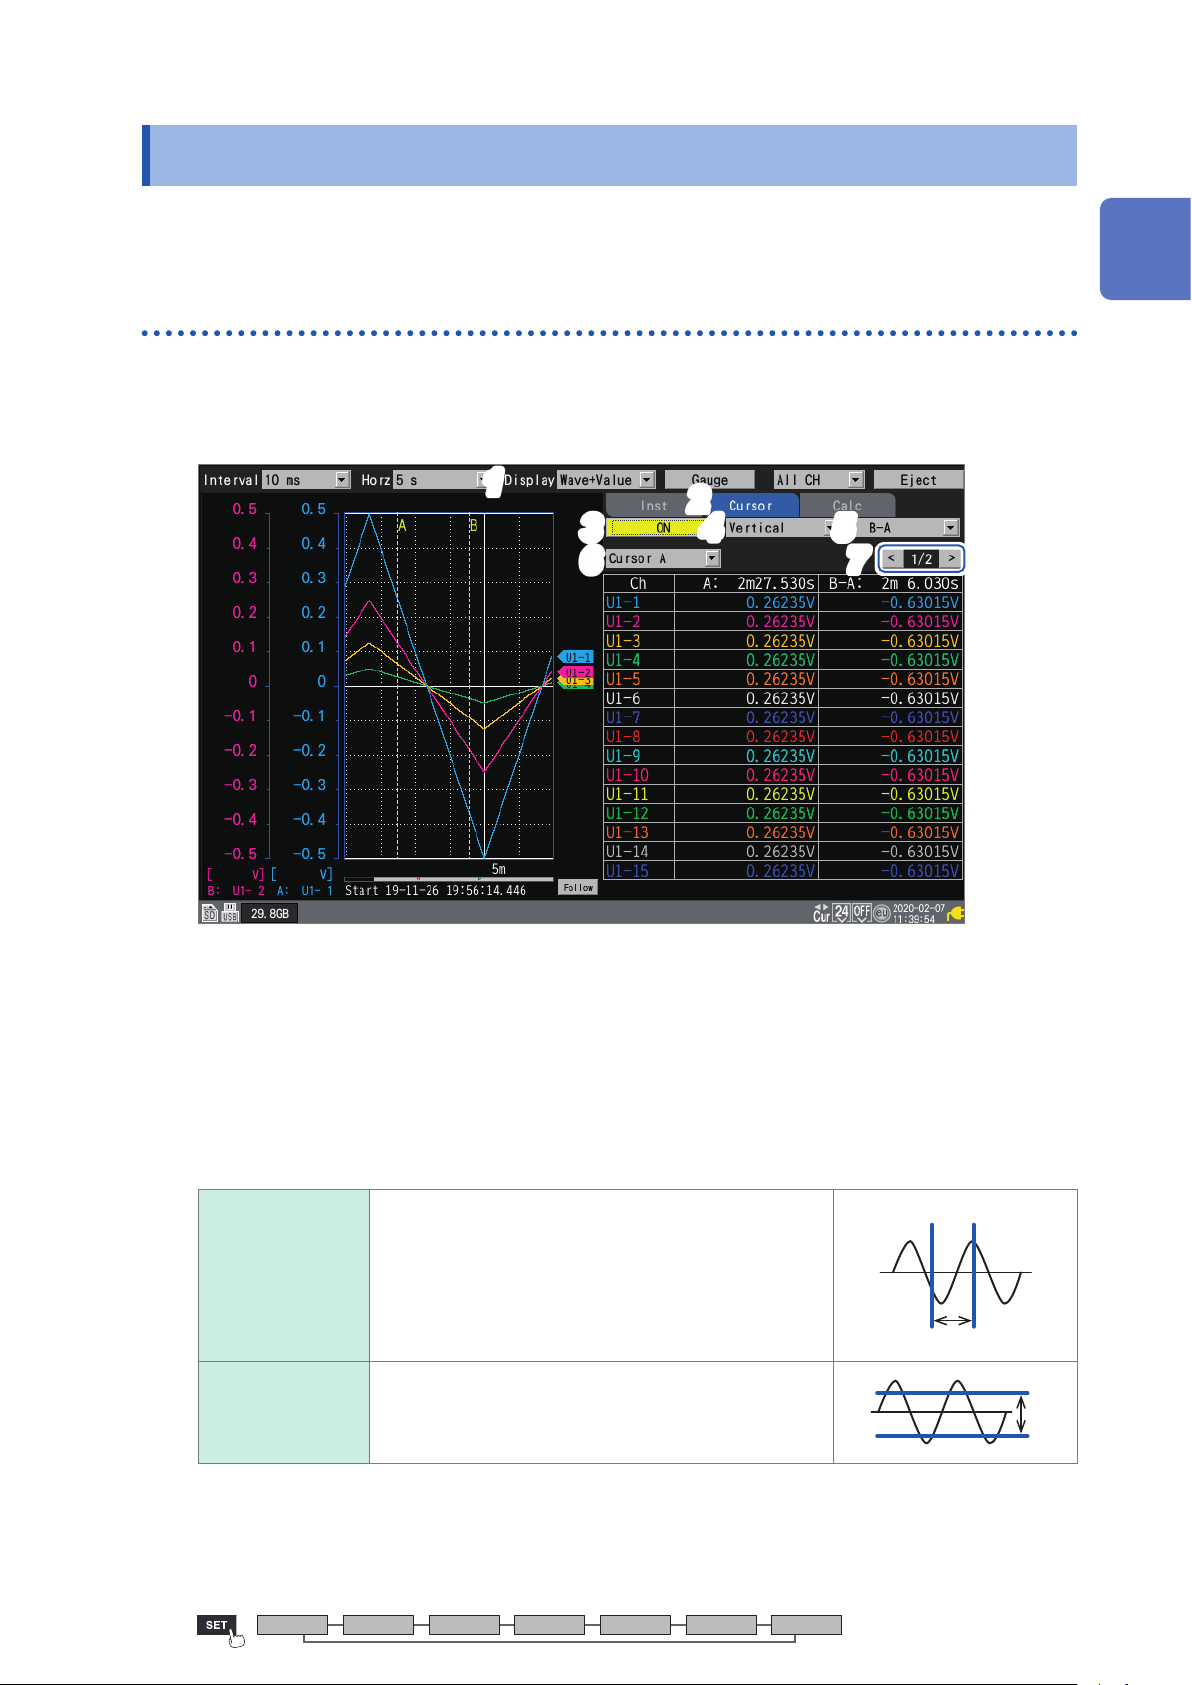
Using the A/B Cursors
A B
A
B
B-A
B-AB-A
1.12 Using the A/B Cursors
This section describes how to read values from the measured waveform using the A/B cursors. You
can also use the cursors to specify a range for saving data or performing numerical calculations.
1
Reading values from the waveforms
This section describes how to read measured values, times, and time dierences between cursors
using the A/B cursors.
When using the scaling function, post-scaling values are displayed.
11
22
33 44 55
66 77
Settings and Operation
Under [Display], set the display to [Wave+Value].
1
Set the display to [Cursor].
2
Select [ON] under the A/B cursor settings.
3
The A/B cursors will be displayed on the screen.
When the Cursor icon is displayed, pressing the any one of the SCROLL/CURSOR keys will
automatically change the setting to [ON] even with the A/B cursors set to [OFF].
Select the A/B cursor type.
4
Vertical Vertical axis cursors
• Time values at the A/B cursor positions*
• Measured values at the intersections of the A/B
cursors and the waveform
• Dierence in time values at the B and A cursors (B-A)*
• Dierence in measured values at the B and A cursors
(B-A)
Horizontal Horizontal axis cursors
• Measured values at the A/B cursor positions
• Dierence in measured values at the B and A cursors
(B-A)
*: The instrument expresses minute, a unit of time, included in cursor reading values in terms of the letter m
instead of min.
B
A
B-A
Unit Measure Channel Trigger Alarm Calculation System
75
Page 82
Using the A/B Cursors
Select the information to display.
5
A, B A cursor measured value, B cursor measured value
A, B−A A cursor measured value, dierence in measured values at the B and A cursors (B-A)
B, B−A B cursor measured value, dierence in measured values at the B and A cursors (B-A)
A, Comment A cursor measured value, channel comments
B, Comment B cursor measured value, channel comments
B-A, Comment Dierence in measured values at the B and A cursors (B-A), channel comments
Select the A/B cursor to move.
6
Cursor A
Cursor B Moves only the B cursor.
Sync Moves the A and B cursors at the same time.
Select the channel to display.
7
You can change the displayed channel by pressing the ENTER key while [<] or [>] is selected.
Press the SELECT key to display the Cursor icon.
8
Each time you press the SELECT key, the display will switch between the Cursor icon (A/B cursor
movement) and the Scroll icon (waveform movement).
For more information about the Cursor icon, see “1.11 Observing Waveforms” (p. 60).
Press the SCROLL/CURSOR keys to move the A/B cursors.
9
Key operation
Moves only the A cursor.
Moves the cursor left a large amount (10 data points at a time).
Moves the cursor right a large amount (10 data points at a time).
Moves the cursor left a small amount (1 data point at a time).
Moves the cursor right a small amount (1 data point at a time).
You can use numerical calculations to calculate values such as the maximum value, minimum
value, and average value for measured waveforms.
See “6.1 Performing Numerical Calculations” (p. 146).
76
Page 83
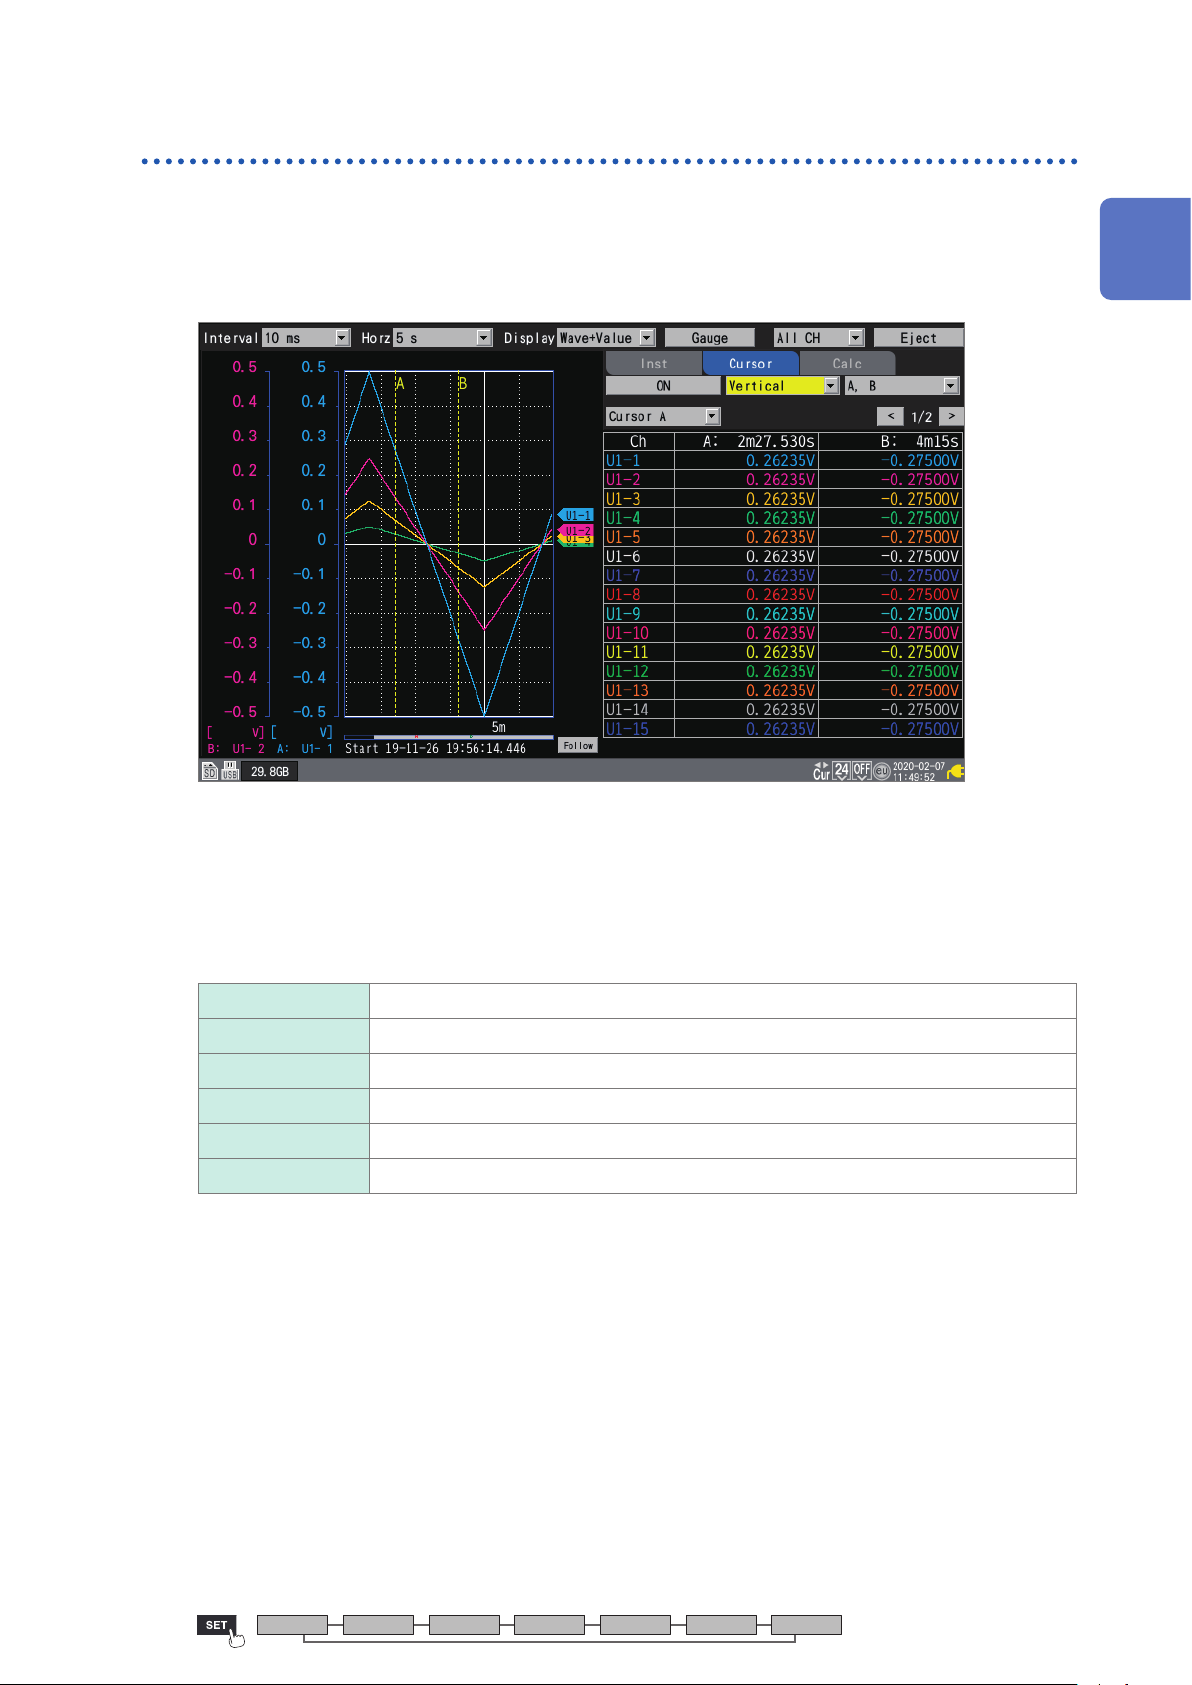
Specifying a waveform range
This section describes how to specify a waveform range using the A/B cursors.
When saving waveform data, you can save only the data in the specied range.
You can also specify the range over which to perform numerical calculations.
Range specication is performed using the vertical axis cursors.
Using the A/B Cursors
1
Settings and Operation
Ranges that can be specied using the A/B cursors
The following settings allow you to specify the range:
• Manual saving: “Under [Range], select the range of data to save.” (p. 113)
• Selective save operation: “Under [Range], select the range of data to save.” (p. 115)
• Numerical calculation: “Specify the range with the A/B cursors.” (p. 152)
All
A-B Selects the waveforms between the A and B cursors.
Start-A Selects the waveforms from the beginning to the A cursor.
Start-B Selects the waveforms from the beginning to the B cursor.
A-End Selects the waveforms from the A cursor to the end.
B-End Selects the waveforms from the B cursor to the end.
Selects the waveforms for the entire recorded length, without regard to the A/B cursors.
Unit Measure Channel Trigger Alarm Calculation System
77
Page 84
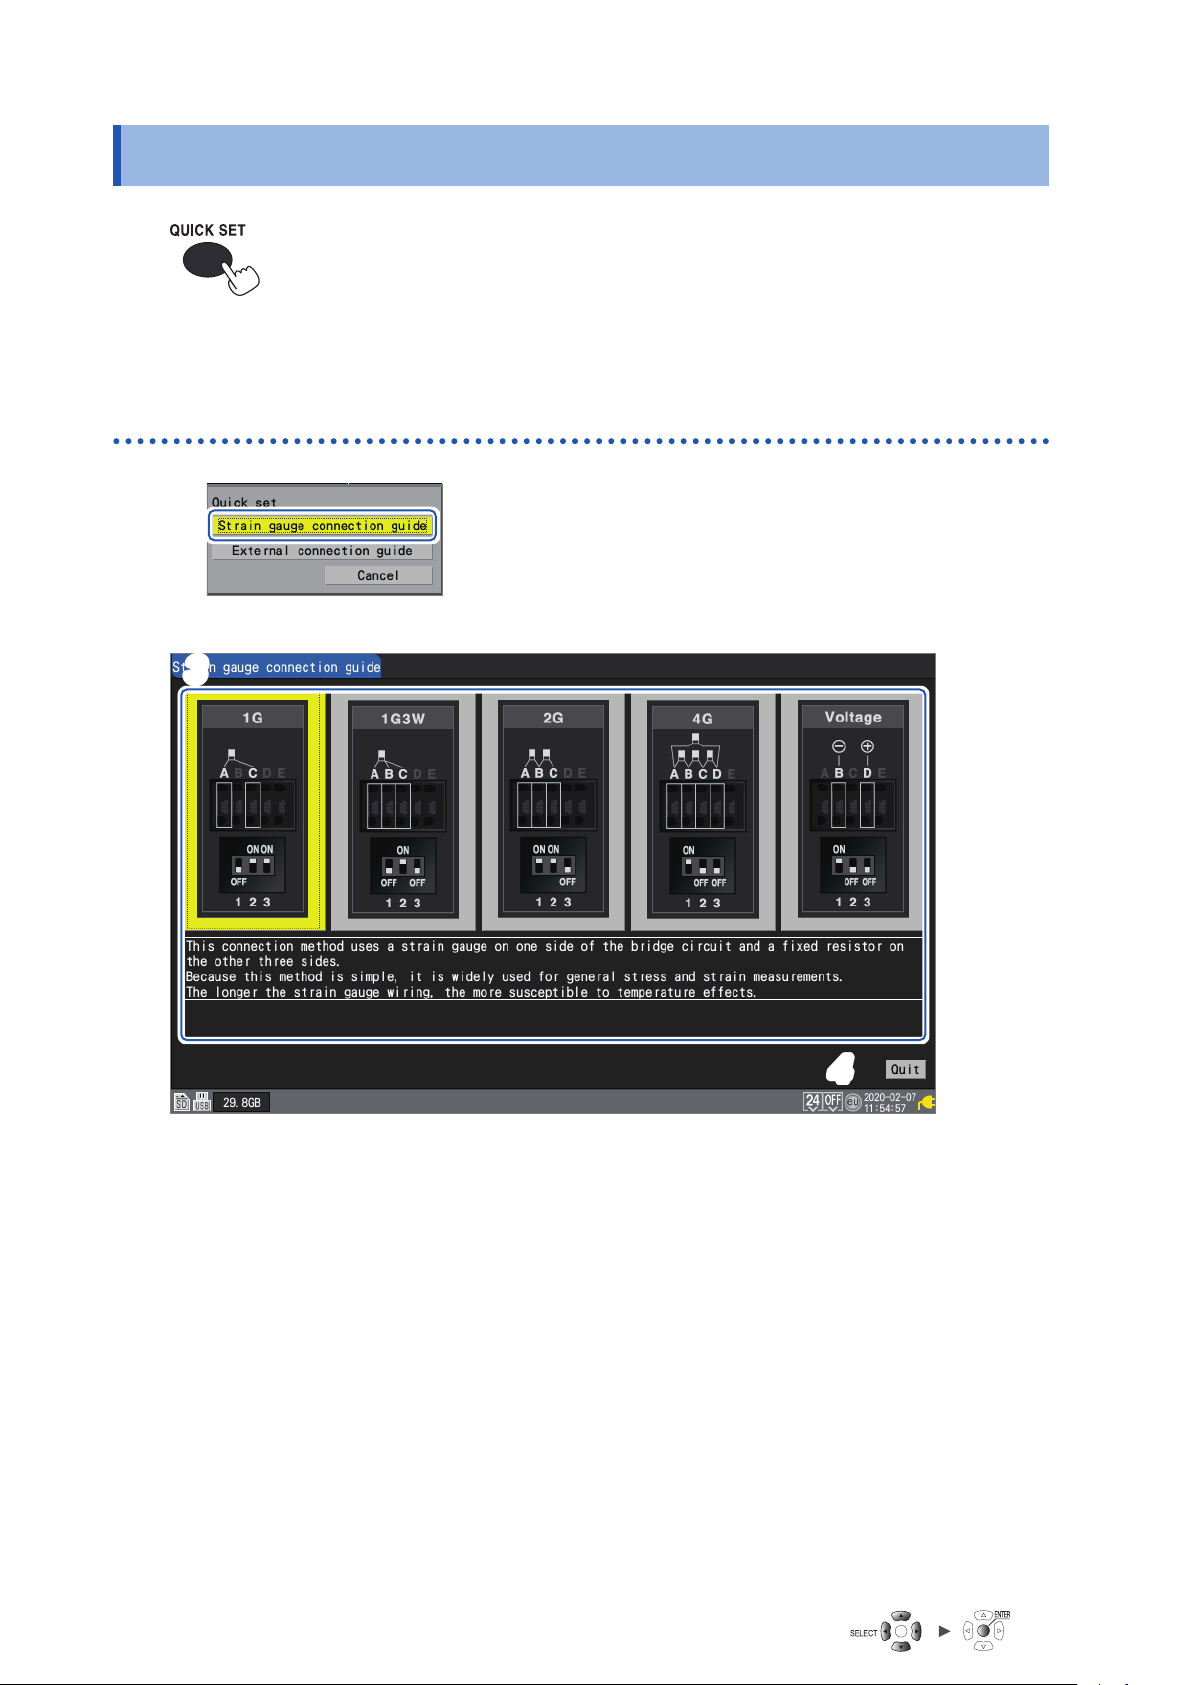
Conguration Navigator (Quick Set)
1.13 Conguration Navigator (Quick Set)
Press the QUICK SET key to display the following guides.
• Strain gage connection guide
• External control terminal connection guide
Strain gage connection diagram
Select [Strain gauge connection guide].
1
11
Press the ENTER key.
2
A strain gage connection guide will be displayed.
33
Select the connection method with the Right Arrow and Left Arrow keys.
3
An explanation for the selected connection method will be displayed.
Press the ENTER key while [Quit] is selected.
4
The guide screen will close.
44
78
Page 85
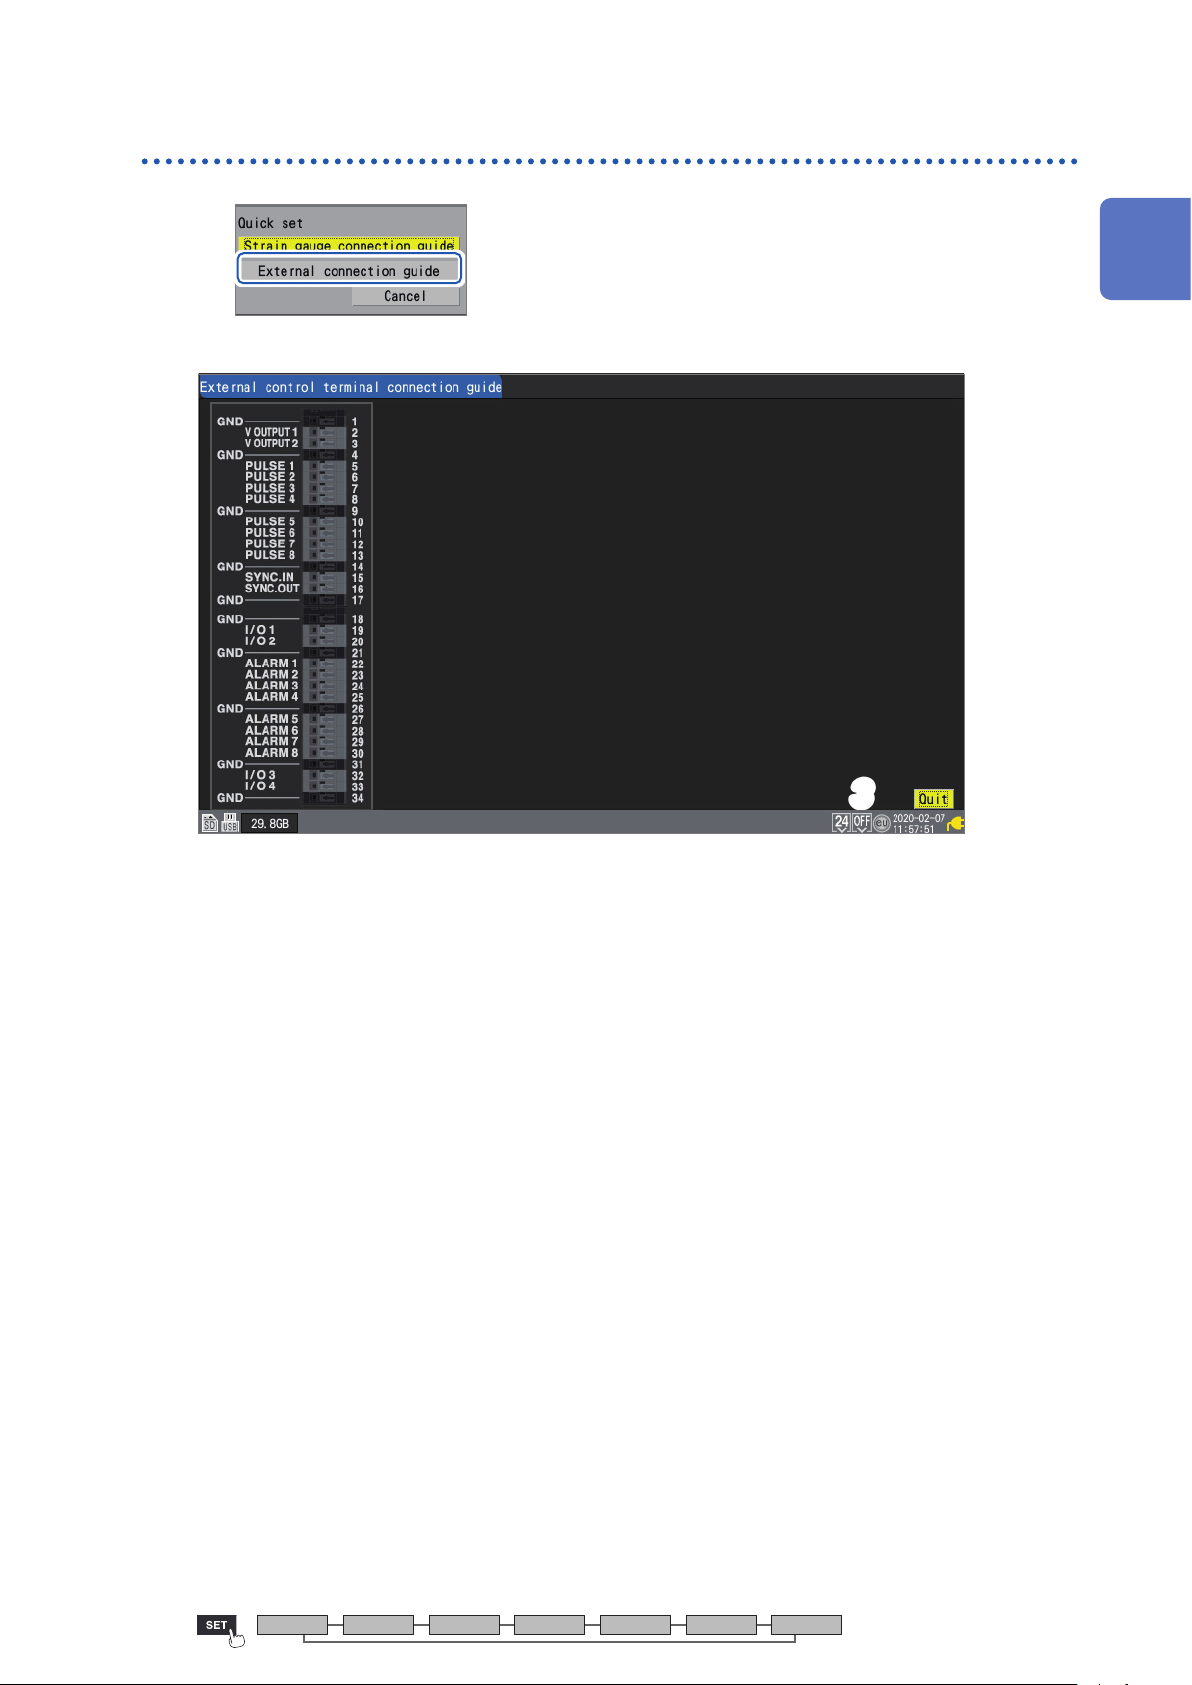
External control terminal pin names
Select [External connection guide].
1
Press the ENTER key.
11
2
A list of external control terminal pin names will be
displayed.
Conguration Navigator (Quick Set)
1
Settings and Operation
Press the ENTER key while [Quit] is selected.
3
The guide screen will close.
33
Unit Measure Channel Trigger Alarm Calculation System
79
Page 86
Conguration Navigator (Quick Set)
80
Page 87
2.1 Trigger Meanings ..................................................................p. 83
2.2 Enabling the Trigger Function .............................................p. 84
2.3 Analog Triggers, Pulse Triggers, Waveform Calculation Triggers
(Level, Window) ........................................................................p. 87
2.4 Logic Triggers (Patterns) .....................................................p. 92
2.5 Applying Triggers Based on External Sources .................p. 94
2.6 Activating a Trigger at a Set Interval ..................................p. 95
2.7 Example Trigger Settings ....................................................p. 97
2
Trigger Function
Triggers provide functionality for starting and stopping
measurement based on specic conditions and signals.
When a specic condition (a trigger condition) occurs, the
trigger is said to activate.
The points at which triggers activate (i.e., the points in time
at which trigger conditions are satised) are known as trigger
points, which are identied by the
When a trigger activates, you can start or stop recording.
Trigger sources can be selected from among the following:
• Analog triggers (level, window)
• Pulse (level, window)
• Logic triggers (condition, pattern)
• Waveform calculation (level, window)
• Interval triggers
• External triggers
mark.
2
Trigger Function
Unit Measure Channel Trigger Alarm Calculation System
81
Page 88
The instrument allows the following specic conditions to be set:
Specic
condition
Start trigger Starts recording when the trigger condition is satised.
Example: Start recording when the temperature reaches or exceeds 50°C.
Stop trigger Stops recording when the trigger condition is satised.
Example: Stop recording if a signal falls below 1 V.
External trigger Allows you to activate a trigger using an external signal. (I/O 3)
Example: Control recording based on the operation of other devices.
Pre-trigger Records data before the trigger point.
Example: Record a phenomenon that precedes an anomaly.
Interval trigger Applies the trigger at a set interval.
Example: Record data at one-hour intervals.
Trigger activation
conditions
You can set the conditions under which the trigger will activate.
Select AND/OR operation between triggers.
Description Reference
page
p. 84
p. 84
p. 94
p. 84
p. 95
p. 85
IMPORTANT
• If the trigger function is [OFF], you can start recording by pressing the START key. (Free-run)
• If the trigger function is [ON], the instrument will remain in the “trigger standby” state until the
trigger condition is satised. Recording will start when the trigger condition is satised.
• The “trigger standby” interval will be shown on the monitor screen.
See “1.9 Checking Input Signals (Monitor Function)” (p. 58).
• The next trigger will not be accepted while trigger processing remains in progress. Trigger
output will be active while trigger processing is in progress. For more information about trigger
output, see “Trigger output” (p. 180).
82
Page 89
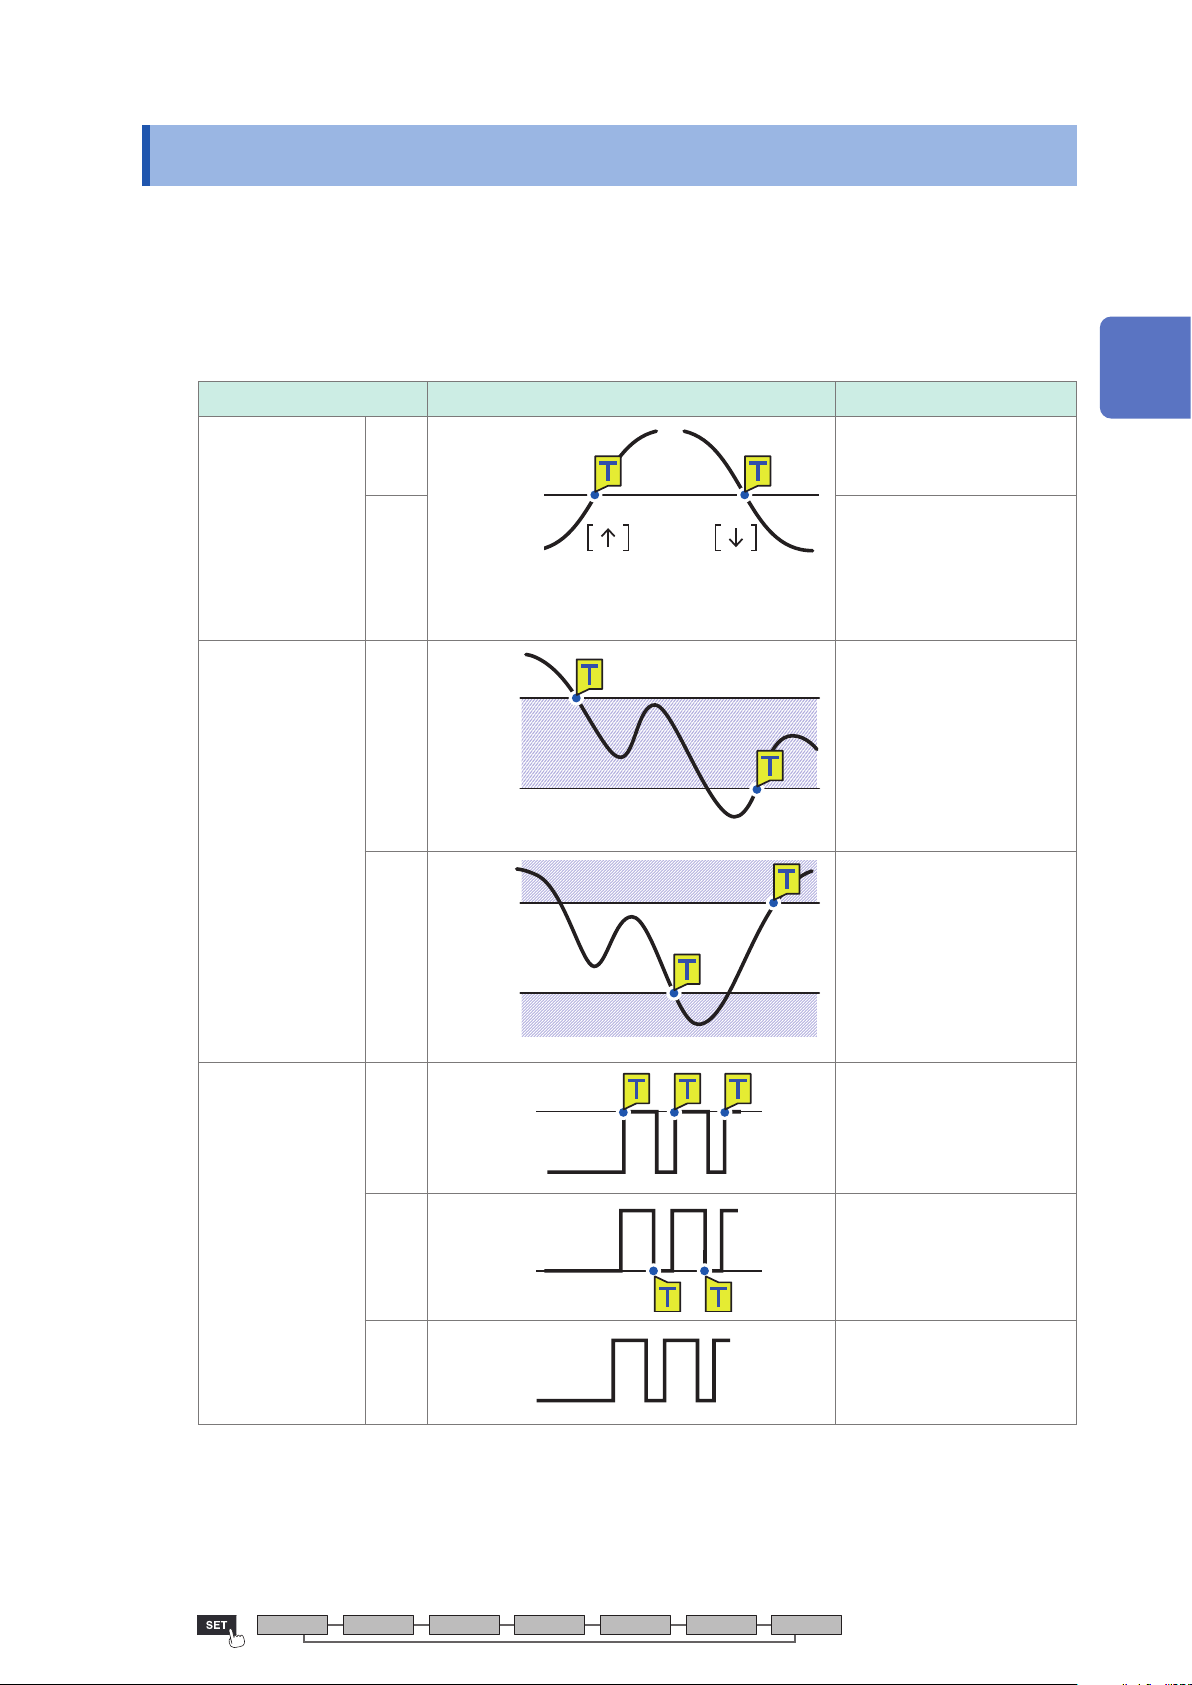
2.1 Trigger Meanings
This section describes how to set start or stop conditions for measurement.
You do so by setting the type of trigger (level, window, or pattern) and the slope (signal rising or
falling).
Trigger types
The following three types of triggers are provided:
Type Operation Description
Level trigger ↑
↓ Activates when the
Trigger level
Input
waveform
Trigger slope
Activates when the
waveform equals or exceeds
the set level while rising.
waveform falls below the set
level value. However, the
trigger cannot activate when
the waveform equals the
value while falling.*
Trigger Meanings
2
Trigger Function
1
Window trigger IN
OUT
Pattern trigger 1
0
Upper
limit value
Lower
limit value
Upper
limit value
Lower
limit value
High
Low
High
Activates when the
waveform enters the range
dened by a pair of upper
and lower limit values. As
well, the trigger activates
when the waveform equals
the upper limit value while
falling and the lower limit
value while rising.
Activates when the
waveform exits the range
dened by a pair of upper
and lower limit values.
However, the trigger cannot
activate when the waveform
equals the upper limit value
while rising or the lower limit
value while falling.*
Activates when a logic signal
changes to 1.
Activates when a logic signal
changes to 0.
2
Low
X
1
*
: For pulse channels , only if the level value is set at zero, the trigger can also activate when the pulse equals
zero while falling.
2
*
: For pulse channels , only if the lower limit value is set at zero, the trigger can also activate when the pulse
equals zero while falling.
As well, only if the upper limit value is set at zero, the trigger can also activate when the pulse equals zero
while rising.
Unit Measure Channel Trigger Alarm Calculation System
High
Low
Ignores the signal. No trigger
will activate.
83
Page 90
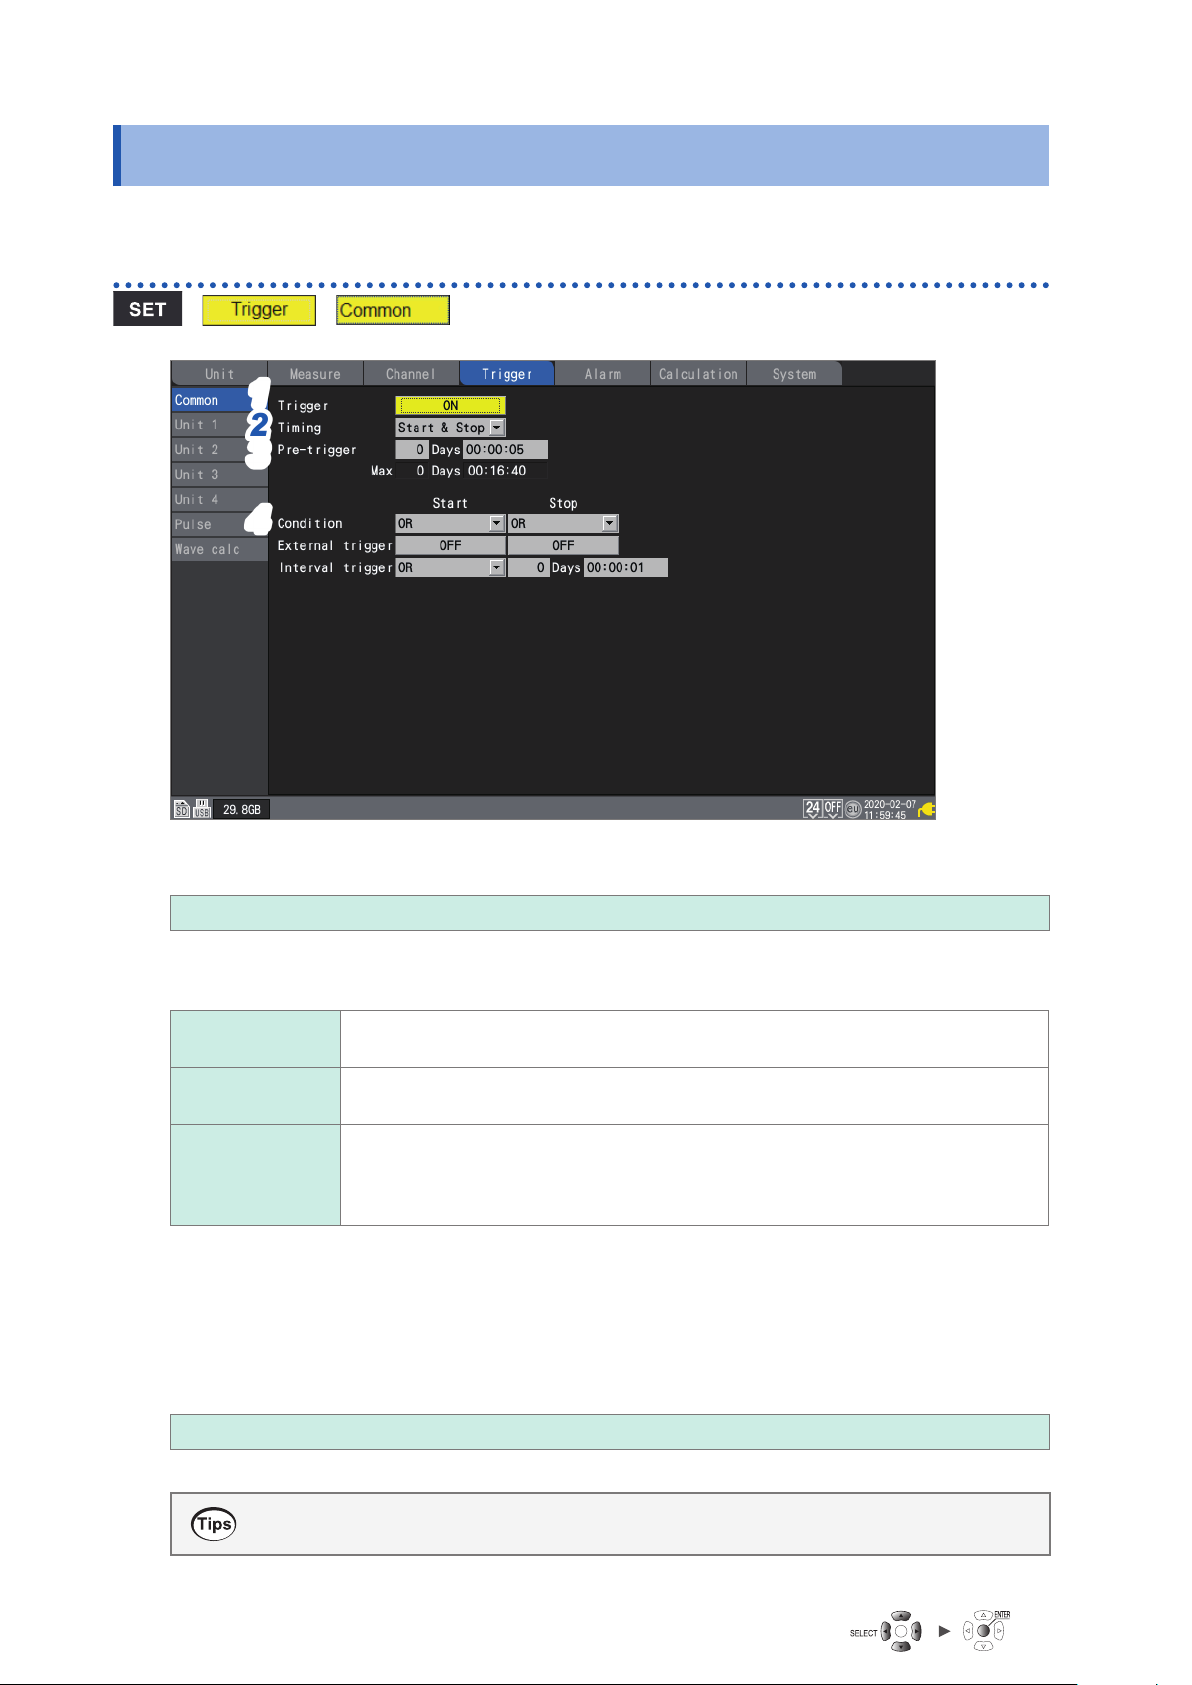
Enabling the Trigger Function
2.2 Enabling the Trigger Function
This section introduces how to start and stop recording using the trigger function.
Shared settings
> >
11
22
33
44
Under [Trigger], set the trigger function to [ON].
1
OFF
, ON
The trigger function will be set to [ON], and trigger settings will be enabled.
Under [Timing], select the operation to perform when the trigger activates.
2
Start
Stop Stops recording when the trigger condition is satised (stop trigger).
Start & Stop Starts recording when the start trigger condition is satised, and stops recording when
Under [Pre-trigger], set the time or number of days you wish to record before the trigger.
3
You can record data before the trigger point (the point in time at which the trigger activates). The
ability to record data preceding an anomaly is useful when you need to analyze the cause of an
issue.
The pre-trigger will be disabled if the operation to perform when the trigger activates has been set
to [Stop] under [Timing].
DD, HH:MM:SS
Starts recording when the trigger condition is satised (start trigger).
Example: Starts recording when the temperature reaches or exceeds 50°C.
Example: Stops recording if a signal falls below 1 V.
the stop trigger condition is satised during recording.
Example: Starts recording when the temperature reaches or exceeds 50°C and stops
recording when the temperature reaches or exceeds 100°C.
The maximum setting available for the instrument is 99 days.
To continue recording the waveform after the trigger, make the recording time longer than the
pre-trigger.
84
Page 91
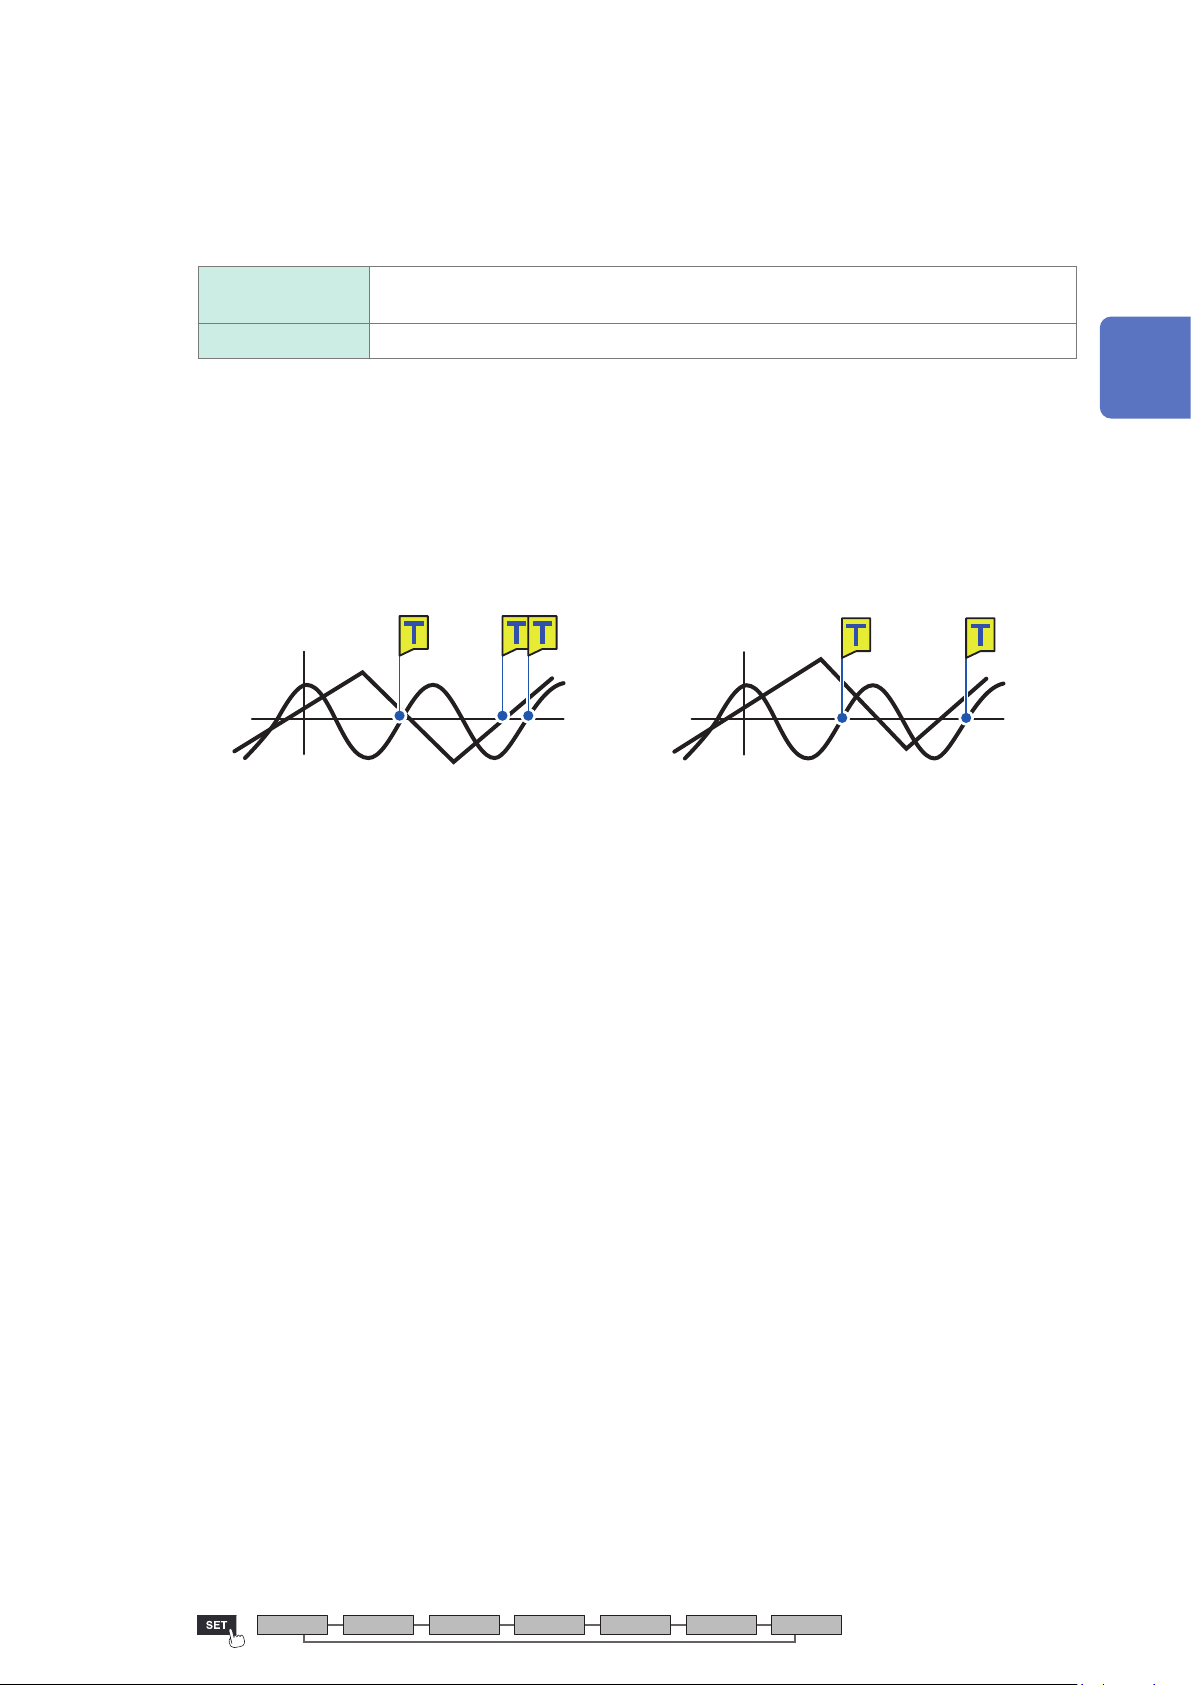
Enabling the Trigger Function
Under [Condition], select the condition for activating the trigger.
4
Set the activation condition between triggers (analog, pulse, logic, waveform calculation, external,
and interval) as a logical AND or logical OR operation.
Recording will start immediately (free-run) if all trigger sources are OFF (if no trigger setting has
been made).
OR
AND The trigger will activate when all of the trigger conditions are satised (level-sensitive).
The trigger will activate when even one of the trigger conditions is satised (edgesensitive).
No trigger can activate when the trigger conditions have already been satised at the start of measurement.
The trigger will become able to activate when input signals that did not satisfy the trigger conditions have just
satised.
Example: To apply the trigger when the waveform crosses 0 V from below to above
Trigger: Level trigger
Level: 0 V
Slope: ↑
[OR]
0 V
Measurement start
Activates the trigger when either one crosses
0 V from below to above.
[AND]
0 V
Measurement start
Activates the trigger when either one crosses
0 V from below to above while the other is
exceeding 0 V.
Dierence between pre-trigger standby and trigger standby
When measurement starts, the instrument does not honor any triggers before the amount of time
set for the pre-trigger has not elapsed. During this period, the screen will display [Waiting for
pre-trigger...]. After the amount of time set for the pre-trigger has elapsed, the instrument will
start waiting for the trigger to be satised. During this period, the screen will display [Waiting for
trigger...].
During pre-trigger standby, the trigger will not activate, even if the trigger conditions are satised.
2
Trigger Function
Unit Measure Channel Trigger Alarm Calculation System
85
Page 92
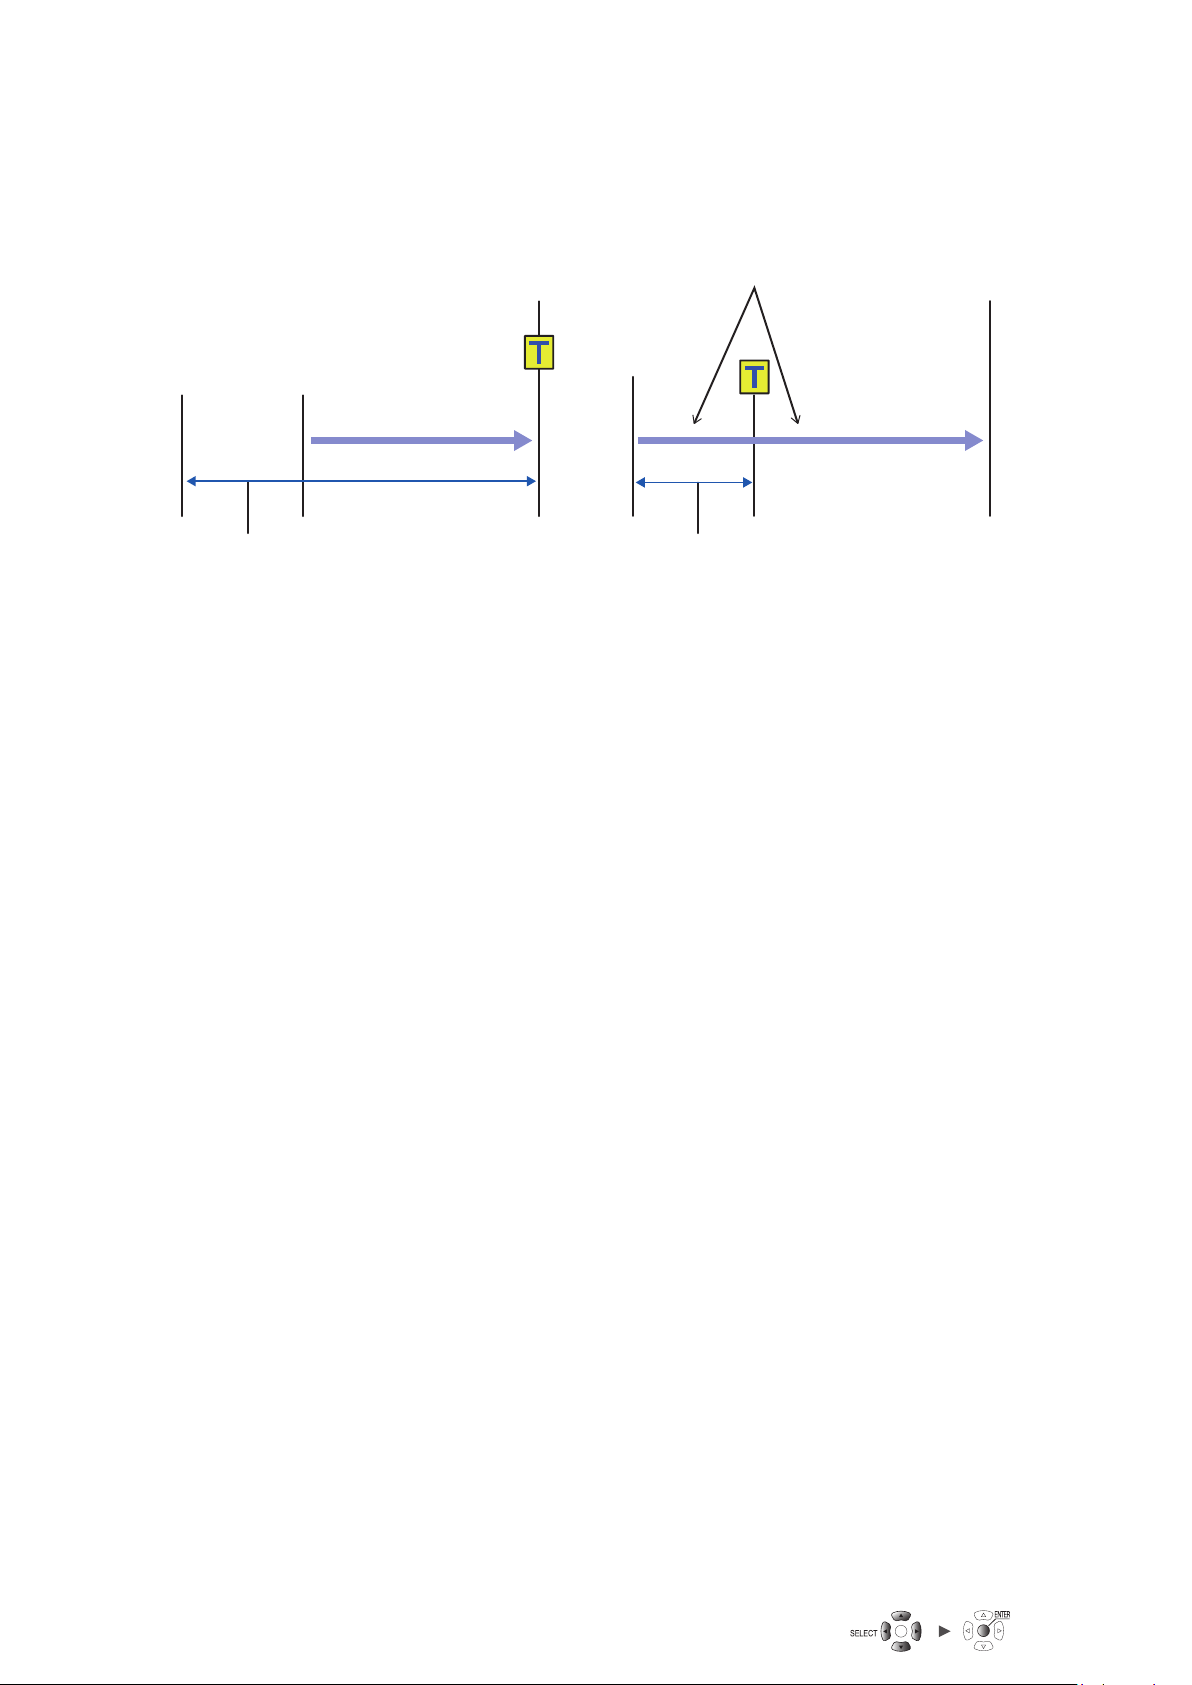
Enabling the Trigger Function
Relationship between pre-triggers and recording time
If the recording time is shorter than the
pre-trigger
Measurement will
stop when the
trigger activates.
Measurement
start
Recording time
(10 min.)
Pre-trigger
(15 min.)
If the recording time is longer than the
pre-trigger
Data will be
measured before
and after the trigger.
Measurement
start
Recording time
(15 min.)
Pre-trigger
(5 min.)
Measurement
will stop at the
recording time.
86
Page 93
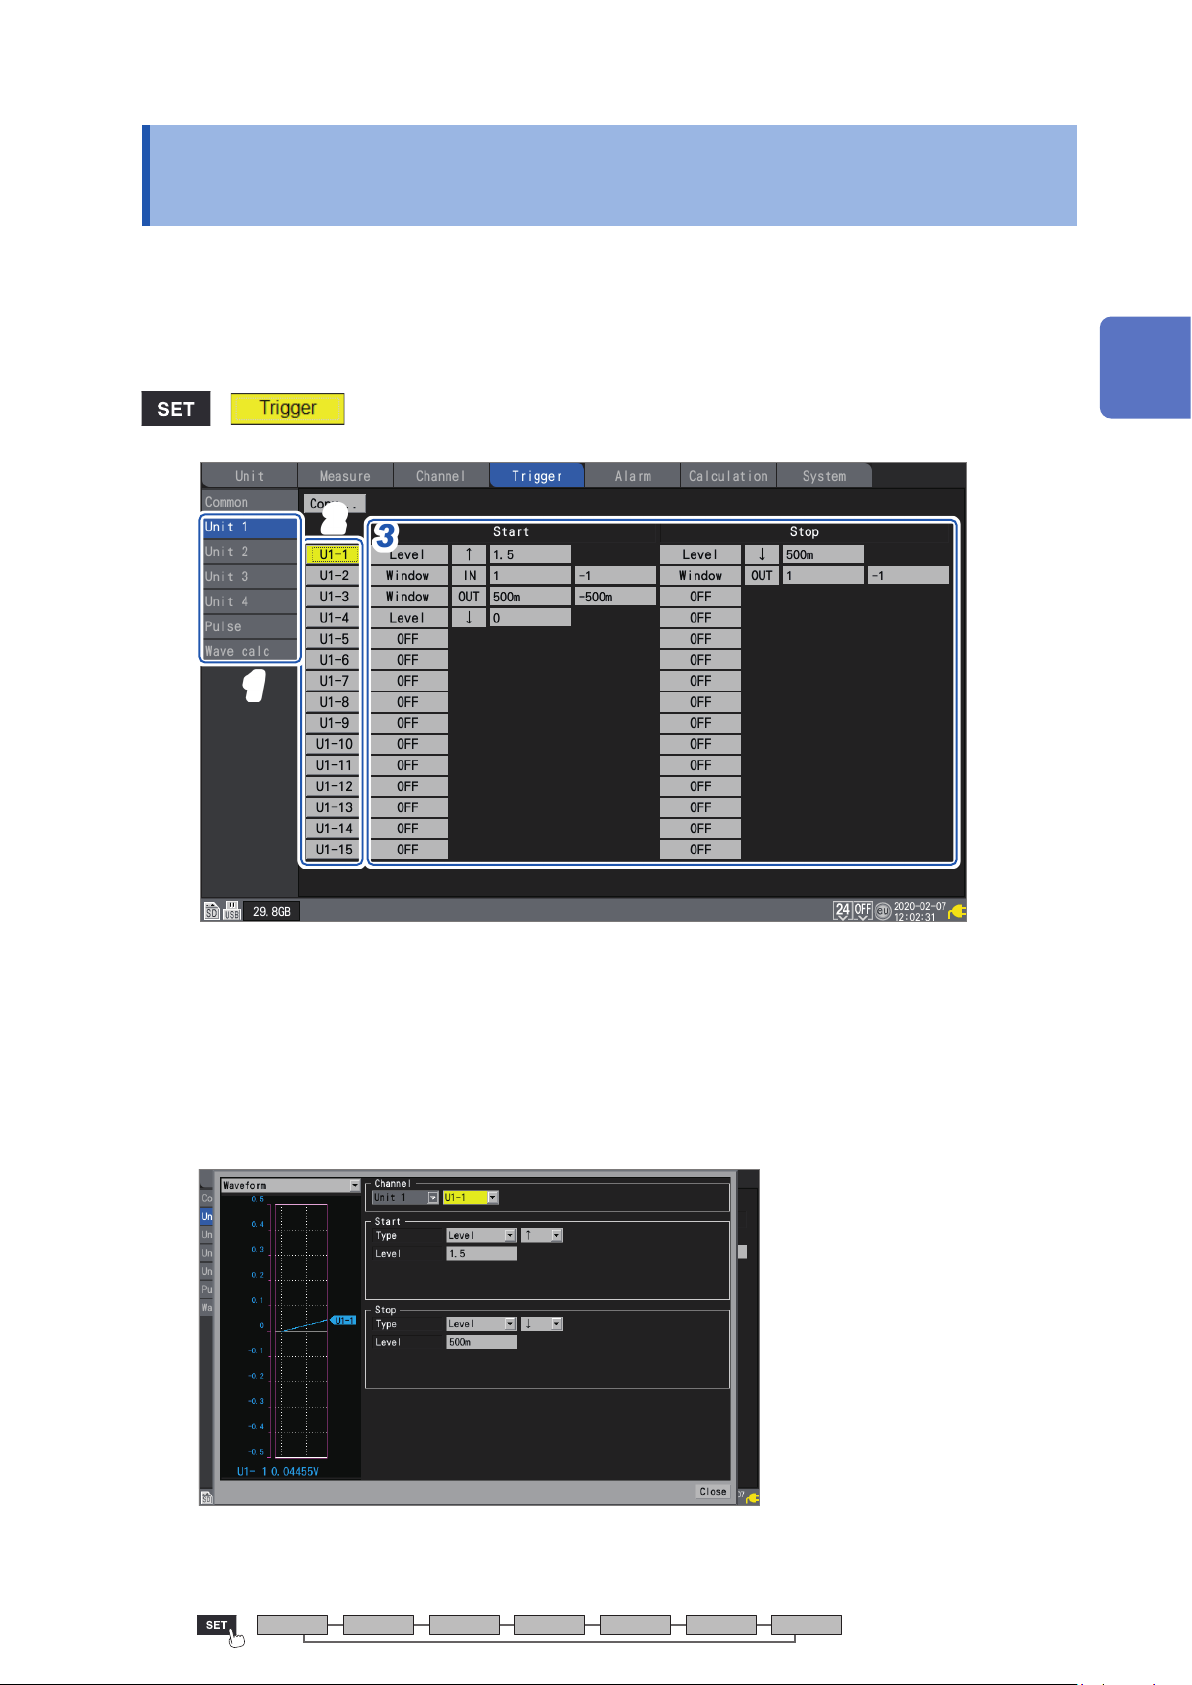
Analog Triggers, Pulse Triggers, Waveform Calculation Triggers (Level, Window)
2.3 Analog Triggers, Pulse Triggers, Waveform Calculation Triggers (Level, Window)
This section describes how to set triggers for individual analog channels, pulse channels, or
waveform calculation channels.
The following triggers are available:
• Level triggers
• Window triggers
> > [Unit n] (n = 1, 2, . . .), [Pulse], or [Waveform calculation]
22
33
2
Trigger Function
11
On the sub tab [Unit n], [Pulse], or [Wave calc], select a module.
1
Unconnected modules will not be displayed.
Press the ENTER key while [Un-m] (analog triggers), [Pm] (pulse triggers), or [Wm] (waveform
2
calculation triggers) for the channel you wish to set is selected (m = 1, 2, . . .).
The channel trigger settings window will open.
Analog triggers
Unit Measure Channel Trigger Alarm Calculation System
87
Page 94
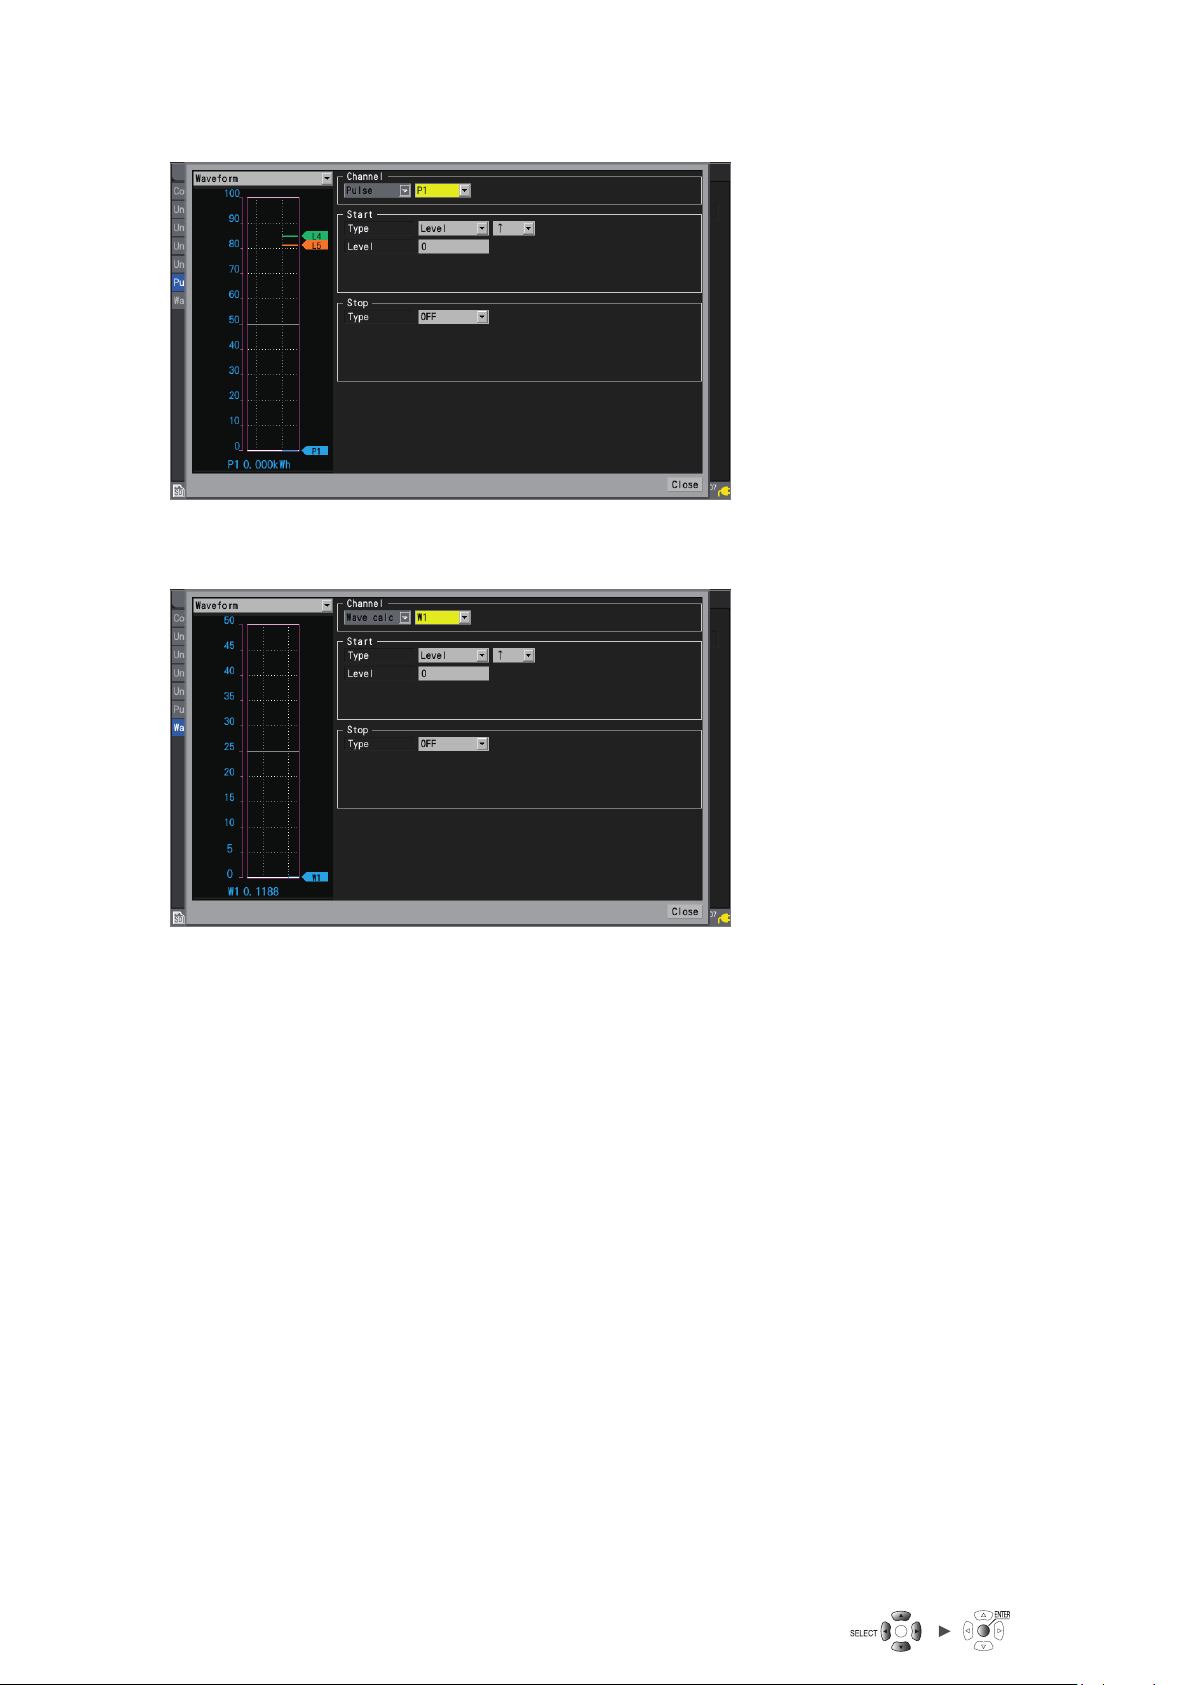
Analog Triggers, Pulse Triggers, Waveform Calculation Triggers (Level, Window)
Pulse triggers
Waveform calculation triggers
See “Level triggers” (p. 89) and “Window triggers” (p. 91) .
Congure the trigger function settings.
3
You can also congure settings on the list screen without opening the settings window.
When [Timing] is set to [Start], a [Start] trigger will be set.
When [Timing] is set to [Stop], a [Stop] trigger will be set.
When [Timing] is set to [Start & Stop], two triggers will be set (one [Start] trigger and one [Stop]
trigger).
For more information about trigger timing, see “Shared settings” (p. 84).
88
Page 95
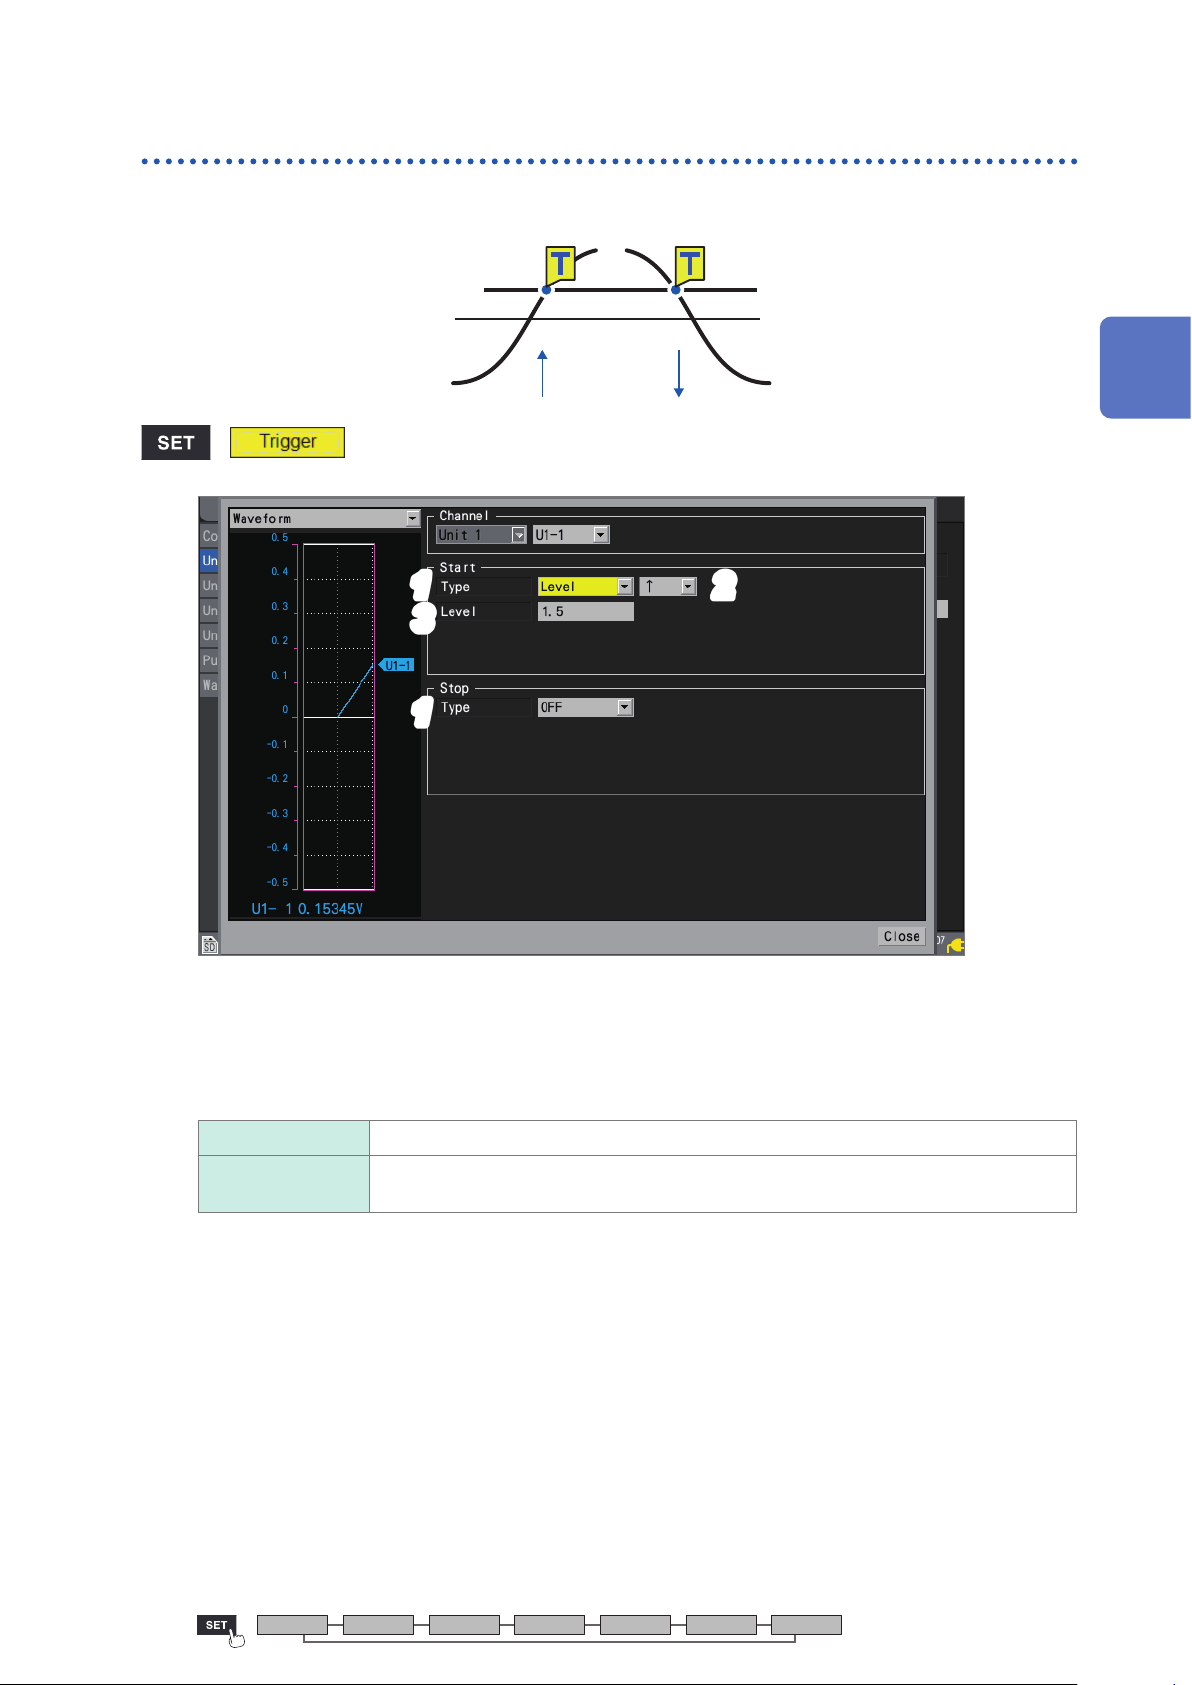
Analog Triggers, Pulse Triggers, Waveform Calculation Triggers (Level, Window)
Level triggers
Level triggers activate when the waveform crosses the specied level (the trigger level).
You can set the direction in which the level is crossed (the slope).
2
> > [Unit n] (n = 1, 2, . . .)
11
33
11
Trigger Function
22
Under [Type] for [Start] or [Stop], set the trigger type to [Level].
1
A level trigger will be used.
Select the slope.
2
The trigger will activate when the level is crossed in the set direction.
↑
↓ Activates the trigger will activate when the level is crossed the specied level from
When [Condition] is set to [AND], the system will determine whether the waveform has exceeded the
specied level.
Under [Level], set the trigger level.
3
The trigger will activate when the set level (temperature, voltage, etc.) is crossed.
When using the scaling function, post-scaling values are displayed.
(When a strain measurement module is used)
The instrument expresses strain in terms of micro epsilon (με). You do not need to enter the SI
prex micro (μ).
Activates the trigger when the level is crossed the specied level from below. (Rising)
above. (Falling)
Unit Measure Channel Trigger Alarm Calculation System
89
Page 96
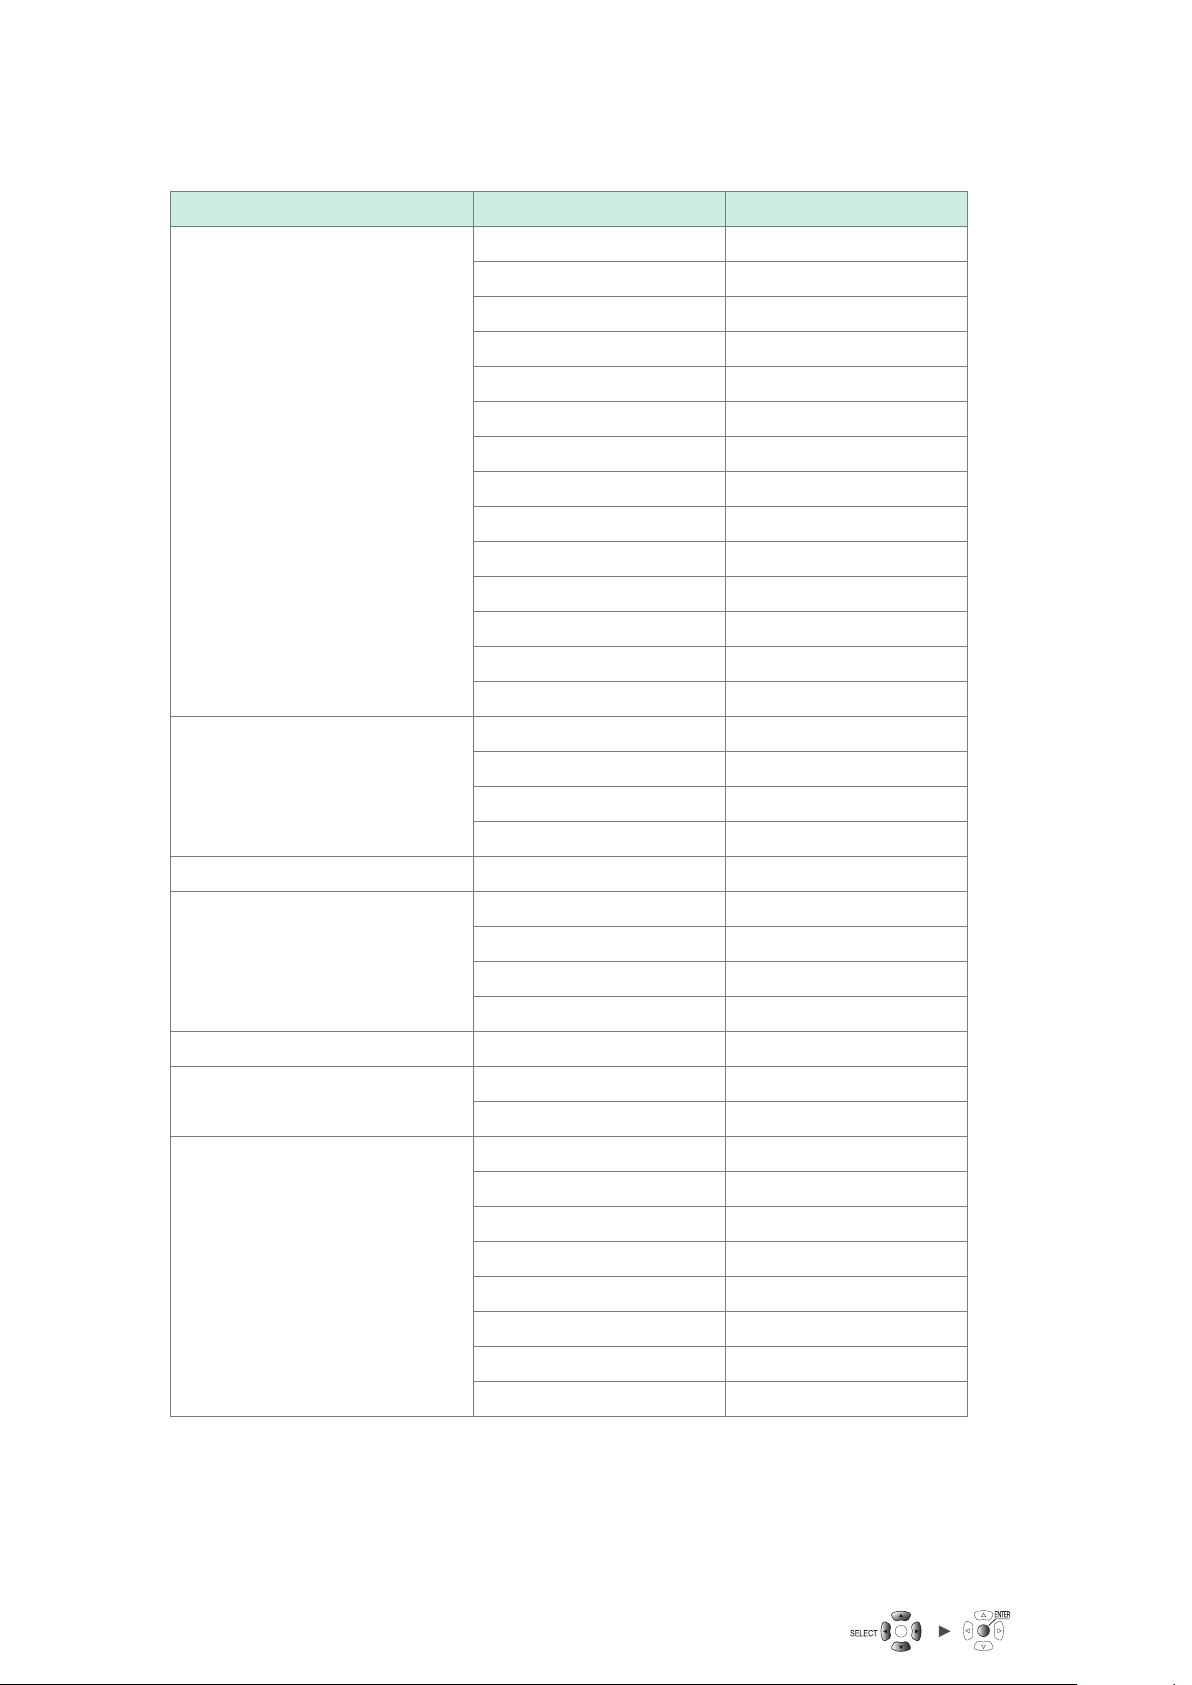
Analog Triggers, Pulse Triggers, Waveform Calculation Triggers (Level, Window)
Trigger level resolution
The trigger level resolution (minimum setting width) varies with the range.
Input Range Resolution
Voltage 1 mV f.s. 0.001 mV
2 mV f.s. 0.002 mV
5 mV f.s. 0.005 mV
10 mV f.s. 0.01 mV
20 mV f.s. 0.02 mV
50 mV f.s. 0.05 mV
100 mV f.s. 0.1 mV
200 mV f.s. 0.2 mV
1 V f.s. 0.001 V
2 V f.s. 0.002 V
10 V f.s. 0.01 V
20 V f.s. 0.02 V
100 V f.s. 0.1 V
1 to 5 V f.s. 0.01 V
Temperature (for both
thermocouples and resistance
temperature detectors)
Humidity 100% RH f.s. 0.1% RH
Resistance 10
Integration – 1 c
Rotational speed 5000 r/s 1 r/s
Strain 1000 με f.s. 1 μ
100°C f.s. 0.1°C
500°C f.s. 0.5°C
1000°C f.s. 1°C
2000°C f.s. 2°C
f.s. 0.01
Ω
20 Ω f.s. 0.02
100 Ω f.s. 0.1
200 Ω f.s. 0.2
300,000 r/min. 1 r/min.
2000 με f.s. 2 μ
5000 με f.s. 5 μ
Ω
Ω
Ω
Ω
ε
ε
ε
90
10000 με f.s. 10 μ
20000 με f.s. 20 μ
50000 με f.s. 50 μ
100000 με f.s. 100 μ
200000 με f.s. 200 μ
ε
ε
ε
ε
ε
Page 97
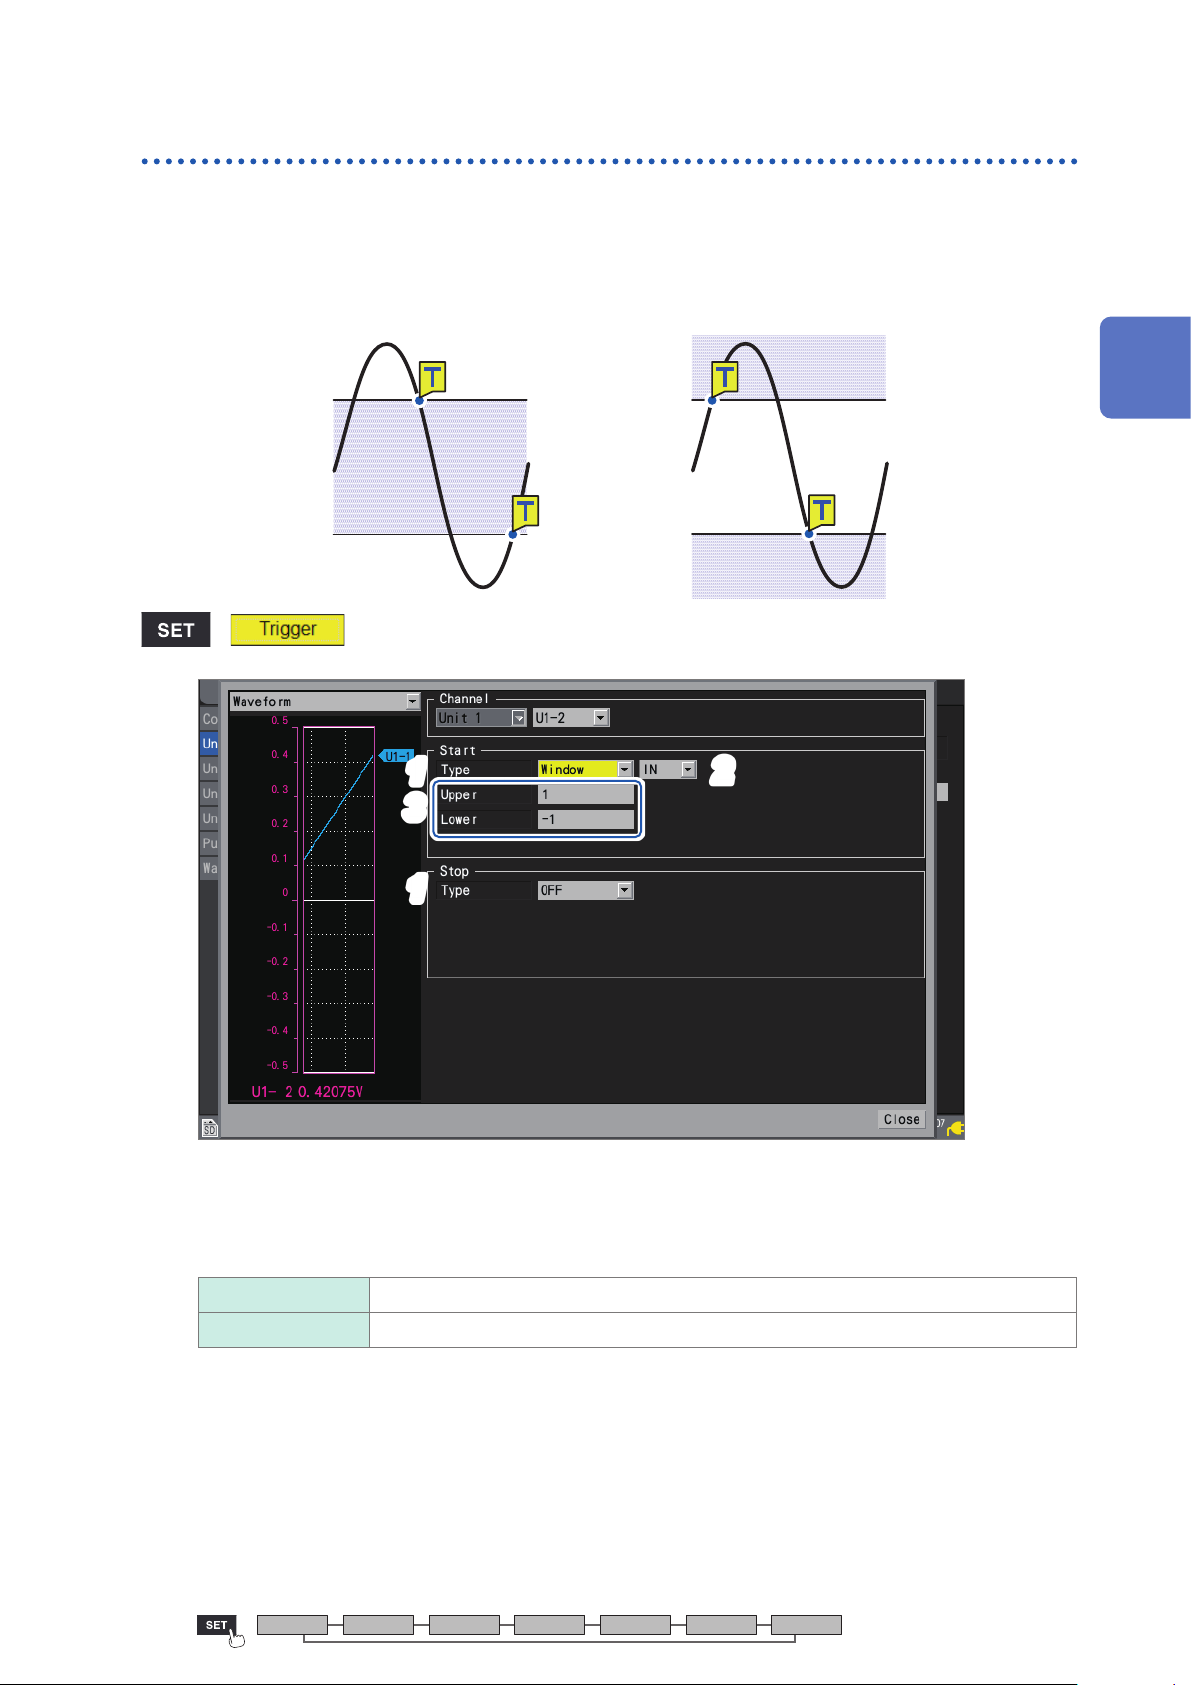
Analog Triggers, Pulse Triggers, Waveform Calculation Triggers (Level, Window)
Window triggers
This section describes how to specify a range (window) using upper and lower limit values and then
activate a trigger when the waveform moves into or out of that range.
You can activate a trigger either when the waveform enters the range (window IN) or when the
waveform exits the range (window OUT).
Window IN Window OUT
> > [Unit n] (n = 1, 2, . . .)
2
Trigger Function
11
22
33
11
Under [Type] for [Start] or [Stop], set the trigger type to [Window].
1
A window trigger will be used.
Choose between [IN] and [OUT] for the waveform.
2
IN
OUT Activates the trigger when the waveform exits the specied range.
Activates the trigger when the waveform enters the specied range.
When [Condition] is set to [AND], the system will determine whether the waveform is inside the specied
range.
Under [Upper] and [Lower], set the upper and lower limit values, respectively.
3
The range dened by the upper and lower limit values will serve as the window.
When using the scaling function, post-scaling values are displayed.
Unit Measure Channel Trigger Alarm Calculation System
91
Page 98
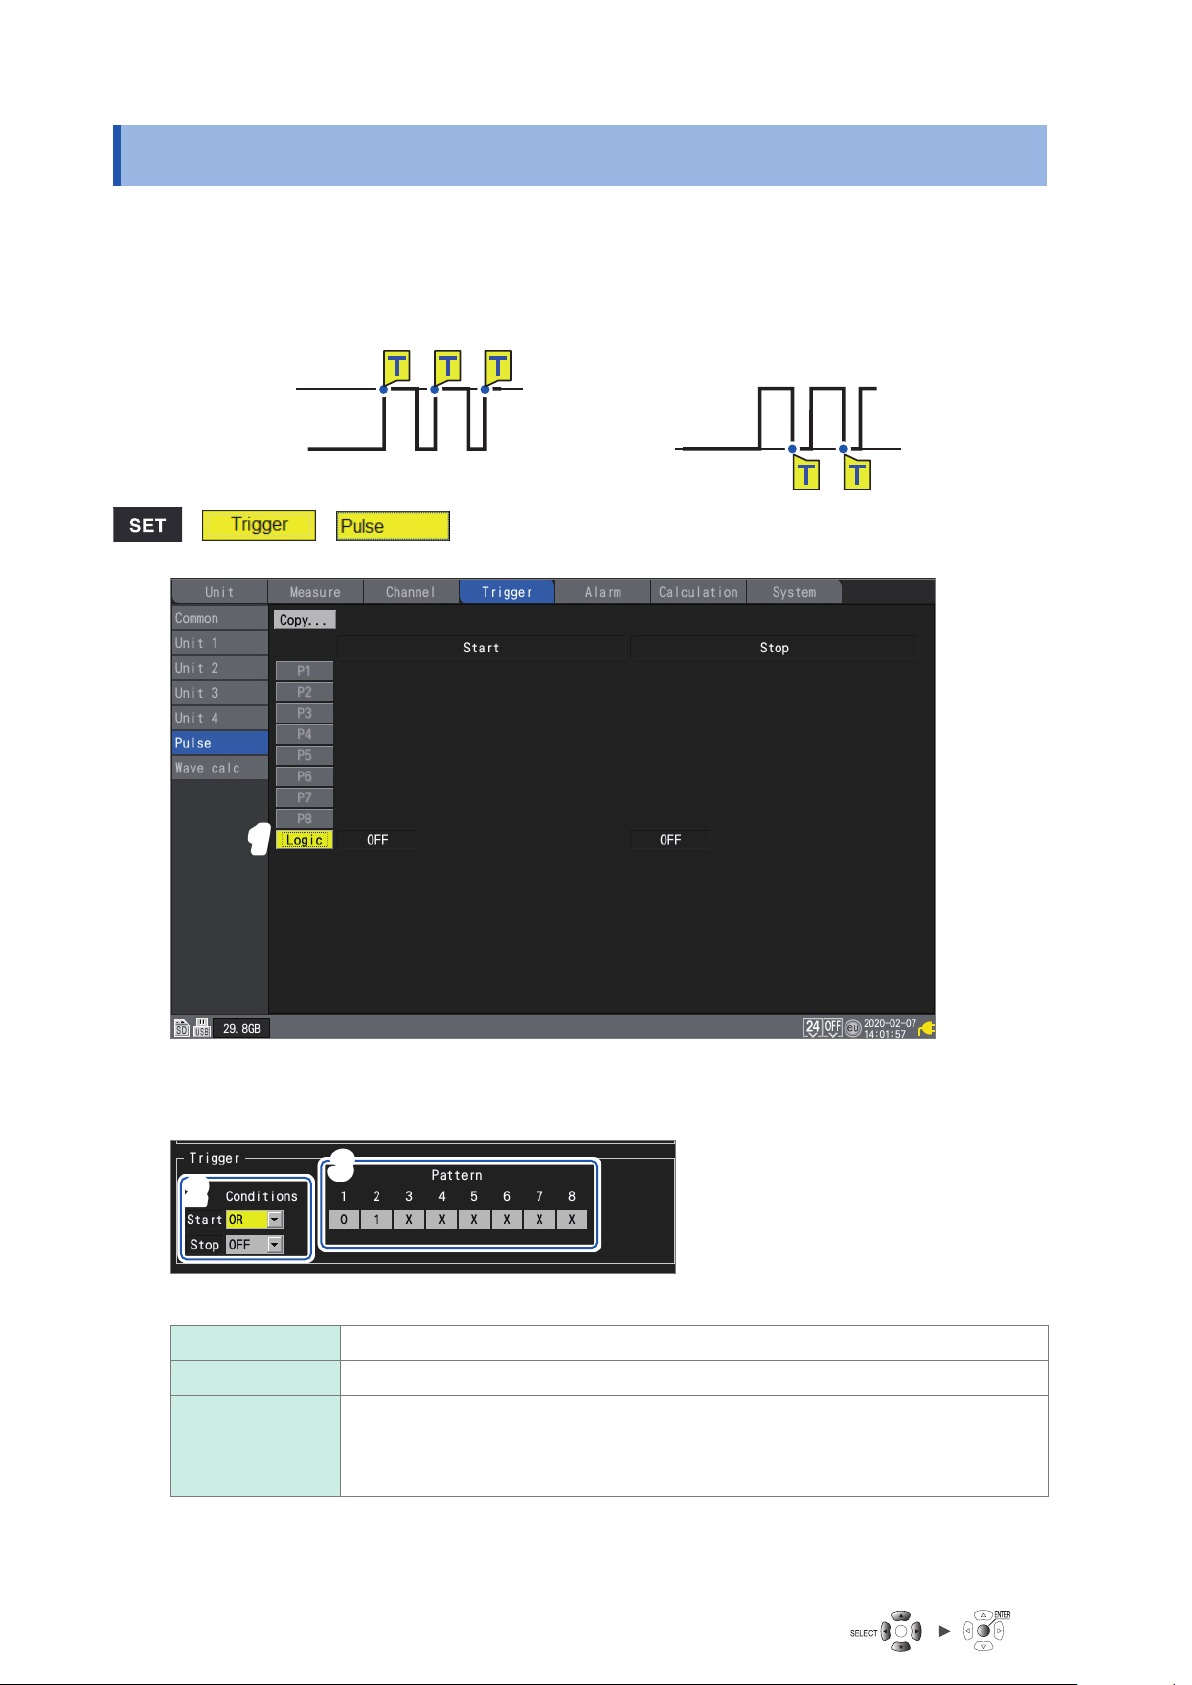
Logic Triggers (Patterns)
2.4 Logic Triggers (Patterns)
This section describes how to activate triggers with logic triggers.
When the logic signal values (1 and 0) match the trigger pattern (1/0/X), the trigger will activate.
This type of trigger can be selected when [Logic] has been selected for pulse (P1 to P8) input.
See “Measuring logic signals” (p. 34).
High
Low
> >
11
High
Low
Press the ENTER key while [Logic] is selected.
1
The logic trigger settings window will open.
33
22
Under [Condition], select the pattern for activating the trigger.
2
OFF
OR Activates the trigger when even one of the trigger patterns matches (edge-sensitive).
AND Activates the trigger when all of the trigger patterns match (level-sensitive). No trigger
92
Does not use a pattern trigger.
can activate, however, when the logic trigger conditions have already satised at the
start of measurement. The trigger will become able to activate once the logic trigger
conditions have not been satised.
Page 99
Select the P1 to P8 trigger pattern.
3
0 Activates the trigger when the signal is [0] (low).
1 Activates the trigger when the signal is [1] (high).
X Excludes from the trigger. The signal will be ignored.
Logic Triggers (Patterns)
2
Trigger Function
Unit Measure Channel Trigger Alarm Calculation System
93
Page 100
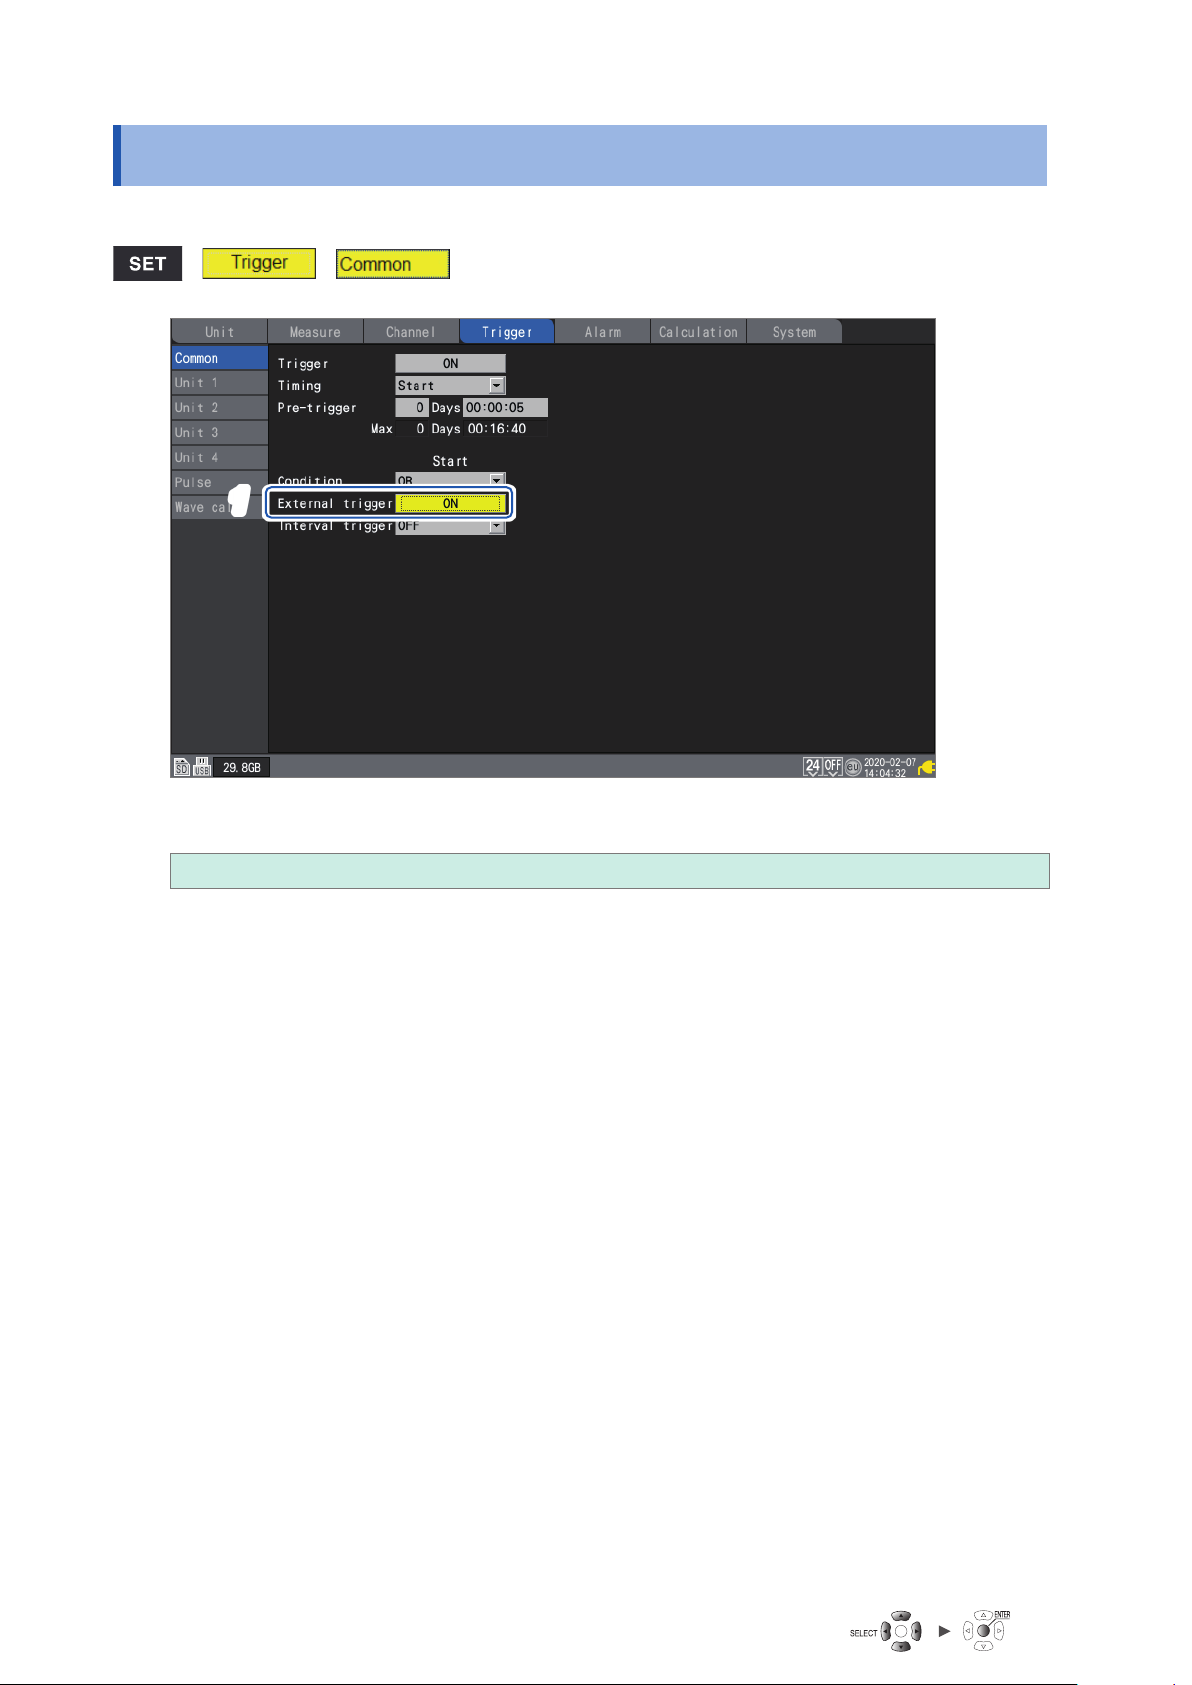
Applying Triggers Based on External Sources
2.5 Applying Triggers Based on External Sources
This section describes how to use signals inputted to the terminal I/O 3 to activate triggers.
> >
11
Under [External trigger], set the external trigger function to [ON].
1
OFF
, ON
The external trigger function will be enabled, allowing you to activate triggers based on signals inputted from
external sources.
When [External trigger] is set to [ON], the external input 3 terminal will be set to [Trigger input].
See “External trigger input” (p. 179).
94
 Loading...