

Page 1
Stat/Math
Calculator
Owner’s
Manual
(fifi
HEWLETT
PACKARD
Page 2
[fi/’
P
B
INPUT
g
E
e\
STAT/MATH_/
\_
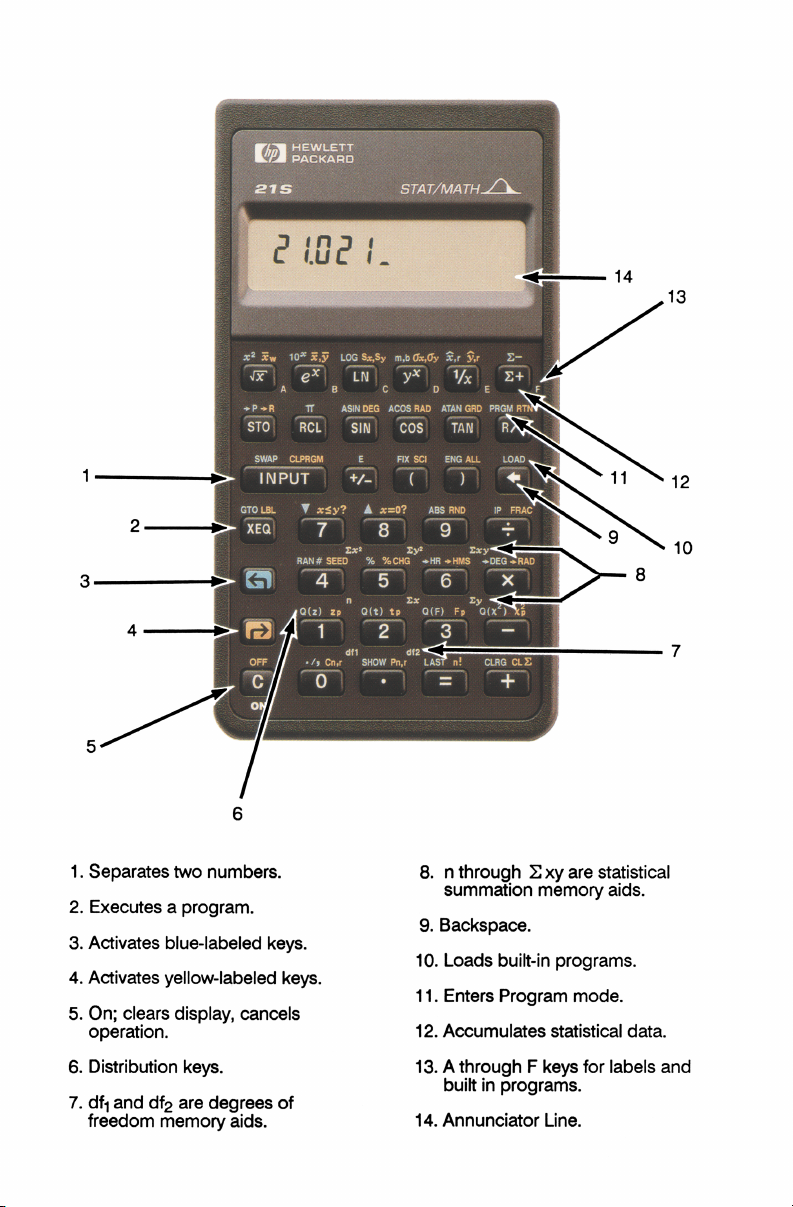
1.
Separates
2.
Executesaprogram.
3.
Activates
4.
Activates
5.
On;
clears
operation.
6.
Distribution
7.
df{and
freedom
two
numbers.
blue-labeled
yellow-labeled
display,
keys.
dfs
are
degrees
memory
8.
9.
keys.
10.
keys.
11.
cancels
12.
13.AthroughFkeys
of
aids. 14.
nthrough2xy
summation
Backspace.
Loads
Enters
Accumulates
builtinprograms.
Annunciator
memory
built-in
Program
statistical
Line.
programs.
are
statistical
aids.
mode.
for
labels
data.
and
Page 3
df(ST0]1
(S)@0c(displays
[XEQ]B(displays
n-1
correct
ng/
x?)
degrees
U,)
5
of
\yes
freedom?
(QJ@xd)(displays
(XEQ)B(displays
x?)
U,)
\
¥
(XEQJF
0,
O,(NPUTIE,[R/S]
[INPUTIE,
(7S)
o
O,[INPUTJE
[XEQIA
unequil/
Expected
values
(\J([COADID
unequal
\Eual
or
equal?
OE]
and
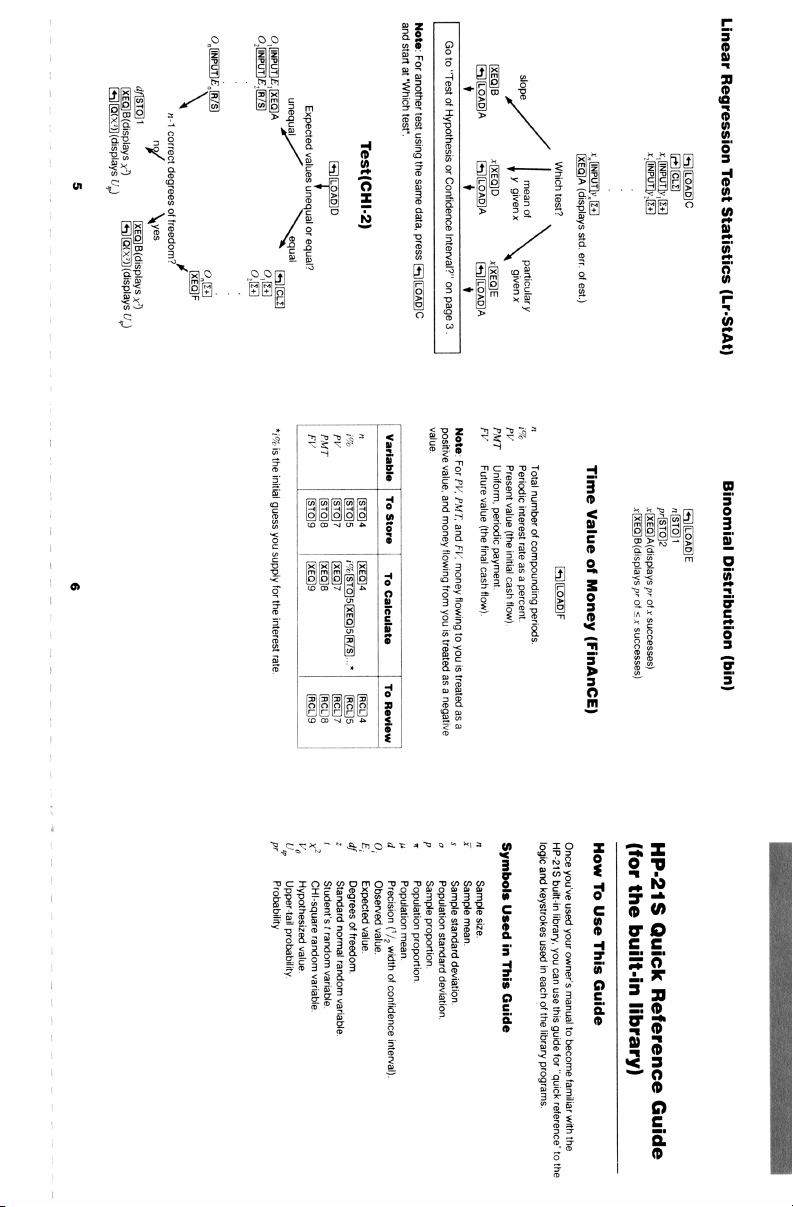
Note:
start
For
at
another
"Which
test
test".
using
Test(CHI-2)
the
same
data,
press
[#][LOAD]C
[
Go
to
“Test
of
Hypothesis
or
Confidence
Interval?”
on
page
3
.
J
[«)(LOADIA
¥
y
givenx
x(XEQIE
given
x
slope
Which
mean
test?
of
particular
y
A
(displays
std.
err.
of
est.)
Linear
Regression
x,(INPUTy,
x,(INPUT]y,(2+]
[«)[COADIC
()L
Test
(£4)
Statistics
(Lr-StAt)
*i%
is
the
initial
guess
you
supply
for
the
interest
rate.
n
%
PV
PMT
Fv
(STO)4
~
TESXTVAMOSTE
Probability
N =
Upper-tail
Hypothesized
CHl-square
Student's
Standard
Degrees
of
normal
t
probability.
random
freedom.
random
value.
random
variable.
variable.
variable.
Observed
Expected
value.
value.
Variable
To
Store
To
Calculate
To
Review
Precision
('/,
width
of
confidence
interval).
value.
ATov
Population
Population
Sample
proportion.
mean.
proportion.
Note:
positive
For
value,
PV,
and
PMT,
money
and
FI/,
flowing
money
from
flowing
you
is
to
treated
you
is
as
treated
a
negative
as a
s
Sample
Sample
Population
standard
mean.
standard
deviation.
deviation.
Fv
Future
value
(the
final
cash
flow).
Sample
size.
PMT
i%
PV
Uniform,
Periodic
Present
value
interest
periodic
(the
rate
payment.
initial
as
a
cash
percent.
flow).
Symbols
Used
in
This
Guide
n
Total
number
of
compounding
[«2)(COADIF
periods.
Once
logic
HP-21S
and
you've
built-in
keystrokes
used
library,
your owner's
used
you
in
can
each
use
manual
of
this
the
guide
to
library
become
for
programs.
“quick
familiar
reference"
with
the
to
the
Time
Value
of
Money
(FinAnCE)
How
(for
To
the
Use
built-in
This
Guide
library)
x[XEQ)B(displays
x(XEQJA(displays
pr
pr
of
of
x
<x
successes)
successes)
HP-21S
Quick
Reference
Guide
Binomial
Distribution
(bin)
Page 4
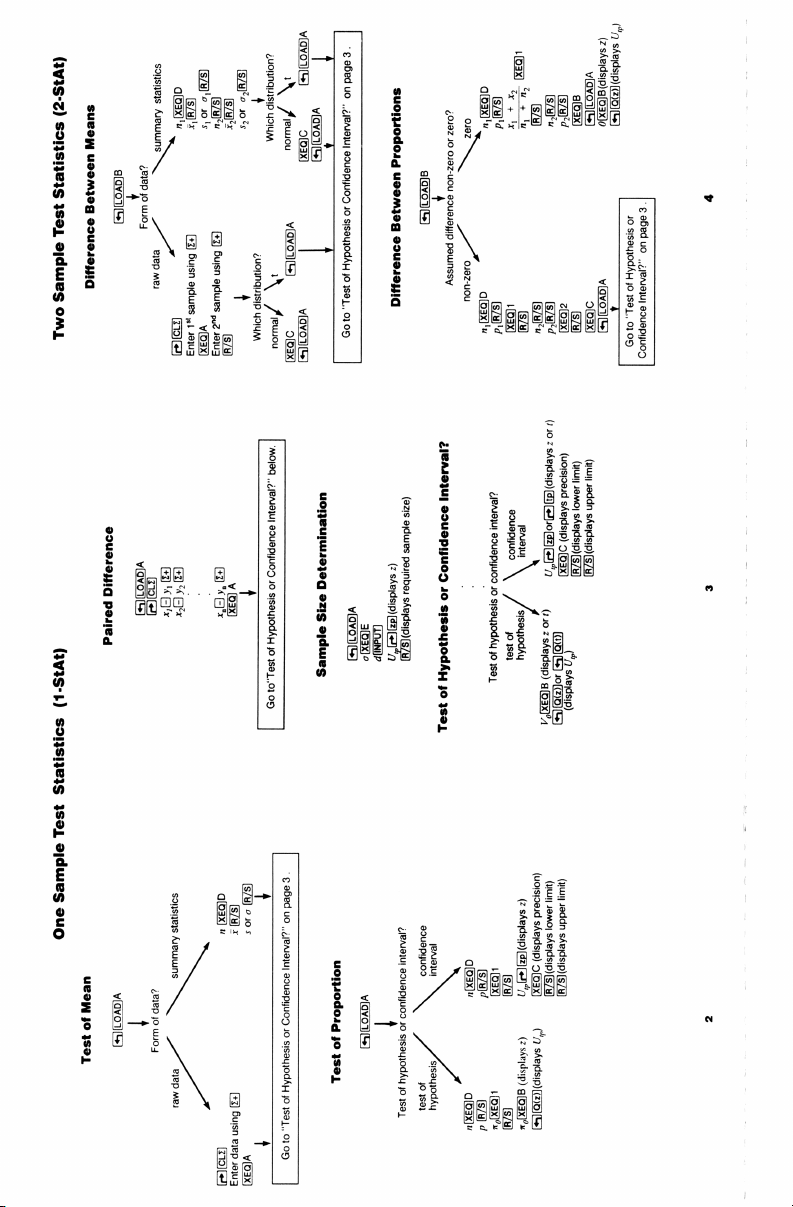
(2-StAt)
Means
Statistics
Between
Test
Difference
Sample
Two
statistics
n,(XEQ)D
summary
datj/
raw
(®JcT)
o,[R/S)
syor
x,[R/8)
(Z+]
using
sample
1%
Enter
(XEQJA
"zm
[T+
using
{
sample
2™
Enter
[R78)
x,[R/S)
o,[R/S]
¥
distribution?
s,0r
Which
\‘t
distribution?
/
Which
normal
(w)CoADIA
\'
¥
”0""3'/
(©)[COADIA l
(XEQIC
l
(©)COADIA
(XEQ)C
()CoADIA
J
.
3
on page
Interval?”
Confidence
or
Hypothesis
of
“Test
to
Go
I
Proportions
v
S)Coans
Between
Difference
zero?
or
\iero
non-zero
difference
/
Assumed
non-zero
(xeQ)
"22
x
+
+
[R7S)
n,(XEQID
"11
le
X
(XEQ]1
fi
n,(KEQID
n,[R7S)
plm
"zm
p,[R/S]
XEQ)2
sz
z)
(XEQ)B
(Q)CSADIA
0(XEQ)B(displays
Y
[R73)
(\J[LoAD)A
(XEQ)IC
U,,)
Bj@@)(displays
.
3
or
page
on
Hypothesis
of
Interval?”"
“Test
to
Go
Confidence
Difference
Paired
(1-StAt)
Statistics
Test
Sample
One
Mean
of
Test
B
[(©9)([LOADIA
(@)eLy
5By,
data?
of
(\)[LOADIA
Form
B
xEy,
statistics
summary
data
raw
(X3
A
XEQ)
I.B;".
(XEQJD
n
x[R/S)
(Z+]
using
data
Enter
¢
[R/S)
oro
s
below.
Interval?”’
Confidence
or
Hypothesis
of
to"Test
Go
.
3
'
page
on
Interval?’
Confidence
or
Hypothesis
of
"Test
to
¢
Go
L
Determination
Size
[«1)[COADIA
o[XEQJE
d[INPUT)
Sample
Proportion
(\)[LOADIA
of
Test
Interval?
size)
sample
z)
Confidence
required
or
[*)(zp)(displays
[R/S](displays
U,
Hypothesis
of
Test
interval?
interval
confidence
confidence
or
hypothesis
of
of
hypothesis
test
Test
n(XEQJD
pRS)
B/S)
n[XEQ)D
p
interval?
confidence
or
hypothesis
of
Test
n,(XEQ)1
limit)
precision)
lower
(displays
interval
confidence
u,[g]@or[a@(dispoayszorr)
[R7S)(displays
@C
P
hypothesis
testof
@(%ao;s[%fl@
VomB(displayszo”)
limit)
limit)
z)
precision)
upper
lower
(displays
[®)(zp)(displays
[R/S])(displays
[R7S])(displays
(XEQJC
U,
[R/S]
(xEQJ1
U,,)
z)
(displays
[R/S)
n,(XEQ)B
[w)@@)(displays
limit)
upper
[R7S)(displays
Page 5
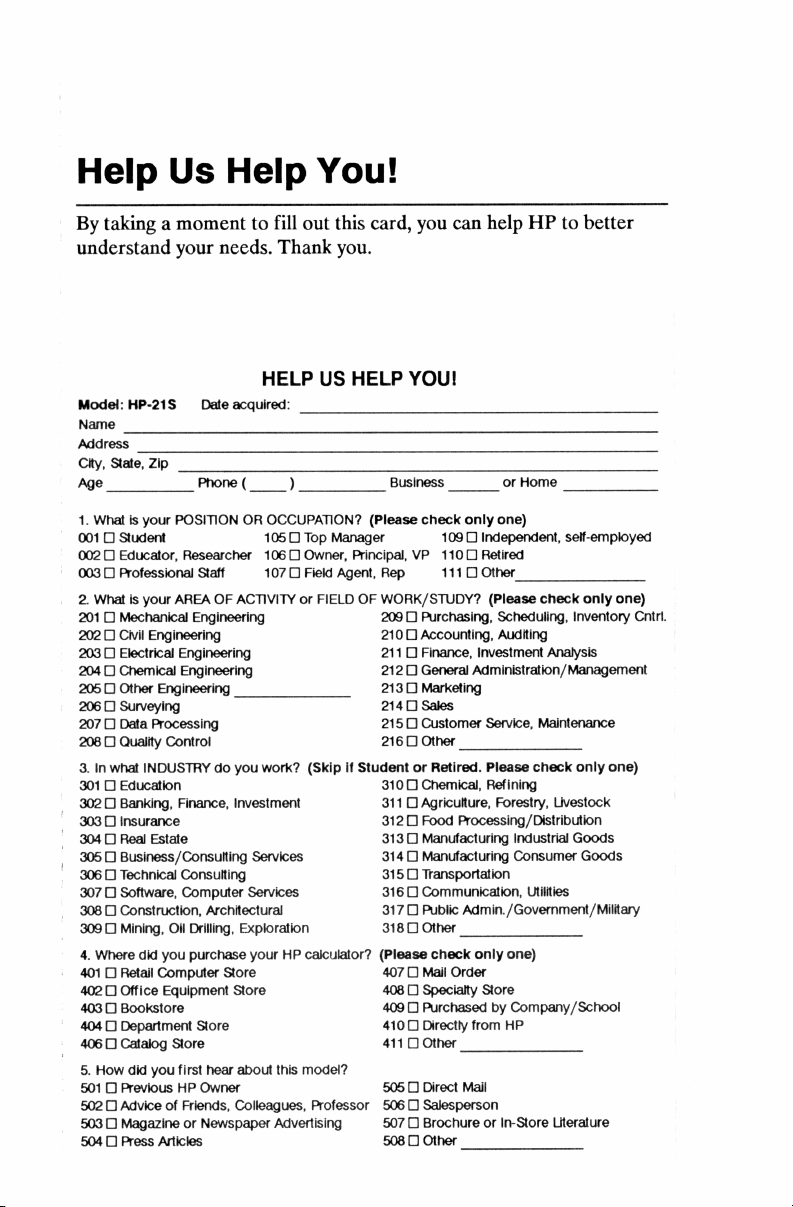
Help
By
takingamomenttofill
understand
Model:
Name
Address
City,
Age
1.
Whatisyour
001[Student
002[0Educator,
003[Professional
2.
Whatisyour
201[0Mechanical
202[JCivil
203[Electrical
204[JChemical
205[Other
206[Surveying
207[0Data
208[JQuality
3.Inwhat
301[JEducation
302[0Banking,
303OInsurance
304[JReal
305[0Business/Consulting
306[0Technical
307OSoftware,
308[JConstruction,
309[0Mining,
4.
Where
401[JRetail
402[JOffice
403[JBookstore
404[]Department
406[JCatalog
5.
How
501OPreviousHPOwner
502[JAdviceofFriends,
503[0MagazineorNewspaper
504[JPress
Us
your
HP-21S
State,
Zip
POSITIONOROCCUPATION?
AREAOFACTIVITYorFIELDOFWORK/STUDY?
Engineering
Engineering
Processing
Control
INDUSTRYdoyou
Estate
Oil
did
you
Computer
Equipment
Store
did
you
Articles
Help
needs.
Date
acquired:
Phone(__
Researcher
Staff
Engineering
Engineering
Engineering
Finance,
Investment
Consulting
Computer
Architectural
Drilling,
purchase
Store
Store
Store
first
hear
Colleagues,
Exploration
about
You!
out
this
Thank
you.
HELP
US
HELP
)
105[0Top
106[JOwner,
107
work?
Services
Services
yourHPcalculator?
Manager
(I Field
this
Advertising
Principal,VP110
Agent,
(SkipifStudentorRetired.
model?
Professor
card,
you
can
helpHPto
YOU!
Business
(Please
check
Rep
209[0Purchasing,
210[0Accounting,
211OFinance,
2120General
213[0Marketing
214
Sales
215[Customer
216[0Other
310[0Chemical,
311[0Agriculture,
3120
Food
313[0Manufacturing
314[0Manufacturing
3150
Transportation
3160Communication,
317OPublic
318(0Other
(Please
check
407[Mail
408[Specialty
4090PurchasedbyCompany/School
410[Directly
411[Other
505[JDirect
506(]Salesperson
507OBrochureorIn-Store
508[Other
or
Home
only
one)
109OIndependent,
Retired
1110Other
(Please
Scheduling,
Auditing
Investment
Administration/Management
Service,
Please
Refining
Forestry,
Processing/Distribution
Admin./Government
only
Order
Store
from
Mail
seif-employed
check
Analysis
Maintenance
check
Livestock
Industrial
Consumer
Utilities
one)
HP
Literature
better
only
one)
Inventory
only
one)
Goods
Goods
/Military
Cntrl.
Page 6

39V.1SOd
AHVYSS3O3aN
ON
a3vin
3HL
NI
4i
S31V1S
a3lINN
I
I
I
L]
I
I
|
I
]
1IVIN
HO
'SITIVAHOO
A1d34
S€
335$3HAAV
"ON
1INY3d
SS3ANISNY
TIVIN
SSV10
1sHld
AQ
divd
39
11IM
39V1S0d
ANYdNOD
¢,66-0£€.6
IN3N1HV43d
aA1g
@HVMOVd-L13TM3IH
370410
HO
STIHINONI
SITIVAHOO
3N
00011
Page 7

HP-21S
Stat/Math
Calculator
Owner’s
Manual
HEWLETT
(bfl]
Edition3June
Reorder
PACKARD
Number
1990
00021-90025
Page 8
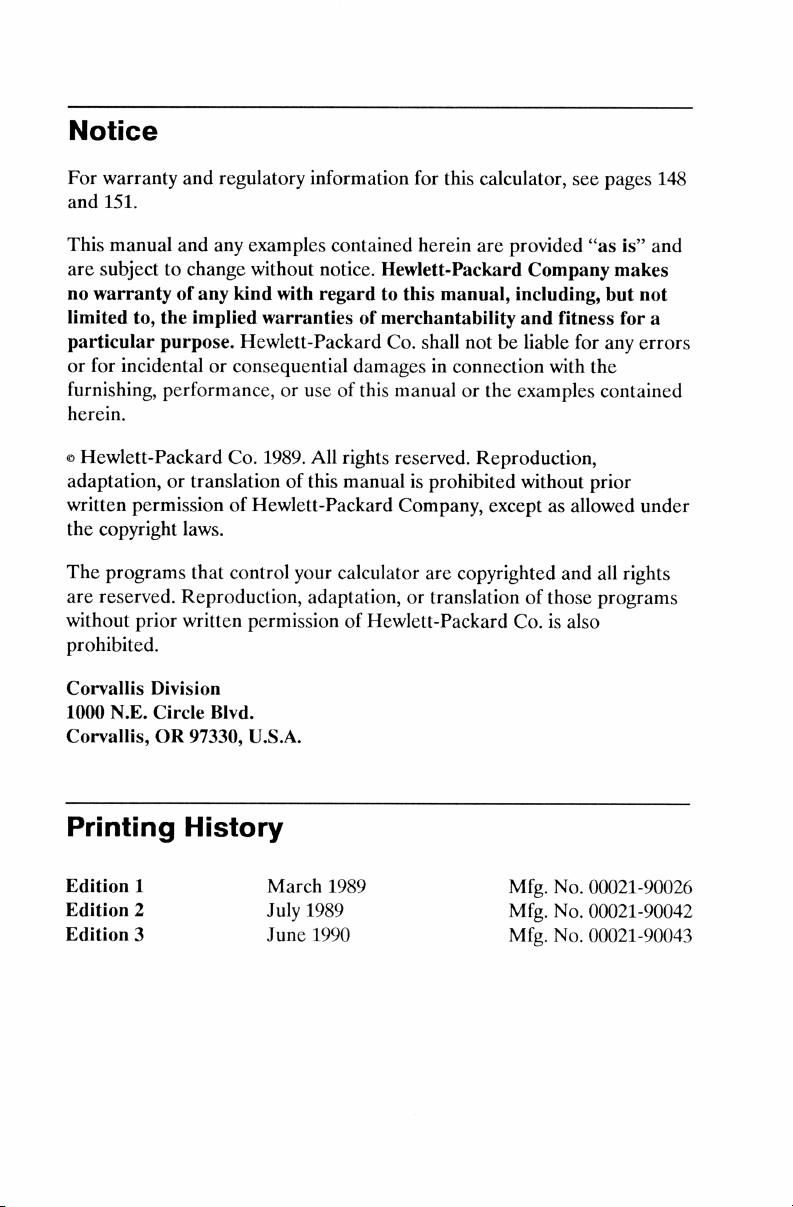
Notice
For
warranty
and
151.
This
manual
are
subjecttochange
no
warrantyofany
limited
particular
or
for
incidentalorconsequential
furnishing,
herein.
o
Hewlett-Packard
adaptation,ortranslationofthis
written
the
copyright
The
programs
are
reserved.
without
prohibited.
and
to,
the
purpose.
regulatory
and
any
implied
examples
kind
Hewlett-Packard
information
without
notice.
with
regardtothis
warrantiesofmerchantability
performance,oruseofthis
Co.
1989.
All
permissionofHewlett-Packard
laws.
that
Reproduction,
prior
written
control
your
adaptation,ortranslationofthose
permissionofHewlett-Packard
for
this
calculator,
contained
herein
are
Hewlett-Packard
manual,
Co.
shall
notbeliable
damagesinconnection
manualorthe
rights
reserved.
Reproduction,
manualisprohibited
Company,
calculator
are
exceptasallowed
copyrighted
see
provided
Company
including,
and
fitness
for
with
examples
without
and
Co.isalso
pages
“as
is”
and
makes
but
not
for
a
any
errors
the
contained
prior
under
all
rights
programs
148
Corvallis
1000
Corvallis,
Division
N.E.
Printing
Edition
Edition
Edition
1
2
3
Circle
OR
97330, U.S.A.
History
Blvd.
March
July
June
1989
1990
1989
Mfg.
Mfg.
Mfg.
No.
00021-90026
No.
00021-90042
No.
00021-90043
Page 9
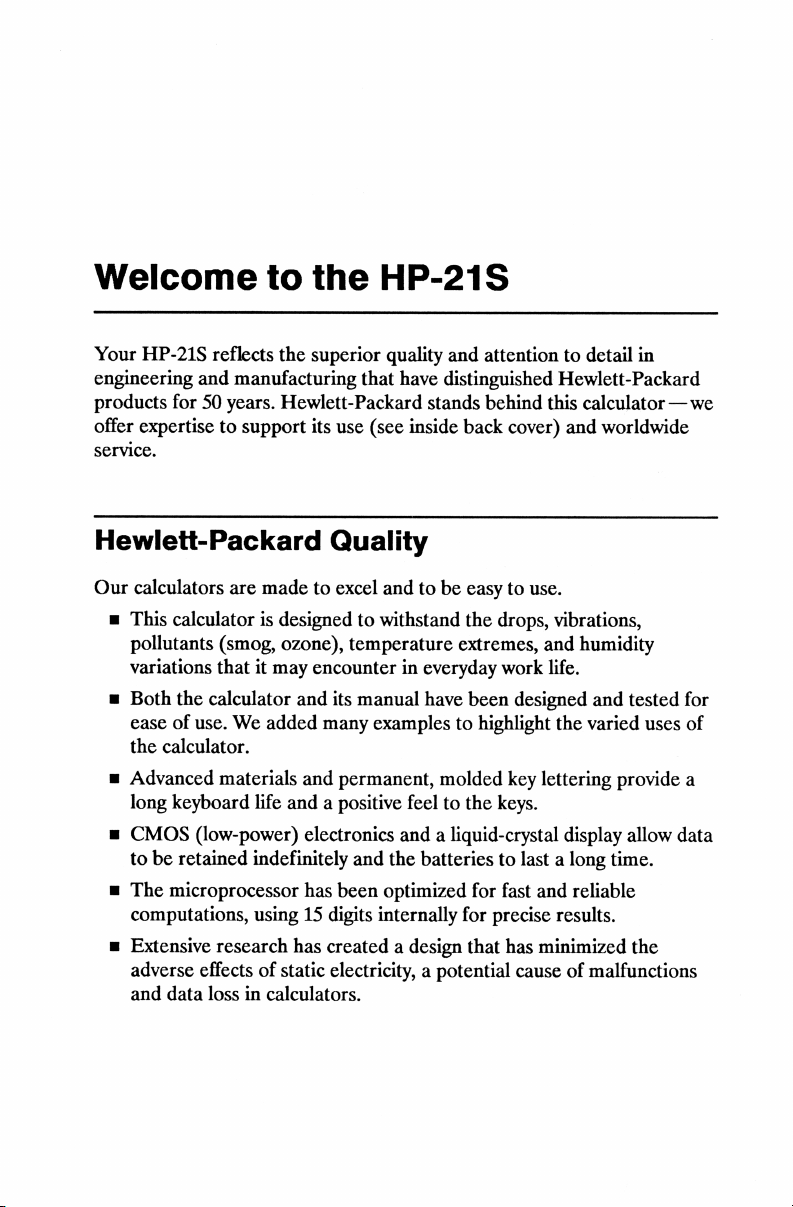
Welcome
Your
HP-21S
engineering
products
offer
service.
and
for50years.
expertisetosupport
to
reflects
the
manufacturing
Hewlett-Packard
Hewlett-Packard
Our
calculators
This
pollutants
variations
Both
caseofuse.Weadded
the
calculator.
Advanced
long
CMOS
toberetained
The
microprocessor
computations,
Extensive
adverse
and
data
are
madetoexcel
calculatorisdesignedtowithstand
(smog,
thatitmay
the
calculator
materials
keyboard
(low-power)
research
effectsofstatic
lossincalculators.
ozone),
life
indefinitely
using15digits
the
superior
its
that
use
HP-21S
quality
have
stands
(see
inside
Quality
andtobe
temperature
encounterineveryday
and
its
manual
many
and
permanent,
andapositive
electronics
and
has
been
has
createdadesign
electricity,apotential
have
examplestohighlight
feeltothe
andaliquid-crystal
the
batteriestolast
optimized
internally
and
attentiontodetail
distinguished
behind
back
easytouse.
the
extremes,
been
molded
for
for
that
this
cover)
drops,
and
work
life.
designed
key
lettering
keys.
fast
and
precise
has
minimized
causeofmalfunctions
in
Hewlett-Packard
calculator
and
worldwide
vibrations,
humidity
and
the
varied
display
a long
reliable
results.
tested
uses
provide
allow
time.
the
—we
for
of
a
data
Page 10
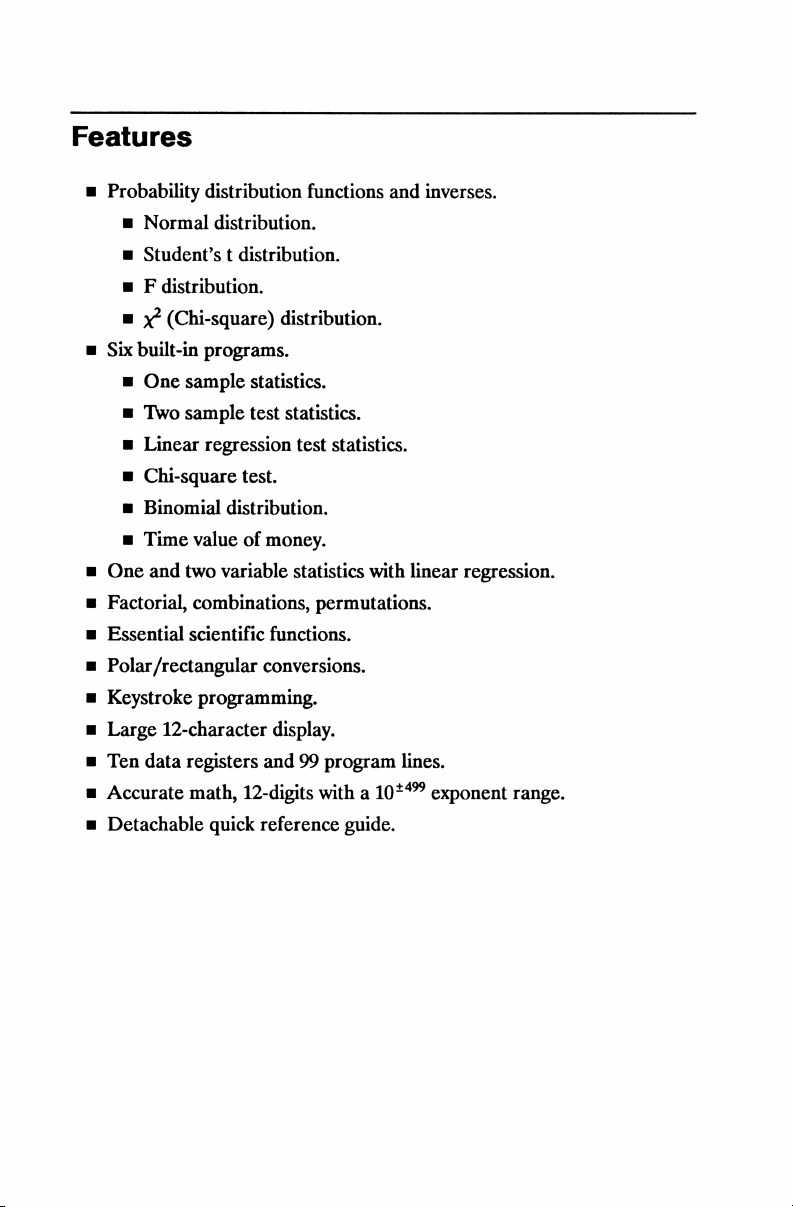
Features
Probability
m
Normal
m
Student’stdistribution.
distribution
distribution.
mFdistribution.
m)?(Chi-square)
Six
built-in
m
Two
m
Linear
m
m
Binomial
m
Time
One
Factorial,
Essential
Polar
Keystroke
Large
Ten
Accurate
Detachable
programs.
One
sample
sample
regression
Chi-square
distribution.
valueofmoney.
and
two
variable
combinations,
scientific
/rectangular
programming,.
12-character
data
registers
math,
quick
statistics.
test
statistics.
test.
functions.
conversions.
display.
and99program
12-digits
reference
functions
and
distribution.
test
statistics.
statistics
with
permutations.
lines.
witha1
0:499
guide.
inverses.
linear
regression.
exponent
range.
Page 11
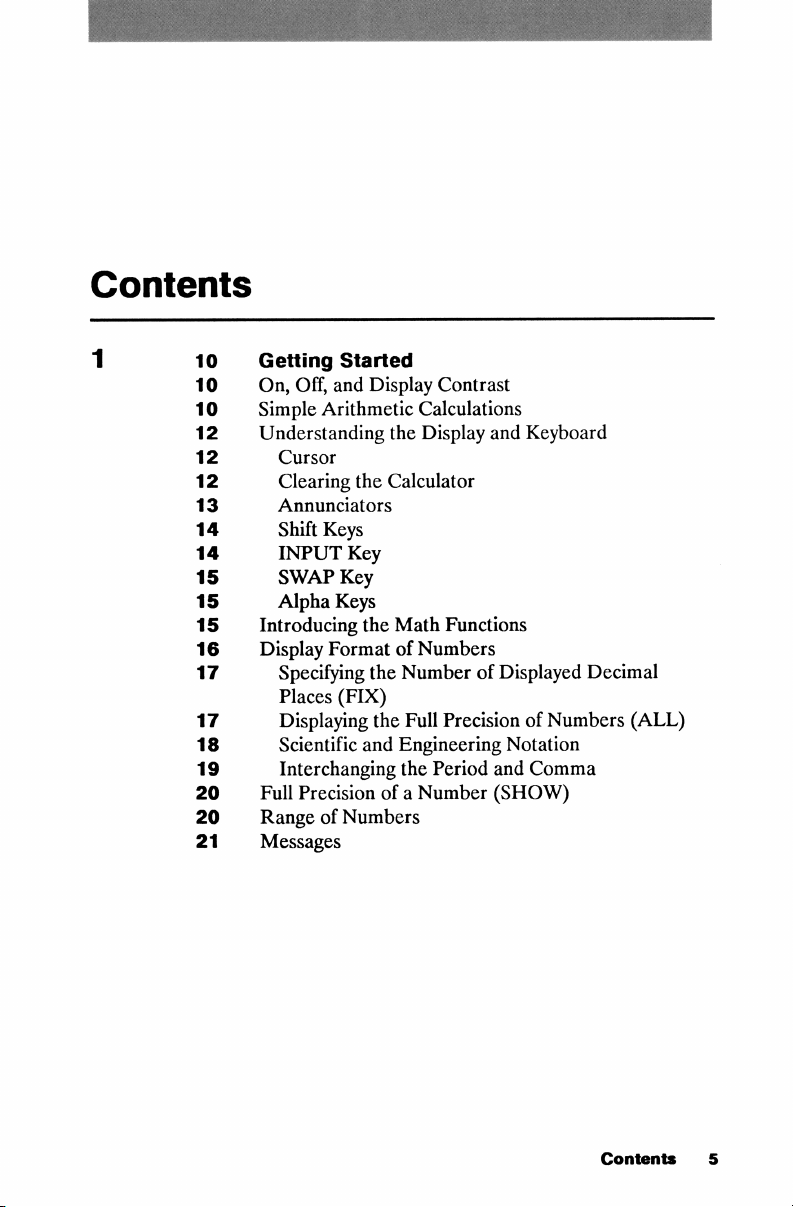
Contents
1
10
10
10
12
12
12
13
14
14
15
15
15
16
17
17
18
19
20
20
21
Getting
On,
Simple
Understanding
Cursor
Clearing
Annunciators
Shift
INPUT
SWAP
Alpha
Introducing
Display
Specifying
Places
Displaying
Scientific
Interchanging
Full
RangeofNumbers
Messages
Started
Off,
and
Display
Arithmetic
the
the Calculator
Keys
Key
Key
Keys
the
FormatofNumbers
the
(FIX)
the
and
Precisionofa
Contrast
Calculations
Display
Math
NumberofDisplayed
Full
Engineering
the
Number
and
Keyboard
Functions
PrecisionofNumbers
Notation
Period
and
Comma
(SHOW)
Decimal
(ALL)
Contents
5
Page 12
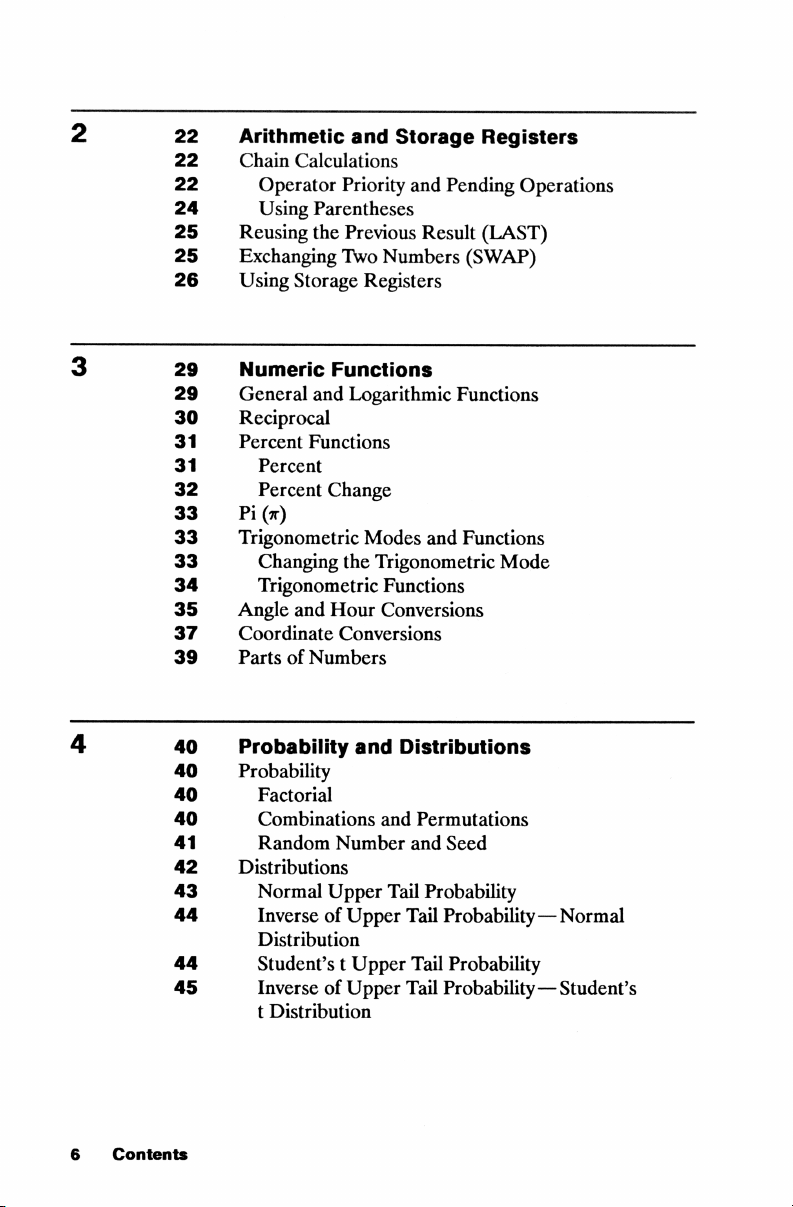
2
3
22
22
22
24
25
25
26
29
29
30
31
31
32
33
33
33
34
35
37
39
Arithmetic
Chain
Operator
Using
Reusing
Exchanging
Using
Numeric
General
Reciprocal
Percent
Percent
Percent
Pi
(7)
Trigonometric
Changing
Trigonometric
Angle
Coordinate
PartsofNumbers
and
Calculations
Priority
Parentheses
the
Previous
Two
Storage
Functions
and
Logarithmic
Functions
Change
the
and
Hour
Conversions
Storage
and
Pending
Result
Numbers
Registers
Modes
Trigonometric
Functions
Conversions
(SWAP)
Functions
and
Functions
Registers
Operations
(LAST)
Mode
4
6
Contents
40
40
40
40
41
42
43
44
44
45
Probability
Probability
Factorial
Combinations
Random
Distributions
Normal
InverseofUpper
Distribution
Student’stUpper
InverseofUpper
t
Distribution
Number
Upper
and
Distributions
and
Permutations
and
Seed
Tail
Probability
Tail
Probability—Normal
Tail
Probability
Tail
Probability—
Student’s
Page 13
46
47
48
49
50
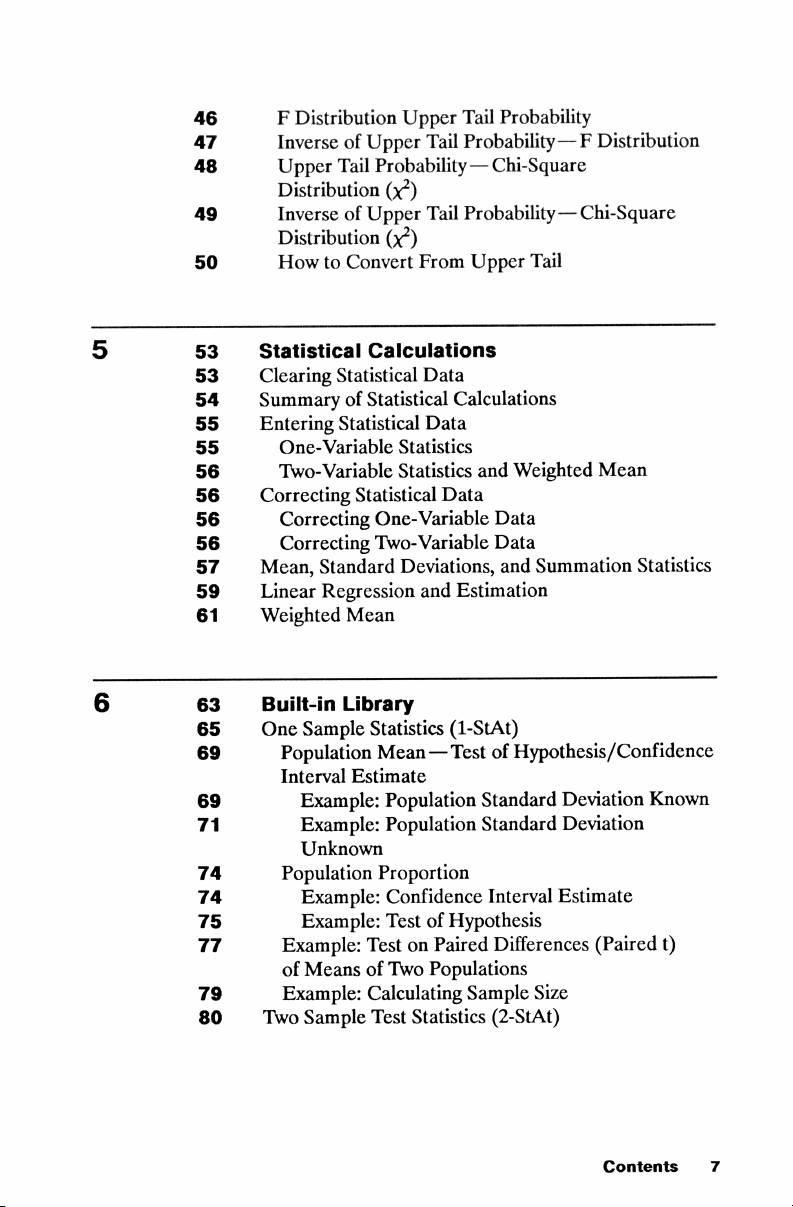
53
53
54
55
55
56
56
56
56
57
59
61
63
65
69
69
71
F
Distribution
InverseofUpper
Upper
Tail
Distribution
InverseofUpper
Distribution
HowtoConvert
Statistical
Clearing
SummaryofStatistical
Entering
Correcting
Mean,
Linear
Weighted
Built-in
One
Statistical
Statistical
One-Variable
Two-Variable
Correcting
Correcting
Standard
Regression
Sample
Population
Interval
Example:
Example:
Upper
Tail
Probability—Chi-Square
(x?)
Tail
(x?)
From
Calculations
Data
Calculations
Data
Statistics
Statistics
Statistical
One-Variable
Two-Variable
Mean
Library
Statistics
Mean—TestofHypothesis/Confidence
Estimate
Data
Deviations,
and
Estimation
(1-StAt)
Population
Population
Tail
Probability
Probability—F
Distribution
Probability—Chi-Square
Upper
Tail
and
Weighted
Mean
Data
Data
and
Summation
Standard
Standard
Deviation
Deviation
Statistics
Known
Unknown
74
74
75
77
79
80
Population
Example:
Example:
Example:
of
MeansofTwo
Example:
Two
Sample
Proportion
Confidence
Interval
TestofHypothesis
TestonPaired
Differences
Populations
Calculating
Test
Sample
Statistics
(2-StAt)
Estimate
Size
(Paired
t)
Contents
7
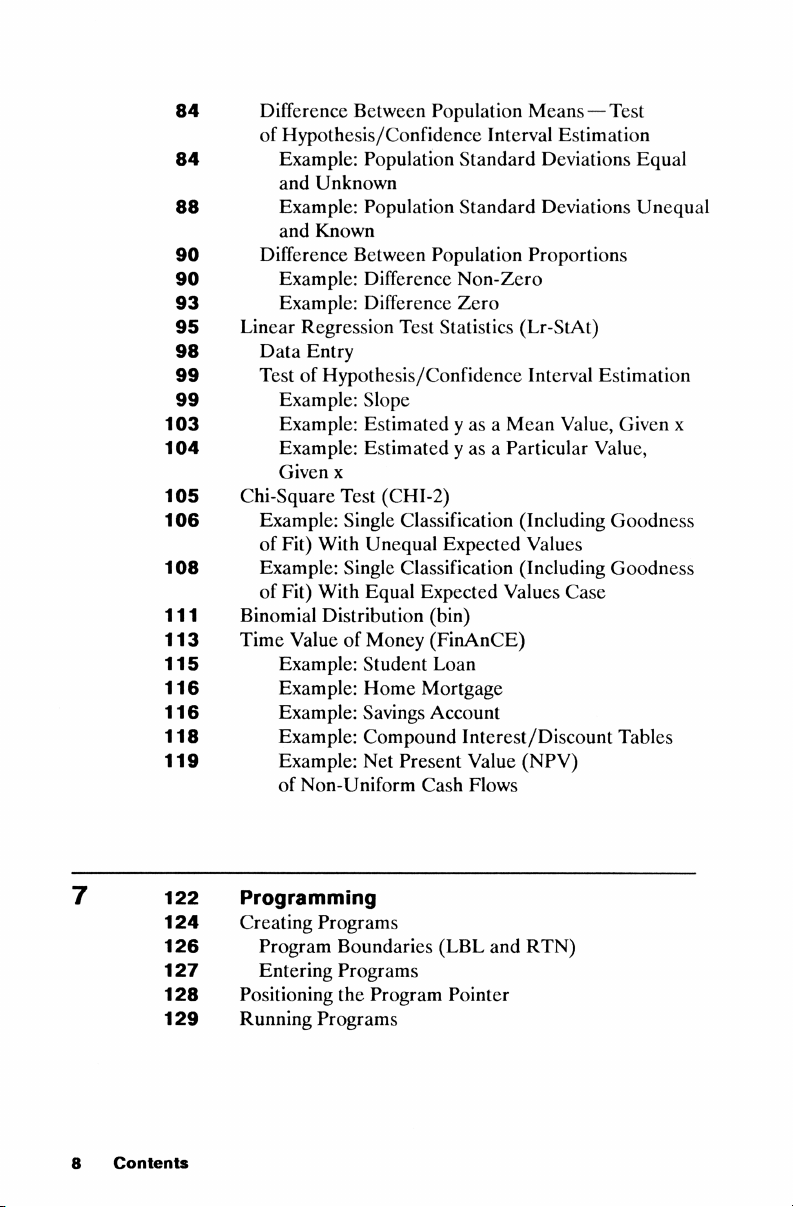
Page 14
84
84
88
90
90
93
95
98
99
99
103
104
105
106
108
111
113
115
116
116
118
119
Difference
of
Hypothesis/Confidence
Example:
and
Example:
and
Difference
Example:
Example:
Linear
Data
Between
Population
Unknown
Population
Known
Between
Difference
Difference
Regression
Entry
Population
Population
Test
Statistics
Standard
Standard
Non-Zero
Zero
TestofHypothesis/Confidence
Example:
Example:
Example:
Given
Chi-Square
Example:
of
Fit)
Example:
of
Fit)
Binomial
Time
ValueofMoney
Example:
Example:
Example:
Example:
Example:
of
Non-Uniform
Slope
EstimatedyasaMean
EstimatedyasaParticular
x
Test
(CHI-2)
Single
Classification
With
Unequal
Single
With
Equal
Distribution
Expected
Classification
Expected
(bin)
(FinAnCE)
Student
Home
Savings
Compound
Net
Loan
Mortgage
Account
Present
Cash
Interest/Discount
Value
Flows
Means—Test
Interval
Deviations
Deviations
Proportions
(Lr-StAt)
Interval
(Including
Values
(Including
Values
(NPV)
Estimation
Equal
Unequal
Estimation
Value,
Given
Value,
Goodness
Goodness
Case
Tables
x
7
8
Contents
122
124
126
127
128
129
Programming
Creating
Positioning
Running
Programs
Program
Entering
Programs
Boundaries
Programs
the
Program
(LBL
Pointer
and
RTN)
Page 15
129
130
130
131
131
132
133
134
138
138
139
141 Sample
143
143
144
144
144
145
145
146
147
148
149
151
Starting
Starting
Stopping
Clearing
Editing
Stepping
Sample
Programs
Programs
Programs
Programs
Programs
Through
Program:
Subroutines
Branching
Branching
Conditional
and
Conditionals
(GTO)
Instructions—Decisions
Program:
Data
Available
Program
Nonprogrammable
Support,
Calculator
Batteries,
Support
AnswerstoCommon
Environmental
Changing
Testing
The
Limited
If
Calculator
Self-Test
One-Year
the
Calculator
Regulatory
Limits
the
Batteries
Information
With
XEQ
With
GTO
Programs
Pythagorean
Standard
DeviationofGrouped
Memory
Functions
and
Questions
Operation
Warranty
Requires
Service
and
Theorem
Service
R/S
and
Control
152
154
Messages
Index
Contents
9
Page 16
Getting
On,
Off,
Started
and
Display
Contrast
|
Since
the
information
itself
off
three
battery
possible
To
change
Simple
|
To
turnonyour
turn
the
()
(GFF)).
the
calculator
you’ve
approximately10minutes
alkaline
symbol
(page
the
batteries
(==1)inthe
145).
display
Arithmetic
||Ifyou
makeatyping
(¢]toerase
HP-21S,
calculator
has
continuous
stored.Toconserve
last
contrast,
off,
after
approximately
display,
hold
Calculations
mistake
the
incorrect
press
press
[®],
memory,
you
replace
down
digits.
(also
labeled
then
turningitoff
energy,
one
while
the
stop
using
year.Ifyou
the
batteriesassoon
and
press
enteringanumber,
“ON”).
(written
calculator
it.
as
does
not
The
calculator’s
see
the
or
[].
To
affect
turns
low-
as
press
10
1:
Getting
Started
Page 17
Arithmetic
arithmetic
press
more
ignored
except
Operators.
operators
than
one
the
last
The
(4],
(=],
(x],
operator,
one.
following
(2],
and
for
example
examples
(¥*]
demonstrate
(exponentiation).Ifyou
(5]
(x]
(#],
all
using
are
the
Keys:
24.715
Afteracalculation
number
19
[x]
The
4.7
To
continueanoperation
1156.5
=
You
6.9
x5.35=+0.918:
6.9
918
62.471
key
startsanew
12.68
(=]
[y*]
keyisthe
3=
candochain
(x]
5.35
(3]
(=]
=)
exponentiation
calculations
Display:
87.1860
has
been
calculation:
240.9200
103.8230
1155
219.3230
36.9150
40.2124
completed
(chain
without
(by
pressing
operator:
calculation),
pressanoperator
using
(=]
Description:
Adds
24.715
and
62.471.
[=]),
pressing
Calculates19x
Calculates
Continues
Completes
a
12.68.
4.7°.
key.
calculation.
calculation
47+1155.
after
each
step.
Calculate
Pressing
intermediate
(resultof6.9x5.35).
Completes
(5]
displays
answer
calculation.
of
Chain
calculations
operatorsinthe
4[+]9(x
3
(=)
are
interpreted
expression.
9.0000
31.0000
accordingtothe
Calculate4+(9x
priority
3):
Delays
higher
of the
addition
priority
Calculates4+(9x
1:
Getting
Started
([x]
than
has
[+]).
3).
11
Page 18
Negative
Calculate
Numbers.
-75
<+ 3.
Enter
the
number
and
press
[*/5].
Keys:
75
]3(5]
Calculate
411
(=)
0.4—e11,
Understanding
Cursor
The
cursor
(_)isvisible
Clearing
|
the
Calculator
Clearing
the
last
its
contents
Display:
-75_
-25.0000
-1.1_
0.3329
0.0671
the
digit
and
the
when
Display.
you
cancels
Display
you
are
entered.
the
Description:
Changes
Calculates
Calculatese11,
Completes
and
enteringanumber.
When
Otherwise,
calculation.
Keyboard
the
cursorison,
[¢]
clears
signof75.
result.
calculation.
[¢]
erases
the
display
of
While
you
are
enteringanumber,
zero.
Otherwise,
cancels
Clearing
HP-218Sisdisplayinganerror
restores
12
1:
the
Getting
Messages.
original
the
current
[¢]
contentsofthe
Started
clears
calculation.
and
also
message,
display.
pressing
the
displayofits
clear
messages.
[¢]
or
clears
clearsitto
contents
When
the
message
and
the
and
Page 19
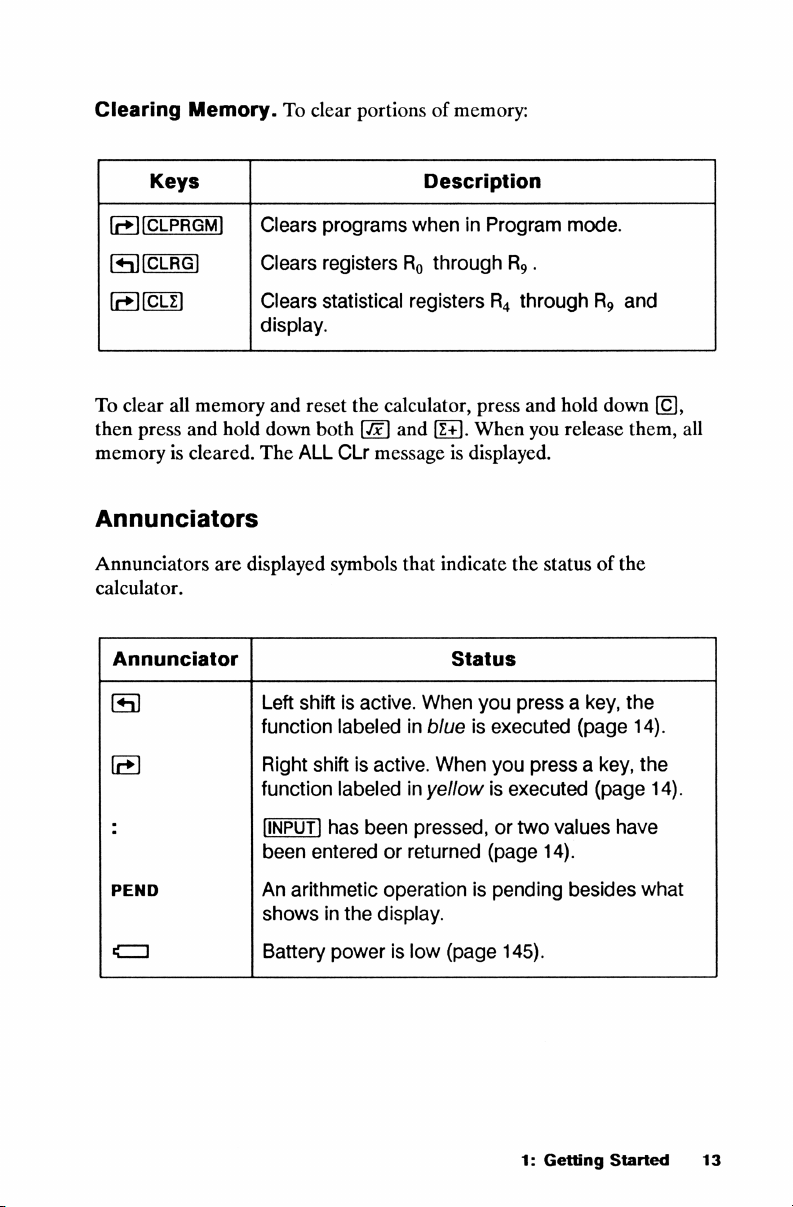
Clearing
Keys
()(CLPRGM]
Memory.
To
Clears
clear
portionsofmemory:
programs
wheninProgram
Description
mode.
(«1)(CLRG]
(]
To
clear
all
then
press
and
memoryiscleared.
Annunciators
Annunciators
calculator.
Annunciator
(¢
()
memory
hold
are
displayed
Clears
Clears
display.
The
Left
function
Right
function
been
registersR,throughR,.
statistical
and
reset
the
down
both
ALL
CLr
symbols
shiftisactive.
labeledinblueisexecuted
shiftisactive.
labeledinyellowisexecuted
has
been
enteredorreturned
registersR,throughR,and
calculator,
and
messageisdisplayed.
that
pressed,ortwo
[Z+].
indicate
Status
When
When
press
When
the
you
pressakey,
you
(page
and
hold
you
release
statusofthe
pressakey,
values
14).
down
(page
(page
them,
the
14).
have
[C],
all
the
14).
PEND
]
An
arithmetic
showsinthe
Battery
powerislow
operationispending
display.
(page
145).
1:
besides
Getting
what
Started
13
Page 20
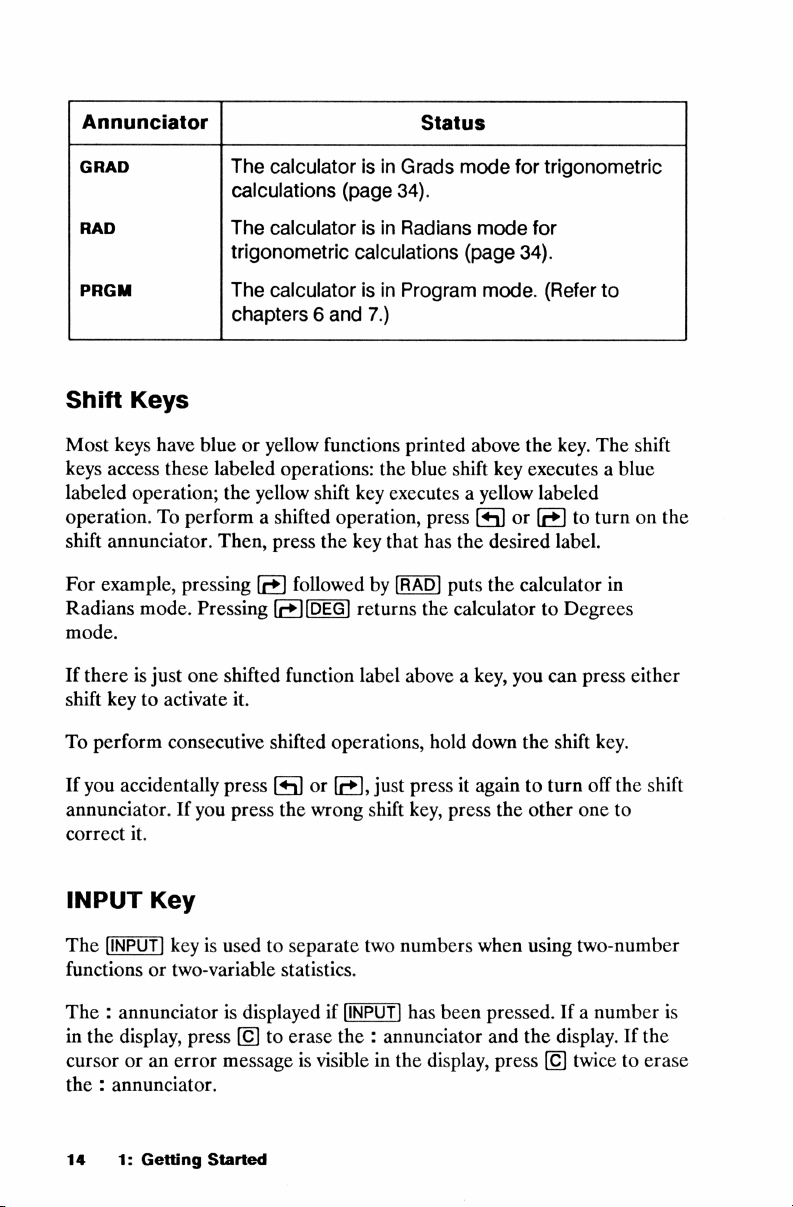
Annunciator
GRAD
The
calculatorisin
calculations
(page
Status
Grads
34).
mode
for
trigonometric
RAD
PRGM
Shift
Most
keys
labeled
Keys
keys
access
have
these
operation;
The
calculatorisin
trigonometric
The
calculatorisin
chapters6and
blueoryellow
labeled
the
yellow
operations:
functions
shift
operation.Toperformashifted
shift
annunciator.
For
example,
Radians
mode.
If
shift
To
If
annunciator.Ifyou
correct
mode.
thereisjust
keytoactivate
perform
you
accidentally
it.
Then,
press
the
pressing(]followed
Pressing
one
consecutive
[®](DEG]
shifted
it.
shifted
press
[€]or(],
press
function
the
wrong
operations,
Radians
calculations
Program
7.)
printed
the
blue
key
executesayellow
operation,
key
returns
label
press
that
has
by
the
aboveakey,
just
pressitagaintoturn
shift
key,
mode
for
(page
34).
mode.
above
shift
(Refer
the
key.
key
executesablue
labeled
(€]or[®]toturnonthe
the
desired
puts
the
calculatortoDegrees
hold
down
press
label.
calculator
you
can
the
shift
the
other
press
off
one
to
The
in
key.
the
to
shift
either
shift
INPUT
The
functionsortwo-variable
The:annunciatorisdisplayed
in
the
cursororan
the:annunciator.
14
Key
(INPUT]
keyisusedtoseparate
display,
1:
error
Getting
press
messageisvisibleinthe
Started
statistics.
to
erase
two
numbers
if
the:annunciator
has
been
display,
when
using
two-number
pressed.Ifa
and
the
press twicetoerase
number
display.Ifthe
is
Page 21
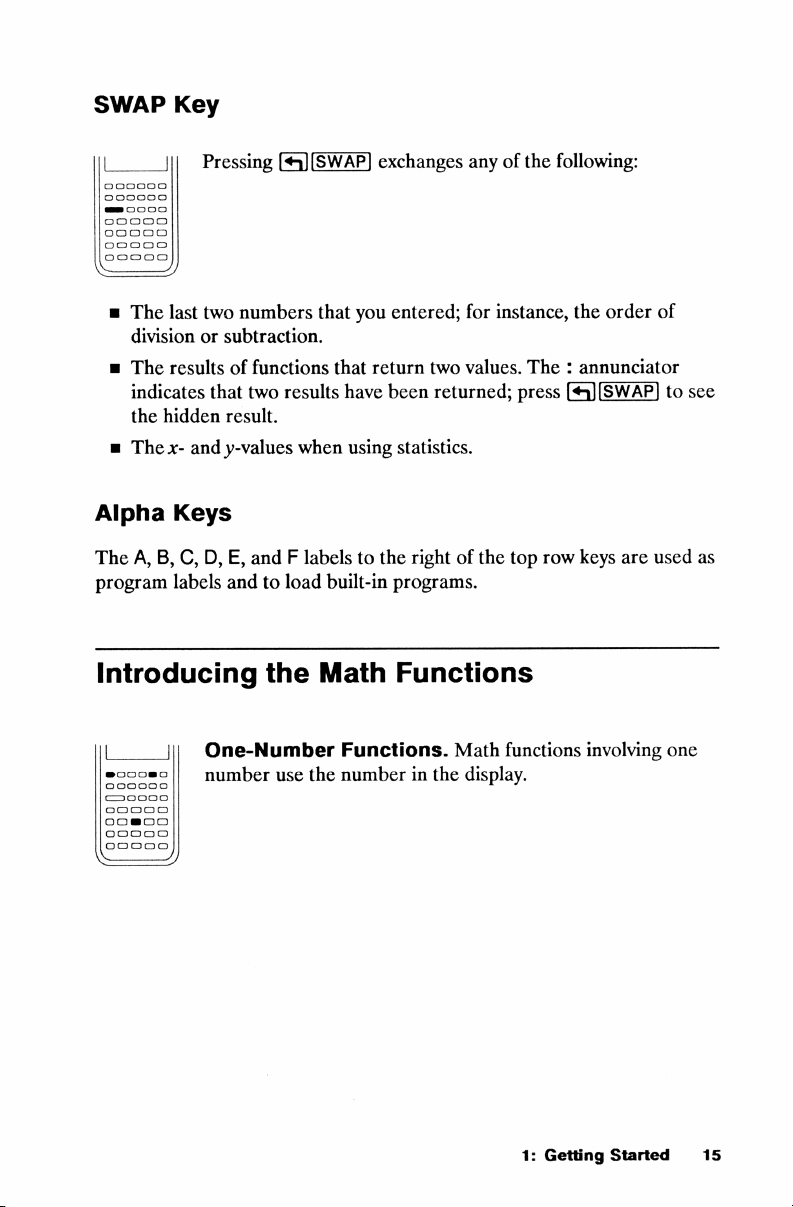
SWAP
Key
m
The
divisionorsubtraction.
m
The
indicates
the
m
Thex-and
Alpha
TheA,B,C,D,E,andFlabelstothe
program
Pressing
last
two
resultsoffunctions
that
hidden
Keys
labels
Introducing the
(4q)(SWAP]
numbers
two
results
result.
y-values
andtoload
when
that
you
that
return
have
using
built-in
Math
exchanges
anyofthe
entered;
been
statistics.
programs.
for
two
values.
returned;
rightofthe
Functions
following:
instance,
top
the
The:annunciator
press
(€)[SWAP]tosee
row
keys
order
are
of
used
as
L
One-Number
number
use
Functions.
the
numberinthe
Math
functions
display.
1:
Getting
involving
Started
one
15
Page 22
Keys:
Display:
Description:
89.25
3.57
(=)
2.36
Two-Number
numbers
evaluates
are
the
keystrokes
Keys:
Functions.
entered
current
calculate
9.4472
0.4237
3.9937
like
expression
the
Display:
17
29 29
(]
If
you
enter
pressing
number,
calculator
Display
numberl,
[INPUT],
press
uses
the
(INPUT],
the
Format
70.5882
then
calculator
and
same
Calculatesv89.25.
1/2.36iscalculated
Adds
Whenafunction
this:
numberl
and
percent
change
displays:.For
requires
number2.
between17and
Description:
17.0000
Enters
:
Enters
Calculates
change.
pressatwo-number
function
suppliesazeroasnumber2.Ifyou
then
pressatwo-number
number
of
for
both
Numbers
numberl
3.57
and
two
numbers,
Pressing
example,
29:
numberl,
annunciator.
number?2.
percent
key
without
function
and
number?2.
1/2.36.
the
following
displays
enter
key,
first.
the
a
the
When
you
turnonthe
with
four
decimal
format
controls
Regardlessofthe
signed,
pressing
the
calculationisa
12-digit
[€][x]inFIX4(four
numberisstoredas3.14159265359x10%%°.Ifthe
number
displayedinthe
to
fit,
but12digit
16
1:
Getting
HP-218S
for
the
places
andaperiodasthe
how
many
digits
appearinthe
current
mantissa
display
format,
withasigned,
decimal
current
containing
display
more
format,
precisionismaintained
Started
first
time,
each
three-digit
places)
significant
the displayed
internally.
numbers
decimal
are
point.
The
display.
numberisstoredasa
exponent.
displays
For
3.1416.
resultofa
digits
than
numberisrounded
displayed
display
example,
Internally,
can
be
Page 23
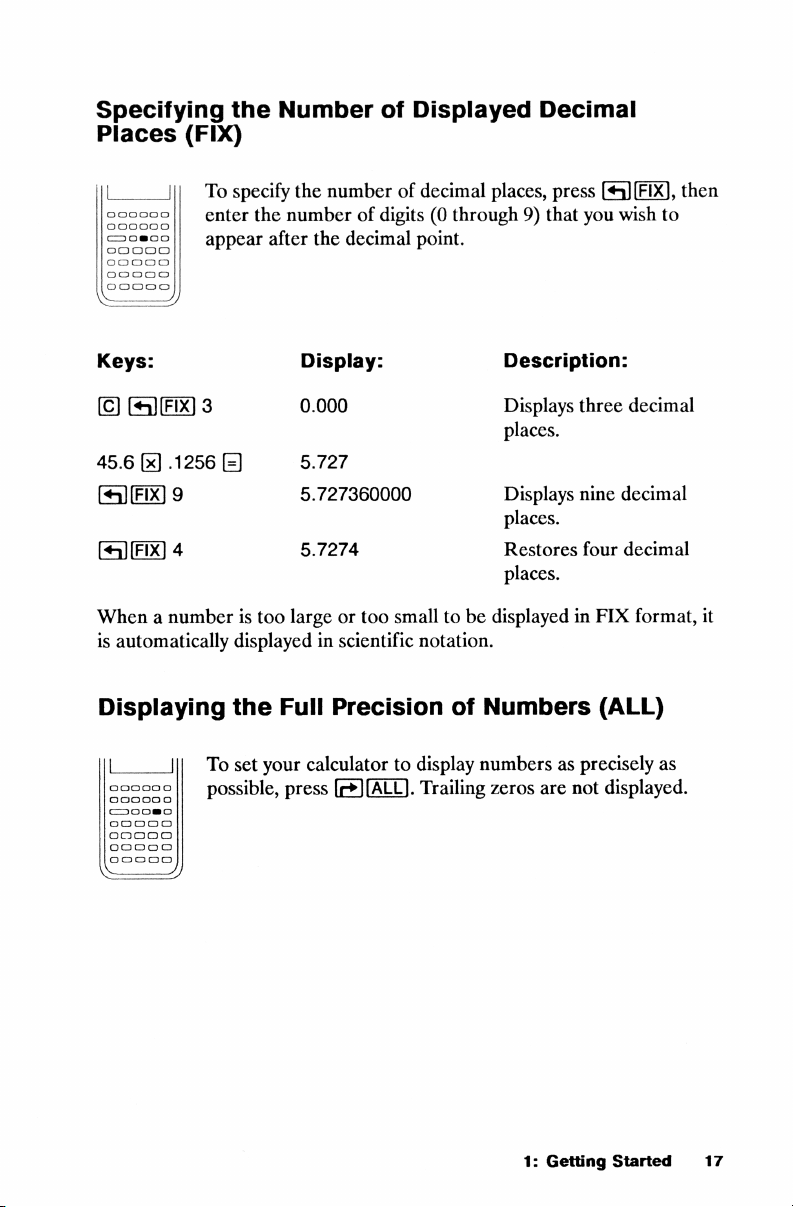
Specifying
Places
(FIX)
To
enter
the
specify
the
appear
Number
the
of
Displayed
numberofdecimal
places,
numberofdigits(0through9)that
after
the
decimal
point.
Decimal
press(][FIX],
you
wish
then
to
Keys:
(«a](FIX]
45.6
[x]
(QJ[FIX]
(«)([FIX]
.1256
9
4
3
(=]
Whenanumberistoo
is
automatically
Displaying
L
oooocoo
oooooo
cCDOooOosOo
ooooo
ococoao
ooooo
oocoOoo
displayedinscientific
the
To
set
your
possible,
Display:
0.000
5.727
5.727360000
5.7274
largeortoo
Full
Precision
smalltobe
calculatortodisplay
press
[®][ALL].
displayedinFIX
notation.
of
Numbers
numbersasprecisely
Trailing
zeros
Description:
Displays
three
places.
Displays
places.
Restores
places.
nine
four
(ALL)
are
not
displayed.
decimal
decimal
decimal
format,
as
it
1:
Getting
Started
17
Page 24
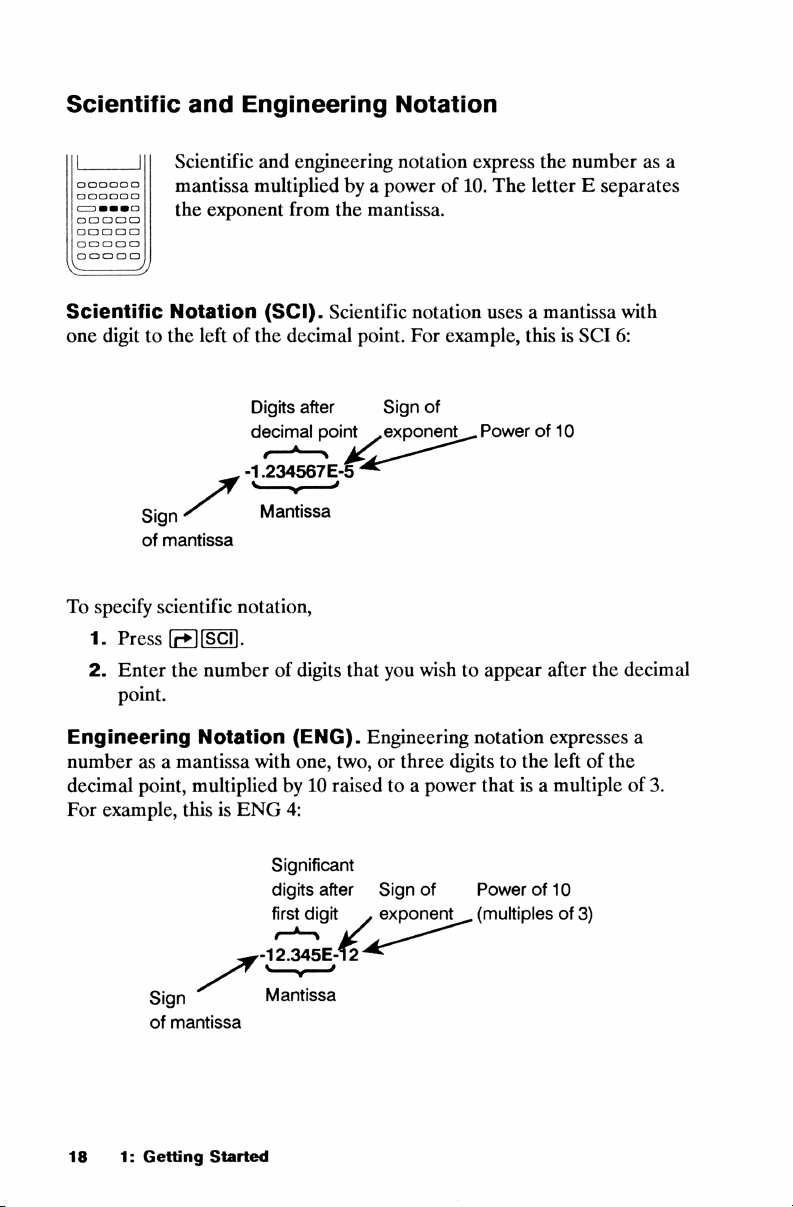
Scientific
and
Engineering
Notation
Sign
of
scientific
Press
Enter
point.
point,
Scientific
mantissa
the
exponent
Notation
leftofthe
mantissa
[*][SCI).
the
numberofdigits
Notation
mantissa
multipliedby10
thisisENG
Scientific
one
digittothe
To
specify
1.
2.
Engineering
numberasa
decimal
For
example,
and
engineering
multipliedbya
from
(SCI).
Digits
decimal
-1.234567
W
Mantissa
notation,
with
Scientific
decimal
after
point
E-S/
(ENG).
one,
4:
notation
powerof10.
the
mantissa.
notation
point.
For
Sign
of
_exponent__
that
you
wishtoappear
Engineering
two,orthree
raisedtoa
power
express
The
usesamantissa
example,
digitstothe
thisisSCI
Powerof10
notation
thatisa
the
numberasa
letterEseparates
with
6:
after
the
decimal
expresses
leftofthe
multipleof3.
a
Significant
digits after
first
digit
el
-12.345E-12
——
Sign
of
mantissa
18
1:
Getting
Mantissa
Started
Sign
of
exponent
Powerof10
(multiplesof3)
Page 25
To
1.
2.
specify
Press
Enter
the
engineering
[¢q])(ENG].
the
first
digit.
notation,
numberofsignificant
digits
that
you
wishtoappear
after
Entering
display
an
exponent:
1.
2.
3.Ifthe
4.
Calculate
Keys:
4.78
8
[\])(E)25[5)
Calculate
2.36
+A-)(x]
Numbers
format,
Enter
the
Press
Enter
[¥)(E]13[
[*/=)[q](E]
you
the
mantissa.Ifthe
sign.
[¢q](E]tostart
exponentisnegative,
the
4.78x10¹³+8x10%.
—2.36x1075x12.
12(=)
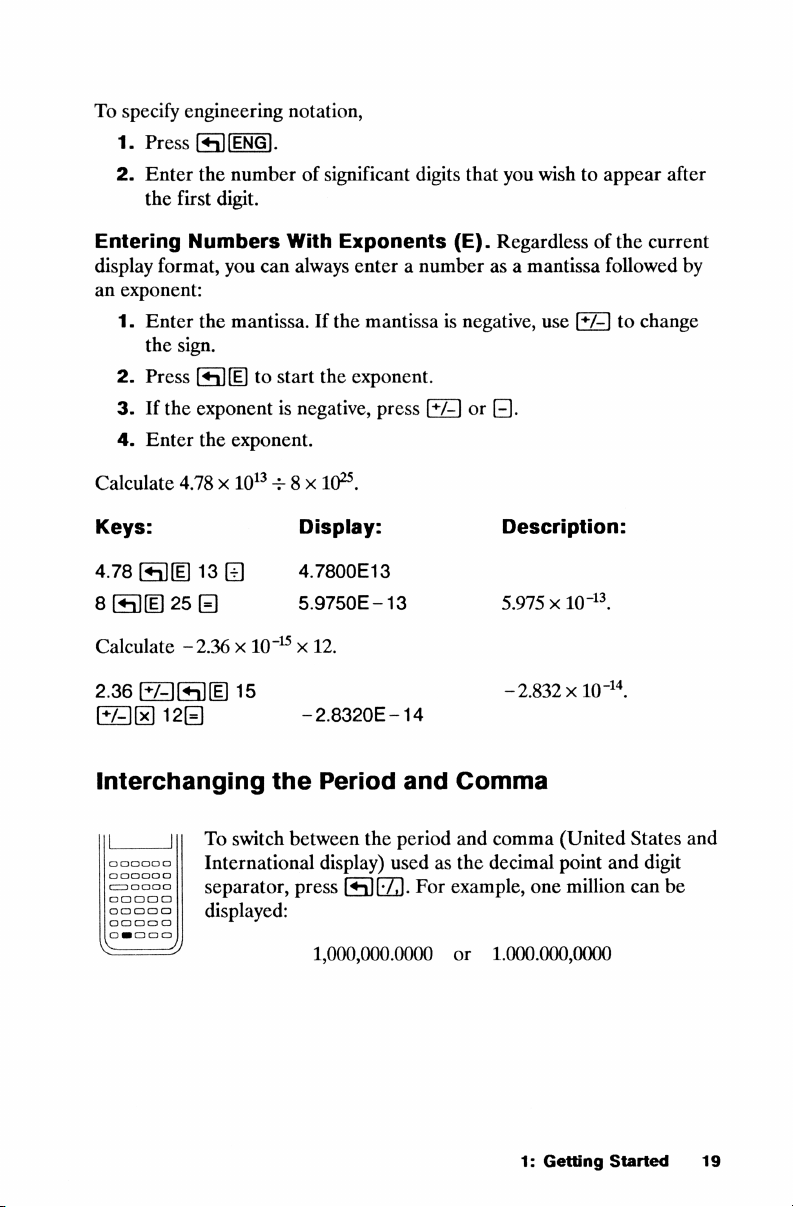
Interchanging
With
can
always
exponent.
Display:
4.7800E13
5.9750E-13
15
-2.8320E-14
the
Exponents
enter a
the
exponent.
Period
numberasa
mantissaisnegative,
press
and
(E).
Regardlessofthe
mantissa
use
or
().
Description:
5975x10713,
-2.832x
Comma
followed
to
1074,
current
by
change
To
L
switch
International
separator,
displayed:
between
press
the
display)
(9][-/,).
1,000,000.0000
period
and
usedasthe
For
example,
or
comma
decimal
1.000.000,0000
one
1:
(United
point
million
Getting
States
and
digit
can
Started
and
be
19
Page 26
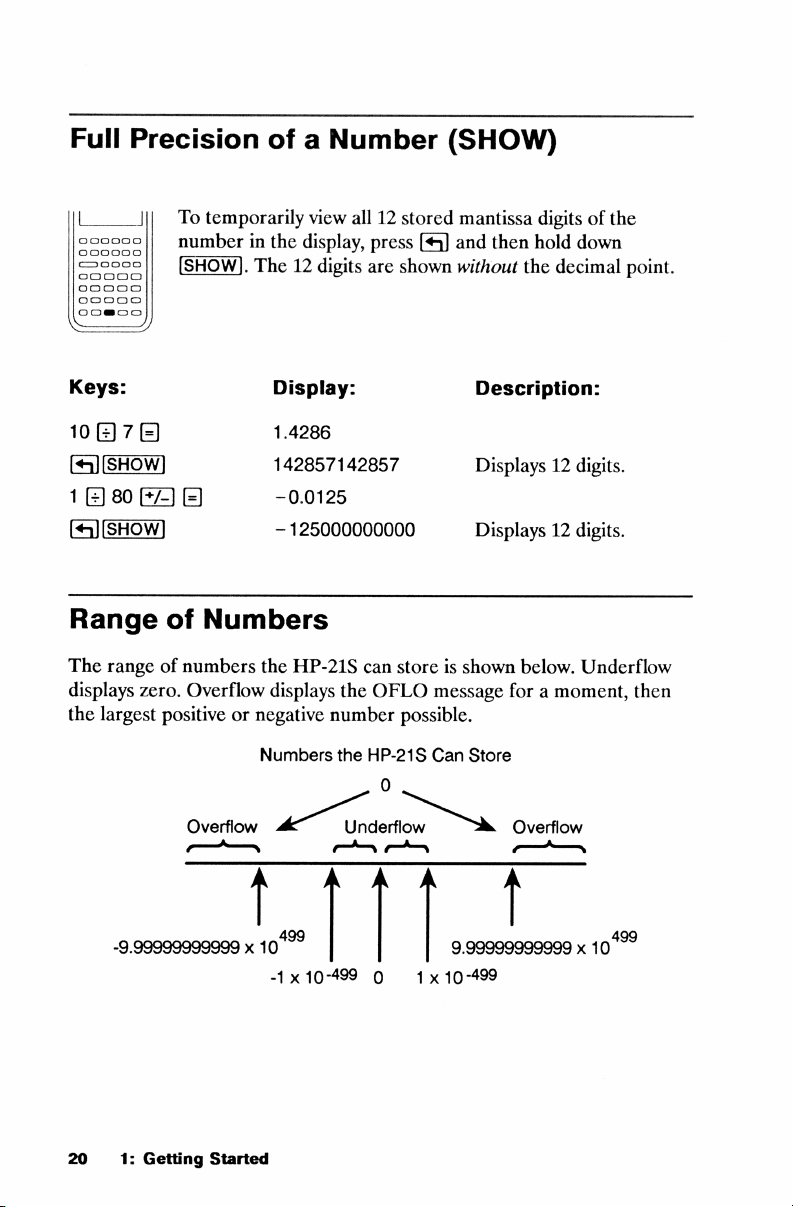
Full
Precision
To
temporarily
numberinthe
(SHOW].
ofaNumber (SHOW)
view
all12stored
display,
The12digits
press
are
(€]
shown
mantissa
and
without
then
the
digitsofthe
hold
down
decimal
point.
Keys:
107
(«q)(SHOW
1
(2]80(/]
(«1)(SHOW
Range
The
rangeofnumbers
displays
the
largest
(=]
of
Numbers
zero.
Overflow
positiveornegative
Overflow
P,
-9.99999999999x10°%°
Display:
1.4286
142857142857
-0.0125
-125000000000
the
HP-21S
displays
Numbers
/Underflow\
-1x10499
the
number
the
~A—
can
storeisshown
OFLO
possible.
HP-21S
0
—r—
0
1x10-499
Description:
Displays12digits.
Displays12digits.
below.
Underflow
message
Can
foramoment,
Store
Overflow
—
9.99999999999x10°°°
then
20
1:
Getting
Started
Page 27

Messages
The
HP-21S
informs
from
and
the
their
youifyou
display,
meanings.
displays
messages
attemptanincorrect
press
or
about
the
[¢].
Refertopage
statusofthe
calculator
or
operation.Toclearamessage
152
foralistofmessages
1:
Getting
Started
21
Page 28
2
Arithmetic
Chain
Chain
each
operator
Keys:
750
360
Operator
Some
example,9+12=+3has
Calculations
calculationsdoa
operation.
priority
[x]12(2]
(=]
The
described
Priority
chain
calculations
HP-21S
and
sequenceofoperations
Display:
9,000.0000
25.0000
and
mightbeinterpreted
two
Storage
interprets
below.
Pending
interpretations:
9+
12
expressions
Calculate
or
9+—1:;2—
750x12+360.
Operations
Registers
without
Calculates
value.
is
Completes
calculation.
annunciatorisoff.
several
pressing
using
the
Description:
intermediate
PEND
on.
the
PEND
different
[=]
after
system
annunciator
ways.
of
For
22
2:
Arithmetic
and
Storage
Registers
Page 29
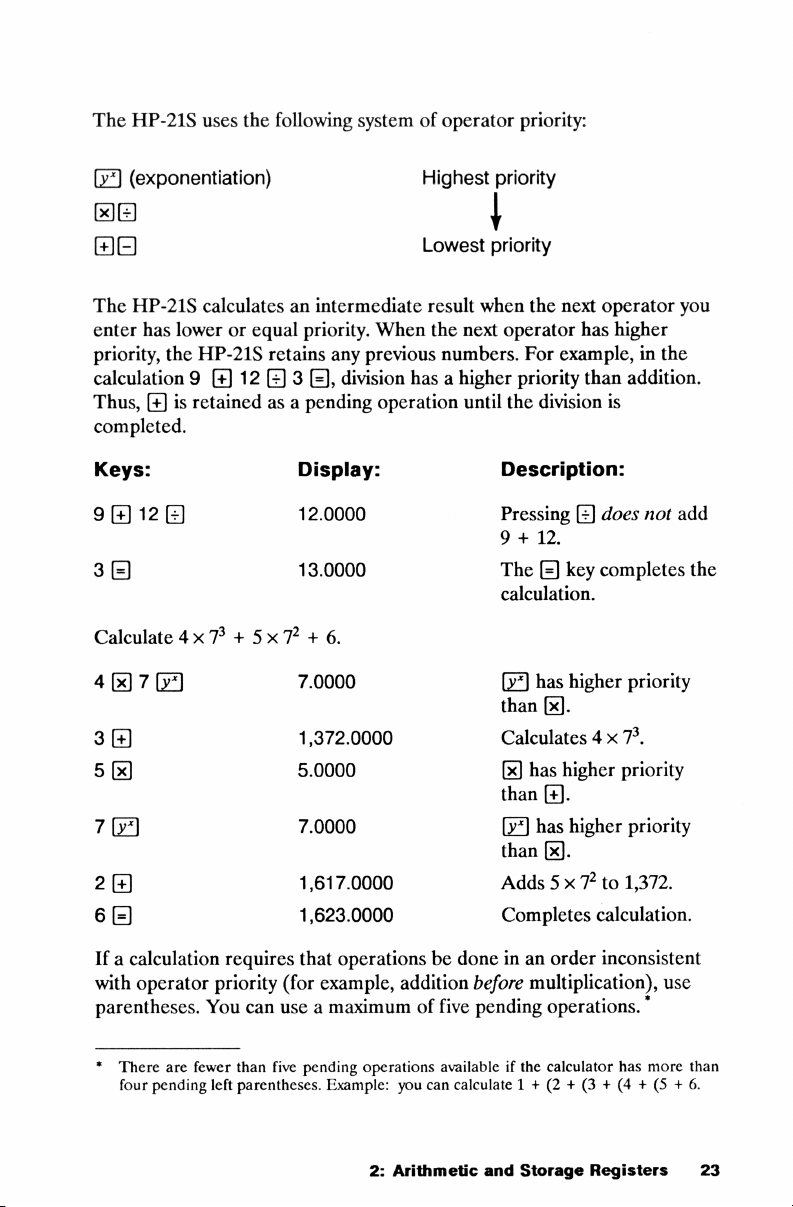
The
HP-21S
(»*]
(exponentiation)
uses
the
following
systemofoperator
Highest
priority
priority:
Ble
(=]
The
HP-21S
enter
has
priority,
calculation912
Thus,
[+]isretainedasa
completed.
Keys:
9+
12
3
(=)
Calculate4x72+5%7%+
4(x]7
3
5
[x]
7
)
2
6
(=)
calculatesanintermediate
lowerorequal
the
HP-21S
retains
(5]3(=],
(5]
priority.
any
When
previous
division
pending
operation
Display:
12.0000
13.0000
6.
7.0000
1,372.0000
5.0000
7.0000
1,617.0000
1,623.0000
|
Lowest
result
hasahigher
when
the
next
numbers.
until
priority
Description:
Pressing
9+12.
The
calculation.
[»*]
than
Calculates4x
(x]
than
than
Adds
Completes
the
next
operator
For
example,inthe
priority
the
division
(=]
key
has
higher
[x].
has
higher
[+].
has
higher
[x].
5x7%to
operator
has
higher
than
addition.
is
(3]
does
not
completes
priority
7.
priority
priority
1,372.
calculation.
you
add
the
Ifacalculation
with
operator
parentheses.
*
There
four
pending
are
priority
You
fewer
left
requires
than
parentheses.
that
operationsbedoneinan
(for
example
can
useamaximumoffive
five
pending
Example:
addition
operations
you
can
2:
Arithmetic
before
pending
availableifthe
calculate1+
and
Storage
order
inconsistent
multlpllcatxon)
use
operations.
calculator
2+
has
(3+(4+(5+6.
more
Registers
than
23
Page 30
Using
Use
they
be
25+
You
Parentheses
parenthesestogroup
are
performed.
omitted.
For
(3%(9+
can
calculate
operations
Closing
example,25+(3x(9+12=isequivalent
12))
=.
+
9
parenthesesatthe
12
by
placing
andtospecify
endofthe
parentheses
around
the
orderinwhich
expression
to
the
addition
can
so
thatitis
Keys:
Qo120
3G
Now
calculate
30
=@
85
&
12
D)
[
16.9
B8l
done
before
_30
85-12
the
division.
Display:
21.0000
7.0000
Vv
(169-8)
30.0000
85
85.0000
73.0000
0.4110
169
8.9000
2.9833
1.2260
Description:
Evaluates
inside
Completes
[0
prevents
by
85.
Evaluates
inside
Calculates30=
Evaluates
inside
CalculatesV'8.9.
Completes
expression
parentheses.
calculation.
divisionof30
expression
parentheses.
expression
parentheses.
calculation.
73.
24
2:
Arithmetic
and
Storage
Registers
Page 31

Reusing
the
When
you
storedinthe
display,
following
Previous
startanew
LAST
press
[\q)
two
calculations:
Result
calculation,acopyofthe
register.Torecall
[LAST].
0.0821x(18+273.1)
2+
0.0821x(18+273.1)
For
13
(LAST)
example,
that
valuetothe
LAST
last
result
shortens
is
the
Keys:
.0821(x]
273.1
2
=
18
(5]
13(][«Q][LAST]
Exchanging
Pressing
entered
entered44(]
numbersto75
Display:
23.8993
23.8993
2.5439
Two
Numbers
(€)(SWAP]
duringacalculation.
exchanges
75,
[(1)[SWAP]
(3]
44.
Description:
Displays
whichisstoredinLAST
when
started.
(€]
previous
Displays
first
next
[LAST]
(SWAP)
the
last
two
For
example,ifyou
reverses
the
orderofthe
result,
calculation
recalls
result.
second
numbers
result.
have
that
is
you
2:
Arithmetic
and
Storage
Registers
25
Page 32

Keys:
Display:
Description:
44(]75
[1][SWAP
B
8+
435
(1][SWAP
(=]
Whenafunction
Pressing
[¢q)[SWAP]
coordinates
returns
(10,-15)topolar
(][DEG]
10
15
(«Q)(>P]
(«][SWAP
You
can
also
use
[€q)(SWAP]
separatedby[INPUT].
statistical
(before
registers,
pressing
enter
[Z+])
75
44.0000
1.7045
5
4.0000
9.2500
two
results,
exchanges
the:annunciator
the
two
coordinates:
10.0000
-56.3099
18.0278
0.0000
with
functions
For
example,toaccumulate
x-value
exchanges
the
x-value
Oops!
Whatifyou
to
enter75<
Swaps75and
Completes
Whatifyou
toadd8+
SwapsS5and
Completes
comes
results.Toconvert
Sets
Degrees
Stores
x.
Displays
cates
another
Displays
Clears
display.
that
y-value
and
require
[Z+].
y-value.
(x,y)
Pressing
two
data
meant
44?
44.
calculation.
really
wanted
5+
4?
4.
calculation.
on.
the
rectangular
mode.
angle(:indi-
result).
radius.
numbers
pairsinthe
[q][SWAP]
Using
26
2:
Storage
Registers
RegistersRythroughRyare
accessed
statistics
summation
Arithmetic
using
functions,R4throughR,are
data.
and
Storage
and
(RCL].
Registers
usedtostore
When
you
usedtostore
numbers.
are
using
They
the
are
Page 33

n
to
the
n
displayedinthe
The
following
n(nisaninteger0through9)copies
designated
n
copies
keystrokes
register,
the
contents ofR,to
current
with
display
useR;andR,to
(27.1+35.6)x1.0823
full12digit
the
display.
format.
calculate
(27.1+35.6)10823
the
numberinthe
precision.
The
number
display
is
Keys:
271
35.6
(=]
1
(x]
1.0823
2
=)
1
[»*]
(=]
To
Clearing
individual
storingavalue
value.
Storage
operations
resultisstoredinthe
cancel
2
or
Registers.
register,
since
Register
that
canbeperformedonnumbers
Display:
62.7000
62.7000
1.0823
67.8602
62.7000
1.0823
0.7699
[RCLJ,
press
Press
store0in
n
Arithmetic.
register.
Description:
Stores
Stores
Recalls
Recalls
Exponentiationisdone
before
or
[e].
[(][CLRG]toclear
it.Itis
unnecessarytocleararegister
replaces
the
This
previous
table
all
value
describes
storedinregisters.
62.7inR;.
1.0823inR,.
contents of
R;.
contentsofR,.
division.
registers.Toclear
before
with
the
new
the
arithmetic
The
an
2:
Arithmetic
and
Storage
Registers
27
Page 34

The
following
Keys
[STO)[+]
(STO)E)
(STOJ(x]
(STO)(:]
keystrokes
n
n
n
n
New
Number
old
number+displayed
old
number-displayed
old
numberxdisplayed
old
number-displayed
use
two
registerstocalculate
1.097x25.6671=?
1.097x35.6671=?
in
Register
n
number
number
number
number
Keys:
1.097
(x]
25.6671
=]
0
(x)10(STO)
(RCL]
1
=
0
[+]
Display:
1.0970
1
25.6671
28.1568
1.0970
1
10.0000
35.6671
39.1268
Description:
Stores
1.097inR,,
Stores
25.6671inR;.
Displays
Recalls contents of
starts
Adds10to
Of
ContentsofR,
right-most
pending
Displays
new
Rl'
first
answer.
calculation.
contents
replace
number
expression.
second
answer.
Ry,
of
2:
28
Arithmetic
and
Storage
Registers
Page 35

3
Numeric
HP-21S
number
functions
acted
m
Functions
example,
m
Functions
For
6
example,4(INPUT]5[*][%CHG]
between4and5.The
1+
3 2
between4and
m
Polar/rectangular
return
two
General
L
Seeco0o
oOOo0oo0oo
COoooo
ocooooa
ooooo
oocooo
ooooo
Functions
require
uponbya
with
one
calculates
with
two
S.
results.
and
Logarithmic
either
oneortwo
function):
argument
the
arguments
arguments
3
[»][%6CHG]
coordinate
arguments
actonthe
square
use
numberinthe
rootof6.
[INPUT]toseparate
calculates
canbeexpressions.
also
calculates
conversions
use
two
Functions
(an
the
the
percent
For
the
percent
arguments
argumentisa
display.
For
arguments.
change
example,
change
and
3:
Numeric
Functions
29
Page 36

Key(s)
Description
Square
root.
Keys:
45
Calculate
45
(x]
=
105
()
3.7
[*/~)(«1)(10*]
Reciprocal
(¢)(x?)
(¢
(]
x1073”7,
Square.
Natural
Base10antilogarithm.
Natural
Base10logarithm.
Display:
6.7082
3.1623E-5
0.0002
6.3096E
antilogarithm.
logarithm.
-9
Description:
V
45.
Calculates
antilogarithmof-4.5.
Calculates
antilogarithmof-3.7.
Multiplies
antilogarithms.
base
base
two
10
10
3:
Press
display.
Numeric
Functions
(I
30
to
calculate
Calculate/5+
the
reciprocalofthe
1/,.
numberinthe
Page 37

Keys:
Display:
Description:
3
=
The
exponentiation
positive
numbers.
3]
4
=
Percent
L
o000
0o
oOoooo00o
COoooo
ooooo
ocOoOsOOo
coooo
oocooo
Percent
4
0.2500
0.5833
operator,
For
example,
[y*],
can
alsobeusedtofind
findV3(whichisequivalentto3'/4):
3.0000
1.3161
Functions
The
subtractapercent,orcalculate
two
and
numbers.
keys
are
Calculates1+~3
4.
Defers
Adds
addition.
two
reciprocals.
roots
of
Exponentiation.
Reciprocalofpower
calculates
root.
usedtofindapercent,
the
percent
change
between
and1+
add
or
The
m
m
[¢q)(%]
When
was
by
function
thereisno
(x],
100.
When
displayed
number
performs
pending
(5],or(7],
or
[5]isthe
numberasa
preceding
pressing
pending
percent
the
or
two
different
operations:
operator,orthe
[4q)(%]
divides
operator,
and
returns
[q](%]
[5].
last
the
that
3:
Numeric
operator
displayed
interprets
percent
of the
Functions
you
number
the
entered
31
Page 38

Example.
Find
27%of85.3.
Keys:
85.3
(x]27(\1](%]
(=)
Find
the
number
200
(=]25[v][%]
=
Percent
To
calculate
Change
the
(expressedasa
Example.
Calculate
Keys:
291.7
316.8
[*][%CHG]
Calculate
the
Display:
0.2700
23.0310
that1s25%
50.0000
150.0000
percent
change
percentageofn,)
the
percent
Display:
291.7000
8.6047
percent
change
Description:
Divides27by
Calculates
less
than
200.
Calculates
Completes
between
two
numbers,n;andn,,
enterny(INPUT]n,[*][%CHG].
change
between
291.7
Description:
Enters
Calculates
change.
between
(12xS)
and
(65+18).
100.
27%of85.3.
25%of200.
calculation.
and
316.8.
n;.
percent
12
65
32
[x]
5
18
[»][%CHG]
3:
Numeric
Functions
60.0000
38.3333
Calculates
Displays
between60and
and
percent
(65+18).
enters
change
n;.
Page 39

Pi
()
Pressing
displayed
12-digit
Example.
Find
the
(A=4nr).
Keys:
4
(x]
[(«q])(m]
x]
4.5
(1)
(x3
(=)
Trigonometric
Changing
the
The
trigonometric
interpreted
conversion
[9q](x]
valueisactually
surface
displays
valueisroundedtothe
areaofa
Display:
3.1416
the
used.
sphere
20.2500
254.4690
Modes
and
Trigonometric
mode
determines
when
using
the
functions.Toexit
value of7.Although
current
witha4.5
display
inch
Description:
Displays
Displays
Calculates
square
inches.
Functions
Mode
how
numbers
trigonometric
one
mode,
and
press
the
format,
radius
.
4.5
surface
are
coordinate
another.
area
the
in
3:
Numeric
Functions
33
Page 40

Keys
(]
()
(DEG]
(RAD]
Description
Sets
Degrees
degreesina
measuredindecimal
than
degrees-minutes-seconds).
Sets
Radians
radiansina
mode.
circle.
mode.
circle.
There
Angles
There
are
degrees
are
are
(rather
2«
360
Annunciator
None
()
(GRD]
Trigonometric
(SIN]
COS
Keys:
Sets
inacircle.
Angles
dependingonthe
Keys
Grads
mode.
There
Functions
are
interpretedindecimal
current
Function
sine
cosine
tangent
trigonometric
(«1][ASIN]
[«9)[ACOS]
(«1][ATAN]
Display:
are
400
grads
degrees,
Keys
Description:
GRAD
radians,orgrads
mode.
Function
arc
sine
arc
cosine
arc
tangent
[DEG]
(]
15
[SIN]
1
60
34
3:
Numeric
Functions
0.2588
1.7321
Degrees
Sets
Displays
Displays
mode.
sineof15°.
tangentof60°.
Page 41

=
.35
[«](ACCS]
(=)
.62
[«1](ACOS)
=
Angle
Keys
(«1][=HR
and
2.7321
69.5127
51.6839
17.8288
Hour
Conversions
Function
To
hours;
hours(degrees)-minutes-seconds-decimal
seconds
decimal
converts
format
hours
the
(H.MMSSss
(or
degrees)
Calculates1+
Displays
0.35.
Displays
0.62.
Displays
0.35-arc
number
or
format.
arc
arc
arc
cosineof0.62.
from
D.MMSSss)
tan
cosine
cosine
cosine
to
60°.
of
of
of
(»][=HMS
(«q)[+DEG]
(»][=RAD]
To
hours-minutes-seconds;
from
decimal
hours(degrees)-minutes-seconds-decimal
seconds
To
degrees;
valuetoits
To
radians;
degree
hours
format
valuetoits
(H.MMSSss
converts
decimal
converts
(or
degree
the
radian
converts
degrees)
or
the
number
equivalent.
number
equivalent.
the
to
D.MMSSss).
fromaradian
fromadecimal
3:
Numeric
Functions
number
35
Page 42

@lT@
Angleindecimal
Angle
radians
degrees
in
(D.d)
Decimal
(H.h)
hours
E@]lTEfl
Keys:
1.79
[x]
(«)(=DEG]
90.2015
25.2589
(«q)(SHOW
Angle
D.MMSSss
format
(«)(x]([=]
[«](>HR]
]
in
Display:
5.6235
322.2000
90.3375
25.1532
251532040000
I:-—:Jl
Hours
H.MMSSss
format
Description:
Calculates
Converts
degrees.
Converts90degrees,
minutes,15seconds
decimal
Converts
to25degrees,
minutes,32seconds.
Shows
(32.04
degrees.
decimal
seconds).
T
QG
in
1.79~.
1.79r
radians
25.2589
15
seconds
to
20
to
degrees
36
3:
Numeric
Functions
Page 43

Coordinate
Conversions
L
oOo000oo
®S0O8e000
-
0000
ooooo
ooooo
cocooo
oococoo
To
convert
1.
2.
Coordinate
INPUT];6is
trigonometric
-—— = = =
from
rectangulartopolar
Enterx
Press
[q][SWAP]todisplay
conversions
interpreted
require
accordingtothe
mode.
==
-
- -
y
[«Q][>P]todisplay
r.
pairsofdata
x
-coordinate,y-coordinate
coordinates,
6.
separated
current
by
To
2.
convert
1.
Enterr
Press
from
polartorectangular
6
[*][>R]todisplay
(q]
to
display
coordinates,
y.
x.
3:
Numeric
Functions
37
Page 44

Example.
Convert
coordinates.
the
rectangular
coordinates
(10,
—15)topolar
Keys:
(]
(DEG]
10
15
(«][SWAP
Convert
7
30
[*][+R]
[1][SWAP
(«q)(>P]
the
polar
Display:
10.0000
-56.3099
18.0278
coordinates
7.0000
3.5000
6.0622
(7,
30°)torectangular
Description:
Sets
Degrees
Enters
x.
mode.
Entersy,calculatesrand
6,
and
displays
Displays
6.
r.
coordinates:
Enters
r.
Enters6,calculatesxand
y,
and
displays
Displays
y.
x.
38
3:
Numeric
Functions
Page 45

Parts
L
(«](IP)
Keys
of
Numbers
Integer
partofthe
Function
number.
()
(«1](ABS]
(r*](RND]
Keys:
12.3456789
(«1](SHOW
(][RND]
Fractional
integer
Absolute
Rounds
specifiedinthe
format.
(=]
[©q][SHOW]
partofthe
part).
valueofthe
the
number
(No
rounding
Display:
12.3457
123456789000
123457000000
internallytothe
current
number
number.
occursinALL
FIX,
SCI,orENG
(the
Description:
Entersanine-digit
number.
Displays
number.
Rounds
internally.
number
without
numberofdigits
display
mode.)
full
precision
number
its
of
3:
Numeric
Functions
39
Page 46

Probability
Probability
and
Distributions
|
Factorial
Pressing
number
Combinations
The
numberofcombinationsofn
of
different
No
item
of
the
calculating
The
numberofpermutationsofn
of
different
ofnitems.Noitem
different
keystrokes
Your
permutations,
probabilities.
[*][nl]
mustbean
occurs
sameritems
orders of
calculates
sets
containingritems,
more
combinations:
arrangementsofr
for
calculating
HP-218S
integerinthe
and
than
are
can
the
provides
and
random
the
factorialofthe
Permutations
onceinthe
not
counted
n-value
objects
items
occur
more
sameritems
permutations:
factorials,
range0through
objects
taken
setof7
separately.
[INPUT]
that
than
are
combinations,
numberstohelp
numberinthe
takenratatimeisthe
fromalarger
items,
Use
r-value
takenratatimeisthe
canbetaken
onceinan
counted
n-value
separately.
you
253.
groupofn
and
different
these
keystrokes
[][Cn.r].
fromalarger
arrangement,
r-value
calculate
display.
number
items.
number
and
Use
these
[®][Pn,r].
The
orders
for
group
40
4:
Probability
and
Distributions
Page 47

Keys:
Display:
Description:
5
3
[](Cn,]
5
3
[*][Pn,r]
Combination
Random
To
storeaseed
number
previous
To
and
contents.
generateasequenceofnumbers
(«(a)(RAN#].
and
Number
for
press
This
5.0000
10.0000
5.0000
60.0000
Permutation
and
the
random
[®](SEED].
The
first
producesapseudo-random
0<RAN#<1."
Cpp=——
BT
(mo-r)r!
Pnr‘_‘
’
(n
Seed
number
The
seedisstoredinR
random
numberinthe
from
Equations.
n!
n!
-r)
generator,
the
previously
numberinthe
Enters
Enters
calculates
the
n-value.
the
r-value;
combinations
of5objects,3atatime.
Enters
Enters
calculates
the
n-value.
the
r-value;
permutations
of5objects,3atatime.
enterapositive
and
writes
over
the
sequenceisdisplayed.
stored
seed,
press
range
*
The
numberispartofa
This
sequence
London:
Addison
passes
Wesley,
sequenceofuniformly
the
spectral
test
1981).
(D.
Knuth,
4:
Probability
distributed
Seminumerical
and
psuedo-random
Algorithms,
Distributions
numbers.
Vol.
41
2.
Page 48

Distributions
under
that
tail
Using
HP-21S,
inverse.
under
You
valueofthe
the
are
other
chapter.
distribution
Distribution
Normal
L
ocooooo
ooOooo0o
CoOoo0o
oOoO0o0oo
ooooo
Oseses
0OooOooo
the
valueofthe
The
area
tables
endofthis
The
upper
the
The
the
can
random
curve
than
four
probability
you
can
calculateanupper
upper
tail
probability
curvetothe
calculate
random
variableifyou
thatiscalculatedisthe
upper
functions
rightofthe
the
area
variable.
tail,
Keys
=
know
use
are:
distribution
under
Conversely,
the
conversion
Inverse
(]
functionsonthe
tail
correspondstothe
random
the
curveifyou
the
area
upper
(zp]
probabilityorits
area
variable
you
under
tail.Ifyou
instructionsatthe
Keys
know
can
calculate
the
value.
the
curve.
are
using
These
distribution
textbooks.
determine
statistical
42
4:
Probability
Student’s
F
X
The
calculator
any
upper
tables.
t
functions
functions
tail
probability,
and
Distributions
()
(]
QEx)]
replace
the
statistical
expand
not
just
(>](tp]
(](Fp)
X%
tables
the
tablesbyallowing
the
selected
found
values
in
in
you
to
Page 49

Normal
Upper
To
upper
Q(z)isthe
variableZis
calculate
tail
Tail
Probability
the
area
under
the
curvetothe
probability),
probability
greater
enter
the
thatastandard
than
z.
z value
and
normal
rightofz
press
[€][Q(z2)].
random
(the
Example.
the
probability
Keys:
1.7
[)[Q@)]
The
variableZisastandard
thatZis
greater
Display:
0.0446
than
1.7?
normal
random
Description:
Calculates
probability.
variable.
the
0
What
upper
tail
Q(z)=0.0446
z=1.7
is
4:
Probability
and
Distributions
43
Page 50

InverseofUpper
Distribution
If
you
know
the
upper
to
calculatez,enter
the
Tail
Probability—
tail
probabilityp(area
probability
and
press
Normal
under
the
[*][zp].
curve)
and
want
Example.
of
0.025?
Keys:
.025
Whatisthezvalue
[*](zp]
Student’stUpper
To
calculate
first
store
value
and
The
label
df;isto
wheretostore
freedom,
numberofdegreesoffreedom
correspondingtoan
Display:
1.9600
Tail
Probability
the
area
under
the
Student’stdistribution
the
degreesoffreedominR,
press
(€]
[Q(1)].
the
lower
rightofthe
degreesoffreedom.Tostore
enter
the
value
and
press
the
upper
tail
Description:
Calculates
calculator
thezvalue.
then
enter
(1]
keytoremind
degrees
1.
The
can
probability
curve,
the
t
you
of
maximum
useis299.
44
4:
Probability
and
Distributions
Page 51

7
Example.
distribution
Keys:
8
1.86
Inverse
Distribution
If
you
to
calculatet,store
(](te].
Whatisthe
with8degreesoffreedom
1
[Hq][Q(1)]
of
know
the
&
Upper
upper
the
upper
tail
probability
(df;)
Display:
8.0000
0.0500
df
-
6
.943
9
=
Tail
tail
probabilityp(area
degreesoffreedominRy,
.01
Probability—
associated
forat
valueof1.86?
Description:
Stores
freedom.
Calculates
probability.
.001
Student’s
under
the
then
withaStudent’s
the
degrees
the
curve)
enterp,and
upper
t
and
of
want
press
t
tail
4:
Probability
and
Distributions
45
Page 52

Example.Ahypothesis
Student’stdistribution
foranupper
Keys:
26
.05
[>](tp)
F
Distribution
tail
1
with26degreesoffreedom
probabilityof0.05.
df
241
27
Upper
test
requires
Display:
26.0000
1.7056
1.711
the
criticaltvalue
.01
@
Tail
Probability
.
(df;).
Description:
Stores
freedom.
Calculates
value.
.001
from
the
Find
degrees
the
the
thetvalue
of
critical
t
and
(2]
keystoremind
store
the
numerator
1.Tostore
and
press
calculator
46
4:
Probability
To
calculate
store
the
denominator
value
and
The
df;
the
2.
The
can
useis299.
the
area
under
numerator
press
and
df,
you
degreesoffreedom,
denominator
maximum
and
Distributions
degreesoffreedominR;
degreesoffreedominR,.
[¥q]
[Q(F)].
appearaslabelstothe
wheretostore
degreesoffreedom,
numberofdegreesoffreedom
theFdistribution
Then
lower
the
degreesoffreedom.
enter
the
value
and
enter
curve,
first
and
the
enter
the
rightofthe
To
press
the
value
the
F
(1]
Page 53

Example.
freedom
to
16,
foranF
Whatisthe
(df;)
equalto3
valueof5.29?
upper
and
denominator
tail
probability
with
numerator
degreesoffreedom
degrees
(df,)
equal
of
Keys:
3
16
5.29
Inverse
If
to
denominator
1
2
[¢][QF)] 0.0100
of
Upper
you
know
the
upper
calculateF,first
degreesoffreedominR,.
Display:
3.0000
16.0000
Description:
Stores
Stores
Calculates
probability.
DLevelofSignificance
|
14
17
tail
store
®
58388
PO
Tail
Probability
probabilityp(area
the
numerator
|
D
288D
PO0O0
—
under
degreesoffreedominR;
Then
enter
F
the curve)
p and
dfj.
df,.
the
upper
Distribution
and
and
press
[](Fp].
tail
want
the
4:
Probability
and
Distributions
47
Page 54

%
7/
Z/y//////////////flmmfi_
F
.
Example.Ahypothesis
distribution
the
denominator
associated
Keys:
4
8
.05
[*][Fp]
Upper
L
1
2
Tail
with
the
numerator
degreesoffreedom
upper
tailFvalue
LeveI
aff
1
Probability—Chi-Square
To
calculate
the
degreesoffreedominR,
press
[\]
[Q(X?)].
test
requires
fora0.05
Display:
4.0000
8.0000
3.8379
of
Significance
2
the
area
the
criticalFvalue
degreesoffreedom
(df,)
equalto8.
levelofsignificance?
Description:
Stores
Stores
Calculates
Co|
under
the¥?distribution
then
enter
from
(df;)
equalto4
Whatisthe
df;.
df;.
F.
s
Distribution
curve,
the
x? value
the
F
and
(x?)
store
and
48
4:
Probability
To
store
degreesoffreedom
1.
The
calculator
and
maximum
can
useis299.
Distributions
(df,),
enter
the
value
and
numberofdegreesoffreedom
press
the
Page 55

.
Example.
are17degreesoffreedom
Keys:
17
33.41
Inverse
Distribution
If
you
calculate
(]
B%e).
The)statistic
1
[q][Q(X?)]
of
Upper
know
the
upper
x?,
store
df|
15
&3
18
(x?)
tail
the
degreesoffreedominR,
calculated
(df;).
Display:
17.0000
0.0100
.10
Tail
Probability—
probability
fromasampleis33.41
Whatisthe
.05
upper
Description:
Stores
freedom.
Calculates
probability.
Chi-Square
(area
under
then
tail
probability?
the
the
curve),
enterpand
and
there
degrees
the
upper
and
press
of
tail
want
to
4:
Probability
and
Distributions
49
Page 56

Example.Atest
value
correspondingtoan
Keys:
19
.001
How
The
probability.
curvetothe
with
some
equaltoone,
symmetric.
mirror
1
[](X3p)
to
Convert
distribution
areas
other
imageofthe
functions
The
upper
rightofthe
other
than
areaifyou
and
That
is,
sample
that
has19degreesoffreedom
upper
Display:
19.0000
43.8202
df
17|
27.59|
28.87|
30.14
31.41
From
return
tail
probability
given
upper
tail.Itis
remember
the
normal
the
portionofthe
portionofthe
.05
value.
\
X
tail
probabilityof0.001.
Description:
Stores
freedom.
Calculates
.01
33.41
34.80
Upper
values
Sometimes
easytoconvert
that
and
curvetothe
Tail
for
the
upper
correspondstothe
you
the
total
area
Student’stdistributions
curvetothe
rightofzero.
(df;).
Find
the
the
degrees
the»?value.
tail
camulative
area
under
will
needtowork
from
upper
tail
under
the
curve
are
leftofzeroisthe
x?
of
the
to
is
50
4:
Probability
and
Distributions
Page 57

Example.
the
probability
The
probability
normal
1.7,
Q(1.7),
The
variableZisastandard
thatZis
thatZis
curvetothe
and
then
less
than
1.7?
less
than
1.7isthe
leftof1.7.
subtractitfrom1(the
You
can
calculate
normal
area
total
random
under
the
areatothe
area
variable.
area=Q(1.7)
the
standard
under
the
What
right
of
curve).
is
Keys:
1.7
[¢q](Q(2)]
1(3)
Example.
the
probability
The
variableZisastandard
thatZis
Display:
0.0446
0.9554
greater
-1.2
than
normal
1.2orless
0
Description:
Calculates
area.
Subtracts
from
1.
random
than
—1.2?
1.2
upper
tail
upper
tail
variable.
area=Q(1.2)
area
What
is
4:
Probability
and
Distributions
51
Page 58

The
Since
you
desired
the
normal
can
calculate
areaisto
distributions
the
the
rightof1.2,
upper
tail
are
symmetric,
area,
plus
the
Q(1.2),
areatothe
the
areas
and
multiplyby2.
leftof—1.2.
are
the
same,
so
Keys:
1.2
[)[Qz)]
x]2(5]
Example.
so
that
0.95.
The
given
normal
(0.05=2=0.025).
of
0.025.
The
variableZisastandard
the
probability
areais0.95.
distributionissymmetric,
Display:
0.1151
0.2301
normal
thatZis
less
thanzand
N
O
The
area
not
includedis1—0.95=0.05.
halfofthis
The
desiredzcorrespondstoan
Description:
Calculates
area.
Calculates
random
greater
area=0.95
area=
N
areaisin
upper
upper
answer.
variable.
than-zis
1—’02—953
the
upper
tail
tail
probability
tail
Find
z
equal
to
=0.025=Q(1.96)
Since
the
Keys:
.025
You
52
(*](zp)
will
find
4:
Probability
other
examplesoftail
and
Display:
1.9600
Distributions
Description:
Desired
conversionsinchapter
valueofz.
6.
Page 59

Statistical
Calculations
The
for
accumulatedinregistersR4through
at
storedineach
the
Mean
and
Linear
Linear
Weighted
regression
estimate
Summation
Clearing
Clear
the
statistical
you
don’t
clear
automatically
statistical
registers,
and
[€][Z-]
one-
and
two-variable
the
lower
rightofthe
register.
statistical
standard
mean.
functionstocalculate
deviation.
statistics.
and
forecasts.
statistics:n,2x,
Statistical
registers
the
registers,
includedinthe
press
(R4
data
summation
[®](CLZ].
keys
are
statistics.
keys
Once
£x%,
Xy,
Data
through
currently
(The
usedtoenter
Summation
indicate
you
enter
the
)2,
and
Lxy.
Ry)
before
storedinR4
calculations.Toclear
displayisalso
and
Rg.
The
what
statistical
the
data,
following:
entering
throughRyis
cleared.)
register
delete
data
you
new
the
data
is
labels
data
can
use
data.
is
If
5:
Statistical
Calculations
53
Page 60

Summary
Some
functions
values
have
Keys
(=]
(]
Ew
()
of
Statistical
return
been
returned.
Arithmetic
(average)ofthe
Meanofthe
weightedbythe
Sample
deviationofthe
two
values.
Press
[4][SWAP]tosee
Description
mean
x-values.
x-values
y-values.
standard
x-values.*
Calculations
The:annunciator
(«1)[SWAP]toDisplay
Arithmetic
(average)ofthe
Sample
deviationofthe
you
entered
indicates
the
hidden
mean
standard
that
value.
y-values.
y-values
y-data.*
two
if
(](ox,0y]
y-value
()
x-value
(]3]
(«a)(m,b]
*
Sample
Population
t
The
correlation coefficientisa
how
closely
correlation,
indicates
Population
deviationofthe
Estimateofx
valueofy.
Estimateofy
valueofx.
Slope
calculated
standard
non-correlated
deviation
standard
and-1indicatesaperfect
the
data
deviation
fits
standard
foragiven
foragiven
(m)ofthe
line.
assumes
assumes
numberinthe
the
calculated
data.
x-values.*
dataisa
negative
samplingofa
the
data
constitutes
range—1through+1that
line.A+1
correlation.Avalue
Population
deviationofthe
you
entered
Correlation
Correlation
y-intercept
calculated
indicatesaperfect
standard
coefficient.t
coefficient.t
(b)ofthe
line.
larger,
the
entire
y-values
y-data.*
complete
population.
measures
positive
closetozero
if
set.
54
5:
Statistical
Calculations
Page 61

Keys
4
(n)
Number
of
data
Description
points
entered.
5(x)
8
Entering
Thereisno
statistical
exceed
warning
(«1][CLRG].
One-Variable
To
enterxdata
1.
2.
3.
limittothe
registers.Ifstatistical
+9.99999999999x10*°,
(OFLO).
Clear
Enter
the
numberofitems
Continue
[Z+].
The
6
(Xy)
7
(&¢*)
(3y%)
9
(Xxy)
Sumofthe
Sumofthe
Sumofthe
Sumofthe
Sumofthe
x-values.
y-values.
squaresofthe
squaresofthe
productsofthex-and
Statistical
numberofvalues
Data
remains
Statistics
for
one-variable
the
contents ofR4throughRyby
first
value
accumulated.
accumulating
n-valueisincremented
Data
data causes
the
stored
statistics,
and
press
valuesbyentering
you
HP-21S
until
[Z+].
The
with
x-values.
y-values.
y-values.
can
accumulateinthe
the
valueofa
displaysatemporary
you
press
pressing
HP-21S
the
each
entry.
register
(]
[®](CLZ].
displaysn,the
numbers
and
to
overflow
or
pressing
5:
Statistical
Calculations
55
Page 62

Two-Variable
To
enter
x,y
pairsofstatistical
1.
Clear
the
2.
Enter
the
3.
x-value
Enter
and
the
displaysn,the
4.
Continue
entry.
To
enter
data
for
x,
and
its
corresponding
Correcting
Statistics
and
data,
contentsofR,
first
x-value
throughRyby
and
press
the:annunciator
corresponding
y-value
numberofpairsofitems
entering
x,y
pairs.
calculating
the
The
weighted
weightasy.
Statistical
Weighted
pressing
(INPUT].
appearsinthe
and
The
press
Mean
[#][CLZ].
HP-21S
display.
[£+].
The
accumulated.
n-valueisincremented
mean,
enter
Data
each
displays
HP-21S
with
data
the
each
value
as
Incorrect
is
incorrect,
entries
Correcting
To
delete
and
1.
Keyinthe
2.
Press
3.
Enter
Correcting
To
delete
and
1.
Keyinthe
2.
Press
3.
Enter
canbedeleted
you
must
delete
One-Variable
reenter
[¢q)(Z-]todelete
the
reenter
[q)(Z-]todelete
the
statistical
x-valuetobe
correct
value
Two-Variable
x,y
pairsofstatistical
x-value,
correct
press
x,y
pair
using
and
reenter
data,
deleted.
the
value.
using
the
values.
using
(€](Z-].Ifeither
both
values.
Data
The
n-valueisdecreasedbyone.
[Z+].
Data
data,
and
then
keyinthe
The
n-valueisdecreasedbyone.
and
valueofanx,y
[Z+].
pair
y-value.
56
5:
Statistical
Calculations
Page 63

Mean,
Standard
Statistics
L
OsseOs
O00000
CoOo0ooo
oooaoo
ooooo
OOoooo
OoOoO0OOos
You
can
calculate
deviation
summation
you
(S,),population
statistics,n,£x,
can
also
population
summation
Deviations,
the
sample
calculate
standard
statistics
the
deviationofthe
Ly,
mean
standard
and
mean,
£y?,
and
and
Summation
(x),
sample
deviation
£x?ofx-data.
sample
standard
y-data,
Zxy.
standard
(o,),and
For
and
the
x,y
data,
deviation,
Example
1.Ayacht
captain
averagetochangeasail.
observes
of
sample
square,
Keys:
()
4.5
4
2
3.25
3.6
3.6
3.5
3.75
[2)(z.7]
(>)(5x.8y]
minutes
standard
using
(]
themasthey
required:
deviationofthe
the
formulaV£x?/n
carry
4.5,4,2,
Display:
0.0000
1.0000
2.0000
3.0000
4.0000
5.0000
4.0000
5.0000
6.0000
3.5000
0.8515
wantstodetermine
She
randomly
out
the
sail
3.25,
3.5,
times.
.
chooses
change,
3.75.
Calculate
Also,
how
longittakes
six
membersofher
and
records
the
calculate
the
Description:
Clears
statistics
Enters
first
Enters
Enters
Enters
to
Oops!
enter
Deletes
second
third
fourth
Whatifyou
3.5?
3.6
n-valuebyone.
Enters
fifth
correctly.
Enters
sixth
Calculates
Calculates
standard
on
crew,
the
number
mean
and
root
mean
registers.
value.
value.
value.
value.
meant
and
decreases
time
time.
the
mean.
the
sample
dewviation.
5:
Statistical
Calculations
57
Page 64

RCL])
7
8
4
=]
The
standard
[«1)[SWAP]
deviations
are
isasamplingofa
If
the
data
constitutes
deviations
canbecalculatedbypressing
[+2)(SWAP]todisplayo,.
the
sample
larger,
77.1250
6.0000
3.5853
calculatedby[®](Sx,Sy]
complete
the
entire
standard
deviations.
setofdata.
population,
[®][ox,0y]todisplayo,and
Displays
Displays
Calculates
square.
and
They
the
population
Tx?.
7.
the
[*][Sx,Sy]
assume
that
standard
root
the
mean
data
(]
Example
193,
182, 177,
kilograms.
heights
and
y-data).
Keys:
(]
193
182
177
185
()
(«](SWAP
[)lox,o
2.
The
and
Find
the
weights,
90
81
83
77
coach
185
centimeters
mean
then
has
four
and
population
find
the
Display:
0.0000
1.0000
2.0000
3.0000
4.0000
184.2500
82.7500
5.8041
new
playersonthe
and
weightsof90,
standard
total
weightofthe
team
with
81,
83,
and
deviationofboth
players
(sumofthe
Description:
Clears
statistics
Begins
and
Calculates
heights
Displays
entryofheights
weights.
mean
(x).
meanofweights
).
Calculates
standard
heights
population
deviation
(x).
heights
of
77
their
registers.
of
for
58
5:
Statistical
Calculations
Page 65

(«)(SWAP
6
Linear
4.7104
331.0000
Regression
Least
squares
for
estimation
throughasetofx,y
x,y
pairs.Astraight
thex-and
slope
andbis
linear
and
y-variablesofthe
the
and
y-intercept.
Estimation
regressionisa
forecasting.Itis
data.
There
line
estimates
formy=mx+b,
Displays
standard
weights
Displays
(sumofy’s).
statistical
usedtofitastraight
mustbeat
the
population
deviation
(y).
total
method
least
two
relationship
wheremis
for
weight
used
line
different
between
the
Linear
Linear
canbeusedtoestimateay-value
linear
Regression.
1.
Enter
the
2.
Press
=
(Q)[E1]
correlation
m
[«¥)[m,b]todisplaym,the
displayb,the
Estimation.
estimation
1.
Enter
the
2.
Enter
the
mToestimatexfor
Todoa
x,y-data
using
[Q)([SWAP]
coefficient.
y-intercept.
The
calculations,
x,y-data
known
using
x-valueory-value.
linear
the
(or
straight
the
the
giveny,enter
[«)(zd.
mToestimateyfor
()
Bu).
the
givenx,enter
regression
instructionsonpage
(][]
slopeofthe
line
calculatedbylinear
foragiven
instructionsonpage
calculation,
[1](SWAP))todisplayr,the
line,
x-value,orvice
the
y-value,
the
x-value,
56.
then
56.
then
then
[¢](SWAP]
regression
versa.Todo
press
press
to
5:
Statistical
Calculations
59
Page 66

Example.
concentrationofone
varying
are observed:
only
X
Y
The
rate
the
initial
|0.050
|[0.0062
of a
certain
chemical.
concentrationofthe
0.075
0.00941
chemical
When
0.10
0.0140
the
reaction
reactionisrun
chemical,
dependsonthe
0.125
0.0146
the following
initial
repeatedly,
rates
0.20
0.023
Calculate
line
fittedtothe
Keys:
(]
.05
.075
.00941
A
125
2
(«a)(m.b]
[«
[SWAP
[«Q](Zr]
Estimate
moles
.09
[«)([SWAP]
per
[](3.1]
the
slope
.0062
.014
.0146
.023
the
rateofthe
liter.
and
y-interceptofthe
data.
Also
Display:
0.0000
5.0000
0.1093
0.0014
0.9890
reaction
0.0113
calculate
when
least
the
correlation
the
concentration
squares
regression
coefficient.
Description:
Clears
statistics
Enters
x,y-data.
Displays
Displays
(:
result).
Displays
coefficient.
Calculates
forx=
slope.
y-intercept
indicates
correlation
equals
0.09.
straight
registers.
another
0.09
estimateofy
60
5:
Statistical
Calculations
Page 67

Estimate
.02
the
(N][Z1]
Weighted
To
calculate
frequencies
1.
Use
frequenciesofthe
2.
Press
concentration
Mean
the
weighted
yy,
y2,...,
¥n,
and
[*][zw].
necessary
0.1700
0.0000
meanofdata
to
enter
x-values.
x,y
for
the
points
pairs.
rate
equalto0.0200.
Calculates
fory=0.02.
Clears
annunciator.
x;, x,,
...,X,occurring
The
y-values
estimateofx
display
are
the
and
:
with
Example.Asurveyof266
54ofthem
$216.
Keys:
(]
200
205
210
216
(]
rent
Whatisthe
54
32
88
92
[zw
for
$200
average
per
Display:
0.0000
1.0000
2.0000
3.0000
4.0000
209.4436
one-bedroom
month,32for
monthly
rent?
rental
apartments
$205,88for
$210,
Description:
Clears
statistics
Begins
entryofrents
numberofapartments.
Calculates
mean.
reveals
and92for
registers.
weighted
that
and
5:
Statistical
Calculations
61
Page 68

Equations:
62
5:
Statistical
Calculations
Page 69

Built-in
Program
Library
The
built-in
be
accessedbypressing
letter
keys,AthroughF,in
pressed,
abbreviated
released.
Name
A
B
C
D
program
the
top
row
program
One
Sample
Two
Sample
Linear
Chi-Square
library
consistsofsix
[€q])(LOAD]
the
keys
assume
nameisdisplayed
Title
Test
Statistics
Test
Statistics
Regression
Test
Test
Statistic
programs
followedbyoneofthe
top
row.
(When
their
letter
values.)
until
the
Statistics
that
[$]
An
letter
Message
1-StAt
2-StAt
Lr-StAt
CHI-2
key
can
is
is
E
you’ve
can
the
(However,
use
without
F
entered
and
Lr-StAt,
calculation,
Whenaprogramisloaded,itclears
memory.
Once
the
statistics
you
Lr-StAt
calculatingastatistic,
repeat
Binomial
Time
Probability
ValueofMoney
the storage
your
tests
describedinthis
load
affecting
youdonot
correcting
data
and
your
registers
(either
use
data.
needtoreenter
the
Distribution
any
other
programs
are
left
raworsummary),
chapterinany
1-StAt,
and
Also,ifyou
mistake.
that
intact.)
you
order.
then
reload
and
makeamistake
your
data.
6:
Built-in
bin
FinAnCE
maybein
can
calculate
For
instance,
use
You
simply
Library
63
Page 70

This
table
lists
the
organizationofthe
quick
reference
guide.
symbols
programs.
usedinthe
The
diagramsinthis
flow
diagrams
chapter
that
show
the
makeupthe
The
restofthis
the
example
asaguidetofind
Symbols
Symbol
%3
»
3T
TESX,~NQAMOQT
that
in
Program
Sample
Sample
Sample
Population
Sample
Population
Population
Precision
Observed
Expected
Degreesoffreedom.
Standard
Student’strandom
Chi-square
Hypothesized
Upper
Probability.
size.
mean.
standard
proportion.
tail
chapter
describes
resembles
the
solution,
the
Flow
Description
deviation.
standard
proportion.
mean.
(1/,
widthofconfidence
value.
value.
normal
random
probability.
each
problem
mixing
random
value
program,
you
and
deviation.
variable.
variable.
(e.q.,
are
matching
Diagrams
interval).
variable.
mg,g,Dy,---)-
mainlybyexample.
tryingtosolve
the
parts.
and
Find
use
it
Quick
quick
perforated
64
Reference
reference
6:
Built-in
lines
Guide.
guide.
and
slipitinside
Library
You
The
diagramsinthis
can
detach
your
the
quick
calculator
chapter
reference
carrying
areinthe
guide
case.
along
the
Page 71

One
1-StAt
Sample
calculates
test
varietyofone-sample
confidence
mean,
The
intervals,
degreesoffreedom,
1-StAt
programisorganizedasfollows.
Statistics
statistics
problems.
the
sample
and
and
confidence
You
size
standard
(1-StAt)
interval
can
calculate
required
for
error.
estimates
test
statistics,
estimation
test
for
a
of the
6:
Built-in
Library
65
Page 72

Test
of
(«1)(COADJA
Formofdata?
Mean
ravV
(](CLz]
data
Enter
(XEQJA
Testofhypothesisorconfidence
V,(XEQ)B
(displays z or
[«\)[@@)]or
(displaysU,)
Testofhypothesisorconfidence
test
hypothesi
[Z+]
using
of
test
hypothesis
[«][Qt)
Test
of
\Tmary
¢)
U,
(e*)(ze)or(e])(te)(displays
(XEQ]C
[R7S](displays
[R/S](displays
of
Proportion
(«1)[COADJA
[XEQJD
n
[R/S]
x
soro
interval?
confidence
interval
(displays
lower
upper
interval?
confidence
interval
statistics
zor1)
precision)
limit)
limit)
n
D
p
m,(XEQ]1
n,(XEQ]B
[«)([@)(displays
6:
66
Built-in
Library
(displays z
)
U,,)
n
pR/S)
D
(XEQ]1
U,
[e*)(zp)(displays
[XEQ]C
(R/S](displays
[R/S](displays
(displays
lower
upper
2)
precision)
limit)
limit)
Page 73

Paired
[«2)[LOADJA
[)[CLs)
x]E]
x=)y,4]
Difference
N
=
,.Elyn
V,(XEQ]B
(displays zorf)
[«)[Q&)or
(displays
Testofhypothesisorconfidence
test
of
hypothesis
[w][Q)
U,)
Sample
Size
Determination
confidence
interval
pE@]orE(displays
[XEQJC
(displays
[R/S)(displays
[R/S](displays
[«2)[LOAD]A
o[XEQJE
dm
U,
[*](zp](displays
fi(dlsplays
z)
required
sample
interval?
precision)
lower
upper
size)
zort)
limit)
limit)
6:
Built-in
Library
67
Page 74

R4
through
LBLA
LBLB
LBLC
LBLD
LBL7
The
method
summary
If
you
are
1.
Clear
2.
Enter
3.
Press
(standard
4.
Optional:
m
m
m
m
m
statistics.
using
1-StAt
n,
the
The
degreesoffreedomn-1.
The
sample
The
standard
Ry
Statistics
Processes
storesinR,
Calculates
Calculates
or
Stores
testofone
Calculates
of
the
for
entering
raw
data,
the
statistics
sample
Press
Press
Press
Press
Press
deviationofthe
data
Atoprocess
deviationofthe
0todisplay
1todisplay
2todisplay
3todisplay
7tocalculate
Registers
sample
meanx
size.
and
or
proportion
deviation,Vp(1-p)
registers
summary
through
test
Aor
confidence
D.
summary
sample
standard
sampling
data
dependsonthe
registersbypressing
using
[Z+].
the
sampling
(page
statistics
Rj.
statistic
distribution.
data
sampling
the
the
the
the
the
distribution).
for
D.
interval.
statistics
meanorproportion.
error,
and
display
distribution).
sample
degreesoffreedom.
sample
sample
standard
Labels
p.
orvVx(1-
55).
for
1-StAt
and
hypothesis.
Used
intoR,throughR;for
the
standard
data
type:
[](CLZ].
the
size.
mean.
standard
error
Used
after
deviation
raw
data
standard
deviation.
(standard
error
).
after
A
or
68
6:
Built-in
Library
Page 75

If
you
1.
2.
3.
4.
are
using
Enter
the
Enter
the
Enter
the
standard
Optional:
Press
Press
Press
Press
summary
sample
mean
standard
error
(standard
statistics,
size
and
press
and
press
[R/S].
deviation
deviationofthe
0todisplay
1todisplay
2todisplay
3todisplay
D.
and
press
[R/S].
sampling
the
sample
the
degreesoffreedom.
the
sample
the
sample
size.
mean.
standard
The
display
distribution).
deviation.
shows
the
Population
Interval
Example:
sampleof75
123.45
and
Part1.First,
statistics.
Keys:
(«1)[LOAD]
75
123.45
6.78
Now
you
interval
Part2.Calculate the
population
meanisnot
estimate
Mean
Estimate
Population
elementsistaken
the
population
enter
A
D
can
either
test
(part
meanis122.
equalto122atthe
—
Test
Standard
standard
the
data.Inthis
Display:
75.0000
123.4500
0.7829
the
hypothesis
3).
This
test
statistic
Testitagainst
of
Hypothesis/Confidence
Deviation
fromapopulation.
deviationis6.78.
example
example
for
the
0.05
significance
the
(part2)or
includes
null
hypothesis
the
alternative
dataissummary
Description:
Loads
Stores
Stores
Stores
and
error.
both.
level.
Known.
The
calculateaconfidence
A
sample
1-StAt.
sample
sample
standard
calculates
that
hypothesis
random
mean
size.
mean.
deviation
standard
the
that
is
the
6:
Built-in
Library
69
Page 76

Because
distribution
The
statistics
the
translatedtoan
the
population
willbeusedtomake
problemisstatedsothat
fallinthe
normal
distribution key,
upper-tail
AN
Equation:
standard
areaofthe
the
0.025
deviationisknown,
the
test.
the
hypothesis
two
tailsofthe
two-tail
probability.
-
0.05
&)
o/Vn
the
normal
willberejectedifthe
normal
significance
distribution.Touse
level
is
test
Keys:
122
(]
Because
hypothesisisnot
Here’sanalternative
.025
122
Because
not
B
the
calculated
(*](zp]
B
the
rejected.
rejectedatthe
test
statisticisless
Display:
1.8521
0.0320
probabilityisgreater
0.05
levelinthis
proceduretotest
1.9600
1.8521
than
the
the
Description:
Enters
population
calculates
Calculates
probability.
than
0.025
two-tail
hypothesis:
Calculates
Calculates
criticalzvalue,
hypothesized
mean
and
test
statistic.
upper-tail
(0.05+2),
test.
criticalzvalue.
test
the
the
statistic.
hypothesis
is
70
6:
Built-in
Library
Page 77

Part3.Calculate
mean.
Equations:
the
90%
confidence
interval
estimateofthe
population
The
inside
two-tail
90%
thatis(1—0.9)=2=
4%\_’/%»
Keys:
.05
[*](zp]
C
precision=——
.
confidence
confidence
0.05sothat
Display:
1.6449
1.2877
122.1623
124.7377
-
.
limits
level
you
zo
vn
—
=x
ZOo
+
T
n
willbetranslatedtoupper-tail,
can
use
the
[*](zp]
key.
Description:
Calculates
normal
Calculates
Calculates
confidence
Calculates
standard
variate.
precision.
lower
limit.
upper
limit.
Example:
followingisa
149.8,
129.6,
Population
random
109.3,
Part1.First,
Keys:
(«a)(LOAD]
A
()
enter
Standard
sampleof8
130.0,
133.4,
the
data.Inthis
Display:
0.0000
elements
116.4,
example
Deviation
Unknown.
fromapopulation:
and
134.8.
the
dataisraw.
Description:
Loads
Clears
1-StAt.
statistics
6:
Built-in
The
129.7,
registers.
Library
71
Page 78

129.7
149.8
129.6
109.3
130
133.4
116.4
134.8
()
A
Now
you
interval
can
either
estimate
test
(part
1.0000
2.0000
3.0000
4.0000
5.0000
6.0000
7.0000
8.0000
129.1250
4.2975
the
hypothesis
3).
This
example
(part2)or
includes
Enters
Calculates
raw
data.
mean
(optional).
Processes
calculates
data
and
standard
calculateaconfidence
both.
error.
Part2.If
would
137,
Because
the
alternativeisthat
you
rejectornot
testingatthe
youdonot
distributionofthe
small,
the
normal
The
alternative
translatestoan
hypothesis
upper-tailsoyou
Equations:
degreesoffreedom
the
reject
the
hypothesis
0.1
levelofsignificance?
know
the
population
test
statisticist
distribution
cannotbeusedasan
impliesalower-tail
can
A=
G
t
=n
-1
population
that
standard
distributed.
Because
test.
use
the
[€]
N
s/\/;z—
meanislower
the
population
deviation,
the
sample
approximation.
This
procedure
key.
than
the
137,
mean
is
sampling
is
72
6:
Built-in
Library
Page 79

Keys:
Display:
Description:
1
137
B
(«]
Because
the
Here’sanalternative
1
137
When
the
Part3.Calculate
the
calculated
hypothesisisrejected.
proceduretotest
[](tp)
B
the
two
values
are
critical
value.
Thus,
the
mean.
7.0000
-1.8325
1.8325
0.0548
tail
probabilityisless
the
hypothesis:
1.4149
-1.8325
1.8325
compared,
the
hypothesisisrejectedatthe
95%
confidence
the
calculated
interval
Checks
calculated
degreesoffreedom
(optional).
Enters
population
calculates
hypothesized
mean
test
statistic.
Convertstoupper
Calculates
upper-tail
probability.
than
0.1
(the
rejection
Calculatestdistribution
critical
Calculates
Convertstoupper
estimateofthe
value.
test
statistic.
statisticisgreater
0.1
level.
population
and
tail.
level),
tail.
than
The
inside
two-tail
probability,
thatis(1-0.95)+2=
Equations:
95%
confidence
/%\_’M
levelistranslatedtoan
0.025.
precision
upper-tail
ts
=
Vn
6:
Built-in
Library
73
Page 80

confidence
limits
=X
,
s
vn
degreesoffreedom
Keys:
.025
(](tp)
C
=n
Display:
2.3646
10.1619
-1
118.9631
139.2869
Population
Example:
Proportion
Confidence
Interval
Estimate.Asampleof65
showed38favoringaproposaltoraise
servicetostudents.
population proportioninfavorofthe
Part1.First,
Keys:
enter
Whatisthe
the
summary
Display:
99%
confidence
proposal?
statistics.
the
Description:
Calculates
statistic.
Calculates
interval.
Calculates
confidence
Calculates
confidence
student
interval
Description:
required
precision
lower
limit.
upper
limit.
feetoprovide
estimateofthe
test
of
students
bus
[«a)[LOAD]
65
38
74
D
[:]65=]
1
6:
Built-in
A
65.0000
0.5846
0.4928
0.0611
Loads
1-StAt.
Enters
sample
Calculates
sample
proportion.
and
size.
stores
CalculatesVp (1-p).
Calculates
standard
error.
Library
Page 81

Part2.The
key
for
impliedinthe
normal
the
calculations,
problem
(1-0.99)+2=
Equations:
approximation
translate
statementtoan
0.005.
4%_"/[%
methodisused.Touse
the
99%
inside-tail
upper-tail
probability:
the
confidence
[*](zp]
level
Keys:
.005
[*](zp]
C
Example:
their
new
logo
the
logo
at
least
Part1.First,
Keys:
TestofHypothesis.Afraternity
opinion
thatatleast
sweatshirt.Of75
sweatshirt,31madeapurchase.Tomeet
52%ofthe
confidence
members
enter
the
precision=zvp(-p)
vn
interval=p*zvp(
Display:
2.5758
0.1574
0.4272
0.7421
52%oftheir
randomly
would
summary
Display:
national
sampled
havetobuy.
statistics.
vn
Description:
Calculateszvalue.
Calculates
Calculates
Calculates
didamarket
members
members
their
Description:
precision.
lower
upper
studytotest
would
who
were
fund
raising
limit.
limit.
buy
their
offered
goal
[«<)[COAD]
75
A
D
75.0000
Loads
Enters
6:
Built-in
1-StAt.
sample
size.
Library
75
Page 82

31
(5]75=)
52
0.4133
1
0.4996
0.0577
Calculates
sample
and
stores
proportion.
CalculatesVn(1-)
hypothesized
Calculates
proportion.
standard
for
Eerror.
Part2.Test
the
populationis0.52
0.52.
Use
the
normal
significance.
With
the
statementofthe
regionofthe
the
lower-tail to
This
test
wherepis
normal
statisticiscalculated:
the
sample
proportion.
Keys:
hypothesis
against
that
the
the
alternative
approximation
alternative
distributionisimplied.
the
upper-tail.
%{\
zZ
=
VvV
proportion
Display:
proportionofbuyersinthe
that
the
proportionisless
method
hypothesis,
and
Use
test at
the
lower-tail
the
the
M
(P-m)
m(1=mp)
vn
and7is
the
hypothesized
Description:
than
0.05
level
of
critical
keytotranslate
population
52
B
+/-
(«]
The
hypothesisisrejected
significance
76
6:
level.
Built-in
Library
-1.8490
1.8490
0.0322
because
the
Enters
population
and
statistic.
Convertstoupper
Calculates
probability.
tail
probabilityisless
hypothesized
proportion
calculates
upper-tail
than
test
tail.
the
Page 83

Here’sanalternative
.05
[*](zp]
.52
B
proceduretotest
1.6449
-1.8490
1.8490
the
hypothesis:
Calculates
critical
Calculates
Convertstoupper
upper
value.
test
statistic.
tail
tail.
Because
fallsinthe
the
test
rejection
Example:
Means
Students
course
to
give
in
the
scores
hypothesis
is
greater
Part1.First,
using
of
have
has
exams
six
students
following
between
that
than
Student
Test
TestB
the
statisticisgreater
area
and
Test
on
Paired
Two
Populations
alleged
enter
key.
that
that
two
table.
the
two
TestAis
zero)?
Usea0.10
A
the
the
varyindifficulty.Inresponse,
different
Can
the
examsiszeroberejectedinfavorofthe
easier
1
90
83
difference
than
the
critical
the
hypothesisisrejected.
Differences
test
bank
foracertain
exams.
hypothesis
thanB(that
85
93 72
The
scoresofthe
that
the
the
mean
levelofsignificance.
2
3
78
between
4
75 80
68
each
value,
the
test
statistic
(Pairedt)of
large-enrollment
the
instructor
two
mean
difference
difference,A-
5
87
pairofobservations
agreed
exams
in
6
98
92
are
B,
Keys:
(«1)[COAD)
()] 0.0000
90
(-]
A
83
Display:
1.0000
Description:
Loads
1-StAt.
Clears
statistics
Enters
6:
raw
Built-in
data.
registers.
Library
77
Page 84

85
(-]
93
78()72
75
(-]
68
80
(-]
87
98
(-]
92
(]
A
Now
you
estimate.
can
test
This
exampleisa
2.0000
3.0000
4.0000
5.0000
6.0000
1.8333
Processes
calculates
difference
2.9599
the
hypothesisorcalculateaconfidence
Calculates
€rror.
testofhypothesis.
data
and
mean
(optional).
standard
interval
Part2.Test the
and,
since
unknown,
hypothesis.
the
sampleissmall
thetdistributionisused.
The
and
Equation:
t
where
disthe
s41sthe
d,isthe
meanofthe
sample
standard
hypothesized
differencesofthe
deviationofthe
mean
difference.
degreesoffreedom=n—1(nis
problemisstatedasan
the
population
d.—-do
Sq
/\/n_
paired
standard
values.
differencesofthe
the
numberofdifferences).
upper-tail
deviation
paired
values.
test
is
78
6:
Built-in
Library
Page 85

Keys:
Display:
Description:
1
0
B
(«]
Because
significance
the
tail
probabilityofthe
level,
the
Here’sanalternative
1
[](te]
0
B
5.0000
0.6194
0.2814
test
hypothesisisnot
A)%b_
proceduretotest
1.4759
0.6194
Reviews
degreesoffreedom
(optional).
Enters
mean
difference
calculates
Calculates
probability.
statisticisgreater
rejected.
the
hypothesis:
Calculatestdistribution
critical
Enters
mean
difference
calculates
calculated
hypothesized
and
test
statistic.
upper-tail
than
the
0.10
value.
hypothesized
and
test
statistic.
Because
the
calculated
hypothesisisnot
Example:
Suppose
random
Calculating
that
the
sample
size
within3unitsofthe
confidence?
The
problemisstatedasan
toanupper-tail
keytosolve
Use
probability,(1-
the
problem.
test
statisticisless
than
the
critical
rejected.
standard
Sample
deviation
Size
of a
populationis34.26.
mustbetakentoproduceanestimateofthe
true
the
population
normal
inside
mean(aprecisionof3)
probability
distribution.
two-tail
probability.Bytranslating
0.9)+2=0.05,
you
6:
can
Built-in
value,
What
with
use
the
Library
the
simple
mean
90%
this
[*](zp]
79
Page 86

Equation:
A
N
Keys:
(«1][LOAD]
34.26
3
.05
[>](zp]
R/S
The
conventionisto
larger
integer,inthis
Two
2-StAt
statistics
between
standard
Sample
stores
and
population
dewviation.
A
E
the
statistics
confidence
h
Display:
34.2600
3.0000
1.6449
352.8472
round
the
case
353.
Test
meansorproportions.Italso
Statistics
neededtoprepare
interval
zo
=
|\———_
[
precision
calculated
estimates
2
]
Description:
Loads
Enters
deviation.
Enters
Calculates
normal
Calculates
sample
sample
(2-StAt)
for
involving
program
standard
precision.
variate.
size.
sizeupto
1-StAttocalculate
the
difference
calculates
A.
standard
required
the
next
the
pooled
test
2-StAtisorganizedasfollows:
80
6:
Built-in
Library
Page 87

Difference
raw
dziy
Between
(«]([LOADIB
Formofdata?
Means
summary
statistics
e
Enter
15t
sample
(XEQJA
Enter2"sample
Which
normal
[XEQ)C
(«1][LOAD]A
distribution?
Test
V,(XEQ)B
[\)[@@)or
(displaysU,)
using
using
t
[«9)[COADJA
of
hypothesis
test
of
hypothesis
(displayszor
[w][Qt)
f)
normal
(XEQJC
[E]m/\
or
confldence
confidence
interval
U,
([e)(zplor(e*](tp]
(XEQ]C
(displays
[R/S)(displays
(R/S](displays
n,(XEQID
x,[R/S]
s,oro,[R/S]
n,[R/S)
%,[R/S)
s,0r
o,[R/S]
Which
distribution?
/
\t
interval?
(displayszor
precision)
lower
limit)
upper
limit)
[LOAD]A
1)
6:
Built-in
Library
81
Page 88

Difference
Between
(«2)(LOAD]B
Proportions
Assumed
non-zero
difference
n,[(XEQJD
P1
(XEQ]1
n,[R/S)
p2
(XEQJ2
(XEQJC
[ElmA
Testofhypothesnsorconfidence
of
test
hypothesis
V,(XEQ)B
[\l
(displaysz)
[Q@)]or
[H][QM)]
(displaysU,)
non-zeroorzero?
zZero
n,[(XEQ]D
P1
X,+X,
n_+
nz
p,[R/S]
(XEQ]B
(<]
0(XEQ]B(displays
()@@
interval?
confidence
interval
U,(e)(zplor(e](tp]
[XEQ]C
(displays
(displays
(R/S](displays
(displaysz)
precision)
lower
limit)
upper
limit)
XEQJ!
[LOAD]A
(displays
z)
U,)
82
6:
Built-in
Library
Page 89

1
(n—1+n_z)
Degreesoffreedomn;+n,-2.
Differenceinsample
Pooled
n,.
X5
S,.
n,.
X1
S
Calculates
entered.
Calculates
unknown
deviations.
Calculates
difference
deviations.
LBLD
LBL
1
LBL
2
Stores
Calculatesv/
Calculatesv/p,(1-p,).
2-StAt
1 1
standard
summary
Registers
or1ifBorCis
deviation.
and
moves
pooled
but
standard
when
standard
assumed
given
statistics
p(1-py)-
and
Labels
executed,
meansorproportions.
statistics
deviation
equal
population
errorofmean/proportion
unequal
from
respectively.
after
raw
estimate
standard
population
two
samples.
data
standard
is
of
The
method
summary
If
you
1.
2.
Enter
3.
Press
for
statistics.
are
using
Clear
the
sample
entering
raw
statistics
A.
data
data,
registersbypressing
data
for
dependsonthe
sample1using
data
type:
[®](CLZ].
[Z4].
6:
raw
Built-in
data
Library
or
83
Page 90

If
you
1.
2.
3.
.
Enter
0
.
Press
.
Optional:
registers
are
using
Enter
Enter
Enter
display
sampling
Enter
.
Enter
.
Enter
.
Optional:
registers
sample
the
the
the
the
the
the
data
to
process
The
values
showninthe
summary
sample
mean
for
standard
shows
the
distribution).
sample
mean
for
standard
The
stored
showninthe
for
sample2using
the
data
stored
tableonpage
statistics,
size
for
sample1and
sample1and
deviation
standard
size
sample2and
deviation
error
for
sample2and
and
calculated
tableonpage
and
and
calculated
press
for
sample1and
(standard
press
for
sample2and
[Z+].
display
83.
press
[R/S].
press
[R/S].
values
83.
the
standard
canberecalled
error.
D.
press
[R/S].
deviationofthe
[R/S].
press
[R/S].
canberecalled
from
The
from
the
the
Difference
Between
Hypothesis/Confidence
Example:
Unknown.
variances
84
are
A|86|109
B|93|101
6:
Built-in
Population
Sample
given
Library
data
below.
Standard
from
11291
111|117
Population
Interval
Deviations
two
populations
|103
105
Means
Estimation
assumedtohave
121
107
|97 |99
—
Equal
100
Test
and
of
equal
97
Page 91

Part1.First,
This
example
Equation:
enter
uses
the
data
and
raw
data.
oo
=g/ODT
calculate
nytn,
the
D
pooled
-2
standard
deviation.
Keys:
(«][LOAD]
(]
86
109
112
91
103
121
107
100
97
()
A
93
101
111
117
105
97
99
Display:
B
0.0000
1.0000
2.0000
3.0000
4.0000
5.0000
6.0000
7.0000
8.0000
9.0000
102.8889
Description:
Loads
2-StAt.
Clears
statistics
Enters
Calculates
sampleAdata.
mean
registers.
(optional).
0.0000
1.0000
2.0000
3.0000
4.0000
5.0000
6.0000
7.0000
Prepares
Enters
sampleBdata.
for
sample
B.
6:
Built-in
Library
85
Page 92

(]
103.2857
9.8355
1
14.0000
Calculates
(optional).
Calculates
standard
Recalls
degreesoffreedom
(optional).
mean
pooled
dewviation.
calculated
Pressing
Now
you
can
either
interval
includes
Part2.Test
equal
distribution
The
translatedtothe
[«a)[Q®))
Equation:
whereDis
andSis
estimate
both.
the
against
the
anda0.10
alternative
key.
the
the
standard
B
displays
the
test
the
(part
3).
The
hypothesis
alternative
levelofsignificance.
hypothesis
upper
impliesatwo-tail
tail
0.10+2=0.05,sothat
A
hypothesized
errorofthe
pooled
hypothesis
that
hypothesis
_
standard
statisticist
the
meansofthe
(1
-x3)-Dy)
-
difference
difference.
(part2)or
distributed.
that
they
rejection
N
S
between
deviation
are
the
again.
calculateaconfidence
This
example
two
populations
not
equal.
Use
area.
This
you
can
use
the
population
means,
is
are
the
t
5pisdefinedinpart1on
degreesoffreedom
86
6:
Built-in
=n;+n,
Library
S=Sp
page
85.
-
2
"—1—+—"l—
nq
n»p
Page 93

Keys:
Display:
Description:
[«<a][LOAD]
0
*/-
A
B
(«)
The
probabilityofgetting
approximately
hypothesis
that
0.47,
whichisgreater
the
two
Here’sanalternative
.05
[>][tp]
0
B
*/-
Because
is
not
rejected.
the
test
statisticisless
-0.0801
0.0801
0.4687
this
statisticifthe
than
means
are
equalisnot
proceduretotest
1.7613
-0.0801
0.0801
than
the
population
the
0.05
rejected.
the
hypothesis:
critical
Loads
1-StAt.
Enters
difference
population
calculatesttest
Convertstoupper
Calculates
hypothesized
between
means
upper
probability.
means
significance
Calculates
critical
Enters
difference
hypothesized
population
calculatesttest
are
level.
upper
value.
between
means
Convertstoupper
test
value,
the
hypothesis
and
statistic.
tail.
tail
equal
is
The
tail
and
statistic.
tail.
Part3.Calculate
between
The
probability,
the
inside
two
two
tail
thatis(1-
the
90%
confidence
population
90%
means.
confidence
0.9)+2=0.05,sothat
%’“’M
interval
estimateofthe
levelistranslatedtoan
you
can
use
6:
Built-in
difference
upper
the
[](tp]
Library
tail
87
Page 94

Equations:
precision=(sp
: :
confidence
s,1sdefinedinpart1on
degreesoffreedom
interval=(x|-x,)*tsp
=n;
Keys:
(q](LOAD]
.05
[][tp]
A
1
C
R/S
R/S
..
page
85.
+n,-2
Display:
14.0000
1.7613
8.7302
-9.1270
8.3333
—
1 1
—
+
—
ny
np
Description:
Loads
Checks
freedom
calculated
(optional).
Calculatestvalue.
Calculates
Calculates
confidence
Calculates
1 1
—
+
ny
1-StAt.
that
have
—
)
degrees
been
and
stored
precision.
lower
limit.
upper
limit.
of
Example:
Known.
population
Population
Samples
standard
are
taken
deviations
of75hasameanof43.2
second
deviationof1.45.
Enter
is
statistics.
88
sampleof125
the
data
hasameanof38.1
and
calculate
calculatedbypressing
6:
Built-in
Library
Standard
from
arc
Deviations
two
populations
known
withapopulation
andapopulation
the
standard
C
after
you've
but
unequal.
standard
error.
The
entered
Unequal
for
which
The
and
the
first
sample
deviationof1.34.
standard
standard
the
error
summary
The
term
Page 95

Equation:
m-m
-7
_
T
01
03
—
t—
hy
hp
Part1.First,
Keys:
[«1])(LOAD)
75
enter
B
D
43.2
1.34
125
38.1
1.45
C
Now
you
can
either
estimate.
confidence
Part2.Whatisthe
between
The
statisticisnormally
interval
the
population
the
data.
Display:
75.0000
43.2000
1.3400
125.0000
38.1000
1.4099
0.2019
test
the
hypothesisorcalculateaconfidence
estimate.
90%
confidence
means?
This
example
distributed.
uses
interval
summary
Description:
Loads
Enters
first
Enters
Enters
standard
Enters
second
Enters
Enters
of
second
statistics.
2-StAt.
sample
sample.
sample
population
deviation.
sample
sample.
sample
standard
Calculates
error.
This
example
estimateofthe
size
mean.
size
mean.
deviation
sample.
standard
interval
calculates
difference
from
of
the
For
these
Once
you've
upper-tail
conditions,
the
translated
probability,
4%\__)%
standard
the
inside
normal
two
distributionisused.
tail
90%
confidence
thatis(1—0.9)+2=0.05,
you
6:
can
Built-in
leveltoan
use
the
Library
[(*](zp]
89
Page 96

Equations:
confidence
Keys:
(«](LOAD]
.05
[*](zp]
A
C
Difference
Example:
populations.
responding
proportion
Difference
“yes”
responding
Between
The
.
.
precision
interval=(x1-X3)*z
Display:
1.6449
0.3321
4.7679
5.4321
Population
Non-Zero.
first
was
sample
0.47.
“yes”
size
The
was
_
=z
was
second
0.35.
-7
0’1
—
hy
_
Samples
400
and
sample
0'2
4
=
nj
ol
1,22
o2
nq
n,
Description:
Loads
1-StAt.
Calculates
value.
Calculates
Calculates
estimateofdifference.
Calculates
upper-tail
precision.
lower
upper
Proportions
were
taken
from
the
proportionofpersons
size
was
500
and
limit
limit.
two
the
z
of
Part1.Enter
term.
Equation:
90
6:
Built-in
the
Tp.-ps
Library
summary
=\/
statistics
and
calculate
pi(1-py)+p2(1-p)
ny
the
h;
standard
error
Page 97

Keys:
(«1)[LOAD]
400
D
47
1
500
.35
2
C
Now
you
can
interval
estimate
B
either
test
(part
Display:
400.0000
0.4700
0.4991
0.4991
500.0000
0.3500
0.4770
0.4869
0.0328
the
hypothesis
3).
This
example
(part2)or
includes
Description:
Loads
2-StAt.
Enters
sample.
Enters
first
Calculatesy/
Enters
Enters
sample.
Enters
second
Calculatesv/p,(1-p,).
Entersitand
data.
Calculates
for
assumedtobe
sizeoffirst
proportion
sample.
result.
sizeofsecond
proportion
sample.
standard
test
with
calculateaconfidence
both.
for
p(1-p»y).
for
processes
difference
non-zero.
error
Part2.Test
proportionsis0.04
Usea0.01
The
problem
two-tail
leveltoupper-tail,
the
hypothesis
levelofsignificance
statement
rejection
area.
that
AN
that
against
the
implies
Once
is,
0.01<+2=0.005,
the
differences
alternative that
and
the
normal
the
useofthe
you've
translated
N
between
the
differenceisnot
approximation
normal
the
you
distribution
two-tail
can
use
6:
Built-in
the
population
method.
significance
the
(4]
Library
0.04.
and
a
key.
91
Page 98

Equation:
zZ
=
\/pl(l
(1
-p2)-Dy
-py)|,(1
hy
-po)
UPp)
D,isthe
Keys:
[«1][LOAD]
.04
hypothesized
A
B
difference.
Display:
2.4369
(«] 0.0074
Because
probabilityof0.005,
Here’sanalternative
.005
.04
Because
not
Part3.Calculatea95%
between
the
[*](zp]
B
the
rejected.
the
probabilityofthe
the
hypothesisisnot
proceduretotest
2.5758
2.4369
test
statisticisless
confidence
population
proportions.
test
statisticisgreater
rejected.
the
than
the
critical
interval
Description:
Loads
Enters
difference
test
statistic.
Calculates
normal
than
hypothesis:
Calculates
Calculates
value,
estimateofthe
1-StAt.
hypothesized
and
calculates
upper-tail
probability.
the
tail
criticalzvalue.
test
statistic.
the
hypothesis
difference
is
To
use
[](zp],
you
must
leveltoupper-tail:(1—
A
92
6:
Built-in
Library
also
translate
0.95)+2=
—
the
0.025.
inside
two-tail
95%
confidence
Page 99

Equations:
confidence
precision
z\/pl(1
=
interval=(p;-p,)*z\/
py)
-
p2(1
s
p1)
-
h,
p1(1-py)sp2(1-py)
ny
h;
Keys:
(«1][LOAD]
.025
A
[](zp)
C
(R/S]
Example:
populations.
“yes”toa
replied
“yes”inthe
Part1.Enter
proportion.
Equation:
Difference
particular
“yes”tothat
two
Display:
1.9600
0.0643
0.0557
0.1843
Zero.
The
first
sample
question.
question.Itis
populationsisthe
the
data,
including
Samples
size
was
The
second
hypothesized
same.
the
—_
(x1
(ny+ny)
Description:
Loads
Calculateszvalue.
Calculates
interval.
Calculates
difference
population
Calculates
were
taken
from
250
and
117
respondents
sample
size
that
the
calculationofthe
+x3)
1-StAt.
precision
lower
between
proportions.
upper
two
was
283
proportion
pooled
limit
limit.
replied
and
124
of
sample
of
of
6:
Built-in
Library
93
Page 100

Keys:
(x2)(LOAD]
250
117
(2]
117
B
D
250
=] 0.4680
124
(5]
(][@250
1
283
124
[z)
283
(5]
B
283
5]
Display:
250.0000
241.0000
0.4522
0.4977
0.4977
283.0000
0.4382
0.4977
Description:
Loads
2-StAt.
Enters
sizeoffirst
sample.
Calculates
first
Calculates
successes.
Calculates
proportion
sample
and
enters
proportion.
sum
of
pooled
p.
CalculatesVp(1-p).
Enters
Enters
result.
sizeofsecond
sample.
Calculates
sample
second
Processes
calculates
term.
and
enters
proportion
sample.
statistics
standard
of
and
error
Part2.Test
samples
0.10
In
the
tail:
94
are
significance
this
problem
(€]
0.10
=2=0.05.
6:
Built-in
the
hypothesis
equal
level
the
key,
AN
Library
against
and
normal
you
must
that
the
proportionsof“yes”inthe
the
alternative that
the
normal
approximation
they
approximationisused.
translate
the
two-tail
N
two
are not
equal.
Use
method.
And,inordertouse
rejection
areatoupper-
a
 Loading...