

Page 1

Hantek
®
Hantek
No.177 zhuzhou road(huite industry city),
QingDao,China
Electronic co.,Ltd.
Page 2
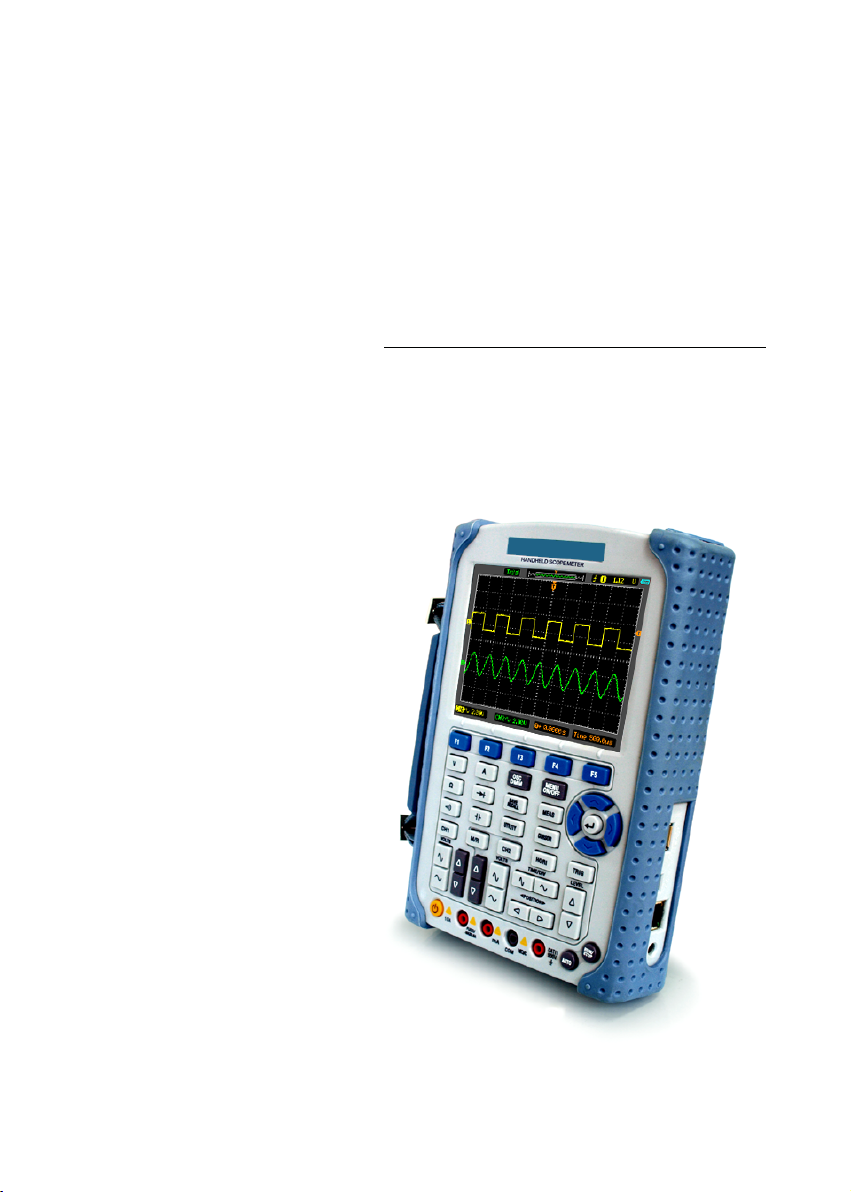
DSO8000 SERIES
HANDHELD SCOPEMETER
USER’S
MANUAL
8060
www.hantek.com.cn
Page 3
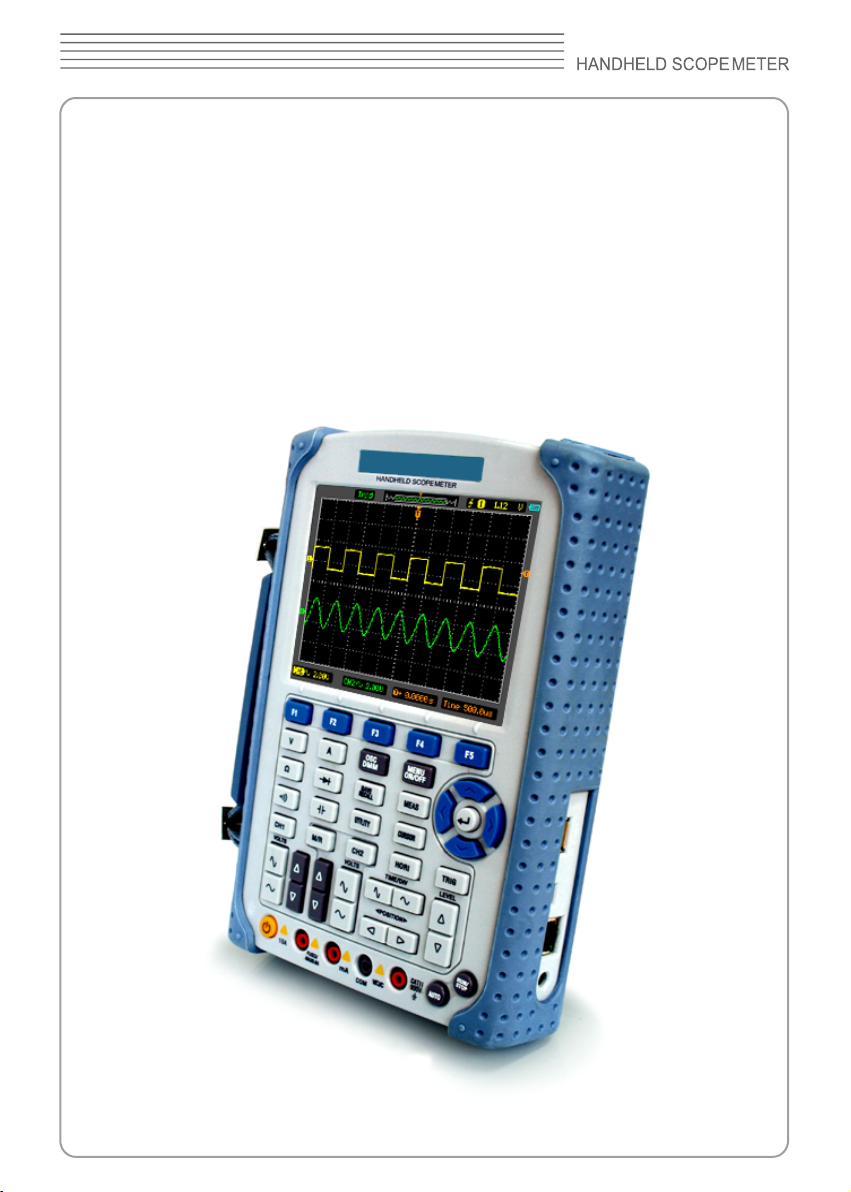
DSO8000 SERIES
USER’S MANUAL
8060
Page 4
8060
Content
General Safety Notice …………………………………….…..3
Digital Scope Meters………………………..…………………4
CHAPTER 1: Getting Start…………………………………... 6
General Check………………………………………....7
User’s Interface……………………………………...…7
Input Connections…………………………………
Function Check……………………………………….13
To compensate probes…………………………
To display a signal automatically…………………....15
Using the Scope Meter……………………………
CHAPTER 2: Operating Scope……………………………..19
Set Vertical System……………………………
Set Horizontal System…………………………
Set Trigger System………………………………
Save / Recall Waveforms and Setups……………...48
Utility Function……………………………
Signal Measurement……………………………
Cursor Measurement…………………………
IO Set.......................................................................70
CHAPTER 3: Using examples…………………………
CHAPTER 4: Multimeter………………………………….....81
CHAPTER 5 Waveform Generator....................................95
CHAPTER 6: Troubleshooting…………………………….106
CHAPTER 7: Specications……………
CHAPTER 8: Appendix...................................................110
…………
………………
....
…..
...
…….
…….
…..
…..
….......
…...73
….107
.12
...14
.16
..20
.36
.40
...52
..63
66
Page 5
DSO8000 SERIES
General Safety Notice
1. Safety Terms and Symbols
Terms in this manual:
These terms may appear in this manual:
WARNING: Warning statements identify conditions or practices that could result in injury
or loss of life.
CAUTION: Caution statements identify conditions or practices that could result in
damage to this product or other property.
Terms on the Product:
These terms may appear on the product:
DANGER: indicates an injury hazard may be immediately accessible.
WARNING: indicates an injury hazard may be not immediately accessible.
CAUTION: indicates that a potential damage to the instrument or other property
might occur.
Symbols on the Product:
These symbols may appear on the product:
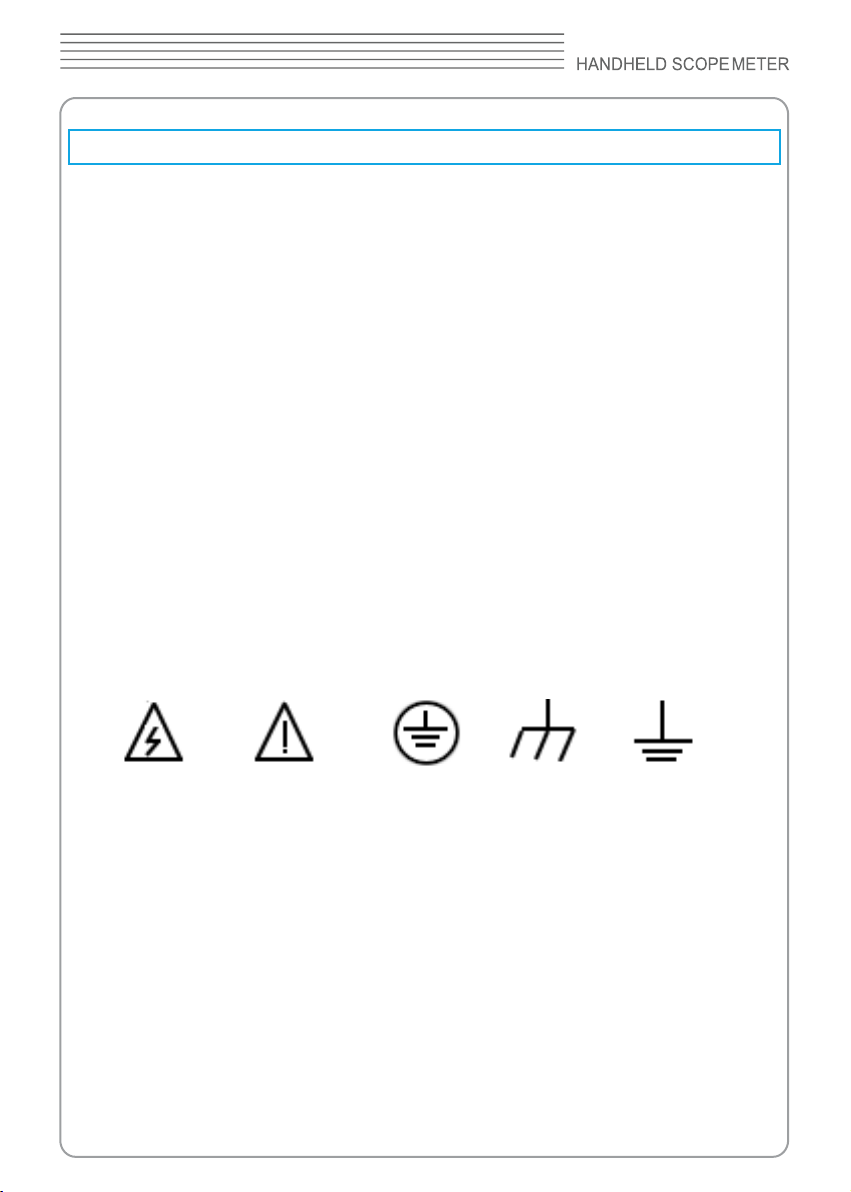
Hazardous Refer to Protective Grounding Test
Voltage Instructions Earth Terminal Terminal Grounding
of Chassis Terrninal
2. General Safety Information
Carefully read the following safety information in order to avoid any personal injury
or damage on this product or any products connected with it. Review the following
safety precautions carefully before operate the device to avoid any personal injuries or
damages to the device and any products connected to it. To avoid potential hazards use
the device as specied by this user’s manual only.
■ To Avoid Fire or Personal Injury.
■ Use Proper Power adapter.
and certied for the country of use.
Use only the power cord specied for this product
Page 6
8060
■ Connect and Disconnect Properly.
leads while they are connected to a voltage source.
■ Connect and Disconnect Properly.
measurement device before connecting the probe to the circuit under test. Disconnect
the probe input and the probe reference lead from the circuit under test before
disconnecting the probe from the measurement device.
■ Observe All Terminal Ratings.
and markings on the product. Consult the product manual for further ratings
information before making connections to the product.
■ Use Proper Probe.
measurement.
To avoid shock hazard, use a properly rated probe for your
■ Avoid Circuit or Wire Exposure.
components when power is on.
■ Do Not Operate With Suspected Failures.
device, have it inspected by qualied service personnel before further operations.
■ Provide Proper Ventilation.
ventilation of the device.
Refer to the installation instructions for proper
Do not connect or disconnect probes or test
Connect the probe output to the
To avoid re or shock hazard, observe all ratings
Do not touch exposed connections and
If suspected damage occurs with the
■ Do not operate in Wet/Damp Conditions.
■ Do not operate in an Explosive Atmosphere.
■ Keep Product Surfaces Clean and Dry.
Digital Scope Meters
DSO8000 Series
measurements in a compact, lightweight package. DSO8000 series is ideal for
production test, eld service, research, design, education and training involving
applications of analog circuit tests and troubleshooting.
digital scope meters offer exceptional waveform viewing and
Product features:
■ Dual Channel, Bandwidth:
60MHz (DSO8060)
■ Maximum real-time sampling rate:
150MSa/s (DSO8060)
Page 7
DSO8000 SERIES
■ Memory depth:
32K points (Single Channel), 16K points (Dual Channels)
■ Color TFT LCD, 320×240 pixels resolution.
■ USB storage and printing supports, rmware upgrade via USB interface.
■ Adjustable waveform intensity, more effective waveform viewing.
■ One-touch automatic setup, ease of use (AUTOSET).
■ 15 Waveforms, 15 setups, supports CSV and bitmap format.
■ 22 Automatic measurements.
■ Automatic cursor tracking measurements.
■ Waveform recorder, record and replay dynamic waveforms.
■ User selectable fast offset calibration.
■ Built-in FFT function, Frequency Counter.
■ Pass/Fail Function.
■ Addition, Subtraction, Multiplication and Division Mathematic Functions.
■ Advanced trigger types include: Edge, Pulse width,ALT,Video.
■ Multiple Language User Interface.
■ Pop-up menu makes it easy to read and easy to use.
■ Built-in multi-language help system.
■ Easy-to-use le system supports Multi-Language characters le name
input.
■ Selectable bandwidth limit:
DSO8060:20MHz
Page 8
8060
CHAPTER 1: Getting Start
This chapter covers the following topics:
General Check
■
Functional Check
■
The User Interface
■
Input Connections
■
To compensate probes
■
To display a signal automatically
■
Using the Scope Meter
■
Page 9
DSO8000 SERIES
General Check
When you have got a new DSO8000 series scope meter, it is suggested that you should
perform a general inspection on the instrument according to the following steps:
■ Check the shipping container for damage:
Keep the damaged shipping container or cushioning material until the contents of the
shipment have been checked for completeness and the instrument has been checked
mechanically and electrically.
■ Check the accessories:
Accessories supplied with the instrument are listed in “Accessories” in this guide. If the
contents are incomplete or damaged,please notify our distributor at your local area or
the overseas sales dept.
■ Check the instrument:
In case there is any mechanical damage or defect, or the instrument does not operate
properly or fails performance tests, please notify our distributor at your local area or
the overseas sales dept.
User’s Interface
The rst thing to do with a new scope meter is to know its front panel. This chapter
helps to be familiar with the layout of the keys and how to use them. Read this chapter
carefully before further operations.
Front Panel (Figure 1-1):
The buttons not only allow you to use some of the functions directly but also bring up the
manual keys on the screen, which enable the access to many measurement features
associated with advanced functions, mathematics, and reference or to run control
features.
Page 10

8060
v
Figure 1-1 Scope Meter Front Panel
Page 11
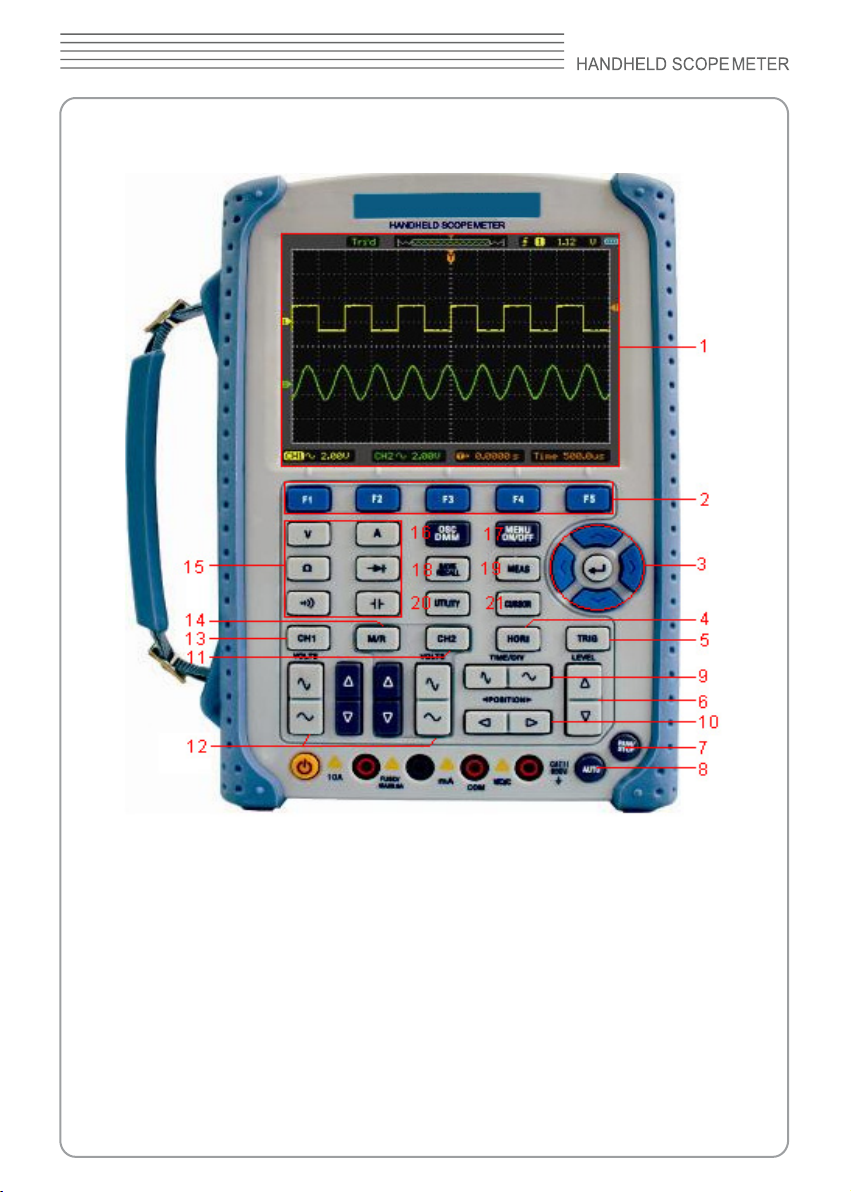
DSO8000 SERIES
Figure 1-2 Front Panel Description
Description
1. LCD Display
2. F1~F5: Sets or switch options for the menu
3. Arrow Keys
4. HORI: Shows Horizontal menu
5. TRIG: Shows Trigger menu
6. LEVEL: Adjust the trigger level
7. RUN/STOP: key for running or stopping the operation
8. AUTO: Be used for auto setting under the oscilloscope operation mode
Page 12
8060
9. TIME/DIV: Decrease or Increase the time base
10. POSITION: Adjust the horizontal trigger position
11. CH2: Shows the CH2 menu
12. VOLTS: Decrease or Increase the voltage/div
13. CH1: Shows the CH1 menu
14. M/R: Shows the Math or REF menu
15. DMM Buttons: The DMM control buttons
16. DMM/SCOPE: Switch DMM , Scope or RPM function
17. MENU ON/OFF: Turn on/off the menu
18. SAVE RECALL: Shows SAVE or RECALL menu
19. MEAS: Shows Measurement menu
20. UTILITY: Shows Utility menu
21. CURSOR: Shows Cursor menu
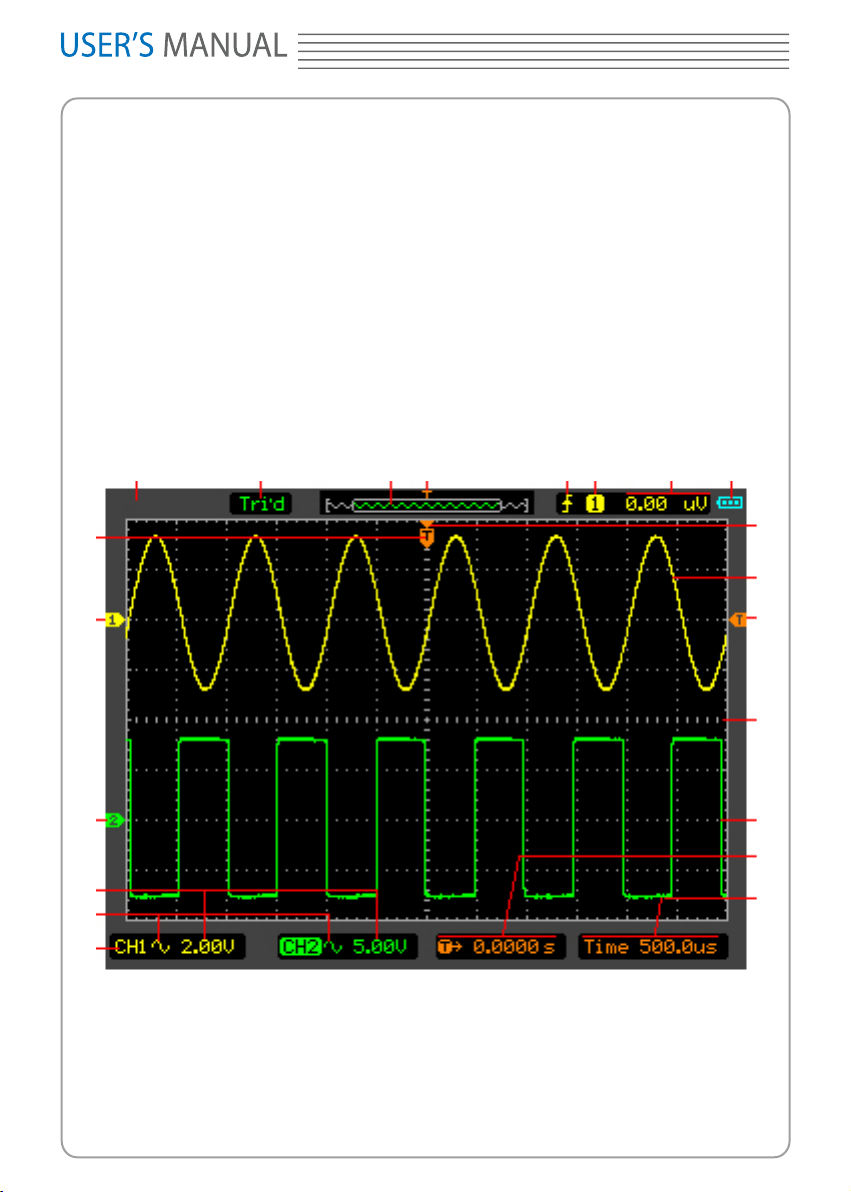
Display screen
1 15 3 4 5 6 7 8
21
20
19
18
17
16
Figure 1-3 LCD Display screen
Description
1. Shows Brand
2. Shows horizontal trigger time
9
10
11
12
13
2
14
0
Page 13
3. Shows location of the current waveform in the memory
4. Shows the trigger position in the memory
5. Shows the trigger mode
6. Shows the trigger source
7. Shows the trigger level
8. Shows the power
9. The center of current waveform window
10. CH1 waveform
11. The trigger level symbol
12. The grid
13. CH2 waveform
14. Shows the time base
15. Shows running staturs
16. CH1/CH2
17. Shows the coupling
18. Shows the voltage/div
19. CH2 mark
20. CH1 mark
21. Shows the trigger position in current waveform window
DSO8000 SERIES
Page 14
8060
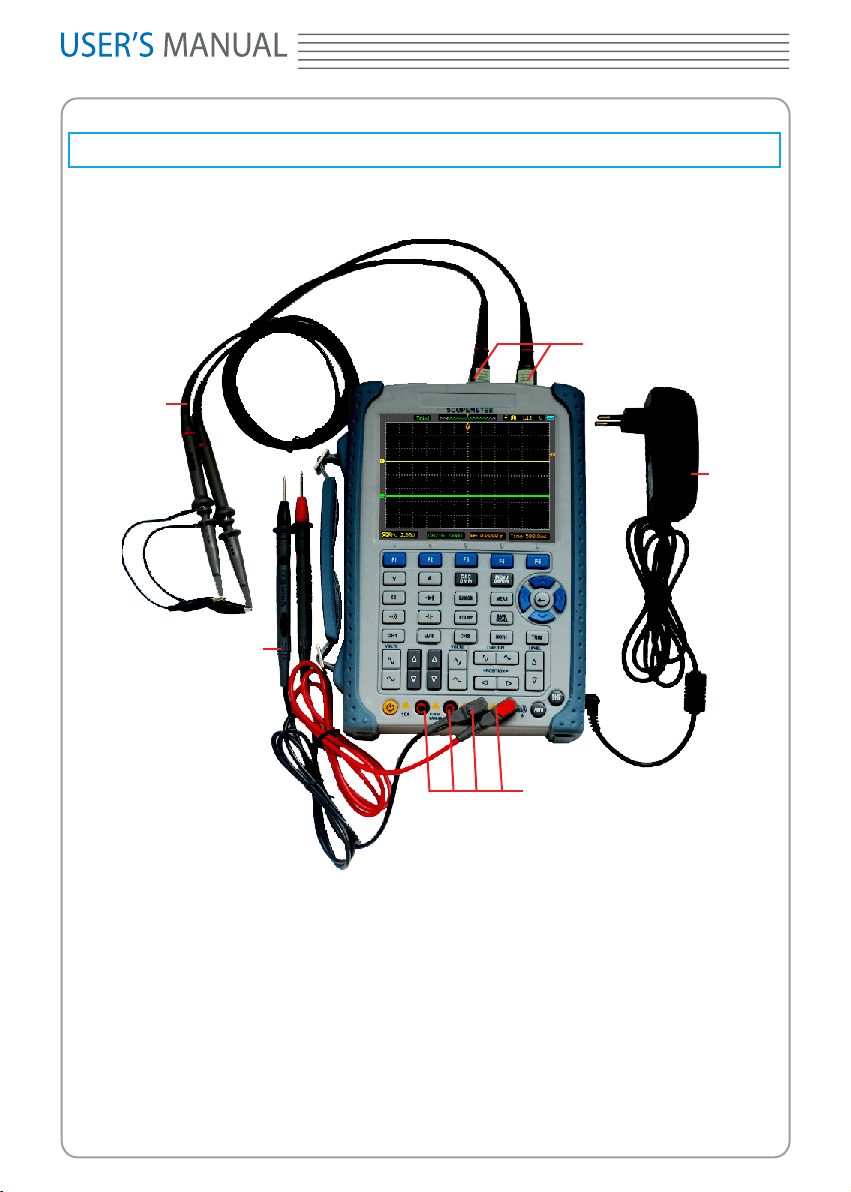
Input Connections
See the following Figure 1-4:
4
5
1
3
2
Figure 1-4 Input Connections
Description:
1. The power adapter is supplied for AC power supply and battery recharging.
2. Multi-meter input jacks, including four circular banana jacks .The four circular jacks
are used for voltage,resistance,mA range current and A range current inputs.
3. Multi-meter test lead.
4. Scope Meter probes.
5. Scope Meter input channels.
Page 15
DSO8000 SERIES
Function Check
Perform this quick functional check to verify that your scope meter is operating correctly.
1. Turn on the instrument.
Use the power adapter designed for your scope meter only. Use a power source that
delivers 100 to 240 VACRMS, 50Hz. Turn on the scope meter.
2. Input a signal to a channel.
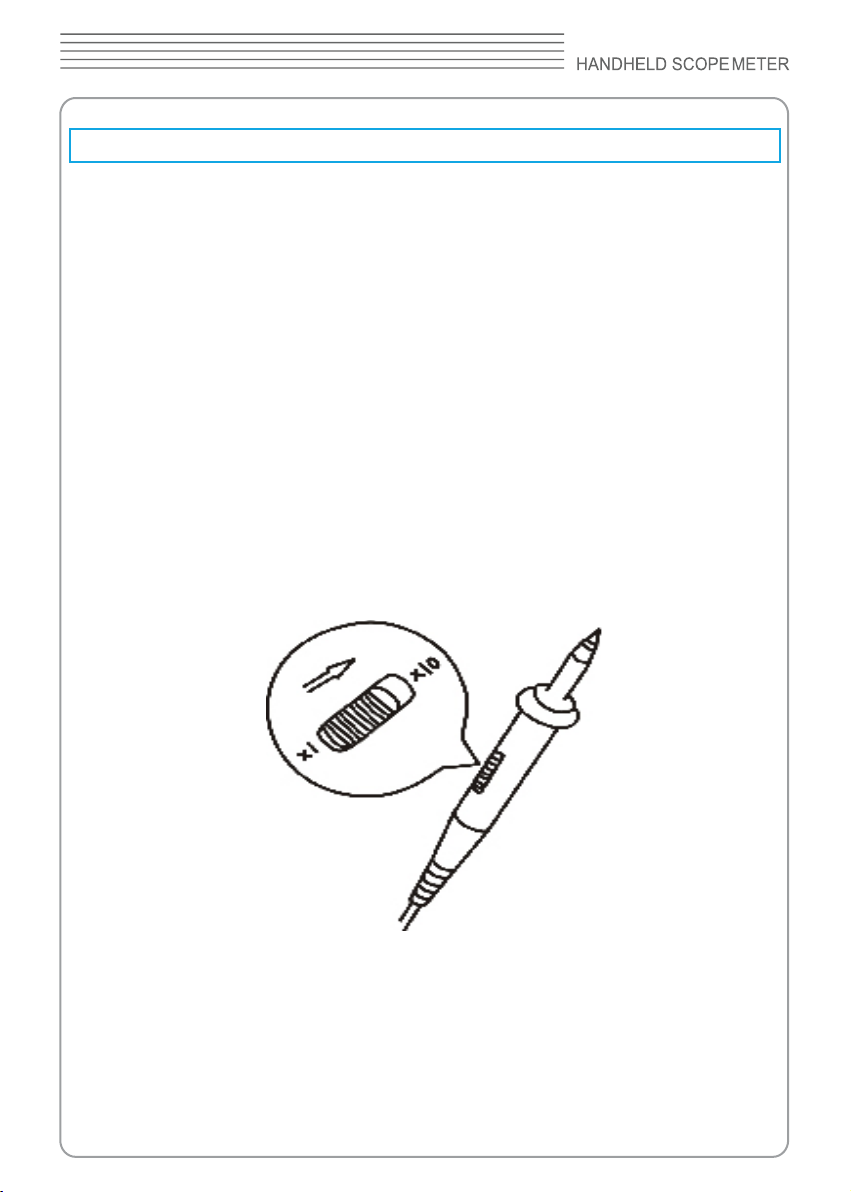
Set the attenuation switch on the probe to X10 and connect the probe to CH1 on the
scope meter.
To do this:
Align the slot in the probe connector with the key on the CH1 BNC connector.
■
Push to connect, and twist to the right to lock the probe in place.
■
Attach the probe tip and ground lead to the OUTPUT port.(Before this,you must press
■
OSC/DMM key to Enter Waveform Generator mode and output a 1kHz 2V peak -to-peak
square wave.And then Enter the Oscilloscope mode.)
Set the probe attenuation of the scope meter to 10X.To do this, push CH1→Probe→10X
.
Figure 1-5 Set the probe
3. Push the
(approximately 1 kHz 2 V peak- to- peak).
Turn off CH1 and turn on CH2, repeat steps 2 and 3.
button. Within a few seconds, a square wave will display
AUTO
Page 16
8060
To compensate probes
Perform this adjustment to match the characteristics of the probe and the channel input.
This should be performed whenever attaching a probe to any input channel the rst time.
1. From CH1 menu, set the probe attenuation to 10X (press
Set the switch to X10 on the probe and connect it to CH1 of the scope meter.
When usiing the probe hook-tip, insert the tip onto the probe rmly to ensure proper
connection.
Attach the probe tip to the probe compensator connector and the reference lead to the
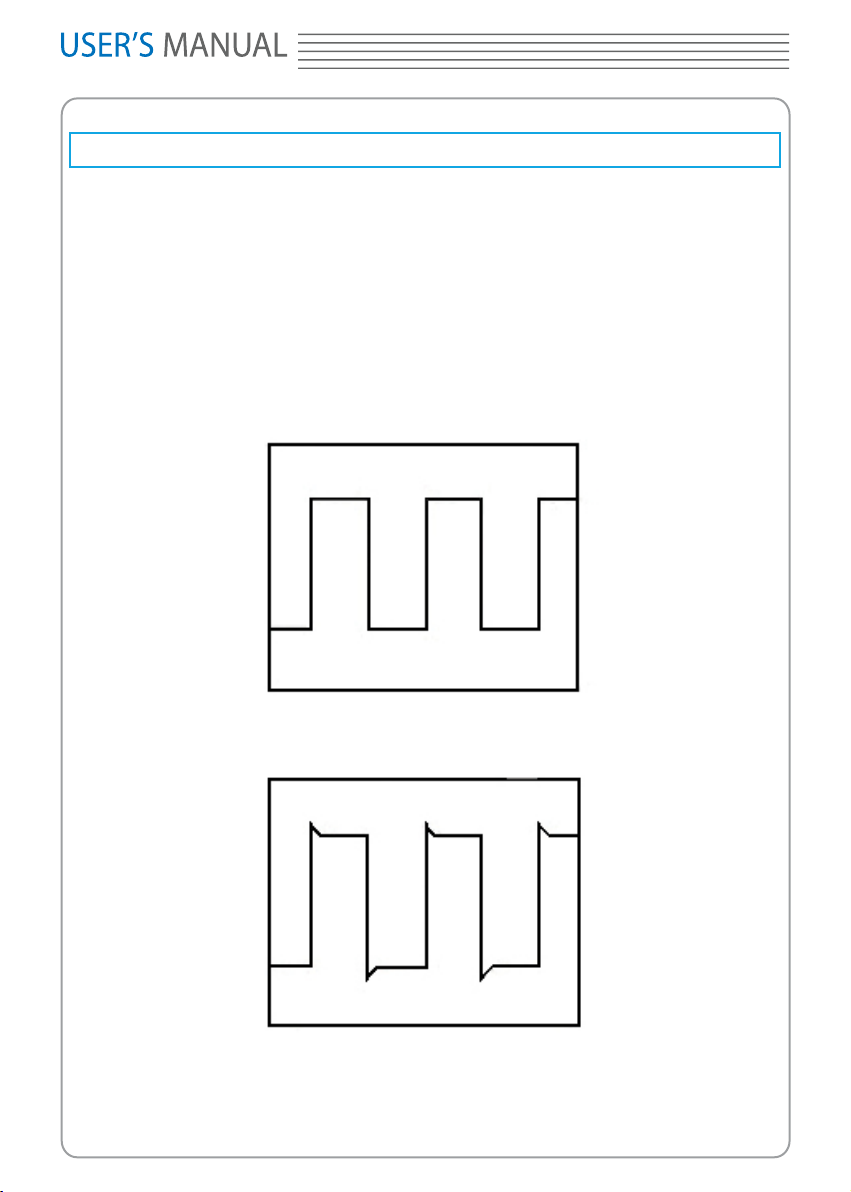
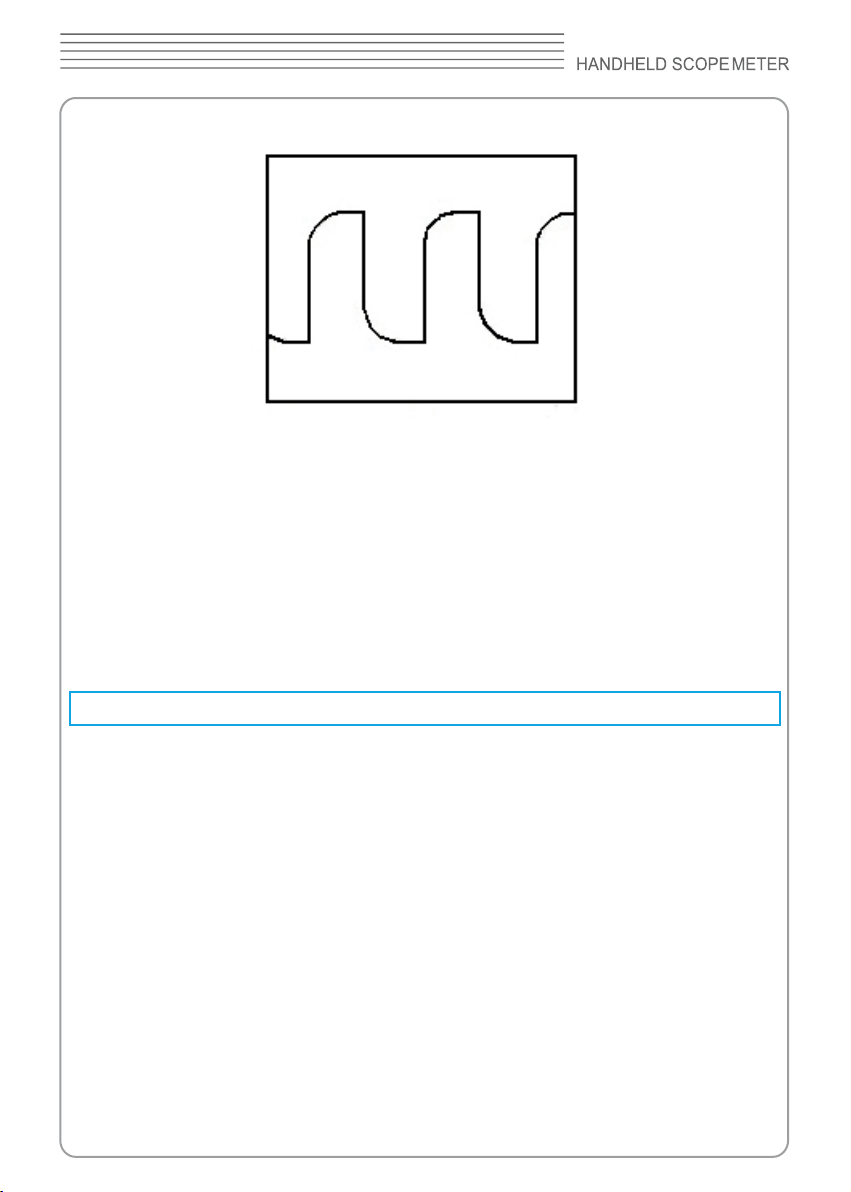
ground pin, Select CH1, and then press AUTO.
2. Check the shape of the displayed waveform.
Correctly Compensated
CH1→Probe→10X
).
Over compensated
Page 17
DSO8000 SERIES
Under Compensated
3. If necessary, use a non-metallic tool to adjust the trimmer capacitor of the probe for
the attest square wave being displayed on the scope meter.
4. Repeat if necessary.
WARNNING: To avoid electric shock while using the probe, be sure the perfection of
the insulated cable, and do not touch the metallic portions of the probe head while it is
connected with a voltage source.
To display a signal automatically
The scope meter has an Auto feature that automatically sets up the scope meter to best
display the input signal. Using Auto requires signals with a frequency greater than or
equal to 50 Hz and a duty cycle greater than 1%.
Press the AUTO button, the scope meter turns on and scales all channels that have
signals applied, and it selects a time base range based on the trigger source. The trigger
source selected is the lowest numbered input that has a signal applied. The scope meter
has two-channels input . Connect a signal to the CH1 input.
1.Connect a signal to the scope meter.
2.Press AUTO.
The scope meter may change the current setting to display the signal. It will automatically
adjust the vertical and horizontal scaling, the trigger coupling, type, position, slope, level,
and mode settings.
Page 18
8060
Using the Scope Meter
This part provides a step-by-step introduction to the scope functions. The introduction
does not cover all of the capabilities of the scope functions but gives basic examples to
show how to use the menus and perform basic operations.
Turn on the scope meter
Connect scope meter to AC power via a power adapter. (The scope meter can still work
with built-in Li-ion battery even without AC power supply.)Turn the scope meter on by
pressing down the power on/off key.The instrument then performs Self-checking after
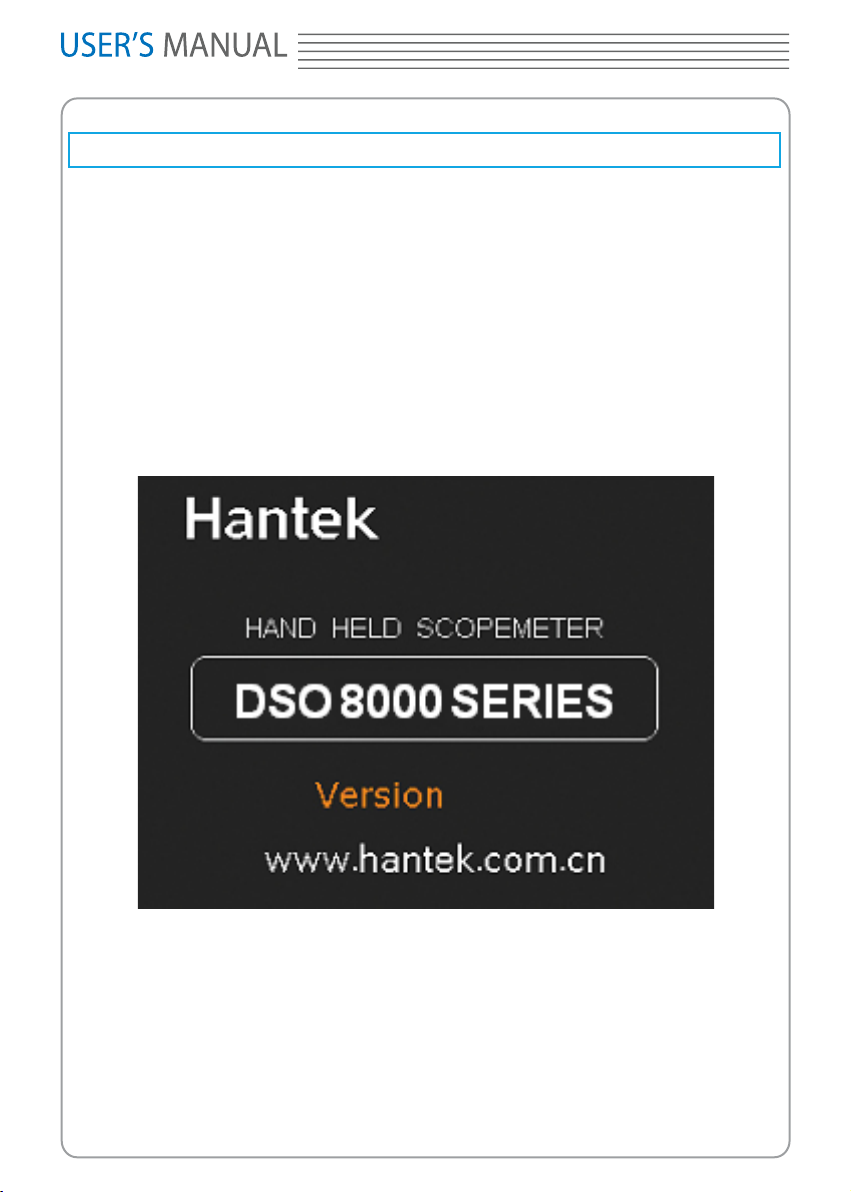
power on. The welcome picture will display on the screen when the system nishes Self-
checking.
The scope meter is powered on in its last setup conguration.
Figure 1-6 The Login window
Menu Operation
The following example shows how to use the tools menus to select a function, as shown
in the following gure.
Page 19
DSO8000 SERIES
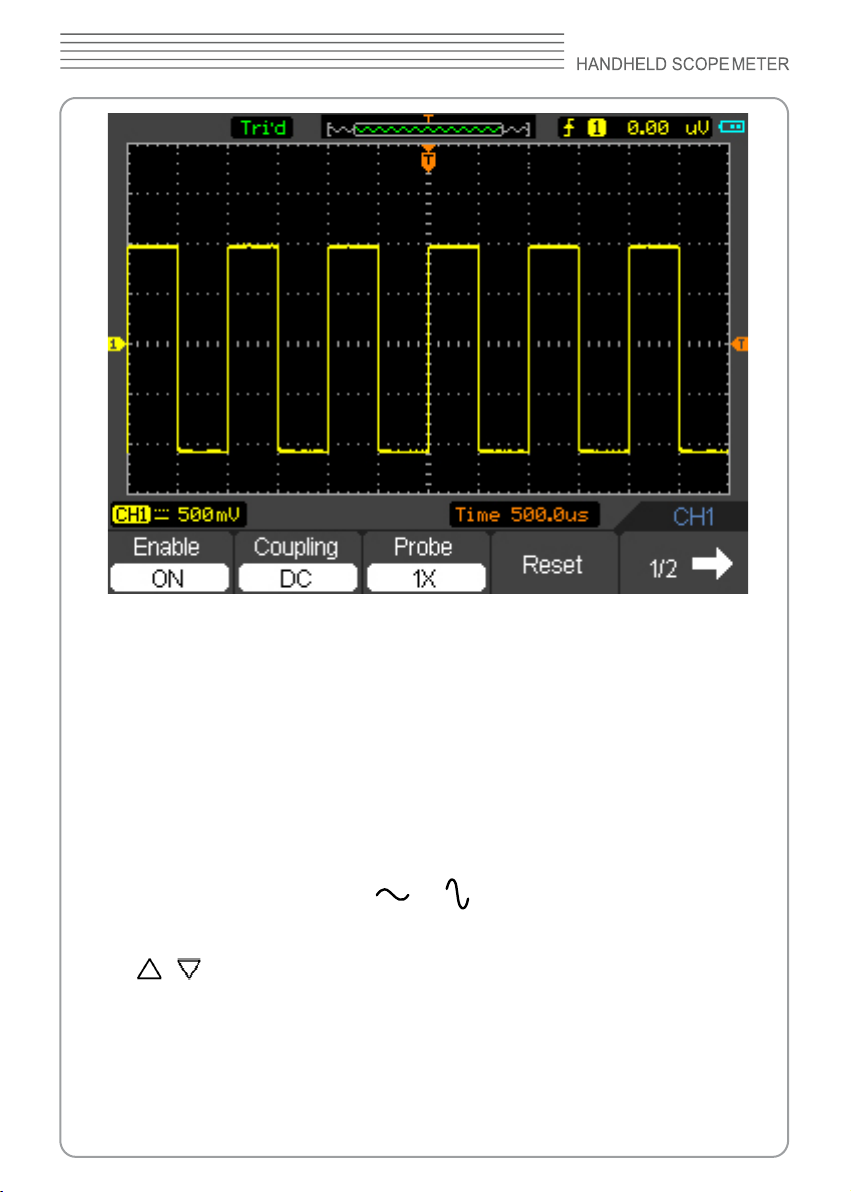
Figure 1-7 The Menu
1. Press the
screen and the corresponding optional settings on the bottom. Press
OFF
2. Choose one key from F1 to F5 and press it to change function setting.
MENU ON/OFF
again to hide the Function Menu.
key to display the Function Menu on the bottom of the
MENU ON/
Set up the vertical system
1. Change the vertical setup and notice that each change affects the
status bar differently.
Change the vertical sensitivity with or button and notice the change in the
■
status bar.
2. Move the signal vertically.
The / button moves the signal vertically. Also notice that the channel symbol
■
on the left side of the display moves in conjunction with the button.
To set up the horizontal system
1. Change the time base.
Page 20
8060
The or button changes the time base in a 1-2-5 step sequence, and displays
■
thevalue in the status bar.
2. Move signal horizontally.
The or button moves displayed signal horizontally on waveform window. It sets
■
the trigger point position.
Set up the trigger system
1. Change the trigger Level
The or button changes the trigger level. The trigger level value is displayed
■
at the top-right of the screen and a line is displayed showing the location of the trigger
level.
2. Change the trigger setup and notice these changes in the status bar.
Press TRIG button in the key panel.Choose one key from F1 to F5 and press it to
■
change function setting.
Page 21

DSO8000 SERIES
CHAPTER 2: Operating Scope
The end user should know how to determine the system setup from the status bar of a
Scope Meter. This chapter will detail the scope meter function of the test tool.
Set Vertical System
■
Set Horizontal System
■
Set Trigger System
■
Save and Recall waveforms and setups
■
Utility Function
■
Measure Signal
■
Cursor Measure
■
Page 22
8060
Set Vertical System
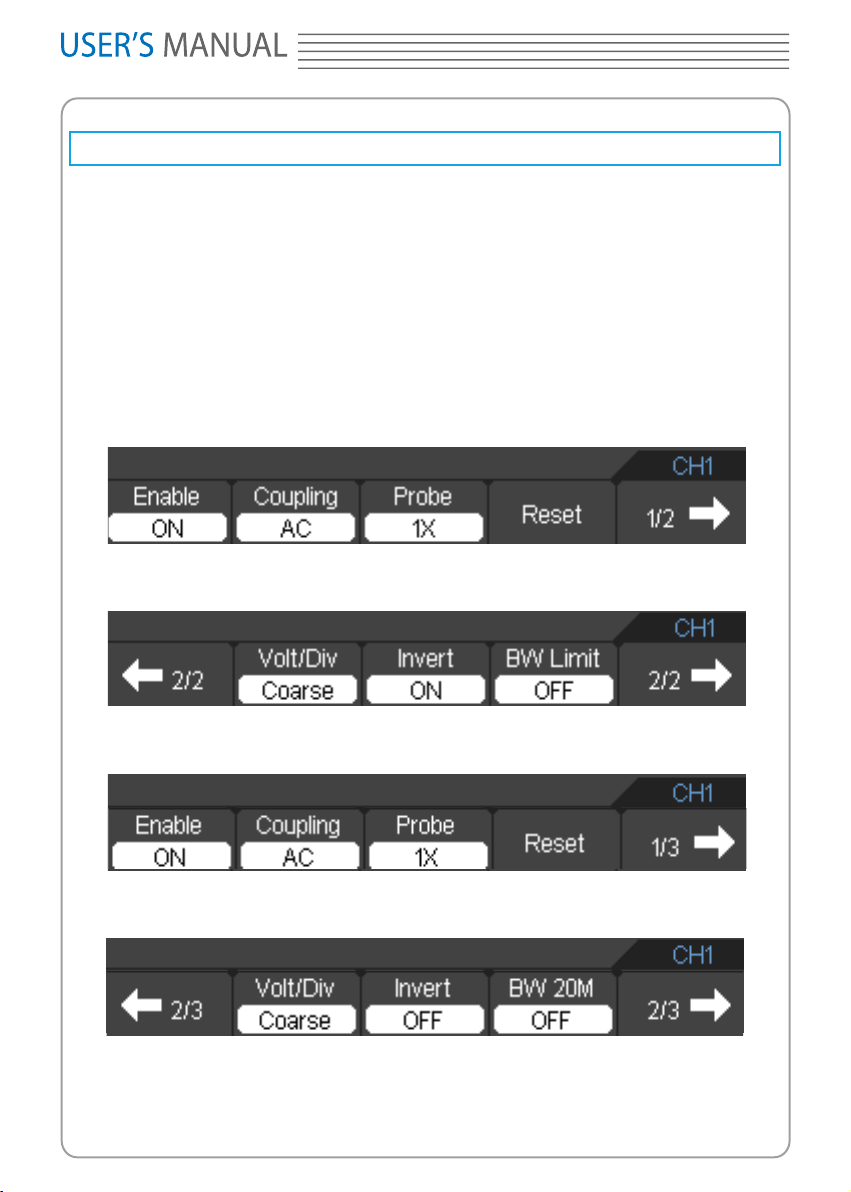
Each channel of Scope meter has its own independent operation menu and it will pop up
after pressing CH1 or CH2 button. The settings of all items in the menu are shown in the
table below.
To make vertical CH1 and CH2 settings, do the following:
1. Press the CH1 or CH2 button and then the function menu appears at the bottom of the
screen.
2. Select and press key from F1 to F5 keys to make different settings.
Now, you can nd the menu that looks like the following gure 2-1.
The CH1 menu (Page 1/2)
The CH1 menu (Page 2/2)
The CH1 menu (Page 1/3)(not include DSO8060)
The CH1 menu (Page 2/3)(not include DSO8060)
The CH1 menu (Page 3/3)(not include DSO8060)
0
Page 23
DSO8000 SERIES
Figure 2-1 The CH1 Menu
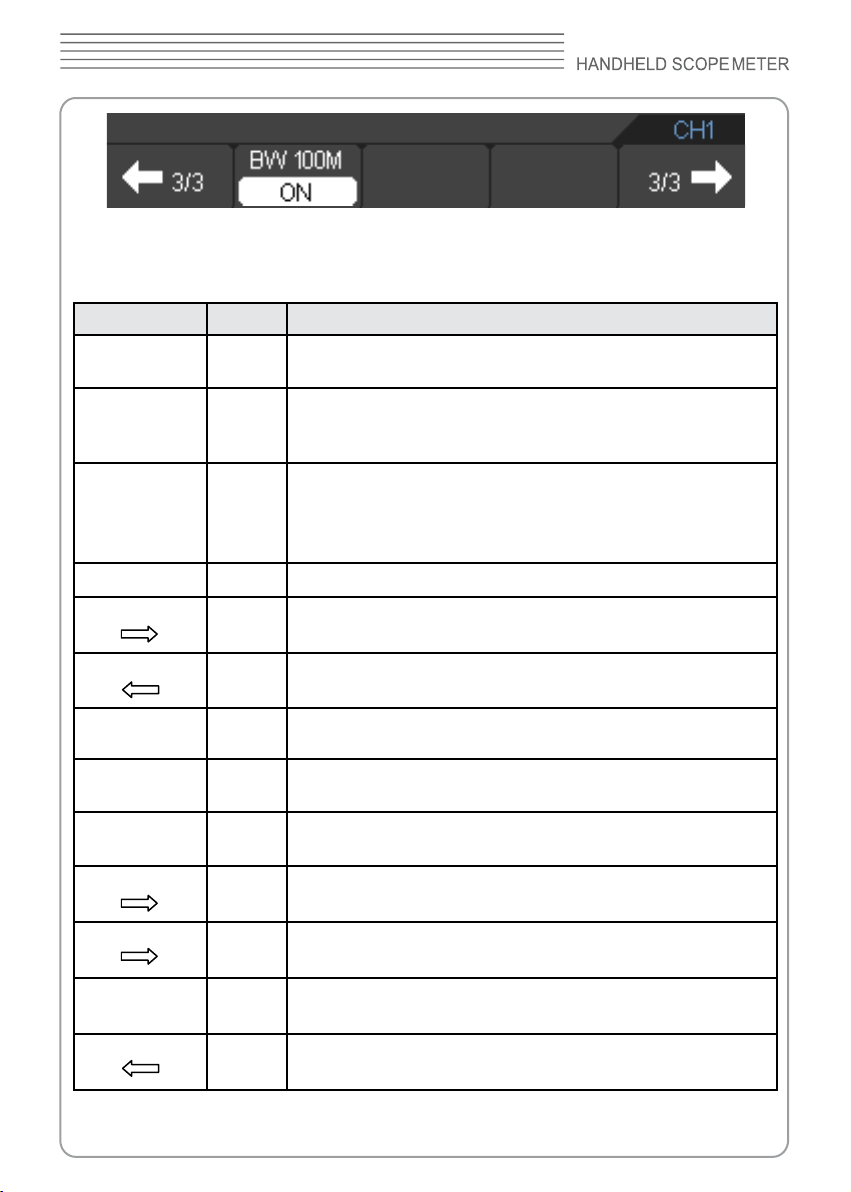
The following table describes the channel menu:
Menu Setting Description
Enable
Coupling
Probe
Reset Set the vertical display position back to middle window
1/2
ON
OFF
AC
DC
GND
10X
100X
1000X
Turn on Channel
Turn off Channel
The dc component in the input signal is blocked
The ac and dc components of the input signal are allowed
Disconnect the input signal
1X
Select one according to the probe attenuation factor to
ensure correct vertical scale reading
Go to the next menu page
2/2
Volt/Div
Invert
BW 20M
2/2
3/3
BW 100M
3/3
Coarse
Fine
ON
OFF
ON
OFF
Back to the previous menu page
Set Voltage range coarsely
Set Voltage range nely
Turn on the invert function
Turn off the invert function
Turn on the BW 20M(not include DSO8060)
Turn off the BW 20M
Back to the previous menu page
Go to the next menu (not include DSO8060)
Turn on the BW 100M(not include DSO8060)
Turn off the BW 100M
Go to the rst menu(not include DSO8060)
Page 24
8060
BW Limit
Turn on the BW Limit
Turn off the BW Limit
1. Change Volt/DIV
It is the default setting of Volts/Div in a 1-2-5-step sequence from 1mV/div,2mV/Div,5mV/
div or 10mV/div, 20mV/div, 50mV/div, ... , to 1V/div,2V/div,5V/div.
The Volt/DIV will be displayed in the status bar on the bottom of the screen.
Figure 2-2 Channel Volt/Div
Press CH1→Volt/Div→Coarse/Fine to Set Volt/Div range.
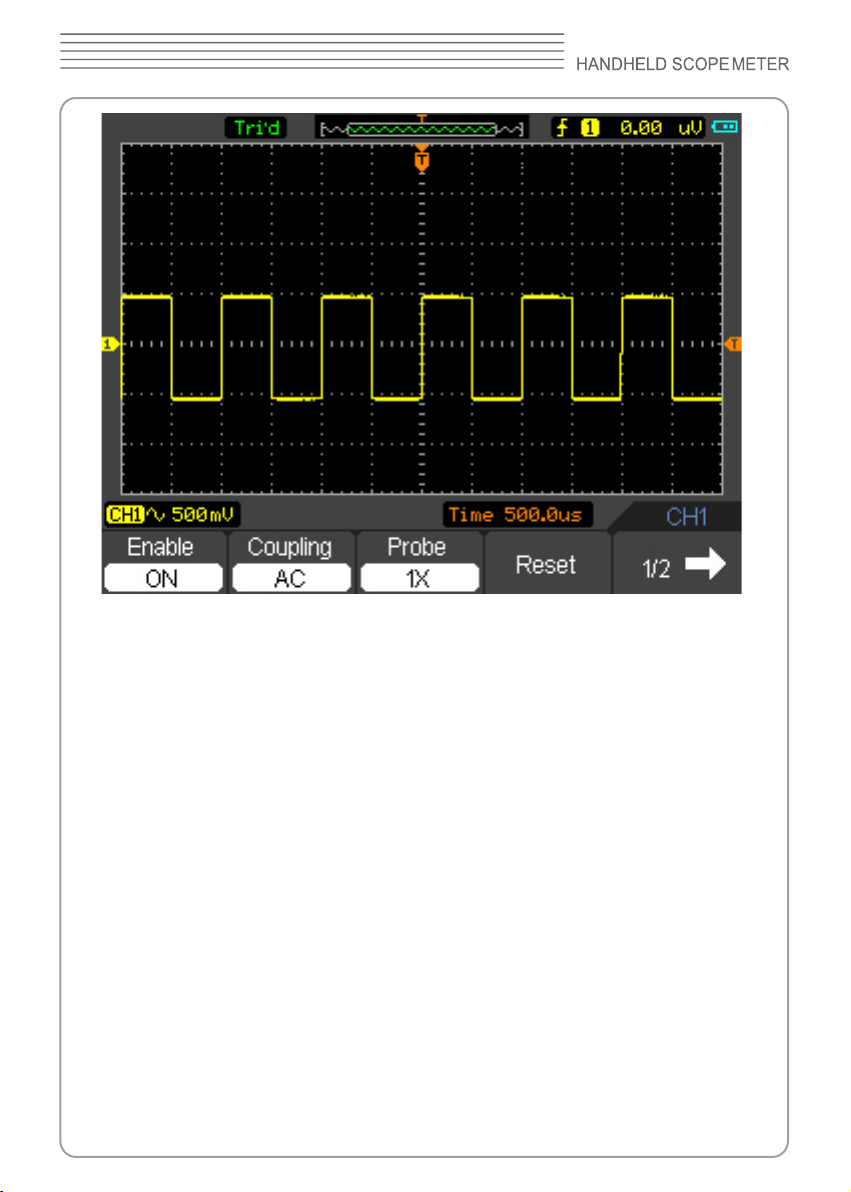
2. Set Channel Coupling
With CH1 taken for example, input a sine wave signal containing a dc offset.
Press CH1→Coupling→AC to set “AC” coupling. It will pass AC component but block the
DC component of the input signal.
The waveform is displayed as Figure 2-3
Page 25
DSO8000 SERIES
Figure 2-3 Waveform Display
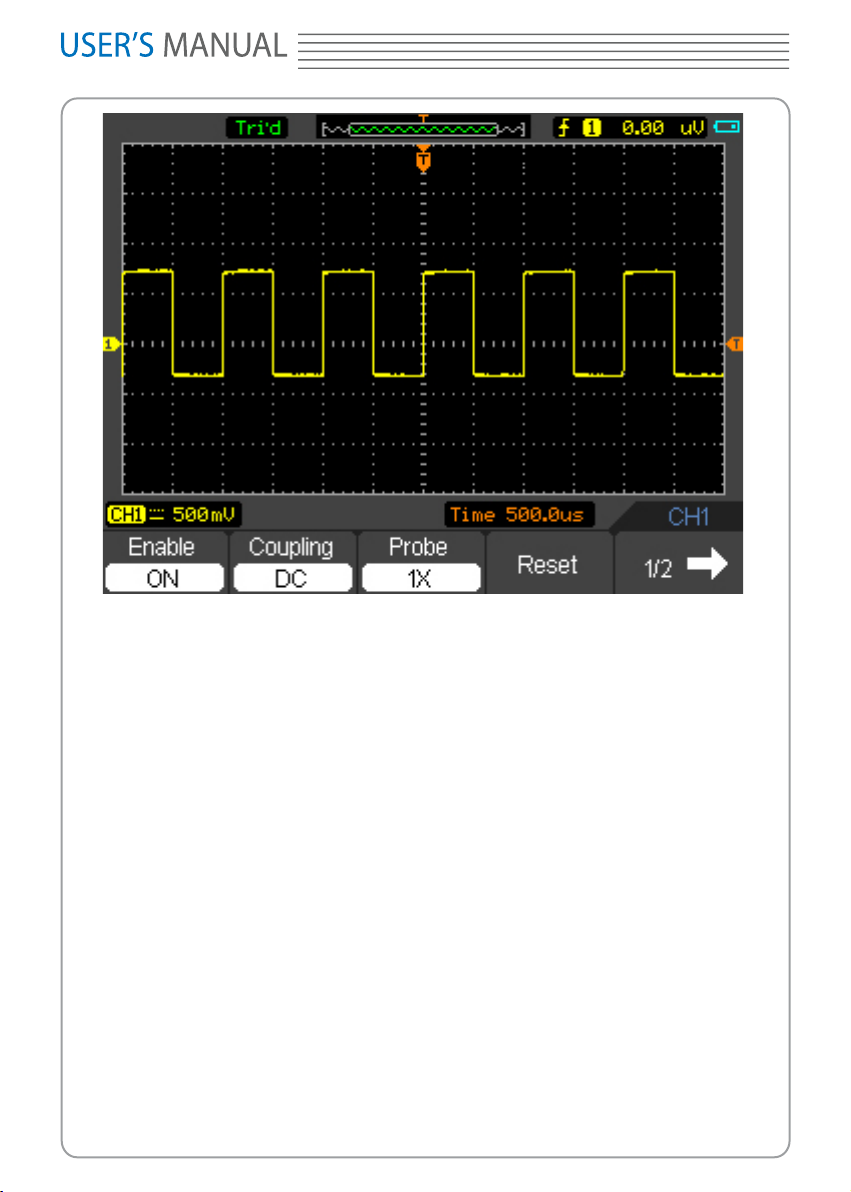
Press CH1→Coupling→DC, to set “DC” coupling. It will pass both AC and DC
components of the input signal.
The waveform is displayed as Figure 2-4.
Page 26
8060
Figure 2-4 Waveform Display
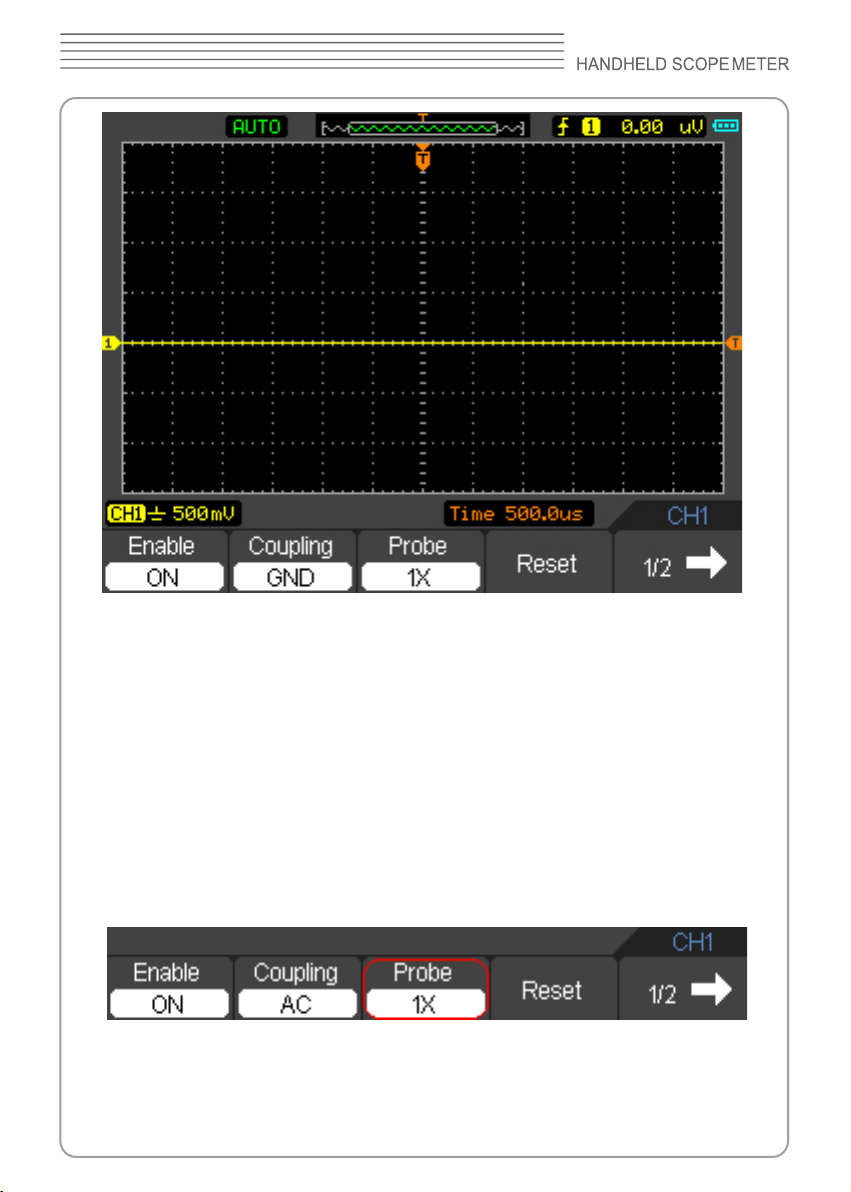
Press
CH1→Coupling→GND
, to set “GND” coupling, it disconnects the input signal.
The screen displays as Figure 2-5:
Page 27
DSO8000 SERIES
Figure 2-5 Waveform Display
3. Set Probe Attenuation
The scope meter allows adjusting the probe attenuation scale factor correspondingly
in the channel operation menu in order to comply with the probe attenuation scale.
The attenuation factor changes the vertical scaling of the scope meter so that the
measurement results reect the actual voltage levels at the probe tip.
To change (or check) the probe attenuation setting, press the CH1 or CH2 button
(according to which channel in using). Toggle the Probe soft button to match the
attenuation factor of the probe.
This setting remains in effect until changes again.
Figure 2-6 Probe Setting
Page 28
8060
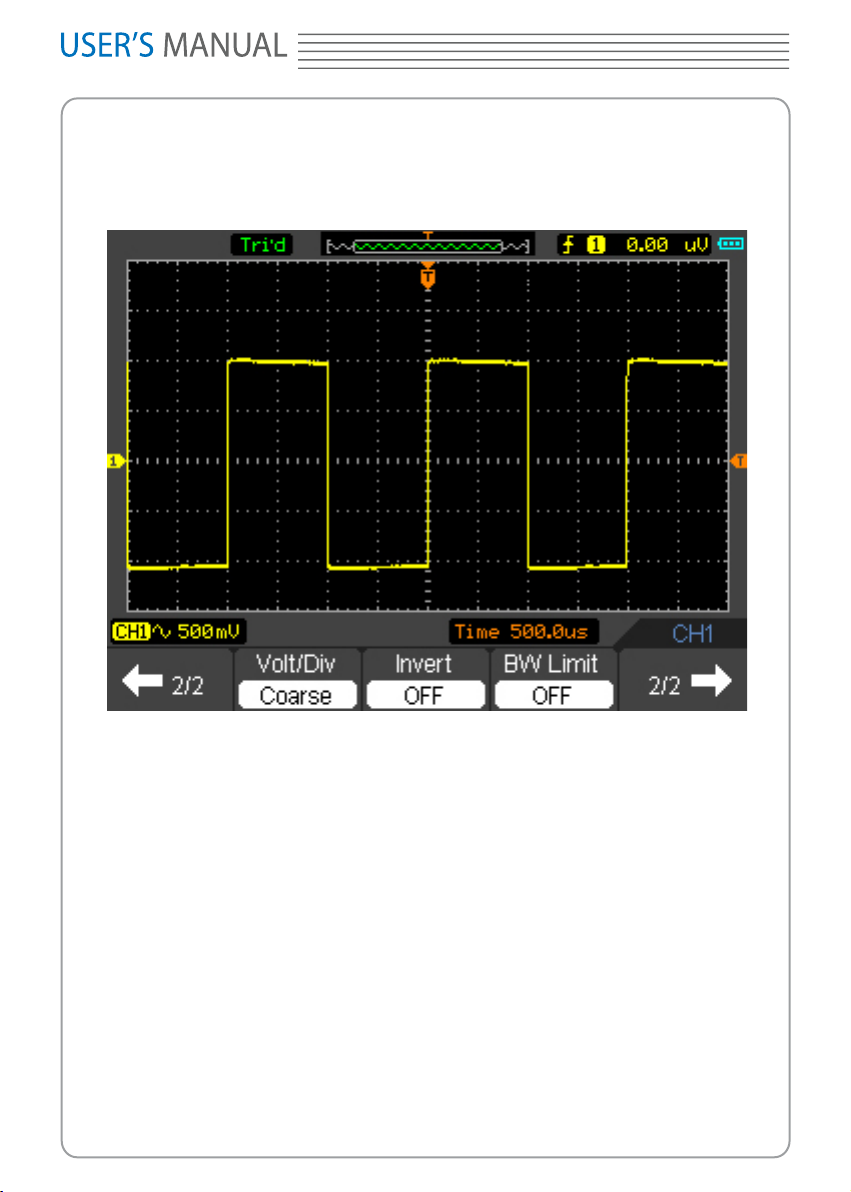
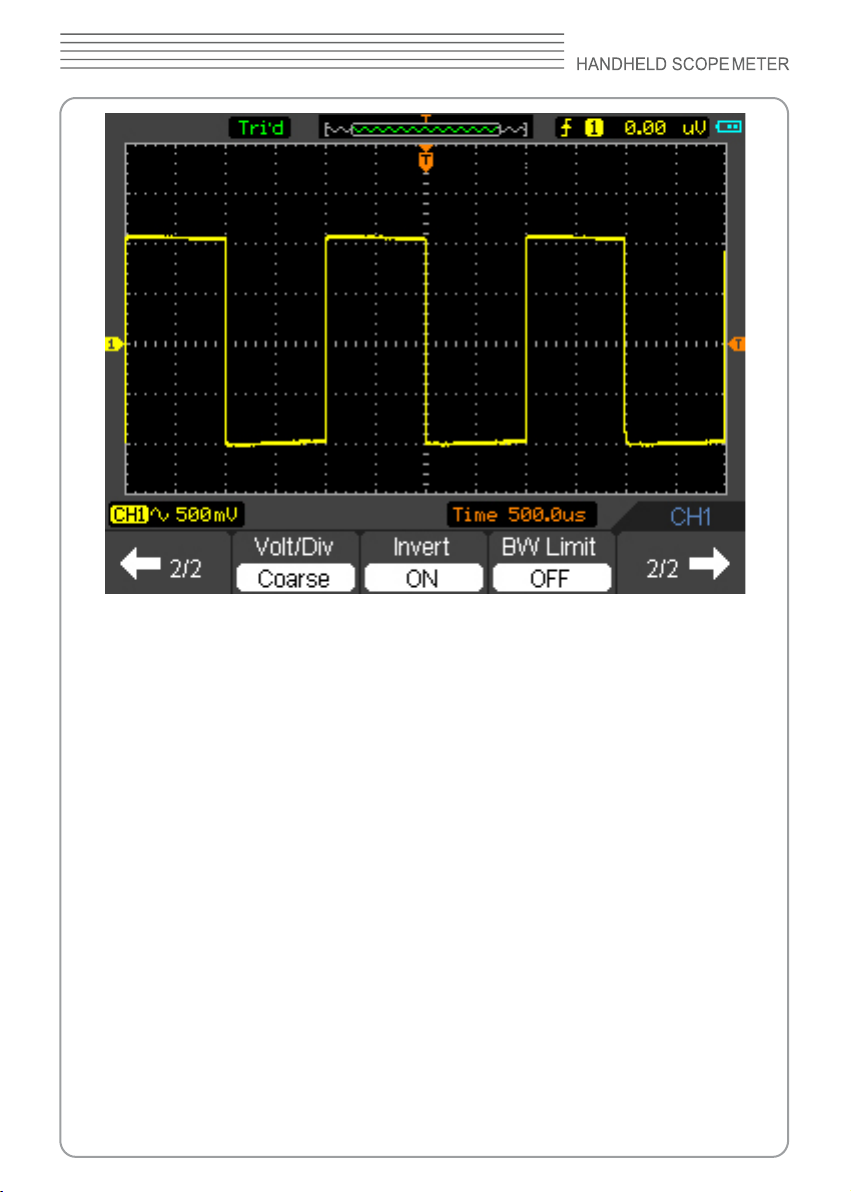
4. Invert a waveform
The displayed waveform reverses 180 degrees relatively to the ground potential.
Press
CH1 or CH2 → F5 → F3
, to turn on/off the
Invert.
Figure 2-7 Turn Invert off
Page 29
DSO8000 SERIES
Figure 2-8 Turn Invert on
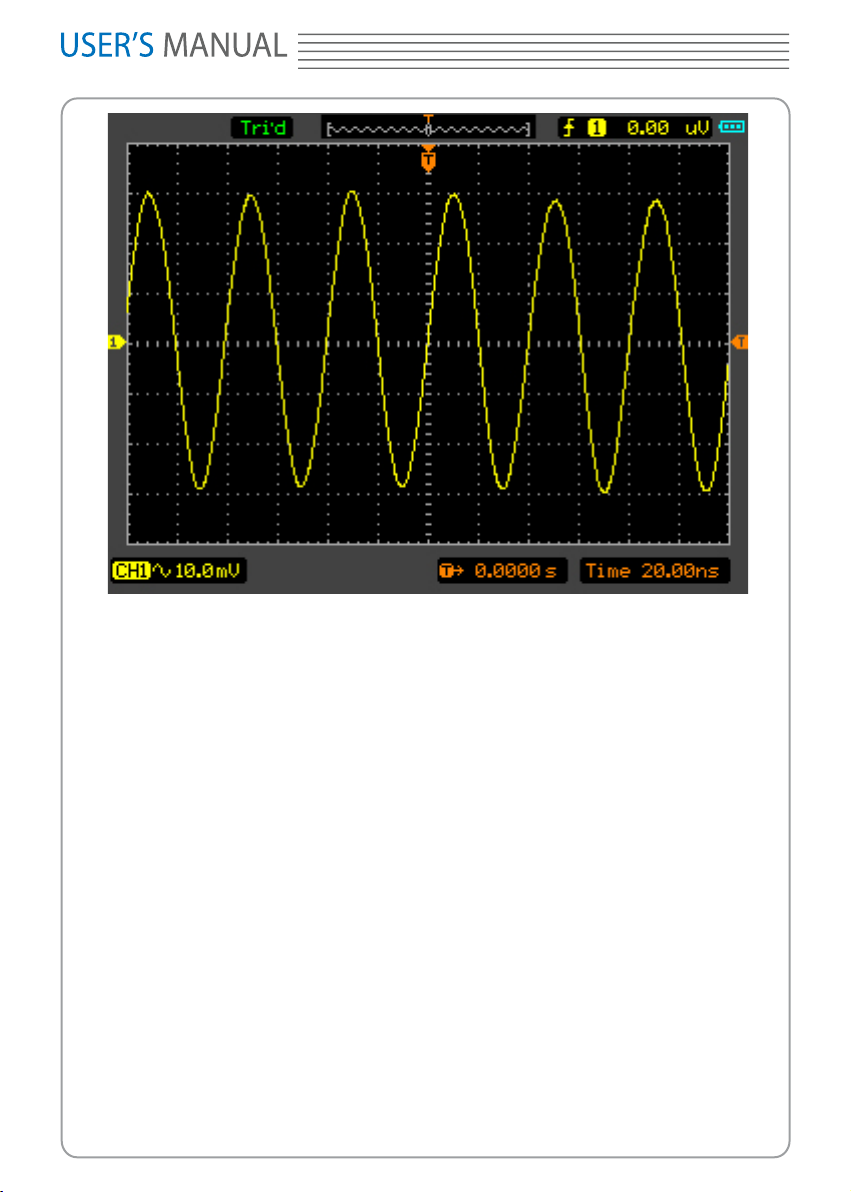
5. Set Band-Width Limit
With CH1 taken for example, input a signal containing high frequency component.
Press CH1→F5→F4→OFF ,to set up bandwidth limit to “OFF” status. The scope meter
is set to full bandwidth and passing the high frequency component in the signal.
The waveform is displayed as Figure 2-9.
Page 30
8060
Figure 2-9 Turn BW limit Off
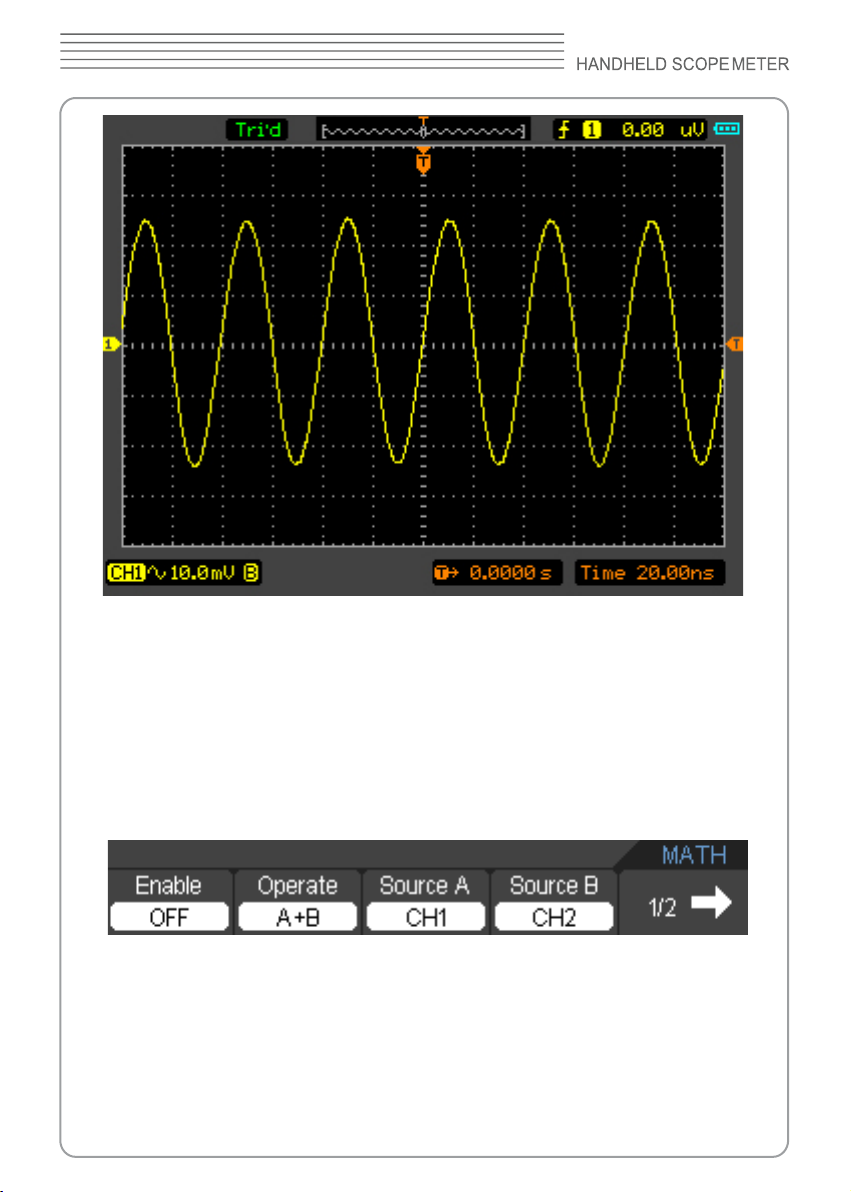
Press CH1→F5→F4→ON, to set up bandwidth limit to “ON” status. It will reject the
frequency component higher than 20MHz.
Press CH1→F5→F5→F2→ON, to set up bandwidth limit to “ON” status. It will reject the
frequency component higher than 100MHz.This function is not used in DS08060.
The waveform is displayed as Figure 2-10:
Page 31
DSO8000 SERIES
Figure 2-10 Turn BW limit On
6. Math Setting
The mathematic functions include “add”, “subtract”, “multiply”, “division”, and “FFT” for
CH1 and CH2. The mathematic result can be measured by the grid and the cursor.
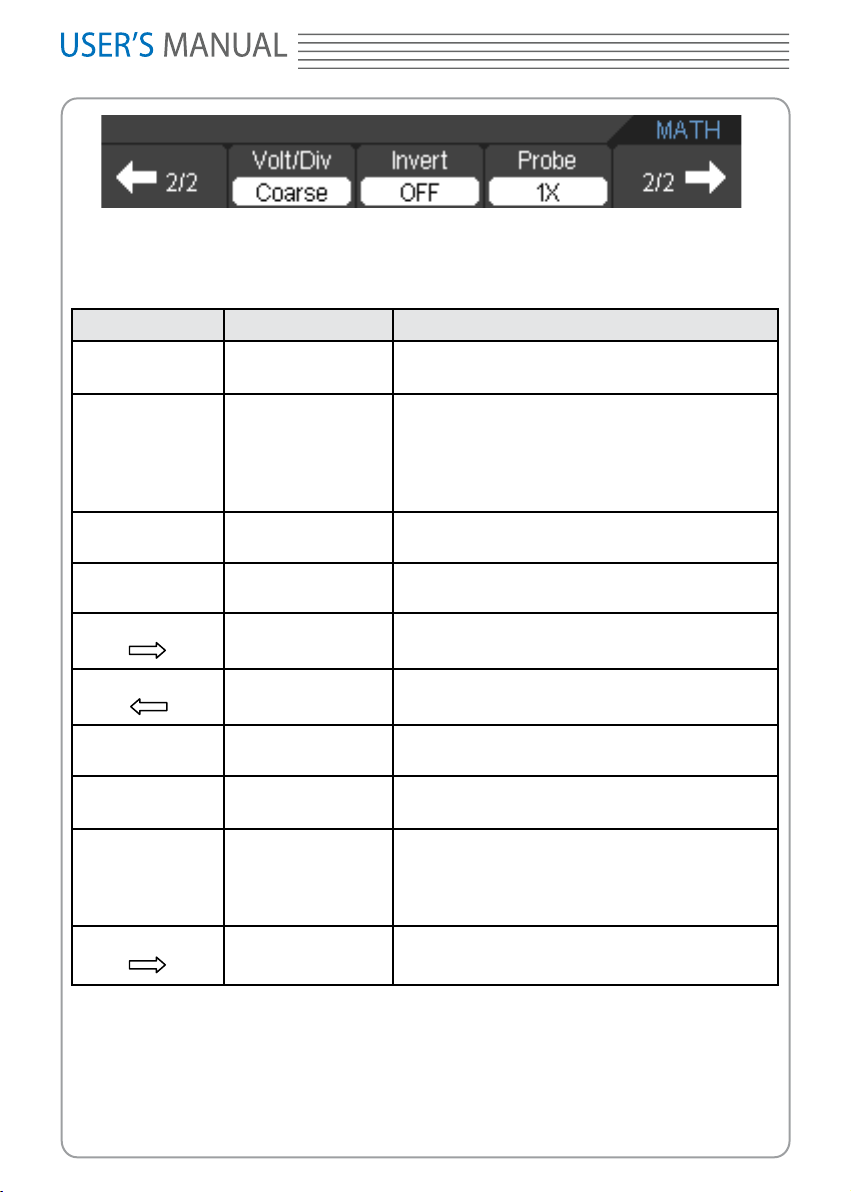
The mathematic window is displayed as gure 2-11.
The Math menu (Page 1/2)
Figure 2-11 The Math menu
The Math menu (Page 2/2)
Page 32
8060
Figure 2-12 The Math menu
The Math menu setting table
Menu Setting Description
Enable
Operate
Source A
Source B
1/2
ON
OFF
A + B
A - B
A X B
A / B
FFT
CH1
CH2
CH1
CH2
Turn on math
Turn off math
Add source A and source B
Subtract source B from source A
Multiply source B by source A
Divide source A by source B
Fast Fourier Transform
Dene CH1 or CH2 as source A
Dene CH1 or CH2 as source B
Go to the next menu page
2/2
Volt/Div
Invert
Probe
2/2
Coarse
Fine
ON
OFF
1x
10x
100x
1000x
Back to the previous menu page
Set Voltage range coarsely
Set Voltage range nely
Invert the MATH waveform
Waveform display normal
Select one according the probe attenuation
factor to ensure a correct vertical scale
reading
Back to the previous menu page
Addition, Subtraction, Multiplication,Division and FFT
In the Math function, use the addition, subtraction, multiplication,division and FFT to
operate and analyze the waveform.
The multiplication function window is displayed in gure 2-13
0
Page 33
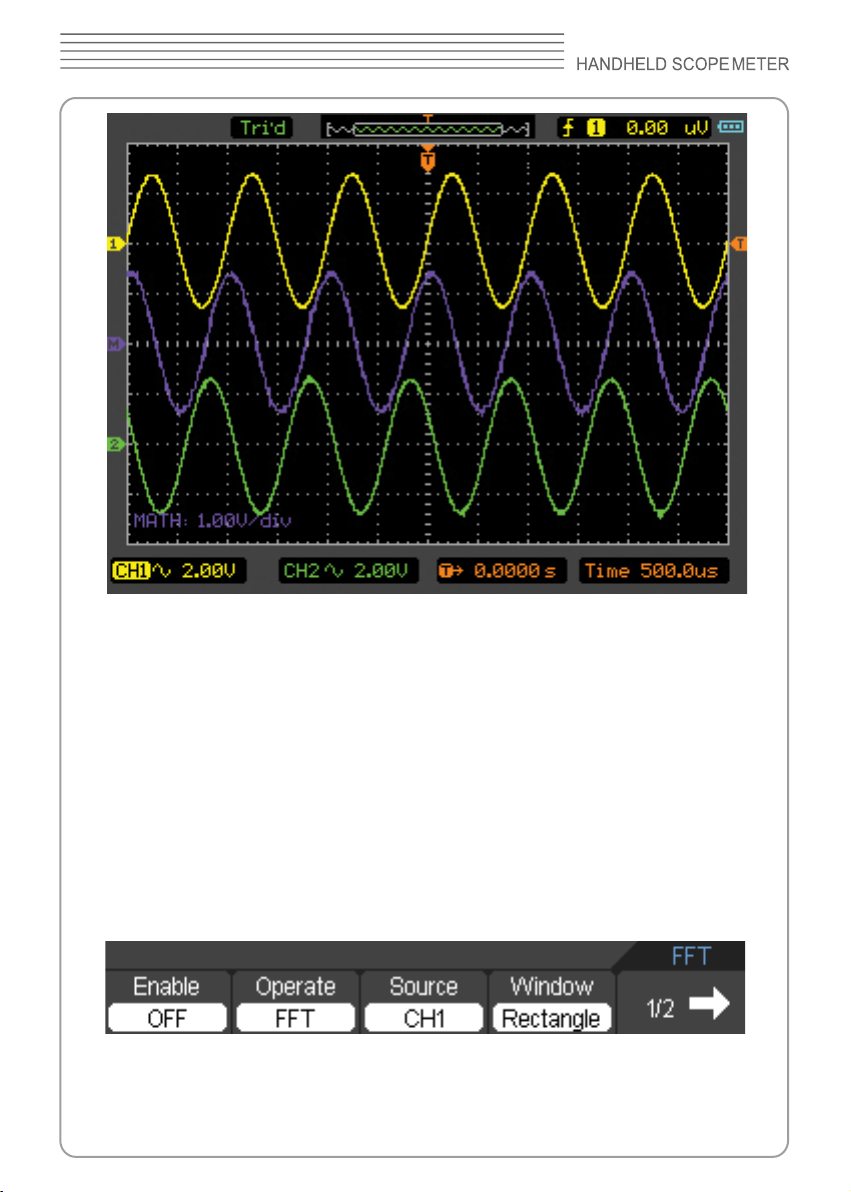
Figure 2-13 The multiplication
DSO8000 SERIES
7. FFT
The FFT (Fast Fourier Transform) process converts a time-domain signal into its
frequency components mathematically.
FFT waveforms are useful in the following applications:
Measure harmonic content and distortion in systems
■
Characterize noise in DC power supplies
■
Analyze harmonics in power lines
■
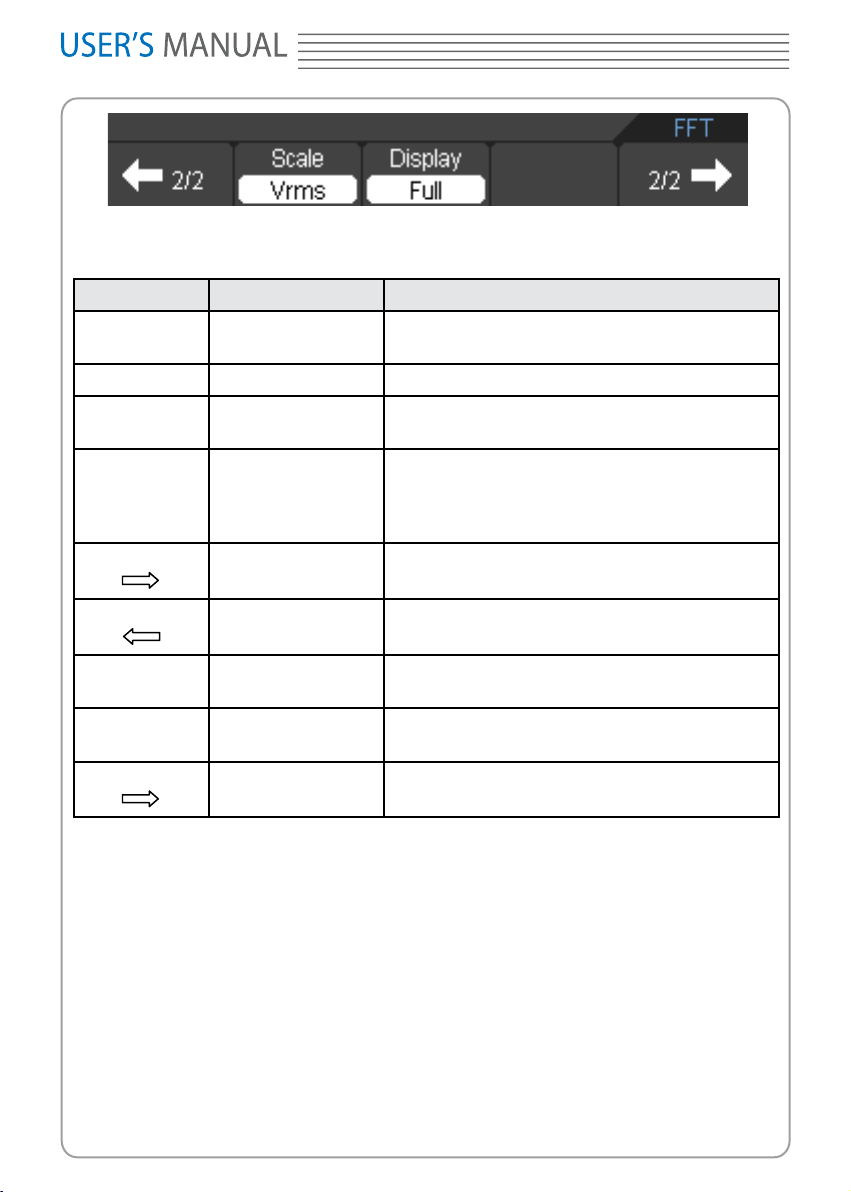
The FFT menu (Page 1/2)
The FFT menu (Page 2/2)
Page 34
8060
Figure 2-14 The FFT menu
The FFT menu table
Menu Setting Description
Enable
Operate FFT Fast Fourier Transform
Source
Window
1/2
ON
OFF
CH1
CH2
Rectangle
Hanning
Hamming
Blackman
Turn on FFT
Turn off FFT
Dene CH1 or CH2 as FFT source
Select window for FFT
Go to the next menu page
2/2
Scale
Display
2/2
Vrms
dBVrms
Full
Split
Back to the previous menu page
Set “Vrms” as vertical unit
Set “dBVrms” as vertical unit
Display waveform in full screen
Display waveform in split screen
Back to the previous menu page
Note:
1. Signals that have a DC component or offset can cause incorrect FFT waveform
component magnitude values. To minimize the DC component, choose AC Coupling
on the source signal.
2. To reduce random noise and aliases components in repetitive or single-shot events,
set the oscilloscope acquisition mode to average.
3. To display FFT waveforms with a large dynamic range, use the “dBVrms” scale. The
“dBVrms” scale displays component magnitudes using a log scale.
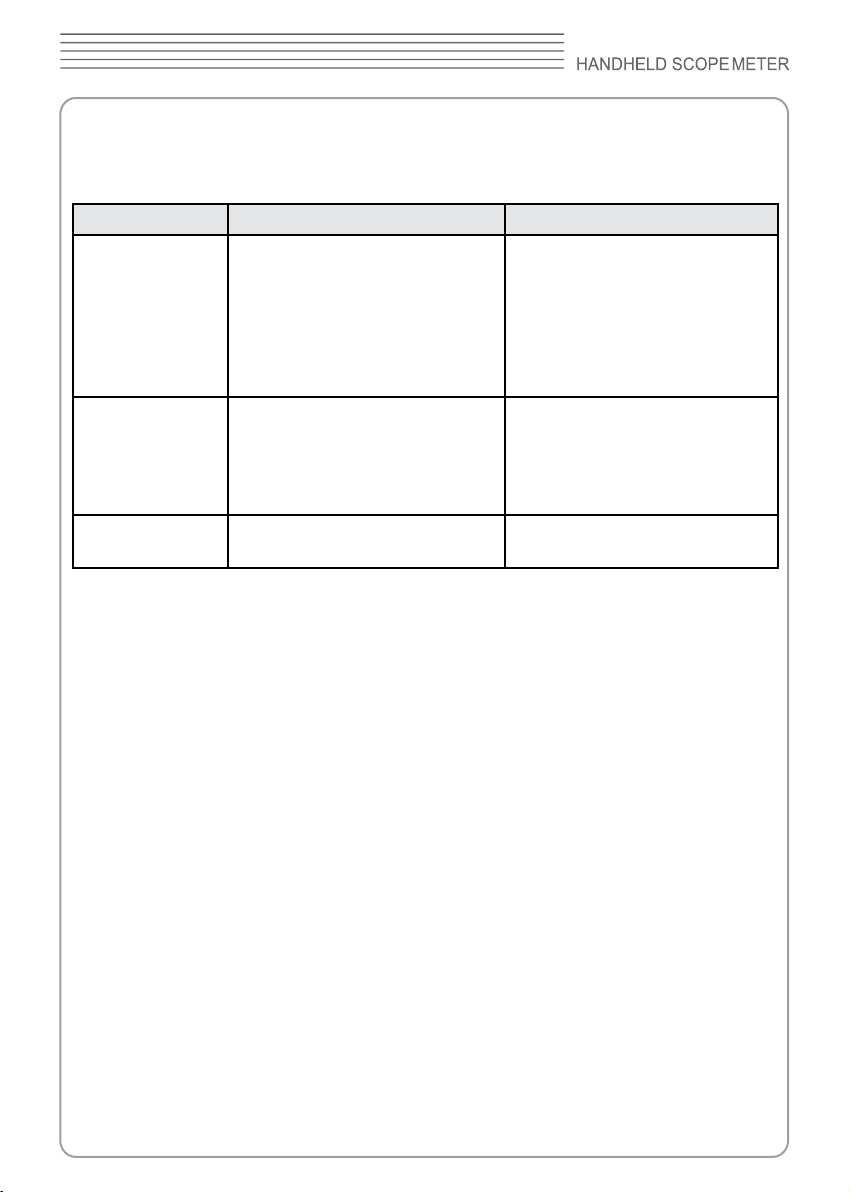
FFT Window
The scope meter provides four FFT windows. Each window is a trade-off between
frequency resolution and amplitude accuracy. It depends on the desired
Page 35
DSO8000 SERIES
measurement and the source signals characteristics to determine the window to use.
Use the following guidelines to select the best window.
The FFT Window table
Window Features Best for measuring
Rectangle
Hanning
Hamming
Blackman
8. REF
Best frequency resolution and
worst magnitude resolution.This
is essentially the same as no
window.
Better frequency, poorer
magnitude accuracy than
Rectangular. Hamming has
slightly better frequency
resolution than Hanning.
Best magnitude, worst frequency
resolution.
Transients or bursts, the signal
levels before and after the
event are nearly equal.Equalamplitude sine waves with xed
frequencies. Broadband random
noise with a relatively slow
varying spectrum.
Sine, periodic, and narrow-band
random noise. Transients or
bursts where the signal levels
before and after the events are
signicantly different.
Single frequency waveforms, to
Find higher order harmonics.
Reference Waveforms are saved waveforms to be selected for display. The reference
function will be available after saving the selected waveform to non-volatile memory.
Press M/R button to display the Reference waveform menu.
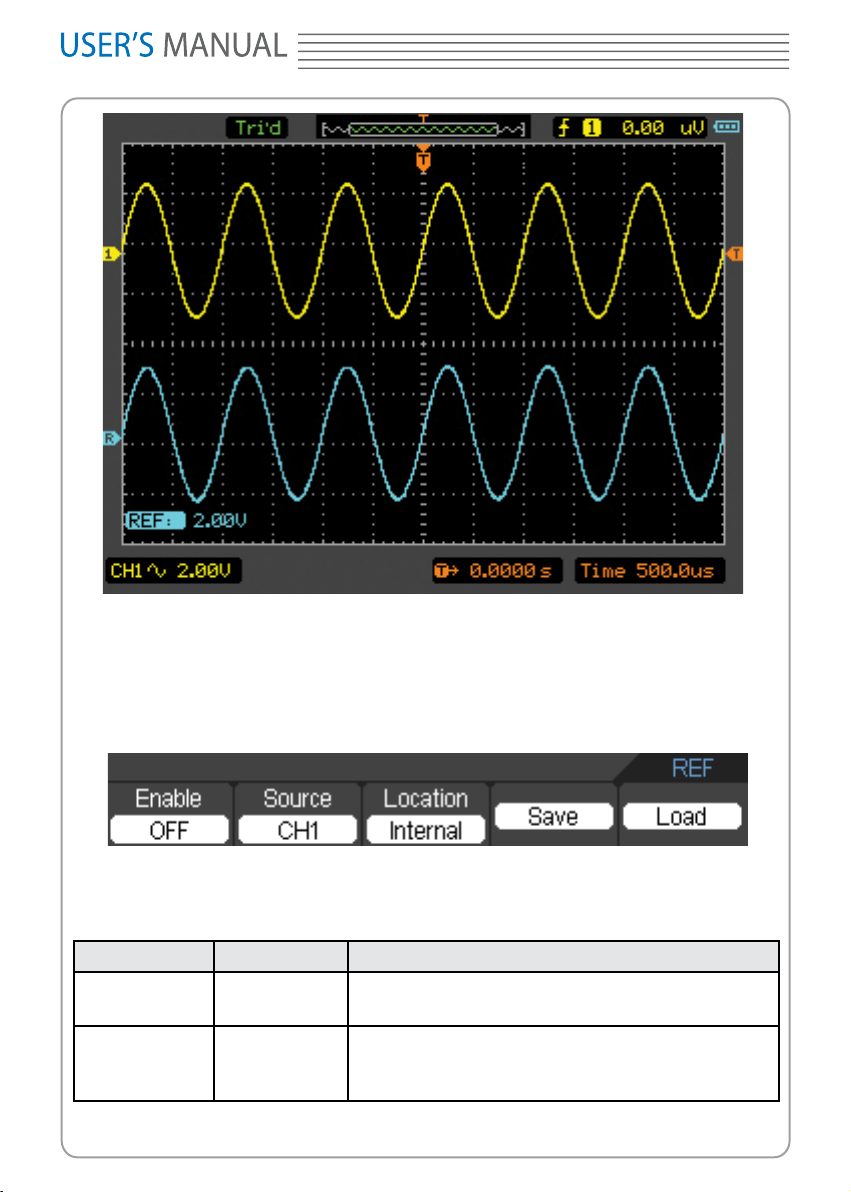
Select menu Enable->ON to enter reference function window. The reference function
window is displayed in Figure 2-15.
Page 36
8060
Figure 2-15 The reference function window
Internal
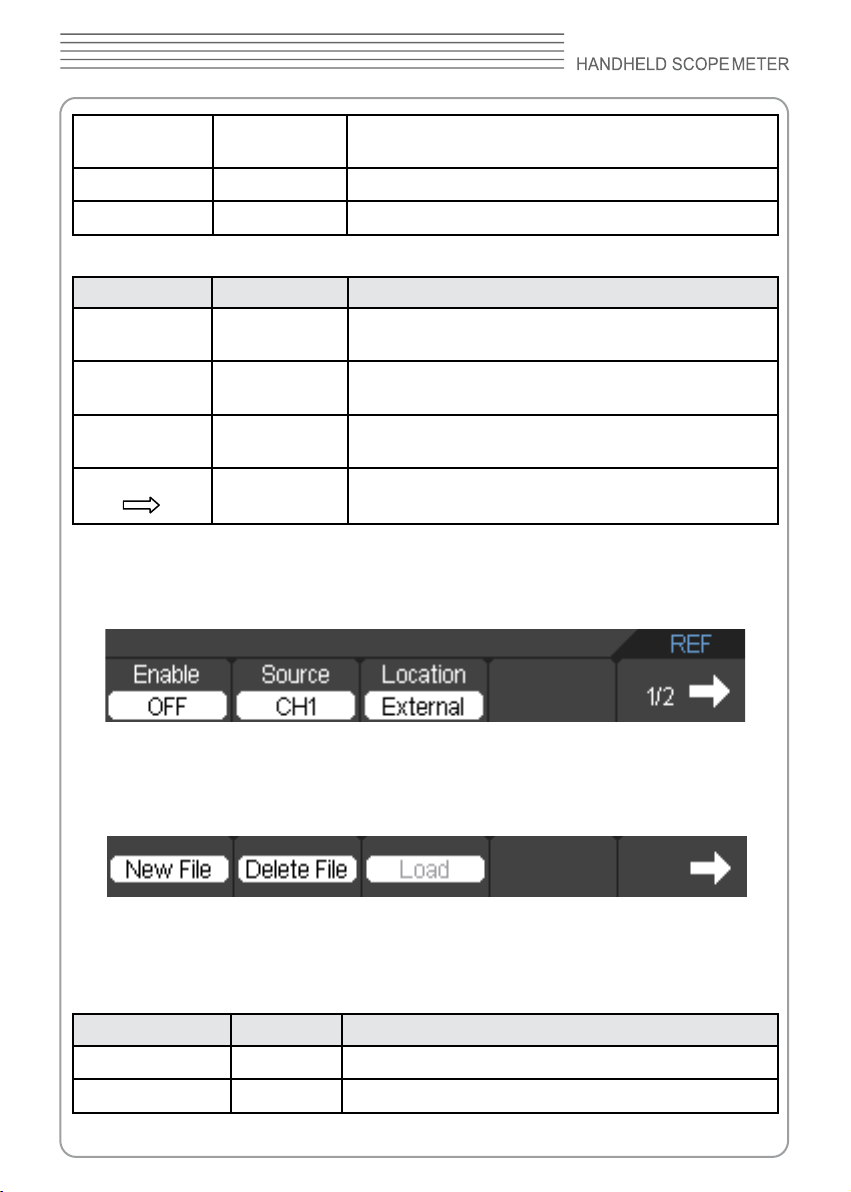
Press
M/R → REF → InternaI
REF menu when using internal memory
REF menu table when using internal memory
Menu Setting Description
Enable
Source
ON
OFF
CH1
CH2
MATH
and go to the following menu.
Figure 2-16 The Internal menu
Turn on REF
Turn off REF
Select CH1 as REF channel
Select CH2 as REF channel
Select MATH as REF channel
Page 37
DSO8000 SERIES
Location
Save
Load
REF menu table when using external memory
Menu Setting Description
Enable
Source
Location
1/2
Internal
External
ON
OFF
CH1
CH2
Internal
External
Select memory location in scope
Select memory location out scope
Save REF waveform
Load REF waveform
Turn on REF
Turn off REF
Select CH1 as REF channel
Select CH2 as REF channel
Select inner memory location
Select outer memory location
Go to the next menu page
External
Press
M/R→REF→External
The External REF menu (Page 1/2)
and go to the following menu.
Figure 2-17 The External menu
The External REF menu (Page 2/2)
Figure 2-18 The External menu
The
External
New File
Delete File
menu table
Menu Setting Description
To create a le
To delete the chosen le
Page 38
8060
Load
Display a Reference Waveform
To load a chosen le
Go to the Storage menu page
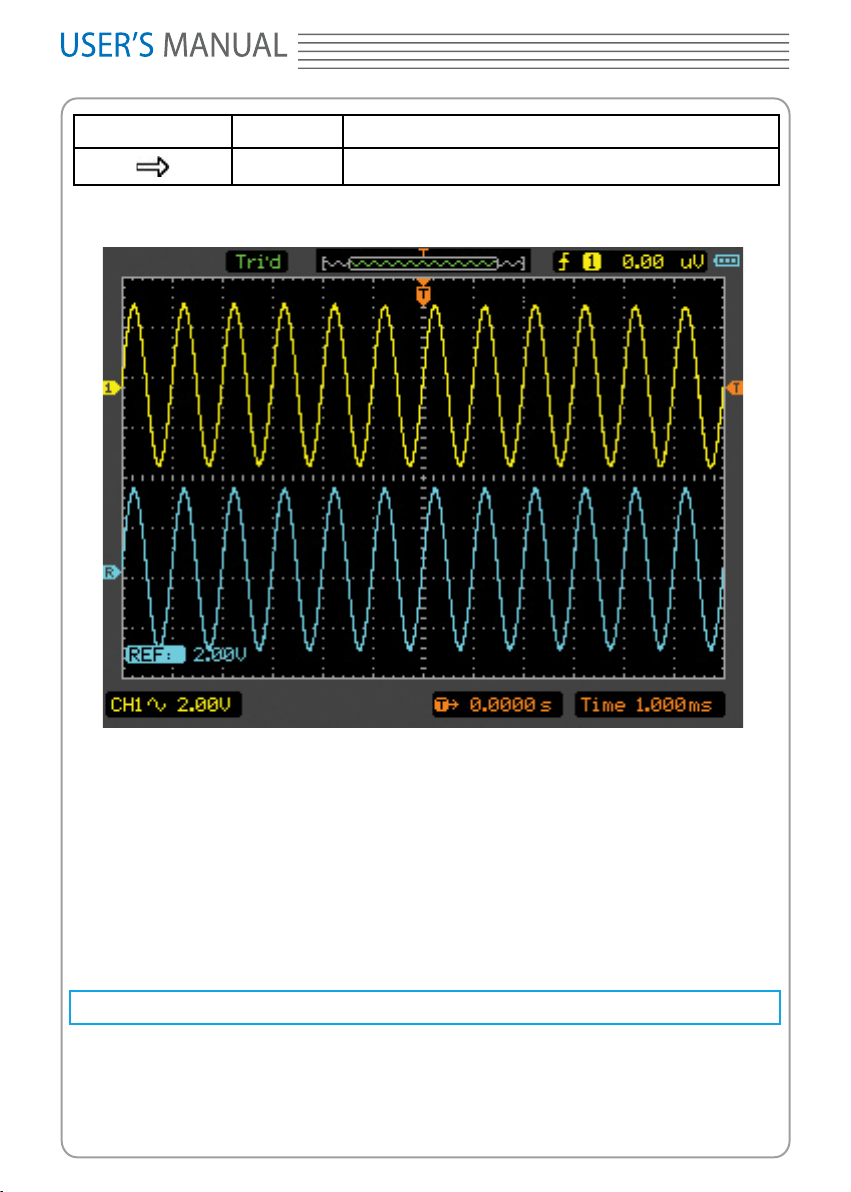
Figure 2-19 Reference display
1. Press M/R button to show the reference waveform menu.
2. Press F2 to select the reference channel: CH1, CH2 or MATH.
3. Press F4 to save REF.
4. Press F5 to load an internal REF le.
5. Press F1 button to turn on REF.
Note:
The Reference function is not available in X-Y mode.
Set Horizontal System
The horizontal system changes the horizontal scale and position of waveforms. The
horizontal center of the screen is the time reference for waveforms. Changing the
horizontal scale causes the waveform to expand or contract with respect to the screen
Page 39
DSO8000 SERIES
center.
Horizontal position changes the displayed waveform position, relative to the trigger point.
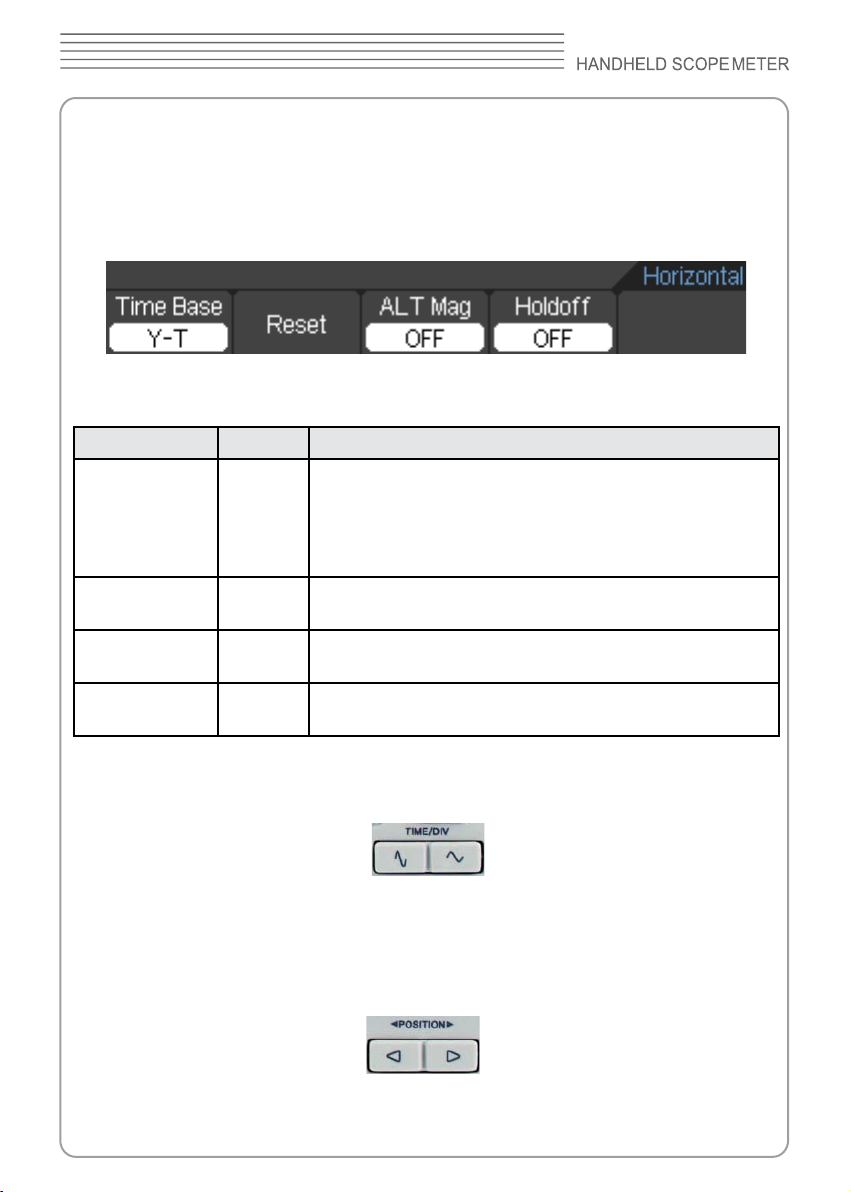
Press HORI button to show the horizontal system menu. The settings of this menu are
listed in the following table.
The Horizontal Menu
Figure 2-20 The Horizontal menu
The Horizontal Menu Table
Menu Setting Description
Time base
Reset
ALT Mag
Holdoff
Y – T
X – Y
Roll
ON
OFF
ON
OFF
Show the relative relation between vertical voltage and
horizontal time.
Show CH1 value at X axis; CH2 value at Y axis.
In Roll Mode, the waveform display updates from right to
left.
Pressing this button clears trigger offset and moves the
trigger point to the horizontal center of the screen.
Turn on ALT Mag
Turn off ALT Mag
Turn on the Holdoff time
Turn off the Holdoff time
1. TIME/DIV
Use this button to select the horizontal time/div (scale factor) for the main.
Figure 2-21 The TIME/DIV button
2. POSITION
Press this button to adjust the horizontal position of all channel waveforms. The
resolution of this control varies with the time base.
Figure 2-22 The POSITION button
Page 40
8060
3
1
2
4
5
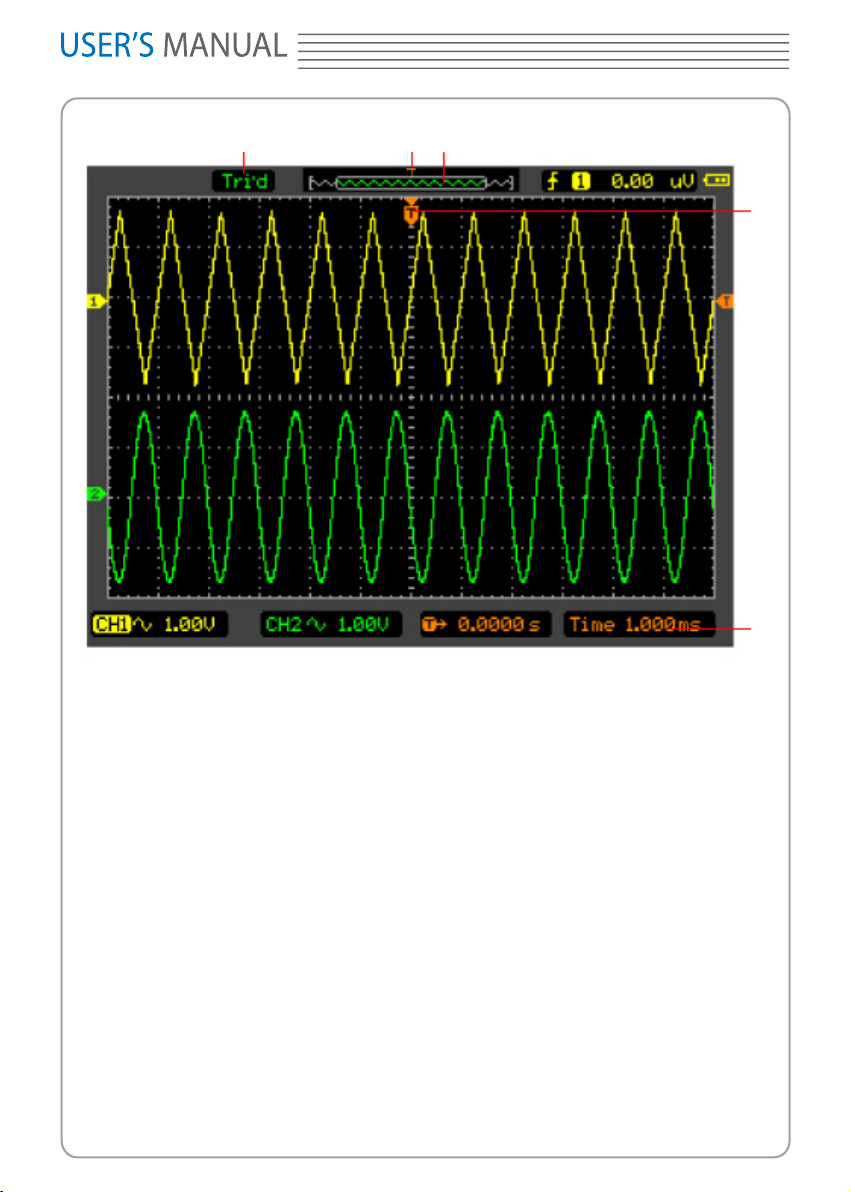
Figure 2-23 The horizontal/Time base marks
Marks Indicator
1. The current running status.
2. The trigger position in the memory.
3. The current waveform window’s position in the memory.
4. The trigger position in the current waveform window.
5. The horizontal time base (main time base).
ALT Mag
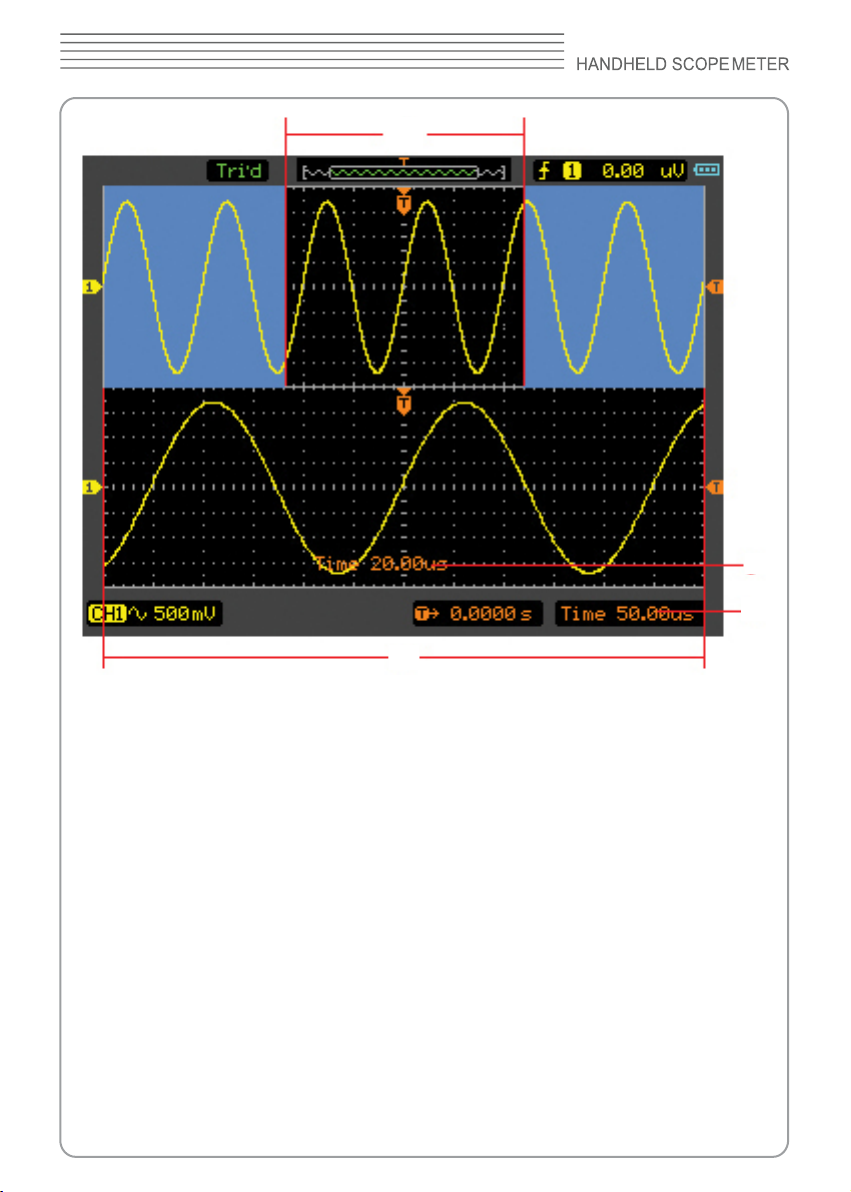
The ALT Mag is a magnied portion of the waveform window. Use ALT Mag to locate
and horizontally expand part of the main waveform window for a more detailed (higher
horizontal resolution) analysis of signal. The ALT Mag time base setting cannot be set
.
Page 41
DSO8000 SERIES
1
3
4
2
Description:
1. Wave to be horizontally expanded.
2.The magnied Wave.
3.The time base of ALT Mag.
4.The main time base.
The following describes the ALT Mag display.
The screen is divides into two parts. The upper half displays the main waveform window
and the lower half displays an expanded portion of the main waveform window.This
expanded portion of the main window is called the ALT Mag window.Two blocks shadow
the upper half. The un-shadowed portion is expanded in the lower half. The key TIME/
DIV control the size and position of the ALT Mag. The symbol at the right bottom of the
screen means the main time base and the symbol on the center bottom means the ALT
Mag time.
Figure 2-24 ALT Mag Mode
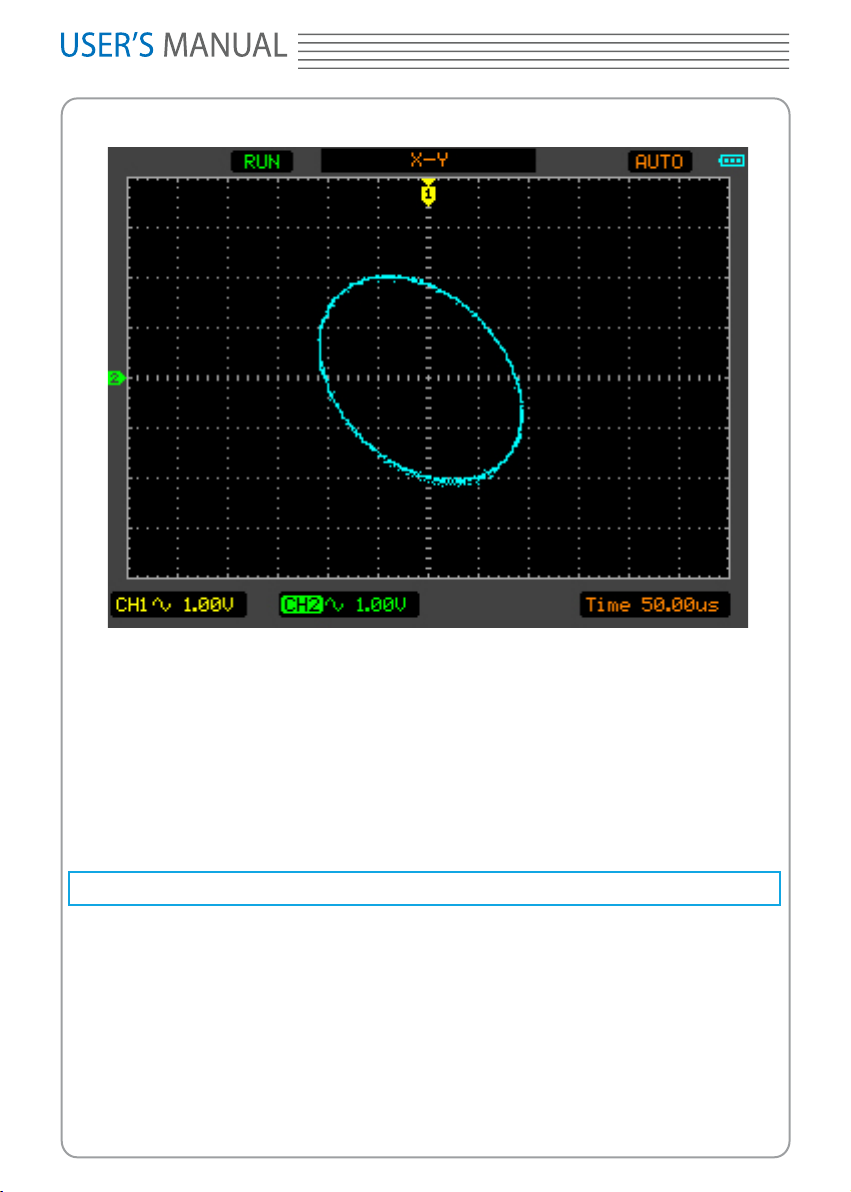
X-Y Format
This format is useful for studying phase relationships between two signals. CH1 in the
Page 42
8060
horizontal axis (X) and CH2 in the vertical axis (Y)
The following modes or functions will not work in X-Y format.
Automatic Measurements
■
Cursor Measurements
■
REF and MATH Operations
■
Horizontal Position
■
Trigger Controls
■
Figure 2-25 X-Y display format
Set Trigger System
The trigger determines when the scope meter starts to acquire data and display a
waveform. When a trigger is set up properly, it can convert unstable displays or blank
screens into meaningful waveforms.
When the scope meter starts to acquire a waveform, it collects enough data so that it can
draw the waveform to the left of the trigger point. The scope meter continues to acquire
data while waiting for the trigger condition to occur. After it detects a trigger, the scope
meter continues to acquire enough data so that it can draw the waveform to the right of
the trigger point.
0
Page 43
DSO8000 SERIES
Trigger Modes
The scope meter provides four trigger modes: Edge, Pulse , Alternative and Video.
: An edge trigger occurs when the trigger input passes through a specied
Edge
voltage level in the specied slope direction.
: Use this trigger type to catch pulses with certain pulse width.
Pulse
Alternative
Video
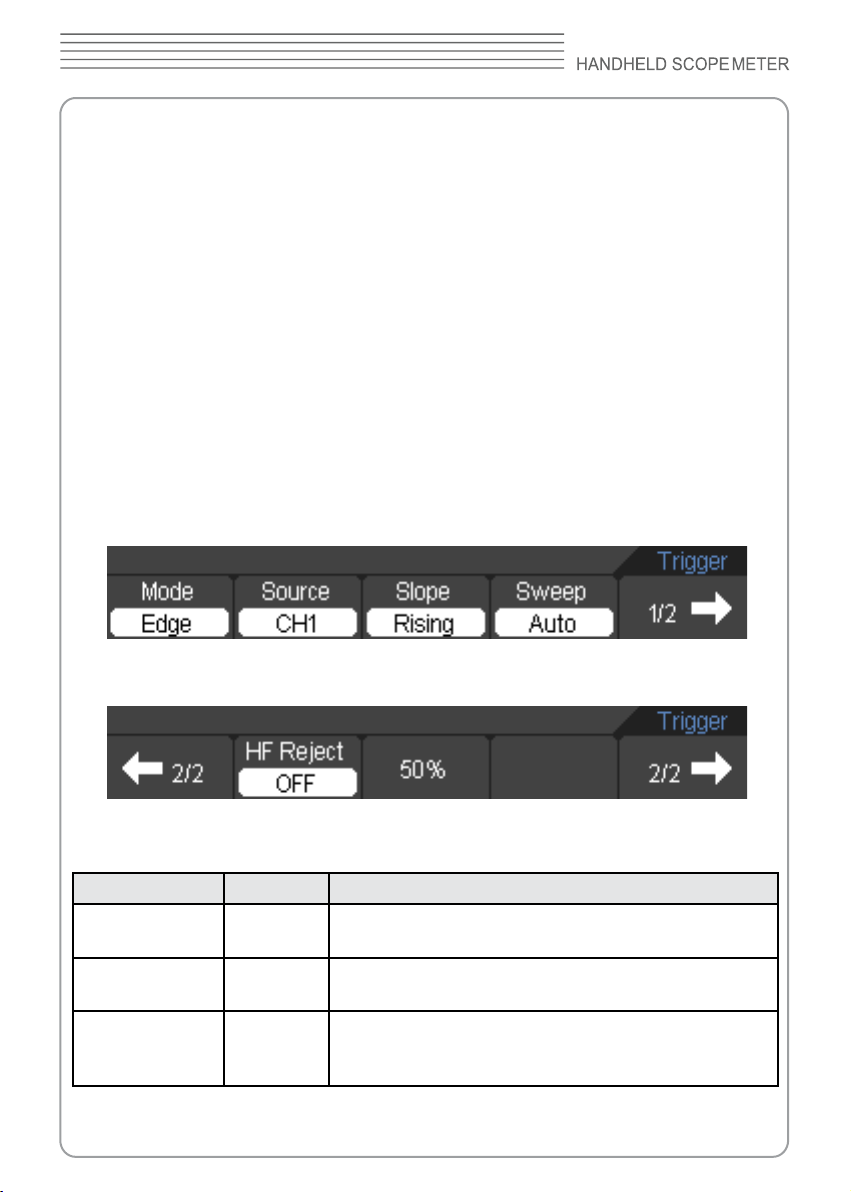
Edge Trigger Setting
An edge trigger determines whether the oscilloscope nds the trigger point on the rising
or the falling edge of a signal. Select Edge trigger mode to trigger on rising edge, falling
edge .
: Trigger on non-synchronized signals.
: Trigger on video-synchronized signals.
Press
TRIG → F1 → Edge
table.
The Edge trigger menu (Page 1/2)
The Edge trigger menu(Page 2/2)
The Edge Trigger Table
Menu Setting Description
Source
Slope
Sweep
button to show the edge trigger menu as the following
Figure 2-26 The Edge trigger menu
CH1
CH2
Rising
Falling
Auto
Normal
Single
Dene CH1 or CH2 as trigger signal
Trigger on rising edge or falling edge
Acquire waveform even no trigger occurred
Acquire waveform when trigger occurred
When trigger occurs, acquire one waveform then stop
Page 44
8060
HF Reject ON/OFF Reject high frequency signals
50% Set the trigger level to the center of the signal
Pulse Trigger Setting
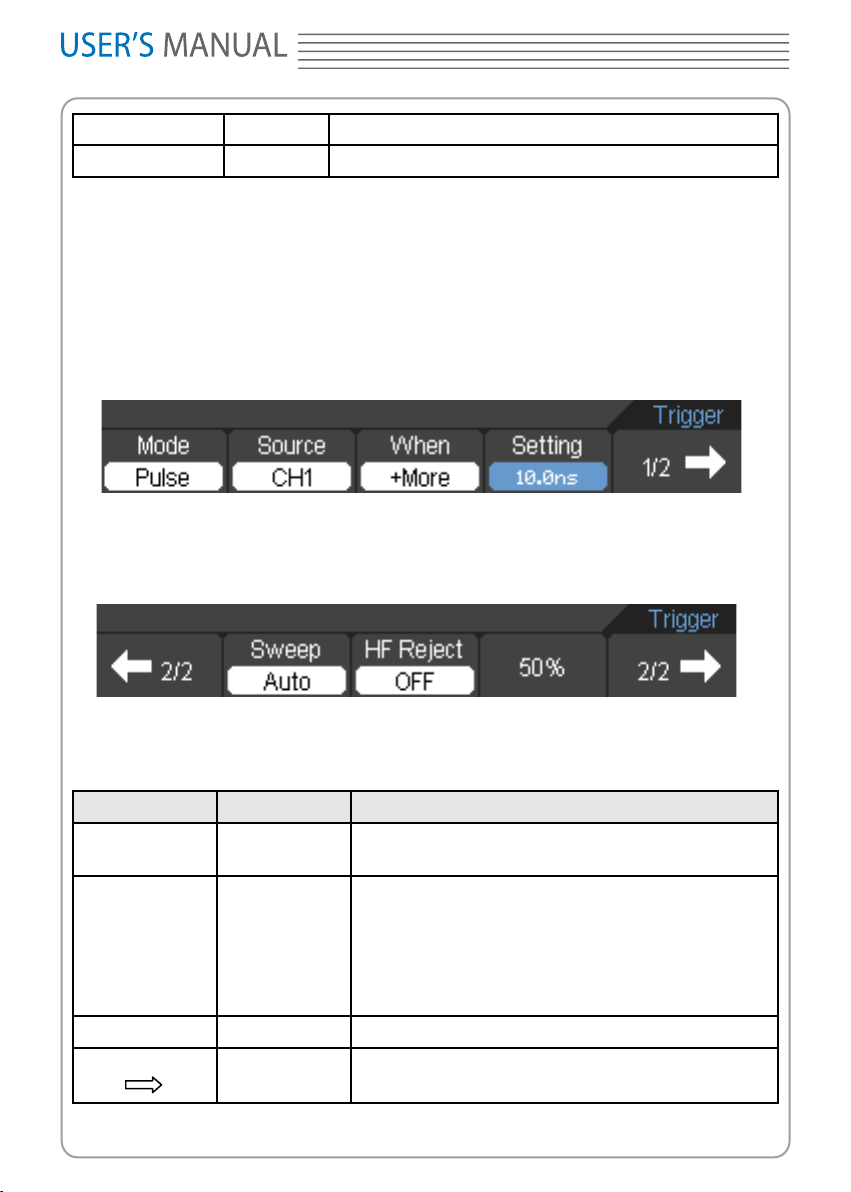
Pulse trigger occurs according to the width of pulse. The abnormal signals can be
detected through setting up the pulse width condition.
Press TRIG → F1 → Pulse button to show the pulse trigger menu as the following table.
The Pulse Trigger menu (Page 1/2)
Figure 2-27 The Pulse Trigger Menu
The Pulse Trigger menu (Page 2/2)
Figure 2-28 The Pulse Trigger Menu
The Pulse Trigger Table (Page 1/2)
Menu Setting Description
Source
When
Setting Value Set required pulse width
1/2
CH1
CH2
+More
+Less
+Equal
-More
-Less
-Equal
Dene CH1 or CH2 as trigger signal
+Pulse width more than selecting pulse condition
+Pulse width less than selecting pulse condtion
+Pulse width equal to selecting pulse condition
-Pulse width more than selecting pulse condition
-Pulse width less than selecting pulse condition
-Pulse width equal to selecting pulse condition
Go to the next menu page
Page 45
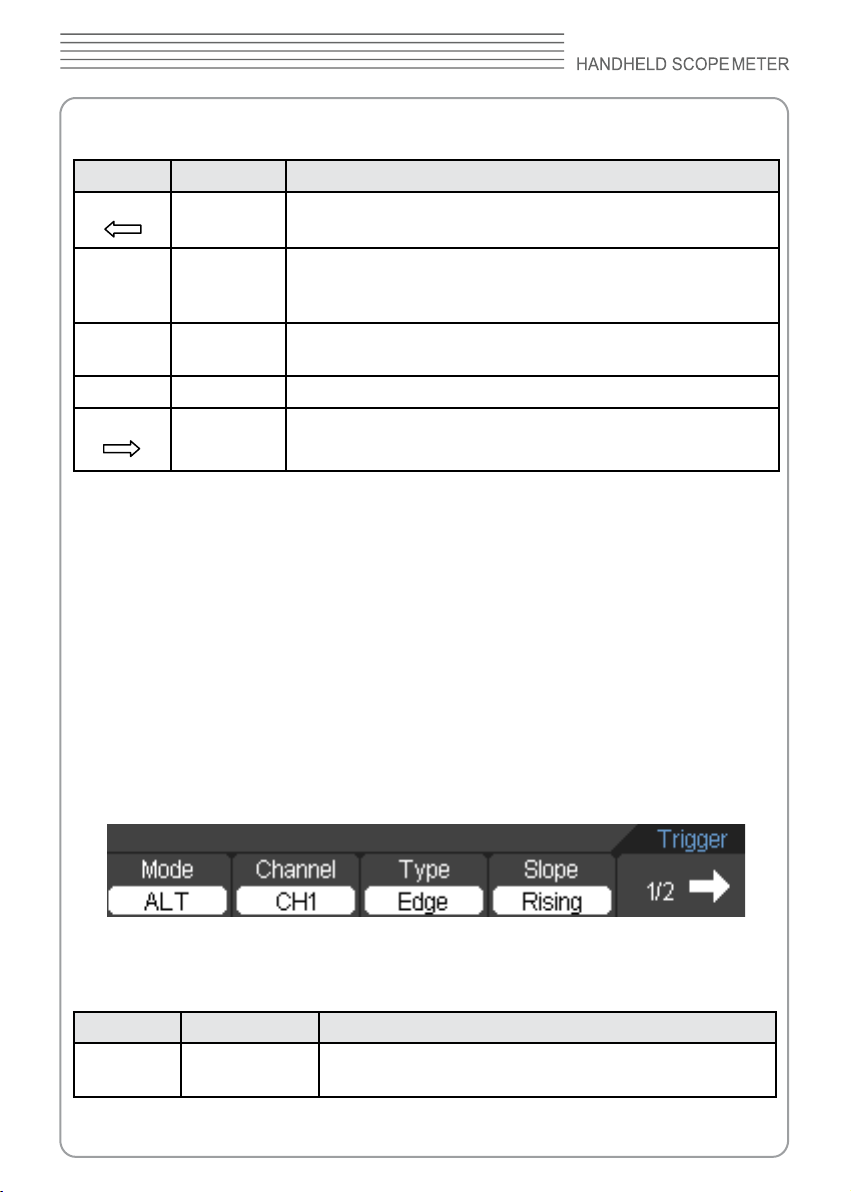
The Pulse Trigger Table (Page 2/2)
Menu Setting Description
2/2
Back to the previous menu page
DSO8000 SERIES
Auto
Sweep
HF
Reject
50%
2/2
: The Pulse width adjust range is10ns ~ 10s. When the condition is met, it will
Note
trigger and acquire the waveform.
Normal
Single
ON
OFF
Acquire waveform even no trigger occurred
Acquire waveform when trigger occurred
When trigger occurs, acquire one waveform and then stop
Reject high frequency signals
Set the trigger level to the center of the signal
Back to the previous menu page
ALT (Alternative) Trigger Setting
When alternative trigger is on, the trigger sources come from two vertical channels. This
mode can be used to observe two non-related signals. You can choose two different
trigger modes for the two vertical channels. The options are as follows: Edge, Pulse. The
info of the trigger level of the two channels will be displayed on the upper-right of the
screen.
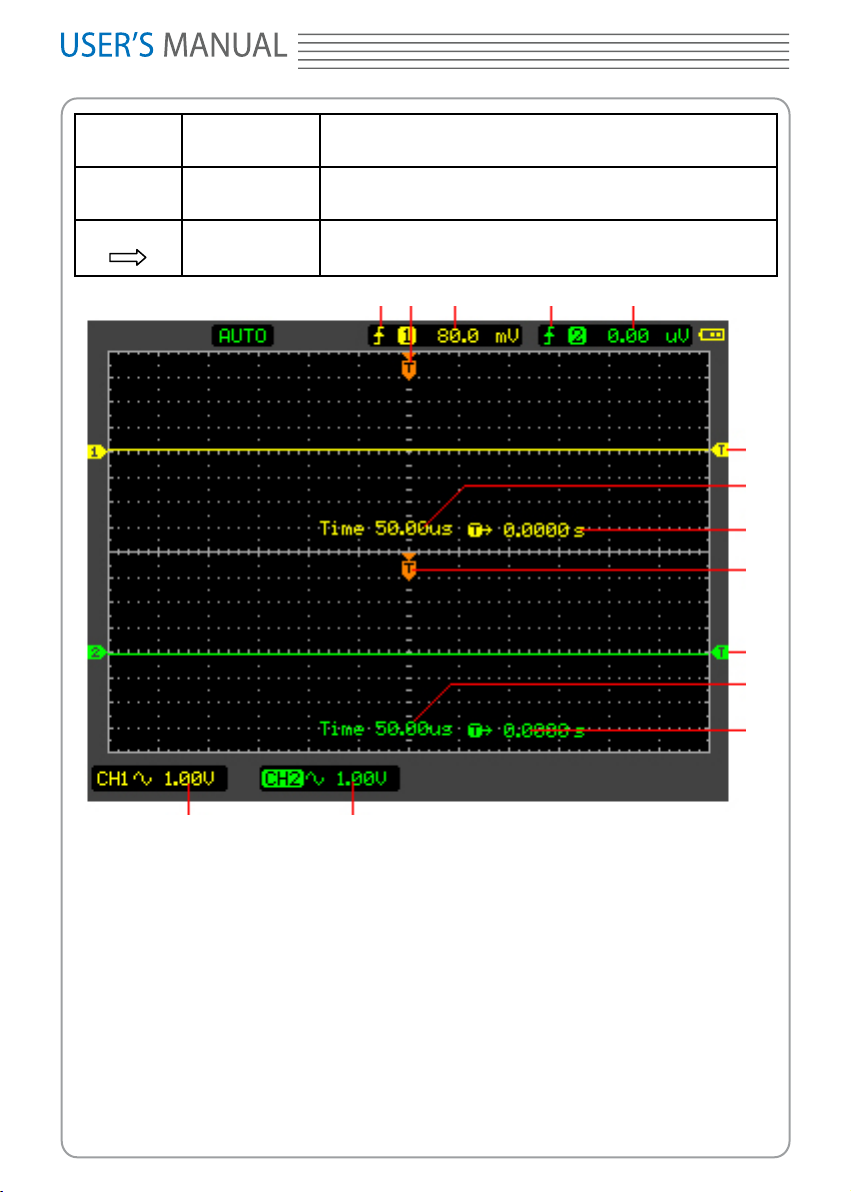
See the ALT screen in gure 2-29.
Press
TRIG → F1 → ALT
The ALT Trigger menu (Type Edge)(Page 1/2)
button to show the ALT trigger menu as the following table.
Figure 2-30 The ALT trigger menu
The ALT menu table (Type Edge)( Page 2/2)
Menu Setting Description
Channel
CH1
CH2
Set trigger for CH1
Set trigger for CH2
Page 46
8060
Type
Slope
1/2
Edge
Pulse
Rising
Falling
Set Edge/Pulse Trigger as the trigger type
Trigger on rising edge
Trigger on falling edge
Go to the next menu page
1 2
43
5
7
6
8
9
11
10
13
14
Figure 2-29 ALT Mode Screen
Description:
1. The trigger type of CH1
2. The horizontal trigger position of CH1
3. The trigger level value of CH1
4. The trigger type of CH2
5. The trigger level value of CH2
6. The time base of CH1
7. The trigger level of CH1
8. The trigger delay time of CH1
9. The horizontal trigger position of CH2
10. The time base of CH2
12
Page 47
11. The trigger level of CH2
12. The trigger delay time of CH2
13.The CH1 Voltage/Div
14.The CH2 Voltage/Div
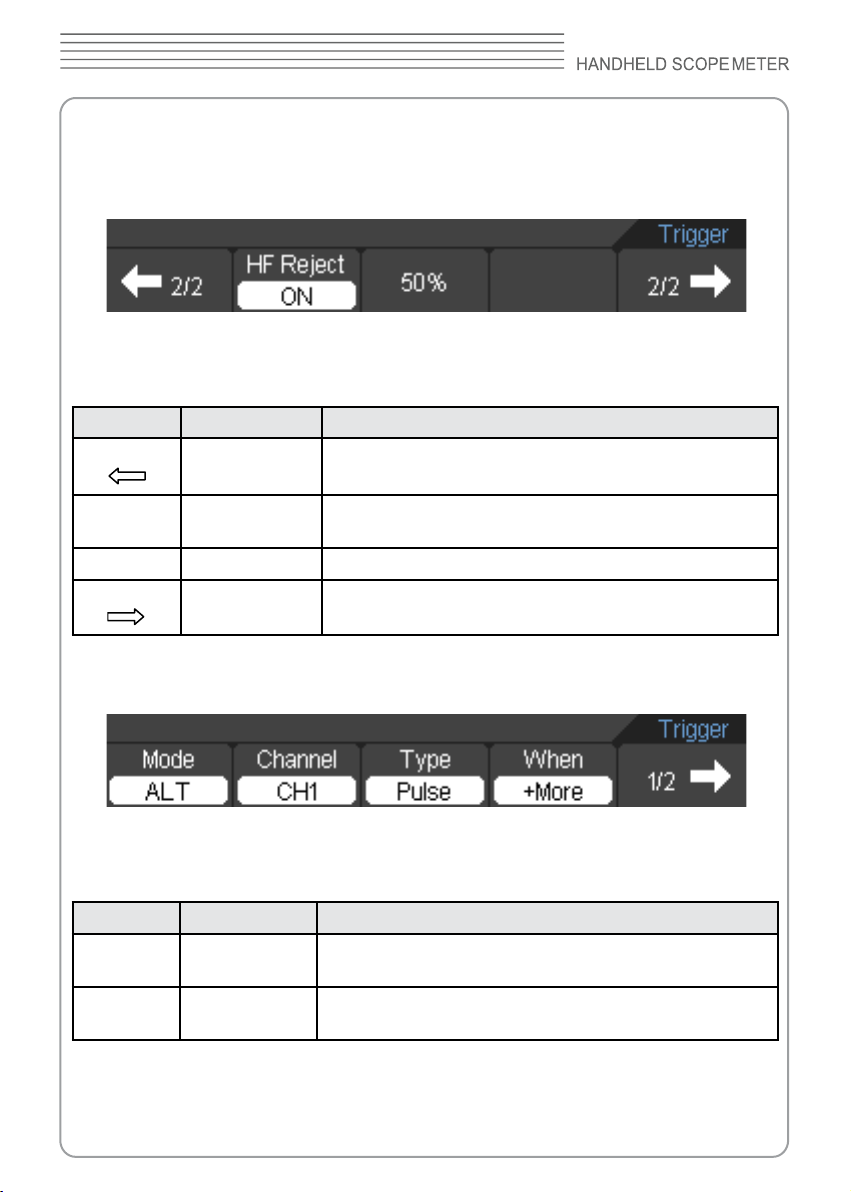
Figure 2-31 The ALT Trigger menu
The Alternative menu table (Type edge)(Page 2/2)
Menu Setting Description
2/2
Back to the previous menu page
DSO8000 SERIES
HF Reject
50% Set the trigger level to the center of the signal
2/2
The ALT Trigger menu (Type Pulse)(Page 1/2)
Figure 2-32 The ALT Tirgger menu
The Alternative menu table (Trigger Type: Pulse Page 1/2)
Menu Setting Description
Channel
Type
ON
OFF
CH1
CH2
Edge
Pulse
Reject high frequency signals or not
Back to the previous menu page
Set trigger mode for CH 1
Set trigger mode for CH2
Set Edge/Pulse Trigger as the trigger type
Page 48
8060
+More
+Less
When
1/2
The ALT Trigger menu (Type Pulse)(Page 2/2)
Figure 2-33 The ALT Trigger menu
The Alternative menu table (Trigger Type: Pulse Page 2/2)
Menu Setting Description
2/2
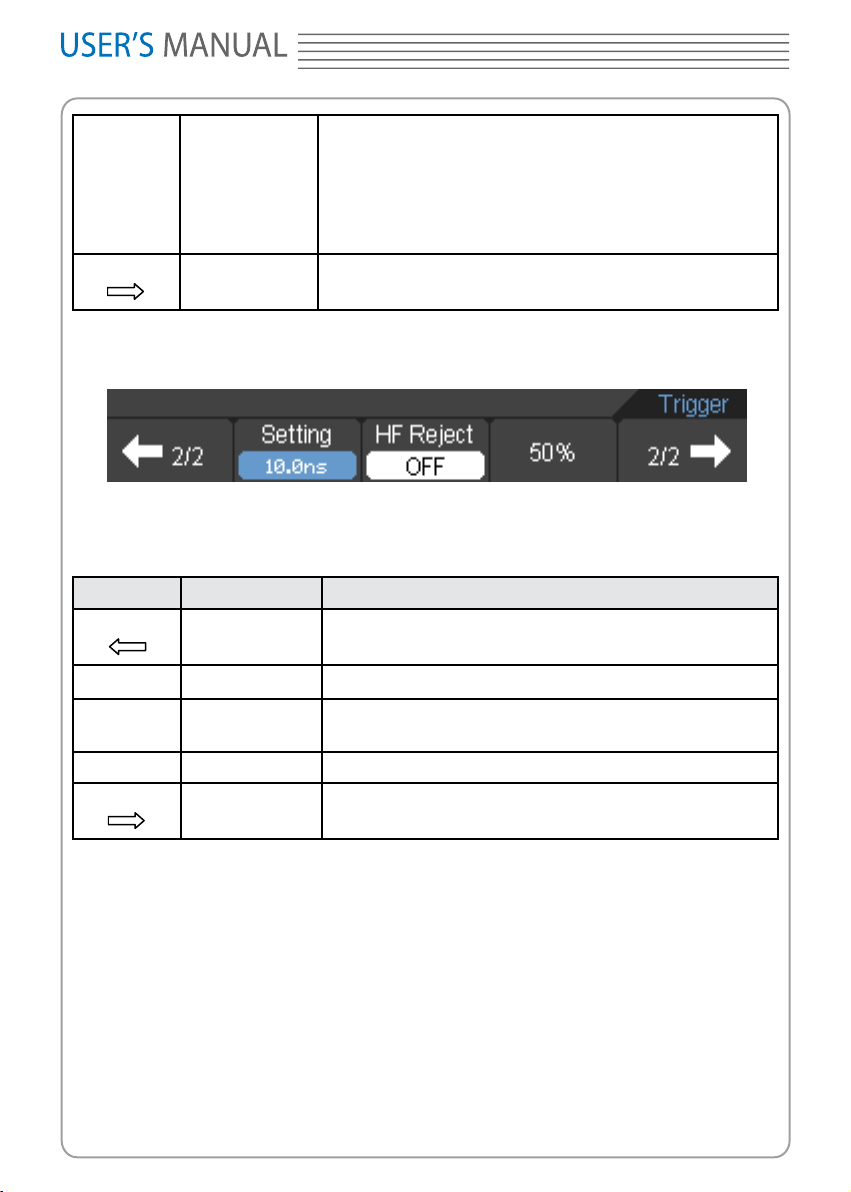
Setting
HF Reject
50% Set the trigger level to the center of the signal
2/2
+Equal
-More
-Less
-Equal
Value
ON
OFF
+Pulse width more than selecting pulse condition
+Pulse width less than selecting pulse condition
+Pulse width equal to selecting pulse condition
-Pulse width more than selecting pulse condition
-Pulse width less than selecting pluse condition
-Pulse width equal to selecting pulse condition
Go to the next menu page
Back to the previous menu page
Set the width of the pulse
Reject high frequency signals or not
Back to the previous menu page
Video Trigger Setting
The Video trigger mode is designed to captrue the video signal type to display stable
NTSC or PAL/SECAM standard composite video waveforms.
Press
TRIG → F1 → Video
table.
The Video Trigger menu (Page 1/2)
(not used in DSO8060)
button to show the Video trigger menu as the following
Page 49
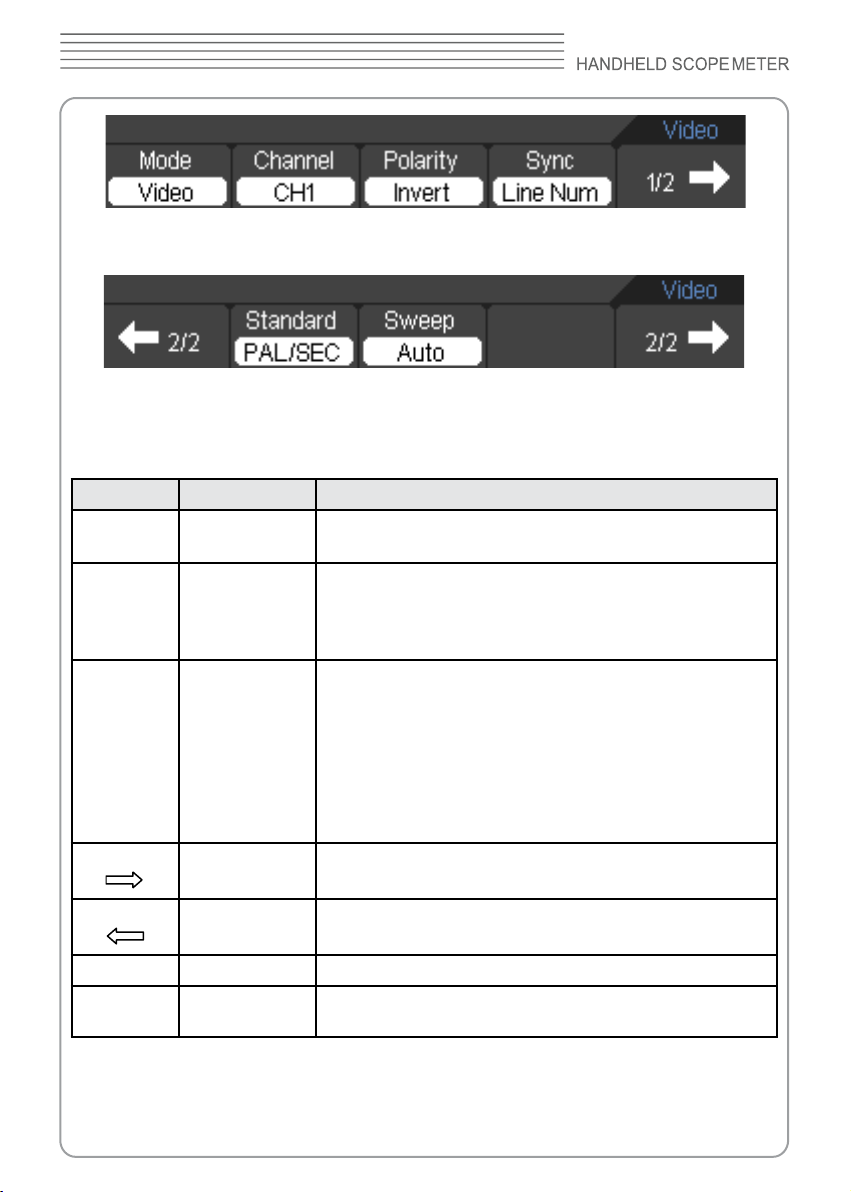
The Video Trigger menu (Page 2/2)
Figure 2-34 The Video Tirgger menu
The Video Trigger menu table
Menu Setting Description
Channel
Polarity
Sync
1/2
CH1
CH2
Normal
Invert
All Field
Odd Field
Even Field
Line Num
All Lines
Set trigger mode for CH1
Set trigger mode for CH2
Applicable to the video signal of which the black level is
low
Applicable to the video signal of which the black level is
high
Set trigger on the falling edge of the rst serration pulse
to eld
Set trigger on the falling edge of the rst serration pulse
to odd eld
Set trigger on the falling edge of the rst serration pulse
to even eld
Set trigger on the selected line in even eld or odd eld
Set trigger on the rst line found
Go to the next menu page
DSO8000 SERIES
2/2
Line Num
Standard
PAL/SEC
NTSC
Back to the previous menu page
Set the lines of trigger video
Set video standard to PAL/SEC
Set video standard to NTSC
Page 50
8060
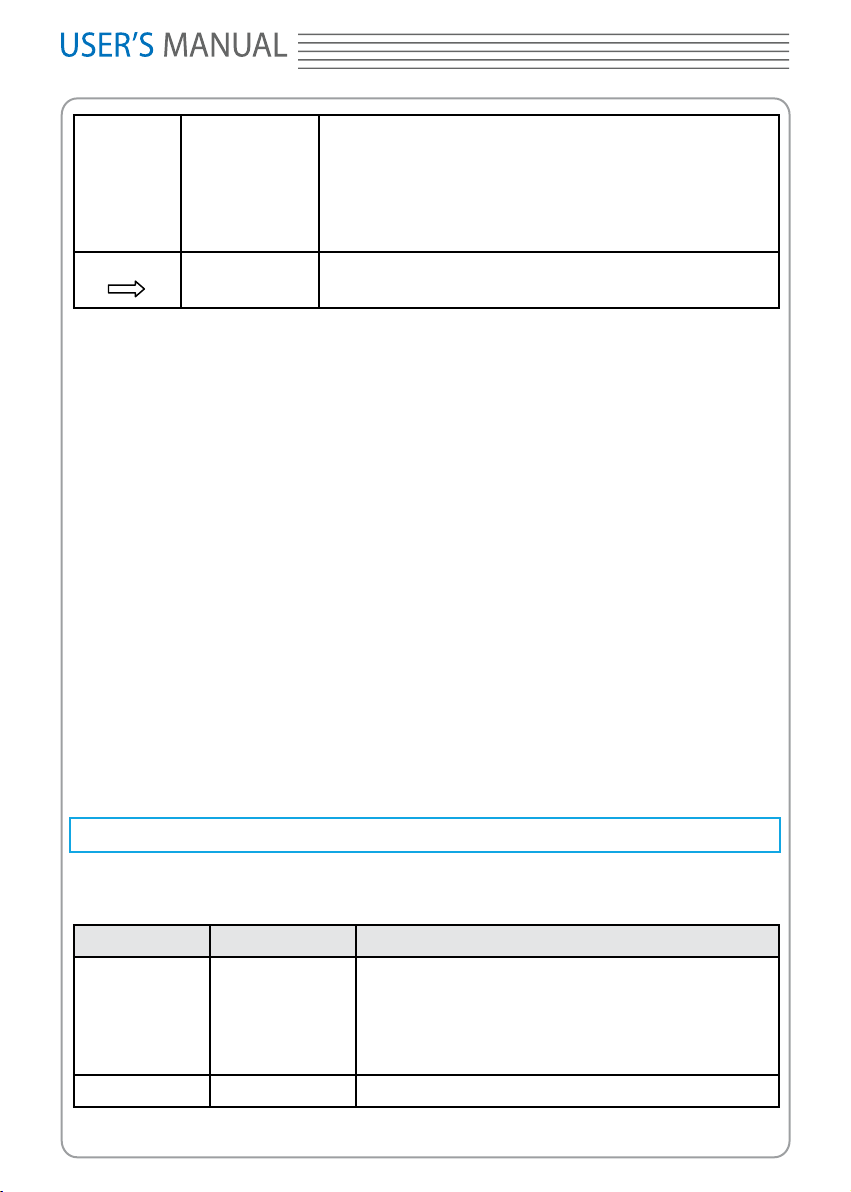
Force the oscilloscope to trigger in the absence conditon
Let oscilloscope to trigger in the suitable trigger conditon
Let osclloscope to trigger one time in the suitable trig-
ger condition,then stop
Back to the previous menu page
Sweep
2/2
Auto
Normal
Single
Term interpretation
■ Auto:
This sweep mode allows the scope meter to acquire waveforms even when it does
not detect a trigger condition. If no trigger condition occurs while the scope meter is
waiting for a specic period (as determined by the time-base setting), it will force itself
to trigger.
When forcing invalid triggers, the scope meter cannot synchronize the waveform,
and the waveform seems to roll across the display. If valid triggers occur, the display
becomes stable on the screen. Any factor results in the un-stability of waveforms can
be detected by Auto Trigger, such as the output of Power supply.
NOTE: When horizontal control is set more than 50 ms/div, Auto mode allows the
oscilloscope to capture without trigger signal.
■ Normal:
The Normal mode allows the scope meter to acquire a waveform only when it is
triggered. If no trigger occurs, the scope meter keeps waiting, and the previous
waveform, if any, will remain on the display.
■ Single:
In Single mode, after pressing the RUN/STOP key, the scope meter waits for trigger.
While the trigger occurs, the scope meter acquires one waveform then stop.
Save / Recall Waveforms and Setups
Press the
The Save/Recall Menu Table
Save/Recall
Menu Setting Description
Type
Internal Go to menu for internal memory operation
button, the interface menu for settings shows as follows.
Wave
Setup
Bitmap
CSV
Factory
Store or recall waveform
Store or recall instrument setups
Create or delete bitmap les
Create or delete CSV les
Recall factory setups
Page 51
DSO8000 SERIES
External Go to menu for external memory operation
Wave
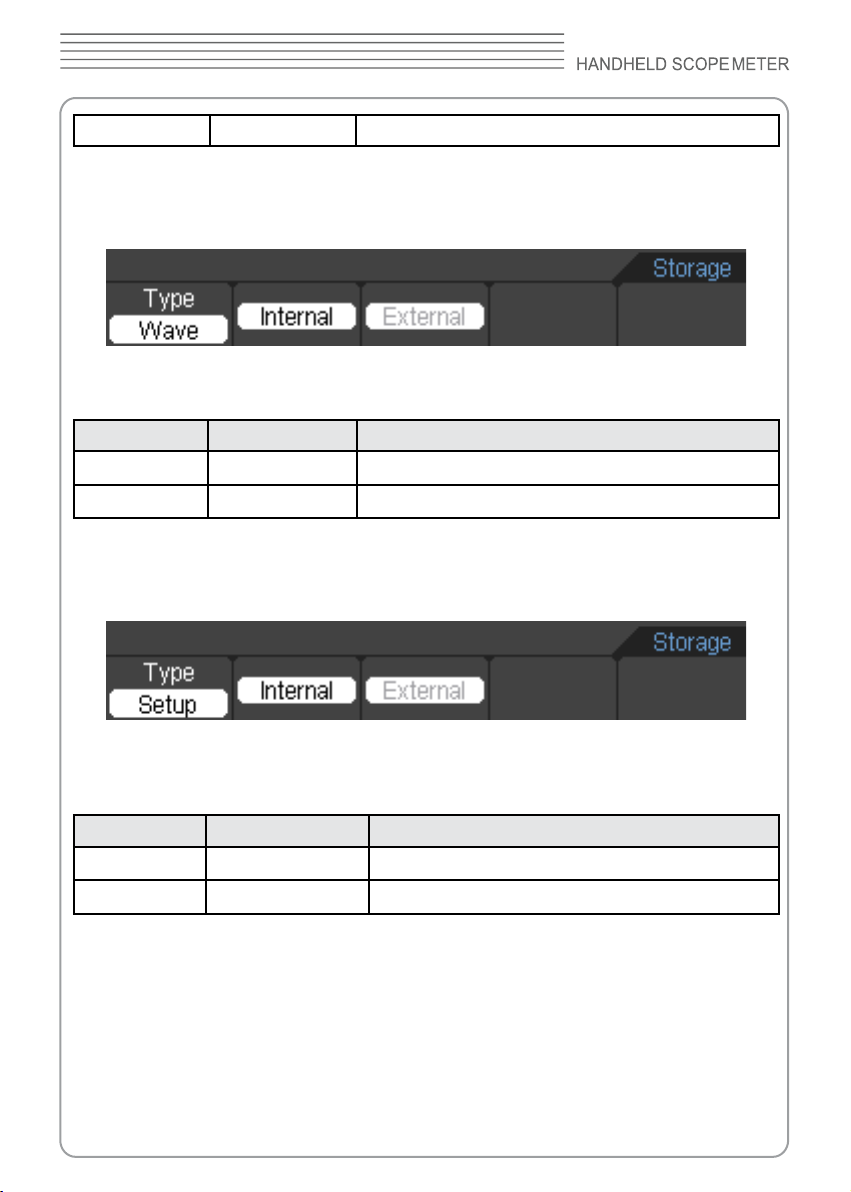
The Wave menu
Figure 2-35 The Wave menu
The Wave menu table
Menu Setting Description
Internal Go to menu for internal memory operation
External Go to menu for external memory operation
Setup
The Setup menu
Figure 2-36 The Setup menu
The Setup menu table
Menu Setting Description
Internal Go to menu for internal memory operation
External Go to menu for external memory operation
Bitmap
The Bitmap menu
Page 52
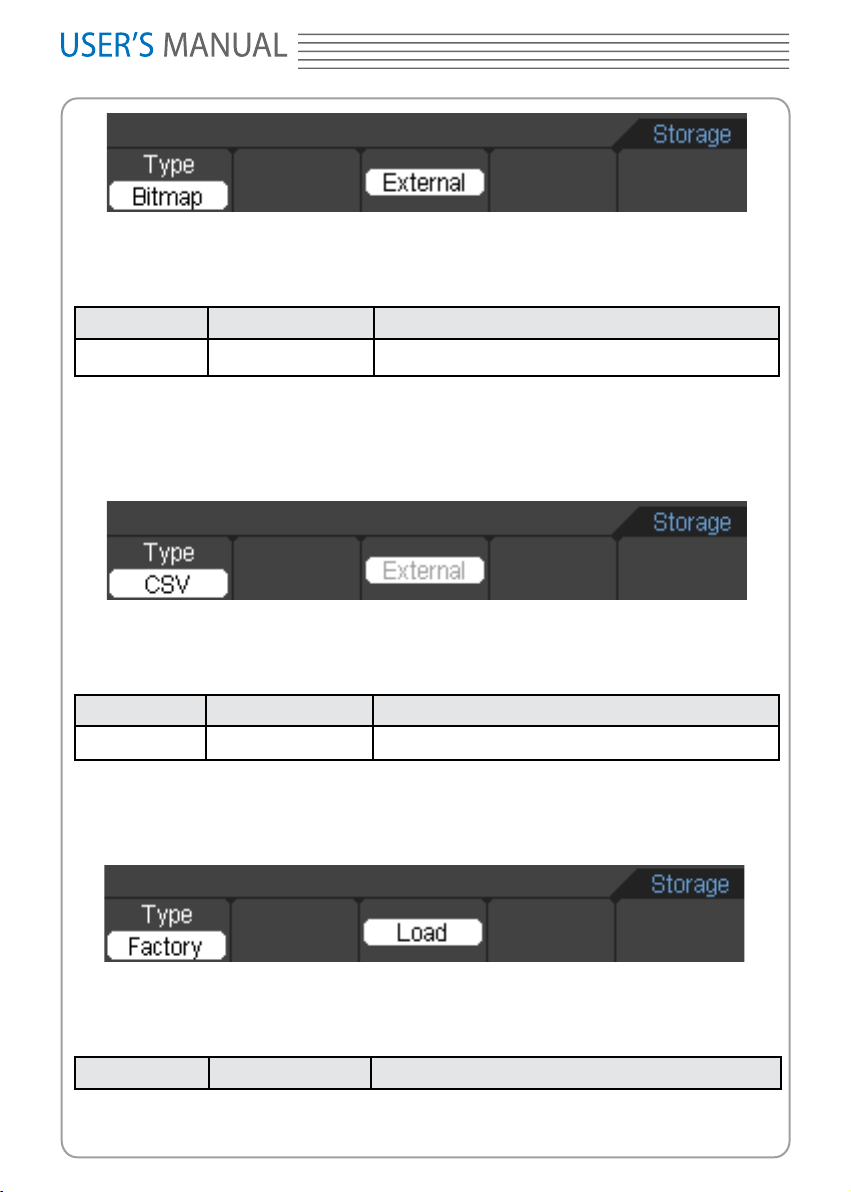
8060
Figure 2-37 The Bitmap menu
The Bitmap menu table
Menu Setting Description
External Go to menu for external memory operation
CSV
The CSV menu
Figure 2-38 The CSV menu
The CSV menu table
Menu Setting Description
External Go to menu for external memory operation
Factory
The Factory menu
Figure 2-39 The Factory menu
The Factory menu table
Menu Setting Description
0
Page 53
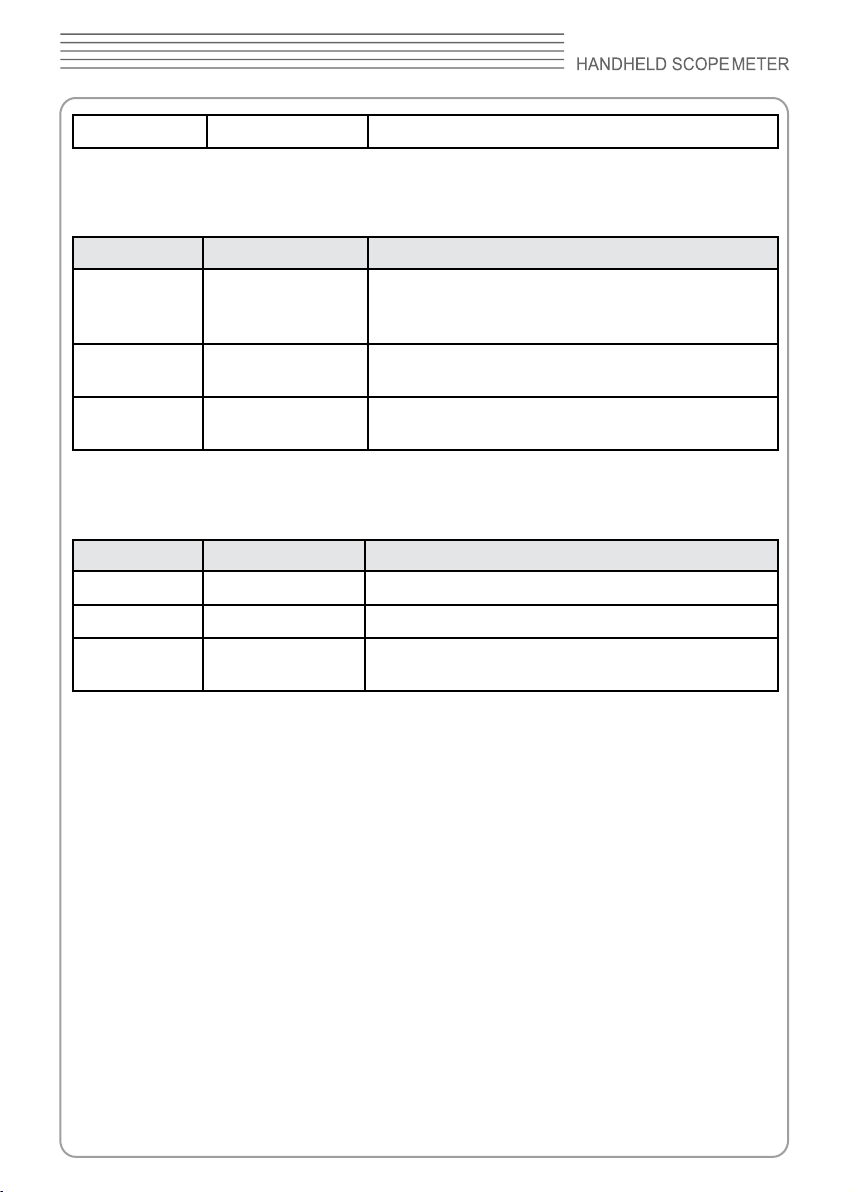
Load Recall factory setups or les
Internal Memory
DSO8000 SERIES
Press
SAVE/RECALL →Internal
Menu Setting Description
Internal
Load
Save
Setup_01
...
Setup_15
to go to the following menu
Set up the location of les in internal memory
Recall waveform les and setup les from the
internal memory location
Save waveform les and setup les to the internal
memory location
External Memory
Press
SAVE/RECALL → External
Menu Setting Description
New File
Delete File
Load
File system as following:
to go to the following menu.
To create new le
Delete le
Recall waveform and setup from USB storage
device
Page 54
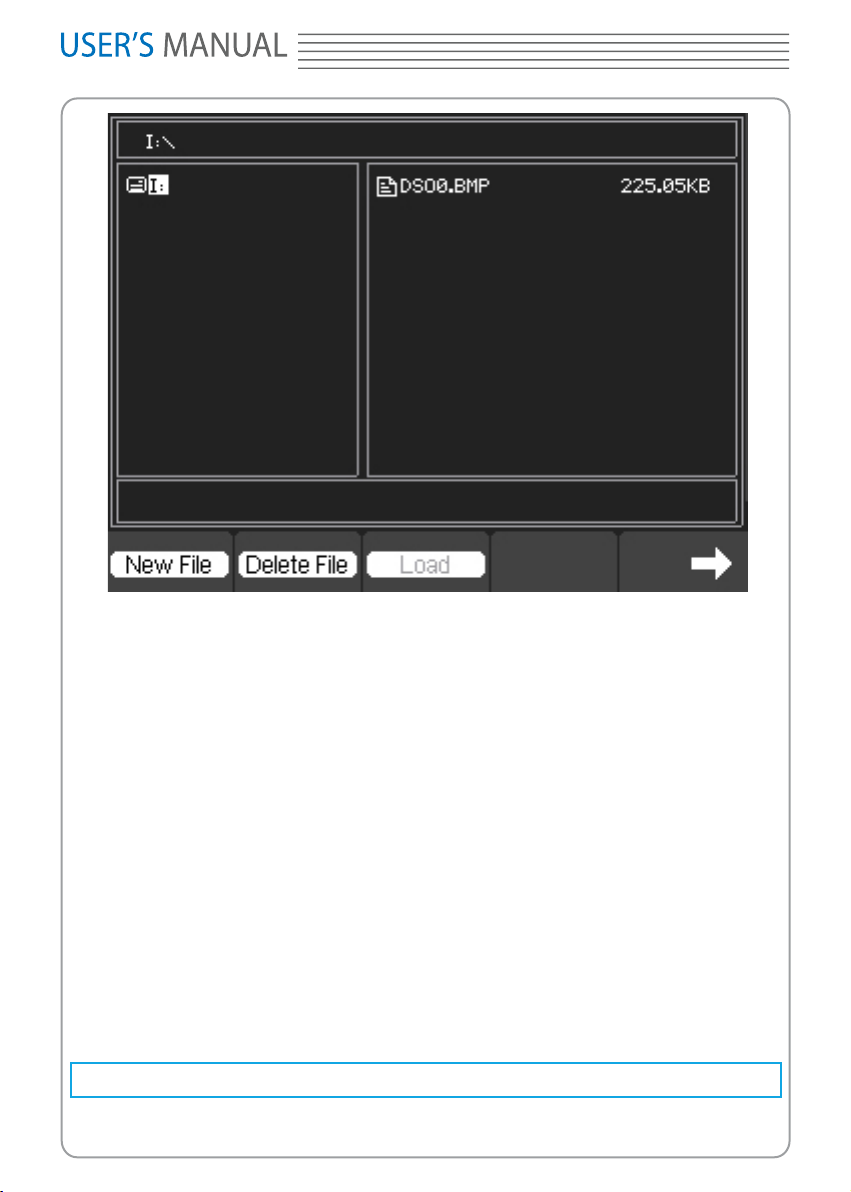
8060
Figure 2-40 File System
Factory
The scope meter has default settings and can be recalled at any time.
Memory location
Specify the memory location to save/recall the waveforms and setups.
Load
Recall saved waveforms, setups and default settings.
Save
Save waveforms and setups.
Note:
1. Select save stores not only the waveforms, but also the current scope meter.
2. The oscilloscope can store 15 settings permanently and can restore at any time.
Utility Function
Page 55
DSO8000 SERIES
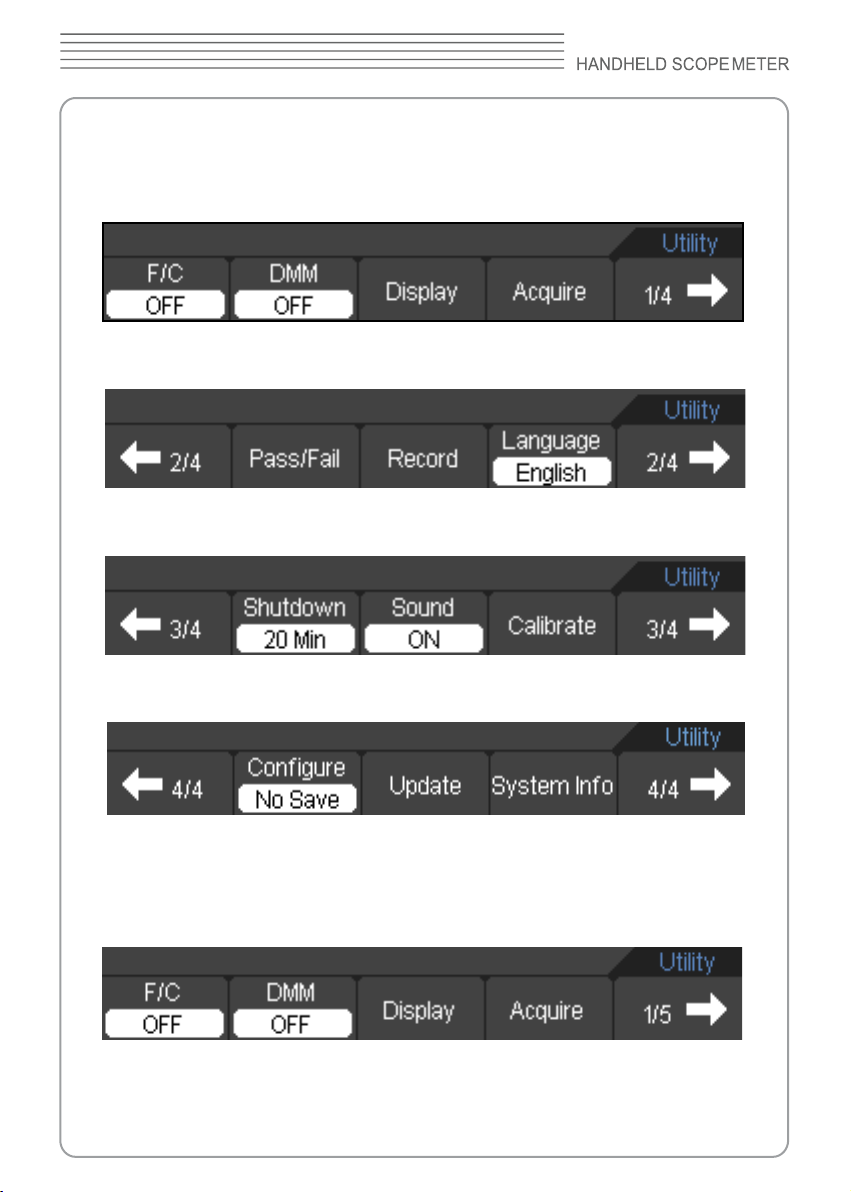
Press the
The series without RS232 and LAN:
The Utility menu (Page 1/4)
The Utility menu (Page 2/4)
The Utility menu (Page 3/4)
The Utility menu (Page 4/4)
button to show the menu of the settings in the
Utility
Utility
system.
Figure 2-41 The Utility menu(without RS232 and LAN)
The series with RS232 and LAN:
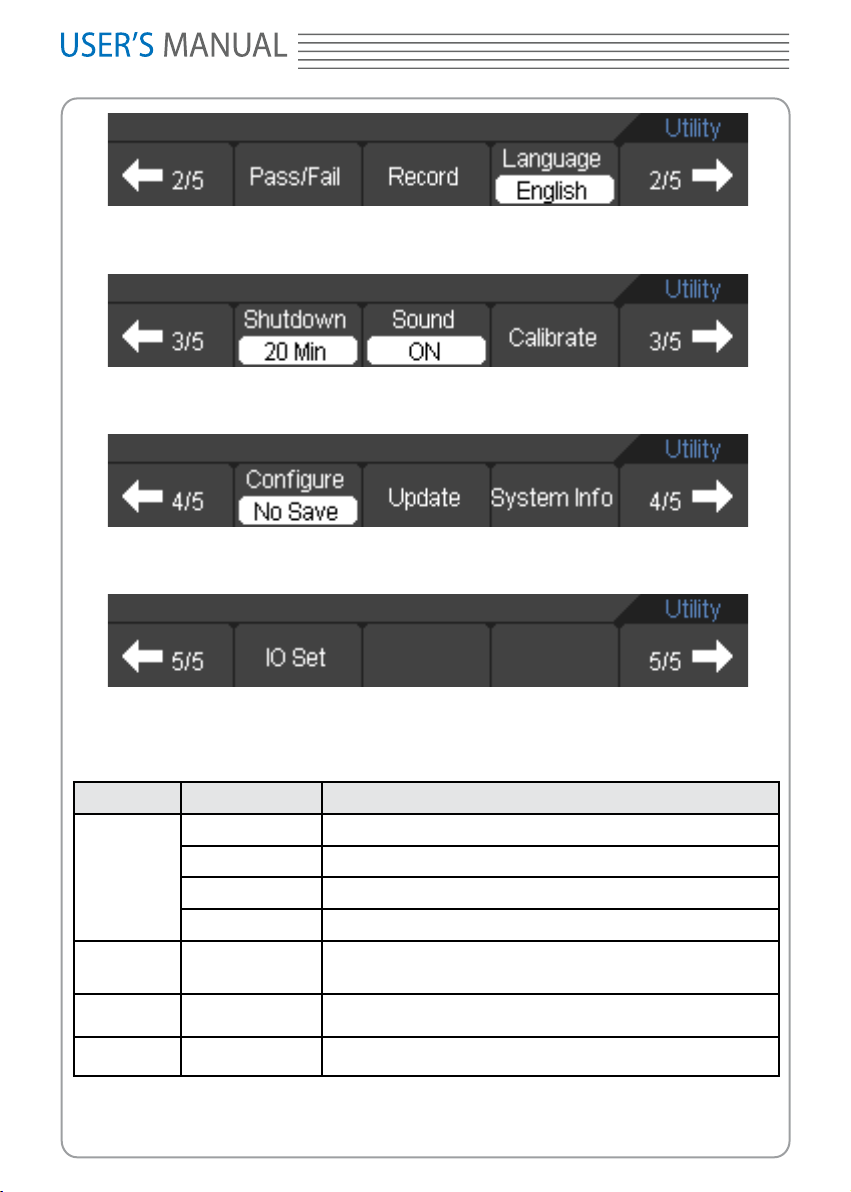
The Utility menu (Page 1/5)
The Utility menu (Page 2/5)
Page 56
8060
The Utility menu (Page 3/5)
The Utility menu (Page 4/5)
The Utility menu (Page 5/5)
Figure 2-42 The Utility menu (with RS232 and LAN)
The Utility menu table (Page 1/4 and Page 1/5)
Menu Setting Description
OFF Turn off Frequency,Counter or RPM
F/C/R
Frequency Turn on Frequency
Counter Turn on Counter
RPM Turn on RPM
DMM
ON
OFF
Turn on the multimeter
Turn off the multimeter
Display Show Display menu page
Acquire Go to the Acquire menu page
Page 57
DSO8000 SERIES
1/4
1/5
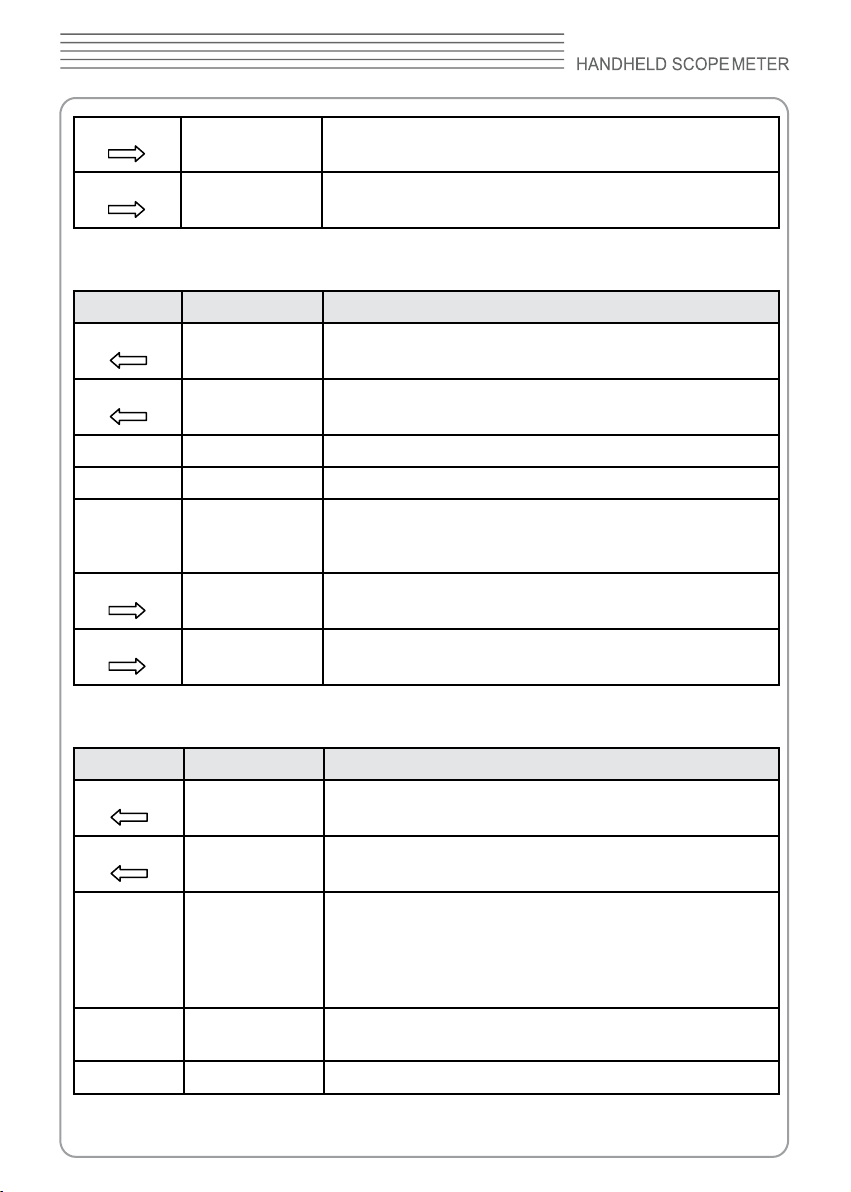
The Utility menu table (Page 2/4 and Page 2/5)
Menu Setting Description
2/4
2/5
Pass/Fail Go to Pass/Fail menu page
Record Go to Record menu page
Language
2/4
2/5
Go to the next menu page
Go to the next menu page
Back to the previous menu page
Back to the previous menu page
Select languages
(More languages may be added in later rmware
versions.)
Go to the next menu page
Go to the next menu page
The Utility menu table (Page 3/4 and Page 3/5)
Menu Setting Description
3/4
3/5
5Min
Shut
Down
Sound
Calibrate Calibrate the scope meter
10Min
20Min
30Min
Innite
ON
OFF
Back to the previous menu page
Back to the previous menu page
Set the shut down time
Turn beeper sound on/off
Page 58
8060
3/4
3/5
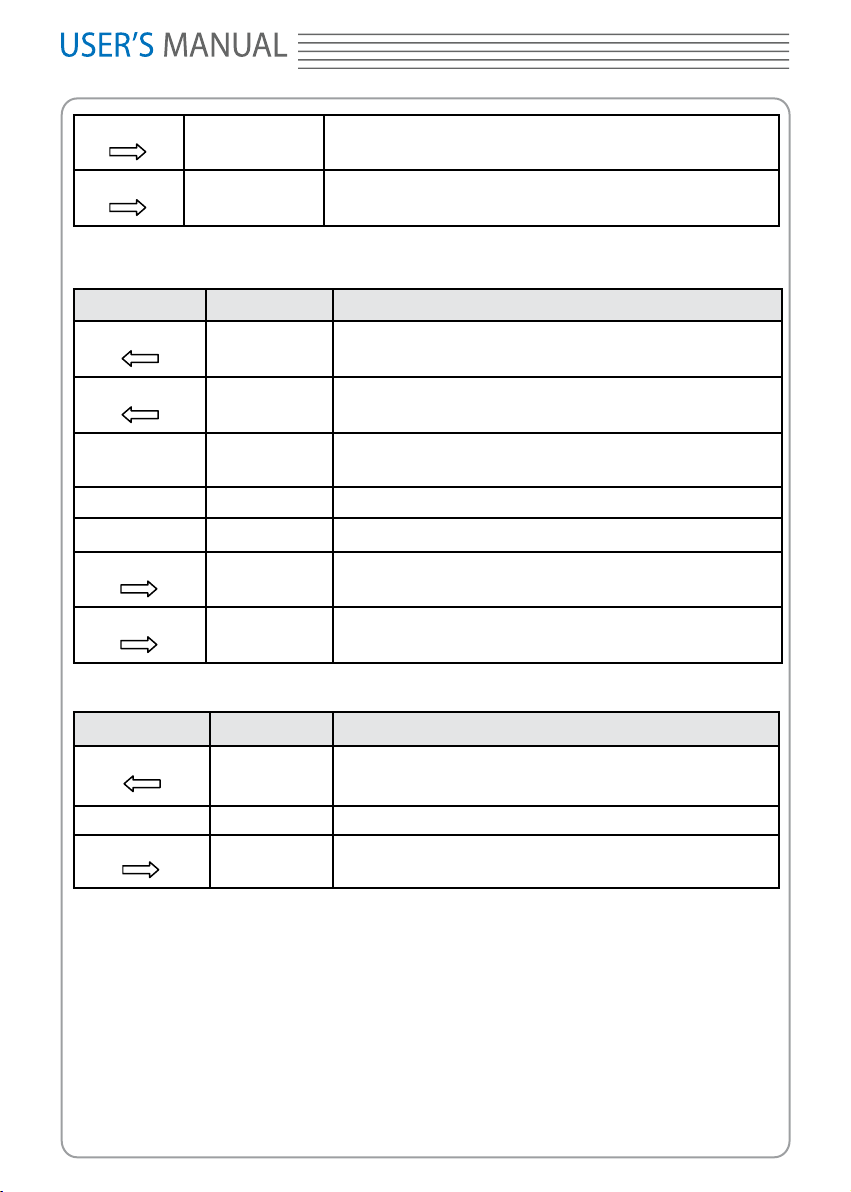
The Utility menu table (Page 4/4 and Page 4/5)
Menu Setting Description
4/4
4/5
Congure
Update Update the system
System Info Show the information of the system
4/4
4/5
The Utility menu table (Page 5/5)
Menu Setting Description
No Save
Save
Go to the next menu page
Go to the next menu page
Back to the previous menu page
Back to the previous menu page
Not save the system conguration when shut down
Save the system conguration when shut down
Go to the rst previou menu page
Go to the next menu page
5/5
IO Set Go to the IO Set menu Page
5/5
Back to the previous menu page
Go the the rst previous menu page
Calibrate
The calibration adjusts the internal circuitry to get the best accuracy. Use these functions
to calibrate the vertical and horizontal systems.
For maximum accuracy at any time, run this calibration if the ambient temperature
changes by 5°C or more.
Before running this procedure, do these steps:
1. Disconnect any probes or cables from all channel inputs, otherwise failure or damage
Page 59
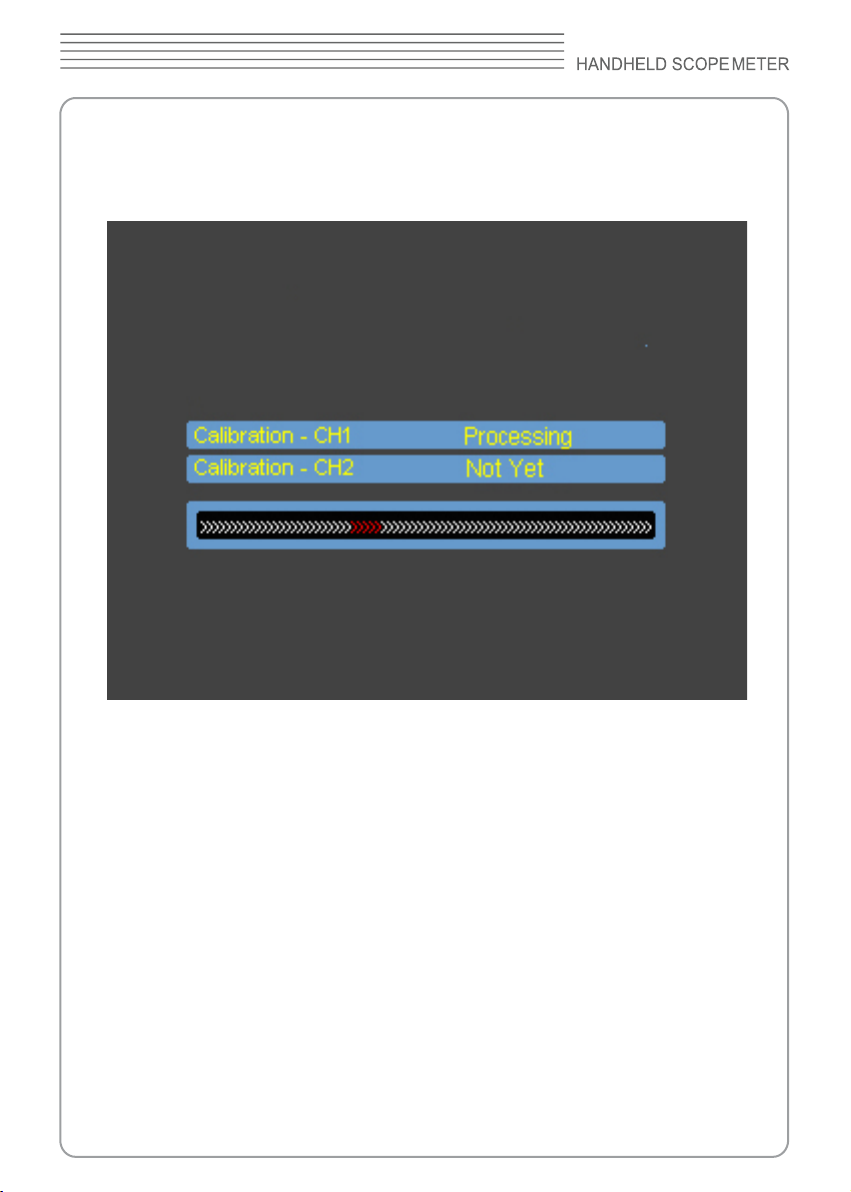
to the scope meter may be occurred.
2. Push the
The calibration screen is shown as in Figure 2-43.
button and select
Utility
Calibrate.
DSO8000 SERIES
Figure 2-43 The Calibration Screen
Note:
The scope meter must have been working or warm-up at least 30-minutes before
running calibration to get best accuracy.
The scope meter will calibrate parameter of vertical system (CH1, CH2).
Pass/Fail
The Pass/Fail function monitors changes of signals and output pass or fail signals by
comparing the input signal is within the pre-dened mask.
Press
Utility→Pass/Fail
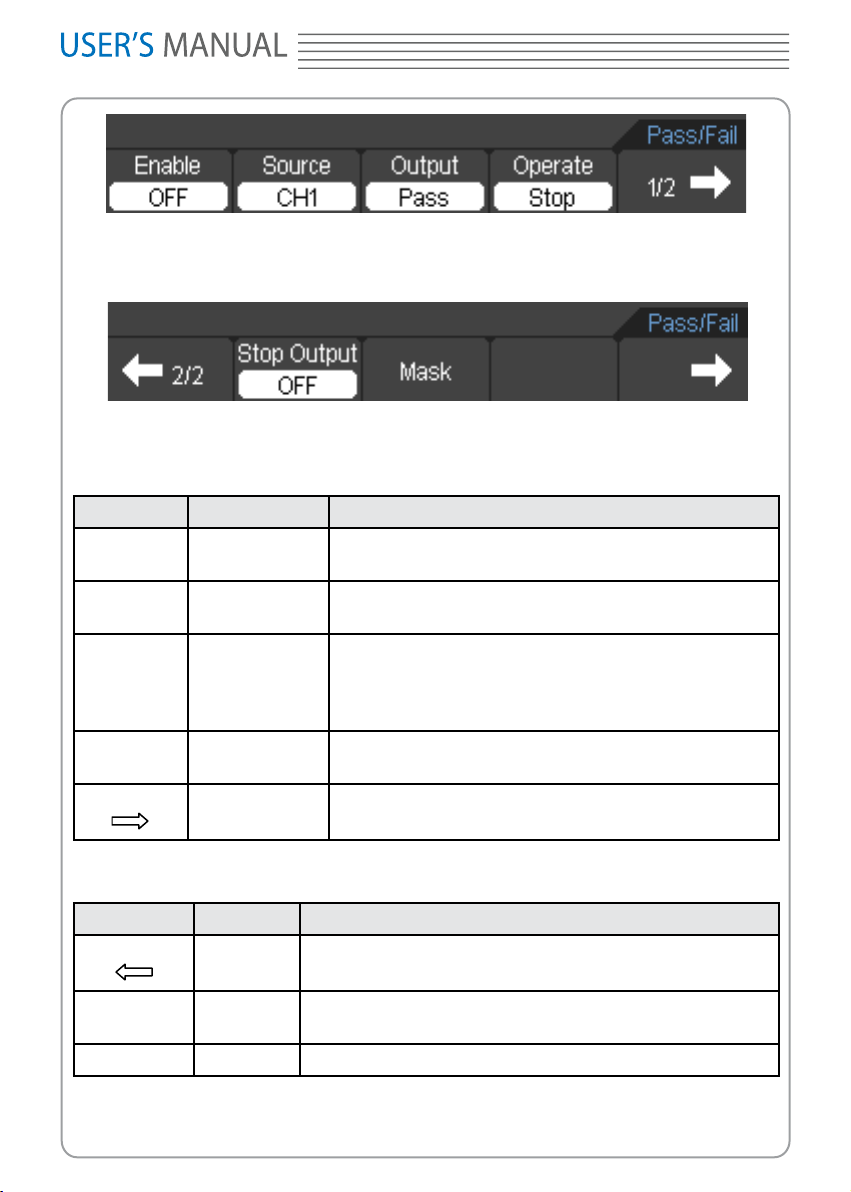
The Pass/Fail menu (Page 1/2)
to go to the following menu.
Page 60
8060
Figure 2-44 The Pass/Fail menu
The Pass/Fail menu (Page 2/2)
Figure 2-45 The Pass/Fail menu
The Pass/Fail menu table (Page 1/2)
Menu Setting Description
Enable
Source
Output
Operate
1/2
ON
OFF
CH1
CH2
Fail
Pass
Fail+Beep
Pass +Beep
Stop
Start
Turn on Pass/Fail test
Turn off Pass/Fail test
Select Pass/Fail test on CH1
Select Pass/Fail test on CH2
Output when Fail condition detected
Output when Pass condition detected
Output and Beep when Fail condition detected
Output and Beep when Pass condition detected
Pass/Fail test stopped, press to run
Pass/Fail test running, press to stop
Go to the next menu page
The Pass/Fail menu table (Page 2/2)
Menu Setting Description
2/2
Stop
output
ON
OFF
Back to the previous menu page
Stop test when output occur
Continue test when output occur
Mask Go to Mask menu
Page 61
DSO8000 SERIES
2/2
Back to the previous menu page
Mask setting
Press
Utility→Pass/Fail→Mask
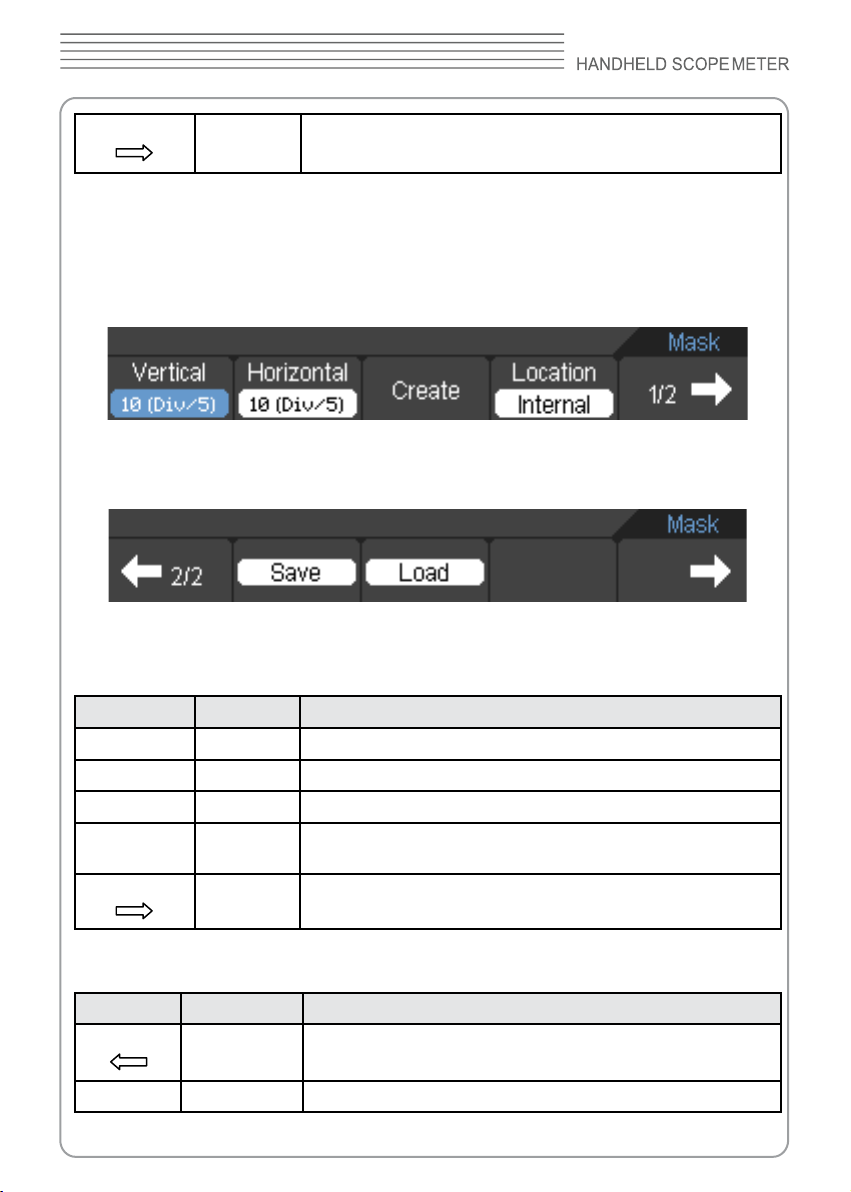
The Mask menu (Page 1/2)
The Mask menu (Page 2/2)
The Mask setting menu table (Page 1/2)
Menu Setting Description
Vertical Set vertical clearance to the waveform
Horizontal Set horizontal clearance to the waveform
Create Create a test mask according to the above clearance
Location
1/2
Internal
External
Setting to go to the following menu.
Figure 2-46 The Mask menu
Figure 2-47 The Mask menu
Store created test mask into internal/External memory
Go to the next menu page
The Mask setting menu table (Page 2/2) When the save as internal memory
Menu Setting Description
2/2
Save Store created test mask into internal memory
Back to the previous menu page
Page 62
8060
Load Recall mask setting le from internal memory
Back to the previous menu page
The Mask setting menu (Page 2/2) When the save as external memory
Menu Setting Description
Save Go to save menu (same as REF save menu)
Load Recall mask setting le from external memory
Waveform Recorder
Waveform recorder records input waveforms from CH1 and CH2, with a maximum record
length of 1000 frames.
Press
Utility→Record
Waveform recorder
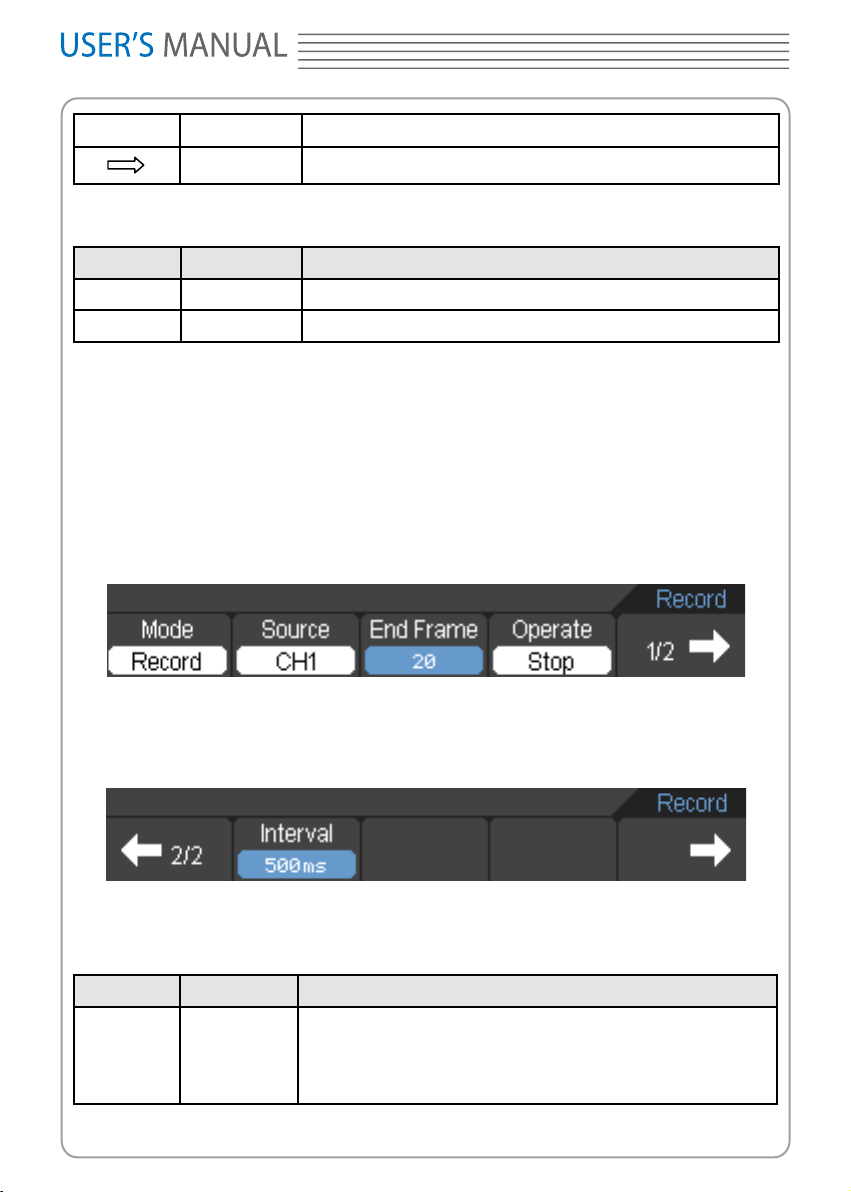
The Recorder menu Record Mode) (Page 1/2)
The Recorder menu (Record Mode) (Page 2/2)
The Record menu table (Record Mode) (Page 1/2)
Menu Setting Description
Mode
Setting to go to the following
: Record the waveforms with specied interval.
Figure 2-48 The Recorder menu (Record Mode)
Figure 2-49 The Recorder menu (Record Mode)
Record
Play
Storage
OFF
Select record mode
Select play mode
Select storage mode
Turn off all recorder function
0
Page 63
DSO8000 SERIES
Source
End Frame <1-1000> Set number of record frames
Operate
1/2
The Record menu table (Record Mode) (Page 2/2)
Menu Setting Description
2/2
Interval <10.0ms-20s> Set time interval between record frames
: Play back the recorded waveforms.
Play
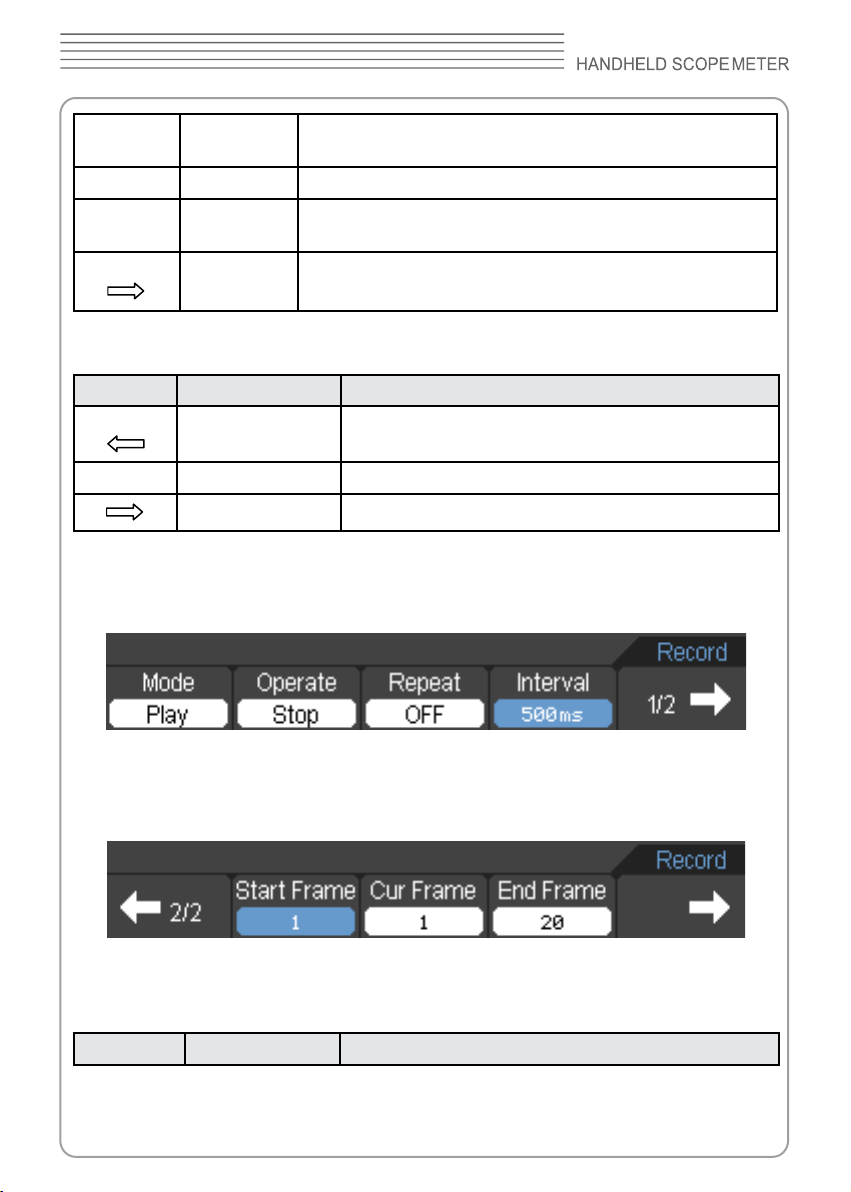
The Record menu(Paly Mode) (Page 1/2)
CH1
CH2
Start
Stop
Select record source channel
Record stopped, press to start recording
Press to stop recording
Go to the next menu page
Back to the previous menu page
Back to the Utility menu page
Figure 2-50 The Record menu (Play Mode)
The Play back menu(Play Mode) (Page 2/2)
Figure 2-51 The Record menu (Play Mode)
The Record menu table(Play Mode) (Page 1/2)
Menu Setting Description
Page 64
8060
Operate
Repeat
Start
Stop
ON
OFF
Play stopped, press to start playback
Press to stop playing
Set repeat play mode or not
Interval <10.0ms-20s> Set interval time to play back
1/2
Go to the next menu page
The Record menu table (Play Mode) (Page 2/2)
Menu Setting Description
2/2
Back to the previous menu page
Start Frame <1-1000> Set start frame
Cur Frame <1-1000> Select current frame to be played
End Frame <1-1000> Set End frame
Back to the previous menu page
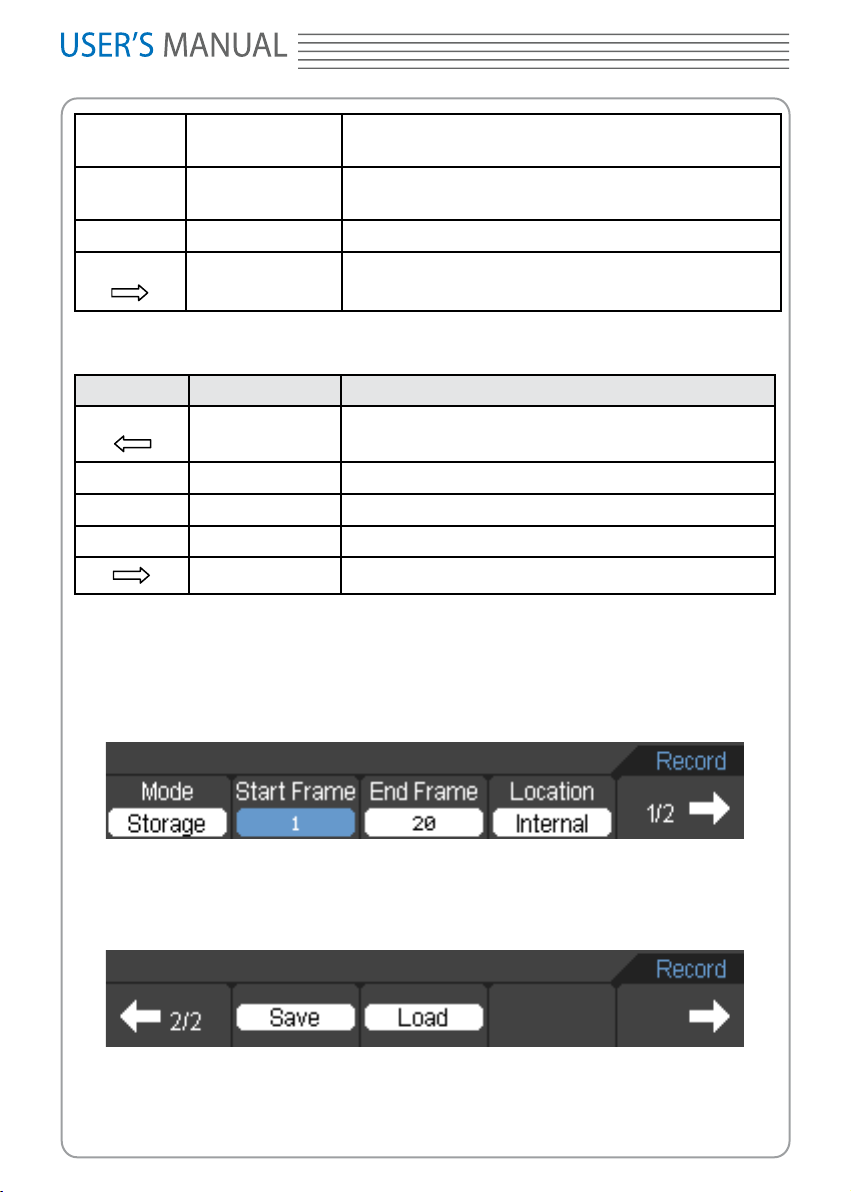
Storage
: Store recorded waveforms to non-volatile memory according to the setup
frames.
The Record menu (Storage Mode) (Page 1/2)
Figure 2-52 The Record menu (Storage Mode)
The Record menu (Storage Mode) (Page 2/2)
Figure 2-53 The Record menu (Storage Mode)
Page 65
DSO8000 SERIES
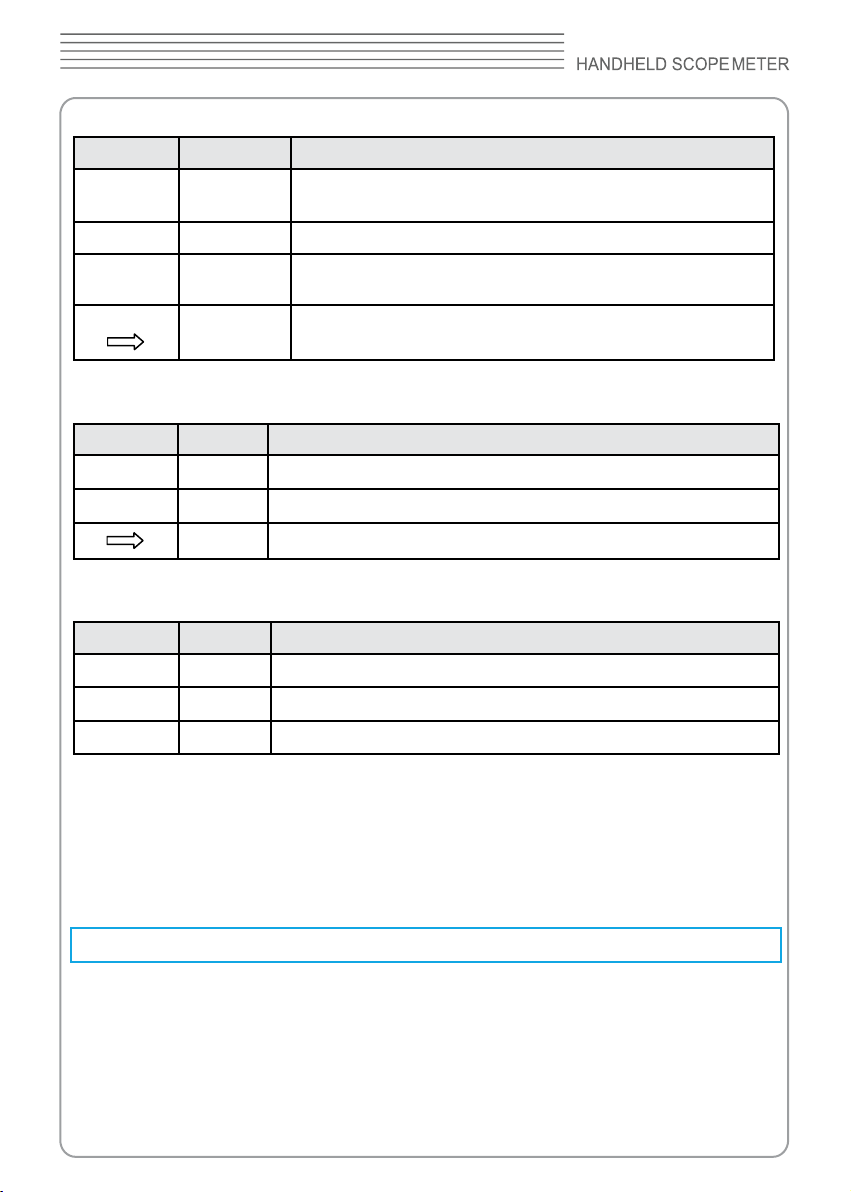
The Record menu (Storage Mode) (Page 1/2)
Menu Setting Description
Start
Frame
End Frame <1-1000>
Location
1/2
The Record menu when the save to Internal memory (Storage Mode)(Page 2/2)
Menu Setting Description
Save
Load Recall recorded waveform from internal memory location
The Record menu when the save as external memory (Storage Mode) (Page 2/2)
Menu Setting Description
Create File
Delete File Delete a selected le
Load Recall recorded waveform from external memory location
<1-1000>
Internal
External
Set rst frame to be saved
Set end frame to be saved
Set up Store location
Go to the next menu page
Save recorded waveform to internal memory location
Back to the Utility menu page
Create a new le
Language:
DSO8000 series scope meters have multi-language user menu, choose as your desire.
Press
Utility→Language
to select the language.
Signal Measurement
Press the
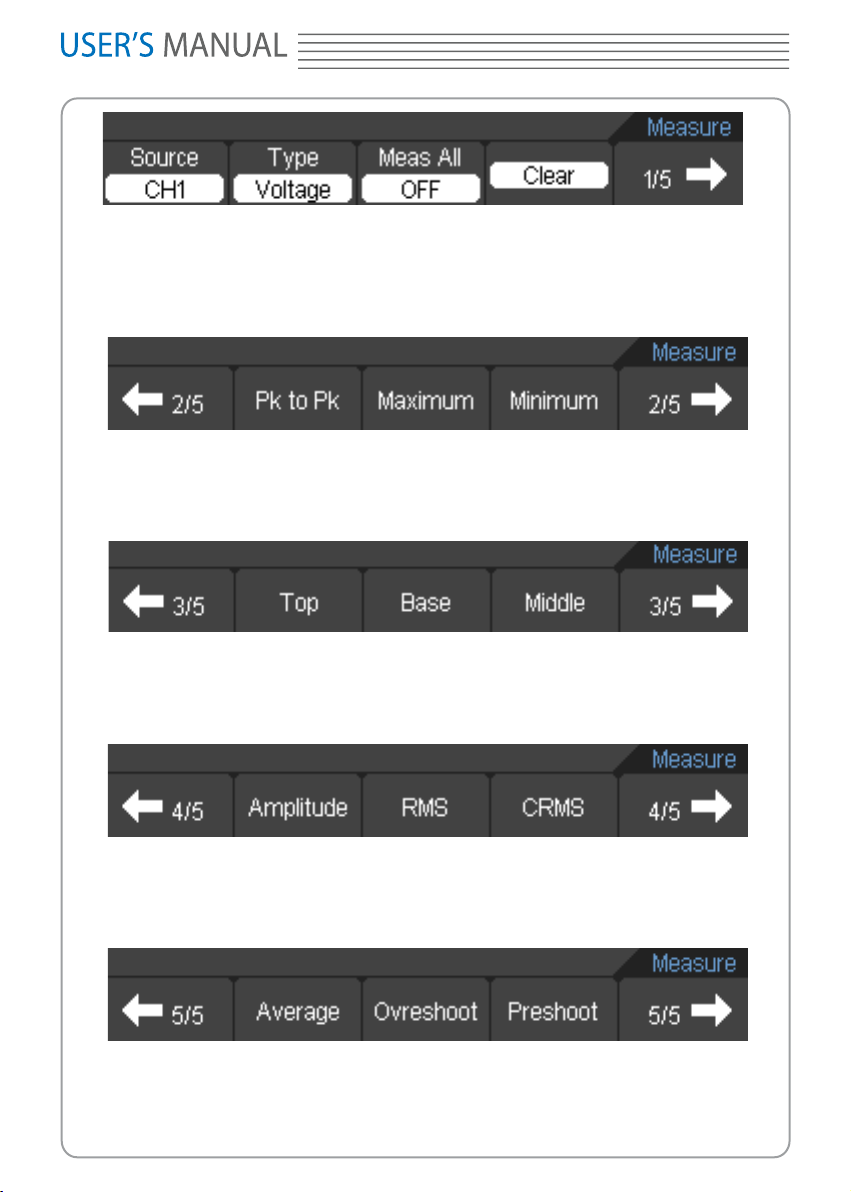
The measure menu (Page 1/5)
button to display the menu of the automatic measurements settings.
MEAS
Page 66
8060
Figure 2-54 The Measure menu
The measure menu (Page 2/5)
Figure 2-55 The Measure menu
The measure menu (Page 3/5)
Figure 2-56 The Measure menu
The measure menu (Page 4/5)
Figure 2-57 The Measure menu
The measure menu (Page 5/5)
Figure 2-58 The Measue menu
Page 67
DSO8000 SERIES
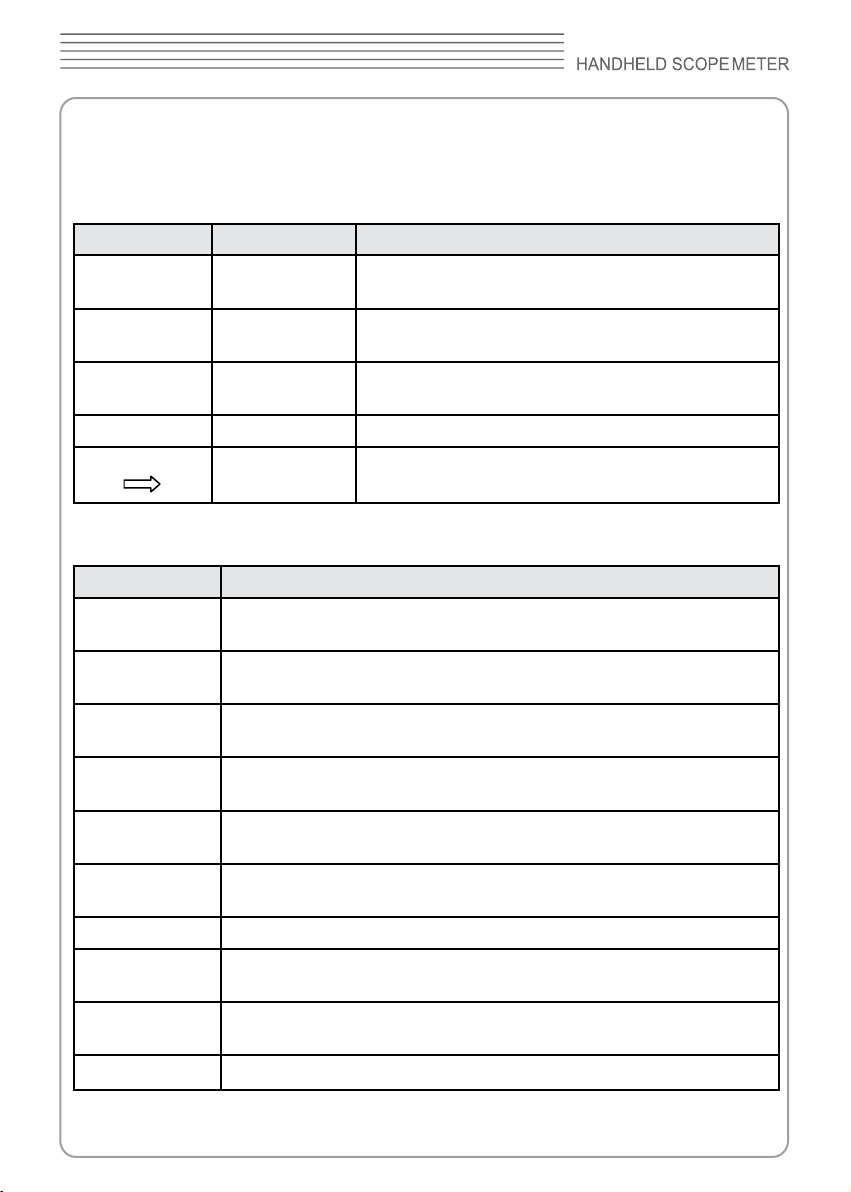
The scope meter provides 22auto measurements:Vpp,Vmax,Vmin,Vtop,Vmid,Vbase,Va
mp, Vavg, Vrms,Vcrms, Overshoot, Preshoot, Freq, Period, Rise Time, Fall Time, +Width,
-Width, +Duty, -Duty, Delay1->2↑, Delay1->2↓ (12 voltage and 10 time measurements).
The Measure menu table
Menu Setting Description
Source
Type
Meas All
Clear Clear measurement result on screen
1/2
The Voltage Measurement menu table
Menu Description
Pk to Pk
Maximum
Minimum
Top
Base
Amplitude
RMS The Root Mean Square voltage over the entire waveform
Preshoot
Overshoot
Middle Voltage of the 50% level from base to top
CH1
CH2
Voltage
Time
ON
OFF
Peak-to-Peak = Max - Min
Measured over the entire waveform
Voltage of the absolute maximum level
Measured over the entire waveform
Voltage of the absolute minimum level
Measured over the entire waveform
Voltage of the statistical maximum level
Measured over the entire waveform
Voltage of the statistical minimum level
Measured over the entire waveform
Amp = Base - Top
Measured over the entire waveform
Positive Overshoot = (Max - Top)/Amp x 100 %
Measured over the entire waveform
Negative Overshoot = (Base - Min)/Amp x 100 %
Measured over the entire waveform
Select CH1 or CH2 as source
channel for measurement
Select to measure voltage parameter
Turn on all measurement result
Turn off all measurement result
Go to the next menu page
Page 68
8060
Average Average voltage of a waveform
CRMS The Root Mean Square voltage over the rst cycle in the waveform
The Time Measurement menu table
Menu Description
Frequency Reciprocal of the period of the rst cycle in the waveform
Period
Rising
Falling
+Width Measured of the rst positive pulse in the waveform
-Width Measured of the rst negative pulse in the waveform
+Duty
-Duty
Delay1->2↑ The delay of rising time between CH1 and CH2
Delay1->2↓ The delay of falling time between CH1 and CH2
Time to take for the rst signal cycle to complete in the waveform
The time taken from lower threshold to upper threshold
The time taken from upper threshold to lower threshold
Positive Duty Cycle = (Positive Pulse Width)/Period x 100%
Measured of the rst cycle in waveform
Negative Duty Cycle = (Negative Pulse Width)/Period x 100%
Measured of the rst cycle in waveform
The results of the automatic measurements will be displayed on the bottom of
Note:
the screen. Maximum 3 results could be displayed at the same time. When there is no
room, the next new measurement result will make the previous results moving left out of
screen.
Cursor Measurement
The screen displays two parallel cursors. Move the cursors to make custom voltage
or time measurements of the signal. The values are displayed on the boxes below the
menu. Before using cursors, make sure to set the Signal Source as the channel for
measuring.
Press
CURSOR
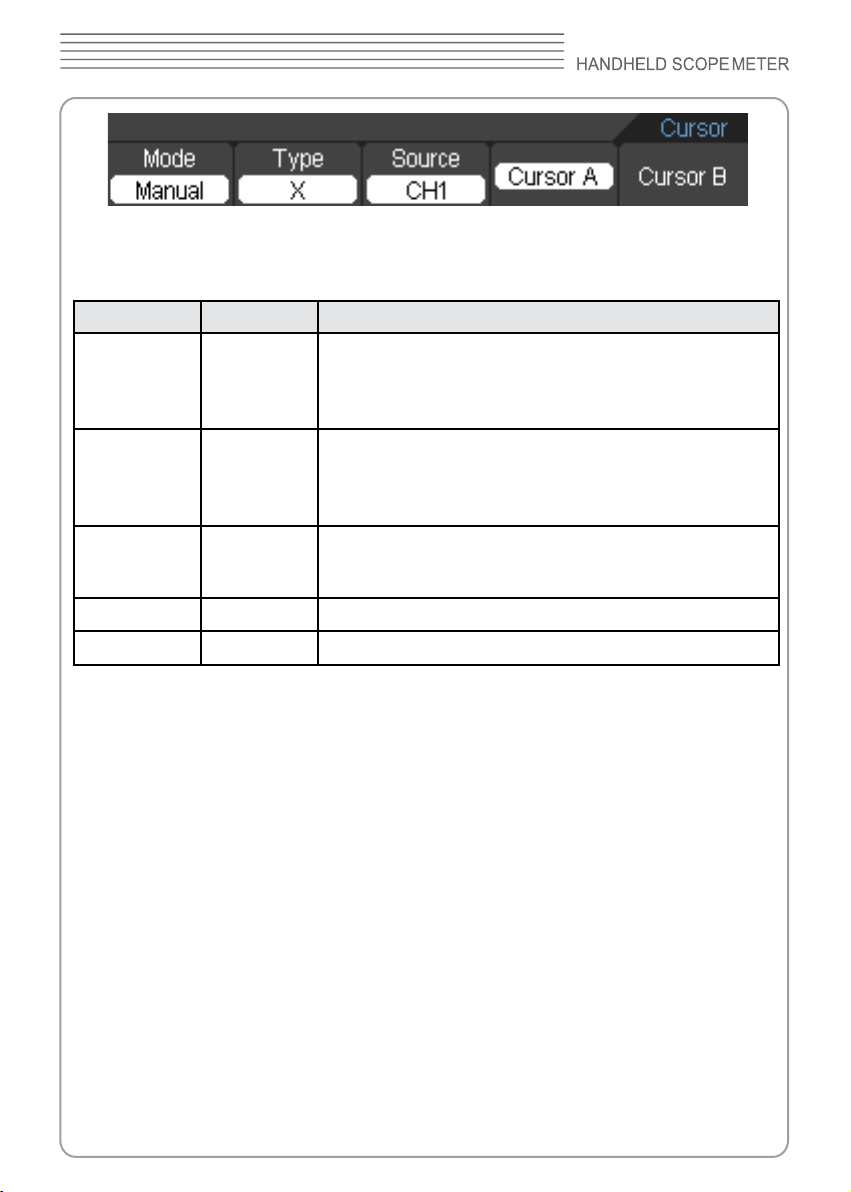
The Cursor menu
to show the cursor menu as the following:
Page 69
DSO8000 SERIES
Figure 2-59 The Cursor menu
The Cursors menu table
Menu Setting Description
Manual
Mode
Type
Source
Cursor A
Cursor B
The scope meter measures the Y or X coordinate values of the cursors, and the
increments between the two cursors.
Track
Auto
OFF
X
Y
CH1
CH2
MATH
Set to Manual Mode
Set to Track Mode
Set to Auto Mode
Turn off the cursor measure
Shown as vertical line to measure the horizontal
parameters
Shown as horizontal line to measure the vertical
parameters
Select the measurement signal source
Select Cursor A or not
Select Cursor B or not
To do cursor measurements, please do as the following steps:
1. Turn on the cursor measurement:
Cursor→Mode→Manual / Track / Auto.
2. Select channel Source for measurements by pressing soft button as:
Cursor→Source→CH1 / CH2 / MATH.
3. Select the cursors type by pressing soft button as Cursor→Type→ X or Y.
4. Press F4 or F5 to select the Cursor A or Cursor B.
5. Move the cursors to adjust the increment between the cursors.
The values will be automatically displayed on the right upper corner of screen when the
cursor function menu is hidden or displaying other menus.
Comments of Cursor Measurements
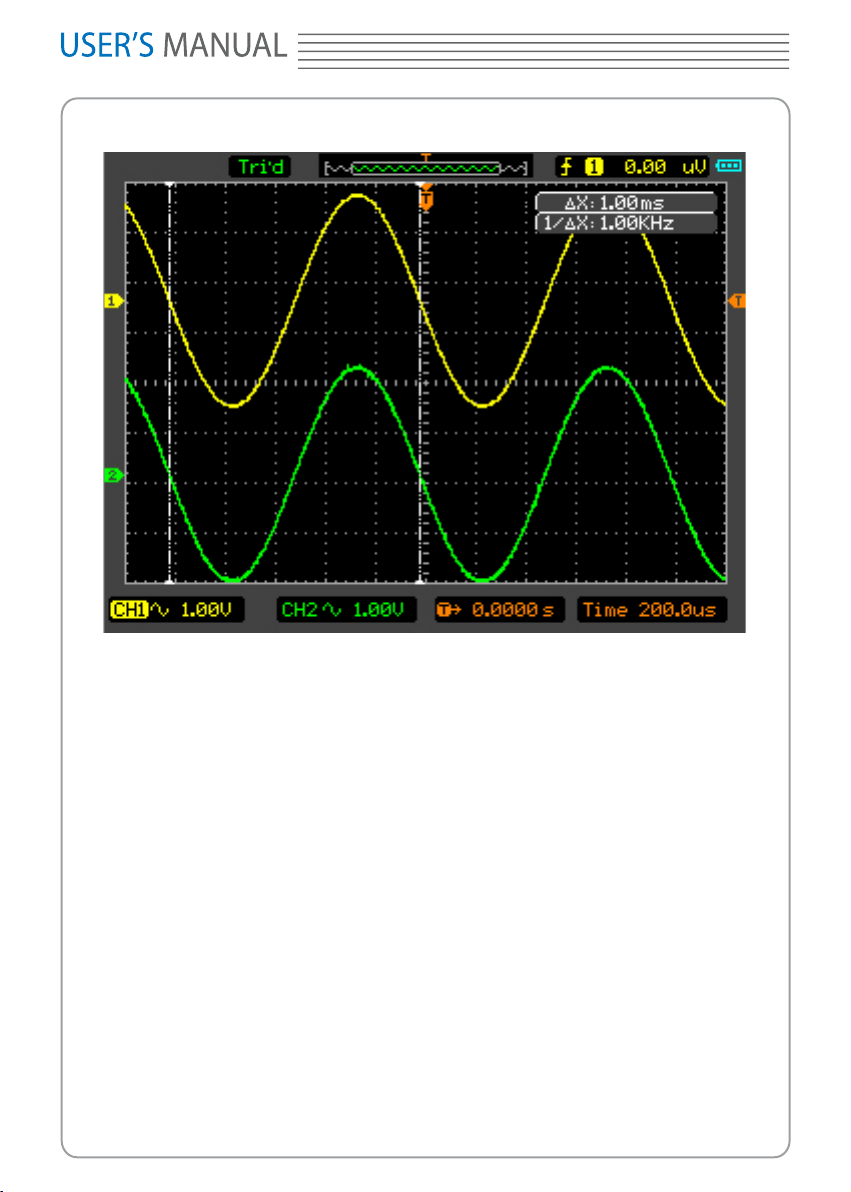
1. Auto Cursor Mode
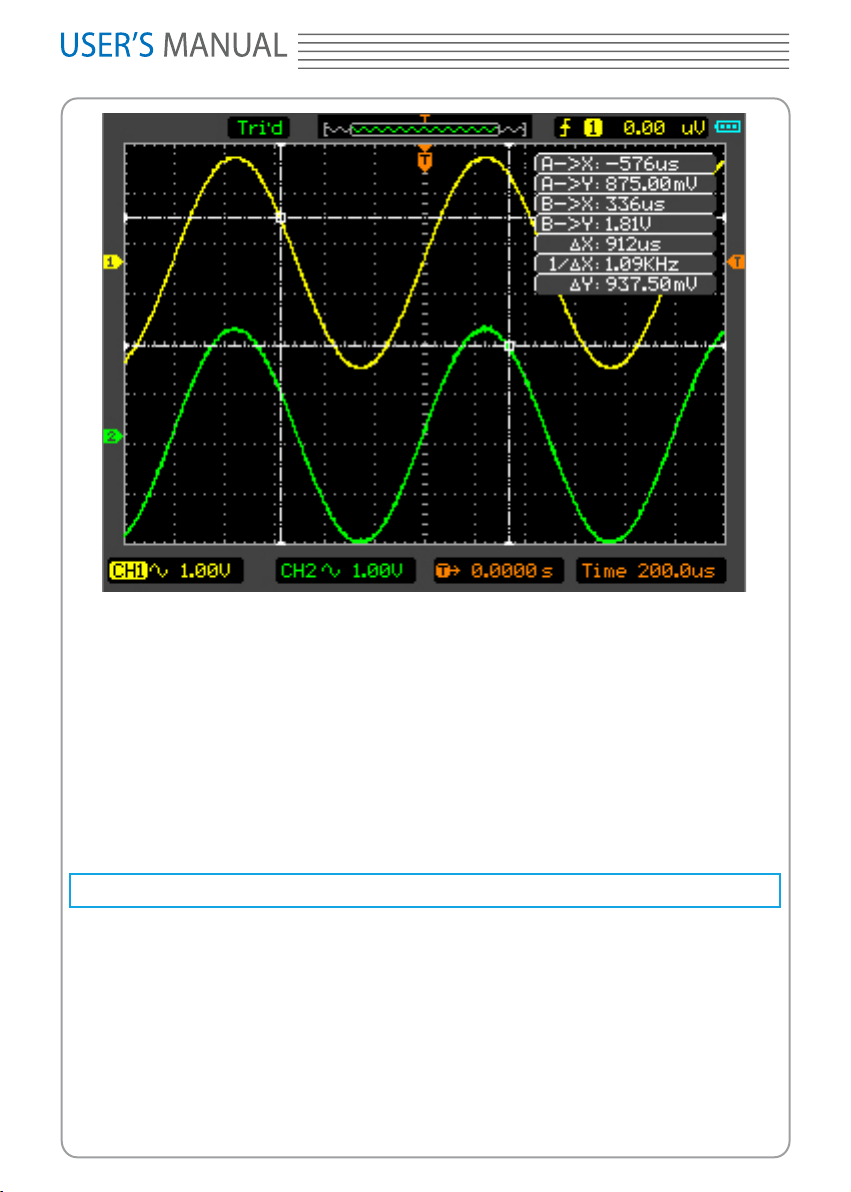
The Auto Cursor Mode displays the cursors for the current measuring automatically. See
Page 70
8060
gure 2-60.
Figure 2-60 The Automatic Cursor Mode
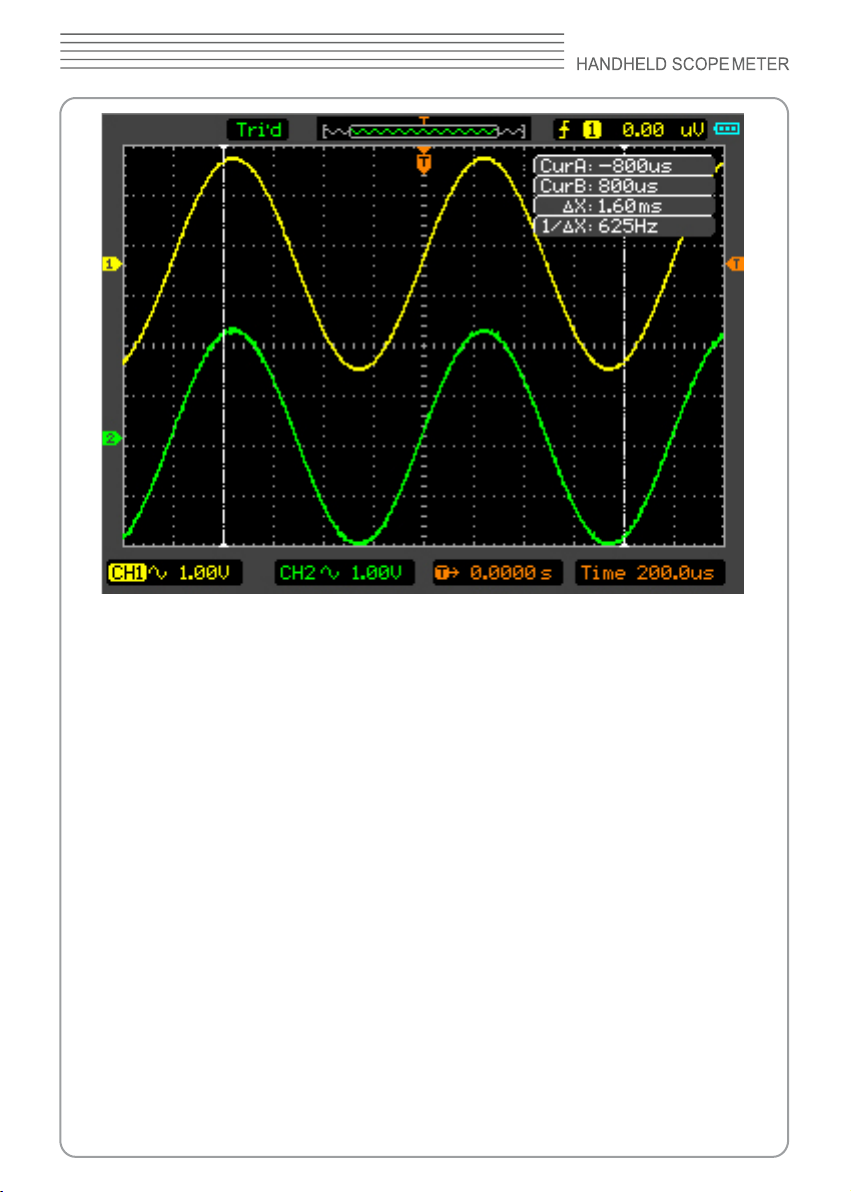
2. Manual Cursor Mode
In this mode, the scope meter measures the Y or X coordinate increments between the
two cursors. See gure 2-61.
1) Select menu Mode->Manual.
2) Select menu Type->X/Y to get the vertical or horizontal of Cursor A or Cursor B.
3) Select menu Source->CH1/CH2/MATH to Get the Cursor Source.
4 )Select Cursor A or Cursor B to adjust the increments between Cursor A and Cursor B.
5) Get the values between Cursor A and Cursor B.
delt x is the time between Cursor A and Cursor B.
1/(delt x) is the frequency between Cursor A and Cursor B.
Page 71
DSO8000 SERIES
Figure 2-61 The Manual Cursor Mode
3. Track Cursor Mode
In Track Cursor Mode, the Cursor A and Cursor B move together with the selected
waveform. See gure 2-62.
Page 72
8060
Figure 2-62 Track Cursor Mode
Please do the following steps:
1. Select menu Mode->Track.
2. Select Source for measurements. Select options as followings.
Cursor A->CH1/CH2. Cursor B->CH1/CH2.
3. Select Cursor A or Cursor B. Move the Select Cursors to adjust the increments
between the Cursors.
4. Get the values between Cursor A and Cursor B.
delt x is the time between Cursor A and Cursor B.1/(delt x) is the frequency between
Cursor A and Cursor B.delt y is the voltage between the Cursor A and Cursor B.
IO Set
Press UTILITY
The IO Set menu (LAN)
→ F5 → F5→ F5 → F5→ F2
button to show the menu of IO Set
0
Page 73
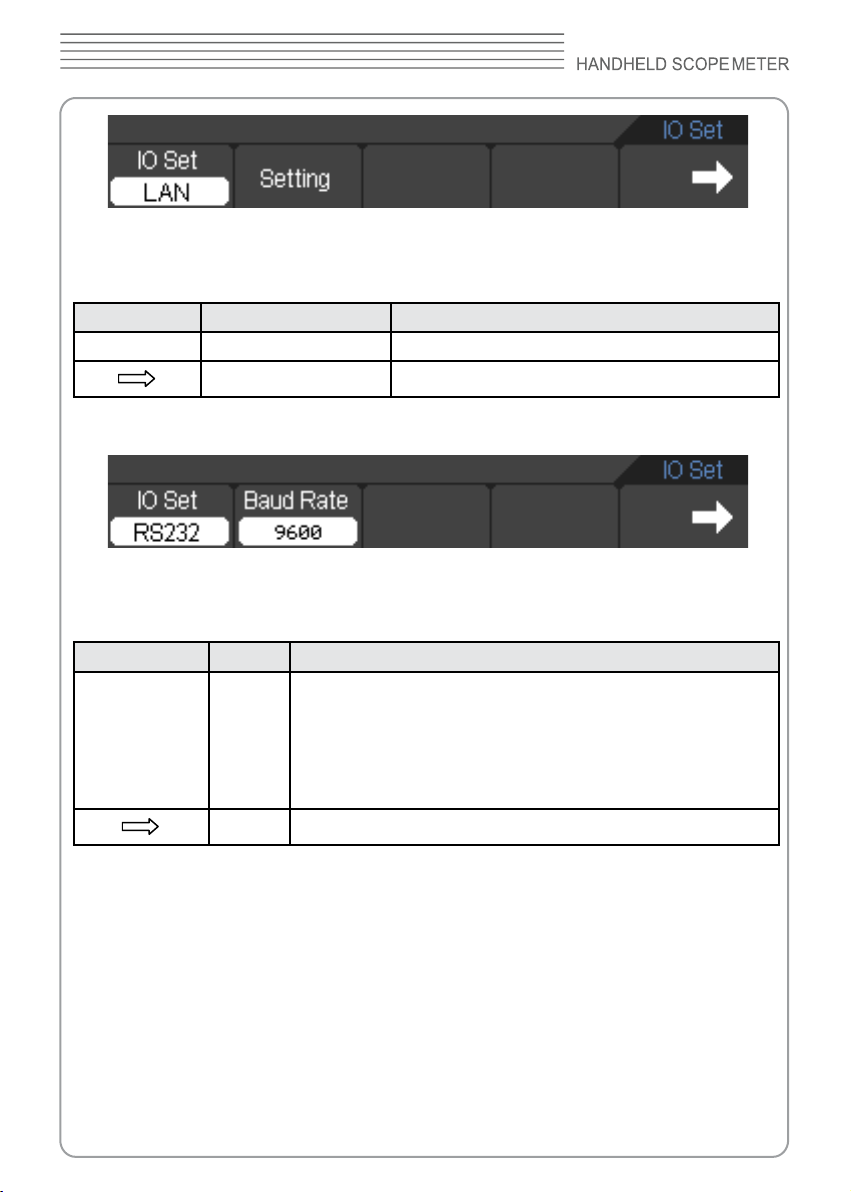
Figure 2-63 The IO Set menu(LAN)
The IO Set menu table(LAN)
Menu Setting Description
Setting Create a new LAN connection
Go to the Utility menu page
The IO Set menu(RS232)
Figure 2-64 The IO Set menu(RS232)
The IO Set menu table(RS232)
Menu Setting Description
300
600
Baud Rate
1200
2400
4800
9600
Set Baud Rate parameter for RS232
Go to the Utility menu page
DSO8000 SERIES
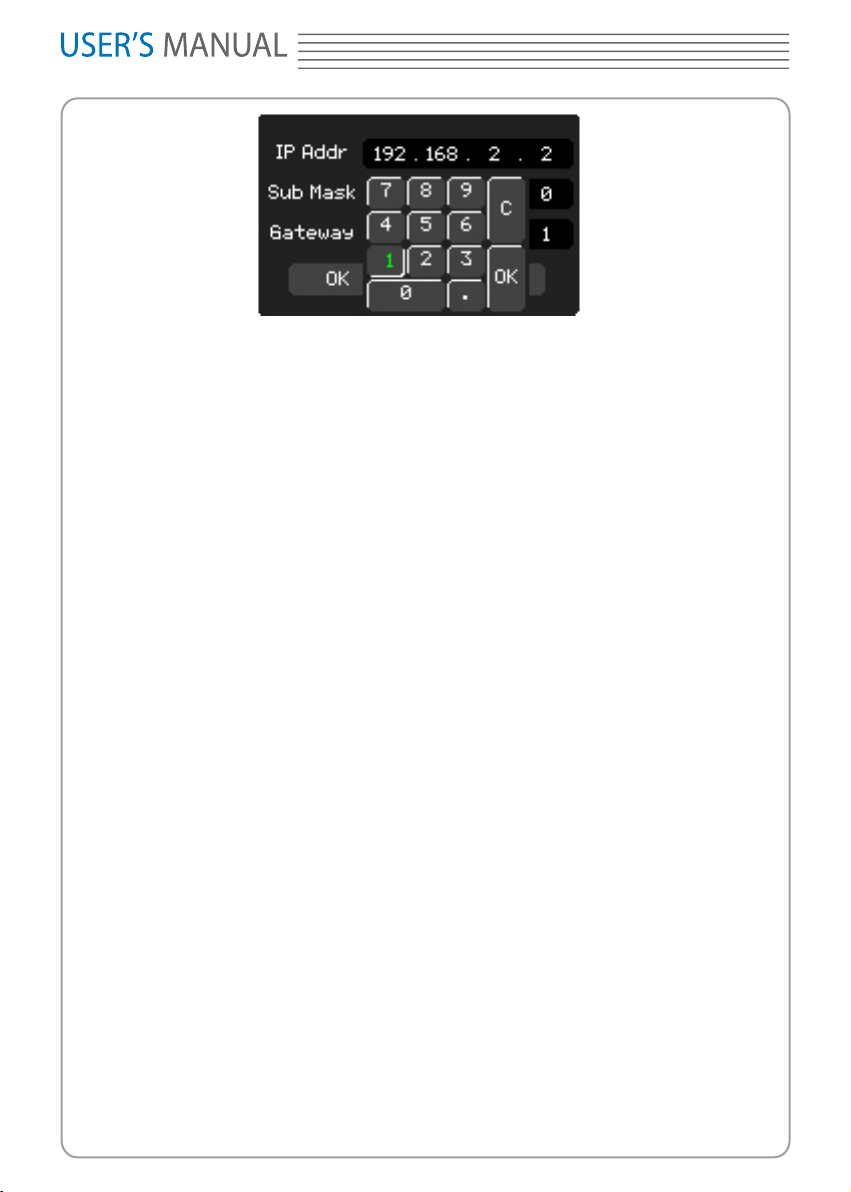
Press the button F2 in the IO Set menu(LAN) ,then a small window pops up.
You can select the Arrow keys to move the cursor position in which you want to modify
parameter, then press the Enter key to pop up a soft key board by which you can set
what you want .
See the LAN setting window in Figure 2-65.
Page 74
8060
Figure 2-65 the Lan Setting window
Press the button F2 in the IO Set menu(RS232),you can modify Baud Rate value.
See the IO Set menu (RS232) in Figure 2-64.
Page 75
DSO8000 SERIES
Chapter 3 Using examples
Example 1: Simple Measurement
To acquire and display a signal, please do the steps as followings:
1. Connect signal to CH1 by using probe.
2. Press the key AUTO on key panel.
The Scope Meter set the vertical, horizontal, and triggers controls at the best status
automatically. Also, you can adjust the controls to meet your measurements to optimize
the waveform display.
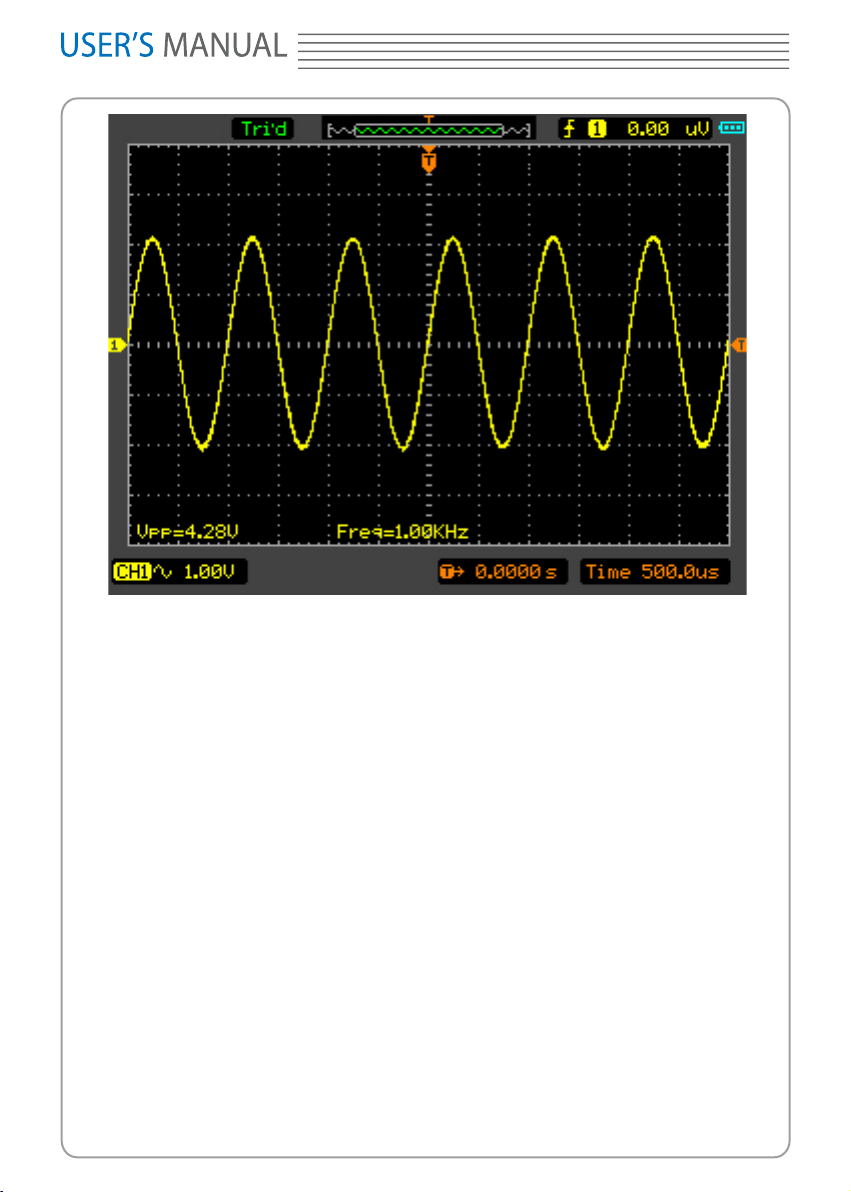
To measure the frequency and Vpp, you can do these steps as followings:
1. Press the key MEAS , Select Source -> CH1 and select Type ->Voltage, then press
the key F5 and then press the key F2 to make a Pk to Pk test. The Vpp value will
display on the bottom of the waveform interface.
2. Press the key MEAS, select Source ->CH1and select type->Time, then Press the
key F5 and then press the key F2 to make a Frequency test. The Frequency value will
display on the bottom of the waveform interface.
3. Click the item Clear in the Measure menu, To clear the measurements on the
waveform interface.
See the measurements in the gure 3-1.
Page 76
8060
Figure 3-1 The Vpp and Freq measurement Window
Example 2: The Application of the X-Y Operation
X-Y Plot acts to analyze correlation of data of two channels. Lissajous diagram
is displayed in the screen when you use X-Y Plot,which enables to compare
frequencies,amplitudes and phases of counterpart waveform against the reference
waveform. This makes it possible to compare and analyze frequency , amplitude and
phase between the input and output.
Do these steps as followings:
1. Set the probe attenuation to “x10”.Set the switch to”x10” on the probes.
2. Connect the CH1 probe to the input of the circuit, and connect the CH2 probe to the
output of the circuit.
3. Click the key AUTO on the panel.
4. Adjust the vertical scale and offset to display approximately the same amplitude
signals on each channel.
5. Select Time Base->X-Y format in Horizontal menu. The Scope Meter will display a
Lissajous pattern representing the input and the output characteristics of the circuit.
6. Adjust the scale and offset of the horizontal and vertical to a desirable waveform
display. The following picture shows a typical example.
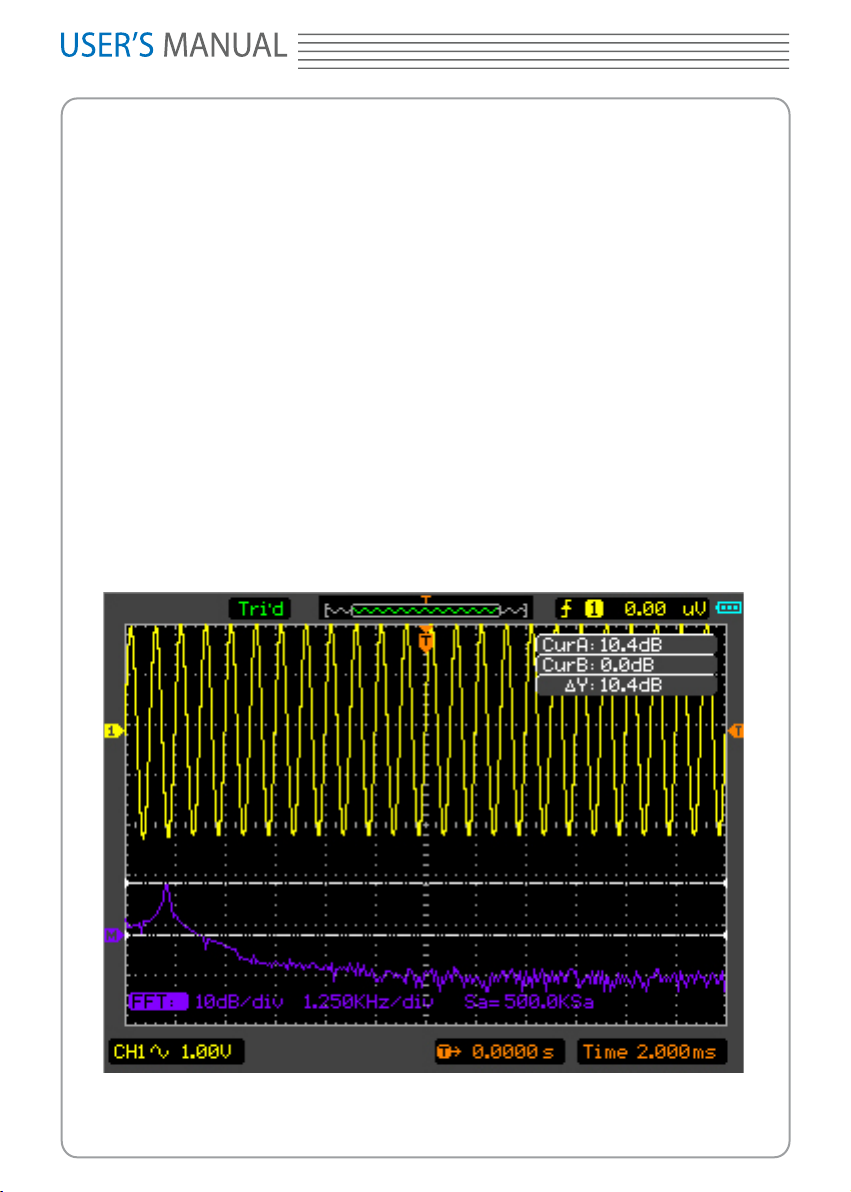
7. Apply the Ellipse Method to observe the phase difference between the two channels.
Page 77
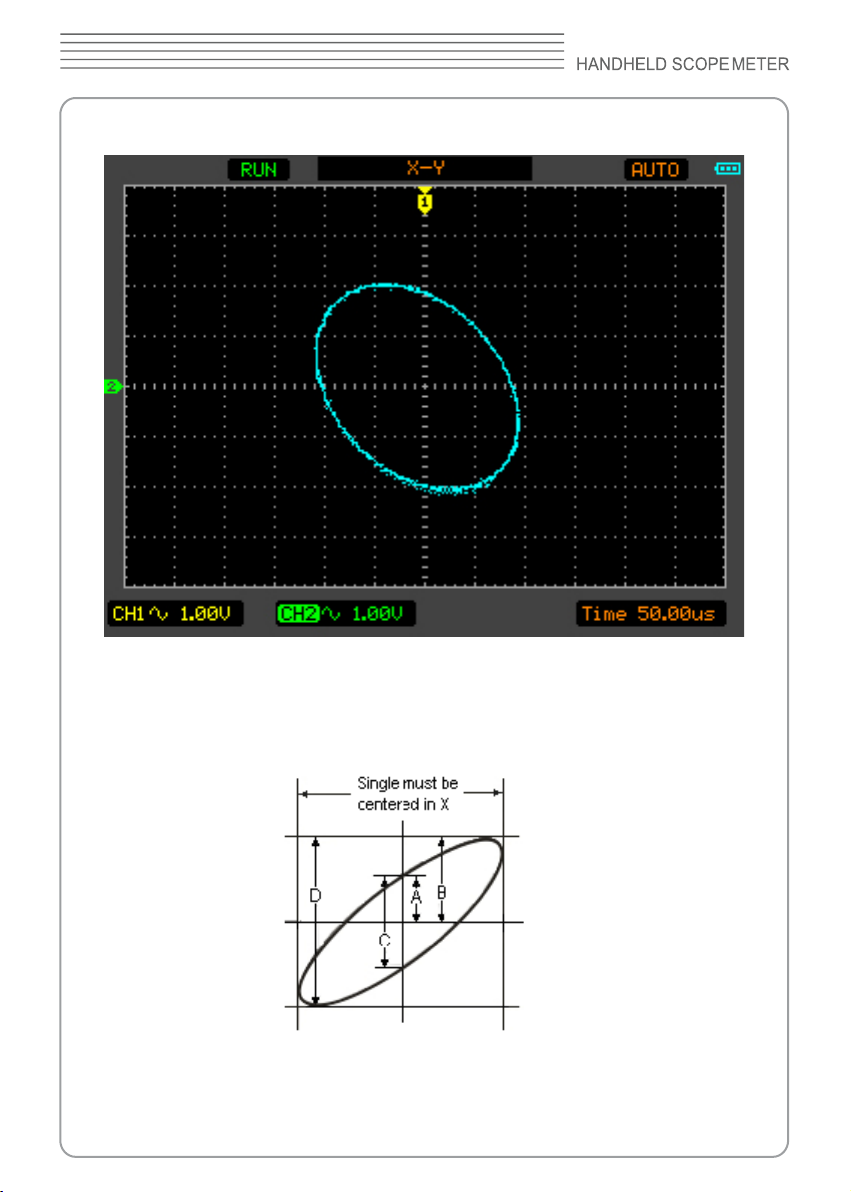
See Signal in X-Y Format in gure 3-2.
DSO8000 SERIES
Figure 3-2 Signal in X-Y Format
Instruction of the Ellipse Method
Page 78
8060
Sinθ = A/B or C/D, where θ = phase shift (in degrees) between the two signals.
From the formula above:
θ = ±arcsine (A/B) or ±arcsine (C/D)
θ must be in the range of (0~π/2) or (3π/2~2π) if the main axis of the ellipse is between
I and III quadrant, . If the main axis is at II and IV quadrant, θ must be in the range of
(π/2~π) or (π~3π/2).
Example 3: The FFT Cursor Measurements
FFT measurement includes: Amplitude measurement (Vrms or dBVrms) and the
Frequency measurement (Hz).
Do these steps as followings:
1. Press the key CURSOR to show Cursor menu.
2.Select Mode->Manual to enter the Manual Cursor Mode window.
3. Select Type->X/Y, select the Cursor Type to X or Y.
3. Select Source->MATH(FFT operation) in the Manual Cursor Mode window.
4. Drag the Cursor to the point of interest.
See the FFT Measurement (Cursor Type Y) in gure 3-3.
Figure 3-3 FFT Measurement (Cursor Type Y)
Page 79
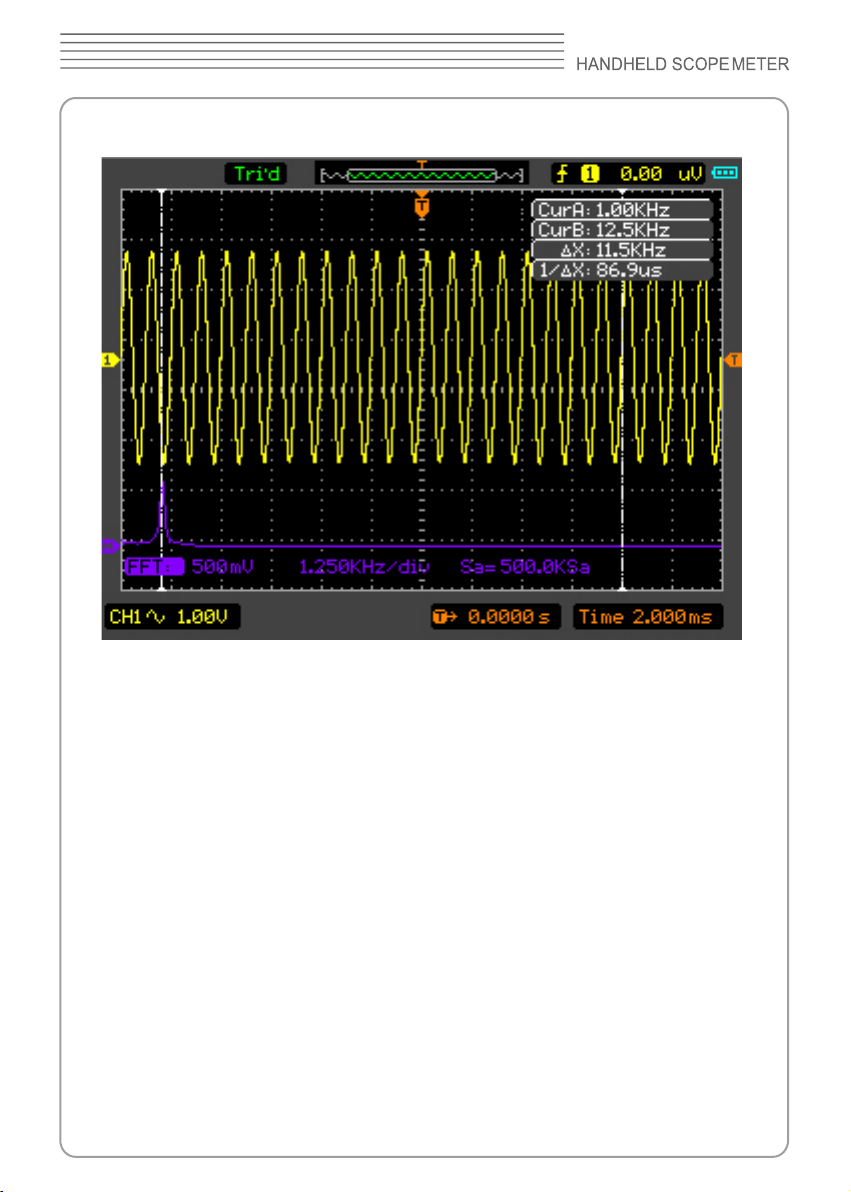
See the FFT Measurement (Cursor Type X) in gure 3-4.
DSO8000 SERIES
Figure 3-4 FFT Measurement (Cursor Type X)
Example 4: The Pass/Fail Test
The Pass/Fail Test is one of the enhanced special functions of the Scope Meter. By this
function, the Scope Meter could compare the input signal with the established waveform
mask. If the waveform “touches” the mask, a “Fail” signal occurs. Otherwise the test
passes. When needed, a programmable output can be used for external automatic
control applications. The output is built in as a standard feature and is optically isolated.
Do the steps as followings:
1. Press the key Utility to enter the Utility menu.
2. Press the key F5 in the panel to enter the page 2/4.
3. Select the Pass/Fail in the Utility menu to enter the Pass/Fail menu.
4. Select Enable to ON to turn on Pass/Fail, Select Source CH2 (the input source), select
Stop Output to OFF or ON in Page 2/2 of Pass/Fail menu.
5. Create the Pass/Fail Mask: Change the Vertical or Horizontal value by click the up or
down key in the panel to set the div of the vertical or horizontal values. Select Create
or Save or Load button if you need.
6. Select Operate to Start in Pass/Fail menu to start the Pass/Fail function.
Page 80
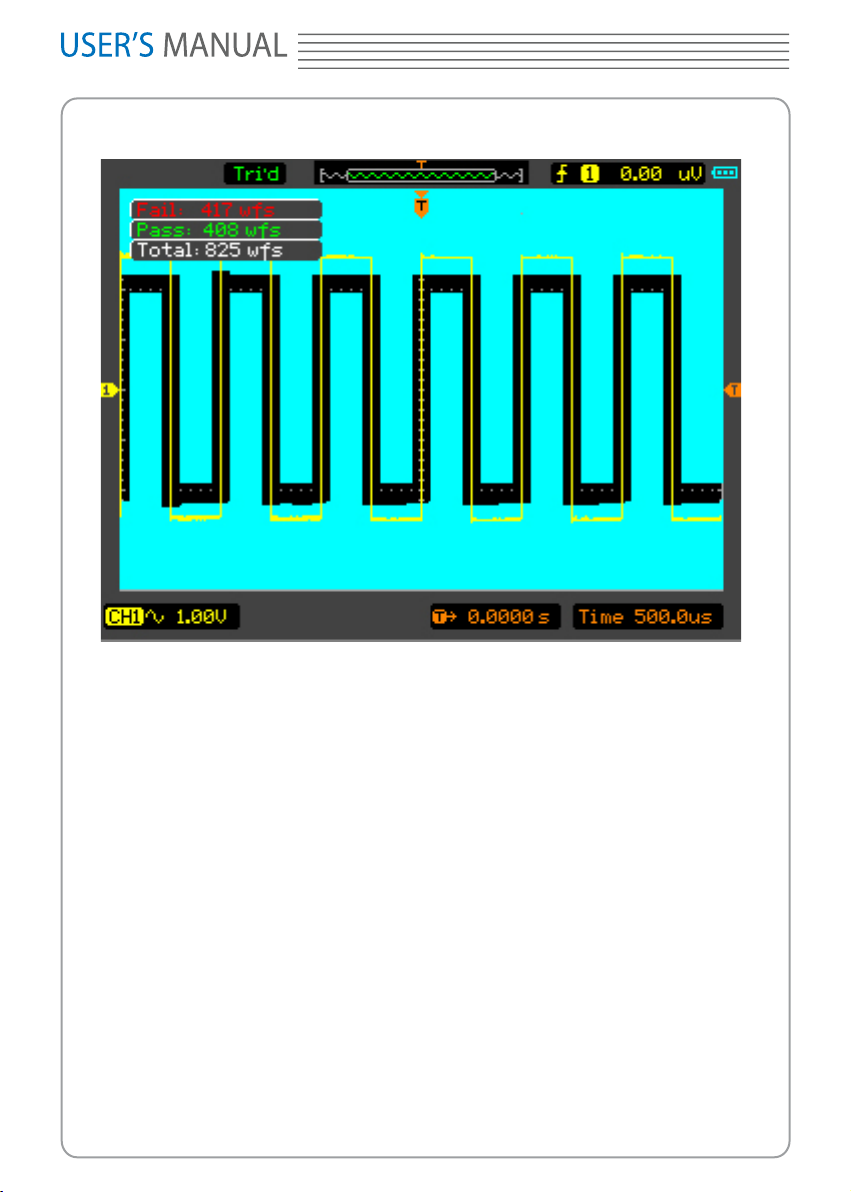
8060
See the Pass/Fail window in gure 3-5.
Figure 3-5 The Pass/Fail Window
Example 5: Reduce the noise on a signal
See the signal with random noise in gure 3-6.
To reduce random noise, do the following steps:
1. Set the Probe and the channel attenuations to “x10”.
2. Connect the signal to the Scope Meter to display a stable wave.
3. Reduce the noise Select the Acquire Mode in Acquire menu.
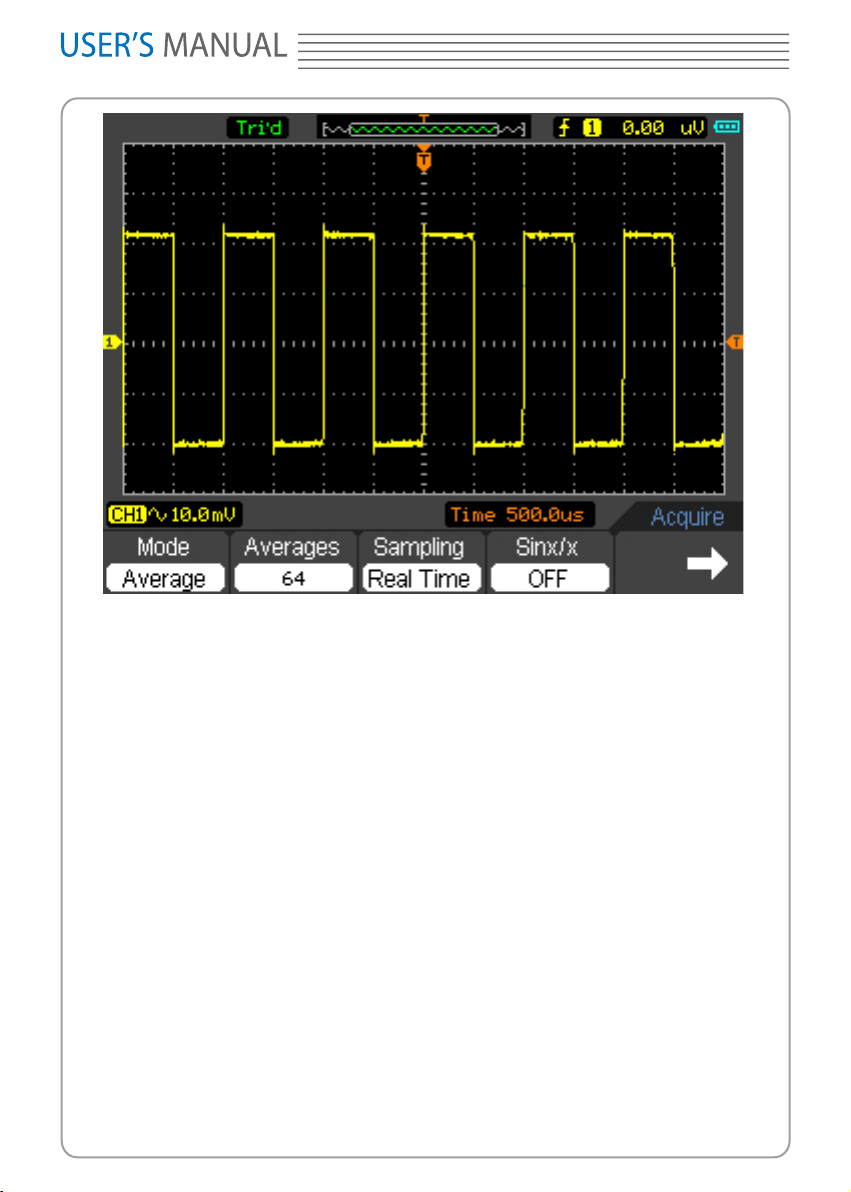
If there is noise within the signal and the waveform looks too wide, in this case, choose
average acquisition. In this mode the waveform will be thin and easy to observe and
measure.
Use the Average following the steps:
1. Select Acquire in the Utility menu to enter the Acquire menu.
2. Select Mode to Average, then Press F2 to change the Averages form 2 to 128 to
switch the number of averages that best eliminates the noise from the
displayed waveform.
3. Select Mode to Normal to cancel this function.
Page 81
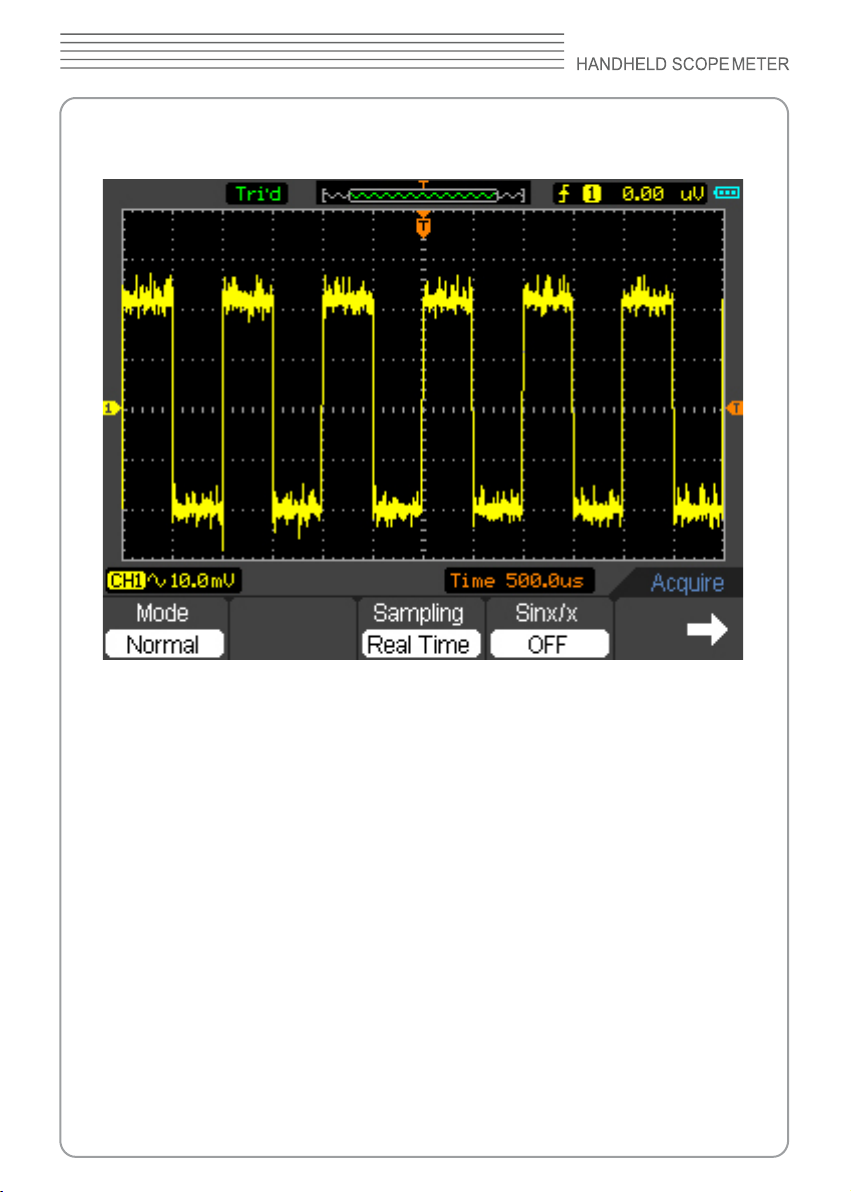
See signal after reducing random noise in gure 3-7.
DSO8000 SERIES
Figure 3-6 Signal with random noise
Page 82
8060
Figure 3-7 Signal afer reducing random noise
Example 6: Capture a Single signal
To capture a single event, it needs to gather some pre-test knowledge of the signal in
order to set up the trigger level and slope correctly. For example, if the event is derived
from TTL logic, a trigger level of 2 Volts should work on a rising edge.
Do these steps as followings:
1. Set the probe and the channel attenuations to 10X.
2. Press the key TRIG to show the Trigger menu.
3. Select Mode->Edge. Set Source to CH1 and Slope to Rising. Set Sweep to Single.
4. Adjust the Volts/Div and the time base in a proper range for the signal.
5. Drag the trigger level sign on the waveform display screen.
6. When the trigger conditions are met, data appears on the display representing the
data points that the Scope Meter obtained with one acquisition.
0
Page 83
DSO8000 SERIES
CHAPTER 4: Multimeter
About this chapter
This chapter provides an introduction to the multimeter functions of DSO8000 Series.
The introduction gives guides to show how to use the menus and perform basic
measurements.
Connecting the Meter
Use the 4-mm safety banana jack inputs for the Meter functions: 10A , mA, COM,V/Ω/C.
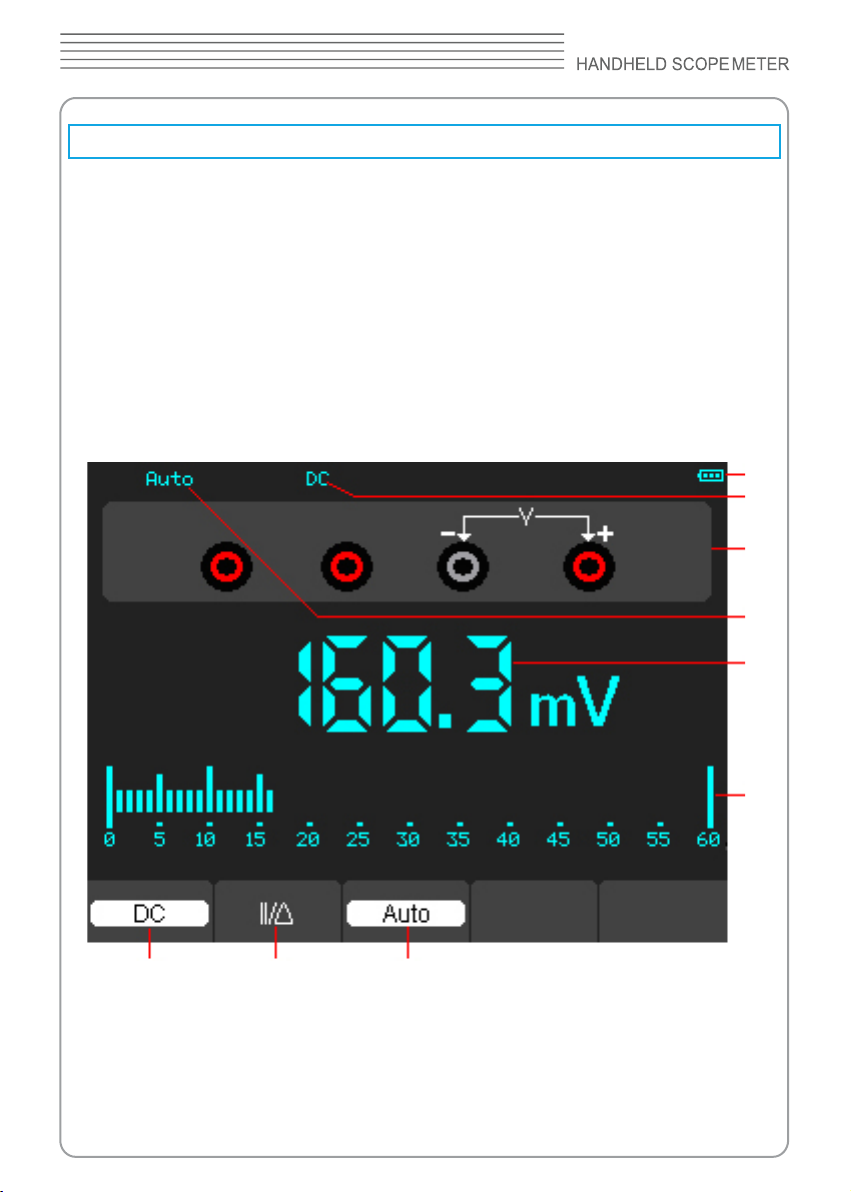
Multimeter Operation Window
1
2
3
4
7 8 9
Figure 4-1 Multimeter operation window
Description
1) Battery electric quantity indictor.
2) Measurement mode indictors:
5
6
Page 84
8060
DC: Direct electric measurement
AC: Alternating electric measurement
3)The symbol of Mutimeter current mode
4) Manual/Auto range indictors, among which the MANUAL refers to measuring range
in manual operation mode and Auto means the measuring range in automatic
operation mode.
5) The reading value of measurement.
6) The bar graph indictor.
7) DC or AC Measurement mode control.
8) Absolute /relative magnitude measuring control: The sign “||” expresses the absolute
magnitude measuring control and “ ” represents the relative magnitude measuring
control.
9) Manually or automatically measuring range control.
Operating the Multimeter
If you are in the scope mode window, press OSC/DMM key, the scope meter will switch
to the multimeter mode window.Then the screen will display the measure mode window
that was in use the last time before you quit multimeter measure. When you switch to the
multimeter measurement the rst time, the default measure mode is DC voltage mode.
Measuring Resistance Values
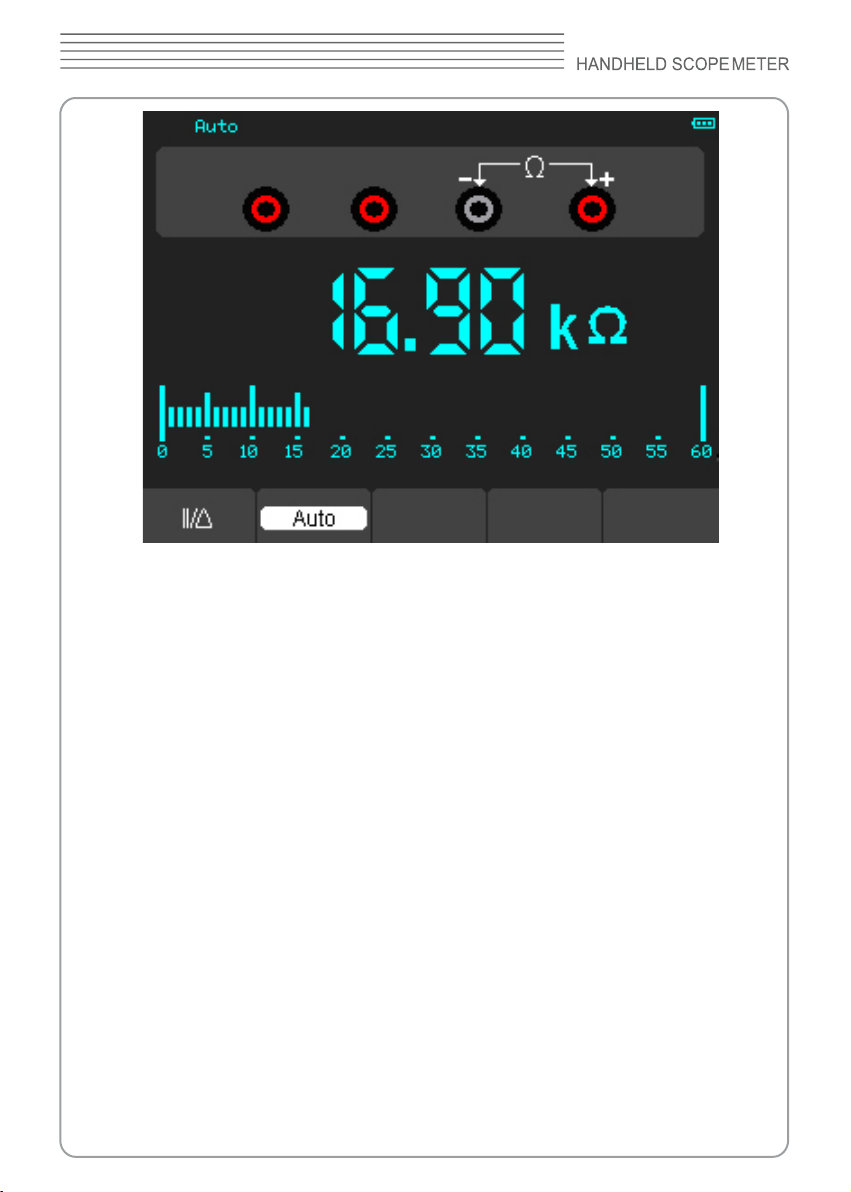
To measure a resistance, do the following:
1) Press the R key and then resistance measurement window appears on the screen.
2) Insert the black lead into the COM banana jack input and the red lead into the V/Ω/C
banana jack input.
3) Connect the red and black test leads to the resistor. The resistance value is shown on
the screen in Ohm.
Then, the screen will look like the following gure 4-2.
Page 85
DSO8000 SERIES
Figure 4-2 Resistance Measurement
Making a Diode Measurement
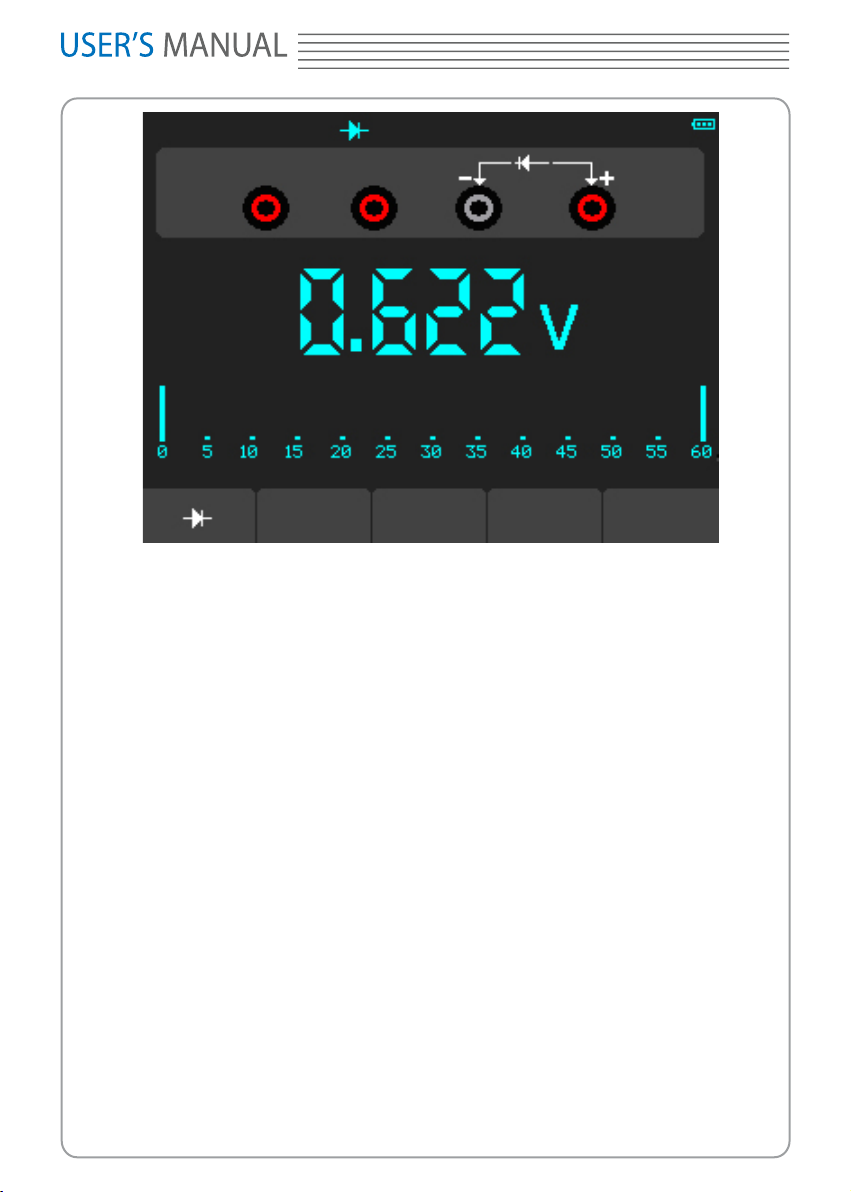
To make a measurement on the diode, do the following:
1) Press the diode key and a diode symbol appears at the top of the screen. .
2) Insert the black lead into the COM banana jack input and the red lead into the V/Ω/C
banana jack input.
3) Connect the red and black leads to the diode and the voltage value of the diode is
displayed on the screen in volt.
Then, the screen will look like the following gure 4-3.
Page 86
8060
Figure 4-3 Diode Measurement
To perform an On-off test, do the following:
1) Press the On-off key and then On-off indictor appears on the top of the screen.
2) Insert the black lead into the COM banana jack input and the red lead into the V/Ω/C
banana jack input.
3) Connect the red and black leads to the tested points. If the resistance value of the
tested points is less than 30 Ω, you will hear beep sound from the test tool.
Then, the screen will look like the following gure 4-4.
Page 87
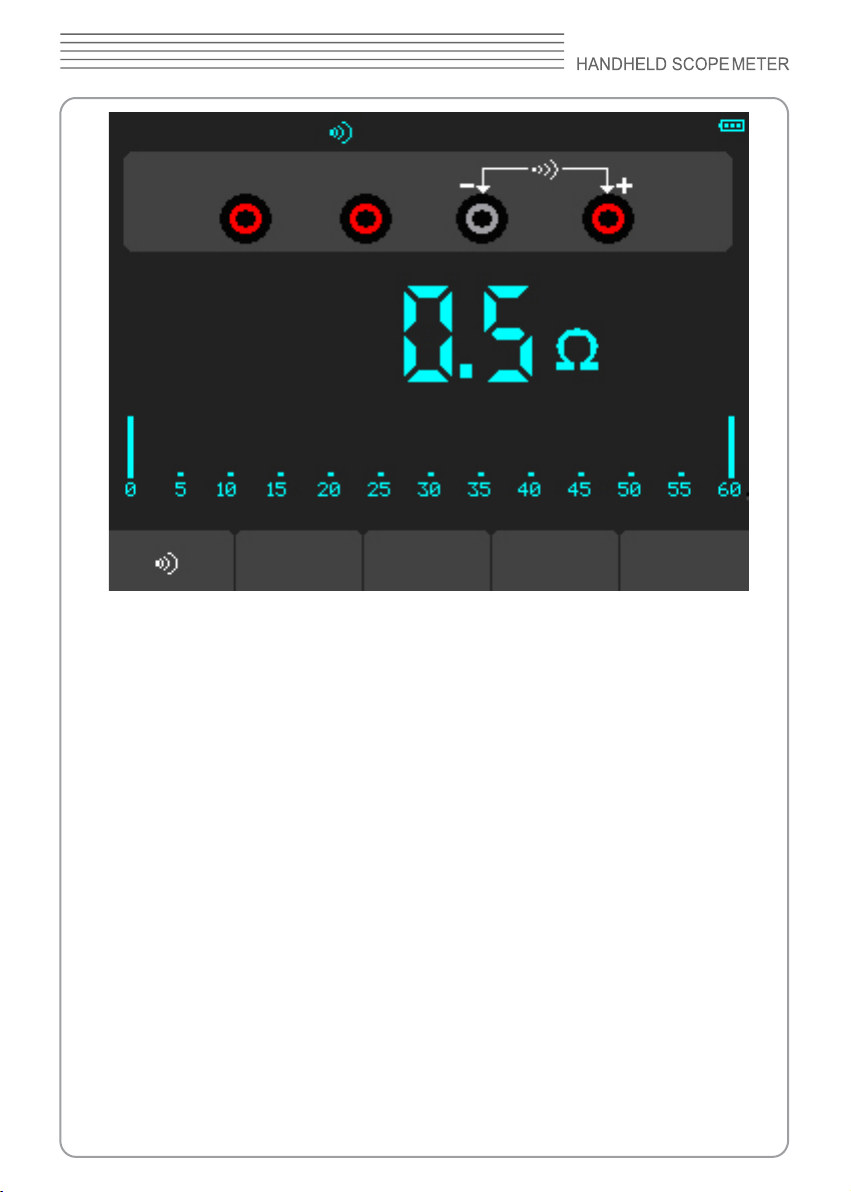
Figure 4-4 On-off Measurement
DSO8000 SERIES
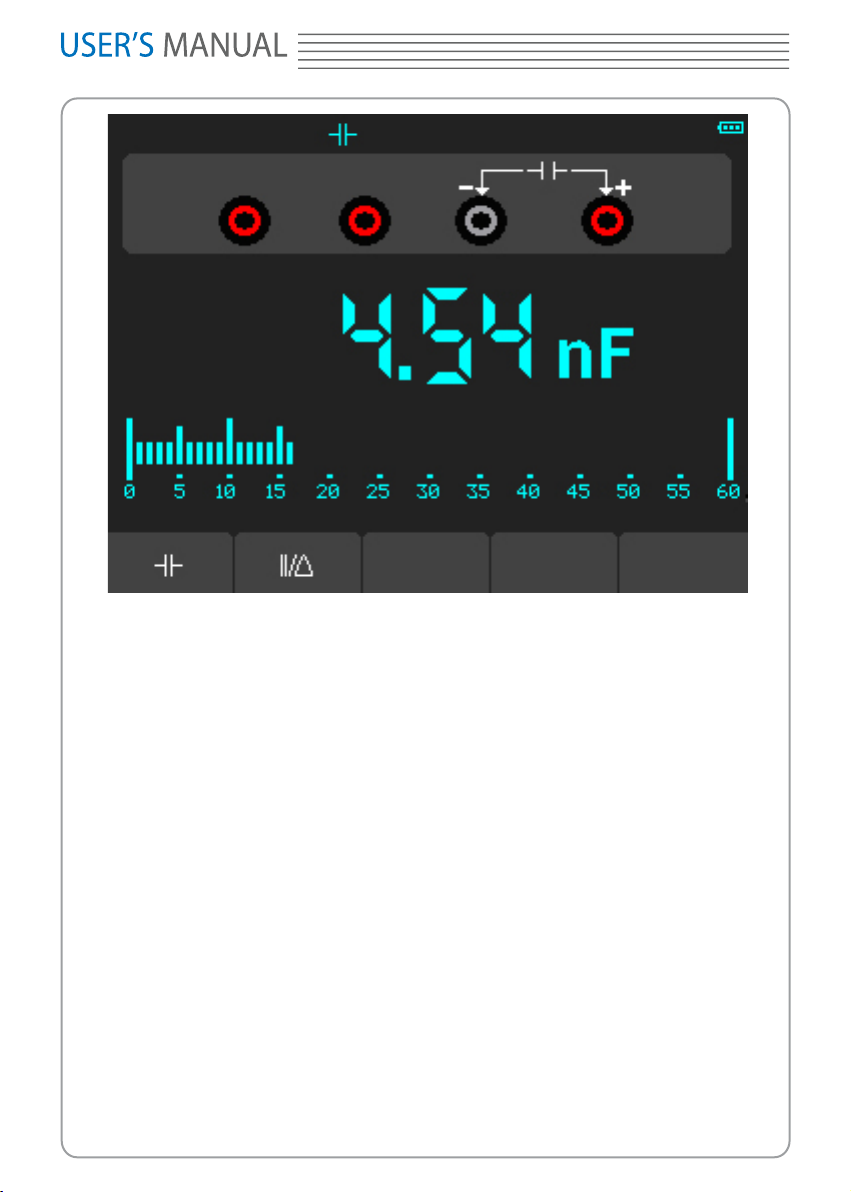
Making a Capacitance Measurement
To measure a capacitance, do the following:
1) Press the C key and a capacitor symbol appears on the top of the screen.
2) Insert the black lead into the COM banana jack input and the red lead into the V/Ω/C
banana jack input.
3) Connect the red and black leads to the capacitor and the capacitance value is
displayed on the screen in μF or nF.
Then, the screen will look like the following gure 4-5.
Page 88
8060
Figure 4-5 Capacitance Measurement
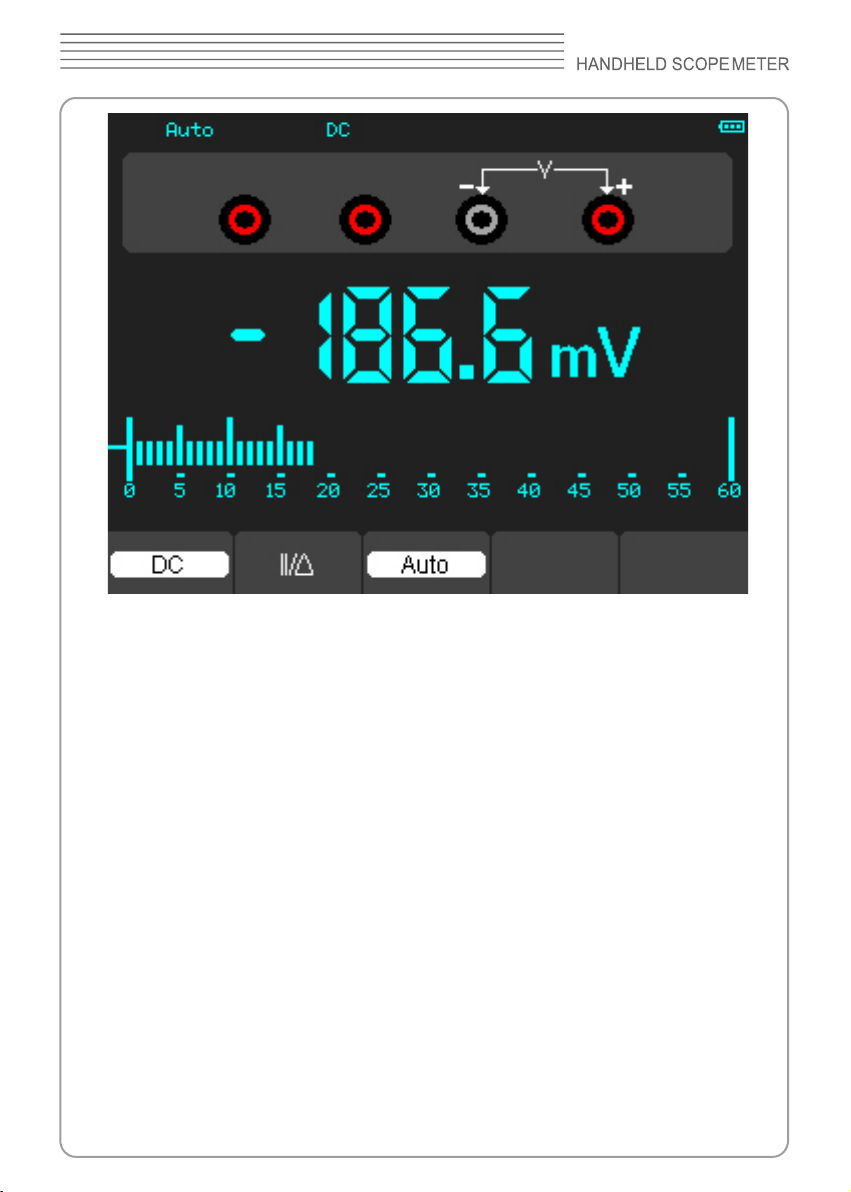
Making a DC Voltage Measurement
To measure a DC voltage, do the following:
1. Press the V key and DC appears at the top of the screen.
2. Insert the black lead into the COM banana jack input and the red lead into the V/Ω/C
banana jack input.
3. Connect the red and black leads to the measured points and the voltage value of
measured points is displayed on the screen.
Then ,the screen will look like the following gure 4-6.
Page 89
DSO8000 SERIES
Figure 4-6 DC voltage Measurement
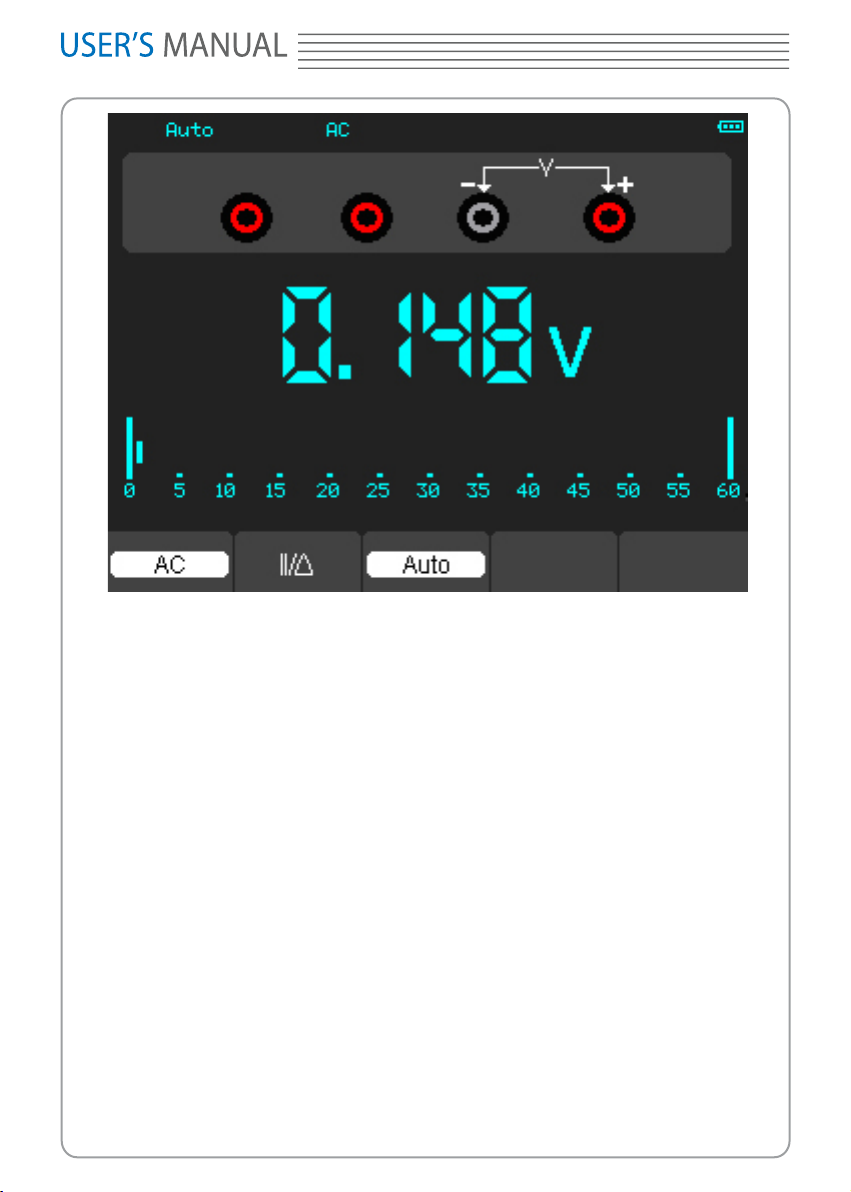
Making an AC Voltage Measurement
To measure the AC voltage, do the following:
1) Press the V key and DC appears on the screen.
2) Press the F1 key and AC appears on the screen.
3) Insert the black lead into the COM banana jack input and the red lead into the V/Ω/C
banana jack input.
4) Connect the red and black leads to the measured points and the AC voltage value of
measured points will be displayed on the screen.
Then, the screen will look like the following gure 4-7.
Page 90
8060
Figure 4-7 AC voltage Measurement
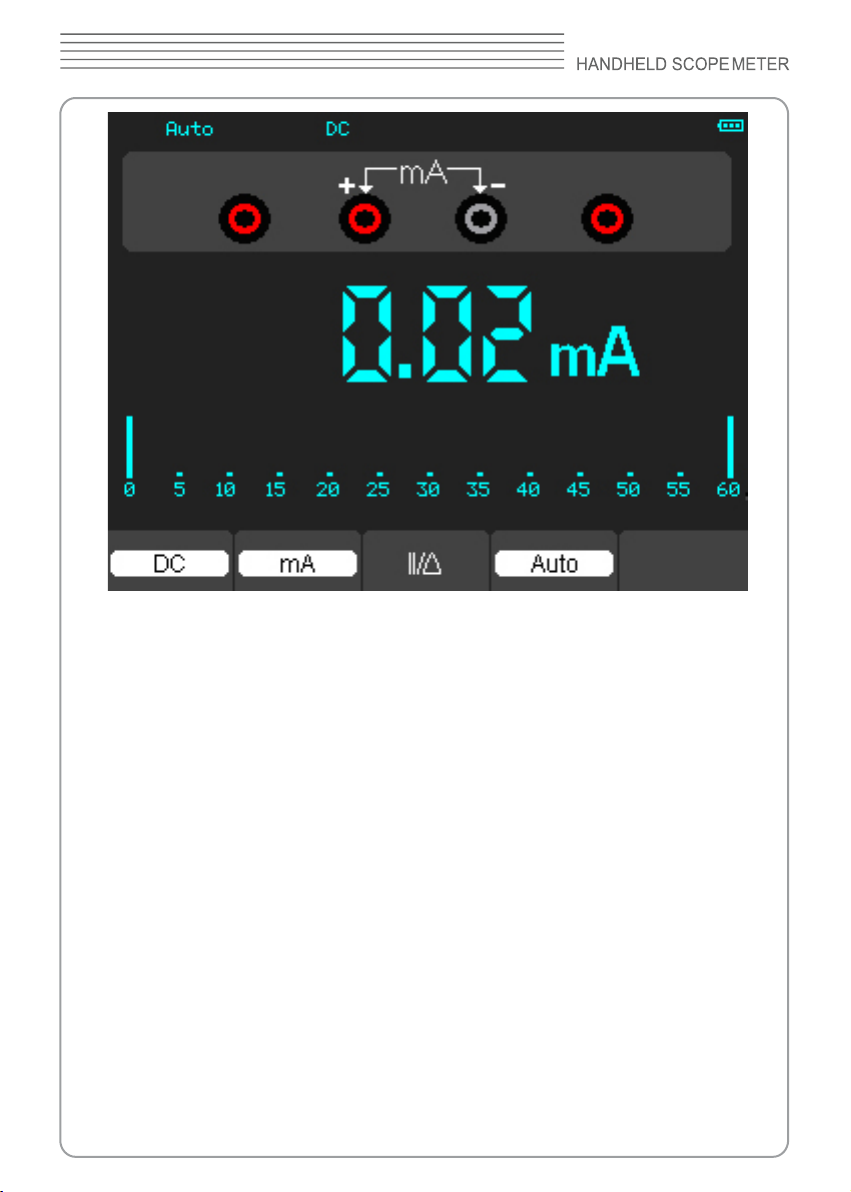
Making a DC Current Measurement
To measure a DC current which is less than 600 mA , do the following:
1) Press the A key and then DC appears on the screen. The unit on the main reading
screen is mA. Press F2 to switch the measurement between mA and 10A. 600mA is
acquiescently.
2) Insert the black lead into the COM banana jack input and the red lead into the mA
banana jack input.
3) Connect the red and black leads to the measured points and the DC current value of
measured points will be displayed on the screen.
Then, the screen will look like the following gure 4-8.
Page 91
DSO8000 SERIES
Figure 4-8 DC current Measurement for 600 mA
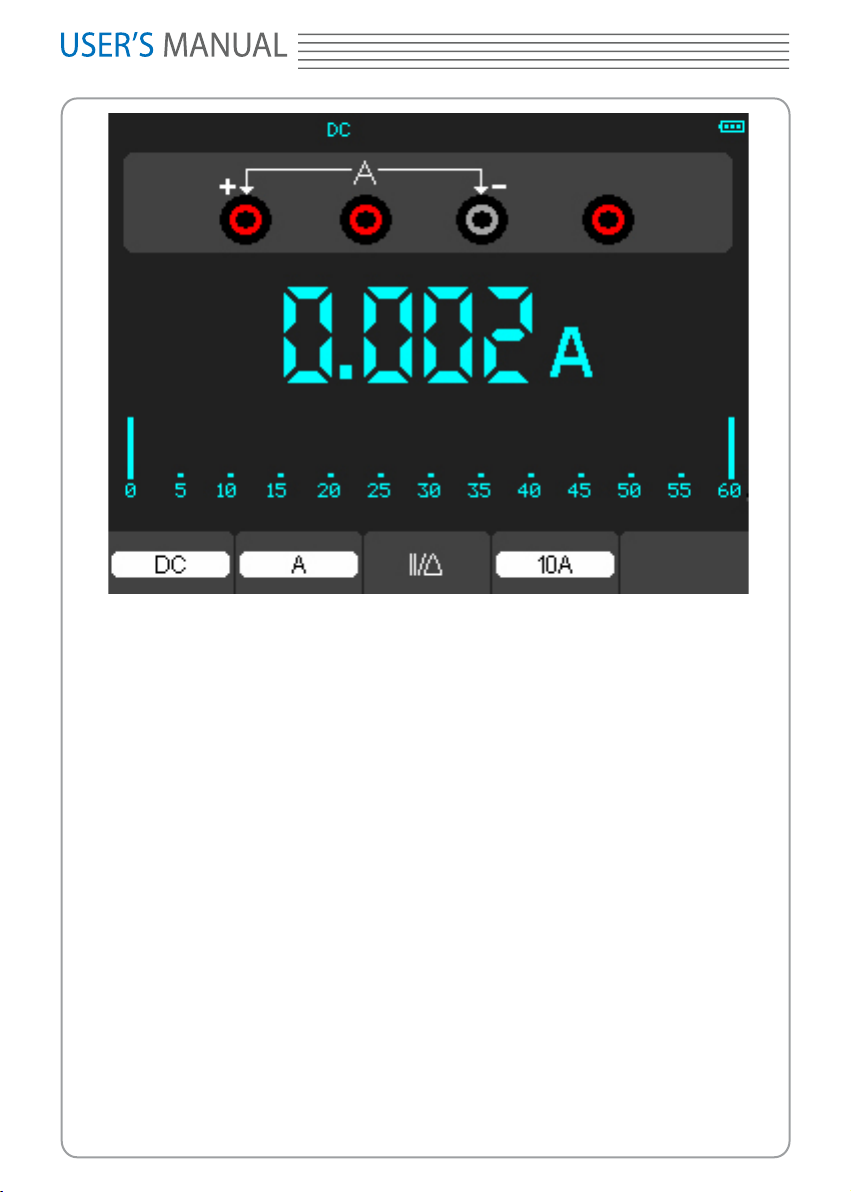
To measure a DC current which is larger than 600 mA, do the following:
1) Press the A key and then DC appears on the screen. The unit on the main reading
screen is mA.
2) Press F2 key to switch to 10A measurement, the unit on the main reading screen is A.
3) Insert the black lead into the COM banana jack input and the red lead into the 10A
banana jack input.
4) Connect the red and black leads to the measured points and the DC current value of
the measured points will be displayed on the screen.
5) Press F2 to return to 600 mA measurement.
Then, the screen will look like the following gure 4-9.
Page 92
8060
Figure 4-9 DC Current Measurement for 10A
Making an AC Current Measurement
To measure an AC current which is less than 600 mA, do the following:
1) Press the A key and then DC appears on the screen. The unit on the main reading
screen is mA,and mA will display on the bottom of the screen, press F2 to switch the
measurement between mA and 10A. 600mA is acquiescently.
2) Press the F1 key once and AC will display on the bottom of the screen.
3) Insert the black lead into the COM banana jack input and the red lead into the mA
banana jack input.
4) Connect the red and black leads to the measured points and the AC current value of
measured points will be displayed on the screen.
Then, the screen will look like the following gure 4-10.
0
Page 93
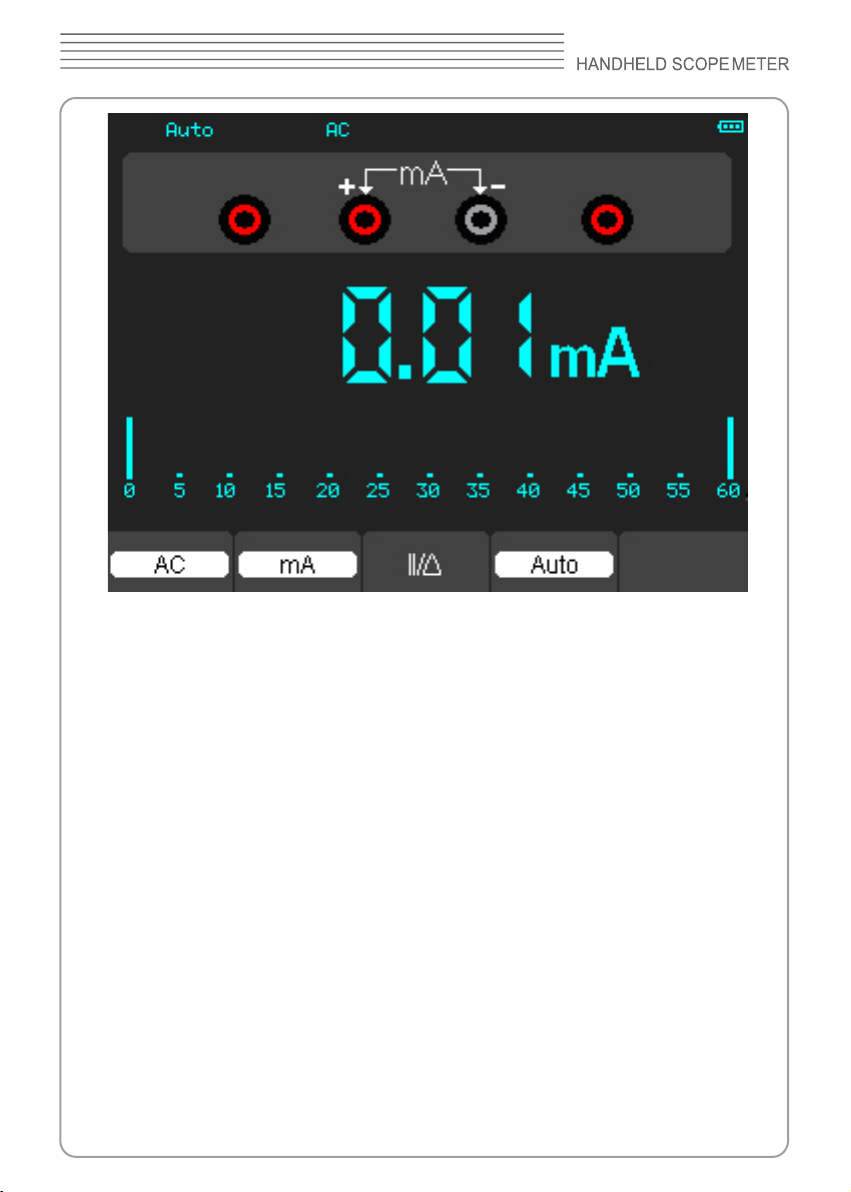
DSO8000 SERIES
Figure 4-10 AC Current Measurement for 600 mA
To measure an AC current which is larger than 600 mA, do the following:
1) Press the A key and then DC appears on the screen. The unit on the main reading
screen is mA.
2) Press F2 key to switch to10A measurement, the unit on the main reading screen is A.
3) Press the F1 key once and AC will display on the bottom of the screen.
4) Insert the black lead into the COM banana jack input and the red lead into the 10A
banana jack input.
5) Connect the red and black leads to the measured points and the AC current value of
the measured points will be displayed on the screen.
6) Press F2 to return to 600 mA measurement.
Then, the screen will look like the following gure 4-11.
Page 94
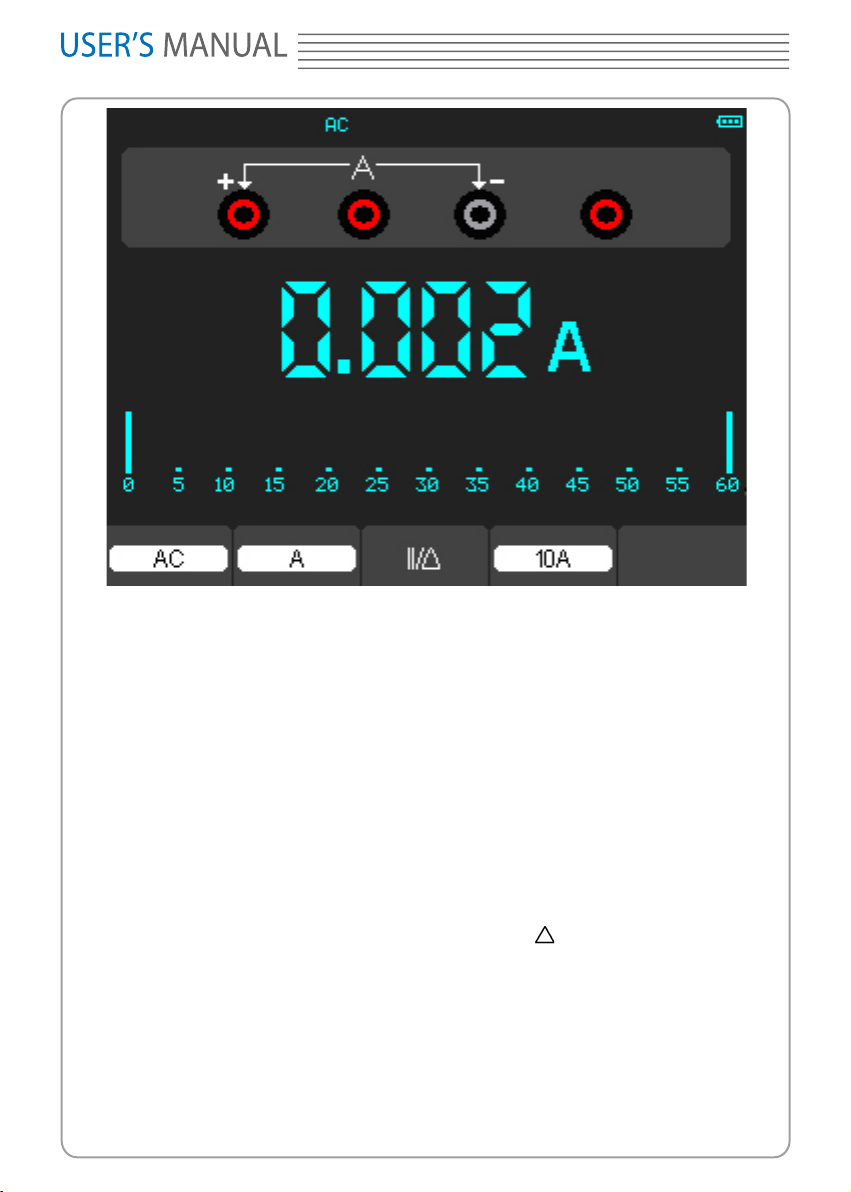
8060
Figure 4-11 AC Current Measurement for 10A
Taking a Relative Measurement
A currently measured result relative to the dened reference value is displayed in a relative measurement.
The following example shows how to take a relative measurement. At rst, it is
required to acquire a reference value.
1) Press the Ω key.
2) Insert the black lead into the COM banana jack input and the red lead into the V/Ω/C
banana jack input.
3) Connect the red and black test leads to the resistor. The resistance value is shown on
the screen in Ohm.
4) When the reading leveling off, press F1 key and then ||/ is displayed on the top of
the screen. The saved reference value is displayed beside.
Then, the screen will look like the following gure 4-12.
Page 95
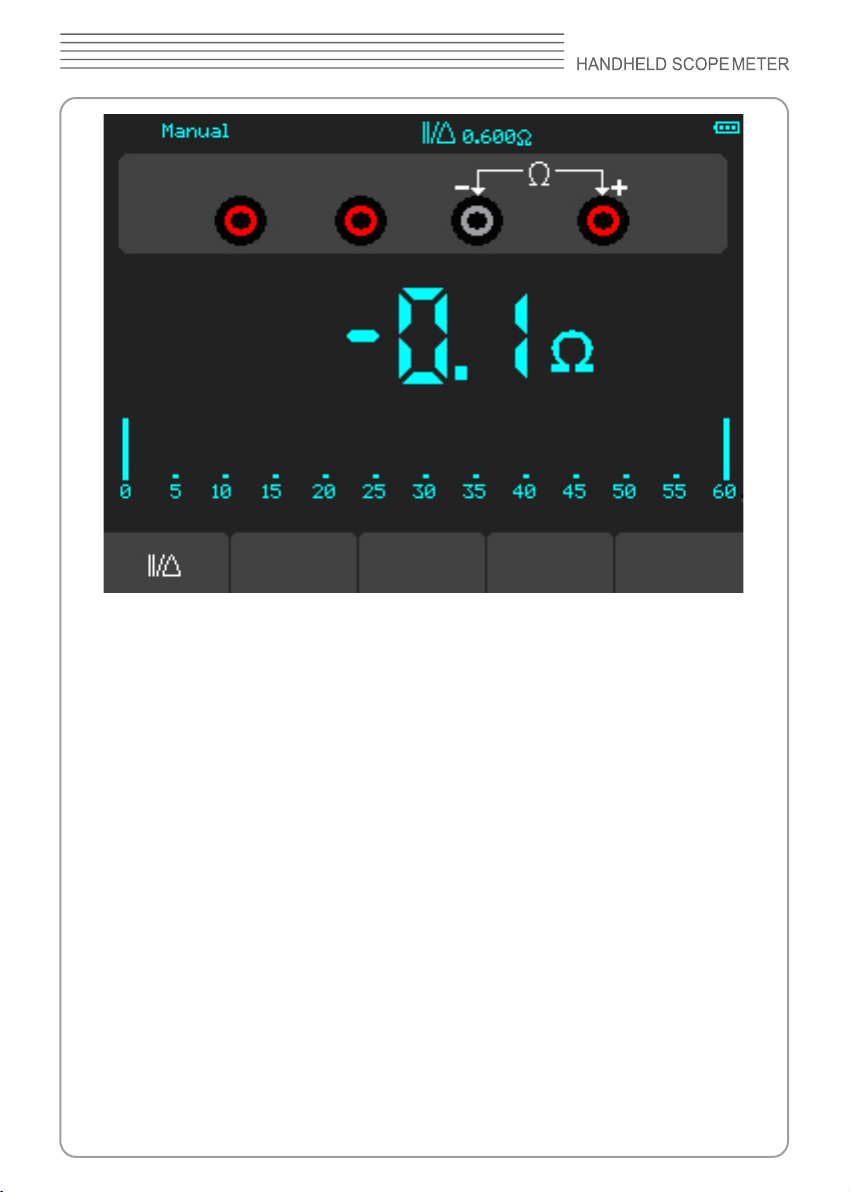
DSO8000 SERIES
Figure 4-12 Relative Measurement
Selecting Automatic/Manual Range Adjustment
The default range mode of the instrument is automatic range. Suppose you are
using the DC voltage mode, to switch to the manual range, perform the following
steps:
1) Press F3 key to enter the manual range mode and then Manual is displayed on the
top of the screen.
2) Under the manual range mode, the measuring range is increased by a stage when
pressing F4 key each time, and when reaching the highest stage, it jumps to the
lowest stage by pressing F4 key once again.
3) Press F3 key to switch back to the automatic range mode and then Auto is displayed
on the top of the screen.
Attention: capacitance measurement without manual range mode.
Then,the screen will look like the following gure 4-13.
Page 96
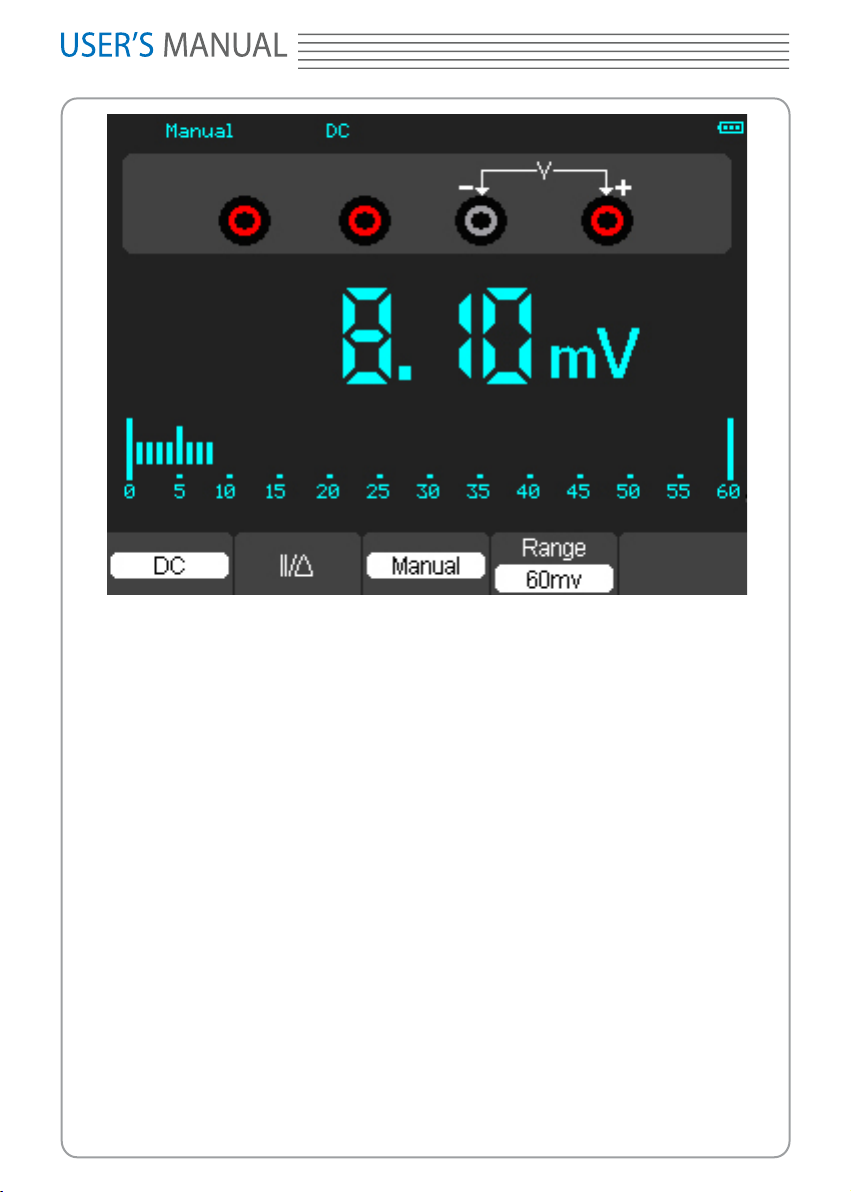
8060
Figure 4-13 The Manual Range Mode
Page 97
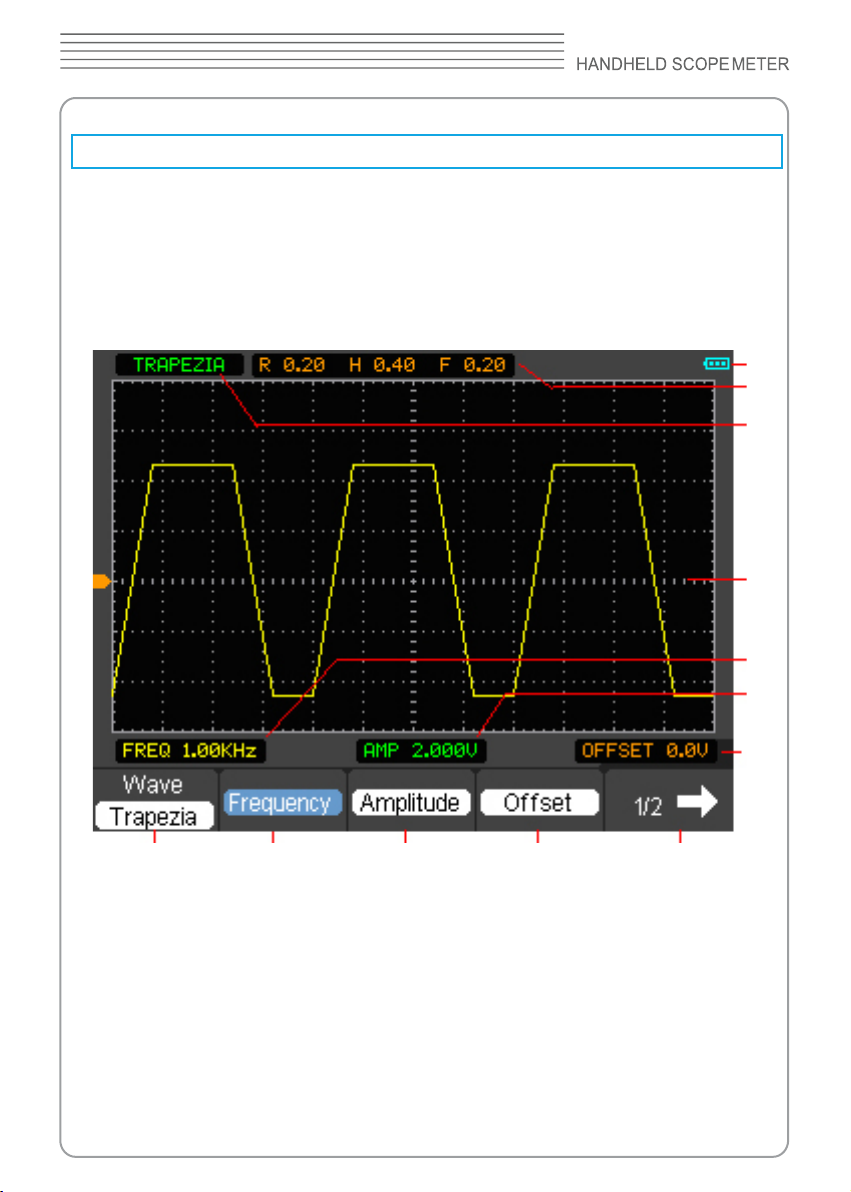
DSO8000 SERIES
CHAPTER 5: Waveform Generator
About this chapter
This chapter provides an introduction to the waveform generator function of DSO8000.
The introduction gives guides to show how to generate a waveform
Waveform Generator Operation Window
1
2
3
4
Figure 5-1 Waveform Generator Display Screen
Description:
1. Battery electric quantity indictor
2. The parameters of the waveform
3. The style of the waveform
4. The graph of the waveform
5. The frequency of the waveform
6. The amplitude of the waveform
7. The offset of the waveform
8
9
10 11
12
5
6
7
Page 98
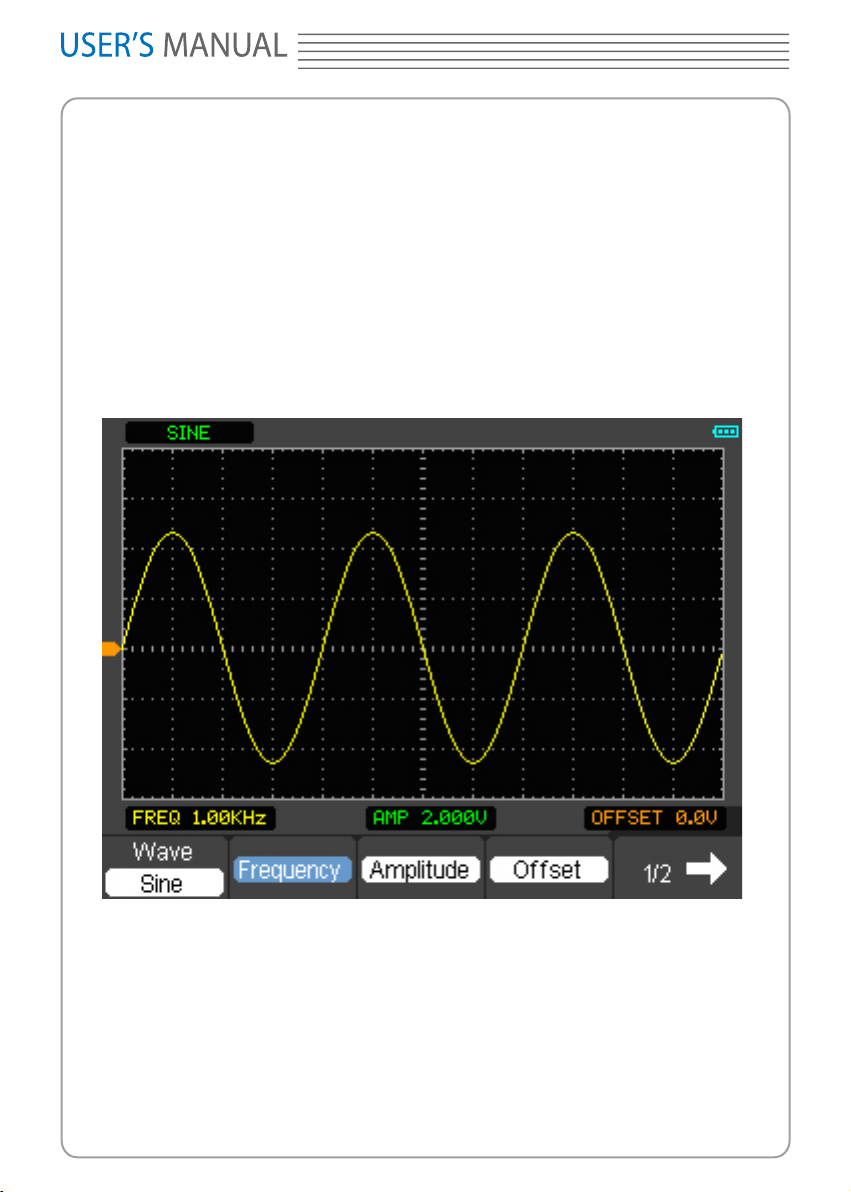
8060
8. The style of the waveform
9. The frequency of the waveform
10. The amplitude of the waveform
11. The offset of the waveform
12. Turn to the next page of the menu
Operate the waveform generator
Waveform is a sine waveform, which has 1 kHz and 2 Vmax.
Generate Sine Waveform
Press F1 to change the waveform to the sine waveform
Figure 5-2 The Sine Waveform Window
Change the parameter of the waveform. For example, change the frequency. Press F2
once to select the “Frequency” menu. If the menu is selected, press direction key on
the keyboard to increase or decrease the value or press F2 again to enter the accurate
value with the virtual keyboard display on the screen.
Page 99
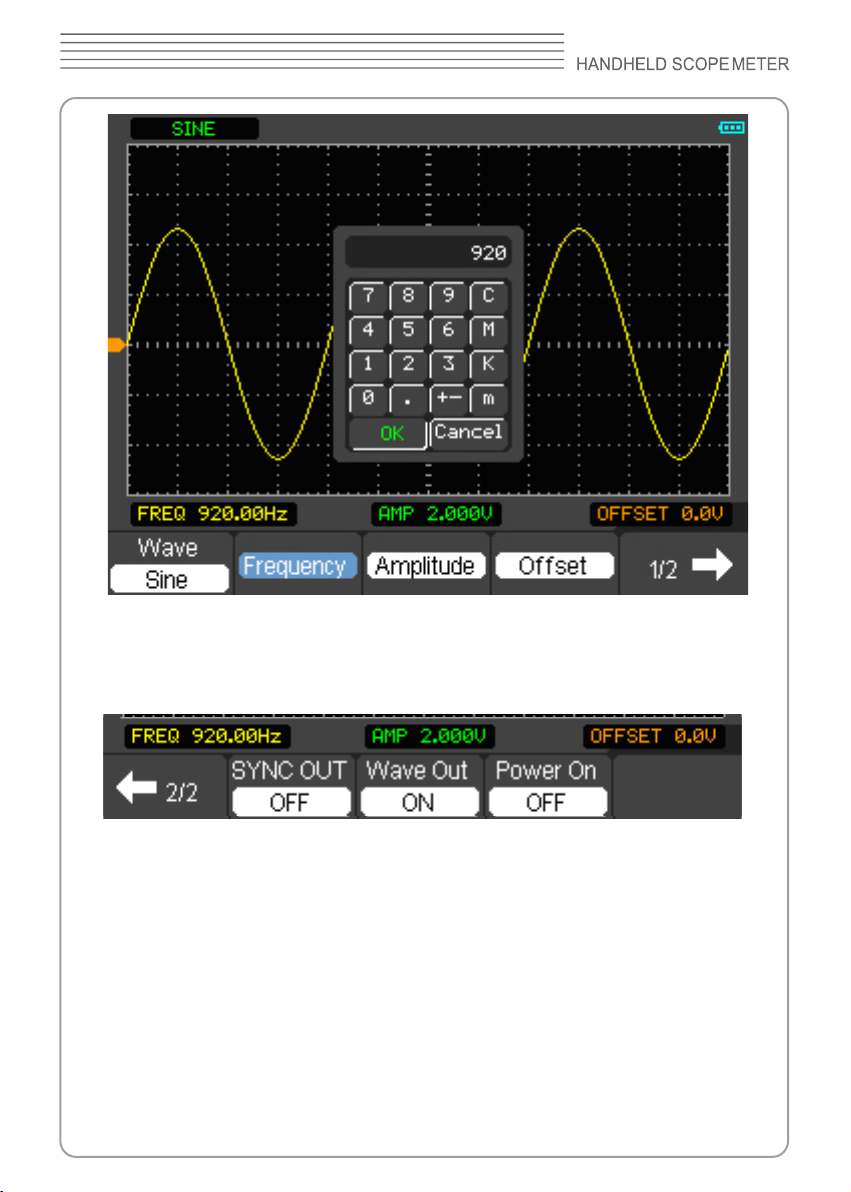
DSO8000 SERIES
Figure 5-3 The Keyboard Window
Press F5 to turn to the second page.
Figure 5-4 The Waveform Generator menu
SYNC OUT: Turn on/off the synchronization output.
Wave Out: Turn on/off the waveform output.
Power On: Whether generate the waveform when power on or not.
Generate Square Waveform
Press F1 to change the waveform to the square waveform
Page 100
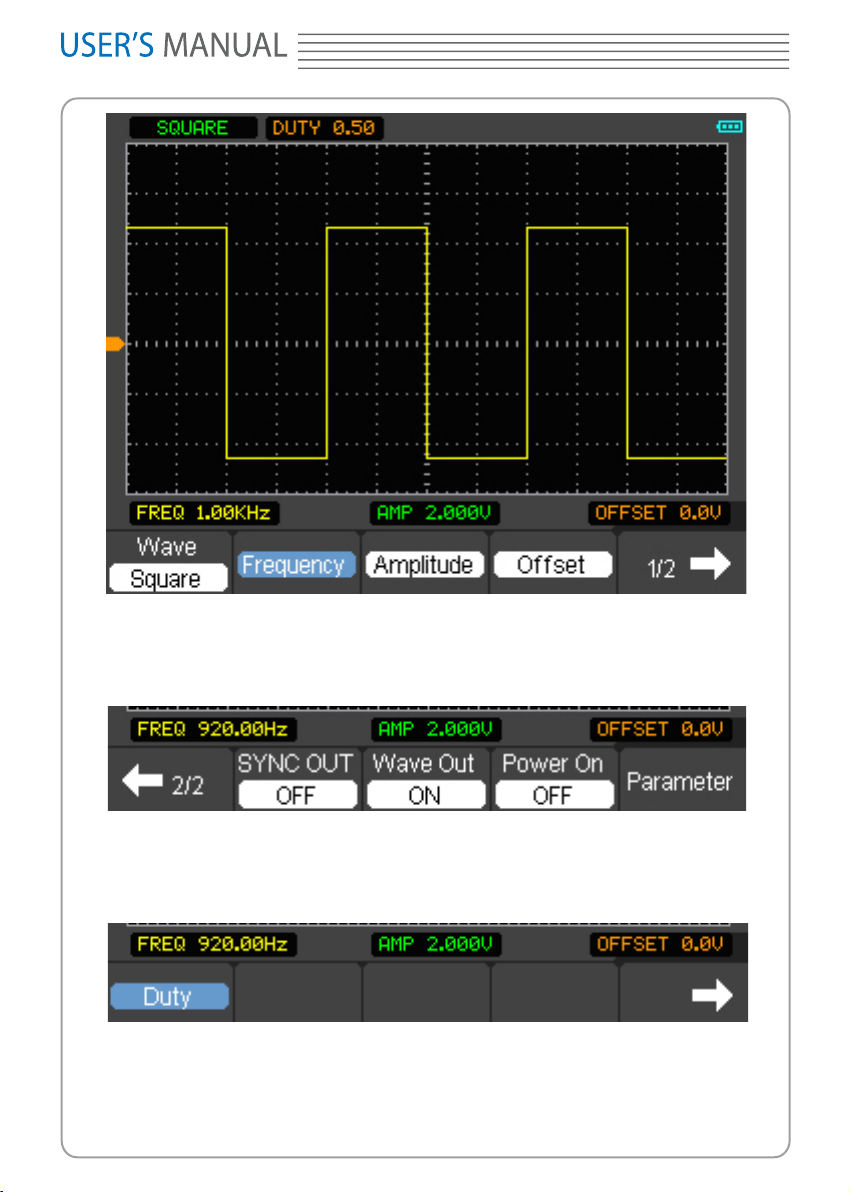
8060
Figure 5-4 The Square Waveform Window
To Change the duty of the waveform, press F5 to page down.
Figure 5-5 The Waveform Generator menu
Press F5 to turn to the “Parameter setup” menu
Figure 5-6 The Waveform Generator menu
Press direction key on the keyboard to increase or decrease the value or press F2 again
 Loading...