

Page 1
(V1.5)
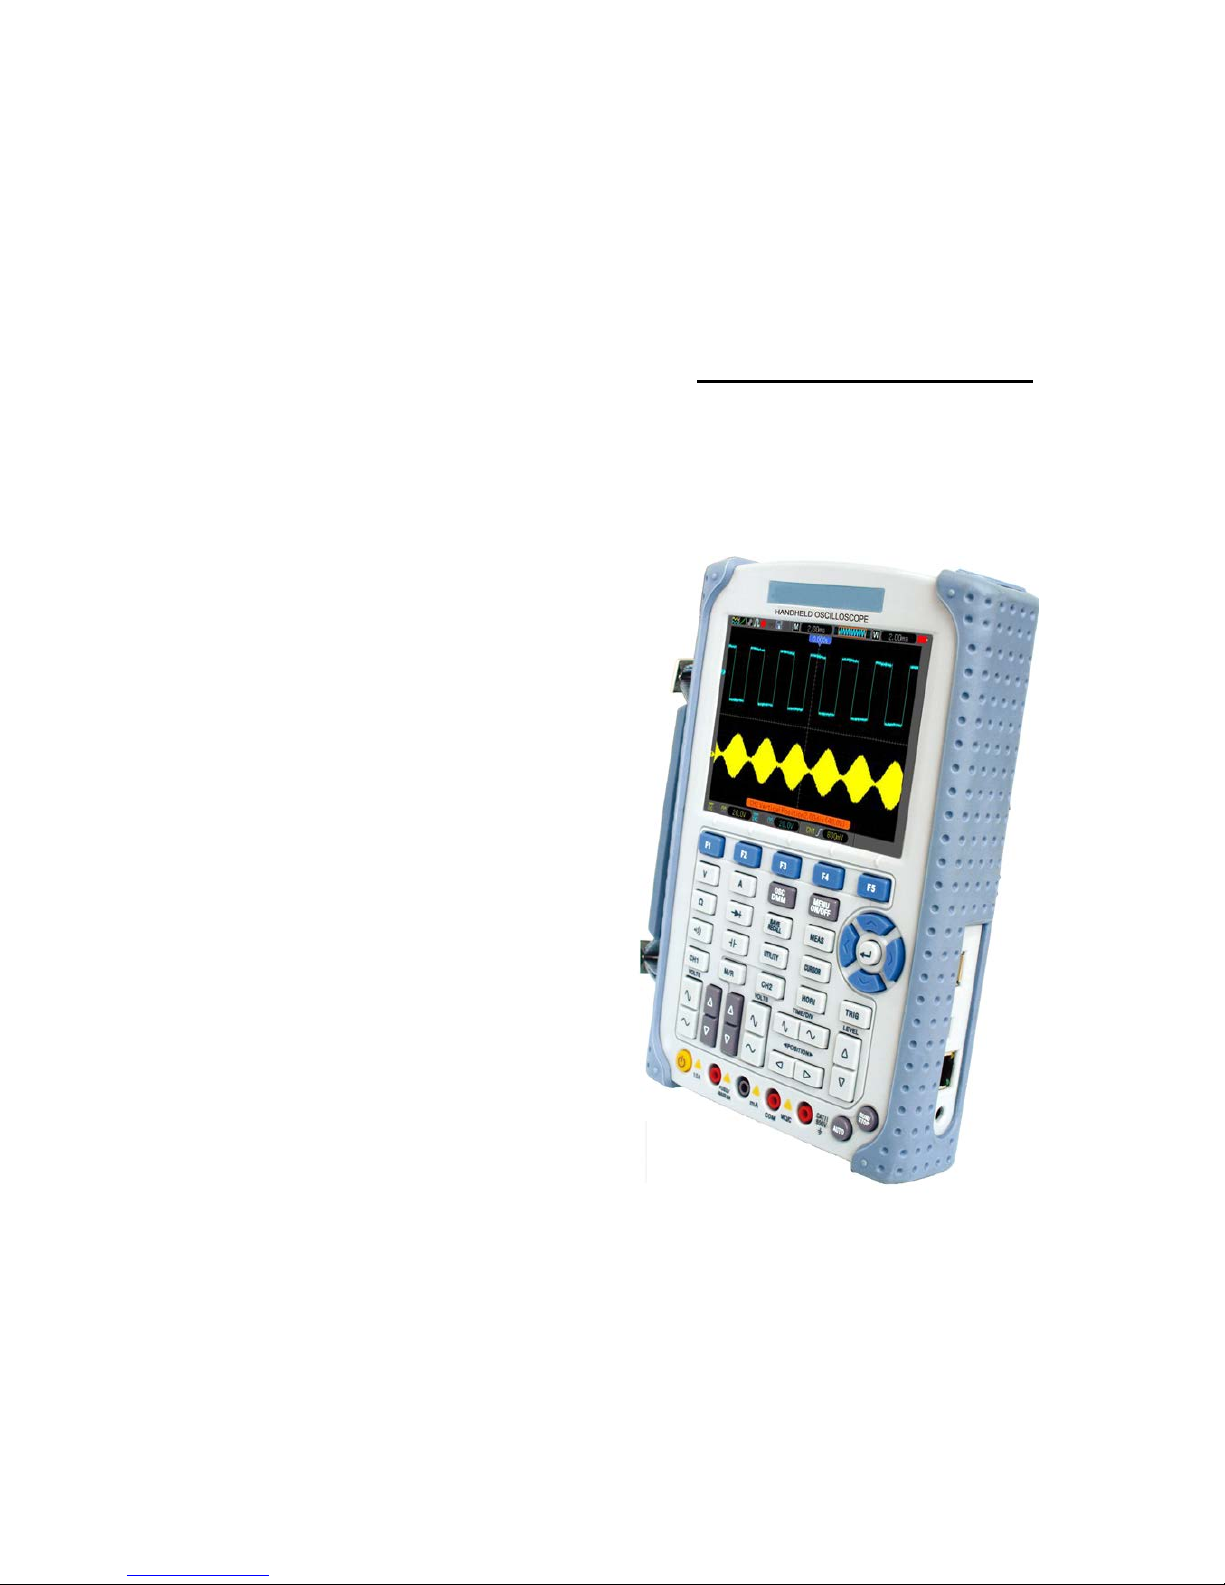
DSO1000B SERIES
HANDHELD OSCILLOSCOPE
1062B/1102B/1202B
USER’S MANUAL
Page 2

Contents
DSO1000B Series HandHeld Oscilloscope User Manual i
Contents
CONTENTS .......................................................................................................................................................I
COPYRIGHT DECLARATION ...................................................................................................................... IV
CHAPTER 1 SAFETY TIPS ...................................................................................................................... 1
1.1 GENERAL SAFETY SUMMARY ................................................................................................................... 1
1.2 SAFETY TERMS AND SYMBOLS ................................................................................................................. 1
1.3 TERMS ON PRODUCT .............................................................................................................................. 2
1.4 SYMBOLS ON PRODUCT .......................................................................................................................... 2
1.5 PRODUCT SCRAPPING ............................................................................................................................ 2
CHAPTER 2 OVERVIEW .......................................................................................................................... 3
2.1 BRIEF INTRODUCTION TO DSO1000B SERIES ........................................................................................... 3
2.2 HELP SYSTEM ....................................................................................................................................... 3
CHAPTER 3 GETTING STARTED GUIDE .............................................................................................. 4
3.1 INSTALLATION ........................................................................................................................................ 4
3.2 FUNCTIONAL CHECK ............................................................................................................................... 4
3.2.1 Power on the oscilloscope ........................................................................................................... 4
3.2.2 Connect the oscilloscope ............................................................................................................. 4
3.2.3 Observe the waveform ................................................................................................................ 5
3.3 PROBE EXAMINATION .............................................................................................................................. 5
3.3.1 Safety ......................................................................................................................................... 5
3.3.2 Use of Probe Check Wizard ........................................................................................................ 6
3.4 MANUAL PROBE COMPENSATION .............................................................................................................. 6
3.5 PROBE ATTENUATION SETTING ................................................................................................................. 7
3.6 SELF CALIBRATION ................................................................................................................................. 7
CHAPTER 4 MAIN FEATURE DESCRIPTION ....................................................................................... 8
4.1 OSCILLOSCOPE SETUP ........................................................................................................................... 8
4.2 TRIGGER .............................................................................................................................................. 8
4.3 DATA ACQUISITION ................................................................................................................................. 9
4.4 WAVEFORM SCALING AND POSITIONING ................................................................................................... 10
4.5 WAVEFORM MEASUREMENT................................................................................................................... 11
CHAPTER 5 BASIC OPERATION ......................................................................................................... 12
5.1 DISPLAYAREA ...................................................................................................................................... 13
5.1.1 XY Format ................................................................................................................................. 14
5.2 HORIZONTAL CONTROLS ....................................................................................................................... 15
5.2.1 Scan Mode Display (Roll Mode) ................................................................................................ 17
5.3 VERTICAL CONTROLS ........................................................................................................................... 17
5.3.1 Math FFT .................................................................................................................................. 18
Page 3

Contents
DSO1000B Series HandHeld Oscilloscope User Manual ii
5.3.1.1
Setting Time-domain Waveform ...................................................................................................................19
5.3.1.2 Displaying FFT Spectrum .............................................................................................................................20
5.3.1.3 Selecting FFT Window ..................................................................................................................................21
5.3.1.4 FFT Aliasing ..................................................................................................................................................22
5.3.1.5 Eliminating Aliases ........................................................................................................................................22
5.3.1.6 Magnifying and Positioning FFT Spectrum .................................................................................................23
5.3.1.7 Using Cursors to Measure FFT Spectrum ....................................................................................................23
5.4 TRIGGER CONTROLS ............................................................................................................................ 24
5.5 MENU AND OPTION BUTTONS................................................................................................................. 29
5.5.1 SAVE/RECALL .......................................................................................................................... 29
5.5.2 MEASURE ................................................................................................................................ 30
5.5.3 ACQUIRE ................................................................................................................................. 31
5.5.4 UTILITY .................................................................................................................................... 33
5.5.5 CURSOR .................................................................................................................................. 33
5.5.6 DISPLAY ................................................................................................................................... 34
5.6 FAST ACTION BUTTONS ......................................................................................................................... 35
5.6.1 AUTO........................................................................................................................................ 35
5.7 SIGNAL CONNECTORS .......................................................................................................................... 36
CHAPTER 6 APPLICATION EXAMPLES ............................................................................................. 38
6.1 EXAMPLE 1: TAKING SIMPLE MEASUREMENTS .......................................................................................... 38
6.2 EXAMPLE 2: TAKING CURSOR MEASUREMENTS ........................................................................................ 40
6.3 EXAMPLE 3: ANA LYZING INPUT SIGNALS TO ELIMINATE RANDOM NOISE ........................................................ 42
6.4 EXAMPLE 4: CAPTURING SINGLE-SHOT SIGNAL ........................................................................................ 44
6.5 EXAMPLE 5: USING X-Y MODE............................................................................................................... 45
6.6 EXAMPLE 6: TRIGGERING ON PULSE WIDTH ............................................................................................. 46
6.7 EXAMPLE 7: TRIGGERING ON VIDEO SIGNAL............................................................................................. 47
6.8 EXAMPLE 8: USING SLOPE TRIGGER TO CAPTURE PARTICULAR SLOPE SIGNAL ............................................. 49
6.9 EXAMPLE 9: USING OVERTIME TRIGGER TO MEASURE LONG PULSE SIGNAL................................................. 49
6.10 EXAMPLE 10: USING MATH FUNCTIONS TO ANALYZE WAVEFORMS .............................................................. 50
6.11 EXAMPLE 11: MEASURING DATA PROPAGATION DELAY .............................................................................. 51
6.12 EXAMPLE 12: SETTING NET IP ............................................................................................................... 53
6.13 EXAMPLE 13: CHARGING ......................................................................................................................... 54
CHAPTER 7 MULTIMETER .................................................................................................................... 55
CHAPTER 8 TROUBLESHOOTING ...................................................................................................... 65
8.1 PROBLEM SETTLEMENT ........................................................................................................................ 65
CHAPTER 9 SPECIFICATIONS ............................................................................................................. 66
9.1 TECHNICAL SPECIFICATIONS .................................................................................................................. 66
9.2 ACCESSORIES ..................................................................................................................................... 72
CHAPTER 10 SERVICES AND SUPPORT ............................................................................................. 74
CHAPTER 11 GENERAL CARE AND CLEANING ................................................................................ 75
11.1 GENERAL CARE ................................................................................................................................... 75
Page 4

Contents
DSO1000B Series HandHeld Oscilloscope User Manual iii
11.2
CLEANING ........................................................................................................................................... 75
APPENDIX A HARMFUL AND POISONOUS SUBSTANCES OR ELEMENTS.................................. 76
Page 5

Copyright Declaration
DSO1000B Series HandHeld Oscilloscope User Manual iv
Copyright Declarati on
All rights reserved; no part of this doc ument may be reproduced or transmit ted in any form or by
any means, electronic or mechanical, without prior written permission from Qingdao Hantek
Electronic Co., Ltd (hereinafter referred to as ‘Hantek’).
Hantek r eserves all rights to modify this document wit hout prior notice. Please contact Hantek for
the latest vers ion of t his document before plac ing an order.
Hantek has made every effort to ensure the accuracy of this document but does not guarantee the
absence of errors. Moreover, Hantek assumes no responsibility in obtaining permission and
authorization of any third party patent, c opyright or product involved in relat ion to the use of this
document.
Page 6

Safety Tips
DSO1000B Series HandHeld Oscilloscope User Manual 1
Chapter 1 Safety Tips
1.1 Gener al Saf ety Summar y
Read the following saf ety precautions to avoid injury and prevent damage to this product or an y
products connected to it. To evade potential hazards, use this product only as specified.
Only qualified personnel should perform maint enance.
Avoid fire or personal injury.
Connect and disconnect properly. Connect a probe with the oscilloscope befor e it is connected
to measured circuits; disconnect the probe from the oscilloscope after it is disconnected from
measured circuits.
Connect the probe in a right way. The probe ground lead is at ground potential. Do not connect
the ground lead to an elevated voltage.
Check all termi nal ratings. To avoid fire or shock hazard, check all rat ings and markings on the
product. Refer to the product manual for detailed information about ratings before making
connections to the product.
Do not operate without covers. Do not operate this product with covers or panels removed.
Avoid exposed circuitry. Do not touch exposed connections and components when power is
present.
Do not operate with suspected fail ures. If you suspect there is damage to t his product, have it
inspected by qualified service pers onnel.
Assure good ventilation.
Do not operate in wet/damp environments.
Do not operate in an explosive atmosphere.
Keep product surfaces clean and dry.
1.2 Safety Terms and Symbols
The following terms may appear in this manual:
WARNING. Warning statements point out conditions or practices that could result in injury
or loss of life.
CAUTION. Caution statements identify conditions or practices that could result in damage
Page 7
Safety Tips
DSO1000B Series HandHeld Oscilloscope User Manual 2
to this product or other pr operty.
1.3 Terms on Product
The following terms may appear on the product:
DANGER indicates an injury hazard immediately accessible as you read the marking.
WARNING indicates an injury hazard not immediately access ible as you read the marking.
CAUTION indicates a possible hazard t o this product or other property.
1.4 Symbols on Product
The following symbols may appear on the product:
1.5 Product Scrapping
Device Recycling
We need extract and utilize nat ural resources to produce this dev ice. If you do not reclaim t he
device in a proper way, some substances it contains may become harmful or poisonous to
environments or human bodies. To avoid them being released outside and to m inimize the waste
of natural resourc es, we suggest you reasonably call bac k this device to ensure prope r recovery
and recycling of most materials within it.
Protective
Ground
(Earth)
Terminal
Measurement
Ground
Terminal
CAUTION
Refer to Manual
Measurement
Input Terminal
Mains
Disconnected
OFF (Power)
Mains
Connected
ON (Power)
High Voltage
Page 8
Overview
DSO1000B Series HandHeld Oscilloscope User Manual 3
Chapter 2 Overview
2.1 Brief Introduction to DSO1000B Series
Model Channels Bandwidth Sample Rate LCD
DSO1062B
2
60MHz
1GS/s
5.6 inch co lor
DSO1102B
2
100MHz
1GS/s
5.6 inch co lor
DSO1202B
2
200MHz
1GS/s
5.6 inch co lor
Table 2-1 Model List of DSO1000B Series
DSO1000B Ser ies osc illoscopes cov er t he ba nd wi dt hs f rom 60MHz to 200MHz, and prov ide
the real-time and equivalent sample rates respectively up to 1GSa/s and 25GSa/s. In addition,
they have maximum 1M memory depth for better observation of the waveform details, and 5.7 inch
color TFT LCD as well as WINDOWS-style interfaces and menus for easy operation.
What’s more, the plenty menu infor mation and t he easy-to-operate butt ons allow you to g ain
information as much as poss ible in measurement; t he multifunctional and powerf ul shortc ut keys
help you save a lot of time in operation; the Autoset function lets yo u detect sine and square
waves automatic ally; the Probe Check Wizard g uides you to adjust the probe compens ation and
set the Probe option attenuation factor. By using these the m ethods t he oscilloscope provides
(context-sensitiv e, hyperlinks , and an index), you may master all operations on the devic e in quite
a short time so as to great ly improve your efficiency in productio n and development.
2.2 Help System
This oscilloscope has a Help system with topics c overing all of its features. You can use the Help
system to display several kinds of information:
General information about understanding and using the oscilloscope, such as Using the Menu
System.
Information about s pecific menus and controls, such as the Vertical Position Control.
Advice to problems you may come across while using an oscilloscope, such as Red ucing
Noise.
Page 9
Getting Started Guide
DSO1000B Series HandHeld Oscilloscope User Manual 4
Chapter 3 Getting Started Guide
3.1 Installation
To keep proper ventilation of the osc illosc ope in operat ion, leav e a space of more t han 5cm away
from the top and the two sides of the product.
3.2 Functional Check
Follow the steps below to perform a quick functional check to your oscilloscope.
3.2.1 Power on the oscilloscope
Press the ON/OFF button. The default Probe option attenuation setting is 1X.
T he default probe parameter
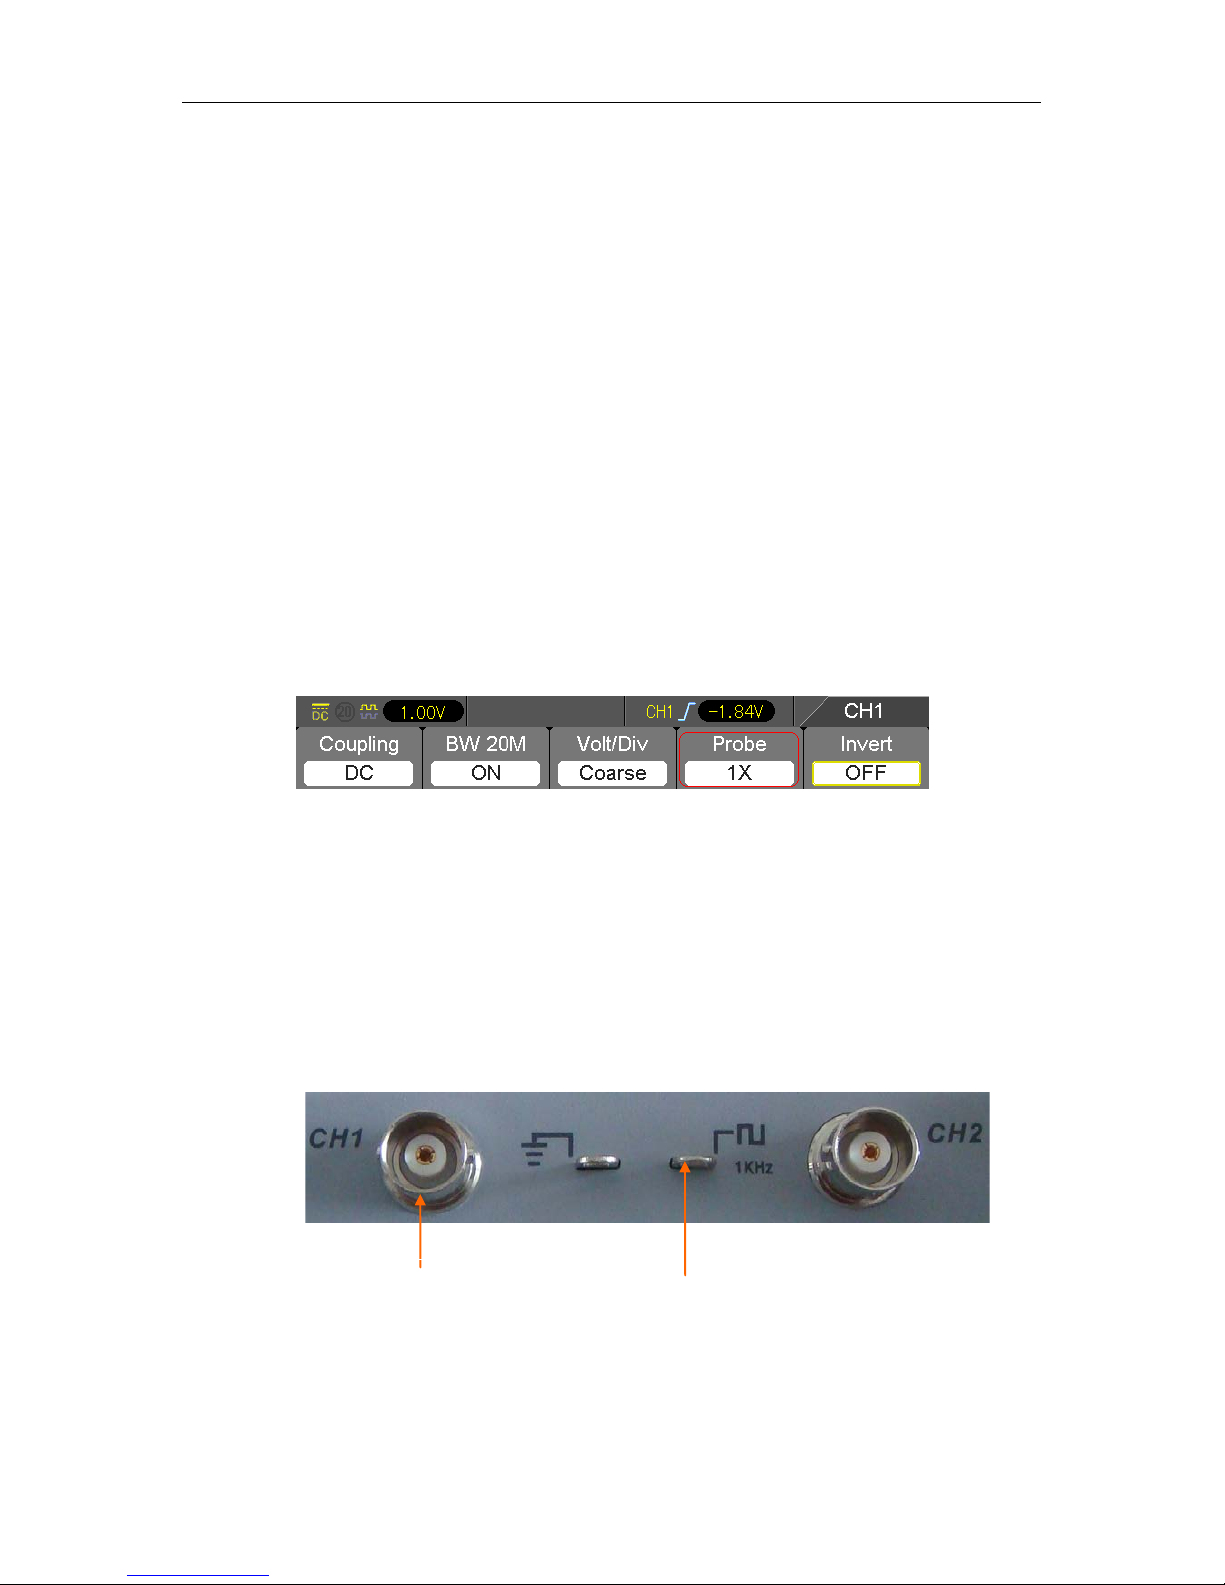
3.2.2 Connect the oscillosc o pe
Set the switch on the probe to 1X and connect the probe to Channel 1 on t he oscilloscope. First,
align the slot in the probe connector with the protuberance on the CH1 BNC and push to connect;
then, turn to right to lock the probe in place; after that, connect the probe tip and reference le ad to
the PROBE COMP connectors. There is a mark on the panel: Probe C O MP ~2V@1KHz.
CH1: to connect with the
probe
PROBE COMP
Page 10
Getting Started Guide
DSO1000B Series HandHeld Oscilloscope User Manual 5
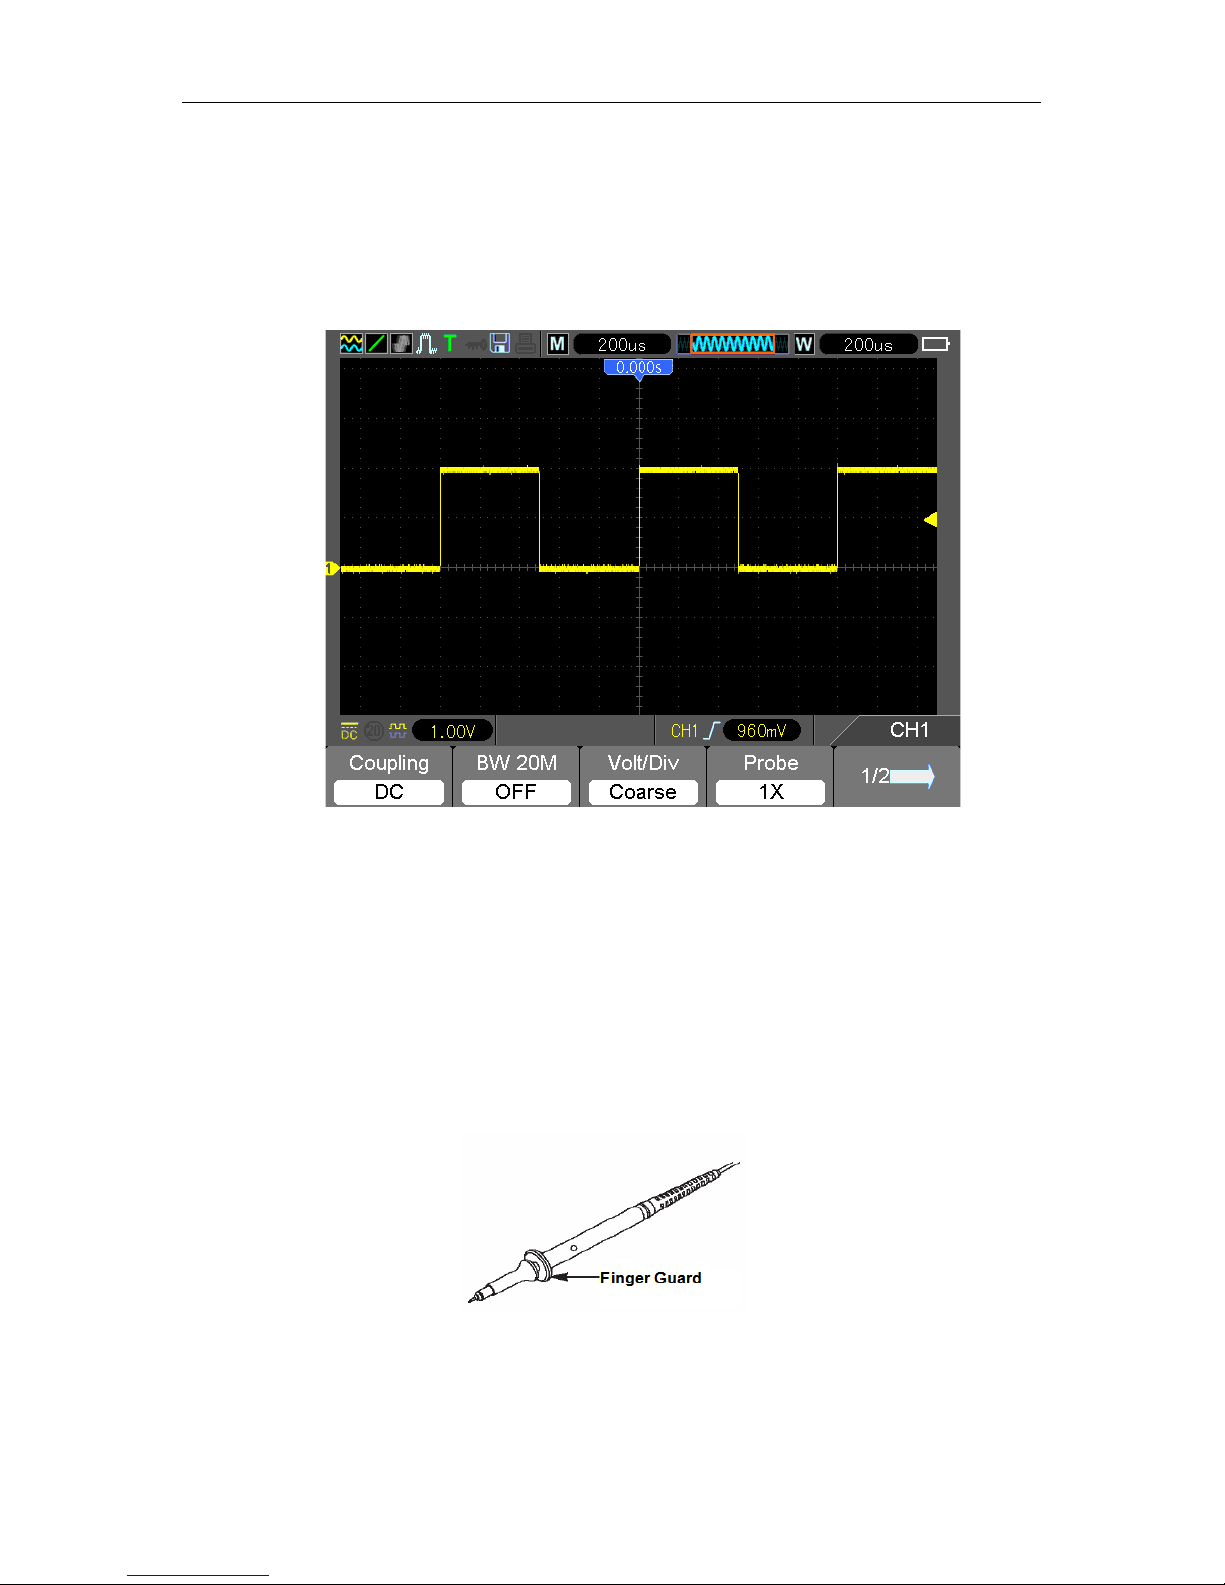
3.2.3 Observe the waveform
Press the AUTO button and you should see within a few seconds a square wave of about 2V
peak-to-peak at 1kHz in the display. Press the CH1 MENU button and remov e Channel 1. Push
the CH2 MENU button and repeat Step 2 and Step 3 to observe Channel 2.
3.3 Probe Examination
3.3.1 Safety
When using the probe, keep your f ingers behind the guard o n the probe body to avoid electric
shock. Do not touch metallic portions of the pr obe head while it is connected to a voltage source.
Connect the probe to the oscilloscope and connect the ground terminal to ground before you start
any measurements.
Page 11

Getting Started Guide
DSO1000B Series HandHeld Oscilloscope User Manual 6
3.3.2 Use of Probe Check Wizard
Every time you connect a probe to an input channel, you should use t he probe check wizard to
verify that this probe is operating correctly. There are two ways to do this:
1) Use the vertical menu (for example, push the CH1 MENU button) to set the Probe option
attenuation fac tor.
2) Press UTILITY ->F5->F5->F2 to use the Probe Check Wizard and configure the probe option
attenuation fac tor properly following menu prompts.
3.4 Manual Probe Compensation
Upon the first connection of a probe and an input channel, you should manually perform this
adjustment to matc h the probe to the i nput channel. Uncompensated or misc ompensated probes
may lead to errors or f aults in measurement. To adjust the probe compensatio n, follow the steps
below.
1. Set the Probe option attenuatio n in the channel menu to 10X. Set the switch on the probe to
10X and connect the probe to Channel 1 o n the oscilloscope. If you use t he probe hook-tip,
ensure it is firmly inserted onto the probe. Attach the probe tip to the PROBE COMP
~5V@1KHz connector and the reference lead to the PROBE COMP Ground connector.
Display the channel and t hen press the AUTO button.
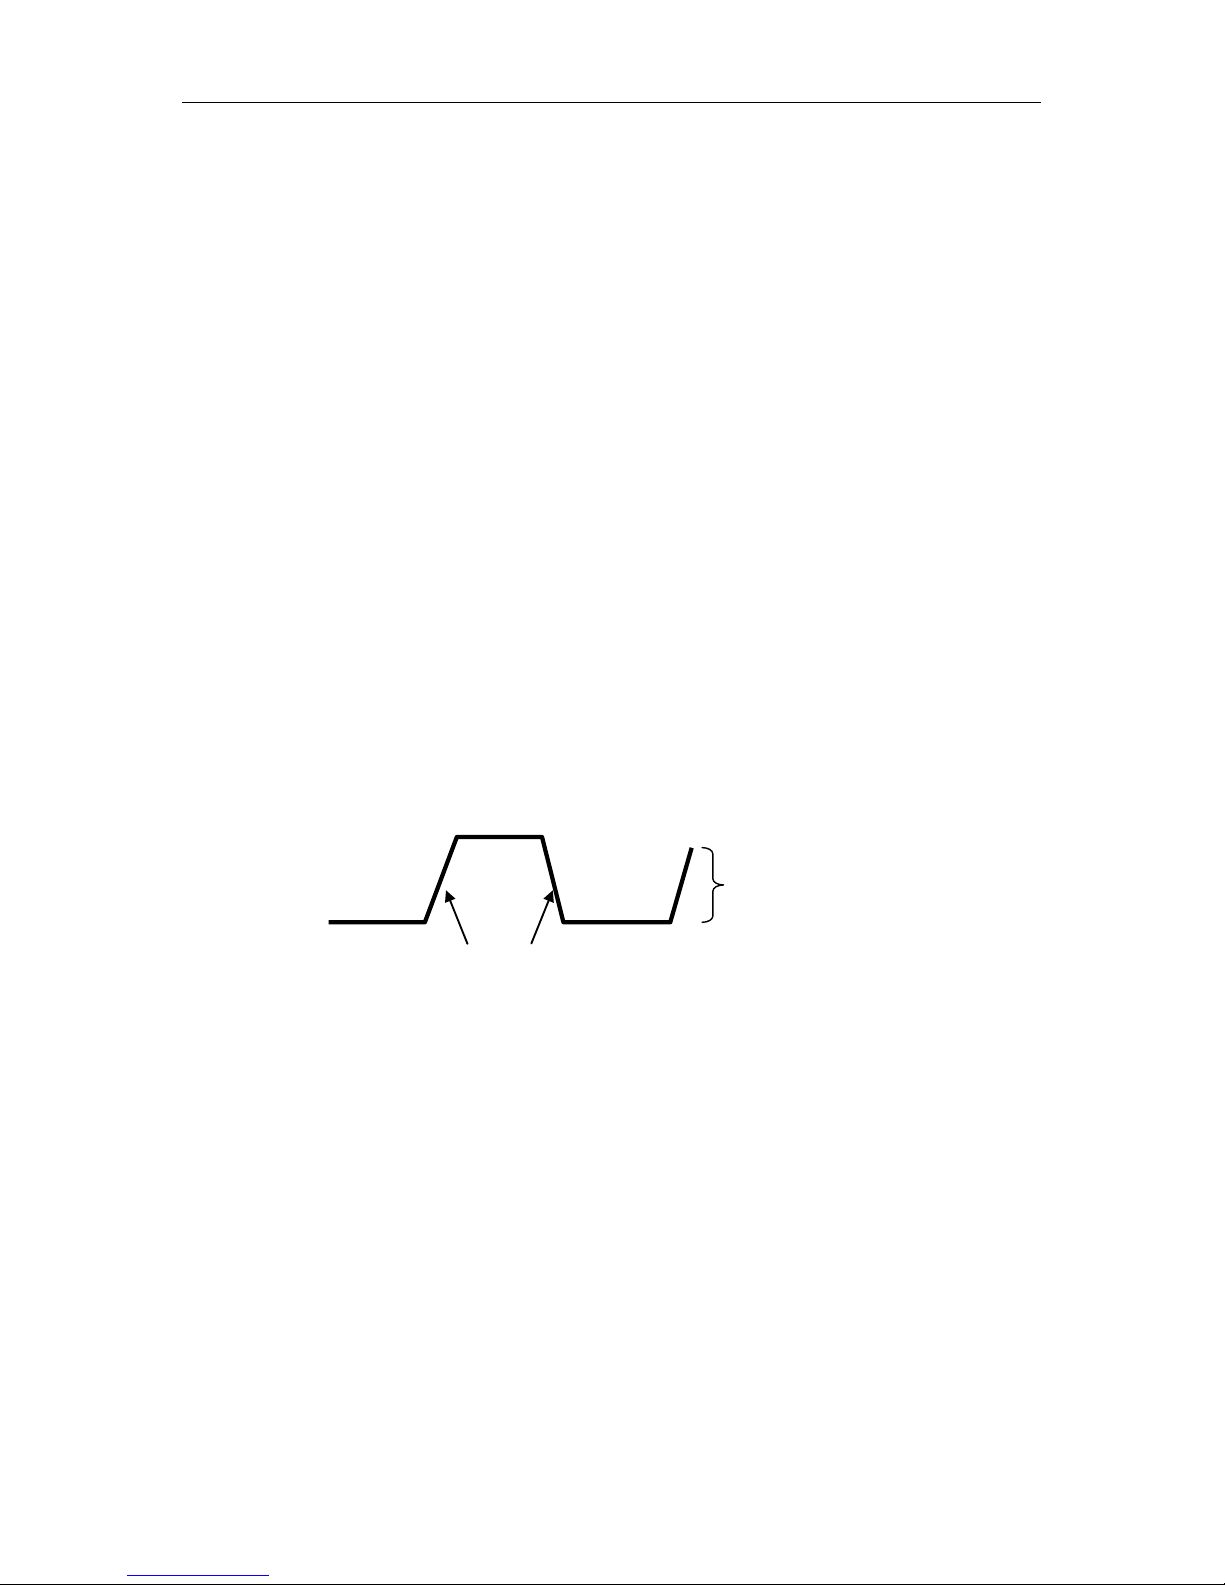
2. Check the shape of the displa yed wav eform.
3. If necessary, use a nonmetallic screwdriver to adjust the variable capacit y of your probe until
the shape of the wavef orm turns to be the same as the above figure. Repeat this step as
necessary. See the figure below for the way of adjustment.
Compensated correctly
Overcompensated
Undercompensated
Page 12
Getting Started Guide
DSO1000B Series HandHeld Oscilloscope User Manual 7
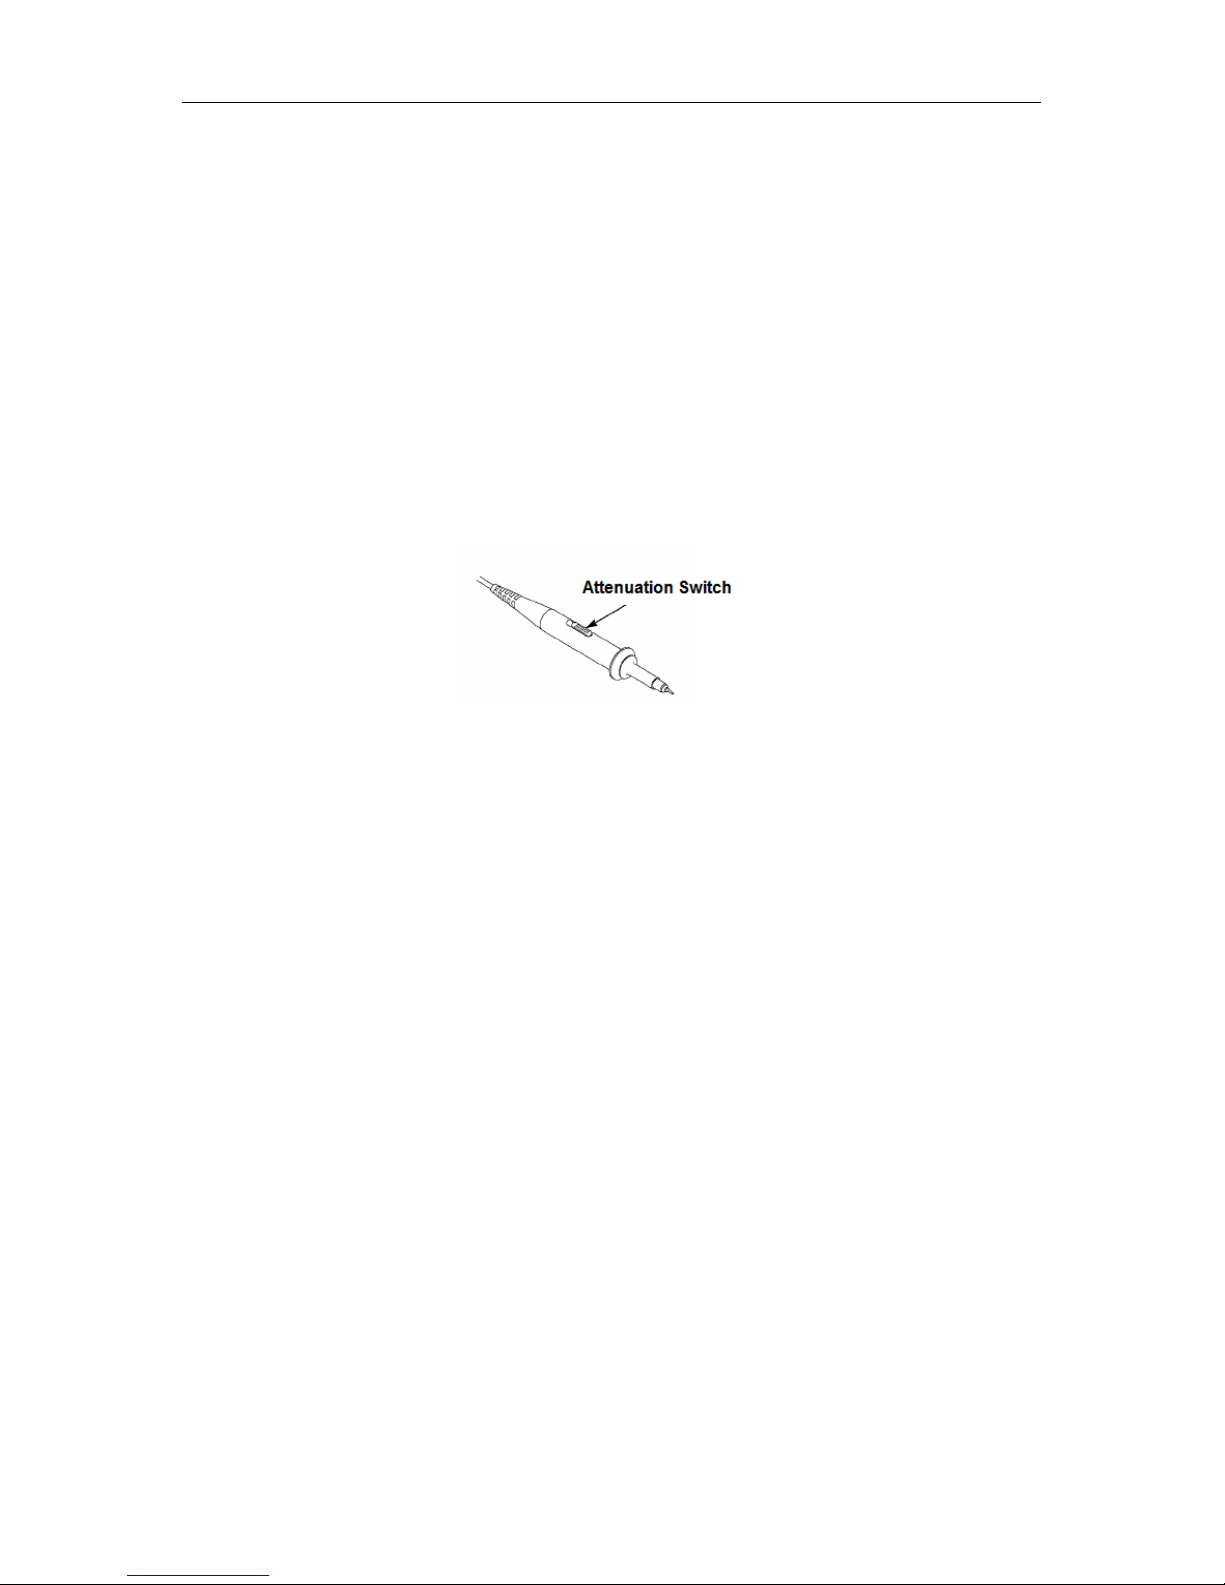
3.5 Probe Attenuation Se tting
Probes are of various attenuation fact ors which affect the vertical scale of the signal. The Probe
Check function is used to verify if the Probe attenuatio n option matches t he attenuation of the
probe.
As an alternative method to Probe Check, you can push a vertical menu button (such as the CH 1
MENU button) and select the Probe option that matches the attenuation fact or of your probe.
Make sure that the Attenuation switc h on the probe matc hes t he Probe option in the oscillosc ope.
Switch settings are 1X and 10X.
When the Attenuation swit ch is set to 1X, the probe limits the bandwidth of the os cilloscope to
6MHz. To use t he full ba ndwidth of the oscillos cope, be sure to set the switch to 10X .
3.6 Self Calibration
The self calibration routine helps optimize the oscilloscope signal path for maximum measurement
accuracy. You can run the routine at any tim e but should always r un it if the ambient temper ature
cha nges by 5 ℃
or more. Fo
wait for 20 minutes until it has adequately warmed up.
To compensate the signal path, disconnect any probes or cables from the front-panel input
connectors. Then, push the UTILITY button, select the Do Self Cal option and follow the directions
on the screen.
.
Page 13

Main Feature Description
DSO1000B Series HandHeld Oscilloscope User Manual 8
Chapter 4 Main Feature Descripti on
This chapter provides some general information that you need to learn before using an
oscilloscope. It contains:
1. Oscilloscope setup
2. Trigger
3. Data acquisition
4. Waveform scaling and positioning
5. Waveform measurement
4.1 Oscill oscope Setup
While operating the oscilloscope, you may oft en use thr feature: Autoset.
Autoset: This function can be used to adjust the horizontal and vertical scales of the oscillosc ope
automatically and s et t he trigg er coupling, type, pos ition, s lope, lev el and m ode, et c., to acquire a
stable waveform display.
4.2 Trigger
The trigger determines when the oscilloscope begins to acquire data and display a waveform.
Once a trigger is proper ly set up, the osc illos c ope can convert unstable dis plays or blank scr eens
to meaningful waveforms. Here introduce some basic concepts about trigger.
Trigger Source: The trigger can be generated with multiple sources. The most common one is the
input channel (alter nat ive bet wee n CH1 and CH2) . W hether the inp ut sig nal is displa y ed or not, it
can trigger normal operations.
Trigger Type: The oscilloscope has six types of triggers: Edge, Video, Pulse Width, Slope,
Overtime and Swap.
Edge Trigger uses the analog or digital test circ uits for triggering. It happens when the
input trigg er source crosses a specified level in a specified directio n.
Video Trigger performs a field or line tr igger through standard video signals.
Pulse Width Trigger can trigger normal or abnorm al puls es that meet trigger conditions.
Slope Tr igger uses the rise and fall times on the edge of signal for triggering.
Overtime Trigger happens after the edge of signal reaches the set time.
Swap Trigger, as a feature of analog os cilloscopes, giv es stable displays of sig nals at
Page 14
Main Feature Description
DSO1000B Series HandHeld Oscilloscope User Manual 9
two different frequencies. Mainly it uses a specific frequency to switch between two
analog channels CH1 and CH2 so that the channels will g enerate swap trigger signals
thr oug h the trigger circuitry.
Trigger Mode: You can select the Auto or Norm al mode to def ine how the osc illosc ope acq uires
data when it does not detec t a trigger condition. Auto Mode performs t he acquisition freely i n
absence of valid tr igger. It allows the generation of untrig gered wav eforms with the time bas e set
to 80ms/div or slower. Normal Mode updates the displayed waveforms only when the
oscilloscope det ects a valid trigger condition. Before t his update, the oscill oscope still displa ys the
old waveforms. This mode shall be used when you want to only view the effectively triggered
waveforms. In this mode, the oscilloscope displays waveforms only after the first trigger. To
perform a singl e seq uence acq uisition, push the SINGLE SEQ button.
Trigger Coupling: Trigger Coupling determines which part of the sig nal will be delivered to the
trigger circ uit. This can help to obtain a stable display of the waveform. To use trigger coupling,
push the TRIG MENU button, select an Edge or Pulse trigger, and then select a Coupling option.
Trigger Position: The horizontal position control establishes the time between the trigger position
and the screen center.
Slope and Level: The Slope and Level controls help to define the trigger. The Slope option
determines whether t he trigger point is on the risi ng or falling edge of a sig nal. To perform the
trigger slope control, press the TRIG MENU button, select an Edge trigger, and use the Slope
button to select rising or falling. The LEVEL button controls the trigger point is on which positio n of
the edge.
4.3 Data Acquisition
When you acquire an analog signal, the oscilloscope will convert it into a digital one. There are
two kinds of acquisition: Real-time acquisition and Equivalent ac quisition. The real-time acquisition
has three modes: Normal, Peak Detect, and Average. The acquisition rate is affected by the
setting of tim e base.
Normal: In this acquisition mode, the oscilloscope samples the signal in evenly spaced intervals to
establish the waveform. This mode accurately represents signals in most time. However, it does
not acquire rapid var iations in the analog signal that m ay occur between two sam ples, which can
result in aliasing and may cause narr ow pulses to be missed. In such cases , yo u sho uld use the
Peak Detect mode to acquire data.
Peak Detect: In this acquisition mode, the oscilloscope gets the maximum and minimum values of
Trigger slope can be rising or falling
Rising Edge
Falling Edge
Trigger level can be
adjusted vertically
Page 15

Main Feature Description
DSO1000B Series HandHeld Oscilloscope User Manual 10
the input signal over each sam ple interval and uses these values to displa y the waveform. I n this
w ay, the oscilloscope can acquire and display t hose narrow pulses that may have otherwis e been
missed in Normal m ode. However, noise will appear t o be higher in this mode.
Average: In this acq uisition mode, the oscillosc ope acquires several wavef orms, aver ages them,
and displays the resulting waveform. You can use this mode to reduce random noise.
Equivalent Acquisition: This kind of acquisitio n can be utilized for periodic s ignals. In c ase t he
acquisition rat e is too low when us ing t he rea l-tim e acq uisition, the osc illoscope will use a fixed
rate to acquire data with a stationary tiny delay after each acquisition of a frame of data. After
repeating this acq uisition for N times, the oscilloscope will arrange the acquired N fr ames of data
by time to make up a new fram e of data. Then the waveform can be rec overed. The number of
times N is related to the equivalent acquisition rate.
Time Base: The oscilloscope digitizes waveforms by acquiring the value of an input signal at
discrete points. The time base helps to control how often the values are digitized. Use the
TIME/DIV button to adjust the time base to a horizontal scale t hat suits your purpose.
4.4 Waveform Scal i n g and Positioning
The display of waveforms on the screen can be changed by adjusting their sc ale and position.
Once the scale changes, the waveform display will increase or decrease in size. Once the position
changes, the waveform will move up, down, right, or left.
The channel reference i ndicator (locat ed on the left of the graticule) ide ntifies each wavef orm on
the screen. It points to the ground level of the waveform record.
Vertical Scale and Position: The vertic al position of a waveform can be changed by moving it up
and down on the screen. T o compare data, you may align a wavef orm over another. W hen you
push the VOLTS button to change the vertical scale of a waveform, the waveform display will
contract or expand vertically to the ground level.
Horizontal Scale and Position: Pretrigger Information
You can adjust the HORIZONTAL PO SITION control to view waveform data before the trigger,
after the trigger, or some of each. When you change the horizontal position of a waveform, you are
actually changing the time between the trigg er position and the screen center .
For example, if you want t o fi nd o ut the ca us e of a glitc h in yo ur tes t cir c uit, you should t rigg er on
the glitch and mak e t he pretr igger period long e nough to capt ure data befor e the gl itc h. Then you
can analyze the pretrigger data and perhaps find the cause. You are allowed to change the
horizontal s cale of all the waveforms by clicking the TIME/DIV button. For example, you may want
to see just one cycle of a waveform to measure the overs hoot on its rising edge. The oscilloscope
shows the horizontal scale as time per division in the scale readout. S ince all active waveforms
use the same time base, the oscilloscope only displays one value for all the activ e channels.
Page 16
Main Feature Description
DSO1000B Series HandHeld Oscilloscope User Manual 11
4.5 Waveform Measurement
The oscilloscope dis plays graphs of voltage versus t ime and can help to measure the displayed
waveform. There are several ways to take measurements, using the graticule, the cursors or
performing an automatic measurement.
Graticule: This method allows you to make a quick, visual estimate and take a simple
measurement throug h the graticule divisio ns and the scale factor.
For example, you can take simple measurements by counting the major and minor graticule
divisions involved and multiplying by the scale factor. If you counted 6 major vertical graticule
divisions between t he minimum and maximum values of a waveform and knew you had a scale
factor of 50mV/division, you could easily calculate your peak-to-peak voltage as follows :
6 divisions x 50mV/division = 300mV.
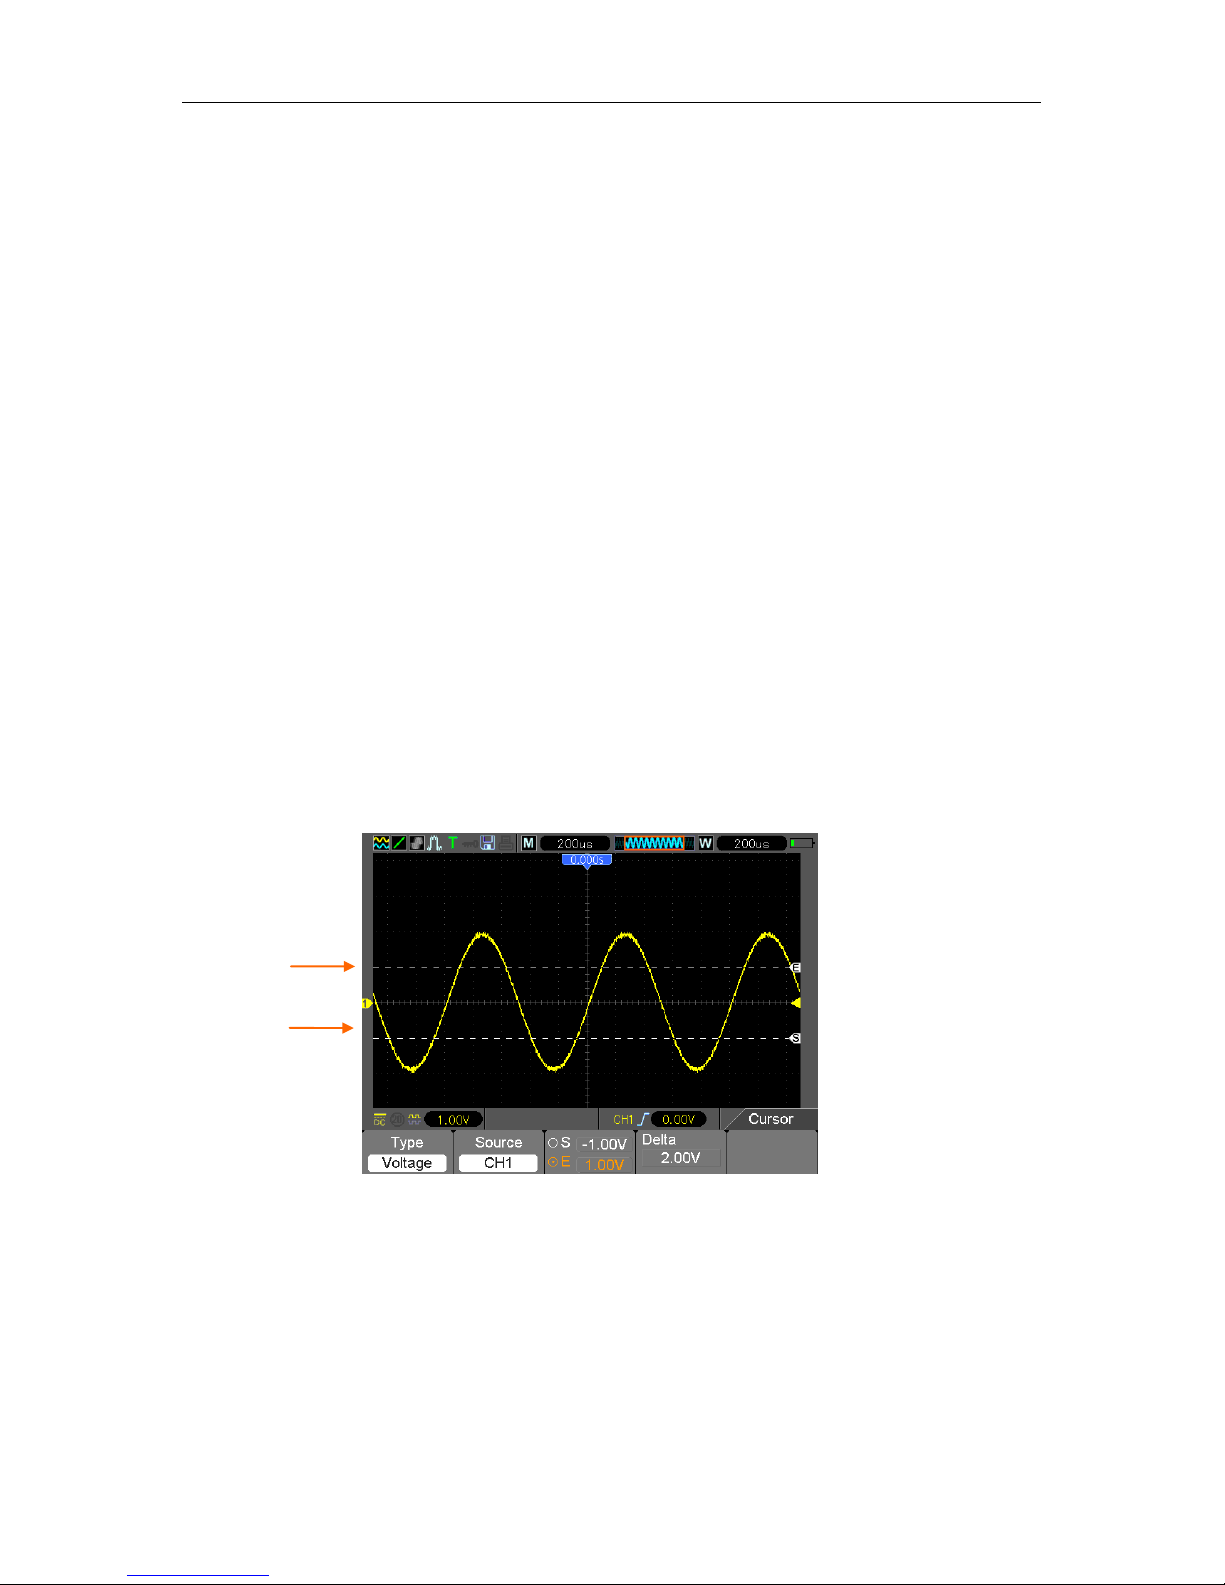
Cursor: This m ethod allows you to take measurements by moving the cursors . Cursors always
appear in pairs and the displayed readouts are just their measured v alues. There ar e two kinds of
cursors: Amplitude Curs or and Time Curs or. The amplitude cursor appear as a horizontal brok en
line, measuring the vertical parameters. The time cursor appear as a vertical broken line,
measuring the horizontal parameters .
When using cursors, please make sure to set the Source to the waveform that you want to
measure on the screen. To use cursors, push the CURSOR button.
Automatic Measurement: The oscilloscope performs all the calculations automatically in this
mode. As this measurement uses the waveform record points, it is more precise than the gr aticule
and cursor measurements. Automatic measurements show the measurement results by readouts
which are periodical ly updated with the new data acquired by the oscilloscope.
Cursor
Cursor
Page 17
Basic Operation
DSO1000B Series HandHeld Oscilloscope User Manual 12
Chapter 5 Basic Operation
The front panel of t he oscillosc ope is divide d into sev eral funct ional areas . In this c hapter we will
give a quick overview of all c ontrol b utto ns on the front panel as well as t he displa yed infor m at ion
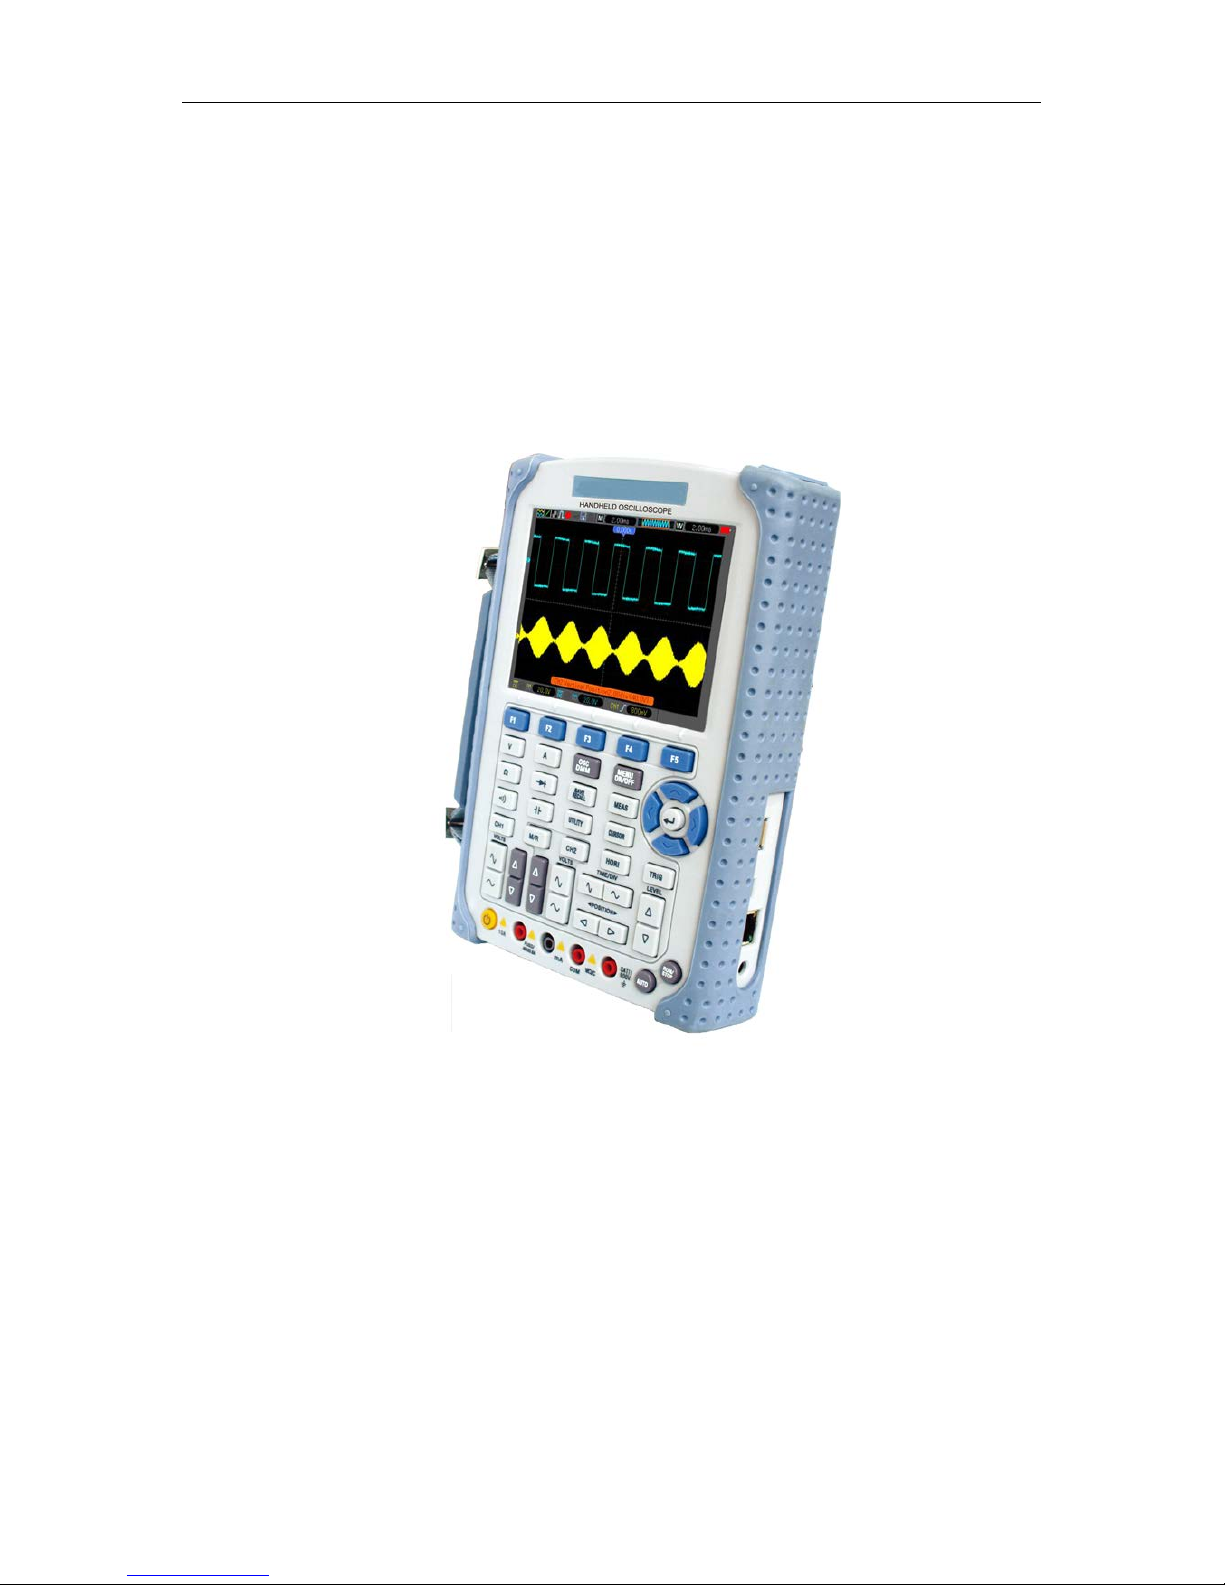
on the screen and relative test ing operations. The fig ure below illustrat es the front panel of the
DSO1000B series digital oscilloscope.
Front Panel of DSO1000B Series
Page 18
Basic Operation
DSO1000B Series HandHeld Oscilloscope User Manual 13
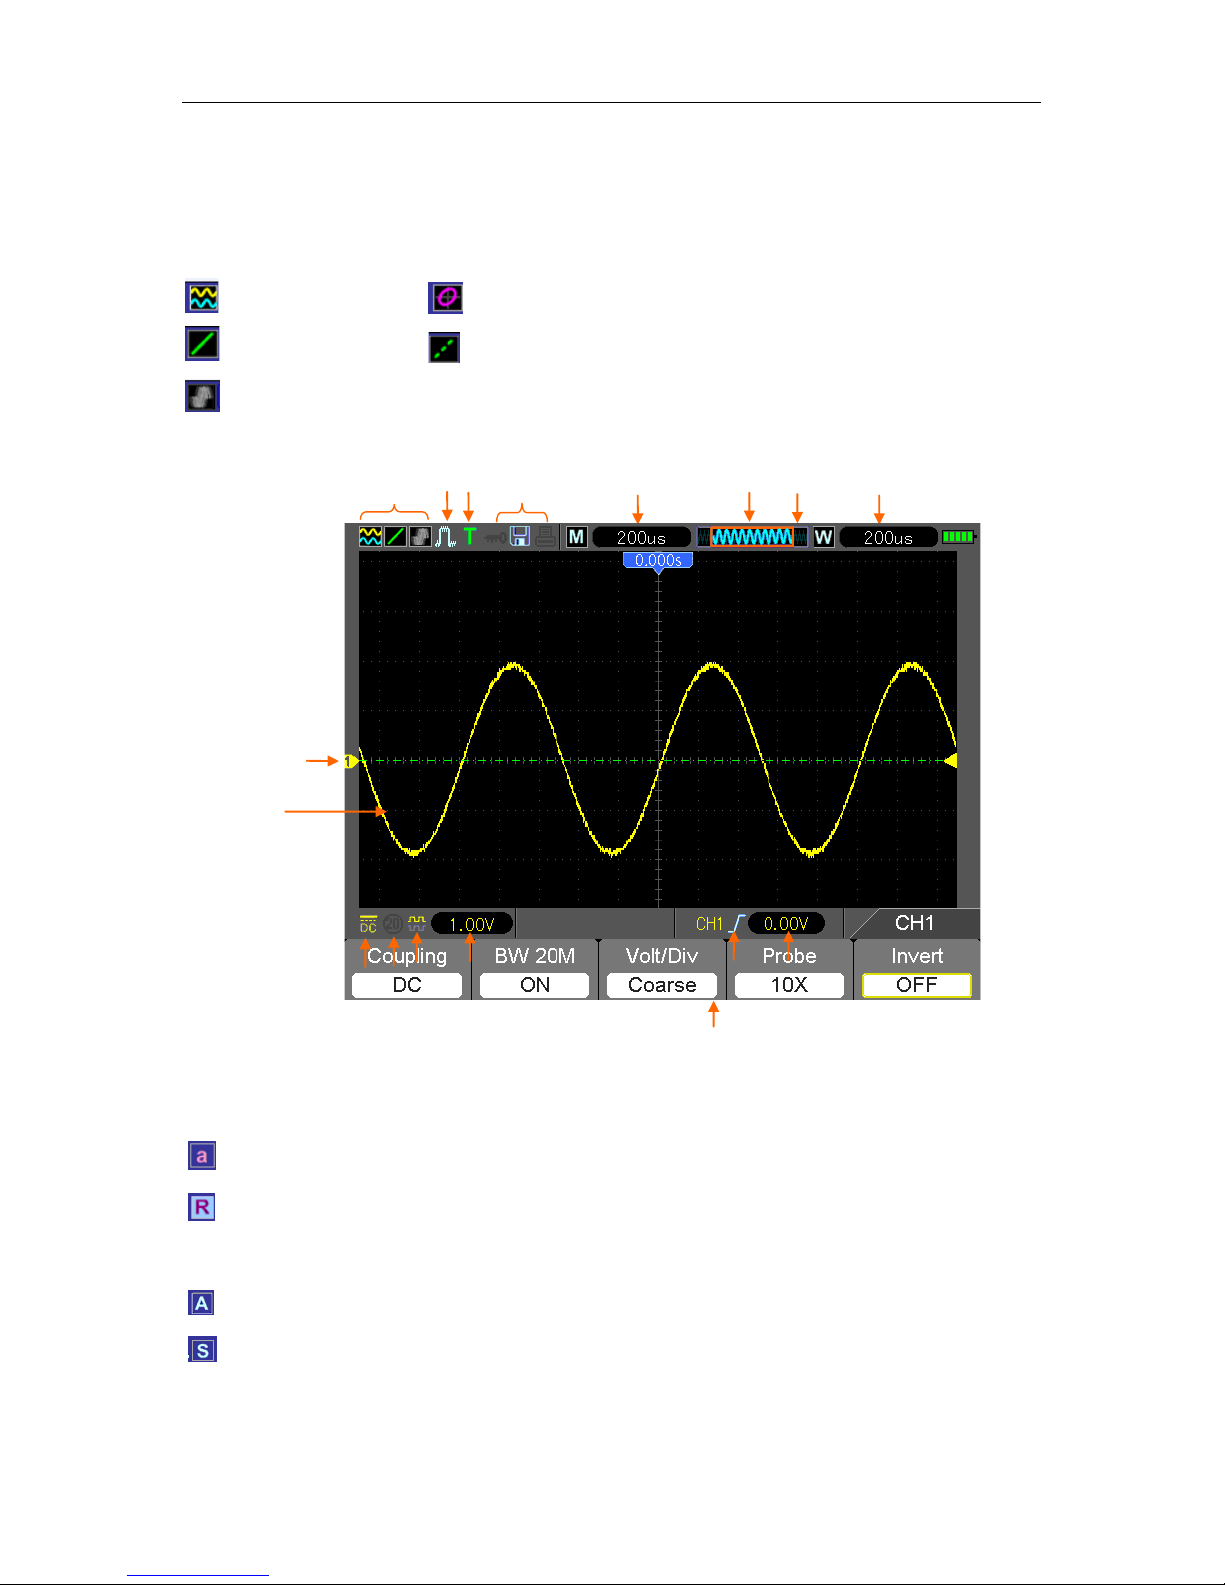
5.1 DisplayArea
1. Display Format:
2. Acquisition Mode: Normal, Peak Detect or Average
3. Trig ger Status:
The oscilloscope is acquiring pretriggered data.
All pretriggered data have been acquired and the oscilloscope is ready to accept a trigger.
T The osc illoscope has detected a tr igger and is acquiring the post trigger inform ation.
The oscilloscope works in auto mode and is acquiring waveforms in the absence of triggers.
The oscillosc ope is acquiring and displaying waveform data continuously in scan mode.
● The oscilloscope has stopped acquiring wavefor m data.
S The oscilloscope has finished a single sequence acquisition.
:
YT
: Vectors
:
Gray indicates auto persistence; Green means pers istence display is enabled.
When
the icon is set to green, the time for persistence display will be shown behind it.
: XY
:
Dots
9
1 2 3 4 5 6 7 8
17
10
13 12 11
14 15
16
Page 19

Basic Operation
DSO1000B Series HandHeld Oscilloscope User Manual 14
4. Tool Icon:
: If this icon li gh ts up, it means the keyboard of the oscilloscope is locked by the host computer
via USB control.
: If this icon lights up, it means the USB disk has been connected.
: This icon lights up only when the USB slave i nterface is connected with t he computer.
5. Readout shows main time base setting.
6. Main Time Base Window
7. Display of window’s position in data memory and data length.
8. Window Time Base
9. Operating Menu shows different information for different function keys.
10. I con indicates channel coupling.
11. Level Range.
12. I con indicates whether the wav eform is inverted or not.
13. 20M Bandw idth Limit. If this icon lig hts up, it means the bandw idth limit is enabled, otherwis e
disabled.
14. Trigger Type:
: Edge trigger on the rising edge.
: Edge trigger on the falli ng edge.
: Video trigger with line sync hronization.
: Video trigger with field synchronization.
: Pulse Width trigger, positive polarity.
: Pulse Width trigger, negative polarit y.
15. Trig Lev el.
16. Channel Marker
17. Window displays waveform.
5.1.1 XY Format
The XY format is used to analyze phase differences, such as those represented by Lissajous
patterns. The format plots the voltage on CH1 against the voltage on CH2, where CH1 is the
horizontal axis and CH2 is the vertical axis. The oscilloscope uses the untriggered Normal
acquis ition mod e and displays data as dots. The sampling rat e is fixed at 1 MS/s.
The oscilloscope c an acquire waveforms in YT format at any sampling rate. You may view the
same waveform in XY format. To perform this operation, stop the acquisition and change the
Page 20
Basic Operation
DSO1000B Series HandHeld Oscilloscope User Manual 15
display f ormat to XY.
The table below shows how to operate some controls in XY format.
Controls
Usable or not in XY format
CH1 VOLTS and VERTICAL POSITION controls
Set the horizontal scale and posit ion
CH2 VOLTS and VERTICAL POSITION controls
Continuously set
the vertical scale and
position
Reference or Math
Unusable
Cursors
Unusable
Autoset (display format reset to YT)
Unusable
Time base controls Unusable
Tri gger con tro l s Unusable
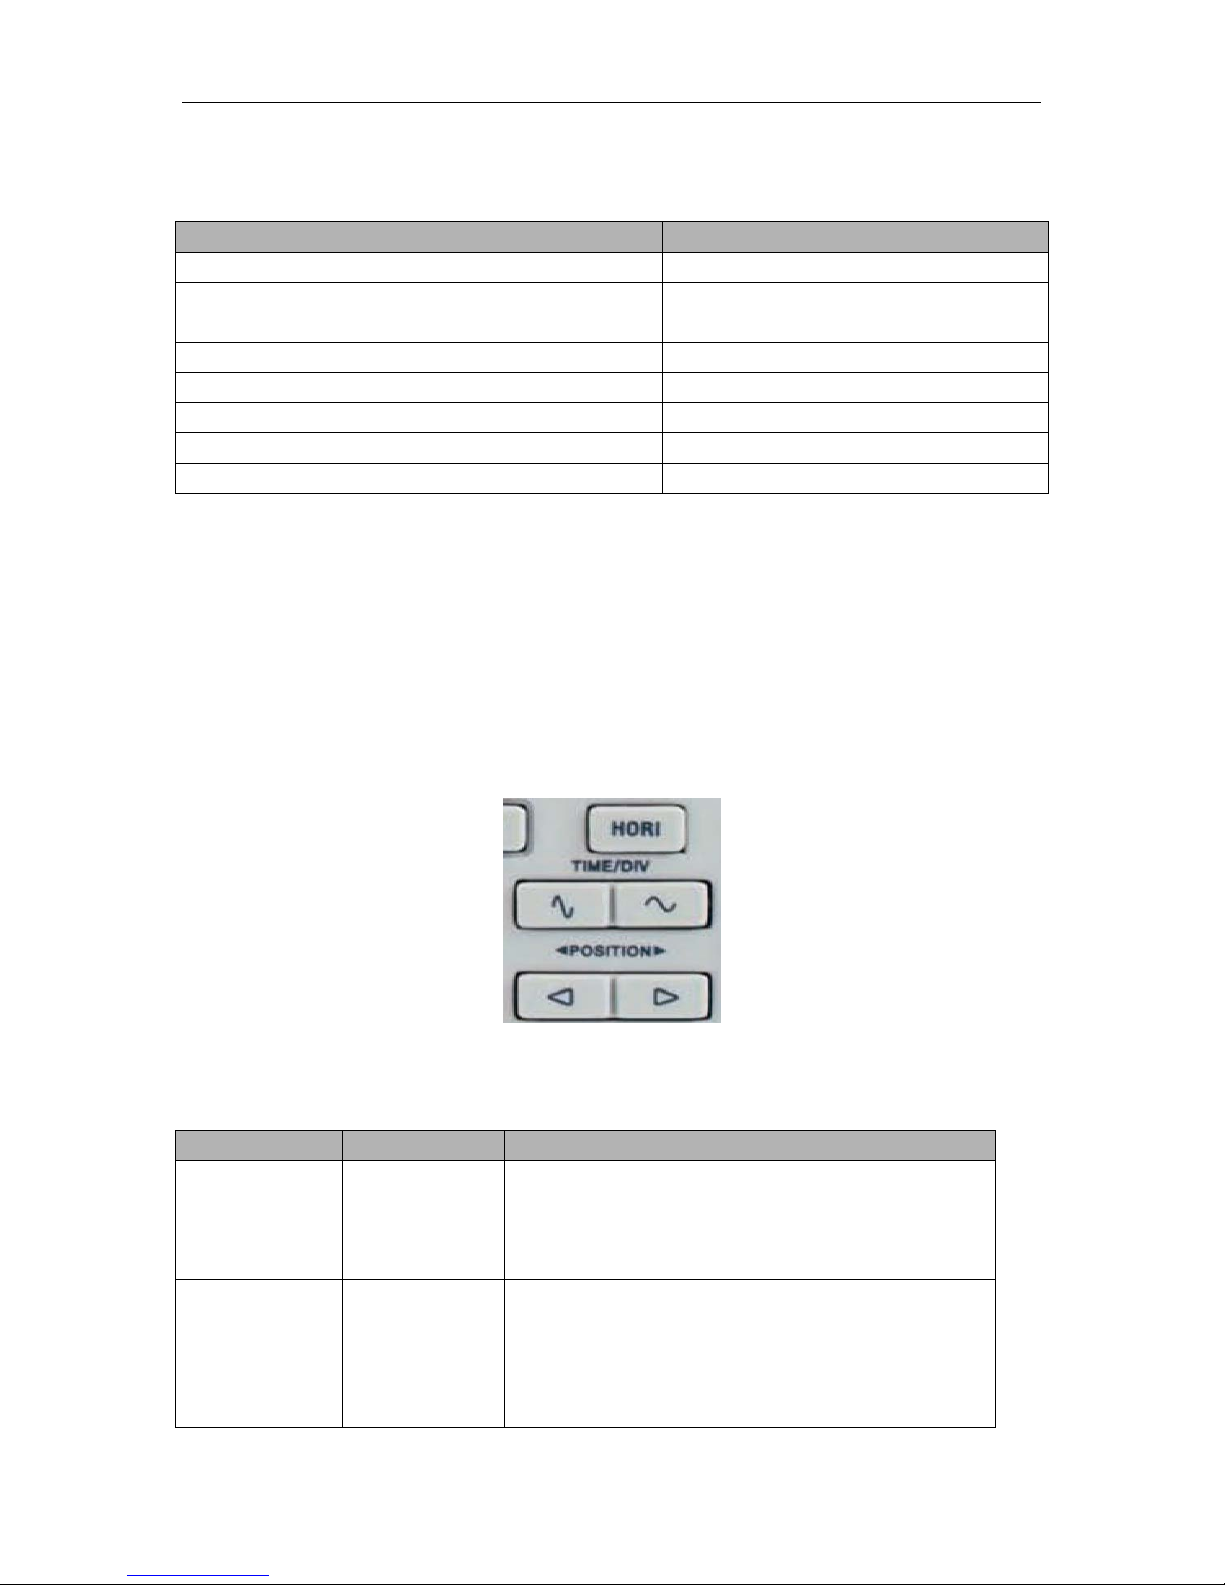
5.2 Horizontal Controls
Use the horizontal controls to change the horizontal scale and position of waveforms. The
horizontal position readout shows the time represented by the center of the screen, using the
trigger tim e as zero. When you change t he hor izontal sc ale, t he wavef orm will expand or contr act
to the screen center. The readout near the upper right of t he screen shows the curre nt horizontal
position in second. M r epresents ‘Main Time Base’, and W indicates ‘W indow Time Base’. The
oscilloscope als o has an arrow icon at the top of the gr aticule to indicate the horizontal position.
1. HORIZONTAL POSITION BAR: Us ed to contr ol the trigger posit ion against the screen center.
2. Each option in HORI MENU is descr ibed as f ollows.
Options
Settings
Comments
Window Control Major Window
Minor Window
Selects the major or minor window in dual-window
mode. The window is highlighted once selected.
Press this option button in single-window mode to
enter the daul-window mode.
Mark Right arrow
Left arrow
Set/Clear
Clear All
This funct ion is us able onl y in dua l-window mode. It
sets marks at some waveform record locations that
users are interes ted in, a nd sear c hes for thes e marks
by right and left arrows. Then it positions the window
to this mark for further observation.
Page 21
Basic Operation
DSO1000B Series HandHeld Oscilloscope User Manual 16
Holdoff None Select this menu and click the up and down Arrow
keys to adjust the trigg er holdoff time within the range
of 100ns-10s.
Autoplay None This function is usable in dual-window mode. Push
this menu button and auto m ove it from left to r ight at
a specified speed. In the expanded window will
display corresponding waveforms until it stops once
reaching the rightmost side of the major scan windo w
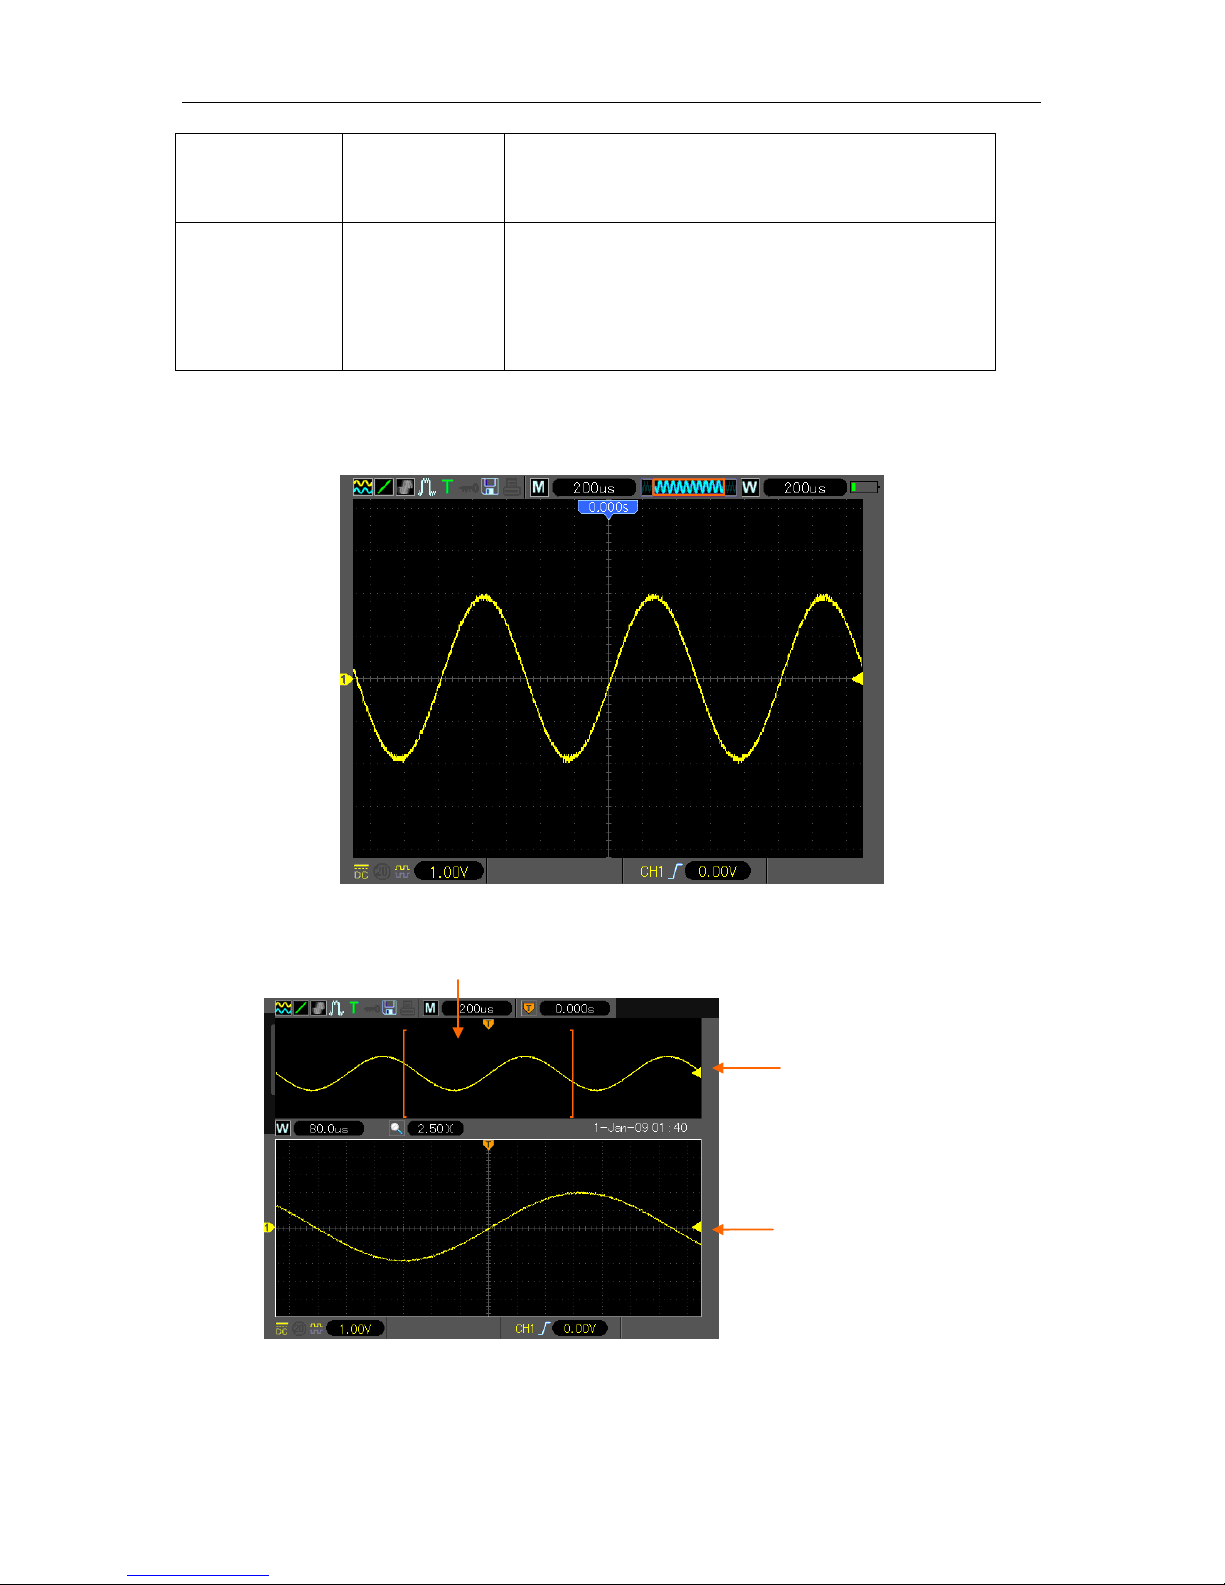
Single-window Mode
Dual-window Mode (Full Screen)
3.TIME/DIV: Used to change the horizontal time scale so as to magnify or compress the waveform
hor izonta lly. If t he wave form acquis ition is stopped (by usi ng the RUN/STOP button), the TIME
Major Window
Minor Window
(Expanded Window)
Location of expanded window data in memory
Page 22
Basic Operation
DSO1000B Series HandHeld Oscilloscope User Manual 17
/DIV control will expand or compress the waveform. In dual-window mode, push button F1 to
select major or minor window. When the major window is selected, the F1 button provides the
same functions as it prov ides in single-mode window. When the minor window is selected, press
TIME/DIV button to scale the waveform whose magnification is up to 1000.
5.2.1 Scan Mode Display (Rol l Mode)
With the TIME/DIV control set to 80ms/div or slower and the trigger mode set to Auto, the
oscilloscope work s in the scan acquisition m ode. In this mode, the waveform dis play is updated
from left to right without a ny trigger or horizontal positio n control.
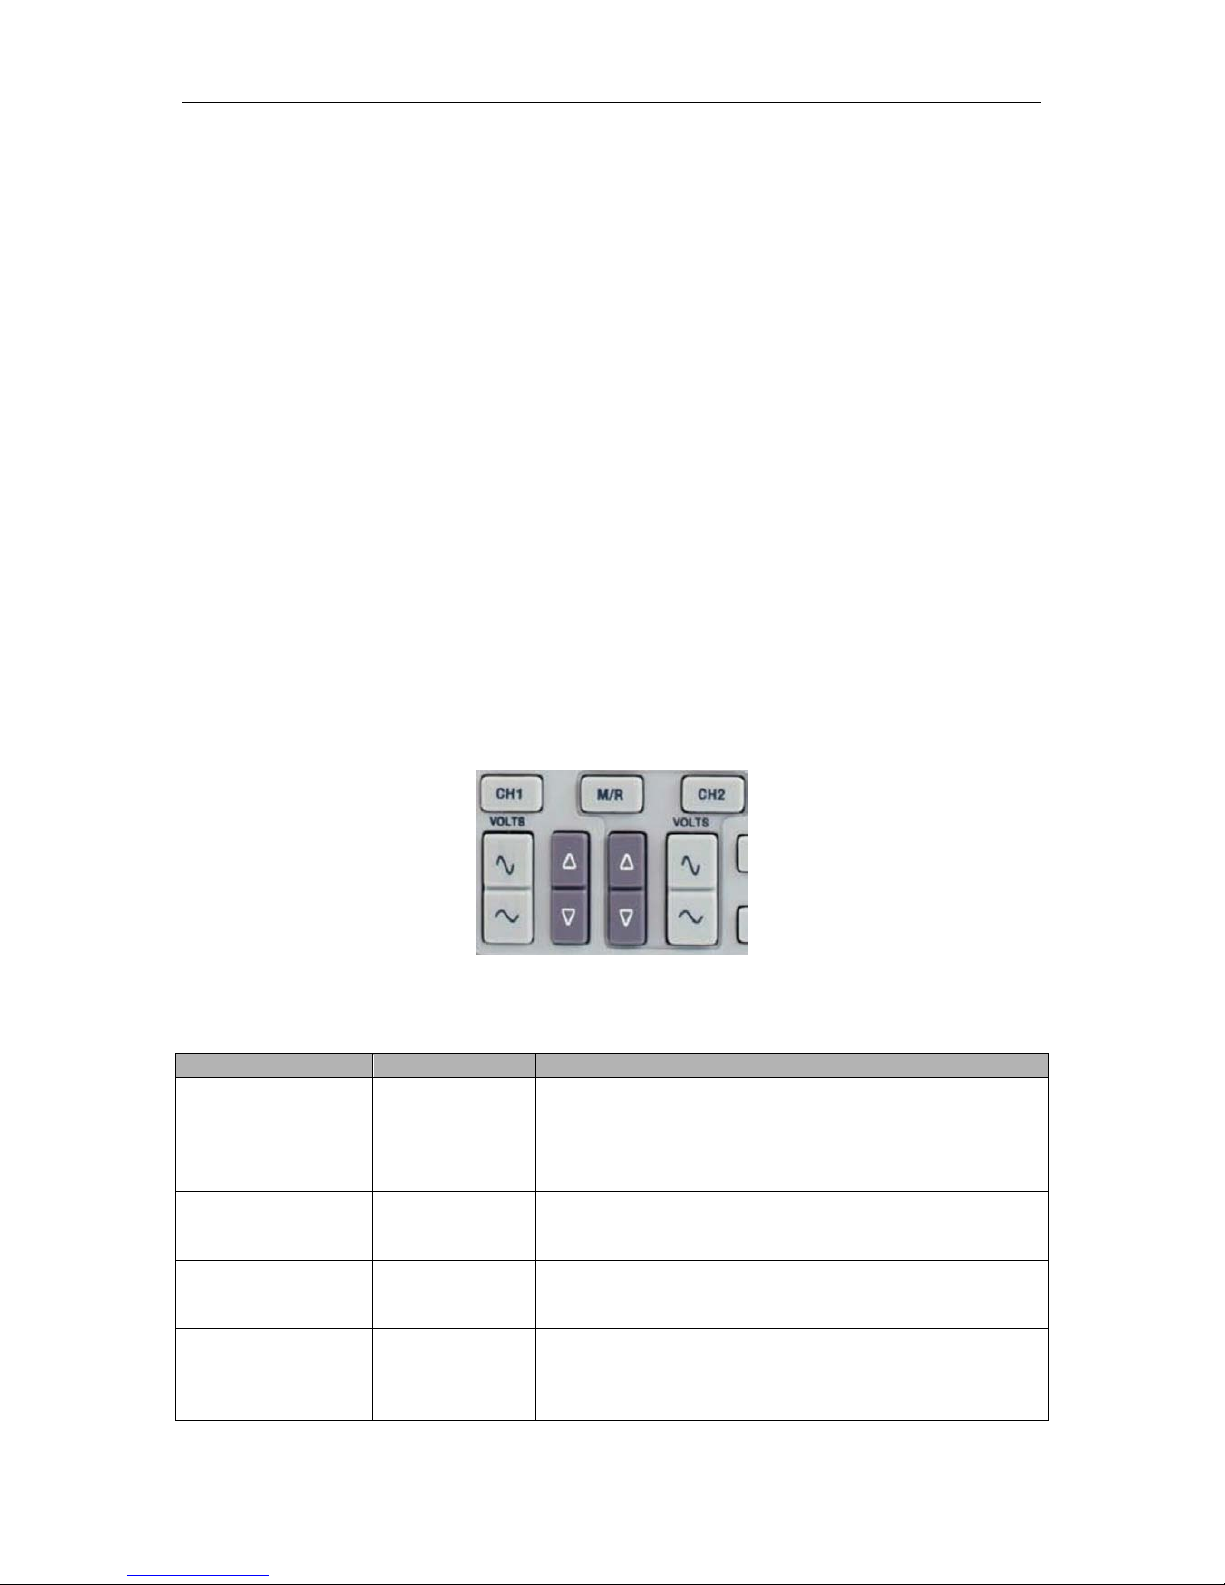
5.3 Vertical Controls
Vertical controls can be used to display and remove waveforms, adjust vertical scale and position,
set input paramet ers and perform m ath calculat ions. Each channel has a s eparate vert ical men u
to set. See below for menu description.
1. VERTICAL POSITION Bar: Move the channel waveform up and down on the screen. In
dual-window mode, move the waveforms in both windows at the same time in a same direction.
Two channels correspond to two bars.
2. Menu (CH1, CH2): Display vertical menu options; turn on or off the display of channel
waveforms.
Options
Settings
Comments
Coupling
DC
AC
Ground
DC passes both DC and AC components of the input
signal.
AC blocks the DC component of the input signal and
attenuates signals below 10Hz.
Ground disconnects the input signal.
20MH z Ba ndwidth
Limit
Unlimited
Limited
Limits the bandwidth to reduce display nois e; filters the
signal to eliminate noise and other unnecessary HF
components.
VOLTS
Coarse
Fine
Selects the resolution of t he VOLTS bar.
Coarse defines a 1-2-5 sequence. Fine changes the
resolution to small steps between the Coarse settings.
Probe Attenuation
1X
10X
100X
1000X
Selects a value according to the probe attenuatio n factor
so as to ensure correct vertical readouts. Reduce
bandwidth to 6MHz wh en using a 1X probe.
Page 23

Basic Operation
DSO1000B Series HandHeld Oscilloscope User Manual 18
Invert
Off
On
Inverts the waveform relative to the reference level.
Ground Coupling
Used to display a zer o-volt waveform . Internally, the channel input is connec ted with a zero-volt
reference level.
Fine Resolution
In the fine reso lution s etting , the vertical scale readout displays the actual VOLTS setting. The
vertical scale c hanges only after you adjust the VOLTS control and set to coarse.
Remove Waveform Display
To remove a waveform from the screen, firs t push the menu butto n to display t he vertical m enu,
then push again to remove the waveform. A channel waveform which is unnecessary to be
displayed can be used as a trigger source or for math operat ions.
3. VOLTS
Control the oscillosc ope to magnify or att enuate the source signal of the channel wav eform . The
vertical size of the display on t he screen will change (increase or decrease) to the ground level.
Also you may use the key F3 to switch between coarse and fine.
4. MA TH MENU: Display the waveform math operations. See the table below for details.
The MATH menu contains source opt ions f or all math operations.
Operations
Source Options
Comments
+
CH1+CH2
Add Channel 1 to Channel 2.
-
CH1-CH2
Subtract the Channel 2 waveform from the
Channel 1 waveform.
CH2-CH1
Subtract the Channel 1 waveform from the
Channel 2 waveform.
FFT CH1 or CH2
Three types of window available for selection:
Hanning, Flattop, R ectangular.
Zoom: Use the FFT Zoom button to adjust the
window size.
Scale: x1, x2, x5, x10.
Note: All selected menus are highligh ted in orange.
5.3.1 Math FFT
This chapter elaborat es how to use the Math FFT (Fast Fourier Transform). You can use the Math
FFT mode to convert a time-domain (YT) signal into its f requency com ponents (s pectr um), and to
observe the followi ng types of signals:
Analyze harmonics in power cords;
Meas ure harmonic content and distortion in systems;
Characterize noise in DC power supplies;
Test impulse response of filters and systems;
Page 24

Basic Operation
DSO1000B Series HandHeld Oscilloscope User Manual 19
Analyze vibration.
To use the Math FFT mode, perform the following tasks:
Set the source (time-domain) waveform;
Display the FFT spectrum;
Choos e a type of FFT window;
Adjust the sample rate to display the fundamental frequenc y and harmonics without aliasing;
Us e zoom controls to magnify the spectrum;
Use cursors to measure the spectrum.
5.3.1.1 Setting Time-domain Waveform
It is necessary to set the time-domain (YT) waveform before using the FFT mode. Follow the steps
below.
1. Push the AUTO button to display a YT waveform.
2. Click the Vertical Position key to vert ically m ove the YT waveform to the center (zer o division)
so as to ensure the FFT will display a tr ue DC value.
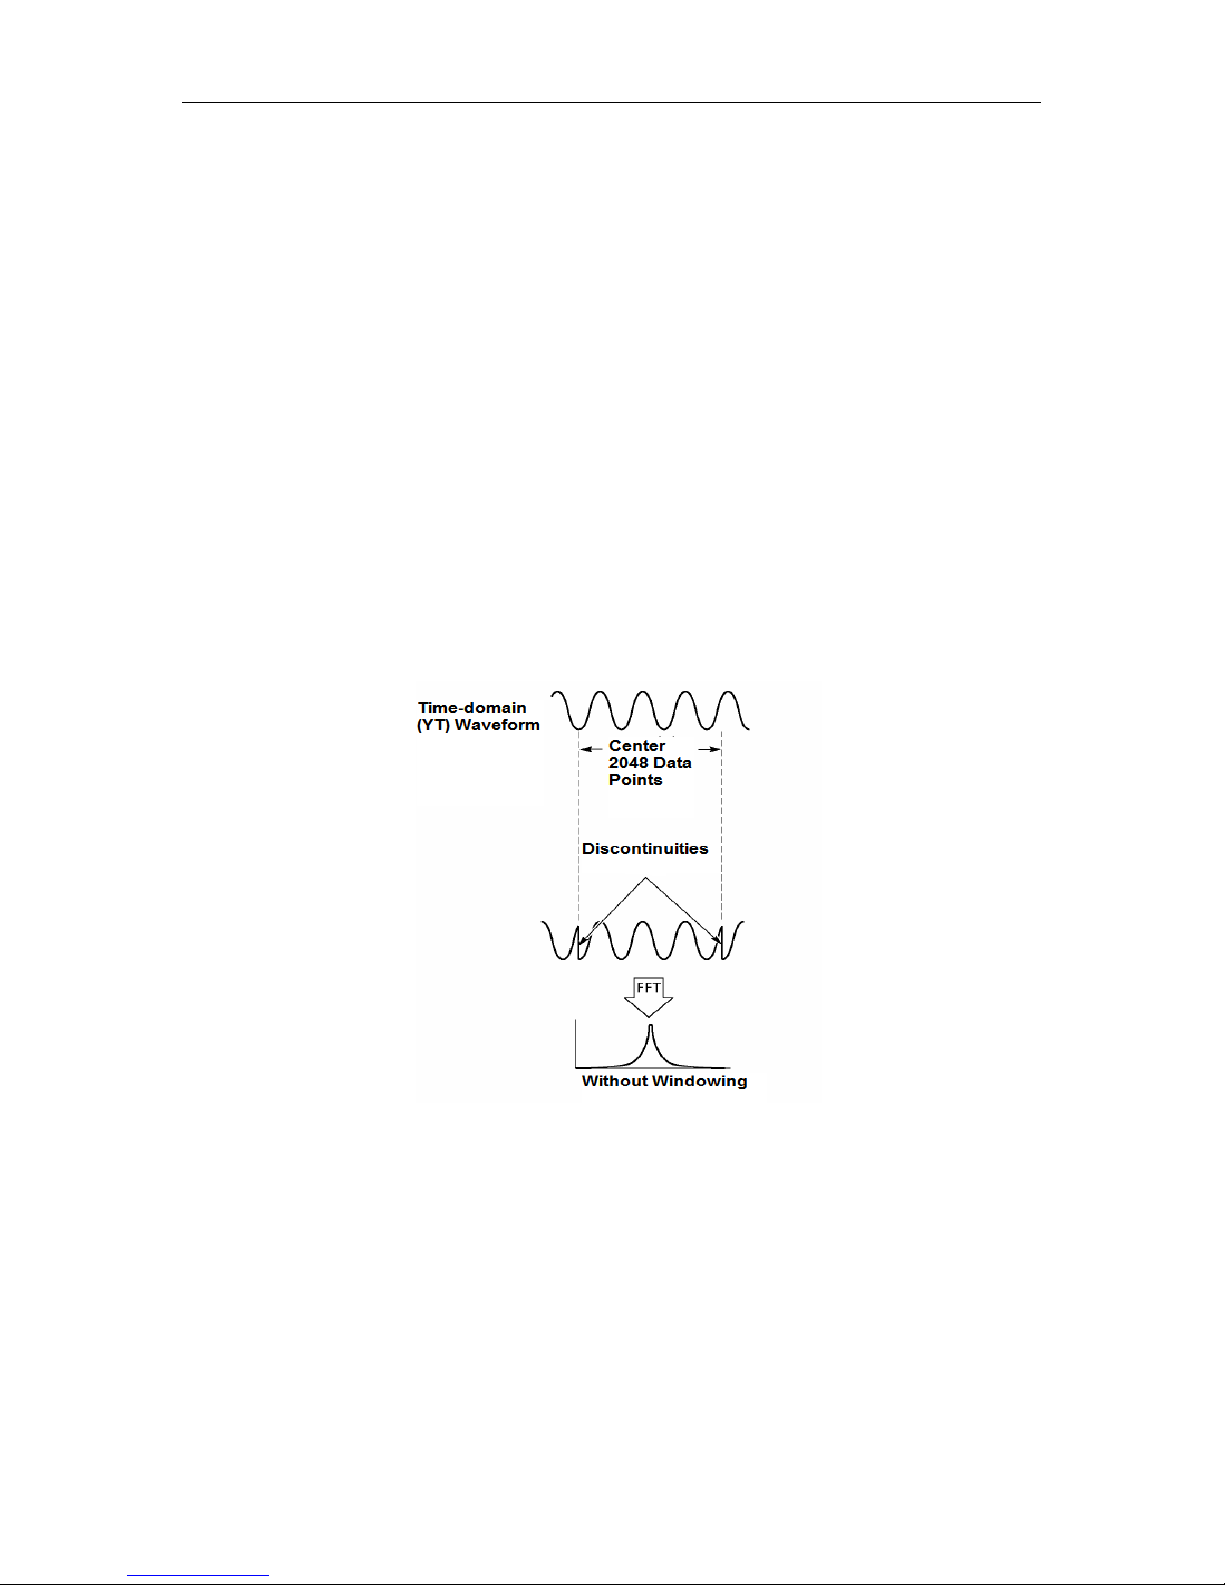
3. Click t he Hor iz o ntal Pos it io n ke y t o pos ition the part of the YT waveform to be analyzed i n the
center eight divisions of the screen. The oscilloscope uses the 2048 center points of the
time-domain waveform to calculate the FFT spectrum.
4. Click the VOLTS Key to ensure the entire waveform remains on the screen. If the entire
waveform is invisible, the oscilloscope may display wrong FFT results by adding
high-frequency comp onents.
5. Click the TIME/DIV key to provide the resolution you need in the FFT spectrum.
6. If possible, set the oscilloscope to display multiple signal cycles.
If you Click the TIME/DIV key to select a faster setting (fewer cycles), the FFT spectrum will
display a larger frequency range and reduce the poss ibility of FFT aliasing.
To set the FFT display, follow the steps below.
1. Push the M/R button;
2. Set the Operation optio n to FFT;
3. Select the Math FFT Source channel.
In many situations, the oscilloscope can also generate a useful FFT spectrum despite the YT
waveform not being trigg ered. This is especially true if the signal is periodic or random (such as
noise).
Note: You should trigger and position transient or burst wavef orms as cl ose as possible t o
the screen center.
Nyquist Frequency
Page 25

Basic Operation
DSO1000B Series HandHeld Oscilloscope User Manual 20
The highest freq uency that any rea l-t im e digital osc illosc ope can m easure wit hout err or s is half of
the sample rate, which is called the Nyquist frequenc y. Frequency information beyond the Nyquist
fr equenc y is und ers ample d whic h bri ngs abo ut the F FT alia sing . The m ath func tio n can co nvert
the center 2048 points of the time-domain waveform to an FFT spectrum. The resulting FFT
spectrum contains 1024 points from DC (0Hz) to the Nyquist frequency. Usually, the screen
compresses the FFT spect rum horizontal ly t o 250 points, but you ca n use the FFT Zoom functio n
to expand the FFT spectrum so that you can clearly view the frequency components at each of the
1024 data points in the FFT spectrum.
Note: The oscilloscope’s verti cal response is a little bit larger than its bandwidth (60MHz,
100MHz or 200MHz, depending on the model; or 20MHz when the Bandwidth Limit option is
set to Limited). Therefore, the FFT spectrum can displ ay vali d frequen cy information above
the oscilloscope bandwidth. However, the amplitude information near or above the
bandwidth will not be accurate.
5.3.1.2 Displaying FFT Spectrum
Pus h the MATH ME NU button to displa y the Math menu. Use the options to select the Source
channel, the Window algorithm and the FFT Zoom factor. Only one FFT spectrum can be
displayed at a time.
Math FFT Options
Settings
Comments
Source
CH1, CH2
Choose a channel to be the FFT source.
Window
Hanning, Flattop,
Rectangular
Select a type of the FFT window. For more
information, r efer to Section 5.3.1.3.
FFT Zoom X1, X2, X5, X10
Change the horizontal magnificat ion of the FFT
display . For detailed information, refer to Section
5.3.1.6.
1
Fundamental frequency component
F
requency compone nt
5
2 3 4
Page 26
Basic Operation
DSO1000B Series HandHeld Oscilloscope User Manual 21
1. Frequency a t the ce nter graticule line
2. Vertical scale in dB per division (0dB=1V
RMS
)
3. Horizontal scale in frequency per division
4. Sample rate in number of sam ples per second
5. FFT window type
5.3.1.3 Selecting FFT Window
Using windows can eliminate the spectral leakage in the FFT spectrum. The FFT algorithm
assumes that the YT waveform repeats all the time. When the number of cycles is integral ( 1, 2,
3 ...), the YT waveform starts and ends at the sam e amplitude and there are no dis continuit ies i n
the signal shape.
If the number of cycles is nonintegral, the YT waveform starts and ends at different amplitudes and
transitions betwee n the star t and end points will ca use disc ontinuit ies i n the signal that i ntrod uces
high-frequency transients.
Applying a window to the YT waveform changes t he waveform so that the start and stop values
are close to each other, which reduces the discontinuities.
Page 27

Basic Operation
DSO1000B Series HandHeld Oscilloscope User Manual 22
The Math FFT function has three FFT Window options. There is a trade-off between frequenc y
resolution and amplitude accuracy for each type of window. You shall determine which one to
choose according to the object you want to measure and the source signal characteristics.
Window
Measurement
Characteristics
Hanning
Periodic Waveform
Better frequency, poorer amplitude accuracy than Flattop
Flattop
Periodic Waveform
Better amplitude, poorer frequency accuracy than Hanning
Rectangular
Pulse or Transient
Waveform
Special-purpose window applicable t o discontinuous
waveforms. This is actually the same as no windows.
5.3.1.4 FFT Aliasing
Problems occur when the time-domain waveform acquired by the oscilloscope contains frequency
components higher than t he Nyquist frequency. The frequency components abov e the Nyquist
frequency will be undersampled and displayed as lower frequency components that ‘fold back’
from the Nyquist frequency. These erroneous components are called ali ases.
5.3.1.5 Eliminating Aliases
To eliminate aliases, use the followi ng methods.
Click the TIME/DIV key to set a faster sample rate. Bec ause the Nyquist fr eq uency increas es
as you increase the sample rate, the aliased frequency components will be displayed c orrect.
If too many frequency com ponents appear on the sc r een, you may use the FFT Zoom option
to magnify the FFT spectrum.
If t here is no need to observe the frequency components above 20MHz, set the Bandwidth
Page 28

Basic Operation
DSO1000B Series HandHeld Oscilloscope User Manual 23
Limit option to Limited.
Filter the signal input fr om outside and limit the bandwidt h of the source wavefor m to lower
tha n the Nyquist frequency.
Identify and ignore the aliased frequencies.
Use zoom controls and cursors to magnify and measure the FFT spectrum.
5.3.1.6 Magnifying and Positioni ng FFT Spect r um
You may scale the FFT spectrum and use cursors t o measure it through the FFT Zoom option
whic h enable s the hor izonta l magnif icati on. To vertic ally mag nify the spectrum, use the vertical
controls.
Horizontal Zoom and Position
You c an use t he F F T Zo o m o p t i on to m a gnify the F F T s p e c t r um horizonta lly w itho ut cha ng ing the
sample rate. The available zoom factors are X1(default), X2, X5 and X10. When the zoom factor is
set to X1 and the waveform is loc ated at the center grat icule, the left gratic ule line is at 0Hz and
the rig ht is at the N yquist frequency.
You magnifies the FFT spect rum to the center gratic ule line when you change the zoom factor.
That is, the axis for horizontal magnification is the center graticule line. Click the Horizontal
Position Key to move the FFT spectrum to the right.
Vertical Zoom and Position
When the FFT spectrum is being displayed, the channel vertical keys become the zoom and
position controls corresponding to their respective channels. The VOLTS key provides the
following zoom f actors: X1(default), X 2, X5 and X10. T he FFT spectr um is magnified v ertic ally to
the marker M (mat h waveform reference poi nt on the left edge of the screen). Click the Vertical
Position key to move up the spectrum.
5.3.1.7 Using Cursors to Measure FFT Spect r um
You may use cursors to take two measurements on the FFT spectrum: amplitude (in dB) and
frequency (in Hz). Am plitude is r ef erenced t o 0db t hat eq uals 1VR MS her e. You may use cursors
to measure at any zoom factor.
Push the CURSOR button, choose the Source option and then selec t Math. Pr ess the Type option
button to select between Amplitude and Frequency. Click the SELECT CURSOR option to choose
a c ur s o r. T hen m ov e Cur s o r S and Cur s o r E. Us e the hor iz o nta l c ur s or to m eas ur e the am pl it ud e
and the vertical cursor to measure the frequency. Now the display at the DELTA menu is just the
measured value, and the values at Cursor S and Cursor E.
Delta is the absolute value of Cur sor S minus Curs or E .
Page 29

Basic Operation
DSO1000B Series HandHeld Oscilloscope User Manual 24
5.4 Trigge r Controls
The trigger c an be defined through the Trigger Menu. There are s ix t ypes of tr igg er: Edge, Video,
Pulse Width, Swap, Slope and Overt ime. Refer to the following tables to find a different s et of
options for each type of trigger.
TRIG MENU
Push this button to display trigger m enus. The edge trigger is in common use. See the table below
for details.
Options
Settings
Comments
Trigger Type
Edge Video
Pulse Slope
Swap Overtime
By default the oscilloscope uses the edge trigger which
triggers the oscilloscope on the rising or falling edge of the
inp ut signal when it crosses the trigger level (thres hold).
Source
CH1
CH2
AC Line
Select the input source as the trigger signal.
CH1, CH2: No matter the waveform is displayed or not, a
certain channel will be triggered.
AC Line: Uses a signal derived from the power cord as the
trigger source.
Mode
Auto
Normal
Select a trigger m ode.
By default, the osc illoscope uses the Auto mode. In this
mode, the oscilloscope is forced to trigger when it does
not detect a trigger wit hin a certain amount of t ime based
on t he TIME/DIV setting. T he oscilloscope goes into the
scan mode at 80ms/div or slower time base settings.
In the Normal mode, the osc illosc ope updates t he displa y
only when it detects a valid trigger condition. New
waveforms are not displa yed until they replac e old ones.
Use this mode to just view valid triggered waveforms.
Only after the first tr igger does the display appear.
Coupling
AC
DC
HF Reject
Select the components of the trigg er signal applied to t he
trigger circuitry.
AC: Blocks DC components and attenuates s ignals below
Frequency Cursors
Amplitude Cursors
Page 30

Basic Operation
DSO1000B Series HandHeld Oscilloscope User Manual 25
LF Reject
10Hz.
DC: Pas ses all comp onent s of the signal.
HF Reject: Attenuates the high-frequency components
above 80kHz.
LF Reject: Blocks DC components and attenuates the
low-frequency components below 8kHz.
NOTE: Trigger coupling only affects the signal passed through the trigger system. It does
not affect the bandwidth or coupling of the signal displayed on the screen.
Video Trigger
Options
Settings
Comments
Video
With Video highlighted, an NTSC, PAL or SECAM
standard video signal will be triggered. The trigger
coupling is pres et to AC.
Source
CH1
CH2
Select the input source as the trigger signal.
Polarity
Normal
Inverted
Normal: Triggers on the negative edge of the sync pulse.
Inverted: Triggers on the positive edge of the sync pulse.
Sync
All Lines
Line Number
Odd Field
Even Field
All Field s
Choose a proper video sync. When selecting Line
Number for the Sync option, you may use the User
Select it to spec ify a line number.
Standard
NTSC
PAL/SECAM
Choose a video standard for sync and line number
count.
Note: When you choose Normal Polarity, the trigger always occur s o n neg ative-going sync
pulses. If t he video signal contains positive-going sync pulses, use the Inver ted Polarity
option.
Pulse Width Trigger
You can use it to trigger on aberrant pulses.
Options
Settings
Comments
Pulse
With Pulse highlighted, t he trigger occurs on pulses that
meet the trigger conditio n (defined by the Source, When
and Set Pulse Width options).
Source
CH1
CH2
Select the input source as the trigger signal.
When
=
≠
<
>
Select the trigg er condition.
Set Pulse
Width
20ns to 10.0sec With Set Pulse Width highlighted, set the pulse width.
Polarity
Positive
Negative
Select to trigg er on posit ive or negative pulses.
Mode
Auto
Normal
Select the type of trigger. The Normal mode is best for
most pulse width trigg er applic ations.
Coupling
AC
DC
HF Reject
LF Reject
Select the components of the trigg er signal applied to the
trigger circuit.
More
Switch between submenu pages.
Page 31
Basic Operation
DSO1000B Series HandHeld Oscilloscope User Manual 26
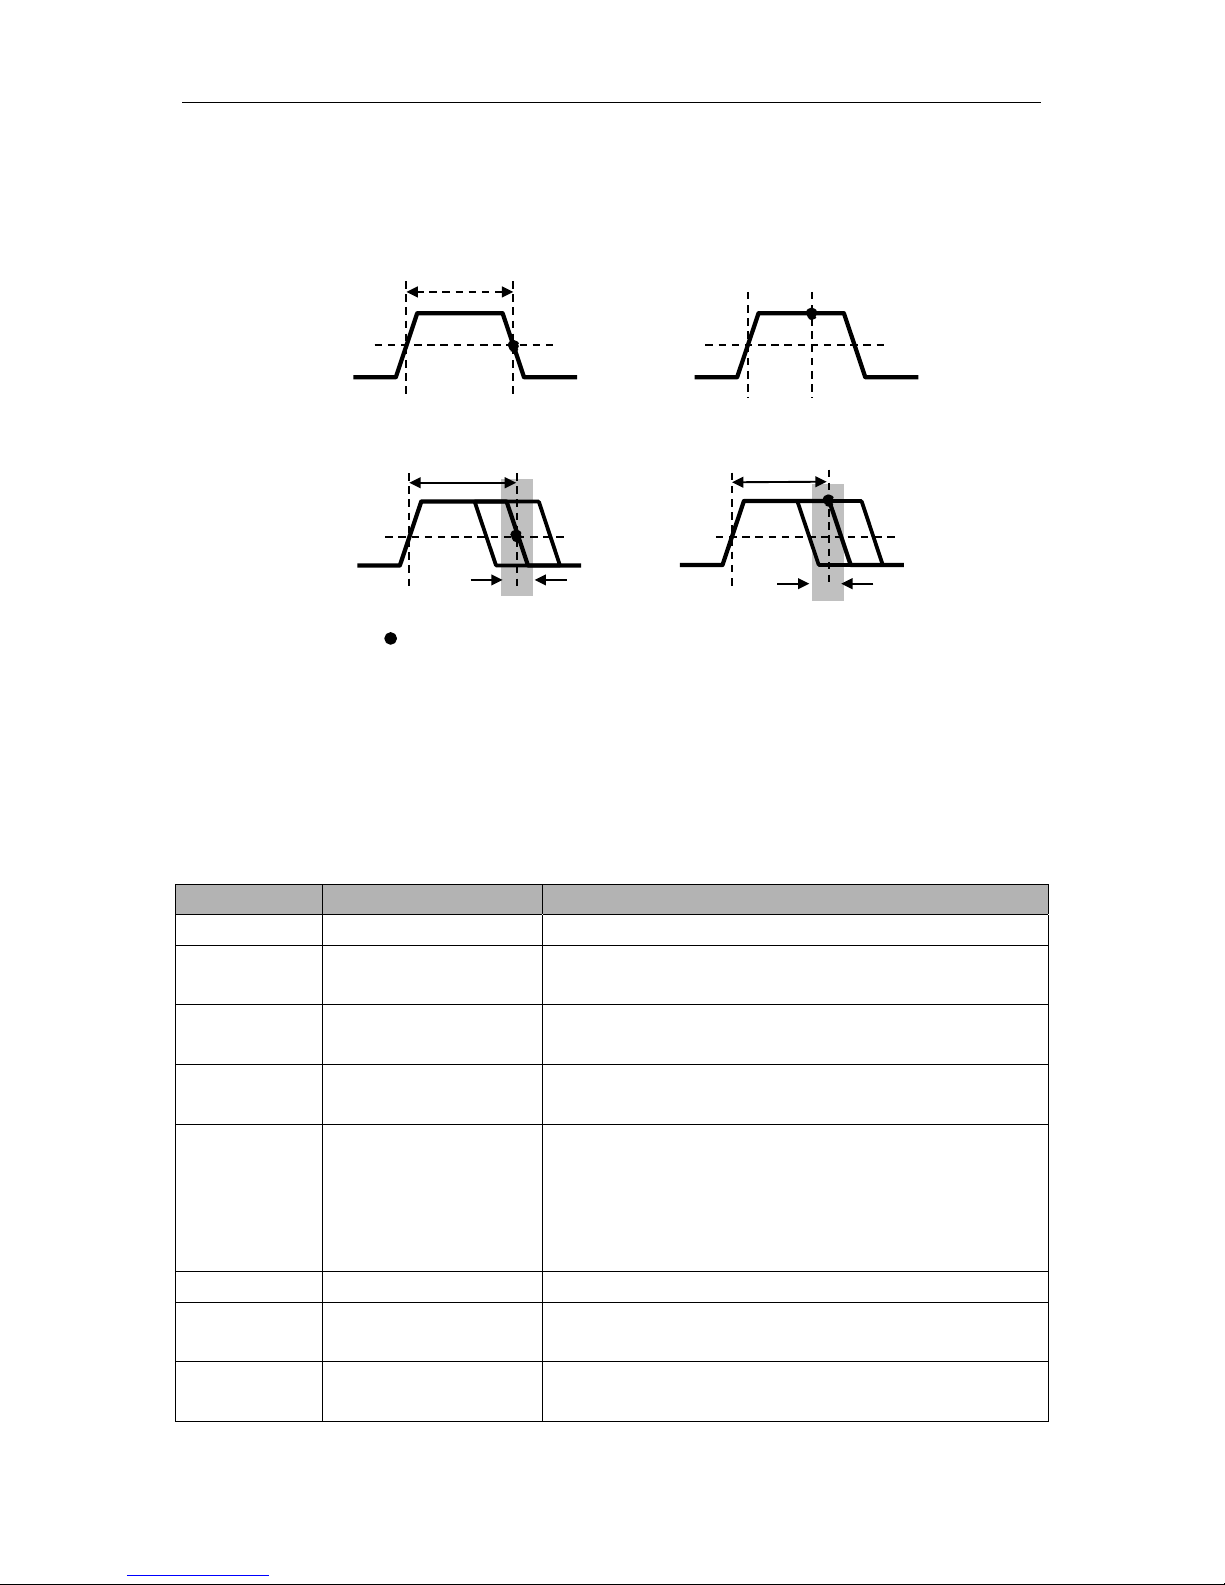
Trigger When: The pulse width of the source must be ≥5ns so that the oscilloscope can detect the
pulse.
=
, ≠: Within a ±5% tolerance, triggers the oscilloscope when the signal pulse width is equal to
or not equal to the specified pulse width.
<, >: Triggers the osc illoscope when the source s ignal pulse width is less than or g reater
tha n the spe cified pulse wi dth.
Slope Trigger: Judges trigger according to the time for rising or falling, more flexible and accurate
tha n the Edge trigger.
Options
Settings
Comments
Slope
Source
CH1
CH2
Select the input source as the trigger signal.
Slope
Rising
Falling
Select the slope type of signal.
Mode
Auto
Normal
Select the type of tr igger. The Normal mode is best for
most pulse width trigg er applic ations.
Coupling
AC
DC
Noise Reject
HF Reject
LF Reject
Selects the components of the trigger signal applied to
the trigger circu i try.
Next Page
Vertical
V1
V2
Adjust the vert ical window by setting t wo trigger lev els.
Select this option and press F3 to choose V1 or V2.
When
=
≠
Select the trigger condition.
Triggers when pulse is
equal to width sett ing ±5%
= Trigger Point
Threshold level
Triggers when pulse is
greater than width setting
Triggers when pulse is not
equal to width sett ing ±5%
Tolerance
Tolerance
Threshold level
Triggers when pulse
is
les s than wi dth set ting
Page 32

Basic Operation
DSO1000B Series HandHeld Oscilloscope User Manual 27
<
>
Time
20ns to 10.0sec
With thi s op tion highlighted, se t the time s pan.
Swap Trigger: As a feature of analog oscilloscopes, it gives stable displays of signals at two
different frequencies . Mainly it uses a s pecific freq uency to switch between t wo analog channels
CH1 and CH2 so that the channels will generate swap trigger signals through the trigger circuitry.
Options
Settings
Comments
Swap
Trigger
Mode
Auto
Normal
Select the type of trigger.
Channel
CH1
CH2
Pus h an optio n s uch as CH1, select the channel tr igg er type
and set the menu interfac e.
Below list options in submenus. Swap Trigger allows CH1 and CH2 to select different trigger
modes and to display waveforms on a same screen. That is, both channels can choose the
following four trigger modes.
Type Edge
Slope
Rising
Falling
Coupling
AC
DC
HF Reject
LF Reject
select the components of the trigger signal applied to the
trigger circuitry.
Type
Video
Polarity
Normal
Inverted
Standard
NTSC
PAL/SECAM
Sync
All Lines
Line Number
Odd Field
Even Field
All Field s
Type
Pulse
Polarity
Positive
Negative
When
=
≠
<
>
Set Pulse
Width
Pulse Width Set the pulse width.
Coupling
AC
DC
Page 33

Basic Operation
DSO1000B Series HandHeld Oscilloscope User Manual 28
Noise Reject
HF Reject
LF Reject
Type Slope
Slope
Rising
Falling
Select the slope type of signal.
Mode
Auto
Normal
Select the type of trigger. The Normal mode is best for most
pulse width trigg er applic ations.
Coupling
AC
DC
Noise Reject
HF Reject
LF Reject
Selects the components of t he trigger signal applied t o the
trigger circuitry.
Next Page
Vertical
V1
V2
Adjust the vertical window by setting two trigger levels.
Select this option and press F3 to choose V1 or V2.
When
=
≠
<
>
Select the trigg er condition.
Time 20ns to 10.0sec Set the time span.
Overtime Trigger: In Pul se W idth t rig ger, you m ay som et imes be puzz led with t he lo ng t ime fo r
trigger, as you do not need a complete pulse width to trigger the oscillosc ope, but want the trigg er
occurs just upon the over time point. This is called Overtime Trigger.
Options
Settings
Comments
Type OT
Source
CH1
CH2
Select the trigg er source.
Polarity
Positive
Negative
Select to trigg er on posit ive or negative pulses.
Mode
Auto
Normal
Overtime t
Coupling
AC
DC
HF Reject
LF Reject
Selects the components of t he trigger signal applied t o the
trigger circuitry.
Holdoff: To use Trigger Holdoff, push the HORI button and set the Holdoff Time option. The
Trig g er Ho ld o ff functi o n ca n be used t o g enerat e a s table display of c om plex waveform s (s uch as
pulse trains) . Holdoff is the time between when the oscilloscope detects one tr igger and when it is
ready to detect another. During the holdoff time, the oscillosc ope will not t rigg er. For a pulse train,
the holdoff time can be adjusted to let the oscilloscope trigger only on the first pulse in the train.
Page 34

Basic Operation
DSO1000B Series HandHeld Oscilloscope User Manual 29
5.5 Menu and Option Buttons
As shown below, these four buttons at the front panel are used mainly to recall relativ e setup
menus.
SAVE/RECALL: Displays the Save/ R ecall menu for setups and waveforms .
MEASURE: Displays the Measure menu.
ACQUIRE: Displays the Acquire menu.
UTIILITY: Displays the Utility menu.
CURSOR: Displays the Cursor menu.
DISPLAY: Displays the Dis p lay menu.
5.5.1 SAVE/RECALL
Press the SAVE/RECALL button to save or recall oscilloscope setups or waveforms.
The first page shows the following menu.
Options
Settings
Comments
Waveforms
Source
CH1
CH2 off
MATH off
Select a waveform display to store.
REF
RefA
RefB
Select the refer ence location to store or recall a waveform.
Operation
Save
Save the source waveform to the selected reference location.
Ref on
Ref off
Display or remov e the ref erence waveform on the screen.
Press ‘Next Page’ to recall the following menu.
Options
Settings
Comments
Setups
Trigger Level
Indicates
Trig ger Points
Holdoff
Holdoff
Acquisition Interval
Acquisition
Interval
Page 35

Basic Operation
DSO1000B Series HandHeld Oscilloscope User Manual 30
Operation
Source
Flash memory
USB disk
Store the current setups to the USB disk or the memory of the
oscilloscope.
Memory 0 to 9
Specify the memory location in which to store the current
waveform settings or from which to recall the waveform settings.
Operation
Save
Complete the sav ing operation.
Recall
Recall the oscillosc ope settings stored in the locatio n selected in
the Setup field. Push the Default Setup button to initialize the
oscilloscope t o a k nown setup.
See below for waveform m enus.
Note: The oscill oscope will save the current settings if you wait 5 seconds after t he last
modificatio n, and it will recall these settings t he next time you power on the oscilloscope.
5.5.2 MEASURE
Push the MEAS button to perf orm auto m easurem ents. There ar e 11 types of measurements and
up to 8 can be displayed at a tim e.
Click the MEAS key then the follow ing menu appears.
Options
Settings
Comments
Source
CH1
CH2
Select the measure source.
Measurement
Type
Frequency Calculate the waveform fr equency by measuring the first cycle.
Period
Calculate the time of the first cycle.
Mean
Calculate the arithm etic mean voltage over the entire record.
Pk-Pk
Calculate the absolute difference between the greatest and the
smallest peaks of the entire waveform.
Cyc RMS
Calculate the actual RMS m easurement of the first complete
cycle of the waveform.
Min
Examine the waveform record of all points in the current
window and display the m inimum value.
Max
Examine the waveform record of all points in the current
window and display the m aximum value.
The white waveforms on the menu is
the recalled RefA waveform
At most 9 groups of
setups can be stored
Page 36

Basic Operation
DSO1000B Series HandHeld Oscilloscope User Manual 31
Rise Time
Measure the time between 10% and 90% of the first rising
edge of the waveform.
Fall Time
Measure the time between 90% and 10% of the first falling
edge of the waveform.
Positive Width
Measure the time between the first rising edge and the next
falling edge at the waveform 50% level.
Negative Width
Measure the tim e between the first falling edg e and the next
rising edge at the waveform 50% level.
Off
Do not take any measurement.
Taking Measurements: For a single waveform (or a waveform divided among multiple
waveforms), up to 8 automat ic m easurements c an be dis played at a tim e. The wavef orm channel
must stay in an ‘ON’ (displayed) stat e to f acilitate the m eas urement. T he autom at ic measurem ent
can not be performed on reference or math waveforms, or in XY or Scan mode.
5.5.3 ACQUIRE
Push the ACQ UIRE button to set the acquisition parameter.
Options
Settings
Comments
Category
Real Time
Equ-Time
Acquire waveforms by real-time digital technique.
Rebuild waveforms by equival ent sample technique.
Mode
(Real Time)
Normal
Peak Detect
Average
Acquire and accurately display most wavef orms.
Detect glitches and eliminate the possibility of
aliasing.
Reduce random or uncorrelated noise in signal
display. The number of aver ages is selectable.
Averages
(Real Time)
4
16
64
128
Select the number of averages.
The readouts in big font size on
the menu are just results of the
corresponding m easurements.
Page 37
Basic Operation
DSO1000B Series HandHeld Oscilloscope User Manual 32
Memory Depth
(Real Time)
4K, 40K, 512K, 1M Select the memory depth for diff erent board models.
Normal: For the oscillosc ope model with the bandwidth of 100 MHz, the maxim um sample rate is
1GS/s. For time base with insufficient sample rate, you may use the Sine Interpolation Algorithm to
interpolate points between sampled points to produce a complete waveform record (4K by
default).
Peak Detect: Use this m ode to detect glitches w ithin 10ns and to l imit the poss ibility of aliasi ng.
This mode is valid at the TIME/DIV setting of 4µs/div or slower. Once you set the TIME/DIV setting
to 4µs/div or faster, the acquisition mode will change to Norm al because the sample rat e is fast
enough that Peak Detect is unnecessary. The oscilloscope does not display a mess age to tell you
that the mode has been changed to Normal.
Average: Use this mode to reduce random or uncorr elated noise in the signal to be displayed.
Acquire data in Normal mode and then average a great number of waveforms. Choose the
number of acquisitio ns (4, 16, 64 or 128) to average for the waveform.
Stopping the Acquisition: When you are running the acq uisition, the waveform displa y is live.
Stop the acquisition (press the RUN/STOP button) to freeze the display. In either mode, the
waveform display can be scaled or positioned by vertical and horizontal controls .
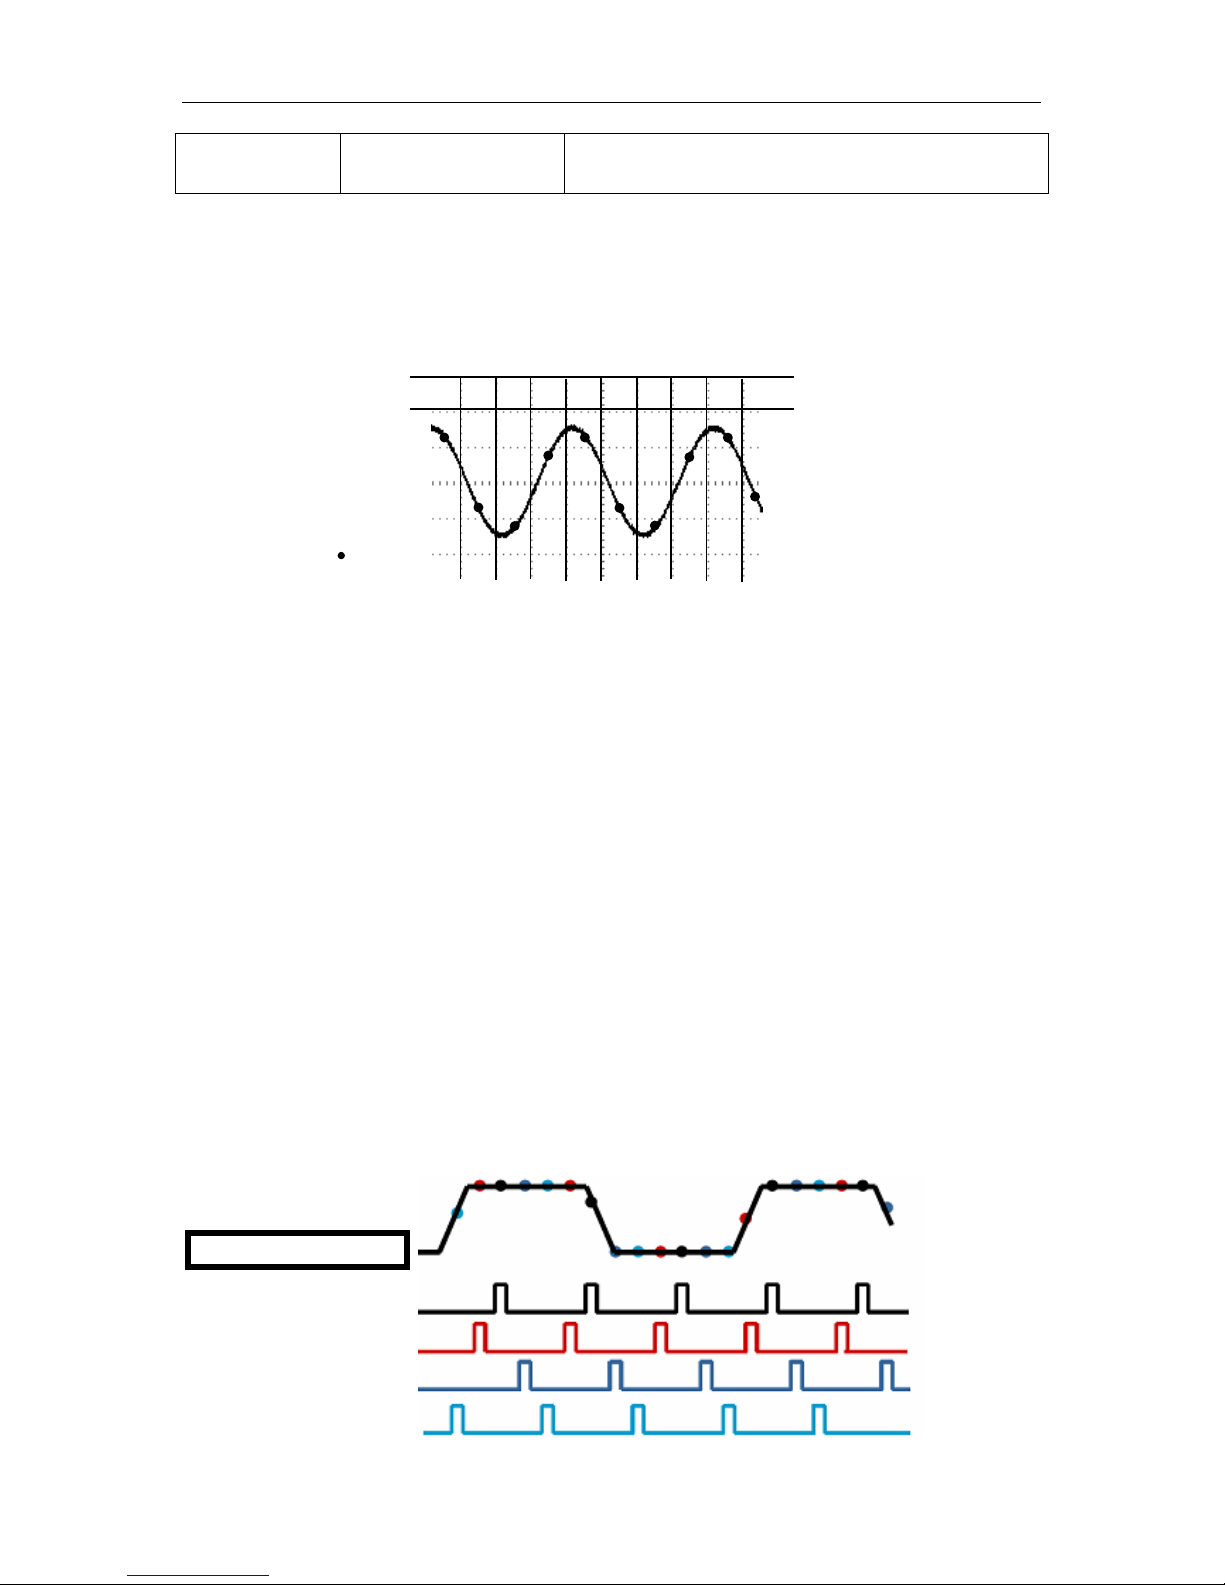
Equivalent Acquisition: Just repeat the Normal acquisition. Use this mode to take a specific
observation on repeatedly displayed periodic signals. You can get a resolution of 40ps, i.e.
25GSa/s sample rat e, which is much higher than that obtained in real-tim e acquisition.
The acquisitio n principle is as follows.
Input repeated signals
First Acquisition
Second Acquisition
Third Acquisition
Fourth Acquisition
Sample Points
Normal Acquisition Intervals
8 3 7 2 4 5 6 1 9
10
Normal Mode Acquires a Single Sample Point in Each Interval
Page 38

Basic Operation
DSO1000B Series HandHeld Oscilloscope User Manual 33
As shown above, acquire input signals (cycle repeatable) for more than once at a slow sample rate,
arrange the sample points by t he time they appear, then recover waveforms.
5.5.4 UTILITY
Push the UTILITY button to display the Utility Menu as follows.
Options
Comments
System In fo Display the software and hardware versions, serial number and some other
information about the oscilloscope.
Update
Program
Insert a USB disk with upgrade program and the disk ic on at the top left corner is
highlighted. Pr ess the Update Prog ram button and the Software Upg rade dialog
pops up.
Save
Waveform
Insert a USB disk and the disk icon at the top left corner is highlig hted. Click on
this icon and you can see t he waveform pause for a while, bei ng sav ed. You can
find the saved waveform data under the Hantek_x folder in the USB disk. Her e X
represents how many times y
ou press the button. Each press generates a
corresponding folder. For example, press once and a folder Hantek_1 is
generated; press twice and two folders Hantek_1, Hantek_2 are generat ed.
Self
Calibration
Press this option and the Self Calibration dialog pops up. Press F6 to perform the
self calibrat ion.
Advance Buzzer and time setups
See the dialog for buzzer and time setups
Self Calibration: The self calibr ation routine can optim ize the precision of the oscilloscope t o fit
the ambient tem perat ure. To maximize the pr ecis ion, you s hould perf or m the self c alibr atio n once
the ambient temperature changes by 5℃ or more. Follow the instructions on the screen.
Tip: Press any menu button on the front panel to remove the stat us display and enter a
corresponding menu.
5.5.5 CURSOR
The Cursor Menu.
Options
Settings
Comments
Type
Off
Voltage
Time
Select a measurement cursor and display it.
Voltage measures amplitude while Time measures time and
frequency.
Source
CH1
CH2
MATH
REFA
REFB
Select a waveform to take the cursor measurement.
Use the readouts to show the measurement.
Page 39

Basic Operation
DSO1000B Series HandHeld Oscilloscope User Manual 34
Select Cursor
S
E
S indicates Cursor 1. E indicates Cursor 2.
A selected cursor is highlighted, which can be moved freely. Both
cursors can be selected and moved at the same time. The box
behind the cursor dis plays the location of the c ursor.
Delta
Display the
difference
(delta)
between the
cursors.
Display the meas urement in the box under this optio n.
Moving Cursors: Press the key near Select Cursor to select a cursor and move it. Cursors can be
moved only when the Cursor Menu is displayed.
5.5.6 DISPLAY
The waveform display is affec ted by settings of the oscilloscope. A waveform can be measured
once it is captured. The different styles to display a waveform on the screen give significant
information about it.
There are two modes to display waveforms Single-window and Dual-window. Refer to
Horizontal
Controls for more information.
The DISPLAY menu.
Options
Settings
Comments
Type
Vectors
Dots
Vectors fills up the space between adjacent sample
points in the display; Dots only displays
the sample
points.
Persist
OFF
0.2S-8S selectable
Infinite
Sets the time length to display each displayed s ample
point.
Format
YT
XY
YT format shows the vertic al voltage in relat ion to tim e
(horizontal scale); XY format displays a dot between
CH1 and CH2 each time when a sample is acquired,
where the voltage or curr ent of CH1 determines the X
coordinate of the dot (horizontal) and the voltage or
current of CH2 determ ines the Y coordinate (vertical).
Time Cursor
Voltage Cursor
Page 40

Basic Operation
DSO1000B Series HandHeld Oscilloscope User Manual 35
For detailed information, refer to descriptions on XY
format in the following text.
Contrast
0-15 16 ranks adjustable, with a progress bar to
display.
Next Page
Grid
Dotted line
Real line
OFF
Off only displays the horizontal and vertical coordinates
at the center grat icule on the screen.
Grid Intensity
0-15 16 ranks adjustable, with a progress bar to
display.
5.6 Fast Action Buttons
AUTO: Automatically set the oscilloscope controls to generate a usable display of the input signals.
Refer to the following table f or relative content.
RUN/STOP: Continuously acquire waveforms or stop the acquisition.
5.6.1 AUTO
Autoset is one of the advantages digital oscilloscopes have. When you push the AUTO button, the
oscilloscope will ident ify the type of waveform (sine or square wave) and adjust controls according
to input signals so that it can accurately display the wavef orm of the input signal.
Functions
Settings
Acquire Mode
Adjusted to Norm al or Peak Detect
Cursor Off
Display Format Set to YT
Display Type Set to Vectors for an FFT spectrum; otherwise, unchanged
Horizonta l P osition
Adjusted
TIME/DIV
Adjusted
Trig ger Coupling
Adjusted to DC, Noise Reject or HF Reject
Trigger Holdoff
Minimum
Trigger Level
Set to 50%
Trigger Mode
Auto
Trigger Source
Adjusted
Trigger Slope
Adjusted
Trigger Type
Edge
Trigger Video Sync
Adjusted
Trigger Video Standard
Adjusted
Vertical Bandw idth
Full
Vertical Coupling
DC (if GND was chosen before); AC for the video signal; otherwise,
unchanged
VOLTS
Adjusted
The Autoset function exami nes all channels for signals and displays cor responding waveforms.
Autoset determines the trigger source according to the following conditions.
Page 41

Basic Operation
DSO1000B Series HandHeld Oscilloscope User Manual 36
If multiply channels get signals, the oscilloscope will use the channel with the lowest
fr eque ncy sig nal as the trigger s ource.
If no signals ar e found, the os cillos cope wil l use t he lowest -number ed c hannel displaye d
in Autoset as the trigger source.
If no signals are found and no channels are displayed, the oscillosc ope will display and
use Channel 1 as the trigger source.
Sine Wave:
Whe n yo u us e t he A ut oset function and the oscillosc ope determines t hat the signal is similar to a
sine wave, the oscilloscope displays the following options.
Sine Wave Options
Details
Multi-cycle Sine
Display multiple cycles that have appropriate vertical and
horizontal scales.
Single-cycle Sine
Set the horizontal scale to display about one cycle of the waveform.
FFT
Convert the input t ime-dom ai n sig na l to its fr eq uenc y c om pone nts
and display the result as a graph of frequency versus amplitude
(spectrum). Since it is a math calculation, see
Section 5.3.1 Math
FFT for more information.
Undo Setup
Let the oscilloscope recall the previous setup.
Square Wave or Pulse:
When you use the Autoset function and the oscilloscope det ermines that t he signal is similar to a
square wave or pulse, the oscilloscope displa ys the following options.
Square Wave Options
Details
Multi-cycle Square
Display multiple cycles that have appropriate vertical and
horizontal scales .
Single-cyc le Squar e
Set the horizontal scale to display about one cycle of the waveform.
The oscilloscope dis plays Min, Mean and Posit ive Width automat ic
measurements.
Rising Edge
Display the risi ng edge.
Falling Edge
Display the falling edge.
Undo Setup
Let the oscilloscope recall the previous setup.
5.7 Signal Connectors
See the figure below to find the two signals connectors and a pair of metal electrodes at the
bottom of the oscilloscope panel.
1. CH1, CH2: Input connectors for waveform display, through which to connect and input the
signal to be measured.
Page 42

Basic Operation
DSO1000B Series HandHeld Oscilloscope User Manual 37
2. Probe Compensation: Voltage probe compensation output and ground, used to electrically
match the probe to the os cilloscope input c ircuit. The probe compensat ion ground and BNC
shields connect to earth ground and are considered to be ground terminals. T o avoid damages,
do not connect a voltage sourc e to any of these ground terminals.
Page 43

Application Examples
DSO1000B Series HandHeld Oscilloscope User Manual 38
Chapter 6 Application Examples
This chapter unfolds a further descript ion on main features of the oscilloscope by giving eleven
simplified application examples f or reference to help solve your own tes t problems.
1. T aking simple measurements
Using AUTO
Using the Measure menu to take auto m easurements
2. Taking cursor measurements
Measuring ring frequency and ring am plitude
Measuring pulse width
Measuring rise time
3. Analyzing input signals to eliminate r andom noise
Observing a noi sy s ignal
Eliminati ng r ando m noise
4. Ca pturing a s ingle-shot signal
5. Using X-Y mode
6. Triggering on a pulse width
7. Triggering on a video signal
Observing triggers on video fields and video lines
8. Using Slope Trigger to capture a particular slope signal
9. Using Overtime Trigger to measure a long pulse signal
10. Using math functions to analyze waveforms
11. Measuring data propagation delay
6.1 Example 1: Taking Simple Measurements
When you want to observe an unknown signal i n a certain circuit without having its amplitude and
frequency parameters , you may use this function to take a f ast measurement on the fr equency,
period and peak-to-peak amplitude of the signal.
Follow the steps below.
1. Set the switch on the oscilloscope probe to 10X;
2. Push the CH1 MENU button and set the Probe option atte nuatio n to 10X;
3. Connect the CH1 probe to the test point of the circuit;
4. Press the AUTO button.
The oscilloscope will automatically set the waveform to a best display. If you want to further
optimize the wavefor m dis play, you may manually adj ust the vert ical and horizontal c ontrols unti l
the waveform meets your particular requirement.
Page 44

Application Examples
DSO1000B Series HandHeld Oscilloscope User Manual 39
T aking Auto Measurements
The oscilloscope can display most signals by automatic measurements. To measure such
parameters as the sig nal freq uenc y, period, peak-to-peak amplitude, r ise t im e and posit ive width,
follow the steps below.
1. Push the MEAS button to see the Measure menu.
2. Select t he fir st ‘unspecified’ option (marked by red arrow), and then enter the submenu.
3. Select CH1 f or the Sourc e option. T hen repeatedl y select measure item s in the Type menu.
Push the back menu to go bac k to the measure i nterfac e. The corr esponding box under the
measure item shows the measurements.
4. Repeat Step 2 and Step 3. Then select other measure items. Totally 8 measure items can be
displayed.
Note: All readouts change with the measured signals.
The figure below s hows three m easure items as an example. The boxes under them dis play t h e
measurements in large fonts.
Page 45
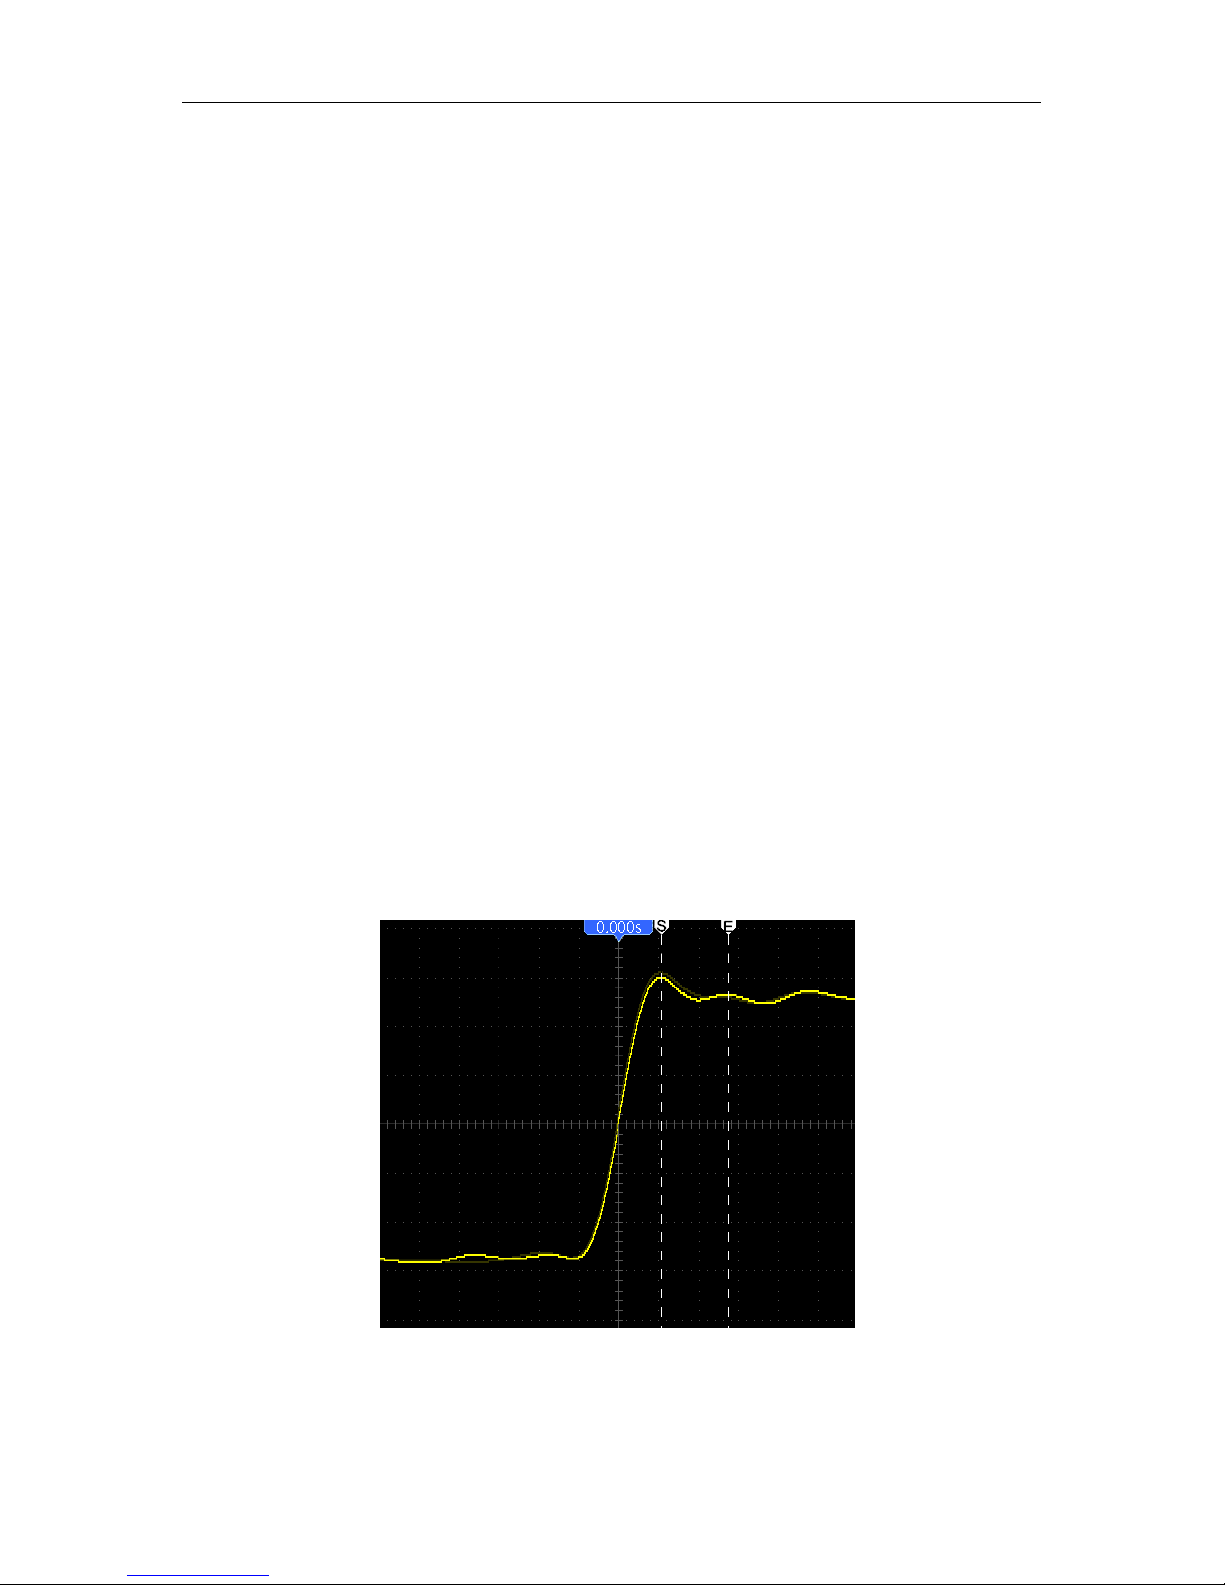
Application Examples
DSO1000B Series HandHeld Oscilloscope User Manual 40
6.2 Example 2: Taking Cursor Measurements
You can use the cursor to quickly measure the time and amplitude of a waveform.
Measuring Ring Time (convertible to Frequency) and Amplitude on Rising Edge of Pulse
To measure the ring time on the rising edge of the pulse, follow the steps below.
1. Push the CURSOR but ton to view the Cursor menu.
2. Push F1 the Type option button and select Time.
3. Push F2 the Source option button and select C H 1.
4. Select a cursor. If S is selected,move Cursor S on the screen; if E is selected, move Cursor E;
if both are selected, move them at the same time.
5. Put Cursor S on the first peak of the ring.
6. Put Cursor E on the sec ond peak of the ring.
7. At Delta displays the measured t ime and at Cursor S an Cursor E display the positions of
these two cursors.
8. Push the Type option button and select Voltage.
9. Put Cursor S on the hig hest peak of the ring.
10. Put Cursor E on the lowest point of the ring. The amplit ude of the ring will be displayed at
Delta.
See figures below for bet ter understanding.
Page 46
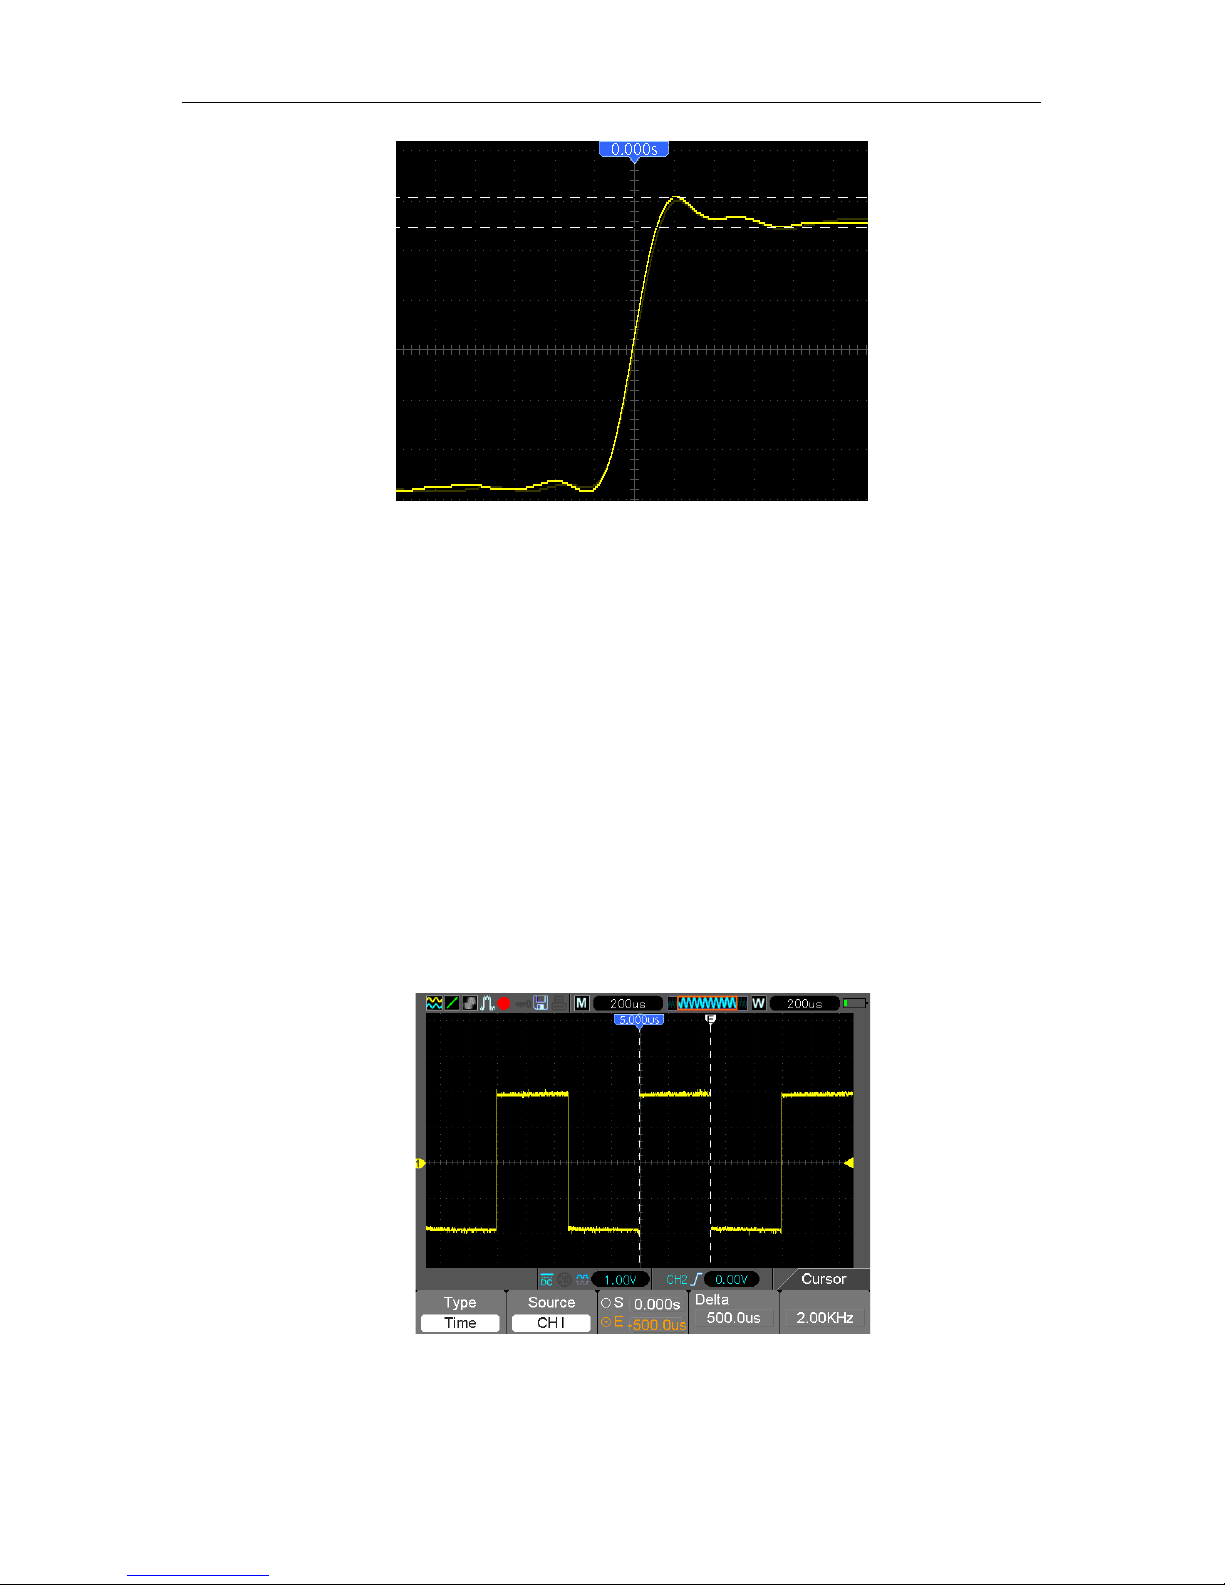
Application Examples
DSO1000B Series HandHeld Oscilloscope User Manual 41
Measuring Pulse Width
To analyze a pulse signal and to know its width, follow the steps below.
1. Push the CURSOR but ton to view the Cursor menu.
2. Push F1 the Type option button and se lect Time.
3. Push F2 the Source option button and select C H 1.
4. Select a cursor. If S is selected, move Cursor S on the screen; if E is selected, move Cursor E;
if both are selected, move them at the same time.
5. Place Cursor S on the rising edge of the pulse and Cursor E on the falling edge.
6. Thus at Delta displays t he measured time and at Cursor S and Cursor E displays t he time
relative to the trigger.
See the figure below for better understanding.
Measuring Rise Time of Pulse
You may need to measure the rise time of the pulse in many applicatio n environments, usually, to
Page 47
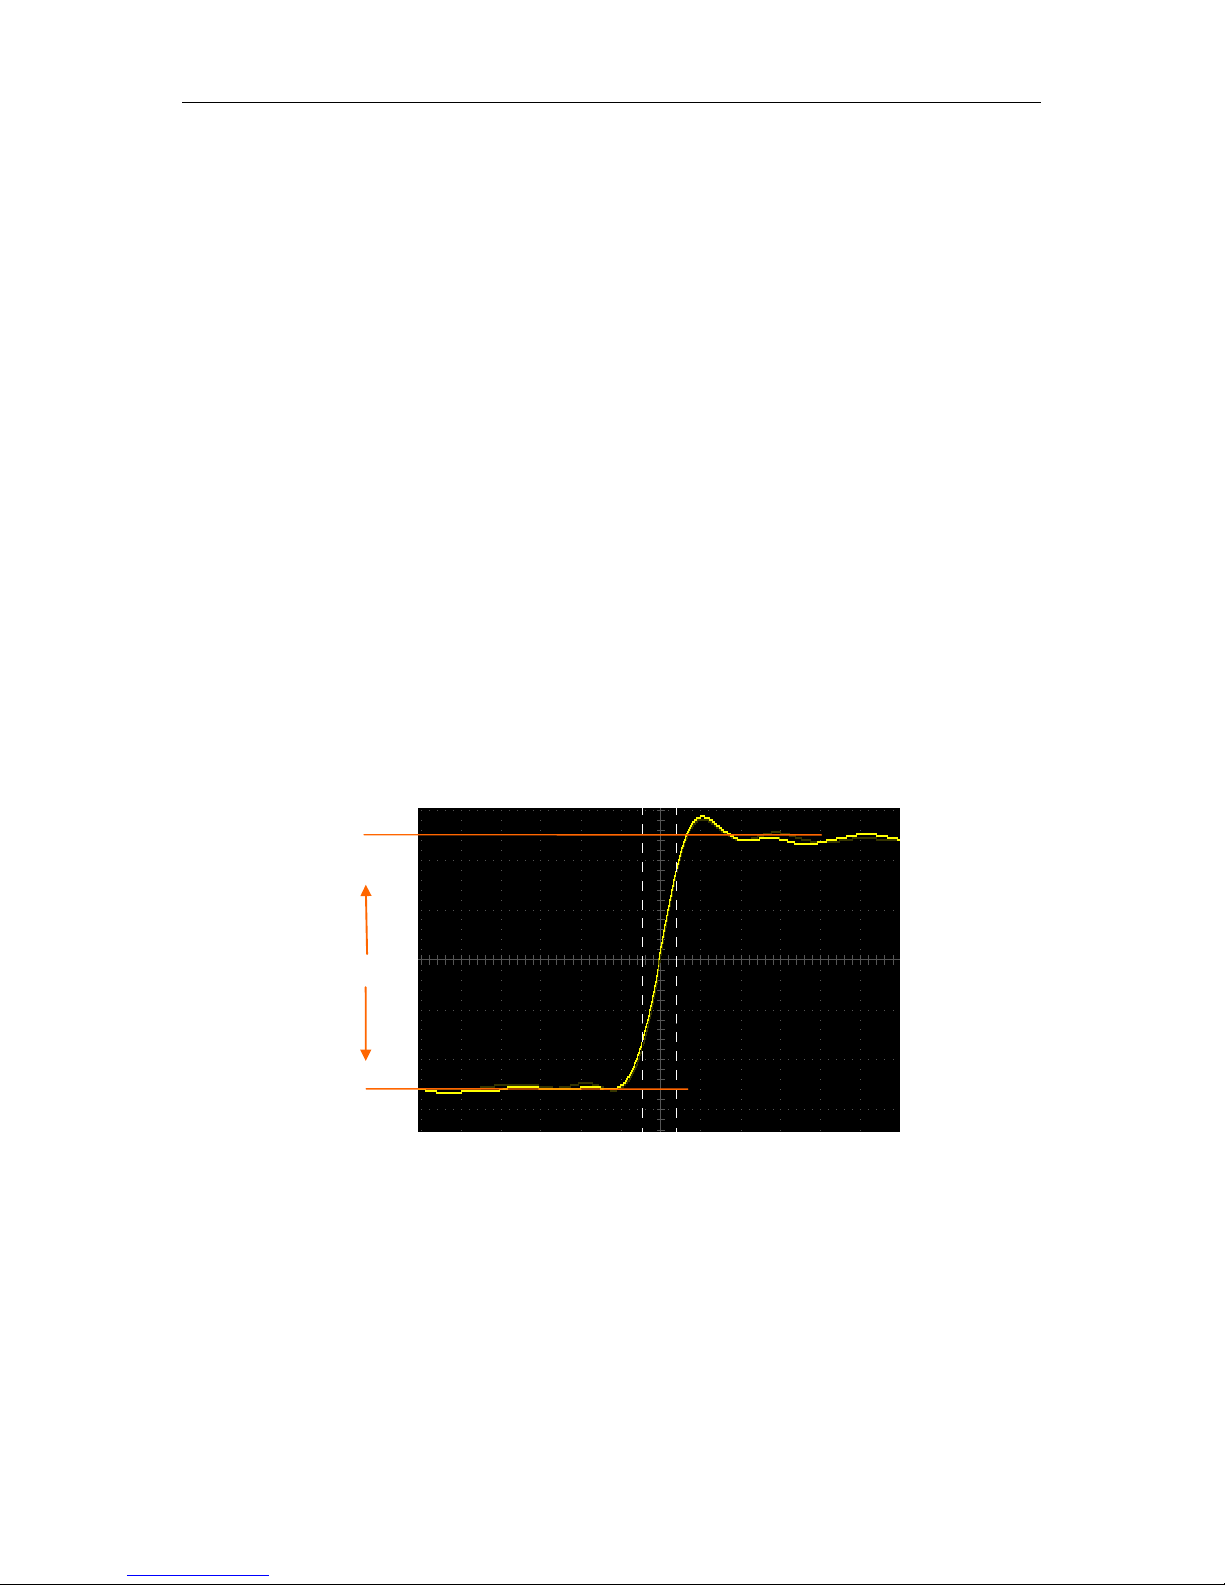
Application Examples
DSO1000B Series HandHeld Oscilloscope User Manual 42
measure the rise time between the 10% and 90% levels of the pulse waveform. To do so, follow
the steps below.
1. Click the TIME/DIV key to display the rising edge of the waveform .
2. Click the VOLTS and Vertical Position keys to adjust the waveform amplitude to about 5
divisions.
3. Push the CH1 MENU button.
4. Push the VOLTS option button and select Fine. Click the Vertical Position key to accurately
separate the waveform into 5 divisions.
5. Click t he Vertical Positon key to center the wavefor m. Positio n the waveform bas eline to 2.5
divisions below the c enter graticule.
6. Press the CURSOR butt on.
7. Push the Type option button and se lect Time. Push the Source opt ion butt on to select CH1.
8. Select Cursor S and place it at the 10% level of the wavefor m.
9. Select Cursor E and place it at the 90% level of the wavefor m.
10. The Delta readout in the Cursor Menu is the rise time of the pulse.
See the figure below for better understanding.
6.3 Example 3: Analyzing Input Signals to Eliminate
Random Noise
In certain circums tances, to display a nois y signal on the os cilloscope a nd to get its details , you
may follow the steps below to analyze this signal.
5
divisions
Page 48

Application Examples
DSO1000B Series HandHeld Oscilloscope User Manual 43
Observing Noisy Signal
1. Enter the Acquire menu.
2. Push the Type option button and select Real Time.
3. Push the Peak Detect option button.
4. If necess ary, enter the DISPLAY menu and set the Contrast option to view the noise more
clearly.
See the figure below for better understanding.
Eliminating Random Noise
1. Enter the Acquire menu.
2. Push the Type option button and select Real Time.
3. Push the Average option button.
4. Push the Averages option button and adj ust the number of running averages to watch the
Page 49

Application Examples
DSO1000B Series HandHeld Oscilloscope User Manual 44
change in the waveform display.
Note: Averaging reduces random noise and let you view the sign al details more easily.
See the figure below for better understanding
6.4 Example 4: Capturing Single-shot Signal
You may refer to the following exam ple to easily capture s ome aperiodic signals like puls es and
glitches.
To set for a single-shot acquisitio n, follow the steps below.
1. First , set up the oscilloscope probe and the attenuation factor of CH1.
2. Click the vertical VOLTS and horizontal TIME/DIV keys to a proper position for a better
examination of the sig nal.
3. Enter the Acquire menu.
4. Push the Peak Detect option button.
5. Pus h the T R I G ME NU but t o n a nd s e le ct R is ing f or t he S l ope op t io n. T he n a dj us t t he t r ig g er
level properly.
6. Select Single m ode to start the acquisition.
Using this feature can help you to capture occasional events more easily. This is an advantage of
the HandHeld oscilloscope.
Page 50

Application Examples
DSO1000B Series HandHeld Oscilloscope User Manual 45
6.5 Example 5: Using X-Y Mode
Viewing Phase Differences between Two Channel Signals
For example, you need to m easure the change in a phase across a circuit network.
Connect the oscilloscope with cir cuitry and view the input and output of the circuit in XY mode.
Follow the steps below.
1. First , prepare two oscilloscope probes and set the switches to 10X on both probes .
2. Push the CH1 MENU button and set the Probe option attenuation to 10X; push the CH2
MENU button and set the Probe option attenuation to 10X.
3. Connect the CH1 probe to the input of the network, and connect the CH2 probe to the output.
4. Push the AUTO b utton.
5. Click
the VOLTS keys to display approximately the same amplitude signals on each channel.
6. Enter the Display menu.
7. Push the Format option button and select XY.
8. Now the oscillos c ope dis plays a Lis saj ous patter n to charac t erize t he input a nd output of the
circuit.
9. Click t he VOLTS and Vertical Position keys to properly scale t he waveform display.
10. Use the Lissajous' s oscillographic method to observe and calculate the phase differences
following the form ula below.
As sinθ=A/B or C/D, in which θ is the phase difference angle between channels and A, B, C, D
represent what shown in the f igure belo w, you can get the val ue of the phase differ enc e angle by
the for mula: θ=±arcsin(A/B) or ±arcsin(C/D).
If the principal axes of the ell ipse are in the first and third quadrants, the phase differ ence angle
Page 51

Application Examples
DSO1000B Series HandHeld Oscilloscope User Manual 46
should be in the first and fourth quadrants, i.e. within (0~π/2) or (3π/2~2π). If the principal axes of
the ellipse are in the sec ond and fourth quadrants, the phase difference angle should be in the
second and third quadrants, i.e. within (π/2~π) or (π-3π/2). See the figure below for better
understanding.
6.6 Example 6: Triggering on Pulse Width
Triggering on a Specific Pulse Width
While testing t he pulse width of a signal in a circ uit, you may need to verif y the pulse width is
consistent wit h the theoretic value. Or even if t he edge t rigger ing shows that your signal has the
same pulse w idth with the specific s ignal, you still doubt about the result. Then you can follow t he
steps below.
1. Set the Probe opt ion attenuation to 10X.
2. Push the AUTO button to trigger a stable waveform display.
3. Push the Single Cycle option button in the Autoset menu and read out t he signal pul se widt h.
4. Push the TRIG MENU b utton.
5. Select Pulse for the Type option; Select CH1 for the Source option; Click the TRIGGER
LEVEL key to set the trigger level at the bottom of the signal.
6. Select t he W hen option button and select ‘=’.
7. Push the Set Pulse Width option button. Set the pulse width to the value read out in Step 3.
8. Click t he TRIGGER LEVE L key to set the pulse width to the value read out in Step 3.
9. Push the More option button and select Normal for the Mode option. Once triggering on
normal pulses, the oscilloscope can give a stable waveform display.
10. When option is set to >, < or ≠ and there appear any aberrant pulses that meet the specified
A
B
C
D
Signal Horizontal
Centering
Page 52

Application Examples
DSO1000B Series HandHeld Oscilloscope User Manual 47
condition, t he oscilloscope will t rigger. For example, the signal c ontains such aberr ant pulses
as shown below, you may select ‘≠’ or ‘<’ to trigger on the pulse.
As shown in the above figure, you can get a stable waveform display if inputting a square wave at
the frequency of 1KHz, with pulse width set to 500μs.
6.7 Example 7: Trigge r ing on Video Signal
Assume that you are monitor i ng the video s ignals of a t elevis ion to see if they are input norm ally,
and the video signal is of an NTSC system. You can get a stable display by using the video trigger.
Triggering on Video Fields
To trigger on the video fields, follow the steps below.
1. Push the TRIG MENU button to see the Trigger menu.
2. Push F1 to select Video for the Type option.
3. Push the Source option button to select CH1; push the Polarity option button to select Normal;
push the Standard option button to select NTSC.
4. Push the Sync optio n butt on to select Odd Field, Ev en Field or All Fields.
5. Push the Trigger Level button to adjust the trigger level and stabilize video signals.
6. Push the horizontal TIME/DIV and the Vertical Position keys to display on the screen a
complete video signal triggering on a video field.
The figure below shows a stable signal trig gering on a video field.
Page 53
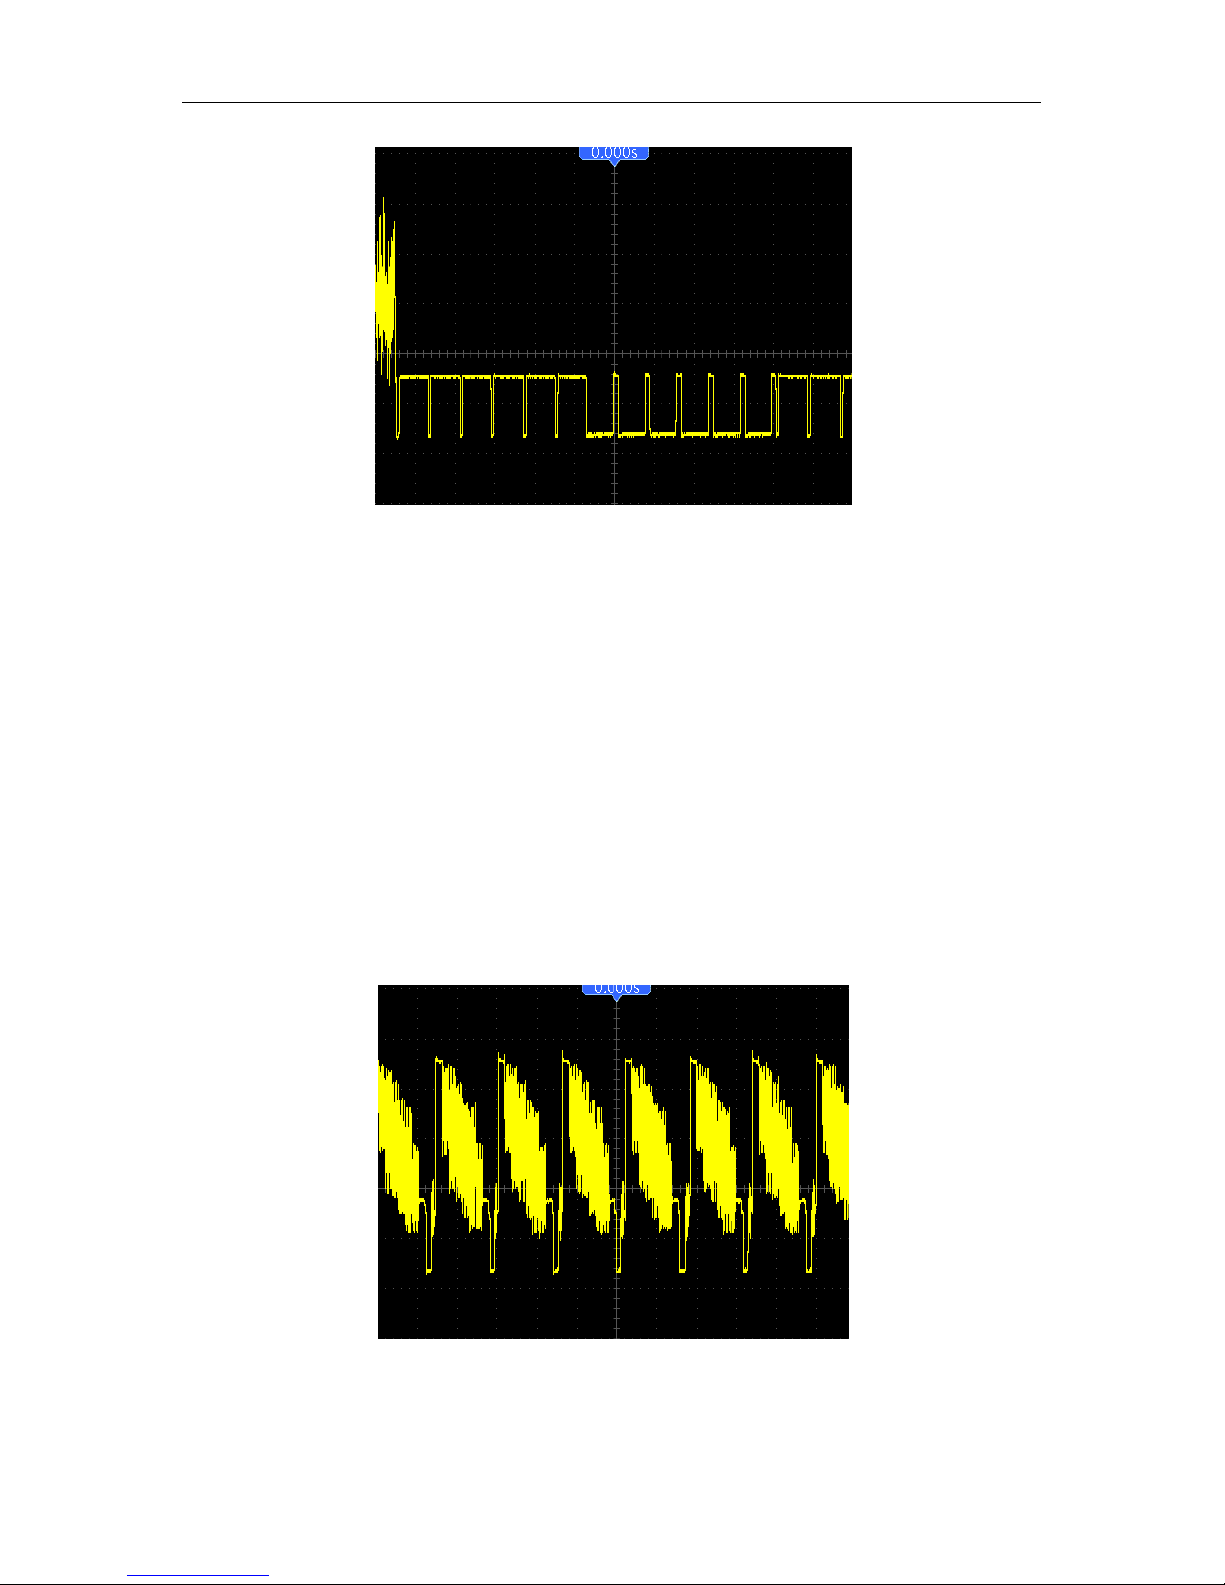
Application Examples
DSO1000B Series HandHeld Oscilloscope User Manual 48
Triggering on Video Lines
To trigger on the video lines, follow t he steps below.
1. Push the TRIG MENU button to see the Trigger menu.
2. Select Video for the Type option.
3. Push the Source option button to select CH1; push the Polarity option button to select Normal;
push the Standard option button to s elect NT SC; push the S ync option b utton to sel ect Line
Number.
4. Click t he Trigger Level key to adjust the trigger level and stabilize video signals.
5. Adjust t he line num ber (NTSC: 0-525 lines).
6. Click the horizontal TIME/DIV and the vertical VOLTS keys to display on the screen a
complete video signal triggering on a video line. See the figure below.
Page 54

Application Examples
DSO1000B Series HandHeld Oscilloscope User Manual 49
6.8 Examp le 8: Using Slope Trigger to Capture Particular
Slope Signal
In many occasions, we are not only concerned about the edge of the signal, but also want to know
the rise and fall times of the signal. To bet ter observe this kind of signals, we bri ng in the slope
trigger. Follow the steps below.
1. Push the TRIG MENU button to see the Trigger menu.
2. Select Slope for the Type option.
3. Pus h t he So ur c e o pt io n b ut t on t o s elect C H1; push the Slope o ption butto n to select Rising;
push the Mode option button to select Auto; push the Coupling option button to select DC.
4. Click t he ‘Next Page’ button and select Vertical. Adjust V1 and V2 to proper locat ions. Select
the When option button and se t it to ‘ =’.
5. Select ‘Time’ and adjust the time until you get a stable display of waveforms. See the figure
below.
6.9 Examp le 9: Using Overtime Trigger to Measure Long
Pulse Signal
It is not easy to observe some part of a long puls e signal by using the edge or pulse width trigger.
In such case, you can use the over time trigger by following s teps.
1. Push the TRIG MENU button to see the Trigger menu.
2. Select OT for the Type option; push the Polarity option butt on to select Nor mal; pus h the
Mode option button to select Auto; push the Coupling option button to selec t DC.
Page 55

Application Examples
DSO1000B Series HandHeld Oscilloscope User Manual 50
3. Click t he Trigger Level key to adjust the trigger level and stabilize video signals.
4. Adjust t he line num ber (NTSC: 0-525 lines).
5. Clck the horizontal TIME/DIV and the vertical VOLTS keys to display on the screen a
complete video signal triggering on a video line. See t he figure below.
Note: The difference between the overtime and the delay triggers is that the overtime
trigger can identify the pulse you need according to your set time and trigger on any point
of the pulse. In the other word, the overtime trigger occurs based on pulse identification. It
is similar to the > mode of the pulse width trigger, but not the same.
6.10 Example 10: Using Math Functions to Analyze
Waveforms
Using math functions t o analyze input waveforms is another advantage of the digital oscilloscope.
For example, you want to g et the instantaneo us difference between two cha nnel waveforms. By
usi ng t he ma th f unct ion of the oscillosc ope, you can get a better representation of the waveform
on the screen. To observe this signal, follow the steps below.
1. Set the Probe opt ion attenuation to 10X.
2. Open CH1 and CH2 at the same time, both with the attenuation of 10X.
3. Push t he AUTO button to trigger a stable wavef orm .
4. Push the M/R MENU butto n to see the Math menu.
5. Push the Operatio n option button and select ‘CH1+CH2’.
6. Click the horizontal TIME/DIV and the vertical VOLTS keys to properly scale the waveform for
easy check.
In addition, the oscilloscope also supports the - and FFT functions. For a detailed analysis on FFT ,
Page 56

Application Examples
DSO1000B Series HandHeld Oscilloscope User Manual 51
refer to C hapter 5.3.1 Math FFT.
Note: You should compensate both probes before performing the math operation;
otherwise, differences in probe compensation will appear as errors in the differential
signal.
As illustrated i n the above figure, input a 1 KHz sine wave from CH1 and a 1KHz sq uare wave
fr om CH2.
Follow the above steps to set up the Math menu, and observe the subtracted waveform as shown
in the figure below.
Those in pink are added waveforms.
6.11 Example 11: Measuring Data Propagation Delay
When you doubt that there appear instabilities in a serial data propagation control circuit, you c an
set the oscilloscope to measure the propagation delay between the enable s ignal and the transfer
Page 57
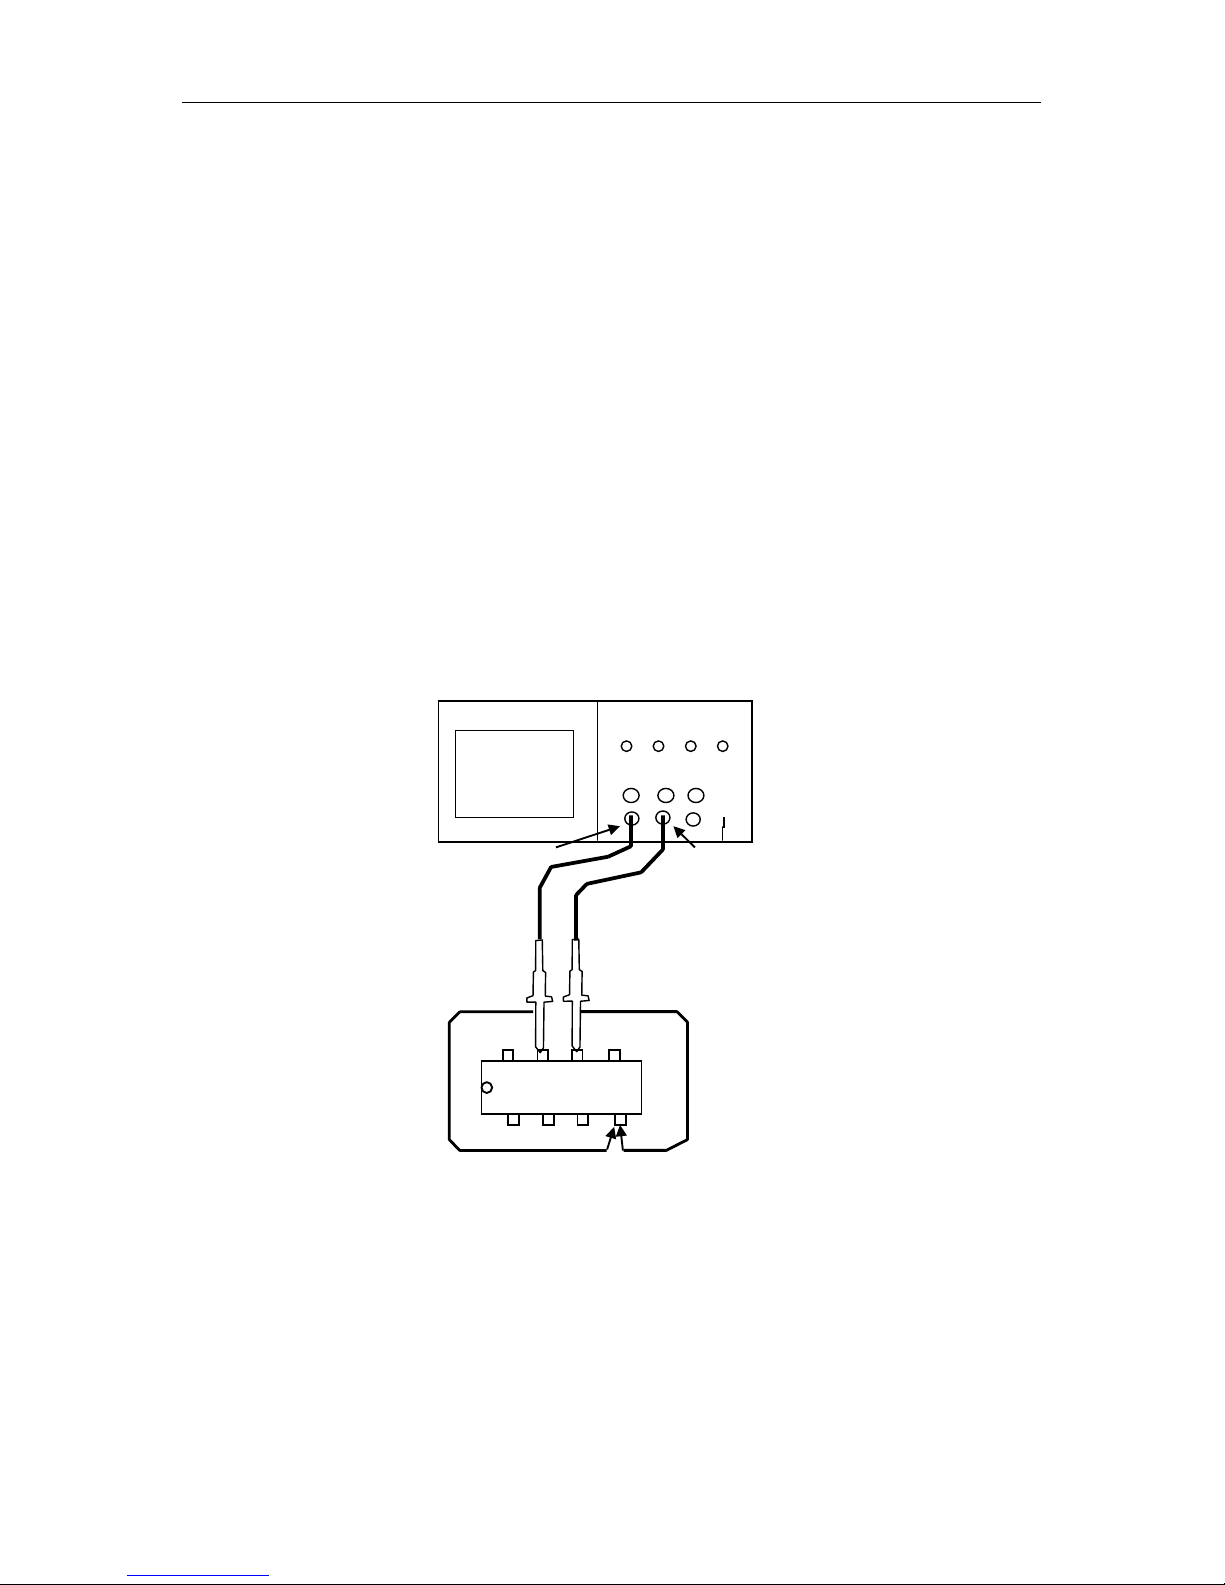
Application Examples
DSO1000B Series HandHeld Oscilloscope User Manual 52
data.
To set the propagation delay measurement, follow the steps below.
1. Connect two oscilloscope probes respectively to the CS (chip-select) pin and the DA TA pin on
the chip.
2. Set the Probe opt ion attenuation to 10X for both probes.
3. Open CH1 and CH2 at the same time, both with the attenuation of 10X.
4. Push the AUTO button to trigger a stable waveform display.
5. Adjust t he horizontal and vertical controls to optimize t he waveform display.
6. Push the CURSOR but ton to view the Cursor menu.
7. Push the Type option button and se lect Time.
8. Select Cursor S and place it on the active edge of the enable signal.
9. Select Cursor E and place it on the data output transition (See the figure below).
10. Read the data propagation delay i n the Delt a readout.
CH2
CS
DATA
CH1
Page 58
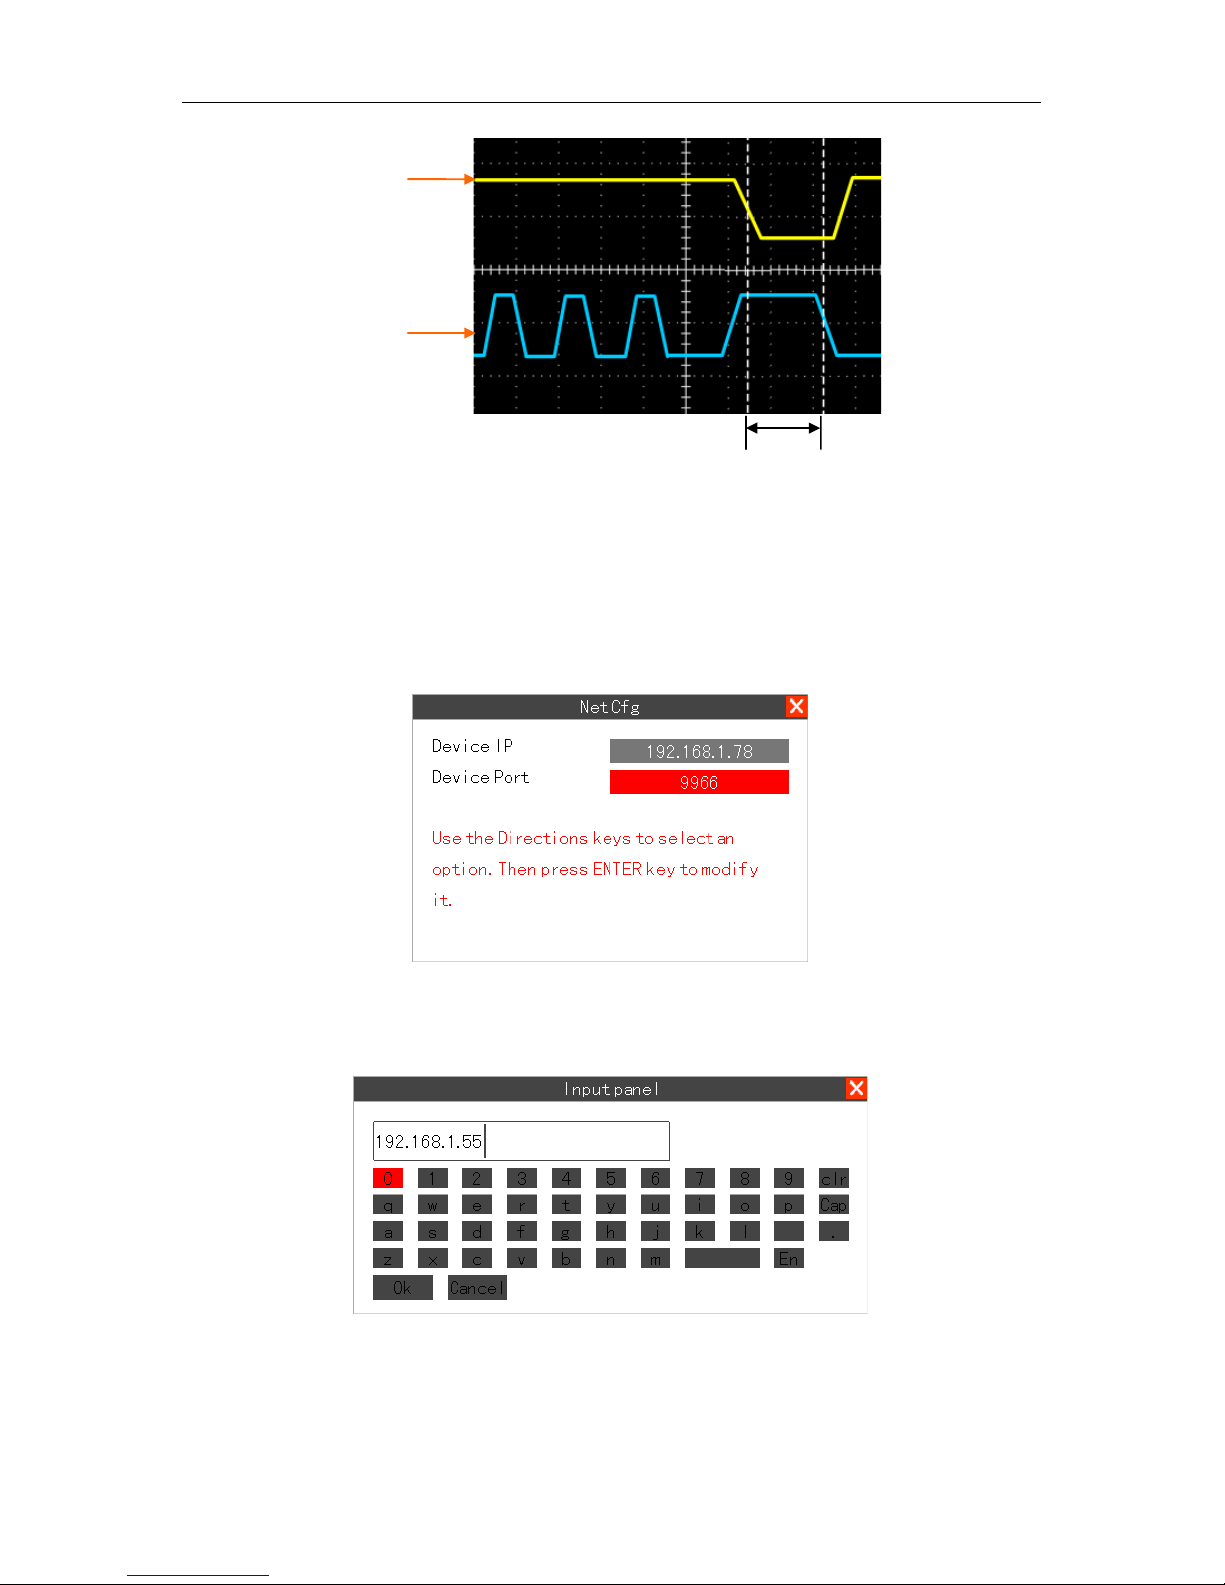
Application Examples
DSO1000B Series HandHeld Oscilloscope User Manual 53
6.12 Example 12: Setting Net IP
To set net IP, follow the st eps below.
1. Select the menu Utility->System->Pc Set->Mode->NET.Then there pushes up the NetCfg
dialog.
2. Select Device IP or Device Por t you want to set and press ENT ER ke y.T hen t her e pus hes up
the Input panel dialog.
3. Modify the parameter by the soft keyboard.
CS
DATA
Page 59

Application Examples
DSO1000B Series HandHeld Oscilloscope User Manual 54
6.13 Examp l e 13: Charging
Your battery has been partiall y charged at the factory, but you may need to recharge it before you
can switch on your device f or the first time.
If the device indicates a low charge, do the following:
1. Connect the Oscilloscope to the power source by the switc hing adpater.
2. You do not need to charge the battery for a specific length of time, and you can use the
device while it is charging.
If the battery has not been used for a long time, to begin charg ing, you may need to
connect the charger, then disconnect and re connect it.
Note: T he oscillosc ope can be charged what ever it is on or off. It ne ed s 5 ho ur s f o r c har g ing t he
battery when the osc illoscope is off.It needs about 12 ho urs fo r charg ing t he batt ery w hen the
oscilloscope is on.The length of the charging time depends on the different batter y.
Battery Type: 7.4V
Page 60
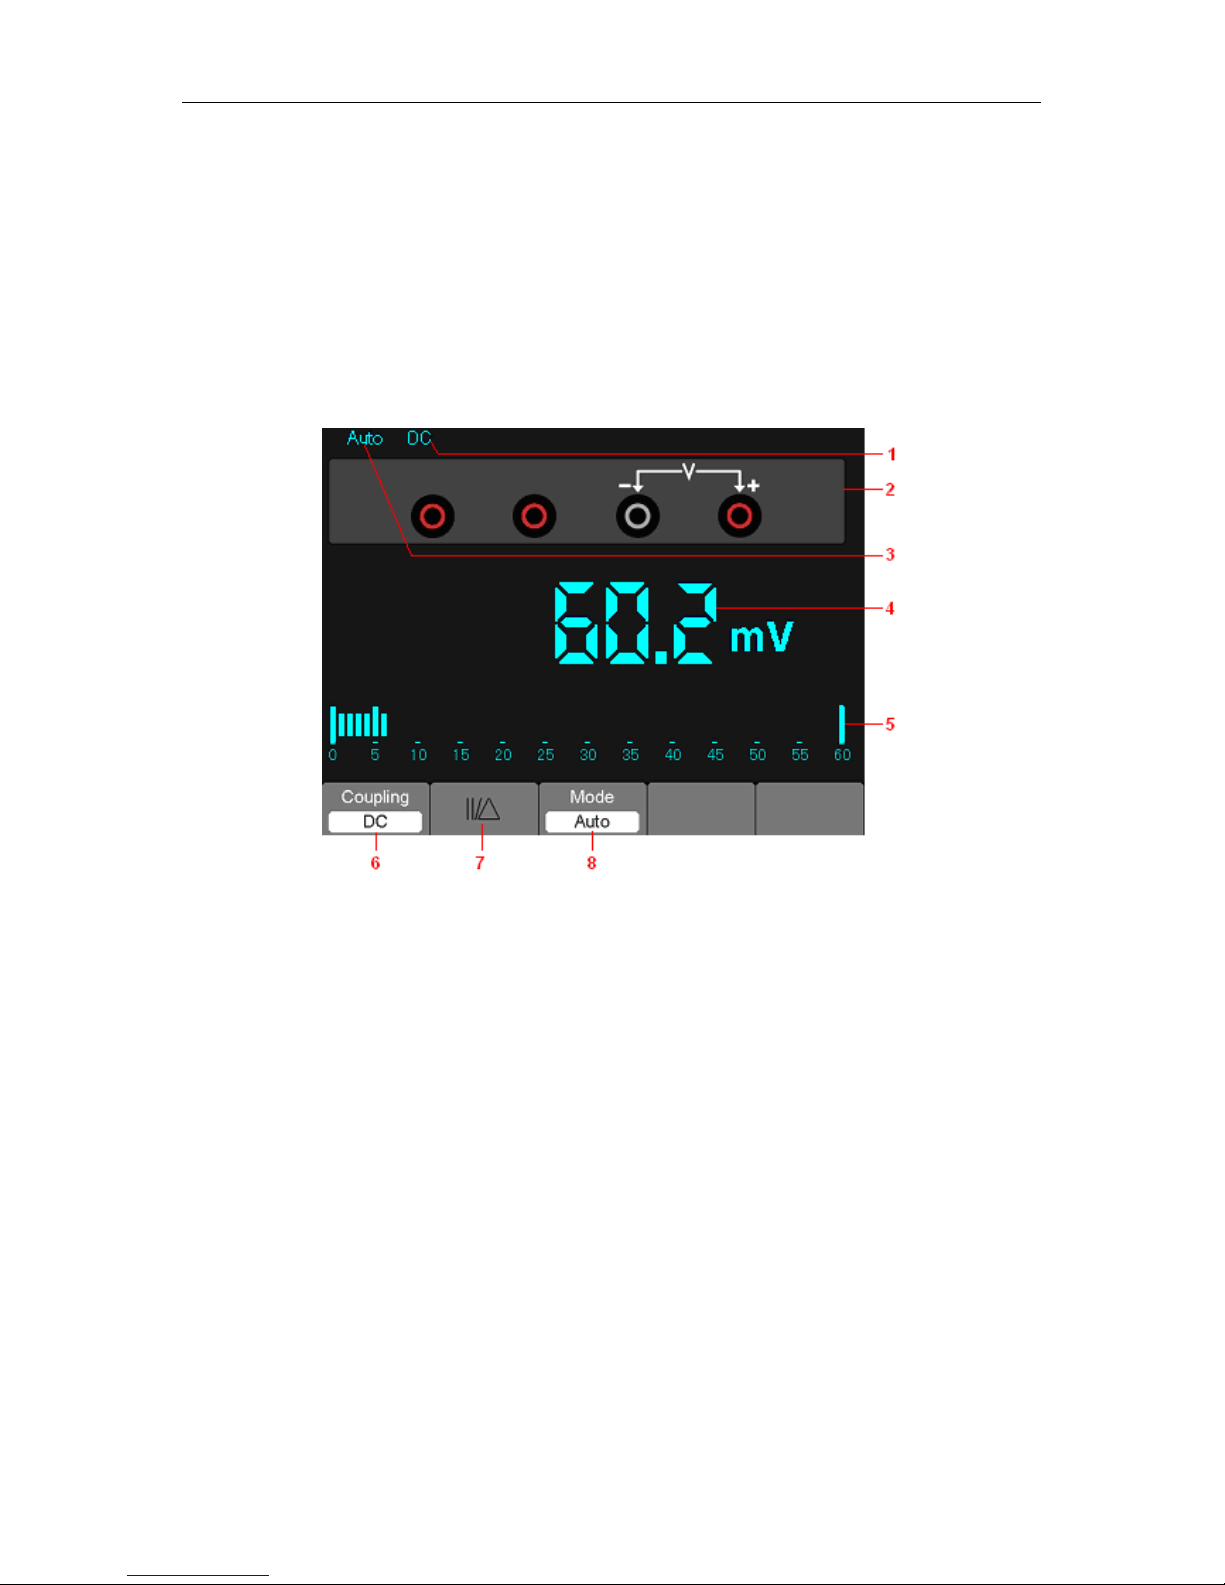
Multimeter
DSO1000B Series HandHeld Oscilloscope User Manual 55
Chapter 7 Multimeter
About this chapter
This chapter provi des an introduction t o the multimeter funct ions of DSO1000B Series. T he introduction gives
guides to show how to use the menus and perform basic measurements.
Connecting the Mete r
Use the 4-mm safety banana jack inputs for the Meter functions: 10A , mA, COM,V/Ω/C.
Multimeter Operation Window
Figure 7-1 Multimeter operation window
Description
1) Measurement mode indictors:
DC: Direct electric measurement
AC: Alternating electric measurem ent
2)The symbol of Mutimeter current mode.
3) Manual/Auto range indictors, among which the MANUAL refers to measuring range in manual
operation mode and Auto means the measuring range in automatic operation mode.
4) The reading value of meas urem ent.
5) The bar graph indictor.
6) DC or AC Measurement mode control.
7) Absolute /relative magnitude measuring control: The sign “||” expresses the absolute magnitude
measuring control and “ ” represents the relative magnitude measuring control.
8) Manually or automat ically measuring rang e control.
Page 61
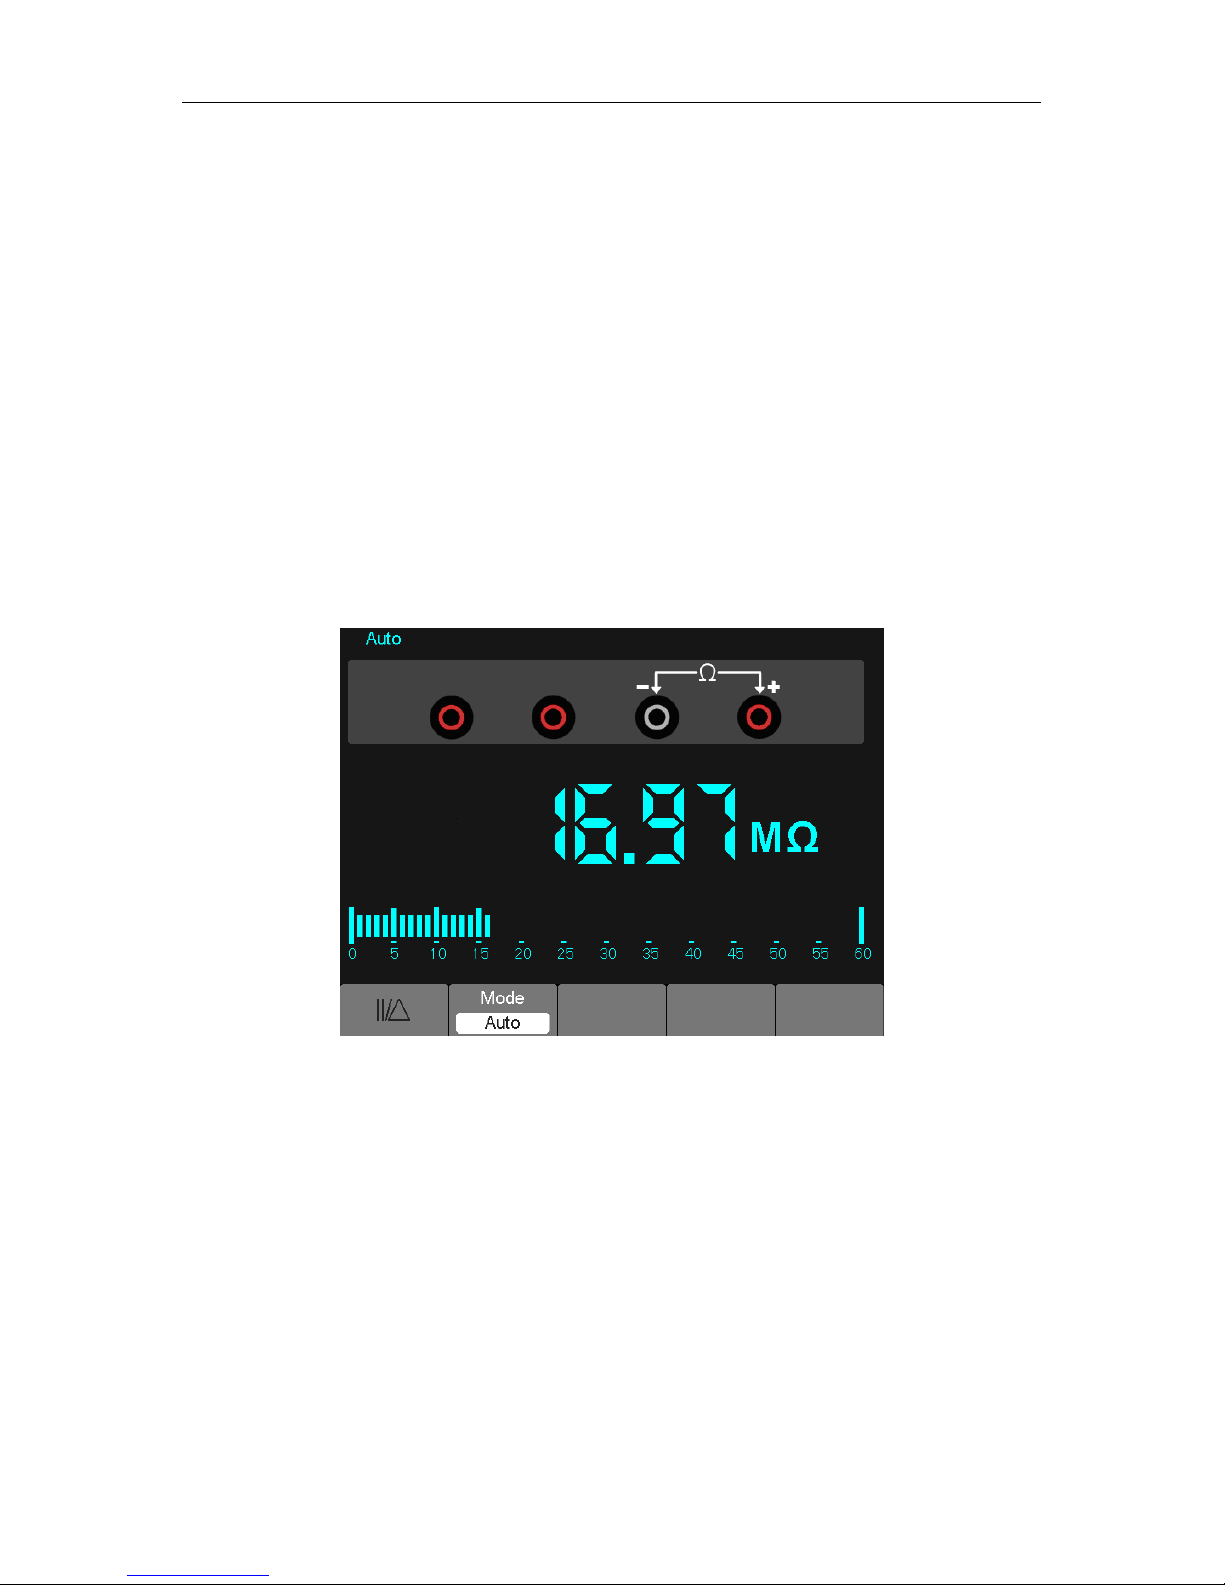
Multimeter
DSO1000B Series HandHeld Oscilloscope User Manual 56
Operating the Multi m e te r
If you are in the oscillosc ope w indow, press OSC/D MM key, the oscilloscope will switc h to the
multimeter m ode window.Then the screen will display the measure mode window t ha t wa s in us e
the last time before you quit multimeter measure. When you switch to the multimeter measurement
the first tim e, t he default measure mode is DC voltag e mode.
Measuring Resistance Values
To measure a resistance, do the following:
1) Press the R key and then resistance measurement window appears on the screen.
2) Insert th e black lead into the COM banana jack input and the red lead into the V/O/C banana jack
input.
3) Connect the red and black test leads to the resistor. The resistance value is shown on the screen
in Ohm.
Then, the screen will look lik e the following figure 7-2.
Figure 7-2 Resistance Meas urement
Making a Dio de Measurement
To make a measurement on the diode, do the following:
1) Press the diode key and a diode symbol appears at the top of t he screen. .
2) Insert the black lead into the COM banana jack input and the red lead into the V/O/C banana jack
input.
3) Connect the red and black leads to the diode and the voltage value of the diode is displayed on
the screen in volt.
Then, the screen will look lik e the following figure 7-3.
Page 62
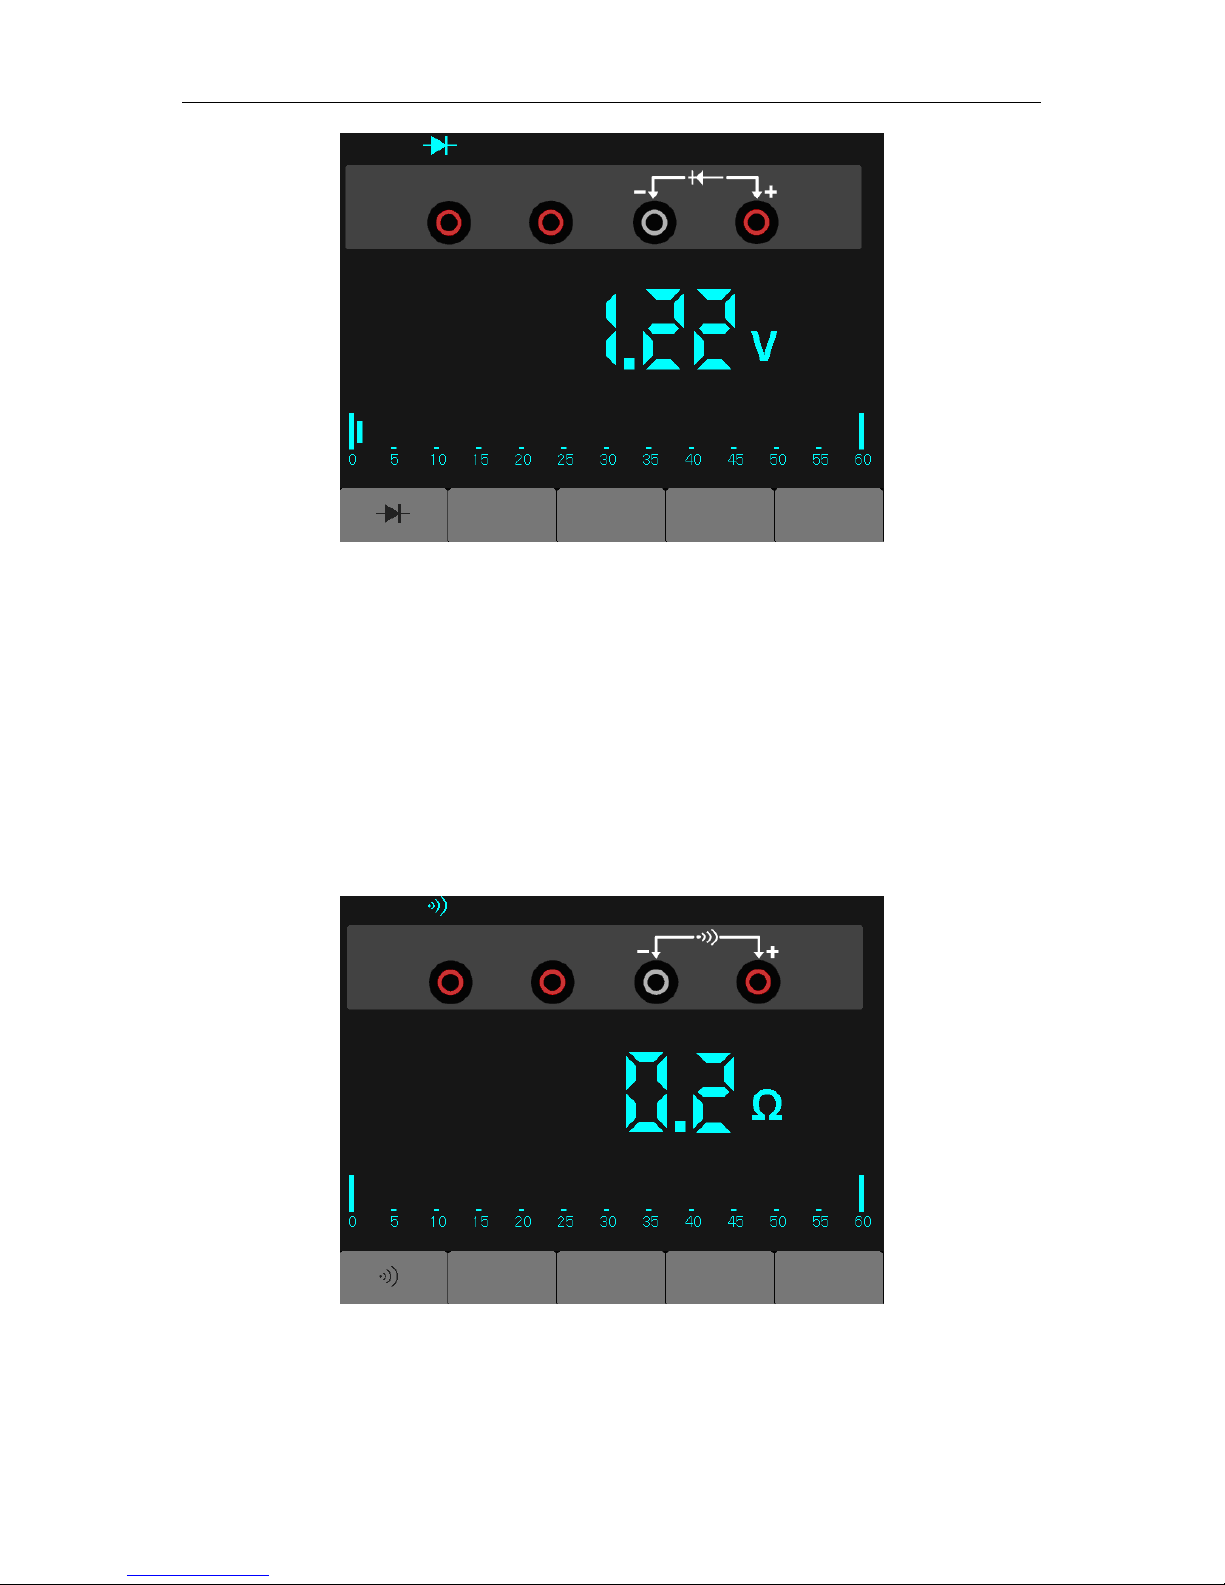
Multimeter
DSO1000B Series HandHeld Oscilloscope User Manual 57
Figure 7-3 Diode Measurement
Making an On-off Measurement
To perform an On-off test, do the following:
1) Press the On-off key and then On-off indictor appears on the top of the screen.
2) Insert the black lead into the COM banana jack input and the red lead into the V/O/C banana jack
input.
3) Connect the red and black leads to the tested points. If the resistance value of the tested points
is less than 30 O, you will hear beep sound from the test tool.
Then, the screen will look lik e the following figure 7-4.
Figure 7-4 On-off Measurement
Making a Capaci t ance Measurem ent
Page 63
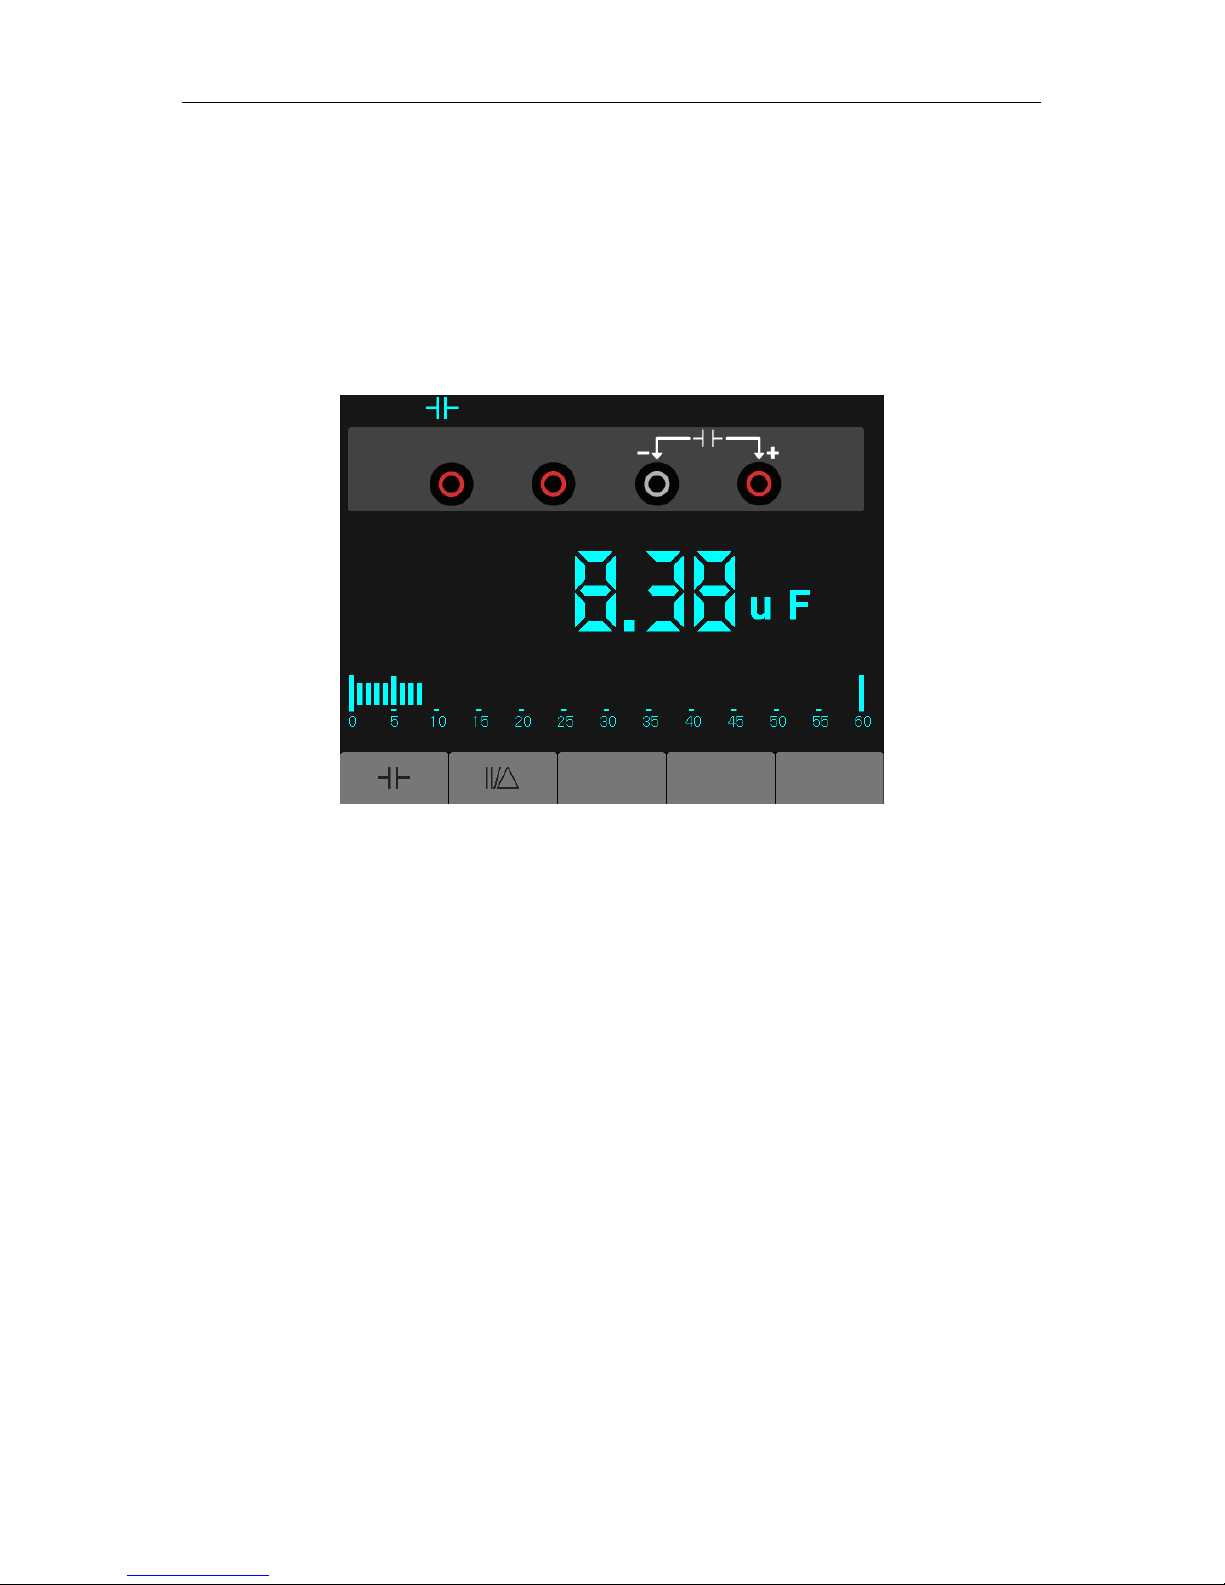
Multimeter
DSO1000B Series HandHeld Oscilloscope User Manual 58
To measure a capacitance, do the following:
1) Press the C key and a capacitor symbol appears on the top of the scr een.
2) Insert the black lead into the COM banana jack input and the red lead into the V/O/C banana jack
input.
3) Connect the red and black leads to the capacitor and the capacitance value is displayed on the
screen in µF or nF.
Then, the screen will look lik e the following figure 7-5.
Figure 7-5 Capacitance Meas urement
Making a DC Voltage Measurement
To measure a DC voltage, do the following:
1. Press the V key and DC appears at the top of the screen.
2. Insert the black lead into the COM banana jack input and the red lead into the V/O/C banana jack
input.
3.Connect the red and black leads to the measured points and the voltage value of measured
points is displayed on the screen.
Then ,the screen will look lik e the following figure 7-6.
Page 64

Multimeter
DSO1000B Series HandHeld Oscilloscope User Manual 59
Figure 7-6 DC voltage Measurement
Making an AC Vol t age Measurement
To measure the AC voltage, d o the following:
1) Press the V key and DC appears on the screen.
2) Press the F1 key and AC appears on the screen.
3) Insert the black lead into the COM banana jack input and the red lead into the V/O/C banana jack
input.
4) Connect the red and black leads t o the measured points and the AC volt age value of measured
points will be displayed on the screen.
Then, the screen will look lik e the following figure 7-7.
Figure 7-7 AC voltage Measurement
Page 65

Multimeter
DSO1000B Series HandHeld Oscilloscope User Manual 60
Making a DC Curren t Measurement
To measure a DC current which is less than 600 mA , do the following:
1) Press the A key and then DC appears on the screen. The unit on the main reading screen is mA.
Press F2 to switch the measurement between mA and 10A. 600mA is acquiescently.
2) Insert the black lead into the COM banana jack input a nd the red lea d into the mA banana j ack
input.
3) Connect the red and black leads to the measured points and the DC current value of measured
points will be displayed on the screen.
Then, the screen will look lik e the following figure 7-8.
Figure 7-8 DC current Measurement for 600 Measurement
To measure a DC current which i s larger than 600 mA, do the following:
1) Press the A key and then DC appears on the screen. The unit on the main reading screen is mA.
2) Press F2 key to switch to 10A measurement, the unit on the main readi ng screen is A.
3) Insert the black lead into the COM banana jack input and the red lead into the 10A banana jack
input.
4) Connect the red and black leads to the measured points and t he DC c urrent value of the
measured points will be displayed on the screen.
5) Press F2 to return to 600 mA measurem ent.
Then, the screen will look lik e the following figure 7-9.
Page 66

Multimeter
DSO1000B Series HandHeld Oscilloscope User Manual 61
Figure 7-9 DC Current Measurement f or 10A
Making an AC Curren t Measurement
To measure an AC current which is less than 600 mA, do the following:
1) Press the A key and then DC appears on the screen. The unit on the main reading screen is
mA,and mA will display on the bottom of the screen, press F2 to switch the measurement between
mA and 10A. 600mA is acquiescent ly.
2) Press the F1 key once and AC will display on the bottom of the scr een.
3) Insert the black lead into the COM banana jack input a nd the red lea d into the mA banana j ack
input.
4) Connect the red and black leads to the measured points and t he AC c urrent value of measured
points will be displayed on the screen.
Then, the screen will look lik e the following figure 7-10.
Page 67

Multimeter
DSO1000B Series HandHeld Oscilloscope User Manual 62
Figure 7-10 AC Current Measurement for 600 mA
To measure an AC current which is larger than 600 mA, do the followi ng :
1) Press the A key and then DC appears on the screen. The unit on the main reading screen is mA.
2) Press F2 key to switch to10A measurement, the unit on the main reading screen is A.
3) Press the F1 key once and AC will display on the bottom of the scr een.
4) Insert the black lead into the COM banana jack input and the red lead into the 10A banana jack
input.
5) Connect the red and black leads to the measured points and t he AC c urrent value of the
measured points will be displayed on the screen.
6) Press F2 to return to 600 mA measurement.
Then, the screen will look lik e the following figure 7-11.
Figure 7-11 AC Current Measurement for 10A
Page 68

Multimeter
DSO1000B Series HandHeld Oscilloscope User Manual 63
Taking a Relat ive Measurement
A currently measured result relative to the defi ned reference value is displayed in a relative
measurement.
The following example shows how to take a relative measur em ent. At first, it is required to
acquire a reference value.
1) Press the Okey.
2) Insert the black lead into the COM banana jack input and the red lead into the V/O/C banana jack
input.
3) Connect the red and black test leads to the resistor. The resistance value is shown on the screen
in Ohm.
4) When the reading leveli ng off, press F1 key and then ||/△is displayed on the top of t he screen.
The saved reference value is displayed beside.
Then, the screen will look lik e the following figure 7-12.
Figure 7-12 Relative Measurement
Selecting A utom a t ic /Manua l Range Adjustme nt
The default range mode of the instrument is automatic range. Suppose you are using the
DC voltage mode, to switch to the manual range, perform the following steps:
1) Press F3 key to enter the manual r ange mode and then Manual is displayed on the top of the
screen.
2) Under the manual range mode, the measuring range is incr eased by a stage when pressing F4
key each time, and when reaching the highest stage, it jumps to the
lowest stage by pressing F4 key once again.
3) Press F3 key to switch back to the automatic range mode and then Auto is displayed on the top
of the screen.
Page 69

Multimeter
DSO1000B Series HandHeld Oscilloscope User Manual 64
Attention: capac itance measurement without manual r ange mode.
Then,the screen will look like the following figure 7-13.
Figure 7-13 The Manual Range Mode
Page 70

Troubleshooting
DSO1000B Series HandHeld Oscilloscope User Manual 65
Chapter 8 Troubleshooting
8.1 Probl em Set t lement
1. If the oscilloscope does not start up at power on, fo ll ow these steps:
1) Check the power cord to verify it has been connect ed properly;
2) Check the power on/off button to ensure it has been pushed;
3) Then restart the oscilloscope.
Contact your local HANTEK distributor or directly keep touch with HANTEK Technical Support
department if the osc illos cope still can not be turned o n normally.
2. If there is no display of waveforms on the screen when the osci lloscope is turned on,
follow these steps:
1) Check the probe to assure its proper connection to the input BNC;
2) Check the channel swit ch (s uch as CH1, CH2 menu buttons) t o make sure it has been turned
on;
3) Check the input s ignal to verify it has been c onnected to the probe correctly;
4) Affirm that all measured circuits have sig nals to output;
5) Turn up the magnitude for DC sig nals with large magnitude;
6) In addition, you may press the Auto Measure button to perform an automatic detection of
signals a t first.
Contact HANTEK Technical Support department in time if t here is still no display of waveforms.
3. If the waveform of the i nput signal is distorted seriou sly, follow these steps:
1) Check the probe to assure its proper connect ion to t he channel BNC ;
2) Check the probe to assure its good connection to the m easured object;
3) Check the probe t o verify it has been well calibrat ed. Otherwise, refer to t he content about
calibration desc ribed in this manual.
4. If the waveform is rolling continuously on the screen but can not be triggered, follow
these steps:
1) Check the trigger source to make sure it consistent with the input chan nel;
2) Check the trigger level to assure its correct adjustment.
3) Check the tr igger mode to confirm it is a right choice for the input signal. The default tr igger
mode is edge trigger. However, it is not suitable for all kinds of input signals.
Page 71

Specifications
DSO1000B Series HandHeld Oscilloscope User Manual 66
Chapter 9 Specifications
9.1 T echnical Specifications
All specifications herein m entioned appl y to the DSO1000B s eries osc illosc opes. Bef ore checking
an oscilloscope f rom HANTEK to see if it com plies with these s pecifications, make sure it meets
the following conditions:
The oscilloscope must have been operating continuously for twenty minutes under the
specified operat ing temperature.
The Do Self Cal operation must be performed through the Utility menu if the operating
temperature changes by m ore than 5 ℃.
T he oscilloscope must be within t he factory calibration interval.
All specifications are guaranteed unless noted ‘typical’.
Oscilloscope Specifications
Horizontal
Sample Rate Range
1GS/s
Waveform Interpolation (sin x)/x
Record Length
Maximum 1M samples per single-
channel; maximum 512K
samples per dual-channel (4K ,16K,40K optional)
TIME/DIV Range
DSO1062B
DSO1102B
DSO1202B
4ns/div to 40s/div, in a 2, 4, 8
sequence
2ns/div to 40s/div, in a 2, 4, 8
sequence
Sample Rate and
Delay Time Accuracy
±50ppm over any ≥1ms time interval
Delta Time Measurement
Accuracy
(Full Bandwidth)
Single-shot, Normal mode
± (1 sample interval +100ppm × reading + 0.6ns)
>16 averages
± (1 sample interval + 100ppm × reading + 0.4ns)
Sample interval = s /div ÷ 200
Position Range
DSO1062B
DSO1102B
4ns/div to 8ns/div (-8div × s/div) to 20ms
20ns/div to 80μs/div (-8div × s/div) to 40ms
200μs/div to 40s/div (-8div × s/div) to 400s
DSO1202B
2ns/div to 10ns/div (-4div × s/div) to 20ms
Page 72

Specifications
DSO1000B Series HandHeld Oscilloscope User Manual 67
Vertical
A/D Converter
8-bit reso lut ion,
each channel sampled s imultaneously
VOLTS Range 2mV/div to 5V/div at inp ut BNC
Position Range
2mV/div to 200mV/ div, ±2V
>200mV/div to 5V/div, ±50V
Analog Bandwidth i n
Normal and Average
modes at BNC or with probe, DC
Coupled
2mV/div to 20mV/div, ±400mV
50mV/div to 200mV/ div, ±2V
500mV/div to 2V/div, ±40V
5V/div, ±50V
Selectable Analog Bandwidth Limit,
typical
20MHz
Low Frequency Response (-3db) ≤10Hz at BNC
Rise Time at BNC, typical
DSO1062B DSO1102B DSO1202B
<5.8ns <3.5ns <1.8ns
DC Gain A ccur acy
±3% for Normal or Average acquisition mode, 5V/ div to
10mV/div
±4% for Normal or Aver age acquisition mode, 5mV/div
to 2mV/div
DC Measurement Accuracy,
Average Acquisition Mode
Measurement Type: Average of ≥16 waveforms with
vertical position at zero
Accuracy: ± (3% × reading + 0.1div + 1mV) when
10mV/div or greater is selected
Measurement Type: Average of ≥16 waveforms with
vertical position not at zero
Accuracy: ± [3% × (readi ng + vertical position) + 1% of
vertical position + 0.2div]
Add 2mV for settings from 2mV/div to 200mV/div ; add
50mV for settings fr om 200m V /div to 5V/div
Volts Measurement Repeatability,
Average Acquisition Mode
Delta volts between any two averages of ≥16 waveforms
acquired under sam e setup and ambient conditions
Note: Bandwidth reduced to 6MHz when using a 1X probe.
Trigger
Trigger Sensitivity
(Edge Trigger Type)
Coupling Sensitivity
DC
Source
DSO1062B
DSO1102B
DSO1202B
CH1
CH2
1div from DC to
10MHz;
1.5div from 10MHz to
1.5div from 10MHz
to 100MHz;
2div from 100MHz to
Page 73

Specifications
DSO1000B Series HandHeld Oscilloscope User Manual 68
Full Full
AC Attenuates signals below 10Hz
HF Reject Att enuates signals above 80k Hz
LF Reject
Same as the DC-coupled limits for frequencies above
150kHz; attenuates signals below 150kHz
Trigger Level Range
Source
Range
CH1, CH2 ±8 divisions from center of screen
Trigger Level
Accuracy, typical
(Accuracy is for
signals having rise
and fall times ≥20ns)
Source Accuracy
CH1、CH2
0.2div × volts/div within ±4 divisions from center of
screen
Set Level to 50%,
typical
Operates with input signals ≥50Hz
Note: Bandwidth reduced to 6MHz when using a 1X probe.
Video Trigger Type
Source
Range
CH1, CH2
Peak-to-peak amplitude of 2
divisions
Signal Formats and
Field Rates, Video
Trigger Type
Supports NTSC, PAL and SECAM
broadcast systems for any field or
any l i ne
Holdoff Range 100ns to 10s
Pulse Width Trigger
Pulse Width Trigger
Mode
Trigger when < (Less than), > (Greater than), = (Equal), or ≠ (Not Equal);
Positive pulse or Negative pulse
Pulse Width Trigger
Point
Equal: The oscilloscope triggers when the trailing edge of the pulse
crosses the trigg er level.
Not Equal: If the pulse is narr ower than the specified width, the trig ger
point is the trailing edge. Otherwise, the oscilloscope triggers when a
pulse continues longer than the time specified as the Pulse Width.
Less than: The trigger point is the trailing edge.
Greater than (also called overtime trigger): The oscilloscope triggers
when a pulse continues longer than the time specified as the Pulse Width.
Pulse Width Range Selectable from 20ns to 10s
Slope Trigger
Slope Trigger Mode
Trigger when < (Less than), > (Greater than), = (Equal), or ≠ (Not Equal);
Positive slope or N egative slope
Slope Trigger Point Equal: The oscillosc ope trigg ers when the waveform slope is equal to the
Page 74

Specifications
DSO1000B Series HandHeld Oscilloscope User Manual 69
set slope.
Not Equal: The oscilloscope triggers when the waveform slope is not
equal to the set slope.
Less than: The oscilloscope triggers when the waveform slope is less
than the set slope.
Greater than: The oscilloscope triggers when the waveform slope is
greater than the set slope.
Time Rang e
Selectable from 20ns to 10s
Overtime Trigger
The leading edge: Rising edge or Falling edge; Time Setting: 20-10s
Swap Trigger
CH1 Internal Trigg er: Edge, Pulse Width, Video, Slope
CH2 Internal Trigg er: Edge, Pulse Width, Video, Slope
Trig ger Frequency
Counter
Readout Resolution 6 digits
Accuracy (typical) ±30ppm (including all f requency reference er rors and ±1 count errors)
Frequency Range AC coupled, from 4Hz minimum to rated bandw idt h
Signal Source
Pulse Width or Edge Trigger modes: all available trigger sources
The Frequency Counter meas ures trigger source at all t imes, including
when the oscilloscope acquisition pauses due to changes in the run
status, or acquisition of a single shot event has completed.
Pulse Width Trigger mode: T he oscillosc ope counts pulses of significa nt
magnitude inside the 1s m easurement wind ow that qualif y as trigger able
events, such as narrow pulses in a PW M pulse tr ain if s et to < mode and
the width is set to a relatively small time.
Edge Trigger mode: The oscilloscope counts all edges of sufficient
magnitude and correct polarity.
Video Trigger mode: The Frequency Counter does not work.
Acquisition
Acquisition Modes Normal, Peak Detect , and Average
Acquisition Rate,
typical
Up to 2000 waveforms per second per channel (Normal acquisitio n mode,
no measurement)
Single Sequenc e Acquisition Mode Acquisition Stop Time
Normal, Peak Detect
Upon single acquis ition o n all
channels
simultaneously
Average
Aft er N acq uisiti ons o n all c hannels
simultaneously, N can be set to 4, 8,
16, 32, 64 or 128
Inputs
Page 75

Specifications
DSO1000B Series HandHeld Oscilloscope User Manual 70
Inputs
Inp ut Coupling DC, AC or GND
Input Impedance,
DC coupled
1MΩ±2% in parallel with 20pF±3pF
Probe Attenuation
1X, 10X
Supported Probe
Attenuation Factor s
1X, 10X, 100X, 1000X
Maximum Input
Voltage
Overvoltage Category
Maximum Voltage
CAT I and CAT II
300V
RMS
(10×), I nstallation Category
CAT III
150V
RMS
(1×)
Installation Categor y II: der ate at 20dB/decade abov e 100kHz to 13V peak
AC at 3MHz* and above. For non-sinusoidal wavef orms, peak value must
be less than 450V. Excursion above 300V should be of less than 100ms
duration. RMS signal l evel including all DC com ponents removed through
AC coupling must be limited to 300V. If these values are exceeded, damage
to the oscilloscope m ay occur.
Measurements
Cursors
Voltage difference between cursors: △V
Time difference between cursors: △T
Reciprocal of △T in Hertz (1/ΔT)
Automatic
Measurements
Frequency, Period, Mean, Peak-to-peak, Cycle RMS, Minim um, Maximum ,
Rise Time, Fall Time, Positive Width, Negative Width
General Specifications
Display
Display Type
5.6 Inch width TFT Display
Display Resolution
480 (Vertical) X 640(Horizontal) pixels
Display Co ntrast Adjust able (16 gears) with the progress bar
Probe Compensator Output
Output Voltage,
typical
About 5Vpp into ≥1MΩ load
Frequency, typical
1kHz
Power Supply
Switching Adatper
AC Input:100-240VAC
RMS
,0.6A MAX,50Hz-60Hz; DC Output:9V,2A
DC Input DC8.5-15V,2A
Power Consumption <30W
Environmental
Temperature
Operating: 32 ℉ to 122℉ (0℃ to 50℃)
Nonoperating: -40
℉ to 1 5 9 .8 ℉ (
-40
℃ to +71℃)
Cooling Method
Convection
Humidity
+104℉ or below (+40℃ or below): ≤90% relative humidity
106
℉ to 1 2 2 ℉ (+ 4 1 ℃ to 5
Page 76

Specifications
DSO1000B Series HandHeld Oscilloscope User Manual 71
Altitude Operating and Nonoperating 3,000m (10,000 feet)
Random Vibration
0.31g
RMS
from 50Hz to 500Hz, 10
minutes on each axis
Nonoperating
2.46g
RMS
from 5Hz to 500Hz, 10
minutes on each axis
Mechanical Shock
Operating
50g, 11ms, half sine
Mechanical
Size
Length
245mm
Height
163mm
Depth
52mm
Weight 1.2 Kg
Meter Mode
Maximum Resol ution
6000 Counts
DMM Testing Modes
Voltage,Current,Resistance,Capacitance,Diode &
Continuity
Maximum Input Voltage
AC : 600V DC : 800V
Maximum Input Current
AC : 10A DC : 10A
Input Impedance
10MΩ
Meter Specification
Range
Accuracy
Resolution
DC Voltage
60.00mV(manual)
±1%±1digit
10uV
600.0mV
100uV
6.000V 1mV
60.00V 10mV
600.0V 100mV
800V 1V
AC Voltage
60.00mV(manual) ±1%±3digit 10uV
600.0mV(manual)
100uV
6.000V
1mV
60.00V
10mV
600.0V
100mV
DC Current 60.00mA ±1.5%±1digit 10uA
600.0mA ±1%±1digit 100uA
6.000A ±1.5%±3digit 1mA
10.00A 10mA
AC C urrent 60.00mA ±1.5%±3digit 10uA
600.0mA ±1%±1digit 100uA
6.000A
±1.5%±3digit
1mA
10.00A
10mA
Resistance
600.0
±1%±1digit
0.1Ω
6.000K
1Ω
Page 77
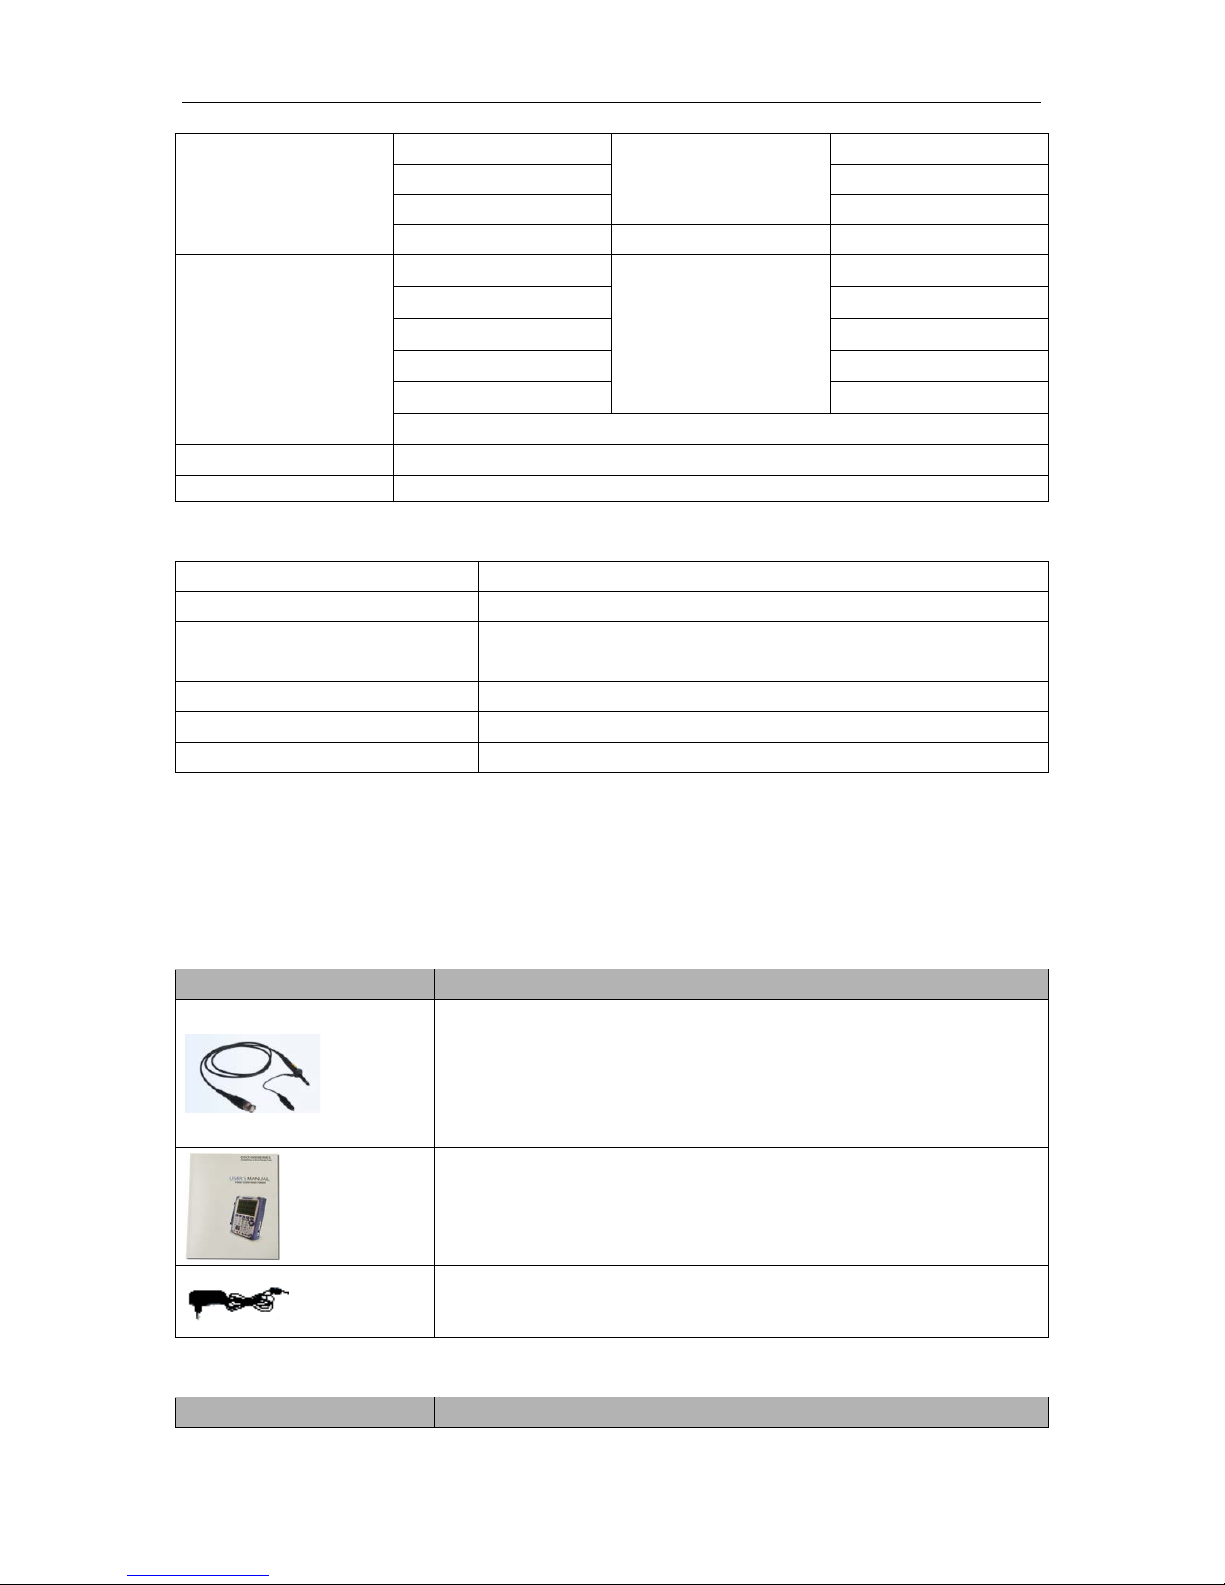
Specifications
DSO1000B Series HandHeld Oscilloscope User Manual 72
60.00K 10Ω
600.0K 100Ω
6.000M 1KΩ
60.00M ±1.5%±3digit 10KΩ
Capacitance
40.00nF
±1%±1digit
10pF
400.0nF 100pF
4.000uF 1nF
40.00uF 10nF
400.0uF 100nF
Attention:The smallest capacitance value that can be measured is 5nF.
Diode
0V~2.0V
On-off Test
< 10Ω
Linux Feature
Kernel Version
Linux2.6.30.4
Supported File system
Yaffs, Fat32
Drivers
Sound Driver, Buzzer Driver, FPGA Driver, SPI Driver, USB
Host Driver, LCD Driver, USB massstorage、gadget Driver
Linux Applications busybox1.18.4, mplayer, watchdog, gnupg1.4.11
U_boot Version u-boot-1.1.6
Sourcecode download website www.hantek.com./download/handscope.zip
9.2 Accessories
All the following accessories are available by contacting your local HANTEK distributor.
Standard Accessories
Sketch
Description
X1, X10 two passive probes. The passive probes have a 6MHz
bandwidth (rated 100Vrms CAT III) when the switch is in the X1
position, and a maximum bandwidth (rated 300Vrms CAT II) when
the switch is in the X10 positio n. Each probe consists of all
necessary fittings.
A quick guide of the DSO1000B
series oscilloscopes. It gives a
description mainly on functions and operating basis of these
oscilloscopes.
A Power Adapter that fits the standard of destination country.
ptional Accessories
Sketch
Description
Page 78

Specifications
DSO1000B Series HandHeld Oscilloscope User Manual 73
A USB A-B line, used to connect external devices with USB-B
interface like a printer or to establish comm unications between PC
and the oscillosc ope.
A software installation CD. It contains the user manual of
DSO1000B, giv ing particular descript ions on the DSO1000B series
oscilloscopes.
Page 79

General Care and Cleaning
DSO1000B Series HandHeld Oscilloscope User Manual 74
Chapter 10 Services and Support
Tha nk yo u fo r c hoos i ng HA NT EK . P lea s e co ntac t us t hro ug h t he f ol lo wi ng wa ys sho ul d yo u hav e
any inquiry regarding our products. We shall do our best to help you.
1. Contact your local HANTEK distributor;
2. Contact your local HANTEK field office;
3. Contact HANTEK headquarters in China.
Headquarters
Qingdao Hantek Electronic Co., Ltd
http://www.hantek.com
Address: 5/F, No.177 Zhuzhou Road (Huite Industry City), Qingdao, China
266101
Tel: +86-532-88703687 / 88703697
Fax: +86-532-88705691
Email: service@hantek.com.cn
Technical Support
Tel: +86-532-88703687 (ext: 607)
Email: support@hantek.com.cn
Marketing Department
Tel: +86-532-88703687 (ext: 603)
Email: david@hantek.com.cn
Sales Department
Tel: +86-532-88703687 (ext: 604)
Email: rose@hantek.com.cn
Page 80

General Care and Cleaning
DSO1000B Series HandHeld Oscilloscope User Manual 75
Chapter 11 General Care and Cleaning
11.1 General Care
Do not put or leave the device in a place where t he LCD displa y will be expos ed t o direct sunlight
for long periods of time.
Note: To avoid damage to the oscilloscope or probes, do not expose them to sprays, liquids, or
solvents.
11.2 Cleaning
Examine the oscilloscope and probes as often as operating conditions require. To clean the
exterior surf ace, perform the following steps:
1) Use a lint-f ree cloth to remove floati ng dust on the outside of the osc illoscope and probes.
Take care to avoid scratching the glabrous display filter.
2) Use a soft cloth dampened with water to clean the oscilloscope. For more efficient cleaning,
you may use an aqueous solution of 75% isopropyl alcohol.
Note: To avoid damage to the surface of the oscilloscope or probes, do not use any
corrosive or chemical cleaning agents.
Page 81

General Care and Cleaning
DSO1000B Series HandHeld Oscilloscope User Manual 76
Appendix A Harm f ul and Poisonous
Substances or Elements
Harmful and poisonous substances or elements 1
Component2 Pb Hg Cd Cr(Vi) PBB PBDE
Shell and Chassis X 0 0 X 0 0
Display Mo dule X X 0 0 0 0
Circuit Board X 0 0 X 0 0
Power Supply
X 0 0 X 0 0 Electric Wire and Cable Assembly
X 0 0 0 0 0 Connector
X 0 0 X 0 0 Fastener and Installed Har dware
X 0 X X 0 0 Other Accessories (including probes )
X 0 0 X 0
0
Others 0 0 0 0 0 0
‘X’ m eans t hat at leas t the c onte nt of t his po iso nous a nd har mful s ubst ance i n a ho moge neous
material of this com ponent exceeds the limit specif ied in the SJ/T 11363-2006 standard.
‘0’ indicates that the content of this poisonous and harmful substance in all homogeneous
materials of t his component is refrained under the limit stated in the SJ/T 11363-2006 standard.
This component list contains components approved in the file ‘Managem ent Measur es’.
 Loading...