

Page 1

DOC024.52.93034
POLYMETRON Model 9240 Multi-Channel Sodium
Analyzer
User Manual
09/2013, Edition 8
Page 2

Page 3

Table of Contents
Section 1 General Information.........................................................................................................5
1.1 Disclaimer .................................................................................................................................... 5
1.2 Contact information...................................................................................................................... 5
1.3 Safety information ........................................................................................................................ 5
1.3.1 Use of hazard information................................................................................................... 5
1.3.2 Safety recommendations .................................................................................................... 6
1.3.3 Service and repairs .............................................................................................................6
1.3.4 Potential safety hazards...................................................................................................... 6
1.3.5 Precautionary labels............................................................................................................7
1.3.6 EMC compliance statement (Korea) ................................................................................... 7
1.4 Product recycling information.......................................................................................................8
1.5 Product disposal ........................................................................................................................ 10
1.6 Restriction of hazardous substances (RoHS) ............................................................................11
Section 2 Specifications.................................................................................................................. 13
2.1 Technical specifications .............................................................................................................13
2.2 Model identification system........................................................................................................ 15
Section 3 Analyzer Overview ......................................................................................................... 17
3.1 Overview .................................................................................................................................... 17
3.2 Schematic process overview ..................................................................................................... 18
3.3 Presentation of the analyzer ...................................................................................................... 19
3.3.1 Analyzer front panel ..........................................................................................................19
3.3.2 Analyzer rear panel........................................................................................................... 20
3.3.3 Pumps box ........................................................................................................................21
3.4 Conditioning reagent.................................................................................................................. 22
3.5 pH regulation..............................................................................................................................23
3.5.1 Non-cationic applications ..................................................................................................23
3.5.2 Cationic applications ......................................................................................................... 23
3.6 Measurement process ............................................................................................................... 25
3.6.1 Smart rinse option............................................................................................................. 25
3.6.2 Measurement steps........................................................................................................... 26
3.6.3 Measurement cycle........................................................................................................... 29
3.6.4 On-line measurement........................................................................................................29
3.7 Automatic calibration cycle ........................................................................................................ 30
3.8 Manual calibration cycle.............................................................................................................32
3.9 Grab sample measurement cycle .............................................................................................. 33
3.10 Analyzer outputs ...................................................................................................................... 34
3.10.1 Sensor reactivation ......................................................................................................... 34
3.10.2 Standard measurement process.....................................................................................34
3.10.3 Grab sample process......................................................................................................34
3.10.4 Auto calibration process..................................................................................................35
3.10.5 Manual calibration process ............................................................................................. 35
3.11 Available options...................................................................................................................... 36
3.11.1 K-Kit (cationic)................................................................................................................. 36
3.11.2 Static heat exchanger system......................................................................................... 36
3.11.3 Extra channels ................................................................................................................ 36
Section 4 Installation........................................................................................................................37
4.1 Analyzer inspection and unpacking ........................................................................................... 37
4.2 Instrument preparation............................................................................................................... 37
4.3 Instrument mounting .................................................................................................................. 38
4.3.1 Panel mounting .................................................................................................................38
4.3.2 Wall mounting ................................................................................................................... 39
4.4 Step-by-step installation.............................................................................................................40
4.4.1 Mains power connection ................................................................................................... 40
4.4.2 RS485 connection............................................................................................................. 45
1
Page 4

Table of Contents
4.4.3 Input/Output connections ..................................................................................................47
4.4.4 Sample tubes installation ..................................................................................................48
4.4.5 Reagents installation .........................................................................................................49
4.4.6 Magnetic stirrer installation................................................................................................50
4.4.7 Reagents volume declaration............................................................................................51
4.4.8 Flow rate adjustment .........................................................................................................52
4.4.9 Sample pH conditioning check ..........................................................................................53
4.4.10 Reference electrode installation......................................................................................54
4.4.11 Sodium ion selective electrode installation......................................................................56
4.4.12 Fill electrolyte reservoir ...................................................................................................57
4.5 Analyzer stabilization..................................................................................................................58
4.6 Analyzer setup............................................................................................................................58
Section 5 Operati ng Instructions ..................................................................................................59
5.1 Data entry...................................................................................................................................59
5.1.1 Function keys ....................................................................................................................59
5.1.2 Numeric fields....................................................................................................................60
5.1.3 Alphanumeric fields...........................................................................................................61
5.1.4 List element fields..............................................................................................................62
5.1.5 Incremental value fields.....................................................................................................62
5.1.6 Data entry input errors.......................................................................................................62
5.2 Measurement screens................................................................................................................63
5.2.1 Principal display ................................................................................................................63
5.2.2 Historical display ...............................................................................................................64
5.2.3 Alarms screen ...................................................................................................................65
5.3 Main menu..................................................................................................................................66
5.3.1 Verification.........................................................................................................................67
5.3.2 Grab sample...................................................................................................................... 69
5.4 Menu structure overview ............................................................................................................71
Section 6 System Setup...................................................................................................................73
6.1 System setup - Menu overview ..................................................................................................74
6.2 Date and time.............................................................................................................................74
6.3 Display options...........................................................................................................................75
6.4 Passwords..................................................................................................................................76
6.5 Default values.............................................................................................................................76
6.6 Adjust mA output........................................................................................................................77
6.7 Factory settings..........................................................................................................................77
Section 7 User Setup........................................................................................................................79
7.1 User setup - Menu overview.......................................................................................................80
7.2 Measurement .............................................................................................................................81
7.2.1 Targeted pH (non-cationic applications only)....................................................................81
7.2.2 Total gas/water ratio (cationic applications only)...............................................................81
7.2.3 Measure steps................................................................................................................... 81
7.2.4 Reactivation frequency......................................................................................................82
7.2.5 Datalogger setup ...............................................................................................................83
7.2.6 Graph time base................................................................................................................84
7.3 Alarms ........................................................................................................................................84
7.3.1 Alarms 1 to 4 .....................................................................................................................85
7.3.2 Warning alarm ...................................................................................................................86
7.3.3 System alarm ....................................................................................................................86
7.3.4 System and warning alarm table.......................................................................................87
7.4 mA outputs .................................................................................................................................88
7.4.1 Outputs 0 to 5....................................................................................................................88
7.4.2 Event indication .................................................................................................................89
7.4.3 Test ...................................................................................................................................90
2
Page 5

Table of Contents
7.5 RS485 (or PROFIBUS) ..............................................................................................................90
7.6 Sample channels ....................................................................................................................... 91
7.6.1 Number of channels.......................................................................................................... 91
7.6.2 Channel activation............................................................................................................. 92
7.6.3 Sequence..........................................................................................................................92
7.6.4 Channel names.................................................................................................................92
Section 8 Calibration........................................................................................................................93
8.1 General ...................................................................................................................................... 93
8.2 Calibration solution concentrations ............................................................................................ 93
8.3 Calibration - Menu overview ...................................................................................................... 94
8.4 Start calibration ..........................................................................................................................94
8.4.1 Calibrate known addition...................................................................................................94
8.4.2 One point calibration ......................................................................................................... 97
8.4.3 Two point calibration .........................................................................................................98
8.5 Automatic calibration setup........................................................................................................99
8.6 Calibration results .................................................................................................................... 100
8.7 Calibration loggings ................................................................................................................. 100
8.8 Custom adjustment .................................................................................................................. 101
8.9 Temperature calibration ........................................................................................................... 101
Section 9 Maintenance and Diagnostics ................................................................................... 103
9.1 Maintenance schedule ............................................................................................................. 103
9.2 Battery replacement................................................................................................................. 103
9.3 Fuse replacement .................................................................................................................... 104
9.4 Cleaning and decontamination ................................................................................................ 104
9.5 Maintenance and diagnostics menu option.............................................................................. 105
9.6 Maintenance and diagnostics - Menu overview....................................................................... 105
9.7 Reagent changes..................................................................................................................... 106
9.7.1 Adjust bottle volumes......................................................................................................106
9.7.2 Priming tubes ..................................................................................................................107
9.7.3 Bottles full........................................................................................................................ 107
9.8 Calibration diagnostics.............................................................................................................108
9.9 Raw values .............................................................................................................................. 108
9.10 Test accessories ....................................................................................................................108
9.10.1 Hydraulics ..................................................................................................................... 109
9.10.2 Relays ...........................................................................................................................109
9.10.3 Logical inputs ................................................................................................................110
9.11 Sensor reactivation ................................................................................................................ 110
9.12 Extended stop ........................................................................................................................ 111
9.13 Startup ................................................................................................................................... 112
9.14 Software versions .................................................................................................................. 112
Section 10 Troubleshooting ......................................................................................................... 113
10.1 General faults.........................................................................................................................113
10.2 Detection of functional faults..................................................................................................116
10.3 Miscellaneous problems ........................................................................................................ 116
Section 11 Spare Parts and Accessories ..................................................................................117
11.1 Accessories - Options - Maintenance kits.............................................................................. 117
11.2 Spare parts - In contact with sample...................................................................................... 118
11.3 Spare parts - In contact with cell or electrodes ...................................................................... 118
11.4 Spare parts - In contact with reagents or standard solution................................................... 119
11.5 Electronics ............................................................................................................................. 119
11.6 Additional hardware ............................................................................................................... 120
Section 12 Default Configuration................................................................................................121
12.1 User configuration table......................................................................................................... 121
3
Page 6

Table of Contents
Section 13 Material Safety Data Sheets (MSDS) ......................................................................127
13.1 Diisopropylamine (DIPA)........................................................................................................127
13.2 Potassium chloride.................................................................................................................130
13.3 Sodium chloride......................................................................................................................132
13.4 Sodium nitrate ........................................................................................................................134
Section 14 Reagent Preparation..................................................................................................137
14.1 Conditioning Reagent.............................................................................................................137
14.2 Standard Solutions.................................................................................................................137
14.3 Automatic Calibration Solution (10 ppm Na) ..........................................................................138
14.4 3M KCl....................................................................................................................................139
14.5 0.5M NaNO3 ..........................................................................................................................139
4
Page 7
Section 1 General Information
1.1 Disclaimer
The information in this manual has been carefully checked and is believed to be accurate.
However, Hach Lange assumes no responsibility for any inaccuracies that may be contained in
this manual. In no event will Hach Lange be liable for direct, indirect, special, incidental, or
consequential damages resulting from any defect or omission in this manual, even if advised of
the possibility of such damages. In the interest of continued product development, Hach Lange
reserves the right to make improvements in this manual and the products it describes at any
time, without notice or obligation.
Copyright © 2007-2013 by Hach Lange. All rights reserved. No part of the contents of this
manual may be reproduced or transmitted in any form or by any means without the written
permission of Hach Lange.
1.2 Contact information
Manufacturing site:
HACH LANGE Sàrl
6, route de Compois
1222 Vésenaz
SWITZERLAND
Tel. +41 22 594 6400
Fax +41 22 594 6499
1.3 Safety information
Read this entire manual before unpacking, setting up or operating this equipment. Pay attention
to all danger and caution statements. Failure to do so could result in serious injury to the
operator or damage to the equipment.
To make sure that the protection provided by this equipment is not impaired, do not use or
install this equipment in any manner other than that specified in this manual.
Note: This equipment has been tested and found to comply with the limits for Class A digital device,
pursuant to Part 15 of the FCC Rules. These limits are designed to provide reasonable protection against
harmful interference when the equipment is operated in a commercial environment. This equipment
generates, uses, and can radiate radio frequency energy and, if not installed and used in accordance with
the instruction manual, may cause harmful interference to radio communications. Operation of this
equipment in a residential area is likely to cause harmful interference in which case the user will be required
to correct the interference at his own expense.
1.3.1 Use of hazard information
European HQ:
HACH LANGE GmbH
Willstätterstraße 11
40549 Düsseldorf
GERMANY
Tel. +49 211 52 880
Fax +49 211 52 88143
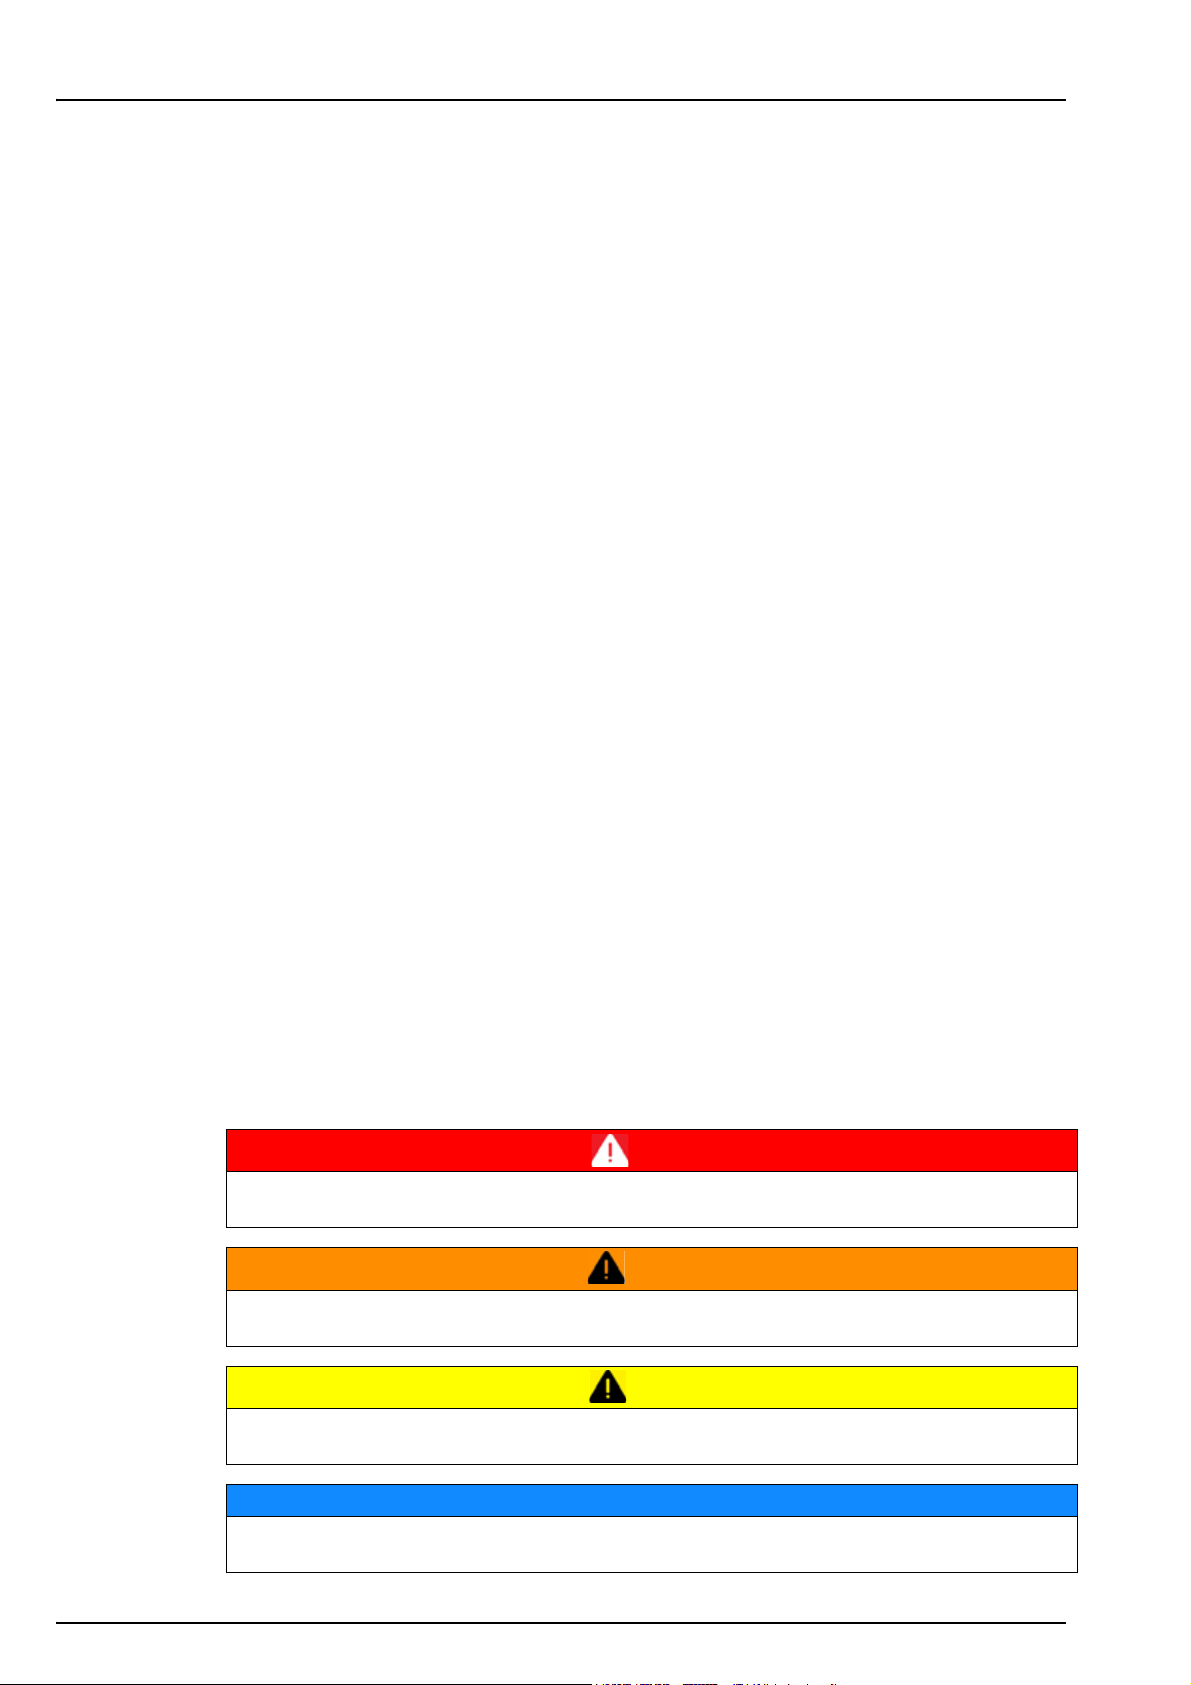
DANGER
Indicates a potentially or imminently hazardous situation which, if not avoided, will result in
death or serious injury.
WARNING
Indicates a potentially or imminently hazardous situation which, if not avoided, could result in
death or serious injury.
CAUTION
Indicates a potentially or imminently hazardous situation that may result in minor or moderate
injury.
NOTICE
Indicates a situation which, if not avoided, may cause damage to the instrument. Information
that requires special emphasis.
5
Page 8
General Information
1.3.2 Safety recommendations
For safe operation, it is imperative that these service instructions be read before use and that
the safety recommendations mentioned herein be scrupulously respected. If repairs or
adjustments are necessary, the analyzer should be returned to an authorized Hach Lange
service center.
If danger warnings are not heeded to, serious material or bodily injury could occur.
In accordance with safety standards, it must be possible to disconnect the power supply of the
analyzer in its immediate vicinity.
The installation of the analyzer should be performed exclusively by personnel specialized and
authorized to work on electrical installations, in accordance with relevant local regulations.
1.3.3 Service and repairs
None of the analyzer’s components can be serviced by the user. Only personnel from Hach
Lange or its approved representative(s) is (are) authorized to attempt repairs to the system and
only components formally approved by the manufacturer should be used. Any attempt at
repairing the analyzer in contravention of these principles could cause damage to the analyzer
and corporal injury to the person carrying out the repair. It renders the warranty null and void
and could compromise the correct working of the analyzer and the electrical integrity or the CE
compliance of the analyzer.
WARNING
WARNING
If you have any problems with installation, starting, or using the analyzer please contact the
company that sold it to you. If this is not possible, or if the results of this approach are not
satisfactory, please contact the manufacturer’s Customer Service.
1.3.4 Potential safety hazards
The following potential safety hazards are associated with operating the analyzer:
• Electrical (line voltage)
• Potentially hazardous chemicals
6
Page 9
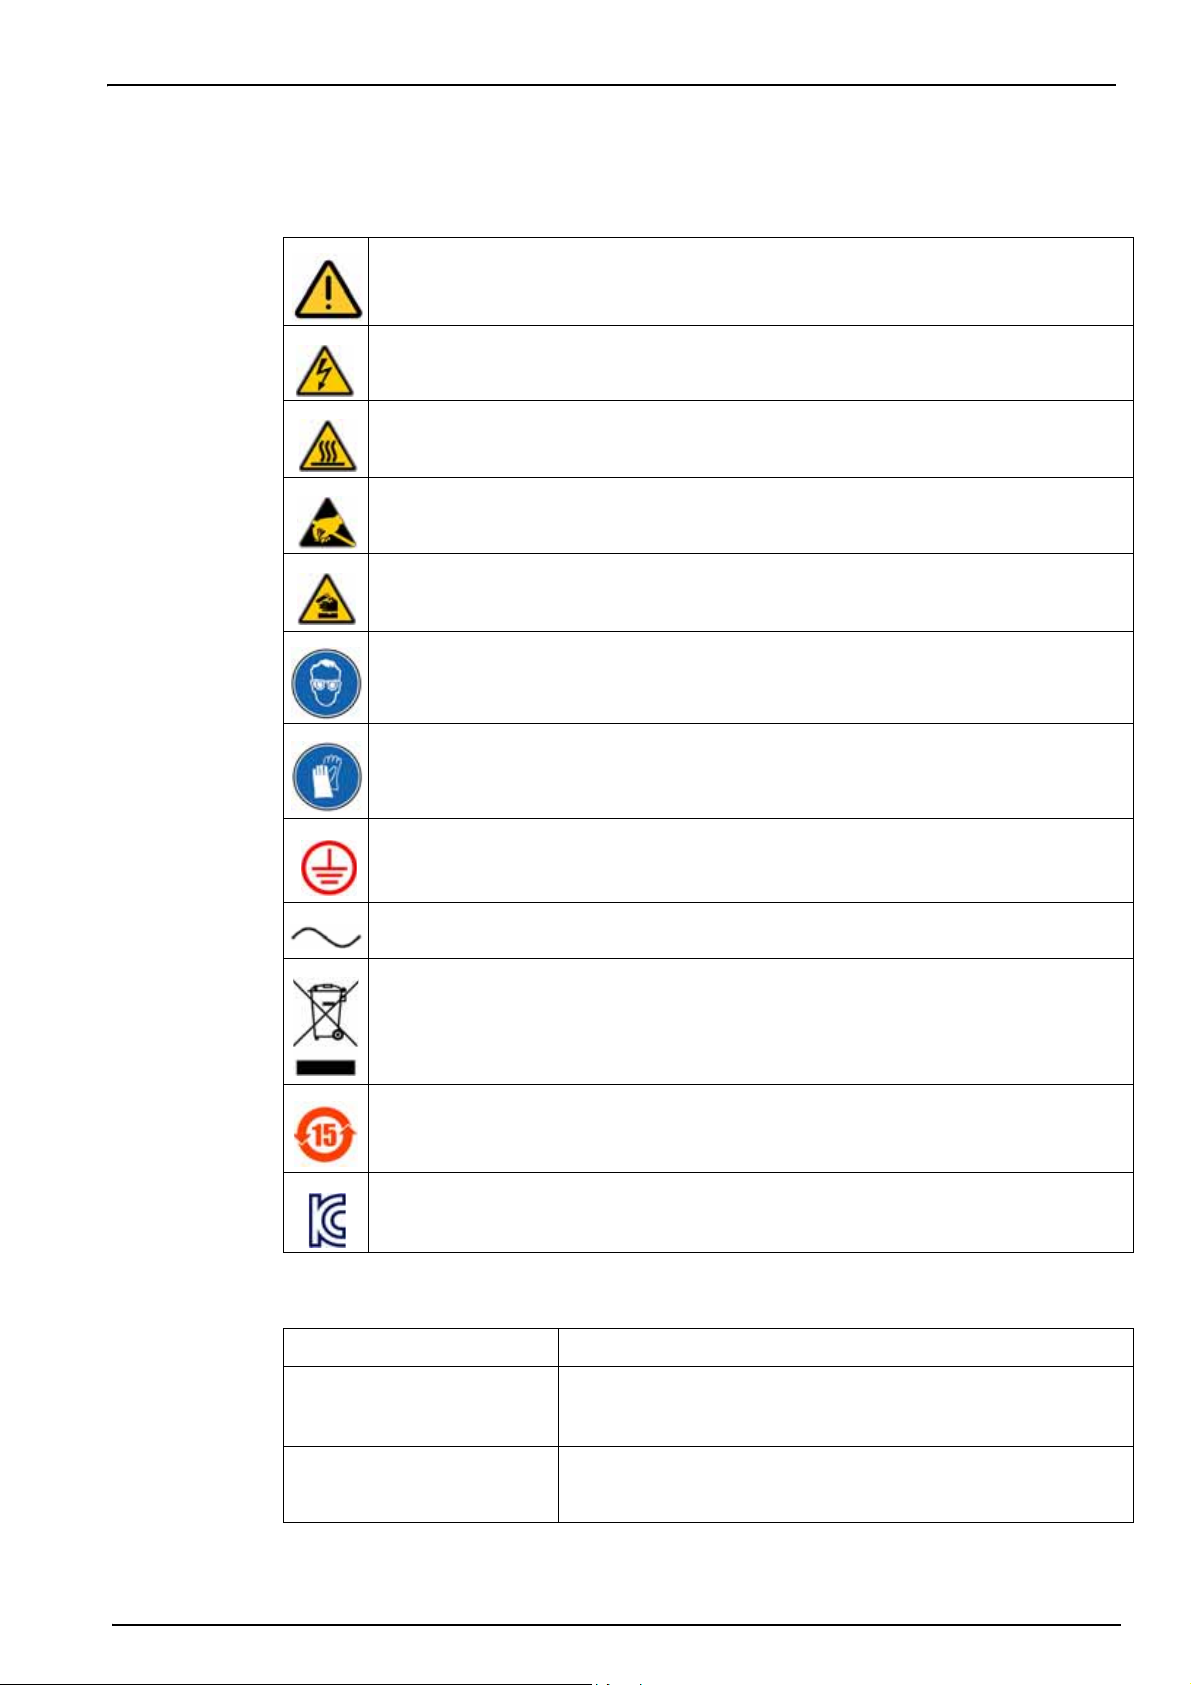
1.3.5 Precautionary labels
Read all labels and tags attached to the analyzer. Personal injury or damage to the analyzer
could occur if not observed.
This symbol, when noted on a product, indicates a potential hazard which could cause serious
personal injury and/or death. The user should reference this instruction manual for operation
and/or safety information.
This symbol, when noted on a product enclosure or barrier, indicates that a risk of electrical
shock and/or electrocution exists and indicates that only individuals qualified to work with
hazardous voltages should open the enclosure or remove the barrier.
This symbol, when noted on the product, indicates that the marked item can be hot and
should not be touched without care.
This symbol, when noted on the product, indicates the presence of devices sensitive to
electrostatic discharge and indicates that care must be taken to prevent damage to them.
This symbol, when noted on the product, identifies a risk of chemical harm and indicates that
only individuals qualified and trained to work with chemicals should handle chemicals or
perform maintenance on chemical delivery systems associated with the equipment.
General Information
This symbol, if noted on the product, indicates the need for protective eye wear.
This symbol indicates the need for protective hand wear.
This symbol, when noted on the product, identifies the location of the connection for protective
earth (ground).
This symbol, when noted on a product, indicates the instrument is connected to
alternate current.
Electrical equipment marked with this symbol may not be disposed of in European public
disposal systems. In conformity with European local and national regulations, European
electrical equipment users must now return old or end-of-life equipment to the manufacturer
for disposal at no charge to the user.
Products marked with this symbol indicates that the product contains toxic or hazardous
substances or elements. The number inside the symbol indicates the environmental protection
use period in years.
Products marked with this symbol indicates that the product conforms to relevant South
Korean EMC standards.
1.3.6 EMC compliance statement (Korea)
Type of equipment Additional information
A급 기기
( 업무용 방송통신기자재 )
Class A equipment
(Industrial Broadcasting and
Communication Equipment)
이 기기는 업무용 (A 급 ) 전자파적합기기로서 판매자 또는 사
용자는 이 점을 주의하시기 바라며, 가정외의 지역에서 사용하
는 것을 목적으로 합니다 .
This equipment meets Industrial (Class A) EMC requirements. This
equipment is for use in industrial environments only.
7
Page 10
General Information
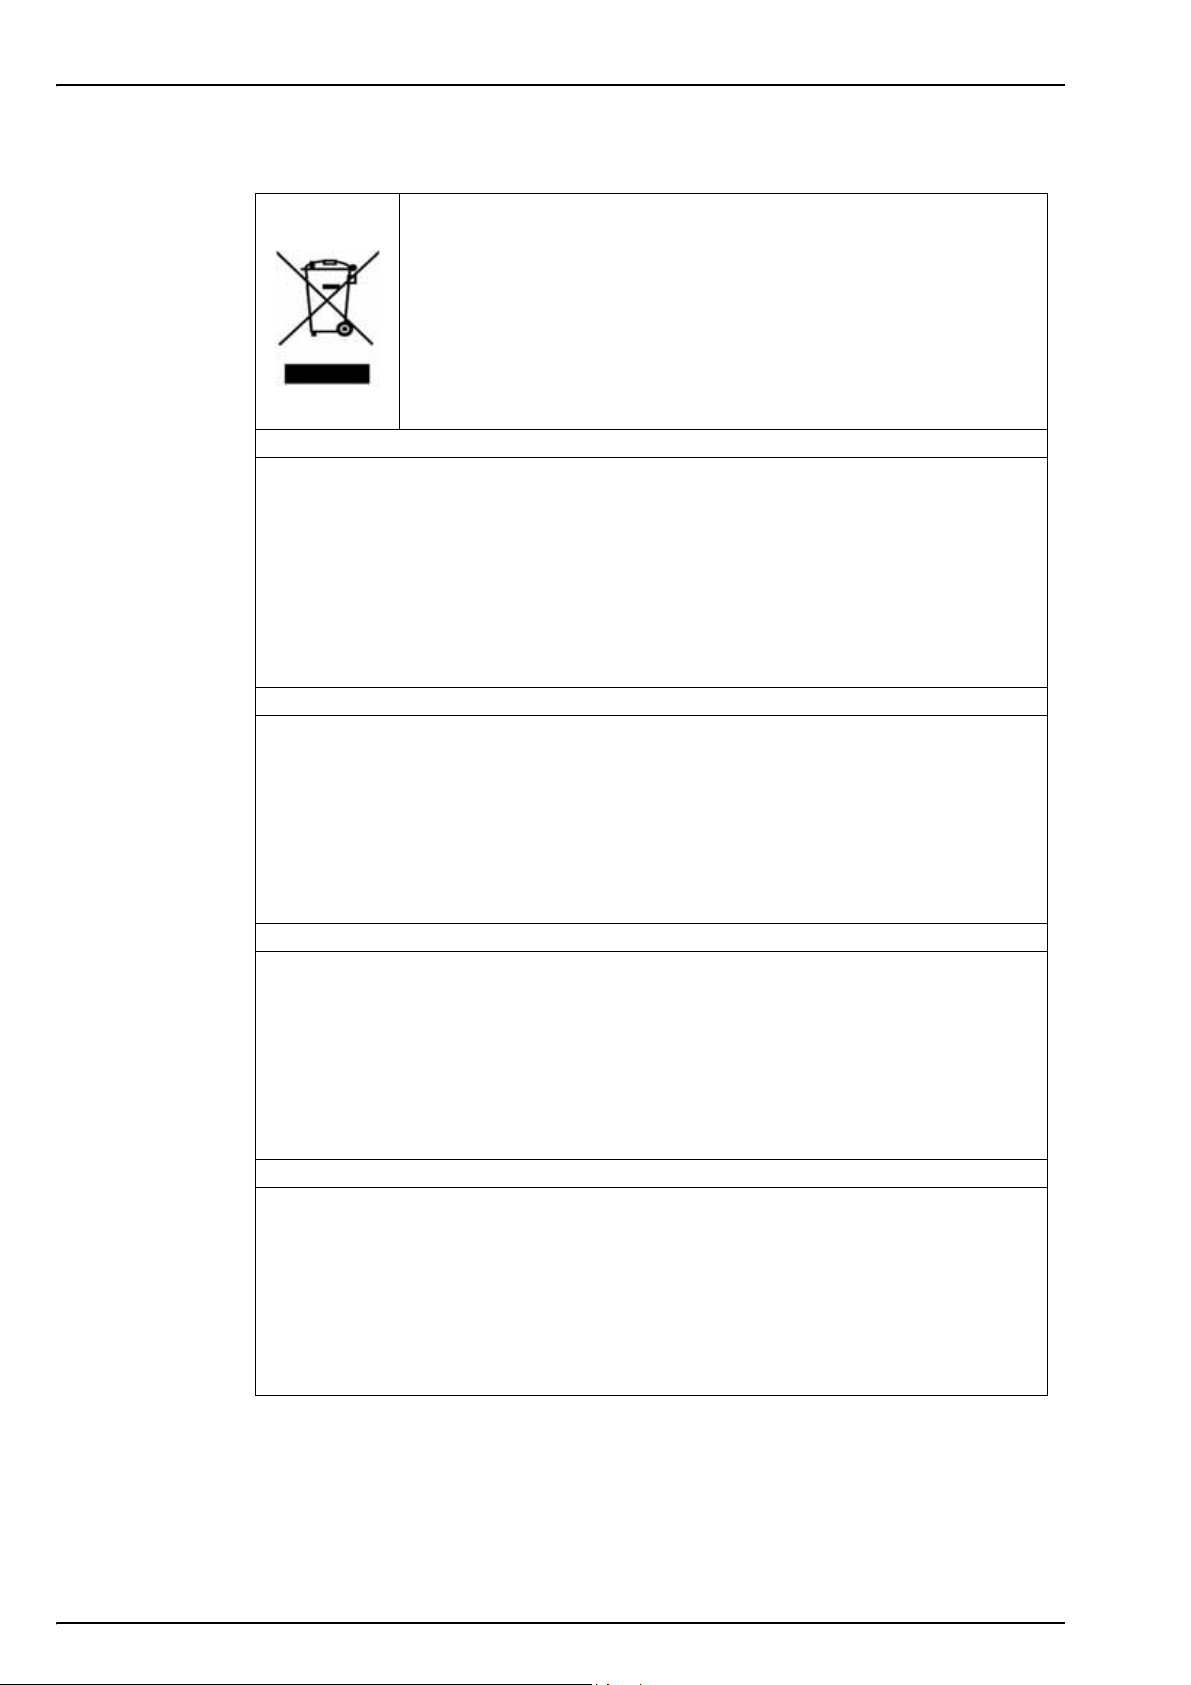
1.4 Product recycling information
ENGLISH
Electrical equipment marked with this symbol may not be disposed of in
European public disposal systems after 12 August 2005. In conformity with
European local and national regulations (EU Directive 2002/96/EC), European
electrical equipment users must now return old or end-of-life equipment to the
manufacturer for disposal at no charge to the user.
Note: For return for recycling, please contact the equipment
manufacturer or supplier for instructions on how to return end-of-life
equipment for proper disposal.
DEUTSCH
Elektrogeräte, die mit diesem Symbol gekennzeichnet sind, dürfen in Europa nach dem 12.
August 2005 nicht mehr über die öffentliche Abfallentsorgung entsorgt werden. In
Übereinstimmung mit lokalen und nationalen europäischen Bestimmungen (EU-Richtlinie
2002/96/EC), müssen Benutzer von Elektrogeräten in Europa ab diesem Zeitpunkt alte bzw. zu
verschrottende Geräte zur Entsorgung kostenfrei an den Hersteller zurückgeben.
Hinweis: Bitte wenden Sie sich an den Hersteller bzw. an den Händler, von dem Sie das Gerät
bezogen haben, um Informationen zur Rückgabe des Altgeräts zur ordnungsgemäßen
Entsorgung zu erhalten.
FRANCAIS
A partir du 12 août 2005, il est interdit de mettre au rebut le matériel électrique marqué de ce
symbole par les voies habituelles de déchetterie publique. Conformément à la réglementation
européenne (directive UE 2002/96/EC), les utilisateurs de matériel électrique en Europe doivent
désormais retourner le matériel usé ou périmé au fabricant pour élimination, sans frais pour
l'utilisateur.
Remarque: Veuillez vous adresser au fabricant ou au fournisseur du matériel pour les
instructions de retour du matériel usé ou périmé aux fins d'élimination conforme.
ITALIANO
Le apparecchiature elettriche con apposto questo simbolo non possono essere smaltite nelle
discariche pubbliche europee successivamente al 12 agosto 2005. In conformità alle normative
europee locali e nazionali (Direttiva UE 2002/96/EC), gli utilizzatori europei di apparecchiature
elettriche devono restituire al produttore le apparecchiature vecchie o a fine vita per lo
smaltimento senza alcun costo a carico dell’utilizzatore.
Nota: Per conoscere le modalità di restituzione delle apparecchiature a fine vita da riciclare,
contattare il produttore o il fornitore dell’apparecchiatura per un corretto smaltimento.
DANSK
Elektriske apparater, der er mærket med dette symbol, må ikke bortskaffes i europæiske offentlige
affaldssystemer efter den 12. august 2005. I henhold til europæiske lokale og nationale regler
(EU-direktiv 2002/96/EF) skal europæiske brugere af elektriske apparater nu returnere gamle eller
udtjente apparater til producenten med henblik på bortskaffelse uden omkostninger for brugeren.
Bemærk: I forbindelse med returnering til genbrug skal du kontakte producenten eller
leverandøren af apparatet for at få instruktioner om, hvordan udtjente apparater bortskaffes
korrekt.
8
Page 11

General Information
SVENSKA
Elektronikutrustning som är märkt med denna symbol kanske inte kan lämnas in på europeiska
offentliga sopstationer efter 2005-08-12. Enligt europeiska lokala och nationella föreskrifter
(EU-direktiv 2002/96/EC) måste användare av elektronikutrustning i Europa nu återlämna gammal
eller utrangerad utrustning till tillverkaren för kassering utan kostnad för användaren.
Obs! Om du ska återlämna utrustning för återvinning ska du kontakta tillverkaren av utrustningen
eller återförsäljaren för att få anvisningar om hur du återlämnar kasserad utrustning för att den ska
bortskaffas på rätt sätt.
ESPANOL
A partir del 12 de agosto de 2005, los equipos eléctricos que lleven este símbolo no deberán ser
desechados en los puntos limpios europeos. De conformidad con las normativas europeas
locales y nacionales (Directiva de la UE 2002/96/EC), a partir de esa fecha, los usuarios
europeos de equipos eléctricos deberán devolver los equipos usados u obsoletos al fabricante de
los mismos para su reciclado, sin coste alguno para el usuario.
Nota: Sírvase ponerse en contacto con el fabricante o proveedor de los equipos para solicitar
instrucciones sobre cómo devolver los equipos obsoletos para su correcto reciclado.
NEDERLANDS
Elektrische apparatuur die is voorzien van dit symbool mag na 12 augustus 2005 niet meer
worden afgevoerd naar Europese openbare afvalsystemen. Conform Europese lokale en
nationale wetgegeving (EU-richtlijn 2002/96/EC) dienen gebruikers van elektrische apparaten
voortaan hun oude of afgedankte apparatuur kosteloos voor recycling of vernietiging naar de
producent terug te brengen.
Nota: Als u apparatuur voor recycling terugbrengt, moet u contact opnemen met de producent of
leverancier voor instructies voor het terugbrengen van de afgedankte apparatuur voor een juiste
verwerking.
POLSKI
Sprzęt elektryczny oznaczony takim symbolem nie może być likwidowany w europejskich
systemach utylizacji po dniu 12 sierpnia 2005. Zgodnie z europejskimi, lokalnymi i państwowymi
przepisami prawa (Dyrektywa Unii Europejskiej 2002/96/EC), użytkownicy sprzętu elektrycznego
w Europie muszą obecie przekazywać Producentowi stary sprzęt lub sprzęt po okresie
użytkowania do bezpłatnej utylizacji.
Uwaga: Aby przekazać sprzęt do recyklingu, należy zwrócić się do producenta lub dostawcy
sprzętu w celu uzyskania instrukcji dotyczących procedur przekazywania do utylizacji sprzętu po
okresie użytkownia.
PORTUGUES
Qualquer equipamento eléctrico que ostente este símbolo não poderá ser eliminado através dos
sistemas públicos europeus de tratamento de resíduos sólidos a partir de 12 de Agosto de 2005.
De acordo com as normas locais e europeias (Directiva Europeia 2002/96/EC), os utilizadores
europeus de equipamentos eléctricos deverão agora devolver os seus equipamentos velhos ou
em fim de vida ao produtor para o respectivo tratamento sem quaisquer custos para o utilizador.
Nota: No que toca à devolução para reciclagem, por favor, contacte o produtor ou fornecedor do
equipamento para instruções de devolução de equipamento em fim de vida para a sua correcta
eliminação.
9
Page 12

General Information
1.5 Product disposal
Note: The following only applies to European customers.
Hach Lange is committed to ensuring that the risk of any environmental damage or pollution
caused by any of its products is minimized as far as possible. The European Waste Electrical
and Electronic Equipment (WEEE) Directive (2002/96/EC) that came into force on August 13
2005 aims to reduce the waste arising from electrical and electronic equipment; and improve the
environmental performance of all those involved in the life cycle of electrical and electronic
equipment.
In conformity with European local and national regulations (EU Directive 2002/96/EC stated
above), electrical equipment marked with the above symbol may not be disposed of in
European public disposal systems after 12 August 2005.
Hach Lange will offer to take back (free of charge to the customer) any old, unserviceable or
redundant analyzers and systems which carry the above symbol, and which were originally
supplied by Hach Lange. Hach Lange will then be responsible for the disposal of this
equipment.
In addition, Hach Lange will offer to take back (at cost to the customer) any old, unserviceable
or redundant analyzers and systems which do not carry the above symbol, but which were
originally supplied by Hach Lange. Hach Lange will then be responsible for the disposal of this
equipment.
Should you wish to arrange for the disposal of any piece of equipment originally supplied by
Hach Lange, please contact your supplier or our After Sales Service department in Geneva for
instructions on how to return this equipment for proper disposal.
10
Page 13
1.6 Restriction of hazardous substances (RoHS)
The European Union RoHS Directive and subsequent regulations introduced in member states
and other countries limits the use of six hazardous substances used in the manufacturing of
electrical and electronic equipment.
Currently, monitoring and control instruments do not fall within the scope of the RoHS Directive,
however Hach Lange has taken the decision to adopt the recommendations in the Directive as
the target for all future product design and component purchasing.
Note: The following only applies to exports of this product into the People’s Republic of China.
General Information
Transmitter box X
CPU PCB (with battery) O O
Power PCB O O
RS485 PCB O
O:
X:
11
Page 14

General Information
12
Page 15
Section 2 Specifications
2.1 Technical specifications
Specifications are subject to change without notice.
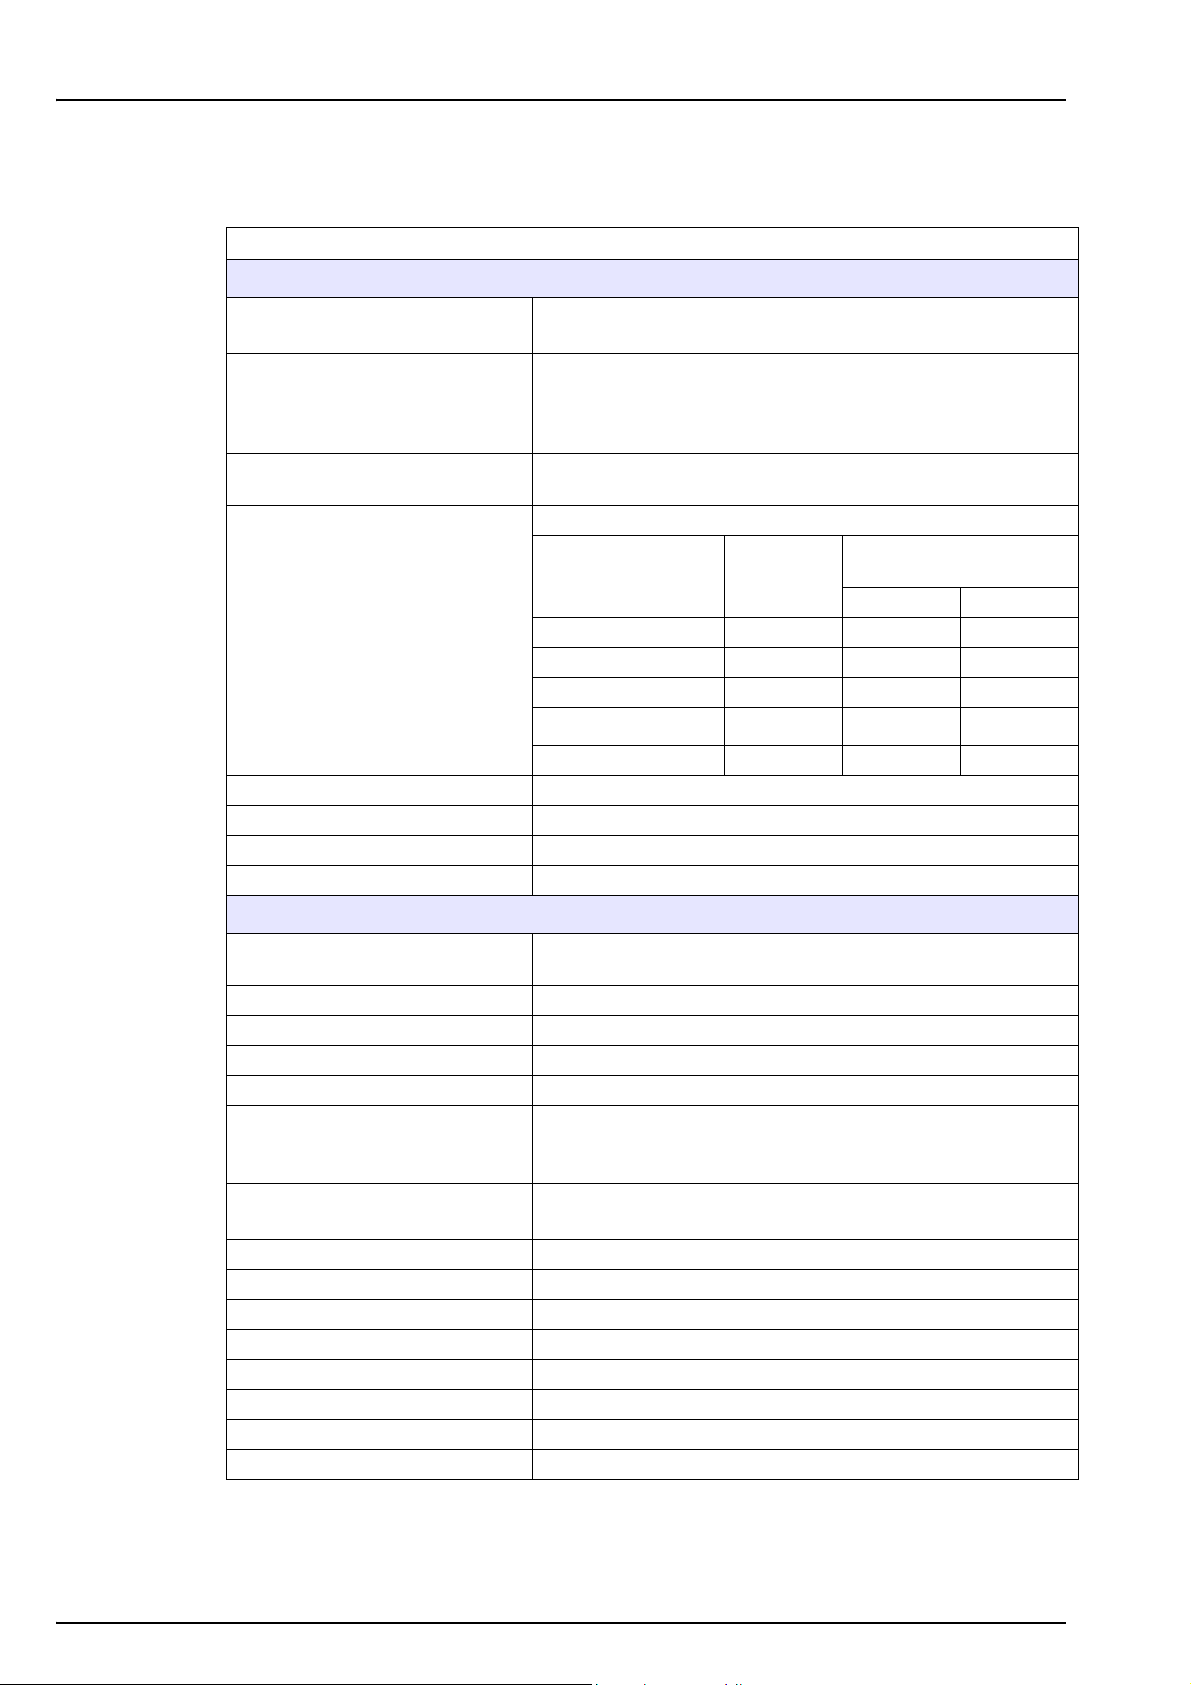
Ta ble 1 Techni c a l sp ec if ic at io n s
PERFORMANCE SPECIFICATIONS
Measuring range
Accuracy
Repeatability
Average response times at 25°C
with a maximum ΔT =15°C between
channels
Electrode type pH glass electrode
Number of channels 1 to 4
Interference phosphate 10 ppm Measurement variation less 0.1 ppb.
Sample temperature interference < 0.5% / °C
0 to 10,000 ppb freely programmable
0 to 200 ppm with K-Kit option
Non-cationic application:
± 0.1 ppb or ± 5% of reading, whichever is greater
Cationic application:
± 2 ppb or 5% reading, whichever is greater
< 0.02 ppb or 1.5% reading, whichever is greater within 10°C
variation
T90% ≤ 10 min
Concentration step
from one channel to
another
0.1 ↔ 5 ppb 3 9 min 27 min
0.1 ↔ 50 ppb 3 11 min 41 min
0.1 ↔ 200 ppb 3 9 min 45 min
< 0.1 ↔ 1 ppb
0.1 ↔ 50 ppb 15 11 min 41 min
ENVIRONMENT AL REQUIREMENTS
(1)
Max. temp
variation
(°C)
3 29 min 36 min
Time to reach accuracy 0.1
ppb or 5%
up down
Typical environment
Suspended solids < 2 NTU, no oil, no grease.
Temperature range for storage -20 to 60°C (2 to 140°F)
Relative humidity 10 to 80%
Ambient temperature 5 to 50°C (41 to 122°F)
Sample temperature variation
pH range of sample
Flow rate 6 to 9 L/hour
Pressure 0.2 to 6 bar (3 - 87 psi)
Acidity Less than 250 ppm (equivalent CaCO
Power supply voltage fluctuation ± 10%
Over voltage category 2 (according to standard EN 61010-1)
Pollution degree 2 (according to standard CEI 664)
Altitude < 2000 m
Measurement category Cat II, Class 1 (overvoltage < 1500V)
Power station / indoor / demineralized water plant or
instrumentation room
Stabilization in 10 mins from 15°C to 30°C
Use the static heat exchanger system when the temperature
difference between samples is higher than 15°C
Non-cationic application: 6 to 10 pH
Cationic application: 2 to 10 pH
)
3
13
Page 16
Specifications
MECHANICAL SPECIFICATIONS
Maximum panel dimension
(H x L x D)
Inlet
Outlet Barbed stem for 12 mm (½" I.D.) hose
Protection rate
Cell PMMA - compact (minimum tubing)
Flame rate Conform UL
Maximum weight 15 - 30 Kg
Mains power supply 100 - 240 VAC, 50-60 Hz, ± 10%, automatic switching
Max. consumption 80 VA.
Fuse 5 x 20 cartridge T2AL-250V following CEI127
Display
Analog outputs
Relays
Logic input
850 x 450 x 252.5mm [33.46 x 17.71 x 9.94in]
Simple fittings for 6 mm O.D. tubing or ¼" O.D. in
PE-low density. ¼" OD in PHED-PTFE-SS as option
Transmitter: IP65 (NEMA 4)
Panel: IP50 (Dust protection)
Optional Enclosure: IP54 (Splash water proof),
Instrument is designed to avoid DIPA vapor inside the enclosure.
All DIPA vapor is collected and sent to the instrument drain
INTERFACE SPECIFICATIONS
Curve trend, Last Cal Date, Historical, Concentration,
Temperature, Potential
Number: 6
4-20 or 0-20 mA (650 ohms)
Linear / Dual / Logarithm
Event indication
4 x Relay (conc)
1 x Warning
1 x System
Active / Inactive channels
Remote AutoCal
ST ANDARDS
European standards
International standards cETLus
1
Experiment performed between ultra pure water (estimated at 50 ppt) and 1 ppb
EN 61326 Class A for EMC
EN 601010-1 for low voltage safety
14
Page 17

2.2 Model identification system
The analyzer identification number and the instrument serial number are located on the label on
the back panel, and can be found on order confirmation and invoice papers.
Each analyzer has the following features:
• Fully automatic conditioning adjustment
• Sample temperature adjustment
• Automatic sensor reactivation
• Automatic and manual calibration
• Grab sample measurement
Specifications
0 Standard (0.01 to 10,000 ppb)
1 Kit K (1 ppb to 200 ppm)
0 Panel Version
1 Wall-Mount Enclosure
0 Standard
09240=A=
Figure 1 Model identification matrix
Example:
09240=A=0124
• Multi channel sodium analyzer model 9240
• Standard version (0.01 to 10,000 ppb)
• Wall mount enclosure
• With Profibus option
• 4-channel version
1 With RS485
2 With Profibus
1 One channel
2 Two channels
3 Three channels
4 Four channels
15
Page 18

Specifications
16
Page 19
Section 3 Analyzer Overview
3.1 Overview
The Polymetron 9240 Sodium Analyzer is a continuous on-line monitor for direct measurement
of sodium in power generation processes.
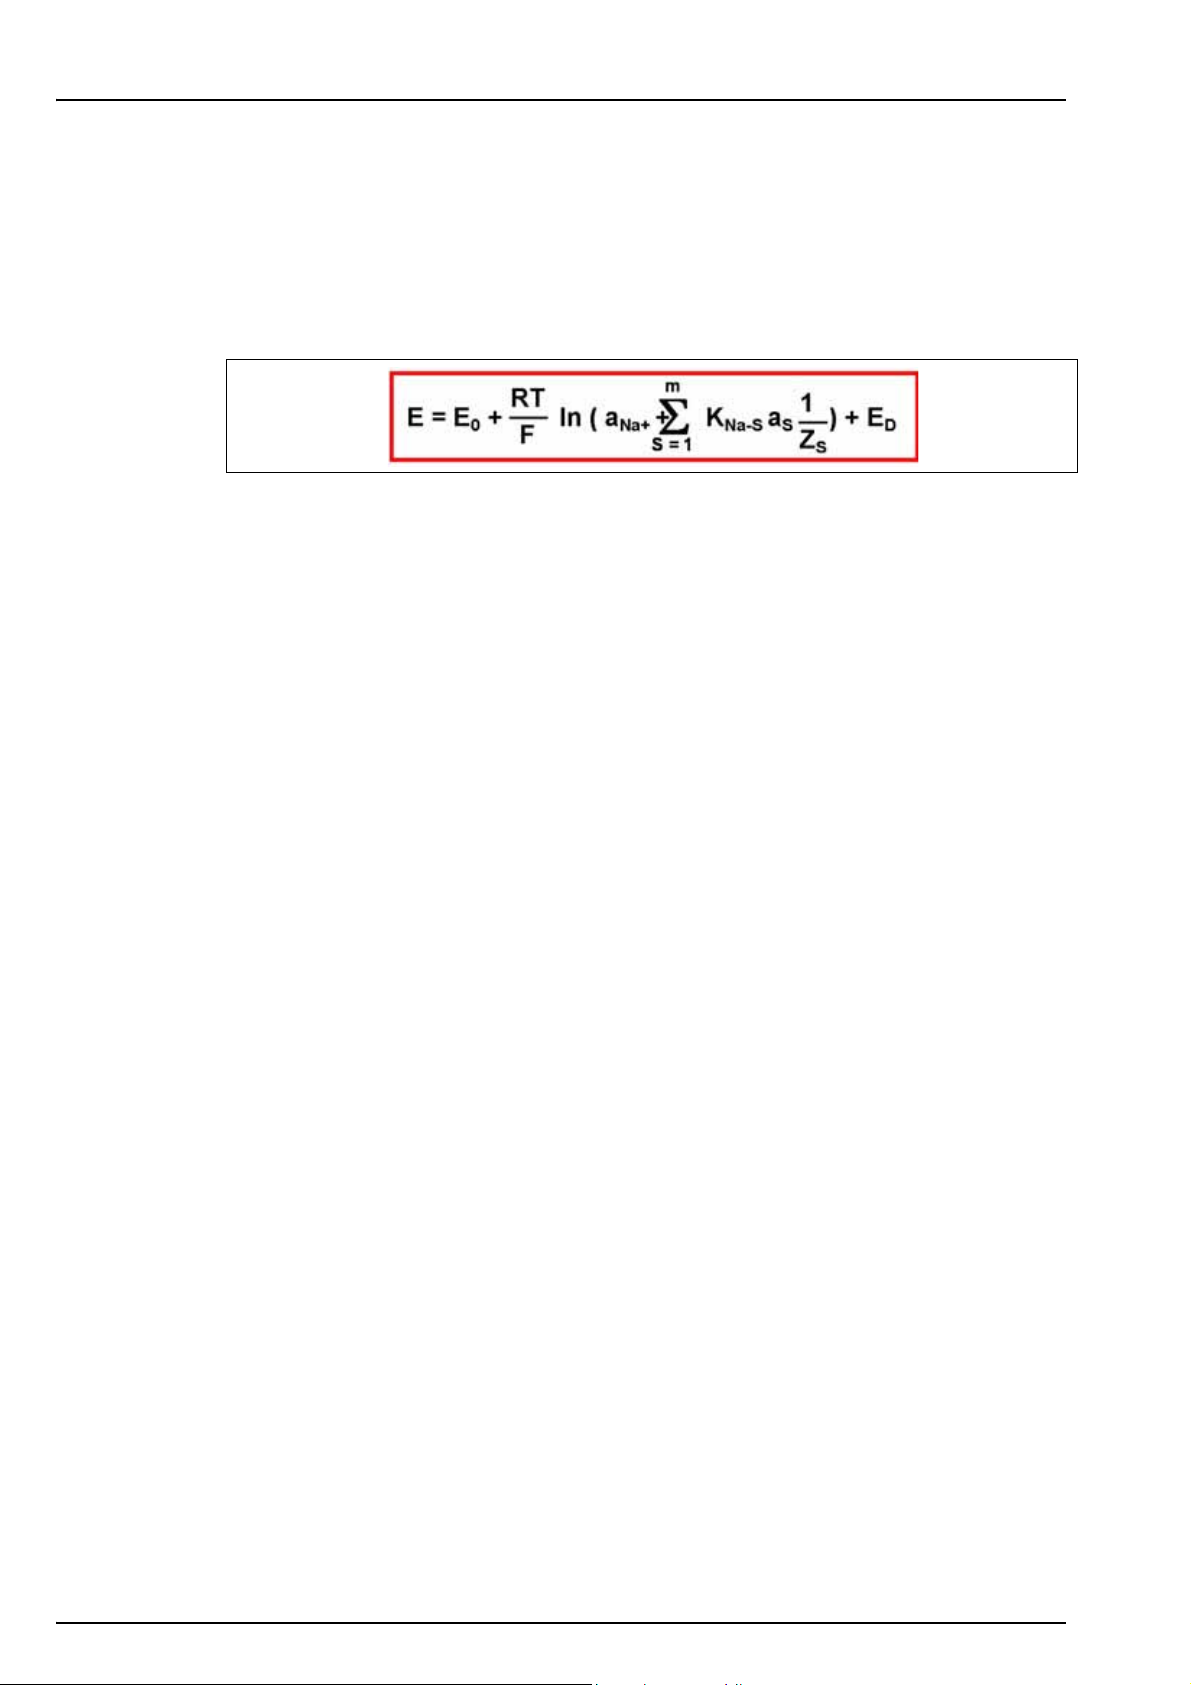
The measurement is based on a direct potentiometric technique using a highly sensitive sodium
glass electrode. The difference of potential between the glass electrode and the reference
electrode is directly proportional to the logarithm of sodium concentration as shown by the
Nernst law:
With:
• K
• a
• Z
• E
The analyzer features low maintenance, automatic or manual process calibration and uses a
sodium-sensitive glass electrode together with a reference electrode to measure sodium
concentrations in a sample that has been previously conditioned to a pH > 10.5.
The pH value can be set to between 10.7 and 11.6 pH and is controlled by measuring the
conductivity of the conditioned sample.
External grab sample analysis is also available for this high-accuracy analyzer.
The physical system consists of two integrated units, the electronics control section and the
liquid handling section.
: Selectivity constant of the ion S
Na-S
: Activity of the ion S
S
: Valency of the ion S
S
: Diffusion potential (conductivity dependant)
D
17
Page 20
Analyzer Overview
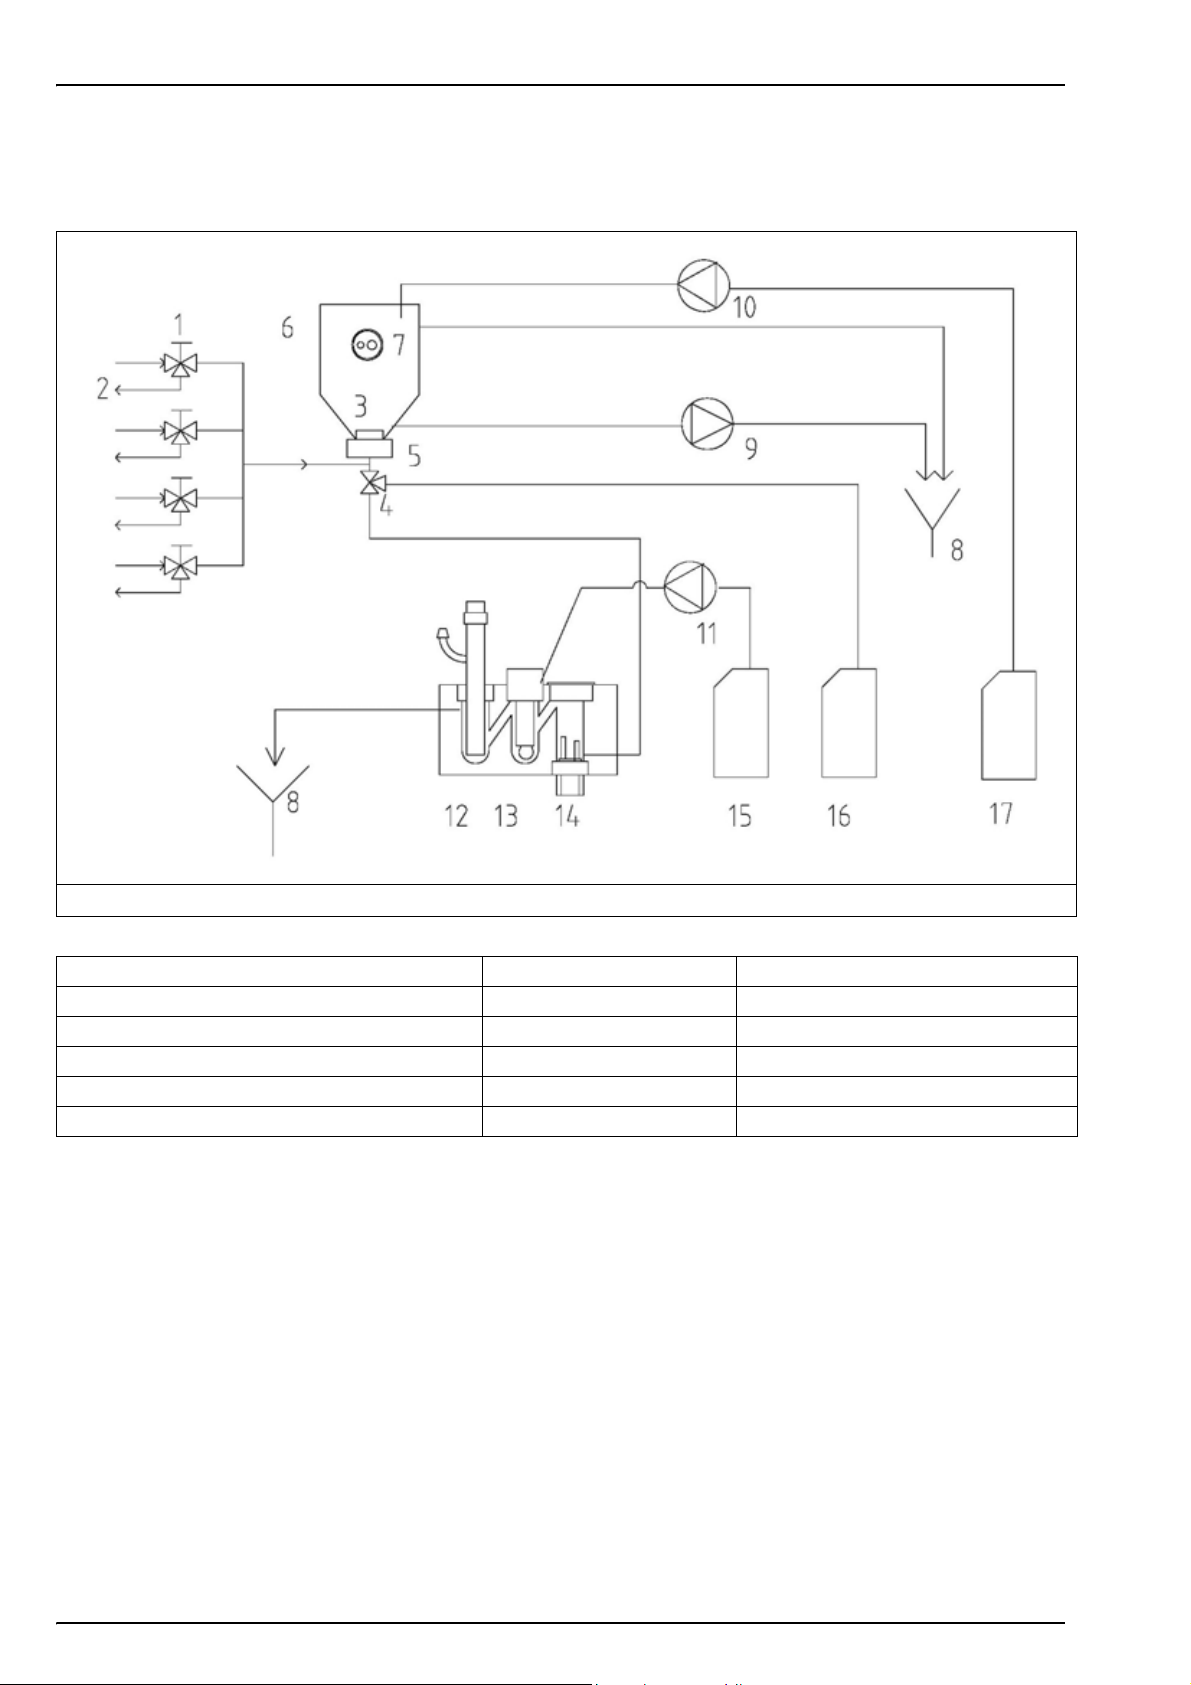
3.2 Schematic process overview
The illustration below shows the major components of the analyzer.
Figure 2 Working principal
1 - Sample inlet flow adjustment (one per channel) 7 - Sample level detector 13 - Sodium ion-selective electrode
2 - Fast loop sample outlet (one per channel) 8 - Drain 14 - Temperature electrode
3 - Magnetic stirrer 9 - Drain pump 15 - Reactivation solution
4 - Conditioning valve 10 - Auto-calibration pump 16 - Conditioning solution
5 - Stirrer motor 11 - Reactivation pump 17 - Calibration solution
6 - Overflow vessel 12 - Reference electrode
18
Page 21
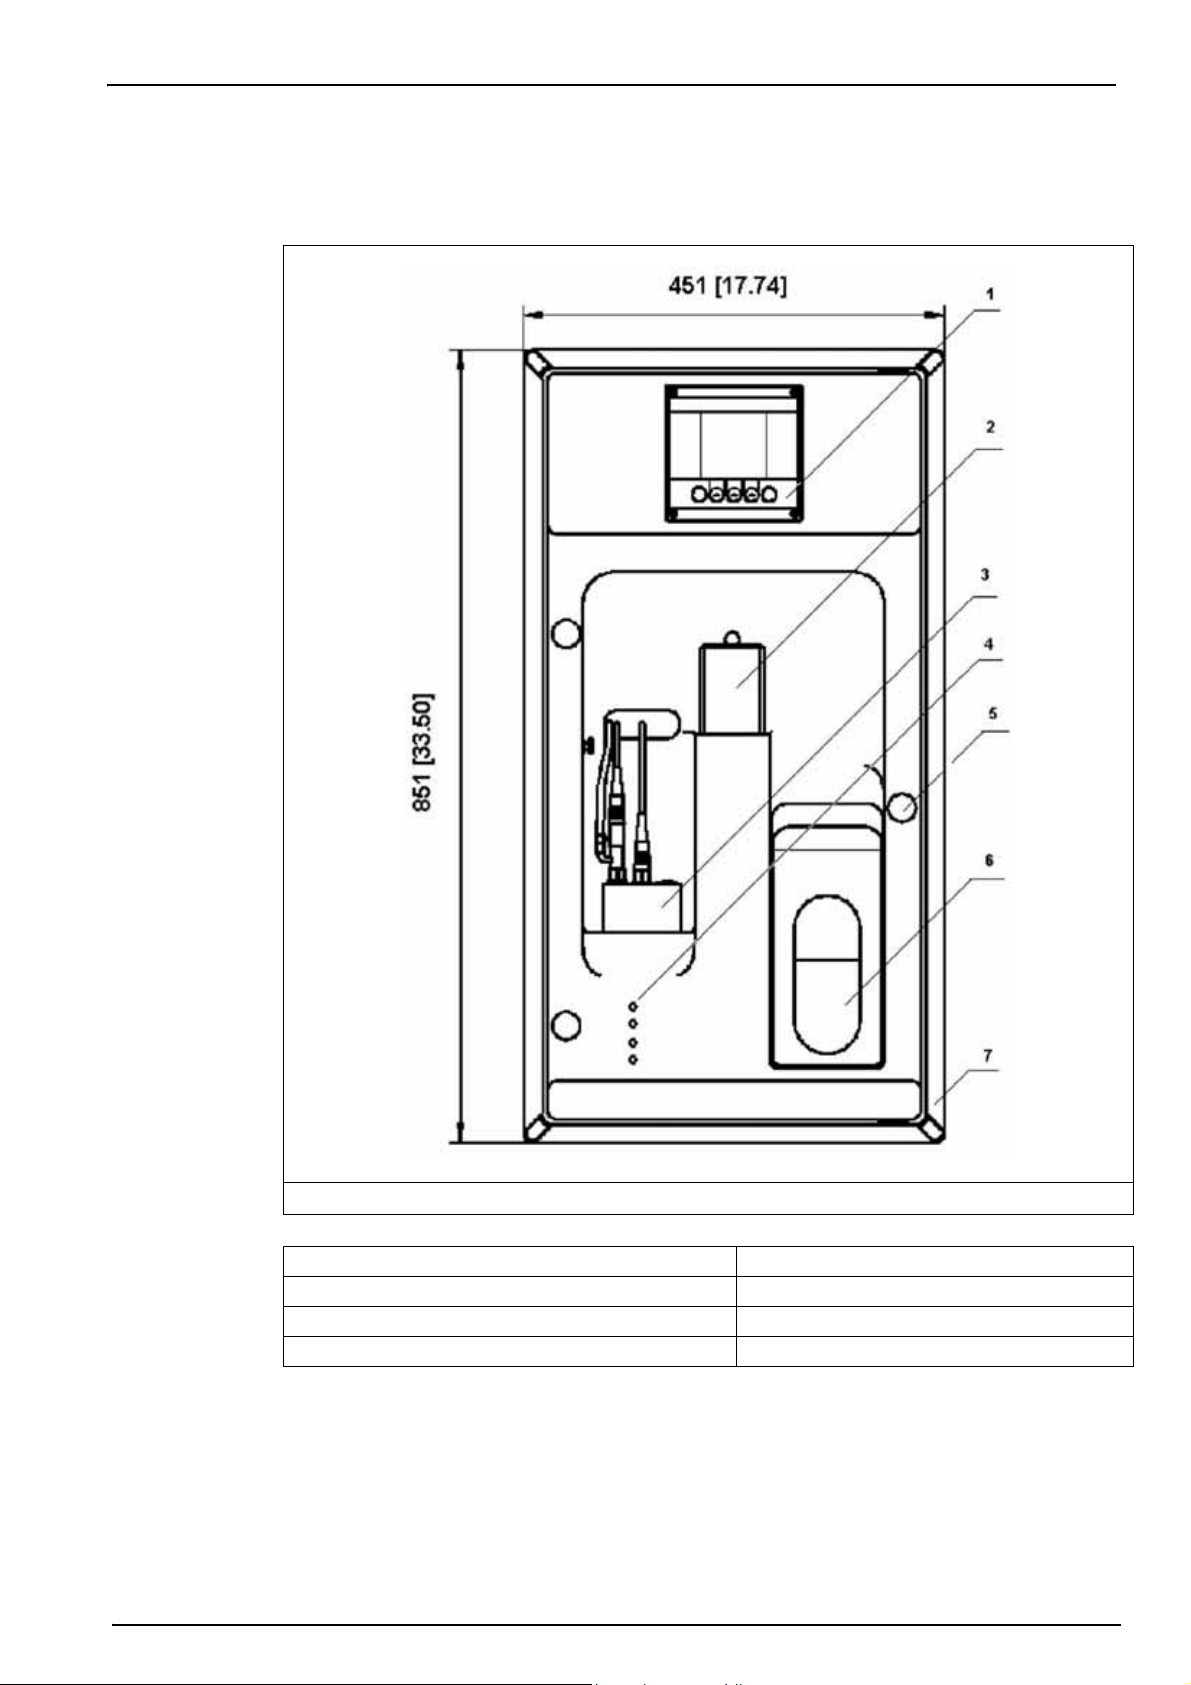
3.3 Presentation of the analyzer
3.3.1 Analyzer front panel
Analyzer Overview
Figure 3 Analyzer front panel
1 - User interface 5 - Door lock
2 - Overflow vessel 6 - Reagent shelf
3 - Measuring cell 7 - Frame for panel mounting
4 - Flow rate adjustment for each channel
19
Page 22
Analyzer Overview
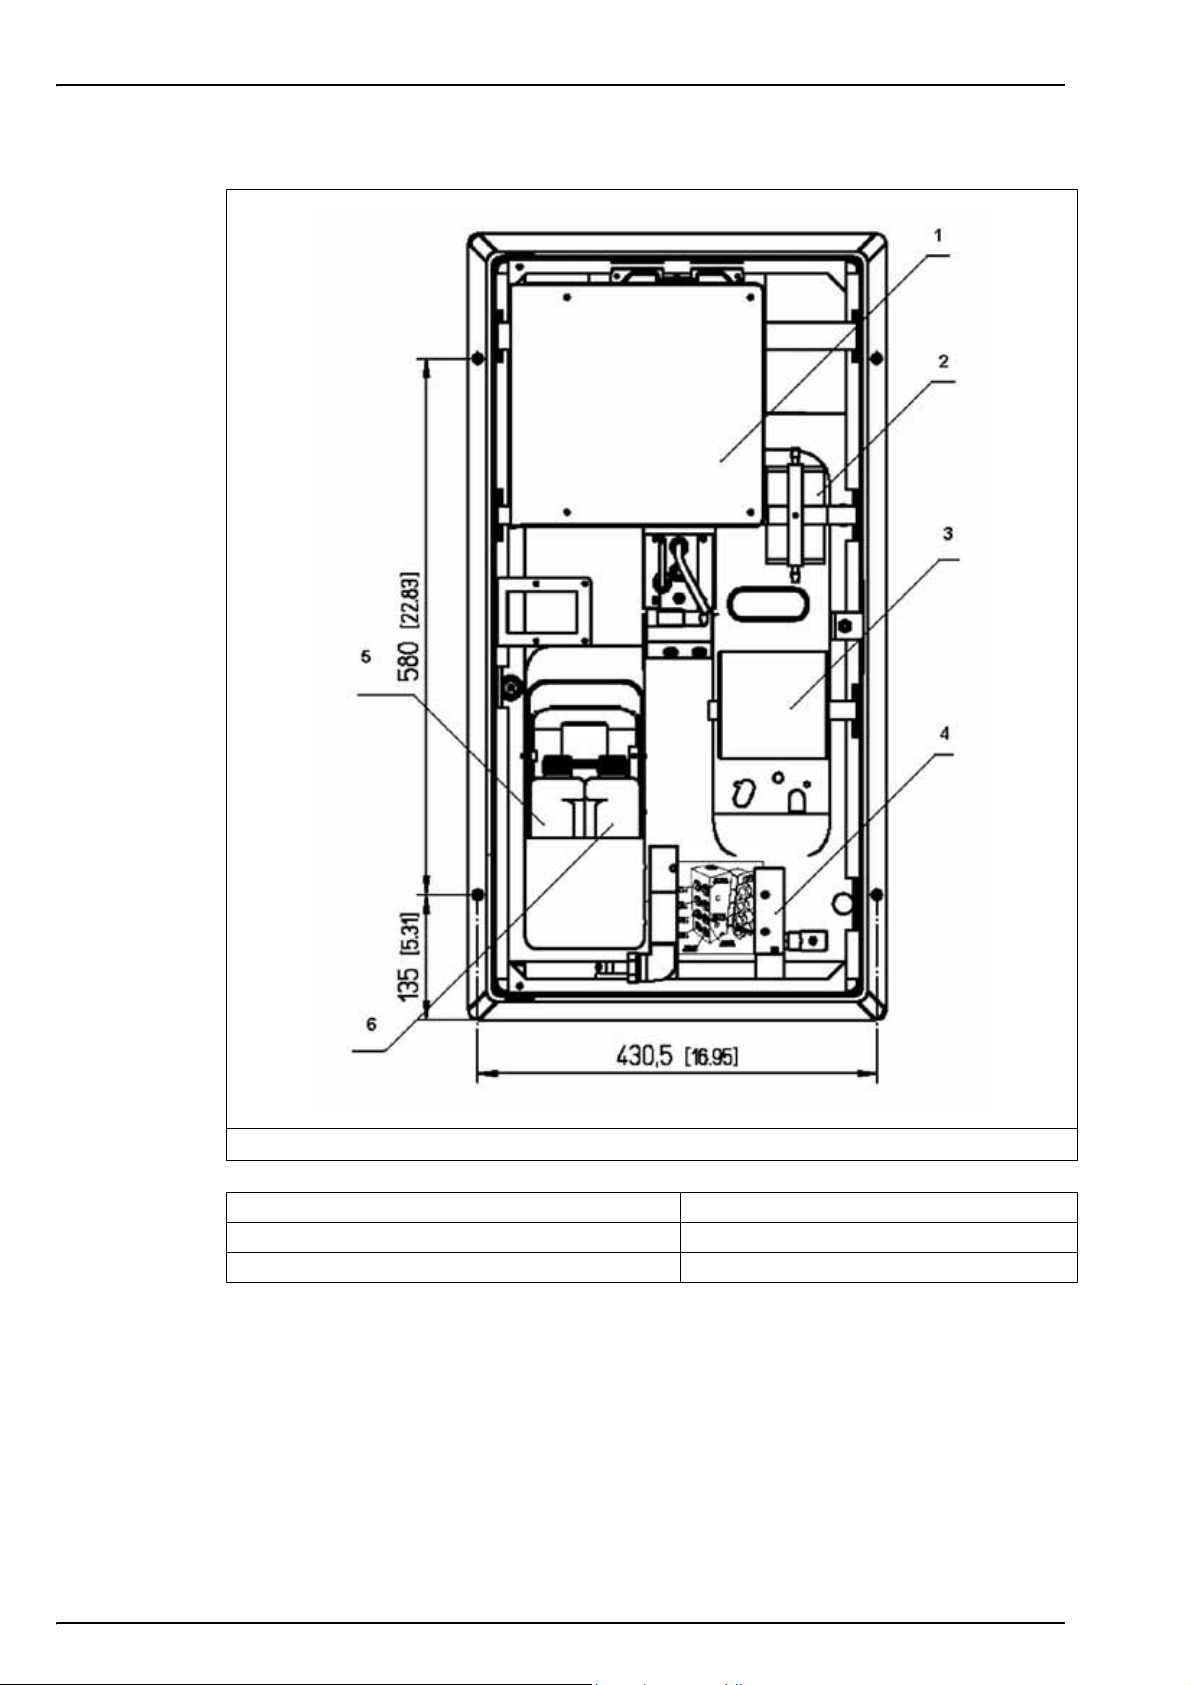
3.3.2 Analyzer rear panel
20
Figure 4 Analyzer rear panel
1 - Local controller box 4 - Sample inlet valves
2 - Electrolyte reservoir 5 - Calibration canister
3 - Pump box (see also Pumps box on page 21) 6 - Reactivation reagent canister
Page 23
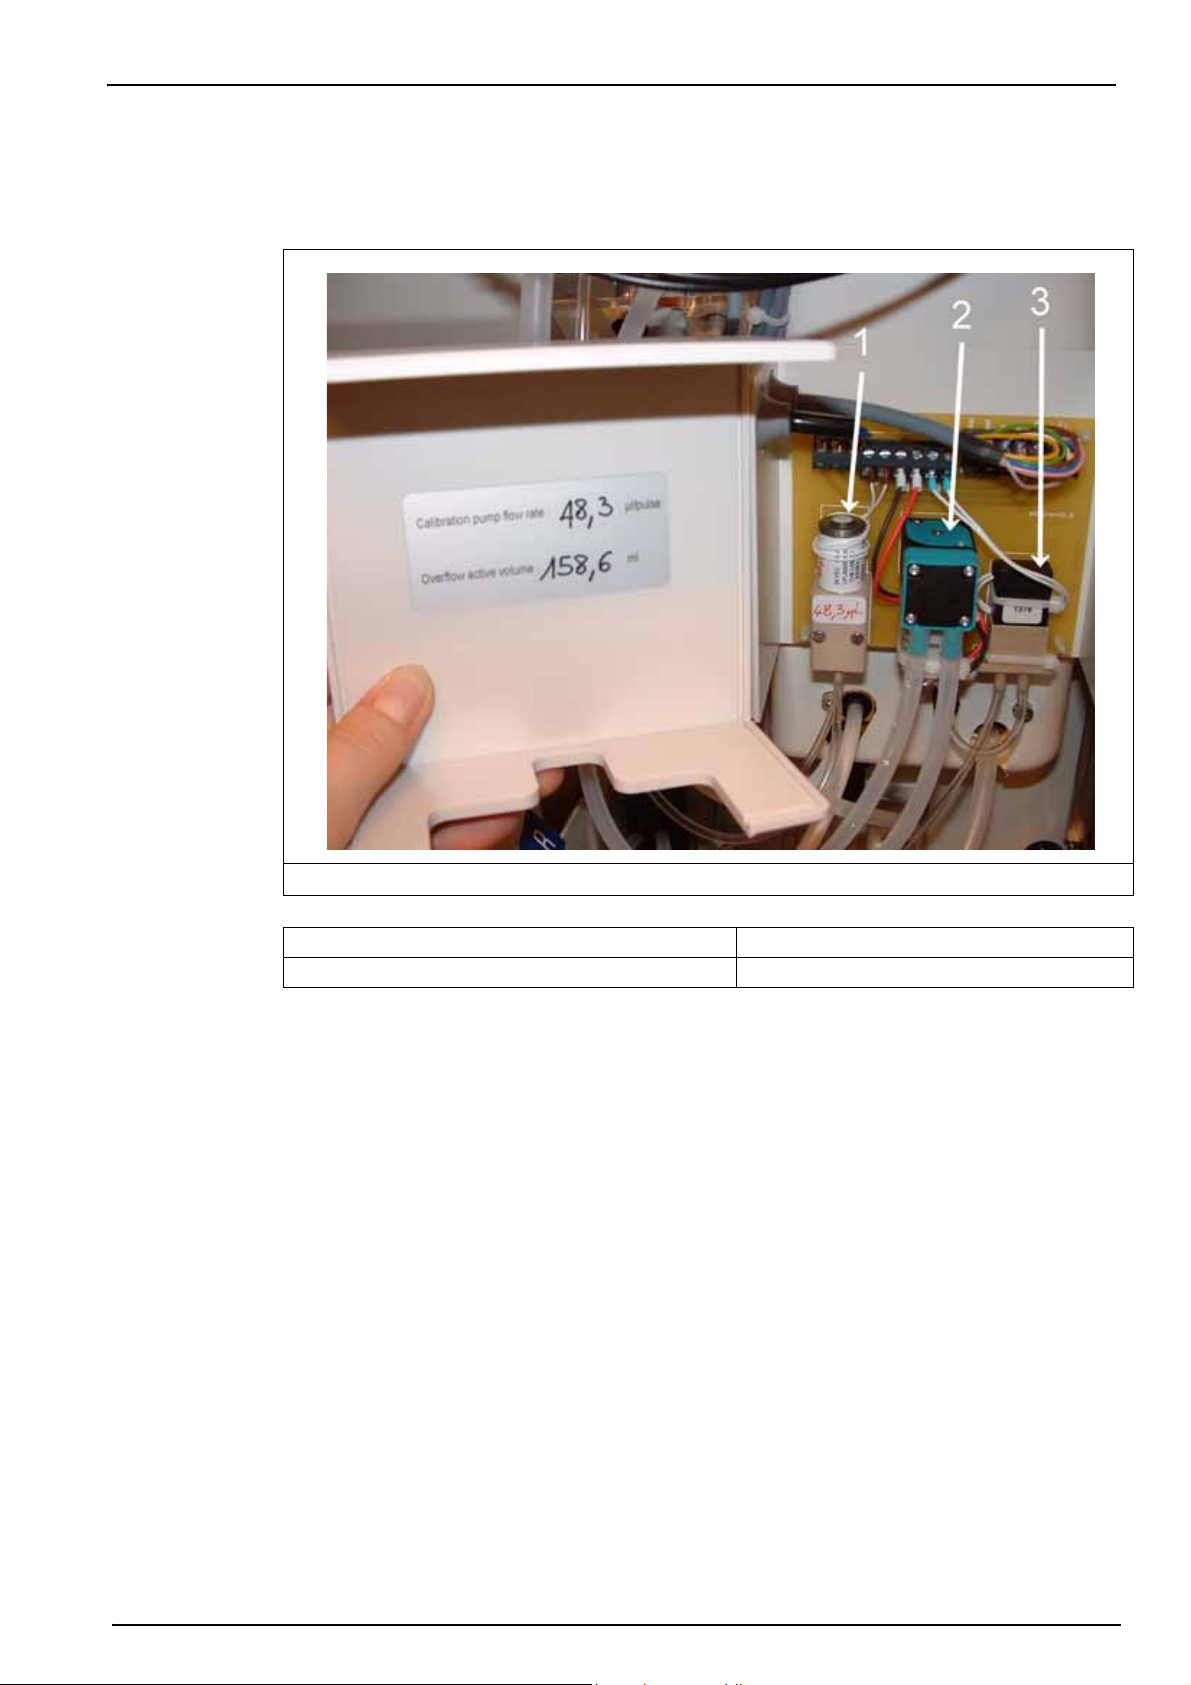
3.3.3 Pumps box
Three pumps have been factory installed in the pump box and are used for the following
purposes:
Analyzer Overview
Figure 5 Pumps box interior
1 - Auto-calibration pump 3 - Reactivation pump
2 - Drain pump
21
Page 24
Analyzer Overview
3.4 Conditioning reagent
Hach Lange highly recommends the use of Diisopropylamine (DIPA) as the conditioning
reagent. Other reagents such as ammonia or ethanolamine can be applied, providing the
specification limitations imposed by amines other than DIPA are clearly understood.
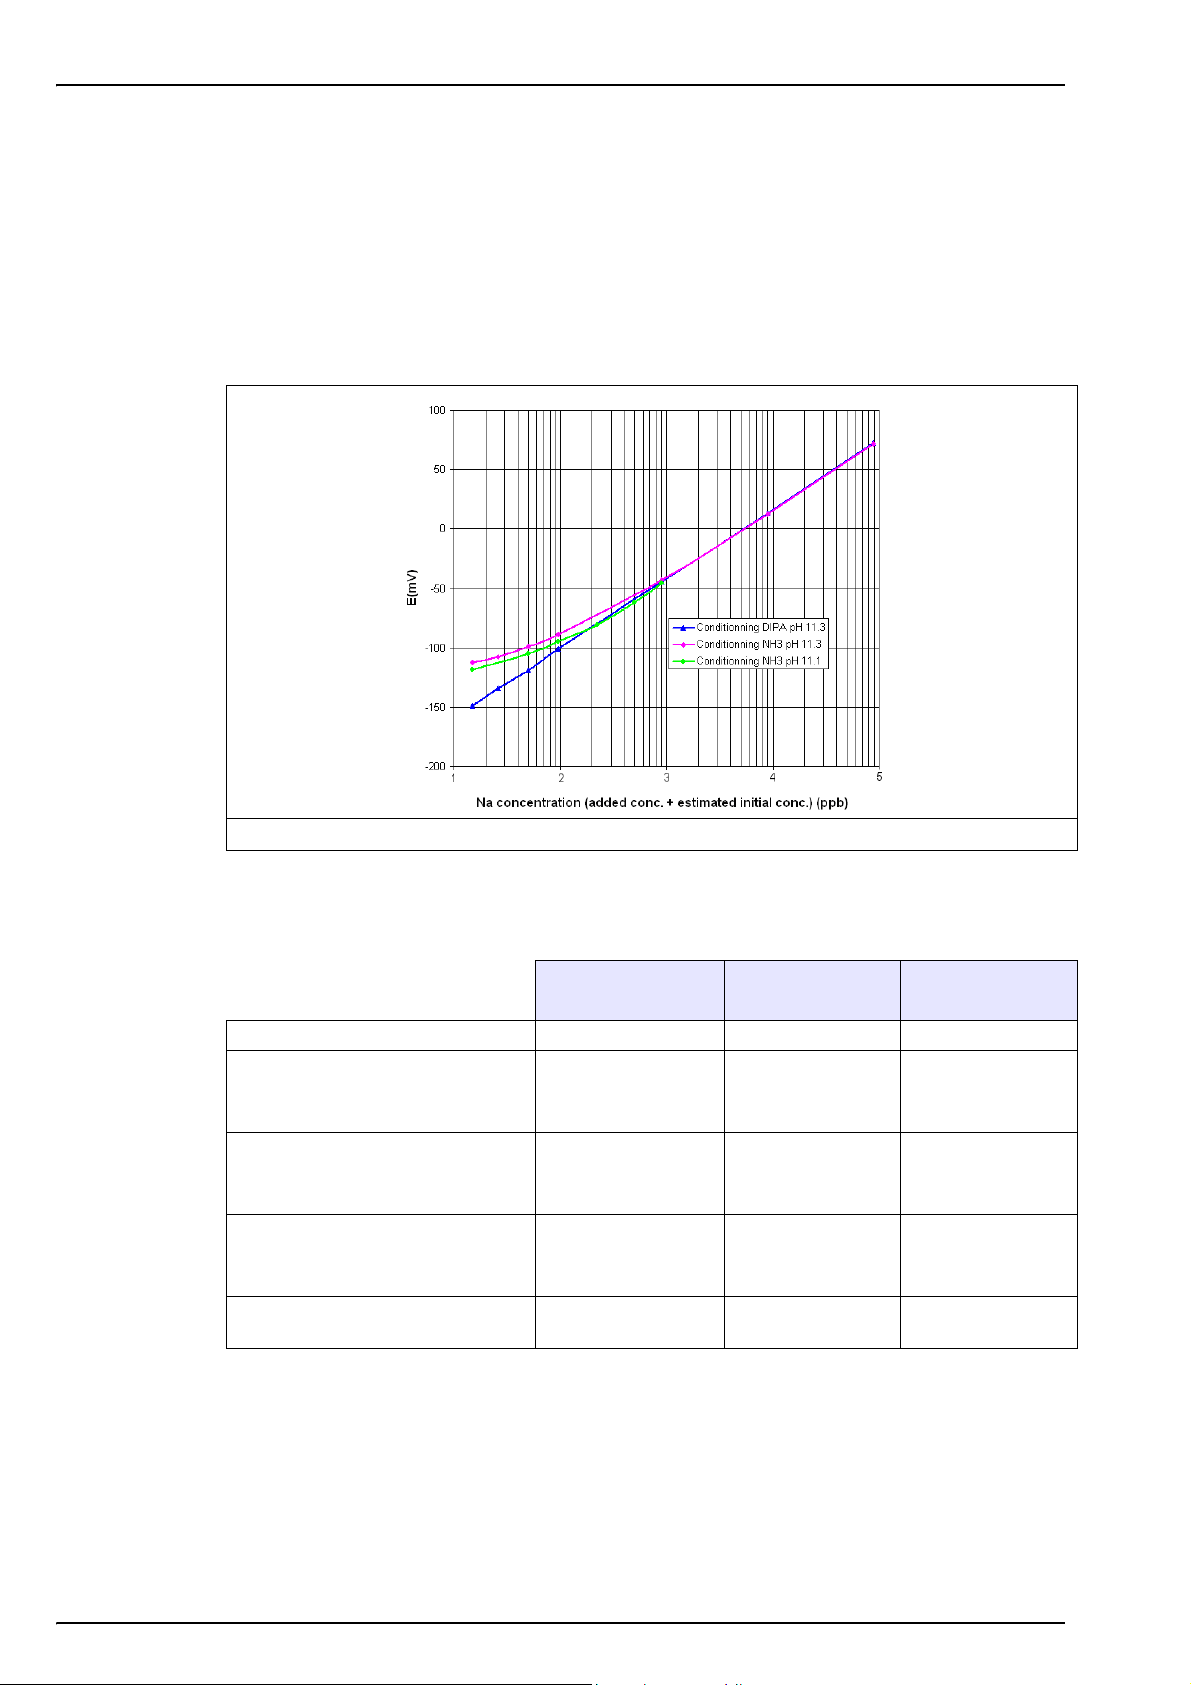
The following graph (Figure 6 below) shows the curves obtained using DIPA and ammonia as
conditioning reagents. As can be seen, the DIPA curve remains linear at a much lower sodium
concentration resulting in better accuracy, repeatability, a lower detection limit, and a lower rate
of reagent consumption.
Figure 6 Calibration curves obtained with DIPA and NH3 as reagents
The following table shows the comparable values of detection limit, accuracy, repeatability, and
consumption for DIPA, ammonia, and ethanolamine:
DIPA
[C
N]
6H15
Lowest detection limit 0.01ppb 2ppb 5ppb
The greater of
Accuracy (non-cationic applications)
Accuracy (cationic applications)
Repeatability within a 10°C variation
Consumption of 1 liter at 25°C for a
pH measurement of 10 to 10.5
Note: As Hach Lange recommends DIPA to be used as the conditioning reagent, all references relating to
the conditioning reagent throughout this manual will be to DIPA.
± 0.1ppb or ± 5%
of the reading
The greater of
± 2ppb or ± 5%
of the reading
The greater of
< 0.02ppb or ±1.5%
of the reading
approx. 13 weeks approx. 3 weeks approx. 7 weeks
Ammonia
[NH
]
3
The greater of
± 1ppb or ± 5%
of the reading
The greater of
± 2ppb or ± 5%
of the reading
The greater of
< 0.1ppb or ±1.5%
of the reading
Ethanolamine
[H
N(CH2)2OH]
2
The greater of
± 2ppb or ± 7%
of the reading
The greater of
± 2ppb or ± 7%
of the reading
The greater of
< 0.2ppb or ±2%
of the reading
22
Page 25

3.5 pH regulation
3.5.1 Non-cationic applications
In order to ensure the accuracy and the repeatability of low sodium concentrations, pH must be
constant and preferably maintained at or above 11.2 to maintain the lowest proton interference.
The 9240 uses the injection of vapor of diisopropylamine (DIPA) to obtain high pH level without
sodium contamination. Using the siphon effect of the liquid sample column, DIPA is mixed with
the sample without using any pump or pressurized gas. A fine regulation of the siphon effect is
performed using a 2/3-way valve.
Analyzer Overview
The pH is evaluated directly and continuously from the conductivity of the conditioned sample in
the cell. In the solution, the most mobile proton (H
Therefore, by controlling the conductivity, its concentration can be maintained constant. In
addition, the pH is controlled from the conductivity by modifying the gas/liquid ratio thus
simultaneously maintaining a constant pH.
In temperature variations, the system automatically modifies the gas/liquid ratio and then adds
DIPA vapors to compensate the DIPA solubility in the sample.
If the sample is already partially conditioned by a customer system (e.g. with NH
10.5), the regulation system evaluates the pH and adds the necessary DIPA quantity to reach its
pH
The pH can be set to between 10.7 and 11.6 pH. The DIPA consumption is 500 mL/month at
25°C for a sample pH
± 0.2 and minimizes DIPA consumption.
target
3.5.2 Cationic applications
Instruments to be used in cationic applications are configured at the factory and can be
identified by their model number of 09240=A=1xxx (the 1 identifies it as being for cationic
applications).
Measurement of trace level sodium concentrations after cationic resin processes requires an
assisted conditioning because the pH in the sample to be measured will only be between 2 and
4.
The 9240 analyzer uses a gas pump with no moving parts (based on the piézo principal) to
effect this assisted conditioning. The pump is controlled by the analyzer’s electronics and works
according to the amount of sample conditioning required. The flow rate of the pump is factory
set at 200 cc/min of gas.
target
of 11.2.
+
) has the biggest influence on conductivity.
up to pH 9.5 -
3
An exit tube ensures that any DIPA vapors not dissolved in the sample are recovered and
evacuated to the drain along with the sample.
In a cationic application, the 9240 does not use conductivity to evaluate the pH. However, it can
be adjusted according to the sample pH by a time ratio of the conditioning valve aperture. A
specific T
and to adjust a constant pH.
gas/Twater
ratio is used for each channel in order to minimize the DIPA consumption
23
Page 26
Analyzer Overview
The usual T
gas/Twater
ratio values are as follows:
pH Tgas/Twater Ratio
2 180%
2.3 80%
2.6 50%
2.9 30%
3.5 15%
4.0 10%
Refer to Sample pH conditioning check on page 53 for the procedure to select the correct ratio
in relation to the initial pH sample.
DIPA consumption
The consumption of DIPA will depend on the values defined in the above table. With a ratio of
100% (i.e. the volume of sample is equal to the volume of gas) the consumption of DIPA will be
approximately 90 mL/day.
The following table gives additional typical consumption according to the Tgas/Twater ratio
setup:
Tgas/Twater Ratio Consumption (days per liter)
180% 6.25
150% 7.5
100% 11
80% 14
50% 22.5
30% 37
The instrument continuously monitors the use of DIPA. A warning alarm will be triggered if the
calculated volume in the bottle is less than 100 mL. A system alarm (and suspension of
measurements) will be triggered when the calculated volume is less than 50 mL.
24
Page 27
3.6 Measurement process
3.6.1 Smart rinse option
The measurement cell is rinsed by the analyzer after a calibration, grab sample, or sensor
reactivation process and prior to resuming sample measurements. Set the smart rinsing
parameter to No (see Measure steps on page 81) for a fixed rinse cycle of 10 minutes or set to
Yes to invoke the smart rinsing option which better guarantees the accuracy of measurements
after the rinsing cycle.
If the parameter is set to Yes, a maximum rinse time must be defined. To ensure a fast rinse the
recommended time is 60 minutes with a flow rate of 6 to 9 L/hour. During the rinse process, as
soon as the analyzer determines that measurements are stable it will revert back to sample
measurement mode. If there is an increase in the sodium concentration at any time, then after a
5 minute period the rinsing will be aborted and the analyzer will revert back to sample
measurement mode.
Analyzer Overview
Figure 7 Rinsing process after a calibration, grab sample or sensor reactivation
25
Page 28
Analyzer Overview
3.6.2 Measurement steps
The 9240 is designed as a multi channel analyzer, though it can be used as a single channel
analyzer. The measurement parameters are different depending on whether the analyzer is set
up as a single or multi channel analyzer.
If the analyzer is configured as a single channel unit, the following parameters are required:
• The on-line measurement time defines the measurement time of the sample, and how often
the measurement values are stored in memory. Regardless of this value the alarms, analog
outputs and RS 485 serial communication output are updated regularly (see Analyzer
outputs on page 34). The recommended (and default) value is 10 minutes, which will ensure
3 months of data stored internally.
• The smart rinse facility can be used for rinsing the measurement cell after a calibration, grab
sample or sensor reactivation. If used, a maximum rinse time must be entered.
If the analyzer is configured as a multi channel unit, the following parameters are required in
addition to the on-line measurement time and smart rinse facility described above, and are
applicable to all configured channels:
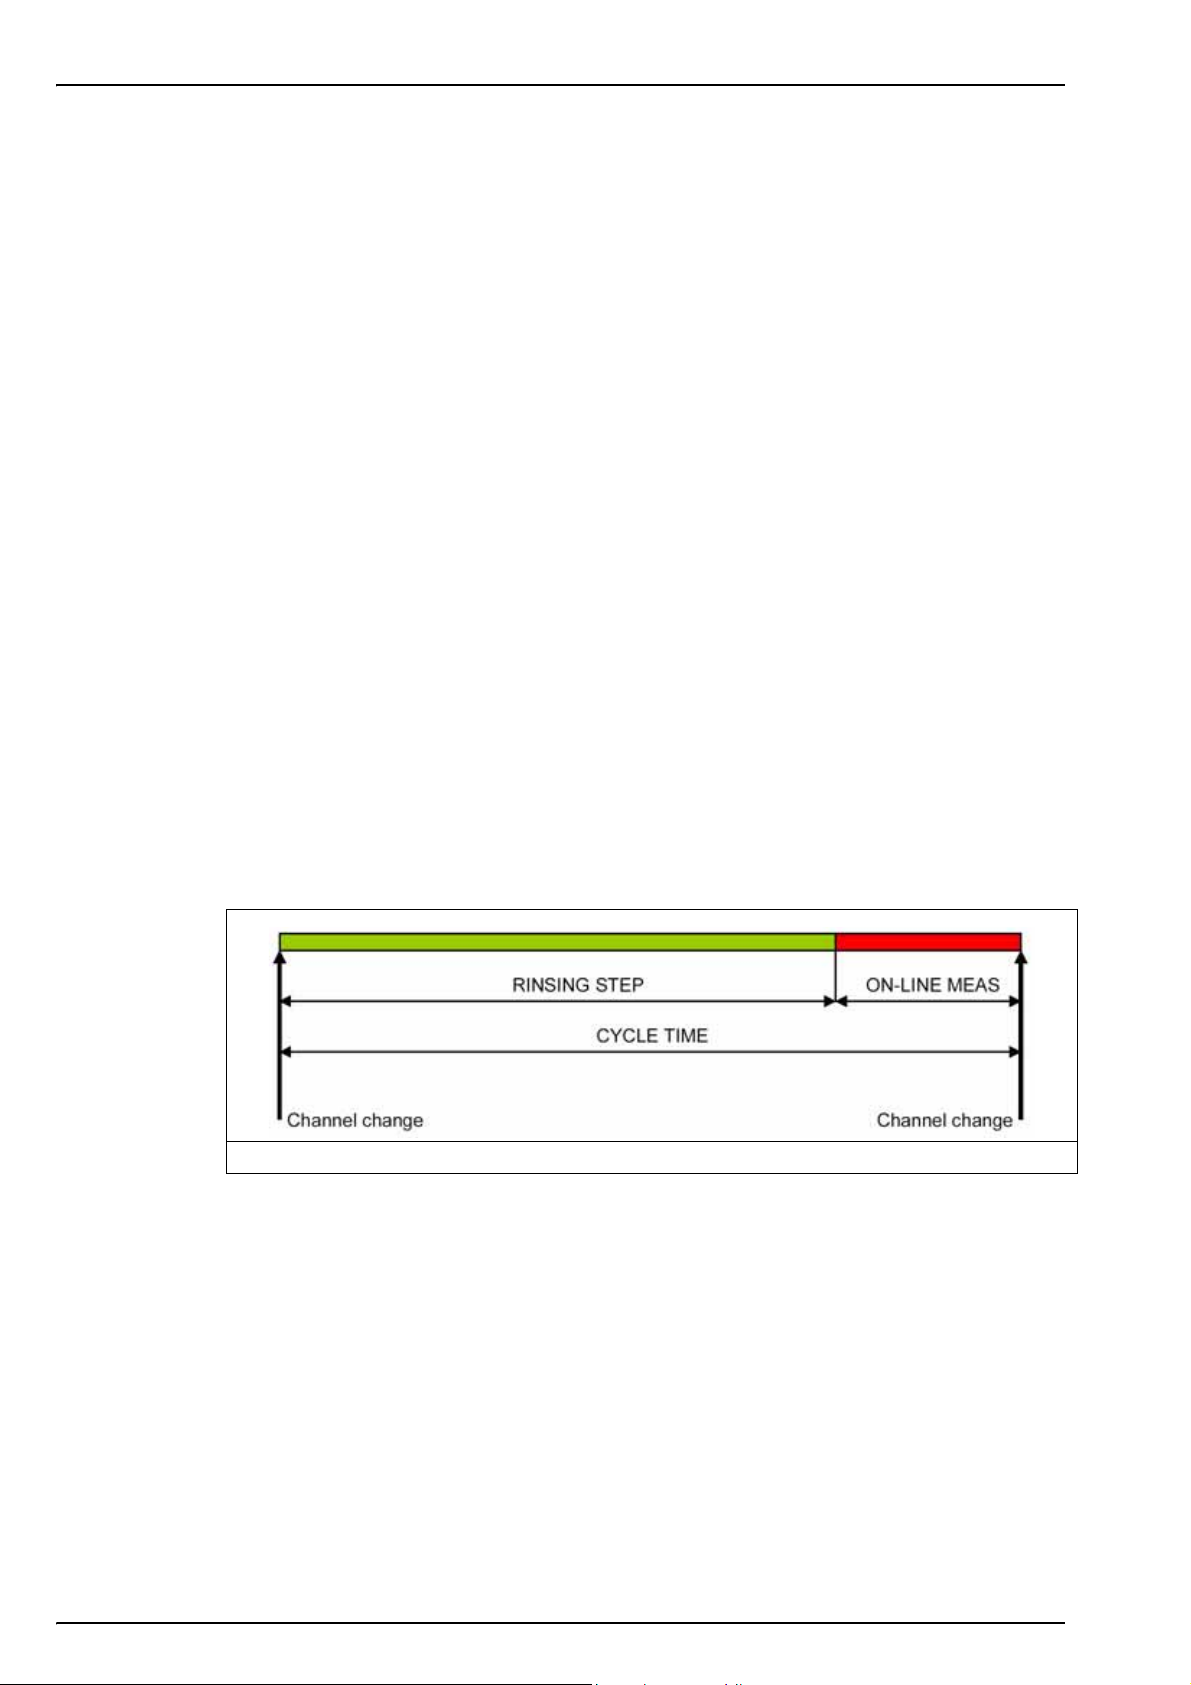
• A cycle time (total measurement and rinse time, see Figure 8 below), which must be greater
than the on-line measurement time. The longest cycle time of all channels needs to be
entered to allow an efficient rinsing time. This will guarantee the accuracy (0.1 ppb or 5%) for
all configurations.
• The search stability parameter can reduce the rinsing time after a change of measurement
channel. Set to Yes to get only accurate measurements transmitted thanks to the “smart
rinsing” cycle which automatically adapts the sample flow rate and duration of the rinsing
step, or set to No for a preferred fixed rinse time (cycle time minus on-line measurement
time), though accuracy could be at risk.
After each change of measurement channel, the analyzer rinses the measurement cell before
measuring the sodium level outputs during the on-line measurement time period as indicated in
the following diagram.
Figure 8 Analyzer cycle time
Note: The choice of the right timings is essential for accurate measurements.
26
Page 29
3.6.2.1 Search stability set to NO - Fixed measurement mode
As the cycle and on-line measurement times defined by the user are fixed and identical for each
channel, they need to be long enough to have an efficient rinsing step for all configurations in
order to achieve accurate measurements.
The rinsing time has to be chosen from either the channel with the highest or the lowest sodium
concentration.
The following table shows the “recommended” rinsing times to guarantee consistent and
accurate measurements. Refer also to Table 1 on page 13 for the “best performance” timings.
Table 2 Recommended rinsing times
Analyzer Overview
Previous
channel
1 → 0.05 ppb 25°C 35 min
0.05 → 1 ppb 25°C 30 min
5 → 0.1 ppb 25°C 35 min
0.1 → 5 ppb 25°C 20 min
50 → 0.1 ppb 25°C 40 min
0.1 → 50 ppb 25°C 15 min
200 → 0.1 ppb 25°C 45 min
0.1 → 200 ppb 25°C 15 min
Current channel T°
Recommended rinsing time
to reach accuracy
Example:
Channel 1: 200 ppb
Channel 2: 0.1 ppb
Channel 3: 5 ppb
Channel 4: 50 ppb
Sequence: 1 2 3 4 * * * * * * * *
In this example, and based on the table above, the best choice for the rinsing time is to choose
at least 45 minutes. If an on-line measurement time of 5 minutes is chosen, a cycle time of 50
minutes will be used to ensure the accuracy. In this case, the analyzer will spend 50 minutes on
each channel before passing on to the next.
27
Page 30

Analyzer Overview
3.6.2.2 Search stability set to YES - Automatic measurement mode
In this configuration, a maximum cycle time not to be exceeded has to be configured. This is the
sum of the maximum rinse time plus the fixed on-line measurement time.
As with the fixed measurement mode, the cycle and on-line measurement times need to be long
enough to meet the needs of the configuration in order to achieve accurate measurements.
In automatic measurement mode, the analyzer will minimize the rinsing time while searching for
a stable measurement. Then the cycle time is minimized by determining the shortest rinsing
time needed to reach accuracy (5% or 0.1ppb) for each channel measurement. The on-line
measurement time is fixed and remains unchanged.
If, at the end of the longest possible cycle time given by the user, the analyzer has still not
reached the stability criteria required for accuracy, the analyzer will give a measurement value
but also issues a stabiliz. errors warning. This warning alarm will stop if the stability criteria are
found the next time the analyzer is at the same point in the sequence.
If the analyzer never finds the stability criteria, a longer cycle time needs to be defined in order
to achieve accurate measurements. The recommended strategy is to give a very long time (e.g.
90 min) and the analyzer will minimize all rinsing times between channels.
Example:
Channel 1: 200 ppb
Channel 2: 0.1 ppb
Channel 3: 5 ppb
Channel 4: 50 ppb
Sequence: 1 2 3 4 * * * * * * * *
In this example, with an on-line measurement time fixed at 5 minutes and maximum cycle time
set at 60 minutes (much more than is necessary), then assuming stability for an accurate
measurement is reached, the analyzer will use the following timings:
The analyzer is assumed to be measuring channel 4:
It switches to channel 1.
Channel 1: to rinse from 50 ppb to 200 ppb, rinsing time < 15 minutes
Actual cycle time < 20 minutes (rinsing time < 15 minutes + on-line measurement time of
5 minutes)
Channel 2: to rinse from 200 ppb to 0.1 ppb, rinsing time ~ 45 minutes
Actual cycle time ~ 50 minutes (rinsing time ~ 45 minutes + on-line measurement time of
5 minutes)
Channel 3: to rinse from 0.1 ppb to 5 ppb, rinsing time ~ 20 minutes
Actual cycle time ~ 25 minutes (rinsing time ~ 20 minutes + on-line measurement time of
5 minutes)
Channel 4: to rinse from 5 ppb to 50 ppb, rinsing time < 15 minutes
Actual cycle time < 20 minutes (rinsing time < 15 minutes + on-line measurement time of
5 minutes)
28
Page 31

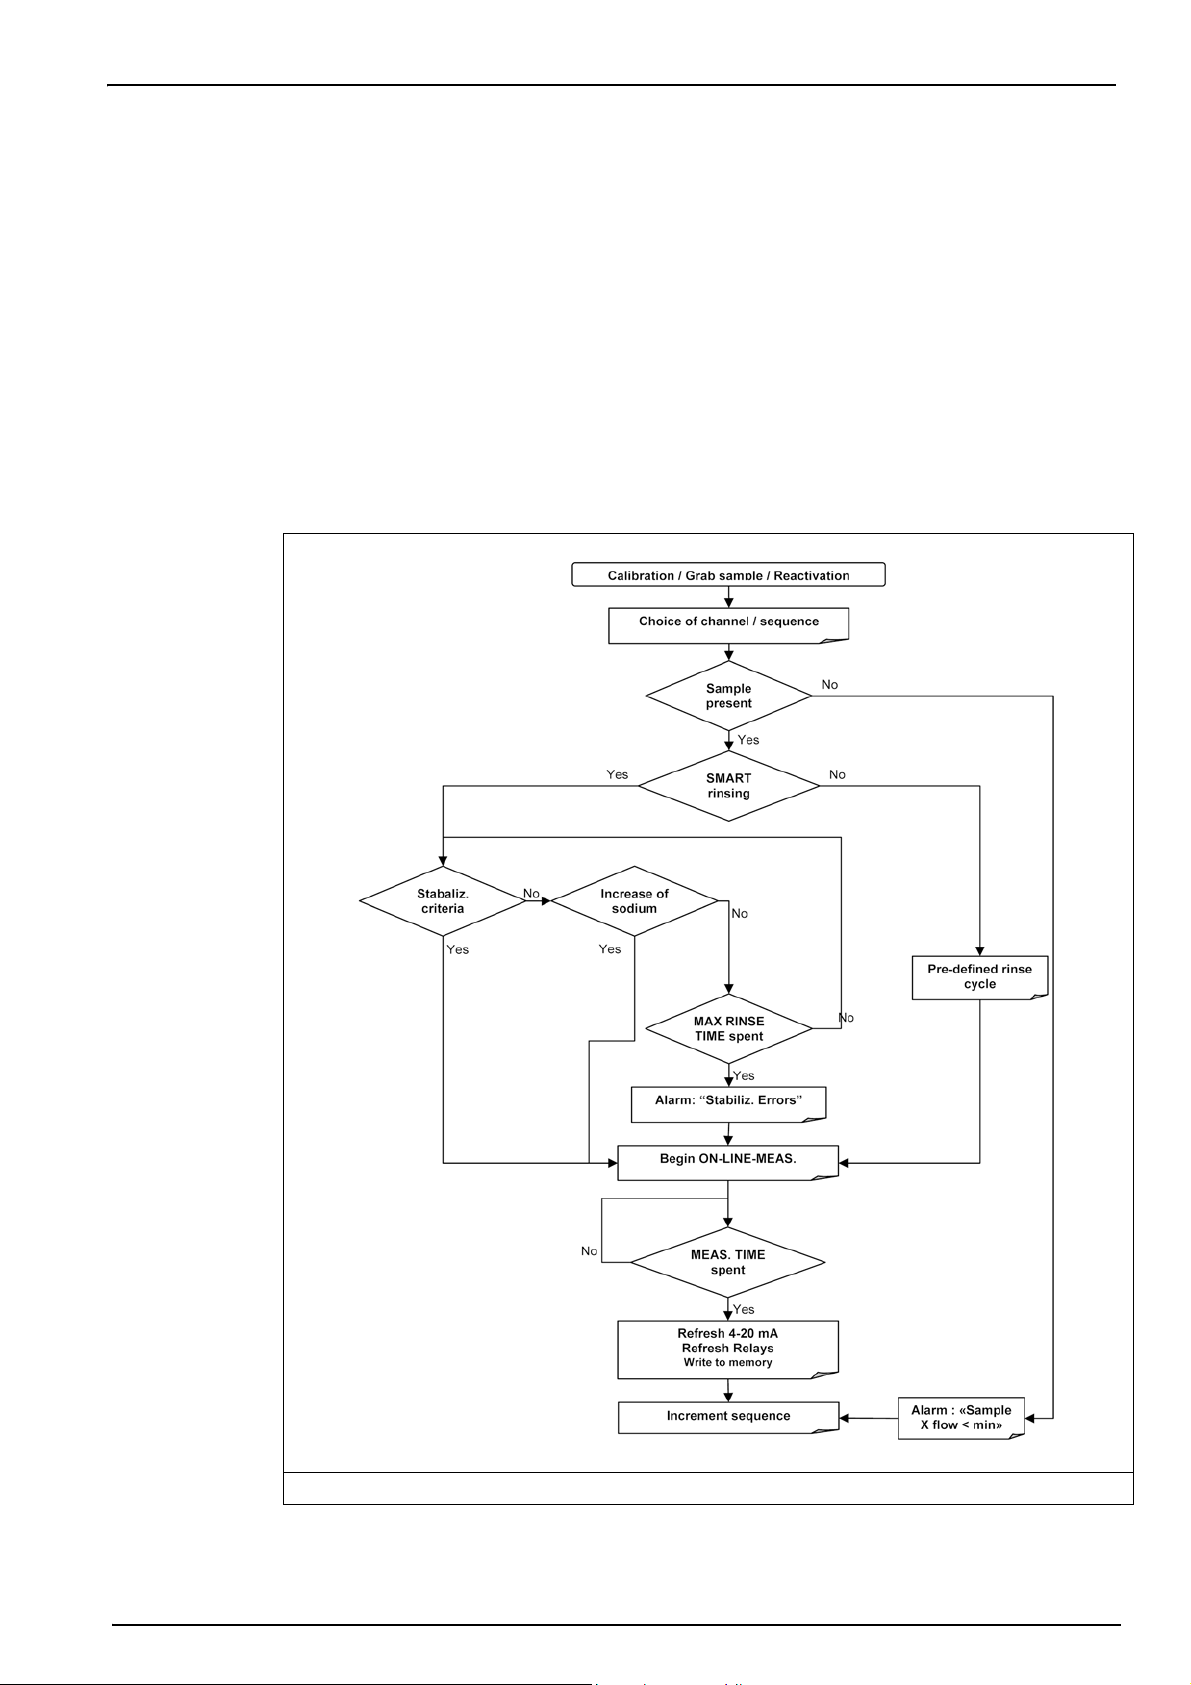
3.6.3 Measurement cycle
The following flow chart illustrates the logic used during the measurement cycle.
Analyzer Overview
3.6.4 On-line measurement
On completion of each rinsing time, the analyzer starts the on-line measurement step. The
sodium concentration is shown on the display panel and output via the RS485 link.
At the end of this step, the analyzer refreshes the 4-20 mA outputs and alarm relays, writes data
to the analyzer memory and the display panel. The concentration displayed is the average
concentration of the final minute of the on-line measurement step.
Figure 9 Measurement cycle
29
Page 32

Analyzer Overview
3.7 Automatic calibration cycle
The following section gives an overview of the automatic calibration process. For details on
setting up and running this process, refer to the section entitled Calibration on page 93. As the
9240 is a multi channel analyzer, the user must define which channel will be used for calibration
(see Automatic calibration setup on page 99). The selected channel will also be used when a
manual calibration is launched. If the analyzer is set up as a single channel unit, then calibration
will always be made on channel 1 by default.
30
Figure 10 Automatic calibration cycle
Page 33

Analyzer Overview
This process calculates the slope and offset of the ISE sodium electrode and the reference
electrode. It is based on the measurement of the potential and temperature of three different
samples, two of which contain known concentrations of sodium:
• Measurement of a first sample of unknown concentration
• Measurement of a second sample of known concentration
• Measurement of a third sample of known concentration
The additions of known concentration are made to the overflow vessel which is partially emptied
to avoid any spillage. The volume of the overflow vessel has been factory defined during
preparation of the instrument. This parameter can only be modified by a qualified service
technician.
The sample to which the known additions will be made is measured. This measurement must be
stable and less than 1 per thousand of calibration solution concentration and becomes the
background point measurement P0 displayed on the analyzer.
The cycle is as follows:
1. Phase 1: The sample to which the known additions will be made is measured. This
measurement must be stable and less than 1 thousandth of the calibration solution
concentration. This becomes the background point measurement P0 displayed on the
analyzer.
2. Phase 2: The electrode is reactivated. This consists of injecting Sodium Nitrate into the
solution to maintain a high level of sodium measurement for a minimum of 5 minutes.
3. Phase 3: The measurement cell is rinsed. The overflow vessel is then refilled with fresh
sample.
4. Phase 4: The overflow vessel is drained slightly to allow enough room for the addition of the
first calibration solution.
5. Phase 5: The first calibration solution of known concentration is added and mixed with the
sample. The overflow vessel is drained into the measurement cell and the first concentration
measured and displayed as P1 on the analyzer.
6. Phase 6: The overflow vessel is rinsed and refilled with fresh sample.
7. Phase 7: The overflow vessel is drained slightly to allow enough room for the addition of the
second calibration solution.
8. Phase 8: The second calibration solution of known concentration is added and mixed with
the sample. The overflow vessel is drained into the measurement cell and the second
concentration measured and displayed as P2 on the analyzer.
9. Phase 9: The slope and offset are calculated and displayed. If the calculated slope and
offset values are within the acceptable limits they will be used for all future measurements.
Normal measurement is then resumed starting with a smart or fixed rinsing step.
31
Page 34

Analyzer Overview
3.8 Manual calibration cycle
The following section gives an overview of the manual calibration process. For details on setting
up and running this processes, refer to the section entitled Calibration on page 93. As the 9240
is a multi channel analyzer, the user must define which channel will be used for calibration (see
Automatic calibration setup on page 99). If the analyzer is set up as a single channel unit, then
calibration will always be made on channel 1 by default.
32
Figure 11 Manual calibration cycle
This process calculates the slope and offset of the ISE sodium electrode and the reference
electrode. It is based on the measurement of potential and temperature of two different samples
of known sodium concentration.
The concentration values of the two calibration solutions must be entered into the analyzer prior
to calibration (see Two point calibration on page 98). The lower concentration should be greater
than 50 ppb and the relationship between low and high concentration should be 10 or more. The
recommended low value is 100 ppb and the high value is 1,000 ppb.
The cycle is as follows:
1. Phase 1: The electrode is reactivated. This consists of injecting Sodium Nitrate into the
solution to maintain a high level of sodium measurement for a minimum of 5 minutes.
2. Phase 2: The measurement cell is rinsed.
3. Phase 3: The overflow vessel is rinsed and refilled with fresh sample.
Page 35

4. Phase 4: The overflow vessel is drained, and the system waits for the operator to fill the
overflow vessel with the low value calibration solution.
5. Phase 5: The overflow vessel is drained into the measurement cell and the first
concentration measured.
6. Phase 6: The overflow vessel is rinsed and then drained. The system waits for the operator
to fill the overflow vessel with the high value calibration solution.
7. Phase 7: The overflow vessel is drained into the measurement cell and the second
concentration measured.
8. Phase 8: The slope and offset are calculated and displayed. If the calculated slope and
offset values are within the acceptable limits they will be used for all future measurements.
Normal measurement is then resumed starting with a smart or fixed rinsing step.
3.9 Grab sample measurement cycle
The following section gives an overview of the grab sample measurement process. For details
on setting up and running this process, refer to the section entitled Grab sample on page 69.
Analyzer Overview
Figure 12 Grab sample measurement cycle
The measurement cycle is as follows:
1. Phase 1: The electrode is reactivated. This consists of injecting Sodium Nitrate into the
solution to maintain a high level of sodium measurement for a minimum of 5 minutes (this
step can be skipped if time is more important than accuracy).
2. Phase 2: When reactivation has completed, the measurement cell is rinsed for 10 minutes
or, if the reactivation has been skipped then the overflow vessel is emptied and refilled with
the sample used for calibration.
3. Phase 3: The overflow vessel is drained, and the system waits for the operator to fill the
overflow vessel with the grab sample.
4. Phase 4: The overflow vessel is drained into the measurement cell and the sample
concentration measured.
5. Phase 5: The measurement value is displayed. Normal measurement is then resumed
starting with a smart or fixed rinsing step.
33
Page 36

Analyzer Overview
3.10 Analyzer outputs
The following tables shows the outputs (screen, analog, alarm relays and RS485) generated by
the analyzer during the various processes (measurement, grab sample, calibration and sensor
reactivation).
For the grab sample and calibration processes, see Automatic calibration cycle on page 30,
Manual calibration cycle on page 32, and Grab sample measurement cycle on page 33 for a
definition of each phase referred to in the table.
The terminology used in the tables is as follows:
• Frozen - output frozen at the last concentration value measured
• Actual - output shows the actual concentration value being measured
For the RS485 output, several variables are accessible:
• Address 0 - actual concentration value being measured
• Address 2, 4, 6, 8 - concentration value for channel 1 to 4 respectively
• Address 163 shows the analyzer status:
• 1 to 4 - number of channel in progress
• 5 - grab sample mode
• 10 - auto calibration mode
• 11 - manual calibration mode
• 13 - sensor reactivation mode
3.10.1 Sensor reactivation
Action Screen 4-20 mA Alarms
Frozen Frozen Frozen Frozen Adr 163=13
3.10.2 Standard measurement process
Action Screen
Output 0 Output 1 - 5 Address 0 Others
Rinsing step Frozen Frozen Frozen Frozen
Measurement Actual Actual
4-20 mA
Updated during
last minute of
measurement.
Alarms
Updated during
last minute of
measurement.
RS485
Address 0 Others
RS485
Address 2, 4, 6, 8:
Actual
Updated at end of
the cycle
3.10.3 Grab sample process
Action Screen
Phase 1
Phase 2
Phase 3
Phase 4
Phase 5 Actual Actual Actual
34
Conc. Other prog. Address 0 Others
Frozen Frozen
4-20 mA
Grab Sample
Event
Alarms
N/A
Frozen
RS485
Address 163=5
Page 37

3.10.4 Auto calibration process
Analyzer Overview
Action Screen
Phase 1 Actual Actual
Phase 2
Phase 3
Phase 4
Phase 5 Actual Actual Actual
Phase 6
Phase 7
Phase 8 Actual Actual Actual
Phase 9 Frozen Frozen Frozen
Frozen Frozen Frozen
Frozen Frozen Frozen
3.10.5 Manual calibration process
Action Screen
Phase 1
Phase 2
Phase 3
Phase 4
Phase 5 Actual Actual Actual
Phase 6
Phase 7
Phase 8 Actual Actual Actual
Frozen Frozen
Frozen Frozen Frozen
4-20 mA
Conc. Other prog. Address 0 Others
Event
Calibration
4-20 mA
Conc. Other prog. Address 0 Others
Event
Calibration
Alarms
Actual Address 163=10
N/A
Alarms
Frozen
N/A
RS485
Address 163=13
Address 163=10
RS485
Address 163=13
Address 163=11
35
Page 38

Analyzer Overview
3.11 Available options
3.1 1.1 K-Kit (cationic)
For a high acidity water such as that from a cation exchanger outlet, the regular gaseous
conditioning is not sufficient to raise the pH to values superior to 10.3. The forced-gas
conditioning system (K-kit) is then needed.
The K-Kit option includes a gas pump with no moving parts, a power supply board, additional
hydraulics and full installation instructions.
For further information contact your local Hach Lange representative.
3.1 1 .2 Static heat exchanger system
A static heat exchanger system is available as an option and is capable of working with up to
four channels. It comes complete with inlet and outlet connectors (4/6mm tubing) and mounting
(2 flanges and screws).
Very easy to install, and requiring no voltage supply, this compact (350 x 40mm)
product absorbs changes of heat even on samples flowing at 5 L/h per channel.
Specially designed for POWER applications, it has a high resistance to corrosion and deposits,
and allows incoming samples from 0 - 60°C to be released to the analyzer within its operating
range of 5 - 45°C.
For further information contact your local Hach Lange representative.
3.11.3 Extra channels
The 9240 analyzer can be configured as a single or multi channel analyzer. Up to 4 channels
can be configured on a single analyzer.
Extra channels are easily installed and setup by following the instructions provided.
For further information contact your local Hach Lange representative.
36
Page 39

Section 4 Installation
The analyzer should only be assembled by qualified staff. Mains power should only be
connected once installation has been completed and checked.
4.1 Analyzer inspection and unpacking
The instrument has been factory tested and checked prior to shipping. We nevertheless
recommend that you perform a visual inspection in order to ensure that it has not been
damaged. Any marked packaging is a potential sign of damage that may not be immediately
visible. Keep all packaging in the event of claims.
4.2 Instrument preparation
Do not connect power prior to mounting and plumbing the instrument.
Personal injury hazard. Instruments or components are heavy. Use assistance to install or
move. Make sure that the wall mounting is able to hold 4 times the weight of the equipment.
WARNING
WARNING
CAUTION
Before installing the analyzer, think about the following:
• Place the analyzer close to the sample point. This will allow the response time to be reduced.
• The sample should be homogenous and representative.
• The temperature of the sample should be between 5 and 45°C.
• The pressure of the sample should be between 0.2 and 6 bar and remain relatively stable.
• The solution should be free of particles. The sample lines should be in PE/PTFE/FEP (4x6
mm).
• Avoid any location with a corrosive atmosphere or subject to liquid spills.
• Chose a dry and dust-free location.
• The ambient temperature of the analyzer should not exceed 45°C. If the temperature is
below 5°C, the analyzer should be installed in a heated cabinet (not provided by Hach
Lange).
37
Page 40

Installation
4.3 Instrument mounting
Whether the instrument is to be mounted on a panel or wall, it is important to note that it must
be placed in an upright position with the transmitter at the top. It is recommended to use a
spirit level to ensure that the instrument is correctly positioned and not leaning to one side or
forward. This is essential to guarantee the accuracy of the analyzer.
4.3.1 Panel mounting
For the panel mount model, the dimensions of the panel and fixation holes are as follows:
CAUTION
38
All dimensions above are in millimeters [inches].
Page 41

4.3.2 Wall mounting
Use the wall mounting kit to fix the instrument to the wall.
Use these to drill the four holes for fixing the instrument on the wall. The distance between the
two pieces is 460 mm.
Installation
Figure 13 Wall mount kit
CAUTION
It is extremely important to respect this gap of 460 mm to avoid bending the cabinet out of
shape while fitting.
39
Page 42

Installation
4.4 Step-by-step installation
No intervention should be made on the instrument without first switching off the power.
The electrical installation should be carried out by duly qualified personnel. A supply voltage of
100-240 VAC is acceptable without changing the configuration. The power supply terminals can
be removed from their housing to make connection easier.
For safety reasons, it is imperative to respect the working procedure below:
• Use a three-wire power cable (live + neutral + earth), sized for supplying the required power.
• The instrument should be connected to the mains via a circuit-breaker or fuse whose value
should be less or equal to 20 A. It should be located in proximity and be identified.
• This connection should cut-off the live and the neutral when electrical problems occur or
when the user wishes to intervene inside the instrument. On the other hand, the earth
conductor should always be connected.
4.4.1 Mains power connection
1. Open the glass window and then open the panel to have access to the rear side of the
analyzer.
WARNING
40
Page 43

2. Pass the power supply
cable through the cable
gland located at the back
left of the bottom of the
cabinet.
Installation
3. Open the I/O connection
box on the rear panel.
4. Unscrew the two fixing
elements...
41
Page 44

Installation
5. ...and allow the I/O box to
rotate down.
6. Pass the mains power
cable through the back
end cable gland on the
transmitter enclosure.
7. Open the transmitter front
door.
42
Page 45

8. Remove the metallic
shielding plate protecting
access to the main board.
Installation
9. Take the power supply
connector and note where
the earth, live, and neutral
must be connected.
10. Connect the power supply
cables to the connector...
43
Page 46

Installation
11. ...and put the connector
back in place.
12. Replace the metallic
shielding plate.
44
Page 47

4.4.2 RS485 connection
1. Connect the RS485
communication cable as
indicated.
Connection is the same
on the CPU board for
both the JBUS/MODBUS
and PROFIBUS options.
Installation
2. Close the transmitter
door.
45
Page 48

Installation
3. Put the I/O box back in its
normal position.
4. Fix the I/O box back in
place with the 2 screws.
46
Page 49

4.4.3 Input/Output connections
Installation
1. Analog output – Iout 0 is used for the current signals of the measurement. Other analog
outputs can be freely linked to different parameters like measurement, temperature – refer
to the section entitled User Setup on page 79 for details.
2. Relays – Rel 8 is linked to the system alarm and is normally energized. Rel 7 is linked to
the warning alarm. The position of the contact represented on the diagram above
corresponds to a state when the relay is not energized. See Alarms on page 84 for more
information on the relays.
3. Logical inputs (5) – four inputs allow sample measurement to be by-passed on selected
channels by providing 1 dry circuit for each selected channel, which will then be closed to
by-pass channel measurement until that circuit is re-opened. The fifth input is to launch the
remote calibration (same principle as sample measurement by-pass).
4. Close the I/O box.
47
Page 50

Installation
4.4.4 Sample tubes installation
• Sample inlet connections - 6 mm (or ¼'') in polyethylene or PTFE or FEP. If particulate
matter is present in the sample, pre-filtration is necessary. A filter should be inserted in the
sample line. One is available as an option. Use new pipes for all connections during
installation.
• Flow rate - 6 to 9 L/hour
•Pressure - 0.2 to 6 bars (8 to 100 psig)
• Sample acidity - Sample acidity should not be more than 300 ppm CaCO
• Temperature - Temperature must be between 5 to 45 °C
At this stage of the installation, make sure that the flow valve is closed.
Connect the pipes by inserting them into the quick release connections found under the
sampling block. Connect one inlet and one outlet per channel.
Be sure that the sample line is correctly flushed before any connection to avoid particle injection
into the 9240 hydraulic system.
1. Connect the drain outlet.
2. Connect the sample inlet/outlets. Up to four are available, though the illustration below
shows only one channel connected with the other three inlet/outlet connections still
available
3
48
A - Drain outlet - 12/17 mm B - Sample outlet tube - 4/6 mm
C - Sample inlet tube - 4/6 mm
Page 51

4.4.5 Reagents installation
1. Prepare the reagents according to Reagent Preparation on page 137. Install the reagent
canisters in their place and connect them to their respective tubes.
2. Install and connect the conditioning solution (diisopropylamine). The diagrams show an
analyzer for non-cationic applications. Analyzers for cationic applications have a small pump
installed above and to the left of the reagent canisters.
Installation
3. Install and connect the reactivation
solution (blue R label).
4. Install and connect the auto calibration
solution (yellow CAL label).
49
Page 52

Installation
4.4.6 Magnetic stirrer installation
1. On the front of the panel,
remove the plastic bag
from the overflow vessel
2. Remove the magnetic
stirrer from the bag and
install it in the overflow
vessel
50
Page 53

4.4.7 Reagents volume declaration
Note: As you will now be using the analyzer menus to input data, it may be useful to familiarize yourself with
the data entry procedures by reading the section entitled Data entry on page 59 of this manual.
1. Open the sample valve and check that there is no leakage in the hydraulic path.
2. Power on the analyzer.
3. Select the Menu option from the display.
4. Select MAINTENANCE/DIAG. from the main menu
and press Enter
Installation
5. Select the REAGENT CHANGES option and press
Enter
6. Set the BOTTLES FULL parameter to Yes and
press Enter.
7. Press Esc to return to the MAINTENANCE/DIAG.
menu.
51
Page 54

Installation
4.4.8 Flow rate adjustment
1. From the MAINTENANCE/DIAG. menu select
START UP and press Enter
2. First, the system automatically primes both the
calibration and reactivation tubes.
3. Check that there are no air bubbles in the reagent
tubes for reactivation and auto calibration.
4. The next step allows you to regulate the sample
flow rate on each measurement channel. The name
of the channel to regulate is displayed (the default
name of Sample 1 for channel 1 is illustrated left).
5. The analyzer automatically empties and refills the
overflow vessel to determine the flow rate which is
displayed on screen.
6. The flow rate for each channel should be 6 to 9
L/hour.
7. Using a screwdriver, regulate the channel’s sample
flow by turning counter-clockwise to increase the
flow rate or clockwise to decrease the flow rate.
8. The process is repeated until the flow is correctly
regulated for the channel. At this point select OK.
9. The system then allows you to regulate the next
channel until all flow rates have been set for the
configured channels.
52
10. Once all flow rates for the configured channels have
been set, an Action completed message will be
displayed.
11. Select Esc to exit and complete the process.
Page 55

4.4.9 Sample pH conditioning check
Note: At this stage, the electrodes should not have been installed.
4.4.9.1 Non-cationic applications
1. Install a calibrated pH sensor in the center position
of the measurement chamber which is normally
used for the ISE sodium electrode.
2. On the analyzer, press Start on the main menu to
start the measurement process.
3. For each channel, check that the pH value of the
sample after conditioning is greater than 10.5. If not,
check the quality of the conditioning product used.
Installation
4.4.9.2 Cationic applications
1. With a calibrated pH sensor, measure the pH of the sample for each channel outside of the
analyzer. Note down these values.
2. The analyzer measurement sequence will be factory set depending on the number of
configured channels (e.g. 1 2 3 4 * for a 4-channel analyzer or 1 2 * for a 2-channel
analyzer). Verify this sequence is correctly setup (see Sequence on page 92 for more
details).
3. Set the following measurement timings (see Measure steps on page 81):
4. For each channel determine the gas injection time ratio depending on the sample pH. Enter
this value into the analyzer as described in Total gas/water ratio (cationic applications only)
on page 81. The standard values are listed below:
CYCLE TIME to 11 min
ON LINE MEAS to 8 min
SEARCH STAB to No.
pH Tgas/Twater Ratio
2 180%
2.3 80%
2.6 50%
2.9 30%
3.5 15%
4.0 10%
5. Install the same calibrated pH sensor in the center position of the measurement chamber.
6. On the analyzer, press Start on the main menu to start the measurement process.
53
Page 56

Installation
7. For each channel, measure the pH in the conditioned sample to check if the pump ratios are
efficient enough to obtain a pH of around 11.0.
8. If necessary, update the ratios of each channel to maintain a final constant pH of 11.0 ± 0.2.
4.4.10 Reference electrode installation
1. Remove the reference
sensor from its box.
2. Remove the plastic
reservoir from the bottom
(the storage solution is
KCl 3M) and install the
O-ring as shown.
3. With care, turn the bottom
electrolyte tube ferrule
with a maximum ¼ turn to
lock it.
4. Remove the plastic plug
on the entry port.
54
Page 57

5. Install the reference
electrode in the extreme
left measurement
chamber.
6. Connect the reference
cable (the one without
the blue label on it) to the
reference electrode.
Installation
7. Connect the electrolyte
tube to the reference
electrode.
55
Page 58

Installation
4.4.11 Sodium ion selective electrode installation
Note: It is critical to preserve the integrity of the sodium ion selective electrode as much as possible. This is
why this electrode must be installed at the very last moment after all other adjustments.
1. Remove the sodium ion
selective sensor from its
box.
2. Remove the plastic
reservoir from the bottom
(the storage solution is
standard tap water) and
shake gently (as you
would a thermometer) to
dispose of any bubbles.
3. Install the O-ring as
indicated right.
4. Install the ISE in the
center position of the
measurement chamber.
5. Connect the AS7 cable
(with the blue label) to the
electrode.
56
CAUTION
After the electrodes installation, it is very important that none of the electrode heads are
touching the bottom part of the measuring cell. An example of the electrodes correct position
is shown above.
Page 59

4.4.12 Fill electrolyte reservoir
1. The electrolyte reservoir is
located at the back of the
analyzer.
2. Take the KCl electrolyte
bottle and insert the tip of
the tapered spout into the
reservoir inlet tube
(illustrated right) as far as
it will go but without
exerting any extra
pressure.
3. Squeeze on the bottle as
many times as necessary
to fill the reservoir to
about 3/4 of its capacity. If
you have any difficulty
filling the reservoir, raise
the spout of the bottle
very slightly to avoid an
air lock.
Installation
4. Using thumb and
forefinger, pump on the
electrolyte tube between
the reservoir and the
reference electrode to
remove any air bubbles
that may have formed.
5. If necessary, clean any
KCl drops from the
analyzer and the
reservoir.
57
Page 60

Installation
4.5 Analyzer stabilization
At this stage the analyzer has been completely installed, but needs to run for a period of time to
stabilize.
1. On the analyzer, press Start on the main menu to start the measurement process.
2. Leave the system to run for a couple of hours before starting any calibrations.
4.6 Analyzer setup
After the analyzer has stabilized, the system and user parameters must be set, followed by an
initial calibration.
1. SYSTEM SETUP - see System Setup on page 73.
2. USER SETUP- see User Setup on page 79.
3. CALIBRATION - see Calibration on page 93 and launch a two point calibration.
Note: The complete calibration cycle will last around 1 hour. However, the instrument cannot be calibrated
until at least one complete measurement cycle has been successfully performed. An attempt to calibrate the
instrument before this will result in a “Not authorized” message being displayed.
58
Page 61

Section 5 Operating Instructions
Note: All screen display examples in the following sections are shown as black on a white background for
reasons of clarity, and do not necessarily reflect the actual colors used on the instrument display.
5.1 Data entry
5.1.1 Function keys
The display panel of the 9240 has 5 function keys (illustrated below) to allow menu option
selection, field selection, and data entry options.
Figure 14 Function keys
• The Esc key cancels data input or goes back to the previous screen.
• The Enter key validates the input and goes on to the next step.
• The Up Arrow keys select the option displayed immediately above them on the screen.
When a screen requiring data entry is displayed, the first editable field is always highlighted (as
illustrated left in Figure 15 below). To select other fields on the screen, scroll through them by
pressing the Up Arrow function key under the Select option. As each field is selected, the data
element available for update is highlighted.
Figure 15 Field and menu selection
The same is also true when a menu is displayed (as illustrated right in Figure 15 above). In this
case, the first available option is always highlighted. Scroll to the required option by pressing the
Up Arrow function key under the Select option.
Data entry is effected in a variety of ways depending upon the characteristics of the data field
being accessed. The following examples show the different ways of entering data when
required.
59
Page 62

Operating Instructions
5.1.2 Numeric fields
These fields require that the user enter one or more numeric values into a field. The type of field
determines the available input. In some fields only digits 0 through 9 would be available to
select whereas in other fields the decimal point and/or minus sign may also be available.
The highlighted field in the example left is a numerical
data element which requires input from the user.
As this is a date field, only digits 0 through 9 will be
available for selection.
For data elements such as these, press the function
key under either the Up Arrow or Down Arrow options
to initiate data entry.
The first digit will then be highlighted, and a new Right
Arrow option replaces the Select option at the bottom
of the screen.
Press the function key under the Up Arrow option to
increase the value of the field by 1.
Press the function key under the Down Arrow option to
decrease the value of the field by 1.
Press the function key under the Right Arrow option to
accept the currently displayed digit and move one digit
to the right (i.e. 5 in the example left).
Press the Enter function key to accept the data and
move to the next input field.
It is not necessary to enter data into each of the
available data elements that make up the data field.
For example, if it was required to simply change the
date from the 25/07/07 to 25/08/07, the following steps
are all that are required:
• Press the function key under the Right Arrow
option until the digit 7 is highlighted.
60
• Press the function key under the Up Arrow option
to increase the value of the field by 1 to 8.
• Press the Enter function key to accept the complete
data field (25/08/07) and move to the next data input
field.
Page 63

5.1.3 Alphanumeric fields
These fields require that the user enter one or more alphanumeric values into a field. The type
of field determines the available input. In some fields only upper case alpha characters may be
allowed, in others upper and lower case alphanumeric characters my be allowed, etc.
Operating Instructions
In this example, a name is required to give to the
channel. The complete alphanumeric character set is
available to choose from, including upper and lower
case alpha characters.
Press the function key under either the Up Arrow or
Down Arrow options to initiate data entry.
The first character will then be highlighted, and a new
Right Arrow option replaces the Select option at the
bottom of the screen.
Press the function key under the Up Arrow or Down
Arrow option to scroll through the list of available
characters.
Press the function key under the Right Arrow option to
accept the currently displayed character and move to
the next character.
Press the Enter function key to accept the complete
field and move to the next data input field.
61
Page 64

Operating Instructions
5.1.4 List element fields
This type of data entry is where a pre-defined list of available data values are available to the
user who must select the one which is applicable. Free-format text is not allowed.
The highlighted field in the example left is a data
element where there is only a limited number of valid
options (i.e. the seven days of the week).
For data elements such as these, press the function
key under the Up Arrow option to scroll forward
through the pre-defined list (in this example Tuesday,
Wednesday, Thursday...) or press the function key
under the Down Arrow option to scroll backward
through the list.
When the required list element is displayed press the
Enter function key to accept the data and move to the
next data input field.
5.1.5 Incremental value fields
These are fields where a value is displayed on the screen and the user has the option of
increasing or decreasing the value.
5.1.6 Data entry input errors
After entering data for a field, the system will verify the validity of the data. For example, if a date
of 41/12/07 is entered, the system will not accept it. If any field is found to be invalid, an
appropriate error message will be displayed at the bottom of the screen and the system reverts
back to the original value for that field.
In this example, the whole value, rather than an
individual digit, is highlighted.
Use the Up Arrow function keys under the plus or
minus symbols to increase or decrease the value by 1.
On completion press the Enter function key, to accept
the new value.
62
Press one of the Up Arrow function keys to acknowledge the error, and re-enter the data, or
Esc to acknowledge the error and exit the screen.
Page 65

5.2 Measurement screens
5.2.1 Principal display
Operating Instructions
Figure 16 Principal measurement screen
An example of this display is given above. It shows the details of the current sample being
measured. In this example, the measurement is for Channel 1 (channel name of Sample 1), but
this will change as the analyzer switches to the next measurement channel in the user-defined
sequence.
The options at the bottom of the screen will include three of the following:
•Hist - Selecting this option will show the last measurements for each channel (see Figure 17
on page 64 as an example) along with the last grab sample and verification details.
•Stop - Select this option to stop the current process on the analyzer. This could be a
measurement, verification or grab sample process. The option is only available when one of
these processes is currently running. You will be asked for confirmation (YES or NO) that you
want to stop the process.
•Start - Select this option to start the analyzer measurement process. This option is only
available if the analyzer has been stopped.
•Menu - This will bring up the main menu screen as illustrated in Figure 19 on page 66.
•Alarm - This option will appear flashing on the screen if any alarms have been set. Selecting
this option will take you to the alarms screen as illustrated in Figure 18 on page 65.
63
Page 66

Operating Instructions
5.2.2 Historical display
This screen shows the last sample measurements for each channel, the last grab sample
measurement and the last verification and gap measurements. The example illustrated is for a
4-channel analyzer. Underneath these measurements, the actual potential between the glass
electrode and the reference electrode is displayed along with the temperature.
Figure 17 Historical measurement screen
Select Main to return to the main measurement screen.
Use the Select option to select one of the measurement channels for viewing and then select
Graph to see the measurement details for that channel.
The measurement channel selected will then be displayed (as illustrated above for channel 2)
on a constant basis. The symbol to the right of the channel name indicates whether or not this
channel is currently being measured by the analyzer. A double right arrow (example above left)
indicates the channel is being measured, and the letter “O” (example above right) indicates
another channel is currently being measured.
64
Note that the bar graph showing measurement progress is not displayed in this mode, unlike on
the principal measurement screen.
Select Main to return to the principal display.
Page 67

5.2.3 Alarms screen
Alarms S1-S4 relate to the four alarm outputs. This is followed by the warning alarm (W!) and
the system alarm (small graphic). The message against each alarm will indicate OK (no
problems encountered), INACTIVE (the alarm has been deactivated), or a message indicating
the reason for the alarm.
Operating Instructions
Figure 18 Alarm screen
For information on setting up the alarms, please refer to Alarms on page 84. In addition, Table 7
on page 87 lists all the possible error messages and indicates the type of alarm (warning or
system).
If a manual alarm acceptance has been set up, select Enter to deactivate the alarms.
Select Hist. to go to the history display, or Esc to return to the measurement display.
65
Page 68

Operating Instructions
5.3 Main menu
For a diagrammatic view of the complete menu structure, please refer to Menu structure
overview on page 71.
The main menu is accessible from any one of the measurement screens (as illustrated in
Figure 16 on page 63 for example). To access the main menu screen press the Up Arrow
function key under the Menu option.
Note: Access to the Main Menu will require a password if a PROGRAMMING password has been set (see
Passwords on page 76).
Figure 19 Main menu screen
The first option in the menu will always be highlighted by default. To scroll to the option required,
press the Up Arrow function key under the Select option.
Note: Scrolling past the last item in the list will take you back to the first item. It is not possible to scroll
upwards through any list.
Detailed information on each of the main menu options is available elsewhere in this manual as
follows:
• VERIFICATI ON - See section entitled Verification on page 67
• GRAB SAMPLE - See section entitled Grab sample on page 69
• CALIBRATION - See section entitled Calibration on page 93
• MAINTENANCE/DIAG. - See section entitled Maintenance and Diagnostics on page 103
• USER SETUP - See section entitled User Setup on page 79
• SYSTEM SETUP - See section entitled System Setup on page 73
66
Page 69

5.3.1 Verification
Operating Instructions
This option allows you to verify the measurement using a
solution of known sodium concentration.
Concentration of the known solution should be higher than 20
ppb (100 ppb is recommended) to ensure a preparation step
in a range with lower risks of contamination.
Note: This is a measurement verification cycle only, and no
adjustments to parameters or calibration data will be made.
First enter the concentration of the verification solution in the
VALID. SOL field.
Select START to commence the process.
The first step of this cycle allows the reactivation of the
electrode. The message SENSOR ACTIVATION is displayed.
Select Yes to reactivate the sensor. Select No if time is more
important than accuracy.
The reactivation process is automatically followed by a rinsing
of the overflow vessel and measuring cell using the process
sample.
A progress bar (regularly refreshed) is displayed showing the
time remaining to complete the verification process.
Flow rate and measurements are also displayed.
67
Page 70

Operating Instructions
Upon completion of the rinsing step, the analyzer is ready for
the first manual step in the cycle.
Place the lid of the overflow vessel on the side and pour
approximately 200 mL of the solution into the overflow vessel,
as prompted on screen. Manual introduction is complete when
the sample overflows at the back of the overflow vessel.
Place the lid back on top of the overflow vessel and select OK
to start the measurement.
The display switches back to the main measurement screen
and displays the measurement value.
The progress bar at the top of the screen monitors the
measurement time of the sample.
If you wish to abort the process at any time during the
measurement cycle, select Stop.
Once measurement of the solution is complete, the measured
value and time will be displayed against verif. s. This should
be almost identical to the value entered in the VALID. SOL
field previously.
The value displayed in gap, will be the percentage difference
between the concentration of the verification solution entered
in the VALID. SOL field, and the concentration measured by
the instrument. If this value is too high, then a calibration of
the analyzer is recommended.
Once the cycle is complete, the analyzer automatically reverts
back to standard measurement mode.
Select Main to go back to the main measurement screen.
68
Page 71

5.3.2 Grab sample
Note: It is recommended that the grab sample should have a concentration of > 10 ppb and should be at
the same temperature as during calibration for better accuracy. Under these conditions, measurement with
manual introduction gives 5% accuracy from 10 ppb to 10 ppm at a temperature which is within ± 5 °C of the
temperature during calibration.
Operating Instructions
Similar to the verification process, this option allows
measurement of a sample of your choice.
Before starting this process, ensure you have a sample of
approximately 200 mL to measure.
The first step of this cycle allows the reactivation of the
electrode. The message SENSOR ACTIVATION is displayed.
Select Yes to reactivate the sensor. Select No if time is more
important than accuracy.
The reactivation process is automatically followed by a rinsing
of the overflow vessel and measuring cell using the process
sample.
A progress bar (regularly refreshed) is displayed showing the
time remaining to complete the process.
Flow rate and measurements are also displayed.
Upon completion of the rinsing step, the analyzer is ready for
the first manual step in the cycle.
Place the lid of the overflow vessel on the side and pour
approximately 200 mL of the solution into the overflow vessel,
as prompted on screen. Manual introduction is complete when
the sample overflows at the back of the overflow vessel.
Place the lid back on top of the overflow vessel and select OK
to start the measurement.
69
Page 72

Operating Instructions
The display switches back to the main measurement screen
and displays the measurement value.
The progress bar at the top of the screen monitors the
measurement time of the sample.
If you wish to abort the process at any time during the
measurement cycle, select Stop.
Once measurement of the sample has completed, the
measurement value and time will be displayed against grab s.
Once the cycle is complete, the analyzer automatically reverts
back to standard measurement mode.
Select Main to go back to the main measurement screen.
70
Page 73

5.4 Menu structure overview
Operating Instructions
71
Page 74

Operating Instructions
72
Page 75

Section 6 System Setup
Before attempting to setup the analyzer, ensure that you have read and understood how to
enter and update data fields as described in the section entitled Function keys on page 59.
Press the Up Arrow function key under the Menu option on
the measurement screen to display the Main Menu.
Access to the Main Menu will require a password if a
PROGRAMMING password has been set (see Passwords on
page 76).
The password is a 4-digit numeric field. Enter the value.
Press the Enter function key to accept and validate the
password.
If no password has been set, or once a valid password has
been entered, then the Main Menu will be displayed.
Press the Up Arrow function key under the Select option to
scroll through the menu until you reach the SYSTEM SETUP
option, then press the Enter function key.
The System Setup Menu is displayed.
73
Page 76

System Setup
6.1 System setup - Menu overview
6.2 Date and time
Figure 20 System setup menu
Select the DATE/TIME option to access the date/time
sub-menu.
This option allows you to set up the system date and time.
Scroll to the required day and press the Enter function key.
Enter the day, month, and year.
74
Enter the time in HH:MM:SS format (24 hour clock).
On completion press Esc to return to the main System Setup
menu.
Page 77

6.3 Display options
System Setup
Select the DISPLAY option to set up the display parameters.
Select the LANGUAGE, CONC. UNIT and TEMPERATURE
UNIT fields in turn, and set your preferences by scrolling
through the available options (listed in Table 3 below).
Language
Concentration Units
Temperature Units
Table 3 Display options
Value Description
GB English
D German
Sp Spanish
I Italian
F French
µg-mg/L Micrograms - Milligrams / Liter
ppb/ppm Parts per Billion / Parts per Million
°C Degrees Celsius
°F Degrees Fahrenheit
75
Page 78

System Setup
6.4 Passwords
Select the PASSWORDS option to set passwords for access
to programming, calibration and system setup options.
By default all passwords are set to 0000.
Each password is a 4-digit numeric field. Enter the required
value for each of the three passwords. A value of 0000
signifies no password is required to gain access to those
menu options.
6.5 Default values
Select the DEFAULT VALUES option to erase all the
previously set user parameters and load the default values
(refer to Default Configuration on page 121 for a list of all the
default values).
A warning message is displayed and confirmation of this
action is required.
To exit from the screen without loading the default values,
press the Esc function key.
To load the default values, select the Yes option.
A number of informational screens will be displayed during the
process.
76
When the process is complete, the display reverts to the
measurement screen.
Page 79

6.6 Adjust mA output
System Setup
Select the ADJUST mA OUTPUT option to access the
analyzer’s analog output parameters. These can be set to
0-20 mA or 4-20 mA (see details on how this is done in mA
outputs on page 88).
Each mA output can be individually calibrated on 2 points.
Adjustments should be made based on accurate readings
from a multimeter.
You have the option to adjust any of the six available outputs.
The process is exactly the same for each of the outputs.
6.7 Factory settings
Select the mA output you wish to change to display the next
screen.
Ensure the multimeter is connected to the selected output.
The option to increase or decrease the low end value (0 mA
or 4 mA depending on your setting) is displayed.
Change the value up or down by selecting the Minus or Plus
indicators at the bottom of the screen.
On completion press the Enter function key and the display
changes to 20 mA.
Enter the adjustment value in the same way as for the low
end value. On completion press the Enter function key, and
the display reverts back to the main ADJUST mA OUTPUT
screen, to allow you to select the next output to adjust.
This option is reserved for qualified Hach Lange service
personnel.
If you believe that changes to the settings may be required,
please contact your local Hach Lange representative.
77
Page 80

System Setup
78
Page 81

Section 7 User Setup
Before attempting to setup the analyzer, ensure that you have read and understood how to
enter and update data fields as described in the section entitled Function keys on page 59.
The default and available settings for these options are listed in Default Configuration on
page 121. For easy reference, it is recommended that once the user setup process has been
completed, your specific settings should be logged in this table.
Press the Up Arrow function key under the Menu option on
the Measurement Screen to display the Main Menu.
Access to the Main Menu will require a password, if a
PROGRAMMING password has been set (see Passwords on
page 76).
The password is a 4-digit numeric field. Enter the value.
Press the Enter function key to accept and validate the
password.
If no password has been set, or once a valid password has
been entered, then the Main Menu will be displayed.
Press the Up Arrow function key under the Select option to
scroll through the menu until you reach the USER SETUP
option, then press the Enter function key.
The User Setup Menu is displayed.
79
Page 82

User Setup
7.1 User setup - Menu overview
80
Figure 21 User setup menu
Page 83

7.2 Measurement
7.2.1 Targeted pH (non-cationic applications only)
If the analyzer has been set up for non-cationic applications,
the screen illustrated left is displayed.
Select the pH option and enter the target pH value for your
application. The measured pH value of the sample in the
measuring cell should be within ±0.2 pH of the target.
7.2.2 Total gas/water ratio (cationic applications only)
User Setup
7.2.3 Measure steps
If the analyzer has been set up for cationic applications, the
screen illustrated left is displayed.
The example screen is for a 3-channel analyzer.
For each channel, enter the ratio of gas to water to minimize
the DIPA consumption. This is part of the installation
procedure and is explained in more detail in Sample pH
conditioning check on page 53.
Select the MEASURE STEPS option to set up the
measurement timings.
The measurement and rinse processes are explained in more
detail in Measurement process on page 25. Please ensure
you have read this before entering any of the measure
step parameters.
If the analyzer has been set up as a single channel analyzer
the screen illustrated left will be displayed.
The on line measurement time defines the measurement time
of the sample and how often the measurement values are
stored in memory. For a single channel configuration, it is
recommended to leave this time at the default value of 10
minutes.
If smart rinsing is required after a calibration, grab sample or
sensor reactivation, set this parameter to Yes and define the
maximum rinse time.
81
Page 84

User Setup
7.2.4 Reactivation frequency
If the analyzer has been set up as a multi channel analyzer
the screen illustrated left will be displayed.
The on line measurement time is the time when the analyzer
displays the true sodium measurement. This value must be at
least 1 minute and less than the cycle time.
If smart rinsing is required after a calibration, grab sample or
sensor reactivation, set this parameter to Yes and define the
maximum rinse time.
The cycle time is the total measurement time for each channel
and cannot be less than 10 minutes.
After a change of measurement channel, for a manual mode
with a fixed cycle time, set the search stability mode to No.
For an automatic mode which minimizes the cycle time, set
this parameter to Yes.
Select the ACTIVAT. FREQ option to set the time period
between electrode reactivation. When this time period
expires, the electrode is reactivated automatically with an
injection of a small amount of reactivation solution.
Set the reactivation mode to either a Frequency or a fixed
date.
If set to frequency, the recommended time period is 24 hours
so that the electrode is reactivated on a daily basis.
Note: If this value is set to zero, then no electrode reactivation will
take place during the calibration process and as such the calibration
may be inaccurate. It is highly recommended to set this parameter to
24.
If set to a fixed date, define the day and time of the week
when reactivation takes place. Set the day of the week to an
asterisk if reactivation is not to take place on that day.
82
When the days have been defined, set the time in HH:MM:SS.
In the example screen shown left, reactivation will occur
automatically every Monday, Wednesday and Friday at 3
o’clock in the afternoon.
Page 85

7.2.5 Datalogger setup
User Setup
This option allows you to view data held in the analyzer’s
internal memory.
Select the VIEW DATA option to display the requested data.
All information matching the parameters selected in the VIEW
SETUP option is displayed on the screen.
If the data covers more than one screen, an Arrow key will be
displayed at the bottom. Use this key to scroll through the
data.
Select the VIEW SETUP option to define the parameters for
the data you wish to view.
The FROM data field is the date (DD/MM/YY) from which you
want to start viewing data.
The AT data field is the time (HH:MM:SS format) from which
you want to start viewing the data.
Enter in the CH field the channel for which you want to view
the data. This can be a single channel, all channels or none.
If you wish to see the ALARMS information (both system and
warning alarms), select Yes in this field, or No if alarm
information is not required.
83
Page 86

User Setup
7.2.6 Graph time base
7.3 Alarms
For graphical displays, enter the number of hours as the base
line for the graph. This can be 4, 8, 12, 16, 20 or a 24 hour
period.
Select the ALARMS option to set up the parameters for all the
alarms including the system and warning alarms.
Select the alarm to set up.
84
Page 87

7.3.1 Alarms 1 to 4
User Setup
Table 4 Alarms 1 to 4 parameters
Value Description
Limit
Mode
Attributes Channel n
Direction
Delay nnn seconds The delay (in seconds) before the alarm is activated
Hysteresis nn% Hysteresis %
Relay
Sample flow Trigger the alarm when the sample flow rate is too low
Active channel
Limit nnnn Define the limit when the alarm should be triggered
Up Trigger alarm when measurement is above the limit
Down Trigger alarm when measurement is below the limit
N.O. Normally open
N.C. Normally closed
Trigger the alarm when the measurement is above or below a
pre-defined limit
Trigger the alarm when the channel is active i.e. during the
measurement cycle
Defines the channel number (1-4) on which the alarm is
triggered
Depending on the mode set, a different screen will be
displayed.
The example left shows the Limit mode screen.
The example illustrated indicates that alarm number 2 is set
up on Channel 1, and the alarm is triggered after a delay of 15
seconds when a measurement of 21.00 ppm is exceeded.
With the mode set to either Active Channel or Sample Flow,
you only have the possibility of setting the relay, as illustrated
left.
85
Page 88

User Setup
7.3.2 Warning alarm
Table 5 Warning alarm parameters
Value Description
Alarm
Accept
Relay
Yes Activate the warning alarm
No Deactivate the warning alarm
Manual When the alarm is triggered, turn it off by pressing the Enter function key
Auto
N.O. Normally open
N.C. Normally closed
When the alarm is triggered, it will turn itself off only when the reason for the
alarm being triggered is no longer valid
Set the parameters as required (see explanations in Table 5
above).
7.3.3 System alarm
Alarm
Relay
Table 6 System alarm parameters
Value Description
Yes Activate the system alarm
No Deactivate the system alarm
N.O. Normally open
N.C. Normally closed
Set the parameters as required (see explanations in Table 6
above).
86
Page 89

7.3.4 System and warning alarm table
The following table lists the different system and warning alarms:
Message Description Category
User Setup
Table 7 System and warning alarms
Reset measure mod. Reset the measure module
Reset LC module Reset the local controller module
LC Error Local controller module error
Err. measure mod. Measure module error
Comms error Communication error
Temp > 45°C (113°F) Temperature too high
Temp < 5°C (45°F) Temperature too low
Measure error Measurement error
Meas.time over Measurement cycle time too long
Cal.time over Calibration cycle time too long
Flow x < min Not enough sample
No condit. No sample conditioner (< 50 mL)
Channel inhib. The sample measurement is by-passed
Cal. sol < 100 mL Calibration solution level low
Electro. < 10 mL Electrolyte volume level low
Activ. sol. < 100 mL Reactivation solution level low
Condit. < 100 mL Conditioning solution level very low
P0 too high Base measurement P0 is too high
P2 < 5 x P1 2nd point calibration < 5 times 1st point
Slope drift Slope over tolerance
Offset drift Offset over tolerance
Stabilize error Stability criteria for accuracy not reached
Sample x < C Sample concentration x is below threshold C
Sample x < 0 ppb Sample concentration x is negative
Sample x > 1000 ppm Sample concentration is too high
System
System
Warning
Warning
Warning
Warning
Warning
Warning
Warning
Warning
Warning
System
Warning
Warning
Warning
Warning
Warning
Warning
Warning
Warning
Warning
Warning
Warning
Warning
Warning
87
Page 90

User Setup
7.4 mA outputs
Select the mA OUTPUTS option to set up the parameters for
all the analog outputs.
7.4.1 Outputs 0 to 5
Attribute
From the list available, select the mA output you wish to set.
Table 8 Analog output parameters
Description
Choose the attribute that triggers the analog output:
• Measurement channel
• Temperature
• Current (mV)
Note: The attribute variable cannot be applied to Output 0, which is reserved for the
continuous live output signal.
Type Choose either a 0-20 mA or 4-20 mA analog output
Mode
Select between linear, dual or logarithm (see graph in Figure 22 on page 89). This
parameter is only selectable if the attribute is set to a measurement channel.
88
Low The value corresponding to the low end of the scale
Middle The value corresponding to the mid-point of the scale (only available in dual mode)
High The value corresponding to the high end of the scale
Page 91

Figure 22 Linear and dual slopes
User Setup
7.4.2 Event indication
The screen illustrated left shows an analog output to be
activated on a measurement on channel 1. The lower end of
the scale will be 0 mA on a value of 1 ppm and the high end
of the scale will be 20 mA on a value of 12 ppm.
The difference in display between this Linear mode and the
Dual mode, is that an extra field (MIDDLE) is required in
addition to the LOW and HIGH values.
Select the EVENT INDICATION option in the mA Outputs
menu to display the options available for event setting.
The illustration is for a 3-channel analyzer allowing an event
to be set for minimum flow rates on each channel.
Select the option for which you want to set an event.
89
Page 92

User Setup
7.4.3 Test
Define the attribute for the event. This is one of the 6 mA
outputs (0 to 5) or None.
The MODE can be either a Preset val or Frozen.
If a preset value is chosen, you will be required to enter the
value of the analog output that will be forced, when that event
occurs.
In the illustration left, as FLOW3 < MIN was the event chosen,
then when then the flow rate on channel 3 drops below the
minimum allowed, a value of 6 mA will be forced on analog
OUTPUT 2.
This option allows you to enter a value into the mA field.
7.5 RS485 (or PROFIBUS)
Note: If the PROFIBUS option has been installed, then the menu option will show PROFIBUS rather than
RS485, and the PROFIBUS parameters will need to be installed.
Press the Enter function key to force this value on all the
analog outputs. The value can then be verified with the use of
a multimeter connected to the analyzer.
Select the RS485 option to set up the parameters for the
communications protocol.
An RS-485 communications interface card can be purchased
as an option with a communications protocol of
MODBUS-JBUS.
90
Table 9 Communications parameters
Device N. The number of the Monec device (0-33) RS485 and PROFIBUS
Baud
Parity Odd, even, or no Only required for RS485
Stop Bit 1 or 2 Only required for RS485
Swap Word
Transmission speed (600, 1200, 2400, 4800, 9600 or
19200)
Yes or No. Yes will reverse the order of the data
transmitted
Only required for RS485
RS485 and PROFIBUS
Page 93

7.6 Sample channels
User Setup
Enter the parameters as described in Table 9 on the previous
page.
Press the Enter function key to accept each data element.
On completion, press the Esc function key to return to the
user setup screen.
7.6.1 Number of channels
Select the SAMPLE CHANNELS option to set up the
parameters for the sample channels.
These options allow the instrument to recognize additional
channels, the activation or deactivation of the measurement
channels, and the assignment of names to the channels.
Measurements are only taken on active channels.
If the number of channels parameter is changed, an activation
key will be required before the additional channel is
recognized.
91
Page 94

User Setup
7.6.2 Channel activation
7.6.3 Sequence
Using the Up and Down Arrow keys, define whether the
channel is active (Activ) or inactive (Inactiv).
The example shown left indicates an analyzer set up with
three channels, of which channel 2 is inactive.
The sequence defines the channel order in which samples are
measured.
7.6.4 Channel names
Only configured channels can be used in the sequence. For
example for a 3-channel analyzer only values 1,2 and 3 are
available.
Up to 12 sequences can be defined. If a channel has been
deactivated, but is still in the sequence, it is simply ignored
and the next channel in sequence is measured.
The example shown left indicates a 4-channel analyzer with
each channel being measured in turn, starting with channel 1.
If there is no sample on a programmed channel, the analyzer
will detect this and after 3 minutes move on to the next
channel in sequence. The channel on which the sample is
missing will be assigned the alarm sample x flow < min
(where sample x is the name of the channel).
If the analyzer is stopped manually from the keyboard, it
restarts from the same place in the sequence.
In the event of a power failure, when restarted the analyzer
with start at the beginning of the sequence.
92
Define the name of each channel with free-format
alphanumeric text up to a maximum of 8 characters.
Page 95

Section 8 Calibration
8.1 General
Before attempting to calibrate the analyzer, ensure that you have read and understood how to
enter and update data fields as described in the section entitled Function keys on page 59.
Note: The instrument cannot be calibrated until at least one complete measurement cycle has been
successfully performed. An attempt to calibrate the instrument before this will result in a “Not authorized”
message being displayed.
In order to obtain accurate measurement results, the analyzer should be calibrated on a regular
basis. Two basic methods of calibration are available:
• Manual calibration - The user can manually perform a calibration on an ad-hoc basis.
• Automatic calibration - Parameters can be set up so that the analyzer will perform a
calibration automatically on pre-defined days at a pre-defined time (see Automatic calibration
setup on page 99). This type of calibration is always done using known calibration solution
concentrations.
Note: Before starting a calibration It is very important to ensure that the Reactivation Frequency
parameter (see Reactivation frequency on page 82) is greater than zero. If set to zero, the electrode
reactivation process will not take place during calibration and as such the measurement results may well be
out of limits.
To access the calibration menu, select CALIBRATION from the main menu and press the Enter
function key.
8.2 Calibration solution concentrations
Important Note: The maximum concentration value for any calibration solution cannot be
greater than 2000 ppm. Any value superior to this is outside the analyzer specifications and
cannot be processed.
Manual calibration
For a manual calibration, the calibration solutions must be between 100 ppb and 2000 ppm
and must respect the following rules:
• LOW CAL SOL must be ≥ sample concentration of Na
• HIGH CAL SOL = (LOW CAL SOL x 10)
Example 1: sample concentration of Na
→
LOW CAL SOL = minimum value = 100 ppb Na
→ HIGH CAL SOL = (100 ppb x 10) = 1000 ppb Na
Example 2: sample concentration of Na
→
LOW CAL SOL = ≥ sample concentration of Na
→ HIGH CAL SOL = (500 ppb x 10) = 5000 ppb Na
Note: The values LOW CAL SOL and HIGH CAL SOL must be entered into the system (see One point
calibration on page 97 or Two point calibration on page 98).
Automatic calibration
For an automatic calibration, the calibration solution must be between 10 ppm and 2000 ppm
and must respect the following rules:
+
= 20 ppb
+
= 450 ppb
+
and a minimum of 100 ppb
+
+
+
= 500 ppb Na
+
+
• CAL SOL minimum = 10 ppm
• CAL SOL = (sample concentration of Na
Example 1: sample concentration of Na
→
CAL SOL = minimum value = 10 ppm Na
Example 2: sample concentration of Na
→
CAL SOL = (1 ppm x 1000) = 1000 ppm Na
Note: The value CAL SOL must be entered into the system (see Automatic calibration setup on page 99).
+
x 1000)
+
= 0.1 ppb
+
+
= 1 ppm
+
93
Page 96

Calibration
8.3 Calibration - Menu overview
8.4 Start calibration
8.4.1 Calibrate known addition
Figure 23 Calibration menu
Select the START CALIBRATION option to calibrate the
analyzer manually.
Select the CAL.KNOWN ADDITION option to calibrate the
analyzer by mixing the sample with a known concentration of
calibration solution.
94
The concentration of the calibration solution is defined in
Automatic calibration setup on page 99.
The instrument first checks that the volume of calibration
solution remaining is enough. If not, a warning alarm is
activated and the instrument returns to normal measurement
with the original parameters.
Page 97

Calibration
If the volume of solution is OK, the background point
measurement (P0) to be used as the base measurement
value is taken. This is the measurement against the sample
before any additions of the calibration solution have been
made.
A progress bar is displayed showing the progress to date and
approximate time remaining.
The instrument waits for a stable measurement (a variation of
less than 1 mV per minute).
The measurement must be stable and less than 1 per
thousand of the calibration solution concentration, otherwise
the instrument returns to normal measurement with the
original parameters. Provided the measurement is OK, the P0
measurement details are displayed on screen.
If the reactivation frequency parameter is not zero (as is
highly recommended), the electrode will be reactivated.
When the reactivation process is complete, the overflow
vessel is rinsed to remove all traces of sample.
After rinsing, the overflow vessel is re-filled with sample plus
2mL of the calibration solution.
The sample is then measured and the details displayed
against P1.
95
Page 98

Calibration
If the volume of solution is OK, the background point
measurement (P0) to be used as the base measurement
value is taken. This is the measurement against the sample
before any additions of the calibration solution have been
made.
A progress bar is displayed showing the progress to date and
approximate time remaining.
The instrument waits for a stable measurement (a variation of
less than 1 mV per minute).
The measurement must be stable and less than 1 per
thousand of the calibration solution concentration, otherwise
the instrument returns to normal measurement with the
original parameters. Provided the measurement is OK, the P0
measurement details are displayed on screen.
If the reactivation frequency parameter is not zero (as is
highly recommended), the electrode will be reactivated.
When the reactivation process is complete, the overflow
vessel is rinsed to remove all traces of sample.
After rinsing, the overflow vessel is re-filled with sample plus
2mL of the calibration solution.
The sample is then measured and the details displayed
against P1.
96
Page 99

Calibration
When the measurement is stable, the details are displayed at
the top of the screen against measurement P1.
The overflow vessel is then rinsed and re-filled with sample
plus 20mL of the calibration solution.
This sample is then measured and the details displayed
against P2.
Once the final measurement is stable, the offset and slope for
this calibration are calculated.
The default values of the offset and slope are displayed along
with the calculated values for the last and current calibration.
A message is displayed indicating the success or failure of the
calibration.
8.4.2 One point calibration
For the details on how this success or failure condition is
determined, and how to proceed, see the description in
Calibration results on page 100.
Select the MAN.OFFSET CAL option to start the one point
calibration process.
This process requires that a calibration solution of known
sodium concentration is available.
Refer to Calibration solution concentrations on page 93 for
information regarding the concentration of the calibration
solution.
If necessary, enter the concentration of the calibration
solution, and select START to initiate the calibration process.
Then, provided the reactivation frequency parameter is not
zero (as is highly recommended), the electrode is reactivated.
On completion this is followed by a rinsing of the overflow
vessel.
97
Page 100

Calibration
When prompted, fill the overflow vessel with the calibration
solution and select OK to start the measurement.
The calibration solution is measured and the results
displayed.
Once the final measurement is stable, the offset for the
calibration is calculated.
The success or failure screen is then displayed (see
examples in Calibration results on page 100).
8.4.3 Two point calibration
Select the MAN.OFFSET+SLOPE CAL option to start the two
point calibration process.
This process requires that two calibration solutions of known
sodium concentrations are available.
Refer to Calibration solution concentrations on page 93 for
information regarding the concentrations of the calibration
solution.
If necessary, enter the concentrations of the calibration
solution, and select START to initiate the calibration process.
Then, provided the reactivation frequency parameter is not
zero (as is highly recommended), the electrode is reactivated.
On completion this is followed by a rinsing of the overflow
vessel.
The process is then very similar to the one-point calibration
above, except after the instrument measures the low value
calibration solution, the overflow vessel will be rinsed and you
will be asked to fill it with the high value calibration solution.
98
The success or failure screen is then displayed (see
examples in Calibration results on page 100).
 Loading...