

Page 1

DOC024.52.93001
ORBISPHERE Model 410 Analyzer
User Manual
05/2013, Edition 10
Page 2

Page 3

Table of Contents
Section 1 General Information.........................................................................................................5
1.1 Disclaimer ....................................................................................................................................5
1.2 Contact information...................................................................................................................... 5
1.3 Safety information ........................................................................................................................ 5
1.3.1 Use of hazard information...................................................................................................5
1.3.2 Safety precautions .............................................................................................................. 6
1.3.3 Service and repairs .............................................................................................................6
1.3.4 Precautionary labels............................................................................................................ 7
1.3.5 Intended use of this equipment...........................................................................................7
1.4 Product recycling information.......................................................................................................8
1.5 Product disposal ........................................................................................................................ 10
1.6 Restriction of hazardous substances (RoHS)............................................................................ 11
Section 2 Specifications.................................................................................................................. 13
2.1 Technical specifications .............................................................................................................13
2.2 Hardware description ................................................................................................................. 14
2.3 Model identification system........................................................................................................ 14
2.4 Security level table..................................................................................................................... 15
2.5 Default parameters ....................................................................................................................16
Section 3 Installation........................................................................................................................17
3.1 Unpacking .................................................................................................................................. 17
3.2 Installation check list .................................................................................................................. 18
3.3 Wall mount and pipe mount instruments.................................................................................... 19
3.3.1 Instrument dimensions......................................................................................................19
3.3.2 Wall mounting ...................................................................................................................20
3.3.3 Pipe mounting ................................................................................................................... 20
3.3.4 Connection panel (bottom of instrument).......................................................................... 21
3.4 Panel mount instrument ............................................................................................................. 22
3.4.1 Instrument dimensions......................................................................................................22
3.4.2 Mounting ...........................................................................................................................23
3.4.3 Connection panel (bottom of instrument).......................................................................... 24
3.5 Connectors assembly instructions ............................................................................................. 25
3.5.1 Cable gland wiring instructions .........................................................................................25
3.5.2 USB-B client adapter cable...............................................................................................26
3.6 Connection to mains power supply ............................................................................................ 26
3.6.1 Power supply connection (low voltage instruments) ......................................................... 26
3.6.2 Power supply connection (high voltage instruments)........................................................ 27
3.7 Connections to electronic boards...............................................................................................28
3.7.1 Sensor cable ..................................................................................................................... 28
3.7.2 Electronic boards connectors............................................................................................ 29
3.7.3 Main board connections....................................................................................................29
3.7.4 Measurement board..........................................................................................................30
3.8 Measurement alarm relays ........................................................................................................ 31
3.9 Sensor installation......................................................................................................................32
3.9.1 EC Sensors.......................................................................................................................32
3.9.2 TC Sensors .......................................................................................................................32
3.10 Define working language ......................................................................................................... 32
3.11 Define security levels ............................................................................................................... 32
Section 4 User Interface..................................................................................................................33
4.1 Instrument .................................................................................................................................. 33
4.2 Touch screen .............................................................................................................................33
4.2.1 Function keys on the header bar.......................................................................................34
4.2.2 Menu navigation................................................................................................................ 35
4.2.3 Rolling list..........................................................................................................................35
4.2.4 Virtual keyboard ................................................................................................................35
1
Page 4

Table of Contents
4.2.5 Identification and authorization level .................................................................................36
4.2.6 Warning windows ..............................................................................................................36
4.3 Main menu structure...................................................................................................................37
Section 5 View Menu ........................................................................................................................39
5.1 Selection of the view style..........................................................................................................40
5.2 Configuration of the view styles..................................................................................................41
Section 6 Measurement Menu........................................................................................................43
6.1 Instrument configuration.............................................................................................................44
6.2 Measurement configuration........................................................................................................44
6.3 Measured data storage ..............................................................................................................47
Section 7 Calibration Menu.............................................................................................................49
7.1 Definitions...................................................................................................................................51
7.2 EC gas sensor calibration ..........................................................................................................51
7.2.1 O
7.2.2 O
7.3 TC gas sensor calibration...........................................................................................................53
7.4 Calibration errors (EC and TC sensors).....................................................................................54
7.5 Barometric pressure calibration..................................................................................................54
7.6 Calibration reports......................................................................................................................54
sensor calibration.........................................................................................................52
2
sensor calibration.........................................................................................................52
3
Section 8 Inputs/Outputs Menu.....................................................................................................55
8.1 Configure snooze .......................................................................................................................56
8.2 View inputs/outputs ....................................................................................................................56
8.3 Relays ........................................................................................................................................56
8.4 Analog outputs ...........................................................................................................................57
8.5 Analog output characteristics .....................................................................................................61
Section 9 Communication Menu....................................................................................................65
9.1 RS-485 simple mode configuration ............................................................................................66
9.1.1 Data available....................................................................................................................67
9.1.2 Example of use..................................................................................................................69
9.2 PROFIBUS-DP communication (optional)..................................................................................70
9.2.1 Installation .........................................................................................................................70
9.2.2 Input/Output data...............................................................................................................71
9.3 USB-A port (host).......................................................................................................................74
9.4 HTTP/TCP-IP .............................................................................................................................75
9.4.1 Overview ...........................................................................................................................75
9.4.2 PC interface.......................................................................................................................75
9.5 Data file transfer through the USB-B port (client).......................................................................77
9.5.1 PC software installation.....................................................................................................77
9.5.2 Microsoft synchronization software ...................................................................................77
9.5.3 Upload report files .............................................................................................................77
Section 10 Security Menu................................................................................................................79
10.1 Access rights management......................................................................................................79
10.2 Configure security ....................................................................................................................80
10.3 User management....................................................................................................................80
10.4 User action log file....................................................................................................................80
Section 11 Products Menu ..............................................................................................................81
Section 12 Global Configuration Menu........................................................................................83
Section 13 Services Menu...............................................................................................................85
13.1 Sensor diagnostics...................................................................................................................87
13.2 Language selection ..................................................................................................................88
13.3 Clock ........................................................................................................................................88
2
Page 5

Table of Contents
13.4 Screen......................................................................................................................................88
13.5 Buzzer...................................................................................................................................... 88
13.6 Boards info............................................................................................................................... 88
13.7 Batteries................................................................................................................................... 89
13.8 Software download ..................................................................................................................89
13.9 End application ........................................................................................................................89
Section 14 Maintenance and Troubleshooting.......................................................................... 91
14.1 Instrument maintenance .......................................................................................................... 91
14.2 Troubleshooting .......................................................................................................................91
14.3 List of events and alarms ......................................................................................................... 92
14.4 Storage, handling and transportation....................................................................................... 92
Section 15 Part Lists........................................................................................................................ 93
15.1 Accessories..............................................................................................................................93
15.2 Spare parts ..............................................................................................................................93
Section 16 Glossary .........................................................................................................................95
16.1 Gas units.................................................................................................................................. 95
16.2 Generic terms and definitions .................................................................................................. 95
3
Page 6

Table of Contents
4
Page 7
Section 1 General Information
1.1 Disclaimer
The information in this manual has been carefully checked and is believed to be accurate.
However, Hach Lange assumes no responsibility for any inaccuracies that may be contained in
this manual. In no event will Hach Lange be liable for direct, indirect, special, incidental, or
consequential damages resulting from any defect or omission in this manual, even if advised of
the possibility of such damages. In the interest of continued product development, Hach Lange
reserves the right to make improvements in this manual and the products it describes at any
time, without notice or obligation.
Copyright © 2006-2013 by Hach Lange. All rights reserved. No part of the contents of this
manual may be reproduced or transmitted in any form or by any means without the written
permission of Hach Lange.
1.2 Contact information
Manufacturing site:
HACH LANGE Sàrl
6, route de Compois
1222 Vésenaz
SWITZERLAND
Tel. +41 22 594 6400
Fax +41 22 594 6499
1.3 Safety information
Please read the entire manual before unpacking, setting up, or operating this analyzer.
Pay particular attention to all warning and caution statements. Failure to do so could result in
serious injury to the operator or damage to the equipment.
To ensure the protection provided by this equipment is not impaired, do not use or install this
equipment in any manner other than that which is specified in this manual.
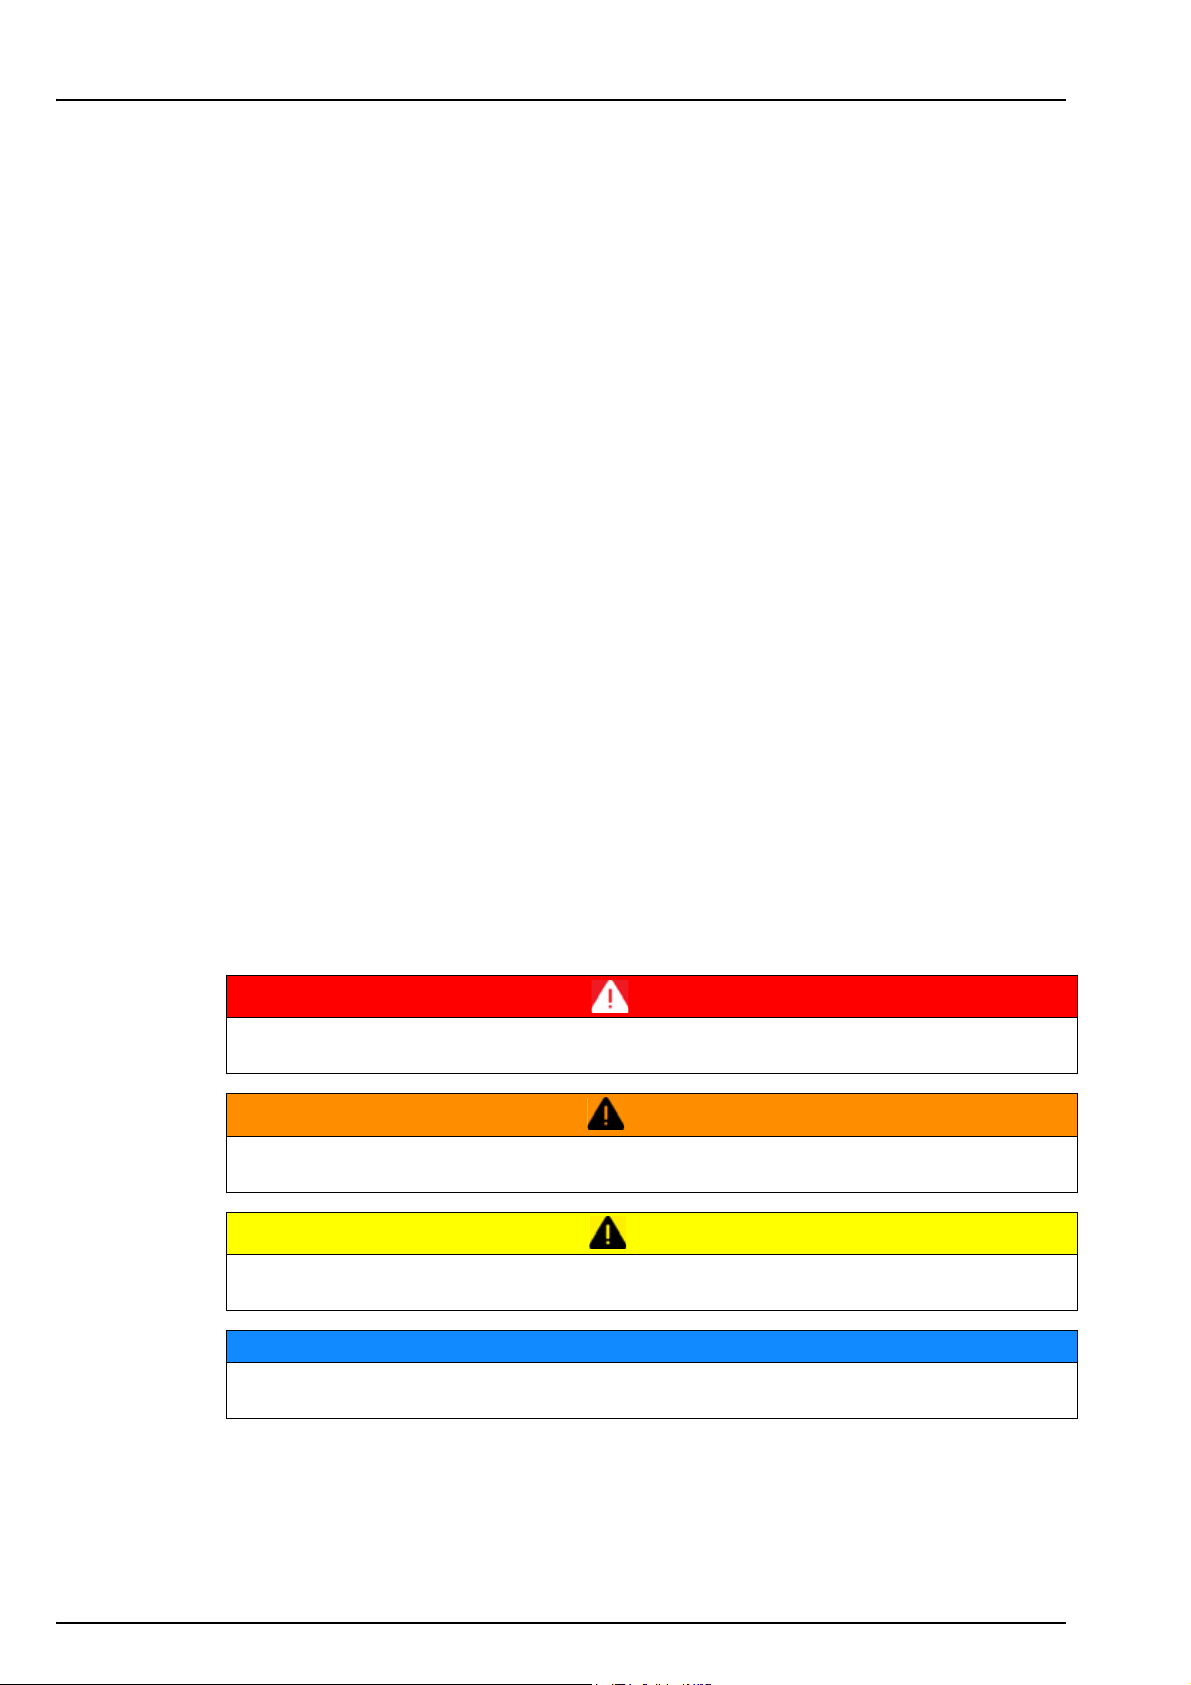
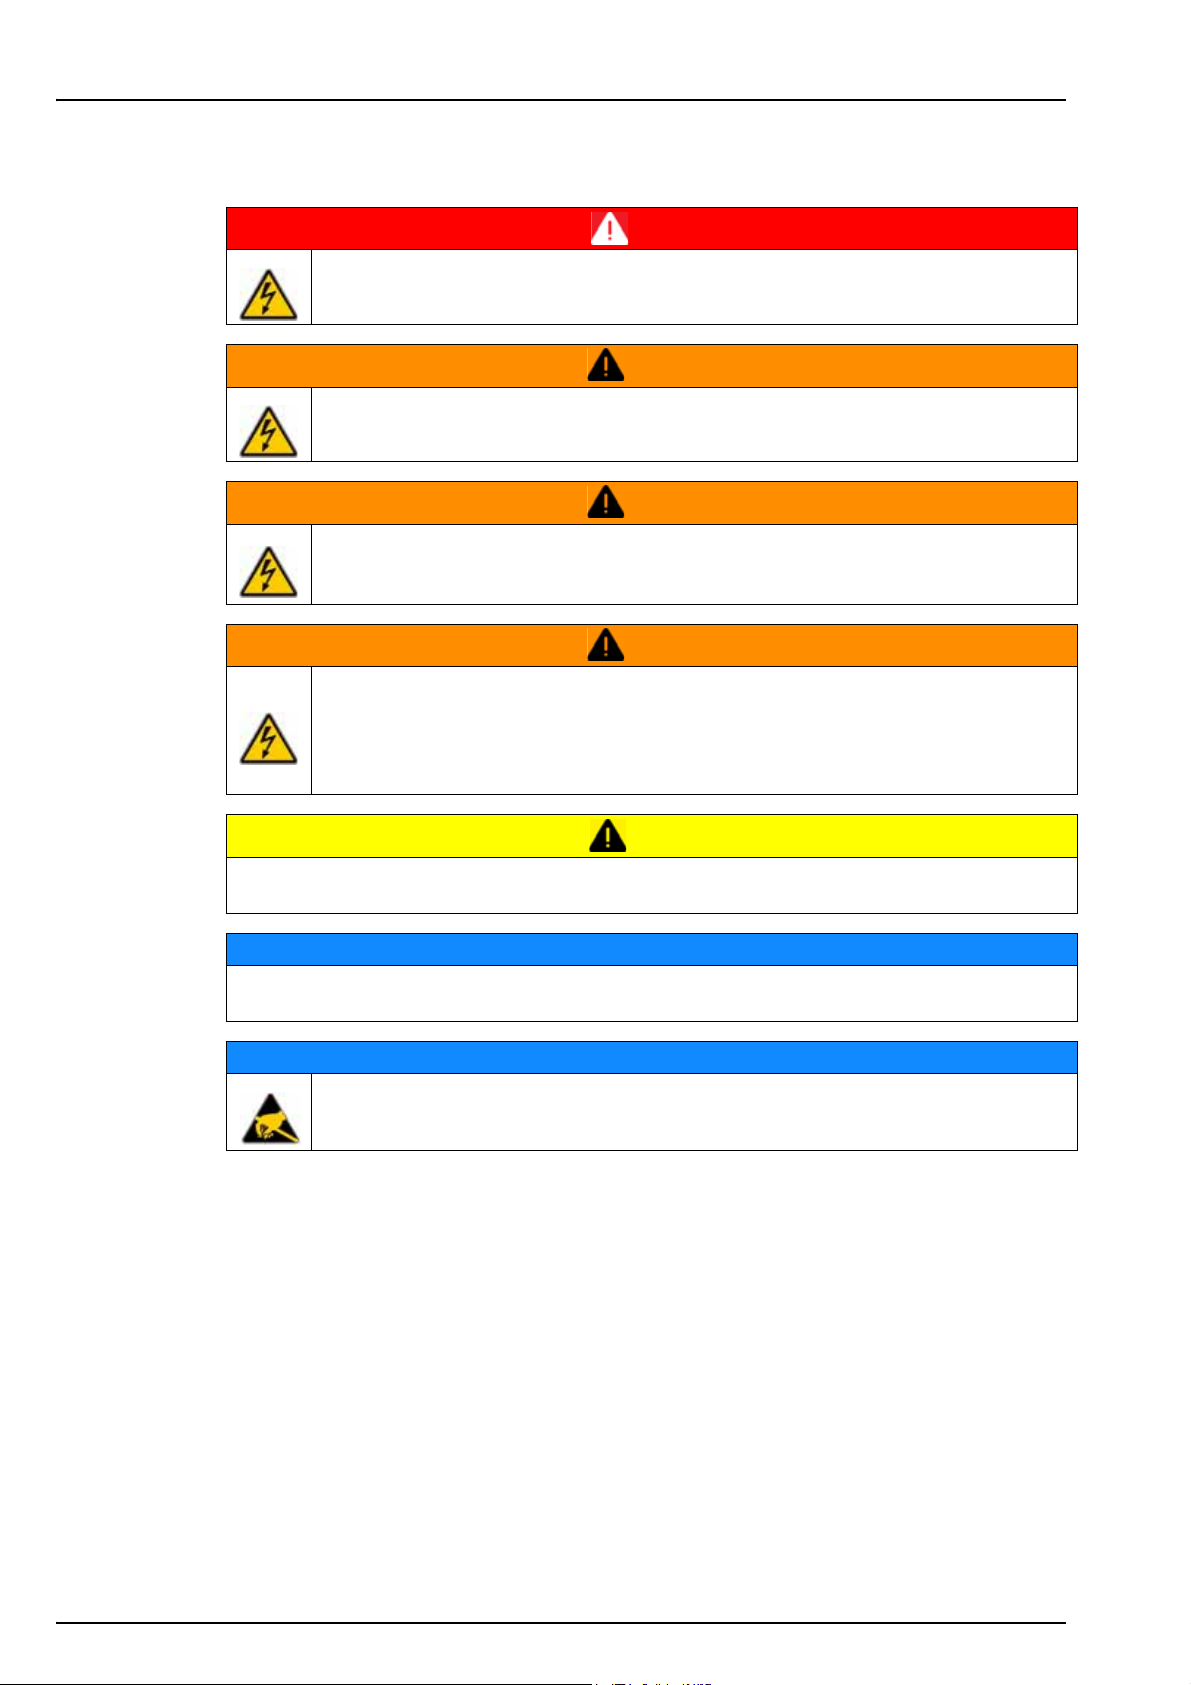
1.3.1 Use of hazard information
Indicates a potentially or imminently hazardous situation which, if not avoided, will result in
death or serious injury.
European HQ:
HACH LANGE GmbH
Willstätterstraße 11
40549 Düsseldorf
GERMANY
Tel. +49 211 52 880
Fax +49 211 52 88143
DANGER
WARNING
Indicates a potentially or imminently hazardous situation which, if not avoided, could result in
death or serious injury.
CAUTION
Indicates a potentially or imminently hazardous situation that may result in minor or moderate
injury.
NOTICE
Indicates a situation which, if not avoided, may cause damage to the instrument. Information
that requires special emphasis.
5
Page 8
General Information
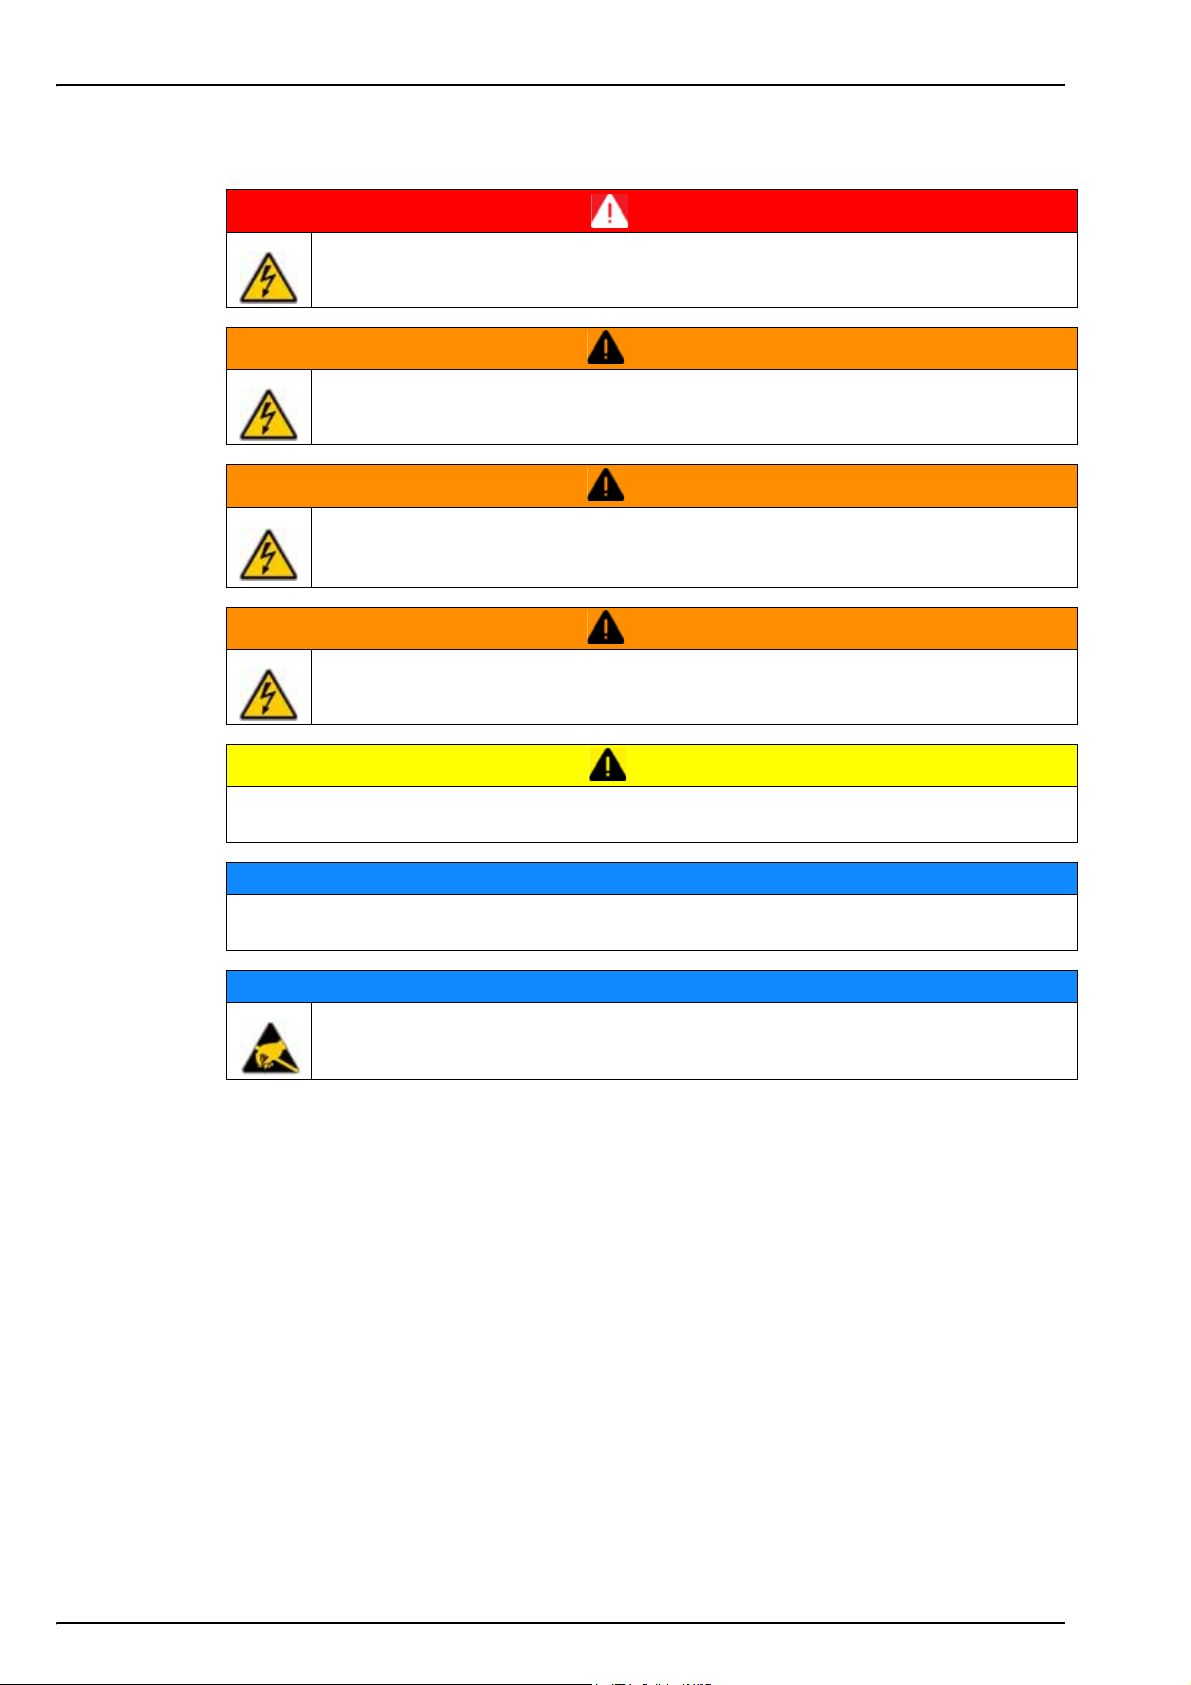
1.3.2 Safety precautions
Always remove power from the controller before performing maintenance activities.
Potential Electrocution Hazard. Always disconnect power to the instrument when
making electrical connections.
Potential Electrocution Hazard. If this equipment is used outdoors or in potentially
wet locations a Ground Fault Interrupt device must be used for connecting the
equipment to its main power source.
DANGER
WARNING
WARNING
WARNING
Potential Electrocution Hazard. Connect only safety low voltage < 33 VAC RMS.
CAUTION
Personal Injury Hazard. Only qualified personnel should conduct the tasks described in this
manual.
NOTICE
Install the device in a location and position that gives easy access to the disconnect device
and its operation.
NOTICE
Potential Instrument Damage. Delicate internal electronic components can be
damaged by static electricity, resulting in degraded performance or eventual failure.
• The power cord plug connection is also used as a main power switch.
• The instrument must be connected to an electrical system which complies with
applicable local regulations.
• All the cables connected to the instrument must be fire resistant, type UL94V-1
• The operator must read and understand this manual before using the instrument .
• The instrument will not be used as a safety device. It does not provide a security
function in a hazardous process.
1.3.3 Service and repairs
None of the analyzer’s components can be serviced by the user. Only personnel from Hach
Lange or its approved representative(s) is (are) authorized to attempt repairs to the system and
only components formally approved by the manufacturer should be used. Any attempt at
repairing the analyzer in contravention of these principles could cause damage to the analyzer
and corporal injury to the person carrying out the repair. It renders the warranty null and void
and could compromise the correct working of the analyzer and the electrical integrity or the CE
compliance of the analyzer.
6
Page 9
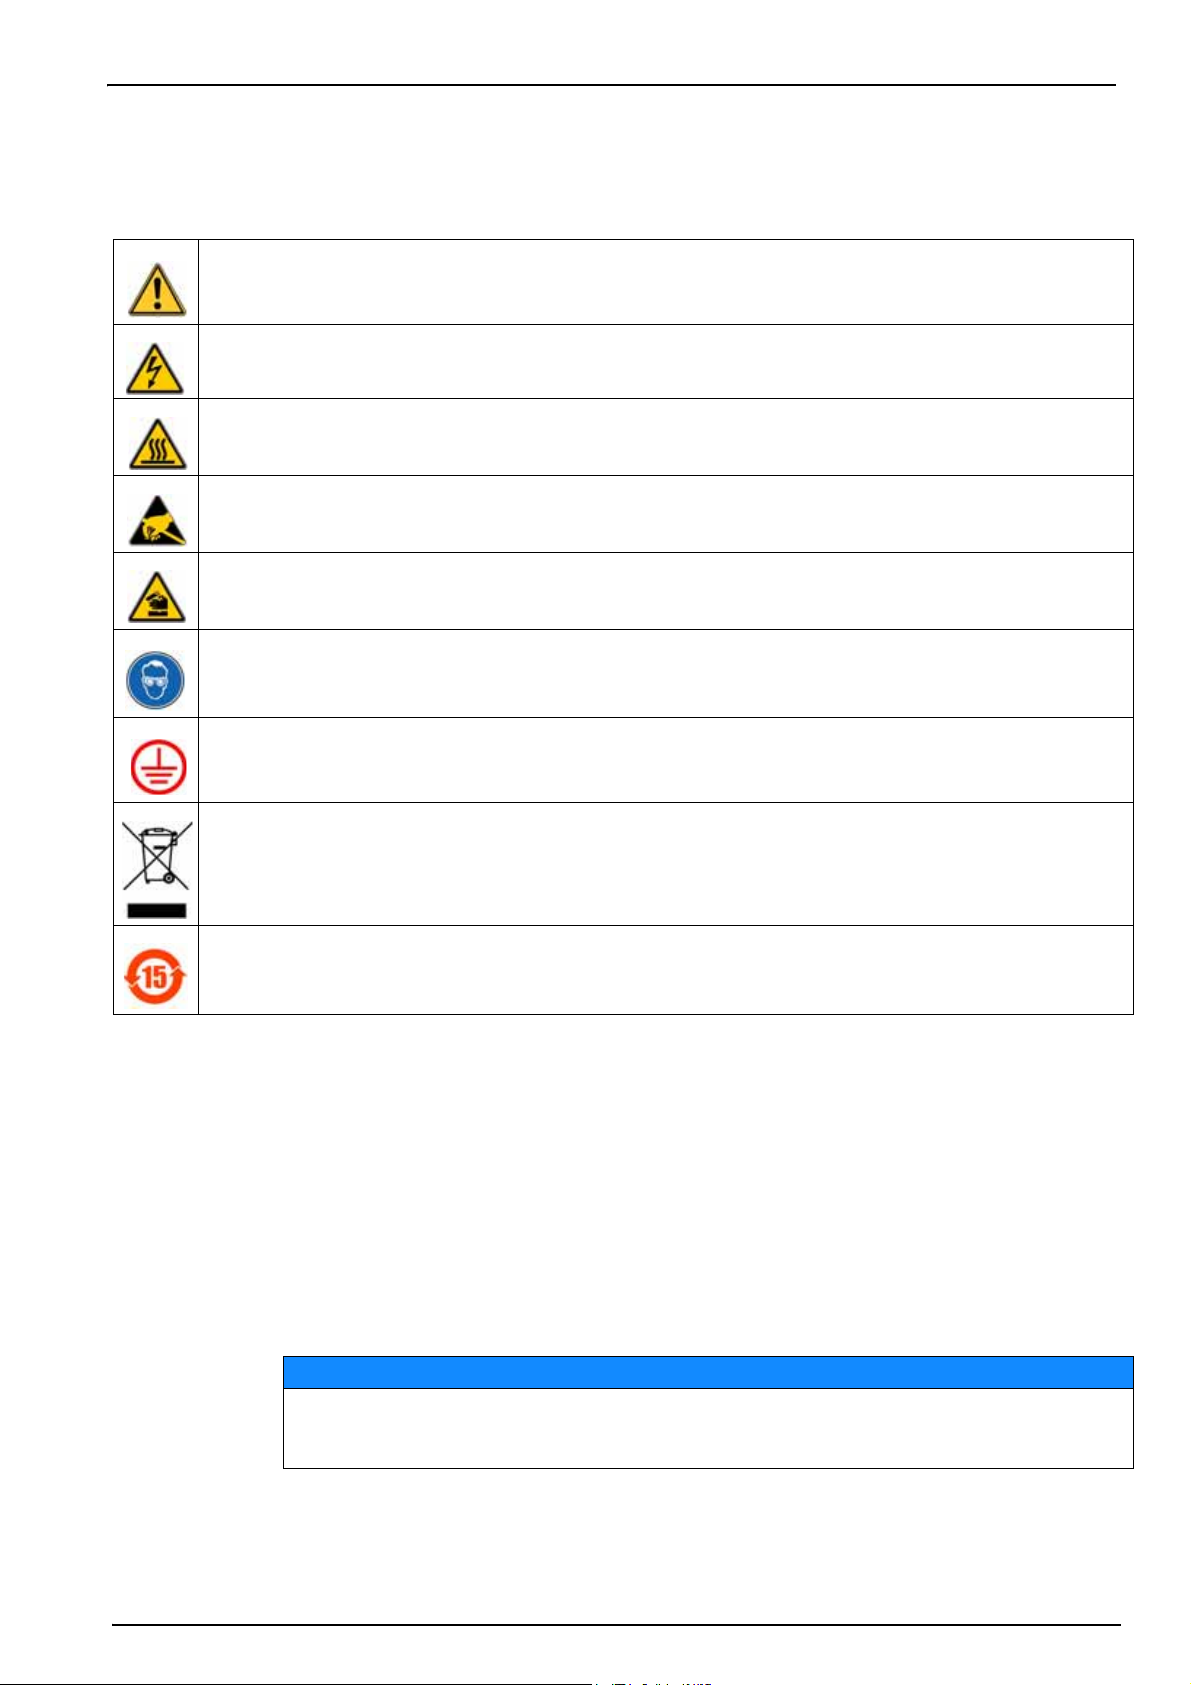
1.3.4 Precautionary labels
Read all labels and tags attached to the analyzer. Personal injury or damage to the analyzer
could occur if not observed.
This symbol, when noted on a product, indicates a potential hazard which could cause serious personal injury
and/or death. The user should reference this instruction manual for operation and/or safety information.
This symbol, when noted on a product enclosure or barrier, indicates that a risk of electrical shock and/or
electrocution exists and indicates that only individuals qualified to work with hazardous voltages should open the
enclosure or remove the barrier.
This symbol, when noted on the product, indicates that the marked item can be hot and should not be touched
without care.
This symbol, when noted on the product, indicates the presence of devices sensitive to electrostatic discharge and
indicates that care must be taken to prevent damage to them.
This symbol, when noted on the product, identifies a risk of chemical harm and indicates that only individuals
qualified and trained to work with chemicals should handle chemicals or perform maintenance on chemical delivery
systems associated with the equipment.
General Information
This symbol, if noted on the product, indicates the need for protective eye wear.
This symbol, when noted on the product, identifies the location of the connection for protective earth (ground).
Electrical equipment marked with this symbol may not be disposed of in European public disposal systems. In
conformity with European local and national regulations, European electrical equipment users must now return old
or end-of-life equipment to the manufacturer for disposal at no charge to the user.
Products marked with this symbol indicates that the product contains toxic or hazardous substances or elements.
The number inside the symbol indicates the environmental protection use period in years.
1.3.5 Intended use of this equipment
This high accuracy ORBISPHERE instrument is designed for the measurement of oxygen,
ozone or carbon dioxide, for process and laboratory analysis in applications such as beverage,
life sciences, power generation and the electronics industry.
ORBISPHERE 410 analyzers are available as wall or pipe mount, and rack mount versions. The
ORBISPHERE 410 uses a patented gas phase (or dissolved gas) ORBISPHERE sensor.
Note: A "Normal sensor" or "Smart Sensor" can be connected to the measurement board. A "Smart sensor"
is a sensor with a non-volatile memory which allows storage of parameters (calibration coefficient, dates,
etc.). When a smart sensor is connected, these parameters are read by the instrument software. The
sensor can be calibrated in the lab and installed on site afterwards.
NOTICE
Use of the instrument outside of the environmental conditions described in Technical
specifications on page 13 may cause damage to the instrument but without endangering the
user.
7
Page 10
General Information
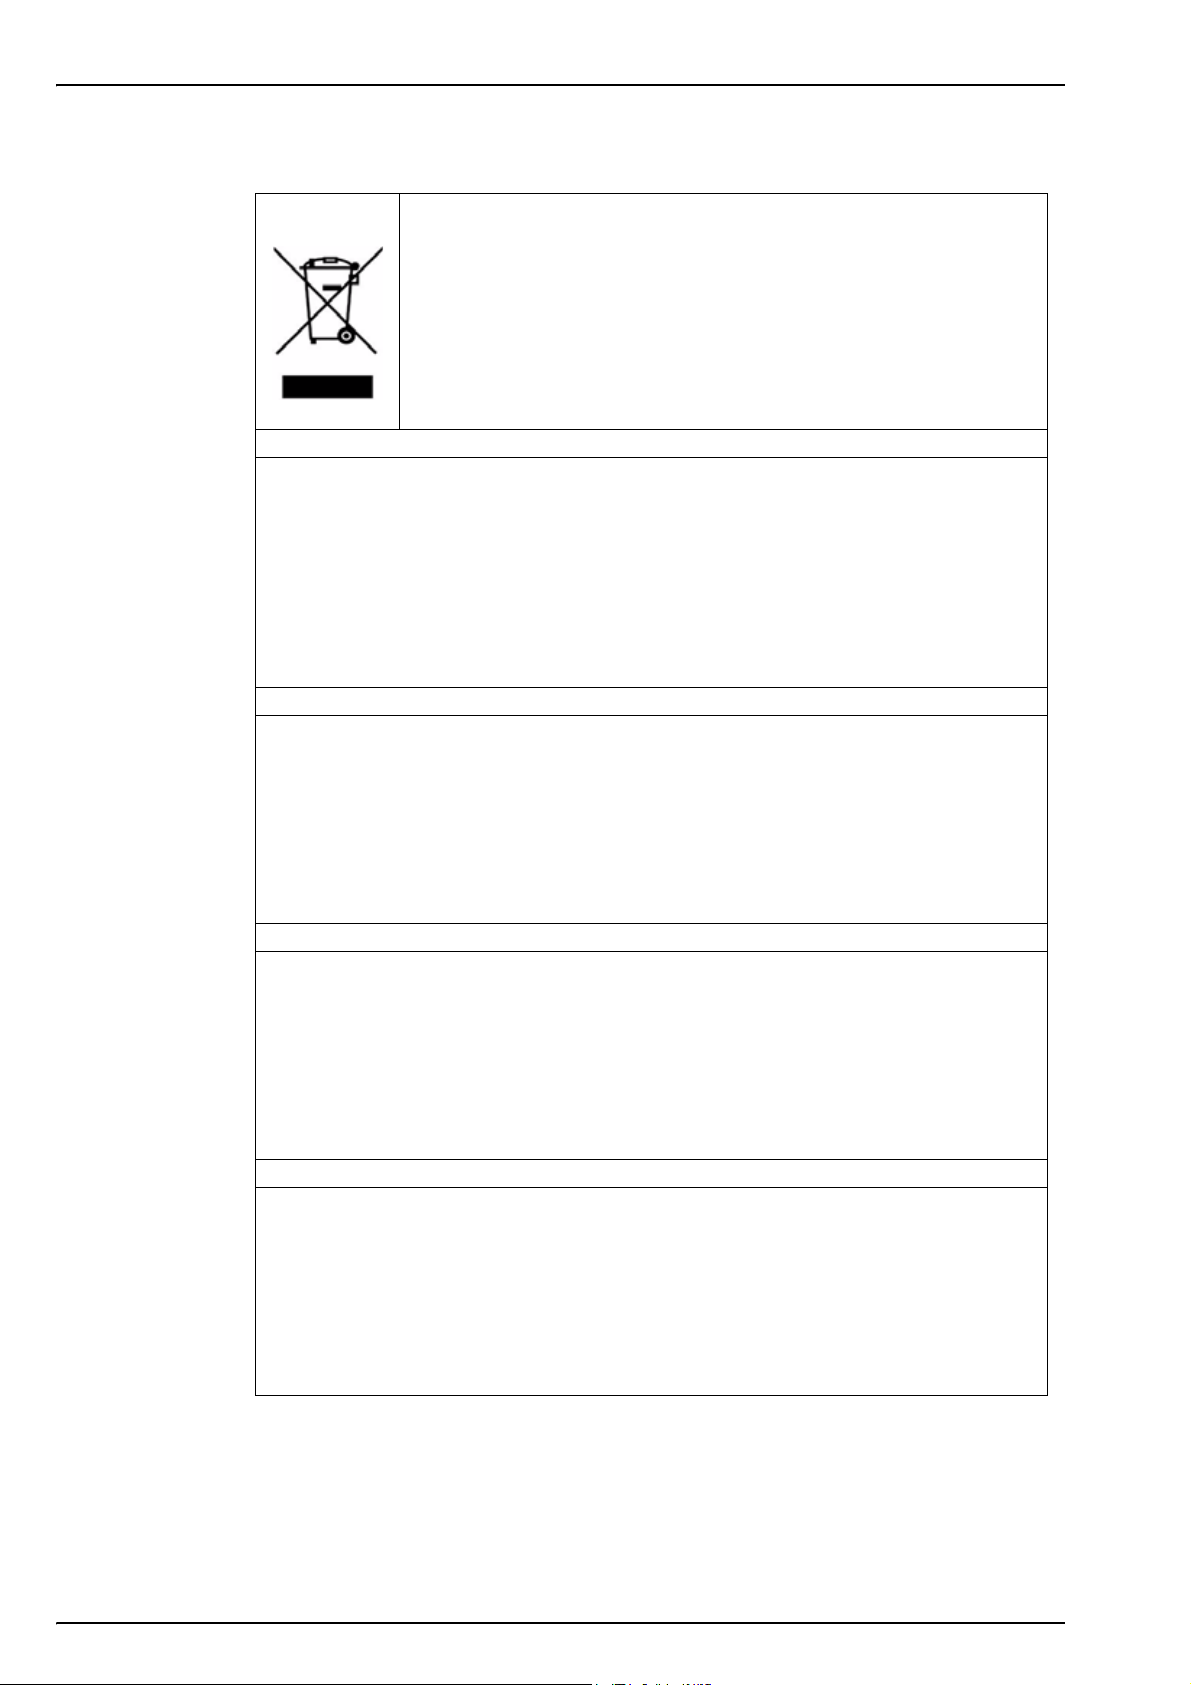
1.4 Product recycling information
ENGLISH
Electrical equipment marked with this symbol may not be disposed of in
European public disposal systems after 12 August 2005. In conformity with
European local and national regulations (EU Directive 2002/96/EC), European
electrical equipment users must now return old or end-of-life equipment to the
manufacturer for disposal at no charge to the user.
Note: For return for recycling, please contact the equipment
manufacturer or supplier for instructions on how to return end-of-life
equipment for proper disposal.
DEUTSCH
Elektrogeräte, die mit diesem Symbol gekennzeichnet sind, dürfen in Europa nach dem 12.
August 2005 nicht mehr über die öffentliche Abfallentsorgung entsorgt werden. In
Übereinstimmung mit lokalen und nationalen europäischen Bestimmungen (EU-Richtlinie
2002/96/EC), müssen Benutzer von Elektrogeräten in Europa ab diesem Zeitpunkt alte bzw. zu
verschrottende Geräte zur Entsorgung kostenfrei an den Hersteller zurückgeben.
Hinweis: Bitte wenden Sie sich an den Hersteller bzw. an den Händler, von dem Sie das Gerät
bezogen haben, um Informationen zur Rückgabe des Altgeräts zur ordnungsgemäßen
Entsorgung zu erhalten.
FRANCAIS
A partir du 12 août 2005, il est interdit de mettre au rebut le matériel électrique marqué de ce
symbole par les voies habituelles de déchetterie publique. Conformément à la réglementation
européenne (directive UE 2002/96/EC), les utilisateurs de matériel électrique en Europe doivent
désormais retourner le matériel usé ou périmé au fabricant pour élimination, sans frais pour
l'utilisateur.
Remarque: Veuillez vous adresser au fabricant ou au fournisseur du matériel pour les
instructions de retour du matériel usé ou périmé aux fins d'élimination conforme.
ITALIANO
Le apparecchiature elettriche con apposto questo simbolo non possono essere smaltite nelle
discariche pubbliche europee successivamente al 12 agosto 2005. In conformità alle normative
europee locali e nazionali (Direttiva UE 2002/96/EC), gli utilizzatori europei di apparecchiature
elettriche devono restituire al produttore le apparecchiature vecchie o a fine vita per lo
smaltimento senza alcun costo a carico dell’utilizzatore.
Nota: Per conoscere le modalità di restituzione delle apparecchiature a fine vita da riciclare,
contattare il produttore o il fornitore dell’apparecchiatura per un corretto smaltimento.
DANSK
Elektriske apparater, der er mærket med dette symbol, må ikke bortskaffes i europæiske offentlige
affaldssystemer efter den 12. august 2005. I henhold til europæiske lokale og nationale regler
(EU-direktiv 2002/96/EF) skal europæiske brugere af elektriske apparater nu returnere gamle eller
udtjente apparater til producenten med henblik på bortskaffelse uden omkostninger for brugeren.
Bemærk: I forbindelse med returnering til genbrug skal du kontakte producenten eller
leverandøren af apparatet for at få instruktioner om, hvordan udtjente apparater bortskaffes
korrekt.
8
Page 11

General Information
SVENSKA
Elektronikutrustning som är märkt med denna symbol kanske inte kan lämnas in på europeiska
offentliga sopstationer efter 2005-08-12. Enligt europeiska lokala och nationella föreskrifter
(EU-direktiv 2002/96/EC) måste användare av elektronikutrustning i Europa nu återlämna gammal
eller utrangerad utrustning till tillverkaren för kassering utan kostnad för användaren.
Obs! Om du ska återlämna utrustning för återvinning ska du kontakta tillverkaren av utrustningen
eller återförsäljaren för att få anvisningar om hur du återlämnar kasserad utrustning för att den ska
bortskaffas på rätt sätt.
ESPANOL
A partir del 12 de agosto de 2005, los equipos eléctricos que lleven este símbolo no deberán ser
desechados en los puntos limpios europeos. De conformidad con las normativas europeas
locales y nacionales (Directiva de la UE 2002/96/EC), a partir de esa fecha, los usuarios
europeos de equipos eléctricos deberán devolver los equipos usados u obsoletos al fabricante de
los mismos para su reciclado, sin coste alguno para el usuario.
Nota: Sírvase ponerse en contacto con el fabricante o proveedor de los equipos para solicitar
instrucciones sobre cómo devolver los equipos obsoletos para su correcto reciclado.
NEDERLANDS
Elektrische apparatuur die is voorzien van dit symbool mag na 12 augustus 2005 niet meer
worden afgevoerd naar Europese openbare afvalsystemen. Conform Europese lokale en
nationale wetgegeving (EU-richtlijn 2002/96/EC) dienen gebruikers van elektrische apparaten
voortaan hun oude of afgedankte apparatuur kosteloos voor recycling of vernietiging naar de
producent terug te brengen.
Nota: Als u apparatuur voor recycling terugbrengt, moet u contact opnemen met de producent of
leverancier voor instructies voor het terugbrengen van de afgedankte apparatuur voor een juiste
verwerking.
POLSKI
Sprzęt elektryczny oznaczony takim symbolem nie może być likwidowany w europejskich
systemach utylizacji po dniu 12 sierpnia 2005. Zgodnie z europejskimi, lokalnymi i państwowymi
przepisami prawa (Dyrektywa Unii Europejskiej 2002/96/EC), użytkownicy sprzętu elektrycznego
w Europie muszą obecie przekazywać Producentowi stary sprzęt lub sprzęt po okresie
użytkowania do bezpłatnej utylizacji.
Uwaga: Aby przekazać sprzęt do recyklingu, należy zwrócić się do producenta lub dostawcy
sprzętu w celu uzyskania instrukcji dotyczących procedur przekazywania do utylizacji sprzętu po
okresie użytkownia.
PORTUGUES
Qualquer equipamento eléctrico que ostente este símbolo não poderá ser eliminado através dos
sistemas públicos europeus de tratamento de resíduos sólidos a partir de 12 de Agosto de 2005.
De acordo com as normas locais e europeias (Directiva Europeia 2002/96/EC), os utilizadores
europeus de equipamentos eléctricos deverão agora devolver os seus equipamentos velhos ou
em fim de vida ao produtor para o respectivo tratamento sem quaisquer custos para o utilizador.
Nota: No que toca à devolução para reciclagem, por favor, contacte o produtor ou fornecedor do
equipamento para instruções de devolução de equipamento em fim de vida para a sua correcta
eliminação.
9
Page 12

General Information
1.5 Product disposal
Note: The following only applies to European customers.
Hach Lange is committed to ensuring that the risk of any environmental damage or pollution
caused by any of its products is minimized as far as possible. The European Waste Electrical
and Electronic Equipment (WEEE) Directive (2002/96/EC) that came into force on August 13
2005 aims to reduce the waste arising from electrical and electronic equipment; and improve the
environmental performance of all those involved in the life cycle of electrical and electronic
equipment.
In conformity with European local and national regulations (EU Directive 2002/96/EC stated
above), electrical equipment marked with the above symbol may not be disposed of in
European public disposal systems after 12 August 2005.
Hach Lange will offer to take back (free of charge to the customer) any old, unserviceable or
redundant analyzers and systems which carry the above symbol, and which were originally
supplied by Hach Lange. Hach Lange will then be responsible for the disposal of this
equipment.
In addition, Hach Lange will offer to take back (at cost to the customer) any old, unserviceable
or redundant analyzers and systems which do not carry the above symbol, but which were
originally supplied by Hach Lange. Hach Lange will then be responsible for the disposal of this
equipment.
Should you wish to arrange for the disposal of any piece of equipment originally supplied by
Hach Lange, please contact your supplier or our After Sales Service department in Geneva for
instructions on how to return this equipment for proper disposal.
10
Page 13
1.6 Restriction of hazardous substances (RoHS)
The European Union RoHS Directive and subsequent regulations introduced in member states
and other countries limits the use of six hazardous substances used in the manufacturing of
electrical and electronic equipment.
Currently, monitoring and control instruments do not fall within the scope of the RoHS Directive,
however Hach Lange has taken the decision to adopt the recommendations in the Directive as
the target for all future product design and component purchasing.
This product is compliant with the European Union RoHS Directive.
Note: The following only applies to exports of this product into the People’s Republic of China.
General Information
Locking system X
Spacer X
External connectors X
O:
X:
11
Page 14

General Information
12
Page 15
Section 2 Specifications
Specifications are subject to change without notice.
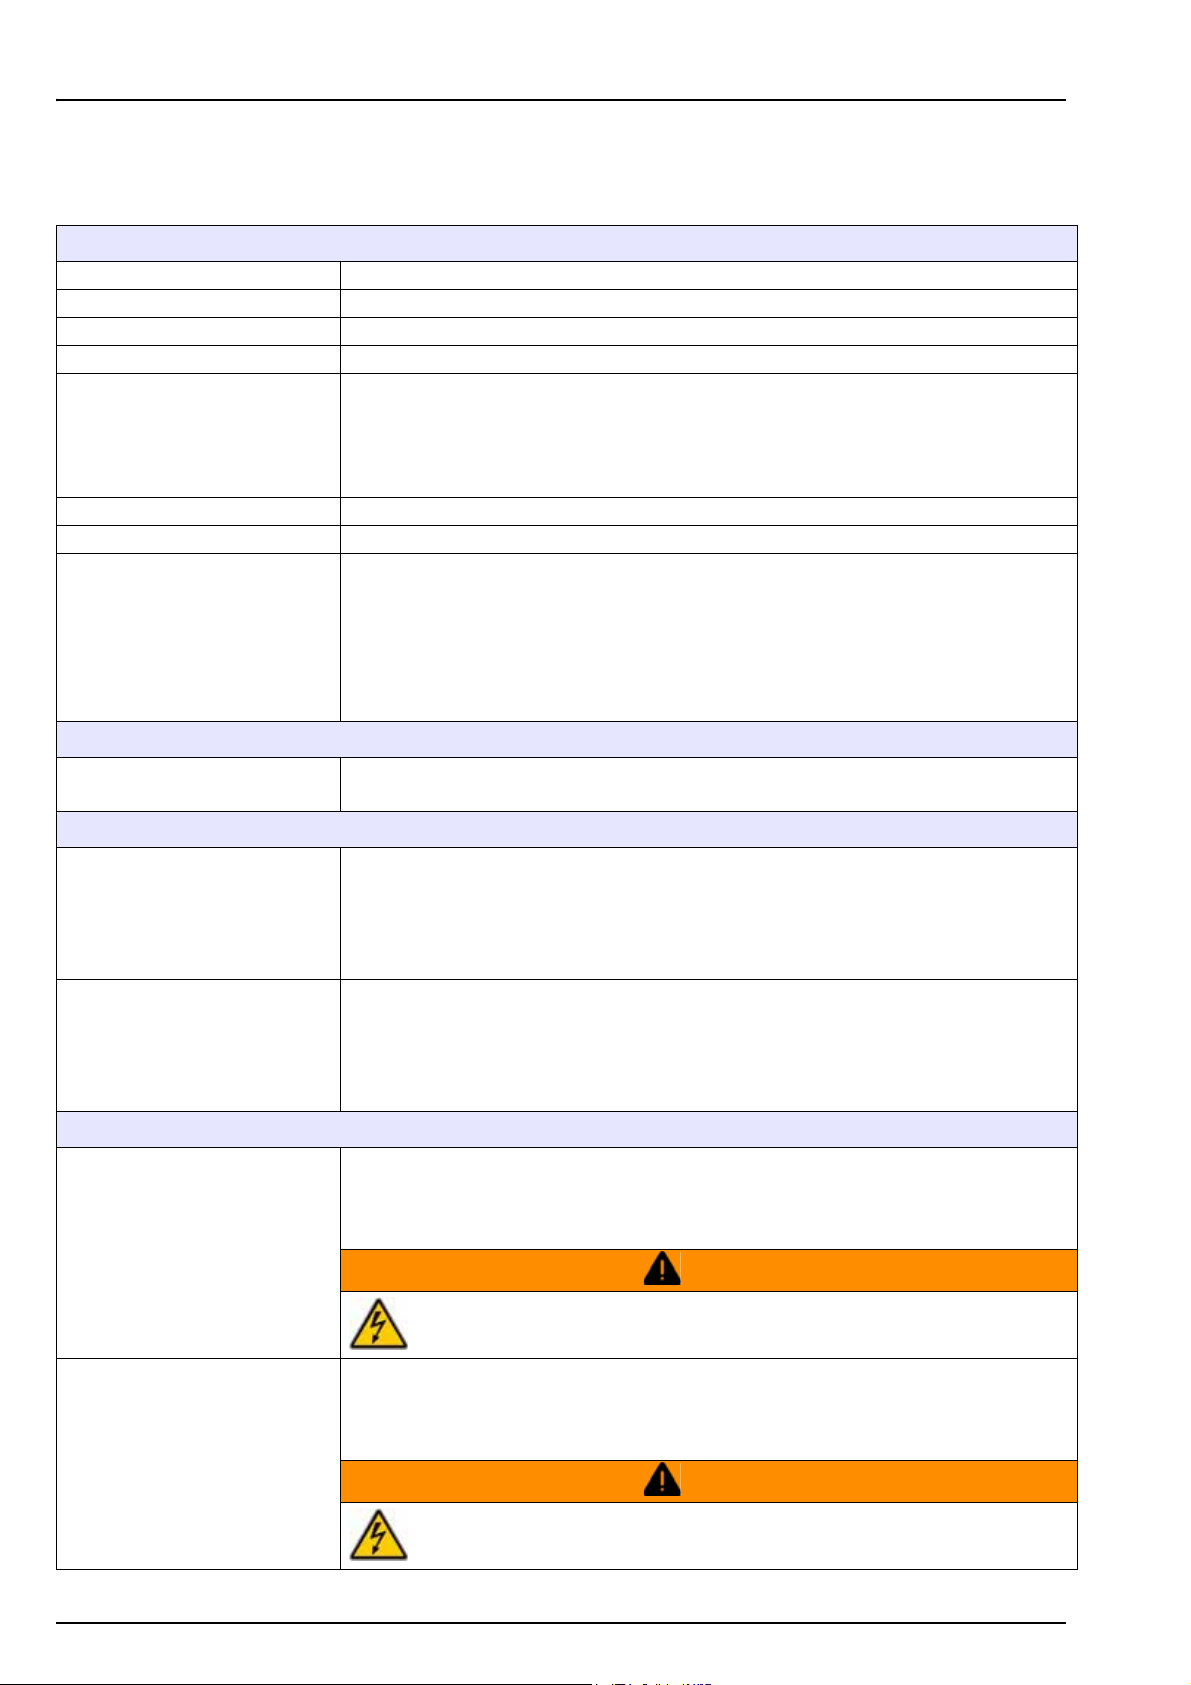
2.1 Technical specifications
OPERATING CONDITIONS
Operating temperature limits -5°C to +50°C
Storage temperature limits -20°C to +70°C
Operating humidity limits 0 to 95% non condensing relative humidity
Operating altitude From 0 to 2,000 m. (6,550 ft.) above sea level
EN61326-1:2006 Directive 2004/108/EEC
EMC requirements
CE compliance EN61010-1: 2010 Directive 2006/95/EEC
Safety rating ETL, conforming to UL 61010-1 and CSA 22.2 No. 61010-1
Enclosure ratings
Power supply
Analog current output version on
the measurement board
Analog voltage output version on
the measurement board
Measurement alarm relays on the
measurement board
Note: The wall mount instrument is a Class A product. In a domestic environment this
product may cause radio interference in which case the user may be required to take
adequate measures.
IP 65
Totally protected against dust.
Protected against low pressure jets of water from all directions.
NEMA4X (wall mount only)
Totally protected against dust.
Protected against pressure jets of water from all directions.
POWER SUPPLY
Universal 100 VAC to 240 VAC @ 50/60Hz - 40VA
10 to 30 VDC - 30W
ANALOG OUTPUTS
4-20 mA (default) or 0-20 mA (configuration with software)
3 configurable outputs
Maximum load: 500 ohm
Sensitivity: 20µA
Accuracy: ± 0.5% (between operating temperature limits)
0- 5 V output (hardware option)
3 configurable outputs
Minimum load: 10 KOhm
Sensitivity: 5 mV
Accuracy: ± 0.5% (between operating temperature limits)
DIGITAL OUTPUTS
Three alarm relays
1A-30 VAC or 0.5A-50 VDC on a resistance load
Configurable to Normally Open [NO] or Normally Closed [NC] contacts by changing the
jumper positions.
WARNING
System alarm relay on the main
board
Potential Electrocution Hazard. Connect only safety low voltage < 33 VAC RMS.
One "instrument system alarm" relay per instrument
1A-30 VAC or 0.5A-50 VDC on a resistance load
Normally closed [NC] (NO relay also available) when instrument is turned on. Opens when
a system alarm is detected, and when it does not receive any signal.
WARNING
Potential Electrocution Hazard. Connect only safety low voltage < 33 VAC RMS.
13
Page 16
Specifications
COMMUNICA TION
RS-485 or PROFIBUS-DP (optional)
Options
Thermal cut off Prevents ageing of sensors when exposed to high temperatures
Wall and pipe mount
(H x D x W)
Panel mount: Face (housing)
(H x D x W)
USB client
USB host
Ethernet 10/100 Base-T
GENERAL
SIZE AND WEIGHT
236.5 x 160 x 250 mm - weight 3.8 kg
9.31 x 6.30 x 9.84 ins. - weight 8.38 lbs
156 (123) x 250 x 220 (214) mm - weight 2.9 kg
6.14 (4.84) x 9.84 x 8.86 (8.43) ins. - weight 6.39 lbs
2.2 Hardware description
The instrument hardware is made of one main board, and one measurement board for the
measurement channel (= the sensor).
The main board includes the controls for power, display, the touch screen, the barometric
sensor, the alarms, and communication ports. The measurement board performs measurements
and executes commands from the main board. It holds the "Analog output" and "Relays" that
send information to external systems.
A hardware watchdog is activated at program start up, to check that the system is not frozen
(i.e. infinite loop, system crash, etc.). If the watchdog is not refreshed by the software every
minute, the measurement display, the relays and the analog output are frozen up to 2 minutes.
Then the reset shuts down the instrument for 10 seconds and the start-up procedure is
performed. At the same time all the hardware (sensor, measurement board) are reset.
2.3 Model identification system
The analyzer identification number and the instrument serial number are located on the label on
the back panel, and can be found on order confirmation and invoice papers.
A Oxygen EC sensor
C Ozone EC sensor
D Carbon dioxide TC sensor
W Wall
P Panel
1 100-240 VAC
410/
/ 000
2 10-30 VDC
C 0/4-20 mA
V 0-5 V
0 RS-485
1 PROFIBUS-DP / RS-485
0 Standard
K Korean language
14
Page 17
Example: 410 / A / W1C0 0000
Main 01234View 01234
iew XXXXX Numeric
Measurement XXXXX Graphic
Calibration X X X Statistical XXXXX
Inputs/outputs X X X Event
Communication X X Diagnostic
Securit
y
X X Configure
Products X X X
Global config X X Measurement 01234
Services X X Config instrument
Config channel
Measurement file
Gas senso
r
01234
Calibration
Calibration 01234
erification
Gas senso
r
Configuration
Interfernces
Reports
Baromete
r
External pressure
Amplifiers
Reports 0 1234
Reports
Senso
r
Interferences
Inputs/Outputs 01234 Baromete
r
Snooze
iew
Relays
Analog outputs
Communication 01234
RS 485
RS 485 simple
Profibus DP
USB-
A
HTTP / TCPIP
Securit
y
01234
Configuration
Access tabl
e
iew log file
Products 01234
Select product
Modify produc
Global config 01234
Save config
Select config
Services 01234
Diagnostic
Language
Clock
Screen
Buzzer
Boards info
Batteries
Soft download
More
Security level : 01234
vailable
Optional
Not available
Diagram Legend:
• Analyzer model 410
• For oxygen measurement
• Wall mounted
• 100-240 VAC
• 0/4 20 mA analog output
• RS-485
• Standard software (English, French, German, Italian, Spanish, Russian, Japanese, Chinese)
2.4 Security level table
A cross means that the user who has this user security level can access this function or setting
(see User management on page 80).
Note: When not shown, the sub-levels carry the same security level as the level above.
Specifications
V
Note: For the USB-A option in the Communication Menu, level 4 access is required to import the access
table data.
XXXXX
XXXXX
XXXXX
XXXXX
XX
XX
XX
XX
XXX
V
V
tXX
XXX
XX
XX
XXX
XX
XXX
XX
XX
XX
XX
XX
XX
XX
XX
XXX
XX
XX
XX
XX
XX
XX
XX
XX
XX
A
V
X
X
X
X
X
XXX
XX
XX
XXX
XXX
XX
XXX
XXX
XXX
XX
15
Page 18

Specifications
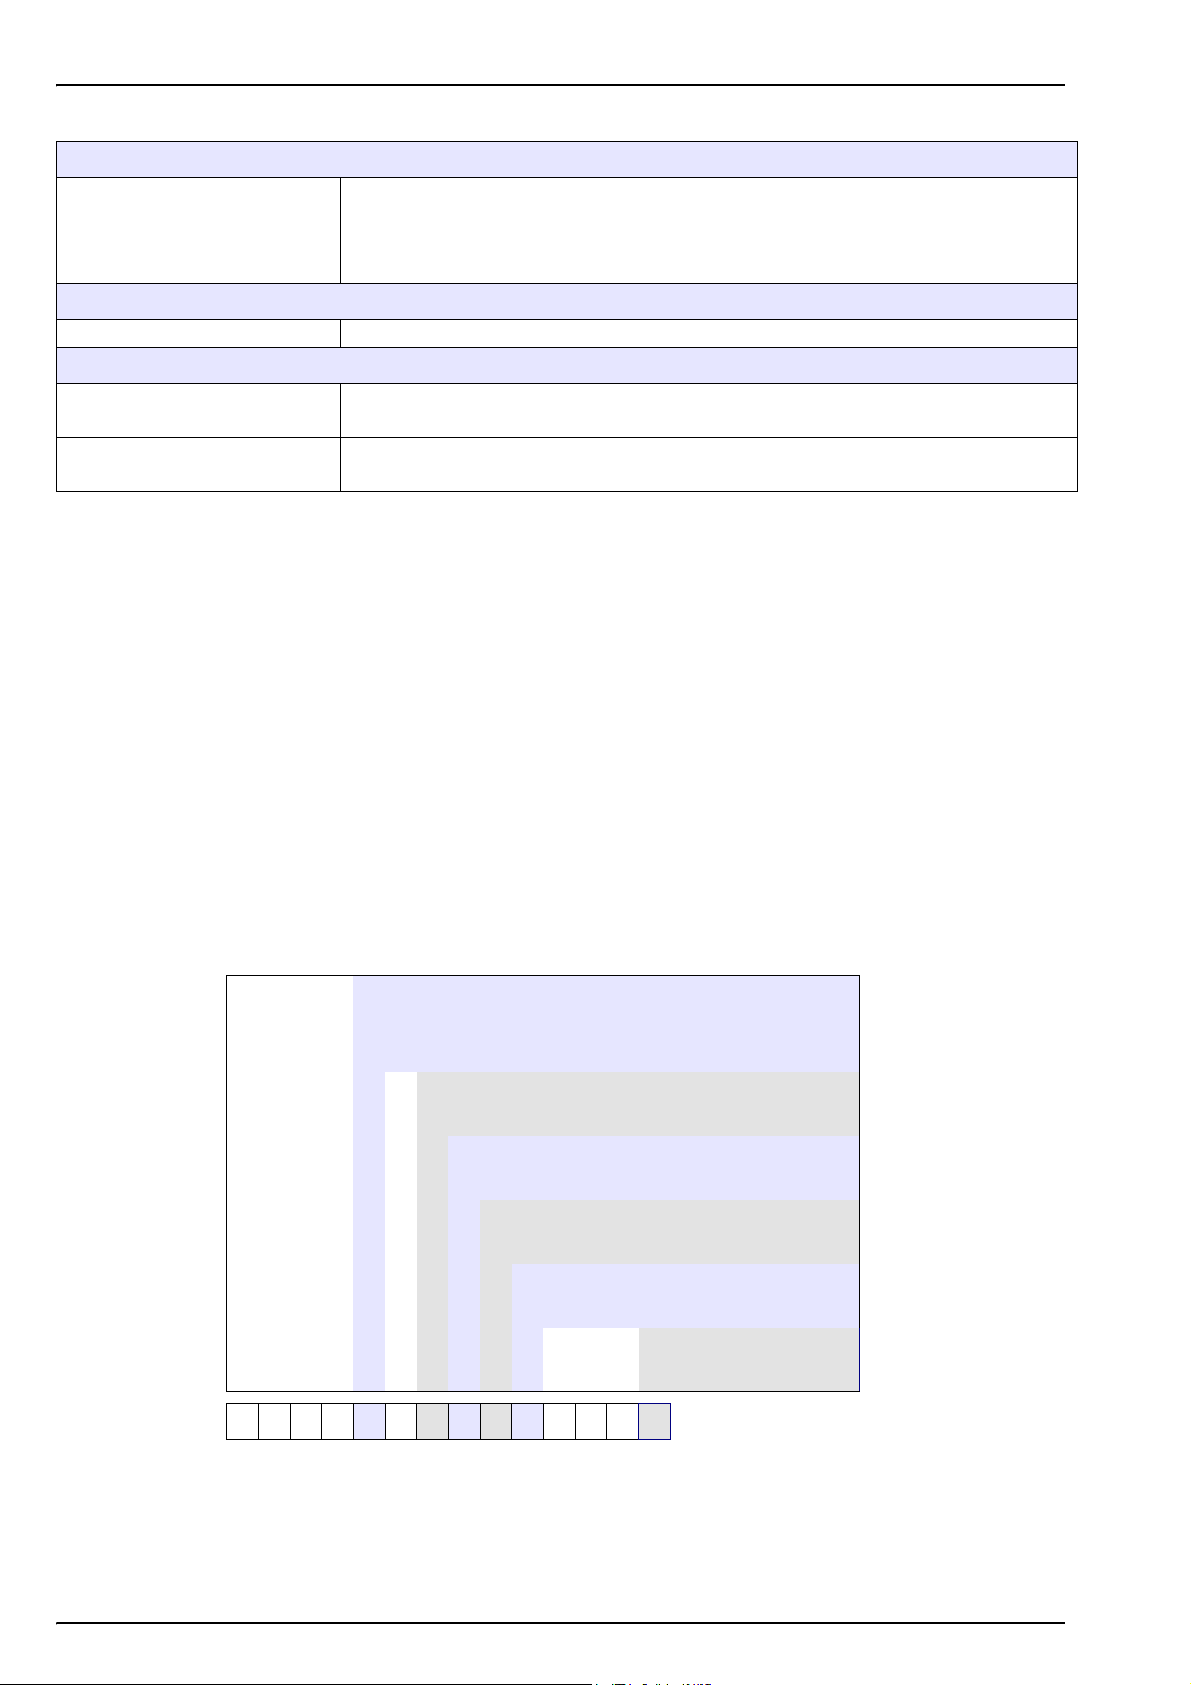
2.5 Default parameters
The table below indicates the factory default configurations. The instrument has these settings
when started for the first time.
Parameter Default settings Customer settings
Security Disabled
Measurement
Measurement mode Continuous
Data filter Disabled
Sample phase Liquid
Units ppm-ppb
Display resolution XX.X
Storage mode Rolling buffer
Sensor Membrane 2956
Temp unit °C
Pressure unit bar
Calibration
Mode in air (O
Hold Enabled
Analog outputs
Range 4-20 mA (0-5V)
Output Gas measurement
Extended mode Disabled
Characteristics Linear mode
Alarm relays Disabled
Thermal cutoff Enabled
Thermal cutoff temp 65°C
Calibration timer Disabled
Service timer Disabled
Buzzer
Screen tap Enabled
Alarm sound Disabled
Display
Minigraph Enabled
Temperature Disabled
, O3)
2
16
Page 19
Section 3 Installation
This section provides necessary information to install and connect the analyzer. The installation
of the analyzer should be performed in accordance with relevant local regulations.
Electrocution Hazard. Do not connect AC power to a 5 VDC powered model.
Potential Electrocution Hazard. Always disconnect power to the instrument when
making electrical connections.
Potential Electrocution Hazard. If this equipment is used outdoors or in potentially
wet locations a Ground Fault Interrupt device must be used for connecting the
equipment to its main power source.
DANGER
WARNING
WARNING
WARNING
Personal Injury Hazard. Only qualified personnel should conduct the tasks described in this
section of the manual.
Install the device in a location and position that gives easy access to the disconnect device
and its operation.
3.1 Unpacking
Remove carefully the instrument and its accessories from the box and packing material,
referring to the packing list included to confirm that everything has been delivered.
Potential Electrocution Hazard. A protective earth (PE) ground connection is
required for both 100-240 VAC and 5 VDC wiring applications. Failure to connect a
good PE ground connection can result in shock hazards and poor performance due
to electromagnetic interferences. ALWAYS connect a good PE ground to the
controller terminal.
CAUTION
NOTICE
NOTICE
Potential Instrument Damage. Delicate internal electronic components can be
damaged by static electricity, resulting in degraded performance or eventual failure.
Please visually inspect the instrument for shipping damage. If anything is missing or damaged,
contact the manufacturer or your dealer immediately.
You may want to retain the box and other packing material in case later you need to ship the
instrument (see Storage, handling and transportation on page 92). Please dispose safely and
ecologically of the box and packing material (if not stored for future use).
Please read through this manual thoroughly before carrying out the installation.
17
Page 20

Installation
3.2 Installation check list
To complete the installation, proceed to the following actions:
1. Follow the installation instructions in this section carefully
2. On completion, verify once more that everything is properly connected
3. Turn the instrument on
4. Set the language
5. Set the security levels, users ID’s and passwords
6. Perform a barometric sensor calibration
7. Perform the gas sensor(s) calibration
8. Perform calibration for the interferences
9. Adjust the settings for correction factors and interferences
The instrument should now be ready for operation. If a problem should arise, please refer
initially to Troubleshooting on page 91. If the difficulty cannot be overcome, please contact your
Hach Lange representative who will be happy to assist you.
18
Page 21
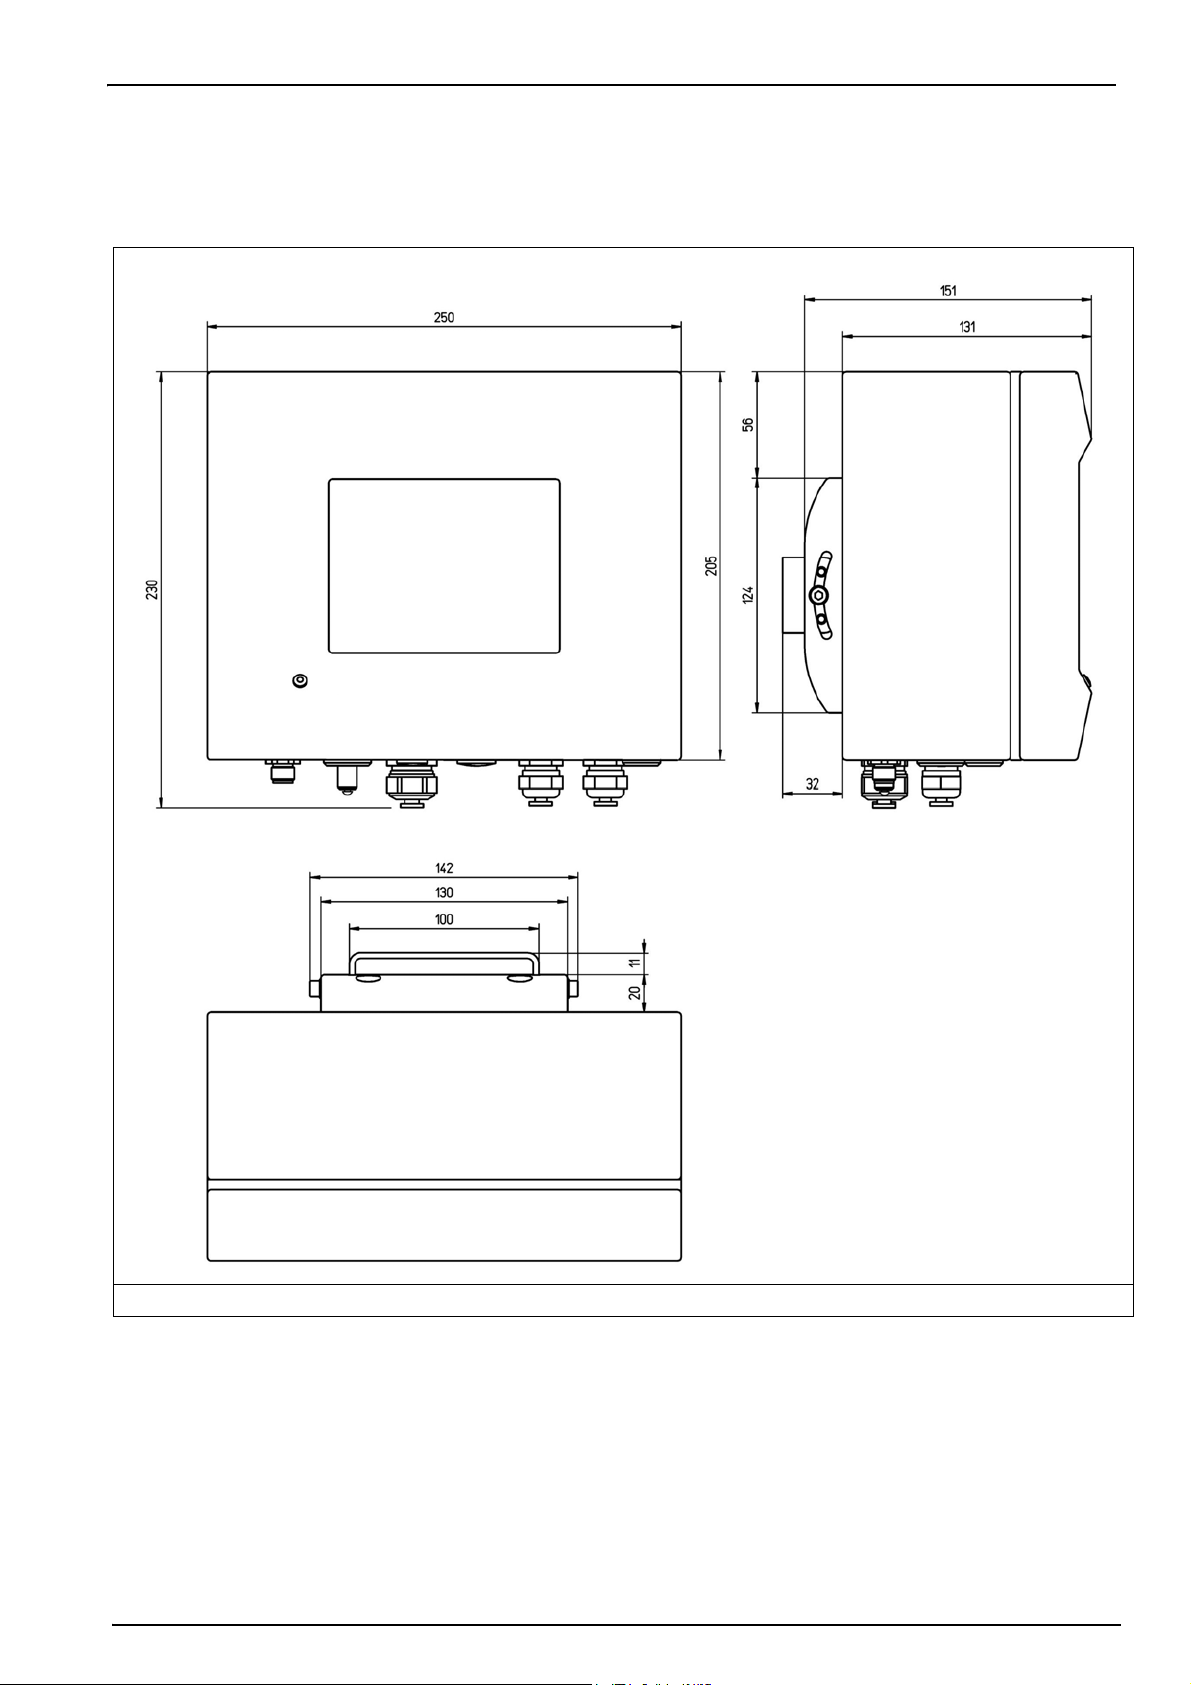
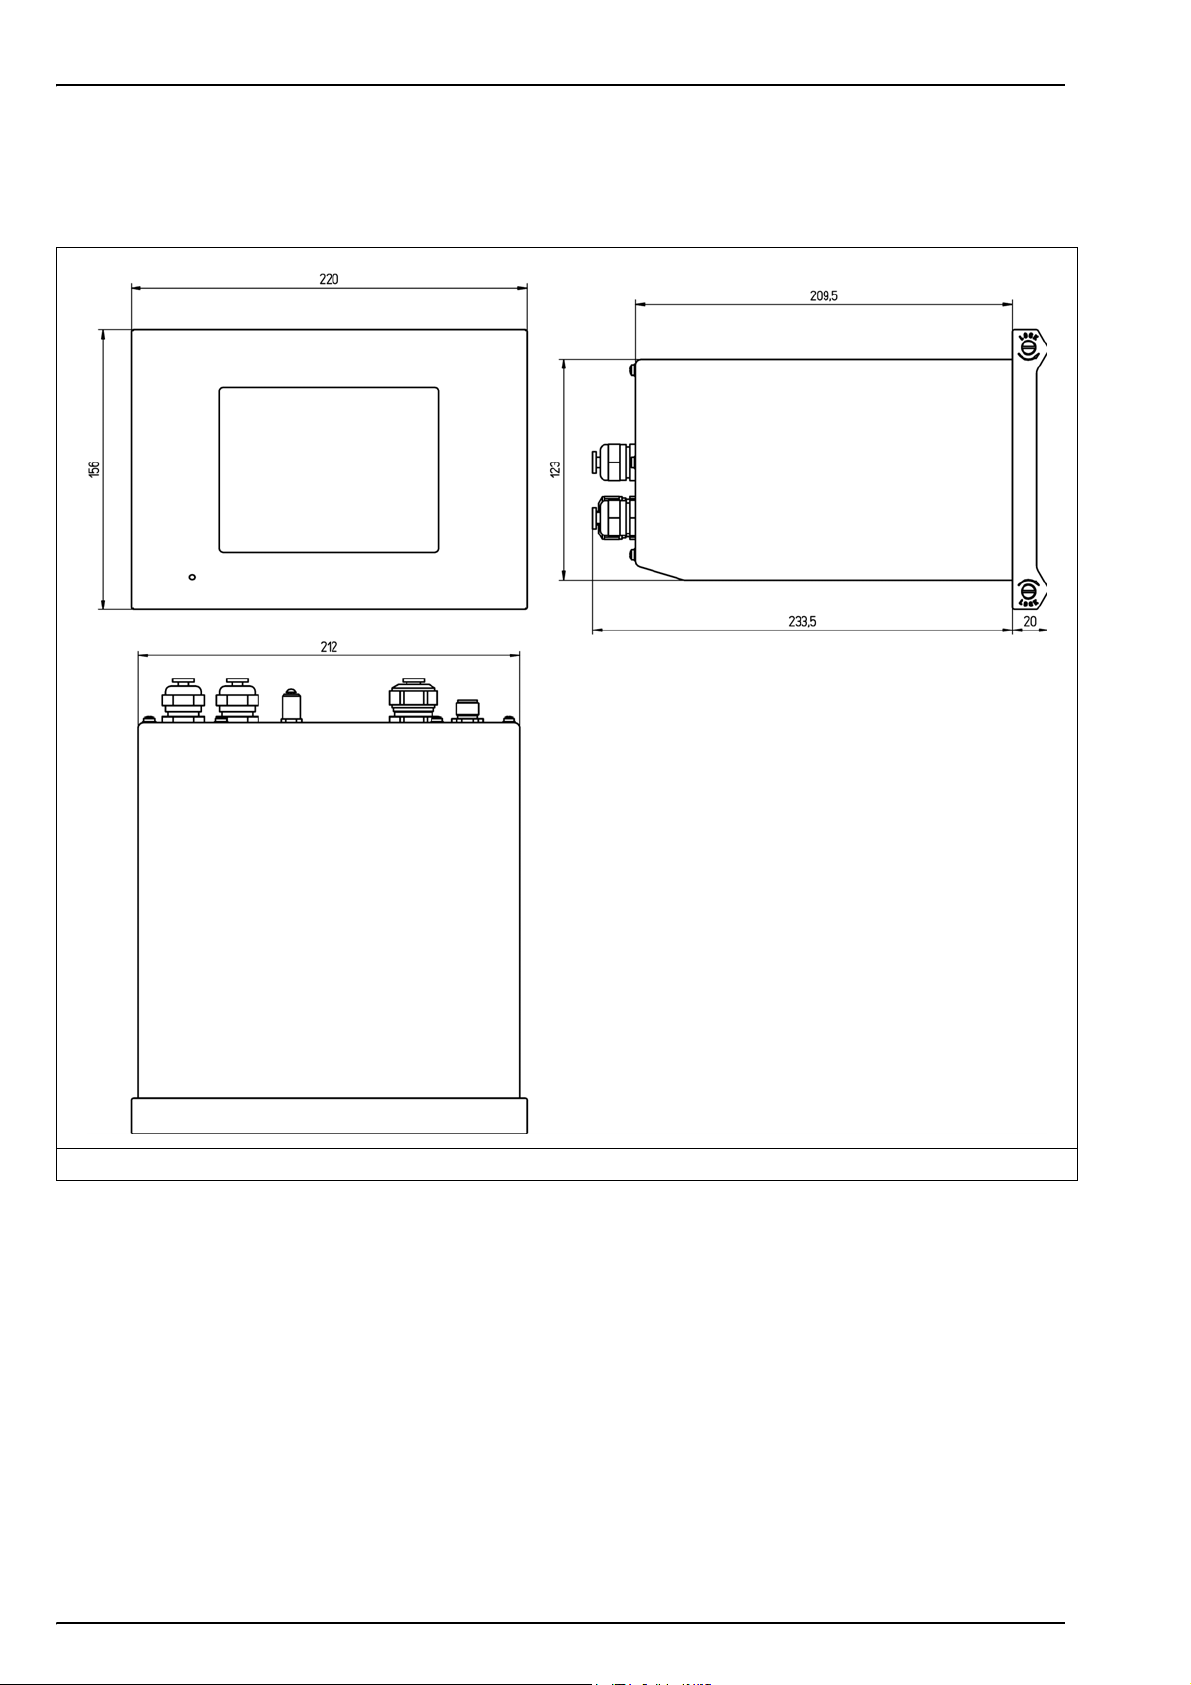
3.3 Wall mount and pipe mount instruments
3.3.1 Instrument dimensions
Installation
Figure 1 Wall and pipe mount instrument dimensions (in millimeters)
19
Page 22
Installation
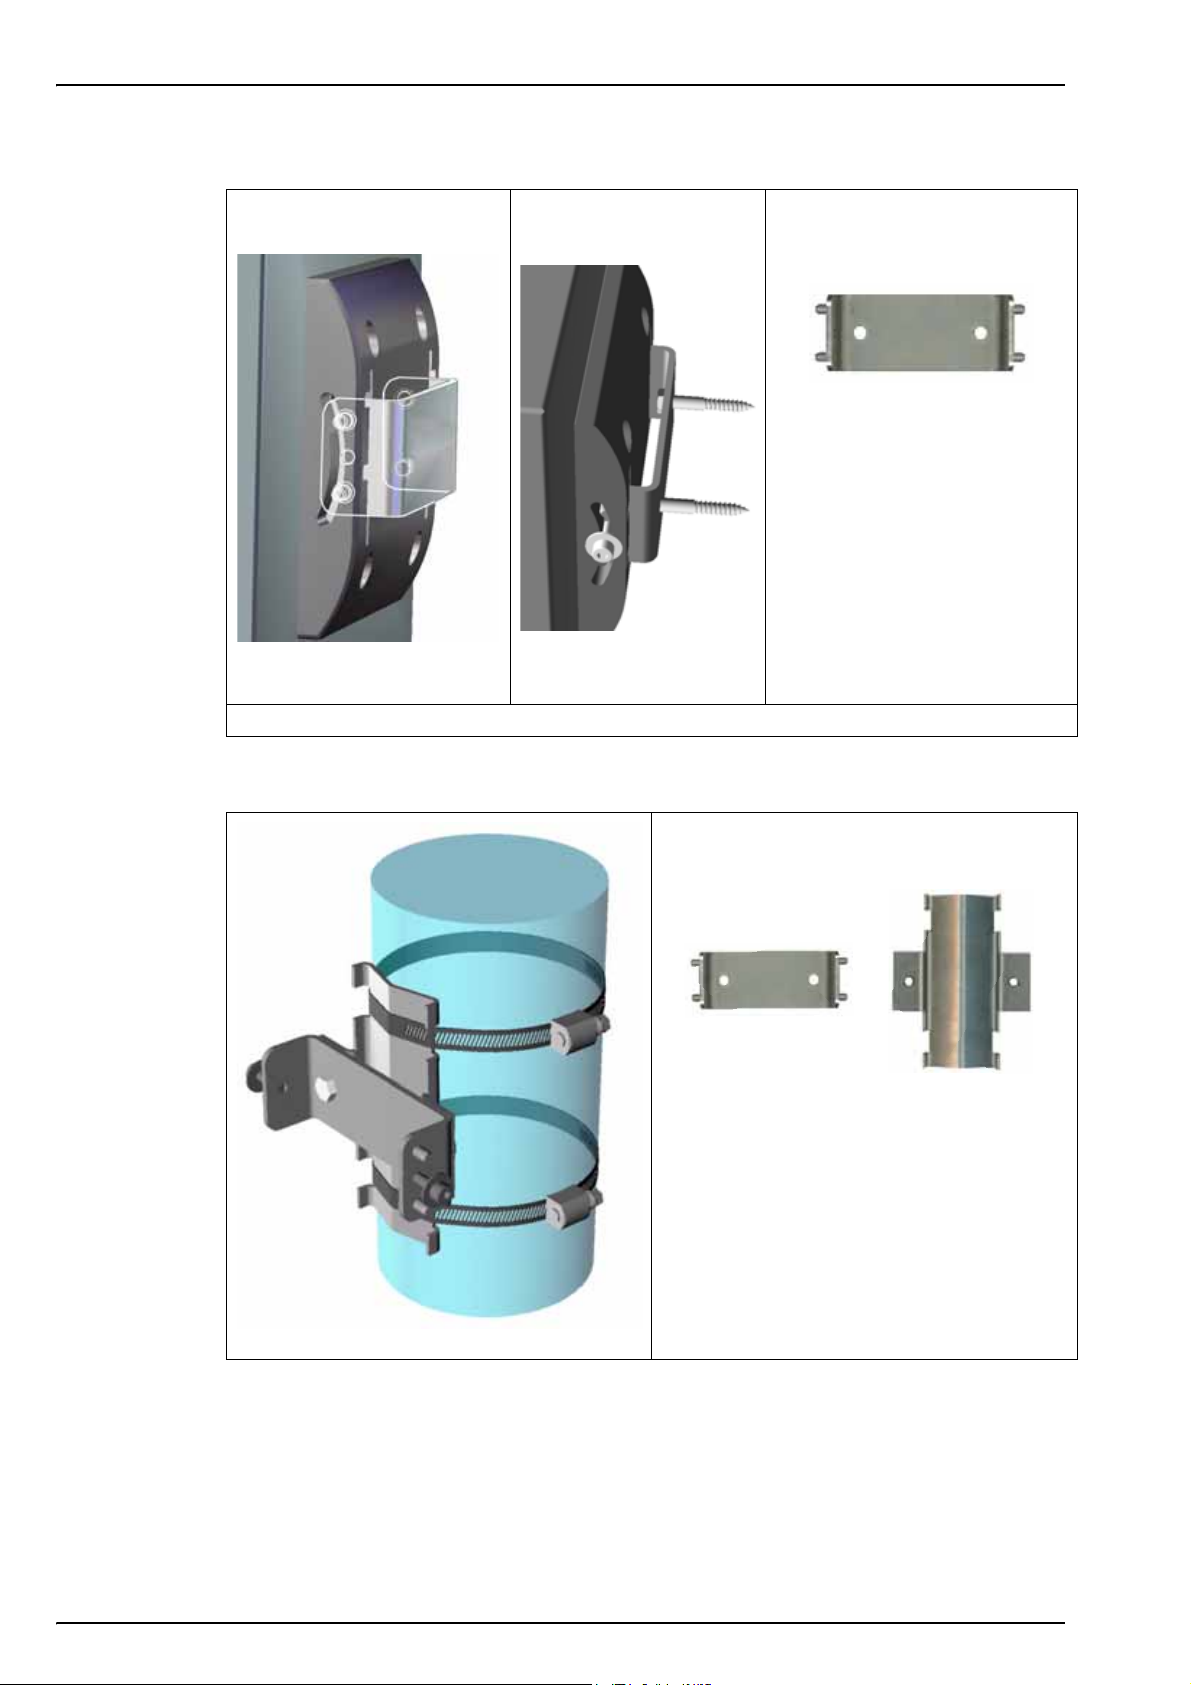
3.3.2 Wall mounting
Attach the U bracket provided to
the wall with two screws (not
provided).
Tilt the instrument slightly
backwards to align the bracket
pins and the insertion slots, and
slide the instrument onto the
bracket as shown.
Insert the 2 locking screws with
washers through the side slots.
Adjust instrument angle for better
screen vision, and lock both side
screws.
3.3.3 Pipe mounting
Figure 2 Wall mount bracket
Assemble the pipe mount bracket to the
U-bracket, using the two screws provided
Attach this assembly to the pipe using two
clamps (not provided) as shown on the left
The rest of the procedure is similar to the wall
mount version, pictured above.
Slide the instrument onto the bracket.
Insert the 2 locking screws with washers
through the side slots.
20
Figure 3 Pipe mount diagram
Adjust the instrument angle for better screen
vision, and lock both side screws.
Page 23
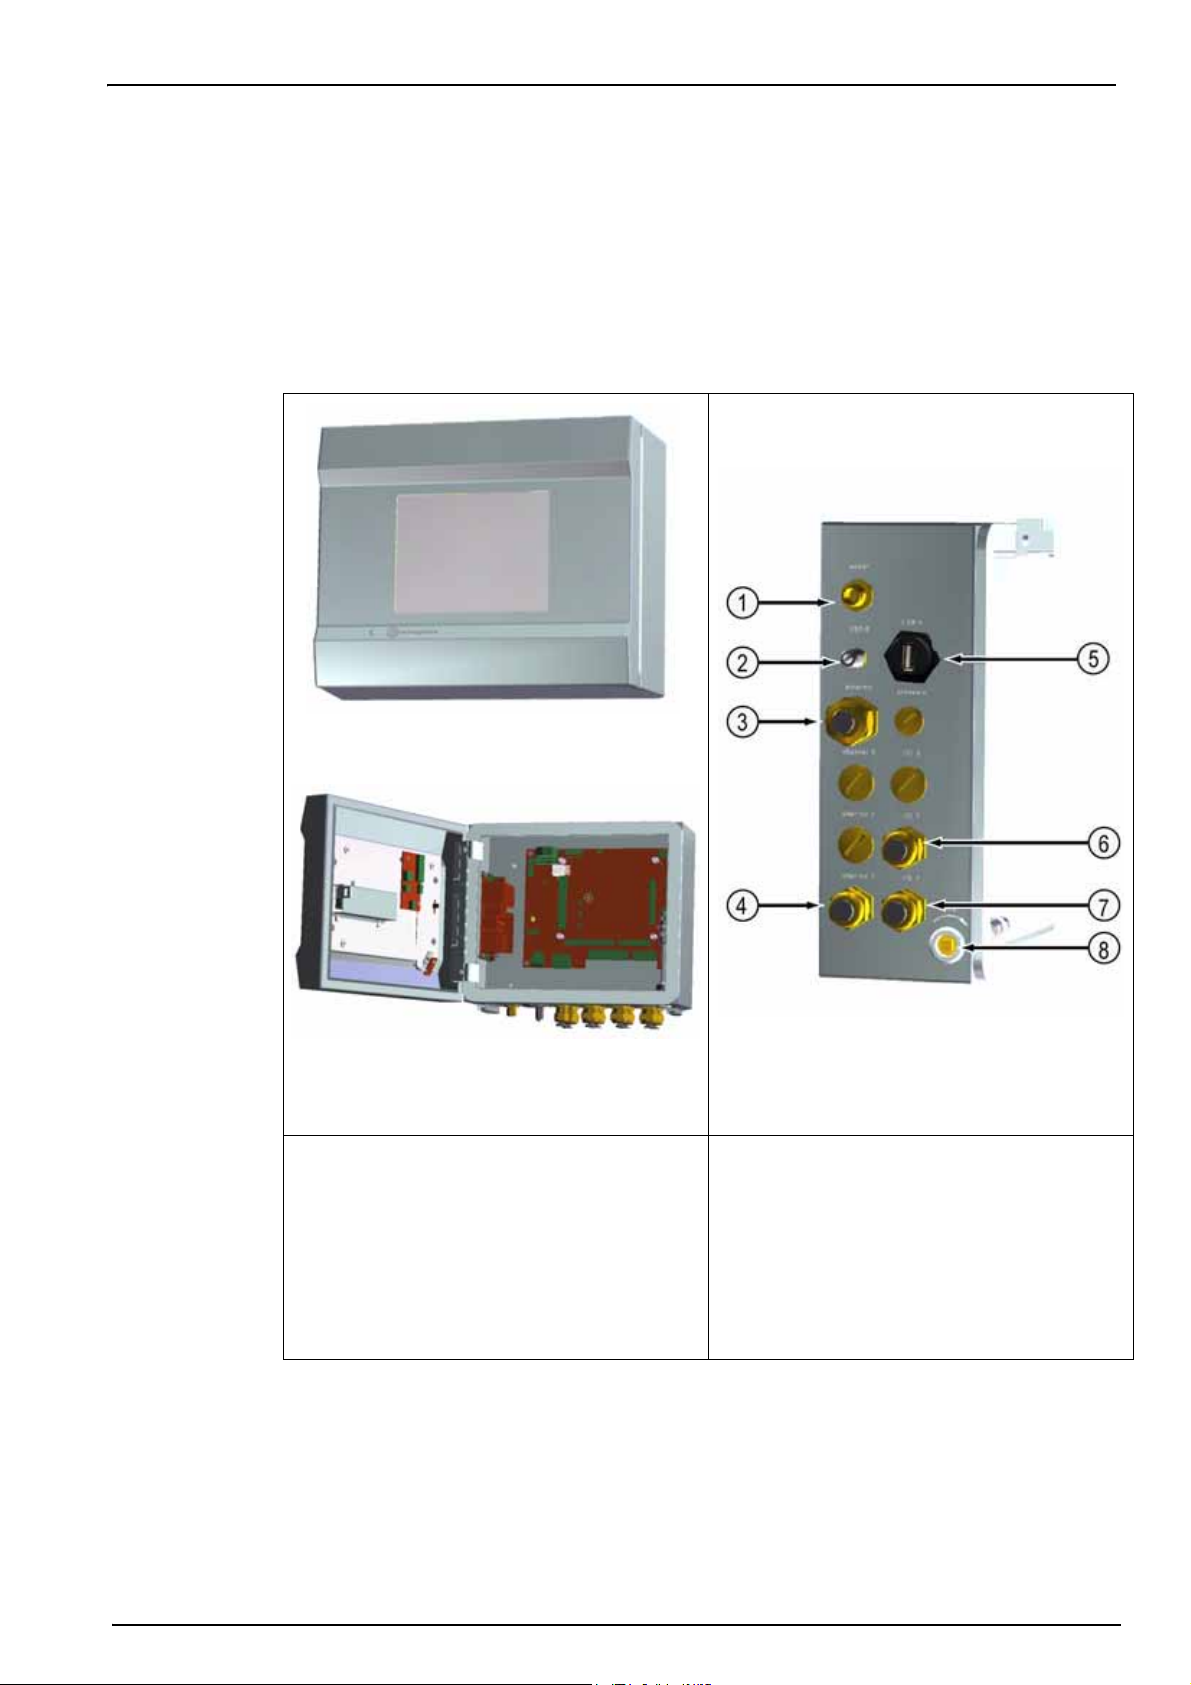
3.3.4 Connection panel (bottom of instrument)
Front panel door
A square key is provided to open the instrument front panel locks. The two locks are located on
the right side of the instrument on the top and bottom panels (bottom panel indicated with the
number 8 in Figure 4 below).
The front panel can be easily pivoted to the left as shown below. To retain the instrument
waterproof tightness, make sure the seal is clean and in good condition before closing the front
panel.
Installation
1. Power cable. The type of connection will
vary depending on the instrument
specification (see Connection to mains
power supply on page 26)
2. USB-B client 4 pin connector. Use the
adapter cable (see USB-B client adapter
cable on page 26)
3. Ethernet cable gland
Figure 4 Wall and pipe mount connection
panel
4. Sensor cable gland
5. USB-A host connector for mass storage
device
6. Input/Output 2 cable gland
7. Input/Output 1 cable gland
8. Keylock (bottom panel)
21
Page 24
Installation
3.4 Panel mount instrument
3.4.1 Instrument dimensions
22
Figure 5 Panel mount instrument dimensions (in millimeters)
Page 25
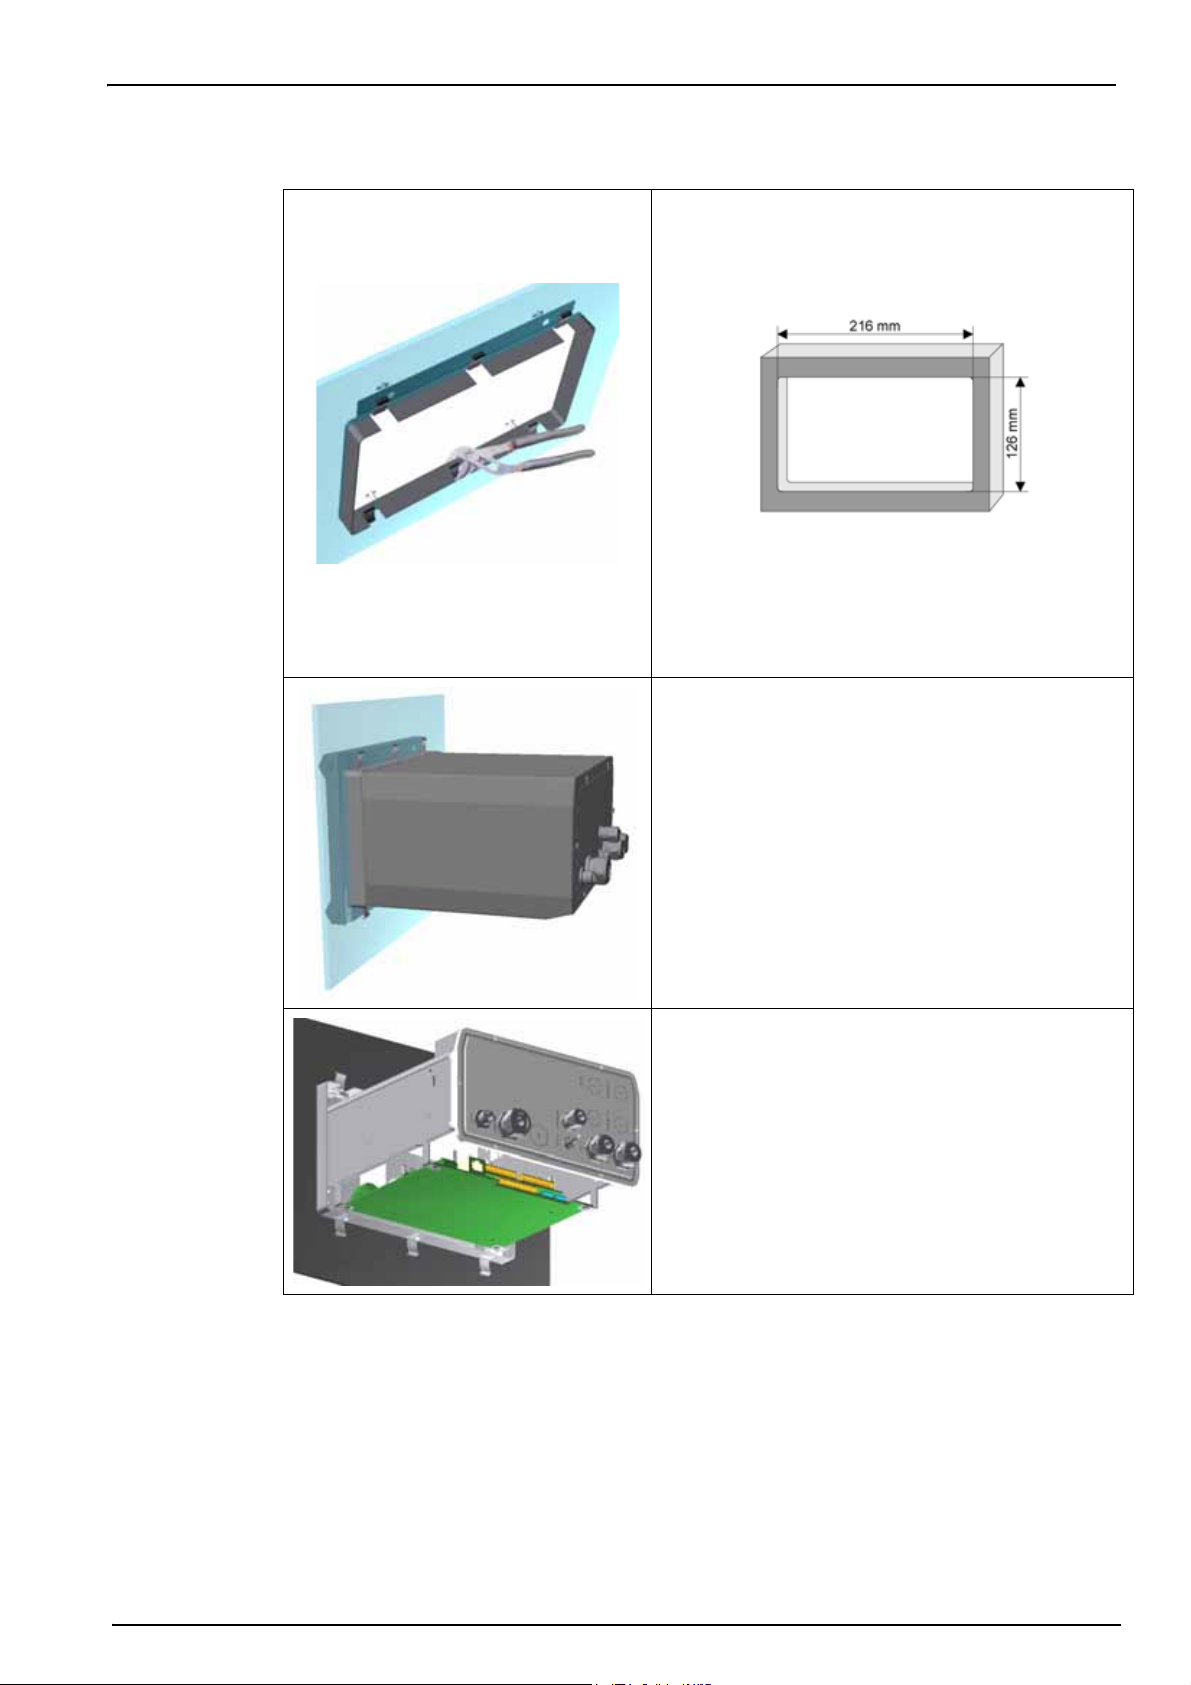
3.4.2 Mounting
Installation
1. Cut an opening in the panel to accommodate
the bracket frame provided (this is the same
size as previous generations of ORBISPHERE
type 3600 instruments).
Figure 7 Opening dimensions
Figure 6 Panel mount bracket frame
2. Install the provided frame in the opening
3. Fold the 6 tabs over the panel lips, using
adjustable joint pliers.
4. Slide the instrument in the bracket frame. The
instrument should go over the four “T” pins.
Rotate the 4 fast locking screws on both sides of
the front panel and slide it in.
5. Rotate the 4 fast locking screws 1/4 turn twice in
the lock direction as indicated on the side of the
front panel. This locks the instrument in place on
the four “T” pins.
6. To access the connections inside the
instrument, remove the instrument housing (six
screws on the back panel, and slide the housing
back out)
7. Pass the cables through the housing, then
through the cable gland (if applicable) and then
perform the connections as detailed below.
Note: Do not forget to pass the cable through the housing
before passing it through the cable gland on the back
panel.
23
Page 26
Installation
Alternative instrument mounting procedure
When it is not convenient to work from the back of the panel, the instrument can be connected
before fitting in the panel.
1. Install the panel support frame in the panel opening
2. Slip the cables through the panel opening
3. Remove the instrument cover
4. Slip the cables through the instrument cover
5. Slip the cables through the instrument back panel cable glands
6. Connect the cables to the instrument electronic boards
7. Tighten the cable glands
8. Reinstall the instrument cover
9. Install the instrument in the panel opening
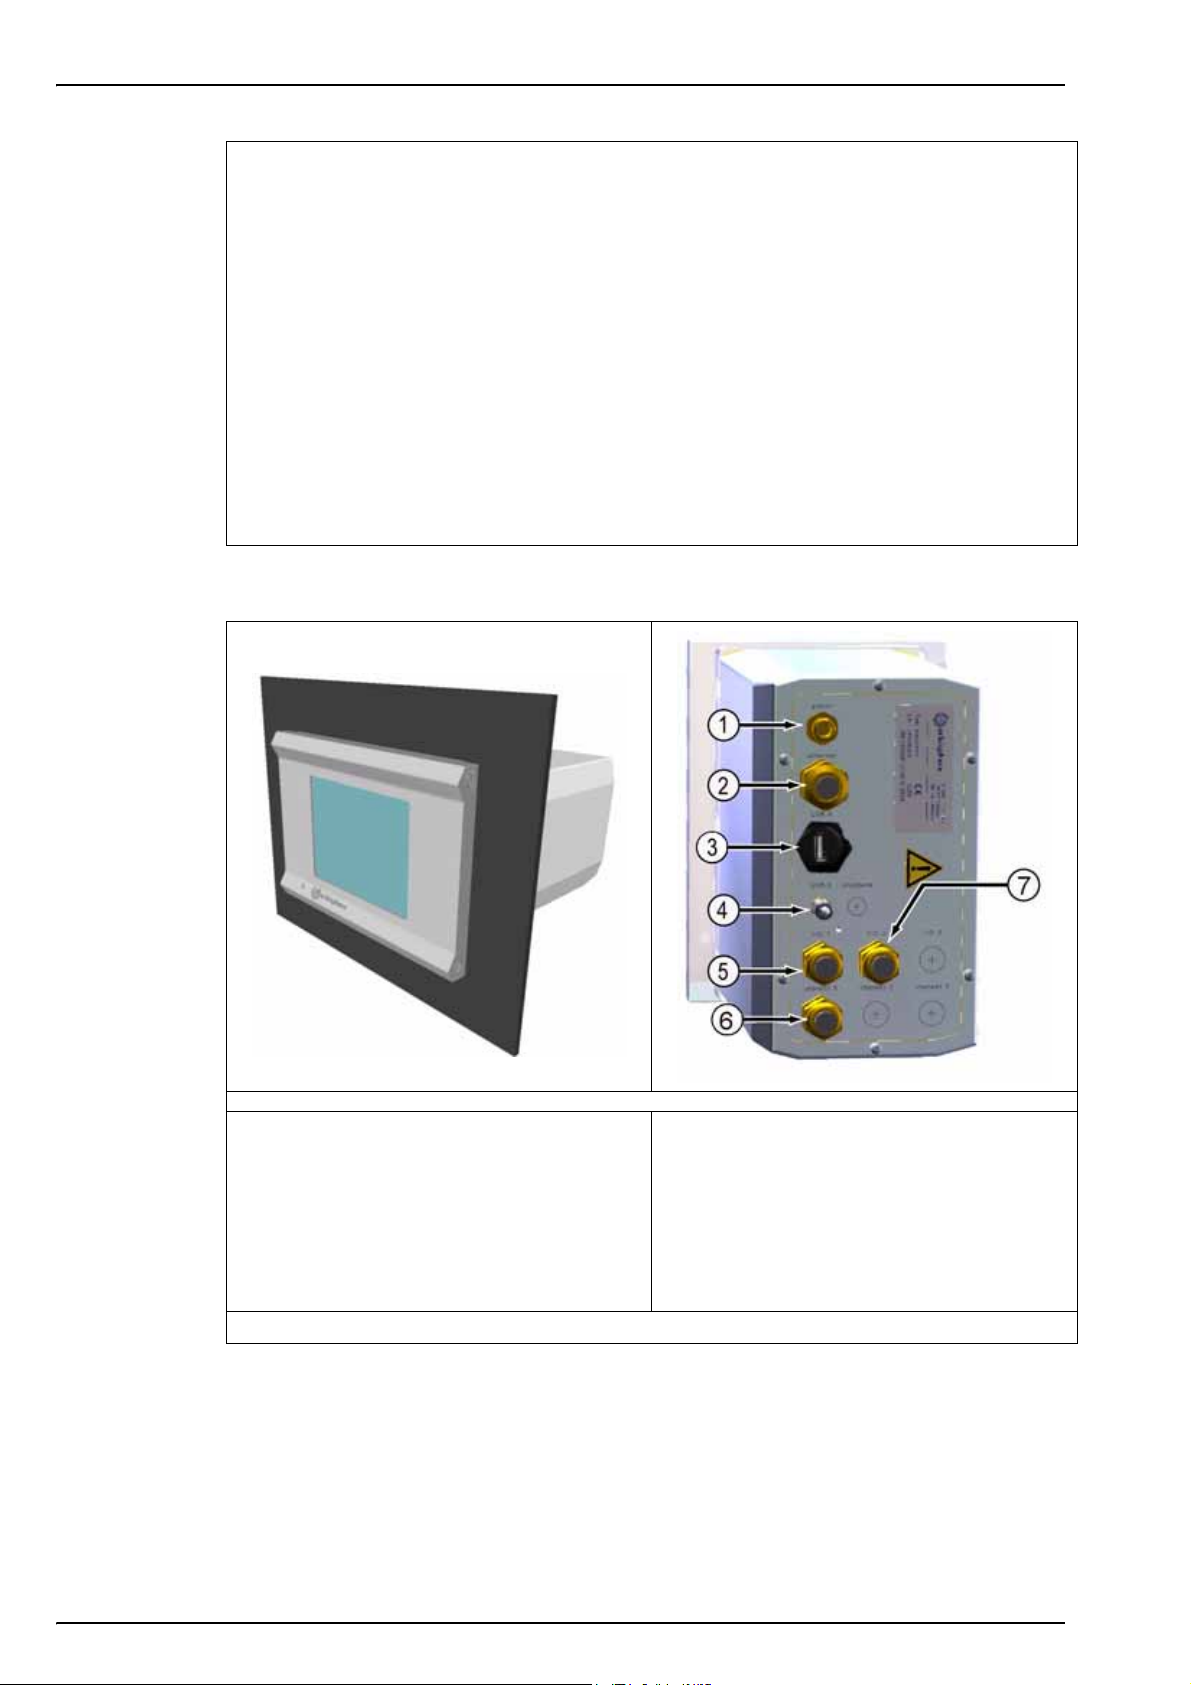
3.4.3 Connection panel (bottom of instrument)
24
1. Power cable. The type of connection will
vary depending on the instrument
specification (see Connection to mains
power supply on page 26)
2. Ethernet cable gland
3. USB-A host connector for mass storage
device
Figure 8 Panel mount connection panel
4. USB-B client 4 pin connector. Use the
adapter cable (see USB-B client adapter
cable on page 26)
5. Input/Output 1 cable gland
6. Sensor cable gland
7. Input/Output 2 cable gland
Page 27
3.5 Connectors assembly instructions
Potential Electrocution Hazard. In order to maintain the NEMA/IP environmental
ratings of the enclosure, use only conduit fittings and cable glands rated for at least
NEMA 4X/IP65 to route cables into the instrument.
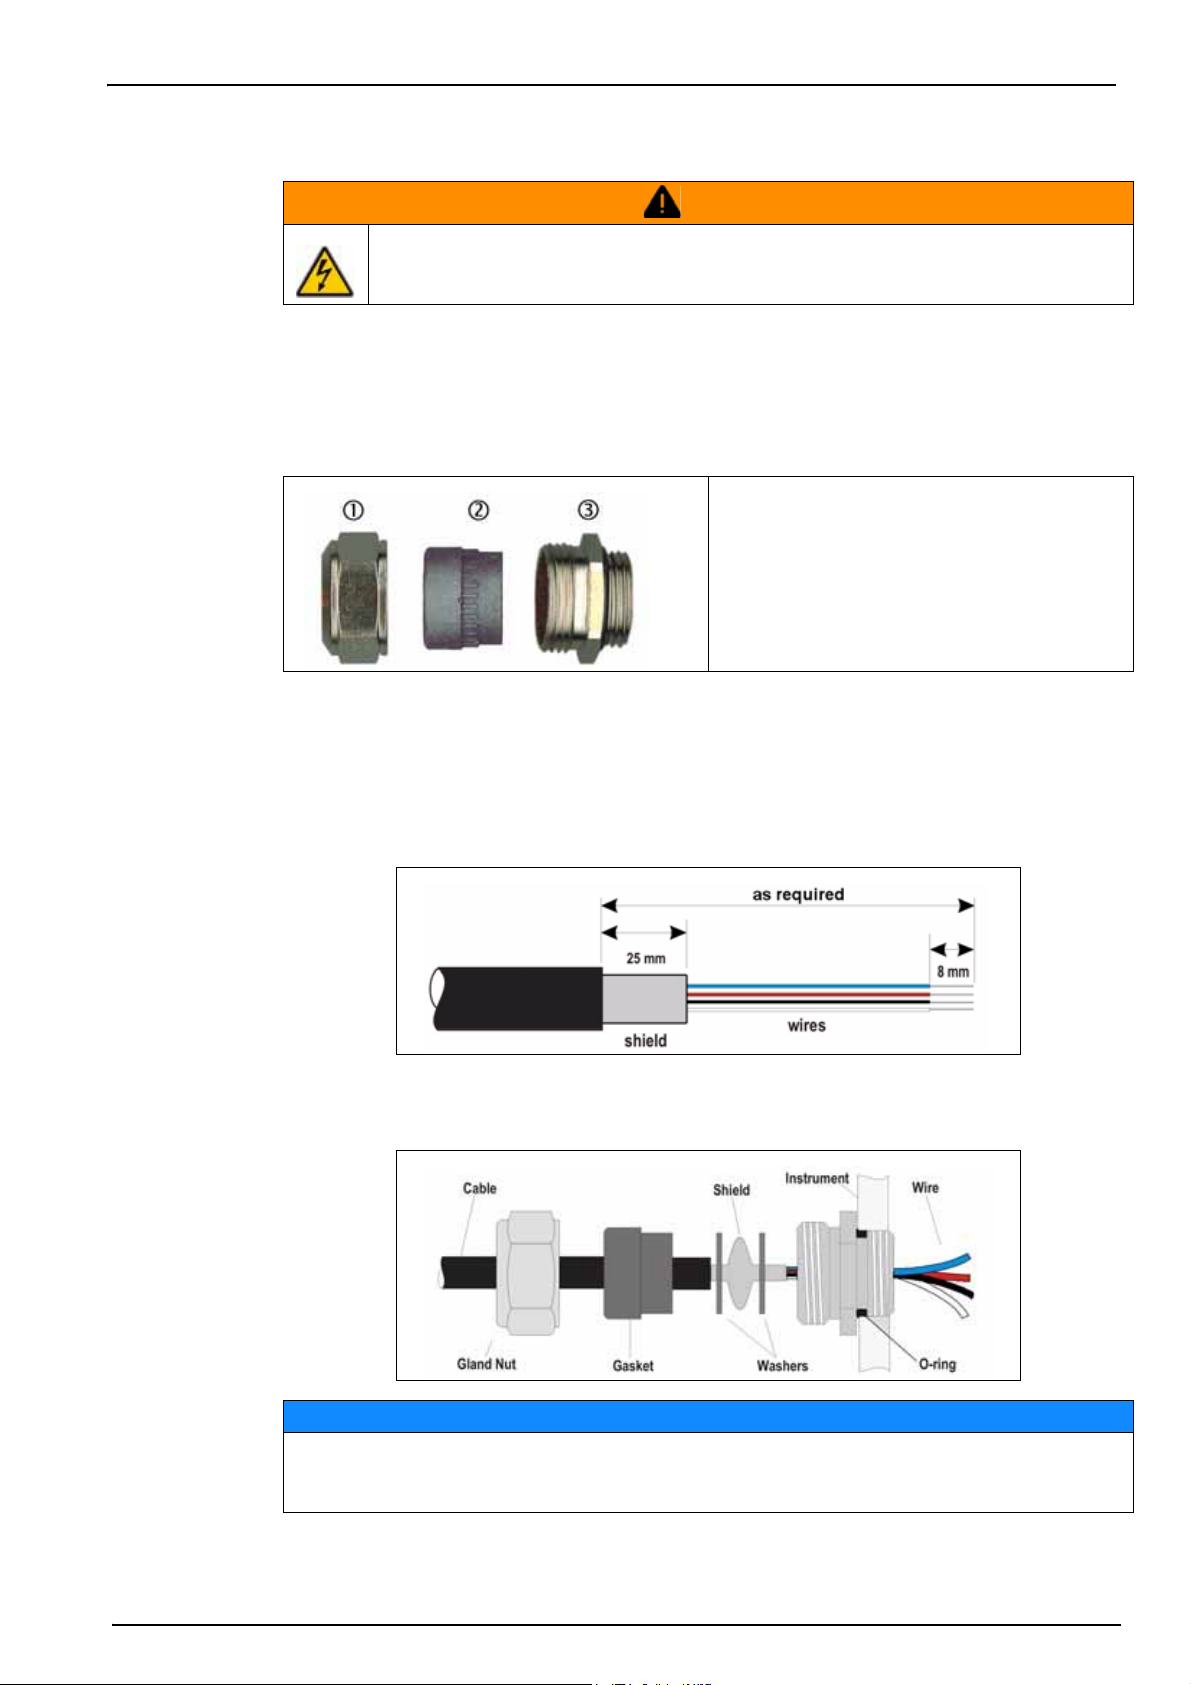
3.5.1 Cable gland wiring instructions
A waterproof cable gland is provided each time a cable must be connected inside the
instrument. The nickel-plated brass cable glands are EMC-types, designed so that the cable
shields attach directly to the instrument housing as a ground. Typical cable wiring instructions
are detailed below.
Installation
WARNING
Gland parts (washers not shown):
1. Nut
2. Rubber gasket (seal)
3. Gland fitting with O-ring (attached to
instrument housing)
1. Unscrew the cable gland nut. Inside, the assembly is composed of a rubber gasket, and two
metal washers. Note that the ethernet gland on panel and wall mount instruments does not
have washers and the gasket is cut.
2. If wiring a sensor cable, the cable has already been prepared so simply remove the piece of
plastic protection from the exposed shielding.
For other cables, strip off external insulation as required, and 25 mm of shielding. Strip the
wires about 8 mm from their ends (see illustration below).
3. Pass the cable through the nut, the rubber gasket, and the two washers
4. Pinch the shield so that its entire circumference is pressed between the two washers and
pass the cable into the housing, blocking the cable gland
NOTICE
It is vitally important to ensure the shielding is pinched and secured between the two washers
to ensure the shielding attaches directly to the instrument housing as a ground. Failure to do
this could cause damage to the instrument, and for sensor cables give incorrect readings.
5. Reattach and tighten the cable gland nut
6. Attach the wires to the corresponding terminal block connections
25
Page 28
Installation
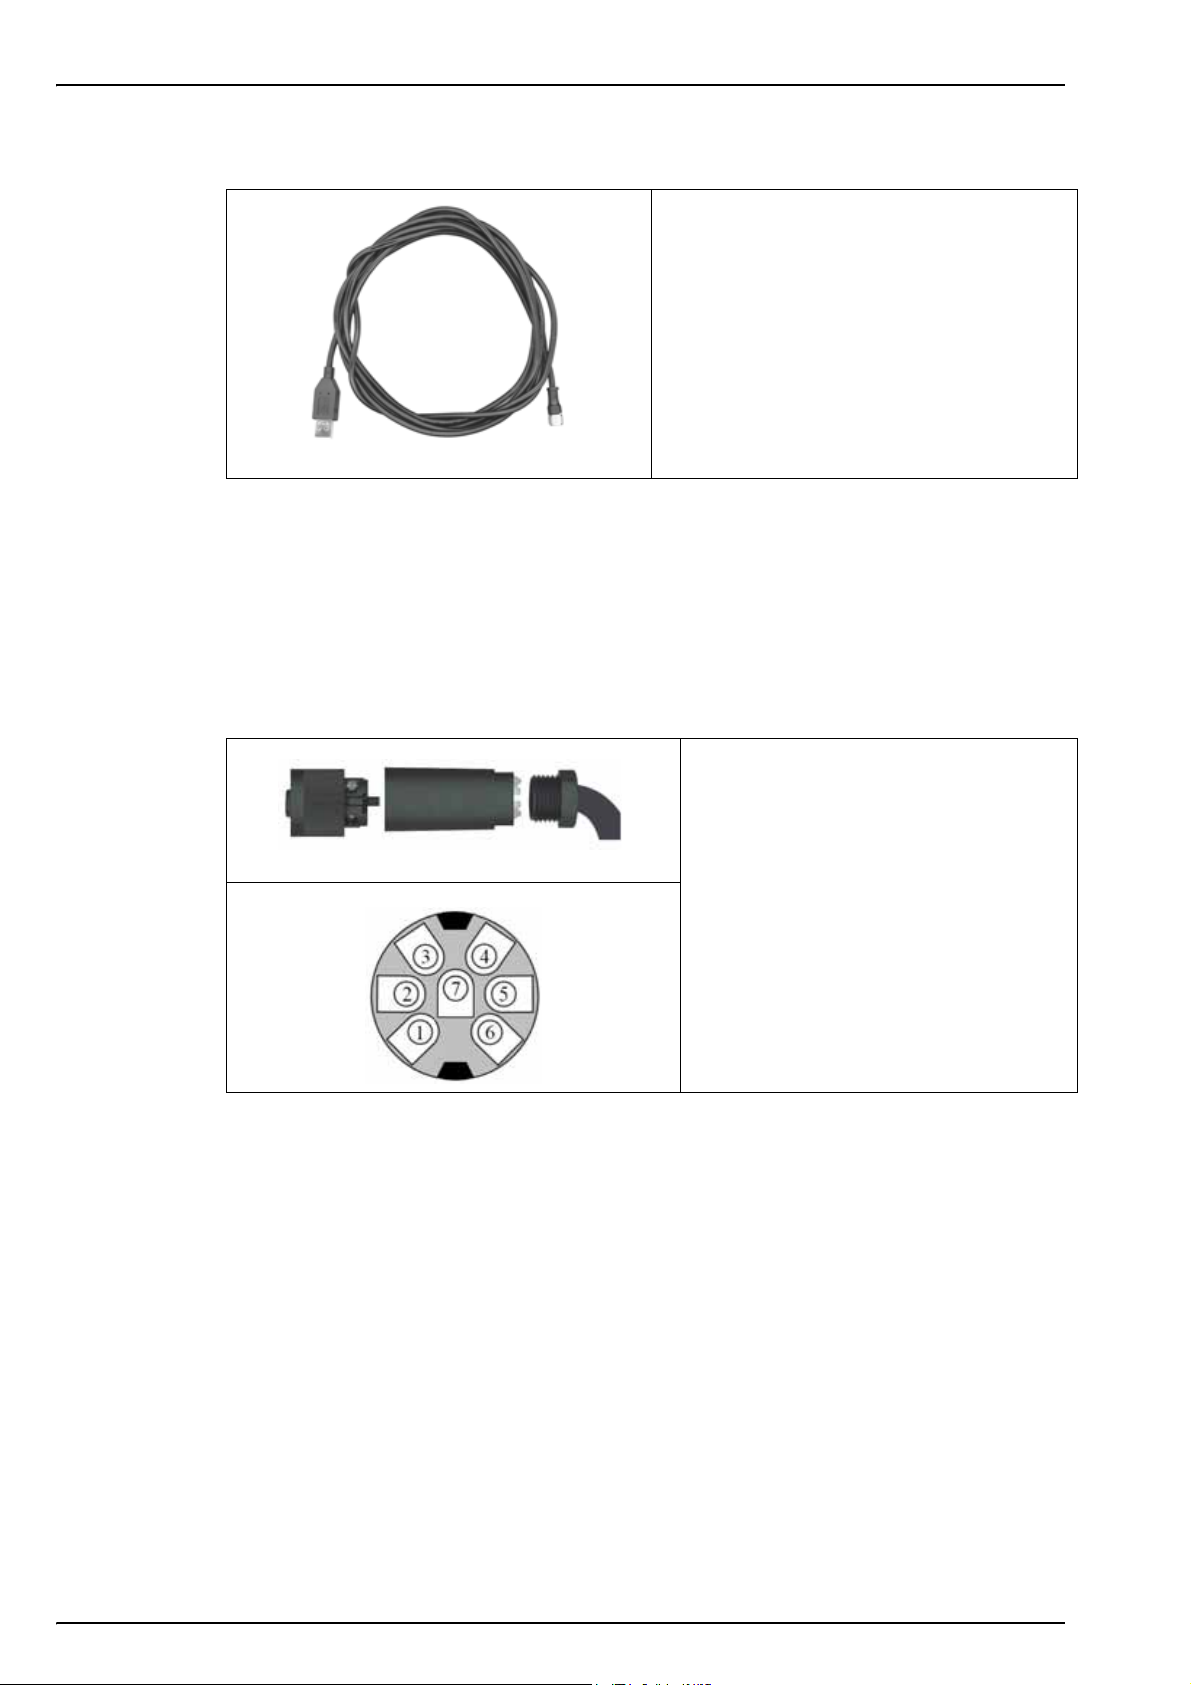
3.5.2 USB-B client adapter cable
This supplied cable is needed to connect the
instrument to a PC.
Connect to the instrument, and connect the
USB connector to the USB outlet on the
user’s PC.
Figure 9 USB-B adapter cable
3.6 Connection to mains power supply
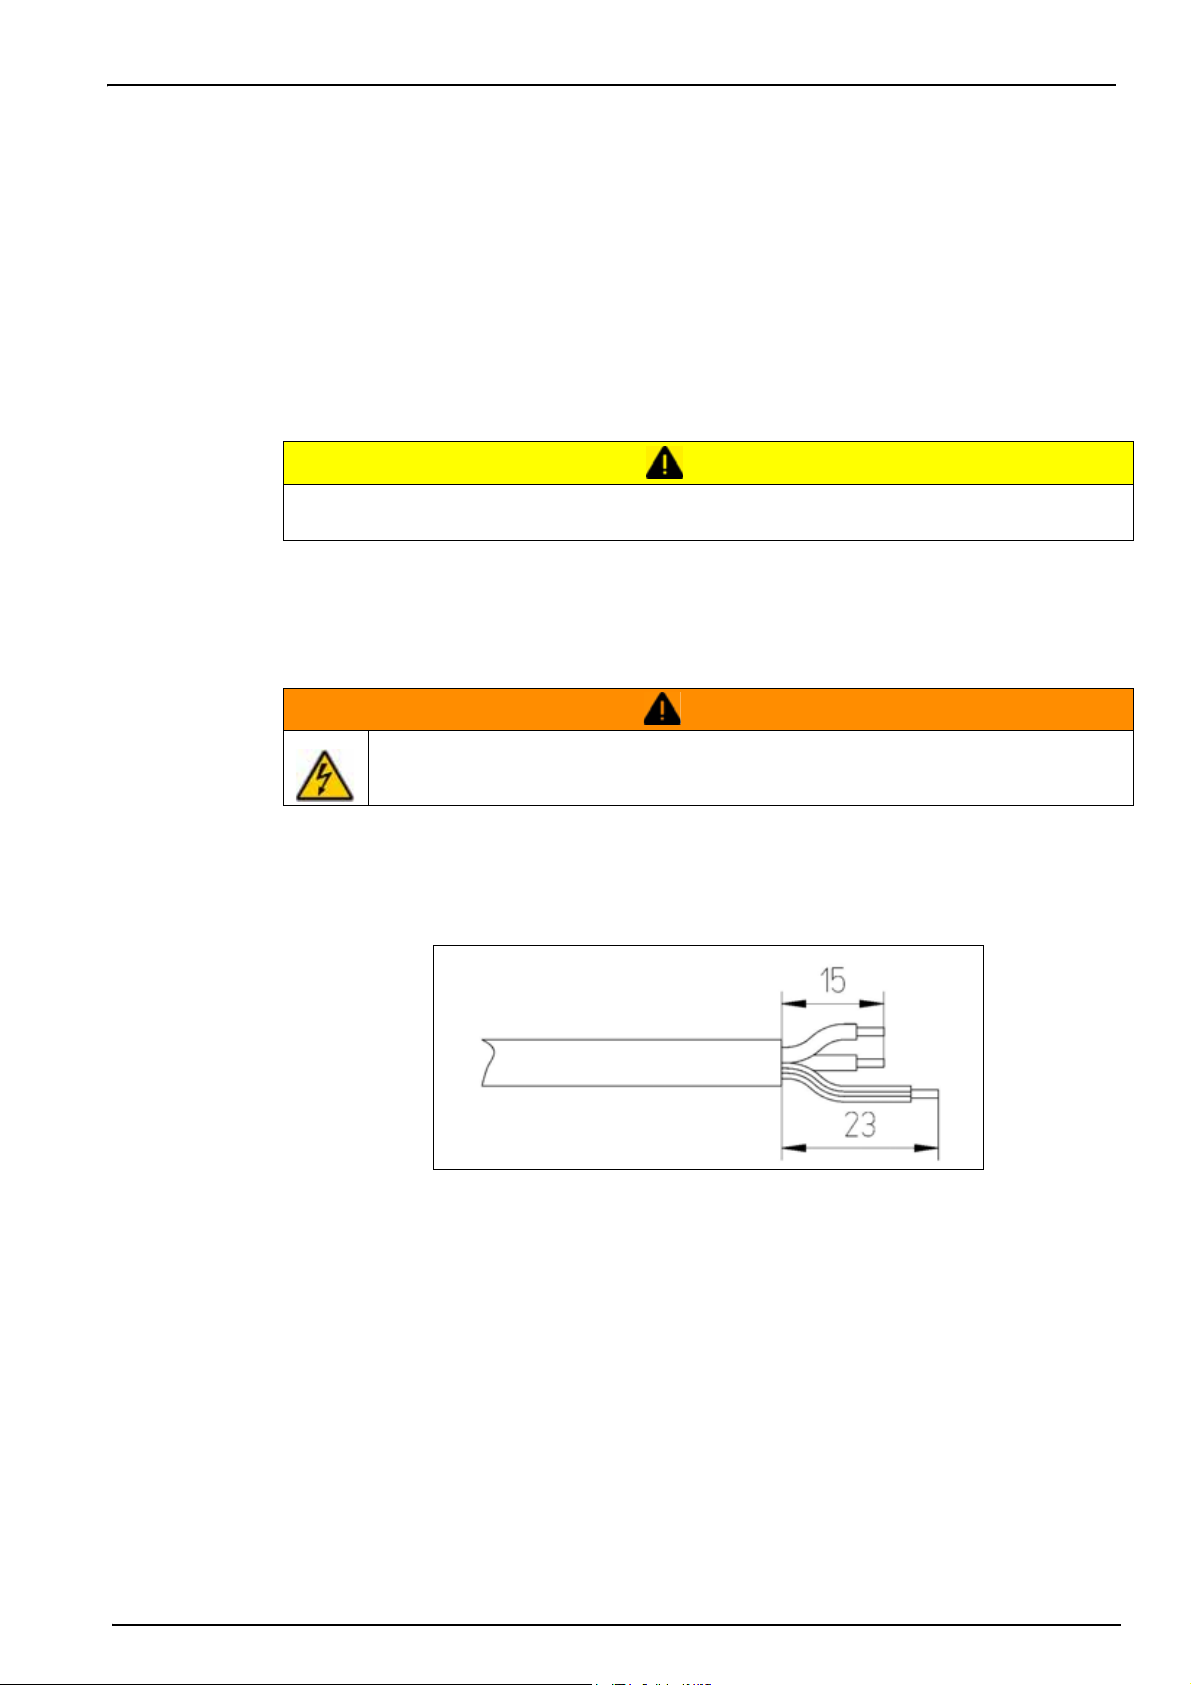
3.6.1 Power supply connection (low voltage instruments)
For low voltage instruments (10-30 VDC), connection to the mains power supply is with a 7-pin
BINDER connector (supplied).
Note: The connectors are grooved to avoid an incorrect fitting to the instrument.
Connect the power cable to the connector as follows:
Pin Connections:
Figure 10 BINDER connector
2) Power 10-30 VDC
5) Ground
7) Earth
1 + 3 + 4 + 6) Unused
26
Page 29
3.6.2 Power supply connection (high voltage instruments)
High voltage instruments (100-240 VAC) have a 4-pin male connector pre-wired internally with a
male BINDER connector ready for mains connection. A compatible female connector is supplied
with the instrument.
If this female connector was supplied with a mains power plug already pre-attached (cable part
numbers 33031, 33032, 33033 and 33034) then the female connector can be plugged directly
into the instrument power connector. The two connectors are grooved to avoid an incorrect
fitting. Tighten the female connector to the instrument power connector finger-tight.
If no power cable was ordered with the equipment, a mains power plug must be connected to
the supplied female connector as described in the following procedure.
CAUTION
Personal Injury Hazard. Only qualified personnel should conduct the tasks described in this
section of the manual.
User-supplied power cable specifications:
• 3-wire (live, neutral and earth)
• cable
• wire selection ≥ 1mm
ø ≥ 7mm; ≤ 9.5mm
2
, AWG18; ≤ 2.5mm2, AWG14
Installation
WARNING
Potential Electrocution Hazard. Always disconnect power to the instrument when
making electrical connections.
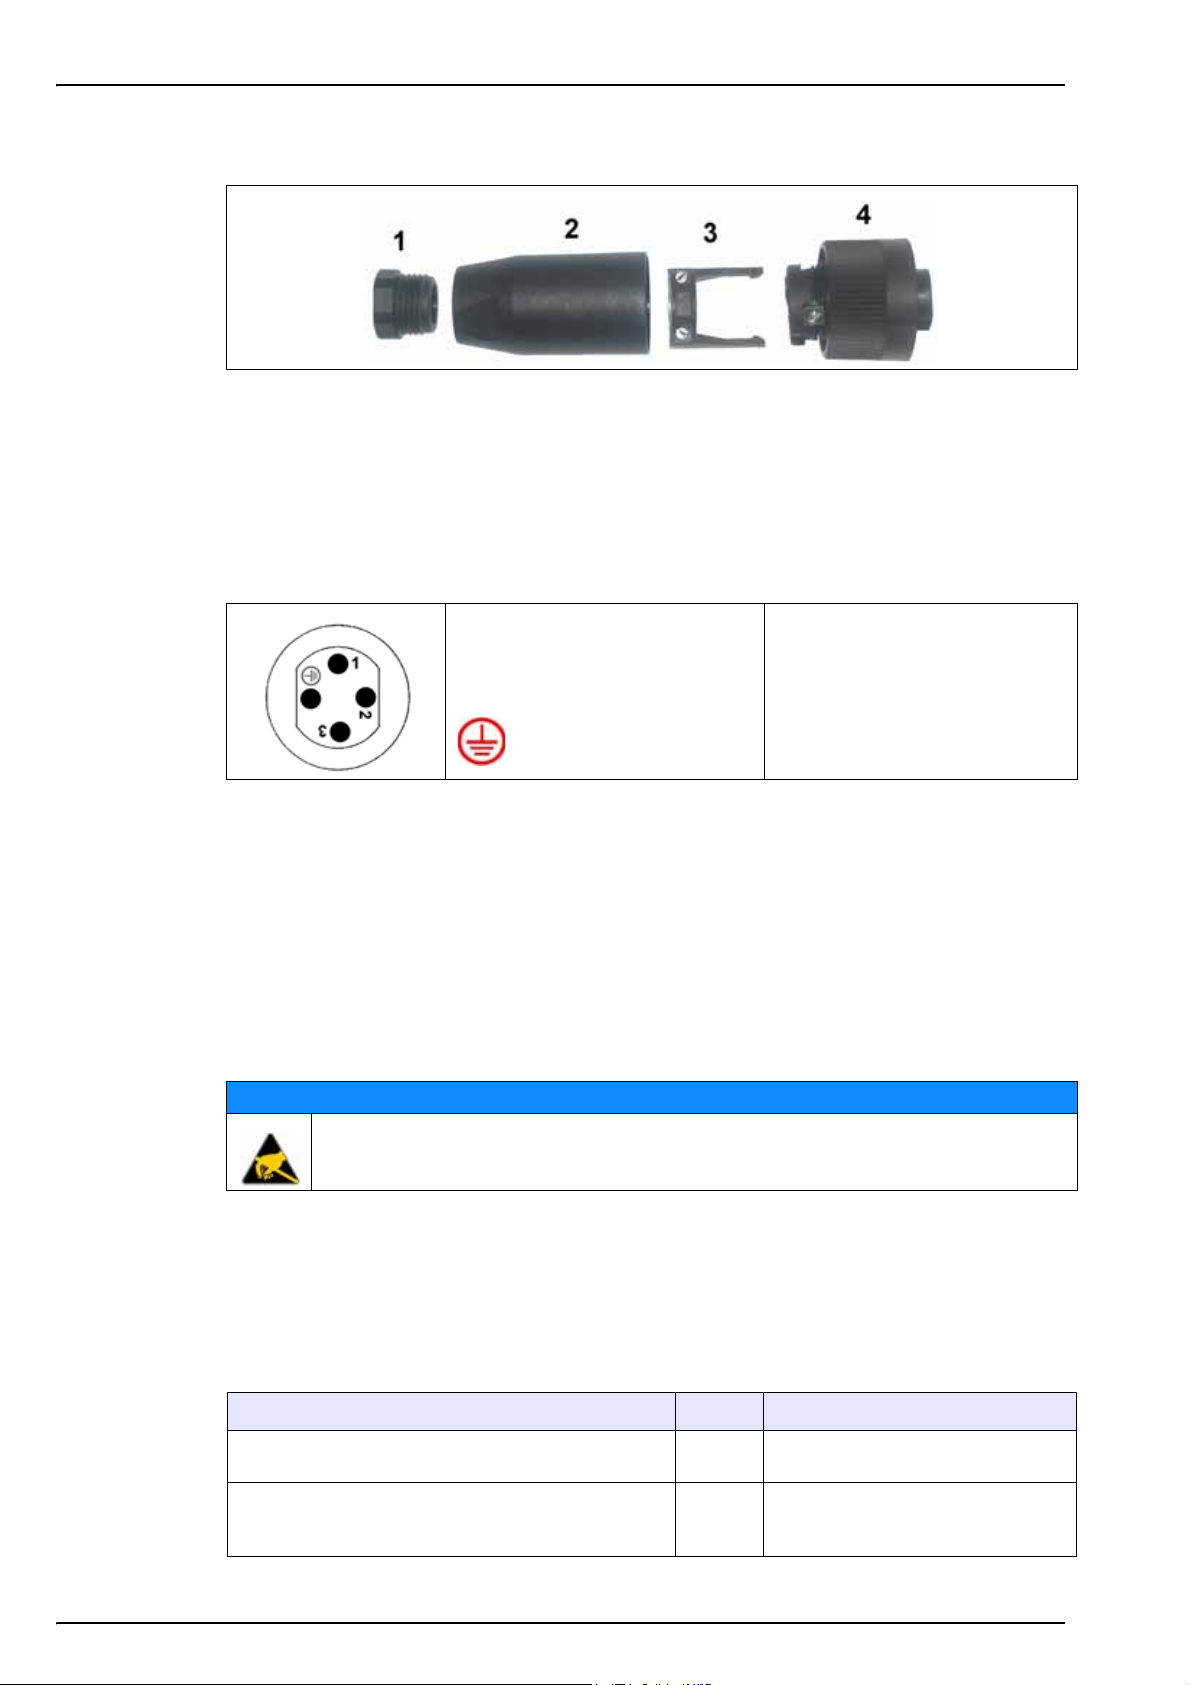
Prepare the user-supplied power cable as follows:
Strip off 23 mm (0.9 ins.) of shielding from the power cable. Cut back the live and neutral wires
to 15 mm (0.6 ins.) in length but leave the earth wire as is. Then strip off a small amount of
external insulation from the three wires as required:
27
Page 30
Installation
Wire the female connector as follows:
1. Take the narrow end of the connector (4) in one hand and the main body (2) in the other
and unscrew the two. Pull away the cable clamp (3) and unscrew the end plug (1) to reveal
the four parts that make up the connector.
2. Loosen the screws on the cable clamp (3) to allow enough room to pass the power cable
through.
3. Pass the power cable through the end plug (1), the main body (2), and the cable clamp (3),
and then connect the three wires (live, neutral and earth) to the connector (4) as follows:
1) Live (brown)
2) Neutral (blue)
3) Not used
Earth (green and yellow)
4. Slide the cable clamp (3) back onto the connector (4) and tighten the screws on the clamp
to secure the cable.
5. Screw the two parts (4) and (2) back together.
6. Secure the power cable by screwing the end plug (1) back in place.
7. The female connector can now be plugged directly into the instrument power connector. The
two connectors are grooved to avoid an incorrect fitting. Tighten the female connector to the
instrument power connector finger-tight.
3.7 Connections to electronic boards
Potential Instrument Damage. Delicate internal electronic components can be
damaged by static electricity, resulting in degraded performance or eventual failure.
Note: The numbers and earth
symbol are stamped on the end of
the connector. Ensure it is connected
correctly.
NOTICE
Note: Any loose connection wires should be bundled tightly together with the use of nylon cable ties.
3.7.1 Sensor cable
An ORBISPHERE cable is needed to connect the sensor to the instrument. There is a cable
gland for cable passage, and the cable must be permanently connected to the measuring board
connector. A sensor cable is required with free wires on the instrument end. The free wires are
connected to the connector J8 on the measuring board, as detailed later in this chapter.
All versions with a cable gland for sensor cable
passage
Adapter to connect a N°32505 cable (connector on
both sides) to the instruments without a Lemo 10
socket on the back panel.
28
Instrument Sensor Sensor cable
EC
EC Part N° 32517.mm
10 wire shielded. Part N° 32501.mm
(connector on sensor side only)
Page 31

3.7.2 Electronic boards connectors
Connectors P8 on the main board, and connectors J7 and J8 on the measurement board are
made of two parts. Push down carefully the black levers on either side of the connector and pull
it out securely. Perform all connections with these connectors unplugged. Once finished, attach
the connectors to the boards by pushing them firmly in place (levers up).
3.7.3 Main board connections
Installation
Figure 12 Connector P8
Figure 11 Main board
Figure 13 Connector P3
Connector P8:
1. RS-485 (signal A)
2. RS-485 (signal B)
3. PROFIBUS-DP (GND)
4. PROFIBUS-DP (+ 5 V)
5. PROFIBUS-DP (signal -)
6. PROFIBUS-DP (signal +)
Connector P3
Ethernet RJ 45. Connect the instrument to the local network by passing an ethernet cable
through the ethernet cable gland (location illustrated in Figure 4 on page 21 for the wall mount
and Figure 8 on page 24 for the panel mount). Connect to the P3 connector illustrated above.
7. PROFIBUS-DP (signal RTS)
8. Not used
9. Not used
10. Not used
11. System alarm relay (N.O.)
12. System alarm relay (N:C.)
13. System alarm relay (Common)
29
Page 32

Installation
3.7.4 Measurement board
The different measurement boards for the EC and TC sensors are illustrated in Figure 14 and
Figure 15 below. The type of board is easily identified by the color of the J8 connector. For EC
boards this connector is colored orange, and for TC boards it is colored black.
It is extremely important that sensors are connected to the correct measurement board.
Connecting a TC sensor to an EC measurement board (and vice versa) will cause irreparable
damage to the measurement board.
The colors indicated are the wire colors in the sensor cable.
NOTICE
Figure 14 EC Measurement board
Figure 16 Connector J7
Connector J7 (inputs & outputs)
Measurement alarms relays
1. Common
2. Output relay 1
3. Output relay 2
4. Output relay 3
Note: Relays N.O. or N.C. depends on the jumper
position on the relays (see Measurement alarm
relays on page 31).
Figure 15 TC Measurement board
Figure 17 Connector J8
Analog current (or voltage) outputs
5. GND
6. Output 1
7. Output 2
8. Output 3
Digital inputs
9. EC sensor: Not used
TC sensor: Hold input (short circuit to pin
12)
30
10. Not used
11. Not used
Page 33

Connector J8 (sensor)
Note: Remember, this connector is colored orange for EC sensors and black for TC sensors.
A1100 EC sensor 31xxx EC sensor
1)
Guard electrode
2)
RS485A+
3)
Thermistor A
4)
Anode electrode
5)
RS485B-
6)
Thermistor B
7)
GND
8)
+ 5V
9)
Cathode electrode
10)
Not used
Note: To change the type of sensor (e.g. from a 31xxx sensor to a 31xxxS smart sensor) contact your local
Hach Lange representative.
Guard electrode
Not used
Thermistor A
Anode electrode
Not used
Thermistor B
Not used
Not used
Cathode electrode
Not used
3.8 Measurement alarm relays
31xxxS smart EC
sensor
Guard electrode
I2C-SCL
Thermistor A
Anode electrode
I2C-SDA
Thermistor B
GND
+ 5V
Cathode electrode
Not used
TC sensor
GND for power
V2 signal
Solenoid
Relay coil
+12V power
+24V power
V3 signal
GND for signal
-5V power
Temperature
Installation
Cable
sensor
Yellow
Pink
Grey
Red
Purple
White
Black
Green
Blue
Brown
Figure 18 Output Relays
The three output relays are located on the measurement
board (see also Figure 14 and Figure 15 on page 30).
They can be individually configured to Normally Open (NO) or
to Normally Closed (NC) by physically moving the jumper on
each relay. The picture example on the left is for the EC
measurement board (the positions are different for the TC
measurement board):
• Upper relay is set to NC
• Middle relay is set to NO
• Lower relay is shown with no jumper, to show the 3 pins.
Note: For all measurement boards, J4 is relay 1, J5 is relay 2 and J6
is relay 3
31
Page 34

Installation
3.9 Sensor installation
3.9.1 EC Sensors
For EC sensor installation, servicing, and maintenance ensure you follow the instructions in the
Sensor Installation and Maintenance manual that was supplied with the instrument.
3.9.2 TC Sensors
For TC sensor installation, servicing and maintenance ensure you follow the instructions in the
TC Sensor Installation and Maintenance manual that was supplied with the instrument. Pay
particular attention to the installation and connection of the purge gas supply.
Do not place the TC sensor into a liquid sample until a constant supply of dry purge gas has
been connected, as liquid could condense inside the measuring chamber and cause damage
to the thermal conductor chip.
To ensure the continuation of purge gas while the sensor is in contact with the sample, it is
highly recommended to use a backup purge gas cylinder with an automatic changeover valve
that activates when the first cylinder is empty.
NOTICE
The use of an ORBISPHERE Model 29089 gas regulator (or similar) is also recommended to
deliver a constant, pressure regulated supply of dry purge gas to the sensor, filtered to 40 µm.
In addition, and to prevent any damage to the sensor electronics, the use of a purge safety
backup unit (ORBISPHERE Model 32605) is highly recommended to ensure the supply of purge
gas remains uninterrupted to the sensor in the event of a mains power outage.
The above ORBISPHERE accessories are explained in more detail in the TC Sensor
Installation and Maintenance manual.
3.10Define working language
See Language selection on page 88.
3.11 Define security levels
By default, access rights are disabled meaning no username/password combinations are
required to access the instrument menus. See User management on page 80 to set up new
users.
32
Page 35

Section 4 User Interface
4.1 Instrument
The instrument front panel provides these user interfaces:
• A touch screen acting as display, touch pad and keyboard. Contrast can be adjusted.
• A LED, showing when the instrument is on.
• A buzzer which sounds each time the screen is touched, and when an event alarm is set.
Turning instrument On and Off
There is no power switch on the instrument. The mains must be disconnected to turn the
instrument off. The LED indicates when the instrument is on.
Measurement window
The main (numeric) measurement window continuously displays:
• Sensor numeric values
• Measured sensor trends (for the last 10 minutes to last hour)
• Measured sensor data alarm limits and other events
• Temperature
4.2 Touch screen
The user interface on the front panel is a 320x240 pixels display with touch screen. To make
navigation user friendly, the interface software is Windows CE based, providing easy selection
through menus.
Figure 19 Numeric view
Touching some items on the display calls a related function, similar to a shortcut.
All the measurement, configuration, calibration and "standard
service" routines can be called by pressing buttons and menu
bars on screen.
Measurement display shows one measurement slope.
Display can be configured to only show a sensor
measurement, or to show a parametrized graphic
representation of the last measurements.
33
Page 36

User Interface
4.2.1 Function keys on the header bar
Shortcut to the user login window. Pressing this button for more than
2 seconds calls the ID and password window (see Identification and
authorization level on page 36).
• Closed padlock indicates that the touch screen is locked.
• Open padlock indicates that the instrument is in view mode only,
• When a user is logged in, this box show the authorization level of
This icon is used for adjusting the display brightness to improve
visibility. It is available all the time to any user, regardless of the user
security level. This icon is a shortcut to the backlight adjustment
window. See Screen on page 88
Short cut to the data storage window. Number shows the number of
measurement currently stored in volatile memory.
but no user is logged in (level 0).
this user as 1, 2, 3 or 4 (4 being the highest, see User
management on page 80).
normal - snooze
• No storage
• Store at once: When the buffer is full (1,000 positions), the
recording of measurement stops.
• Rolling buffer: When the buffer is full, the latest measurement set
replaces the oldest one (first-in, first-out)
In the event of an alarm, the “snooze” button stops the instrument
buzzer and returns all the relays in the instrument to their normal
state during the "snooze time". The icon indicates if the alarms is on
“snooze” or not. This "snooze" is configurable (see Configure
snooze on page 56).
Current date and time. This is also a shortcut to the date and time
setting window.
Call the contextual menu. This menu is in the header bar and its
content is related to the view displayed.
34
Opens the main menu page for easy navigation through all available
menus.
Page 37

4.2.2 Menu navigation
User Interface
Pressing the “menu” button in the header bar calls the main
menu. The display is made of three columns:
• The left column is the menus, or submenus (greyed out
options are not available)
• The center column shows a tree view of actual position
inside the menu structure
Figure 20 Main menu window
4.2.3 Rolling list
• The right column has the generic controls detailed below.
Return to previous menu (one step back)
Jump directly to main menu
Close the menu and go back to measurement view display. If the
menu button is pressed again, the menu returns to its previous state
(tree structure is saved)
Help topics concerning current menu
For convenience, selection through a possible large list of
items has been designed with a rolling list, like in this
example. Use the up and down arrow to navigate, or select
directly one item and press OK.
Figure 21 Rolling list
4.2.4 Virtual keyboard
Figure 22 Virtual editing
example
When a text box (alphanumeric field) has to be edited and is
pressed, a virtual keyboard appears on screen. It can be used
as a PC keyboard (pressing CAP gives access to special
keys).
Once values have been entered, press the Enter key to
confirm and exit the virtual keyboard.
During the editing, the edited field name is displayed, along
with units where applicable.
keyboard
35
Page 38

User Interface
4.2.5 Identification and authorization level
Once the access rights have been set, (User management on
page 80) it is necessary to log in as an authorized user to get
access to the instrument functionalities and settings.
Press the closed padlock for two seconds to open the
identification window. The user identification and password
must be entered to access functionalities authorized by the
security level of the given user (5 levels available. See User
management on page 80).
Figure 23 Identification
Note: To get to level 0, press the unlock button and OK, without entering any ID or password.
4.2.6 Warning windows
Figure 24 Warnings
window
For security, when the session inactivity delay period has
expired (adjustable, via Configure security on page 80), the
user is logged off automatically.
At various stages, a warning message may be displayed to
request confirmation from the operator that his last action(s)
must really be saved or cleared, or that there is a problem that
did not enable the requested action, such as during
instrument calibration (example shown left).
36
Page 39

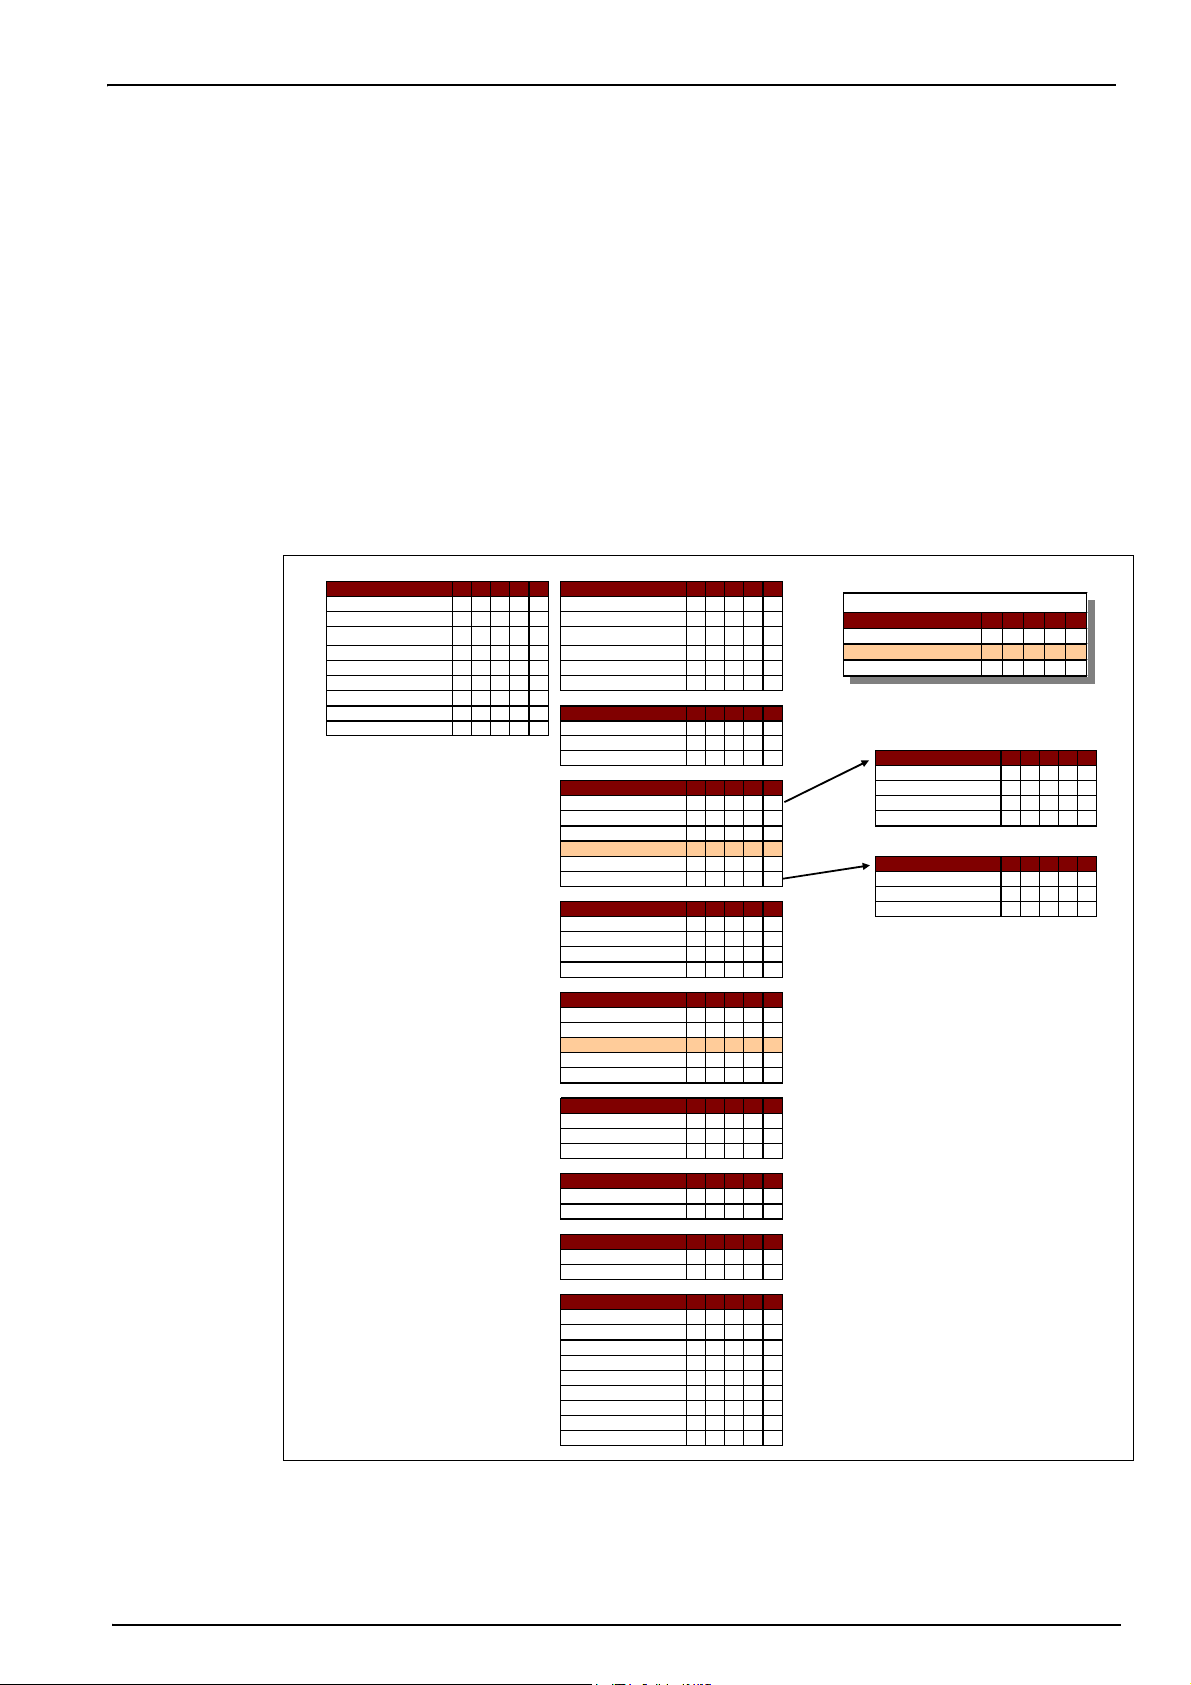
4.3 Main menu structure
This is the structure of the main menu which is used to control every functionality of the
instrument. These submenus are detailed in the following sections of this Operator Manual.
User Interface
Figure 25 Main menu structure
37
Page 40

User Interface
38
Page 41

Section 5 View Menu
Figure 26 View menu
39
Page 42

View Menu
5.1 Selection of the view style
Numeric view
This is the default view. Display shows the numeric measurement value identified for the gas
measurement channel, a graphic showing measurement value evolution during the set time
frame, and sample temperature.
This display can be configured to suit individual conditions and convenience.
Diagnostic view
The diagnostic view contains useful information for troubleshooting purposes. The amount of information
displayed depends on the gas being measured and the channel configuration.
Statistic view
This feature offers statistical data that matches with Total Quality management tools. Statistics is a tool
to better analyze how a process behave. The 410 statistics window gives some useful information.
The statistics are calculated from the data in the measurement file. The values are updated each time a
new value is added to this file. Therefore the changes made in the configuration window are considered
only once a new value is added.
Cp process capability
Cp is an index used to assess the width of the process spread in comparison to the width of the
specification. It is calculated by dividing the allowable spread by the actual spread.
• A Cp of one indicates that the width of the process and the width of the specification are the
same.
• A Cp of less than one indicates that the process spread is greater than the specification. This
means that some of the data lies outside the specification.
• A Cp of greater than one indicates that the process spread is less than the width of the
specification. Potentially this means that the process can fit inside the specification limits
CPk process variability
Cpk takes into account the center of the data relative to the specifications, as well as the variation in
the process.
• A Cpk value of one indicates that the tail of the distribution and the specification are an equal
distance from the overall average.
• A Cpk of less than one means that some of the data is beyond the specification limit.
• A Cpk greater than one indicates that the data is within the specification.
• The larger the Cpk, the more central and within specification the data.
CPm process repeatability
Capability index that takes into account variation between the process average and the target. If the
process average and the target are the same value, Cpm will be the same as Cpk. If the average
drifts from the target, Cpm will be less than Cpk.
Skewness
negative
An asymmetric frequency distribution is skewed to the left if the lower tail
is longer than the upper tail, and skewed to the right if the upper tail is
longer than the lower tail. Distributions of positive-valued random
variables values are often skewed right.
40
positive
Figure 27 Skewness
Page 43

Kurtosis
Kurtosis is a parameter that describes the shape of a random variable’s
probability distribution.
The graphs on the left illustrate the notion of kurtosis. The lower curve
has higher kurtosis than the upper curve. It is more peaked at the center,
and it has fatter tails
Figure 28 Kurtosis
5.2 Configuration of the view styles
Numeric view configuration
List of parameters that can be adjusted to customize the numeric view display:
• Display temperature: no, channel temperature
• Display mini graph: yes/no
• Display time base: yes/no
• Upper bound: Adjust graph upper limit
• Lower boun d: Adjust graph lower limit
• Time base: Adjust graph time span
• Grid button: Set up the graph to display the x or y axes, the grid, or the thresholds
• Auto Scale update: Automatically set the graph upper and lower bounds to best fit the actual values
displayed.
• Clean button: Clear the slope displayed. The slope restarts from the left side.
View Menu
Statistic view configuration
Scope:
• Number of values: Statistic calculation range (from 10 to 1,000 values). Number of value taken in
consideration in the log file since last value stored. The recorded values with alarms are not
considered for calculation, but are part of the log file.
Histogram:
• Upper limit: Select High or High High alarm value, or a custom value.
•Lower limit: Select Low or Low Low alarm value, or a custom value.
Capability:
• Upper limit: Select High or High High alarm value, or a custom value.
•Lower limit: Select Low or Low Low alarm value, or a custom value.
41
Page 44

View Menu
42
Page 45

Section 6 Measurement Menu
Figure 29 Measurement menu
43
Page 46

Measurement Menu
6.1 Instrument configuration
Continuous mode description
Continuous mode is typically used for process measurement.
Continuous mode cycle
• Every 2 sec. measurements are refreshed on the display
• The relays and the analog outputs are updated
• Measurements are continuously stored in memory (volatile and non volatile memory) according to
individual settings
Measurement mode is locked on Continuous for on line process. Select the units for barometric
pressure and temperature.
6.2 Measurement configuration
EC sensor
• Sensor’s membrane number selection
•Medium: Liquid or gas phase.
• Gas unit type: Partial, Fraction, Dissolved.
• Gas unit: The list of available units depends on unit type selected above.
Note: This is the gas concentration measured by the EC sensor. When a composite unit is selected (e.g.
ppm-ppb) the unit will change depending on the range of the value to display.
•Liquid: When medium is liquid, select water or a liquid with a different solubility (if available).
• Display resolution: Maximum resolution depends on gas, membrane and unit. A maximum of 5
digits can be displayed. Decimals can be limited to 0, 1, 2 or 3 decimals for easier reading. That does
not affect the actual resolution of data measured and stored, but only the data displayed.
• Thermal cutoff: To protect the sensor, the thermal cutoff function allows for setting a sample high
temperature limit. If exceeded (during a Cleaning In Place cycle for example) the electrical signal to
the sensor is cut off, the measurement session is suspended and the system displays a “HOT” alarm
message. The system resumes when temperature drops to 90% of the specified cutoff temperature.
• Thermal cut off options: Disabled / enabled.
• Thermal cut off temperature: To be set according to conditions.
TC sensor
The measurement configuration for a TC sensor is the same as for an EC sensor with the addition of one
extra selection criteria:
• Purge gas: From the drop-down list, select the purge gas being used for the TC sensor.
44
Page 47

Measurement Menu
Measurement alarms configuration
Set the thresholds for the low/high concentration levels, according to the application. Each alarm type
can be individually enabled or disabled without losing its settings.
These events can activate the relays and can be displayed.
•Low-low: 2nd stage for too low concentration
•Low: 1st stage for too low concentration
•High: 1st stage for too high concentration
• High-high: 2nd stage for too high concentration
• Hysteresis: A percentage of the above concentration values. The hysteresis is used to prevent relay
“flickering” when the measurement is just at the alarm levels. Set this to a minimum, but enough to
eliminate flickering.
As an example, if the High Alarm is set to 40 units and the Hysteresis is set to 10%, then the High
Alarm is activated once the measurement reaches 40 units, but only deactivated once the
measurement drops below 36 units. With the Low Alarm the opposite is true, in that if the Low Alarm
is set to 20 units and the Hysteresis set to 10%, then the Low Alarm is activated when the
measurement drops below 20 units, and deactivated when the measurement rises above 22 units.
• Delay: The delay in seconds, before alarms go on whenever concentration values go above ”High
alarms” or below “Low alarms”. Set this to a minimum value, but enough to avoid alarms for
non-representative peaks beyond the set level.
Figure 30 Alarms system diagram
Measurement filter configuration
The filters are aimed at “flattening” the measurement curve in situations where the process shows
atypical peak values that could otherwise hamper the interpretation of measurement readings. The filter
is applied on the last set of measurements each time a measurement is taken.
• Mean: Mathematical average of the last set (depth) of measurement values.
• Median filter: Allows for eliminating atypical peak measurement values, and average the remaining
ones. The calculation sorts the last measurements set (depth) by values, then delete the highest and
lowest values, and averages the remaining values (central depth).
Example for depth 7, central depth 5:
Sorted values, both ends eliminated, the average of the center five is then 3.88.
0.7 - 1.1 - 4.0 - 4.3 - 4.4 - 5.6 - 7.0
Example for depth 5, central depth 3:
Sorted values, both ends eliminated, the average of the center three is then 4.23.
1.1 - 4.0 - 4.3 - 4.4 - 5.6
Example for depth 8, central depth 4:
Sorted values, both ends eliminated, the average of the center four is then 4.43.
0.7 - 1.1 - 4.0 - 4.3 - 4.4 - 5.0 - 5.6 - 7.0
45
Page 48

Measurement Menu
Advanced configuration - EC sensor
• Enable negative concentration: Check as appropriate. See O
Advanced configuration - TC sensor
• Enable negative concentration: Check as appropriate.
• Continuous purge during thermal cut off: If thermal cutoff has been enabled (see Measurement
Note: To manually set the TC sensor into a continuous purge mode, press the Continuous Purge button
that is available from the Services - Diagnostic - Channel x - Amplifiers menu. See details in the
section entitled Amplifiers (TC sensor only) on page 88.
• Offset and slope corrections: Enable correction as appropriate.
• If enabled, the correction values for offset and slope must be entered. These values cannot be
• Liquid to gas factor: Enable correction as appropriate. If checked, the percentage correction factor
Note: If you believe you need to enable these corrections, it is advisable to contact a Hach Lange Service
Representative first.
sensor calibration on page 52
3
configuration on page 44), then check this box to ensure that a continuous purge of the TC sensor
takes place while the measurement session is suspended due to the thermal cutoff temperature
value being exceeded.
negative.
must be entered. This value cannot be negative.
Oxygen interference configuration
These options are available to take into account the influence of some components or gases in the
sample during measurement. All available interference corrections are disabled by default.
• Select CO2, H2S or all disabled (see notes below).
• Select Chlorinity, Salt or disabled. For chlorinity or salt, it is required to enter the actual concentration
in sample.
Note 1: In some applications, like in the beverage industry, there can be high concentrations of CO
sample. Hach Lange recommends to select “CO
interference” whenever a CO2 concentration of over 1%
2
in the
2
in gas phase, or 15 ppm in dissolved phase, is present.
Note 2: The detection of O
S in the sample. Hach Lange recommends to select “H2S interference” whenever the H2S
of H
2
in the petroleum industry is sometime hampered by significant concentrations
2
concentration exceeds 0.15% in gas phase, or 5 ppm in dissolved phase. To operate the O2 sensor in
these conditions requires using a different sensor and electrolyte. When using this mode your system will
experience sensitivity loss of about 50 times higher than the minimum sensitivity for the membrane.
46
Page 49

6.3 Measured data storage
Measured data storage
There is one measurement file which contains the data generated by the measurement cycle. The
measurement files are updated in volatile memory, and regularly copied in non-volatile memory (file
back-up). At start up, the measurement files in volatile memory are updated with the files from the
non-volatile memory.
Note: When the measurement file is full, it is managed as a First in-First out buffer.
This dialog box allows adjustment of the parameters for recording and storing measurements.
Storage modes:
• No storage
•Store once: When the volatile memory is full (1,000 positions), the recording of measurement stops
• Rolling buffer: When the volatile memory is full, the latest measurement set replaces the oldest one
continuously (first-in, first-out)
Note: Data stored in volatile memory are lost when instrument is off, non-volatile memory is permanent.
In case of an accidental power off event, the instrument resumes measurement storage after the last
measurement stored in flash.
• RAM time (volatile memory): Delay in seconds between two recordings of measured data.
• FLASH time (non-volatile memory): Delay in seconds between two data file transfers from volatile
memory into non-volatile memory. The last data file erases the previous one. This field is only
available if the Auto save in flash box is checked.
• Save in flash now: Press this button to store measurement data in flash (non-volatile memory)
immediately. After pressing this button, press OK to initiate the process. A warning screen appears
informing you that the operation can take up to 30 seconds. Press Yes to continue with the process,
or No to abort.
• Auto save in flash: Check this box to save measurements in flash (non-volatile memory)
automatically. Measurements are saved at regular time intervals as defined in the FLASH time box.
• Start logging measurement: Store once mode. Starts and stops the measurement recording
session. Measurement recording is stopped when the buffer is full.
• Purge data: Clear all data for all channels in the volatile and non-volatile memories.
• Open data: Opens a table showing the measured values which are stored in the volatile memory
(RAM). Use the scroll bar at the right to move to another data range (the id range will be shown in the
title bar). The page number being viewed and the total number of pages are shown at the bottom.
Use the keys at the bottom to move directly to the first page, previous page, next page or last page.
Measurement Menu
47
Page 50

Measurement Menu
48
Page 51

Section 7 Calibration Menu
Figure 31 Calibration menu
Note: The amplifiers calibration option is reserved for Hach Lange service technicians only, and is therefore
not explained in this manual.
49
Page 52

Calibration Menu
50
Figure 32 Calibration menu (cont. from previous page)
Page 53

7.1 Definitions
Definitions
To calibrate the gas to measure (main gas), the user usually puts the sensor in the main gas without any
interfering gas.
Calibrations can only be performed once the instrument has been installed, configured and the channel
has been set up. You must also ensure that you have the correct access rights to access the calibration
menu.
Select Sensor calibration from the calibration menu. There are two types of gas sensor calibration
available:
1. In Air: For Oxygen and Ozone with an EC sensor.
2. Direct value: Any gas with either an EC or TC sensor. This calibration exposes the sensor to a gas
with a known partial pressure, or a liquid sample with a known gas concentration.
Note: All the calibration information for a smart EC Sensor is stored in the sensor’s memory. When a
smart sensor is connected to the instrument for the first time, a calibration report (see example in
Calibration reports on page 54) is automatically generated giving the details of the last calibration.
If the sensor being calibrated is an EC sensor, follow the instructions in the next section entitled EC gas
sensor calibration. For TC sensors, refer to TC gas sensor calibration on page 53.
7.2 EC gas sensor calibration
Calibration Menu
Calibration of the measured gas
Start Before initiating a calibration process, the calibration parameters must be
set by pressing on the Modify button. The last calibration parameters are
memorized, so this step can be ignored if the correct parameters are
already set.
Note: When calibration is started, a calibration event is set, and the analog
output and relay are put on hold (if selected below) to avoid unwanted alarms
or potential process problems. This resumes when calibration is finished.
Modify calibration
parameters
• Calibration mode: 2 types available, depending on the gas being
measured:
• Direct value: Any gas
•In Air (default): For O
•Medium: Select liquid or gas (direct calibration only)
• Concentration unit type: Partial, fraction or dissolved (dissolved is
for calibration in a liquid only)
• Concentration unit: The list of available units depends on unit type
selected above.
•Liquid: Select as appropriate, available when liquid has been selected
in medium (above).
• Enter the gas concentration according to the value in the calibration
media, when direct value is used
• Hold during calibration: On by default, this stops any output from the
instrument during the calibration process to avoid sending invalid
information to any connected device.
Press OK to start calibration
or O
2
3
51
Page 54

Calibration Menu
Calibration results A calibration screen will be displayed showing current measurement data
Verification Similar to the calibration procedure, but for verification of the actual
which is continually refreshed.
The value “% ideal current” is a percentage of the current against the ideal
current for the membrane type selected. If this percentage is not within the
accepted range, an error message is displayed and the calibration process
fails (see Calibration errors (EC and TC sensors) on page 54). A warning
message can be displayed when this value is close to the boundaries, but
when calibration can be accepted.
The message is first displayed in the result box. The dialog box with the
error message or the warning is displayed when the finish button is pressed.
The value “% last calibration” shows the ratio between the current
measurement and the previous sensor calibration.
The value “% variation” indicates the variation during the last 3
measurements, which is the stability of the measurements. A variation as
low as possible is needed for a precise calibration.
The display shows the actual calibration parameters, and the actual
readings (temperature, barometer, current).
Note: In case of calibration failure, consider replacing the membrane. See
the sensor maintenance manual for details.
calibration values. The result of the measurements made during the
verification is not stored and the actual calibration data is not modified.
7.2.1 O2 sensor calibration
O2 sensor calibration
The O2 sensor needs to be calibrated after each sensor service. Wait at least 30 minutes after mounting
a new membrane before recalibrating. The sensor is in contact with either:
• Air at atmospheric pressure (In Air)
at known concentration (Direct value). The gas can be dissolved or not.
• O
2
In air calibration This calibration procedure places the O2 sensor in water-saturated air, to
Direct calibration This procedure calibrates the oxygen sensor against a liquid sample
provide a known oxygen reference against which to calibrate.
Dry the sensor thoroughly, before placing the sensor storage cap under tap
water. Shake off any excess water, but leave a few drops inside the cap.
Verify that the screw-on protection cap is in place on the sensor head. If you
use a Dacron mesh inside the protection cap, make sure it is dry before
attempting to calibrate. Then, loosely place the storage cap back on the
sensor, holding it in place with a few turns of its collar.
Set the calibration parameters accordingly (see Modify calibration
parameters on page 51), and press calibrate.
containing a known level of dissolved O
The instrument displays the sensitivity of the sensor as a percentage of the
sensitivity determined when calibration was last performed.
Set the calibration parameters accordingly (see Modify calibration
parameters on page 51), and press calibrate.
flowing through the sample line.
2
7.2.2 O3 sensor calibration
O3 sensor calibration
The sensor is either in contact with:
• Air at atmospheric pressure (In Air)
at known concentration (Direct Value). The gas can be dissolved or not.
• O
3
The procedure is the same as for the O
sensor measures O
the sensor behaves in O
the O
measurement takes a long time to stabilize.
3
To facilitate the follow up after an O
52
sensor. In the case of the In air calibration, the
during calibration. The O3 coefficient is deduced taking into account how
2
. As a different voltage is used at the anode to measure O2 and O3,
2
2
in air calibration, negative values can be displayed.
3
Page 55

7.3 TC gas sensor calibration
Calibration of the measured gas
Start Before initiating a calibration process, the calibration parameters must be
Modify calibration
parameters
Calibration results A calibration screen will be displayed showing current measurement data
Verification Similar to the calibration procedure, but for verification of the actual
Calibration Menu
set by pressing on the Modify button. The last calibration parameters are
memorized, so this step can be ignored if the correct parameters are
already set.
Similarly, if only the calibration value has changed, then this can be updated
directly instead of pressing the Modify button.
Note: When calibration is started, a calibration event is set, and the analog
output and relay are put on hold (if selected below) to avoid unwanted alarms
or potential process problems. This resumes when calibration is finished.
• Gas Phase: Select liquid or gas (direct calibration only)
• Gas unit type: Partial, fraction or dissolved (dissolved is for
calibration in a liquid only)
•Gas unit: The list of available units depends on unit type selected
above.
•Liquid: Select as appropriate.
• Enter the gas concentration according to the value in the calibration
media.
• Hold during calibration: On by default, this stops any output from the
instrument during the calibration process to avoid sending invalid
information to any connected device.
• Automatic calibration stop: If selected, when the stability criteria is
reached, the calibration process stops automatically.
• Interferences enab led: Option not available.
Press OK to start calibration
which is continually refreshed.
The value “% ideal current” is a percentage of the current against the ideal
current for the membrane type selected. If this percentage is not within the
accepted range, an error message is displayed and the calibration process
fails (see Calibration errors (EC and TC sensors) on page 54). A warning
message can be displayed when this value is close to the boundaries, but
when calibration can be accepted.
The message is first displayed in the result box. The dialog box with the
error message or the warning is displayed when the finish button is pressed.
The value “% last calibration” shows the ratio between the current
measurement and the previous sensor calibration.
The value “% variation” indicates the variation during the last 3
measurements, which is the stability of the measurements. A variation as
low as possible is needed for a precise calibration.
The display shows the actual calibration parameters, and the actual
readings (temperature, barometer, current).
Note: In case of calibration failure, consider replacing the membrane. See
the sensor maintenance manual for details.
calibration values. The result of the measurements made during the
verification is not stored and the actual calibration data is not modified.
53
Page 56

Calibration Menu
7.4 Calibration errors (EC and TC sensors)
Calibration errors (EC and TC sensors)
The calibration is not possible in the following circumstances:
• When the "ratio ideal current" is greater than 170% or smaller than 30%
• When the sensor cannot measure (thermal cut off, sensor out, etc.)
• When the "ratio ideal current" is greater than 150% or smaller than 50%, a warning is displayed but
the calibration is valid.
7.5 Barometric pressure calibration
Barometric pressure calibration
Upper box shows the barometric pressure measured by the instrument.
Using a precision certified barometer, measure barometric pressure in the location where the measuring
instrument is used. Compare the values, if values are the same press Cancel, otherwise enter the new
barometric value in the lower box and Validate the new setting.
On completion a calibration report is created.
Note: The barometric sensor has been factory calibrated.
7.6 Calibration reports
Calibration reports
Once a calibration is completed (for a gas or pressure sensor), the calibration report is updated with the
new details. The calibration report contains data for the last 10 calibrations.
For full details on the data displayed for all the different type of calibration reports, refer to the examples
listed under Data available on page 67.
Each calibration record will contain parameters useful for traceability. For instance, it will contain:
• the user name and ID
• the date and time
• the calibration coefficient
• all the measurements which influence the calibration (temperature, barometric pressure, current,
etc.)
Calibration reports are generated after a sensor calibration. In addition, once a smart sensor is
connected to the instrument for the first time, a calibration report is automatically generated giving details
of the last calibration of that sensor.
54
Page 57

Section 8 Inputs/Outputs Menu
Figure 33 Inputs/Outputs menu
55
Page 58

Inputs/Outputs Menu
8.1 Configure snooze
Configure snooze
In the event of an alarm, the “snooze” button stops the instrument buzzer and returns all the relays in the
instrument to their normal state during a "snooze time".
Enter the snooze time in seconds and press OK.
8.2 View inputs/outputs
View inputs/outputs
This view option displays the state of the 3 alarm relays (on or off), and the analog output current (or
voltage, depending on the instrument version) value for each.
8.3 Relays
Relays
There are three measurement alarm relays and one system alarm relay for the instrument. These relays
are configurable as either standard or custom events through the instrument menu.
• An alarm relay can be activated or deactivated
• When the alarm is OFF, it is activated,
• When the alarm is ON, it is deactivated
All the relays are activated as soon as the instrument is ON (but alarms are OFF). When the instrument
is OFF, the relays are deactivated, thus in this state, all alarms are ON. The logic "Relay deactivated =
Alarm ON" has been chosen for this safety reason.
When the main board does not communicate with the measurement board for more than 30 seconds, the
measurement board switches all the alarm relays and the analog output to the alarm state.
Relays configuration The three relays can be triggered by several standard events, or a
Test channel relays The three measurement alarm relays can be manually activated for testing
Test system relay Similarly, the system alarm relay can be manually activated for testing
Note: In both the Test Channel Relays and Test System Relay options above, once the tests have been
completed press Cancel to exit the screen. At the same time, this will reset all relays (including the system
relay) back to a status of “Not under test”.
combination of events (custom). The relays output can be used to turn on a
beacon, horn or PLC (see Connections to electronic boards on page 28)
Note: Relays can be set to Normally Open [NO] or Normally Closed [NC] by
changing the jumper positions on the measurement board (see
Measurement alarm relays on page 31).
• Select a standard event in the rolling list
• If “Custom event” has been selected, it has to be configured by touching
the configure button
• Press on the text box to open the selection menu (rolling menu). Select
the events that must trigger the relay, and press OK.
Proceed in the same manner for other events that should trigger the relay.
purposes:
• Select Relay On, Off or Not under test.
See note regarding the relays below. “Not under test” means the relay is in
operating mode, and it will be triggered normally.
Note: A relay set to NO will close when activated (On), but a relay set to NC
will open. See Measurement alarm relays on page 31.
purpose.
• Select Relay On, Off or Not under test.
56
Page 59

8.4 Analog outputs
Inputs/Outputs Menu
Figure 34 Analog outputs menu
57
Page 60

Inputs/Outputs Menu
Analog outputs
There are three analog outputs available. These outputs are configurable in terms of function, content,
and behavior through the instrument menus. Analog outputs are used to output a voltage or a current
which is a function (e.g. a linear characteristic) of a measurement: AOut = f (M). The analog outputs can
be typically connected to a PLC. Knowing the function (f), the PLC can compute the value of the
measurement.
Two types of instrument hardware are available:
• measurement board with current output (I = 0-20 mA or 4-20 mA).
• measurement board with voltage output (U = 0-5 V).
Instrument
configuration
Standard event
indication
Extended event
indication
• Select analog output range of current:
4-20 mA or 0-20 mA
• The 4-20 mA range (recommended) allows for an extended event
indication mode that can be selected and configured (default = standard
mode)
Note: Features of the instrument with a voltage analog output are similar to
the 0-20 mA features.
For some events (sensor out, purge failure, etc.) the actual measurement is
not significant, but the PLC needs to know how the analog output behaves
in these cases. Two "Event indication modes" are available:
• Standard mode (default)
• Extended mode
Refer to Table 1 Standard event indication below.
The "Extended event indication" mode is only available when the 4-20 mA
output is selected. In this mode, the range between 0 mA and 4 mA is used
to indicate selected events. The events are defined using the channel
configuration option (see Channel configuration on page 59).
Note: The extended mode is not available for the voltage output versions of
the instrument.
Table 1 Standard event indication
Analog output
Gas
concentration
Temperature 20 mA 20 mA 5 V
Event output range
0-20 mA 4-20 mA 0/5 V
20 mA 20 mA 5 V
Event
• Channel out
• Sensor out
• Thermal cut-off
• Interfering gas error
• Channel out
• Sensor out
58
Page 61

Inputs/Outputs Menu
Analog outputs (continued)
Channel configuration Set the type of measurement that will be transmitted through each output
channel, and the output characteristics.
• Meas. type: Select between the type of measurements available in the
rolling list.
• Characteristics: Select either Linear, Tri-linear or None (see Analog
output characteristics on page 61).
• Limits: Press the configure button to adjust the analog output set points
for each output. Enter values in the appropriate text boxes. In Linear
mode, only the ML and MH values can be adjusted. Tri linear mode
allows all limits to be adjusted, and the None mode denies access to this
screen.
The authorized user may define a maximum of 12 customized events for
each analog output and change the order of priority of all events.
Note: This only applies to Tri linear and Linear outputs. It is not available if
the output characteristic is set to None.
Configure the events that should be signaled at the corresponding current
shown in the right column.
• Only one event signal at a time can be sent via the current output. As
there is a possibility to have several events at the same time, an order of
priority must be set. This order has been set by default, but it can be
modified to suit particular needs and conditions. Touch the priority
number in the left column and edit it.
• The shaded events in the list have preset outputs and only the priority
can be changed. The other events can be customized by the user.
Touch a white text box to call up the rolling list. Select an event from this
list and press OK. Then adjust the priority as required.
Note: When an event occurs, measurement information is superseded by
the event information on the output.
The following table lists the default configuration. The first three events on the list are pre-set
and only the priority can be changed:
Table 2 Extended event table
Priority Event I [mA]
0
Sensor out 0.25
External pressure sensor out 0.50
1
Interfering gas error 0.75
2
3 Custom Event 1 1.00
4 Custom Event 2 1.25
5 Custom Event 3 1.50
6 Custom Event 4 1.75
7 Custom Event 5 2.00
8 Custom Event 6 2.25
9 Custom Event 7 2.50
10 Custom Event 8 2.75
11 Custom Event 9 3.00
12 Custom Event 10 3.25
13 Custom Event 11 3.50
14 Custom Event 12 3.75
59
Page 62

Inputs/Outputs Menu
Analog outputs (continued)
Calibration of the analog
output
Direct test Test to check the calibration of the analog outputs. A precision amperometer
Characteristics test This is a test for the correct operation of the peripherals connected to each
The calibration of the analog output is aimed at aligning the internally
calculated current to the real current output. This was performed at factory,
but could become necessary again because of electronic tolerances. A
precision amperometer (or voltmeter for the voltage versions) connected at
the corresponding analog output connection point is required. See
Measurement board on page 30.
• Select the analog output channel to calibrate and press the Start button.
• Measure with the amperometer the current value for point 1. It should be
below 4 mA
• Edit point 1 and enter the same value as read on the amperometer, then
press the Continue button.
• Measure with the amperometer the current value for point 2. It should be
above 20 mA.
• Edit point 2 and enter the same value as read on the amperometer,
before pressing the Continue button.
Calibration of the selected analog output channel is completed.
connected at the analog output connection point is required.
• Select a value (4, 12, 20 mA available) for each channel and compare
this value (+ 0.02 mA) with what the amperometer shows.
A calibration is required if the value on the amperometer differs from the
current selected +
Note: It is possible to test one analog output without interfering with the
others. During the test, the other analog outputs will continue to indicate the
measurement.
analog output, by verifying that the PLC computes the correct value.
The analog output will send the current corresponding to the value entered
in the text boxes.
• Type in a test value for each analog output, and check for the related
action on the peripheral.
0.02 mA).
60
Page 63

8.5 Analog output characteristics
Analog output characteristics
“Linear” analog output The "Linear" output is the default setting for the analog output. It is
illustrated below (4-20 mA output is shown, 0-20 mA or 0-5 V settings are
similar).
Inputs/Outputs Menu
The goal of this setting is to use all the points available on the slope from
4 mA to 20 mA to show the range of measurements that are usual in the
measured process. Setting the output this way allows for the highest signal
resolution for the actual conditions.
The downside is that any measures below the set range will have the same
analog signal locked at 4 mA. Similarly, any measure over the set range will
have the same analog signal locked at 20 mA. Settings must be made in
balancing these aspects.
Settings
For the output, set ML and MH in the current measuring unit (e.g. °C for a
temperature output). When a compound unit is selected the smallest unit will
be used (e.g. ppb for a "ppm-ppb" compound unit).
These points should be set keeping in balance the following conditions (see
illustration above):
• The smaller is Range 1, the better is the analog signal resolution within
the expected range of measure.
• In Range 0 the analog output only shows that measurement is below the
ML value. Similarly in Range 2 the analog output only shows that
measurement is over the MH value.
The formula to compute the measurement knowing the current I (or voltage
U) and the resolution R is given in the following table:
Linear Range Measurement M Resolution R
4-20 mA 20 > I > 4 M = ML + (MH - ML)
(I - 4) / 16 R = (MH-ML) / 808
*
0-20 mA 20 > I > 0 M = ML + (MH - ML) * I / 20 R = (MH-ML) / 1010
0 - 5 V 5 > U > 0 M = ML + (MH - ML)
U / 5 R = (MH-ML) / 1010
*
61
Page 64

Inputs/Outputs Menu
Analog output characteristics (continued)
“Tri-linear” analog
output
The "Tri-linear" output brings benefits over the “Linear output” discussed
before. It is illustrated below (4-20 mA output is shown, 0-20 mA or 0-5 V
settings are similar).
Compared to the “Linear” mode, the expected range of measure is Range 2.
A Range 1 and 3 are available to show the measures falling out of this
Range 2, but normally at a lower resolution. Expected measurements for the
measured process are supposed to be in Range 2 most of the time, and in
Range 1 or 3 occasionally (problems, calibration, line stop, etc.). The
benefits are:
• The PLC can compute the measurement over a large range (1, 2 and 3).
• The PLC can compute a higher resolution signal for the expected
measuring range (Range 2: MH > M > ML).
• Carefully selecting the set points allows for an individual resolution for
each range, so a different resolution can be applied to Range 1, 2 and 3,
allowing to tailor the analog output to the actual conditions.
As before, the downside is that any measure below or over the Range 1, 2
and 3 will have the same signal locked at 4 mA and 20 mA respectively, but
Range 1, 2 and 3 should cover a larger range than in the “Linear” mode.
Settings must made in balancing these aspects.
Settings
For each output, set MLL, ML, MH, and MHH in the current measuring unit
(e.g. °C for a temperature output). When a compound unit is selected, the
smallest unit will be used (e.g. ppb for a "ppm-ppb" compound unit). Also set
AOL (Analog Output Low) and AOH (High) in mA (or Volts).
These points should be set keeping in balance the following conditions (see
illustration above):
• The smaller is Range 2, the better is the analog signal resolution within
the expected range of measure.
• Size of Range 1 and 3 should be set to deliver an adequate level of
resolution for the measures falling out of the expected range of
measure.
• In Range 0 the analog outputs only shows that measurement is below
the MLL value. Similarly in Range 4 the analog output only shows that
measurement is over the MHH value.
The formula to compute the measurement knowing the current or the
voltage and the resolution R is given in the following table:
62
Page 65

Inputs/Outputs Menu
Tri-linear Range Measurement M Resolution R
1: AOL >
4-20 mA
0-20 mA
0-5 V
Analog output characteristics (continued)
None This is the default value.
2: AOH > I > AOL M=ML+(MH-ML)*(I-AOL)/ (AOH-AOL) R=(MH-ML)*20/((AOH-AOL)*1010)
3: 20 > I > AOH M=MH+(MHH-MH)
1: AOL >
2: AOH >
3: 20 > I > AOH M=MH+(MHH-MH)*(I-AOH)/(20-AOH) R=(MHH-MH)*20/((20-AOH)*1010)
1: AOL >
2: AOH >
3: 5 > U > AOH M=MH+(MHH-MH)*(U-AOH) / (5-AOH) R=(MHH-MH)*5/((5-AOH)*1010)
I > 4 M=MLL+(ML-MLL)*(I-4)/(AOL-4) R=(ML-MLL)*20/((AOL-4)*1010)
I > 0 M=MLL+(ML-MLL)*I/AOL R=(ML-MLL)*20/(AOL*1010)
I > AOL M=ML+(MH-ML)*(I-AOL)/ (AOH-AOL) R=(MH-ML)*20/((AOH-AOL)*1010)
U > 0 M=MLL+(ML-MLL)*U/AOL R=(ML-MLL)*5/(AOL*1010)
U > AOL M=ML+(MH-ML)*(U-AOL)/ (AOH-AOL) R=(MH-ML)*5/((AOH-AOL)*1010)
Setting the analog output to “None” means that the output value will always
be zero and importantly ensures that no current is emitted on that output, so
reducing power consumption as well as reducing heat within the instrument.
(I-AOH) / (20-AOH) R=(MHH-MH)*20/((20-AOH)*1010)
*
63
Page 66

Inputs/Outputs Menu
64
Page 67

Section 9 Communication Menu
Figure 35 Communication menu
The external RS-485 port of the main board is directly connected to a RS-485 bus (single
twisted pair). Optionally it can be connected to a fieldbus module (gateway).
The RS 485 menu allows to select between RS485 simple or Profibus DP communication
protocol, depending on application.
• Click on the text box to select either the RS-485 simple or the PROFIBUS-DP
communication protocol.
65
Page 68

Communication Menu
9.1 RS-485 simple mode configuration
This protocol allows the instrument to output data to an external device (PLC, SCADA, PC,
etc.). The communication is unidirectional. The data are output on the RS-485 link as simple
ASCII text. If for instance you use a PC, the data can be easily visualized and saved in a file
using the "Hyperterminal" software.
To use this communications mode, on the instrument:
• Select the RS-485 option from the Communication menu
• Choose the protocol Simple (default configuration) and press on OK
• Then select the RS-485 Simple option from the Communication menu:
• "Baud rate", "Parity", "No of stop bits", "Byte size" Standard parameters of the RS-485
link.
• "Enable" The measurements can be sent continuously (approximately every 2 sec.).
This field allows enabling or disabling this feature.
• "Mode" This is the format of the measurements sent continuously (see Cyclic
measurements on page 67 of this document). In "Expert" mode, more data are sent.
These additional data can be useful for diagnostic purpose.
Note: In case of problem verify first that jumper J3 is not installed on the mother board (default
configuration).
Send data
This dialog box is used to send text files to an external device. The possible files are the
following:
• Calibration reports
• User actions log file
• Instrument configuration
Measurements stored in the instrument memory.
The button "Stop Cyclic meas." allows to stop and to restart the cyclic transmission of
measurements. It is advised to stop the cyclic transmission in order not to mix cyclic
measurements and data of the file being transmitted. This button has the same effect as the
"Enable" checkbox of the "Communication/RS-485 Simple/Configuration" window.
After stopping the cyclic measurements, select the "Calibration Reports", "User Actions",
"Configuration", "Measurements" button to send the corresponding file, or the "All files" button to
send all these files in one shot.
Once the button is pressed, the file is sent immediately. The field "Current file status" shows
“Sending” alongside the file transmission progress bar. On completion this changes to “Sent”.
66
Page 69

9.1.1 Data available
All individual data are separated by at least one tabulation character (ASCII code=0x09).
For the cyclic measurements, the data format is detailed. For the files, only one example for
each file is given to explain the data format.
Cyclic measurements
1. If the option "Mode = standard" is chosen, the following message is sent:
CHn\t Gas\t Gas Unit\t Temperature\t Temperature Unit\t Barometric Pressure\t Barometric Pressure Unit\t\ Event\t\r\n
with:
\t ................................................the ASCII tab character: code=0x09
\r ................................................the ASCII Carriage Return character: code=0x0D
\n ..............................................the ASCII Line Feed character: code=0x0A
CHn ..........................................the 2 ASCII characters "CH" + the channel no.
Gas............................................the gas concentration.
Gas Unit ....................................the gas unit.
Temperature..............................the temperature.
Temperature Unit.......................the temperature unit.
Barometric Pressure..................the barometric pressure.
Barometric Pressure Unit ..........the barometric pressure unit.
Event .........................................the event bit mask in hexadecimal format.
Communication Menu
The values are not described here (see List of events and alarms on page 92).
• Example of one measurement:
CH1 697.176 mbar 20.1 °C 0.982 bar C00
2. If the option "Mode = expert" is chosen, the following message is sent:
CHn\t Gas\t Gas Unit\t Temperature\t Temperature Unit\t BarometricPressure\t Barometric Pressure Unit\t
Event\t Current\t µA\t Partial pressure\t bar\t External Pressure\t External Pressure Unit\t Time\t Index\r\n
with:
Current ......................................The current measured in [microA].
Partial pressure .........................The partial pressure in [bar].
External Pressure .....................The external pressure.
External Pressure Unit...............The external pressure unit.
Time ..........................................The time of the measurement. Format "hh:mm:ss."
Index..........................................This is the index of the last measurement.
This number starts at 0 at power up of the program.
• Example of one measurement:
CH1 697.173 mbar 20.1 °C 0.982 bar C00 80.056229 µA 0.697
bar 1.000 bar 12:59:42 5923
67
Page 70

Communication Menu
Gas sensor calibration report example
Calibration report nb 1
Type . . . . . . . . . . . . . . . . . . . . .Sensor calibrated on this instrument
Date (yy.mm.dd - hh:mm) . . . . .05.02.17 - 18:40
Operator . . . . . . . . . . . . . . . . . .jp
Operator ID . . . . . . . . . . . . . . . .3
Calibration coefficient . . . . . . . .122.40 µA/bar
Ratio with ideal membrane . . . . 92.72 %
Ratio with last calibration . . . . .97.35 %
Stability . . . . . . . . . . . . . . . . . . .0.000 %
Calibration mode . . . . . . . . . . . .Direct value
Calibration value . . . . . . . . . . . .0.750000
Gas unit. . . . . . . . . . . . . . . . . . .bar
Gas phase. . . . . . . . . . . . . . . . .Liquid
Liquid. . . . . . . . . . . . . . . . . . . . .Water
Interferences . . . . . . . . . . . . . . .Disable
Temperature . . . . . . . . . . . . . . .20.1 °C
Barometric pressure . . . . . . . . .1.020 bar
External pressure . . . . . . . . . . .0.976 bar
Sensor current. . . . . . . . . . . . . .79.857 µA
Smart gas sensor connection calibration report example
Calibration report nb 1
Type . . . . . . . . . . . . . . . . . . . . .Sensor calibrated on another instrument
Date (yy.mm.dd - hh:mm) . . . . .05.01.17 - 15:30
Operator . . . . . . . . . . . . . . . . . . Armstrong
Calibration coefficient . . . . . . . .62.75 µA/bar
Connection date . . . . . . . . . . . .05.03.15 - 12:26
Serial number . . . . . . . . . . . . . .1
Membrane . . . . . . . . . . . . . . . . .2956A
Barometric sensor calibration report example
Calibration report nb 1
Date (yy.mm.dd - hh:mm) . . . . .05.02.16 - 20:38
Operator . . . . . . . . . . . . . . . . . .jp
Operator ID . . . . . . . . . . . . . . . .3
Former barometric pressure . . .0.970 bar
New Barometric pressure . . . . .0.971 bar
User action log file example
The "User action log file" below contains 3 user actions.
Nr mm/dd hh:mm:ss User ID User Name Action ID Description
1 1/21 15:13:44 1007 Armstrong 140 Measurement config.
0 1/21 15:13:27 1007 Armstrong 132 Identification
2 1/21 15: 9:15 1007 Armstrong 132 Identification
68
Measurement file example
6 measurements are described below:
Nr mm/dd hh:mm:ss Gas Temp Mask Fluor. phi Barom Ext P. Index
[ppb] [°C] [°] [bar] [bar]
0 2/17 21:15:37 75.051 20.1 400 26.039 1.005 0.000 2271
1 2/17 21:15:27 75.043 20.1 400 26.045 1.005 0.000 2266
2 2/17 21:15:17 75.047 20.1 400 26.052 1.005 0.000 2261
3 2/17 21:14:57 75.044 20.1 400 26.041 1.005 0.000 2256
4 2/17 21:14:47 75.047 20.1 400 26.038 1.005 0.000 2251
5 2/17 21:14:37 75.050 20.1 400 26.054 1.005 0.000 2246
Page 71

Configuration report example
The "Configuration" below is given for a one channel instrument.
INSTRUMENT CONFIGURATION
Measurement mode . . . . . . . . . Continuous mode
Pressure unit. . . . . . . . . . . . . . . [bar]
Temperature unit. . . . . . . . . . . .[°C]
Storage mode . . . . . . . . . . . . . . Rolling buffer
Storage RAM time. . . . . . . . . . .10 [s]
Storage FLASH time . . . . . . . . . 3600 [s]
Channel 1
Membrane. . . . . . . . . . . . . . . . .2956A
Medium . . . . . . . . . . . . . . . . . . . Liquid
Gas unit. . . . . . . . . . . . . . . . . . . mbar
Liquid . . . . . . . . . . . . . . . . . . . . Water
Resolution displayed. . . . . . . . . 3
Thermal cut off . . . . . . . . . . . . .Enabled60.0 [°C]
Alarms
Low Low . . . . . . . . . . . . . . . . . .Disabled0.000000 [mbar]
Low . . . . . . . . . . . . . . . . . . . . . . Disabled0.100000 [mbar]
High. . . . . . . . . . . . . . . . . . . . . .Enabled5.000000 [mbar]
High High . . . . . . . . . . . . . . . . .Disabled1.100000 [mbar]
Hysteresis . . . . . . . . . . . . . . . . .1 [%]
Delay. . . . . . . . . . . . . . . . . . . . .0 [s]
Filter State. . . . . . . . . . . . . . . . . Disabled
Type . . . . . . . . . . . . . . . . . . . . .Median
Depth . . . . . . . . . . . . . . . . . . . .5
Central depth . . . . . . . . . . . . . . 3
Interferences
CO
or H2S . . . . . . . . . . . . . . . .All disabled
2
Chlorinity/Salinity . . . . . . . . . . . All disabled19.000000 [g/l]
H
. . . . . . . . . . . . . . . . . . . . . . .Disabled0.100000 [bar]
2
Communication Menu
9.1.2 Example of use
In this example we use:
• One PC with a RS232 port.
• One "RS-485<->RS232 converter"
Procedure:
1. Connect both RS-485 wires of the instrument to the "RS-485<->RS232 converter".
2. Connect the "RS-485<->RS232 converter" to the PC RS232 port using a standard cable
(RS232 DB9 straight cable).
On the PC:
1. Run "Hyperterminal" on the PC.
2. Configure the PC COM port used (e.g. COM2). Menu "File/Properties/Configure".
3. Configure the parameters "Baud rate", "Parity", "Nb of stop bits", "Byte size" (Menu
"File/Properties/Configure"). Use the same parameters for the instrument and the PC.
4. Configure the "Font = Courier 10" (Menu "View/Font").
5. Connect "Hyperterminal" (Menu "Call/Call").
6. Save the data received in the file of your choice (Menu "Transfer/Capture Text/Start").
On the instrument:
1. Use the menu "Communication/RS-485 Simple/Send files" and the button "All files".
When the transfer is finished, close the file with "Hyperterminal" (Menu "Transfer/Capture
Text/Stop"). Now, all the reports are saved in a text file on your PC.
69
Page 72

Communication Menu
9.2 PROFIBUS-DP communication (optional)
9.2.1 Installation
On the ORBISPHERE CD, there is an “Orbi3218.gsd” and an “Orbi3218.bmp” file available in
the “Profibus DP” folder to help configure the PROFIBUS-DP. The GSD file contains the
following elements:
• The module Gateway Version >= 2.0 - 1 channel for receiving data from the instrument.
Note: Gateway version >= 2.0 and user software version >= 2.15 are mandatory
• The module Gateway Version < 2.0 for receiving data from an instrument equipped with a
profibus gateway version < 2.0 or user software version < 2.15
WARNING
Potential Electrocution Hazard. Always disconnect power to the instrument when
making electrical connections.
CAUTION
Personal Injury Hazard. Only qualified personnel should conduct the tasks described in this
section of the manual.
NOTICE
Potential Instrument Damage. Proper ESD (electrostatic discharge) protocols must
be followed to prevent damage to the product. All fittings must be properly seated
and tightened to prevent any water and dust ingress.
1. Install the PROFIBUS-DP module and the jumper J3 on the main board (location highlighted
in the illustration below).
70
2. Select the menu "Configuration/RS-485" and choose "PROFIBUS-DP" as the protocol.
3. Select the menu "Configuration/PROFIBUS-DP", choose the slave address and restart the
instrument.
Page 73

9.2.2 Input/Output data
The main board:
• Writes the latest measurement data to the Profibus Input Buffer.
• Checks if a command written by the Profibus Master must be executed (Profibus Output
Buffer). If a command is to be executed, the instrument executes it and writes the result
(status, data, etc.) in the Profibus Input Buffer.
All numbers are coded in “Big Endian” format, and float values are coded according to IEEE
Standards. The field types “Byte” and “Double Word” are unsigned.
Measurements
Measurements are formatted in the Profibus Input Buffer as follows:
Barometric pressure Input float 32 bits 0
Barometric pressure unit Input byte 8 bits 4
Channel 1 gas concentration Input float 32 bits 5
Channel 1 gas unit Input byte 8 bits 9
Channel 1 temperature Input float 32 bits 10
Channel 1 temperature unit Input byte 8 bits 14
Channel 1 external pressure Input float 32 bits 15
Channel 1 external pressure unit Input byte 8 bits 19
Channel 1 events Input double word 32 bits 20
Channel 1 measurement index Input double word 32 bits 24
Communication Menu
Name Type Size Offset
71
Page 74

Communication Menu
The gas, temperature and barometric pressure unit values are coded as defined in the following
tables:
Gas unit Value Temperature unit Value
bar 0 K 0 bar 0
mbar 1 °C 1 mbar 1
Pa 2 °F 2 psia 2
kPa 3 atm. 3
hPa 4 Pa 4
psia 5 kPa 5
atm. 6 hPa 6
mbar->bar 9
Pa->KPa 10
%Vbar 12
ppm Vbar 13
%Vext 14
ppm Vext 15
ppm Vbar->%Vbar 16
ppm Vext->%Vext 17
ppm 18
ppb 19
g/l 20
mg/l 21
µg/l 22
%O
2
%Air 24 Note: For the field “Event”, please see the column “Bit mask
g/kg 25
V/V 26
%W 27
cc/kg 28
ml/l 29
23
value” in Table 4 on page 92.
Barometric
pressure unit
Value
Note: If the instrument stops sending measurement data to the module, then after 30 seconds the module
sets the event mask to the value PROFIBUS-DP value not updated (0x80000000) bit mask.
72
Page 75

Communication Menu
Commands
The “Command Output Buffer” is formatted as follows:
Name Type Size Offset
Output command toggle (OCT) Output byte 8 bits 0
Output command ID (OCI) Output byte 8 bits 1
Output command data byte 1 (OCD1) Output byte 8 bits 2
Output command data byte 2 (OCD2) Output byte 8 bits 3
Output command data byte 3 (OCD3) Output byte 8 bits 4
Output command data byte 4 (OCD4) Output byte 8 bits 5
The “Command Input Buffer” is located just after the measurement data and is formatted as
follows:
Name Type Size Offset
Input command toggle (ICT) Input byte 8 bits 74
Input command status (ICS) Input byte 8 bits 75
Input command data byte 1 (ICD1) Input byte 8 bits 76
Input command data byte 2 (ICD2) Input byte 8 bits 77
Input command data byte 3 (ICD3) Input byte 8 bits 78
Input command data byte 4 (ICD4) Input byte 8 bits 79
The following commands are available:
• Change product
• Activate sensor (valid for EC sensors only)
Change product command - output
Name Value Comment
OCT 1-2
OCI 1
OCD1 0
OCD2 0-99 Product number
OCD3 0-1
OCD4 Not used
Channel number:
0 = Channel 1
Erase measurement files:
0 = Never erase the measurement files.
1 = Erase measurement file if necessary (e.g. gas unit changes)
Change product command - input
Name Value Comment
ICT 1-2
0 = OK
ICS 0-3
ICD1 Not used
ICD2 Not used
ICD3 Not used
ICD4 Not used
1 = Unknown command ID
2 = Invalid parameter (e.g. invalid channel no or product number)
3 = Execution failure
73
Page 76

Communication Menu
Activate sensor command - output
Name Value Comment
OCT 1-2
OCD1 0
OCD2 0-1
OCD3 Not used
OCD4 Not used
Activate sensor command - input
Name Value Comment
ICD1 Not used
ICD2 Not used
ICD3 Not used
ICD4 Not used
OCI 2
ICT 1-2
ICS 0-3
Channel number:
0 = Channel 1
Sensor activation:
0 = Deactivate the EC sensor
1 = Activate the EC sensor
0 = OK
1 = Unknown command ID
2 = Invalid parameter (e.g. invalid channel no)
3 = Execution failure
9.3 USB-A port (host)
This option allows the export or import of data from an external mass storage device. The
device must first be connected to the instrument through the USB-A port.
Select one of the two import options (product list or access table) to import data from the
storage device. This is useful for transferring these files to additional instruments without the
need of having to re-enter the data individually on each instrument.
Note: The imported data will override any current settings on the instrument.
Select the export option to export data from the instrument to the storage device. For
information regarding the uploaded files, refer to Uploaded Files on page 78.
For both import and export options, the progress bar is updated to give an indication of the
progress of the selected option.
74
Page 77

9.4 HTTP/TCP-IP
9.4.1 Overview
When activated this option downloads data from the instrument directly to a web page that can
be accessed from a PC. To be able to use this option, the instrument must be connected to the
network (specifically Connector P3 - see details in Main board connections on page 29) and
the network must have a DHCP server installed.
• Check the Enable server box to enable the web server communication link.
• Enter the Server name for the instrument. This is free format text and should typically be
used to identify the instrument.
• Check the Enable security box if you require a password to be entered on the PC to access
the web page.
If any of the details on the previous screen have been changed, a warning message will be
displayed as illustrated left.
The changes must be confirmed, after which the instrument must be powered down and
powered up again for the changes to take effect.
Note: The IP Diagnostics button at the bottom of the screen is for use by experienced IT personnel only to
help resolve any communications problems.
Communication Menu
9.4.2 PC interface
Once the server has been enabled and the interface information set up, access the information
by launching an internet browser and typing “http://” followed by the server name that has been
assigned to the instrument, in the address box as illustrated below:
If the enable security option has been checked on the
instrument, you will be required to enter a username
and password on your PC to gain access to the web
page.
The username and password must be a valid
username/password combination that has been set up
on the instrument (see also User management on
page 80 on how to set up users on the instrument).
Domain information is not required.
75
Page 78

Communication Menu
Once a valid username/password combination has been entered, the initial web page will be
displayed giving a list of options:
Click on any of these options and the data will be displayed on the PC screen. The following
shows an example of the screen when selecting the Current Measurement option:
76
Page 79

9.5 Data file transfer through the USB-B port (client)
The USB port allows you to copy data files from the instrument to a PC using Microsoft
synchronization software. The files in the instrument are coded in a binary format, so they must
be converted to a readable format on your PC to make them suitable for viewing. This is done
automatically using the software supplied on the ORBISPHERE CD (see PC software
installation below and Upload report files on page 77 for details).
Check that the instrument and PC are powered, then connect them with the USB cable that was
supplied with the instrument. Follow the instructions below:
9.5.1 PC software installation
Insert the ORBISPHERE CD inside the PC drive. If the auto executable installation does not
start, browse the CD with Windows Explorer and double click on the setup.exe file to start the
installation. Follow the step by step instructions appearing on the screen.
Once the installation is complete, two icons are installed on the PC Desktop:
• Orbisphere 410, 51x USB upload is used to upload and convert report files from the
instrument to the PC (see Upload report files on page 77).
• Orbisphere 410, 51x Setup is software used by the Hach Lange after sales technicians to
upload new software versions. To avoid an accidental software modification, a key is
required.
Communication Menu
9.5.2 Microsoft synchronization software
• Windows XP - A copy of the synchronization software is available on the ORBISPHERE CD.
Inside the ActiveSync folder double click on ActiveSync.exe to install on the PC.
• Windows Vista and Windows 7 - Download and install the Windows Mobile Device
Center application which contains the synchronization software.
Once installed, the synchronization software starts automatically when the instrument is
connected to the PC and an icon will appear in the taskbar at the bottom of the screen.
Note: By default the software proposes to set up a partnership with the instrument. This is not required, so
make sure this is set to NO before continuing.
9.5.3 Upload report files
Double click on the Orbisphere 410, 51x USB upload icon on the PC desktop (created during
the process described previously in PC software installation on page 77) to start the upload and
convert process.
When the main screen is displayed, click on the Wizard button in the top left corner.
• Check that the USB connection from the instrument to PC has been made, and that the
synchronization software has been activated and the link recognized (the icon in the taskbar
should be colored green). Click on Next.
• Choose the directory where the files are to be stored. If the directory path does not exist it will
be automatically created. Click on Next.
• A warning message appears to warn that all files currently in the directory (if any exist) will be
deleted prior to upload. Click on Yes to continue with the process or No to abort. If Yes is
selected, a progress bar of the upload is displayed.
• Should any of the files be missing (e.g. a calibration file will be missing if no calibration has
been performed), a warning message is displayed, but no action is required. Click on OK.
Once the upload is complete, the files are converted and stored in the folder defined above.
• Click on Finish to terminate the process, or on either of the other two buttons to open the
folder or view the text files.
77
Page 80

Communication Menu
Uploaded Files
There are a number of files that are uploaded to the PC during this process. However, only the
text files (with a .txt file extension) are in a readable format on the PC. Most document editors
(Word, Notepad, etc.) can be used to open these files, as well as spreadsheet and other
reporting tools (e.g. Excel).
There are four reports available:
• Instrument Configuration
• Calibration Reports
• Measurements
• User Actions
The reports show information for the channel. Below is an example of the Instrument
Configuration report as viewed using the Notepad utility.
78
Page 81

Section 10 Security Menu
Note: When the instrument is started for the very first time, security is disabled by default. It is highly
recommended that each user be entered into the system and given appropriate access rights as soon as
possible to avoid any unauthorized access. Details of this process are described in this section.
10.1 Access rights management
Access rights management
Each user has a unique ID and user password. The ID and password are used by the software to:
• Allow or deny a user to perform specific actions.
• To trace this action with his "ID" in a log file.
Once the ID and password are entered, the user is allowed to perform actions according to the "Access
level" that has been attributed to his ID by the Manager. See Security level table on page 15.
Level Typical rights Comments
0 View parameters, change views Press the unlock button and OK to access
1 + Start / Stop measurements
2 + Calibration
Figure 36 Security menu
Table 3 Access levels
3 + Modify parameters
+ Modify table "User ÅÆ Access level"
4
+ Enable/Disable "Access right" features
Note: At startup, all the menus are locked. The user has to identify himself to get access beyond the
different views (see Function keys on the header bar on page 34)
There is at least one ID having the level 4
79
Page 82

Security Menu
10.2 Configure security
Configure security
This enables defining the users with their access level when the software starts for the first time. It is
possible to configure several parameters related to confidentiality. This requires a user access level 4.
Note: Access rights are disabled by default.
• Access rights: When enabled, it is required to log in as a registered user (see User management on
page 80) to access the menus. When disabled (default), all menu are access free, and the effect of
leaving the text box blank in user login window is that there will be no name recorded for the action in
the log file.
• Enter a maximum session time in minutes for improved confidentiality. The user is logged out
automatically when the set delay for inactivity is over.
• User action logging: When enabled, every action from a logged on user is recorded in a user log file
for traceability.
• Clear all user actions log file. Confirm to clear the log file. This functionality is aimed at clearing demo
or test logs for example. The log file is a rolling buffer recording the past 100 actions.
10.3 User management
User management
This window shows the list of registered users for the instrument. They are listed by name, ID, password
and access level.
Note: The "User password" must be at least 4 characters long.
Pressing on an empty line, or pressing the Add button brings a window to add a new user. Name, ID,
password and access level (from 1 to 4) must be entered.
Pressing on a registered user line brings a window for editing or deleting the user data in the list.
Note: The list can contain up to 99 users
10.4 User action log file
User action log file
Each time the user performs an important action, a record is written in the "User action log file". It is a
rolling buffer which contains the last 1000 user actions. The "User Interface" will allow viewing this log file
(Menu Security / View log file). This log file contains the following data:
• line number
• the action name
• the user name and ID
• the current date and time.
Note: Unsuccessful attempts to register are recorded in the log file without a user ID.
80
Page 83

Section 11 Products Menu
Figure 37 Products menu
81
Page 84

Products Menu
Products
This option allows users to save and/or use previously saved product configurations. A maximum of 100
different product configurations can be stored in the instrument. The basic measurement configuration
(gas to analyze, gas unit, alarm limits, analog outputs, etc.) can be set up for a product and will be
automatically used by the instrument when that product is selected.
Product configurations can be moved from instrument to instrument if required. However, as the sensor
only analyzes oxygen, only products configured to analyze oxygen can be selected on this instrument.
Products configured to analyze other gases can, however, be set up on this instrument and easily
transferred to other 410 or 51x instruments analyzing gases other than oxygen.
For ease of use, where product configurations are identical or similar, a Copy facility exists on the modify
product screen. This enables copying a stored configuration and storing it in one or more additional
locations. Then use the modify product option to identify and/or modify the duplicate configurations.
Select product Note: If the PROFIBUS-DP communications protocol has been enabled,
products can be selected for analysis using that facility (see Input/Output
data on page 71 and specifically Change product command - output on
page 73 for details).
• Select the product (0-99) to be analyzed, or use the Next and Previous
buttons to scroll sequentially through the existing product list.
Alternatively, use the Search facility to search for a product. Enter a full
or partial search criteria. If only one match is found, this product is
automatically selected. If a number of products match the search
criteria, then a list of matches will be displayed. Select a product directly
from the list of matching products.
• Press OK to select the product or Cancel to exit.
Modify product • Select the product (index 0-99) to modify, or use the Next and Previous
buttons to scroll sequentially through the existing product list.
Alternatively, use the Search facility to search for a product. Enter a full
or partial search criteria. If only one match is found, this product is
automatically selected. If a number of products match the search
criteria, then a list of matches will be displayed. Select a product directly
from the list of matching products.
• Select the gas to analyze (up to three can be selected) from the drop
down list.
• After selecting a product and gas, press Configure to configure the
product. Configure the product as required (refer to Measurement
configuration on page 44 for additional information).
• Press Analog out to configure the analog outputs. Configure the analog
output as required (refer to Channel configuration on page 59 for
additional information).
• Press OK to accept the configuration, or Cancel to exit.
82
Page 85

Section 12 Global Configuration Menu
Figure 38 Global configuration menu
Global configuration
The global configuration option allows users to save, and use previously saved, instrument
configurations. A maximum of 10 configurations can be saved, with configuration 0 (zero) the instrument
default.
Once all the instrument parameters have been set up, use this option to save the configuration. Selecting
pre-defined configurations avoids the need to re-enter all the parameters when using the instrument for a
different application.
Save • Define the index (1-9) to save the current configuration. Use the Next
and Previous buttons to scroll sequentially through existing
configurations, to overwrite an existing configuration or save as a new
one.
• Enter a name to define the current configuration.
• Enter any comments to associate with this configuration.
Select • Select the configuration (index 0-9) to use on the instrument.
Confirmation will be required for the selected configuration. The
instrument must then be restarted (powered off and then back on) in
order for the new configuration to take effect.
83
Page 86

Global Configuration Menu
84
Page 87

Section 13 Services Menu
Figure 39 Services menu - Part 1
85
Page 88

Services Menu
86
Figure 40 Services menu - Part 2
Page 89

13.1 Sensor diagnostics
Sensor diagnostics
Calibration timer The instrument can automatically remind the user when the next sensor
Service timer The instrument can automatically remind the user when the next sensor
Null current
measurement (EC
sensor only)
Gas/Temperature (EC
sensor process)
Gas/Temperature (TC
sensor process)
Services Menu
calibration is due.
• Select enable and enter a delay in days.
• The display shows the current instrument date and time, next calibration
due date and time, and the remaining days.
The next calibration date is updated when the sensor is calibrated. The
event “Cal. required” is generated when the delay has elapsed.
service is due.
• Select enable and enter a delay in days. This should be validated by a
level 3 user.
The display shows the current instrument date and time, the next sensor
service due date and time, and the remaining days.
The next service date is updated when the button Service done is pressed
after a service. The event “Service required” is generated when the delay
has elapsed.
The sensor attached to your instrument will require periodic servicing and
maintenance. For more information on this, please refer to the manual
delivered with the sensor.
This is a diagnostic tool for Hach Lange technicians. This feature will allow
checking the ability of the EC measurement board to measure a null current.
This ability is very important to measure traces of gas.
• Press Start to measure the sensor current generated.
• The measurement board opens a contact in order to measure a null
current instead of the sensor current.
• The window displays the current measured, and information as to
whether the value is acceptable or not.
If the test fails please contact your Hach Lange representative.
This feature allows you to check the ability of the EC measurement board to
measure a range of currents and temperatures. To use this feature an EC
sensor simulator (Part N° 32304) must be used in place of the sensor.
• Select Temp or Gas and press Start
The software performs the check in several steps. It asks the user to select
different gas values and temperatures on the simulator. For each position, it
applies different anode voltages. For each position and voltage applied:
1. it waits some time (typically 1 minute for a null current)
2. it displays if the values measured are acceptable (OK)
3. it displays the current and temperature measured
If the current or the temperature is not acceptable, a solution can be the
calibration of the "gas amplifier" or the "temperature amplifier". To do this,
please contact your Hach Lange representative.
This feature allows you to check the ability of the TC measurement board to
measure a range of currents and temperatures. To use this feature a TC
sensor simulator (Part N° 29117) must be used in place of the sensor.
• Depending on the operation(s) to be performed, select V2, V3, Temp or
Select All and press Start
The software performs each check in several steps and asks the user to
select different values on the simulator. For each position, it applies different
anode voltages. For each position and voltage applied:
1. it waits some time (typically 1 minute for a null current)
2. it displays if the values measured are acceptable (OK)
3. it displays the current and temperature values measured
If the current or the temperature is not acceptable, a solution may be the
calibration of the "gas amplifier" or the "temperature amplifier", in which
case please contact your Hach Lange representative.
87
Page 90

Services Menu
Amplifiers (TC sensor
only)
13.2 Language selection
Language selection
Check the language as required and restart the instrument to apply the change. The instrument will
restart in the language selected.
13.3 Clock
Clock
Type in each appropriate box the actual time and date, and select the display format for them.
13.4Screen
Screen
Screen calibration This screen allows you to adjust the click position corresponding to the
Screen brightness Press the up or down arrow to increase or decrease the screen brightness.
This feature will display the measured values for V2 and V3 along with the
recommended values. It is advisable to put the sensor in continuous purge
mode during this operation by pressing the Continuous purge button.
If the measured and recommended values differ by a large margin, please
contact your Hach Lange representative for advice.
displayed buttons. Use it if ever the sensitive areas are no longer properly
aligned with the buttons on display.
Place the stylus right on the cross when asked and proceed. User will be
asked to press on the screen to accept the new setting. If not, the new
setting is not recorded and no change is made.
Four levels are pre-set: Max, Comfortable, Standard (default setting) and
Economy. Press OK when finished.
Note: This can also be called through the brightness icon on the
main display.
13.5 Buzzer
Buzzer
Adjust the sounds available on the instrument.
When “screen tap” is enabled, a click sound is heard each time the screen is touched.
The instrument alarm sound can be enabled or disabled to suit the application. The sound type can also
be adjusted. Press the Test button to test the adjustment made. Press again to stop.
13.6 Boards info
Boards info
Main board info For reference, this display gives information on the instrument model,
Measurement board info For reference, this display gives information on the sensor measurement
Sensor parameters For reference this display gives information on the sensor model and type,
software version and instrument ID.
board hardware and software.
The Model field indicates if the sensor is an EC or TC sensor.
Pressing the Analog outputs corr. button displays the correction factor that
is applied to the analog outputs.
Pressing the Amplifiers corr. button displays the value of the actual
correction factor on the amplifiers.
last calibration, settings and behavior.
88
Page 91

13.7 Batteries
Batteries
On all instruments this display gives the real time clock battery charge level and voltage.
Note: A warning message (and icon) is displayed if the battery level becomes too low and needs to be
replaced.
13.8 Software download
Software download
For Hach Lange technician use only. Used when reloading the software for new versions.
This ends the application. User must stop and restart the instrument to restart the program.
13.9 End application
End application
This ends the application. User must stop and restart the instrument to restart the program.
Services Menu
89
Page 92

Services Menu
90
Page 93

Section 14 Maintenance and Troubleshooting
14.1 Instrument maintenance
CAUTION
Personal Injury Hazard. Any instrument maintenance should be carried out by a qualified
Hach Lange Service Technician. Please contact your local representative should you feel any
maintenance or instrument adjustments are required
14.2 Troubleshooting
The possible events, along with the text message displayed on the instrument numeric view
screen, the reason for the event and its criticality are listed in Table 4 on page 92. An event is
something which affects the measurement. In the numeric view, the current events are indicated
with the gas concentration at the same place.
Whenever an abnormal event is met, a sign is displayed on the upper left of the screen.
Pressing on the sign calls a window giving further details about the actual situation.
There are three levels of abnormal conditions:
•Alarm - There is a severe problem causing the channel to
be out of action, and the system alarm relay to be enabled
• Warning - Events less critical than a system alarm (e.g.
measurement alarm)
• Information - For information only; no action is required
Note: Use the Diagnostic view for troubleshooting (see Sensor diagnostics on page 87).
In addition to the above, if the RTC battery is running low and needs to be
changed, the icon illustrated left is displayed in the bottom right corner of the
numerical view screen.
If using a portable instrument, this icon blinks alternatively with the standard
battery icon.
Note: If the RTC battery is running low, the date and time of the instrument are reset. Also, on startup the
instrument will automatically reboot after the initial startup is complete.
91
Page 94

Maintenance and Troubleshooting
14.3 List of events and alarms
Table 4 List of Events
Event
type
Information
Warning
Alarm
Bit mask
Name Description
Measure Normal measurement mode. 0x00000000
Filter enabled The gas measurements are filtered. 0x00000001
Sample measurement The sample measurement is started. 0x00000002
Meas. not ready The measurement is not ready (e.g. at startup) 0x80000000
Autotest in progress The autotest is running. 0x00100000
Autotest failed The autotest has failed. 0x00200000
Alarm snooze The alarm snooze is ON. 0x00000004
Calibration Channel in calibration. 0x00000008
Hold The measurement is frozen. 0x00400000
Alarm low low The gas concentration below the Alarm LowLow limit. 0x00000010
Alarm low The gas concentration is below the Alarm Low limit. 0x00000020
Alarm high The gas concentration is above the Alarm High limit. 0x00000040
Alarm high high The gas concentration is above Alarm HighHigh limit. 0x00000080
Calibration required The calibration of the sensor is required. 0x00000100
Service required The sensor requires a service. 0x00000200
TC hold TC measurement on hold 0x08000000
Continuous purge on Continuous purge is on 0x10000000
Channel disabled The channel has been disabled. 0x00000400
Channel out The measurement board has been disconnected (or does not answer). 0x00000800
Sensor out The sensor has been disconnected. 0x00001000
PROFIBUS-DP
Thermal cut off The temperature is above the thermal cut off. 0x00004000
Ramp limit violated V3 voltage outside range -3V to +8V 0x04000000
The PROFIBUS-DP module has not received measurements from the
instrument for 30 seconds.
value (32
bits long)
0x00080000
14.4Storage, handling and transportation
Protect the instrument against the elements: rain, splashing, direct sunlight, etc.
A properly packaged instrument can be stored and transported at a temperature -20°C to +70°C
and relative humidity up to 80%. Best practice for packing the instrument for transportation is to
reuse the original packaging in which the instrument was first delivered. The instrument should
be stored in suitable premises, free of dust, condensation and chemical evaporation.
In cold weather, avoid sudden temperature change (like when entering a warm room) and give
the instrument enough time to adapt to the ambient temperature in order to avoid condensation
inside.
To clean the instrument, wipe the housing clean with a cotton cloth or tissue. Always clean the
instrument before storage. Pay attention not to scratch the surface of the display to retain good
clarity over time.
Never use liquids such as oil, benzene, or detergents for cleaning the instrument. A mild glass
cleaner can be used to remove greasy stains.
92
NOTICE
Page 95

Section 15 Part Lists
15.1 Accessories
Part N° Description
29089 Purge gas pressure regulator kit for TC sensors
32501.03
32517.00
32531.03
32531.10
32531.20
32534.03
32605 Purge backup unit for TC sensors
32959
32973
32501.MM
32517.MM
32534.MM
10 wire cable to connect 31xxx sensors to Orbisphere 410/510 wall and panel
instrument, length 3m
LEMO 10 adapter to connect 32505 type sensor cable to 410 or 510 wall and panel
instruments, length 40 cm
Ethernet cable for Orbisphere 410/510 wall and panel instruments including connectors
(length = 3m)
Ethernet cable for Orbisphere 410/510 wall and panel instruments including
connectors, total length = 10 meters
Ethernet cable for Orbisphere 410/510 wall and panel instruments including
connectors, total length = 20 meters
PROFIBUS-DP cable for Orbisphere 410 and 510 instruments including SUB-D 9
female connector (length = 3m)
Converter RS232/RS-485 for 3662Ex, 410 and 510.
Battery powered; batteries not included.
PROFIBUS-DP upgrade kit for Orbisphere 410 and 510 instruments (includes board
and software key)
Longer 10 wire cable to connect 31xxx sensors to Orbisphere 410/510 wall and panel
instrument, total length = MM, price added per meter of length greater than 3m.
Longer LEMO 10 adapter to connect 32505 type sensor cable to 410 or 510 wall and
panel instruments, total length = MM meters, price to be added by meter
PROFIBUS-DP cable for Orbisphere 410 and 510 instruments including SUB-D 9
female connector, total length = MM, price added per meter of length greater than 3m.
15.2 Spare parts
Part N° Description
32533.03 USB client cable including connectors, length = 3m
32963 Wall mounting kit for 410 and 510 instruments
32964 Panel mounting kit for 410 and 510 panel instruments
32972 Pipe mounting kit for 410 or 510 wall instrument
32965 Locking key for Orbisphere 410/510 wall instruments
32970 Cap to protect USB connector on 410 or 510 instruments
32975 Power supply connector (10-30 VDC) for 410/510 panel and wall instruments
DG33263 IP65 sealing kit for 410 and 510 panel instruments
93
Page 96

Part Lists
94
Page 97

Section 16 Glossary
16.1 Gas units
Unit Meaning
percentage, by weight. A concentration of 100% air corresponds to liquid saturated with air at current
% air
% O
2
%Vbar ratio in percent between the partial pressure of gas measured and the atmospheric pressure
%Vext
µg/L micrograms per liter
atm atmosphere
bar, mbar bar, millibar
cc/kg
g/kg grams per kilogram
pressure and temperature. The equivalent concentration of O
conditions.
percentage, by weight. A concentration of 100% O2 corresponds to liquid saturated with pure O2 at
current pressure and temperature.
ratio in percent between the partial pressure of gas measured and the external pressure. Available when
an external pressure sensor is present.
volume of gas per kg of liquid. The volume of gas is calculated considering normal conditions
(T = 0°C, p = 1atm)
is approximately 20% O2 in normal
2
3
g/m
mg/L milligrams per liter
ml/L milliliters per liter
Pa, hPa, kPa Pascal, hecto Pascal, kilo Pascal
ppb parts per billion, by weight
ppm parts per million, by weight (same as mg/kg)
ppm Vb
ppm Ve
psia pound per square inch, absolute
V / V volume per volume (ratio)
grams per cubic meter
parts per million, per volume, barometric pressure referenced.
= %Vbar / 10,000
parts per million, per volume, external pressure referenced.
= %Vext / 10,000
16.2 Generic terms and definitions
Terms Meaning
Absolute pressure This is the total pressure in a system (i.e. relative pressure, plus atmospheric pressure)
Analog output A voltage or current signal that is a continuous function of the measured parameter.
ASCII
Baud rate
CIP Cleaning In Progress
Concentration The relative content of a component in a gaseous or liquid media.
Conductivity The reciprocal of electrical resistivity.
FIFO (First In First Out)
Headspace The empty volume above a liquid or solid in a closed container.
American Standard Code for Information Interchange. A standard character-coding scheme used
by most computers to display letters, digits and special characters.
Baud rate means transmission speed (Unit: bits per second, bps ), especially for RS-232/422/485
interfaces.
FIFO is a concept to describe the behavior of a buffer. It means the data which entered first will
exit first.
95
Page 98

Glossary
Master / Slave modes
Parallel communication
PLC
PROFIBUS-DP
PROFIBUS-DP
GSD files
Relative pressure
Resistivity
RS-232
RS-422
RS-485
Serial communication
Single twisted pair
USB
A device operating as a master will poll one or more devices operating as a slave. This means a
slave device cannot volunteer information; it must wait to be asked for it.
Parallel communication represents a connection in a computer system in which the bits of a byte
are transmitted over separate channels at the same time.
Programmable Logic Controller. It communicates with other process control components through
data links. It is used in process control for simple switching tasks, PID control, complex data
manipulation, arithmetic operations, timing and process and machine control.
The PROFIBUS-DP (Decentralized Peripheral) fieldbus is designed especially for communication
between automation control systems and distributed I/O at the device level. Each DP device has
specific parameters such as device version, baud rate, data format, I/O length, user parameters,
etc. These parameters are stored in a file with .GSD extension.
The GSD file is provided by the manufacturer and is required for device configuration. A GSD file
is a readable ASCII text file that contains both general and device-specific specifications for
communication (Communication Feature List) and network configuration.
Relative pressure is the over pressure in a system (i.e. absolute pressure less atmospheric
pressure). This is the customary gauge reading.
The opposition offered by a body or substance to the passage through it of a steady electric
current.
RS-232 is a serial communication standard providing asynchronous communication capabilities
with hardware flow control, software flow control, and parity check. Maximum transmission
distance is up to 15 meters at a max. 20,000 bps. A converter is required to interface RS-232 with
RS-422 or RS-485.
RS-422 is intended for point-to-point communications. It provides much longer transmission
distance but less signal line compares to RS-232. RS-422 adopts differential transmission
technology and thus provides high-speed transmission up to 10mbps and maximum transmission
distance up to 1.2km/110kbps.
RS-485 is an enhanced version of RS-422 and is used for multipoint communications, meaning
that many devices may be connected to a single signal cable. It is compatible to RS-422 interface
and provides 2 wire bus topology.
Serial communication represents a connection in a computer system in which the bits of a byte
are transmitted sequentially over a single wire.
In this version, all devices are connected to a single Twisted Pair. Thus, all of them must have
drivers with tri-state outputs (including the Master). Communication goes over the single line in
both directions. It is important to prevent more devices from transmitting at once (software
problem).
Universal Serial Bus. An external peripheral interface standard for communication between a
computer and external peripherals over a cable using bi-serial transmission. The USB host uses a
type A connector, and the USB peripheral uses a type B connector.
96
Page 99

97
Page 100

HACH COMPANY World Headquarters
P.O. Box 389, Loveland, CO 80539-0389 U.S.A.
Tel. (970) 669-3050
(800) 227-4224 (U.S.A. only)
Fax (970) 669-2932
orders@hach.com
www.hach.com
©
Hach Lange, 2006-2013. All rights reserved. Printed in Europe.
HACH LANGE GMBH
Willstätterstraße 11
D-40549 Düsseldorf, Germany
Tel. +49 (0) 2 11 52 88-320
Fax +49 (0) 2 11 52 88-210
info@hach-lange.de
www.hach-lange.de
HACH LANGE Sàrl
6, route de Compois
1222 Vésenaz
SWITZERLAND
Tel. +41 22 594 6400
Fax +41 22 594 6499
 Loading...