

Page 1

Spectrum Analyzer
GSP-930
USER MANUAL
REVISION 1.1 APRIL 2012
ISO-9001 CERTIFIED MANUFACTURER
Page 2

This manual contains proprietary information, which is protected by
copyright. All rights are reserved. No part of this manual may be
photocopied, reproduced or translated to another language without
prior written consent of Good Will company.
The information in this manual was correct at the time of printing.
However, Good Will continues to improve products and reserves the
rights to change specification, equipment, and maintenance
procedures at any time without notice.
Good Will Instrument Co., Ltd.
No. 7-1, Jhongsing Rd., Tucheng Dist., New Taipei City 236, Taiwan.
Page 3

SAFETY INSTRUCTIONS
Table of Contents
SAFETY INSTRUCTIONS .................................................. 3
GETTING STARTED .......................................................... 8
GSP-930 Introduction ............................ 9
Accessories .......................................... 11
Appearance .......................................... 13
First Use Instructions .......................... 24
BASIC OPERATION ........................................................ 36
Frequency Settings ............................... 39
Span Settings ....................................... 43
Amplitude Settings .............................. 46
Autoset ................................................ 59
Bandwidth/Average Settings ................ 61
Sweep .................................................. 66
Trace .................................................... 72
Trigger ................................................. 79
Marker ................................................. 84
Display................................................. 98
System Settings ................................. 105
Preset ................................................ 109
ADVANCED OPERATION ............................................... 111
Measurement ..................................... 112
Limit Line Testing .............................. 159
Sequence ........................................... 165
Tracking Generator ............................ 170
Power Meter ...................................... 173
FILE .............................................................................. 178
File Overview ..................................... 178
1
Page 4

GSP-930 User Manual
REMOTE CONTROL ...................................................... 194
Interface Configuration ...................... 195
FAQ .............................................................................. 205
APPENDIX .................................................................... 206
Replace the Clock Battery ................... 206
Glossary of Acronyms ........................ 207
GSP-930 Default Settings ................... 209
Menu Tree .......................................... 211
GSP-930 Specifications ...................... 240
GSP-930 Dimensions ......................... 249
Declaration of Conformity .................. 250
INDEX .......................................................................... 251
2
Page 5

SAFETY INSTRUCTIONS
WARNING
Warning: Identifies conditions or practices that
could result in injury or loss of life.
CAUTION
Caution: Identifies conditions or practices that
could result in damage to the instrument or to
other properties.
DANGER High Voltage
Attention Refer to the Manual
Earth (ground) Terminal
Frame or Chassis Terminal
Do not dispose electronic equipment as unsorted
municipal waste. Please use a separate collection
facility or contact the supplier from which this
instrument was purchased.
SAFETY INSTRUCTIONS
This chapter contains important safety
instructions that you must follow during
operation and storage. Read the following before
any operation to insure your safety and to keep
the instrument in the best possible condition.
Safety Symbols
These safety symbols may appear in this manual or on the
instrument.
3
Page 6

GSP-930 User Manual
General
Guideline
CAUTION
Do not place any heavy object on the
instrument.
Avoid severe impact or rough handling that
leads to damaging the instrument.
Do not discharge static electricity to the
instrument.
Use only mating connectors, not bare wires, for
the terminals.
Ensure signals to the RF input do not exceed
+30dBm.
Ensure reverse power to the TG output terminal
does not exceed +30dBm.
Do not supply any input signals to the TG
output.
Do not block the cooling fan opening.
Do not disassemble the instrument unless you
are qualified.
(Measurement categories) EN 61010-1:2010 specifies the
measurement categories and their requirements as follows. The
instrument falls under category II.
Measurement category IV is for measurement performed at the
source of low-voltage installation.
Measurement category III is for measurement performed in the
building installation.
Measurement category II is for measurement performed on the
circuits directly connected to the low voltage installation.
Measurement category I is for measurements performed on
circuits not directly connected to Mains.
Power Supply
WARNING
AC Input voltage range: 100V~240V
Frequency: 50/60Hz
To avoid electrical shock connect the protective
grounding conductor of the AC power cord to
an earth ground.
Safety Guidelines
4
Page 7

SAFETY INSTRUCTIONS
Battery
CAUTION
Rating: 10.8V, 6 cell Li-ion battery
Turn off the power and remove the power cord
before installing or removing the battery.
Cleaning
Disconnect the power cord before cleaning.
Use a soft cloth dampened in a solution of mild
detergent and water. Do not spray any liquid.
Do not use chemicals containing harsh material
such as benzene, toluene, xylene, and acetone.
Operation
Environment
Location: Indoor, no direct sunlight, dust free,
almost non-conductive pollution (Note below)
Temperature: 5°C to 45°C
Humidity: <90%
(Pollution Degree) EN 61010-1:2010 specifies the pollution degrees
and their requirements as follows. The instrument falls under
degree 2.
Pollution refers to “addition of foreign matter, solid, liquid, or
gaseous (ionized gases), that may produce a reduction of dielectric
strength or surface resistivity”.
Pollution degree 1: No pollution or only dry, non-conductive
pollution occurs. The pollution has no influence.
Pollution degree 2: Normally only non-conductive pollution
occurs. Occasionally, however, a temporary conductivity caused
by condensation must be expected.
Pollution degree 3: Conductive pollution occurs, or dry, non-
conductive pollution occurs which becomes conductive due to
condensation which is expected. In such conditions, equipment
is normally protected against exposure to direct sunlight,
precipitation, and full wind pressure, but neither temperature
nor humidity is controlled.
Storage
environment
Location: Indoor
Temperature: -20°C to 70°C
Humidity: <90%
5
Page 8

GSP-930 User Manual
Disposal
Do not dispose this instrument as unsorted
municipal waste. Please use a separate collection
facility or contact the supplier from which this
instrument was purchased. Please make sure
discarded electrical waste is properly recycled to
reduce environmental impact.
6
Page 9

SAFETY INSTRUCTIONS
Green/ Yellow:
Earth
Blue:
Neutral
Brown:
Live (Phase)
Power cord for the United Kingdom
When using the instrument in the United Kingdom, make sure the
power cord meets the following safety instructions.
NOTE: This lead/appliance must only be wired by competent persons
WARNING: THIS APPLIANCE MUST BE EARTHED
IMPORTANT: The wires in this lead are coloured in accordance with the
following code:
As the colours of the wires in main leads may not correspond with
the coloured marking identified in your plug/appliance, proceed
as follows:
The wire which is coloured Green & Yellow must be connected to
the Earth terminal marked with either the letter E, the earth symbol
or coloured Green/Green & Yellow.
The wire which is coloured Blue must be connected to the terminal
which is marked with the letter N or coloured Blue or Black.
The wire which is coloured Brown must be connected to the
terminal marked with the letter L or P or coloured Brown or Red.
If in doubt, consult the instructions provided with the equipment
or contact the supplier.
This cable/appliance should be protected by a suitably rated and
approved HBC mains fuse: refer to the rating information on the
equipment and/or user instructions for details. As a guide, a cable
of 0.75mm2 should be protected by a 3A or 5A fuse. Larger
conductors would normally require 13A types, depending on the
connection method used.
Any exposed wiring from a cable, plug or connection that is
engaged in a live socket is extremely hazardous. If a cable or plug is
deemed hazardous, turn off the mains power and remove the cable,
any fuses and fuse assemblies. All hazardous wiring must be
immediately destroyed and replaced in accordance to the above
standard.
7
Page 10

GSP-930 User Manual
GSP-930 Introduction ....................................................... 9
Main Features .................................................................................................................9
Accessories..................................................................... 11
Package Contents ....................................................................................................... 12
GETTING STARTED
This chapter provides a brief overview of the
GSP-930, the package contents, instructions for
first time use and an introduction to the front
panel, rear panel and GUI.
8
Page 11

GETTING STARTED
Performance
9kHz~3GHz bandwidth
1Hz resolution
Nominal RBW accuracy of 5% <750kHz, 8%
@>750kHz
Video bandwidth 1Hz~1MHz (10 steps)
Amplitude measurement range: DANL~30dBm
(frequency dependent)
Input attenuation: 0 ~ 50dB
Phase noise: < -88dBc/Hz@1GHz, 10kHz
Features
10%-step increments for RBW bandwidth
Three display modes: Spectrum, Topographic
and Spectrographic
Split window display
Built-in EMI filter
Auto Wake-up
Built-in preamplifier
Gate sweep
Marker Frequency counter
Two operating modes: Spectrum and Power
Meter mode
SEM measurement
ACPR measurement
OCBW measurement
GSP-930 Introduction
The GSP-930 is the most advanced spectrum analyzer GW Instek
has produced to date. The GSP-930 features a split window display
to view data in spectrum, topographic or spectrographic views.
Main Features
9
Page 12

GSP-930 User Manual
Channel power measurement
Demodulation analyzer
Diverse marker functions and features with
Peak Table
Sequence function to automatically perform pre-
programmed sequential operations
Optional battery operation
Interface
8.4 color LCD (800600)
On-screen menu icons
DVI-I video output
RS-232 with RTS/CTS hardware flow control
USB 2.0 with support for USB TMC
LAN TCP/IP with LXI support
Optional GPIB/IEEE488 interface
IF output @ 886MHz
Headphone output
REF (reference clock) input/output BNC ports
Alarm/Open collector output BNC port
Trigger/Gate input BNC ports
RF N-type input port
Tracking generator output
DC +7V/500mA output SMB port
10
Page 13

GETTING STARTED
Standard
Accessories
Part number
Description
Region dependant
User manual
Region dependant
Power cord
Options
Option number
Description
Opt1.
Tracking generator
Opt2.
Battery (11.1V/5200mAH
Li-ion battery)
Opt3.
GPIB interface (IEEE 488
bus)
Optional
Accessories
Part number
Description
PWS-06
USB Average Power Sensor
(up to 6200 MHz;
-32 to 20 dBm)
GRA-415
6U Rack mount kit
Accessories
11
Page 14

GSP-930 User Manual
Opening the box
Contents
(single unit)
Main unit
(may include optional
GPIB, TG output)
Quick Start manual
User Manual CD
Power cord x1 (region
dependent)
Optional battery pack
Calibration certificate
Package Contents
Check the contents before using the GSP-930.
12
Page 15

GETTING STARTED
Frequency
Autoset
Amplitude
Span
BW/Avg
Display
Trace
Sweep
Meas
Trigger
Sequence
File
Recall
Save
Peak
Marker->
Marker
System
Mode
Preset
Search
Quick
Save
Limit
Line
7
4
1
0
8
5
2
9
6
3
/
Enter
BK SP
F 4
F 3
F 2
F 1
F 6
F 5
F 7
GSP-930
9 kHz 3 GHz
Spectrum Analyzer
LOCAL
RF INPUT 50
REV PWR +30dBm
TG OUTPUT 50
W W
500mA MAX.
DC 7V
OUTPUT +30dBm MAX.
MAX.DC ±50V MAX.DC ±50V
CONTROL FILE
MARKER STATE
LCD
display
Main
keys
Function
keys
Control
keys
Power key
File keys
State keys
Scroll wheel
Arrow keys
RF input
terminal
DC power
supply
Tracking
generator
output
Numeric,
Enter and
BK SP keys
USB A,
Micro SD
port
Marker keys
LCD display
800600 color LCD display. The display shows the
soft keys for the current function, frequency,
amplitude and marker information.
Function keys
F 1
~
F 7
The F1 to F7 function keys directly
correspond to the soft keys on the
right-hand side of display.
Main keys
Frequency
Sets the center frequency, start
frequency, stop frequency, center
frequency step and frequency
offset values.
Appearance
GSP-930 Front Panel
13
Page 16

GSP-930 User Manual
Span
Sets the span, with options for full
span, zero span and last span.
Amplitude
Sets the amplitude reference level,
attenuation, pre-amplifier
controls, scale and other options
for attenuation and scale.
Autoset
Automatically searches the peak
signal with maximum amplitude
and displays it with appropriate
horizontal and vertical scales.
Control keys
BW/Avg
Sets the resolution bandwidth,
video bandwidth, average type
and turns the EMI filter on/off.
Sweep
Sets the sweep time and gate time.
Trace
Sets traces and trace related
functions.
Display
The Display key configures the
windowing mode and basic
display properties.
Meas
Accesses measurement options
such as ACPR, OCBW,
demodulation measurements,
SEM, TOI and other advanced
measurements.
Limit
Line
Sets and tests Pass/Fail limit lines.
Sequence
Access, set and edit program
sequences.
14
Page 17

GETTING STARTED
Trigger
Sets the triggering modes.
File
File
File utilities options
Quick
Save
The Quick Save utility allows you
to save either the state, trace,
screen limit line, correction or
sequence with only a single press.
Save
Save the trace, state etc., and save
options.
Recall
Recall the trace, state etc., and
recall options.
Marker
Marker
Turns the Markers on/off and
configures the markers.
Marker->
The Marker-> key positions the
markers on the trace.
Peak
Search
Finds each maximum and
minimum peak. Used with the
Marker function.
State
Preset
LOCAL
The Preset key will restore the
spectrum analyzer to the Factory
or User-defined settings.
The Preset key will also return the
instrument back to local control
after it has been in remote control
mode.
15
Page 18

GSP-930 User Manual
Mode
The Mode key sets the spectrum
analyzer to either Spectrum or
Power Meter mode.
System
The System key shows system
information, settings and other
system related functions.
Power key
Turns the instrument on/off.
Scroll wheel
Edit values, select listed items.
Arrow keys
Increment/decrement values (in
steps), select listed items.
RF input terminal
RF INPUT 50
W
+30dBm MAX.
MAX.DC ±50V
RF input port. Accepts RF inputs.
Maximum input: +33dBm
Input impedance: 50Ω
Maximum DC voltage: ±50V
N-type: female
DC power supply
500mA MAX.
DC 7V
OUTPUT
SMB port supplies power for
optional accessories.
DC +7V
500mA Max.
16
Page 19

GETTING STARTED
Numeric keypad
7 8 9
654
1 2 3
/
0
BK SP
Enter
The numeric
keypad is used to
enter vales and
parameters. It is
often used in
conjunction with
the arrow keys and
scroll wheel.
TG output port
REV PWR +30dBm
TG OUTPUT 50
W
MAX.DC ±50V
The Tracking Generator (TG)
output source.
N-type: female
Input impedance: 50Ω
Output power: -50dBm to 0dBm
Maximum reversed power:
+30dBm
USB A, Micro SD
USB A port, Micro SD port for
saving/recalling settings/files.
17
Page 20

Rear Panel
AC 100 240V
50 60 Hz 82W MAX.
AC 100 240V
50 60 Hz 82W MAX.
USB-B,
LAN port
FanDVI-I
port
IF OUT
TRIG IN/GATE
IN port
ALARM OUT/
OPEN
COLLECTOR
REF OUT Battery cover/
Optional
battery pack
REF IN
RS232 port
GPIB port
(optional)
Power
socket
RS232
RS232 9 pin DSUB port.
IF OUT
SMA IF Out port.
DVI-I
DVI video out port. Supports SVGA
(800X600) @ 60Hz.
Fan
Power Socket
Power Socket:
100~240V, 50/60Hz.
GSP-930 User Manual
18
Page 21

GETTING STARTED
Battery pack
Voltage: 10.8V
Capacity: 5200mAH
REF IN
BNC female reference input.
REF OUT
BNC female reference output:
10MHz, 50Ω impedance
Security Lock
ALARM OUT
BNC female open collector Alarm
output.
TRIG IN/GATE IN
BNC female 3.3V CMOS trigger
input/gated sweep input.
Phone
3.5mm stereo headphone jack
(wired for mono operation)
USB B
USB B Device port. USB 1.1/2.0
LAN
RJ-45 10Base-T/100Base-Tx
19
Page 22

Display
Scale and
Reference
level
Attenuation
level
Date
and time
Function
menu
Marker
information
Trigger
settings
Pre-amp
settings
Trace and
Detection
settings
Frequency/Bandwidth
settings
Status icons
Sweep
settings
Traces and
waveforms
LXI icon
Entry /
Message
area
Reference level
Displays the reference level. For details, see page
46.
Attenuation
Displays the vertical scale (attenuation) of the
input signal. For details, see page 47.
Date/Time
Displays the date and time. See page 106 for
details.
Marker
information
Displays marker information. For details see page
83.
LXI icon
This icon indicates the status of the LXI connection.
For details, see page 196.
Function menu
Soft menu keys associated with the F1 to F7
function keys to the right of the display.
GSP-930 User Manual
20
Page 23

GETTING STARTED
Sweep settings
Sweep icon that shows the sweep
status. See page 66 for details.
Trigger settings
Trigger icon that shows the trigger
status. See page 79 details.
Pre-amp settings
Pre-amplifier icon that shows the
Pre-amplifier status. See from page
48 for details.
Trace and
detection settings
Trace icon that shows the trace type
and the detection mode used for
each trace. See from page 72 for
details.
Status Icons
Displays the interface status, power source status,
and alarm status, etc. See the Status Icon Overview
on page 22 for a list of the status icons.
Frequency/
Bandwidth
settings
Displays the Start, Center and Stop frequencies,
RBW, VBW, Span and Sweep settings.
Entry/Message
area
This area is used to show system messages, errors
and input values/parameters.
Trace and
waveforms
Main display showing the input signals, traces
(page 72), limit lines (159) and marker positions
(83).
21
Page 24

GSP-930 User Manual
PreAmp
Indicates that the pre amplifier is
on.
AC
Shown when running on AC
power.
AC Charge
Shown when the AC power is
charging the battery.
Alarm Off
Alarm buzzer output is currently
off.
Alarm On
Alarm buzzer output is currently
on.
Amplitude Offset
Indicates that the amplitude-shift is
active. This icon appears when
amplitude-related functions are
used:
Reference level offset
Amplitude Correction
Input Z = 75Ω
Input Z cal >0
Battery indicator
~
Indicates the battery charge.
Bandwidth
Indicator
Indicates that the RBW or VBW
settings are in manual mode.
Average
Indicates that the Average function
is active.
Status Icon Overview
22
Page 25

GETTING STARTED
External Lock
Indicates that the system is now
locked and refers to the external
reference input signal
External Trigger
External trigger signal is being
used.
Math
Trace math is being used.
Sequence
Indicator
Shown when a sequence is running.
Sweep Indicator
Indicates that the sweep time is
manually set.
Tracking
generator
Indicates the tracking generator is
turned on.
TG Normalization
Indicates that the tracking generator
has been normalized.
Wake-up clock
Indicates that the wake-up clock is
turned on.
USB
Indicates that a USB flash drive is
inserted into the front panel and is
recognized.
Micro SD
Indicates that a micro SD card is
inserted into the front panel and is
recognized.
23
Page 26

GSP-930 User Manual
Description
The GSP-930 has two adjustable rubber feet
that can used to position the instrument into
two preset orientations.
Upright Position
Tuck the feet under
the bottom of the
instrument to stand
the instrument
upright.
Leaning Position
Pull the feet back to
have the instrument
leaning back.
First Use Instructions
Use the procedures below when first using the GSP-930 to tilt the
stand, insert the battery pack, power up the instrument, setting the
internal clock, the wake-up clock, updating the firmware and
restoring the default settings. Lastly, the Conventions sections will
introduce you to the basic operating conventions used throughout
the user manual.
Tilting the Stand
24
Page 27

GETTING STARTED
Description
The GSP-930 has an optional battery pack. The
battery should be inserted before power is
connected to the AC power socket and before
the unit is turned on.
Steps
1. Ensure the power is off and the AC power is
disconnected.
2. Remove the battery cover.
3. Insert the battery as shown in the diagram
below.
4. Replace the battery cover.
Display Icon
The battery icon is displayed when GSP930 is running on battery power.
Insertion Diagram
Inserting the Battery Pack
25
Page 28

Power UP
Steps
1. Insert the AC power cord into the power
socket.
2. The power button exterior will be lit blue to
indicate that the GSP-930 is in standby mode.
3. Press the power button to turn the GSP-930 on.
4. The power button will turn orange and the
GSP-930 will start to boot up.
Note
It takes approximately 1.5 minutes for the GSP-930
to fully startup.
GSP-930 User Manual
26
Page 29

Power Down
Description
The GSP-930 has two methods to power down:
Normal and Forced Power Down.
The normal power down method will save the
system state and end any running processes.
The state is saved for the next time the
instrument is turned back on.
The forced power down method only does a
minimum state save.
Normal Power
Down
Press the power button. The system will
automatically handle the power down
procedure in the following order:
The system state is saved.
Outstanding processes are closed in
sequence.
The LCD backlight is turned off.
The system enters standby mode (the
power key changes from orange to
blue).
Note
The process takes ~10 seconds.
Forced Power
Down
Press and hold the power button for ~4
seconds until the system turns off and the
power button turns blue.
Note
The forced down mode might cause the GSP930 to perform a longer system check the next
time it is powered up.
GETTING STARTED
27
Page 30

GSP-930 User Manual
Description
The GSP-930 can be setup to power-up
automatically using the Wakeup Clock
function. This feature is useful to wake-up the
instrument early and eliminate settling time.
System Date
Example: Set the System Date to March 1, 2012
1. Press
System
>Date/Time[F4]>Set
Date[F1]>Year[F1].
2. Press 2012>Enter[F1].
3. Press Month[F2]>3>Enter[F1].
4. Press Day[F3]>1>Enter[F1].
5. Press Return[F7].
Note
The System Date will be shown at the top of the
display.
System Time
Example: Set the System Time to 9.00 AM
1. Press
System
>Date/Time[F4]>Set
Time[F2]>Hour[F1].
2. Press 9>Enter[F1].
3. Press Minute[F2]>0>Enter[F1].
4. Press Second[F3]>0>Enter[F1].
5. Press Return[F7].
Setting the Date, Time and Wake-Up Clock
28
Page 31

GETTING STARTED
Note
The System Time will be shown at the top of the
display.
System Wake-Up
Clock
Example: Set the GSP-930 to wake up at 9.00
AM
1. Press
System
>Date/Time[F4]>Wake-Up
Clock[F3]>Clock[F1].
2. Press Clock[F1] to choose a clock (1 ~ 7).
3. Press State[F2] to turn the clock on/off.
4. Press Hour[F3]>9>Enter[F1].
5. Press Minute[F4]>0>Enter[F1].
6. Press [F5] and choose Rept. (Repeat) or Single.
7. Press Select Date[F6] and select a day.
8. Press Return[F7] to save the Wake-Up Clock
settings.
Note
The system time is kept with the CR2032 clock
battery. If the system time/ wake up clock can no
longer be set, please replace the clock battery. See
page 206.
29
Page 32
GSP-930 User Manual
Description
The GSP-930 allows the firmware to be
updated by end-users. Before using the GSP930, please check the GW Instek website or ask
your local distributor for the latest firmware.
System version
Before updating the firmware, please check the
firmware version.
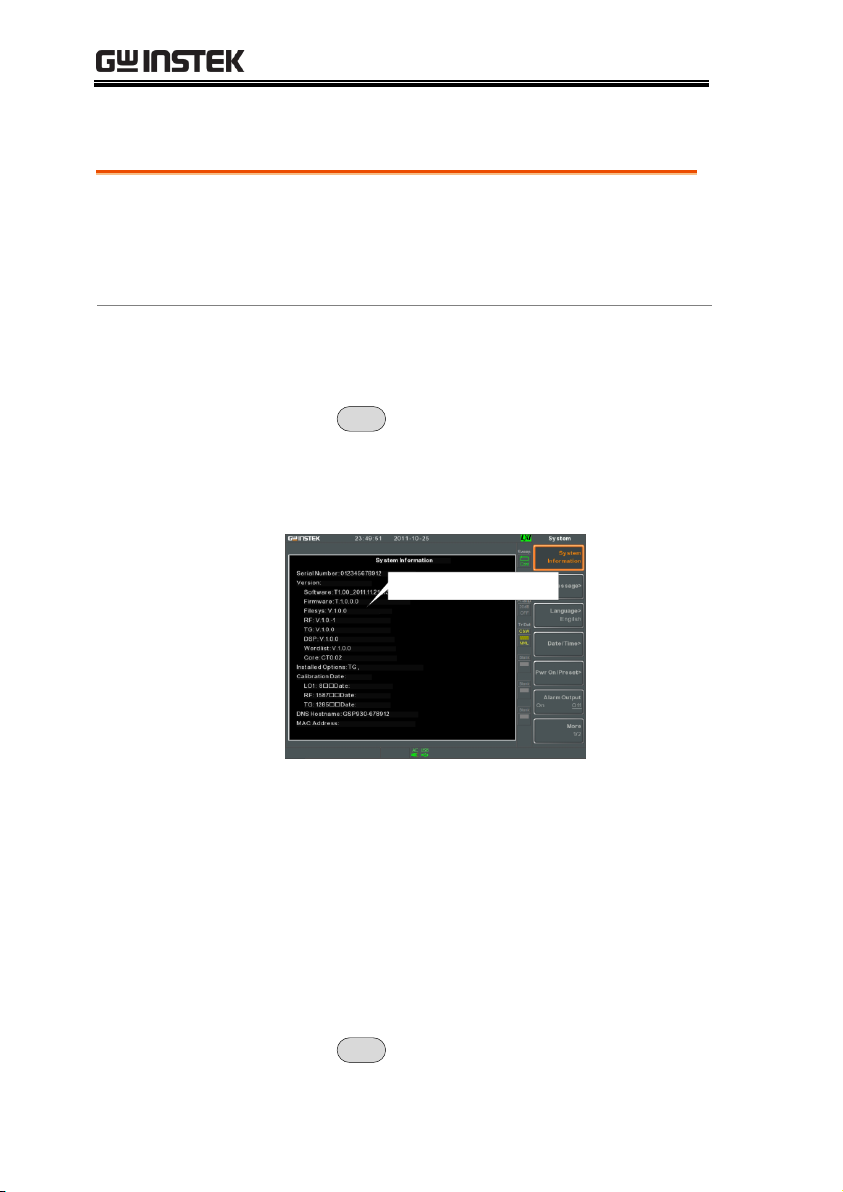
1. Press
System
>System Information[F1].
2. The firmware will be listed on the display.
Firmware: T. 1. 0. 0
3. Press any other key to exit out of the System
Information screen.
4. To upgrade the firmware, insert the new
firmware onto a USB flash drive or Micro SD
card and put the drive/ card into the
appropriate front panel port. The firmware
files should be located in a directory named
“gsp930”.
5. Press
System
>More 1/2[F7]>Upgrade[F3].
Firmware Update
30
Page 33
GETTING STARTED
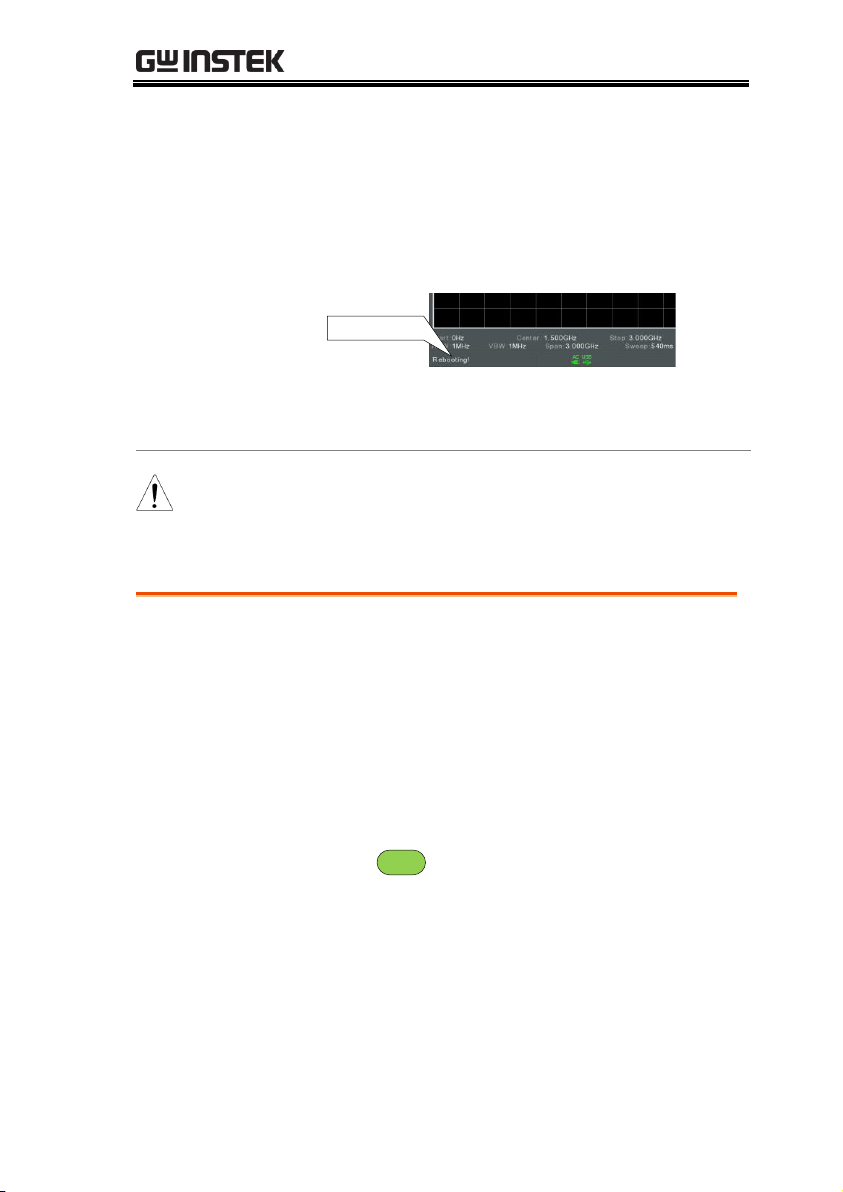
6. The spectrum analyzer will automatically find
the firmware on the USB flash drive and start
to update the firmware. When finished, the
message “Upgrade is finished” will be shown
at the bottom of the screen followed by
“Rebooting”.
Rebooting
7. The system will automatically restart after the
rebooting message.
Note
The upgrade process may take a few minutes.
Description
The factory default settings or user-defined
presets can be easily restored using the Preset
key on the front panel. By default, the factory
default settings are restored with the Preset
key.
For details on how to configure the preset
settings, please see page 109.
Steps
1. Press
Preset
.
2. The spectrum analyzer will load the preset
settings.
Restoring Default Settings
31
Page 34
GSP-930 User Manual
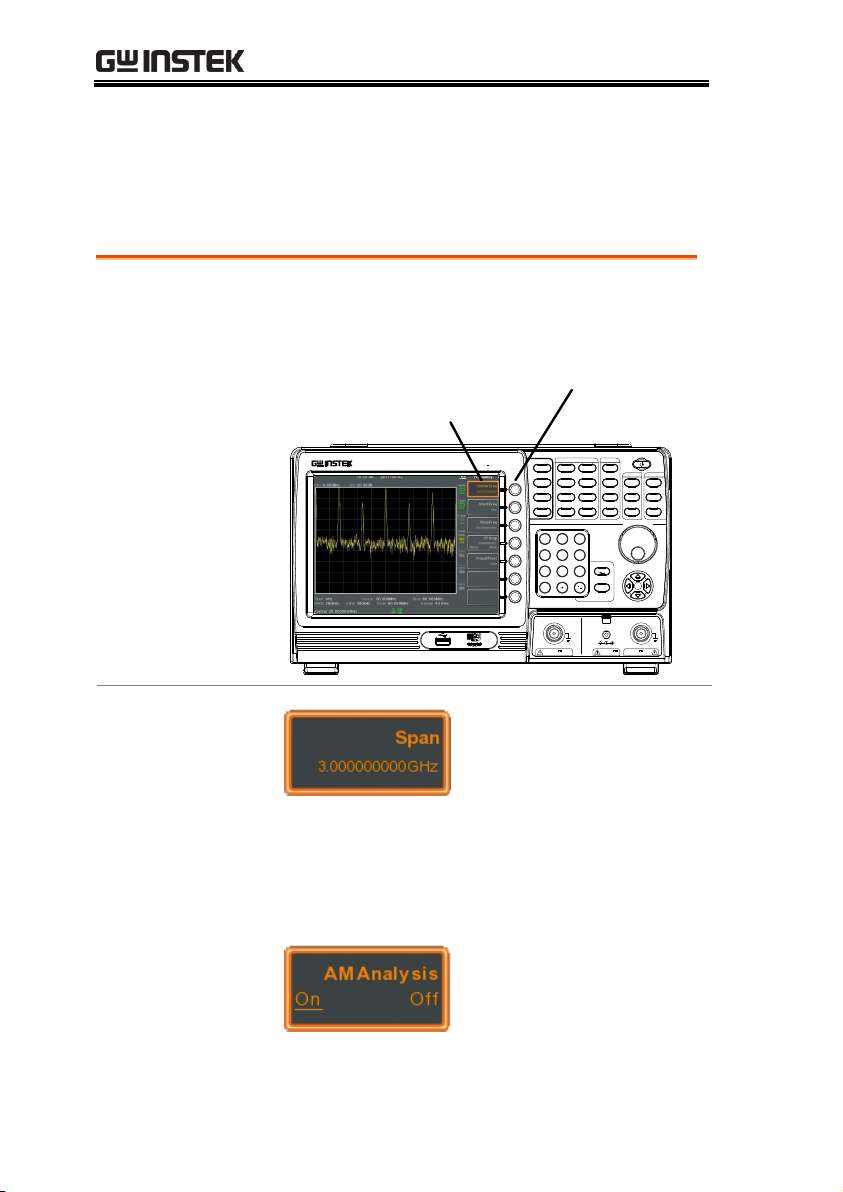
Soft Menu keys
The F1 to F7 function keys on the right side of
the display correspond directly to the softmenu keys on their left.
Frequency
Autoset
Amplitude
Span
BW/Avg
Display
Trace
Sweep
Meas
Trigger
Sequence
File
Recall
Save
Peak
Marker->
Marker
System
Mode
Preset
Search
Quick
Save
Limit
Line
7
4
1
0
8
5
2
9
6
3
/
Enter
BK SP
F 4
F 3
F 2
F 1
F 6
F 5
F 7
GSP-930
9 kHz 3 GHz
Spectrum Analyzer
LOCAL
RF INPUT 50
REV PWR +30dBm
TG OUTPUT 50
W W
500mA MAX.
DC 7V
OUTPUT +30dBm MAX.
MAX.DC ±50V MAX.DC ±50V
CONTROL FILE
MARKER STATE
Soft-menu keys
F1 ~ F7 function keys
Input Parameter
Values
Selecting this type of menu key will allow you
to enter a new value with the numeric keypad
or increment/decrement the value using the
scroll wheel.
Toggle State
Pressing this menu key will toggle the state.
Conventions
The following conventions are used throughout the user manual.
Read the conventions below for a basic grasp of how to operate the
GSP-930 menu system and front panel keys.
32
Page 35
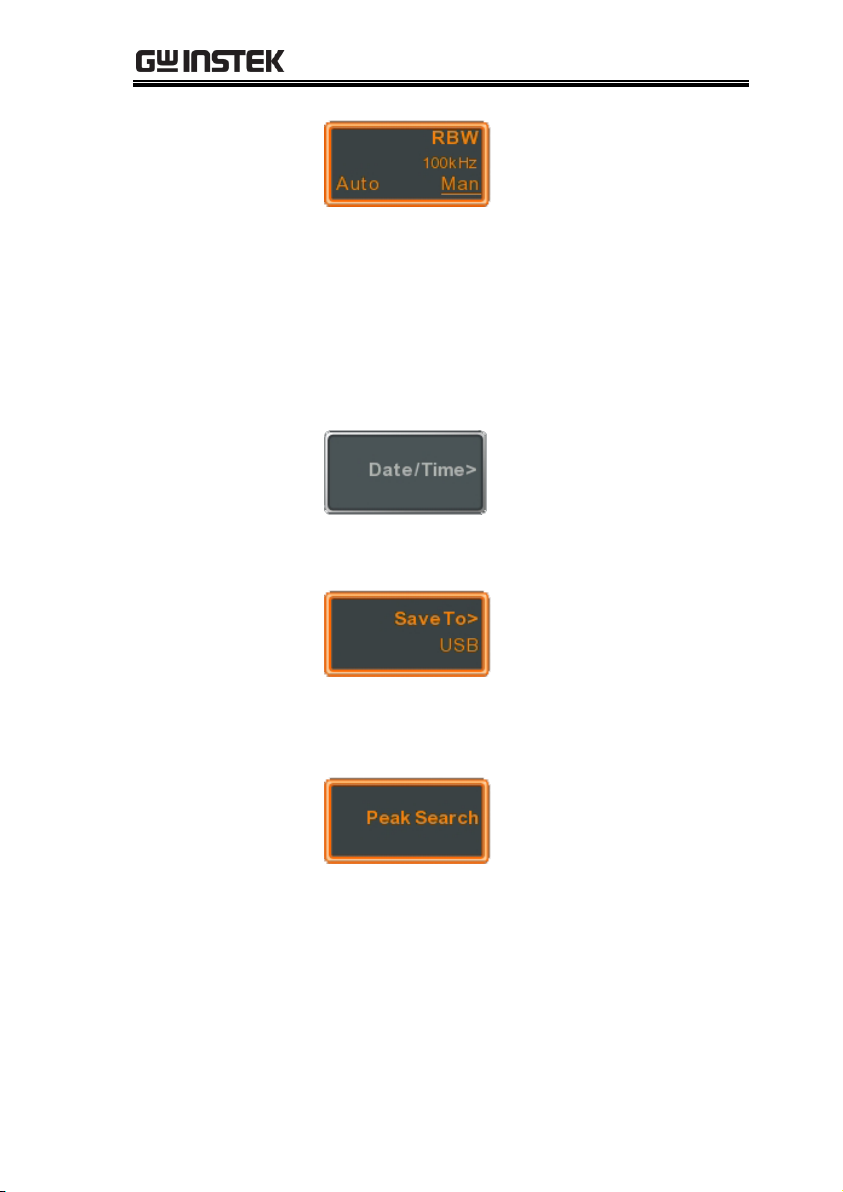
GETTING STARTED
Toggle State &
Input Parameter
Pressing this menu key will allow you to toggle
the state of the function between Auto and
Man(ual) state. When in the Man state, the
parameter value can be manually edited. Use
the numeric keypad to enter the new value or
use the scroll wheel to increment/decrement
the current value.
Sub Menu
Pressing this menu key will enter a submenu.
Sub Menu to
select parameter
Pressing this menu key will enter a submenu to
select a parameter.
Active Function
Pressing this type of menu key will activate
that function. The menu key will be
highlighted to show it is the active function.
33
Page 36
GSP-930 User Manual
Parameter input
Numerical keypad
Scroll wheel
7
4
1
0
8
5
2
9
6
3
/
Enter
BK SP
Directional arrow keys
Backspace, Enter keys
Parameter values can be entered using the
numeric keypad, the scroll wheel and
occasionally with the arrow keys.
Using the numeric
keypad
When prompted to enter a parameter, use the
number keys (0~9), the decimal key (.) and the
sign key (+/-) to enter a value. After a value
has been entered, the soft-menu keys can be
used to select the units.
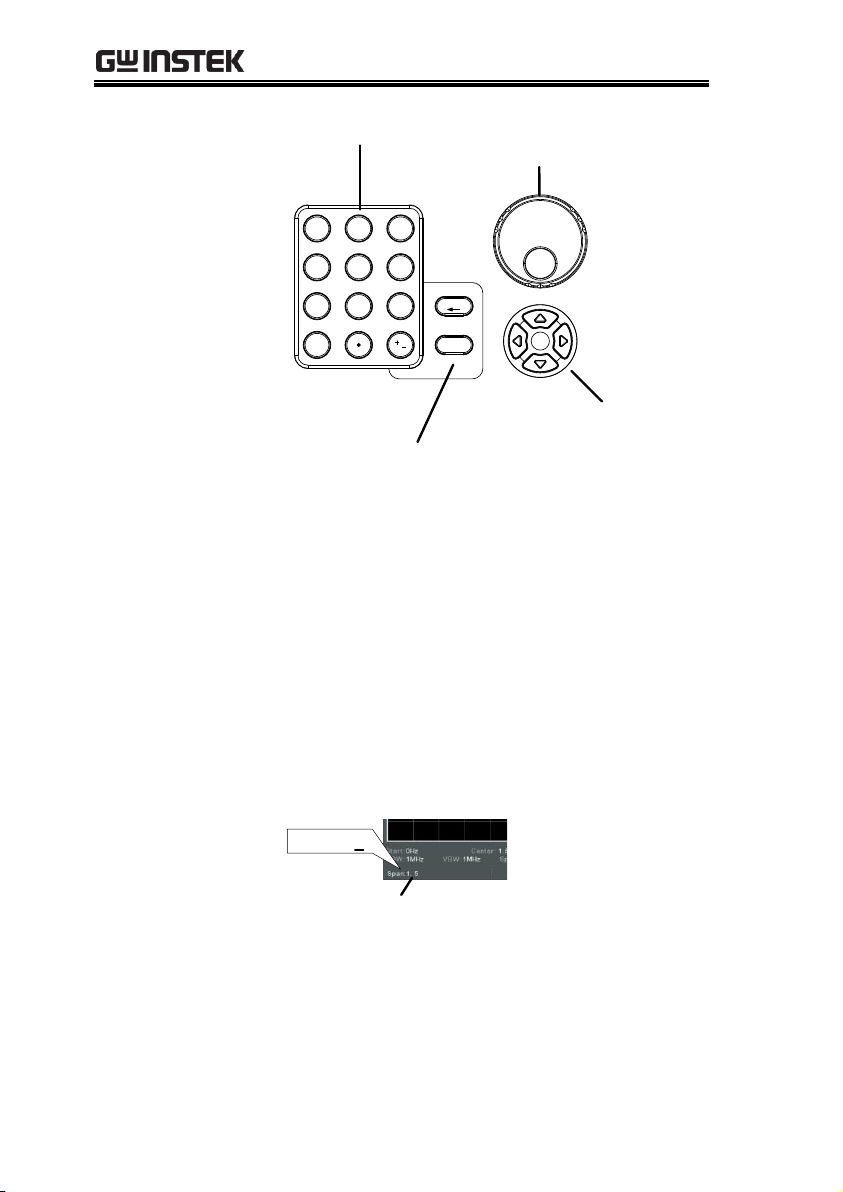
The value of the parameter is shown at the
bottom of the screen as it is edited.
Edited parameter
Span: 1.5
Back Space
Use the backspace key to delete the last
character or number entered.
34
Page 37

GETTING STARTED
Using the scroll
wheel
Use the scroll wheel to alter the current value.
Clockwise increases the value, anti-clockwise
decreases the value.
Directional arrows
Use the directional arrows to select discrete
parameters or to alter values by a coarser
resolution than the scroll wheel. Left decreases
the value, right increases the value.
35
Page 38

GSP-930 User Manual
Frequency Settings .......................................................... 39
Center Frequency ....................................................................................................... 39
Start and Stop Frequency .......................................................................................... 40
Center Frequency Step .............................................................................................. 41
Frequency Offset ........................................................................................................ 42
Span Settings ................................................................. 43
Span .............................................................................................................................. 43
Full Span ...................................................................................................................... 44
Zero Span .................................................................................................................... 44
Last Span ...................................................................................................................... 45
Amplitude Settings ......................................................... 46
Reference Level .......................................................................................................... 46
Attenuation .................................................................................................................. 47
Scale/Div ..................................................................................................................... 48
Scale Type .................................................................................................................... 48
View Scale .................................................................................................................... 49
Vertical Scale Units .................................................................................................... 50
Reference Level Offset .............................................................................................. 50
Amplitude Correction ................................................................................................ 51
Create a Correction Set ............................................................................... 52
Amplitude Correction On/Off .................................................................. 54
Delete Correction Set .................................................................................. 55
Save Correction Set To Memory ............................................................... 55
Recall Correction Set From Memory ........................................................ 56
Input Impedance ........................................................................................................ 56
Input Impedance Calibration ................................................................................... 57
Using the Built-in Pre-Amplifier ............................................................................. 57
Autoset ........................................................................... 59
Using Autoset ............................................................................................................. 59
Limiting the Autoset Vertical Search Range .......................................................... 60
BASIC OPERATION
36
Page 39

BASIC OPERATION
Limiting the Autoset Horizontal Search Range .....................................................60
Bandwidth/Average Settings ........................................... 61
Resolution Bandwidth Setting (RBW) .....................................................................61
Video Bandwidth Settings (VBW) ...........................................................................62
VBW/RBW Ratio .......................................................................................................62
Average Trace ..............................................................................................................63
Average Type ...............................................................................................................65
EMI Filter .....................................................................................................................66
Sweep ............................................................................ 66
Sweep Time ..................................................................................................................66
Single Sweep .................................................................................................................67
Continuous Sweep ......................................................................................................68
Gated Sweep Overview ..............................................................................................68
Using the Gated Sweep Mode ..................................................................................70
Trace ............................................................................. 72
Selecting a Trace ..........................................................................................................72
Trace Math ...................................................................................................................74
Trace Detection Mode ...............................................................................................75
Trigger ........................................................................... 79
Selecting a Trigger Type .............................................................................................79
Free Run Mode ..............................................................................................79
Activate Video Trigger .................................................................................79
Activate External Trigger .............................................................................81
Selecting the Trigger Mode .......................................................................................82
Set the Trigger Delay Time .......................................................................................83
Marker ........................................................................... 84
Activating a Marker.....................................................................................................85
Activate a Normal Marker ...........................................................................85
Move Marker Manually ................................................................................86
Move Marker to Preset Locations ..............................................................86
Activate Delta Marker ..................................................................................87
Move Delta Marker(s)Manually ..................................................................88
Marker Functions ........................................................................................................89
Marker Noise .................................................................................................89
Frequency Counter .......................................................................................90
Move Marker to Trace ...............................................................................................91
Show Markers in Table ..............................................................................................92
Peak Search ..................................................................................................................93
37
Page 40

GSP-930 User Manual
Move Marker to Peak .................................................................................. 93
Move Marker and Peak to Center ............................................................. 93
Search for Peaks ........................................................................................... 94
Peak Configuration ...................................................................................... 95
Peak Table ................................................................................................................... 96
Display ........................................................................... 98
Adjusting the LCD Brightness ................................................................................. 98
Turning the LCD Backlight Off .............................................................................. 98
Setting a Display Line (Reference Level Line) ...................................................... 99
Using the Video Out Port ......................................................................................... 99
Setting the Display Mode ........................................................................................ 100
Split Spectrum View ................................................................................................ 103
System Settings ............................................................ 105
System Information ................................................................................................. 105
Error Messages ......................................................................................................... 105
Set the System Language ......................................................................................... 106
Set the Date and Time ............................................................................................. 106
Using the Wake-Up Clock ...................................................................................... 107
Alarm Output ............................................................................................................ 108
Preset ........................................................................... 109
Using the Preset Key ............................................................................................... 109
Save the User Preset Settings ................................................................................. 109
Preset Type Settings ................................................................................................. 110
Power on Preset Settings ........................................................................................ 110
38
Page 41

BASIC OPERATION
Description
The center frequency function sets the center
frequency and centers the display to the center
frequency.
Operation
1. Press
Frequency
>Center[F1] and enter the
frequency and unit.
Range:
Resolution:
Default
0kHz~3GHz
1Hz
1.5GHz
Display
Center frequency
Set Center Frequency
Frequency Settings
Center Frequency
39
Page 42

GSP-930 User Manual
Description
The start/stop frequency function will set the
start and stop frequency of the span.
Operation
1. To set the start frequency, press
Frequency
> Start
Freq[F2] and enter the frequency and unit.
2. To set the stop frequency, press
Frequency
> Stop
Freq[F3] and enter the frequency and unit.
Range:
Resolution:
Default Start frequency:
Default Stop frequency:
0kHz~3GHz
1Hz
0Hz
3GHz
Display
Start Frequency
Start Frequency Stop Frequency
Stop Frequency
Note
The start and stop frequency can change when the
span settings are used.
The stop frequency must be set higher than the
start frequency (for spans 0), otherwise the span
will be automatically set to 100Hz.
Start and Stop Frequency
40
Page 43

BASIC OPERATION
Description
The CF Step function sets the step size of the
center frequency when using the arrow keys.
When the arrow keys are used to alter the
center frequency, each press will move the
center frequency by the step size specified by
the CF Step function.
In auto mode, the center frequency step size is
equal to 10% (1 division) of the span.
Operation
1. Press
Frequency
> CF Step[F4] and set the CF Step to
Auto or Man.
2. If Man was selected, set the frequency and unit
of the center frequency step size.
Manual Range:
Auto range:
100Hz~3GHz
1/10 of span frequency
Display
CF Step size
Center Frequency Step
41
Page 44

GSP-930 User Manual
Description
The Freq Offset function allows you to add an
offset to the Center, Start and Stop frequencies
as well as the marker frequencies. The offset
value does not affect displaying the trace on the
display.
Operation
1. Press
Frequency
>Freq Offset[F5] and set the offset
value.
The Center, Start, Stop and Marker frequencies
are updated accordingly.
Offset Range:
0Hz~100GHz
Display
Frequency
Offset
Frequency Offset
42
Page 45

BASIC OPERATION
Description
The Span function will set the frequency range
of the sweep. The sweep will be centered
around the center frequency.
Setting the span will alter the start and stop
frequencies.
Operation
1. Press
Span
> Span[F1] and enter the span
frequency range and unit.
Range:
Resolution:
Default Span:
0kHz~3GHz
1Hz
3GHz
Display
Span
Set Span
Span Settings
Span
43
Page 46

Full Span
Description
The Full Span function will set the span to the
full frequency range.
This function will set the start and stop
frequencies to 0Hz and 3GHz respectively.
Operation
1. Press
Span
> Full Span[F2].
Description
The Zero Span function will set the frequency
range of the sweep to 0Hz and fixes the start
and stop frequencies to the center frequency.
The Zero Span function measures the time
domain characteristics of the input signal at the
center frequency. The horizontal axis is
displayed in the time domain.
Operation
1. Press
Span
> Zero Span[F3].
The span changes accordingly.
Zero Span
GSP-930 User Manual
44
Page 47

Display
Time domain
0Hz Span
Example: Amplitude modulation
Note
The measurement functions such as TOI, SEM,
CNR, CTB, CSO, ACPR, OCBW, phase, Jitter and
NdB are not available with the zero span setting:
Last Span
Description
The last span function returns the spectrum
analyzer to the previous span settings.
Operation
1. Press
Span
> Last Span[F4].
BASIC OPERATION
45
Page 48
GSP-930 User Manual
Description
The reference level defines the absolute level of
the amplitude on the top graticule in voltage or
power.
Operation
1. Press
Amplitude
> Ref Level[F1] and enter the
reference level amplitude and unit.
Range:
Units:
Resolution:
-120dBm ~ 30dBm
dBm, W, V, dBmV, dBuV
1dBm
Display
Reference LevelRef Level reading
Amplitude Settings
The vertical display scale is defined by the reference level
amplitude, attenuation, scale and external gain/loss.
Reference Level
46
Page 49
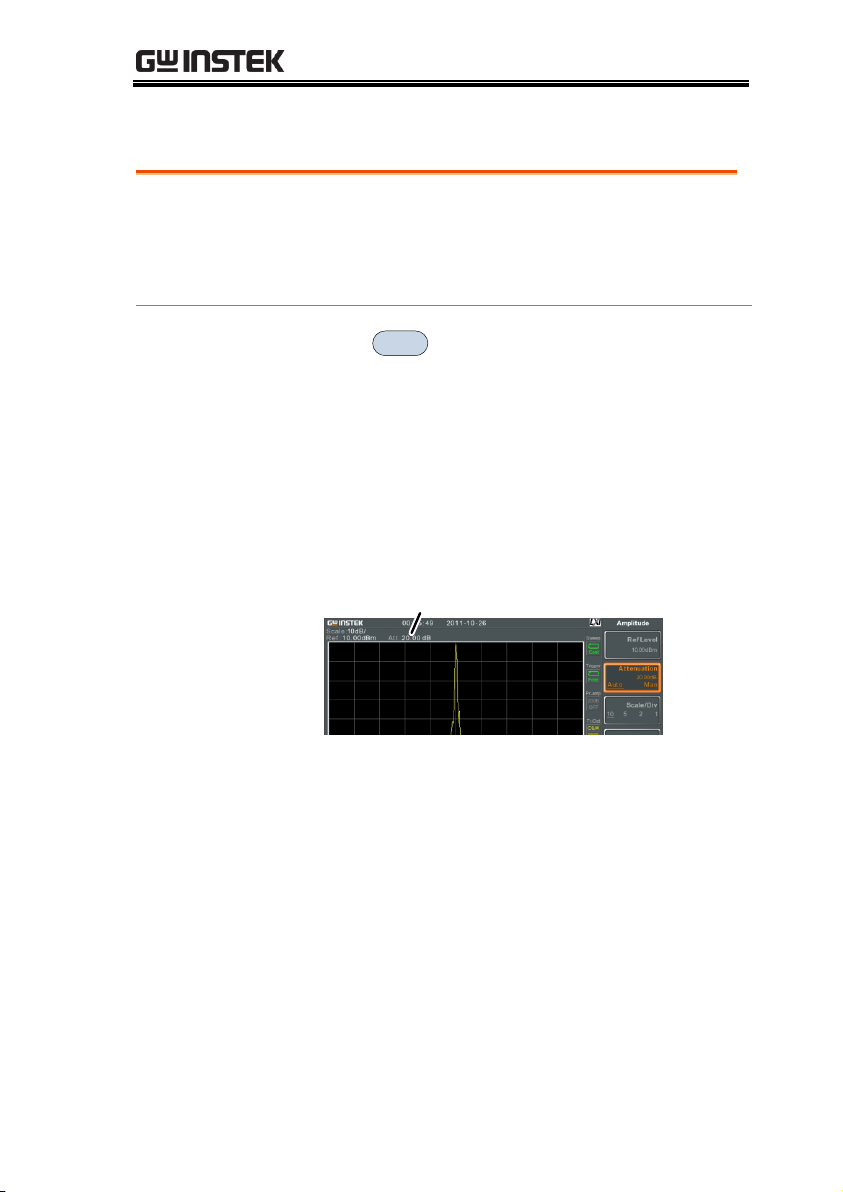
Attenuation
Description
The attenuation of the input signal level can set
to automatic (Auto) or manual (Man). When the
attenuation is set to Man, the input attenuator
can be changed manually in 1dB steps.
Operation
1. Press
Amplitude
> Attenuation[F2] and select Auto
or Man.
2. If Man was selected, enter the attenuation level
and unit.
Range:
Units:
Resolution:
0dBm ~ 50dBm
dBm
1dB
Display
Attenuation level
BASIC OPERATION
47
Page 50
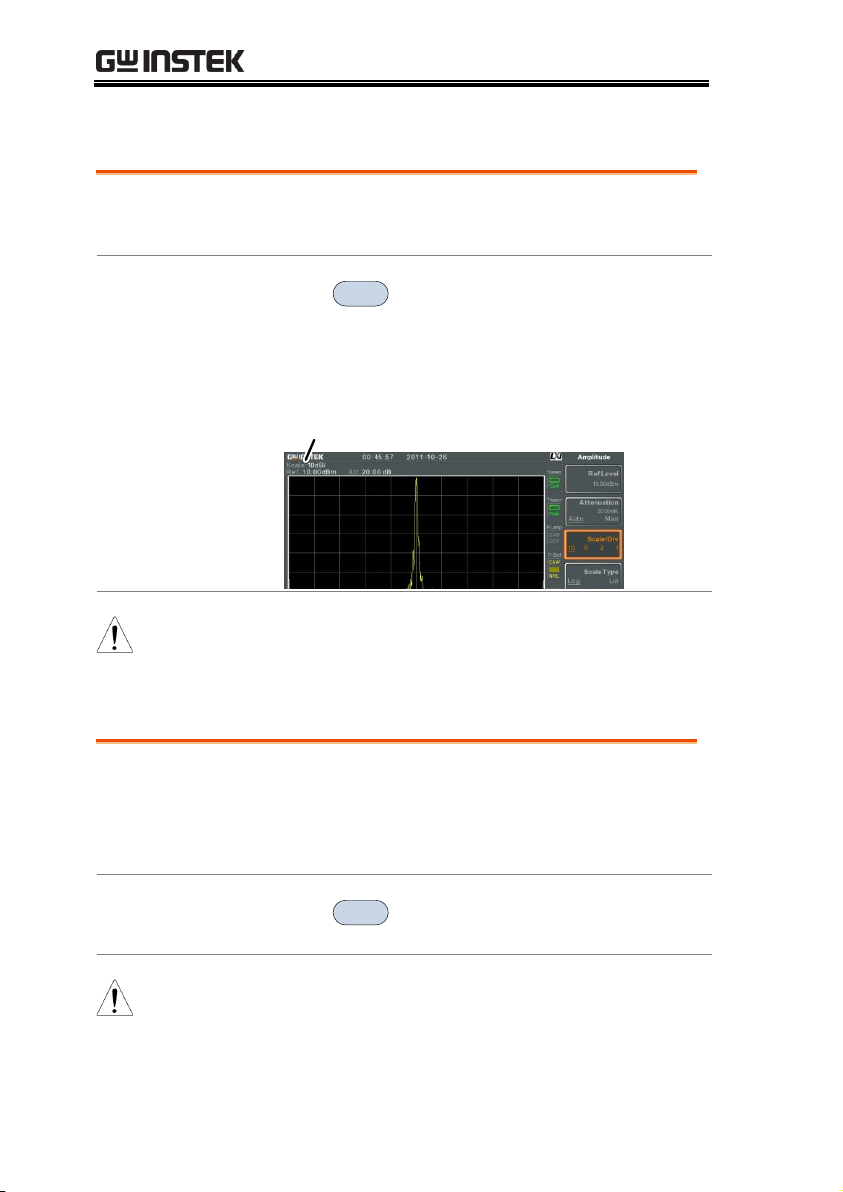
Scale/Div
Description
Sets the logarithmic units for the vertical
divisions when the scale is set to Log.
Operation
1. Press
Amplitude
> Scale/Div[F3] repeatedly to select
the vertical division units.
Unit Range:
10, 5, 2, 1
Display
Scale
Note
The Scale/Div function is only selectable when the
scale is set to Log (logarithmic).
Description
Sets the vertical scale in linear or logarithmic
units.
By default the linear scale is set to volts and the
logarithmic scale is set to dBm.
Operation
1. Press
Amplitude
> Scale Type[F4] and set the vertical
scale to Log or Lin.
Note
If the unit scale is changed (i.e. dBm → volts), the
displayed
vertical scale type will remain in the set
linear or logarithmic setting.
GSP-930 User Manual
Scale Type
48
Page 51
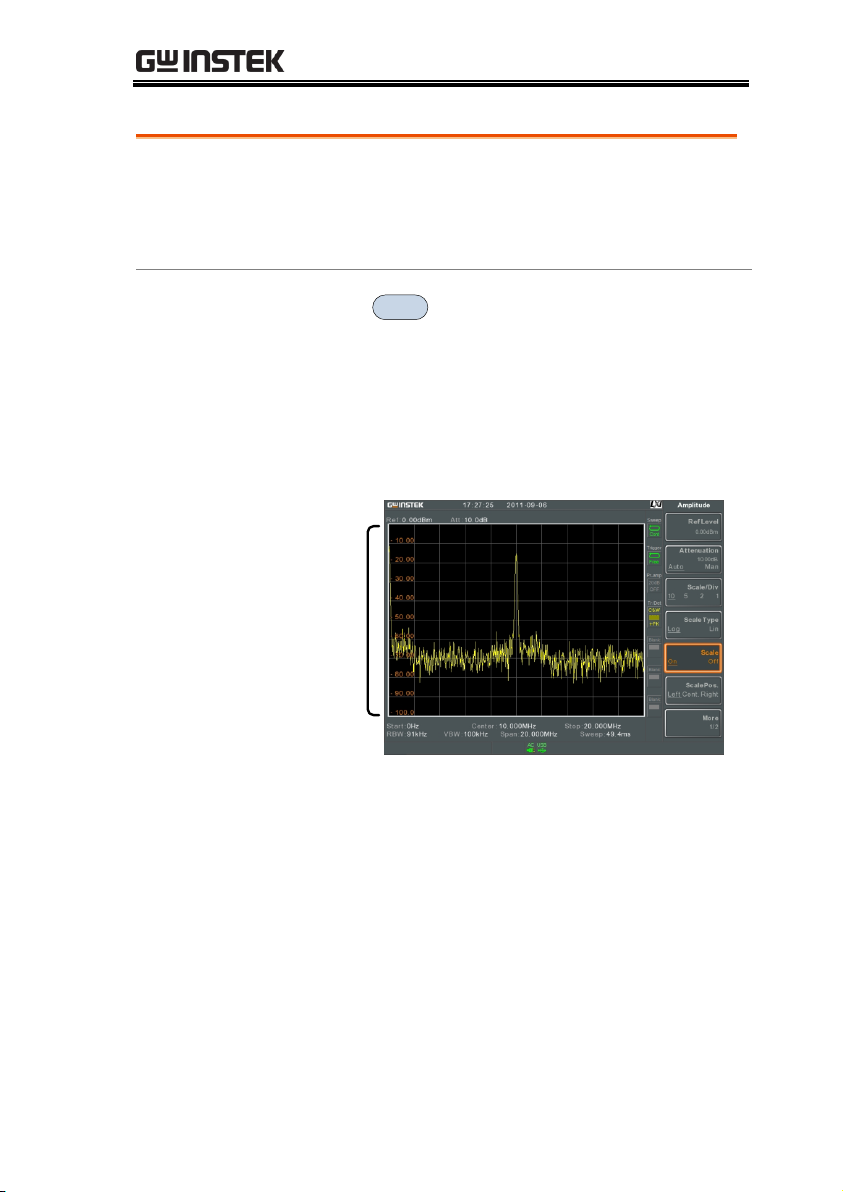
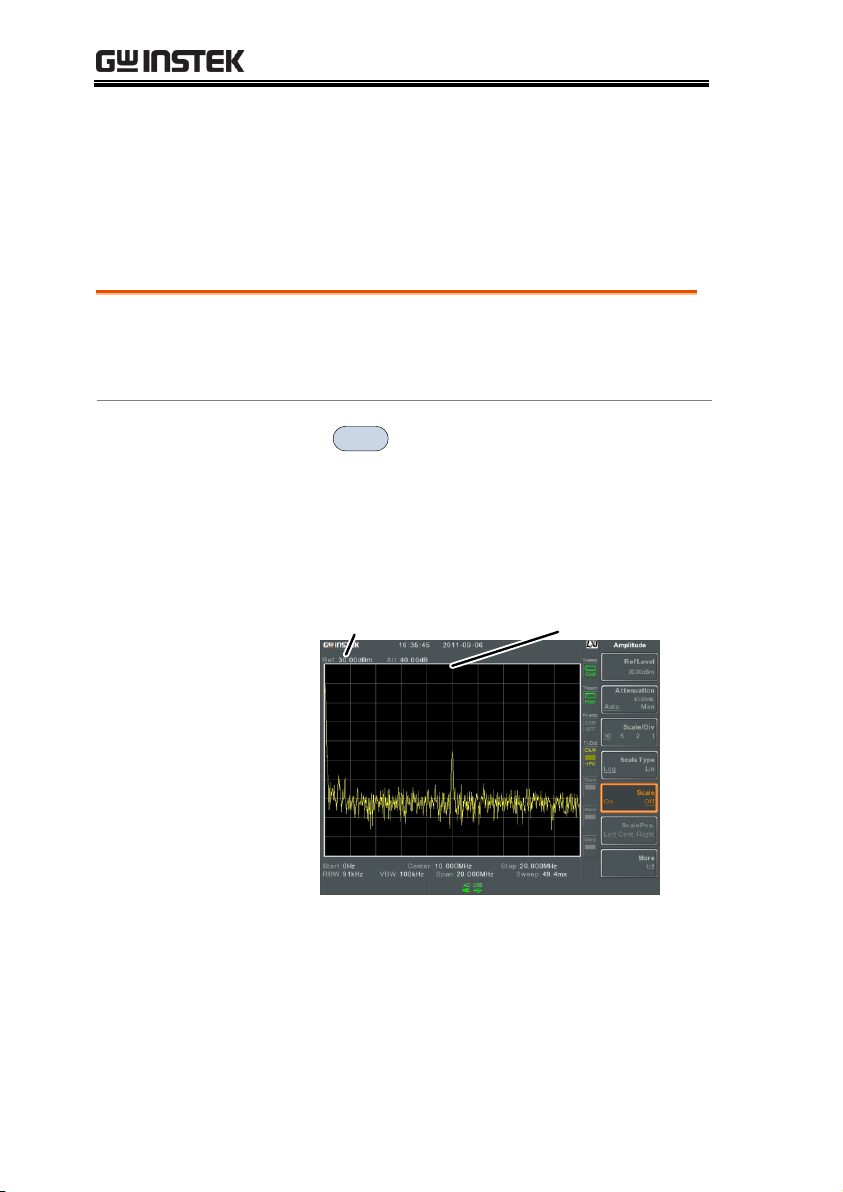
View Scale
Description
The Scale function turns the vertical scale
on/off. The value of each graticule division is
displayed with same units used for the Ref
Level settings.
Operation
1. Press
Amplitude
> Scale[F5] to toggle the Scale on or
off.
2. Press Scale Pos.[F6] to toggle the position of the
scale when on.
Scale position:
Left, Center, Right
Display
Scale
Left
The vertical scale is displayed on the left hand side
by default.
BASIC OPERATION
49
Page 52

GSP-930 User Manual
Description
Change the vertical units for both linear or
logarithmic scales.
Operation
1. Press
Amplitude
> More[F7]>Y Axis[F1] and then
choose the desired units.
2. The units are changed accordingly.
Units:
dBm, dBmV, dBuV,
Watts, Volts
Description
The Reference Level Offset function sets an
offset value to the reference level to compensate
for any loss or gain from an external network or
device.
The offset value does not affect the input
attenuation or the on-screen trace.
This setting will change the reference level
readout, the scale readout and the marker
readout.
Operation
1. Press
Amplitude
> More[F7]>RefLvlOffset[F2] and set
the offset level and unit.
2. To remove the offset level, set the reference
offset to 0 dB.
Range:
0dB ~ 50dB
Display Icon
The AMP icon is displayed at the bottom
of the screen.
Vertical Scale Units
Reference Level Offset
50
Page 53
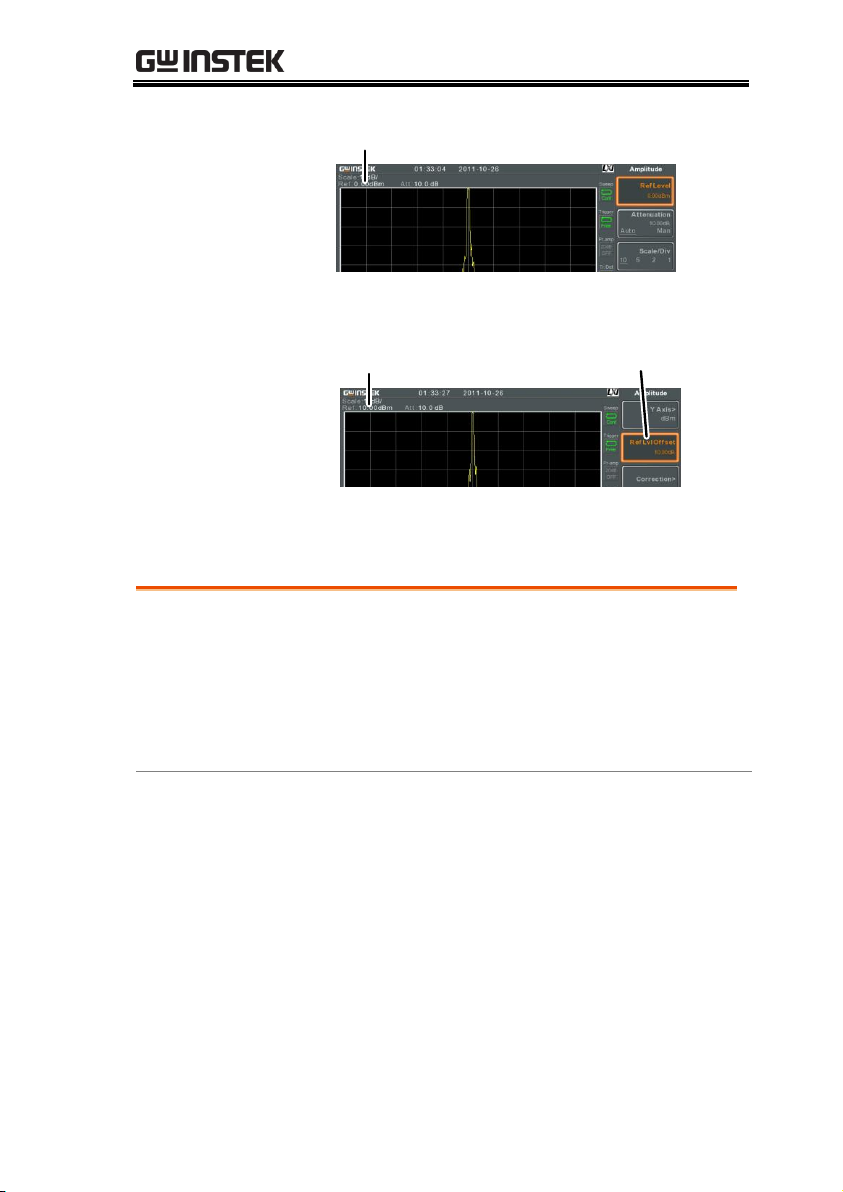
BASIC OPERATION
Example:
Ref: 0dBm
Before reference level offset(offset: 0dB)
Ref: 10dBm
Reference level
offset: 10dB
After reference level offset (offset: 10dB)
Description
Amplitude correction adjusts the frequency
response of the spectrum analyzer by altering
the amplitudes at specified frequencies. This
allows the spectrum analyzer to compensate for
loss or gain from an external network or device
at certain frequencies.
Range
Correction Sets:
5 sets of 30 points
Amplitude:
-40dB to +40dB
Amplitude Resolution:
0.1dB
Frequency:
9kHz to 3GHz
Frequency Resolution:
1Hz
Amplitude Correction
51
Page 54

GSP-930 User Manual
Display
Correction points
Original waveform
Corrected
output
Example: The diagram above shows how amplitude
correction is used to compensate for any losses or
gains at specific frequencies.
Description
The GSP-930 can create and edit up to 5 sets of
correction points. The correction points and
associated values are all tabulated for ease of
use.
Operation
1. Press
Amplitude
> More[F7]>Correction[F3]>
Correction Set[F1] and choose a correction set to
edit/create.
Correction set:
1~5
Create a Correction Set
52
Page 55

BASIC OPERATION
2. Press Edit[F3].
The GSP-930 will split into two screens. The top
screen will show the waveform and the bottom
screen will provide an overview of the
correction points.
Spectrum display
Correction points
Frequency of
selected point
3. Press Point Num[F1] and choose a point number
to edit.
Point Num:
1~30
4. Press Frequency[F2] and choose the frequency of
the selected point.
Press Gain Offset[F3] and choose the amplitude
of the select point. The units will be the same as
those used for the vertical scale.
The frequency of the point values displayed in
the correction table on the bottom display.
53
Page 56
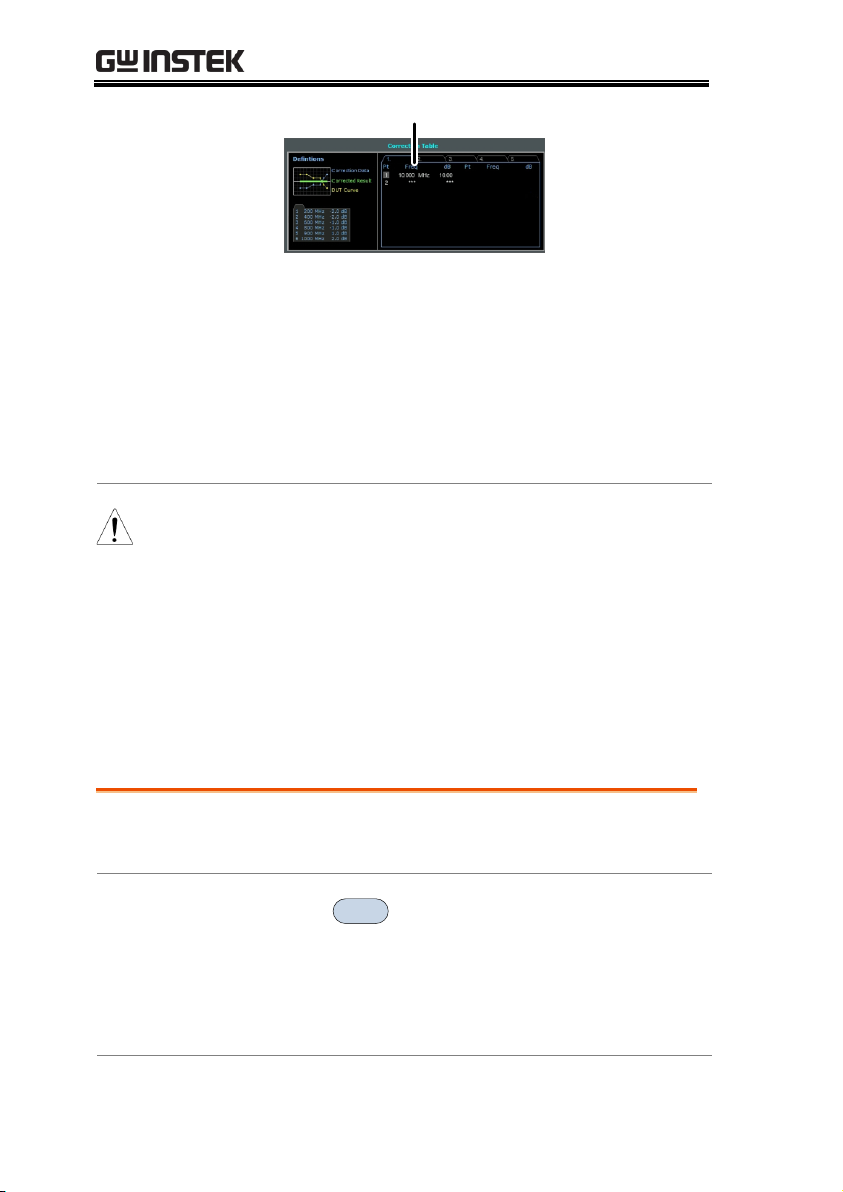
GSP-930 User Manual
Correction Table
5. Repeat steps 2 to 4 for any other correction
points.
6. To delete the selected point, press Delete
Point[F6].
7. Press Return[F7]>Save Correction[F5] to save the
correction set.
Note
Note that the correction points are automatically
sorted by frequency (low → high).
The correction set must be saved before it can be
turned on.
The frequency values
displayed
in the correction
table are rounded down for display purposes only.
The actual frequency for each point can be seen in
the Frequency soft-key.
Description
Any one of the 5 correction sets can be turned
on.
Activate
Correction
1. Press
Amplitude
> More[F7]>Correction[F3]>
Correction Set[F1] and choose a correction set.
Correction Set:
1~5
2. Press Correction[F2] and toggle correction on.
Amplitude Correction On/Off
54
Page 57

BASIC OPERATION
Deactivate
Correction
1. Press
Amplitude
> More[F7]>Correction[F3]>
Correction[F2] to turn correction back off.
Operation
1. Press
Amplitude
> More[F7]>Correction[F3]>
Correction Set[F1] and choose the correction set
to delete.
Correction Set:
1~5
2. Press Delete Correction[F6].
The selected correction set will be deleted.
Operation
1. Press
Save
> Save To[F1] and choose the save
location.
Location:
Register, Local, USB, SD
2. Press Type[F2]> Correction[F5].
3. Press Data Source[F3] and choose a correction.
Correction Set:
Correction 1~5
4. Press Save Now[F7].
5. The correction set will be saved to the selected
location. For more information on Save and
Recall, please see page 170.
Delete Correction Set
Save Correction Set To Memory
55
Page 58

GSP-930 User Manual
Operation
1. Press
Recall
> Recall[F1] and choose the recall
location:
Location:
Register, Local, USB, SD
2. Press Type[F2]> Correction[F5].
3. Press Destination[F3] and choose a correction
set.
Correction Set:
Correction 1~5
4. Press Recall Now[F4].
5. The current correction set will be recalled from
the selected location. For more information on
Save and Recall, please see page 170.
Description
Sets the input impedance to 75Ω or 50Ω.
Operation
1. Press
Amplitude
> More[F7]>Input Z[F4] to toggle
the input impedance.
Range:
75Ω, 50Ω
Recall Correction Set From Memory
Input Impedance
56
Page 59

BASIC OPERATION
Description
When an external impedance converter module
(optional accessory ADP-101) is used to convert
the impedance of a device from 50Ω to 75Ω,
some external loss can be induced. The Input Z
Cal function can be used to compensate for
these losses with an offset value.
Note
The Input Z Cal function is only available when the
input impedance is set to 75Ω.
Operation
1. Press
Amplitude
> More[F7]>Input Z Cal[F5] and set
the impedance offset.
Range:
Resolution:
0dB to +10dB
1dB
Display Icon
The AMP icon is displayed at the bottom
of the screen when Input Z Cal0dB.
Description
The built-in pre-amplifier boosts weak input
signals, such as EMI testing signals, to levels
that are easy to handle, over the entire
frequency range. The built-in pre-amplifier on
the GSP-930 has a nominal gain of 20dB.
In the Auto setting, the pre-amplifier will be
automatically turned on when the reference
level is less than -30dBm. When the reference
level is greater than -30dBm, the pre-amplifier
is turned off.
The bypass setting turns the pre-amplifier off.
Input Impedance Calibration
Using the Built-in Pre-Amplifier
57
Page 60

GSP-930 User Manual
Operation
1. Press
Amplitude
> More[F7]>Preamp[F6] to toggle
the Preamp state.
Range:
Auto, Bypass
Display Icon
The Pr-amp icon indicates that the pre
amplifier is on.
Example:
Pr-amp icon
Note
When the pre-amplifier is on, the attenuator
becomes fixed at 0dB (i.e. Attenuation = 0dB).
58
Page 61

Operation
1. Press
Autoset
> Autoset[F1].
Autoset Range
Amplitude:
Span:
-80dBm ~ +20dBm
100Hz ~ 3GHz
Example:
Before Autoset, preset state
After Autoset
BASIC OPERATION
Autoset
The Autoset function searches the peak signals in two stages (full
span & 0Hz - 100MHz limited span), picks the signal peak with the
maximum amplitude, and then shows it in the display.
Using Autoset
59
Page 62

GSP-930 User Manual
Note
RBW, VBW and sweep settings are reset to Auto
when the Autoset function is used.
Description
You can set the amplitude floor so that the
signals lower than the setting will be ignored
by the Autoset search.
Operation
1. Press
Autoset
> Amp.Floor[F2] and switch the
range from Auto to Man.
2. Enter the amplitude limit and unit for the
Autoset search.
Range:
−80 to +20dBm
Note
See page 48 for setting the amplitude units.
Description
You can change the frequency span limit in the
display to get a better view of the Autoset
result. By default, the frequency span after
Autoset is set at 3MHz.
Operation
1. Press
Autoset
> Span[F3] and switch the range
from Auto to Man.
2. Enter the span frequency for the Autoset
search.
Manual Range:
100Hz to 3GHz
Limiting the Autoset Vertical Search Range
Limiting the Autoset Horizontal Search Range
60
Page 63

BASIC OPERATION
Description
RBW (Resolution Bandwidth) defines the width
of the IF (intermediate frequency) filter that is
used to separate signal peaks from one another.
The narrower the RBW, the greater the
capability to separate signals at close
frequencies. But it also makes the sweep time
longer under specific frequency spans (the
display is updated less frequently).
Operation
1. Press
BW/Avg
> RBW[F1] and set the RBW to
Auto or Man.
2. Set the resolution bandwidth and unit for Man
mode.
Mode:
Frequency Range(3dB):
Frequency Range(6dB):
Auto, Man
10Hz~3kHz (1-3-10 step)
10kHz~1MHz (10% step)
200Hz, 9kHz, 120kHz
Display Icon
The BW icon is displayed at the bottom of
the screen when the RBW is in Man mode.
Note
If the RBW settings have an asterisk (*), it
indicates that the -6dB filters are used.
Bandwidth/Average Settings
BW/Avg key sets the resolution bandwidth (RBW), video
bandwidth (VBW) and averaging functions. The resolution, sweep
time, and averaging are in a trade-off relationship, so configuration
should be done with care.
Resolution Bandwidth Setting (RBW)
61
Page 64

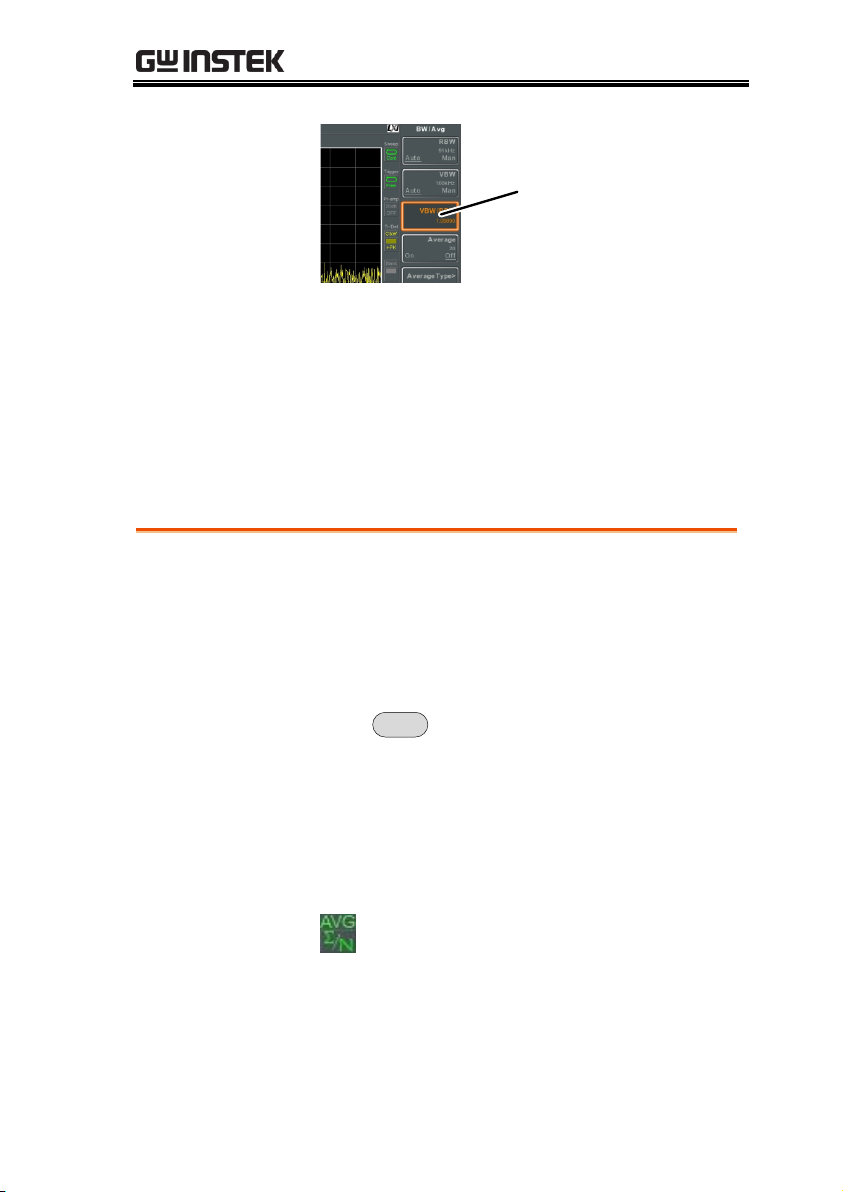
GSP-930 User Manual
Description
VBW (Video Bandwidth) defines the
smoothness of the trace on the display.
Combined with RBW, VBW defines the ability
to sort out the target signal from surrounding
noise or adjacent peaks.
Operation
1. Press
BW/Avg
> VBW[F2] and set the VBW to
Auto or Man.
2. Set the video bandwidth and unit for Man
mode.
Mode:
Frequency Range(3dB):
Auto, Man
1Hz~1MHz (1-3-10 step)
Display Icon
The BW icon is displayed at the bottom of
the screen when the VBW is in Man mode.
Description
The VBW/RBW function is used to view the
ratio between the video bandwidth and the
resolution bandwidth.
The VBW/RBW ratio is altered by setting the
RBW and or VBW settings, see page 61 & 62
respectively.
View VBW/RBW
ratio
1. Press
BW/Avg
.
2. The ratio is displayed on the VBW/RBW[F3] soft
key.
Video Bandwidth Settings (VBW)
VBW/RBW Ratio
62
Page 65
Display
VBW/RBW
Ratio
Tip
Signals that are masked by the noise floor level
should have a ratio of less than 1 to smooth the
noise out.
Signals with strong frequency components should
use a ratio equal to or greater than 1.
Average Trace
Description
The Average function averages the trace for a
user-defined number of times before it is
displayed. This feature smoothes the noise
level, but has the drawback of slowing down
the display update rate.
Operation
1. Press
BW/Avg
> Average[F4] and toggle Average
on or off.
2. Set the number of averages.
Range:
Default:
4 ~ 200
20
Display Icon
The AVG icon is displayed at the bottom of
the screen when the Average function is
on.
BASIC OPERATION
63
Page 66
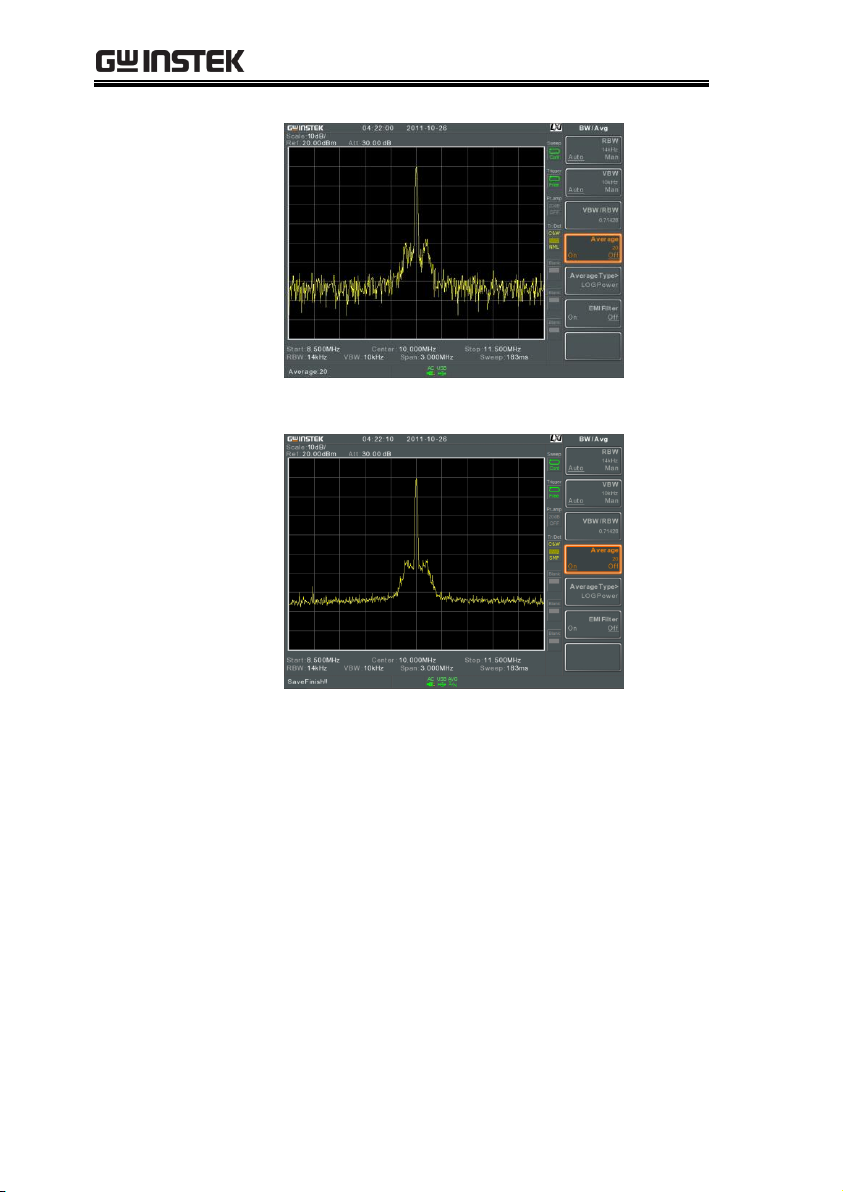
Example:
Average:Off
Average: On (20)
GSP-930 User Manual
64
Page 67

Average Type
Description
The Average Type function determines how the
GSP-930 determines the average value.
LOG Average: Averages the trace points on a
logarithmic scale.
Volt Average: Averages the amplitudes of the
trace points on a linear voltage scale.
Power Average: Averages the trace points on a
logarithmic scale in watts.
Operation
1. Press
BW/Avg
> Average Type[F5] and choose the
average type.
Range:
Default:
LOG Power, Volt
Average, Power Average
LOG Power
BASIC OPERATION
65
Page 68

EMI Filter
Description
The built-in EMI filter is used for specific
measurement situations such as EMI average
detection, where a higher level of sensitivity is
required than the standard configuration.
When turned on, the RBW is set to -6dB,
indicated by an asterisk (*).
When any measurement functions are turned
on (see page 111 for details), the EMI filter is
automatically disabled. Conversely if the EMI
filter is turned on, any measurement functions
are turned off.
Operation
1. Press
BW/Avg
> EMI Filter[F6] and toggle EMI
filter on or off.
Description
Sweep time defines the length of time the
system takes to "sweep” the current frequency
span. Note, however, that sweep time and
RBW/VBW are in a trade-off. Faster sweep
times update the display more frequently but
make RBW and VBW wider, reducing the
capability to separate signals at close
frequencies.
Sweep
GSP-930 User Manual
The GSP-930 has a number of sweep options including setting the
sweep time and sweep mode(continuous, single). The GSP-930 also
has gated sweep modes.
Sweep Time
66
Page 69
Operation
1. Press
Sweep
> Sweep Time[F1] and toggle the
Sweep time to Auto or Man.
2. Set the sweep time for the Man mode.
Mode:
Range:
Resolution:
Auto, Man
22ms ~ 1000s (span>0Hz)
50us ~ 1000s (span=0Hz)
10us
Display Icon
The SWT icon will be displayed at the
bottom of the screen when in the sweep is
in manual mode.
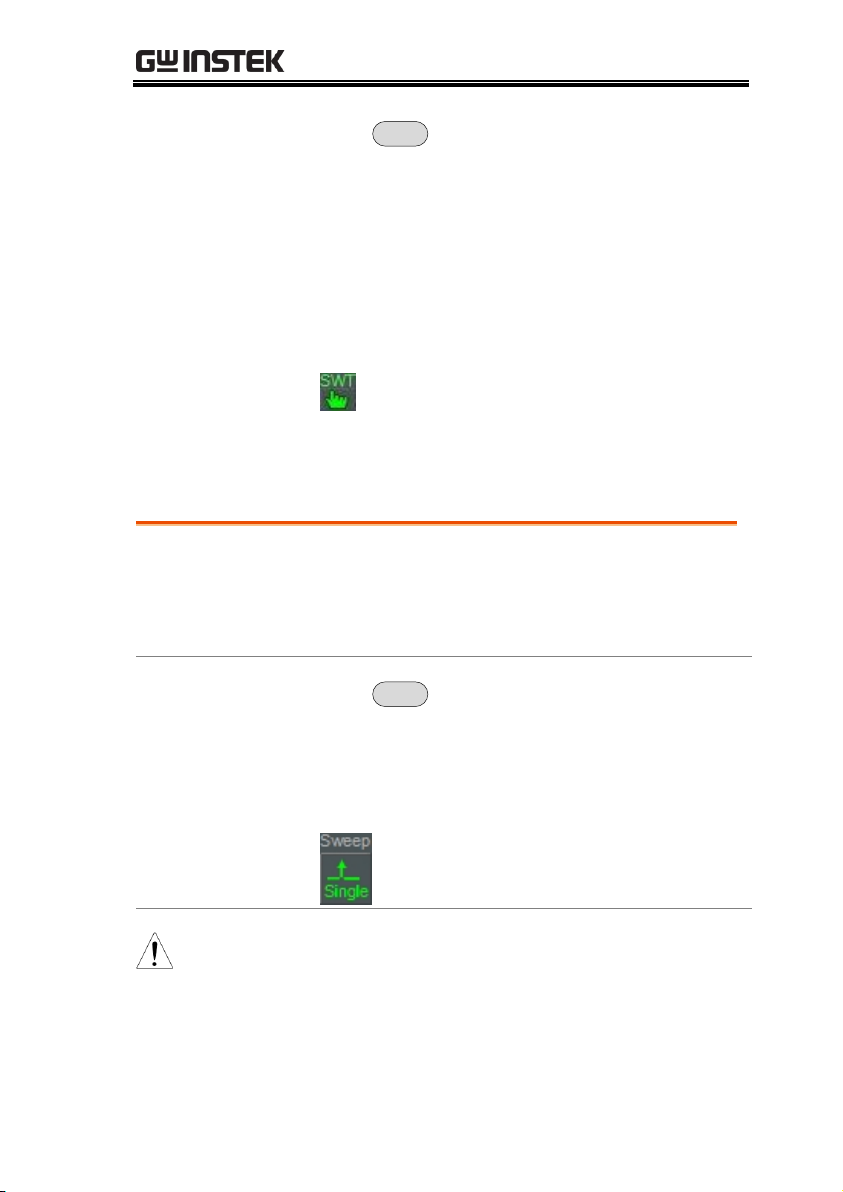
Single Sweep
Description
The single sweep function is used to perform a
single sweep. When Sweep Single is pressed the
GSP-930 will perform a single sweep and then
stop.
Operation
1. Press
Sweep
> Sweep Single[F2] to put the
spectrum analyzer into single sweep mode.
2. Press Sweep Single[F2] again to perform a single
sweep.
Display Icon
The Sweep Single icon is displayed on the
right-hand side of the screen when the
sweep is in single mode.
Note
You must wait for the single sweep to finish before
pressing the Single Sweep key again.
If a setting is changed whilst the spectrum analyzer
is still sweeping, the single sweep will immediately
start over.
BASIC OPERATION
67
Page 70
GSP-930 User Manual
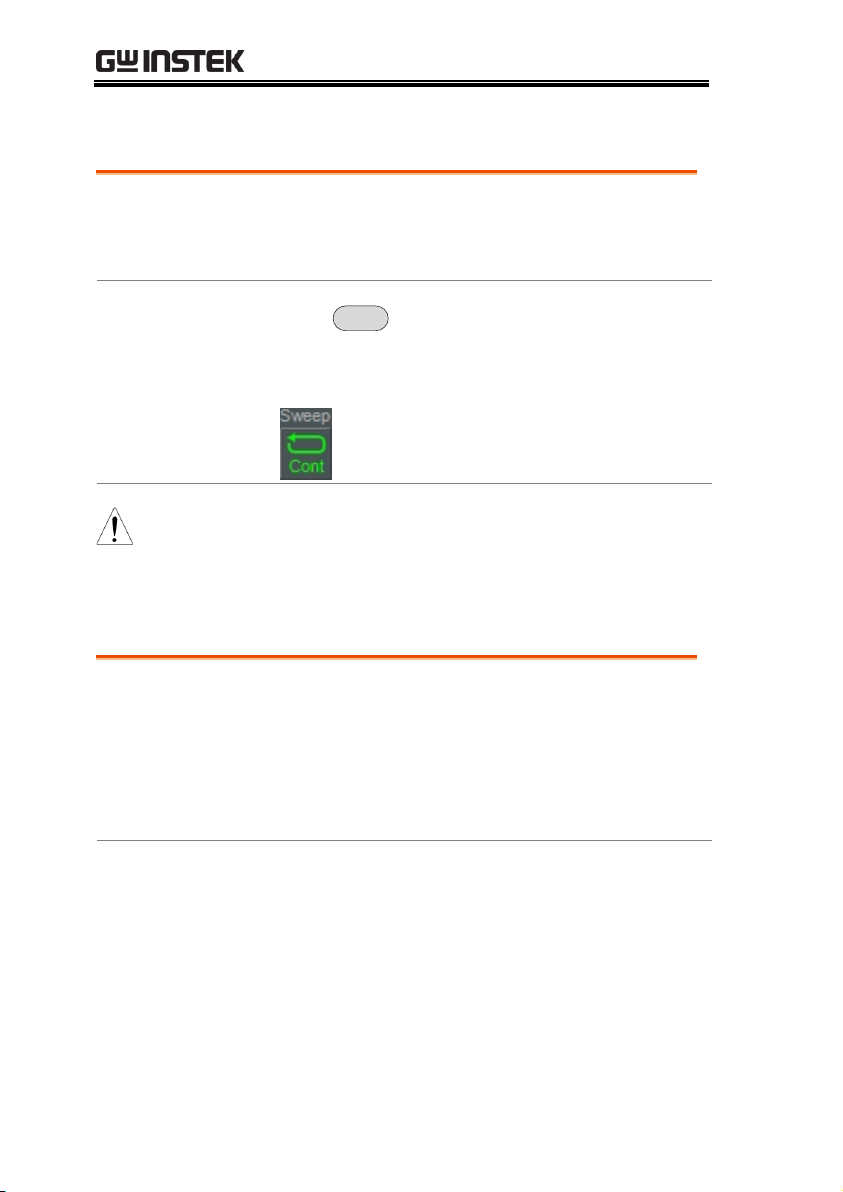
Description
The GSP-930 has two main sweeping modes:
single and continuous. Use the continuous
mode to have the sweep constantly updated.
Operation
1. Press
Sweep
> Sweep Cont[F3] to put the
spectrum analyzer into continuous sweep
mode.
Display Icon
The Sweep Cont icon is displayed on the
right-hand side of the screen when the
sweep is in continuous mode.
Note
The GSP-930 will now continuously sweep unless
the mode is changed to single sweep mode or if
the system is waiting for a trigger condition.
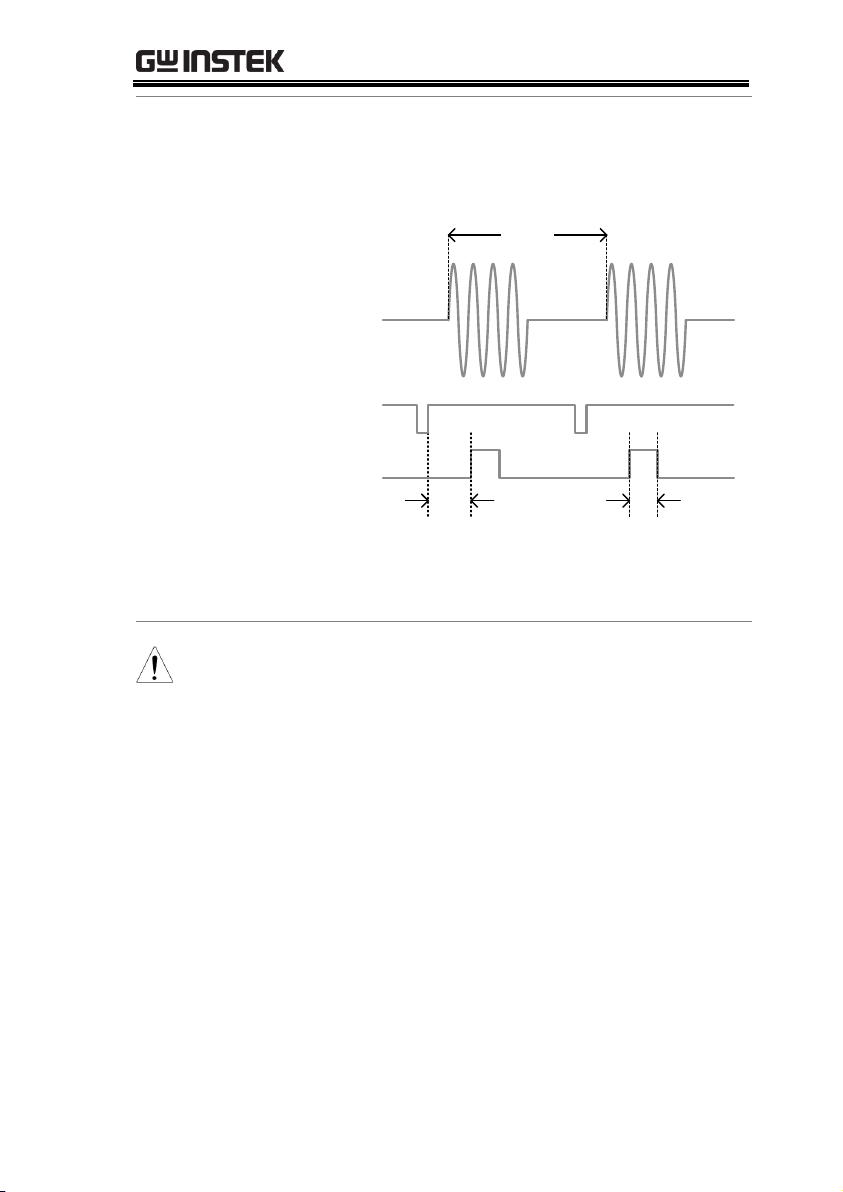
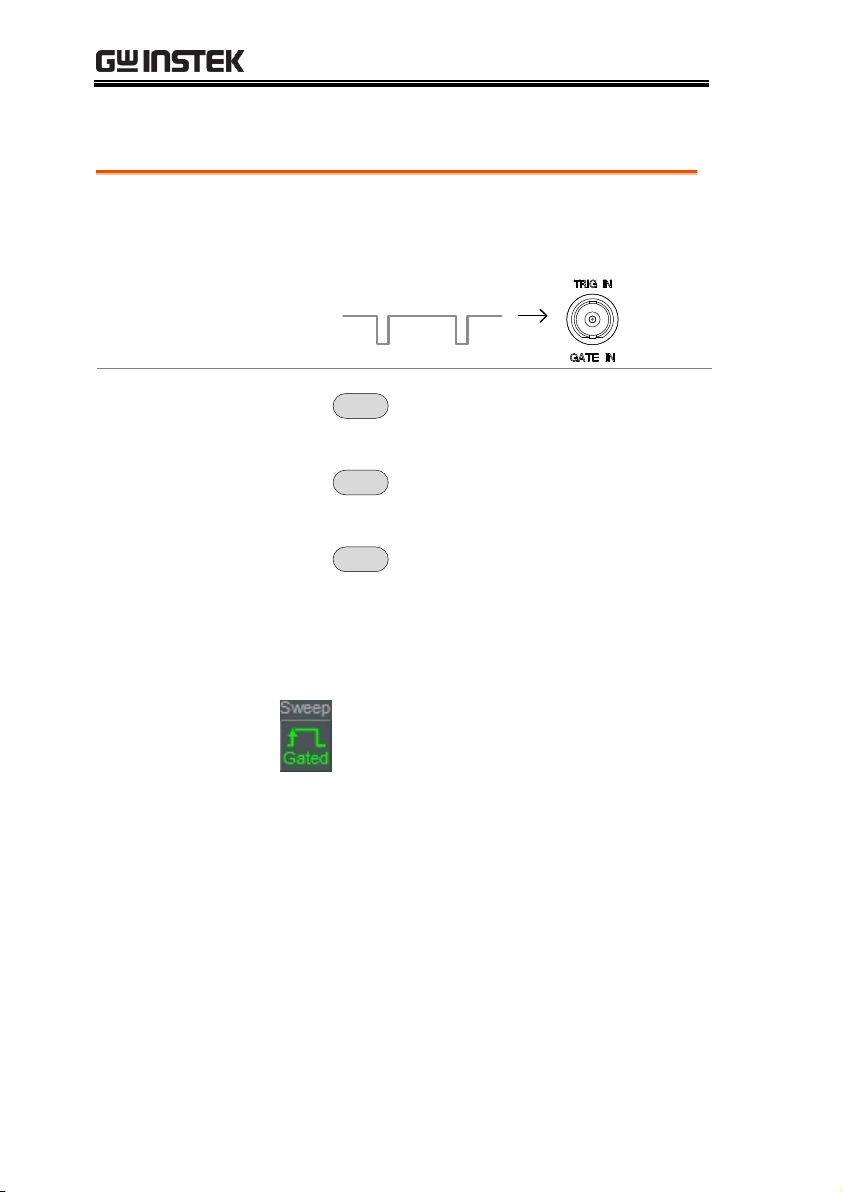
Description
The Gated Sweep mode allows a trigger signal
to dictate when the spectrum analyzer can
sweep. This mode is useful for characterizing
signals that are pulsed on and off, such as RF
burst transmissions or for measuring spurious
noise levels between transmission bursts.
Overview
1. The trigger signal must be synchronized to the
period of the input signal (shown as RF burst
below).
2. The start of the gate time is produced from the
positive or negative edge of the trigger signal +
the delay time.
3. The end of the gate time is determined by the
Continuous Sweep
Gated Sweep Overview
68
Page 71
BASIC OPERATION
set gate length.
4. The gated sweep should not be positioned at
either end of the transmission.
Delay Length
Gate
Trigger
RF Burst
period
Example: The diagram above demonstrates the
relationship between the input trigger, the input
signal and the position of the gated sweep relative
to the input signal.
Note
Please take into consideration RBW settling time.
Setting the delay time too short may not leave
enough time for the RBW filter to resolve.
69
Page 72
GSP-930 User Manual
Connection
1. Connect a trigger signal (3.3v CMOS) to the
GATE IN port on the rear panel.
Trigger
Operation
1. Press
Sweep
> GateDelay[F5] and set the gate
delay time.
2. Press
Sweep
> Gated Length[F6] and set the gate
time length.
3. Press
Sweep
> Gated Sweep[F4] and turn the
mode on.
Gate Delay:
Gate Length:
0s ~ 1000s
10us ~ 1000s
Display Icon
The Sweep Gated icon is displayed when
Gated Sweep is turned on.
Using the Gated Sweep Mode
70
Page 73
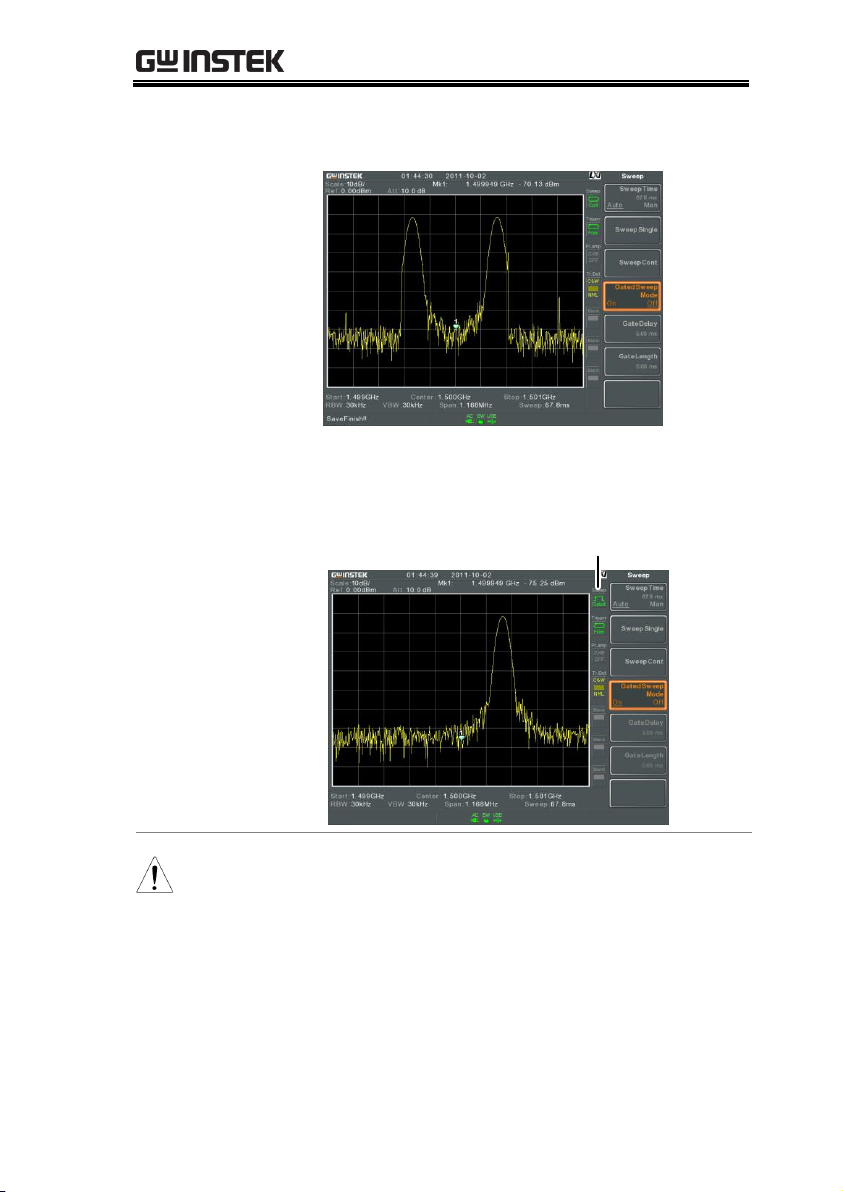
BASIC OPERATION
Example:
The example below shows the spectrum of an FSK
modulated signal when gated sweep mode is off.
The example below shows the same signal with the
gated sweep timed to sweep when only the desired
frequency is output.
Gated sweep icon
Note
Gate Delay and Gate Length must first be set
before Gated Sweep is turned on.
71
Page 74

GSP-930 User Manual
Description
Each trace (1, 2, 3, 4) is represented by a
different color. When activated, an icon for each
trace color and function is shown to the left of
the display. When a trace is selected,
parameters can be set/edited from the trace
menu.
Trace Color:
1: Yellow
2: Pink
3: Blue
4: Red
Trace Type
The type of trace used determines how the trace
data is stored or manipulated before being
displayed. The analyzer updates each trace
according to the type of trace used.
Clear and
Write
The GSP-930 continuously
updates the display with each
sweep.
Hold Max/
Hold Min
The maximum or minimum
points are maintained for the
selected trace. The trace points
are updated each sweep if new
maximum or minimum points
are found.
Trace
The GSP-930 is able to set the parameters of up to 4 different
trances on the display at once. Each trace is represented by a
different color and is updated with each sweep.
Selecting a Trace
72
Page 75

BASIC OPERATION
View
View will hold the selected
trace and stop updating the
trace data for the selected trace.
Pressing View[F4] will display
the trace data that was cleared
using the Blank[F5] key.
Blank
Clears the selected trace from
the display and stores trace
data. The trace data can be
restored by pressing View[F4].
Display Icon
Clear & Write
Hold Max
View
Blank
Trace 1
Trace 2
Trace 3
Trace 4
Operation
1. Press
Trace
> Trace[F1] and choose the trace
number.
Trace:
1, 2, 3, 4
2. Select the trace type:
Clear & Write[F2]
Max Hold[F3]
Min Hold[F4]
View[F5]
Blank[F6]
Note
Traces, 2, 3 and 4 are set to
Blank
by default.
73
Page 76

Trace Math
Description
Performs trace math from two traces (TR1, TR2)
and stores the result in the currently selected
trace. It also performs trace shift.
Math functions
Power Diff
Subtracts the TR1 amplitude
data from the TR2 amplitude
data. The TR1 data TR2 data
are converted to watts. The
result is converted back to
dBm.
Log Diff
Subtracts the TR1 amplitude
data from the TR2 amplitude
data and then adds a
logarithmic reference. Both the
TR1 and TR2 data is in dBm.
The resultant trace of the
subtraction is in dB. When the
result is added to a logarithmic
reference the resulting data is
in dBm.
LOG Offset
Adds a reference to the TR1
trance
Operation
1. Press
Trace
> More[F1]>Trace Math[F1].
2. Press TR1[F1] and select the first trace source:
TR1:
Trace 2, Trace 3, Trace 4
3. Press TR2[F2] and select the second trace
source:
TR2:
Trace 2, Trace 3, Trace 4
GSP-930 User Manual
74
Page 77

BASIC OPERATION
4. Select the trace math function:
PowerDiff[F3]
LogDiff[F4]
LogOffset[F5]
5. If LogDiff was selected, set the reference level
and unit.
LogDiff ref range:
LogDiff ref units:
-120dBm ~ 30dBm
dBm, W
6. If LogOffset was selected, set the offset level
and unit.
LogOffset range:
-50dB~+50dB
7. To turn trace math off, press the OFF[F6].
Display Icon
The Math icon is displayed when trace
math is turned on.
Description
Each time the spectrum analyzer samples data
for each point on the trace, a number of samples
are usually taken for each point, known as a
sample bucket. The actual value of each point is
determined by the detector from the samples in
each bucket.
Each selected trace, (1, 2, 3, 4), can use a
different detection mode.
Trace Detection Mode
75
Page 78

GSP-930 User Manual
Detection modes
Auto
Automatically chooses an
appropriate mode based on the
values of all the samples.
Normal
While the signal level is constantly
increasing or decreasing, the
positive peaks are detected.
Otherwise, detecting mode
switches between positive peak
and negative peaks. Useful for
picking up burst phenomenon
while avoiding excessive noise.
Peak+
Detects positive peak signals by
selecting the maximum peak value
for each point from each bucket.
This mode is useful for sinusoidal
signals.
Peak-
Detects negative peak signals by
selecting the lowest peak value for
each point from each bucket. This
mode is not recommended for
amplitude measurement.
Sample
Randomly selects a value from the
bucket sample. Useful for noise
signals.
Average
Calculates the average of all the
samples in the sample bucket.
76
Page 79

BASIC OPERATION
Auto Detector
Selection Method
Below is a flow chart diagram showing the
Detector selection for the Auto mode.
Is (trace) Average
on?
Are any traces set
to Max Hold?
Are any traces set
to Min Hold?
Is Average Type
set to Power?
AverageSample
Peak+
Peak-
Normal
Y
N
Y
N
Y
N
N
Y
Is Phase Jitter
measurement on?
Sample
Y
N
Are any windows
set to Topographic?
Peak+
Y
N
Detector
(Auto mode)
Operation
1. Press
Trace
> More[F7]>Detection[F2].
2. Select the trace detection mode for the selected
trace:
Auto[F1]
Normal[F2]
Peak+[F3]
Peak-[F4]
Sample[F5]
Average[F6]
77
Page 80
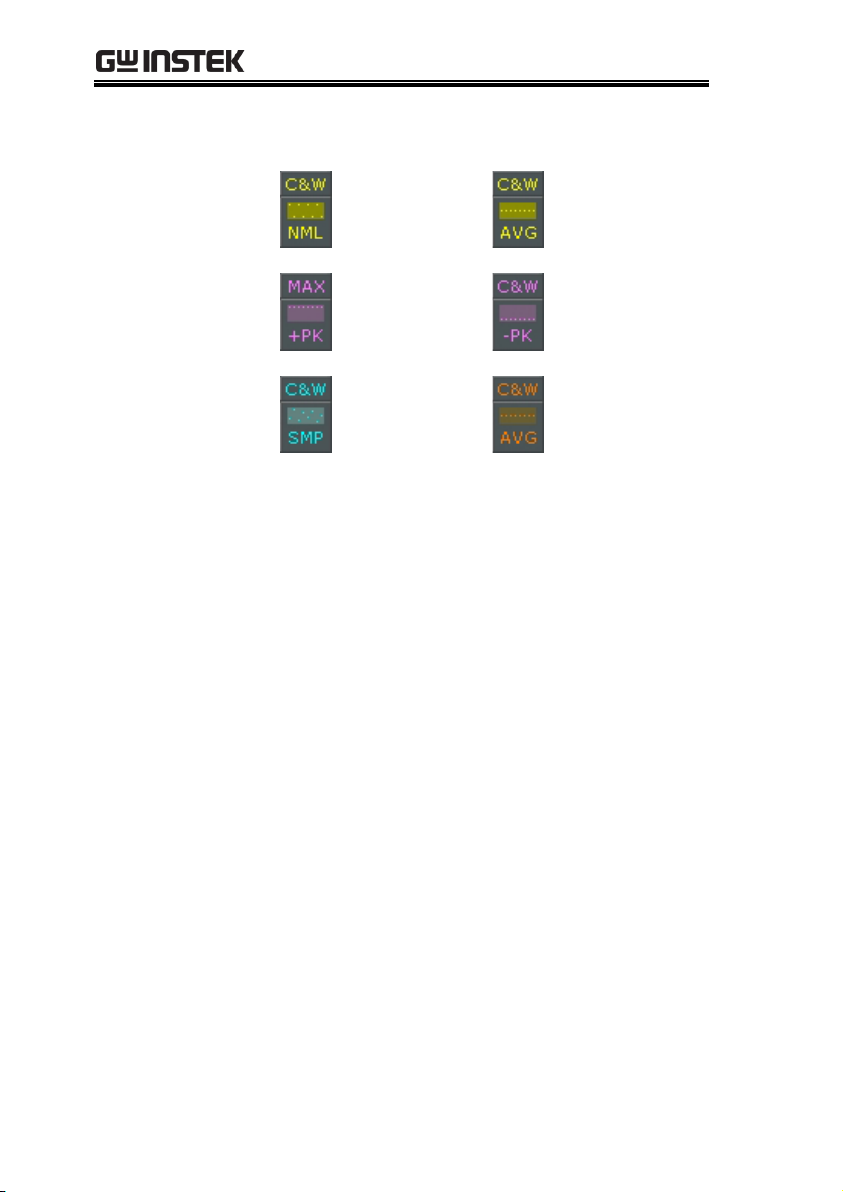
GSP-930 User Manual
3. The display will return the Trace menu.
Display Icon
Normal
Average icon
Peak+ icon
Peak - icon
Sample icon
Average icon
78
Page 81

BASIC OPERATION
Description
In free run mode all signals are captured and
the trigger conditions are not used.
Free Run Mode
1. Press
Trigger
> Free Run[F1] to run in free mode.
Description
Sets the video trigger level for video signals.
When the video signal voltage level exceeds*
the video trigger level, a trigger signal will be
generated.
*for positive video edge
Trigger
The Trigger function sets the signal conditions upon which the
spectrum analyzer triggers captured waveforms, including
frequency, amplitude, and delay. An external trigger signal, instead
of the default internal signal, may be used as required for special
conditions.
The sections below can be used to skip to the relevant section:
Free Run Mode → from page 79
Activate Video Trigger → from page 79
Activate External Trigger → from page 81
Selecting Trigger Mode → from page 81
Set the Trigger Delay Time → page 83
Selecting a Trigger Type
Free Run Mode
Activate Video Trigger
79
Page 82

GSP-930 User Manual
Parameters
Video Edge:
Determines the polarity of the
video trigger.
Positive: The signal voltage
exceeds the video level at the
trigger frequency.
Negative: The signal voltage is
lower than the video level at the
trigger frequency.
Video Level:
The trigger voltage level.
Trigger
Frequency:
Sets the frequency to start
triggering
Operation
1. Press
Trigger
>Trigger Condition[F2]>Video[F1]
2. Press Video Edge[F1] and choose the edge.
Range:
Positive, Negative
3. Press Video Level[F2] and set the video voltage
trigger level.
Trigger level:
(-120dBm to +30dBm)
+Ref Level Offset
4. Press Trigger Freq[F3] and choose the frequency
at which the spectrum analyzer will check the
triggering conditions.
Frequency:
0-3GHz+frequency offset
Note
Set the trigger back to Free Run to disable the
video trigger.
80
Page 83
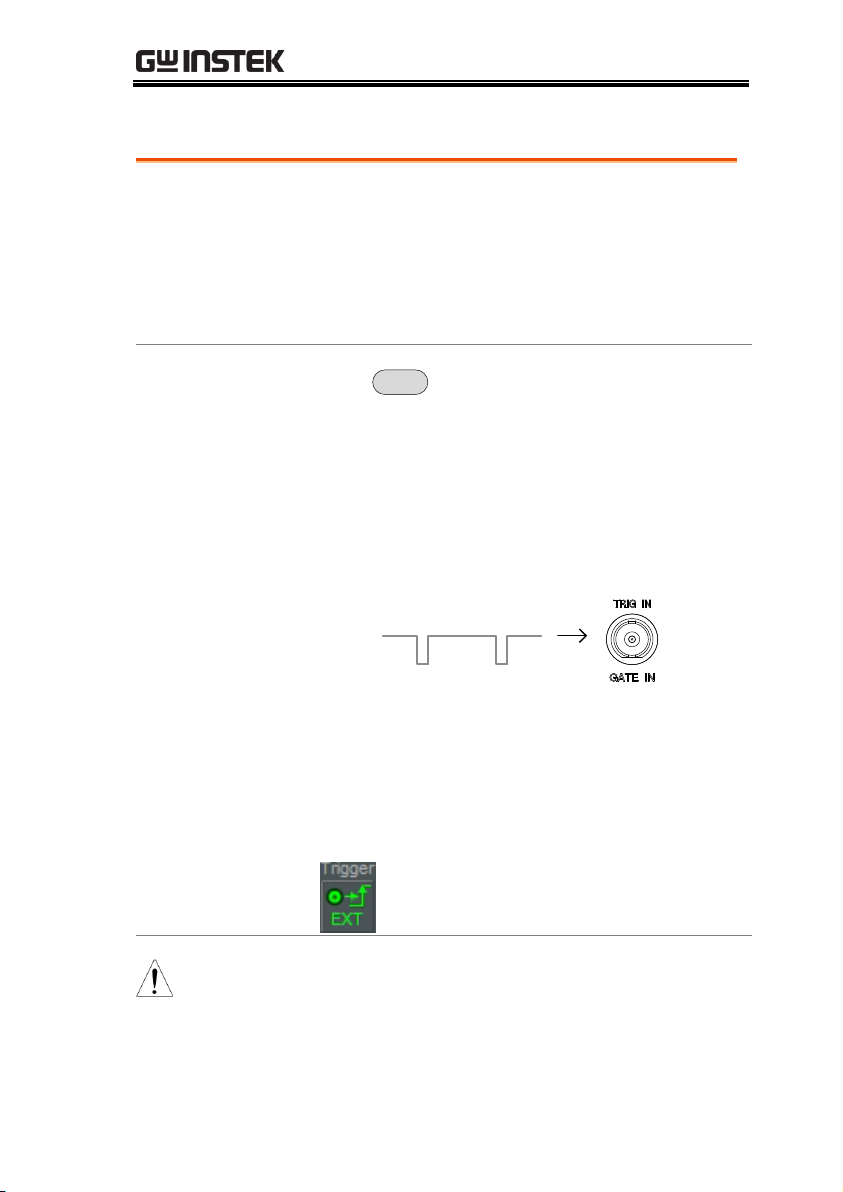
BASIC OPERATION
Description
The external trigger is used when an external
trigger signal is input into the rear panel TRIG
IN port. The external trigger signal can be
configured as positive or negative edge.
Trigger: 3.3V, CMOS
Operation
1. Press
Trigger
>Trigger Condition[F2]>Ext.Edge[F2]
and select the trigger edge:
Pos:
Neg:
Positive edge
Negative edge
2. Connect the external trigger signal to the rear
panel TRIG IN port.
Trigger
3. Press Action Now[F5] to activate the external
trigger.
4. The system will now wait the trigger conditions
to be matched before starting a sweep.
Display Icon
The EXT Trigger icon is displayed when the
external trigger is activated.
Note
The trigger will revert back to the Free Run mode if
any parameter settings are changed, such as the
span or amplitude settings.
Activate External Trigger
81
Page 84

GSP-930 User Manual
Description
In free run mode all signals are captured and
the trigger conditions are not used.
Modes
Normal:
The spectrum analyzer captures
every signal that meets the trigger
conditions.
Single:
The spectrum analyzer captures
the first signal that meets the
trigger conditions.
Continuous:
The spectrum analyzer captures
the first signal that meets the
trigger conditions then switches to
free run mode thereafter.
Operation
1. Press
Trigger
> Trigger Mode[F3] to toggle the
trigger mode:
Nor.:
Sgl.:
Cont.:
Normal
Single
Continuous
2. Press Action Now[F5] to manually start
triggering.
Selecting the Trigger Mode
82
Page 85

BASIC OPERATION
Description
Sets the delay time between when the analyzer
triggers and when the analyzer begins to
capture the signal.
Delay time range: 1ns to 1ks
Operation
1. Press
Trigger
>Trigger Delay[F4] and set the
trigger delay time.
Delay range:
0~1000s
Set the Trigger Delay Time
83
Page 86

GSP-930 User Manual
Marker
A Marker shows the frequency and amplitude of a waveform point.
The GSP-930 can activate up to 6 markers or marker pairs
simultaneously as well as up to 10 peak markers in the marker table.
The marker table helps editing and viewing multiple markers in a
single display.
A delta marker shows the frequency and amplitude differences
between the reference marker.
The GSP-930 can automatically move a marker to various locations
including the peak signal, center frequency, and start/stop
frequency. Other marker operations regarding signal peaks are
available in the Peak Search function.
Activating a Marker → from page 85
Move Marker Manually → from page 86
Move Marker to Preset Locations → from page 86
Activate Delta Marker → from page 87
Move Delta Marker(s)Manually → from page 88
Marker Functions → from page 89
Move Marker to Trace → from page 91
Show Markers in Table → from page 92
Peak Search → from page 93
Peak Configuration → from page 95
Peak Table → from page 96
84
Page 87
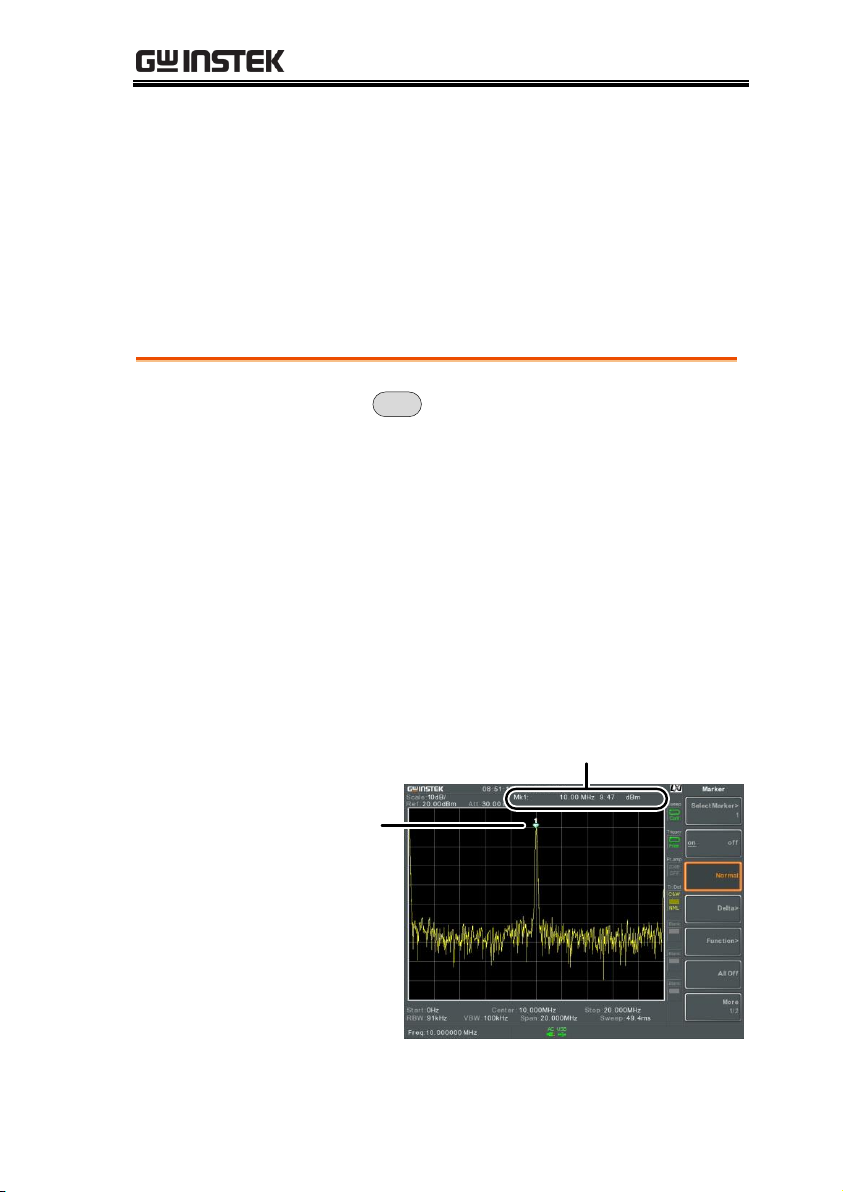
BASIC OPERATION
Operation
1. Press
Marker
> Select Marker[F1] and select a
marker number.
Marker:
1~6
2. Press [F2] to turn the selected marker on.
3. Press Normal[F3] to set the selected marker to
the Normal type.
4. The display will show the marker on the trace
(centered by default) with the marker
measurement at the top of the display.
Marker
Maker ID, Frequency, Amplitude
Activating a Marker
There are two basic marker types, normal markers and delta
markers. Normal markers are used to measure the frequency/time
or amplitude of a point on the trace. Delta markers are used to
measure the difference between a reference point and a selected
point on the trace.
Activate a Normal Marker
85
Page 88
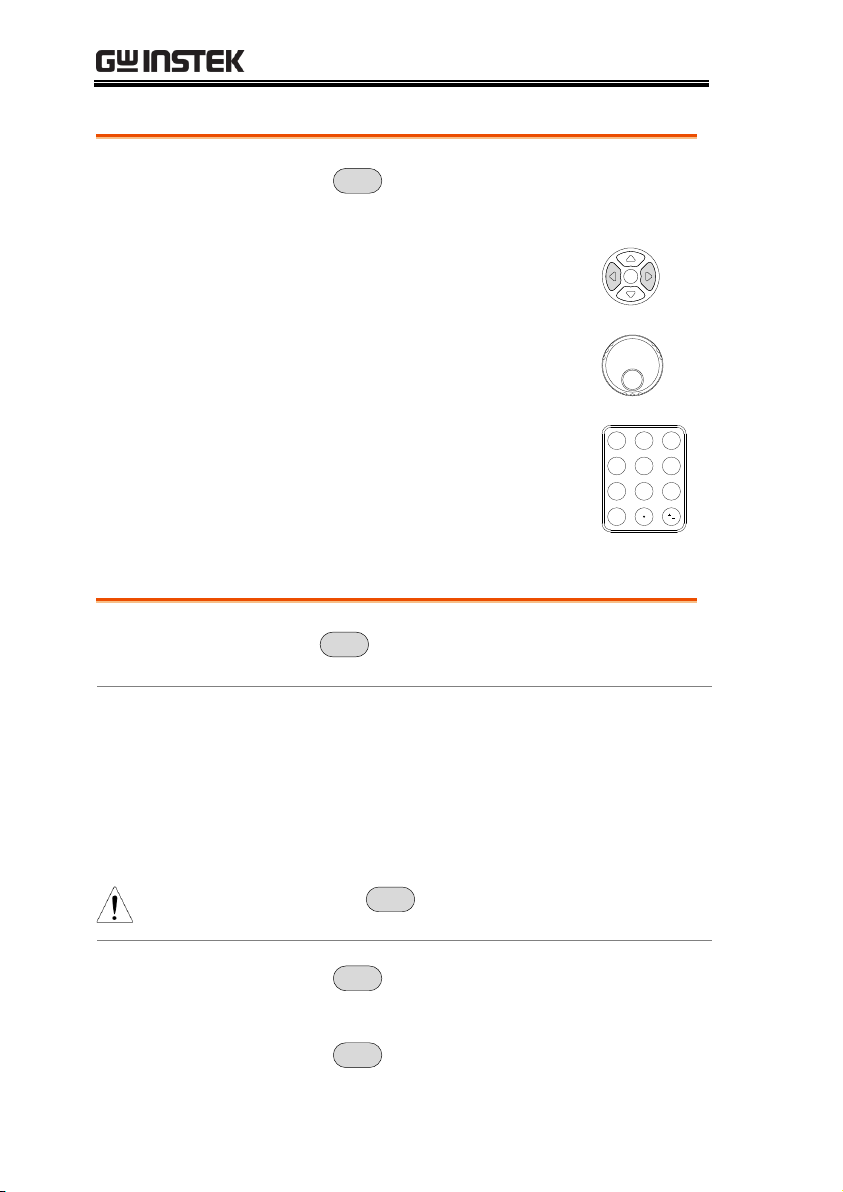
GSP-930 User Manual
Operation
1. Press
Marker
> Select Marker[F1] and select a
marker number.
2. Use the left/right arrow keys to
move the marker one grid division.
3. Use the scroll wheel to move the
marker in fine increments.
4. Alternatively, the numeric keypad
can be used to directly enter the
frequency of the marker position.
7 8 9
654
1 2 3
/0
Description
The
Marker->
key is used to move the selected
marker to a number of preset positions.
Functions
Mkr>Center:
Mkr>Start:
Mkr>Stop:
Mkr>CF Step:
Mkr>Ref Lvl:
Move to center frequency.
Move to start frequency.
Move to stop frequency.
Move to step frequency.
Move to reference level
amplitude.
Note
When the
Marker->
key is used, the span and other
settings may be automatically changed.
Operation
1. Press
Marker
> Select Marker[F1] and select a
marker number.
2. Press
Marker->
and select a marker position:
Move Marker Manually
Move Marker to Preset Locations
86
Page 89

BASIC OPERATION
Mkr>Center[F1]
Mkr>Start [F2]
Mkr>Stop[F3]
Mkr>CF Step[F4]
Mkr>Ref Lvl[F5]
Description
Delta markers are marker pairs that measure
the difference in frequency/time and amplitude
between a reference marker and a delta marker.
When delta markers are activated, the reference
and delta marker appear at the position of the
selected marker, or in the center of the display
if the selected marker has not yet be activated.
The marker measurement is located at the top
of the display, under the “normal marker”
measurement.
Delta Markers
Ref:
Reference marker, designated as 1.
Delta:
Delta marker, designated as Δ1.
Operation
1. Press
Marker
> Select Marker[F1] and select a
marker number.
2. Press [F2] to turn the selected marker on.
3. Press Delta[F4]>Delta[F1] to set the selected
marker to the Delta type.
Activate Delta Marker
87
Page 90

GSP-930 User Manual
Move Delta or
Reference Marker
1. Press
Marker
> Delta[F4]> Move[F2]>Move Ref[F2]
to move the reference marker.
2. Press
Marker
> Delta[F4]> Move[F2]>Move
Delta[F3] to move the Delta marker.
3. Move the selected marker in the same fashion
as a normal marker, see page 86
Move Both
reference and
delta marker
1. Press either Move Pair Span[F4] or Move Pair
Center[F5] to move both markers at the same
time.
Move Pair Span:
Sets the frequency span
between both markers.
The span can be positive
or negative:
1
+spanΔ1
Δ1
-span1
Move Pair Center:
Moves both markers at
the same time, keeping
the span between both
markers even
throughout.
2. Move both markers in the same fashion as a
normal marker, see page 86
Move Delta Marker(s)Manually
88
Page 91
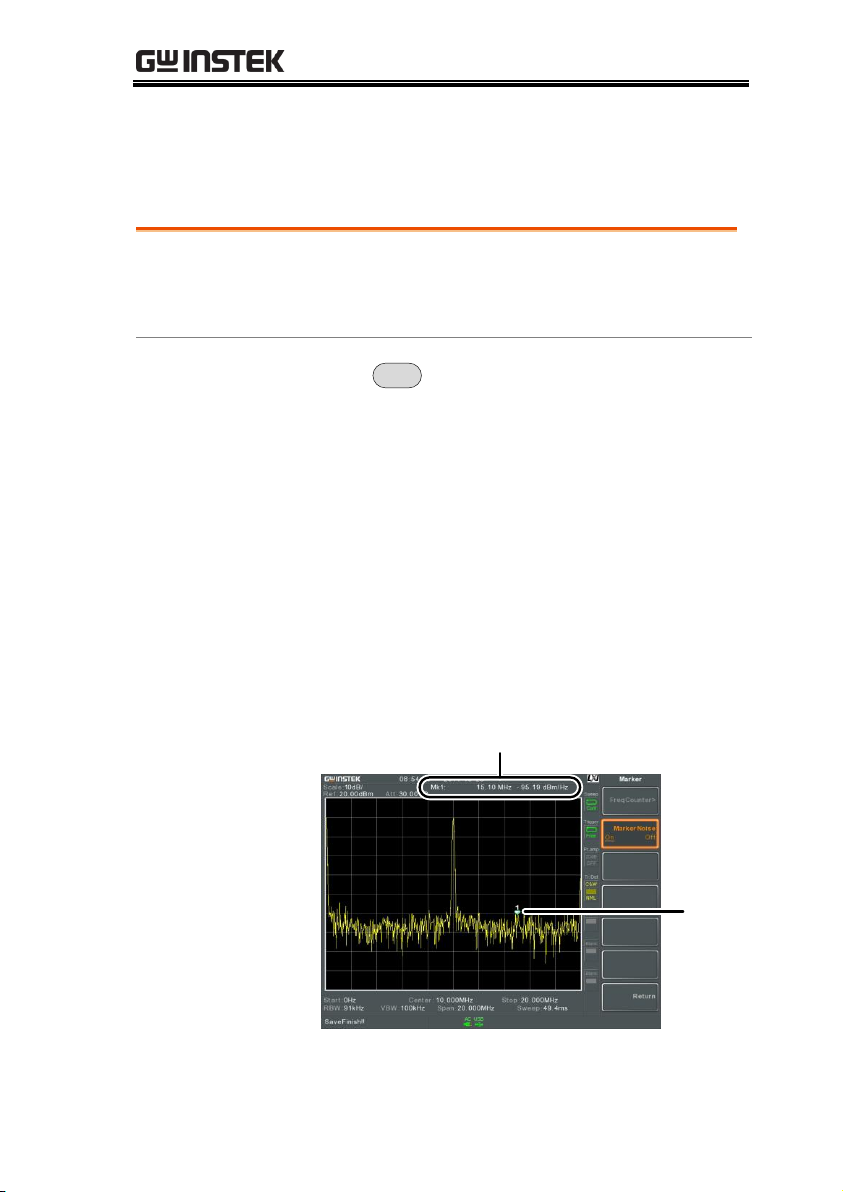
BASIC OPERATION
Description
The noise marker function calculates the
average noise level over a bandwidth of 1Hz,
referenced from the marker position.
Operation
1. Press
Marker
> Select Marker[F1] and select a
marker number.
2. Press [F2] to turn the selected marker on.
3. Press Normal[F3] and then position the marker
to the desired location.
4. Press Function[F5]>Marker Noise and turn
Marker Noise on.
5. The display will show the noise level
measurement at the top of the screen in
dBm/Hz.
Marker ID, Frequency, dBm/Hz
Marker
Marker Functions
Marker Noise
89
Page 92

GSP-930 User Manual
Description
The frequency counter function is used to make
accurate frequency measurements.
Operation
1. Press
Marker
> Select Marker[F1] and select a
marker number.
2. Press [F2] to turn the selected marker on.
3. Press Normal[F3] and then position the marker
to the desired location.
4. Press Function[F5]>Frequency Counter[F1] and
turn the counter function on.
5. Press Resolution[F2] and set the resolution:
Auto:
Automatically chooses
the best resolution.
Man:
Allows the resolution to
be manually set.
Man Range:
1Hz, 10Hz, 100Hz, 1kHz
6. The display will show the frequency
measurement at the top of the screen at the
selected resolution.
Frequency
Marker
Frequency Counter
90
Page 93

BASIC OPERATION
Description
The Marker Trace function moves the selected
marker to any of the currently active traces.
Operation
1. Press
Marker
> Select Marker[F1] and select a
marker number.
2. Press [F2] to turn the selected marker on.
3. Press More 1/2[F7]>Marker Trace[F1] and choose
a trace to move the current marker to. Only
active traces can be selected.
Auto[F1]
Trace1[F2]
Trace2[F3]
Trace3[F4]
Trace4[F5]
4. In the example below, marker 1 is set to Trace1
and marker 2 is set to Trace2.
Marker 1, Trace 1
Marker 2, Trace 2
Move Marker to Trace
91
Page 94

GSP-930 User Manual
Description
The GSP-930 has a Marker Table function to
show all the active markers and measurements
at once.
Operation
1. Press
Marker
> More 1/2[F7]>Marker Table[F2] and
turn the marker table on.
2. The display will split into two screens. The
bottom half will show the Marker Table with
the marker ID(normal, reference or delta), trace,
x-axis position (frequency/time) and the
amplitude of the marker.
Marker Table
Show Markers in Table
92
Page 95

BASIC OPERATION
Description
The
Peak
Search
key is used to find trace peaks.
Operation
1. Press
Marker
> Select Marker[F1] and select a
marker number.
2. Press
Peak
Search
>Peak Search[F1]. The marker will
move to the highest signal peak.
3. To continually search for the peak each sweep,
press,
Peak
Search
>More 1/2[F7]>Peak Track[F1] and
set Peak Track to on.
Description
The Center function moves the marker to the
highest signal peak and moves the center
frequency to that peak.
Operation
1. Press
Marker
> Select Marker[F1] and select a
marker number.
2. Press
Peak
Search
>Mkr>Center[F2].
Note
The span will not be changed.
Peak Search
Move Marker to Peak
Move Marker and Peak to Center
93
Page 96
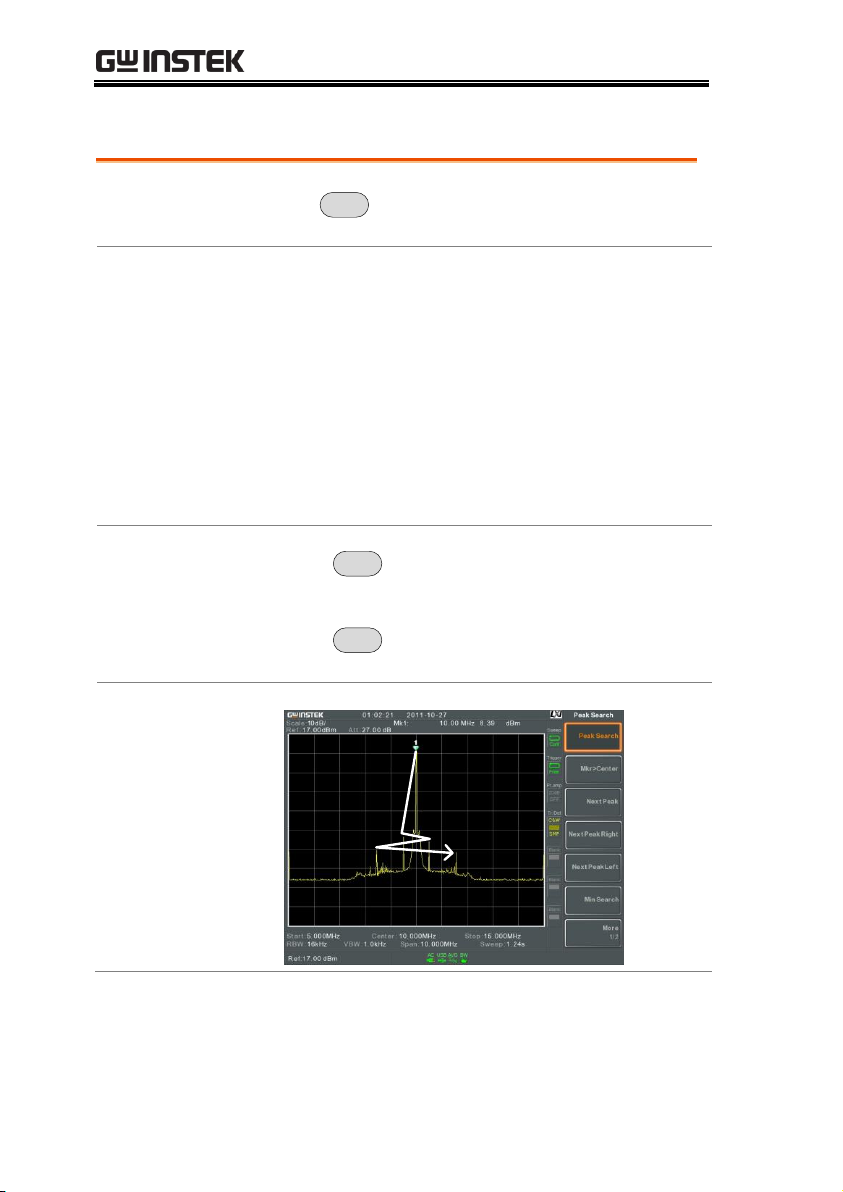
Search for Peaks
Description
The
Peak
Search
key can be used to search for a
number of different peaks.
Peak Search
Next Peak:
Searches for next highest
peak visible on the display.
Next Peak Right:
Searches for the next peak to
the right of the marker.
Next Peak Left:
Searches for the next peak to
the left of the marker.
Min Search:
Searches for the lowest peak.
Operation
1. Press
Marker
> Select Marker[F1] and select a
marker number.
2. Press
Peak
Search
and select the type of peak you
wish to find.
Example:
Next Peak
GSP-930 User Manual
94
Page 97
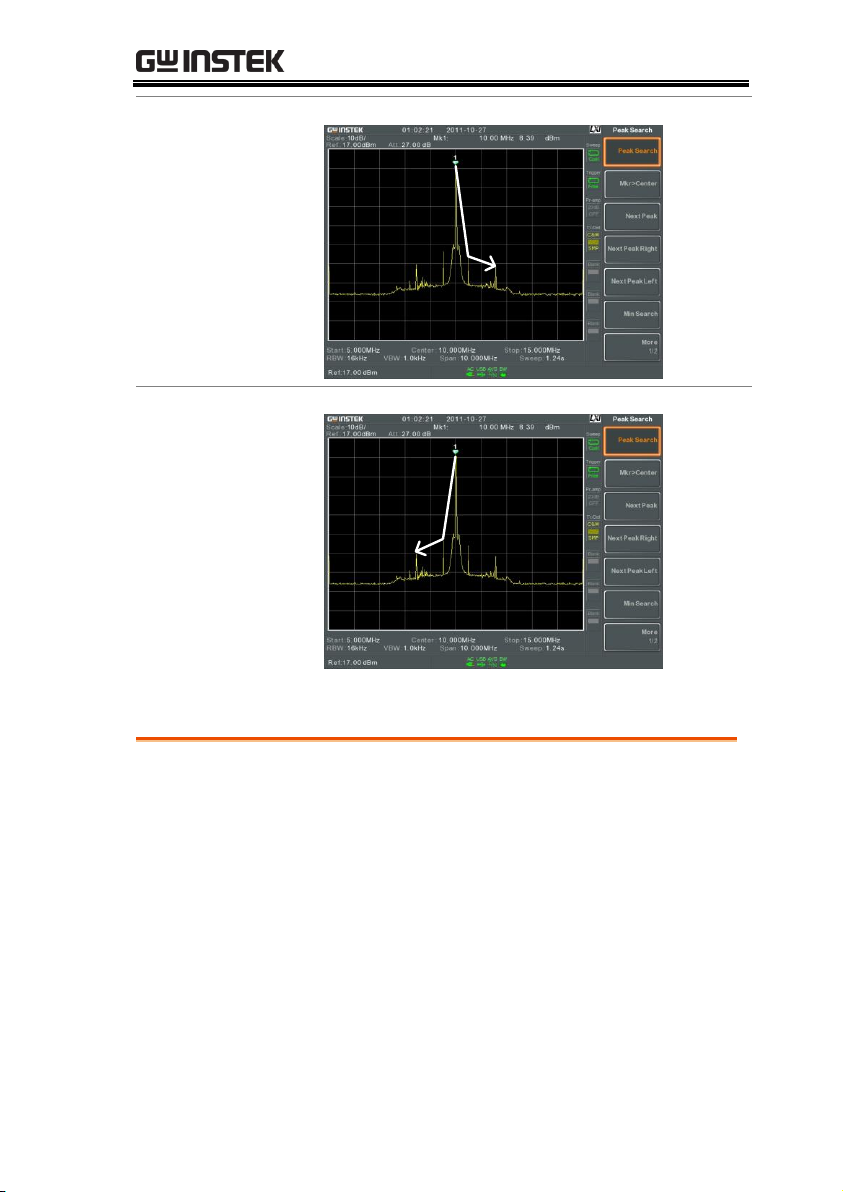
BASIC OPERATION
Example:
Next Peak Right
Example:
Next Peak Left
Description
There are two peak search configuration
options: Peak Excursion and Peak Threshold.
Peak Excursion:
Peak Excursion sets the
minimum value above the
peak threshold for which
peaks will be detected.
Peak Configuration
95
Page 98
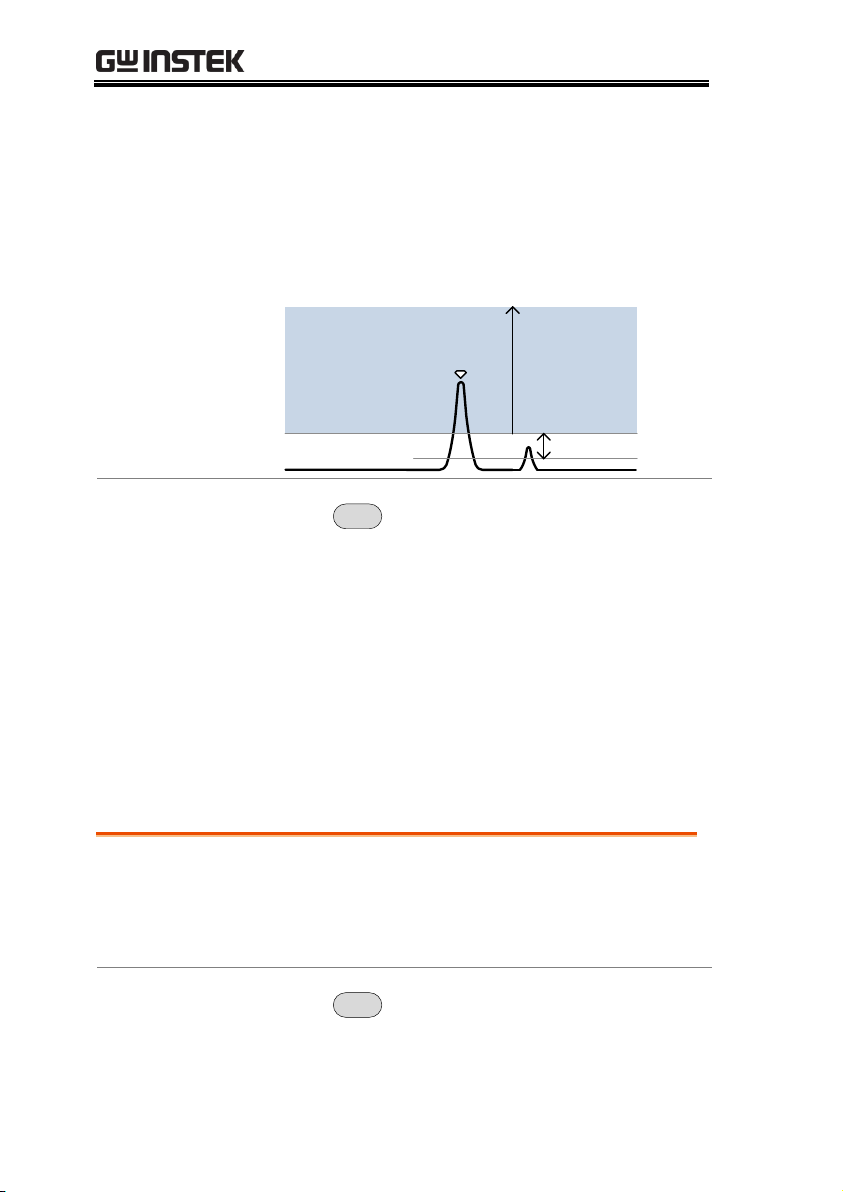
GSP-930 User Manual
Peak Threshold:
Peak threshold sets the
minimum threshold level for
the analyzer to detect peaks.
Any value above the Peak
Threshold + Peak Excursion
will be detected as a peak.
Peak Threshold
Peak Excursion
1
Peak
detection area
Operation
1. Press
Peak
Search
>More 1/2[F7].
2. Press Peak Excursion[F2] to set the excursion
level.
3. Press Peak Threshold[F3] to set the peak
threshold.
Peak Excursion:
0~100dB
Peak Threshold:
-120dB~+30dB
Description
The Peak Table function will display all peaks
(up to 10) that meet the peak configuration
settings. The amplitude and frequency for each
peak is listed.
Operation
1. Press
Peak
Search
>More 1/2[F7]>Peak Table[F5].
Peak Table
96
Page 99
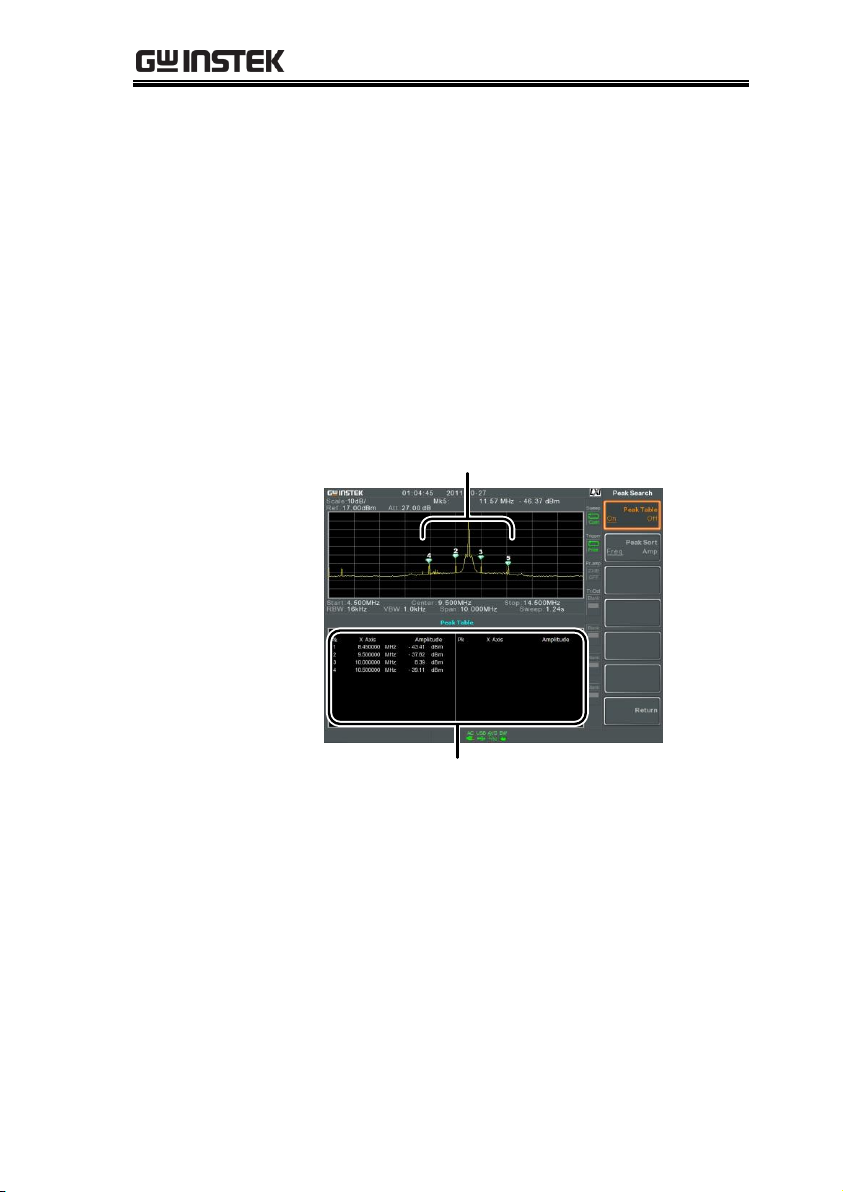
BASIC OPERATION
2. Press Peak Sort[F2] and set the sorting type:
Freq:
Amp:
Sort by frequency in
ascending order.
Sort by amplitude in
ascending order.
3. Press Peak Table[F1] to turn the peak table on.
4. The display splits in two. The bottom screen
shows the peak table with the peak marker ID,
X-axis position and amplitude.
Peak Table
Peak markers
97
Page 100

GSP-930 User Manual
Description
The LCD brightness levels can be adjusted to
three pre-set levels.
Operation
1. Press
Display
> LCD Brightness[F2] to toggle the
display brightness:
Hi:
Mid:
Lo:
High brightness
Medium brightness
Low brightness
Description
The LCD backlight can be turned off to
preserve power or to prolong the lifetime of the
LCD display when not in use.
Operation
1. Press
Display
> LCD Backlight[F3] and turn the
LCD backlight off.
2. When the backlight is off, press any function
key to turn the LCD backlight back on.
Display
The Display key configures the basic display settings as well as
setting up the display mode (spectrum, spectrographic,
topographic) and the split screen modes.
Adjusting the LCD Brightness
Turning the LCD Backlight Off
98
 Loading...