

Page 1

Digital Storage Oscilloscope
GDS-1000A-U Series
USER MANUAL
GW INSTEK PART NO. 82DS-112AUEC1
ISO-9001 CERTIFIED MANUFACTURER
Page 2

May 2014 edition
This manual contains proprietary information, which is protected by
copyright. All rights are reserved. No part of this manual may be
photocopied, reproduced or translated to another language without
prior written consent of Good Will Corporation.
The information in this manual was correct at the time of printing.
However, Good Will continues to improve its products and therefore
reserves the right to change the specifications, equipment, and
maintenance procedures at any time without notice.
Good Will Instrument Co., Ltd.
No. 7-1, Jhongsing Rd., Tucheng Dist., New Taipei City 236, Taiwan.
Page 3

TABLE OF CONTENTS
Table of Contents
SAFETY INSTRUCTIONS .................................. 8
Safety Symbols ....................................................................... 8
Safety Guidelines .................................................................... 9
Power cord for the United Kingdom .................................... 12
GETTING STARTED ........................................ 13
Main Features ................................................................... 13
Panel Overview .................................................................. 15
Front Panel ........................................................................... 15
Rear Panel ............................................................................. 19
Display .................................................................................. 20
Setting up the Oscilloscope ............................................... 21
QUICK REFERENCE ....................................... 24
Menu Tree and Shortcuts................................................... 24
CH1/CH2 key ....................................................................... 25
Cursor key 1/2 ...................................................................... 26
Cursor key 2/2 ...................................................................... 26
Display key ............................................................................ 27
Autoset key ........................................................................... 27
Hardcopy key ........................................................................ 27
Help key ................................................................................ 28
Horizontal menu key ............................................................ 28
Math key 1/2 (+/-/x) ............................................................. 29
Math key 2/2 (FFT/FFT rms) ............................................... 30
Measure key.......................................................................... 31
Run/Stop key ........................................................................ 31
Save/Recall key 1/10 ............................................................ 32
Save/Recall key 2/10 ............................................................ 32
Save/Recall key 3/10 ............................................................ 33
Save/Recall key 4/10 ............................................................ 33
Save/Recall key 5/10 ............................................................ 34
Save/Recall key 6/10 ............................................................ 34
Save/Recall key 7/10 ............................................................ 35
Save/Recall key 8/10 ............................................................ 35
Save/Recall key 9/10 ............................................................ 36
Save/Recall key 10/10 .......................................................... 36
Trigger key 1/6 ...................................................................... 37
3
Page 4

GDS-1000A-U Series User Manual
Trigger key 2/6 ..................................................................... 37
Trigger key 3/6 ..................................................................... 38
Trigger key 4/6 ..................................................................... 38
Trigger key 5/6 ..................................................................... 39
Trigger key 6/6 ..................................................................... 39
Utility key 1/11 (Utility #1) .................................................. 40
Utility 2/11 (Utility #2) ........................................................ 40
Utility key 3/11 (Utility #3) .................................................. 41
Utility key 4/11 (Hardcopy -Save All) ................................... 41
Utility key 5/11 (Hardcopy -Printer) .................................... 42
Utility key 6/11 (Hardcopy -Save Image) ............................. 42
Utility key 7/11 (Probe compensation) ............................... 43
Utility key 8/11 (Go-NoGo) ................................................. 43
Utility key 9/11 (Data Logging 1/2) ..................................... 44
Utility key 10/11 (Data Logging 2/2) ................................... 44
Utility key 11/11 (Self CAL Menu) ....................................... 44
Default Settings ................................................................. 45
Built-in Help ...................................................................... 46
MEASUREMENT ............................................ 47
Basic Measurements ......................................................... 47
Activating a channel ............................................................. 47
Using Autoset ...................................................................... 48
Running and stopping the trigger ....................................... 50
Changing the horizontal position and scale........................ 51
Changing the vertical position and scale ............................ 52
Using the probe compensation signal ................................ 53
Automatic Measurements .................................................. 55
Measurement items ............................................................. 55
Automatic measurement gating .......................................... 57
Automatically measuring the input signals ......................... 58
Cursor Measurements ....................................................... 61
Using the horizontal cursors ............................................... 61
Using the vertical cursors .................................................... 62
Math Operations ............................................................... 63
Overview ............................................................................... 63
Adding, subtracting or multiplying signals ......................... 64
Using the FFT function ........................................................ 65
Go No-Go Testing .............................................................. 67
Overview ............................................................................... 67
Edit: NoGo When ................................................................. 68
Edit: Source .......................................................................... 68
Edit: NoGo Violation Conditions ......................................... 69
4
Page 5

TABLE OF CONTENTS
Edit: Template (boundary) ................................................... 69
Run Go-NoGo Tests ............................................................. 73
Data Logging ..................................................................... 74
Overview ............................................................................... 74
Edit: Source .......................................................................... 75
Edit: Setup Parameters ........................................................ 75
Run Data logging ................................................................. 77
CONFIGURATION .......................................... 78
Acquisition ........................................................................ 78
Selecting the acquisition mode ............................................ 78
Selecting Delay mode ........................................................... 80
Real time vs Equivalent time sampling mode ..................... 82
Display .............................................................................. 83
Selecting vector or dot drawing ........................................... 83
Accumulating the waveform ................................................ 83
Adjusting the display contrast ............................................. 84
Selecting the display grid ..................................................... 84
Horizontal View ................................................................. 85
Moving the waveform position horizontally ........................ 85
Selecting the horizontal scale .............................................. 85
Selecting the waveform update mode ................................. 86
Zooming the waveform horizontally .................................... 87
Viewing waveforms in the X-Y mode ................................... 88
Horizontal Adjustment Menu .............................................. 89
Vertical View (Channel) ..................................................... 91
Moving the waveform position vertically ............................. 91
Selecting the vertical scale ................................................... 91
Selecting the coupling mode ............................................... 91
Expand Vertical Scale Center / Ground ............................... 92
Inverting the waveform vertically ......................................... 93
Limiting the waveform bandwidth ....................................... 94
Probe attenuation level and type ......................................... 94
Trigger ............................................................................... 96
Trigger type ........................................................................... 96
Trigger parameter ................................................................. 96
Configuring Holdoff ............................................................. 98
Configuring the edge trigger ................................................ 99
Configuring the video trigger ............................................. 100
Configuring the pulse width trigger ................................... 101
Manually triggering the signal ........................................... 103
Rear Panel USB Port Interface ......................................... 104
Remote Control Interface ................................................ 105
5
Page 6

GDS-1000A-U Series User Manual
System Settings ............................................................... 107
Viewing the system information ........................................ 107
Selecting the language ....................................................... 107
SAVE/RECALL .............................................. 109
File Structures ................................................................. 109
Display image file format ................................................... 109
Waveform file format ......................................................... 109
Setup file format ................................................................ 112
Using the USB file utilities ................................................. 113
Quick Save (HardCopy) ................................................... 115
Save ................................................................................ 117
File type/source/destination.............................................. 117
Saving the panel settings ................................................... 118
Saving the waveform .......................................................... 119
Saving the display image ................................................... 121
Saving all (panel settings, display image, waveform) ....... 122
Recall .............................................................................. 124
File type/source/destination.............................................. 124
Recalling the default panel settings ................................... 125
Recalling a reference waveform to the display .................. 126
Recalling panel settings ..................................................... 126
Recalling a waveform ......................................................... 127
Recall Image ....................................................................... 129
MAINTENANCE ........................................... 131
Vertical Resolution Calibration ........................................ 131
Probe Compensation ....................................................... 132
FAQ .............................................................. 134
The input signal does not appear in the display. .............. 134
I want to remove some contents from the display. .......... 134
The waveform does not update (frozen). .......................... 135
The probe waveform is distorted. ...................................... 135
Autoset does not catch the signal well. ............................. 135
I want to clean up the cluttered panel settings. ................ 135
The saved display image is too dark on the background. . 135
The accuracy does not match the specifications. ............. 136
The oscilloscope will not allow a 2M waveform to be saved.
............................................................................................ 136
6
Page 7

TABLE OF CONTENTS
APPENDIX .................................................... 137
Fuse Replacement ........................................................... 137
GDS-1000A-U Series Specifications ................................. 138
Model-specific specifications ............................................. 138
Common specifications ..................................................... 139
Probe Specifications ........................................................ 141
GDS-1072A-U Probe ........................................................... 141
GDS-1102A-U Probe ........................................................... 141
GDS-1152A-U Probe ........................................................... 142
Dimensions ..................................................................... 143
EC Declaration of Conformity .......................................... 144
INDEX .......................................................... 145
7
Page 8
GDS-1000A-U Series User Manual
WARNING
Warning: Identifies conditions or practices that
could result in injury or loss of life.
CAUTION
Caution: Identifies conditions or practices that
could result in damage to the oscilloscope or to
other objects or property.
DANGER High Voltage
Attention: Refer to the Manual
Protective Conductor Terminal
Earth (Ground) Terminal
SAFETY INSTRUCTIONS
This chapter contains important safety instructions
that should be followed when operating and
storing the oscilloscope. Read the following before
any operation to ensure your safety and to keep
the oscilloscope in the best condition.
Safety Symbols
These safety symbols may appear in this manual or on the
oscilloscope.
8
Page 9
SAFETY INSTRUCTIONS
Do not dispose electronic equipment as unsorted
municipal waste. Please use a separate collection
facility or contact the supplier from which this
instrument was purchased.
General
Guideline
CAUTION
Make sure the BNC input voltage does not
exceed 300V peak.
Never connect a hazardous live voltage to the
ground side of the BNC connectors. It might
lead to fire and electric shock.
Do not place heavy objects on the oscilloscope.
Avoid severe impact or rough handling that
may damage the oscilloscope.
Avoid discharges of static electricity on or near
the oscilloscope.
Use only mating connectors, not bare wires, for
the terminals.
Do not block the cooling fan vent.
Do not perform measurements at power sources
and building installation sites (Note below).
The oscilloscope should only be disassembled
by a qualified technician.
(Measurement categories) EN 61010-1:2001 specifies the
measurement categories and their requirements as follows. The
GDS-1000A-U falls under category II.
Measurement category IV is for measurement performed at the
source of a low-voltage installation.
Measurement category III is for measurement performed in a
building installation.
Measurement category II is for measurement performed on
circuits directly connected to a low voltage installation.
Measurement category I is for measurements performed on
circuits not directly connected to Mains.
Safety Guidelines
9
Page 10

GDS-1000A-U Series User Manual
Power Supply
WARNING
AC Input voltage: 100 ~ 240V AC, 47 ~ 63Hz
The power supply voltage should not fluctuate
more than 10%.
Connect the protective grounding conductor of
the AC power cord to an earth ground.
Fuse
WARNING
Fuse type: T1A/250V
To ensure fire protection, replace the fuse only
with the specified type and rating.
Disconnect the power cord before replacing the
fuse.
Make sure the cause of fuse blowout is fixed
before replacing the fuse.
Cleaning the
oscilloscope
Disconnect the power cord before cleaning the
oscilloscope.
Use a soft cloth dampened in a solution of mild
detergent and water. Do not spray any liquid
into the oscilloscope.
Do not use chemicals containing harsh products
such as benzene, toluene, xylene, and acetone.
Operation
Environment
Location: Indoor, no direct sunlight, dust free,
almost non-conductive pollution (Note below)
Relative Humidity: ≤ 80%, 40°C or below
≤ 45%, 41°C~50°C
Altitude: < 2000m
Temperature: 0°C to 50°C
10
Page 11
SAFETY INSTRUCTIONS
(Pollution Degree) EN 61010-1:2001 specifies pollution degrees and
their requirements as follows. The oscilloscope falls under degree 2.
Pollution refers to “addition of foreign matter, solid, liquid, or
gaseous (ionized gases), that may produce a reduction of dielectric
strength or surface resistivity”.
Pollution degree 1: No pollution or only dry, non-conductive
pollution occurs. The pollution has no influence.
Pollution degree 2: Normally only non-conductive pollution
occurs. Occasionally, however, a temporary conductivity caused
by condensation must be expected.
Pollution degree 3: Conductive pollution occurs, or dry, non-
conductive pollution occurs which becomes conductive due to
condensation which is expected. In such conditions, equipment
is normally protected against exposure to direct sunlight,
precipitation, and full wind pressure, but neither temperature
nor humidity is controlled.
Storage
environment
Location: Indoor
Storage Temperature: -10°C~60°C, no
condensation-
Relative Humidity: 93% @ 40°C
65% @ 41°C ~60°C
Disposal
Do not dispose this instrument as unsorted
municipal waste. Please use a separate collection
facility or contact the supplier from which this
instrument was purchased. Please make sure
discarded electrical waste is properly recycled to
reduce environmental impact.
11
Page 12
GDS-1000A-U Series User Manual
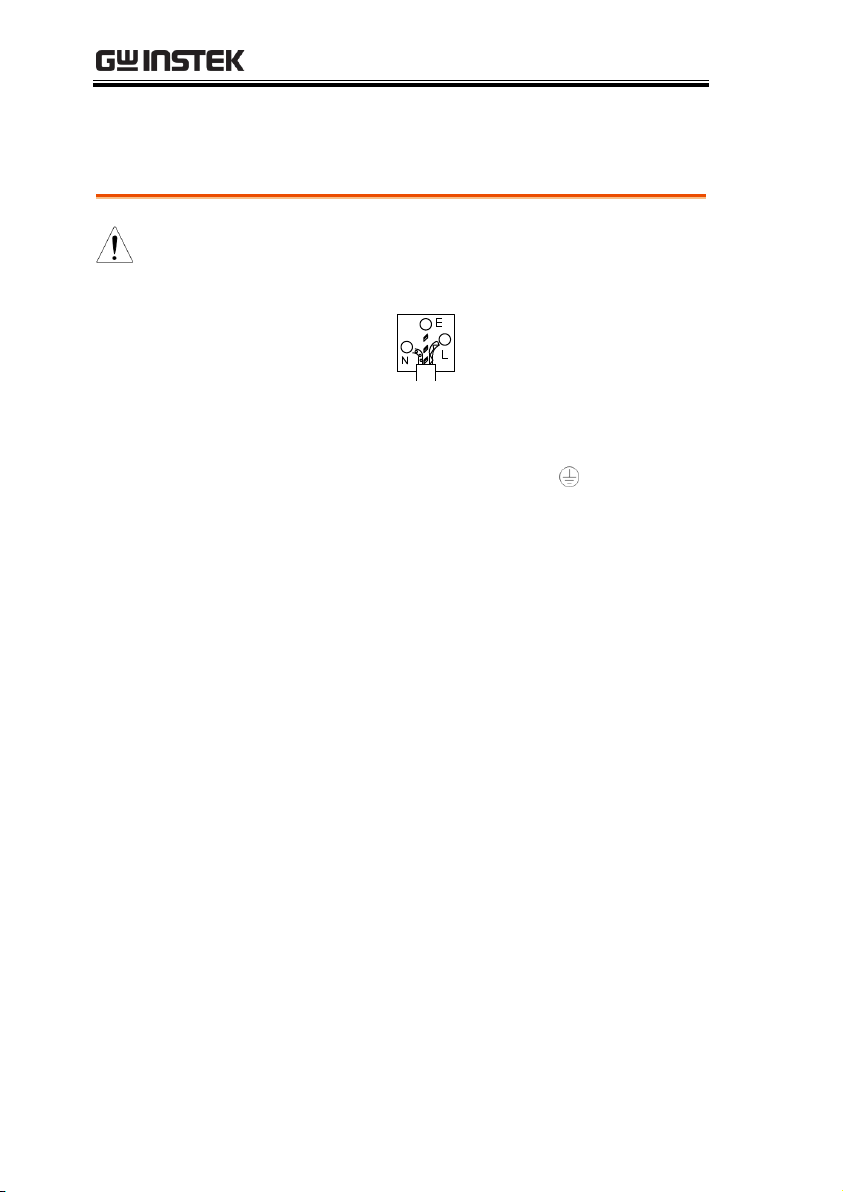
Green/ Yellow:
Earth
Blue:
Neutral
Brown:
Live (Phase)
Power cord for the United Kingdom
When using the oscilloscope in the United Kingdom, make sure the
power cord meets the following safety instructions.
NOTE: This lead/appliance must only be wired by competent persons
WARNING: THIS APPLIANCE MUST BE EARTHED
IMPORTANT: The wires in this lead are coloured in accordance with the
following code:
As the colours of the wires in main leads may not correspond with the
coloured marking identified in your plug/appliance, proceed as follows:
The wire which is coloured Green & Yellow must be connected to the Earth
terminal marked with either the letter E, the earth symbol or coloured
Green/Green & Yellow.
The wire which is coloured Blue must be connected to the terminal which is
marked with the letter N or coloured Blue or Black.
The wire which is coloured Brown must be connected to the terminal
marked with the letter L or P or coloured Brown or Red.
If in doubt, consult the instructions provided with the equipment or contact
the supplier.
This cable/appliance should be protected by a suitably rated and approved
HBC mains fuse: refer to the rating information on the equipment and/or
user instructions for details. As a guide, a cable of 0.75mm2 should be
protected by a 3A or 5A fuse. Larger conductors would normally require
13A types, depending on the connection method used.
Any exposed wiring from a cable, plug or connection that is engaged in a
live socket is extremely hazardous. If a cable or plug is deemed hazardous,
turn off the mains power and remove the cable, any fuses and fuse
assemblies. All hazardous wiring must be immediately destroyed and
replaced in accordance to the above standard.
12
Page 13

GETTING STARTED
Model name
Frequency bandwidth
Input channels
GDS-1072A-U
DC – 70MHz (–3dB)
2
GDS-1102A-U
DC – 100MHz (–3dB)
2
GDS-1152A-U
DC – 150MHz (–3dB)
2
Performance
1 GS/s real-time sampling rate
25GS/s equivalent-time sampling rate
2M points record length
Up to 10ns peak detection
2mV~10V vertical scale
1ns ~ 50s time scale
Features
5.7 inch color TFT display
Saving and recalling setups and waveforms
27 automatic measurements
Multi-language menu (12 languages)
Math operation: Addition, Subtraction,
multiplication, FFT, FFT RMS
Data logging
Go-NoGo testing
Edge, video, pulse width trigger
GETTING STARTED
The Getting started chapter introduces the
oscilloscope’s main features, appearance, and set
up procedure.
Main Features
13
Page 14

GDS-1000A-U Series User Manual
Compact size: (W) 310 x (D) 140 x (H) 142 mm
Probe factor from 0.1X~2000X voltage/current
Interface
USB 2.0 full-speed interface for saving and
recalling data
Calibration output
External trigger input
USB slave interface for remote control
14
Page 15
GETTING STARTED
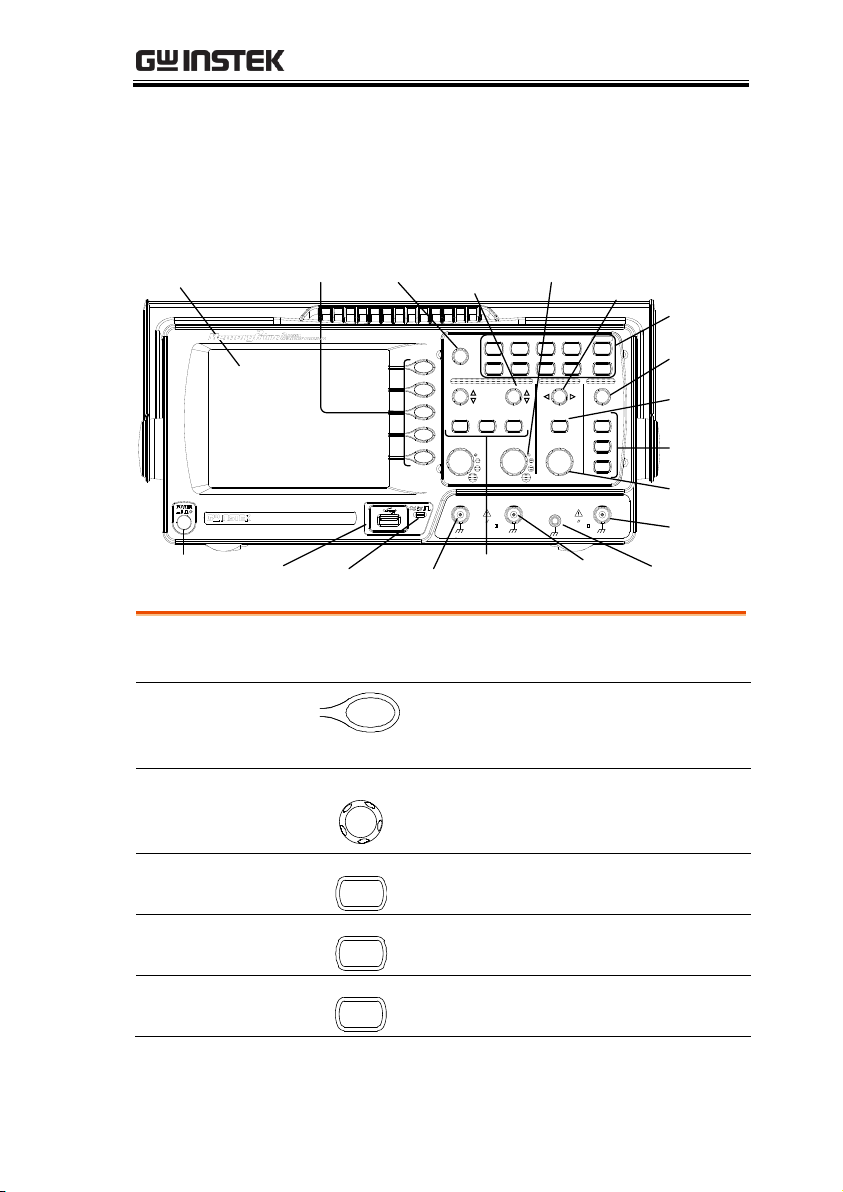
LCD
Display
Function
keys
VARIABLE
knob
Menu keys
Trigger
LEVEL knob
Trigger
keys
Ground
Terminal
CH1
terminal
USB port CH2
terminal
Probe
compensation
output
EXT TRIG
terminal
Power
switch
Horizontal
POSITION
knob
Horizontal
MENU key
TIME/DIV
knob
CH1/CH2/
MATH keys
Vertical
POSITION
knob
VOLTS/DIV
knob
VOLTS/DIV VOLTS/DIV TIME/DIV
CH 1 MATH CH 2 MENU MENU
Acquire
Display
Utility Help
Run/Stop
VARIABLE
FORCE
Autoset
Cursor
SINGLE
Hardcopy
Measure
Save/Recall
LEVEL
VERTICAL HORIZONTAL TRIGGER
CH1
CAT300V
MW15pF
MAX. 300Vpk
1
CH2 EXT TRIG
CAT300V
MW15pF
MAX. 300Vpk
1
X Y
150 MHz 1 G Sa/s
Digital Storage Oscilloscope
GDS-1152A-U
LCD display
TFT color, 320 x 234 resolution, wide angle view
LCD display.
Function keys:
F1 (top) to
F5 (bottom)
Activates the functions which
appear in the left side of the LCD
display.
Variable knob
VARIABLE
Increases or decreases values and
moves to the next or previous
parameter.
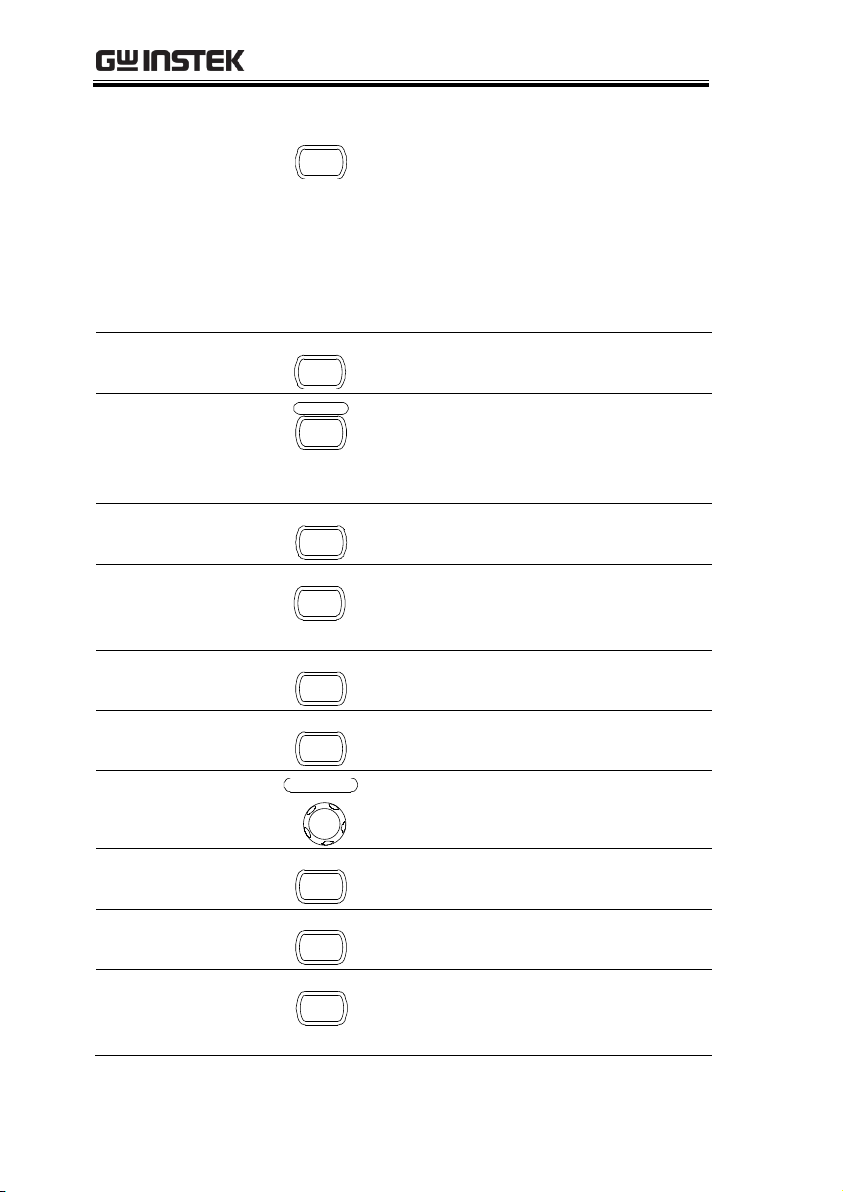
Acquire key
Acquire
Configures the acquisition mode
(page 78).
Display key
Display
Configures the display settings
(page 83).
Cursor key
Cursor
Runs cursor measurements (page
61).
Panel Overview
Front Panel
(Continued on next page)
15
Page 16
GDS-1000A-U Series User Manual
Utility key
Utility
Configures the Hardcopy function
(page 115), shows the system
status (page 107), selects the menu
language (page 107), runs the self
calibration (page 131), configures
the probe compensation signal
(page 132), and selects the USB
host type(page 104).
Help key
Help
Shows the Help contents on the
display (page 46).
Autoset key
Autoset
Automatically configures the
horizontal, vertical, and trigger
settings according to the input
signal (page 48).
Measure key
Measure
Configures and runs automatic
measurements (page 55).
Save/Recall key
Save/Recall
Saves and recalls images,
waveforms, or panel settings
(page 109).
Hardcopy key
Hardcopy
Stores images, waveforms, or
panel settings to USB (page 115).
Run/Stop key
Run/Stop
Runs or stops triggering (page 50).
Trigger level knob
LEVEL
TRIGGER
Sets the trigger level (page 96).
Trigger menu key
MENU
Configures the trigger settings
(page 96).
Single trigger key
SINGLE
Selects the single triggering mode
(page 103).
Trigger force key
FORCE
Acquires the input signal once
regardless of the trigger condition
at the time (page 103).
16
Page 17
GETTING STARTED
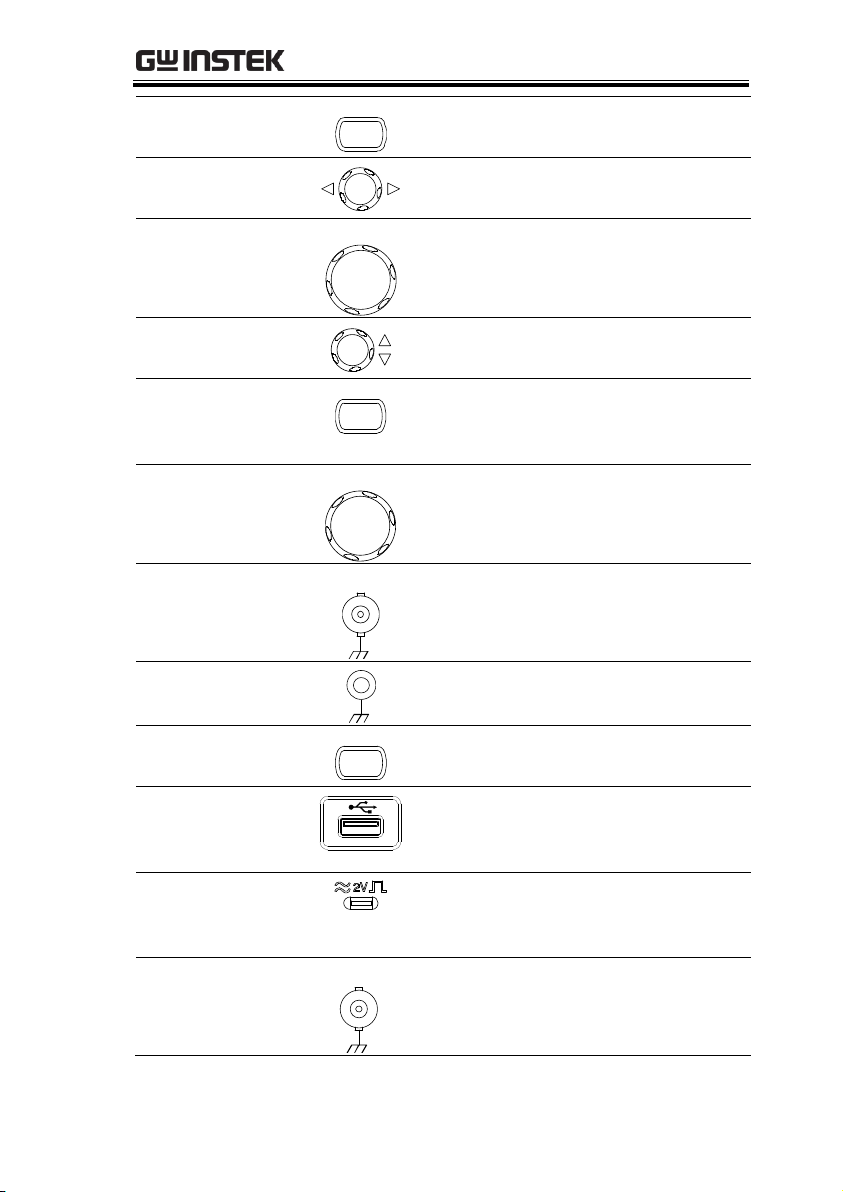
Horizontal menu
key
MENU
Configures the horizontal view
(page 85).
Horizontal
position knob
Moves the waveform horizontally
(page 85).
TIME/DIV knob
TIME/DIV
Selects the horizontal scale (page
85).
Vertical position
knob
Moves the waveform vertically
(page 91).
CH1/CH2 key
CH 1
Configures the vertical scale and
coupling mode for each channel
(page 91).
VOLTS/DIV knob
VOLTS/DIV
Selects the vertical scale (page 91).
Input terminal
CH1
Accepts input signals: 1MΩ±2%
input impedance, BNC terminal.
Ground terminal
Accepts the DUT ground lead to
achieve a common ground.
MATH key
MATH
Performs math operations (page
63).
USB port
Facilitates transferring waveform
data, display images, and panel
settings (page 109).
Probe
compensation
output
Outputs a 2Vp-p, square signal for
compensating the probe (page
132) or demonstration.
External trigger
input
EXT TRIG
Accepts an external trigger signal
(page 96).
17
Page 18

GDS-1000A-U Series User Manual
Power switch
Powers the oscilloscope on or off.
18
Page 19
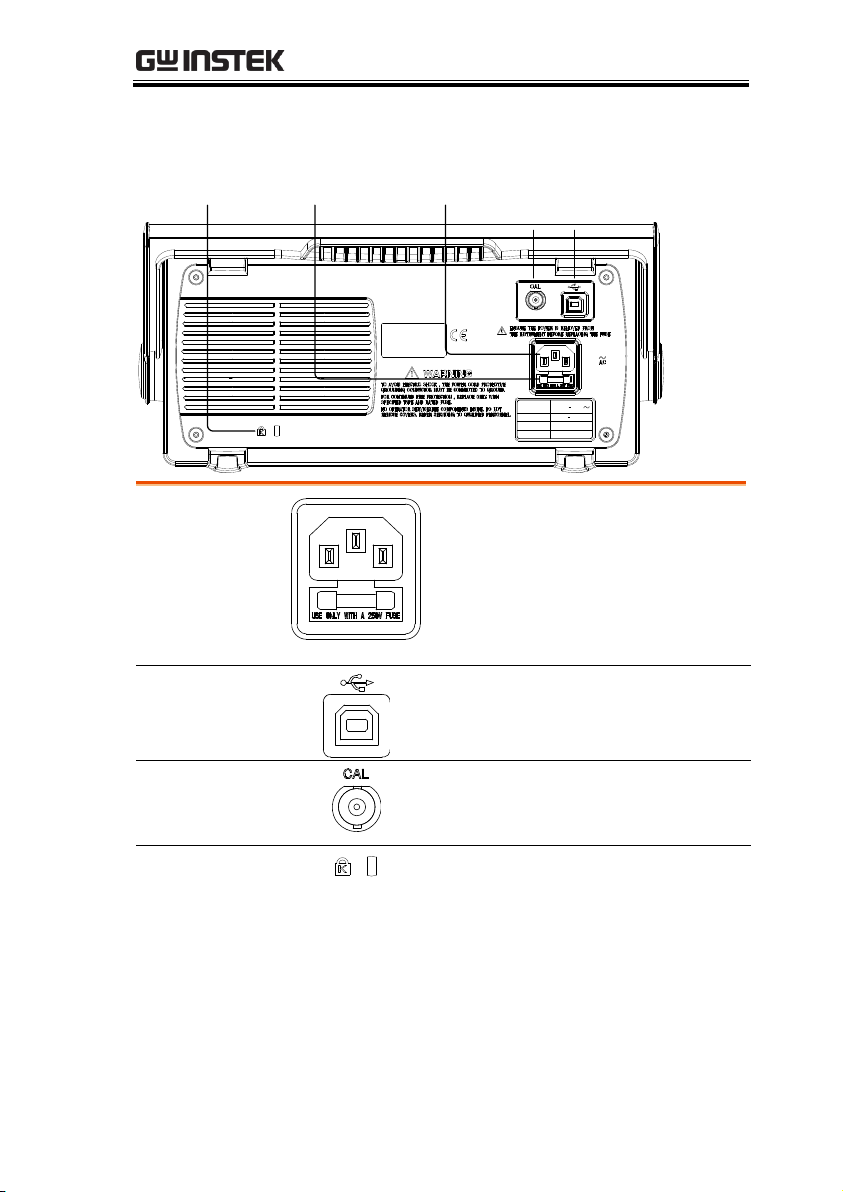
Rear Panel
LINE VOLTAGE
AC 100 240V
FUSE RATING
RANGE
T1A 250V
FREQUENCY 50 60Hz
POWER MAX. 18W 40VA
USB portCAL outputPower cord socketFuse socket
Security lock
slot
Power cord
socket
Fuse socket
Power cord socket accepts the AC
mains, 100 ~ 240V, 50/60Hz.
The fuse socket holds the AC main
fuse, T1A/250V.
For the fuse replacement
procedure, see page 137.
USB slave port
Accepts a type B (slave) male USB
connector for remote control of the
oscilloscope (page 104).
Calibration
output
Outputs the calibration signal used
in vertical scale accuracy calibration
(page 131).
Security lock slot
Standard laptop security lock slot
for ensuring the security of the
GDS-1000A-U.
GETTING STARTED
19
Page 20
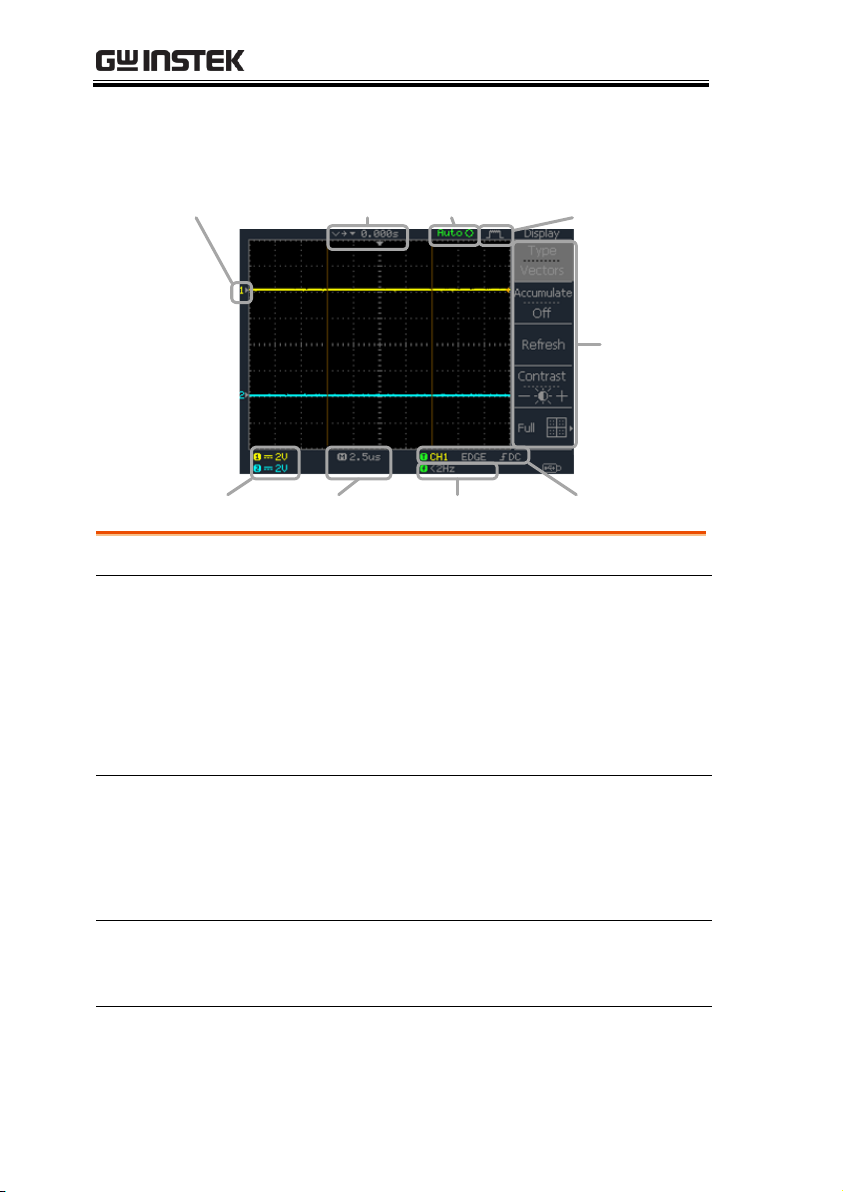
Display
Waveform marker
Vertical status Horizontal status Frequency Trigger condition
Waveform position Trigger status Acquisition
Menu
Waveforms
Channel 1: Yellow
Channel 2: Blue
Trigger status
Trig’d
A signal is being triggered
Trig?
Waiting for a trigger condition
Auto
Updating the input signal
regardless of trigger conditions
STOP
Triggering is stopped
For trigger setting details, see page 96.
Input signal
frequency
Updates the input signal frequency (the trigger
source signal) in real-time.
“< 2Hz” Indicates that the signal frequency is less
than the lower frequency limit (2Hz) and thus not
accurate.
Trigger
configuration
Shows the trigger source, type, and slope. In case
of the Video trigger, shows the trigger source and
polarity.
Horizontal status
Vertical status
Shows the channel configurations: coupling mode,
vertical scale, and horizontal scale.
GDS-1000A-U Series User Manual
20
Page 21
GETTING STARTED
Background
This section describes how to set up the
oscilloscope properly including adjusting the
handle, connecting a signal, adjusting the scale,
and compensating the probe. Before operating the
oscilloscope in a new environment, run these steps
to make sure the oscilloscope is functionally stable.
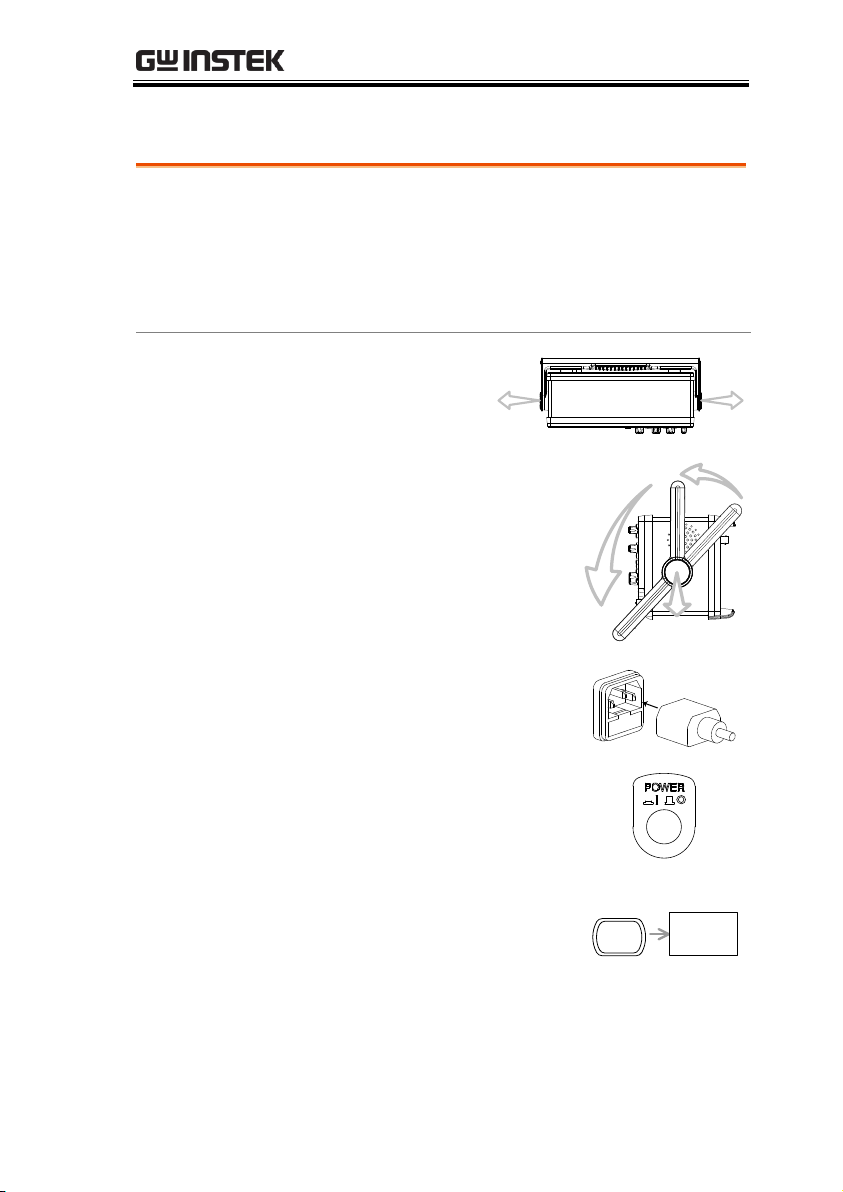
Procedure
1. Pull both bases of
the handle out
slightly.
2. Turn to one of the three
preset positions.
3. Connect the power cord.
4. Press the power switch. The
display will become active
in approximately 10
seconds.
5. Reset the system by recalling
the factory settings. Press
the Save/Recall key, then
Default Setup. For details
regarding the factory
settings, see page 45.
Default
Setup
Save/Recall
Setting up the Oscilloscope
21
Page 22
GDS-1000A-U Series User Manual
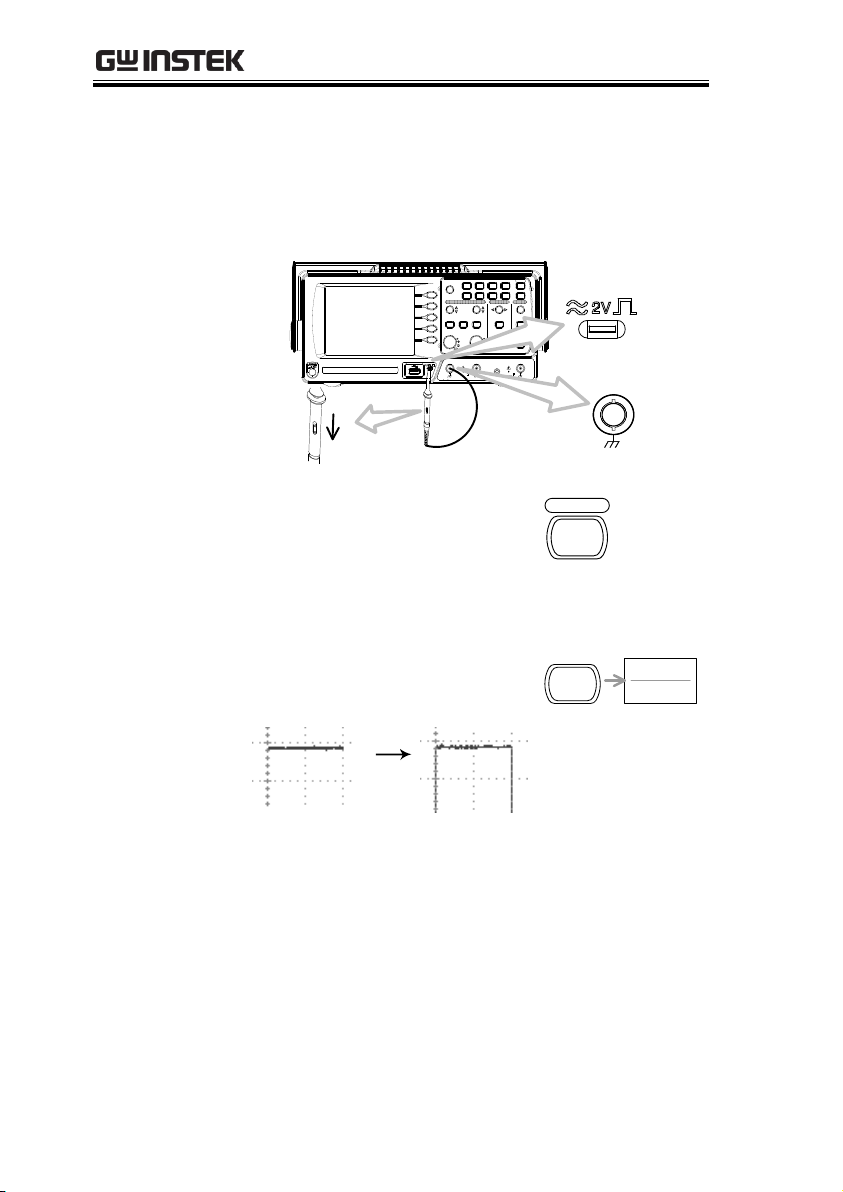
6. Connect the probe between the Channel1 input
terminal and probe compensation signal output
(2Vp-p, 1kHz square wave).
7. Set the probe attenuation voltage to x10.
VOLTS/DIV VOLTS/DIV TIME/DIV
CH 1 MATH CH 2 MENU MENU
Acquire
Display
Utility Help
Run/Stop
VARIABLE
FORCE
Autoset
Cursor
SINGLE
Hardcopy
Measure
Save/Recall
LEVEL
VERTICAL HORIZONTAL TRIGGER
CH1
CAT300V
MW15pF
MAX. 300Vpk
1
CH2 EXT TRIG
CAT300V
MW15pF
MAX. 300Vpk
1
X Y
X
10
X
1
CH1
x1
x10
8. Press the Autoset key. A
square waveform will
appear in the center of the
display. For details on
Autoset, see page 48.
Autoset
9. Press the Display key, then
Type and select the vector
waveform type.
Type
Vectors
Display
10. Turn the adjustment point on the probe to
flatten the square waveform edge.
22
Page 23

GETTING STARTED
Over
Compensation
Normal
Under
Compensation
11. Setting up the oscilloscope is complete. You
may continue with the other operations.
Measurement: page 47
Configuration: page 78
23
Page 24

GDS-1000A-U Series User Manual
Conventions
Examples
Normal
= Press the functional key for “Normal”
Average
= Repeatedly press the functional key for
“Average”
Normal ~ Average
= Select a menu from “Normal” to “Average” and
press its functionality key
Normal→VAR
= Press the functionality key for “Normal”, and
then use the Variable knob
QUICK REFERENCE
This chapter lists the oscilloscope menu tree,
operation shortcuts, built-in help coverage, and
default factory settings. Use this chapter as a
handy reference to access the oscilloscope
functions.
Menu Tree and Shortcuts
24
Page 25
Normal
Peak
Detect
2/ 4/ 8/ 16/ 32/
64/ 128/ 256
Average
Sample Rate
500MS/s
Acquire
Delay
On
On/ Off
Select acquisition mode
Normal ~ Peak-Detect
Select average number
Average
Turn Delay on/off
Delay On
On/ Off
On/ Off
/ /
Coupling
Invert
Off
BW Limit
Off
Voltage
x1
CH 1
Expand
Center
Voltage/Current
Center/Ground
Turn channel on/off
CH 1/2
Select coupling mode
Coupling
Invert waveform
Invert
Turn bandwidth limit on/off
BW Limit
Select probe type
Voltage↔Current
Select probe attenuation
VAR (0.1x~2000x) (1-2-5 step)
Expand type
Expand
CH1/CH2 key
QUICK REFERENCE
25
Page 26
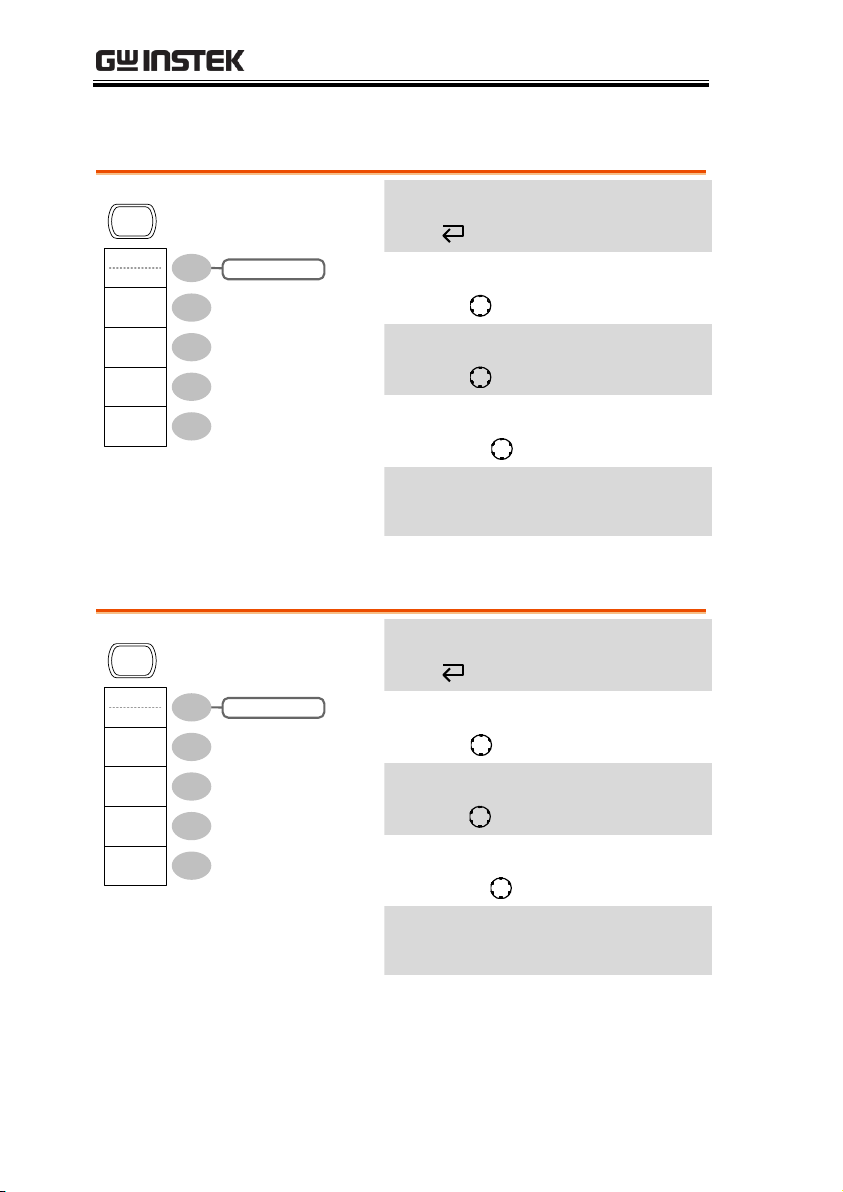
Cursor key 1/2
CH1/ 2/ MATH
Source
CH1
X↔ Y
Cursor
X1X2
10.00uS
100.0kHz
0.000uV
X1
-5.000uS
0.000uV
X2
5.000uS
0.000uV
∆ :
f :
Turn cursor on/off
Cursor
Move X1 cursor
X1→ VAR
Move X2 cursor
X2→ VAR
Move both X1 and X2 cursor
X1X2→ VAR
Switch to Y cursor
X↔Y
CH1/ 2/ MATH
Source
CH1
X↔ Y
Cursor
Y1
123.4mV
Y2
12.9mV
Y1Y2
10.5mV
Turn cursor on/off
Cursor
Move Y1 cursor
Y1→ VAR
Move Y2 cursor
Y2→ VAR
Move both Y1 and Y2 cursor
Y1Y2→ VAR
Switch to X cursor
X↔Y
Cursor key 2/2
GDS-1000A-U Series User Manual
26
Page 27
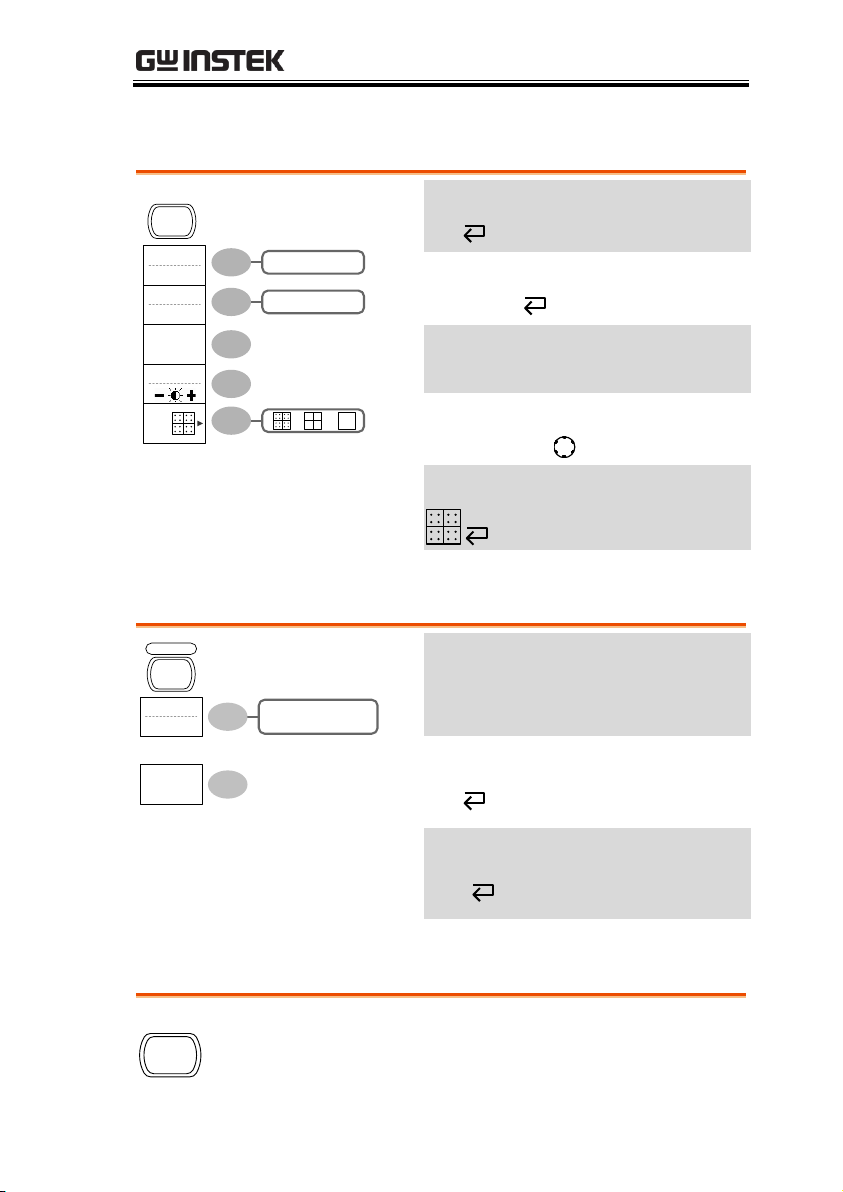
Display key
Vectors/ Dots
Type
Vectors
On/ Off
Accumulate
Off
Refresh
Contrast
Full
/ /
Display
Select waveform type
Type
Waveform accumulate On/Off
Accumulate
Refresh accumulation
Refresh
Set display contrast
Contrast→VAR
Select display grid
Undo
Type
Fit Screen
Fit Screen
AC Priority
Autoset
Automatically find the signal and set
the scale
Autoset
Change the Type of Autoset mode.
Type (available for a few seconds)
Undo Autoset
Undo (available for a few seconds)
Hardcopy
→ See Utility key (page 40)
Autoset key
QUICK REFERENCE
Hardcopy key
27
Page 28
GDS-1000A-U Series User Manual
Help
Turn help mode on/off
Help
MENU
Main
Window
Window
Zoom
XY
Roll
MENU
H Pos Adj
Fine
Reset
Hor Pos
Previous
180.0uS
Next
340.0uS
Set/Clear
180.0uS
Fine/Coarse
Switch from Horizontal Menu
to Horizontal Position Menu.
Horizontal MENU
Select main (default) display
Main
Select window mode
Window→TIME/DIV
Zoom in window mode
Window Zoom
Select window roll mode
Roll
Select XY mode
XY
Toggle adjustment mode
H Pos Adj
Reset horizontal marker
Reset
Set Horizontal marker/delete
horizontal marker.
HOR →Set/Clear
Navigate to previous
horizontal marker.
Previous
Navigate to next horizontal
marker.
Next
Help key
Horizontal menu key
28
Page 29
QUICK REFERENCE
Operation
CH1+CH2
Position
0.00 Div
Unit/Div
2V
-12div ~ +12div
CH1+CH2
CH1-CH2
CH1xCH2
FFT
FFT rms
MATH
200mV~10V/div
Math on/off
Math
Select math operation type (+/–
/x/FFT/FFT rms)
Operation
Set result position
Position→VAR
Math result Volt/Div
Unit/Div→VOLTS/DIV(CH2)
Math key 1/2 (+/-/x)
29
Page 30
GDS-1000A-U Series User Manual
Operation
FFT
Source
CH1
Zoom
1X
0.0000Hz
1/2/5/10/20X
Window
Hanning
Flattop/
Rectangular/
Blackman/
Hanning
CH1/2
MATH
-12div ~ +12div
20/10/5/2/1 dB
CH1+CH2
CH1-CH2
CH1xCH2
FFT
FFT rms
Vertical
2V
0.00 Div
Math on/off
Math
Select math operation type (+/–
/x/FFT/FFT rms)
Operation
Select FFT source channel
Source
Select FFT window
Window
Select FFT result position
Vertical→VAR
Select vertical scale
Vertical→VOLTS/DIV
Select vertical units
Vertical
Select Zoom level
Zoom(X)→VAR
Select Horizontal position
Zoom(Hz)→VAR
Math key 2/2 (FFT/FFT rms)
30
Page 31

Measure key
Voltage
Vpp
Previous
Menu
View all/Select
Measurements
(Voltage/
Time/Delay)
Vpp
1:204mV
2: 300mV
Vavg
1: 1.93mV
2: 28.0mV
Frequency
1: 1.000kHz
2: 3.003kHz
Duty Cycle
1: 50.01%
2: 49.88%
Rise Time
1. 76.20us
2. 70.11us
Measure Measure
Source 2
CH2
Source 1
CH1
Turn on/off measurement
Measure
Select measurement type
Voltage/Time/Delay
Select measurement item
VAR or Icon(F3) / → VAR
Go back to previous menu
Previous Menu
Run/Stop
Freeze/unfreeze waveform or trigger
Run/Stop
QUICK REFERENCE
Run/Stop key
31
Page 32

GDS-1000A-U Series User Manual
Recall
Setup
Recall
Waveform
Display
Refs.
Save
Setup
Save
Waveform
Save
Image
Save
All
To Recall
Setup
To Recall
Waveform
To Save
Setup
To Save
Waveform
To Save
Image
To Save
All
Default
Setup
Save/Recall Save/Recall
To Display
Refs
Recall
Image
To Recall
Image
CSV Format
Fast
Fast/ Detail
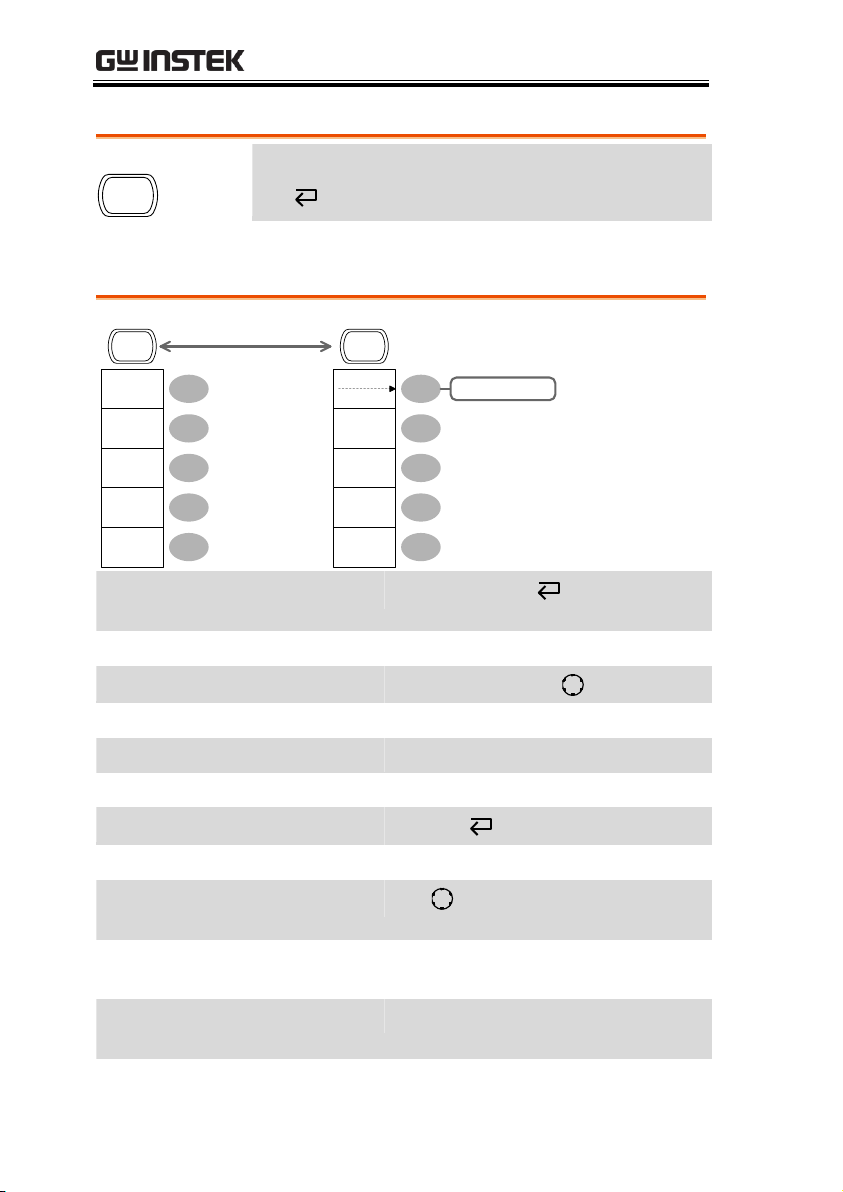
Switch to Save or Recall menu
Save/Recall
Recall default setup
Default Setup
Change CSV format
CSV Format
Recall
Setup
Recall
File
Utilities
(USB only)
To File Utilities
Recall Setup
Source
Memory
Memory/USB
Select other menu
Recall Setup
Select setup source
Source →VAR
Recall setup
Recall
Go to USB file utilities
File Utilities
Save/Recall key 1/10
Save/Recall key 2/10
32
Page 33

QUICK REFERENCE
Recall
Waveform
Recall
File
Utilities
Recall Waveform
Destination
Source
Memory
Memory/USB
(USB only)
To File Utilities
RefA/B
Select other menu
Recall Waveform
Select waveform source
Source →VAR
Select waveform destination
Destination→VAR
Recall waveform
Recall
Go to USB file utilities
File Utilities
Recall
Image
Ref Image
Off
Recall
File
Utilities
(USB only)
To File Utilities
Recall Image
Source
USB
On/Off
Select other menu
Recall Image
Turn reference image on/off
Ref image
Recall waveform
Recall
Go to USB file utilities
File Utilities
Save/Recall key 3/10
Save/Recall key 4/10
33
Page 34

GDS-1000A-U Series User Manual
Display
Refs.
Ref.A Off
Ref.B Off
On/ Off
On/ Off
Display Refs.
Ref.A On
1V
2.5ms
Select other menu
Display Refs.
Turn ref. waveform A on/off
Ref.A
Turn ref. waveform B on/off
Ref.B
Save
Setup
Destination
Memory
Save
File
Utilities
(USB only)
To File Utilities
Save Setup
Memory/USB
Select other menu
Save Setup
Select destination
Destination →VAR
Save setup
Save
Go to USB file utilities
File Utilities
Save/Recall key 5/10
Save/Recall key 6/10
34
Page 35

QUICK REFERENCE
Save
Waveform
Source
Save
File
Utilities
Save Waveform
Destination
Memory
Memory
USB Normal
USB 1M
USB 2M/Refs.
(USB only)
To File Utilities
CH1/2/Math
Ref A/B
Select other menu
Save Waveform
Select source
Source →VAR
Select destination
Destination →VAR
Save waveform
Save
Go to USB file utilities
File Utilities
Save
Image
Destination
USB
Save
File
Utilities
(USB only)
To File Utilities
Save Image
Ink Saver
Off
On/ Off
Select other menu
Save Image
Turn on/off ink saver
Ink Saver
Save image
Save
Go to USB file utilities
File Utilities
Save/Recall key 7/10
Save/Recall key 8/10
35
Page 36

GDS-1000A-U Series User Manual
Save
All
Save
File
Utilities
Save All
Destination
USB
(USB only)
To File Utilities
Ink Saver
Off
On/ Off
USB Normal
USB 1M/ USB 2M
Select other menu
Save All
Turn on/off ink saver
Ink Saver
Select destination
Destination →VAR
Save all
Save
Go to USB file utilities
File Utilities
Select
Delete
Previous
Menu
File Utilities
Rename
New
Folder
Enter
Character
Save
Previous
Menu
Back
Space
Select file/folder
VAR →Select
Create or rename folder/file
New Folder/Rename
VAR →Enter character / Backspace
/ Save / Previous menu
Delete folder/file
Delete
Go to previous menu
Previous menu
Save/Recall key 9/10
Save/Recall key 10/10
36
Page 37

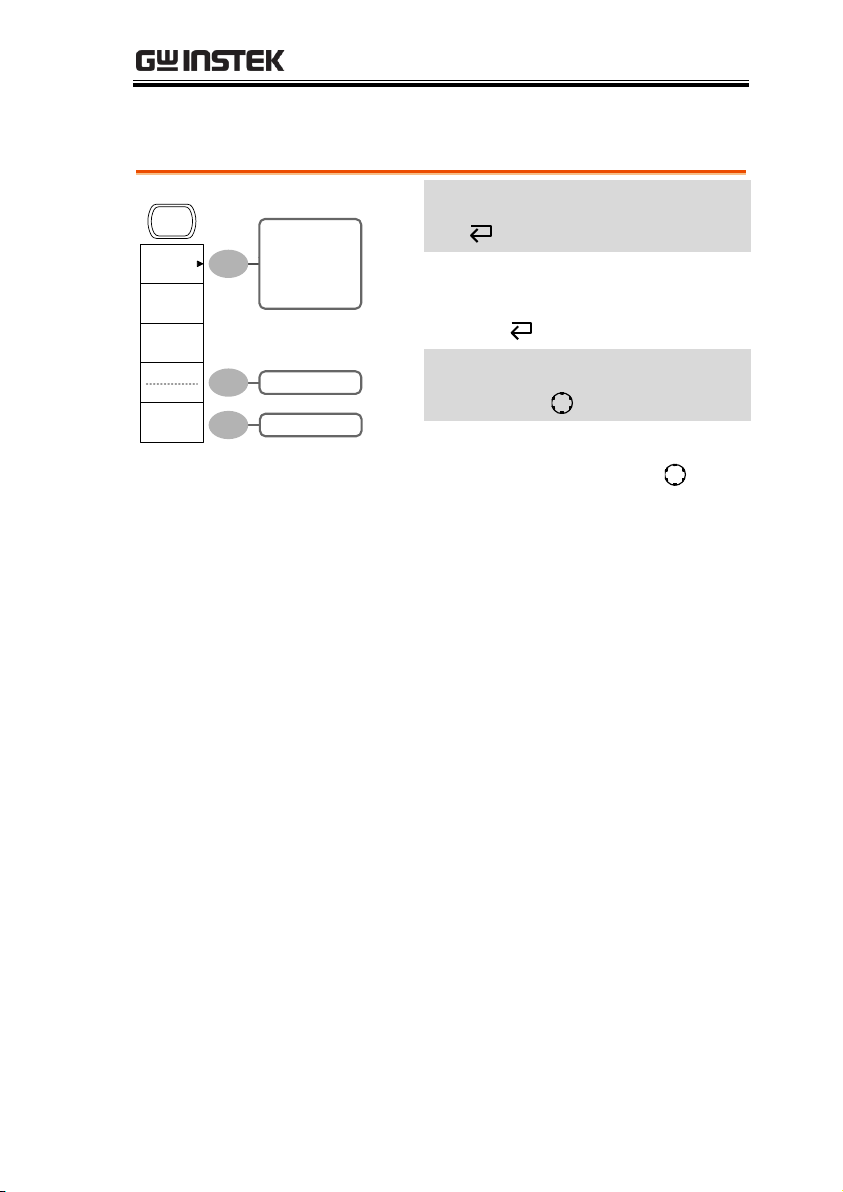
Trigger key 1/6
Type
Edge
Source
CH1
Mode
Auto
Slope /
Coupling
Holdoff
40.0ns
Set to
Minimum
MENU MENU
Trigger Type
Trigger Holdoff
Select Trigger type or Trigger
Holdoff menu
Type
Type
Video
Source
CH1
Standard
NTSC
NTSC/SECAM/PAL
Line
CH1/2
/
Field 1/ Field 2/ Line
Polarity
Video Trigger
Select video trigger type
Type
Select trigger source
Source
Select video standard
Standard
Select video polarity
Polarity
Select video field/line
Line →VAR
Trigger key 2/6
QUICK REFERENCE
37
Page 38

Trigger key 3/6
Type
Edge
Source
CH1
Mode
Auto
Slope /
Coupling
CH1/2/Ext/Line
Auto/ Normal
To Slope/Coupling
Edge Trigger
Select edge trigger type
Edge
Select trigger source
Source
Go to slope/coupling menu (page
39)
Slope/Coupling
Select trigger mode
Mode
Type
Pulse
Source
CH1
Mode
Auto
Slope /
Coupling
When <
20.0ns
To Slope/Coupling
>/ </ =/ =
20ns~10s
CH1/2/Ext/Line
Pulse Trigger
Auto/ Normal
Select pulse trigger type
Type
Select trigger source
Source
Select pulse trigger condition and
pulse width
When →VAR
Go to slope/coupling menu (page
39)
Slope/Coupling
Select trigger mode
Mode
Trigger key 4/6
GDS-1000A-U Series User Manual
38
Page 39

Trigger key 5/6
LF/ HF/ Off
On/ Off
/
Slope
Coupling
AC
Rejection
Off
Previous
Menu
Noise Rej
Off
AC/ DC
Coupling/Slope
Select trigger slope type
Slope
Select trigger coupling mode
Coupling
Select frequency rejection
Rejection
Turn noise rejection on/off
Noise Rej
Go back to previous menu
Previous Menu
Holdoff
40.0ns
Set to
Minimum
40ns~2.5s
Trigger Holdoff
Select Holdoff time
VAR
Set to minimum Holdoff time
Set to Minimum
Trigger key 6/6
QUICK REFERENCE
39
Page 40

GDS-1000A-U Series User Manual
Hardcopy
Menu
More
ProbeComp
Menu
Language
English
To Probe
Comp menu
To Hardcopy
menu
English/
Chinese(T) etc
Utility
Utility #2 menu
System
Info.
Go to hardcopy menu
Hardcopy
Go to probe compensation menu
ProbeComp
Select language
Language
Show system information
System Info.
Go to the next Utility menu
More
Go-NoGo
Menu
/
More
No Go When
Data logging
Menu
Utility
To Go-NoGo
menu
To Data
Logging menu
To Utility #3 menu
Go to the Go-NoGo menu
Go-NoGo
Set the NoGo conditions to inside
/outside limits
No Go When
Go to the Data Logging Menu
Data Logging
Go to the next Utility menu
More
Utility key 1/11 (Utility #1)
Utility 2/11 (Utility #2)
40
Page 41

QUICK REFERENCE
Self CAL
Menu
Calibration
USB Port
Auto Detect
Auto Detect
Computer
Printer
More
To Utility #1 menu
To Self CAL menu
Enter self calibration
Self CAL
Select USB port interface
USB Port
Go to the first Utility menu
More
Function
Save All
Previous
Menu
On/ Off
Ink Saver
Off
Hardcopy – Save All
Mem Leng
USB 1M
USB Normal
USB 1M/2M
Fast/ Detail
CSV Format
Fast
Select Hardcopy function
Function
Turn on/off Ink saver
Ink Saver
Set the memory length
Mem Leng
Change CSV format
CSV Format
Go to previous menu
Previous Menu
Utility key 3/11 (Utility #3)
Utility key 4/11 (Hardcopy -Save All)
41
Page 42

GDS-1000A-U Series User Manual
Function
Printer
Previous
Menu
On/ Off
Ink Saver
Off
Hardcopy – Printer
Page Size
Default
Default/ 4X6/ A4
Select Hardcopy function
Function
Turn on/off Ink saver
Ink Saver
Set default page size
Page Size
Go to previous menu
Previous Menu
Function
Save Image
Previous
Menu
On/ Off
Ink Saver
Off
Hardcopy – Save Image
Select Hardcopy function
Function
Turn on/off Inksaver
Ink Saver
Go to previous menu
Previous Menu
Utility key 5/11 (Hardcopy -Printer)
Utility key 6/11 (Hardcopy -Save Image)
42
Page 43

QUICK REFERENCE
Wave Type
( only)
1k ~ 100k
( only)
5% ~ 95%
Default
1kHz
/
Previous
Menu
Frequency
1 K
Duty Cycle
50%
Probe compensation
Select probe compensation signal
Wave Type
Set frequency for square wave
Frequency→VAR
Set duty cycle for square wave
Duty Cycle→VAR
Go to previous menu
Previous Menu
0.4%~40%
0.4DIV~40DIV
Max/Min/Auto
To previous
menu
Edit
Template
Max
Auto: CH1, CH2
Max|Min: Ref A/
Ref B, W01~W15
Source
W 01
Tolerance
0.4%
Save &
Create
Previous
Menu
Switch between templates
Template
Select the template source
Source
Set the tolerance (% or Divisions)
Tolerance →VAR
Save the template
Save & Create
Go back to previous menu
Previous Menu
Utility key 7/11 (Probe compensation)
Utility key 8/11 (Go-NoGo)
43
Page 44

GDS-1000A-U Series User Manual
Off
CH1/CH2
On/Off
To previous
menu
Data logging
Data logging
Source
CH1
Setup
File
Utilities
Previous
Menu
(USB only)
To File Utilities
To the Edit
menu
Turn Data Logging On/Off
Data logging
Set the logging source
Source
Go to the Data Logging Edit menu
Setup
Go to the File Utilities menu
File Utilities
Go back to previous menu
Previous Menu
2 secs~30 mins
Waveform/Image
To previous
menu
Edit
Save
Waveform
Interval
2 secs
Duration
5 mins
Previous
Menu
5 mins~100 hrs
Save the logs as waveform data or
as image files
Save
Set the logging interval
Interval→VAR
Set the duration of the record log
Duration→VAR
Go back to previous menu
Previous Menu
Vertical
Self Cal.
Start Vertical
Calibration
Start Vertical Calibration
Vertical
Utility key 9/11 (Data Logging 1/2)
Utility key 10/11 (Data Logging 2/2)
Utility key 11/11 (Self CAL Menu)
44
Page 45

QUICK REFERENCE
Here are the factory installed panel settings which
appear when pressing the Save/Recall key→
Default Setup.
Default
Setup
Save/Recall
Acquisition
Mode: Normal
Channel
Scale: 2V/Div
Invert: Off
Coupling: DC
Probe attenuation
voltage: x1
BW limit: Off
Channel 1 & 2: On
Cursor
Source: CH1
Cursor: Off
Display
Type: Vectors
Accumulate: Off
Grid: Full
Horizontal
Scale: 2.5us/Div
Mode: Main Timebase
H Pos Adj: Fine
Hor Pos: 0
Math
Type: + (Add)
Position: 0.00 Div
Unit/Div: 2V
Measure
Item: Vpp, Vavg, Frequency, Duty Cycle, Rise
Time
Trigger
Type: Edge
Source: Channel1
Mode: Auto
Slope:
Coupling: DC
Rejection: Off
Noise Rejection: Off
Utility
Hardcopy: SaveImage,
InkSaver On
ProbeComp: Square
wave, 1k, 50% duty cycle
Go-NoGo
Go-NoGo: Off
Source: CH1
When:
Violating: Stop
Default Settings
(Continued)
45
Page 46

GDS-1000A-U Series User Manual
Data Logging
Data logging: Off
Source: CH1
Setup: Waveform
Interval: 2 secs
Duration: 5 mins
The Help key shows the contents of the built-in
help support. When you press a function key, its
descriptions appear in the display.
Help
Applicable keys
Acquire Display Utility Help
Run/Stop
Autoset
Cursor HardcopyMeasure Save/Recall
(Vertical)
CH 1 MATH CH 2
(Horizontal)
MENU
(Trigger)
MENU
FORCE
SINGLE
Procedure
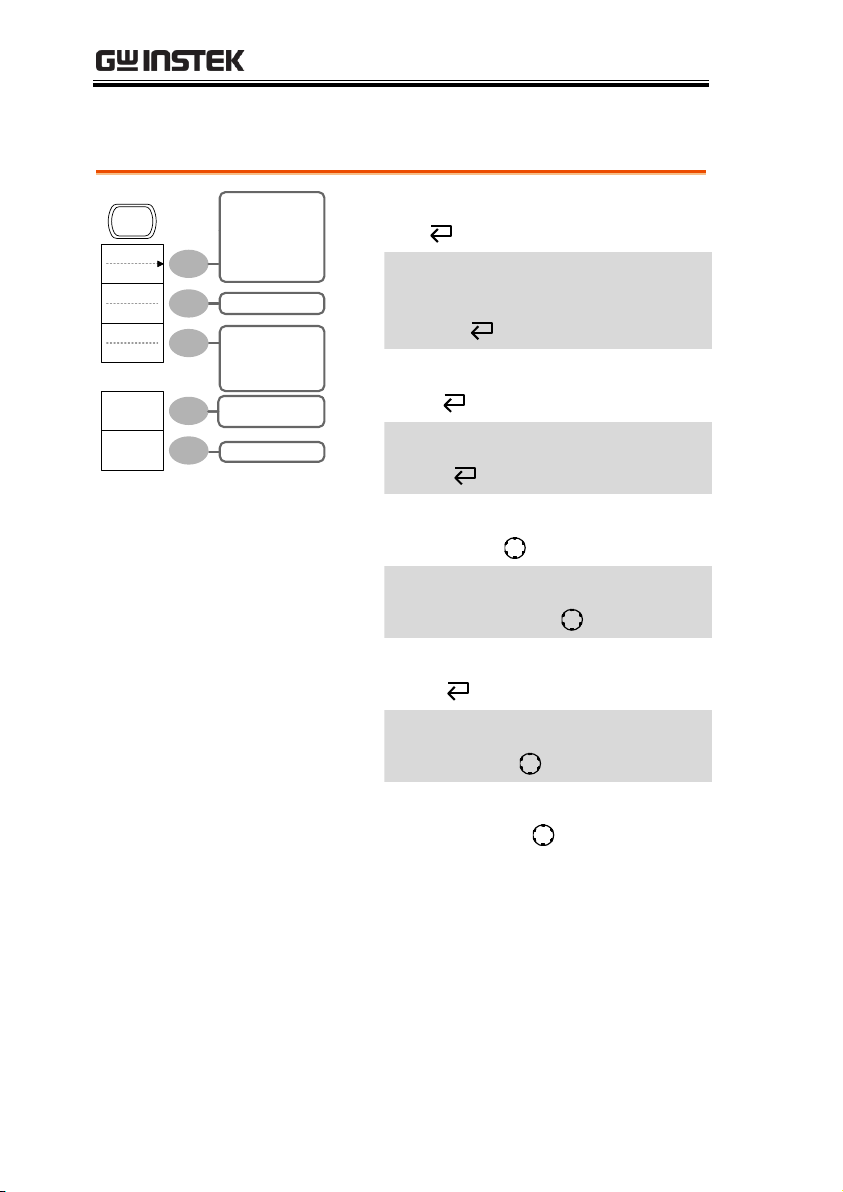
1. Press the Help key. The
display changes to the Help
mode.
Help
2. Press a functional key to
access its help contents.
(example: Acquire key)
Acquire
3. Use the Variable knob to
scroll the Help contents up
and down.
VARIABLE
4. Press the Help key again to
exit the Help mode.
Help
Built-in Help
46
Page 47

MEASUREMENT
Activating a
channel
To activate an input channel,
press the Channel key, CH1 or
CH2. The channel indicator
appears at the left side of the
display and the channel icon
changes accordingly.
CH 1
or
CH 2
MEASUREMENT
The Measurement chapter describes how to
properly observe a signal using the oscilloscope’s
basic functions, and how to observe a signal in a
detailed manner using some of the advanced
functions such as:
Automatic measurements, cursor measurements,
and math operations.
Basic Measurements
This section describes the basic operations required in capturing and
viewing an input signal. For more detailed operations, see the
following chapters.
Measurements → from page 47
Configuration → from page 78
Activating a channel
(Continued on next page)
47
Page 48

Channel icon
Channel
indicator
Channel 1 off Channel 1 on
De-activating a
channel
To de-activate the channel, press the Channel key
twice (once if the channel menu is already
selected).
Background
The Autoset function automatically configures the
panel settings to the best viewing conditions, in the
following way.
Selecting the horizontal scale
Positioning the waveform horizontally
Selecting the vertical scale
Positioning the waveform vertically
Selecting the trigger source channel
Activating the channels
Autoset can be configured into two types of
modes, AC Priority Mode or Fit Screen Mode.
AC Priority mode will scale the waveform to the
screen removing any DC component.
Fit Screen Mode will fit the waveform to the best
scale, including any DC components (offset).
Using Autoset
GDS-1000A-U Series User Manual
48
Page 49

MEASUREMENT
Procedure
1. Connect the input signal to
the oscilloscope and press
the Autoset key.
Autoset
2. The waveform(s) appears in the center of the
display.
Undo option
Before Autoset After Autoset
Type Option
Undoing the
Autoset
To undo the Autoset, press
Undo (available for a few
seconds).
Undo
Adjusting the
trigger level
If the waveform is still
unstable, try adjusting the
trigger level up or down by
using the Trigger Level knob.
LEVEL
Change Modes
To change the type of mode,
press Type (available for a few
seconds). The Type icon will
change to next type.
Type
AC Priority
Type
Fit Screen, AC Priority
The next time the Autoset key is pressed, the new
mode will be activated.
49
Page 50

GDS-1000A-U Series User Manual
Fit Screen AC Priority
Limitation
Autoset does not work in the following situation.
Input signal frequency less than 2Hz
Input signal amplitude less than 30mV
Background
In the trigger Run mode, the oscilloscope
constantly searches for a trigger condition and
updates the signal onto the display when the
condition is met.
In the trigger Stop mode, the oscilloscope stops
triggering and thus the last acquired waveforms
stay in the display. The trigger icon at the top of
the display changes into Stop mode.
Pressing the Trigger Run/Stop key
switches between the Run and Stop
mode.
Run/Stop
Trigger Run mode Trigger Stop mode
Stop icon
Auto or
Trig icon
Running and stopping the trigger
50
Page 51

MEASUREMENT
Waveform
operation
Waveforms can be moved or scaled in both the
Run and Stop mode. For details, see page 85
(Horizontal position/scale) and page 91 (Vertical
position/scale).
Setting the
horizontal
position
The horizontal position knob
moves the waveform left or right.
The position indicator moves along with the
waveform and the distance from the center point is
displayed as the offset in the upper side of the
display.
Horizontal offset
Position indicator
Selecting the
horizontal scale
To select the timebase (scale), turn
the TIME/DIV knob; left (slow) or
right (fast).
TIME/DIV
Range
1ns/Div ~ 10s/Div, 1-2.5-5 increment
Changing the horizontal position and scale
For more detailed configurations, see page 85.
51
Page 52

GDS-1000A-U Series User Manual
Horizontal scale: 50us/div Horizontal scale: 250us/div
Set vertical
position
To move the waveform up or
down, turn the vertical position
knob for each channel.
As the waveform moves, the vertical position of
the cursor appears at the bottom left corner of the
display.
Run/Stop mode
The waveform can be moved
vertically in both Run and Stop
mode.
Select vertical
scale
To change the vertical scale,
turn the VOLTS/DIV knob; left
(down) or right (up).
VOLTS/DIV
Range
2mV/Div ~ 10V/Div, 1-2-5 increments
The vertical scale indicator for each channel on the
bottom left of the display changes accordingly.
Changing the vertical position and scale
For more detailed configuration, see page 91.
52
Page 53

MEASUREMENT
Background
This section introduces how to use
the probe compensation signal for
general usage, in case the DUT
signal is not available or to get a
second signal for comparison. For
probe compensation details, see
page 132.
Note: The frequency accuracy and duty factor are
not guaranteed. Therefore the signal should not be
used for reference purposes.
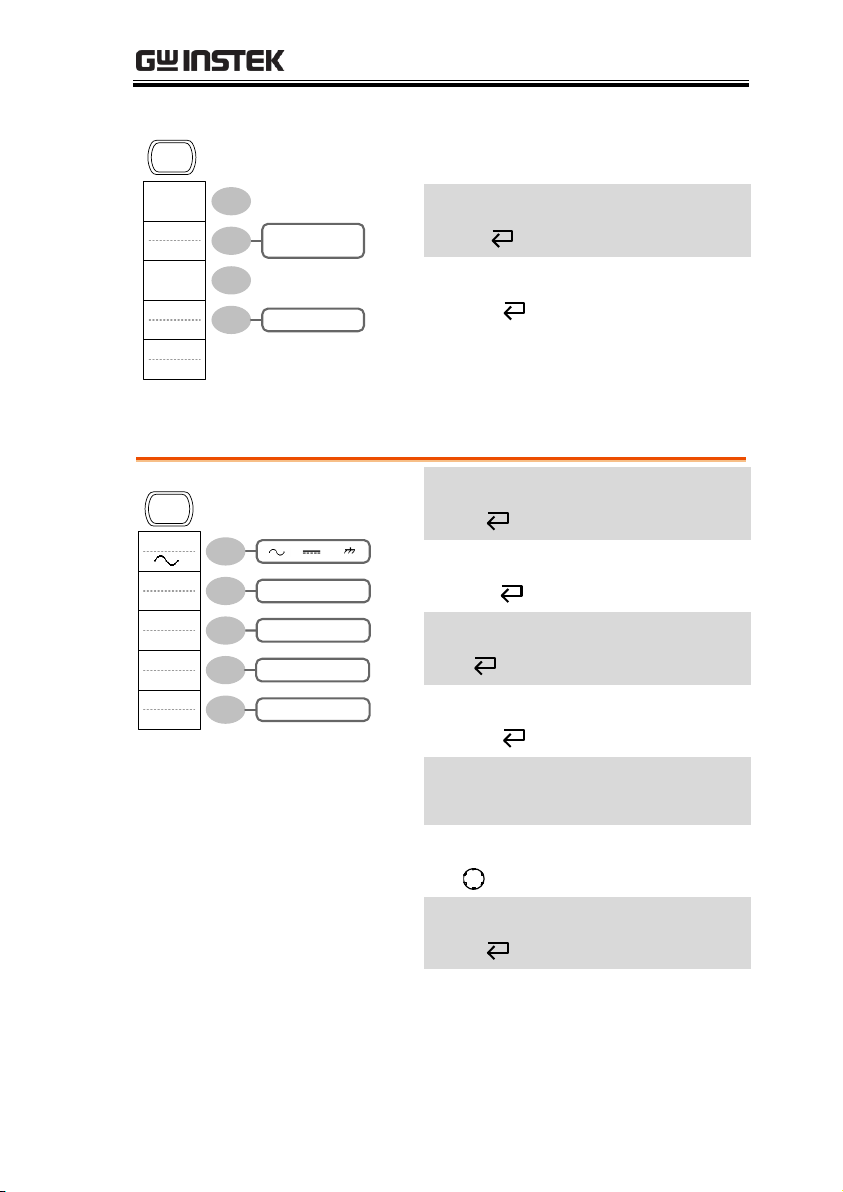
Waveform type
Square waveform used for probe
compensation. 1k ~ 100kHz, 5% ~
95%.
Demonstration signal for showing
the effects of peak detection. See page
78 for peak detection mode details.
View the probe
compensation
waveform
1. Connect the probe between the compensation
signal output and Channel input.
VOLTS/DIV VOLTS/DIV TIME/DIV
CH 1 MATH CH 2 MENU MENU
Acquire
Display
Utility Help
Run/Stop
VARIABLE
FORCE
Autoset
Cursor
SINGLE
Hardcopy
Measure
Save/Recall
LEVEL
VERTICAL HORIZONTAL TRIGGER
CH1
CAT300V
MW15pF
MAX. 300Vpk
1
CH2 EXT TRIG
CAT300V
MW15pF
MAX. 300Vpk
1
X Y
X
10
X
1
CH1
x1
x10
2. Press the Utility key.
Utility
3. Press ProbeComp.
ProbeComp
Menu
Using the probe compensation signal
53
Page 54

GDS-1000A-U Series User Manual
4. Press Wave type repeatedly
to select the wave type.
Wave Type
5. (For only) To change
the frequency, press
Frequency and use the
Variable knob.
Frequency
1 K
VARIABLE
Range
1kHz ~ 100kHz
6. (For only) To change
the duty cycle, press Duty
Cycle and use the Variable
knob.
Duty Cycle
50%
VARIABLE
Range
5% ~ 95%
Probe
compensation
For probe compensation details, see page 132.
54
Page 55

MEASUREMENT
Overview
Voltage type
Time type
Delay type
Vpp
Vmax
Vmin
Vamp
Vhi
Vlo
Vavg
Vrms
ROVShoot
FOVShoot
RPREShoot
FPREShoot
Frequency
Period
RiseTime
FallTime
+Width
-Width
Dutycycle
FRR
FRF
FFR
FFF
LRR
LRF
LFR
LFF
Voltage
measurement
items
Vpp
Difference between positive
and negative peak voltage
(=Vmax − Vmin)
Vmax
Positive peak voltage.
Vmin
Negative peak voltage.
Vamp
Difference between global
high and global low voltage
(=Vhi − Vlo)
Vhi
Global high voltage.
Automatic Measurements
The automatic measurement function measures input signal
attributes and updates them in the display. Up to 5 automatic
measurement items can be updated at any one time on the side
menus. All automatic measurement types can be displayed on
screen if necessary.
Measurement items
55
Page 56

GDS-1000A-U Series User Manual
Vlo
Global low voltage.
Vavg
Averaged voltage of the first
cycle.
Vrms
RMS (root mean square)
voltage.
ROVShoot
Rise overshoot voltage.
FOVShoot
Fall overshoot voltage.
RPREShoot
Rise preshoot voltage.
FPREShoot
Fall preshoot voltage.
Time
measurement
items
Freq
Frequency of the waveform.
Period
Waveform cycle time
(=1/Freq).
Risetime
Rising time of the pulse
(~90%).
Falltime
Falling time of the pulse
(~10%).
+Width
Positive pulse width.
–Width
Negative pulse width.
Duty Cycle
Ratio of signal pulse
compared with whole cycle
=100x (Pulse Width/Cycle)
Delay
measurement
items
FRR
Time between:
Source 1 first rising edge and
Source 2 first rising edge
56
Page 57

MEASUREMENT
FRF
Time between:
Source 1 first rising edge and
Source 2 first falling edge
FFR
Time between:
Source 1 first falling edge and
Source 2 first rising edge
FFF
Time between:
Source 1 first falling edge and
Source 2 first falling edge
LRR
Time between:
Source 1 first rising edge and
Source 2 last rising edge
LRF
Time between:
Source 1 first rising edge and
Source 2 last falling edge
LFR
Time between:
Source 1 first falling edge and
Source 2 last rising edge
LFF
Time between:
Source 1 first falling edge and
Source 2 last falling edge
Background
Automatic measurements can be restricted to a
specific area (gating). When cursors are turned on,
the area between the cursors is used for automatic
measurements. When cursors are turned off,
measurements are derived from all the points that
are displayed on screen.
Turn gating on
1. Turn on cursors to enable
gated automatic
measurements.
page 61
Automatic measurement gating
57
Page 58

GDS-1000A-U Series User Manual
2. Press the Measure key.
Measure
3. The measurement results appear on the menu
bar, constantly updated. All measurements are
derived from the cursor positions. See
Automatically measuring the input signals for
more details (page 58).
X
1
X
2
Horizontal Cursor
Gating
Turn gating off
4. Turn off cursors to turn off
gated automatic
measurements.
page 61
Viewing the
measurement
result
1. Press the Measure key.
Measure
2. The measurement results appear on the menu
bar, constantly updated. 5 measurement slots
(F1 to F5) can be customized.
Automatically measuring the input signals
58
Page 59

MEASUREMENT
Editing a
measurement
item
3. Press the corresponding
menu key (F1~F5) to select
the measurement slot to be
edited.
Voltage
Vpp
4. The editing menu appears
Change
measurement
item
5. Use the Variable knob to
select a different
measurement item.
VARIABLE
Change
measurement
source
6. Press Source 1 repeatedly to
change Source1 from CH1
to CH2 or MATH.
Source 1
CH1
Range
CH1, 2, Math
59
Page 60

GDS-1000A-U Series User Manual
7. Press Source 2 repeatedly to
change the channel for
Source2.
Source 2
CH2
Range
CH1, 2, Math
View all
measurements
8. Press F3 to view all
measurement items.
Voltage
Vpp
9. All the measurements
appear in the center of the
screen.
10. Press F3 again to return.
Note: All the editing operations can still be
performed when viewing all the measurement
items.
11. Press Previous Menu to
confirm the item selection
and to go back to the
measurement results view.
Previous
Menu
60
Page 61

MEASUREMENT
Procedure
1. Press the Cursor key. The
cursors appear in the
display.
Cursor
2. Press X
↔
Y to select the
horizontal (X1&X2) cursor.
X↔Y
3. Press Source repeatedly to
select the source channel.
Source
CH1
Range
CH1, 2, MATH
4. The cursor measurement results will appear in
the menu, F2 to F4.
Parameters
X1
Time position of the left cursor. (relative to
zero)
X2
Time position of the right cursor. (relative
to zero)
X1X2
The difference between the X1 and X2.
∆: us
The time difference between X1 and X2.
f: Hz
The time difference converted to
frequency.
V/A
The voltage/current difference from X1
and X2.
Cursor Measurements
Cursor lines, horizontal or vertical, show the precise position of the
input waveforms or the math operation results. The horizontal
cursors can track time, voltage/current* and frequency, whilst the
vertical cursors can track voltage/current*. All measurements are
updated in real-time. *probe type dependant (page 94).
Using the horizontal cursors
61
Page 62

GDS-1000A-U Series User Manual
M1:dB
Position of the left cursor in dB.
M2:dB
Position of the right cursor in dB.
∆: dB
The dB difference between M1 and M2.
Div:
The frequency per division.
Moving the
horizontal
cursors
To move the left cursor, press
X1 and then use the Variable
knob.
X1
-5.000uS
0.000uV
To move the right cursor, press
X2 and then use the Variable
knob.
X2
5.000uS
0.000uV
To move both cursors at once,
press X1X2 and then use the
Variable knob.
X1X2
10.00uS
100.0kHz
0.000uV
∆ :
f :
Remove cursors
Press Cursor to remove the
onscreen cursors.
Cursor
Procedure
1. Press the Cursor key.
Cursor
2. Press X
↔
Y to select the
vertical (Y1&Y2) cursor.
X↔Y
3. Press Source repeatedly to
select the source channel.
Source
CH1
Range
CH1, 2, MATH
4. The cursor measurement results will appear in
the menu.
Parameters
Y1
Voltage level of the upper cursor
Y2
Voltage level of the lower cursor
Using the vertical cursors
62
Page 63

MEASUREMENT
Y1Y2
The difference between the upper and
lower cursor
V/A
The voltage/current difference (Y1-Y2).
Moving the
vertical cursors
To move the upper cursor,
press Y1 and then use the
Variable knob.
Y1
123.4mV
To move the lower cursor,
press Y2 and then use the
Variable knob.
Y2
12.9mV
To move both cursors at once,
press Y1Y2 and then use the
Variable knob.
Y1Y2
10.5mV
Remove cursors
Press Cursor to remove the
onscreen cursors.
Cursor
Addition (+)
Adds the amplitude of CH1 & CH2 signals.
Subtraction (–)
Extracts the amplitude difference between CH1 &
CH2.
Multiplication (×)
Multiplies CH1 and CH2.
FFT
Performs a FFT calculation on a signal. Four types
of FFT windows are available: Hanning, Flattop,
Rectangular, and Blackman.
Math Operations
The Math operations can add, subtract, multiply or perform
FFT/FFT RMS on the input waveforms. The resulted waveform can
be measured using the cursors, and saved or recalled just like
normal input signals.
Overview
63
Page 64

GDS-1000A-U Series User Manual
FFT RMS
Performs a FFT RMS calculation on a signal. RMS
is similar to FFT, however the amplitude is
calculated as RMS and not dB. Four types of FFT
windows are available: Hanning, Flattop,
Rectangular, and Blackman.
Hanning FFT
window
Frequency resolution
Good
Amplitude resolution
Not good
Suitable for....
Frequency measurement on
periodic waveforms
Flattop FFT
window
Frequency resolution
Not good
Amplitude resolution
Good
Suitable for....
Amplitude measurement on
periodic waveforms
Rectangular FFT
window
Frequency resolution
Very good
Amplitude resolution
Bad
Suitable for....
Single-shot phenomenon
(this mode is the same as
having no window at all)
Blackman FFT
window
Frequency resolution
Bad
Amplitude resolution
Very good
Suitable for....
Amplitude measurement on
periodic waveforms
Procedure
1. Activate both CH1 and
CH2.
CH 1
CH 2
2. Press the Math key.
M
A
TH
Adding, subtracting or multiplying signals
64
Page 65

MEASUREMENT
3. Press Operation repeatedly
to select addition (+),
subtraction (–) or
multiplication (×).
Operation
CH1+CH2
4. The math measurement
result appears in the
display.
Unit/Div
2V
5. To move the math result
vertically, use the Variable
knob. The position will be
displayed in Position.
VARIABLE
Position
0.00 Div
6. To clear the math result
from the display, press the
Math key again.
M
A
TH
Procedure
1. Press the Math key.
M
A
TH
2. Press Operation repeatedly
to select FFT or FFT RMS.
Operation
FFT
3. Press Source repeatedly to
select the source channel.
Source
CH1
4. Press Window repeatedly to
select the FFT window type.
Window
Hanning
Using the FFT function
65
Page 66

GDS-1000A-U Series User Manual
5. The FFT result appears. The horizontal scale
changes from time to frequency, and the
vertical scale from voltage to dB or RMS.
6. To move the FFT waveform
vertically, press Vertical
repeatedly until Div is
selected. Use the Variable
knob to change the vertical
scale.
Vertical
2V
0.00 Div
VARIABLE
Range
–12.00 Div ~ +12.00 Div
7. To select the vertical scale of
an FFT waveform, press
Vertical repeatedly until dB
is selected. Use the Variable
knob to change the vertical
scale.
Vertical
1 dB
0.00 Div
VARIABLE
Range
1, 2, 5, 10, 20 dB/Div
8. To select the vertical scale of
an FFT rms waveform, use
the VOLTS/DIV knob to
change the vertical scale.
The scale will be shown in
the Vertical soft-key.
VOLTS/DIV
Range
Volts/Div
9. To zoom in on the FFT/FFT
rms waveform, press Zoom
repeatedly until X is
selected. Use the Variable
knob to change the Zoom
level.
Zoom
1X
0.0000Hz
VARIABLE
Range
1/2/5/10/20X
66
Page 67

MEASUREMENT
10. To move the FFT/FFT rms
waveform horizontally,
press Zoom repeatedly until
Hz is selected. Use the
Variable knob to change the
horizontal position.
Zoom
1X
0.0000Hz
VARIABLE
Range
0~50.000MHz
11. To clear the FFT result from
the display, press the Math
key again.
M
A
TH
Background
Go-NoGo testing checks if a waveform conforms to
a user-specified maximum and minimum
boundary (template). The testing can be set to stop
or continue each time the template has or has not
been violated by the input waveform.
Settings
Item
Default
Details
NoGo criteria: When inside
or outside the boundary
Inside
Page 68
Source
Channel 1
Page 68
Test continue or stop when
NoGo occurs
Stop
Page 69
Boundary (template) –
selects the minimum and
maximum boundaries
(template) from a single
waveform
Auto (0.4%)
Page 69
Run Tests
Page 73
Go No-Go Testing
Overview
67
Page 68

GDS-1000A-U Series User Manual
Procedure
1. Press the Utility key.
Utility
2. Press the More key.
More
3. Press No Go When
repeatedly to select the
NoGo conditions.
No Go When
NoGo when the waveform is
inside the boundary (template)
NoGo when the waveform is
outside of the boundary
(template)
Procedure
1. Press the Utility key.
Utility
2. Press the More key.
More
3. Press the Go-NoGo Menu
key.
Go-NoGo
Menu
4. Press Source repeatedly to
select the source channel
(CH1 or CH2).
Source
CH1
Edit: NoGo When
Edit: Source
68
Page 69

MEASUREMENT
Procedure
1. Press the Utility key.
Utility
2. Press the More key.
More
3. Press the Go-NoGo Menu
key.
Go-NoGo
Menu
4. Press Violating repeatedly to
select the NoGo conditions.
Violating
Stop
Stop
Stops the test when the NoGo
conditions have been met.
Continue
The tests continue even when the
NoGo conditions have been met.
Background
The NoGo template sets the upper and lower
amplitude boundary. Two methods are available:
Min/Max and Auto.
Min/Max
Selects the upper boundary (Max)
and lower boundary (Min) as
separate waveforms, from the
internal memory. The upper
boundary is saved to Ref A, the
lower boundary is saved to Ref. B.
Advantage: The template shape
and distance (allowance) between
the source signal are fully
customizable.
Edit: NoGo Violation Conditions
Edit: Template (boundary)
69
Page 70

GDS-1000A-U Series User Manual
Disadvantage: The waveforms
(templates) have to be stored
internally prior to this selection.
Auto
Creates the upper and lower
boundary (template) from the
source signal, not from an
internally stored waveform.
Advantage: No need to store the
waveforms prior to this selection.
Disadvantage: The template shape
is proportional to the source
signal. The distance (allowance)
between the source signal and the
upper and lower template is the
same.
Max/Mix
1. The template is based on the source signal.
Ensure the source signal appears on the
display.
2. Press the Utility key.
Utility
3. Press the More key.
More
4. Press the Go-NoGo Menu
key.
Go-NoGo
Menu
5. Press the Template Edit key.
Template
Edit
6. Press Template repeatedly to
select the upper (Max) or
lower (Min) boundaries.
Template
Max
70
Page 71

MEASUREMENT
7. Press Source and use the
Variable knob to select the
waveform template.
Source
W 01
VARIABLE
Max
Waveform A: Ref A, W01~W15
Min
Waveform B: Ref B, W01~W15
8. Press Position and use the
Variable knob to set the
waveform amplitude.
Source
W 01
VARIABLE
9. Repeat steps 5-7 for the other template setting
(Max or Min).
10. When both Max and Min
templates have been
configured, press Save &
Create to save the templates.
Save &
Create
Min: Waveform B
Max: Waveform A
Position
71
Page 72

GDS-1000A-U Series User Manual
Auto
1. The template is based on the source signal.
Ensure the source signal appears on the
display.
2. Press the Utility key.
Utility
3. Press the More key.
More
4. Press the Go-NoGo Menu
key.
Go-NoGo
Menu
5. Press the Template Edit key.
Template
Edit
6. Press Template repeatedly to
select the Auto template.
Template
Auto
7. Press Source and use the
Variable knob to select the
template source.
Source
CH1
VARIABLE
Source
CH1, CH2
8. Press Tolerance repeatedly to
choose the tolerance units,
% or Div. Use the Variable
knob to set the tolerance.
The tolerance is for both the
horizontal and vertical axis.
Tolerance
0.4%
VARIABLE
%
0.4% ~ 40.0%
72
Page 73

MEASUREMENT
Div
0.04 Div ~ 4.0 Div
9. When the Auto template has
been configured, press Save
& Create to save the
template.
Save &
Create
Auto template
Source waveform
Tolerance
Procedure
1. Press the Utility key.
Utility
2. Press the More key.
More
3. Press the Go-NoGo Menu
key.
Go-NoGo
Menu
Ensure the source signal and boundary templates
appear on the screen.
Run Go-NoGo Tests
73
Page 74

GDS-1000A-U Series User Manual
4. Press Go-NoGo. The test
starts and stops according to
the conditions set on page
68, 69. To stop the test that
has already started, press
Go-NoGo again.
Go-NoGo
On
5. The test results appear in
the Ratio soft-key. The
numerator denotes the total
number of failed tests. The
denominator denotes the
total number of tests.
Ratio:
2 BMP
9 BMP
Numerator
Number of “failed“ tests.
Denominator
Total number of tests.
Background
The Data logging function allows you to log data
or a screen image over timed intervals for up to
100 hours to a USB flash drive.
The data or images are stored to a USB flash drive
in a directory named LogXXXX. LogXXXX is
incremented each time the data logging function is
used.
The files saved in the LogXXXX directory are
named DSXXXX.CSV, or DSXXXX.BMP for data or
image files, respectively. At each timed interval
data or an image file is saved and the file number
incremented. For example, DS0000 is the first
logged data, DS0001 is the second and so on.
Data Logging
Overview
74
Page 75

MEASUREMENT
Procedure
1. Press the Utility key.
Utility
2. Press the More key.
More
3. Press the Data logging Menu
key.
Data logging
Menu
4. Press Source repeatedly to
select the source channel
(CH1 or CH2).
Source
CH1
Background
The logging function must set the type of data that
will be logged (waveform/image), the capture
interval time and the duration of the data logging.
Procedure
1. Press the Utility key.
Utility
2. Press the More key.
More
3. Press the Data logging Menu
key.
Data logging
Menu
4. Press the Setup key.
Setup
Edit: Source
Edit: Setup Parameters
75
Page 76

GDS-1000A-U Series User Manual
5. Press Save repeatedly to log
data or screen images.
Save
Waveform
6. Press Interval and use the
Variable knob to select the
interval time.
Source
W 01
VARIABLE
Interval
time
2 secs~ 2min (duration = 5 min)
2 secs~ 5 min (duration 5~ 30 min)
2 secs~ 30 min (duration 30+ min)
7. Press Duration and use the
Variable knob to set the
duration time.
Duration
5 mins
VARIABLE
Duration
5 mins ~ 100 hours
8. Press Previous menu to
return to the Data logging
menu. Data logging is now
ready to begin.
Previous
Menu
76
Page 77

MEASUREMENT
Background
Ensure the data source (page 75) and data logging
setup has been set (page 75).
Procedure
1. Insert a USB flash drive into
the USB front panel port.
2. Press the Utility key.
Utility
3. Press the More key.
More
4. Press the Data logging Menu
key.
Data logging
Menu
5. Press Data logging to turn
data logging On.
Data/image files start
logging to the USB flash
drive automatically. To stop
the Data logging, press the
Data logging key again.
On
Data logging
Run Data logging
77
Page 78

GDS-1000A-U Series User Manual
Procedure
1. Press the Acquire key.
Acquire
2. Select the acquisition mode
between Normal, Average
and Peak Detect.
Normal
Peak
Detect
Average
Range
Normal
All of the acquired data is used to
draw the waveform.
CONFIGURATION
The Configuration chapter describes how to
configure panel settings to make measurements
and observations suited to the application needs.
Acquisition
The acquisition process samples the analog input signals and
converts them into digital format for internal processing. You may
select the normal, average, or peak detect acquisition mode.
Selecting the acquisition mode
78
Page 79

CONFIGURATION
Average
Multiple data is averaged to form a
waveform. This mode is useful for
drawing a noise-free waveform. To
select the number, press Average
repeatedly.
Average number: 2, 4, 8, 16, 32, 64, 128,
256
Peak detect
To activate the Peak detect mode,
press Peak-Detect. Only the minimum
and maximum value pairs for each
acquisition interval (bucket) are used.
This mode is useful for catching
abnormal glitches in a signal.
Peak detect effect
using the probe
comp. waveform
1. One of the probe
compensation waveforms
can demonstrate the peak
detection mode. Connect the
probe to the probe
compensation output.
2. Press the Utility key.
Utility
3. Press ProbeComp.
ProbeComp
Menu
4. Press Wave Type and select
the waveform.
Wave Type
5. Press the Autoset key. The
oscilloscope positions the
waveform in the center of
the display.
Autoset
6. Press the Acquire key.
Acquire
79
Page 80

GDS-1000A-U Series User Manual
7. Press Normal.
Normal
8. Press Peak-Detect and see
that a spike noise is
captured.
Peak
Detect
Example
The peak detect mode reveals the occasional glitch.
Normal mode
Peak detect mode
Background
When delay time is ON, the displayed output is
delayed for a defined amount of time from the
trigger point. Using the delay function is useful
for observing an area of the waveform that occurs
some time after the trigger point.
Delay On
With Delay On the expansion point and trigger
point become separated by the amount of delay
time. As the delay time is increased the trigger
point moves left from the expansion point. When
the horizontal scale is adjusted, the waveform
expands from the expansion point, not the trigger
point.
Selecting Delay mode
80
Page 81

CONFIGURATION
Expansion
Point
Horizontal scale
Trigger
Point
Expansion
Point
Horizontal scale
Trigger
Point
Delay Off
With Delay Off the expansion point and trigger
point are always in the same position. Thus when
the horizontal scale is adjusted, the waveform
expands from the trigger point.
Expansion
Point
Horizontal scale
Trigger
Point
Horizontal scale
Expansion
Point
Trigger
Point
Procedure
1. Press the Acquire key.
Acquire
2. Press Delay On/Off to
toggle Delay On/Off.
Delay
On
3. Use the Horizontal Position
knob to increase or decrease
the delay time when Delay
is set to On.
4. Adjust the horizontal scale
to zoom into the waveform.
TIME/DIV
81
Page 82

GDS-1000A-U Series User Manual
Background
The oscilloscope automatically switches between
two sampling modes, Real-time and Equivalenttime, according to the number of active channels
and sampling rate.
Real-time
sampling
Once sampled data is used to reconstruct a single
waveform. Short-time events might get lost if the
sampling rate gets too high. This mode is used
when the sampling rate is relatively low (1GSa/s
or lower).
Equivalent-time
sampling
Multiple numbers of sampled data are
accumulated to reconstruct a single waveform.
ETS restores more waveform detail but takes
longer to update the waveform. This mode is used
when the sampling rate becomes higher than
1GSa/s. The maximum equivalent-time sampling
rate is 25GSa/s.
Real time vs Equivalent time sampling mode
82
Page 83

CONFIGURATION
Procedure
1. Press the Display key.
Display
2. Press Type repeatedly to
select the waveform
drawing.
Type
Vectors
Types
Dots
Only the sampled dots are displayed.
Vectors
The sampled dots are connected by
lines.
Background
Accumulation preserves the old waveform
drawings and overwrites new waveforms on top
of it. It is useful for observing waveform variation.
Procedure
1. Press the Display key.
Display
2. Press Accumulate to turn on
the waveform accumulation.
Accumulate
On
3. To clear the accumulation
and start it over (refresh),
press Refresh.
Refresh
Display
The Display section describes how to configure the display settings:
drawing type, waveform accumulation, contrast adjustment, and
grid settings.
Selecting vector or dot drawing
Accumulating the waveform
83
Page 84

GDS-1000A-U Series User Manual
Example
Accumulation off
Accumulation on
Procedure
1. Press the Display key.
Display
2. Press Contrast.
Contrast
3. Turn the Variable knob left
to lower the contrast (dark
display) or right to raise the
contrast (bright display).
VARIABLE
Procedure
1. Press the Display key.
Display
2. Press the grid icon
repeatedly to select the grid.
Full
Parameters
Shows the full grid.
Shows the outer frame and X/Y axis.
Shows only the outer frame.
Adjusting the display contrast
Selecting the display grid
84
Page 85

CONFIGURATION
Procedure
The horizontal position knob
moves the waveform left or
right. The position indicator at
the top of the display shows the
center and current position.
Center position
Moving right
Select horizontal
scale
To select the timebase (scale),
turn the TIME/DIV knob; left
(slow) or right (fast).
TIME/DIV
Range
1ns/Div ~ 50s/Div, 1-2.5-5-10 increment
The timebase indicator at the bottom of the display
updates the current horizontal scale.
Horizontal View
The Horizontal view section describes how to configure the
horizontal scale, position, waveform update mode, window zoom,
and X-Y mode.
Moving the waveform position horizontally
Selecting the horizontal scale
85
Page 86

GDS-1000A-U Series User Manual
Background
The display update mode is switched
automatically or manually according to the
horizontal scale.
Main mode
Updates the whole displayed waveform at once.
The main mode is automatically selected when the
horizontal scale (timebase) is fast.
Horizontal scale
≤100ms/div
Trigger
All modes available
Roll mode
Updates and moves the waveform gradually from
the right side of the display to the left. The Roll
mode is automatically selected when the
horizontal scale (timebase) is 50ms or slower.
When in the Roll mode, an indicator appears at the
bottom of the display. When in roll mode the
record length is 2M (1 channel) or 1M (2 channel).
Main mode
Roll mode
Timebase
≥50ms/div (≤1.25MS/s)
Trigger
Auto mode only
Selecting the Roll
mode manually
1. Press the Horizontal menu
key.
MENU
2. Press Roll. The horizontal
scale automatically becomes
50ms/div and the
waveform starts scrolling
from the right side of the
display (If the oscilloscope
is already in the Roll mode,
there will be no change).
Roll
Selecting the waveform update mode
86
Page 87

CONFIGURATION
Procedure/ range
1. Press the Horizontal Menu
key.
MENU
2. Press Window.
Window
3. Use the horizontal position
knob to move the zoom
range sideways, and
TIME/DIV knob to change
the zoom range width.
TIME/DIV
The width of the bar in the middle of the
display is the actual zoomed area.
Zoom range
1ns ~ 25s
4. Press Window Zoom. The
specified range gets
zoomed.
Window
Zoom
Example
Zoom width
Setting the zoom width Zooming in
Zooming the waveform horizontally
87
Page 88

GDS-1000A-U Series User Manual
Background
The X-Y mode compares the voltage of Channel 1
and Channel 2 waveforms in a single display. This
mode is useful for observing the phase relationship
between the two waveforms.
Procedure
1. Connect the signals to
Channel 1 (X-axis) and
Channel 2 (Y-axis).
2. Make sure both Channel 1
and 2 are activated.
CH 1
CH 2
3. Press the Horizontal key.
MENU
4. Press XY. The display
shows two waveforms in XY format; Channel 1 as Xaxis, Channel 2 as Y-axis.
XY
Adjusting the X-Y
mode waveform
Horizontal position
CH1 Position knob
Horizontal scale
CH1 Volts/Div knob
Vertical position
CH2 Position knob
Vertical scale
CH2 Volts/Div knob
Example
Main mode XY mode
XY mode
Viewing waveforms in the X-Y mode
88
Page 89

CONFIGURATION
Background
The horizontal adjustment menu allows markers to
be set at different times relative to the Horizontal
position marker at 0 seconds. Each marker is
linked to the mark directly before and after (in
time). There can be up to 30 markers linked
together.
1. Press the Horizontal menu
key twice to enter the
horizontal adjustment menu
MENU MENU
2. Press H Pos Adj to toggle
between coarse and fine
adjustments.
H Pos Adj
Fine
3. Adjust the horizontal
position with the horizontal
position knob.
Set marker
4. Press Set/Clear to create a
marker at the current
horizontal position.
Set/Clear
180.0uS
Delete marker
5. If there is already a marker
at the current horizontal
position press Set/Clear to
delete the current marker.
Set/Clear
180.0uS
Reset horizontal
position
6. Press Reset to reset the
horizontal position to 0
seconds when the trigger is
running, or to the last
position before the trigger
was stopped.
Reset
Hor Pos
Horizontal Adjustment Menu
89
Page 90

GDS-1000A-U Series User Manual
Navigate markers
7. Press Previous to go to the
previous marker.
Previous
180.0uS
8. Press Next to go to the next
marker.
Next
340.0uS
Position
Indicator
Marker
90
Page 91

CONFIGURATION
Procedure
To move the waveform up or
down, turn the vertical position
knob for each channel.
Procedure
To change the vertical scale,
turn the VOLTS/DIV knob; left
(down) or right (up).
VOLTS/DIV
Range
2mV/Div ~ 10V/Div, 1-2-5 increments
Procedure
1. Press the Channel key.
CH 1
2. Press Coupling repeatedly to
select the coupling mode.
Coupling
Range
DC coupling mode. The whole
portion (AC and DC) of the signal
appears on the display.
Ground coupling mode. The display
shows only the zero voltage level as a
horizontal line. This mode is useful
for measuring the signal amplitude
with respect to the ground level.
Vertical View (Channel)
The Vertical view section describes how to set the vertical scale,
position, bandwidth limitation, coupling mode, and attenuation.
Moving the waveform position vertically
Selecting the vertical scale
Selecting the coupling mode
91
Page 92

GDS-1000A-U Series User Manual
AC coupling mode. Only the AC
portion of the signal appears on the
display. This mode is useful for
observing AC waveforms mixed with
DC components.
Background
Normally when the vertical scale is increased, the
scaled image is centered from ground. However a
signal with a voltage bias could be obscured when
the vertical scale is increased. The Expand Center
function expands the image from the center of the
signal, rather than ground.
Expand Ground
Position Indicator
Position Indicator
Expand Center
Position Indicator
Position Indicator
Expand Vertical Scale Center / Ground
92
Page 93

CONFIGURATION
Procedure
1. Press the Channel key.
CH 1
2. Press F5 to toggle between
Expand Center and Expand
Ground.
Expand
Center
3. To change the vertical scale,
turn the VOLTS/DIV knob;
left (down) or right (up).
VOLTS/DIV
The vertical scale indicator on
the bottom left of the display
changes accordingly.
Procedure
1. Press the Channel key.
CH 1
2. Press Invert. The waveform
becomes inverted (upside
down) and the Channel
indicator in the display
shows a down arrow.
Invert
Off
Original
Inverted
Inverting the waveform vertically
93
Page 94

GDS-1000A-U Series User Manual
Background
Bandwidth limitation puts the input signal into a
20MHz (−3dB) low-pass filter. This function is
useful for cutting off high frequency noise to see
the clear waveform shape.
Procedure
1. Press the Channel key.
CH 1
2. Press BW Limit to turn on or
off the limitation. When
turned on, the BW indicator
appears next to the Channel
indicator in the display.
BW Limit
Off
Example
BW Limit Off
BW Limit On
Background
The probe can be set to either voltage or current.
A signal probe has an attenuation switch to lower
the original DUT signal level to the oscilloscope
input range, if necessary. The probe attenuation
selection adjusts the vertical scale so that the
voltage or current level on the display reflects the
real value, not the attenuated level.
Procedure
1. Press the Channel key.
CH 1
Limiting the waveform bandwidth
Probe attenuation level and type
94
Page 95

CONFIGURATION
2. Press F4 repeatedly to select
voltage or current probes.
Voltage
x1
3. Use the variable knob to
edit the voltage or current
attenuation.
VARIABLE
4. The voltage/current scale in the channel
indicator changes accordingly. There is no
change in the waveform shape.
Range
0.1X~2000X (1-2-5 steps)
Note: The attenuation factor adds no influence on
the real signal; it only changes the voltage/current
scale on the display.
95
Page 96

GDS-1000A-U Series User Manual
Edge
Triggers when the signal crosses an amplitude
threshold in either a positive or negative slope.
Video
Extracts a sync pulse from a video format signal
and triggers on a specific line or field.
Pulse
Triggers when the pulse width of the signal
matches the trigger settings.
Indicators
Edge/Pulse
(CH1, Edge, Rising edge,
DC coupling)
Video
(CH1, Video, Positive
polarity, NTSC standard)
Trigger source
CH1, 2
Channel 1, 2 input signals
Line
AC mains signal
Ext
External trigger input
signal
EXT TRIG
Trigger mode
Auto
The oscilloscope updates the input signal
regardless of the trigger conditions (if
there is no trigger event, the oscilloscope
generates an internal trigger). Select this
mode especially when viewing rolling
waveforms at a slow timebase.
Trigger
The Trigger function configures the conditions by which the
oscilloscope captures the incoming signals.
Trigger type
Trigger parameter
96
Page 97

CONFIGURATION
The Auto trigger status appears in the
upper right corner of the display.
Single
The oscilloscope acquires the
input signals once when a
trigger event occurs, then
stops acquiring. Pressing the
Single key again will repeat
the process.
SINGLE
The Single trigger status appears in the
upper right corner of the display.
(Searching)
(Triggered)
Normal
The oscilloscope acquires and updates
the input signals only when a trigger
event occurs.
The Normal trigger status appears in the
upper right corner of the display.
(Searching)
(Triggered)
Holdoff
The holdoff function defines the waiting period
before the GDS-1000A-U starts triggering again
after a trigger point. The Holdoff function ensures
a stable display.
Video standard
(video trigger)
NTSC
National Television System Committee
PAL
Phase Alternative by Line
SECAM
SEquential Couleur A Mémoire
Sync polarity
(video trigger)
Positive polarity
Negative polarity
Video line
(video trigger)
Selects the trigger point in the video signal.
field
1 or 2
97
Page 98

GDS-1000A-U Series User Manual
line
1~263 for NTSC, 1~313 for PAL/SECAM
Pulse condition
(pulse trigger)
Sets the pulse width (20ns ~ 10s) and the triggering
condition.
>
Longer than
=
Equal to
<
Shorter than
≠
Not equal to
Trigger slope
Triggers on the rising edge.
Triggers on the falling edge.
Trigger coupling
AC
Triggers only on AC component.
DC
Triggers on AC+DC component.
Frequency
rejection
LF
Puts a high-pass filter and rejects the
frequency below 50kHz.
HF
Puts a low-pass filter and rejects the
frequency above 50kHz.
Noise rejection
Rejects noise signals.
Trigger level
LEVEL
Using the trigger level knob moves the
trigger point up or down.
Background
The Holdoff function defines the waiting period
before GDS-1000A-U starts triggering again after
the trigger point. The holdoff function is especially
useful for waveforms with two or more repetitive
frequencies or periods that can be triggered.
Panel operation
1. Press the Trigger menu key
twice.
MENU
MENU
2. To set the Holdoff time, use
the Variable knob. The
resolution depends on the
horizontal scale.
Range
40ns~2.5s
Configuring Holdoff
98
Page 99

CONFIGURATION
Pressing Set to Minimum
sets the Holdoff time to the
minimum, 40ns.
Holdoff
40.0ns
Note: The holdoff function is automatically
disabled when the waveform update mode is
in Roll mode.
Procedure
1. Press the Trigger menu key.
MENU
2. Press Type repeatedly to
select edge trigger.
Type
Edge
3. Press Source repeatedly to
select the trigger source.
Source
CH1
Range
Channel 1, 2, Line, Ext
4. Press Mode repeatedly to
select the Auto or Normal
trigger mode. To select the
single trigger mode, press
the Single key.
Mode
Auto
SINGLE
Range
Auto, Normal
5. Press Slope/coupling to enter
into the trigger slope and
coupling selection menu.
Slope /
Coupling
6. Press Slope repeatedly to
select the trigger slope,
rising or falling edge.
Slope
Range
Rising edge, falling edge
Configuring the edge trigger
99
Page 100

GDS-1000A-U Series User Manual
7. Press Coupling repeatedly to
select the trigger coupling,
DC or AC.
Coupling
AC
Range
DC, AC
8. Press Rejection to select the
frequency rejection mode.
Rejection
Off
Range
LF, HF, Off
9. Press Noise Rej to turn the
noise rejection on or off.
Noise Rej
Off
Range
On, Off
10. Press Previous menu to go
back to the previous menu.
Previous
Menu
Procedure
1. Press the Trigger menu key.
MENU
2. Press Type repeatedly to
select video trigger. The
video trigger indicator
appears at the bottom of the
display.
Type
Video
3. Press Source repeatedly to
select the trigger source
channel.
Source
CH1
Range
Channel 1, 2
Configuring the video trigger
100
 Loading...