

Page 1

User’s Manual
DataScout 10G
Version 14
© 2019 Greenlee Communications
52071568
Page 2

Page 3

User’s Manual
DataScout 10G
i
Copyright
© 2017-18 – Greenlee Communications, All Rights Reserved
Last Revision Date: March 8, 2019
Version: 14
Warning:
Reproduction by any means mechanically, electronically, photographically, chemically
or any other process, including photocopying, is strictly prohibited without express written permission of Greenlee Communications and is in violation of United States copyright laws. Violators will be prosecuted.
All images are either original artwork copyrighted to Greenlee Communications, artwork created by third party copyright holders properly identified and used with permission, or artwork believed to be in the public domain. If a public domain image is used
and the proper copyright holder wishes to assert their rights, Greenlee will gladly remove said images from future text revisions upon written request and proof of copy-
right. If public domain images depict a third party’s copyrighted industrial design and
the proper copyright holder wishes to assert their rights, Greenlee will gladly remove
said images from future text revisions upon written request and proof of copyright. All
other materials in these texts, unless otherwise identified or in public domain, are copyrighted solely to Greenlee. Any requests to use our copyrighted materials or requests
by third party copyright holders wishing to assert their rights should be directed to the
address below:
Greenlee Communications
ATTN: Document Control
1390 Aspen Way
Vista, CA 92081
760-510-0556
www.greenleecommunications.com
Any requests to use images or materials copyrighted to third parties should be directed
to that proper party and not Greenlee Communications.
Page 4

Page 5

User’s Manual
DataScout 10G
iii
Table of Contents
Table of Contents
Copyright ............................................................................................................................ i
Table of Contents ................................ ................................................................ ............. iii
Table of Contents ................................ ................................................................ ............. iii
Safety Information ........................................................................................................... 15
Overview ......................................................................................................................... 15
Shock Hazard .............................................................................................................. 15
Eye Protection ............................................................................................................. 15
Laser Safety ................................................................................................................ 15
Battery Safety .............................................................................................................. 16
FCC/IC Notifications .................................................................................................... 16
Getting Started ................................................................................................................ 19
Battery Information .......................................................................................................... 19
Warranty.......................................................................................................................... 19
Calibration ....................................................................................................................... 20
Training Videos ............................................................................................................... 20
Buttons & Icons ............................................................................................................... 21
User Interface .................................................................................................................. 21
Power on/off ................................................................................................................ 21
Touch screen ............................................................................................................... 21
Unlocking the screen ................................................................................................... 22
User Settings ............................................................................................................... 22
Navigation Buttons ...................................................................................................... 22
Indicator Lights ............................................................................................................ 22
Power Indicator ........................................................................................................ 22
Low Battery.............................................................................................................. 23
Battery Charging ...................................................................................................... 23
Interfaces ........................................................................................................................ 25
Test Interfaces................................................................................................................. 25
Charger, Wi-Fi & Remote Management Interfaces .......................................................... 26
LCD Display .................................................................................................................... 26
Proper Care ................................................................................................................. 26
LCD settings ................................................................................................................ 26
Page 6

iv
Table of Contents
Results (Test/Capture) Retrieval ..................................................................................... 26
User Interface Overview ................................................................................................ .. 27
Ethernet Testing .............................................................................................................. 29
Overview ......................................................................................................................... 29
Test Interfaces................................................................................................................. 29
Test Interface Connections .............................................................................................. 30
Home .............................................................................................................................. 30
Menu Bar ..................................................................................................................... 30
Link Status Indication Bar ............................................................................................ 30
System Info Button ...................................................................................................... 31
Settings ................................................................................................................... 31
Install ................................ ....................................................................................... 31
Port Configuration ........................................................................................................... 32
Port A & B Selection .................................................................................................... 32
Physical Interface Configuration .................................................................................. 33
Interface Speed ....................................................................................................... 33
Auto Negotiate, Duplex and Flow Control ................................................................ 33
Route A to B ............................................................................................................ 34
SFP Info and Laser On/Off .......................................................................................... 35
SFP Info .................................................................................................................. 35
Laser On/Off ................................................................................................ ............ 36
Port B Configuration .................................................................................................... 36
Physical Interface Configuration .............................................................................. 36
Loopback Mode Configuration ................................................................................. 36
Statistics View ......................................................................................................... 37
Test Selection ................................................................................................................. 37
General Test Configuration ............................................................................................. 38
Frame Configuration .................................................................................................... 38
Select Frame Size ................................................................................................... 39
Destination MAC Address ........................................................................................ 40
Source MAC Address .............................................................................................. 41
VLAN ................................ ....................................................................................... 41
MPLS....................................................................................................................... 43
IPv4 ......................................................................................................................... 44
IPv6 ......................................................................................................................... 46
Payload ................................................................................................................... 48
Page 7

User’s Manual
DataScout 10G
v
802.3 ....................................................................................................................... 49
ETH2 ....................................................................................................................... 49
Rate............................................................................................................................. 49
Duration ....................................................................................................................... 50
Maximum Duration ................................................................................................... 50
Test Mode ................................................................................................................... 51
Looped Test Mode ................................................................................................... 51
End-to-End Test Mode ............................................................................................. 52
Test ID ......................................................................................................................... 52
Test Profile .................................................................................................................. 52
Quick Test (BERT) .......................................................................................................... 53
Frame Configuration .................................................................................................... 53
Rate Configuration ....................................................................................................... 53
Test Duration ............................................................................................................... 53
Test Mode ................................................................................................................... 54
Test ID ......................................................................................................................... 54
Test Profile .................................................................................................................. 54
Running the Quick Test ............................................................................................... 54
Quick Test Results ...................................................................................................... 55
Multi Stream Test ............................................................................................................ 55
Frame Configuration .................................................................................................... 55
Rate Configuration ....................................................................................................... 57
Test Duration ............................................................................................................... 58
Test Mode ................................................................................................................... 58
Test ID ......................................................................................................................... 58
Test Profile .................................................................................................................. 58
Running the Multi Stream Test .................................................................................... 58
Multi Stream Test Results ............................................................................................ 59
RFC-2544 ........................................................................................................................ 59
Frame Configuration .................................................................................................... 60
Rate Configuration ....................................................................................................... 60
Test Duration ............................................................................................................... 60
Test Mode ................................................................................................................... 60
Test ID ......................................................................................................................... 60
Test Profile .................................................................................................................. 61
Test Configuration ....................................................................................................... 61
Page 8

vi
Table of Contents
Thresholds ................................................................................................................... 62
Running the RFC-2544 Test ........................................................................................ 63
RFC-2544 Test Results ............................................................................................... 64
ITU-T Y.1564 ................................................................................................................... 65
Frame Configuration .................................................................................................... 65
Traffic Rate Configuration ............................................................................................ 67
Service Configuration Test .......................................................................................... 68
Service Performance Test ........................................................................................... 68
Service Acceptance Criteria ........................................................................................ 69
Test Mode ................................................................................................................... 70
Test ID ......................................................................................................................... 70
Test Profile .................................................................................................................. 70
Running the ITU-T Y.1564 Test ................................................................................... 70
ITU-T Y.1564 Test Results .......................................................................................... 71
Advanced Loopback ........................................................................................................ 73
Configuration ............................................................................................................... 74
This Device Configuration ........................................................................................ 74
This Device Statistics View ...................................................................................... 75
Remote Device Query and Control .......................................................................... 75
IP Tools ........................................................................................................................... 78
Ping ............................................................................................................................. 78
Traceroute ................................................................................................................... 79
Browse ................................ ........................................................................................ 79
Files ................................................................................................................................ 80
Company Logo ............................................................................................................ 80
Import ...................................................................................................................... 81
Current .................................................................................................................... 82
Save Logo ............................................................................................................... 82
Technician Profiles ...................................................................................................... 82
Test Profiles ................................................................................................................ 83
Test Type Selector Tabs .......................................................................................... 84
Saved Profile List ..................................................................................................... 84
View Profile Function ............................................................................................... 84
Profile Load/Edit/Delete Bar ..................................................................................... 85
Test Results ................................................................................................................ 85
Test Type Selector Tabs .......................................................................................... 85
Page 9

User’s Manual
DataScout 10G
vii
Saved Result List ..................................................................................................... 86
Test Result Control Bar ........................................................................................... 86
Test Result Export Function ..................................................................................... 86
IEEE C37.94 Testing ....................................................................................................... 89
Overview ......................................................................................................................... 89
Test Interface .................................................................................................................. 89
Test Interface Connections .............................................................................................. 89
Home .............................................................................................................................. 90
Menu Bar ..................................................................................................................... 90
Link Status Indication Bar ............................................................................................ 90
System Info Button ...................................................................................................... 91
Channel Setup ................................................................................................................ 91
Tx/Rx Rate Selection ................................................................................................... 92
Clock Selection ............................................................................................................ 92
Optical SFP and Laser On/Off buttons ......................................................................... 93
SFP Info .................................................................................................................. 93
Laser On/Off ................................................................................................ ............ 93
Save Port Profile.......................................................................................................... 93
Test Selection ................................................................................................................. 94
BERT ........................................................................................................................... 94
BERT Setup ................................................................................................................ 94
Duration Selection ................................................................................................... 95
Test Pattern Selection ............................................................................................. 95
Remote Loop Control ............................................................................................... 96
Test ID ..................................................................................................................... 96
Save Test Profile ..................................................................................................... 96
Start Test ................................................................................................................. 97
BERT Results .............................................................................................................. 97
Elapsed Time & Nx64 Details .................................................................................. 97
Test Pattern Selection, Error and Alarm Injection .................................................... 98
Stop & Reset Test.................................................................................................... 99
Live View Test Results .......................................................................................... 100
Delay (Propagation) ................................................................................................... 100
Delay Test Setup ....................................................................................................... 100
Duration Selection ................................................................................................. 101
Delay Mode Selection ............................................................................................ 101
Page 10

viii
Table of Contents
Test ID ................................................................................................................... 102
Save Test Profile ................................................................................................... 102
Start Test ............................................................................................................... 102
Monitor Mode ............................................................................................................ 103
Test Results .............................................................................................................. 103
Elapsed Time & Nx64 Details ................................................................................ 103
Reset Test ............................................................................................................. 104
Live View Test Results .......................................................................................... 104
Loopback Mode ......................................................................................................... 105
Elapsed Time & Nx64 Details ................................................................................ 105
Manual Loopback .................................................................................................. 105
Automatic Loopback Response ................................................................ ............. 106
Reset Test ............................................................................................................. 106
Live View Test Results .......................................................................................... 106
Files .............................................................................................................................. 107
DS1 Testing .................................................................................................................. 109
Overview ....................................................................................................................... 109
Test Interface Connections ............................................................................................ 109
DS1 Configuration ......................................................................................................... 109
DS1 Auto Configuration ............................................................................................. 110
DS1 Mode Selection .................................................................................................. 110
Clock Settings ........................................................................................................... 111
DS1 Framing Selection .............................................................................................. 111
Framing Status Indicators ...................................................................................... 111
Line Code Selection ................................................................................................ ...... 112
Reception of Valid B8ZS Code Words ....................................................................... 112
Excessive Jitter monitor ............................................................................................. 112
Loopback....................................................................................................................... 112
PairGain HDSL .......................................................................................................... 112
Adtran HDSL ............................................................................................................. 112
Smart Repeaters ....................................................................................................... 113
In-band & FDL ........................................................................................................... 113
User & Self-loop ........................................................................................................ 113
Loopback Commands.................................................................................................... 113
NIU5 Smart Jack ....................................................................................................... 113
Loop Up ................................................................................................................. 113
Page 11

User’s Manual
DataScout 10G
ix
Loop Down ............................................................................................................ 113
BERT (Bit Error Rate Test) ............................................................................................ 114
Test Pattern Selection ................................................................ ............................... 114
Stopping a BERT ....................................................................................................... 114
BERT results ............................................................................................................. 114
Send Errors ............................................................................................................... 115
Round Trip Delay ................................................................................................... 115
Clear Errors & Elapsed-Time ..................................................................................... 115
Alarms & Events ........................................................................................................ 116
Reported Alarms: ................................................................................................... 116
Reported Events: ................................................................................................... 116
Frequency, Level and Slips ....................................................................................... 117
DS1-B Test Interface ..................................................................................................... 118
DS3 Testing .................................................................................................................. 119
Test Interface ................................................................................................................ 119
Test Interface Connections ............................................................................................ 119
DS3 Main Menu ............................................................................................................. 119
Configuration ................................................................................................................. 120
Mode Selection .......................................................................................................... 120
Clocking .................................................................................................................... 121
Framing Selection ...................................................................................................... 121
DS3 Receive Framing ............................................................................................... 121
DS3 Line Code .......................................................................................................... 121
Loopback....................................................................................................................... 121
Local Loopbacks........................................................................................................ 121
Transmit FEAC Codes ............................................................................................... 122
BERT (Bit Error Rate Test) ............................................................................................ 122
BERT Default ............................................................................................................ 122
BERT Results ............................................................................................................ 122
Error Injection ................................................................................................................ 123
Clear Errors & Elapsed-Time ..................................................................................... 123
Alarms & Events ............................................................................................................ 123
Alarms & Events Current ........................................................................................... 123
Alarms & Events History ............................................................................................ 123
DS3 Signal: Frequency & Level ................................ ..................................................... 124
Signaling TIMS Testing ................................................................................................. 125
Page 12

x
Table of Contents
Signaling-TIMS Interfaces ............................................................................................. 125
Test Interface Connections ............................................................................................ 125
Impedance Selection ................................................................................................. 126
Signaling Mode Selection .......................................................................................... 126
Station LS .............................................................................................................. 126
Station GS ............................................................................................................. 126
Station DID ............................................................................................................ 127
Station DID WINK .................................................................................................. 127
CO LS .................................................................................................................... 127
CO GS ................................................................................................................... 127
CO (Signaling) E&M I-V ......................................................................................... 127
CO DID IMMEDIATE ............................................................................................. 127
CO DID WINK ........................................................................................................ 128
SELECTIVE SIGNALING (SS1/SS4) 2&3 Digit ...................................................... 128
Return Loss (RL) – Tx Complex Tones ...................................................................... 129
Measurements............................................................................................................... 129
Voltage & Current ...................................................................................................... 129
RX Frequency & Level ............................................................................................... 129
TX Frequency & Level ............................................................................................... 129
Noise ......................................................................................................................... 129
Capturing DTMF/DP & MF Digits and Timing ............................................................ 130
Ringing & Dial Tone ................................................................................................... 130
Dialing ....................................................................................................................... 130
Quick Tones .............................................................................................................. 130
Quiet Termination ...................................................................................................... 130
Sweep ....................................................................................................................... 130
Tone 1-4 Buttons ....................................................................................................... 130
Speaker Adjust .......................................................................................................... 131
4-Wire TIMS .................................................................................................................. 131
Terminations .............................................................................................................. 131
4-Wire TIMS Wideband ............................................................................................. 132
Measurements ........................................................................................................... 132
Transmit & Receive ............................................................................................... 132
Sweep Button ........................................................................................................ 132
Quick Tones .............................................................................................................. 132
Quiet Termination ...................................................................................................... 133
Page 13

User’s Manual
DataScout 10G
xi
Level Zero Button ...................................................................................................... 133
Tone 1-4 Buttons ....................................................................................................... 133
Speaker Adjust .......................................................................................................... 133
4-Wire Noise Measurements ......................................................................................... 133
Impulse Noise ............................................................................................................ 134
Dropouts, Gain & Phase Hits Amplitude Jitter & Phase Jitter ..................................... 134
Amplitude & Phase Jitter ........................................................................................... 135
Return Loss (RL) – Tx Complex Tones ...................................................................... 136
23-Tone Test ............................................................................................................. 136
23-Tone Results Display ........................................................................................ 137
4-Wire Signaling Mode Selection ............................................................................... 137
Station DID ............................................................................................................ 137
Station DID-wink .................................................................................................... 137
CO (Signaling) ....................................................................................................... 137
PBX (TRUNK) E&M I-V.......................................................................................... 138
CO DID .................................................................................................................. 138
CO DID-Wink ......................................................................................................... 138
SELECTIVE SIGNALING (SS1, SS4) 2&3 Digit ..................................................... 139
Transmit SS digits: .................................................................................................... 139
Receive SS digits: ..................................................................................................... 139
Menu Functions ................................................................................................ ............. 139
PRI-ISDN Testing .......................................................................................................... 141
Test Interface Connections ............................................................................................ 141
Initial Layer-1 Test ................................................................................................ ..... 141
E1 .......................................................................................................................... 142
PRI Configuration .......................................................................................................... 142
Emulation Mode......................................................................................................... 142
PRI “Link Active” Layer’s 1 & 2 .................................................................................. 143
Placing a VOICE or Audio Call .................................................................................. 143
Hang Up .................................................................................................................... 144
Placing a Data Call ................................ ................................................................ .... 144
BERT ..................................................................................................................... 144
Receiving a Call ..................................................................................................... 145
Terminate Call ....................................................................................................... 145
Multiple B-Channel Calls ........................................................................................... 146
Q.931 Decodes & Status Window .............................................................................. 146
Page 14

xii
Table of Contents
Protocol Decode Messages ................................................................................... 146
Clear CALL Status & BERT ....................................................................................... 146
List of Common Problems ............................................................................................. 146
DDS Testing .................................................................................................................. 147
DDS 4-Wire Connections .............................................................................................. 147
Test Interface Connections ............................................................................................ 148
DDS 4-Wire Configuration ............................................................................................. 148
Receive Loopbacks ....................................................................................................... 148
CSU Loopback .......................................................................................................... 148
DSU Loopback .......................................................................................................... 149
V.54 Loopback .......................................................................................................... 149
Local Loopbacks ........................................................................................................... 149
TX Control Codes .......................................................................................................... 149
RX Level and Sealing Current Detection ....................................................................... 150
BERT - Bit Error Rate Test and Display ......................................................................... 150
Bit Error Insertion ....................................................................................................... 151
CLEAR Errors ............................................................................................................ 151
Receive Byte and Control Code Decode ................................................................... 151
Datacomm Testing ........................................................................................................ 153
Datacomm Test Option .............................................................................................. 153
Test Interface Connections ............................................................................................ 153
DTE BERT Testing ................................ ................................................................ .... 153
BERT SYNC .............................................................................................................. 154
DCE BERT ................................................................................................................ 154
Byte Encoder Display ................................................................................................ 154
Auto Mode ................................................................................................................. 155
Other Features .............................................................................................................. 155
Up/Down buttons ................................................................................................... 155
Invert button........................................................................................................... 155
Bi-Directional loopback button ............................................................................... 155
Remote Control ............................................................................................................. 157
Remote Control Option .............................................................................................. 157
Management Port Configuration ................................................................................ 157
Wired Connection .................................................................................................. 157
Wireless Connection .............................................................................................. 158
VMLite VNC Server Application ................................................................................. 158
Page 15

User’s Manual
DataScout 10G
xiii
Specifications ................................................................................................................ 161
Specification Download ................................................................................................. 161
Page 16

Page 17
User’s Manual
DataScout 10G
15
Safety Information
Overview
Hazards exist in every workplace in many different forms: sharp edges, falling objects,
flying sparks, chemicals, noise and a myriad of other potentially dangerous situations.
Controlling hazards at their source is the best way to protect you from accidents. While
the test set is designed to be a safe and reliable tool, the environment in which you
perform work in may expose you to hazards.
Shock Hazard
While this test device does not produce, or emit harmful sources of electrical voltage or
current, network elements and circuitry you are testing may. Always follow your established safety practices and the instructions in this user manual regarding proper connection to the circuit under test.
Please note that this test device is not designed to warn you if connection to input voltage or current exceeds the maximum allowed by the test interfaces installed in this
unit. Exceeding maximum values may result in damage and not be covered under
warranty.
Eye Protection
Wear eye protection when using this device.
Failure to observe this precaution may result in injury.
Laser Safety
Never look into laser transceivers (SFP/SFP+).
Failure to observe this precaution may result in eye damage.
Optical small form-factor pluggable (SFP/SFP+) transceivers use laser radiation to
generate communication signals. Always keep the optical transmit and receive ports
covered whenever the optical patch cord is not plugged in and turn the laser off prior to
connecting or disconnecting fiber optic patch cords.
Page 18

16
Overview
Battery Safety
Failure to observe these precautions may
result in injury or property damage.
Do not allow anything to contact the battery terminals.
► Do not immerse batteries in liquid. Liquid may
create a short circuit and damage the battery. If
batteries are immersed, contact your service
center for proper handling.
► Do not place the battery into a pocket, tool
pouch, or tool box with conductive objects. Conductive objects may create a short circuit and
damage the battery.
► Do not place a battery on moist ground or grass.
Moisture may create a short circuit and damage
the battery.
► Do not store the battery at more than 122 °F
(50 °C) or less than –4 °F (–20 °C). Damage to
the battery can result.
► Do not use another manufacturer’s charger. Other manufacturers’ chargers may
overcharge and damage the battery.
► Do not attempt to open the battery. It contains no user-serviceable parts
► Use this product only in the manner described in this manual. If the equipment is
used in a manner not specified by the manufacturer, the protection provided by
the equipment may be impaired.
FCC/IC Notifications
The following notifications apply for models DataScout 10G and DataScout 10Gx when
802.11 and/or Bluetooth radio interfaces are installed:
This device complies with part 15 of the FCC Rules and Industry Canada RSS stand-
ards. Operation is subject to the following two conditions: (1) This device may not
cause harmful interference, and (2) this device must accept any interference received,
including interference that may cause undesired operation.
Cet appareil est conforme à la partie 15 des normes FCC RSS Règles et Industrie
Canada. Son fonctionnement est soumis aux deux conditions suivantes: (1) Ce dispositif ne peut causer des interférences nuisibles, et (2) cet appareil doit accepter toute
interférence reçue, y compris les interférences qui peuvent provoquer un fonctionnement indésirable.
Changes or modifications not expressly approved by the party responsible for compliance could void the user's authority to operate the equipment.
Page 19

User’s Manual
DataScout 10G
17
Les changements ou modifications non expressément approuvés par la partie responsable de la conformité pourraient annuler l'autorité de l'utilisateur à utiliser
l'équipement.
Page 20

Page 21

User’s Manual
DataScout 10G
19
Getting Started
Upon receipt of your test set perform a visual inspection, accessories and power supply. If any item is missing appears damaged, please contact your local Greenlee Communications representative or our customer support team using one of these methods:
Phone:
Americas: 800-642-2155
EMEA: +44 1633 627710
Email:
Mail:
Greenlee Communications
1390 Aspen Way
Vista, CA 92081
Battery Information
The test set can be powered from its internal rechargeable battery pack or from the
provided universal 100-240VAC wall mount charger. Battery life will depend on the active test interface selection but on average a single test interface supports approximately 6-8 hours of continuous operation. Multiple test interface selections will decrease the battery life by approximately 30% per interface. The Ethernet 10G interface
consume the most power and thus you should expect typically around 2-3 hours of
testing on batteries when using this interface.
Before using the test set for the first time you will need to charge the battery for approximately 8 hours to achieve a full charge. A yellow graphic battery charge icon located
to the left of the display indicates the batteries are charging. This indicator is independent of the power state (On/Off) of the test set. The ON/OFF power indicator is located
on the upper left panel next to the display.
Warranty
The test set is warranted for a period of at least one year from the date of shipment
against defects in material and workmanship. This warranty applies to the original
equipment purchaser and is non-transferable without express written authorization.
Warranty is void if:
1. The warranty sticker has been tampered with or
2. The equipment has been altered
3. The equipment has not been serviced by a Greenlee Communications authorized service and repair center
4. The equipment is installed or operated in any manner other than those specifically described in the instructions and operating literature.
No other warranty is expressed or implied.
Page 22
20
Calibration
Calibration
This test set is of modern design incorporating components which do not require a periodic calibration schedule. If desired or required by your internal quality processes, the
device may be returned to the factory, for a charge, to confirm conformance to factory
settings.
Training Videos
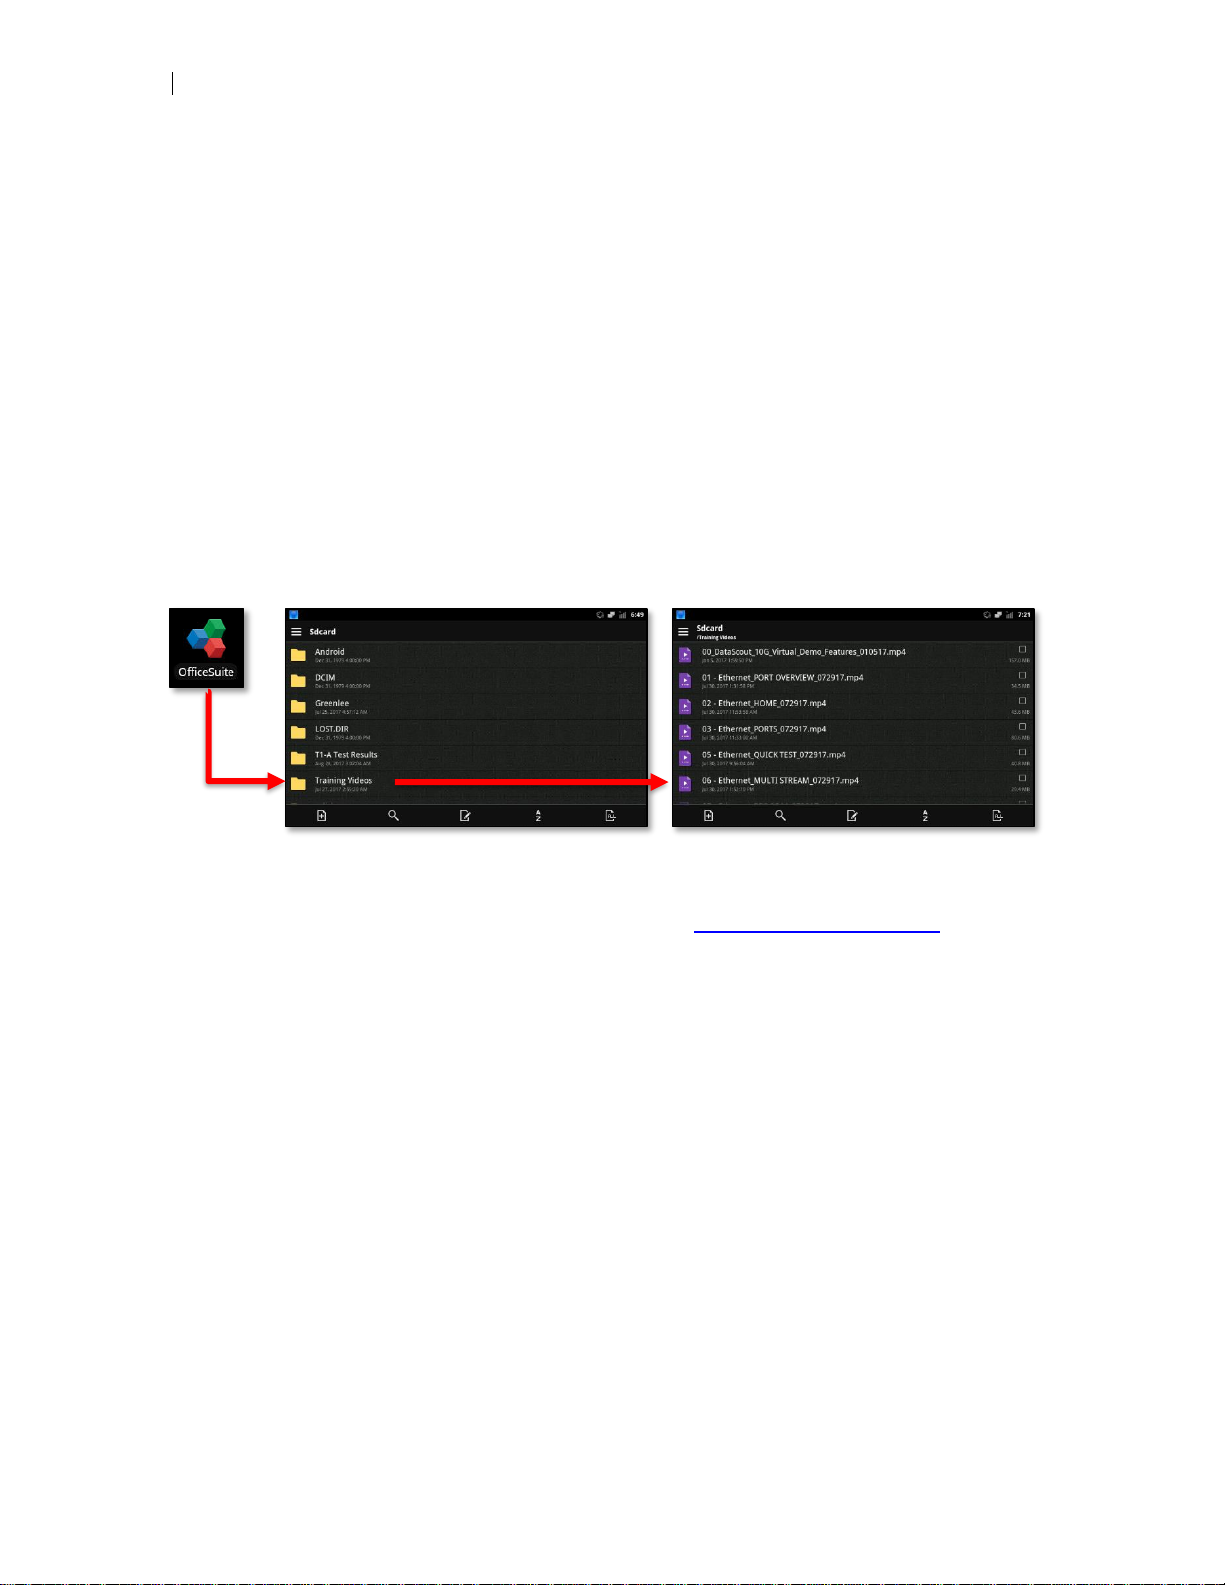
Portions of this user manual are preloaded onto your test set and available online in
video format. To access videos preloaded on your test set:
1. Plug headphones into the headphone jack on the right side of the test unit
2. Press the Office Suite application icon
3. Tap on the folder named “Training Videos”
4. Tap on the video you wish to watch
Figure 1 - Accessing Training Videos
Alternately, you can copy these files to a USB drive and install on a device of your
choice. These videos are also available online at: https://www.youtube.com.
Page 23
User’s Manual
DataScout 10G
21
Buttons & Icons
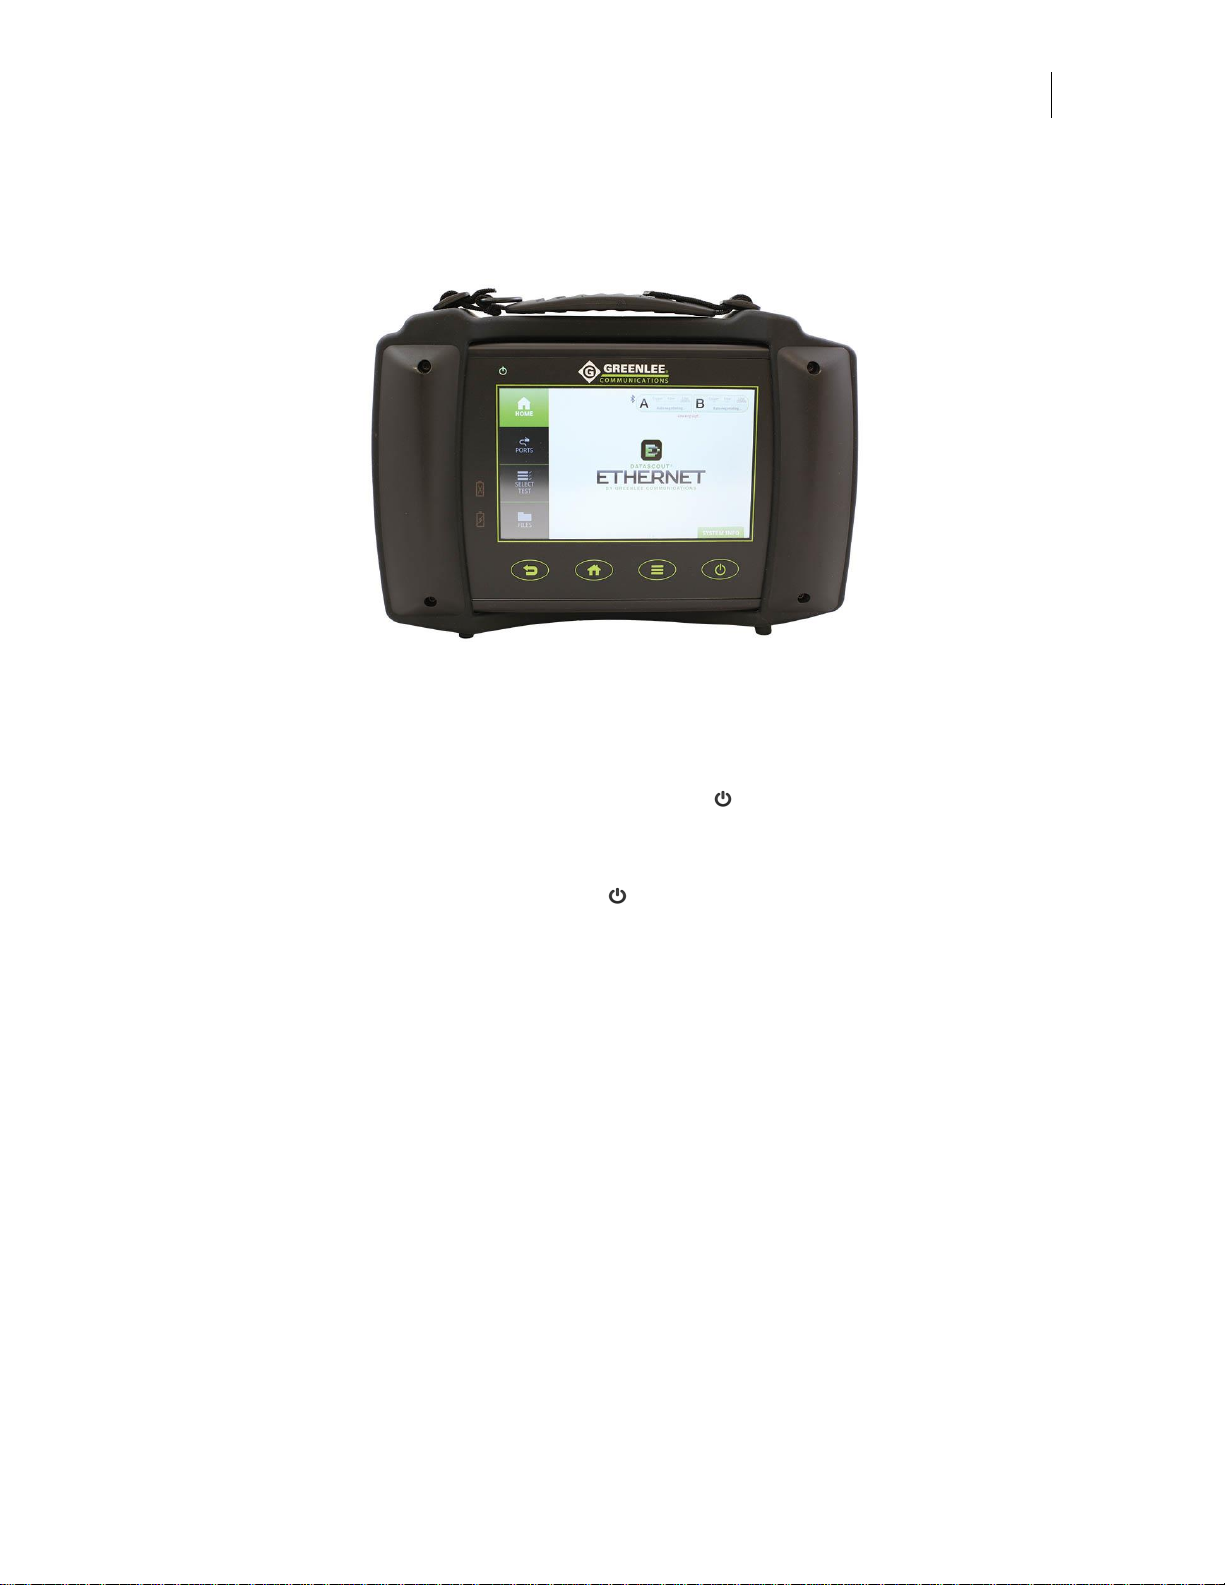
Figure 2 - DataScout 10G Front View
User Interface
Power on/off
To power ON the test set, press and hold the power button for two seconds or until
the green power indicator lights. Once powered on, the unit takes approximately 35
seconds to display the home screen.
To Power OFF press and hold the power button for four seconds or until the green
power indicator turns off. Note that the yellow charge Icon may or may not be lit depending on the state of the battery and if the AC charger is plugged into the unit.
Touch screen
Unlike your smart phone which may utilize capacitive touch screen technology, this device utilizes an industrial grades resistive touch technology. Resistive touch screens
require pressing or sliding your finger in a deliberate medium force action when interacting with the touch screen. If you slide or press lightly like you would a smart phone
the unit may not respond and is a design feature, not a limitation. Additionally, advanced touch screen features such as pinch, flick and zoom are not supported by resistive touch screens.
Utilization of a stylus or your finger nail is usually the best way to interact with the touch
screen. Never use metal objects (knives, snips, screwdrivers, picks, etc.) as a stylus.
Doing so may damage the touch screen and void your warranty.
Page 24
22
User Interface
Unlocking the screen
Slide the unlock button from bottom to top to unlock the unit. You are now at the
home screen. Press a test Icon for the tests you would like to perform or use your finger and slide from left to right or right to left to view additional screens.
User Settings
To adjust various user settings such as LCD brightness or data and time press the all
applications menu icon located middle right of LCD followed by the settings icon.
Alternately from the home screen you can also press the menu icon followed by settings.
Using your finger or a stylus scroll down to the setting you wish to change then press
the setting. The only settings recommend for changing is the Display and Date & Time
located at the bottom of the menu.
Important: Do not use the reset or default option available in the settings
menu. All user settings and test applications will be deleted which will require
a return to the factory for reload.
Navigation Buttons
From left to right the navigations buttons are BACK, HOME, MENU, and POWER.
BACK will take you to the previous screen. Press and hold to view recently ac-
cessed apps.
HOME quickly returns you to the home screen from whatever application or screen
you are in. This is the screen with the test applications. Press and hold to view recent accessed apps
MENU when on the home screen displays a menu for changing wallpaper, search,
and other settings. Within a test application pressing the menu button enables and disables test options. Additionally, pressing and holding the menu button in a test application displays the keyboard. Press and hold the menu button to close the keyboard.
POWER turns on/off the test set. Press and hold two seconds to turn on or press
and hold for four seconds to turn off.
Indicator Lights
Power Indicator
The green powered-on indicator is located above the upper left corner of the display
and is only lighted when the unit is powered on. When this indicator is off it indicates
that unit is powered off.
Page 25

User’s Manual
DataScout 10G
23
Low Battery
A red battery indicator to the left side of the screen will flash rapidly, indicating the battery charge status is critically low. If this occurs the test set should be immediately
plugged into power to continue testing.
Battery Charging
An orange battery indicator with a lightning bolt will appear to the left side of the screen
when the battery is charging. A full charge cycle will take approximately eight hours to
complete when the battery is fully discharged.
Page 26

Page 27
User’s Manual
DataScout 10G
25
Interfaces
Test Interfaces
The test set uses a plug & stay architecture which eliminates removing, damaging or
losing modules like you would with other test sets. Plug & stay also enables testing
multiple services at the same time without powering off the device to change modules.
You can’t do that with many modular test systems.
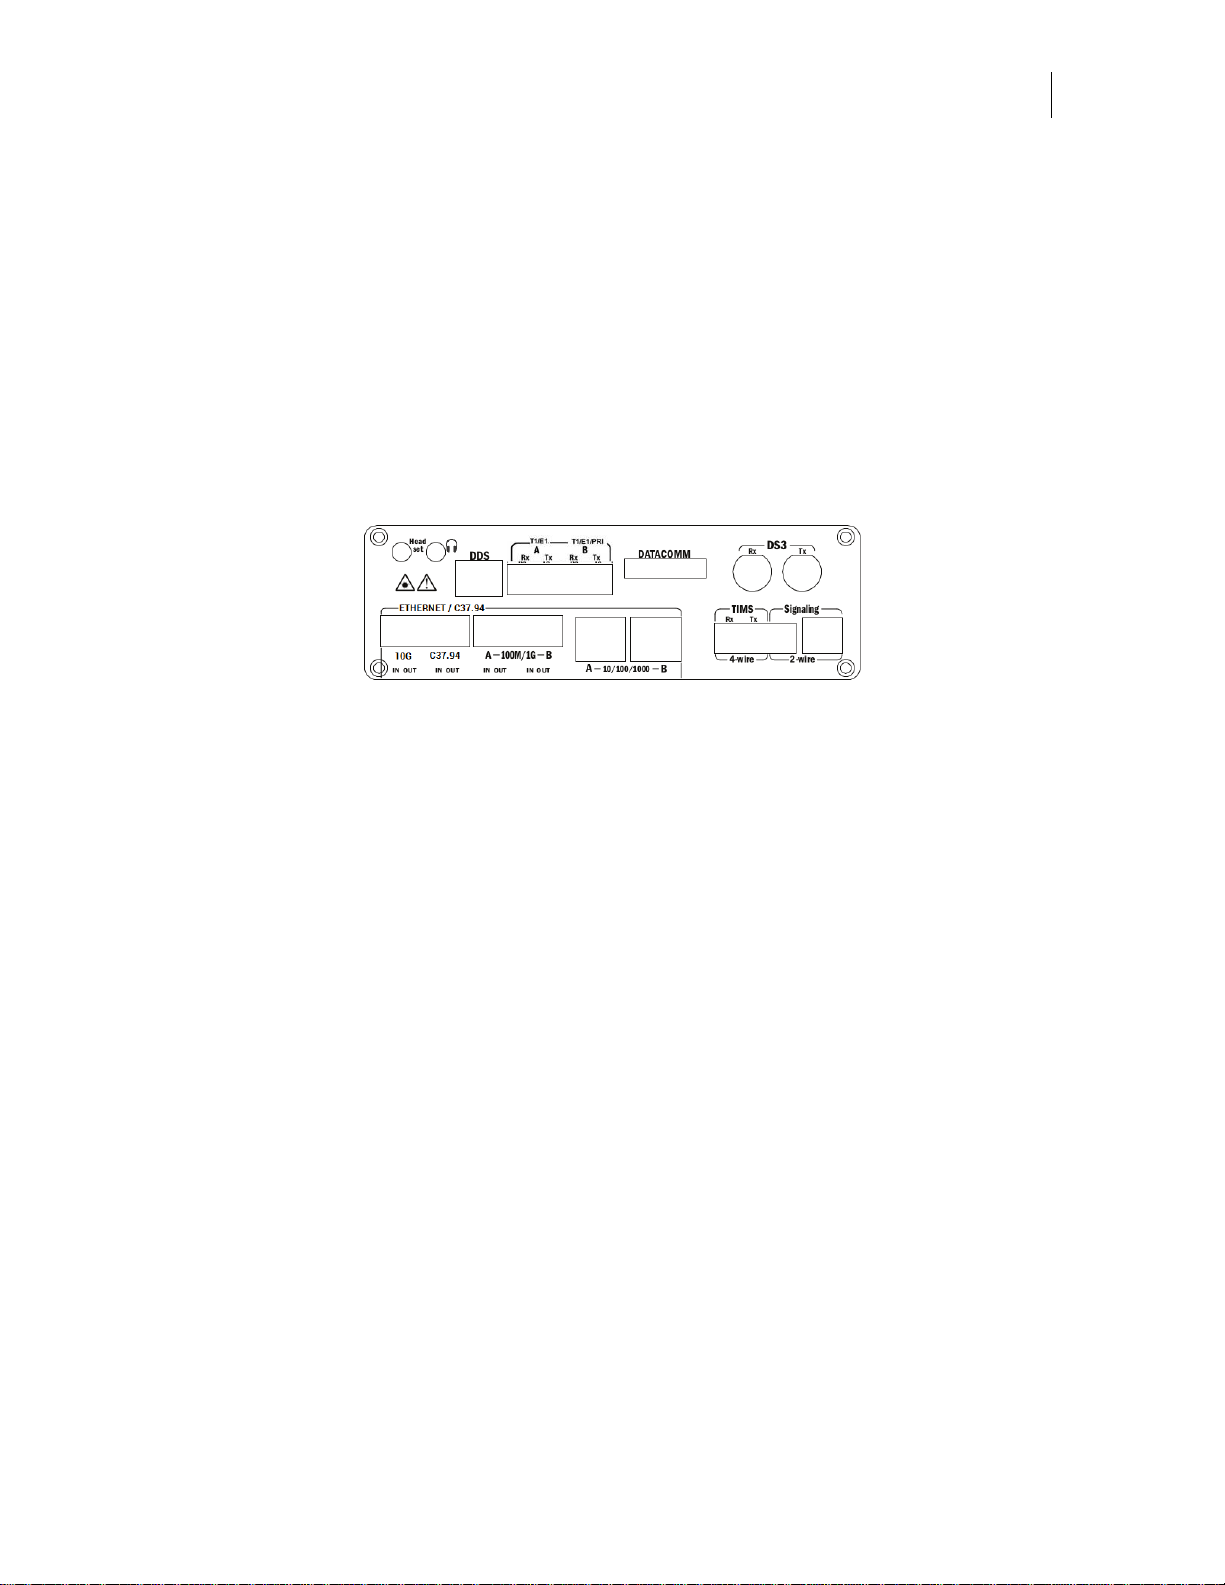
All test interfaces are located on the right side of the unit as shown in the graphic below. Please note that depending on your configuration you may not have all ports installed on your unit.
Figure 3 - Test Interface Ports
► Ethernet (10/100) Copper
► Fast Ethernet (100) Fiber SFP
► Dual Gigabit Ethernet (1000) Copper
► Dual Gigabit Ethernet (1000) Fiber
► Dual 10 Gigabit Ethernet Fiber
► T3 Test Interface
► First T1/E1 Test Interface
► Second fully independent T1/E1/PRI-ISDN Test Interface
► PRI-ISDN NT/TE Voice & Data Testing
► Datacomm Testing SYNC/ASYNC DTE/DCE RS232, V.35, RS449, RS530
► 2-Wire Signaling TIMS–CO, PBX, DID, E&M type I-V, Selective, Wink,
Loop/Ground Start Test Interface
► 4-Wire Voice-band and Wideband TIMS Test Interface
► 4-Wire DDS & Frame Relay DLCI Decode Test Interface
Page 28
26
Charger, Wi-Fi & Remote Management Interfaces
Charger, Wi-Fi & Remote Management Interfaces
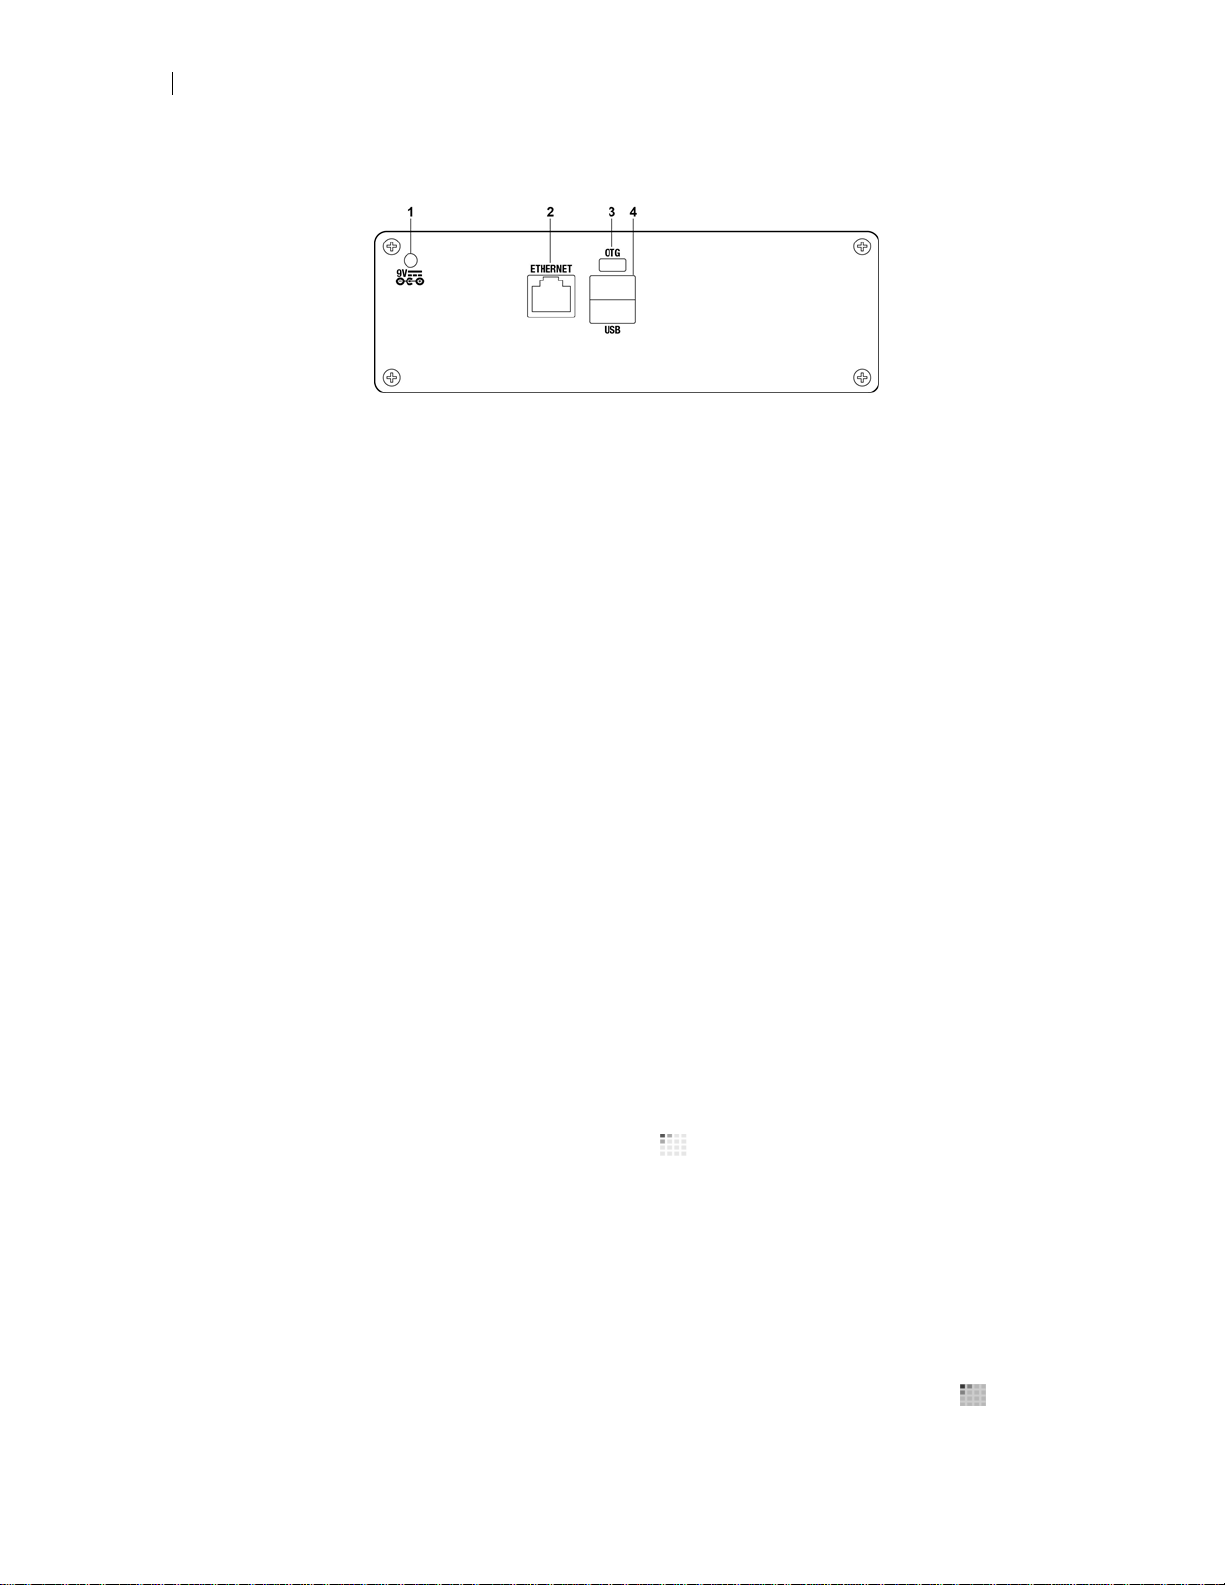
Figure 4 - Management Interface Ports
1. Charger input is in the upper left corner and is labeled 9V. Only use the approved Greenlee Communications supplied charger as other models may damage the internal power supply and will void the warranty.
2. RJ45 Ethernet port enables full remote control of the test set when the DS10SW-RC option is enabled.
3. OTG (On-the-Go) Micro-AB USB port is to connect to your PC in order to perform application updates or copy/delete documents and save test results.
4. Two USB type-A ports are used to connect a variety of USB accessories such as
flash drives, monitor or keyboards/mice. Do not use the USB for charging external products or accessories.
LCD Display
The test set is equipped with a bright 7” color tablet LCD enabling test results, web
pages, documents and office applications to be easily viewed, even in bright sunlight.
Proper Care
Always use clean fingers or a touch screen stylus when interacting with the touch
screen. Never use hard objects such as screw drivers, knives, or pen tips as they may
damage the LCD screen. To clean the LCD, use a cloth lightly dampened with clean
water only.
Failure to follow any of the above could result in permanent damage to the LCD and
void the warranty.
LCD settings
To change the LCD display settings, press the icon, then settings, select Display
and then select Brightness. Slide the bar left or right to increase or decrease brightness.
To change how long the screen should remain lit before dimming to save power select
Screen Timeout.
Results (Test/Capture) Retrieval
The test set has 4GB of internal storage (up to 16GB optional) and can store thousands of phone numbers (TIMS) and contacts (via the built-in contacts app in )
along with thousands of test results and set up information – by test type. To Log
Page 29
User’s Manual
DataScout 10G
27
(Capture errors) you must be in the DS1 or DS3 app; the unit can store thousands of
events in internal memory. Tap the menu button and then “Log Results”. Select the
Alarm, Event, Slips or BERT error then hit OK. Note the log will capture any alarm or
event and place in a DS1 or DS3 folder with a date and time stamp. Note to prevent
streaming errors from creating many files the unit will stop logging at greater than 45%
error rate.
To copy time-stamped test results from internal memory to your PC simply power-on
the test set and connect a USB OTG (On-the-Go) cable to your PC USB port. Press
the Menu button on the test set and select Notifications followed by USB connected.
Tap on the “Turn on USB storage”. Your PC will now treat the test set as a removable
storage device (like a USB stick) and you can copy, paste, add and delete test results
(files) to/from the unit. From here you can easily add to your database, print or backup
your test results.
User Interface Overview
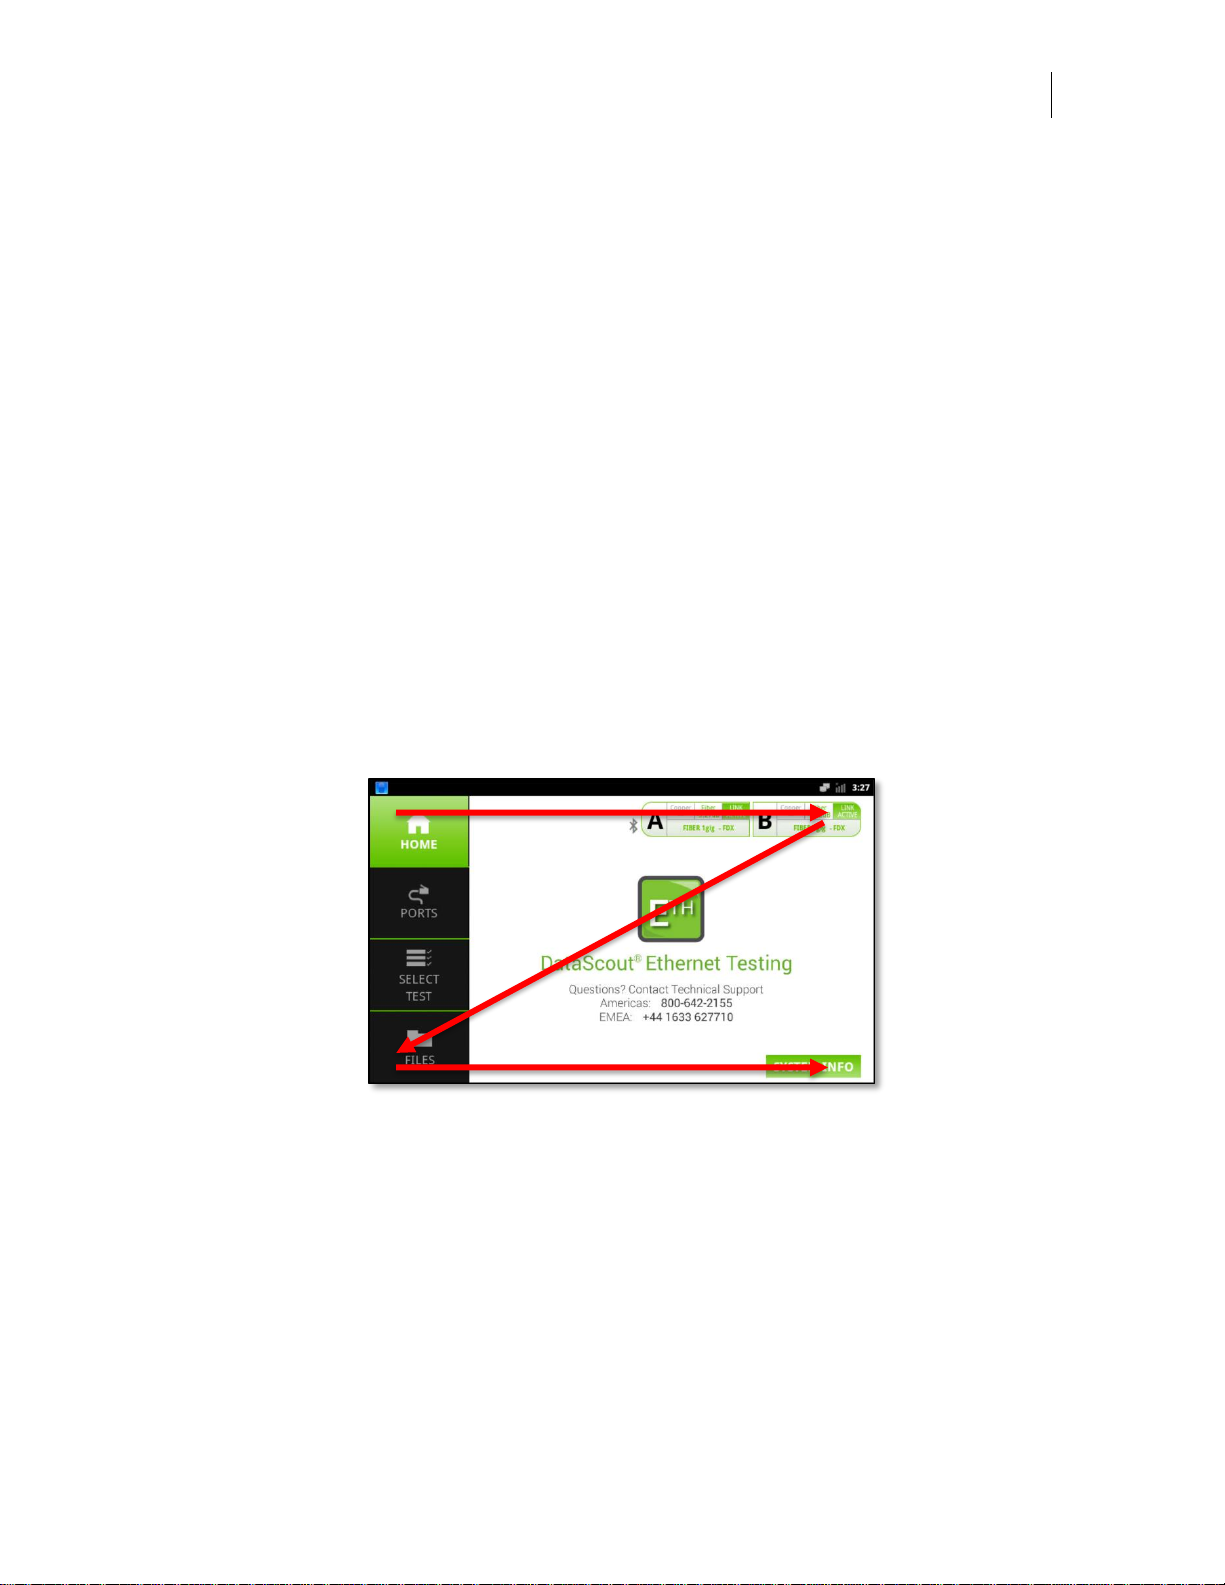
Upon launching the Ethernet application, the home screen will be displayed. The
home screen provides a convenient place to view current port status and begin test
configuration. For all DataScout test applications it is recommended to interact with the
unit much like you would do when reading a book, start at the top left side of the screen
and work your way to the bottom right. All work flows follow this concept as much as
possible, ensuring an intuitive user experience.
Figure 5 - User Interface Flow
Page 30

Page 31
User’s Manual
DataScout 10G
29
Ethernet Testing
Overview
Service providers rely on enterprise and carrier Ethernet technology as the need for
more bandwidth and quality of service is desired. The need for bandwidth and quality
services has never been more important, making comprehensive Ethernet testing immediately at service turn-up vital to ensuring service quality and increasing customer
satisfaction.
Customer Service-Level Agreements (SLAs) dictate certain performance criteria that
must be met, with the majority documenting network availability and mean-time-to-repair values which are easily verified. Today, Ethernet performance criteria are more difficult to prove. Demonstrating performance availability, transmission loss, bursts, latency and delay, link and service integrity cannot be accomplished accurately by a
PING or a volt meter.
With the DS10G-HW-ETH Ethernet test interface option installed field technicians, installers and contractors can perform traditional BERT or RFC-2544 tests as well as
modern Multi Stream or ITU-T Y.1564 service level testing to demonstrate Ethernet
services meet the customer SLA.
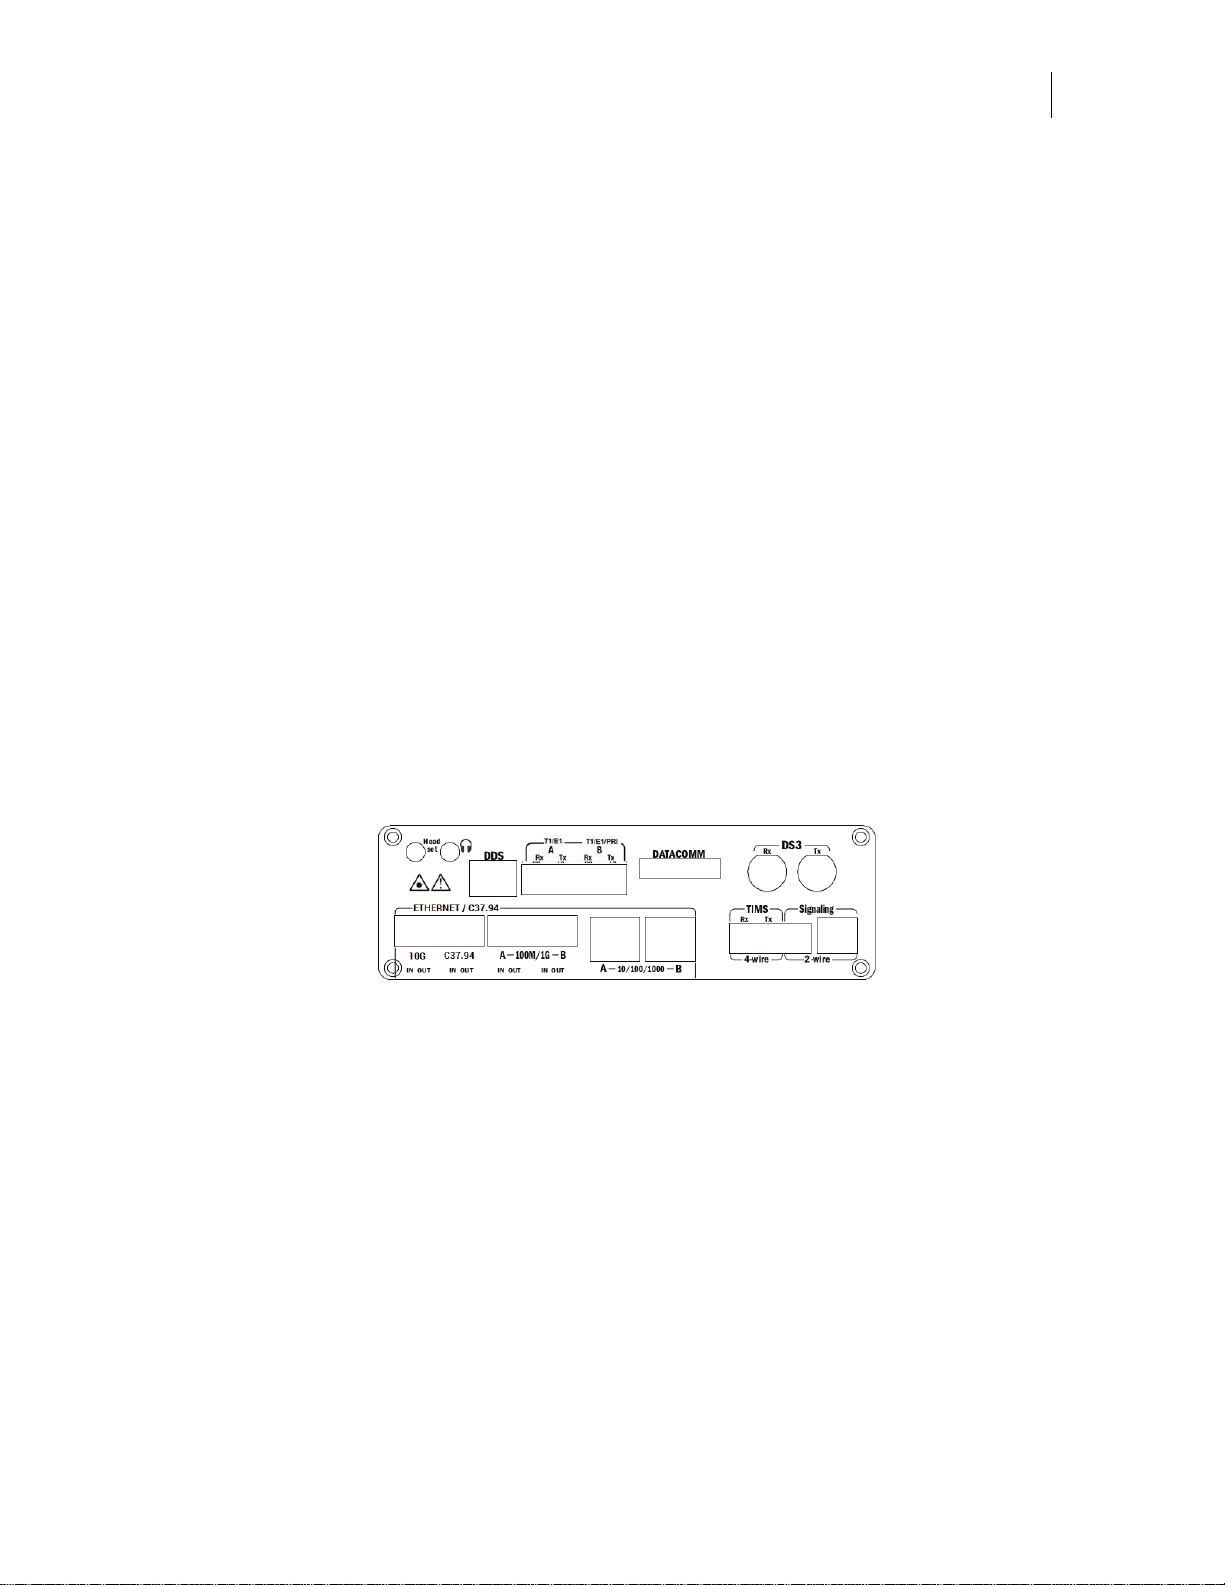
Test Interfaces
Figure 6 - Ethernet Test Ports
The test set supports testing:
1. Single port 10000Base-X
2. Single port IEEE C37.94
3. Dual port 100FX or 1000Base-X SFP (1GbE)
4. Dual port 10/100/1000Base-T
Page 32
30
Test Interface Connections
Test Interface Connections
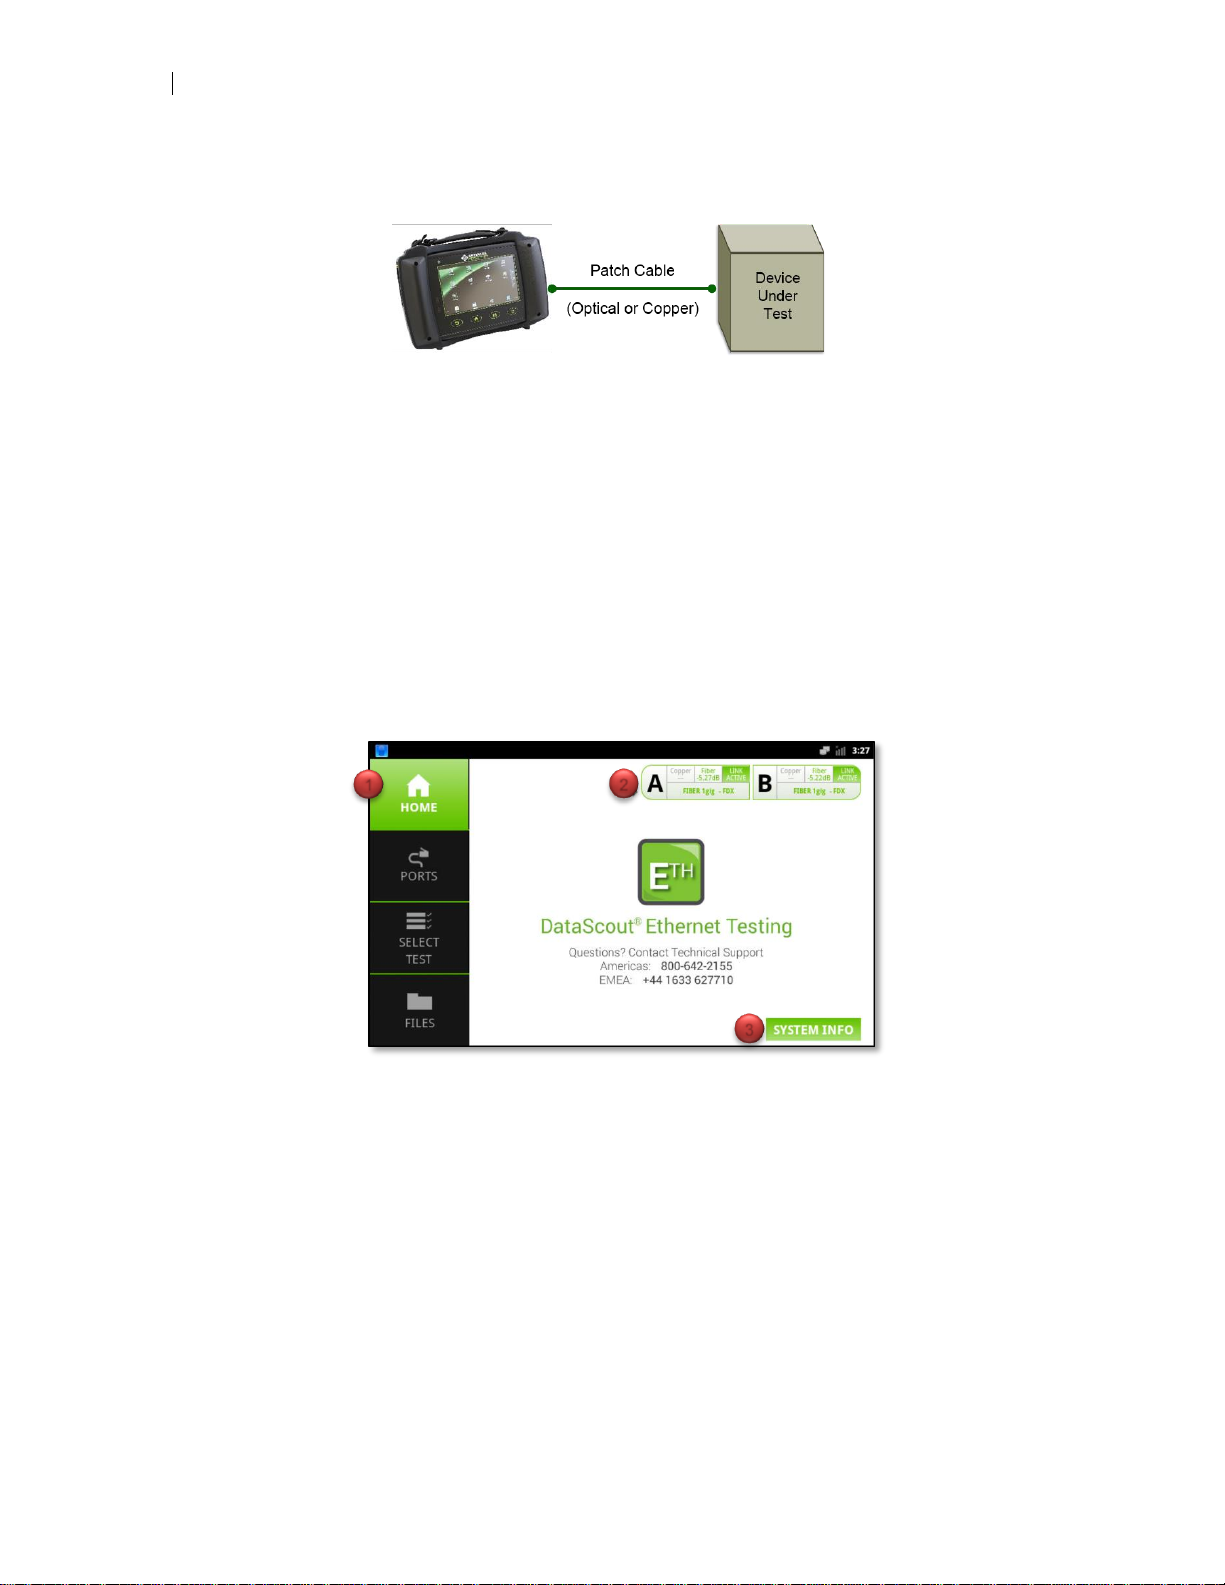
To connect the test interface to the device under test you must select the proper patch
cable depending on which interface you are testing and the termination type if using
the optical ports. There is no specific order of connection required. You can connect
the patch cord to the test device or network device first.
Home
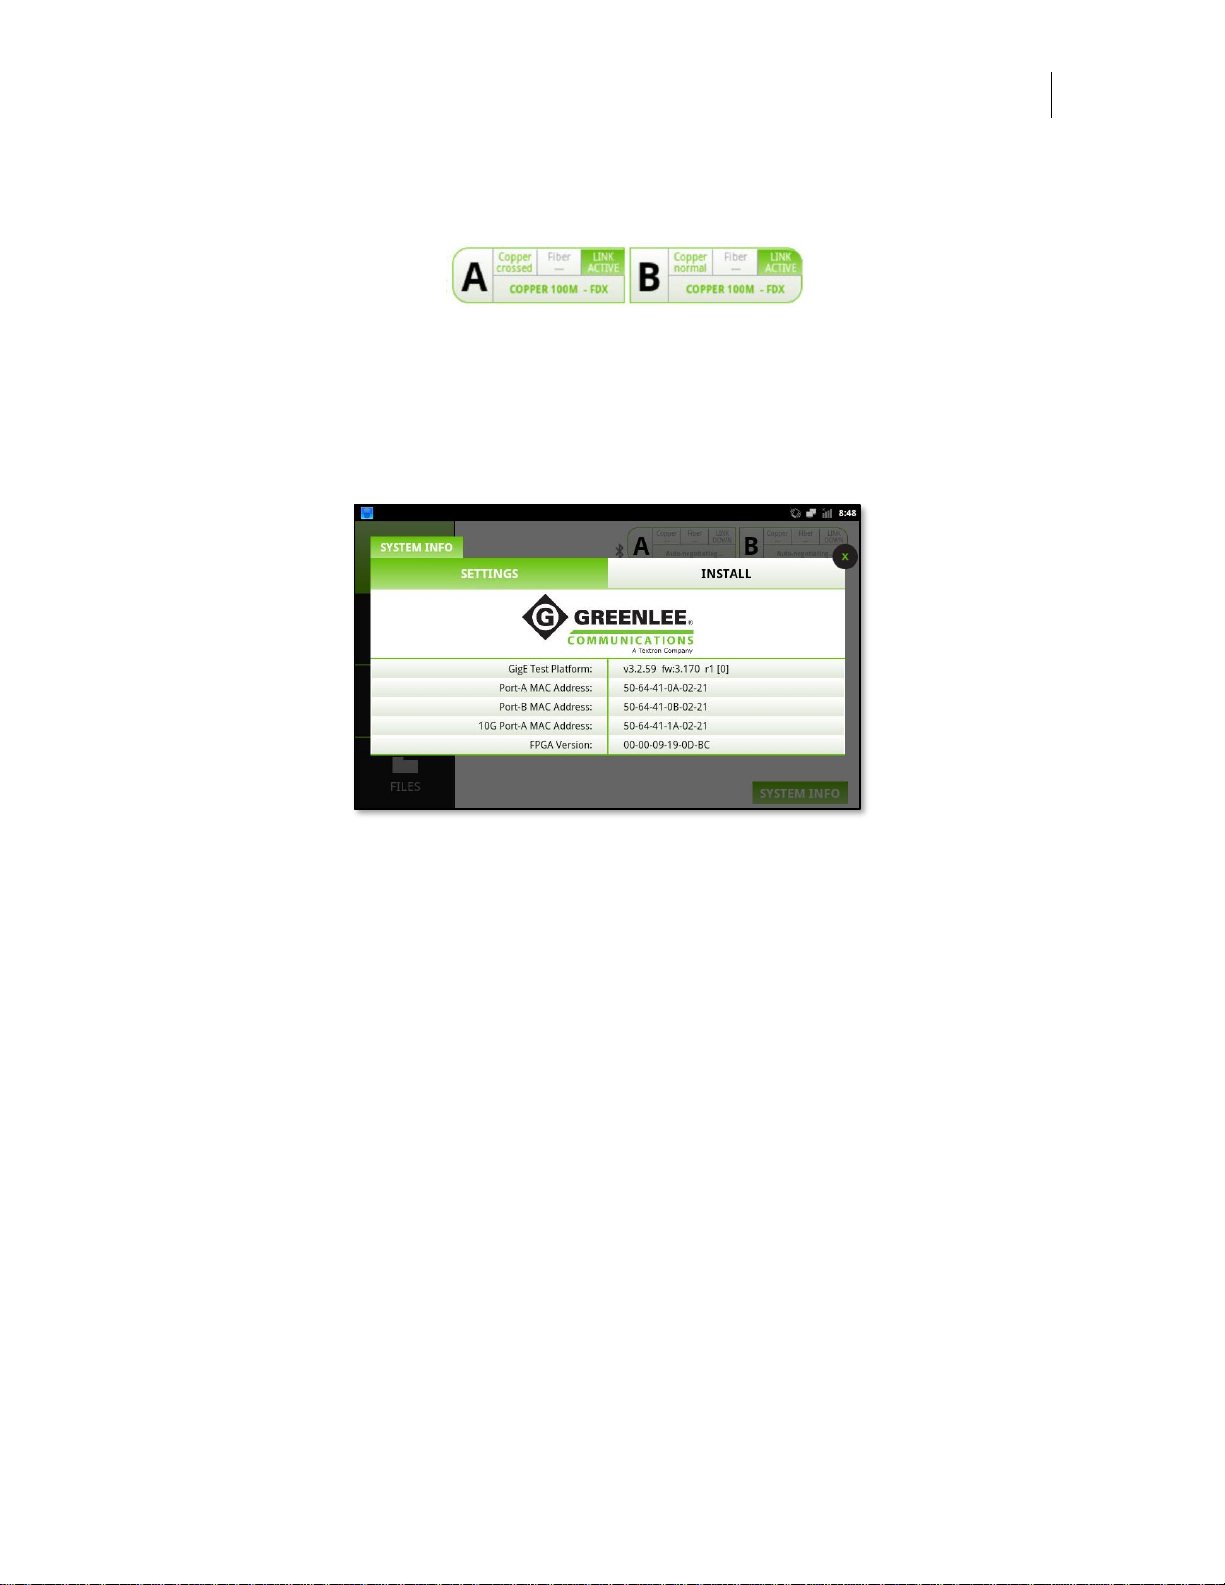
There are three sections of note on the home view:
1. Menu bar
2. Link status indication bar
3. System Info button
Figure 8 - Home View Sections
Menu Bar
The menu bar provides access to port configuration, selecting which test to run and
view or retrieving test profiles as well as results. Menu bar buttons, when selected and
active, will be green. When not select or active they will be black. In the figure above,
the HOME button on the menu bar is active.
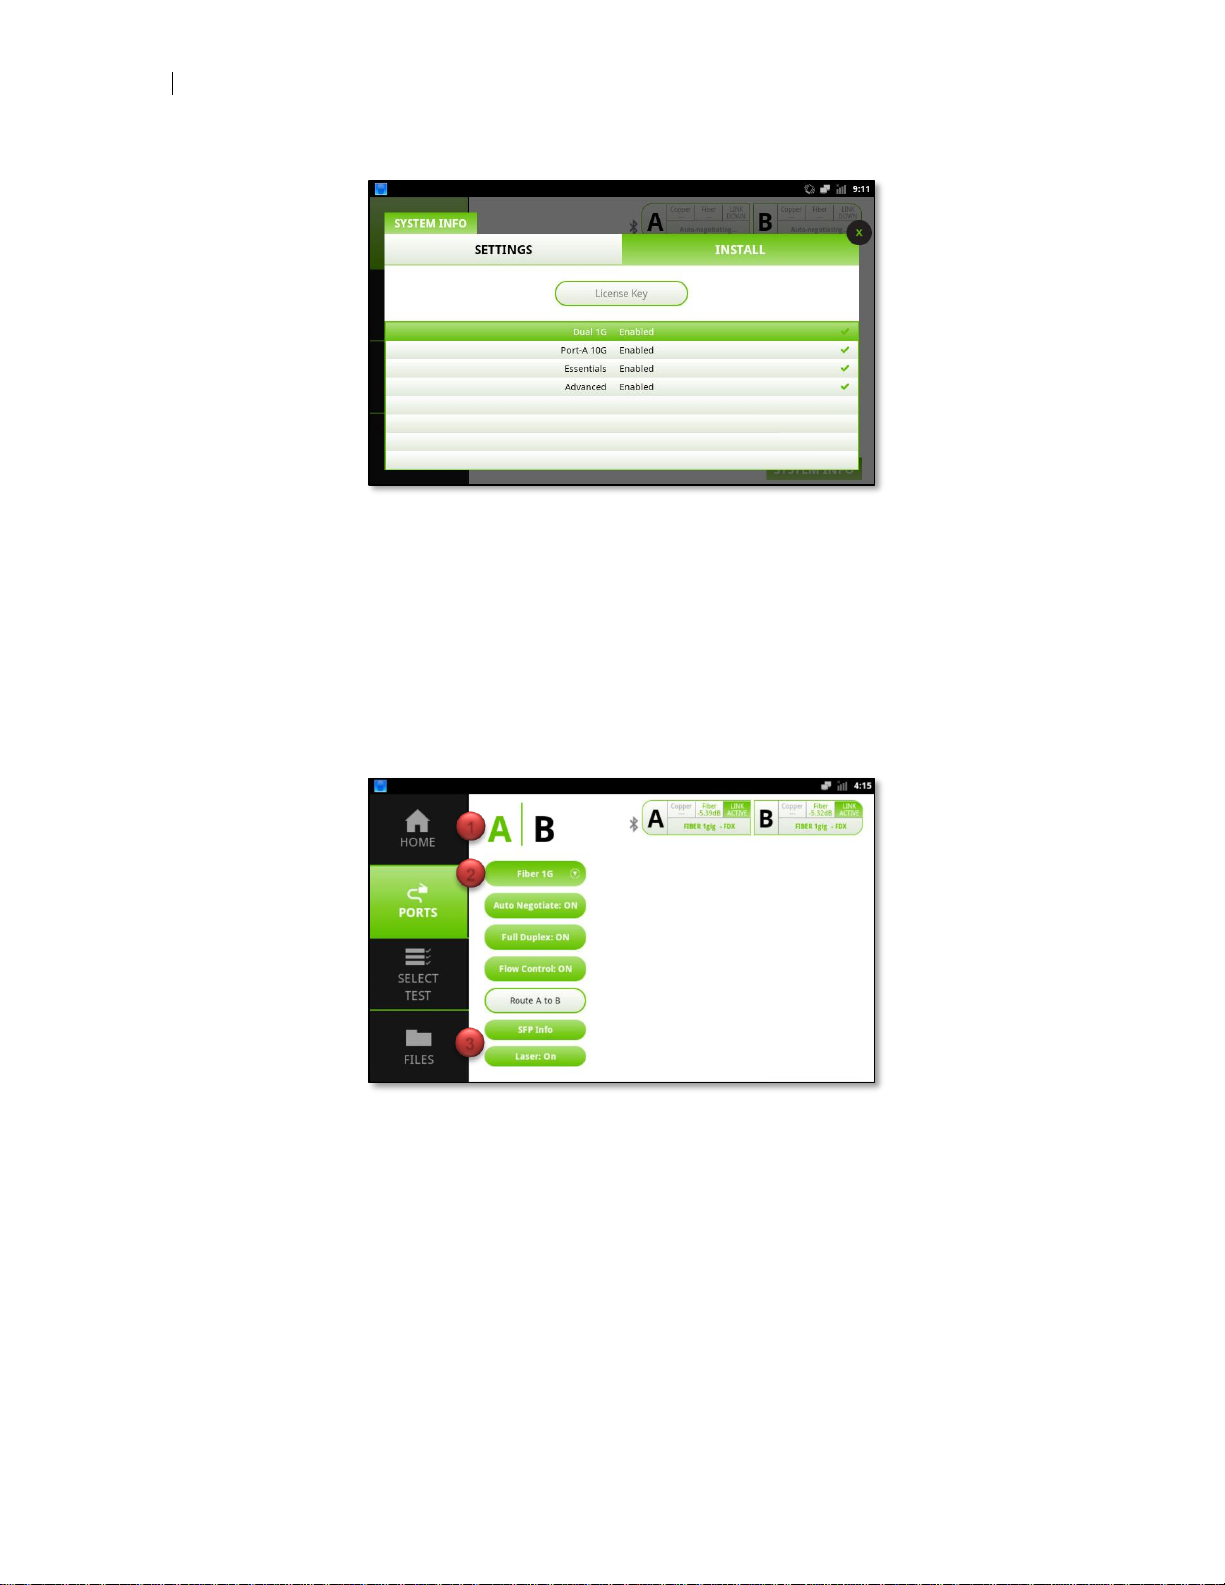
Link Status Indication Bar
The link status indication bar is present in the port configuration and test application
views. It provides real time feedback regarding current link status of both Ports A and
Figure 7 - Ethernet Interface Connection
1
2
3
Page 33
User’s Manual
DataScout 10G
31
B as well as optical and copper link speed status. When link is established the LINK
ACTIVE indicator will be green.
Figure 9 - Link Status Indication Bar
Along with link status, the status bar also displays fiber optic receive power in dB relative to 1 milliwatt (mW) if an optical transceiver is plugged in and receiving optical signals.
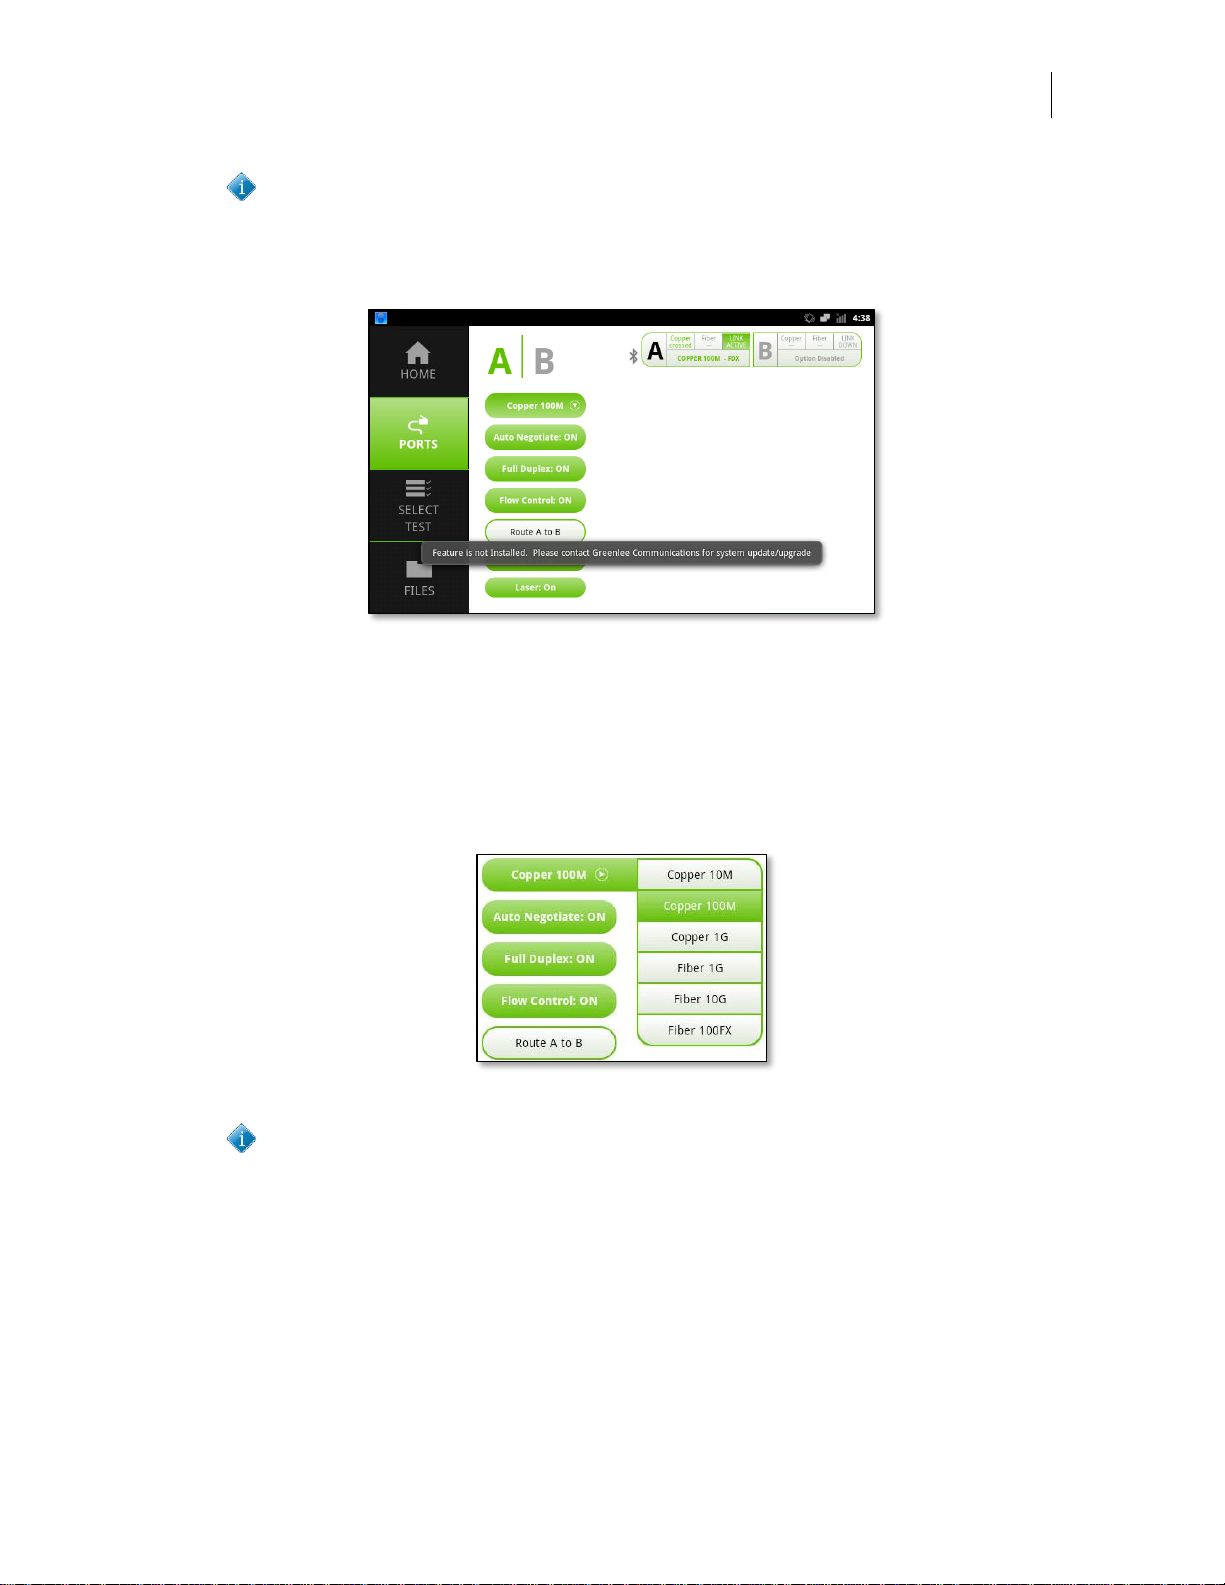
System Info Button
Figure 10 - System Info, Settings Tab
Pressing the system info button activates a popover view with two tabs labeled settings
and install.
Settings
The Settings tab displays system information such as test Platform software and firmware versions, port default MAC addresses and FPGA code version. This information
is helpful to have on hand before calling customer service or technical support as the
agent may ask you to provide it.
Install
The install tab enables viewing of installed test options and activation of new options by
entering a key into the License Key field.
Page 34
32
Port Configuration
Figure 11 - System Info, Install Tab
Port Configuration
To configure physical port attributes, press the PORTS button. The Ports view has
three sections of note on the home view:
1. Port A/B selection icons
2. Physical interface configuration
3. System Info and Laser On/Off buttons
Figure 12 - Ports View
Port A & B Selection
Pressing the A | B port icons enables configuring the physical interface settings for port
A and B respectively. The currently selected port will be green in color, in the example
above port A is currently the currently selected port.
Port A can operate as either a traffic generation port (BERT, RFC-2544, Y.1564, etc.)
or as a loopback port. Port B is a dedicated loopback port. The test set can generate
traffic or reflect traffic on port A and loopback traffic on port B simultaneously.
1
2
3
Page 35
User’s Manual
DataScout 10G
33
Port B is only active if option DS10G-SW-201 is enabled. If this option is not
enabled port B will be inactive and the link status indication bar for port be will
display “Option Disabled”. Pressing the port B icon will also display an error
message confirming the feature is not enabled as shown below.
Figure 13 - DS10G-SW-201 Not Enabled
Physical Interface Configuration
Interface Speed
To configure the physical interface speed, press the Copper 100M button [default] to
select a different interface type or speed as shown below.
Figure 14 - Interface Speed Selection
If option DS10G-SW-110 is not enabled the Fiber 10G menu option will be dis-
abled.
Auto Negotiate, Duplex and Flow Control
Auto negotiation is an Ethernet procedure by which two connected devices choose
common transmission parameters, such as speed, duplex mode, and flow control. In
this process, the connected devices first share their capabilities regarding these parameters and then choose the highest performance transmission mode they both support. 1000BASE-T, 1000BASE-TX and 10GBASE-T require auto negotiation to be always present and enabled.
Page 36
34
Port Configuration
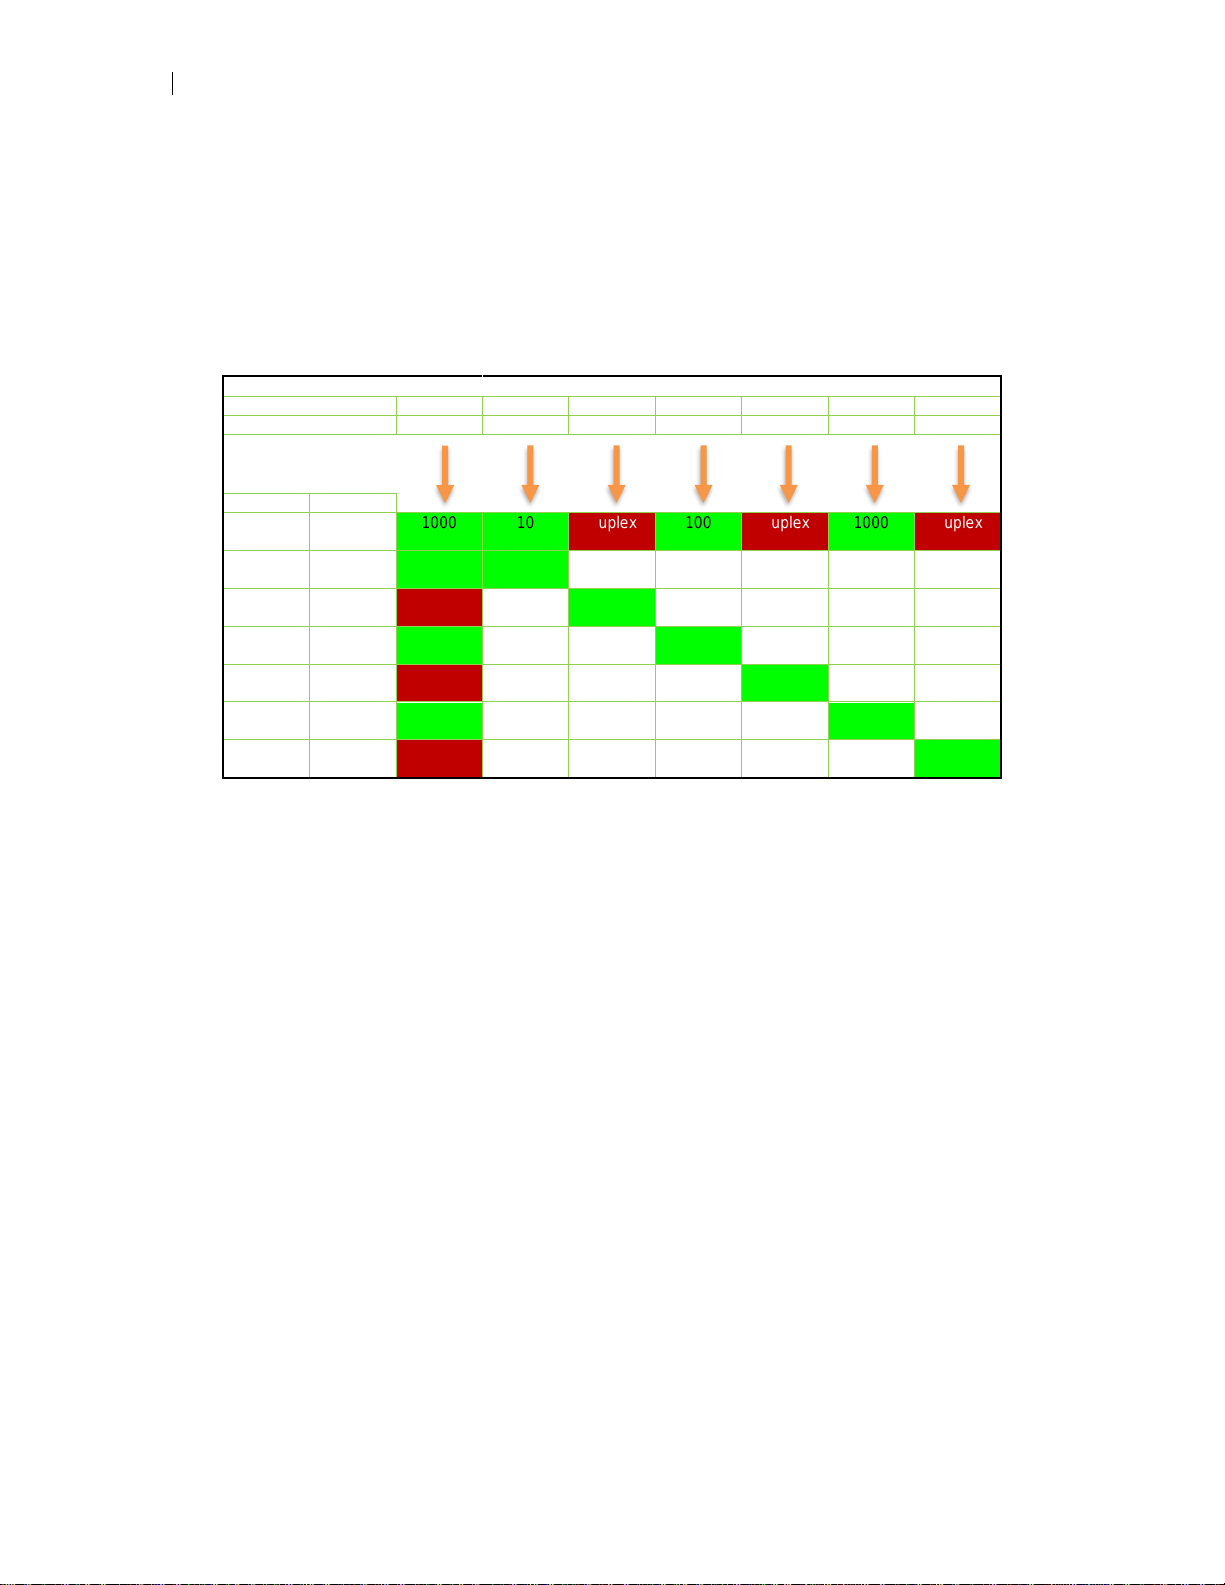
A duplex mismatch occurs when two connected devices are configured in different duplex modes. This may happen for example if one is configured for auto negotiation
while the other one has a fixed mode of operation that is full duplex (no auto negotiation). In such conditions, the auto negotiation device correctly detects the speed of operation, but is unable to correctly detect the duplex mode. Thus, it sets the correct
speed but uses half-duplex mode. In the table below, various configuration results are
shown, combinations marked “Duplex Conflict” or blank indicates no link is possible.
Test Set Configuration
Speed
Auto
10
10
100
100
1000
1000
Duplex
Full
Half
Full
Half
Full
Half
Full
DUT Configuration
Speed
Duplex
Auto
1000
FDX
10
HDX
Duplex
Conflict
100
HDX
Duplex
Conflict
1000
HDX
Duplex
Conflict
10
Half
10
HDX
10
HDX
10
Full
Duplex
Conflict
10
FDX
100
Half
100
HDX
100
HDX
100
Full
Duplex
Conflict
100
FDX
1000
Half
1000
HDX
1000
HDX
1000
Full
Duplex
Conflict
1000
FDX
Table 1 - Speed / Duplex Interoperability
Flow control manages the rate of data transmission between two nodes to prevent a
fast sender from overwhelming a slow receiver. It allows the receiver to control the
transmission speed so it is not overwhelmed with data from transmitting node.
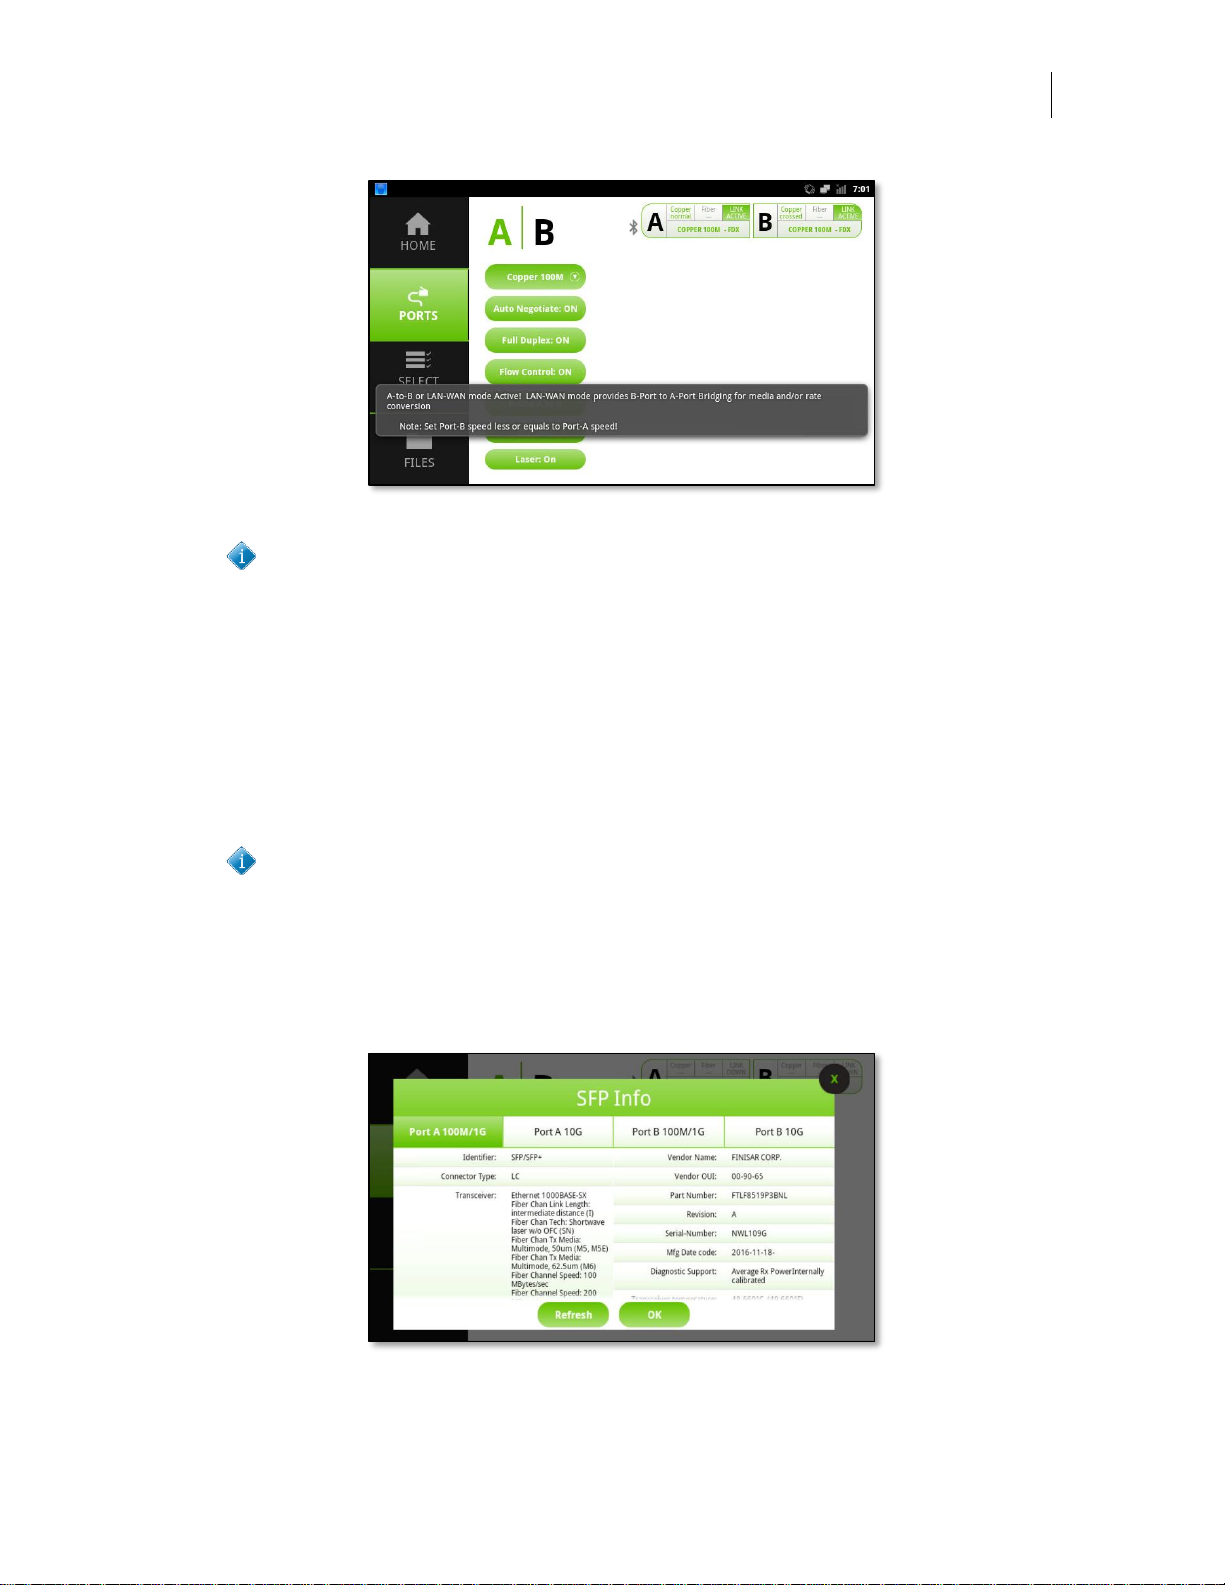
Route A to B
When the Route A to B button is active the test set passes all traffic from Port A to Port
B, providing several innovative functions:
► Type Conversion: Pass traffic from Port A to Port B at different physical types
but same rates
Set Fiber 1G on Port A and Copper 1G on Port B
► Speed Conversion: Drop traffic from Port A to Port B at same physical type
but different rates
Set Copper 1G on Port A and Copper 100M on Port B
► Speed and Type Conversion: Drop traffic from high rate on Port A to lower
rate on Port B
Set Fiber 10G on Port A and Copper 1G on Port B
Page 37
User’s Manual
DataScout 10G
35
Figure 15 - A to B Mode
When A to B mode is enabled, Port B will automatically be set from Loopback
mode to Through mode and cannot be used to loop back traffic.
SFP Info and Laser On/Off
SFP Info
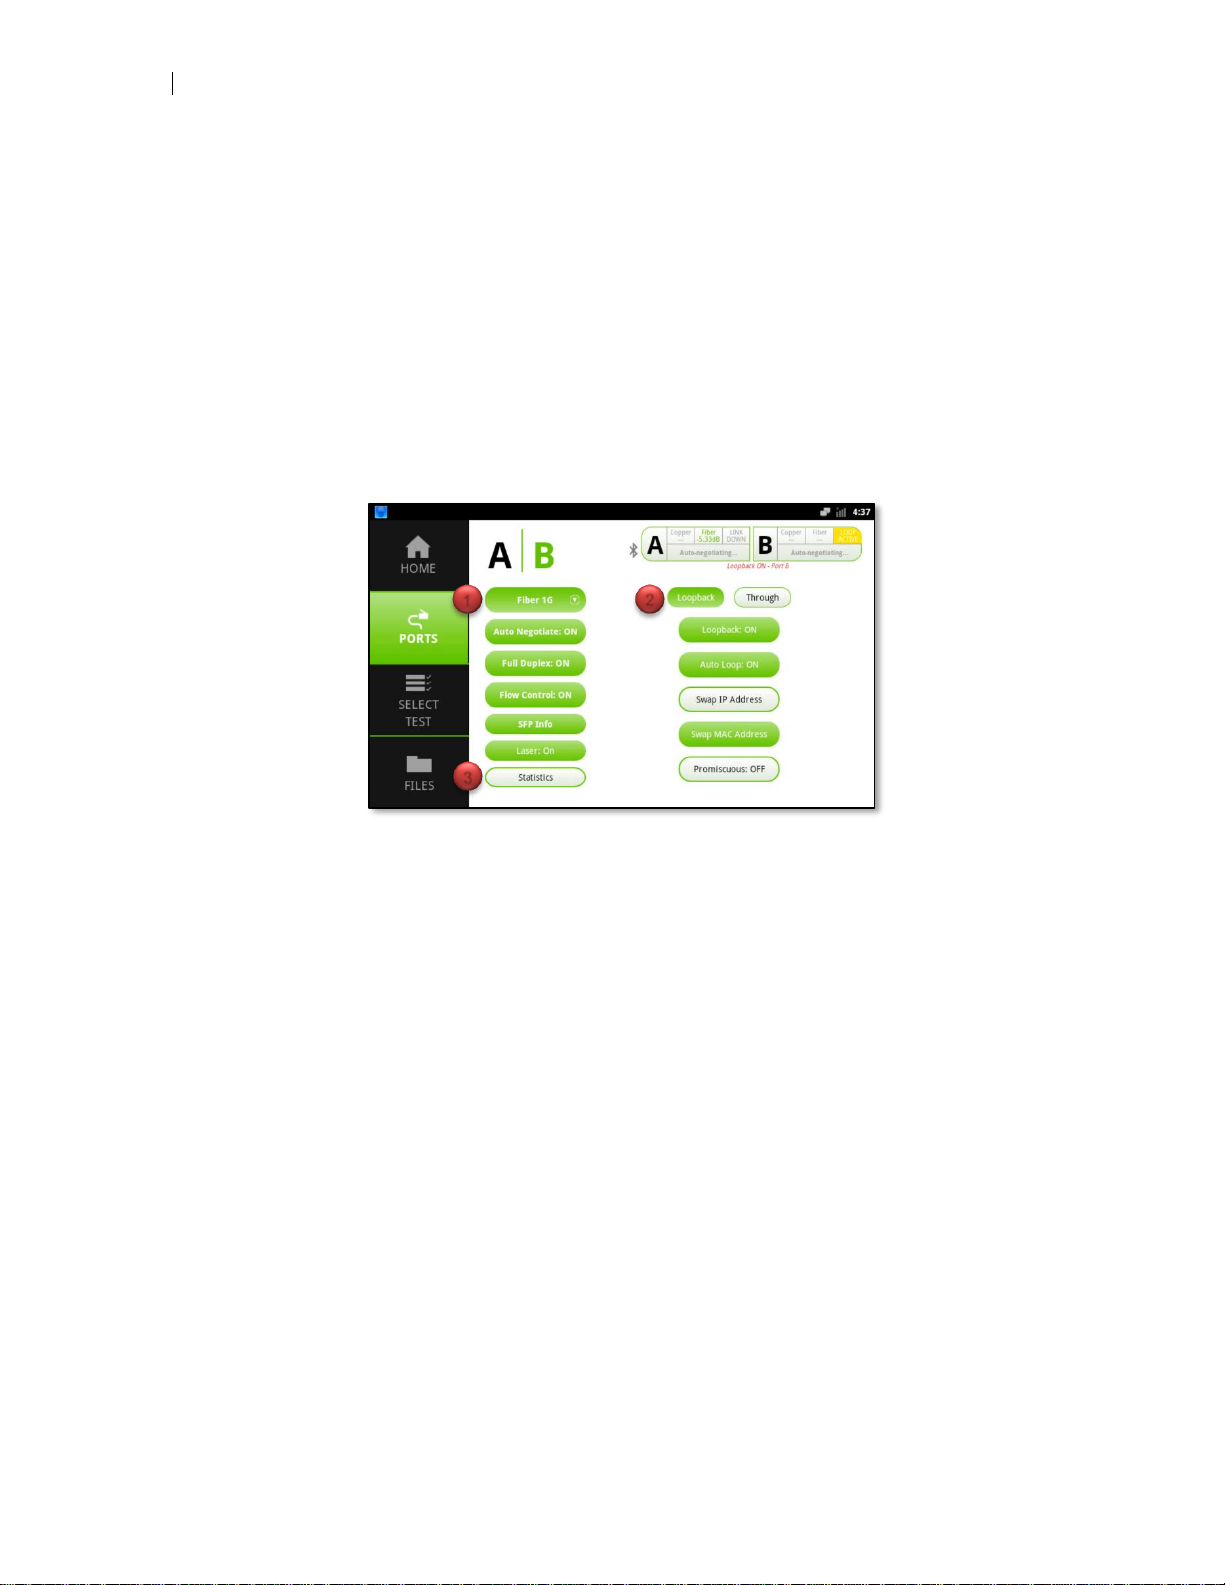
Pressing the SFP Info button will display diagnostic information provided by SFP transceivers which support reporting this information. If details are not populated in the information popover, pressing the refresh button will query the SFP again and attempt to
refresh the information.
Not all SFPs provide diagnostic information. In these situations, the SFP info
table may not display full, or any, information.
Pressing the tabs at the top of the table will allow viewing SFP information for different
ports. The test set will always select the currently selected port and interface speed
automatically. In the example below Port A 100M/1G SFP information is being displayed.
Figure 16 - SFP Information
Page 38
36
Port Configuration
Laser On/Off
When an optical SFP is plugged into the test set it is on by default. To turn off the laser, press the Laser: On button and it will toggle to Laser: Off.
Port B Configuration
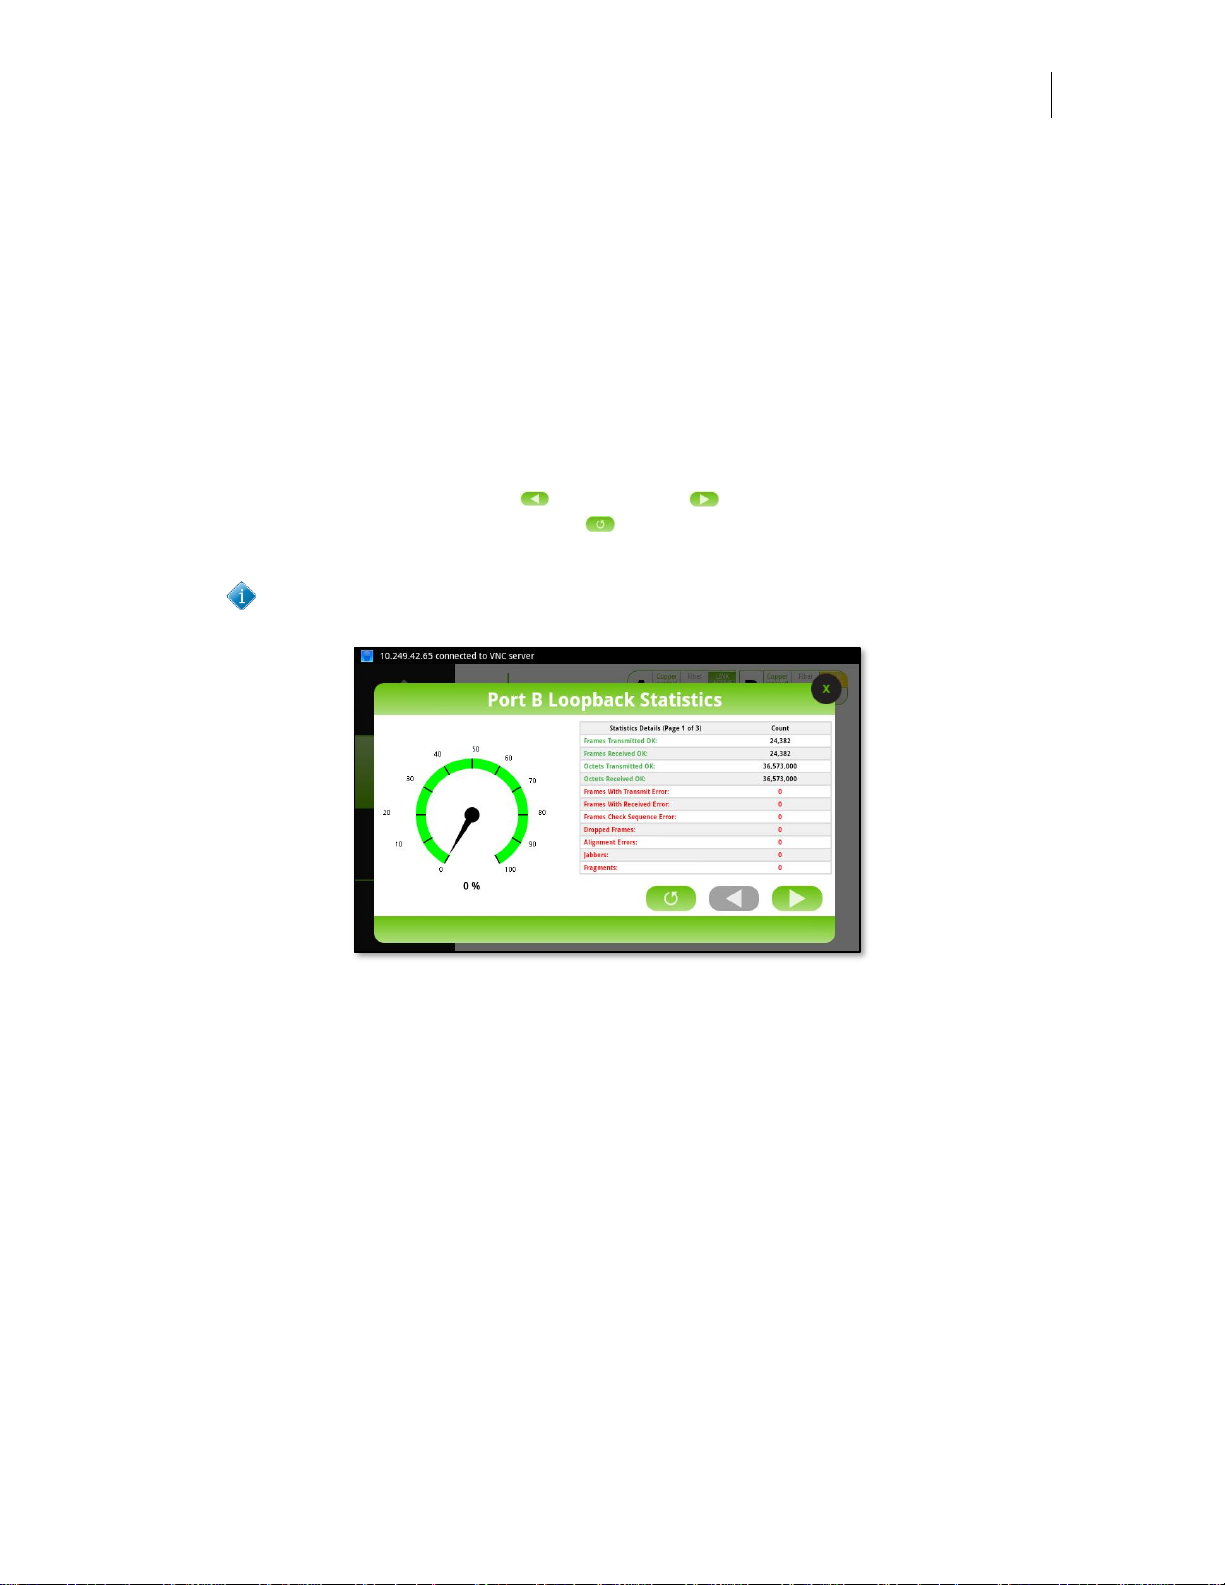
The Port B configuration view has three sections of note:
1. Physical interface configuration
2. Loopback mode configuration
3. Statistics view
Figure 17 - Port B Configuration
Physical Interface Configuration
Port B configuration is similar to Port A with regards to interface speed, auto negotiate,
duplex, and flow control. Because it is a dedicated loopback port there are additional
configuration buttons to configure though.
Loopback Mode Configuration
Loopback and Through – These buttons determine if port B is in active loopback
mode or is in through mode. By default, port B is always in loopback mode unless A to
B is active on port A.
Loopback On/Off – This button manually turns loopback mode on or off. When on,
the test set will reflect traffic coming into Port B. When off, the port will not loopback
traffic.
Auto Loop On/Off – This button determines whether Port B will respond to loopback
queries received from remote devices. When auto loop is on, Port B will respond to
queries and loop up/down commands received from compatible devices. When auto
loop is off, Port B will not respond to queries or loop up/down commands.
1 2 3
Page 39
User’s Manual
DataScout 10G
37
Swap IP Address – This button, when enabled, instructs Port B to swap the source
and destination IP addresses of received traffic.
Swap MAC Address – This button, when enabled, instructs Port B to swap the source
and destination MAC addresses of received traffic.
Promiscuous Mode On/Off – This button, when enabled, instructs Port B to reflect all
traffic received, even if the traffic is not addressed to Port B specifically. This includes
unicast, multicast and broadcast traffic.
Statistics View
Pressing the statistics button will activate a popover view displaying the current loopback statistics. Pressing the left or right arrow buttons will display the previous
or next page of statistics. Pressing the reset button will reset counts back to zero.
The speedometer reflects the current percentage, from 0 to 100%, of received traffic.
When Port B is selected the Select Test and Files buttons are not active.
Figure 18 - Port B Statistics View
Test Selection
Once port configuration is completed, tap on the SELECT TEST button to select which
test to run.
Page 40
38
General Test Configuration
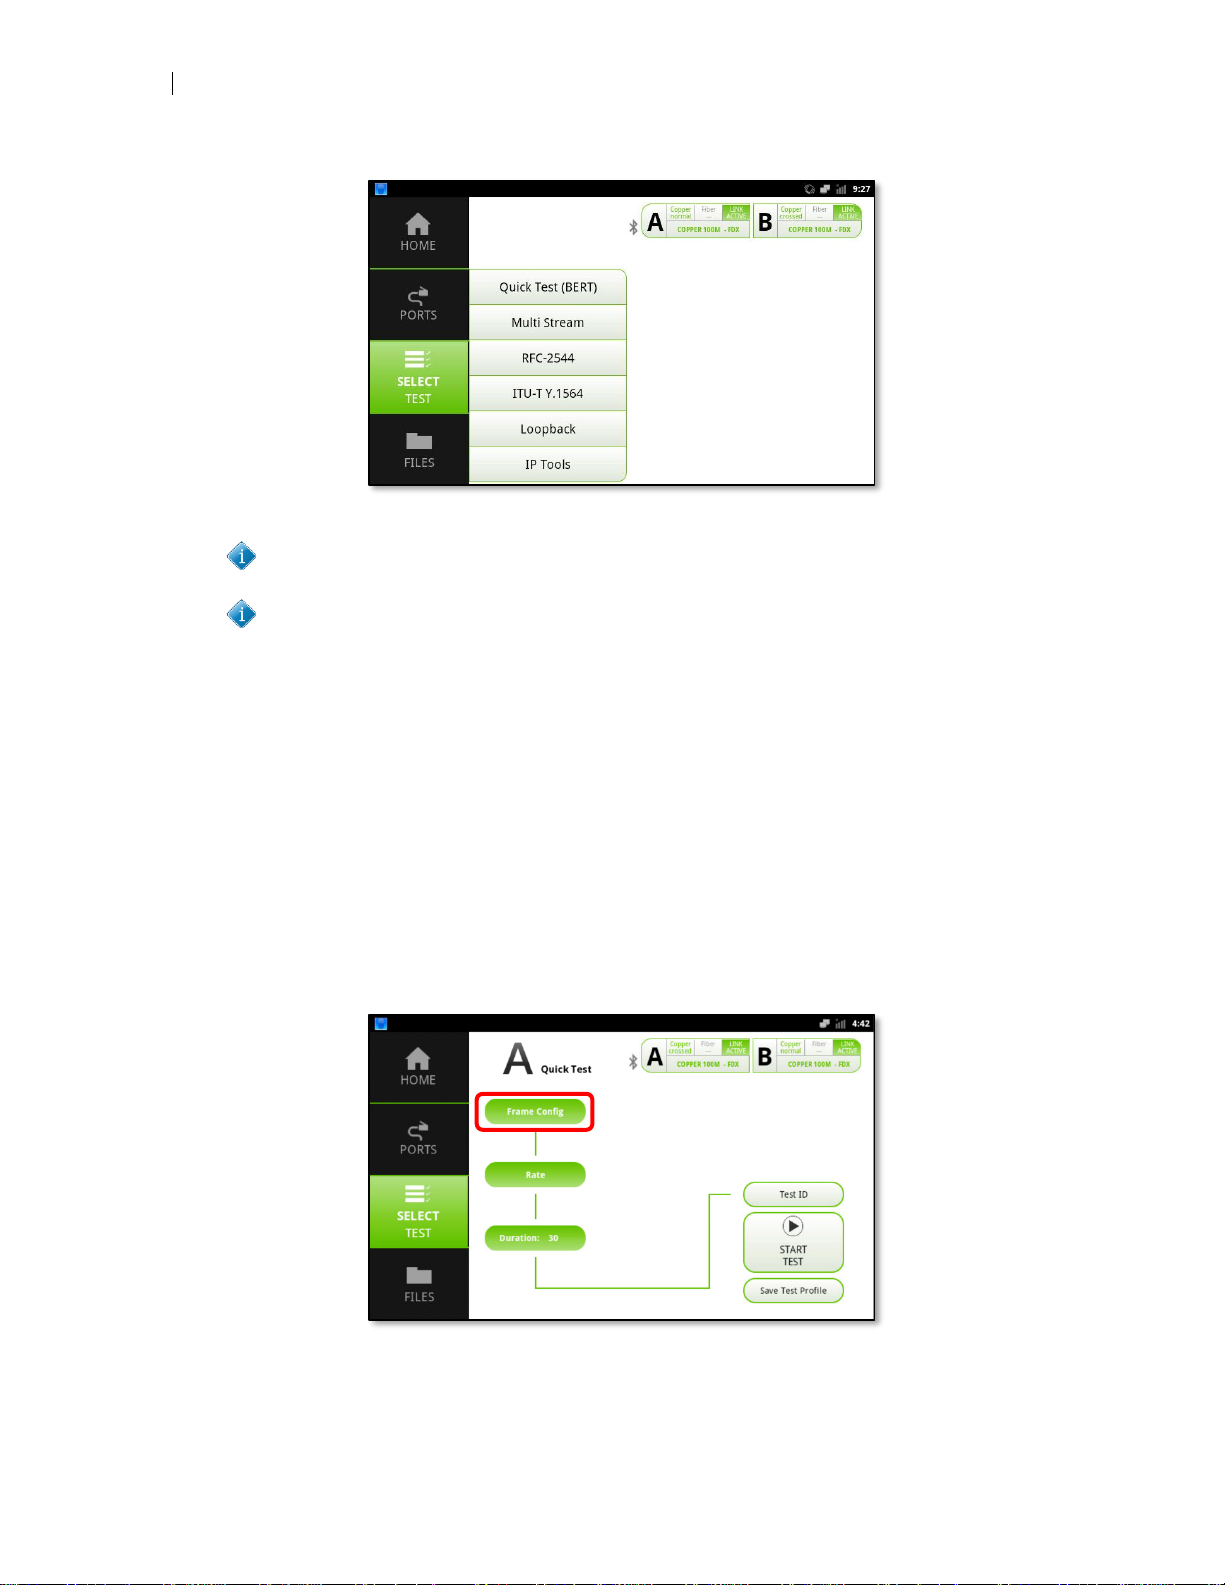
Figure 19 - Select Test Menu
If your unit is configured only to support loopback, this is the only menu item
which will be active.
Test feature option DS10-SW-ADV must be active to enable the Multi-stream
and ITU-T Y.1564 menu items.
General Test Configuration
Individual sections below will detail how to perform Quick Test (BERT), Multi-Stream,
RFC-2544 and ITU-T Y.1564 tests. Each test though requires the same general test
configuration such as framing, traffic rate and test duration. As such, this section will
describe test configuration pertaining to all tests. Where differences exist, they will be
detailed in their respective test section.
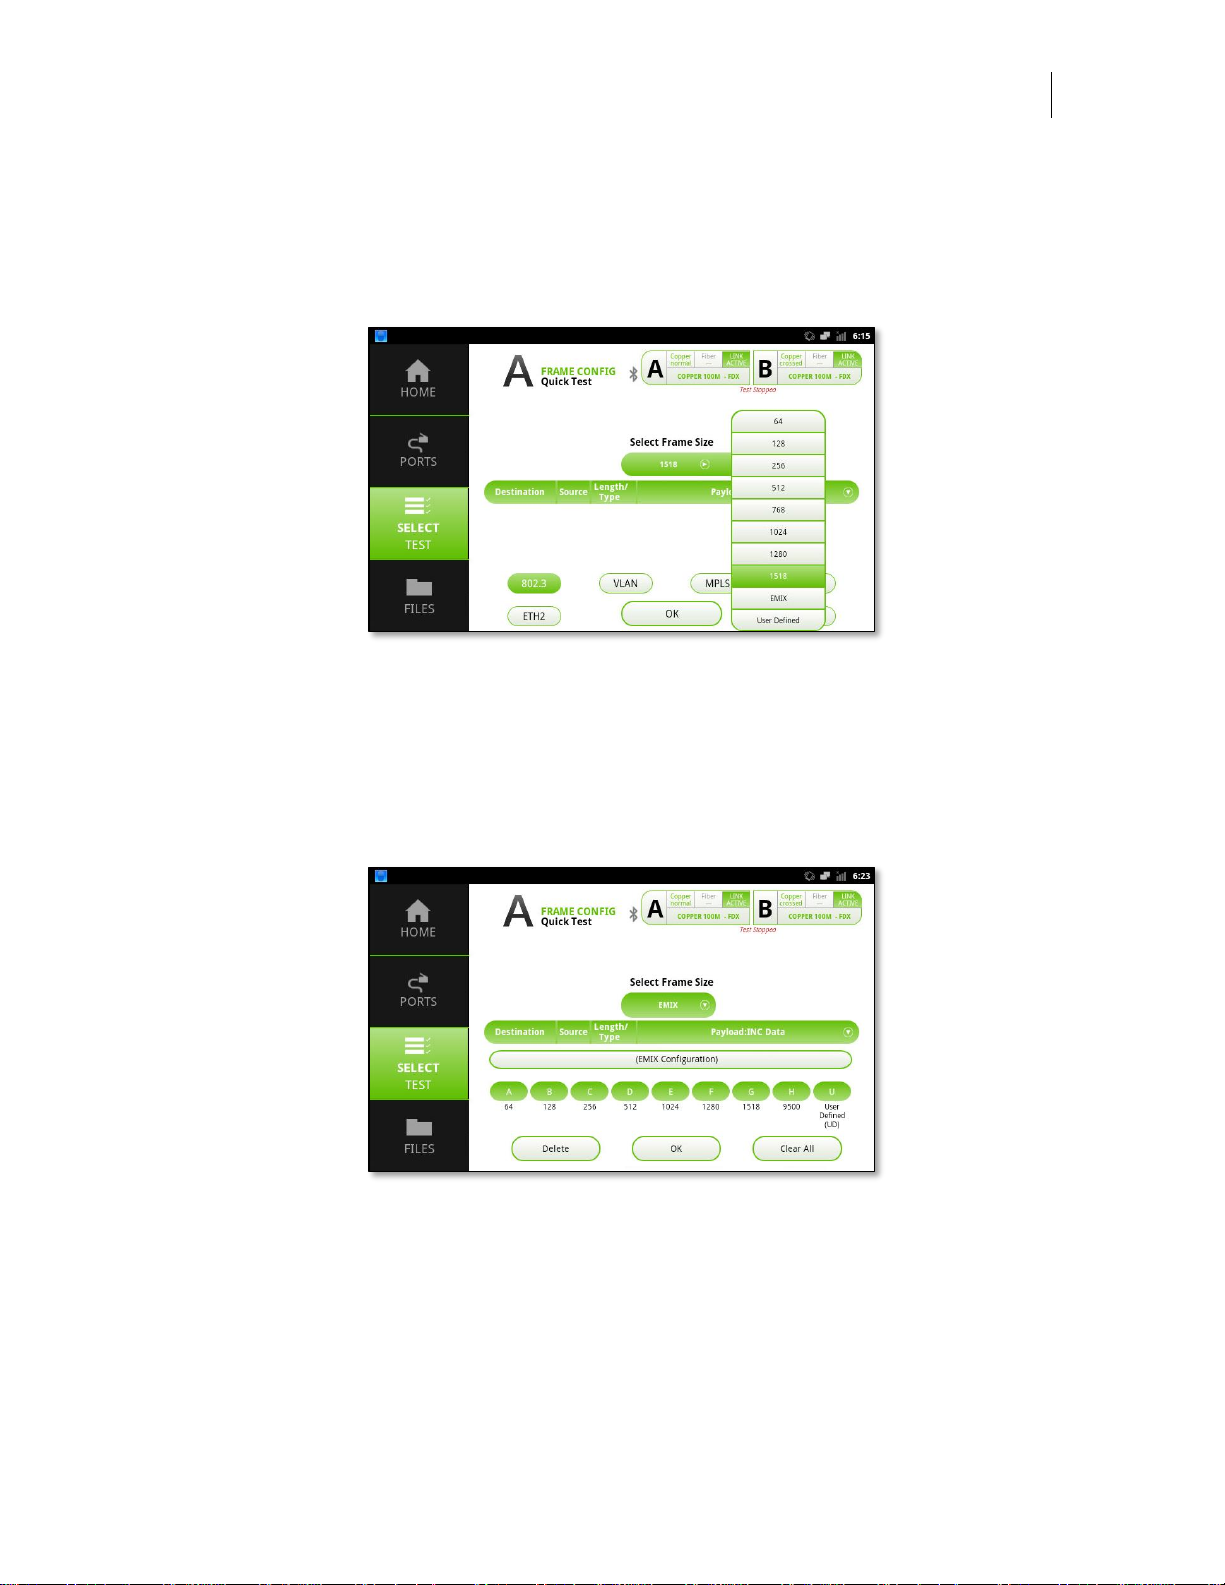
Frame Configuration
Regardless of test type, pressing the frame configuration button will activate the frame
configuration view.
Figure 20 - Frame Configuration Button
Page 41
User’s Manual
DataScout 10G
39
Select Frame Size
Pressing the “Select Frame Size” button will display a list of common Ethernet frame
sizes and options for EMIX and User Defined frame sizes. Select the desired frame
size by tapping it.
Figure 21 - Select Frame Size Menu
EMIX
Ethernet MIX, also known as EMIX is designed to mimic realistic data flows on a network by mixing different size Ethernet frames and sending as a consolidated test flow.
When EMIX a new button labeled EMIX Config is displayed to the right of the Select
Frame Size button. Press to enter the EMIX configuration view.
Figure 22 - EMIX Configuration View
Each letter conforms to a specific frame size as shown below the EMIX Configuration
bar. To move a frame size onto the bar, press the letter of choice. Up to 32 letters, in
any combination, can be entered into the configuration bar. When a test is started, the
test set will generate the first frame size in the sequence and then move onto the next.
Each frame size in the mix is generated until the last one is transmitted at which point
the tester begins the sequence generation again. This repeats until the test is completed.
Page 42
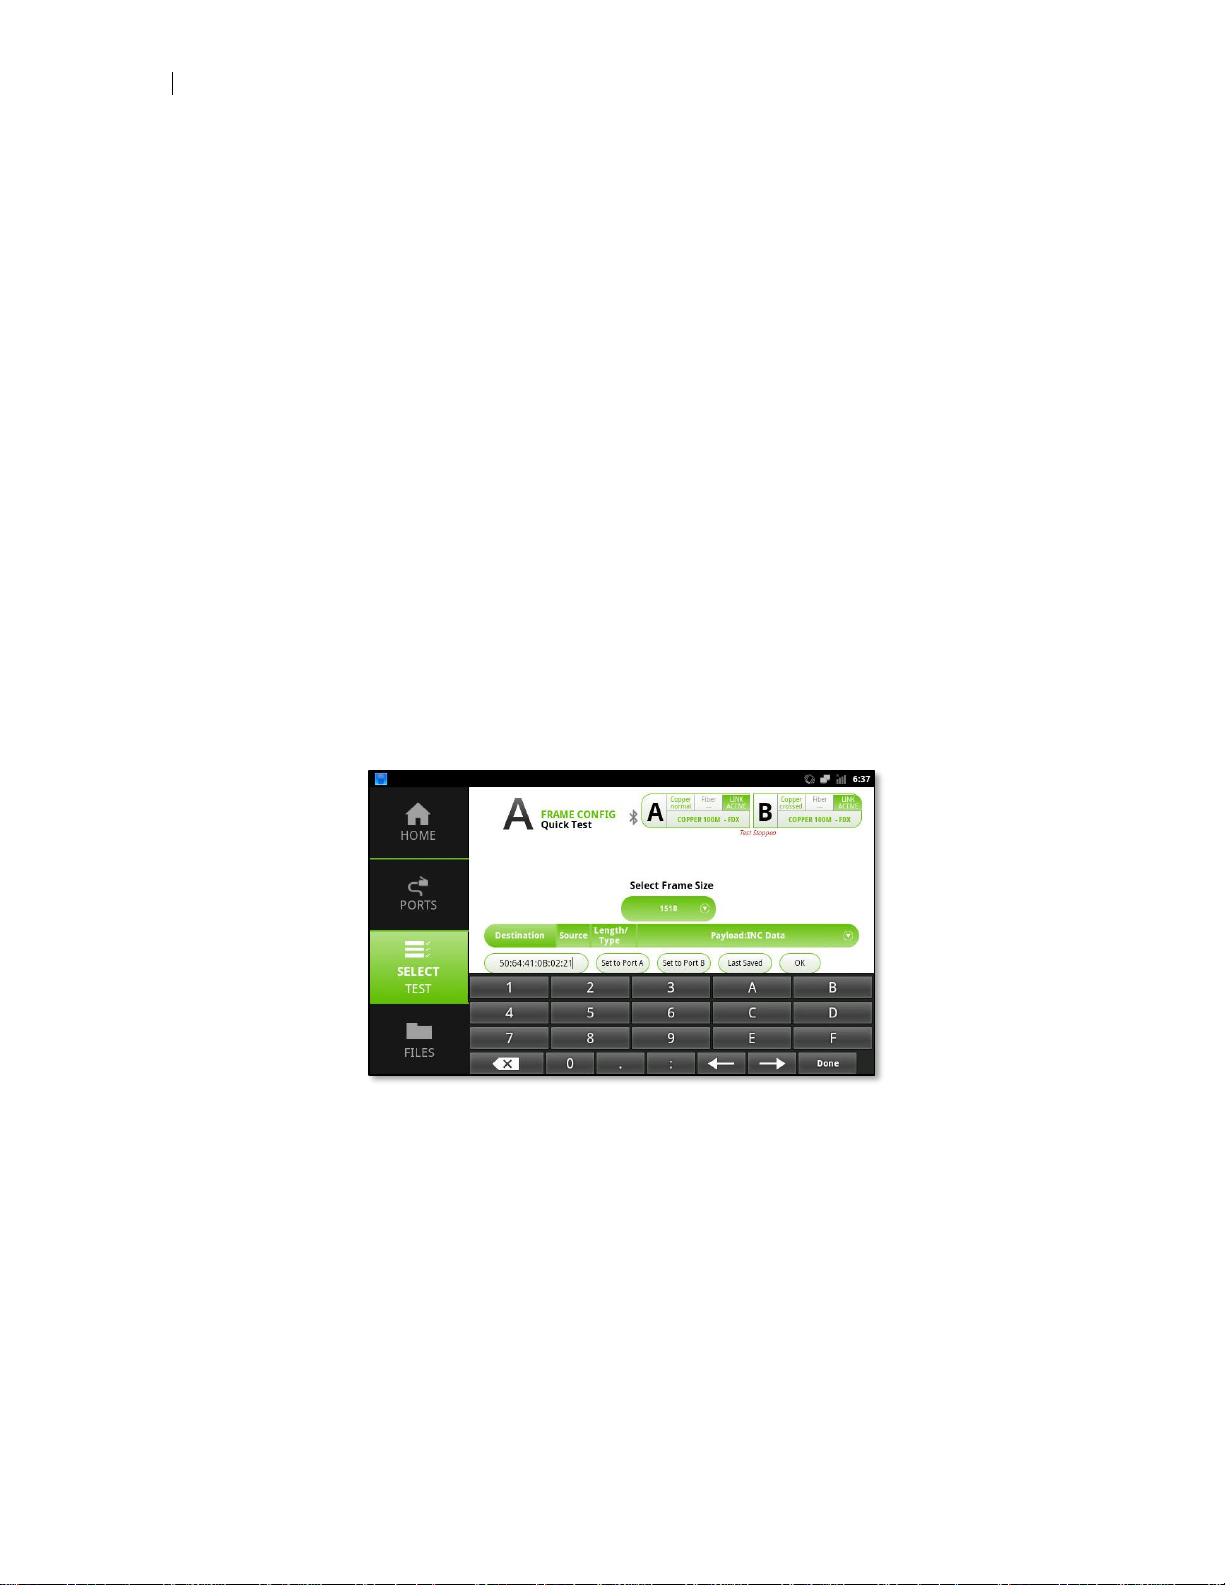
40
General Test Configuration
Letters A to G – Standard frame sizes
Letter H – Maximum transmission unit (MTU) frame size. Depending on the interface
speed selected and if IPv4 or IPv6 is enabled, the MTU size may range from 2024 to
9500 bytes.
Letter U – User defined frame size. The first time you press letter U, a dialogue will be
displayed prompting you to enter a user defined frame size.
Delete – Clears out the last entry on the configuration bar.
Clear All – Clears out all entries from the configuration bar.
OK – Closes the EMIX configuration view
User Defined Frame Size
Selecting User Defined in the Select Frame Size menu button allows entering a custom
frame size to be generated. Any valid frame size may be entered.
Destination MAC Address
Pressing the Destination button on the frame configuration bar will enable entering the
destination MAC address to which test traffic will be sent.
Figure 23 - Destination MAC Address Entry
Destination MAC – Enter a custom MAC address by tapping on the MAC address
field. Acceptable values are 0-9 and A-F. Press the Done button to close the keypad.
Set to Port A / B – automatically enters the default MAC address for each respective
port.
Last Saved – Automatically populates the last entered MAC address, even if the unit
has been powered cycled.
OK – Closes the Destination MAC address view.
Page 43
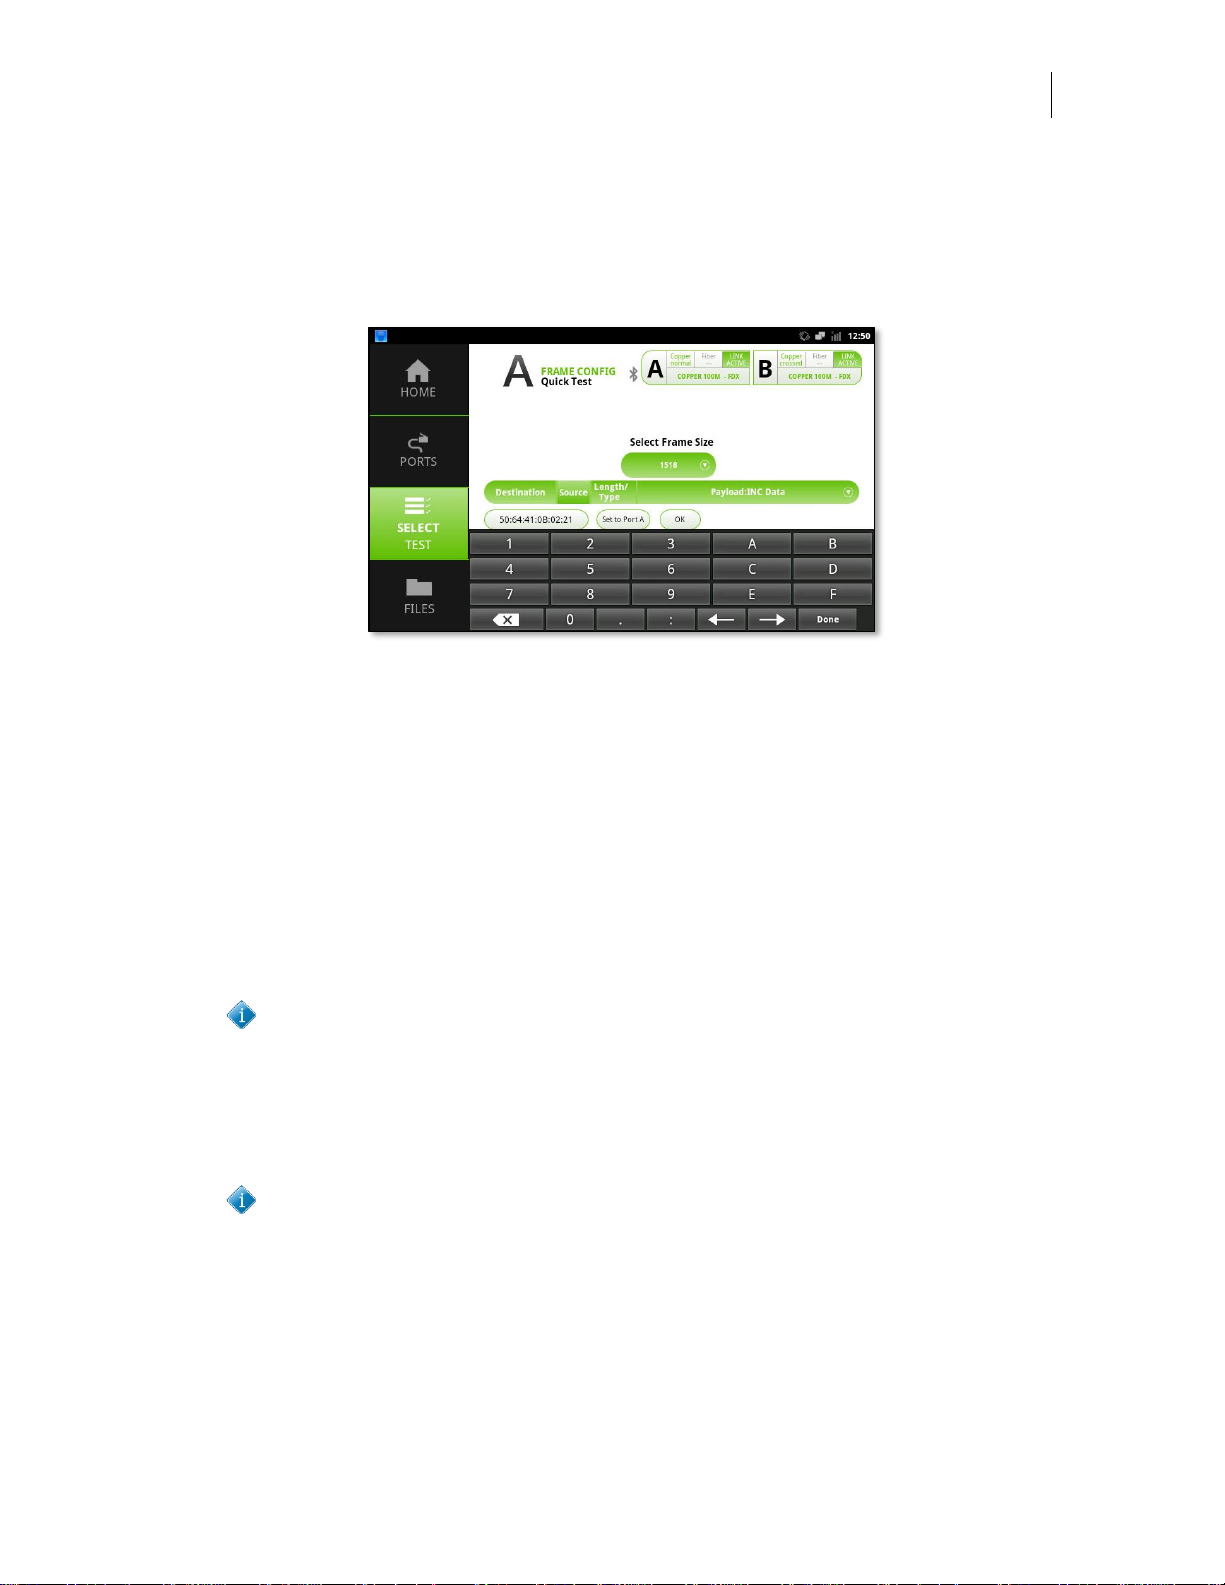
User’s Manual
DataScout 10G
41
Source MAC Address
Pressing the Source button on the frame configuration bar will enable entering the
source MAC address from which test traffic will be sent. Enter a custom MAC address
by tapping on the MAC address field.
Figure 24 - Source MAC Address Entry
Set to Port A – automatically enters the default MAC address.
OK – Closes the Destination MAC address view.
VLAN
Pressing the VLAN button on the frame configuration view will enable configuration of
up to eight stacked VLANs. Each VLAN in the stack may have unique properties depending on the setting required by the network under test.
TPID – The Tag Protocol ID (TPID) menu button by default is set to 8100 but three dif-
ferent ID’s are available: 8100, 88A8 and 9100.
When stacking two or more VLANs, the inner tag is the tag which is closest to
the payload portion of the frame; it is officially called the C-TAG (Customer
Tag) and uses TPID 8100. The outer tag is the one closer/closest to the Ethernet header and is called the S-TAG (Service Tag) and uses TPID 88a8. Some
vendors also utilize TPID 9100 instead of 8100 when VLAN-tagged (IEEE
802.1Q) frame with double tagging is utilized.
When in doubt, it is recommended to use TPID 8100 for the first VLAN tag and
TPID 88A8 for all subsequent tags.
Page 44
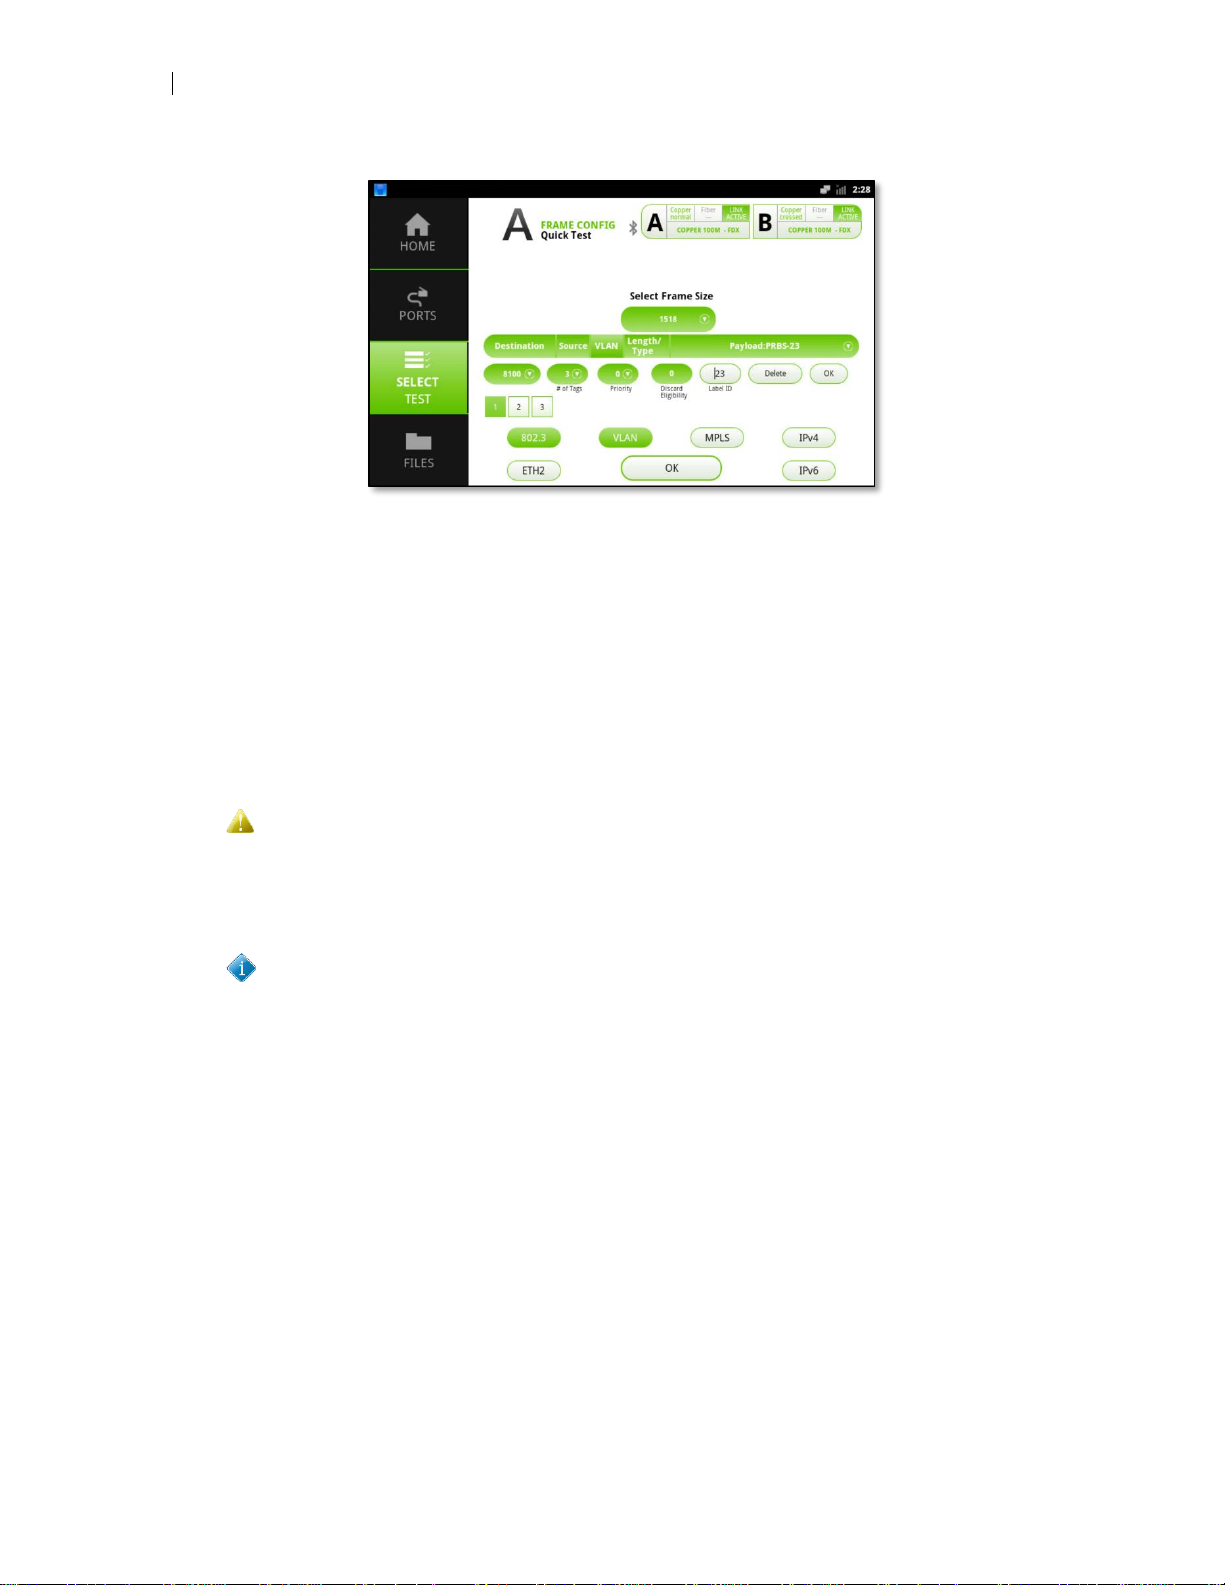
42
General Test Configuration
Figure 25 - VLAN Configuration
# of Tags – Enables selecting up to eight stacked VLAN tags. If more than one tag is
selected a series of number boxes will be displayed below the VLAN configuration
menu. Tap on the desired VLAN to configure specific VLAN values for that VLAN.
Priority – Enables configuring the priority value to be assigned for the selected VLAN.
Values range from 0 (low priority) to 7 (high priority).
Discard Eligibility – Drop eligible indicator (DEI), formally used as a Canonical Flag
Indicator (CFI) is by default set to 0 (not drop eligible). Setting this field to 1 indicates
to the network the frames are eligible to be dropped in the presence of congestion.
Unless you are specifically testing a networks ability to perform DEI functions it
is recommended to always leave this field set to 0.
Label ID – This field enables configuration or the VLAN identifier (VID). Acceptable
values are 0 to 4,095.
Label ID 0 indicates the frame does not carry a VLAN ID, in this case, the tag
specifies only a priority and is referred to as a priority tag. On bridges, label ID
1 is often reserved for a management VLAN but this is vendor-specific. A label
ID value 4095 is reserved for implementation use only and should not be used.
However, the DataScout allows this label ID to be configured for experimental
purposes.
Delete – Deletes all VLAN configuration. Use this only when you want to remove all
VLAN information and start in a default state.
OK – Closes the VLAN configuration view.
Once you have configured the desired VLAN(s) and press the OK button, a new VLAN
button will be present on the frame configuration bar. To return to the VLAN configuration view, tap this button.
Page 45
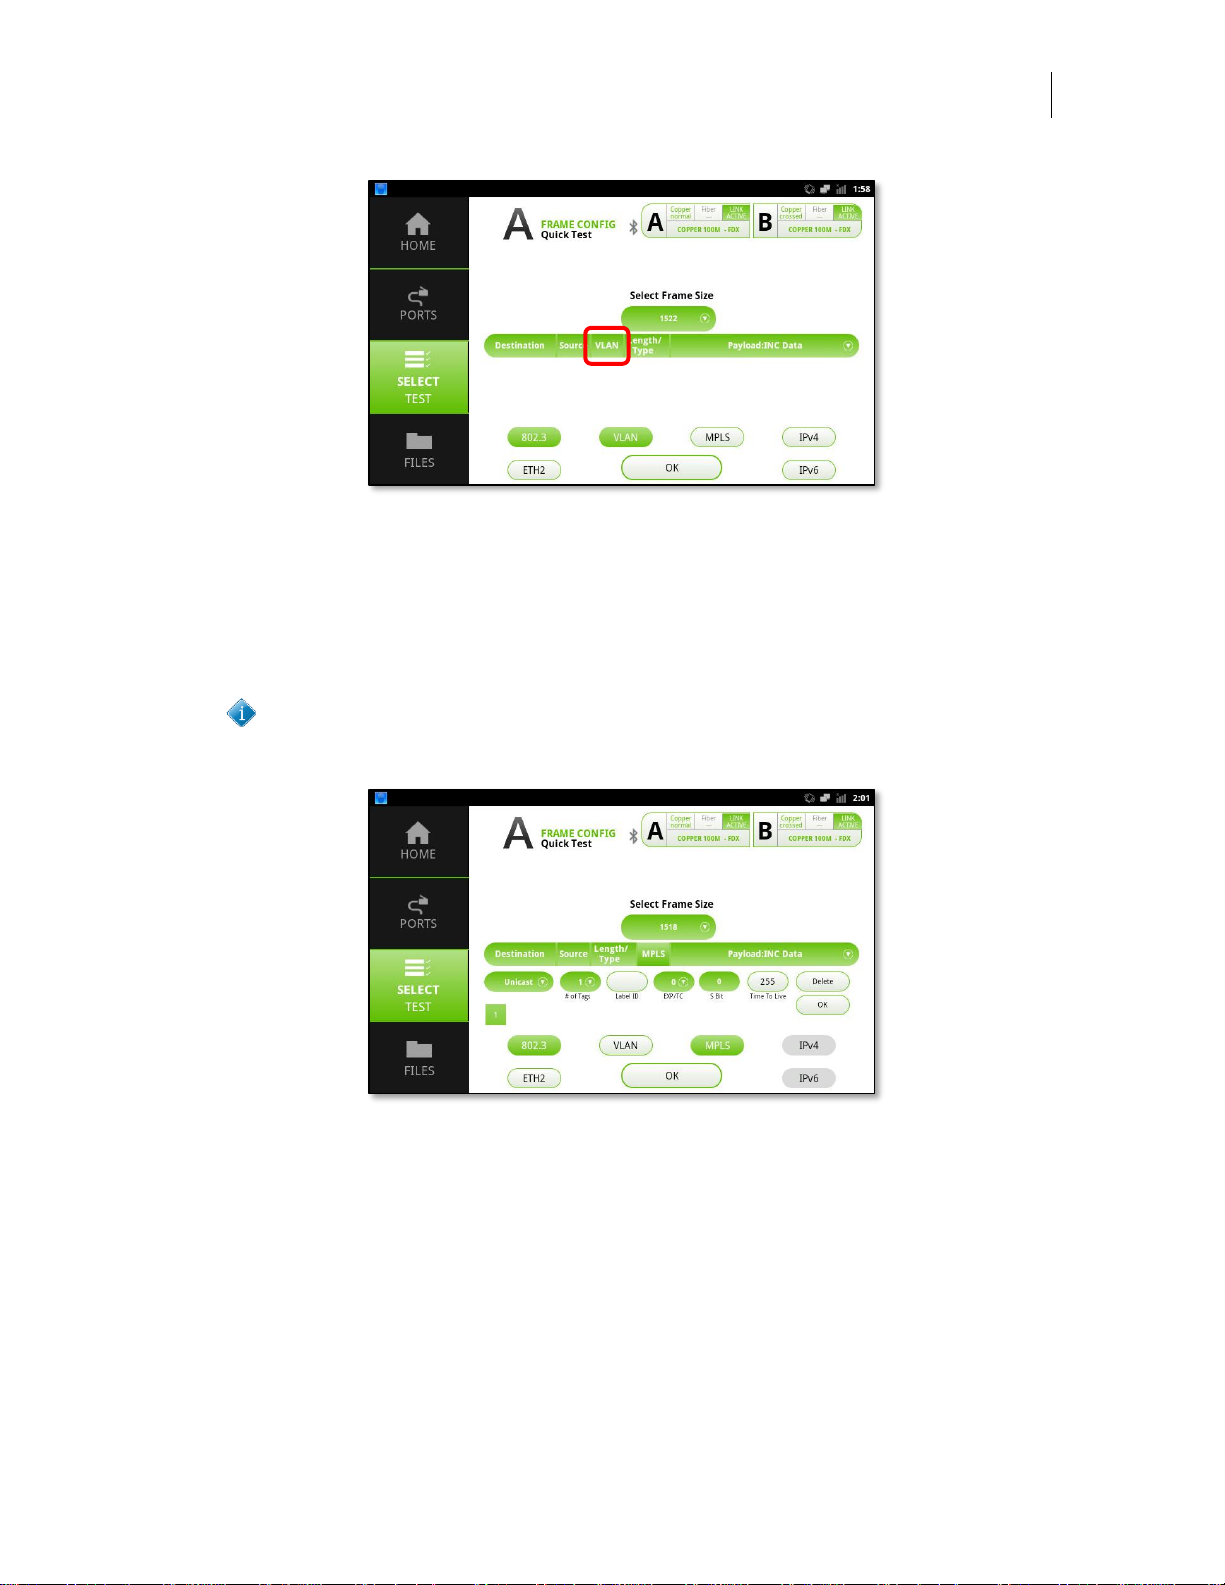
User’s Manual
DataScout 10G
43
Figure 26 - VLAN button on Frame Configuration Bar
MPLS
Pressing the MPLS button on the frame configuration view will enable configuration of
up to eight stacked MPLS tags. Each MPLS in the stack may have unique properties
depending on the setting required by the network under test.
MPLS is a layer two routing protocol. As such, IPv4 and IPv6 are disabled
when MPLS is enabled.
Figure 27 - MPLS Configuration
Unicast/Multicast – The unicast/multicast menu button by default is set to unicast
tagged traffic but can be set to multicast when desired.
# of Tags – Enables selecting up to eight stacked MPLS tags. If more than one tag is
selected a series of number boxes will be displayed below the MPLS configuration
menu. Tap on the desired MPLS tag to configure specific MPLS values for that tag.
Label ID – This field enables configuration or the MPLS label ID. Acceptable values
are 0 to 1,048,575.
Page 46
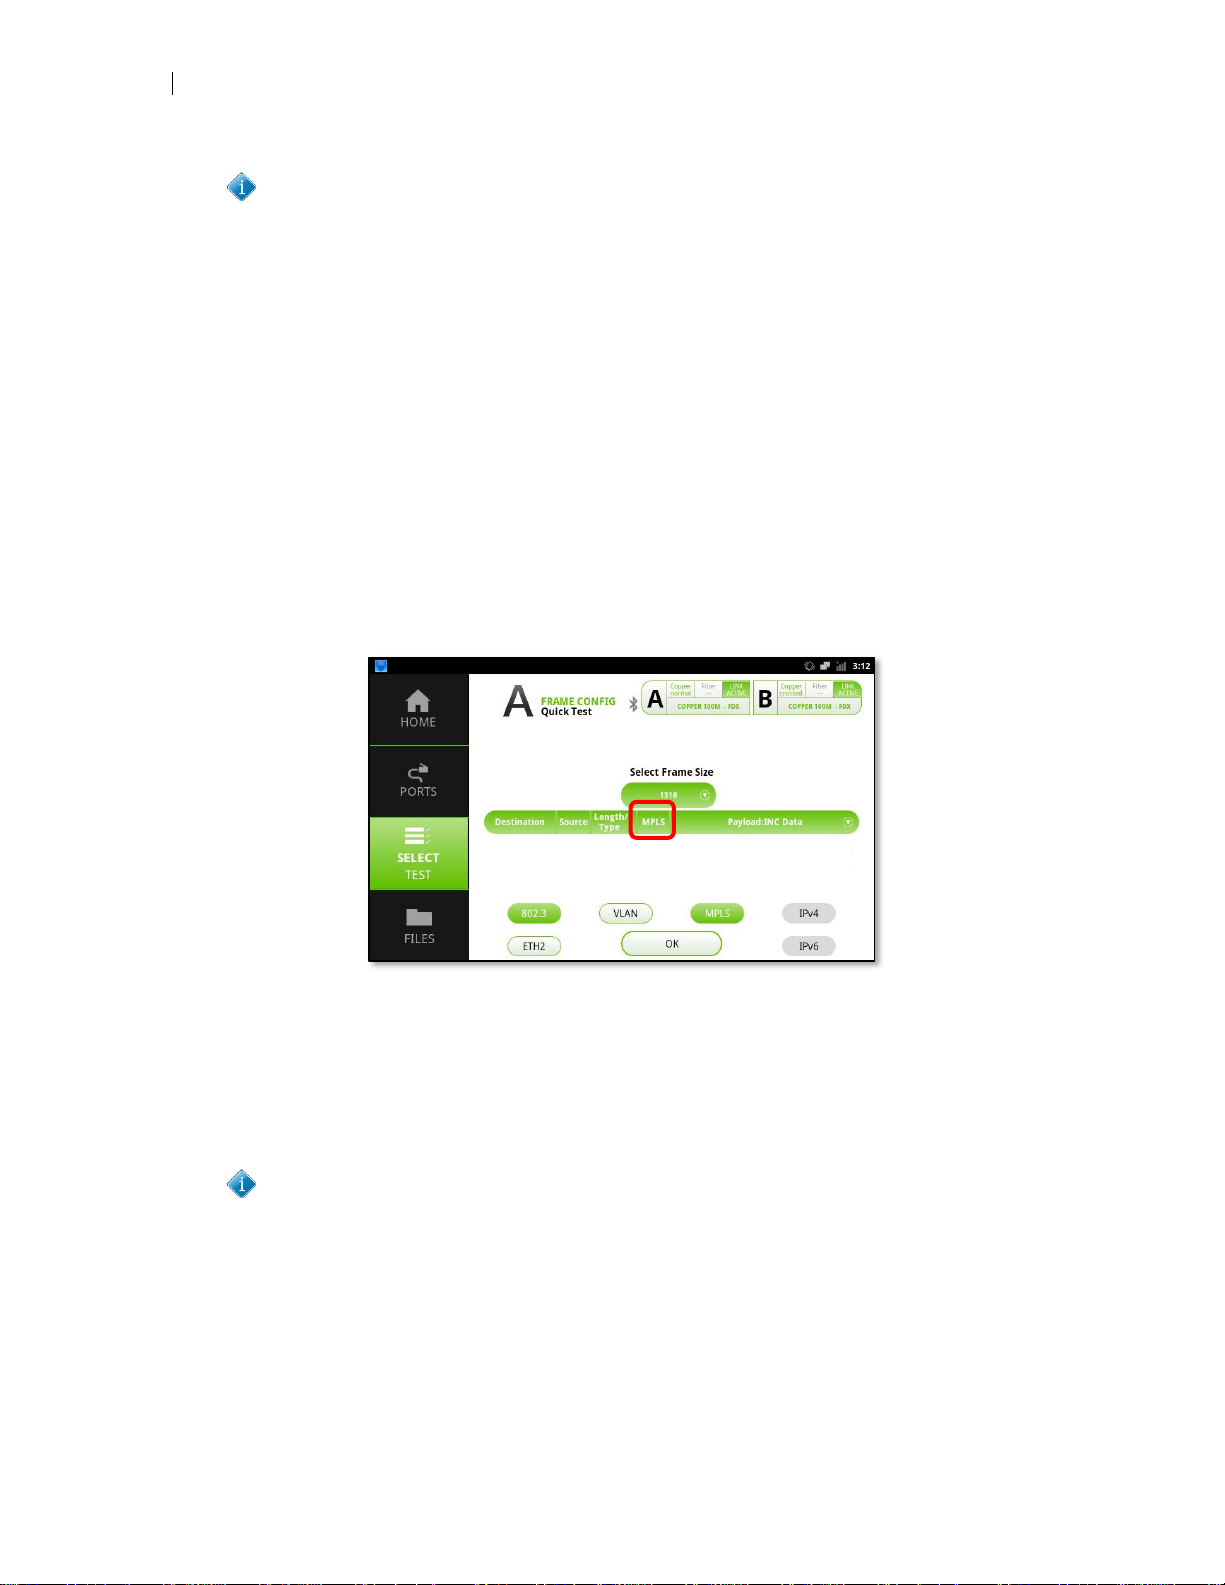
44
General Test Configuration
MPLS label ID values 0-15 are reserved values and should not be used for live
traffic flows.
EXP/TC – Enables configuring the priority value to be assigned for the selected MPLS.
Values range from 0 (low priority) to 7 (high priority).
S Bit – When set to one this field Indicates the MPLS tag is the last tag in the stack.
Time to Live – Sets the TTL value for the MPLS tag. Acceptable values are 0-255
hops, with the default set to 255.
Delete – Deletes all MPLS configuration. Use this only when you want to remove all
MPLS information and start in a default state.
OK – Closes the MPLS configuration view.
Once you have configured the desired MPLS tags and press the OK button, a new
MPLS button will be present on the frame configuration bar. To return to the MPLS
configuration view, tap this button.
Figure 28 – MPLS button on Frame Configuration Bar
IPv4
Pressing the IPv4 button on the frame configuration view will enable configuration of
static IPv4 test traffic.
MPLS is a layer two routing protocol. As such, MPLS is disabled when IPv4 is
enabled.
Page 47
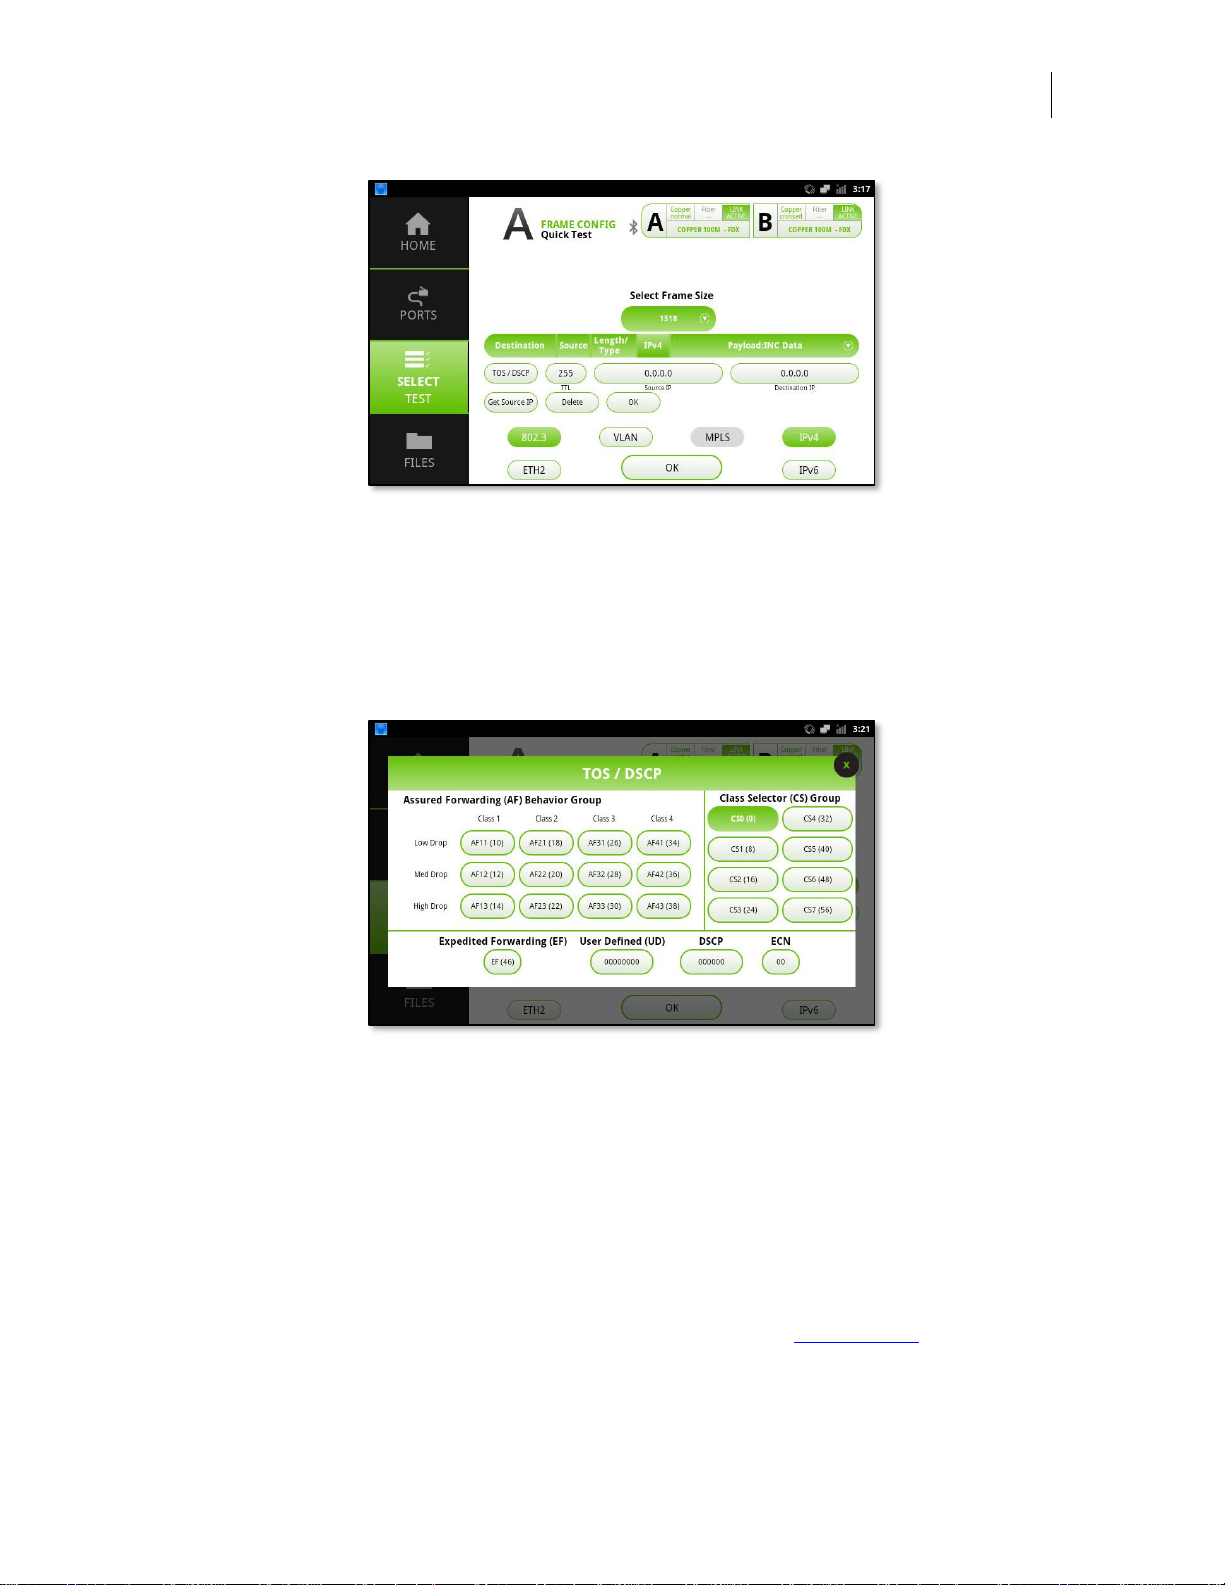
User’s Manual
DataScout 10G
45
Figure 29 - IPv4 Configuration
TOS/DSCP – The type of service (TOS), differentiated services code point (DSCP) button activates a popover view, enabling you to select the desired TOS or DSCP value.
The currently selected TOS/DSCP value will be highlighted in green. Alternately, you
can enter your own binary user defined value in the User Defined (UD) field. To close
the popover, press the “X” button in the upper right-hand corner.
Figure 30 - TOS/DSCP Popover View
Time to Live – Sets the TTL value for the IP packet. Acceptable values are 0-255
hops, with the default set to 255.
Source IP – Sets the IP address from which packets are being transmitted. Accepta-
ble values are 0-9. Press the Done button to close the keypad.
Destination IP – Sets the IP address from which packets should be received. Ac-
ceptable values are 0-9. Press the Done button to close the keypad.
Get Source IP – Utilizes the test sets management port and Route A to B mode to
pass DHCP request from the controller to test port A. If A to B mode is not activated
the test set will display a warning message.
Page 48
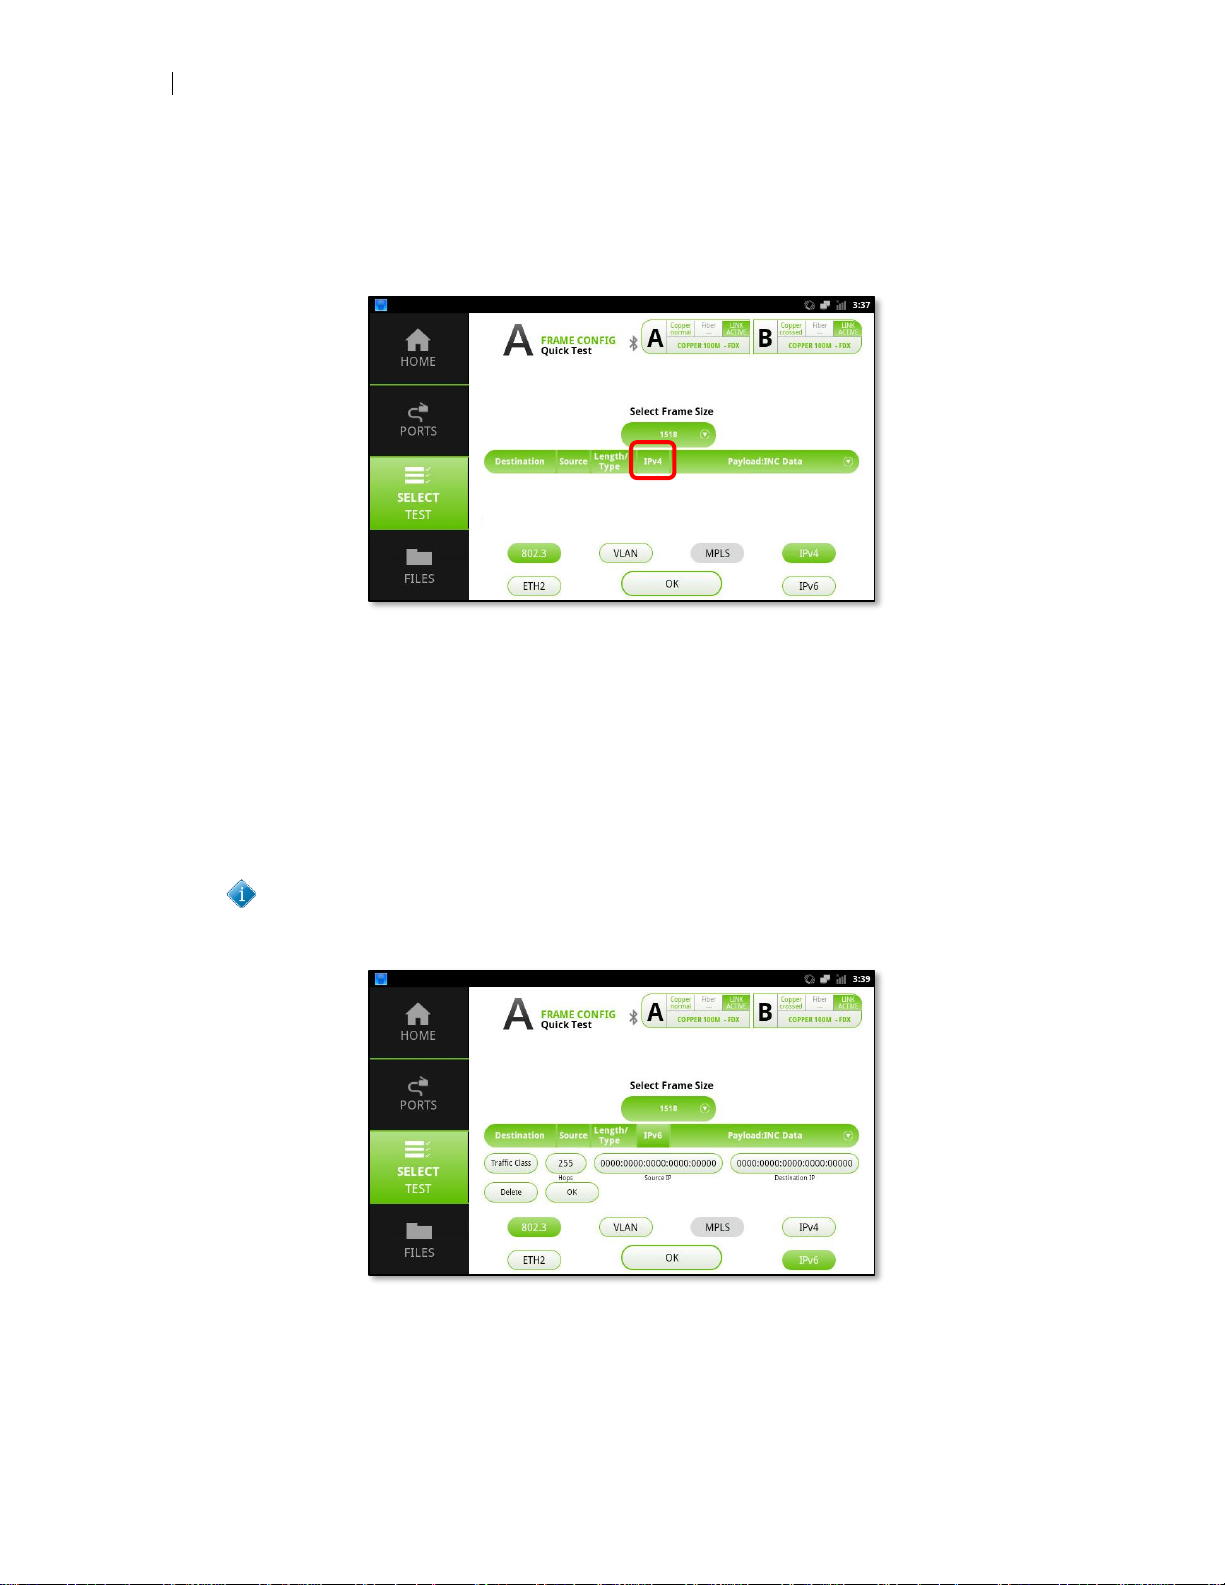
46
General Test Configuration
Delete – Deletes all IP configuration. Use this only when you want to remove all IP in-
formation and start in a default state.
OK – Closes the IP configuration view.
Figure 31 - IPv4 button on Frame Configuration Bar
Once you have configured the desired IP information press the OK button, a new IPv4
button will be present on the frame configuration bar. To return to the IPv4 configuration view, tap this button.
IPv6
Pressing the IPv6 button on the frame configuration view will enable configuration of
static IPv4 test traffic.
MPLS is a layer two routing protocol. As such, MPLS is disabled when IPv6 is
enabled.
Figure 32 – IPv6 Configuration
Traffic Class – The traffic class button activates a popover view, enabling you to select the desired traffic class value. The currently selected value will be highlighted in
Page 49
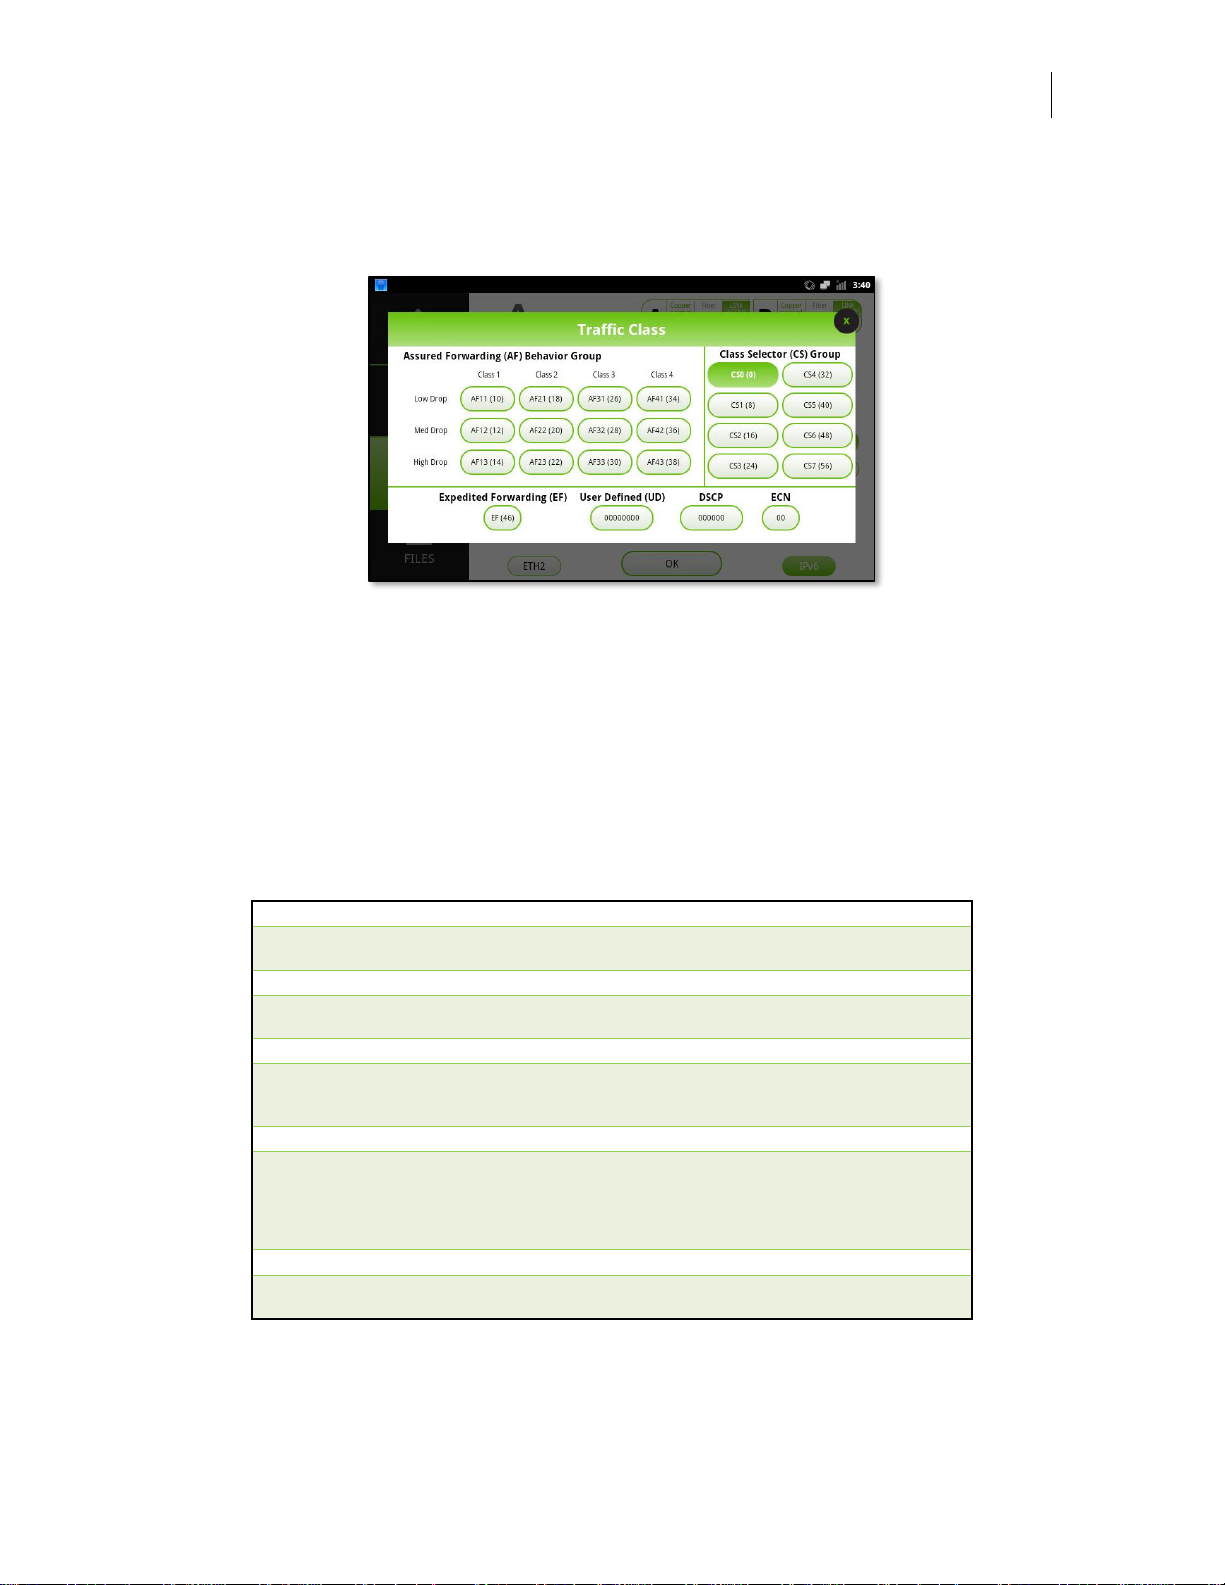
User’s Manual
DataScout 10G
47
green. Alternately, you can enter your own binary user defined value in the User De-
fined (UD) field. To close the popover, press the “X” button in the upper right-hand
corner.
Figure 33 – Traffic Class Popover View
Hops – Sets the hop value for the IP packet. Acceptable values are 0-255 hops, with
the default set to 255.
Source IP – Sets the IP address from which packets are being transmitted. Accepta-
ble values are 0-9 and A-F in any format complying to RFC-4291. Press the Done button to close the keypad.
Destination IP – Sets the IP address from which packets should be received. Ac-
ceptable values are 0-9 and A-F in any format complying to RFC-4291. Press the
Done button to close the keypad.
Rule #1
The preferred form is x:x:x:x:x:x:x:x, where the 'x's are one to four hexadecimal digits of the eight
16-bit pieces of the address. EXAMPLE: ABCD:EF01:2345:6789:ABCD:EF01:2345:6789
Rule #2
It is not necessary to write the leading zeros in an individual field, but there must be at least one
numeral in every field. EXAMPLE: 2001:DB8:0:0:8:800:200C:417A
Rule #3
The use of "::" indicates one or more groups of 16 bits of zeros. The "::" can only appear once in
an address and can also be used to compress leading or trailing zeros in an address. EXAMPLE:
2001:DB8::8:800:200C:417A
Rule #4
An alternative form that is sometimes more convenient when dealing with a mixed environment of
IPv4 and IPv6 nodes is x:x:x:x:x:x:d.d.d.d, where the 'x's are the hexadecimal values of the six
high-order 16-bit pieces of the address, and the 'd's are the decimal values of the four low-order 8bit pieces of the address (standard IPv4 representation). EXAMPLES: 0:0:0:0:0:0:13.1.68.3 and
0:0:0:0:0:FFFF:129.144.52.38
Rule #5
Alternative forms can also be displayed in compressed form. Examples: ::13.1.68.3 and
::FFFF:129.144.52.38
Table 2 - Valid IP Address Notation per RFC-4291
Page 50
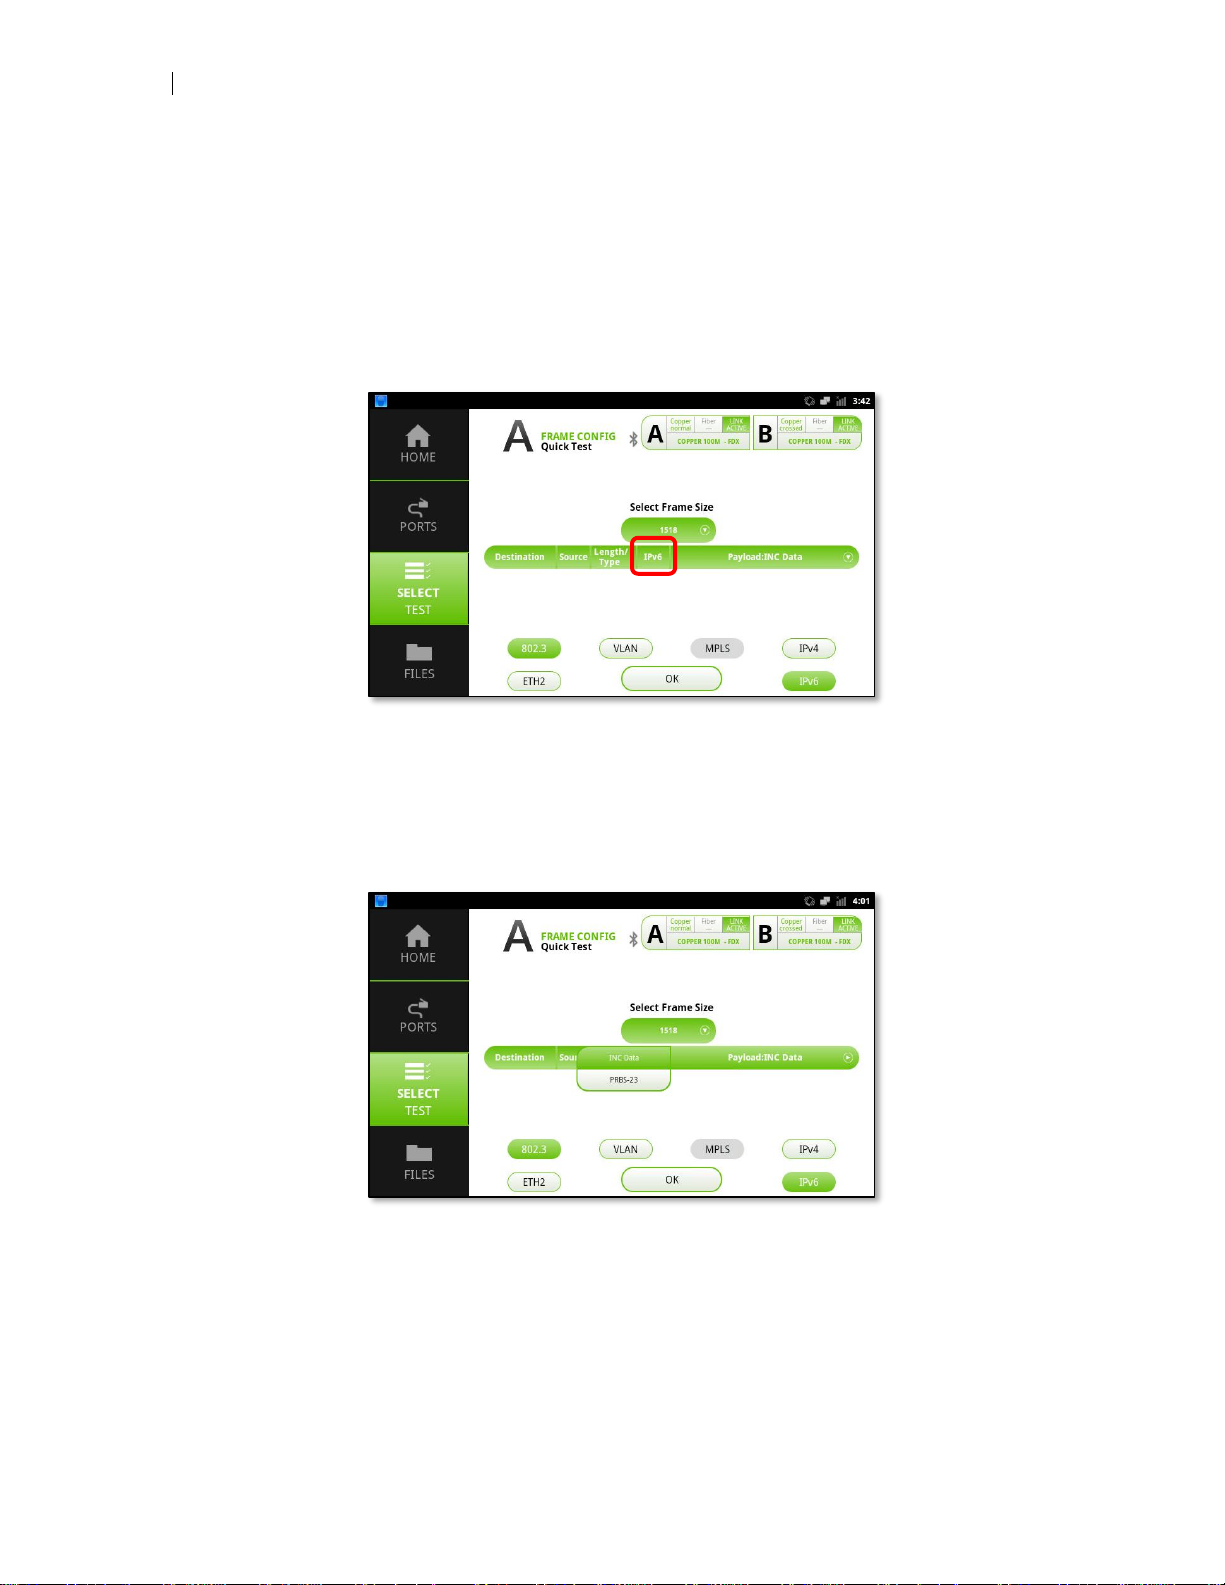
48
General Test Configuration
Delete – Deletes all IP configuration. Use this only when you want to remove all IP in-
formation and start in a default state.
OK – Closes the IP configuration view.
Once you have configured the desired IP information press the OK button, a new IPv6
button will be present on the frame configuration bar. To return to the IPv6 configuration view, tap this button.
Figure 34 – IPv6 Button on Frame Configuration Bar
Payload
Pressing the Payload: INC Data button on the frame configuration bar enables selection of two different test patterns.
Figure 35 - Payload Button on Frame Configuration Bar
INC Data – Creates traffic which increments from lowest to highest numerical value
supported by the frame size.
PRBS-23 – Creates pseudo-random bit stream data.
Page 51
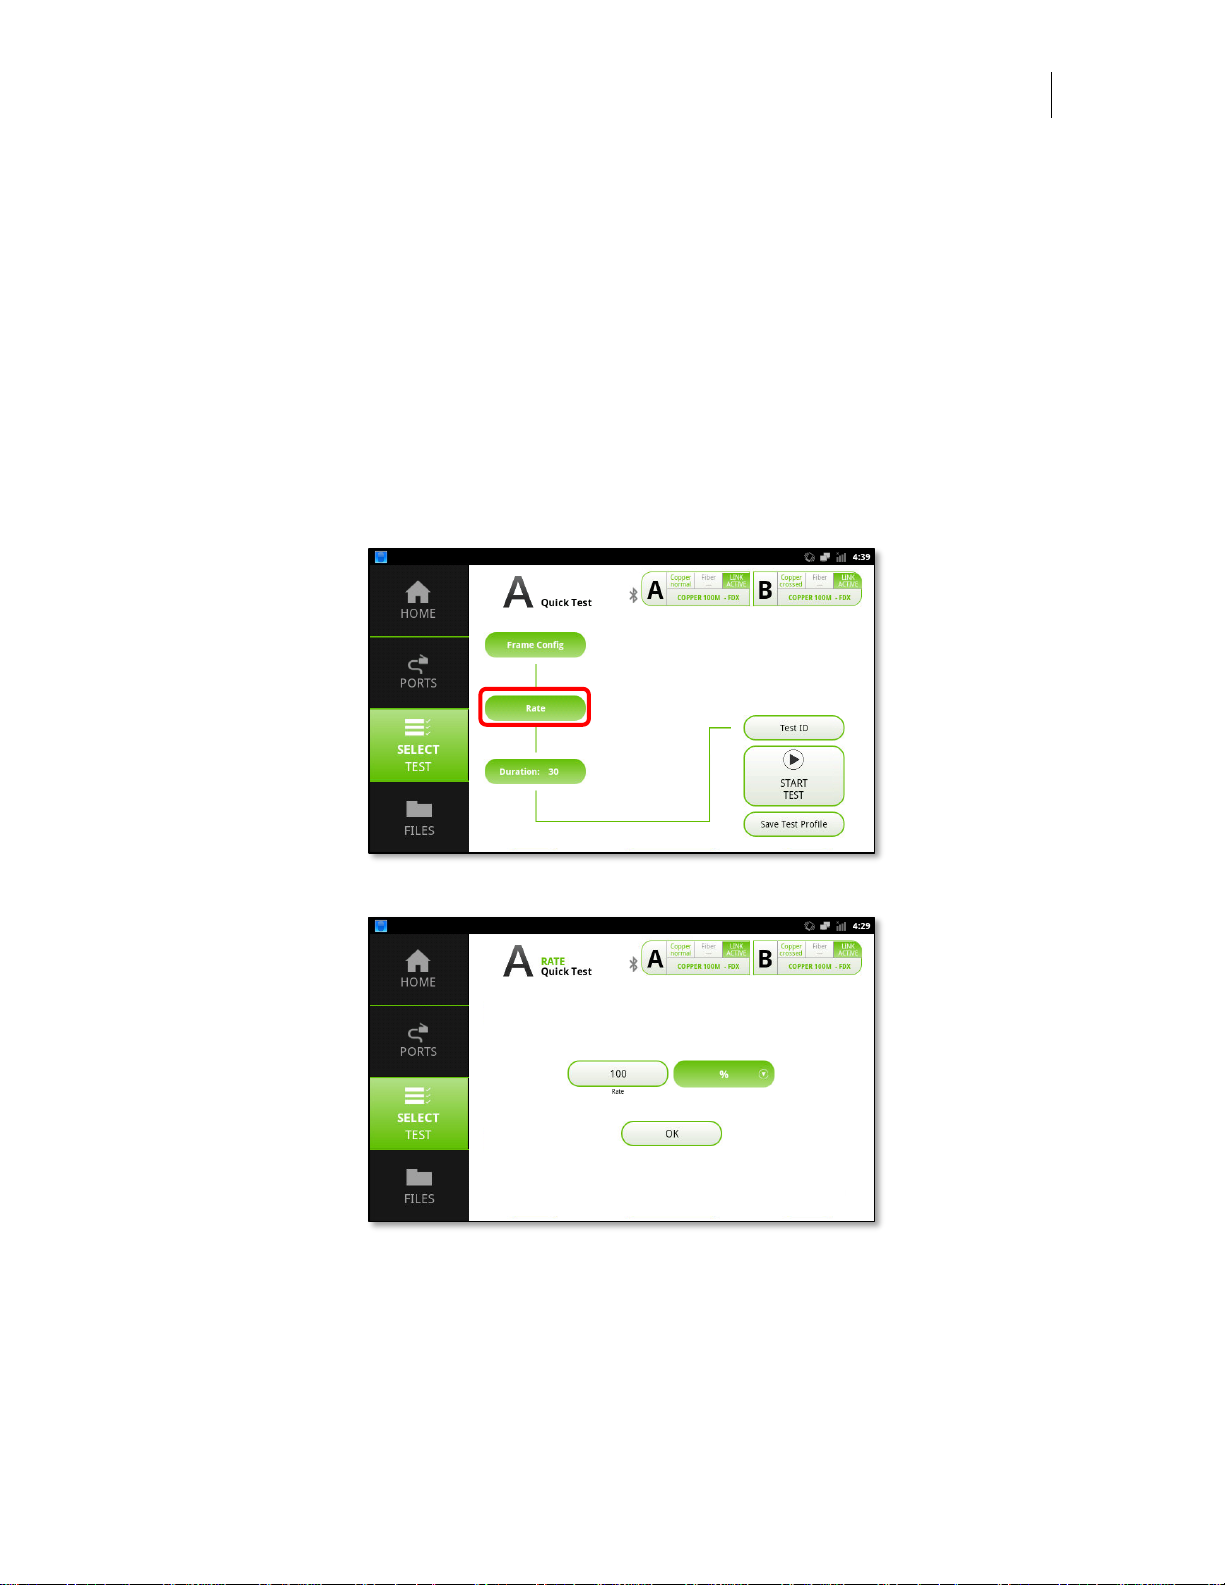
User’s Manual
DataScout 10G
49
802.3
Pressing the 802.3 button on the frame configuration view configures the test unit to
transmit Ethernet frames conforming to IEEE 802.3 format.
ETH2
Pressing the ETH2 button on the frame configuration view configures the test unit to
transmit Ethernet frames in Ethernet 2 (DIX) format.
Rate
Regardless of test type, pressing the rate configuration button will activate the frame
configuration view.
Figure 36 - Rate Selection Button
Figure 37 - Rate Configuration View
Rate – Enter the desired rate value. Depending on interface speed selected valid en-
tries will be limited but typically range in value from 0.01 to 100 maximum line rate in %
or speed selected.
Page 52
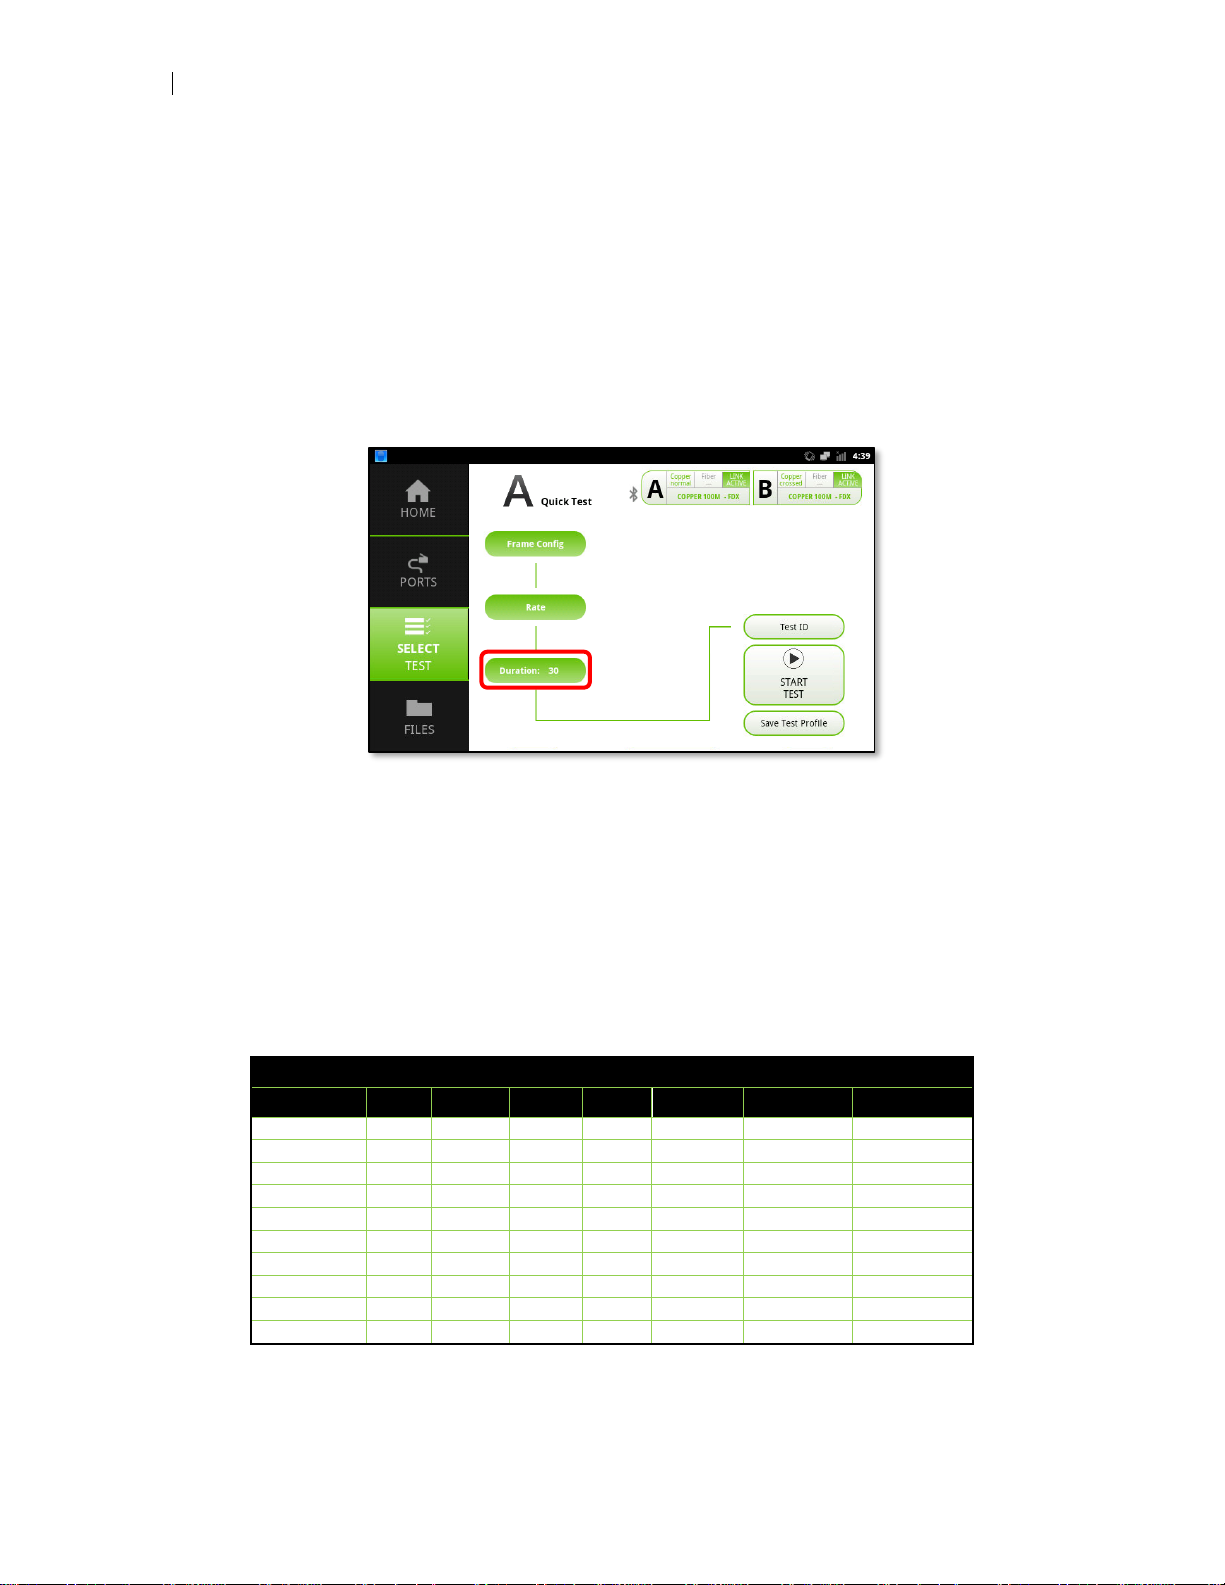
50
General Test Configuration
Rate Value – Press the rate value (default is %) to select entering traffic rate in Kbps,
Mbps or Gbps. Some values may not be active depending on which physical port
speed it selected.
OK – Closes the rate configuration view.
Duration
Regardless of test type, pressing the duration button will prompt you to enter how long
the test should run in seconds. The default test length for most tests is 30 seconds.
Figure 38 - Test Duration Field
Maximum Duration
Maximum test duration is dependent on the frame size(s) selected during frame configuration. The test unit calculates prior to starting a test the maximum number of test
frames to generate which will fit within the duration window and line rate selected.
Smaller frame sizes exhaust the total available pool of sequence numbers faster than
larger frames which limits the total duration a test can run. In the tables below, estimated maximum test durations are detailed.
10 Gbps
Frame Size
Years
Months
Weeks
Days
Hours
Minutes
Seconds
64
1
21
1,231
73,887
128
2
36
2,169
130,182
256
3
67
4,046
242,772
512
1 5 130
7,798
467,952
768
1 8 193
11,551
693,132
1024
2
11
255
15,303
918,312
1280
2
13
318
19,056
1,143,492
1518
1 2 16
376
22,544
1,352,839
9500
3
14
97
2,326
139,547
8,373,881
EMIX (A-G)
1 7 174
10,451
627,161
Table 3 - Maximum Approximate Duration at 10 Gbps
Page 53
User’s Manual
DataScout 10G
51
1 Gbps
Frame Size
Years
Months
Weeks
Days
Hours
Minutes
Seconds
64 1 9
205
12,313
738,872
128 2 15
362
21,694
1,301,822
256
1 4 28
674
40,457
2,427,722
512
2 8 54
1,300
77,982
4,679,521
768
3
11
80
1,925
115,507
6,931,321
1024
3
15
106
2,551
153,033
9,183,121
1280
4
19
132
3,176
190,558
11,434,921
1518
5
22
157
3,757
225,445
13,528,391
9500
3
32
138
969
23,258
1,395,470
83,738,806
EMIX (A-G)
2
10
73
1,742
104,514
6,271,614
Table 4 - Maximum Approximate Duration at 1 Gbps
100 Mbps
Frame Size
Years
Months
Weeks
Days
Hours
Minutes
Seconds
64 3
12
86
2,052
123,130
7,388,718
128
5
22
151
3,616
216,943
13,018,218
256
1 9 40
281
6,743
404,569
24,277,217
512
1
18
77
542
12,997
779,821
46,795,215
768
2
26
115
802
19,251
1,155,074
69,313,213
1024
3
35
152
1,063
25,505
1,530,326
91,831,211
1280
4
44
189
1,323
31,760
1,905,578
114,349,209
1518
4
51
224
1,566
37,574
2,254,446
135,283,911
9500
27
319
1,384
9,691
232,578
13,954,698
837,388,056
EMIX (A-G)
2
24
104
726
17,419
1,045,136
62,716,143
Table 5 - Maximum Approximate Duration at 100 Mbps
10 Mbps
Frame Size
Years
Months
Weeks
Days
Hours
Minutes
Seconds
64
2
28
122
855
20,522
1,231,297
73,887,181
128
4
50
215
1,507
36,157
2,169,428
130,182,177
256
8
92
401
2,810
67,428
4,045,690
242,772,167
512
15
178
774
5,415
129,970
7,798,213
467,952,149
768
22
264
1,146
8,021
192,512
11,550,737
693,132,130
1024
29
349
1,518
10,627
255,054
15,303,261
918,312,112
1280
36
435
1,890
13,233
317,596
19,055,785
1,143,492,093
1518
43
515
2,237
15,656
375,741
22,544,459
1,352,839,107
9500
266
3,186
13,844
96,908
2,325,783
139,546,976
8,373,880,557
EMIX (A-G)
20
239
1,037
7,258
174,189
10,451,365
627,161,432
Table 6 - Maximum Approximate Duration at 10 Mbps
Test Mode
Looped Test Mode
Tests can be performed in both Looped Test Mode where the test expects a reflector of
some type (NID, port in administrative loopback or another test set) as well as End to
Page 54
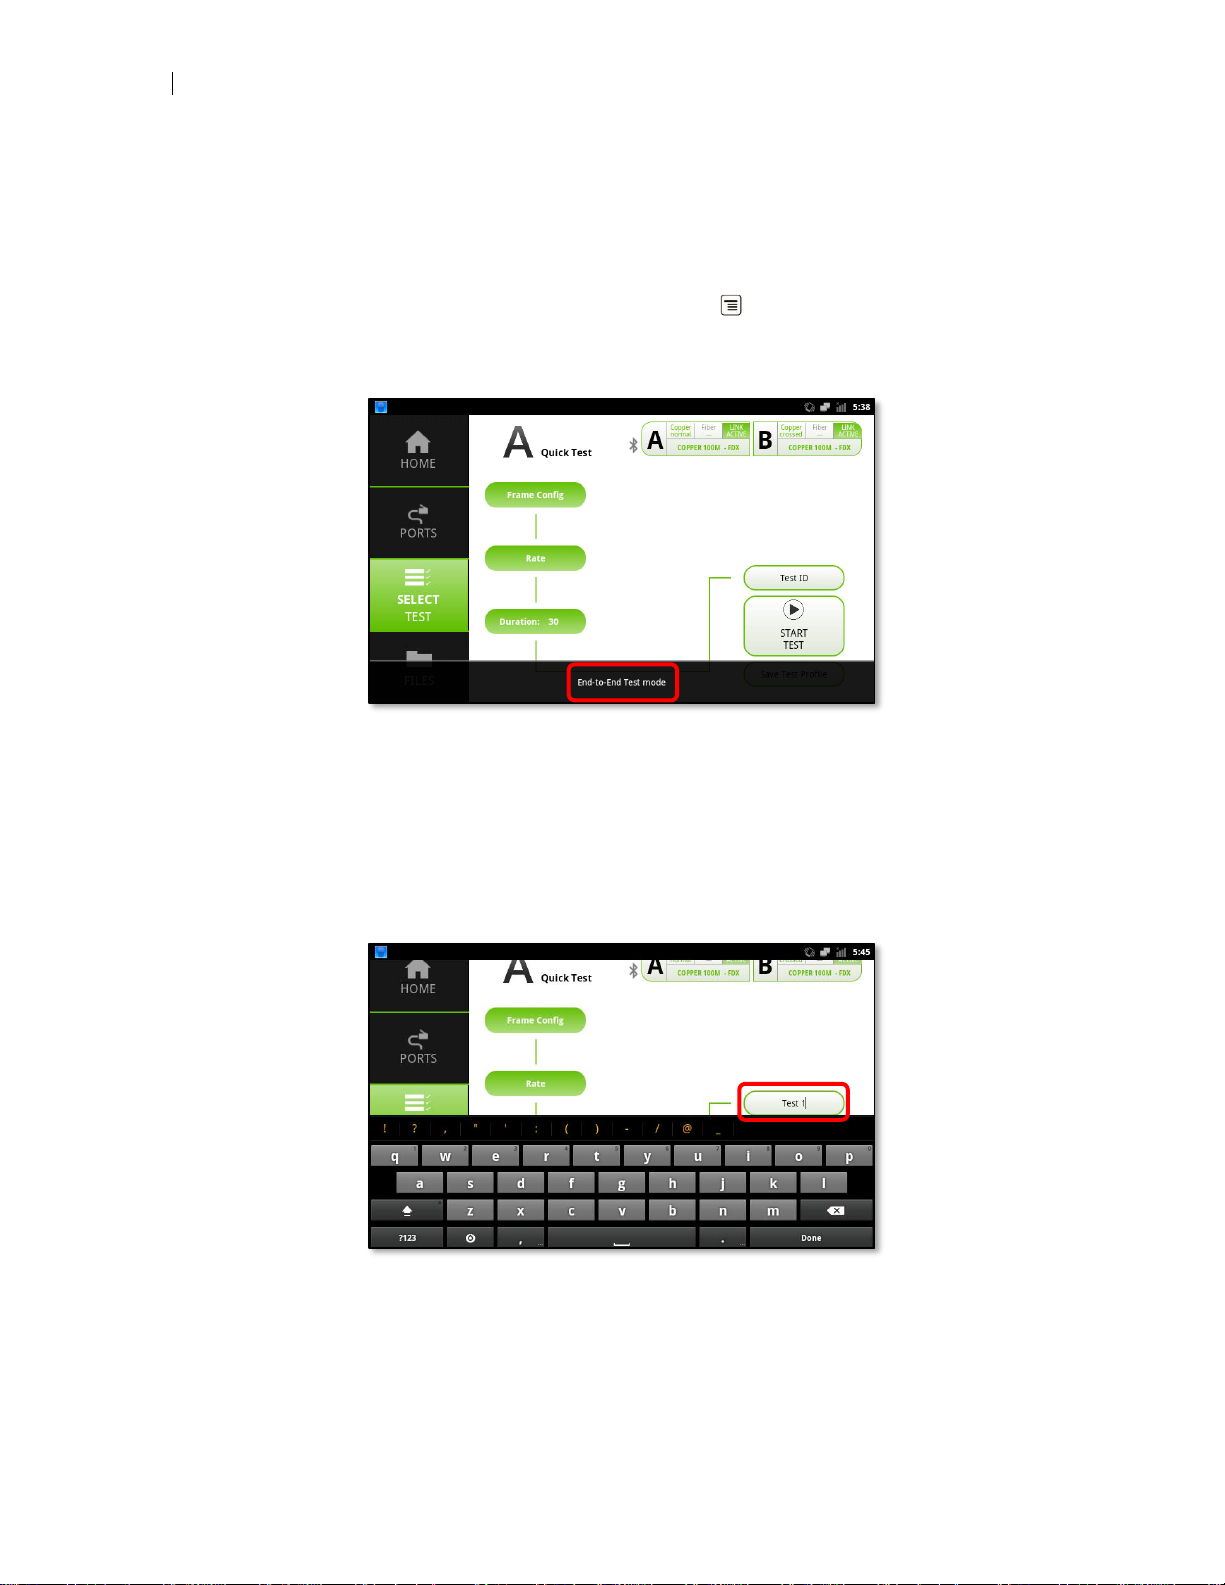
52
General Test Configuration
End mode where the test set will synchronize itself with another DataScout unit and
send bidirectional test data. By default, the test set operates in looped test mode.
End-to-End Test Mode
To activate end-to-end mode, press the menu button and tap the End-to-End Test
mode button. To return to Looped test mode, press the menu button again and tap the
Looped Test mode button.
Figure 39 - End-to-End Test Mode
Test ID
Most test results automatically save when the START TEST button is pressed. If a test
ID is not entered in the Test ID field the unit will generate a file name for you. This test
file name can always be changed by navigating to the Files, then Results menu.
Figure 40 - Test ID Field
Test Profile
After configuring the test unit, especially when the test configuration is complicated, it
may be desired to save the configuration as a profile so you can recall it later for rapid
Page 55
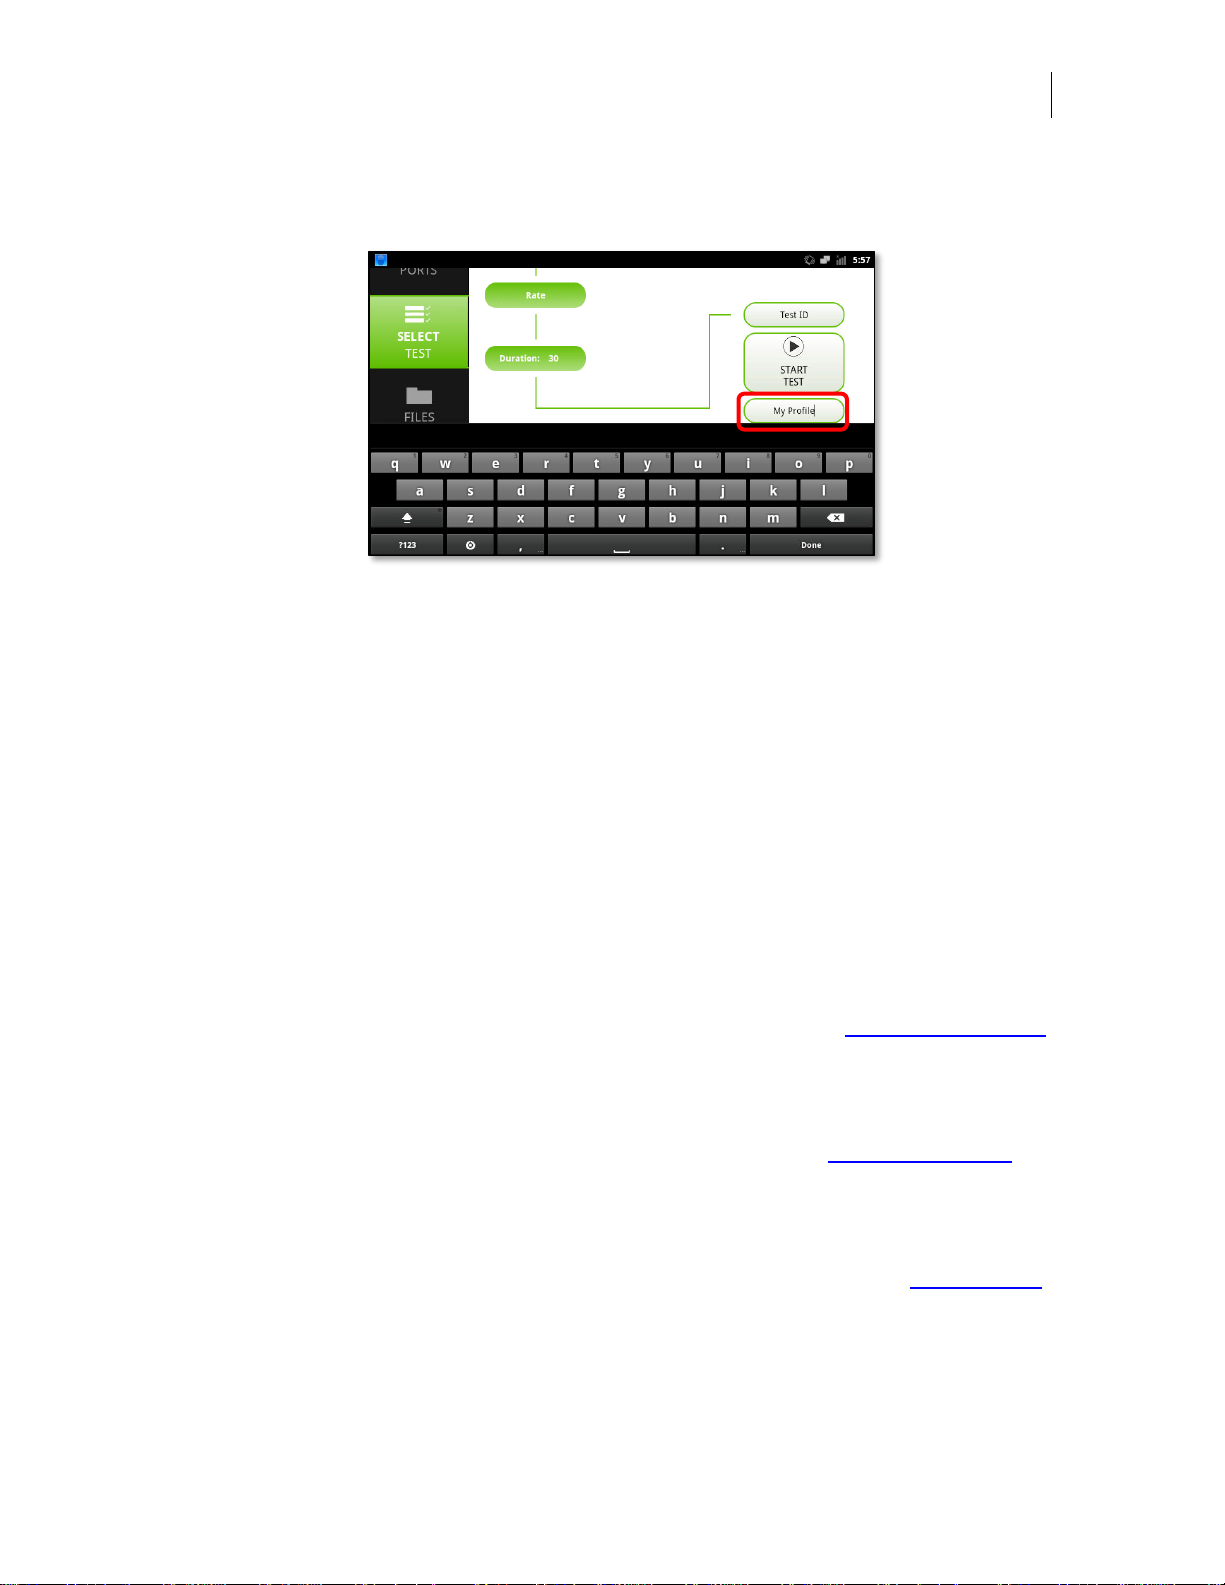
User’s Manual
DataScout 10G
53
test setup. To save a test profile, press the Save Test Profile button. The test file can
be retrieved by navigating to the Files, then Profiles menu.
Figure 41 - Test Profile Field
If a test profile name is not saved in the Test Profile field, the test configuration will not
be saved. The current test configuration will persist until you change the test type or
power cycle the test unit. If you neglect to save a test profile and desire to do so, return to the test view you are on prior to initiating another test or changing the configuration, then press the Test Profile button and save the profile.
Quick Test (BERT)
This test is designed to accomplish two tasks:
► Quickly establish if test settings or a network is correctly configured
► Perform longer duration single stream BER tests
Frame Configuration
Frame configuration is detailed in the General Test Configuration, Frame Configuration
section above.
Rate Configuration
Rate configuration is detailed in the General Test Configuration, Rate Configuration
section above.
Test Duration
Test duration configuration is detailed in the General Test Configuration, Test Duration
section above.
Page 56
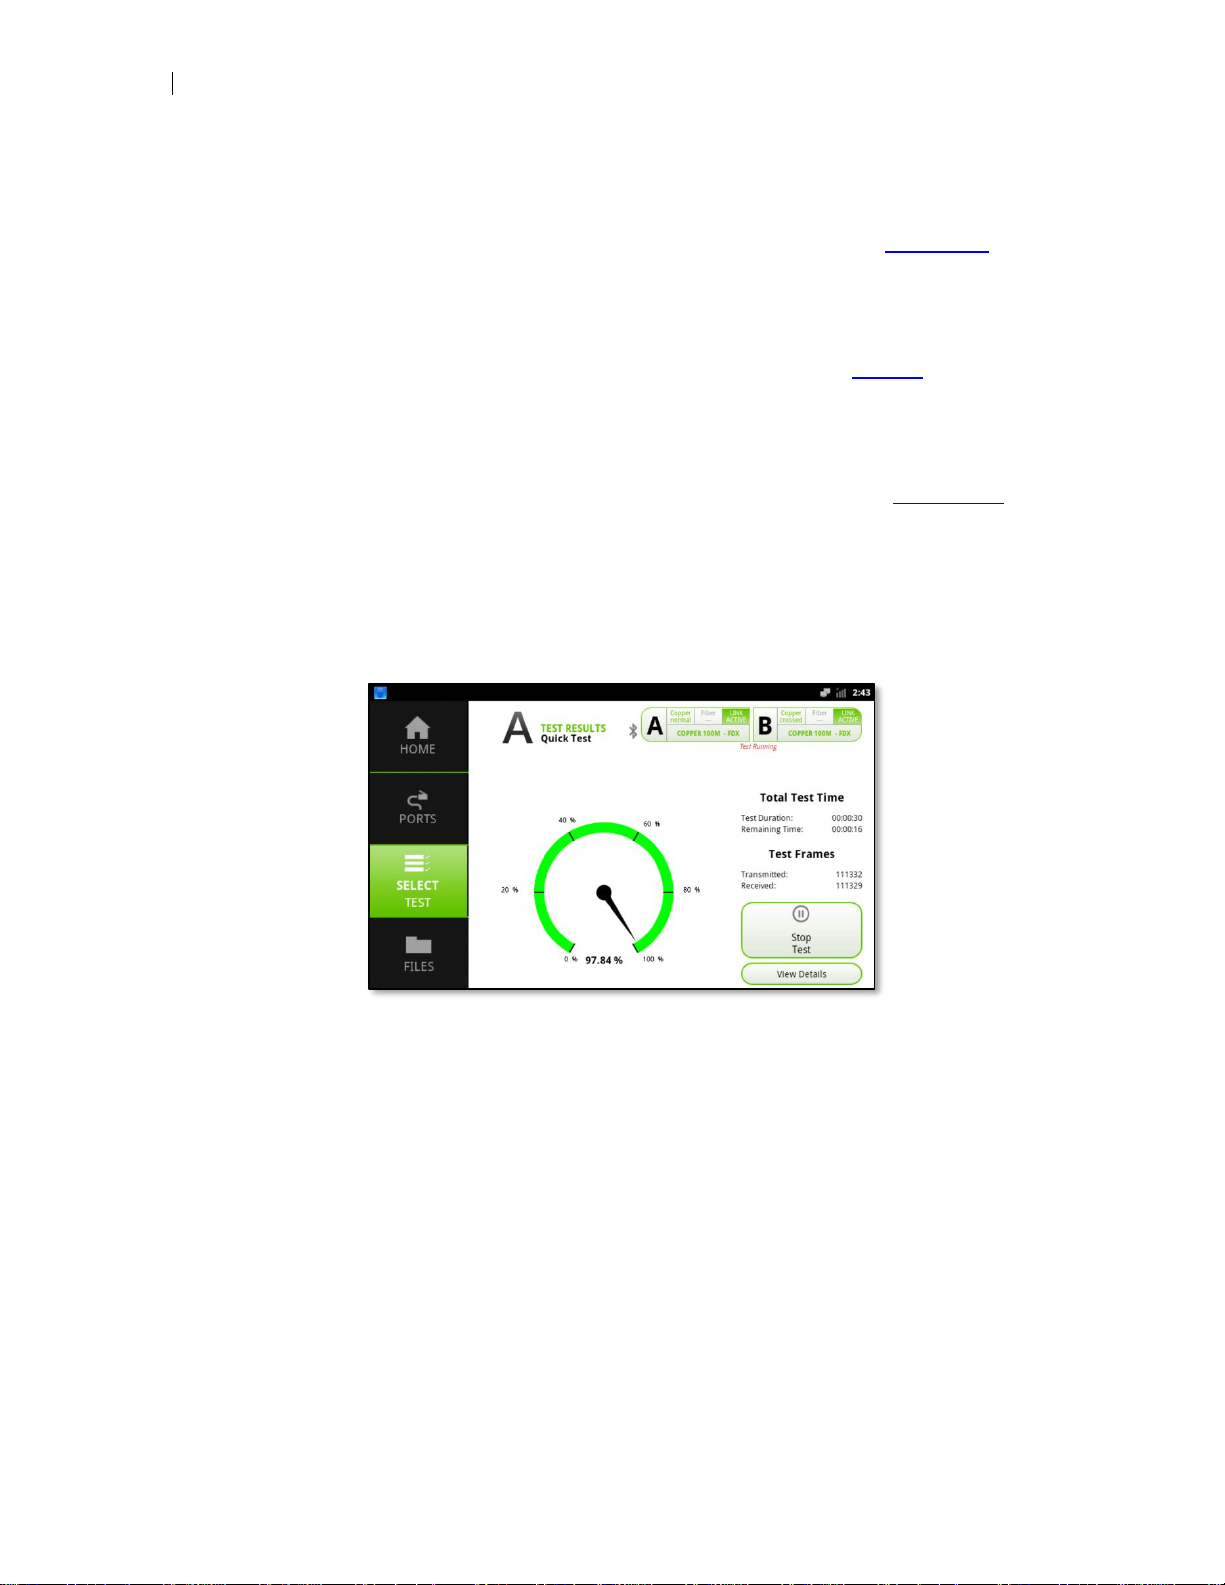
54
Quick Test (BERT)
Test Mode
Test mode configuration is detailed in the General Test Configuration, Test Mode section above.
Test ID
Test ID configuration is detailed in the General Test Configuration, Test ID section
above.
Test Profile
Test Profile configuration is detailed in the General Test Configuration, Test Profile
section above.
Running the Quick Test
Press the START TEST button to initiate your test. The following gauges and indicators are provided:
Figure 42 - Quick Test in Progress
Rx Traffic Gauge – The received rate indicator gauge provides an indication test traffic
is being looped back and at what rate.
Total Test Time – Provides an active count of the total test duration and time remain-
ing until the test is completed.
Test Frames – Provides an active count of the number of transmitted and received
frames. Counts update once per second so a minor discrepancy may be displayed
while the test is actively running.
Stop Test – Pressing this button will abort the current test in progress.
View Details – Pressing the button activates the test result popover view. If the test is
currently running not all statistics will be populated in real time so it is recommended to
wait until the test completes, which will automatically display test results.
Page 57
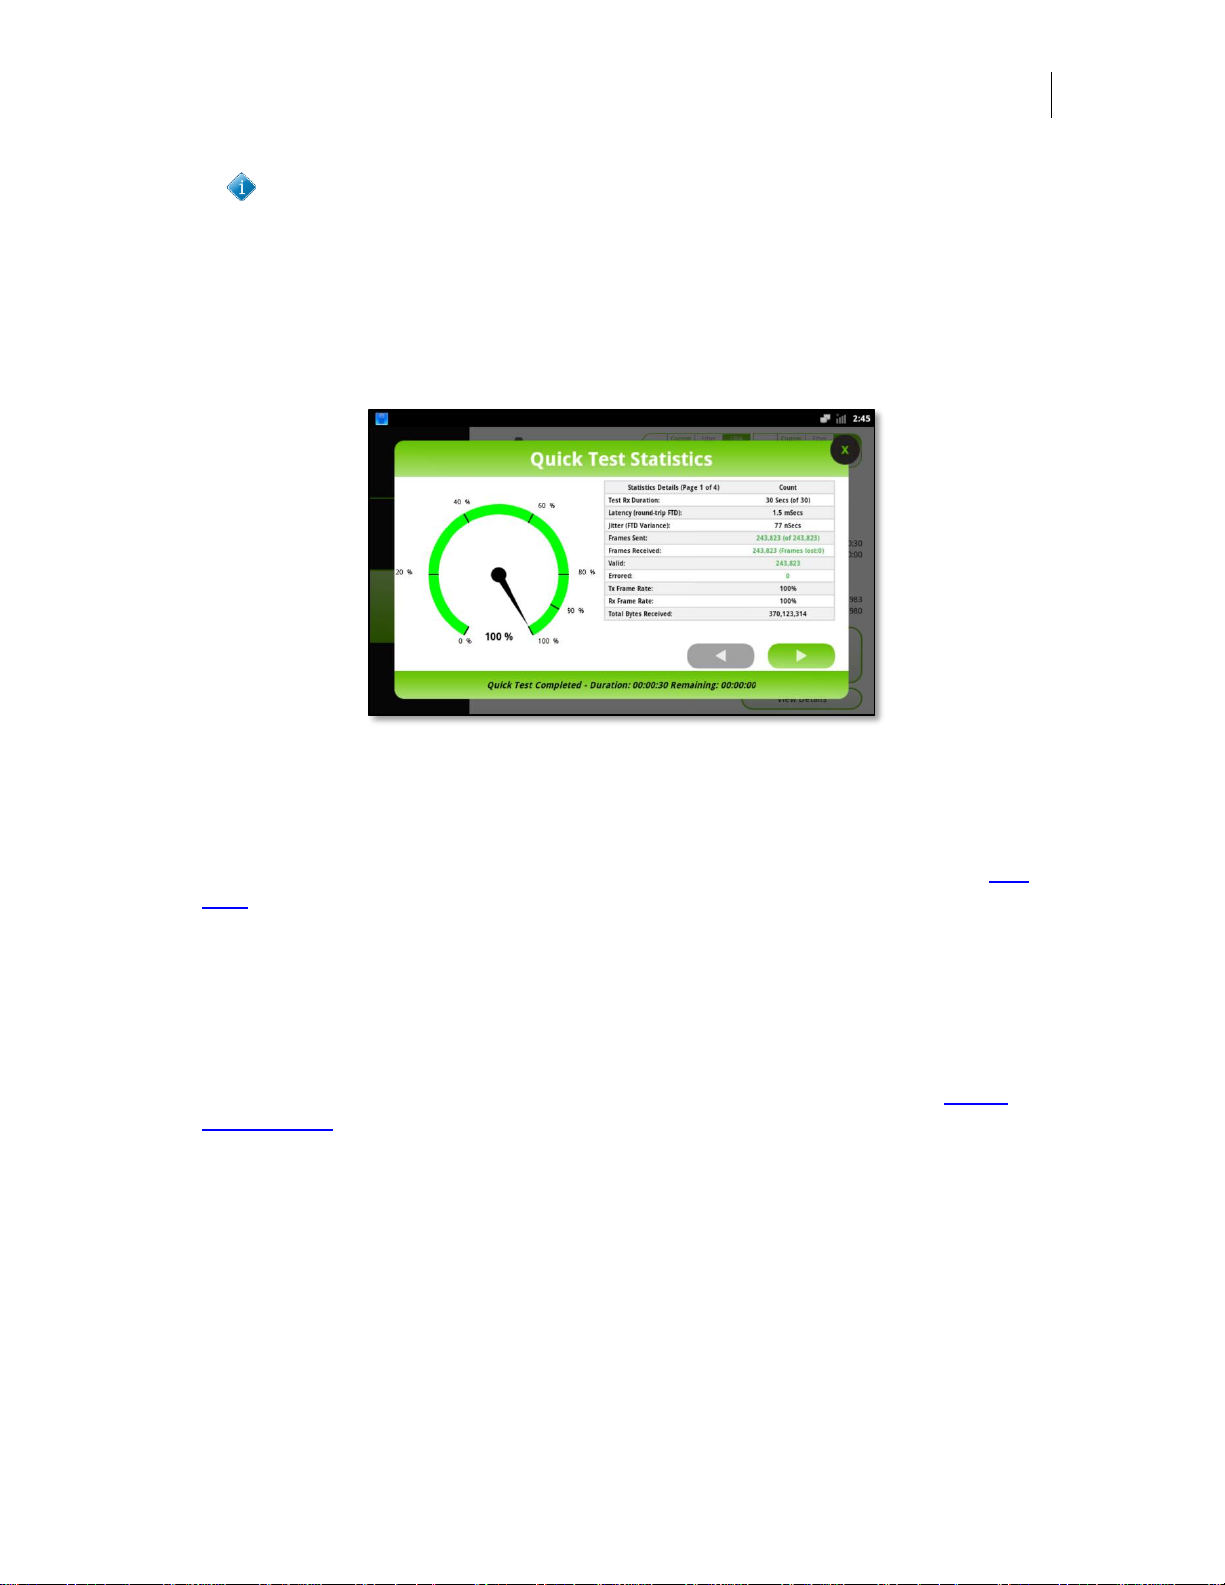
User’s Manual
DataScout 10G
55
You may need to run quick test once when first connected to a HUB or
SWITCH so the device can learn the MAC address of the test device.
Quick Test Results
The quick test popover view provides detailed test results and statistics. Passing test
results are displayed in black or green type, failing results are displayed in red. Press
the right arrow button to access additional test details.
Figure 43 - View Details Popover View
Multi Stream Test
This test is only activated when feature option DS10G-SW-ADV is purchased. This option can be activated in the field by entering a valid license key as detailed in the Set-
tings section above. The multi stream test enables generation of up to 16 unique
streams of test traffic. Each stream can have a different:
► Frame configuration (frame type, size, VLAN, MPLS or IP type)
► Traffic rate
Frame Configuration
Frame configuration is similar as detailed in the General Test Configuration, Frame
Configuration section above with the following differences:
# of Streams – This menu button enables selecting how many streams of traffic the
test unit will generate. Valid options are 1-16 streams.
Page 58
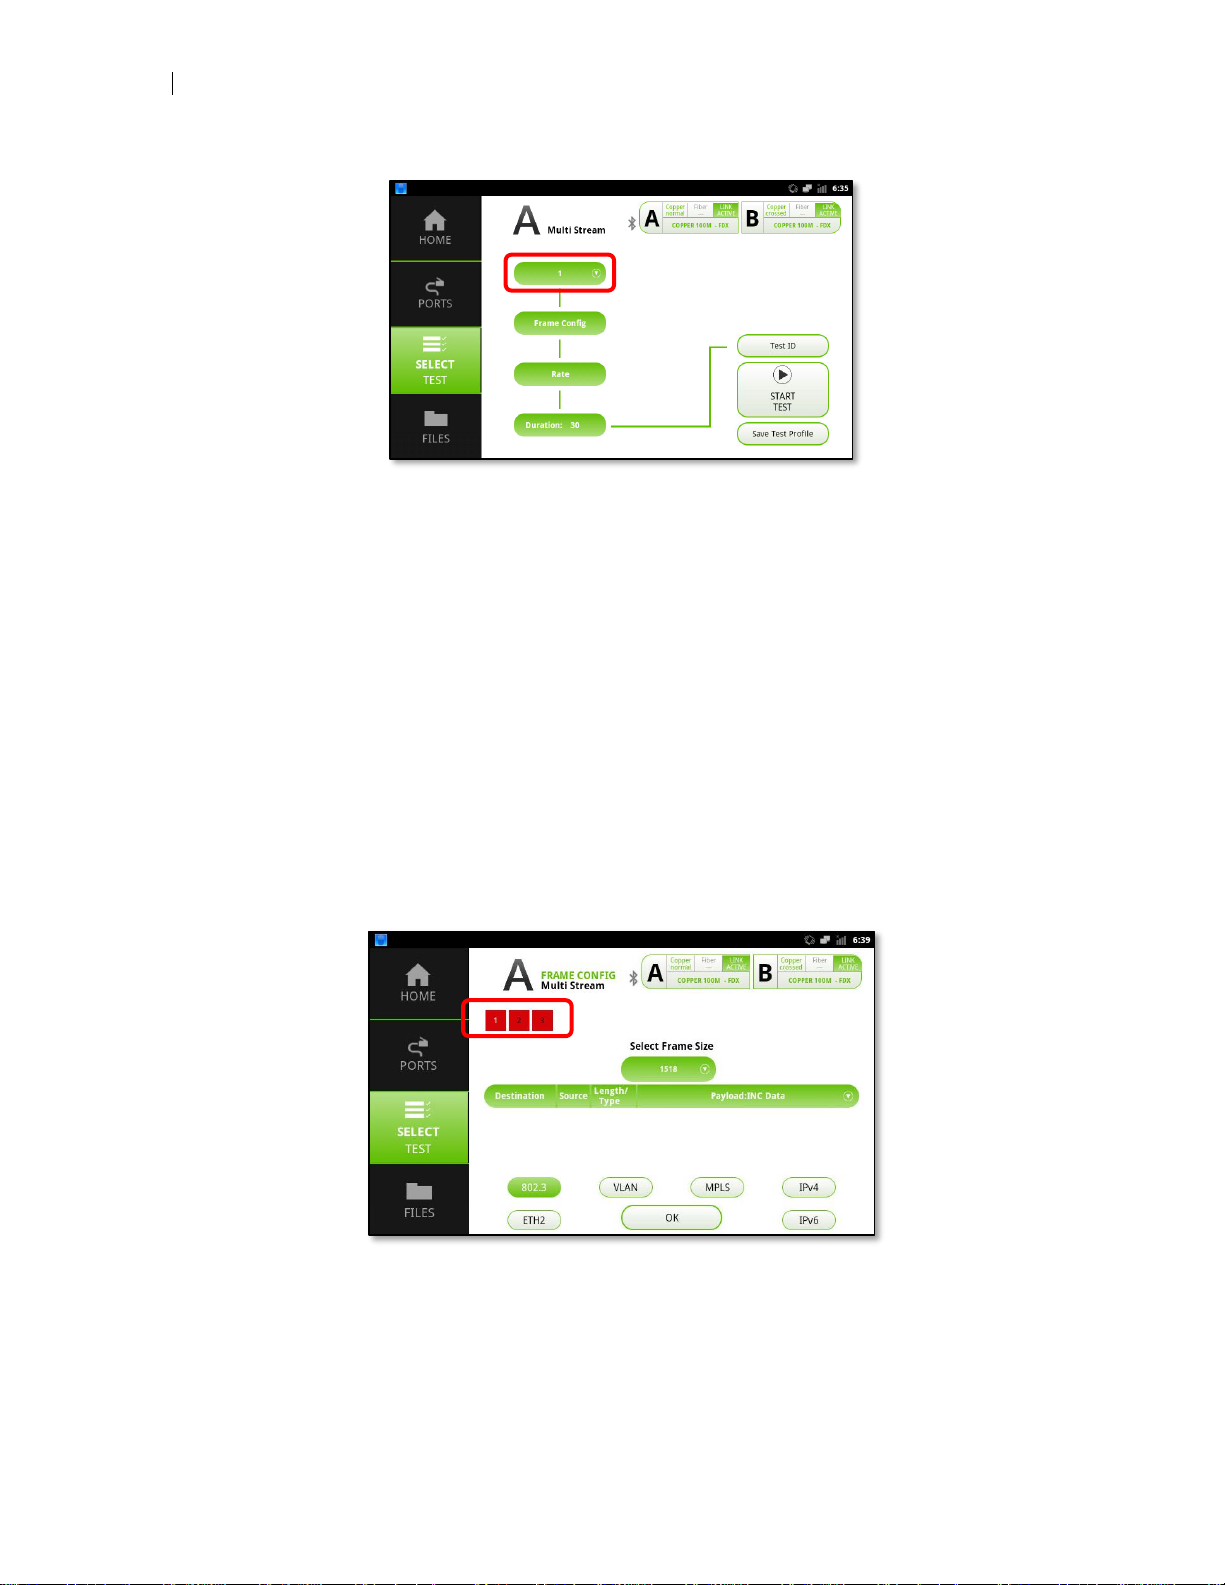
56
Multi Stream Test
Figure 44 - Multi Stream Main View
When the frame configuration view is activated, a series of stream selection buttons
will be displayed above the frame configuration bar. Press the desired stream to configure settings for the selected stream.
Each stream must be configured to be unique from all other streams using any one or
combination of the following:
► Different 802.3 or ETH2 framing
► Different destination or source MAC
► Different VLAN configuration
► Different MPLS configuration
► Different IPv4 or IPv6 destination or source
Stream buttons that do not contain a unique setting will be colored red. Changing the
configuration and then selecting another stream will validate the configuration again.
Continue adjusting settings until all streams are displayed outlined in Green.
Figure 45 - Invalid Multi Stream Configuration
Page 59
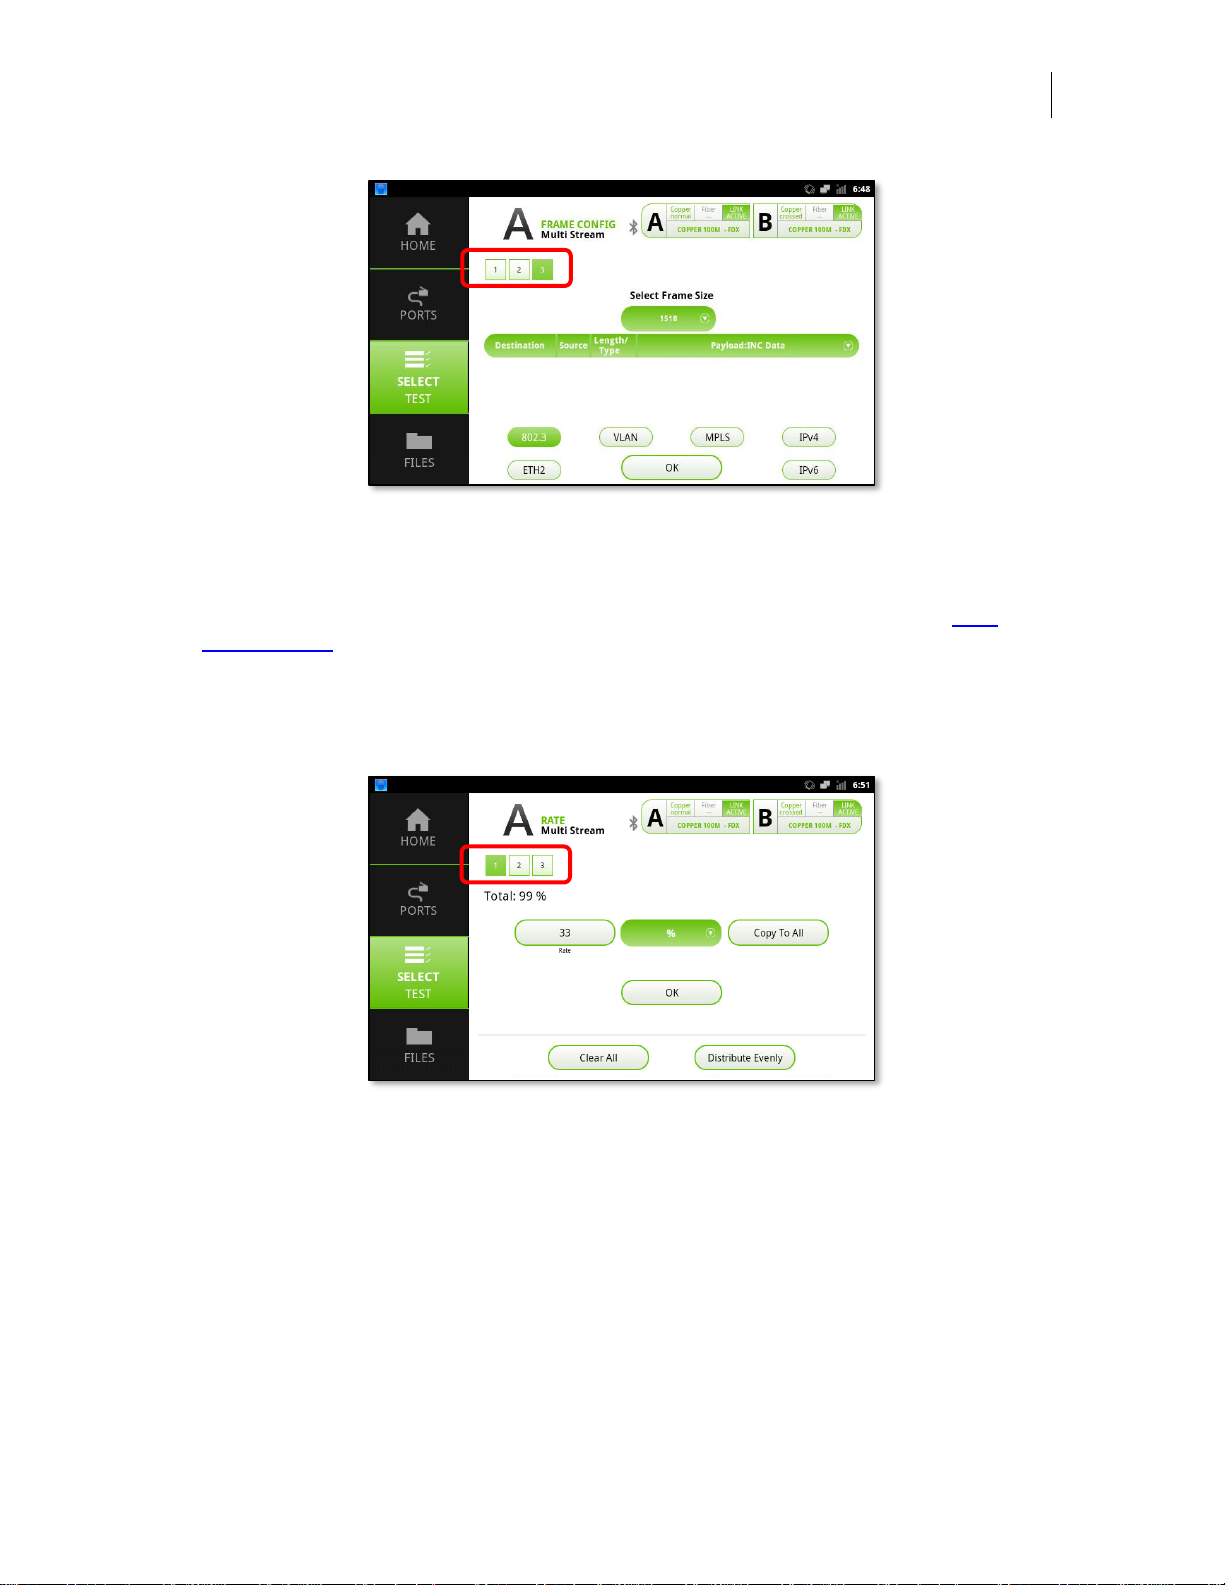
User’s Manual
DataScout 10G
57
Figure 46 - Valid Multi Stream Configuration
Rate Configuration
Rate configuration is similar to as detailed in the General Test Configuration, Rate
Configuration section above with the following differences:
When the rate configuration view is activated, a series of stream selection buttons will
be displayed above the rate selection button. Press the desired stream to configure
rate settings for the selected stream.
Figure 47 - Multi Stream Rate Configuration
Copy To All – When pressed, this button will copy the rate entered in the Rate field to
all streams
Clear All – When pressed, this button will clear out all custom values and reset to the
default values
Distribute Evenly – When pressed, this button will distribute the total line rate across
all streams evenly
OK – Closes the Traffic Rate view
Page 60
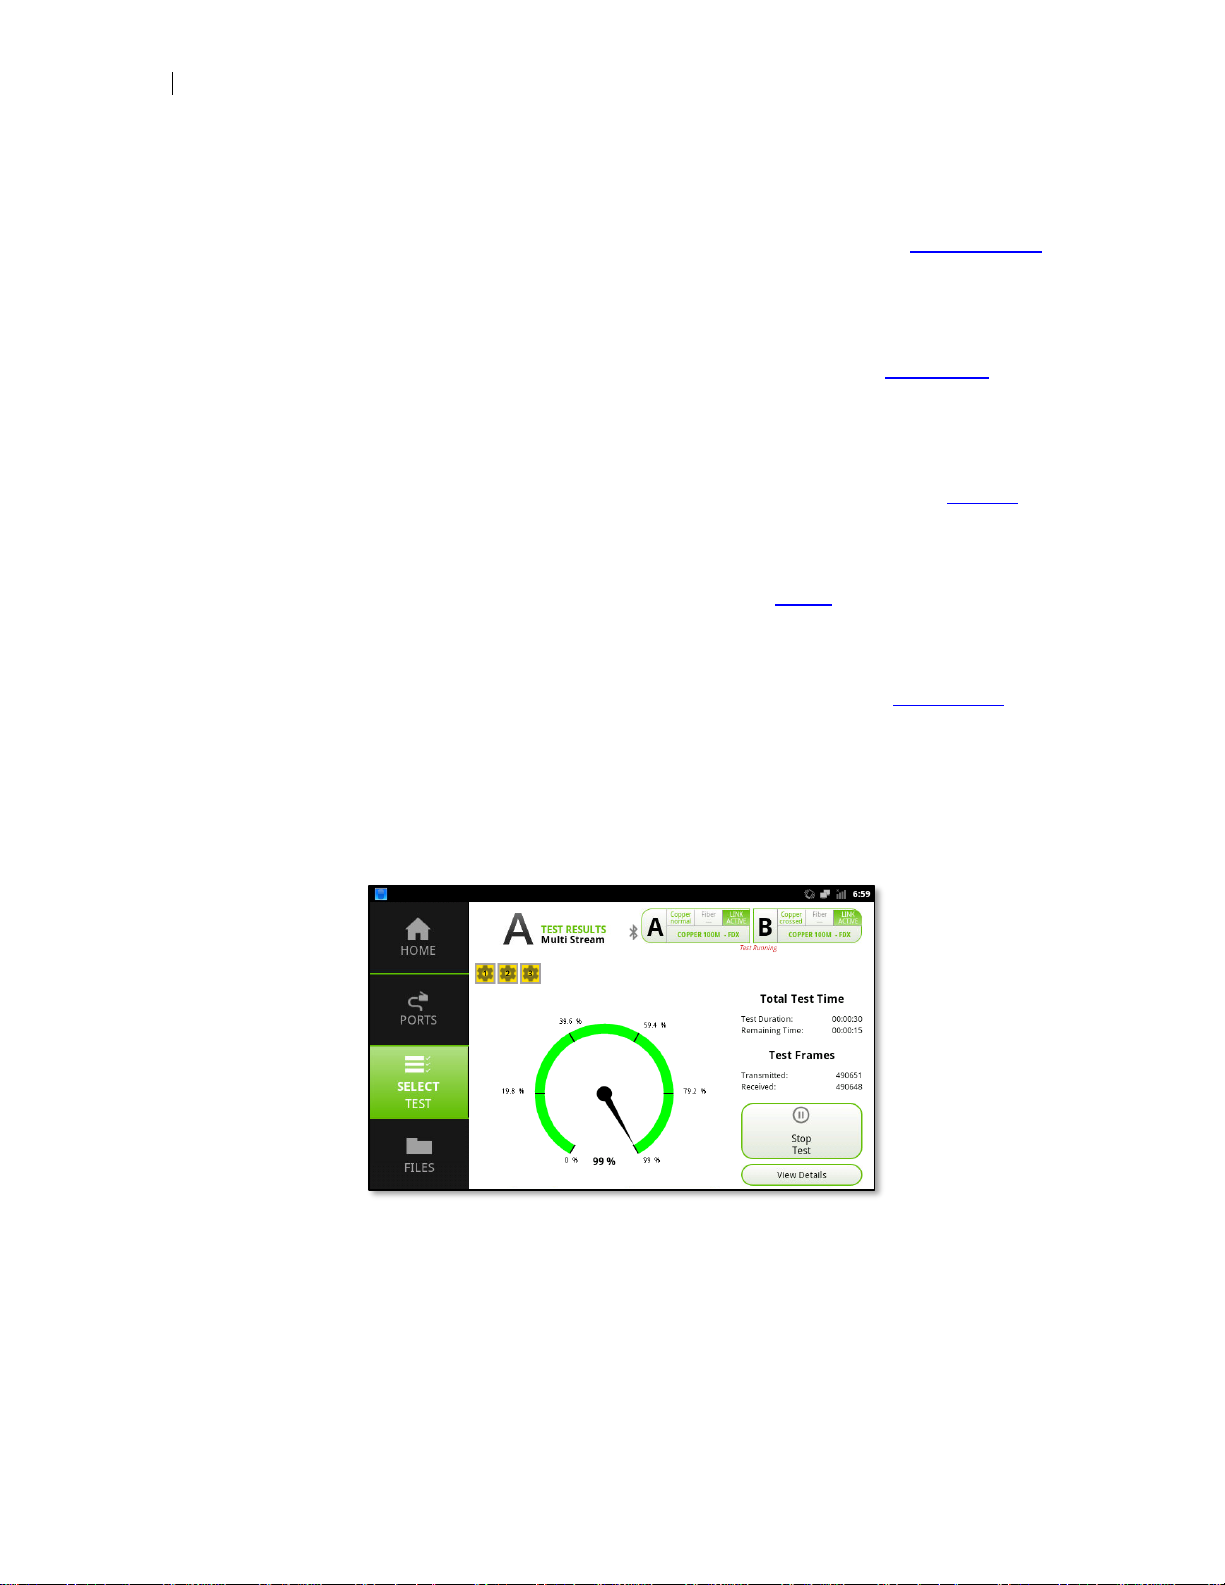
58
Multi Stream Test
Test Duration
Test duration configuration is detailed in the General Test Configuration, Test Duration
section above.
Test Mode
Test mode configuration is detailed in the General Test Configuration, Test Mode section above.
Test ID
Test ID configuration is similar to detailed in the General Test Configuration, Test ID
section above with the following differences:
► Tests are not automatically saved. Instead, the SAVE RESULTS button must
be press on the test result popover view as shown below.
Test Profile
Test Profile configuration is detailed in the General Test Configuration, Test Profile
section above.
Running the Multi Stream Test
Press the START TEST button to initiate your test. The following gauges and indicators are provided:
Figure 48 - Multi Stream Test in Progress
Stream Icons – Stream icons provide a visual reminder of the number of streams the
tester is currently generating.
Rx Traffic Gauge – The received rate indicator gauge provides an indication test traffic
is being looped back and at what rate.
Total Test Time – Provides an active count of the total test duration and time remain-
ing until the test is completed.
Page 61
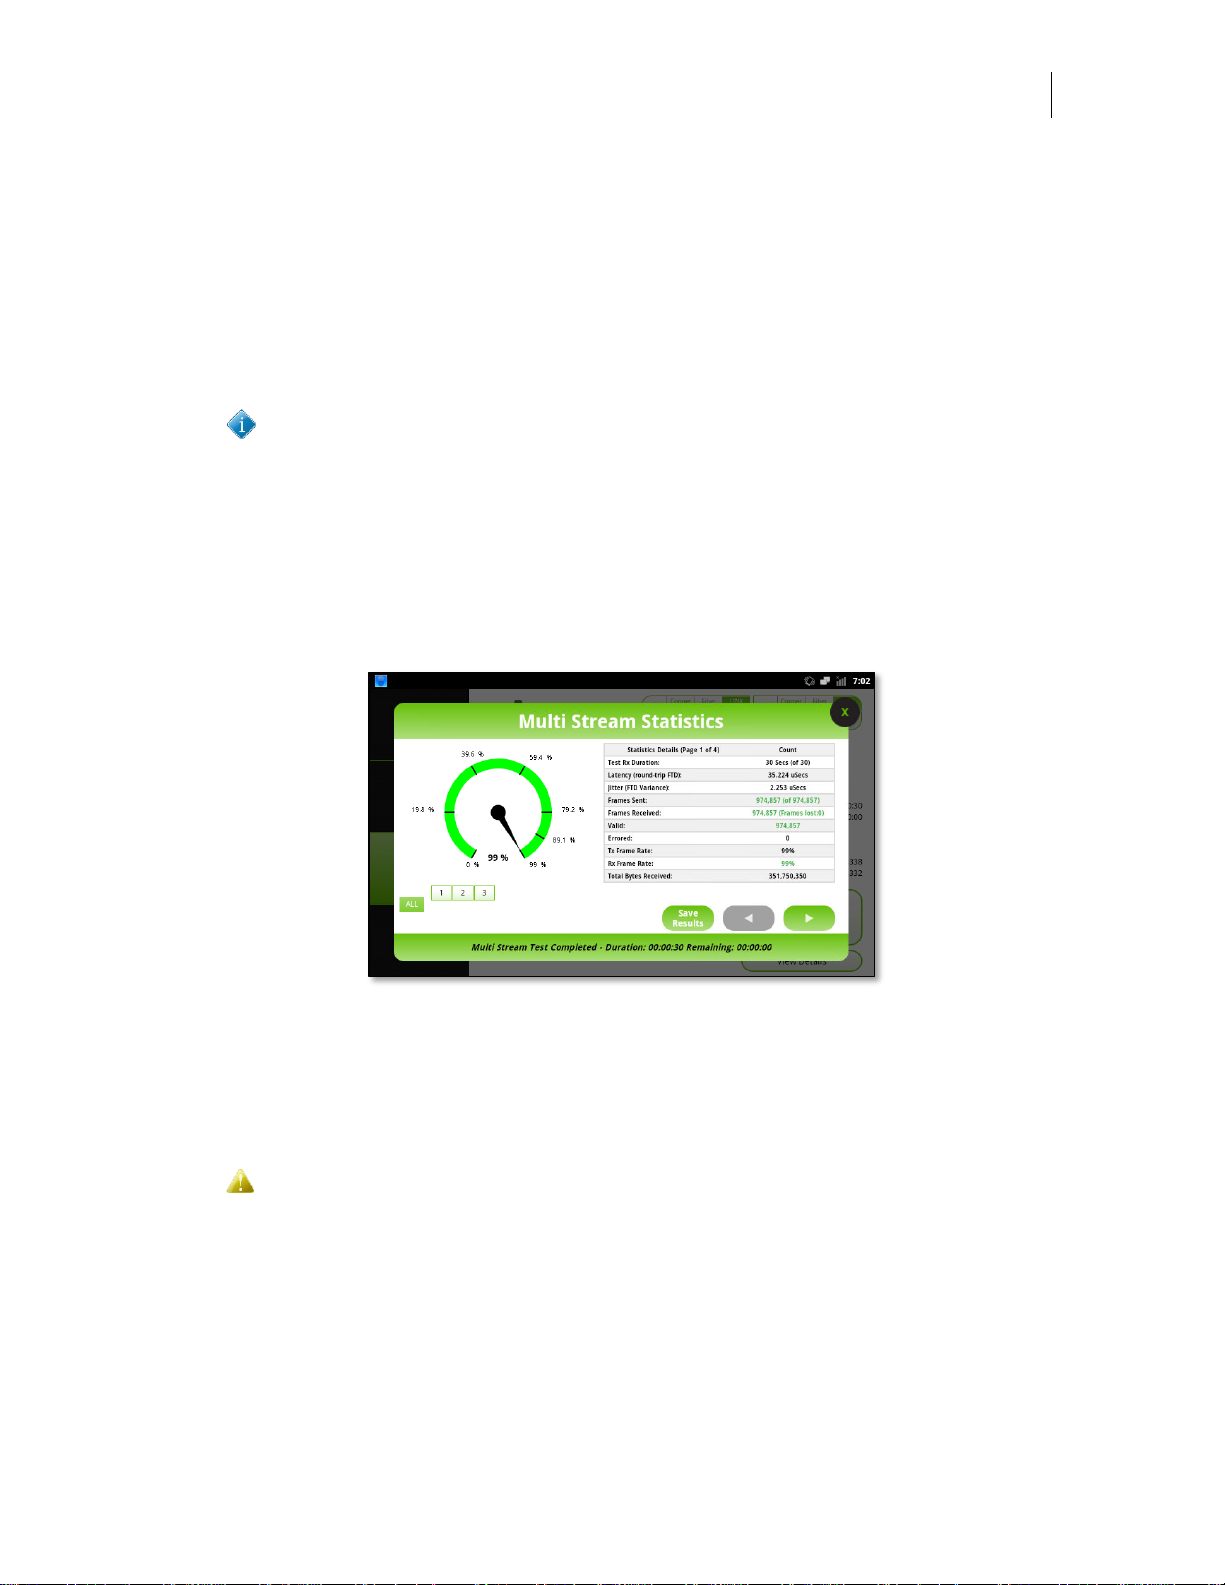
User’s Manual
DataScout 10G
59
Test Frames – Provides an active count of the number of transmitted and received
frames. Counts update once per second so a minor discrepancy may be displayed
while the test is actively running.
Stop Test – Pressing this button will abort the current test in progress.
View Details – Pressing the button activates the test result popover view. If the test is
currently running not all statistics will be populated in real time so it is recommended to
wait until the test completes, which will automatically display test results.
You may need to run quick test once when first connected to a HUB or
SWITCH so the device can learn the MAC address of the test device.
Multi Stream Test Results
The multi stream test popover view provides detailed test results and statistics. Passing test results are displayed in black or green type, failing results are displayed in red.
Press the right arrow button to access additional test details.
Figure 49 - Multi Stream Test Results
ALL – Pressing this button displays aggregate results for all streams
Stream Buttons – Pressing a stream button displays statistics for the selected stream
Save Results – When pressed this button saves test results for all streams
Multi Stream test results accumulate a large amount of statistics and can take
up to a minute to store results for 16 streams. Once the save test button is
pressed the process cannot be aborted.
RFC-2544
RFC-2544 is a benchmark test allowing both service providers and end users to validate performance of a circuit or network device. The RFC-2544 methodology published by the Internet Engineering Task Force (IETF) outlines the tests required to
measure and prove performance criteria. This standard provides an out-of-service
Page 62
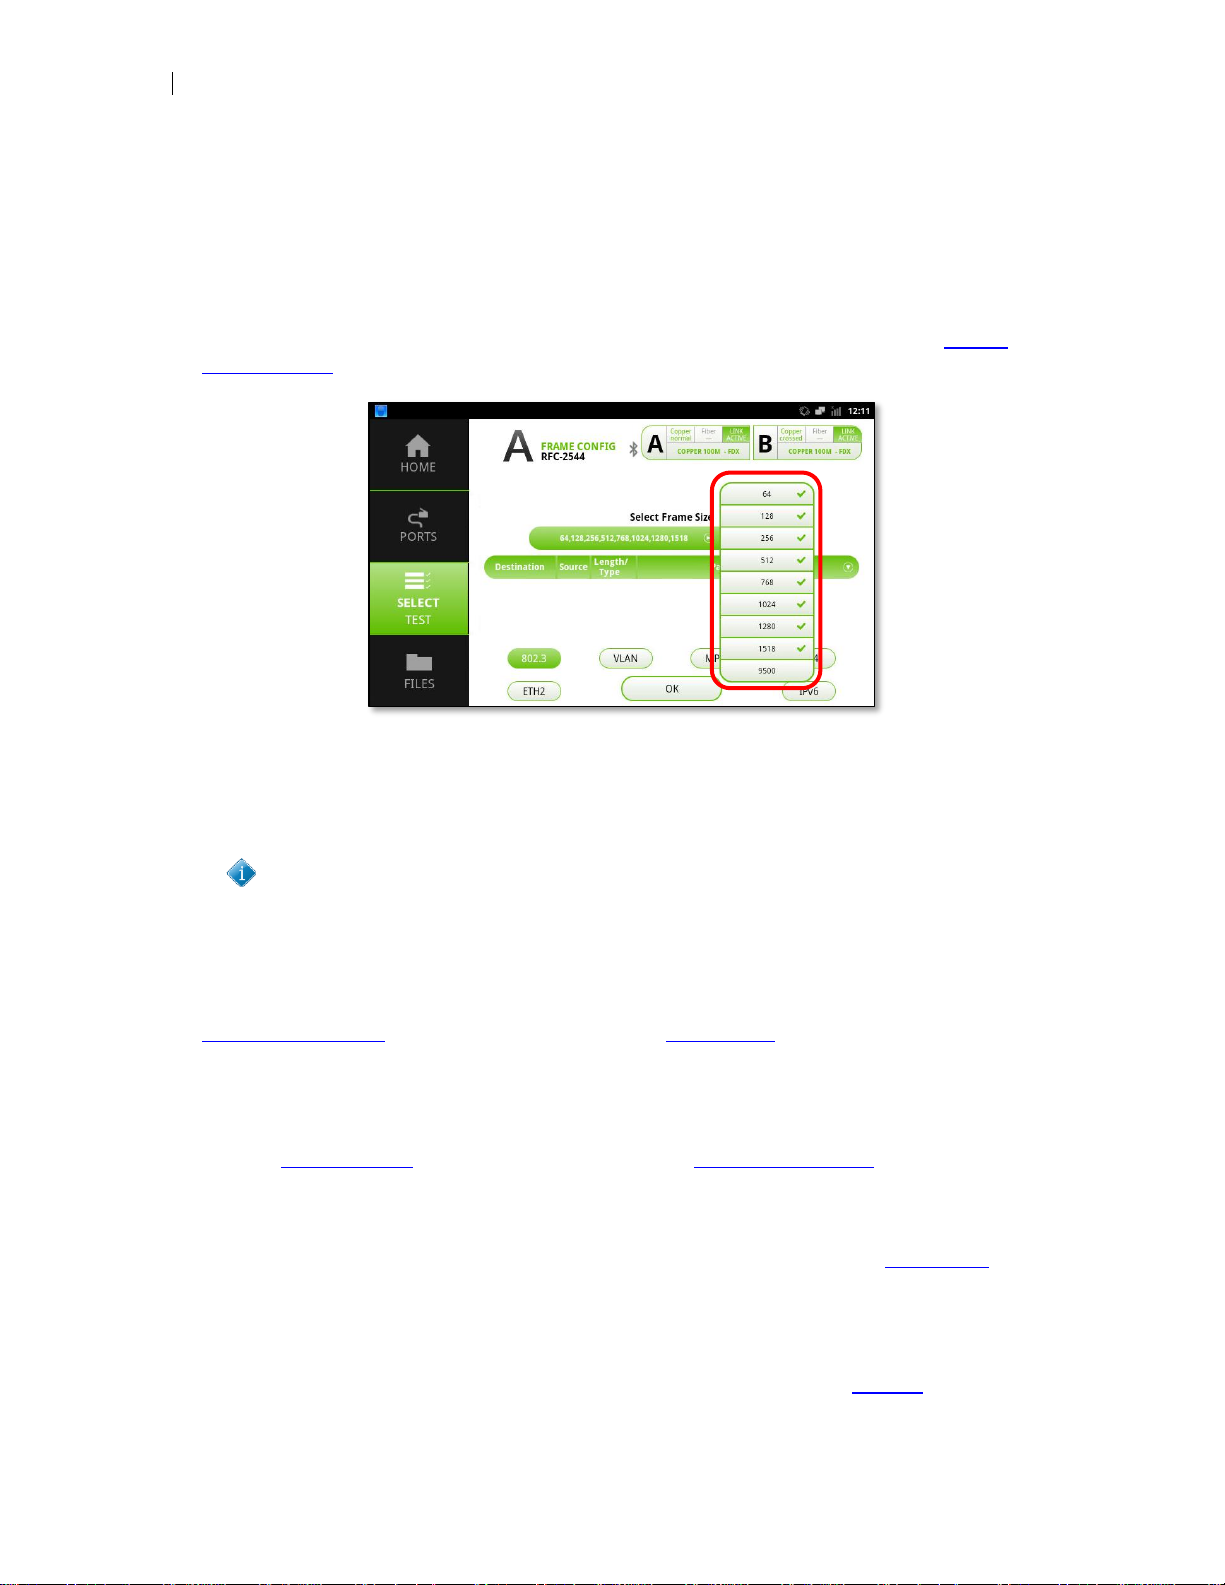
60
RFC-2544
benchmarking evaluation of the performance of network devices using throughput,
frame loss, latency, jitter and burst tests. Each test validates a specific aspect of the
circuit or network.
Frame Configuration
Frame configuration is similar as detailed in the General Test Configuration, Frame
Configuration section above with the following differences:
Figure 50 - RFC-2544 Frame Size Selection
Select Frame Size – Pressing the frame size menu button displays all RFC-2544
standard frames sizes as well as an optional jumbo frame size. Tap each frame you
want to add to include in the test trials.
To fully comply with the RFC-2544 recommendation selecting the following
frame sizes is required: 64, 128, 256, 512, 1024, 1280, 1518
Rate Configuration
Rate configuration is different from what is detailed in the General Test Configuration,
Rate Configuration section above. Refer to the Thresholds section below for details.
Test Duration
Test duration configuration is different from what is detailed in the General Test Configuration, Test Duration section above. Refer to the Test Configuration section below.
Test Mode
Test mode configuration is detailed in the General Test Configuration, Test Mode section above.
Test ID
Test ID configuration is detailed in the General Test Configuration, Test ID section
above.
Page 63
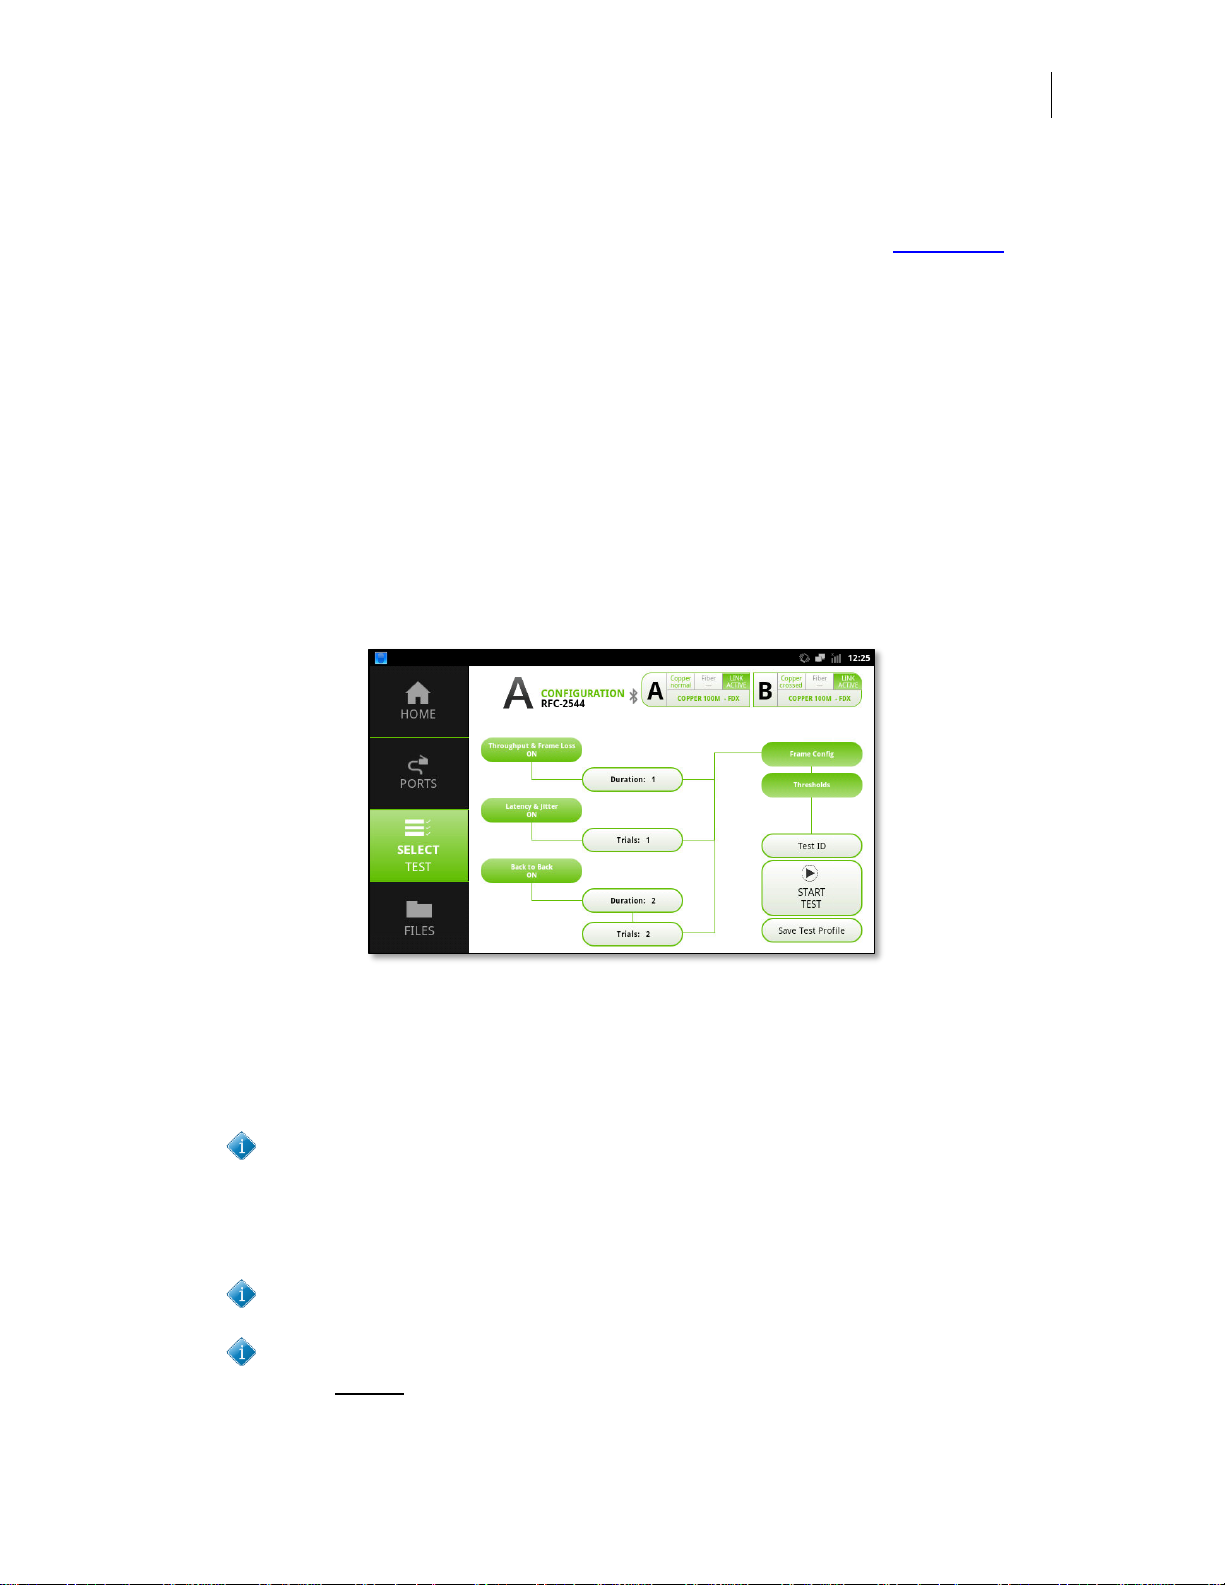
User’s Manual
DataScout 10G
61
Test Profile
Test Profile configuration is detailed in the General Test Configuration, Test Profile
section above.
Test Configuration
Performing a test which conforms to the complete RFC-2544 recommendation requires
running the following standard tests:
► Throughput
► Frame Loss
► Latency
► Back to Back (Burst)
In addition to the standard tests many providers have opted to include testing for Jitter
as well even thought this is not part of the recommendation. The DataScout supports
testing all standard tests and jitter.
Figure 51 - RFC-2544 Configuration View
Some customers or service providers opt to not run a complete RFC-2544 test per the
recommendation because it can take up to 7.5 hours to finish. To accommodate deviating from performing a complete RFC-2544 test the configuration menu allows turning
each test on or off to shorten the test time.
Latency and Jitter measurements are performed simultaneously with the
Throughput and Frame Loss test. Turning on Latency and Jitter will automatically activate the Throughput and Frame Loss Test.
Duration – Sets the test duration, in seconds, the test will be performed
To fully comply with the RFC-2544 recommendation selecting the duration of
each trial should be at least 60 seconds.
To fully comply with the RFC-2544 recommendation selecting the duration of
each latency trial should be at least 120 seconds. This requires setting the
Throughput and Frame Loss duration on the test set to be 120 seconds
Page 64
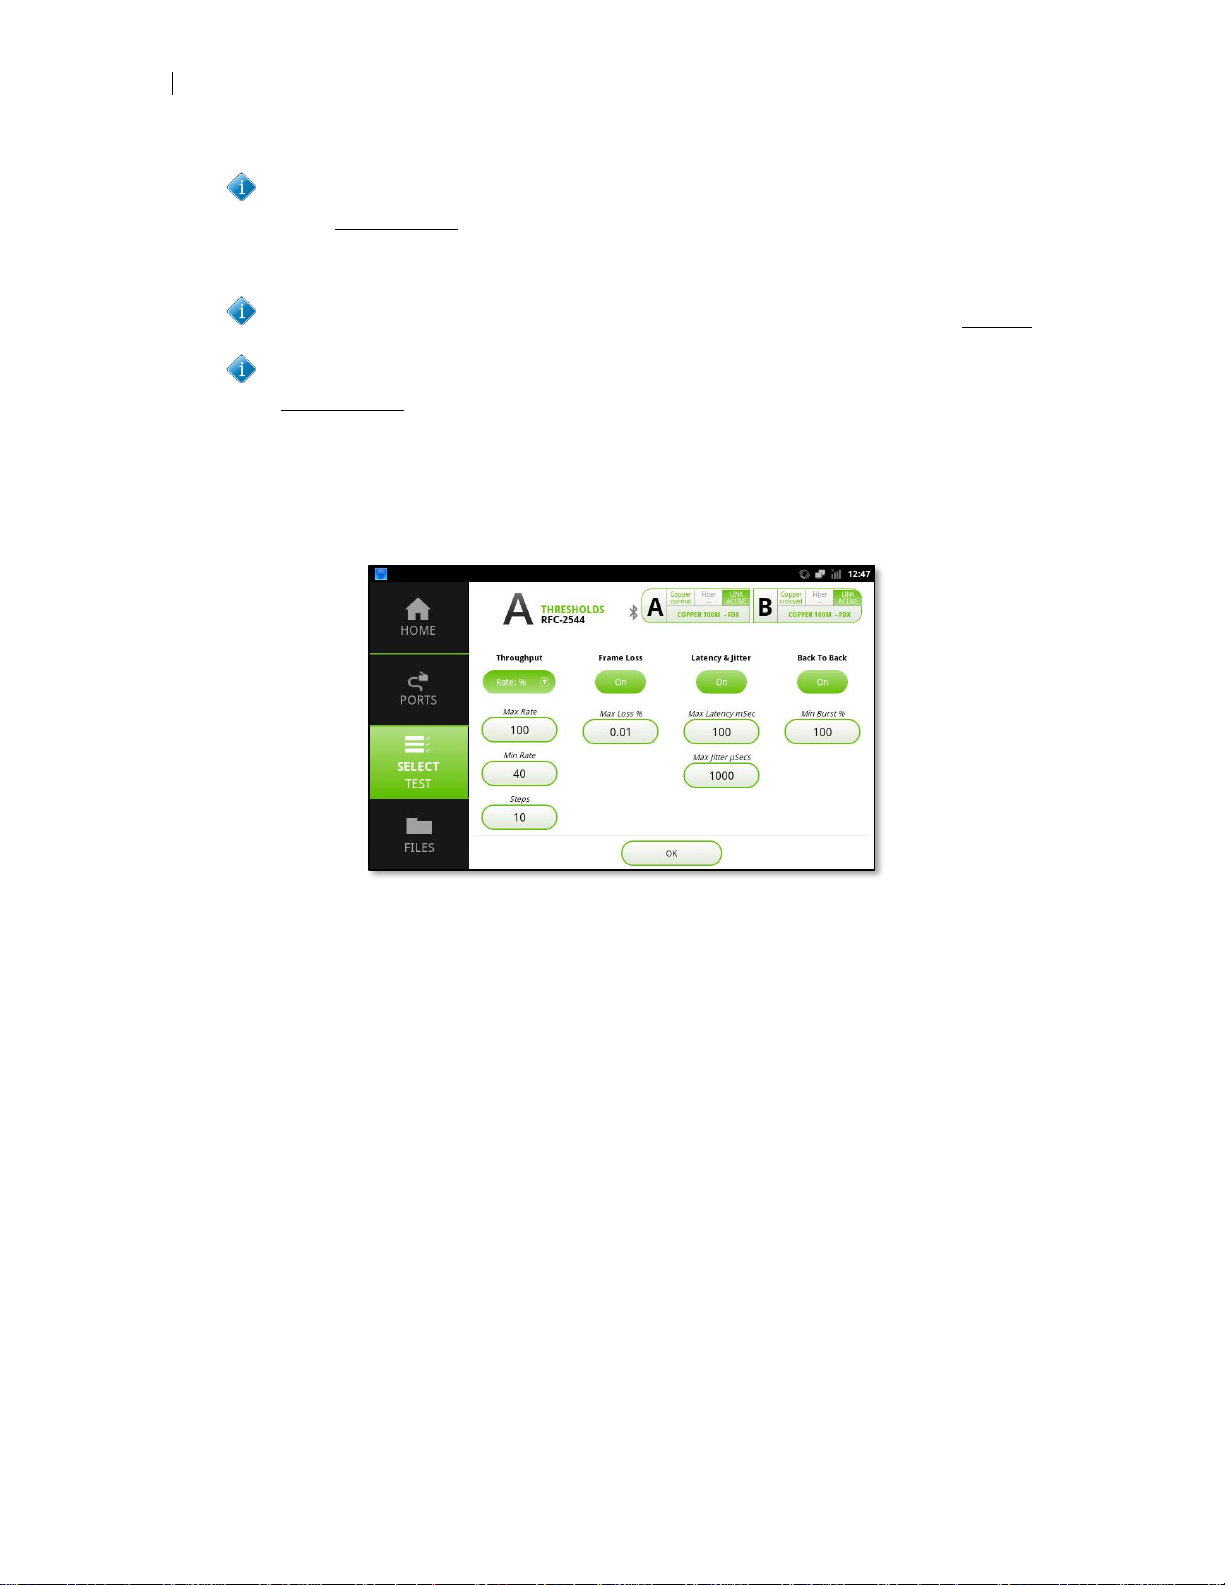
62
RFC-2544
To fully comply with the RFC-2544 recommendation selecting the duration of
each back to back trial should be at least 2 seconds
Trials – Sets the number of test iterations that will be performed
To fully comply with the RFC-2544 recommendation a minimum of 20 latency
trials is required
To fully comply with the RFC-2544 recommendation selecting a minimum of 50
back to back trials is required
Thresholds
Pressing the Thresholds button activates the thresholds view. This enables setting
pass/fail criteria for each test and whether to test against that criteria.
Figure 52 - RFC-2544 Thresholds View
Throughput Rate – Is set to % and cannot be changed
On/Off – Thresholds with these buttons at the top can be selectively enabled or disa-
bled. When the button is on, the test set will measure against the threshold and present a pass/fail result in the test details as well as reports. When off, the threshold is
ignored and “N/A” is displayed in test details and reports.
Max Rate – Sets the maximum rate to transmit test traffic during throughput and frame
loss test. By default, this is set to 100% but it may be desirable to set this to a lower
rate if it is clearly understood the network under test cannot support maximum frame
rates.
Min Rate – Sets the minimum rate at which test traffic must pass without frame loss or
errors. If the minimum rate cannot be achieved error free, the test set aborts testing for
the current frame size under test and displays “Fail” in test details and reports. Minimum rate must be set to less than maximum rate.
Steps – Sets the percent resolution, or delta, of each test sequence if the previous trial
failed.
Page 65

User’s Manual
DataScout 10G
63
Setting smaller steps results in more granular detail regarding precise maxi-
mum throughput of a given frame size but may greatly extend total test time
Max Loss % – Sets the maximum acceptable frame loss before displaying “Fail” in test
details and reports.
Max Latency mSec – Displays the maximum acceptable latency, in milliseconds, be-
fore displaying “Fail” in test details and reports.
Max Latency µSec – Displays the maximum acceptable jitter, in microseconds, before
displaying “Fail” in test details and reports.
Min Burst % – Sets the minimum acceptable 2 second burst deviation from theoretical
maximum burst, before displaying “Fail” in test details and reports.
Minimum burst % is set to 100% by default. This means no deviation is permit-
ted and any frame loss during the back-to-back test will cause the test to fail
due to the total number of frames received in a two second burst is not equal
to the theoretical total possible.
OK – Closes the Thresholds view
Running the RFC-2544 Test
Press the START TEST button to initiate your test. The following gauges and indicators are provided:
Rx Traffic Gauge – The received rate indicator gauge provides an indication test traffic
is being looped back and at what rate. The yellow inner portion of the gauge indicates
the Maximum and Minimum rate selected in the thresholds view
Current Test Status Table – Provides a visual indication of the current test, frame size
and iteration in progress. At the completion of each iteration a Pass/Fail indication will
also be briefly displayed
Total Test Time – Provides an active count of the total test duration and time remain-
ing until the test is completed.
Test Progress – Provides a visual indication of the total progress of each test step
Page 66
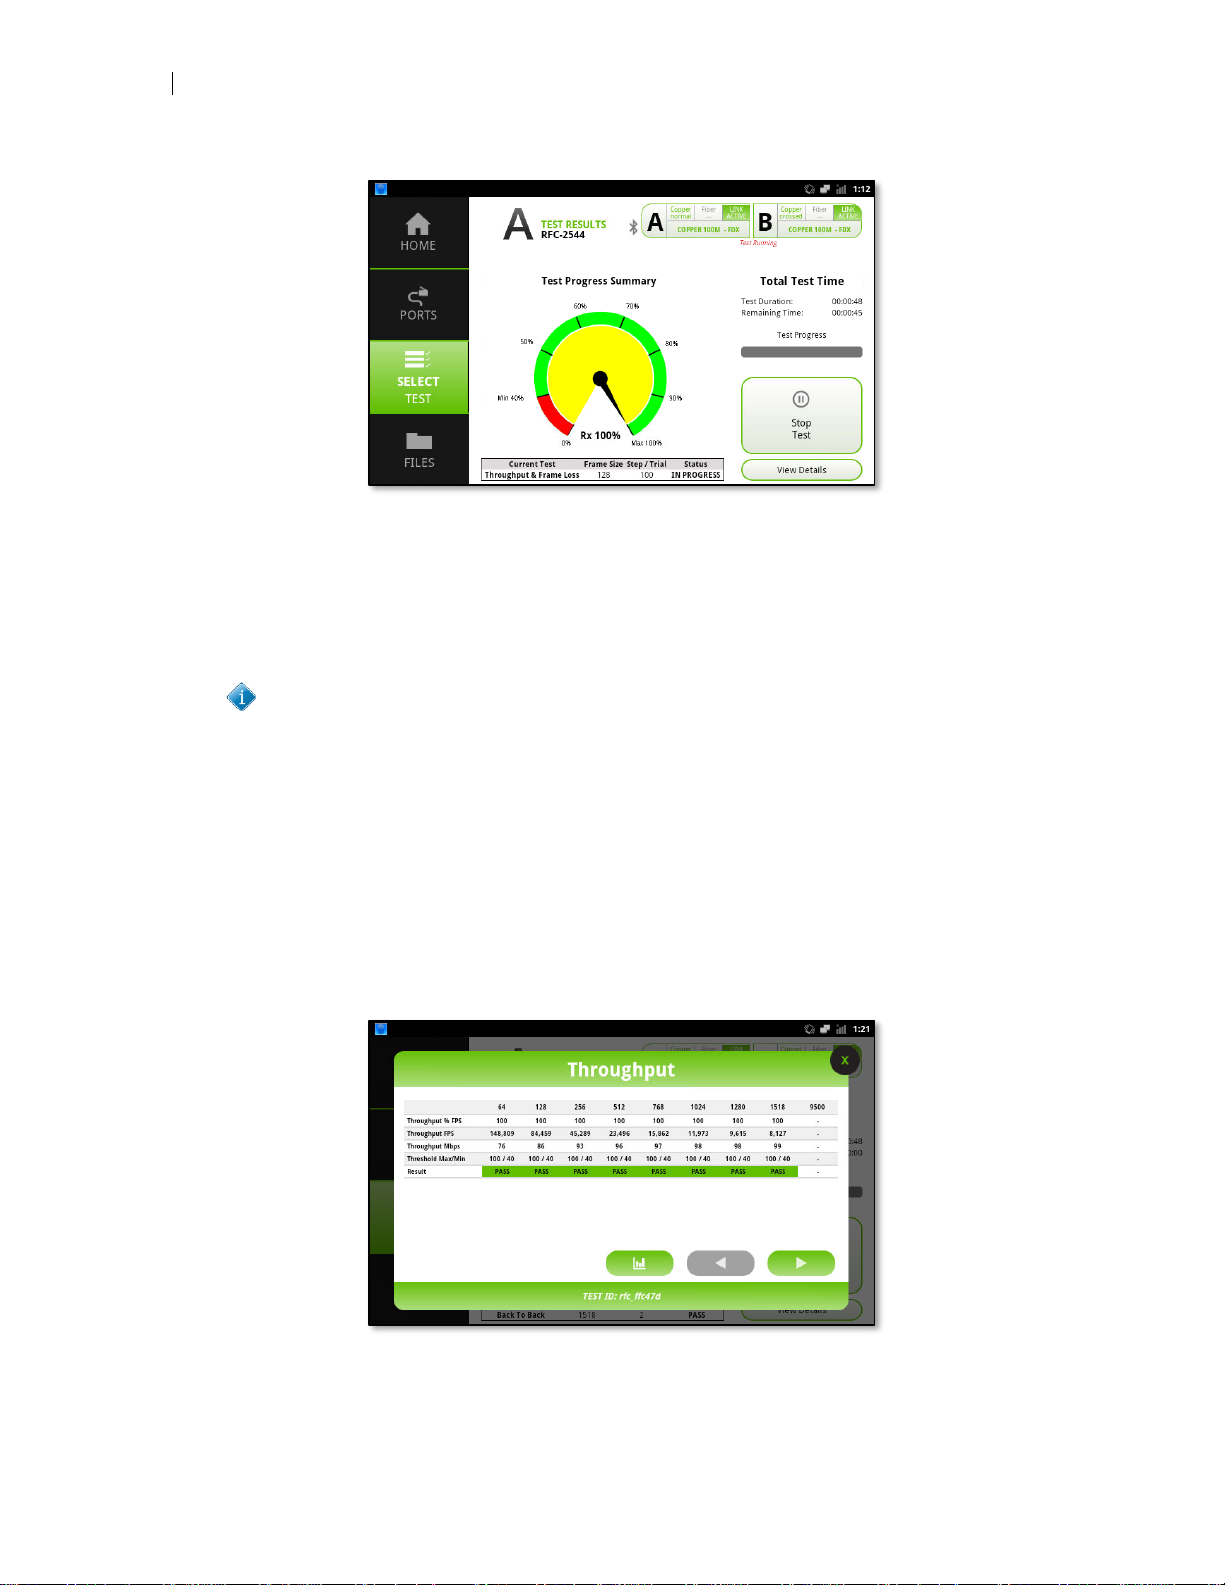
64
RFC-2544
Figure 53 – RFC-2544 Test in Progress
Stop Test – Pressing this button will abort the current test in progress.
View Details – Pressing the button activates the test result popover view. If the test is
currently running not all statistics will be populated in real time so it is recommended to
wait until the test completes, which will automatically display test results.
You may need to run quick test once when first connected to a HUB or
SWITCH so the device can learn the MAC address of the test device.
RFC-2544 Test Results
The RFC-2544 test popover view provides several pages of detailed test result tables
and graphics. Press the right arrow button to access additional test details.
Table/Graphic – Pressing this button alternates between displaying test results in tab-
ular form or graphical form. Multiple graphics may be available depending on the test
selected.
Figure 54 - RFC-2544 Results Table View
Page 67
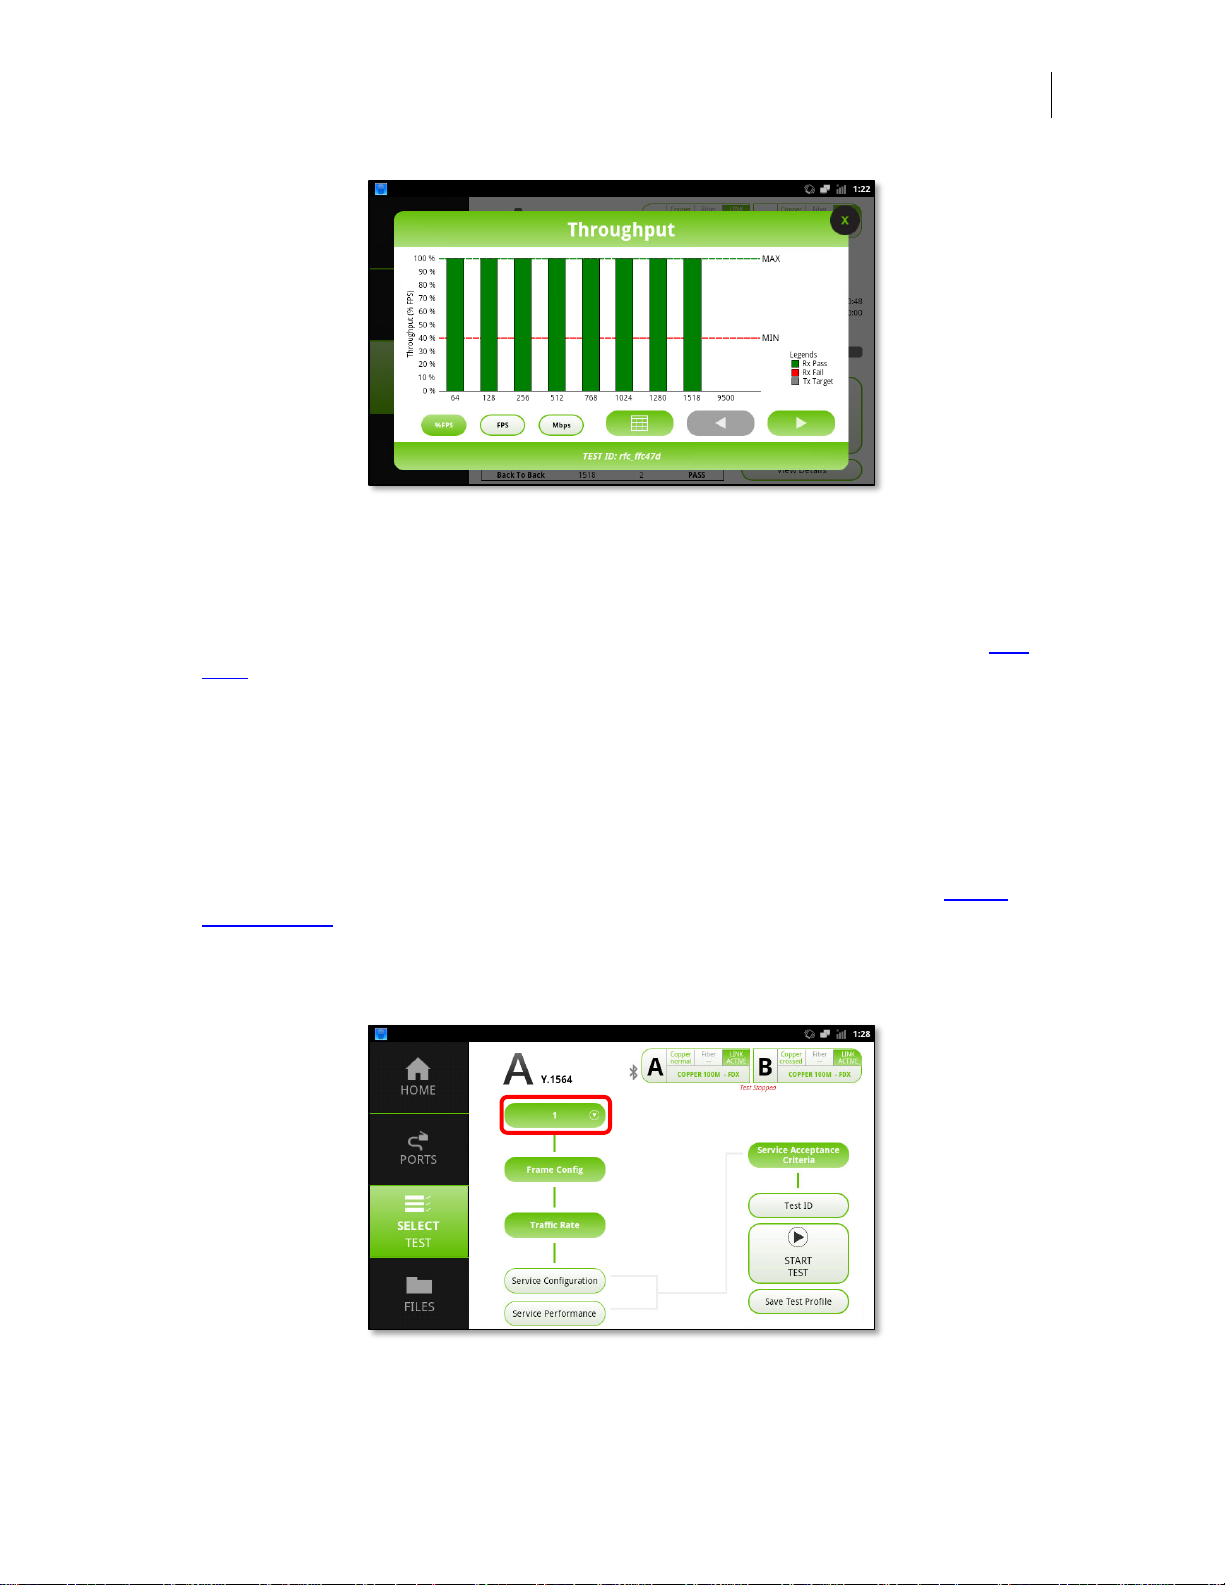
User’s Manual
DataScout 10G
65
Figure 55 - RFC-2544 Results Graphic View
ITU-T Y.1564
This test is only activated when feature option DS10G-SW-ADV is purchased. This option can be activated in the field by entering a valid license key as detailed in the Set-
tings section above. The ITU-T Y.1564 test enables generation of up to 16 unique ser-
vices, verifying conformance to the subscriber Service Level Agreement (SLA). Each
service can have a different:
► Frame configuration (frame type, size, VLAN, MPLS or IP type)
► Traffic rate
Frame Configuration
Frame configuration is similar as detailed in the General Test Configuration, Frame
Configuration section above with the following differences:
# of Services – This menu button enables selecting how many services the test unit
will generate. Valid options are 1-16 services.
Figure 56 – ITU-T Y.1564 Main View
Page 68
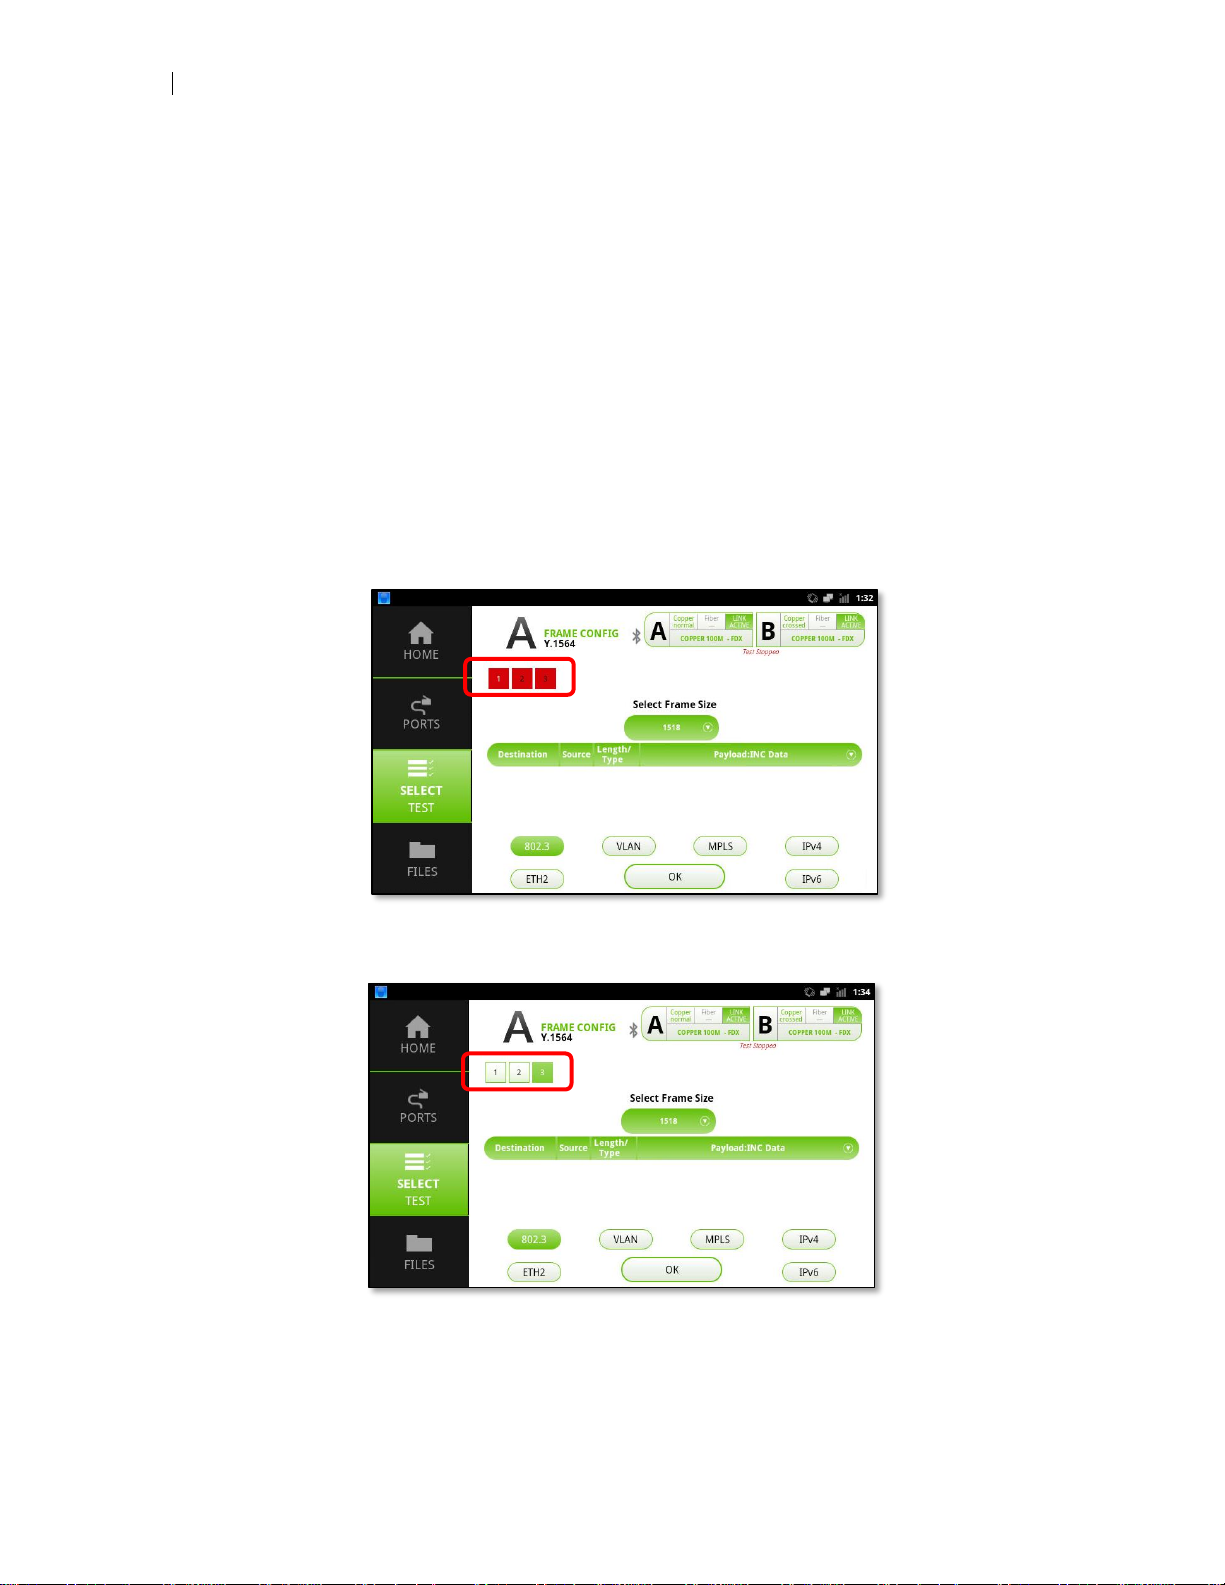
66
ITU-T Y.1564
When the frame configuration view is activated, a series of service selection buttons
will be displayed above the frame configuration bar. Press the desired service to configure settings for the selected stream.
Each stream must be configured to be unique from all other streams using any one or
combination of the following:
► Different 802.3 or ETH2 framing
► Different destination or source MAC
► Different VLAN configuration
► Different MPLS configuration
► Different IPv4 or IPv6 destination or source
Stream buttons that do not contain a unique setting will be colored red. Changing the
configuration and then selecting another stream will validate the configuration again.
Continue adjusting settings until all streams are displayed outlined in Green.
Figure 57 - Invalid ITU-T Y.1564 Configuration
Figure 58 - Valid ITU-T Y.1564 Configuration
Page 69
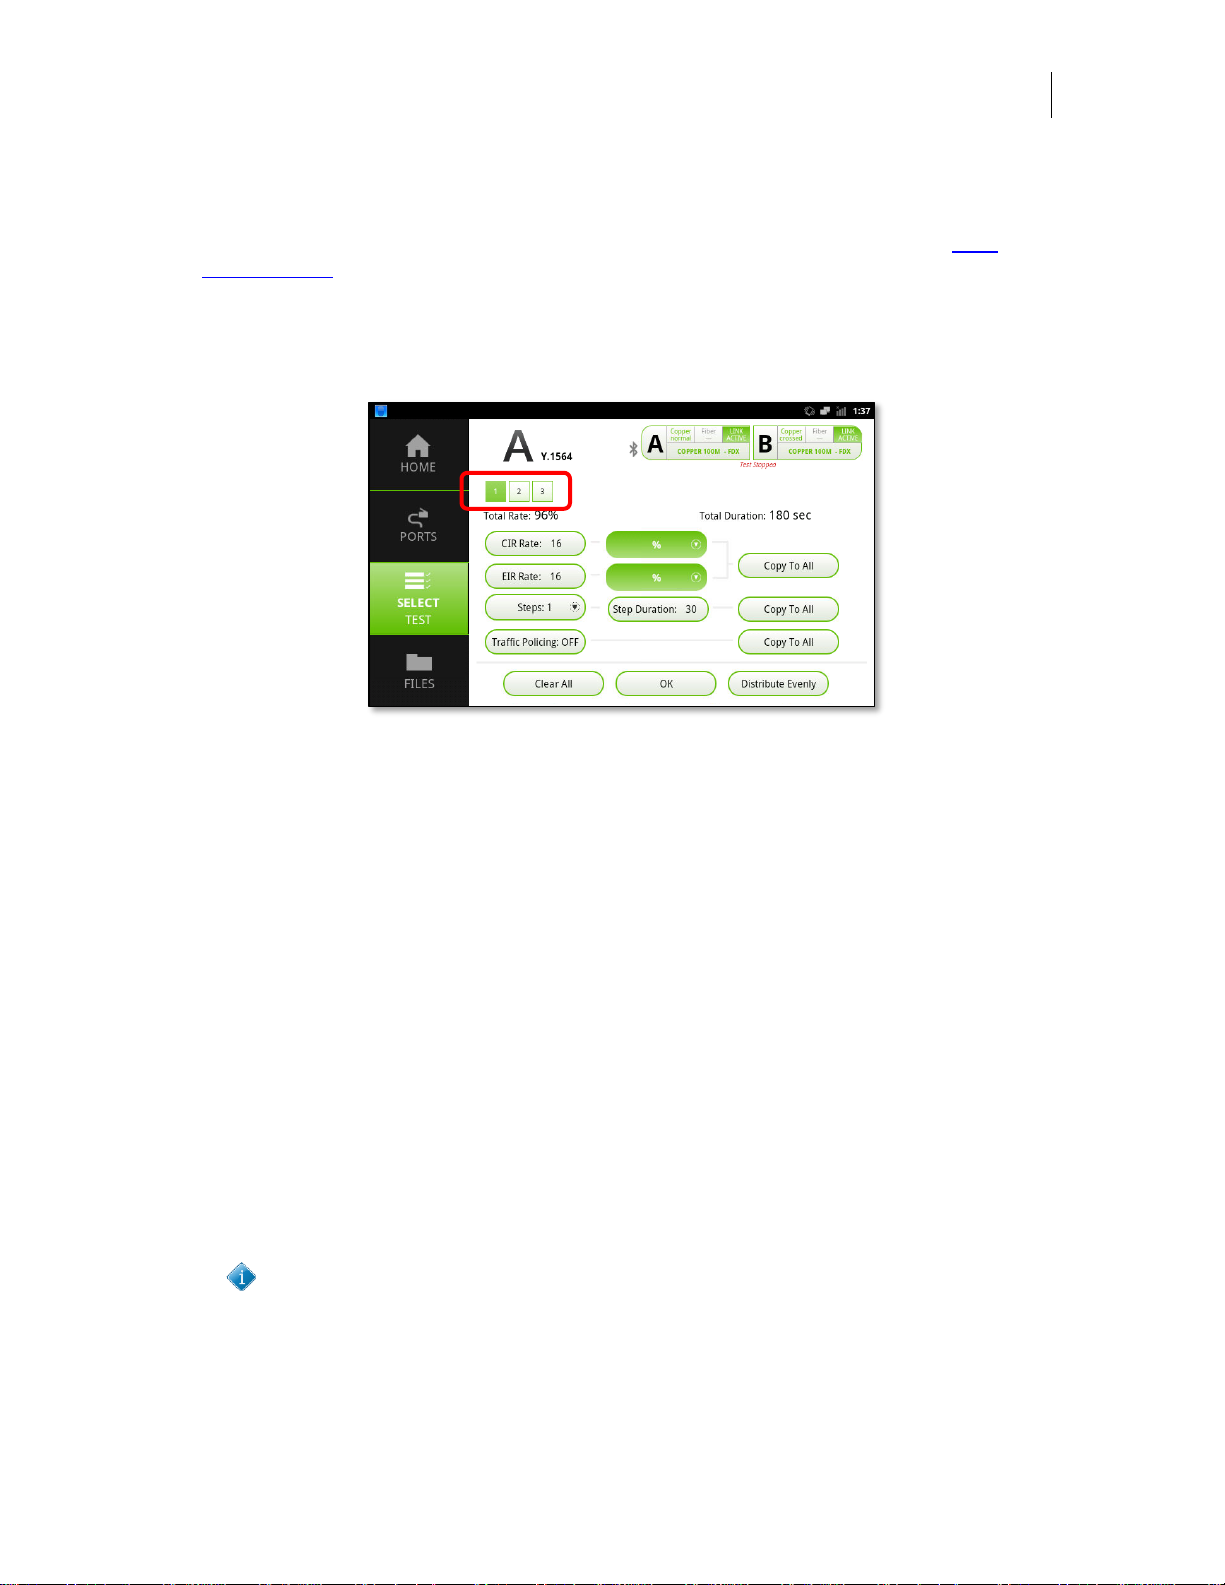
User’s Manual
DataScout 10G
67
Traffic Rate Configuration
Rate configuration is similar to as detailed in the General Test Configuration, Rate
Configuration section above with the following differences:
When the rate configuration view is activated, a series of stream selection buttons will
be displayed above the rate selection button. Press the desired stream to configure
rate settings for the selected stream.
Figure 59 – ITU-T Y.1564 Traffic Rate Configuration
CIR Rate – When pressed, sets the Committed Information Rate (CIR) of the service
EIR Rate – When pressed, sets the Excess Information Rate (EIR) of the service. Set-
ting EIR to 0 disables EIR measurement
% – When pressed for either CIR or EIR rate, sets whether the rate is displayed in %,
Kbps, Mbps or Gbps. Depending on the line rate selected, not all selections may be
active
Steps – When pressed, this button enables configuring the number of steps the test
set should take when ramping up to CIR rate
Step Duration – This field sets the duration for each test step iteration. It also sets the
duration for EIR and Traffic Policing test iterations
Traffic Policing – When pressed, this button toggles between on and off. When on,
the test set assumes a traffic policer exists on the network under test and attempts to
transmit above CIR or CIR+EIR depending on configuration. When off, the test set assumes a traffic policer does not exist on the network under test and will not transmit
above CIR or CIR+EIR
To comply with ITU-T Y.1564, if EIR < 20%*CIR, the traffic policing rate gener-
ated will be 125%*CIR + EIR. When EIR > 125% of CIR, traffic policing rate
generated will be equal to CIR + 125% EIR.
Page 70
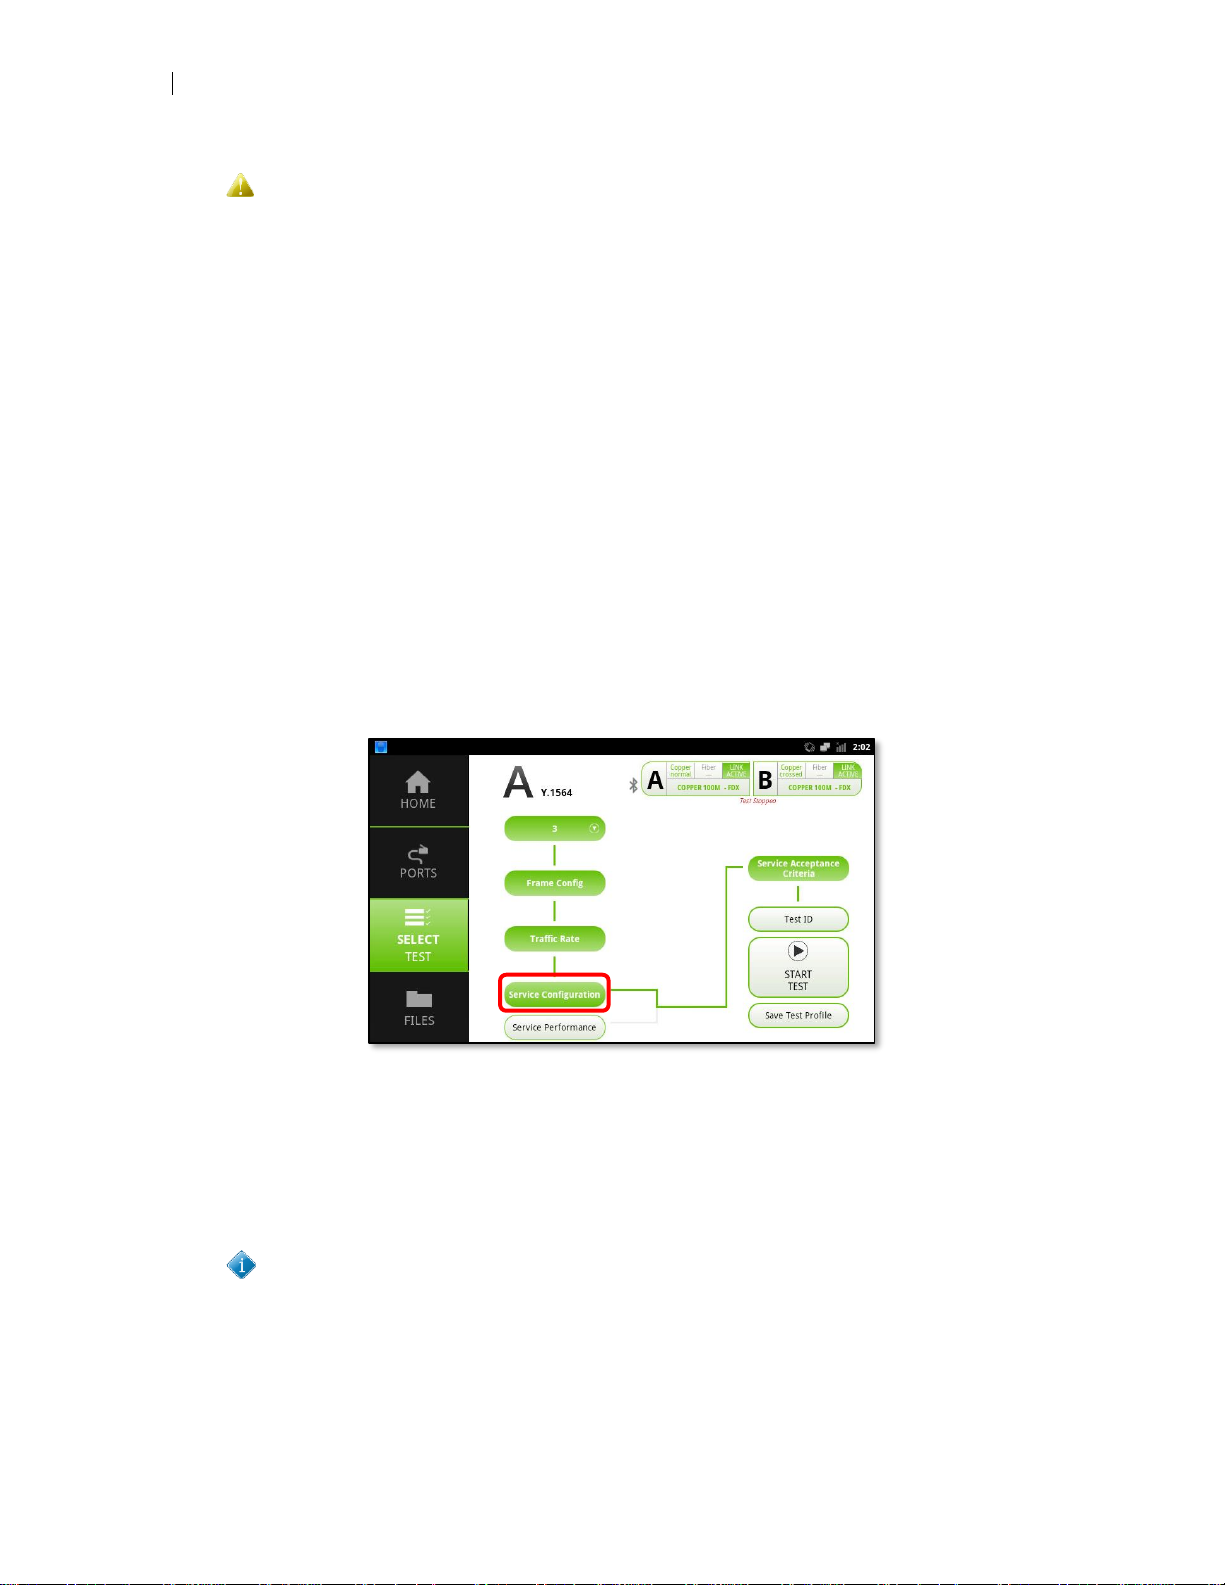
68
ITU-T Y.1564
Activating the traffic policing test when a traffic policer is not present on the
network under test will always result in failing test results. The test set is actively testing for the policer to prevent overshoot traffic more than CIR+EIR.
Because the network will accept the overshoot traffic the test set will detect this
and declare the test a failure.
Copy To All – When pressed for CIR, EIR, or Traffic Policing, this button will copy the
value entered in the respective field to all services
Clear All – When pressed, this button will clear out all custom values and reset to the
default values
Distribute Evenly – When pressed, this button will distribute the total line rate across
all streams evenly
OK – Closes the Traffic Rate view
Service Configuration Test
Pressing the Service Configuration button will toggle on or off the service configuration test. When on, the test set will test each service individually to confirm it is configured properly and meeting the SLA for the service under test.
Figure 60 - Service Configuration On/Off Button
Service Performance Test
Pressing the Service Performance button will toggle on or off the service performance
test. When on, the test set will test all services simultaneously to confirm the services
meet the SLA for all services under test.
To comply with ITU-T Y.1564, if the Service Configuration Test fails for any
service, the performance test will not be performed.
Page 71
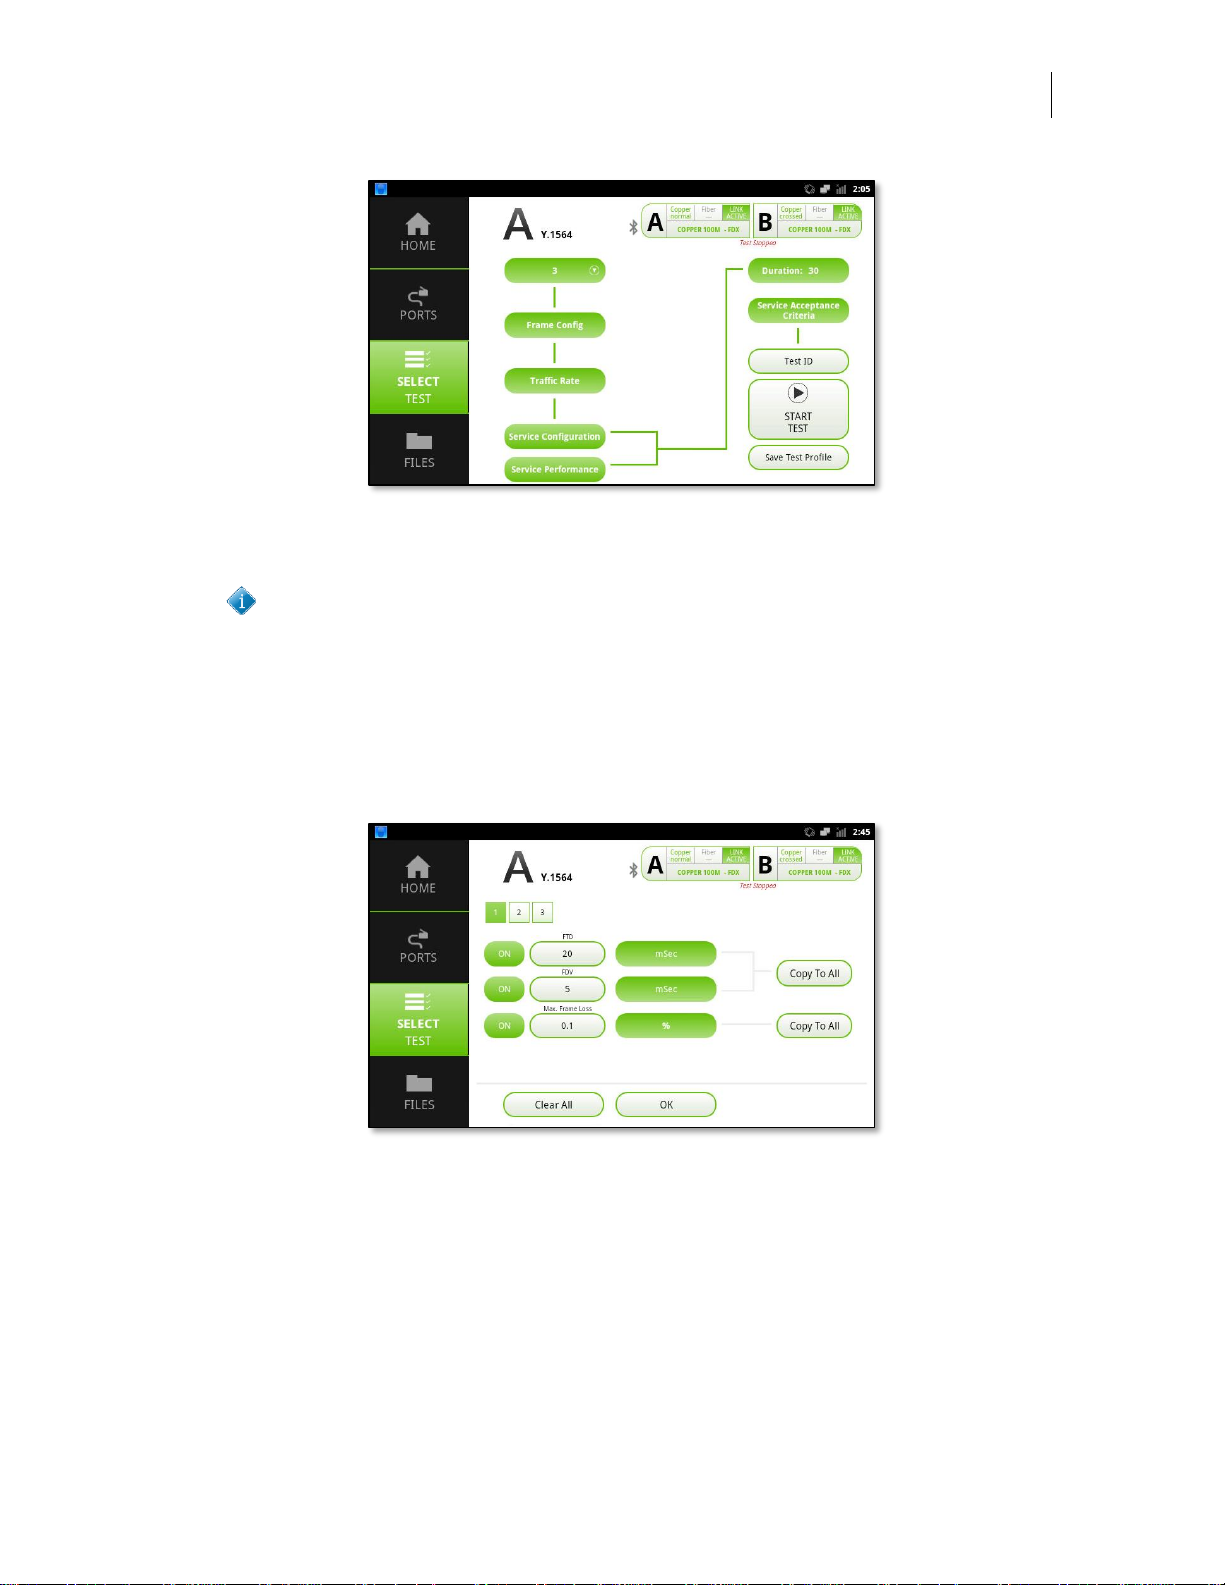
User’s Manual
DataScout 10G
69
Figure 61 - Service Performance On/Off Button
Step Duration – This field sets the duration for the service performance test
To comply with ITU-T Y.1564, the Service Performance test should be per-
formed for at least 15 minutes (900 seconds).
Service Acceptance Criteria
Pressing the Service Acceptance Criteria button activates the service acceptance cri-
teria view. This enables setting pass/fail criteria for each service and whether to test
against that criteria.
Figure 62 - Service Acceptance Criteria View
On/Off – When the button is on, the test set will measure against the criteria and pre-
sent a pass/fail result in the test details as well as reports. When off, the criteria is ignored and “N/A” is displayed in test details and reports
FTD – Displays the maximum acceptable frame transfer delay (latency), in millisec-
onds, before displaying “Fail” in test details and reports
FDV – Displays the maximum acceptable frame delay variation (jitter), in milliseconds,
before displaying “Fail” in test details and reports
Page 72

70
ITU-T Y.1564
Max Frame Loss – Sets the maximum acceptable frame loss before displaying “Fail”
in test details and reports
Copy To All – When pressed for any criteria, this button will copy the value entered in
the respective field to all services
Clear All – When pressed, this button will clear out all criteria values and reset to the
default values
OK – Closes the Service Acceptance Criteria view
Test Mode
Test mode configuration is detailed in the General Test Configuration, Test Mode section above.
Test ID
Test ID configuration is similar to detailed in the General Test Configuration, Test ID
section above with the following differences:
► Tests are not automatically saved. Instead, the SAVE RESULTS button must
be press on the test result popover view as shown below.
Test Profile
Test Profile configuration is detailed in the General Test Configuration, Test Profile
section above.
Running the ITU-T Y.1564 Test
Press the START TEST button to initiate your test. The following gauges and indicators are provided:
Service Icons – Service icons provide a visual reminder of the number of streams the
tester is currently generating. The following indicators are provided for each service:
► Pending services will be displayed outlined in yellow
► Services currently under test will display a yellow cog
► Services with passing test results will be highlighted green
► Services with failing test results will be highlighted red
Rx Traffic Gauge – The received rate indicator gauge provides an indication test traffic
is being looped back and at what rate. CIR traffic segments are colored green, EIR is
colored yellow and Traffic Policing segments are colored red
Step Progress – Provides a visual indicator of the total percent complete for the cur-
rent step under test
Test Duration – Provides total test duration
Remaining Time – Provides time remaining until the test is completed
Page 73
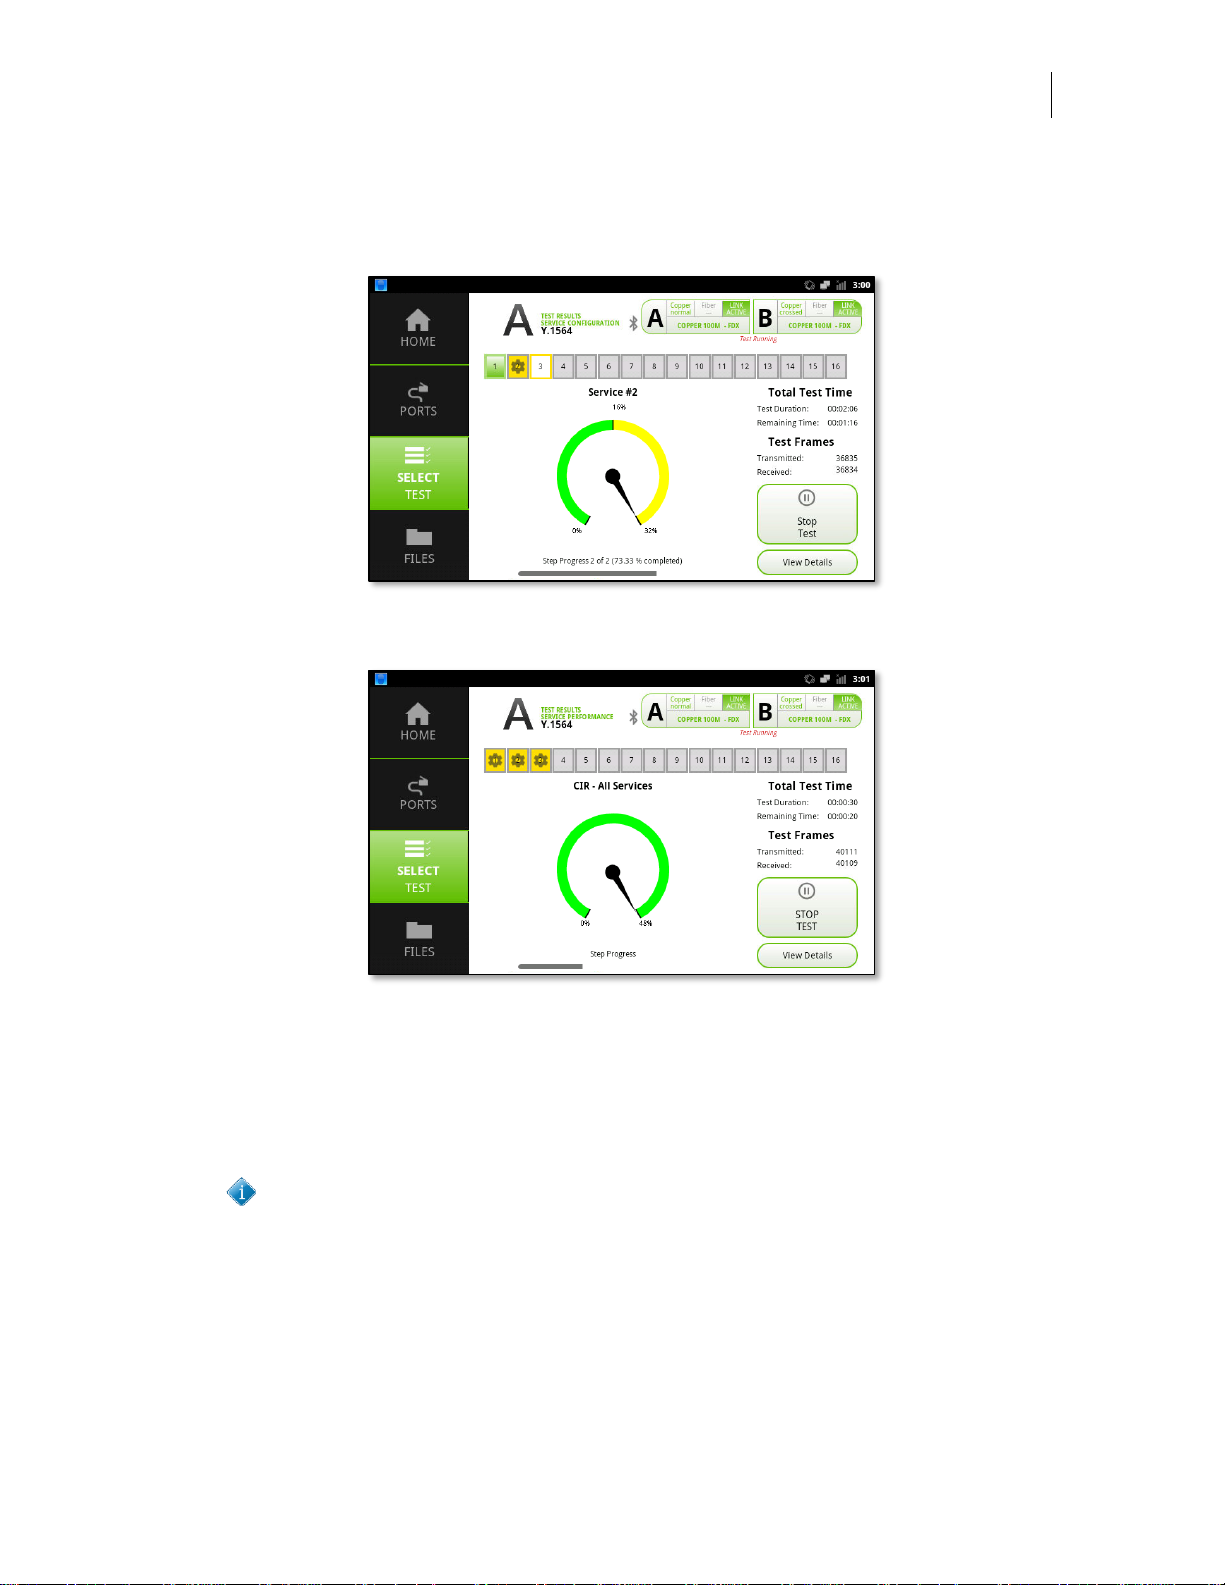
User’s Manual
DataScout 10G
71
Test Frames – Provides an active count of the number of transmitted and received
frames. Counts update once per second so a minor discrepancy may be displayed
while the test is actively running.
Figure 63 - ITU-T Service Configuration Test in Progress
Figure 64 - ITU-T Service Performance Test in Progress
Stop Test – Pressing this button will abort the current test in progress.
View Details – Pressing the button activates the test result popover view. If the test is
currently running not all statistics will be populated in real time so it is recommended to
wait until the test completes, which will automatically display test results.
You may need to run quick test once when first connected to a HUB or
SWITCH so the device can learn the MAC address of the test device.
ITU-T Y.1564 Test Results
The ITU-T Y.1564 test popover view provides both summary and detailed test results
and statistics for configuration and performance tests. Several report views are available:
Page 74
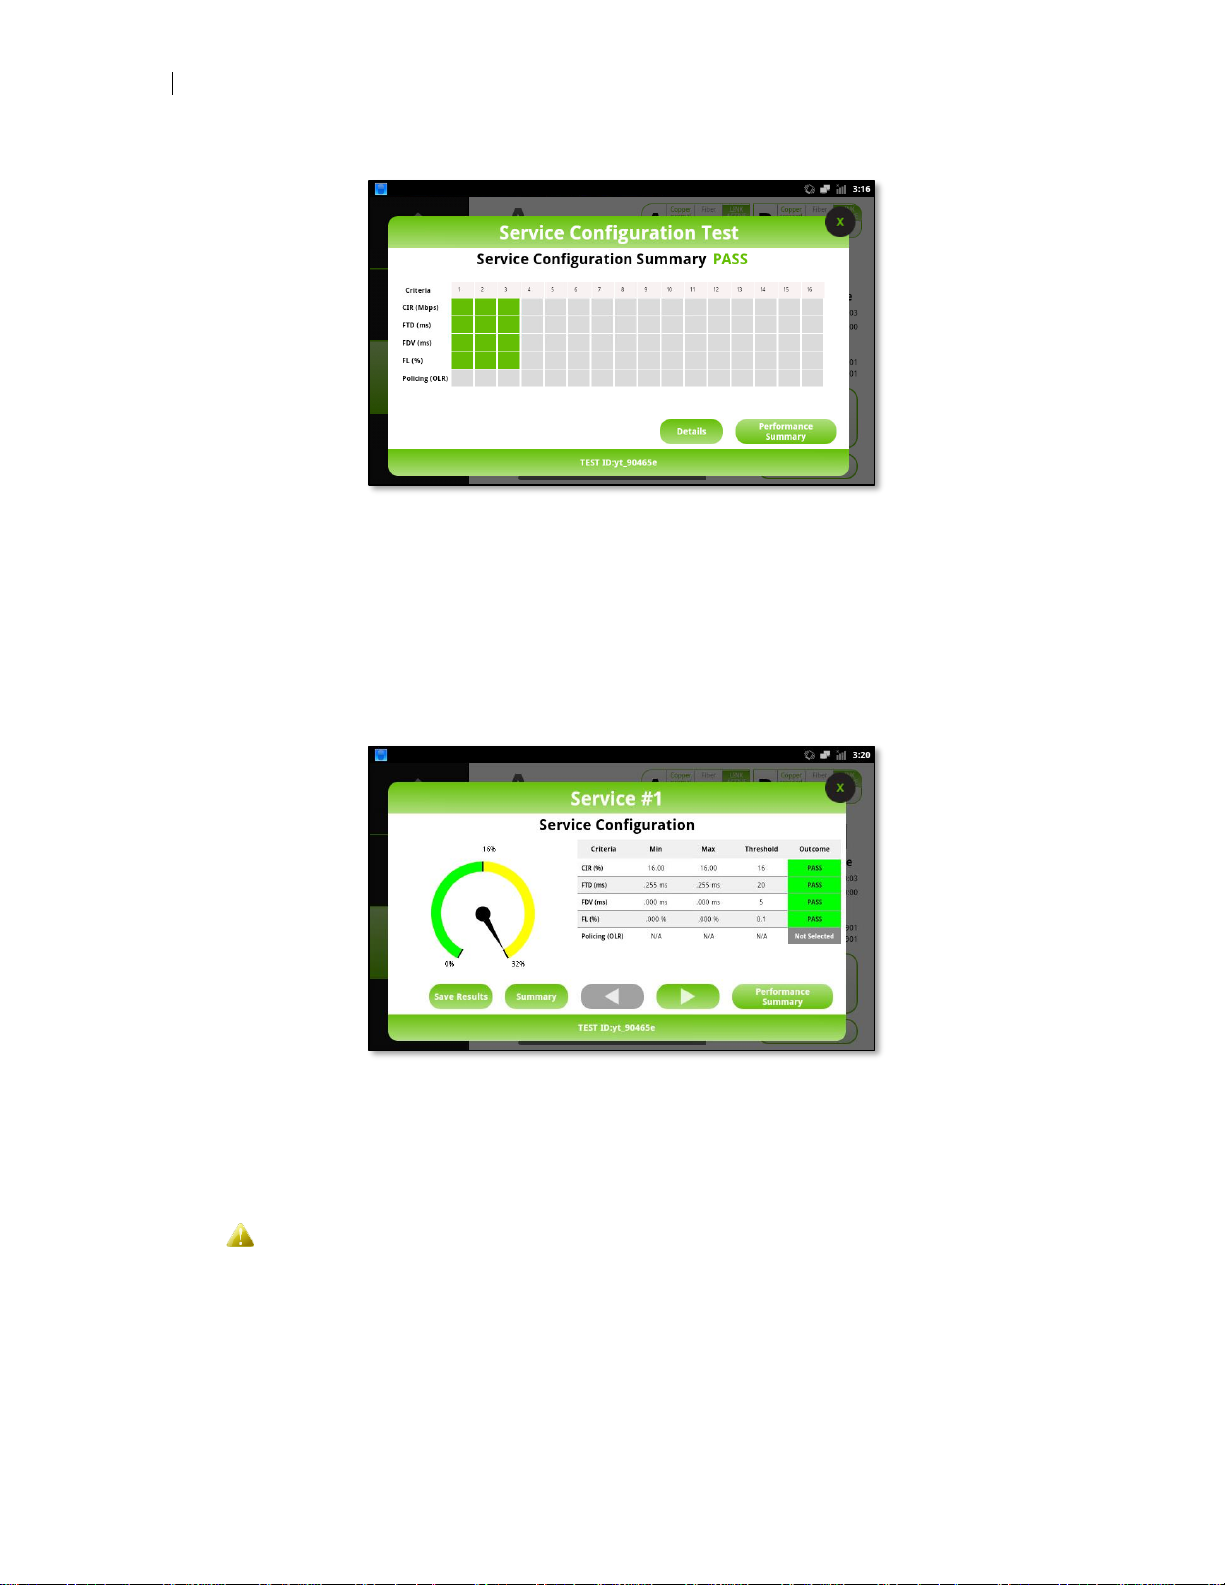
72
ITU-T Y.1564
Figure 65 - ITU-T Y.1564 Service Configuration Summary Results
Service Configuration Summary Results – Display a visual scorecard of key perfor-
mance metrics for each service in a consolidated view. Passing result cells in the table
are shaded green, failing result cells are shaded red and inactive services or tests are
shaded gray.
Details – Press the details button to view service configuration detailed test results for
each service
Figure 66 - ITU-T Y.1564 Service Configuration Detail Results
Service Configuration Detail Results – Display a detailed results of service ac-
ceptance criteria for each service.
Save Results – When pressed this button saves test results for all services and tests
ITU-T Y.1564 test results accumulate a large amount of statistics and can take
up to a minute to store results for 16 services. Once the save test button is
pressed the process cannot be aborted
Summary – Press the summary button to return to the service configuration summary
view
Arrow Buttons – Moves to the next or previous service detailed test results
Page 75
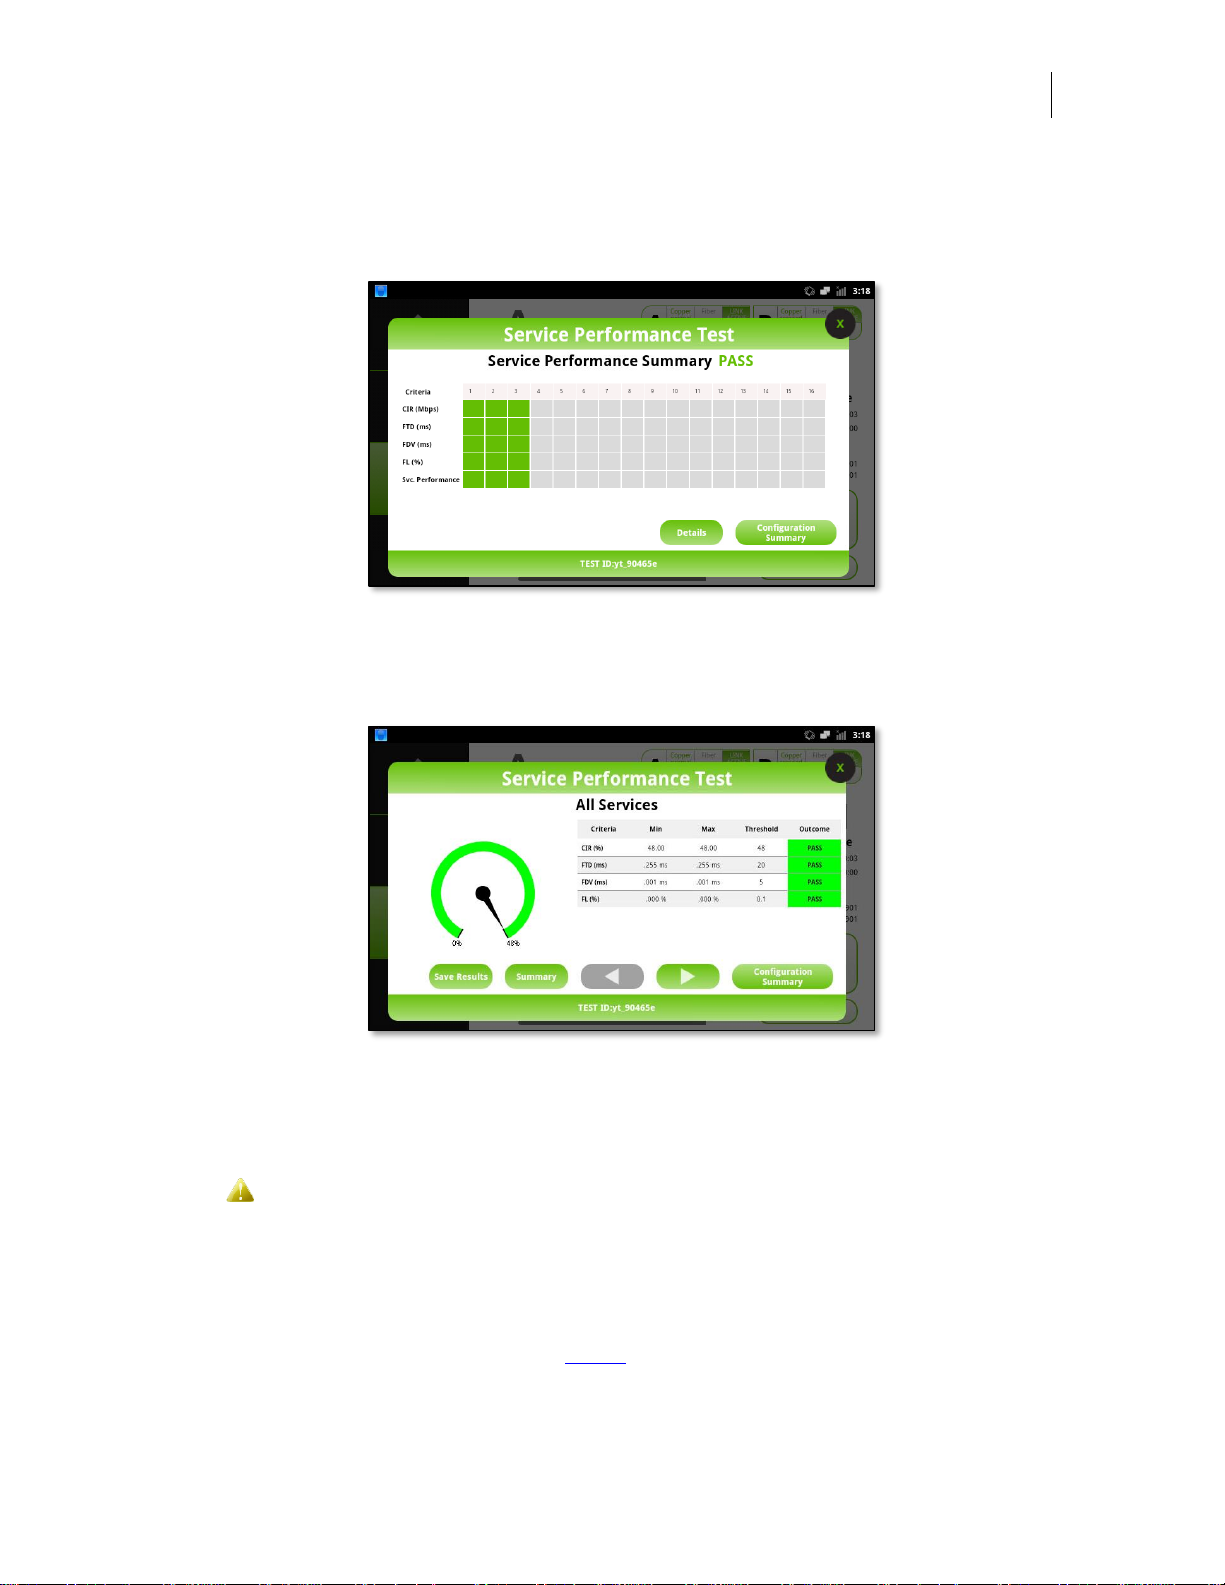
User’s Manual
DataScout 10G
73
Performance Summary – Displays a visual scorecard of key performance metrics for
each service in a consolidated view. Passing result cells in the table are shaded
green, failing result cells are shaded red and inactive services or tests are shaded gray
Figure 67 - ITU-T Y.1564 Service Performance Summary Results
Details – Press the details button to view service performance detailed test results for
each service
Figure 68 - ITU-T Y.1564 Service Performance Detail Results
Stream Buttons – Pressing a stream button displays statistics for the selected stream
Save Results – When pressed this button saves test results for all streams
Multi Stream test results accumulate a large amount of statistics and can take
up to a minute to store results for 16 streams. Once the save test button is
pressed the process cannot be aborted
Advanced Loopback
Port A loopback operates similarly to Port B loopback but provides advanced loopback
control capability:
Page 76
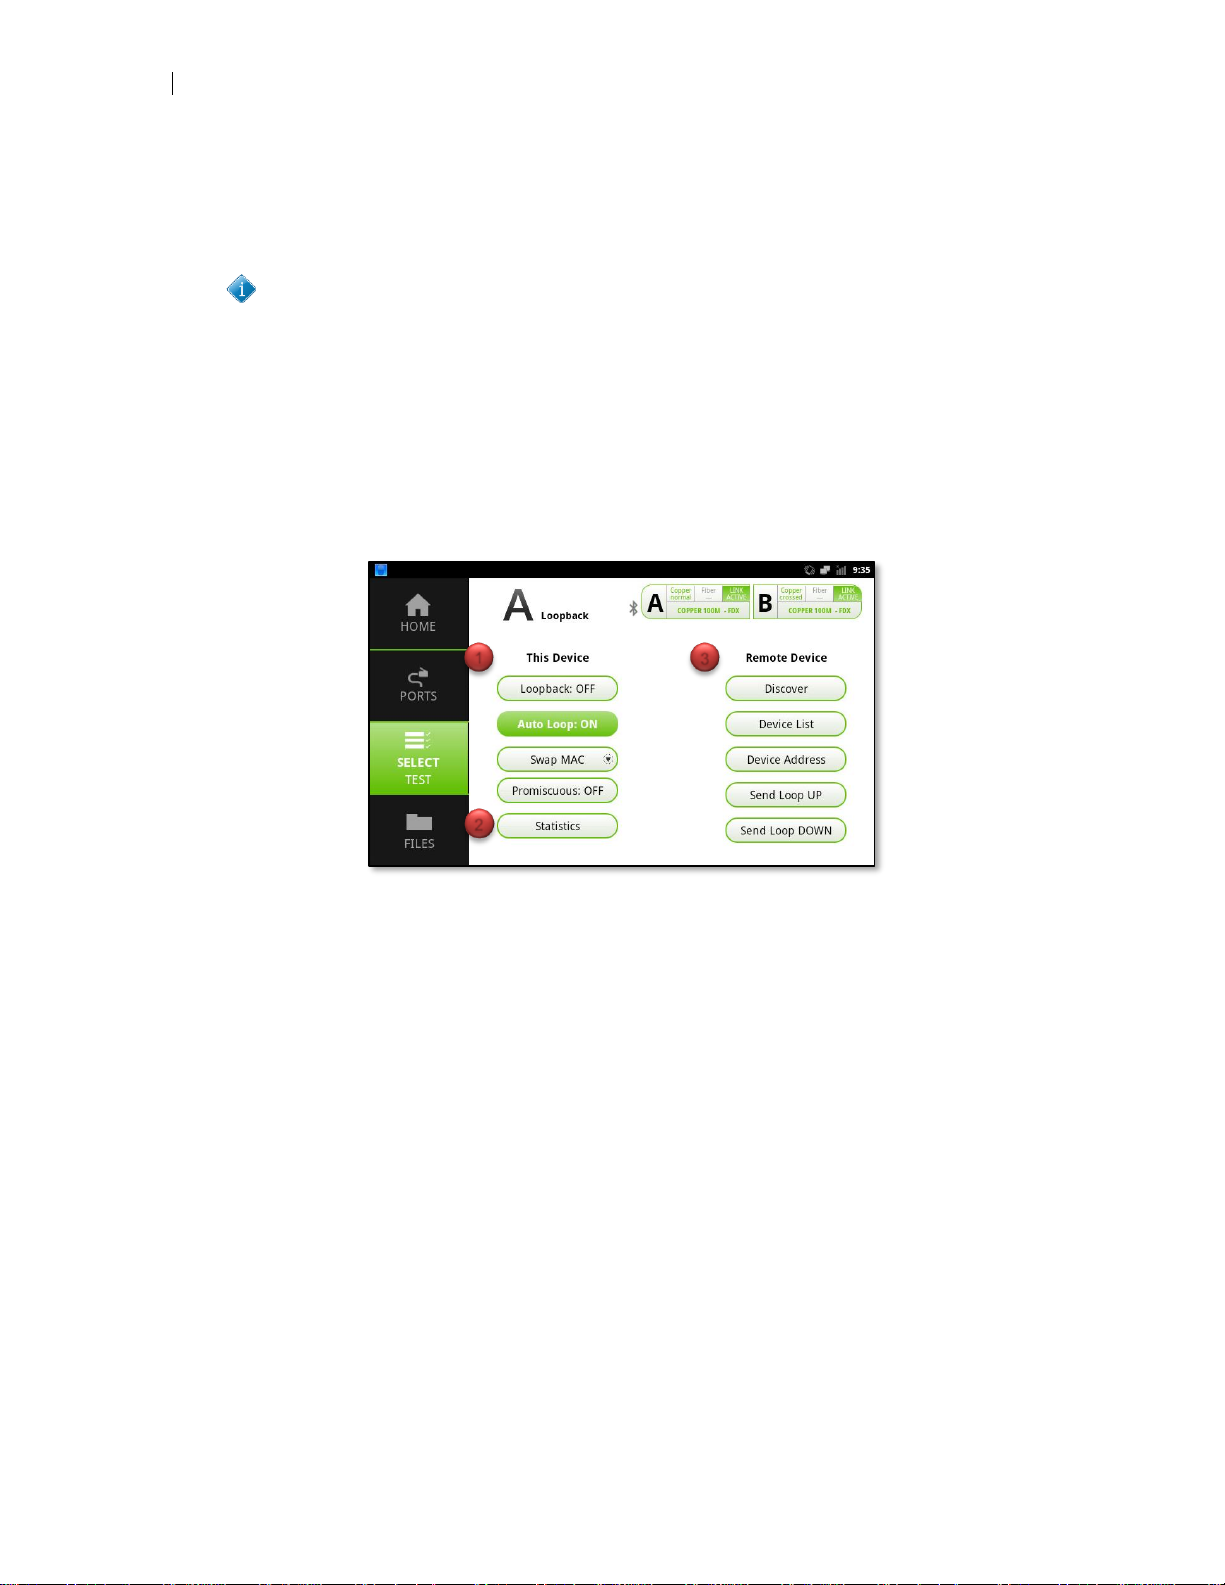
74
Advanced Loopback
► Support for 10Gbps loopback
► Query and discover up to six different remote devices
► Send loop up and down commands to individual devices
The advanced loopback feature is compatible with both Greenlee DataScout
test units and JDSU/Viavi™ test units
Configuration
The Port A advanced loopback view has three sections of note:
1. This Device configuration
2. This Device Statistics view
3. Remote Device query and control
Figure 69 – Advanced Loopback View
This Device Configuration
Loopback On/Off – This button manually turns loopback mode on or off. When on,
the test set will reflect traffic coming into Port B. When off, the port will not loopback
traffic.
Auto Loop On/Off – This button determines whether Port B will respond to loopback
queries received from remote devices. When auto loop is on, Port B will respond to
queries and loop up/down commands received from compatible devices. When auto
loop is off, Port B will not respond to queries or loop up/down commands
Swap IP Address – This button, when enabled, instructs Port B to swap the source
and destination IP addresses of received traffic
Swap MAC/IP Address – This menu button, when set to MAC, instructs Port A to
swap the source and destination MAC addresses of received traffic. When set to IP, it
instructs Port A to swap both source and destination MAC and IP addresses of received traffic
1 3 2
Page 77
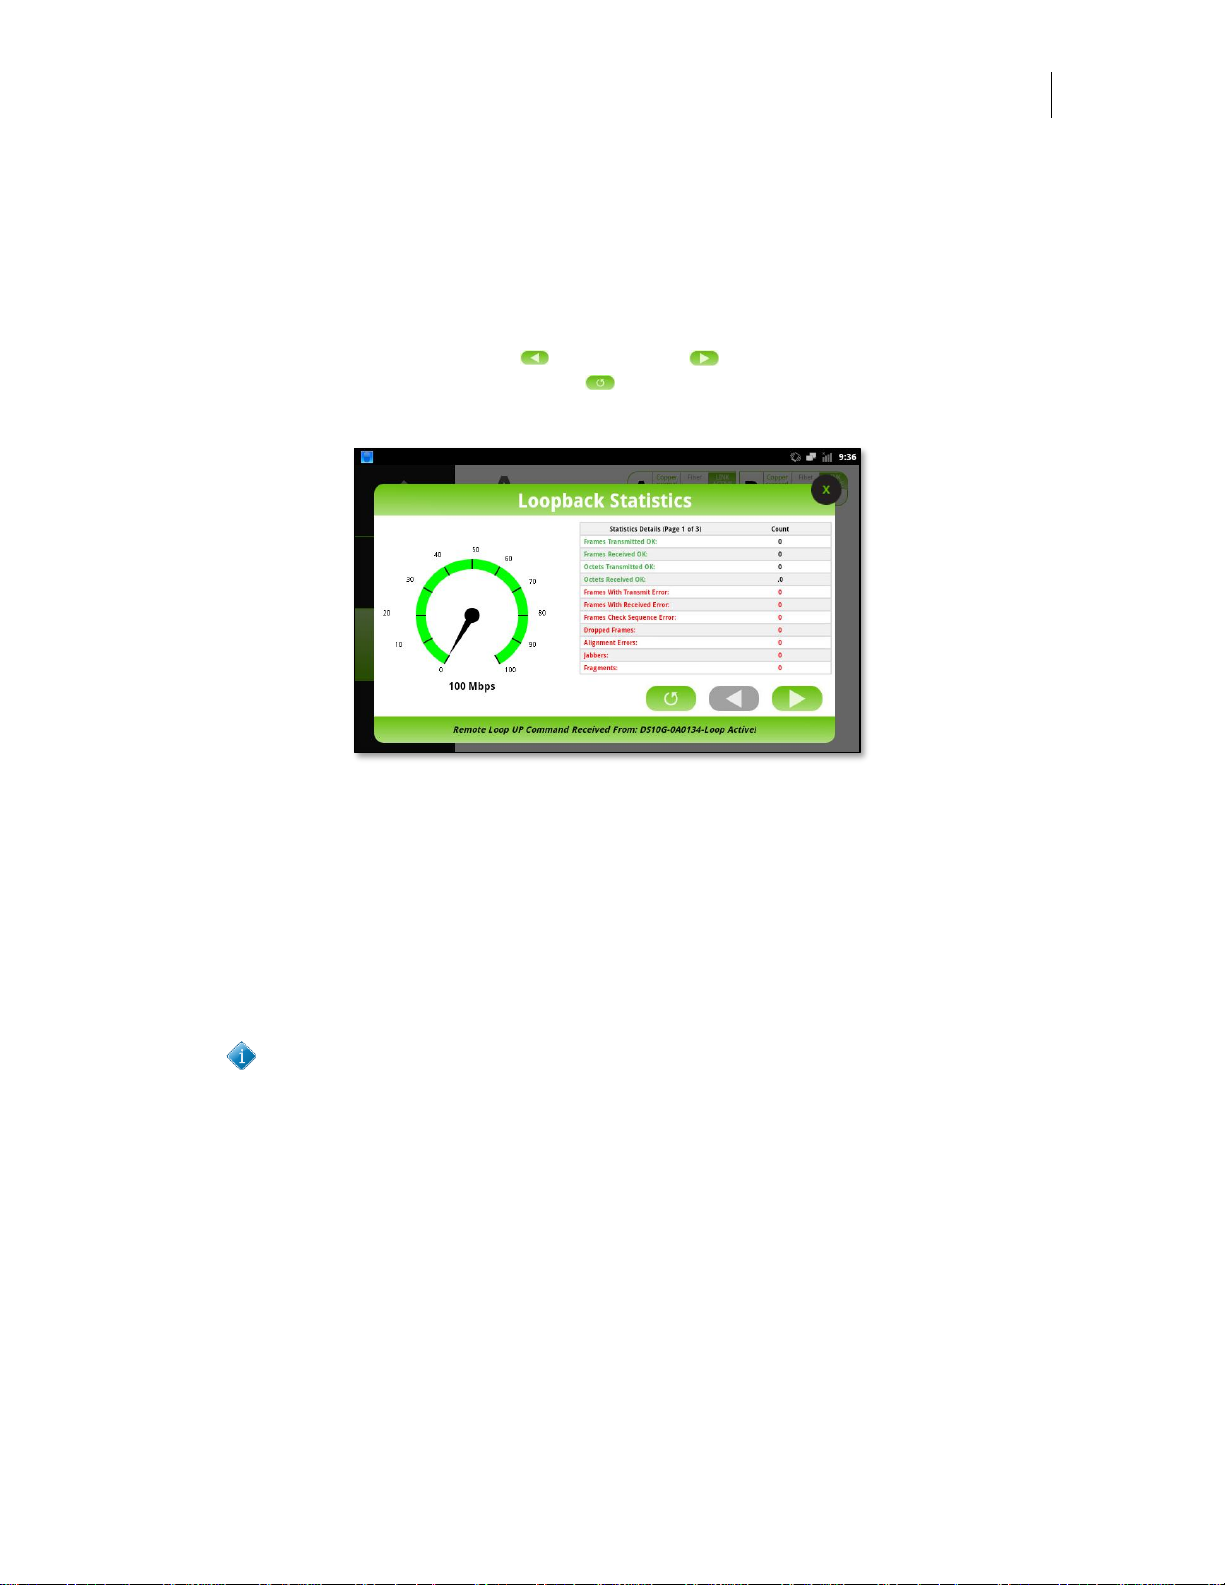
User’s Manual
DataScout 10G
75
Promiscuous Mode On/Off – This button, when enabled, instructs Port A to reflect all
traffic received, even if the traffic is not addressed to Port A specifically. This includes
unicast, multicast and broadcast traffic
This Device Statistics View
Pressing the statistics button will activate a popover view displaying the current loopback statistics. Pressing the left or right arrow buttons will display the previous
or next page of statistics. Pressing the reset button will reset counts back to zero.
The speedometer reflects the current percentage, from 0 to 100%, of received traffic.
Figure 70 - Port A Statistics View
Remote Device Query and Control
Several options are available in the Remote Device column of advanced loopback:
Discover – This button, when pressed, instructs the test set to send out a query to all
loopback devices requesting their address information and current loopback status. Up
to six remote devices may respond. If more than six remote devices are available the
first six devices to respond will be displayed.
It takes up to thirty seconds for network link and routing to be established on a
network device. Pressing Discover before waiting at least thirty seconds for
the link to “settle” may result in time out error messages. If this occurs, wait at
least thirty seconds before pressing the Discover button again.
Page 78
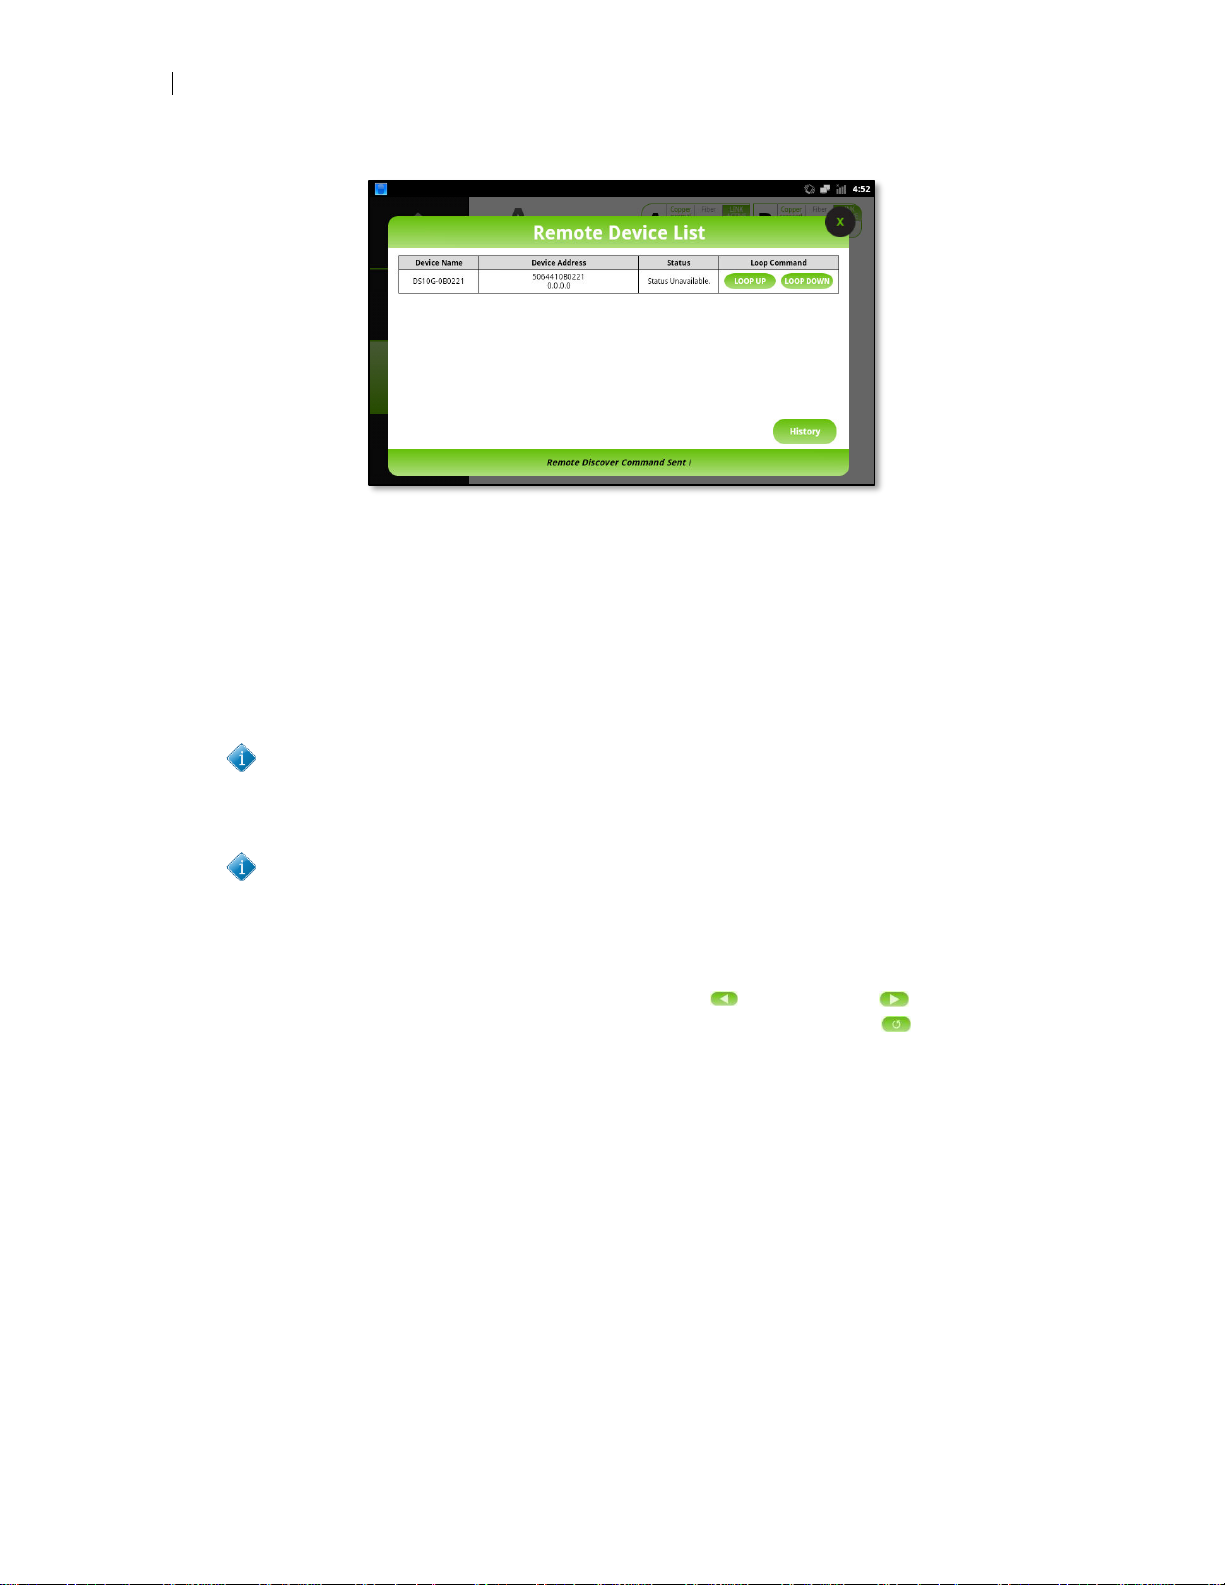
76
Advanced Loopback
Figure 71 - Remote Device List
Loop Up – This button, when pressed, instructs the test unit to send a loop up com-
mand to the selected remote device. If successful, the remote device will respond with
“Looped Up” in the status column.
Loop Down – This button, when pressed, instructs the test unit to send a loop down
command to the selected remote device. If successful, the remote device will respond
with “Looped Down” in the status column.
If the remote device responds with “Status Unavailable” it does not indicate the
remote device is unavailable, only that a status message was not sent back to
the test unit.
If the remote device responds with “Busy” this indicates the test set is currently
looping back traffic to another device and cannot be looped up/down by the
test unit.
History – This button, when pressed, displays a running history of all devices discov-
ered, looped up and looped down. Pressing the left or right arrow buttons will
display the previous or next page of history information. Pressing the reset button
will reset history.
Page 79
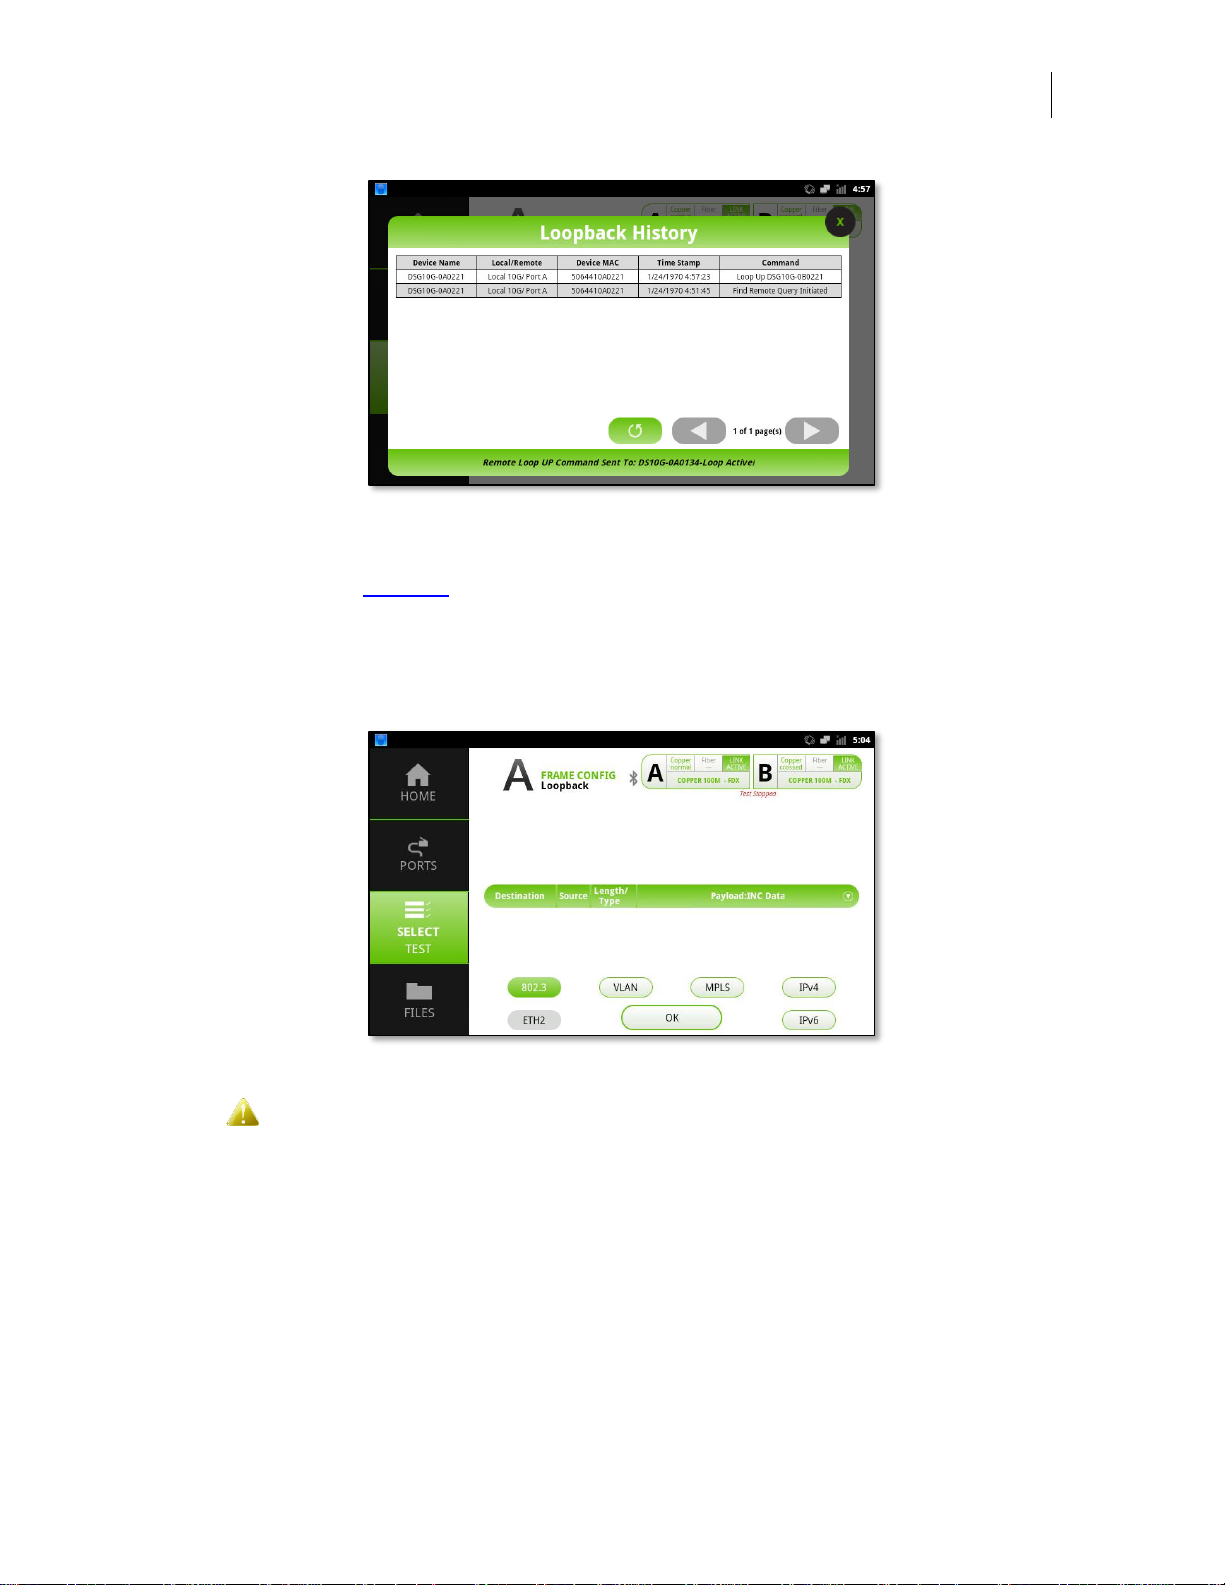
User’s Manual
DataScout 10G
77
Figure 72 - Loopback History Popover
Device List – This button, when pressed, will activate the device list popover view as
described in the Discover section above.
Device Address – This button, when pressed, enables manually setting the destina-
tion MAC/IP address of a device in the event it does not respond to a query or is not
compatible with the advanced loopback function.
Figure 73 - Device Address View
The current frame configuration entered on any other test menu (Quick Test,
Multi Stream, RFC-2544 or ITU-T Y.1564 will be overwritten when this view is
active. Use caution if you have a complex frame configuration entered.
Send Loop UP – This button, when pressed, instructs the test unit to send a loop up
command to the selected remote device.
Send Loop DOWN – This button, when pressed, instructs the test unit to send a loop
down command to the selected remote device.
Page 80
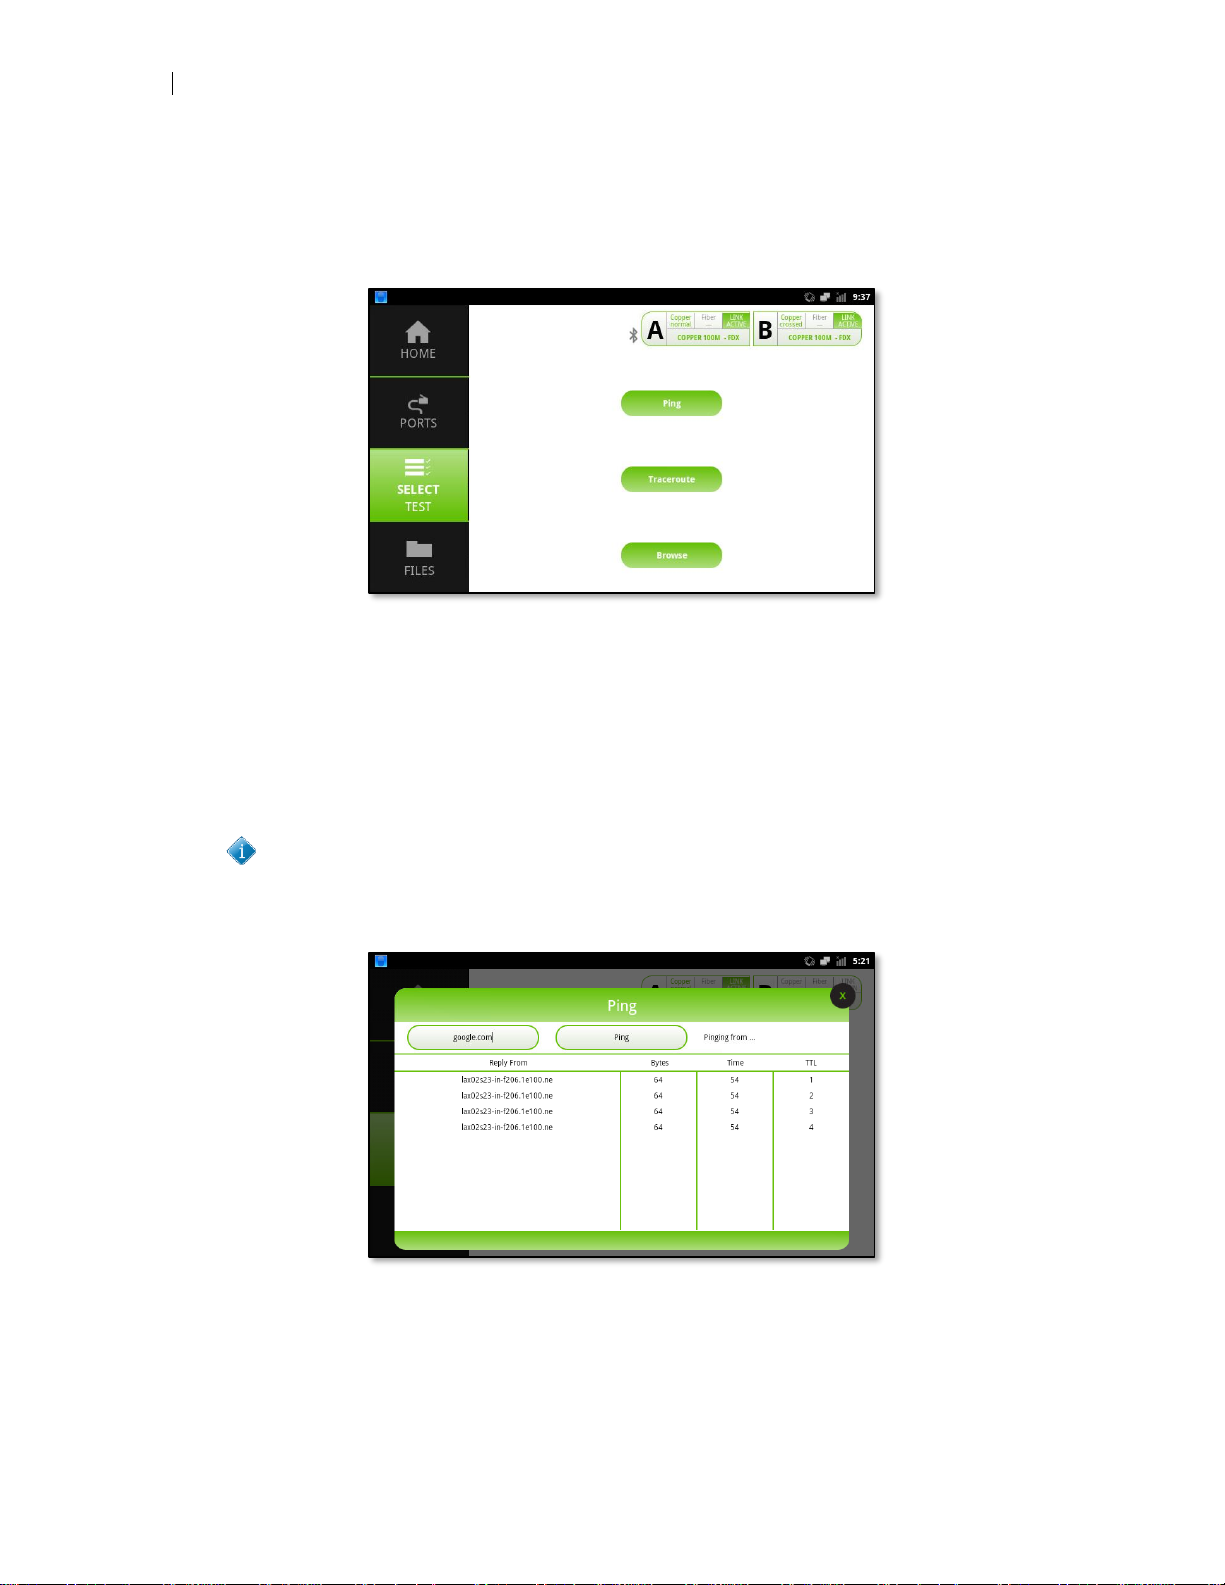
78
IP Tools
IP Tools
IP Tools provide the ability to perform PING, Traceroute and Web Browser capability.
Figure 74 - IP Tools View
Ping
Ping is a computer network administration software utility used to test the reachability
of a host on an Internet Protocol (IP) network. It measures the round-trip time for messages sent from the test set to a destination URL or IP address. If the destination responds the pings are echoed back to the test set.
The name Ping comes from active sonar terminology that sends a pulse of
sound and listens for an echo to detect objects under water. It is also sometimes interpreted as an acronym to Packet INternet Groper (PING).
Figure 75 - Ping Function
Page 81
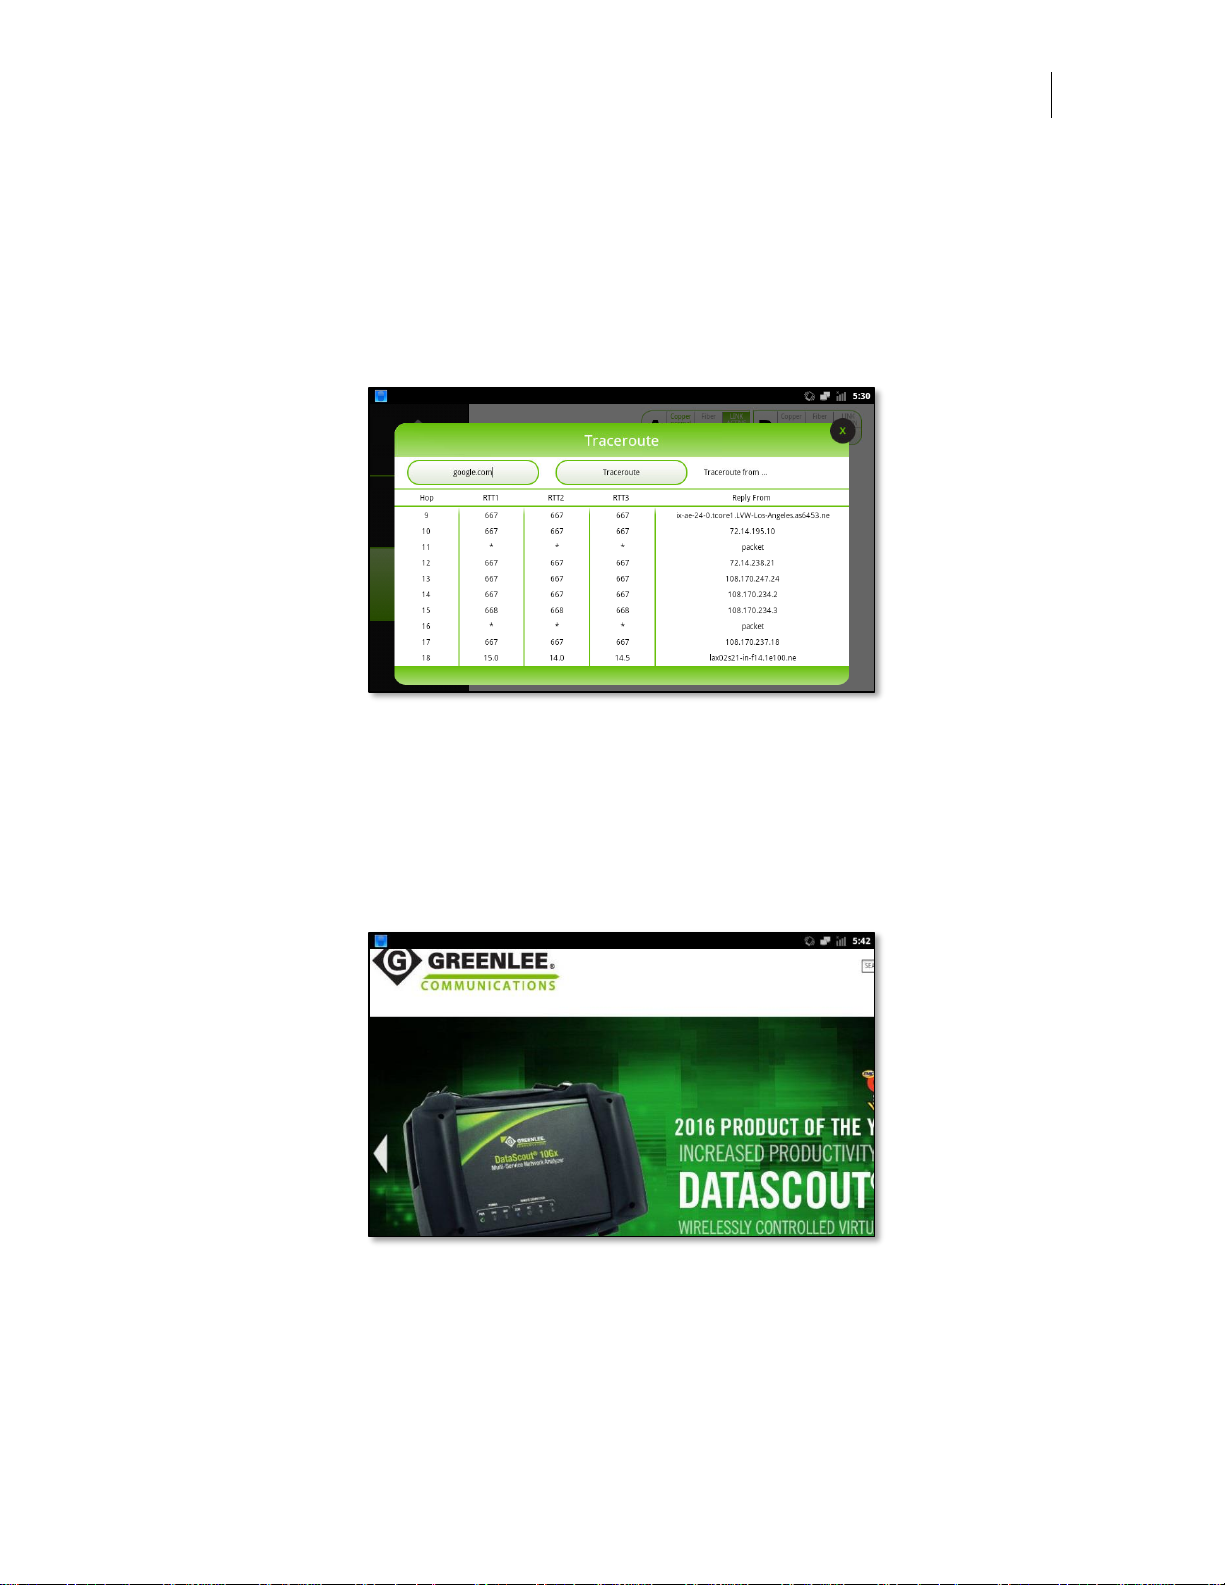
User’s Manual
DataScout 10G
79
Traceroute
Traceroute is a computer network diagnostic tool for displaying the route (path) and
measuring transit delays of packets across an IP network. The history of the route is
recorded as the round-trip times of the packets received from each successive host
(remote node) in the route (path); the sum of the mean times in each hop is a measure
of the total time spent to establish the connection.
Figure 76 - Traceroute Function
Browse
The browse function activates the internal browser. This provides the ability to verify
websites can be reached or to read online documentation.
Figure 77 - Browse Function
Page 82
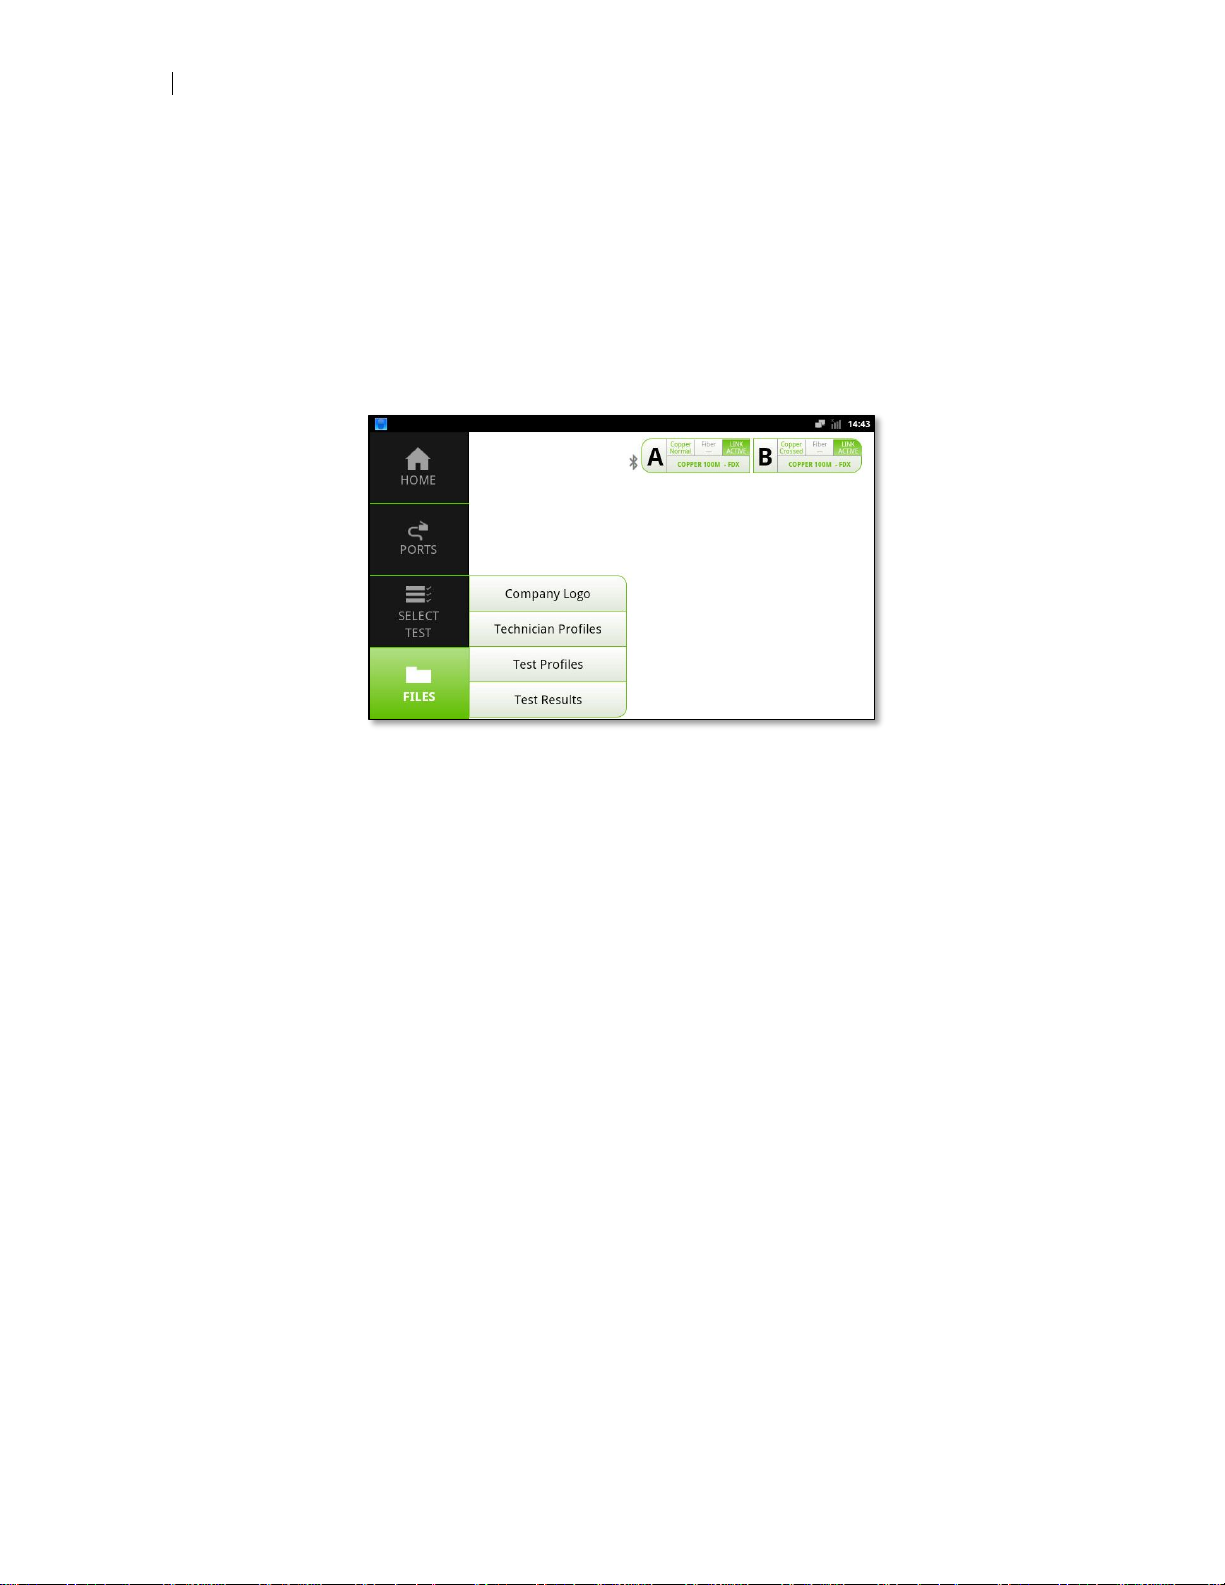
80
Files
Files
When the files button is pressed four different options are available:
► Company Logo – Add a custom logo to test reports
► Technician Profiles – Technician information used for test reports
► Test Profiles – Manage saved test profiles
► Test Results – Export results in PDF and/or CSV format
Figure 78 - Files Menu
Company Logo
Adding a company logo to test reports allows personalizing reports you send to customers. Any custom logo in PNG or JPG format can be used and should not exceed
100x240 pixels in size. Larger pictures should be resized to be as close as possible to
minimize distortion. To add a custom logo into the header of test reports, tap the Company Logo menu button.
The company logo view has three sections of note:
1. Import
2. Current
3. Save Logo
Page 83
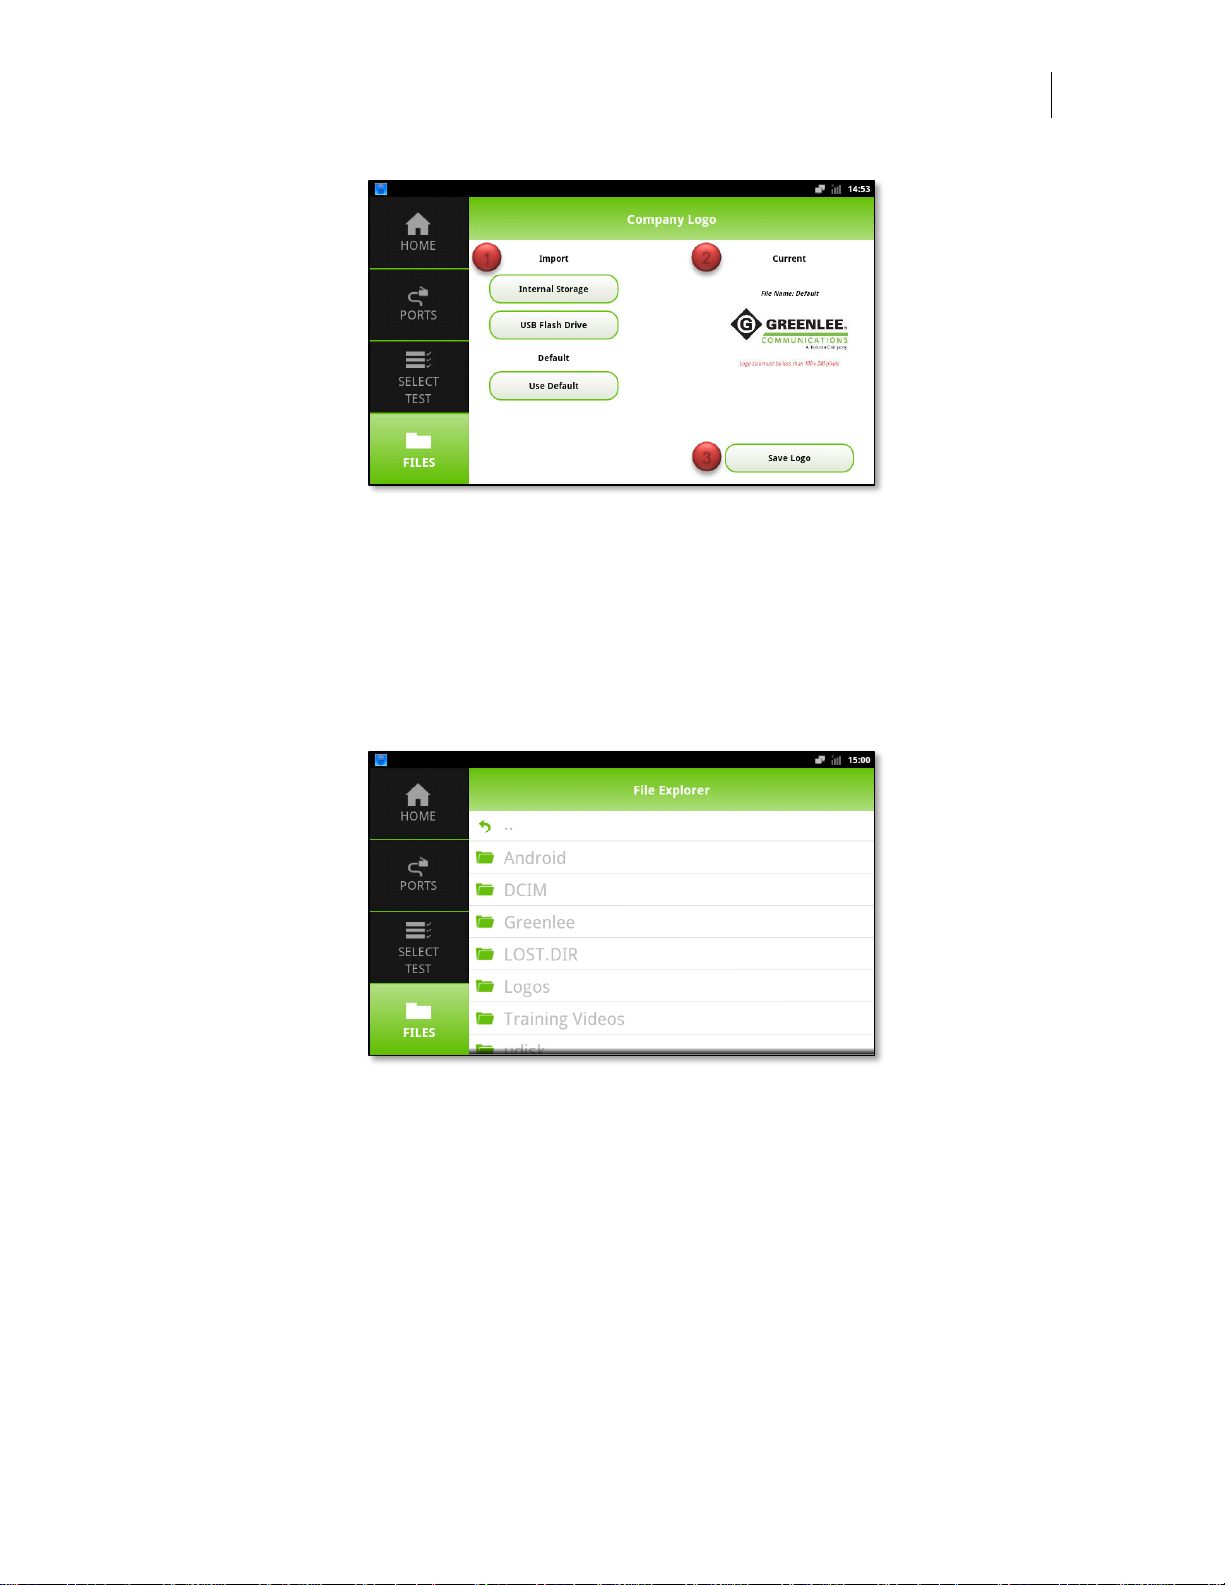
User’s Manual
DataScout 10G
81
Figure 79 - Company Logo View
Import
Internal Storage – This button opens a dialogue which enables selecting a logo image
already stored on the system. Previously imported logos initiated by pressing the USB
Flash Drive button will be stored in the Logos folder. If you imported a logo into a different folder, either scroll up/down the folder list or press the back button on the screen
to access the folder where you saved your logo.
Figure 80 – Internal Storage Explorer View
USB Flash Drive – This button opens a dialogue which enables selecting a logo image
stored on a USB flash drive. Insert the flash drive containing your logo and wait for the
device to mounted by the operating system. This typically takes about five seconds.
Once the device is mounted, press the USB Flash Drive and select the logo file desired.
Use Default – Pressing the Use Default button will revert the system back to using the
factory default Greenlee Communications logo image.
1 2 3
Page 84
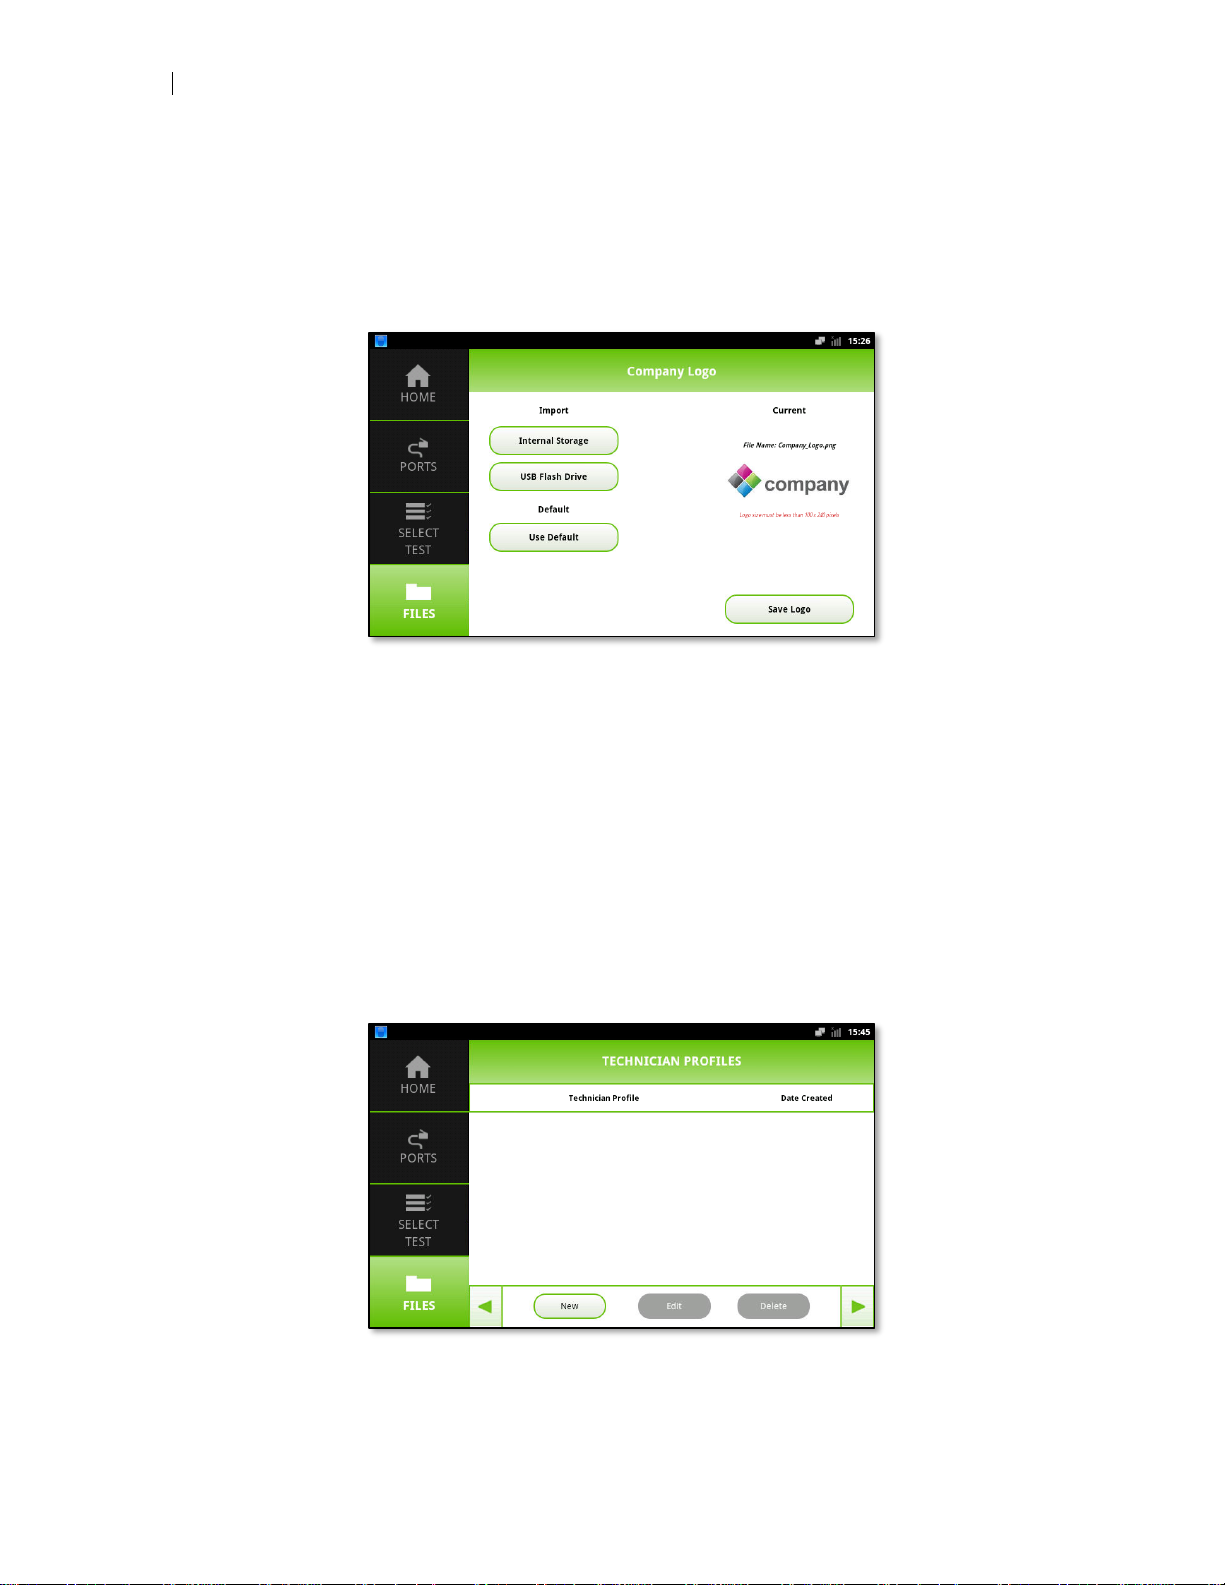
82
Files
Current
The current section provides an example of the current company logo selected. If the
logo appears distorted or of low visual quality in this section it will likely not display well
on reports.
Figure 81 – Current Section Displaying Custom Logo
Save Logo
The Save Logo button commits the currently selected logo to the internal memory in
the Logo folder and makes it active for all reports generated in the future.
Technician Profiles
When generating reports, you may be required to include information about the technician who performed the test. This menu option enables storing multiple technician profiles which can then be selected to include in the test report, saving time entering the
same information after every job.
Figure 82 - Technician Profile View
Page 85
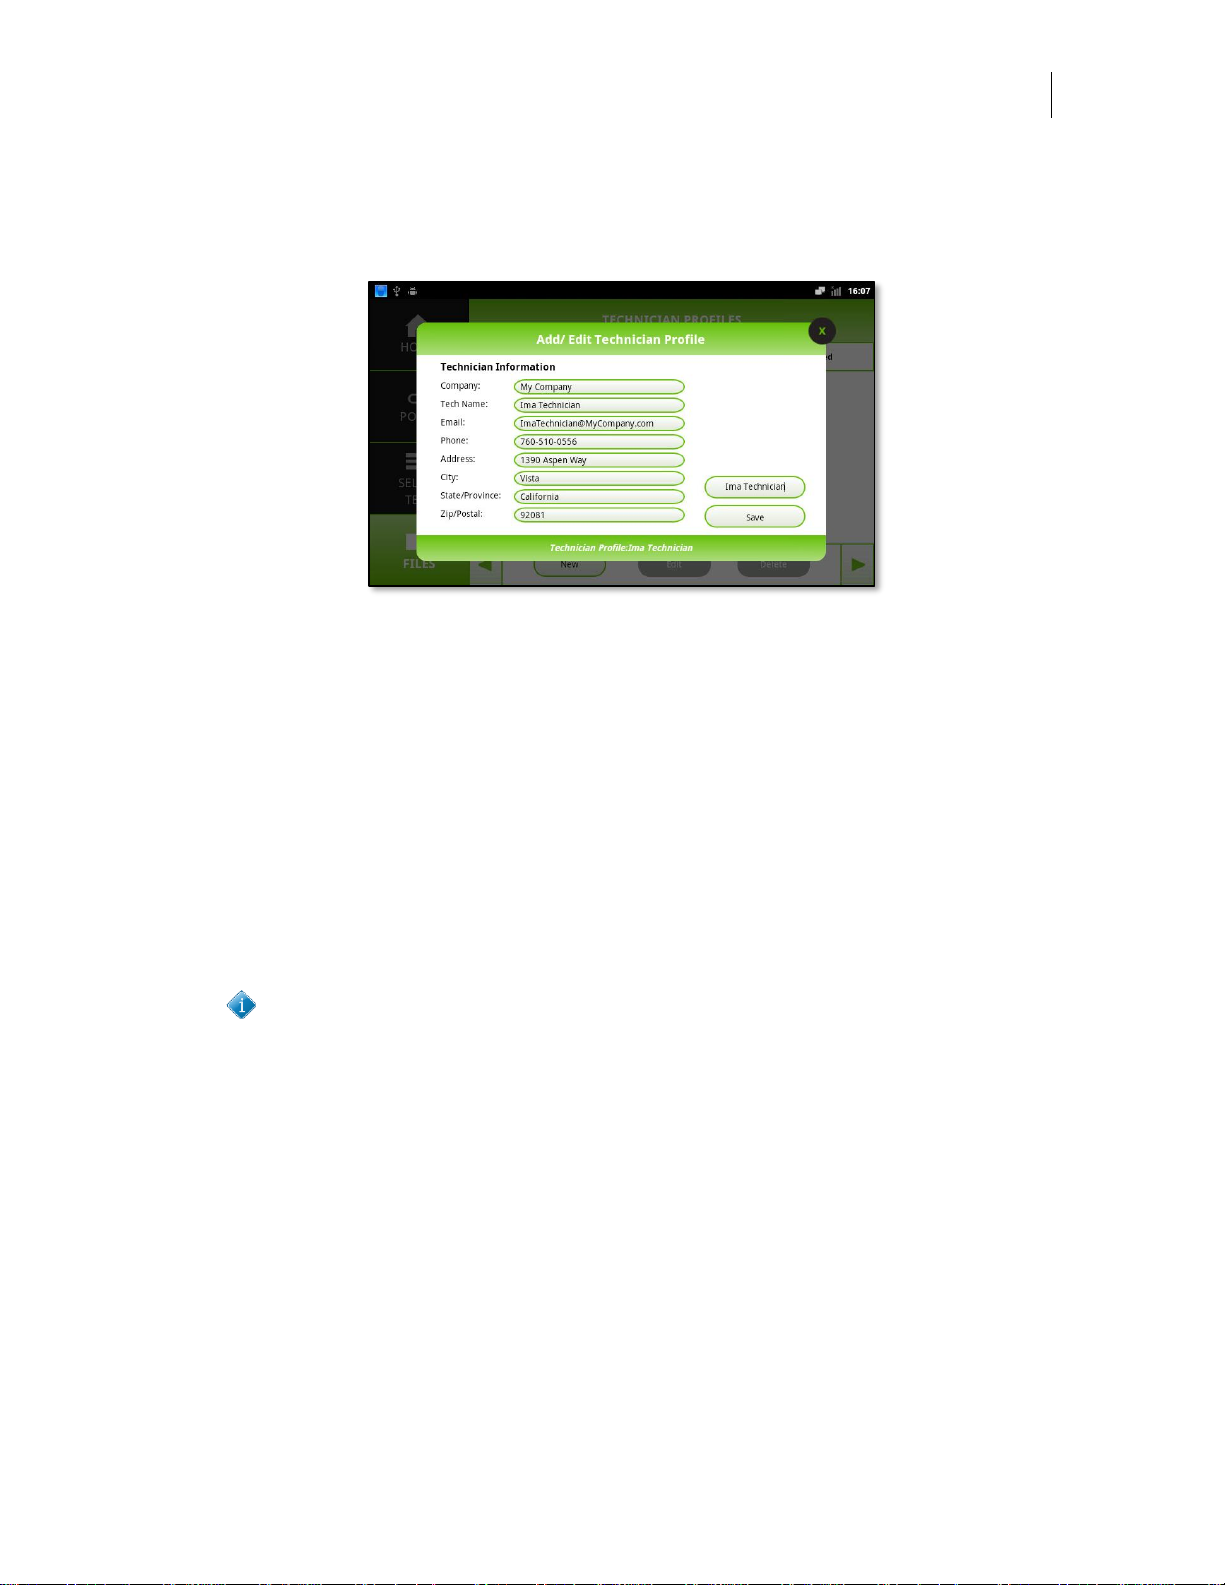
User’s Manual
DataScout 10G
83
New – To create a new technician, press the New button and enter your information
into the desired fields on the popover entry form. Once you are done entering information enter the desired technician profile name and then press the Save button.
Figure 83 - New Technician Profile Popover Form
Edit – To edit an existing technician profile, select the desired profile and press the edit
button. Once you are done editing information press the Save button.
Delete – To delete an existing technician profile, select the desired profile and press
the delete button. Press OK on the warning message to permanently delete the profile.
Test Profiles
When performing complex tests, it is often easier to save the test configuration for
rapid recall later. This menu option enables storing multiple test profiles which can
then be loaded later or used as a template for creating new test profiles, saving time
entering the same information. Thousands of test profiles can be created and stored
on the test set.
Test profiles, results and technician profiles are stored in a database on the
test set. If a consistent master list of test profiles is desired to be loaded on all
devices in your fleet the database can be copied to multiple devices. Contact
Greenlee Communications technical support for more information on how this
is performed.
The test profile view has four sections of note:
1. Test Type Selector Tabs
2. Saved Profile List
3. View Profile Function
4. Profile Load/Edit/Delete Bar
Page 86
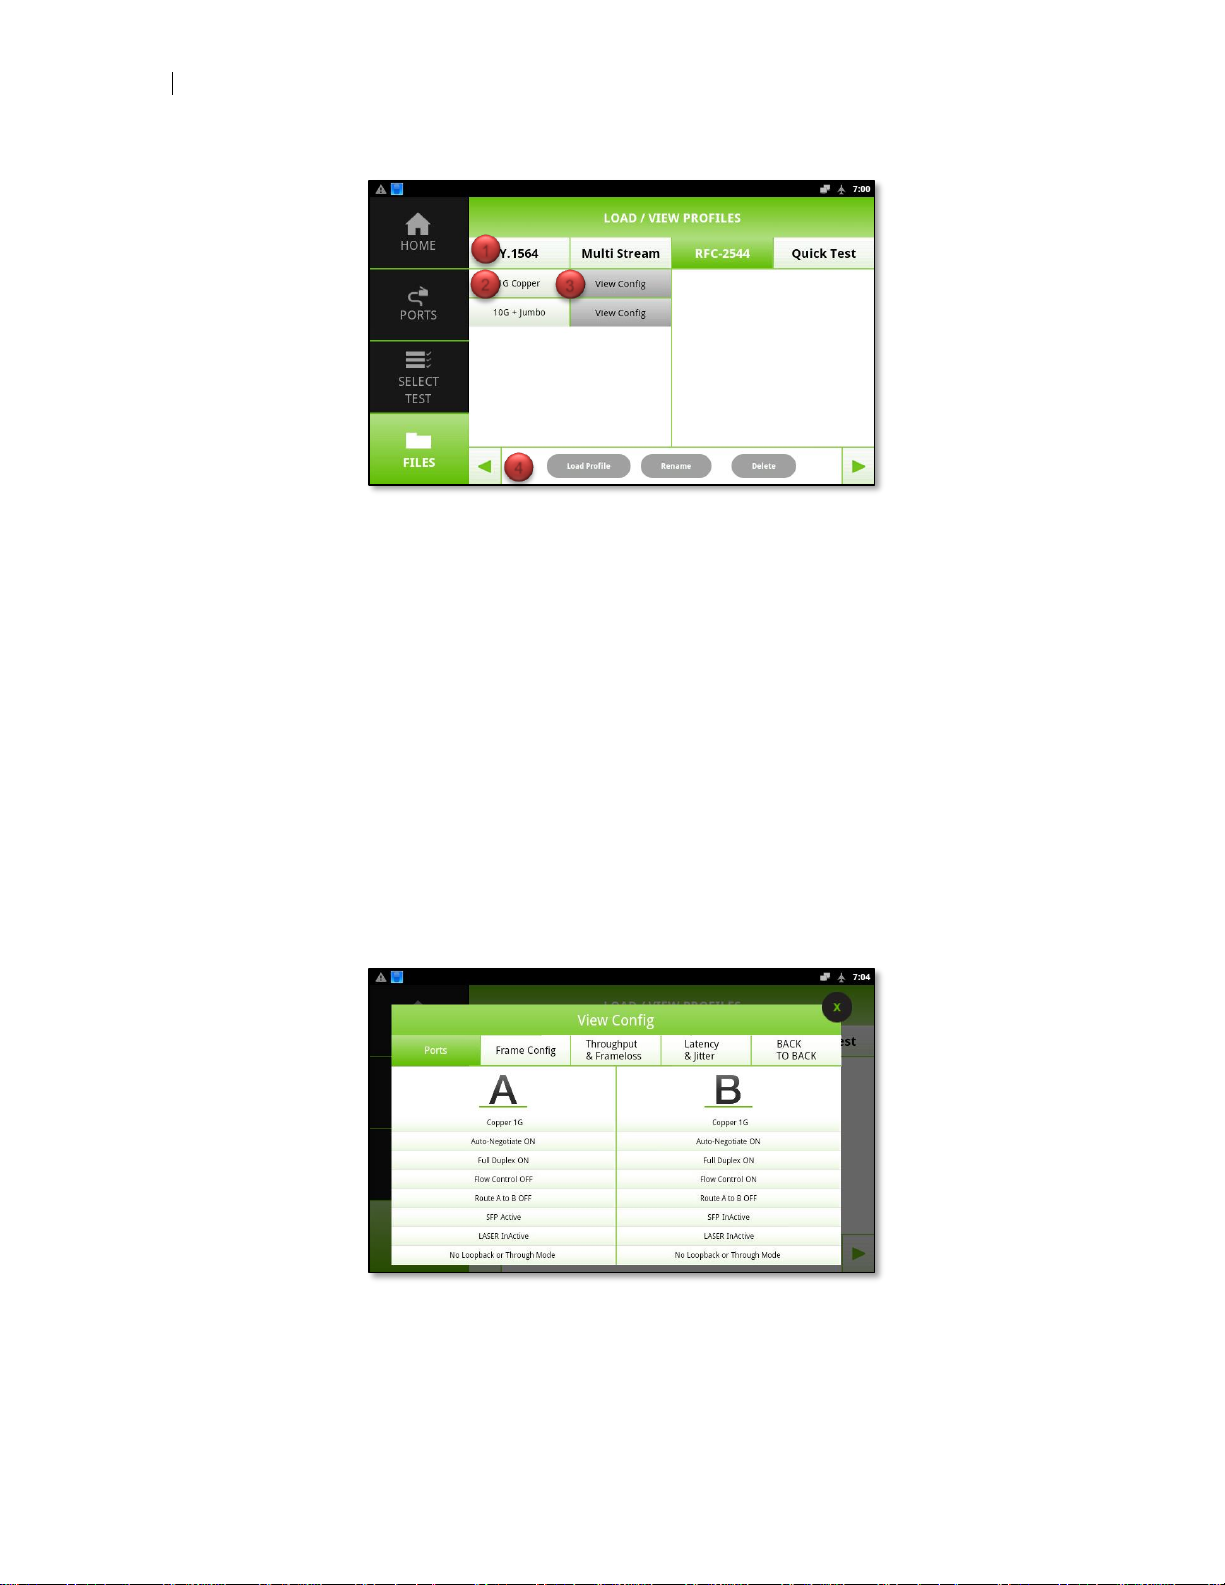
84
Files
Figure 84 – Test Profile Main View
Test Type Selector Tabs
The test type selector tab sub-divides all test profiles by the type of test it performs.
This enables quickly finding the desired profile.
Saved Profile List
Profiles for the selected test type are displayed in the saved profile list. Tap the desired test profile to select it.
View Profile Function
Pressing the View Profile button will display the configuration settings for the test so
you can confirm this is the correct profile you desire. Press the “X” to close the View
Config popover view once you are finished.
Figure 85 - View Config Popover View
1 3 4
2
Page 87
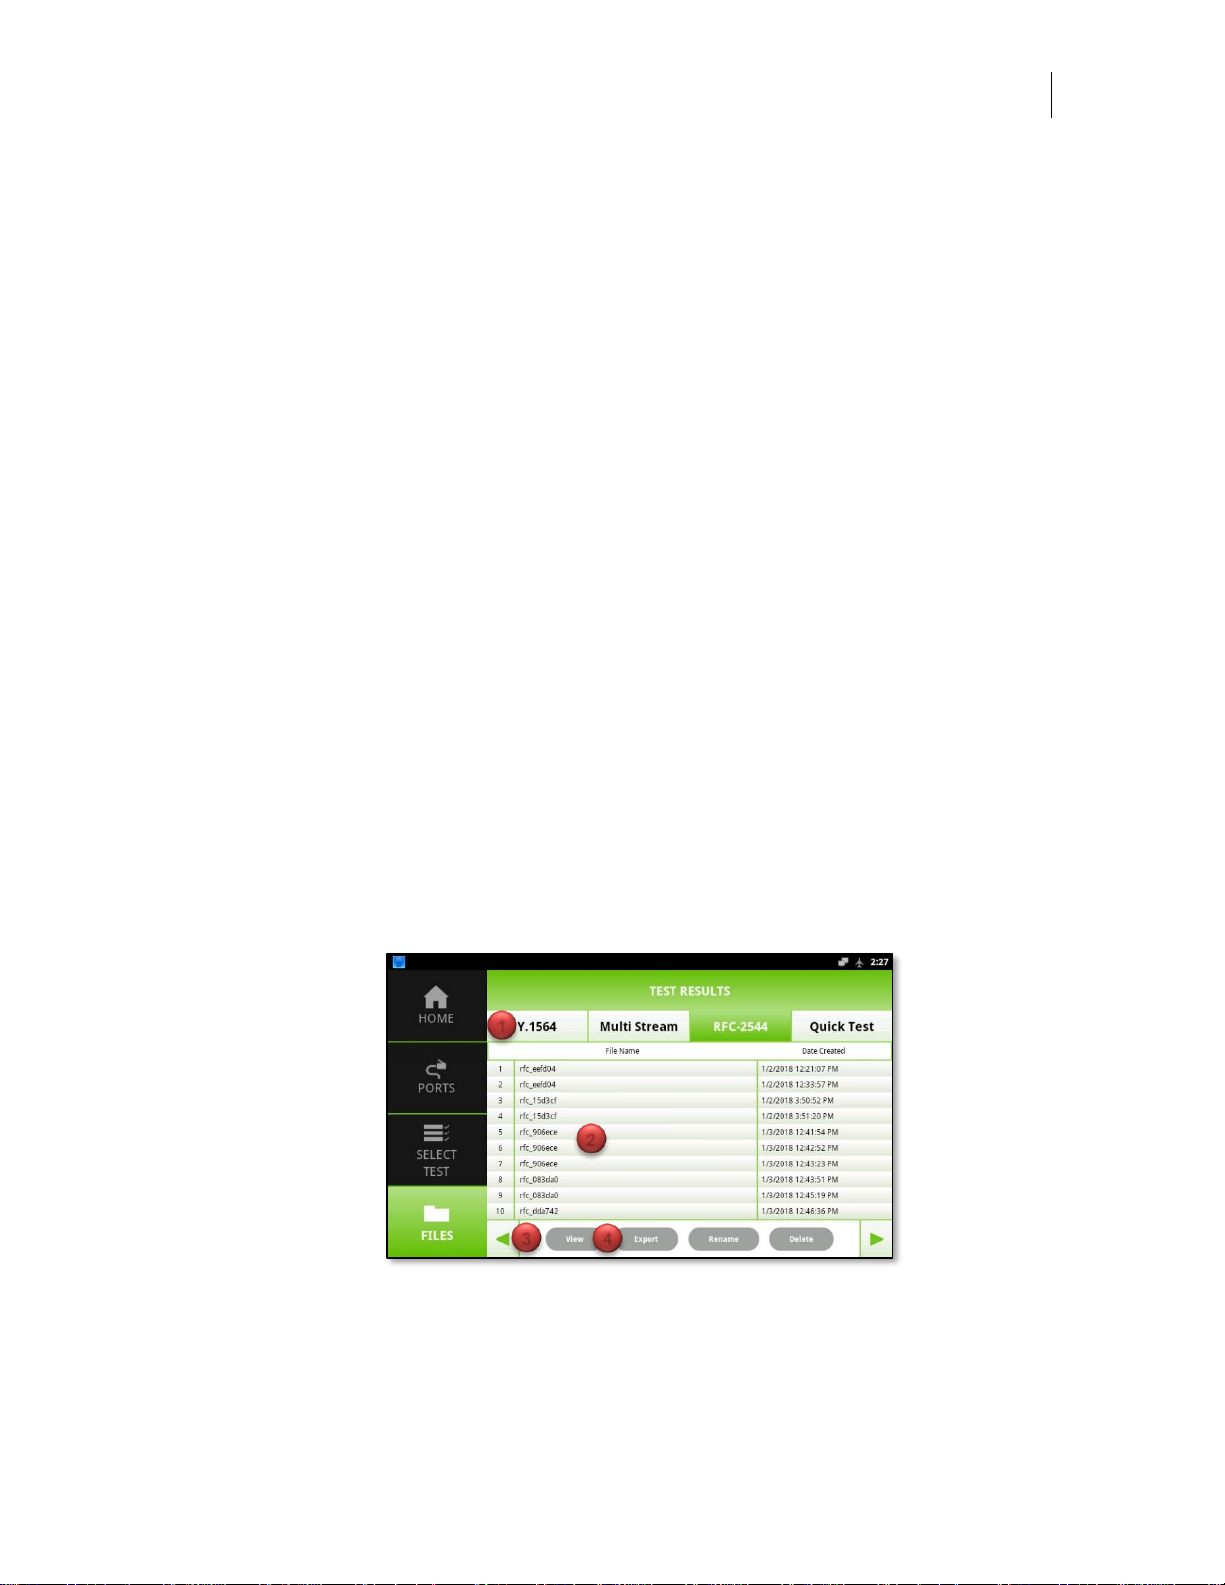
User’s Manual
DataScout 10G
85
Profile Load/Edit/Delete Bar
Load Profile – Once you have selected the desired profile from the saved profile list,
press the Load Profile button and wait for the configuration to be loaded. You will be
automatically taken to the correct test view once profile loading is completed.
Rename – To rename a profile select it from the saved profile list and tap the Rename
button.
Delete – To delete an existing test profile, select the desired profile and press the de-
lete button. Press OK on the warning message to permanently delete the profile.
Arrow Buttons – Each test profile type may have multiple pages of stored test profiles.
Profiles are listed in last saved first order from top to bottom in the first table column,
then the second. Once the second table column is filled a new page is created. To
move between pages, use the left and right arrow buttons.
Test Results
This menu option enables viewing and exported storing test results. Each time a test
completes it is automatically stored to the results database. If no test ID is entered
when the test is started the system will generate a random test ID name which can be
edited if desired. Thousands of test results can be stored on the test set.
The test profile view has four sections of note:
1. Test Type Selector Tabs
2. Saved Result List
3. Test Result Control Bar
4. Test Result Export Function
Figure 86 – Test Results Main View
Test Type Selector Tabs
The test type selector tab sub-divides all test results by the type of test it performs.
This enables quickly finding the desired result.
1
2
3
4
Page 88

86
Files
Saved Result List
Results for the selected test type are displayed in the saved result list. Tap the desired
test result to select it.
Test Result Control Bar
View – Once you have selected the desired result from the saved result list, press this
button to recall test results and display it on the screen again.
Export – Used to export test results in PDF or CSV format. See the Test Profile Ex-
port Function section below for more information.
Rename – To rename an existing test result, select the desired result and press the re-
name button.
Delete – To delete an existing test result, select the desired result and press the delete
button. Press OK on the warning message to permanently delete the result.
Arrow Buttons – Each test result type may have multiple pages of stored test results.
Results are listed in last saved first order from top to bottom. Once ten results are
stored a new page is created. To move between pages, use the left and right arrow
buttons.
Test Result Export Function
This function enables exporting customized test results in both PDF and/or CSV format. By selecting which sections are desired to include reports they can be as simple
as a one-page summary to in-depth reports that include detailed results, test configuration and even technician/job information sections. If a custom logo was imported, this
logo is also added to the report header.
The test result export view has three sections of note:
1. Report Details
2. Report Format
3. Export To
Page 89
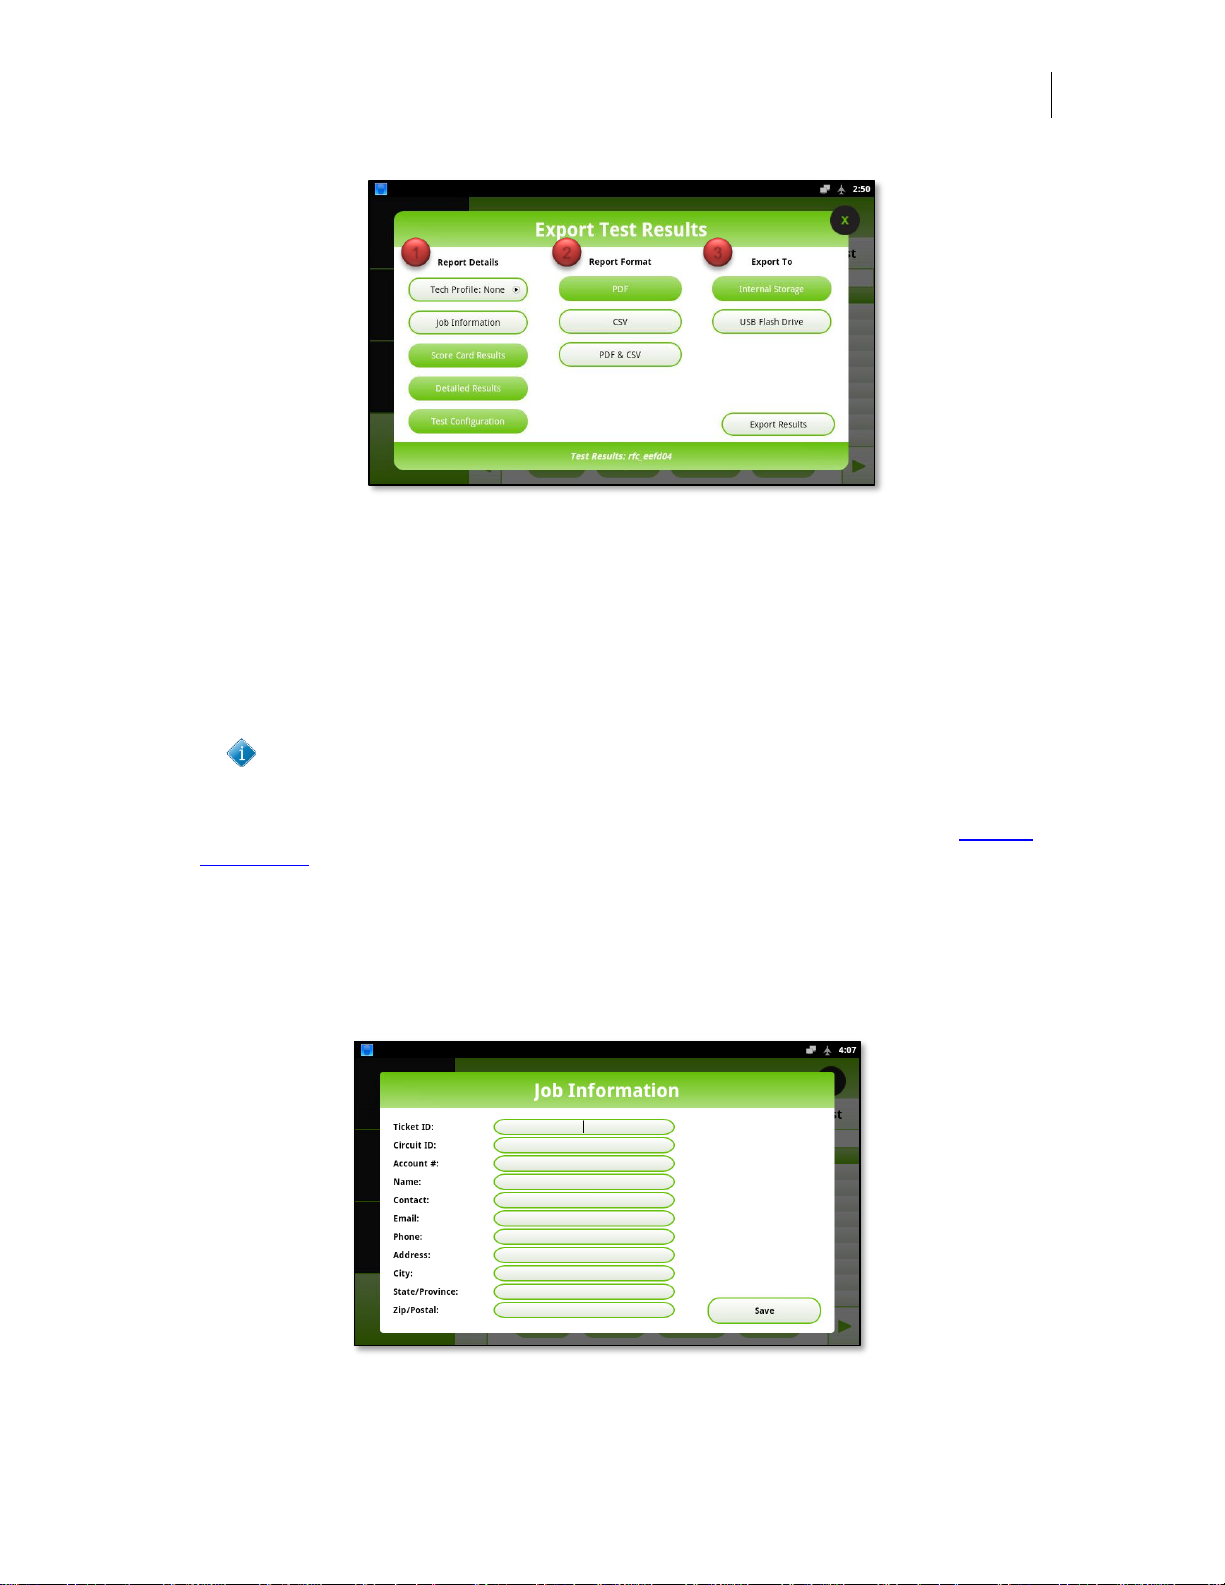
User’s Manual
DataScout 10G
87
Figure 87 - Export Test Results Popover View
Report Details
This section defines what details should be included in the test report. Each section
option button toggles on/off, enabling which sections should be included in the report.
Any or all sections may be included in reports, enabling creation of simple summary reports to in-depth comprehensive ones.
Enabling all report sections may result in a very long report being generated for
RFC-2544, Multi Stream or ITU-T Y.1564 reports with many streams.
Technician Profile – When a technician profile is created as described in the Techni-
cian Profile section above, this information is included in the header of the report, ena-
bling identification of which technician performed the test.
Job Information – Enabling this section activates the job information popover view, al-
lowing you to enter pertinent job information which is then added to the report header.
Job information entered is stored in the database so it does not have to be entered
again if the report is generated in the future.
Figure 88 - Job Information Popover View
1 2 3
Page 90

88
Files
Score Card Results – Enabling this section activates population of the score card re-
port section. The score card provides a visual and simple to understand tabular summary of test pass/fail status and is appropriate for customers who desire only a highlevel report of test results.
Detailed Results – Enabling this section activates population of test result details, in-
cluding frame transmitted/received counts, errors and performance information. The
detailed results section provides a traditional tabular summary of all test results and is
appropriate for customers who require in depth metrics for analysis or validation.
Test Configuration – Enabling this section activates population of port, frame and rate
configuration used to perform the test. If optical ports are used, the SFP information is
also provided showing SFP vendor, wavelength, transmitted and receive power as well
as other diagnostic information.
Report Format
This section defines what format(s) the test report should be exported to. The report
file name will be taken from the test result ID name.
PDF – Report is generated as a PDF (Portable Document Format). When printed, the
report will support both letter 8.5” x11” and A4 210 x 297 mm paper sizes.
CSV – Report is generated in CSV (Comma Separated Value) format. This format can
be opened using most spreadsheet or text editors.
PDF & CSV – Reports are generated in both formats simultaneously.
Export To
This section defines where to export the report files to. All reports are saved to the
folder path /Greenlee/Results/[Test Type] where [Test Type] is a separate folder matching the test run.
Internal Storage – The results are stored to the internal SD memory card
USB Flash Drive – The results are stored to an external USB drive. The USB drive
must be plugged in prior to exporting test results to this location.
Export Results – Once you have selected the desired report detail, format and loca-
tion parameters, press the Export Results button to start the export process.
Test results are saved in the local language configured and cannot be ex-
ported in a different language. For example, you cannot save a test result
while in English language mode, switch to Spanish language mode, then export the test result.
Page 91
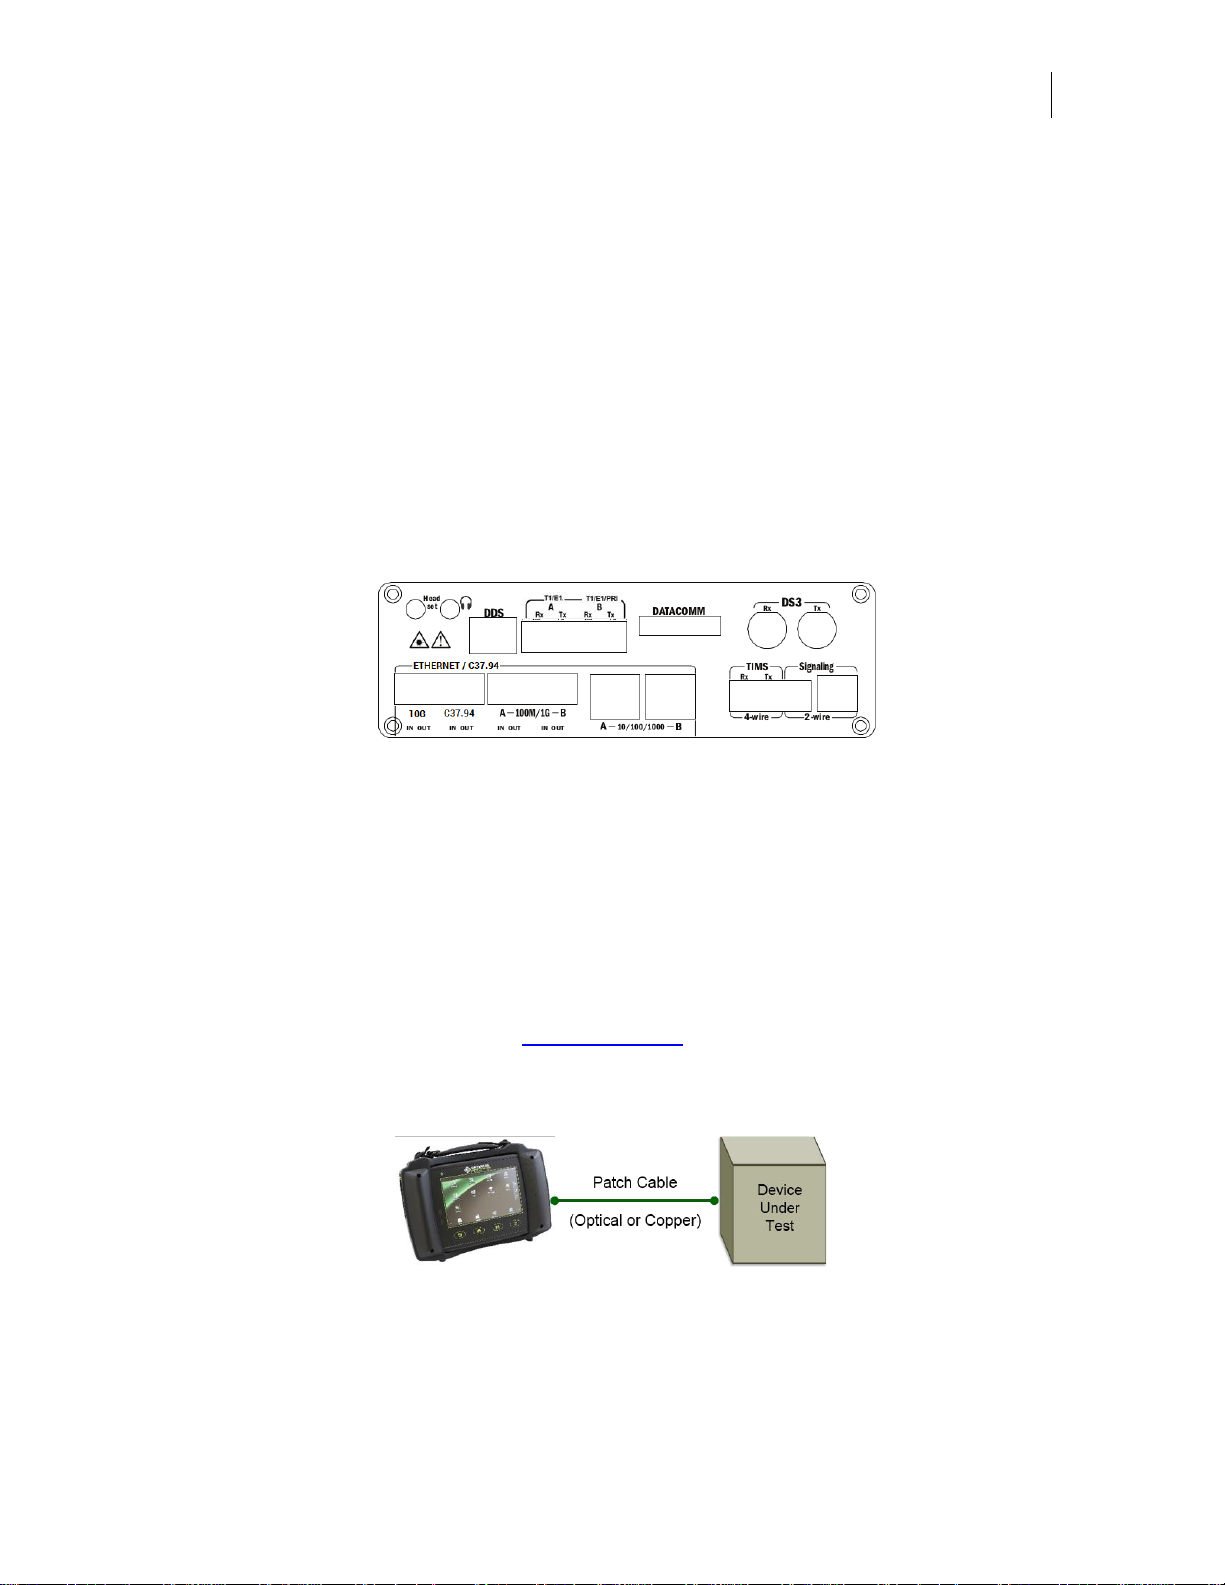
User’s Manual
DataScout 10G
89
IEEE C37.94 Testing
Overview
IEEE C37.94 defines an optical transmission interface used by utilities to monitor and
control mission critical supervisory control and data acquisition (SCADA) links. C37.94
typically utilizes an 850 nm MMF interface with ST connectors but 1310 nm SMF variants with other connector types are also used. The protocol can transmit a single data
stream utilizing between 1 and 12 separate 64kbps channels for a maximum of
768kbps maximum throughput using a basic framing structure with a line rate of
2048kbps.
Test Interface
Figure 89 - Ethernet Test Ports
C37.94 testing is incorporated into the Ethernet test interface and as such can support
the following:
1. Single port 10000Base-X
2. Single port IEEE C37.94
3. Dual port 100FX or 1000Base-X SFP (1GbE)
4. Dual port 10/100/1000Base-T
This chapter will focus only on the C37.94 test option. For more information regarding
Ethernet test options refer to the Ethernet Testing chapter.
Test Interface Connections
To connect the test interface to the device under test you must select the proper patch
cable depending on the termination on the network element you are testing. In all
cases the only termination supported on the test set is LC. It is also required to use the
SFP provided with the test set at time of purchase for C37.94 testing, other models
Figure 90 – C37.94 Interface Connection
(MMF Optical LC/ST)
Page 92
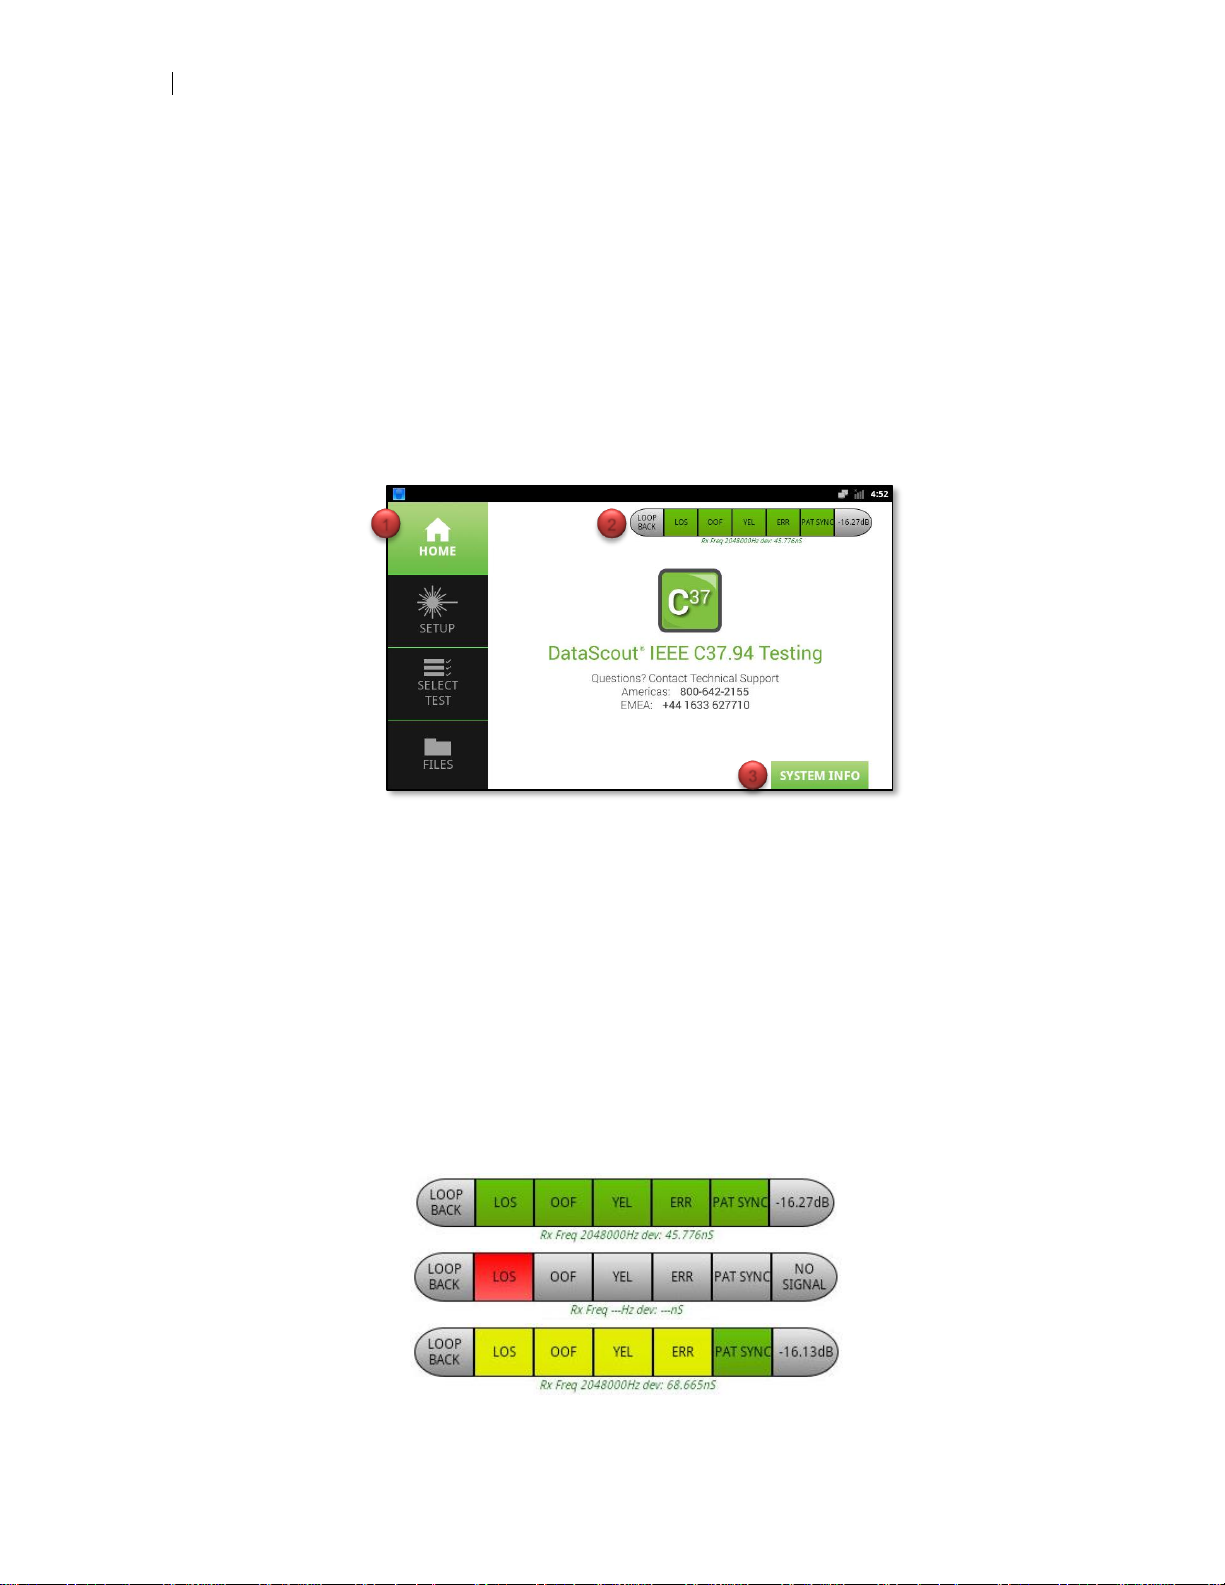
90
Home
may operate but are not guaranteed to work to specification. There is no specific order
of connection required. You can connect the patch cord to the test device or network
device first.
Home
There are three sections of note on the home view:
1. Menu bar
2. Link status indication bar
3. System Info button
Figure 91 - Home View Sections
Menu Bar
The menu bar provides access to channel configuration, selecting which test to run and
view or retrieving test profiles as well as results. Menu bar buttons, when selected and
active, will be green. When not select or active they will be black. In the figure above,
the HOME button on the menu bar is active.
Link Status Indication Bar
The link status indication bar is present on all setup and test application views. It provides real time feedback regarding current optical link receive power, alarms, errors
and loopback mode status.
Figure 92 - Link Status Indication Bar
1 2 3
Page 93
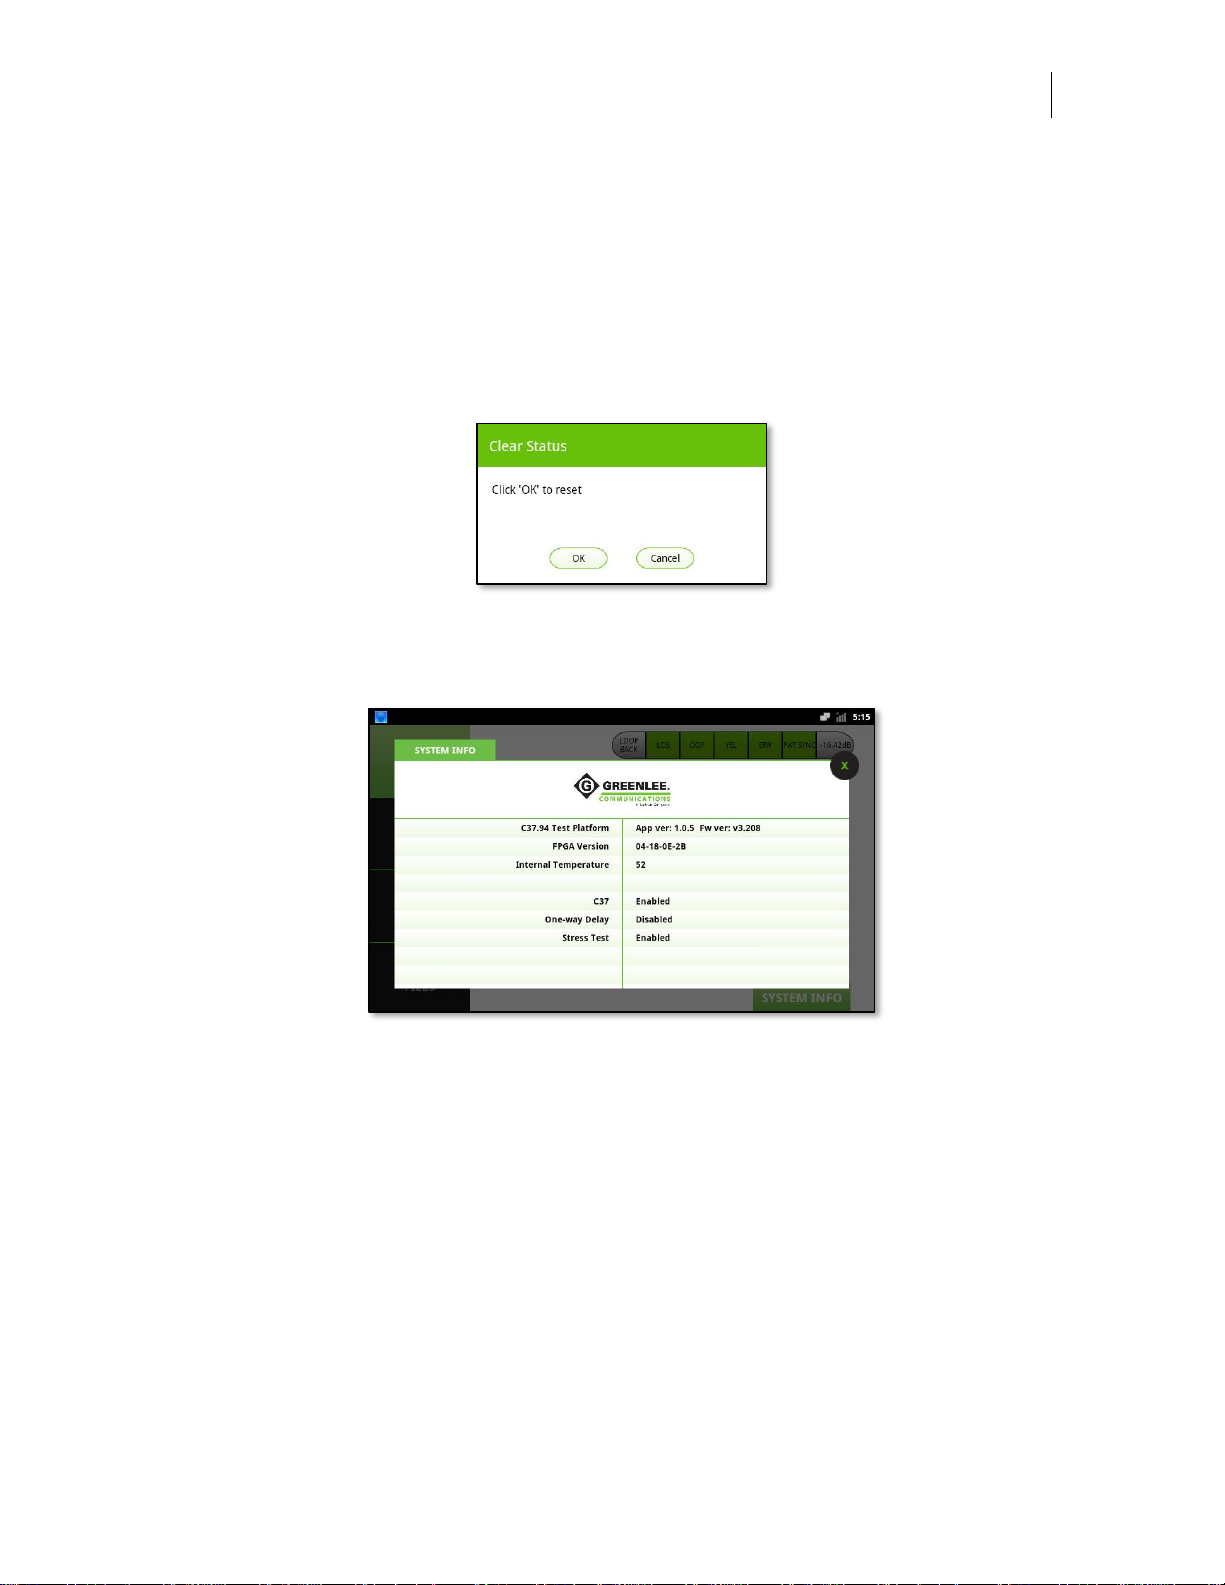
User’s Manual
DataScout 10G
91
The status of the signal or alarm or error is displayed in one of four colors:
► Gray – Mode is off or providing advisory status
► Red – Alarm or Error state currently occurring
► Yellow – Alarm or Error state has occurred but is no longer active
► Green – Normal state, operating properly
To reset the status bar and clear yellow history indication status, press anywhere on
the status bar and tap the OK button on the pop over warning message.
Figure 93 – Link Status Bar Reset History
System Info Button
Figure 94 - System Info
Pressing the system info button activates a popover view which displays system information such as test platform software and firm-ware version, internal temperature and
options installed. This information is helpful to have on hand before calling customer
service or technical support as the agent may ask you to provide it.
Channel Setup
To configure physical channel attributes, press the SETUP button. The Setup view has
three sections of note on the home view:
1. Tx/Rx rate selection
2. Clock selection
3. Optical SFP and Laser On/Off buttons
4. Save Port Profile
Page 94
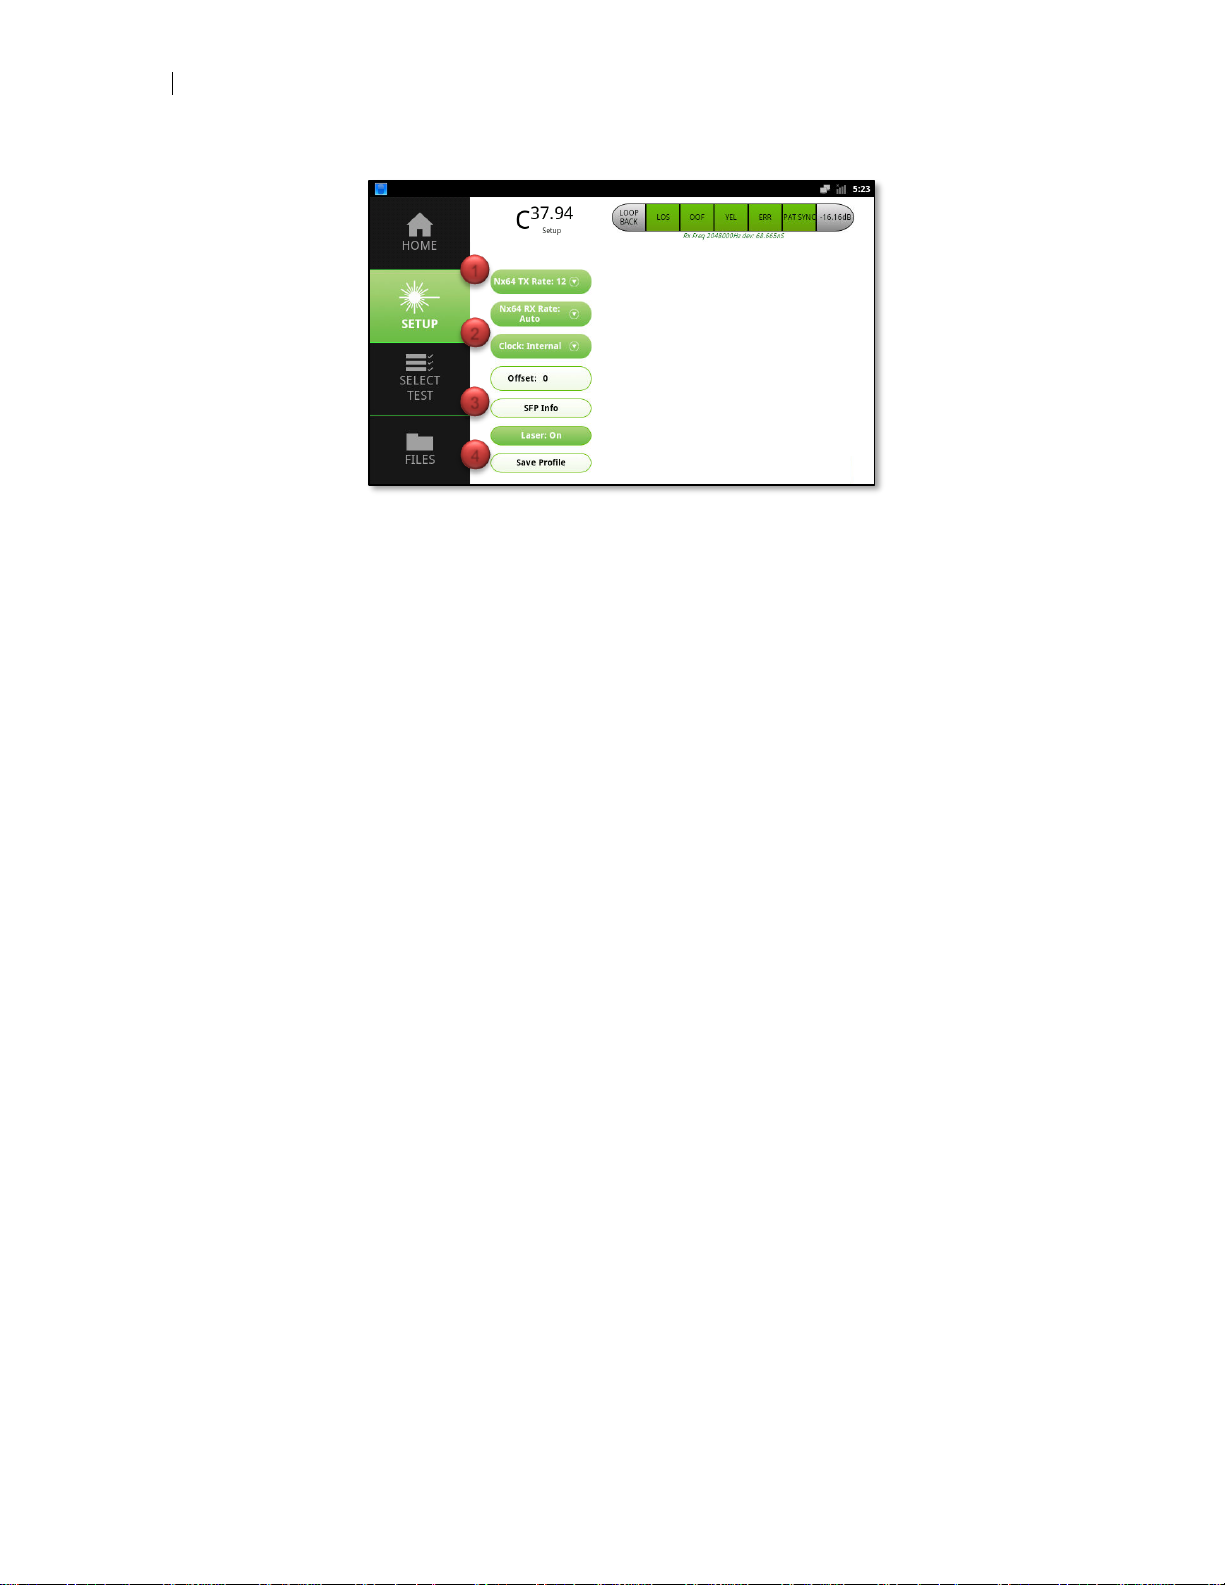
92
Channel Setup
Figure 95 - Setup View
Tx/Rx Rate Selection
IEEE C37.94 supports up to 12 separate 64kbps data channels. The Nx64 rate selection menus determine the total number of channels to generate test traffic on. If the total number of channels selected is less than 12, the unused channels will carry idle indication information.
Nx64 TX Rate – Select desired number of channels to transmit on (1-12)
Nx64 RX Rate – Select desired number of channels to receive on (1-12). Selecting
“From Tx” instructs the test set to use the same number of channels as TX rate. Selecting “Auto” allows the test set to detect the incoming number of channels and auto-
matically match that rate.
Clock Selection
The test set supports internal, recovered and external transmit clock sources.
Internal – The internal precision clock as the transmit time source.
Recovered – Transmit timing is derived from the receive clock source.
External – When external timing is selected, an external clock source must be con-
nected to the EXT CLK input located on the left side of the unit. The test set supports
input sources ranging from 2MHz to 254MHz.
If an external clock source is not connected the system will display “No Signal” in the
status table located to the right of the clock source button. Once a supported clock
source is connected and detected the system will display “Connected”. If a connected
clock source is not within the acceptable range of 2-254MHz the system will display
“Out of Range”.
1 2 3
4
Page 95
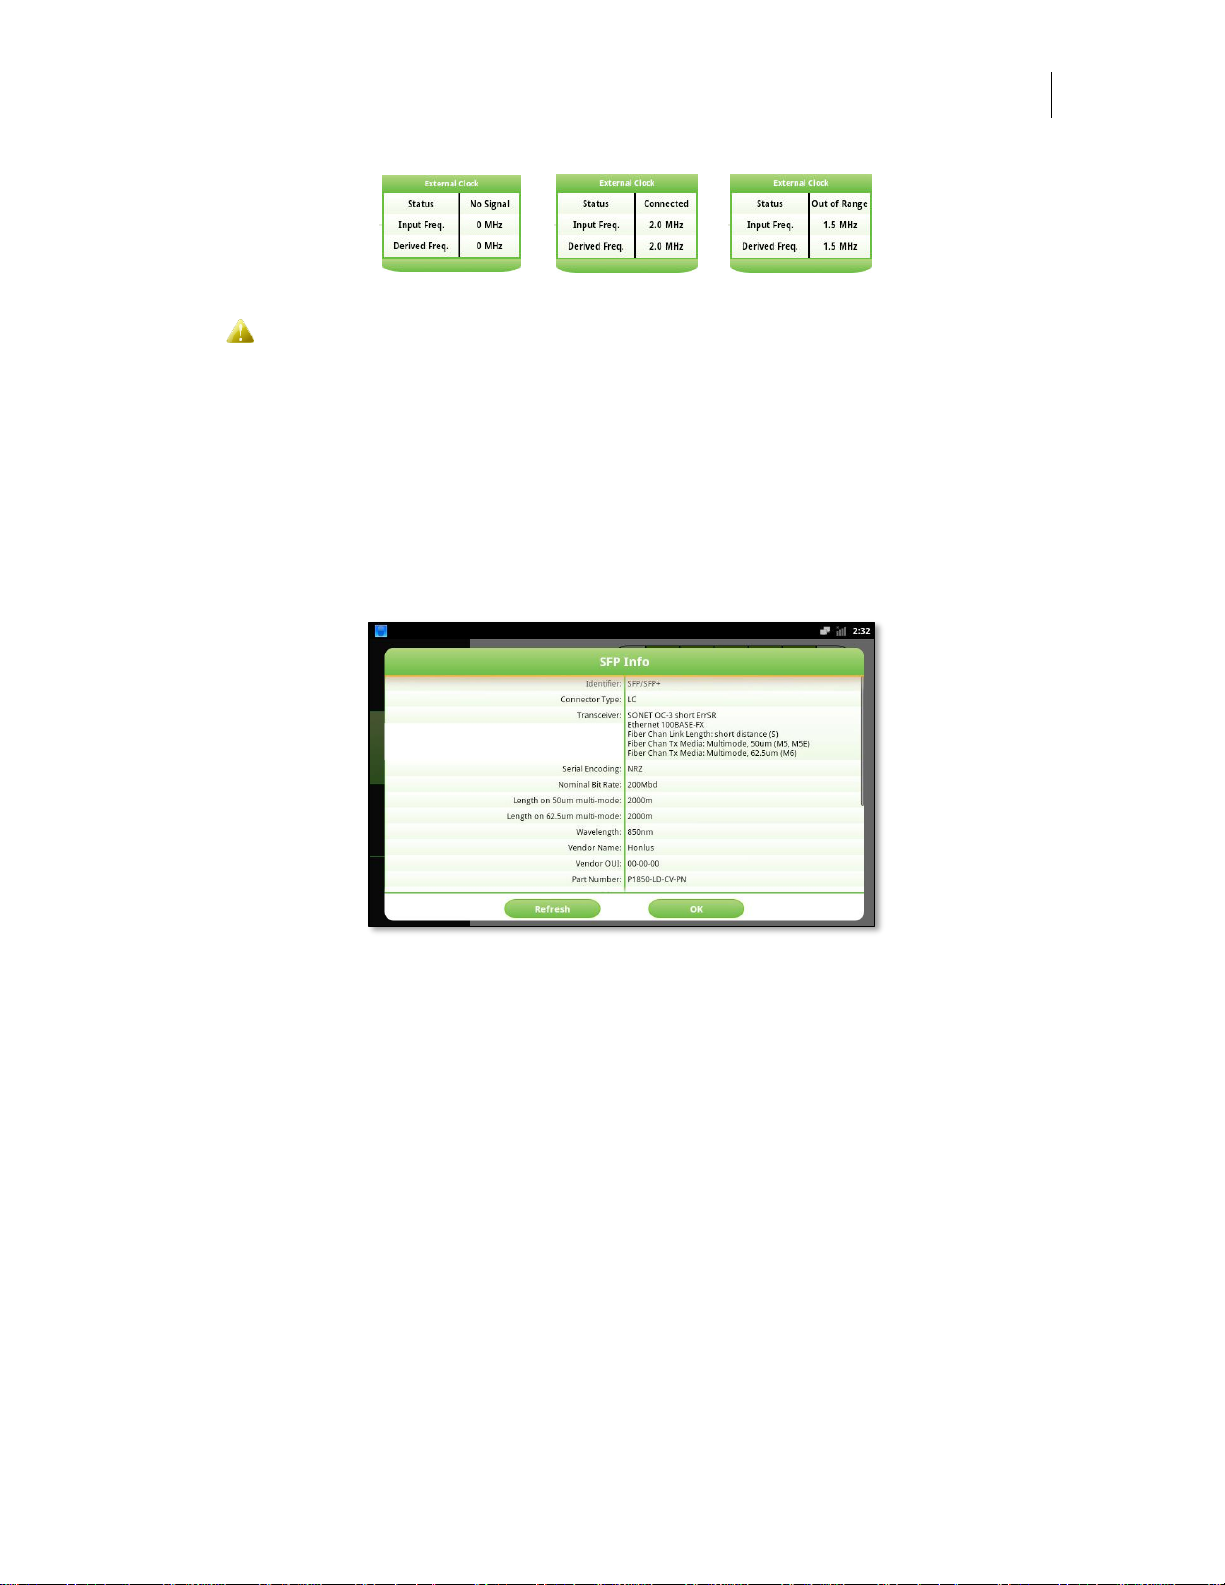
User’s Manual
DataScout 10G
93
Figure 96 - External Clock Status Messages
The external clock setup on this screen does not accept a 1PPS input. 1PPS
is only applicable on the one-way delay test setup screen.
Optical SFP and Laser On/Off buttons
SFP Info
Pressing the SFP Info button will display a popover view of the SFP diagnostic information. Use your finger to scroll down the screen to see more information. To refresh
the SFP diagnostic information press the “Refresh” button. Press OK to close the SFP
popover view.
Figure 97 - SFP Info Popover View
Laser On/Off
Pressing the “Laser: On” button will toggle the button to “Laser: Off” and turn off the
transmit portion of the laser. Press the button again to toggle the laser back on again.
Save Port Profile
Pressing the “Save Profile” button will allow saving the entire port configuration for
rapid recall after powering down your test set.
Page 96
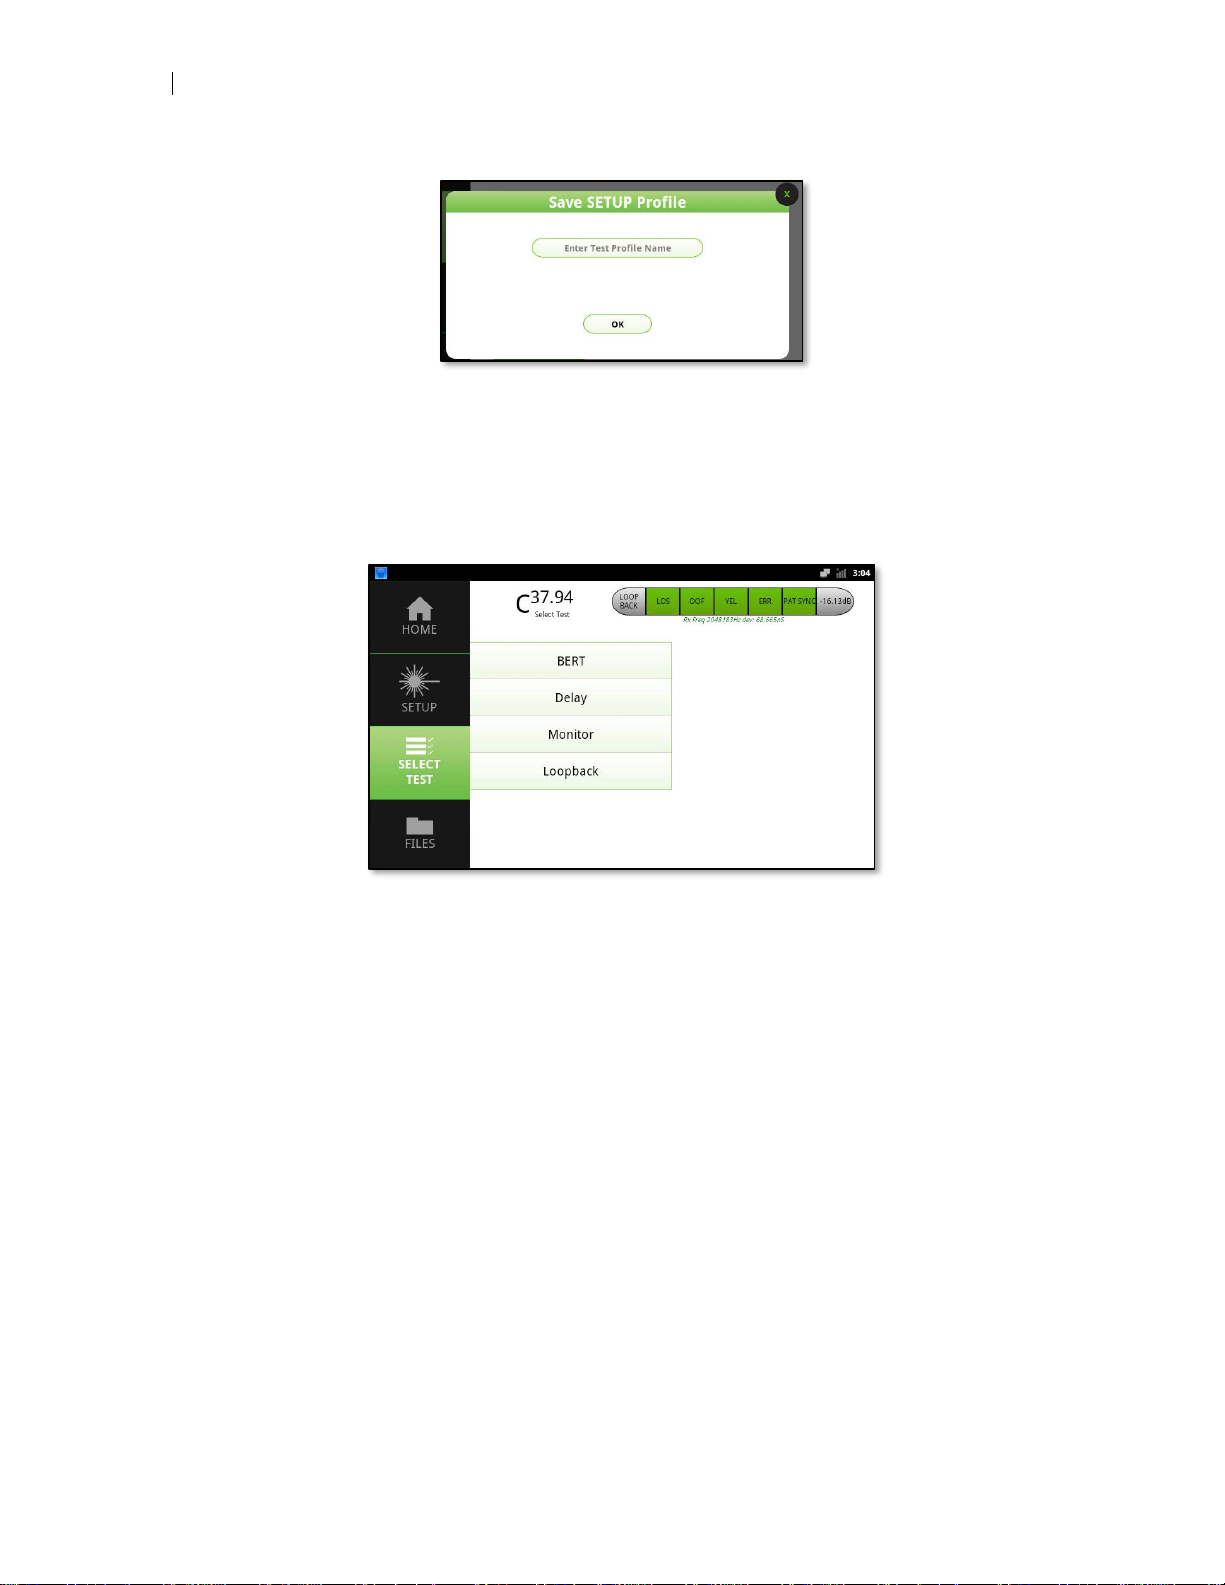
94
Test Selection
Figure 98 - Save Port Profile Entry
Test Selection
Once channel setup is completed, tap on the SELECT TEST button to select which
test to run.
Figure 99 - Select Test Menu
BERT
This test is designed to accomplish several tasks simultaneously or concurrently:
► Generate a user selectable test pattern on the active Nx64 channels and com-
pare received data to what was transmitted for errors
► Remotely loop up/down Greenlee test devices at the remote side of the circuit
► Display and count received errors and alarms
► Display G.821 performance metrics
► Display received data
► Inject alarms and errors
BERT Setup
There are six areas of note in the BERT setup view:
1. Duration Selection
2. Test Pattern Selection
3. Remote Loop Control
Page 97
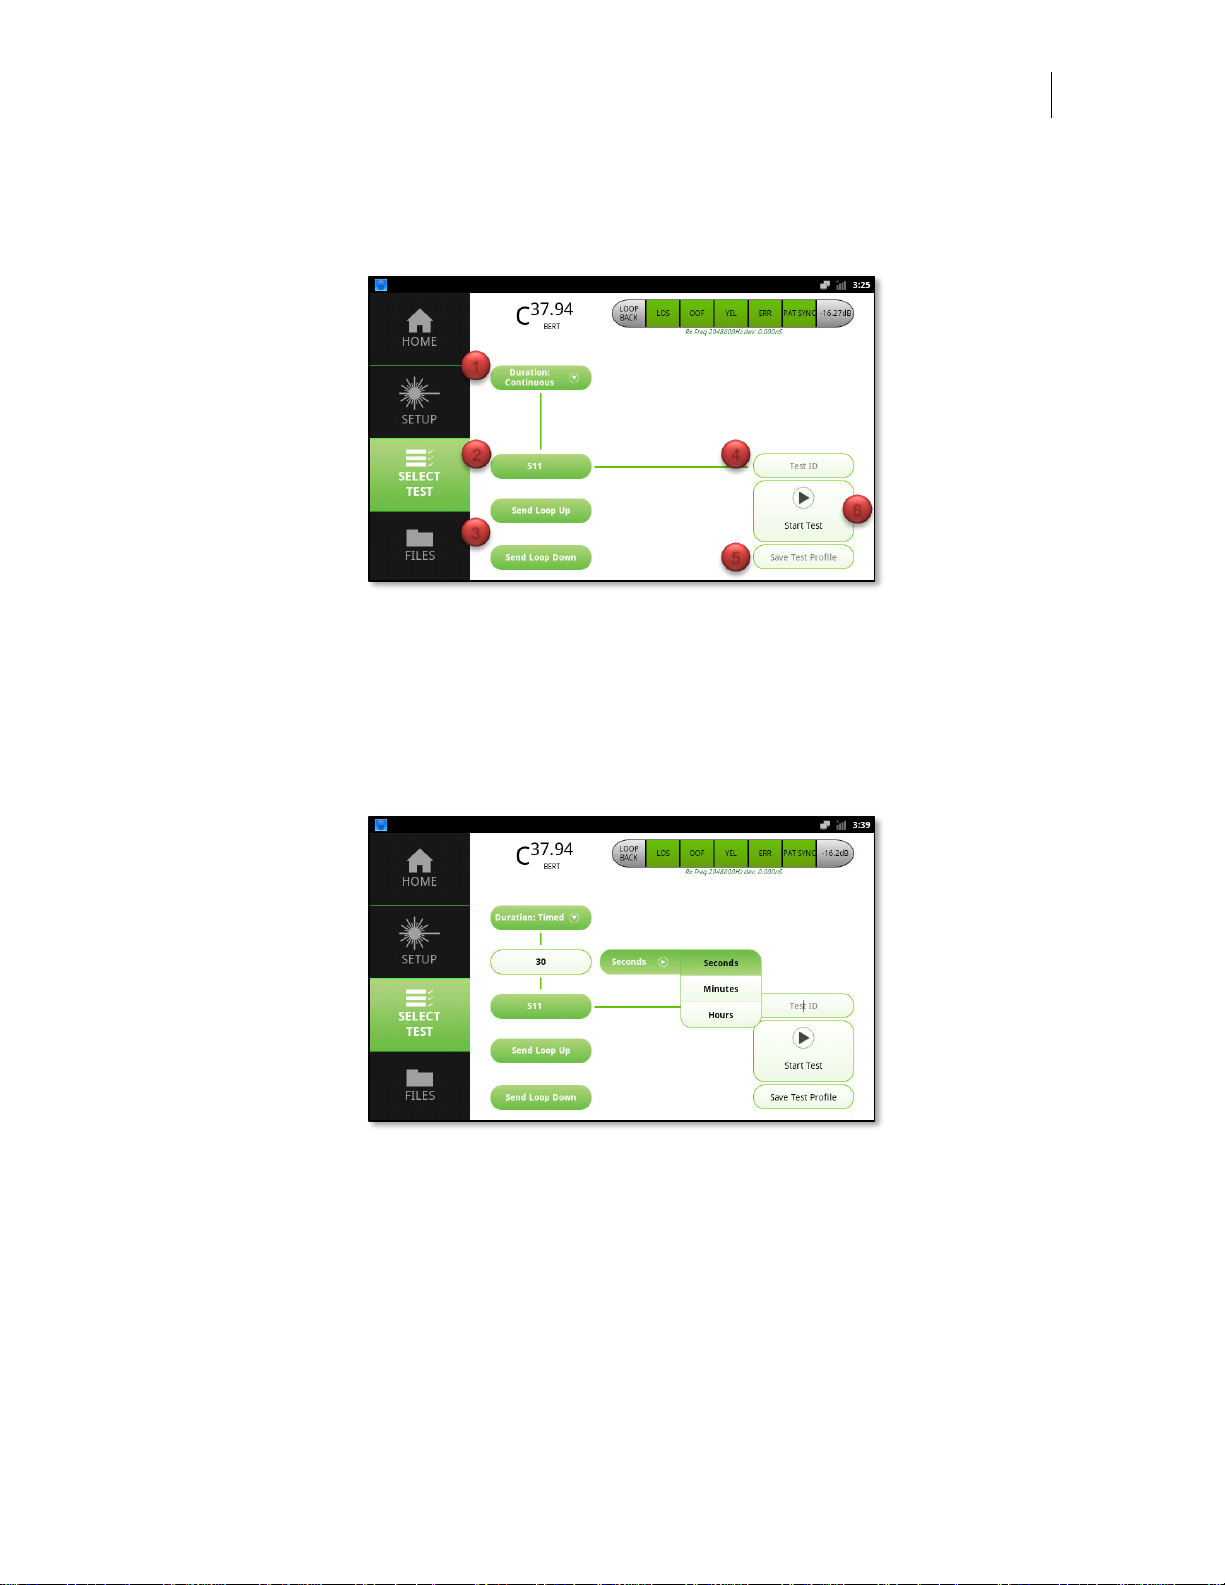
User’s Manual
DataScout 10G
95
4. Test ID
5. Save Test Profile
6. Start Test
Figure 100 - C37.94 BERT Configuration View
Duration Selection
By default, the test set performs BERT in continuous mode. Pressing the “Duration:
Continuous” button will display a menu enabling configuration of timed tests. Enter the
total duration desired by typing the quantity into numeric field and then selecting the
desired range of seconds, minutes or hours.
Figure 101 – Timed Duration Configuration
Test Pattern Selection
Pressing the pattern selection button enables selecting the desired test pattern to generate when the test is started. Note that you may change the test pattern once the test
begins on the test results view as well. Press the “Invert BERT Pattern” button to invert
the test pattern. Press the OK button to close the popover view.
1
2 3 4
5
6
Page 98
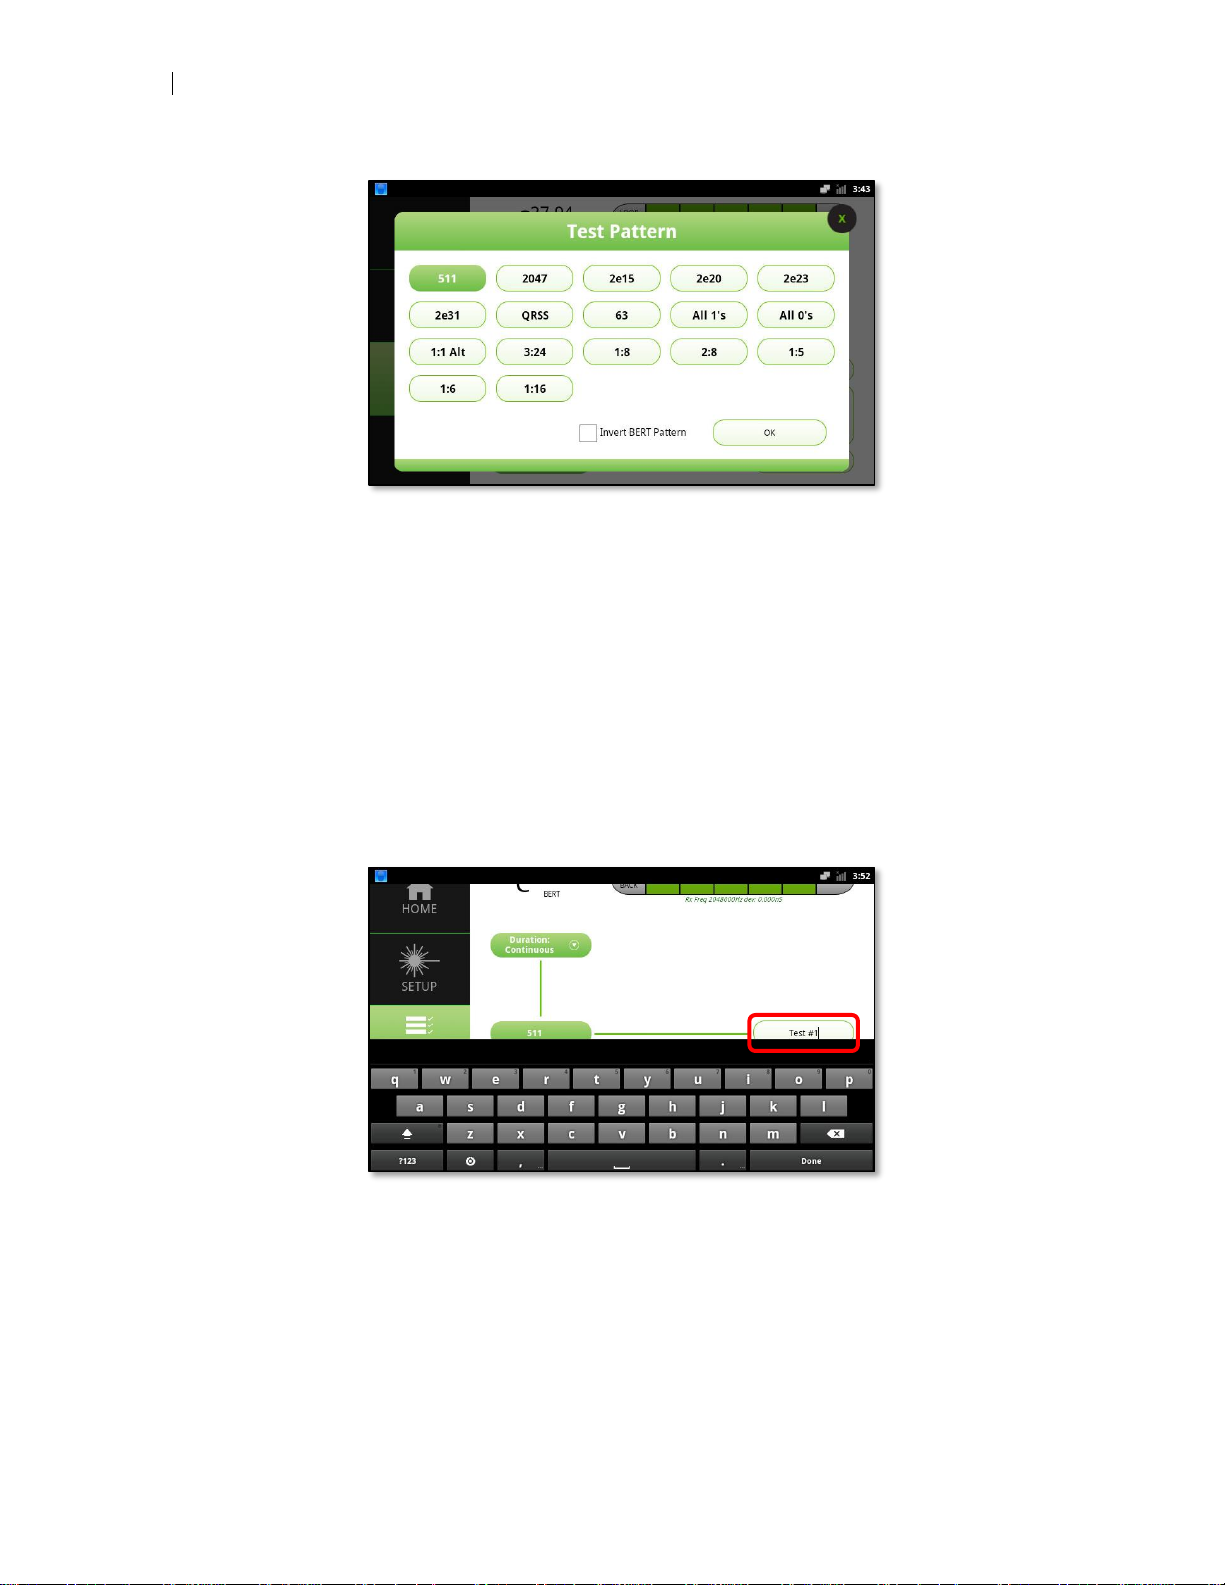
96
Test Selection
Figure 102 - BERT Test Pattern Popover View
Remote Loop Control
If there is another Greenlee DataScout unit connected to the far side of the circuit it is
possible to send remote loop up and down commands to remote test set by pressing
the loop up and loop down buttons respectively. The test set will provide status information regarding feedback received from the far end device.
Test ID
Test results are automatically saved when the START TEST button is pressed. If a
test ID is not entered in the Test ID field the unit will generate a file name for you. This
test file name can always be changed by navigating to the Files, then Results menu.
Figure 103 - Test ID Field
Save Test Profile
After configuring the test setup, it may be desired to save the configuration as a profile
so you can recall it later for rapid test setup. To save a test profile, press the Save
Test Profile button. The test file can be retrieved by navigating to the Files, then Pro-
files menu.
Page 99
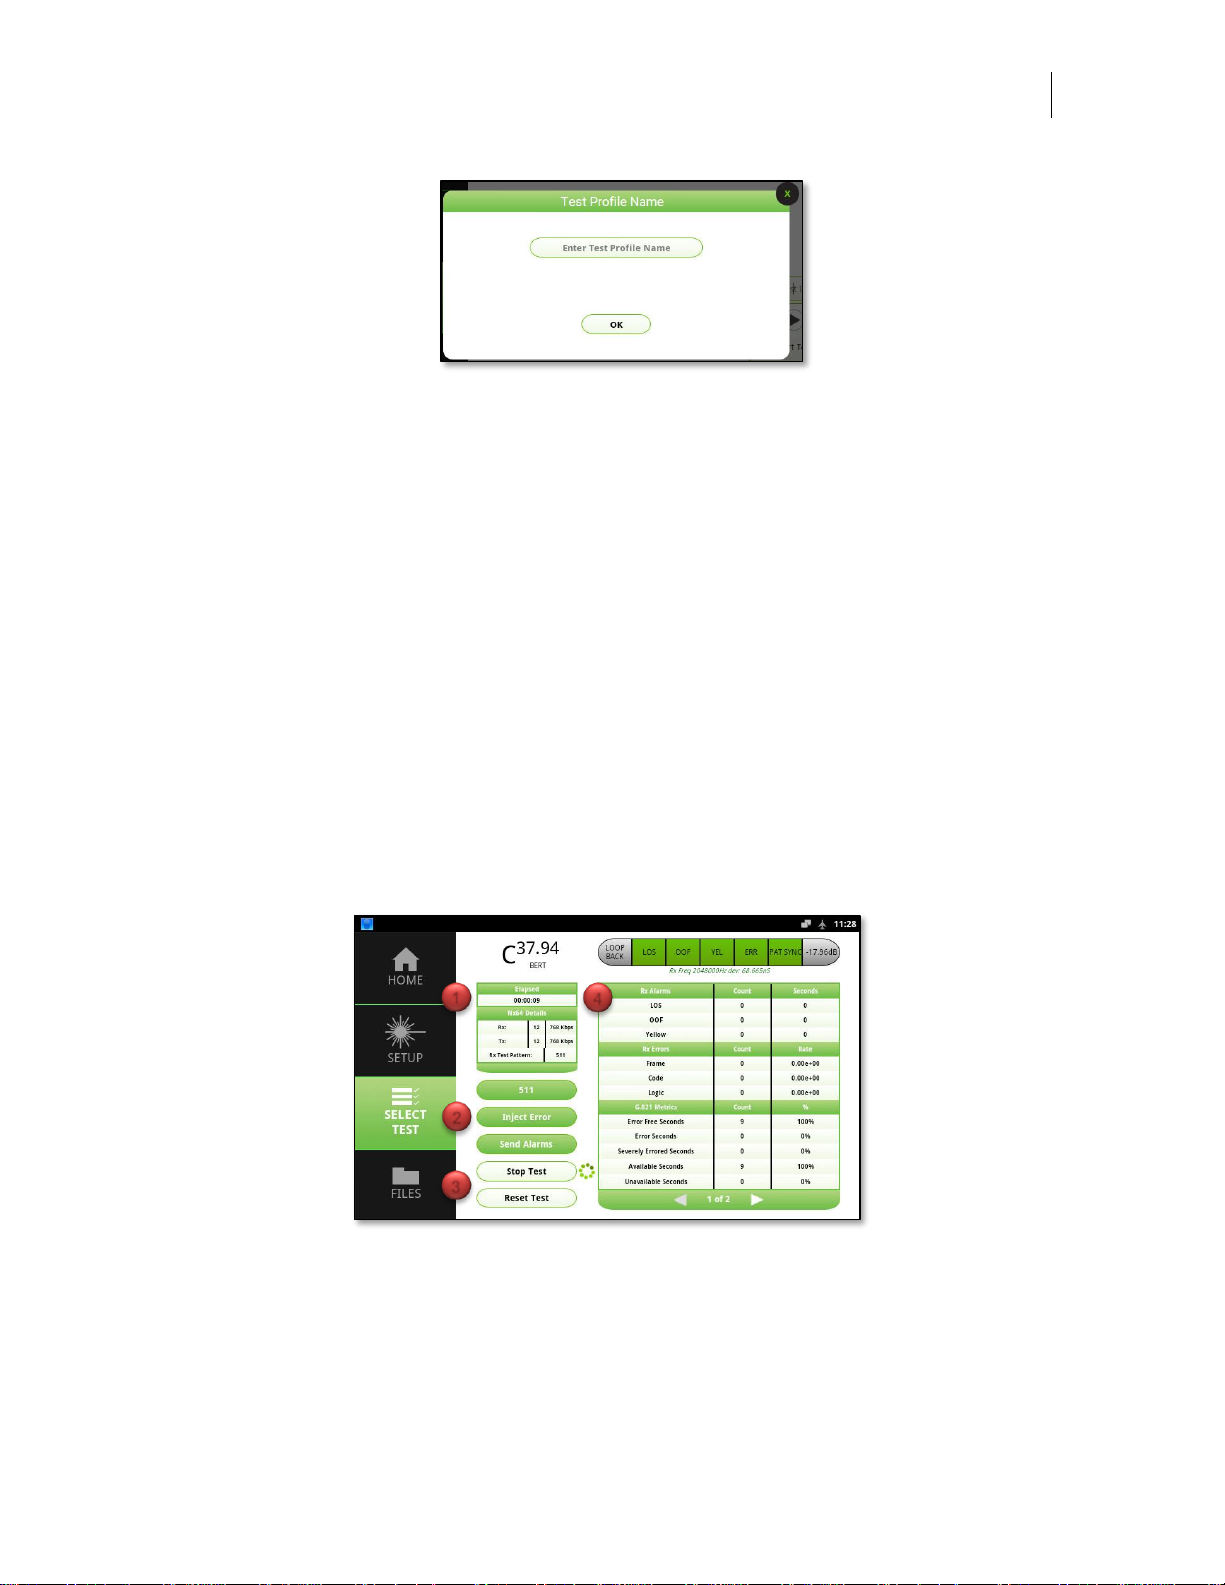
User’s Manual
DataScout 10G
97
Figure 104 - Test Profile Field
If a test profile name is not saved in the Test Profile field, the test configuration will not
be saved. The current test configuration will persist until you change the test type or
power cycle the test unit. If you neglect to save a test profile and desire to do so, return to the test view you are on prior to initiating another test or changing the configuration, then press the Test Profile button and save the profile.
Start Test
To start a test, press the START TEST button. The test set will begin transmitting the
initial test pattern selected in the previous view and display live test results.
BERT Results
There are four areas of note in the BERT results view:
1. Elapsed Time & Nx64 Details
2. Test Pattern Selection, Error & Alarm Injection
3. Stop & Reset Test
4. Live View Test Results
Figure 105 - BERT Test Result View
Elapsed Time & Nx64 Details
When the test set is in continuous mode the elapsed time counter will increment to
show the total elapsed time the test has been running. When in timed mode both
elapsed and remaining time is displayed.
1 2 3
4
Page 100
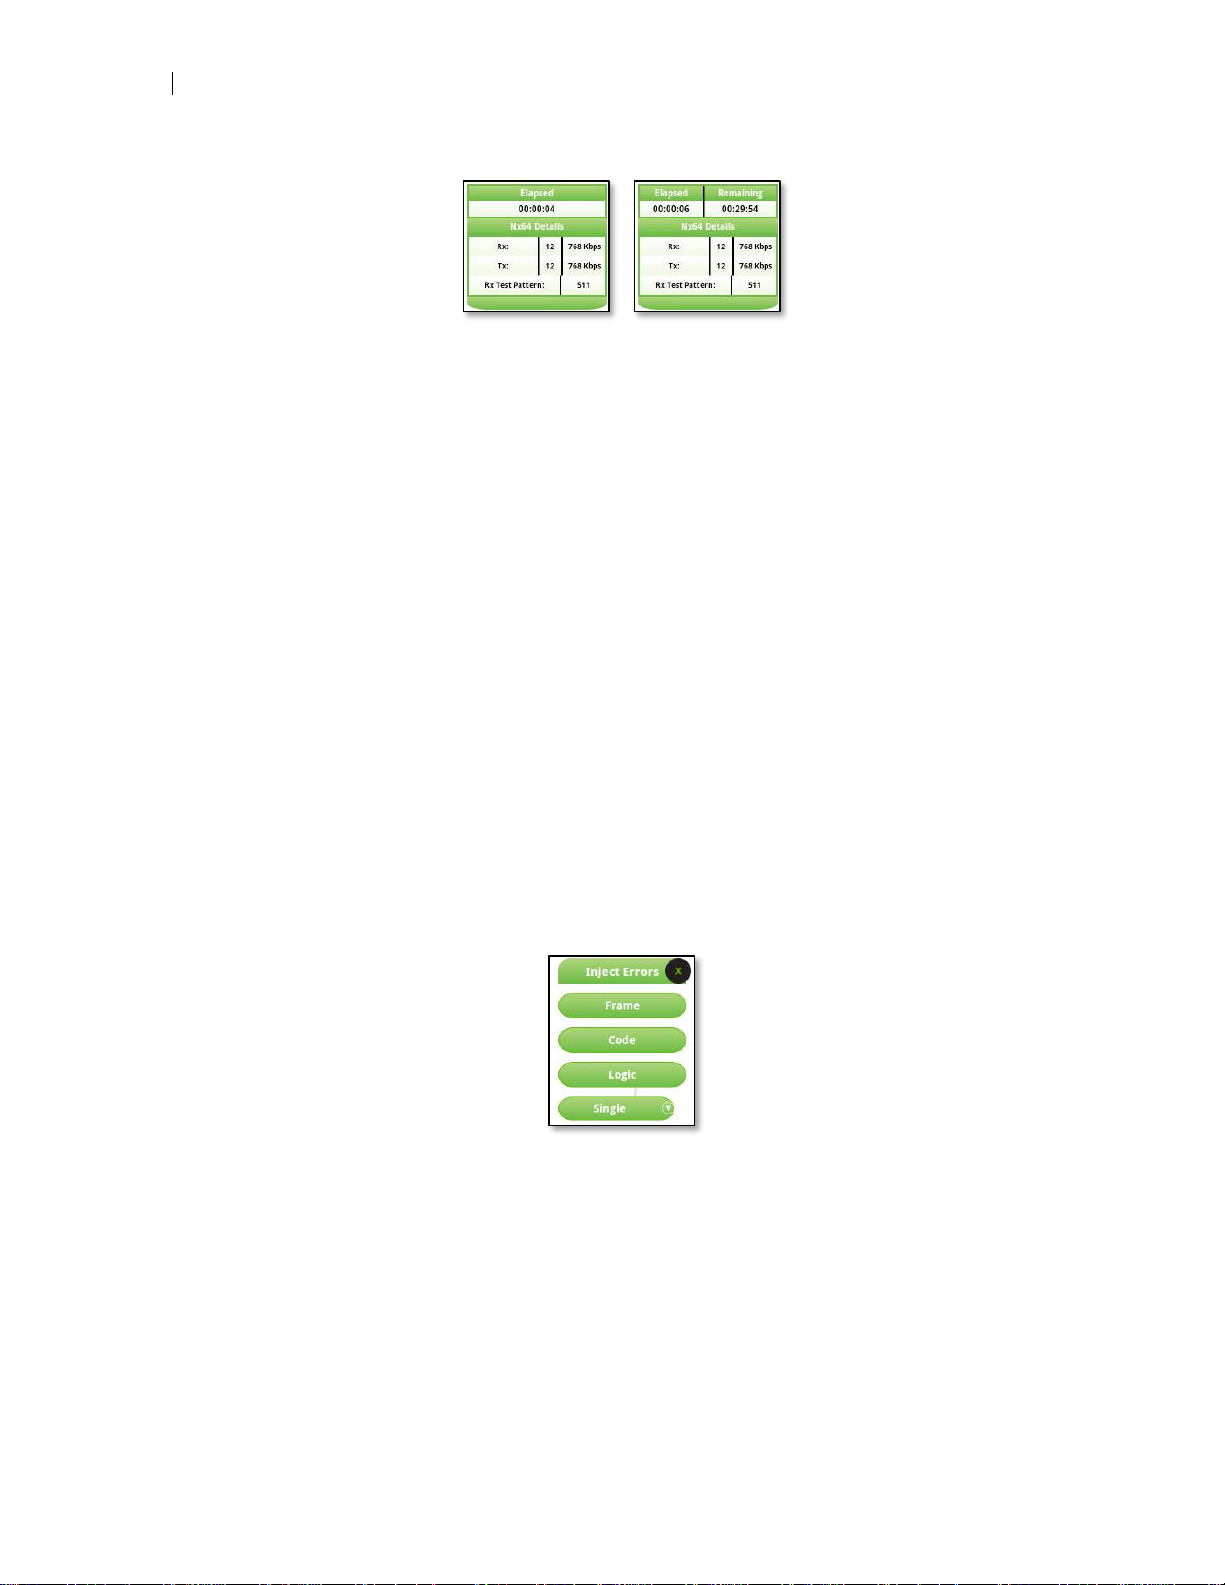
98
Test Selection
Figure 106 - Elapsed Time Display
Below the elapsed time entry is the Nx64 Details which displays the total number of
Nx64 channels being transmitted and received as well as the total throughput of the
channels.
Lastly, below the Nx64 details entry is the Rx Test Pattern display. The test set automatically determines the test pattern received and displays this information to the user.
If the test pattern received does not match what is being sent the PAT SYNC indicator
will be red. This indicates the test set at the far side of the circuit is transmitting a different test pattern from the local test set.
Test Pattern Selection, Error and Alarm Injection
Test Pattern Selection
To change the test pattern currently being transmitted, press the test pattern button
(default 511) and select the desired test pattern just as you did on the initial setup
screen. It is common to receive a few errors during the transition of test patterns.
Error & Alarm Injection
During a test it is possible to inject frame, code or logic errors into the test stream to
verify proper circuit response to these events. To inject errors, press the “Inject Errors”
button. A popover selector view will appear.
Figure 107 - Error & Alarm Injection Popover View
Pressing the Frame and Code buttons will inject a single frame or code error each time
either button is pressed. The Logic button can be used to inject a single logic error
(default) or at a desired rate by pressing the “Single” button and then selecting the desired rate to transmit logic errors at.
 Loading...