

Page 1
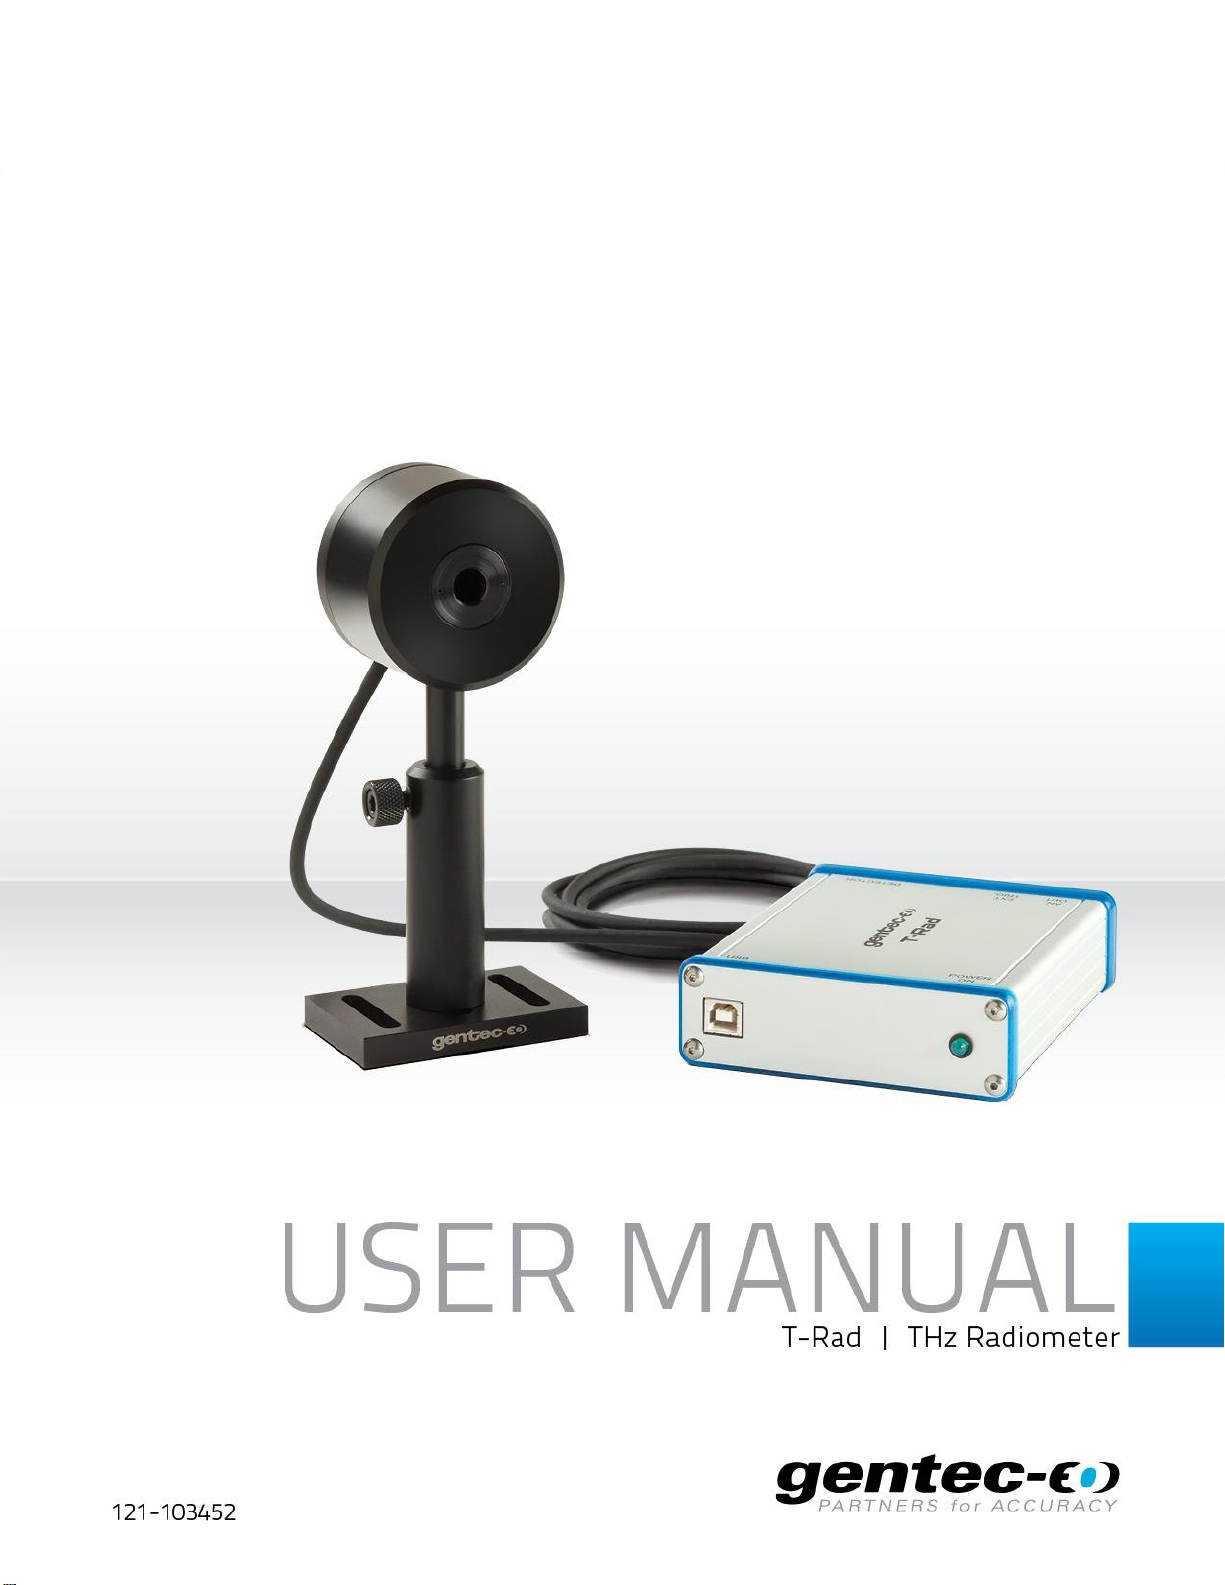
T-RAD-DB15--USB Instruction Manual
Version 2.1
December. 2012
1
Page 2

T-RAD-DB15--USB Instruction Manual
Version 2.1
December. 2012
2
WARRANTY
The Gentec-EO T-RAD THz Radiometer carries a one-year warranty (from date of shipment) against
material and/or workmanship defects, when used under normal operating conditions. The warranty does
not cover damages related to misuse.
Gentec-EO Inc. will repair or replace, at Gentec-EO Inc.’s option, any T-RAD that proves to be defective
during the warranty period, except in the case of product misuse.
Any attempt by an unauthorized person to alter or repair the product voids the warranty.
The manufacturer is not liable for consequential damages of any kind.
In case of malfunction, contact your local Gentec-EO distributor or nearest Gentec-EO Inc. office to obtain
a return authorization number. The material should be returned to:
Gentec Electro-Optics, Inc.
445, St-Jean-Baptiste, Suite 160
Québec, QC
Canada G2E 5N7
Tel: (418) 651-8003
Fax: (418) 651-1174
e-mail: [email protected]
Website: www.gentec-eo.com
CLAIMS
To obtain warranty service, contact your nearest Gentec-EO agent or send the product, with a description
of the problem, and prepaid transportation and insurance, to the nearest Gentec-EO agent. Gentec-EO Inc.
assumes no risk for damage during transit. Gentec-EO Inc. will, at its option, repair or replace the
defective product free of charge or refund your purchase price. However, if Gentec-EO Inc. determines
that the failure is caused by misuse, alterations, accident or abnormal conditions of operation or handling,
you will be billed for the repair and the repaired product will be returned to you, transportation prepaid.
Page 3

T-RAD-DB15--USB Instruction Manual
Version 2.1
December. 2012
3
TABLE OF CONTENTS
1.1 GENERAL INFORMATION................................................................................................................... 8
1.1.1 System Overview ...................................................................................................................... 8
1.1.2 Specifications ............................................................................................................................ 8
1.2 Lock In Amplifier Theory of Operation ............................................................................................. 9
1.2.1 Mathematical Description of a Lock In Amplifier. .................................................................... 9
1.2.2 Time Domain Description of a Lock In Amplifier. ................................................................... 11
1.2.3 Frequency Domain Description of a Lock In Amplifier. .......................................................... 14
1.3 Communications with Host PC ....................................................................................................... 15
1.4 Data Format .................................................................................................................................... 18
1.5 Instrument Connections ................................................................................................................. 18
1.6 Using the Instrument ...................................................................................................................... 19
1.7 Using the Applications Software ..................................................................................................... 20
1.7.1 The Main Display Panel ........................................................................................................... 20
1.7.2 The Digital Display ................................................................................................................... 20
1.7.3 Digital Controls........................................................................................................................ 21
1.7.4 Data Collection ........................................................................................................................ 21
1.7.5 Log to File ................................................................................................................................ 21
1.7.6 Range ...................................................................................................................................... 21
1.7.7 Filter Tau ................................................................................................................................. 21
1.7.8 Null .......................................................................................................................................... 21
1.7.9 Batch Size ................................................................................................................................ 21
1.7.10 Reset ....................................................................................................................................... 22
1.7.11 Auto Reset ............................................................................................................................... 22
1.7.12 Sample Collection ................................................................................................................... 22
1.7.13 Collection Mode ...................................................................................................................... 22
Page 4

T-RAD-DB15--USB Instruction Manual
Version 2.1
December. 2012
4
1.7.14 Time Interval (s) ...................................................................................................................... 22
1.7.15 Digital Indicators ..................................................................................................................... 22
1.7.16 Live Data ................................................................................................................................. 22
1.7.17 Rv ............................................................................................................................................ 23
1.7.18 Wavelength (nm) .................................................................................................................... 23
1.7.19 Frequency (Hz) ........................................................................................................................ 23
1.7.20 Frequency Range .................................................................................................................... 23
1.7.21 Frequency in Range ................................................................................................................. 23
1.7.22 Locked ..................................................................................................................................... 23
1.7.23 Current Sample ....................................................................................................................... 23
1.7.24 Corrections Active ................................................................................................................... 23
1.8 The Strip Chart Display ................................................................................................................... 24
1.8.1 Strip Chart Controls................................................................................................................. 24
1.8.2 Auto Scale ............................................................................................................................... 24
1.8.3 Strip Chart Indicators .............................................................................................................. 24
1.8.4 Strip Chart Plot ........................................................................................................................ 24
1.9 The Statistics Display ...................................................................................................................... 25
1.9.1 Statistics Controls ................................................................................................................... 25
1.9.2 Display as % ............................................................................................................................. 25
1.9.3 Statistics Indicators ................................................................................................................. 25
1.9.4 Min .......................................................................................................................................... 25
1.9.5 Max ......................................................................................................................................... 26
1.9.6 Mean ....................................................................................................................................... 26
1.9.7 Standard Deviation ................................................................................................................. 26
1.9.8 Filter Bandwidth...................................................................................................................... 26
1.9.9 Data File .................................................................................................................................. 26
Page 5

T-RAD-DB15--USB Instruction Manual
Version 2.1
December. 2012
5
1.10 The Tuning Needles Display ............................................................................................................ 27
1.10.1 Tuning Needles Controls ......................................................................................................... 28
1.10.2 Tuning Scale ............................................................................................................................ 28
1.10.3 Reset Needles ......................................................................................................................... 28
1.10.4 Tuning Needles Indicators ...................................................................................................... 28
1.10.5 Tuning Needles ....................................................................................................................... 28
1.10.6 Current .................................................................................................................................... 28
1.10.7 Minimum ................................................................................................................................. 28
1.10.8 Maximum ................................................................................................................................ 28
1.11 The Setup Display............................................................................................................................ 29
1.11.1 Setup Controls......................................................................................................................... 29
1.11.2 Wavelength (nm) .................................................................................................................... 29
1.11.3 % Transmissivity ...................................................................................................................... 30
1.11.4 Diameter (mm) or Area (cm2) ................................................................................................ 30
1.11.5 Entry Type ............................................................................................................................... 30
1.11.6 Display W/cm2 ........................................................................................................................ 30
1.11.7 User Serial Number ................................................................................................................. 30
1.11.8 User Calibration Date .............................................................................................................. 30
1.11.9 Write to Instrument ................................................................................................................ 30
1.11.10 Read From Instrument ........................................................................................................ 30
1.11.11 Update Firmware ................................................................................................................ 31
1.11.12 Setup Indicators .................................................................................................................. 32
1.11.13 Wavelength Factor .............................................................................................................. 32
1.11.14 Transmissivity Factor .......................................................................................................... 32
1.11.15 Area (cm2) ........................................................................................................................... 32
1.11.16 T-RAD Serial Number .......................................................................................................... 32
Page 6

T-RAD-DB15--USB Instruction Manual
Version 2.1
December. 2012
6
1.11.17 T-RAD Calibration date ....................................................................................................... 32
1.11.18 Device ID ............................................................................................................................. 32
1.11.19 Firmware Version ................................................................................................................ 32
1.11.20 Application Menus .............................................................................................................. 32
1.11.21 The "File" Menu .................................................................................................................. 33
1.11.22 Open Data File .................................................................................................................... 33
1.11.23 Close Data File ..................................................................................................................... 33
1.11.24 View Existing Data File ........................................................................................................ 33
1.11.25 Print Window ...................................................................................................................... 33
1.11.26 Exit ...................................................................................................................................... 33
1.12 The Display Menu ........................................................................................................................... 34
1.12.1 Display Options ....................................................................................................................... 34
1.13 View Wavelength Correction Table ................................................................................................ 34
1.14 The Help Menu ............................................................................................................................... 35
1.14.1 Help ......................................................................................................................................... 35
1.14.2 Show Context Help ................................................................................................................. 35
1.14.3 About ...................................................................................................................................... 35
1.15 Recycling and separation procedure. ............................................................................................. 35
1.15.1 Separation: .............................................................................................................................. 35
1.15.2 Dismantling procedure: .......................................................................................................... 35
1.16 DECLARATION OF CONFORMITY .................................................................................................... 36
Page 7

T-RAD-DB15--USB Instruction Manual
Version 2.1
December. 2012
7
LIST OF ILLUSTRATIONS
Fig. 1 Input signal.......................................................................................................................11
Fig. 2 Reference
signal
..............................................................................................................12
Fig. 3 Result of
multiplication
...................................................................................................12
Fig. 4 Output with 100ms time
constant
..................................................................................13
Fig. 5 Output with 1s time constant .........................................................................................13
Fig.6 Corrupted Input
Signal
..................................................................................................14
Fig. 7 Band Pass Filtered Corrupted Input Signal ................................................................14
Fig.8 Phase Specific Detector Output Signal .......................................................................15
Page 8
T-RAD-DB15--USB Instruction Manual
Version 2.1
December. 2012
8
1.1 GENERAL INFORMATION
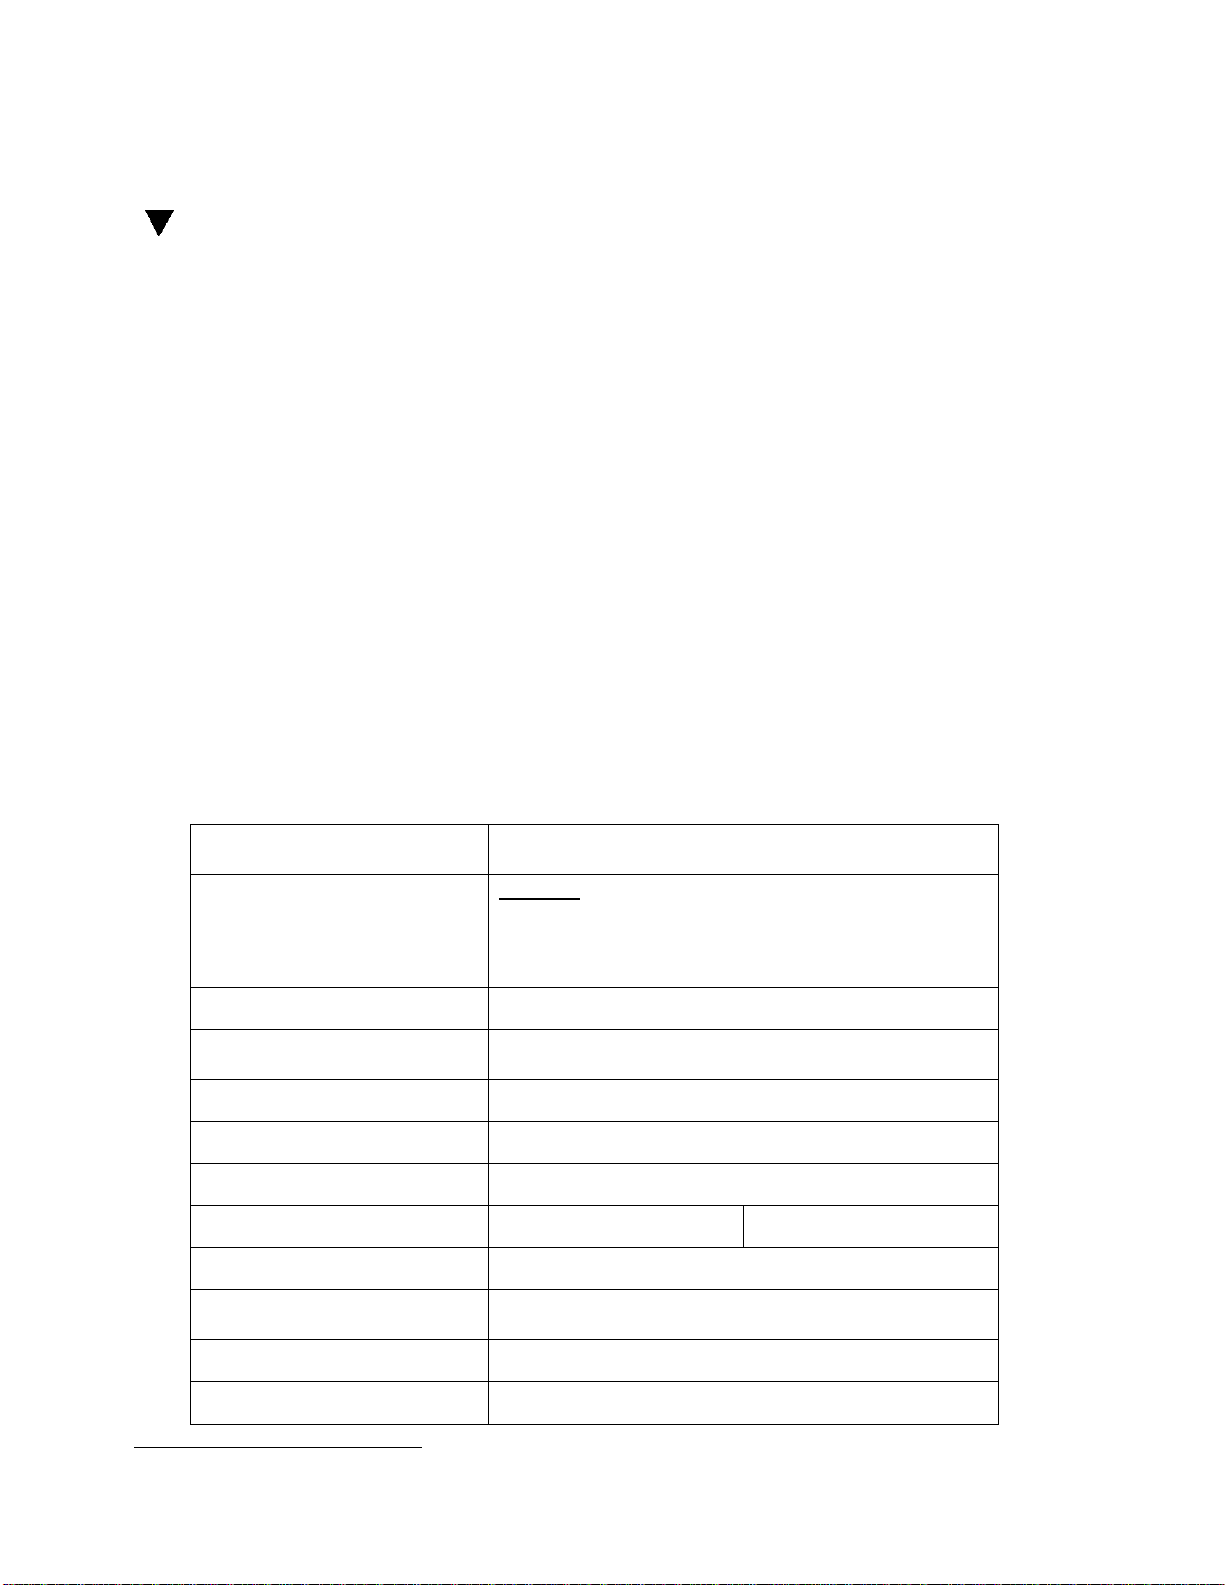
Power meter specifications T-RAD
Power Scales
(depends on THZ-B probe
model)
6 scales: 200 nW, 2uW, 20 uW, 200 uW, ,
2 mW, 20 mW, 200 mW.
Resolution (digital)
Current scale/3000
Accuracy
±1%±3uV from 10% to full scale1
Integration Time range
0.1 to 50 sec
Data Transfer Rate
5 Hz
Statistics
Current value, Max, Min, Average, Std Dev.
Data Storage
Limited to PC hard drive free space
General Specifications T-RAD
Digital Display
Computer screen
Display Rate
5 Hz
1
1.1.1 System Overview
Welcome to the T-RAD Application Software. This software, when coupled with a Gentec-EO TRAD, provides the user with a versatile measurement system. There are multiple THz sensors
available for the system. When a sensor is mated to the USB module, and the software is started,
the module reads
the hardware appropriately.
the sensor
type, sensor calibration, sensor wavelength response, and configures
The Applications Software communicates with the host PC via a USB port. The system uses the
T-RAD Command Set to do this.
Data is sent to the host PC when the instrument has had its data gate turned on. The data is
sent to the application at 5Hz.
1.1.2 Specifications
The following specifications are based on a one-year calibration cycle, an operating temperature of 18 to
28ºC (64 to 82ºF) and a relative humidity not to exceed 80%.
Table 1-1 List of Specifications
The accuracy will be limited by the head noise floor and the integration time.
Page 9
T-RAD-DB15--USB Instruction Manual
Version 2.1
December. 2012
9
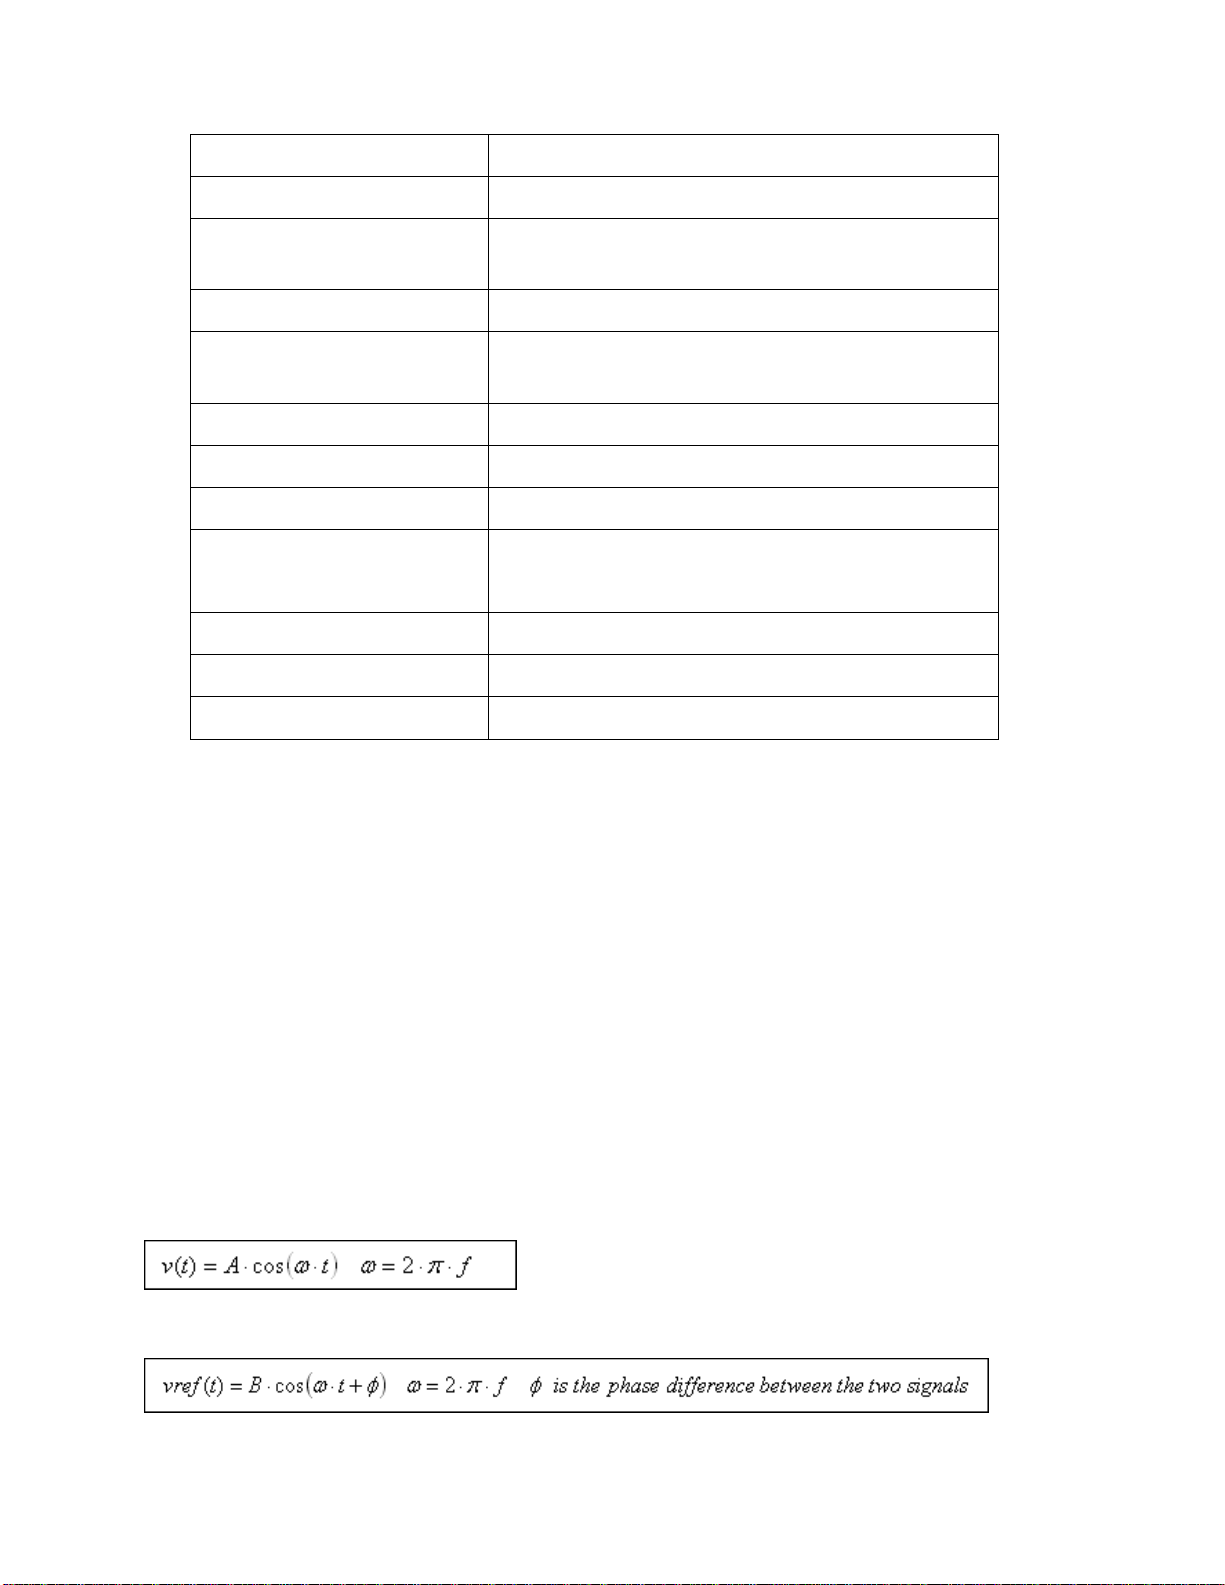
Data Displays
Real time, Strip chart, Tuning, Statistics
User input correction
factors
1 multiplier (transmission adjustment) (7 digits
floating point)
Positive External trigger
4.5 to 10 V @ 20 mA, optically isolated
External trigger pulse
width
80 ms
Analog-out
AC signal of the ADC input.
Internet Upgrades
Yes
PC Serial Commands
Yes
Dimensions
(connectors included)
147 (L) x 106 (W) x 34 (H) mm
Weight
0.424 kg
Power Over USB
Yes
T-RAD
1 Channel
1.2 Lock In Amplifier Theory of Operation
The operation of a Lock In Amplifier can seem mysterious given its ability to pull a useful
out
of noise and interference, but the basics of operation are not complex. A lock in amplifier's
operation can be explained in three ways: mathematically, in the time domain, or in the frequency
domain. While all explanations are equally useful, the one that makes sense to the user is the
most useful, so a brief description of all three will be presented.
1.2.1 Mathematical Description of a Lock In Amplifier.
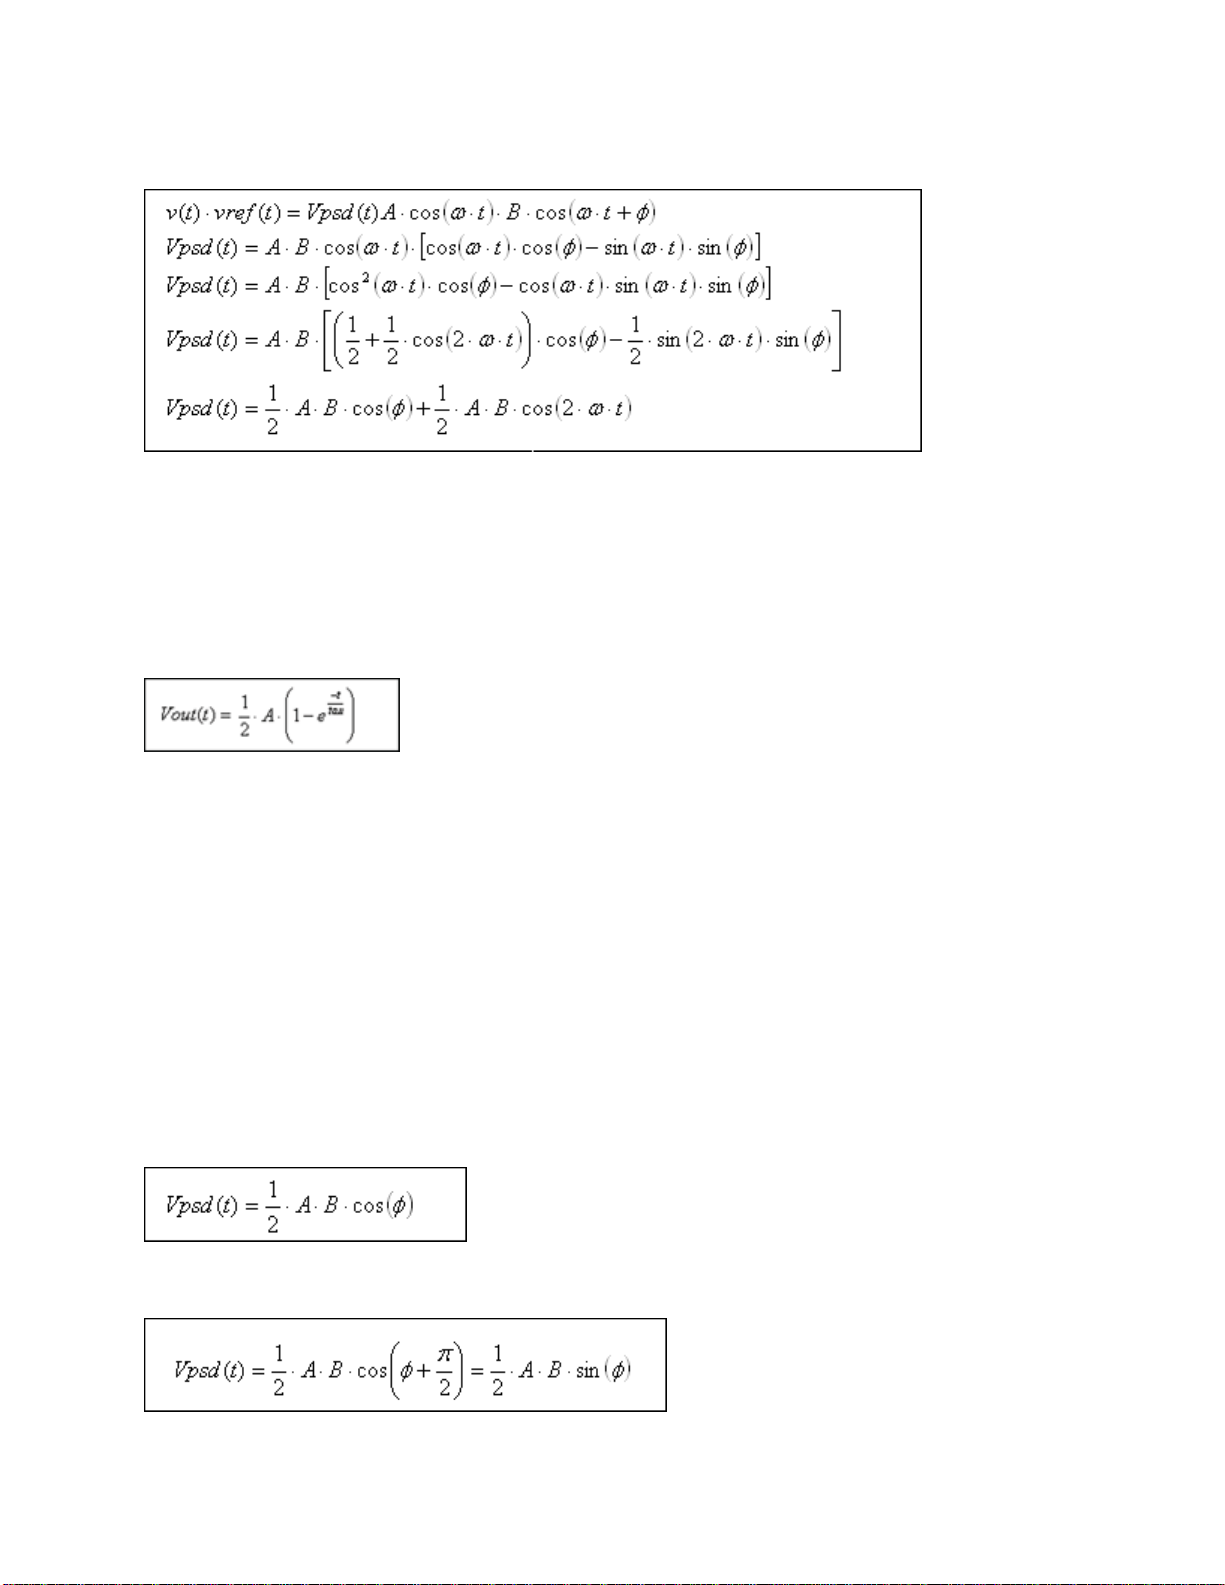
Fourier Theory tells us that all repetitive signals can be broken down into a series of sine’s and
cosines. Because of this fact, we can describe the lock in operation using a signal that is a pure
cosine wave. To go further, even if the input signal is not a pure cosine wave, the lock will extract
the pure cosine wave component of the signal anyway, so the approach is justified. Consider an
input signal, v (t), given by:
signal
Now consider a second signal, the reference signal, given by:
This reference signal is at the same frequency as the input signal and is supplied by the lock in.
Page 10
T-RAD-DB15--USB Instruction Manual
Version 2.1
December. 2012
10
If we multiply the two signals, we get
If we set B to unity and hold it constant, then the result is a signal that is:
1. Proportional to the A, the amplitude of the input signal.
2. Proportional to the cosine of the phase angle between the two signals.
3. Modulated at two times the input signal frequency.
If we set the phase difference to zero degrees then the resulting signal can be passed through a
low pass filter with a time constant of tau and the result will be:
This shows that once the filter has settled, the signal is a DC representation of the original input. We can
now set the filter time constant as high as needed to block out unwanted noise and interference. The
details of how the lock in implements this math can be found in the literature.
One subject of interest arises from the requirement to set the phase difference to zero degrees. In
practice, the phase difference is not known. Since the cosine function returns values between one and
negative one as the phase is changed, the phase is simply adjusted until the signal maximizes. It is
actually easier to adjust the phase until the signal goes to zero and then shift the phase by 90 degrees. If
the signal goes negative, shift the phase 180 degrees. The signal will now be maximized.
If this seems like a bother, it is. The Gentec-EO Lock In Amplifier uses a dual phase approach which
relieves the user of the need to adjust the phase. A sine wave signal is generated by the instrument at the
reference frequency, and at the reference frequency plus 90 degrees, or pi divided by 2. The input signal
is multiplied by both reference signals. The results of those multiplications are then squared, summed,
and the square root is taken. Look at the final equation for the output after the multiplication, ignoring the
second term:
The output of the second multiplication will be:
Page 11
T-RAD-DB15--USB Instruction Manual
Version 2.1
December. 2012
11
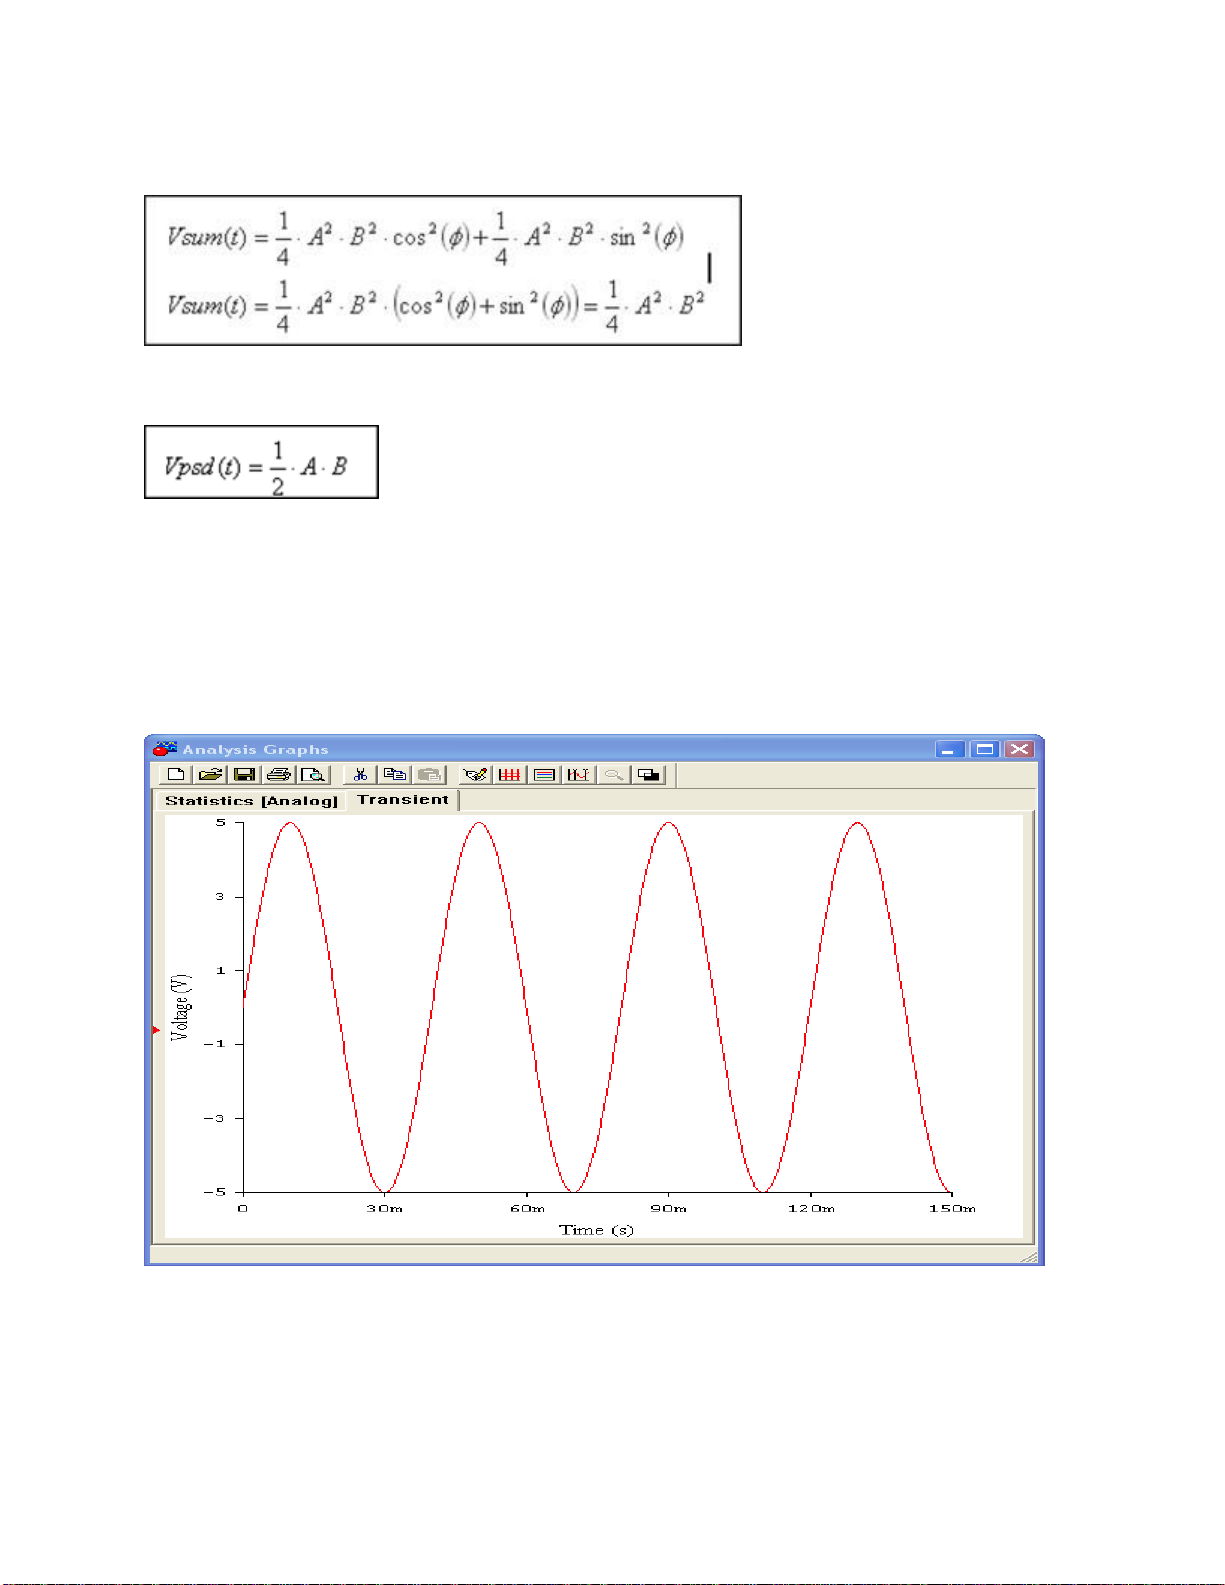
If we square these and add them together we obtain:
Now taking the square root gives:
The output of the multiplication is no longer phase dependent.
1.2.2 Time Domain Description of a Lock In Amplifier.
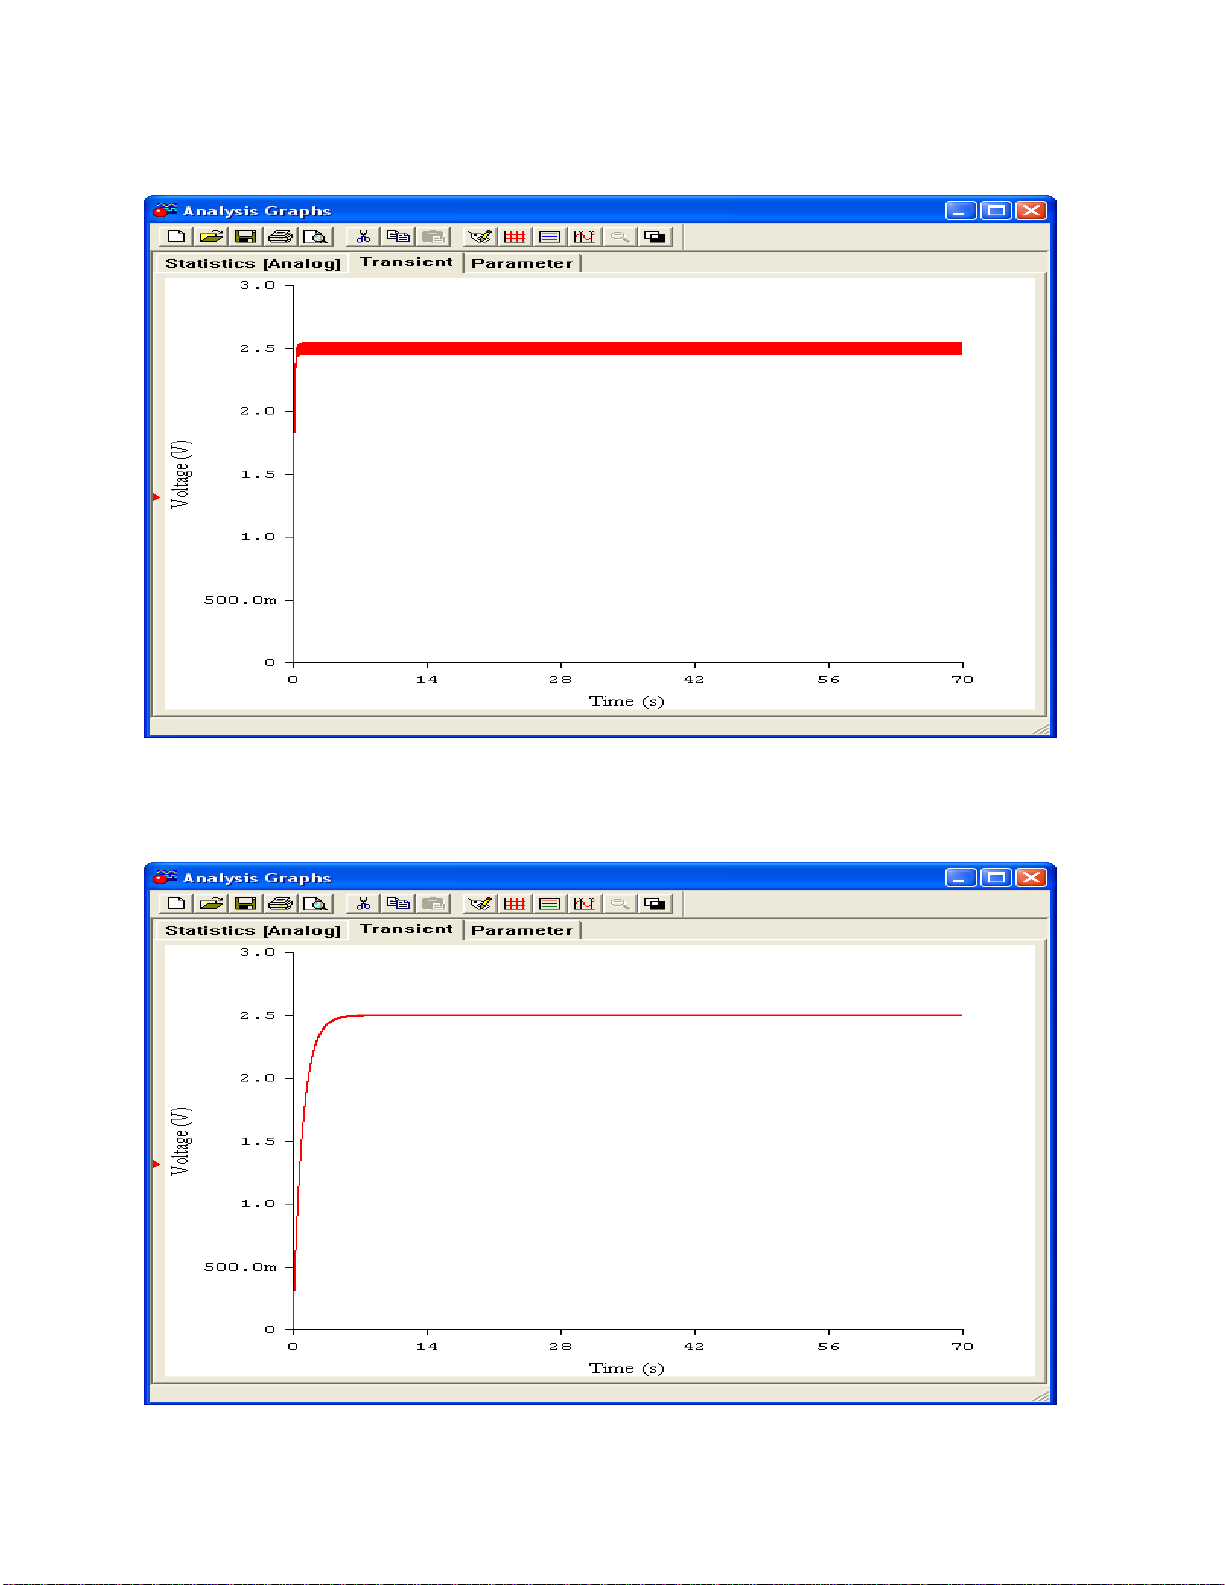
The input signal has peak amplitude of 5V (10V peak to peak) and a frequency of 25Hz and is
shown in figure 1.
Figure 1 Input Signal
Page 12

T-RAD-DB15--USB Instruction Manual
Version 2.1
December. 2012
12
The reference signal supplied by the lock in signal has peak amplitude of 1V and a frequency of
25Hz and is shown in figure 2.
Figure 2 Reference Signal
After multiplying the two signals using a circuit called a Phase Specific Detector in an analog lock in, or by
direct math in a digital lock in, the output signal is shown in figure3. Note that its peak to peak amplitude is
5V, or ½ of the input and its frequency is 50Hz,or twice the input frequency. Also note it now has a DC
offset of the peak voltage of the input signal divided by 2 as predicted. This DC offset is what the low pass
filter will pull from figure 3.
Figure 3 Result of Multiplication
Page 13
T-RAD-DB15--USB Instruction Manual
Version 2.1
December. 2012
13
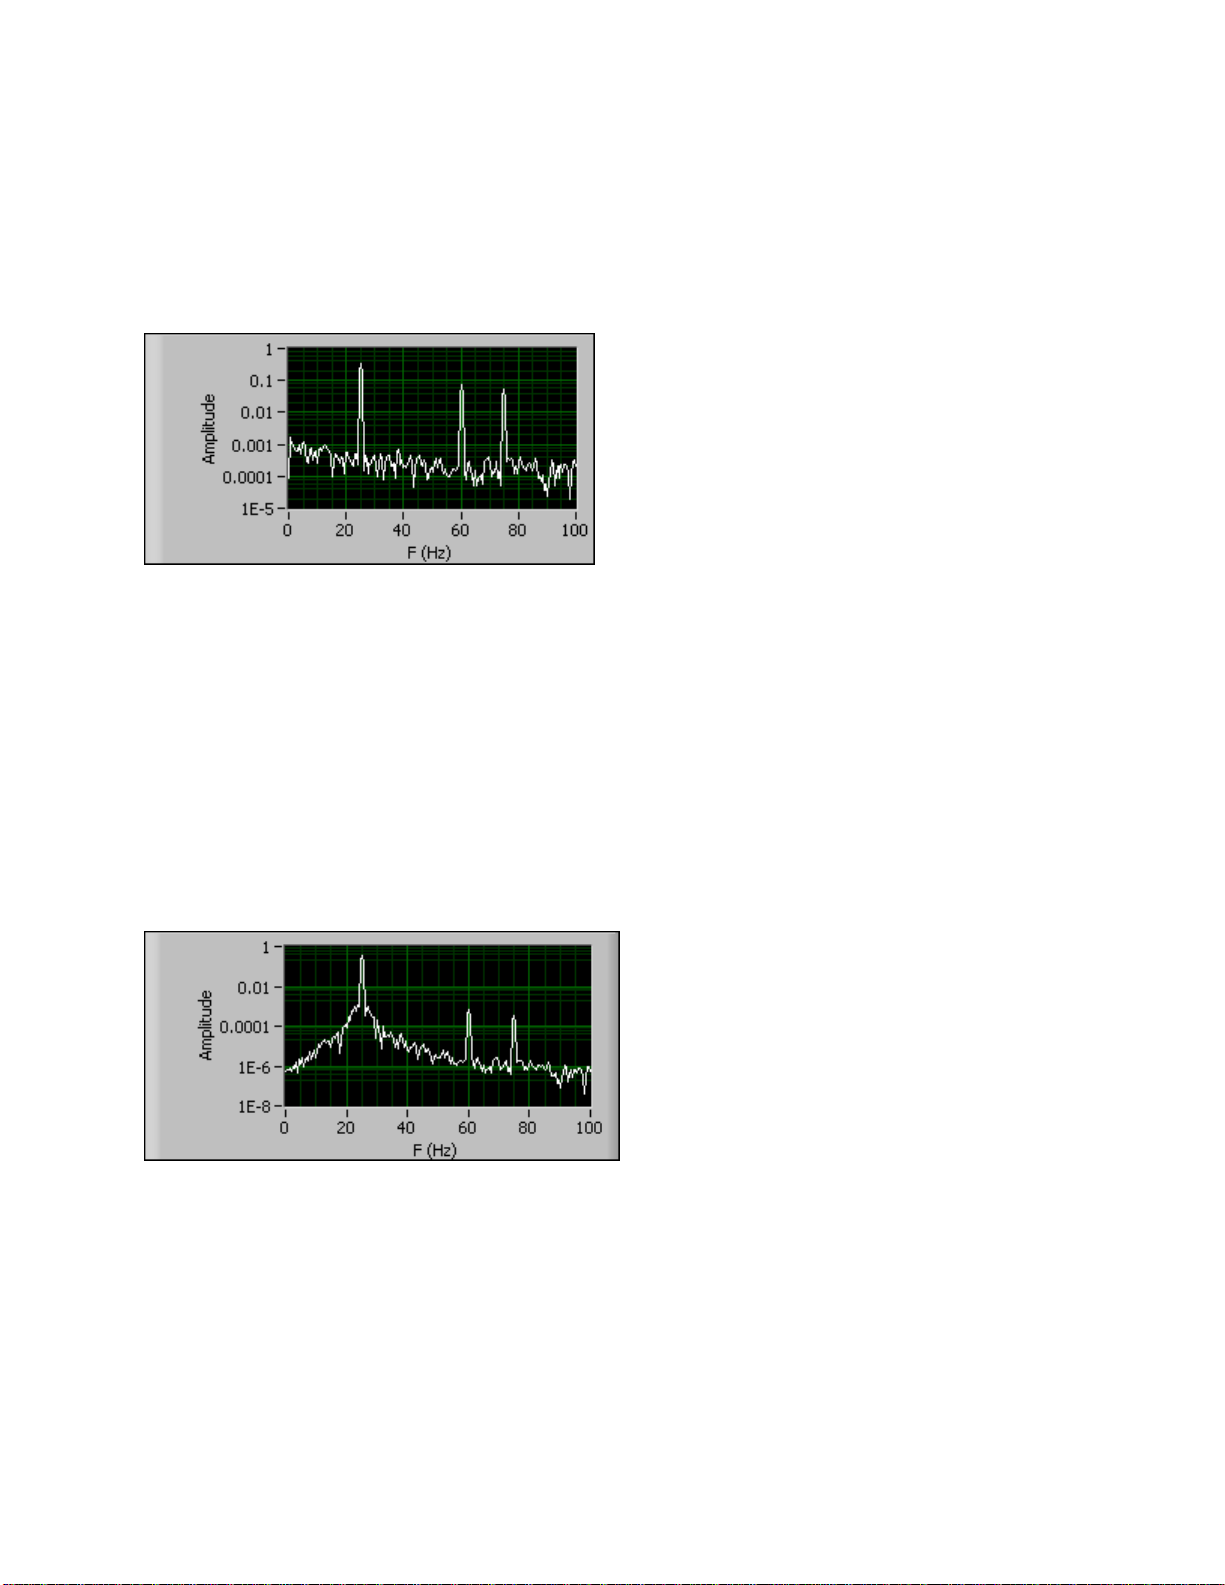
Figure 4 shows the output using a 100ms time constant. Note that the ripple is still visible on the DC level.
Figure 4 Output with 100ms Time Constant
Figure 5 shows the output using a 1s time constant. Note that the ripple is greatly
reduced.
Figure 5, Output with 1s Time Constant
Page 14
T-RAD-DB15--USB Instruction Manual
Version 2.1
December. 2012
14
1.2.3 Frequency Domain Description of a Lock In Amplifier.
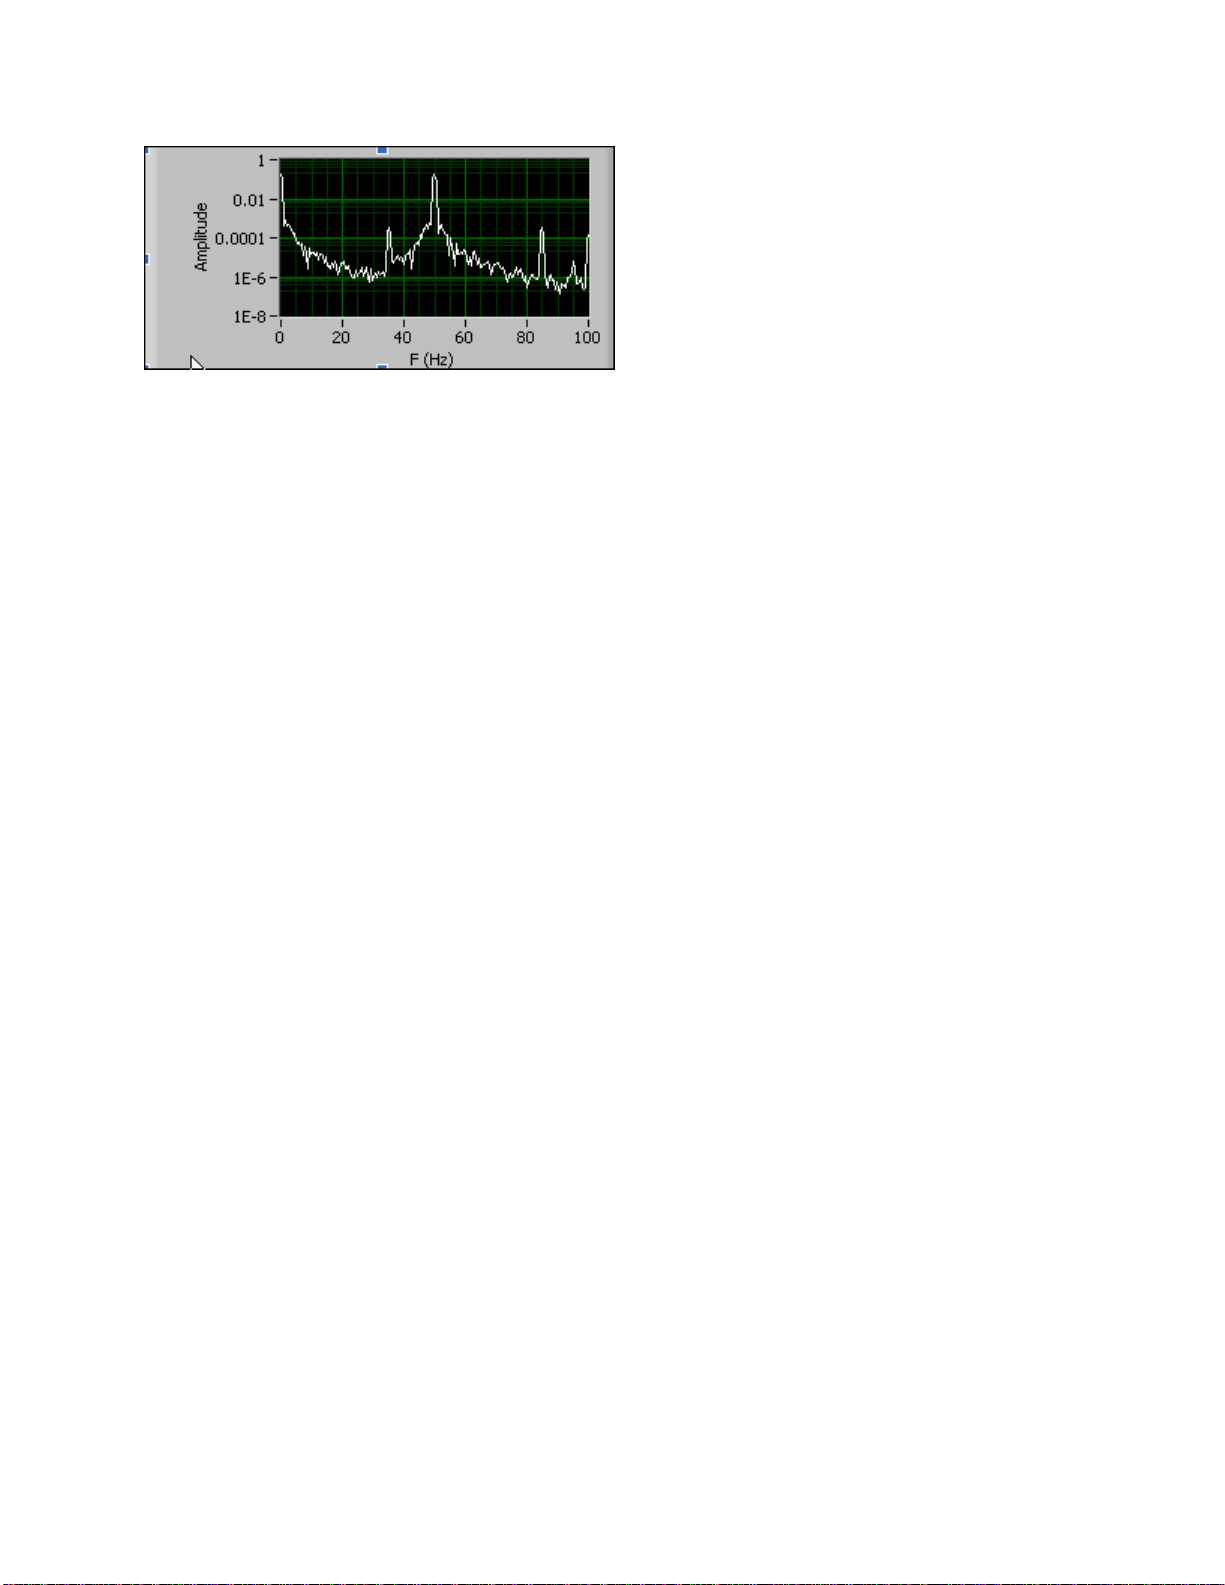
Figure 6 shows the frequency contents of a 25Hz square wave with a 60Hz interference signal
and broadband noise at about 1% of the signal.
Figure 6 Corrupted Input Signal
Since the input is a square wave, there are only odd harmonics. The fundamental is seen at 25Hz,
the 3rd harmonic is seen at 75Hz, and the 60Hz interference is seen. Remember when we said
that even if the input signal is not a pure sine wave, the lock will extract the pure sine wave
component of the signal? Figure 6 shows why this is so. The reference signal is a pure sine wave
at the same frequency as the input signal so only the fundamental sine wave component of the
input signal is extracted. Of course this statement depends on the purity of the reference sine
wave. In an analog system, a pure sine wave cannot be generated due to distortion and phase
noise as well as frequency jitter. All of these combine to decrease the accuracy of the instrument.
Since the Gentec-EO Lock In Amplifier is a digital device, the reference sine wave is pure to a
much greater extent and these errors are minimized.
Figure 7 shows the spectrum of the signal after it has been passed through a band pass filter set
to 25Hz.
Figure 7 Band Pass Filtered Corrupted Input Signal
Note that the relative amplitude of the 60Hz and 75Hz signals have been reduced by the
band pass filter. The noise floor has also taken on the shape of the filter. Figure 8 shows
the spectrum of the multiplied signal.
Page 15
T-RAD-DB15--USB Instruction Manual
Version 2.1
December. 2012
15
Figure 8 Phase Specific Detector Output Signal
The multiplier action moves the signal to the frequencies at the sum and difference of the signal
and the reference frequency at 25Hz. Therefore the signal at 25Hz will move to 0Hz and 50Hz, as
seen. The 60Hz interference will move to 85Hz and -35Hz, not shown here. The odd harmonic of
the input signal at 75Hz moved to 100Hz and 50Hz, where it will add to the frequency shifted
signal. These signals can now be low pass filtered to extract the DC component.
1.3 Communications with Host PC
The T-RAD communicates with the host PC via a USB port. The device supports full speed USB
2.0. The implementation of the port in the host PC is accomplished via a Virtual Com Port, or
VCP. This in effect mimics a standard com port so that the user can take advantage of the ease
of developing custom applications with existing terminal emulators.
The Ports Settings are:
Baud Rate: 921600
Data Bits: 8
Stop Bits: 1
Parity: None
Flow Control: None
If the host PC cannot supply a baud rate of 921600, the T-Rad will adjust its baud rate to match
the fastest one available from the PC. The host PC must have a terminal emulator as well as the
T-RAD USB drivers installed. These drivers are installed by the disc supplied with the T-RAD
instrument.
The command set for the T-RAD instrument is shown below.
All commands and replies are followed by a carriage return (0x0D) and a line feed (0x0A). If a command is
used with no arguments it will become a query.
All commands except STR1 reply with:
Ok if the command executed correctly.
Err if the command could not be executed.
All Queries reply with the item that was queried or Err if the query could not be executed.
With the exception noted above, the host software should wait for an instrument reply before executing a
subsequent command or query.
Page 16
T-RAD-DB15--USB Instruction Manual
Version 2.1
December. 2012
16
VER
Queries the Firmware Version. No arguments are used.
Example.
Send: verCRLF
Reply: 1.00.00CRLF
RNG
Sets or Queries the instrument range
Example.
Send rng27CRLF sets the range to index 27, the 30mW range. See table
below for ranges versus indices
rngCRLF queries the current range.
Example
rngCRLF returns the range index
Reply 27CRLF
STR
Starts or stops the data flow.
Example.
Send str1CRLF The T-Rad will send data to the com port. Data is sent at
5Hz for power.
Send str0CRLF T-Rad will stop sending data and reply Ok.
Data is the hexadecimal data string. See the note below for how to decode
this value.
MAX
Query only. Returns the maximum range index for the head in use.
Example
Send maxCRLF
Reply 27CRLF
MIN
Query only. Returns the minimum range index for the head in use.
Example
Send minCRLF
Reply 20CRLF
ZRO
Command only. Sets the DC offset of the signal to the desired value.
Page 17
T-RAD-DB15--USB Instruction Manual
Version 2.1
December. 2012
17
Example
Send zroCRLF
Reply 27,2350,2048CRLF
The values used are for example only. 2048 counts represent 1.25V of offset.
All heads use this value. 0 counts is 0V, 4095 counts is 2.5V. The reply is
Offset DAC0, Offset DAC1 code, ADC counts.
MRD
Query only. Returns the maximum reading for the head in use.
Example
Send mrdCRLF
Reply 216.7E-6CRLF, The maximum reading is 216.7uW.
TAU
Sets or Queries the time constant used by the Lock In Amplifier. The
argument is in seconds.
Example.
Send tau1.3CRLF sets the time constant to 1.3 seconds
tauCRLF queries the current time constant.
Example
tauCRLF returns the current time constant.
Reply 1.3CRLF
USN
Sets or Queries the User Serial Number
Example.
Send usnMySerialCRLF sets the user serial number to MySerial
This value is stored in Flash and allows a unique user specified serial number
to be assigned to each instrument.
usnCRLF queries the user serial number
UCD
Sets or Queries the User Calibration Date
Example.
Send ucdMM/DD/YYYYCRLF sets the local calibration date to
MM/DD/YYYY. The date must be in this format.
This value is stored in Flash and allows a unique user specified calibration
date to be assigned to each instrument.
ucdCRLF queries the user calibration date
Page 18
T-RAD-DB15--USB Instruction Manual
Version 2.1
December. 2012
18
Scale
Index
Range
2fW
00
2 femptowatt
20fW
01
20 femptowatts
200fW
02
200 femptowatts
2pW
03
2 picotowatts
20pW
04
20picowatts
200pW
05
200 picowatts
2nW
06
2 nanowatt
20nW
07
20 nanowatts
200nW
08
200 nanowatts
2uW
09
2 microwatts
20uW
10
20 microwatts
200uW
11
200microwatts
2mW
12
2 milliwatts
20mW
13
20milliwatts
200mW
14
200 milliwatts
2W
15
2 Watts
1.4 Data Format
Measurement Data is sent from the T-RAD as an Hexadecimal string.
PPPP,DDDCRLF
PPPP is the pulse period counts. 1 million counts represent 1 second.
DDD is the pulse data in ADC counts with 3276 being full scale.
Example:
Data = 99F9,1B4CRLF and T-Rad is in the 2mW range (index 12)
The pulse is 0x1B4, or 436 counts.
The reading will be 436 / 3276 x 2mW = 0.266mW
The period is 0x99F9, or 39417 counts.
1E6 counts / second / 39417 counts = 25.37Hz.
1.5 Instrument Connections
The T-RAD is connected to the host PC with a supplied USB cable. The instrument communicates
with the host PC via this cable, and the host PC supplies the power required by the instrument.
There are two BNC’s and one DB15 connector on the instrument. The probe in use is plugged into
the DB15 connector and must be plugged in before connecting the USB cable. One BNC is labeled
Detector Output; the other is labeled External Trigger In.
The Detector Output BNC supplies a buffered signal that is the same value sampled by the
instrument’s ADC. The output impedance of this connector is 100Ω.
Page 19
T-RAD-DB15--USB Instruction Manual
Version 2.1
December. 2012
19
The External Trigger Input is the connection for the reference chopping frequency. This signal’s
frequency is measured by the instrument and used to generate the reference sine wave described in
the Theory of Operation section. This BNC must be connected to the Sync Output BNC of the
chopper controller in use before starting the Applications Software.
1.6 Using the Instrument
To use the T-RAD, connect the probe to the instrument first, then plug the instrument into the USB connector
on the PC that is running the Applications Software. For the T-RAD Monitor with a DB-15, use the PC-TRAD - V2.00.00 software or the most recent. Connect the chopper frequency reference to the External
Trigger Input BNC. Do not remove the External trigger while the software is running. Now start the
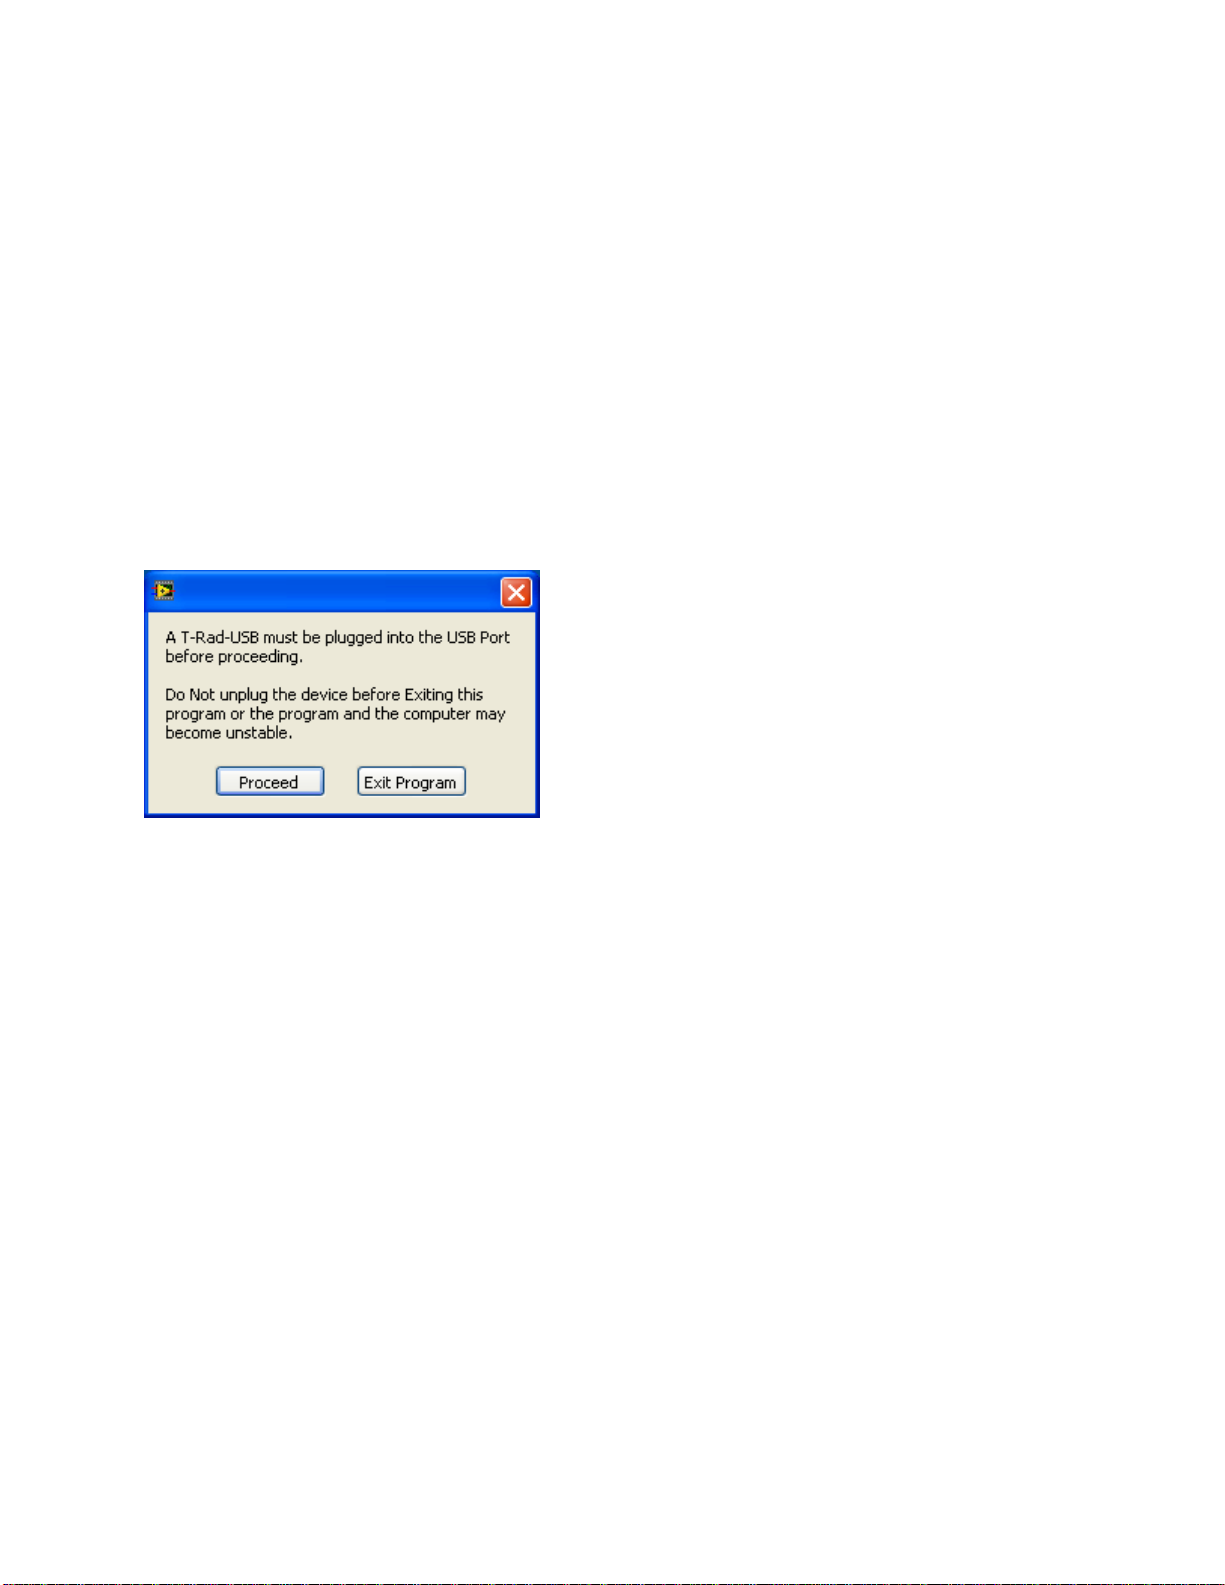
software. A window will appear, as shown below.
Press the Proceed button. The software will examine the available communications ports and
establish communications with the instrument. When the WAIT prompt disappears from the data
display, the software and instrument are ready to use. The T-RAD is not a triggered
always taking data, but it will not send data to the application until asked to do so. Pressing the Data
Collection Button causes data to be sent to the application where the lock in algorithm is
implemented. The user need only select an appropriate range and filter time constant.
device. It
The Frequency Range indicator will display the correct chop rate to use. If the range is 24.5 Hz to 25.5
Hz, set the chopper to 25 Hz. Caution: For stable readings the chopping frequency must be stable to +/-
0.1 Hz or better. The instrument will extract the signal at the
any other signal with components at the reference fr equency, they will be measure along with the
desired signal. The longer the filter time constant, the longer it will take to settle on a reading, but the
more noise and interference will be rejected. The user must make a tradeoff between measurement
time and accuracy when using a lock in amplifier. It will take 5 time constants for the reading to settle
to 1%, 7 time constant for the reading to settle to 0.1%. Fluctuations in the signal after this amount of
time are not due to the lock in settling time but are real signal variations.
reference frequency.
Note that if there is
The subsequent sections explain in detail how to use the Applications Software to makes
measurements.
is
Page 20
T-RAD-DB15--USB Instruction Manual
Version 2.1
December. 2012
20
1.7 Using the Applications Software
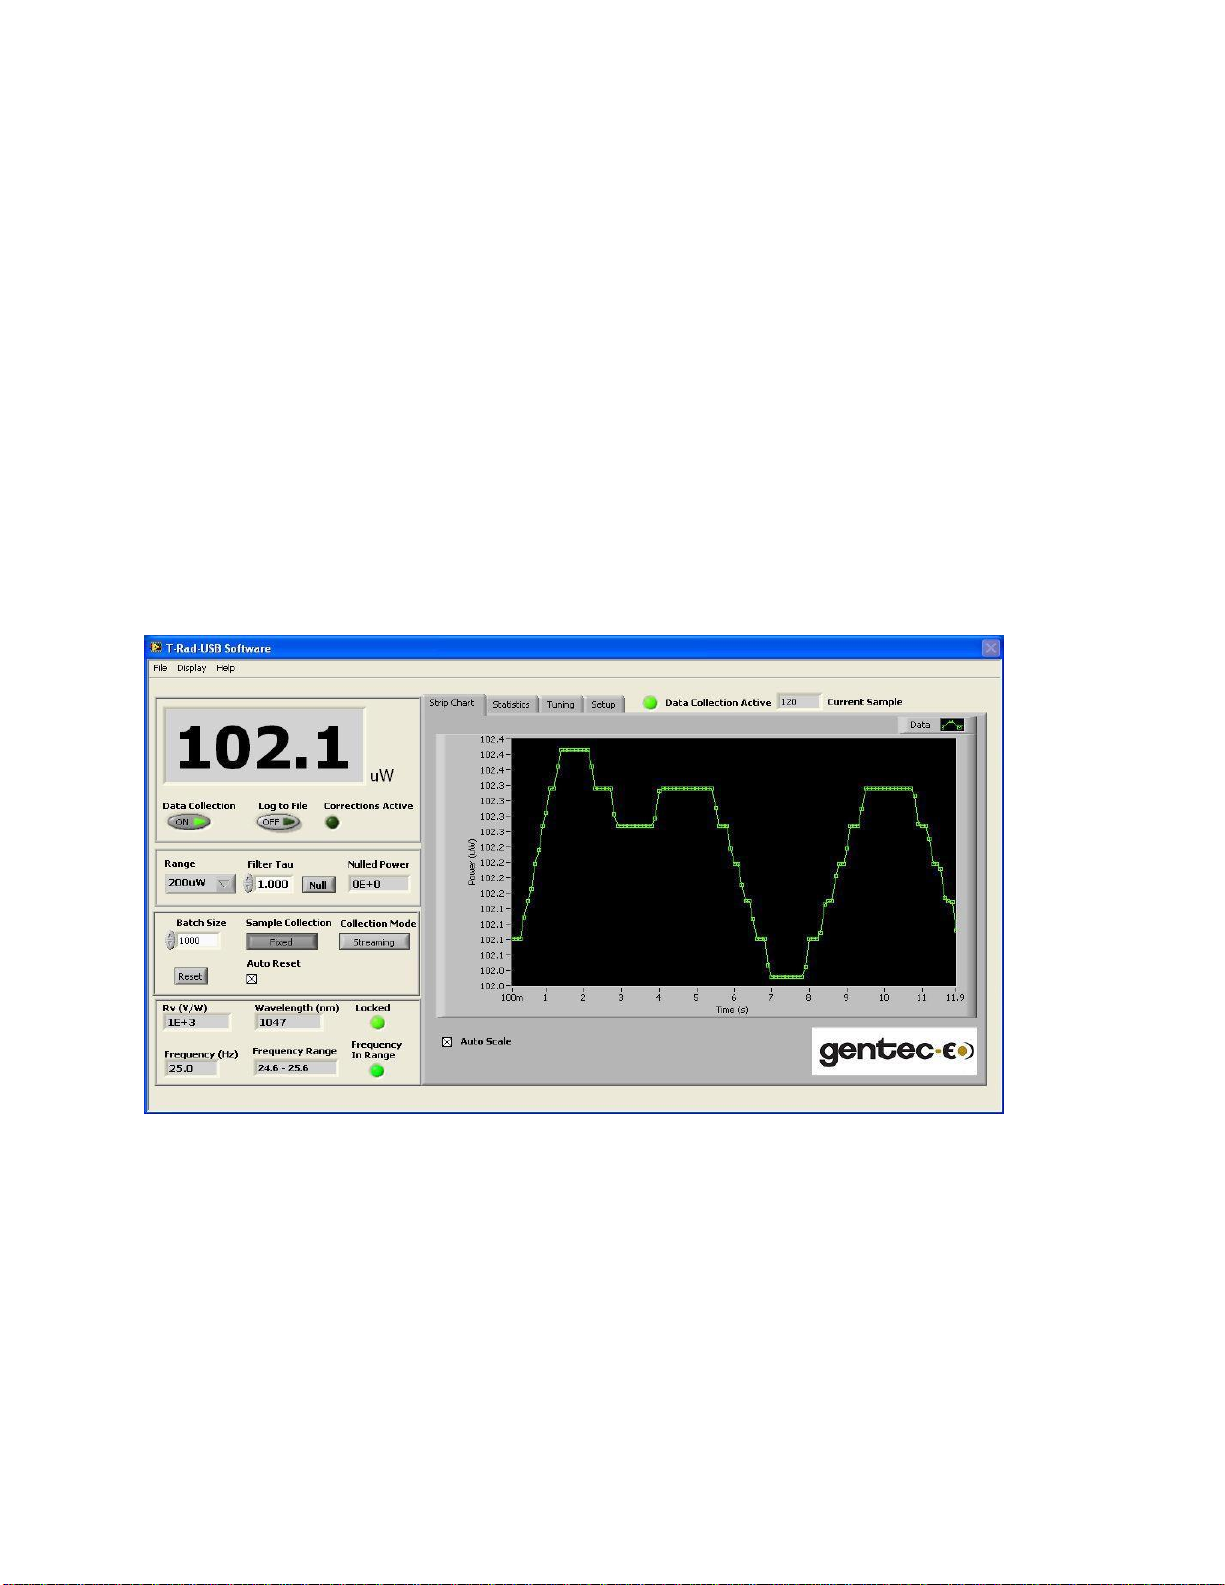
1.7.1 The Main Display Panel
The Main Display Panel has five display regions. They are:
1. The Digital Display which is always visible.
2. The Strip Chart, which is on a user selectable tab.
3. The Statistics Display, which is on a user selectable tab.
4. The Tuning Needles, which are on a user selectable tab.
5. The Setup Controls, which are on a user selectable tab.
1.7.2 The Digital Display
The Digital Display is always visible to the user. It contains Controls and Indicators. A control is
an input to the application set by the user. An indicator is an output from the application for use by
the user.
Page 21

T-RAD-DB15--USB Instruction Manual
Version 2.1
December. 2012
21
1.7.3 Digital Controls
The Controls on the Digital Display area are:
Data Collection
Log to File
Range
Filter Tau
Null
Batch Size
Reset
Auto Reset
Sample Collection
Collection Mode
Time Interval
1.7.4 Data Collection
Data Collection Control. When active the data is collected for display if the device is triggered. Data
Collection is suspended if another control is activated, then resumed when the other control is
released. This is done to prevent the communications buffers from overflowing.
Do Not disconnect the device when Data Collection is active.
1.7.5 Log to File
Log data to selected file. if no file is currently open, a prompt will request the file to log data to.
Data files can be opened, saved, closed and viewed via the File menu.
1.7.6 Range
Selects the desired device measurement range.
1.7.7 Filter Tau
Sets the time constant of the low pass filter used in the Lock In Amplifier.
1.7.8 Null
Subtracts the value of displayed Power or Irradiance when pressed from the subsequent
measured values. Releasing the control returns to normal measurements.
Note that the total maximum displayed measurement, that is the measured value plus the Nulled
value, cannot exceed the selected Range when Null is active.
1.7.9 Batch Size
The Batch Size to collect in Fixed Sample Collection Mode. Resets with the Reset Button or Auto
Reset.
If the Current Sample exceeds the Batch Size when Fixed Sample Collection is selected, a Reset
must be issued to start the new batch.
Page 22

T-RAD-DB15--USB Instruction Manual
Version 2.1
December. 2012
22
1.7.10 Reset
The Reset button resets the current data set in all collection modes.
1.7.11 Auto Reset
Resets the batch when the Current Sample meets the Batch Size if in Fixed Sample Collection
mode.
1.7.12 Sample Collection
Sample Collection is:
Continuous. Data is streamed whenever Data Collection is on. Always only withTime Interval Collection
mode.
Fixed. Data is collected whenever Data Collection is on until the Current Sample meets the Batch
Size.
1.7.13 Collection Mode
Collection Mode is:
Streaming. Data is streamed at the data frequency rate. Always only with Fixed Data Sample Collection
mode.
Time Interval. Data is collected when the selected time interval is met. The Time Interval control
is shown when Collection Mode is set to Time Interval.
1.7.14 Time Interval (s)
The Time Interval to wait between taking a data point. Intervening data points are discarded.
1.7.15 Digital Indicators
The Indicators on the Digital Display area are:
Live Data
Rv
Wavelength (nm)
Frequency (Hz)
Frequency Range
Frequency In Range
Locked
Current Sample
Corrections Active
1.7.16 Live Data
The Main Display for:
Power (W) or Irradiance (W/cm2) .
Page 23

T-RAD-DB15--USB Instruction Manual
Version 2.1
December. 2012
23
1.7.17 Rv
Responsivity in V/W of the sensor for the selected Range.
1.7.18 Wavelength (nm)
The wavelength of the light source being measured. Enter this value on the Setup Tab.
1.7.19 Frequency (Hz)
The frequency of the measured data in Hz. Resolution is 0.1Hz.
1.7.20 Frequency Range
The allowed range of chopper (Radiometers) frequencies.
1.7.21 Frequency in Range
Illuminates when the Frequency is within the calibrated range.
1.7.22 Locked
Illuminates when the device is Locked to the synthesized reference frequency used by the Digital
Lock In algorithm and Data Collection is active.
1.7.23 Current Sample
The current sample in the batch. Resets with the Reset Button or and Auto reset in Fixed Sample
Collection Mode.
If the Current sample exceeds the batch size when Fixed is selected, a Reset must be issued to
start the new batch.
1.7.24 Corrections Active
Illuminates when Wavelength Corrections or Transmissivity Corrections or Area Corrections are
active.
Page 24

T-RAD-DB15--USB Instruction Manual
Version 2.1
December. 2012
24
1.8 The Strip Chart Display
The Strip Chart Display is visible to the user when its tab is selected. It contains Controls and
Indicators for the Strip Chart.
1.8.1 Strip Chart Controls
The Controls on the Strip Chart area are:
Auto Scale
There are more Strip Chart Display controls available in the Display Options Menu
1.8.2 Auto Scale
Auto Scales the Strip Chart Display to the running minimum and maximum values in the data set.
1.8.3 Strip Chart Indicators
The Indicators on the Strip Chart area are:
Strip Chart Plot
1.8.4 Strip Chart Plot
Displays each data point as it is acquired.
In Continuous Mode the plot functions as a strip chart and fills until Data Collection is turned off.
In Fixed Mode the plot functions as a strip chart and fills until Batch Size is met. On Reset the
chart clears and refills with the new batch.
Right click on the Data Icon to set the Plot Options.
Right click on the X-Axis set the X-Axis Options.
Right click on the Y-Axis set the Y-Axis Options.
Page 25
T-RAD-DB15--USB Instruction Manual
Version 2.1
December. 2012
25
Min and Max Tracking Cursors can be set using the Display Options Menu.
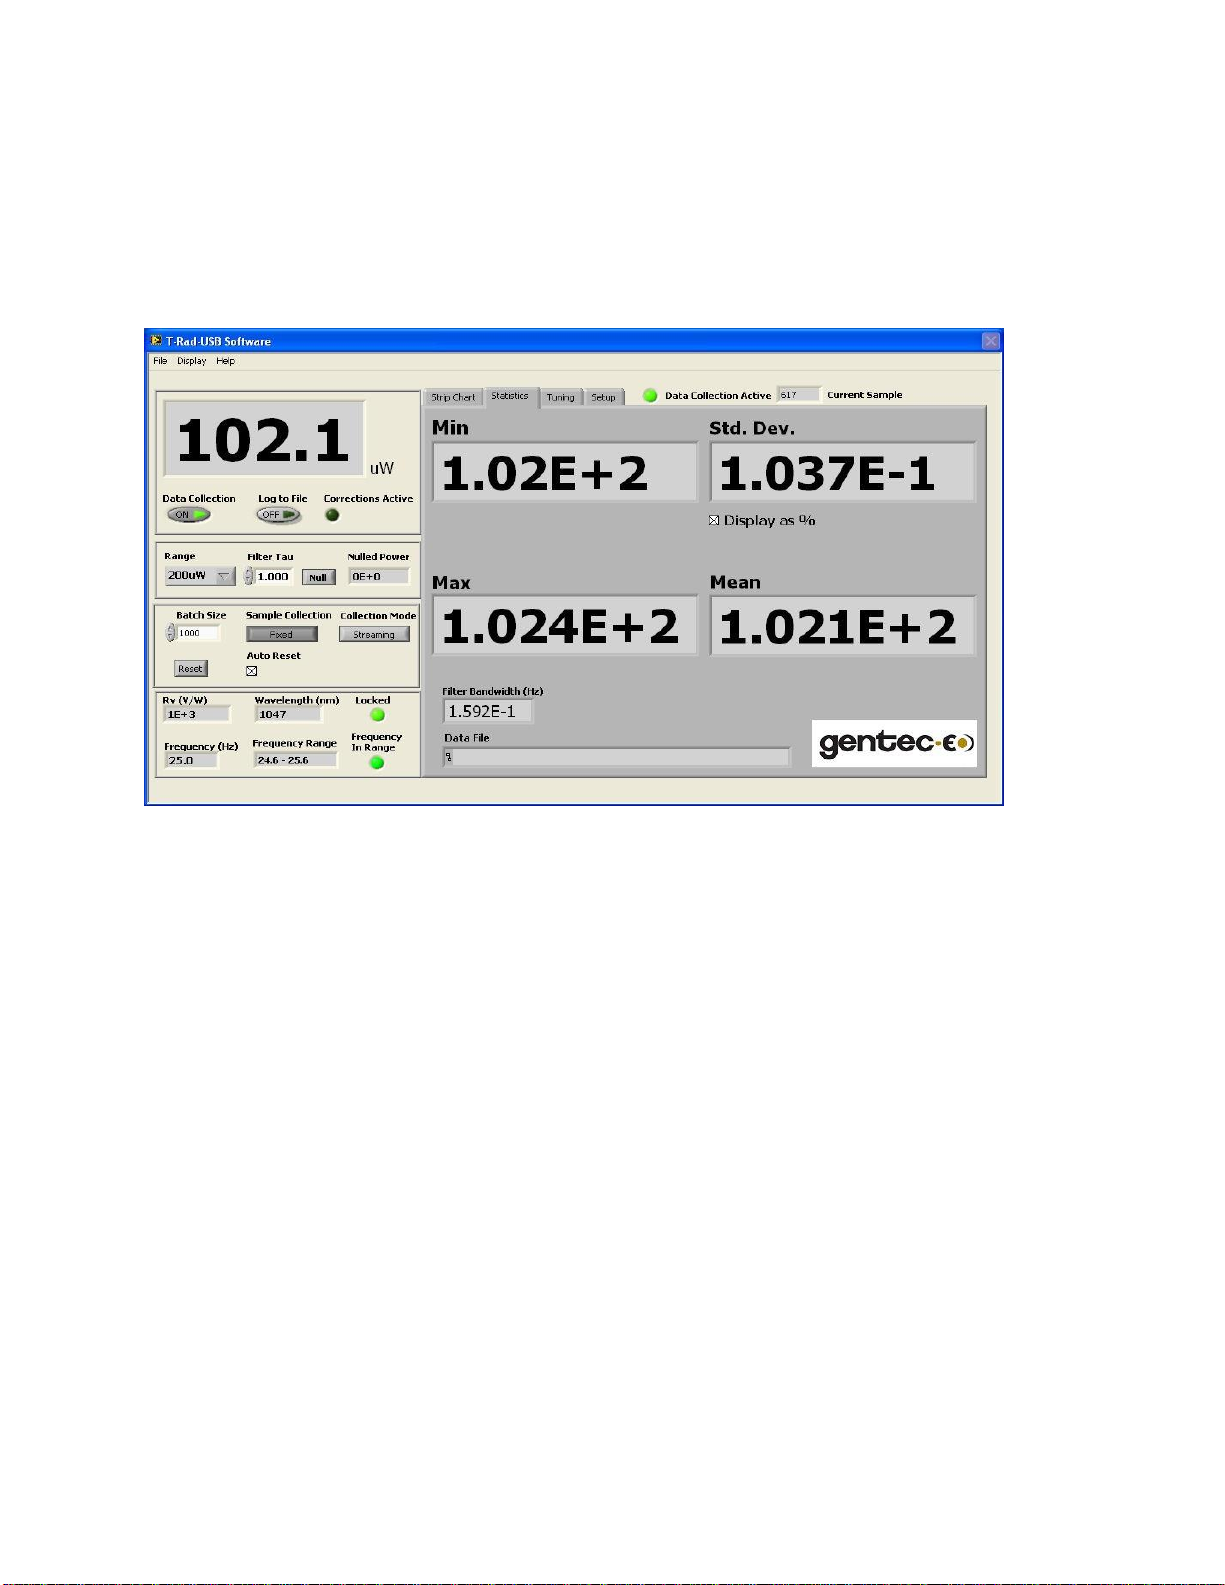
1.9 The Statistics Display
The Statistics Display is visible to the user when its tab is selected. It contains Controls and
Indicators for the statistics on the data set.
1.9.1 Statistics Controls
There is a single control on the Statistics tab; Display as %.
1.9.2 Display as %
Displays the Std. Dev. as a percentage of the Mean.
1.9.3 Statistics Indicators
The Indicators on the Statistics tab are:
Min
Max
Mean
Standard
Deviation Filter
Bandwidth
Data File
1.9.4 Min
The minimum value of the current data set. Resets with the Reset button or an auto reset when in
Fixed Sample Collection mode. Updates on each sample.
Page 26

T-RAD-DB15--USB Instruction Manual
Version 2.1
December. 2012
26
1.9.5 Max
The maximum value of the current data set. Resets with the Reset</B> button or an auto
reset when in Fixed Sample Collection mode. Updates on each sample.
1.9.6 Mean
The Mean of the current data set. Active in Fixed Sample Collection mode. Updates when the
Batch Size is met. Resets with the Reset button or an Auto Reset when the Batch Size is met.
1.9.7 Standard Deviation
The standard deviation of the data set. This can be interpreted as the RMS noise.
Standard Deviation and Variance Details:
The VI calculates the output values using the following equations.
n - 1
µ = SUM [ Xi / n ]
i = 0
where N is mean and n is the number of elements in X.
standard deviation = Q^2
n - 1
Q^2 = SUM [ ( Xi - N)^2 /( n - 1) ]
i = 0
where Q is variance, N is mean.
1.9.8 Filter Bandwidth
The filter bandwidth that results from the selected filter Tau.
1.9.9 Data File
The path of the currently open data file. If the indi cator is empty, no file is currently open to log
data.
Page 27
T-RAD-DB15--USB Instruction Manual
Version 2.1
December. 2012
27
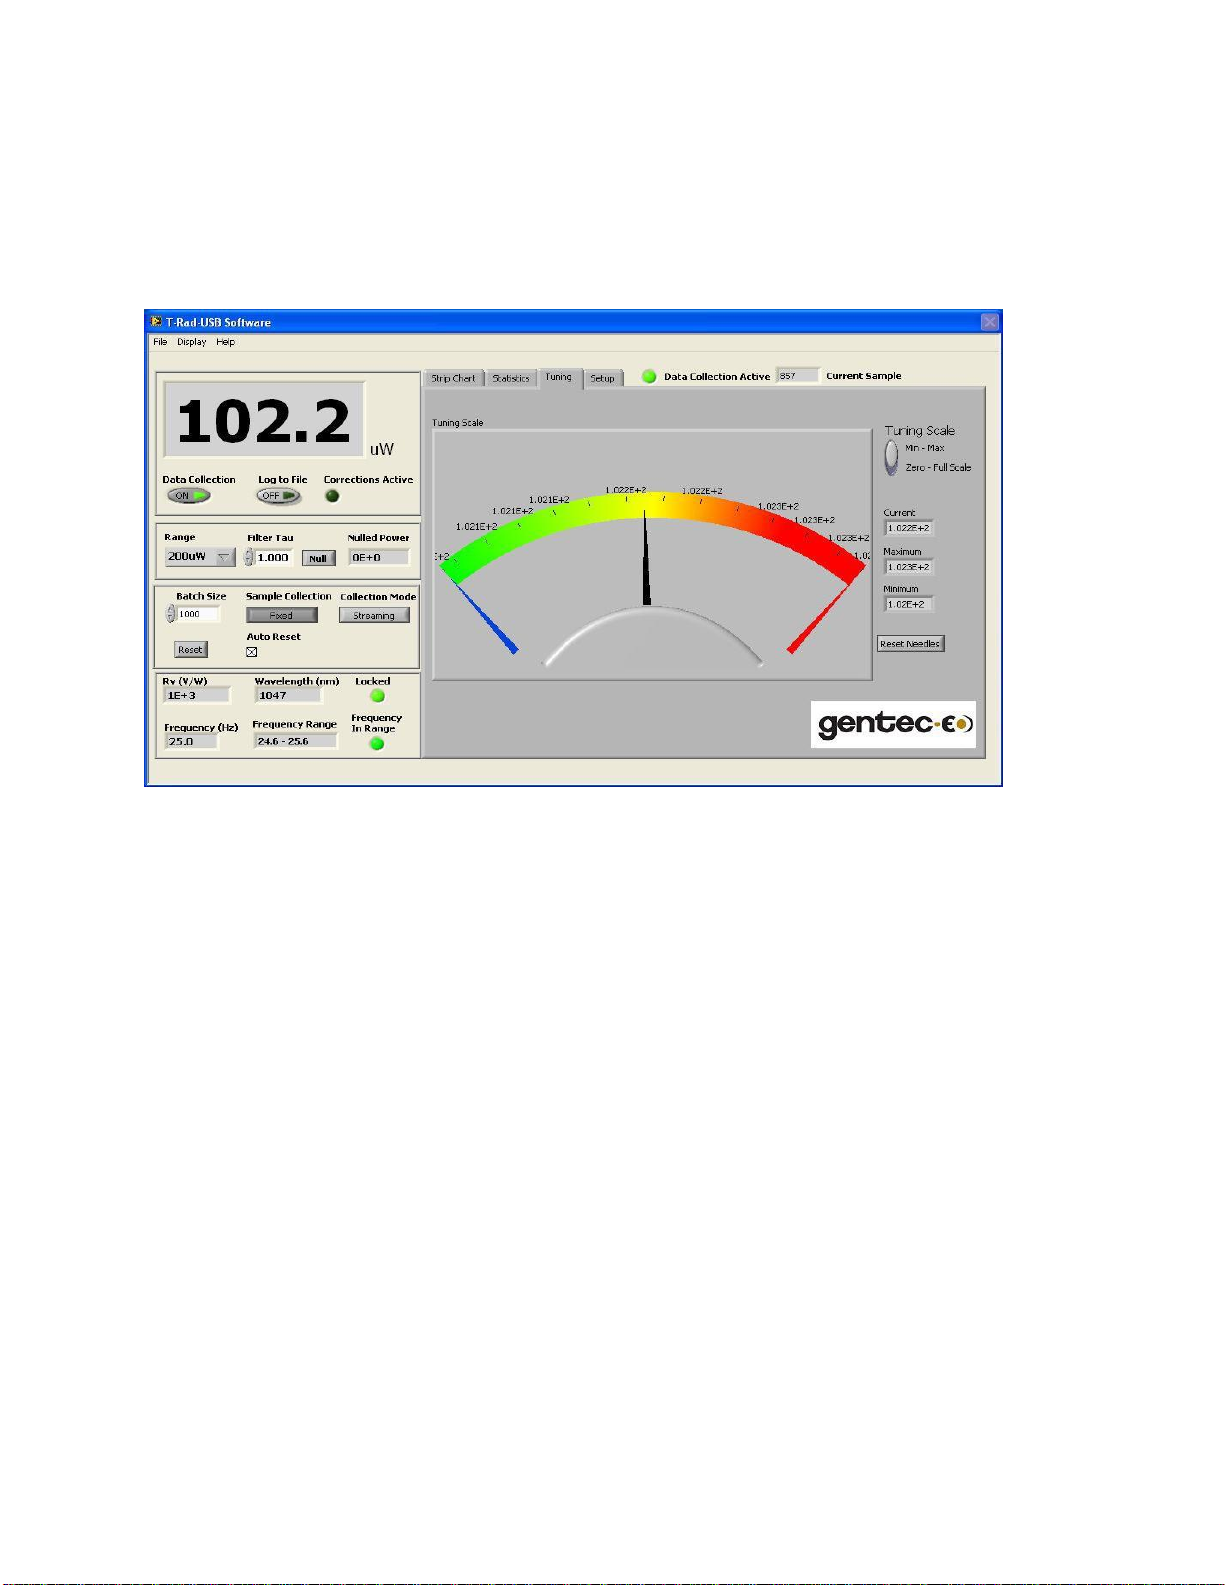
1.10 The Tuning Needles Display
The Tuning Needles Display is visible to the user when its tab is selected. It contains Controls
and Indicators for the Tuning Needles.
Page 28

T-RAD-DB15--USB Instruction Manual
Version 2.1
December. 2012
28
1.10.1 Tuning Needles Controls
The Controls on the Tuning Needles area are:
Tuning Scale
Reset Needles
1.10.2 Tuning Scale
Use this button to select the scaling range of the tuning meter.
Min - Max: sets the low end of the scale range to the Minimum value in the data set and the high
end of the scale range to the Maximum value in the data set since the last Reset Needles.
Zero - Max: sets the scale range from Zero to the Maximum of the measurement Range.
1.10.3 Reset Needles
Resets the Minimum and Maximum to the value of Current.
1.10.4 Tuning Needles Indicators
The Indicators on the Tuning Needles area are:
Tuning Needles
Current
Minimum
Maximum
Current Sample
Data Collection Active
1.10.5 Tuning Needles
Displays the Maximum (Red Needle), Minimum (Blue Needle) and the Current (Black Needle)
measured value. Scale Range is set with the Tuning Scale control.
Minimum and Maximum are reset when Reset Needle is pressed.
1.10.6 Current
The Current Measured Value.
1.10.7 Minimum
The Minimum Measured Value.
1.10.8 Maximum
The Maximum Measured Value.
Page 29
T-RAD-DB15--USB Instruction Manual
Version 2.1
December. 2012
29
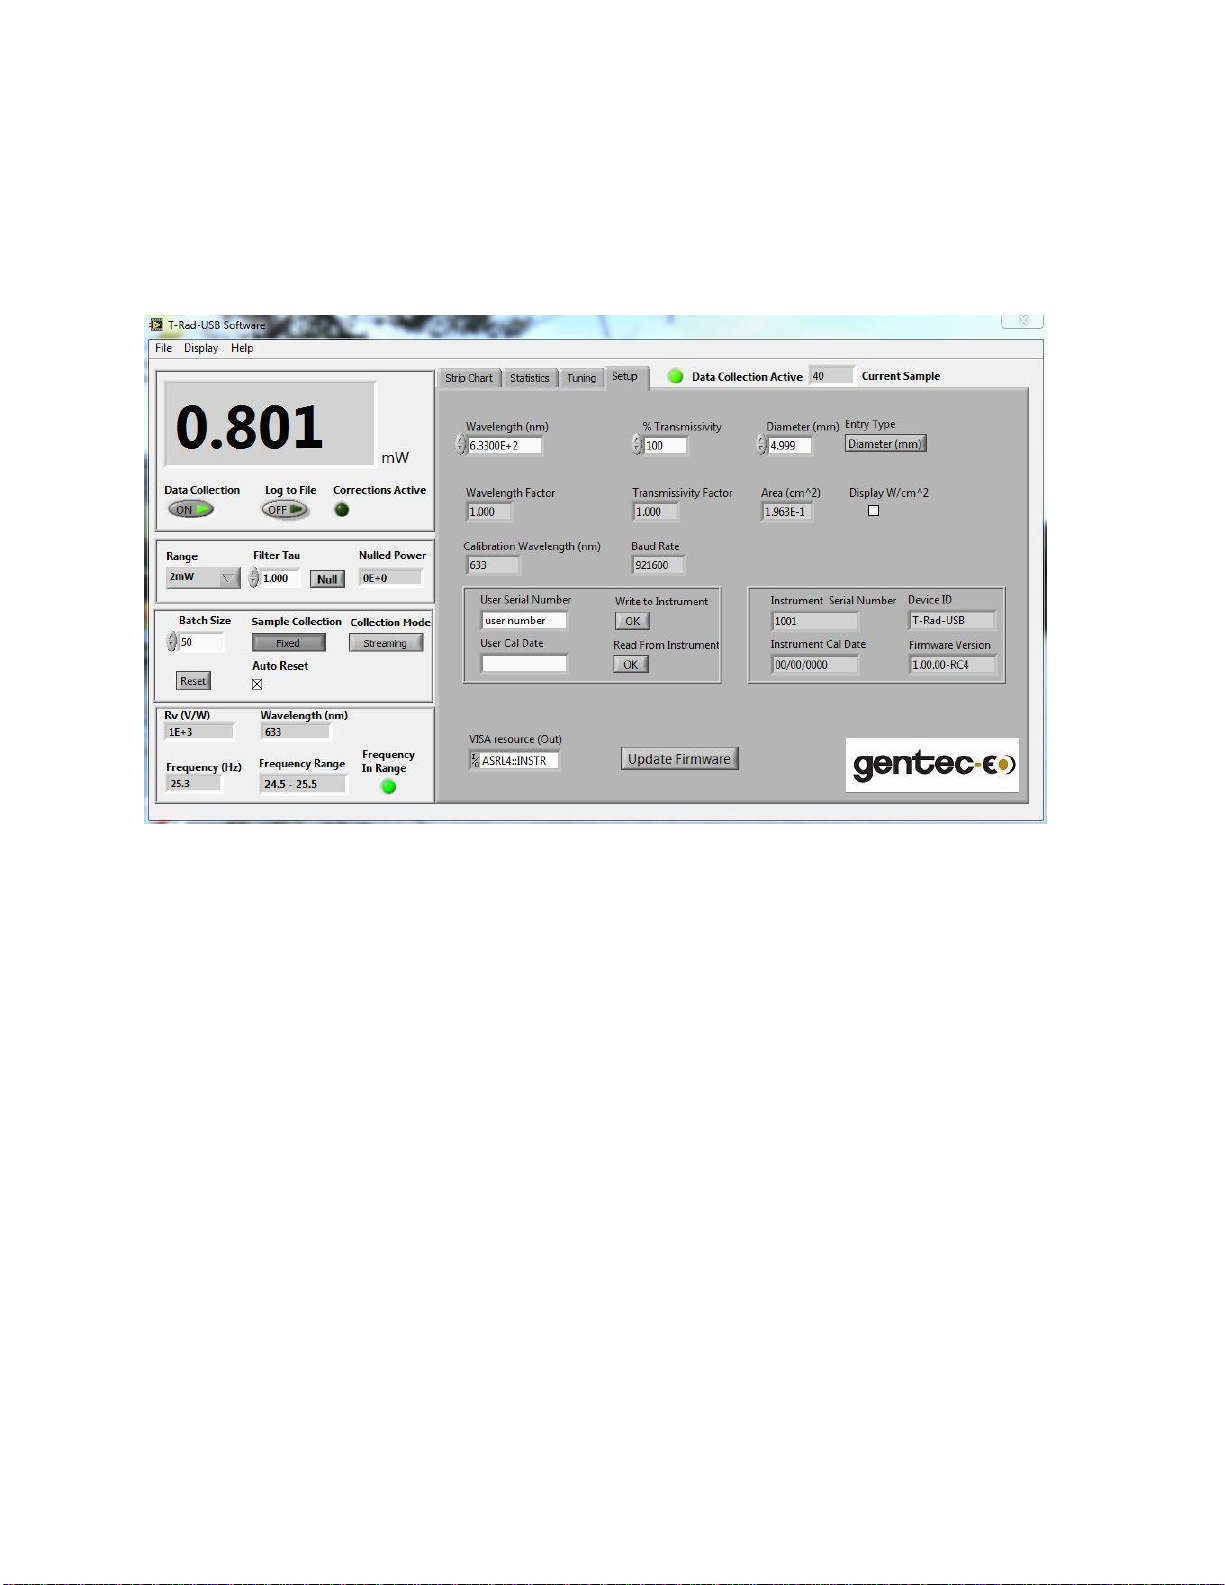
1.11 The Setup Display
The Setup Display is visible to the user when its tab is selected. It contains Controls and
Indicators for the Setup.
1.11.1 Setup Controls
The Controls on the Setup area are:
Wavelength (nm)
% Transmissivity
Diameter (Area)
Entry Type
Display W/cm^2
User Serial Number
User Calibration Date
Write to Instrument
Read From Instrument
Zero Baseline
Reset Instrument
Update Firmware
1.11.2 Wavelength (nm)
Enter the Wavelength of the light source being measured.
Wavelengths other than the calibration wavelength may result in wavelength corrections being
applied. If corrections are applied, the Corrections Active LED will illuminate.
To view the wavelength response of the sensor, use the Display menu item.
Note: The wavelength correction factors are not absolute but rather represent an approximate value.
Page 30

T-RAD-DB15--USB Instruction Manual
Version 2.1
December. 2012
30
For complete details on the use of these factors please contact the factory.
1.11.3 % Transmissivity
Enter the Transmissivity of external optics being used
1.11.4 Diameter (mm) or Area (cm2)
Enter the Diameter or the Area, based on the Entry Type, of the light source or external
aperture being used.
1.11.5 Entry Type
Change the Diameter control to an Area control.
1.11.6 Display W/cm2
Toggles the data displays from Watts to Irradiance. Uses the Area indicator to compute
the values.
1.11.7 User Serial Number
The User Serial Number. Stored in persistent memory
1.11.8 User Calibration Date
The User Calibration Date. Stored in persistent memory
1.11.9 Write to Instrument
Writes the User Serial Number and the User Cal Date to the persistent memory of the device.
1.11.10 Read From Instrument
Reads the User Serial Number and the User Cal Date from the persistent memory of the device.
Page 31
T-RAD-DB15--USB Instruction Manual
Version 2.1
December. 2012
31
1.11.11 Update Firmware
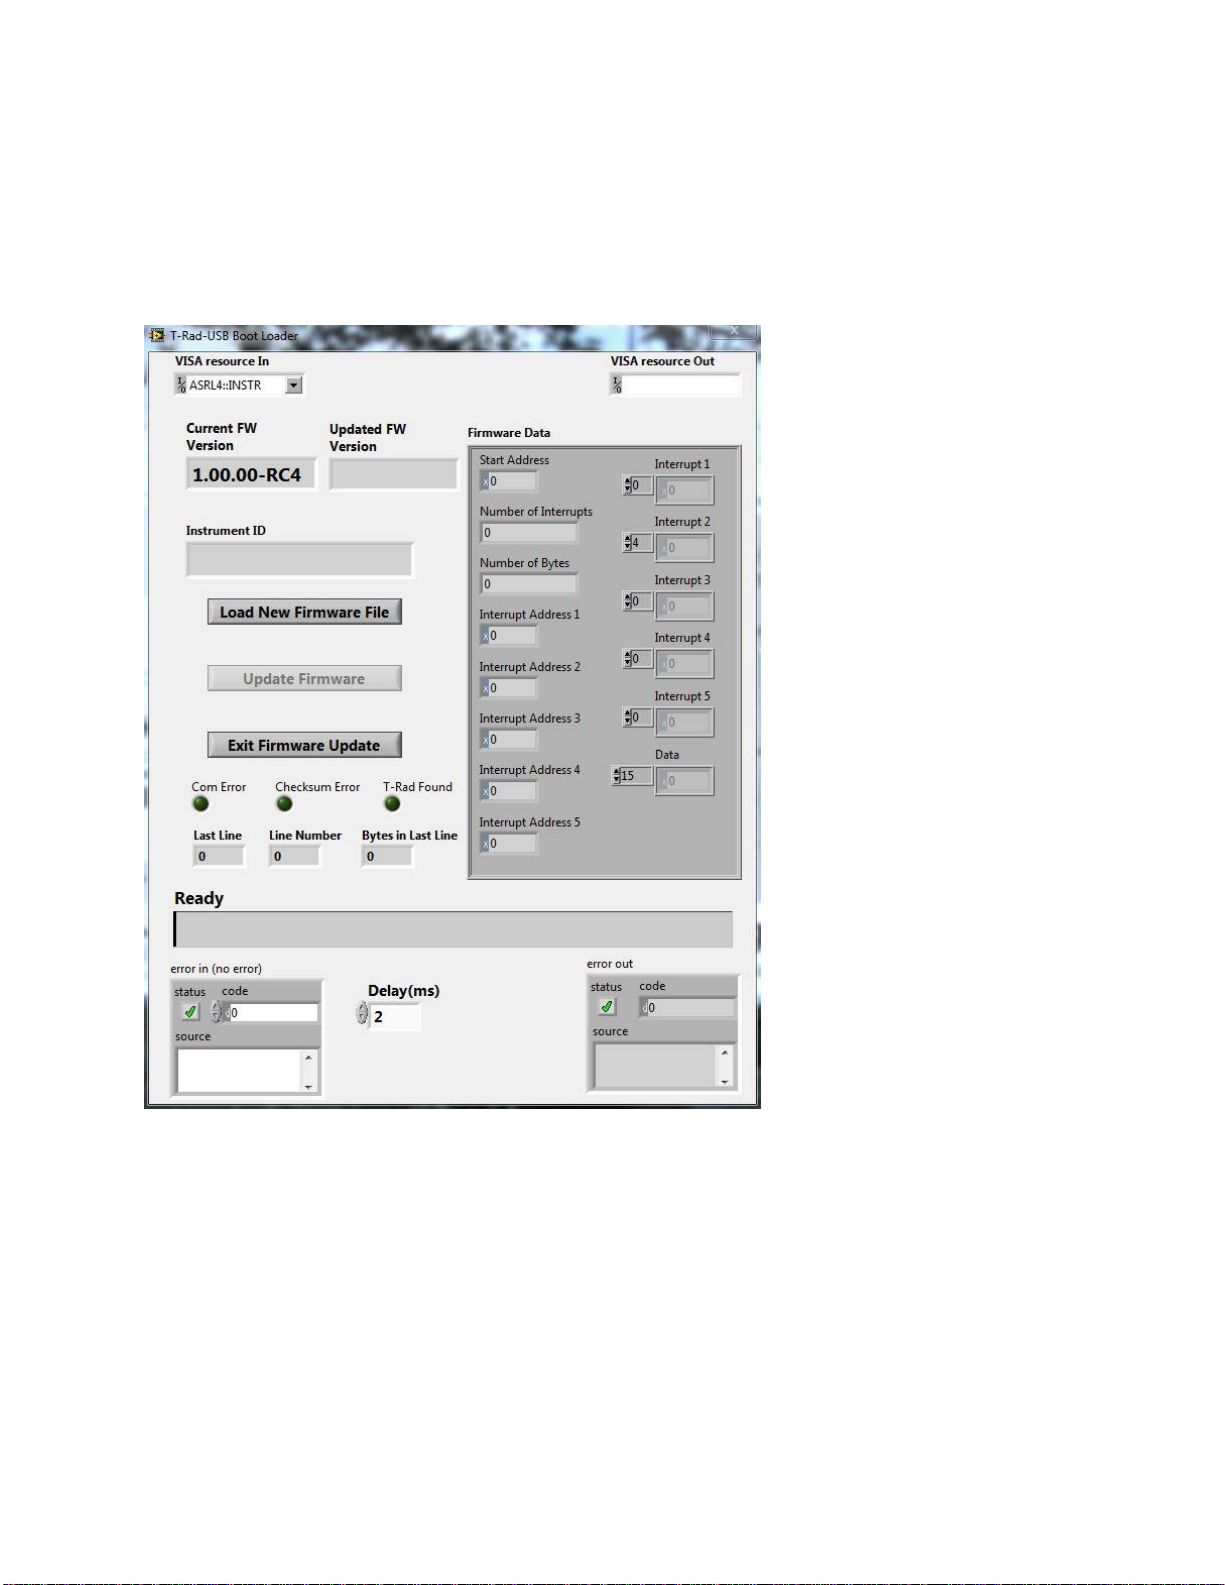
Calls a VI that allows you to update the T-RAD firmware using the USB port and a new firmware file
obtained from Gentec-EO. New firmware updates are posted on the Gentec-EO website as they
become available.
Press the Load New Firmware File button to select a new firmware file you have downloaded from the
Gentec-EO website. You can exit the update with the Exit Firmware Update button. This will leave the
current firmware intact. Once the file has been processed, the Update Firmware button will become
active. Press it to begin the update. Follow the prompts to complete the update. You must let the
update complete and cannot exit the update once this button has been pressed.
Page 32

T-RAD-DB15--USB Instruction Manual
Version 2.1
December. 2012
32
1.11.12 Setup Indicators
The Indicators on the Setup area are:
Wavelength
Factor
Transmissivity
Factor Area
(cm2)
T-RAD Serial Number
T-RAD Calibration Date
Device ID
Firmware
version
1.11.13 Wavelength Factor
The correction factor for the current Wavelength.
1.11.14 Transmissivity Factor
The correction factor for the current Transmissivity.
1.11.15 Area (cm2)
The current Area of the measured beam.
1.11.16 T-RAD Serial Number
The Factory Serial Number.
1.11.17 T-RAD Calibration date
The Factory Calibration Date.
1.11.18 Device ID
The Device ID of the instrument plugged into the USB.
1.11.19 Firmware Version
The Device Internal Firmware Version.
1.11.20 Application Menus
The T-RAD Application Software has three main menu items, each with its own sub menus. They
are:
The File Menu
The Display Menu
The Help Menu
Page 33

T-RAD-DB15--USB Instruction Manual
Version 2.1
December. 2012
33
1.11.21 The "File" Menu
The File menu is used to open, close, and view data sets. The menu items are:
Open Data File
Close Data File
View Existing Data File
Print Window
Exit
1.11.22 Open Data File
Opens a File too write data to. User is allowed to name a new file or overwrite an old one.
1.11.23 Close Data File
Closes the currently open data file.
1.11.24 View Existing Data File
Allows the user to choose an existing data file for viewing with the Data Analysis Panel.
1.11.25 Print Window
Prints the current window.
1.11.26 Exit
Exits the Application. Closes all open files and stops the T-RAD data stream. Exit saves the state
of all Application Controls and restores them on restart.
Page 34

T-RAD-DB15--USB Instruction Manual
Version 2.1
December. 2012
34
1.12 The Display Menu
The Display menu is used to modify the characteristics of the Digital Display and the Strip Chart.
It also displays the Wavelength Correction Table stored in the sensor. The menu items are:
Display Options
View Wavelength Correction Table
1.12.1 Display Options
Calls new panel that allows the user to set Cursors on the Strip Chart, Cursor Colors, and Cursor
Range.
If Auto Track Min/Max is selected, then the Cursors track the min and max values in the data set.
If User Min/Max is Checked, then User Min and User Max sets the Cursor Range.
Right click on the Cursor Color Box to display a color palette.
1.13 View Wavelength Correction Table
Calls new panel that allows the user to View the Sensor Wavelength Correction Curve.
Page 35

T-RAD-DB15--USB Instruction Manual
Version 2.1
December. 2012
35
1.14 The Help Menu
The Help menu is used to display help for the Application. The menu items are:
Help
Show Context Help
About
1.14.1 Help
Calls this Help file.
1.14.2 Show Context Help
Shows a Context Sensitive Help Window when the Mouse Cursor is over a Control or Indicator.
1.14.3 About
Application Information is Displayed.
1.15 Recycling and separation procedure.
This section is used by the recycling center when the monitor is at the end of its life.
Breaking the calibration seal or opening the monitor will void the T-RAD warranty.
The complete Monitor contains
1 Monitor
1 USB cable
1 Instruction manual
1 Calibration certificate
1 Software cdrom
1.15.1 Separation:
Paper: Manual and certificate
Aluminum: Monitor enclosure.
Printed circuit board: inside the monitor.
1.15.2 Dismantling procedure:
To open the monitor:
Remove all the screws on both sides of the monitor:
Remove the PCB by sliding it out of the enclosure.
Page 36

T-RAD-DB15--USB Instruction Manual
Version 2.1
December. 2012
36
1.16 DECLARATION OF CONFORMITY
Standard
Description
Performance
Criteria
CISPR 11 :2009
+A1 2010
Industrial, scientific and medical equipment – Radiofrequency disturbance characteristics – Limits and
methods of measurement
Class A
EN 61000-4-2:2009
Electromagnetic compatibility (EMC) – Part 4-2: Testing
and measurement techniques- Electrostatic discharge.
Class B
EN 61000-4-3:2006
+A2:2010
Electromagnetic compatibility (EMC) – Part 4-3: Testing
and measurement techniques- Radiated, Radio
Frequency, electromagnetic field immunity test.
Class A
Application of Council Directive(s): 2004/108/EC EMC Directive
Manufacturer’s Name: Gentec Electro Optics, Inc.
Manufacturer’s Address: 445 St-Jean Baptiste, suite 160
Representative’s Name: Laser Component S.A.S
Representative’s Address: 45 bis Route des Gardes
Type of Equipment: Laser Power/Energy Meter
Model No.: T-RAD
Year of test & manufacture: 2011
Standard(s) to which Conformity is declared:
EN 61326-1: 2006 Emission generic standard
(Québec), Canada G2E 5N7
92190 Meudon (France)
I, the undersigned, hereby declare that the equipment specified above
conforms to the above Directive(s) and Standard(s)
Place: Québec (Québec)
Date : June 11, 2012
(President)
Page 37
T-RAD-DB15--USB Instruction Manual
Version 2.1
December. 2012
37
 Loading...