

Page 1

ClassComm 5
Interactive Response
System Software
User Guide
October 2011 – Rev. 3
Page 2

Contents
CD Contents: ................................................................................................................................. 3
Minimum System Requirements: ................................................................................................... 3
Phase 1 - Installation and Hardware Setup ..................................................................................... 4
Phase 2 – Adding and mapping a PowerPoint Presentation. ........................................................... 6
Phase 3 – Creating and Adding Teachers, Classes and Students ................................................... 10
Phase 4 – Presentation/Class Settings in ClassComm ................................................................... 20
Phase 5 – Running a Presentation ................................................................................................ 29
Phase 6 – Viewing Reports and Charts in ClassComm ................................................................... 35
ClassComm Application Preferences ............................................................................................ 41
Custom Tests ............................................................................................................................... 47
Group/Team Allocation ............................................................................................................... 52
HOCKEY GAME ............................................................................................................................ 61
CRICKET GAME ............................................................................................................................ 62
Text and Drop within ClassComm ................................................................................................ 66
Personalised Learning Test – Quick Guide .................................................................................... 82
Interface Editor for Corporate Mode ........................................................................................... 93
Pebble Pad (5g Hardware) – Quick Guide ..................................................................................... 98
Appendix A – Troubleshooting Flowchart .................................................................................. 109
Appendix B – FAQ ..................................................................................................................... 109
TROUBLESHOOTING FLOWCHART .............................................................................................. 110
FAQ ........................................................................................................................................... 111
2
Page 3

CD Contents:
ClassComm 5.exe – Main Software
Sample Content – Includes educational content for Genee Pads, IQ Pads and Pebble Pads.
PowerPoint Plug-in (Slide Mapper) – Plug-in that adds a “Slide Mapper” module to MS
PowerPoint. You can then map your quizzes/presentation directly within MS PowerPoint
ready for use in ClassComm.
Backup/Restore tool For existing customers upgrading from an older version of ClassComm.
Quick Start Guide
Minimum System Requirements:
Processor: Pentium III 450 MHz processor (1 gigahertz (GHz) Pentium processor
recommended)
Memory: 512 MB (1 GB or above recommended)
Display: 800 x 600, 256 colours (Recommended: 1024 x 768 high colour, 32-bit)
CDROM Drive: 4x or faster
HDD: 300MB free hard drive space for basic installation – 500 MB hard drive space required
for curriculum sample content
Microsoft.Net Framework 4.0 (Full version)
Microsoft® PowerPoint 2003 or above
Adobe Flash player version 9
Operating System: Windows XP, Windows Vista and Windows 7 - 32 and 64 bit Compatible
3
Page 4
Phase 1 - Installation and Hardware Setup
NOTE: For the rechargeable GeneePads, a 7 – 10 hour full charge will be needed before they can be used
with ClassComm.
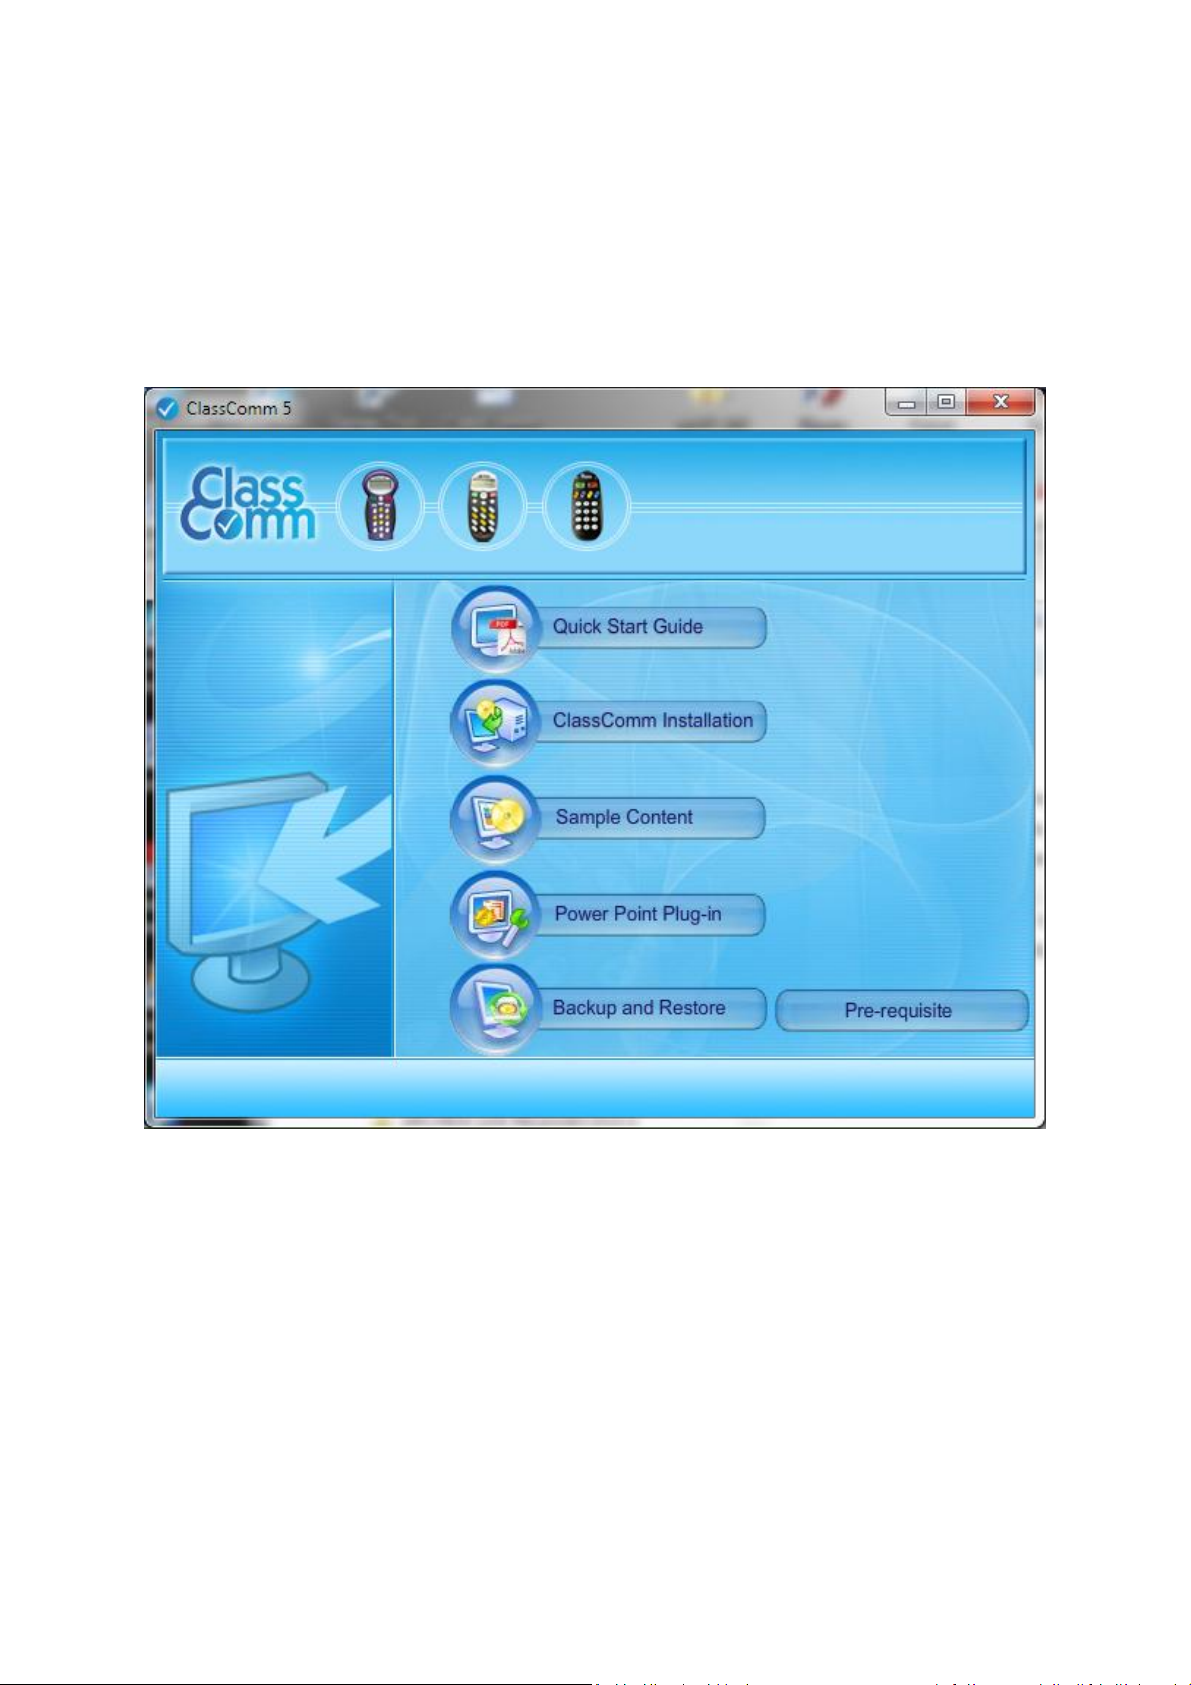
1 – Insert the disk and double-click ClassComm.exe. This will open the ClassComm installation menu
screen:
2 – Click the “ClassComm Installation” option to install the main application. Follow on screen
instructions to complete the installation. Note – You may get a message stating that you need .net
Framework 4.0. If so, please click the Pre-requisite button to install it.
3 – Click “Sample Content” to select and install the required sample educational content which
contains fully mapped PowerPoint presentations. (Optional)
4 – Install the “Power Point Plug-in” module. This will add the Slide Mapper module to MS
PowerPoint allowing for presentation mapping.
5 – The “Backup and Restore” option allows users to take a Backup from older ClassComm
installations and then restore these settings into the latest ClassComm software. (Optional Step).
4
Page 5
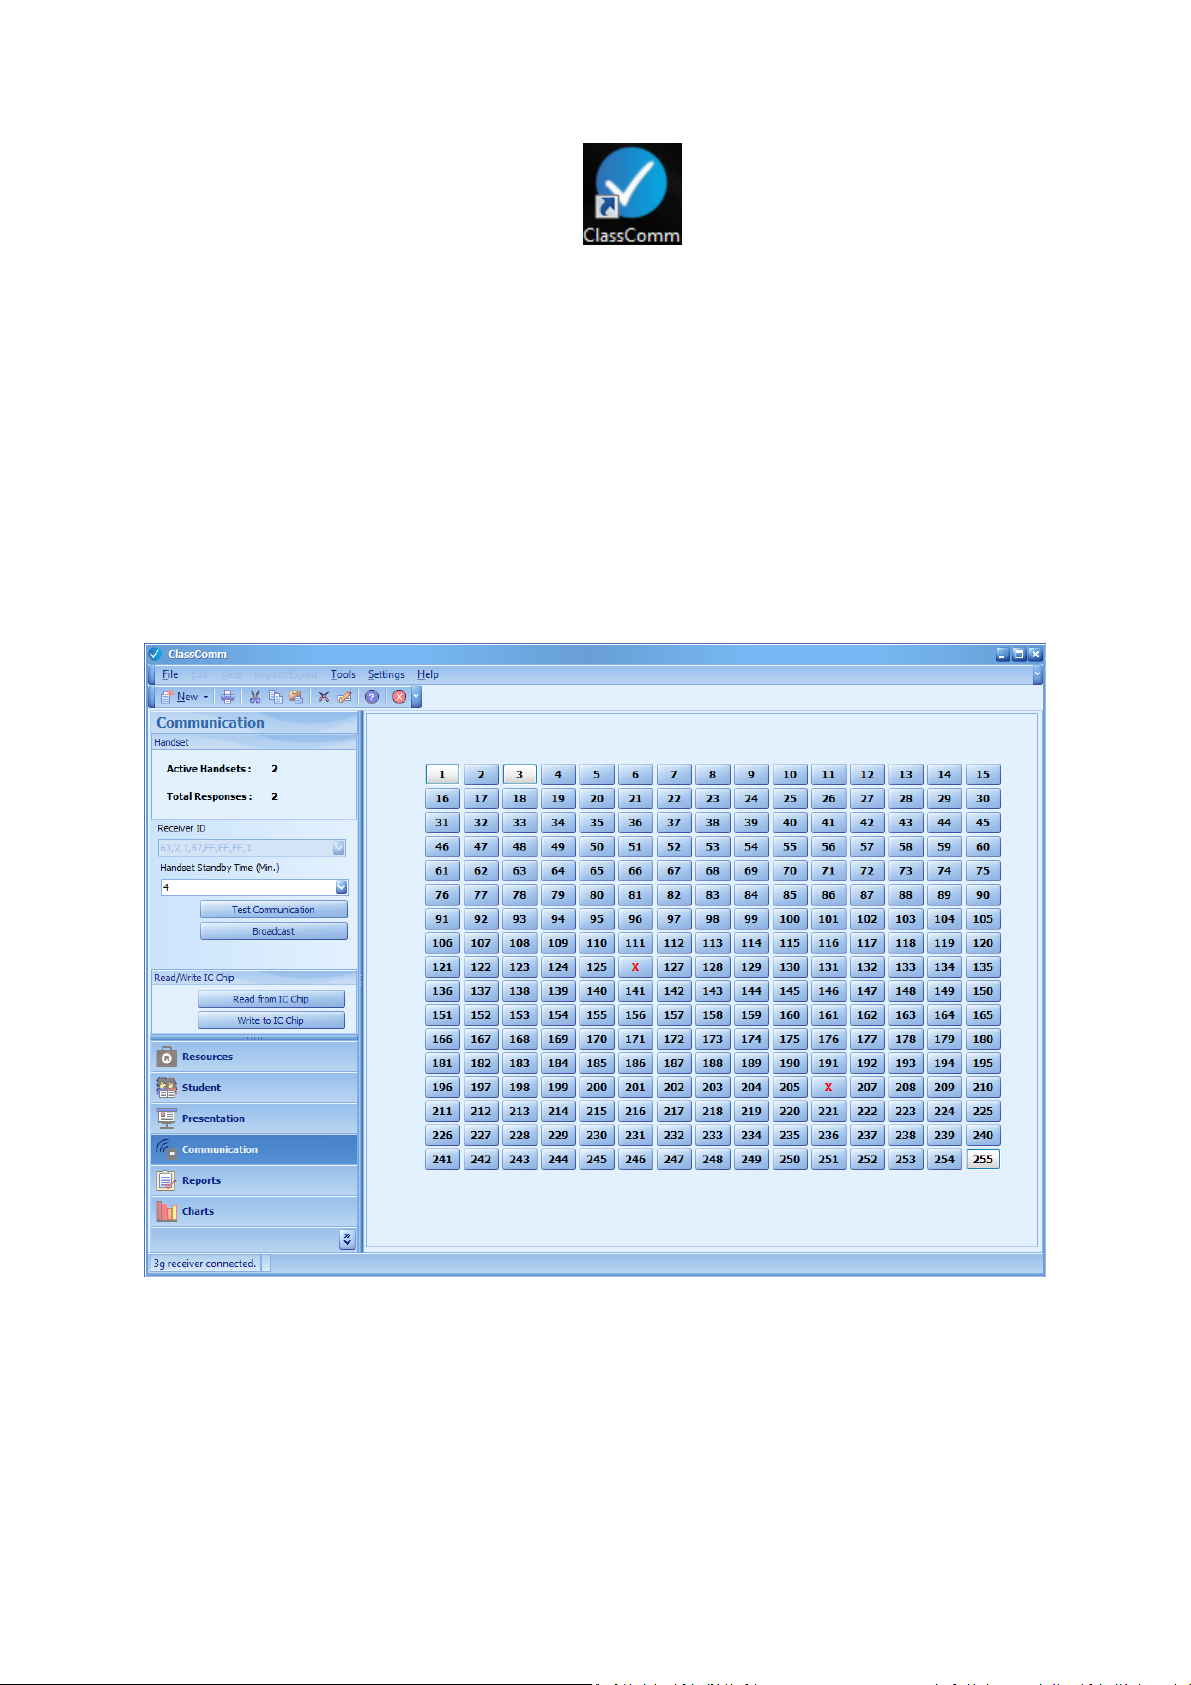
6 – Launch ClassComm from the Desktop icon...
7 –Connect the Receiver to an available USB port. The drivers will automatically install and a
message will appear in the bottom left of the ClassComm software interface stating “xyz receiver
connected” where xyz represents the type of hardware purchased.
8 – Once the receiver connected message appears, open the Communication tab of ClassComm.
Now test handset communication to the receiver by pressing some keys on the handset and then
pressing “send”. The corresponding cell ID’s will light up in the grid.
The following image shows the communication grid. In the left panel it shows the number of active
handsets and responses received. Note that cells 1 – 4 are lit up to indicate that those are the active
handsets. Also note that cell 255 is lit up. This is the Teacher Handset which is a different colour to
student handsets and is set to ID 255.
The software is now installed and the hardware is configured correctly and has been tested in the
communication area of ClassComm.
5
Page 6

Phase 2 – Adding and mapping a PowerPoint Presentation.
Question Types in ClassComm
The next step is to get the PowerPoint presentation “mapped” so that ClassComm can treat it as an
activity/resource. To do this, you need to associate each slide in your PowerPoint activity with one
of the following slide mapping options:
1. INFORMATION – Information slides have no question data associated with them. They are used
for informational purposes only.
2. TRUE/FALSE – Use for True or False type question slides.
3. YES/NO – Use for Yes or No type question slides.
4. MULTIPLE MARK – Use this option for multiple choice questions that have more than one
correct answer.
5. MULTIPLE CHOICE – Multiple choice slides can have the choices set as text or numeric with a
single correct answer.
6. SEQUENCE – Sequence slides are used when you have a slide that has a number of phrases,
words or numbers that need to be put into the correct order by participants.
7. NUMERIC – Numeric answer question slides.
8. TEXT - Text answer’s up to 87 characters from genee pads and IQ Pads.
9. LIKERT SCALE – The Likert scale slide type is used when there is no right or wrong answer. They
can be used gather opinion/views on a subject and as a type of survey research tool. Choose the
default scale or create up to 5 custom likert scales. Also, a Text(essay) option is available for
opinion type questions.
10. E-Vote – Voting slide that accepts 3 responses only – YES, NO or ABSTAIN.
Adding a PowerPoint Activity into the ClassComm Resources Section
Whilst in the Resources area of ClassComm, select File > New > New Activity > New PowerPoint
Activity. Now click browse and choose the location of the PowerPoint Activity you wish to add and
click open in the “Please select a presentation” window.
By default, any un-mapped presentations added to ClassComm will set all slides to Information type.
A previously mapped PowerPoint presentation will retain its previous mapping only if the associated
XML mapping file is stored in the same location as the original PowerPoint.
Mapping a PowerPoint Activity – Method 1 - MAP ACTIVITY WINDOW
6
Page 7
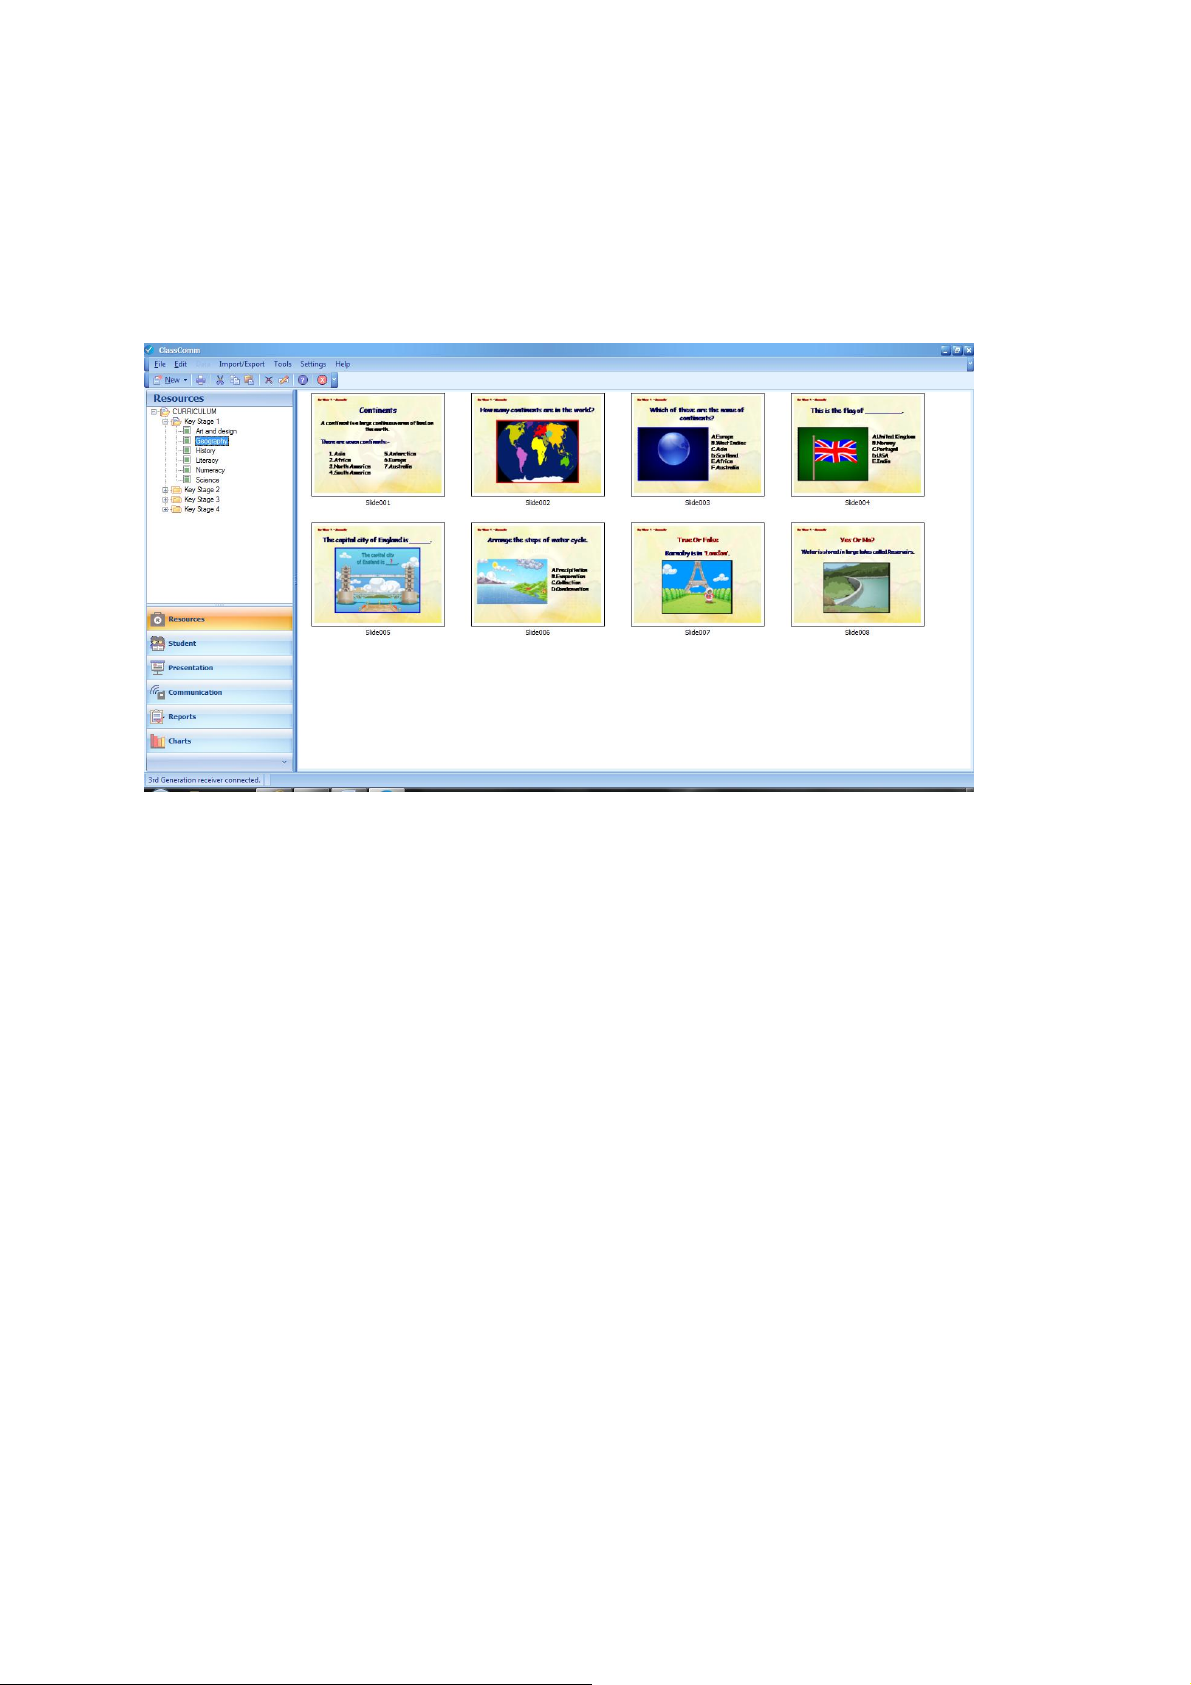
Select the PowerPoint presentation that has been added to the Resources window from the previous
step by clicking on it once. The presentation slides will appear as thumbnails in the right side of the
screen as shown in the following image:
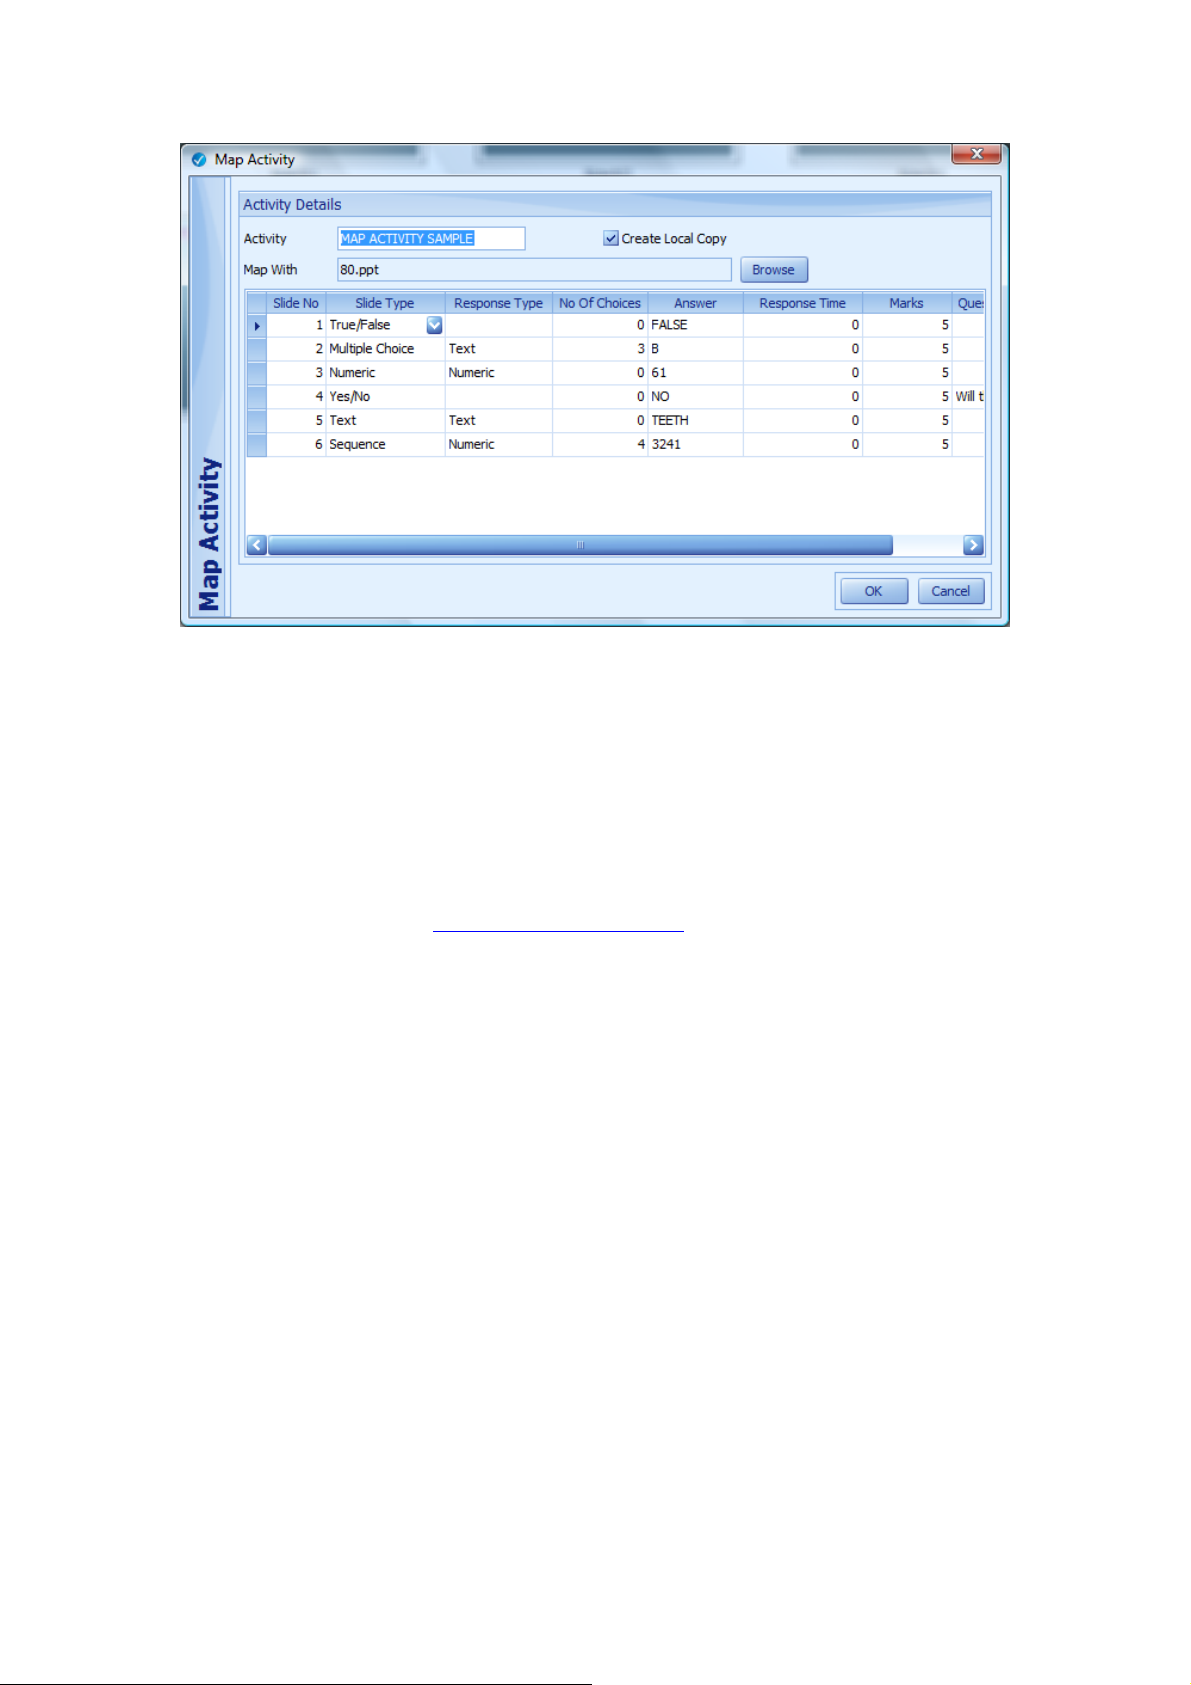
Go to Settings > Map Activity from the top main menu bar. The “Map Activity” screen will appear as
shown in the following image. All the slides will be numbered and listed in the Map Activity window.
Using the drop-down boxes next to each slide number, select the appropriate options in order to
map the slide as required for the selected activity/presentation. Note that depending upon the type
of Slide Type selected, certain options may be unavailable. For example, for True/False, Yes/No,
Text and Numeric type slides, there will be no option to select response type or numbers of choices
as these options are only relevant to Multiple Choice, Multiple Mark, Sequence and Likert slide
types. Click OK once mapping is completed.
7
Page 8
Mapping a PowerPoint Activity – Method 2 - POWERPOINT PLUG-IN (Needs to be installed from
ClassComm software CD prior to following the steps below)
Select File > New > New Activity > New PowerPoint Activity as described above in the Adding a
PowerPoint Activity into ClassComm Resources Section. Now double-click the newly added resource.
This will open the presentation within MS PowerPoint. The Plug-in appears on the left side of the
screen and is called “Slide Mapper” – Note that the plug-in shown is version 2.2.2. If you are using
an older version, please contact technical@geneeworld.com and request a link to download the
latest software.
8
Page 9
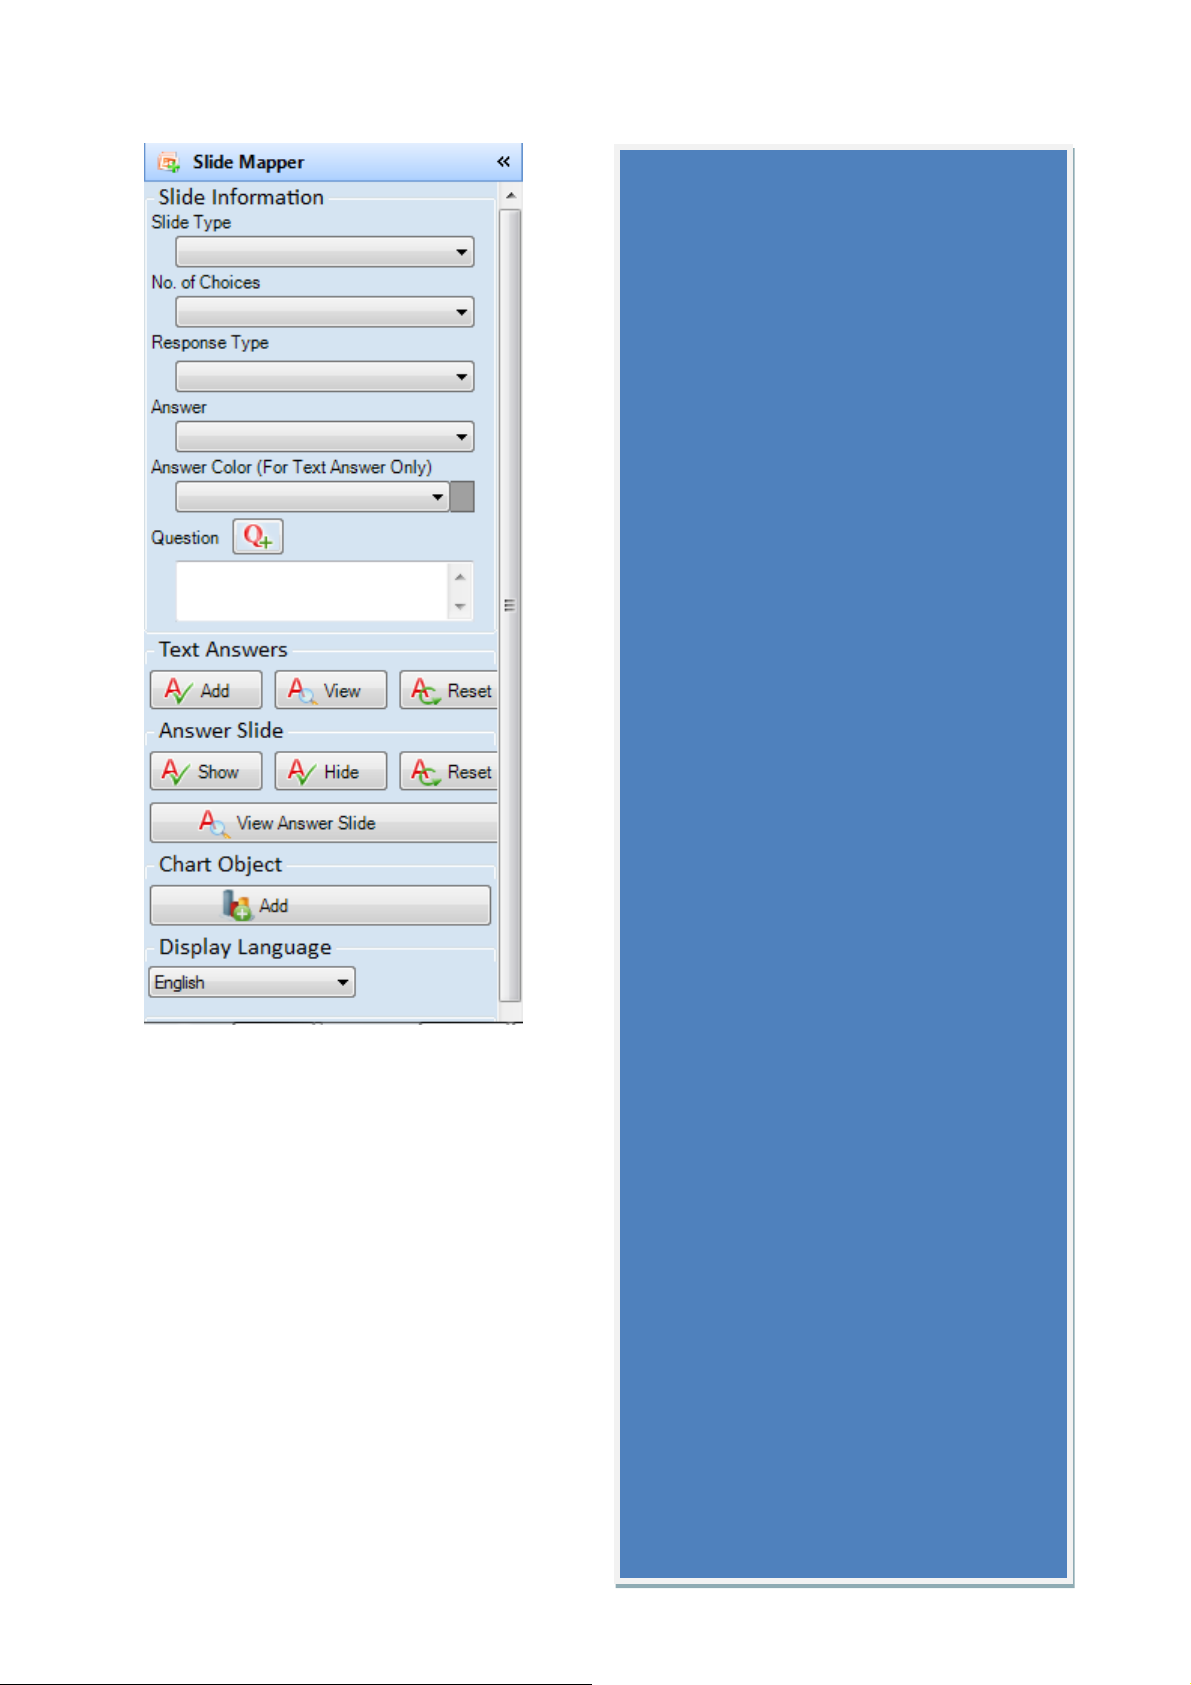
The slide Mapper is a convenient way to map
your slides within PowerPoint. Follow the steps
below to map a presentation slide:
1 – Select the Slide Type.
2 – Select the No. Of Choices if the slide Type is
Multiple Choice/Mark or Sequence. For other
slide types this option will not be available or set
by default in the case of Likert Scale.
3 – Select Response Type – Option available for
Multiple Choice/Mark and Sequence. Select Text
to label choices with alpha characters and
Numeric to label choices as numbers. (Max 6
choices available i.e. A-F or 1-6).
4 – Enter the correct answer – (optional in Plug-
in 2.0.0 and above for SURVEY presentations
where right/wrong answers are not needed)
5- Highlight the question text from the
PowerPoint slide and click the Q+ button to add
the question. This will then appear on the
reports in ClassComm.
6 – The Text Answers option allows you to
highlight the correct answer in a different colour
when running a presentation/quiz in ClassComm.
First choose the answer colour from the Answer
Colour (For Text Answer Only) drop-down box.
Now highlight the correct answer on the slide
and press the “Add” button under Text
Answers”. Press reset to revert back to no
answer colour.
7 – The “Answer Slide” option allows object’s
e.g. image, text box to be revealed and/or
hidden when the presenter shows the answer.
Once an object has been added, select it and
then press the “Show” or “Hide” button to show
an object or hide an object when the answer is
revealed. The Reset button will cancel the
show/hide effect.
8 – The “Chart Object” option adds a chart
container to the slide. This container can be
used to embed charts during a live presentation
for review later whilst viewing the instant charts.
Repeat the above steps for each slide in the
presentation. SAVE the changes before closing
PowerPoint and re-entering ClassComm.
9
Page 10
Phase 3 – Creating and Adding Teachers, Classes and Students
When running a presentation in ClassComm, the students must be added into the ClassComm
software before they can used with the “Existing Class” presentation This can be done either by data
entry or via import of a CSV or excel file.
Method 1 – Data Entry
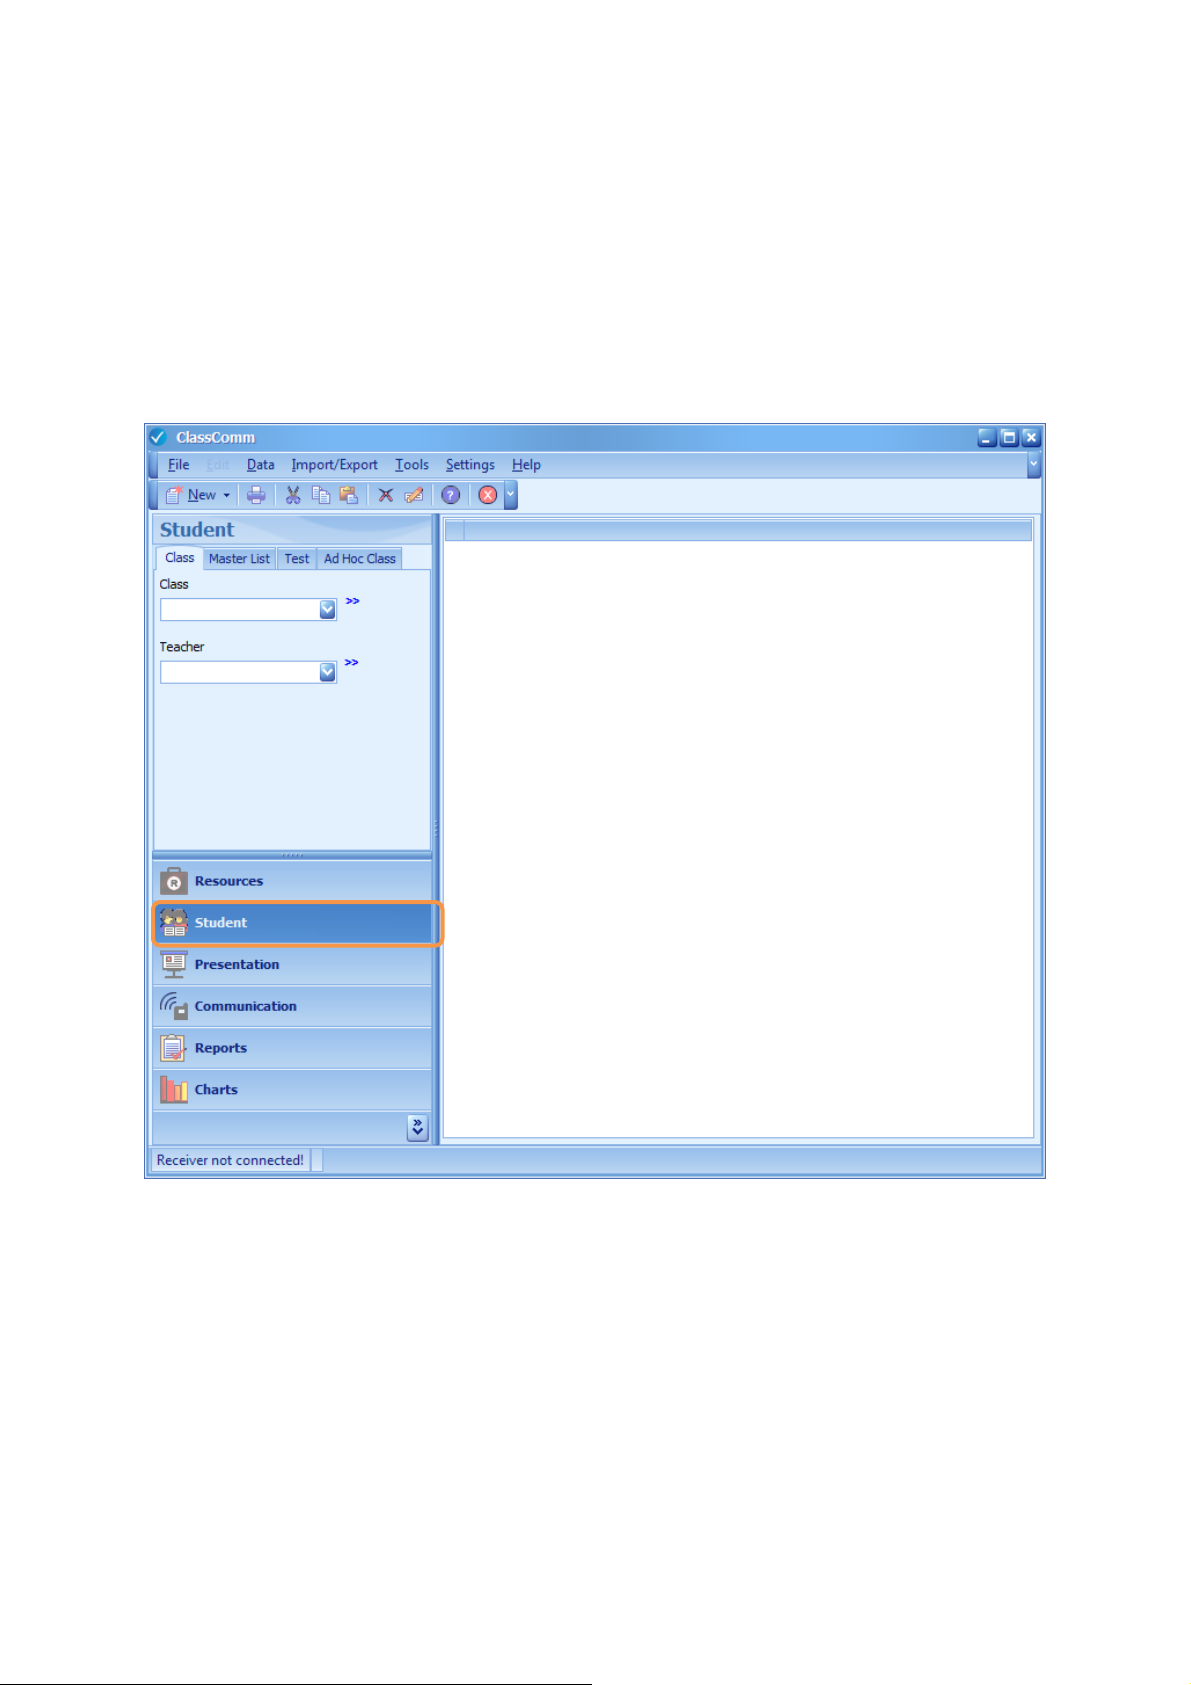
1. Enter the STUDENT area of ClassComm. The following screen will appear:
2. Create a new teacher by clicking the >> symbol next to the teacher drop-down box. From
the pop-up menu, select Add Teacher.
10
Page 11
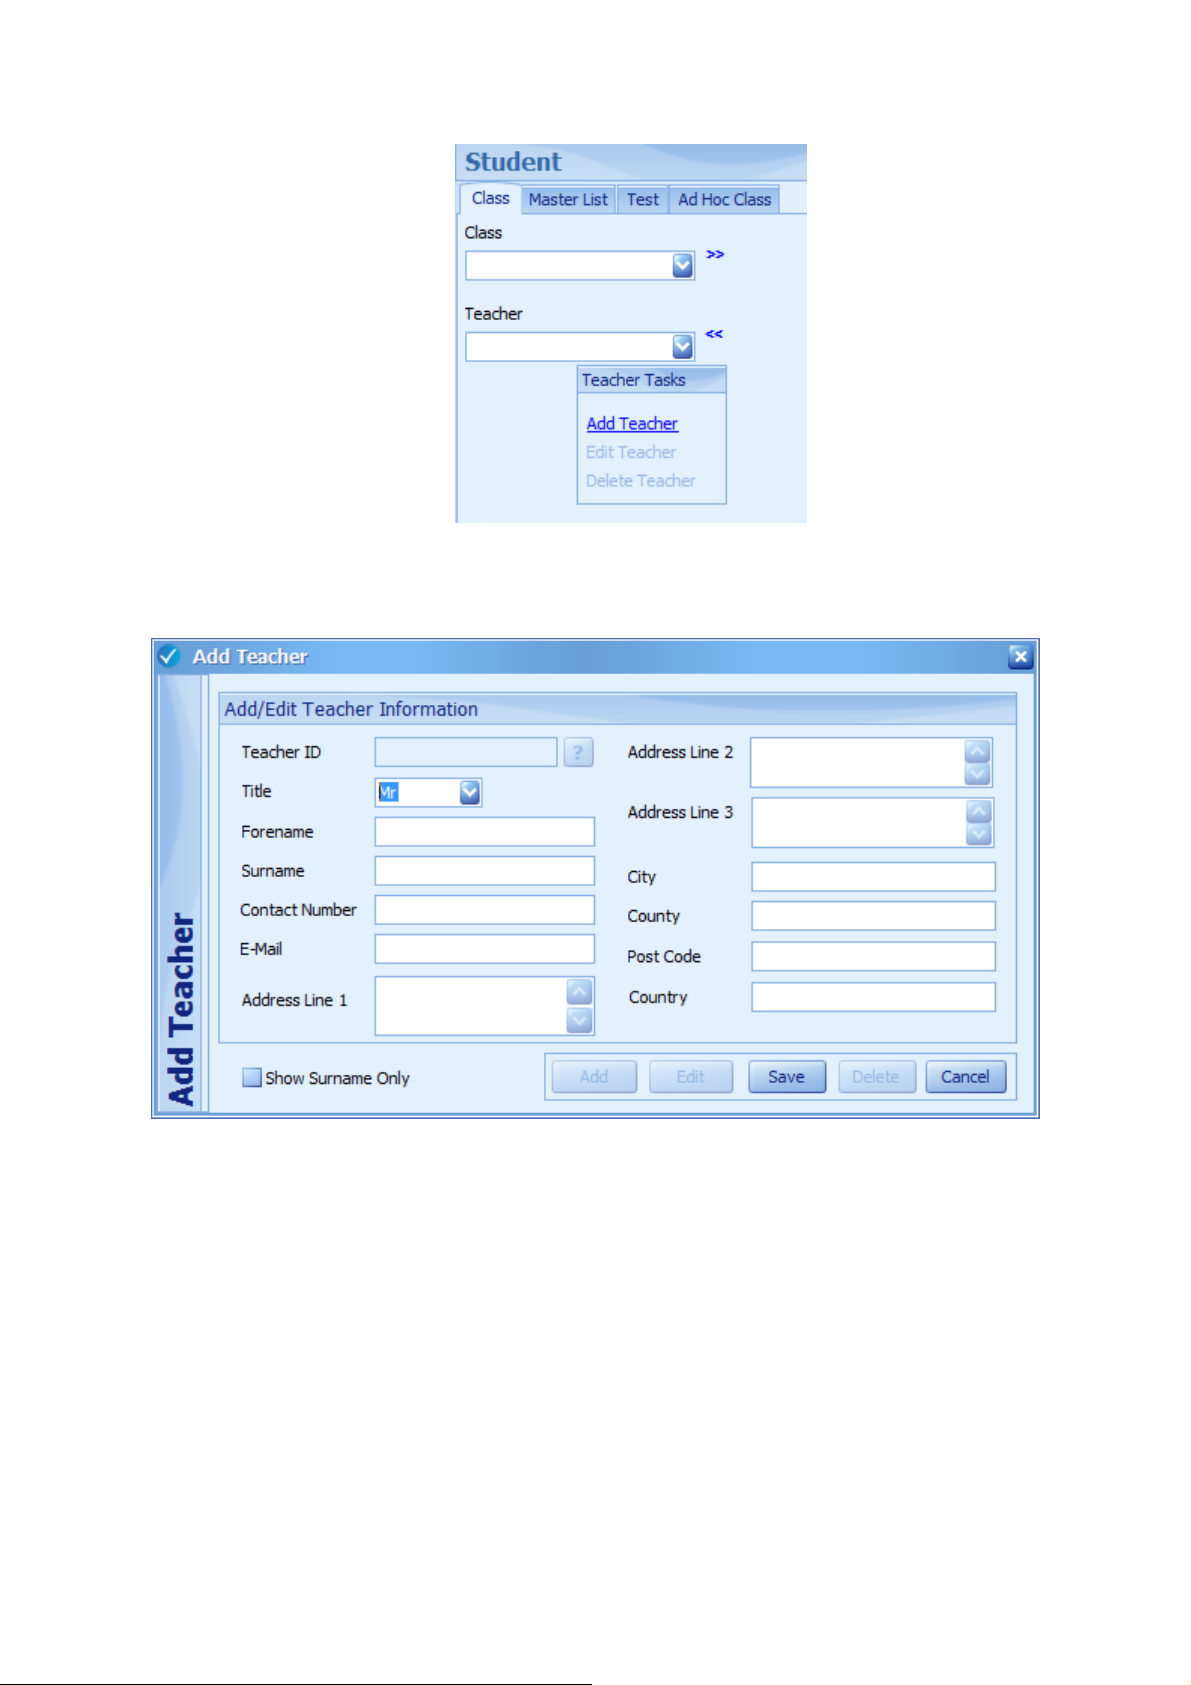
3. Enter the new teacher details and press the SAVE button. At this point, the Cancel button
will change to a CLOSE button which will exit out of the Add Teacher window.
4. Create a new Class by clicking on the >> next to the Class drop-down box and select Add
Class.
11
Page 12
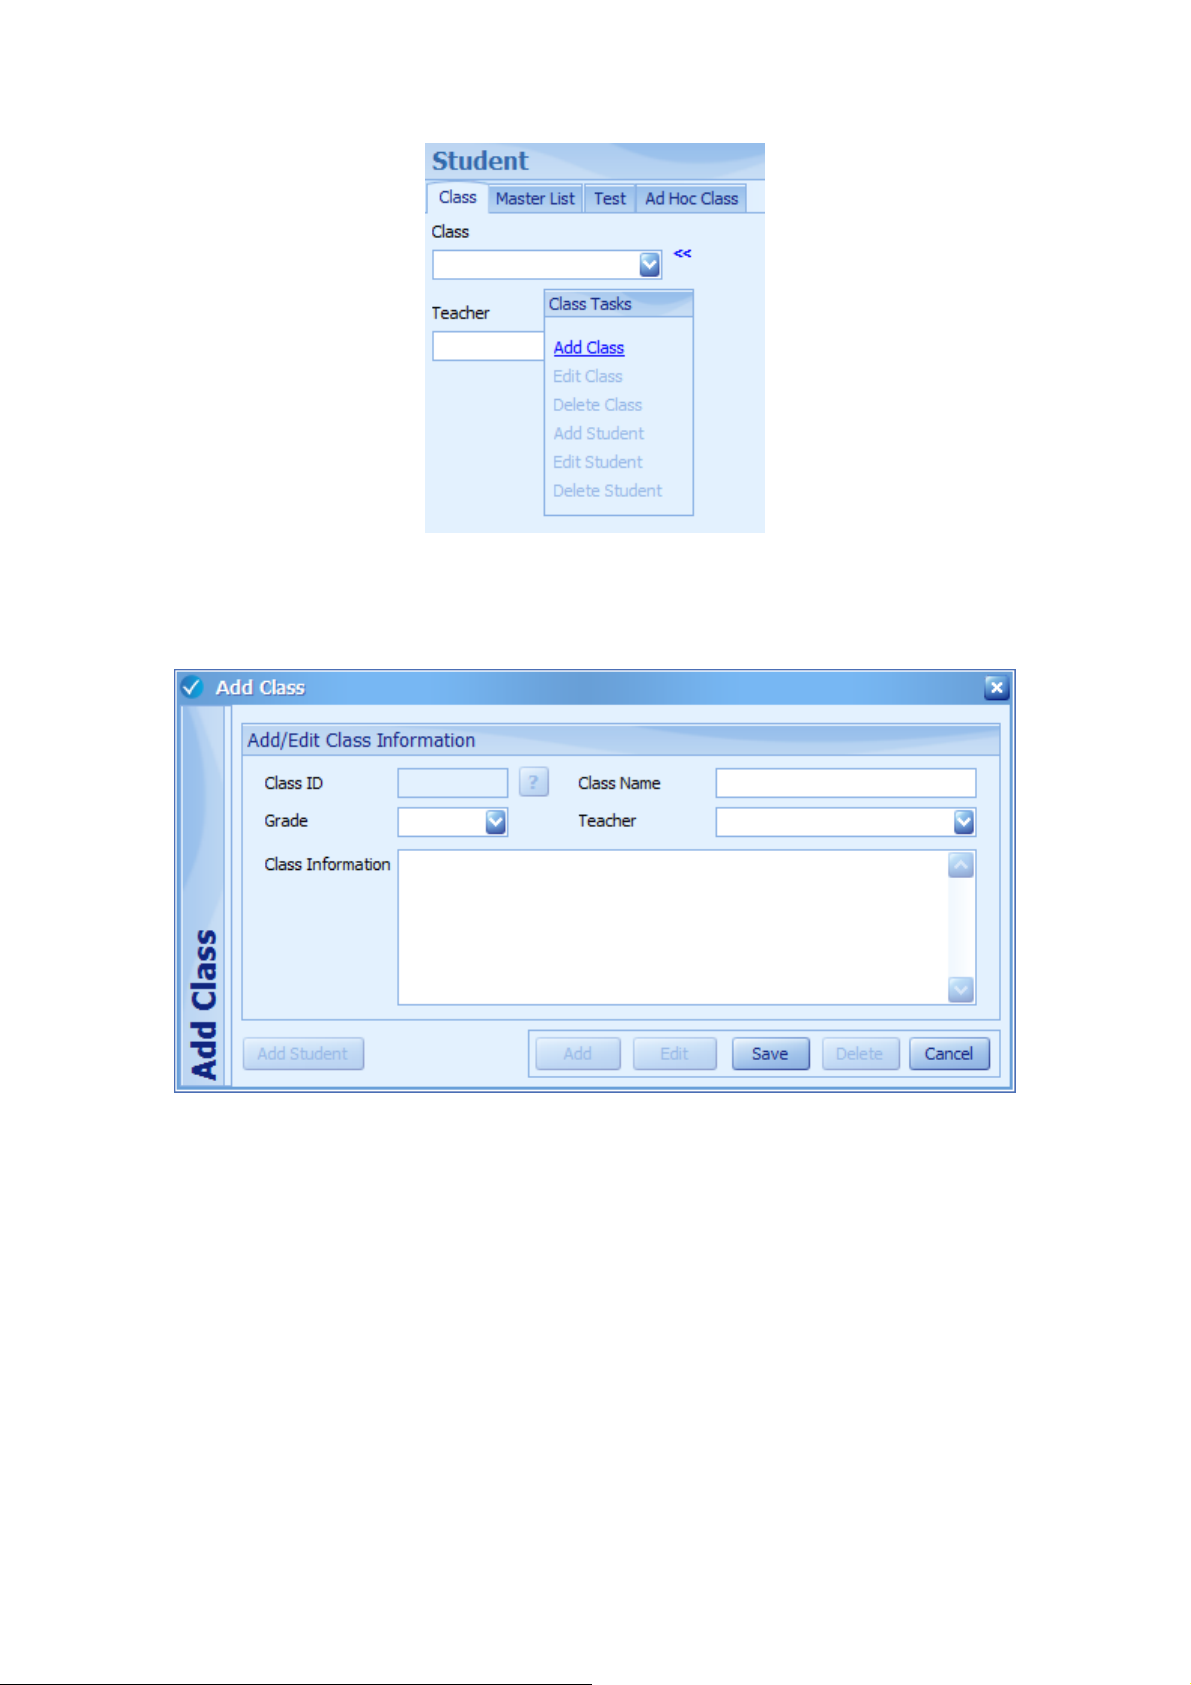
5. Enter the new class details in the Add Class window that appears and Press SAVE followed by
CLOSE. Note that the only mandatory fields are Class Name and teacher.
6. To add new students into the class, select the class from the drop-down box, click >> and
select Add Student from the pop-up menu.
12
Page 13
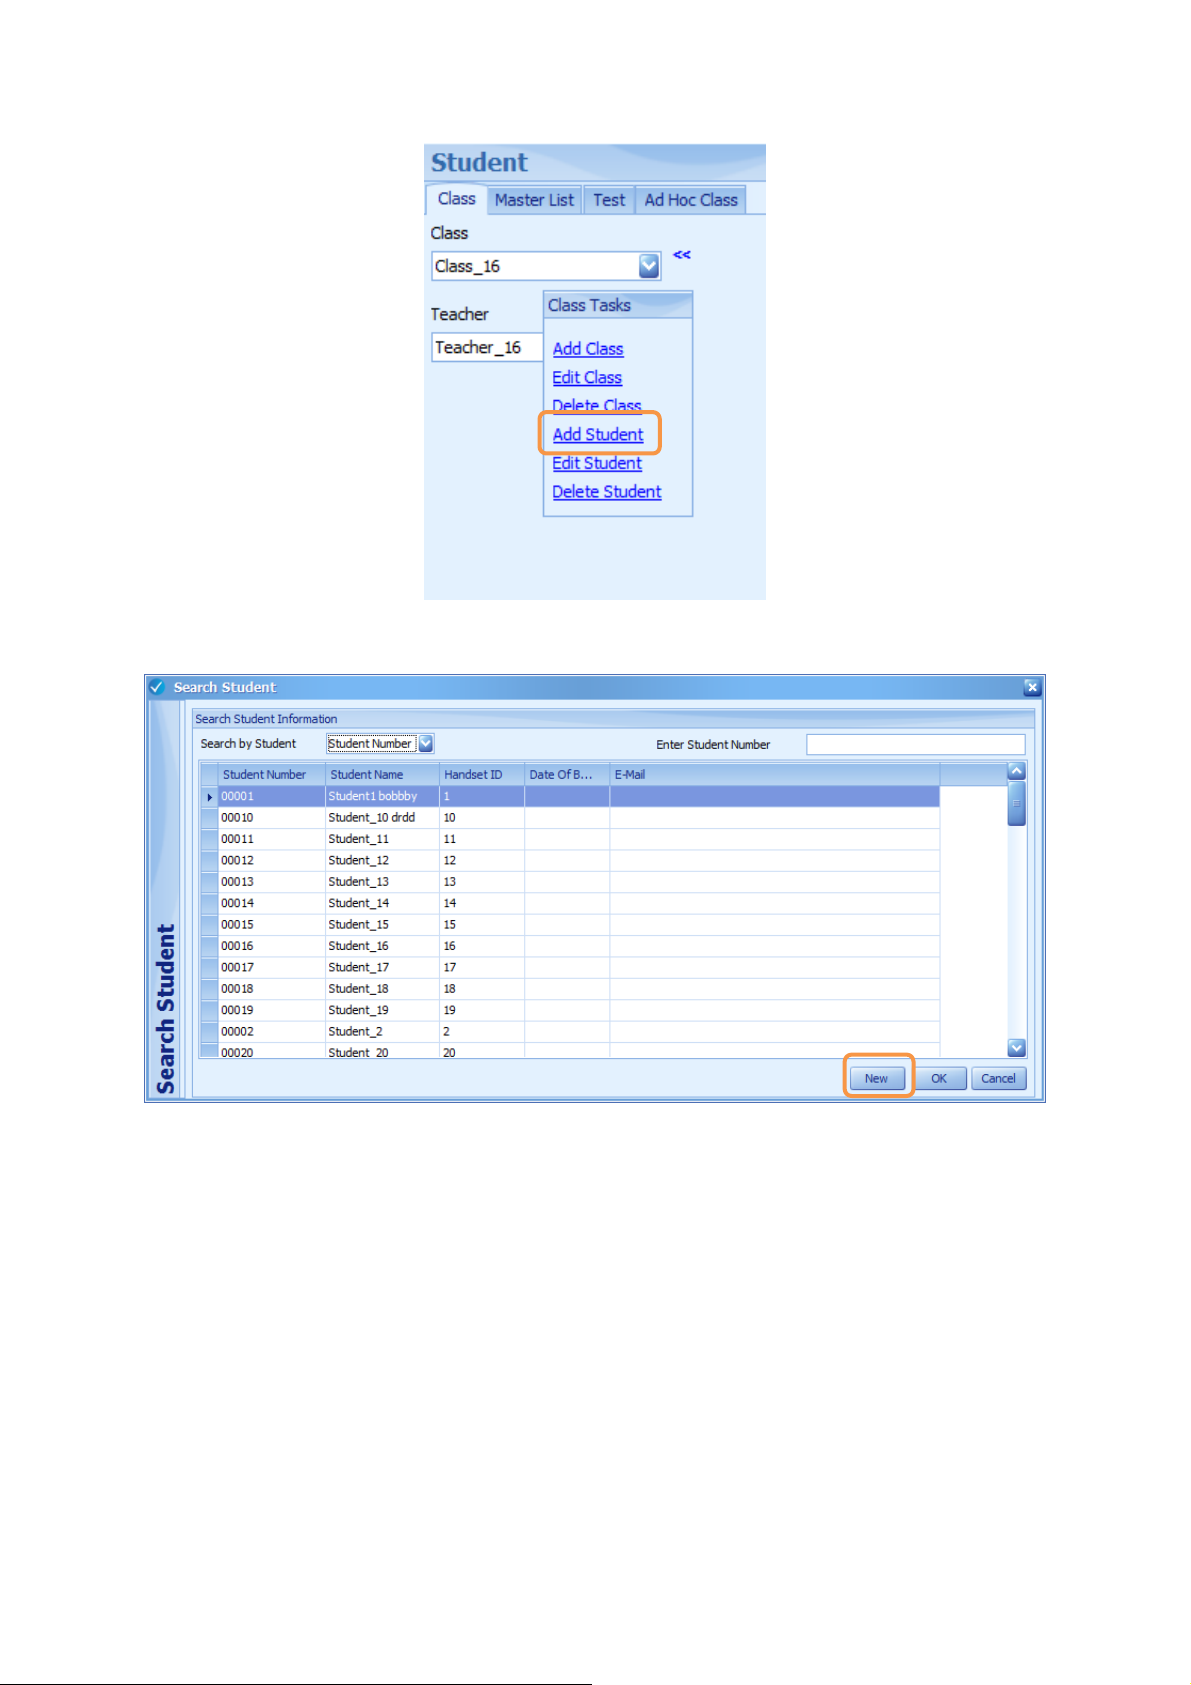
7. From the Search Student window that appears, click the NEW button.
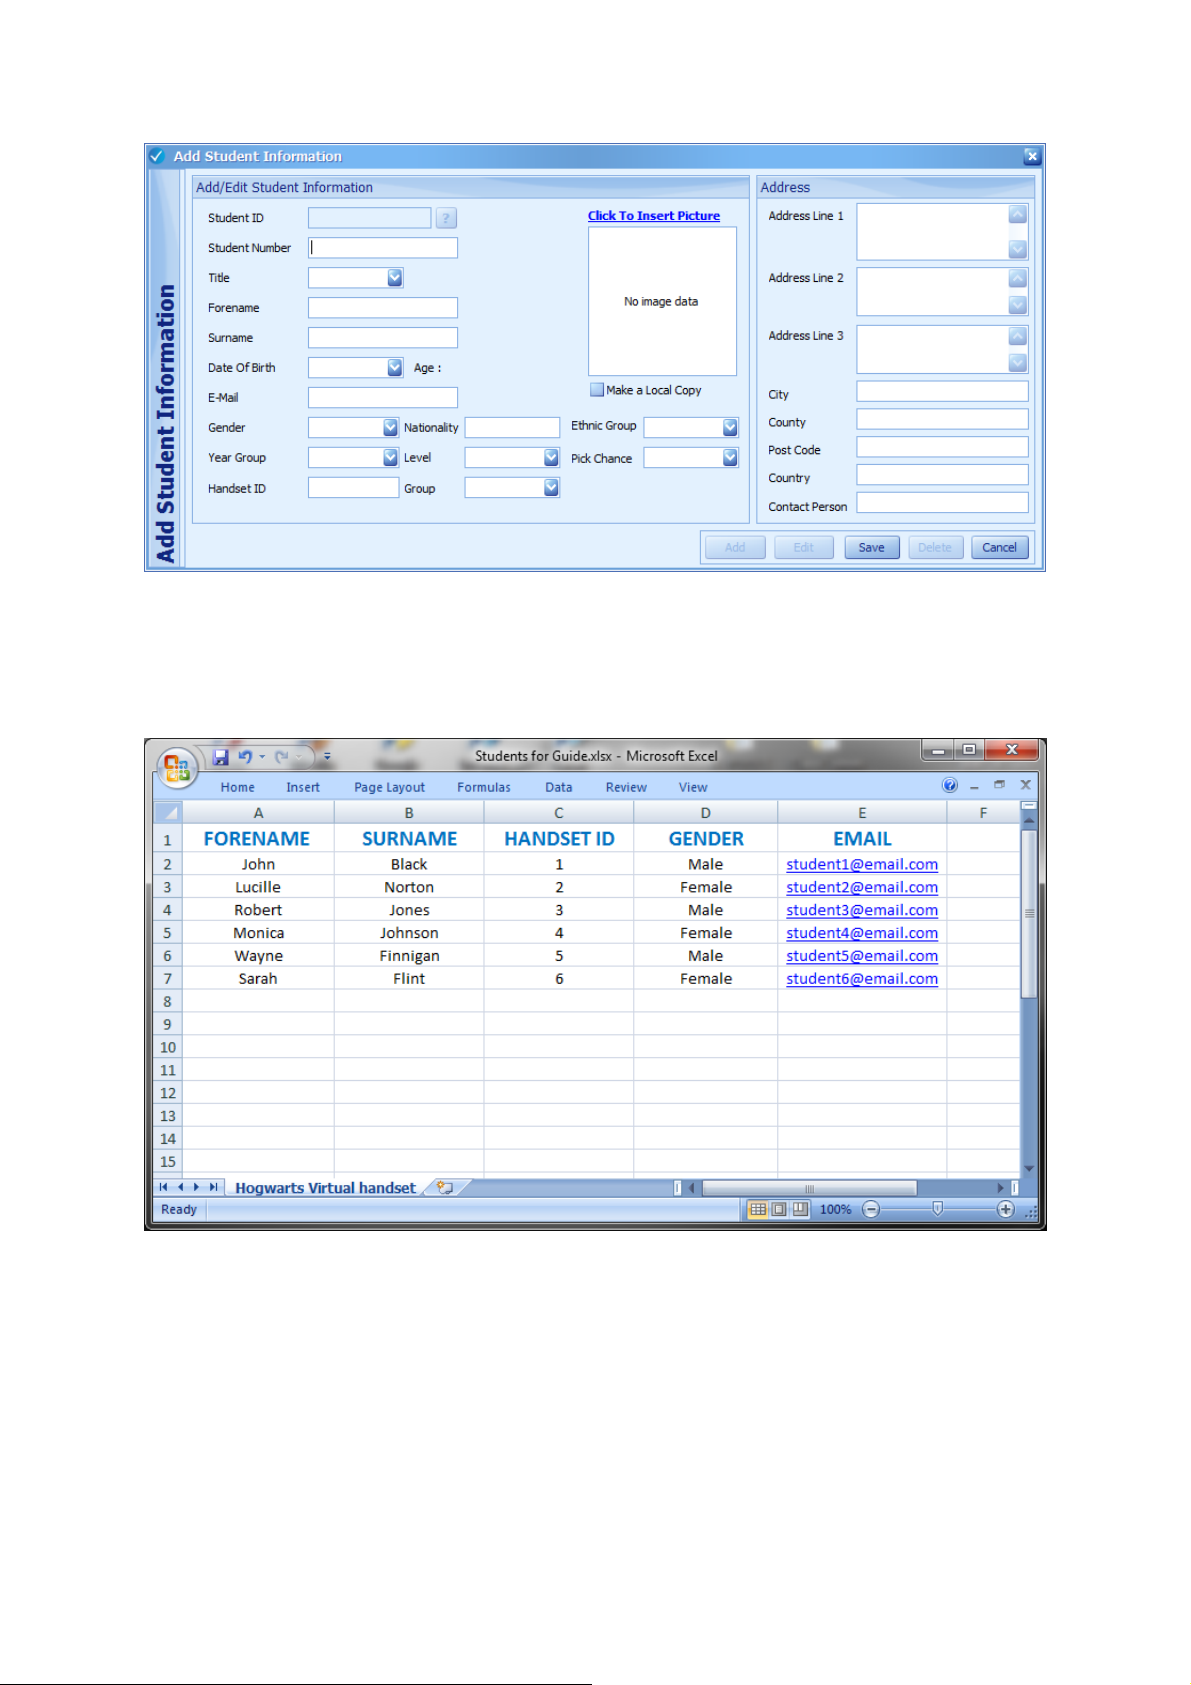
8. Enter the new student details in the Add Student Details window that appears. The only
other mandatory fields are forename and Handset ID (for use with “Existing Class”
presentation mode). Press SAVE and then ADD to enter further new students to the class.
Once all student details have been entered and saved, press CLOSE.
13
Page 14
Method 2 – Import Student List from CSV/Excel
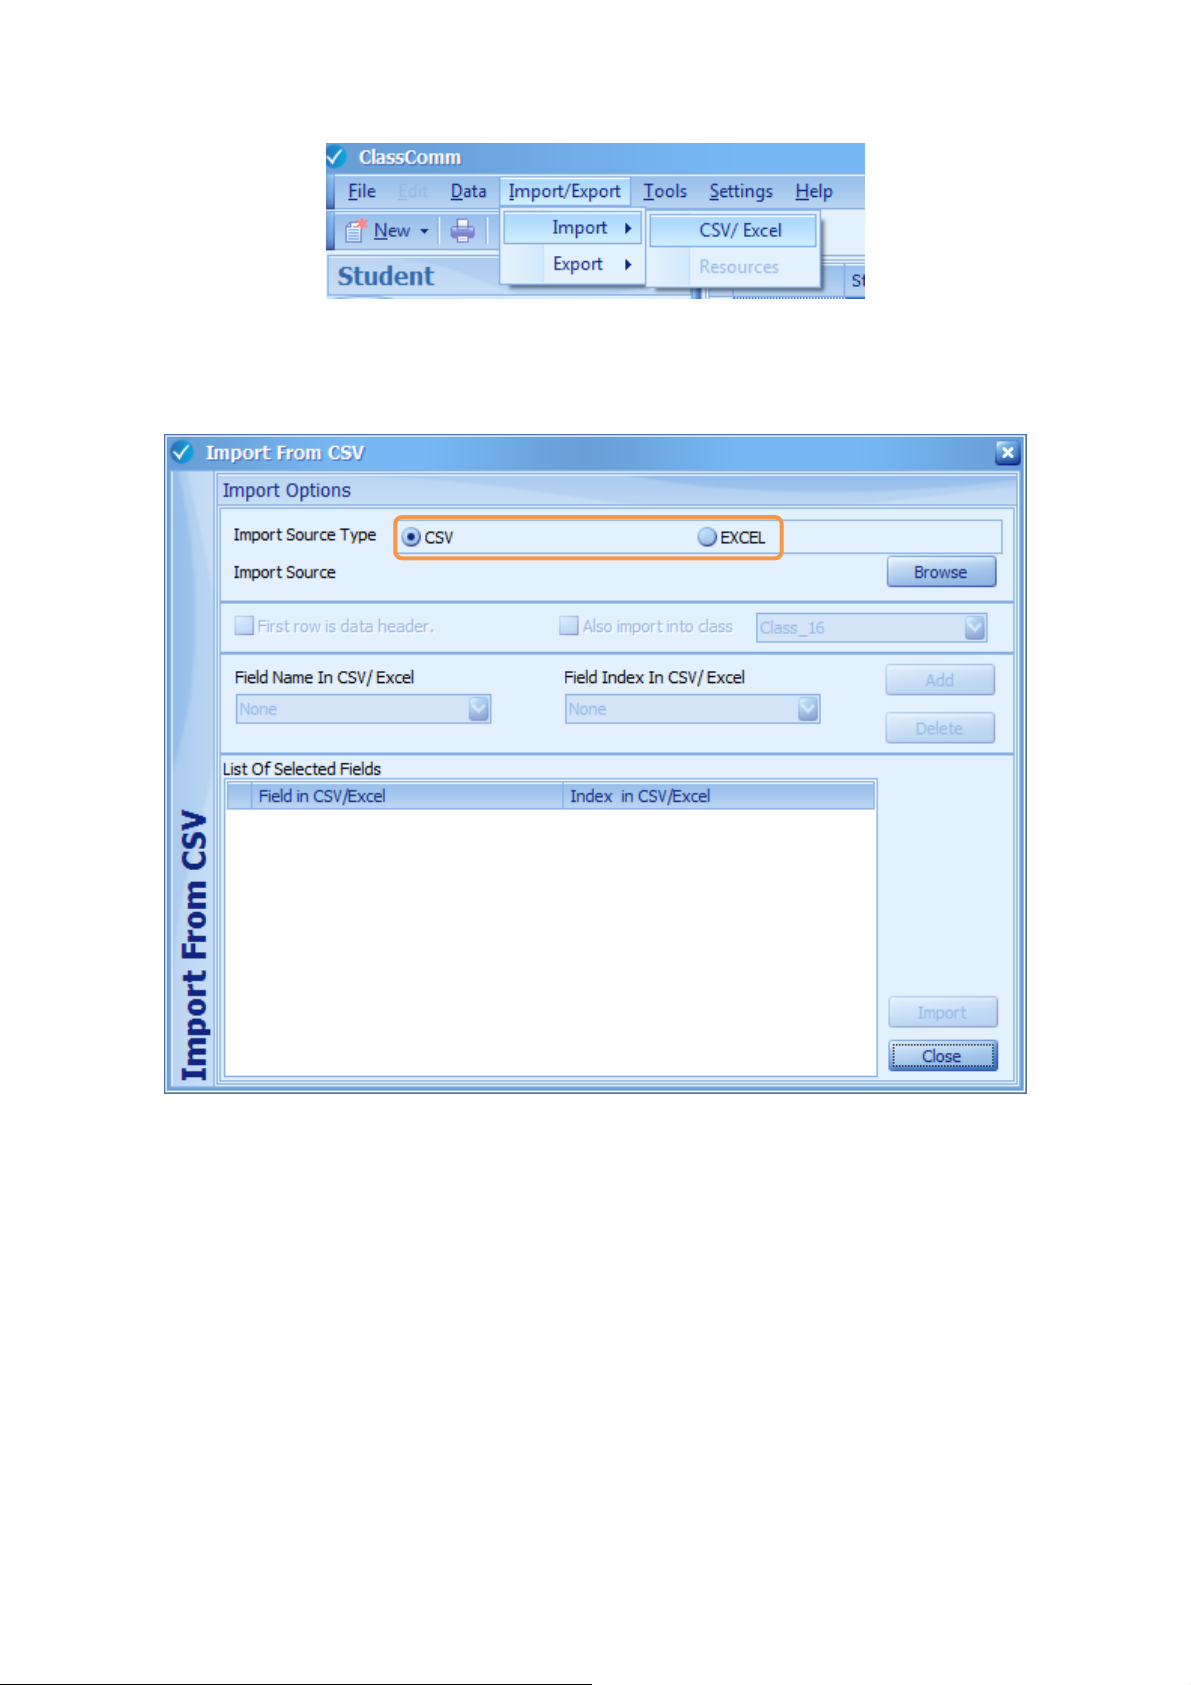
To import via CSV/Excel, we need to ensure that ClassComm can recognise the fields of the
spreadsheet and import them accordingly into the application database. Here is a sample excel
spreadsheet with 5 columns – Forename, Surname, Handset ID, Gender and Email.
To import the above spreadsheet into ClassComm, here are the steps to follow:
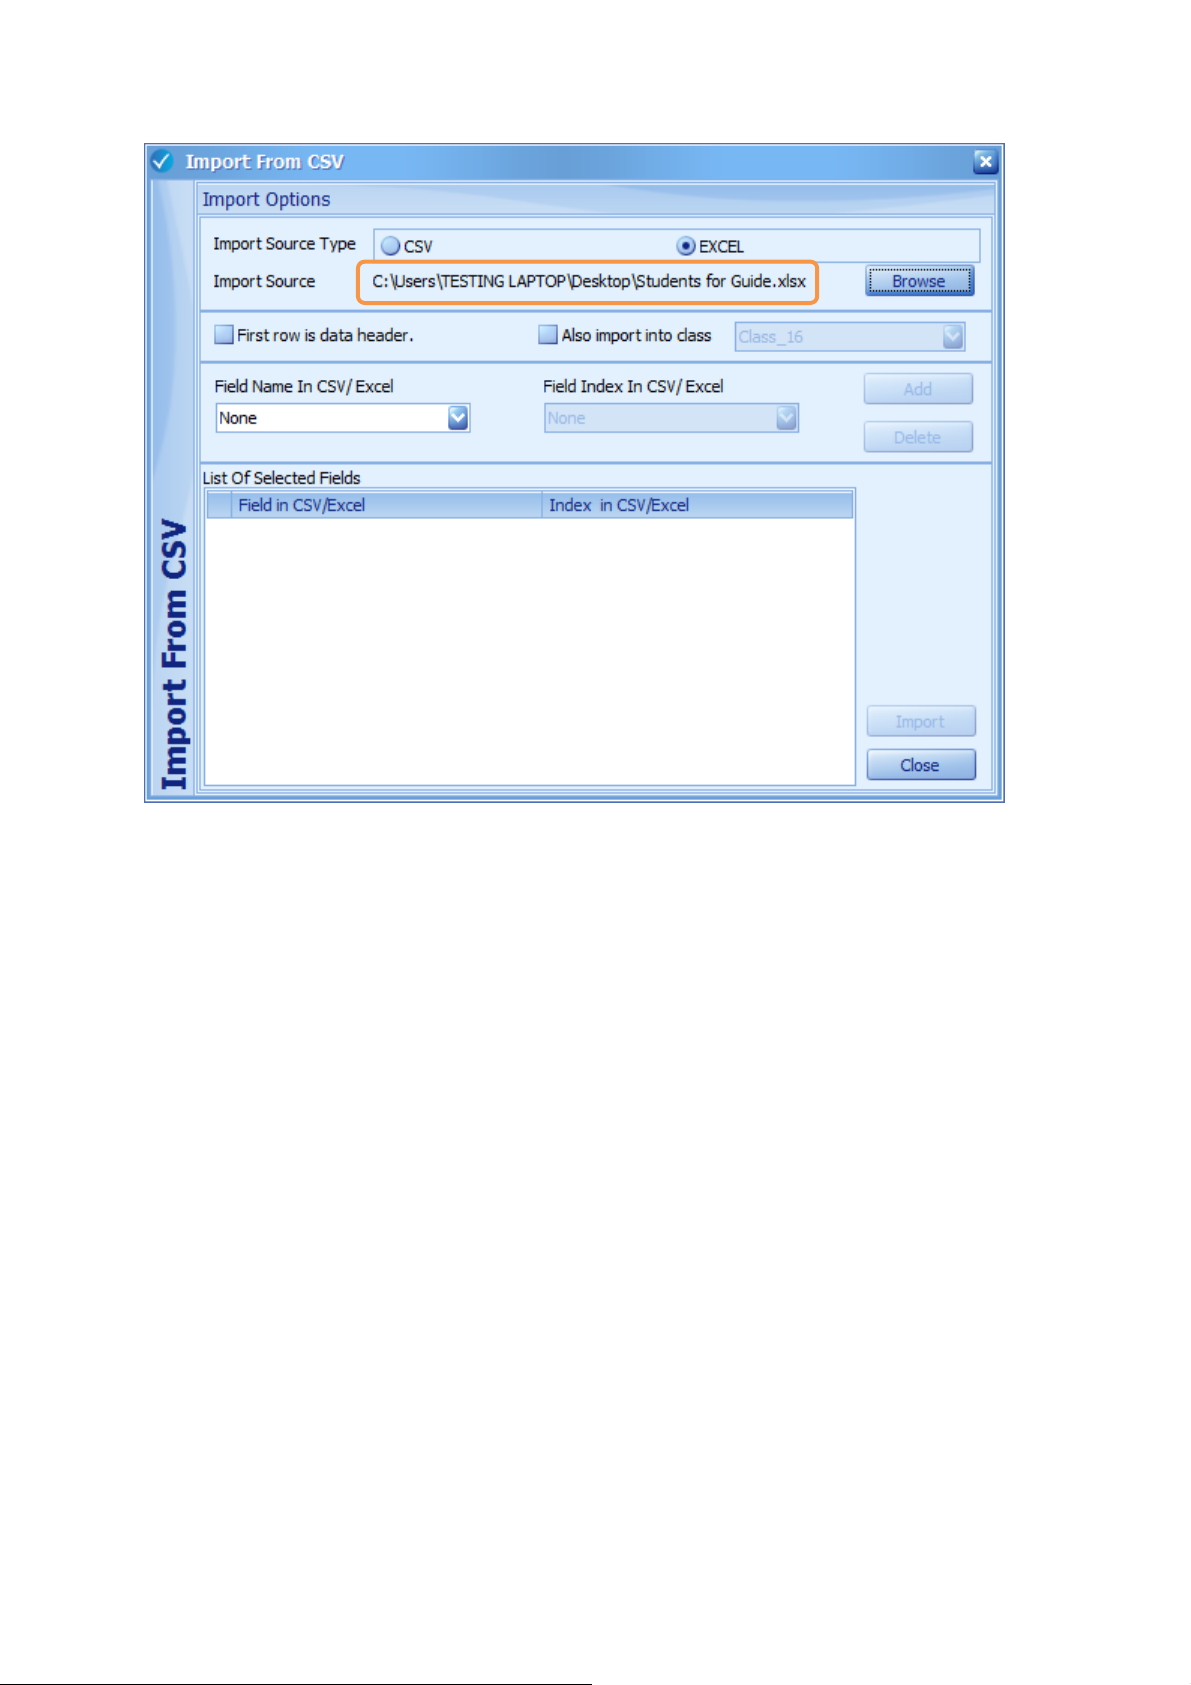
1. Enter the STUDENT area of ClassComm.
2. Go to IMPORT/EXPORT > IMPORT > CSV/EXCEL
14
Page 15
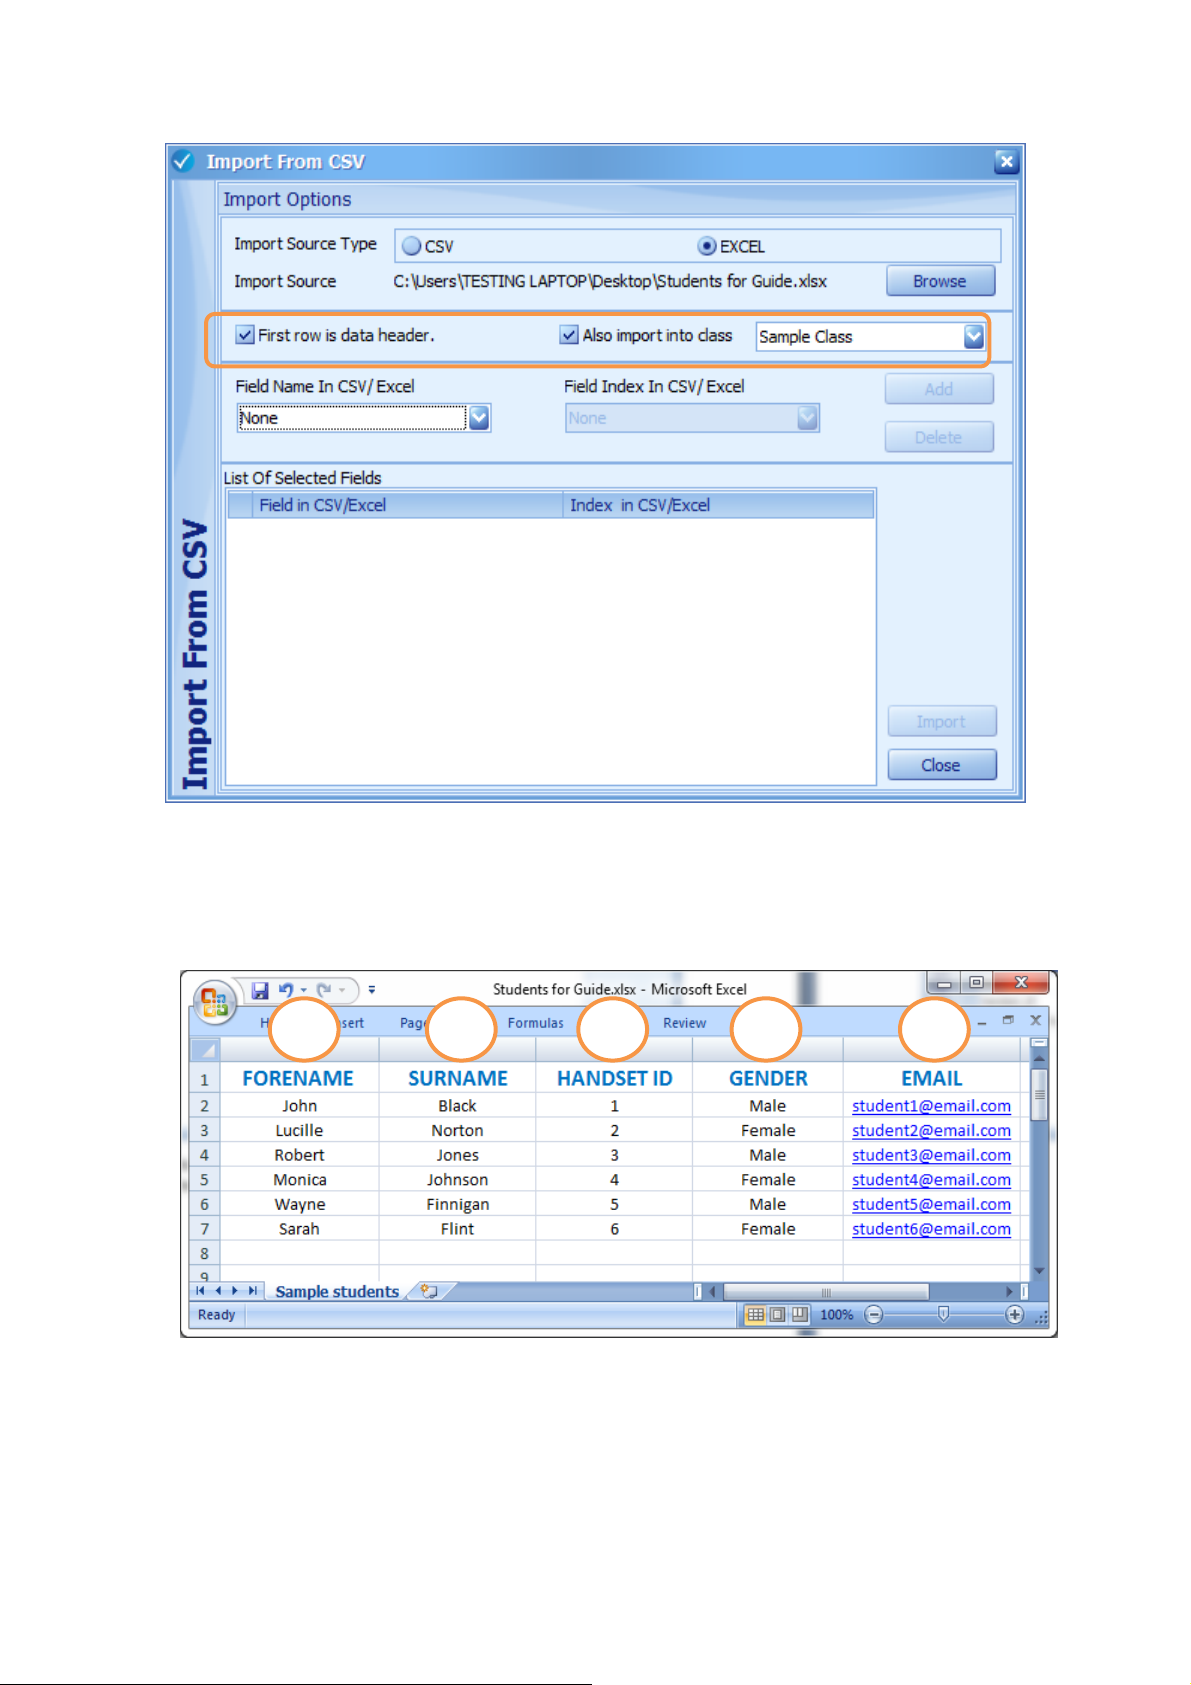
3. The Import from CSV window will open. Select the Import source type that matches the file
that holds the student details (CSV or Excel) and click the Browse button. Locate the Import
Source file.
15
Page 16
4. Select “First row is data header” if the source file has column headings. Check the “Also
import into class” option and select the class from the drop-down menu. Note that classes
must be pre-created when using this option. If de-selected, the students will be imported
into the MASTER LIST and can be allocated to classes as required from within the Student
section of ClassComm.
16
Page 17
5. The Field names in the CSV/Excel file need to be matched to an index number so that they
1 2 3 4 5
will be recognised and imported correctly into the ClassComm software. From the sample
spreadsheet below, it can be seen that the FORENAME field is the first column hence it is
index 1; SURNAME is index 2 and so on.
17
Page 18
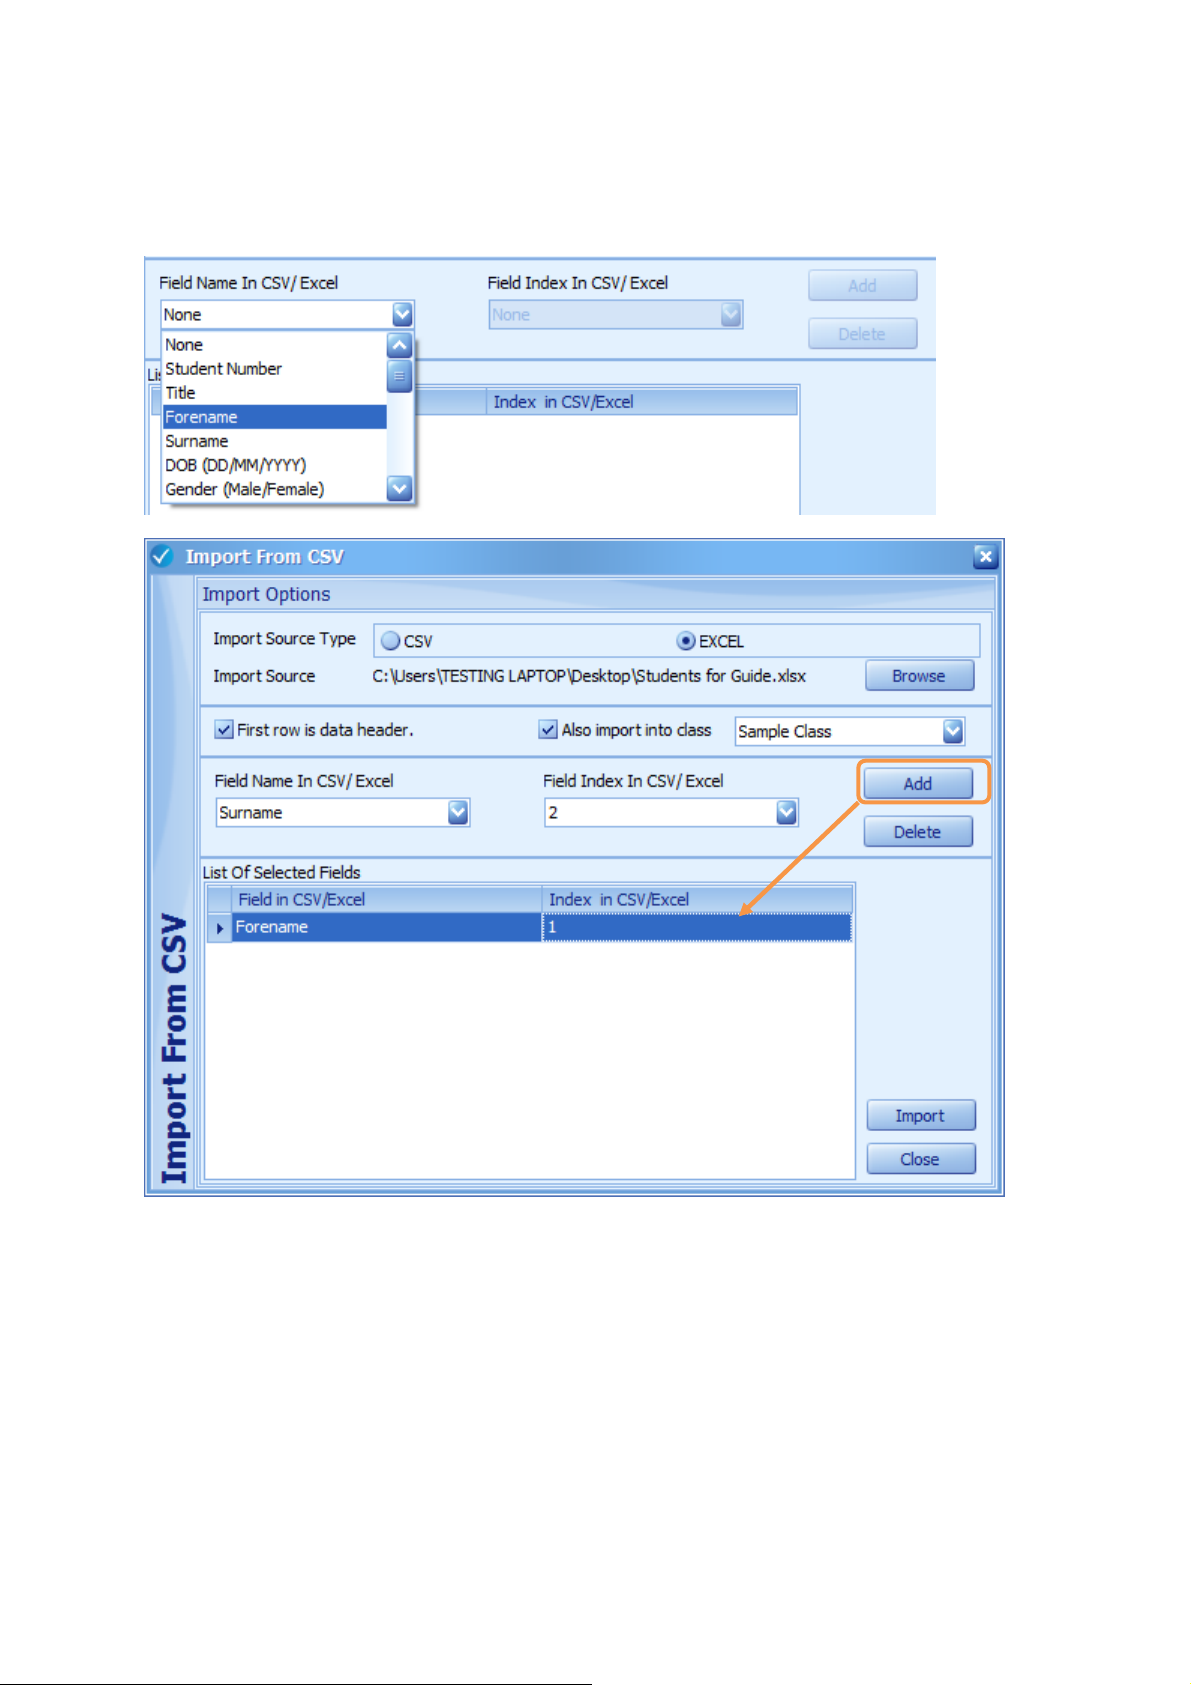
Select Forename from the Field Name is CSV/Excel dropdown box and then select 1 from the Field
Index in CSV/Excel dropdown list. Click the Add button. The data will be displayed in the table as
shown in the images below:
18
Page 19
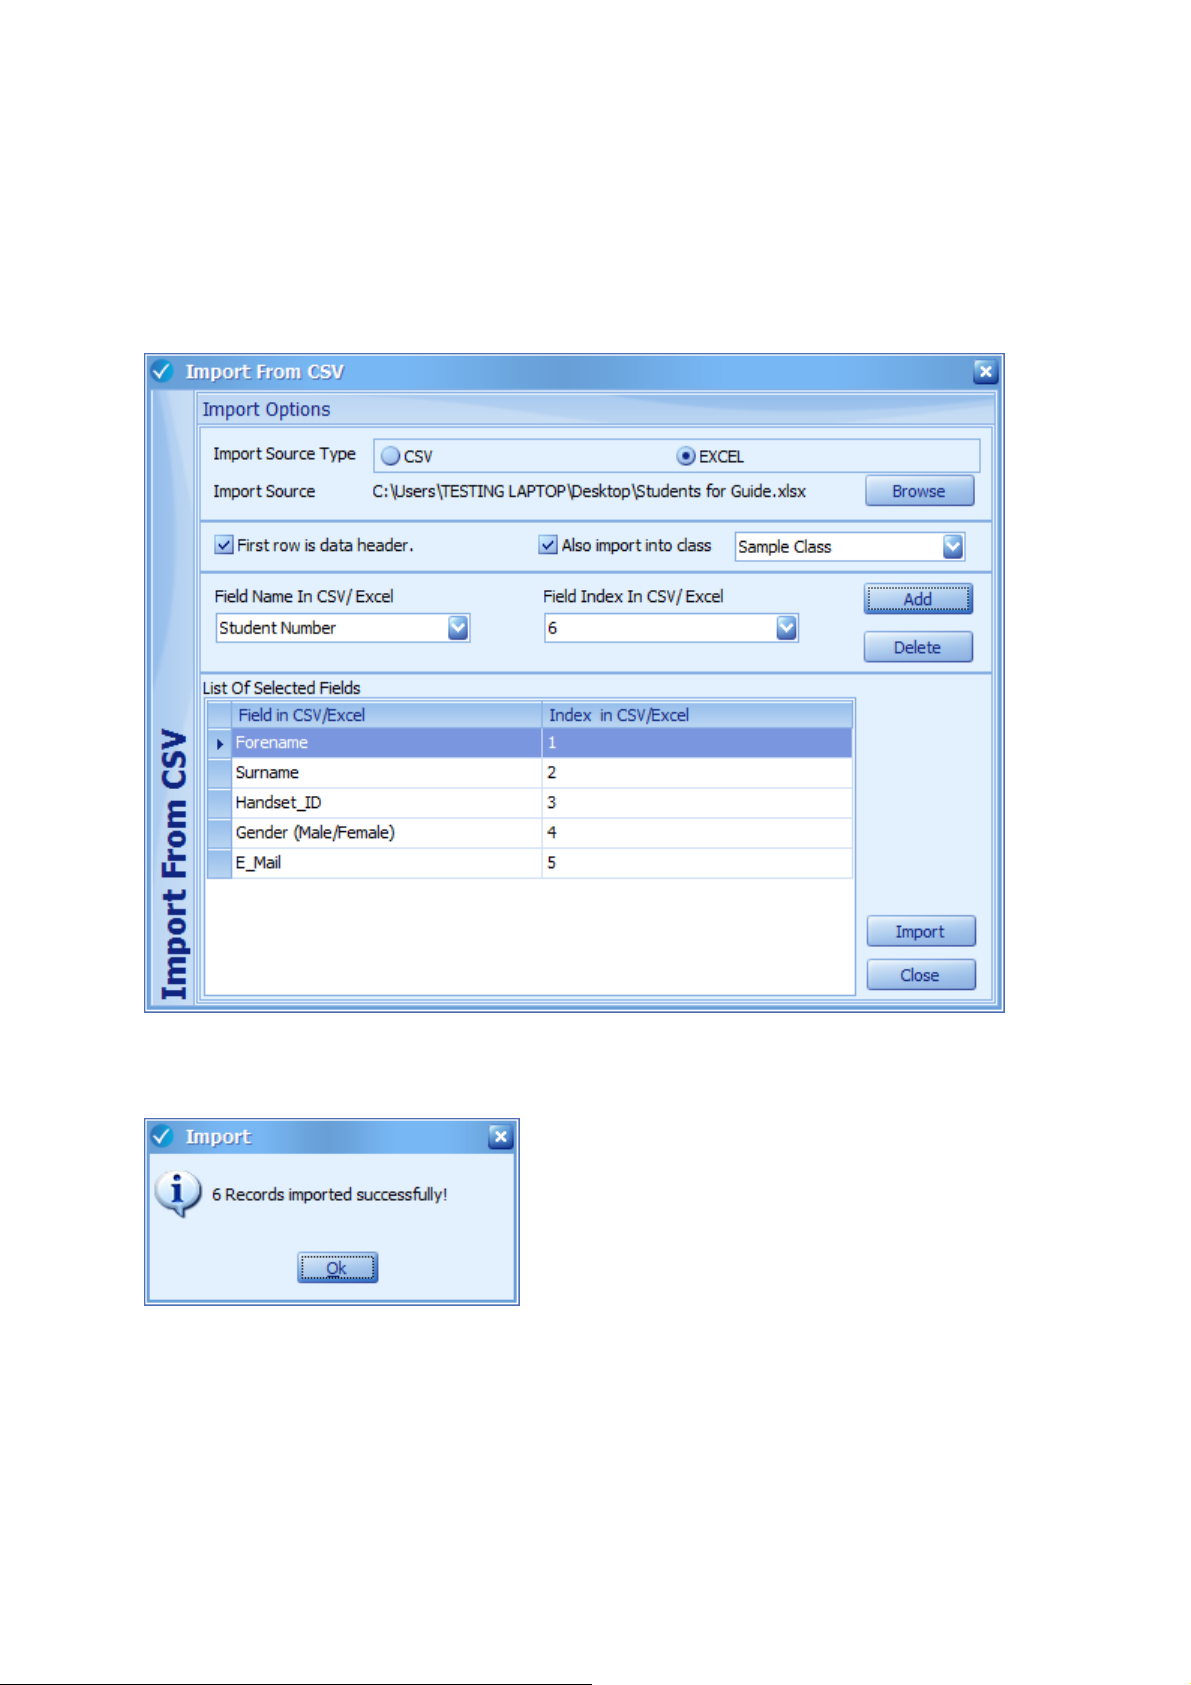
6. When the fields have been indexed correctly, the List of selected Fields table will look as
follows:
7. Click the IMPORT button. After a short time, the following message will appear. Click OK to
proceed and then CLOSE on the Import from CSV window.
8. The student’s have now been added to the Class selected during the import process or if no
class was selected, they will be viewable in the Master List ready for addition to a class or
classes.
19
Page 20
Phase 4 – Presentation/Class Settings in ClassComm
Now that a PowerPoint Activity has been successfully mapped and added to the ClassComm
Resources area, we can setup the activity/resource to run as a quiz with a group of
participants/student’s. To do this, click on the Presentation tab within ClassComm. The
Presentation area of the software is where the presenters can set the presentation mode, how the
participant responses will be taken, and game and pace settings. There are two ways to select the
Class/audience with which you wish to present to: -
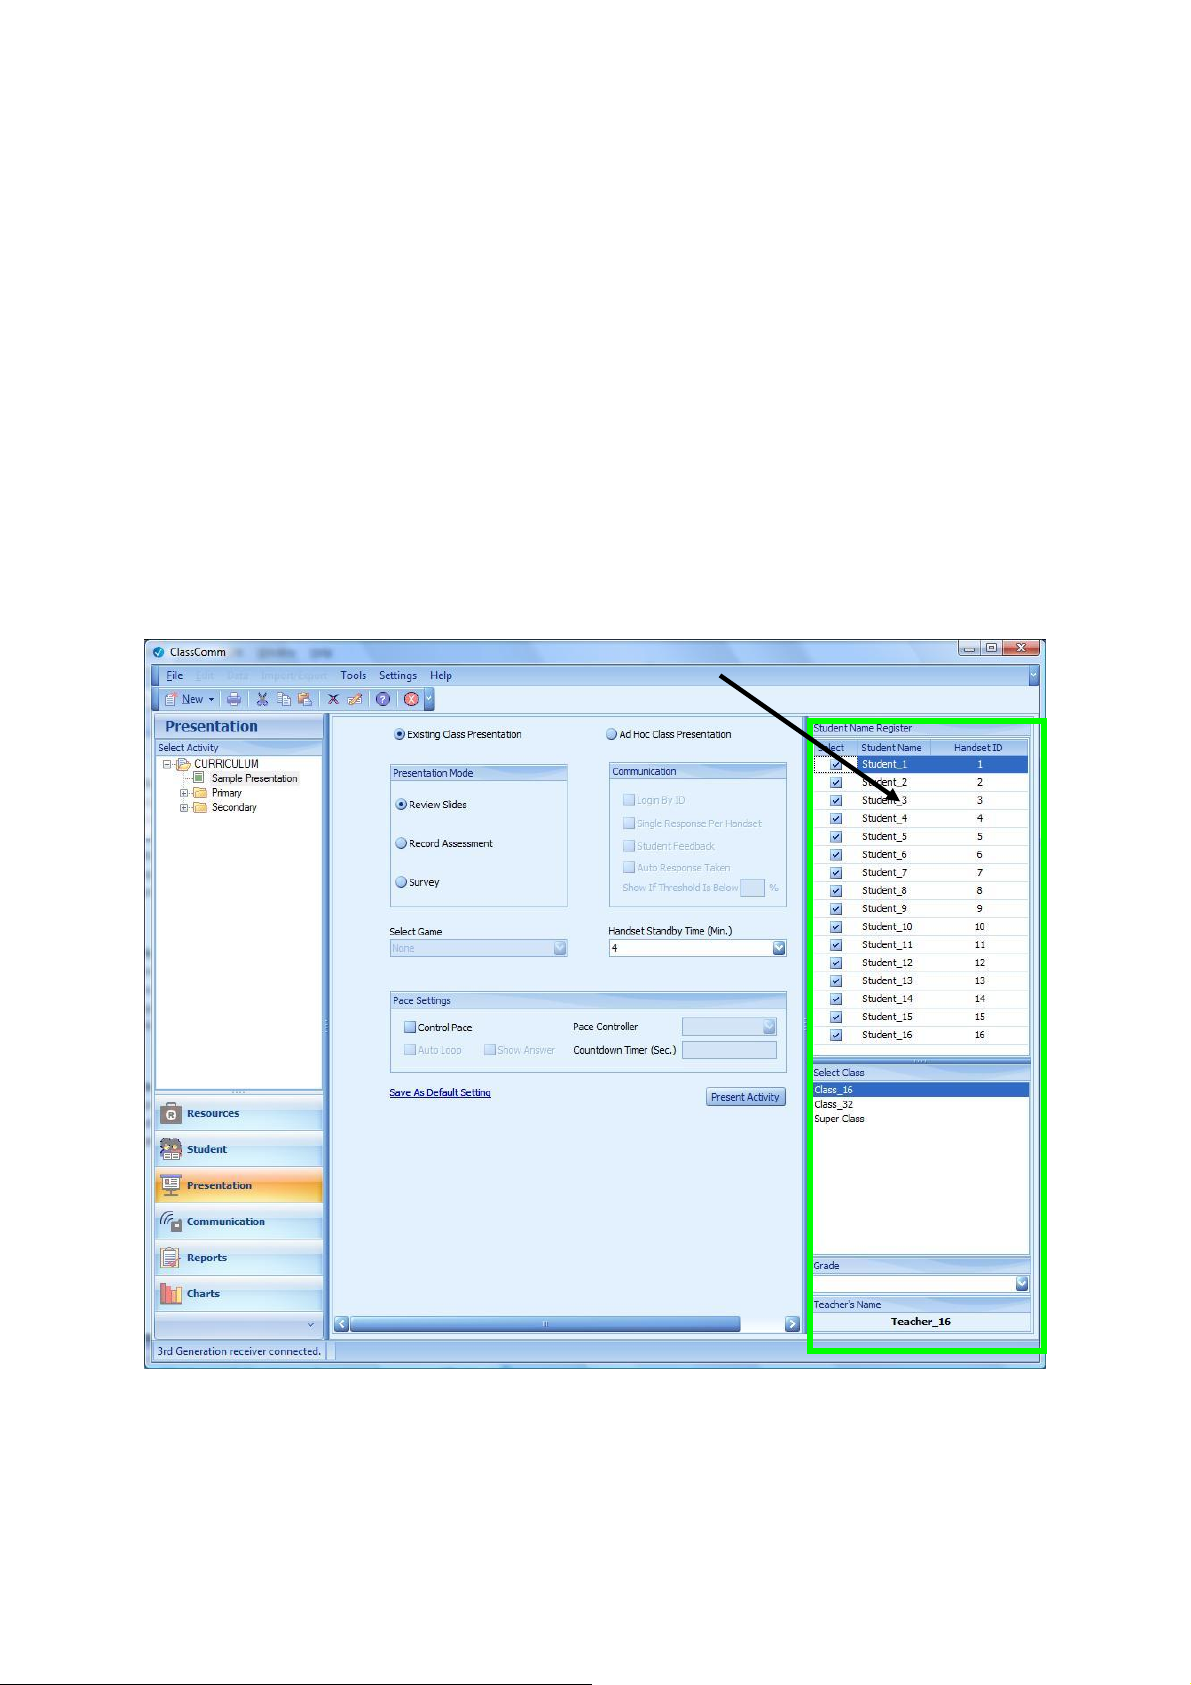
1 – Existing Class Presentation – When this option is selected, only existing Class and Teacher data
can be used for the presentation. Class and Teacher data has to have been pre-entered onto the
system via the Student section of ClassComm (See Phase 3 – Creating and Adding Teachers, Classes
and Students). When using the Existing Class presentation option, the class and teacher need to be
selected from the bottom-right pane and then active participants need be selected from the Student
Name Register pane before an activity can be presented.
2 – Ad-Hoc Class - When this option is selected, an Ad-hoc class can be created by participant’s
texting in their names from the handsets. After selecting Ad-hoc, click the “New Class” button on
the bottom right of the ClassComm interface to bring up the Ad-hoc class interface. Clicking the
20
Page 21
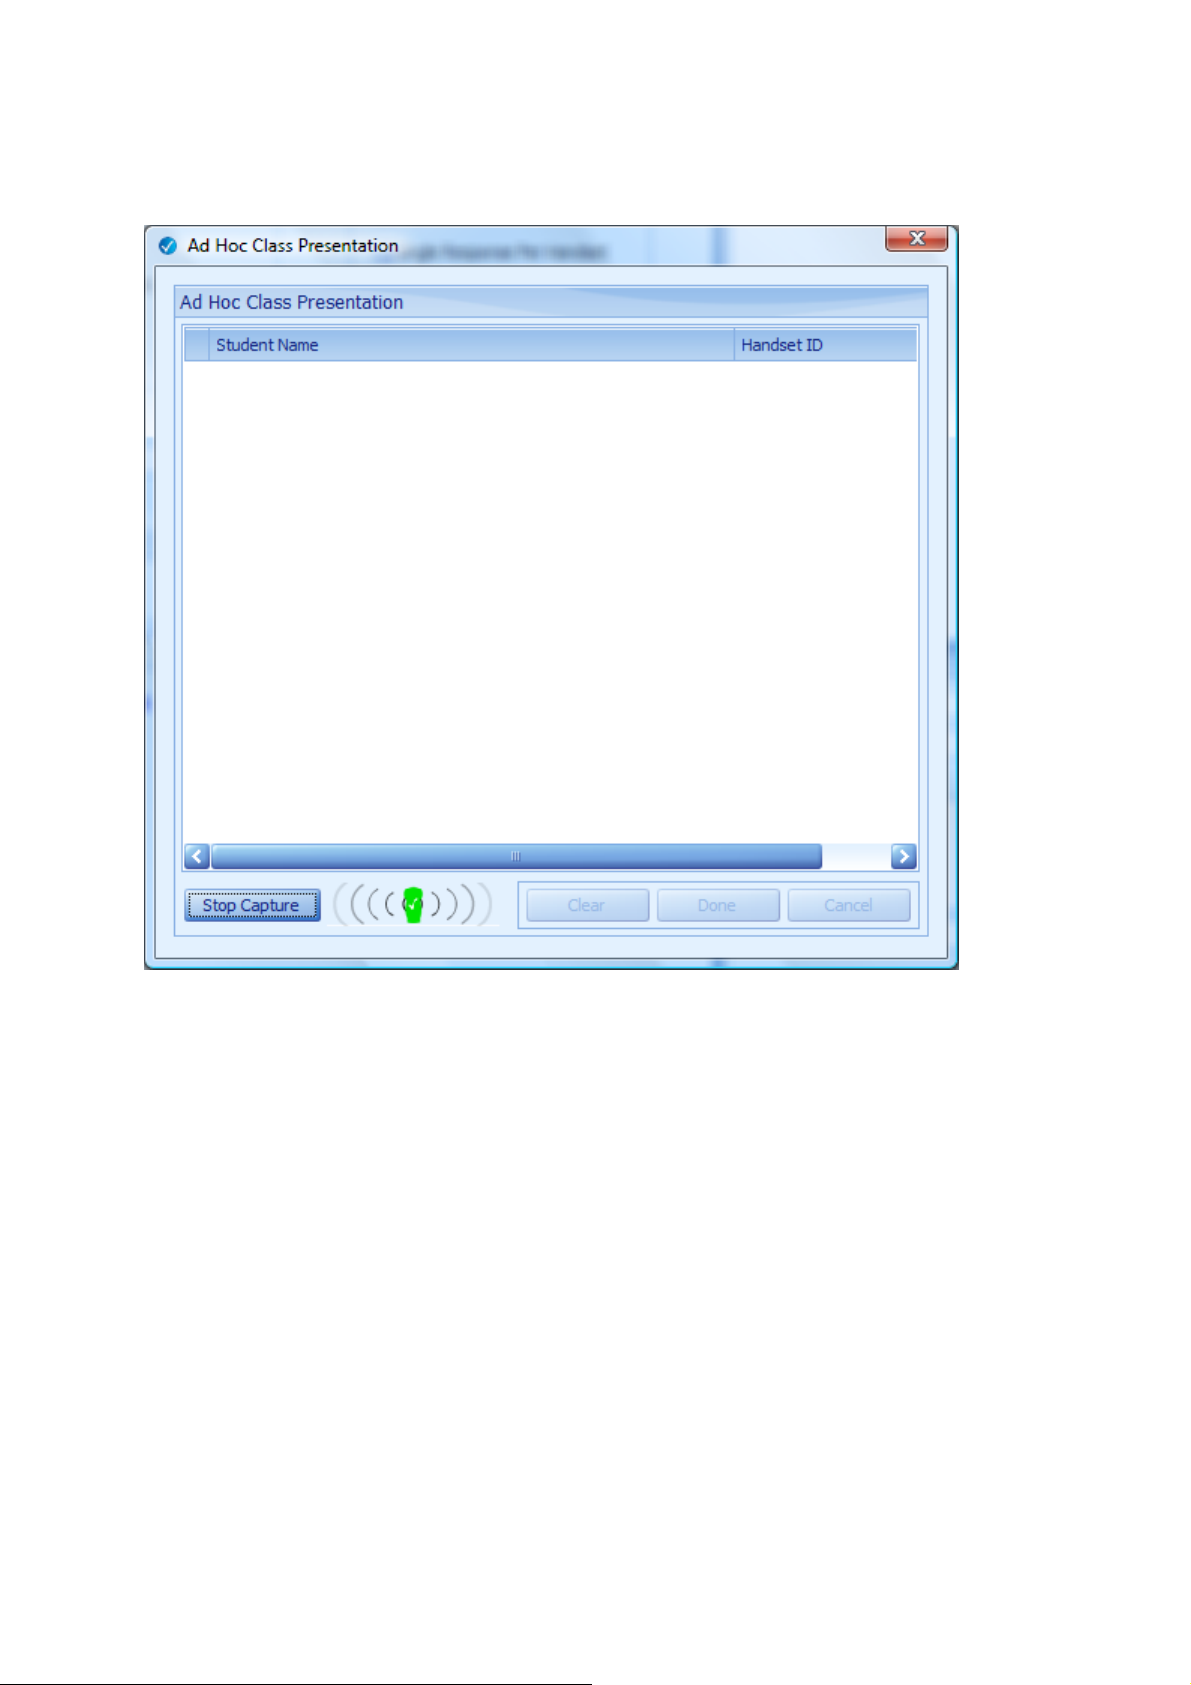
“Capture Names” button sets all active handsets to texting mode. Participants can now text in their
names and press the send button on the handset.
Once, participants have texted in their names, the presenter presses the “Stop Capture” button. The
Clear, Done and Cancel buttons now become active.
21
Page 22
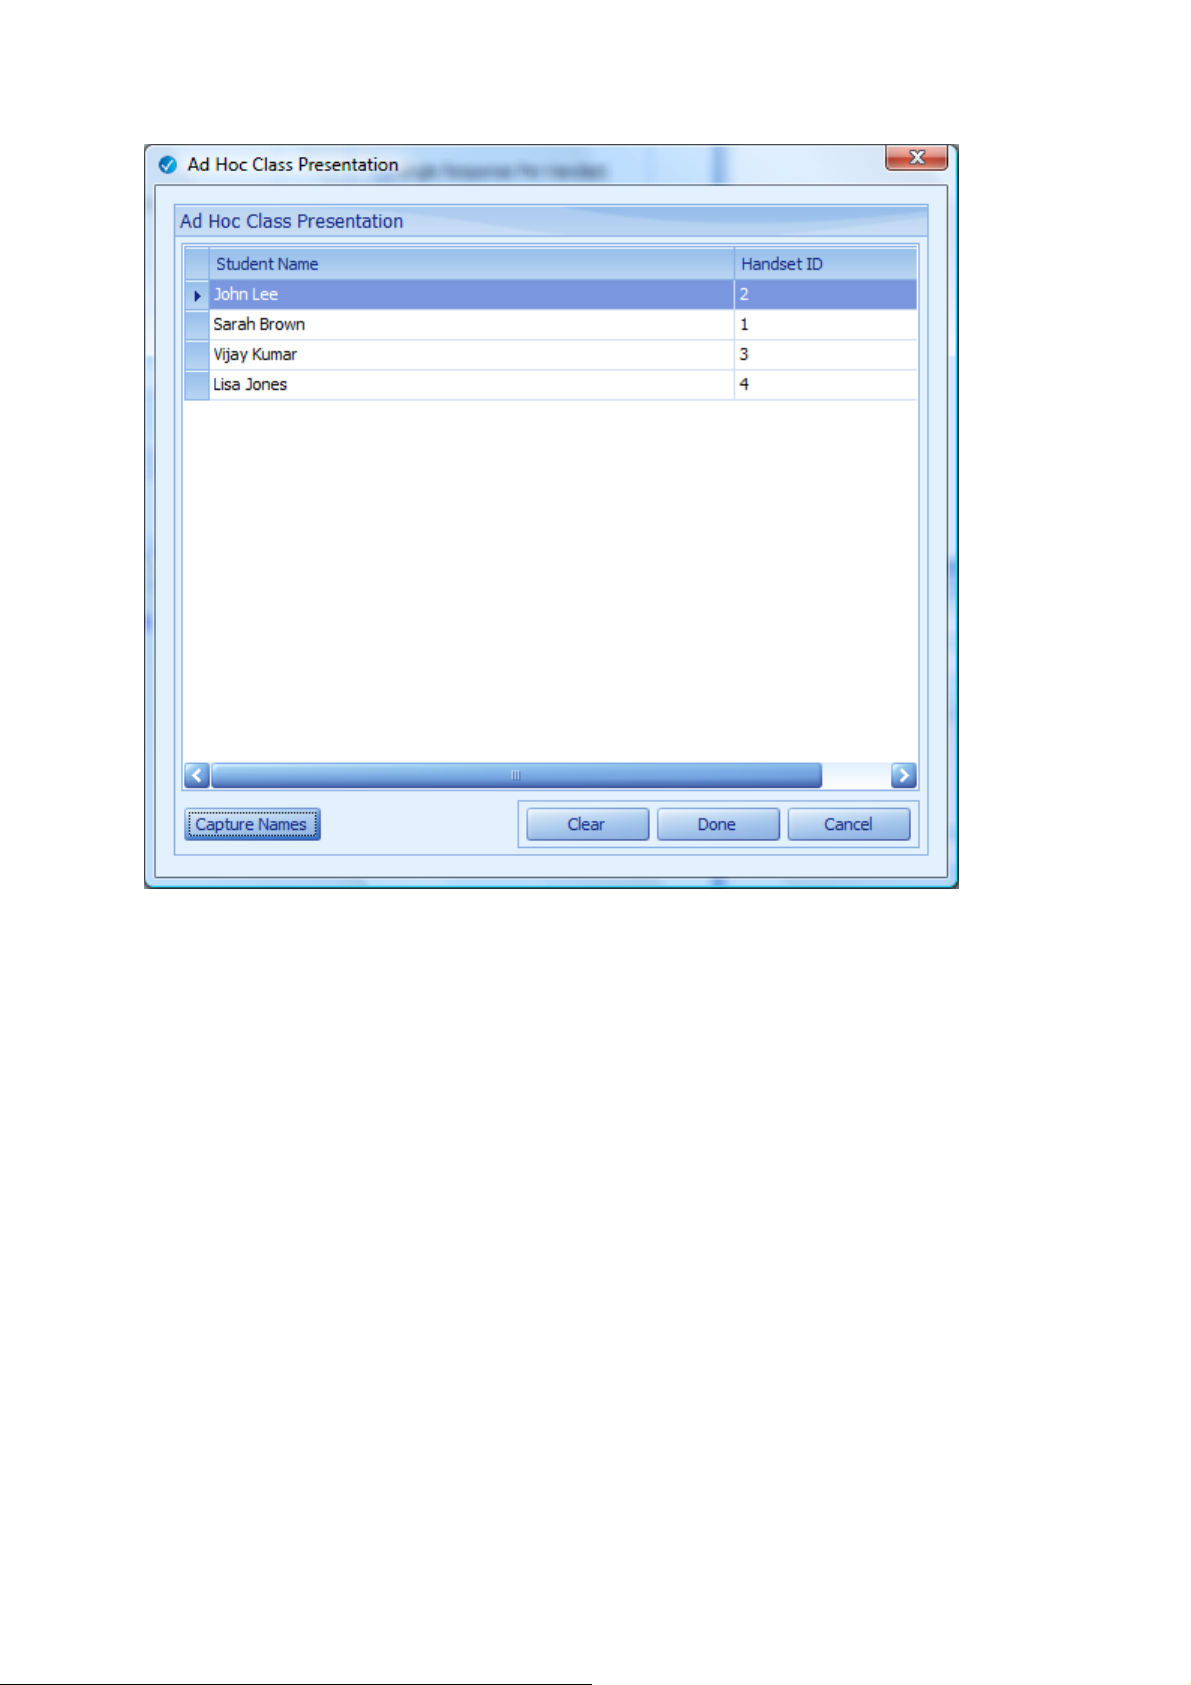
Done - Saves the captured names and populates the Student Register Pane.
Clear – Deletes all captured names and resets Ad-hoc display ready for re-capturing names.
Cancel – Deletes all captured names and returns user to the default Presentation screen.
Once all students’ have texted in their names, clicking the “Done” button will transfer the student
names to the student register as shown in the following screenshot.
22
Page 23
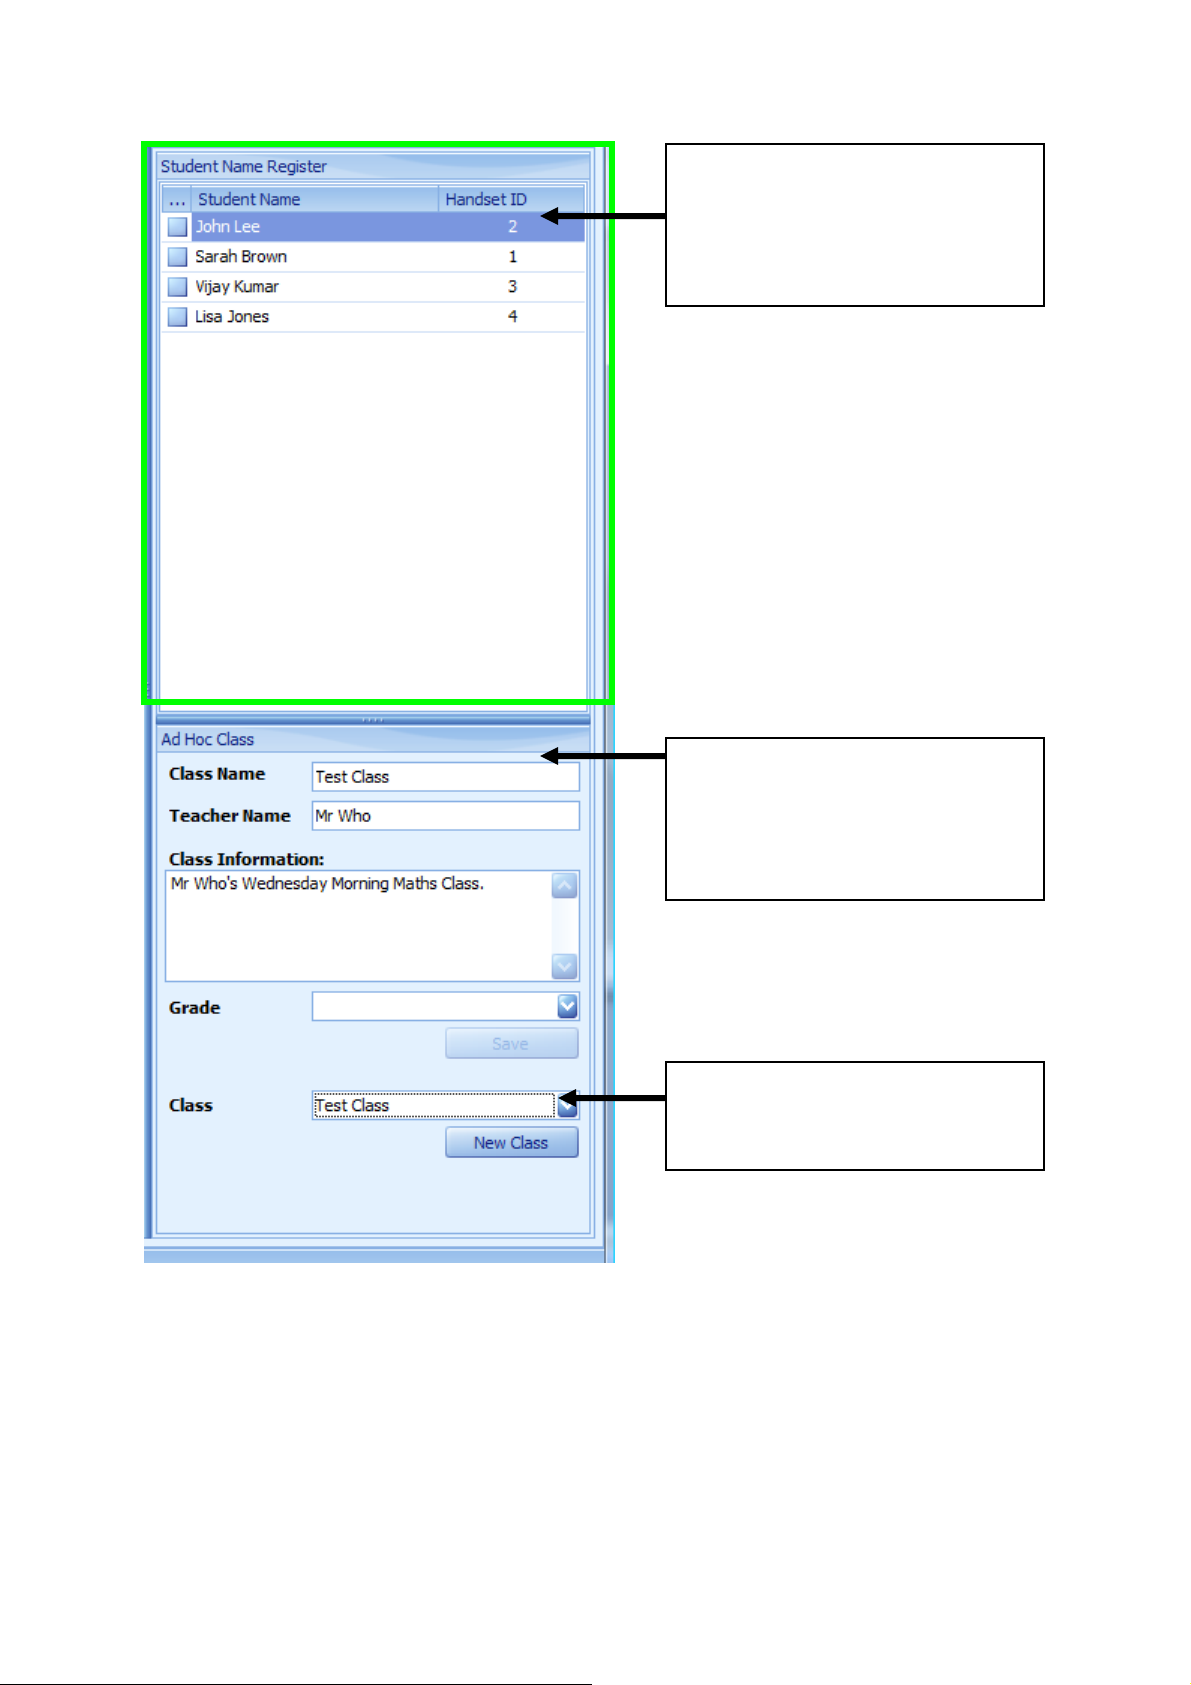
Now that a class has been created, we need to set the presentation mode, communication settings
Student Name Register – Captured
student names are transferred here
and assigned to the relevant Handset
ID
Ad-hoc Class – The Ad hoc class details
must be entered in this section and
saved before the class can be used in a
Presentation.
Class – The Class drop-down box
contains all previously saved Ad-hoc
classes for future use.
and Game and Pace control settings.
23
Page 24

There are four types of presentation mode:
Review Slides – This option allows the teacher/presenter to quickly present an activity that has been
selected from within the Select Activity area of the screen. With the Review slides option selected,
no responses are taken from participant handsets and therefore the communication, game and
handset standby time options are disabled. The Pace Settings of the Review Slides presentation
mode can be customized by the user.
Record Assessment – The Record Assessment presentation mode allows for full interactivity with
participants via the handsets. Reports and charts are created based upon the responses received as
each question has a correct answer and associated mark. The marks are used to create reports and
charts. This mode allows for formative and summative assessment. NOTE – To run Record
Assessment, the PowerPoint activity must be mapped fully with answers to each question. The only
exception to this rule is Likert scale and E-vote which will not have correct answers.
Survey – Survey mode presentations do not require correct answers to be mapped to questions and
are ideally suited to opinion based presentations’. When survey mode is selected, the game option
will be disabled since marks for questions are ignored and the games use marks to determine the
“winner”. Survey mode presentations can be reviewed from within the Reports section using only 4
reports – Class Answer Report A, Class Answer Report B, Student Report B and Question Summary
Report.
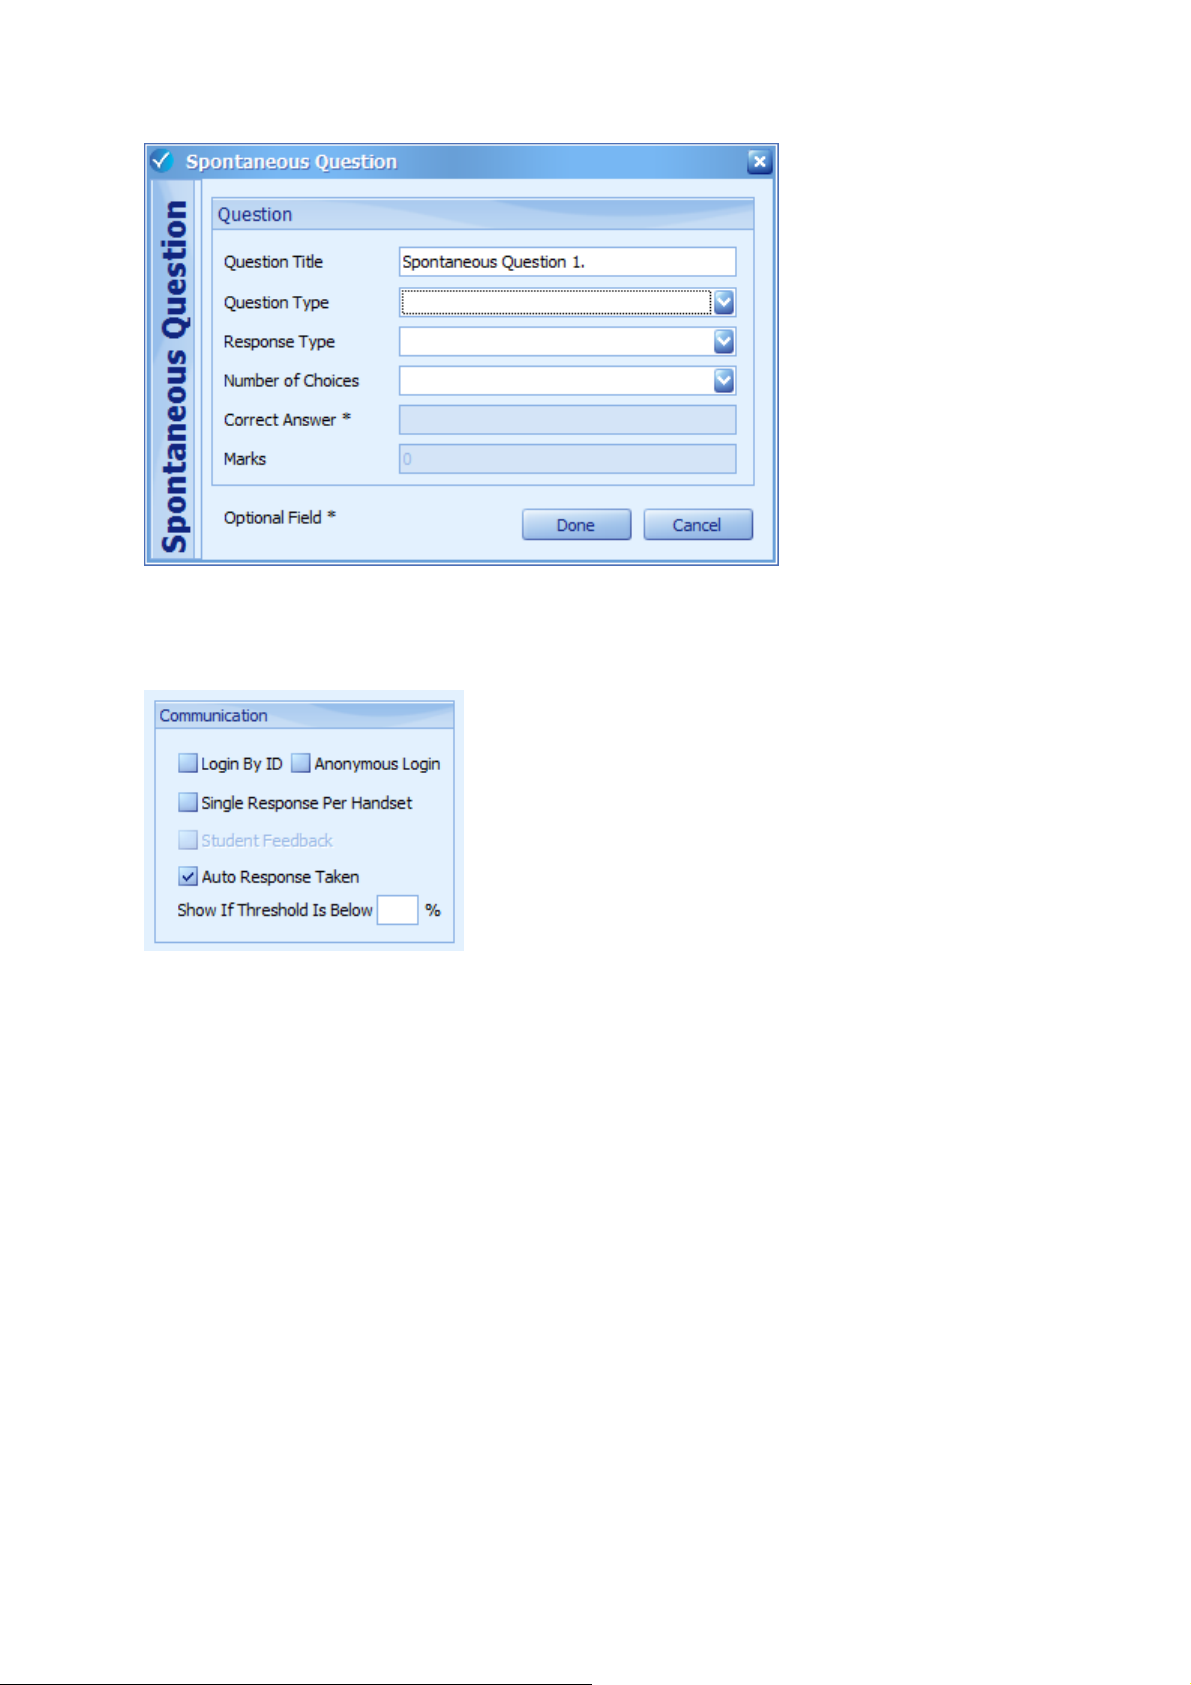
Spontaneous – The Spontaneous Question mode allows presenters to create questions in a few
simple steps and then run the questions. Answers are optional and spontaneous question
reports/charts can be created and saved for analysis. Spontaneous Questions do not have to be
linked to a pre-mapped PowerPoint presentation. The questions can be created “spontaneously”
using an on-screen wizard and run over any open document, web page or resource. (See Screenshot
below for Spontaneous Question Setup Wizard
24
Page 25
After the presentation mode has been set, Communication options need to be set...
Login by ID (Only available for Existing Class Presentation’s): If handset ID’s have not been
specifically assigned to student’s, then all participating students in an existing class with a handset
will have to Login by ID – when this option is selected, after the presenter has set all the
presentation data and clicked the “Present Activity” button, the grid shown below will appear. At
this stage, the participants must type in their Student Number in 5-digit format and press send on
their handsets. The Student Number can be found in the STUDENT area of ClassComm either
through the Master List or by selecting a class.
25
Page 26
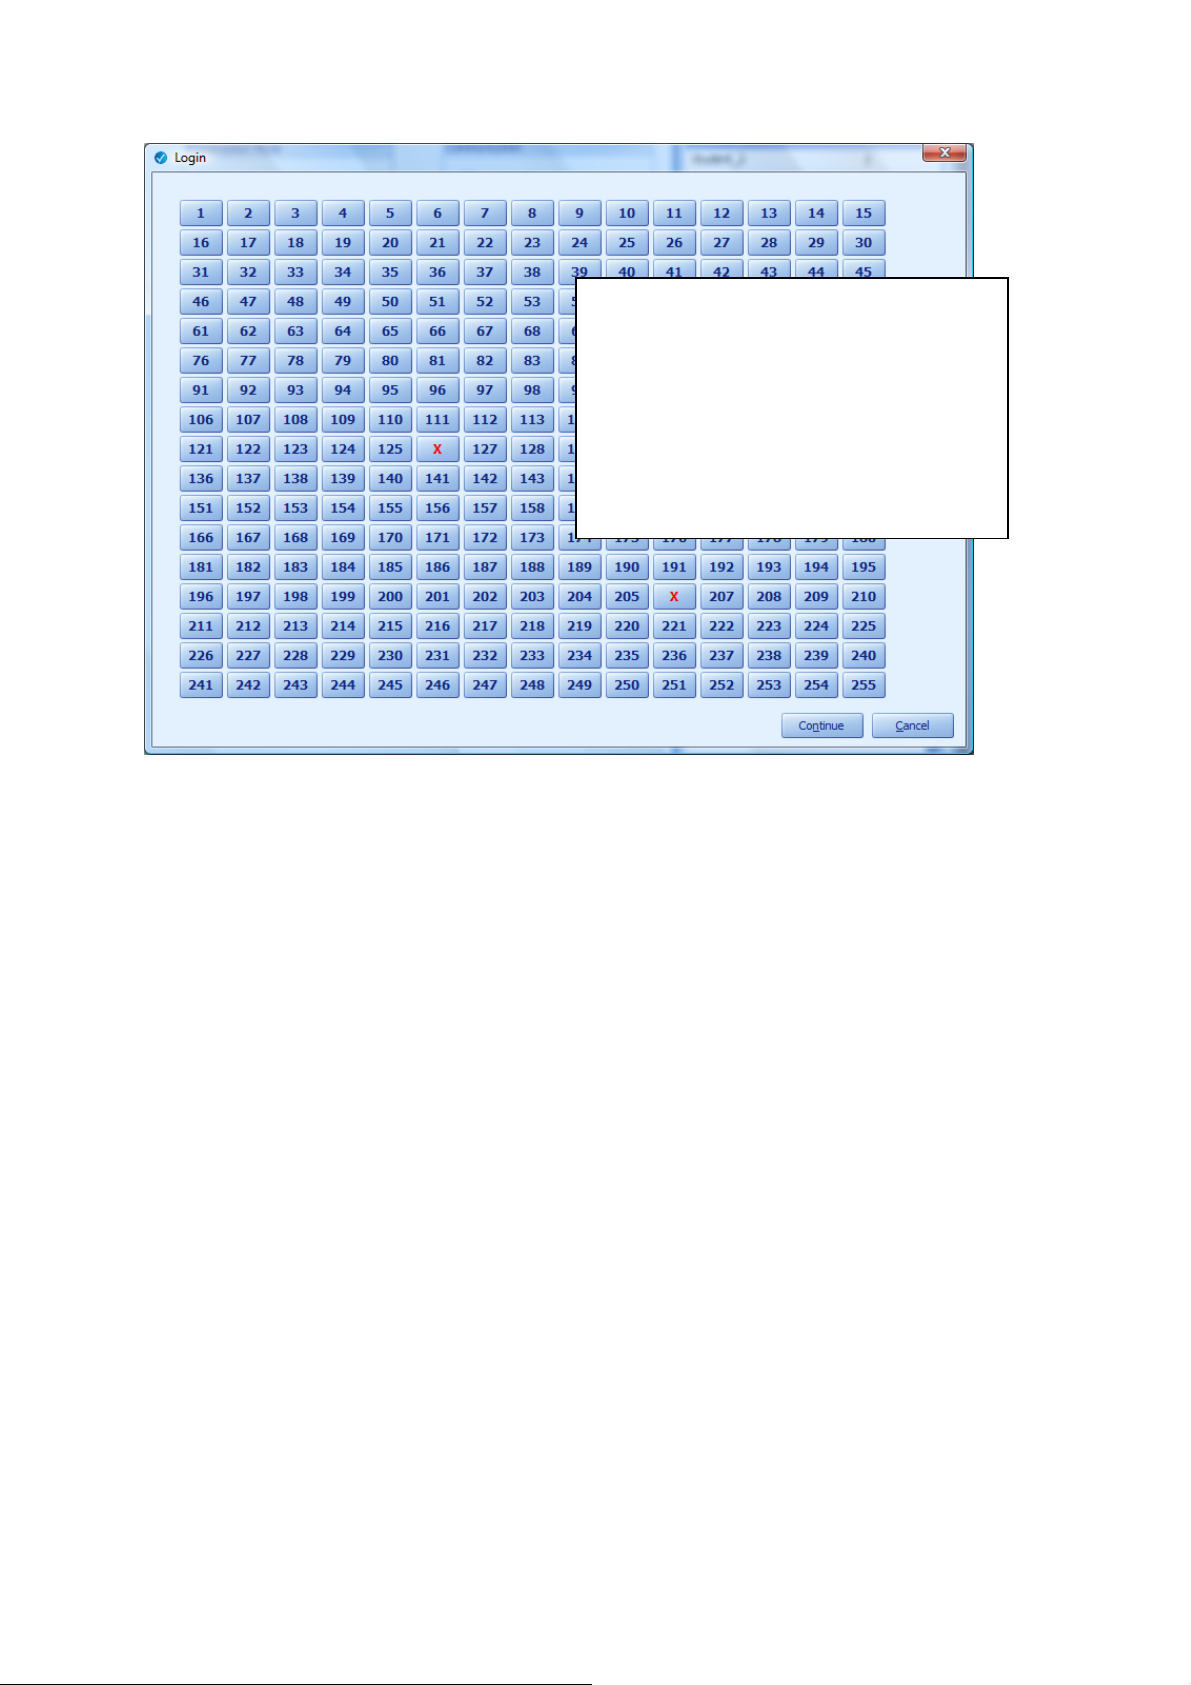
Login by ID – Each participating student will
have to enter their Student Number in 5digit format and press the SEND button on
the handset e.g.
Student No. is 1 = Login ID is 00001
Student No. 12 = Login ID is 00012 etc
Anonymous Login (Option available when Existing Class Presentation is selected): Selecting the
Anonymous Login option allows a presentation to be carried out without using/storing any individual
student data. When Anonymous login is selected, all active handsets i.e. handsets currently
switched on will appear in the Active Handsets pane. Additional handsets can be added or removed
from the presentation at this point by switching them on/off. See the following screenshot for
further details.
26
Page 27
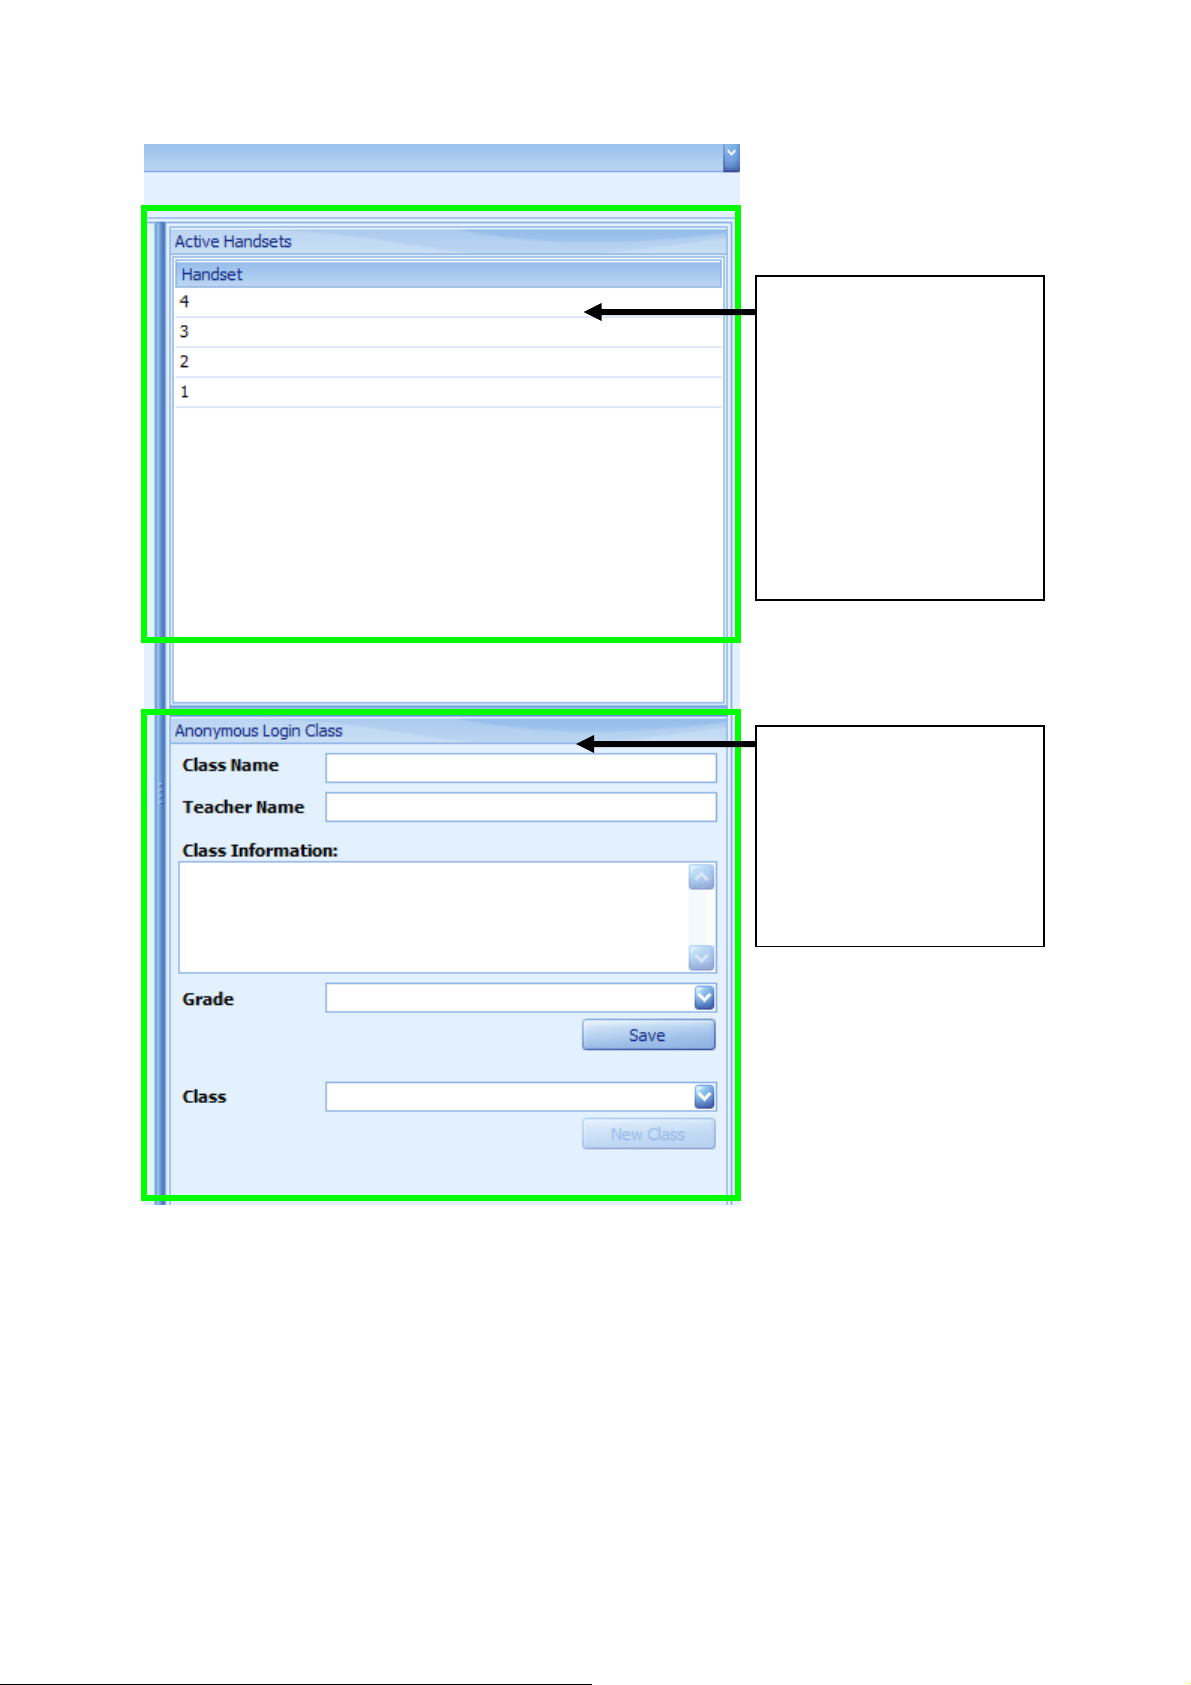
Active Handsets – All
handsets currently switched
on and mapped to the active
receiver will appear here.
The handset ID will be the
only identifier used in the
presentation reports and
charts giving participants
total anonymity.
Anonymous Login Class –
Anonymous Class details
must be entered and saved
here before an activity can
be presented in Anonymous
Login mode.
Single response per Handset: If this communication option is selected only the first response from
the student handset will be accepted.
Student feedback: If this feature is selected the student will get instant feedback on their handset
stating if their response was correct or incorrect.
Show if threshold is below (optional): A notification will appear during the running of a presentation
if the percentage of correct responses received falls below the threshold set here.
27
Page 28
Auto Response Taken: If selected, this option automatically starts the recording of student
responses as each slide in a presentation is displayed. If this option is de-selected, the presenter has
to manually “play” each slide before student responses from the handset’s are accepted.
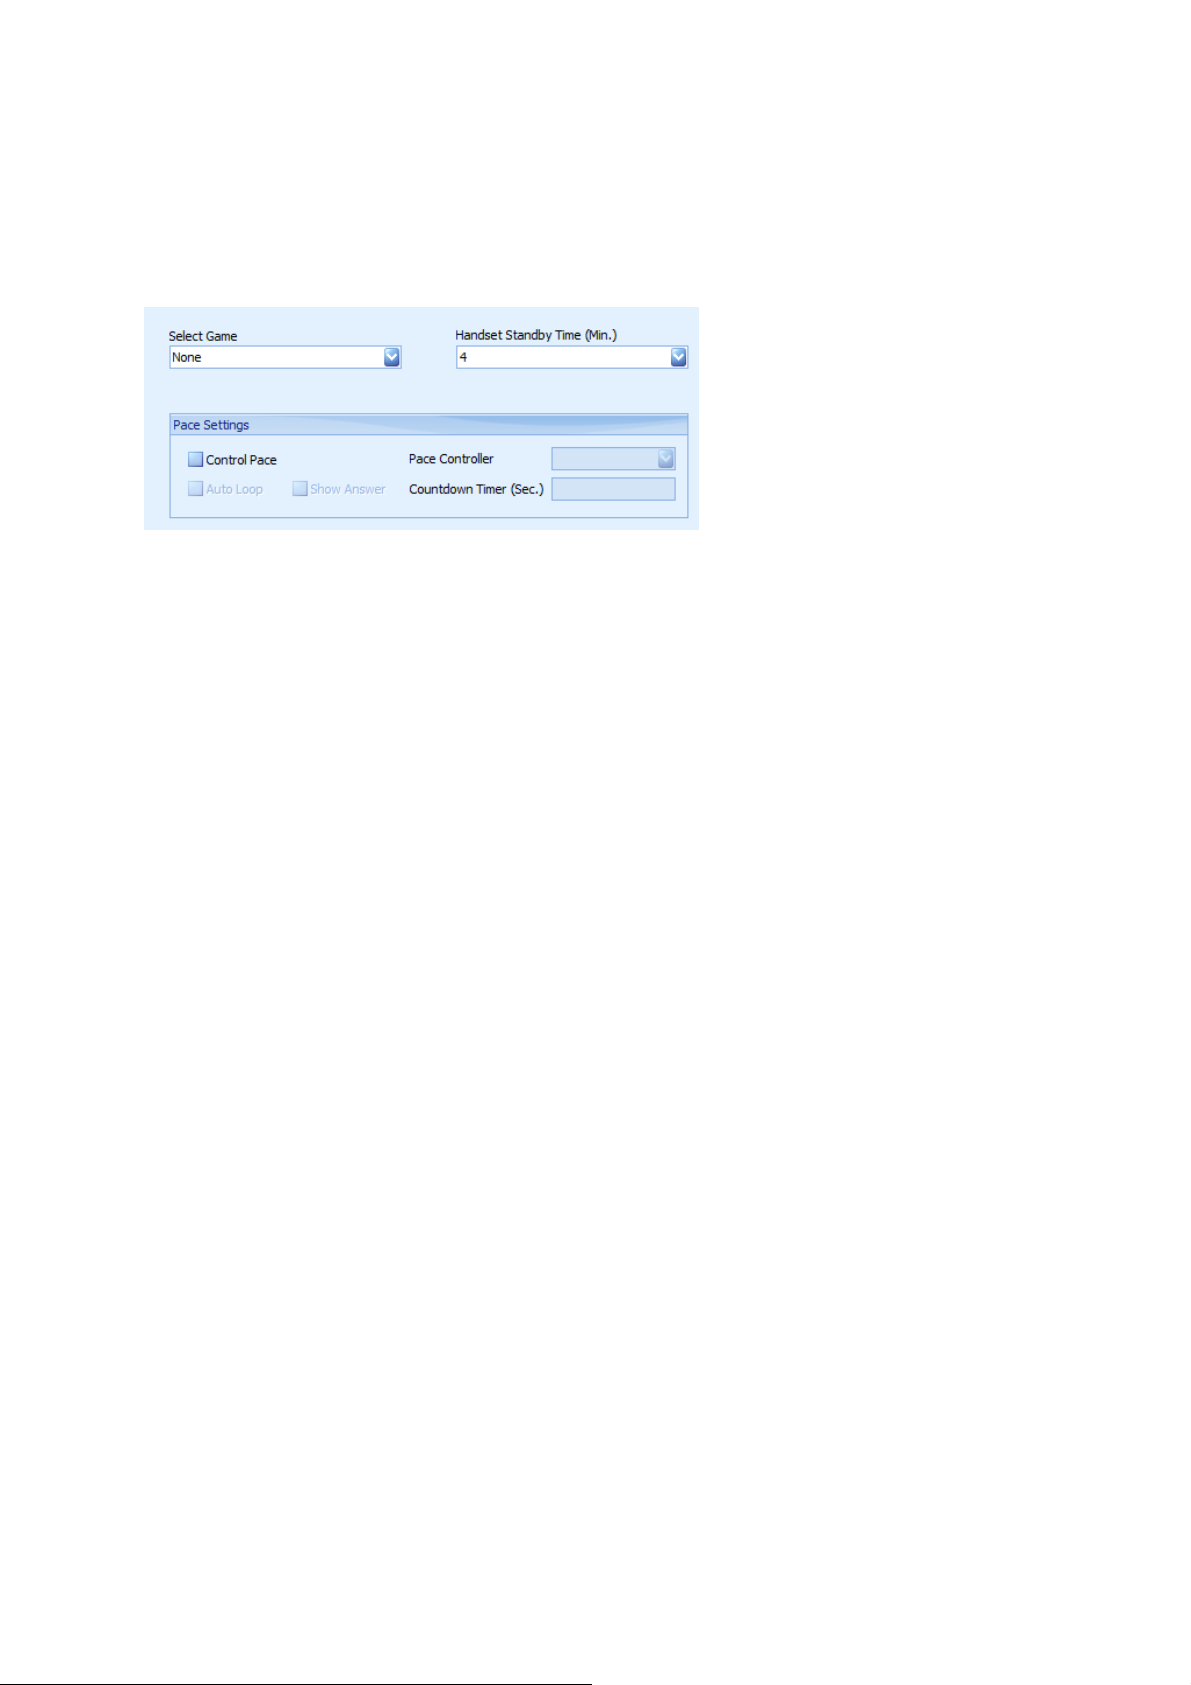
Game and Pace settings
Select Game: The presenter can include a game in the activity they are about to present by selecting
one from the drop down list. The student with the most correct answers and fastest responses will
win the game. The Games option is only available in Record Assessment Mode for Existing Class and
Ad Hoc Class Presentations. NOTE: ClassComm 5 introduces 2 new group based games – Hockey
and Cricket. These require a specific setup to play. See the Advanced functionality – Hockey and
Cricket games setup section towards the end of this guide for further details.
Handset standby time (Min.): The time selected here determines how long in minutes the handsets
will remain powered on without use before powering down to standby mode. If the handset does go
into standby mode during a presentation, it will retain its last setting when switched on again so that
the participant can continue to send responses in sync with the Presentation question.
Pace controller Options:
Countdown timer (sec.): This option allows the presenter to set the time in seconds that a slide will
be shown. For example, if the countdown timer option is selected and the time is set to 20 seconds,
each slide in the presentation will remain on display for 20 seconds before moving sequentially to
the next slide and so on.
Per question: This option can be used by the presenter when the activity to be presented has had
the RESPONSE TIME set during the mapping of the presentation. Without Response Times being
mapped into the presentation, this feature will not function.
Auto loop: Note: Available only for Review Slides Presentation Mode. Selecting this option will
repeat the presentation after the last slide has shown.
Show Answer: This functionality is used for displaying the answer. When this option is used in
combination with the Countdown timer, the time specified within the timer will determine both how
long the slide is displayed AND how long the answer will remain on view. For example, if the
presenter runs a presentation with the countdown timer set to 10 seconds, then the slide will
display for 10 seconds followed by the correct answer on screen for a further 10 seconds. Similarly,
with show answer selected in combination with the Per question option (in Pace Controller), the
28
Page 29
slides’ mapped response time will dictate how long the slide followed by the answer is displayed on
screen.
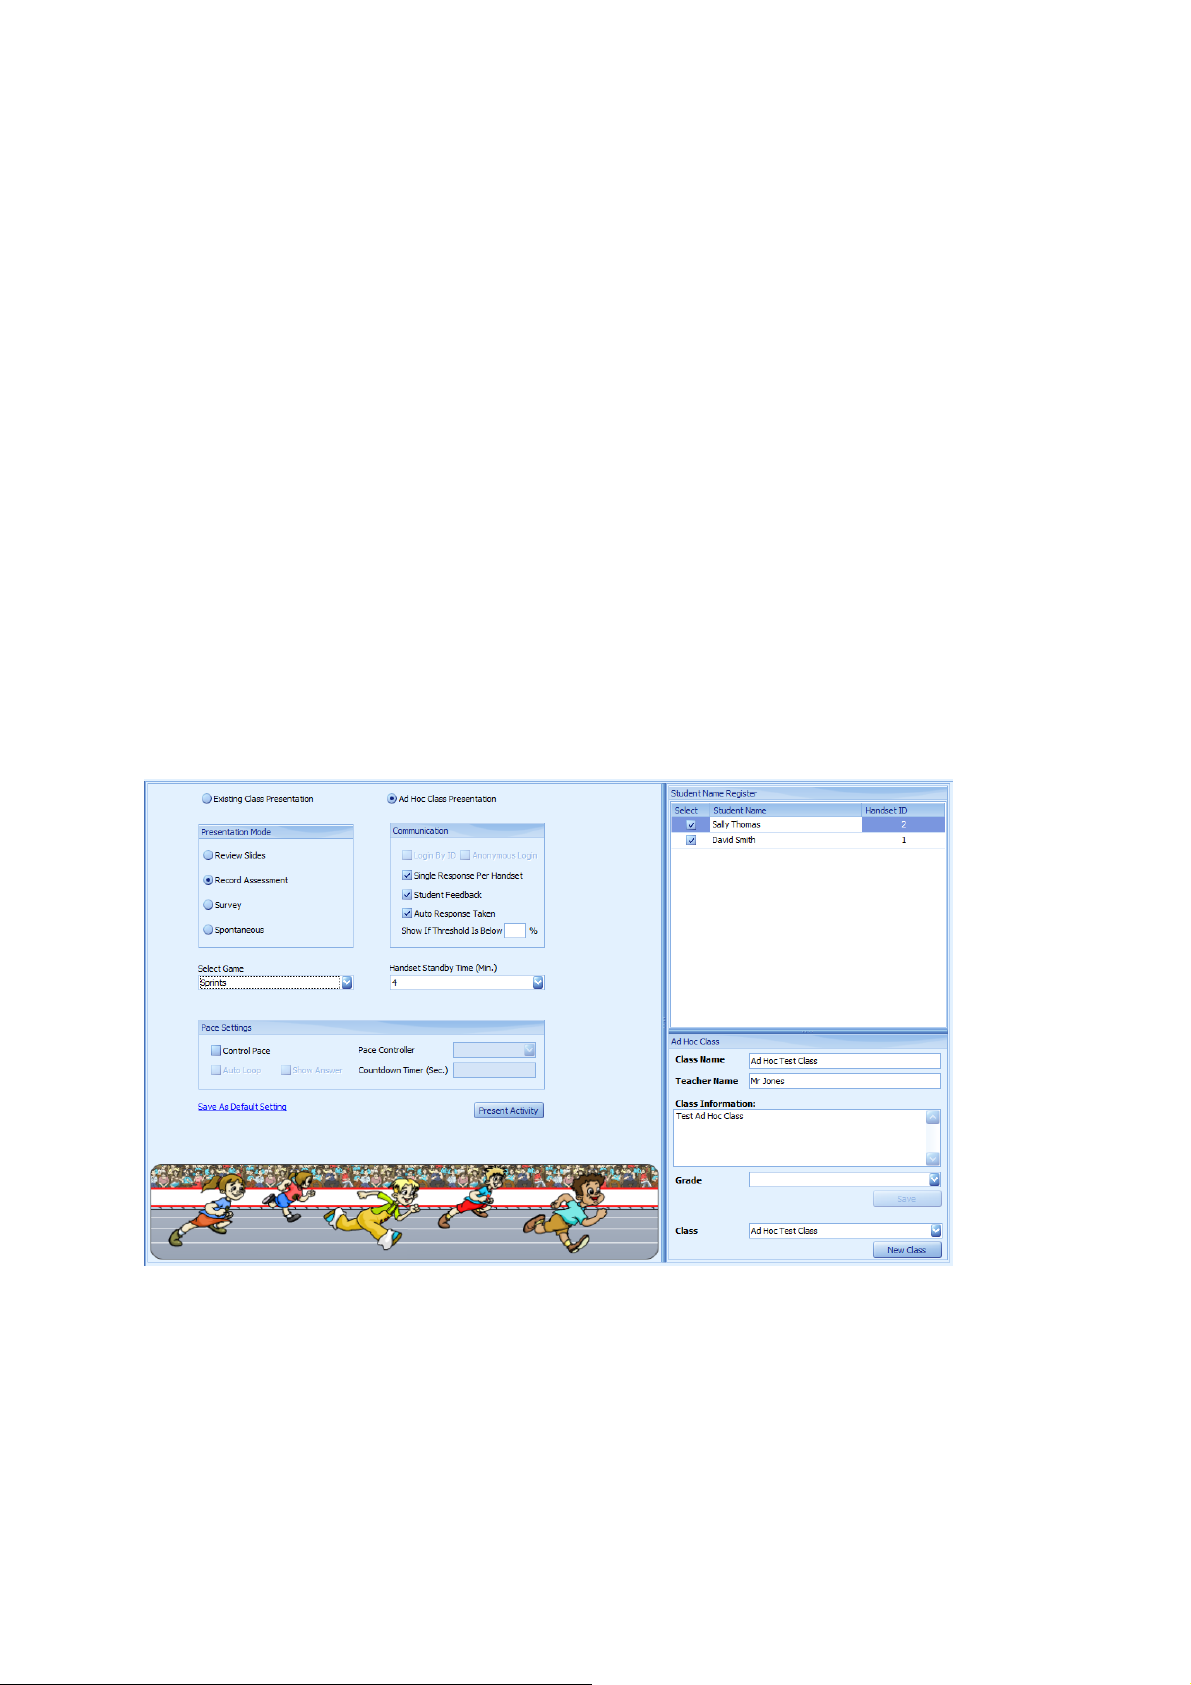
Phase 5 – Running a Presentation
At this stage, we have installed the software, tested the hardware communication, mapped a
PowerPoint presentation and covered the various Presentation options. This section will cover
running the presentation. The Presentation/Class settings for the following section are:
Ad Hoc Class called “Test Ad Hoc Class” with 2 students called David Smith and Sally Thomas.
Class teacher is Mr Jones.
Record Assessment Presentation Mode
Auto Response Taken, Student Feedback and Single Response per Handset Communication
options all selected.
Sprints Game Selected
Handset Standby Time = 4 minutes (default setting)
Pace Settings all de-selected.
The Presentation area will look as follows when the above settings have been input into
ClassComm...
From within the Presentation area of ClassComm, select the Key stage 1 > Geography activity
(Available in ClassComm 4.0.0 and above as sample content) from the Select Activity pane on the left
side of the ClassComm Interface. Click it once to highlight it and now click the “Present Activity”
button.
ClassComm will minimize and the selected activity will open in PowerPoint slideshow mode with 2
floating toolbars on display as shown in the following image:
29
Page 30
1 - Presentation Toolbar – This is used to control the presentation, view/hide answers, show charts
Response Bar
Presentation
Toolbar
and so on. All the features on this tool bar can be controlled via the TEACHER HANDSET. Below are
two images of the presentation tool bar – on the left is the initial state of the toolbar when it is in
recording mode – at this point, the participant’s are able to respond via the handsets and the
response bar cells will light up orange to indicate that a valid response has been recorded. It is
important to note that the 5th button down on the presentation toolbar is a RED STOP button. This
indicates that the software is in recording mode (i.e. ready to accept handset responses). If it is a
GREEN PLAY button, no responses’ will be taken until it is pressed – The green play button will only
be available when the “Auto Response Taken” option is de-selected in the Presentation settings area
prior to running the activity.
Note that in Information type slides, only the “Next” button is available as no responses are
expected from Information questions.
30
Page 31

True – Start recording of
handset responses
False – Stop Recording of
handset responses
Del – End Presentation
? – Show/Hide Answer
Bar Chart – Show Results
charts
1, 2, and 3 – decrease
opacity/full opacity/increase
opacity of the Response Bar
4 – Show/hide the
Presentation Toolbar
5 -Toggle Response Bar Format
between standard cell view
and percentage bar view.
6 – Replay the question
7 and 9 – Navigate Slides
8 – Play Game
. And / - Navigate the Chart
views
0 – Pick Functionality
PICK STUDENT
VIEW RESULTS SUMMARY CHARTS
REPLAY QUESTION
VIEW GAME IF SELECTED
VIEW REGISTER
START/STOP TAKING RESPONSES
SHOW/HIDE ANSWERS
NAVIGATE SLIDES
END PRESENTATION
INSERT NEW SPONTANEOUS QUESTION
The teacher handset contains all the functionality of the Presentation toolbar barring adding a new
spontaneous question. Here is a listing of the teacher handset (Genee Pad in this example)
functionality and its associated key.
31
Page 32

Question Type
Response’
Received
Toggle Student
Name/Handset ID
view.
Question No.
Response
Type
Active
Handsets
Cells light up when a valid response is
sent. Click on individual cells to view
responses.
The response bar gives the presenter a snapshot of the responses received from the handset. It can
be manually re-sized and also docked to different sides of the screen by dragging it to the edges of
the screen. Pressing the “5” key on the teacher handset changes the response bar view to
percentage of responses received.
Percentage Response Bar view
During a presentation, the receiver will send a signal to the student handsets’ setting them to the
correct mode to match the question mapping. The mode of the student handset can give certain
keys on the handset additional functionality.
True/False and Yes/No Questions: Simply Press the green True/Yes key or the false/No key to send
the response. No need to press the Send key.
Multiple Choice – Press the relevant key on the handset and the response will be sent immediately.
Multiple Mark – Requires the Send button to be pressed after entering the answer as more than 1
keystroke will make up the answer.
Sequence - Requires the Send button to be pressed after entering the answer as more than 1
keystroke will make up the answer.
32
Page 33

Numeric - Requires the Send button to be pressed after entering the answer as more than 1
/ key + - * / = < >
. key @ ( ) [ ] { } £ $ € α #
1/A key . , ; 1 : ‘ “ ? ! \ _ |
Delta key Toggle
Uppercase/Lowercase
? key Clear screen – works in
all question modes
del key Clear individual
characters
keystroke may make up the answer.
Likert Scale – Single key press will send the response as the answer will be a single number/letter.
Send key press not required. However, if Text(essay) option is selected under Likert Scale, then
handset will be in text mode and send key press will be required after answer is input.
E-Vote – Only Yes, No or Abstain (send key on older handsets will send the abstain response).
Text – Will require the Send key to be pressed after entering the answer. Note that when in Text
mode the following keys carry additional functionality/symbols:
Embed Instant Feedback Charts
It is possible to embed the results and/or charts for each slide/question during a presentation. To do
this a chart object must be added to the slide before running the presentation using the PowerPoint
Plug-in. Here are the steps to follow.
- Open the PowerPoint activity and select the “ADD CHART” option from the slide mapper.
- Position the chart container on the slide as required. This can be re-positioned and re-sized
after the presentation has been completed and saved. Do this for all slides in the
presentation to which you may wish to embed charts and/or results. Save the Presentation.
33
Page 34

- Add the mapped activity into ClassComm (See Phase 2 of this guide for information on how
to do this).
- Run the presentation and after responses have been taken and the question stopped, press
the graph button from the teacher handset or the presentations toolbar. Notice that an
“Embed Chart” button has become enabled (See image below).
- Select the chart or results grid that you wish to add to the slide and click “Embed Chart”.
The selected chart or grid will drop into the previously mapped chart container.
- When the presentation is completed, a Save As window will appear. Name and save the
presentation. This will not affect the original, mapped PowerPoint Activity in ClassComm. It
will save as a separate PowerPoint (ppt) file that can be opened and reviewed with the
embedded charts.
After a presentation has been completed, saving the presentation will close the PowerPoint
slideshow view and the ClassComm software interface will re-open.
34
Page 35

Phase 6 – Viewing Reports and Charts in ClassComm
Select the Report Appearance and Colour schemes.
A preview will be displayed. Click the “Apply Report
Format Changes” button to save the changes.
Charts and Reports are generated when a RECORD ASSESSMENT presentation has been saved. In
ClassComm 4.0.0 and above, reports and charts are also saved with SURVEY mode presentations.
However, when running survey mode note that only 4 of the 6 available reports will be viewable:
Class Answer Report A
Class Answer Report B
Student Report B
Question Summary Report
To view reports, go to the REPORTS section of ClassComm. On the left-hand side of the interface is
the report settings panel – see following image.
Also, the default report appearance can be changed by the user by opening Settings > Report
Appearance:
35
Page 36

REPORT SETTINGS
From the report settings panel, you can
select the presentation and report type for
any saved record assessment presentations.
1 – “Report For” area - From here select
whether the report you wish to view is from
a Standard (existing class) presentation, Ad
Hoc class presentation or Anonymous Class
Presentation. Under each of these class
types, it is possible to perform a
spontaneous presentation. If it is a
spontaneous presentation you wish to view,
select the Class type from standard, Ad hoc,
anonymous and then check the spontaneous
box as well.
2 – “Select Report Type” – Currently
ClassComm offers 6 Reports as shown.
Simply check the option for the report you
wish to view.
3 – “Report Settings” - Select the Class,
Teacher and Test from the drop-down
boxes. The Student option is only available
when the report selected is either Student
Report A or Student Report B as these are
individual student reports.
4 – Once the above options have been
selected, click “Generate Report” to view the
report.
The report will open in the right-hand pane
of the interface. Note that all of the reports
can be exported into one or more of the
following formats by clicking the downarrow on this icon:
Export formats:
PDF
HTML
MHT
RTF
Excel
CSV
Text
36
Page 37

CHART SETTINGS
From the chart settings panel, you can select
the presentation and report type for any
saved record assessment presentations.
1 – “Chart For” From here select whether
the chart you wish to view is from a
Standard (existing class) presentation, Ad
Hoc class presentation or Anonymous Class
Presentation. Under each of these class
types, it is possible to perform a
spontaneous presentation. If it is a
spontaneous presentation chart you wish to
view, select the Class type from standard, Ad
hoc, anonymous and then check the
spontaneous box as well.
2 – “Chart Type” – Currently ClassComm
offers 5 charts as shown. Simply check the
option for the chart you wish to view.
3 – “Chart Settings” - Firstly select either a
Class Chart or Student Chart. Then select
the Class, Teacher and Test from the dropdown boxes. .
4 – Once the above options have been
selected, click “Show Chart” to view the
chart.
The colour schemes used in the charts can be changed by right-clicking on a generated chart and
selecting Chart settings:
37
Page 38

Select
Colours as
required
Select Styles
as required
Click Finish to apply
the new chart
settings
38
Page 39

Advanced Features
1.0 ClassComm Application Preferences
2.0 Create and Run Custom Tests
2.0 Creating Groups
3.0 Text and Drop
4.0 Personalised Learning Tests
5.0 ClassComm Corporate Mode – Interface Editor
6.0 Multiple Receiver Setup
7.0 Pebble Pad 5g hardware
39
Page 40

ClassComm
Application Preferences
Revision 1.00
40
Page 41

ClassComm Application Preferences
Presentation options
can be set from this
tab.
Language
Selection
Multiple
Receiver Setup
Options
Virtual G-Pad
Summary
Charts options
1 2 4 3 5 6 7 8 9
The Application preferences allow for the customisation of many powerful features and settings
within ClassComm. To open the preferences window, go to Settings > Application Preferences. The
following window will open:
41
Page 42

1. The Synchronize with PowerPoint slides feature gives you two options whilst presenting a
Insert new
Spontaneous
Question
End
presentation
Instant
Charts/Graphs
Next
Question
Question
No.
Response
Received Counter
Replay
Question
Previous
Question
Compact
Toolbar
Opacity Slider
powerpoint activity/test through ClassComm:
Block Navigation in PowerPoint – Selecting this option will ensure that the slide does not
advance when there is a mouse-click on during the slideshow. The slide will only
advance when the “Next” button is pressed on the teacher handset or presentation
toolbar. This option is useful when you use “on-click” animations within your
PowerPoint activity.
Synchronize ClassComm as per PowerPoint slides – Selecting this option will ensure that
ClassComm and the PowerPoint presentation always remain synchronized both when
clicking on the actual powerpoint slide to advance or using the teacher
handset/presentation toolbar navigation.
2. If you have mapped chart containers into your PowerPoint Activity and you proceed to
embed charts during the live presentation, this option allows you to set the default path
where the review PowerPoint file will be saved to. This will not affect your original, mapped
PowerPoint file in the ClassComm Resources area.
3. The Automatically embed chart into PowerPoint presentation option, will auto-embed the
selected chart into a PowerPoint slide wherever a chart container has been mapped.
4. The Compact Toolbar can be used in place of both the response bar and presentation
toolbar during a ClassComm presentation. It uses much less screen space and is therefore
less intrusive:
5. The Position of the Countdown timer during a live presentation can be set using this option.
6. The Auto-run activity allows the presenter to start an activity and the presentation will then
continue automatically with no further teacher intervention. To use this feature, you must
enable the countdown timer from within the presentation area to inform users how long
they have to answer the question. Set the question interval as required (this will be the
pause length between questions).
42
Page 43

7. The E-vote type compatible handset option should be checked if your handsets state “Yes”
Select the
ClassComm
interface language
and restart the
application for the
changes to take
effect.
“No” and “abs” on the true, false and send buttons respectively. Contact
technical@geneeworld.com if you require further information.
8. The Present Questions in Random order option will change the sequence of the presented
questions each time the presentation is run.
9. Check the Use Virtual G-Pads option if you purchased this system for use ClassComm.
Contact technical@geneeworld.com if you require further information.
Application preferences – Languages:
43
Page 44

Application preferences – Communication:
The multiple receiver option is an advanced functionality that allows for up to 4
receivers to be connected allowing up to 1000 handsets to be used on a single
PC. Please contact technical@geneeworld.com for further details on this
feature.
44
Page 45

Application preferences – Virtual G-Pad:
If you are using the Virtual G-Pad system with ClassComm, you have an option
to turn on/off certain summary charts/tables that are viewable to the students
upon completion of a presentation activity. The Group Results shows all
students and their % score. The Ranking chart shows the top 5 performers in a
bar chart.
Please contact technical@geneeworld.com for further details on this feature.
45
Page 46

Create and Run
Custom Tests
Revision 1.00
46
Page 47

Custom Tests
Custom Tests are a powerful feature that allows users to work with ANY file. The process involves
creating a mapping file within ClassComm. This file can then be presented over any desktop
application, file, web page and so on.
1.1 Create a Custom Test
Go to File > New > New Activity > Custom Test.
Enter a Test Name.
Browse to the Source File (optional step).
Map the Test (See 1.2. Mapping a Custom Test below)
Click the Save button
1.2 Mapping a Custom Test
The mapping of a custom test uses the same principle as mapping a PowerPoint resource within the
Map Activity window (see pages 6-8)
47
Page 48

1 2 4 3 5 6 8
7
1 – The Question No. Field is an auto-number field. No data entry required.
2 - Enter the Question data.
3 – Select the type of question from the options available in the drop-down list. [See page 6 for
question type description]
4 – Enter Response Type (for multiple choice, multiple mark, sequence and likert scale question
types only)
5 – Enter the No. of Choices if relevant to Question Type selected (i.e. multiple choice, multiple
mark, sequence and likert scale only)
6 – Enter the Correct Answer to the question (with the exception of Likert scale and e-vote questions
which have no right or wrong answer).
7 – Assign a marks value to the question.
8 – Delete the question.
Repeat the above steps as is necessary to add further questions to the test. The questions can be rearranged using the green up and down arrows to the right of the question mapping area. Once all
test questions have been entered, SAVE the test.
Once a test has been saved, pressing the EDIT button will allow you to add/modify/delete questions
from the custom test. There is also an option to hide the answer field from view if required whilst
navigating the ClassComm application. [See image below]
48
Page 49

1.3 – Running a Custom Test
Custom Test Resource
has a green tick when
mapped correctly (Red
cross when mapping is
incomplete)
Once a Custom test has been created, mapped and saved, it can be run from within the Presentation
section of ClassComm in much the same way as running a standard PowerPoint resource.
49
Page 50

To run a custom test, select it from the Select Activity window on the left and then enter the
Presentation settings as required. [See Phase 4 – Presentation/Class Settings in ClassComm of this
guide]
Once all presentation settings have been set, click the Present Activity button. ClassComm will
minimise and the presentation toolbar and response bar will appear over the desktop. Open the file
to which the custom test has been mapped and then run the presentation [See Phase 5 – Running a
Presentation for further details]
After completing and saving the custom test activity, ClassComm will re-open and the results will be
viewable in the reports/charts section of ClassComm.
50
Page 51

Group/Team
Allocation
Revision 1.01
51
Page 52

Group/Team Allocation
In ClassComm, classes of student’s can be split into groups (teams in corporate mode). Each
participant will take part in the activity and the reports/charts can then be viewed on an individual
basis or group view. When creating groups/teams, it is important to note the following:
Groups can be allocated to Existing Classes and Ad Hoc classes only
The Classes must be created before group allocation can occur
1.0 – Creating groups/teams
From within the Student or presentation, go to Data > Group (Data > Team in corporate mode)
This will open the Group allocation window as shown in the following image. From this window,
groups can be created and students can be allocated to the groups. Note that there are 4 preexisting groups by default: Male, Female, Odd and Even. Male and Female will work with existing
classes where gender has been assigned to the students. Odd and Even is based upon the handset
ID’s assigned to student’s. The steps to create custom groups are as follows:
1. Enter the Group names and click Add. Repeat as is necessary. For example you may wish to
create Team 1, Team 2, and Team 3 and so on. As you add the new groups, the will appear
in the “Select Group” area.
2. Select whether you are using “Standard Class” or “Ad Hoc Class” from the radio buttons.
3. Select the class from the “Select Class” Drop down menu options.
4. Select the Type of group to be created.
5. Check the group check boxes that you want to split the class into.
6. Click the create button to automatically create the groups.
7. After creating the groups, they can be manually modified in the main Groups window by
clicking on the “+” symbol and then drag and dropping individual participant’s as required.
8. Click “Save” to save the group allocations. A message stating “Group Allocated Successfully”
will appear. Click OK on the message and “Close” to exit group allocation window.
52
Page 53

9. To present with the groups, enter the Presentation area of ClassComm and select the
“Present With Group” option under the student register.
10. Once the presentation has been completed, enter the charts/reports area to review the
presentation on a group basis or individual basis by toggling the “Group View” check box.
[Group Allocation Window – Default View]
53
Page 54

[Group Allocation Window – In the above scenario, 3 additional groups have been created and
selected – Team1, Team2 and Team3. After creating the teams, select them and click the CREATE
button to split the selected class into the selected groups/teams]
54
Page 55

[Group Allocation Window –Click on the “+” symbol next to each team to view the team members.
Individuals can be re-arranged by drag and drop method as required.]
[Group Allocated Successfully message – Once groups have been created as required, clicking on
the SAVE button will show the message above. Click CLOSE to exit out of the group allocation
window.]
55
Page 56

[Presenting with assigned groups – Once groups/teams have been allocated to a standard/ad hoc
class, enter the presentation area of ClassComm. Select the presentation settings as required and
then select the class to which groups have been assigned. The “Present with Group” option will be
available beneath the student register. Check this option. Now select Group Allocation Setting
and click the main “Present Activity” button. ClassComm will minimise and PowerPoint will open
ready for responses from the participants.]
56
Page 57

[Odd/Even instant groups – Checking the ODD/EVEN GROUP button will overwrite any groups
currently allocated to the selected class and use the handset ID’s to create 2 groups based upon
odd/even handset numbers]
Once group settings have been successfully applied, the instant charts available after each question
during an activity/presentation will have a group view option (available for Grid Views and Ranking
options only). Use this to toggle between current group status and individual participant status:
57
Page 58

58
Page 59

Once a presentation has been completed and saved using groups, enter the reports and/or charts to
review the results. Note that there will be a “Group Report” checkbox in the reports/charts area.
This option will only be available when a presentation using groups has been selected. Check this
box to view reports containing group data:
59
Page 60

Hockey and
Cricket Games
60
Page 61

ClassComm 5 includes 2 new games: Hockey and Cricket. These are team based games that
require classes to be split into groups/teams and PowerPoint activities/tests with a pre-defined
number of questions. These games are designed to increase student motivation, create team
building skills and add a sense of fun to a lesson. See Previous advanced functionality section –
Group/Team allocation for details on splitting classes into groups/teams.
HOCKEY GAME
In order to run the hockey game, the following conditions must be met:
An activity/presentation with 5 or more questions.
Record assessment mode with an activity/presentation that has correct answers and
marks/score assigned to each question.
2 groups/teams with an equal number of students in each group BUT no less than 5 students
per group.
When the above conditions have been met, the hockey can be selected. The rules of the game are
as follows:
The winner of a question is based on total group marks and where marks are equal; the total
time taken (for correct responses) will be used to identify the winner of the question.
After question 1, the winning group/team makes a pass. If there is a tie, hockey sticks will
clash.
To score a goal, a group must win 4 consecutive questions (3 passes and then score on the
4th consecutive correct answer).
Teams can steal the ball and go on the attack. Example: Team 1 has won 1, 2 or 3
consecutive correct answers and then Team 2 wins, Team 2 will be on the attack.
IMPORTANT NOTE:
o If you go back and replay a previous question, the game button will be disabled for
that question and only the score from the first time the question was played will be
counted. The game will be enabled when you return to the current question.
o The team/group that wins the game may not be the team that has scored the
highest actual marks as question weighting is not taken into consideration with the
games.
61
Page 62

CRICKET GAME
In order to run the cricket game, the following conditions must be met:
An activity/presentation with 10 or more questions but total questions must be an even
number.
Record assessment mode with an activity/presentation that has correct answers and
marks/score assigned to each question.
2 groups/teams with an equal number of students in each group BUT no less than 5 students
per group.
When the above conditions have been met, the cricket game can be played. Here is the premise of
the cricket game:
The presentation is split into 2 even parts. This is so that each team can bat and bowl over
an equal number of questions. Example: In a 20 question activity/presentation, Team 1 will
be batting and Team 2 bowling for questions 1-10 and then the reverse will occur with Team
2 batting and Team 1 bowling for questions 11-20.
Scoring occurs based upon the following scenarios:
If the batting team attain 70% or above for a question and the bowling team gets a
lower score, the batting team will get 6 runs. If the reverse occurs, the batting team get
1 run.
If the batting team attain 60% -69% and the bowling team gets a lower score, the batting
team gets 4 runs. If the reverse occurs, the batting team get 1 run.
For 2 or 3 runs to be obtained the batting team must achieve:
o 55% or higher for 3 runs with the bowling team achieving a lower score.
o 50% or higher for 2 runs with the bowling team achieving a lower score.
For the bowling side to get a wicket the batting team has to get a score less than 50%
and the Bowling team needs to outscore the batting team. If a wicket is taken, the
batting side get no runs.
If the batting team attain 10%-49% with the bowling side achieving a lower score, the
batting team gets 1 run. If the reverse occurs, the batting team lose a wicket.
If a batting team score’s below 10% in a question, they lose a wicket regardless of the
bowling team’s score.
IMPORTANT NOTE:
62
Page 63

o If you go back and replay a previous question, the game button will be disabled
for that question and only the score from the first time the question was played
will be counted. The game will be enabled when you return to the current
question.
o The team/group that wins the game may not be the team that has scored the
highest actual marks as question weighting is not taken into consideration with
the games.
63
Page 64

64
Page 65

Text and Drop
Revision 1.03
65
Page 66

Text and Drop within ClassComm
Step 1.1 – To open the Text and Drop
application interface within ClassComm, go
to File > Text and Drop.
The Text and Drop feature allows for participants to text in responses that can then be dragged and
dropped by the presenter onto an image or canvas area. Image capture from a video source,
annotation tools and spontaneous question features are available to allow for the creation of truly
interactive lessons. [Text and Drop feature compatible with 3g hardware or above]
66
Page 67

Step 1.2– Click the
RESOURCES button
67
Page 68

Step 1.3 – The Text and Drop feature uses resources. Resources can be Microsoft
PowerPoint files, blank canvas or image files (jpg, png or bmp files). From the Resource
window, you can add New Resources or select the View Resources to view existing
resources previously created. The following sections of this document will
demonstrate how to add: -
Blank Canvas
PowerPoint Files
Image Files
68
Page 69

Step 2.1 – Enter an Activity Name
and then select “Blank Canvas” from
the Activity type drop down list.
Click Next.
Lock a response so that
handset can then send
another response.
Reset ALL texted
responses on canvas
back to left pane
Right-click on a text
response and select
“Reset” to send the
individual response
2.0 BLANK CANVAS IN TEXT AND DROP
Once a blank canvas is open (as shown in the following screen), all active student handsets will enter
“Text” mode. This will allow participants to text in responses up to 90 characters long. Pressing
“Send” on the handset will display the response in the left pane of the application window. From
here the responses can be dragged onto the main canvas. To reset individual responses on the
canvas back to the left pane, right-click on the response and select “Reset”. To lock them so that the
same student can send an alternative response, right-click on the response and select “Lock
Response”.
69
Page 70

To lock all responses sent, go to Tools > Auto-Lock responses as shown below:
Go to Tools > Auto-Lock
Responses and click
once on the Auto-Lock
Responses option
Once selected, a small tick
indicates that Auto-lock
Responses is selected
70
Page 71

Add a new
blank page
Left Pane – Text Responses
from student handsets will be
displayed here. From here
they can be dragged onto the
canvas.
Clear all texted
responses
Reset all texted
responses on canvas to
left pane
Add
snapshot
from video
source
Main Canvas Area – Some of the functions that can be performed
on the canvas: -
Drag and drop texted objects from student handsets
Add images from a Visualiser/Camera source
Rotate/Resize/Duplicate objects on the canvas.
Annotate on the canvas using annotator pen tool
Use Set Question to test student’s understanding of the
lesson material.
Show /hide
Handset ID’s
next to texted
responses.
Auto-number text
responses on the
Auto-number text
responses on the
canvas area
Set a
spontaneous
question
Save the Project
Create New or view
existing resources.
Navigation and
Exit buttons
- 71 -
Page 72

3.0 ADD A POWERPOINT FILE
Step 3.2 – Enter the Activity Name or
leave blank to use the PowerPoint file
name.
Step 3.3 – Select the Activity Type. In this
example, a PowerPoint presentation will be
added.
Step 3.4 – Click Browse to locate the
PowerPoint file you wish to add and then
press the Next button.
Step 3.1 – Select New Resources
button.
Step 3.1 – Select the New Resources button.
- 72 -
Page 73

Step 3.5 – The PowerPoint slides in the presentation will be converted into flat, image
files for use with the text and drop application.
- 73 -
Page 74

Step 4.1 – Select New Resources button
and then the “Image” option from the
Activity Type drop down menu.
4.0 ADD IMAGES INTO TEXT AND DROP
- 74 -
Page 75

Step 4.2 – Click “Browse” and navigate to
a folder that contains jpegs, png or bmp
files only.
Click “Next” button. At this point, the
images contained within the folder will be
added as background pages within the
Text and Drop application.
5.0 SET QUESTION FUNCTIONALITY
- 75 -
Page 76

Step 5.1 – The Question Title will
be displayed in the charts.
Step 5.2 – There are 9 Question
Types: -
1. Yes/No
2. True/False
3. Multiple Choice
4. Multiple Mark
5. Text
6. Sequence
7. Numeric
8. Likert Scale
9. E-Vote
Step 5.3 – Response type will be
active when Multiple Choice or
Likert Scale is selected as
Question Type.
Step 5.4– Number of Choices is
related to multiple choice and
Numeric Likert Scale question
types. Up to 6 options are
allowed.
Step 5.7– Correct Answer is an
optional field. The answer will be
hidden using stars (**). For
True/False use “T or F” and for
Yes/No use “Y or N”. Note that
Correct answer field will be
disabled for Likert Scale questions
as these questions have no right
or wrong answer.
Step 5.8– Marks can be assigned
to questions if desired.
Step 5.8– Click “Done” to run the
question.
- 76 -
Page 77

77
Play/Stop question
New Question
Replay Question
View charts/results
End Set Question presentation
After a question has been played and responses recorded, the charts/results can be viewed by
pressing the charts button on the presentation toolbar shown above. Below is an example of the
results window. There are 3 views available: -
Bar Chart
Pie Chart
Grid View
Page 78

78
Each of the views can be exported by displaying the view and selecting the “Export” option. There
are currently 4 export file types: -
PDF
Excel
HTML
MHTML
Page 79

79
6.1 –From the Tools menu, select the Annotator Pen option.
The pen size and colour can be changed via Annotator Options.
The “Arrow” option changes the pen to the arrow cursor which
can then be used to select, move, rotate objects on the canvas.
6.2 – Click the small pen icon in the canvas area to display the sub
menu shown in the image above. Select the Annotator Pen option to
use the pen on the canvas.
6.0 ANNOTATION FUNCTIONALITY
The annotator pen can be accessed in two ways within Text and Drop:
Page 80

80
Step 7.1 – Clicking on the “Save” button within Text and Drop, brings up the above
window. The Text and Drop session can be saved as Image files (jpg, png or bmp) or
as a CCL file. A CCL file will retain the text objects for re-use.
Note that when saving as jpg, png or bmp, the image files will be saved into a single
folder as selected in the Location and File/Folder name option boxes in the window
above.
The CCL file will be saved as single, independent file that can be re-opened within
Text and Drop using the “View Resources” option. Once re-opened, the text objects
will be active. In image files, the text objects will be fixed.
7.0 SAVE OPTIONS
Page 81

81
Personalised
Learning (PL) Tests
Revision 1.06
[Note – 3G or 4G hardware required]
Page 82

82
Personalised Learning Test – Quick Guide
Personalised Learning tests (PL) tests enable the user to convert paper-based tests to ClassComm
activities that can then be stored, run and automatically marked and graded within the ClassComm
software. The PL tests can then be carried out by students at their own pace using an on-screen
visual grid. [Compatible with 3g or 4g hardware only]
1 – MAPPING A PL TEST
PL tests are type of activity and are created within the Resources area of ClassComm. There are 3
ways to create a new PL test:
a) File > New > New Activity > New PL test from the top menu bar.
b) Right-click a resources folder, choose New Activity > New PL Test.
c) From the toolbar icons, click the down arrow on the New button, select New Activity > New PL
Test.
Page 83

83
1 2 3 4 6
5
Enter a “Test Name” or browse to an XML file from a previously mapped PowerPoint activity. Enter
the Question data (Note the Question No. field is auto number):
1 – Enter the Question.
2 – Select the type of question from the options available
3 – Enter Response Type if relevant to Question Type
4 – Enter the No. of Choices if relevant to Question Type.
5 – Enter the Correct Answer
6 – Assign a marks value to the question.
Repeat the above steps to add further questions to the PL test. The questions can be re-arranged
using the green up and down arrows to the right of the question mapping area. Once all test
questions have been entered, SAVE the test.
Page 84

84
PowerPoint
Activity icon has
a green square.
PL Test Activity
icon has a green
circle.
1 - Select the PL test from the Select Activity
Window. PL tests can be run with an Existing
Class or an Ad-Hoc class.
2 - Communication
options will be
disabled and
Record Assessment
option will be
automatically
selected.
3 - A countdown timer for the PL test can be
selected from within the Pace Settings options.
Finally, click the Present Activity button to open the
PL Test participant visual interface.
2 – RUNNING A PL TEST IN STANDARD VIEW
PL tests are run from within the Presentation area of ClassComm. Note that PL tests can only be run
in Record Assessment mode and they have a different icon to the PowerPoint activities.
Page 85

85
1 –
Student
Names
Column.
2 – Question Cells. In this PL Test, there are 11 questions, hence each
student has 11 cells next to their name which they will be able to
navigate and answer at their own pace using the handsets.
3 – THE PL TEST PARTICIPANT VISUAL GRID
After selecting a PL Test and clicking the Present Activity button, the following screen will appear:
Page 86

86
3 – Press the “START” button to begin
the test. At this point, Q1 cells will
change to red and navigation control will
pass to student handsets.
4 – Students navigate using the yellow 4 (left) and 6 (right) keys on the handset.
When in navigation mode, the active cell will be red. To answer a question,
press the “delta” key – the cell turns from red to amber – At this point, the student
enters their answer and presses “send” (except for True/False and Yes/No
questions where pressing “send” key is not necessary). Once the question has
been answered, the cell turns green and the student can navigate to another
question. NOTE: if a handset fails to navigate, press “…” followed by send to
enter navigation mode.
To go back and change a previously entered answer, highlight the answered
(green) cell and press the “delta” key. Cell will change to amber and the previous
response will be cleared. Enter the new answer and press “send”. Cell turns to
green and the navigation keys are enabled. IMPORTANT NOTE: For TEXT and
NUMERIC type questions, it is possible to re-submit the previous answer after
pressing the delta key. For TEXT type questions, when returning to a previously
answered question, you can re-submit the previous answer by pressing the “1/A”
key to display a period (.) on the LCD and pressing the “send” key. For
NUMERIC type questions, press the “.” to display a decimal point on the LCD
screen and press “send”.
* See Further Information on Completing a PL Test at the end of this Guide*
Page 87

87
Show/Hide
Result
Save
Presentation
Close
Presentation
5 - As students answer questions at
their own pace, the Current Status
column will automatically update to
indicate individual test progress as a %.
6 – Here is a fully completed test with 4 students having answered all
questions. Note, that PL tests can be stopped at any time by using the
STOP button, regardless of whether all questions have been answered
or not. Once stopped, a PL test cannot be restarted.
Page 88

88
7 -Clicking the show/hide result button at the
end of a PL Test provides an instant snapshot
of correct/incorrect answers. Red cells
indicate incorrect answers and green cells are
correct answers.
1 – Click this icon to toggle between
multiple question view and single
question view.
2 –The single question PL test view shows the following columns – Student, Previous
Question, Current Question, Current Question Type, Next Question and Current Status.
This view is better suited to PL tests with a large amount of questions. The functionality
works the same as described previously for the multiple question PL test view.
4 – Running a PL Test in Single Question View (Available in ClassComm 3.7.4 and above)
Page 89

89
1 –Select the Class type that was used to
complete the PL Test – Standard or Ad-Hoc
classes are the two class types that can be
1 –Select the Class type that was used to
complete the PL Test – Standard or Ad-Hoc
classes are the two class types that can be
used with the PL Test feature.
2 –Select the Report Type to view from the 6
available formats.
3 –Select the Report Settings – Select the
Class, Teacher and PL Test. Note that all PL
Tests are pre-fixed with “PL”
4 –Finally, click the Generate Report button.
The report will appear in the right-hand pane.
Repeat the steps above to view any other
Report Type.
4 – Viewing PL Test Reports
Page 90

90
Student 1 is in Navigation mode- RED
CELL. Use 4 and 6 keys to move red cell
left and right respectively.
Student 2 is in Answer mode– Question
has been activated with “Delta” key.
AMBER CELL
Student 3 has answered Q1 – GREEN
CELL – using 4 and 6 on handset will
enable navigation once a question has
been answered.
5 - Further Information on Completing a PL Test
Page 91

91
Navigate Right
Navigate Left
1 - Activate Cell to
answer. (Amber)
2 – Re-activate
answered cell
(Green to Amber)
Delete Current
answer when in
Active Cell (Amber)
Jump to last
question cell when
in navigation mode
Jump to first
question cell when
in navigation mode
Page 92

92
ClassComm
Corporate –
Interface Editor
Revision 1.01
Page 93

93
Interface Editor for Corporate Mode
ClassComm has two modes that can be set – Educational and Corporate. Educational mode uses
terminology such as class, student and teacher. Corporate uses group, participant and presenter
instead. An option appears during ClassComm installation to select the required mode. However,
the mode can also be set from within the ClassComm interface. Go to Settings > Application Mode
to select the desired mode. Note that if you change modes, ClassComm will need to be restarted for
changes to take effect.
The Interface Editor
When in corporate mode, all strings used within ClassComm can be customised/modified using the
Interface Editor. The Interface Editor can be used to tailor the ClassComm application to your
organisation. Note that any modified strings will only be viewable in corporate mode. To open the
Interface Editor, go to:
Start > All Programs > ClassComm> Interface Editor.
The editor has 3 tabs – Interface Text, Messages and Application Settings. The Interface Text tab
shows all corporate strings/labels used in ClassComm (corporate mode). The messages tab shows all
application messages that appear within ClassComm. Application Settings can be used to change the
ClassComm interface logo and application name and also customise reports by adding a company
crest/logo.
Interface Text
There are 4 main interface text items that most users will want to change to make them more
relevant to their organisation:
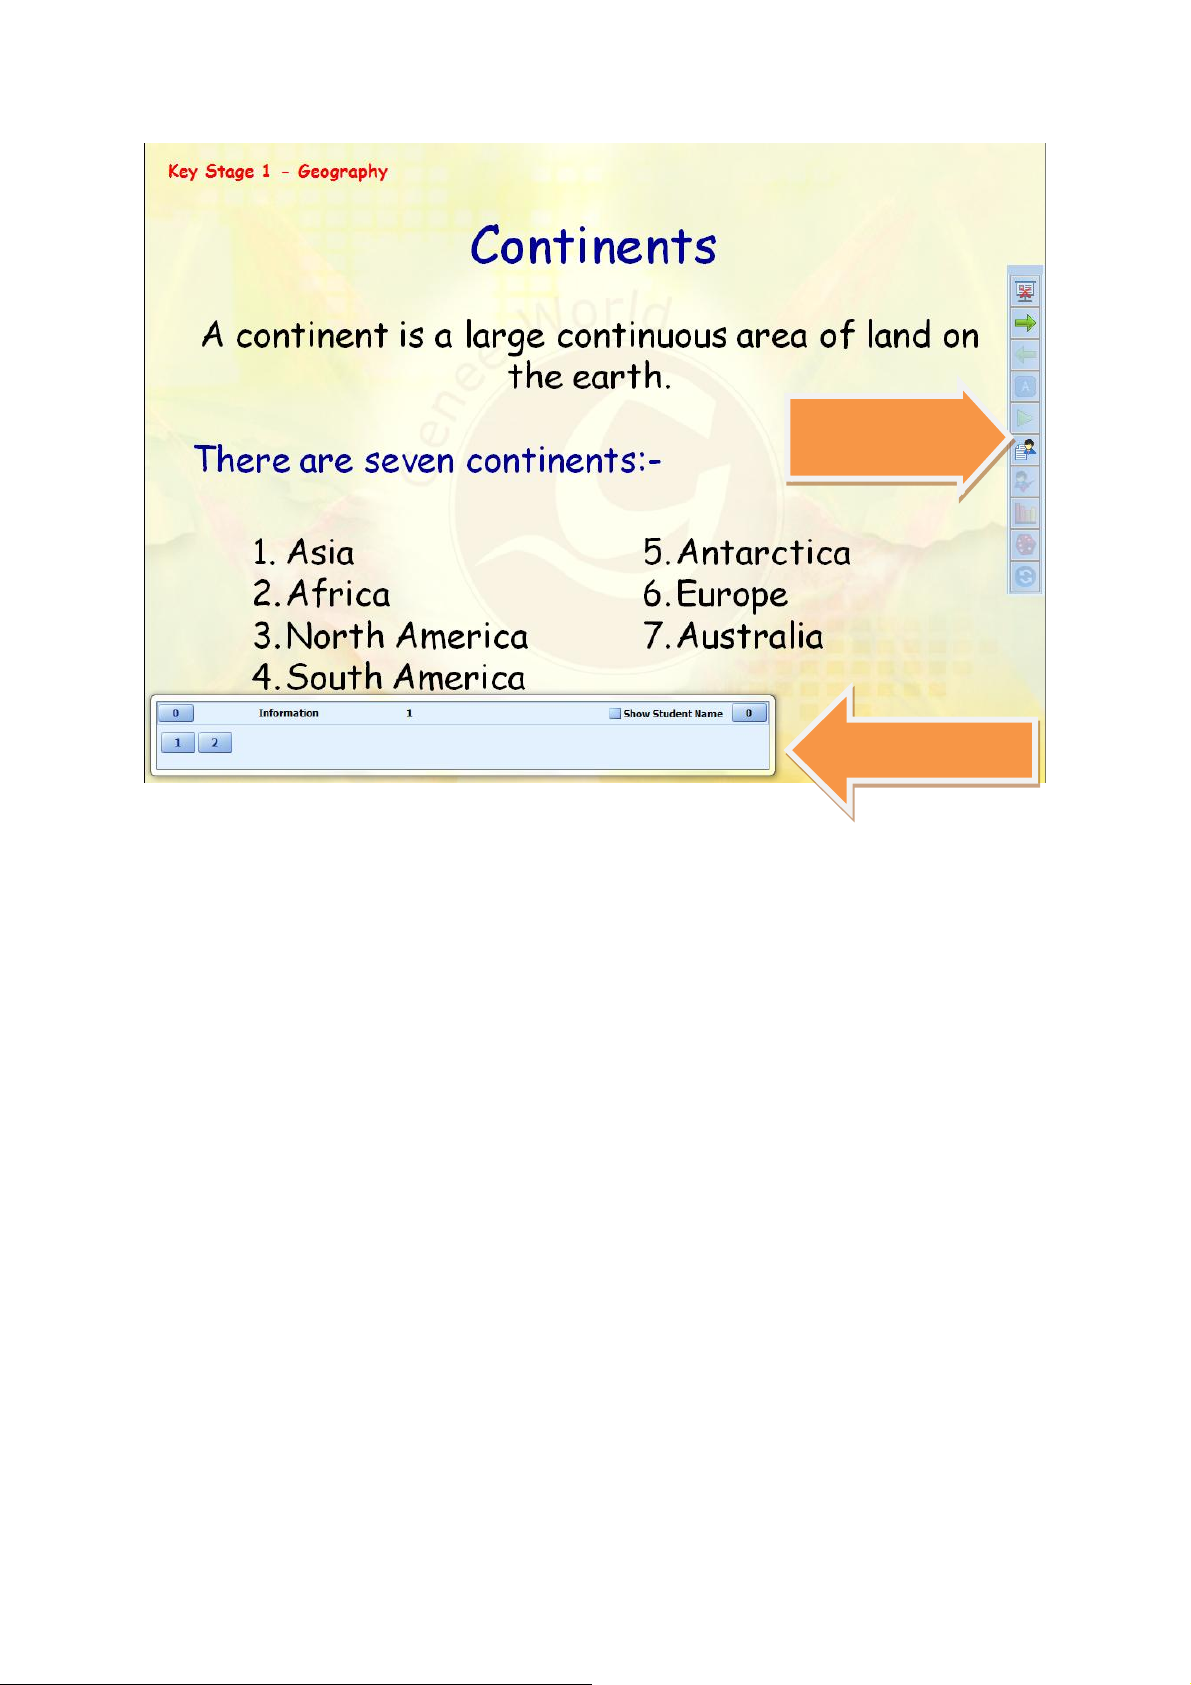
Participant – In education mode, these are the student’s. In corporate mode they are Participant’s
by default. This can be changed to any terminology you prefer e.g. Trainee, Councillor, Member etc.
Presenter – In education mode, the presenter is the Teacher. Using the interface editor, you can
change the term Presenter to Trainer, Mentor, Supervisor etc
Group – Normally Classes, this can be changed to suit your organisation e.g. Committee,
Department, Area
Event – This is the term used to describe the actual presentation/activity presented. Normally a Test
in educational mode, it can be changed to suit your needs e.g. Session, Quiz, Induction etc.
To change any value/string to a custom value, complete the following steps for Interface Text:
Page 94
94
1 – Double-click the value to be customised from the left pane. In this example, we will change
Presenter to Trainer. The Default value and Current value will appear in the respective panes on the
right of the Interface Editor.
2 – Make the changes required to the text string in the “Current” area in the right pane. In the
example above, Presenter has been changed to Trainer.
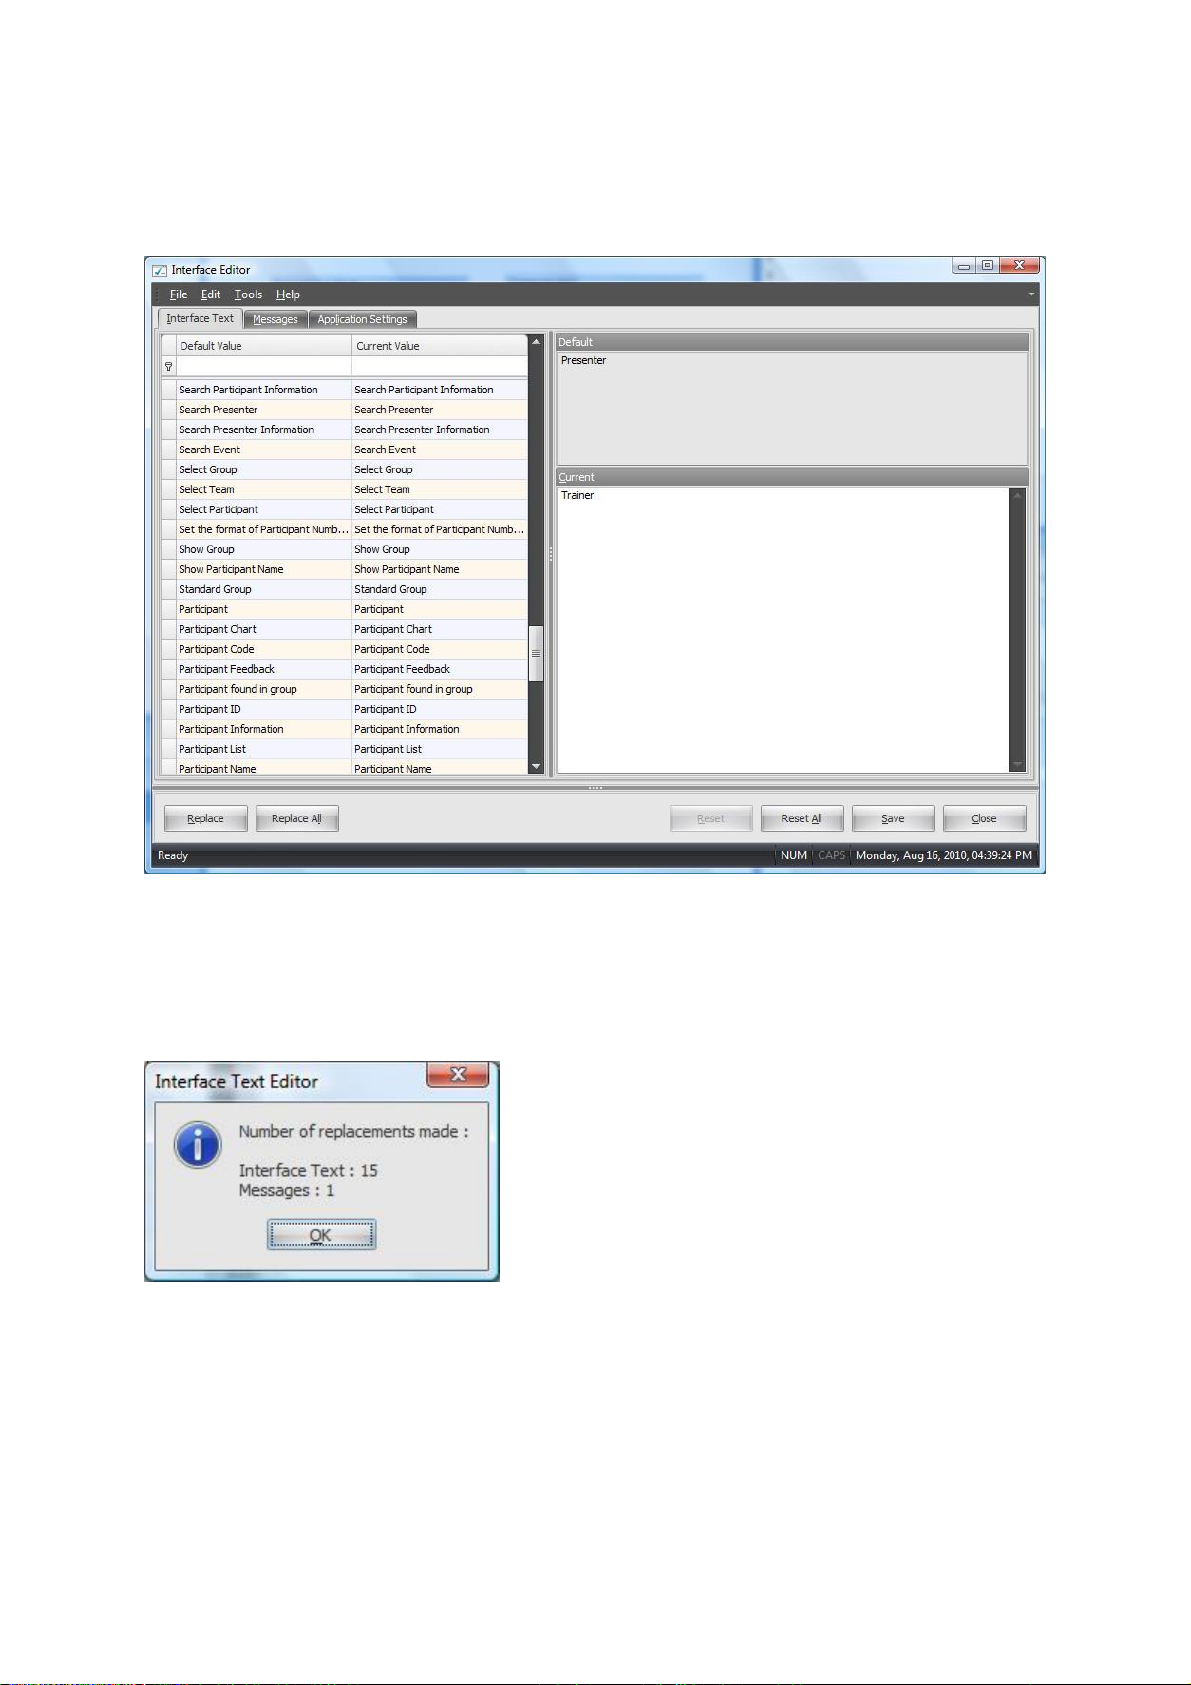
3 – Press “Replace” to change only this string or “Replace All” to change all instances of the Default
string.
4 – The confirmation message shown informs you how many strings, labels and/or messages will be
affected by the changed. Click OK to make the changes.
5 – To undo a change, double-click the string you wish to undo from the left-pane and press the
“Reset” button to return the string to its original text.
6 – To reset all changes made to the default settings, select the “Reset All” button and press Yes on
the confirmation message.
Page 95

95
6 –After all changes have been made, click the “Close” button. A message will appear “Do you wish
to save all changes?” Click “Yes” to save all changes made or “No” to cancel all changes made.
7 – Run ClassComm in corporate mode for new changes to appear.
Messages
Click the “Messages” tab to open all the messages that are used within ClassComm. These messages
are informational or warning. Note that changing key phrases in the Interface Text area
(participant, presenter, group and event) will also affect the messages where these strings are used.
Follow steps 1 – 4 above to edit these messages.
Application Settings
Click the “Application Settings” tab. From within the Application Settings, the ClassComm title and
icon can be changed (optional). Note that the desktop shortcut icon and application name for
ClassComm cannot be changed. Only the icon and name used within ClassComm will be changed.
The file type for the application icon is .ico.
The Report Header and logo will be displayed at the top of the ClassComm Reports. This feature will
work in both education and corporate mode.
Page 96

96
Change the Application Title here.
Click Browse to locate an icon file
(.ico).
Enter “Report Header” and browse
to locate company logo/crest (jpeg,
png, gif).
Press “Save” to store the changes.
Close the Interface Editor and
launch ClassComm for changes to
take effect.
Page 97

97
Pebble Pad (5g)
hardware
Revision 1.00
Page 98

98
Pebble Pad (5g Hardware) – Quick Guide
The Pebble Pad (5g) Installation process is the same as 3g and 4g hardware as described in Phase 1
of this Quick Start guide. Here is a brief overview of the steps to follow:
1. Install ClassComm Software
2. Install the Sample Content (Optional) – The sample content will install both Genee/IQ pad
sample and Pebble pad compatible sample resources.
3. Install the PowerPoint Plug-in (Slide Mapper)
4. Attach the Pebble Pad (5g) receiver
5. Launch ClassComm – Message stating “5g receiver connected” should appear in the bottom
left of the ClassComm interface.
Mapping Pebble Pad Handsets to a 5g receiver
With the receiver connected and the handset within 2-3 inches of the receiver, press and hold the -
/? Key on the handset. The light on the top left of the handset will blink 3 times with a GREEN light.
If it blinks red, repeat this step until the LED blinks with green lights.
If you experience issues, use a small, pointed object and press the reset button on the back of the
handset and attempt to remap. The reset switch is located in the small hole on the back of the
handset.
Testing the Handsets
After mapping all handsets, enter the Communication section of ClassComm. Pressing down keys on
the handset will light up the cells sequentially in the communication grid. The white handset
included in a Pebble Pad set is the Teacher handset and will light up cell 255 after mapping.
Note that there is an option to change Channel Numbers for receivers. By default, the channel set is
1. If you have more than one 5g receiver, you will need to change channels to ensure that each
receiver is unique. After changing receiver channel numbers, handsets will need to be re-mapped to
that receiver and its new channel number.
Creating Resources for Pebble Pad
Pebble Pad hardware supports the following types of questions:
1. Yes/No
2. True/False
3. Numeric
4. Multiple Choice (Alpha A-D, Numeric 1-6 options)
Page 99

99
5. Multiple Mark (Alpha A-D, Numeric 1-6 options)
6. Sequence
7. Likert Scale (Numeric 1-6 options)
Note with multiple choice, multiple mark and sequence type questions, up to 6 choices can be set in
numeric mode but only 4 choices in alpha (A-D).
See Phase 2 – Adding and mapping PowerPoint Presentations for details on how to map
presentations for use with ClassComm.
Setting up Presentation’s with Pebble Pad Hardware.
Existing Class Presentation
To run an existing class presentation, you must first create the class with associated
teacher/presenter and students/participants from within the Student area of ClassComm. Once a
class has been created successfully, it will display in the Presentation area of ClassComm under
“Select Class”.
To run an Existing Class Presentation, perform the following steps from within the Presentation area
of ClassComm:
Select “Existing Class Presentation” option
Select Presentation Mode (Record assessment, Survey or Spontaneous –See Phase 4
Presentation/Class Settings in ClassComm)
Select a game (optional and only available with Record Assessment).
Set Communication Settings (See See Phase 4 - Presentation/Class Settings in ClassComm
guide for communication setting explanation)
Select the existing class from the Select Class area.
Click the Register Class button. This will open the “Register Standard Class” window.
Click “Start Mapping”.
Students can now enter their mapping key followed by “Lock” key on their individual
handsets. The Lock key has a key image on it and is located on the bottom-right of the
pebble pad student handsets.
Use the “Remap” button to unlock any student that has been incorrectly mapped allowing
them to remap with the correct key.
After mapping is successfully completed, a green box with a tick will appear in the “Login
Status” column.
Press “Stop Mapping” once all students have successfully mapped their handsets to their
name and then press “OK”.
The mapping window will close and the Student Register will update all connected students.
Press “Present Activity” to run the presentation.
Page 100

100
SELECT CLASS area – all existing
classes will be listed here ready
to present with
In this example, we have
selected the sample “Class_32”
that is available within
ClassComm. After Class_32 has
been highlighted, the students
appear in the Student register
above. At this point the status
of the students is “not
connected”. To connect the
students, click the “Register
Class” button to bring up the
existing class mapping interface.
REGISTER CLASS area – all
students in the selected class
will appear along with their
status. They will appear as
connected after successful
mapping.
 Loading...