

Page 1

GE
LISTED
Grid Solutions
Multilin™ EPM 2200
Power Meter
Instruction Manual
Software Revision: 1.0x
Manual P/N: 1601- 9111-A5
Manual Order Code: GEK-113575D
*1601-911-A5*
Page 2

Copyright © 2016 GE Multilin Inc. All rights reserved.
EPM 2200 Power Meter Instruction Manual for product revision 1.0x.
The contents of this manual are the property of GE Multilin Inc. This documentation is
furnished on license and may not be reproduced in whole or in part without the permission
of GE Multilin. The manual is for informational use only and is subject to change without
notice.
Part number: 1601-9111-A5 (June 2016)
ii
Page 3

Note
GENERAL SAFETY PRECAUTIONS - EPM 2200
• Failure to observe and follow the instructions provided in the equipment manual(s)
could cause irreversible damage to the equipment and could lead to property
damage, personal injury and/or death.
• Before attempting to use the equipment, it is important that all danger and
caution indicators are reviewed.
• If the equipment is used in a manner not specified by the manufacturer or
functions abnormally, proceed with caution. Otherwise, the protection provided by
the equipment may be impaired and can result in Impaired operation and injury.
• Caution: Hazardous voltages can cause shock, burns or death.
• Installation/service personnel must be familiar with general device test practices,
electrical awareness and safety precautions must be followed.
• Before performing visual inspections, tests, or periodic maintenance on this device
or associated circuits, isolate or disconnect all hazardous live circuits and sources
of electric power.
• Failure to shut equipment off prior to removing the power connections could
expose you to dangerous voltages causing injury or death.
• All recommended equipment that should be grounded and must have a reliable
and un-compromised grounding path for safety purposes, protection against
electromagnetic interference and proper device operation.
• Equipment grounds should be bonded together and connected to the facility’s
main ground system for primary power.
• Keep all ground leads as short as possible.
• At all times, equipment ground terminal must be grounded during device
operation and service.
• In addition to the safety precautions mentioned all electrical connections made
must respect the applicable local jurisdiction electrical code.
• Before working on CTs, they must be short-circuited.
• To be certified for revenue metering, power providers and utility companies must
verify that the billing energy meter performs to the stated accuracy. To confirm the
meter’s performance and calibration, power providers use field test standards to
ensure that the unit’s energy measurements are correct.
This product cannot be disposed of as unsorted municipal waste in the European
Union. For proper recycling return this product to your supplier or a designated
collection point. For more information go to www.recyclethis.info.
iii
Page 4

Safety words and definitions
NOTE
The following symbols used in this document indicate the following conditions
Note
Indicates a hazardous situation which, if not avoided, will result in death or serious
injury.
Note
Indicates a hazardous situation which, if not avoided, could result in death or serious
injury.
Note
Indicates a hazardous situation which, if not avoided, could result in minor or
moderate injury.
Note
Note
Indicates practices not related to personal injury.
Indicates general information and practices, including operational information, that
are not related to personal injury.
For further assistance
For product support, contact the information and call center as follows:
GE Solutions
650 Markland Street
Markham, Ontario
Canada L6C 0M1
Worldwide telephone: +1 905 927 7070
Europe/Middle East/Africa telephone: +34 94 485 88 54
North America toll-free: 1 800 547 8629
Fax: +1 905 927 5098
Worldwide e-mail: multilin.tech@ge.com
Europe e-mail: multilin.tech.euro@ge.com
Website: http://www.gegridsolutions.com/multilin
Warranty
For products shipped as of 1 October 2013, GE warrants most of its GE manufactured
products for 10 years. For warranty details including any limitations and disclaimers, see
our Terms and Conditions at
https://www.gegridsolutions.com/multilin/warranty.htm
For products shipped before 1 October 2013, the standard 24-month warranty applies.
iv
Page 5

Table of Contents
1: THREE-PHASE POWER
MEASUREMENT
2: OVERVIEW AND
SPECIFICATIONS
3: MECHANICAL
INSTALLATION
THREE PHASE SYSTEM CONFIGURATIONS ........................................................................... 1-1
WYE CONNECTION ..........................................................................................................................1-1
DELTA CONNECTION ......................................................................................................................1-3
BLONDEL’S THEOREM AND THREE PHASE MEASUREMENT ......................................... 1-4
POWER, ENERGY AND DEMAND ............................................................................................... 1-6
REACTIVE ENERGY AND POWER FACTOR ............................................................................. 1-9
HARMONIC DISTORTION ..............................................................................................................1-11
POWER QUALITY .............................................................................................................................. 1-13
HARDWARE OVERVIEW ................................................................................................................. 2-1
V
OLTAGE AND CURRENT INPUTS ...................................................................................... 2-2
O
RDER CODES ..................................................................................................................... 2-2
M
EASURED VALUES ............................................................................................................ 2-3
U
TILITY PEAK DEMAND .......................................................................................................2-3
SPECIFICATIONS ............................................................................................................................... 2-4
COMPLIANCE ..................................................................................................................................... 2-8
ACCURACY .......................................................................................................................................... 2-9
INTRODUCTION ................................................................................................................................ 3-1
ANSI INSTALLATION STEPS .......................................................................................................... 3-2
DIN INSTALLATION STEPS ...........................................................................................................3-3
4: ELECTRICAL
INSTALLATION
5: COM OPTION S:
MODBUS/KYZ OUTPUT
CONSIDERATIONS WHEN INSTALLING METERS ................................................................. 4-1
CT L
EADS TERMINATED TO METER ...................................................................................4-2
CT L
EADS PASS-THROUGH (NO METER TERMINATION) ................................................ 4-3
Q
UICK CONNECT CRIMP CT TERMINATIONS ................................................................... 4-5
V
OLTAGE AND POWER SUPPLY CONNECTIONS .............................................................. 4-6
G
ROUND CONNECTIONS ....................................................................................................4-6
V
OLTAGE FUSES .................................................................................................................. 4-6
ELECTRICAL CONNECTION DIAGRAMS ..................................................................................4-7
D
ESCRIPTION ........................................................................................................................ 4-7
(1) W
YE, 4-WIRE WITH NO PTS AND 3 CTS, NO PTS, 3 ELEMENT ............................ 4-8
(2) W
YE, 4-WIRE WITH NO PTS AND 3 CTS, 2.5 ELEMENT ........................................ 4-11
(3) W
YE, 4-WIRE WITH 3 PTS AND 3 CTS, 3 ELEMENT .............................................. 4-12
(4) W
YE, 4-WIRE WITH 2 PTS AND 3 CTS, 2.5 ELEMENT ...........................................4-13
(5) D
ELTA, 3-WIRE WITH NO PTS, 2 CTS ....................................................................... 4-14
(6) D
ELTA, 3-WIRE WITH 2 PTS, 2 CTS ......................................................................... 4-15
(7) D
ELTA, 3-WIRE WITH 2 PTS, 3 CTS ......................................................................... 4-16
(8) C
URRENT-ONLY MEASUREMENT (THREE-PHASE) .................................................... 4-17
(9) C
URRENT-ONLY MEASUREMENT (DUAL-PHASE) ...................................................... 4-18
(10) C
URRENT-ONLY MEASUREMENT (SINGLE-PHASE) ................................................ 4-19
CONNECTING TO THE RS485/KYZ OUTPUT PORT ............................................................. 5-1
EPM 2200 POWER METER – INSTRUCTION MANUAL TOC–1
Page 6

6: USING THE METER PROGRAMMING USING THE FACEPLATE ...............................................................................6-1
M
ETER FACE ELEMENTS ..................................................................................................... 6-2
M
ETER FACE BUTTONS ....................................................................................................... 6-2
S
TART UP .............................................................................................................................. 6-3
M
AIN MENU ........................................................................................................................6-4
R
ESET MODE .......................................................................................................................6-4
E
NTER PASSWORD (IF ENABLED) .......................................................................................6-5
C
ONFIGURATION MODE ......................................................................................................6-6
C
ONFIGURING THE SCROLL FEATURE ............................................................................... 6-8
C
ONFIGURING THE CT SETTING ........................................................................................6-9
C
ONFIGURING THE PT SETTING ........................................................................................6-10
C
ONFIGURING THE CONNECTION (CNCT) SETTING ......................................................... 6-11
C
ONFIGURING THE COMMUNICATION PORT SETTINGS .................................................. 6-12
O
PERATING MODE ...............................................................................................................6-14
% OF LOAD BAR ...............................................................................................................................6-15
WATT-HOUR ACCURACY TESTING (VERIFICATION) ...........................................................6-15
I
NFRARED & KYZ PULSE CONSTANTS FOR ACCURACY TESTING ................................. 6-16
GE COMMUNICATOR PROGRAMMING OVERVIEW ............................................................ 6-17
F
ACTORY INITIAL DEFAULT SETTINGS ............................................................................... 6-17
H
OW TO CONNECT USING GE COMMUNICATOR SOFTWARE ......................................6-17
D
EVICE PROFILE SETTINGS ................................................................................................. 6-20
7: COM OPTION B:
BACNET MS/TP WITH
MODBUS TCP/IP
A: EPM 2200
NAVIGATION MAPS
B: MODBUS MAPPING
FOR EPM 2200
BACNET MS/TP .................................................................................................................................. 7-1
EPM 2200 METER BACNET OBJECTS ....................................................................................... 7-2
CONFIGURING COM OPTION B: BACNET MS/TP WITH MODBUS TCP/IP ................. 7-4
R
ESETTING THE ETHERNET CARD ...................................................................................... 7-11
USING THE EPM 2200 METER’S WEB INTERFACE ..............................................................7-11
H
OME WEB PAGE ................................................................................................................. 7-11
BAC
NET OBJECTS STATUS WEB PAGE ............................................................................. 7-13
C
HANGE PASSWORD WEB PAGE ....................................................................................... 7-14
S
TATISTICS WEB PAGE ......................................................................................................... 7-14
R
ESET CONFIGURATION WEB PAGE ...................................................................................7-15
USING THE EPM 2200 IN A BACNET APPLICATION ........................................................... 7-15
INTRODUCTION ................................................................................................................................ A-1
NAVIGATION MAPS (SHEETS 1 TO 4) ........................................................................................ A-1
EPM 2200 N
AVIGATION MAP TITLES: ............................................................................A-1
INTRODUCTION ................................................................................................................................ B-1
MODBUS REGISTER MAP SECTIONS ........................................................................................ B-1
DATA FORMATS ............................................................................................................................... B-2
FLOATING POINT VALUES ........................................................................................................... B-2
MODBUS REGISTER MAP .............................................................................................................. B-3
C: MANUAL REVISION
RELEASE NOTES ................................................................................................................................C-1
HISTORY
TOC–2 EPM 2200 POWER METER – INSTRUCTION MANUAL
Page 7

GE
Grid Solutions
EPM 2200 Power Meter
Chapter 1: Three-Phase Power
Measurement
Three-Phase Power Measurement
This introduction to three-phase power and power measurement is intended to
provide only a brief overview of the subject. The professional meter engineer or meter
technician should refer to more advanced documents such as the EEI Handbook for
Electricity Metering and the application standards for more in-depth and technical
coverage of the subject.
1.1 Three Phase System Configurations
Three-phase power is most commonly used in situations where large amounts of
power will be used because it is a more effective way to transmit the power and
because it provides a smoother delivery of power to the end load. There are two
commonly used connections for three-phase power, a wye connection or a delta
connection. Each connection has several different manifestations in actual use.
When attempting to determine the type of connection in use, it is a good practice to
follow the circuit back to the transformer that is serving the circuit. It is often not
possible to conclusively determine the correct circuit connection simply by counting
the wires in the service or checking voltages. Checking the transformer connection will
provide conclusive evidence of the circuit connection and the relationships between
the phase voltages and ground.
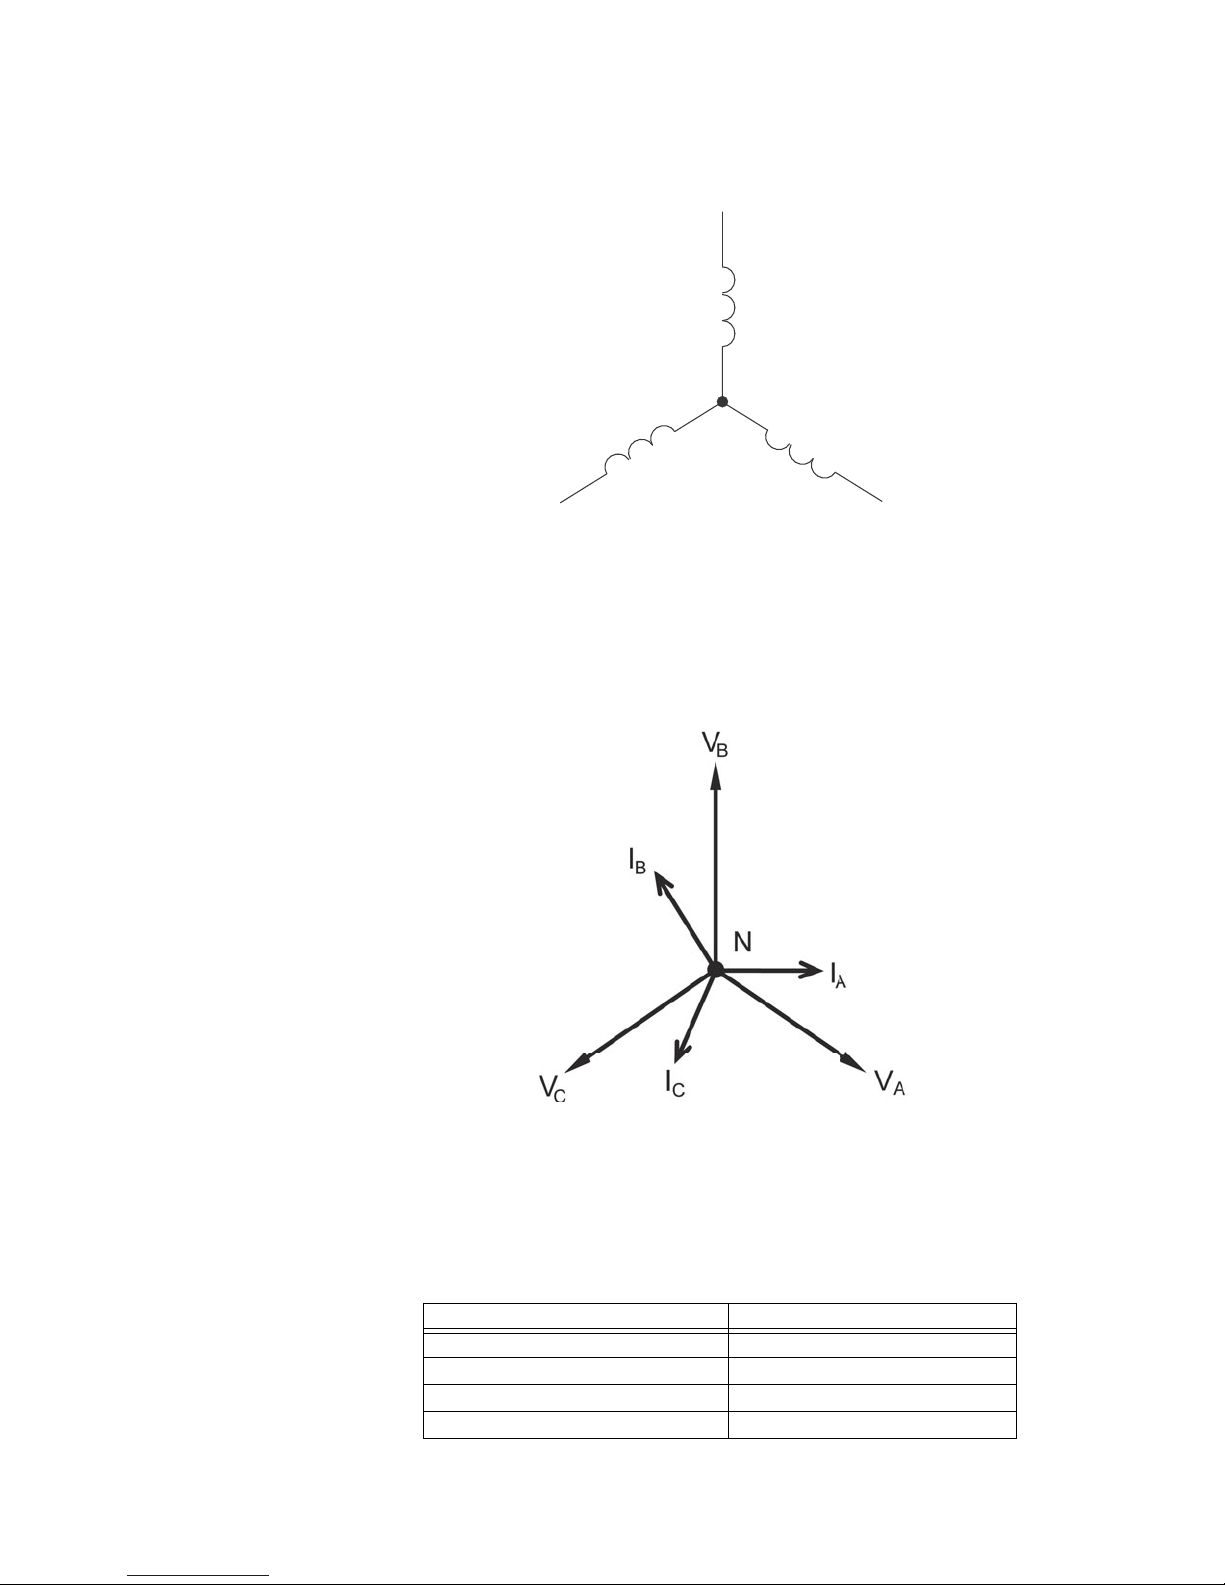
1.2 Wye Connection
The wye connection is so called because when you look at the phase relationships and
the winding relationships between the phases it looks like a Y. Figure 1.1 depicts the
winding relationships for a wye-connected service. In a wye service the neutral (or
center point of the wye) is typically grounded. This leads to common voltages of 208/
120 and 480/277 (where the first number represents the phase-to-phase voltage and
the second number represents the phase-to-ground voltage).
EPM 2200 POWER METER – INSTRUCTION MANUAL 1–1
Page 8
WYE CONNECTION CHAPTER 1: THREE-PHASE POWER MEASUREMENT
Phase 2
V
A
V
B
V
C
Phase 3
Figure 1-1: Three-phase Wye Winding
The three voltages are separated by 120o electrically. Under balanced load conditions
the currents are also separated by 120
conditions can cause the currents to depart from the ideal 120
phase voltages and currents are usually represented with a phasor diagram. A phasor
diagram for the typical connected voltages and currents is shown in Figure 1.2.
N
Phase 1
o
. However, unbalanced loads and other
o
separation. Three-
The phasor diagram shows the 120o angular separation between the phase voltages.
The phase-to-phase voltage in a balanced three-phase wye system is 1.732 times the
phase-to-neutral voltage. The center point of the wye is tied together and is typically
grounded. Table 1.1 shows the common voltages used in the United States for wyeconnected systems.
1–2 EPM 2200 POWER METER – INSTRUCTION MANUAL
Figure 1-2: Phasor Diagram Showing Three-phase Voltages and Currents
Table 1.1: Common Phase Voltages on Wye Services
Phase to Ground Voltage Phase to Phase Voltage
120 volts 208 volts
277 volts 480 volts
2,400 volts 4,160 volts
7,200 volts 12,470 volts
Page 9
CHAPTER 1: THREE-PHASE POWER MEASUREMENT DELTA CONNECTION
V
A
V
B
Table 1.1: Common Phase Voltages on Wye Services
Phase to Ground Voltage Phase to Phase Voltage
7,620 volts 13,200 volts
Usually a wye-connected service will have four wires: three wires for the phases and
one for the neutral. The three-phase wires connect to the three phases (as shown in
Figure 1.1). The neutral wire is typically tied to the ground or center point of the wye.
In many industrial applications the facility will be fed with a four-wire wye service but
only three wires will be run to individual loads. The load is then often referred to as a
delta-connected load but the service to the facility is still a wye service; it contains
four wires if you trace the circuit back to its source (usually a transformer). In this type
of connection the phase to ground voltage will be the phase-to-ground voltage
indicated in Table 1, even though a neutral or ground wire is not physically present at
the load. The transformer is the best place to determine the circuit connection type
because this is a location where the voltage reference to ground can be conclusively
identified.
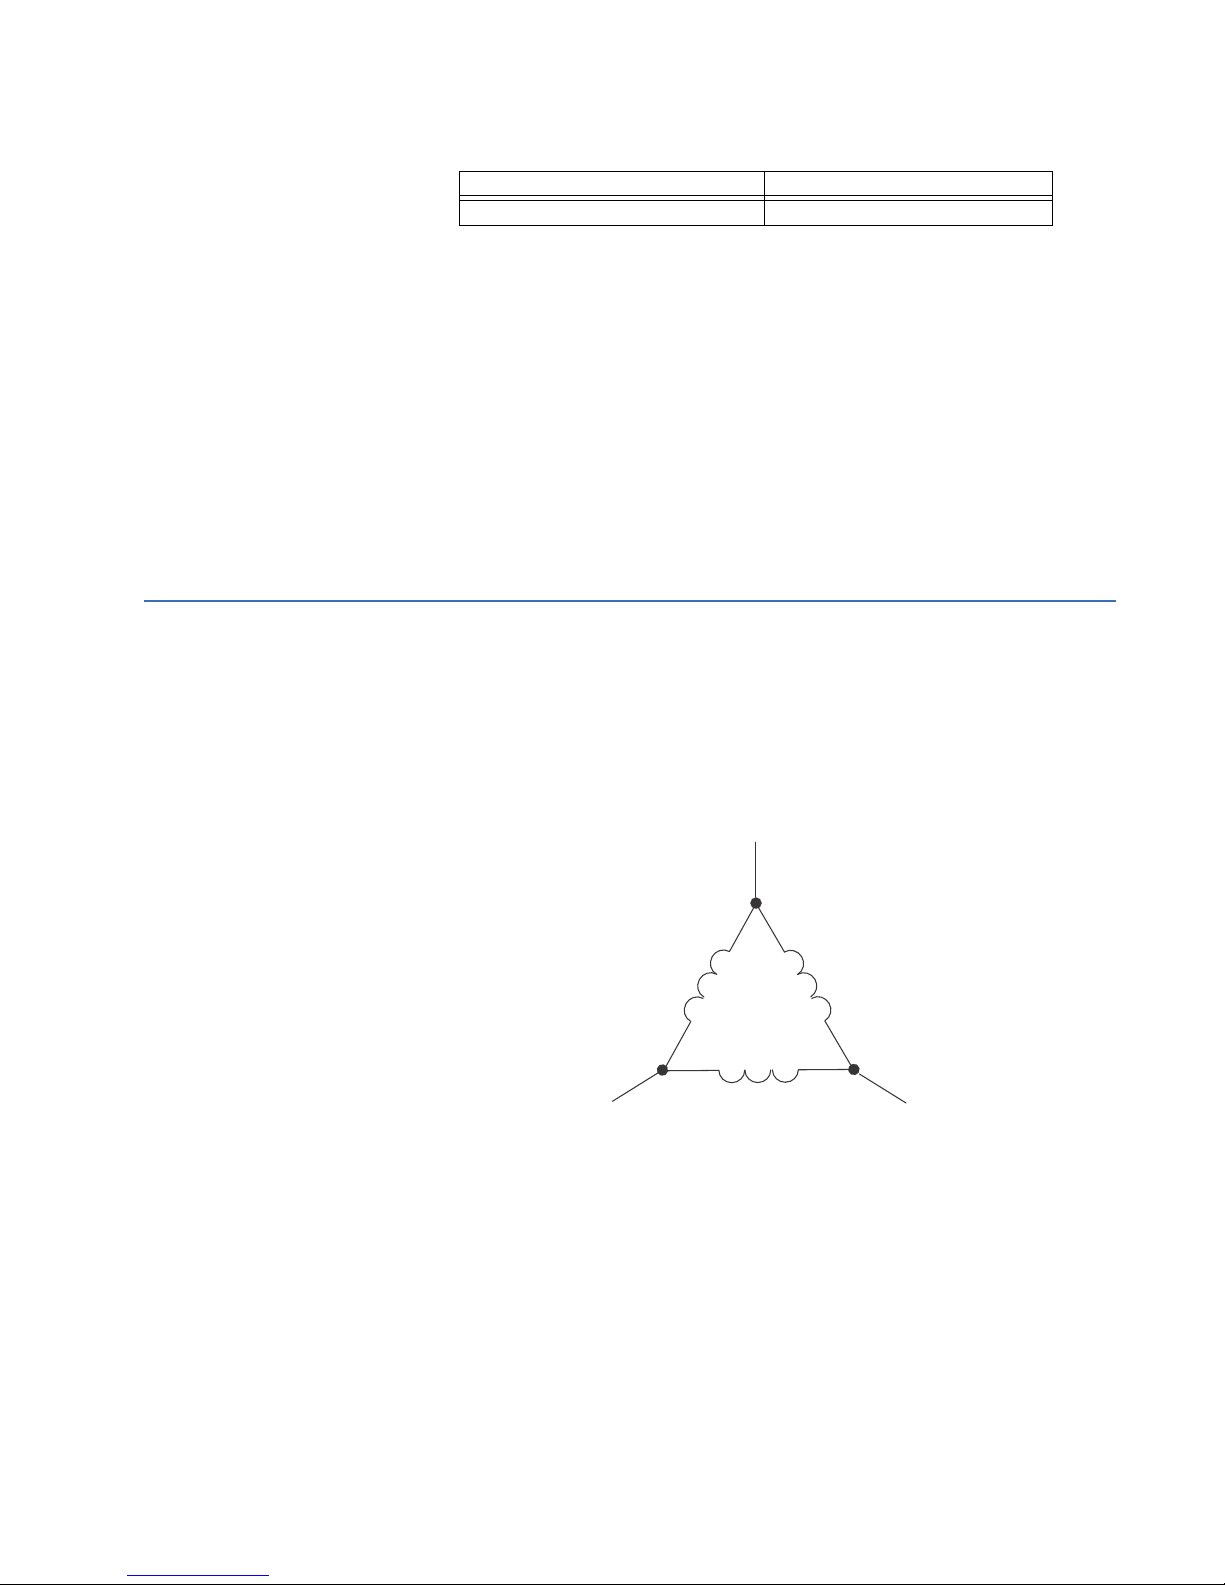
1.3 Delta Connection
Delta-connected services may be fed with either three wires or four wires. In a threephase delta service the load windings are connected from phase-to-phase rather
than from phase-to-ground. Figure 1.3 shows the physical load connections for a
delta service.
V
C
Phase 2
Phase 1
Figure 1-3: Three-phase Delta Winding Relationship
In this example of a delta service, three wires will transmit the power to the load. In a
true delta service, the phase-to-ground voltage will usually not be balanced because
the ground is not at the center of the delta.
Phase 3
Figure 1.4 shows the phasor relationships between voltage and current on a threephase delta circuit.
In many delta services, one corner of the delta is grounded. This means the phase to
ground voltage will be zero for one phase and will be full phase-to-phase voltage for
the other two phases. This is done for protective purposes.
EPM 2200 POWER METER – INSTRUCTION MANUAL 1–3
Page 10

BLONDEL’S THEOREM AND THREE PHASE MEASUREMENT CHAPTER 1: THREE-PHASE POWER MEASUREMENT
V
A
V
BC
Figure 1-4: Phasor Diagram, Three-Phase Voltages and Currents, Delta-Connected
Another common delta connection is the four-wire, grounded delta used for lighting
loads. In this connection the center point of one winding is grounded. On a 120/240
volt, four-wire, grounded delta service the phase-to-ground voltage would be 120
volts on two phases and 208 volts on the third phase. Figure 1.5 shows the phasor
diagram for the voltages in a three-phase, four-wire delta system.
V
BC
N
V
I
C
I
B
V
AB
C
V
CA
I
A
V
CA
Figure 1-5: Phasor Diagram Showing Three-phase Four-Wire Delta-Connected System
1.4 Blondel’s Theorem and Three Phase Measurement
1–4 EPM 2200 POWER METER – INSTRUCTION MANUAL
In 1893 an engineer and mathematician named Andre E. Blondel set forth the first
scientific basis for polyphase metering. His theorem states:
If energy is supplied to any system of conductors through N wires, the total power in
the system is given by the algebraic sum of the readings of N wattmeters so arranged
that each of the N wires contains one current coil, the corresponding potential coil
being connected between that wire and some common point. If this common point is
on one of the N wires, the measurement may be made by the use of N-1 Wattmeters.
V
V
AB
B
Page 11

CHAPTER 1: THREE-PHASE POWER MEASUREMENT BLONDEL’S THEOREM AND THREE PHASE MEASUREMENT
The theorem may be stated more simply, in modern language:
In a system of N conductors, N-1 meter elements will measure the power or energy
taken provided that all the potential coils have a common tie to the conductor in
which there is no current coil.
Three-phase power measurement is accomplished by measuring the three individual
phases and adding them together to obtain the total three phase value. In older
analog meters, this measurement was accomplished using up to three separate
elements. Each element combined the single-phase voltage and current to produce a
torque on the meter disk. All three elements were arranged around the disk so that the
disk was subjected to the combined torque of the three elements. As a result the disk
would turn at a higher speed and register power supplied by each of the three wires.
According to Blondel's Theorem, it was possible to reduce the number of elements
under certain conditions. For example, a three-phase, three-wire delta system could
be correctly measured with two elements (two potential coils and two current coils) if
the potential coils were connected between the three phases with one phase in
common.
In a three-phase, four-wire wye system it is necessary to use three elements. Three
voltage coils are connected between the three phases and the common neutral
conductor. A current coil is required in each of the three phases.
In modern digital meters, Blondel's Theorem is still applied to obtain proper
metering. The difference in modern meters is that the digital meter measures each
phase voltage and current and calculates the single-phase power for each phase. The
meter then sums the three phase powers to a single three-phase reading.
Some digital meters measure the individual phase power values one phase at a time.
This means the meter samples the voltage and current on one phase and calculates a
power value. Then it samples the second phase and calculates the power for the
second phase. Finally, it samples the third phase and calculates that phase power.
After sampling all three phases, the meter adds the three readings to create the
equivalent three-phase power value. Using mathematical averaging techniques, this
method can derive a quite accurate measurement of three-phase power.
More advanced meters actually sample all three phases of voltage and current
simultaneously and calculate the individual phase and three-phase power values. The
advantage of simultaneous sampling is the reduction of error introduced due to the
difference in time when the samples were taken.
EPM 2200 POWER METER – INSTRUCTION MANUAL 1–5
Page 12
POWER, ENERGY AND DEMAND CHAPTER 1: THREE-PHASE POWER MEASUREMENT
Phase B
Phase C
Phase A
A
B
C
N
Node "n"
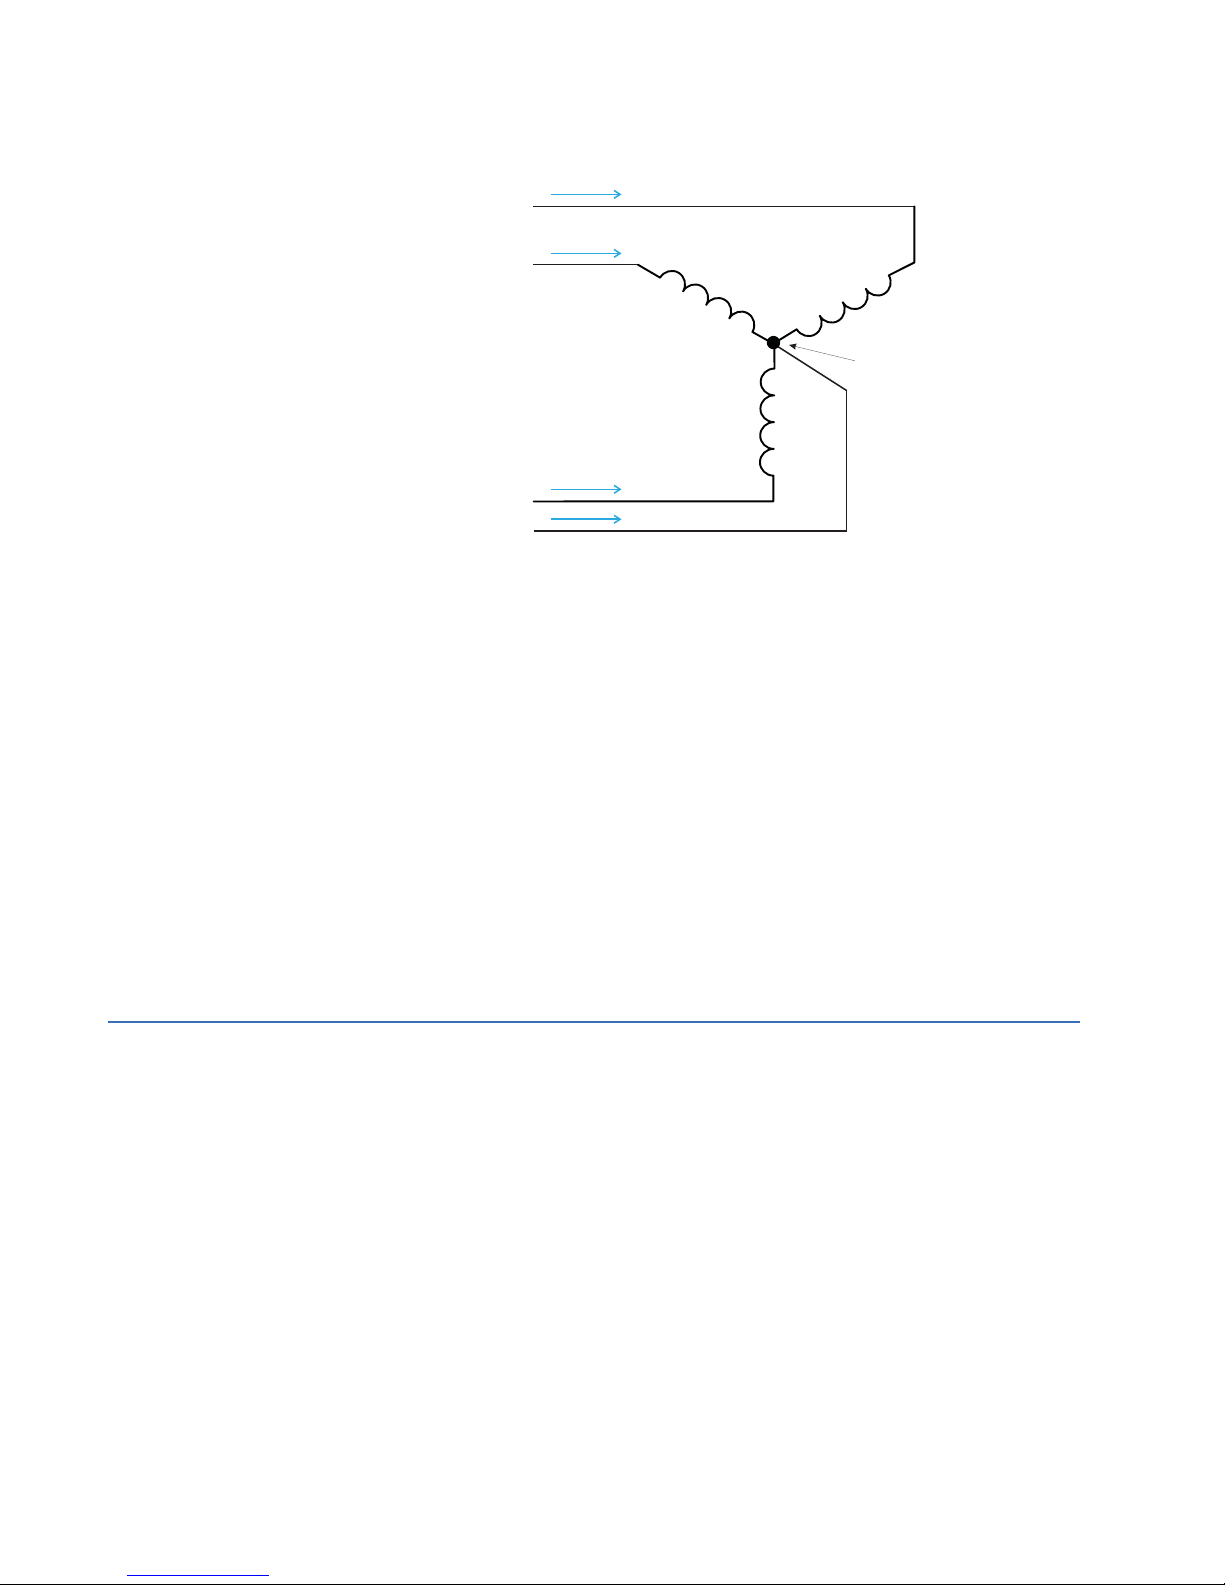
Figure 1-6: Three-Phase Wye Load Illustrating Kirchoff’s Law and Blondel’s Theorem
Blondel's Theorem is a derivation that results from Kirchoff's Law. Kirchoff's Law states
that the sum of the currents into a node is zero. Another way of stating the same thing
is that the current into a node (connection point) must equal the current out of the
node. The law can be applied to measuring three-phase loads. Figure 1.6 shows a
typical connection of a three-phase load applied to a three-phase, four-wire service.
Kirchoff's Law holds that the sum of currents A, B, C and N must equal zero or that the
sum of currents into Node "n" must equal zero.
If we measure the currents in wires A, B and C, we then know the current in wire N by
Kirchoff's Law and it is not necessary to measure it. This fact leads us to the
conclusion of Blondel's Theorem- that we only need to measure the power in three of
the four wires if they are connected by a common node. In the circuit of Figure 1.6 we
must measure the power flow in three wires. This will require three voltage coils and
three current coils (a three-element meter). Similar figures and conclusions could be
reached for other circuit configurations involving Delta-connected loads.
1.5 Power, Energy and Demand
It is quite common to exchange power, energy and demand without differentiating
between the three. Because this practice can lead to confusion, the differences
between these three measurements will be discussed.
Power is an instantaneous reading. The power reading provided by a meter is the
present flow of watts. Power is measured immediately just like current. In many digital
meters, the power value is actually measured and calculated over a one second
interval because it takes some amount of time to calculate the RMS values of voltage
and current. But this time interval is kept small to preserve the instantaneous nature
of power.
Energy is always based on some time increment; it is the integration of power over a
defined time increment. Energy is an important value because almost all electric bills
are based, in part, on the amount of energy used.
1–6 EPM 2200 POWER METER – INSTRUCTION MANUAL
Page 13

CHAPTER 1: THREE-PHASE POWER MEASUREMENT POWER, ENERGY AND DEMAND
0
10
20
30
40
50
60
70
80
1 2 3 4 5 6 7 8 9 10 11 12 13 14 15
Time (minutes)
sttawolik
Typically, electrical energy is measured in units of kilowatt-hours (kWh). A kilowatthour represents a constant load of one thousand watts (one kilowatt) for one hour.
Stated another way, if the power delivered (instantaneous watts) is measured as 1,000
watts and the load was served for a one hour time interval then the load would have
absorbed one kilowatt-hour of energy. A different load may have a constant power
requirement of 4,000 watts. If the load were served for one hour it would absorb four
kWh. If the load were served for 15 minutes it would absorb ¼ of that total or one
kWh.
Figure 1.7 shows a graph of power and the resulting energy that would be transmitted
as a result of the illustrated power values. For this illustration, it is assumed that the
power level is held constant for each minute when a measurement is taken. Each bar
in the graph will represent the power load for the one-minute increment of time. In
real life the power value moves almost constantly.
The data from Figure 1.7 is reproduced in Table 1.2 to illustrate the calculation of
energy. Since the time increment of the measurement is one minute and since we
specified that the load is constant over that minute, we can convert the power
reading to an equivalent consumed energy reading by multiplying the power reading
times 1/60 (converting the time base from minutes to hours).
Time Interval
EPM 2200 POWER METER – INSTRUCTION MANUAL 1–7
(minute)
Figure 1-7: Power Use over Time
Table 1.2: Power and Energy Relationship over Time
Power (kW) Energy (kWh) Accumulated Energy
(kWh)
1300.500.50
2500.831.33
3400.672.00
4550.922.92
5601.003.92
6601.004.92
Page 14

POWER, ENERGY AND DEMAND CHAPTER 1: THREE-PHASE POWER MEASUREMENT
Table 1.2: Power and Energy Relationship over Time
Time Interval
(minute)
7701.176.09
8701.177.26
9601.008.26
10 70 1.17 9.43
11 80 1.33 10.76
12 50 0.83 12.42
13 50 0.83 12.42
14 70 1.17 13.59
15 80 1.33 14.92
Power (kW) Energy (kWh) Accumulated Energy
(kWh)
As in Table 1.2, the accumulated energy for the power load profile of Figure 1.7 is
14.92 kWh.
Demand is also a time-based value. The demand is the average rate of energy use
over time. The actual label for demand is kilowatt-hours/hour but this is normally
reduced to kilowatts. This makes it easy to confuse demand with power, but demand
is not an instantaneous value. To calculate demand it is necessary to accumulate the
energy readings (as illustrated in Figure 1.7) and adjust the energy reading to an
hourly value that constitutes the demand.
In the example, the accumulated energy is 14.92 kWh. But this measurement was
made over a 15-minute interval. To convert the reading to a demand value, it must be
normalized to a 60-minute interval. If the pattern were repeated for an additional
three 15-minute intervals the total energy would be four times the measured value or
59.68 kWh. The same process is applied to calculate the 15-minute demand value.
The demand value associated with the example load is 59.68 kWh/hr or 59.68 kWd.
Note that the peak instantaneous value of power is 80 kW, significantly more than the
demand value.
Figure 1.8 shows another example of energy and demand. In this case, each bar
represents the energy consumed in a 15-minute interval. The energy use in each
interval typically falls between 50 and 70 kWh. However, during two intervals the
energy rises sharply and peaks at 100 kWh in interval number 7. This peak of usage
will result in setting a high demand reading. For each interval shown the demand
value would be four times the indicated energy reading. So interval 1 would have an
associated demand of 240 kWh/hr. Interval 7 will have a demand value of 400 kWh/
hr. In the data shown, this is the peak demand value and would be the number that
would set the demand charge on the utility bill.
1–8 EPM 2200 POWER METER – INSTRUCTION MANUAL
Page 15

CHAPTER 1: THREE-PHASE POWER MEASUREMENT REACTIVE ENERGY AND POWER FACTOR
0
20
40
60
80
100
12345678
Intervals (15 mins.)
sruoh-ttawolik
Figure 1-8: Energy Use and Demand
As can be seen from this example, it is important to recognize the relationships
between power, energy and demand in order to control loads effectively or to monitor
use correctly.
1.6 Reactive Energy and Power Factor
The real power and energy measurements discussed in the previous section relate to
the quantities that are most used in electrical systems. But it is often not sufficient to
only measure real power and energy. Reactive power is a critical component of the
total power picture because almost all real-life applications have an impact on
reactive power. Reactive power and power factor concepts relate to both load and
generation applications. However, this discussion will be limited to analysis of reactive
power and power factor as they relate to loads. To simplify the discussion, generation
will not be considered.
Real power (and energy) is the component of power that is the combination of the
voltage and the value of corresponding current that is directly in phase with the
voltage. However, in actual practice the total current is almost never in phase with the
voltage. Since the current is not in phase with the voltage, it is necessary to consider
both the inphase component and the component that is at quadrature (angularly
rotated 90o or perpendicular) to the voltage. Figure 1.9 shows a single-phase voltage
and current and breaks the current into its in-phase and quadrature components.
EPM 2200 POWER METER – INSTRUCTION MANUAL 1–9
Page 16

REACTIVE ENERGY AND POWER FACTOR CHAPTER 1: THREE-PHASE POWER MEASUREMENT
V
I
I
R
I
X
0
Figure 1-9: Voltage and Complex Current
The voltage (V) and the total current (I) can be combined to calculate the apparent
power or VA. The voltage and the in-phase current (IR) are combined to produce the
real power or watts. The voltage and the quadrature current (IX) are combined to
calculate the reactive power.
The quadrature current may be lagging the voltage (as shown in Figure 1.9) or it may
lead the voltage. When the quadrature current lags the voltage the load is requiring
both real power (watts) and reactive power (VARs). When the quadrature current leads
the voltage the load is requiring real power (watts) but is delivering reactive power
(VARs) back into the system; that is VARs are flowing in the opposite direction of the
real power flow.
Reactive power (VARs) is required in all power systems. Any equipment that uses
magnetization to operate requires VARs. Usually the magnitude of VARs is relatively
low compared to the real power quantities. Utilities have an interest in maintaining
VAR requirements at the customer to a low value in order to maximize the return on
plant invested to deliver energy. When lines are carrying VARs, they cannot carry as
many watts. So keeping the VAR content low allows a line to carry its full capacity of
watts. In order to encourage customers to keep VAR requirements low, some utilities
impose a penalty if the VAR content of the load rises above a specified value.
A common method of measuring reactive power requirements is power factor. Power
factor can be defined in two different ways. The more common method of calculating
power factor is the ratio of the real power to the apparent power. This relationship is
expressed in the following formula:
Total PF = real power / apparent power = watts/VA
This formula calculates a power factor quantity known as Total Power Factor. It is
called Total PF because it is based on the ratios of the power delivered. The delivered
power quantities will include the impacts of any existing harmonic content. If the
voltage or current includes high levels of harmonic distortion the power values will be
affected. By calculating power factor from the power values, the power factor will
include the impact of harmonic distortion. In many cases this is the preferred method
of calculation because the entire impact of the actual voltage and current are
included.
1–10 EPM 2200 POWER METER – INSTRUCTION MANUAL
Page 17
CHAPTER 1: THREE-PHASE POWER MEASUREMENT HARMONIC DISTORTION
Displacement PF θcos=
Time
Amps
– 1000
– 500
0
500
1000
A second type of power factor is Displacement Power Factor. Displacement PF is
based on the angular relationship between the voltage and current. Displacement
power factor does not consider the magnitudes of voltage, current or power. It is solely
based on the phase angle differences. As a result, it does not include the impact of
harmonic distortion. Displacement power factor is calculated using the following
equation:
where
θ is the angle between the voltage and the current (see Fig. 1.9).
In applications where the voltage and current are not distorted, the Total Power
Factor will equal the Displacement Power Factor. But if harmonic distortion is present,
the two power factors will not be equal.
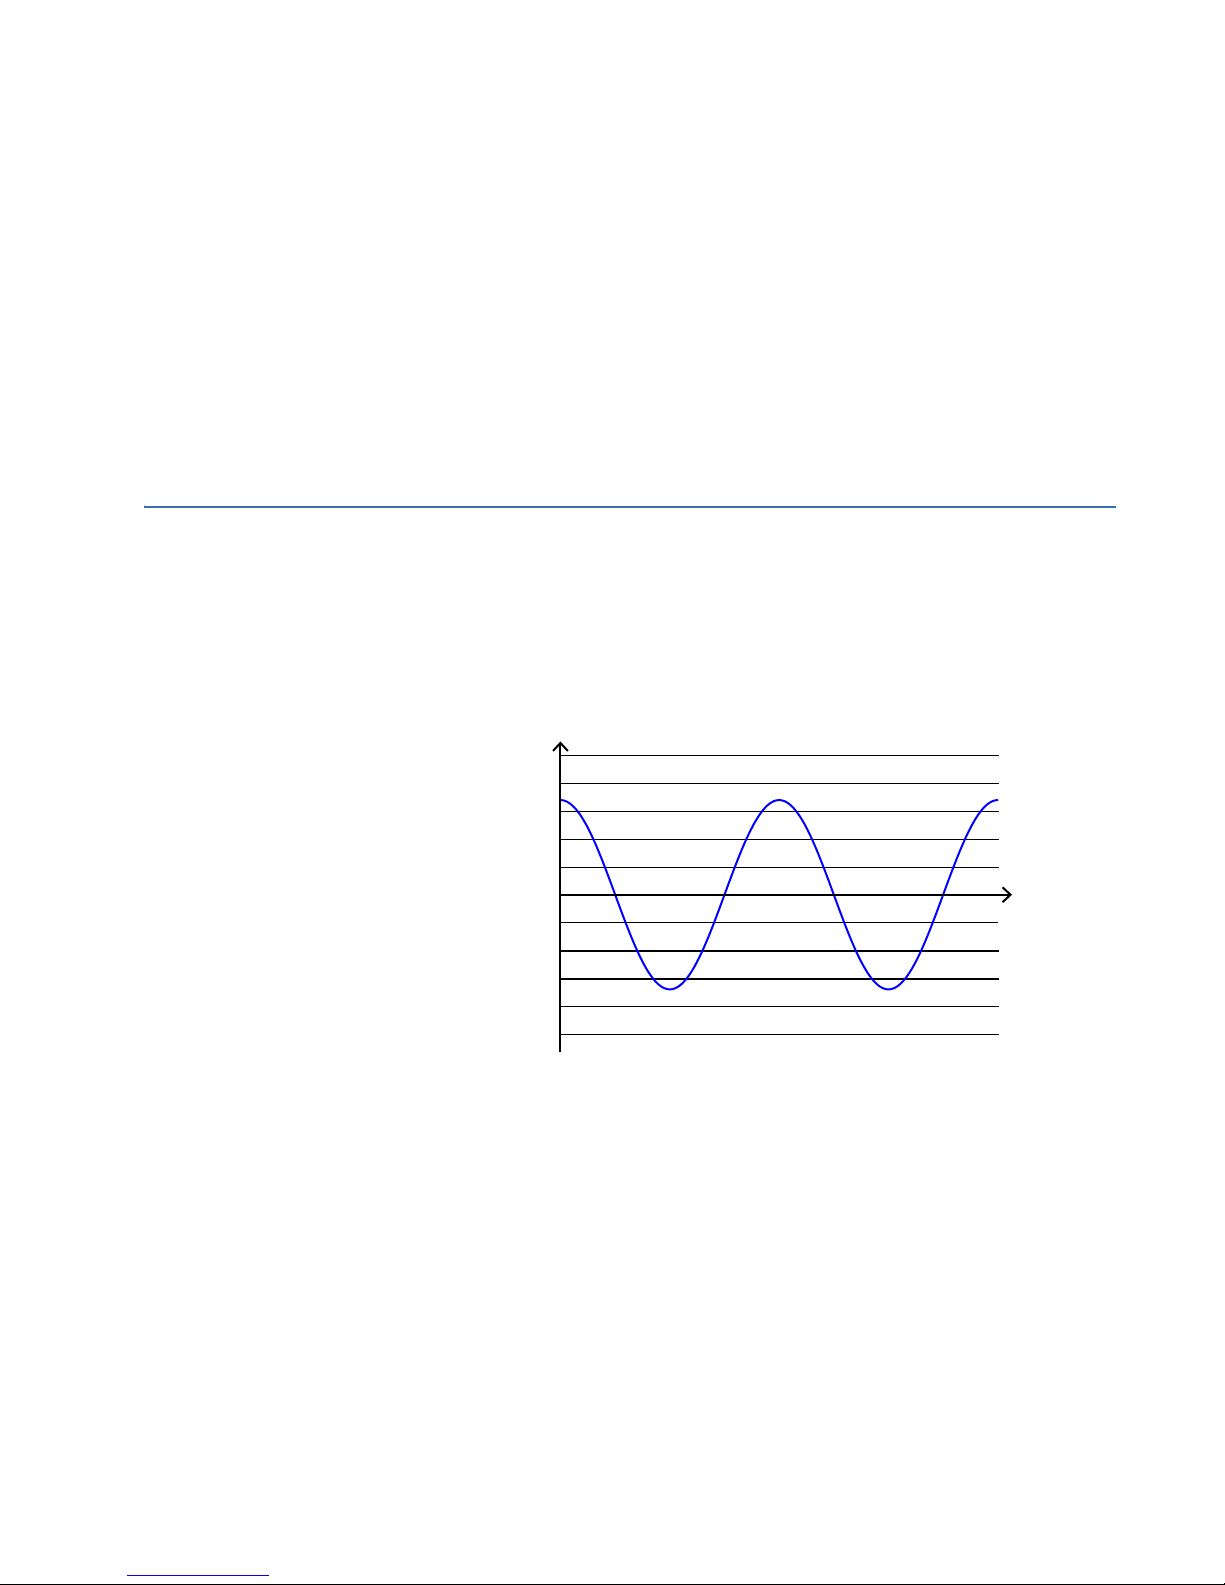
1.7 Harmonic Distortion
Harmonic distortion is primarily the result of high concentrations of non-linear loads.
Devices such as computer power supplies, variable speed drives and fluorescent light
ballasts make current demands that do not match the sinusoidal waveform of AC
electricity. As a result, the current waveform feeding these loads is periodic but not
sinusoidal. Figure 1.10 shows a normal, sinusoidal current waveform. This example
has no distortion.
Figure 1.11 shows a current waveform with a slight amount of harmonic distortion.
The waveform is still periodic and is fluctuating at the normal 60 Hz frequency.
However, the waveform is not a smooth sinusoidal form as seen in Figure 1.10.
EPM 2200 POWER METER – INSTRUCTION MANUAL 1–11
Figure 1-10: Nondistorted Current Waveform
Page 18

HARMONIC DISTORTION CHAPTER 1: THREE-PHASE POWER MEASUREMENT
–1000
–500
0
500
1000
t
)s
p
m
a(
tner
r
u
C
a
2a
–1500
1500
Time
Amps
3rd harmonic
5th harmonic
7th harmonic
Total
fundamental
– 500
0
500
1000
Figure 1-11: Distorted Current Waveform
The distortion observed in Figure 1.11 can be modeled as the sum of several
sinusoidal waveforms of frequencies that are multiples of the fundamental 60 Hz
frequency. This modeling is performed by mathematically disassembling the distorted
waveform into a collection of higher frequency waveforms.
These higher frequency waveforms are referred to as harmonics. Figure 1.12 shows
the content of the harmonic frequencies that make up the distortion portion of the
waveform in Figure 1.11.
The waveforms shown in Figure 1.12 are not smoothed but do provide an indication of
1–12 EPM 2200 POWER METER – INSTRUCTION MANUAL
the impact of combining multiple harmonic frequencies together.
When harmonics are present it is important to remember that these quantities are
operating at higher frequencies. Therefore, they do not always respond in the same
manner as 60 Hz values.
Figure 1-12: Waveforms of the Harmonics
Page 19

CHAPTER 1: THREE-PHASE POWER MEASUREMENT POWER QUALITY
Inductive and capacitive impedance are present in all power systems. We are
accustomed to thinking about these impedances as they perform at 60 Hz. However,
these impedances are subject to frequency variation.
XL = jwL and
XC = 1/jwC
At 60 Hz, w = 377; but at 300 Hz (5th harmonic) w = 1,885. As frequency changes
impedance changes and system impedance characteristics that are normal at 60 Hz
may behave entirely differently in the presence of higher order harmonic waveforms.
Traditionally, the most common harmonics have been the low order, odd frequencies,
such as the 3rd, 5th, 7th, and 9th. However newer, non-linear loads are introducing
significant quantities of higher order harmonics.
Since much voltage monitoring and almost all current monitoring is performed using
instrument transformers, the higher order harmonics are often not visible. Instrument
transformers are designed to pass 60 Hz quantities with high accuracy. These devices,
when designed for accuracy at low frequency, do not pass high frequencies with high
accuracy; at frequencies above about 1200 Hz they pass almost no information. So
when instrument transformers are used, they effectively filter out higher frequency
harmonic distortion making it impossible to see.
1.8 Power Quality
However, when monitors can be connected directly to the measured circuit (such as
direct connection to a 480 volt bus) the user may often see higher order harmonic
distortion. An important rule in any harmonics study is to evaluate the type of
equipment and connections before drawing a conclusion. Not being able to see
harmonic distortion is not the same as not having harmonic distortion.
It is common in advanced meters to perform a function commonly referred to as
waveform capture. Waveform capture is the ability of a meter to capture a present
picture of the voltage or current waveform for viewing and harmonic analysis.
Typically a waveform capture will be one or two cycles in duration and can be viewed
as the actual waveform, as a spectral view of the harmonic content, or a tabular view
showing the magnitude and phase shift of each harmonic value. Data collected with
waveform capture is typically not saved to memory. Waveform capture is a real-time
data collection event.
Waveform capture should not be confused with waveform recording that is used to
record multiple cycles of all voltage and current waveforms in response to a transient
condition.
Power quality can mean several different things. The terms “power quality” and
“power quality problem” have been applied to all types of conditions. A simple
definition of “power quality problem” is any voltage, current or frequency deviation
that results in mis-operation or failure of customer equipment or systems. The causes
of power quality problems vary widely and may originate in the customer equipment,
in an adjacent customer facility or with the utility.
EPM 2200 POWER METER – INSTRUCTION MANUAL 1–13
Page 20

POWER QUALITY CHAPTER 1: THREE-PHASE POWER MEASUREMENT
In his book Power Quality Primer, Barry Kennedy provided information on different
types of power quality problems. Some of that information is summarized in Table 1.3.
Table 1.3: Typical Power Quality Problems and Sources
Cause Disturbance Type Source
Impulse transient Transient voltage disturbance,
sub-cycle duration
Oscillatory
transient with decay
Sag/swell RMS voltage, multiple cycle
Interruptions RMS voltage, multiple
Under voltage/over
voltage
Voltage flicker RMS voltage, steady state,
Harmonic distortion Steady state current or voltage,
Transient voltage, sub-cycle
duration
duration
seconds or longer duration
RMS voltage, steady state, multiple
seconds or longer
duration
repetitive condition
long-term duration
Lightning
Electrostatic discharge
Load switching
Capacitor switching
Line/cable switching
Capacitor switching
Load switching
Remote system faults
System protection
Circuit breakers
Fuses
Maintenance
Motor starting
Load variations
Load dropping
Intermittent loads
Motor starting
Arc furnaces
Non-linear loads
System resonance
It is often assumed that power quality problems originate with the utility. While it is
true that power quality problems can originate with the utility system, many problems
originate with customer equipment. Customer-caused problems may manifest
themselves inside the customer location or they may be transported by the utility
system to another adjacent customer. Often, equipment that is sensitive to power
quality problems may in fact also be the cause of the problem.
If a power quality problem is suspected, it is generally wise to consult a power quality
professional for assistance in defining the cause and possible solutions to the
problem.
1–14 EPM 2200 POWER METER – INSTRUCTION MANUAL
Page 21

GE
Grid Solutions
Note
EPM 2200 Power Meter
Chapter 2: Overview and
Specifications
Overview and Specifications
In European Union member state countries, this meter is NOT certified for revenue
metering. See the Safety Precautions section for meter certification details.
2.1 Hardware Overview
The EPM 2200 multifunction power meters is designed for use with and/or within Industrial
Control Panels in electrical substations, panel boards, and as a power meter for OEM
equipment. EPM 2200 meters provide multifunction measurement of all electrical
parameters.
The EPM 2200 monitor is a 0.5% class electrical panel meter. Using bright and large 0.56”
LED displays, it is designed to be used in electrical panels and switchgear. The meter has a
unique anti-dither algorithm to improve reading stability. The EPM 2200 meter uses highspeed DSP technology with high-resolution A/D conversion to provide stable and reliable
measurements. UL 61010-1 does not address performance criteria for revenue generating
watt-hour meters for use in metering of utilities and/or communicating directly with
utilities, or use within a substation. Use in revenue metering, communicating with utilities,
and use in substations was verified according to the ANSI and IEC standards listed in the
Compliance Section (2.3).
The EPM 2200 meter is a meter and transducer in one compact unit. Featuring an optional
RS485 port, it can be programmed using the faceplate of the meter or through software.
ANSI or DIN mounting may be used.
EPM 2200 meter features that are detailed in this manual are as follows:
• 0.5% Class Accuracy
• Multifunction Measurement including Voltage, Current, Power, Frequency, Energy, etc.
• Percentage of Load Bar for Analog Meter Perception
• Easy to Use Faceplate Programming
• One Communication Option:
• RS485 Modbus/KYZ output (Option S)
EPM 2200 POWER METER – INSTRUCTION MANUAL 2–1
Page 22

HARDWARE OVERVIEW CHAPTER 2: OVERVIEW AND SPECIFICATIONS
• BACnet MS/TP Serial Multifunction Meter with Modbus TCP/IP Internet (Option B)
2.1.1 Voltage and Current Inputs
Universal Voltage Inputs
Voltage Inputs allow measurement to 416 Volts Line-to-Neutral and 721 Volts Line-to-Line.
One unit will perform to specification when directly connected to 69 Volt, 120 Volt, 230
Volt, 277 Volt, 277 Volt and 347 Volt power systems.
Current Inputs
The EPM 2200 meter Current Inputs use a unique dual input method:
Method 1: CT Pass Through
The CT passes directly through the meter without any physical termination on the meter.
This insures that the meter cannot be a point of failure on the CT circuit. This is preferable
for utility users when sharing relay class CTs.
Method 2: Current “Gills”
This unit additionally provides ultra-rugged Termination Pass Through Bars that allow CT
leads to be terminated on the meter. This, too, eliminates any possible point of failure at
the meter. This is a preferred technique for insuring that relay class CT integrity is not
compromised (the CT will not open in a fault condition).
2.1.2 Order Codes
The order codes for the EPM 2200 are indicated below.
Table 2–1: EPM 2200 Order Codes
PL2200
Base Unit PL2200
Enclosure Option ENC120 | | NEMA1 Rated - Indoor, Single Meter Enclosure, 120V
Software Option*
Communications Option
– * – * – *
|||
EPM 2200 Meter
ENC277 | | NEMA1 Rated - Indoor, Single Meter Enclosure, 277V
A1 |
B1 |
C1 |
BN |
Volts and Amps Meter
Volts, Amps, Power and Frequency Meter
Volts, Amps, Power, Frequency and Energy Counters Meter
BACnet Volts, Amps, Power, Frequency and Energy Counters
meter
RS485 Serial/KYZ Pulse
S
None
X
BACnet MS/TP Serial and Modbus TCP/IP Internet
B
* Software Options are only available with Communications Option S.
For example, to order an EPM 2200 to measure Volts, Amps, Power & Frequency, with
Modbus/KYZ output communications, use PL2200-XXXXXX-B1-S.
Accessories available for the EPM 2200 are indicated below.
2–2 EPM 2200 POWER METER – INSTRUCTION MANUAL
Page 23

CHAPTER 2: OVERVIEW AND SPECIFICATIONS HARDWARE OVERVIEW
Table 2–2: EPM 2200 Accessory Order Codes
PL2200 –
DIN Bracket PL2200 –
*
ACC
–
*
–
EPM 2200 Meter DIN Mounting Bracket
DIN
2.1.3 Measured Values
The following table lists the measured values available in real time, average, maximum,
and minimum.
Table 2–3: EPM 2200 Measured Values
Measured Values Real Time Average Maximum Minimum
Voltage L-N XXX
Voltage L-L XXX
Current per phase XXXX
Current Neutral X
Watts XXXX
VARs XXXX
VA XXXX
Power Factor (PF) XXXX
Positive watt-hours X
Negative watt-hours X
Net watt-hours X
Positive VAR-hours X
Negative VAR-hours X
Net VAR-hours X
VA-hours X
Frequency XXX
Voltage angles X
Current angles X
% of load bar X
2.1.4 Utility Peak Demand
The EPM 2200 provides user-configured Block (fixed) window, or Rolling window demand.
This feature allows you to set up a customized demand profile. Block window demand is
demand used over a user-configured demand period (usually 5, 15, or 30 minutes). Rolling
EPM 2200 POWER METER – INSTRUCTION MANUAL 2–3
Page 24

SPECIFICATIONS CHAPTER 2: OVERVIEW AND SPECIFICATIONS
window demand is a fixed window demand that moves for a user-specified subinterval
period. For example, a 15-minute demand using 3 subintervals and providing a new
demand reading every 5 minutes, based on the last 15 minutes.
Utility demand features can be used to calculate kW, kVAR, kVA and PF readings. All other
parameters offer maximum and minimum capability over the user-selectable averaging
period. Voltage provides an instantaneous maximum and minimum reading which
displays the highest surge and lowest sag seen by the meter.
2.2 Specifications
POWER SUPPLY
Range:.................................................Universal, (90 to 265) VAC @50/60Hz
Power consumption: ....................5 VA, 3.5 W
VOLTAGE INPUTS (MEASUREMENT CATEGORY III)
Range:.................................................Universal, Auto-ranging up to 416 V AC L-N, 721 V AC L-L
Supported hookups:.....................3-element Wye, 2.5-element Wye,
2-element Delta, 4-wire Delta
Input impedance: ..........................1 MOhm/phase
Burden:...............................................0.0144 VA/phase at 120 Volts
Pickup voltage:................................10 V AC
Connection: ......................................Screw terminal
Maximum input wire gauge: ...AWG #12 / 2.5 mm
Fault withstand:..............................Meets IEEE C37.90.1
Reading:.............................................Programmable full-scale to any PT ratio
CURRENT INPUTS
Class 10:.............................................5 A nominal, 10 A maximum
Burden:...............................................0.005 VA per phase maximum at 11 A
Pickup current:................................0.1% of nominal
Connections:....................................O or U lug;
Pass-through wire, 0.177" / 4.5 mm maximum diameter
Quick connect, 0.25" male tab
Fault Withstand (at 23°C):..........100 A / 10 seconds, 300 A / 3 seconds, 500 A / 1 second
Reading:.............................................Programmable full-scale to any CT ratio
ISOLATION
All Inputs and Outputs are galvanically isolated to 2500 V AC
ENVIRONMENTAL
Storage:..............................................–20 to 70°C
Operating: .........................................-20 to 70°C
Humidity:...........................................up to 95% RH, non-condensing
Faceplate rating:............................NEMA 12 (water resistant), mounting gasket included
METER ENCLOSURE ENVIRONMENTAL
Storage:..............................................–20 to 70°C
Operating: .........................................-10 to 50°C
Humidity:...........................................up to 95% RH, non-condensing
Faceplate rating:............................NEMA 1 (Indoor Use)
Pollution degree.............................II
Overvoltage Category.................III (this product is designed for indoor use only)
MEASUREMENT METHODS
Voltage and current: ....................True RMS
Power: .................................................Sampling at 400+ samples/cycle on all channels measured; readings
simultaneously
A/D conversion: ..............................6 simultaneous 24-bit analog-to-digital converters
2
2–4 EPM 2200 POWER METER – INSTRUCTION MANUAL
Page 25

CHAPTER 2: OVERVIEW AND SPECIFICATIONS SPECIFICATIONS
UPDATE RATE
All parameters:...............................Up to 1 second
COMMUNICATIONS FORMAT
Types: ................................................. RS485 port through back plate plus KYZ Pulse (Com Option S)
RS485 serial port and RJ45 Ethernet port through backplate (Com
Option B)
COMMUNICATIONS PORTS
Protocols:.......................................... Modbus RTU, Modbus ASCII (Com Option S)
Modbus TCP/IP, BACnet MS/TP Serial (Com Option B)
Baud rate:.........................................9600 to 57600 bps
Port address:................................... 001 to 247
Data format:....................................8 bits, no parity
MECHANICAL PARAMETERS
Dimensions:..................................... 4.25" × 4.85" × 4.85" (L × W × H)
105.4 mm × 123.2 mm × 123.2 mm (L × W × H)
Mounting:.......................................... mounts in 92 mm square DIN or ANSI C39.1, 4-inch round cut-out
Weight:............................................... 2 pounds / 0.907 kg
METER ENCLOSURE MECHANICAL PARAMETERS
Dimensions:..................................... 8.08" × 11.06" × 13.50" (L × W × H)
205.23 mm × 280.92 mm × 342.9 mm (L × W × H)
Weight:............................................... 25 pounds / 11.4 kg
KYZ/RS485 PORT SPECIFICATIONS
RS485 Transceiver; meets or exceeds EIA/TIA-485 Standard:
Type: .................................................. Two-wire, half duplex
Min. Input Impedance: ............... 96kΩ
Max. Output Current: .................. ±60mA
EPM 2200 POWER METER – INSTRUCTION MANUAL 2–5
Page 26
SPECIFICATIONS CHAPTER 2: OVERVIEW AND SPECIFICATIONS
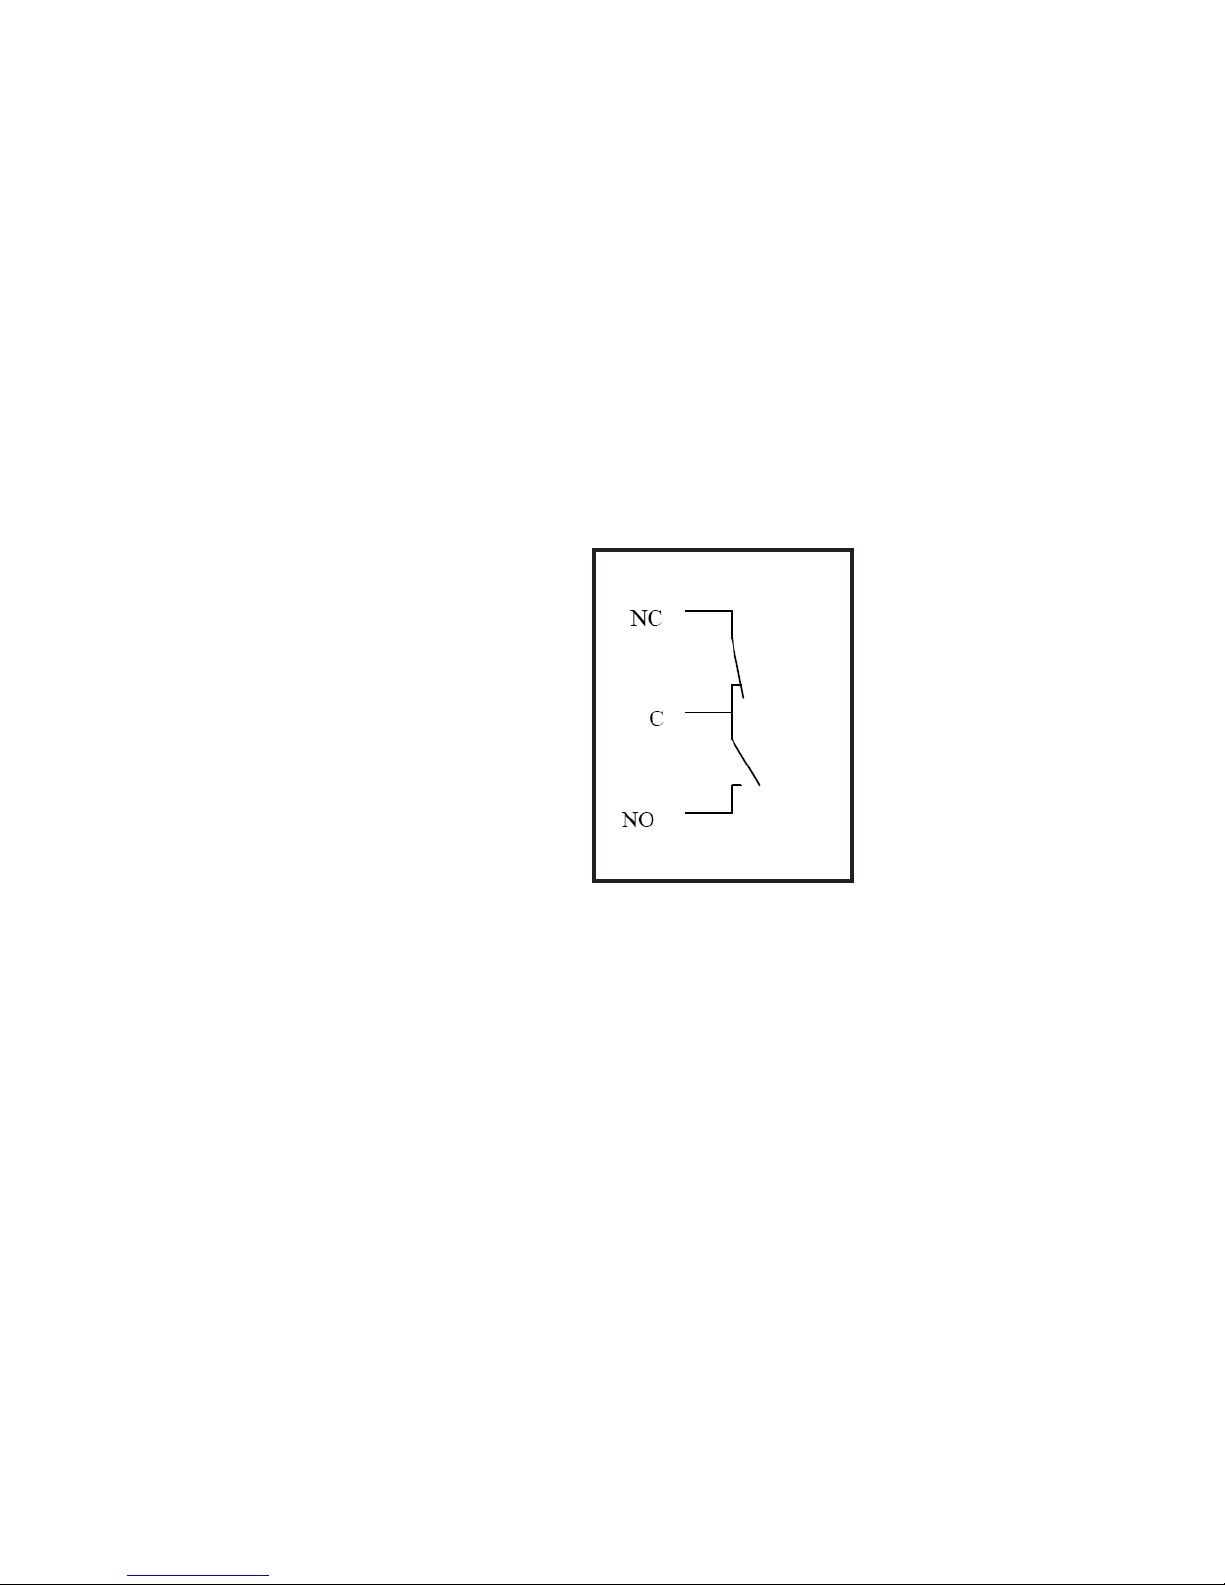
WH PULSE
KYZ output contacts (and infrared LED light pulses through face plate):
Pulse Width: ....................................40ms
Full Scale Frequency: ..................6Hz
Contact type: ..................................Solid State – SPDT (NO – C – NC)
Relay type: .......................................Solid state
Peak switching voltage: .............DC ±350V
Continuous load current: ..........120mA
Peak load current: ........................350mA for 10ms
On resistance, max.: ....................35Ω
Leakage current: ...........................1μA@350V
Isolation: ...........................................AC 3750V
Reset State: ......................................(NC - C) Closed; (NO - C) Open
Infrared LED:
Peak Spectral Wavelength: ......940nm
Reset State: ......................................Off
Figure 2-1: Internal Schematic (De-energized State)
2–6 EPM 2200 POWER METER – INSTRUCTION MANUAL
Page 27

CHAPTER 2: OVERVIEW AND SPECIFICATIONS SPECIFICATIONS
Figure 2-2: Output Timing
EPM 2200 POWER METER – INSTRUCTION MANUAL 2–7
Page 28

COMPLIANCE CHAPTER 2: OVERVIEW AND SPECIFICATIONS
2.3 Compliance
Test Reference Standard
IEC62053-22 (0.5% Accuracy)
ANSI C12.20 (0.5% Accuracy)
CE Compliant
REACH Compliant
RoHS Compliant
Surge Withstand ANSI (IEEE) C37.90.1
Burst ANSI C62.41
Electrostatic Discharge IEC61000-4-2
RF Immunity IEC61000-4-3
Fast Transient IEC61000-4-4
Surge Immunity IEC61000-4-5
Conducted Disturbance Immunity IEC61000-4-6
Magnetic Field Immunity IEC61000-4-8
Voltage Dips and Sags Immunity IEC61000-4-11
Immunity for Industrial Environments EN61000-6-2
Emission Standards for Industrial
EN61000-6-4
Environments
EMC Requirements EN61326-1
APPROVALS
Applicable Council Directive According to:
North America UL Recognized
ISO Manufactured under a registered
quality program
UL61010-1
C22.2. No 61010-1 (PICQ7)
File e200431
ISO9001
2–8 EPM 2200 POWER METER – INSTRUCTION MANUAL
Page 29

CHAPTER 2: OVERVIEW AND SPECIFICATIONS ACCURACY
NOTE
2.4 Accuracy
For 23 °C, 3 Phase balanced Wye or Delta load.
Parameter Accuracy Accuracy Input Range
Voltage L-N [V] 0.2% of reading
Voltage L-L [V] 0.4% of reading (120 to 600)V
Current Phase [A] 0.2% of reading
Current Neutral (calculated)
2% of Full Scale
[A]
Active Power Total [W] 0.5% of reading
Active Energy Total [Wh] 0.5% of reading
Reactive Power Total [VAR] 1.0% of reading
Reactive Energy Total [VARh] 1.0% of reading
Apparent Power Total [VA] 1.0% of reading
Apparent Energy Total [VAh] 1.0% of reading
Power Factor 1.0% of reading
Frequency +/- 0.01Hz (45 to 65)Hz
Load Bar +/- 1 segment
1
For 2.5 element programmed units, degrade accuracy by an additional 0.5% of reading.
2
For unbalanced voltage inputs where at least one crosses the 150V auto-scale threshold
(for example, 120V/120V/208V system), degrade accuracy by additional 0.4%.
2
(69 to 480)V
1
(0.15 to 5)A
1
(0.15 to 5)A @ (45 to 65)Hz
1,2
(0.15 to 5)A @ (69 to 480)V @ +/- (0.5 to 1) lag/lead PF
1,2
(0.15 to 5)A @ (69 to 480)V @ +/- (0.5 to 1) lag/lead PF
1,2
(0.15 to 5)A @ (69 to 480)V @ +/- (0 to 0.8) lag/lead PF
1,2
(0.15 to 5)A @ (69 to 480)V @ +/- (0 to 0.8) lag/lead PF
1,2
(0.15 to 5)A @ (69 to 480)V @ +/- (0.5 to 1) lag/lead PF
1,2
(0.15 to 5)A @ (69 to 480)V @ +/- (0.5 to 1) lag/lead PF
1,2
(0.15 to 5)A @ (69 to 480)V @ +/- (0.5 to 1) lag/lead PF
1
(0.005 to 6)A
EPM 2200 accuracy meets the IEC62053-22 Accuracy Standards for 0.5% Class Meters.
This standard is shown in the table below.
Value of Current Power Factor Percentage Error Limits for
0.01 I
n ≤ I < 0. 05 In 1 ±1.0
0.05 I
n ≤ I ≤ Imax 1 ±0.5
0.02 I
n ≤ I < 0.1 In 0.5 inductive
0.8 capacitive
0.1 I
n ≤ I ≤ Imax 0.5 inductive
0.8 capacitive
When specially requested by the
user, from:
0.1 I
n ≤ I ≤ Imax
Note
In the table above:
I
n = Nominal (5A)
max = Full Scale
I
0.25 inductive
0.8 capacitive
Meters of Class 0.5 S
±1.0
±1.0
±0.6
±0.6
±1.0
±1.0
EPM 2200 POWER METER – INSTRUCTION MANUAL 2–9
Page 30

ACCURACY CHAPTER 2: OVERVIEW AND SPECIFICATIONS
2–10 EPM 2200 POWER METER – INSTRUCTION MANUAL
Page 31

GE
Grid Solutions
3.1 Introduction
EPM 2200 Power Meter
Chapter 3: Mechanical Installation
Mechanical Installation
The EPM 2200 meter can be installed using a standard ANSI C39.1 (4" Round) or an IEC
92mm DIN (Square) form. In new installations, simply use existing DIN or ANSI punches. For
existing panels, pull out old analog meters and replace with the EPM 2200 meter. The
various models use the same installation. See Chapter 4 for wiring diagrams.
POTENTIAL ELECTRICAL EXPOSURE - The EPM 2200 must be installed in an electrical
enclosure where any access to live electrical wiring is restricted only to authorized
service personnel.
EPM 2200 POWER METER – INSTRUCTION MANUAL 3–1
Page 32

ANSI INSTALLATION STEPS CHAPTER 3: MECHANICAL INSTALLATION
DIN
Mounting
Brackets
ANSI Mounting
Rods (screw-in)
Recommended Tools for EPM 2200 Meter Installation:
• #2 Phillips screwdriver, small wrench and wire cutters.
• Mount the meter in a dry location free from dirt and corrosive substances. The meter
is designed to withstand harsh environmental conditions. (See Environmental
Specifications in 2.2 Specifications on page 2–4.)
3.2 ANSI Installation Steps
3–2 EPM 2200 POWER METER – INSTRUCTION MANUAL
Figure 3-1: EPM 2200 Mounting Information
1. Insert 4 threaded rods by hand into the back of meter. Twist until secure.
2. Slide ANSI 12 Mounting Gasket onto back of meter with rods in place.
3. Slide meter into panel.
Page 33

CHAPTER 3: MECHANICAL INSTALLATION DIN INSTALLATION STEPS
NEMA12 mounting
gasket
threaded rods
lock washer
and nut
4. Secure from back of panel with lock washer and nut on each threaded rod.
Use a small wrench to tighten. Do not overtighten. The maximum installation
torque is 0.4 Newton-Meter.
Figure 3-2: ANSI Mounting Procedure
3.3 DIN Installation Steps
1. Slide meter with NEMA 12 Mounting Gasket into panel. (Remove ANSI Studs, if
in place.)
2. From back of panel, slide 2 DIN Mounting Brackets into grooves in top and
bottom of meter housing. Snap into place.
3. Secure meter to panel with lock washer and a #8 screw through each of the 2
mounting brackets. Tighten with a #2 Phillips screwdriver. Do not overtighten.
The maximum installation torque is 0.4 Newton-Meter.
EPM 2200 POWER METER – INSTRUCTION MANUAL 3–3
Page 34

DIN INSTALLATION STEPS CHAPTER 3: MECHANICAL INSTALLATION
DIN mounting
bracket
top-mounting
bracket groove
bottom mounting
bracket groove
#8 screw
EPM 2200 meter
with NEMA 12
mounting gasket
Remove (unscrew)
ANSI studs for DIN
Installation
Figure 3-3: DIN Mounting Procedure
3–4 EPM 2200 POWER METER – INSTRUCTION MANUAL
Page 35

GE
Grid Solutions
EPM 2200 Power Meter
Chapter 4: Electrical Installation
Electrical Installation
4.1 Considerations When Installing Meters
POTENTIAL ELECTRICAL EXPOSURE - The EPM 2200/6010T must be installed in an
electrical enclosure where any access to live electrical wiring is restricted only to
authorized service personnel.
• Installation of the EPM 2200 Meter must be performed by only qualified personnel
who follow standard safety precautions during all procedures. Those personnel should
have appropriate training and experience with high voltage devices. Appropriate
safety gloves, safety glasses and protective clothing is recommended.
• During normal operation of the EPM 2200 Meter, dangerous voltages flow through
many parts of the meter, including: Terminals and any connected CTs (Current
Transformers) and PTs (Potential Transformers), all I/O Modules (Inputs and Outputs)
and their circuits. All Primary and Secondary circuits can, at times, produce lethal
voltages and currents. Avoid contact with any current-carrying surfaces.
• Do not use the meter or any I/O Output Device for primary protection or in an
energy-limiting capacity. The meter can only be used as secondary protection.
• Do not use the meter for applications where failure of the meter may cause harm or
death. Do not use the meter for any application where there may be a risk of fire.
• All meter terminals should be inaccessible after installation.
• Do not apply more than the maximum voltage the meter or any attached device can
withstand. Refer to meter and/or device labels and to the Specifications for all devices
before applying voltages. Do not HIPOT/Dielectric test any Outputs, Inputs or
Communications terminals.
EPM 2200 POWER METER – INSTRUCTION MANUAL 4–1
Page 36

CONSIDERATIONS WHEN INSTALLING METERS CHAPTER 4: ELECTRICAL INSTALLATION
• GE requires the use of Fuses for voltage leads and power supply and Shorting Blocks
to prevent hazardous voltage conditions or damage to CTs, if the meter needs to be
removed from service. CT grounding is optional, but recommended.
Note
The current inputs are only to be connected to external current transformers provided
by the installer. The CT's shall be Listed or Approved and rated for the current of the
meter used.
If the equipment is used in a manner not specified by the manufacturer, the protection
provided by the equipment may be impaired.
Note
There is no required preventive maintenance or inspection necessary for safety.
However, any repair or maintenance should be performed by the factory.
DISCONNECT DEVICE: A switch or circuit-breaker shall be included in the end-use
equipment or building installation. The switch shall be in close proximity to the
equipment and within easy reach of the operator. The switch shall be marked as the
disconnecting device for the equipment.
4.1.1 CT Leads Terminated to Meter
The EPM 2200 is designed to have Current Inputs wired in one of three ways. Figure 4-1: CT
leads terminated to meter, #8 screw for lug connection below, shows the most typical
connection where CT Leads are terminated to the meter at the Current Gills.
This connection uses Nickel-Plated Brass Studs (Current Gills) with screws at each end. This
connection allows the CT wires to be terminated using either an “O” or a “U” lug. Tighten
the screws with a #2 Phillips screwdriver. The maximum installation torque is 1 NewtonMeter.
Other current connections are shown in Figures 4-2 and 4-3. A Voltage and RS-485
Connection is shown in Figure 4-4: Voltage Connection on page 4–6.
4–2 EPM 2200 POWER METER – INSTRUCTION MANUAL
Page 37

CHAPTER 4: ELECTRICAL INSTALLATION CONSIDERATIONS WHEN INSTALLING METERS
Current gills
(nickel-plated
brass stud)
Figure 4-1: CT leads terminated to meter, #8 screw for lug connection
Wiring diagrams are detailed in the diagrams shown below in this chapter.
Communications connections are detailed in Chapter 5.
4.1.2 CT Leads Pass-Through (No Meter Termination)
The second method allows the CT wires to pass through the CT Inputs without terminating
at the meter. In this case, remove the current gills and place the CT wire directly through
the CT opening. The opening will accommodate up to 0.177" / 4.5 mm maximum diameter
CT wire.
EPM 2200 POWER METER – INSTRUCTION MANUAL 4–3
Page 38

CONSIDERATIONS WHEN INSTALLING METERS CHAPTER 4: ELECTRICAL INSTALLATION
Current gills
removed
CT wire passing
through the meter
Figure 4-2: Pass-Through Wire Electrical Connection
4–4 EPM 2200 POWER METER – INSTRUCTION MANUAL
Page 39

CHAPTER 4: ELECTRICAL INSTALLATION CONSIDERATIONS WHEN INSTALLING METERS
Crimp CT
terminations
4.1.3 Quick Connect Crimp CT Terminations
For quick termination or for portable applications, a quick connect crimp CT connection
can also be used.
EPM 2200 POWER METER – INSTRUCTION MANUAL 4–5
Figure 4-3: Quick Connect Electrical Connection
Page 40

CONSIDERATIONS WHEN INSTALLING METERS CHAPTER 4: ELECTRICAL INSTALLATION
Power supply
inputs
Voltage
inputs
RS485 outputs
(do not place voltage
on these terminals!)
4.1.4 Voltage and Power Supply Connections
Voltage Inputs are connected to the back of the unit via a optional wire connectors. The
connectors accommodate up to AWG#12 / 2.5 mm wire.
Figure 4-4: Voltage Connection
4.1.5 Ground Connections
The EPM 2200 ground terminals ( ) should be connected directly to the installation's
protective earth ground. Use 2.5 mm wire for this connection.
4.1.6 Voltage Fuses
GE requires the use of fuses on each of the sense Voltages and on the control power.
• Use a 0.1 Amp fuse on each voltage input.
• Use a 3.0 Amp fuse on the Power Supply.
4–6 EPM 2200 POWER METER – INSTRUCTION MANUAL
Page 41

CHAPTER 4: ELECTRICAL INSTALLATION ELECTRICAL CONNECTION DIAGRAMS
4.2 Electrical Connection Diagrams
4.2.1 Description
Choose the diagram that best suits your application and maintains the CT polarity.
(1) Wye, 4-Wire with no PTs and 3 CTs, no PTs, 3 Element on page 4–8.
(1a) Dual Phase Hookup on page 4–9.
(1b) Single Phase Hookup on page 4–10.
(2) Wye, 4-Wire with no PTs and 3 CTs, 2.5 Element on page 4–11.
(3) Wye, 4-Wire with 3 PTs and 3 CTs, 3 Element on page 4–12.
(4) Wye, 4-Wire with 2 PTs and 3 CTs, 2.5 Element on page 4–13.
(5) Delta, 3-Wire with no PTs, 2 CTs on page 4–14.
(6) Delta, 3-Wire with 2 PTs, 2 CTs on page 4–15.
(7) Delta, 3-Wire with 2 PTs, 3 CTs on page 4–16.
(8) Current-Only Measurement (Three-Phase) on page 4–17.
(9) Current-Only Measurement (Dual-Phase) on page 4–18.
(10) Current-Only Measurement (Single-Phase) on page 4–19.
EPM 2200 POWER METER – INSTRUCTION MANUAL 4–7
Page 42

ELECTRICAL CONNECTION DIAGRAMS CHAPTER 4: ELECTRICAL INSTALLATION
lc
HI
LO
lb
HI
LO
la
HI
LO
Earth Ground
L(+)
Power
Supply
Connection
N(-)
L(+)
GND
N(-)
Vref
Va
Vb
Vc
LINE
LOAD
CT
Shorting
Block
FUSES
3 x 0.1A
FUSE
3A
C
C
B
B
A
A
N
N
4.2.2 (1) Wye, 4-Wire with no PTs and 3 CTs, no PTs, 3 Element
For this wiring type, select 3ELWYE (3-element Wye) in the meter programming setup.
4–8 EPM 2200 POWER METER – INSTRUCTION MANUAL
Figure 4-5: 4-Wire Wye with no PTs and 3 CTs, 3 Element
Page 43

CHAPTER 4: ELECTRICAL INSTALLATION ELECTRICAL CONNECTION DIAGRAMS
lc
HI
LO
lb
HI
LO
la
HI
LO
Earth Ground
x
L(+)
Power
Supply
Connection
N(-)
L(+)
GND
N(-)
Vref
Va
Vb
Vc
LINE
LOAD
CT
Shorting
Block
FUSES
2 x 0.1A
FUSE
3A
C
C
B
B
A
A
N
N
Figure 4-6: (1a) Dual Phase Hookup
EPM 2200 POWER METER – INSTRUCTION MANUAL 4–9
Page 44

ELECTRICAL CONNECTION DIAGRAMS CHAPTER 4: ELECTRICAL INSTALLATION
lc
HI
LO
lb
HI
LO
la
HI
LO
Earth Ground
x
L(+)
Power
Supply
Connection
N(-)
L(+)
GND
N(-)
Vref
Va
Vb
Vc
LINE
LOAD
CT
Shorting
Block
x
FUSE
0.1A
FUSE
3A
C
C
B
B
A
A
N
N
Figure 4-7: (1b) Single Phase Hookup
4–10 EPM 2200 POWER METER – INSTRUCTION MANUAL
Page 45

lc
HI
LO
lb
HI
LO
la
HI
LO
Earth Ground
L(+)
Power
Supply
Connection
N(-)
L(+)
GND
N(-)
Vref
Va
Vb
Vc
LINE
LOAD
CT
Shorting
Block
FUSES
2 x 0.1A
FUSE
3A
C
C
B
B
A
A
N
N
CHAPTER 4: ELECTRICAL INSTALLATION ELECTRICAL CONNECTION DIAGRAMS
4.2.3 (2) Wye, 4-Wire with no PTs and 3 CTs, 2.5 Element
For this wiring type, select 2.5EL WYE (2.5-element Wye) in the meter programming setup.
EPM 2200 POWER METER – INSTRUCTION MANUAL 4–11
Figure 4-8: 4-Wire Wye with no PTs and 3 CTs, 2.5 Element
Page 46

ELECTRICAL CONNECTION DIAGRAMS CHAPTER 4: ELECTRICAL INSTALLATION
lc
HI
LO
lb
HI
LO
la
HI
LO
Earth Ground
Earth Ground
L(+)
Power
Supply
Connection
N(-)
L(+)
GND
N(-)
Vref
Va
Vb
Vc
LINE
LOAD
CT
Shorting
Block
FUSES
3 x 0.1A
FUSE
3A
C
C
B
B
A
A
N
N
4.2.4 (3) Wye, 4-Wire with 3 PTs and 3 CTs, 3 Element
For this wiring type, select 3ELWYE (3-element Wye) in the meter programming setup.
4–12 EPM 2200 POWER METER – INSTRUCTION MANUAL
Figure 4-9: 4-Wire Wye with 3 PTs and 3 CTs, 3 Element
Page 47

CHAPTER 4: ELECTRICAL INSTALLATION ELECTRICAL CONNECTION DIAGRAMS
lc
HI
LO
lb
HI
LO
la
HI
LO
Earth Ground
Earth Ground
L(+)
Power
Supply
Connection
N(-)
L(+)
GND
N(-)
Vref
Va
Vb
Vc
LINE
LOAD
CT
Shorting
Block
FUSES
2 x 0.1A
FUSE
3A
C
C
B
B
A
A
N
N
4.2.5 (4) Wye, 4-Wire with 2 PTs and 3 CTs, 2.5 Element
For this wiring type, select 2.5EL WYE (2.5-element Wye) in the meter programming setup.
EPM 2200 POWER METER – INSTRUCTION MANUAL 4–13
Figure 4-10: 4-Wire Wye with 2 PTs and 3 CTs, 2.5 Element
Page 48

lc
HI
LO
lb
HI
LO
la
HI
LO
Earth Ground
L(+)
Power
Supply
Connection
N(-)
L(+)
GND
N(-)
Vref
Va
Vb
Vc
LINE
LOAD
CT
Shorting
Block
FUSES
3 x 0.1A
FUSE
3A
C
C
B
B
A
A
ELECTRICAL CONNECTION DIAGRAMS CHAPTER 4: ELECTRICAL INSTALLATION
4.2.6 (5) Delta, 3-Wire with no PTs, 2 CTs
For this wiring type, select 2CtdEL (2 CT Delta) in the meter programming setup.
4–14 EPM 2200 POWER METER – INSTRUCTION MANUAL
Figure 4-11: 3-Wire Delta with no PTs and 2 CTs
Page 49

CHAPTER 4: ELECTRICAL INSTALLATION ELECTRICAL CONNECTION DIAGRAMS
4.2.7 (6) Delta, 3-Wire with 2 PTs, 2 CTs
For this wiring type, select 2CtdEL (2 CT Delta) in the meter programming setup.
LINE
B
A
C
CT
Shorting
Block
Earth Ground
HI
lc
LO
FUSES
2 x 0.1A
lb
Power
Supply
Connection
GND
FUSE
HI
HI
la
LO
LO
L(+)
N(-)
Vref
Va
Vb
Vc
3A
L(+)
N(-)
B
A
C
LOAD
EPM 2200 POWER METER – INSTRUCTION MANUAL 4–15
Earth Ground
Figure 4-12: 3-Wire Delta with 2 PTs and 2 CTs
Page 50

ELECTRICAL CONNECTION DIAGRAMS CHAPTER 4: ELECTRICAL INSTALLATION
lc
HI
LO
lb
HI
LO
la
HI
LO
Earth Ground
Earth Ground
L(+)
Power
Supply
Connection
N(-)
L(+)
GND
N(-)
Vref
Va
Vb
Vc
LINE
LOAD
CT
Shorting
Block
FUSES
2 x 0.1A
FUSE
3A
C
C
B
B
A
A
4.2.8 (7) Delta, 3-Wire with 2 PTs, 3 CTs
For this wiring type, select 2CtdEL (2 CT Delta) in the meter programming setup.
4–16 EPM 2200 POWER METER – INSTRUCTION MANUAL
Figure 4-13: 3-Wire Delta with 2 PTs and 3 CTs
Page 51

CHAPTER 4: ELECTRICAL INSTALLATION ELECTRICAL CONNECTION DIAGRAMS
lc
HI
LO
lb
HI
LO
la
HI
LO
Earth Ground
L(+)
Power
Supply
Connection
N(-)
L(+)
GND
N(-)
Vref
Va
Vb
Vc
LINE
LOAD
CT
Shorting
Block
FUSE
3A
FUSE
0.1A
20VAC
Minimum
C
C
B
B
A
A
4.2.9 (8) Current-Only Measurement (Three-Phase)
For this wiring type, select 3ELWYE (3 Element Wye) in the meter programming setup.
Note
Even if the meter is used only for current measurement, the unit requires a AN volts
reference. Please ensure that the voltage input is attached to the meter. AC control power
can be used to provide the reference signal.
Figure 4-14: Current-Only Measurement (Three-Phase)
EPM 2200 POWER METER – INSTRUCTION MANUAL 4–17
Page 52

ELECTRICAL CONNECTION DIAGRAMS CHAPTER 4: ELECTRICAL INSTALLATION
lc
HI
LO
lb
HI
LO
la
HI
LO
Earth Ground
L(+)
Power
Supply
Connection
N(-)
L(+)
GND
N(-)
Vref
Va
Vb
Vc
LINE
LOAD
CT
Shorting
Block
FUSE
3A
FUSE
0.1A
20VAC
Minimum
B
B
A
A
4.2.10 (9) Current-Only Measurement (Dual-Phase)
For this wiring type, select 3ELWYE (3 Element Wye) in the meter programming setup.
Figure 4-15: Current-Only Measurement (Dual-Phase)
Note
Even if the meter is used only for current measurement, the unit requires a AN volts
reference. Please ensure that the voltage input is attached to the meter. AC control power
can be used to provide the reference signal.
4–18 EPM 2200 POWER METER – INSTRUCTION MANUAL
Page 53

CHAPTER 4: ELECTRICAL INSTALLATION ELECTRICAL CONNECTION DIAGRAMS
lc
HI
LO
lb
HI
LO
la
HI
LO
Earth Ground
L(+)
Power
Supply
Connection
N(-)
L(+)
GND
N(-)
Vref
Va
Vb
Vc
LINE
LOAD
CT
Shorting
Block
FUSE
3A
FUSE
0.1A
20VAC
Minimum
N
N
A
A
4.2.11 (10) Current-Only Measurement (Single-Phase)
For this wiring type, select 3ELWYE (3 Element Wye) in the meter programming setup.
Figure 4-16: Current-Only Measurement (Single-Phase)
Note
Even if the meter is used only for current measurement, the unit requires a AN volts
reference. Please ensure that the voltage input is attached to the meter. AC control power
can be used to provide the reference signal.
EPM 2200 POWER METER – INSTRUCTION MANUAL 4–19
Page 54

ELECTRICAL CONNECTION DIAGRAMS CHAPTER 4: ELECTRICAL INSTALLATION
4–20 EPM 2200 POWER METER – INSTRUCTION MANUAL
Page 55

GE
Grid Solutions
EPM 2200 Power Meter
Chapter 5: Com Option S: Modbus/
KYZ output
Com Option S: Modbus/KYZ output
The Communication Options available for the EPM 2200 are connected and used in
different ways.
• Com Option S: Modbus/KYZ output is explained here in Chapter 5.
• Com Option B: BACnet MS/TP with Modbus TCP/IP Internet is explained in Chapter 7 on
page 7-1.
5.1 Connecting to the RS485/KYZ Output Port
The EPM 2200 Meter with Communications Option S provides a combination RS485 and a
KYZ Pulse Output for pulsing energy values. The RS485 / KYZ Combo is located on the
terminal section of the meter, and provides RS485 communication speaking Modbus ASCII
and Modbus RTU protocols.
The EPM 2200 meter’s RS485 port can be programmed with the buttons on the face of the
meter or by using GE Communicator software.
The standard RS485 Port Settings are as follows:
• Address: 001 to 247
• Baud Rate: 9600, 19200, 38400 or 57600
• Protocol: Modbus RTU, Modbus ASCII
Details of changing the RS485 port settings are given in Chapter 6, using the faceplate: 6.1
Programming Using the Faceplate on page 6–1, and using the GE Communicator software:
6.4.2 How to Connect Using GE Communicator Software on page 6–17.
EPM 2200 POWER METER – INSTRUCTION MANUAL 5–1
Page 56

CONNECTING TO THE RS485/KYZ OUTPUT PORT CHAPTER 5: COM OPTION S: MODBUS/KYZ OUTPUT
Figure 5-1: 485P Option with RS-485 Communication Installation
RS485 allows you to connect one or multiple EPM 2200 meters to a PC or other device, at
either a local or remote site. All RS485 connections are viable for up to 4000 feet (1219.20
meters).
Figure 5-2: EPM 2200 Connected to PC via RS485
As shown in Figure 5-2, to connect a EPM 2200 to a PC, you need to use an RS485 to RS232
converter.
Figure 5-3 below, shows the detail of a 2-wire RS485 connection.
5–2 EPM 2200 POWER METER – INSTRUCTION MANUAL
Page 57

CHAPTER 5: COM OPTION S: MODBUS/KYZ OUTPUT CONNECTING TO THE RS485/KYZ OUTPUT PORT
NOTE
+
-
SH
EPM2200 Meter
RS485 Connection
- Connect (-) to (-)
- Connect (+) to (+)
Twisted Pair, Shielded Cable
From other RS-485 device:
- Connect Shield (SH)
to Shield (SH)
SH
+
-
Figure 5-3: 2-wire RS485 Connection
Note
For All RS485 Connections:
• Use a shielded twisted pair cable 22 AWG (0.33 mm2) or larger, grounding the shield at
one end only.
• Establish point-to-point configurations for each device on a RS485 bus: connect ’+’
terminals to ’+’ terminals; connect ’-’ terminals to ’-’ terminals.
• You may connect up to 31 meters on a single bus using RS485. Before assembling the
bus, each meter must be assigned a unique address: refer to the GE Communicator
Instruction Manual.
• Protect cables from sources of electrical noise.
• Avoid both “Star” and “Tee” connections (see Figure 5.5).
• No more than two cables should be connected at any one point on an RS485 network,
whether the connections are for devices, converters, or terminal strips.
• Include all segments when calculating the total cable length of a network. If you are
not using an RS485 repeater, the maximum length for cable connecting all devices is
4000 feet (1219.20 meters).
• Connect shield to RS485 Master and individual devices as shown in Figure 5.4. You
may also connect the shield to earth-ground at one point.
• Termination Resistors (RT) may be needed on both ends of longer length transmission
lines. However, since the meter has some level of termination internally, Termination
Resistors may not be needed. When they are used, the value of the Termination
Resistors is determined by the electrical parameters of the cable.
Figure 5-4 shows a representation of an RS485 Daisy Chain connection.
EPM 2200 POWER METER – INSTRUCTION MANUAL 5–3
Figure 5-4: RS485 Daisy Chain Connection
Page 58

CONNECTING TO THE RS485/KYZ OUTPUT PORT CHAPTER 5: COM OPTION S: MODBUS/KYZ OUTPUT
Figure 5-5: Incorrect “T” and “Star” Topologies
5–4 EPM 2200 POWER METER – INSTRUCTION MANUAL
Page 59

GE
Grid Solutions
EPM 2200 Power Meter
Chapter 6: Using the Meter
Using the Meter
You can use the Elements and Buttons on the EPM 2200 meter face to view meter
readings, reset and/or configure the meter, and perform related functions. You can also
use the GE Communicator software to configure the meter through communication.
The following sections explain meter programming, first by using the faceplate and then
with GE Communicator software.
6.1 Programming Using the Faceplate
The EPM 2200 meter can be configured and a variety of functions can be accomplished
simply by using the Elements and the Buttons on the meter face. Complete Navigation
Maps can be found in Appendix A of this manual.
EPM 2200 POWER METER – INSTRUCTION MANUAL 6–1
Page 60

PROGRAMMING USING THE FACEPLATE CHAPTER 6: USING THE METER
Parameter
designator
% of Load Bar
Reading
type indicator
Scale Selector
ENTER
button
RIGHT
button
DOWN
button
MENU
button
6.1.1 Meter Face Elements
Figure 6-1: Faceplate of EPM 2200 Meter with Elements
The meter face features the following elements:
• Reading Type Indicator:
Indicates Type of Reading
• % of Load Bar:
Graphic Display of Amps as % of the Load
• Parameter Designator:
Indicates Reading Displayed
• Scaling Factor:
Kilo or Mega multiplier of Displayed Readings
6.1.2 Meter Face Buttons
Figure 6-2: EPM 2200 Faceplate Buttons
6–2 EPM 2200 POWER METER – INSTRUCTION MANUAL
Page 61

CHAPTER 6: USING THE METER PROGRAMMING USING THE FACEPLATE
Using Menu, Enter, Down and Right Buttons, perform the following functions:
• View Meter Information
• Enter Display Modes
• Configure Parameters (Password Protected)
•Perform Resets
• Perform LED Checks
• Change Settings
• View Parameter Values
• Scroll Parameter Values
The EPM 2200 has three MODES:
• Operating Mode (Default)
• Reset Mode
• Configuration Mode.
The MENU, ENTER, DOWN and RIGHT buttons navigate through the modes and navigate
through all the screens in each mode.
In this chapter, a typical set up will be demonstrated. Other settings are possible. The
complete Navigation Map for the Display Modes is in Appendix A of this manual. The meter
can also be configured with software (see GE Communicator Instruction Manual).
6.1.3 Start Up
Upon Power Up, the meter will display a sequence of screens. The sequence includes the
following screens:
• Lamp Test Screen where all LEDs are lighted
• Lamp Test Screen where all digits are lighted
• Firmware Screen showing build number
• Error Screen (if an error exists)
If auto-scrolling is enabled, the EPM 2200 will then automatically Auto-Scroll the
Parameter Designators on the right side of the front panel. Values are displayed for each
parameter.
The KILO or MEGA LED lights, showing the scale for the Wh, VARh and VAh readings.
An example of a Wh reading is shown here.
EPM 2200 POWER METER – INSTRUCTION MANUAL 6–3
Page 62

PROGRAMMING USING THE FACEPLATE CHAPTER 6: USING THE METER
Figure 6-3: Typical Wh Reading
The EPM 2200 will continue to scroll through the Parameter Designators, providing
readings until one of the buttons on the front panel is pushed, causing the meter to enter
one of the other MODES.
6.1.4 Main Menu
Push the MENU button. The MAIN MENU screen appears.
•The Reset mode (rSt) appears in the A window. Use the Down button to scroll,
causing the Configuration (CFG), and Operating (OPr) modes to move to the A
window.
• The mode that is currently flashing in the A window is the “Active” mode, which
means it is the mode that can be configured.
Press the ENTER button from the Main Menu to view the Parameters screen for the mode
that is currently active.
6.1.5 Reset Mode
1. Push ENTER while rSt is in the A Screen and the rSt ALL? no screen appears.
6–4 EPM 2200 POWER METER – INSTRUCTION MANUAL
Figure 6-4: Main Menu Screens
Page 63

CHAPTER 6: USING THE METER PROGRAMMING USING THE FACEPLATE
NOTE
.
• If you push ENTER again, the Main Menu continues to scroll. (The DOWN button does
not change the screen.)
• If you push the RIGHT button, the rSt All? YES screen appears. Press Enter to perform
a reset.
Note
Note
CAUTION! All Max and Min values will be reset.
If Password protection is enabled in the software for reset, you must enter the four
digit password before you can reset the meter.
2. Once you have performed a reset, the screen displays rSt ALL donE and then resumes
auto-scrolling parameters.
6.1.6 Enter Password (if enabled)
If PASSWORD is Enabled in the software (see 6.4.3 Device Profile Settings on page 6–20 to
Enable/Change Password), a screen appears requesting the Password. PASS appears in the
A Screen and 4 dashes in the B Screen. The LEFT digit is flashing.
1. Use the DOWN button to scroll from 0 to 9 for the flashing digit. When the correct
number appears for that digit, use the RIGHT button to move to the next digit.
Example: On the Password screens below:
• On the left screen, four dashes appear and the left digit is flashing.
• On the right screen, 2 digits have been entered and the third digit is flashing.
EPM 2200 POWER METER – INSTRUCTION MANUAL 6–5
Page 64

PROGRAMMING USING THE FACEPLATE CHAPTER 6: USING THE METER
.
PASS or FAIL:
2. When all 4 digits have been entered, push ENTER.
If the correct Password has been entered, rSt ALL donE appears and the screen
returns to Auto-Scroll the Parameters. (In other Modes, the screen returns to the
screen to be changed. The left digit of the setting is flashing and the Program (PRG)
LED flashes on the left side of the meter face.)
.
If an incorrect Password has been entered, PASS ---- FAIL appears and the screen
returns to rSt ALL? YES.
.
6.1.7 Configuration Mode
Navigating the configuration mode menu.
1. Press the MENU Button from any of the auto-scrolling readings.
2. Press DOWN to display the Configuration Mode (CFG) string in the A screen.
6–6 EPM 2200 POWER METER – INSTRUCTION MANUAL
Page 65

CHAPTER 6: USING THE METER PROGRAMMING USING THE FACEPLATE
3. Press ENTER to scroll through the configuration parameters, starting at the
SCrL Ct Pt screen.
4. Push the DOWN Button to scroll all the parameters: scroll, CT, PT, connection
(Cnct) and port.
The active parameter is always flashing and displayed in the A screen.
Programming the screen for configuration mode.
1. Press the DOWN or RIGHT button (for example, from the Ct-n message below)
to display the password screen, if enabled in the software.
2. Use the DOWN and RIGHT buttons to enter the correct password (refer to
Reset Mode on page 7–4 for steps on password entry).
3. Once the correct password is entered, push ENTER.
The Ct-n message will reappear, the PRG faceplate LED will flash, and the first
digit of the “B” screen will also flash.
EPM 2200 POWER METER – INSTRUCTION MANUAL 6–7
4. Use the DOWN button to change the first digit.
5. Use the RIGHT button to select and change the successive digits.
6. When the new value is entered, push ENTER twice.
This will display the Stor ALL? no screen.
Page 66

PROGRAMMING USING THE FACEPLATE CHAPTER 6: USING THE METER
7. Use the RIGHT button to scroll to change the value from no to YES.
8. When the Stor ALL? YES message is displayed, press ENTER to change the
setting.
The Stor ALL donE message will appear and the meter will reset.
6.1.8 Configuring the Scroll Feature
When in Auto Scroll mode, the meter performs a scrolling display, showing each
parameter for 7 seconds, with a 1 second pause between parameters. The parameters
that the meter displays are determined by the following:
• They have been selected through software (refer to the GE Communicator Instruction
Manual).
• They are available through the appropriate software options (see 2.1.2 Order Codes on
page 2–2).
Use the following procedure to configure the scroll feature.
1. Press the ENTER button to display the SCrL no message.
2. Press the RIGHT button to change the display to SCrL YES as shown below.
6–8 EPM 2200 POWER METER – INSTRUCTION MANUAL
Page 67

CHAPTER 6: USING THE METER PROGRAMMING USING THE FACEPLATE
Figure 6-5: Scroll Mode Configuration
3. Push ENTER to select YES or no.
The screen scrolls to the CT parameters.
6.1.9 Configuring the CT Setting
Use the following procedure to program the CT setting.
1. Push the DOWN Button to scroll through the configuration mode parameters.
Press ENTER when Ct is the active parameter (i.e. it is in the A screen and flashing).
This will display the and the Ct-n (CT numerator) screen.
The Ct-d value is preset to a 1 or 5 A at the factory and cannot be changed.
EPM 2200 POWER METER – INSTRUCTION MANUAL 6–9
2. Press ENTER again to change to display the Ct-d (CT denominator) screen.
3. Press ENTER again to select the to Ct-S (CT scaling) value.
Page 68

PROGRAMMING USING THE FACEPLATE CHAPTER 6: USING THE METER
NOTE
NOTE
The Ct-S value can be “1”, “10”, or “100”. Refer to Programming the screen for configuration
mode. on page 6–7 for instructions on changing values.
Example settings for the Ct-S value are shown below:
200/5 A: set the Ct-n value for “200” and the Ct-S value for “1”
800/5 A: set the Ct-n value for “800” and the Ct-S value for “1”
2000/5 A: set the Ct-n value for “2000” and the Ct-S value for “1”.
10000/5 A: set the Ct-n value for “1000” and the Ct-S value for “10”.
Note
The value for amps is a product of the Ct-n and the Ct-S values.
4. Press ENTER to scroll through the other CFG parameters.
Pressing DOWN or RIGHT displays the password screen (see Reset Mode on
page 7–4 for details).
5. Press MENU to return to the main configuration menu.
Note
Ct-n and Ct-S are dictated by primary current.
Ct-d is secondary current.
6.1.10 Configuring the PT Setting
Use the following procedure to program the PT setting.
1. Push the DOWN Button to scroll through the configuration mode parameters.
2. Press ENTER when Pt is the "active" parameter (i.e. it is in the A screen and
flashing) as shown below.
This will display the Pt-n (PT numerator) screen.
6–10 EPM 2200 POWER METER – INSTRUCTION MANUAL
3. Press ENTER again to change to display the Pt-d (PT denominator) screen.
Page 69

CHAPTER 6: USING THE METER PROGRAMMING USING THE FACEPLATE
NOTE
4. Press ENTER again to select the to Pt-S (PT scaling) value.
The Pt-S value can be “1”, “10”, or “100”. Refer to Programming the Configuration Mode
Screens on page 7–7 for instructions on changing values.
Example settings for the Pt-n, Pt-d, and Pt-S values are shown below:
277/277 Volts: Pt-n value is 277, Pt-d value is 277, Pt-Multiplier is 1
14400/120 Volts: Pt-n value is 1440, Pt-d value is 120, Pt-S value is 10
138000/69 Volts: Pt-n value is 1380, Pt-d value is 69, Pt-S value is 100
345000/115 Volts: Pt-n value is 3450, Pt-d value is 115, Pt-S value is 100
345000/69 Volts: Pt-n value is 345, Pt-d value is 69, Pt-S value is 1000
5. Press ENTER to scroll through the other CFG parameters.
6. Press DOWN or RIGHT to display the password screen (see Reset Mode on
page 7–4 for details).
7. Press MENU to return to the Main Configuration Menu.
Note
Pt-n and Pt-S are dictated by primary voltage.
Pt-d is secondary voltage.
6.1.11 Configuring the Connection (Cnct) Setting
Use the following procedure to program the connection (Cnct) setting.
EPM 2200 POWER METER – INSTRUCTION MANUAL 6–11
1. Push the DOWN Button to scroll through the Configuration Mode parameters:
Scroll, CT, PT, Connection (Cnct), and Port. The "active" parameter is in the A
screen and is flashing
Page 70

PROGRAMMING USING THE FACEPLATE CHAPTER 6: USING THE METER
NOTE
3-Element Wye 2.5-Element Wye
2 CT Delta
2. Press ENTER when Cnct is the "active" parameter (i.e. it is in the A screen and
flashing).
This will display the Cnct (Connection) screen. To change this setting, use the RIGHT button
to scroll through the three settings. Select the setting that is right for your meter.
The possible Connection configurations are
•3-element Wye (3ELWYE)
•2.5-element Wye (2.5EL WYE)
•2 CT Delta (2CtdeL)
as shown below:
3. Press ENTER to scroll through the other CFG parameters.
4. Press DOWN or RIGHT to display the Password screen (see Reset Mode on
page 6–4 for details).
5. Press MENU to return to the main Configuration menu.
6.1.12 Configuring the Communication Port Settings
Use the following procedure to program the communication port (POrt) settings of the
RS485 port if you have an EPM 2200 meter with Com Option S: RS485/KYZ output.
Note
If you have an EPM 2200 meter with Com Option B (BACnet), the RS485 port is used only for
BACnet and is not programmed.
1. Push the DOWN Button to scroll through the configuration mode parameters.
2. Press ENTER when POrt is the active parameter (i.e. it is in the A screen and
flashing) as shown below.
6–12 EPM 2200 POWER METER – INSTRUCTION MANUAL
Page 71

CHAPTER 6: USING THE METER PROGRAMMING USING THE FACEPLATE
Address 005
The following parameters can be configured through the POrt menu
•The meter Address (Adr, a 3-digit number).
•The Baud Rate (bAUd). Select from “9600”, “19.2”, “38.4”, and
“57.6” for 9600, 19200, 38400, and 57600 kbps, respectively.
•The Communications Protocol (Prot). Select “rtU” for Modbus
RTU, and “ASCI” for Modbus ASCII.
•The first POrt screen is Meter (Adr). The current address appears on the screen.
Select a three-digit number for the address.
Refer to Programming the Configuration Mode Screens above for details on changing
values.
• The next POrt screen is the baud rate (bAUd). The current baud rate is displayed on
the “B” screen. Refer to Programming the Configuration Mode Screens above for
details on changing values. The possible baud rate screens are shown below.
EPM 2200 POWER METER – INSTRUCTION MANUAL 6–13
• The final POrt screen is the Communications Protocol (Prot).
The current protocol is displayed on the “B” screen.
Page 72

PROGRAMMING USING THE FACEPLATE CHAPTER 6: USING THE METER
Refer to Programming the Configuration Mode Screens above for details on changing
values. The three protocol selections are shown below.
3. Press ENTER to scroll through the other CFG parameters.
4. Press DOWN or RIGHT to display the Password screen (see Reset Mode on
page 7–4 for details).
5. Press MENU to return to the main Configuration menu.
6.1.13 Operating Mode
Operating mode is the EPM 2200 meter’s default mode. If scrolling is enabled, the meter
automatically scrolls through these parameter screens after startup. The screen changes
every 7 seconds. Scrolling is suspended for 3 minutes after any button is pressed.
Push the DOWN button to scroll all the parameters in operating mode. The active
parameter has the indicator light next to it on the right face of the meter.
Push the RIGHT button to view additional displays for that parameter. A table of the
possible displays in the operating mode is below. Refer to Appendix A: EPM 2200
Navigation Maps on page A–1 for a detailed navigation map of the operating mode.
Table 6–1: Operating Mode Parameter Readings
Parameter designator
Available by Software
Option (see Order Code
table)
VOLTS L-N A1, B1, C1 VOLTS_LN VOLTS_LN_ MAX VOLTS_LN_ MIN
VOLTS L-L A1, B1, C1 VOLTS_LL VOLTS_LL_ MAX VOLTS_LL_ MIN
AMPS A1, B1, C1 AMPS AMPS_NEUTRAL AMPS_MAX AMPS_MIN
W/VAR/PF B1, C1 W_VAR_PF W_VAR_PF
_MAX_POS
VA/Hz B1, C1 VA_FREQ VA_FREQ_ MAX VA_FREQ_ MIN
Wh C1 KWH_REC KWH_DEL KWH_NET KWH_TOT
VARh C1 KVARH_ POS KVARH_ NEG KVARH_ NET KVARH_TOT
Possible Readings
W_VAR_PF
_MIN_POS
W_VAR_PF
_MAX_NEG
W_VAR_PF
_MIN_NEG
VAh C1 KVAH
6–14 EPM 2200 POWER METER – INSTRUCTION MANUAL
Page 73

CHAPTER 6: USING THE METER % OF LOAD BAR
NOTE
Note
6.2 % of Load Bar
Readings or groups of readings are skipped if not applicable to the meter type or hookup,
or if explicitly disabled in the programmable settings.
The 10-segment LED bargraph at the bottom of the EPM 2200 unit display provides a
graphic representation of Amps. The segments light according to the load in the %Load
Segment Table below.
When the Load is over 120% of Full Load, all segments flash “On” (1.5 secs) and “Off” (0.5
secs).
Table 6–2: % Load Segments
Segments Load ≤ % Full Load
None No Load
11%
1 - 2 15%
1 - 3 30%
1 - 4 45%
1 - 5 60%
1 - 6 72%
1 - 7 84%
1 - 8 96%
1 - 9 108%
1 - 10 120%
All Blink >120%
6.3 Watt-hour Accuracy Testing (Verification)
To be certified for revenue metering, power providers and utility companies have to verify
that the billing energy meter will perform to the stated accuracy. To confirm the meter's
performance and calibration, power providers use field test standards to ensure that the
unit's energy measurements are correct. Since the EPM 2200 is a traceable revenue meter,
it contains a utility grade test pulse that can be used to gate an accuracy standard. This is
an essential feature required of all billing grade meters.
EPM 2200 POWER METER – INSTRUCTION MANUAL 6–15
Page 74

WATT-HOUR ACCURACY TESTING (VERIFICATION) CHAPTER 6: USING THE METER
Watt-Hour
Test Pulse
Energy Standard
Comparator
Results
Test Pulses Energy Pulses
Figure 6-6: Watt-hour Test Pulse
Refer to the figure below for an example of how this test works.
Refer to Table 6-2 below for the Wh/Pulse Constant for Accuracy Testing.
6.3.1 Infrared & KYZ Pulse Constants for Accuracy Testing
6–16 EPM 2200 POWER METER – INSTRUCTION MANUAL
Figure 6-7: Using the Watt-Hour Test Pulse
Table 6–3: Infrared & KYZ Pulse Constants for Accuracy Testing
Voltage Level Class 10 Models
Below 150 V 0.2505759630
Above 150 V 1.0023038521
Page 75

CHAPTER 6: USING THE METER GE COMMUNICATOR PROGRAMMING OVERVIEW
NOTE
NOTE
Click the Connect Icon
Note
• Minimum pulse width is 40 ms.
•Refer to Specifications on page 2–4 for Wh Pulse specifications.
• The EPM 2200 with Communications Option B: BACnet does not have a KYZ pulse
output.
6.4 GE Communicator Programming Overview
The EPM 2200 meter can be programmed either through the buttons on the faceplate or
through software. Software programming and communication utilize either the RS485
connection on the back of the meter (Com Option S) or the ethernet port (Com Option B).
Once a connection is established, GE Communicator software can be used both to
program the meter and to communicate with EPM 2200 slave devices.
6.4.1 Factory Initial Default Settings
You can connect to the EPM 2200 Com Option S in Default communication mode, using the
RS485 port. This feature is useful in debugging or if you do not know the meter's
programmed settings and want to find them.
When the EPM 2200 is powered up, you have up to 5 seconds to poll the Name Register as
shown in the example below: “How to Connect.” You will be connected to the meter with
the Factory Initial Default Settings. The meter continues to operate with these default
settings for 5 minutes. During this time, you can access the meter’s Device Profile to
ascertain/change meter information. After the 5 minutes have passed, the meter reverts
to the programmed Device Profile settings.
Factory Initial Default Settings:
• Baud Rate: 9600
•Address: 001
•Protocol: Modbus RTU
Note
Connecting in Default communication mode does not apply to the EPM 2200 meter with
Com Option B.
6.4.2 How to Connect Using GE Communicator Software
1. Open the GE Communicator software.
2. Click the Connect button on the tool bar.
Figure 6-8: Connect Button
EPM 2200 POWER METER – INSTRUCTION MANUAL 6–17
Page 76

GE COMMUNICATOR PROGRAMMING OVERVIEW CHAPTER 6: USING THE METER
3. The Connect screen opens.
• For Communication Option S (connecting through the RS485 port) make sure your
settings are the same as shown here. Use the pull-down windows to make
changes, if necessary.
Figure 6-9: Serial Port settings
• For Communication Option B (connecting through the Ethernet port) your settings
screen is shown below. Enter the address of the Ethernet card.
Figure 6-10: Network Port settings
(See 7.3 Configuring Com Option B: BACnet MS/TP with Modbus TCP/IP on page 7–4
for Ethernet configuration details.)
4. Click the Connect button. If you have a problem connecting, you may have to
disconnect power to the meter, then reconnect power and click the Connect button,
again.
6–18 EPM 2200 POWER METER – INSTRUCTION MANUAL
Page 77

CHAPTER 6: USING THE METER GE COMMUNICATOR PROGRAMMING OVERVIEW
NOTE
Click the Profile Icon
5. You will see the Device Status screen, confirming connection to your meter. Click OK.
Figure 6-11: Device Status screen
6. Click the Profile icon in the Icon Bar.
7. You will see the Device Profile screen. The tabs at the top of the screen allow you to
navigate between setting screens (see below).
8. Click the Communication tab. The Communication Settings appear.
Note
Valid Communication Settings
• COM2 (RS485)
EPM 2200 POWER METER – INSTRUCTION MANUAL 6–19
Use drop-down menus to change settings of the RS485 port (Com 2) if you have an
EPM 2200 meter with Com Option S: RS485/KYZ output.
• COM1 is not used by the EPM 2200 meter with Com Option S.
• If you have an EPM 2200 meter with Com Option B (BACnet), the RS485 port is used
only for BACnet and is not programmed.
• (1-247)
• Protocol (Modbus RTU, ASCII)
Page 78

GE COMMUNICATOR PROGRAMMING OVERVIEW CHAPTER 6: USING THE METER
NOTE
NOTE
• Baud Rate (9600 to 57600)
• Response Delay (0-750 msec)
9. When changes are complete, click Update to send a new profile to the meter.
10. Click Cancel to exit the Profile or click other tabs to update other aspects of the Profile
(see the next section).
6.4.3 Device Profile Settings
Only the basic Device Profile settings are explained in this manual. Refer to the GE
Communicator Instruction Manual for details of the meter’s Device Profile.
The Device Profile settings are described in the following sections. After programming the
Device Profile, click the options at the bottom of the screen to continue:
• Update to send the new Profile to the connected meter.
Note
If the Update fails, the software asks if you want to try to Update again.
• Cancel to exit the EPM 2200 Device Profile screen.
• Load to load new Device Profile settings from a file.
• Save to save the Device Profile settings in a file.
• Report to view or print a summary of the Device Profile settings.
• Help to view the full GE Communicator Instruction Manual
Note
If you click Cancel before Save or Update, you will lose any changes you have made to the
Device Profile.
SCALING (CT, PT Ratios and System Wiring)
6–20 EPM 2200 POWER METER – INSTRUCTION MANUAL
Page 79

CHAPTER 6: USING THE METER GE COMMUNICATOR PROGRAMMING OVERVIEW
NOTE
WARNING
NOTE
• CT Numerator (Primary): 1-9999
• CT Denominator (Secondary): 1 or 5 (factory set)
• CT Multiplier: 1, 10, or 100
• CT Fullscale: Calculation Based on Selections (click Recalculate to view)
• PT Numerator (Primary): 1-9999
• PT Denominator (Secondary): 40-600
• PT Multiplier: 1, 10, 100, or 1000
• PT Fullscale: Calculation Based on Selections (click Recalculate to view)
• System Wiring: 3 Element Wye; 2.5 Element Wye; 2 CT Delta
• Phases Displayed: A, AB, or ABC
Note
VOLTS FULL SCALE = PT Numerator x PT Multiplier
You must specify Primary and Secondary Voltage in Full Scale. Do not use ratios! The PT
Denominator should be the Secondary Voltage level.
Example:
A 14400/120 PT would be entered as:
PT Num: 1440
PT Denom: 120
Multiplier: 10
This example would display a 14.40kV.
Example CT Settings:
200/5 Amps: Set the Ct-n value for 200, Ct-Multiplier value for 1.
800/5 Amps: Set the Ct-n value for 800, Ct-Multiplier value for 1.
2,000/5 Amps: Set the Ct-n value for 2000, Ct-Multiplier value for 1.
10,000/5 Amps: Set the Ct-n value for 1000, Ct-Multiplier value for 10.
Example PT Settings:
277/277 Volts Pt-n value is 277, Pt-d value is 277, Pt-Multiplier is 1.
14,400/120 Volts: Pt-n value is 1440, Pt-d value is 120, Pt-Multiplier value is 10.
138,000/69 Volts: Pt-n value is 1380, Pt-d value is 69, Pt-Multipier value is 100.
345,000/115 Volts: Pt-n value is 3470, Pt-d value is 115, Pt-Multiplier value is 100
345,000/69 Volts: Pt-n value is 345, Pt-d value is 69, Pt-Multiplier value is 1000.
Note
Settings are the same for Wye and Delta configurations.
ENERGY AND DISPLAY
The settings on this screen determine the display configuration of the meter
faceplate.
EPM 2200 POWER METER – INSTRUCTION MANUAL 6–21
Page 80

GE COMMUNICATOR PROGRAMMING OVERVIEW CHAPTER 6: USING THE METER
NOTE
NOTE
The fields and allowed entries are as follows:
Power and Energy Format
• Power Scale: Unit, kilo (k), Mega (M), or auto
• Energy Digits: 5, 6, 7, or 8
• Energy Decimal Places: 0-6
• Energy Scale: Unit, kilo (k), or Mega (M)
• Example: Based on Selections (click Recalculate to view)
For Example: a reading for Digits: 8; Decimals: 3; Scale: k would be formatted:
00123.456k
• Power Direction: View as Load
Demand Averaging
• Averaging Method: Block or Rolling
• Interval (Minutes): 5, 15, 30, or 60
• Sub Interval (if Rolling is selected): 1-4
Auto Scroll: Click to Activate
Display Configuration:
•Click Values to be displayed.
Note
You MUST have at least ONE Display Configuration value selected.
Note
If incorrect values are entered on the Energy and Display screen the following message
appears:
6–22 EPM 2200 POWER METER – INSTRUCTION MANUAL
Page 81

CHAPTER 6: USING THE METER GE COMMUNICATOR PROGRAMMING OVERVIEW
NOTE
Current, CT, PT and Energy Settings will cause invalid energy accumulator values.
Change the inputted settings until the message disappears.
SETTINGS
Note
The EPM 2200 Meter is shipped with Password Disabled; there is NO DEFAULT
PASSWORD)
The fields are as follows:
• Enable Password for Reset: click to enable
• Enable Password for Configuration: click to enable
• Change Password: click to change
• Device Designation: optional user-assigned label
EPM 2200 POWER METER – INSTRUCTION MANUAL 6–23
Page 82

GE COMMUNICATOR PROGRAMMING OVERVIEW CHAPTER 6: USING THE METER
6–24 EPM 2200 POWER METER – INSTRUCTION MANUAL
Page 83

GE
Grid Solutions
EPM 2200 Power Meter
Chapter 7: Com Option B: BACnet
MS/TP with Modbus
TCP/IP
Com Option B: BACnet MS/TP wit h Modbus TCP/IP
The Communication Options available for the EPM 2200 are connected and used in
different ways.
• Com Option S: Modbus/KYZ output is explained in Chapter 5 on page 5-1.
• Com Option B: BACnet MS/TP with Modbus TCP/IP Internet is explained in here in
Chapter 7.
7.1 BACnet MS/TP
BACnet is a data communication protocol developed for Building Control applications in
1987. BACnet allows applications to process data from many different kinds of equipment
and manufacturers. Originally it was used for HVAC control systems, but it has been
extended to other building systems, including lighting and energy management. Today
BACnet is one of the two most widely used Building Automation protocols in use. It is an
ASHRAE/ANSI/ISO standard protocol.
The BACnet protocol consists of Objects that contain different kinds of information. Each
Object has properties that contain data related to it. Below is the example of an Object for
Total Watts:
• Object_Name, PWR_ELEC
• Object_Type, Analog Input
• Object_Instance, AI-101018
• Present_Value, watt, tot (value in watts)
BACnet operates in a client-server environment. A client machine sends a service request
(message) to a server machine; once the service is performed the results are reported back
to the client machine. BACnet defines 5 groups (or classes) of 35 message types. For
example, one class contains messages for retrieving and manipulating the object
properties described above. An example of a common service request in this class is
"ReadProperty." When the server machine receives this message from a client machine, it
EPM 2200 POWER METER – INSTRUCTION MANUAL 7–1
Page 84

EPM 2200 METER BACNET OBJECTS CHAPTER 7: COM OPTION B: BACNET MS/TP WITH MODBUS TCP/IP
locates the requested property of the requested object and sends the value to the client.
Other classes of service requests have to do with alarms and events; file uploading/
downloading; managing remote device operation; and virtual terminal functions.
The EPM 2200 meter communicates BACnet MS/TP protocol though its RS485 serial port,
allowing it to act as a BACnet device in any BACnet application. The meter also has a Web
interface via its RJ45 Ethernet port that you can use to remotely set up the BACnet MS/TP
and for Modbus TCP/IP configuration. The Ethernet port can also track energy readings
through the internet using any standard Web browser. The EPM 2200 meter uses BACnet
MS/TP (master-slave/token-passing), which is designed to run at speeds of 1 Mbps or less
over twisted pair wiring, and in which the device takes turns being a master and a slave,
dependent on whether it is sending or receiving data.
For more detailed information, visit the BACnet website at www.bacnet.org.
7.2 EPM 2200 meter BACnet Objects
The EPM 2200 meter BACnet MS/TP implementation has 56 predefined objects of electrical
measurements. No programming or mapping is necessary to use the BACnet objects. The
object’s names easily identify the measurements they contain.
All of the objects, with the exception of Modbus Meter and PO LL_DELAY are AI (Analog
Input) Object type. The following table lists each of the objects with their units of
measurement and description.
Object Name Unit of Measurement Description
Modbus Meter-147222 none (Addr. 1)
POLL_DELAY AV-1 Polling Delay
VOLTAGE_LN-A volt Voltage A-N
VOLTAGE_LN-B volt Voltage B-N
VOLTAGE_LN-C volt Voltage C-N
VOLTAGE_LL-AB volt Voltage A-B
VOLTAGE_LL-BC volt Voltage B-C
VOLTAGE_LL-CA volt Voltage C-A
CURRENT_LN-A amp Current A
CURRENT_LN-B amp Current B
CURRENT_LN-C amp Current C
PWR_ELEC watt Total Active Power
PWR_ELEC_K kilowatt Total kWatt
PWR_ELEC_REACT volt-amp-reactive Total Reactive Power
PWR_ELEC_REACT_K kilovolt-amp-reactive Total kVAR
PWR_ELEC_APPAR volt-amp Total Apparent Power
7–2 EPM 2200 POWER METER – INSTRUCTION MANUAL
Page 85

CHAPTER 7: COM OPTION B: BACNET MS/TP WITH MODBUS TCP/IP EPM 2200 METER BACNET OBJECTS
Object Name Unit of Measurement Description
PWR_ELEC_APPAR_K kilovolt-amp Total kVA
PWR_FACTOR --- Total Power Factor
FREQUENCY Hertz Frequency
CURRENT_NG amp Neutral Current
ENERGY_ELEC_ACCUM_REC* watt-hour Active Energy Received
ENERGY_ELEC_ACCUM_REC_K kilowatt-hour kWh Received
ENERGY_ELEC_ACCUM_DEL* watt-hour Active Energy Delivered
ENERGY_ELEC_ACCUM_DEL_K kilowatt-hour kWh Delivered
ENERGY_ELEC_ACCUM_NET* watt-hour Active Energy Net
ENERGY_ELEC_ACCUM_NET_K kilowatt-hour kWh Net
ENERGY_ELEC_ACCUM* watt-hour Total Active Energy
ENERGY_ELEC_ACCUM_K kilowatt-hour Total kWh
ENERGY_ELEC_ACCUM_REACT_REC* volt-amp-hours-reactive Positive Reactive Energy
ENERGY_ELEC_ACCUM_REACT_REC_K kilovolt-amp-hours-
Positive kVARh
reactive
ENERGY_ELEC_ACCUM_REACT_DEL* volt-amp-hours-reactive Negative Reactive Energy
ENERGY_ELEC_ACCUM_REACT_DEL_K kilovolt-amp-hours-
Negative kVARh
reactive
ENERGY_ELEC_ACCUM_REACT_NET* volt-amp-hours-reactive Reactive Energy Net
ENERGY_ELEC_ACCUM_REACT_NET_K kilovolt-amp-hours-
kVARh Net
reactive
ENERGY_ELEC_ACCUM_REACT* volt-amp-hours-reactive Total Reactive Energy
ENERGY_ELEC_ACCUM_REACT_K kilovolt-amp-hours-
Total kVARh
reactive
ENERGY_ELEC_ACCUM_APPAR* volt-amp-hours Total Apparent Energy
ENERGY_ELEC_ACCUM_APPAR_K kilovolt-amp-hours Total kVAh
DEMAND_POS watt Positive Active Demand, 3-
Phase, Average Demand
DEMAND_POS_K kilowatt Positive kW, 3-Phase Average
Demand
DEMAND_REACT_POS volt-amp-reactive Positive Reactive Demand, 3-
Phase, Average Demand
DEMAND_REACT_POS_K kilovolt-amp-reactive Positive kVAR, 3-Phase, Average
Demand
DEMAND_NEG watt Negative Active Demand, 3-
DEMAND_NEG_K kilowatt Negative kW, 3-Phase, Average
EPM 2200 POWER METER – INSTRUCTION MANUAL 7–3
Phase, Average Demand
Demand
Page 86

CONFIGURING COM OPTION B: BACNET MS/TP WITH MODBUS TCP/IP CHAPTER 7: COM OPTION B: BACNET MS/TP WITH MODBUS TCP/IP
Object Name Unit of Measurement Description
DEMAND_REACT_NEG volt-amp-reactive Negative Reactive Demand, 3-
DEMAND_REACT_NEG_K kilovolt-amp-reactive Negative kVAR, 3-Phase,
DEMAND_APPAR volt-amp Apparent Demand, 3-Phase,
DEMAND_APPAR_K kilovolt-amp kVA, 3-Phase, Average Demand
DEMAND_PEAK_POS watt Positive Active Demand, 3-
DEMAND_PEAK_POS_K kilowatt Positive kW, 3-Phase Max
DEMAND_REACT_PEAK_POS volt-amp-reactive Positive Reactive Demand, 3-
DEMAND_REACT_PEAK_POS_K kilovolt-amp-reactive Positive kVAR, 3-Phase, Max
DEMAND_PEAK_NEG watt Negative Active Demand, 3-
DEMAND_PEAK_NEG_K kilowatt Negative kW, 3-Phase, Max
DEMAND_REACT_PEAK_NEG volt-amp-reactive Negative Reactive Demand, 3-
DEMAND_REACT_PEAK_NEG_K kilovolt-amp-reactive Negative kVAR, 3-Phase, Max
Phase, Average Demand
Average Demand
Average Demand
Phase, Max Average Demand
Average Demand
phase, Max Average Demand
Average Demand
Phase, Max Average Demand
Average Demand
Phase, Max Average Demand
Average Demand
DEMAND_APPAR_PEAK volt-amp Apparent Demand, 3-Phase, Max
DEMAND_APPAR_PEAK_K kilovolt-amp kVA, 3-Phase, Max Average
Average Demand
Demand
* For optimal accuracy and resolution the accumulators’ attributes are factory preset to: 6
digits, no fractions – zero decimal places and kilo multiplier (Modbus register address:
30,006, decimal). We recommended you maintain these settings all of the time.
7.3 Configuring Com Option B: BACnet MS/TP with Modbus TCP/IP
You must first set the Network configuration so you can communicate with the EPM 2200
meter. Follow these steps:
1. Configure your LAN connection to IP address 10.0.0.100, subnet mask 255.255.255.0:
7–4 EPM 2200 POWER METER – INSTRUCTION MANUAL
Page 87

CHAPTER 7: COM OPTION B: BACNET MS/TP WITH MODBUS TCP/IP CONFIGURING COM OPTION B: BACNET MS/TP WITH MODBUS TCP/IP
•Click Start > Control Panel > Network Connections.
You will see a screen like the one shown below.
EPM 2200 POWER METER – INSTRUCTION MANUAL 7–5
Page 88

CONFIGURING COM OPTION B: BACNET MS/TP WITH MODBUS TCP/IP CHAPTER 7: COM OPTION B: BACNET MS/TP WITH MODBUS TCP/IP
• Right-click on the LAN connection you want to use and click Properties.
You will see the screen shown below.
• Scroll and highlight Internet Protocol TCP/IP, then click the Properties
button.
You will see the screen shown below.
7–6 EPM 2200 POWER METER – INSTRUCTION MANUAL
Page 89

CHAPTER 7: COM OPTION B: BACNET MS/TP WITH MODBUS TCP/IP CONFIGURING COM OPTION B: BACNET MS/TP WITH MODBUS TCP/IP
NOTE
Insert Ethernet
Cable here
•Click the Use the Following IP Address radio button and enter:
• IP Address: 10.0.0.100
• Subnet Mask: 255.255.255.0
•Click OK.
The Local Area Connection Properties screen redisplays.
•Click OK.
2. Use an Ethernet cable to connect the meter to your LAN port.
3. Open your web browser and connect to the meter at the default address by typing
http://10.0.0.1.
Note
If this doesn’t work, reset the meter to this default address by pressing the Reset button for
30 seconds. See “Resetting the Ethernet Card” on page 11 for instructions.
4. You will see a User Authentication screen. Enter the following default settings:
•User name: admin
• Password: admin
EPM 2200 POWER METER – INSTRUCTION MANUAL 7–7
Page 90

CONFIGURING COM OPTION B: BACNET MS/TP WITH MODBUS TCP/IP CHAPTER 7: COM OPTION B: BACNET MS/TP WITH MODBUS TCP/IP
5. Click OK. You will see the BACnet MS/TP Interface webpage, shown below.
6. Click TCP/IP and BACnet Settings on the left side of the webpage to see the page
shown below. Use this page to change the default IP address (10.0.0.1) to an IP address
in the same subnet as your Network. Contact your System Administrator if you are
unsure of the correct address to use.
You can also change the following fields:
• Network Mask - the subnet mask. The default is 255.255.255.0.
• Default Gateway - the IP address of the gateway. The default is 10.0.0.224.
• BACnet Device Number - a numeric code used to identify the meter. This number
• BACnet Device Name - field for the device name, which can be up to 63
• BACnet Device Description - optional field where you can enter a description of
7–8 EPM 2200 POWER METER – INSTRUCTION MANUAL
is auto-generated from the MAC address.
characters in length.
up to 63 characters which will be added as a prefix in the name of all registers
representing the meter’s BACnet objects.
Page 91

CHAPTER 7: COM OPTION B: BACNET MS/TP WITH MODBUS TCP/IP CONFIGURING COM OPTION B: BACNET MS/TP WITH MODBUS TCP/IP
NOTE
• Modbus TCP Port for TCP to RTU Router - the default port is 502. As long as this
field is not 0, the router is enabled, which lets the meter communicate with
Modbus TCP/IP Master devices.
• Enable BACnet/IP Control Objects - Check this box to allow direct access to
Modbus registers. If enabled, the Control Objects are represented by the following
three Analog-Value BACnet Objects:
• 500001 is a writeable object called MOD_ID_TARGET (“target device
identifier to be read/written”). Since the meter has a hard-coded Modbus
address of “1” only this value needs to be entered before first access to a
Modbus register. The default = -1.0. -1.0 also means do not execute
#500003 (neither read nor write).
• 500002 is a writeable object called MOD_REGISTER (“register to be read/
written”); for example, “1000” to access the first register of volts A-N. The
default = -1.0 after any reboot. -1.0 also means do not execute #500003
(neither read nor write).
• 500003 is a readable/writeable value called MOD_VALUE (“value to be read
from or written to select register”).
The MOD_REGISTER resets with -1.0 after each Read/Write (whether or not
successful), from/to MOD_VALUE with valid MOD_ID_TARGET and
MOD_REGISTER. MOD_REGISTER will also be set to -1.0 30 seconds after it is
written to.
7. Click OK to process your changes. You will see the following message
You still need to activate the configuration for the changes to take effect.
Note
You can change all settings back to their default by clicking the Restore Default button at
the bottom of the page.
8. Click MS/TP Settings on the left side of the webpage to see the page shown below.
Use this page to make any necessary changes to your MS/TP settings.
You can change the following fields:
• Baud Rate - select the baud rate you need from the pull-down menu.
• This station (MAC) - the MAC address of this MS/TP node (the EPM 2200 meter).
EPM 2200 POWER METER – INSTRUCTION MANUAL 7–9
Page 92

CONFIGURING COM OPTION B: BACNET MS/TP WITH MODBUS TCP/IP CHAPTER 7: COM OPTION B: BACNET MS/TP WITH MODBUS TCP/IP
NOTE
• Max Info Frames - this is the maximum number of information frames the node is
allowed to send before it needs to pass the token.
• Max Master - this is the highest allowable address for master nodes (cannot be
higher than 127); a Max master greater than 36 is recommended for data sets.
9. Click the Advanced button to display additional settings.
Note
We recommend you do not change any Advanced settings.
10. Click OK to process your changes.
11. Click Activate Configuration from the left side of the webpage to implement any
changes you made. You will see the page shown below.
12. Click the Confirm button to process the changes. You will see the message shown
below (the IP Address shown in the link is just an example).
13. The meter resets. Connect the meter Ethernet cable to your Network (remove it from
your PC). You can now connect to the meter through your Network using the new IP
address.
7–10 EPM 2200 POWER METER – INSTRUCTION MANUAL
Page 93

CHAPTER 7: COM OPTION B: BACNET MS/TP WITH MODBUS TCP/IP USING THE EPM 2200 METER’S WEB INTERFACE
NOTE
Reset Button
7.3.1 Resetting the Ethernet Card
The Ethernet card’s Reset Button is accessed from the back of the EPM 2200 meter. See
figure below for button location.
Figure 7-1: Backplate of EPM 2200 meter, showing Reset Button placement
Using an implement such as a ballpoint pen tip, press and hold the Reset button for 30
seconds. The Ethernet card will be reset to its default settings.
7.4 Using the EPM 2200 Meter’s Web Interface
As shown in Section 7.3, you can use the meter’s web interface to change the IP address
and other Network parameters. You can also view information and readings using the web
interface. This section explains the web pages other than the BACnet MS/TP Settings and
Activate Configuration web pages, which are explained in Section 7.3.
7.4.1 Home web page
The Home web page is shown at the top of page 7–8. It is the first page you see when you
connect to the meter.
Note
To access this web page from any of the other pages, click Home on the left side of the
page.
EPM 2200 POWER METER – INSTRUCTION MANUAL 7–11
Page 94

USING THE EPM 2200 METER’S WEB INTERFACE CHAPTER 7: COM OPTION B: BACNET MS/TP WITH MODBUS TCP/IP
This web page shows the current power, power factor, accumulated energy, and peak
demand readings from the meter. You can download all of the meter BACnet data by
clicking the Download data.csv button. You will see the following screen:
This screen gives you the option to open or save an Excel file with the BACnet meter data.
•Click Open to open an Excel file with the meter’s BACnet data.
•Click Save to save a copy of the Excel file.
•Click Cancel to close the screen without opening or saving the file.
An example file is shown below:
7–12 EPM 2200 POWER METER – INSTRUCTION MANUAL
Page 95

CHAPTER 7: COM OPTION B: BACNET MS/TP WITH MODBUS TCP/IP USING THE EPM 2200 METER’S WEB INTERFACE
7.4.2 BACnet Objects Status web page
•Click BACnet Objects Status on the left side of the web page to view readings for the
meter’s embedded BACnet objects. You will see a screen like the one shown below.
Scroll to see all of the objects on the screen. The following items are shown for each
BACnet Object:
•Name
•Object
•Value
•Units
• OK (Reliability)
•Description
EPM 2200 POWER METER – INSTRUCTION MANUAL 7–13
Page 96

USING THE EPM 2200 METER’S WEB INTERFACE CHAPTER 7: COM OPTION B: BACNET MS/TP WITH MODBUS TCP/IP
7.4.3 Change Password web page
•Click Change Password on the left side of the web page to access the page shown
below.
Use this page to change the Administrator Login and Password for this interface. We
recommend that you change the Login and Password rather than continuing to use the
default sign-on (be sure to store this information someplace safe).
7.4.4 Statistics web page
•Click Statistics on the left side of the web page to access the page shown below.
This page lists information and any Error log for the meter.
• To erase the Error log, click the Clear Log button.
7–14 EPM 2200 POWER METER – INSTRUCTION MANUAL
Page 97

CHAPTER 7: COM OPTION B: BACNET MS/TP WITH MODBUS TCP/IP USING THE EPM 2200 IN A BACNET APPLICATION
7.4.5 Reset Configuration web page
•Click Reset Configuration on the left side of the web page if you want to set the
configuration back to its default or last configuration. You will see the page shown
below.
• Click the Restore Default button to restore all settings to the factory
default values.
• Click the Discard Changes button to restore all settings to the last saved
configuration.
7.5 Using the EPM 2200 in a BACnet Application
Once you have configured the EPM 2200 meter, you can connect the RS485 port to your
BACnet implementation and use it as a standard BACnet client . As there are many kinds of
BACnet applications, we recommend you consult your application’s instructions for details.
In addition to integrating with BACnet applications, the EPM 2200 meter can also be
accessed through GE Communicator software (see the GE Communicator Instruction
Manual). Additionally, all of the BACnet data can be polled through the Modbus registers
(see Appendix B: “Modbus Mapping for EPM 2200” on page 1 for the Modbus map).
EPM 2200 POWER METER – INSTRUCTION MANUAL 7–15
Page 98

USING THE EPM 2200 IN A BACNET APPLICATION CHAPTER 7: COM OPTION B: BACNET MS/TP WITH MODBUS TCP/IP
7–16 EPM 2200 POWER METER – INSTRUCTION MANUAL
Page 99

GE
Grid Solutions
A.1 Introduction
EPM 2200 Power Meter
Appendix A: EPM 2200 Navigation
Maps
EPM 2200 Navigation Maps
The EPM 2200 meter can be configured and a variety of functions performed using the
buttons on the meter face.
• An Overview of the Elements and Buttons on the meter face, and programming using
the buttons can be found in Chapter 6 on page 6-1.
• The meter can also be programmed using software (see the GE Communicator
Instruction Manual).
A.2 Navigation Maps (Sheets 1 to 4)
The EPM 2200 Navigation Maps begin on the next page.
They show in detail how to move from one screen to another and from one Display Mode
to another using the buttons on the face of the meter. All Display Modes will automatically
return to Operating Mode after 10 minutes with no user activity.
A.2.1 EPM 2200 Navigation Map Titles:
Main Menu Screens (Sheet 1)
Operating Mode Screens (Sheet 2)
Reset Mode Screens (Sheet 3)
Configuration Mode Screens (Sheet 4)
EPM 2200 POWER METER – INSTRUCTION MANUAL A–1
Page 100

NAVIGATION MAPS (SHEETS 1 TO 4) APPENDIX A: EPM 2200 NAVIGATION MAPS
MAIN MENU Screen
MAIN MENU:
RST (blinking)
CFG
OPR
ENTERDOWN DOWN
MAIN MENU screen scrolls through 3 choices, showing
all 3 at once. The top choice is always the "active" one,
which is indicated by blinking the legend.
MAIN MENU:
CFG (blinking)
OPR
RST
MAIN MENU:
OPR (blinking)
RST
CFG
CONFIGURATION MODE*
grid of meter settings screens
with password-protected edit
capability.
See sheet 4
ENTER
OPERATING MODE
grid of meter data screens.
See sheet 2
ENTER
STARTUP
sequence run once at meter startup:
2 lamp test screens, hardware
information screen, firmware version
screen, error screen (conditional)
sequence completed
RESET MODE
sequence of screens to get
password, if required, and reset
meter data.
See sheet 3
single
screen
all screens
for a display
mode
button
group of
screens
MENU
ENTER
DOWN, RIGHT
Navigation:
Editing:
Returns to previous menu from any screen in any mode
Indicates acceptance of the current screen and advances to the next one
Navigation and edit buttons
No digits or legends are blinking. On a menu, down advances to the next menu selection, right does nothing. In a grid of
screens, down advances to the next row, right advances to the next column. Rows, columns, and menus all navigate circularly.
A digit or legend is blinking to indicate that it is eligible for change. When a digit is blinking, down increases the digit value, right
moves to the next digit. When a legend is blinking, either button advances to the next choice legend.
action taken
BUTTONS
MENU
DOWN
MENU
MENU
10 minutes with no user activity
10 minutes with no user activity
MENU
10 minutes with
no user activity
* Configuration Mode is
not available during a
Programmable Settings
update via a COM port.
Figure A-1: Main Menu Screens (Sheet 1)
A–2 EPM 2200 POWER METER – INSTRUCTION MANUAL
 Loading...