

Page 1

POWER LEADER
PMCS 6.11a
Interface Toolkit
TM
Installation Guide
GEH-6513
GE Power Management Control System 6.11a
PMCS Interface Toolkit Back to Main Menu •••• i
Page 2

Notice
The information contained in this document is subject to change without notice. GE makes no warranty of any
kind with regard to this material, including, but not limited to, the implied warranties of merchantability and
fitness for a particular purpose. GE shall not be liable for errors contained herein or incidental consequential
damages in connection with the furnishing, performance, or use of this material.
This document contains proprietary information which is protected by copyright. All rights are reserved. No part
of this document may be photocopied or otherwise reproduced without consent of GE.
Copyright ©2000 - 2002 by GE. Published in a limited copyright sense, and all rights, including trade secrets,
are reserved.
Document Edition - First 5/96
Second 5/97
Third 1/98
Fourth 06/98
Fifth 03/99
Sixth 07/99
Seventh 03/00
Eighth 10/00
Ninth 02/01
Tenth 06/01
Eleventh 01/02
The following are products of General Electric Company:
POWER LEADERTM Meter 239 Motor Protection Relay GE Fanuc Series 90/30 PLC
POWER LEADER Modbus Monitor 269 Plus Motor Management Relay GE Fanuc Series 90/70 PLC
POWER LEADER Electronic Power
Meter
Spectra MicroVersaTrip SR469 Motor Management Relay EPM 7300 Electronic Power Meter
EPM 7600 Electronic Power Meter EPM 7500 Electronic Power Meter EPM 7330 Electronic Power Meter
Enhanced MicroVersaTrip-C SR489 Generator Management Relay EPM 7700 Electronic Power Meter
Enhanced MicroVersaTrip-D 565 Feeder Management Relay EPM 3710 Electronic Power Meter
MDP Overcurrent Relay 735 Feeder Relay EPM 3720 Electronic Power Meter
SR750/SR760 Feeder Management Relay SR745 Transformer Management Relay Spectra Electronic Control Module
Universal Relay EPM7430D/EPM7450D Motor Manager II (MMII)
GE-Zenith MX200 (Microprocessor
Controller)
EPM5350P (DMMS350) EPM5000P (DMWH300) EPM9450Q/EPM9650Q
369 Motor Management Relay Power Quality Meter (PQM)
GE-Zenith Generator PLC (Series 90-
70)
EPM5300P/EPM5200P
Electronic Power Meter 3710 , Electronic Power Meter 3720, Electronic Power Meter 7300, Electronic Power
Meter 7330, Electronic Power Meter 7500, Electronic Power Meter 7600, and Electronic Power Meter 7700 are
products of Power Measurement Limited.
Multilin 269+ Motor Management Relay® is a registered trademarks of Multilin Inc., and Multilin SR489
Generator Management Relay™ and Multilin SR745 Transformer Management Relay™ are trademarks of
Multilin Inc.
Microsoft, Microsoft Access, Microsoft Excel, Microsoft PowerPoint, Microsoft Visual Basic, and MS-DOS are
registered trademarks, and Windows NT is a trademark of Microsoft Corporation.
Wonderware is a registered trademark of WonderWare Corporation. Wonderware InTouch and NetDDE are
trademarks of WonderWare Corporation.
US Pat Nos 5,768,148; 5,764,155; 5,862,391
ii •••• Back to Main Menu PMCS Interface Toolkit
Page 3

Back to Main Menu
Contents
INTRODUCTION.............................................................................................................................................................. 1
W
ELCOME......................................................................................................................................................................... 1
H
OW SHOULD I USE THIS MANUAL? .................................................................................................................................. 2
C
ONVENTIONS .................................................................................................................................................................. 3
A
BOUT THE INTERFACE TOOLKIT...................................................................................................................................... 3
I
NSTALLATION .................................................................................................................................................................. 3
USING AND CONFIGURING PMCS WIZARDS ......................................................................................................... 5
A
BOUT THE WIZARDS ....................................................................................................................................................... 5
S
MALL FACEPLATE WIZARDS ........................................................................................................................................... 6
Usage ........................................................................................................................................................................... 6
Configuration............................................................................................................................................................... 6
L
ARGE FACEPLATE WIZARDS............................................................................................................................................ 8
Usage ........................................................................................................................................................................... 8
Configuration............................................................................................................................................................... 9
Special Considerations ................................................................................................................................................ 9
T
ABULAR DATA SCREEN WIZARDS................................................................................................................................. 11
Usage ......................................................................................................................................................................... 11
Configuration............................................................................................................................................................. 11
O
NE-LINE WIZARDS........................................................................................................................................................ 16
Usage ......................................................................................................................................................................... 16
Configuration............................................................................................................................................................. 17
Circuit Breaker One-Line Wizards............................................................................................................................. 21
E
LEVATION WIZARDS ..................................................................................................................................................... 22
Usage ......................................................................................................................................................................... 22
Configuration............................................................................................................................................................. 22
F
LOOR PLAN WIZARDS ................................................................................................................................................... 23
Usage ......................................................................................................................................................................... 23
Configuration............................................................................................................................................................. 23
T
OOLBAR WIZARD .......................................................................................................................................................... 24
Usage ......................................................................................................................................................................... 24
Configuration............................................................................................................................................................. 24
A
NNUNCIATOR PANEL WIZARD ...................................................................................................................................... 25
Usage ......................................................................................................................................................................... 25
Configuration............................................................................................................................................................. 29
PMCS Interface Toolkit Back to Main Menu •••• iii
Page 4

Troubleshooting Tips for the Annunciator Panel Wizard .......................................................................................... 34
C
USTOM TABLE WIZARD ................................................................................................................................................ 35
Usage ......................................................................................................................................................................... 35
Configuration............................................................................................................................................................. 35
S
YSTEM STATISTICS WIZARD .......................................................................................................................................... 40
Usage ......................................................................................................................................................................... 40
Configuration............................................................................................................................................................. 40
L
OCKOUT/TAGOUT WIZARD ........................................................................................................................................... 42
Usage ......................................................................................................................................................................... 42
Supported Devices...................................................................................................................................................... 42
Configuration............................................................................................................................................................. 43
Example of Lockout/Tagout Wizard........................................................................................................................... 44
S
PECIAL SCRIPTING CONSIDERATIONS FOR THE EPM 7700............................................................................................. 48
Installing the Application Script ................................................................................................................................ 49
EPM 7700 Tabular Data Screen Scripting ................................................................................................................ 54
CREATING FLOOR PLANS, ELEVATION VIEWS, AND ONE-LINE DIAGRAMS ........................................... 55
I
NTRODUCTION ............................................................................................................................................................... 55
E
LEVATION VIEWS .......................................................................................................................................................... 55
F
LOOR PLANS.................................................................................................................................................................. 57
E
LECTRICAL ONE-LINE DIAGRAMS ................................................................................................................................. 58
C
REATING A BASIC INTERFACE ........................................................................................................................................ 61
FEATURES OF GE LARGE FACEPLATE WIZARDS.............................................................................................. 67
A
BOUT THE LARGE FACEPLATE WIZARDS ...................................................................................................................... 67
POWER LEADER EPM................................................................................................................................................ 68
S
PECTRA MICROVERSATRIP TRIP UNIT .......................................................................................................................... 71
E
NHANCED MICROVERSATRIP-C TRIP UNIT .................................................................................................................. 72
E
NHANCED MICROVERSATRIP-D TRIP UNIT .................................................................................................................. 74
POWER LEADER M
S
PECTRA ECM................................................................................................................................................................ 78
EPM 3710 M
EPM 3720 M
EPM 7700 M
269 P
LUS MOTOR MANAGEMENT RELAY ....................................................................................................................... 87
565 F
EEDER MANAGEMENT RELAY ................................................................................................................................92
ETER.......................................................................................................................................................... 80
ETER.......................................................................................................................................................... 82
ETER.......................................................................................................................................................... 84
ETER............................................................................................................................................. 76
FEATURES OF TABULAR DATA SCREEN WIZARDS........................................................................................... 99
I
NTRODUCTION ............................................................................................................................................................... 99
F
EATURES OF TABULAR DATA SCREENS ......................................................................................................................... 99
P
OWER LEADER EPM ................................................................................................................................................... 101
S
PECTRA MICROVERSATRIP ......................................................................................................................................... 102
E
NHANCED MICROVERSATRIP-C TRIP UNIT ................................................................................................................ 103
E
NHANCED MICROVERSATRIP-D TRIP UNIT ................................................................................................................ 104
POWER LEADER M
S
PECTRA ECM.............................................................................................................................................................. 106
MDP D
IGITAL OVERCURRENT RELAY .......................................................................................................................... 107
ETER........................................................................................................................................... 105
Monitoring Tab ........................................................................................................................................................ 107
Command Tab .......................................................................................................................................................... 108
Setup Tab ................................................................................................................................................................. 109
PQM (P
OWER QUALITY METER) .................................................................................................................................. 110
Metering Tab............................................................................................................................................................ 111
Status Tab................................................................................................................................................................. 112
Demand Tab............................................................................................................................................................. 113
IV Range Tab ........................................................................................................................................................... 114
iv •••• Contents PMCS Interface Toolkit
Page 5

P Range Tab............................................................................................................................................................. 115
Analysis Tab............................................................................................................................................................. 116
IO Tab ...................................................................................................................................................................... 117
Setpoints Tab............................................................................................................................................................ 118
M
OTOR MANAGER II (MMII) ....................................................................................................................................... 119
EPM 3710 M
EPM 3720 M
EPM 7300 M
ETER........................................................................................................................................................ 120
ETER........................................................................................................................................................ 121
ETER........................................................................................................................................................ 122
Metering Tab............................................................................................................................................................ 123
Min/Max Tab............................................................................................................................................................ 124
Setup Tab ................................................................................................................................................................. 125
EPM 7330 M
ETER........................................................................................................................................................ 126
Metering Tab............................................................................................................................................................ 127
Min/Max................................................................................................................................................................... 128
Setup Tab ................................................................................................................................................................. 129
EPM 7500/7600 M
ETER............................................................................................................................................... 130
Metering Tab............................................................................................................................................................ 130
Min/Max Tab............................................................................................................................................................ 132
Power Quality Tab................................................................................................................................................... 133
Demand Tab............................................................................................................................................................. 134
Inputs Tab ................................................................................................................................................................ 135
Setup 1 Tab .............................................................................................................................................................. 136
Setup 2 Tab .............................................................................................................................................................. 138
EPM 7700 M
ETER........................................................................................................................................................ 140
Metering Tab............................................................................................................................................................ 140
Min/Max Tab............................................................................................................................................................ 142
Power Quality Tab................................................................................................................................................... 143
Demand Tab............................................................................................................................................................. 144
Inputs Tab ................................................................................................................................................................ 145
Setup 1 Tab .............................................................................................................................................................. 146
Setup 2 Tab .............................................................................................................................................................. 148
U
NIVERSAL RELAY ....................................................................................................................................................... 150
Metering Tab............................................................................................................................................................ 151
Power Quality Tab................................................................................................................................................... 152
Protection Control Tab ............................................................................................................................................ 153
Power System Configuration Tab ............................................................................................................................ 154
Transformer Tab ...................................................................................................................................................... 156
Elements Tab............................................................................................................................................................ 157
Digital Counter Tab................................................................................................................................................. 158
Virtual Inputs Tab.................................................................................................................................................... 159
Virtual Outputs Tab ................................................................................................................................................. 160
Contact Inputs Tab................................................................................................................................................... 161
Contact Output Tab.................................................................................................................................................. 162
DCMA Tab ............................................................................................................................................................... 163
Source Tabs.............................................................................................................................................................. 164
Demand Tab............................................................................................................................................................. 165
Line Tab ................................................................................................................................................................... 166
Breaker Tab ............................................................................................................................................................. 167
Contact Output Current States Tab.......................................................................................................................... 168
Remote Temperature Detection Tab ........................................................................................................................ 169
Bus Tab .................................................................................................................................................................... 170
239 M
OTOR PROTECTION RELAY.................................................................................................................................. 171
Metering tab............................................................................................................................................................. 171
Status Tab ................................................................................................................................................................ 172
Trip Data.................................................................................................................................................................. 173
PMCS Interface Toolkit Contents •••• v
Page 6

Setpoints Tab............................................................................................................................................................ 174
269 P
LUS MOTOR MANAGEMENT RELAY ..................................................................................................................... 175
369 M
OTOR MANAGEMENT RELAY .............................................................................................................................. 176
Metering Tab............................................................................................................................................................ 176
Alarms Tab............................................................................................................................................................... 178
Demand Tab............................................................................................................................................................. 179
Local RTD Tab......................................................................................................................................................... 180
Remote RTD Tab...................................................................................................................................................... 181
Control Tab.............................................................................................................................................................. 182
Setup Tab ................................................................................................................................................................. 183
SR469 M
OTOR MANAGEMENT RELAY.......................................................................................................................... 184
Metering Tab............................................................................................................................................................ 184
Status Tab................................................................................................................................................................. 185
Alarms Tab............................................................................................................................................................... 186
Trip Tab.................................................................................................................................................................... 187
IO Tab ...................................................................................................................................................................... 188
Maintenance Tab...................................................................................................................................................... 189
Analog Tab............................................................................................................................................................... 190
RTD HI Tab.............................................................................................................................................................. 191
Setpoints Tab............................................................................................................................................................ 191
SR489 G
ENERATOR MANAGEMENT RELAY.................................................................................................................. 192
Metering Tab............................................................................................................................................................ 192
Pickup Tab ............................................................................................................................................................... 193
Alarms Tab............................................................................................................................................................... 193
Trip Data Tab........................................................................................................................................................... 194
IO Tab ...................................................................................................................................................................... 195
Maintenance Tab...................................................................................................................................................... 196
Setpoints Tab............................................................................................................................................................ 197
565 F
EEDER MANAGEMENT RELAY .............................................................................................................................. 198
735 F
EEDER RELAY ...................................................................................................................................................... 200
Metering Tab............................................................................................................................................................ 200
Trip Data Tab........................................................................................................................................................... 201
Setpoints Tab............................................................................................................................................................ 202
SR745 T
RANSFORMER MANAGEMENT RELAY.............................................................................................................. 203
Metering Tab............................................................................................................................................................ 203
Flags Tab ................................................................................................................................................................. 204
IO Tab ...................................................................................................................................................................... 204
Demand Tab............................................................................................................................................................ 205
Harmonic Tab .......................................................................................................................................................... 206
Setpoints Tab............................................................................................................................................................ 207
Power Tab................................................................................................................................................................ 208
SR750/760 F
EEDER MANAGEMENT RELAY .................................................................................................................. 209
Metering Tab............................................................................................................................................................ 210
Status Tab................................................................................................................................................................. 211
Fault Tab.................................................................................................................................................................. 211
Trip Tab.................................................................................................................................................................... 212
Demand Tab............................................................................................................................................................. 213
Logic Tab ................................................................................................................................................................. 214
IO Tab ...................................................................................................................................................................... 214
Setpoints Tab............................................................................................................................................................ 215
F
ANUC 90/30 ................................................................................................................................................................ 216
F
ANUC 90/70 ................................................................................................................................................................ 216
F
ANUC MICRO 90.......................................................................................................................................................... 217
MX200 ......................................................................................................................................................................... 218
Metering Tab............................................................................................................................................................ 218
vi •••• Contents PMCS Interface Toolkit
Page 7

Setup Tab ................................................................................................................................................................. 220
GEN PLC..................................................................................................................................................................... 223
Master Tab............................................................................................................................................................... 223
Generator Tab.......................................................................................................................................................... 224
PSG .......................................................................................................................................................................... 225
EPM5300P ................................................................................................................................................................... 227
Metering Tab............................................................................................................................................................ 227
Setup One Tab.......................................................................................................................................................... 229
Setup Two Tab.......................................................................................................................................................... 230
EPM5200P ................................................................................................................................................................... 232
Metering Tab............................................................................................................................................................ 232
Setup One Tab.......................................................................................................................................................... 233
EPM5350P ................................................................................................................................................................... 235
Metering Tab............................................................................................................................................................ 235
Setup One Tab.......................................................................................................................................................... 236
Setup Two Tab.......................................................................................................................................................... 237
EPM5000P ................................................................................................................................................................... 239
Metering................................................................................................................................................................... 239
Setup......................................................................................................................................................................... 240
EPM9450Q/EPM9650Q .............................................................................................................................................. 241
Metering................................................................................................................................................................... 241
Min/Max................................................................................................................................................................... 242
Demand.................................................................................................................................................................... 243
Thermal Average...................................................................................................................................................... 244
Digital Inputs ........................................................................................................................................................... 245
Setup......................................................................................................................................................................... 246
EPM7430D/EPM7450D .............................................................................................................................................. 247
Metering................................................................................................................................................................... 247
Min/Max................................................................................................................................................................... 248
Limits........................................................................................................................................................................ 249
Setup......................................................................................................................................................................... 251
TROUBLESHOOTING ................................................................................................................................................ 252
A
SSERTION ERROR........................................................................................................................................................ 252
EPM 3710/EPM 3720 –
EPM 3720 – KVAH
L
ONG UPDATE WHEN CHANGING SETPOINTS.................................................................................................................. 252
PLEPM – W
I
NTOUCH APPLICATIONS – WINDOWS NOT DISPLAYED PROPERLY................................................................................. 253
RONG METERING TAB DISPLAYED............................................................................................................. 252
NO DATA OR INCORRECT DATA DISPLAYED ............................................................................ 252
IMPORT VALUES INCORRECT ........................................................................................................ 252
APPENDIX A: EPM 3720 SLIDING WINDOW DEMAND KEYS ......................................................................... 255
D
OWNLOADING SLIDING DEMAND WINDOW KEYS TO THE EPM 3720 ......................................................................... 255
APPENDIX B: AUTOMATIC WAVEFORM CAPTURE AND WAVEFORM RETRIEVAL ON EPM3720.... 263
U
SING A SETPOINT TO TRIGGER WAVEFORM CAPTURE OR RECORD ON THE EPM 3720 ................................................. 263
APPENDIX C: EPM 7700 - SPECIAL CONSIDERATIONS ................................................................................... 279
EPM 7700 T
AGS SUBJECT TO DEACTIVATION BY TABULAR DATA SCREEN WIZARD ................................................... 279
INDEX............................................................................................................................................................................. 293
PMCS Interface Toolkit Contents •••• vii
Page 8

Page 9

Introduction
Welcome
The PMCS Interface Toolkit is a POWER LEADER Power Management Control
System (PMCS) version 6.11a tool that provides a custom toolkit to efficiently create
flexible, accurate, and friendly user interfaces to your power management data. With
the PMCS Wizards (accurate graphical representations of power management
devices and other commonly encountered objects), you can create applications to
provide a customized interface that accurately represents physical, electrical, and
geographical plant layouts. The wizards can significantly cut new system
development time, providing results in less than an hour.
The PMCS Interface Toolkit allows you to create one-line diagrams, elevation views,
and floor plans that you can combine with tabular data screens and three-dimensional
device wizards to create a virtual representation of your facility and equipment. With
this graphical user interface, you actually see and control devices on the screen,
without having to make a trip out to the meter or trip unit.
The Toolkit, which consists of the Wonderware InTouch development environment
coupled with GE’s wizards, is easy to use, taking advantage of state-of-the-art dragand-drop technology. Wizards are provided for all the devices most commonly used
with the PMCS DDE Server. Creating a custom interface is as easy as selecting
wizards for the devices installed in a facility and placing them on the screen.
Here’s what you’ll find in this guide:
• Chapter 2 explains the kinds of PMCS Wizards, their use and
configuration – Small Faceplate wizards, Large Faceplate wizards,
Tabular Data Screen wizards, One- Line wizards, Elevation wizards,
and Floor Plan wizards.
• Chapter 3 illustrates the use of the GE wizards described in Chapter 2
to create animated displays of the facility floor plan, switchgear
elevations, and system one- line diagrams.
• Chapter 4 gives an example of application development, using the
wizards described in Chapters 2 and 3 to create an actual PMCS
application.
• Chapter 5 describes the functions available with each of the GE Large
Faceplate wizards. These wizards are accurate graphical representations
1
Page 10

of power management devices, complete with working controls that are
linked to the corresponding devices in your facility.
• Chapter 6 describes the Tabular Data wizards. These wizards list the
data and setpoints of power management devices in a tabular format.
Simply point and click to select the appropriate tab of information to
display and view the related data.
The examples and references in this guide enable you to create custom interfaces for
your PMCS system, and allow you to access power management data in the way that
best suits you.
How should I use this manual?
How you use this book depends on your level of expertise with Wonderware
InTouch. Consult the table below to determine where you should start.
If this describes you… Start here:
I’ve never seen this stuff before! What’s
Wonderware InTouch? What are
“Wizards”?
I’ve just opened this package – where do I
go first?
I’m familiar with Wonderware InTouch
and I’d like to build a custom application
for some GE power management devices.
The GE PMCS Wizards are already
installed on my system, I’m already
experienced with InTouch, and I’m ready
to start building custom applications.
Just tell me about the wizards; I’m an old
pro and ready to go!
Refer to the documentation that came with your
Wonderware InTouch package. Start with the
introduction and tutorial sections, which will teach you
about Wonderware InTouch and how to use it to create
custom applications. When you understand what wizards
are and how to use them, come back here.
Go to Chapter 1, Introduction. Chapter 1 explains what
the User Screen Configurator is, what it’s good for, and
where to go after that.
Go to Chapter 1 for installation instructions, then to
Chapter 2 for descriptions of the wizards and how to use
them. Chapter 4 provides a demo of actual application
development. This package contains wizards for the
power management devices supported by GE’s PMCS
6.11a software.
Turn to Chapter 2 for information on how to use the GE
PMCS Wizards, and Chapter 4 for a quick example of
application development. For detailed descriptions of
the Large Faceplate wizards or the Tabular Data Screen
wizards, refer to Chapters 5 and 6 respectively.
Skim through Chapters 2 and 3 for an overview of
what’s in the package, then Chapter 4 for a quick
example of application development. Chapter 5
describes the GE Large Faceplate wizards and Chapter 6
the associated Tabular Data Screen wizards.
2 PMCS Interface Toolkit
Page 11
Conventions
You will find this book easy to use if you look for these simple conventions:
About the Interface Toolkit
The Interface Toolkit consists of the Wonderware InTouch development
environment and a special set of wizards developed for use with the power
management devices supported by PMCS.
Installation
To install the Interface Toolkit from the CD-ROM, refer to the instructions provided
in GEH-6514, Read This Book First.
When InTouch is successfully installed, you must add the PMCS wizards to
InTouch’s library of available wizards.
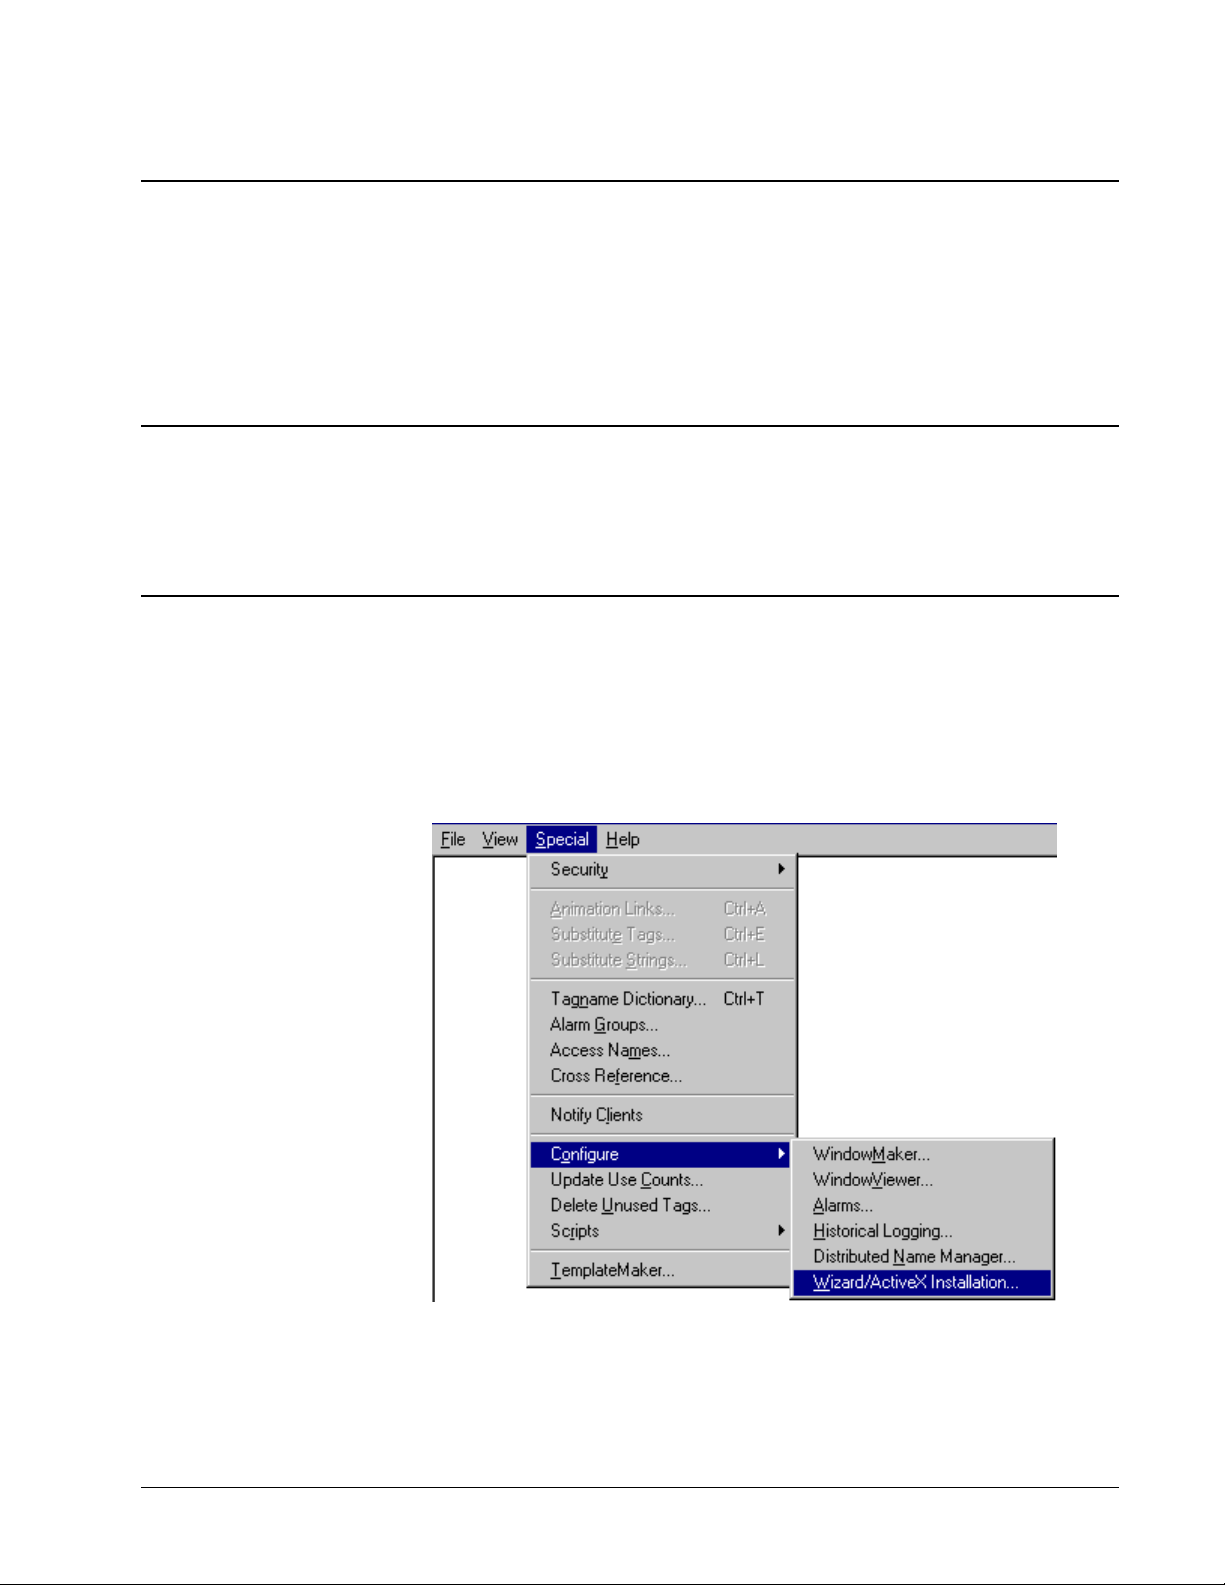
To add the wizards to InTouch, start InTouch and enter Development mode. Pull
down the Special menu and select Configure > Wizard.
• Boldface type indicates the name of an item you need to select.
• Monospace type indicates an example or text that is displayed on the
screen.
• UPPERCASE type indicates a file name, command name, or acronym.
3
Page 12
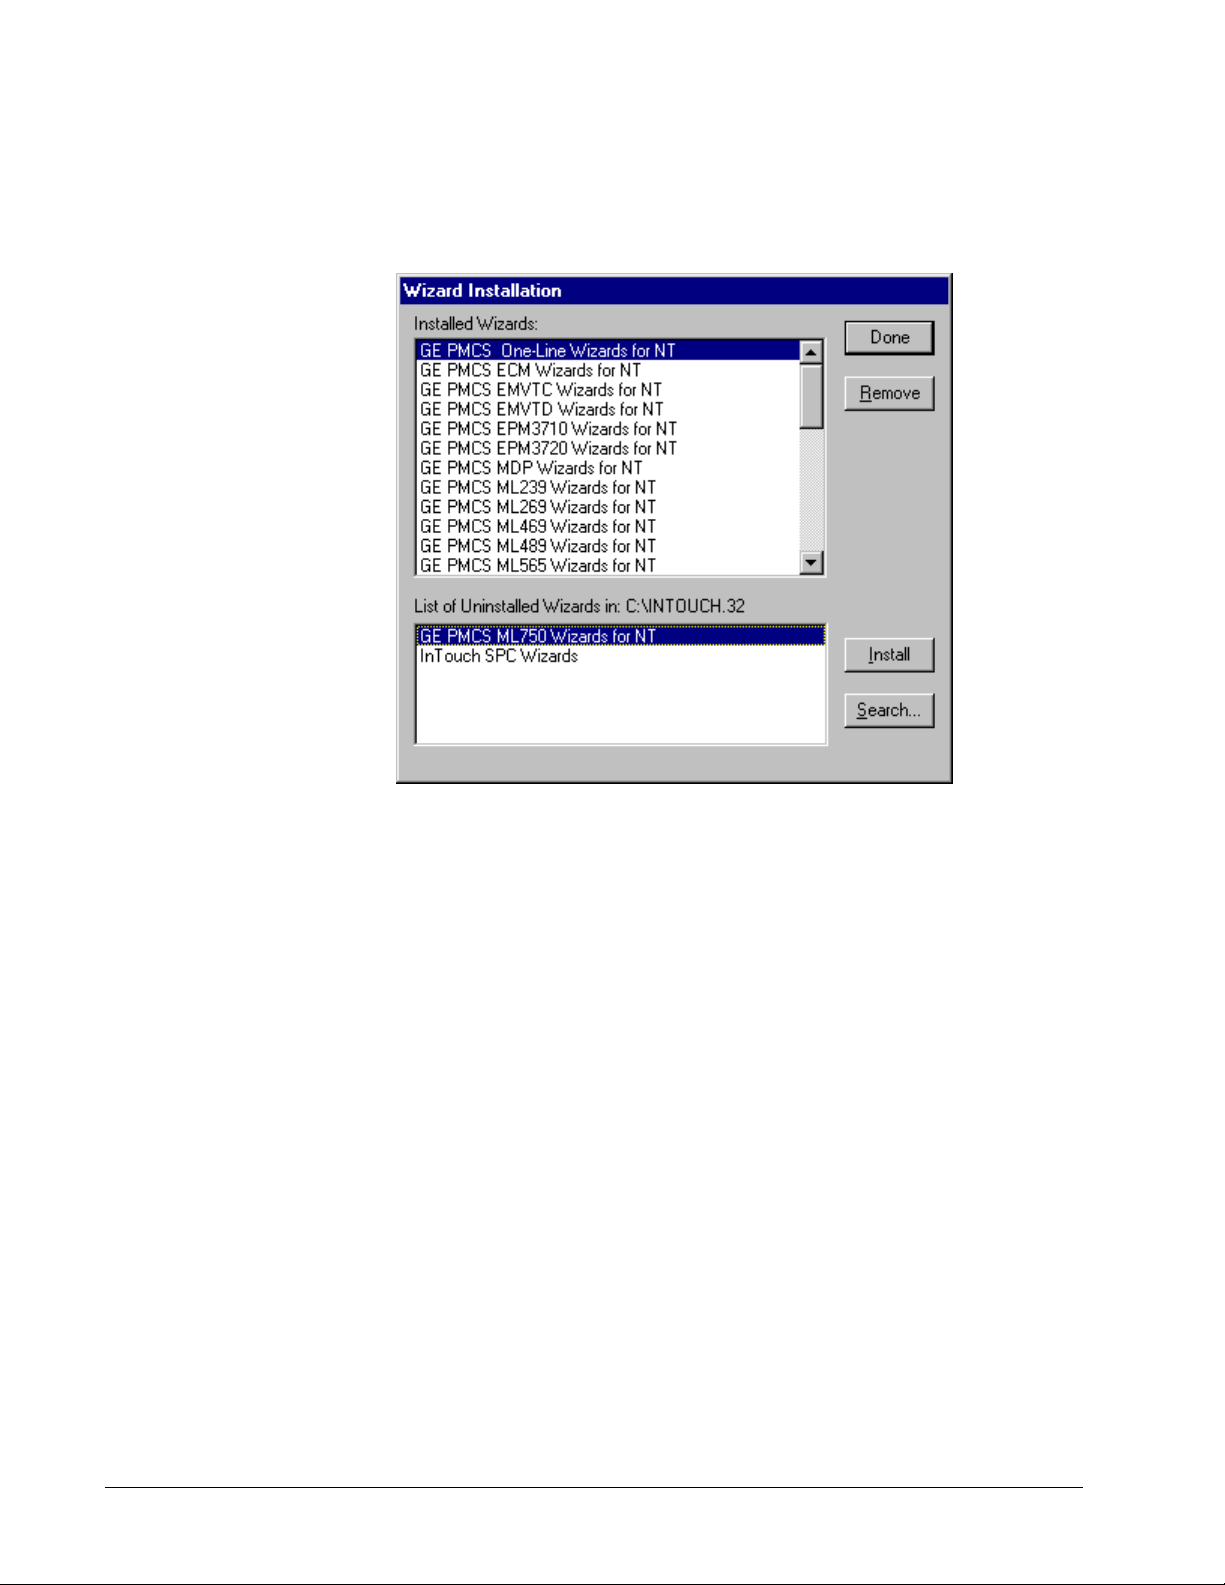
From the InTouch Configuration menu, select Install Wizards.
The Wizard Installation dialog displays two list boxes, showing the currently
installed wizards and the wizards available for installation. Select the desired wizards
from the bottom box and click Install. When the installation is complete, click Done.
Exit from the InTouch Configuration dialog box by clicking OK. The PMCS wizards
should now be loaded and ready for use.
4 PMCS Interface Toolkit
Page 13

Using and Configuring PMCS Wizards
About the Wizards
The wizards contained in the PMCS Interface Toolkit allow you to quickly build
accurate and friendly user interfaces with InTouch. In addition to the various wizards
standard with InTouch development systems, the Interface Toolkit provides six types
of powerful GE wizards:
• GE Small Faceplates
• GE Large Faceplates
• GE Tabular Screens
• GE One-Line Tools
• GE Elevation Wizards
• GE Floor Plan Wizards
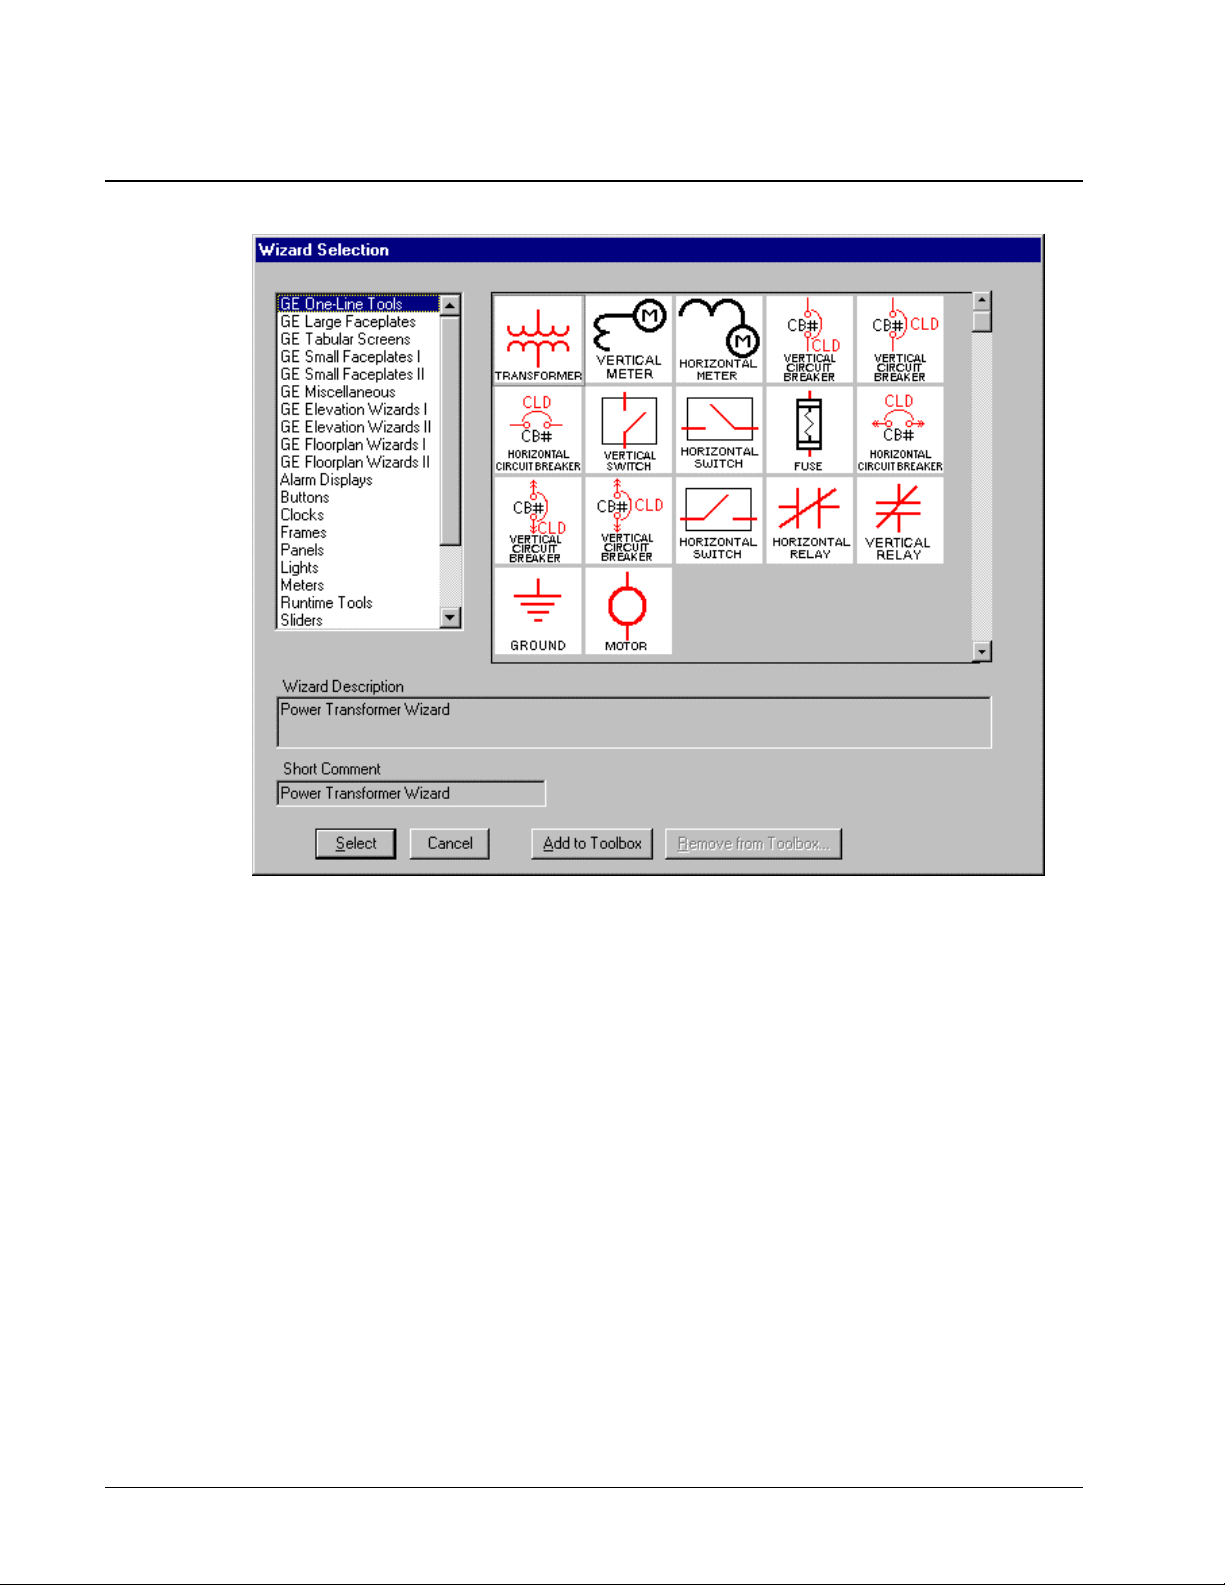
The five-step procedure below outlines how to use InTouch wizards.
1. From InTouch, either create a new window or open an existing window
to modify.
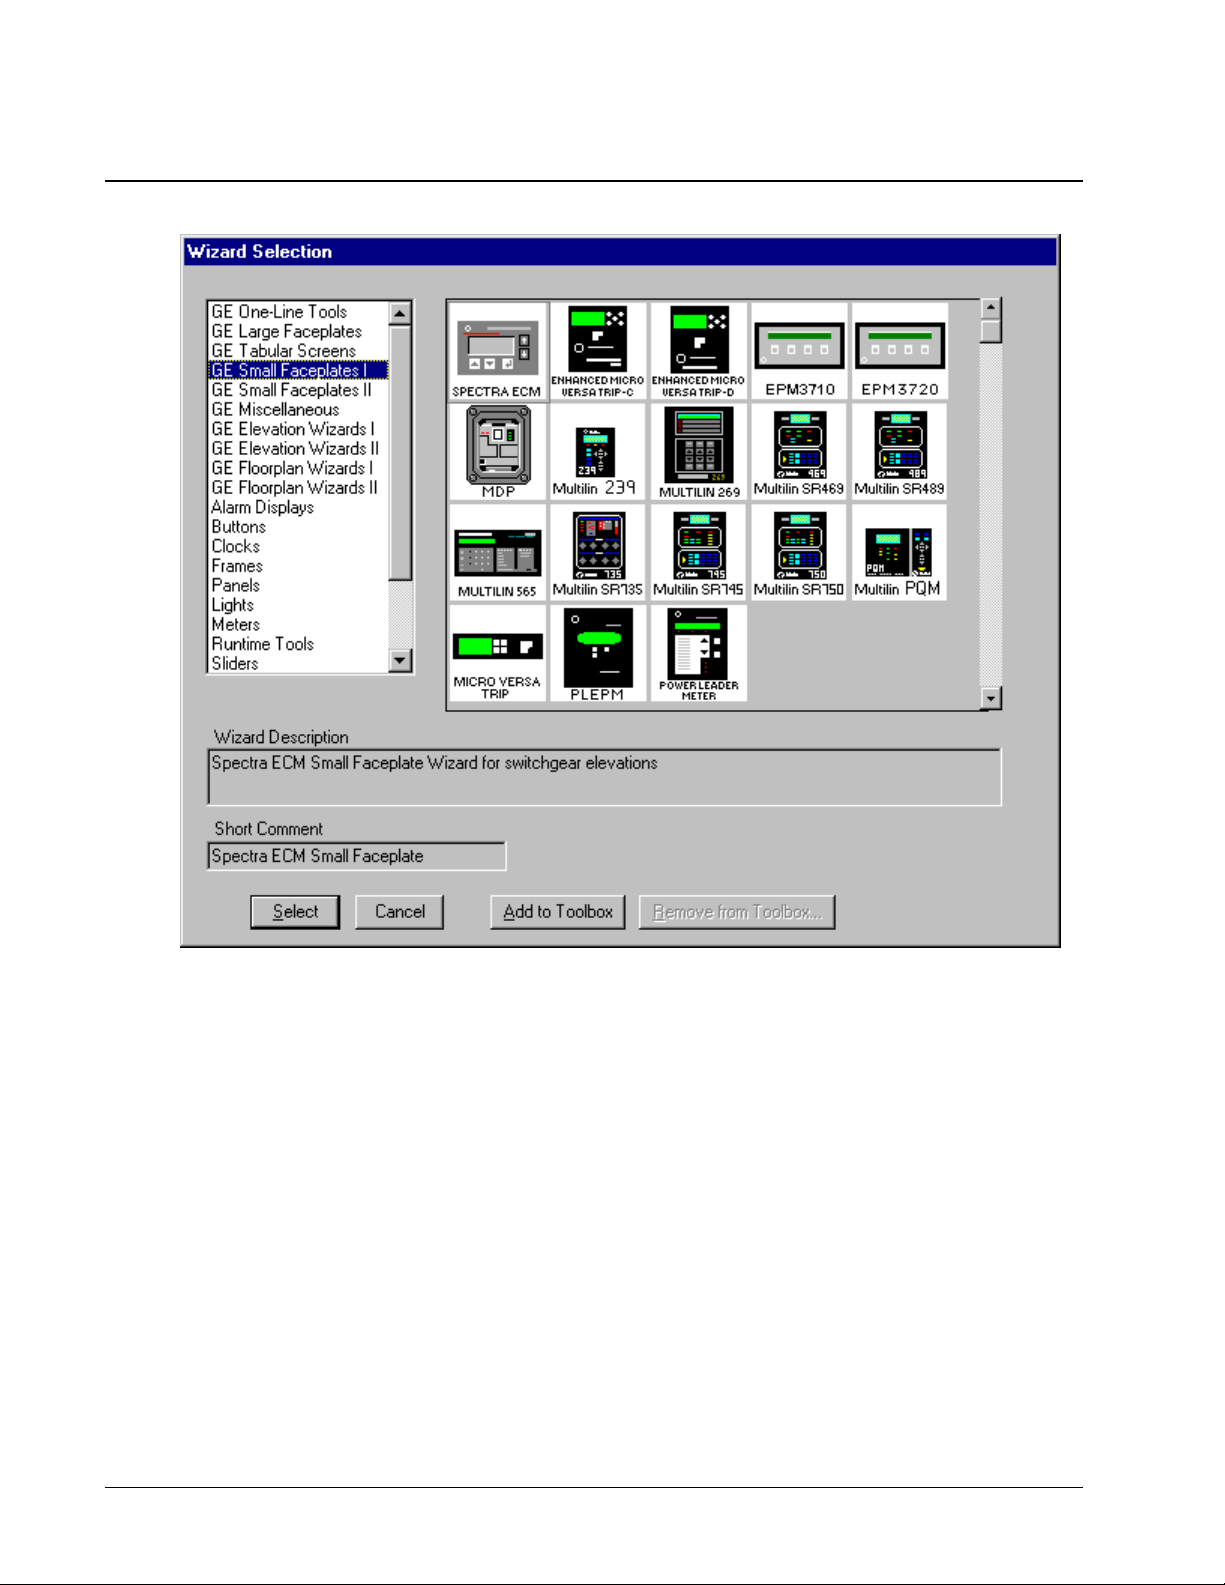
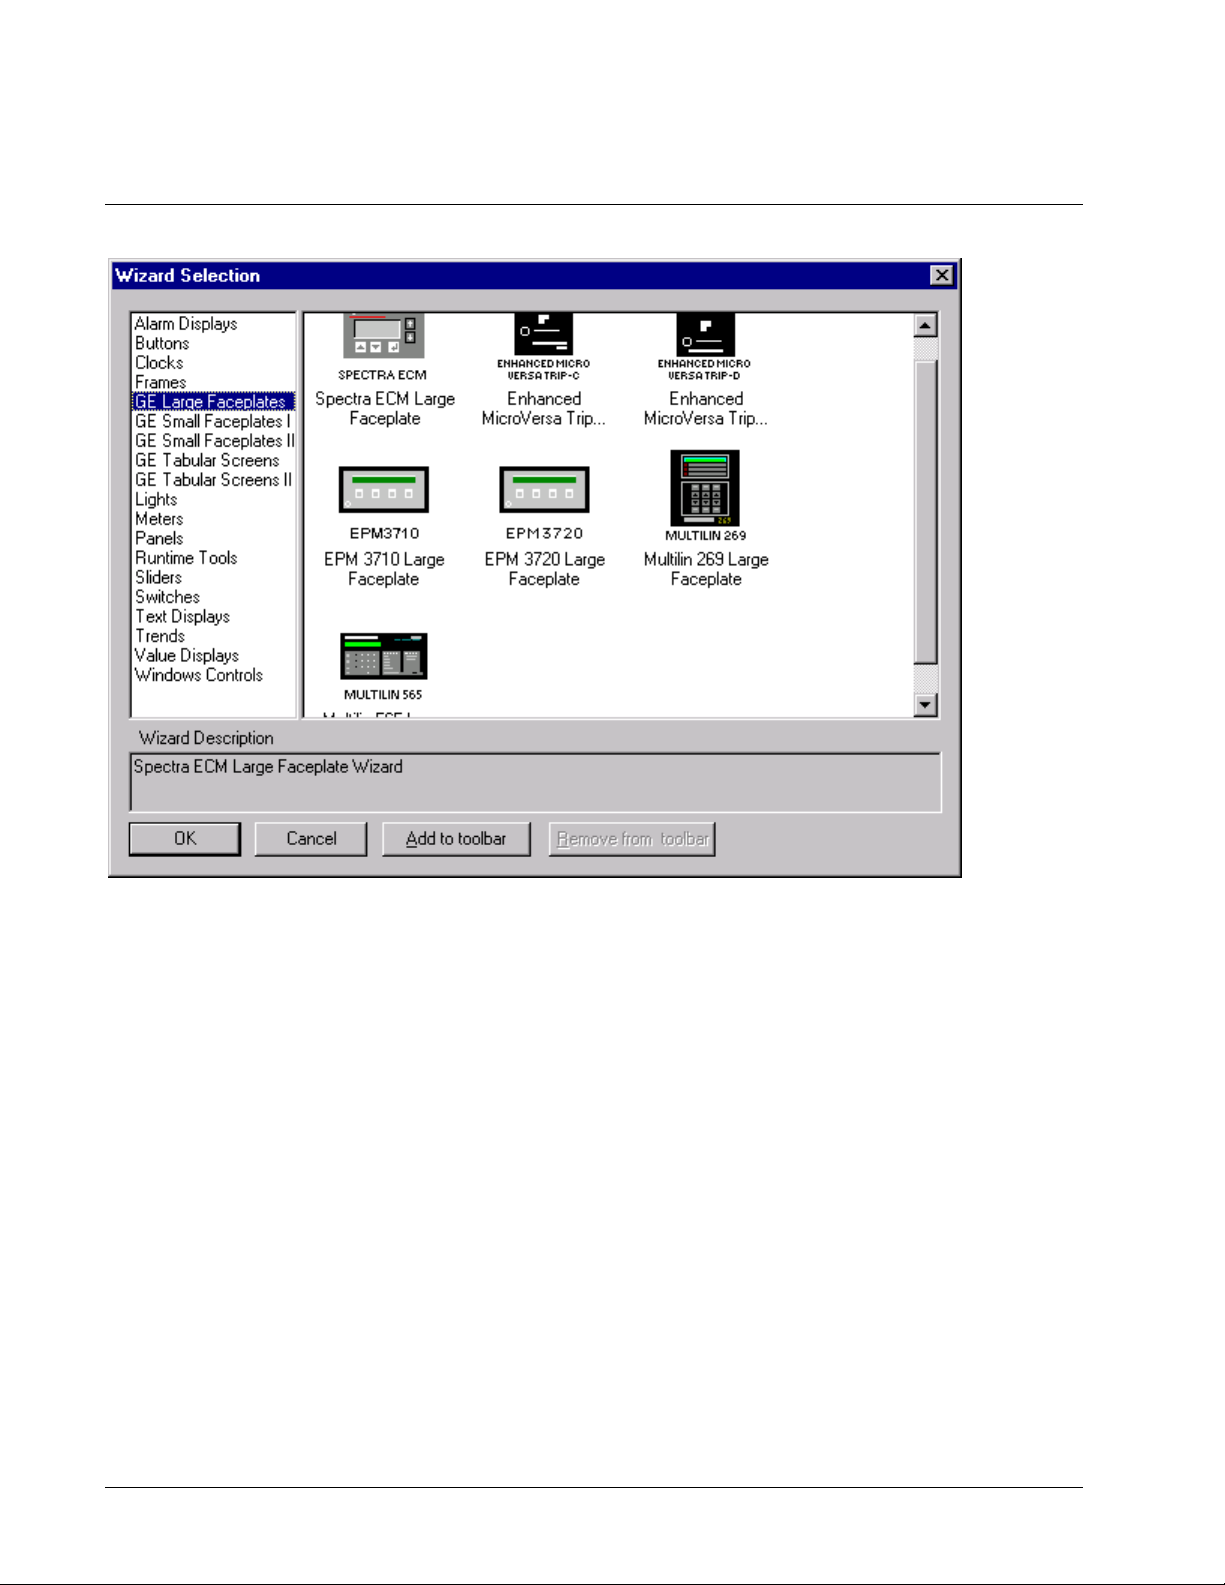
2. Select the wizards button
Selection dialog box pops up.
3. Select the class of wizard from the list of wizards on the left side of the
Wizard Selection dialog. Several classes contain too many devices to fit
on one palette and have been broken up into several palettes; for
example; Small Faceplates 1 and Small Faceplates 2.
4. Double-click on the desired wizard, then click on the window to place
the wizard.
5. Once the wizard has been placed, double-click anywhere on the wizard
to open a configuration dialog (if appropriate), and complete any
necessary configuration based on the instructions later in this chapter.
The remainder of this chapter is devoted to describing and illustrating the various
kinds of wizards included in the PMCS Interface Toolkit.
5
from the floating toolbars. The Wizard
Page 14
Small Faceplate Wizards
Usage
The Small Faceplate wizards are icon-sized graphics typically used to create accurate
elevation views and one-line diagrams. These wizards are provided with logic to
open another window, typically either a Large Faceplate or Tabular Data Screen
wizard. There are two palettes of Small Faceplates to choose from.
Configuration
In development mode, after placing the Small Faceplate, double-click on the icon to
open the Small Faceplate Dialog box, as illustrated below. Typically, a Small
Faceplate wizard is linked to a window containing either a Large Faceplate or a
Tabular Data Screen wizard. You can move or resize Small Faceplate wizards in the
window as desired.
6 PMCS Interface Toolkit
Page 15
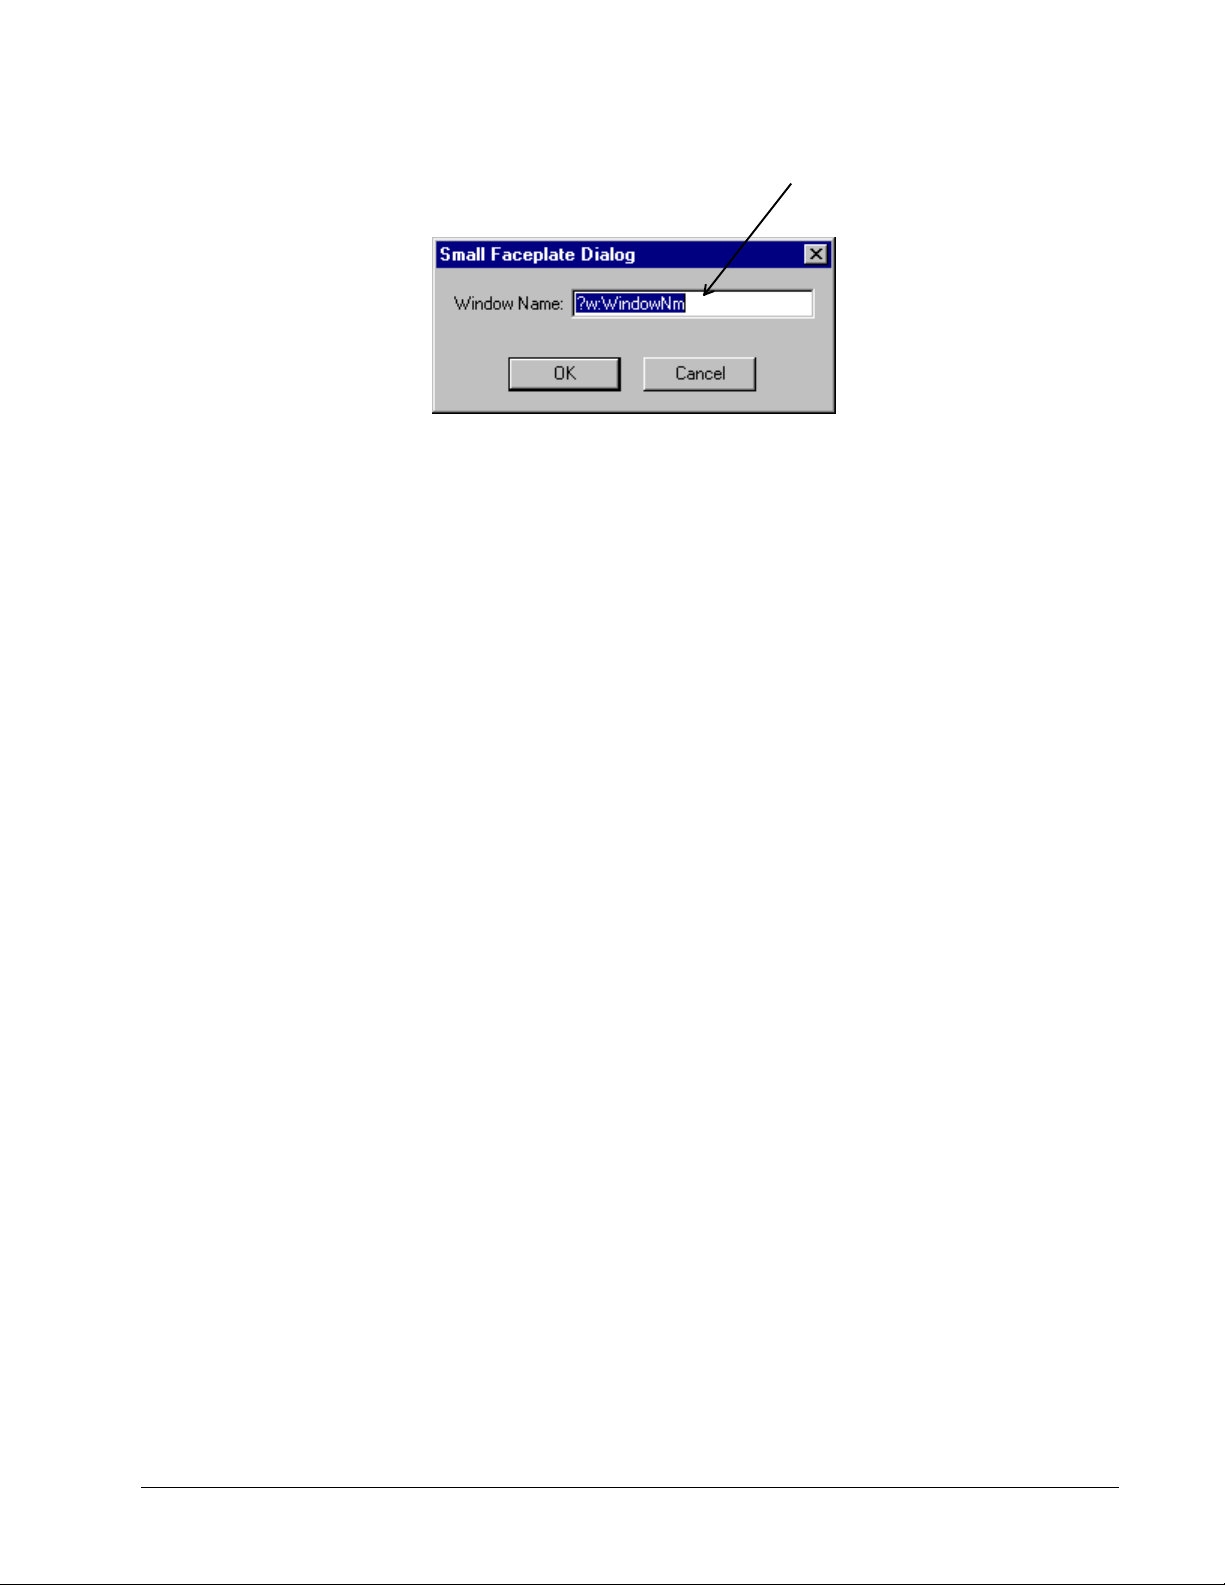
Enter the name of the window
to open when the icon is
clicked on during runtime.
7
Page 16
Large Faceplate Wizards
Usage
Large Faceplate wizards are three-dimensional representations of device faceplates
that can be used to display data from the device. These three-dimensional wizards
include extensive logic that provides an accurate reproduction of the actual display
and keys of the device. Large Faceplate wizards are typically placed in overlay
windows.
8 PMCS Interface Toolkit
Page 17
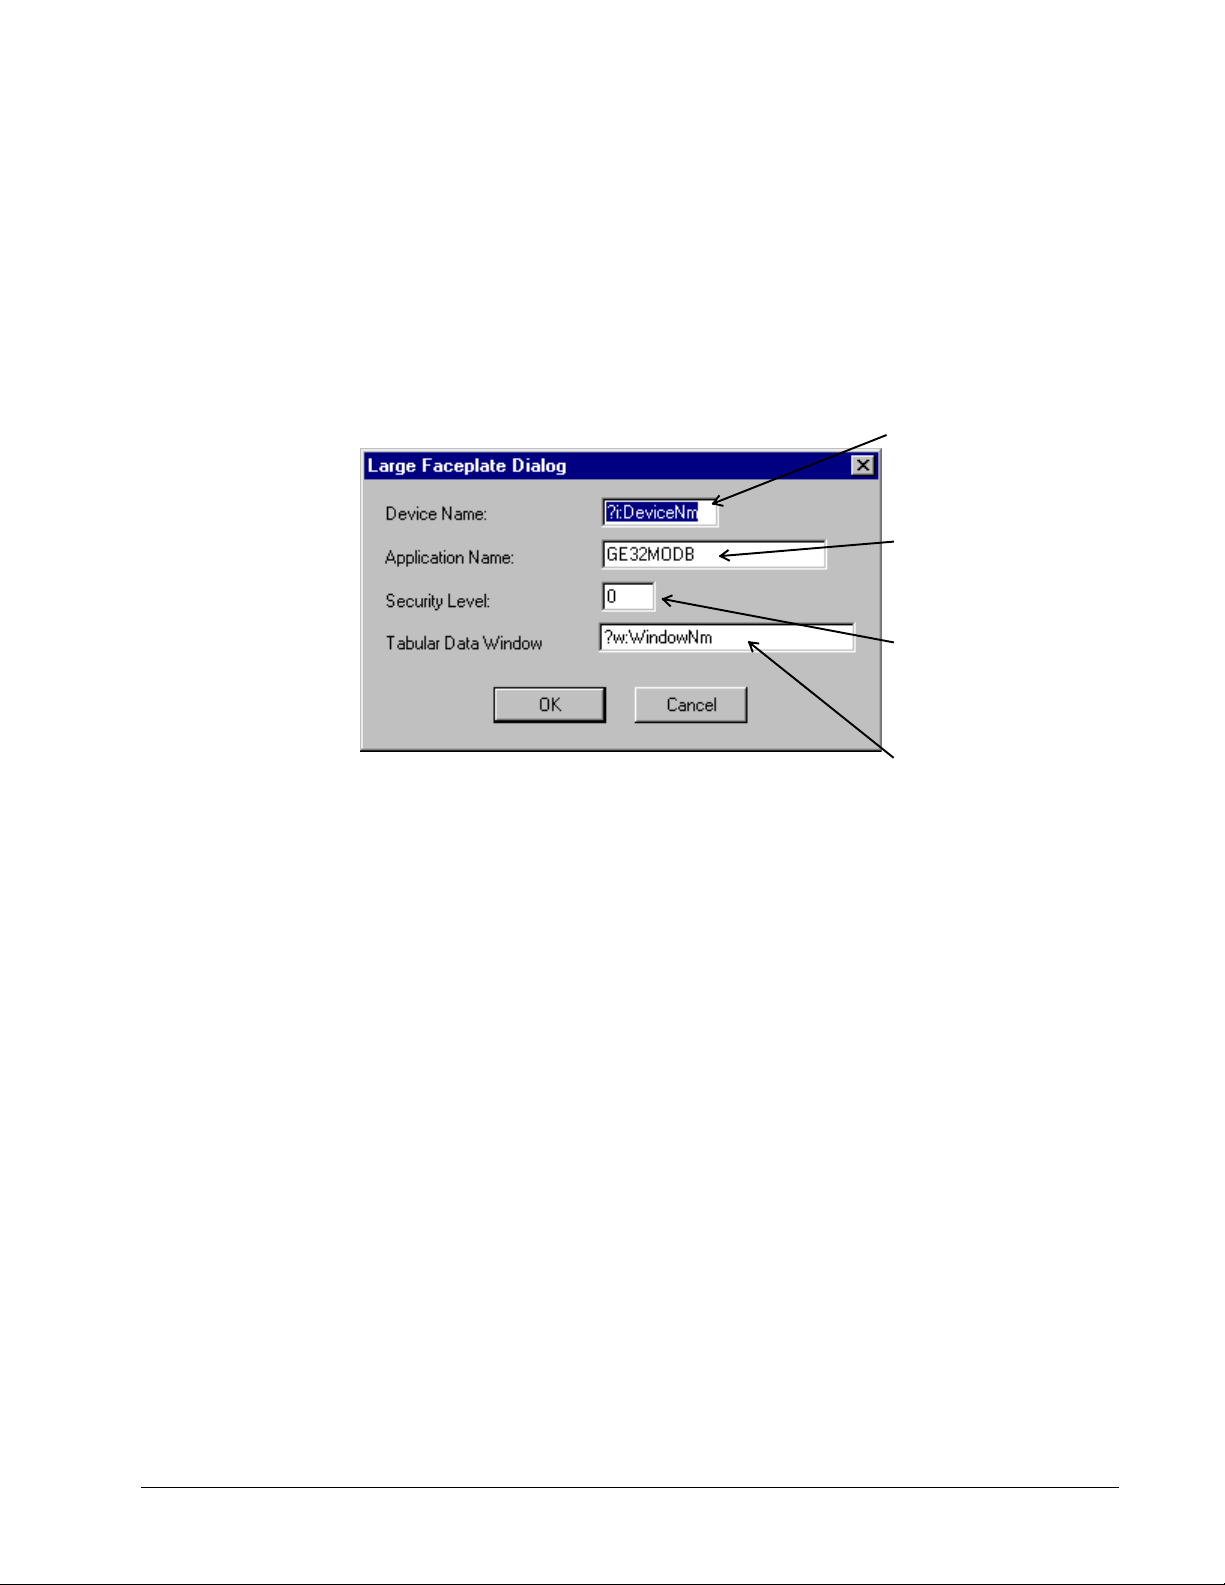
Configuration
Place the Large Faceplate wizard into an open window, then double-click on it to
display the Large Faceplate Dialog box. Configure the wizard by entering the
appropriate information into each of the boxes.
The figure shown below is the dialog for a typical wizard. Some wizards have
additional features which may be configured. See the section titled Features of GE
Large Faceplate Wizards for more details.
Enter the unique eight-character
name matching the appropriate Topic
in the PMCS DDE Server.
Enter the application name of the
PMCS DDE Server (GE32MODB or
GE32MTCP) for most PMCS
devices; ION_LINK for EPM 7700
devices).
Enter the minimum security
level for enabling remote
command functions.
Enter the name of the window to
open when the device display is
clicked on during runtime.
You can move and resize Large Faceplate wizards as desired.
Special Considerations
The button controls on the 3-D representation emulate the controls of the actual
device. This may be useful for reducing software training time for personnel already
familiar with device operation. The detailed features of each of the Large Faceplate
wizards are described in the section titled Features of GE Large Faceplate
Wizards .
EPM 7700
The EPM 7700 Large Faceplate Dialog box contains an extra field, which must be
completed during configuration. The Node Name field requires that you enter the
name of the computer running the Communications Server that connects to this
particular device. Depending on the configuration of the EPM7700 network, this can
be either the Primary node computer, or a computer setup as a "Full Station"
Secondary node. Refer to DEH-40035, the GE 7700 Gateway Users Guide, and
GEH-6514, PMCS Read This Book First, for more information on network
configuration. The Node Name field is required because the EPM7700 does not use
the same DDE server as the rest of the standard PMCS devices, and the wizard must
be directed to the location of the correct Communications Server for proper
configuration of DDE topic names.
9
Page 18

Also, the Application Name field must be completed as ION_LINK rather than
GE32MODB or GE32MTCP for the EPM7700 device. The ION LINK program is
installed during initial PMCS 6.11a setup if the EPM7700 software option is selected.
When configuring Wizards on Secondary nodes, the Application Name field entry
does not follow the PMCS wizard convention of “\\RemoteComputer\ION_LINK”.
EPM7700 Secondary nodes run a local copy of the ION LINK server, thus the
application name for EPM7700 Large Faceplate wizards is always “ION_LINK”
whether the wizard is installed on the Primary node or a Secondary node. The Node
Name entry determines if the wizard is on a Secondary node.
Finally, the EPM 7700 device type requires special InTouch scripting for the large
faceplate wizard. Refer to the section at the end of this chapter titled Special
Scripting Considerations for the EPM 7700.
10 PMCS Interface Toolkit
Page 19
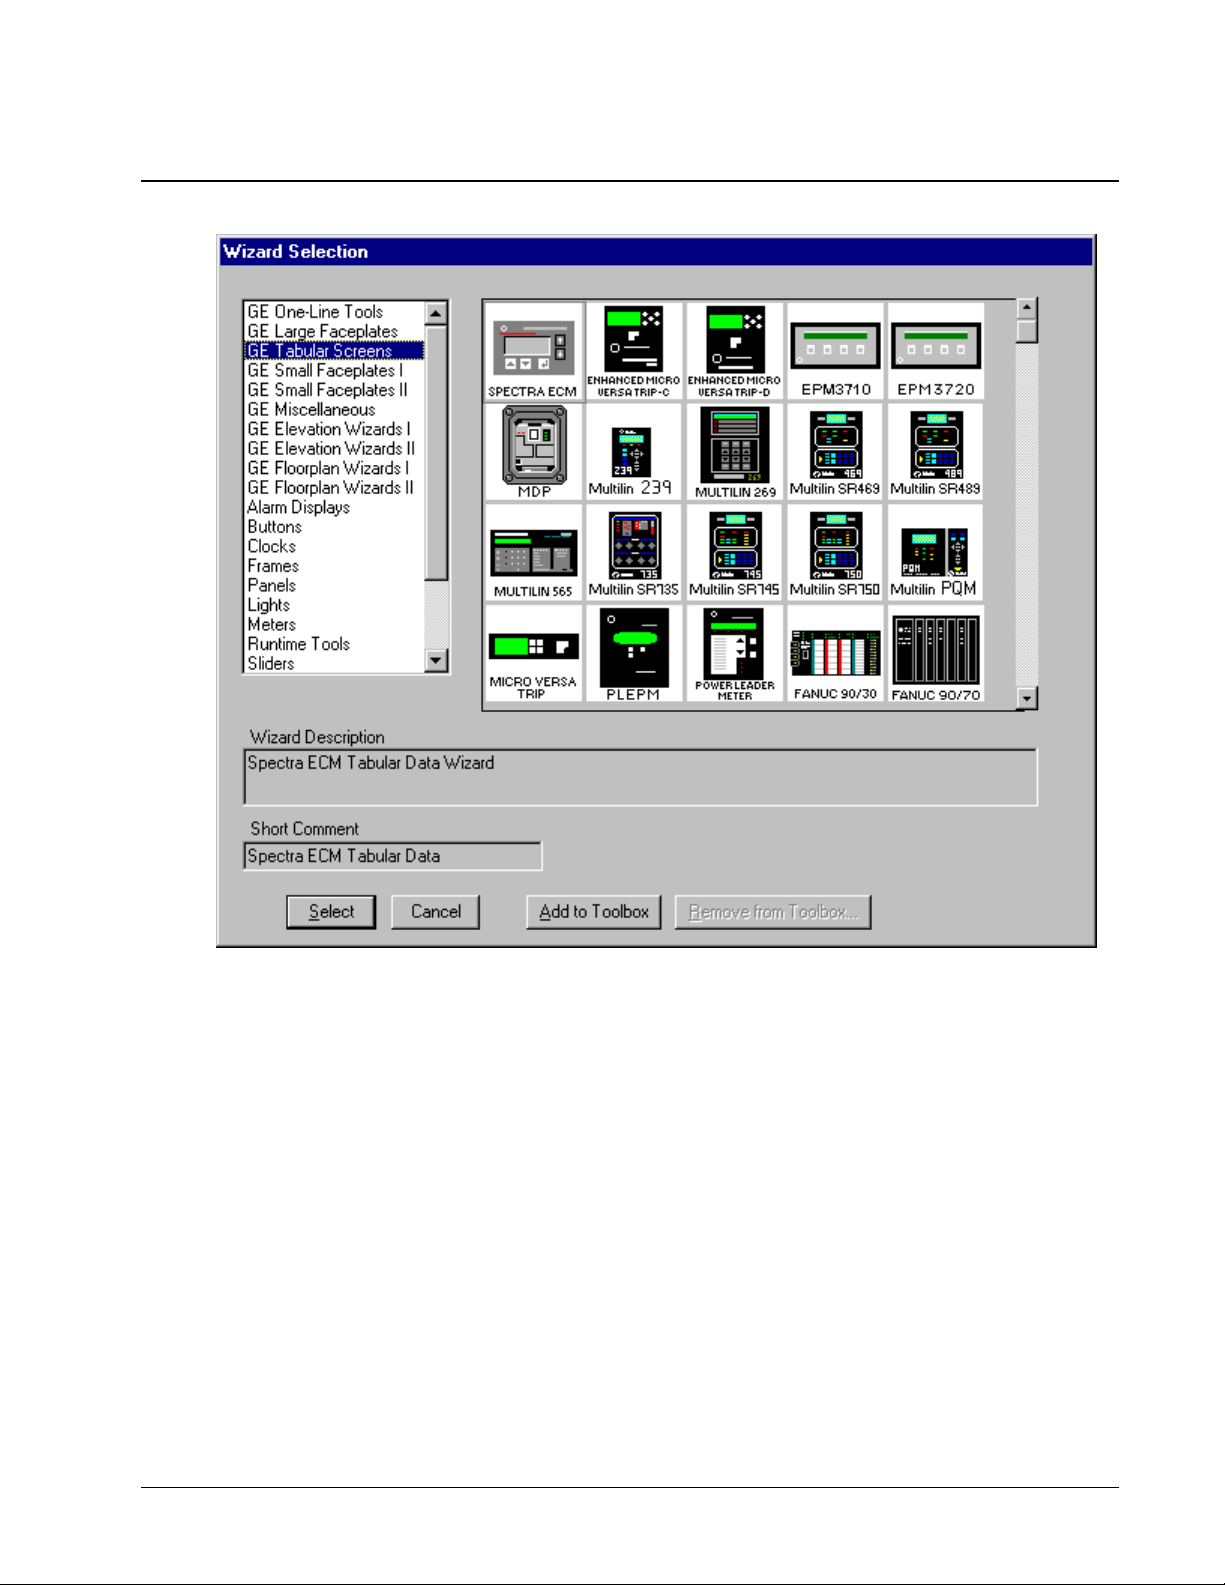
Tabular Data Screen Wizards
11
Usage
Tabular Data Screen wizards contain organized, comprehensive, tabular layouts of
device parameters including additional configuration and remote control features.
Depending on the device, there may be multiple file-tabs beneath the tabular data
section. These switch among various pages relating to data and setpoints.
Each Tabular Data Screen wizard contains buttons for activating the help file, trend
window, setup window (if applicable), Event Logger, Waveform Capture, and for
closing the window.
You can move and resize Tabular Data Screen wizards as desired.
Configuration
In development mode, after placing a wizard into an open window, double-click on it
to display the Tabular Data Dialog box. The figure below shows the dialog box for a
typical Tabular Data wizard. Some wizards have additional features which may be
configured. See the section titled Features of Tabular Data Screen Wizards for
more details.
Page 20
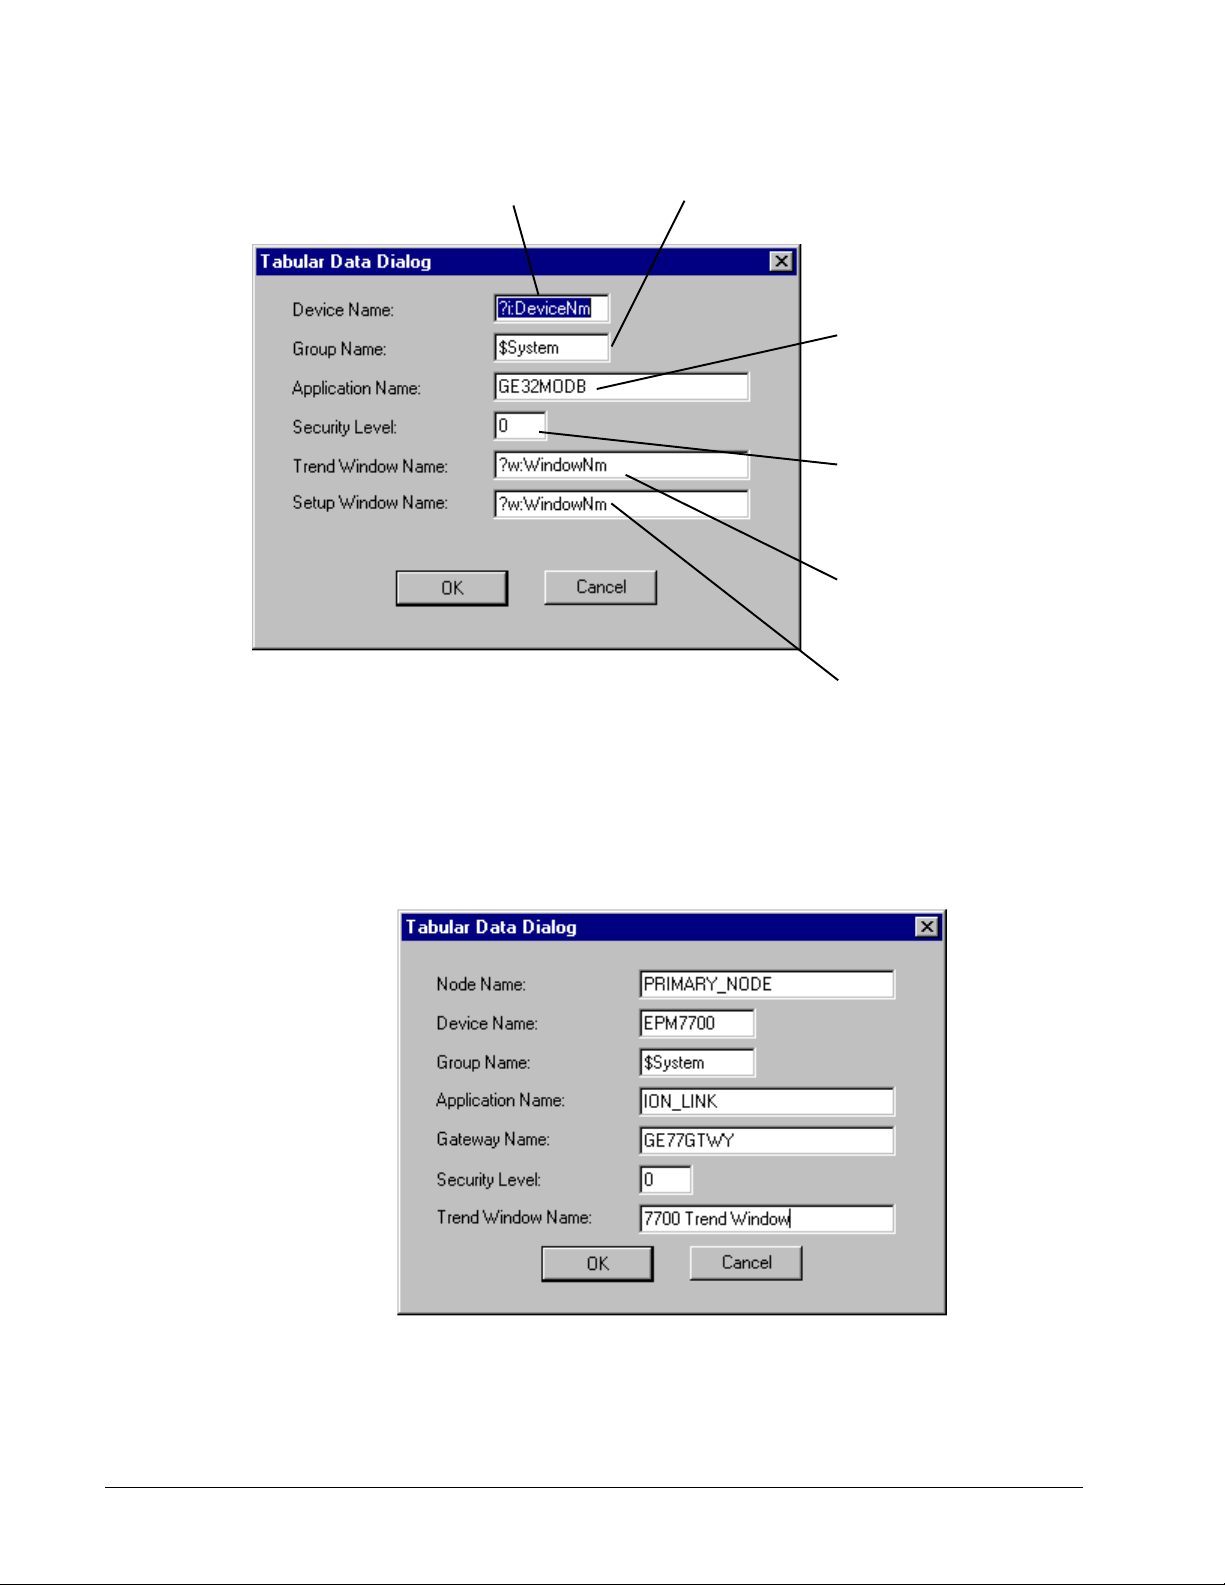
Enter the unique eight- character
l
name matching the appropriate
Topic in the PMCS DDE Server.
Use the Group Name field to logically group devices,
if desired. Enter the name of the group to which the
device belongs.
Enter the application name of
the PMCS DDE Server
(GE32MODB or GE32MTCP).
Enter the minimum security leve
for enabling remote command
and setup functions.
Enter the name of the window to
be opened when the Trend
button is clicked on during
runtime.
Enter the name of the window to
be opened when the Setup
button is clicked on during
runtime.
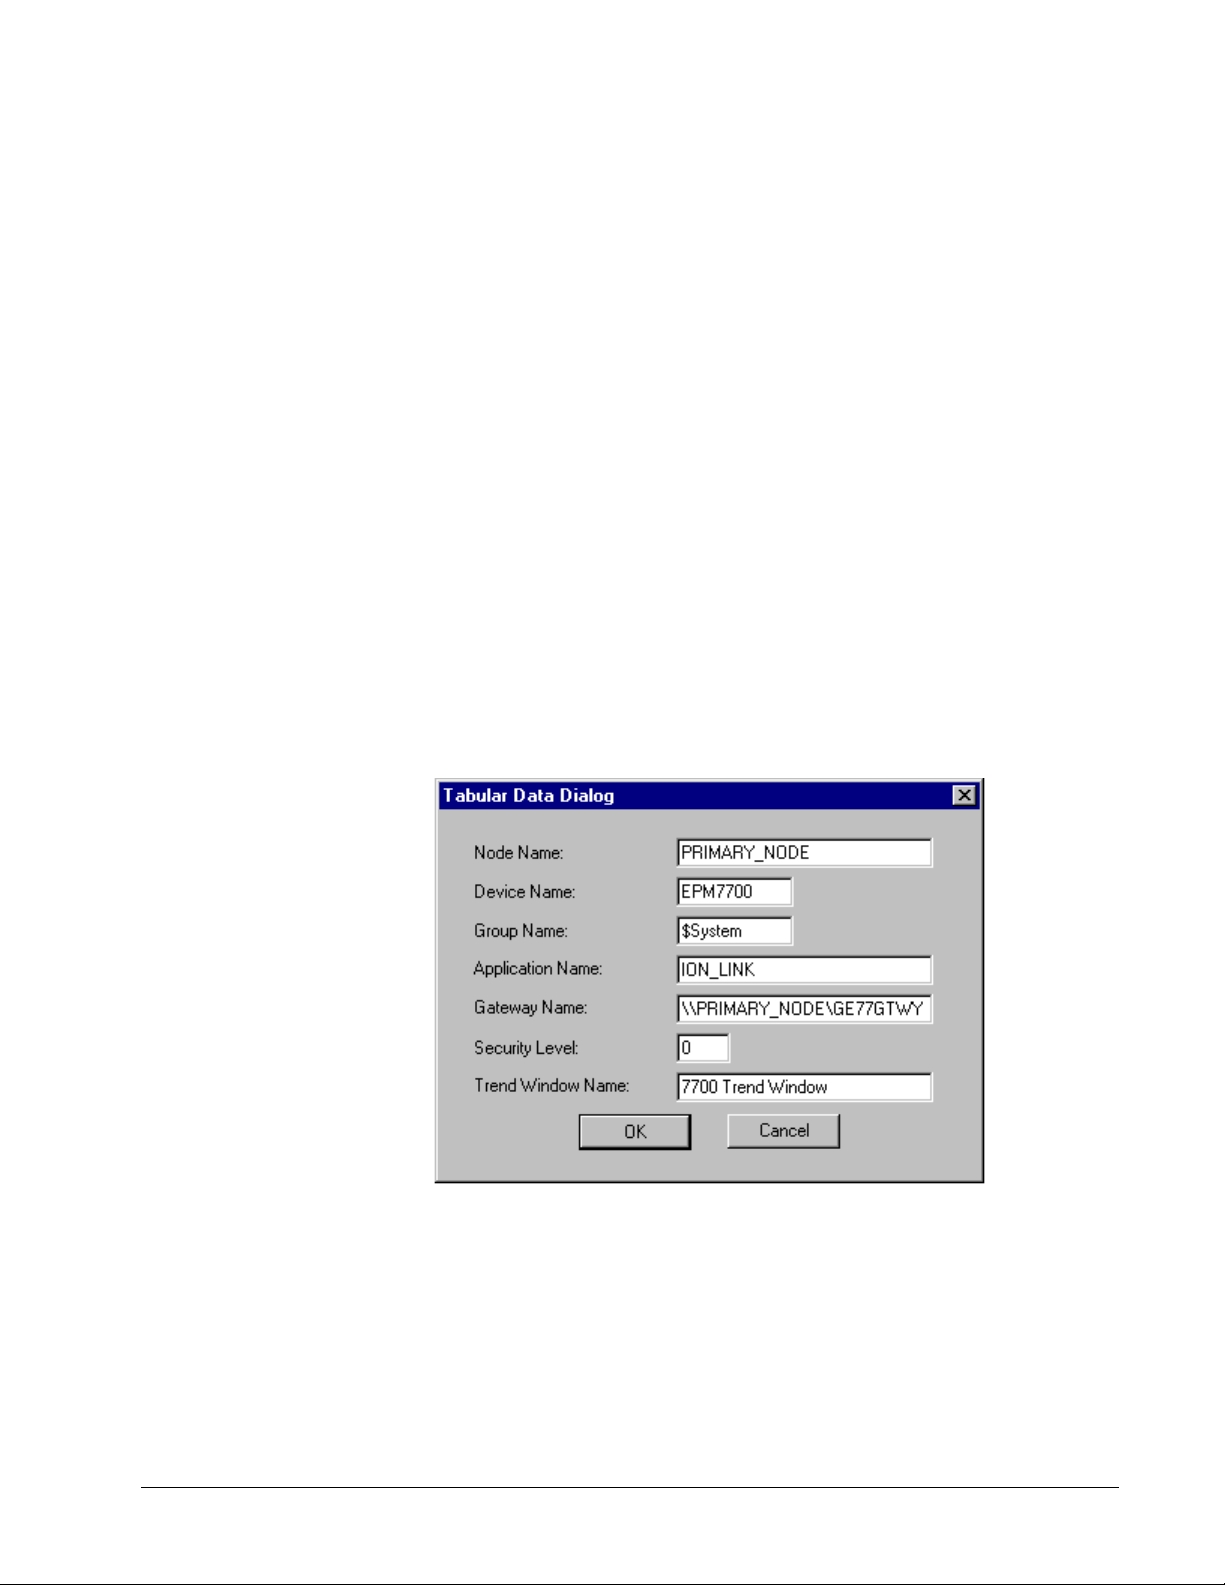
EPM 7700
The EPM 7700 Tabular Data Dialog box is slightly different from the other PMCS
device types, containing two extra fields and requiring minor differences in
configuration. The Tabular Data Dialog for the EPM 7700 is shown below, followed
by the special configuration requirements.
The Node Name field requires that you enter the name of the computer running the
Communications Server that connects to this particular device. Depending on the
configuration of the EPM7700 network, this can be either the Primary node
computer, or a computer setup as a “Full Station” Secondary node. Refer to DEH-
12 PMCS Interface Toolkit
Page 21
40035, the GE 7700 Gateway Users Guide, and GEH-6514, PMCS Read This Book
First, for more information on network configuration. The Node Name field is
required because the EPM7700 does not use the same DDE server as the rest of the
standard PMCS devices, and the wizard must be directed to the location of the
correct Communications Server for proper configuration of DDE topic names.
Also, the Application Name field must be completed as ION_LINK rather than
GE32MODB or GE32MTCP for the EPM7700 device. The ION LINK program is
installed during initial PMCS setup if the EPM7700 software option is selected.
When configuring Wizards on Secondary nodes, the Application Name field entry
does not follow the PMCS wizard convention of “\\RemoteComputer\ION_LINK”.
EPM7700 Secondary nodes run a local copy of the ION LINK server, thus the
application name for EPM7700 Tabular Data Wizards is always “ION_LINK”
whether the wizard is installed on the Primary node or a Secondary node. The Node
Name entry determines if the wizard is on a Secondary node.
The Gateway Name field must be completed with GE77GTWY, the application name
of the GE 7700 Gateway Server program. When configuring the EPM7700 Tabular
wizard on a Secondary node, the Gateway Name does follow the PMCS wizard
convention of “\\RemoteComputer\GE77GTWY” in the Gateway Name field, where
‘RemoteComputer’ is the name of the PC where the GE 7700 Gateway application is
running – the Primary Node. The following example shows a Tabular Data Dialog
box as it would appear when configuring a Tabular Data wizard on a Secondary
node. The Node Name field contains the name of the Primary Node computer, the
Application Name field is ION_LINK (as it is for ALL EPM7700 wizards on ANY
node) and the Gateway Name field points to the GE 7700 Gateway Server running on
the Primary Node PC.
13
Finally, the EPM 7700 device type requires special InTouch scripting for the tabular
data screen wizard. Refer to the section at the end of this chapter titled Special
Scripting Considerations for the EPM 7700.
Refer to DEH-40035 for information on the Communications Server and 7700
Gateway Server.
369 Motor Management Relay
The 369 Motor Management Relay offers an optional Remote RTD module, which
can provide support for up to 12 additional RTDs. Accordingly, the 369 Tabular
Page 22
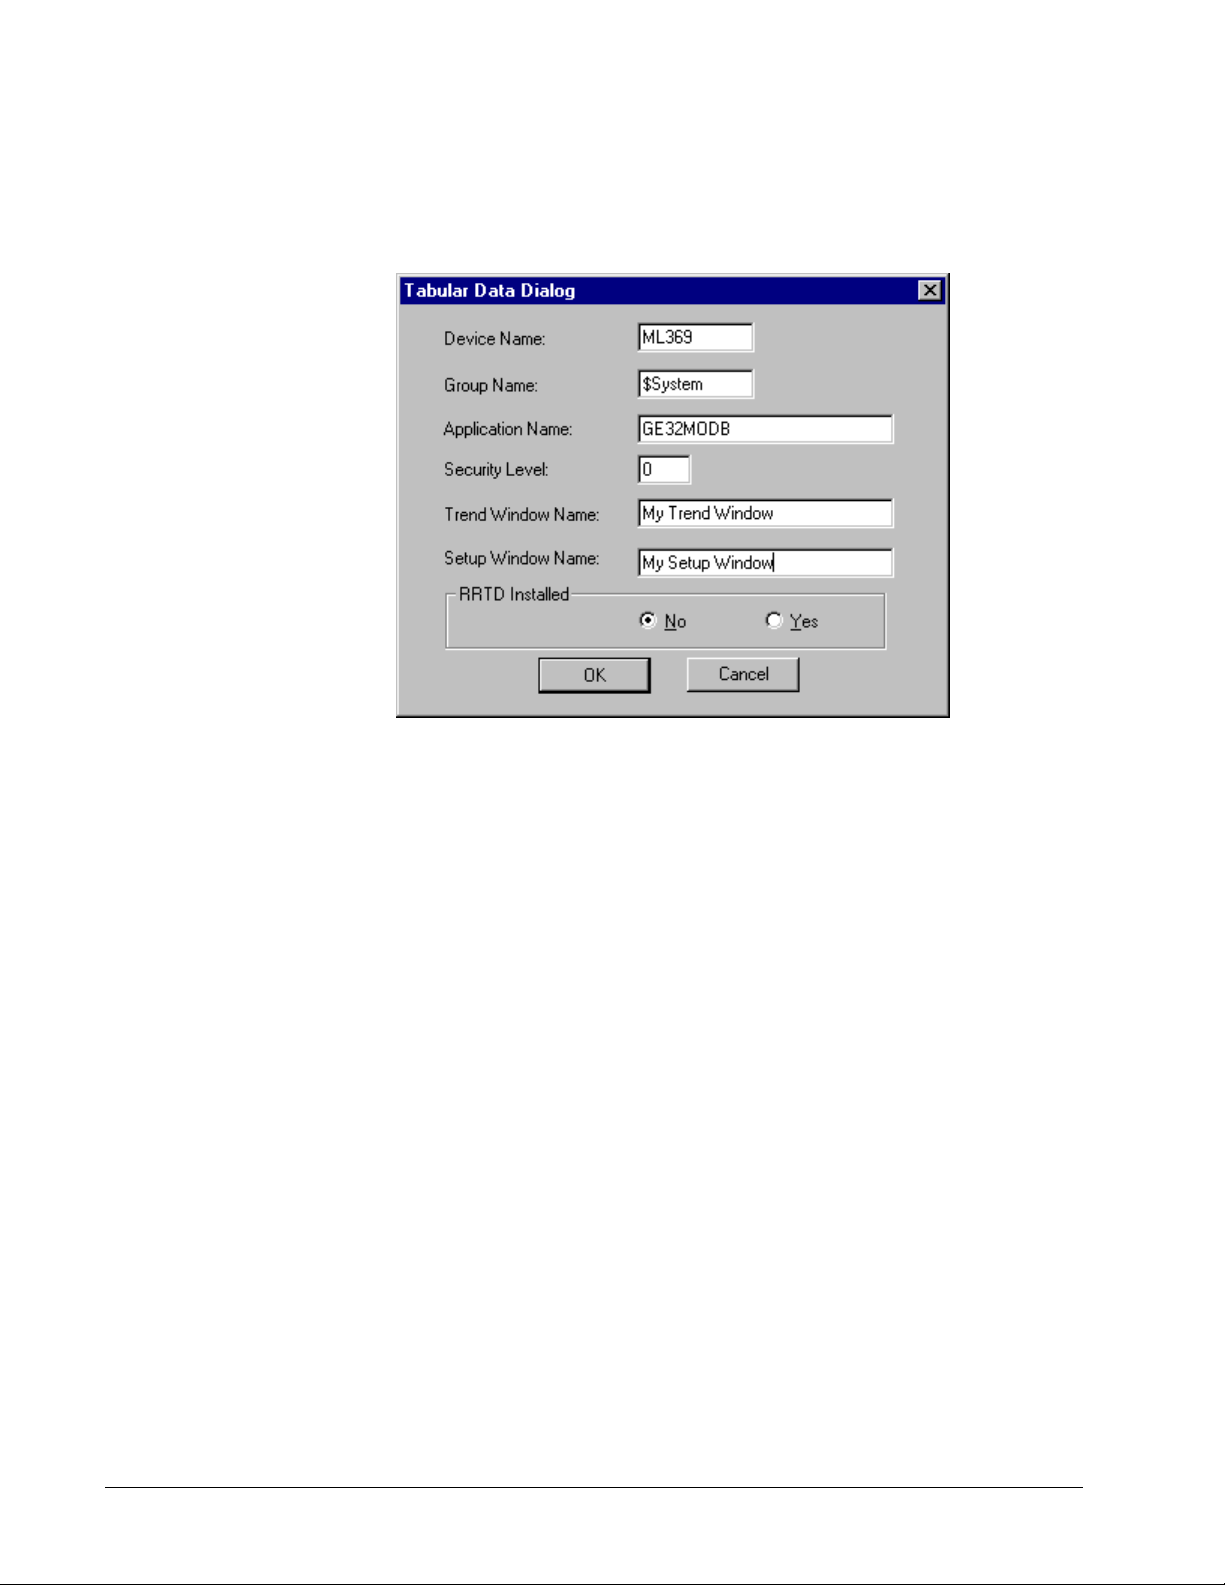
Data Dialog box has an extra field for indicating when the RRTD option is installed.
Be sure to select the correct RRTD option when completing the 369's Tabular Data
Dialog window. If you are not planning to use an RRTD module with your relay,
select the "No" button. This minimizes the number of I/O tags created by the wizard,
providing better performance.
14 PMCS Interface Toolkit
Page 23
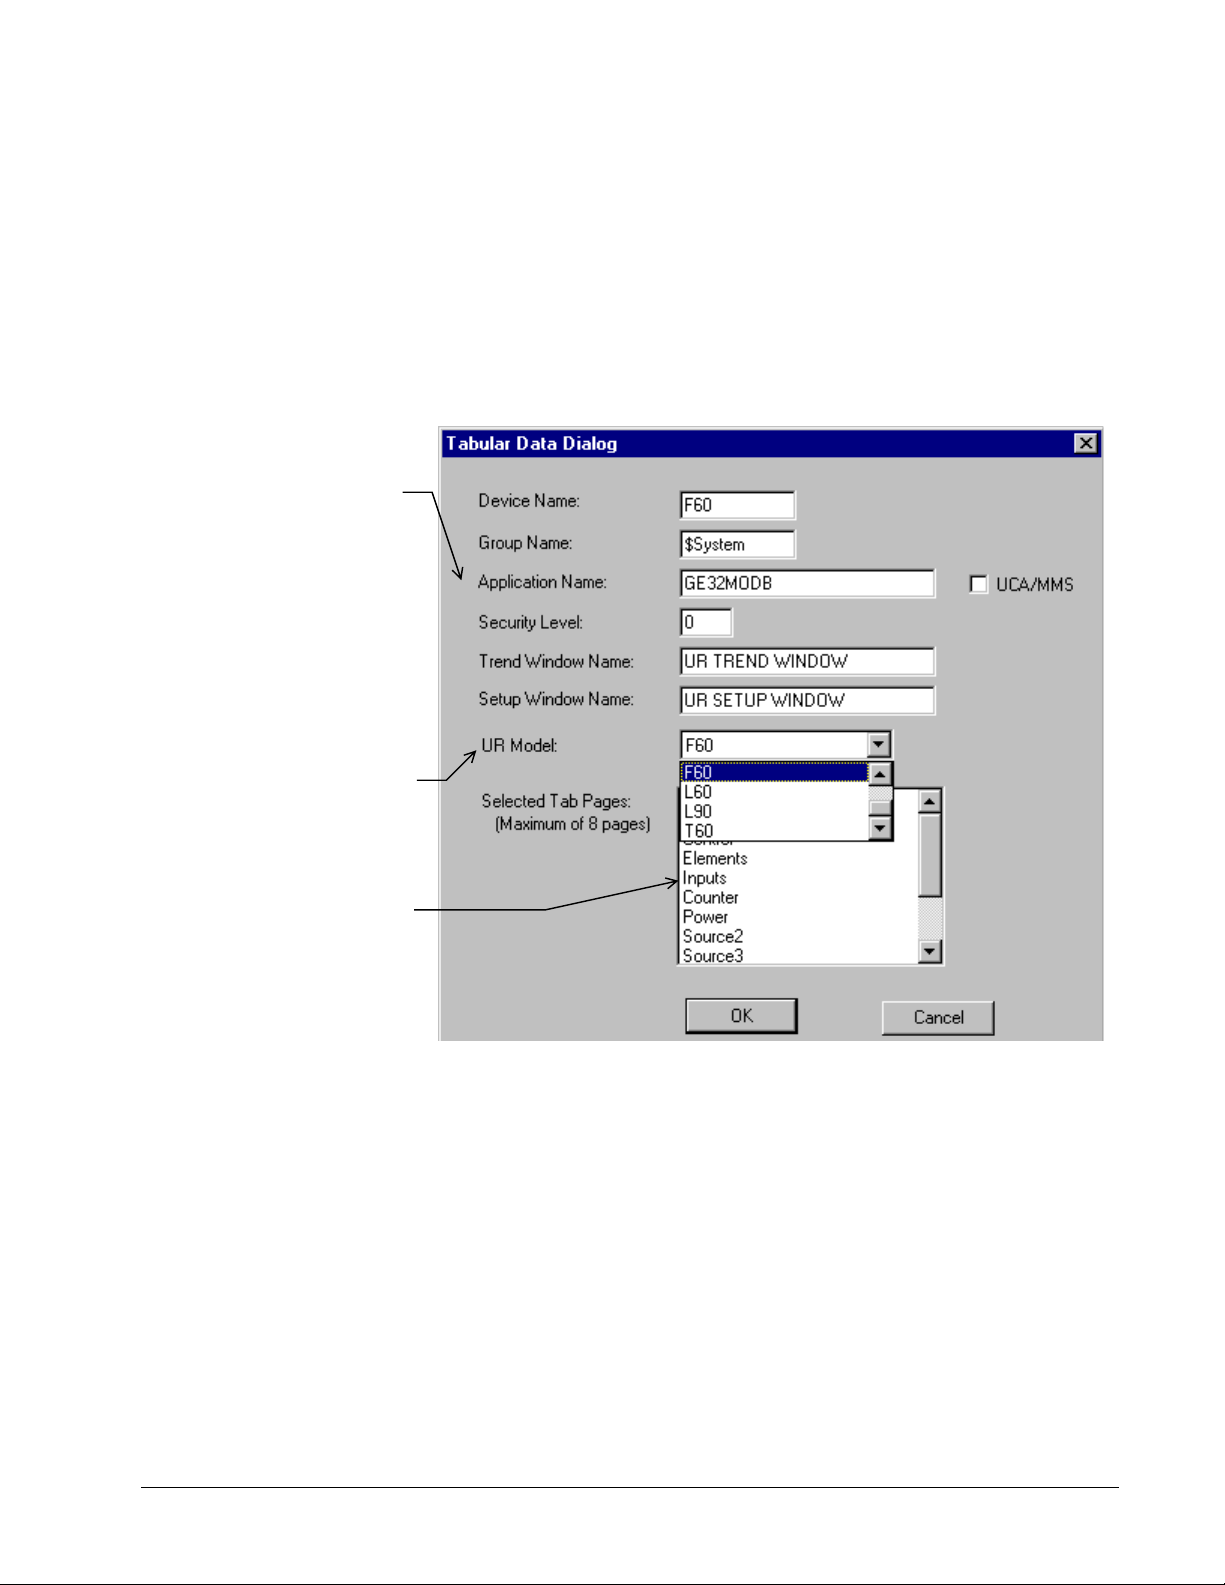
Complete the Application Name
field; typically GE32MODB or
GE32MTCP.
Special Note:
The UCA/MMS is not supported in
this version. So don’t Check this
checkbox.
Universal Relay
The Universal Relay device comes in several different models, and each model
supports different capabilities, which are reflected by the various tabs available for
each model. When configuring a Universal Relay device, you first select the UR
Model, then choose which tabs will be displayed for the particular device.
The UR devices are also capable of communicating with a different type of PMCS
DDE Server than the other PMCS Advanced Wizards. By selecting the UCA/MMS
checkbox, you indicate that you wish the UR wizard to retrieve its data for display
from the MMS Server whose name is entered in the Application Name field.
Select the Model of UR which you are
configuring. This determines the
contents of the Available Tabs list.
Highlight the tabs you wish to display
on the Tabular Data Screen wizard.
Use the control key to select multiple
tabs.
15
Page 24
One-Line Wizards
Usage
You can use one-line wizards to create animated one-line diagrams that represent an
electrical schematic of the devices monitored by the software. These wizards are
provided with logic to either open another window or display device status.
One-Line wizards are divided into five functional groups according to the type of
animation:
• Horizontal and Vertical Meter wizards display another window, such as
a 3-D faceplate.
• Transformer, Fuse, Ground Symbol, and Motor Symbol wizards have a
discrete color-change animation indicating the On/Off state of the
device.
• Horizontal and Vertical Relay wizards also have discrete color-change
animation indicating the On/Off state of the device.
• Horizontal and Vertical Switch wizards have four discrete animations;
two are color changes indicating the On/Off state of the device and two
are used for a three-state display (Open, Closed, and Error conditions).
16 PMCS Interface Toolkit
Page 25
• Circuit Breaker wizards have two discrete color-change animations for
On/Off status display and one analog animation for a five-state display
(Open, Closed, Out, Trip, and Error conditions).
• Lockout/Tagout symbols have discrete visibility animations for various
tags. Refer to the section Using and Configuring PMCS Wizards:
Lockout/Tagout Wizard for more information.
Configuration
In development mode, after placing the one-line device icon, double-click on the icon
to open its configuration dialog box. All one-line wizards have two configuration
items in common:
•
Line Size is a number between 1 and 20 that sets the pixel width of
the lines in the wizard.
• Size configuration consists of three radio buttons (Small, Medium,
and
Large) that determine the overall size of the wizard on the screen.
Use the snap-to-grid feature in InTouch to quickly align One-Line wizards.
Configuration of each of the five classes of One-Line wizards is described below.
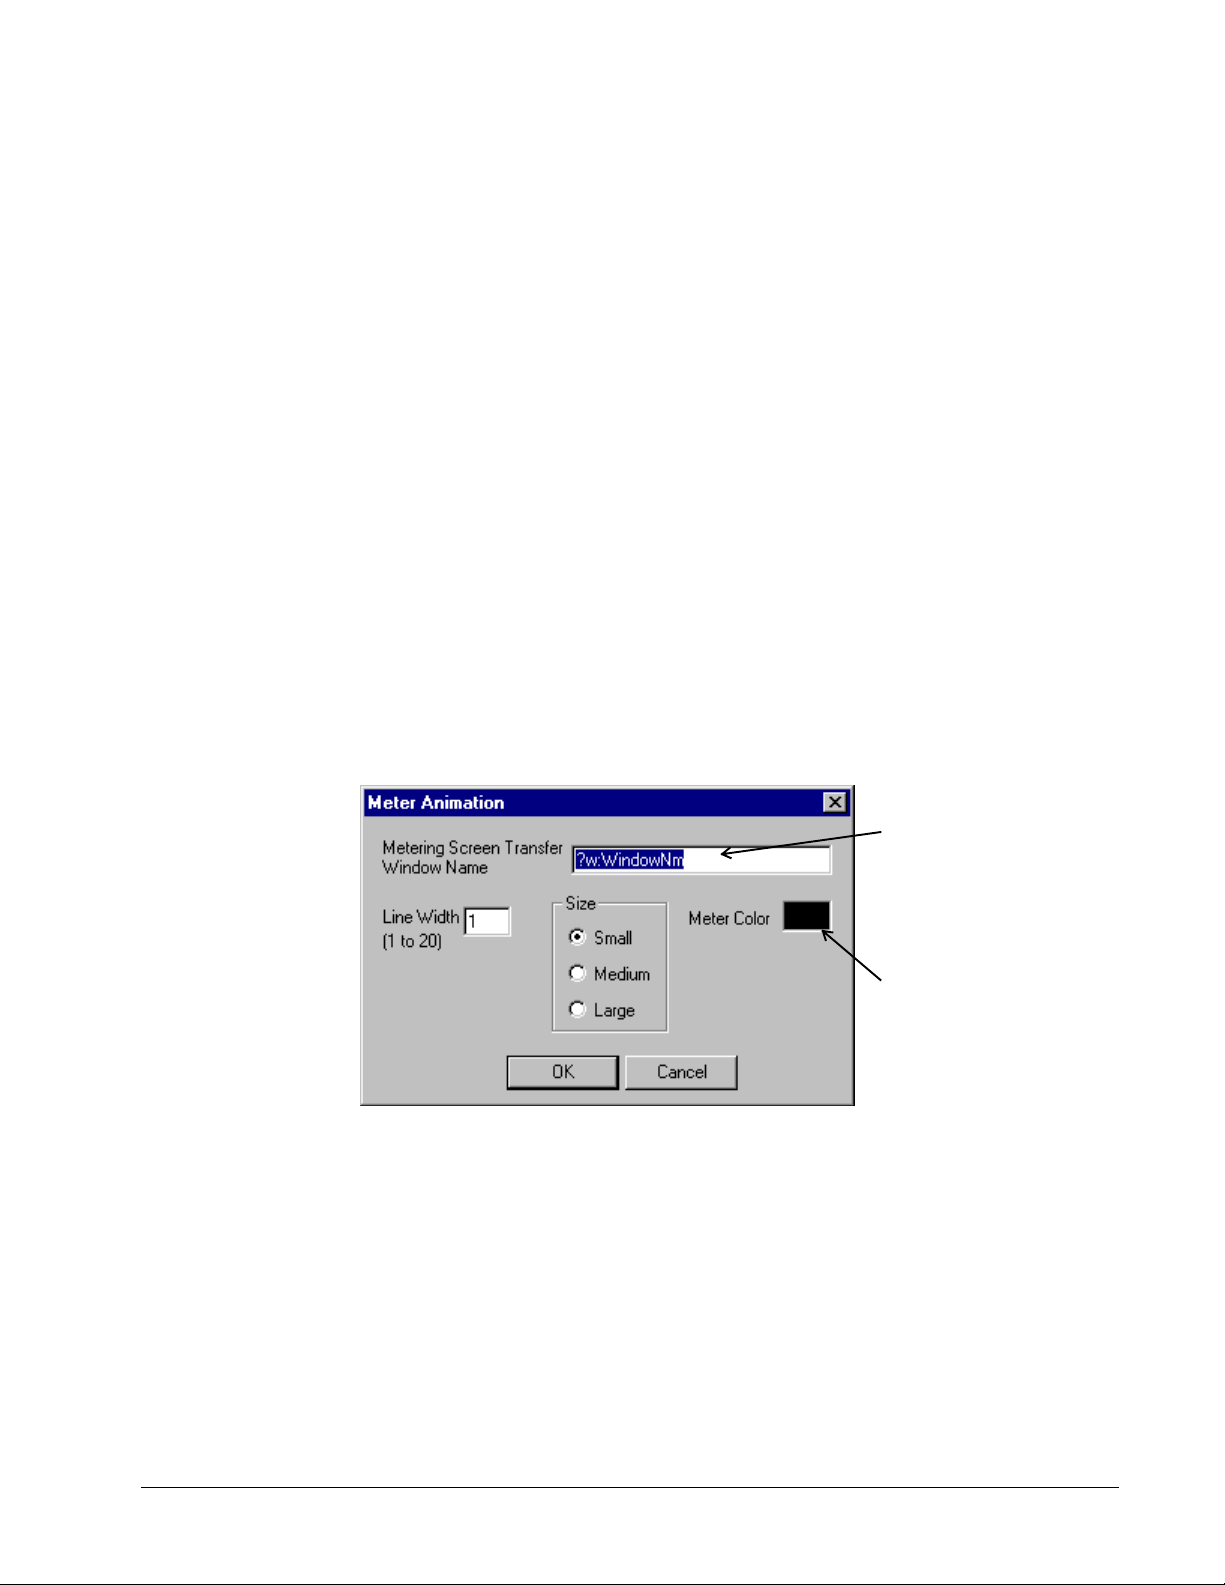
Meter One-Line Wizards
After placing a meter wizard in a window, double-click on it to display the dialog
box shown below. Configure the wizard by entering the appropriate information into
each of the boxes.
Enter the name of the
window to open when the
icon is clicked on during
runtime.
Select the color of the meter
wizard.
17
Page 26
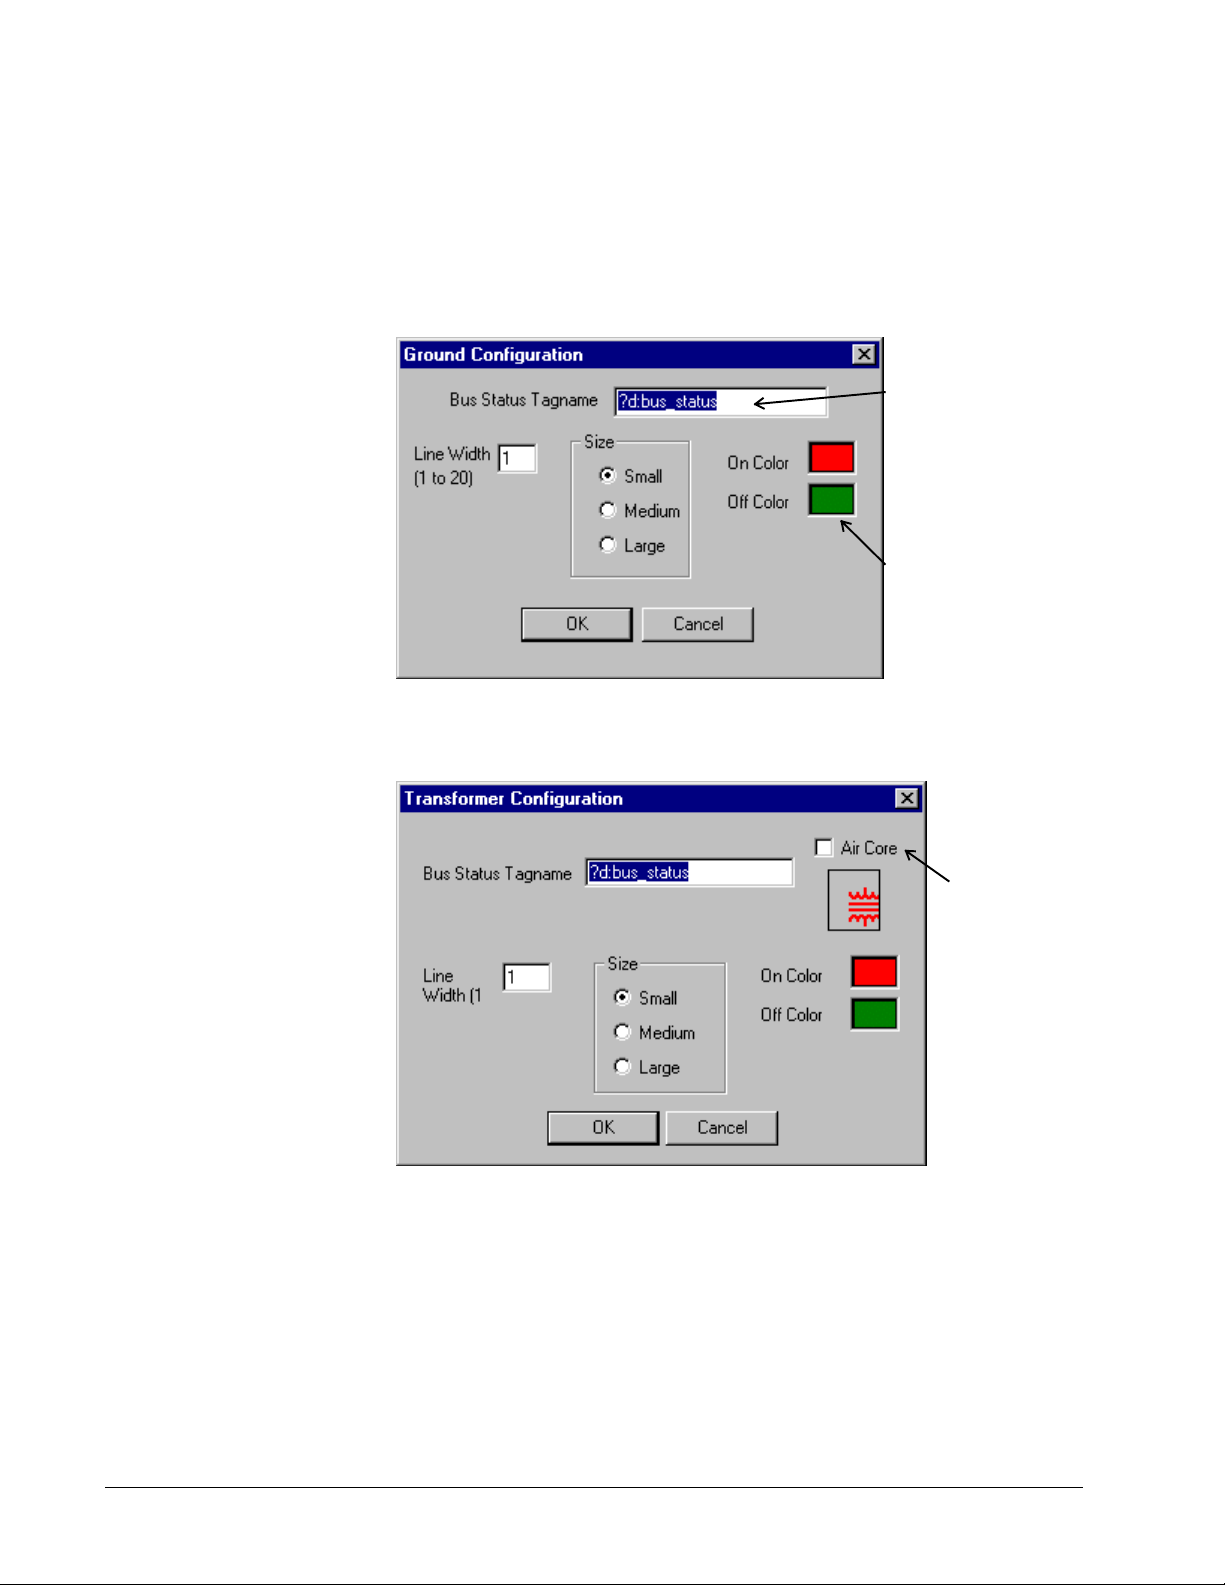
Transformer, Fuse, Ground, and Motor One-Line Wizards
After placing a Fuse, Ground, or Motor wizard in a window, double-click on it to
display the dialog box shown below. Configure the wizard by entering the
appropriate information into each of the boxes.
Enter the name of the
InTouch discrete tag that
determines the state of the
line colors during runtime.
Specify the colors of the lines
when the Bus Status is On and
Off. The wizard is displayed in
the On Color when the Bus
Status Tagname = 1, Off Color
when the Bus Status Tagname =
0.
The dialog box for the Transformer wizard has an extra check box that specifies
either an air-core or iron-core transformer, as shown below.
Click on the check
box to specify an
air-core
transformer.
18 PMCS Interface Toolkit
Page 27
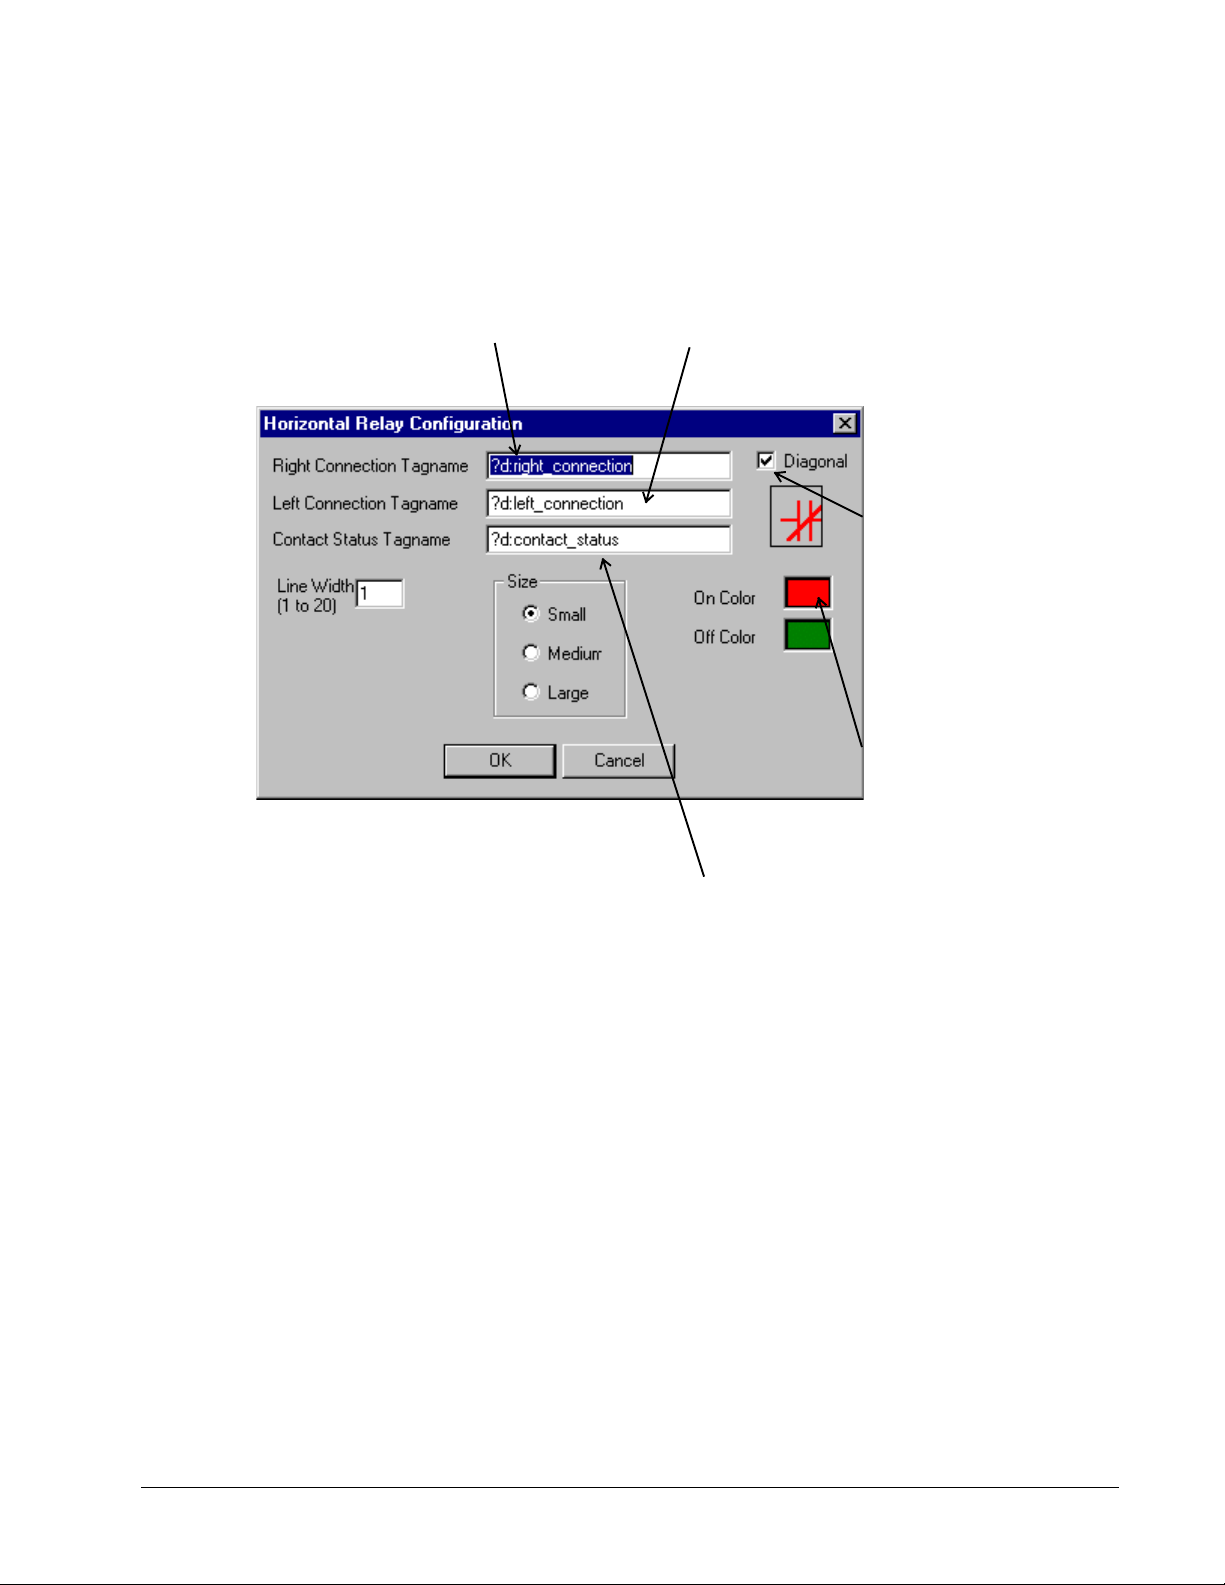
Horizontal and Vertical Relay One-Line Wizards
After placing a Horizontal or Vertical Relay wizard in a window, double-click on it
to display the dialog box shown below. Configure the wizard by entering the
appropriate information into each of the boxes.
Enter the name of the InTouch discrete
tag that determines the color of the line
to the right (or top) of the relay symbol
during runtime.
Enter the name of the InTouch discrete tag that
determines the color of the line to the left (or bottom)
of the relay symbol during runtime.
Click the check box to
display a slash through the
contacts (normally closed
contact).
Specify the colors of the
wizard elements when the
contact status and
connection discrete tags
are On or Off.
Enter the name of the InTouch discrete tag
that determines the color of the relay
symbol during runtime.
19
Page 28
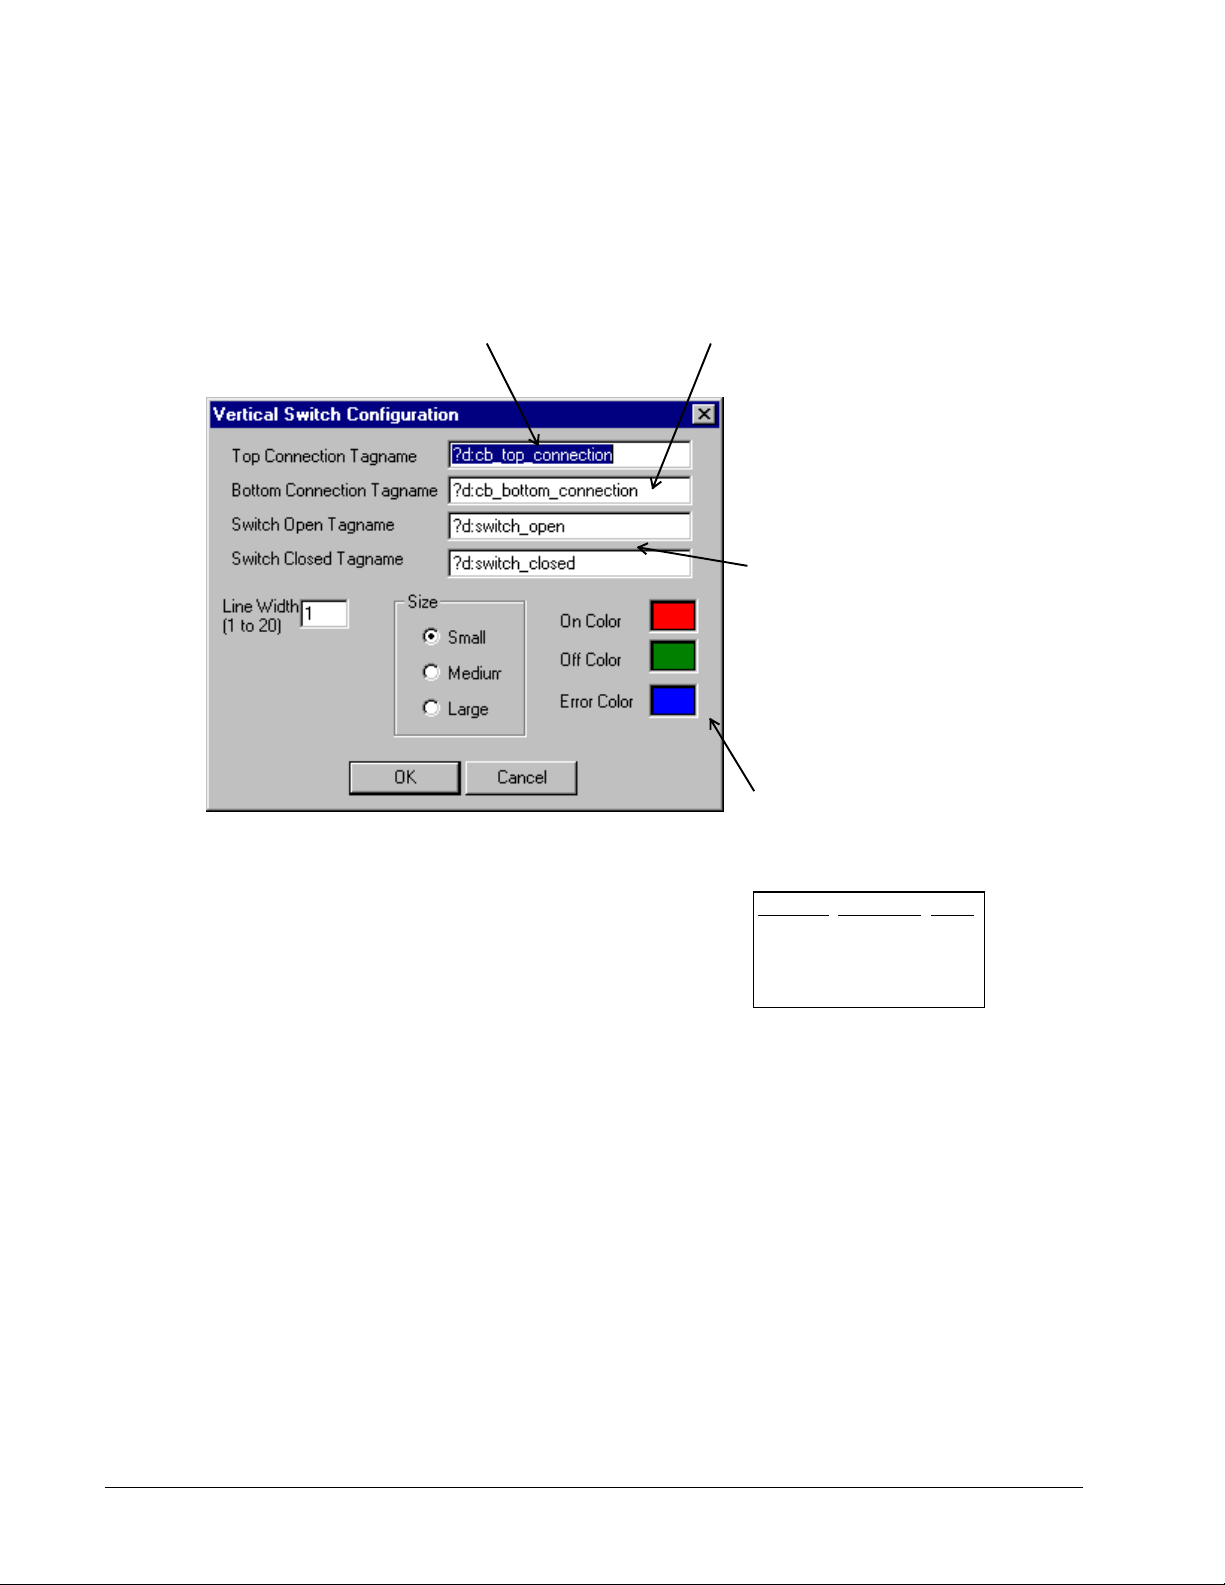
Horizontal and Vertical Switch One-Line Wizards
r
r
r
After placing a Horizontal or Vertical Switch wizard in a window, double-click on it
to display the dialog box shown below. Configure the wizard by entering the
appropriate information into each of the boxes.
Enter the name of the InTouch discrete tag
that determines the color of the line to the
right (or top) of the switch symbol during
runtime.
Enter the name of the InTouch discrete
tag that determines the color of the line
to the left (or bottom) of the switch
symbol during runtime.
Enter the names of the
InTouch discrete tags that
determine the state of the
switch during runtime.
Specify the colors of the wizard
elements when the connection
and switch discrete tags are On
and Off and when there is an
Error condition. The switch
symbol color is determined by
the following logic:
SwOpen SwClosedColo
0 0 erro
0 1 on
1 0 off
1 1 erro
20 PMCS Interface Toolkit
Page 29
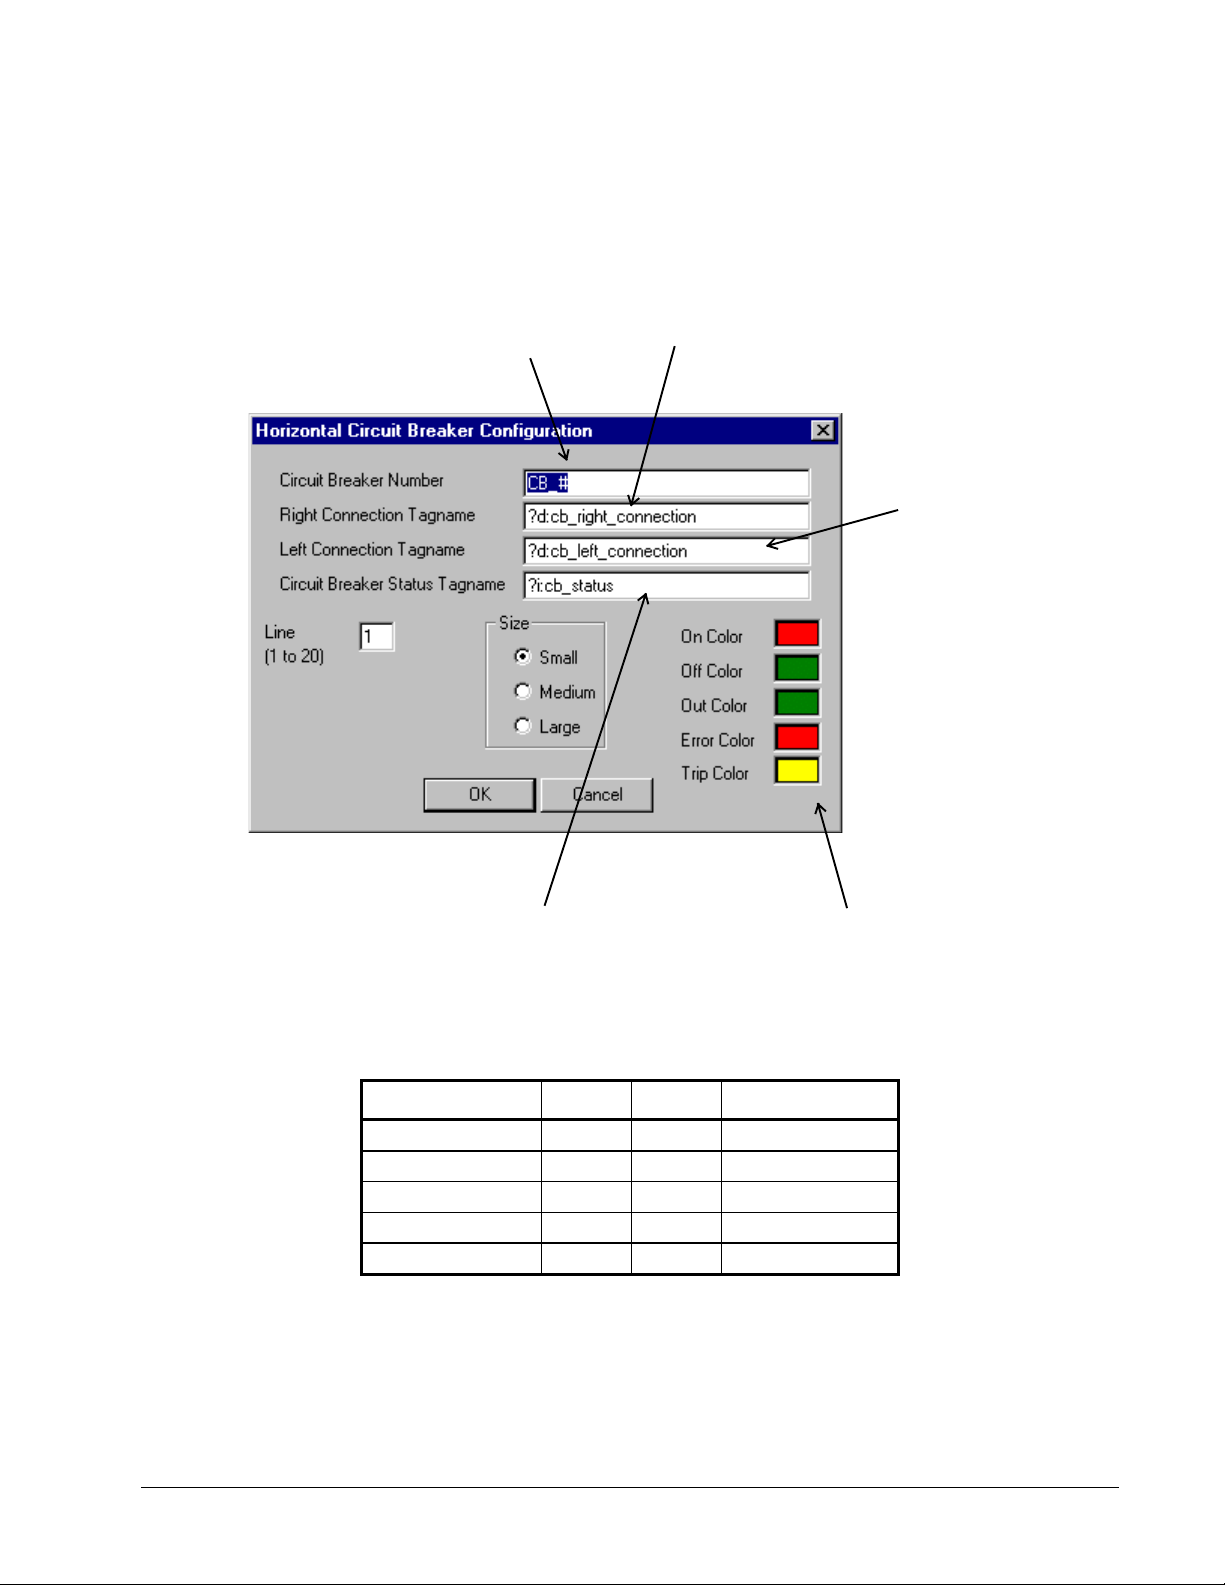
Circuit Breaker One-Line Wizards
After placing a Horizontal or Vertical Circuit Breaker wizard in a window, doubleclick on it to display the dialog box shown below. Configure the wizard by entering
the appropriate information into each of the boxes.
Enter text to display next to the
breaker graphic during runtime
(optional).
Enter the name of the InTouch analog tag that
determines the color of the circuit breaker
symbol, the state of the breaker, and the status
text displayed next to the breaker icon during
runtime.
Enter the name of the InTouch discrete tag that
determines the color of the line to the right (or
top) of the breaker symbol during runtime.
Enter the name of
the InTouch discrete
tag that determines
the color of the line
to the left (or bottom)
of the breaker
symbol during
runtime.
Specify the colors of the wizard
elements and status text for the
breaker states during runtime.
See the table below for default
status/color mappings.
21
The breaker status values and the associated default colors are listed in the table
below. Error status indicates that the breaker status inputs create an indeterminate
state for the breaker.
Breaker Status Value Text Default Color
Open 1 OPN Green
Closed 3 CLD Red
Drawn Out 5 OUT Green
Tripped 7 TRP Yellow
Error 9 ERR Flashing Red
Breaker status values & display colors.
Page 30
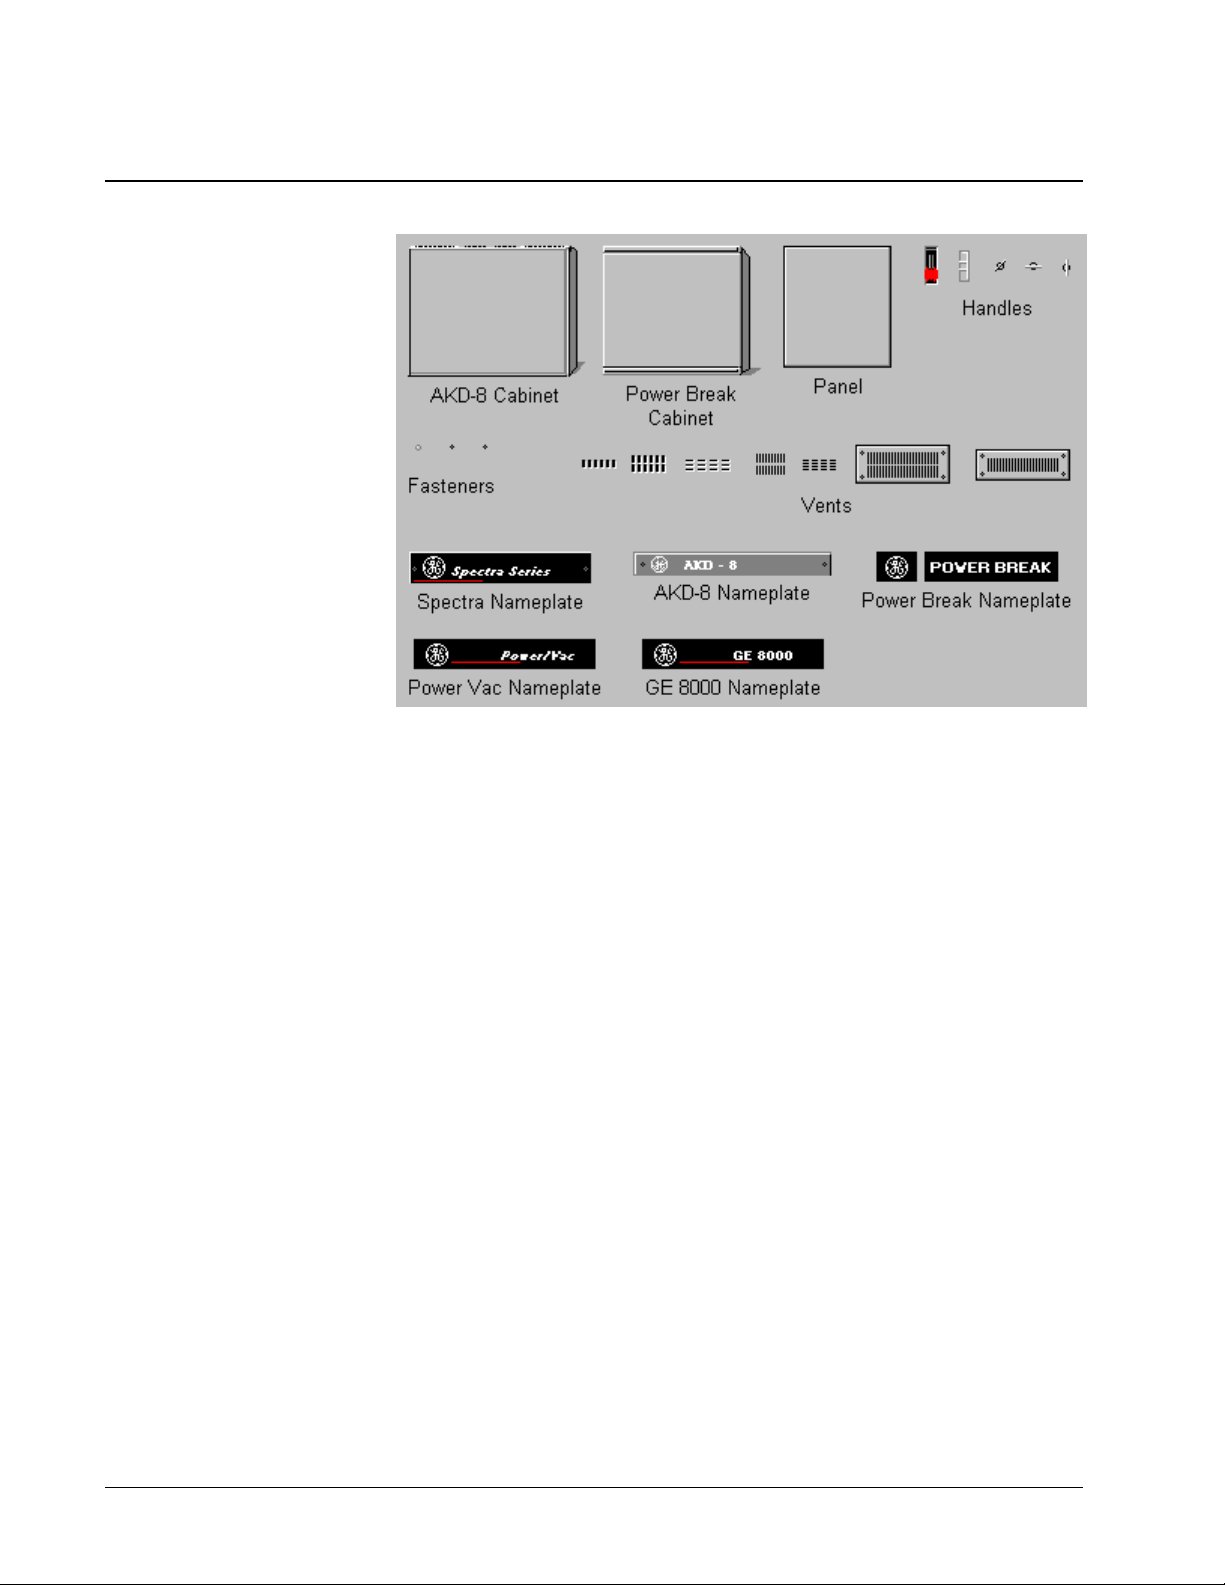
Elevation Wizards
Usage
Elevation wizards are graphical elements that represent switchgear components
useful for creating 3-D elevation views. These wizards are not associated with any
logic or animation, but are provided to create more visually accurate screens and
representations of equipment. Device icon wizards are typically placed on the
Elevation wizards to show the breakers, trip units, and meters and provide navigation
to device 3-D wizards, tabular displays, or arbitrary windows.
Configuration
After placing an Elevation wizard in an open window, it may be moved or resized,
but no other configuration is possible. Elevation wizards are not provided with logic
for opening another window.
22 PMCS Interface Toolkit
Page 31

Floor Plan Wizards
23
Usage
Floor Plan wizards are graphical elements that are useful for creating accurate
representations of a facility layout. You can use a floor layout as an overview display
of an entire plant, with animated areas for navigation to various switchgear elevation
views or one-line diagrams. You can paste miniature elevation views as bitmap
objects onto the floor layout, sized to fit, and then animate them as push buttons to
display elevation views or one-line diagrams (see Chapter 3).
Configuration
After placing a Floor Plan wizard in an open window, it may be moved or resized,
but no other configuration is possible. Floor Plan wizards are not provided with logic
for opening another window.
Page 32

Toolbar Wizard
Usage
The Toolbar wizard is a navigational tool which allows the user to move between
recently-used or frequently-used windows, and provides a clock for quick reference.
The first/last arrows jump to the first or last window in the windows list (see
Configuration below); the inner forward and back arrows move to the next or
previous window in the list. The window buttons to the right of the arrows provide
quick access to the windows assigned to each button.
Configuration
The arrow buttons on the Toolbar wizard operate by maintaining a list of windows
for access by the toolbar navigational controls. To allow a window to be added to the
windows list when viewed by a user, a call to WLAddWindow( ) must be placed in
the OnShow window script. This call must be placed in each window that you want to
have on the window list.
The eight hot buttons are configured by double clicking on the wizard, and
completing the Toolbar Wizard Edit dialog box:
For each button, you can set the top and bottom caption, and specify the window to
be opened when that button is clicked.
24 PMCS Interface Toolkit
Page 33

Annunciator Panel Wizard
Usage
The Annunciator Panel wizard provides an industrial-style annunciator display panel,
consisting of a bank of 48 indicator lights which change colors and blink to indicate
various device conditions. For instance, a circuit breaker could be associated with an
annunciator panel wizard to display grey when closed and change to red if it trips.
This wizard requires the PMCS Event Logger software to be installed and properly
configured before it can be used, because it operates by monitoring special DDE tags
which change state based on alarms or events recorded by the Event Logger.
The panel consists of an array of 48 buttons (six columns by eight rows), each of
which may be labeled with up to three lines of text, and each of which is associated
with a particular device (topic) at the PMCS DDE Server.
The annunciator panel wizard provides buttons for acknowledging alarms, resetting
acknowledged alarms, and for viewing an alarm summary via the PMCS Event
Logger.
Annunciator Panel Theory of Operation
The Annunciator Panel wizard provides a screen full of indicator tiles, each relating
to a particular device, event, or group of events. These tiles are displayed in different
colors to indicate different alarm conditions. The Annunciator Panel wizard monitors
selected DDE items in the Event Logger and responds to changes of state in these
items by changing the colors of individual indicator tiles. For example, you might
configure a relay trip event to have a tile in the Annunciator Panel wizard. The
wizard monitors a DDE tag at the Event Logger corresponding to the trip status of
the relay and displays a grey indicator if the relay is operating properly, and a red
indicator if the relay has tripped.
25
Page 34

From the Event Logger’s perspective, there are two parts to configuring the
Annunciator Panel. First, each DDE Item that will be displayed on the Annunciator
Panel wizard must be added (using the Add Items dialog). For the example we’re
discussing, we’ll assume you’ve created a DDE Item named Trip1. Each DDE item
will connect to an individual tile in the Annunciator Panel wizard.
The second part consists of defining events which will turn individual DDE items ON
or OFF. Each DDE item (or Annunciator Panel tile) can be turned on or off by any
number of device events you define. The events are logically ORed together to
determine ON or OFF conditions; i.e., if any of the events occurs, the DDE item is
ON; if none of the events have occurred, the DDE item remains OFF.
We’ll continue the relay example we began above. For example, you might configure
the Trip1 DDE Item to be ON if any of the following events occurs: the relay is
tripped, or the relay reports an error condition, or the relay senses an overvoltage
condition. The Annunciator Panel wizard displays a grey indicator tile for the relay
for as long as the DDE item remains in the OFF condition. If the Annunciator Panel
wizard sees the DDE Item change from OFF to ON, it reacts by changing the
indicator tile from grey to red. The Event Logger Annunciator Panel logic will also
change the state of a DDE Item in response to actions performed at the Annunciator
Panel Wizard. The user can both acknowledge and reset individual Annunciator DDE
Items. The following diagram shows the relationship of the Annunciator Panel
wizard, the Event Logger, and the PMCS DDE Server.
26 PMCS Interface Toolkit
Page 35

Annunciator Pan el W izard m onitors DDE Item s at Event Logger
Relay 1
(green)
Relay 1
(red)
Relay 2
(green)
Annunciator Panel Wizard
Annunciator Pan el W izard m onitors DDE Item s at Event Logger
Relay 2
(green)
Annunciator Panel Wizard
Relay 3
(green)
Relay 3
(green)
DDE Item Name: Trip1
Status: OFF
Configured Events Received
Relay Tripped? NO
Error Condition? NO
Overvoltage Condition? NO
DDE Item Name: Trip1
Status: ON
Configured Events Received
Relay Tripped? YES
Error Condition? NO
Overvoltage Condition? NO
Event Logger
Event Logger
Event Logger
tracks events
reported by
PMCS DDE
Server
PMCS
DDE Server
Event Logger
tracks events
reported by
PMCS DDE
Server
Relay 1
Relay 2
Relay 3
27
PMCS
DDE Server
Relay 1
Relay 2
Relay 3
In the upper illustration, the Event Logger watches for any of the three events
configured to cause a change of state to the Trip 1 DDE Item. None of these three
events have occurred, so the status of the Trip 1 DDE Item is at OFF. The
Annunciator Panel wizard is monitoring the configured DDE Items at the Event
Logger, but all DDE Items are “OFF” so the Annunciator Panel displays green
indicator tiles.
In the lower illustration, the Event Logger has recorded a “Trip” event for the unit in
question, and changed the state of the Trip 1 DDE Item to “ON”. The Annunciator
Panel wizard sees this change, and responds by changing the color of the annunciator
panel tile for Relay 1 to red.
Page 36

Each "Alarm indicator" as defined by the Event Logger will appear to InTouch as a
DDE Integer item which can have the following values/states:
State Tag
Value
Normal (no alarm) 10 - 19 Solid Gray
Alarm Active - Unacknowledged 20 - 29 Red Blinking
Alarm Active - Acknowledged 30 - 39 Solid Red
Alarm Reset - Unacknowledged
(alarm occurred but later went off before being
acknowledged)
Alarm Disabled
(Event Logger has disabled this alarm indicator)
40 - 49 Solid Yellow
0 Dark Gray
Default
Color
Each panel button displays one of five different colors, based on the states defined
above. A fill color animation link controlled by an indirect integer tag is used to
change colors. The fill color link is set as follows:
<= 9: Dark Grey
10 -> 19: Grey
20-> 29: Grey (will also have a flashing Red animation link)
30 -> 39: Red
>= 40: Yellow
28 PMCS Interface Toolkit
Page 37

Configuration
Note: Prior to configuring an Annunciator Panel Wizard, you should have completed
configuration of the Annunciator Panel Items at the PMCS Event Logger. Refer to
GEH-6512, PMCS Event Logger Users Guide, for details.
When the Annunciator Panel wizard is dropped, it appears as a blank panel of 48
indicators:
29
Page 38

Double-click on the wizard to display the Annunciator Panel
Dialog:
Complete the Annunciator Panel Name field (up to 8 characters), and the Security
Access Level (level of security required to Reset any Acknowledged alarms. The
color codes for different alarm states can be modified by clicking on each color. Note
that the color codes apply to all 48 indicators on the annunciator panel wizard.
Finally, click on an indicator to display the configuration dialog for that individual
button:
30 PMCS Interface Toolkit
Page 39

Enter the text to display on any of the three lines available for the selected button. It
is not necessary to enter text on all three lines. Click OK when you have finished
assigning text labels to the button.
As each annunciator panel button is labeled, the Annunciator Panel Dialog reflects
these changes by showing the Row/Column coordinates of the labeled buttons:
When you have finished labeling your annunciator panel buttons, click OK to close
the Annunciator Panel Dialog box. When you close this dialog box, InTouch
automatically creates indirect analog tags for each panel button. These tags are
named xxx_R1C1 through xxx_R8C6, where xxx is the name assigned to the wizard
(for example, Panel1), and R1C1 indicates the row and column position on the
annunicator panel.
31
Page 40

Two steps remain after the wizard has been configured.
First, InTouch DDE Integer tags must be created for the DDE items configured in the
Event Logger corresponding to the Alarm Panels. Make sure the DDE Item names
created in InTouch match the DDE Item names configured in Event Logger. (If you
are unsure of how to create DDE tags in InTouch, please refer to WonderWare’s
documentation.) The DDE Access name for the Event Logger should be configured
in InTouch as follows:
Second, an InTouch script must be written to associate the InTouch indirect tags
created by the wizard with the InTouch DDE tags created for DDE Items in Event
Logger. Typically, this script is placed in the InTouch “On Startup” application
script.
32 PMCS Interface Toolkit
Page 41

An example of a simple script is shown below:
Panel1_R1C1.Name = ANN_P_1A.Name;
Panel1_R1C2.Name = ANN_P_1B.Name;
Panel1_R1C3.Name = ANN_P_2A.Name;
At run-time, InTouch will receive DDE data from the Event Logger which will
control the colors of all indicators that have been configured properly.
33
Page 42

Troubleshooting Tips for the Annunciator Panel Wizard
• Make sure that all DDE Items associated with the annunciator panel
have been created in the Event Logger.
• You must create associated InTouch DDE Integer Tags by hand in the
InTouch tagname database. The DDE Access name for the tags should
use “EVENTLOG” for the Application Name and “SYSTEM” for the
Topic Name. Make sure the “Request Initial Data” option is selected
for this DDE Access name.
• Check the WWLogger at runtime for possible DDE errors.
• Make sure your application script is mapping the proper DDE tags with
the proper indirect tags.
• Make sure the Event Logger is running before starting InTouch
Windowviewer.
34 PMCS Interface Toolkit
Page 43

Custom Table Wizard
Usage
The Tabular Data Screen wizards provide the ability to view extensive device data in
tabular form. However, they do not allow you to select the data to view - you must
view all the data presented and locate the particular data points you are interested in.
The Custom Table wizard differs from the Tabular Data wizards by providing an
easy-to-use, highly-flexible way to view a limited number of registers for a particular
device. It presents only the data you are interested in, displaying it in a convenient
table format as shown above. Each table consists of 1 to 12 rows of information, one
register per row.
Each table takes up approximately one-quarter of an average display, so up to four
Custom Table wizards may be placed on a screen.
Configuration
When the Custom Table wizard is dropped, it appears as a blank screen. Doubleclick on the wizard to display the Custom Table Dialog:
35
Page 44

Begin configuring the Custom Table by completing the following fields:
Field Description
Device Name Enter the name of the device (topic). Must
exactly match the topic name at the DDE
Server.
DDE Server Name Enter the name of the PMCS DDE Server.
Device Description Optionally, enter a brief description of this
device, up to 32 characters maximum.
Device Type Select the device type corresponding to this
topic.
36 PMCS Interface Toolkit
Page 45

EPM 7700 Users Only: When the EPM 7700 device type is selected, an additional
field appears in the Custom Table Dialog box, adjacent to the Device Name (shown
below).
The Node Name field requires that you enter the name of the computer on which the
meter’s Communications Server is located, either the Primary Node or a Full Station
Secondary Node. This field is required because the EPM 7700 does not use the same
DDE Server as the rest of the standard PMCS devices, and the wizard must be
directed to the location of the correct Communications Server for proper
configuration of DDE topic names. For more information on configuring EPM7700
networks, refer to DEH-40035, the GE 7700 Gateway Users Guide, and GEH-6514,
PMCS Read This Book First.
Also, the Application name field must be completed as ION_LINK rather than
GE32MODB or GE32MTCP for the EPM7700 device. The ION LINK program is
installed during initial PMCS setup if the EPM7700 software option is selected.
When configuring Custom Tabular wizards on Secondary nodes, the Application
Name field entry does not follow the PMCS wizard convention of
“\\RemoteComputer\ION_LINK”. EPM7700 Secondary nodes run a local copy of the
ION LINK server; thus the application name is always “ION_LINK” whether the
wizard is installed on the Primary node or a Secondary node.
Finally, the EPM 7700 device type requires special InTouch scripting for the custom
tabular wizard. Refer to the section at the end of this chapter titled Special Scripting
Considerations for the EPM 7700.
37
Page 46

When these fields are completed, click the Select Multiple Tags button to select
several tags at once, or click the Select Tag X button to assign tags one at a time. The
Select Device Tags dialog appears:
The Select Device Tags dialog shows a list of all the pre-configured tags which the
Custom Table wizard supports for the selected device type, sorted by address, and
displaying the tagname and description. Most tags are metering value registers.
Select up to twelve tags from the list by clicking (high-lighting) each one. To deselect a tag, simply click it a second time. When you have selected up to 12 tags,
click OK to return to the Custom Table dialog box. The selected tags will now be
displayed as shown in the following example:
38 PMCS Interface Toolkit
Page 47

You may select OK to select this table configuration, or you may edit the tags one at
a time using the Select Tag X buttons (for instance, if you wish to change the order
the tags appear in).
The tag descriptions and units may also be edited (useful for non-English
applications), but caution is urged when modifying descriptions or units; it may be
difficult to remember what they were originally if needed.
Note for users of the MDP device type: This device uses a memory tag to scale many
of the data values displayed in the wizard.: "DeviceName_CTRatio" (where
DeviceName is the name entered for the device within the wizard). The wizard
creates this tag within InTouch (memory tag with a format type of "Real"). The
InTouch application must provide a value for this tag (usually entered by the user at
run-time). If no value is entered at runtime, a value of zero will be used as the default
value for this tag, and many of the metering data registers (AMPS A, B, C, etc) on
this device type will appear as zero as well. See the MDP Tabular Data wizard for
additional information. If the application has a Tabular Data Screen Wizard with the
same device name as this wizard, then the end user can set the CTRatio tag value via
the MDP Tabular Data Screen wizard.
Note for users of the EPM7300 device type: The custom table wizard will display
N/A for certain metering values when the PM Volts Mode parameter is set to Demo
in the device. Please use the EPM 7300 Tabular Data Wizard to view these values
when the device is in Demo mode.
39
Page 48

System Statistics Wizard
Usage
The System Statistics wizard is an informational tool which allows the user to view
detailed statistics about the system, including port information from the DDE Server
and disk information.
The wizard consists of a single screen displaying Port Statistics on the top portion
and disk information on the bottom. Statistics on up to eight COM ports are
displayed. The user may page forward or backward eight ports at a time by clicking
the Prev 8 Ports or Next 8 Ports button.
Whenever a new DDE Server name is entered, the user must click the Refresh button
to update the DDE links to correspond to the new parameters.
Configuration
When the wizard is dropped, the following dialog box appears:
40 PMCS Interface Toolkit
Page 49

The System Statistics wizard requires a name itself, and also the name of a DDE
Server to access.
By default, the System Statistics wizard assumes that the DDE Server is located
locally and is named GE32MODB. You may change this to access a DDE Server
located on a networked PC by entering the name as \\NODENAME\SERVER, where
NODENAME is the name of the host PC and SERVER is the name of the PMCS
DDE Server, which will be GE32MODB.
During runtime, the default drive letter is C, corresponding to the local hard drive.
You may change this value to any valid drive letter corresponding to either a fixed
local drive or a mapped network drive.
41
Page 50

Lockout/Tagout Wizard
Usage
The Lockout/Tagout provides a method for assigning danger or ground tag graphics
to various one-line diagrams or wizards.
On-screen tags and indicators are for informational
purposes only and DO NOT represent real-world
conditions! Actual lockout status must be verified prior
to performing any work. Failure to follow appropriate
lockout procedures can result in SEVERE INJURY or
DEATH!
The Wizard consists of a single screen (shown above) displaying the presence or
absence of danger and ground tags for a particular device. The user installs or
removes Danger and/or Ground Tags using the Install/Remove buttons on the Tag
Assignment window shown above. Any wizards belonging to the same Status Group
will display Danger and/or Ground Tag indicators mirroring the tags installed in the
Tag Assignment window.
Supported Devices
42 PMCS Interface Toolkit
Page 51

Several PMCS breaker management devices support the Lockout/Tagout Wizard in
their Large Faceplate and Tabular Data Screen wizards. These devices are:
• 750 / 760 Feeder Management Relay
Configuration
When Lockout/Tagout wizard is dropped and double-clicked, the following dialog
box appears:
Complete the following fields to configure the Lockout/Tagout Panel Display:
• Enter a name for this panel. The Panel Name is used to distinguish the
tags used internally by a particular instance of a panel from other panels
within an application. Each panel within an application should have a
unique Panel Name.
• Enter the name of the Status Group associated with this Lockout/Tagout
Panel. The Status Group is the name that links this panel to
Lockout/Tagout Online Symbols and the breaker management device
wizards that can support it. It is important to remember the Status
Group assignment since it must be used to configure the associated
Oneline Symbols and IED wizards.
• Enter the minimum Security Level required to add and remove Danger
or Ground tag symbols within the application.
The second part of the Lockout/Tagout wizard that can be configured is the Oneline
Tagout Symbol.
The Oneline Tagout Symbol is a small wizard for placement in oneline diagrams, to
be associated with a circuit breaker. It displays the presence or absence of any
Danger or Ground tag symbols assigned to the breaker symbol by the PMCS user.
After dropping the Oneline Tagout Symbol wizard onto a oneline diagram, associate
it with a particular circuit breaker and any other devices you wish to have the tags
displayed at by making it a member of a Status Group. The Oneline Tagout Symbol
Dialog box is displayed when you double-click the wizard:
43
Page 52

Complete the following fields:
• Enter the name of the Status Group associated with this Lockout/Tagout
symbol. The Status Group is the name that links this symbol to the
Lockout/Tagout panel and the breaker management device wizards that
can support it. It is important to remember the Status Group assignment
since it must be used to configure the associated panel and IED wizards.
• Enter the name of the window to open when the Oneline Tagout
Symbol wizard is clicked on during runtime. It should be the name of
the window in which the Lockout/Tagout Panel is located.
Example of Lockout/Tagout Wizard
The following example may help clarify the use of the Lockout/Tagout wizard.
Suppose that we have a breaker being monitored by a redundant pair of ML 750/760
devices in our system. We wish to be able to display Lockout/Tagout symbols for this
breaker.
We create a oneline diagram in InTouch which represents this configuration, placing
the circuit breaker wizard, then each of the ML 750/760 small faceplate wizards, then
a Lockout/Tagout wizard for each ML 750/760 device. It looks like this:
When configuring the Lockout/Tagout wizard in the oneline diagram, we complete
the Oneline Tagout Symbol dialog as follows:
44 PMCS Interface Toolkit
Page 53

Breaker_Group_1 is the name of the Status Group we’ll assign to all wizards
associated with this breaker; Tag Window is the name of the window we want to
appear when someone clicks on the Oneline Tagout wizard during runtime.
Next, we create separate screens containing Large Faceplate wizards and Tabular
Data screen wizards for each ML 750/760 device. While configuring each wizard, we
make sure that each one is given the Status Group “Breaker_Group_1”. This ensures
that any Danger or Ground tag symbols present will be shown on any large faceplate,
tabular data screen, or oneline wizards associated with this group. An example of the
Tabular Data configuration dialog box is shown below; note that the Status Group
field is assigned to Breaker_Group_1, the same Status Group as our Oneline Tagout
Symbol wizard. Do not confuse the Status Group parameter with the Group Name
parameter. The Group Name parameter is not used for configuring Lockout/Tagout
Status Groups.
45
We drop and configure our Lockout/Tagout Wizard next; double clicking this
wizard, the Lockout/Tagout Panel dialog appears:
Page 54

We name the Lockout/Tagout panel Panel_1. We associate the Panel with the same
Status Group as our other wizards, Breaker_Group_1. Finally, we set the minimum
security level required to add or remove tags.
Now in Runtime mode, when the Tag Assignments dialog is displayed, it appears as
follows:
Clicking Install Danger Tag checks our security level, and if we have sufficient
access, displays a Danger Tag for the breaker as follows:
46 PMCS Interface Toolkit
Page 55

The Installed By field on the tag shows the name of the current operator who
installed the tag; the Installed At field shows the time and date stamp of the tag’s
installation.
When we view a wizard which belongs to this group, for example the Large
Faceplate wizard of one of our ALPS devices, the Danger tag shows up as a red
indicator with a “D” in it, as shown below:
47
Page 56

Special Scripting Considerations for the EPM 7700
This section describes the special InTouch scripting which is required for the EPM
7700 device’s Large Faceplate, Tabular Data Screen, and Custom Tabular wizards.
The EPM 7700 is a powerful and highly flexible device, supporting hundreds of
discrete data items. This scripting is required due to the large number of DDE items
available for this device type. For performance reasons, not all DDE items are kept
active simultaneously by the EPM 7700 Tabular Data Screen wizard; at any given
moment, DDE items which are not used may be disconnected to save the Server the
additional overhead of monitoring unused items. The scripts described in this section
automatically configure the DDE links used by the Tabular Data Screen wizard when
it is displayed, and enable the Large Faceplate wizard to re-connect to items which
may have been disabled by the Tabular Data Screen wizard.
NOTE: Failure to install these scripts for the Large Faceplate and Tabular Data
Screen wizards may result in faulty behavior of the wizard!
Templates for the required scripts are automatically installed in the InTouch directory
when PMCS is installed with the EPM 7700 Software Components option selected.
You may use the Notepad accessory program to open the files, then copy the text
from the file to InTouch when appropriate.
There are three scripts described in this section. The first script is an InTouch
Application Script that is required whenever a Large Faceplate or Tabular Data
Screen wizard is installed for a given device. The purpose of this script is to provide
communication status indication on the wizard. If the application script is not
installed, the “Communications Failed” indicator on the Large Faceplate and Tabular
Data wizards will not function. The second script, the EPM 7700 Large
Faceplate/Custom Table Script, is an InTouch Window Script that must be applied to
each Large Faceplate and Custom Tabular wizard window. This script ensures that
any tags which were disabled by the Tabular Data wizard are properly restored when
switching to a Large Faceplate or Custom Table screen. The third script, the Tabular
Data Screen Script, also an InTouch Window Script, applies only to the EPM 7700
Tabular Data Screen wizard. Its purpose is to automatically initialize the wizard for
optimum performance whenever its window is displayed.
Note that the application script is required whenever a Large Faceplate or Tabular
wizard is installed. The Windows scripts are required whenever your application uses
Tabular Data wizards.
48 PMCS Interface Toolkit
Page 57

Installing the Application Script
1. After configuring the EPM 7700 Large Faceplate wizard or Tabular Data Screen
wizard, select “Special \ Scripts \ Application Scripts…” from the
WindowMaker main menu. The Application Script Dialog box opens:
49
2. Select “While Running” from the Condition Type drop down list, and enter
“30000” in the “Every … Msec” text box next to the Condition Type drop down
list.
3. Use Notepad.exe to open the file “EPM7700 Application Script.txt”, located in
the Intouch directory of the PC. Select (highlight) all the file text and copy it to
the clipboard using the CTRL-C keyboard command.
4. Switch back to WindowMaker and paste the clipboard contents into the
Application Script dialog text box, using the CTRL-V keyboard command.
5. From the dialog box menu, select Edit \ Find… to bring up the Replace dialog
box as shown in the example below. In the “Find What” field, type in
“DeviceNm”. In the “Replace With” field type in the Device Name used to
configure the Large Faceplate wizard. Click the “Replace All” button to modify
the text, then click the Cancel button to close the Replace dialog.
Page 58

1. Click the OK button to close the Application Script Dialog.
NOTE: The application script text is only needed once for each configured device. If
you are installing more than one wizard for a particular EPM7700 device (for
example, a Large Faceplate and a Tabular Wizard), you only need to copy the
application script once. If you are installing more than one EPM7700 device in your
InTouch application, the application script window must contain a copy of the
application script text for each configured device. See the example below:
50 PMCS Interface Toolkit
Page 59

51
Page 60

EPM 7700 Large Faceplate or Custom Table Wizard Scripting
Configuring the Large Faceplate/Custom Table Script
1. After configuring the Large Faceplate or Custom Table wizard, and with its
window displayed, select “Special \ Scripts \ Window Scripts… from the
WindowMaker main menu. The Window Script Dialog box opens:
2. Select "On Show" from the Condition Type drop down list.
3. Use Notepad.exe to open the file “EPM7700 Non-Tabular Window Script.txt”,
located in the Intouch directory of the PC.
4. Select (highlight) all the file text and copy it to the clipboard using the CTRL-C
keyboard command.
5. Switch to WindowMaker and paste the clipboard contents into the Window
Script dialog text box, using the CTRL-V keyboard command.
6. From the dialog box menu, select Edit \ Find… to bring up the Replace dialog
box as shown in the following example. In the “Find What” field, type in
“DeviceNm”. In the “Replace With” field, enter the Device Name used to
configure the Large Faceplate wizard. Click the “Replace All” button to modify
the text. Click the Cancel button to close the Replace dialog. Click the OK
button to close the Window Scripts Dialog.
52 PMCS Interface Toolkit
Page 61

53
Page 62

EPM 7700 Tabular Data Screen Scripting
All EPM7700 Tabular wizards require the creation of a Window Script in InTouch.
The Window Script automatically configures DDE Links used by the Tabular Wizard
when it is displayed. The script must first be configured, then installed, per the
following procedures.
Configuring the Tabular Data Screen Script
1. After configuring the Tabular wizard, and with its window displayed, select
"Special \ Scripts \ Window Scripts… from the WindowMaker main menu. The
Window Script Dialog box opens.
2. Select “On Show” from the Condition Type drop down list.
3. Use the Notepad.exe accessory program to open the file “EPM7700 Tabular
Window Script.txt”, located in the Intouch directory of the PC. Select (highlight)
all the file text and copy it to the clipboard using the CTRL-C keyboard
command.
4. Switch back to WindowMaker and paste the clipboard contents into the Window
Script dialog text box, using the CTRL-V keyboard command.
5. From the dialog box menu, select Edit \ Find… to bring up the Replace dialog
box, as shown in the example below. In the “Find What” field, type in
“DeviceNm”. In the “Replace With” field type in the Device Name used to
configure the Tabular wizard. Click the “Replace All” button to modify the text.
Click the Cancel button to close the Replace dialog. Click the OK button to close
the Window Scripts Dialog.
54 PMCS Interface Toolkit
Page 63

Creating Floor Plans, Elevation Views, and One-Line Diagrams
Introduction
This chapter illustrates how to use the GE wizards described in Chapter 2 to create
animated displays of the facility floor plan, switchgear elevations, and system oneline diagrams. These examples are typical, but are not intended to display the limits
of creative system design.
Elevation Views
Elevation views of switchgear and switchboards are typically created first, because
miniature bitmaps of the elevations can be conveniently placed in floor plans as
navigation items.
To build an elevation view, place GE Elevation and Small Faceplate wizards into the
window, as follows:
1. Place the appropriate cabinet.
2. Place panels onto the cabinet.
3. Add nameplates, louvers, handles, and fasteners to create the desired
level of detail.
4. Place GE Small Faceplate wizards representing the components
installed in the equipment on top of the elevation wizards, as shown in
the figure on the following page.
5. Configure each of the Small Faceplate wizards to open a window
containing an appropriate Large Faceplate or Tabular Data Screen for
the device.
55
Page 64

6. You can add additional navigation buttons (using standard InTouch
controls) to open windows containing one-line views or other
information.
7. If the switchgear shown in the elevation view is fed from or feeds
another lineup, you can add buttons to navigate to elevation views
representing those lineups.
56 PMCS Interface Toolkit
Page 65

Floor Plans
A floor plan should be a recognizable overhead representation of a facility. These
windows are built using the GE Floor Plan wizards, described in Chapter 2. They can
be made as detailed or as simple as desired. The example below shows an overview
of a facility, showing all of the areas containing equipment.
You can link each of these areas in the main window to a more detailed window by
adding a labeled navigation button (using standard InTouch controls) that is
configured to show that window. In this way, you can provide paths to move up and
down through a complete floor plan hierarchy.
Floor plans may be as detailed as you desire and may include miniature bitmaps of
equipment elevations. The procedure for creating a miniature bitmap in a floor plan
view is as follows:
1. In the floor plan window, use the toolbox to create a bitmap object with the
desired size of the miniature switchgear.
2. Switch to the desired elevation window.
3. Select and copy the elevation view.
4. Switch back to the floor plan window.
5. In the floor plan window, use the Paste Bitmap command to insert the elevation
view into the bitmap object.
6. Double-click on the miniature elevation bitmap to configure a link to the full-
sized elevation view window.
7. You can add additional buttons, using standard InTouch controls, to navigate to
windows containing one-line views of the switchgear or other information.
57
Page 66

Electrical One-Line Diagrams
One-line diagrams are built by placing and linking circuit elements using the OneLine wizards, then creating scripts to provide animation for those wizards whose
status can be determined or controlled, such as breakers and switches.
A one-line diagram is drawn by placing GE One-Line wizards into a window. All
animated One-Line wizards have at least one discrete tag to indicate the status of the
bus feed to the device, while others may have tags for in and out connections and for
device status. If you do not require animation, link the wizard’s discrete tags to a
constant tag with a value of true.
After the device wizards have been placed and configured, they may be connected by
standard InTouch line graphics. Double-click on lines to configure them for
animation. You can link a line to a discrete variable, with the colors set to indicate on
(typically green) and off (typically red). If several lines are used to indicate one
section of bus, animate them together with the Make Symbol toolbox selection.
When a one-line diagram is too large to comfortably fit into a single window, place
navigation buttons with links to other windows near each bus line that continues to
another screen. This allows intuitive navigation up and down a distribution system
hierarchy.
To accurately animate your one-line diagram once all the graphics are in place,
condition scripts must be written with the logic for the distribution system. See the
InTouch documentation for details of the scripting language. The following example
shows a simple double-ended substation with a tie breaker and the scripting that
animates it.
An example of the scripting for this one-line diagram is shown below:
58 PMCS Interface Toolkit
Page 67

{ Set values of local discrete variables based
on state of integer status of breaker. This
section sets the breaker status memory
discretes to true if the breaker’s analog
status value is 3 (closed).}
brk1_s = (brk1 == 3 OR brk1 ==9);
brk2_s = (brk2 == 3 OR brk1 ==9);
brk3_s = (brk3 == 3 OR brk1 ==9);
brk4_s = (brk4 == 3 OR brk1 ==9);
brk5_s = (brk5 == 3 OR brk1 ==9);
brk6_s = (brk6 == 3 OR brk1 ==9);
{ set the bus status for the incoming feeds to
the dependent bus above in the
distribution hierarchy. This section sets the
dependencies of the bus pieces to other
sections of the one-line diagram and resets
pieces of the bus located entirely on this
screen to false.}
bus1 = feed1;
bus2 = feed2;
{ set the bus status for the incoming feeds to
the dependent bus above in the
distribution hierarchy. This section sets the
dependencies of the bus pieces to other
sections of the one-line diagram and resets
pieces of the bus located entirely on this
screen to false.}
bus1 = feed1;
bus2 = feed2;
Sets the breaker status
memory discretes to
true if the breaker’s
analog status value is 3
(closed).
Sets the
dependencies of the
bus pieces to other
sections of the oneline diagram and
resets the pieces of
the bus located
entirely on this screen
to false.
{ reset internal bus pieces to off for
computations }
bus3 = 0;
bus4 = 0;
bus5 = 0;
{ set the bus status for the incoming feeds to
the dependent bus above in the
distribution hierarchy. This section sets the
dependencies of the bus pieces to other
sections of the one-line diagram and resets
pieces of the bus located entirely on this
screen to false.}
bus1 = feed1;
bus2 = feed2;
{ reset internal bus pieces to off for
computations }
bus3 = 0;
bus4 = 0;
bus5 = 0;
IF…THEN statements
traverse the hierarchy
from top to bottom,
left to right, and then
bottom to top, right to
left.
59
Page 68

{ set the bus status for the incoming feeds to
the dependent bus below in the
distribution hierarchy. The IF_THEN
statements in this section traverse the
hierarchy from top to bottom, left to right,
and then bottom to top, right to left.}
bus6 = 0;
bus7 = 0;
{ two main feeds }
IF (bus1 AND brk1_s) THEN
bus3 = 1;
ENDIF;
IF (bus2 AND brk2_s) THEN
bus4 = 1;
ENDIF;
{ left to right across tie breaker }
IF (bus3 AND brk3_s) THEN
bus4 = 1;
ENDIF;
IF (bus4 AND brk4_s) THEN
bus5 = 1;
ENDIF;
{ two outgoing feeders }
IF (bus3 AND brk5_s) THEN
bus6 = 1;
ENDIF;
IF (bus5 AND brk6_s) THEN
bus7 = 1;
ENDIF;
{ back feed from two outgoing feeds }
IF (bus7 AND brk6_s) THEN
bus5 = 1;
ENDIF;
IF (bus6 AND brk5_s) THEN
bus3 = 1;
ENDIF;
{ right to left across tie breaker }
IF (bus5 AND brk4_s) THEN
bus4 = 1;
ENDIF;
IF (bus4 AND brk3_s) THEN
bus3 = 1;
ENDIF;
{ two incoming feeds }
IF (bus5 AND brk2_s) THEN
bus2 = 1;
ENDIF;
IF (bus3 AND brk1_s) THEN
bus1 = 1;
ENDIF;
60 PMCS Interface Toolkit
Page 69

Sample Application
Creating a basic interface
We’ve learned about the various parts and pieces of the Interface Toolkit; now let’s
put it to work.
Suppose we have a very basic power management system installed at our corporate
home office. The system consists of four trip units and a PQM (Power Quality
Meter). We’d like to set up a computer in the front office to provide a front end to
this system, allowing us to monitor all these devices at one station without having to
walk back to the individual devices on the plant floor.
We plan the application on paper first so that we know how many screens to create
and what each screen will look like. This will help us save time when in development
by providing a starting point and a map of what we’re trying to create. This
‘storyboard’ for our application looks something like this:
PQM
Faceplate
Trip Unit 1
Faceplate
Intro
screen
As shown above, for this basic application, we’ll need 12 screens — an introduction
screen, a shot of the panelboard showing all five of our power management devices,
and then a large faceplate and tabular screen for each device. We’ll link the Large
Faceplate screen for each unit to the Small Faceplate wizard shown on the
Panelboard screen, and, from the Large Faceplate, we can click on the device’s
display to jump to the Tabular data screen for that device. To make it easier to
navigate the screens, we’ll create extra buttons on the bottom of the Faceplate and
Tabular screens that will jump back to the Panelboard screen.
Panel
board
Trip Unit 2
Faceplate
Trip Unit 3
Faceplate
Trip Unit 4
Faceplate
PQM
Tabular
Trip Unit 1
Tabular
Trip Unit 2
Tabular
Trip Unit 3
Tabular
Trip Unit 4
Tabular
61
With our plan in hand, and after completing the installation procedures described in
Chapter 1, we’re ready to begin development. Launch InTouch and select the button
to create a new file, then click the Development button.
Page 70

First, we’ll create all our new windows and name them, then we’ll go back and flesh
them out with their contents and add links between them. Create the following twelve
windows:
• Main Screen • Trip2_Face
• Panelboard • Trip2_Tab
• PQM_Face • Trip3_Face
• PQM_Tab • Trip3_Tab
• Trip1_Face • Trip4_Face
• Trip1_Tab • Trip4_Tab
Select the window named Main Screen, and use the Wonderware tools to sketch a
floorplan of the facility, as shown below.
In the Manufacturing Floor area, we place a button labeled “Click here to begin…,”
and give it an animation link to the window named Panelboard.
Select the Panelboard window. Use the PMCS Elevation wizards to create a mock-up
of the panelboard, then use the PMCS Small Faceplate wizards to populate the
panelboard with our PQM meter and the four trip units. The Panelboard screen
should look like this:
62 PMCS Interface Toolkit
Page 71

We’ll include a note about the panelboard’s location, describing where to find the
real panel, and also a note of instruction: “Click a device to see the large faceplate
screen.”
Create the links to the device screens by double-clicking on each small faceplate and
entering the name of the device’s Large Faceplate screen. For example, double-click
on the PQM’s Small Faceplate on the panelboard; then, in the resulting dialog box,
type the name of the PQM_Face window. Complete these links for the remaining
devices.
Next we’ll develop the device screens. For the purposes of this chapter, we’ll just
walk through the two PQM screens. The development of the trip unit screens follows
the same procedure.
Select the PQM_Face window, then use the Wonderware Button tool found on the
Toolbox to create two new buttons, “HOME” and “Go back to Panel.” Use the
Animation Links command to tie these buttons to the Main Screen and Panelboard
windows, respectively. Now use the Wizards tool to place the PQM Large Faceplate
wizard on the PQM_Face window. The screen should look similar to the following:
63
Page 72

Now we’ll develop the PQM Tabular data screen. Select the PQM Tab window and
use the Wizards tool to place the PQM Tabular Data wizard on the screen. Double
click the wizard and fill in the Device Name and the Trending windows as shown
below. Click OK.
Finally, add some navigation buttons to the Tabular screen for returning to the Main
Screen (HOME), to the Panelboard (Go to Panel), or to the Large Faceplate screen
(Go back to Faceplate). Link each button to the appropriate screen, and you’re all set!
64 PMCS Interface Toolkit
Page 73

Complete the application by developing the Faceplate and Tabular screens for each
of the four trip units and that’s it — we’ve just developed a PMCS application using
the GE Wonderware Wizards.
65
Page 74

(This page left blank intentionally)
66 PMCS Interface Toolkit
Page 75

Features of GE Large Faceplate Wizards
About the Large Faceplate Wizards
This chapter contains descriptions of the functions available with each of the GE
Large Faceplate wizards. While a majority of the most popular data available at each
device have been made available in the Wizards, some functions available with the
actual devices are not provided in the Large Faceplate representations, such as the
following:
• Test Mode or Simulation Mode on some devices is not fully supported
• Details on status/alarm/trips other than the information displayed by the
front LEDs and a brief text message (see Tabular Data Screens for
detailed status/alarm/trip information)
• Any flashing status messages which may be produced by a device
• Some actual values are not displayed on the Large Faceplate Wizard,
but can be found on Tabular Data Screen Wizards
Users should be aware that not all values displayed by the GE Large Faceplate
Wizards are automatically updated. Also, some rapidly changing values, especially
those requiring calculation, cannot be displayed as rapidly on the wizard as on the
actual device’s screen.
For a more detailed description of the functions of a device, see the user’s guide for
that device.
67
Page 76

POWER LEADER EPM
The large faceplate representation of the POWER LEADER EPM provides the
following animated functions:
Click on... Function
Display Window Clicking on the display area opens the tabular data window
specified during wizard configuration and sets the view to
the Normal Metering page.
GE Logo Clicking the GE logo opens the tabular data window
specified during wizard configuration and sets the view to
the Setup page.
SELECT/ENTER
Button
SCROLL Buttons Loop through all metered parameters for the current mode,
Table 1. PLEPM Faceplate animated functions.
Toggles the display between the normal and alternate lists
of metering parameters.
displaying two values at a time. The down arrow scrolls
down through the parameter list, with the new value
appearing on the lower line of the display. The up arrow
scrolls up through the parameter list with the new value
appearing on the display’s upper line. Depending on
whether the EPM has been configured as a Delta or Wye
device, certain parameters display either line-to-line or
line-to-neutral values.
The electrical parameters and status information displayed by the EPM are listed
below for both the normal and alternate scrolls. Note that the displayed parameters
68 PMCS Interface Toolkit
Page 77

differ depending on whether the EPM is configured as Wye or Delta. Please note that
the Normal Scroll Delta and Alternate Scroll Delta lists contain several parameters
marked with an asterisk; these parameters were included in the wizard for
programming reasons, but are not valid for Delta configurations and should not be
used.
Normal Scroll, Wye Normal Scroll, Delta
Current, RMS Phase A Current, Phase A
Current, RMS Phase B Current, Phase B
Current, RMS Phase C Current, Phase C
Current, RMS Neutral Current, RMS Neutral *
Voltage, RMS Phase A–N Voltage, RMS Phase A–N *
Voltage, RMS Phase B–N Voltage, RMS Phase B–N *
Voltage, RMS Phase C–N Voltage, RMS Phase C–N *
Voltage, RMS Phase A–B Voltage, RMS Phase A–B
Voltage, RMS Phase B–C Voltage, RMS Phase B–C
Voltage, RMS Phase C–A Voltage, RMS Phase C–A
Watts, Phase A Watts, Phase A–B
Watts, Phase B Watts, Phase B–C
Watts, Phase C Watts, Total
Watts, Total Watts, Demand
Watts, Demand Watts, Peak Demand
Watts, Peak Demand Vars, Phase A–B
Vars, Phase A Vars, Phase B–C
Vars, Phase B Vars, Total
Vars, Phase C Volt-amperes, Phase A–B
Vars, Total Volt-amperes, Phase B–C
Volt-amperes, Phase A Volt-amperes, Total
Volt-amperes, Phase B Power Factor, Total
Volt-amperes, Phase C Watthours, Total
Volt-amperes, Total Varhours, Total Lag (+)
Power Factor, Total Varhours, Total Lead (–)
Watthours, Total Volt-ampere-hours, Total
Varhours, Total Lag (+) Frequency, in hertz
Varhours, Total Lead (–)
Volt-ampere-hours, Total
Frequency, in hertz
69
Page 78

Alternate Scroll, Wye Alternate Scroll, Delta
Current, Phase A Demand Current, Phase A Demand
Current, Phase A Peak Demand Current, Phase A Peak Demand
Current, Phase B Demand Current, Phase B Demand *
Current, Phase B Peak Demand Current, Phase B Peak Demand *
Current, Phase C Demand Current, Phase C Demand
Current, Phase C Peak Demand Current, Phase C Peak Demand
Watts Demand at Peak VA Demand Watts Demand at Peak VA Demand
Vars, Demand Lag (+) Vars, Demand Lag (+)
Vars, Demand Lead (–) Vars, Demand Lead (–)
Vars, Peak Demand Lag (+) Vars, Peak Demand Lag (+)
Vars, Peak Demand Lead (–) Vars, Peak Demand Lead (–)
Volt-amperes, Demand Volt-amperes, Demand
Volt-amperes, Peak Demand Volt-amperes, Peak Demand
Q-hours, Total Q-hours, Total
Power Factor, Phase A Power Factor, Phase A–B
Power Factor, Phase B Power Factor, Phase B–C
Power Factor, Phase C Power Factor, Average Since Reset
Power Factor, Average Since Reset Power Factor, Demand Average
Power Factor, Demand Average Power Factor at Peak VA Demand
Power Factor at Peak VA Demand Number of Demand Resets
Number of Demand Resets Time Left in Demand Subinterval
Time Left in Demand Subinterval Number of Power Outages
Number of Power Outages Potential Transformer Ratio
Potential Transformer Ratio Current Transformer Ratio
Current Transformer Ratio
70 PMCS Interface Toolkit
Page 79

Spectra MicroVersaTrip Trip Unit
The large faceplate representation of the Spectra MicroVersaTrip trip unit provides
the following animated functions:
Click on... Function
Display
Window
FUNCTION
Button
ENTER Button Opens the tabular data window specified during wizard
VALUE Button Changes phases in appropriate modes, depending on
SELECT
Button
Opens the tabular data window specified during wizard
configuration and sets the view to the Normal Monitoring
page.
Opens the tabular data window specified during wizard
configuration and sets the view to the Setup page.
configuration and sets the view to the Setup page.
whether the device has been configured as Wye or Delta
Phase is indicated by letters in the upper right of the
display; press VALUE to display a different phase.
Rotates among six different modes, as shown in the lower
left of the display, with units in the lower right.
Table 2. Spectra MVT Faceplate animated functions.
71
The metering modes available with the SELECT button are as follows:
Mode Description
AMPS Current, with no label in the units area of the display. Phase shifting in both
Delta and Wye configurations.
VOLTS Voltage, displayed as line-to-line (V
for Wye. Phase shifting in both configurations.
ENGY Energy, displayed in kWh; no phase shifting.
PWR Real power indicated by non-blinking units symbol (kW). Apparent power
indicated by blinking units symbol. Phase shifting in Wye configuration.
FREQ Frequency, displayed in Hz. Phase shifting in both Delta and Wye
configurations.
) for Delta and line-to-neutral (VL-N)
L-L
Page 80

Enhanced MicroVersaTrip-C Trip Unit
The large faceplate representation of the Enhanced MicroVersaTrip-C trip unit
provides the following animated functions:
Click on ... Function
Display
Window
FUNCTION
Button
ENTER Button Opens the tabular data window specified during wizard
BATTERY
Button
VALUE Button Changes phases in appropriate modes, depending on
SELECT
Button
Opens the tabular data window specified during wizard
configuration and sets the view to the Monitoring page.
Opens the tabular data window specified during wizard
configuration and sets the view to the Setup page.
configuration and sets the view to the Setup page.
Opens the tabular data window specified during wizard
configuration and sets the view to the Setup page.
whether the device has been configured as Wye or Delta,
Phase is indicated by numbers in the upper right of the
display; press VALUE to display a different phase.
Rotates among eight different modes, as shown in the lower
left of the display, with units in the lower right.
Table 3. EMVT-C Faceplate animated functions.
72 PMCS Interface Toolkit
Page 81

The EMVT-C’s metering modes available with the SELECT button are as follows:
Mode Description
AMPS Current, with no label in the units area of the display. Phase shifting
in both Delta and Wye configurations.
VOLTS Voltage, displayed as line-to-line (Ph-Ph) for Delta and line-to-
neutral (Ph-N) for Wye. Phases shown as 01, 02, or 03 for Wye and
01 02, 01 03, or 02 03 for Delta.
kWh Energy; no phase shifting.
kW Real power; no phase shifting.
kVA Apparent power; no phase shifting.
Demand Power demand, displayed with steady kW symbol. Peak power
demand, displayed with blinking kW symbol. No phase shifting.
FREQ Frequency, displayed in Hz. Phase shifting in both Delta and Wye
configurations.
73
Page 82

Enhanced MicroVersaTrip-D Trip Unit
The large faceplate representation of the Enhanced MicroVersaTrip-D trip unit
provides the following animated functions:
Feature Function
Display
Window
FUNCTION
Button
ENTER Button Opens the tabular data window specified during wizard
BATTERY
Button
VALUE Button Changes phases in appropriate modes, depending on whether
SELECT
Button
Opens the tabular data window specified during wizard
configuration and sets the view to the Monitoring page.
Opens the tabular data window specified during wizard
configuration and sets the view to the Setup page.
configuration and sets the view to the Setup page.
Opens the tabular data window specified during wizard
configuration and sets the view to the Setup page.
the device has been configured as Wye or Delta Phase is
indicated by numbers in the upper right of the display; press
VALUE to display a different phase.
Rotates among eight different modes, as shown in the lower
left of the display, with units in the lower right.
Table 4. EMVT-D Faceplate animated functions.
74 PMCS Interface Toolkit
Page 83

The metering modes available with the SELECT button are as follows:
Mode Description
AMPS Current, with no label in the units area of the display. Phase
shifting in both Delta and Wye configurations.
VOLTS Voltage, displayed as line-to-line (Ph-Ph) for Delta and line-to-
neutral (Ph-N) for Wye. Phases shown as 01, 02, or 03 for Wye
and 01 02, 01 03, or 02 03 for delta.
kWh Energy; no phase shifting.
kW Real power; no phase shifting.
kVA Apparent power; no phase shifting.
Demand Power demand, displayed with steady kW symbol. Peak power
demand, displayed with blinking kW symbol. No phase shifting.
FREQ Frequency, displayed in Hz. Phase shifting in both Delta and
Wye configurations.
75
Page 84

POWER LEADER Meter
The large faceplate representation of the POWER LEADER Meter provides the
following animated functions:
Feature Function
Display Window Opens the tabular data window specified during wizard
configuration and sets the view to the Monitoring page.
GE Logo Opens the tabular data window specified during wizard
configuration and sets the view to the Setup page.
RESET/ENTER
Button
PHASE Button Rotates among phase readings for appropriate modes, indicated
SCROLL UP
and SCROLL
DOWN Buttons
Opens the tabular data window specified during wizard
configuration and sets the view to the Setup page.
by the phase LEDs below the display window.
Loop through display modes either down or up the list of
parameters. Fourteen modes available with a Delta-configured
device; one additional with Wye.
Table 5. PL Meter Faceplate animated functions.
76 PMCS Interface Toolkit
Page 85

The parameters available with the SCROLL buttons are listed below:
Mode Description
RMS Current Units in Amps; phase shifting among A, B, and C.
RMS Voltage L-N Units in Volts; available only in Wye configuration, with phase shifting
among A, B, and C.
RMS Voltage L-L Units in Volts; phase shifting among AB, BC, and CA.
Watts Units in kW; phase shifting among A, B, C, and total.
Vars Units in kVARs; phase shifting among A, B, C, and total.
Volt-Amps Units in kVA; phase shifting among A, B, C, and total.
Power Factor No units; no phase shifting.
Watt-Hours Units in kWH; no phase shifting.
VAR-Hours Units in kVARH; no phase shifting.
Current Demand Units in A; phase shifting among A, B, and C.
Peak Current Units in A; phase shifting among A, B, and C.
Watt Demand Units in kW; no phase shifting.
Peak Watt Demand Units in kW; no phase shifting.
Frequency Units in Hz; no phase shifting.
Harm Distortion Value area of display is blank; degree of harmonic distortion is shown as
negligible, mild, moderate, or severe.
77
Page 86

Spectra ECM
The large faceplate representation of the Spectra ECM provides the following
animated functions:
Feature Function
Display Window Opens the tabular data window specified during wizard
configuration and sets the view to the Monitoring page.
CONTRAST
Buttons
Refresh Button Updates the display to the most current readings.
SCROLL
Buttons
SELECT/EXIT
Button
Table 6. Spectra ECM Faceplate animated functions.
Open the tabular data window specified during wizard
configuration and sets the view to the Setup page.
Loop through all selections for each of the valid modes
accessed by the SELECT/EXIT button.
Displays the top-line message “Press SELECT for”. Press
one of the SCROLL buttons to rotate among the four
modes. Press SELECT/EXIT to display the first value of
the current mode and the SCROLL buttons for all other
values available in that mode. Press again to redisplay the
“Press SELECT for” prompt for mode selection.
The modes and the parameters available in each mode are as follows:
78 PMCS Interface Toolkit
Page 87

Mode Parameters and Units
STATUS Motor Status
ECM Status
Trip Status
SETPOINTS FLA Setting, amps
Rating Plug, amps
Phase Unbalance, disabled/enabled
Ground Fault, disabled/enabled
Commnet Address
METERING Phase A Current, amps
Phase B Current, amps
Phase C Current, amps
Average Current, amps
Phase Unbalance, percent
Ground Current, amps
Motor Load, percent
LAST TRIP INFO Last Trip Cause
Phase A @ Trip, amps
Phase B @ Trip, amps
Phase C @ Trip, amps
Unbalance @ Trip, percent
Ground Current @ Trip, amps
79
Page 88

EPM 3710 Meter
Feature Function
Display
Window
MIN/MAX
Buttons
PHASE
Button
FUNCTION
Button
The large faceplate representation of the EPM 3710 provides the following animated
functions:
Opens the tabular data window specified during wizard
configuration and sets the view to the Monitoring page.
Open the tabular data window specified during wizard
configuration and set the view to the Setup page.
Rotates the left side of the display through eight sets of
instantaneous values, as described in the table below.
Rotates the right side of the display through 13
accumulated values.
Table 7. EPM 3710 Faceplate animated functions.
The parameters displayed by the PHASE button are listed in the following table.
Display Indication Parameters
A Phase A current and line-to-neutral voltage
B Phase B current and line-to-neutral voltage
C Phase C current and line-to-neutral voltage
* Average current and line-to-neutral voltage
A, Phase A current and A-B line-to-line voltage
B, Phase B current and B-C line-to-line voltage
C, Phase C current and C-A line-to-line voltage
*, Average current line-to-line voltage
The parameters displayed by the FUNCTION button are listed in the following table.
If any of the import or export values are zero, they are not displayed and the next
nonzero value is shown. When any of these parameters are displayed, the AMPS
portion of the display window is used to allow display of the complete value.
80 PMCS Interface Toolkit
Page 89

Display Indication Parameter
kW Total real power
kVA Total apparent power
kQ Total reactive power
PFLG or PFLD Power factor; lagging or leading
Hz Frequency
kWD Kilowatt total demand
A or kVA Current average demand or apparent power demand
VX RMS auxiliary voltage
I4 RMS neutral current
kWH-F Import energy
kWH-R Export energy
kVARH-F Import reactive energy
kVARH-R Export reactive energy
81
Page 90

EPM 3720 Meter
The large faceplate representation of the EPM 3720 meter provides the following
animated functions:
Feature Function
Display Window Opens the tabular data window specified during wizard
configuration and sets the view to the Monitoring page.
GROUP Buttons Opens the tabular data window specified during wizard
configuration and sets the view to the Setup page.
PHASE Button Rotates the left side of the display through eight sets of
instantaneous values, as described in the table below. May
also affect the POWER FUNCTIONS portion of the
display, depending on the FUNCTION selection.
FUNCTION
Button
Rotates the right side of the display through 24
accumulated values, in conjunction with the PHASE
button.
Table 8. EPM 3720 Faceplate animated functions.
The parameters displayed by the PHASE button are listed in the following table.
Display Indication Parameters
A Phase A current and line-to-neutral voltage
B Phase B current and line-to-neutral voltage
C Phase C current and line-to-neutral voltage
* Average current and line-to-neutral voltage
A, Phase A current and A-B line-to-line voltage
82 PMCS Interface Toolkit
Page 91

Display Indication Parameters
B, Phase B current and B-C line-to-line voltage
C, Phase C current and C-A line-to-line voltage
*, Average current line-to-line voltage
The parameters displayed by the FUNCTION button are listed in the following table.
When any of the import, export, or net parameters are displayed, the AMPS portion
of the display window is used to allow display of the complete value.
Display
Parameter
Indication
kW Real power for phase A, B, or C as set by PHASE button, or
total real power if PHASE is set to * or *,.
kVR Reactive power for phase A, B, or C as set by PHASE button, or
total reactive power if PHASE is set to * or *,.
kVA Apparent power for phase A, B, or C as set by PHASE button,
or total apparent power if PHASE is set to * or *,.
PFLG or PFLD Power factor, lagging or leading, for phase !A, B, or C as set by
PHASE button, or total power factor if PHASE is set to * or *,.
I4 RMS neutral current
Hz Frequency
VX RMS auxiliary voltage
kWH IM Import energy
kWH EX Export energy
kVARH IM Import reactive energy
kVARH EX Export reactive energy
kVAH NET Net reactive energy
83
Page 92

EPM 7700 Meter
The large faceplate representation of the EPM 7700 meter provides the following
animated functions:
Feature Function
LCD display
window
ESC Opens the displays the main menu on the faceplate as
Blank Buttons Pressing the keys adjacent to the LCD Display window
Table 9. EPM 7700 Faceplate animated functions.
Opens the tabular data window specified during wizard
configuration and sets the view to the Metering page.
shown above.
displays the selected screen. For instance, selecting the
Total Power button displays the Total Power screen of
data.
The parameters displayed by the various data screen buttons are listed in the
following table.
84 PMCS Interface Toolkit
Page 93

Screen Selected Description
1 - Total Power
• KW Total
• KVAR Total
• KVA Total
• PF Signed Total
2 - Three-Phase Measurements
• Vln a; Vln b: n/a when Voltage Mode is DELTA
• Vln c: n/a when Voltage Mode is DELTA or SINGLE
• Vln Avg: n/a when Voltage Mode is DELTA
• Vll ab
• Vll bc; Vll ca; Vll avg: n/a when Voltage Mode is SINGLE
• Ia, Ib, I4, Iavg
• Ic: n/a when Voltage Mode is SINGLE
• V unbal
• I unbal
• Line Frequency
3 - Per-Phase Power
• KW a; KW b: n/a when Voltage Mode is DELTA
• KW c: n/a when Voltage Mode is DELTA or SINGLE
• KW Total
• KVAR a; KVAR b: n/a when Voltage Mode is DELTA
• KVAR c: n/a when Voltage Mode is DELTA or SINGLE
• KVAR Total
• KVA a; KVA b: n/a when Voltage Mode is DELTA
• KVA c: n/a when Voltage Mode is DELTA or SINGLE
• KVA Total
• PF Signed a; PF Signed b: n/a when Voltage Mode is
DELTA
• PF Signed c: n/a when Voltage Mode is DELTA or
SINGLE
85
4 - Energy
5 - Symmetrical Components
6 - Digital Inputs
• KWh Import; KWh Export; KWh Total; KWh Net
• KVARh Import; KVARh Export; KVARh Total; KVARh
Net
• KVAh Total
• KW Total Min; KVAR Total Min; KVA Total Min
• KW Total Max; KVAR Total Max; KVA Total Max
• I ZeroSeqMag; I PosSeqMag; I NegSeqMag
• V ZeroSeqMag; V PosSeqMag; V NegSeqMag
• I ZeroSeqPhs; I PosSeqPhs; I NegSeqPhs
• V ZeroSeqPhs; V PosSeqPhs; V NegSeqPhs
• Status Inputs 1 - 8
Page 94

Screen Selected Description
7 - Per-Phase Minimums
• Vln a Min; Vln b Min: n/a when Voltage Mode is DELTA
• Vln c Min: n/a when Voltage Mode is DELTA or SINGLE
• Vln Avg Min: n/a when Voltage Mode is DELTA
• Vll ab Min
• Vll bc Min; Vll ca Min; Vll Avg Min: n/a when Voltage
Mode is SINGLE
• Ia Min; Ib Min
• Ic Min: n/a when Voltage Mode is SINGLE
• I Avg Min
8 - Per-Phase Maximums
9 - Power & Amp Demand
10 - THD and K-Factor
**NOTE: If the Sliding Demand Reset is initiated, or a SWD setup register is
changed, SWD values are “N/A” in the meter until the number of sub-intervals
specified in the #sub intervals setup register have expired. The 3D faceplate and
Tabular wizard will display 0 for these values during this state.
• Vln a Max; Vln b Max : n/a when Voltage Mode is
DELTA
• Vln c Max: n/a when Voltage Mode is DELTA or SINGLE
• Vln Avg Max: n/a when Voltage Mode is DELTA
• Vll ab Max
• Vll bc Max; Vll ca Max; Vll Avg Max: n/a when Voltage
Mode is SINGLE
• Ia Max; Ib Max
• Ic Max: n/a when Voltage Mode is SINGLE
• I Avg Max
• KW SWD; KVAR SWD; KVA SWD**
• KW PD; KVAR PD; KVA PD**
• KW Total; KVAR Total; KVA Total
• V1 THD; V2 THD; V3 THD: n/a when Source is n/a
• I1 THD; I2 THD; I3 THD; I4 THD: n/a when Source is n/a
• I1 K Factor; I2 K Factor; I3 K Factor; I4 K Factor: n/a
when Source is n/a
86 PMCS Interface Toolkit
Page 95

269 Plus Motor Management Relay
The large faceplate representation of the 269 Plus provides the following animated
functions:
Feature Function
Display Window Opens the tabular data window specified during wizard
configuration and sets the view to the Monitoring page.
SET POINTS
Button
RESET Button Opens the tabular data window specified during wizard
CLEAR Button Opens the tabular data window specified during wizard
VALUE Buttons Open the tabular data window specified during wizard
HELP Button Displays a Windows help screen for PMCS.
ACTUAL
VALUES Button
REFRESH
Button
STORE Button Resets the meter at two special points in the display of values.
PAGE Buttons Rotate among seven pages of parameter data. Press one of the
Opens the tabular data window specified during wizard
configuration and sets the view to the Setup page.
configuration and sets the view to the Setup page.
configuration and sets the view to the Setup page.
configuration and set the view to the Setup page.
Brings the meter to an initial setting point and displays ACTUAL
VALUES HAS SEVEN PAGES OF DATA.
Updates the display to the current meter reading.
Press STORE to toggle the response on the bottom line.
arrow keys to display PAGE #: ACTUAL VALUES on the top
line, a description on the bottom, and reset to the first parameter
value. The seven pages are listed in the table below.
87
Page 96

Feature Function
LINE Buttons Rotate among parameters within a page. Certain configurations
or meter values may prevent display of all parameters within a
page. The parameters in each page are listed in the table below.
Panel Display
Lights
Display animation that shows the status of the 269 Plus relay. If
a trip or alarm has occurred, auxiliary relay 1 or 2 is active. If the
meter fails its self-test, the dark red square to the left of the label
appears bright red.
Table 10. 269+ Faceplate animated functions.
The following table lists the pages that can be accessed with the PAGE buttons, with
the parameters available in each page that can be accessed with the LINE buttons.
Page Value Text Displayed Description
1 PAGE 1: ACTUAL VALUES
PHASE CURRENT DATA
2 I1=xxx I2=xxx
I3=xxx (AMPS)---
3 I(3 Ph avg.)=xxx AMPS
Max Stator RTD=xxx C
1 4 UNBALANCE RATIO (In/Ip)
U/B=xx PERCENT
5 GROUND FAULT CURRENT
G/F=xxx.0 AMPS
6 ST/HR TIMERS (MIN)
xx xx xx xx xx
7TIME
Page header
Phase current in amps; --- or RUN based on
motor status
Average phase current
Hottest stator temperature
Units = *.1 if G/F CT
ratio = 2000:1
Starts per hour
BETWEEN STARTS
TIMER = xxx MIN
8 END OF PAGE ONE
ACTUAL VALUES
1 PAGE 2: ACTUAL VALUES
RTD TEMPERATURE DATA
2 HOTTEST STATOR RTD
RTD #xx = xxx
3-12 RTD TEMPERATURE
RTD # xx = xxx
2 13 MAX STATOR SINCE LAST
ACCESS: RTD #x = xxx DEGREES C
14-17 MAXIMUM RTD #x TEMP SINCE
LAST ACCESS: xxx DEGREES C
18 CLEAR LAST ACCESS DATA?
NO
19 END OF PAGE TWO
ACTUAL VALUES
88 PMCS Interface Toolkit
Page footer
Page header
Displays temperatures of RTDs #1-10
Displays #7-10 max
Press STORE to clear; message changes to
YES
Page footer
Page 97

Page Value Text Displayed Description
1 PAGE 3: ACTUAL VALUES
MOTOR CAPACITY DATA
2 ESTIMATED TIME TO
TRIP = xxx SECONDS
3 3 MOTOR LOAD AS A PERCENT
FULL LOAD = xxx PERCENT
4 THERMAL CAPACITY
USED = xxx PERCENT
5 END OF PAGE THREE:
ACTUAL VALUES
1 PAGE 4: ACTUAL VALUES
STATISTICAL DATA
2 RUNNING HOURS SINCE LAST
COMMISSIONING xxx HOURS
3 MEGAWATTHOURS SINCE LAST
COMMISSIONING xxx MWHR
4 # OF STARTS SINCE LAST
COMMISSIONING xxx
5 # OF TRIPS SINCE LAST
COMMISSIONING xxx
6 # O/L TRIPS SINCE LAST
COMMISSIONING xxx
7 # RAPID TRIPS SINCE LAST
COMMISSIONING xxx
8 # U/B TRIPS SINCE LAST
COMMISSIONING xxx
4 9 # G/F TRIPS SINCE LAST
COMMISSIONING xxx
10 # RTD TRIPS SINCE LAST
COMMISSIONING xxx
11 # S/C TRIPS SINCE LAST
COMMISSIONING xxx
12 # START TRIPS SINCE LAST
COMMISSIONING xxx
13 # U/V TRIPS SINCE LAST
COMMISSIONING xxx
14 # O/V TRIPS SINCE LAST
COMMISSIONING xxx
15 # PF TRIPS SINCE LAST
COMMISSIONING xxx
16 VOLTAGE PHASE REVERSALS
SINCE COMMISSIONING xxx
17 START NEW COMMISSIONING
NO
4 18 END OF PAGE FOUR:
ACTUAL VALUES
1 PAGE 5: ACTUAL VALUES
PRE-TRIP DATA
Page header
Page footer
Page header
Displayed only if MTM unit is installed in 269
Overload trips
Unbalance trips
Ground-fault trips
Short-circuit trips
Undervoltage trips
Overvoltage trips
Power-failure trips
Press STORE to start; message changes to
YES
Page footer
Page header
89
Page 98

Page Value Text Displayed Description
2 CAUSE OF LAST TRIP
message
3 PRE-TRIP AVERAGE MOTOR
CURRENT = xxx AMPS
4 PRE-TRIP U/B RATIO
(lI/Ip) xxx PERCENT
5 PRE-TRIP G/F CURRENT
G/F=xxx.0 AMPS
56 PRE-TRIP MAX STATOR RTD
RTD #XX = xxx C
7 PRE-TRIP AVERAGE VOLTAGE
VOLTS = xxx
8 PRE-TRIP KWATTS
KW = xxx
9 PRE-TRIP KVARS
KVAR = xxx
10 PRE-TRIP POWER FACTOR
PF = xxx
11 PRE-TRIP FREQUENCY
HZ = xxx
12 END OF PAGE FIVE
ACTUAL VALUES
1 PAGE 6: ACTUAL VALUES
LEARNED PARAMETERS
2 LEARNED Istart (AVG OF 4
STARTS)=xxx AMPS
3 LEARNED Istart (last one)
=xxx AMPS
4 LEARNED K FACTOR
K = xxx AMPS
6 5 LEARNED RUNNING COOL
TIME-xxx MIN
6 LEARNED STOPPED COOL
TIME = xxx MIN
7 LEARNED ACCEL TIME
ACCEL TIME = xxx SEC
8 LEARNED Start Capacity
Required = xxx PERCENT
9 END OF PAGE SIX
ACTUAL VALUES
1 PAGE 7: ACTUAL VALUES
METERING DATA
2 Vab = xxx Vbc = xxx
Vac = xxx (VOLTS)
or
MTM METER MODULE
NOT INSTALLED
3 3 PHASE KWATTS
KW = xxx
Message is a brief explanation of trip cause
Unbalance
Units = *.1 if G/F CT
ratio = 2000:1
Displayed only if MTM unit is installed in 269
Displayed only if MTM unit is installed in 269
Displayed only if MTM unit is installed in 269
Displayed only if MTM unit is installed in 269
Displayed only if MTM unit is installed in 269
Page footer
Page header
Page footer
Page header
Displayed only if MTM unit is on line
Displayed only if MTM unit is on line
90 PMCS Interface Toolkit
Page 99

Page Value Text Displayed Description
7 4 3 PHASE KVARS
KVAR = xxx
5 POWER FACTOR
PF = xxx
6 FREQUENCY
HZ = xx.x
7 END OF PAGE SEVEN
ACTUAL VALUES
Displayed only if MTM unit is on line
Displayed only if MTM unit is on line
Displayed only if MTM unit is on line
Page footer
91
Page 100

565 Feeder Management Relay
The large faceplate representation of the 565 provides the following animated
functions:
Feature Function
Display Window Opens the tabular data window specified during wizard configuration and sets the view to Monitoring page.
SET POINTS
Button
RESET Button Opens the tabular data window specified during wizard configuration and sets the view to the Setup page.
CLEAR Button Opens the tabular data window specified during wizard configuration and sets the view to the Setup page.
NEXT CHOICE Opens the tabular data window specified during wizard configuration and sets the view to the Setup page.
0 to 9 Buttons Open the tabular data window specified during wizard configuration and set the view to the Setup page.
HELP Button Displays a Windows help screen for PMCS.
ACTUAL
VALUES Button
REFRESH Button Updates the display to the current meter reading.
STORE Button Resets the meter at six special points in the display of values. Press STORE to toggle the response on the
PAGE UP Button Rotates among nine pages of parameter data. Press the key to display ACTUAL VALUES on the top line, a
LINE Buttons Rotate among parameters within a page. Certain configurations or meter values may prevent display of all
Panel Display
Lights
Opens the tabular data window specified during wizard configuration and sets the view to the Setup page.
Brings the meter to an initial setting point and displays ACTUAL VALUES HAS NINE PAGES OF DATA.
bottom line.
description on the bottom, and reset to the first parameter value. The nine pages are listed in the table below.
parameters within a page. The parameters in each page are listed in the table below.
Display animation that shows the status of the 565 relay. The dark red square to the left of the label appears
bright red to indicate an active state. The TRIP bar shows the current trip condition. Auxiliary relays 1, 2, and
3 show user-selected function status. The BREAKER CLOSED and BREAKER OPEN bars show the status
of the monitored feeder breaker. The SERVICE bar is not animated.
Table 11. 565 Faceplate animated functions.
The following table lists the pages that can be accessed with the PAGE UP button,
with the parameters available in each page that can be accessed with the LINE buttons.
92 PMCS Interface Toolkit
 Loading...