

Page 1
Industrial Radiography
Image forming techniques
Issued by GE Inspection Technologies
©
2006 General Electric Company. All Rights Reserved. We reserve the right to technical modifications without prior notice. GEIT-30158EN (06/08)
GE
Inspection Technologies
GE imagination at work
GE imagination at work
Inspection Technologies
GE
Inspection Technologies
www.geinspectiontechnologies.com/en
Page 2
Industrial Radiography
Image forming techniques
1
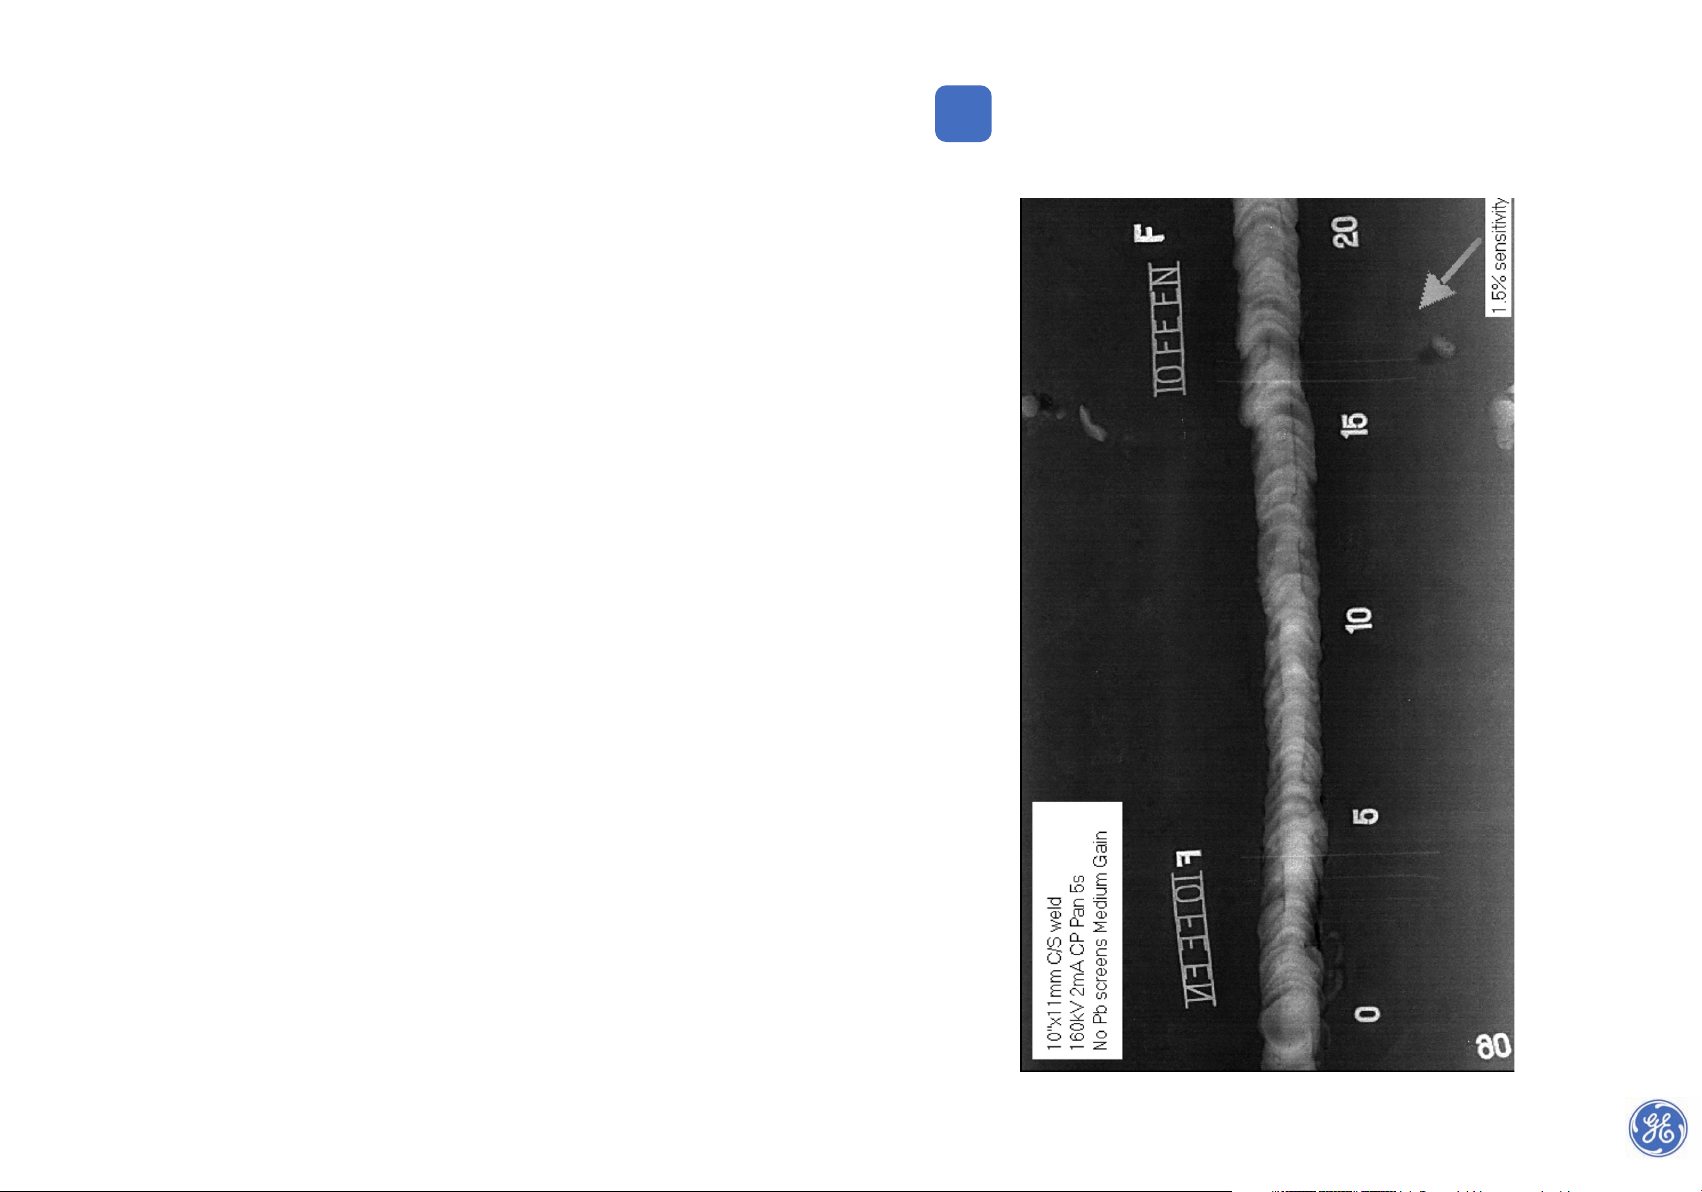
Digital radiography CR-image of a weld
see acknowledgements*
Page 3

The first issue of “Industrial Radiography” was published by Agfa in the sixties, for
educational and promotional purposes. Some improved editions have been released since,
providing information on the latest image forming radiographic techniques.
The booklet has been published in a number of languages and has been very much in demand.
The latest edition was compiled in the seventies but is now obsolete, because of the large
number of computer-aided NDT techniques which have entered the market in recent years.
In 2007 a new edition in the English language was published by GE Inspection Technologies.
That edition was compiled by Mr. J.A. de Raad, NDT-expert and consultant, who has a
considerable number of publications on the subject of Non-Destructive Testing to his name.
Mr. A. Kuiper, an experienced specialist and tutor on industrial radiography, assisted him.
Both had been involved in Non-Destructive Testing during their professional careers at
Applus RTD NDT & Inspection headquartered in Rotterdam, the Netherlands.
Apart from the developments in conventional radiography, primarily regarding X-ray
equipment and films, the 2007 issue describes the now mature methods of digital radiography
using radiation-sensitive plate- and panel detectors, including digitisation of traditional film.
Several other computer-assisted methods such as the CT technique are also included as well
as a separate chapter describing a variety of applications.
In this latest 2008 edition we considerably extended the chapters on digital radiography and
special techniques, such as microfocus and X-ray microscopy. In addition, the impact and
(non) existence of norms, codes and standards on new NDT-technologies and their applications
are addressed.
We trust that this new issue of “Industrial Radiography” will fulfil a need once again.
GE Inspection Technologies, 2008
The author expresses his appreciation to all employed by GE Inspection Technologies and
Applus RTD NDT & Inspection who cooperated and provided ample information to update
this new edition.
3
Introduction to the overview of
“Industrial Radiography”
Image forming techniques
2
Page 4

Introduction to the overview of “Industrial Radiography”
Image forming techniques
Preface 13
1. Introduction to industrial radiography 15
2. Basic properties of ionising radiation 19
2.1 Wavelengths of electromagnetic radiation 19
2.2 X-rays 20
2.3 Gamma-rays (γ-rays) 21
2.4 Main properties of X-rays and γ-rays 22
2.5 Radiation energy-hardness 22
2.6 Absorption and scattering 23
Photoelectric effect
Compton effect
Pair production
Total absorption/attenuation
2.7 Penetrating power 25
2.8 Filtering (hardening) 26
2.9 Half-value thickness 26
3. Units and definitions 29
3.1 Units 29
3.2 Definitions 30
Radioactivity
Ionisation dose rate
Ionisation dose
Absorbed energy dose
Equivalent dose (man dose)
4. Radiation sources 33
4.1 X-ray tube 33
4.2 The anode 33
Cooling the anode
The focal spot
Effective focal spot size
4.3 Tube voltage and tube current 35
4.4 Radioactive sources (isotopes) 36
Natural radioactive sources
4
Contents
Artificial radioactive sources
4.5 Advantages and disadvantages of artificial radioactive sources 36
4.6 Properties of radioactive sources 37
Activity (source strength)
Specific activity
Specific gamma-ray emission (k-factor)
Half-life of a radioactive source
5. NDT equipment 39
5.1 X-ray equipment 39
Types of X-ray tubes
Bipolar X-ray tubes
Unipolar X-ray tubes
Special types of X-ray tubes
5.2 High voltage generators 41
5.3 Megavolt equipment 42
The Bètatron
The linear accelerator (linac)
5.4 Radioactive sources 45
Average energy level (nominal value)
5.5 Source holders (capsules) 46
5.6 Transport- and exposure containers 46
5.7 Checking for container leakage 49
6. Radiation images, filters and intensifying screens 51
6.1 Radiation images 51
6.2 Radiation filters 53
6.3 Intensifying screens 53
Lead screens
Steel and copper screens
Fluorescent screens
Fluorescent salt screens
Fluorometallic screens
7. The X-ray film and its properties 59
7.1 Structure of the X-ray film 59
7.2 Radiographic image 59
Latent image
Developing the latent image
7.3 Characteristics of the X-ray film 60
Density (optical)
Contrast
7.4 Characteristic curve (density curve) 61
5
Page 5

7
Stopbath
Fixing
Final wash
Drying in the drying cabinet
Roller dryers
10.3 Recommendations for the darkroom 90
10.4 Silver recovery 90
10.5 Automatic film processing 91
NDT-U (universal) film processor
NDT-E (economy) film processor
10.6 Checking the developing process and film archiving properties 93
PMC-strips to check the developing process
Thiosulphate-test to check the film archival properties
10.7 Storage of exposed films 95
11. Defect discernibility and image quality 97
11.1 Unsharpness 97
Geometric unsharpness
Inherent (film) unsharpness
Total unsharpness
11.2 Selection source-to-film distance 101
11.3 Other considerations with regard to the source-to-film distance 102
Inverse square law
Selection of radiation energy (kV)
Selection of gamma source
11.4 Radiation hardness and film contrast 104
11.5 Summary of factors that influence the image quality 105
12. Defect orientation, image distortion and useful film length 107
12.1 Defect detectability and image distortion 107
12.2 Useful film length 108
13. Image quality 111
13.1 Factors influencing image quality 111
13.2 Image quality indicators (IQI) 112
Wire type IQI according to EN 462-1
13.3 List of common IQI’s 114
ASTM IQI’s
AFNOR IQI’s
Duplex IQI’s
13.4 Position of the IQI 117
13.5 IQI sensitivity values 117
14. Film exposure and handling errors 119
6
Gradient of the density curve
Average gradient
Effect of developing conditions on the density curve
7.5 Film speed (sensitivity) 65
7.6 Graininess 65
8. Film types and storage of films 67
8.1 The Agfa assortment of film types 67
8.2 Film type selection 70
8.3 Film sizes 70
8.4 Handling and storage of unexposed films 70
9. Exposure chart 73
9.1 Exposure chart parameters 73
Type of X-ray equipment
The radioactive source
Source-to-film distance
Intensifying screens
Type of film
Density
Developing process
9.2 Densitometer 75
9.3 Producing an exposure chart for X-rays 75
9.4 The exposure chart 78
9.5 Use of the exposure chart 78
9.6 Relative exposure factors 80
9.7 Absolute exposure times 80
9.8 Use of the characteristic (density) curve with an exposure chart 81
10. Processing and storage of X-ray films 85
10.1 The darkroom 85
Entrance and colour
Darkroom lighting
Darkroom layout
Tanks
10.2 Chemicals and film-development 86
Making-up processing solutions
Developer
Fixer
Developing time and bath temperatures
Film agitation
Replenishing
Page 6

9
16.7 Resolution number of bits 163
Bit depth
Lateral resolution
16.8 Comparison of film, CR- and DR methods 164
16.9 Impact and status of CR- and DR standards 165
Development of standards
Status of CR standards
Status of DR standards
Impact of standards
Standards for weld inspection
Data exchange and tamper proof standard
16.10 Selection of CR- and DR methods 167
16.11 Applications for CR- and DR methods 168
Corrosion detection
Weld inspection
Dose reduction and controlled area
Automated/mechanised inspection
Girth weld inspection
Useful life of plate and panel
16.12 Work station 171
Hardware and software
Versatility of the software
Archiving and reliability of images
Exchange of data
17. Special radiographic techniques 17 7
17.1 Image magnification techniques 177
17.1.1 Common image magnification technique 177
17.1.2 High resolution X-ray microscopy 178
Magnification factors
Microfocus and nanofocus X-ray tubes
Tube heads
System set-up
Effect of focal dimensions
Imaging systems for high resolution radiography
17.2 Fluoroscopy, real-time image intensifiers 182
Stationary real-time installations
Portable real-time equipment
17.3 Computer Tomography (CT) 185
Unique features
Computing capacity and scanning time
Reverse engineering
CT metrology
High resolution and defect sizing
8
15. Film interpretation and reference radiographs 123
15.1 Film interpretation 123
15.2 The film-interpreter 124
15.3 Reference radiographs 124
Weld inspection
Casting radiography
Examination of assembled objects
16. Digital Radiography (DR) 14 5
16.1 Introduction to DR 145
16.2 Digital image formation 146
16.3 Digitisation of traditional radiographs 146
16.4 Computed Radiography (CR) 148
Two-step digital radiography
The CR imaging plate
Image development
Scanners-Readers
CR cassettes
Dynamic range-Exposure latitude
Exposure time and noise
Fading
Optimisation
Improvements
16.5 Genuine Digital Radiography (DR) 153
One-step digital radiography
16.5.1 Detector types 153
Direct versus indirect detection
Linear detectors
2D detectors
16.5.2 Fill Factor 155
16.5.3 Flat panel and flat bed detector systems 156
Amorphous silicon flat panels
CMOS detectors and flat bed scanners
Limitations
16.6 Image quality and exposure energy 158
16.6.1 Exposure energy 158
16.6.2 Determination of image quality 159
16.6.3 Indicators of image quality- MTF and DQE 160
Factors influencing image quality
Image quality definitions
Exposure parameters
MTF (Modulation Transfer Function)
DQE (Defective Quantum Efficiency)
Noise, image averaging and DQE
Page 7

11
20.
Standards, literature / references, acknowledgements and appendices
215
European norms (EN-standards)
Literature and references
Acknowledgements
Appendices: tables and graphs.
10
17.4 CT for defect detection and sizing 187
Effect of defect orientation
3D CT for sizing of defects in (welded) components
17.5 Neutron radiography (neutrography) 190
17.6 Compton backscatter technique 190
18. Special radiographic applications 193
18.1 Measuring the effective focal spot 193
18.2 Radiographs of objects of varying wall thickness 194
18.3 Radiography of welds in small diameter pipes 195
Elliptical technique
Perpendicular technique
18.4 Determining the depth position of a defect 197
18.5 Determining the depth position and diameter of
reinforcement steel in concrete 198
18.6 On-stream inspection - profiling technique 198
Projection technique
Tangential technique
Selection of source, screens and filters
Exposure time
18.7 Flash radiography 201
18.8 Radiography of welds in large diameter pipes 202
19. Radiation hazards, measuring- and recording instruments 207
19.1 The effects of radiation on the human body 179 207
19.2 Responsibilities 207
The client
The radiographer
19.3 The effects of exposure to radiation 208
19.4 Protection against radiation 208
19.5 Permissible cumulative dose of radiation 209
19.6 Radiation measurement and recording instruments 210
Radiation measuring instruments
Dose rate meters
Scintillation counter
Personal protection equipment
Pendosismeter (PDM)
Thermoluminescent dose meter (TLD-badge)
Film dose meter (film-badge)
19.7 Dose registration 212
19.8 Radiation shielding 212
Distance
Absorbing barrier and distance
Page 8

Preface
13
To verify the quality of a product, samples are taken for examination or a non-destructive
test (NDT) is carried out. In particular with fabricated (welded) assemblies, where a high
degree of constructional skill is needed, it is necessary that non-destructive testing is
carried out.
Most NDT systems are designed to reveal defects, after which a decision is made as to
whether the defect is significant from the point of view of operational safety and/or
reliability. Acceptance criteria for weld defects in new constructions have been specified
in standards.
However, NDT is also used for purposes such as the checking of assembled parts, the
development of manufacturing processes, the detection of corrosion or other forms of
deterioration during maintenance inspections of process installations and in research.
There are many methods of NDT, but only a few of these allow the full examination of a
component. Most only reveal surface-breaking defects.
One of the longest established and widely used NDT methods for volumetric examination
is radiography: the use of X-rays or gamma-rays to produce a radiographic image of an
object showing differences in thickness, defects (internal and surface), changes in
structure, assembly details etc. Presently, a wide range of industrial radiographic equipment, image forming techniques and examination methods are available. Skill and experience are needed to select the most appropriate method for a particular application.
The ultimate choice will be based on various factors such as the location of the object to
be examined, the size and manoeuvrability of the NDT equipment, the existance of
standards and procedures, the image quality required, the time available for inspection
and last but not least financial considerations.
This book gives an overview to conventional industrial radiography, as well as digital
(computer-aided) techniques and indicates the factors which need to be considered for
selection of the most suitable system and procedures to be followed.
At the end of the book a chapter is added describing aspects of radiation safety.
12
Page 9
1514
1
Introduction to industrial radiography
Image forming techniques
In industrial radiography, the usual procedure for producing a radiograph is to have a
source of penetrating (ionising) radiation (X-rays or gamma-rays) on one side of the
object to be examined and a detector of the radiation (the film) on the other side as shown
in figure 1-1. The energy level of the radiation must be well chosen so that sufficient radiation is transmitted through the object onto the detector.
The detector is usually a sheet of photographic film, held in a light-tight envelope or cassette having a very thin front surface that allows the X-rays to pass through easily.
Chemicals are needed to develop the image on film, which is why this process is called the
classic or “ wet” process.
Nowadays, different kinds of radiation-sensitive films and detectors not requiring the use
of chemicals to produce images, the so-called “dry” process, are used increasingly. These
techniques make use of computers, hence the expressions; digital or computer aided
radiography (CR) or genuine (true) digital radiography (DR), see chapter 16.
A DR related technique that has been available for many decades is the one in which images are formed directly with the aid of (once computerless) radiation detectors in combination with monitor screens (visual display units: VDU’s), see chapter 17. This is in fact is
an early version of DR.
These through transmission scanning techniques (known as fluoroscopy) the storage of
images and image enhancement are continually improved by the gradual implementation
of computer technology. Nowadays, there is no longer a clear division between conventional fluoroscopy with the aid of computers and the entirely computer-aided DR. In time
DR will, to some extent, replace conventional fluoroscopy.
Summarising, the image of radiation intensities transmitted through the component can
be recorded on:
The conventional X-ray film with chemical development, the “ wet” process, or one of
the following “dry” processes:
• A film with memory phosphors and a work station for digital radiography, called
computer-assisted radiography or CR.
• Flat panel and flat bed detectors and a computer work station for direct
radiography, called DR.
• A phosphorescent or fluorescent screen (or similar radiation sensitive medium)
and a closed-circuit television (CCTV) camera as in conventional fluoroscopy,
an early version of direct radiography.
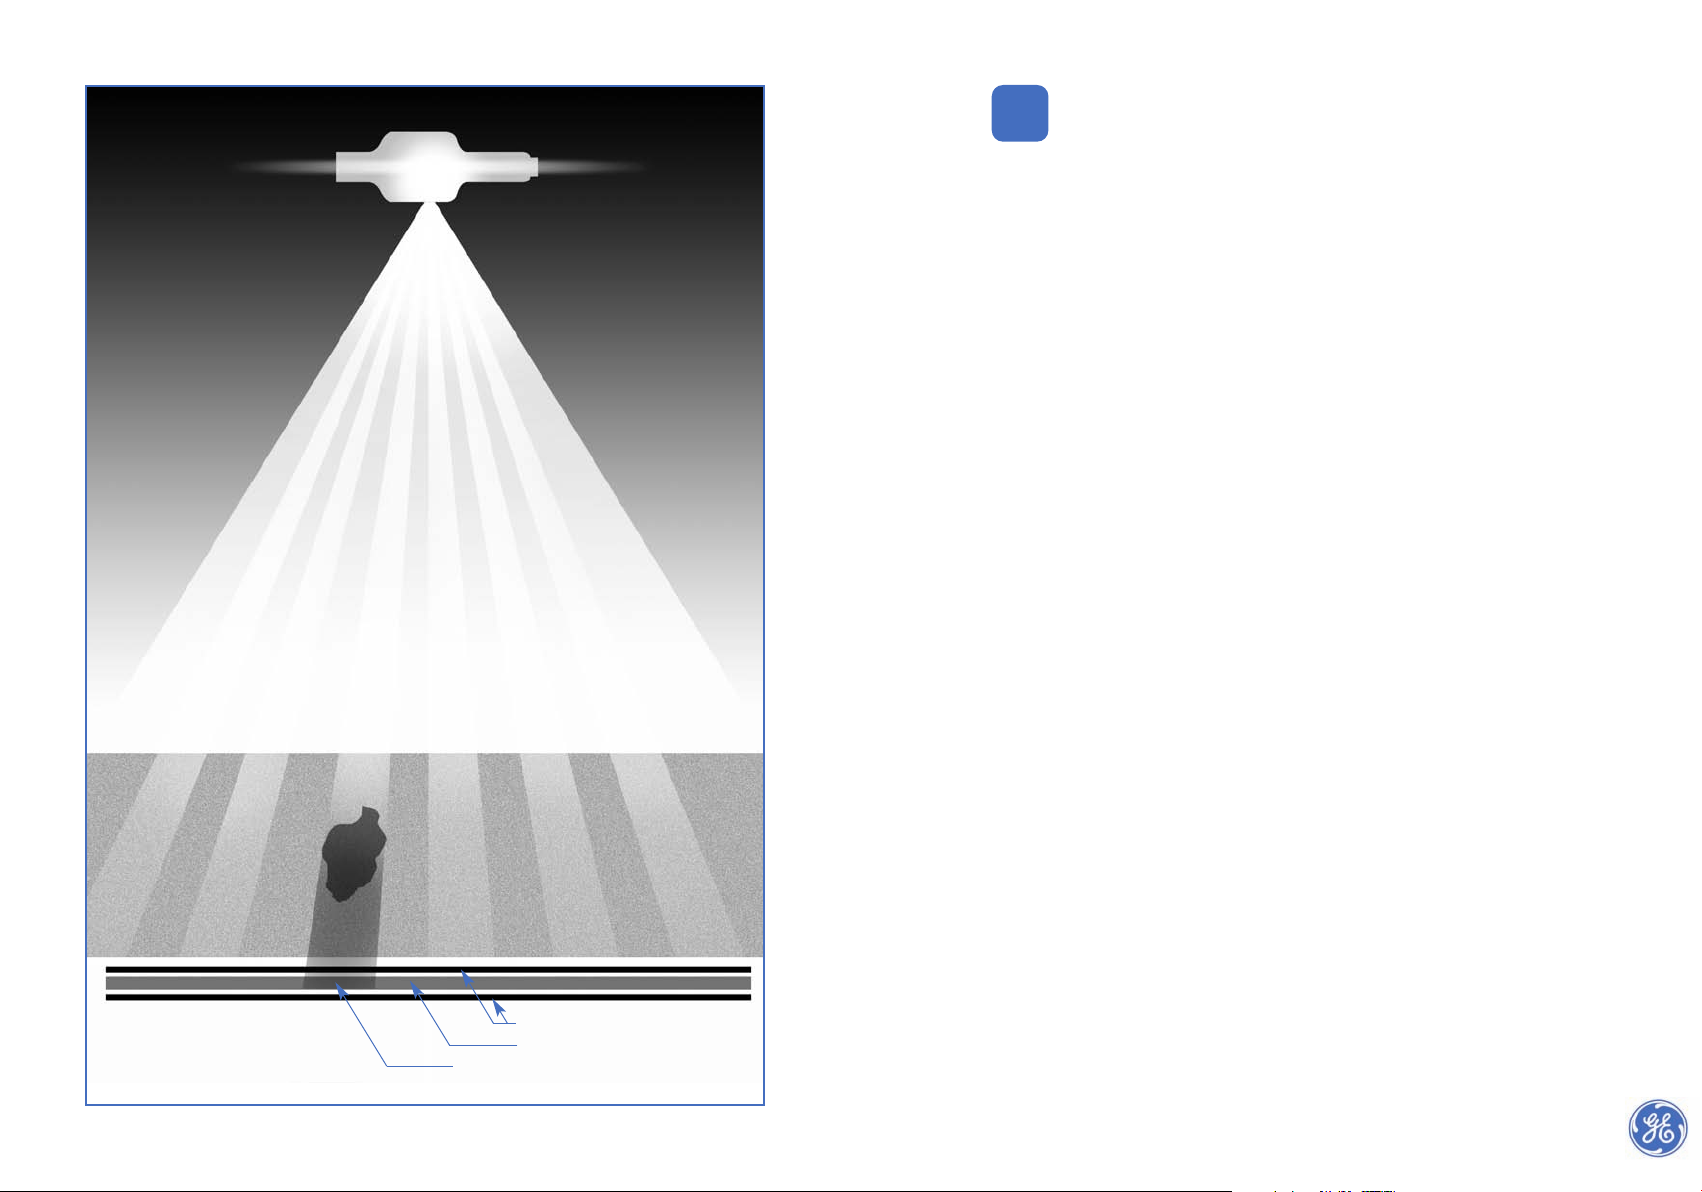
Fig. 1-1. Basic set-up for film radiography
screens
X-ray film
projection of defect on film
cavity
object
homogeneous
radiation
source
Page 10

1716
• By means of radiation detectors, e.g.: crystals, photodiodes or semiconductors in a
linear array by which in a series of measurements an image is built up of a moving
object. This method is applied in systems for luggage checks on airports.
The source of radiation should be physically small (a few millimetres in diameter), and as
X-rays travel in straight lines from the source through the specimen to the film, a sharp
“image” is formed of the specimen and discontinuities. This geometric image formation is
identical to the shadow image with a visible light source. The sharpness of the image
depends, in the same way, on the radiation source diameter and its distance away from
the surface on which the image is formed.
The “classic” film in its light-tight cassette (plastic or paper) is usually placed close behind
the specimen and the X-rays are switched on for an appropriate time (the exposure time)
after which the film is taken away and processed photographically, i.e. developed, fixed,
washed and dried. In direct radiography (DR), a coherent image is formed directly by
means of an computerised developing station.
The two methods have a negative image in common. Areas where less material (less
absorption) allows more X-rays to be transmitted to the film or detector will cause increased density. Although there is a difference how the images are formed, the interpretation of the images can be done in exactly the same way. As a result, the DR- technique is
readily accepted.
The “classic” film can be viewed after photochemical treatment (wet process) on a film
viewing screen. Defects or irregularities in the object cause variations in film density
(brightness or transparency). The parts of the films which have received more radiation
during exposure – the regions under cavities, for example – appear darker, that is, the film
density is higher. Digital radiography gives the same shades of black and white images,
but viewing and interpretation is done on a computer screen (VDU).
The quality of the image on the film can be assessed by three factors, namely :
1. Contrast
2. Sharpness
3. Graininess
As an example, consider a specimen having a series of grooves of different depths machined in the surface. The density difference between the image of a groove and the background density on the radiograph is called the image contrast. A certain minimum image
contrast is required for the groove to become discernible.
With increased contrast:
a. the image of a groove becomes more easily visible
b. the image of shallower grooves will gradually also become discernible
Assuming the grooves have sharp-machined edges, the images of the grooves could
still be either sharp or blurred; this is the second factor: image blurring, called image
unsharpness.
At the limits of image detection it can be shown that contrast and unsharpness are interrelated and detectability depends on both factors.
As an image on a photographic film is made up of grains of silver, it has a grainy appearance, dependent on the size and distribution of these silver particles. This granular appearance of the image, called film graininess, can also mask fine details in the image.
Similarly, in all other image forming systems these three factors are fundamental parameters. In electronic image formation, e.g. digital radiography or scanning systems with
CCTV and screens, the factors contrast, sharpness and noise are a measure for the image
quality; pixel size and noise being the (electronic) equivalent of graininess .
The three factors: contrast, sharpness and graininess or noise are the fundamental parameters that determine the radiographic image quality. Much of the technique in making
a satisfactory radiograph is related to them and they have an effect on the detectability of
defects in a specimen.
The ability of a radiograph to show detail in the image is called “radiographic sensitivity”.
If very small defects can be shown, the radiographic image is said to have a high (good)
sensitivity. Usually this sensitivity is measured with artificial “defects” such as wires or
drilled holes. These image quality indicators (IQIs) are described in chapter 13.
Page 11
2
Basic properties
of ionising radiation
19
In 1895 the physicist Wilhelm Conrad Röntgen discovered a new kind of radiation, which
he called X-rays. The rays were generated when high energy electrons were suddenly
stopped by striking a metal target inside a vacuum tube – the X-ray tube.
It was subsequently shown that X-rays are an electromagnetic radiation, just like light,
heat and radiowaves.
2.1 Wavelengths of electromagnetic radiation
The wavelength lambda (λ) of electromagnetic radiation is expressed in m, cm, mm,
micrometer (μm), nanometer (nm) and Ångstrom (1 Å = 0.1 nm).
18
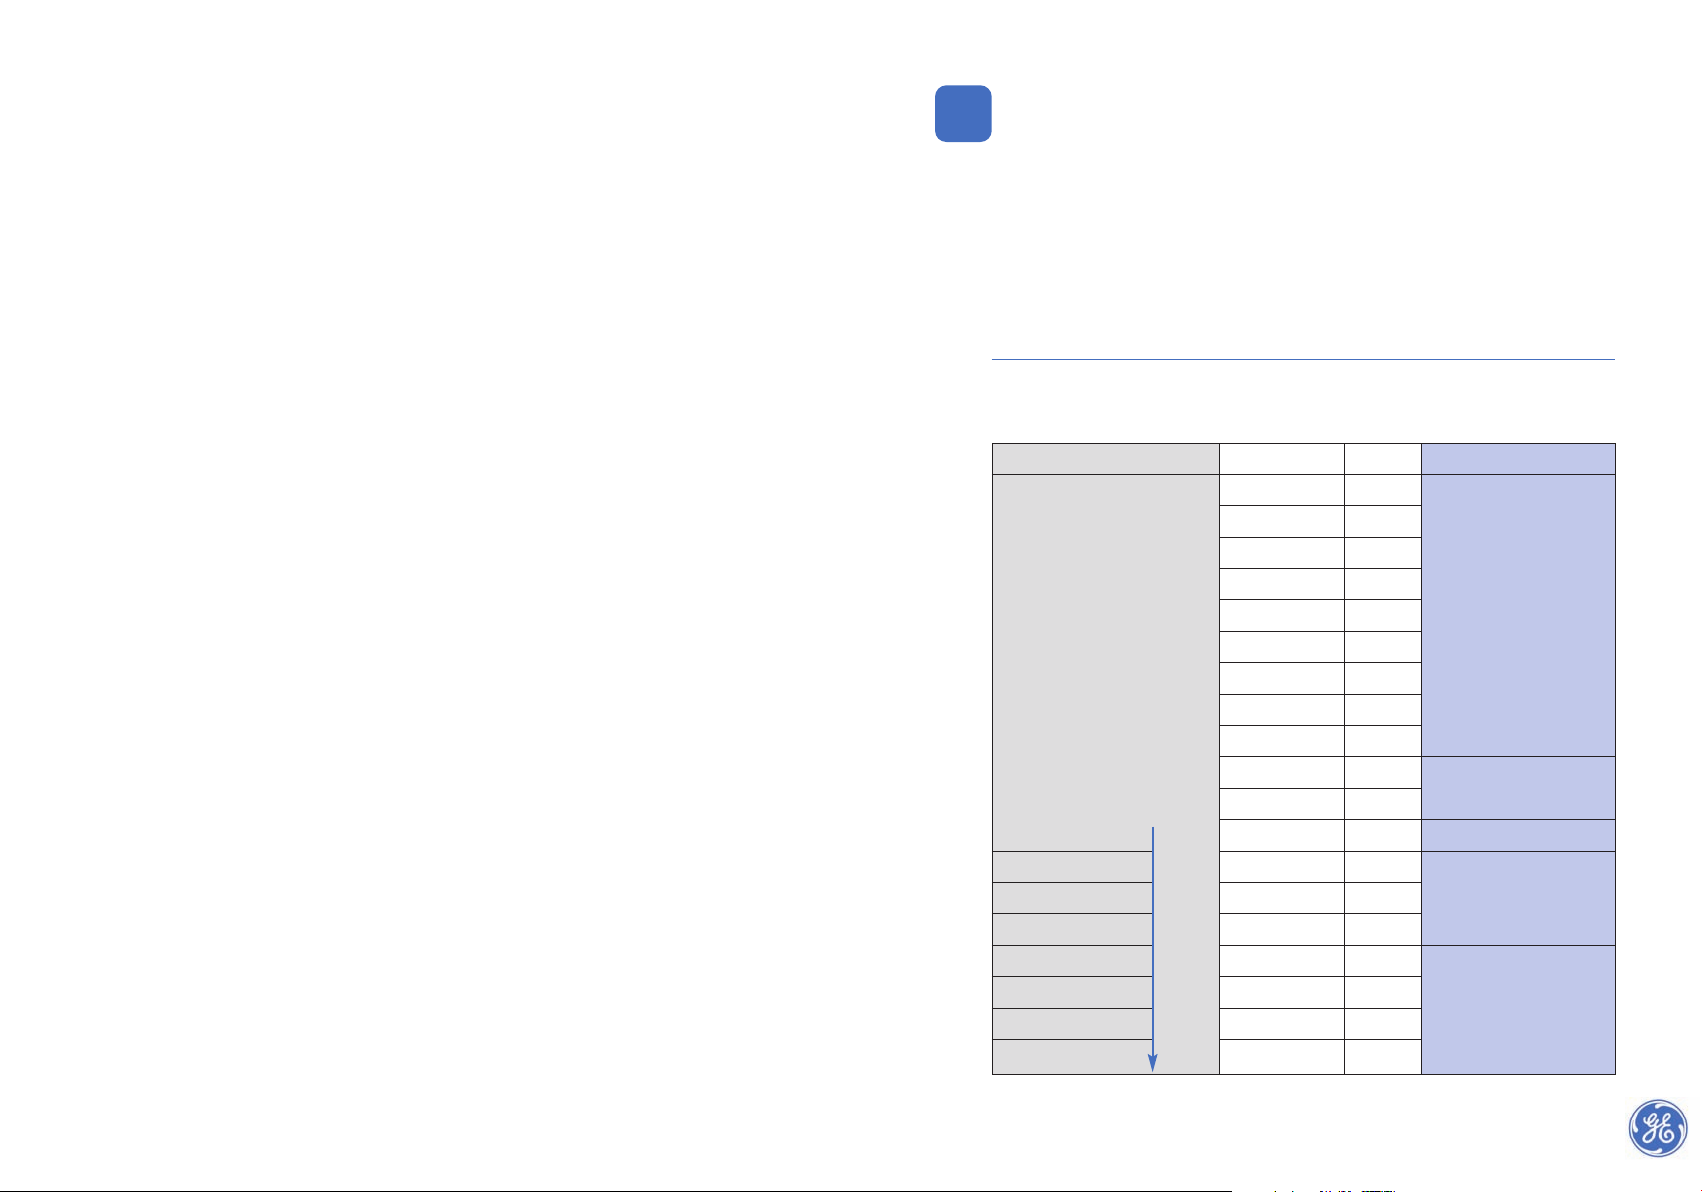
Electromagnetic radiation Wavelength λ m Type
10 km 10
4
1 km 10
3
100 m 10
2
10 m 10
1
1 m 1
10 cm 10
-1
1 cm 10
-2
1 mm 10
-3
100 μm 10
-4
10 μm 10
-5
1 μm 10
-6
100 nm 10
-7
10 nm 10
-8
1 nm 10
-9
0.1 nm 10
-10
0.01 nm 10
-11
1 pm 10
-12
0.1 pm 10
-13
0.01 pm 10
-14
X-ray energy
100 eV
1 keV
10 keV
100 keV
1 MeV
10 MeV
100 MeV
Visible light and Ultraviolet (UV)
X-rays and Gamma-rays
(Radiography)
Heat-rays, Infra-red rays,
microwaves
Table 1-2. Overview of wavelength, energy and type of electromagnetic radiation
Page 12
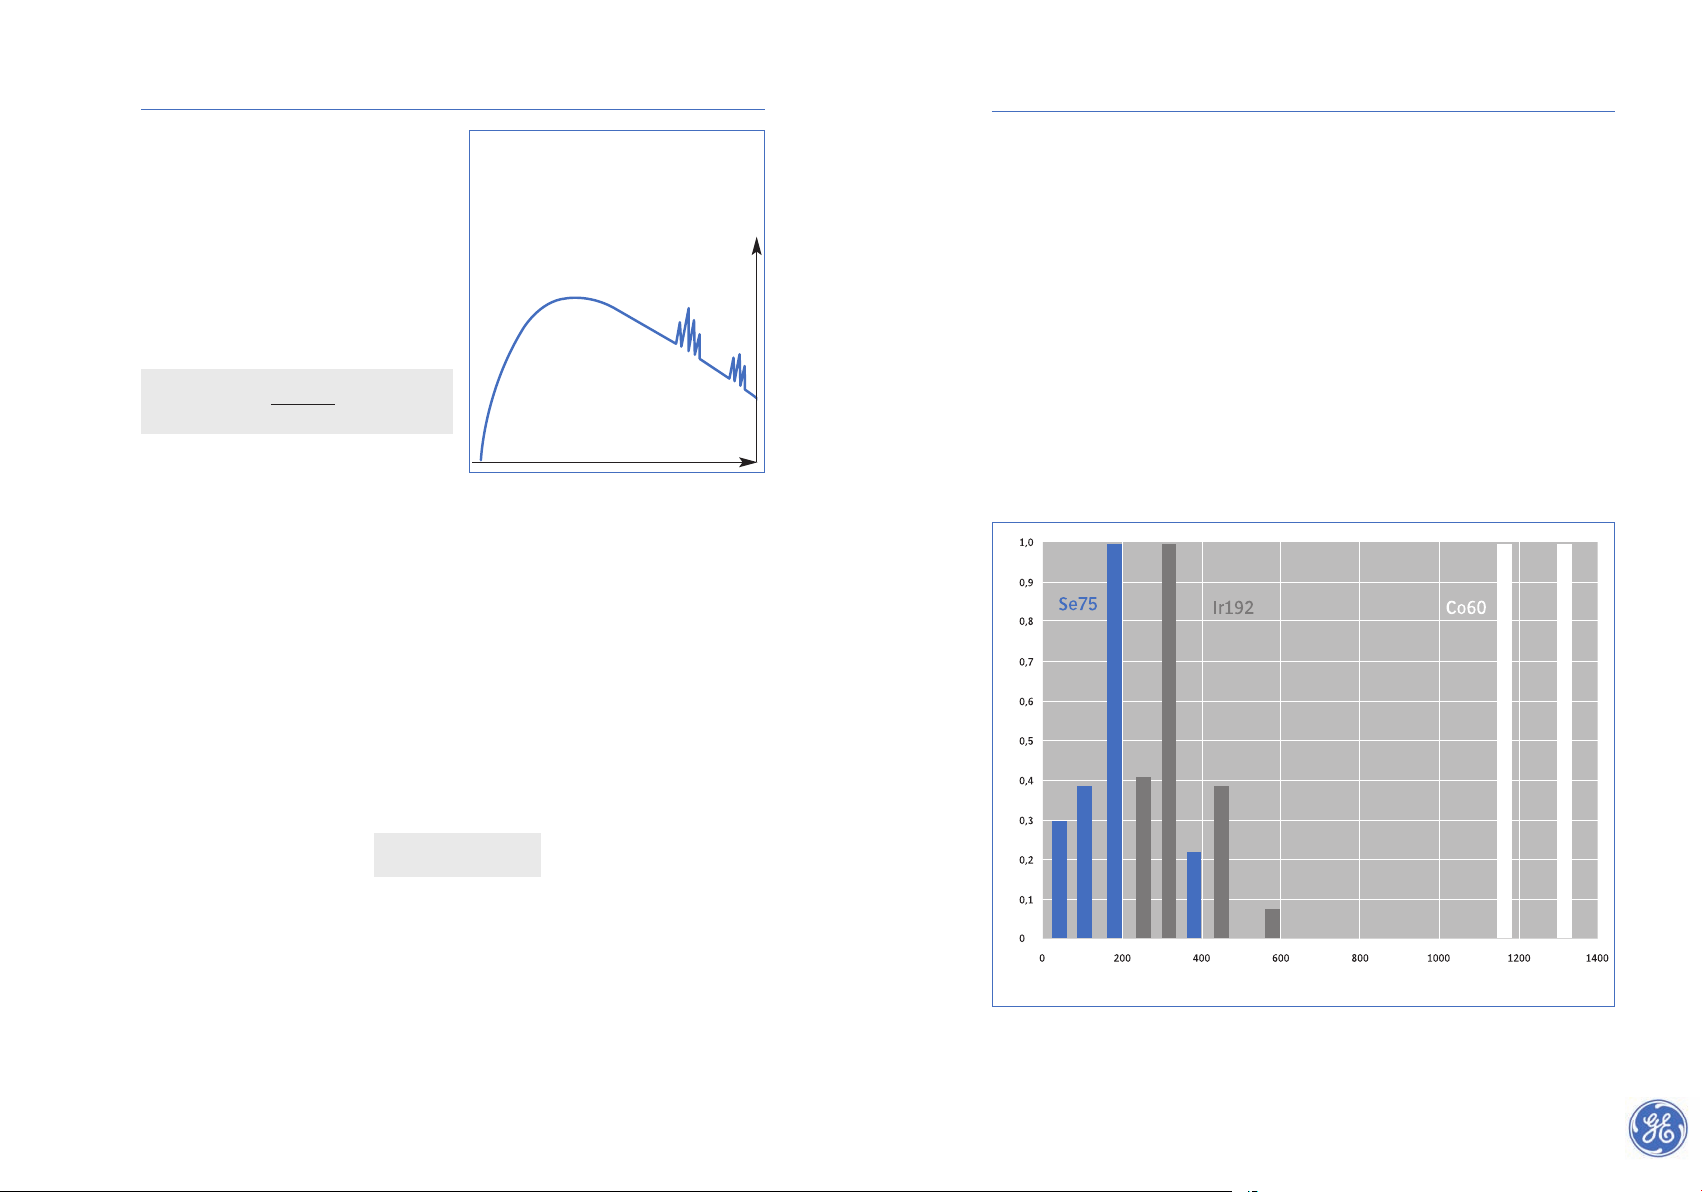
2.2 X-rays
The radiation which is emitted by an X-ray
tube is heterogeneous, that is, it contains
X-rays of a number of wavelengths, in the
form of a continuous spectrum with some
superimposed spectrum lines.
See fig. 1-2.
The shortest wavelength of the spectrum is
given by the Duane-Hunt formula:
In which :
λ = wavelength in nanometers (10
-9
m)
kV = voltage in kilovolts
The average shape of the X-ray spectrum is generally the same however not truely identical
for different X-ray sets; it depends chiefly on the energy range of the electrons striking the
X-ray tube target and, therefore, on the voltage waveform of the high-voltage generator.
A constant potential (CP) X-ray set will not have the same spectrum as a self-rectified set
operating at the same nominal kV and current. The spectrum shape also depends on the
inherent filtration in the X-ray tube window (glass, aluminium, steel or beryllium).
The energy imparted to an electron having a charge e, accelerated by an electrical potential V is (eV) so the energy of the electrons can be quoted in eV, keV, MeV. These same
units are used to denote the energy of an X-ray spectrum line.
The energy of a single wavelength is :
In which:
E = the energy in electronVolt (eV)
h = Planck’s constant
v = frequency
c = the velocity of electromagnetic radiation, such as light (300,000 km/s)
The heterogeneous X-rays emitted by an X-ray tube do not however have a single
wavelength, but a spectrum, so it would be misleading to describe the X-rays as (say)
120 keV X-rays. By convention therefore, the ‘e’- in keV- is omitted and the X-rays
described as 120 kV, which is the peak value of the spectrum.
21
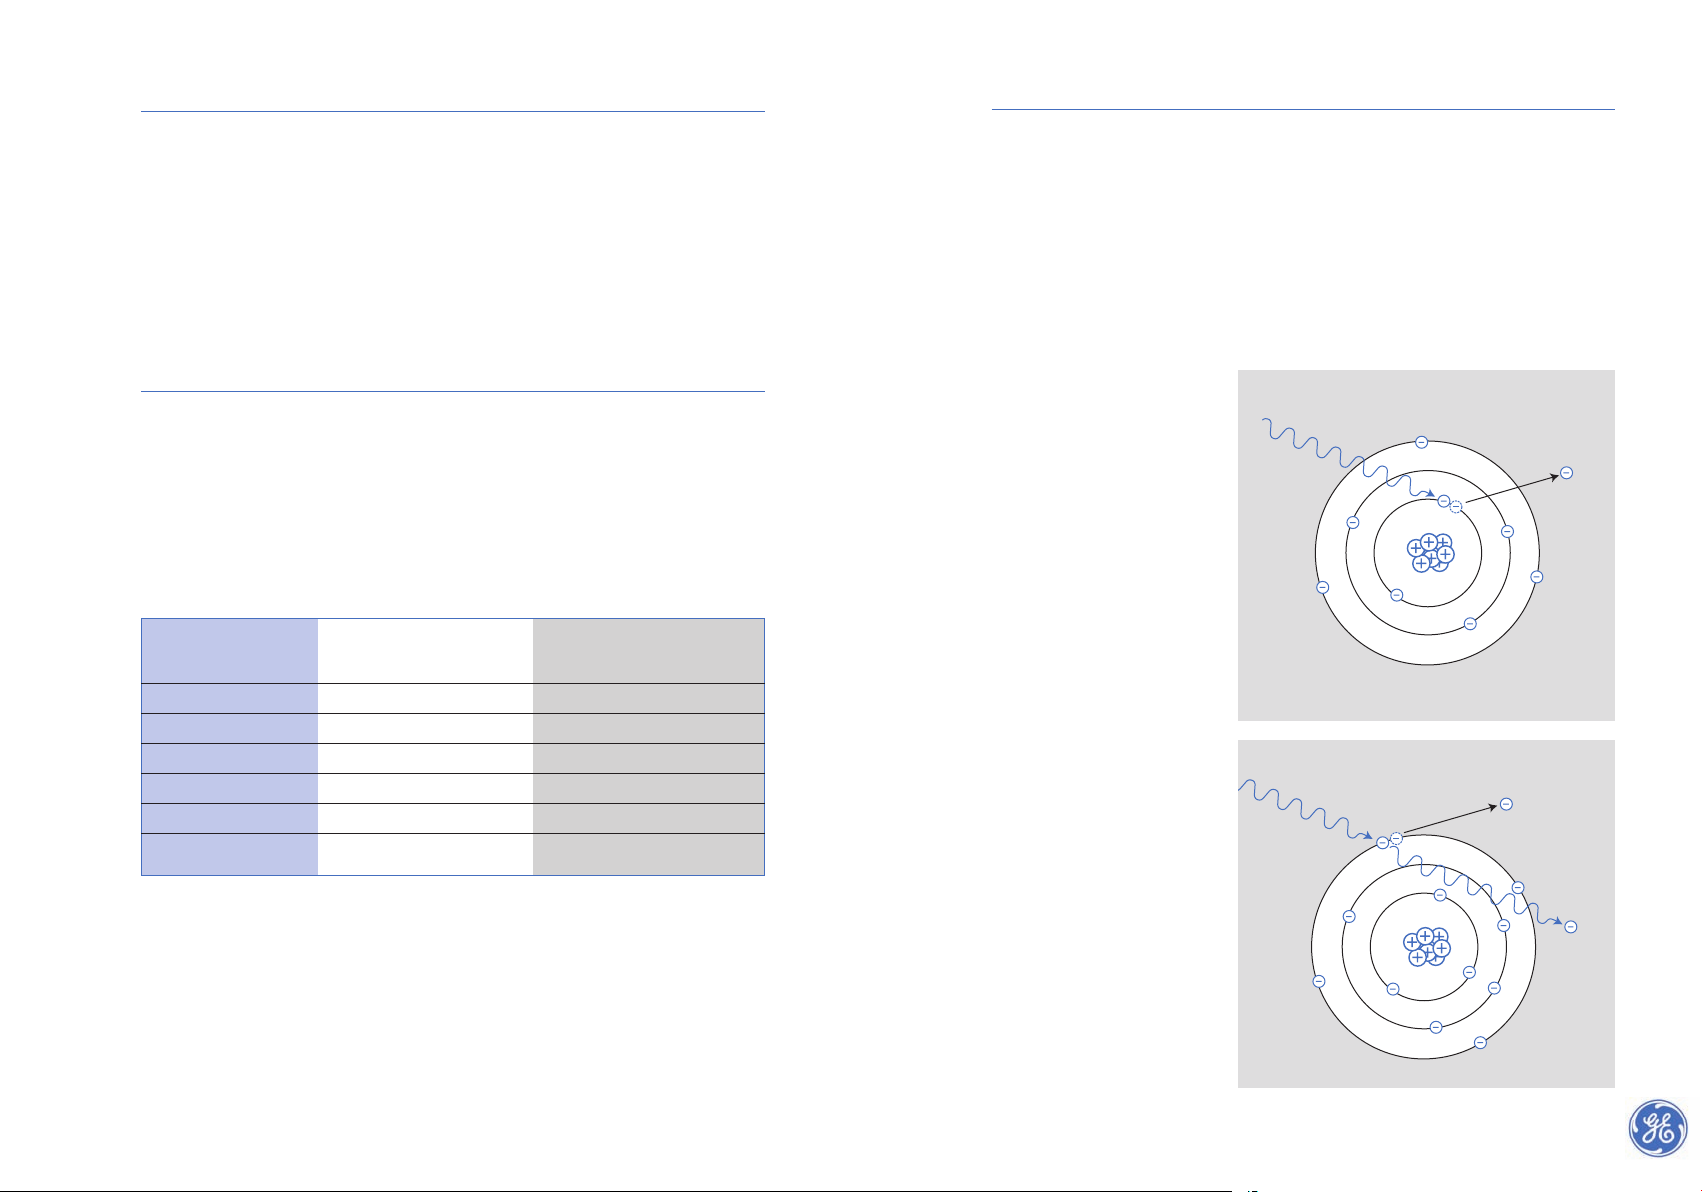
2.3 Gamma-rays (γ-rays)
Radioactivity is the characteristic of certain elements to emit alpha (α), beta (β) or
gamma (γ) rays or a combination thereof. Alpha and beta rays consist of electrically charged particles, whereas gamma rays are of an electromagnetic nature.
Gamma rays arise from the disintegration of atomic nuclei within some radioactive substances, also known as isotopes. The energy of gamma-radiation cannot be controlled; it
depends upon the nature of the radioactive substance. Nor is it possible to control its
intensity, since it is impossible to alter the rate of disintegration of a radioactive substance.
Unlike X-rays, generated to a continuous spectrum, Gamma-rays are emitted in an isolated line spectrum, i.e. with one or more discrete energies of different intensities.
Figure 2-2 shows the energy spectrum lines for Selenium75, Cobalt60 and Iridium192.
In practical NDT applications, sources (radio active isotopes) are allocated an average
nominal energy value for calculation purposes, see section 5.4. Spectrum components
with the highest energy levels (keV values) influence radiographic quality the most.
20
λ
min
=
1.234
Ε=h.v λ.v=c
kV
Fig. 1-2. X-ray spectrum – intensity/wavelength
distribution
The small peaks are the characteristic radiation of the
target material
wavelength
intensity
relative intensity
energy (keV)
Fig. 2-2. Energy spectrum (lines) for Se75, Ir192 and Co60
Page 13
2.4 Main properties of X-rays and γ-rays
X-rays and γ-rays have the following properties in common:
1. invisibility; they cannot be perceived by the senses
2. they travel in straight lines and at the speed of light
3. they cannot be deflected by means of a lens or prism, although their path can be bent
(diffracted) by a crystalline grid
4. they can pass through matter and are partly absorbed in transmission
5. they are ionising, that is, they liberate electrons in matter
6. they can impair or destroy living cells
2.5 Radiation energy-hardness
Radiation hardness (beam quality) depends on wavelength. Radiation is called hard
when its wavelength is small and soft when its wavelength is long. In industry the quality
of the X-ray tube ranges from very soft to ultra hard. The beam quality is related to a tube
voltage (kV) range, or keV for isotopes.
The first two columns of table 2-2 below indicate the relationship hardness/tube voltage
range applied in NDT. The third column gives the related qualification of the radiation
effect, i.e. half-value thickness (HVT), described in detail in section 2.9.
Table 2-2. Comparative values of radiation quality (hardness) against tube voltage.
2.6 Absorption and scattering
The reduction in radiation intensity on penetrating a material is determined by the
following reactions :
1. Photoelectric effect
2. Compton effect
3. Pair production
Which of these reactions will predominate depends on the energy of the incident
radiation and the material irradiated.
Photoelectric effect
When X-rays of relatively low
energy pass through a material
and a photon collides with an
atom of this material, the total
energy of this photon can be
used to eject an electron from the
inner shells of the atom, as figure
3-2 illustrates. This phenomenon
is called the photoelectric effect
and occurs in the object, in the
film and in any filters used.
Compton effect
With higher X-ray energies (100
keV to 10 MeV), the interaction
of photons with free or weakly
bonded electrons of the outer
atom layers causes part of the
energy to be transferred to these
electrons which are then
ejected,
as illustrated in figure 4-2.
At the
same time the photons will be
deflected from the initial angle
of incidence and emerge from
the collision as radiation of reduced energy, scattered in all directions including backward, known
as “backscatter”, see section 17.6.
In this energy band, the absorption of radiation is mainly due to
the Compton effect and less so to
the photoelectric effect.
22
Radiation quality Tube voltage Global half-value
Hardness thickness for steel (mm)
Very soft Less than 20 kV
Soft 20 – 60 kV
Fairly soft 60 – 150 kV 0.5-2
Hard 150 – 300 kV 2-7
Very hard 300 – 3000 kV 7-20
Ultra hard more than 3000 kV > 20
incident
X-ray s
ejected
electron
Fig. 3-2. Photoelectric effect
X-ray
100keV - 10 MeV
ejected
electron
scattered
radiation
Fig. 4-2. Compton effect
23
Page 14
2.7 Penetrating power
The penetrating power of X-radiation increases with the energy (hardness).
The relationship of energy and penetrating power is complex as a result of the various
mechanisms that cause radiation absorption. When monochromatic ( homogeneous single wave length) radiation with an intensity I
o
passes through matter, the relative
intensity reduction ΔI/I
o
is proportional to the thickness Δt. The total linear absorption
coefficient (μ) consisting of the three components described in section 2.6 is defined by
the following formula:
Expressed differently:
In which:
Io= intensity at material entry t = thickness
I = intensity at material exit e = logarithm: 2.718
μ = total absorption coefficient
Figure 7-2 shows the resulting radiation
intensity (logarithmic) as a function of
increased material thickness, for soft and
hard homogeneous radiation.
When radiation is heterogeneous the
graphs are not straight, see figure 7-2, but
slightly curved as in figure 8-2.
The slope of the curves becomes gradually
shallower (because of selective absorption
of the softer radiation) until it reaches the
so-called “point-of-homogeneity”.
After passing this point the coefficient of
absorption remains virtually unchanged, as
if the radiation had become homogeneous.
The position of the point of homogeneity
varies with the nature of the material irradiated. The graph shows that with increasing
material thickness, softer radiation is filtered out, more than hard radiation.
This effect is called “hardening”.
2524
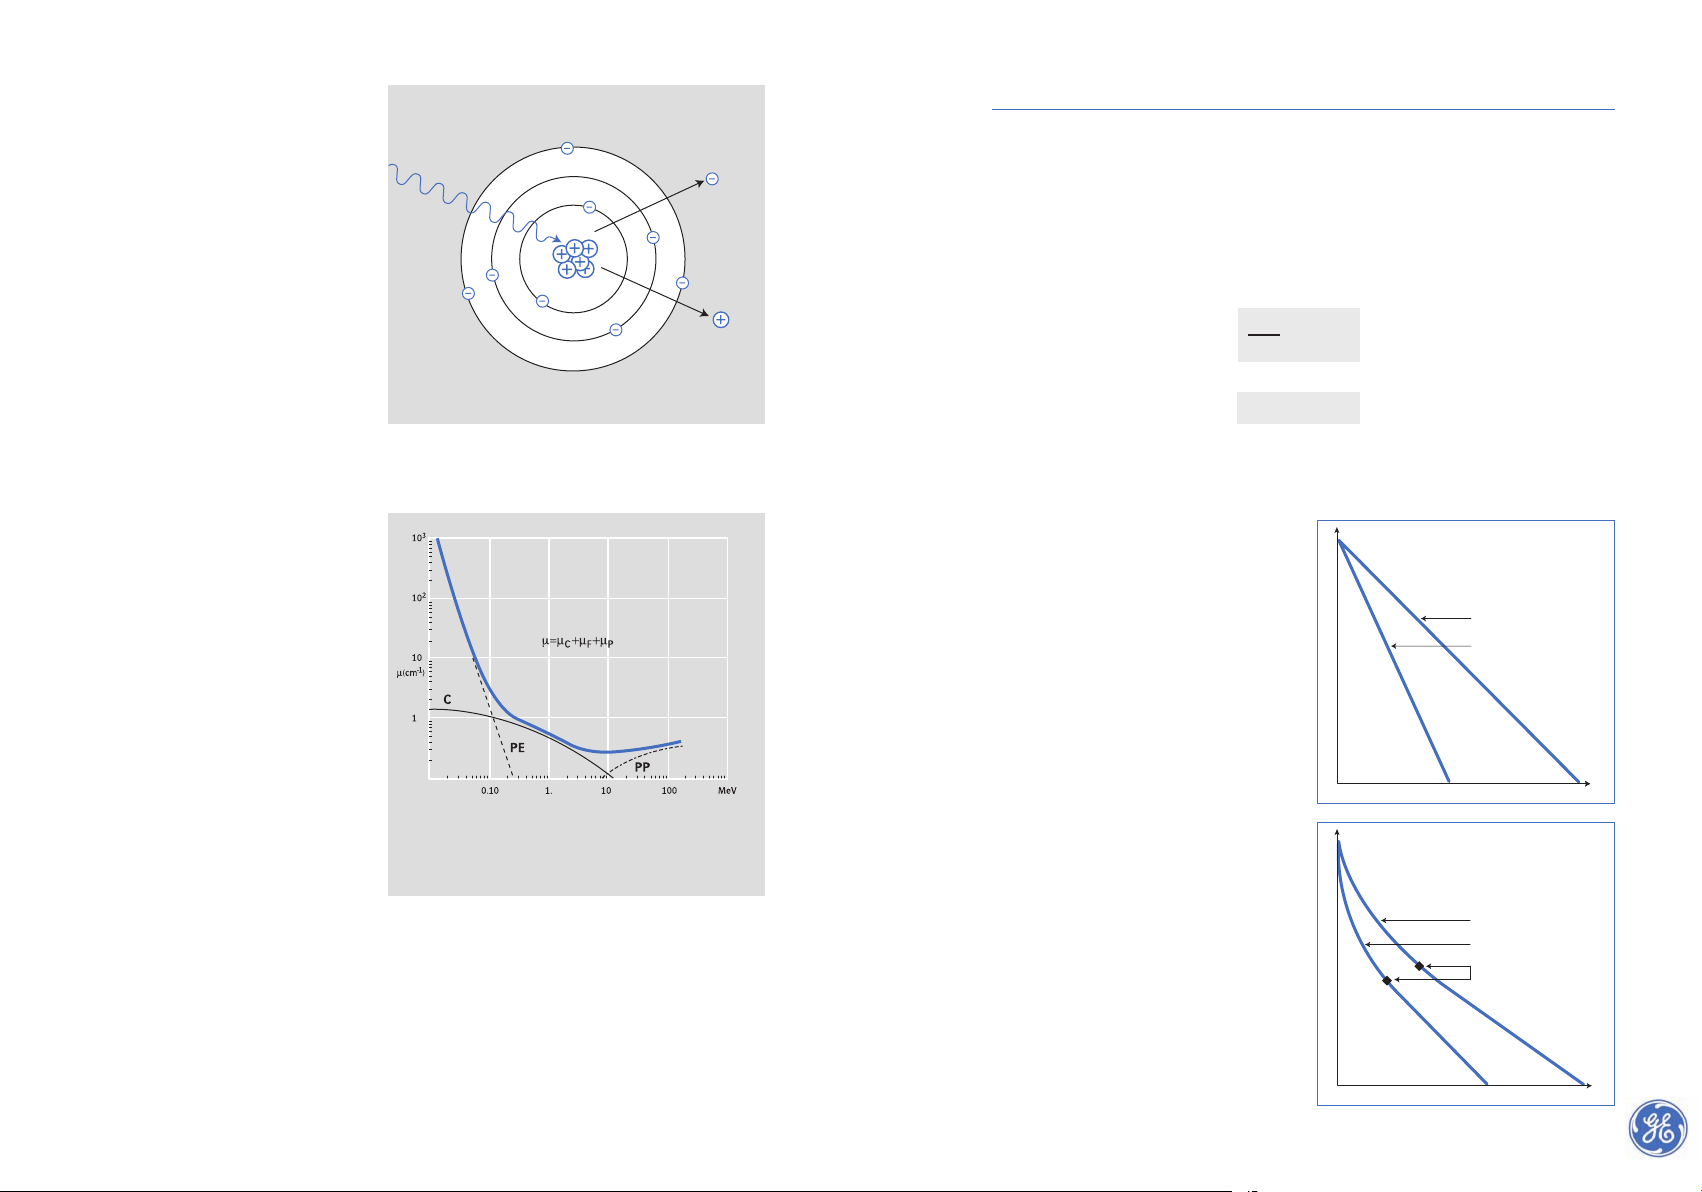
Pair production
The formation of ion pairs, see
figure 5-2, only occurs at very
high energy levels (above 1 MeV).
High-energy photons can cause
an interaction with the nucleus
of the atom involved in the collision. The energy of the photon is
here converted tot an electron(e-)
and a positron (e+).
Total absorption/attenuation
The total linear absorption or
attenuation of X-rays is a combination of the three absorption
processes described above, in
which the primary X-ray energy
changes to a lower form of energy. Secondary X-ray energy arrises of a different wavelength and
a different direction of travel.
Some of this secondary (scattered) radiation does not contribute to radiographic image forming
and may cause loss of image
quality through blurring or fog.
The contribution of the various
causes of X-ray absorption to the
total linear absorption coefficient (μ) for steel plotted against
radiation energy, are shown in
figure 6-2.
X-ray
> 1 MeV
ejected
electron
ejected
positron
Fig. 5-2. Pair production
Fig. 6-2 Absorption coefficient for steel plotted against radiation energy
PE = Photoelectric effect
C = Compton effect
PP = Pair production
= μ.Δt
I = I
o
.
e
-μt
ΔI
I
o
hard radiation,
high tube voltage
hard radiation
soft radiation
points of homogeneity
soft radiation,
low tube voltage
penetrated material thickness
intensityintesity
penetrated material thickness
Fig. 7-2. Intensity of homogeneous
radiation as function of increasing
thickness
Fig. 8-2. Intensity of heterogeneous
radiation as function of increasing
thickness hard radiation
Page 15
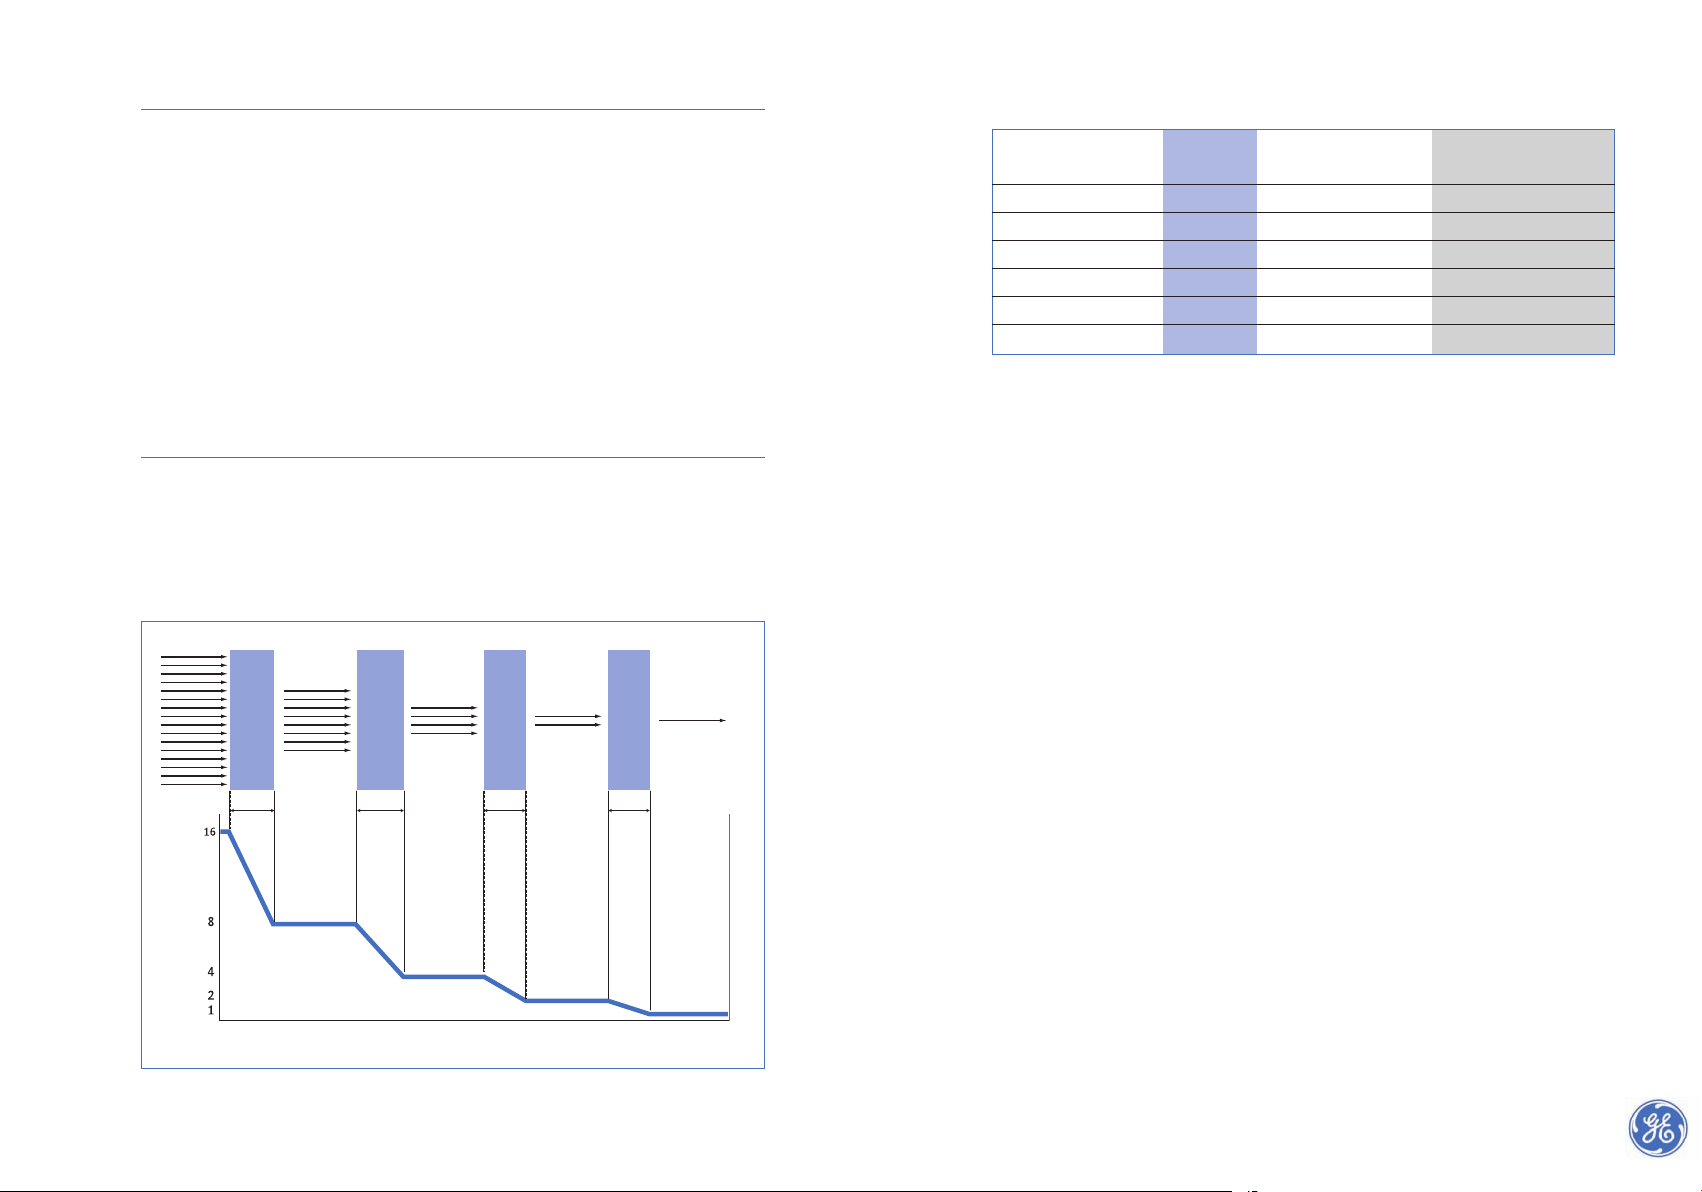
Table 2-2 shows the average HVT-values for steel, table 3-2 shows the values for lead.
For a heterogeneous beam the HVT is not constant; the second HVT is slightly larger
than the first. In general, in industry where relatively hard radiation is used, a fixed
“average” HVT is applied.
2726
2.8 Filtering (hardening)
All materials, for example a metal layer between the radiation source and the film, cause
absorption and filtering. The position of the metal layer plays an important role in the
effect it has. A metal layer in front of the object will “harden” the radiation because it filters out the soft radiation. The degree of hardening depends on the type and the thickness
of the material. This phenomenon is used to reduce excessive contrast (variation in density) when examining objects of which the thickness varies greatly.
A metal layer between the object and the film filters the soft scattered radiation that
occurs in the object, thereby increasing the contrast and consequently the image quality.
This method of filtering is for example applied in the use of Cobalt60 in combination with
exposure time reducing intensifying screens, which are sensitive to scattered radiation.
Lead, copper and steel are suitable filtering materials.
2.9 Half-value thickness
A convenient practical notion (number) of the linear absorption coefficient is the introduction of the half-value thickness (HVT). It quantifies the penetrating power of radiation for a particular type of material and is defined as the thickness of a particular material necessary to reduce the intensity of a monochromatic beam of radiation by half, as
shown in figure 9-2. This HVT-value depends on the hardness of radiation.
Table 3-2. Half-value thickness for lead
Fig. 9-2. Illustration of half-value thickness
thickness
HVT HVT HVT HVT
intensity
Element/Isotope Symbol Average energy level Half-value thickness
in MeV in mm lead
Ceasium137 Cs137 0.66 8.4
Cobalt60 Co60 1.25 13
Iridium192 Ir192 0.45 2.8
Selenium75 Se75 0.32 2
Ytterbium169 Yb169 0.2 1
Thulium170 Tm170 0.072 0.6
Page 16
3.1
Units
Until 1978 the “International Commission of Radiation Units and Measurements” (ICRU)
used the conventional radiation units of roentgen (R), rad (rd), and curie (Ci). Since 1978
the ICRU has recommended the use of the international system units (SI) with special
new units for radiation quantities; the Becquerel, Gray and Sievert.
Table 1-3 shows the relationships of these new units to the older units.
In radiography and radiation safety, units are preceded by prefixes.
Table 2-3 shows the ones mostly used.
3
Units
and definitions
2928
Table 1-3. Overview of new and old units
* disintegrations per second C = Coulomb = A.s J = Joule
** RBE = Relative Biological Effect A = Ampère
Table 2-3. Prefixes
SI –units Formerly used Conversion
Designation of quantity Name Unit Name Unit Old to SI
Designation Designation
Activity (A) Becquerel 1/s* Curie Ci 1 Ci = 37 GBq
(Bq)
Ionisation dose Coulomb (C) C/kg Röntgen R 1 R=2.58 x 10
-4
C/kg
Ionisation dose rate Coulomb (C) C/kg.s R/s
Ampère (A) or A/kg
Absorbed energy Gray J/kg Rad Rad 1 Rad = 0.01 Gy
dose (D) (Gy)
Equivalent dose (H) Sievert J/kg Rem Rem 1 Rem = 0.01 Sv
H=D x RBE** (Sv)
Prefix Meaning Value Notation
p pico 0.000000000001 10
-12
n nano 0.000000001 10
-9
μ micro 0.000001 10
-6
m milli 0.001 10
-3
- 11 1
k kilo 1000 10
3
M Mega 1000000 10
6
G Giga 1000000000 10
9
Page 17

3130
3.2 Definitions
Radioactivity
The activity of a radioactive source of radiation (isotope) is equal to the number of disintegrations per second. The SI-unit is the Becquerel (Bq) and is equal to 1 disintegration per
second. The Becquerel is too small a unit to be used in industrial radiography. Source
strengths are, therefore, quoted in Giga Becquerel (GBq).
1 Curie = 37 GBq, see table 2-3.
Ionisation dose rate
The output of an X-ray set or isotope per unit of time is generally quoted at one metre
distance from the source, and designated in C/kg, see table 1-3.
Ionisation dose
The ionising effect of radiation in one kilogram of dry air is used to define the ionisation
dose. The dose of radiation delivered is equal to the ionisation dose rate multiplied by the
amount of time during which radiation takes place.
The designation used is C/kg.sec.
The output of an X-ray set, however, is quoted in Sievert per hour, measured at 1 metre
distance.
Absorbed energy dose
The radiation energy that is absorbed is expressed in Joules per kilogram (J/kg).
The SI-unit is called Gray (Gy) whereby 1 J/kg = 1 Gy.
Equivalent dose (man dose)
The Sievert (Sv) is the SI-unit for the biological effect of ionising radiation upon man. It
corresponds with the product of the absorbed energy dose gray (Gy) with a factor that has
been experimentally determined and that indicates the relative biological effect (RBE) of
the ionising radiation. For X- and
γ-radiation this factor is equal to one, so that the Sievert
is equal to the Gray.
Page 18
4
Radiation sources
33
4.1 X-Ray tube
The X-ray tube, see figure 1-4, consists of a glass (or ceramic) envelope containing a positive
electrode (the anode) and a negative electrode (the cathode) evacuated to an ultra high
vacuum [10
- 9
hPa (hectoPascal)].
The cathode comprises a filament that generates electrons. Under the effect of the electrical tension set up between the anode and the cathode (the tube voltage) the electrons from
the cathode are attracted to the anode, which accelerates their speed.
This stream of electrons is concentrated into a beam by a “cylinder” or “focusing cup”.
When the accelerated electrons collide with a target on the anode, part of their energy is
converted to X-radiation, know as X-rays.
4.2 The anode
The target is generally made of tungsten. Not only because it has a high atomic number, but
also because of its high melting point (approx. 3400˚C). It is essential to use a material with
a high melting point because of the substantial amount of heat dissipated as the electron“bombardment” is concentrated (focused) on a very small surface. Only a part (approx. 0.1
% at 30 keV; 1 % at 200 keV; 40 % at 30 to 40 MeV) of the kinetic energy of the electrons
is converted into X-radiation; the remainder is transformed into heat.
Cooling the anode
The heat which accompanies the production of X-radiation is quite considerable, so that
the anode has to be cooled. This can be done in a variety of ways :
1. by natural radiation
2. by convection
3. by forced circulation of liquid or gas
4. by conduction
The focal spot
The area of the target which is struck by the electrons, see figure 2-4, is called the focal spot
or “the focus”. It is essential that this area is sufficiently large to avoid local overheating,
which might damage the anode.
From the radiographic point of view, however, the focus has to be as small as possible in
order to achieve maximum sharpness in the radiographic image. This “focal loading” is
expressed in Joule/mm
2
. A tungsten target can take a maximum loading of 200 Joule/mm2.
A higher loading might damage the anode.
32
Fig 1-4. Glass envelope X-ray tube
cathode
focusing
cylinder
or cup
filament
electron beam
X-ray beam
anode
glass
target
Page 19
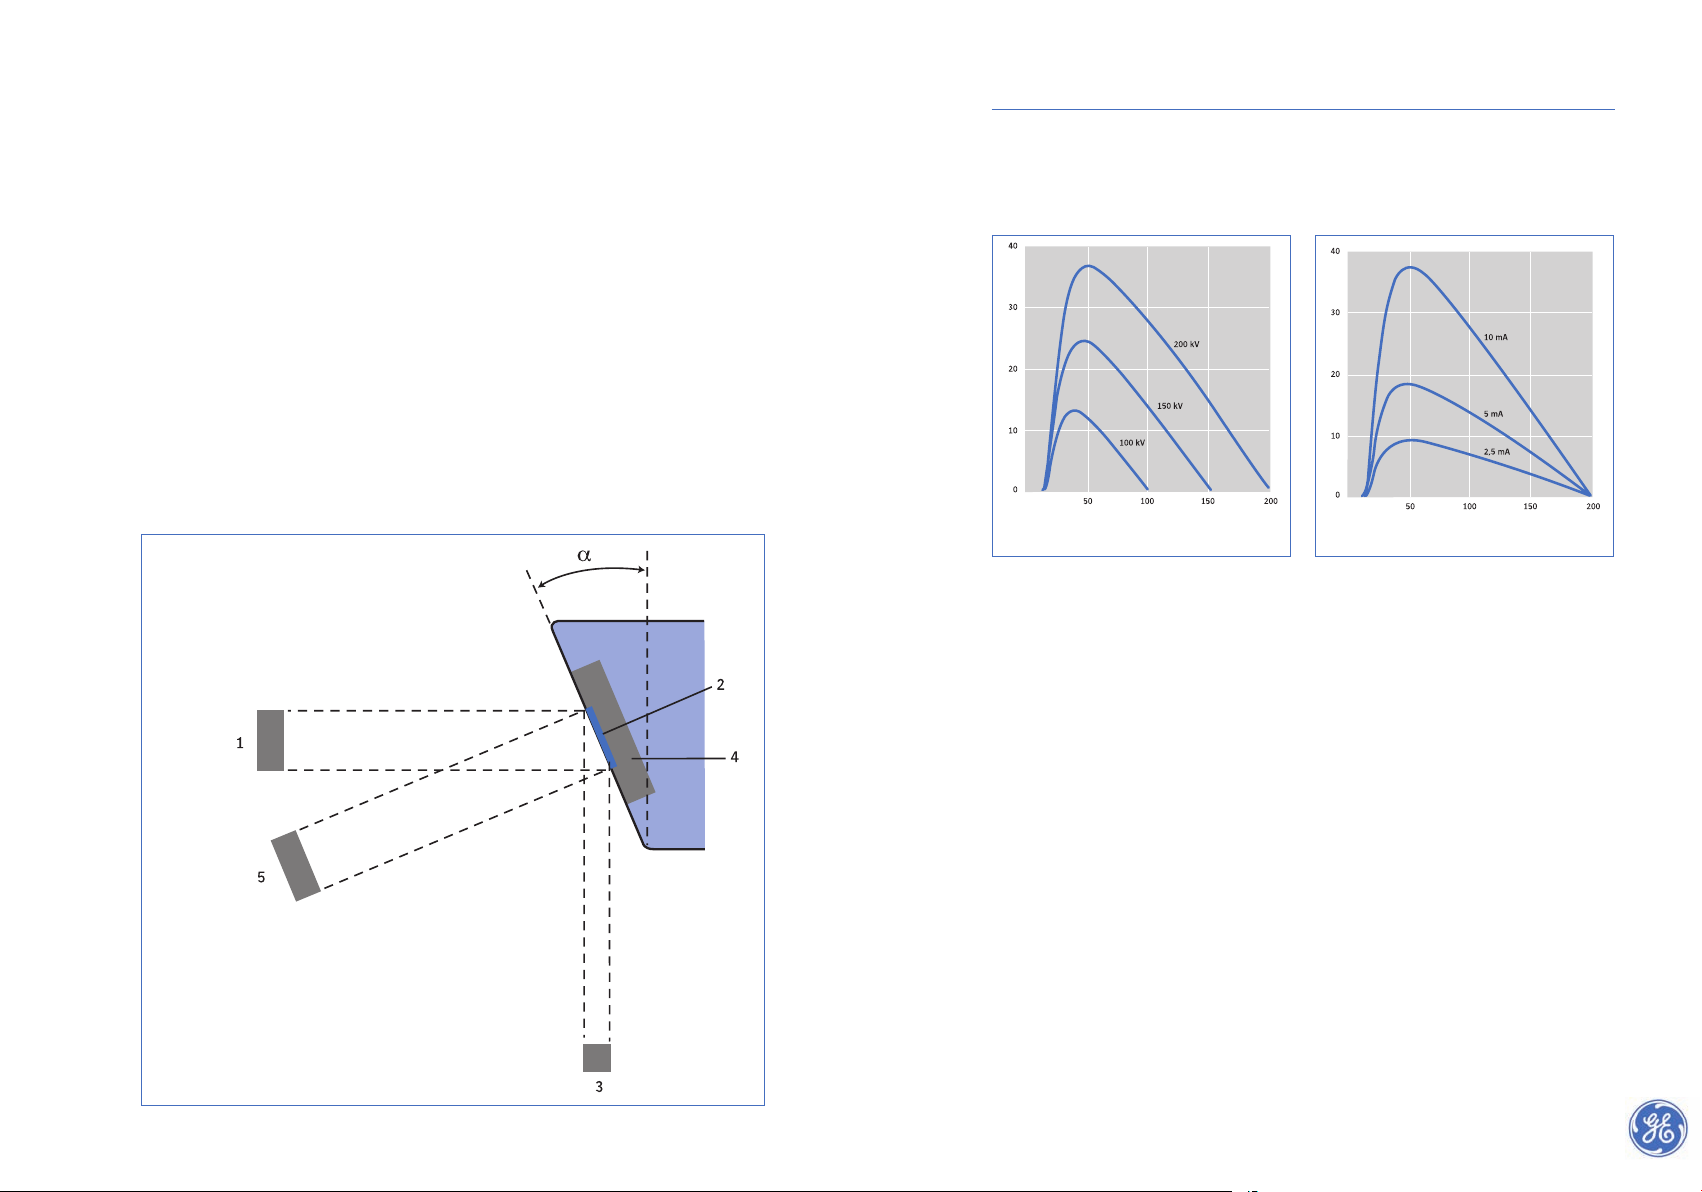
4.3 Tube voltage and tube current
The voltage across the X-ray tube determines the energy spectrum and so the hardness of the
radiation, see figure 3-4. The intensity is proportional to the tube current, see figure 4-4.
This graph shows that, contrary to a change in tube voltage, a change in tube current does
not shift the spectrum (in other words: the hardness does not change).
The energy spectrum is also influenced by the characteristics of the high voltage applied to
the tube. When the spectrum of one X-ray tube on constant voltage is compared with that
of another with a current of pulsating voltage, of the same kV value, both spectra will be
slightly different. With a current of pulsating voltage there are, during each cycle, moments
of relatively low voltage, during which there will be a greater proportion of “soft” X- rays,
with their side-effects. This means that a set working on a constant voltage will provide a
higher intensity of hard radiation than one on a pulsating voltage; although both working
at the same nominal kV value.
However, even identical X-ray tubes may also show differences in generated energy. The
energy generated by one 200 kV X-ray tube will not be true identical to the energy generated by another X-ray tube with the same applied voltage, not even if they are the same type
of tube. This behaviour impedes individual calibration in kV of X-ray sets. Another reason
why it is hard to calibrate an X-ray tube within a small tolerance band is, that the absolute
level and wave characteristics of the supplied high voltage are difficult to measure.
It follows that it is difficult to standardise and calibrate X-ray equipment as far as spectra
and kV-settings is concerned, which precludes the exchange of exposure charts, see section 9.1. Each X-ray set therefore requires its own specific exposure chart. Even the exchange of a similar control panel or another (length) of cable between control panel and X-ray
tube can influence the level of energy and its spectrum. Usually after exchange of parts or
repair the exposure chart for that particular type of X-ray set is normalised (curve-fitting)
for the new combination of components. In practice adjusting the zero point of the exposure graph is sufficient.
3534
Effective focal spot size
The projections of the focal spot on a surface perpendicular to the axis of the beam of
X-rays is termed the “ effective focal spot size” or “ focus size”, see figure 2-4. The effective
focus size is one of the parameters in radiography, see section 11-1. The effective focus size,
principally determining the sharpness in the radiographic image, has to be as small as possible in order to achieve maximum sharpness. The dimensions of the focus are governed by:
1. The size of the focal spot, and
2. The value of angle α, see figure 2-4.
It should be noted that when in radiography we speak of the “size of the focus” without specifying this more exactly, it is normally the effective focal spot size which is meant.
Conventional X-ray tubes have effective focal spot sizes in the range 4 x 4 mm to 1 x 1 mm.
There are fine-focus tubes with focal spots from 0.5 x 0.5 mm ad microfocus tubes down to
50 μm diameter or even much less, known as nanofocus tubes.
The effective focal spot size can be determined in accordance with the procedures described in EN 12543 replacing the old IEC 336 which however is still in use. For more information on focal spot measurement see section 18.1.
1. Dimension of the electron beam
2. Focal spot
3. Effective focal spot size
4. Anode target
5. True focus size
Fig 3-4. Energy spectra at varying tube voltages and constant tube current (here 10mA)
Fig. 4-4. Energy spectra at varying values for tube current
and constant high voltage (here 200 kV)
Fig. 2-4. Effective focal spot size
KeV
KeV
relative intensity
relative intensity
Page 20

4.6 Properties of radioactive sources
Activity (source strength)
The activity of a radioactive substance is given by the number of atoms of the substance
which disintegrate per second.
This is measured in Becquerels (Bq), 1 Becquerel corresponds to 1 disintegration per
second(1 Bq = 1/s).
Specific activity
The specific activity of a radioactive source is the activity of this substance per weight unit,
expressed in Bq/g.
Specific gamma-ray emission factor (k-factor)
The k-factor is the generally used unit for radiation output of a source and is defined
as the activity measured at a fixed distance. It indicates the specific gamma-emission
(gamma constant) measured at 1 metre distance.
The higher the k-factor, the smaller the source can be for a particular source strength.
A source of small dimensions will improve the sharpness of a radiograph.
Table 1-4 shows the various k-factors and half-life values.
Half-life of a radioactive source
Of an Iridium192 source with an activity of 40 GBq for example 10 GBq will remain after
two half-lives (148 days), 5 GBq after three half-lives (222 days) etc.
3736
4.4 Radioactive sources (isotopes)
Natural radioactive sources
The elements from this group which have been used for the purposes of industrial radiography are radium and mesothorium. These give a very hard radiation, making them particularly suitable for examining very thick objects.
A disadvantage of natural sources, next to their high cost, is that it is not possible to make
them in dimensions small enough for good quality images and still give sufficient activity.
Artificial radioactive sources
Artificial radioactive sources for NDT are obtained by irradiation in a nuclear reactor. Since
1947, it has been possible to produce radioactive isotopes this way in relatively large quantities and in a reasonably pure state and particularly of sufficiently high concentration; the
latter being extremely important in NDT because the size of the source has to be as small
as possible. Among the many factors deciding a source suitability for non-destructive
testing are the wavelength and intensity of its radiation, its half-life and its specific radiation. In fact, only a few of the many artificial radio-isotopes available have been found to
be suitable for industrial radiography.
4.5 Advantages and disadvantages
of artificial radioactive sources
Advantages
1. require no electric power supply; easy to use in the field
2. can be obtained in a range of source diameters, so that if necessary a very short
source-to-film distance with a small diameter source can be used, for example,
for pipes of small diameter
3. a wide variety of radiation hardnesses
4. higher radiation hardness (more penetration power) than those of conventional
X-ray equipment can be selected
Disadvantages
1. cannot be switched off
2. the energy level (radiation hardness) cannot be adjusted
3. the intensity cannot be adjusted
4. limited service life due to source deterioration (half-life)
5. less contrast than X-ray equipment
Isotope Half-life Specific gamma constant
or k-factor
Ytterbium169 31 days 0.05
Iridium192 74 days 0.13
Selenium75 120 days 0.054
Cobalt60 5.3 years 0.35
Caesium137 30 years 0.09
Table 1-4 Various k-factors and half-life values
Page 21
5
NDT equipment
39
5.1 X-ray equipment
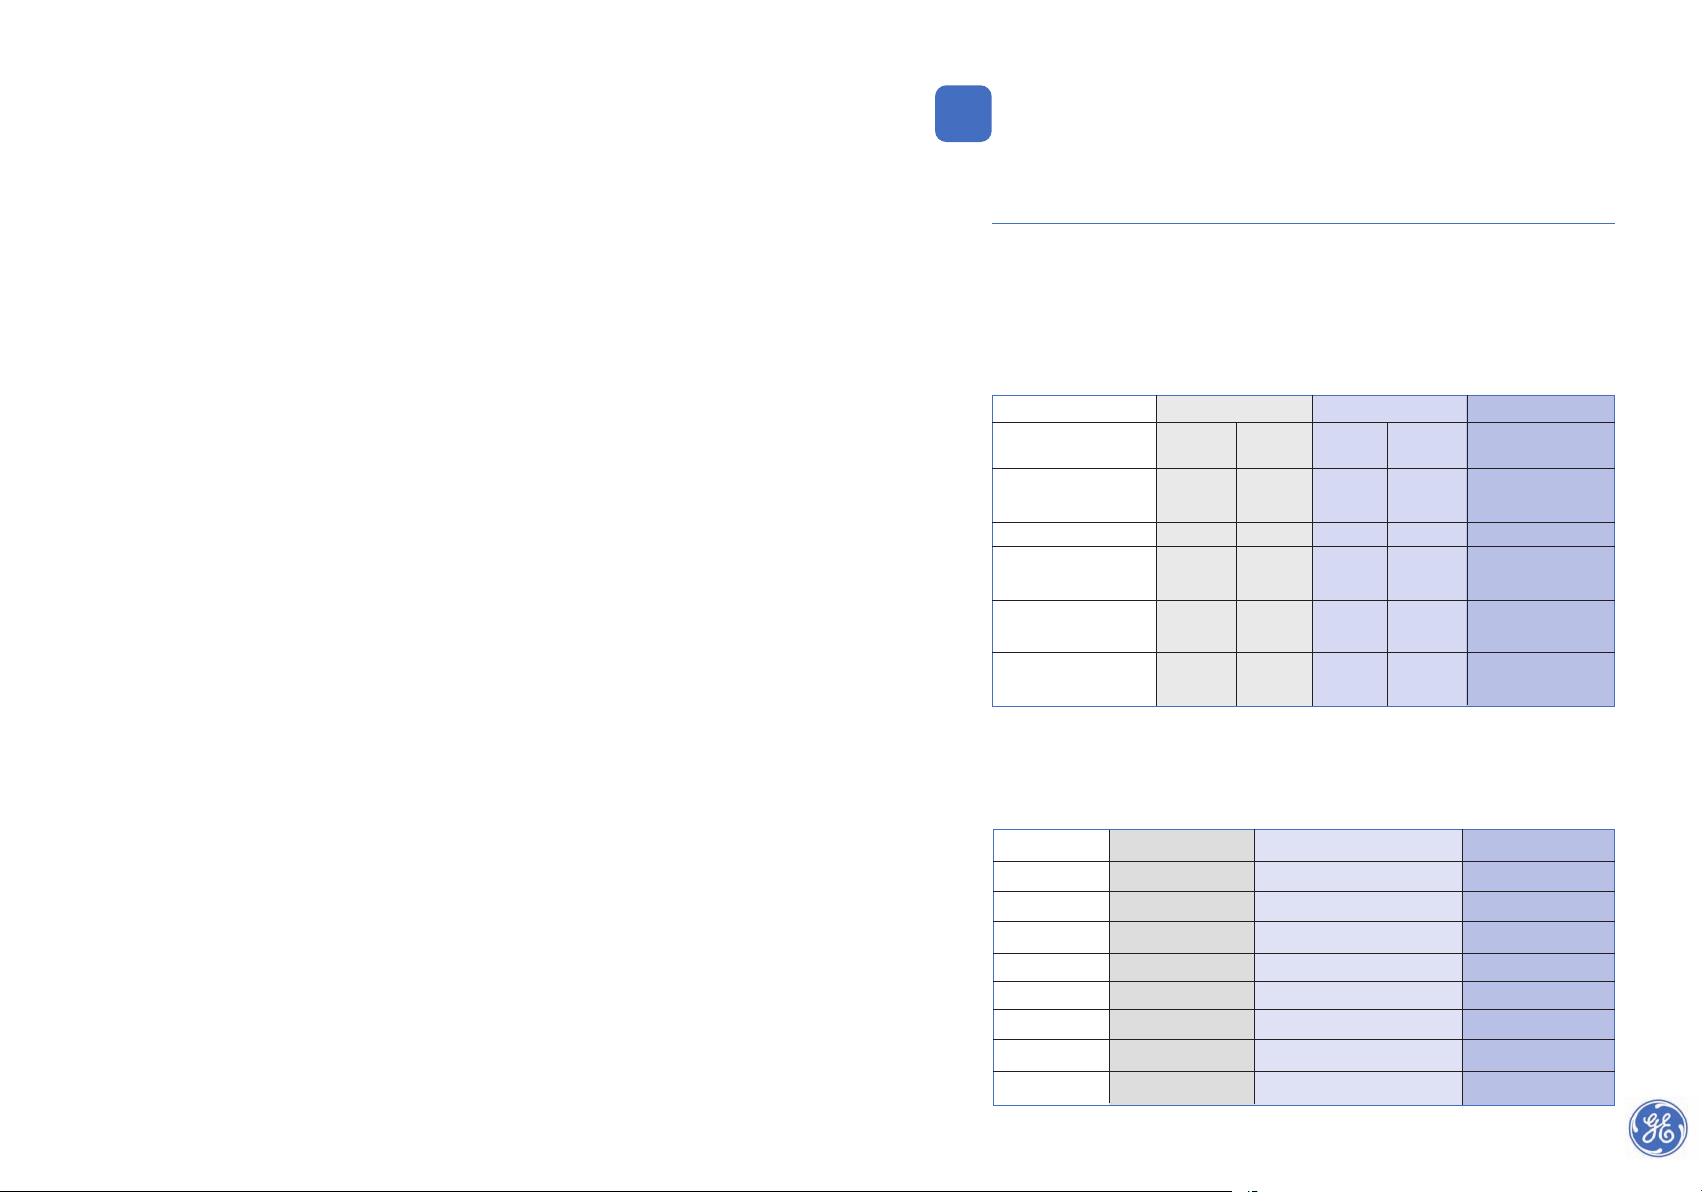
X-ray sets are generally divided in three voltage categories, namely:
1. Up to 320 kV, mainly for use on intermittent, ambulatory work. Tubes are generally of
the unipolar alternating current type. Higher voltages are hardly possible with this
type of equipment because of insulation problems.
2. Up to 450 kV, mainly for use on continuous, stationary or semi-ambulatory work,
because of their dimensions, limited manageability and weight.
Tubes are of the bipolar direct current type.
3. Up to 16 MeV, so called Megavolt equipment.
Virtually exclusively applied to stationary work.
The first two categories are suitable for radiography on most common objects. Objects of
extreme thickness, however, require an energy even higher than 450 kV. In this case
Megavolt equipment is used, if alternative sources such as Cobalt60 prove unsuitable.
It will normally involve stationary installations of large dimensions and high weight. Lately,
portable versions have become available meant for ambulatory use.
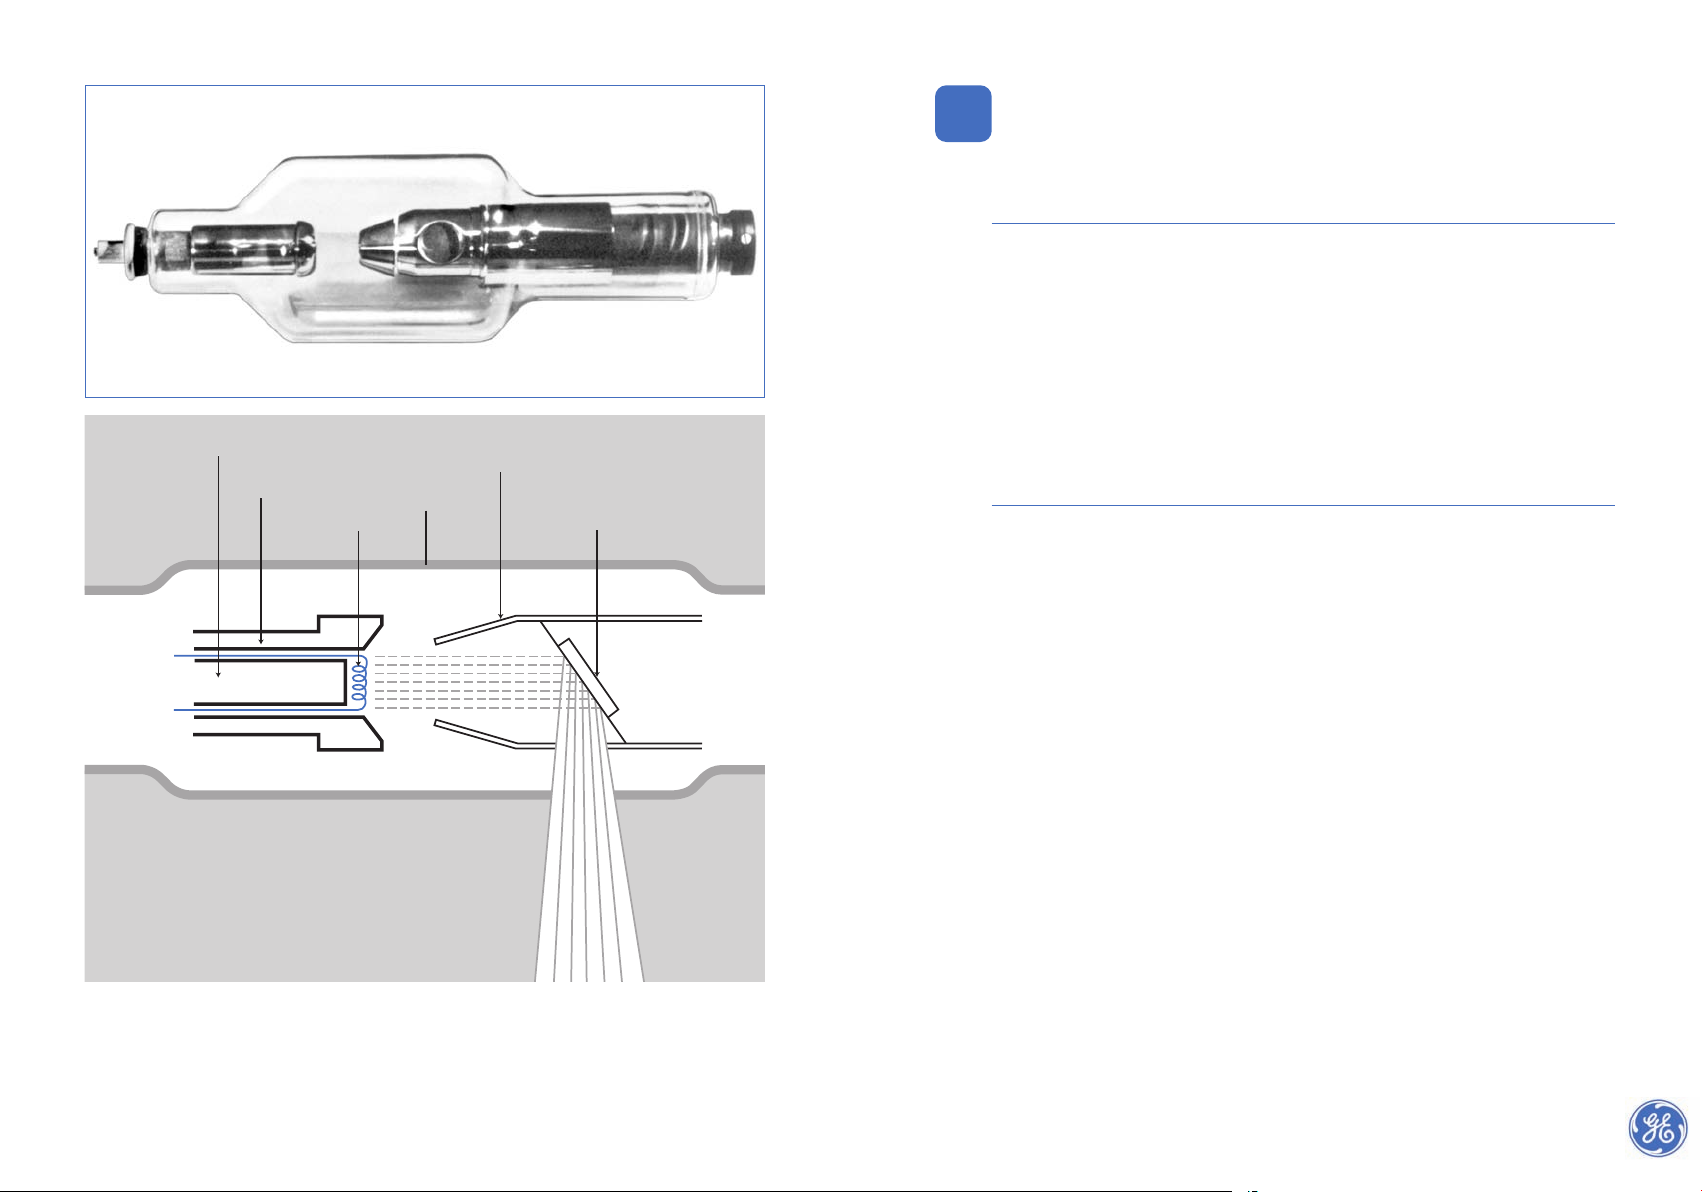
Types of X-ray tubes
Depending on the shape of the anode, X-ray tubes produce :
a. a beam of radiation in one direction (directional tube)
b. an annular beam (panoramic tube)
X-ray tubes are either unipolar or bipolar.
Bipolar tubes
Figure 1a-5 shows a bipolar tube. The bipolar tube has the advantage that the potential difference with respect to earth on both the anode and the cathode is equal to one-half of the
tube voltage, which is a great help from the point-of-view of insulation. The exit window
is necessarily situated in the middle of the tube. Bipolar tubes usually operate on direct current and are generally air, oil or water cooled. They are designed to operate at voltages of
100 to 450 kV and a tube current of up to 20 mA.
Unipolar tubes
In these (shorter) tubes, as shown in figure 1b-5, the anode is held at earth potential and
the cathode only has a potential difference to earth. This makes anode cooling a simpler
operation. It also means that for low/medium kilo-voltage sets, up to approx. 300 kV as often
used in ambulant applications, a single simpler high voltage supply source will suffice.
The radiation window is placed asymmetric which can be advantageous in practice.
38
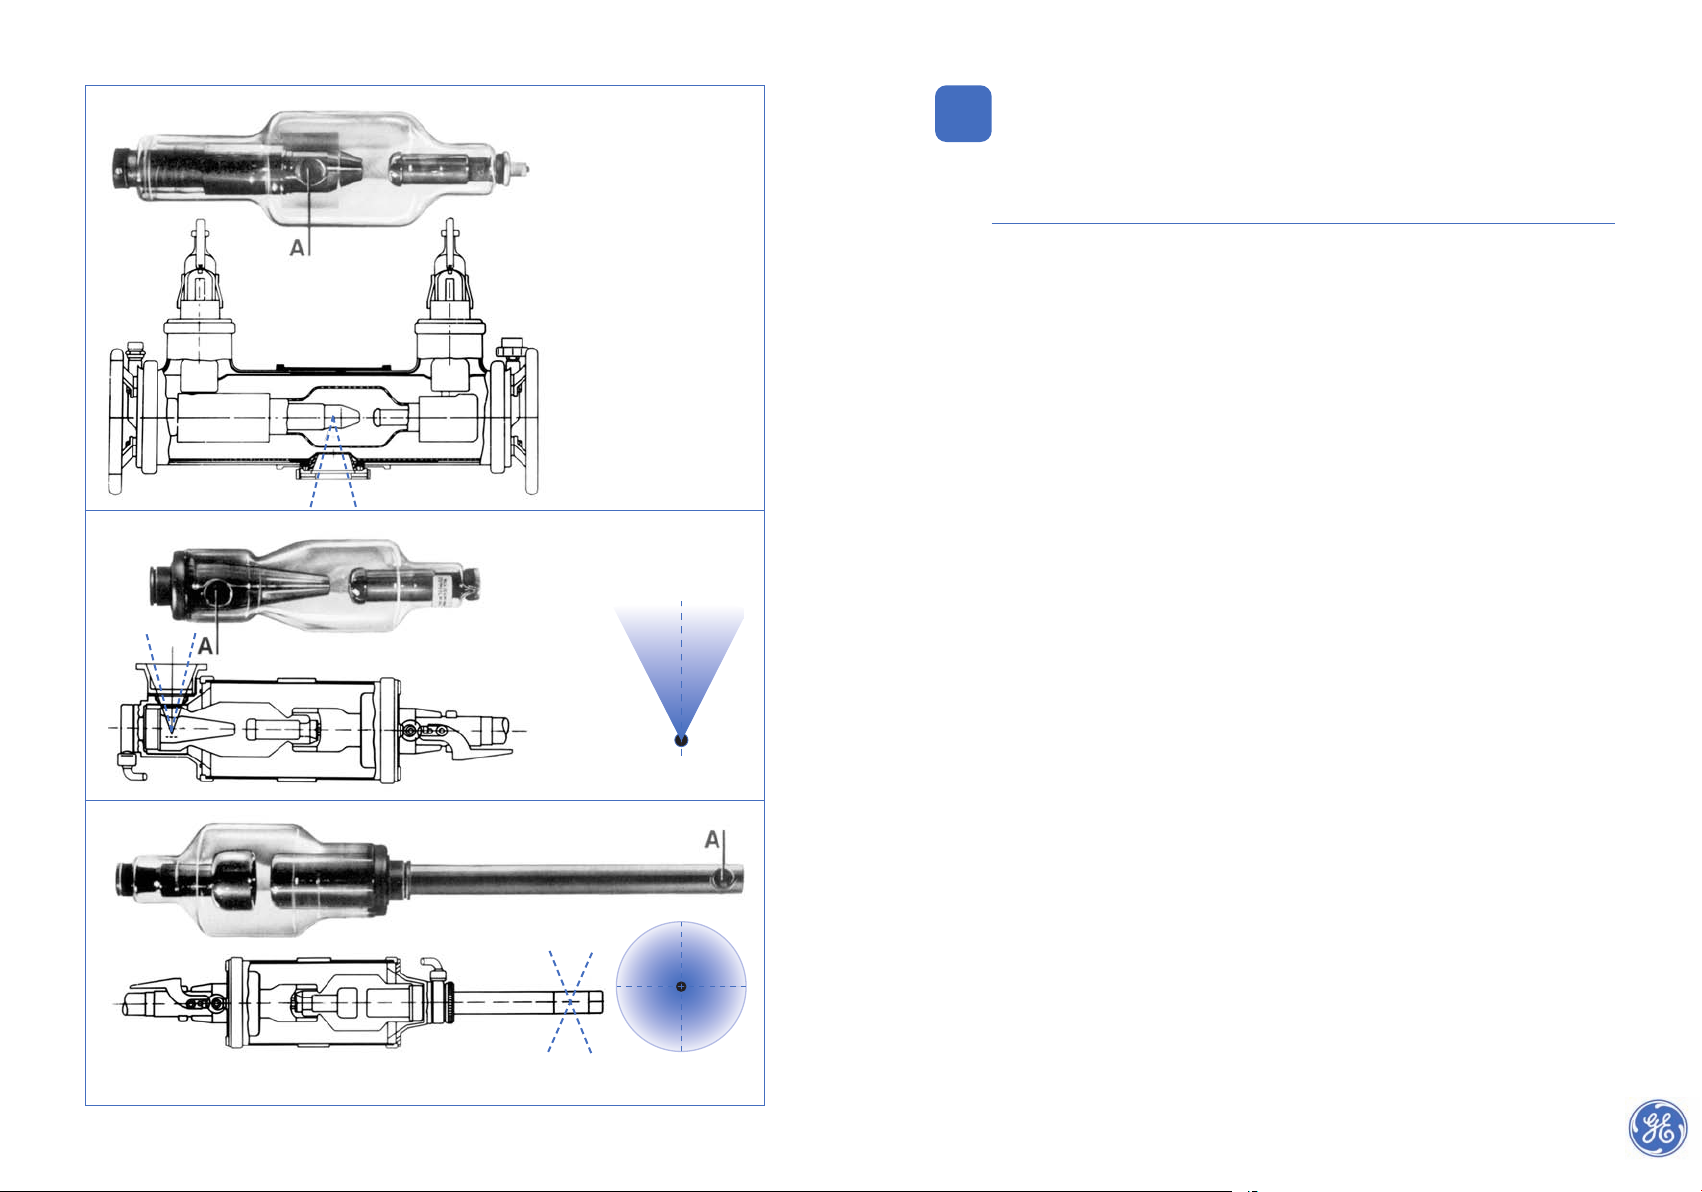
Fig. 1-5. – X-ray tubes
A = position of target
Panoramic
X-ray beam
Directional
X-ray beam
1a-5 Bipolar tube
1b-5 Unipolar tube
Directional
X-ray beam
Directional
X-ray beam
1c-5 Hollow anode tube giving annular (panoramic) beam
Focus
Focus
Page 22
41
5.2 High voltage generators
Conventional (trans)portable X-ray equipment for use up to approximately 300 kV are provided with step-up HT transformers, rectifiers and smoothing capacitors. The X-ray tube
and the circuitry of this equipment are usually placed in an insulated tank. In most cases
these tank type sets use oil for insulation and cooling and weigh approximately 60 kg.
Gas is used when weight is important; the set than weighs approximately 30 kg.
Figure 3-5 shows an integrated
(all-in-one) tank set for 300 kV
with an asymmetric window. At
voltages over 300 kV housing everything in one tank becomes very
difficult because the high voltage
insulation would be inadequate.
Figure 4-5 shows a direct current
X-ray tube with a symmetric window.
Equipment up to 450 kV operating
on direct current is connected to a
separate high tension (HT) supply
unit by means of HT leads. As a result this equipment is bigger and heavier than “all-in-one”
tank sets and mostly meant for stationary or semi-ambulant use.
The 300 kV “all-in-one” tank set and the 450 kV direct current X-ray tube only are of
roughly the same dimensions.
Most tank sets are connected to a mains power supply with a frequency of 50 or 60 Hz. At
this frequency the supply voltage can be transformed upward.
This is followed by rectifying, which occurs in various forms. With some sets the X-ray tube
itself functions as rectifier, so called single-phase rectifying. If there is no smoothing
applied, considerable changes in voltage per cycle of alternating current will occur.
This periodic and greatly varying high voltage affects the intensity and spectrum of the
radiation generated, see section 4.3.
40
Special types of X-ray tubes
Unipolar X-ray tubes with a long hollow anode, as shown in fig. 1c-5, are generally known
as “rod anode tube” and can be inserted into pipes or vessels. These tubes produce an
annular (panoramic) beam over 360º, so allowing a complete circumferential weld to be
radiographed in one exposure.
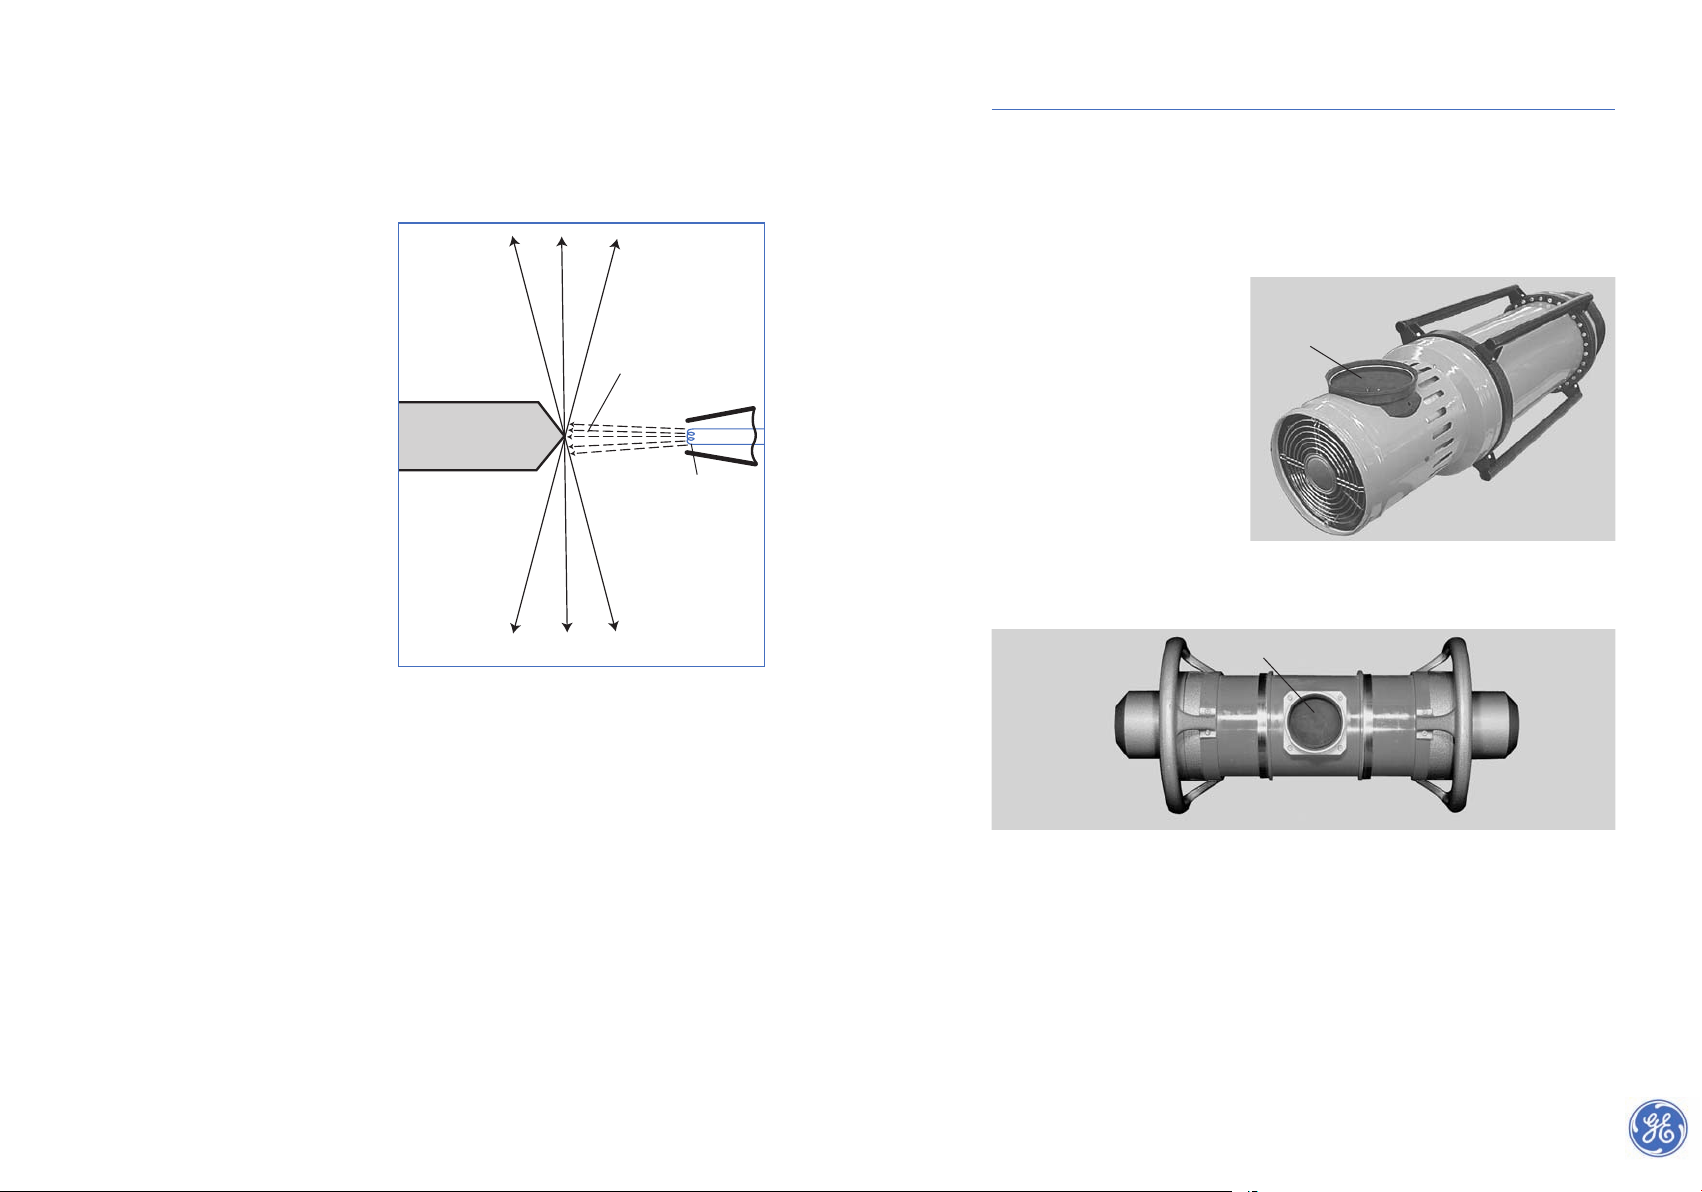
Figure 2-5 shows the conical anode
of a (360º) panoramic tube, which
allows a circumferential weld to be
radiographed centrally, hence uniformly, from within. With this
anode the axis of the electron
beam must strike the top of the
cone in such a way that the centre
of the generated X-ray beam is
perpendicular to the longitudinal
axis of the tube.
Note: Anodes shaped so that the centre of the generated X-ray beam is
not perpendicular (oblique) to the
centre line of the tube (which was
acceptable in the past), are no longer
allowed when work is to be performed to official standards.Tubes that
produce a real perpendicular beam
are known as "true panoramics"
There are also panoramic tubes in which the electron beam is focused over an extended
length by means of a magnetic lens or an electrostatic lens (Wehnelt-cylinder) to produce
a very small focal spot size. These sets are called microfocus rod anode tubes with which a
very small focal spot size, of less than 10 micrometers, can be achieved. Since the anode
can be damaged relatively easy through overheating the anode is usually interchangeable.
This requires a separate vacuum unit in order to restore the vacuum after replacement. The
advantage of this construction is that with different types of anodes, different radiation
patterns can be obtained for special applications. The maximum energy level is usually
below 150 kV.
However, there are 150 kV microfocus tubes with a fixed anode for enlarging or scanning
purposes, see section 17.1. With these tubes the tube current has to be kept low, because of
heat dissipation limitations of the non-interchangeable anode.
Some X-ray tubes used in the radiography of plastics and aluminium are equipped with a
beryllium window to allow the softer radiation generated at the lower tube voltages of
5 to 45 kV, to pass.
Fig. 2-5. Anode configuration for an annular panoramic tube
Fig. 4-5. Direct current X-ray tube for 450 kV with a symmetric window
X-ray
electron beam
cathode
X-ray
anode
filament
Window
Window
Fig. 3-5. “All-in-one“ 300 kV tank set with an asymmetric window
Page 23
43
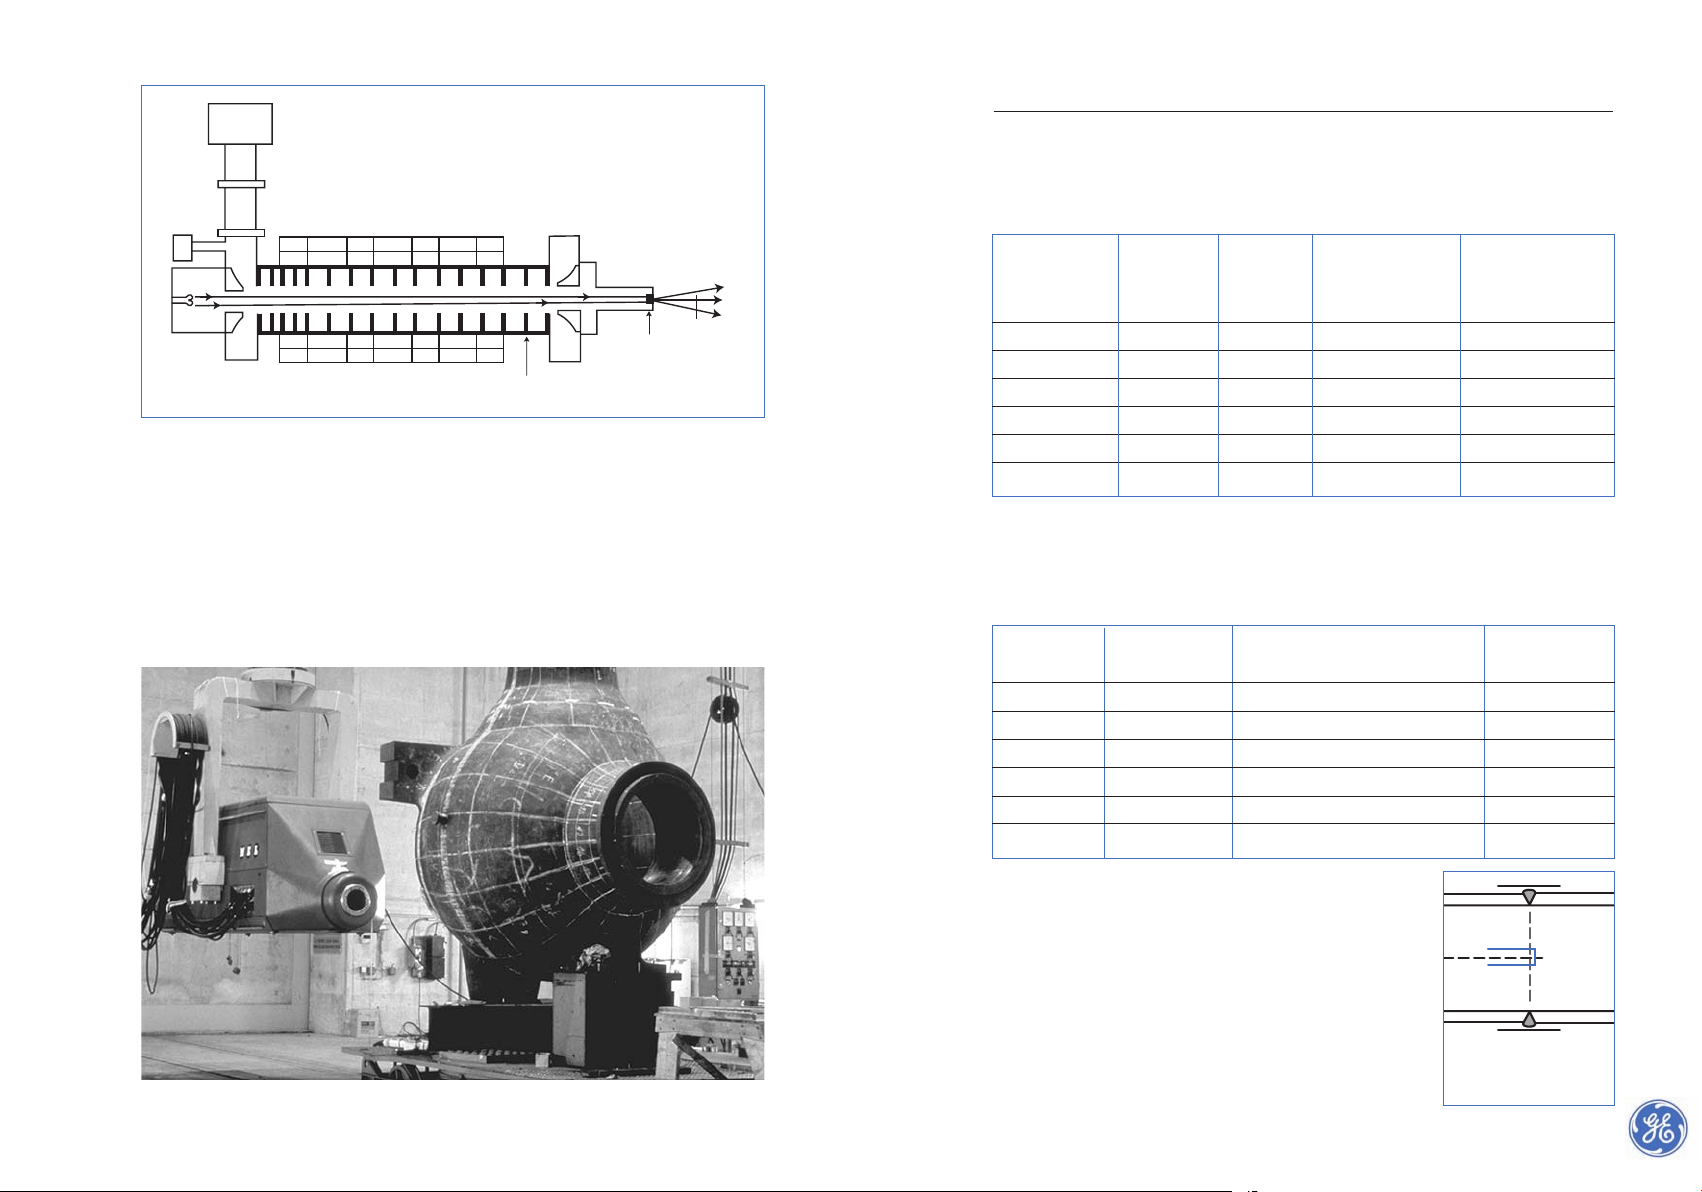
The linear accelerator (linac)
The energy levels mostly used for linacs (linear accelerators) are 4 MeV and 8 MeV. Linear
accelerators can be constructed for one or two energy levels.
In the travelling-wave linac, the acceleration of electrons from a heated filament to very
high energies results from the electrons “riding” a high-frequency (3-10 MHz) electromagnetic wave travelling in a straight line down an acceleration tube (the hollow guide).
The electrons are bunched into pulses at a frequency of a few hundred pulses per second.
The target, which the electrons strike to generate X-radiation, is at the opposite end of the
main wave guide of the filament assembly. This is a transmission type target from which
the radiation beam passes in a straight line.
The X-ray output from a linear accelerator is many times higher than from a Bètatron of the
same energy. An 8 MeV linac with a 2 mm diameter focal spot can deliver a radiation dose
rate of 30 Sv/minute at 1 metre distance from the focus. Small light-weight portable linacs
of 3 MeV capacity can have outputs of 1.5 Sv/minute at 1 metre distance.
42
The intensity of radiation is increased by double-phased rectifying and varying degrees of
smoothing. At very low voltage ripple these sets are considered constant potential (CP)
equipment.
In the latest types of tank sets the mains frequency is first converted to a high frequency
alternating current and only then transformed upward, which makes it easier still to
smooth the ripple. At very high frequencies, up to 50 kHz, smoothing is hardly necessary
anymore and such X-ray sets can be called CP systems. Additional features may be built in,
for example an automatic warm-up facility, see note below. This type of circuitry with
advanced electronics leads to a higher degree of reliability and significant space and weight
reduction compared with earlier power supply systems. As a result of the various improvements that have gradually been implemented, present day (high frequency) AC X-ray sets
perform as well as true CP sets.
Note: Because of the high vacuum prevailing inside the X-ray tube, it carefully has to be warmed-up
after a period of rest. During rest the vacuum deteriorates. This warm-up procedure has to be done
in accordance with the supplier’s instructions, to prevent high voltage short-circuiting which might
damage the tube or render it useless.
5.3 Megavolt equipment
The equipment described in sections 5.1 and 5.2 is used to generate X-radiation up to
approximately 450 kV. However, sometimes higher energy levels are needed.
Several types of equipment have been built to operate in the 1 MeV to 16 MeV range. In
industrial radiography almost exclusively Bètatrons or linear accelerators (linacs) are used.
Operating high-energy X-ray installations requires (costly) safety precautions.
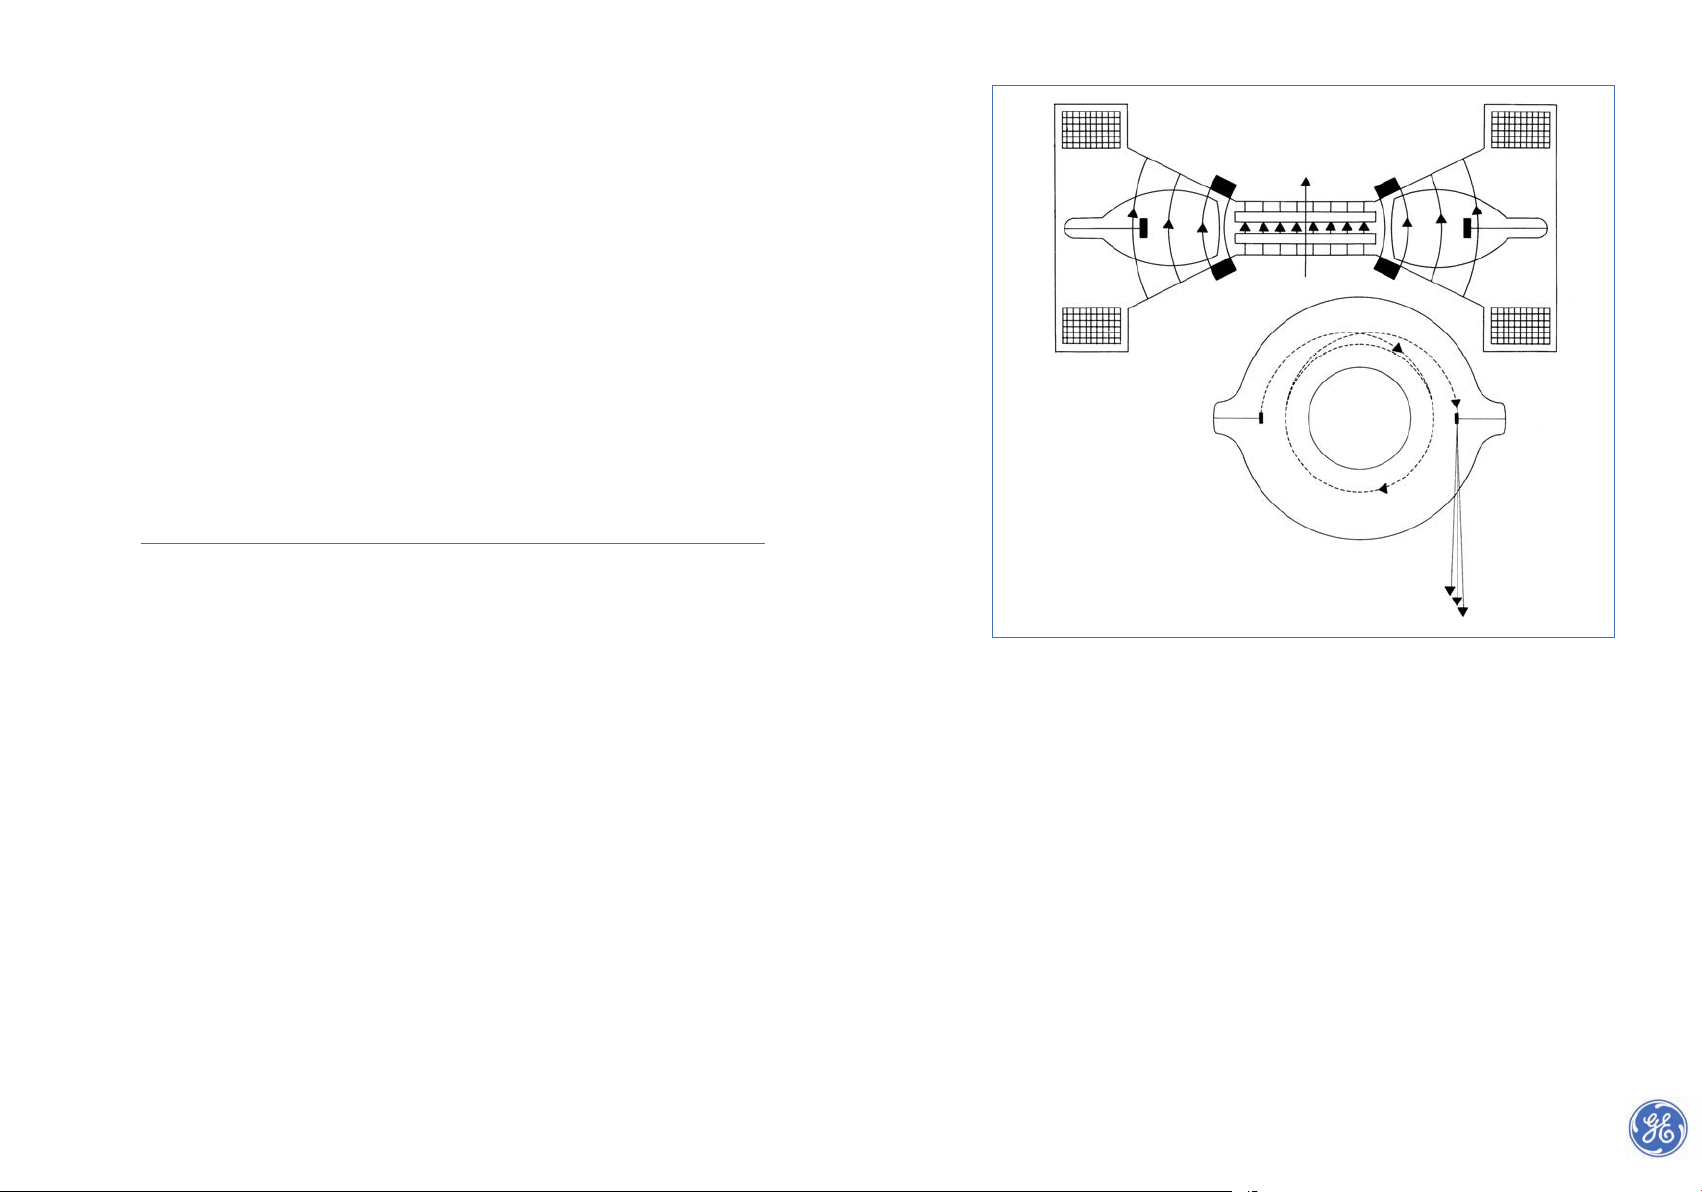
The Bètatron
The Bètatron is an electron accelerator, which can produce X-radiation in the 2-30 MeV
energy range. The electrons are emitted into a round-sectioned donut shaped glass
vacuum tube, as shown in figure 5-5. After several millions of revolutions the electrons
reach maximum energy and are deflected towards the target. On the target, part of the
electron energy is converted into a tangentially directed beam of X-radiation.
To obtain a reasonably high radiation intensity, most Bètatrons have been designed to operate in the 10-30 MeV energy range, as these voltages achieve maximum conversion rate of
electron energy into radiation. Even so the output of Bètatrons is usually small compared
to linacs. Transportable low energy Bètatrons (2-6 MeV) have been built, but these generally have a low radiation output, which limits their application.
One advantage of Bètatrons is that they can be built with very small (micromillimeter)
focal spots. A disadvantage is that with these very high energy levels the X-ray beam is usually narrow, and the coverage of larger film sizes is only possible by using increased source-to-film distances. The extended exposure times required can be a practical problem.
Fig. 5-5. Bètatron
X-rays
1. Ring-shaped accelerator tube
2. Anode
3. Cathode filament (emitting electrons)
4.&5 magnetic fields
6. Coils
7. Auxiliary winding
1
2
3
6
5
7
7
4
Page 24
5.4 Radioactive sources
Table 1-5 shows various radioactive sources for industrial NDT. The most commonly used
ones are Cobalt, Iridium and increasingly Selenium. Selenium is very attractive while it
permits lighter containers than Iridium. Due to its average energy level it often is a good
alternative for an X-ray tube, also attractive while no electricity is needed.
Average energy level (nominal value)
The spectrum of a source has one or more energy lines, as shown in figure 2-2. For sources
with multiple energy lines an average energy level is assumed, the so-called nominal value.
On the basis of these spectra data it is clear that Co60, Cs137
and Ir192 sources produce high-energy radiation and are therefore well suited to irradiate thick materials.
Yb169, on the other hand, is a source that produces relatively
soft radiation and is of a very small size (0.5 mm), which makes
it particularly suitable for radiographic examination of circumferential welds in pipes of a small diameter and thin wall thickness, with the source centrally positioned so that the weld can
be exposed uniformly in one exposure, as shown in figure 8-5.
4544
The main properties of a linear accelerator are:
1. very high output of radiation
2. very small focal spot dimensions (<2 mm)
3. considerable weight (approx. 1200 kg for an 8 MeV stationary installation)
Figure 7-5 shows an 8 MeV linac in a radiation bunker examining a pump housing.
Fig.7-5. Linac and pump house in a radiation bunker
Table 1-5. Radioactive sources used in industrial radiography, in sequence of nominal (average) energy level
Table 2-5. Radiation spectra and nominal values
Element Symbol Mass Specific gamma Average energy
Number constant level
k-factor in MeV
Cobalt60 Co 60 0.35 1.25
Caesium137 Cs 137 0.09 0.66
Iridium192 Ir 192 0.13 0.45
Selenium75 Se 75 0.054 0.32
Ytterbium169 Yb 169 0.05 0.2
Thulium170 Tm 170 0.001 0.072
Source Number of Main energy Nominal value
spectrum lines levels in MeV in MeV
Cobalt60 2 1.17 and 1.34 MeV 1.25 MeV.
Caesium137 1 0.66 MeV 0.66 MeV
Iridium192 >10 0.3; 0.31; 0.32; 0.47 en 0.6 MeV 0.45 MeV.
Selenium75 >4 120, 140 and 400 keV 320 keV.
Ytterbium169 >6 0.06 and 0.2 MeV 200 keV.
Thulium170 2 52 and 84 keV 72 keV.
source
film
Fig. 8-5. Ytterbium169 source in
central position for exposure of
circumferential weld
Fig. 6-5. Linear electron accelerator (linac)
X-rays
target
wave guide
electron gun
vacuum pump
magnetron
focus coils
Page 25
Also greatly depleted uranium (with the highest radiation absorption) is used for shielding,
resulting in very compact exposure containers. A disadvantage of this material, however, is
that it has a certain minimal radioactivity, which is reason that in some countries the use of
depleted uranium is not allowed.
Regardless of the shielding material used, all containers have a considerable weight in
common.
There are several solutions to the problem of safely storing a source on the one hand, and
of putting it in a simple but absolutely safe manner in its radiation position on the other
hand. Two regularly used constructions for this purpose are: source S is situated in a rotating cylinder, as shown in figure 11-5, or in an S-channel container as shown in figure 12-5.
The S-channel container is usually provided with a means to move the source out from a
distance (after all, distance is the safest protection from radiation). This may be done by
means of a flexible cable in a hose (Teleflex design) as shown in figures 13-5 and 14-5.
With this construction it is possible to extend the flexible hose in such a way that the source
can safely be moved several metres out of the container to the most favourable exposure
position.
4746
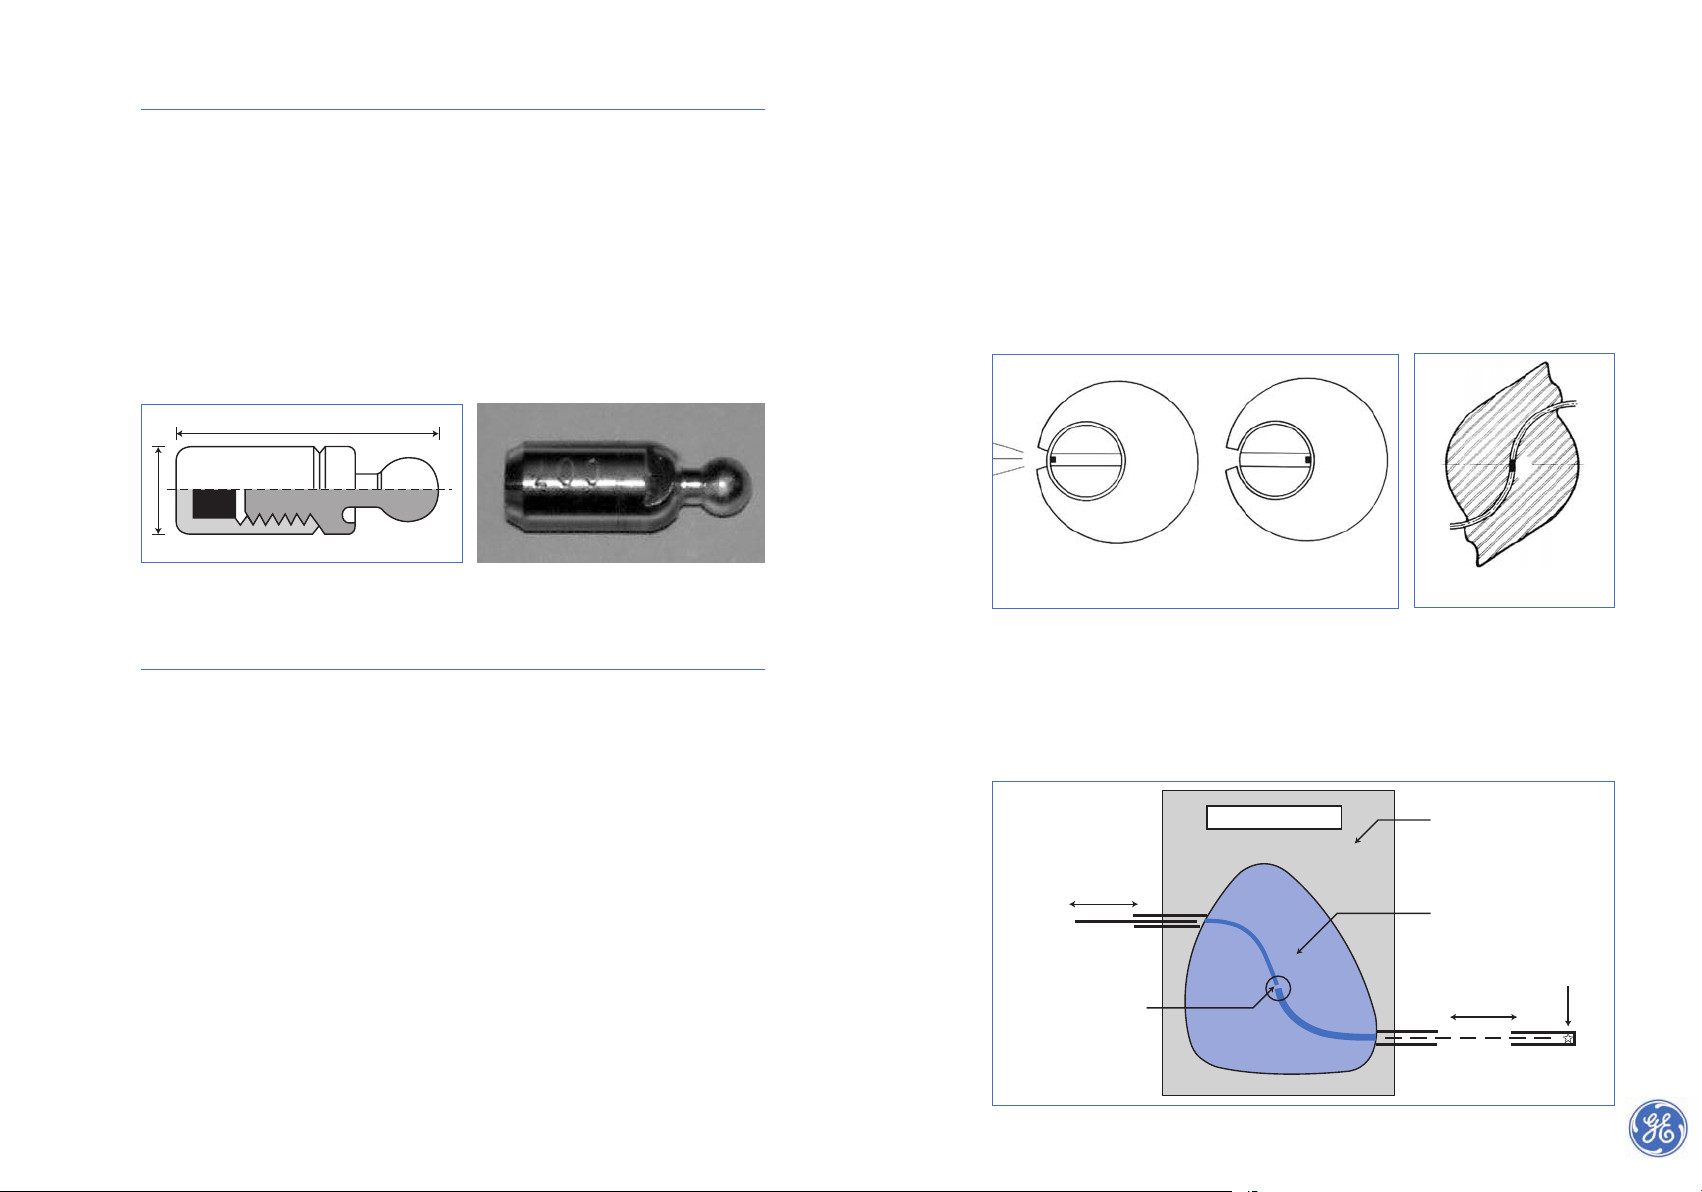
5.5 Source holders (capsules)
All gamma-ray sources for radiography are supplied in hermetically sealed, corrosion
resistant source holders (capsules), made out of monel, vanadium or titanium.
The Atomic Energy Authority in the country of origin encapsulates the radioactive material. The supplier will supply the source with a certificate which indicates the type of source,
its serial number, the activity at a certain date, and a disintegration graph.
The radiation material proper, also called the source or pellet, ranges in size from
1 to 4 mm. The size is dictated by the specific radiation activity of the source material.
The outside dimensions of the cylindrical capsule are approximately 5.5 x 15 mm, as shown
in figure 9-5.
5.6 Transport- and exposure containers
Transportation and handling of sealed sources are subject to strict international safety
regulations, as a source is continuously emitting radiation in all directions, in contrast to an
X-ray tube which can be switched off. During transportation and use the source must be
surrounded by a volume of radiation absorbing material, which in turn is encapsulated in
a container. The level of radioactivity at the outside surface of the container shall not
exceed the legally established maximum limit.
Like the transport container, the exposure container needs to be robust and must function
safely at all times. The exposure container, also called camera, must be fail-safe and waterand dirt proof. It must also not be effected by impact.
Moreover, if the radiation-absorbing material, for example lead, melts (in a fire) the radiation absorbing qualities must not be lost.
This requires a casing made of a material with a high melting point, for example steel.
Besides lead, increasingly a new sintered material with very high tungsten content (97%)
is used as shielding material. This material is easily worked and finished and not prone
to melting.
Fig. 9-5. Cross-section of a capsule for a radioactive source
15 m m
5.5 O
/
Fig. 10-5. Sealed capsule
handling / operation side
flexible connection
storage position
of the source
casing/container
exposure position
of the source
shielding
Fig 11-5. Exposure container with source S in a rotating inner cylinder
Fig. 12-5. S-channel container with
source S in storage position
Fig. 13-5. Exposure container
with S-channel and flexible
operating hose ad cable
open
SS
S
closed
Page 26
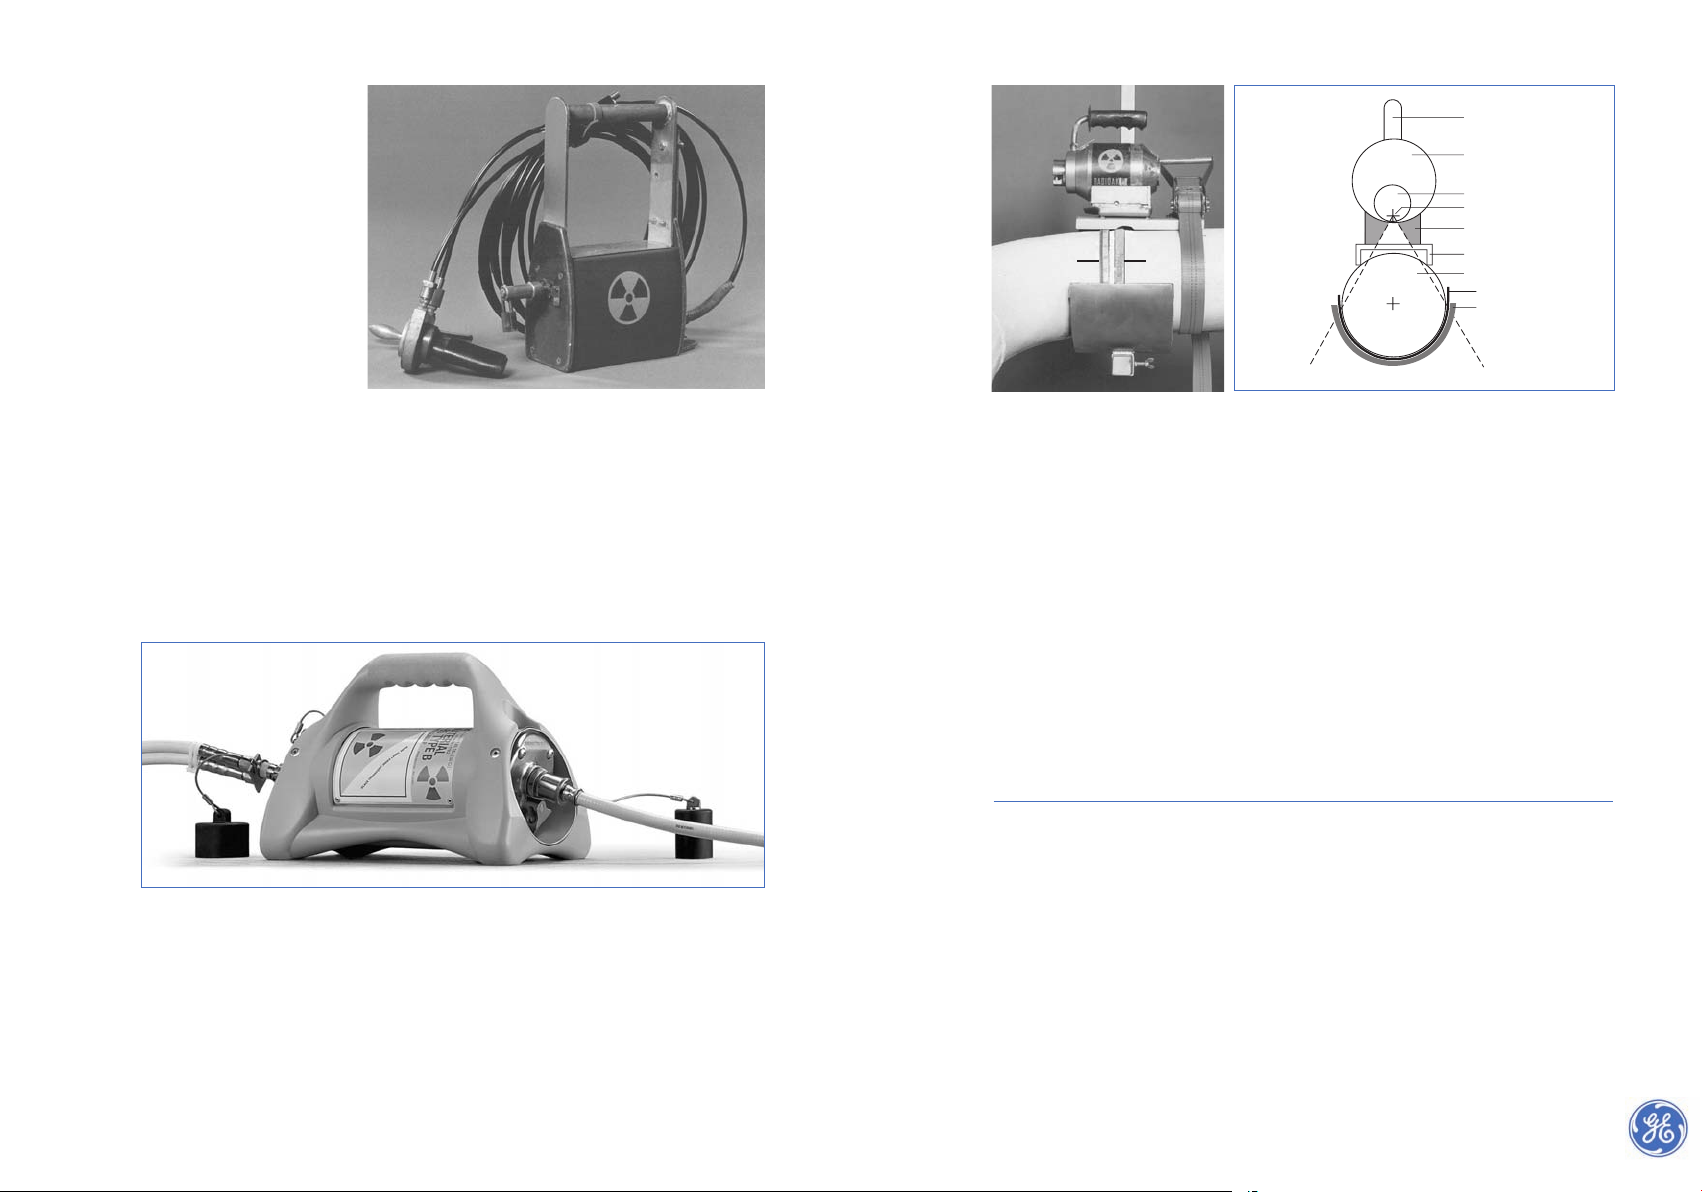
Figure 14-5 shows an S-channel container with a flexible
(metal) hose and cable in rolled up (transport) position.
Figure 15-5 shows a more
recent (2006) S-channel
Selenium75 container with
operation hoses and pigtail.
Selenium75 radio-isotope is
becoming popular since new
production (enrichment)
methods resulted in a much
better k-factor. Thus for a certain activity (source strength)
a much smaller source size (focus) is achieved. This results in a better/sharper image quality than could be achieved with the old Selenium75 production method.
Due to its average energy level of 320 kV, Selenium75 increasingly replaces X-ray
equipment for a thickness range from 5 mm to 30 mm of steel. This eliminates the need for
electric power, very attractive in the field for reasons of electrical safety and more
convenient at remote- or work locations with difficult access (high, deep, offshore,
refineries, etc). Last but not least, a Selenium container is of much lower weigth than
needed for an Iridium192 container with the same source strength.
To enable radiography on work sites with (many) people in the vicinity, for example on
offshore installations or in assembly halls, containers with rotating cylinders
and collimators were developed so that only the beam of radiation required for the
radiograph is emitted.
The remainder of radiation is absorbed by the collimator material which allows people to
work safely at a distance of a few metres while radiography is in progress. Such containers
with collimators are known by the name of “CARE” (Confined Area Radiation Equipment)
or “LORA” (Low Radiation) equipment.
4948
Fig. 14-5. S-channel container with the flexible cable and deployment mechanism.
Fig. 15-5. S-channel container for Selenium75 with pigtail (at right) and operating hoses (at left)
Fig. 16a-5. Gamma container with collimator
on a circumferential weld in a pipe
handle
tungsten container
rotating cylinder
source
Collimator
base
pipe and weld
film
lead shielding
boundaries of the beam of radiation
Fig. 16b-5. Cross-section of CARE/LORA container on the pipe
Without collimating the minimum safety distance is considerably more than 10 metres (in
all directions!).
Such containers with collimators are particularly suitable for frequent and
identical repetitive NDT work, for example radiographic testing of welds in pipes of
< 300 mm diameter.
Figure 16a-5 shows such a special container with collimator set up for a double wall
radiograph. The cross-section drawing of figure 16b-5 shows the boundaries of the beam of
radiation. For bigger focus-to-film distances, longer collimators are used to restrict the
beam of radiation.
This type of container is suitable for Iridium sources up to 1000 GBq and weighs “only”
approx. 20 kg. A similar system (Saferad) with a weight of up to 15 kg exists, using
Selenium75, which almost eliminates the usual disruption to construction, maintenance
and process operations in the vicinity of the exposure.
5.7 Checking for container leakage
A sealed radioactive source (capsule) might start to leak and become an open source as a
result of corrosion, mechanical damage, chemical reactions, fire, explosion etc.
Regular mandatory “wipe-tests” by specialists serve to detect leakage at an early stage.
measuring tape
weld
lead
Page 27
51
50
6
Radiation images, filters and
intensifying screens
To influence the effects of radiation on an image, filters and intensifying screens are used to :
• filter / harden the radiation to influence contrast and/or
• to intensify the effect of radiation to improve contrast
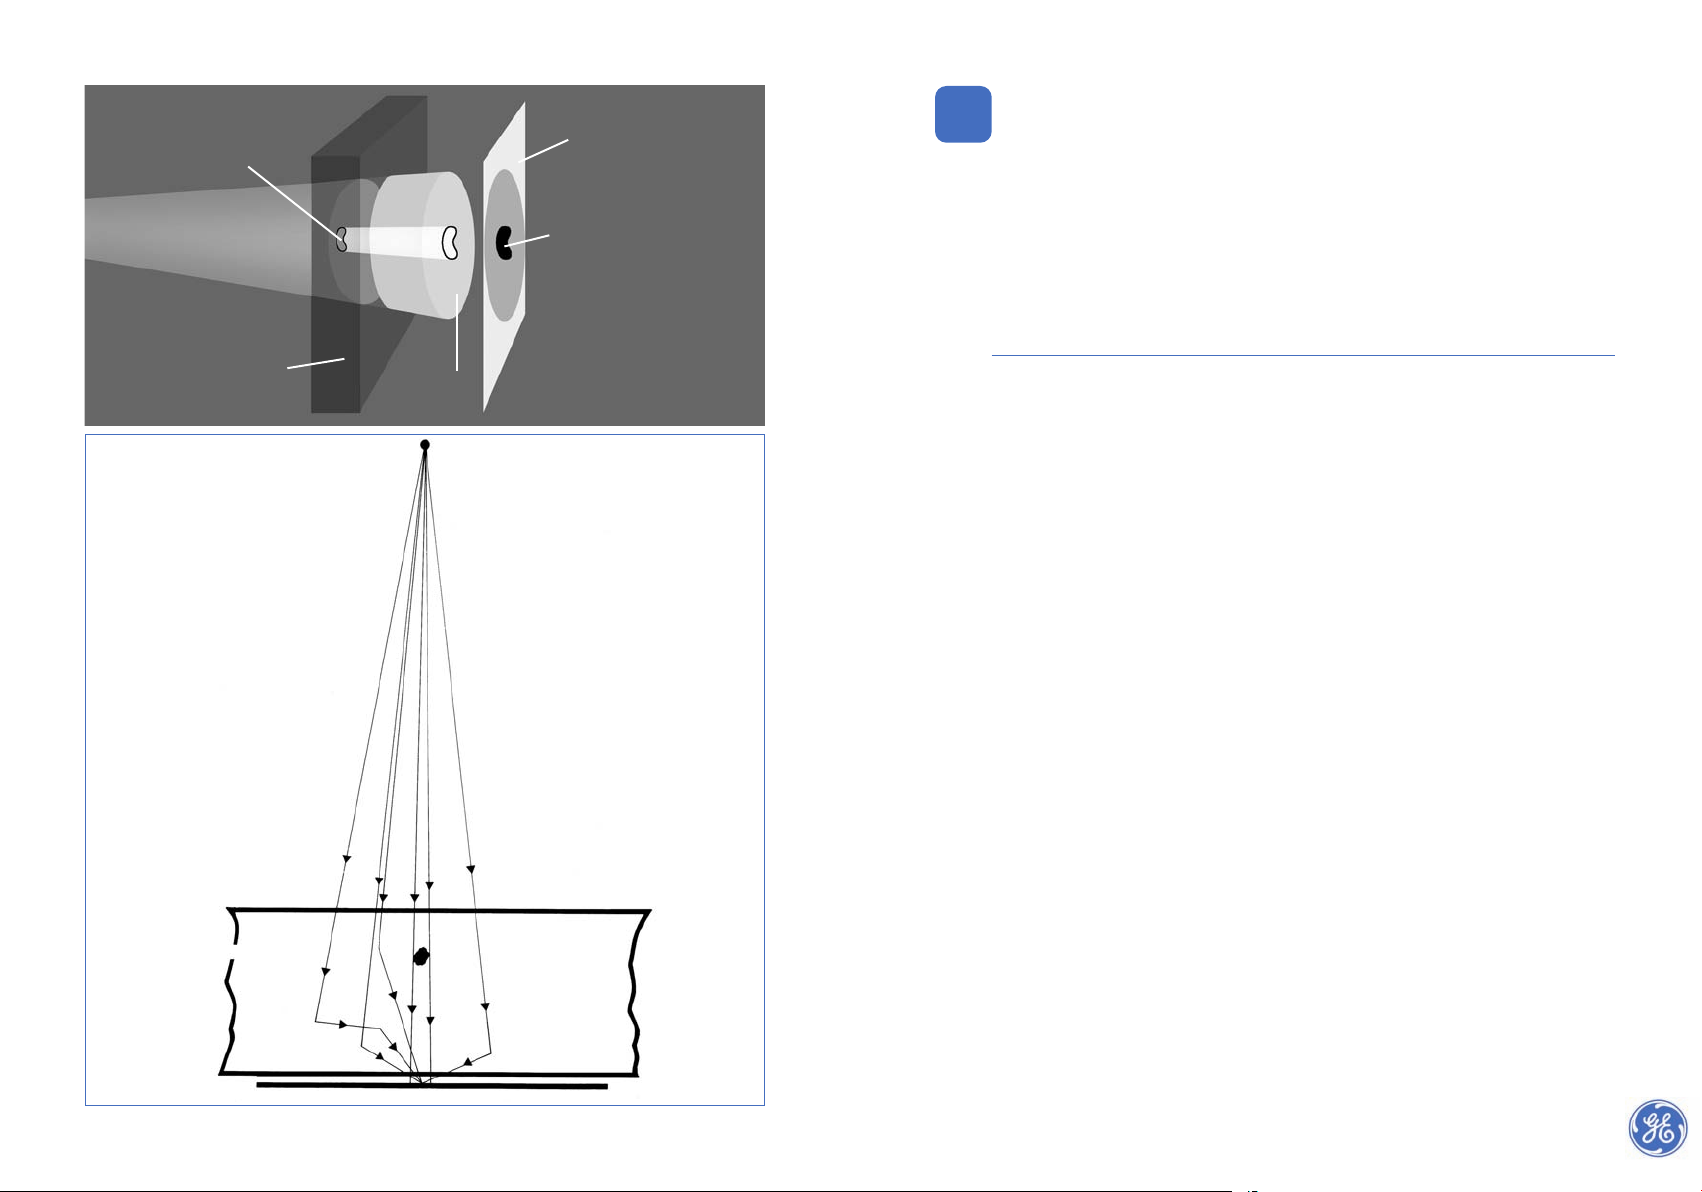
6.1 Radiation images
The intensity of a beam of X-rays or gamma-rays undergoes local attenuation as it passes
through an object, due to absorption and scattering of the radiation. On a uniform object
attenuation of the primary beam will also be uniform and the film evenly exposed. If the
object contains defects or is of variable thickness, the surface of the film will be unevenly
exposed resulting in a shadow image of the object and the defects in it. When the film is
processed the variations in radiation intensity show up as varying film densities; higher
radiation intensity producing higher film density resulting in a negative X-ray image as
shown in figure 1-6.
When the primary beam is partly absorbed in the object, some radiation,
as shown in figure 2-6, will be scattered and reach the film as secondary radiation by an
indirect path. The quality of the radiograph is reduced by this scattered radiation, and it is
important to keep its effects to a minimum.
At any point P on the film, therefore, the total radiation reaching that point is made up of
some transmitted primary radiation forming the image of cavity (N), the “image forming”or direct radiation intensity Ip, and some secondary “ non-image forming” , scattered radiation, intensity Is. Hence, the total radiation intensity at P is (I
p
+ Is).
The ratio Is/Ipis called the “scattered radiation factor” and can be as high as 10 for great
wall thicknesses, which means that the scattered radiation is ten times higher than the
image-forming radiation. The ratio (I
p+Is
)/Ip = 1+Is/Ipis called the “build-up factor” and
is of considerable importance for the detectability of defects. It usually has a value between
2 and 20, depending on radiation energy and object thickness.
It must also be appreciated that any object in the neighbourhood of the object being examined (table, walls, ground and so on) which is struck by the gamma- or X-rays will partially reflect these rays in the form of “backscatter” which is liable to fog the film.
Backscatter coming from the object under examination is less hard than the primary radiation that has caused it and can be intercepted by a metal filter between object and film.
Radiation scattered by objects nearby the film can be intercepted by means of a protective
sheet of lead at the rear face of the film cassette.
defect
object
object
film
A
A
C
N
D
E
B
F
P
source (S)
primary radiation
Fig. 1-6. The negative X-ray image
film
negative
(shadow) image
on the film
radiation intensity
after passing
through the object
Fig. 2-6. Image forming and non-image
forming radiation
Only the radiation from source (S) that
reaches the film in straight lines via beam
section DE, produces an image of cavity
N at P. The remainder, not reaching P
directly, is scattered radiation, no defect
image forming thus reducing the image
quality.
Page 28
53
6.2 Radiation filters
When a metal plate, usually lead or copper, is placed between the tube window and the
object, radiation “hardening” occurs leading to a lower image contrast.
This may be counter-balanced by a metal filter placed immediately behind the object (i.e.
between object and film). This filter will cause the (softer) scattered radiation passing
through the object to be absorbed by the filter to a greater extent than the primary (harder) radiation. This also improves the image quality.
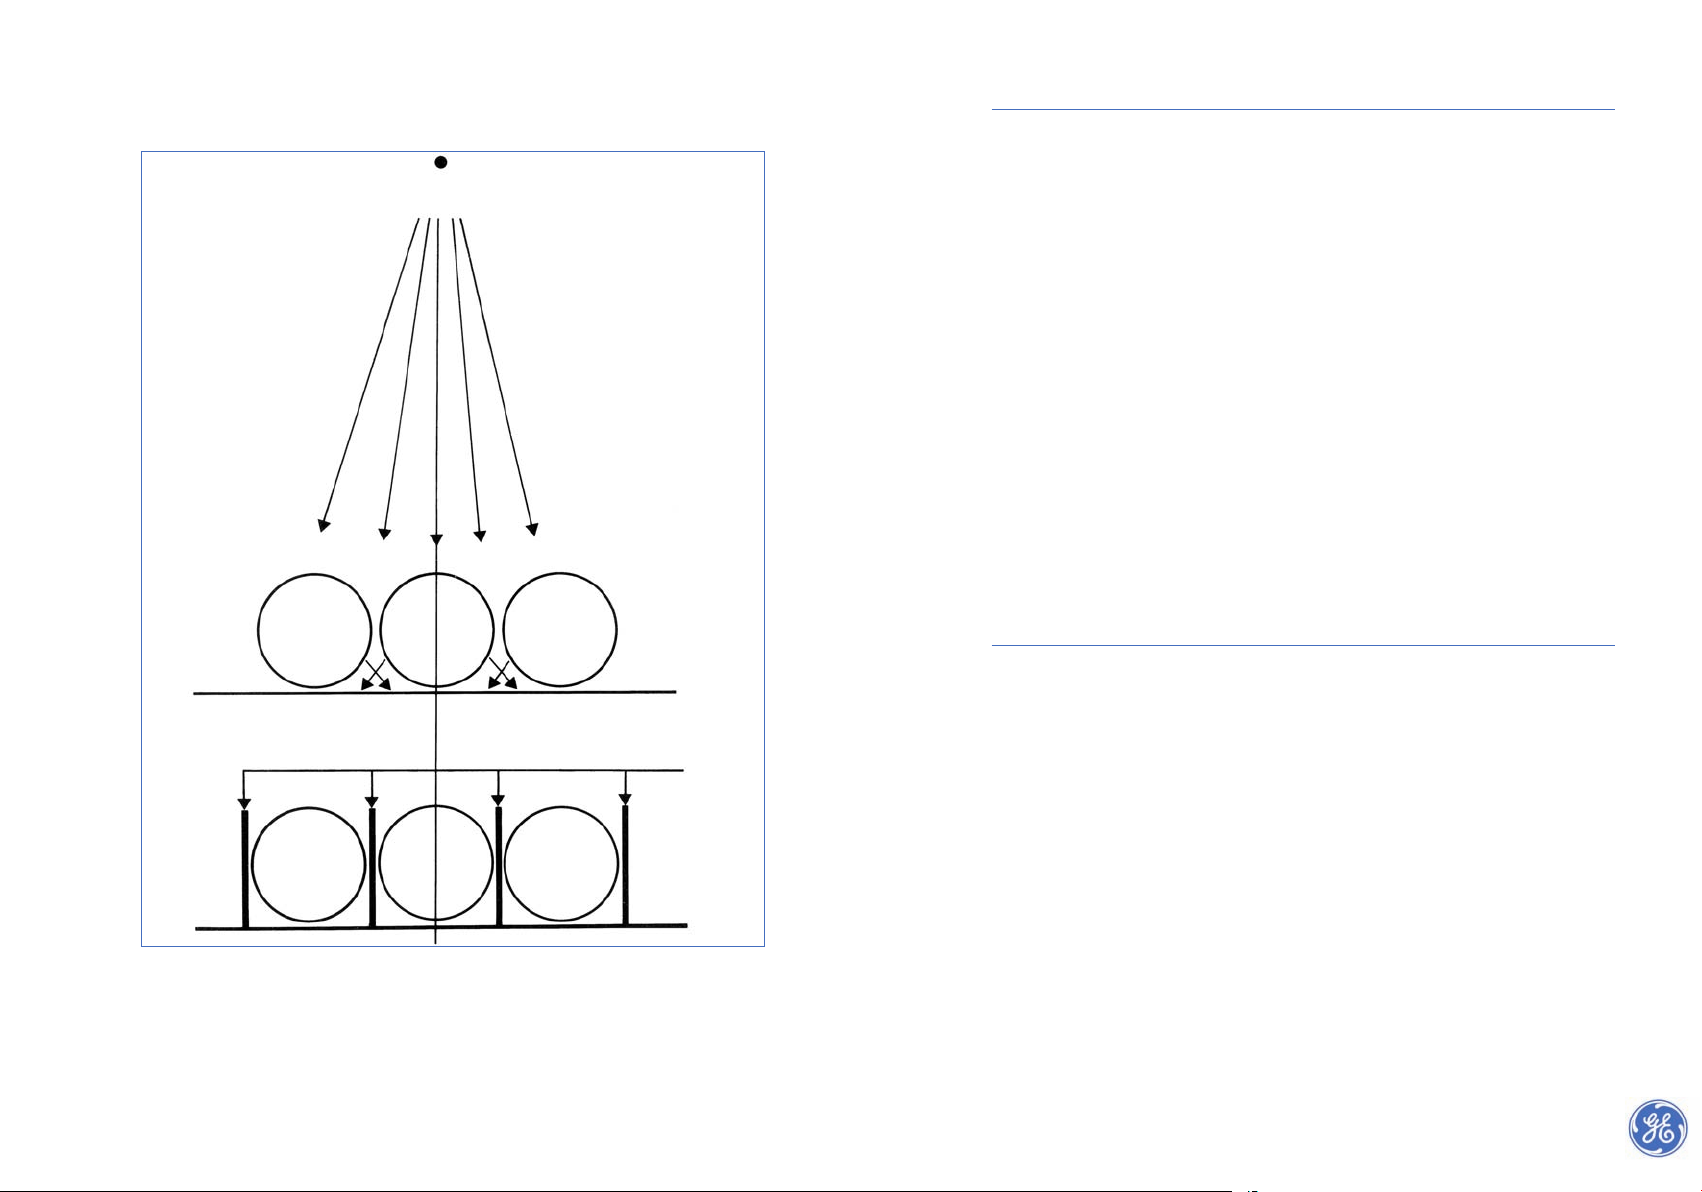
If the edges of an object being radiographed are not close to the film (as in the case of a
cylindrical body in figure 3-6) considerable scatter of the primary radiation can occur,
leading to fogging. This scatter can be prevented by positioning sheets of lead foil between
the object and the film as illustrated in this figure.
Reducing the contrast by filtration is also desirable when a radiographic image of an object
of widely varying thicknesses has to be obtained on a single film see section 18.2.
Typical filter thicknesses are :
0.1 – 0.25 mm lead for 300 kV X-rays
0.25 – 1.0 mm lead for 400 kV X-rays
6.3 Intensifying screens
The radiographic image is formed by only approximately 1 % of the amount of radiation
energy exposed at the film. The rest passes through the film and is consequently not used.
To utilise more of the available radiation energy, the film is sandwiched between two intensifying screens. Different types of material are being used for this purpose.
Lead screens
Under the impact of X-rays and gamma-rays, lead screens emit electrons to which the film
is sensitive. In industrial radiography this effect is made use of: the film is placed between
two layers of lead to achieve the intensifying effect and intensity improvement of approximately factor 4 can be realised. This method of intensification is used within the energy
range of 80 keV to 420 keV, and applies equally to X-ray or gamma-radiation, such as produced by Iridium192.
Intensifying screens are made up of two homogeneous sheets of lead foil (stuck on to a thin
base such as a sheet of paper or cardboard) between which the film is placed: the so called
front and back screens.
The thickness of the front screen (source side) must match the hardness of the radiation
being used, so that it will pass the primary radiation while stopping as much as possible of
the secondary radiation (which has a longer wavelength and is consequently less penetrating).
52
Scattered radiation also occurs in radiographic examination of cylindrical objects,
as shown in figure 3-6.
The effects of scattered radiation can be further reduced by :
• limiting the size of the radiation beam to a minimum with a diaphragm in front
of the tube window
• using a cone to localise the beam, a so called collimator
• the use of masks: lead strips around the edges of the object.
1
S
X-ray s
Fig. 3-6.
Scattered radiation in radiography of cylindrical objects.
Scattered radiation from object 1
causes a spurious band at B,
object 2 at A etc, unless lead strips
are used as shown in the lower
part of this figure
film
film
lead strips
A B C D
23
123
Page 29
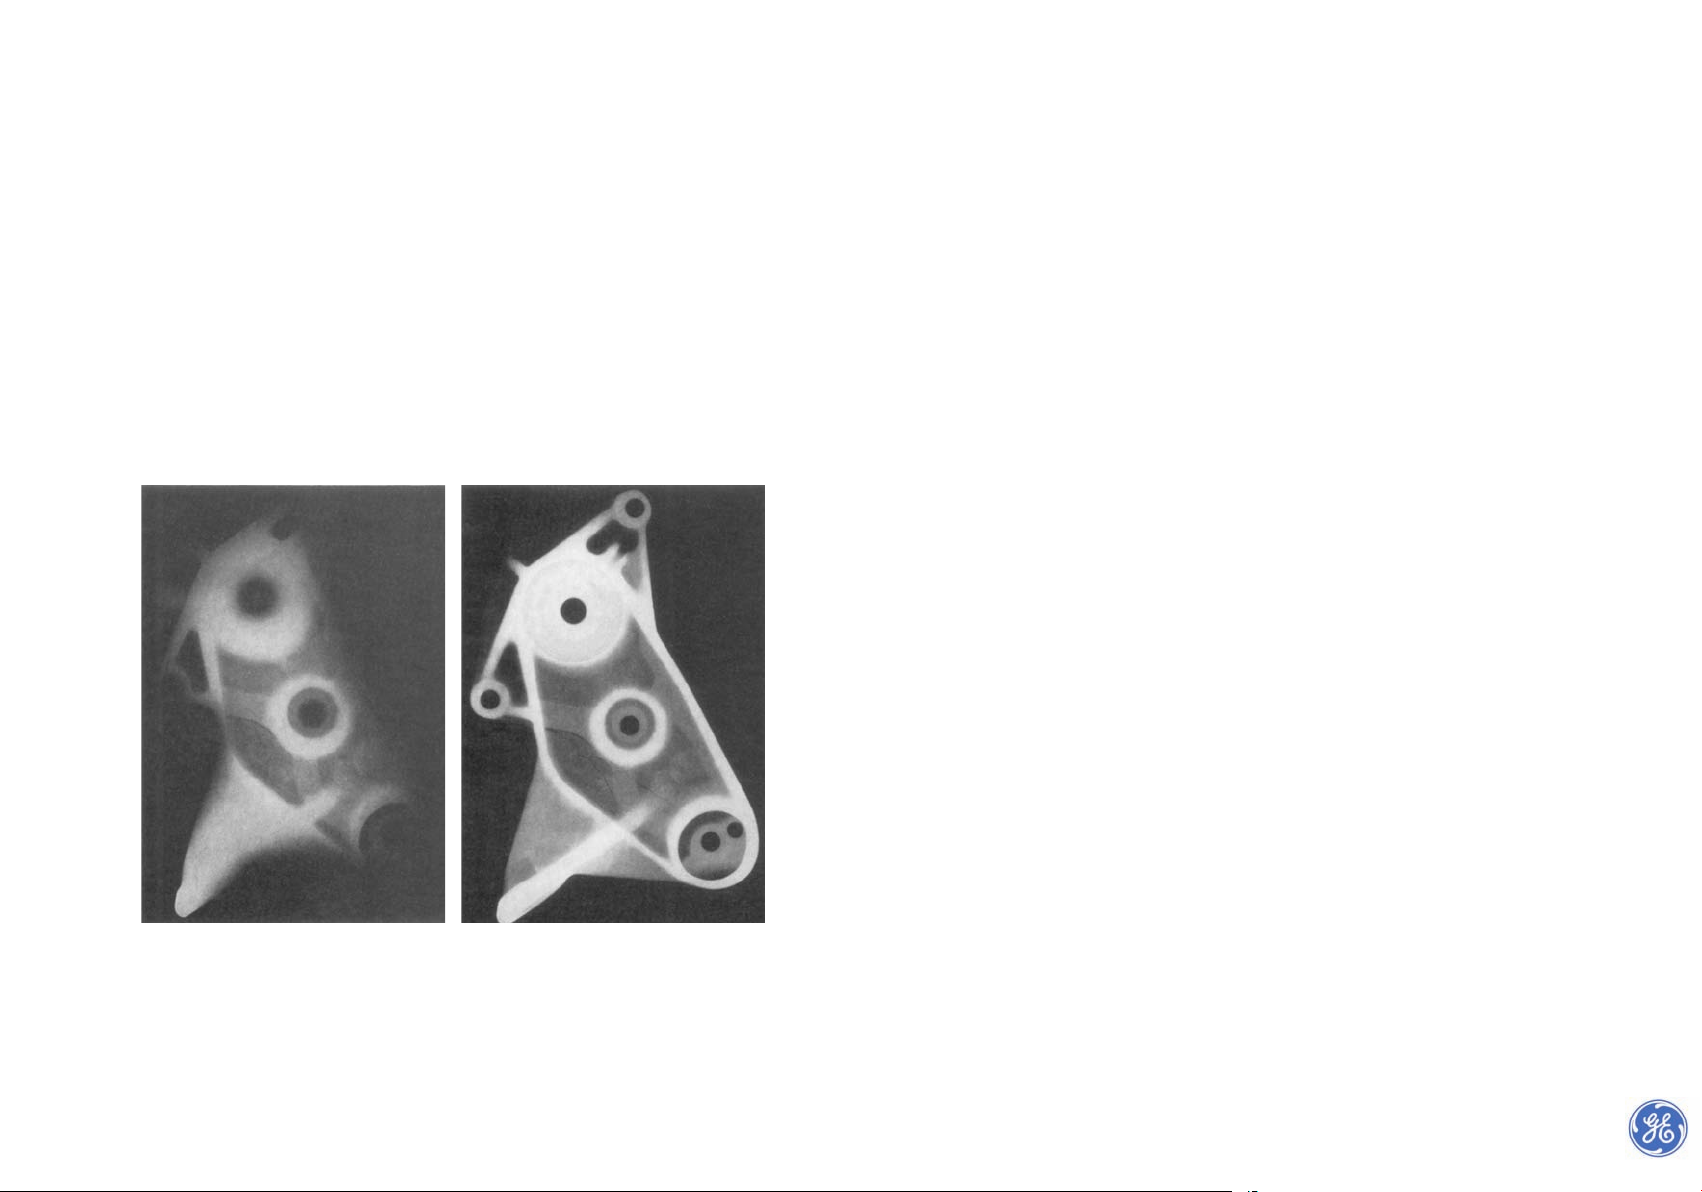
55
Steel and copper screens
For high-energy radiation, lead is not the best material for intensifying screens. With
Cobalt60 gamma-rays, copper or steel have been shown to produce better quality radiographs than lead screens. With megavoltage X-rays in the energy range 5-8 MeV (linac)
thick copper screens produce better radiographs than lead screens of any thickness.
Fluorescent screens
The term fluorescence (often mistaken for phosphorescence) is used to indicate the characteristic of a substance to instantly instantly emit light under the influence of electromagnetic radiation. The moment radiation stops, so does the lighting effect. This phenomenon is made good use of in film based radiography. Certain substances emit so much
light when subjected to ionising radiation, that they have considerably more effect on the
light sensitive film than the direct ionising radiation itself.
• The term phosphorescence is used to describe the same luminescent phenomenon, but
once the electromagnetic radiation ceases, light fades slowly (so called after-glow).
• NDT additionally uses the “memory effect” of some phosphorous compounds to store
a latent radiographic image in order to develop it later into a visible image with the aid
of laser stimulation, see section 16.4.
Fluorescent salt screens
Fluorescent screens consist of a thin, flexible base coated with a fluorescent layer made up
from micro-crystals of a suitable metallic salt (rare earth; usually calcium tungstate) which
fluoresce when subjected to radiation. The radiation makes the screen light up. The light
intensity is in direct proportion to the radiation intensity. With these screens a very high
intensification factor of 50 can be achieved, which means a significant reduction in exposure time. The image quality, however, is poor because of increased image unsharpness.
Fluorescent screens are only used in industrial radiography when a drastic reduction of
exposure time, in combination with the detection of large defects, is required.
Fluorometallic screens
Apart from fluorescent and lead intensifying screens, there are fluorometallic screens
which to a certain extent combine the advantages of both. These screens are provided with
a lead foil between the film base and the fluorescent layer. This type of screen is intended
to be used in combination with so-called RCF-film (Rapid Cycle Film) of the types F6 or F8,
see section 8.1.
The degree of intensification achieved largely depends on the spectral sensitivity of the
X-ray film for the light emitted by the screens. Due to the considerable exposure time reduction the application is attractive for work on lay barges and in refineries.
54
The lead foil of the front screen is usually 0.02 to 0.15 mm thick. The front screen acts not
only as an intensifier of the primary radiation, but also as an absorbing filter of the softer
scatter, which enters in part at an oblique angle, see figure 2-6. The thickness of the back
screen is not critical and is usually approx. 0.25 mm.
The surface of lead screens is polished to allow as close a contact as possible with the surface of the film. Flaws such as scratches or cracks on the surface of the metal will be visible
in the radiograph and must, therefore, be avoided. There are also X-ray film cassettes on
the market with built-in lead screens and vacuum packed to ensure perfect contact between emulsion and lead foil surface.
Figure 4a-6 and figure 4b-6 clearly show the positive effect of the use of lead screens.
Summarizing, the effects of the use of lead screens are :
• improvement in contrast and image detail as a result of reduced scatter
• decrease in exposure time
Fig. 4a-6. Radiograph of a casting without lead
intensifying screens
Fig. 4b-6. Radiograph of a casting with lead intensifying screens
Page 30
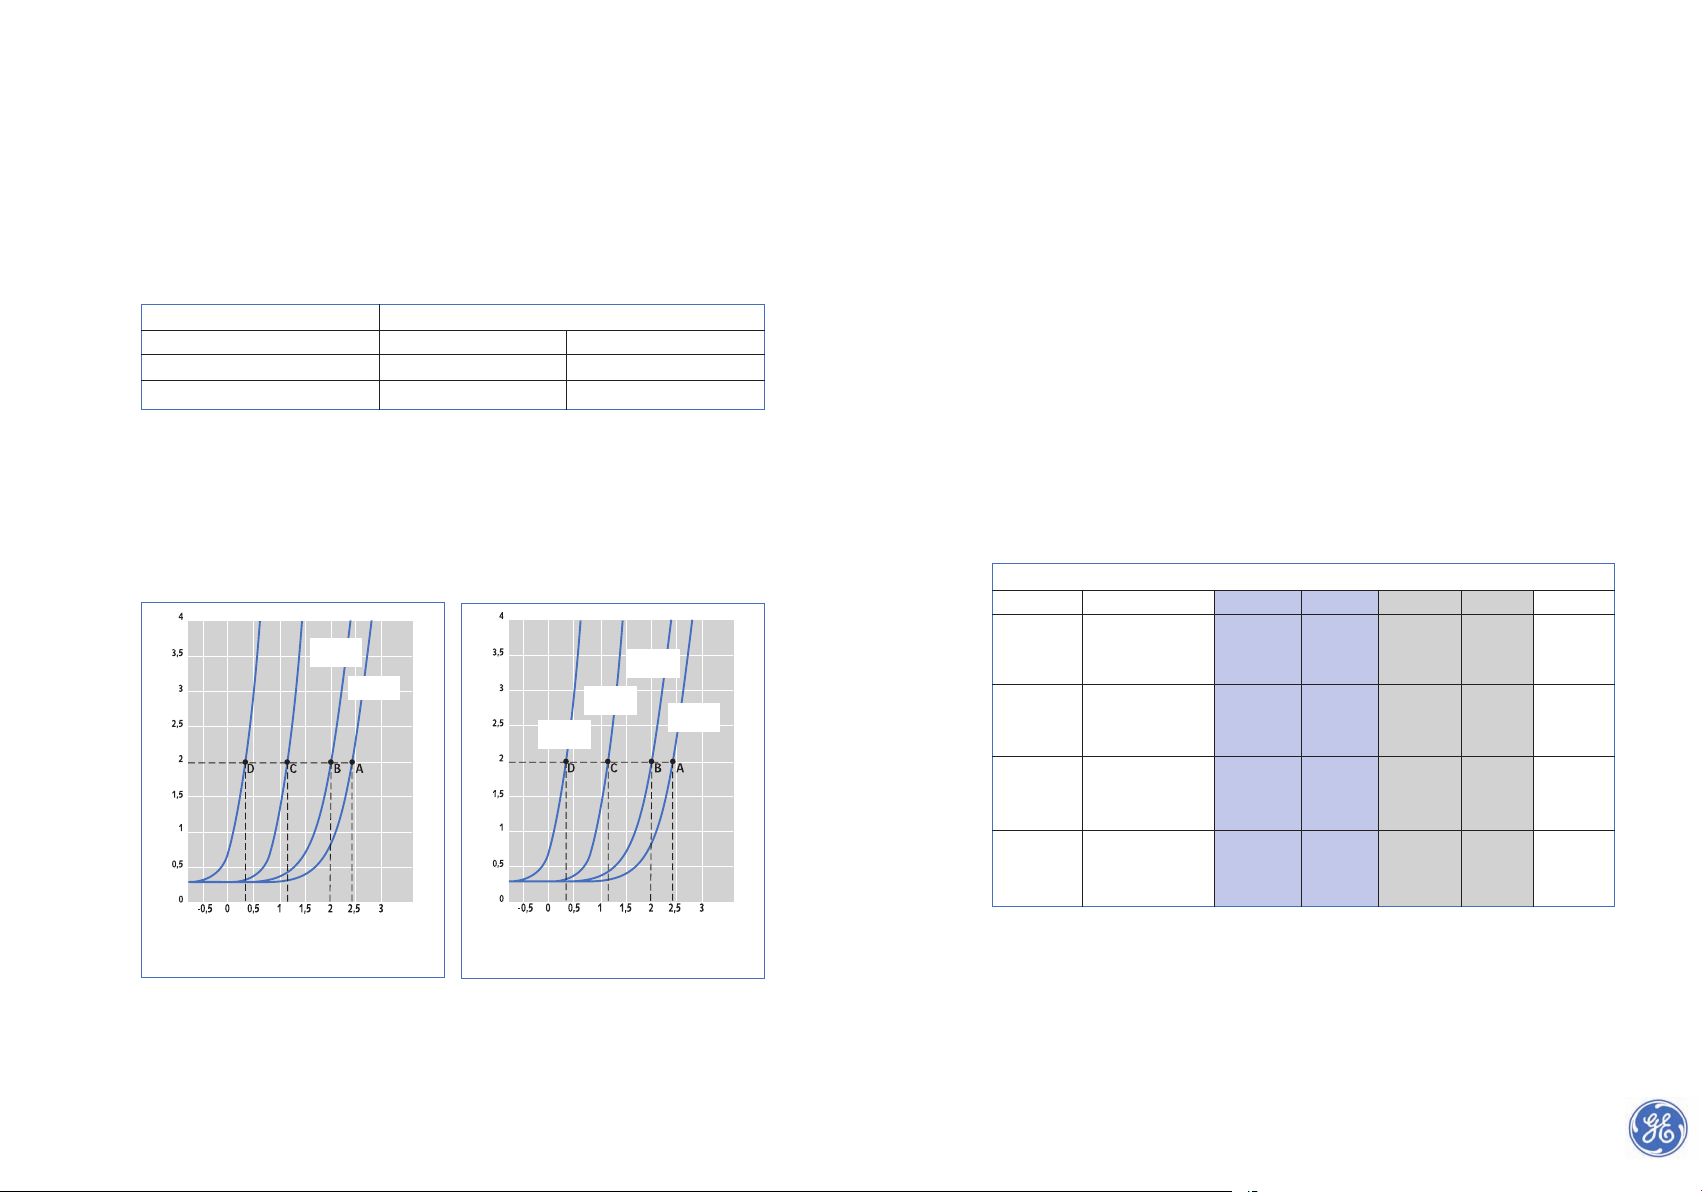
On balance for on-stream inspection, the relative time saving is much smaller; usually no
more than a factor 2 for an F6-film (at Ir192 and Co60) instead of 10 in the D7 lead screen
technique. See the bold figures (2.5 and 1.7) in table 2-6.
Figure 6-6 gives an overview of graphs from which the relative exposure times can be deduced when using different films and screens at 200 kV, (for film-density 2). The graph shows
that an F8-film with RCF screen (point C) is approximately 8 times faster than a D8-film
with lead (point B) and approximately 15 times faster than a D7-film with lead (point A).
Since on-stream examination as well as examination of concrete, and also flash radiography (see section 18.7) allow concessions to image quality, a special fluorometallic screen
(NDT1200) has been developed with extremely high light emission. In combination with
an F8-film it may result in a reduction in exposure time at a factor 100 at 200 kV, against a
D7-film with lead (point D as opposed to point A in figure 6-6), or even a factor 140 to 165,
depending on source selection, see table 2-6. The intensification factor of the NDT1200
screens increases significantly at lower temperatures.
Table 2-6 shows the effect of radiation hardness on relative exposure times for the various
film/screen combinations compared with D7 film with lead screen.
Noticeably, for the NDT1200 screen and F-8 film the factor increases with the increase in
energy, but for the F6 film the factor decreases at energy levels exceeding 300 keV.
It is clear from the above tables and graphs that there are many ways to reduce the exposure time or radiation dose needed. The required image quality is decisive (a higher exposure rate automatically means reduced image quality), and next the economic factors, for
example the cost of the screens against time saved need to be weighed.
5756
To achieve satisfactory radiographs with fluorometallic screens, they should be used in
combination with the appropriate F-film type.
When used correctly and under favourable conditions, exposure time can be reduced by a
factor 5 to 10, compared with D7 film in combination with lead screens. This is not a constant factor because the energy level applied (radiation hardness) and ambient temperature also affects the extent of fluorescence. For example, at 200 kV a factor 10 can be achieved, but with Iridium192 (nominal value 450 kV) it will only be a factor 5 compared to D7
film. Table 1-6 shows the relative exposure factors for the RCF-technique.
A total processing cycle of a few minutes is possible with the use of an automatic film processor which makes it a very attractive system to deploy offshore (on lay barges) where
weld examination has to be done at a very fast rate and few concessions are made towards
image quality. Fig. 5-6 shows that a time saving at 10
(3.7-2.8)
or 10
0.9
works out at approxi-
mately a factor 8. The actual time saving is often closer to factor 10.
These RCF screens are also used for “on-stream” examination - also known as profile radiography- (see section 18.6), whereby long exposure times and mostly hard (gamma) radiation are applied because of the penetrating power required. However, the relatively long
exposure time (causing reciprocity) and hard radiation (Cobalt60) together considerably
reduce the light emission effect, as tables 1-6 and 2-6 show.
Film system Relative exposure time
200 kV Ir192 (450 kV)
F6 + RCF screens 0.1 0.2
D7 + lead screens 1.0 1.0
Table 1-6. Relative exposure factors for RCF technique
Table 2-6. Relative exposure times for NDT1200, RCF and lead screens.
Relative exposure times
Energy level Screen type Film F8 Factor Film F6 Factor Film D7
100 kV NDT1200 0.01 100 0.05 20
RCF 0.03 33 0.17 6
none 1
300 kV NDT1200+Pb 0.008 125 0.04 25
RCF 0.02 50 0.13 8
Lead 1
Ir192 NDT1200+Pb 0.007 140 0.06 17
450 keV RCF 0.035 30 0.4 2.5
Lead 1
Co60 NDT1200 0.006 165 0.1 10
1.25 MeV RCF 0.04 25 0.6 1.7
Lead 1
F6+
RCF screen
F8 +
NDT 1200
F8+RCF
D8+lead
D7+lead
density
density
log. rel.bel. log. rel.bel.
D7+lead
Fig. 5-6. Relative exposure time RCF and lead
intensifying screen, for 300kV
Fig. 6-6. Speed comparison F8 film +NDT1200
and RCF versus D7 and D8 +lead, for 200kV
Page 31

5958
7
The X-ray film
and its properties
7.1 Structure of the X-ray film
An X-ray film, total thickness approx. 0.5 mm, is made up of seven layers,
see figure 1-7 consisting of :
A transparent cellulose triacetate or polyester base (d). On both sides of this base
are applied:
• a layer of hardened gelatine (a) to protect the emulsion
• emulsion layer (b) which is suspended in gelatine, sensitive to radiation
• a very thin layer called the substratum (c)
which bonds the emulsion layer to the base
The normal X-ray film, therefore, has two coatings of emulsion doubling the speed
compared to a film with a single emulsion layer. Photographic emulsion is a substance
sensitive to ionising radiation and light, and consists of microscopic particles of silver
halide crystals suspended in gelatine.
Note: In the past radiography on paper was not unusual. In this ‘ instant cycle’ process
results became available within 60 seconds. The quality of the images, however, was extremely poor and the life of the film limited to a few months.
The availability of better and faster “instant cycle” techniques such as digital radiography
(see chapter 16), has made radiography on paper obsolete.
7.2 Radiographic image
Latent image
When light or X-radiation strikes a sensitive emulsion, the portions receiving a sufficient quantity of radiation undergo a change; extremely small particles of silver halide
crystals are converted into metallic silver.
These traces of silver are so minute that the sensitive layer remains to all appearances
unchanged. The number of silver particles produced is higher in the portions struck by
a greater quantity of radiation and less high where struck by a lesser quantity.
In this manner a complete, though as yet invisible, image is formed in the light-sensitive layer when exposure takes place, and this image is called the “ latent image”.
Before and after exposure, but prior to development of the film, the latent image has a
shiny pale green appearance.
a.layer of
hardened gelatine
b. emulsion layer
b. emulsion layer
c. substratum
(bonding layer)
c. substratum
d. cellulose
triacetate or
polyester base
a.layer of
hardened gelatine
Fig. 1-7. Schematic cross-section of an X-ray film, total thickness approx. 0.5 mm.
Page 32

61
7.4 Characteristic curve (density curve)
The characteristic or density curve indicates the relationship between increasing exposures
and resulting density. By exposure (E) is meant the radiation dose on the film emulsion. It
is the product of radiation intensity (Io) and exposure time (t), therefore: E = Io.t
The ratio between different exposures
and related densities is not usually plotted
on a linear scale but on a logarithmic
scale; i.e. density D versus log E.
The curve is obtained by applying increasing exposures to a series of successive
areas of a strip of film, whereby each following exposure is a certain factor (for
example 2) greater than the previous one.
After development, the densities (D) are
measured by means of a densitometer and
then plotted against the logarithmic
values of the corresponding exposures
(log E). The points obtained are then joined together by a continuous line. It is not
necessary to know the absolute exposure
values; relative values can be used, so at a
fixed X-ray intensity only exposure time
needs to be changed.
Density (D) of a photographic emulsion does not increase linearly with exposure (E) over
the entire density range, but has a shape as in figure 2-7. The lower part of the curve (a-b)
is called the “toe”, the middle part (b-c) is called the “straight line (linear) portion”, and the
upper part (c-d) is called the “shoulder”. Usually the characteristic curve of industrial X-ray
films shows an S-like shape.
The shoulder of a characteristic curve relating to industrial X-ray film corresponds to densities higher than 4. Since such densities are too high for normal film viewing, the curve from
density D = 3.5 upwards is shown as a broken line.
It should be noted that the straight-line portion (b-c) is not truly straight, but slightly
continues the trend of the toe of the curve.
60
Developing the latent image
Development is the process by which a latent image is converted into a visible image. This
result is obtained by selective reduction into black metallic silver of the silver halide crystals
in the emulsion. These crystals carry traces of metallic silver and in doing so form the latent
image. Several chemical substances can reduce the exposed silver halides to metallic silver:
these are called “developing agents”.
7.3 Characteristics of the X-ray film
The use of X-ray film and the definition of its characteristics call for an adequate knowledge of sensitometry. This is the science which studies the photographic properties of a film,
and the methods enabling these to be measured.
The density (or blackness) of the photographic layer, after development under closely defined conditions, depends on exposure. By exposure is meant a combination of radiation
dose striking the emulsion, that is to say intensity (symbol I) and the exposure time (symbol t). In sensitometry, the relationship between exposure and density (I.t) is shown in the
so-called characteristic curve or density curve.
Density (optical)
When a photographic film is placed on an illuminated screen for viewing, it will be observed that the image is made up of areas of differing brightness, dependent on the local optical densities (amount of silver particles) of the developed emulsion.
Density (D) is defined as the logarithm to base 10 of the ratio of the incident light Ioand
the transmitted light through the film It, therefore: D = log (Io/ It) . Density is measured
by a densitometer, see section 9.2.
Industrial radiography on conventional film covers a density range from 0 to 4, a difference corresponding with a factor 10,000.
Contrast
The contrast of an image is defined as the relative brightness between an image and the
adjacent background.
The contrast between two densities D1and D2on an X-ray film is the density difference
between them and is usually termed the “radiographic contrast”.
Film contrast, or emulsion contrast, are rather vague terms used to describe the overall
contrast inherent in a particular type of film. When an emulsion type shows most of the
image contrasts present, the film is said to be “of high contrast” or “hard”.
For the measurement of film contrast, the term “ film gradient” is used, for which the symbol is G
D
. Suffix Dindicates the density at which G is measured.
Fig. 2-7. The characteristic curve for an
industrial X-ray film
log E (exposure) – relative units
density D
a
Page 33

A steeper gradient means an increase in
density difference at equal radiation dose
and so a greater contrast, resulting in better
defect discernibility. If one requires high
contrast, it is therefore necessary to use the
highest possible density radiograph, while
remaining within the acceptable density
range of the viewing screen so as not to
impede film interpretation.
Most codes of good practice ask for densities
between 2.0 and 3.0 in the relevant area of
the image.
Table 1-7 shows the loss in contrast on
typical film as density values obtained fall
below 3.0 .
The specimen in figure 6-7 containing a
small step is radiographed with an exposure
time resulting in a density difference of 0.5
(B minus A). If now, using the same type of
film and the same tube voltage, a longer
exposure time is given, the density difference
is 0.9 (D minus C). The second radiograph,
therefore, shows more contrast.
Fig. 5-7. Gradient/density curves
for three types of film:
A low sensitivity: very fine grain film (D2)
B average sensitivity: fine grain film (D4)
C high sensitivity: medium grain film (D8)
density
6362
Gradient of the density curve
The density curve shows one of the most important characteristics of a film. The slope of
the characteristic curve at any given point is equal to the slope of the tangent line at this
point. This slope (a/b in figure 3-7), is called the “film gradient” G
D
, “film contrast” or the
“film gamma”.
Average gradient
The straight line connecting two points on a characteristic curve, as figure 4-7 shows, is
equal to the “average gradient” of the segment of the curve linking these two points. This
gradient (G
D
) is the average of all gradients in the segment between density values 3.50
and 1.50, and is a standard characteristic of a particular type of radiographic film.
In all films (for example D2 through to D8) the gradient (a/b) increases with increasing
density within the for conventional viewing screens useful density range of D<5.
The various types of films are not identical. This becomes clear if plotting the values of
gradient G
D
against the density resulting in the gradient/density curves, as shown in
figure 5-7. At higher film sensitivity the gradient is lower and, hence, the density curve
less steep.
Fig. 3-7. Gradient of an X-ray film
D
log.rel.exp.
Fig. 4-7. Average gradient (a/b)
of an X-ray film
Table 1-7. Contrast loss with reduced film density
D
log.rel.exp.
Density D Film contrast as a %
of the value at
D = 3.0
3.0 100
2.5 85
2.0 71
1.5 54
1.0 35
Fig. 6-7. Illustration of enhanced contrast
at increasing density
density
Page 34

65
7.5 Film speed (sensitivity)
In radiography the relationship between exposure (in C/kg) and resulting density is commonly referred to as film speed. Other than in normal photography where film speed is
indicated by a DIN or ASA number, films for industrial radiography do not carry an internationally recognised speed number.
The generally accepted method of measuring the film speed of radiographic films is to measure the exposure required to achieve a density of 2.0 above base and fog, using a specific
processing technique. The various relative exposure values are shown in table 1-8.
7.6 Graininess
When a developed X-ray film is viewed in detail on an illuminated screen, minute density
variations are visible in a grainy sort of structure. This visual impression is called “graininess”
and a measurement of this phenomenon establishes a degree of “granularity”.
64
Effect of developing conditions on the density curve
The characteristic curve of an X-ray film is not only determined by the emulsion characteristics but also by the way the film is developed. Parameters which can influence the characteristic curve are: developing time and its temperature, developer concentration and
agitation.
The effect of, for example, the developing time on speed (relative exposure factor),
contrast and fog, has been made visible in figure 7-7. Initially, up to approx. 4 minutes,
speed and contrast are low but increase rapidly with developing time.
From 8 minutes on, a further increase in developing time increases the background fog,
and eventually a decrease in contrast will occur.
Although it is possible to compensate, to a certain extent, for minor variations from the correct radiation exposure by adapting the developing time, normally a fixed time is maintained. In manual developing the standard time is 5 minutes. Developer type, film agitation
in the tank and temperature also influence density. That is why the overall developing process should preferably be standardised or automated. In most cases, deviating from the
optimum developing conditions leads to reduced image quality.
Fig. 7-7.
Film characteristics at various
developing times
developing time (min)
relative exposure factor contrastdevelopment fog
industrial X-ray film developer G128 at 20ºC
speed
development fog
contrast effect
(average gradient for
densities between
1.5 and 3.5)
Page 35

8
Film types
and storage of films
67
Industrial X-ray films are produced by a limited number of manufacturers in an assortment
for use with or without intensifying screens and filters. The selection of a particular film
type not only depends on economics but in particular on the required, often prescribed,
image quality.
8.1 The Agfa assortment of film types
The films produced by Agfa are exclusively marketed world-wide by GE Inspection
Technologies. The assortment of industrial standard radiographic film comprises the following types in sequence of increased speed and granularity : D2, D3, D4, D5, D7 and D8,
complemented with the very fast films F6 and F8.
The ultra-fine-grain D2-film is used in the radiography of very small components, when
optical magnification is applied to allow very fine details to be observed. D3 also exists as
D3 s.c. (single coating) as alternative for D2 and is extremely suitable for optical enlargements in case of very small components which require large magnification factors of the
image. Moreover this type of film is suitable for neutrography, see section 17.5. D8 is used
for the examination of big castings and steel reinforced concrete. D10 film is also produced
for exposure monitoring purposes, see section 19.6. Figures 1-8 and 2-8 show the relationship between film speed and image quality and film contrast respectively.
In addition to these graphs, figure 27-16 gives a graphical representation of relative image
quality as a function of relative dose and exposure time (film speed) for D-films and
computer-assisted CR and DR techniques.
Agfa has developed special intensifying screens specifically for use in combination with F6
and F8 films, see section 6.3. These so-called rapid cycle film screens are usually referred
to as RCF-screens indicated as Agfa NDT1200. F8 has the highest film speed. Depending
on quality requirements, F6 is mostly used for weld inspection on lay barges and on-stream
application (profile radiography); since it shortens examination time by a factor 10, see
section 6.3. This combination can also be used for (hand held) flash radiography to enable
lowest possible dose to make a quick but nevertheless suitable image.
Film and screens are available in a wide variety of sizes and packings. For example as separate items to create a specific combination of film and screen or fully prepared for the job
in daylight packing including lead screens and evacuated (Vacupac) to guarantee the best
possible contact between film and screens. Films with screens are available on a roll
(Rollpac) to cut suitable lengths, or even precut at a specified length for large jobs which
require large numbers of identical film lengths, e.g. for girth weld inspection of long
distance pipelines. Last but not least films can be made in sizes on customer demand.
66
Fig. 1-8. Image quality versus film speed
The film speed is presented on a linear scale
Fig. 2-8. Contrast versus film speed
D2
D2
D3
D3
D4
D4
D5
D5
D7
D7
D8
D8
image quality - better
film speed
faster
image quality - better
film speed
faster
Page 36

Part of the Agfa film range with relative exposure factors and code classification has been
listed in table 1-8 for various radiation intensities :
Note I: It is common practice to compare relative exposure factors with those of D7 film, which
are shown bold as reference value 1.0 in the table.
Note II: The numbers (1) to (5) used in the table indicate the use of the following screen types:
1 without lead screens
2 with lead screen 0.027 mm thickness
3 with lead screen 0.027 mm thickness
4 with lead screen, front 0.10 mm, back 0.15 mm thickness
5 with fluorometallic screen (RCF)
Note III: Developing process for table 1-8: automatic, 8 minute-cycle, 100 seconds immersion
time in developer G135 at 28˚C.
Note IV: The relative exposure factor depends not only on radiation intensity, but also on exposure time and is, therefore, not a constant value.
6968
Figure 3-8 shows graphs of relative exposure time versus density for the entire Agfa D-film
range. For density 2, the difference between a D8 and a D2 film is a factor 14 (10
(3.25-2.1)
),
at 200 kV.
Filmtype
Fig. 3-8. Density graphs of the
Agfa film range D2 through to D8
with lead intensifying screens at 200 kV
and automatic film development.
Note: Developing process for figure 3-8 above:
Automatic, 8 min cycle, 100 seconds immersion time in developer G135 at 28˚C.
Table 1-8.
Listing of various Agfa films and their relative exposure factors and film system classification
log.rel.exp.
density
Film type Relative exposure factors Film system
Class
100 kV 200 kV 300 kV Ir192 Co60 EN 584 -1 ASTM
(1) (2) (3) (4) E 1815
D2 9.0 7.0 8.0 9.0 C1 Special
D3 4.1 4.3 5.0 5.0 C2 1
D4 3.0 2.7 3.0 3.0 C3 1
D5 1.7 1.5 1.5 1.5 C4 1
D7 1.0 1.0 1.0 1.0 1.0 C5 2
D8 0.6 0.6 0.6 0,6 C6 3
F6+RCF (5) 0.174 0.132 0.389 0.562
F8+RCF (5) 0.03 0.022 0.035 0.040
Page 37

7170
8.2 Film type selection
Most procedures and codes of good practice for the performance of industrial radiography
base the choice of type of film for a specific application on the EN or ASTM classification
systems. For weld inspection, when one is attempting to detect small cracks, a film of class
C2 or C3 would be specified. For the examination of castings or general radiography a film
of class C4 or C5 would normally be used. For small component inspection, where the
image might be viewed under magnification to reveal small details, a film of class C2 or
possibly even a single emulsion film of class C1 would be desirable.
In megavoltage radiography, because most equipment have a very high radiation output,
class C3 films can be used for objects of great wall thickness. This has the advantage that a
high film gradient can be achieved.
8.3 Film sizes
Film sizes in industrial radiography are to a large extent standardised according to
ISO 5565. Non-standard sizes are possible. Standard film sizes and metal screens are
supplied separately, but can also be supplied vacuum-packed so that the risk of film faults
is considerably reduced. For weld inspection there is so-called Rollpac film strip on the
market which is available on a roll together with the lead screen. For very large projects the
strip film can even be pre-cut to suit a particular weld length or pipe/vessel circumference.
8.4 Handling and storage of unexposed films
The conditions under which unexposed films are handled and stored play a very important
role in the final quality of the exposed film. Recommendations for handling and storage
are contained in, for example, ASTM E1254. “Pre-exposure” as a result of background radiation must be avoided as it causes unacceptable fogging of the film.
If films are to be kept for a longer period, the following storage conditions must be
adhered to:
• background radiation levels below 90 nGray
• temperatures below 24˚C
• relative humidity levels below 60 %
• away from X-ray film chemicals
• preferably stacked on edge
In the long run, minor fogging will occur to films stored. Background fog to a maximum
density of 0.3 is considered acceptable.
Page 38

9
Exposure chart
73
9.1 Exposure chart parameters
Codes for the inspection of welds and castings specify the maximum allowed radiation
intensity, based on the type of material and the thickness of the object. Exposure charts are
necessary to etablish the correct exposure value. A universal exposure graph or slide-rule
can be used for radioactive sources, as these have a fixed natural radiation spectrum.
The radiation spectrum of X-ray tubes varies with each tube, even if they are of the same
type. This problem is easily solved by using a universal exposure chart for the specific type
of tube, and then individualise it for each tube, the so-called “curve fitting”. The adaptation
is normally limited to a zero-point correction, based on a few measured values obtained by
trial. Sometimes the gradient of the exposure graph needs to be adjusted as well.
An exposure chart is produced by making a series of radiographs of a step wedge as
illustrated in figure 1-9.
The radiation intensity level of most X-ray equipment is expressed by the amperage of the
current through the X-ray tube, measured in milliampères (mA).
The exposure (radiation dose) is specified as the product of radiation intensity and
exposure duration in mA.min. (intensity x time).
The exposure chart shows the relationship between the thickness of the object (in mm) and
the exposure value (for X-ray tubes in kV and mA.min; for sources in GBq/h).
The exposure chart is applied for:
1. a given density, for example: 2 or 2.5
2. a given film-screen combination, for example D7 with lead screens
3. a given type of material, for example steel
The chart depends amongst others on:
4. type of X-ray equipment or radioactive source
5. source-to-film distance, usually 800 mm
6. development conditions, for example: automatic, 8 minutes at 28°C.
72
X-ray photograph of a Van Gogh painting, presumably a self-portrait, on canvas.
X-rays are made to prove a paintings authenticity, check the condition of the canvas material,
or determine possible paint-overs.
Cadmium and/or lead in the paint absorb radiation, thus forming an image.
Applied X-ray process data: 30 kV, 10 mA.min, Agfa D4 without lead screens and a source-to-film
distance of 100 cm.
Page 39

75
9.2 Densitometer
A densitometer is used to accurately measure the photographic (optical) density at any spot
on a radiographic film. For most types of densitometers the size of the measured area is
approx. 1 mm
2
. The measuring range runs from density 0 to 4.
Since it is a logarithmic scale, this equals a factor 10,000 (10
4
) in density.
It is very important to regularly recalibrate these instruments, particularly around values
2 and 2.3, since those are the minimum densities (depending on class: A or B) which a film
must have in accordance with standard EN 444, to allow it to be interpreted.
Densitometers are supplied with reference material (density strips) to re-calibrate them.
Regular recalibration, at least once a year according to code, is essential.
The most commonly used density strips deteriorate quickly as a result of scratching and disintegration of the sealed transparent wrapping in which they are usually kept.
Their service-life, depending on use, is usually not much longer than six months. Agfa has
developed the “Denstep” density step wedge film and has succeeded in considerably
extending the service-life of these strips by supplying them in special wear proof wrapping.
These density strips are certified and have a guaranteed minimum service life of four years.
The 15 steps of the “Denstep” comprise a density range from 0.3 to 4.
9.3 Producing an exposure chart for X-rays
The step wedge
The production of an exposure chart calls for either a large
step wedge or a series of
plates of different thicknesses
made from the same material
to which the chart relates.
The increase in thickness
between each consecutive
step is constant, but varies for
different materials from
0.5mm to several millimetres.
For examinations using a tube voltage of less than 175 kV the thickness of the wedge might
increase by 0.5 or 1.0 mm at each step, while for radiographs using a higher tube voltage
the increase could be in the order of 2-3 mm. In addition several flat plates made from the
same material and of a specified thickness (e.g. 10 mm) should be available.
If the thickness range of a step wedge runs from, say, 0.5 to 10 mm, the step wedge and flat
plate together would give a thickness range of 10.5 – 20 mm
74
Type of X-ray equipment
Among the factors to be taken into account are: the voltage (in kV), whether alternating or
direct current, the limits of voltage adjustment and the current through the tube (in mA).
It follows that the exposure chart is unique for a particular X-ray set.
The radioactive source
Radiation intensity and half-life-time of the source have to be taken into account.
Source-to-film distance
The exposure chart for an X-ray set is produced for a specified source-to-film distance. If
another distance is used, corrections will be necessary, using the inverse square law.
Intensifying screens
When drawing up the exposure chart, intensifying screens used must be recorded and the
same type of screens used again when making radiographs.
Type of film
The type of film must be indicated on the exposure chart, since the various types of
industrial X-ray films are substantially different in sensitivity (speed).
Density
An exposure chart must be as accurate as possible. Densities indicated are to be measured
by a densitometer, see section 9.2. The radiographs that form the basis for the chart must
have been made under controlled and reproducible conditions, whereby quality monitoring tools such as PMC strips as described in section 10.6 are used.
Developing process
Developer formula, processing temperature and developing time all influence the final
result. The exposure chart produced will be related to a particular well-defined developing
process.
Fig. 1-9. Step wedge
Page 40

77
The “density-thickness (preliminary) charts” as described, provide the data needed to
prepare the final exposure chart. In order to eliminate any inaccuracies, an intermediate
chart (based on the preliminary charts) is prepared for density 2, using the data already
recorded in the first charts.
This is how the “thickness-tube voltage chart” of figure 3-9 is arrived at. Points relating to
the same series of exposures are then joined in a smooth line producing the intermediate
curves for 8 mA.min and 200 mA.min. In this way deviations in the results of any of the
radiographs can be compensated for.
76
Preliminary charts
Before producing an exposure chart it is useful to first draw up preliminary charts, the
so-called “density-thickness chart” for the voltage range of the specific X-ray set and a
“kV- thickness chart”.
The two preliminary charts are produced on the basis of the following data:
1. X-ray set: tube voltage 60-200 kV, tube current 5-10 mA
2. Filter: none
3. Source-to-film distance: 80 cm
4. Material: steel
5. Intensifying screens: none
6. Type of film: D7
7. Density: 2.0
8. Development: automatic, 8 minutes at 28°C in G135 developer
Exposures
Using a tube current of say 8 mA and an exposure time of 1 minute (i.e. 8 mA.min) radiographs of the step wedge are made at voltages of, for example 75, 90, 105, 120, 135, 150,
165, 180 and 195 kV. Only a narrow strip of the film is used for each exposure. The same
process is repeated at, say 10 mA with an exposure of 20 minutes (i.e. 200 mA.min).
Measuring the density
After development of the radiographs, the density of all steps is measured by a densitometer, see section 9.2.
Drawing up the preliminary charts
The densities measured are plotted graphically against the material thickness for
which they were obtained. A smoothly curved line then joins the points relating to one
particular voltage. The result is two preliminary charts (figure 2-9), made at 8 mA.min and
200 mA.min.
Fig. 2-9. Density-thickness preliminary charts
Fig. 3-9. Thickness versus tube-voltage preliminary chart
density=2
Page 41

79
Therefore, an exposure chart for each individual X-ray set should be drawn up. This is an
excellent way to become familiar with the equipment, while time and money put into this
work will be amply repaid at a later stage.
Exposure charts for gamma-ray examination are drawn up in a similar way as described
above. Figure 5-9 shows one for a Cobalt60 source. A specially designed slide-rule can also
be used, since there is no need to consider individual radiation spectra as for X-ray tubes.
Figure 6-9 shows a similar exposure chart for an Iridium192 source.
78
9.4 The exposure chart
The exposure chart should be drawn on uni-directional logarithmic paper. The material
thickness (in mm) is plotted on the horizontal linear axis and the exposure value (in
mA.min) on the vertical logarithmic axis. For a given kilovoltage (for example 150 kV), we
can, using the previously described intermediate kV-thickness chart, determine that for an
exposure dose of 8 mA.min a density of 2 can be obtained at a thickness of 4.5 mm and for
an exposure dose of 200 mA.min, at a thickness of 15.2 mm.
These thicknesses, and the corresponding exposures, are then plotted on the graph paper
to give points A and B, see figure 4-9. Drawing a straight line linking points A and B, the
150 kV line is obtained. In a similar way the lines for other kV-values can be drawn in the
diagram, eventually resulting in the complete exposure chart of figure 4-9.
9.5 Use of the exposure chart
While it may be possible to gradually build up a store of information which can be consulted in day-to-day work, it is better to make use of good exposure charts. This system has
many advantages to offer, particularly when it comes to choosing the most suitable working method. Apart from saving time, it gives a guarantee of efficiency and moreover does
away with, or reduces to an acceptable extent, the need for trial exposures on jobs which
are a little outside the normal routine.
Different X-ray tubes can in practice give quite different results, even though they may be
of the same type. Even a different cable length between the control panel and the tube may
be of influence.
Fig. 4-9. Exposure chart for a 200 kV X-ray set
Fig. 5-9. Exposure chart for examination of steel with a Cobalt60 source
Fig. 6-9. Exposure chart for examination of steel with an Iridium192 source
FFD = focus-to-film distance
density=2
Cobalt60
Film type C3
(Agfa D4)
Steel screens
Density 2.5
Iridium192
Film type C5
(Agfa D7)
Lead screens 0.027 mm
Density 2.5
mm steel
mm steel
Page 42

9.6 Relative exposure factors
“Relative exposure factors” can be used to convert an exposure chart for one type of film
to another film, although still for the same radiation energy.
These factors are not constant for different radiation energies and should, therefore, be
used with some caution. Some examples of relative exposure factors for Agfa films are
shown in table 1-9.
These are the factors by which to increase or decrease the exposure-time when using the
types of film other than those for which the exposure charts have been prepared. In view
of the widely-varying quality of the radiation emitted by different types of X-ray equipment and the appreciably different characteristics of the various types of X-ray films made
for industrial use, caution should be exercised in applying these relative exposure factors
generally.
Darkroom technique too, plays an important role and a uniform manual or automatic
development process is, therefore, essential.
With radioactive sources, which give a constant quality (hardness/energy) of radiation, the
relative exposure factors listed can be used quite safely.
9.7 Absolute exposure times
Table 2-9, derived from reference [2], lists the widely varying absolute exposure times
when different radiation sources are used for radiography on steel of varying thickness.
The relative exposure factors from table 1-9 for both types of film can be recognised
in this table.
9.8 Use of the characteristic (density) curve
with an exposure chart
In the following examples the tube voltage and focus-to-film distance (FFD) are assumed
to be constant, and automatic development is for 8 minutes in G135 developer at 28°C.
Example 1:
Effect of the thickness of the
object on the density of the radiographic image
It is required to radiograph, on
D7 film, a steel object comprising
two sections of different thickness of 12 mm and 15 mm.
The exposure chart figure 7-9
shows that at 160 kV and an
FFD. of 70 cm, using 10mA.min,
a density of 2 behind the section
measuring 15 mm in thickness
will be obtained.
Question: What image density
will be obtained behind the section measuring 12 mm under
these given conditions?
80
Type of film Relative exposure factors
100 kV 200 kV 300 kV Ir192 Co60
(1) (2) (3) (4)
D2 9.0 7.0 8.0 9.0
D3 4.1 4.3 5.0 5.0
D4 3.0 2.7 3.0 3.0
D5 1.7 1.5 1.5 1.5
D7 1.0 1.0 1.0 1.0 1.0
D8 0.6 0.6 0.6 0.6
RCF+F6 (5) 0.174 0.132 0.389 0.562
RCF+F8 (5) 0.03 0.022 0.035 0/040
Table 1-9. Relative exposure factors. For (1) to (5) refer table 1-8.
Table 2-9. Absolute exposure times for steel of varying thicknesses, derived from [ref. 2]
X-ray tube Gamma source Linac
Energy 100 kV 250 kV 300 kV 450 keV 1,25 MeV 8 MeV
mA 3 10 10
Exp. C/Kg.s 1.8 4.7 5000
FFD. mm 500 700 700 1000 2000 2000
Film type D4 D7 D4 D7 D4 D7 D4 D7 D7 D7
Mat.thickness
Exposure time in seconds
15 mm 50 10
25 mm 100 20 70 15 80
50 mm 1080 210 660 210 6300 1980 1680
100 mm 6300
150 mm 32400 10
200 mm 30
400 mm 4200
Fig. 7-9 Exposure chart for D7
Material = steel; density = 2; ffd = 70 cm;
screens = 0.02 mm lead;
Automatic processing, with developer G135 at 28°C,
8 min. cycle.
81
Page 43

83
Method and answer
The characteristic curve (fig. 9-9) shows that at the measured densities of 1.5 and 0.5
respectively, the corresponding logarithm of relative exposures are 2.15 and 1.65.
Since density 3.0 should not be exceeded, the area which is most important for interpretation, which showed density 1.5 on the first exposure, must now display 3.0
Characteristic curve, figure 9-9, shows that density 3.0 corresponds with log.rel.exp.
2.45 and the difference between the two values amounts to 2.45 - 2.15 = 0.3.
This means that the exposure time must be doubled (10
0.3
= 2), resulting in a radiation
dose of 30 mA.min. This answers the first question.
If the exposure time is doubled, the log.rel.exposure of the lowest density value
originally measured will increase by 0.3, i.e. 1.65 + 0.3 = 1.95. The corresponding
density will be 1.0 (fig. 9-9).
The average gradient between the upper and lower densities on the original radiograph
was (1.5 - 0.5) / (2.15 - 1.65) = 2.0.
The average gradient on the new radiograph is (3.0 - 1.0) / (2.45 - 1.95) = 4.0, so the
average contrast has doubled.
82
Method and answer
The exposure chart (fig.7-9) shows that under the conditions mentioned above density
D = 2 is obtained on D7-film through the 15 mm thick section, using an exposure of
10 mA.min, point A on the chart.
Under the same conditions the
12 mm section would require an
exposure of 5 mA.min (point B in
the chart), which means an exposure ratio of 10/5.
The exposure through the 12 mm
section is two times greater than
through the 15 mm section.
The logarithm of this ratio equals:
0.3 (log 2 = 0.3).
The characteristic curve (fig. 8-9)
of the D7-film shows that density 2
corresponds to log relative exposure 2.2 (point C in fig. 8-9).
At 12 mm the log. rel. exposure is
2.2 + 0.3 = 2.5.
The corresponding density is then
3.5 (point D in fig. 8-9)
Example 2:
Effect of exposure on contrast
Assume that when an exposure
of 15 mA.min is used for a
radiograph on D7-film, both
average density and contrast
prove to be too low after processing. The highest and lowest
density in the most relevant
section of the image are only
1.5 and 0.5.
The intention was to make a
radiograph with a maximum
density of 3.0.
Questions:
What exposure time would be required for the same radiation intensity and
what contrast increase would be achieved?
Fig. 8-9. Characteristic (density) curve of the D7-film
Fig. 9-9. Characteristic density curve of the D7-film
film
base
log.rel.exp.
log.rel.exp.
density
density
film
base
Page 44

10
Processing and
storage of X-ray films
85
Film developing is the process by which a latent image, see section 7.2, is converted into
a visible image. The crystals in the emulsion - carriers of the silver traces forming the
latent image - are transformed into metallic silver by selective reduction as a result of
which the visible image is created. The development procedure must be carried out
carefully to achieve this and guarantee successful archiving over a longer period.
Manual developing is a laborious process that must be carried out meticulously in order
to get the high quality results.
For increased efficiency and uniform quality, X-ray films are more commonly processed
automatically. The manual process is, however, still frequently applied.
It will therefore be useful to describe manual processing in this chapter and so become
familiar with the developing process.
10.1 The darkroom
Entrance and colour
For practical reasons the darkroom needs to be as close as possible to the place where
the exposures are made, although naturally out of reach of radiation.
The darkroom needs to be completely lightproof, so the entrance must be a “light-trap”
usually in the form of two doors, (one after the other), a revolving door or a labyrinth.
In practice the labyrinth is found to be the best arrangement, although it does take up
a comparatively large space. The walls of the passage are painted matt black, and a
white stripe about 10 cm wide running along its walls at eye-level is enough as a guide.
Inside the darkroom itself, the walls should preferably be painted in a light colour; light
walls reflect the little light there is and are easier to keep clean.
Darkroom lighting
X-ray films are best-processed in normal orange-red (R1) or green (D7) darkroom
lights. The distance between film and darkroom lighting needs to be considered, depending on the sensitivity of the film and the duration of the development process.
The “light safety” of the darkroom lighting can be tested by covering half of a pre-exposed film (density 2) lengthways, leave it for 5 minutes and then process it as usual.
The difference in density may not exceed 0.1.
84
Preparation for an X-ray exposure of a painting by Rembrandt
Page 45

87
Developer
Development fog, graininess and contrast are dependent on the type of developer,
which is preferably made up to suit the film used.
If a concentrated manual developer is used, for example G128 made by Agfa, and the
developer tank has a capacity of, say, 25 litres, then all to do is pour 5 litres of the concentrated developer into the tank and add 20 litres of water (ratio 1 part of concentrate to 4 parts of water). G128 developer is also used as a replenisher, in which case 3
parts of water are added to 1 part of concentrate.
Fixer
Fixer too is supplied as a concentrated liquid (G328). The same instructions as for preparing developer apply here.
Developing times and bath temperatures
The film is clipped on or slipped into a frame, depending on the type of frame, and hung
in the developer tank. As soon as the film is submerged in the developer, the darkroom
timer is set for the required number of minutes. The optimal developing time is the time
at which the most favourable “contrast to fog ratio” is achieved. Minor deviations from
the correct exposure time may be compensated by adjusting the developing time.
The recommended developing time for Agfa films in G128- manual developer is
5 minutes at 20°C. In the automatic process using G135 developer, the developing time
is 100 seconds at 28°C. Deviating from the recommended developing times and
temperatures will almost always lead to reduced image quality (e.g. increased coarsegraininess).
Raising the tank temperature will speed up the development process as table 1-10
shows, but the developer will oxidise more rapidly. Should it not be possible to achieve
a bath temperature of 20°C, the following developing times can be used at the
temperatures as indicated in table 1-10. This applies to all D-type films.
The temperature of the developer shall never be less than 10°C, but is preferably
higher than 18°C to obtain optimal image contrast. It is best to always maintain the
same developing conditions, so that the exposure technique can be matched to these
and uniform results obtained.
86
Another method is to place an unexposed film on the workbench and cover part of it up
with a sheet of cardboard, which is then gradually removed so as to produce a series of
different exposures. By developing the film in the usual way, it will then be possible to
see how “safe” the light is, and how long a film can be exposed to it before it exceeds the
maximum acceptable difference in density of 0.1.
Darkroom layout
The darkroom should preferably be divided into a dry side and a wet side. The dry side
will be used for loading and emptying cassettes, fitting films into developing frames and
so on - in short, for all the work that does not allow dampness.
On the wet side, the films will be processed in the various tanks of chemical solution.
For efficient working, and to ensure uniform quality, there should be automatic control
of the temperature of the solutions.
Tanks
In processing tanks used in the manual process, films are held vertically in their frames.
These tanks can be made of stainless steel or plastic. The dimensions of the tank must
be suited to the size and number of films to be processed. There must be a space of at
least 1.5 cm between films. The top edge of the films must be approx. 2 cm below the
surface of the solution.
The wet side of the darkroom will have five tanks, arranged in the following sequence:
1. developer tank
2. stopbath or rinse tank
3. fixer tank
4. final wash tank
5. tank for wetting solution
10.2 Chemicals and film-development
Making-up processing solutions
Nowadays, chemicals are supplied as a liquid concentrate, suitable for the particular
type of film used.
The processing solutions can be prepared either directly in the tanks or in plastic buckets. In the latter case each type of solution must be prepared in a separate bucket,
which is never used for other chemicals.
Temp. °C 18 20 22 24 26 28 30
Time/mins 6 5 4 3.5 3 2.5 2
Table 1-10. Developing time versus developer temperature.
Page 46

89
Final wash
The final wash is intended to remove the residual fixer and the soluble silver compounds left behind in the emulsion, which if not flushed out, would reduce film shelf
life. Washing should preferably be done with running water, ensuring that all parts of
the film are reached by fresh water. The duration of the final wash depends on the temperature of the water. See table 2-10. Temperatures over 25°C must be avoided.
Drying in the drying cabinet
When the film is taken out of the water, the water on the film, as a result of its surface
tension, runs together to form droplets of varying size. The film will, therefore, dry unevenly, causing “drying marks”. For this reason it is advisable to immerse the films in a
solution of 5-10 ml wetting agent to each litre of water. Wetting agent reduces the surface tension of the water so that, after the film has drained, the surface will be evenly
wetted and will dry evenly with no risk of marks. Films should be hung to drain for
about 2 minutes before they are placed in the drying cabinet.
Drying should preferably be done in a drying cabinet, or alternatively in a dry and dust
free room. No drops of water must be allowed to fall on films that are already drying, as
this will cause marks. Wet films should, therefore, always be hung below already
drying films.
Drying time will depend on temperature, air circulation and relative humidity of the air
in the cabinet. Films will dry more quickly when they have first been put into a wetting
agent.
Before a film is taken out of the drying cabinet, it must be checked that the corners and
edges of the film are thoroughly dry. Air temperatures above 40°C should be avoided as
this may cause ugly drying marks. There must be free circulation of air between the
films in a cabinet; if they cannot dry evenly on both sides, they may curl or distort.
Roller dryers
Industrial dryers can be used to dry films quickly and uniformly after washing.
This mechanised drying process only takes minutes. Dryers and chemicals should
preferably be matched. There are compact roller dryers on the market which are
capable of developing approx. 15 cm of film per minute and take up far less space than
a drying cabinet.
88
Film agitation
To prevent air bubbles from forming on the surface of the emulsion (which will cause
spots on the finished radiographs), and to make sure that the developer penetrates all
areas of the emulsion evenly, the films should be kept moving during their first 30
seconds in the developer. After that, it is recommended to move the film from time to
time to prevent film faults such as lines or streaks.
Replenishing
Up to 400 ml of liquid per square meter of film processed may be carried over to the next
tank. When developing frames used it is, therefore, preferable to hold the film
2-3 seconds over the developer tank to drip.
After each square meter of film developed, 600 ml of replenisher must be added to the
bath regardless of the quantity of developer lost from the tank. Up to about 4 litres of
replenisher can be added in this way, for every litre of the original developer in the tank.
The solution must be discarded and replaced with fresh developer when the total
quantity of replenisher added is three times the original total contents, but in any case
after eight weeks, irrespective of the number of X-ray films processed.
Stopbath
Before transferring the developed film to the fixer tank, it is placed in a stopbath
(consisting of 30 ml glacial acetic acid to 1 litre of water) for 30 seconds to prevent the
fixer solution from being neutralized too rapidly by the developer, and stripes or
dichroitic fog from forming on the film.
If a film is not passed through a stopbath, it must be rinsed in running water for a few
minutes immediately after leaving the developer.
Fixing
Fixing renders the image formed during development permanent, by removing undeveloped silver halide salts from the emulsion. When the film is taken from the stopbath
it still has a milky appearance; this changes in the fixer and the light areas of the film
become transparent.
As a rule the film is left in the fixer twice as long as it takes to “clear” or become transparent. Fixing time (in a fresh solution approx. 3 minutes) is twice the clearing time
(1.5 min.). As soon as it takes double that time to “clear” a film in G328 fixer solution
at 20°C, it must be replaced.
For every liter of solution in the fixing tank, a square meter of film can be treated.
Films have to be kept moving during the first 30 seconds in the fixing bath.
Temperature range (°C) Washing time (minutes)
5-12 30
13-25 20
26-30 15
> 30 10
Table 2-10. Relationship between water temperature and washing time
Page 47

91
10.5 Automatic film processing
NDT-U (universal) film processor
Over the last few years there has been a vast increase in the use of automatic processors for
handling industrial X-ray films. Not only is it a faster and more efficient process, the
uniform process also leads to improved image quality. The total processing time may be
between 1.5 and 12 minutes (nominally 8 minutes), significantly shorter than in manual
processing. Of these 8 minutes, the film will be in the developer solution for only 100
seconds, the so-called “immersion time”. These shorter processing times have been made
possible by the use of special chemicals (G135 and G335), and by a higher temperature of
the solutions: 28°C instead of 20°C.
The shortest processing time of 1.5 minute is essential for the development of the special
films used on board lay-barges, where the results must be available quickly.
The chemicals used are more active at higher temperatures. The higher temperature of the
solutions makes the emulsion layers swell, resulting in a faster diffusion of the liquid
through the layers and, consequently, more rapid action of the chemicals.
Swollen emulsion coatings do, however, have the disadvantage of being softer and hence
more vulnerable to damage; a compromise between the advantages and drawbacks is reached by adding a carefully determined proportion of hardening ingredients to the fixer.
Chemicals for use in automatic processors also have additives to inhibit oxidation of the
solutions and formation of fog in the emulsions.
Automatic film processing not only makes the results available sooner, it also standardises
(improved reproducibility/uniformity) the development process and, consequently, the
exposure technique. This increases the quality and reliability of radiography as a method
of non-destructive testing.
GE Inspection Technologies supplies integrated Agfa-systems in which X-ray films, chemicals and processing equipment are all adapted to each other. Through the uniform characteristics of its films, carefully formulated chemicals, continuous agitation, automatic replenishment and accurate temperature control of the solutions in the processors, Agfa systems
ensure top-quality results.
The Agfa NDT-U processor is equipped with an infrared film drier while its functions are
controlled by a microprocessor. Its throughput depends on the required cycle time (adjustable between 1.5 and 12 minutes) and film size. All normal film sizes, including roll film,
can be processed. When set for an 8-minute cycle (100 seconds immersion time) for example, approximately 100 films of size 10 x 48 cm can be processed per hour.
90
10.3 Recommendations for the darkroom
Cleaning of tanks
Whenever the processing solution is renewed the tank must be cleaned, preferably with
hot water and soap. If this proves inadequate, polyester tanks can be cleaned using a
bleach solution (100-200 ml/litre of water), hydrochloric acid (10 ml/litre of water) or
acetic acid (50 ml/litre of water). Stainless steel tanks may be cleaned with a solution
of nitric acid (10 ml/litre of water) or acetic acid (50 ml/litre of water). Hydrochloric
acid must never be used for stainless steel tanks.
There are industrial cleaning agents on the market (for example Devclean and the, environment-friendly, Fixclean), specially developed for cleaning of darkrooms.
Stained fingers
Brown stains on the fingers can be avoided by rinsing the hands in water whenever they
come into contact with developer. If fingers do become stained, they should be immersed
in a solution of:
a. 1 litre of water
b. 2 gr of Potassium-permanganate
c. 10 ml of concentrated sulphuric acid
d. Next the hands should be rinsed in an acid fixer solution, and finally washed
with soap and water.
Chalky water
If hard, chalky water is used for mixing the solutions, troublesome processing faults
may occur. Calcium salts may, in the presence of carbonates and sulphites, result in a
whitish deposit on the films which is insoluble in water. To prevent this, the diluant can
be softened by using a special filter, or by boiling it first and letting it cool down before
making up the chemical solutions.
To remove chalk deposit from films, they may be soaked in a solution of 7 ml glacial
acetic acid to a litre of water.
10.4 Silver recovery
The silver halides in the emulsion which were not reduced during development, are
dissolved in the fixer. Silver can be recovered from the fixer in order to keep the silver
content of the fixer solution as low as possible so that the fixer lasts two to four times
longer, and sell the silver.
Silver recovery can, for example, be done by electrolysis. In addition to electrolysis
equipment, there are other silver recovery systems commercially available.
It is worthwhile considering subcontracting this work to a specialised firm in view of
secondary aspects such as organisation, logistics, storage and environmental requirements.
Page 48

93
10.6 Checking the development process
and film archiving properties
Besides exposure technique, many aspects influence the quality of the final radiograph.
An important factor is the development system. Monitoring and quantifying the proper
functioning of a development system is an essential part of quality control, as a properly
exposed radiograph can be spoilt if the processes that follow are performed incorrectly.
For the monitoring of the development process and archival properties of X-ray-films,
Agfa has produced two methods: the so-called PMC-strips, and the Thio-Test.
Both methods are based on the international standard ISO 11699 part 2, and the
European standard EN 584 part 2, which describe a standard development process and
the means to control its execution.
PMC-strips to check the developing process
To facilitate ongoing quality control, and ensure compliance with existing standards on
systems classification, certified PMC-strips are used to monitor the development process.
PMC is short for Processing Monitoring Control.
The purpose is to:
• demonstrate conformance with the standard film system as described in the
standards ISO 11699 or EN 584
• demonstrate the consistency of the development system
• monitor and promote uniformity of the various development systems in
different locations
• initiate timely corrective action if deviations occur
PMC-strips are film strips that have been “ pre-exposed” in a regular step-pattern by the
supplier, under special conditions and within narrow tolerances, but have not as yet been
developed. They are supplied with a certificate of compliance with EN 584-2 and
ISO 11699-2.
In the development system to be checked, a PMC-strip is processed routinely in a way
identical to a normal radiograph. Finally, the various densities are measured with
a densitometer.
92
NDT-E (economy) film processor
In order to limit any detrimental effects on the environment, Agfa has developed the “Eco”
(Ecology and economy) designated processors. Here, too, equipment and chemicals are
carefully matched, thus complying with strict ecological requirements such as a maximum
of 50 mg silver per square metre of processed film, for the disposal of rinse water.
This figure for silver content is at least fifteen times lower than for conventional developing
systems. This is achieved through the considerably improved (cascade) fixing process,
which additionally results in a bigger quantity of recovered silver.
Furthermore, measures have been taken to save on energy, chemical and water usage, thereby making the “eco” range of film processors as environmentally friendly as possible.
Figure1-10 shows the schematic lay-out of this high-tech processor.
The “S eco”-version has a 50 % higher production capacity than the U-version.
A very useful option is its suitability for use in daylight, in combination with a matching
film feeding system.
1 Film feeder
2 Film surface scanner
3 Developer tank
4 Rinse tank
5a/b Fixer tanks
6 Final wash tank
7 Infrared dryer
8 Film exit
9 Film receiving tray
10 Fixer pump
11 Developer pump
12 Overheating protection
Fig. 1-10. Schematic layout of the Agfa NDT S eco processor
Page 49

The unexposed area on the PMC-strip shown in figure 2-10, apart from providing a
reference for fog and base density, also allows for the Thio-Test to be carried out.
The components used for this test are:
1 The Thio-Test colour step-wedge
2 A dropper-bottle of Thio-Test reagent
The reagent consists of a 1 % silver nitrate solution in demineralised water
The working method, which only takes a few minutes, is as follows:
1 apply the test liquid (reagent) to an unexposed part of undeveloped, dry film
2 allow to soak for 2 minutes,
15 seconds
3 remove excess liquid with absorbent paper
4 leave to dry for 1 minute before treating the reverse side
5 repeat the above procedure on the other side of the film, in exactly the same spot.
Evaluate as follows, within 30 minutes:
6 the test zone of the film is put against a white background
7 the Thio-Test colour strip is put on the film, as close to the spot as possible
8 the colour step of the wedge that resembles the colour of the test zone closest,
is regarded definitive for life expectancy.
A regular Thio-Test provides early detection of deficiencies in the development process,
for example exhausted fixer solutions, irregular water supply or insufficient rinsing, and
so prevents poorly processed films being archived.
10.7 Storage of exposed films
The way in which radiographs are handled and stored plays a very important role in their
keeping properties. Films that must be kept for longer periods of time require the same
ambient conditions as new unexposed films, i.e.:
• ambient temperatures below 24°C
• relative humidity of less than 60 %
• preferably stacked on edge
9594
A PMC-strip as shown in figure 2-10 has to be used whenever the chemicals in an automatic or manual processing system are replenished or changed. It is also advisable to use
a PMC-strip regularly, but at least once a month, for a routine check of the development
system.
A calibrated densitometer measures the following steps:
D
0
: fog and base density ( 0.3)
D
3
: density of step 3
D
7
: density of step 7
The reference values according to the corresponding certificate are S
r
and Cr.
The following calculations are then made:
• Sensitivity index Sx= D3– D
0
• Contrast index Cx= (D7– D3) . Sr/S
x
The system is acceptable if the following criteria are met:
a. D
0
= 0.3
b. S
x
has a value 10 % of S
r
c. Cxhas a value between Cr+15 % and Cr–10 %
If one or more of these criteria are not met, the development process must be adjusted.
Thiosulphate-test to check film archiving properties
The archival properties of a radiographic image must also be determined in accordance
with the standards ISO and EN by analysing the quantity of residual thiosulphate in the
film’s emulsion layers. This quantity depends on the thoroughness with which the fixing
and rinsing processes have been carried out.
For storage over a period of 100 years, 100 g/m
2
is allowed; for a period of 10 years double this figure is allowed, see table 3-10. These values are difficult to measure however.
The so-called Thio-Test, developed by Agfa, is a very useful and quick method to quantify
film-keeping properties in practice.
Unexposed area for the Thio-Test
fog + base density
Fig. 2-10. PMC-strip with an unexposed area
for the Thio-Test
Reference step
for film sensitivity
Table 3-10. Colour steps for the Thio-Test . (*)These values apply to films with double-sided emulsion layers.
Reference step
for film contrast
Colour wedge Thiosulphate Archival quality
(from dark to light) (*)g/m
2
L.E. (Life expectancy)
Darkest Min. 0.35 Film needs
repeat treatment
Dark Max. 0.20 L.E. 10 years
Light Max. 0.10 L.E. 100 years
Lightest max. 0.04 L.E. 500 years
Page 50

Three factors govern the discernibility of defects in a radiograph:
1. Geometrical effects:
• Size of the source
• Source-to-object distance
• Defect-to-film distance
2. Film properties (governing image quality):
• Graininess
• Contrast
•Fog
• Inherent unsharpness
3. Quality of radiation applied.
11.1 Unsharpness
Geometric unsharpness
X-ray tubes and radioactive sources always produce radiographs with a certain amount
of blurring – the “geometric unsharpness”, U
g
in fig. 1-11, because of the finite dimen-
sions of the focal spot or source size.
The magnitude of this unsharpness, U
g
, is given in the following equation:
In which:
s is the effective focus (or source) size
F is the focus-to-film (or source-to-film) distance
a is the defect-to-film distance
The maximum value of Ugrelated to a defect situated at a maximum distance from the
film (and for which a = t) can be calculated from the formula:
In which: t = the thickness of the object
11
Defect discernibility
and image quality
9796
Fig. 1-11. Geometric unsharpness.
The source diameter, S, is shown very
large for clarity.
source
anode
film
(ffd)
density across film
Ug =
s
.
a
F-a
U
g
(max)
=
s
.
t
F-t
Page 51

99
In this situation the unsharp images of each of the two edges of the defect may overlap,
as shown in example C. The result is that image C not only becomes unsharp, but also
suffers a reduction in contrast compared to image A, made with a point source and
image B made with a relatively small source.
Inherent unsharpness
Not only the silver halide crystals directly
exposed to X-radiation are formed into
grains of silver, but also (albeit to a lesser
degree) the surrounding volume of emulsion. This cross-sectional area represents
the “inherent unsharpness” or “film unsharpness” U
f
.
So, even in the absence of geometric unsharpness, if the radiation energy is high
enough, film unsharpness can occur: the so
called “inherent unsharpness”. If a steel test
plate with a sharp thickness transition is
radiographed with high energy X-rays,
there will be a gradual transition of film
density across the image of the “step” from
A to B.
Without inherent unsharpness, the film
would show an absolutely sharp transition
between the two densities, as shown in figure 3a-11. In practice, the density change
across the image is as shown in figures 3b,
3c and 3d-11.
The width of this transitional area (U
f
),
expressed in mm, is a measure of film
unsharpness.
98
Consequently, Ugcan be reduced to any required value by increasing the source-to-film
distance. However, in view of the inverse square law this distance cannot be increased
without limitation, as extremely long exposure-times would result. The formula also
indicates that geometric unsharpness assumes more and more importance as the distance between defect and film increases.
A special case arises, however, when one uses a micro focus X-ray tube with a focal spot
size in the range 10-50
m. With such a small focus size, the image can be deliberately
magnified (see section 17.1) by using a short source-to-specimen distance, and a large
specimen-to-film distance, and still retain an acceptably small value of U
g
. The advantage of this technique, called the “projective magnification method”, is that the graininess always present in a photographic image is less of a disturbing factor in the discernibility of very small defects.
Figure 2-11 shows the effect of geometric unsharpness on the image of a defect smaller
than the focus size.
film film film
Fig. 2-11. Geometric unsharpness: effect on the image of a small defect.
A. Point focus size - s -: no geometric unsharpness - defect image sharp
B. Small focus size – s -: geometric unsharpness U
g
– defect image blurred
C. Increased focus size – s -: still larger Ug - defect image blurred and loss of contrast - C
o
is less than in A and B
C
o
= contrast
Fig. 3-11. Inherent (film) unsharpness for X and
Gamma-radiation.
For clarity, the density curves are magnified along the X-axis.
(a) density distribution across image of sharp edge,
assuming Uf= 0
(b) (c) and (d) density distribution due to film unsharpness
(b) theoretical; (c) with grain; (d) smoothed.
film
test plate
film density
Page 52

11.2 Selection of source-to-film distance
Preceding paragraphs of this chapter described the effects of geometric unsharpness and
the possibility to influence this by adjusting the source-to-film distance.
This section will expand on this.
To obtain a radiograph which is as sharp as possible, so as to show maximum detail, the
total unsharpness should be kept to a minimum. The radiation energy level selected for
making the radiograph, see chapter 9, can serve as a lead. It is, after all, determined by
the thickness of the material to be radiographed, but is at the same time also responsible for film unsharpness Uf, which can be extracted from table 1-11 and or figure 4-11.
It is no use to try and keep geometric unsharpness U
g
far below the value of Uf, as in that
case U
f
determines the total unsharpness anyhow.
If the aim is to make geometric unsharpness U
g
equal to the value of Uf, the source-to-
film distance (F) required can be calculated from the following formula :
In which:
F = source-to-film-distance
Ut= total unsharpness
t = thickness of the object
s = effective source size
All measurements in mm.
Instead of calculating F, various
code-based procedures and guidelines provide graphs from which
minimum distance (F
min
) can be
determined. Figure 5-11 shows a
nomogram on the basis of EN 1435,
from which the minimum focus
distance for two quality levels (category A and B) can be extracted.
Table 1-11 and figure 4-11 show experimentally determined values of inherent unsharpness for film exposed at various radiation energy levels.
These values are based on the use of filters and thin lead intensifying screens; thicker
screens produce slightly higher values. If no lead screens are used, U
f
is 1.5 to 2 times
smaller. Ufis influenced mainly by radiation intensity and the type of intensifying
screens used; the type of film is hardly of any consequence.
The distance between film and intensifying screen is of great importance for the value of
U
f
. Good contact between film and intensifying screen is imperative and can be achie-
ved by vacuum-packing of film and screens together.
From the above information it can be deduced that Ufincreases at higher radiation energies.
Total unsharpness
Total film unsharpness Utis determined by the combination of Ugand Uf. The two values
cannot be just added up to arrive at a figure for U
t
. In practice, the following formula pro-
duces the best approximation for film unsharpness U
t
:
Broadly, if one value of unsharpness (U
g
or Uf) is more than twice the value of the other,
the total unsharpness is equal to the largest single value; if both values of unsharpness
are equal, total unsharpness is about
2 = 1.4 times the single value.
If necessary, U
g
can be reduced by increasing the focus-to-film distance. This can only be
done to a limited extent because, due to the inverse square law, exposure times would
become extremely long. As a compromise an optimum focus-to-film distance F is chosen
whereby U
g
= Uf.
101100
Radiation energy Ufin mm
50 kV 0.05
100 kV 0.10
200 kV 0.15
400 kV 0.20
2 MeV 0.32
8 MeV 0.60
31 MeV 1.00
Se75 (320 keV) 0.18
Ir192 (450 keV) 0.25
Co60 (1.25 MeV) 0.35
Table 1-11. Empirical values of film unsharpness Uf at various radiation energies
using lead intensifying screen
Fig. 4-11. Graphical representation of table 1-11.
Values of Uffor X - and Gamma radiation at increasing radiation energies
Ut=
U
2
g
+U
2
f
F =
t(U
t
+1.4s)
U
t
Fig.5-11. Nomogram for minimum source-to-film distance f
min
according to EN 1435-criteria.
Catagory A - less critical applications (general techniques)
Catagory B - techniques with high requirements
of detail discernability
The above graph appears enlarged in the appendix.
distance f
min
for catagory B
distance f
min
for catagory A
distance (b)
f
min
= minimum distance
source to source-side object (mm)
s = source size (mm)
b = distance source-side object to film (mm)
Page 53

Examples :
15 mm steel: 100 + 15 x 8 = 220 kV
12 mm aluminium: 50 + 12 x 2 = 74 kV
10 mm plastics: 20 + 10 x 0.2 = 22 kV
In the range 200-400 kV, only a significant change in voltage, say 30-40 kV, will cause a
noticeable difference in defect discernibility.
Selection of gamma source
As it is not possible to vary the radiation energy emitted by a gamma-ray source, it is
necessary to indicate a range of thickness which may be satisfactorily examined with
each type of radio-isotope.
The upper limit is decided by the source strengths commercially available and the maximum tolerable exposure time: the lower limit is determined by the decrease in contrast
and the related reduced image quality.
The lower limit, therefore, depends on the required degree of defect discernibility.
When this is insufficient in comparison to what is achievable by the use of X-ray equipment, another type of isotope providing a reduced energy radiation could be selected.
Table 3-11 shows the thickness range usually recommended for various gamma sources.
The table applies to steel. If, for reasons of convenience, gamma rays are used on thin
specimens which could also be X-rayed, it should be understood that the resulting radiographs will be of poorer quality compared to X-radiographs.
103102
11.3 Other considerations with regard
to the source-to-film distance
Inverse square law
As explained in the previous section, the effect
of U
g
can be reduced by increasing the focus-tofilm distance F.
One of the properties of electromagnetic radiation is that its intensity is inversely proportional
to the square of the distance, better known as
the “inverse square law”. Both X - and Gamma
radiation follows that law.
The intensity of radiation per unit area of film is
inversely proportional to the square of the source-to-film distance (s-f-d).
As figure 6-11 shows, at a distance 2F from the
source, a beam of rays will cover an area (b)
four times greater than area (a) at distance F.
Consequently, the intensity per unit of surface area for (b) will be only 1/4 of the value
for area (a). This means that, all other parameters being equal, at distance 2F exposure
time must be multiplied by four to obtain the same film density.
This principle obviously has its (economical and practical) limitations, beyond which a
further increase in s-f-d is just not feasible.
Selection of radiation energy (kV)
Once the appropriate source-to-film distance is chosen, the correct kilo voltage can be
determined from an exposure chart (see chapter 9).
The importance of choosing the exact kilo voltage varies considerably with the kilo voltage range being considered. For X-rays below 150 kV the choice is reasonably critical
and gets more critical still at lower kilo voltages.
The kilo voltage to be applied is specified in (EN) standards, see chapter 20.
Table 2-11 gives useful empirical rule-of-thumb values for radiographs of aluminium,
steel or plastic objects.
Fig. 6-11. Inverse square law for distances
Table 3-11.Thickness ranges in mm for examining steel with the usual types of gamma sources.
Note: Standard sensitivity permits a slightly poorer image quality than high sensitivity.
Thus a larger thickness range can be inspected coping with the quality requirements.
Table 2-11. Rule-of-thumb values for the selection of kilo voltage
Material kV-value
Steel 100 kV + 8 kV/mm
Aluminium 50 kV + 2 kV/mm
Plastics 20 kV + 0.2 kV/mm
Source type Standard sensitivity High sensitivity
technique in mm technique in mm
Co60 30 - 200 60 - 150
Ir192 10 - 80 20 - 70
Se70 5 - 40 10 - 30
Yb169 1 - 15 3- 10
Tm170 1- 10 4 - 8
Page 54

105
11.5 Summary of factors that influence image quality
The factors that influence image quality are:
1. Contrast
2. Unsharpness
3. Graininess
1 Contrast depends on:
• Radiation energy (hardness)
• Variation in thickness
• Backscatter
• Front- and back screen
• Film-screen combination
• Film-screen contact
• Defect location, depth as well as orientation
2 Unsharpness depends on:
• Size of focus
• Thickness of the object
• Source-to-film distance
• Radiation energy (hardness)
• Film-screen combination
• Film-screen contact
3 Graininess depends on:
• Type of film
• Type of screen
• Developing procedure
• Radiation energy (hardness)
104
11.4 Radiation hardness and film contrast
When radiation hardness increases, the half-value thickness (HVT) also increases.
Tables 2-2 and 3-2 for steel and lead respectively show this in figures.
This is why in an object with different thicknesses, image contrast diminishes when radiation hardness increases. Figure 7-11 clearly illustrates this.
The left side of a step-wedge is radiographed with 150 kV, the right side with 80 kV.
The right side shows the greater contrast between two steps, whereas on the left the
contrast range is the biggest.
Fig. 7-11. X-rays of a step-wedge with 150 kV (left) and 80 kV (right).
150 kV 80 kV
Page 55

12
Defect orientation, image distortion
and useful film length
107
12.1 Defect detectability and image distortion
On a radiograph, a three-dimensional object is presented in a two-dimensional plane
(the film). The appearance of both the object and its defects depends on the orientation
of radiation relative to the object. As shown in figure 1-12, the image of a gas cavity in a
casting may be circular or elongated depending on beam orientation.
In general, the beam of radiation should be at right angles to the film and a specimen
should whenever possible be laid flat on the film cassette. Special angle shots are, however, sometimes useful to detect defects which are unfavourable oriented with regard to
the X-ray direction. This influence of X-ray beam angles relative to the orientation of a
defect is also described and illustrated in section 17.4.
Figure 2-12 (A) shows a situation whereby detection of lack-of-side wall fusion in a
V-weld is not performed optimally. Angled radiation (B) is more likely to show up this
type of weld defect.
106
Fig. 1-12. Distortion of the image of a gas cavity due to beam orientation
source source
circular image
elongated image
source source
lack of side
wall fusion
lack of side
wall fusion
blurred image of the defect
sharp image
Fig. 2-12. Lack of sidewall fusion in a V-shaped weld joint.
Shot A is unlikely to detect the defect; shot B will.
AB
Page 56

109
The number of radiographs necessary for 100 % examination of a circumferential weld
can, through calculation, also be obtained from the codes. When large numbers of similar welds are involved, this is an important figure, because too many radiographs would
be uneconomical and too few would lead to insufficient quality of the examination.
The minimum number of radiographs required for various pipe diameters and wall
thicknesses at varying source positions can be derived from the graph in figure 4-12.
The graph is applicable to single wall and double wall technique, whereby the maximum
increase in thickness to be penetrated is 20 %, in accordance with EN 1435 A.
Example 1:
An X-ray tube with an outside diameter of 300 mm is used to examine a circumferential
weld in a pipe of a diameter De of 200 mm and a wall thickness t of 10 mm.
The distance between the focal spot and the outside of the X-ray tube is 300/2 = 150 mm.
F = half the X-ray tube diameter + De = 150 + 200 = 350 mm.
t/De = 10/200 = 0.05 and De/F = 200/350 = 0.57
The intersection of the two
co-ordinates (0.05 and 0.57) is
in the range where n = 5, so the
number of radiographs must be
at least 5.
Example 2:
When using a source placed
against the pipe wall,
t/De = 10/200 = 0.05 and
De/F = 200/(200+10) =
200/210 = 0.95.
The intersection of the two coordinates now lies in the area
where n = 4.
So, by using a radioactive source which is located closer to the
pipe surface, one less exposure
would still ensure compliance
with EN 1435A.
Initially, the code would however have to allow the use of an
isotope instead of an X-ray tube.
108
12.2 Useful film length
When radiographing curved objects, for example a
circumferential weld in a
pipe, as figure 3-12 shows,
the resulting image will be
distorted. Variations in density will also occur. As a
result of the curvature of
the pipe with a wall thickness t, the material thickness to be penetrated increases to T, so film density is
lower at the ends of the film
than in the middle.
Moreover, if defects are projected nearer the ends of a
film, distortion of the defect
image will become greater.
The film length suitable for
defect interpretation is therefore limited. This so-called ”useful film length” is,
depending on the nature of
the work, defined in codes
e.g. in EN 1435.
It is not always practicable to apply the single-wall technique as shown in figure 3-12.
In order to still achieve 100 % examination, the double-wall / single-image technique
(DW-SI) is applied. (In NDT jargon the abbreviations DW-SI and DW-DI are frequently
used for Double Wall–Single Image and Double Wall-Double Image respectively.)
In that case several radiographs are made, spaced equally around the circumference of
the item under examination. The number of radiographs to be made depends on the standard or code to be complied with.
In codes, useful film length is determined by the percentage of extra wall thickness
which may be penetrated in relation to the nominal wall thickness (t) of the pipe.
Percentages of 10, 20 and 30 are commonly applied. For general use, 20 % is a practical
value whereby the lightest section of the film shall have a density of at least 2.
source
crack
distorted
image of
crack
film
t
T>t
T
Fig. 3-12. Image distortion caused by the curved shape of the object
Fig. 4-12. Graph for the minimum number of exposures in accordance
with EN 1435 A at maximum thickness increase of 20 %.
This graph appears enlarged in the appendix.
Operating range
not being used.
Page 57

111
13.1 Factors influencing image quality
With regard to image quality, the term frequently used is “sensitivity”.
Sensitivity determines the extent to which a radiograph is able to clearly show (anomaly) details of a certain size. Sensitivity in this sense must not be confused with the
sensitivity or “speed” of the film. (see section 7.5).
Discernibility of defects on a radiograph depends in general on:
• the quality of the radiation
• the properties of the film
• the film viewing conditions
Image quality is governed by contrast, sharpness and film graininess.
Image contrast is affected by :
• differences in thickness of the specimen
• the radio-opacity (radiation transparency) of the specimen and its defects
• the shape and (depth)location of the defects
• the quality (hardness) of the radiation
• the amount and effects of scattered radiation
• the effect of filters used
Film contrast depends on:
• the type of film
• the density level
Sharpness of an image is governed by:
• the (effective) size of the focal spot or radiation source
• the source-to-object distance
• the object-to-film distance
• the contact between film and intensifying screens
• the type of intensifying screens used
• the radiation energy used
110
13
Image quality
Digitised and enhanced image of a radiograph of the (American) Liberty Bell.
The image was used to monitor possible lengthening of the crack.
Page 58

113
The image quality of a radiograph is, for example, defined as the number of the thinnest
wire still visible, and is generally said to have “image quality number -X-”.
The image quality can also be expressed as a percentage of the object thickness examined. If, for instance, the diameter of the thinnest wire visible to the naked eye is 0.2 mm
and material thickness at the point of exposure is 10 mm, wire discernibility or wire
recognizability is quoted as 2 %.
As emphasised above, the use of an IQI does not guarantee detection of defects of comparable size.
It would be incorrect to say that because a wire of 2 % of the object thickness can be seen
on the radiograph, a crack of similar size can also be detected.
The orientation, relative to the X-ray beam, of a defect plays an important role in its discernibility (see section 12.1.)
There are various types of IQI, but the four most commonly used are:
1. the wire type (used in most European countries)
2. the step-hole type (still occasionally used in France, but the wire type is
generally accepted as well.)
3. small plates with drilled holes, called penetrameters, which are used for
ASME-work, although the ASME-code nowadays includes the wire-type IQI.
4. the duplex IQI.
In some countries (e.g. Japan and France) additional means (such as step-wedges) are
used, to verify contrast and check the kV-value used.
At the location of the (step)-wedge, there must be a minimum specified difference in
density compared to the density at a location on the film where penetrated material
thickness equals nominal wall thickness.
Wire-type IQI according to EN 462-1
EN 462-1 standardises
four wire-type IQI’s. Each
one is made up of seven
equidistant parallel wires
of various diameters, as
shown in figure 1-13.
In the USA IQ’s are known
as penetrameters.
112
The last factor, graininess, depends on :
• the thickness of the emulsion layer
• the concentration of silver crystals in the emulsion (silver/gelatine ratio)
• the size of the silver crystals
• the radiation energy used
• the developing process employed
The radiation energy level is the only factor that can be influenced by the radiographer;
the other factors are determined by the film making process.
13.2 Image quality indicators (IQI’s)
In the past it was thought possible to assess the smallest defect detectable, by fixing a
simple type of indicator on the test object during exposure.
This would supposedly guarantee that defects of a certain minimum size, expressed as a
percentage of the material thickness, could be detected. In practice, however, this proved not to be achievable.
In particular where small cracks and other two-dimensional defects are concerned, it
can never be guaranteed that they are not in fact present when no indication of them can
be found in the X-ray image.
However, it is reasonable to expect that at least the quality of the radiographs, and of
course the rest of the entire process the film undergoes, meets certain requirements.
The probability is high that defects will be more easily detected when the image quality
is high. The exposure technique and required image quality, described in the code,
depend on the purpose for which the object involved will be used.
In order to be able to assess and quantify the image quality of a radiograph, it needs to
be converted into a numerical value, and to do this “image quality indicators” (IQI) are
used, known in the USA as “penetrameters”.
Image quality indicators typically consist of a series of wires of increasing diameters, or
a series of small plates of different thicknesses, with holes drilled in them of increasing
diameters.
Although codes describe their techniques differently, they agree on the following points:
• An image quality indicator shall be placed at the source-side of the object being
examined,
• If it is not possible to place the indicator on the source-side, it may be located on
the film-side. This exceptional situation must be indicated by a lead letter “F” on
or directly adjacent to the indicator,
• The material of the indicator must be identical to the material being examined.
Fig.1-13. Wire-type IQIs with different wire diameters
Batch numberBatch number
Page 59

115
ASTM 1025 IQI’s
The plaques have markings
showing their thickness in
thousandths of an inch. Ea ch
plaque has three holes of diameters 1T, 2T and 4T. T being
the thickness of the plaque.
Thin plaques with T < 0.01”
form an exception to this rule.
Hole diameters for these
plaques are always 0.01”, 0.02”
and 0.04”, so do not comply
with the 1T, 2T, 4T rule.
These types of plaque are identifiable through notches cut in the edge, by which they can
also be identified on the radiograph.
Originally it was standard practice to use a plate of 2 % of the specimen thickness, but at
present 1 % and 4 % plates are used too.
If T is 2 % of the specimen thickness and the 2T hole can be seen on the radiograph, the
attained sensitivity level is said to be (2-2T), etc. Equivalent sensitivity values in percentages are shown in table 3-13.
At least three sides of a penetrameter must be visible on the radiograph. The thickness of
the penetrameter in relation to the specimen thickness defines the “contrast sensitivity”.
The size of the smallest hole visible defines the “detail sensitivity”.
MIL-STD IQI’s (military standards)
In the past for some applications specific MIL-standard (MIL-STD) IQI’s should be used
only. They are very similar to ASTM IQI’s. Nowadays the MIL-STD accepts that they are
replaced by the almost identical ASTM type IQI’s providing they meet the requirements
specified in the MIL-STD. Nevertheless MIL-STD IQI’s are still available and in use.
114
Table 1-13 shows the wire combinations for the four IQI’s according to EN 462-01.
The diameters of the wires are given in table 2-13.
EN-type IQI’s are manufactured with wires of steel, aluminium, titanium or copper,
depending on the type of material to be examined. On each IQI the wire material is indicated. Fe for steel, Al for aluminium, Ti for titanium and Cu for copper.
13.3 List of common IQI’s
Figure 2-13 shows the five most common
IQI’s. Their origin and description can be
found in the following standards:
• EN 462-01 Europe
• BS 3971 Great Britain
• ASTM 747 USA
• ASTM 1025 USA
• AFNOR NF A 04-304 France
ASTM 747 describes the wire penetrameter quite similar to wire penetrameters of
other origin. ASTM 1025 describes the
plaque penetrameter similar to AFNOR.
Both types of ASTM IQI’s have been
developed and standardised in the USA,
they now are used world-wide.
IQI Wire numbers Wire diameter from/to (mm)
1 EN 1 to 7 inclusive 3.2 to 0.80 inclusive
6 EN 6 to 12 inclusive 1 to 0.25 inclusive
10 EN 10 to 16 inclusive 0.40 to 0.10 inclusive
13 EN 13 to 19 inclusive 0.2 to 0.05 inclusive
Table 1-13. Wire IQIs according to EN 462-01.
Diameter
(mm) 3.20 2.50 2.00 1.60 1.25 1.00 0.80 0.63 0.50 0.40
Wire nr. 1 2 3 4 5 6 7 8 9 10
Diameter
(mm) 0.32 0.25 0.20 0.16 0.125 0.10 0.08 0.063 0.05
Wire no. 11 12 13 14 15 16 17 18 19
Fig. 2-13. Examples of image quality indicators
Fig. 3-13. ASTM plaque type IQI
Table 3-13. ASTM Equivalent image quality indicator
Level Equivalent (%) Level Equivalent (%)
1 - 1T 0.7 2 - 2T 2.0
1- 2T 1.0 2 - 4T 2.8
2 - 1T 1.4 4 - 2T 4.0
Page 60

117116
AFNOR IQI’s
The AFNOR-type IQI’s originate in
France. They consist of metal step
wedges of the same material as the
object to be examined. The thickness of the steps increases in arithmetical progression. Each step has
one or more holes with a diameter
equal to the thickness of that step.
There are various models of step
wedges. The most common types
are rectangular with square steps
measuring 15x15 mm and hexagonal with triangular steps measuring 14mm.
See figure 4-13.
Steps thinner than 0.8 mm, have two holes of the same diameter. For a step to be regarded
as visible, all the holes in that particular step must be clearly seen on the film.
The French standard AFNOR NF A04.304 includes an addendum, which defines the
“index of visibility”.
For each radiograph a record is made of:
1. the number of visible holes (a)
2. the number of holes (b) of a diameter equal to or greater than 5 % of the
material thickness being radiographed.
The index of visibility N is given by the formula: N = a-b.
The value of N may be positive, zero or negative.
Image quality improves as the value of N increases.
Duplex IQIs
Fig. 4-13. French AFNOR IQIs
Duplex IQI’s are described in norm EN 462-5. The duplex IQI consists of a number of
pairs (“duplex”) of wires or thin strips made of platinum or tungsten, of increasingly
smaller size and diminishing distances for each pair.
Figure 5-13 shows such an IQI made up of pairs of wires.
The duplex IQI has been in existence for decades but is no longer current in conventional film radiography because of their high cost and limited possibilities of application.
It is, however, increasingly used in digital radiography, because it is perfectly suited to
determine contrast and (un)sharpness.
13.4 Position of the IQI
To be of any value in checking the factors defining sharpness and quality, the IQI must
be placed on the source side of the specimen. If the source side is not accessible, the IQI
is placed on the film side. In the latter position visibility is no longer an indication of
geometric unsharpness, but still a check on the developing process and radiation
energy used.
13.5 IQI sensitivity values
It is important to realise that any IQI acceptance-value must be based on a particular
type of IQI and the thickness of the object being examined. When IQI sensitivity is
expressed in a percentage of object thickness, a lower recorded value indicates a higher
radiographic sensitivity, hence better image quality.
Fig. 5-13. Duplex wire IQI
Page 61

14
Film exposure
and handling errors
119
Before a particular difference in density in a radiograph is attributed to a defect in the
object examined, it must be sure that it is not the result of incorrect handling- or processing of the film. It is, therefore, essential to be able to recognise such faults when examining the film in order to prevent their recurrence. It is often possible to identify faults due
to wrong processing by looking obliquely at the surface of the film while facing towards
the light, and comparing the two emulsion surfaces. The X-ray image usually is identical
on both sides of the film, while a fault in processing will frequently affect only one surface, and can be seen as a change in reflection on the surface.
The most common faults, and their possible causes, are listed below:
Insufficient contrast
a: with normal density:
1. radiation too hard
2. over-exposure compensated by reduced developing time
3. unsuitable or wrongly mixed developer
4. prolonged development in too cold a developing bath
b: with insufficient density:
1. insufficient development
2. exhausted developer
3. unsuitable or wrongly mixed developer
Excessive contrast (i.e. lack of intermediate tones)
1. radiation too soft
2. under-exposure, compensated by prolonged developing
3. unsuitable or wrongly mixed developer
General lack of density
1. radiation too soft
2. under-exposure, compensated by prolonged developing
3. unsuitable or wrongly mixed developer
General excessive density
1. over-exposure
2. prolonged development or developing temperature too high
3. unsuitable or wrongly mixed developer
Insufficient sharpness
1. source-to-focus distance too short
2. source or object moved during exposure
3. film-to-object distance too great
4. dimensions of source or focus too big
5. poor contact between film and screens
6. wrong type of foil used
118
Page 62

121
7. screen(s) in poor condition
8. foreign bodies (for example metal particles ) between film and screen
during exposure
9. small, clear, hollow spots (usually with dark edges) may occur when the emulsion
has been subjected to local attack of bacteria. This is generally the result of slow
drying in a warm damp climate, particularly if there are impurities in the wash water.
Clear lines or streaks
1. the film envelope has been scored with a pointed object before exposure.
2. film insufficiently moved during development
3. uneven drying (film has been carelessly wiped dry after washing)
4. drops of fixer or stopbath have fallen on the emulsion before development
Clear shapes
1. clear crescent shapes may appear when, before exposure, the film has been
bent between two fingers
2. fingerprints may occur when the film has been touched with dirty fingers,
contaminated for example with grease, fixer, stopbath or acid
Dark patches
1. drops of developer have fallen onto the film before development
2. drops of water have fallen onto the film before development
3. electrical discharge marks, especially at low relative humidity of the air
4. marks from mechanical damage to the emulsion after exposure
Dark lines or streaks
1. the emulsion has been scratched after exposure
2. the film envelope containing the film has been scored or written on
with a pointed object after exposure
3. insufficient agitation of the film during development
4. uneven drying
5. water or developer has trickled down the surface of the emulsion prior
to development
Dark shapes
1. dark crescent shapes (see “clear shapes” above); these are darker than
the surrounding area if the bending occurred after exposure
2. fingerprints: the film has been touched with dirty fingers
3. electrical discharge (see “dark patches).
120
Grey fog (local or overall)
1. unsuitable dark room safelighting
2. excessive exposure to safelight (i.e. too long or too close)
3. film accidentally exposed to X-ray or Gamma-ray or to white light
4. heavy scatter
5. film out-of-date or stored under unsuitable conditions (ground fog)
6. extreme under-exposure compensated by excessive developing
7. exhausted or wrongly mixed developer
8. film cassette with film exposed to heat (e.g. sunlight, heat from radiators etc.)
9. cassette not properly closed (edge fog)
Yellow fog
1. prolonged development in badly oxidised developer
2. exhausted fixing bath
3. insufficient rinsing between developing and fixing
Note: It may take months before yellow fog becomes apparent.
Dichroic fog
(i.e. greenish-yellow by reflected light, pink by transmitted light)
1. developer contaminated with fixer
2. film insufficiently rinsed after development and subsequently fixed
in exhausted fixer
3. film stuck to another film when placed in fixer (in which case the development
continues in the fixing bath)
4. prolonged development in exhausted developer
5. film partly fixed in an exhausted fixing bath, exposed to white light
and then fixed again
Mottled fog
A greyish, mottled fog generally means the film is out-of-date or that it has been stored
under unfavourable conditions, e.g. in damp surroundings.
Whitish deposit
1. water used to make up developer or fixer too hard
2. wash water too hard
3. film insufficiently rinsed after development
Clear patches
1. minute round spots with sharp edges: the film was not kept moving
in the first 30 seconds of development
2. drops of fixer or water fell onto the film before development
3. marks from mechanical damage to the emulsion before exposure
4. marks due to rapid and uneven drying of the film (this occurs when there are
still droplets of water on the film when placed in the drying cabinet)
5. clear patches can occur from the film sticking to another film or to the tank wall
during development
6. grease on the film slowing down or preventing the penetration of the developer
Page 63

15
Film interpretation
and reference radiographs
123
15.1 Film interpretation
The common term for film interpretation is film viewing. Film viewing in fact means the
evaluation of the image quality of a radiograph for compliance with the code requirements and the interpretation of details of any possible defect visible on the film.
For this purpose, the film is placed in front of an illuminated screen of appropriate
brightness/luminance. The edges of the film and areas of low density need to be masked
to avoid glare. The following conditions are important for good film interpretation:
• brightness of the illuminated screen (luminance)
• density of the radiograph
• diffusion and evenness of the illuminated screen
• ambient light in the viewing room
• film viewer’s eye-sight
Poor viewing conditions may cause important defect information on a radiograph to go
unseen.
EN 25880 provides detailed recommendations for good film viewing conditions.
The luminance of the light passing through a radiograph shall not be less than 30 cd/m
2
and, whenever possible, not less than 100 cd/m2(cd = candela). These minimum values require a viewing box luminance of 3000 cd/m
2
for a film density of 2.0.
The practical difficulties of providing the required luminance for a film density of 4.0 are
considerable. The main problem with constructing a film-viewing box for these higher
densities is the dissipation of heat from the lamps. However, by limiting the film area
requiring such high power lighting, it becomes possible to view radiographs of a film
density of 4.
The light of the viewing box must be diffuse and preferably white. Radiographs should
be viewed in a darkened room, although total darkness is not necessary.
Care must be taken that as little light as possible is reflected off the film surface towards
the film viewer. If the film viewer enters a viewing room from full daylight, some time
must be allowed for the eyes to adapt to the dark.
A yearly eye-test according to EN473 for general visual acuity is required while especially sight at close range needs to be checked. The film viewer must be able to read a Jaeger
number 1 letter at 300 mm distance with one eye, with or without corrective aids.
The trained eye is capable of discerning an abrupt density change/step of 1 %.
While interpreting, a magnifying glass of power 3 to 4 can be advantageous.
122
Neutron radiograph of an iris flower made on Agfa D3 s.c. (single coated)
Organic substances are well suited to examination by this type of radiation.
Page 64

125
124
15.2 The film-interpreter
Apart from the requirements regarding “viewing conditions” and “viewing equipment”
the film-interpreter (film viewer) shall have thorough knowledge of the manufacturing
process of the object being examined and of any defects it may contain. The type of
defects that may occur in castings, obviously, differs from those in welded constructions.
Different welding processes have their own characteristic defects which the film interpreter must know to be able to interpret the radiograph.
To become a qualified NDT operator, various training courses, course materials and leaflets specifying the requirements they need to comply with, exist. The European NDTindustry conforms to the qualification standards of the American ASNT organisation.
So far, a training programme for film-interpreter has not been established in similar
fashion. Textbooks for example are not uniform. Sometimes, the IIW-weld defect reference collection is used, beside which the instructor usually has his own collection of
typical examples, supplemented with process-specific radiographs.
ASTM has a reference set of defects in castings available.
There are incidental initiatives to introduce classification of film-interpreters by level, in
a system comparable to the qualification of NDT-personnel. Some countries have already implemented such a system.
15.3 Reference radiographs
The two main areas for the application of radiography are weld examination and
examination of castings. Radiography is also used to check complex assemblies for proper construction, and for many other technical applications. The following selection of
radiographs illustrates the wide variety of possibilities for detection possibilities of
defects or errors.
Weld inspection:
The following examples are from the booklet published by GE Inspection Technologies,
called “Radiographer’s Weld Interpretation Reference”
Note: All of these examples illustrating a variety of defects in welds are also issued on poster
format (60 x 90 cm) by GE Inspectio technologies.
Offset or mismatch (Hi-Lo).
An abrupt change in film density across the width
of the weld image
Offset or mismatch with Lack of Penetration (LOP).
An abrupt density change across the width of the weld image
with a straight longitudinal darker density line at the centre of
the width of the weld image along the edge of the density change.
Page 65

127126
External concavity or insufficient fill.
The weld density is darker than the density of the pieces welded
and extending across the full width of the weld.
Excessive penetration.
A lighter density in the centre of the width of the weld image,
either extended along the weld or in isolated circular drops.
External undercut.
An irregular darker density along the edge of the weld image.
The density will always be darker than the density of the pieces
being welded.
Internal (root) undercut.
An irregular darker density near the centre of the width of the
weld image and along the edge of the root pass image.
Page 66

129128
Internal concavity (suck back).
An elongated irregular darker density with fuzzy edges, in the
centre of the width of the weld image.
Burn through.
Localized darker density with fuzzy edges in the centre of the
width of the weld image. It may be wider than the width of the
root pass image
Incomplete - or Lack of Penetration (LoP)
A darker density band, with very straight parallel edges, in the
center of the width of the weld image.
Interpass slag inclusions.
Irregularly-shaped darker density spot, usually slightly
elongated and randomly spaced.
Page 67

131
Elongated slag lines (wagon tracks).
Elongated parallel or single darker density lines, irregular in
width and slightly winding lengthwise.
Lack of side wall fusion (LOF).
Elongated parallel, or single, darker density lines sometimes
with darker density spots dispersed along the LOF-lines which
are very straight in the lengthwise direction and not winding
like elongated slag lines
Interpass cold lap
Small spots of darker densities, some with slightly elongated
tails in the welding direction.
Scattered porosity.
Rounded spots of darker densities random in size and location.
130
Page 68

133132
Cluster porosity.
Rounded or slightly elongated darker density spots in clusters
with the clusters randomly spaced.
Root pass aligned porosity.
Rounded and elongated darker density spots that may be connected, in a straight line in the centre of the width of the weld
image.
Transverse crack
Feathery, twisting lines of darker density running across the
width of the weld image.
Longitudinal crack
Feathery, twisting line of darker density running lengthwise
along the weld at any location in the width of the weld image.
Page 69

135
Casting radiography
For the interpretation of X-ray films of castings, thorough knowledge of the specific manufacturing process is required. The type of defects in castings varies for the different types of
materials and casting processes. Figures 15-1 and 15-2 show X-rays of complex castings.
These radiographs were made to check the overall shape and possible presence of casting
defects.
As it solidifies during the casting process, metal contracts and unless precautions are taken
shrinkage cavities can occur inside the casting.
These can take various forms, such as piping/worm-holes, (figure 15-3), sponginess or
filamentary cavities, depending on the rate at which the metal has solidified. When the
contracting spreads slowly through the metal, filamentary shrinkage (figure 15-4) or even
inter-crystalline shrinkage (figure 15-5) may occur, while if the solidification front shifts
rapidly, shrinkage cavities tend to occur (figure 15-6).
Gas cavities in the form of porosity or larger gas holes can occur either due to a damp mould
or release of gas from the molten metal, and can be particularly troublesome in cast light
alloys (figure 15-7). Cracks can also occur in castings.
If they are formed while the metal is still semi-solid they are usually called “hot tears” (figure 15-8); if they occur when the metal has solidified, they are called “stress cracks” or “cold
tears” (figure 15-9).
A collection of radiographs of defects in iron/steel castings is provided in ASTM E446, and
for aluminium in ASTM E155.
Fig. 15-1. Radiograph of an aluminium casting
Longitudinal root crack.
Feathery, twisting lines of darker density along the edge of the
image of the root pass The “twisting” feature helps to distinguish the root crack from incomplete root penetration.
Tungsten inclusions.
Irregularly shaped lower density spots randomly located in the
weld image.
134
Page 70

137
Fig. 15-3. Shrinkage (worm-hole cavities) in a (high heat conductive) copper casting
136
Fig. 15-2. Radiograph of an aluminium precision casting. Exposure on D2 film at 75 kV/5 mA/3.5 min/film-focus distance 100 cm
Page 71

139
Fig. 15-6. Shrinkage cavities in a bronze casting
Fig. 15-7. Gas-holes and porosity in an aluminium alloy casting
138
Fig. 15-5. Micro shrinkage (layer porosity) in a magnesium alloy casting
Fig. 15-4. Filamentary shrinkage in an aluminium alloy casting
Page 72

141
Fig. 15-10. Radiograph of an aluminium casting with coarse porosity
Exposure on D7 film at 60 kV/5 mA/15 sec, film-focus distance 100 cm
140
Fig. 15-8. Hot cracks (hot tears)
Fig. 15-9. Stress cracks (cold tears)
Page 73

143
Fig. 15-12. Radiograph of transistors
Exposure on D2 film with 27 μm lead screens at 100 kV/5 mA/2 min film-focus distance 70 cm.
Fig. 15-13. Radiograph of electric detonators, taken to check details of assembly
Examination of assembled objects
142
Fig.15-11. Radiograph of 25mm thick aluminium-copper alloy casting with gas porosity
Exposure on D7 film at 140 kV/5 mA, film-focus distance 100 cm
In addition to radiography for detection of defects in welds and castings, it can also be applied
to check for proper assembly of finished objects as figures 15-12 and 15-13 illustrate
Page 74

16
Digital Radiography (DR)
145
16.1 Introduction to DR
As in other NDT methods, the introduction of microprocessors and computers has
brought about significant changes to radiographic examination. Chapter 17 describes
a number of systems such as Computed Tomography (CT), radioscopy and X-ray
microscopy that have been made possible by newly developed technology which involves
rapid digital processing of vast quantities of data. But as this chapter will show, computer technology has also entered the field of conventional image forming radiography, as
applied in industry.
The driving force was the medical world where digital radiography already earned its credits and has become standard technology. Along with a few other companies, GE
Inspection Technologies and its affiliated suppliers developed a variety of digital systems
with a wide range of computer-aided NDT applications. Digital radiography partly replaces conventional film and also permits new applications. The growing number of available standards, norms, codes and specifications -essential for industrial acceptance and
application-supports this tendency.
Although the process itself is different from film radiography, DR resembles traditional
radiography to a large extent. The optical impression of the X-ray images is similar so
that RT trained personnel can quickly adopt this new technology and adapt to it without
great efforts. Moreover the images can be interpreted in analogy to film.
Digitisation of traditional radiographs although not real digital radiography, uses the
same digitisation technology, presentation on a display of a work station and image
adjustment, and therefore is part of this section too. Digitisation of film is done for the
purpose of archiving and/or image enhancement (adjustment).
Two main methods of real filmless digital imaging can be distinguished:
1. digital radiography by means of phosphor coated semi-flexible imaging plates
(compared with flexible film) in combination with computer processing,
so-called “Computed Radiography”, CR for short
2. digital radiography with rigid flat panel- or flat bed detectors and instant
computer processing, referred to as “Digital Radiography”, DR for short, and
considered as the genuine (true) DR method and sometimes in the field referred
to as “Direct Radiography”.
Each method has differing strengths, advantages and limitations that should be
evaluated in terms of specific application, inspection requirements and economics:
capital, human investment and productivity (number of exposures in a certain time).
144
Digitally enhanced radiograph of a “mermaid/man”.
The radiograph negated a myth by demonstrating that it concerns
a man-made creature.
©The British Museum
Page 75

147
Digitisation of these films provides an excellent alternative that also prevents
degrading. Special equipment has been developed for this purpose. Current digitisation
equipment actually consists of a fast computer-controlled flat bed scanner that scans the
film spot wise in a linear pattern, identical to the formation of a TV image, measuring
densities while digitising and storing the results.
The spot of the laser beam can be as small as 50
μ
m in diameter (1 μm = 1 micron, equivalent to one thousand’s of a millimetre), but the equipment can be adjusted for a coarser
scan, for example 500 microns, to achieve shorter scanning times. The values measured are
compared to a calibrated density scale and processed digitally. Density variations between 0.05 up to 4.7 can be measured.
The scanner has part of its technology in common with the CR film scanner, of which the
schematic principle is shown in figure 3-16. Contrary to the CR film scanner which measures reflected (stimulated) light, the density measurement in the film digitiser takes
place in transmission mode using a scanning light beam synchronised with a light detector.
Usually the density (blackening/
blackness) of a film is digitised in 12
bits, equal to 4096 steps or grey
levels. For convenience, these over
4000 levels are divided by 1000,
resulting in relative digital density
values from 0 to 4. This provides a
mean comparison with traditional
film density values.
GE Inspection Technologies supplies film digitisers, made by Agfa. A desk top version is
shown in figure 1-16. In these scanners, films with a maximum width of 350 mm can be
digitised in a single run. Even for the smallest laser beam spot size of 50
μ
m, approximately
4 mm of film (in length) can be scanned per second, so for the largest standard film size
(350 x 430 mm) this process would take approximately 2 minutes to complete.
Scanners exist without length limitation of film, and adapters exist for digitisation of roll
(stripe) films.
Apart from greatly reduced storage space and (almost) deterioration-free archiving,
digitising also makes it possible to (re)analyse the film’s images on a computer screen (see
work station in figure 33-16), with the possibility of electronic image adjustment (enhancement), see section 16.12. Thus defect indication details not discernible on the original
film using a viewing screen can be made visible.
For use in laboratory environments only, high-resolution film digitisation systems exist
that use a scan spot size as small as 10
μ
m. This is an inherently time consuming process
but enables detailed analysis of particular film areas, e.g. to make tiny cracks visible at
the work station.
146
The major parameters to compare film to digital radiography are spatial resolution,
contrast sensitivity and optical density range. The major merits of digital radiography
compared to conventional film are:
• Shorter exposure times and thus potentially safer
• Faster processing
• No chemicals, thus no environmental pollution
• No consumables, thus low operational costs
• Plates, panels and flat beds can be used repeatedly
• A very wide dynamic exposure range/latitude thus fewer retakes
• Possibility of assisted defect recognition (ADR)
Despite all these positive features, the image resolution of even the most optimised digital method is (still)not as high as can be achieved with finest grain film. A few other
limitations are also explained in this chapter.
16.2 Digital image formation
In conventional (film) radiography, the human eye is used to examine a physical record of
the radiographic image, which has recorded the intensity of X-rays incident on the film as
varying degrees of opacity (shades of grey between black and white). In digital imaging the
intensity of X-rays is first measured point by point and then individually digitised and converted into many (e.g. 12 bit = 4096 levels) discrete grey values including their corresponding
coordinates. This recording process is known as mapping; a map consists of many (millions)
discrete measuring points with their individual grey levels. Finally, these grey levels and
their coordinates are displayed to form a coherent image on a video screen, or printed, as a
collection of picture elements (“pixels”) for examination by the human eye.
Because of the 1-to-1 correspondence between each final image pixel and the discrete measurement area (sensor size), the areas on a digital detector are also commonly referred to as
pixels. For digital radiography using panel, flat bed or line array detectors this process of
digitisation with assigned grey levels is done at once, at the detector itself. In case of
imaging plates the digitisation and grey level assignment is done in the so-called
“reader”, see section 16.4. The mapping process allows data to be measured and stored
from a much wider dynamic range than the eye can normally perceive. After an image has
been stored, different maps can later be applied to show different thickness ranges, without
affecting the original measurements. These maps can be linear or non-linear: for example, a
logarithmic map is sometimes used to more closely mimic the response of conventional films.
16.3 Digitisation of traditional radiographs
Although the image forming of traditional film has nothing to do with digital radiography, digitisation of such films makes use of a major part of the technology and hardware
also used for CR and DR and as such is part of this chapter of the book. Storing and archiving of chemically processed X-ray films not only demands special storage conditions, see
section 10.7, but also takes up quite a bit of space.
Fig. 1-16. Desk- top film digitiser
Page 76

Because scanners vary widely in resolution, dynamic range, and ability to scan dense
films, evaluation is required to ensure that adequate scanning fidelity is achieved.
Depending on selected resolution many Megabytes are needed to store a single film, see
paragraph 16.12. Archiving of a digitised film, identical to CR- and DR images, is usually
done on an optical mass storage facility e.g.: CD-ROM, DVD etc. For uniform application
of film digitisation norm EN 14096 has been issued.
16.4 Computed Radiography (CR)
Digital radiography using storage phosphor plates is known as “Computed Radiography” or
CR for short. This “filmless” technique is an alternative for the use of medium to coarsegrain X-ray films, see the graph in figure 27-16. In addition to having an extremely wide
dynamic range compared to conventional film, CR technique is much more sensitive to
radiation, thus requiring a lower dose, see figures 8-16 and 27-16. This results in shorter
exposure times and a reduced controlled area (radiation exclusion zone).
Two-step digital radiography
CR is a two-step process. The image is not formed directly, but through an intermediate
phase as is the case with conventional X-ray films. The image information is, elsewhere and
later, converted into light in the CR scanner by laser stimulation and only then transformed
into a digital image. Instead of storing the latent image in silver-halide crystals and
developing it chemically, as happens with film, the latent image with CR is stored (the intermediate semi-stable phase) in a radiation sensitive photo-stimulable phosphor layer.
This phosphor layer consists of a mix of bonded fine grains of Fluor, Barium and Bromium
doped with Europium.
The CR imaging plate
The phosphor layer has been applied to a flexible carrier and been provided with a protective coating. An additional laminate layer mainly determines the mechanical properties
such as flexibility ( CR imaging plates are not as flexible as X-ray films). Such plates can
be used in a temperature range from -5° C to +30° C. Figure 2-16 shows the layered structure of this type of plate, which is generally called an imaging plate or sometimes
(wrongly) imaging screen.
Note: Screens in the world of NDT, made of lead or another metal, are used to intensify
the effect of incident radiation or to reduce the effect of (scattered) radiation.
149
148
Image development
As a result of incident X-ray or gamma ray radiation on the storage phosphor, part of
its electrons are excited and trapped in a semi-stable, higher-energy state. This creates the
latent image. These trapped electrons can be released by laser beam energy. This stimulation causes visible light to be emitted, which can then be captured by a PMT (Photo
Multiplier Tube). The wavelength of the laser beam (550 nanometres) and that of the emitted visible blue light (400 nm) are of course different to separate the two .
The laser-scanning device used to scan (develop) the latent image contains the PMT and
its electronics, which digitises the analogue light signal that is generated. This process as
illustrated in figure 3-16 takes place in the phosphor scanner, or so called “CR scanner” or
“reader”. The plate is scanned in a linear pattern similar to the formation of a TV-image and
identical to the film digitisation process.
Scanners-Readers
There are various types of scanners. In the most professional scanners, all that needs to be
done is to insert the cassette in the input tray and the machine automatically completes the
processing cycle. After completion of this process, including erasing the latent image, the
cassette is released from the CR scanner and ready for re-use. Figure 4-16 shows a typical
tower-type (man-size) automated scanner.
In smaller and portable desktop scanner models intended for use at remote locations e.g. on
offshore platforms, the CR imaging plate is manually removed from the cassette and inserted into the scanner, which slightly increases the risk of the plates being damaged.
In addition to flat bed CR scanners drum type scanners exist. Figure 5-16 shows an example.
This scanner can handle unlimited lengths of CR plates.
Protective coating
Storage phosphor layer
(thickness approx 200 micron)
Laminate
Flexible PET-carrier/base
Fig. 2-16. Structure of the CR imaging plate
Rotating
mirror
Red light 550 nm
A/D Converter
Display
Storage phosphor plate
Light guide
Blue light
400 nm
CR SCANNER OR READER WORK STATION
Laser
PMT
Fig. 3-16. Schematic
of CR imaging process
Fig. 4-16. Automated CR scanner
Fig. 5-16. CR drum type scanner
Page 77

151
150
For desktop scanners the cassette can be opened, as
shown in figure 6-16. CR plates can be exposed to
subdued light (< 10 lux: a candle creates 5 lux) for
one minute with acceptable consequences for the
image quality. The effect strongly depends on the
type of the light source, e.g. tube light causes most
damage to the latent image. The scanned image is
ultimately or instantly made visible on a high-resolution monitor (computer screen) of the workstation, see figure 33-16.
Depending on the line distance selected, typically
50 or 100 microns, the plate speed (lengthwise
progress) is 5 to 10 mm per second. This is similar
to the speed of digitisation of a traditional film. In all scanners, the latent image on the plate
is not only read but also subsequently erased (reset) which takes about one minute, and therefore the CR plate is almost immediately available for the next exposure.
CR cassettes
Bare CR plates are nearly as pliable as film. They can be packed in paper or vinyl
cassettes either with or without lead screens. These packages are still pliable.
Technically the plates can be used many times (up to 1000 x), provided they are
handled with utmost care while their surface despite a protective coating is very
sensitive to touching and dirt. A single scratch can make the plate unsuitable for
further use. Rigid cassettes developed especially for the NDT-market have built-in intensifying lead screens at the source side, and a second lead screen at the back to absorb radiation
caused by backscatter. These multi-layer cassettes are not flexible anymore but can be reused more often than the flexible cassettes (even a few 1000 times).
Figure 7-16 shows a cross-section of the CR imaging plate in a rigid cassette. The steel and
magnetic plates ensure that the various active layers are evenly and closely pressed
together. For low energy exposures clip-type cassettes exist (to replace the steel- and
magnetic plate) which also ensure intimate contact between the layers. The steel- and
magnet plate would otherwise absorb the low energy radiation.
Dynamic range – Exposure latitude
CR plates have an extremely wide dynamic range (exposure latitude). In practice the
phosphor crystals on a CR plate cannot be saturated and react almost linearly to incident
radiation, while in a conventional film the silver-halide crystals react exponentially, see
the graph in figure 8-16.
As a result the dynamic
range of a CR plate is much
wider than for conventional
film, which makes exposure
times less critical, reducing
re-shoots (re-takes), and
allows various material
thicknesses to be examined
at the same time. The wide
dynamic range can also be
useful in case of under-exposure, this can be compensated
for by a more sensitive readout scan or image adjustment
at the work station.
This wide range is illustrated
in figure 9-16. The images
have been obtained from a
stepwedge from 5 up to 25 mm
thickness, in steps of 1mm.
The digitised image of the
film shows only a portion of
the step wedge thicknesses,
the logarithmic CR image
shows all steps proportionally.
The matching analogue records,
at right handside of this figure,
confirm this behaviour.
Furthermore, those sensitivity (speed) of CR is five to ten
times higher as well, compare
point A and B at a density of
2, see also figure 27-16.
Fig . 6-16. Opened CR cassette
CR plate
Fig. 7-16. Structure of a CR cassette with storage phosphor
Plastic front of cassette
Lead intensifying foil 250
μ
m
Magnetic sheet
Storage phosphor plate
Lead screen 150 μ
m
Steel sheet
Plastic back of cassette
Fig. 8-16. Density/intensity versus dose for film and digital methods
Fig. 9-16. Dynamic range of digitised film versus CR plate. (courtesy BAM Berlin)
Density film
Relative dose
A
B
Film
CR plate
DR panel
Intensity digital methods
Useful
dynamic
range of film
Useful dynamic range of CR/DR
Imaging plate
Imaging plate
Digitised film
Digitised film
Density
Density
Page 78

16.5 Genuine Digital Radiography (DR)
One-step digital radiography
Digital radiography, DR for short, is also known as “direct” radiography to indicate the difference with CR, which is a two-step, and thus slower process. With DR technology, there is
an immediate conversion of radiation intensity into digital image information.
Similar to common digital photo cameras, the radiographic image is almost immediately
available. Exposure and image formation happen simultaneously, allowing near real-time
image capture, with the radiographic image available for review only seconds after
the exposure. Some systems even provide a true real-time (radioscopic) mode with display
rates up to 30 images per second. This almost instant image formation is the reason that
some consider DR the only “genuine” (true) method of digital radiography. This instant
availability of results offers immediate feedback to the manufacturing process to quickly
correct production errors.
16.5.1 Detector types
Many materials or combinations thereof are sensitive to the impact of ionising radiation.
Over the years a considerable number of them proved to be efficient and commercially viable
to create radiation detectors for NDT applications. As a result a wide variety of detector
types are in use for formation of DR images. Often the application dictates the selection of
a particular detection/sensor system dependent on pros and cons of such a system. The
detectors can be characterised by detection method (direct versus indirect) and by geometry
(linear versus two-dimensional: 2D). All the different detector types that are useful in industrial inspection applications have a wide dynamic range similar to CR plates, see figure 8-16.
Direct versus indirect detection
All X-ray detection methods rely on the ionising properties of X-ray photons when they
interact with matter. In direct detection
(one-step) devices the amount of electric
charge created by the incident X-rays is
directly detected in semiconductor materials.
In indirect (two-step) devices, the X-ray
energy is absorbed by phosphorescent
materials (known as “scintillators”) which
emit visible light photons, and these photons are then detected by a photo detector
being the second layer, thus being an indirect process.
The different active layers are illustrated in figure 11-16. Because many thousands of ionised charges can be created by a single X-ray, direct photo detectors must be both very sensitive and able to measure large amounts of charge to produce good image quality. The technologies for CMOS, scintillator materials and amorphous photo-detectors are relatively
mature and used in many commercially available DR detector products.
153
Exposure time and noise
In addition to the wide dynamic range the dose sensitivity (speed) of CR plates is five to
ten times higher, compare point A and B in figure 8-16 at a density of 2 (see also figure
27-16). This allows for shorter exposure times or weaker sources, reducing the unsafe
radiation area. Unfortunately, if a source with lower energy is chosen this will result in
reduction of the image quality. Iridium192, with a lower energy than Cobalt60, requires
a longer exposure time and this in turn reduces image quality due to the larger quantity
of scattered radiation. For profile radiography applications (sometimes also called onstream radiography) Iridium can replace Cobalt for pipes with a diameter up to 6”
(150 mm), with still an acceptable image quality, or even 8” (200 mm) in case of thin wall
pipe. The general rule is: the shorter the exposure time the less the scatter thus the
better the image quality.
Note: CR plates are more sensitive to low energy scatter (more noise) than conventional film.
Careful filtering and collimation of the radiation and control of backscatter are vital to good CR.
Fading
After exposure the intensity of the stored information (cassette closed) naturally decays
over time, resulting in some signal loss. Scanning within 1 hour of exposure provides the
best results; typically 50% of the information is lost after 24 hours, dependent on the manufacturer of the plate. Fading is dependent on ambient temperature. To avoid image fading,
scanning of the CR plate should not be delayed longer than necessary. In critical applications, where signal loss is expected due to delayed scanning, the plates can be exposed with
a higher radiation dose to compensate for this information decay.
Optimisation
To optimise the use of CR imaging plates in
practice, a small handheld terminal as
shown in figure 10-16 has been developed to
superimpose specific project- and exposure
information to the images. To this end the
cassette contains a microchip which can
receive (wireless) information from the terminal. On site and prior to the exposure the
relevant information is sent from this terminal
to the microchip on the cassette. The specific
data is ultimately added to the image in the
CR scanner. Once the data from the microchip
has been erased the cassette is ready for re-use.
Improvements
Due to ongoing efforts for improvement the image quality of the phosphor plate one has
already achieved a level equal to the quality obtainable with a medium-grain conventional X-ray film, see figure 27-16. In fine-grain films, graininess is only a few microns, while
in current (2008) phosphor plates this is considerably more (approximately 10 microns).
152
Fig. 10-16. Terminal for CR imaging plates
Radiation
(photons)
Amorphous silicon array (detector)
light
CsI Scintillator - TFT photodiode array
electrons
Read-out electronics + digitisation
Digital data to workstation
Fig. 11 -16. Schematic of an indirect (two-step)
flat panel detector
Page 79

155154
Linear detectors
Linear detector arrays (LDAs) based on CMOS technology, as shown in figure 12-16, are commonly
used in applications where a mechanical means provides a relative motion between the object being
inspected and the X-ray beam. LDAs can be made in
virtually any length. In practice active lengths are
available up to over 1 metre and energy ranges from
100 kV to several MeV.
A common well-known application is airport luggage inspection, where a conveyor belt
carries objects through a fan-shaped (collimated) X-ray beam and past a linear detector
array as illustrated in figure 13-16. A series of row-like subimages from successive locations
is then assembled to form a two-dimensional radiograph for interpretation.
In NDT, similar linear arrays
with small sensor elements
are typically used in high
speed testing machines for
production inspection applications that incorporate
either a manipulator or a
conveyor to move parts past
a stationary X-ray tube detector arrangement similar
to figure 13-16.
A relatively new application is the inspection of circumferential welds (so-called girthwelds) during construction of pipe lines, either cross country or on lay barges, see
section 16.11. For such systems CMOS type linear arrays are in use because of their efficiency, fast response and erase properties (< 0.2 msec) and last but not least their robustness; an essential requirement for application under adverse field conditions.
Linear (or curvilinear) arrays are also commonly used in CT applications .
Direct linear arrays using CdTe (Cadmium Telluride) and other semiconductor materials
are now available, but most commonly linear arrays are of the indirect type with a scintillator material to convert incident X-rays into visible light and crystalline silicon photodiodes measuring the light. These analogue signals are subsequently digitised and converted into grey levels.
2D detectors
The “simplest” type of DR detector used in NDT is a two-dimensional array of detection
“pixels” to measure incident X-ray intensity to directly create a radiographic image
without the need for any motion of the component. Small 2D detectors typically use a
photo detector array made from a crystalline silicon integrated circuit, optically mated to
a powdered scintillator screen.
Both Charge-Coupled Devices (CCD’s) and Complimentary Metal-Oxide Semiconductor
(CMOS) devices are used. Typically the screens use a powdered Gadolinium
OxySulfide (GOS) material to convert the incident X-rays to visible light. These
devices can have very good spatial resolution, but are often used with thin scintillator
screens that can limit X-ray absorption efficiency (detection) over the full range of Xray
energies used in common NDT applications. Because they are made from singlecrystal
silicon wafers, they are also limited in size. Thus detector designs that cover a
larger area either require tiling of multiple devices or an x-y motion of a single small
device to simulate over time the effect of a larger device.
Larger 2D detectors (up to the size of common X-ray films) are usually made from photo
diode arrays of amorphous semiconductors. Some early direct detector products were
made from relatively thick film of amorphous selenium, but these direct radiography
detectors are no longer widely available for NDT applications.
More common are the indirect devices with photo detector arrays made from very
thin film of amorphous silicon, its schematic is shown in figure 11-16.
These detector panels are available both with GOS screen scintillators and with thick
layers of needle-crystal Caesium Iodide (CsI) grown directly on the photodiode arrays.
The thicker scintillator layer in the CsI devices typically provides better absorption of the
incident X-rays, and thus better imaging efficiency.
16.5.2 Fill Factor
Lateral resolution of a 2D digital
detector array is determined
by the packing density of
the
individual sensor elements
(pixels).
The denser the better.
This packing density is known as the “Fill Factor” and is illustrated in figure 14-16. This factor is dependent on the minimum possible spacing between individual elements. The Fill
Factor can be a reason to select a CMOS type detector for a particular application. For CMOS
this factor (active portion) is up to 90%, for amorphous materials up to 80%.
Fig. 12-16. CMOS linear detector array
(courtesy Envision)
Fig. 13-16. Inspection set-up using a linear array
Fig. 14-16. Fill Factor for amorphous silicon and CMOS
X-ray tube
Object
Workstation
Linear diode array
and electronics
Collimator
Moving direction
Length 640 mm
~7500 pixels
Amorphous silicon CMOS
Page 80

157
CMOS detectors and flat bed scanners
For some applications CMOS detectors are an alternitive for temperature controlled
amorphous materials. CMOS has a lower energy consumption and the effect of temperature is less than for amorphous silicon. This in industry is an important feature because it
requires less frequent recalibration for systems using CMOS detectors versus unregulated
amorphous silicon devices. For amorphous materials with every 5°C to 10°C of temperature variation a recalibration is recommended. CMOS has a wider tolerance of up to 40°C.
With CMOS there is no risk of saturation causing blooming and edge burn-out. In addition they show no ghost/memory effect, thus no latent images.
Another fact is that the Fill Factor
(active portion of the detector) of
CMOS is better than amorphous silicon, see figure 14-16.
Similar to amorphous silicon, CMOS
is suitable for an energy range from
20 kV to several MeV, CMOS even to
15 MeV.
So far no true large flat panels using CMOS detectors exist, the maximum size known at
present measures 100 x 100 mm with very small pixels sizes of approximately 50 microns,
and 200 x 300 mm with pixel sizes of 100 microns. To nevertheless make use of the technical advantages a clever design provides the solution to mimic a large flat panel. Figure
16-16 shows such a virtual “panel” detector, in fact it is a flat bed scanner in which a fast
moving linear detector array (LDA) is applied. Such “panels” exist in many formats, up to
600 x 1200 mm, and can even be custom made.
For linear arrays smaller pixel sizes of 50 microns exist, this size can technically be reduced further. Probably negative side effects (cross-talk and noise) would then eliminate the
advantages of such smaller pixels.
Limitations
In practice DR flat panel detectors have proven to be excellent tools for the NDT-industry,
however some limitations apply as well:
• Both true DR and flat bed CMOS scanners have a restricted lifetime cuased by the
accumulated radiation. Flat panel detectors can be used continuously for years in
mass production processes. The ultimate lifetime is determined by a combination
of total dose, the dose rate and radiation energy. Flat panel detectors are less
tolerant for high than for low energy radiation, hence extremely high energies
should be avoided.
156
16.5.3 Flat panel and flat bed detector systems
There are different types, sizes and suppliers of true 2D flat panel detectors.
A variety of flat panel systems exists with a wide range of pixel sizes and resolutions.
More and smaller pixels and a high Fill Factor increase the resolution of a panel.
As an indirect sensor material amorphous silicon is in wide use. As direct sensors CCD’s
(Charge Coupled Devices) and CMOS (Complementary Metal Oxide Semiconductors) are
also applied. So far they have limited dimensions. To mimic a large flat panel detector, fast
moving CMOS linear arrays are also in use providing an almost similar solution.
Amorphous silicon flat panels
For industrial DR, flat panel detectors (knowm as DDA’s: Digital Detector Arrays) in a variety
of sizes are used, up to approximately 400 x 400 mm(maximum in 2008) as shown in
figure 15-16. Thes detectors convert incident radiation intensity into proportional and digitised electronic signals. These digital signals can, by means of a computer and screen
(workstation), without intermediate steps, be presented as a coherent radiographic
image. A cable typically links the detector to the workstation from which the panel is
controlled as well.
The most common high resolution two-step flat panels, as illustrated in figure 15-16, use
amorphous silicon technology. First a scintillator made of structured Caesium Iodide(CsI)
converts incident radiation directly and instantly into light. The conversion is proportional to the radiation dose. Secondly light is converted into a proportional electric signal by
thin film transistors (TFT’s).
Each pixel contributes to the radiographic image formed on the screen of the workstation.
Each element is square in effective area, with pixel pitch typically ranging from 50 to 400
microns. The smaller the pixels the better the resolution, but the poorer the imaging
efficiency. Figure 11-16 illustrates this two-step process. Reasearch and development is in
progress to make sensor elements/pixels smaller. Depending on overall active area and
detector pixel pitch, a panel consists of up to several millions of such elements/pixels.
Fig. 15-16. DR flat panel component
with 400 x 400 mm active area.
Assembled flat panel detector
Physical data: Dimensions: ~500 x 600 x 100 mm
Weight: ~ 10 kg
Fig. 16-16. Flat bed LDA scanner/panel (courtesy Envision)
Page 81

159
16.6.2 Determination of image quality
To determine the quality of a digital image, existing codes require two different IQIs in
analogy to radioscopy. One wire- or plaque IQI for contrast, and one duplex wire IQI for the
determination of spatial resolution (unsharpness).
To establish spatial resolution a density line scan across the X-ray image at the location of
theduplex IQI should be made to determine this resolution. The resulting linear analogue
response of this scan is then interpreted to determine achieved resolution as illustrated in
figure 18-16. The criterion is that the dip between two peaks of the wire pair must be equal
to or more than 20% of the peak heights.
To avoid line interference or Moiré-effects during the line scan process of the reader, the IQI
for that purpose should be rotated for 5° with respect to edge of the CR plate or DR panel,
as required by EN 14784-1 and illustrated in figure 19-16.
158
• With millions of pixels it is “normal” that over time a few pixels become less
responsive, similar to pixels of flat panel displays as used with (notebook) computers.
Usually the un-acceptable number and pattern of dead pixels is specified by the
manufacturer. Fortunately, in cases a small area of the panel is out of order, an
experienced interpreter of DR images is able to differentiate (by pattern recognition and known position on the panel) real component defects from less responsive
pixels. Also "interpolation" software is used to reduce or eliminate the effect of bad
pixels. So, when a small portion of the pixels respond typically, the corresponding
pixel values can be interpolated with data from neighbouring pixels. In document
ASTM 2597 a number of terms and definitions are given for malfunctioning pixels
or pixel clusters.
• Some flat panel DR detectors are also subject to some memory effect, in jargon
called “ghosting”. This is due to hysteresis of the scintillation layer after exposure.
The image slowly fades away, particularly in case of high energy - and dose levels.
This hysteresis causes a certain dead time of the system, from seconds to minutes
depending on the application during which the detector cannot immediately be
re-used.
16.6 Image quality and exposure energy
16.6.1 Exposure energy
To achieve the best image quality the maximum X-ray tube voltage or energy of the isotope
selected should be as low as possible. This applies for both film and digital radiography.
Figure 17-16 shows a graph taken from EN 14784-2 showing the optimum energy versus
wall thickness for different materials.
Fig. 17-16. Optimum radiation energies for best image quality
Fig. 18-16. Resolution criterion of duplex IQIs for digital X-ray images
Fig. 19-16. CR image of a weld with rotated duplex IQI
Material thickness
COPPER
STEEL
TITANIUM
ALUMINUM
mm
According to EN14784-2
kV/keV
Energy
The two wires of a pair are resolved if the dip
between the peaks is greater than 20% of the
maximum intensity.
Peak
Duplex IQI
Scan line
Signal amplitude
Linear scale
Analogue signal intensity
Relevant part of CR image
Page 82

161
Exposure parameters
The quality of a digital image is affected by a number of factors. The final image cannot be
better than the quality of the X-ray information arriving at the detector. Just as with conventional film radiography, this inherent loss of information is determined by a variety of
parameters. These are; the X-ray spectrum (kV, filters, and screens), the part to be inspected (thickness, material) and exposure conditions (focal distance, backscatter, exposure
time). The overall effect is visible as loss of contrast and sharpnes of the final image on the
screen of the workstation. Some optimisation is possible for digital systems, the majority of
measures quite similar to those appropriate for good conventional film techniques.
MTF (Modulation Transfer Function)
No imaging system is perfect. All imaging systems record their inputs imperfectly. One obvious shortcoming - of paramount importance for radiography - is a reduction in sharpness by
imperfect contrast transmission throughout the total imaging chain. The scientific method
to quantify performance (fidelity) to transfer contrast information is characterised by the
“Modulation Transfer Function”, MTF for short. MTF describes the relation between
contrast and spatial frequency.
In practice MTF characterises the unsharpness (blurriness) that a digital system adds
to an image, thus indicating the level of
distortion of contrast/sharpness in the
resulting image as illustrated in figure 21-16.
The graph shows the distortion of contrast
of a square wave (black-white) input and
output for an ideal MTF of 1 (100%) and a
low MTF. Each step in an imaging chain has
an individual MTF.
The MTF of a complete system is the product of the MTF's of the individual steps. In the end
of an imaging process the effect is visible in the amount of loss of image quality. MTF for a
total system typically ranges from 0 to 1 (0 to 100 %). Sharp features and small flaw indications will be more easily visible in images produced with a system that has a high MTF.
Figure 22-16 graphically shows the
image distortion of for example an
ideal pin-shaped detail that through
successive distortions by the steps in
the system, is presented as a blurred
spot on the screen of the work station.
Every step in the process widens the
detail that was ideal in the beginning
with a simultaneous reduction of
contrast and sharpness.
160
16.6.3 Indicators of image quality - MTF and DQE
Factors influencing image quality
In the process of making a radiograph three factors influence the ultimate image quality:
1. exposure conditions
2. detector performance/efficiency
3. performance of the processing equipment to form an image
To enable quantification of the quality of digital radiographs and the hardware used to
create them, two notions are in use: MTF and DQE.
Image quality definitions
Image quality is the total result of resolution/sharpness, contrast resolution and noise.
Conventional X-ray films exhibit an extremely high intrinsic resolution due to the fine granularity of the radiation sensitive crystals (a few microns in size). The resolution of the
resulting image is far better than the human eye can resolve. Hence for film contrast IQI’s
provide an adequate measure of indicating resolution and image quality that meets the qualification needs of industry, thus there is no need for any additional resolving criteria for traditional film. However, digital radiography has a much coarser intrinsic resolution (typically
50 microns or more) so a different situation exists compared to film radiography.
To select or purchase the proper digital system, information that quantifies the resolving
power of a digital system is needed. Although generic methods to measure optical resolution exist, they have not yet been fully specified for digital radiographic systems.
To fulfil the need for quantification of resolution, prior to anticipated release of future standards, suppliers of digital radiography systems already proactively use methods and definitions
that are common in other
sciences
.
Resolution is defined as the smallest separation (distance) between two objects that the
human eye can distinguish. Because the human eye is not easily quantifiable, an objective
method to indicate resolution is needed. Resolution is dependent on contrast (grey levels)
and separation (distance).
Resolution is expressed as the number of line pairs (black and white) that can be distinguished in one mm, see figure 20-16.
Fig. 20-16. Resolution: line pairs per mm
Fig. 21-16. MTF and resulting contrast distortion
Fig. 22-16. MTF causing step-wise image distortion
1 mm
1 Lp/mm
1 mm
4 Lp/mm
Ideal MTF input = output
Low MTF with distorted output
Initial information
Process steps
Image contrast
Final image
on monitor
screen
Page 83

163
162
Remark: MTF and DQE are used to characterise detectors and systems. Some users may
find these scientific notions rather abstract and hard to understand. While very useful in
selecting a detector for a particular application, in practice they do not replace the duplex
IQI as final indicator of image quality for CR- and DR applications.
Noise, image averaging and DQE
Noise is a dominant factor in the DQE value. System noise can be reduced by signal averaging resulting in improved image quality as illustrated by the images of figure 24-16.
Noise in turn depends on dose, thus the time needed for an exposure to create an
image that might include signal averaging to achieve the required image quality.
Reduction of noise by averaging the signals from a number of exposures increases the image
quality but reduces the DQE value due to the longer exposure time.
16.7 Resolution – number of bits
Resolution is a key word connected with digital radiography. Apart from all digital processing inside the system it is ultimately the image resolution that determines its quality.
Two resolutions are of importance:
1. depth resolution – the number of grey levels in which a signal is presented
2. lateral resolution – the pixel size
Bit depth
For depth resolution, to present the densities in a map like image, usually 12 bit (212) is
applied. This corresponds to 4096 different grey levels, which corresponds (when for convenience divided by 1000), to 4 in film technology. The effect of the number of bits is
illustrated in figure 25-16. Image A shows a 1 bit (2
1
) 2 level image and hardly contains any
information. Image B shows a 2 bits (2
2
) image equal to density 4 grey levels with still lots
of missing details. Image C shows a 12 bit image, providing more than sufficient information and showing all details even far beyond what the human eye can distinguish.
DQE (Defective Quantum Efficiency)
Just as it is more difficult to discern fine
detail when an object is dimly lit, it is also
more difficult to observe defect indications
in a noisy X-ray image with limited detected
dose. The effects of contrast and noise on
defect recognition is illustrated in figure 23-16.
Thus, in addition to the two factors (exposure parameters and MTF) already mentioned
there is an additional loss of image quality if
some of the X-rays are not absorbed during
the primary detection process determined by
the ability of the detector to accurately transfer the information present in the incident X-rays. MTF does not take into account the inherent noise resulting from the X-ray dose available for an image or noise added by the detection system. The measure that combines MTF with detection efficiency and noise considerations is known as “Detective Quantum Efficiency”, or DQE for short.
In mathematical terms DQE can best be thought of as the square of the signal-to-noise ratio
(SNR
out
) of the X-ray contrast measured by the detector, divided by the square of the
contrast-SNRinincident on the detector, for each spatial frequency:
DQE (f) = (SNR
out
)2 / (SNRin)2 otherwise: DQE ≈ Image quality / Dose
So, DQE indicates a detector system's ability to accurately represent all of the contrast information present in the incident X-ray field as a function of spatial frequency. A perfect detector will give a DQE of one (100%) over all frequencies, while a poor detector has a DQE that
approaches zero.
For example, assume there are two detectors with different DQE's. If the same incident dose
is applied, the detector with the higher DQE will give a larger SNR
out
and better image quality. Alternatively, the same image quality can be achieved with the other detector as well, but
requiring a higher dose, which translates to increased exposure time or higher tube current.
In general, DQE consolidates many individual parameters (resolution, efficiency/exposure
time, noise etc.) into a single parameter describing the overall plate- or panel performance.
Therefore specifying DQE for a detector will also help determine both the final image quality and inspection times required for a given application. Like MTF, DQE can range from 0.0
to 1.0; numbers in practice vary from 0.05 to 0.9.
In summary: MTF quantifies the maximum possible resolution of the total system, but DQE
quantifies the actual performance of the detector including its resolution, noise and dose
efficiency (exposure efficiency). The DQE function characterises the final image quality versus the inspection time required for a given application.
Increasing contrast
Decreasing noise
WORST
BEST
Fig. 23-16. Defect recognition versus contrast and noise
Fig. 24-16. Effect of image-averaging on noise and image quality
Fig. 25-16. Depth resolution by number of bits
DR image - one shot DR image - 16 shots
A
B
1 bit 2 bits 12 bits
Page 84

165164
Lateral resolution
Lateral resolution is determined by pixel size. First
of all the pixel size of the detector and secondly the
pixel size of the display screen. The effect of pixel size
and number of pixels is illustrated in figure 26-16.
The same text is displayed in four different resolutions. The text on top shows 6 pixels vertically, step
by step increasing to 50 pixels for the lowest text.
For this reason also the hardware of work stations
is specified by standards to guarantee best possible
image presentation without loss of information as
contained in the original digital data.
Hardware performance should be equal to or
better than the required exposure/detector quality.
16.8 Comparison of film, CR- and DR methods
The choice of which technique to use
depends first of all on the requirements with regard to the ultimate
image quality. In both the CR- and DR
methods the same IQI’s also used in
conventional radiography are applied
to check the radiographic processand
image quality. The major parameters
to compare the three methods (film,
CR and DR) are speed (dose needed
for creating the image) and image
quality (noise, resolution, contrast).
Figure 27-16 graphically illustrates
the relative image quality of different
films and digital techniques.
This overview shows that the best image quality (best IQI visibility) of CR plates is similar to
what can be achieved with medium to finer grain film (compare point A with B) but is
appoximately five times faster. At point C the quality is less than what can be achieved with
coarse grain film but the speed is more than ten times faster compared to point B. RCF films
(five tot ten times faster than D7-film) are positioned in the same range as CR plates. The
graph for DR panels is based on the results obtained with common flat panel detectors with
different numbers of pixels (25 to 400 microns). The best quality that can be achieved with
DR panels comes close to fine grain film D3 (compare point D to point E).
The graph also shows that the speed is much higher to achieve the same image quality of
D-type films. Depending on the required image quality a time saving of at least a factor 20
(D against E) and roughly 200 (F against E) can be achieved, however with poorer quality.
The range for true real-time (real instant) images shows that exposures can be made with
extremely low dose but at cost of image quality.
16.9 Impact and status of CR- and DR standards
Development of standards
The application of established NDT methods is almost
exclusively possible thanks to the existence of written standards (codes, norms, guidelines, procedures, specifications, qualification of personnel, etc.). For the introduction
and market acceptance of a new non-established NDT
method - apartfrom economic considerations - it is therefore essential that standards support its use.
The standards for film radiography were written many
years ago and did not envisage digital radiography, so a
whole set of new standards is required.
In general the issue of standards lags far behind the introduction of a new method.
Development of standards starts earliest once a new NDT method is almost mature and has
shown certain market viability. The creation of a standard usually is a time consuming and
painstaking formal process. Standards are compiled by (international) working groups consisting of NDT-specialists of different disciplines e.g. research and development, industry,
universities and authorities. Participation of authorities at an early stage can speed-up legalisation (legislation) and release of a standard.
Sometimes industrial, economic and scientific interests do
not fully match and hamper quick release of a new standard. Even under the most favourable conditions, making a
standard is a process that takes many years; at first it requires a “working document” followed by a “preliminary version” prior to official release. Until 2005 this was the situation for CR and it still is for DR.
In addition to the many specialists involved, there is also a
large number of national and international normalisation
organisations that issue such standards. They often adopt
the content of each other’s documents, to save time, after
careful judgment of the content and give them their own
specific issue numbers and annotations.
Fig. 26-16. Effect of number of pixels on
lateral resolution
Fig. 27-16. Relative image quality and speed of the various
radiographic methods
This graph appears enlarged in the appendix.
Relative dose
Faster
Relative image quality DQE
True real-time
Radioscopy
F
D
A
C
B
D2
(fine grain)
D7
(coarse grain)
E
CR-Plates
DR-Panels
RCF-Films
D-Films
Better
Terminology
What’s in a name?
Standard
Standard practice
Recommended practice
Norm
Code
Procedure
Specification
Qualification
Guideline etc.
Major
Issuing
Organisations
ISO
EN
ASTM
ASME
JIS
IEC
DNV
Page 85

167166
Status of CR standards
For CR, standard EN 14784 has been issued with EN 444, EN 584-1 and EN 462-5 in mind
to achieve conformity with film radiography. Part 1 of EN 14784 describes classification of
systems and part 2 describes principles and applications (not including welds). Although a
working group for the compilation of an EN standard for welds exists, the issue of such a
standard would still take several years.
Status of DR standards
Application standards for DR do not exist at all, which hampers the strong potentials of this
method to be used. A first document (ASTM E 2597-07) related to DR hardware has been
issued. It is intended for use by manufacturers of digital detector arrays to quantify the performance of such devices. This is also of importance for those involved in the selection/purchase of systems. This ASTM document includes paragraphs describing the terminology for
specification of the condition of pixels (e.g. dead, noisy, over- or under responding, bad
clusters, etc.), as well as figures on noise, contrast sensitivity, etc.
Impact of standards
Despite the lack of a full range of supporting documents CR and DR are in use for lots of applications that do not require international standards. Example are e.g. in manufacturing plants
(castings), corrosion detection (profile or on-stream radiography, which is a fast growing
market) and a limited amount of weld inspections based on the ASME or DNV standards
that allow CR and DR. Certainly CR and DR would already have found more applications if
standards would have been available. Regardless of the availability of such documents, if there
is a choice, economics will determine which method is selected for a particular application.
In addition to codes, standards, norms etc. (which permit a certain NDT-technique), plant
owners often compile specifications, which complement codes and standards with their
own requirements. NDT service providers often compile so-called application processes
which describe how to apply a technique in a defined application. Such procedures are often
part of the formal contract between parties and are essential to achieve uniformity. To speed
up the instruction of a new NDT method or technique industry sometimes takes initiatives
through JIP’s (Joint Industry Projects) to develop procedures or recommended practices, in
order to obtain the quality and uniformity of results industry requires. For example HOIS
(an international working group with members active in the offshore industry), is working
on an improved procedure for the application of CR. Such documents indicate the requirements for NDT-education (level), CR application training and image interpretation.
The results of such efforts are often (partly or in their entirety) implemented in documents
issued by international standards-issuing organisations.
Standards for weld inspection
No EN standards exist (2008) for weld inspection. However, other standards are formulated
in such a manner that digital radiography can be an alternative.
For example ISO 3183-2007 permits other means as formulated below:
E.4.2.1 The homogeneity of weld seams examined by radiographic methods shall be determined by
means of X-rays directed through the weld material in order to create a suitable image on a radiographic film or ano
ther X-ray imaging system, provided that the required sensitivity is demonstrated.
Also API 1104 20th edition permits X-ray imaging with other means:
11.1.2.3 Other Imaging Media
As a minimum, the procedure f
or radiography using imaging media other than film shall
include the following details: (....)
A similar formulation is included in DNV OS F101:
Radioscopic testing:
Specific requirements to radiography of installation of girth welds.
213 R
adioscopic testing techniques in accordance with 13068 may be used provided the
equipment has been demonstrated, in accordance with Subsection F, to give sensitivity and
detection equivalent to conventional X-ray according to ISO 12096.
Last but not least ASME V (2007) supports the use of the CR technique for weld inspection
as well. Although no EN-standard for welds exists until yet, an international working group
is involved in its compilation. It is the intention to split existing EN 1435 covering weld
inspection into three parts; respectively for film, CR and DR.
For CR, already many years on the market, not even an (EN) “working document” for weld
inspection exists, so it will take several more years for it to appear.
Data exchange and tamper proof standard
Similar to the medical world, where digital radiography has been in use long before its
introduction in the NDT industry, standards for data recording have been developed. For
industry a standard practice exists (ASTM E 2339-04) to facilitate interoperability (between
systems and third parties) of digital NDT data acquisition and imaging.
This document harmonises image file formats. ASTM E 1475-02 regards DICONDE file
formats. DICONDE is the acronym for D
igital Imaging and COmmunication in Non
D
estructive Evaluation. This document includes a tamper proof file protocol to eliminate
potential concerns. In any case data is recorded in unprocessed format.
16.10 Selection of CR- and DR methods
In radiography, as in other areas of NDT, no one method or technique will serve all situations of need. There are a number of factors to be considered when evaluating a radiographic imaging system beginning with the size, shape and the flexibility of the sensor.
Contrast sensitivity or grey scale range (e.g. 8 bit versus 12 bit), and resolution (pixel size)
are major factors in determining the imaging performance and scan rate. All these factors
must be traded off against size, mobility and cost.
In storage on phosphor based imaging plates for computed radiography, the conversion of
radiation into an image is a two-step process. The DR technique, however, immediately
(during exposure or within seconds following exposure) produces an image on the screen of
the workstation (see figure 33-16). This makes DR extremely useful in automated, robotic,
production processes. Although DR, with the correct exposure parameters, offers a higher
relative image quality than CR, flat panel detectors are less suitable for field use and for applications with difficult access requirements due to their physical size (thickness) and inflexibility/rigidness. Contrary to DR, CR plates are thin and can be bent to conform with to curvature of the component which sometimes is a condition for certain exposures. Moreover flat
panel detectors require a considerably higher capital investment than the CR method.
Page 86

169168
Although the electronics needed for both methods, e.g. workstation, cost approximately the
same (and partly can be shared!), a flat panel detector (~ € 150,000 ) is roughly 200 times
more expensive than a phosphor plate (~ € 750 ). Hence selection of a DR solution requires careful considerations with regard to return of investment (pay back period). Another
aspect of paramount importance, which influences selection between CR and DR, is the
availability (or lack) of industrial standards.
In summary: Numerous aspects with a great diversity such as: image quality, process speed,
productivity, portability, robustness/fragility, (in)flexibility of plate or panel, available field
space, logistics, environmental issues, capital investment, human investment, (non)existence
of industrial standards etc. play a role in the ultimate choice between conventional film or
CR or DR .
16.11 Applications of CR- and DR methods
Corrosion detection
For certain applications, e.g. when the requirements for image quality are less stringent and
normal or coarse-grain film could be used, the CR technique is an excellent alternative to
film. Examples include profile (on-stream) radiography, the majority of the work in 2008
(using isotopes) to detect general internal erosion or corrosion of non-insulated piping, see
figure 28-16 and detection of internal and external corrosion under thermal insulation
(CUI) see figure 29-16. For wall thickness determination of (insulated) pipes the so-called
projection (shadow technique) or tangential technique is applied, see section 18.6.
CR is also very suitable for detection and quantification of erosion/corrosion in or adjacent
to the root of welds and for detection and quantification of scaling or clogging, concrete
inspection and non-critical castings. In case of offshore work CR is attractive using low activity sources first of all because its smaller controlled area and secondly to avoid that level
detectors using radiation are falsely activated or disturbed.
Weld inspection
Although conventional film is still superior compared to the CR technique, standards permit
CR in several cases because it can under circumstances provide sufficient image quality,
even for weld inspection, see section 16.9. Figure 30-16 shows an image of a weld with a
clear indication of a serious longitudinal defect.
Dose reduction and controlled area
Not only are CR- (~ 5x to10x) and DR techniques (~ 20x with film-quality, to 200x with
low quality) much faster than standard X-ray film exposures, (see figure 27-16) another
attractive feature is their far greater dynamic range/latitude (> 1000x).
These methods are, therefore, not over-sensitive to variations in radiation dose and very
tolerant to less than exact exposure times, see figure 8-16.
This can reduce so-called re-shoots (retakes) and can decrease the need for multiple exposures of some parts with different thicknesses, thus further improving inspection throughput.
The reduced exposure times - in practice a factor 2 to10 dependent on the type of plate
- or weaker sources that can be used, are deciding efficiency- and safety factors (smaller
controlled area). The controlled area (radiation exclusion zone) reduces with the square
root of source strength ratio:
source strength 1 ÷source strength 2
Note: For a given application the source activity/strength (Bq) can be reduced, but not its
energy level (MeV/keV) because it is the energy level that determines the penetration
capability.
Fig. 28-16. CR image of bare pipe with areas marked
for WT measurements
Fig. 29-16. CR image of insulated pipe with WT-values
Fig. 30-16. CR image of a weld with a longitudinal defect
see acknowledgements*
Defect Defect Defect
Page 87

171
Useful life of plate and panel
CR plates (by handling), like DR detectors (by radiation) have a finite useful life which has
to be included in an economic evaluation. The working life of flat panel devices can range
up to millions of images, dependent on application-specific details, see paragraph 16.5.3.
Thus cost-per-image should be considered in any return-on-investment financial analysis.
CR plates in flexible cassettes can be used up to one thousand times.
If used in a rigid cassette their life can considerably be prolonged. In the field, care must
be taken that rigid cassettes are not too tightly strapped to a curved component (pipe)
to prevent permanent bending causing problems with automated readers as shown in
figure 4-16. Such readers refuse over-bended cassettes. This may result in undesirable
manual handling of the plates causing plate damage and excessive wear.
16.12 Work station
Hardware and software
A computer and extremely high-resolution display screen are recommended for digitised
films as well as for displaying and processing the images obtained with CR- and DR
techniques. The number of pixels of the display screen should at least match with the
digitisation spot- or pixel size of the applied CR plates or DR panels to achieve maximum
resolution. Radiographic images contain more information than the human eye can discern.
For this purpose workstations, as shown in figure 33-16, are used as an “image-processing
centre”. This workstation operates with powerful dedicated proprietary software (e.g.
“Rhythm” of GE Inspection Technologies) to manage, process and adjust images.
170
Automated/mechanised inspection
The choice of DR flat panel detectors depends on the image quality
required and the number of parts
to be inspected to make it cost
effective (return on investment).
High performance DR detectors
are most suitable on stationary
locations, for example as part of a
production line where vast numbers of precision components are
checked at high speed with the
lowest possible radiation dose, or
in situations where mechanical
automation (robotising) can be
applied to achieve significant throughput improvements, see figure 31-16.
Girth weld inspection
Instant results as provided by DR
systems would also very attractive to replace film to inspect the
circumferential (girth) welds of
long distance pipelines under
construction, either on land or at
lay barges. Until recently DR
systems were more complex and
vulnerable than equipment for
film radiography, thus not suitable
for harsh field conditions. But this has changed.
The resolution of DR (although better than CR) is still (2008) too low compared to film to
meet the image quality requirements for the majority of such girth welds. Nevertheless, for
some type of girth welds, systems using CMOS line detectors with small pixels combined
with a high contrast resolution which rapidly orbit around the pipe, could provide a solution.
They can scan a weld in a few minutes with a reasonable image- and contrast resolution.
Figure 32-16 shows the scanner of such a system. The radiation source can be located inside the pipe on a crawler (single wall panoramic image) or outside at a 180° shifted position
and rotates simultaneously with the line array (double wall image).
Similar scanners exist not using a band wrapped around the pipe but using magnetic wheels
instead. For such applications the CMOS line array must have a fast response- and erase
time in order to frequently (many times per second) refresh the information. CMOS detectors are able do that; and are thus fast enough for girth weld inspection in the field.
Fig. 31-16. DR inspection of narrow beam weld and turbine blades
Fig.33-16. Work station
Fig. 32-16. CMOS weld scanner (courtesy Envision USA)
X-ray beam
Flat panel
Component
X-ray head
Page 88

173
In addition algorithms have been developed for e.g. the comparison of parts of an image with
conformance criteria, carrying out dimensional checks (sizing), for instance to measure
remaining wall thickness (see figure 37-16).
For this latter function algorithms exist that takes the source-to-object distance and the nominal pipe diameter as a reference to calculate remaining wall thickness or metal loss due to corrosion. Also defect area measurement, image statistics and a reporting module are part of the
tools of the work station.
In cases of stationary DR systems in use for large production quantities so-called
"Assisted or Automated Defect Recognition” (ADR) programs (software algorithms) can be
applied with no human interference to speed up uniform interpretation of images.
Apart from the original image and its imprinted exposure parameters, on a true copy
comments and display characteristics (e.g., zoom, contrast, filters) can be superimposed and
archived as well. This enables inspection professionals to streamline the process and improve
the quality of distributed inspection information.
Figure 38-16 shows a screen
shot made of the worksttions
display. The screen shows
the results of an on-stream
exposure on a CR plate
taken of a valve with connecting pipe.
The screen shot includes
one of the selectable frames
of the report module.
The image itself shows marks
(white lines) super-imposed
by the workstation’s operator
to establish the remaining
wall thickness at those places
to be calculated by the software.
172
Versatility of the software
Images can be adjusted and enhanced in
many ways: brightness, contrast, sharpness,
noise suppression (averaging), rotation, filtering, inversion, colouring, magnification,
zoom-pan-scroll, etc.
In this way, hidden details can be made visible, see figure 34-16.
Figure 35-16 graphically shows the effect of
two control mechanisms for selecting a part
of the density range of the image for a closer
look. The Z-shape can be shifted from left to
right through the whole range of densities of
the image. The angle of the vertical part can
be changed to increase the width of the
window (steeper or more flat) to alter the
range of contrast/densities.
The position of the “working point” determines the brightness of the image. In this
graph 16 grey levels on the digital image
result in one level on the monitor, this can be
set at 1-to-1. These are a few examples of the
versatility of the adjustment features provided by the work station.
Figure 36-16 shows the effect on an image by contrast enhancement and sharpening. Here
the contrast improvement, flat Z-shape (wide density window), makes the interior of a valve
clearly visible compared to the initial image. It proves that the information is present in the initial image but has to be adjusted to make it visible for the human eye.
Fig 34-16. Effect of image- averaging on noise
Fig. 36-16. Image enhancement in two steps
Original image Contrast improvement Sharpness improvement
Fig. 35-16. Flexibility of image (grey values) adjustment
Density window (contrast range)
Adjustable
angle
Black
256
Black
White
Digitized image
Grey levels
High resolution monitor / grey values
700 grey values
Selectable
brightness level
(working point)
Fig. 37-16. Wall thickness profile from on-stream image of figure 28-16 and report with statistics of all WT measurements
OD ID
WT
Fig. 38-16. On-stream image and report of a valve
WT 1
3.5 0,1 mm
WT 2
1.3 0,2 mm
Page 89

175174
Figure 39-16 shows a detail of the
selected pipe wall area with the
reported results.
This example of a valve with a
great variety of wall thicknesses
also shows one of the strengths of
a digital exposure. If needed the
same image can be used to study
the thin and thick wall parts of the
valve thanks to the large dynamic
range contained in the image.
Archiving and reliability of images
Archiving can be done on almost all existing professional mass storage facilities, e.g.
CD-ROM (~700 MB), double layer DVD (~10 GB), double layer HD-DVD (~30 GB),
double layer blu (blue) ray disk (~50 GB) or hard disk.
In the not too distant future other high capacity optical solutions such as holographic disk
technology (~300 GB) will become available.
Such mass memories are needed to be able to store a number of high resolution digital
images A single image of a ~ 400 x 400 mm panel with a pixel size of 50 microns requires
120 Mb (position and up to16 bit of density data). A pixel size of 100 micron needs “only” 30 MB.
Integrity-procedures should be applied to prohibit manipulation or even forgery of digital
images. To exclude such tampering with images, it is part of the data handling protocol to
always include the original unprocessed data with the processed data set (images), see section 16.9.
Although attractive to save memory space, it is impossible to compress the original umprocessed data. However, for reporting purposes, algorithms such as JPEG, are in use to reduce file sizes of processed images and for printing .
Exchange of data
The workstation can also transfer images electronically over great distances (through
internet, intranet or wireless), which can be viewed, interpreted or stored by remote
users on identical satellite workstations.
This way information is sent to the experts rather than sending the experts to the
information. Because the images are digital, multiple copies of the images are always
identical. These capabilities are driving the latest trends of enhanced database capabilities
and common workstation standards for digital radiography software.
Figure 40-16 shows a block diagram of the various components that make up a complete
system for digital radiography.
Fig. 39-16. Detail of pipe wall of figure 38-16 with report
Wall Thickness Result
Nr. Material D
A
WD
Soll
WD
Ist
1 Steel 3,5 3,5
2 3,5 1,3
Wireless
transmission
DR- panel
Printer
Storage/
Archive
Film
digitiser
Satellite
workstation(s)
CR - tower
CR-plate
in cassette
Main
workstation
Fig. 40-16. Block diagram for digital radiography with workstation and supporting equipment
Page 90

177176
The previous chapter (16) dealt with techniques that would be impossible without the aid
of computers. These techniques share a common feature, whereby the processing, interpretation and storage of data is done by a central computer and monitor, also called the work
station. In the current chapter (17) computers also play an everincreasing important role in
some of the techniques discussed. Computer tomography (CT) and the Compton backscatter
technique for example would not exist without them.
17.1 Image magnification techniques
17.1.1 Common image magnification technique
By positioning an object between an X-ray tube and film or detector, as illustrated in
figure 1-17, a magnified image is obtained. As a consequence any defect will be magnified
as well. The sharpness of the image is dependent of focal spot size, the smaller the spot size
the better the sharpness.
Any unsharpness, as illustrated in figure 1-17, is determined by the relationship between F
1
and F2 , and the size of Uf.
The effective unsharpness is calculated as follows: U
g
= Uf(F2- F1) / F
1
For example: An X-ray tube with a focal spot size of 20 microns with focus-to-object
distance (F
1
) of 50 mm and focus-to-film distance (F2) of 550 mm will have a
geometric unsharpness of: 0.02 (550 - 50) : 50 = 0.20 mm
The magnification factor is: F
2
: F1= 550 : 50 = 11
The magnification technique is mainly used in combination with a radiation-sensitive
device such as fluorescent screen, image intensifier or flat panel detector. A computer
workstation may be used for image processing and/or enhancement prior to interpretation
on the screen.
17
Special
radiographic techniques
focal spot
film,
detector,
image intensifier
object
density
brightness
geometric
unsharp-
ness
Fig. 1-17. Image magnification
Page 91

179
Two types of X-ray tubes exist:
• The closed X-ray tube, a sealed evacuated glass tube containing all components to
generate X-rays. No part in it can be replaced or repaired
• The open X-ray tube with a removable/replaceable anode/target and filament
with its own high vacuum system for an almost unlimited life.
A closed system is cheaper and maintenance-free, but has a shorter life time than an open
tube. An open tube, with an almost unlimited life-time, can operate at higher voltages and
currents. Replacement of target or filament once damaged requires less than half an hour;
a very acceptable down-time.
Using micro- or nanofocus X-ray tubes has the following advantages:
• Very small defects are discernible
• Low backscatter because a small part of the object is being irradiated
• High resolution.
Disadvantages are:
• Costly if (separate) high-vacuum equipment is required
• Time-consuming, as for each high resolution exposure only a small part of the
object is being irradiated.
Tube heads
There are two types of tube heads for small focus X-ray tubes.
Figure 2-17 illustrates the two types.
The transmission tube provides the highest magnification (smallest focus).
The directional tube, as common in standard X-ray tubes, provides the highest energy.
This figure also shows the magnetic lenses that create the essential focussing of the
electron beam.
178
17.1.2 High resolution X-ray microscopy
Magnification factors
For a number of years magnification factors up to 25 were sufficient. The maximum magnification factor was determined by the smallest possible focal spot size. As illustrated in figure
1-17 larger magnification factors create unsharp images without providing more information. Moreover the intensity of the output is limited by the heat dissipation of the target
anode. For some time this was a physical barrier. With the introduction of microfocus and
more recently nanofocus X-ray tubes, new techniques have been developed for inspection of
low absorbing objects like electronics, applying large magnification factors with still high
resolution.
Because of the need to inspect parts with ever decreasing dimensions, such as electronic
components and their joints or other products with extreme quality requirements and product process control, ever growing image magnification factors were necessary, ending up
in so called “X-ray microscopy”.
The need for geometric magnification factors of up to 2,000 are no exception. This was the
incentive to develop X-ray tubes with extreme small spot sizes. Because there is a physical
limit to the minimum focal spot size (limited heat dissipation and output) other measures
(tricks) can be taken: a combination of software, lenses and cameras to further zoom in,
even up to 25,000 . It should be realised that magnification only make sense if the initial image
quality is sufficient, a poor image just creates bigger pixels or results in a vague image.
Microfocus and nanofocus X-ray tubes
Over the years industry developed X-ray systems with ever decreasing focal spot sizes to
meet the need for large magnification factors . At present focal spot sizes expressed in a few
hundreds of nanometres (nm) are on the market.
By conformation, manufacturers of X-ray tubes classify their tubes dependent on focus size
in a few categories:
• macrofocus with spot sizes > 100 microns (0.1 mm)
• microfocus with spot sizes ranging from 1 micron up to 10 microns
• nanofocus with spot sizes far below 1 micron.
Sizes of down to 0.25 micron (250 nm) do exist.
The Nanofocus** (see acknowledgements in chapter 20) X-ray system is just one
example of such a system.
The output of nanofocus X-ray tubes is proportionally lower than for tubes with larger
focal spot sizes. Heat dissipation of the target anode generating the X-ray beam puts a limit
to the output. The smaller the target the lower its output. Over-heating destroys the anode
by burn-in.
Magnetic
lens
Target
X-ray beam
Window
X-ray beam
Fig. 2-17. Transmission- and directional small focus tube heads
Target
Page 92

181
System set-up
Figure 3-17 shows the concept of a two-dimensional
(2D) X-ray microscopy system
to inspect
small components consisting of a micro- or nanofocus X-ray tube, an X-Y-Z manipulator and
detector. The manipulator can be joystick- or CNC-controlled. Full automation is possible.
The geometric magnification can be controlled by the Z-axis. Closer to the tube results in a
larger magnification factor.
The set-up of figure 3-17 is used for flat components. For certain applications, dependent on
the geometry of the component, the so called “ovhm” technique (oblique view at highest magnification) is in use.
In such cases an open transmission X-ray tube generates an adjustable oblique (angled) beam,
the detector is angled accordingly as illustrated in figure 4-17. Instead of tilting the sample,
which would result in a certain distance D that would limit the magnification factor, the beam
is tilted as
illustrated reducing D to almost zero.
180
Tube control
X-ray tube
Manipulator
Component
Detector (image chain)
Joystick / CNC
Image processing
Workstation
Fig. 3-17. System set-up for X-ray microscopy
Fig. 4-17. Oblique (ovhm) technique for maximum magnification.
Effect of focal dimensions
Figure 1-17 illustrates in one way the effect of focal spot size (unsharpness), figure 5-17
shows the same in another way for a micro- and nanofocus tube head.
Figure 6-17 shows the effect of focus size on images of a connection (wire diameter 25
micron) in an electronic package. Image A is taken with a focal spot size of 10 micron, image
B shows the result for a 5 micron focus and image C was taken with a focus of less than 1
micron. Details of approximately 250 nm are visible.
There are rules-of-thumb to determine resolution and potential defect detectability as
a function of focal spot size.
For large magnifications, exceeding 100x, the following applies:
• resolution equals the focal spot size divided by two
• detectability or feature recognition equals focal spot size divided by three
Focal spot : 10 microns 5 microns <1 micron
Fig. 6-17. Effect of spot sizes on image sharpness for different focal spot sizes
X-ray tube
Detector
Adjustable
detector position
Detector
ABC
Object
Source
Fig. 5-17. Effect of focal spot size on sharpness
D
Y
Z
X
0 -70°
Page 93

Stationary real-time installations
Display monitor systems, as illustrated in figure 9-17, are almost exclusively used in
stationary set-ups for production line testing of varying types of objects, in particular in
metal casting plants, pipe mills and component assembly industries. Often they provide
some image magnification and software features to improve defect detectability.
Sometimes real-time systems are utilised in the food industry to check for instance for the
presence of glass fragments or other foreign objects. Being part of a production line and due
to the necessary radiation safety provisions (such as cabins) these systems can be very
expensive. The display monitors are located at a safe distance.
The choice of a radiographic system to be used for a specific application depends on a
number of factors:
• Hardness of the radiation required and appropriate detector
• Resolution or detail discernibility required. The type of defects to be detected
in mass-production is normally known
• Magnification factor required when it concerns small defects
• Image dynamics (density range) with regard to object thickness range
• Image contrast required facilitating ease of defect detection.
Sometimes this can be “automated” when it concerns common defects
• Time restraints, number of objects to be examined per unit of time
• Budget
• Space available
• Installation and specimen dimensions
• Sufficient safety measures
A number of these factors also influence the choice of detector system.
Some of the options are:
• Phosphorescent screen (afterglow) with TV camera and display monitor
(CCTV) at a remote (safe) location
• Fluorescent screen (instant image) with CCTV-system at a safe location
• X-ray image intensifier with conversion screen, in combination with a CCTV-system
Fig. 9-17. Radiography with image magnification
X-ray
tube
object
digital
signal
digital
signal
flat panel detector
or
image intensifier
image processing
system and
archiving
display monitor
183182
Imaging systems for high resolution radiography
High-resolution X-ray inspection systems usually apply an image intensifier for presentation
of results as shown in figure 7-17. This electro-optical device amplifies and converts the invisible X-ray shadow to visible light by means of a scintillation crystal and photo cathode.
Electrons from the photo cathode are then accelerated and focused onto a phosphor screen
where a bright and visible image is produced that is digitised by a CCD camera. In order to
avoid unnecessary losses of resolution, it is crucial to at least use 2 mega pixel high-resolution cameras. To meet highest demands, 4 mega pixel cameras are the best choice.
The advantage of the image intensifier-based digital image chain is its relatively low cost
and relatively sharp real-time image.
As an alternative, a digital flat panel detector as shown in figure 8-17 can be used. In that
cas the X-ray shadow image is still converted by a scintillator foil to visible light, which is
then directly detected by the photo diode array. This option is more expensive than the traditional image intensifier of figure 7-17.
Digital flat panel detectors provide better images with far superior contrast resolutions of
0.5% compared to 2% of image-intensifiers. This can be a decisive factor for low contrast
objects and for high quality computed tomography (CT), see section 17.3.
17.2 Fluoroscopy, real-time image intensifiers
Fluoroscopy, also known as radioscopy, is a technique whereby “real-time” detection of
defects is achieved by the use of specialised fluorescent screen technology.
At present, there are many alternatives to photographic film for making an X-ray image
visible. In addition to the CR- and DR techniques described in chapter 16, a wide range of
real-time image forming techniques using display monitors are available.
It can generally be said that the image quality of conventional X-ray film is superior to
either true digital (direct) radiography (DR) or computer-aided radiography (CR).
Therefore these new techniques cannot be considered acceptable alternatives at all times.
However, when the installation is adjusted to optimal refinement for a single application, for
example weld inspection in a pipe mill, a filmequivalent image quality can be obtained,
which would only just comply with the requirements. This would possibly require the use of
a microfocus tube, see section 5.1.
Figure 7-17. Schematic setup of an image-intensifier
digital image chain
Object
Object
X-rays
X-rays
Scintillator
Scintillator
Single component
Diode array
Photocathode
Electrons
Focusing
electrodes/coils
Phosphor
Lens
Light
Light
CCDcamera
Fig. 8-17. Arrangement of a flat panel based
image system
Page 94

185
This way an image is obtained of the pipe “horizon” with possible presence of
corrosion (swelling or pitting). The image is presented real-time on a portable
monitor. The battery-powered equipment uses soft radiation of low intensity, so that it
can manually be moved along the pipe. The system can also be used to locate welds
under insulation, providing the weld crown has not been removed.
17.3 Computer Tomography (CT)
Unique features
For medical diagnostic purposes, techniques have been developed to obtain a radiographic
quasi 3D picture, a so called CT-image with a high resolution of a few tenths of a mm.
Powerful computers are used to transform a large number of absorption variations that
occur when irradiating a human body with a moving source around the stationary patient,
and their coordinates into a comprehensive 3D (volumetric) image. This technique is now
also used in industry, e.g. for checking the integrity of components with complex geometries, high quality castings, miniature electronic circuits as built into mobile telephones and
even for 3D metrology: a method to measure even internal (inaccessible) dimensions of
components that otherwise cannot be measured at all. CT systems with a resolution of only
a few microns for a wide variation of tasks have already been successfully applied. To interpret the results, CT images can be freely rotated and virtually sliced in all directions for different views of a defect or other anomaly; a unique and very useful feature.
Computing capacity and scanning time
In NDT contrary to medical applications, it is usually the object that rotates between the
source and the detector as shown in figure 11-17. This can be done continuously or stepwise
to obtain a great number of 2D images that ultimately are reconstructed into a 3D CT image.
The object is scanned section by section with increments of say 1° over 360° with a very
narrow beam of radiation (small focus X-ray or collimated gamma-ray). The more increments, the better the CT quality. The receiver in this illustration is a flat panel detector.
184
• CCD-camera as a substitute for the relatively slow conversion screen
• Photo array detector, minimal size per diode (pixel) approx. 100 microns to
inspect slowly moving objects (airport luggage checks)
• Flat panel detector consisting of millions of light-sensitive pixels.
Although the image intensifier is still most commonly used, the flat panel detector is
becoming more and more attractive. Flat panel detectors provide various pixel sizes with
extensive image dynamics (a very wide density range, far greater than is possible with film).
Since the signals received by the computer are digital, the screen image can be optimised for
interpretation (contrast, brightness, sharpness, magnification, filtering, noise suppression)
and subsequently stored.
These advanced systems also offer the possibility of comparing the image obtained with a
reference image and of automatic defect interpretation, see chapter 16.
Selection of the most suitable (expensive) system is made even more difficult because of the
rapid development in sensor- and electronic technology.
Fluoroscopy, image intensifiers and-magnifiers are more elaborately described in the
booklets: “Die Röntgenprüfung” and its translation “The X-ray Inspection” [3].
Portable real-time equipment
A portable version of real-time equipment is used to detect external corrosion under
thermal insulation. It is generally very difficult to detect corrosion on piping with
insulation still in place whereas removing and re-installing the insulation is a costly
and time consuming operation. Sometimes the likely presence of corrosion is
indicated by moisture/water detected in the insulation, see section 17.4.
External corrosion in a low-alloy steel pipe becomes apparent by local swelling of the
pipe surface as a result of volume increase of the corrosion layer.
Figure 10-17 illustrates a system by which the swelling and even severe pitting can be detected.
On one side a strongly collimated source or X-ray tube is located that must be aligned in a
way as to direct a narrow beam of radiation along the tangent of the pipe towards a small
flat panel detector behind.
1. pipe 6. tangent ( pipe horizon)
2. sheet metal (Al) cladding 7. portable monitor
3. insulation material 8. adjustable bracket
4. collimated radiation source 9. sliders/rollers
5. miniature flat panel detector 10. corrosion spot
Fig. 10-17. Schematic arrangement of a portable real-time radiographic corrosion detector
1
X-ray
source
Focus-object
distance
Focus- detector
distance
Rotating object
Focu s
Detector
Fig. 11-17. Rotating component to create a 3D CT image
Page 95

187
If too close to the X-ray source the geometry of the object can hamper full rotation as illustrated
in this figure.
The subject of CT is more elaborately described in the booklets (German) “Die Röntgenprüfung”
and (English) “The X-ray Inspection”, see literature reference[3].
17.4 CT for defect detection and sizing
Effect of defect orientation
Traditional radiography almost exclusively uses one single exposure from a fix position,
thus one direction of the X-ray beam. This can result in distortion of the defect image on the
film, see section 12.1, or even missing a defect. This single shot practice also applies for weld
inspection. Welds and their adjacent heat affected zones might contain planar (2D) defects,
possibly unfavourably oriented for detection. The probability of detection (POD) of
planar defects is strongly dependent on the angle O/ between the centre line of the
beam (radiation angle) and the orientation of the defect, as shown in figure 13-17.
Only transmission under an angle equal to or close to the orientation of the 2D defect
will provide sufficient contrast. Figure 14-17 illustrates this.
186
Each individual detector element measures, during a short exposure period, the total
absorption across a certain angular position of the object. This information including the
coordinates is used to create a numerical reconstruction of
the volumetric data.
This process produces a huge data stream to be stored and simultaneously processed, in particular when an image of high resolution is required. A three dimensional representation
(3D CT) of the radiographic image requires vast computing capacity. With present day computers, depending on resolution required, the total acquisition and reconstruction time needed for a 3D image is between a few seconds and 20 minutes.
Reverse engineering
CT offers an effective method of mapping the internal structure of components in three
dimensions. With this technique, any internal anomaly, often a defect, that results in a difference of density can be visualized and the image interpreted. These properties allow the
use of CT as an NDT tool, permitting examination of samples for internal porosity, cracks,
(de)laminations, inclusions and mechanical fit. It shows the exact location of the anomaly
in the sample providing information on size, volume and density. Due to the fact that CT
images are rich in contrast even small defects become detectable.
CT widely expands the spectrum of X-ray detectable defects in process control and failure
analysis, increasing reliability and safety of components for, e.g., automotive, electronics,
aerospace, and military applications. It opens a new dimension for quality assurance and
can even partially replace destructive methods like cross-sectioning: saving costs and time.
CT is increasingly used as a reverse engineering tool to optimise products and for failure
analysis which otherwise would require destructive examination.
CT metrology
CT systems can also be used for so-called 3D metrology. CT metrology systems replace conventional physical or optical measuring devices for components with complex geometries or
measure dimensions at places with no access at all. These systems include the software to
transfer the part to be measured visible on the CT image into actual dimensions with accuracies of ±1 micron.
High resolution and defect sizing
In CT, absorption values are determined with a very high degree of accuracy, which
means that the contrast of an image can be varied over an extraordinaraly wide range.
Absorption/density variations of 0.02 % can be displayed in a range of density 6 and
over. This offers great possibilities for image processing.
For the most challenging X-ray inspections the best results are obtained by high
resolution CT using microfocus or nanofocus X-ray sources. The achievable resolution or
image sharpness is primarily influenced by the focal-spot size of the X-ray tube.
Defect detectability down to 250 nm (0.25 microns) is possible.
Increasingly, 3D CT is used on high-quality castings often in combination with automatic
object and defect identification.
Sometimes the magnification factor is not sufficient. In that case the factor can be
increased by scanning only the region of interest. To achieve maximum magnification, the
region of interest should be within the X-ray beam (cone) as illustrated in figure 12-17.
Fig. 12-17. CT scan of object detail
Fig. 13-17. Effect of position of X-ray source
versus defect orientation
X-ray
source
Object
Limited rotation
Dedector
Focus-object
distance
Highest resolution/
magnification
Focus- detector
distance
Region of
interest
Region of
interest
Fig. 14-17. Image formation versus relative radiation angle
X-ray beam
Positions of X-ray source
Relative radiation angle
Good image
Poor image
No image
Weld
Film
Defect
Height
Defect
Width
Wall
thickness
Angle O/
Page 96

189188
In practice the following rule of thumb is
applied to the detection of planar defectswith a high probability:
“a defect is detectable if the angle between
the X-ray beam and the defect is
approximately 10° or less”.
The value of 10° is based on decades of
practical experience but does not guarantee detection. The rule is visualised
in the graph of figure 15-17. To detect
2D defects with unknown orientations
and exceeding 10°, a multi-angle technique would be required, which in
general is impractical. As a measure to
enhance detection of lack of fusion
defects in critical welds, sometimes two
additional shots are made in the direction of the weld preparation. Apart from orientation,
the detectability of 2D defects is also dependent on the type of defect, its height and its opening (width). Lack of side wall fusion (LOF) - dependent on the welding method - will in
general be easier to detect than a crack because LOFis often accompanied by small 3D slagtype inclusions.
In fact, LOF defects are in practice often
detected because of the presence of these
small inclusions rather than because of
the LOF itself. Such secondary small
defects do usually not occur along with
cracks, although their character might be
erratic and their small facets under diffe-
rent angles - some of them just in line with
the X-ray beam - might help to detect them
as illustrated in figure 16-17. From experi-
ments it is known that, if more than 1 to
2% of the material in the line of radiation
is missing, a defect is detectable.
3D CT for sizing of defects in (welded) components
To know the through-thickness size of a defect can be of paramount importance to calculate the strength of a cracked component, its remaining strength or its fitness for purpose.
Traditional single-shot (and even multi-shot radiography) is unable to measure throughthickness height of planar defects.
Even detection itself is not always easy, as the previous paragraph describes. Therefore
sizing of defects once detected with radiography is often done by ultrasonics, with acceptable sizing accuracies for engineering critical assessment (ECA) calculations.
The application of ultrasonics on welds requires that both the material and the weld are
acoustically transparent. This requirement is often not met in welded or cast austenitic
materials as used in nuclear power plants.
In such cases 3D Computer Tomography
(3D CT) can provide a solution. In section 17.3, CT systems for low to moderate
energies and with extreme small foci are
described to inspect small components
with low radiation absorption.
For sizing and sometimes detection of
defects in welds or (cast) stainless steel,
high energy 3D CT systems have been
developed which are able to accurately
size randomly oriented cracks or other
(planar) defects with a minimum width
as small as 20 microns.
Such systems use common high-energy
X-ray tubes with common focus dimen-
sions of a few mm
2
, in combination with line detector arrays. Figure 17-17 schematically
shows the set-up for a series of exposures to create a 3D CT image. Synchronised and simultaneous movement of the X-ray source and the detector causes only a particular volume of
the material (slice) to be “in focus”. All information from the adjacent area is out of focus
and does not contribute to the image of the defect. Many of such focus areas (volume pixels
or “voxels”) are stored, for instance a few hundreds per slice. If the detector has sufficient
length, it does not need to move (“virtual movement”).
In performing a CT scan, the X-ray beam goes through a wide range of angles including the
angle(s) of the defect. Numerous slices are made, together resulting in a large number of
voxels. On the basis of these many voxels the image of the entire defect can be reconstructed,
including its position, orientation and depth location in the component. This can be done
with considerable accuracy, typically 1mm or better; accurate enough for calculation purposes. Figure 18-17 shows a crack in an austenitic weld and next to it its CT reconstruction. Figure
19-17 shows another example of a CT image obtained with this system. The image
shows two
planar defects in a V-shaped weld with a clear indication of their orientation and size.
Fig. 15-17. Graphical presentation of “rule-of-thumb”
Fig. 16-17. Crack facets creating the defect image
Fig. 17-17. Schematic of 3D CT defect detection and sizing
GOOD
DEFECT CONTRAST
POOR
X-ray beam
Film
Unfavourable
orientations
invisible
on film
Facets creating
the image
Crack image
Movement
X-ray positions
Out of focus
Area of focus
Detector positions
Open planar
defects
Tight planar
defects
Angle O/
Rule-of-thumb
Crack with facets
Fig. 18-17. Crack in austenitic weld
CT reconstruction of the crack
Macro of crack in a weld
Fig. 19-17. CT reconstruction of two planar
defects in a weld
Page 97

191
The scanner comprises an X-ray tube and a detector consisting of a number of elements as
illustrated in figure 13-17. A collimator reduces the beam of rays to 0.5 mm in diameter, so
that it cannot irradiate the detectors directly.
When a photon and an electron collide in the material, the primary X-radiation is scattered
as somewhat softer radiation in all directions, and thus partly also back from the material to
the scanner. This secondary radiation is then caught by the detector through a specially shaped diaphragm, see figure 20-17. The detector is made up of 20 or more detector elements
marked A’, B’, C’ etc. each of which measures the quantity of back scattered radiation from
at a certain depth (A, B, C) in the object, as figure 20-17 shows. Each sensor element is, say,
focussed at a certain depth.
The cylindrical scanner measures only 7 x 7 cm and scans the object in a grid. By linking the
scanning system with a data processor, a comprehensive “Compton image” of the object
develops and any possible defects in it. The Compton backscatter technique is for instance
frequently applied to honeycomb constructions and composite materials and has a penetration depth of approximately 50 mm.
The method is (still) fairly slow; scanning a 50 cm
2
surface takes approximately 5 minutes.
An added advantage is however that the depth position of defects becomes known
immediately as a result of the “quasi-focussing” of each individual detector element.
190
Such 3D CT systems are primarily intended for defect analysis. Scanning of a girth weld
typically takes about one hour. Inspection and reconstruction of one cross section takes less
than 10 minutes. An example of such a system is the so-called TomoCAR***, see “acknowledgments” at the end of this book. This system uses a CMOS line array and is capable to
inspect (analyse) pipe diameters of up to 500 mm with a total irradiated thickness of up to
50 mm (2 x 25 mm). To analyse a defect in a circumferential weld the X-ray tube is at one
side of the pipe and the detector is located diametrically (at 180°) at the other side. Both are
moving synchronously. Condition for use is that there is enough space in the vicinity of the
pipe/weld for the scanner to move.
17.5 Neutron radiography (neutrography)
Neutrons, which are atomic particles without an electric charge will penetrate most materials, are attenuated in passage, and so can be used to produce “radiographs”. There are various kinds of neutron energies, but only the thermal and cold neutrons are suitable for NDT
applications. Contrary to ionising radiation in the keV and MeV range, neutron absorption
is higher in light than in heavy materials. Neutrons will be strongly influenced by hydrogenous materials, plastics (all types), explosives, oil, water etc., even when these materials are
inside metal containments made of lead, steel or aluminium.
There are many potential applications for neutrography, but its practical use is limited to a
large extent by the lack of suitable, portable neutron sources. A neutron “window” in an atomic reactor is by far the best source, but such facilities are not commonly available. The only
neutron-emitting radioactive source is Californium
252, which is extremely costly and has a
half-life of only 2.65 years. An X-ray film also reacts to neutron energy, but useably results
are not obtained until it is combined with gadolinium or cadmium intensifying screens. The
Agfa D3SC (SC = single coated) film is frequently used for this purpose. The secondary radiation generated in the intensifying screens brings about the image formation.
Another filmless application of neutron radiography in NDT is moisture detection in insulation. This portable equipment that is on the market uses a very weak neutron source.
With the aid of this neutron backscatter method, the presence of water, actually that of
hydrogen atoms, is established. The presence of moisture is generally an indication of external corrosion in a pipe, or the likelihood that corrosion will occur in the near future.
The portable real-time equipment as described in section 17.3, or flash radiography described in section 18.7, can in some cases confirm the presence or absence of corrosion without
removing the insulation.
17.6 Compton backscatter technique
The Compton backscatter technique, see section 2.6, benefited from the introduction of
computer technology into NDT equipment, just as most other methods discussed in this
chapter. This method is very attractive for objects with access from one side only.
It is now an accepted NDT-technique for plastics and light metals [2].
Fig. 20-17. The Compton back scatter technique
X-ray beam
diaphragm
detector
collimator
object
detector
Page 98

193192
X-ray image of an X-ray crawler in pipe at weld location
18
Special
radiographic applications
There are many special applications of radiography in NDT. This chapter describes a limited
number of different examples to illustrate this diversity. Apart from the use of radiation in
image forming radiography, it is also used in, for instance, measuring instruments such as
metal alloy analysing instruments (Positive Material Identification, PMI) and humidity
detection in insulation of thermally insulated pipping. This type of non-image forming
instruments and applications are outside the scope of this book.
18.1 Measuring the effective focal spot
The effective focal spot size is an important feature of an X-ray tube and is specified by the
manufacturer. In general it can be said; “the smaller the better”. As focal spot size is a critical exposure parameter (see section 11.1) for a particular application, the accuracy of the
manufacturer’s information is of vital importance.
Since 1999, EN 12543-1 requires a standardised method which, however, does not have the
general support of suppliers, as it requires expensive instrumentation and is
time-consuming. The EN-method, suitable for effective foci >0.2 mm, involves scanning the
X-ray tube radiation beam with a scintillation counter through a double collimator with an
extremely small opening of 10 £gm. The resulting intensity values are then represented in
a three-dimensional (isometric) diagram from which the effective focal spot can be deduced.
EN 12543-1 replaces the (older) less accurate IEC 336 procedure. The values based on
EN 12543 are often still reported together with data based on the IEC 336
procedure, for example: “3.5 mm (EN 12543) / 2.2 (IEC 336)". The numbers based
on the IEC refer to a look-up table from which the focal dimensions expressed in mm
can be derived. Those dimensions are given with a wide tolerance. In fact the IEC values
were too inaccurate to calculate image sharpness, being the main reason to develop the ENprocedure. Manufacturers of X-ray tubes usually apply the so called Sténopé pinhole technique (camera obscura) to determine focal spot size.
The X-ray tube projects its focus through a very small hole (pinhole) in a lead plate onto a
film. The lead plate is positioned exactly halfway between focus and film. To prevent
scattered radiation, the hole is sometimes made in a tungsten plug which forms part of the
lead plate. After development, the effective focal spot size can be measured on the film, with
the aid of a magnifying glass. The latter method, still allowed and accepted by EN, results in
marginally smaller effective focal spot sizes.
Establishing the effective focal spot size of a panoramic X-ray tube is considerably more
complicated. To circumvent this, it is therefore recommended to just make a radiograph of
the object - pipe or vessel weld - with the right IQI’s and check the results for compliance
with the quality requirements specified.
Page 99

195194
18.2 Radiographs of objects of varying wall thickness
For radiographs of an object with limited differences in wall thickness, it is common to base
exposure time on the average thickness to obtain the required film density of at least 2. It
is possible that parts of the film are either under- or over-exposed if there are great differences in wall thickness. This can be explained by the shape of the toe (lower part) of the
characteristic curve of the X-ray film used. The film gradient (contrast) is lower and, consequently, so is the defect discernibility. In accordance with EN 1435, therefore, there is a
limit to the thickness range covered by one single exposure.
There are a number of practical ways to prevent over-exposure of thinner and under-exposure of thicker sections. These can be divided in two groups: compensation by single film
or by two film techniques.
For exposures on one film, the following techniques can be applied:
• Reduce contrast by utilizing a filter on the X-ray tube to make the radiation harder.
• Reduce contrast by increasing the radiation energy using higher tube voltage or using
Iridium192 or Cobalt60 sources.
• Compensate the difference in wall thickness as the left sketch of figure 1-18 shows,
with material B of similar composition as object A.
• Instead of insertion of B in the previous method, use a special putty (filling material)
mainly consisting of metal powder.
When two films are used, the following techniques can be applied:
• Simultaneous use of two films of different sensitivity but similar screens, for a single
exposure. For example an Agfa D7 and D4 type film could be used. This is the least
complicated and most practical method (see figure 1-18 at right).
• Simultaneous exposure on Agfa D7 and D4 films with different screens (see figure 1-18).
• Make two exposures on film of the same sensitivity and screen type:
one with the exposure time based on the thinner and one on the thicker section.
• Make two exposures on film of the same sensitivity but different screen types.
Fig. 1-18. Compensating for differences in wall thickness
Single film technique
Material A - test object
Material B – material of comparable absorption
Double film technique
Section C. evaluate on D4
Section D. evaluate on D7
18.3 Radiography of welds in small diameter pipes
For pipe welds, the single wall-single image technique (SW-SI), or if this is not feasible, the
double wall-single image technique (DW-SI) is to be applied. For small diameter pipes this
alternative is not really practical, as a disproportionate number of double wall-single image
exposures needs to be made due to the limited effective film length (see section 12.2). In
such a case the double wall-double image technique should be used (DW-DI). Normally, the
DW-DI technique is only applied on diameters <75 mm and wall thickness of <8 mm. Both,
the weld on the source side and film side of the pipe are simultaneously interpreted.
Two more DW-DI techniques are suitable for small diameter pipes:
• the elliptical technique and
• the perpendicular technique
Elliptical technique
The elliptical technique, as illustrated in figure 2-18, is the preferred technique, but should
only be applied if the following conditions are met:
• external diameter (D
e
) is <100 mm (in practice 75 mm)
• wall thickness (t) is <8 mm
• weld width < D
e
/4
The number of exposures is determined by the relation between wall thickness (t) and
diameter (D
e
). If t / Deis < 0.12, two images - rotated 90° in relation to each other - are
sufficient for 100 % coverage. If t / D
e
is equal to or bigger than 0.12, three exposures rotated 60 or 120° in relation to each other (i.e. equally divided over the circumference) is considered to be a 100 % examination.
Fig. 2-18. Elliptical double wall–double image technique
Film Film
Page 100

196 197
When using the elliptical exposure technique, the images of the weld on the source side
and on the film side are shown separately, next to each other. The distance between two
weld images has to be approximately one weld width. This requires a certain amount of
source offset (O), relative to the perpendicular through the weld. The offset can be calculated with the following formula :
In which:
w = width of the weld
f = distance from source to the source side of the object, measured perpendicularly
De= external pipe diameter
O = Offset distance
Perpendicular technique
Alternatively, the perpendicular technique can be used if the elliptical technique is not
practical, (see fig. 3-18). This is the case when, for instance, pipes of different wall thickness are joined or a pipe is joined to a 45 °/ 90 ° bend.
Three exposures equally divided over the circumference are sufficient for 100% coverage.
Fig. 3-18. Perpendicular double wall-double image technique
Film Film
O= 1.2 . w . f/D
e
18.4 Determination the depth position of a defect
The depth position (d) of a defect can be determined by the parallax-method, as shown in
figure 4-18. The radiograph is exposed from two opposite angles. The required quantity of
radiation is equally divided over positions A and B. Only one film is used.
The shift in defect image on the film (G in mm) is a measure for the depth position; the
shift of the source (A to B in mm) and the source-to-film distance (H in mm) are important
data. The depth position is calculated with the formula: d = (GxH) / (AB+G).
Another, much more complex method of depth determination is stereo-radiography, by
which two separate films are exposed which are viewed simultaneously via mirrors.
However, this method is rarely used.
Fig. 4-18. Determining the depth position of a defect
= defect shift
source shift
 Loading...