

Page 1

GE
Sensing & Inspection Technologies
DigitalFlow™ GC868
Panametrics Gas Clamp-On Ultrasonic Flowmeter
Programming Manual (1-Channel)
Page 2

GE
Sensing & Inspection Technologies
DigitalFlow™ GC868
Panametrics Gas Clamp-On Ultrasonic Flowmeter
Programming Manual (1-Channel)
910-226P1F1
April 2008
The DigitalFlow GC868 is a GE Panametrics product. GE Panametrics has joined other GE high-technology
businesses under a new name—GE Sensing & Inspection Technologies.
Page 3

April 2008
Warranty Each instrument manufactured by GE Sensing, Inc. is warranted to be
free from defects in material and workmanship. Liability under this
warranty is limited to restoring the instrument to normal operation or
replacing the instrument, at the sole discretion of GE. Fuses and
batteries are specifically excluded from any liability. This warranty is
effective from the date of delivery to the original purchaser. If GE
determines that the equipment was defective, the warranty period is:
• one year for general electronic failures of the instrument
• one year for mechanical failures of the sensor
If GE determines that the equipment was damaged by misuse,
improper installation, the use of unauthorized replacement parts, or
operating conditions outside the guidelines specified by GE, the
repairs are not covered under this warranty.
The warranties set forth herein are exclusive and are in lieu of
all other warranties whether statutory, express or implied
(including warranties of merchantability and fitness for a
particular purpose, and warranties arising from course of
dealing or usage or trade).
Return Policy If a GE Sensing, Inc. instrument malfunctions within the warranty
period, the following procedure must be completed:
1. Notify GE, giving full details of the problem, and provide the model
number and serial number of the instrument. If the nature of the
problem indicates the need for factory service, GE will issue a
RETURN AUTHORIZATION number (RA), and shipping instructions
for the return of the instrument to a service center will be
provided.
2. If GE instructs you to send your instrument to a service center, it
must be shipped prepaid to the authorized repair station indicated
in the shipping instructions.
3. Upon receipt, GE will evaluate the instrument to determine the
cause of the malfunction.
Then, one of the following courses of action will then be taken:
• If the damage is covered under the terms of the warranty, the
instrument will be repaired at no cost to the owner and returned.
• If GE determines that the damage is not covered under the terms
of the warranty, or if the warranty has expired, an estimate for the
cost of the repairs at standard rates will be provided. Upon receipt
of the owner’s approval to proceed, the instrument will be repaired
and returned.
iii
Page 4

April 2008
Table of Contents
Chapter 1: Programming Site Data
Introduction . . . . . . . . . . . . . . . . . . . . . . . . . . . . . . . . . . . . . . . . . . . . . . . . . . . . . . . . . . . . . . . . . . . . . . . . . . . . . . . 1-1
Using the Keypad . . . . . . . . . . . . . . . . . . . . . . . . . . . . . . . . . . . . . . . . . . . . . . . . . . . . . . . . . . . . . . . . . . . . . . . . . . 1-2
Obtaining On-line Help . . . . . . . . . . . . . . . . . . . . . . . . . . . . . . . . . . . . . . . . . . . . . . . . . . . . . . . . . . . . . . . . . . . . . 1-6
Using the Console Control Keys . . . . . . . . . . . . . . . . . . . . . . . . . . . . . . . . . . . . . . . . . . . . . . . . . . . . . . . . . . . . . 1-7
Audio Alarm Volume. . . . . . . . . . . . . . . . . . . . . . . . . . . . . . . . . . . . . . . . . . . . . . . . . . . . . . . . . . . . . . . . . . . . 1-7
Stopwatch Totalizer . . . . . . . . . . . . . . . . . . . . . . . . . . . . . . . . . . . . . . . . . . . . . . . . . . . . . . . . . . . . . . . . . . . . 1-7
Display Brightness. . . . . . . . . . . . . . . . . . . . . . . . . . . . . . . . . . . . . . . . . . . . . . . . . . . . . . . . . . . . . . . . . . . . . . 1-7
Display Contrast. . . . . . . . . . . . . . . . . . . . . . . . . . . . . . . . . . . . . . . . . . . . . . . . . . . . . . . . . . . . . . . . . . . . . . . . 1-7
The User Program. . . . . . . . . . . . . . . . . . . . . . . . . . . . . . . . . . . . . . . . . . . . . . . . . . . . . . . . . . . . . . . . . . . . . . . . . . 1-8
Entering Programming Mode . . . . . . . . . . . . . . . . . . . . . . . . . . . . . . . . . . . . . . . . . . . . . . . . . . . . . . . . . . . 1-8
Activating the Channel . . . . . . . . . . . . . . . . . . . . . . . . . . . . . . . . . . . . . . . . . . . . . . . . . . . . . . . . . . . . . . . . . . . . . 1-9
Entering System Data . . . . . . . . . . . . . . . . . . . . . . . . . . . . . . . . . . . . . . . . . . . . . . . . . . . . . . . . . . . . . . . . . . . . .1-10
Entering System Units . . . . . . . . . . . . . . . . . . . . . . . . . . . . . . . . . . . . . . . . . . . . . . . . . . . . . . . . . . . . . . . . . 1-10
Entering Volumetric Data . . . . . . . . . . . . . . . . . . . . . . . . . . . . . . . . . . . . . . . . . . . . . . . . . . . . . . . . . . . . . . 1-11
Entering Totalizer Data . . . . . . . . . . . . . . . . . . . . . . . . . . . . . . . . . . . . . . . . . . . . . . . . . . . . . . . . . . . . . . . .1-11
Mass Flow (static)?. . . . . . . . . . . . . . . . . . . . . . . . . . . . . . . . . . . . . . . . . . . . . . . . . . . . . . . . . . . . . . . . . . . . .1-11
Entering Pipe Data . . . . . . . . . . . . . . . . . . . . . . . . . . . . . . . . . . . . . . . . . . . . . . . . . . . . . . . . . . . . . . . . . . . . . . . . 1-13
Special Transducers . . . . . . . . . . . . . . . . . . . . . . . . . . . . . . . . . . . . . . . . . . . . . . . . . . . . . . . . . . . . . . . . . . . 1-13
Wedge Temperature . . . . . . . . . . . . . . . . . . . . . . . . . . . . . . . . . . . . . . . . . . . . . . . . . . . . . . . . . . . . . . . . . . 1-13
Pipe Material . . . . . . . . . . . . . . . . . . . . . . . . . . . . . . . . . . . . . . . . . . . . . . . . . . . . . . . . . . . . . . . . . . . . . . . . . .1-14
Pipe OD . . . . . . . . . . . . . . . . . . . . . . . . . . . . . . . . . . . . . . . . . . . . . . . . . . . . . . . . . . . . . . . . . . . . . . . . . . . . . . . 1-14
Pipe Wall. . . . . . . . . . . . . . . . . . . . . . . . . . . . . . . . . . . . . . . . . . . . . . . . . . . . . . . . . . . . . . . . . . . . . . . . . . . . . . 1-15
Fluid Type. . . . . . . . . . . . . . . . . . . . . . . . . . . . . . . . . . . . . . . . . . . . . . . . . . . . . . . . . . . . . . . . . . . . . . . . . . . . . 1-15
Reynolds Correction . . . . . . . . . . . . . . . . . . . . . . . . . . . . . . . . . . . . . . . . . . . . . . . . . . . . . . . . . . . . . . . . . . . 1-15
Calibration Factor . . . . . . . . . . . . . . . . . . . . . . . . . . . . . . . . . . . . . . . . . . . . . . . . . . . . . . . . . . . . . . . . . . . . .1-15
Number of Traverses . . . . . . . . . . . . . . . . . . . . . . . . . . . . . . . . . . . . . . . . . . . . . . . . . . . . . . . . . . . . . . . . . . 1-15
Transducer Spacing . . . . . . . . . . . . . . . . . . . . . . . . . . . . . . . . . . . . . . . . . . . . . . . . . . . . . . . . . . . . . . . . . . . 1-16
Setting Up Inputs/Outputs . . . . . . . . . . . . . . . . . . . . . . . . . . . . . . . . . . . . . . . . . . . . . . . . . . . . . . . . . . . . . . . . . 1-17
Selecting Error Handling . . . . . . . . . . . . . . . . . . . . . . . . . . . . . . . . . . . . . . . . . . . . . . . . . . . . . . . . . . . . . . . 1-17
Setting Up Analog Outputs. . . . . . . . . . . . . . . . . . . . . . . . . . . . . . . . . . . . . . . . . . . . . . . . . . . . . . . . . . . . . 1-18
Option Card Alarms . . . . . . . . . . . . . . . . . . . . . . . . . . . . . . . . . . . . . . . . . . . . . . . . . . . . . . . . . . . . . . . . . . .1-19
Setting Up the Totalizer/Frequency Outputs . . . . . . . . . . . . . . . . . . . . . . . . . . . . . . . . . . . . . . . . . . . . 1-20
Setting up the Analog Inputs . . . . . . . . . . . . . . . . . . . . . . . . . . . . . . . . . . . . . . . . . . . . . . . . . . . . . . . . . . . 1-22
Setting up RTD Inputs. . . . . . . . . . . . . . . . . . . . . . . . . . . . . . . . . . . . . . . . . . . . . . . . . . . . . . . . . . . . . . . . . . 1-23
Entering the Zero Cutoff . . . . . . . . . . . . . . . . . . . . . . . . . . . . . . . . . . . . . . . . . . . . . . . . . . . . . . . . . . . . . . . 1-23
Setting Up Temperature and Pressure Inputs . . . . . . . . . . . . . . . . . . . . . . . . . . . . . . . . . . . . . . . . . . .1-24
Entering Setup Data . . . . . . . . . . . . . . . . . . . . . . . . . . . . . . . . . . . . . . . . . . . . . . . . . . . . . . . . . . . . . . . . . . . . . . . 1-27
Setting Signal Limits . . . . . . . . . . . . . . . . . . . . . . . . . . . . . . . . . . . . . . . . . . . . . . . . . . . . . . . . . . . . . . . . . . . 1-27
Setting Response Time. . . . . . . . . . . . . . . . . . . . . . . . . . . . . . . . . . . . . . . . . . . . . . . . . . . . . . . . . . . . . . . . . 1-33
Initializing the System . . . . . . . . . . . . . . . . . . . . . . . . . . . . . . . . . . . . . . . . . . . . . . . . . . . . . . . . . . . . . . . . . 1-33
Setting Advanced Parameters . . . . . . . . . . . . . . . . . . . . . . . . . . . . . . . . . . . . . . . . . . . . . . . . . . . . . . . . .1-34
Setting the Clock . . . . . . . . . . . . . . . . . . . . . . . . . . . . . . . . . . . . . . . . . . . . . . . . . . . . . . . . . . . . . . . . . . . . . . . . . . 1-42
Setting the Date . . . . . . . . . . . . . . . . . . . . . . . . . . . . . . . . . . . . . . . . . . . . . . . . . . . . . . . . . . . . . . . . . . . . . . . 1-42
Setting the Time . . . . . . . . . . . . . . . . . . . . . . . . . . . . . . . . . . . . . . . . . . . . . . . . . . . . . . . . . . . . . . . . . . . . . . . 1-42
v
Page 5

April 2008
Table of Contents (cont.)
Chapter 1: Programming Site Data (cont.)
Setting Up Serial Communications . . . . . . . . . . . . . . . . . . . . . . . . . . . . . . . . . . . . . . . . . . . . . . . . . . . . . . . . . 1-44
Entering MODBUS Data. . . . . . . . . . . . . . . . . . . . . . . . . . . . . . . . . . . . . . . . . . . . . . . . . . . . . . . . . . . . . . . . 1-45
MODBUS/TCP Parameters . . . . . . . . . . . . . . . . . . . . . . . . . . . . . . . . . . . . . . . . . . . . . . . . . . . . . . . . . . . . . 1-45
MODBUS Register Map . . . . . . . . . . . . . . . . . . . . . . . . . . . . . . . . . . . . . . . . . . . . . . . . . . . . . . . . . . . . . . . . 1-46
Notes: . . . . . . . . . . . . . . . . . . . . . . . . . . . . . . . . . . . . . . . . . . . . . . . . . . . . . . . . . . . . . . . . . . . . . . . . . . . . . . . . 1-47
Saving Site Data . . . . . . . . . . . . . . . . . . . . . . . . . . . . . . . . . . . . . . . . . . . . . . . . . . . . . . . . . . . . . . . . . . . . . . . . . . 1-48
Recalling a Site . . . . . . . . . . . . . . . . . . . . . . . . . . . . . . . . . . . . . . . . . . . . . . . . . . . . . . . . . . . . . . . . . . . . . . . . . . . 1-49
Activating Security . . . . . . . . . . . . . . . . . . . . . . . . . . . . . . . . . . . . . . . . . . . . . . . . . . . . . . . . . . . . . . . . . . . . . . . . 1-50
Chapter 2: Displaying Data
Introduction . . . . . . . . . . . . . . . . . . . . . . . . . . . . . . . . . . . . . . . . . . . . . . . . . . . . . . . . . . . . . . . . . . . . . . . . . . . . . . . 2-1
The BIG Submenu . . . . . . . . . . . . . . . . . . . . . . . . . . . . . . . . . . . . . . . . . . . . . . . . . . . . . . . . . . . . . . . . . . . . . . . . . . 2-2
The DUAL Submenu . . . . . . . . . . . . . . . . . . . . . . . . . . . . . . . . . . . . . . . . . . . . . . . . . . . . . . . . . . . . . . . . . . . . . . . . 2-3
The GRAPH Submenu . . . . . . . . . . . . . . . . . . . . . . . . . . . . . . . . . . . . . . . . . . . . . . . . . . . . . . . . . . . . . . . . . . . . . . 2-4
Setting Up the GRAPH Format . . . . . . . . . . . . . . . . . . . . . . . . . . . . . . . . . . . . . . . . . . . . . . . . . . . . . . . . . . 2-4
Using the GRAPH Format . . . . . . . . . . . . . . . . . . . . . . . . . . . . . . . . . . . . . . . . . . . . . . . . . . . . . . . . . . . . . . . 2-5
The LOG Submenu . . . . . . . . . . . . . . . . . . . . . . . . . . . . . . . . . . . . . . . . . . . . . . . . . . . . . . . . . . . . . . . . . . . . . . . . . 2-7
Entering the LOG Submenu . . . . . . . . . . . . . . . . . . . . . . . . . . . . . . . . . . . . . . . . . . . . . . . . . . . . . . . . . . . . . 2-7
Numeric Format . . . . . . . . . . . . . . . . . . . . . . . . . . . . . . . . . . . . . . . . . . . . . . . . . . . . . . . . . . . . . . . . . . . . . . . 2-8
Graphical Format . . . . . . . . . . . . . . . . . . . . . . . . . . . . . . . . . . . . . . . . . . . . . . . . . . . . . . . . . . . . . . . . . . . . . . 2-9
Displaying the Transducer Signal . . . . . . . . . . . . . . . . . . . . . . . . . . . . . . . . . . . . . . . . . . . . . . . . . . . . . . . . . . 2-11
Setting the LCD Backlight. . . . . . . . . . . . . . . . . . . . . . . . . . . . . . . . . . . . . . . . . . . . . . . . . . . . . . . . . . . . . . . . . . 2-14
Activating Sleep Mode. . . . . . . . . . . . . . . . . . . . . . . . . . . . . . . . . . . . . . . . . . . . . . . . . . . . . . . . . . . . . . . . . . . . . 2-15
Chapter 3: Logging Data
Introduction . . . . . . . . . . . . . . . . . . . . . . . . . . . . . . . . . . . . . . . . . . . . . . . . . . . . . . . . . . . . . . . . . . . . . . . . . . . . . . . 3-1
Creating a Standard Log . . . . . . . . . . . . . . . . . . . . . . . . . . . . . . . . . . . . . . . . . . . . . . . . . . . . . . . . . . . . . . . . . . . 3-2
Log Type. . . . . . . . . . . . . . . . . . . . . . . . . . . . . . . . . . . . . . . . . . . . . . . . . . . . . . . . . . . . . . . . . . . . . . . . . . . . . . . 3-3
STARTTIME Prompt . . . . . . . . . . . . . . . . . . . . . . . . . . . . . . . . . . . . . . . . . . . . . . . . . . . . . . . . . . . . . . . . . . . . . 3-3
START DATE Prompt . . . . . . . . . . . . . . . . . . . . . . . . . . . . . . . . . . . . . . . . . . . . . . . . . . . . . . . . . . . . . . . . . . . . 3-4
END TIME Prompt . . . . . . . . . . . . . . . . . . . . . . . . . . . . . . . . . . . . . . . . . . . . . . . . . . . . . . . . . . . . . . . . . . . . . . 3-4
END DATE Prompt . . . . . . . . . . . . . . . . . . . . . . . . . . . . . . . . . . . . . . . . . . . . . . . . . . . . . . . . . . . . . . . . . . . . . . 3-5
DURATION Prompt . . . . . . . . . . . . . . . . . . . . . . . . . . . . . . . . . . . . . . . . . . . . . . . . . . . . . . . . . . . . . . . . . . . . . 3-5
LOG TIME Prompt . . . . . . . . . . . . . . . . . . . . . . . . . . . . . . . . . . . . . . . . . . . . . . . . . . . . . . . . . . . . . . . . . . . . . . 3-5
TIME INCREMENT Prompt . . . . . . . . . . . . . . . . . . . . . . . . . . . . . . . . . . . . . . . . . . . . . . . . . . . . . . . . . . . . . . . 3-6
Checking the Memory . . . . . . . . . . . . . . . . . . . . . . . . . . . . . . . . . . . . . . . . . . . . . . . . . . . . . . . . . . . . . . . . . . . . . . 3-7
Stopping a Log. . . . . . . . . . . . . . . . . . . . . . . . . . . . . . . . . . . . . . . . . . . . . . . . . . . . . . . . . . . . . . . . . . . . . . . . . . . . . 3-8
Creating an ERROR Log. . . . . . . . . . . . . . . . . . . . . . . . . . . . . . . . . . . . . . . . . . . . . . . . . . . . . . . . . . . . . . . . . . . . . 3-9
Log Type. . . . . . . . . . . . . . . . . . . . . . . . . . . . . . . . . . . . . . . . . . . . . . . . . . . . . . . . . . . . . . . . . . . . . . . . . . . . . . 3-10
STARTTIME Prompt . . . . . . . . . . . . . . . . . . . . . . . . . . . . . . . . . . . . . . . . . . . . . . . . . . . . . . . . . . . . . . . . . . . . 3-10
START DATE Prompt . . . . . . . . . . . . . . . . . . . . . . . . . . . . . . . . . . . . . . . . . . . . . . . . . . . . . . . . . . . . . . . . . . . 3-11
vi
Page 6

April 2008
Table of Contents (cont.)
Chapter 4: Printing Data
Introduction . . . . . . . . . . . . . . . . . . . . . . . . . . . . . . . . . . . . . . . . . . . . . . . . . . . . . . . . . . . . . . . . . . . . . . . . . . . . . . . 4-1
Print Live Data . . . . . . . . . . . . . . . . . . . . . . . . . . . . . . . . . . . . . . . . . . . . . . . . . . . . . . . . . . . . . . . . . . . . . . . . . . . . . 4-2
Numeric Format. . . . . . . . . . . . . . . . . . . . . . . . . . . . . . . . . . . . . . . . . . . . . . . . . . . . . . . . . . . . . . . . . . . . . . . . 4-2
Graphical Format. . . . . . . . . . . . . . . . . . . . . . . . . . . . . . . . . . . . . . . . . . . . . . . . . . . . . . . . . . . . . . . . . . . . . . . 4-3
Printing Logs. . . . . . . . . . . . . . . . . . . . . . . . . . . . . . . . . . . . . . . . . . . . . . . . . . . . . . . . . . . . . . . . . . . . . . . . . . . . . . . 4-5
Numeric Format. . . . . . . . . . . . . . . . . . . . . . . . . . . . . . . . . . . . . . . . . . . . . . . . . . . . . . . . . . . . . . . . . . . . . . . . 4-5
Graphical Format. . . . . . . . . . . . . . . . . . . . . . . . . . . . . . . . . . . . . . . . . . . . . . . . . . . . . . . . . . . . . . . . . . . . . . . 4-6
Print Site File . . . . . . . . . . . . . . . . . . . . . . . . . . . . . . . . . . . . . . . . . . . . . . . . . . . . . . . . . . . . . . . . . . . . . . . . . . . . . . . 4-7
Stop Printing . . . . . . . . . . . . . . . . . . . . . . . . . . . . . . . . . . . . . . . . . . . . . . . . . . . . . . . . . . . . . . . . . . . . . . . . . . . . . . . 4-8
Setting Up a Printer . . . . . . . . . . . . . . . . . . . . . . . . . . . . . . . . . . . . . . . . . . . . . . . . . . . . . . . . . . . . . . . . . . . . . . . . 4-9
Printing Signal Array Data . . . . . . . . . . . . . . . . . . . . . . . . . . . . . . . . . . . . . . . . . . . . . . . . . . . . . . . . . . . . . . . . .4-10
Printing RTD Data . . . . . . . . . . . . . . . . . . . . . . . . . . . . . . . . . . . . . . . . . . . . . . . . . . . . . . . . . . . . . . . . . . . . . . . . . 4-12
Chapter 5: Clearing Data
Introduction . . . . . . . . . . . . . . . . . . . . . . . . . . . . . . . . . . . . . . . . . . . . . . . . . . . . . . . . . . . . . . . . . . . . . . . . . . . . . . . 5-1
Reset Totals. . . . . . . . . . . . . . . . . . . . . . . . . . . . . . . . . . . . . . . . . . . . . . . . . . . . . . . . . . . . . . . . . . . . . . . . . . . . . . . . 5-2
Deleting Site Files . . . . . . . . . . . . . . . . . . . . . . . . . . . . . . . . . . . . . . . . . . . . . . . . . . . . . . . . . . . . . . . . . . . . . . . . . . 5-3
Deleting Log Files . . . . . . . . . . . . . . . . . . . . . . . . . . . . . . . . . . . . . . . . . . . . . . . . . . . . . . . . . . . . . . . . . . . . . . . . . . 5-4
Chapter 6: Serial Communications
Introduction . . . . . . . . . . . . . . . . . . . . . . . . . . . . . . . . . . . . . . . . . . . . . . . . . . . . . . . . . . . . . . . . . . . . . . . . . . . . . . . 6-1
Wiring the RS232 Interface . . . . . . . . . . . . . . . . . . . . . . . . . . . . . . . . . . . . . . . . . . . . . . . . . . . . . . . . . . . . . . . . . 6-1
Checking the GC868 Baud Rate . . . . . . . . . . . . . . . . . . . . . . . . . . . . . . . . . . . . . . . . . . . . . . . . . . . . . . . . . . . . . 6-2
Setting Up the Terminal Software and Transferring Data . . . . . . . . . . . . . . . . . . . . . . . . . . . . . . . . . . . . . 6-2
Windows 9X/NT Systems . . . . . . . . . . . . . . . . . . . . . . . . . . . . . . . . . . . . . . . . . . . . . . . . . . . . . . . . . . . . . . . 6-3
The Optional RS485 Serial Interface . . . . . . . . . . . . . . . . . . . . . . . . . . . . . . . . . . . . . . . . . . . . . . . . . . . . . . . . . 6-4
Interface Converter Mounting. . . . . . . . . . . . . . . . . . . . . . . . . . . . . . . . . . . . . . . . . . . . . . . . . . . . . . . . . . . 6-4
Point-To-Point Wiring. . . . . . . . . . . . . . . . . . . . . . . . . . . . . . . . . . . . . . . . . . . . . . . . . . . . . . . . . . . . . . . . . . . 6-5
Multi-Point Wiring . . . . . . . . . . . . . . . . . . . . . . . . . . . . . . . . . . . . . . . . . . . . . . . . . . . . . . . . . . . . . . . . . . . . . . 6-6
Setting Up an Ethernet Connection. . . . . . . . . . . . . . . . . . . . . . . . . . . . . . . . . . . . . . . . . . . . . . . . . . . . . . . . . . 6-9
Setting Up a MODBUS/TCP Connection . . . . . . . . . . . . . . . . . . . . . . . . . . . . . . . . . . . . . . . . . . . . . . . . . . . . . 6-10
Appendix A: Menu Maps
Appendix B: Data Records
Option Cards Installed . . . . . . . . . . . . . . . . . . . . . . . . . . . . . . . . . . . . . . . . . . . . . . . . . . . . . . . . . . . . . . . . . . . . . . B-1
Initial Setup Data. . . . . . . . . . . . . . . . . . . . . . . . . . . . . . . . . . . . . . . . . . . . . . . . . . . . . . . . . . . . . . . . . . . . . . . . . . . B-2
vii
Page 7

April 2008
Table of Contents (cont.)
Appendix C: Programming with PanaView
Introduction . . . . . . . . . . . . . . . . . . . . . . . . . . . . . . . . . . . . . . . . . . . . . . . . . . . . . . . . . . . . . . . . . . . . . . . . . . . . . . . C-1
Wiring the RS232 Interface . . . . . . . . . . . . . . . . . . . . . . . . . . . . . . . . . . . . . . . . . . . . . . . . . . . . . . . . . . . . . . . . . C-1
Setting Up the Communications Port. . . . . . . . . . . . . . . . . . . . . . . . . . . . . . . . . . . . . . . . . . . . . . . . . . . . . . . . C-2
Setting up Ethernet Communications . . . . . . . . . . . . . . . . . . . . . . . . . . . . . . . . . . . . . . . . . . . . . . . . . . . C-4
Adding the GC868. . . . . . . . . . . . . . . . . . . . . . . . . . . . . . . . . . . . . . . . . . . . . . . . . . . . . . . . . . . . . . . . . . . . . . . . . . C-5
Editing Meter Properties. . . . . . . . . . . . . . . . . . . . . . . . . . . . . . . . . . . . . . . . . . . . . . . . . . . . . . . . . . . . . . . . . . . . C-7
Setting the Meter Clock . . . . . . . . . . . . . . . . . . . . . . . . . . . . . . . . . . . . . . . . . . . . . . . . . . . . . . . . . . . . . . . . . C-9
Reading Transducer Signals . . . . . . . . . . . . . . . . . . . . . . . . . . . . . . . . . . . . . . . . . . . . . . . . . . . . . . . . . . . C-10
Plotting Transducer Signals . . . . . . . . . . . . . . . . . . . . . . . . . . . . . . . . . . . . . . . . . . . . . . . . . . . . . . . . . . . . C-10
Saving Transducer Signals. . . . . . . . . . . . . . . . . . . . . . . . . . . . . . . . . . . . . . . . . . . . . . . . . . . . . . . . . . . . . C-11
Clearing Totalizers . . . . . . . . . . . . . . . . . . . . . . . . . . . . . . . . . . . . . . . . . . . . . . . . . . . . . . . . . . . . . . . . . . . . C-11
Handling Site Files. . . . . . . . . . . . . . . . . . . . . . . . . . . . . . . . . . . . . . . . . . . . . . . . . . . . . . . . . . . . . . . . . . . . . C-12
Changing Meter Settings . . . . . . . . . . . . . . . . . . . . . . . . . . . . . . . . . . . . . . . . . . . . . . . . . . . . . . . . . . . . . . . . . . C-15
Appendix D: Foundation Fieldbus Communications
Optional Measurements. . . . . . . . . . . . . . . . . . . . . . . . . . . . . . . . . . . . . . . . . . . . . . . . . . . . . . . . . . . . . . . . . . . . D-1
Configuration Utility Setup . . . . . . . . . . . . . . . . . . . . . . . . . . . . . . . . . . . . . . . . . . . . . . . . . . . . . . . . . . . . . . . . . D-2
Selecting the Desired Measurements. . . . . . . . . . . . . . . . . . . . . . . . . . . . . . . . . . . . . . . . . . . . . . . . . . . . . . . . D-2
Selecting Units for AI Blocks . . . . . . . . . . . . . . . . . . . . . . . . . . . . . . . . . . . . . . . . . . . . . . . . . . . . . . . . . . . . . . . . D-4
Resetting Instrument Totalizers . . . . . . . . . . . . . . . . . . . . . . . . . . . . . . . . . . . . . . . . . . . . . . . . . . . . . . . . . . . . . D-5
Function Block Application . . . . . . . . . . . . . . . . . . . . . . . . . . . . . . . . . . . . . . . . . . . . . . . . . . . . . . . . . . . . . . . . . D-6
viii
Page 8

Chapter 1
Page 9

Programming Site Data
Introduction. . . . . . . . . . . . . . . . . . . . . . . . . . . . . . . . . . . . . . . . . . . . . . . . . . . . 1-1
Using the Keypad . . . . . . . . . . . . . . . . . . . . . . . . . . . . . . . . . . . . . . . . . . . . . . . 1-2
Obtaining On-line Help . . . . . . . . . . . . . . . . . . . . . . . . . . . . . . . . . . . . . . . . . . 1-6
Using the Console Control Keys . . . . . . . . . . . . . . . . . . . . . . . . . . . . . . . . . . 1-7
The User Program . . . . . . . . . . . . . . . . . . . . . . . . . . . . . . . . . . . . . . . . . . . . . . 1-8
Activating the Channel . . . . . . . . . . . . . . . . . . . . . . . . . . . . . . . . . . . . . . . . . . 1-9
Entering System Data . . . . . . . . . . . . . . . . . . . . . . . . . . . . . . . . . . . . . . . . . . 1-10
Entering Pipe Data. . . . . . . . . . . . . . . . . . . . . . . . . . . . . . . . . . . . . . . . . . . . . 1-13
Setting Up Inputs/Outputs. . . . . . . . . . . . . . . . . . . . . . . . . . . . . . . . . . . . . . 1-17
Entering Setup Data . . . . . . . . . . . . . . . . . . . . . . . . . . . . . . . . . . . . . . . . . . . 1-27
Setting the Clock . . . . . . . . . . . . . . . . . . . . . . . . . . . . . . . . . . . . . . . . . . . . . . 1-42
Saving Site Data . . . . . . . . . . . . . . . . . . . . . . . . . . . . . . . . . . . . . . . . . . . . . . . 1-48
Recalling a Site . . . . . . . . . . . . . . . . . . . . . . . . . . . . . . . . . . . . . . . . . . . . . . . . 1-49
Activating Security. . . . . . . . . . . . . . . . . . . . . . . . . . . . . . . . . . . . . . . . . . . . . 1-50
Page 10

April 2008
Introduction The Model GC868 flowmeter cannot provide accurate flow rate
measurements until the instrument has been properly installed and the
basic system and pipe parameters have been programmed into the
meter. See the Startup Guide for detailed instructions on performing
these tasks. After completing the installation and initial setup, use this
chapter to program the Model GC868’s advanced features.
T en submenus within the User Program provide access to the various
programmable features of the Model GC868. Step-by-step
programming instructions are presented in this chapter. Refer to the
appropriate section for a discussion of the following User Program
submenus:
• ACTIV - select the desired measurement method
• SYSTM - enter the system data
• PIPE - enter the pipe parameters
• I/O - set up the inputs and outputs
• SETUP - set the signal limits and response times
• CLOCK - set the time and date
• COMM - set the serial port parameters
• SAVE - save site files
• RECLL - recall stored site files
• SECUR - enter a passcode
As an aid in following the programming instructions, a complete
menu map of the User Program is included in Appendix A, Menu
Maps.
Note: In the menu map drawings, plain text represents prompt area
messages and boxed text represents option bar choices. Fx
represents a function key to select an option bar choice.
Programming Site Data 1-1
Page 11
April 2008
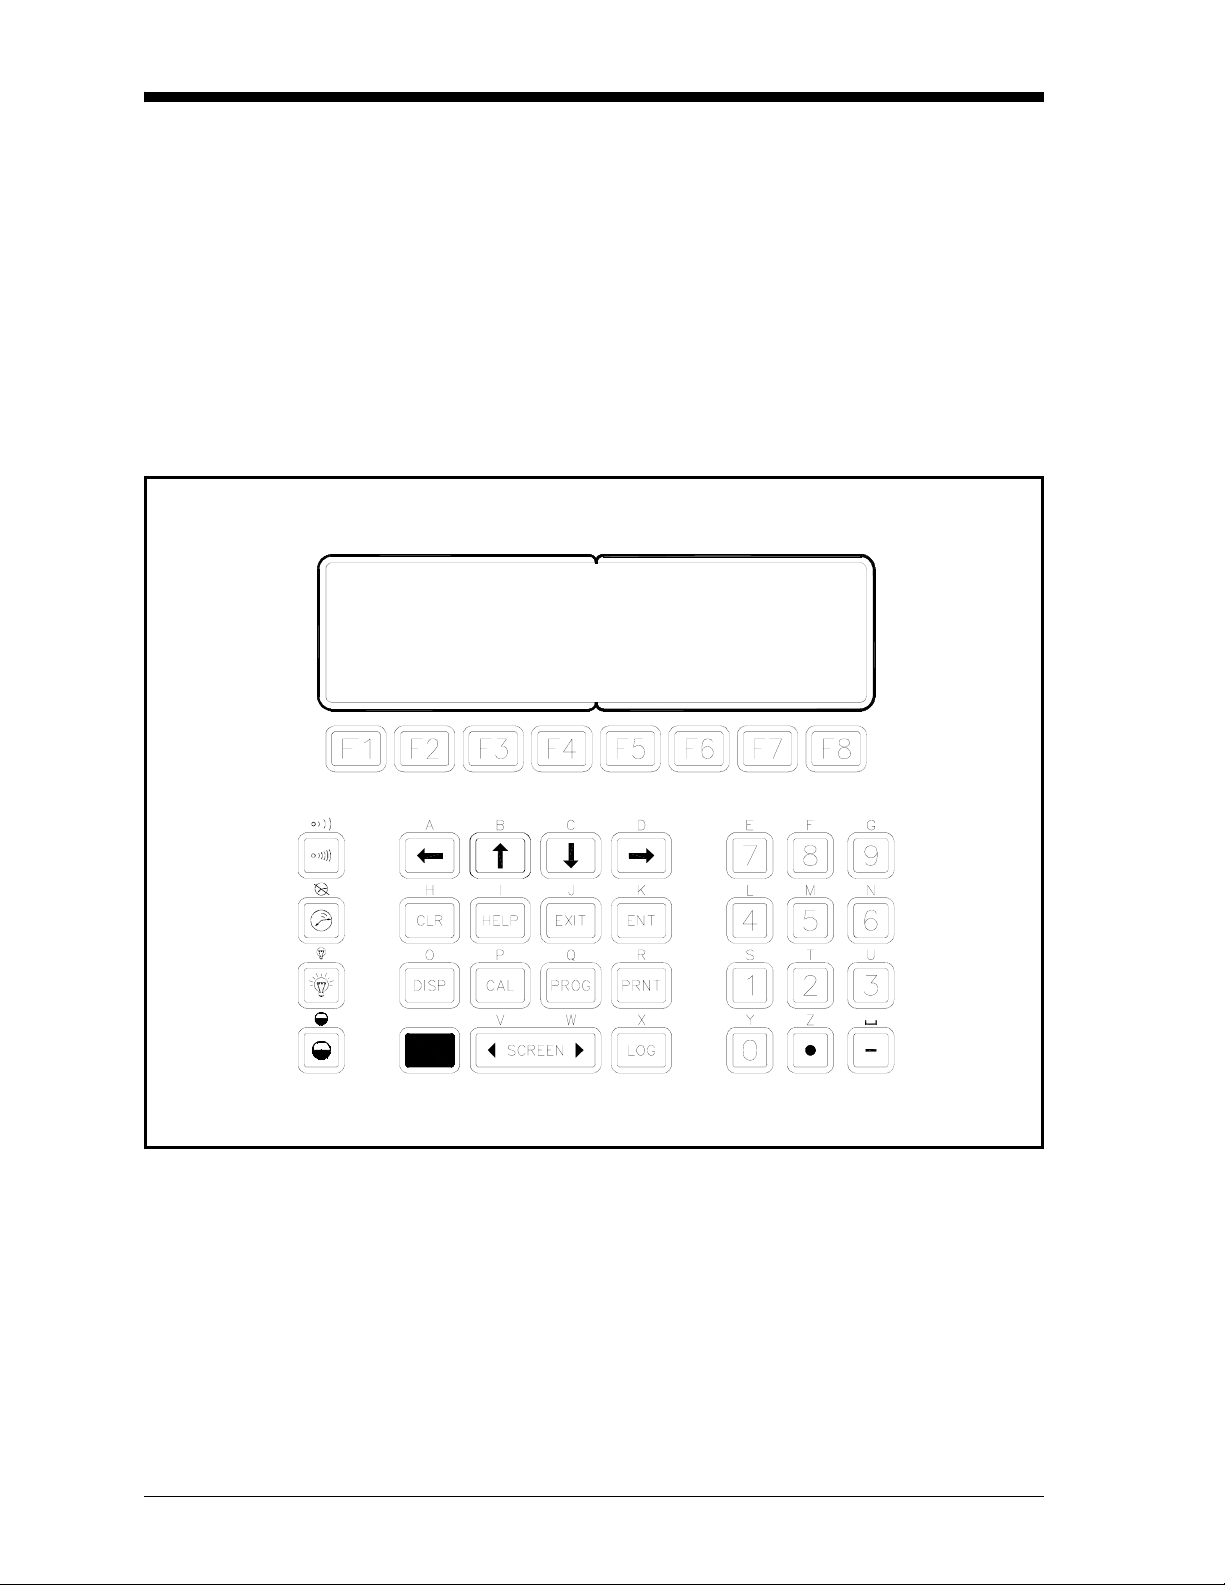
Using the Keypad The Model GC868 keypad contains 39 keys, that are labeled with
their primary (unshifted) functions. In addition, pressing the red
[SHIFT] key will access the secondary functions assigned to most of
the keys.
The complete keypad is illustrated in Figure 1-1 below and a detailed
description of both the unshifted and shifted functions for each of the
39 keys is listed in Table 1-1 on pag e 1-3.
Note: Only the
function.
[SHIFT] key and the eight [Fx] keys have no shifted
Figure 1-1: The Model GC868 Keypad
Note: Although the keypad is essentially the same, the front panel
layout of meters supplied in one of the optional enclosures is
different. See Appendix C, Optional Enclosures, of the Startup
Guide for a picture of the applicable front panel.
1-2 Programming Site Data
Page 12
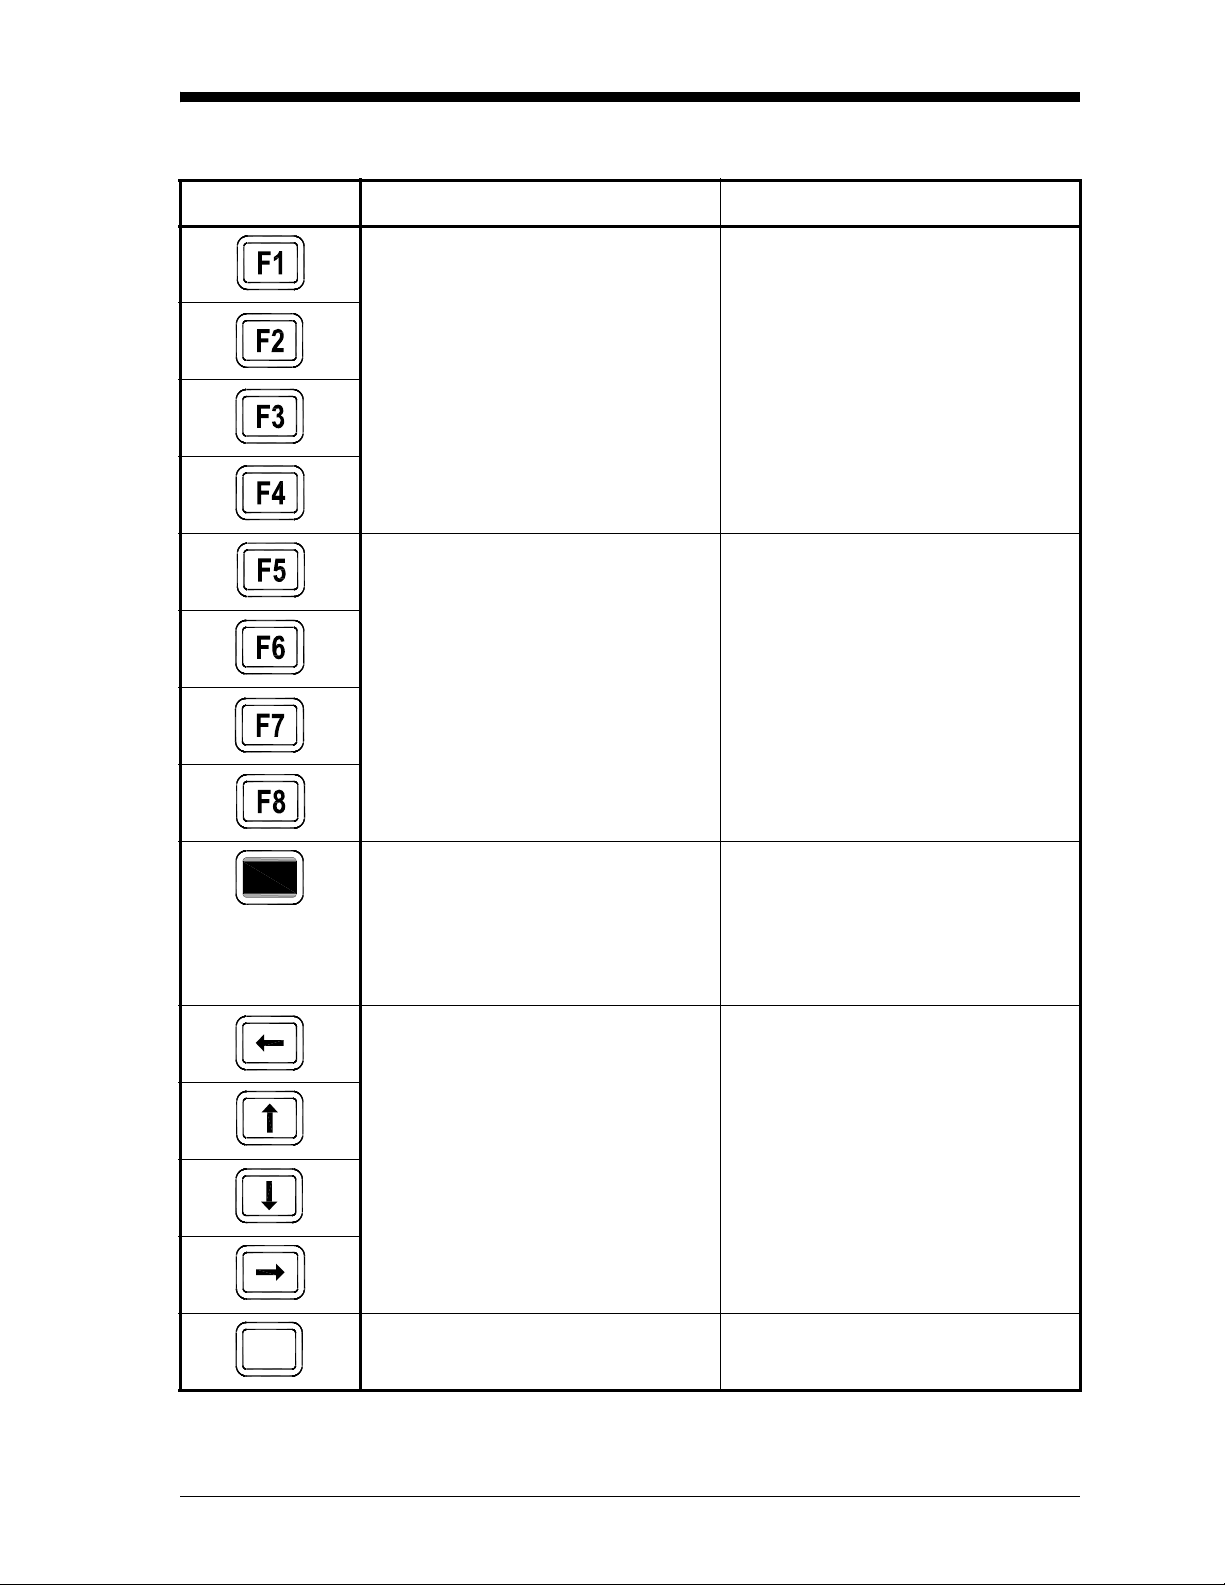
Table 1-1: Model GC868 Key Functions
Key Unshifted Function Shifted Function
Software Function Keys - press to
None
select the functions displayed directly
above them in the option bar. These
keys apply only to the left pane of the
display screen.
April 2008
Software Function Keys - press to
select the functions displayed directly
above them in the option bar. These
keys apply only to the right pane of the
display screen.
Shift Key - use this red key to access
the shifted function of the other keys.
One press shifts the next keystroke
only, while two presses locks the keypad in shifted mode. A third press
releases the shift function.
Arrow Keys - in measurement mode,
use to scroll through function choices
on the option bar. In programming
mode, use to scroll through menu
choices. The [←] also acts as a backspace key in programming mode.
None
None
Use to enter the letters A, B, C and D,
respectively.
PROG
Programming Site Data 1-3
Program. See page 1-8 for details.
Program Key - press to enter the User
Use to enter the letter Q.
Page 13

April 2008
Table 1-1: Model GC868 Key Functions (Continued)
Key Unshifted Function Shifted Function
DISP
Display Key - use to display data in a
variety of numeric and graphic format-
Use to enter the letter O.
ting options. See page 2-2 for details.
LOG
Log Key - use to set up logs. See page
3-1 for details.
Use to enter the letter X.
PRNT
CLR
CAL
EXIT
ENT
HELP
Print Key - use to print live measurements, log files and signal arrays. See
page 4-1 for details.
Clear Key - use to reset totals and to
delete site and log files from the Model
GC868 memory. See page 5-1 for
details.
Calibration Key - use to calibrate the
analog inputs and outputs and to test
the alarm relays and the totalizer/frequency outputs. See Chapter 1, Cali-
bration, of the Service Manual for
details.
Exit Key - use to move up one level in
the user program or to exit the user
program. See page 1-8 for details.
Enter Key - use to confirm the most
recent input information.
Help Key - use to access the Model
GC868’s context-sensitive on-line help
system. See the next section for details.
Use to enter the letter R.
Use to enter the letter H.
Use to enter the letter P.
Use to enter the letter J.
Use to enter the letter K.
Use to enter the letter I.
SCREEN
Screen Key - press the left side to
select the left display pane or press the
right side to select the right display
Press the left side to enter the letter V
or press the right side to enter the letter
W.
pane.
Decimal Point Key - press to enter a
Use to enter the letter Z.
decimal point during numeric entry.
Minus Key - use to enter a minus sign
Use to enter a space character.
or a dash.
Zero Key - use to enter the number 0. Use to enter the letter Y.
0
One Key - use to enter the number 1. Use to enter the letter S.
1
1-4 Programming Site Data
Page 14

Table 1-1: Model GC868 Key Functions (Continued)
Key Unshifted Function Shifted Function
Two Key - use to enter the number 2. Use to enter the letter T.
2
Three Key - use to enter the number 3. Use to enter the letter U.
3
Four Key - use to enter the number 4. Use to enter the letter L.
4
Five Key - use to enter the number 5. Use to enter the letter M.
5
Six Key - use to enter the number 6. Use to enter the letter N.
6
Seven Key - use to enter the number 7. Use to enter the letter E.
7
April 2008
8
9
Eight Key - use to enter the number 8. Use to enter the letter F.
Nine Key - use to enter the number 9. Use to enter the letter G.
Audio Level Key - press to increase
the audio alarm volume.
Stopwatch Timer Key - press to turn
the stopwatch timer on.
Backlight Key - press to turn the display backlight on or to increase its
brightness.
Contrast Key - press to increase the
contrast of the display screen.
Press to decrease the audio alarm vol-
ume.
Press to turn the stopwatch timer off.
Press to turn the display backlight off
or to decrease its brightness.
Press to decrease the contrast of the
display screen.
Programming Site Data 1-5
Page 15
April 2008
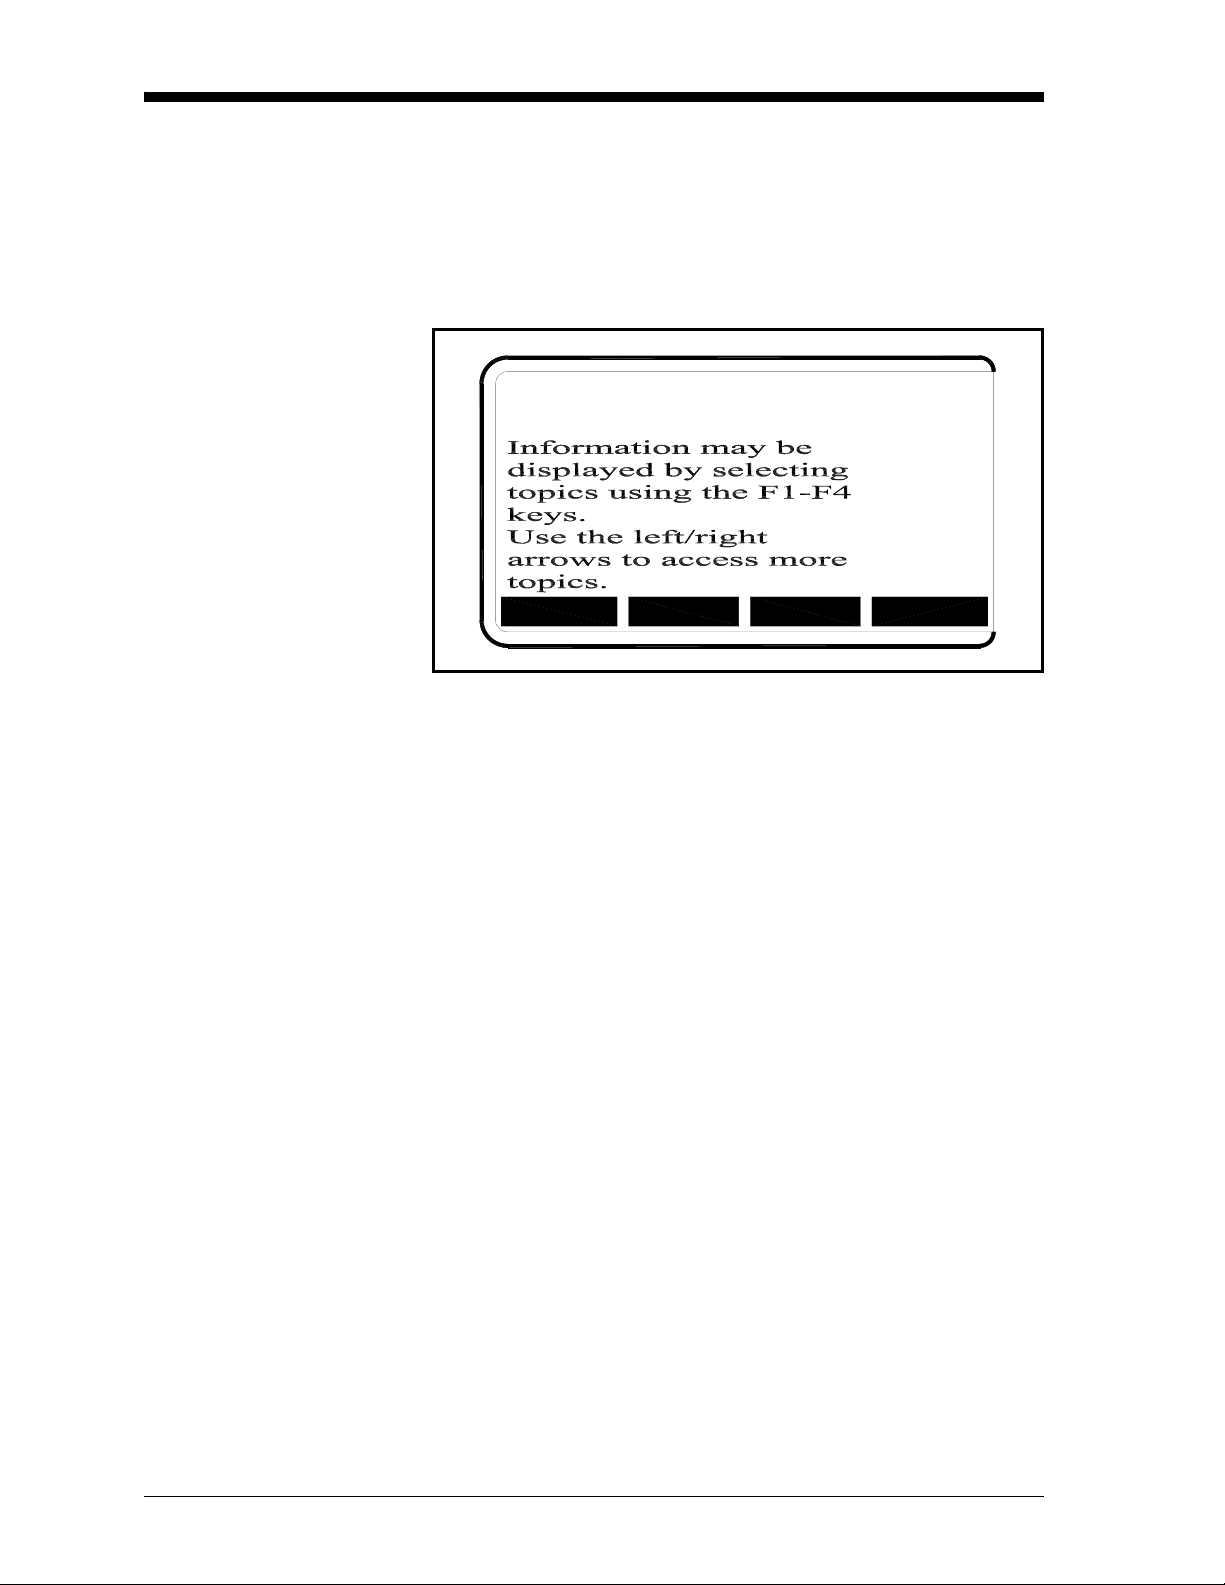
Obtaining On-line Help A context-sensitive, on-line help system is programmed into every
Model GC868 flowmeter. On-line help, which displays additional
information related to the current task, may be accessed at any time
by pressing the
be shown on the currently selected pane of the display screen, as
shown in Figure 1-2 below.
[HELP] key on the keypad. The help information will
ON-LINE HELP
MORE FLOWEXIT ERROR
Figure 1-2: Typical On-Line Help Screen
After entering the on-line help system, the following functions are
available on the option bar of the selected display pane:
• MORE: Press [F1] (or [F5]) to access this function, and the next
screen of text is displayed in the prompt area.
• EXIT: Press [F2] (or [F6]) to access this function, and the Model
GC868 returns to measurement mode.
• ERROR: Press [F3] (or [F7]) to access this function, and the various
Model GC868 error codes are displayed. Use the
[F8]) function keys, in conjunction with the [←] and [→] keys, to
obtain additional information on the desired error code or to exit
the help system.
Note: See the Service Manual for a complete listing of all error
codes and messages
[F1]-[F4] (or [F5]-
• FLOW: Press [F4] (or [F8]) to access this function, and the various
flow measurement parameters are displayed. Use the
[F5]-[F8]) function keys, in conjunction with the [←] and [→] keys,
to obtain additional information on the desired measurement
parameter or to exit the help system.
[F1]-[F4] (or
1-6 Programming Site Data
Page 16

April 2008
Using the Console Control Keys
The Model GC868 has four console control keys, which are located
on the left side of the keypad. Use these keys, which are described
and pictured in Table 1-1 on page 1-3, as follows:
Audio Alarm Volume Use the top console control key to adjust the audio alarm volume.
Discrete presses will incrementally increase the volume of the audio
alarm. Hold the key down for continuous increase. Use the key in
shifted mode to decrease the volume of the audio alarm.
Stopwatch Totalizer Use the second console control key for the stopwatch totalizer.
Press the key once to start the stopwatch totalizer . Press the key once,
in shifted mode, to stop the stopwatch totalizer.
Note: Instructions on properly setting up the stopwatch totalizer are
given later in this chapter. Also, the Service Manual provides
information on the error response of the stopwatch totalizer.
Display Brightness Use the third console control key to adjust the display backlight.
Discrete presses of this key will increase the backlight brightness
through settings of Off, Mid and Full. Discrete presses of this key in
shifted mode, will decrease the backlight brightness through settings
of Full, Mid and Off.
Note: The display backlight has an automatic time-off feature. See
page 2-14 for setup instructions.
Display Contrast Use the bottom console key to adjust the display contrast.
Discrete presses will incrementally increase the display contrast.
Hold the key down for continuous increase. Use the same key, in
shifted mode, to decrease display contrast.
Programming Site Data 1-7
Page 17

April 2008
The User Program Use the keypad, as described in the previous section, to navigate
through the User Program. The menu map may be followed in
sequence, or the [↑] and [↓] keys may be used to scroll through the
prompt screens. The [←] key may be used to delete the last
alphanumeric character that was entered from the keypad.
The following discussion assumes that the left screen pane is active.
If the right screen pane is active, only the function key designations
change. That is, replace
Note: Be sure to record all the programming data entered in this
chapter in Appendix B, Data Records.
[F1]-[F4] with [F5]-[F8].
Entering Programming Mode
Programming of the
ACTIV, SYSTM and PIPE submenus is necessary for
operation of the Model GC868. Failure to accurately enter all of the
required information will result in unreliable flow rate data.
Therefore, be sure to complete at least the sections of this chapter
pertaining to those three submenus.
Note: Because it is so essential, instructions for programming the
ACTIV, SYSTM and PIPE submenus are also included in the
Startup Guide. If that programming has already been
completed, those sections of this chapter may be skipped.
Except for the three submenus noted above, it is not necessary to
program the Model GC868 flowmeter in any particular order.
Therefore, the sections of this chapter need not be completed in
sequence. Proceed immediately to any section of interest.
T o access the User Program, press the [PROG] key on the keypad. The
standard measurement mode screen is replaced by the following
initial programming mode screen:
PROGRAM Start
Press the [←] and [→] keys
and one of the function keys
[F1]-[F4] to select the desired
submenu. From this screen,
[EXIT] to return to
PROGRAM
status
ACTIV SYSTM PIPE I/O
press
measurement mode.
Note: If the security feature is active, enter the password and press
[ENT] key to enter the User Program. See the SECUR
the
submenu section of this chapter for more information on the
security feature.
1-8 Programming Site Data
Page 18

April 2008
Activating the Channel The ACTIV submenu permits selection of the desired measurement
method. While following the programming instructions, refer to
Figure A-1 on page A-1 of Appendix A, Menu Maps.
1. Enter the
prompt. Then press
Note: The current status of the meter appears in the bottom line.
2. Press
Integrate mode,
select Skan/Correlation mode. The meter returns to the
screen.
a. If you select Skan or Skan/Measure Count modes, the GC868
The Model GC868 can take measurements in four different ways
ACTIV submenu by pressing [F1] at the User PROGRAM
[F1] to activate the channel in BURST mode.
[F1] to select Skan mode, [F2] to select Skan/Measure
[F3] to select Skan/Measure Coun t mode, or [F4] to
PROG
asks if you will Use 703-1273 DSP? (the digital signal
processing board). Press
the onboard signal processing. (The factory recommends using
the DSP for improved response time.)
[F2] to apply the board, or [F1] to apply
• Skan is a low resolution technique for locating the acoustic signal
and for high velocity measurements. It is more robust in a noisy
environment than the Measure technique. A variation, the Skan/
Correlation mode, is used primarily for liquid detection
applications.
• Measure is a more precise technique best used for low velocity
measurements. You can choose from Skan/Measure Count (the
default technique) or Skan/Measure Integrate (the traditional Skan/
Measure mode).
IMPORTANT: Consult with the factory before selecting the Skan/
Correlation or Skan/Measure Integrate modes.
If Skan is selected at the next prompt, the instrument uses this
technique exclusively. However, if one of the S/M modes is selected,
the meter uses Skan to find the acoustic signal and then tries to use the
Measure technique for a more precise measurement.To change the
Skan and Measure parameters, see the
sections of this chapter.
SIGNL and ADVAN submenu
Procedure Options After completing the above steps, continue as follows:
• To continue programming the meter, refer to the menu maps in
Appendix A and navigate to the desired menu. Then, proceed to
the appropriate section of the manual for instructions.
• To leave the User Program and retain the previous settings,
[EXIT] and then press [F1] = NO at the SAVE prompt. Any
press
programming changes will be discarded and you will be
returned to the data display.
• To leave the User Program and return to measurement mode,
[EXIT] and then press [F2] = YES at the SAVE prompt. Your
press
programming changes will be entered into the meter’s memory,
and you will be returned to the data display.
Programming Site Data 1-9
Page 19

April 2008
Entering System Data 1. At the User Program screen, press the [F2] function key to
program the
SYSTM submenu.
2. Enter a Site Label of up to 9 characters and press
[ENT]. (While
taking measurements, the site label will appear on the locator bar.)
3. Enter a Site Message of up to 21 characters. Press
[ENT].
Entering System Units 4. To select the System Units, press [F1] to display parameters and
measurements in English units, or press
and measurements in Metric units.
5. Use the
[F1]-[F4] keys to select the type of Pressure Units desired.
The available pressure units are shown in Figure A-1 on page A-1.
The choices shown on the option bar are determined by the
selections made at the previous
SYSTEM UNITS prompt.
a. If you have entered the local Atmospheric Pressure (PSIg,
BARg or kPag), use the numeric keys to enter the atmospheric
pressure value. Press
[ENT].
6. At the Stopwatch Totalizer prompt, press
flow continuously, or
Stopwatch Timer. (With
[F2] to measure totals manually with the
MNUAL ([F2]), the console key on the
keypad is used to start and stop the totalizer. See page 1-7 for
details.)
[F2] to display parameters
[F1] to totalize all liquid
IMPORTANT: After setting up the Stopwatch Totalizer , pr ess
[CLR] to
clear the Stopwatch Totalizer, or the new totals will
be added to any previously accumulated totals.
Note: The manner in which the Stopwatch Totalizer responds to an
error condition may be set in the
7. At the Equation prompt, press
data in standard volumetric units or press
I/O submenu.
[F1] to display the measurement
[F2] to display the
measurement data in actual volumetric units.The Model GC868
will use the appropriate gas equation to calculate the flow rate,
corresponding to the measured data, in the volumetric units
indicated.
a. If you selected Standard, press
gas as an ideal gas or press
[F1] to have the meter treat the
[F2] to have the meter treat the gas
as a supercompressed gas.
1-10 Programming Site Data
Page 20

April 2008
Entering Volumetric Data 8. Use the [F1]-[F4] and [→] keys to select the desired Volumetric
Units for the flow rate display. The available volumetric and
totalizer units are shown in Figure A-1 on page A-1.
9. Use the
[F1]-[F4] keys to select the Volumetric Time (units for the
volumetric flow rate display).
10.Use the
[F1]-[F4] keys to select the Vol Decimal Digits (the desired
number of digits to the right of the decimal point) in the
volumetric flow rate display.
Entering Totalizer Data 11. Use the [F1]-[F4] and [→] keys to select the Totalizer Units.
12.Use the
desired number of digits to the right of the decimal point) in the
totalized flow display .
[F1]-[F4] keys to select the Total Decimal Digits (the
Mass Flow (static)? 13.If the Static Density? prompt in the ADVAN option (SETUP submenu)
is set to
Otherwise, proceed as follows:
a. Use the
English Mass Flow Units Metric Mass Flow Units
LB- Pounds KG - Kilograms
NO, the GC868 returns to the initial User Program screen.
[F1]-[F4] keys to select the Mass Flow units, listed in
Table 1-2 below.
Table 1-2: Available Mass Flow Units
KLB - Thousands of Pounds
MMLB - Millions of Pounds
TONS - Tons Tonnes - Metric Tons
b. Use the
c. Use the
[F1]-[F4] keys to select the Mass Flow Time units.
[F1]-[F4] keys to select the MDOT DECIMAL DIGITS
(the number of digits to the right of the decimal point) for
displaying mass flow.
d. Use the
[F1]-[F4] keys to select the Mass (Totalizer) units, li sted
in Table 1-2 above.
e. Use the
[F1]-[F4] to specify the Mass Decimal Digits (the
number of digits to the right of the decimal point) for
displaying totalized mass flow. The meter returns to the initial
User (or Channel) Program screen.
Programming Site Data 1-11
Page 21

April 2008
Procedure Options After completing the above steps, the meter returns to the User
PROGRAM
prompt. Continue as follows:
• To continue programming the meter, refer to the menu maps in
Appendix A and navigate to the desired menu. Then, proceed to
the appropriate section of the manual for instructions.
• To leave the User Program and retain the previous settings,
press
[EXIT] and then press [F1] = NO at the SAVE prompt. Any
programming changes will be discarded and you will be
returned to the data display.
• To leave the User Program and return to measurement mode,
press
[EXIT] and then press [F2] = YES at the SAVE prompt. Your
programming changes will be entered into the meter’s memory,
and you will be returned to the data display.
1-12 Programming Site Data
Page 22

Entering Pipe Data The PIPE submenu permits entry of the transducer and pipe
specifications. To program this menu, complete the following steps:
April 2008
1. At the User Program screen, press
[F3] to program the PIPE
submenu.
2. Enter the Transducer Number (normally engraved on the head of
the transducer). Press
[ENT]. If there is no engraved number,
complete the steps below. Otherwise, proceed to step 3.
IMPORTANT: Special transducers, which have no engraved
number on the head, are rarely used. Examine the
transducer head carefully for a number.
Special Transducers a. Assign a number between 91 and 99 to the Special Transducer
and press
199.)
b. Press
Note: While three choices are available (Rayleigh, Shear wave or
wetted transducers), the GC868 is designed for use with Shear
wave clamp-on transducers. Consult the factory before
selecting Rayleigh or wetted transducers.
[ENT]. (The meter will only accept values from 1 to
[F2] to select Shear wave as the Transducer Type.
c. Use the [→] and
[F1]-[F4] keys to select the Frequency of the
special transducer. The meter can not transmit an excitation
voltage at the transducer’s natural frequency without this data.
d. Press
[F1]-[F4] to select the Wedge Material. The available
options include
temperature),
VHT (very high temperature), MT (medium
HT (high temperature) and OTHER. Refer to the
data sheet supplied with your transducer to determine the
appropriate setting.
e. Use the numeric keys to enter the Wedge Angle (the angle of
the ultrasonic transmission) supplied by the factory in degrees
and press
[ENT].
• If you selected OTHER in step d, use the numeric keys to enter
the Wed ge Soundspeed in ft/sec or m/sec supplied by GE and
[ENT]. The meter proceeds to step 5.
press
Wedge Temperature 3. Use the numeric keys to enter the Wedge Temperature supplied by
the factory in deg F and press
[ENT].
Programming Site Data 1-13
Page 23

April 2008
Pipe Material 4. Press [F1]-[F4] to select the Pipe Material. Press [→] to access
additional options, as listed in Table 1 -3 below.
Table 1-3: Pipe Materials
Category Specific Material
Steel Carbon Steel or Stainless Steel
Iron Ductile Iron or Cast Iron
Cu - Copper None
Al - Aluminum None
Brass None
CuNi - Copper/Nickel 70% Cu 30% Ni or 90% Cu 10% Ni
Glass Pyrex, Flint, or Crown
Plastic Nylon, Polyester, Polypropylene, PVC
(CPVC), Acrylic
Other* Any material
• Depending on the pipe material choice, another prompt may
ask you to select the Specific Material.
• If you have selected “Other,” enter the pipe material Sound
Speed. Press
Pipe OD 5. Enter the known Pipe OD or circumference and use the [F1]-[F4]
keys to select the appropriate units. Press
only accept values from 1/8 to 648 in.)
The required pipe data may be obtained by measuring either the pipe
outside diameter (OD) or circumference at the transducer installation
site. The data may also be obtained from standard pipe size tables (see
the GE document Sound Speeds and Pipe Size Data, #914-004). For a
list of the available English and Metric units and their definitions for
PIPE OD prompt, refer to Table 1-4 on page 1-15.
the
[ENT].
[ENT]. (The meter will
1-14 Programming Site Data
Page 24

April 2008
Pipe OD (cont.)
Table 1-4: Available Pipe OD Units
English Metric
inch = pipe OD in inches mm = pipe OD in millimeters
feet = pipe OD in feet m = pipe OD in meters
in/PI = pipe circumference
in inches
ft/PI = pipe circumference
in feet
mm/PI = pipe circumference
in millimeters
m/PI = pipe circumference
in meters
Pipe Wall 6. Enter the known thickness of the Pipe Wall, in the same units used
for the pipe OD. Press
from 0 to 4 in.)
If the pipe wall thickness is not known and cannot be conveniently
measured, look up the value in a table of standard pipe size data or
use the Model GC868’s on-line Help Menu.
[ENT]. (The meter will only accept values
Fluid Type 7. Press [F1] = natural gas, [F2] = air, [F3] = steam, or [F4] = any other
gas to select the Fluid Type. If
of sound (in feet per second) in the gas to be measured. Press
[ENT]. (The meter will only accept values from 125 to 9000 ft/sec.)
OTHER was selected, enter the speed
Reynolds Correction 8. The Reynolds Correction factor is a number based on the
kinematic viscosity and flow rate of the gas. At the prompt, press
[F1] to turn Reynolds Correction off, or [F2] to turn it on.
• If you select Reynolds Correction, the GC868 asks for the
Kinematic Viscosity of the gas (available in the brochure Sound
Speeds and Pipe Size Data, 914-004). Use the numeric keys to
enter the correct value and press
Calibration Factor 9. Enter a value for the flow Calibration Factor and press [ENT]. The
default value is 1.00. (The meter will only accept values from
0.5000 to 2.0000.) If you are using wetted transducers, you have
completed programming in the
Number of Traverses 10. Press [F1]-[F4] to select the desired number of traverses (times the
ultrasonic signal traverses the pipe, from 1 to 9).
Note: Most clamp-on gas applications require a single traverse
(1(Z)).
[ENT].
PIPE menu.
Programming Site Data 1-15
Page 25

April 2008
Transducer Spacing 11. The Transducer Spacing prompt displays the spacing of the
transducers, as calculated from the information you have entered.
Record this number in Appendix B, Data Records, and use it to
properly space the transducers.
Note: If necessary, you can overwrite the spacing shown at the
previous prompt (using the numeric keys) to match the actual
physical spacing of the transducers. GE does not recommend
overwriting the spacing. If you must, do not change the
spacing by more than ±10% from the value shown.
Procedure Options After completing the above steps, the meter returns to the User
Program prompt. Continue as follows:
• To continue programming the meter, refer to the menu maps in
Appendix A and navigate to the desired menu. Then, proceed to
the appropriate section of the manual for instructions.
• To leave the User Program and retain the previous settings,
press
[EXIT] and then press [F1] = NO at the SAVE prompt. Any
programming changes will be discarded and you will be
returned to the data display.
• To leave the User Program and return to measurement mode,
press
[EXIT] and then press [F2] = YES at the SAVE prompt. Your
programming changes will be entered into the meter’s memory,
and you will be returned to the data display.
1-16 Programming Site Data
Page 26

April 2008
Setting Up Inputs/ Outputs
Set up the GC868’s inputs and outputs via the four options in the I/O
submenu. While following the programming instructions, refer to
Figure A-2 on page A-2 of Appendix A, Menu Maps.
• ERROR - program the meter’s response during an error condition
• OPTN - set up the Slot 0 analog outputs and any option cards
• ZERO - set the meter’s zero point cutoff value
• T,P - set up the temperature and pressure inputs
Enter the
screen. Then press
Note: In this section, a slot’s number will appear on the option bar
Proceed to the appropriate section to program the option selection
made at the above prompt. Remember to record all programmed data
in Appendix B, Data Records.
Selecting Error Handling This menu option permits programming of the mann er in which the
Model GC868’s totalizers respond during an error condition. See
Chapter 2, Error Codes and Screen Messages, of the Service Manual
for a discussion of the built-in error codes.
I/O submenu by pressing [F4] at the initial User Program
[F1]-[F4] to select the desired I/O option.
only if an option card is installed in that slot. The generic
designations
expansion slots and the function key used to select it.
Slot x and Fx are used to indicate any one of the
1. At the I/O prompt, press [F1] = Error.
2. Press
[F1] if you want the GC868 to Hold the last “good” reading
and continues to totalize, based on that reading, or press
No Up,
if you want the meter to stop totalizing.
[F2],
Programming Site Data 1-17
Page 27

April 2008
Setting Up Analog Outputs The Model GC868 has two built-in analog outputs, which are
assigned to
the six expansion slots. See Chapter 1, Installation, of the Startup
Guide for a complete description of the available option cards.
This menu option is used to set up and/or scale the analog inputs and
outputs. To accomplish this, complete the following steps:
Slot 0. Also, a variety of option cards may be installed in
I/O
Use the [←] and [→] and the
[F1]-[F4] keys to select the
desired slot number. (Only
those slots which contain an
I/O
last selection appears here
SLOT0 SLOT1 SLOT2 SLOT3
option card will appear on
the option bar.)
Note: If the number of a slot with an installed option card does not
appear, the card may not have been initialized or it may be
defective. Call the factory for assistance.
Complete the following steps to set up the
1. Use the
[F1]-[F4] keys to set up outputs A, B, C or D, respectively.
Slot x analog outputs:
Note: The set up of output A is used as an example. Identical
procedures would be used to set up the other outputs.
2. Press
[F1] = OFF to disable output A and return to the previous
prompt, or press
[F2] = 0-20 m or [F3] = 4-20 m to specify the
desired range for output A.
3. Use the [←] and [→] and
[F1]-[F4] keys to specify the desired
Output Measurement parameter (see Figure A-2 on page A-2).
4. Enter the Zero value for the low end of the chosen output range.
[ENT].
Press
5. Enter the Full value for the high end of the chosen output range.
[ENT].
Press
6. Press
[F1]-[F4] to select the desired Error Response option, as
described in Table 1-5 on the next page.
1-18 Programming Site Data
Page 28

April 2008
Setting Up Analog Outputs
(cont.)
Option Display Response
HOLD Holds the last “good” reading.
LOW Forces the outputs to the low set point.
HIGH Forces the outputs to the high set point.
OTHER Allows user to enter 4-20 mA error level in mA.
7. Use the [F1]-[F4] keys to set up another output or press [EXIT] to
select another slot for setup.
For instructions on setting up additional inputs and/or outputs
proceed to the appropriate section. Otherwise, press
the main
I/O menu prompt.
Table 1-5: Error Response Options
[EXIT] to return to
Option Card Alarms 1. Use the [←] and [→] and the [F1]-[F4] keys to select the desired
slot number.
2. Use the
respectively.
[F1]-[F3] keys to set up alarm relays A, B, or C,
Note: The set up of alarm A is used as an exa mple. Identical
procedures would be used to set up the other alarms.
3. Press
[F1] = OFF to disable Alarm A and return to the previous
prompt, or press
[F2] = HIGH, [F3] = LOW or [F4] = FAULT to specify
the type for Alarm A.
4. Press
[F1] = NO for standard operation or [F2] = YES for Failsafe
operation.
5. Do one of the following:
• If you selected FAULT, proceed to step 6.
• If you selected HIGH or LOW, complete the steps below.
a. Use the [←] and [→] and
Output Measurement parameter, as shown in Figure A-2 on
page A-2.
b. Enter a value for the trigger point of the alarm and press
6. Press
[F1]-[F3] to set up another alarm or press [EXIT] to select
another slot for set up.
[F1]-[F4] keys to specify the desired
[ENT].
For instructions on setting up additional inputs and/or outputs
proceed to the appropriate section. Otherwise, press
the main
Programming Site Data 1-19
I/O menu prompt.
[EXIT] to return to
Page 29

April 2008
Setting Up the Totalizer/ Frequency Outputs
Programming a Frequency
Output
1. Use the [←] and [→] and the [F1]-[F4] keys to select the desired
slot number.
2. Press
3. Press
[F1]-[F4] to set up outputs A, B, C or D, respectively.
[F1] = OFF to disable output A and return to the previous
prompt, or press
[F2] = FREQ or [F3] = TTLZR to designate output A
as a frequency or a totalizer output, respectively.
Note: The setup of output A is used as an example. Identical
procedures would be used to set up the other outputs.
• To program a frequency output, go to step 4.
• To program a totalizer output, go to step 5.
4. The FREQ output, [F2], produces a frequency pulse that is
proportional to the output measurement. Complete the steps below
to program the frequency output.
a. Use the [←] and [→] and
Output Measurement parameter.
b. Enter the Base value for the low end of the frequency output
range and press
[ENT].
[F1]-[F4] keys to specify the desired
c. Enter the Full value for the high end of the frequency output
range. Press
[ENT].
d. Enter a value between 1 and 10,000 for the Full Scale
Frequency. Press
e. Use the
[F1]-[F4] keys to select the desired Error Option, the
[ENT].
way the display responds during an error condition. Available
options are shown in Table 1-6 below. Then skip to step 6 on
the next page.
Table 1-6: Error Response Options for Frequency Output
Option Display Response
HOLD Holds the last “good” reading.
LOW Forces the outputs to the low setpoint.
HIGH Forces the outputs to the high setpoint.
OTHER Allows user to enter Hertz error level.
1-20 Programming Site Data
Page 30

April 2008
Programming a Totalizer
Output
5. The TTLZR output, [F3], issues one pulse per selected volume of
flow. The meter produces a pulse each time the programmed
amount of flow passes through the pipe. Complete the steps below
to program the totalizer output.
a. Press
[F1] = +TOTL to totalize the forward flow, [F2] = -TOTL to
totalize the reverse flow,
the forward mass flow or
[F3] = +MASS (if available) to totalize
[F4] = -MASS (if available) to totalize
reverse mass flow.
b. Enter a value from 50 to 500,000 μsec for the Minimum Pulse
ON Time and press [ENT].
Note: A complete pulse consists of equal amounts of
ON and OFF
times. Choose a value that is compatible with the frequency
counter to be used.
c. Enter a value for the number of measurement Units/Pulse and
[ENT].
press
6. Press
[F1]-[F4] to set up another totalizer/frequency output or press
[EXIT] to select another slot for setup.
Programming Site Data 1-21
Page 31

April 2008
Setting up the Analog Inputs
1. Use the [←] and [→] and the [F1]-[F4] keys to select the desired
slot number.
2. Press
[F1] to set up input A or [F2] to set up input B.
Note: The set up of input A is used as an example in this manual.
Identical procedures would be used to set up input B. (An
analog input option card may contain one standard analog
input and one RTD analog input.)
3. Enter a Label of up to eight characters for input A and press
4. At the Input Measurement prompt, press
A and return to the previous prompt, or press
(pressure), [F3]= TEMP (temperature) or [F4] = SPEC (special)
[F1] = OFF to disable input
[F2] = PRESR
[ENT].
to
designate the input.
5. Do one of the following:
• If you selected PRESR or TEMP, proceed to step 6.
• If you selected SPEC, complete the steps below.
a. Enter an Input Name and press
b. Enter the Input Units of measurement and press
[ENT].
[ENT].
6. Enter the Zero Value for the low end of the chosen input range and
[ENT].
press
7. Enter the Full Scale Value for the high end of the chosen input
range and press
8. Press
[F1]-[F2] to set up another input or press [EXIT] to select
[ENT].
another slot for setup.
For instructions on setting up additional inputs and/or outputs
proceed to the appropriate section. Otherwise, press
the main
I/O menu prompt.
[EXIT] to return to
1-22 Programming Site Data
Page 32

April 2008
Setting up RTD Inputs Option cards with RTD inputs have a temperature range of –100° to
350°C. C omplete the foll owing steps to set up the two RTD inputs of
an option card installed in Slot x:
1. Use the [←] and [→] and the
[F1]-[F4] keys to select the desired
slot number.
2. Press
[F1] to set up RTD input A or [F2] to set up R TD input B.
Note: The setup of RTD input A is used as an example. Identical
procedures would be used to set up RTD input B.
3. Enter a label of up to eight characters and press
4. At the Input Measurement prompt, press
[F1] = OFF to disable RTD
input A and return to the previous prompt, or press
[ENT].
[F2] = TEMP to
enable RTD input A.
5. Enter the Zero Value for the low end of the chosen input range and
[ENT].
press
6. Enter the Full Scale Value for the high end of the chosen input
range and press
7. Press
[F1]-[F2] to set up another input or press [EXIT] to select
[ENT].
another slot for set up.
For instructions on setting up additional inputs and/or outputs
proceed to the appropriate section. Otherwise, press
the main
I/O menu prompt.
[EXIT] to return to
Entering the Zero Cutoff Near zero flow, the Model GC868’s readings may fluctuate due to
small offsets caused by thermal drift or similar factors. To force a
zero reading when there is minimal flow, enter a zero cutoff value as
described below:
1. At the main I/O menu prompt, press
2. Enter the desired Zero Cutoff value and press the [ENT] key. A
value of 0.1 ft/s (0.03 m/s) is recommended, but values from 0–1
ft/s (0–0.3 m/s) are acceptable. The menu returns to the main I/O
prompt.
[F3] = ZERO.
Programming Site Data 1-23
Page 33

April 2008
Setting Up Temperature and Pressure Inputs
Entering the Temperature
Input
Note: This option only appears if you have selected “Standard” as
the equation type in the
10.
The Model GC868 can use either fixed temperature and pressure
quality values or live measurement inputs to calculate standard
volumetric or mass flow . Complete the following steps to configure
these inputs:
1. At the main I/O menu prompt, press
2. At the Temperature Input prompt, press [F1] to enter a constant
temperature value or press
that will supply the live temperature input.
Note: Each slot that contains an o ption card with an analog input
assigned to
bar. If the process temperature is stable, a fixed value may be
used, but most applications require a live temperature input.
3. Do one of the following:
TEMP or an RTD input will appear on the option
SYSTM submenu, as shown on page 1-
[F4] =T,P.
[Fx] to select the option card in Slot x
• If you selected FIXED, enter the known fixed process
temperature. Press
from –148° to 662°F.)
[ENT]. (The meter will only accept values
Entering the Pressure
Input
• If you selected SLOT X,
a. Press
Note: The set up of input A is used as an example. Identical
b. Enter the Base Temperature (from –148° to 662°F), and press
4. At the Pressure Input prompt, press [F1] to enter a constant
pressure value or press
will supply the live pressure input.
Note: Each slot that contains an option card with an analog input
5. Do one of the following:
[F1] to select input A or press [F2] to select input B.The
inputs were labeled during setup.
procedures would be used to set up input B.
[ENT]. The ratio of this value to the actual temperature is used to
calculate the standard volumetric flow.
[Fx] to select the option card in Slot X that
assigned to
pressure is stable, a fixed value may be used, but most
applications require a live pressure input.
PRESR will appear on the option bar. If the process
• If you selected FIXED, enter the known fixed process pressure.
[ENT]. (The meter will only accept values from 0–5000
Press
psia.)
1-24 Programming Site Data
Page 34

April 2008
Entering the Pressure
Input (cont.)
• If you selected SLOT X,
a. Press
b. Enter the Base Pressure (standard) value for the process, and
If you selected a supercompressed gas in the
additional prompts appears. Otherwise, the program returns to the
main
c. Enter the Specific Gravity for the Forward Flow and press
d. Enter the Specific Gravity for the Reverse Flow and press
e. Enter the Percentage of Carbon Dioxide for the Forward Flow
[F1] to select input A or press [F2] to select input B.The
inputs were labeled during setup.
press the
[ENT] key. (The meter will only accept values from 0
to 7508 psia, or 0 to 500 bar.)
SYSTM menu, a series of
I/O menu prompt.
[ENT]. (The meter will only accept values from 0.1000 to
1.5000.)
(The meter will only accept values from 0.1000 to 1.5000.)
and press
[ENT]. (The meter will only accept values from 0 to
40%.)
[ENT].
f. Enter the Percentage of Carbon Dioxide for the Reverse Flow
and press
[ENT]. (The meter will only accept values from 0 to
40%.)
g. Press
[F1] to select a Fixed Nitrogen Forward Input.
h. Enter the Percentage of Nitrogen for the Forward Flow and
[ENT]. (The meter will only accept values from 0 to 40%.)
press
i. Press
[F1] to select a Fixed Nitrogen Reverse Input.
j. Enter the Percentage of Nitrogen for the Reverse Flow and
[ENT]. (The meter will only accept values from 0 to 40%.)
press
[F1]-[F4] to select another option or press [EXIT] to return to the
Press
initial User Program.
Programming Site Data 1-25
Page 35

April 2008
Procedure Options After completing the above steps, the meter returns to the main I/O
prompt. Continue as follows:
• To continue programming the meter, refer to the menu maps in
Appendix A and navigate to the desired menu. Then, proceed to
the appropriate section of the manual for instructions.
• To leave the User Program and retain the previous settings,
press
[EXIT] and then press [F1] = NO at the SAVE prompt. Any
programming changes will be discarded and you will be
returned to the data display.
• To leave the User Program and return to measurement mode,
press
[EXIT] and then press [F2] = YES at the SAVE prompt. Your
programming changes will be entered into the meter’s memory,
and you will be returned to the data display.
1-26 Programming Site Data
Page 36

April 2008
Entering Setup Data The signal limits and response times for the Model GC868 are
specified via the
instructions, see Figure A-3 and Figure A-4 in Appendix A, Menu
Maps.The following four submenus are included in this section:
SETUP submenu. While following the programming
• SIGNL - set the parameters related to the transducer signal
• AVRG - specify the response of the meter to step changes
• INIT - initialize all parameters to default values.
• ADVAN - setting parameters for special operations.
Enter the
SETUP submenu by pressing [→] and [F1] at the initial User
Program screen and complete the following steps:
SETUP
PROGRAM
SET UP
SET UP
last selection appears here
SIGNL AVRG INIT ADVAN
Press [F1]-[F3] to select the
desired
SETUP option.
Proceed to the appropriate section to program the option selection
made at the above prompt. Remember to record all programmed data
in Appendix B, Data Records.
Setting Signal Limits Use this option to set the limits for the incoming signal and other
parameters affecting the transducer signal. For example, the
programmed signal strength low limit may be used to determine the
trigger point for an alarm.
Caution!
SIGNL default settings are suitable for most
The
applications. Before changing any of these parameters,
consult the factory.
Complete the following steps to enter the signal parameters:
1. To enter the
2. Press
new value and press
SIGNL submenu, press [F1] at the SETUP window.
[ENT] to accept the current Signal Low Limit value or enter a
[ENT].
The default value for this parameter is 50 and values from –20 to 100
are acceptable. The
signal strength falls below the programmed
E1: LOW SIGNAL error message appears when the
SIGNAL LOW LIMIT value.
See the Service Manual for a discussion of error codes.
Programming Site Data 1-27
Page 37

April 2008
Setting Signal Limits
(cont.)
3. Press [ENT] to accept the current Signal High Limit value or enter a
new value and press
[ENT].
The default value for this parameter is 68 and values from 25 to 100
are acceptable. The
signal strength falls above the programmed
E16: HIGH SIGNAL error message appears when the
SIGNAL HIGH LIMIT value.
See the Service Manual for a discussion of error codes.
4. Press
[ENT] to accept the current Cor. Peak Limit value or enter a
new value and press
[ENT].
The default value for this parameter is 100 and values from 0 to 500
are acceptable. The
the signal quality falls below the programmed
E4: SIGNAL QUALITY error message appears when
COR. PEAK LIMIT value.
See the Service Manual for a discussion of error codes.
5. Press
[ENT] to accept the current Soundspeed +– Limit value or
enter a new value and press
[ENT].
The default value for this parameter is 10% and values from 1% to
50% are acceptable.
6. Press
[ENT] to accept the current Velocity Low Limit value or enter
a new value and press
[ENT].
The default value for this parameter is –75.0 ft/sec (–23 m/sec) and
values from –500 to 500 ft/sec (–150 to 150 m/sec) are acceptable.
E3: VELOCITY RANGE error message appears when the calculated
The
fluid velocity is less than the programmed
VELOCITY LOW LIMIT value.
See the Service Manual for a discussion of error codes.
Note: The actual maximum velocity depends on your application.
Refer to Tables 1-1 to 1-3 of the Startup Guide for a list of
maximum velocities.
7. Press
[ENT] to accept the current Velocity High Limit value or enter
a new value and press
[ENT].
The default value for this parameter is 75.0 ft/sec (23 m/sec) and
values from –500 to 500 ft/sec (–150 to 150 m/sec) are acceptable.
E3: VELOCITY RANGE error message appears when the calculated
The
fluid velocity exceeds the programmed
VELOCITY HIGH LIMIT value.
See the Service Manual for a discussion of error codes.
1-28 Programming Site Data
Page 38

April 2008
Setting Signal Limits
(cont.)
8. Press [ENT] to accept the current Acceleration value or enter a new
value and press
The default value for this parameter is 5.0 ft/sec
values from 0 to 100 ft/sec
CYCLE SKIP
error message appears when the calculated fluid velocity
changes by more than the programmed
[ENT].
2
(4.6 m/sec2) and
2
(0 to 30 m/sec2) are acceptable. The E6:
ACCELERATION LIMIT value
from one reading to the next. See the Service Manual for a discussion
of error codes.
9. Press
[ENT] to accept the current Amp. Discrim Low value or enter
a new value and press
[ENT].
IMPORTANT: Consult the factory before performing this step.
The amplitude discriminator measures the size of the transducer
signal received by the Model GC868. The default value for this
parameter is 14 and values from 0 to 100 are acceptable. The
AMPLITUDE
falls below the programmed
error message appears when the amplitude discriminator
AMP. DISCRIM LOW value. See the Service
E5:
Manual for a discussion of error codes.
10.Press
[ENT] to accept the current Amp. Discrim High value or enter
a new value and press
[ENT].
IMPORTANT: Consult the factory before performing this step.
The amplitude discriminator measures the size of the transducer
signal received by the Model GC868. The default value for this
parameter is 34 and values from 0 to 100 are acceptable. The
AMPLITUDE
exceeds the programmed
error message appears when the amplitude discriminator
AMP. DISCRIM HIGH value. See the Service
E5:
Manual for a discussion of error codes.
11. Press
[ENT] to accept the current Delta T Offset value or enter a
new value and press
[ENT].
IMPORTANT: Consult the factory before performing this step.
An offset between the upstream and downstream transit times is
specified at this prompt. The default value for this parameter is 0 μsec
and values from –1000 to 1000 μsec are acceptable.
12.Press
[ENT] to accept the current Skan T Offset value or enter a new
value and press
[ENT].
At this prompt, specify a time measurement offset that compensates
for any shift resulting from cross-correlation. The default value for
this parameter is 12.6 μsec and values from –500 to 500 μsec are
acceptable.
Programming Site Data 1-29
Page 39

April 2008
Setting Signal Limits
(cont.)
Note: If you enter a value of 0 for this command, you enable a
special mode of operation, ACTIVE SKAN T-OFFSET, that
dynamically calculates the offset.
13.Press
[ENT] to accept the current % of Peak value or enter a new
value and press
[ENT].
The percentage of peak used to calculate the transit times and Delta T
is specified at this prompt. The default value for this parameter is
50% and values from 1 to 100% are acceptable.
14.Use the [→] and
[F1]-[F4] keys to select one of the preset values for
the XMIT Sample Size from the option bar.
IMPORTANT: Consult the factory before performing this step.
Both the upstream and downstream transducers transmit ultrasonic
pulses in bursts, which consist of a series of transmit pulses.
SAMPLE SIZE
determines how many bursts are sent in one direction
XMIT
before sending in the other direction. The default value for this
parameter is 8 and values of 2, 4, 8, 16 and 32 are acceptable.
15.Press
[ENT] to accept the current M>S_Switch value or enter a new
value and press
[ENT].
IMPORTANT: Consult the factory before performing this step.
If the burst mode is set to Skan/Measure (S/M), the meter switches
from Skan to Measure Mode when Delta T is less than the
M>S_Switch value. DO NOT change this value unless advised to do
so by the factory. The default value for this parameter is 50 μsec and
values from 0 to 250 μsec are acceptable.
16.Press
[ENT] to accept the current # shifts value or enter a new value
and press
[ENT].
The number of shifts corresponds to the actual number of transmits
per cycle (number of signals added together in one direction to
produce an averaged signal for one interrogation of the fluid) and
need only be changed if the environment is very noisy or the acoustic
signal is weak. The default value for this parameter is 3 and values
from 0 to 10 are acceptable.
17.Press
A Divisor is used in the calculation of the Measure Mode integrated
[ENT] to accept the current A Divisor value or enter a new
value and press
[ENT].
threshold level and is not normally changed. The default value for this
parameter is 2.5 and values from 0.1 to 10 are acceptable.
1-30 Programming Site Data
Page 40

April 2008
Setting Signal Limits
(cont.)
18.Press [ENT] to accept the current # Transmit Pulses value or enter a
new value and press
[ENT].
IMPORTANT: Consult the factory before performing this step.
# Transmit Pulses specifies the number of pulses in a burst. The
default value for this parameter is 1 and values from 1 to 16 are
acceptable. For difficult conditions (i.e., long paths, high velocity or
high temperature), settings as high as 16 may be necessary.
19.Press
[ENT] to accept the current T Window (Cycles) value or enter
a new value and press
[ENT].
IMPORTANT: Consult the factory before performing this step.
Normally, the Model GC868 calculates the size of the transmit
window based on pipe size and fluid sound speed. However, for
special diagnostic purposes, it may sometimes be necessary to reset
the window size. The default value for this parameter is 0 and values
from 0 to 1,000 are acceptable. If you select 0 or 1, the GC868 applies
automated calculation, and the following prompt does not appear.
20.Press
[ENT] to accept the current R WINDOW (cycles) value or
enter a new value and press
[ENT].
IMPORTANT: Consult the factory before performing this step.
Normally, the Model GC868 calculates the size of the receive
window based on pipe size and fluid sound speed. However, for
special diagnostic purposes, it may sometimes be necessary to reset
the window size. The default value for this parameter is 10 and values
from 10 to 128 are acceptable.
After completing these steps, the program returns to the
SETUP
window. Table 1-7 on the next page lists the default values and limits
for SETUP parameters.
Programming Site Data 1-31
Page 41

April 2008
Setting Signal Limits
(cont.)
Table 1-7: Default Values and Limits for GC868
SETUP Parameters
Default
Parameter
Value Low Limit High Limit
Signal Low Limit 50 -20 100
Signal High Limit 68 25 100
Cor. Peak Limit 400 0 500
Soundspeed ±
10% 1% 50%
Limit
Velocity Low Limit -75.0 ft/sec
(-23 m/sec)
Velocity High Limit 75.0 ft/sec
(23 m/sec)
Acceleration Limit
5.0 ft/sec
(4.6 m/sec2)
-500 ft/sec
(-150 m/sec)
-500 ft/sec
(-150 m/sec)
2
+500 ft/sec
(+150 m/sec)
+500 ft/sec
(+150 m/sec)
0
100 ft/sec
(30 m/sec2)
Amp. Discrim Low 14 0 100
Amp. Discrim High 34 0 100
Delta T Offset 0 -1,000 µsec 1,000 µsec
2
Skan T Offset 12.6 µsec -500 µsec 500 µsec
% of Peak 80% 1% 100%
XMIT Sample Size 8 2 32
M>S Switch 5 µsec 0 µsec 250 µsec
# shifts 3 0 10
A Divisor 2.5 0.1 10
# Transmit Pulses 1 1 16
T Window 1 0 1,000
R Window 10 10 128
1-32 Programming Site Data
Page 42

April 2008
Setting Response Time Use this option to specify the number of readings that occur before
the meter will respond to a step change in flow rate. In general, the
smaller the number of readings, the less steady the display will
appear.
1. To enter the
2. Use the [→] and
available response time options are
best results, select
AVRG submenu, press [F2] at the SETUP window.
[F1]-[F4] keys to select the desired option. The
1, 2, 5, 10, 30, 60 and STATS. For
STATS (statistics), as this increases the response
time under steady flow conditions while still allowing a rapid
response to changes in flow rate.
The GC868 program returns to the
SETUP window. Remember to
record all programmed data in Appendix B, Data Records.
Initializing the System Use this option to initialize (reset) all of the parameters within the
SETUP menu to their default values.
1. To enter the
2. Press
all values to their default settings.
INIT submenu, press [F3] at the SETUP window.
[F1] = NO to keep the current values or press [F2] = YES to reset
Programming Site Data 1-33
Page 43

April 2008
Setting Advanced Parameters
In the ADVAN option, you can enter parameters for a variety of
specialized operations. You can set parameters for static density,
program tables for steam or natural gas and for multiple K factors,
and modify parameters for the Skan and Skan/Measure techniques.
While following the programming instructions, refer to Figure A-4 on
page A-4 of Appendix A, Menu Maps.To enter the
[F4] at the SETUP window.
press
ADVAN submenu,
Static Density Use this option to specify basic parameters for mass flow
measurement.
1. To enter the
2. At the
press
3. If you press
[F1] = Rho (Fluid Density) or [F2] = Mw (Molecular Weight).
MASS submenu, press [F1] at the ADVAN window.
Static Density? prompt , press [F1] = NO or [F2] = YES. If you
NO, the GC868 returns to the ADVAN window.
YES, select the Density Type to calculate Mass Flow:
4. The next prompt depends upon your selection in step 3.
• If you select Rho,
a. The GC868 asks for the type of volumetric flow. Press
AcVOL (Actual Volumetric Flow) or [F2] to select StVOL
select
(Standard Volumetric Flow).
b. Then enter the Fluid Density of the gas to be measured and
[ENT]. (The meter will only accept values from 0.00001-
press
100 lb/ft
3
.)
• If you select Mw,
Enter the Molecular W eight of the gas to be measured and press
[ENT].
The GC868 program returns to the
ADVAN window.
[F1] to
1-34 Programming Site Data
Page 44

April 2008
Setting the A Value In the Skan/Measure Integrate mode, the A value aids in minimizing
cycle skipping. Use this option to specify parameters for the A value.
IMPORTANT: The
AVAL default settings are suitable for most
applications. Before changing any of these
parameters, consult the factory.
1. To enter the
AVAL submenu, press [F2] at the ADVAN window.
2. Use the numeric keys to enter the desired A_Value Minimum, and
[ENT]. (The available range is from 75 to 100, and the default
press
value is 75.)
3. Use the numeric keys to enter the desired A_Value Maximum, and
[ENT]. (The available range is from 100 to 125, and the
press
default value is 125.)
4. Enter the desired -Offset % of Peak from 0 to 95%, and press
[ENT]. (The default value is 20%.)
5. Enter the number of Cycle Count Samples (from 1 to 40) and press
[ENT]. (The default number is 8.)
6. Enter the Cycle # (from 1 to 100) and press
[ENT]. (The default
number is 1.)
The GC868 returns to the
ADVAN window.
Programming Site Data 1-35
Page 45

April 2008
Setting Skan/Measure
Parameters
Use the MEAS option to modify the parameters of the Skan/Measure
modes.
IMPORTANT: The
MEAS default settings are suitable for most
applications. Before changing any of these
parameters, consult the factory.
1. Press
[F3] to enter the Measurement Settings option.
2. The first prompt asks for the number of cycles in the MEAS R
Window. While this window is normally 24 cycles wide, the option
allows you to customize the width from 1 to 60. Press
accept the current value, or enter a new value and press
3. Press
[F1] to use both skan and measure times, or [F2] to Use Meas
[ENT] to
[ENT].
Times only. (The default setting is “Yes”.)
4. Press
[F1] to retain skan, or [F2] to Skip Skan. If [F2] is selected, the
GC868 will skip skan except for every 10th reading, when an error
appears, or when the Delta-T exceeds the M>S Switch limit.
5. At the SkanDT>MeasDT Check?, press
[F1] to omit a test to
determine whether the Skan Delta T is greater than the Measure
Delta T, or
[F2] to apply the test. (The default setting is “No”.)
6. Enter a value (from 0 to 100 µsec) for the Absolute Skan Delta T
to be used in the test in step 5, and press
[ENT]. (The default is 4.)
7. The next prompt, Normalize to 100?, asks if the program will keep
the Skan Delta T within the 0 to 100 range (?), rather than the
actual amplitude. Press
[F1] to use actual amplitude, or [F2] to
normalize the parameter. (The default setting is “No”.)
8. Press
[F1] to omit measurement of SNR (signal to noise ratio), or
[F2] to measure SNR. (The default setting is “Yes.”)
a. If you measure SNR, the program asks for the Minimum SNR
for Error 4. (The default is 7.0.) Enter the desired value, and
[ENT].
press
The GC868 returns to the
ADVAN window.
1-36 Programming Site Data
Page 46

April 2008
Entering Multiple K Factors In the MULTK option, you can enter velocity or Reynolds Correction
values into a K-Factor table. You can thus “curve fit” velocity or
Reynolds calibration multiple data points (from several different data
sources or flow variables) to the flow rate reported by the GC868.
1. Press
2. Press
[F4] to enter the Multiple K Factors option.
[F1] = NO to disable or [F2] = YES to enable Multiple K-
factors.
• If you press NO, the GC868 returns to the ADVAN window.
3. If you press
Press
a. If you select a Reynolds table, the meter asks for the Kinematic
Viscosity. Enter the appropriate value, and press
4. Press
ADVAN window, or press [F2] = YES to Edit The K-factor Table.
Note: If velocity vs. K-factor data was not provided with the Model
GC868, the K-factor table can not be edited.
a. Enter the Number of K-factors to be entered into the table.
Press
YES, the program asks for the Custom type of data.
[F1] to select velocity data, or [F2] to select Reynolds data.
[ENT].
[F1] = NO to retain the current K-factor table and return to the
[ENT]. (The meter will only accept values from 2 to 20.)
IMPORTANT: When editing the K-factor table, the velocities must
be entered in increasing order.
b. Enter the Velocity (or Reynolds) V alue for K-factor number “x”.
[ENT]. (The meter will only accept values from –30,000 to
Press
+30,000 ft/sec.)
c. Enter the K-factor corresponding to velocity or Reynolds
number “x”. Press
[ENT].
d. Repeat steps b and c until all of the data points have been
entered.
The GC868 returns to the
ADVAN window.
Programming Site Data 1-37
Page 47

April 2008
Programming a Gas
Compressibility Table
In the ZTABL option, you can enter data into a global table to define
particular compressibility values. The GC868 can thus implement
SonicWare® and other data tables to meet specific applications.
1. Press [→] and
2. Press
[F1] if you do not want to Use Global Z-table, or [F2] to
program the table. (If you press
ADVAN window.)
[F1] to enter the ZTABL option.
[F1], the GC868 returns to the
3. Use the numeric keys to enter the Base Compr essibility of the gas,
and press
[ENT].
4. Enter the number of desired Pressure Columns, from 1 to 10. Press
[ENT].
a. Enter the Pressure Value for Column 1. Press
[ENT].
b. Repeat step a for each succeeding column, until you have
programmed all the desired columns.
5. Enter the number of desired Temperature Rows, from 1 to 10.
[ENT].
Press
a. Enter the Temperature Value for Row 1. Press
[ENT].
b. Repeat step a for each succeeding row, until you have
programmed all the desired rows.
6. Enter the Z-Factor for column 1, row 1 (1,1).
7. Repeat step 6 for each succeeding column, row location, until you
have programmed the entire table.
The GC868 returns to the
ADVAN window.
1-38 Programming Site Data
Page 48

April 2008
Setting Correlation
Parameters
The CORR option allows you to adjust parameters for the Skan/
Correlation technique in the
IMPORTANT: The
CORR default settings are suitable for most
ACTIV menu.
applications. Before changing any of these
parameters, consult the factory.
1. Press [→] and
2. Use the [→] and
[F2] to enter the CORR option.
[F1]-[F4] keys to select the desired Signals per
reading, from 8 to 128. (The default is 8.)
3. Use the numeric keys to enter the desired # Correlation Xmit
Pulses, from 1 to 16. Press
4. Use the [→] and
[F1]-[F4] keys to select the desired Correlation
[ENT].
Xmit Code. The available choices include None, Code A, Code B,
Code C and Code D.
5. Enter the value (from 0 to 250 µsec) for the C>S
(Correlation>Skan) Switch, and press
[ENT].
6. Enter the % of Peak (Correlation) from -100 to 100%, and press
[ENT].
7. Enter the Minimum Peak % limit from -100 to 100%, and press
[ENT].
8. Enter the Maximum Peak % limit from -100 to 100%, and press
[ENT].
The GC868 returns to the
ADVAN window.
Programming Site Data 1-39
Page 49

April 2008
Setting Skan Parameters In the SKAN option, you can activate and set parameters for a negative
peak percent for both the Skan measurement technique (in the
submenu) and the Skan portion of the Skan/Measure technique. When
negative peak percent is active, the GC868 searches for the maximum
negative peak before the positive peak, and then calculates the T at
both negative peak percents entered; these times are averaged for the
T measurement.
ACTIV
Synchronizing Meter
Transmissions
IMPORTANT: The
SKAN default settings are suitable for most
applications. Before changing any of these
parameters, consult the factory.
1. Press [→] and
2. Press
[F1] if you do not want to Use Negative Peak, or [F2] to
activate negative peak. (If you press
ADVAN window.)
[F3] to enter the SKAN option.
[F1], the GC868 returns to the
3. Enter the Minimum Negative Peak % from -100 to -10%, and
[ENT].
press
4. Enter the Maximum Negative Peak % from -100 to -10%, and
[ENT].
press
The GC868 returns to the
ADVAN window.
The TRANS (Transmit) option appears only if an alarm card has been
installed in the GC868. It allows the GC868 and its transducers to
operate synchronously with another meter on the same flowcell.
When triggered, the alarm card can close a relay when the other meter
is transmitting, to prevent conflicting signals.
1. Press [→] and
2. Press
[F1] if you do not want to activate the Gate Alarm, or [F2] to
[F4] to enter the TRANS option.
activate the alarm.
1-40 Programming Site Data
Page 50

April 2008
Procedure Options After completing the above steps, the meter returns to the ADVAN
prompt. Continue as follows:
• To continue programming the meter, refer to the menu maps in
Appendix A and navigate to the desired menu. Then, proceed to
the appropriate section of this manual for instructions.
• To leave the User Program and retain the previous settings,
press
[EXIT] twice and then press [F1] = NO at the SAVE prompt.
Any programming changes will be discarded and you will be
returned to the data display.
• To leave the User Program and return to measurement mode,
press
[EXIT] twice and then press [F2] = YES at the SAVE prompt.
Your programming changes will be entered into the meter’s
memory, and you will be returned to the data display.
Programming Site Data 1-41
Page 51

April 2008
Setting the Clock Use the CLOCK submenu to enter the current date and time. Refer to
Figure A-3 on page A-3.
1. To program the
User Program.
CLOCK submenu, press [→] and [F2] at the initial
Setting the Date 2. The first prompt displays the programmed Date.
• If the displayed date is correct, press [F1] = OK and proceed to
step 2.
• If the displayed date is incorrect, press [F2] = EDIT to change the
date, and complete the steps below.
a. Enter the current Year and press
to 99.
b. Use the [←], [→] and
Month.
c. Enter the current Day and press
to the number of days in the current month.
[F1]-[F4] keys to select the current
Setting the Time 3. The next prompt displays the programmed Time.
[ENT]. The allowable range is 0
[ENT]. The allowable range is 1
• If the displayed time is correct, press [F1] = OK to return to the
User Program.
• If the displayed time is incorrect, press [F2] = EDIT to change the
time, and complete the steps below.
a. Press
Note: A time of 12 PM represents Noon and a time of 12 AM
b. Enter the current Minutes and press
c. Enter the current Seconds and press
[F1] = AM or [F2] = PM. Then enter the current Hour and
[ENT]. The allowable range is 1 to 12.
press
represents Midnight.
[ENT]. The allowable range
is 0 to 59.
[ENT]. The allowable range
is 0 to 59.
1-42 Programming Site Data
Page 52

April 2008
Procedure Options After completing the above steps, the meter returns to the User
Program. Continue as follows:
• To continue programming the meter, refer to the menu maps in
Appendix A and navigate to the desired menu. Then, proceed to
the appropriate section of this manual for instructions.
• To leave the User Program and retain the previous settings,
press
[EXIT] and then press [F1] = NO at the SAVE prompt. Any
programming changes will be discarded and you will be
returned to the data display.
• To leave the User Program and return to measurement mode,
press
[EXIT] and then press [F2] = YES at the SAVE prompt. Your
programming changes will be entered into the meter’s memory,
and you will be returned to the data display.
Programming Site Data 1-43
Page 53

April 2008
Setting Up Serial Communications
The Model GC868 flowmeter can transmit stored data and displayed
readings to a remote ANSI terminal or a personal computer by
connecting the meter’s RS232 interface to the serial port of the PC. In
addition, the Model GC868 can receive and execute remote
commands via this link. The meter can also be configured with a
MODBUS option card for MODBUS communications, a Foundation
Fieldbus option card for Foundation Fieldbus communications, an
Ethernet option card for Ethernet communications, or with a
MODBUS/TCP option card for MODBUS communication over the
Ethernet, if desired.
Note: To set Fieldbus communications parameters, see Appendix D,
Foundation Fieldbus Communications.
Use the
COMM submenu to set the RS232, MODBUS, Ethernet and
MODBUS/TCP communications port parameters and to enter a
network identification number. A network identification number is
required to use the GE Instrument Data Manager or PanaView
software. While following the programming instructions, refer to the
menu map in Figure A-3 on page A-3. Enter the
pressing [→] and
[F3] at the initial User Program screen and complete
COMM submenu by
the following steps:
1. Use the [←] and [→] and
[F1]-[F4] keys to select the desired Baud
Rate. The available rates are 300, 600, 1200, 2400, 4800, 9600 and
19,200 baud.
2. Use the [←] and [→] and
[F1]-[F4] keys to select the number of
UART Bits, as listed in Table 1-8 below.
Table 1-8: UART Bits Options
Option Bar # Data Bits # Stop Bits Parity
8,no 8 0 None
8,odd 8 0 Odd
8even 8 0 Even
7,odd 7 1 Odd
7even 7 1 Even
3. Enter a Network ID number between 1 and 254 and press
[ENT].
The default number is 1.
A network ID number is only necessary for communication with the
GE Instrument Data Manager or PanaView software. See the
software User’s Manual for more information.
IMPORTANT: If the network ID number is changed, communication
with the Instrument Data Manager or PanaV iew must
be re-established with the new ID number.
1-44 Programming Site Data
Page 54

April 2008
Entering MODBUS Data 4. If your GC868 does not include an option card for MODBUS
communications, you have completed programming the
submenu. However, if you have installed a MODBUS option card,
complete the following steps:
COMM
a. Use the
[F1]-[F3] keys to select the desired MODBUS Baud
Rate from four selections: 2400, 4800, 9600 and 19200.
b. Use the
[F1]-[F3] keys to select the desired MODBUS Parity
from three selections: none, odd and even.
c. Press
[F1] to select one MODBUS Stop Bit, or [F2] to select two
stop bits.
d. Use the numeric keys to enter a MODBUS Address (from 1 to
247) and press
[ENT].
Note: If you change any of these MODBUS options, you will need to
power down your meter and power up again to load the
changes into the MODBUS option card.
MODBUS/TCP Parameters If your GC868 does not include an option card for MODBUS/TCP
communications, you have completed programming the
submenu. However, if you have installed a MODBUS/TCP option
card, you must complete the following steps:
1. Press
[F3] to select the appropriate MODBUS Baud Rate of 9600.
COMM
2. Press
3. Press
[F1]-[F3] to set the MODBUS Parity as none, odd or even.
[F1] to select one MODBUS Stop Bit, or [F2] to select two
stop bits.
4. Use the numeric keys to enter a MODBUS Address (from 1 to 247)
and press
[ENT].
Programming of the COMM submenu has now been completed. To
leave the User Program, press
any of the submenus, the
[F1] to return to measurement mode without saving the file or press
[F2] to enter the SAVE submenu and save the file.
[EXIT]. If changes have been made in
SAVE screen (shown above) appears. Press
Programming Site Data 1-45
Page 55

April 2008
Procedure Options After completing the above steps, the meter returns to the User
Program. Continue as follows:
• To continue programming the meter, refer to the menu maps in
Appendix A and navigate to the desired menu. Then, proceed to
the appropriate section of this manual for instructions.
• To leave the User Program and retain the previous settings,
press
[EXIT] and then press [F1] = NO at the SAVE prompt. Any
programming changes will be discarded and you will be
returned to the data display.
• To leave the User Program and return to measurement mode,
press
[EXIT] and then press [F2] = YES at the SAVE prompt. Your
programming changes will be entered into the meter’s memory,
and you will be returned to the data display.
MODBUS Register Map When equipped with the optional MODBUS output card, the GC868
flow transmitter can send flow data and diagnostic information to a
flow computer (or SCADA) serially, using a Gould-type RTU
protocol. In this case, only the MODBUS function command, 3 (read
multiple registers), 6 (write multiple registers) is valid. The format for
the data exchange is as follows:
• The send command (initiated by the host flow computer or
controller) comes in the form:
[time delimiter]<Addr><3><First Register MSB>
<First Register LSB><Register Count MSB>
<Register Count LSB><CRC Low><CRC High>[time delimiter]
• The response (initiated by the host flow computer or controller)
comes in the form:
[time delimiter]<Addr><3><Byte count><Data.........>
<CRC Low><CRC High>[time delimiter]
The format for the returned data types is as follows:
• Integer (16 bit Integer) <MSB><LSB>
1 Register - 16 bit integer
• Integer (32 bit IntegerI) <MSB><LSB><LSB><LSB>
2 Register - 32 bit integer
• Floating Point (FP) <EXP><MAN><MAN><MAN>
2 Registers - 32 bit IEEE floating point number
To request specific parameters from the GC868 via the MODBUS,
the control system must enter the appropriate register number. Only
registers 1 through 90 are available for MODBUS communications,
while registers 508 through 512 are used by the GC868 to sto r e the
MODBUS parameters. For details, see Table 1-9 on page 1-47.
Note: If you request Ch2 or AVE data from a 1-Channel meter, the
values will all be zero.
1-46 Programming Site Data
Page 56

Table 1-9: MODBUS Registers for a 1-Channel GC868
MODBUS
Reg #
10
2 2 Not Used -- 2 (16 bit signed)
3 4 Velocity 2 4 (2 16-bit int)
5 8 Act Volumetric #Q DIGITS 4 (IEEE 32 bit)
7 C Std Volumetric #Q DIGITS 4 (IEEE 32 bit)
9 10 Fwd Totals #T DIGITS 4 (2 16 bit int)
11 14 Rev Totals #T DIGITS 4 (2 16 bit int)
13 18 #Tot Digits 0 2
14 1A Mass Flow #M DIGITS 4 (IEEE 32 bit)
16 1E Fwd Mass Totals #MT DIGITS 4 (2 16-bit int)
18 22 Rev Mass Totals #MT DIGITS 4 (2 16-bit int)
20 26 #Mass Tot Digits 0 2
21 28 Timer 2 4 (2 16-bit int)
23 2C Error Code 0 2
24 2E Sound Speed 3 4 (2 16-bit int)
26 32 Density 4 4 (2 16-bit int)
28 36 Signal Strength Upstream 1 4 (2 16-bit int)
30 3A Signal Strength Downstream 1 4 (2 16-bit int)
32 3E Temperature 2 4 (2 16-bit int)
34 42 Pressure 3 4 (2 16-bit int)
508 3F6
509 3F8
510 3FA
511 3FC MODBUS meter addr 0 2
512 3FE RESERVED --- ---
DPR
Hex Addr Description
1”
Clear Ch1 Totalizers”
2
MODBUS baud rate
3
MODBUS parity
4
MODBUS stop bits
Scaling
(decimal places) Size in Bytes
-- 2 (16 bit signed)
02
02
02
April 2008
Notes: 1.Clear Totalizers:
flag from the 8051 to clear either the Channel 1 or Channel 2 totalizers.
2.MODBUS baud rate:
5 = 2400, 6 = 4800, 7 = 9600, 8=19,200
3.MODBUS parity:
0 = none, 1 = odd, 2 = even
4.MODBUS stop bits:
1 = 1 stop bit, 2 = 2 stop bits
5.AVG Er ro r Code:
0=Both Ch1 and Ch2 are in error.
1=Ch1 only is in error
2=Ch2 only is in error
3=Both channels are error free
Programming Site Data 1-47
Page 57

April 2008
Saving Site Data The currently programmed site data may be stored in the Model
GC868’s non -volatile memory by saving it as a site file. Up to ten site
file names, consisting of up to five characters each, may be stored at
any given time. While following the programming instructions, refer
to Figure A-3 on page A-3 of Appendix A, Menu Maps. Enter the
SAVE submenu by pressing [→] and [F4] at the initial User Program
screen and complete the following steps:
1. Enter a new site file name and press
[F1]-[F4] keys to select and overwrite an existing site file.
[ENT], or use the [←], [→] and
Note: The option bar will show only as many choices as there are
existing site files.
If ten site files are already stored in memory , an existing site file must
be deleted before a new site file name can be assigned. See Chapter 5,
Clearing Data, for details.
When a site file is stored in memory, it becomes the active site file
until another site file is created or retrieved. (See the next section for
instructions on retrieving a site file.) To verify that the site file has
been saved, use the [↑] key to scroll back to the
SITE NAME prompt
and see if the name appears on the option bar (use the [←] and [→]
keys to scroll through the list, if necessary). Whenever a new site file
name is saved, it is automatically assigned to the next available
function key. Press
2. Use the [←] and [→] and
[EXIT] to leave the User Program and return to measurement
press
[EXIT] to leave the SAVE submenu.
[F1]-[F4] keys to select another menu, or
mode.
1-48 Programming Site Data
Page 58

April 2008
Recalling a Site Any site file currently stored in the Model GC868’s non-volatile
memory may be recalled at any time. Up to ten site file names,
consisting of up to five characters each, may be stored at any given
time. While following the programming instructions, see Figure A-3
on page A-3 of Appendix A, Menu Maps. Enter the
by pressing [→] twice and
[F1] at the initial User Program screen and
complete the following steps:
RECLL submenu
1. Use the [←], [→] and
[F1]-[F4] keys to select and recall an existing
site file.
Note: The option bar shows only as many choices as there are
existing site files. The files are listed in chr onological order by
creation date.
Upon recall, the selected site file becomes active and all of its
programmed parameters become current.
IMPORTANT: The
CLOCK and I/O data is not recalled with the site
file, while the
SYSTM and COMM data is recalled with
the site file.
Note: If you have loaded a site file into a GC868, but the option
cards are not in the same slots or programmed the same way
as when the site file was first saved, the GC868 displays a
warning to review slot information. This display does not
mean that the option cards have lost their program
information!
2. Use the [←] and [→] and
[EXIT] to leave the User Program and return to measurement
press
[F1]-[F4] keys to select another menu, or
mode.
Programming Site Data 1-49
Page 59

April 2008
Activating Security In order to prevent unauthorized tampering with the flowmeter’s
programming, the Model GC868 is equipped with a security feature
that locks out the following menus:
• Program Menu [PROG]
• Calibration Menu [CAL]
• Log Menu [LOG]
• Clear Menu [CLR]
When the system is locked, access to the above menus will be denied
unless the correct password is entered. The Model GC868 is shipped
with a default password, which is given later in this section. For
increased security, the default password should be changed.
IMPORTANT: Once the system has been locked, it can only be
unlocked by entering the password, because access
SECUR submenu is restricted.
to the
To program the
User Program screen. Refer to Figure A-3 on page A-3.
IMPORTANT: It is recommended that all program parameters be
1. At the Lock Out prompt, press
and return to the
lock the system.
Note: If the system was unlocked at the above prompt, the following
three prompts do not appear.
2. Enter the current Password (2719 is the default password) and
press
3. At the ?Edit Password prompt, press
password unchanged and proceed to Procedure Options on the
next page, or press
SECUR submenu, press [→] twice and [F2] at the initial
recorded be fore
information should be recorded in Appendix B, Data
Records, as a matter of routine.) If the password is
lost, the site data is not
be re-entered.
Global PROGRAM prompt, or press [F2] = LOCK to
[ENT].
[F2] = YES to enter a new password.
changing the password. (This
retrievable and will have to
[F1] = UNlck to unlock the system
[F1] = NO to leave the
IMPORTANT: Since the default password is printed in this manual,
a new password should be enter ed. If the password is
ever lost, contact the factory for assistance.
1-50 Programming Site Data
Page 60

April 2008
Activating Security (cont.) 4. Enter the New Password and press [ENT]. Any combination of
letters and numbers up to a total of 21 characters may be used as a
password.
Note: Keep in mind that the password may have to be entered
frequently from the keypad. A long and/or complex password
may soon become annoying to use.
5. Verify the New Password by entering it again and press
sure to record the new password in a safe place.
[ENT]. Be
Procedure Options After completing the above steps, the meter returns to the User
Program
prompt. Continue as follows:
• To continue programming the meter, refer to the menu maps in
Appendix A and navigate to the desired menu. Then, proceed to
the appropriate section of this manual for instructions.
• To leave the User Program and retain the previous settings,
press
[EXIT] and then press [F1] = NO at the SAVE prompt. Any
programming changes will be discarded and you will be
returned to the data display.
• To leave the User Program and return to measurement mode,
press
[EXIT] and then press [F2] = YES at the SAVE prompt. Your
programming changes will be entered into the meter’s memory,
and you will be returned to the data display.
Programming Site Data 1-51
Page 61

Chapter 2
Page 62

Displaying Data
Introduction. . . . . . . . . . . . . . . . . . . . . . . . . . . . . . . . . . . . . . . . . . . . . . . . . . . . 2-1
The BIG Submenu . . . . . . . . . . . . . . . . . . . . . . . . . . . . . . . . . . . . . . . . . . . . . . . 2-2
The DUAL Submenu . . . . . . . . . . . . . . . . . . . . . . . . . . . . . . . . . . . . . . . . . . . . . 2-3
The GRAPH Submenu. . . . . . . . . . . . . . . . . . . . . . . . . . . . . . . . . . . . . . . . . . . . 2-4
The LOG Submenu . . . . . . . . . . . . . . . . . . . . . . . . . . . . . . . . . . . . . . . . . . . . . . 2-7
Displaying the Transducer Signal. . . . . . . . . . . . . . . . . . . . . . . . . . . . . . . . 2-11
Setting the LCD Backlight. . . . . . . . . . . . . . . . . . . . . . . . . . . . . . . . . . . . . . . 2-14
Activating Sleep Mode. . . . . . . . . . . . . . . . . . . . . . . . . . . . . . . . . . . . . . . . . . 2-15
Page 63

April 2008
Introduction This chapter explains how to display measurement data in various
formats. Each of the two display screen panes may be programmed
independently.
Note: The instructions in this chapter assume that the left display
pane is active. If the right display pane is active, simply
change all
The following submenus are included in the Display Menu:
[F1]-[F4] designations to [F5]-[F8].
• BIG - displays a single measurement in large size text
• DUAL - permits the simultaneous display of two measurements, in
the same screen pane, in standard size text
• GRAPH - displays a graph of either velocity or volumetric flow
versus time
• LOG - displays the data stored in a log file either graphically or
numerically
• SIGNL - graphically displays any one of five transducer signals
versus time
• BACKL - sets the time that the LCD display backlight remains on
before it is automatically turned off.
• SLEEP - blanks out the display screen until a key is pressed.
Refer to Figure A-5 on page A-5 and proceed to the appropriate
section to set up the Model GC868 display screen(s), using one of the
listed submenus.
Displaying Data 2-1
Page 64
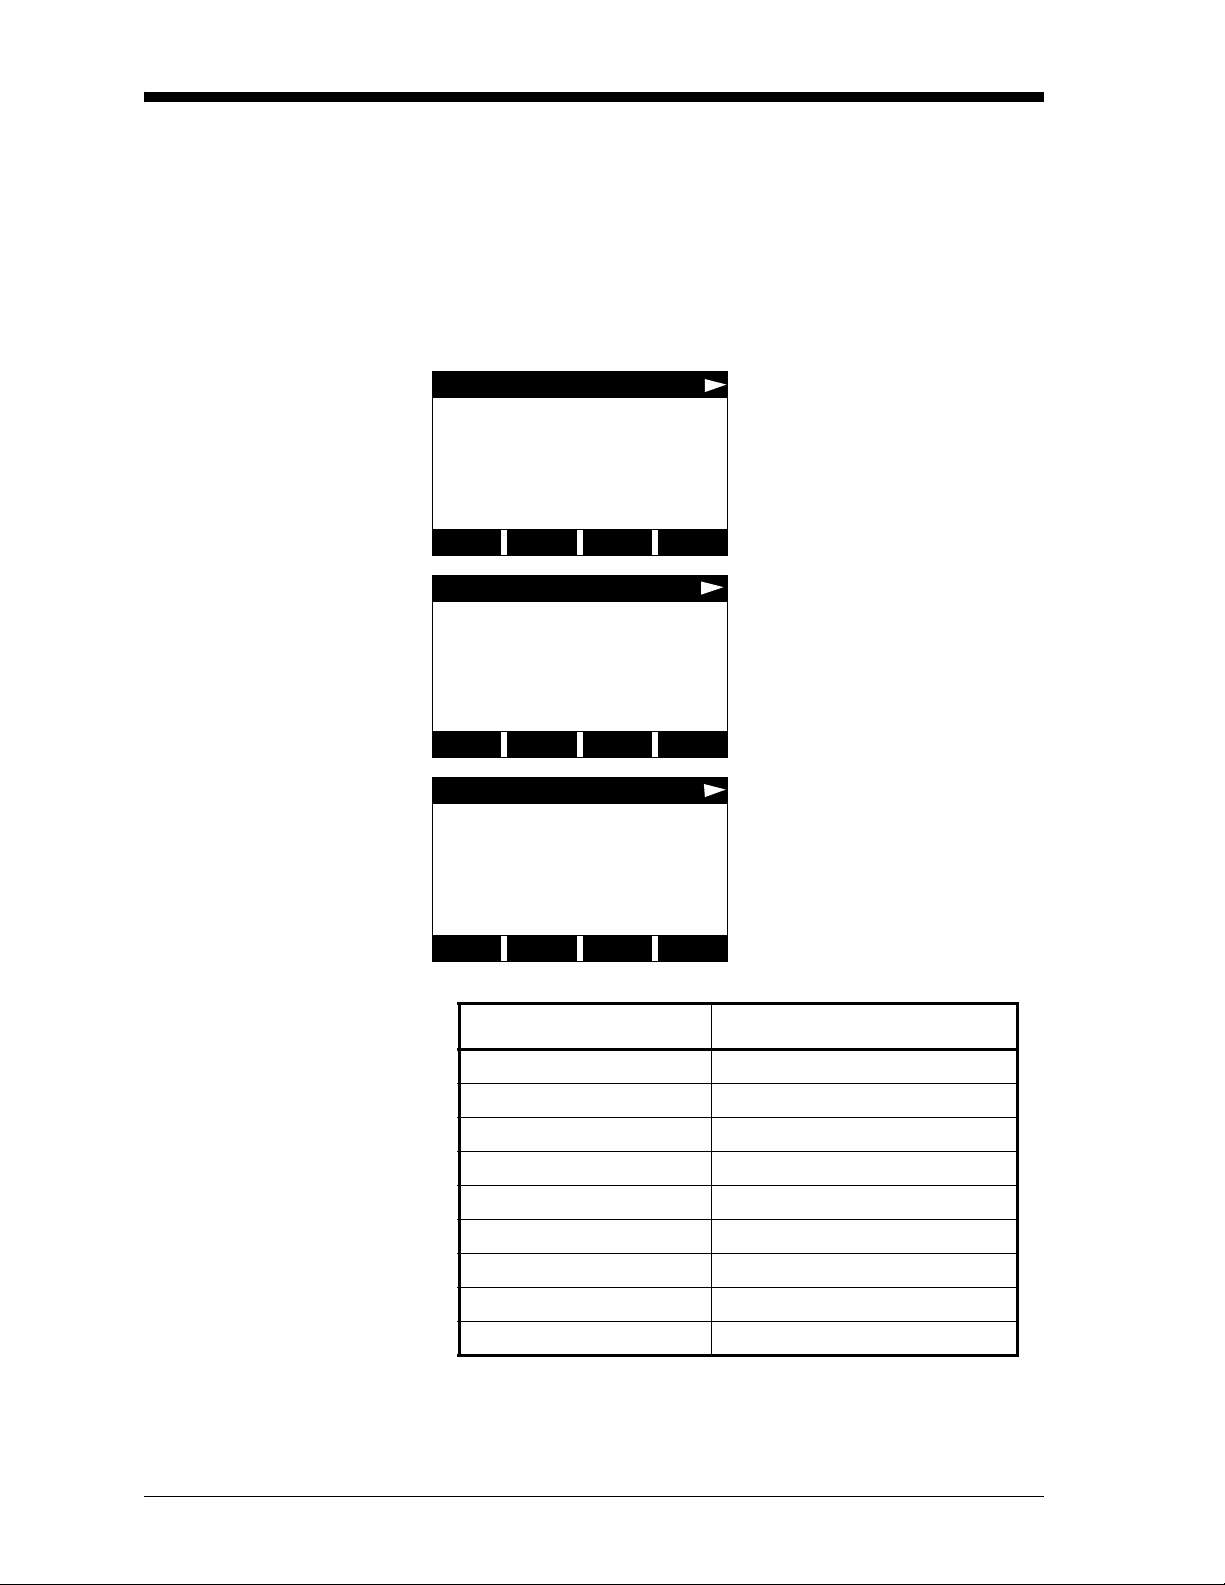
April 2008
The BIG Submenu The BIG format, which is the Model GC868’s default power up
format, displays one measurement in large print. To select the
format and the measurement to display in this format, follow the
instructions in this section.
Upon power up, a standard measurement mode display (similar to the
one shown below) appears. Press the appropriate side of the
key to activate the desired pane of the display screen, and complete
the following steps:
[SCREEN]
BIG
site label site file
Velocity Ft/s
6.95
(error codes appear here)
VEL VOLUM +TOTL -TOTL
DISPLAY FEATURES
DISPLAY FORMAT
previous selection appears here
BIG DUAL GRAPH LOG
site label site file
Velocity Ft/s
6.95
(error codes appear here)
VEL VOLUM +TOTL -TOTL
The default power up screen is
already in
BIG mode. If a
different display mode is active,
access the Display Menu by
pressing the
[DISP] key.
Press [F1] to select the BIG
option. The measurement mode
screen reappears with the display
BIG format.
in the
Use the [F1]-[F4], [←] and [→]
keys to select the desired display
parameter option. See Table 2-1
below for a complete description
of the available options.
Table 2-1: Measurement Parameter Options
Option Bar Choice Description
[F1] = VEL Flow Velocity
[F2] = VOLUM Volumetric Flow
[F3] = +TOTL Forward Totalized Volume Flow
[F4] = -TOTL Reverse Totalized Volume Flow
[→]
+ [F1] = TIME Total Flow Measurement Time
[→]
+ [F2] = MDOT Mass Flow
[→]
+ [F3] = +MASS Forward Totalized Mass Flow
[→]
+ [F4] = -MASS Reverse Totalized Mass Flow
[→]
+ [→] + [F1] = DIAG Diagnostic
Note: See Chapter 3, Operation, of the Startup Guide for more
details on selecting a measurement parameter to display.
2-2 Displaying Data
Page 65

April 2008
The DUAL Submenu The DUAL format displays two measurements simultaneously in
normal print. T o select the
display in this format, follow the instructions in this section.
Upon power up, a standard measurement mode display (similar to the
one shown below) appears in
[SCREEN] key to activate the desired pane of the display screen,
the
and complete the following steps:
DUAL format and the measurements to
BIG format. Press the appropriate side of
1. To access the Display Menu, press the
2. Press
3. Use the
[F2] = DUAL. The measurement mode display reappears and
the display is now in the
[F1]-[F4], [←] and [→] keys to select the desired display
DUAL format.
[DISP] key.
parameter option. See Table 2-1 on page 2-2 for a complete
description of the available options.
Note: See Chapter 3, Operation, of the Startup Guide for more
details on selecting a measurement parameter to display.
With the
DUAL format display screen active, when a measurement
parameter is selected, the top line of the prompt area will be changed
to show that parameter. The parameter previously displayed at the top
of the display is moved to the bottom of the display, and the previous
bottom parameter is no longer shown.
Displaying Data 2-3
Page 66

April 2008
The GRAPH Submenu The GRAPH submenu permits the display of either the flow velocity,
mass flow or the volumetric flow on an XY bar graph, with a
specified time interval on the x-axis. This section describes the
procedures for setting up and using the graph format.
Setting Up the GRAPH Format
Press the appropriate side of the [SCREEN] key to activate the desired
pane of the display screen, and complete the following steps:
1. To access the Display Menu, press the
2. Press
3. Press
[F3] = GRAPH.
[F1]-[F3] to graph the Flow Velocity, Volumetric Flow or
[DISP] key.
Mass Flow, respectively.
4. Use the [←], [→] and
[F1]-[F4] keys to select the desired Time
Increment.
5. Enter a maximum value for the Y-axis (vertical) scale that is larger
than the maximum expected reading and press
6. At the Y Range prompt, press
or press
After the
[F2] to graph both positive and negative Y values.
Y RANGE is entered, the Model GC868 automatically begins
[F1] to graph only positive Y values
[ENT].
taking measurements and displays them in the specified graphical
format. Proceed to the next section for a discussion of manipulating
the graphical display.
2-4 Displaying Data
Page 67

April 2008
Using the GRAPH Format While viewing data in the GRAPH format, the function keys are
programmed to permit a variety of actions. These options are
described in detail below.
1.23 Ft/s 10:16
V
E
L
ST: 08 MAR 09:50
<CURS CURS> START END
At any given time, 120 data points will be shown on the
Use the [←], [→] and [F1]-[F4]
keys to select the desired option.
See Table 2-2 on page 2-6 for a
listing of the available choices.
GRAPH
screen. The cursor, which is displayed as a vertical line that extends
the full height of the graph window, can be used to select any one of
these data points.
The typical screen shown above is for a Velocity vs. Time graph with
only the positive y-axis displayed. The measurement parameter
(VEL)
is shown to the left of the y-axis and there is a message line below the
graph that initially indicates the starting date and time of the graphed
data. Notice that most of the locator bar has been replaced by a status
line in standard video that shows the value, units and time of the
measurement at the current cursor location. However, there is still an
inverse video pointer at the far right of this line to indicate that
additional option bar choices are available.
Note: The date in the message line includes only the day and the
month (not the year), and the times in the status line and the
message line include only the hours and minutes (not the
seconds).
Because the times displayed in the
GRAPH format are in whole
minutes only, movement of the cursor may not result in a visible
change in the posted times. For example, if a
TIME INCREMENT of 30
seconds has been programmed, two presses of either cursor
movement key will be required to change the displayed time by one
minute.
Displaying Data 2-5
Page 68

April 2008
Using the GRAPH Format
(cont.)
Table 2-2: Graph Display Options
Option Bar Choice Description
Moves the cursor to the left and displays
[F1] = <CURS
the corresponding measurement value and
time in the status line:
(i.e.
6.85 Ft/s 10:38)
Moves the cursor to the right and displays
[F2] = CURS>
the corresponding measurement value and
time in the status line:
(i.e.
5.31 Ft/s 10:38)
Moves the cursor all the way to the left
[F3] = START
side of the graph and posts the starting date
and time in the message line:
(i.e.
ST: 08 MAR 10:38)
Moves the cursor all the way to the right
[F4] = END
side of the graph and posts the ending date
and time in the message line:
(i.e.
END 08 MAR 11:14)
Displays the programmed maximum Y
[→] + [F1] = YMAX
value in the message line:
(i.e.
YMAX 25.0 Ft/s)
[→] + [F2] = T INC
[→] + [F3] = EXIT
Displays the programmed time increment
value in the message line:
(i.e.
T INC 30 seconds)
Leaves the GRAPH format and returns the
display to the previous data format. (The
[EXIT] key on the keypad will also perform
this function.)
2-6 Displaying Data
Page 69

April 2008
The LOG Submenu The LOG submenu permits the display of the data in a log file either
graphically or numerically. Although the Model GC868 can display
all of the data in a log file, screen size limitations prevent the
simultaneous display of the complete log file. Therefore, the function
keys must be used to view the remaining data. Follow the instructions
in this section to display a log file in the desired format.
Entering the LOG Submenu
Press the appropriate side of the [SCREEN] key to activate the desired
pane of the display screen, and complete the following steps:
1. To access the Display Menu, press the
2. Press
3. Use the [←], [→] and
[F4] = LOG.
display. At the
[F1]-[F4] keys to select the desired log file to
NAME prompt, the option bar will show the names
[DISP] key.
of all log files that are currently stored in memory. If there are no
log files currently stored in memory, the following prompt will
appear instead:
DISPLAY FEATURES
DISPLAY FORMAT
logging
There are no log files currently
stored in memory. Either all of
the log files have been cleared or
no log files have yet been
All Logs Cleared!
hit key
All Logs Cleared! prompt appears, at least one log file must be
If the
created. Press any key to return
to measurement mode.
created and stored in memory before the Display Log function can be
accessed. See Chapter 3, Logging Data, for instructions on creating a
log file. After at least one log file is stored in memory and selected at
NAME prompt of the LOG submenu, proceed to the next step.
the
4. At the Format prompt, press
numeric format or press
[F1] to display the selected log in
[F2] to display the selected log in
graphical format.
• If you pressed [F1], go to the next page.
• If you pressed [F2], go to page 2-9.
Displaying Data 2-7
Page 70

April 2008
Numeric Format The Model GC868 can log up to three parameters simultaneously.
Each set of data values is called a record, and up to 120 consecutive
records can be stored in a page. A log file can consist of up to 120
pages. The numeric log display, which shows one record at a time,
includes the following components:
• page number
• record number
• time and date of creation
• measurement value set
• error messages (if any)
Upon choosing
NUM at the FORMAT prompt, the first record of the
selected log file is displayed in a screen similar to the following:
PAGE# 1 REC# 80
09 MAR 98
11.66 Ft/s
1.32 KACF/MI
6.91 KACF
E5: Amplitude
<CURS CURS> <PAGE PAGE>
Use the [←], [→] and [F1]-[F4]
keys to view additional records
or to exit the log display. The
options are listed in Table 2-3
below.
In the numeric display screen, the locator bar (except for the inverse
video pointer at the far right) is replaced by a standard video display
of the page number and record number. The first line of the prompt
area shows the time and date that the record was created, and the next
three lines list the values for the three logged parameters. Finally , any
error condition that existed at the time the record was taken is
indicated by an error code in the bottom line of the prompt area.
Table 2-3: Numeric Log Display Options
Option Bar Choice Description
[F1] = <CURS display previous record on the current page
[F2] = CURS> display the next record on the current page
[F3] = <PAGE display the previous page
[F4] = PAGE> display the next page
[→] + [F1] = START display the first record on the current page
[→] + [F2] = END display the last record on the current page
Leave the numeric LOG display and return to
[→] + [F3] = EXIT
the previous data format. (The
[EXIT] key on
the keypad will also perform this function.)
2-8 Displaying Data
Page 71

April 2008
Graphical Format After choosing PLOT at the FORMAT prompt, the programming
sequence continues as follows:
5. Enter a maximum value for the Y-axis (vertical) scale that is larger
than the maximum expected reading. Press
6. At the Y Range prompt, press
or press
After the
[F2] to graph both positive and negative Y values.
Y RANGE is entered, the Model GC868 automatically
[F1] to graph only positive Y values
displays the chosen log file records in the specified graphical format.
[ENT].
1.23 Ft/s 10:16
V
E
L
ST: 08 MAR 09:50
<CURS CURS> START END
Use the [←], [→] and [F1]-[F4]
keys to select the desired option.
The options are listed in
Table 2-4 on page 2-10.
At any given time, the 120 records stored in one page of the log file
will be graphed on the display screen. The cursor, which is shown as
a vertical line that extends the full height of the graph window , can be
used to highlight any one of these records.
IMPORTANT: Only the first of the three logged parameters is
displayed in the graphical format of the
LOG
submenu. Therefor e, when creating a log file, be sure
to specify the parameter to be graphed at the
Value Logged
prompt. See Chapter 3, Logging Data ,
1st
for details on creating a log file.
In the typical graphical display shown, the first logged parameter
(VEL)
is shown to the left of the y-axis and there is a message line below the
graph that initially indicates the starting date and time of the current
page. Notice that most of the locator bar has been replaced by a status
line in standard video that shows the value, units and time of the
record at the current cursor location. However, there is still an inverse
video pointer at the far right of this line to indicate that additional
option bar choices are available.
Note: The date in the message line includes only the day and the
month (not the year), and the times in the status line and the
message line include only the hours and minutes (not the
seconds).
Because the times displayed in the
LOG graph are in whole minutes
only, movement of the cursor may not result in a visible change in the
posted times. For example, if a
TIME INCREMENT of 30 seconds has
been programmed, two presses of either cursor movement key will be
required to change the displayed time by one minute.
Displaying Data 2-9
Page 72

April 2008
Graphical Format (cont.)
Table 2-4: Graphical Log Display Options
Option Bar
Choice Description
Move the cursor one record to the left and
[F1] = <CURS
display the value and time of that record in the
status line:
(i.e.
6.85 Ft/s 10:38)
Move the cursor one record to the right and
[F2] = CURS>
[F3] = <PAGE Display the previous page of records
[F4] = PAGE> Display the next page of records
display the value and time of that record in the
status line:
(i.e.
5.31 Ft/s 10:38)
Move the cursor to the first record on the
[→] + [F1] = START
current page and post the date and time of that
record in the message line:
(i.e.
ST: 08 MAR 10:38)
Move the cursor to the last record on the
[→] + [F2] = END
current page and post the date and time of that
record in the message line:
(i.e.
END 08 MAR 11:14)
[→] + [F3] = YMAX
[→] + [F4] = T INC
[←] + [F1] = EXIT
Display the programmed maximum Y value in
the message line:
(i.e.
YMAX 25.0 Ft/s)
Display the time increment value, as set when
the log file was created, in the message line:
T INC 30 seconds)
(i.e.
Leave the graphical LOG display and return the
display to the previous data format. (The
[EXIT]
key will also perform this function.)
2-10 Displaying Data
Page 73

April 2008
Displaying the Transducer Signal
The SIGNL submenu permits the direct graphical display of several
transducer signals. Specifically, the signals listed in Table 2-5 below
may be viewed in this format.
Note: Only one side of the display (either left or right) can show a
signal at any given time.
Table 2-5: Available Transducer Signals
Transducer Signal Description
Skan Types
Sup upstream Skan signal
Sdown downstream Skan signal
Cup upstream Skan correlation
Cdown downstream Skan correlation
Measure Types
Mup upstream Measure signal
Mdown downstream Measure signal
Note: The Measure type signals (Mup and Mdown) are only
available if the
S/M burst technique was selected in the ACTIV
menu.
Refer to Figure A-5 on page A-5 and complete the following steps to
display the transducer signals. Press the appropriate side of the
[SCREEN] key to activate the desired pane of the display screen, then
proceed as follows:
Note: For this discussion, it is assumed that the left pane of the
display screen is active. If the right pane is active, it is only
necessary to replace the
[F8]
keys.
1. To access the Display Menu, press the
2. Press [→] and
3. Press
[F1] to display the Skan type signals or press [F2] to display
Measure type signals.
the
Note: If the
Signal to Display prompt does not appear and the Measur e type
[F1] = SIGNL.
Skan burst technique was selected in the ACTIV menu, the
signals are not available. To access these signals, the
[F1]-[F4] keys designations by the [F5]-
[DISP] key.
S/M
burst technique must be selected.
The signal graph is a plot of signal amplitude (y-axis) vs. time in
microseconds (x-axis). When the
SIGNL display screen first appears, it
may briefly remain blank. As soon as the signal is acquired,
processed and loaded into the display memory, the graph will appear.
A cursor, which is displayed as a vertical line that extends the full
height of the graph window, is used to highlight any point in time
along the x-axis.
Displaying Data 2-11
Page 74

April 2008
Displaying the
Transducer Signal (cont.)
107 686.798mi
S
U
P
ST: 594.298usec
<CURS CURS> <PAGE PAGE>
Use the [←], [→] and [F1]-[F4]
keys to select the desired option.
The options are listed in
Table 2-6 below.
The typical display screen shown has the Sup transducer signal listed
to the left of the y-axis and there is a message line below the graph
that initially indicates the starting date and time of the graphed signal.
Notice that most of the locator bar has been replaced by a status line
in standard video that shows the signal amplitude and the time (in
microseconds) of the measurement at the current cursor location.
However, there is still an inverse video pointer at the far right of this
line to indicate that additional option bar choices are available.
Table 2-6: Graphical Log Display Options
Option Bar Choice Description
Move the cursor to the left and display the
[F1] = <CURS
amplitude and time in the status line:
107 686.798mi)
(i.e.
Move the cursor to the right and display the
[F2] = CURS>
amplitude and time in the status line:
(i.e.
107 686.798mi)
[F3] = <PAGE Display the previous page
[F4] = PAGE> Display the next page
Move the cursor to the start of the current
[→] + [F1] = START
page and post the starting date and time in
the message line: (i.e.
Move the cursor to the end of the current
[→] + [F2] = END
page and post the ending date and time in the
message line:
(i.e.
END: 744.298usec)
Display the maximum Y value, which is set
[→] + [F3] = YMAX
to 128 divisions in arbitrary units, in the
message line.
Display the time increment value in the
[→] + [F4] = T INC
message line. This is based on the frequency
of the transducers and would equal
0.125 μsec for a 1 MHz transducer.
Leave the graphical SIGNL display and return
[←] + [F1] = EXIT
the display to the previous data format. (The
[EXIT] key on the keypad will also perform
this function.)
ST: 451.798usec)
2-12 Displaying Data
Page 75

April 2008
Displaying the
Transducer Signal (cont.)
In addition to the functions available on the option bar, some of the
numeric keys are used to specify which transducer signal is displayed
and to scale the resulting graph. Table 2-7 below lists these functions.
Table 2-7: Numeric Key Functions
Key Function
1
Scroll down the transducer signal list
2
Scroll up the transducer signal list
4
Expand the graph vertically
5
Return expanded graph to previous size
7
Compress graph horizontally
8
Return compressed graph to previous size
In summary, three basic functions are performed with the numeric
keys:
• Signal Selection: use the “1” and “2” keys to select a transducer
signal for display by scrolling through the list of available signals.
• Vertical Scaling: The “4” and “5” keys are used to scale the graph
vertically. Each press of the “4” key doubles the height of the
graph, while each press of the “5” key halves the height of the
graph. The three available scale factors are 1x, 2x and 4x.
• Horizontal Scaling: The “7” and “8” keys are used to scale the
graph horizontally. Each press of the “7” key doubles the
value (2x horizontal compression), while each press of the “8” key
halves the
T INC value (2x horizontal expansion). The four
available compression ratios are 1x, 2x, 4x and 8x.
T o return to the standard data screen either select
bar or press the
[EXIT] key on the keypad.
EXIT from the option
T INC
Displaying Data 2-13
Page 76

April 2008
Setting the LCD Backlight Use the BACKL submenu to specify the number of minutes the LCD
display backlight remains on before it is automatically turned off.
Press the appropriate side of the
pane of the display screen, then proceed as follows:
Note: For this discussion, it is assumed that the left pane of the
display screen is active. If the right pane is active, replace the
[F1]-[F4] keys designations by the [F5]-[F8] keys.
[SCREEN] key to activate the desired
1. To access the Display Menu, press the
2. Press [→] and
[F2] = BACKL.
[DISP] key.
3. Use the numeric keys to enter a value from 1 to 60 minutes and
[ENT]. To keep the backlight on constantly, enter a value of 0
press
and press
[ENT].
The Model GC868 will automatically return to the previous data
display screen and the programmed backlight timeout interval will
begin.
If no entries are made from the keypad before the backlight timeout
interval expires, the backlight will automatically be turned off. At the
next keypad entry, the backlight will be turned on and the specified
timeout interval will begin again.
2-14 Displaying Data
Page 77

April 2008
Activating Sleep Mode During times when the display is not in use, use the SLEEP submenu to
temporarily suspend LCD display activity, which allows the Model
GC868 to process data more quickly . Press the appropriate side of the
[SCREEN] key to activate the desired pane of the display screen, then
proceed as follows:
Note: For this discussion, it is assumed that the left pane of the
display screen is active. If the right pane is active, replace the
[F1]-[F4] keys designations by the [F5]-[F8] keys.
1. To access the Display Menu, press the
2. Press [→] and
any key . . .”
[F3] = SLEEP. The message “LCD SLEEP MODE -Press
appears.
[DISP] key.
3. To reactivate the display and return to the previous data screen,
press any key on the keypad. The Model GC868 will
automatically return to the previous data display screen.
Note: With
BIG as the selected display format, exiting SLEEP mode
may not erase the sleep mode message and the data screen
will be superimposed on the message. If this occurs, simply
enter the
DISP menu and reselect the BIG format to refresh the
screen. See the instructions earlier in this chapter.
Displaying Data 2-15
Page 78

Chapter 3
Page 79

Logging Data
Introduction. . . . . . . . . . . . . . . . . . . . . . . . . . . . . . . . . . . . . . . . . . . . . . . . . . . . 3-1
Creating a Standard Log. . . . . . . . . . . . . . . . . . . . . . . . . . . . . . . . . . . . . . . . . 3-2
Checking the Memory . . . . . . . . . . . . . . . . . . . . . . . . . . . . . . . . . . . . . . . . . . . 3-7
Stopping a Log . . . . . . . . . . . . . . . . . . . . . . . . . . . . . . . . . . . . . . . . . . . . . . . . . 3-8
Creating an ERROR Log. . . . . . . . . . . . . . . . . . . . . . . . . . . . . . . . . . . . . . . . . . 3-9
Page 80

April 2008
Introduction This chapter explains how to use the Model GC868’s data logging
capability. The
key on the keypad, is divided into four submenus:
LOG menu, which is accessed by pressing the [LOG]
• STD - used to log up to three of the available measurement data
parameters
• MEM - used to check the data logger memory to determine if the
specified log will exceed the available memory
• STOP - used to terminate current data logging activity
• ERROR - used to log any generated error messages.
Up to twenty standard or error log files may be created and stored in
battery-backed memory. Each log file contains up to three
measurement parameters, the log start time and date, the log end time
and date, the time interval between updates, and any error messages.
Error logs record data only when an error message is generated.
The Model GC868 allocates up to 120 pages of memory, each of
which can contain up to 120 records, for data logging. Each page is
assigned a header, to distinguish one page from another. The header
contains the log title, start date and time, end date and time, and the
time increment. Each record contains the date and time of the
measurement and the values for the three logged parameters.
Note: Each log file uses at least one page of memory, and the same
page can not be shared by two different logs.
Since a fixed amount of memory is allocated for data logging, the
number of active logs, the log time increments, and the length of the
log runs will all affect how much memory is available for additional
logging. For example, a log that updates every 5 seconds will use
more memory than a log that updates every 6 minutes, assuming that
they both run for the same length of time.
After a log file has been created, it may be displayed, printed, cleared
or uploaded to a personal computer. Refer to the appropriate chapters
of this manual for specific instructions.
Refer to Figure A-7 on page A-7 and proceed to the appropriate
section for the desired
in the sequence shown or the [↑] and [↓] keys may be used to scroll
through the prompts.
LOG submenu. Each submenu may be followed
Logging Data 3-1
Page 81

April 2008
Creating a Standard Log Use the STD submenu to create a new standard log and to select the
parameters to log, the log start time and date, the log end time and
date, and the time increment. Also, any log file already stored in
memory may be inspected and/or changed.
Press the appropriate side of the
[SCREEN] key to activate the desired
pane of the display screen, and complete the following steps:
1. To access the Log Menu, press the
[LOG] key.
a. If you have activated the security feature (see Chapter 1,
Programming Site Data, page 1-50 for details), enter the
assigned password and press
2. Press
[F1] = STD.
3. Use the [←], [→] and
[F1]-[F4] keys to inspect a completed log or
[ENT].
to change an active log, or enter a new name (up to 5 characters)
and press
Note: At the
[ENT] to create a new log file.
NAME prompt, the option bar will show the names of all
completed or active log files that are currently stored in
memory. Recall that a flashing asterisk (*) appears at the far
right of the locator bar if the Model GC868 is currently
logging data (see Chapter 3, Operation, of the Startup Guide).
4. At the Log Message prompt, enter a brief description (up to 21
characters) of the log. Press
5. Use the [←], [→] and
[ENT].
[F1]-[F4] keys to select the first parameter to
be logged. See Table 3-1 below for a list of the available options.
IMPORTANT: Only the first
displayed in the
Keep this in mind when selecting a parameter. See
Chapter 2, Displaying Data, for instructions.
Table 3-1: Measurement Parameter Options
Option Bar Choice Description
[F1] = VEL Flow Velocity
[F2] = VOLUM Volumetric Flow
[F3] = +TOTL Forward Totalized Volume Flow
[F4] = -TOTL Reverse Totalized Volume Flow
[→] + [F1] = MDOT Mass Flow
[→] + [F2] = +MASS Forward Totalized Mass Flow
[→] + [F3] = -MASS Reverse Totalized Mass Flow
[→] + [F4] = DIAG Diagnostic
parameter logged may be graphically
LOG Submenu of the Display Menu.
3-2 Logging Data
Page 82

Creating a Standard Log Refer to Chapter 3, Diagnostics, of the Service Manual for a
discussion of the many parameters accessible via the
Note: The units assigned to the parameters in Table 3-1 on page 3-2
are those selected in the User Program (
DIAG option.
SYSTM submenu).
April 2008
6. Use the [←], [→] and
to be logged.
7. Use the [←], [→] and
be logged.
[F1]-[F4] keys to select the second parameter
[F1]-[F4] keys to select the third parameter to
• If you selected a totalized value for display, go to step 8.
• If you did not, go to step 9.
8. At the Set Log Totals to 0 prompt, press
at their present value or press
Choosing
has no effect on the meter totals.
YES at this prompt only resets the log totals to zero and
[F2] to reset the log totals to zero.
Log Type 9. Press [F1] to create a non-circular log or press [F2] to create a
circular log.
A non-circular log automatically stops when the meter runs out of
memory or the specified
continuously until manually stopped, but only the data from the most
recent log cycle is saved. At the start of each cycle, the oldest
recorded data is overwritten by the new data from the current cycle.
END TIME is reached. A circular log runs
[F1] to leave the log totals
Caution!
If data from one circular log cycle exceeds the meter’s
memory capacity, the earliest logged data will be lost.
STARTTIME Prompt 10.Press [F1] to accept the displayed start time or press [F2] to enter a
different start time. To start logging immediately, press
[F3].
• If OK was selected, proceed to step 11.
• If NOW was selected, proceed to step 12 if you selected a the
non-circular log or to step 14 for a circular log.
• If EDIT was selected, complete the steps listed on the next page.
Logging Data 3-3
Page 83

April 2008
STARTTIME Prompt (cont.) a. Press [F1]-[F2] to select AM or PM. Then, enter the desired Hour
(1-12) and press
current time will generate an error message.)
[ENT]. (Entry of a start time earlier than the
b. Enter the desired Minutes and press
range is 0 to 59.
c. Enter the desired Seconds and press
range is 0 to 59.
[ENT]. The acceptable
[ENT]. The acceptable
START DATE Prompt 11.Press [F1] to accept the displayed Start Date or press [F2] to enter a
different start date. To start logging today, press
[F3].
• If OK or TODAY was selected, proceed to step 12 for a non-
circular log or to step 13 for a circular log.
• Otherwise, complete the following steps to Edit the Start Date.
a. Enter the desired Year and press
0 to 99.
b. Use the [←], [→] and
Month.
c. Enter the desired Day and press
1 to the number of days in the selected month (28, 29, 30 or
31).
[F1]-[F4] keys to select the desired
[ENT]. The acceptable range is
[ENT]. The acceptable range is
END TIME Prompt 12.Press [F1] to accept the displayed End Time or press [F2] to enter a
different end time. To select a specific time period for the log to
run, press
[F3].
• If OK was selected, proceed to the END DATE prompt.
• If TIMED was selected, proceed to the LOG TIME prompt.
• If EDIT was selected, complete the steps on the next page.
Note: The log
five minutes. Failure to observe this restriction will result in
an error message.
END TIME must exceed the log START TIME by at least
3-4 Logging Data
Page 84

April 2008
END TIME Prompt (cont.) a. Press [F1]-[F2] to select AM or PM. Then, enter the desired Hour
(1-12) and press
current time will generate an error message.)
[ENT]. (Entry of a start time earlier than the
b. Enter the desired Minutes and press
[ENT]. The acceptable
range is 0 to 59.
c. Enter the desired Seconds and press
[ENT]. The acceptable
range is 0 to 59.
END DATE Prompt 13.Press [F1] to accept the displayed end date or press [F2] to enter a
different end date. To end the log today, press
[F3].
• If OK or TODAY was selected, proceed to the TIME INCREMENT
prompt. Refer to Figure A-7 on page A-7 for a flow diagram of
the programming sequences.
• Otherwise, complete the steps below.
a. Enter the desired Year and press
0 to 99.
b. Use the [←], [→] and
[F1]-[F4] keys to select the desired
Month.
c. Enter the desired Day and press
1 to the number of days in the selected month (28, 29, 30 or
31). The program proceeds to step 15.
[ENT]. The acceptable range is
[ENT]. The acceptable range is
DURATION Prompt If a circular log was specified, the programming sequence continues
here after the log start time and/or start date is entered.
14.Press
[F1] and enter a log duration in hours or press [F2] and enter a
log duration in days. When the desired value has been entered,
[ENT]. The program proceeds to step 16.
press
LOG TIME Prompt If TIMED was selected at step 12, the programming sequence continues
here.
15.Use the [←], [→] and
duration.The available options are: 10min, 30min, 60min, 3 HR,
6 HR, 12 HR and 24 HR.
Logging Data 3-5
[F1]-[F4] keys to select the desired log
Page 85

April 2008
TIME INCREMENT Prompt Regardless of which of the various options were selected during the
previous programming steps, all of the paths converge at this point.
16.Use the [←], [→] and
Increment. The available options are: 5sec, 10sec, 30sec, 1min,
3min, 6min, 12min, 30min and 60 min.
The time increment is the frequency at which the Model GC868 takes
and records data measurements. If any reading takes longer than the
programmed time increment, the log is filled in with the next
consecutive reading. For example, assume that a velocity value of 3
ft/sec is recorded at 12:00:00 in a log with a time increment of five
seconds. If the next reading is 8 ft/sec and it takes the meter 12
seconds to read this value, then both of the missed readings (12:00:05
and 12:00:10) will be filled in with the 8 ft/sec value.
[F1]-[F4] keys to select the desired Time
Procedure Options You have completed entering data for a standard log. You can now do
one of the following:
• Use [↑] and [↓] to review the previous menu prompts.
• Press [F1]-[F4] to select one of the LOG submenus.
• To return to the data screen and begin logging data, press the [ENT]
key.
Although each log is restricted to only three logged parameters, it is
still possible to log more than three parameters. Simply re-enter the
STD submenu as many times as necessary to set up additional logs.
Select the other desired parameters, and run these logs simultaneously
with the first log.
3-6 Logging Data
Page 86

April 2008
Checking the Memory Use the MEM submenu to verify that the available log memory is
sufficient for the desired log. If the expected amount of logged data
will exceed the remaining memory capacity, the Model GC868
suggests that some old logs be cleared to make room for the new log.
Press the appropriate side of the
[SCREEN] key to activate the desired
pane of the display screen, and complete the following steps:
1. To access the Log Menu, press the
[LOG] key.
a. If you have activated the security feature (see Chapter 1,
Programming Site Data, page 1-50 for details), enter the
assigned password and press
2. Press
[F2] = MEM.
3. After noting the information, press
[ENT].
[ENT] to return to the main Log
Menu screen.
MEM screen lists the number of remaining unused memory pages
The
out of the total number of 120 available pages. Also, the number of
pages expected to be used by all currently programmed logs is given.
If the number of pending pages exceeds the number of free pages,
additional memory may be made available by clearing some old logs
(see Chapter 5, Clearing Data).
If it is undesirable to delete old logs to free up additional memory, the
number of pages pending may be reduced by altering the parameters
of one or more of the currently active logs. For example, either
increasing the time increment or decreasing the total logging time
will reduce the memory requirements for a log file. Use the following
equations to calculate the number of pages used by a log:
number of records
number of pages
length of log
------------------------------------=
time increment
number of records
------------------------------------------- -=
120
(3-1)
(3-2)
Consider a log that is set to run for 24 hours with a time increment of
3 minutes. From Equation 3-1, the number of records = (24 x 60)/3 =
480 records. Then, from Equation 3-2 above, the number of pages =
480/120 = 4 pages. Thus, at least four pages of memory must be
available for this log to run to completion. Notice that increasing the
time increment to 6 minutes or decreasing the length of the log to 12
hours would reduce the memory requirement to only 2 pages.
Logging Data 3-7
Page 87

April 2008
Stopping a Log Use the STOP submenu to terminate a logging process that is currently
active. Press the appropriate side of the
desired pane of the display screen, and complete the following steps:
[SCREEN] key to activate the
1. To access the Log Menu, press the
[LOG] key.
a. If you have activated the security feature (see Chapter 1,
Programming Site Data, page 1-50 for details), enter the
assigned password and press
[ENT].
Note: Once a log is stopped it cannot be restarted, but the log
remains in memory. To clear the log from memory, refer to
Chapter 5, Clearing Data, for instructions.
2. Press
3. Use the [←], [→] and
Note: At the
[F3] = STOP.
[F1]-[F4] keys to select a log file to stop.
NAME prompt, the option bar will show the names of all
completed or active log files that are currently stored in
memory. Recall that a flashing asterisk (*) appears at the far
right of the locator bar if the Model GC868 is currently
logging data (see Chapter 3, Operation, of the Startup Guide).
4. Press
[F1] to continue logging and return to the initial Log Menu
screen. Press
[F2] to stop logging and return to the initial Log Menu
screen.
Procedure Options Do one of the following:
• Press [F1]-[F4] to enter another LOG submenu.
• Press [EXIT] to return to the data screen.
3-8 Logging Data
Page 88

April 2008
Creating an ERROR Log Use the ERROR submenu to create a new error log and to select the
logging parameters. An error log updates every 5 seconds (when the
display updates), but only if a new error condition occurs. Error logs
have a fixed length of 2 pages and contain sixty records per page.
Each record shows the time of the error, the measurement parameter
values at that time, and the error code message. The logged values of
the chosen measurement parameters at the time of the error condition
provide valuable troubleshooting information.
Press the appropriate side of the
[SCREEN] key to activate the desired
pane of the display screen, and complete the following steps:
1. To access the Log Menu, press the
[LOG] key.
a. If you have activated the security feature (see Chapter 1,
Programming Site Data, page 1-50 for details), enter the
assigned password and press
2. Press
[F4] = ERROR.
3. Use the [←], [→] and
[F1]-[F4] keys to inspect a completed log or
[ENT].
to change an active log, or enter a new Name (up to 5 characters)
and press
[ENT] to create a new log file.
Note: The option bar lists all error logs currently stored in memory.
Recall that a flashing asterisk (*) appears at the far right of
the locator bar if the Model GC868 is currently logging data
(see Chapter 3, Operation, of the Startup G uide).
4. At the Log Message prompt, enter a brief description (up to 21
characters) of the log. Press
5. Use the [←], [→] and
[ENT].
[F1]-[F4] keys to select the first parameter to
be logged. See Table 3-2 below for a list of the available options.
IMPORTANT: Only the first
parameter logged may be graphically
displayed (see Chapter 2, Displaying Data).
Table 3-2: Measurement Parameter Options
Option Bar Choice Description
[F1] = VEL Flow Velocity
[F2] = VOLUM Volumetric Flow
[F3] = +TOTL Forward Totalized Volume Flow
[F4] = -TOTL Reverse Totalized Volume Flow
[→] + [F1] = MDOT Mass Flow
[→] + [F2] = +MASS Forward Totalized Mass Flow
[→] + [F3] = -MASS Reverse Totalized Mass Flow
[→] + [F4] = DIAG Diagnostic
Logging Data 3-9
Page 89

April 2008
Creating an ERROR Log
(cont.)
In addition, refer to Chapter 3, Diagnostics, of the Service Manual for
a discussion of the many parameters accessible via the
Note: The units assigned to the parameters in Table 3-2 on page 3-9
are those selected in the User Program (
6. Use the [←], [→] and
to be logged.
7. Use the [←], [→] and
be logged.
[F1]-[F4] keys to select the second parameter
[F1]-[F4] keys to select the third parameter to
SYSTM submenu).
DIAG option.
• If you selected a totalized value for display, go to step 8.
• If you did not, go to step 9.
8. At the Set Log Totals to 0 prompt, press
at their present value or press
Choosing
has no effect on the meter totals.
YES at this prompt only resets the log totals to zero and
[F2] to reset the log totals to zero.
Log Type 9. Press [F1] to create a non-circular log or press [F2] to create a
circular log.
[F1] to leave the log totals
A non-circular log automatically stops when the meter runs out of
memory or the specified
continuously until manually stopped, but only the data from the most
recent log cycle is saved. At the start of each cycle, the oldest
recorded data is overwritten by the new data from the current cycle.
If data from one circular log cycle exceeds the meter’s
memory capacity, the earliest logged data will be lost.
END TIME is reached. A circular log runs
Caution!
STARTTIME Prompt 10.Press [F1] to accept the displayed start time or press [F2] to enter a
different start time. To start logging immediately, press
[F3].
• If OK was selected, proceed to step 11.
• If NOW was selected, you have finished setting up the error log.
Proceed to Procedure Options on the next page.
• If EDIT was selected, complete the steps listed on the next page.
3-10 Logging Data
Page 90

April 2008
STARTTIME Prompt (cont.) a. Press [F1]-[F2] to select AM or PM. Then, enter the desired Hour
(1-12) and press
current time will generate an error message.)
[ENT]. (Entry of a start time earlier than the
b. Enter the desired Minutes and press
range is 0 to 59.
c. Enter the desired Seconds and press
range is 0 to 59.
[ENT]. The acceptable
[ENT]. The acceptable
START DATE Prompt 11.Press [F1] to accept the displayed Start Date or press [F2] to enter a
different start date. To start logging today, press
[F3].
• If OK or TODAY was selected, you have finished setting up the
error log. Proceed to Procedure Options below.
• Otherwise, complete the following steps to Edit the Start Date.
a. Enter the desired Year and press
0 to 99.
b. Use the [←], [→] and
Month.
c. Enter the desired Day and press
1 to the number of days in the selected month (28, 29, 30 or
31).
[F1]-[F4] keys to select the desired
[ENT]. The acceptable range is
[ENT]. The acceptable range is
Procedure Options You have completed setting up the error log. Do one of the following:
• Use [↑] and [↓] to review the previous menu prompts.
• Press [F1]-[F4] to select one of the LOG submenus.
• To return to the data screen and begin logging data, press the
[ENT] key. The * on the locator bar indicates that the Model
GC868 is now compiling the specified error log.
The error log will continue to run until it is manually stopped, the
meter runs out of memory (for a non-circular log), or the entire 120
records (2 pages x 60 records/page) have been logged.
Logging Data 3-11
Page 91

Chapter 4
Page 92

Printing Data
Introduction. . . . . . . . . . . . . . . . . . . . . . . . . . . . . . . . . . . . . . . . . . . . . . . . . . . . 4-1
Print Live Data . . . . . . . . . . . . . . . . . . . . . . . . . . . . . . . . . . . . . . . . . . . . . . . . . 4-2
Printing Logs . . . . . . . . . . . . . . . . . . . . . . . . . . . . . . . . . . . . . . . . . . . . . . . . . . . 4-5
Print Site File . . . . . . . . . . . . . . . . . . . . . . . . . . . . . . . . . . . . . . . . . . . . . . . . . . . 4-7
Stop Printing . . . . . . . . . . . . . . . . . . . . . . . . . . . . . . . . . . . . . . . . . . . . . . . . . . . 4-8
Setting Up a Printer . . . . . . . . . . . . . . . . . . . . . . . . . . . . . . . . . . . . . . . . . . . . . 4-9
Printing Signal Array Data . . . . . . . . . . . . . . . . . . . . . . . . . . . . . . . . . . . . . . 4-10
Printing RTD Data. . . . . . . . . . . . . . . . . . . . . . . . . . . . . . . . . . . . . . . . . . . . . . 4-12
Page 93

April 2008
Introduction The Model GC868 flowmeter has the capability to print any of the
data stored in its memory via the built-in RS232 communications
port. In order to use the function, the RS232 port must be connected
to a printer with a serial port input. A printer with a parallel port input
may be used with a third-party serial-to-parallel adapter.
Note: See Chapter 1, Installation, of the Startup Guide for
instructions on wiring the RS232 port. For additional
information, refer to Chapter 6, Serial Communications.
After connecting the Model GC868 to a printer, the Print Menu is
used to print live or logged data in either numeric or graphical format.
In addition, any site files stored in memory may be printed. The Print
Menu is divided into the following submenus:
• DATA - use to print live data in numeric or graphical format
• LOG - use to print a log file in numeric or graphical format
• PROG - use to print a site file
• STOP - use to terminate any active print jobs
• PRNTR - use to specify the printer currently connected
• SGNLS - use to print transducer signal array data
• RTDs - use to send the numeric point value of a connected RTD
device to the RS232 port.
For purposes of this discussion it is assumed that the left pane of the
data display screen is active. If the right pane of the data display
screen is active, all of the instructions remain the same, except that
any references to the
keys.
Refer to Figure A-6 on page A-6 and proceed to the desired section
for detailed instructions. As an additional aid, the relevant portion of
the full menu map is reproduced in each section of this chapter. Any
submenu may be followed in the sequence shown or the [↑] and [↓]
keys may be used to scroll through the prompts.
Note: If a printer has not yet been set up, the instructions in “The
PRNTR Submenu” must be completed before proceeding to any
of the other submenus.
[F1]-[F4] keys should be replaced by the [F5]-[F8]
Printing Data 4-1
Page 94

April 2008
Print Live Data Use the DATA submenu to print live measurement data, as it is
collected. The data may be printed in either numeric or graphical
format, with a user specified time increment.
IMPORTANT: Make sure that a printer has been properly set up
before proceeding with this section.
To print live measurement data, refer to Figure A-5 on page A-5 and
complete the following steps:
1. To access the Print Menu, press the
Note: The Print Menu is not
protected by the security feature and a
[PRNT] key.
password is never required to access this menu.
2. Press
3. Press
[F1] to select the DATA option.
[F1] = NUM to print the data in numeric format or press [F2] =
PLOT
to print the data in graphical format.
• If you press [F1], go to step 4.
• If you press [F2], go to step 8.
Numeric Format 4. Use the [←], [→] and [F1]-[F4] keys to select the first parameter to
be printed. See Table 4-1 below for a list of the available options.
Table 4-1: Measurement Parameter Options
Option Bar Choice Description
[F1] = VEL Flow Velocity
[F2] = VOLUM Volumetric Flow
[F3] = +TOTL Forward Totalized Volume Flow
[F4] = -TOTL Reverse Totalized Volume Flow
[→] + [F1] = MDOT Mass Flow
[→] + [F2] = +MASS Forward Totalized Mass Flow
[→] + [F3] = -MASS Reverse Totalized Mass Flow
[→] + [F4] = DIAG Diagnostic
Refer to Chapter 3, Diagnostics, of the Service Manual for a
discussion of the many parameters accessible via the
DIAG option.
Note: The units assigned to the parameters in Table 4-1 above are
those selected in the User Program (
4-2 Printing Data
SYSTM submenu).
Page 95

April 2008
Numeric Format (cont.) 5. Use the [←], [→] and [F1]-[F4] keys to select the second parameter
to be printed.
6. Use the [←], [→] and
[F1]-[F4] keys to select the third parameter to
be printed.
7. Use the [←], [→] and
[F1]-[F4] keys to select the desired time
increment (the frequency at which measurements are tak e n). The
available options are: 5sec, 10sec, 30sec, 1min, 3min, 6min and
12min.
After the time increment is chosen, the Model GC868 returns to the
standard data display screen and continues to take measurements. The
live data is printed at the specified time intervals, until a
command is issued (see the instructions for the
STOP submenu). A
STOP
portion of a typical printout is shown in Figure 4-1 below.
DATA_DUMP OF (SITE NAME)
Channel LABEL Channel MESSAGE
Start Date
Start Time
HH:MM:SS
CH1 CH1 CH1
VOLUM
ACF/HR
20 OCT 97
03:08:40 PM
+TOTL
ACF
SNDSP
FT/S
03:08:40 P
03:08:50 P
03:09:00 P
03:09:10 P
03:09:20 P
03:09:30 P
03:09:40 P
03:09:50 P
03:10:00 P
03:10:10 P
.
.
686.85
666.71
662.28
675.59
669.79
675.99
670.70
684.00
680.58
678.12
.
.
218.92
220.83
222.70
224.84
226.71
228.58
230.45
232.57
234.46
236.34
.
.
1039.147
1039.003
1039.511
1039.509
1039.470
1039.137
1039.105
1039.082
1039.255
1038.860
.
.
Figure 4-1: Typical Numeric Printout
Graphical Format To print live data in graphical format, continue as follows:
8. Use the [←], [→] and
be printed. See Table 4-2 on page 4-4 for a list of the available
options.
[F1]-[F4] keys to select the first parameter to
Printing Data 4-3
Page 96
April 2008
Graphical Format (cont.)
Table 4-2: Measurement Parameter Options
Option Bar Choice Description
[F1] = VEL Flow Velocity
[F2] = VOLUM Volumetric Flow
[F3] = +TOTL Forward Totalized Volume Flow
[F4] = -TOTL Reverse Totalized Volume Flow
[→] + [F1] = MDOT Mass Flow
[→] + [F2] = +MASS Forward Totalized Mass Flow
[→] + [F3] = -MASS Reverse Totalized Mass Flow
[→] + [F4] = DIAG Diagnostic
Refer to Chapter 3, Diagnostics, of the Service Manual for a
discussion of the many parameters accessible via the
DIAG option.
Note: The units assigned to the parameters in Table 4-2 above are
those selected in the User Program (
SYSTM submenu).
9. Enter the desired maximum value for the Y (vertical) axis and
[ENT].
press
Note: Enter a
Y AXIS MAX value that is larger than the largest
expected measurement value.
10.At the Y Range prompt, press
or press
11. Use the [←], [→] and
[F2] to display both the positive and negative y axis.
[F1]-[F4] keys to select the desired Time
[F1] to show only the positive Y axis
Increment (the frequency at which measurements are taken). The
available options are: 5sec, 10sec, 30sec, 1min, 3min, 6min and
12min.
After the time increment is chosen, the Model GC868 returns to the
standard data display screen and continues to take measurements. The
live data is printed at the specified time intervals, until a
command is issued (see the instructions for the
STOP submenu). A
STOP
portion of a typical printout is shown in Figure 4-2 below.
CHANNEL NAME CHANNEL MESSAGE
1.0
.9
.8
.7
.6
.5
.4
.3
.2
.1
0.0
START TIME
03:27:01 PM
20 OCT 97
X-AXIS 50 seconds PER-DIV
Y-AXIS MAX 500 ACF/M
1.0
0.0
END TIME
03:28:46 PM
20 OCT 97
.9
.8
.7
.6
.5
.4
.3
.2
.1
Figure 4-2: Typical Graphical Printout
4-4 Printing Data
Page 97

April 2008
Printing Logs Use the LOG submenu to print logged measurement data, from a log
file in the meter’s memory. The data may be printed in either numeric
or graphical format, with a user specified time increment.
IMPORTANT: Make sure that a printer has been properly set up
before proceeding with this section.
To print logged measurement data, refer to Figure A-6 on page A-6
and complete the following steps:
1. To access the Print Menu, press the
Note: The Print Menu is not
protected by the security feature and a
[PRNT] key.
password is never required to access this menu.
2. Press
3. At the Format prompt, press
4. Use the [←], [→] and
Note: At the
[F2] = LOG.
or press
[F1] to print the log in numeric format
[F2] to print the log in graphical format.
[F1]-[F4] keys to select a log file to print.
NAME prompt, the option bar shows the names of all
completed or active log files currently stored in memory. If an
active log is selected for printing, only the data already
accumulated at the time of the print command will be printed.
5. Enter the number of the First Page of the log to print and press
[ENT]. (This prompt does not appear if the log file is only one page
long.)
6. Enter the total number of log pages to print and press
[ENT]. (This
prompt does not appear if the log file is only one page long.)
• If you chose [F1] (Numeric) at step 3, see the section below.
• If you chose [F2] (Graphic) at step 3, go to the next page.
Numeric Format After the numeric format (and starting page and number of pages, if
applicable) is chosen, the Model GC868 returns to the standard data
display screen and begins printing the log file. The printout continues
until the entire log has been printed or until a
(see the instructions for the
STOP submenu). A portion of a typical
printout is shown in Figure 4-3 below.
LOG DUMP
LOG NAME Page# 1
LOG MESSAGE
Start Date
Start Time
End Date
End Time
HH:MM:SS
11:50:45 A
11:50:55 A
11:51:05 A
09 SEP 97
11:50:43 AM
09 SEP 97
11:54:45 PM
Ch1 Ch1 Ch2
VOLUM
ACF/HR
686.85
666.71
662.28
Figure 4-3: Typical Numeric Printout
Printing Data 4-5
STOP command is issued
+TOTL
ACF
218.92
220.83
222.70
SNDSP
FT/S
1039.147
1039.003
1039.511
Page 98

April 2008
Graphical Format After the graphical format (and starting page and number of pages, if
applicable) is chosen, complete the following additional steps:
7. Enter the desired maximum value for the Y (vertical) axis and
[ENT].
press
Note: Enter a
Y AXIS MAX value that is larger than the largest logged
measurement value.
8. At the Y Range prompt, press
or press
[F2] to display both the positive and negative y axis.
[F1] to show only the positive Y axis
The Model GC868 returns to the standard data display screen and
begins printing the log file. The printout continues until the entire log
has been printed or until a
instructions for the
STOP submenu). A portion of a typical printout is
STOP command is issued (see the
shown in Figure 4-4 below.
1.0
.9
.8
.7
.6
.5
.4
.3
.2
.1
0.0
START TIME
03:27:01 PM
20 OCT 97
CHANNEL NAME
X-AXIS 50 seconds PER-DIV
Y-AXIS MAX 500 ACF/M
CHANNEL MESSAGE
1.0
0.0
END TIME
03:28:46 PM
20 OCT 97
.9
.8
.7
.6
.5
.4
.3
.2
.1
Figure 4-4: Typical Graphical Printout
4-6 Printing Data
Page 99

April 2008
Print Site File Use the PROG submenu to print the data in a site file that was set up
and saved as described in Chapter 1, Programming Site Data. T o print
a site file, refer to Figure A-6 on page A-6 and complete the following
steps:
IMPORTANT: Make sure that a printer has been properly set up
before proceeding with this section.
1. To access the Print Menu, press the
Note: The Print Menu is not
protected by the security feature and a
[PRNT] key.
password is never required to access this menu.
2. Press
3. Use the [←], [→] and
[F3] = PROG.
[F1]-[F4] keys to select the desired Site File
to print.
Note: All site files currently in memory appear on the option bar.
The active site file is always listed as the first choice
(Work).
The Model GC868 returns to the standard data display screen and
generates a site file printout similar to the one shown in Figure 4-5
below. The printout continues until the entire file has been printed or
until a
STOP command is issued (see the instructions for the STOP
submenu on the next page.
PROGRAM PARAMETERS of SITE NAME
Model GF868 GF3G
With 1K FIFO and 1113 receiver board.
At 9:54:39 AM on 11 FEB 99
ACTIVE PARAMETERS:
Site status
Skan/measure mode
SYSTEM PARAMETERS:
no LABEL No MESSAGE
System Units
Totalizer Option
Volumetric Units
Volumetric Time
VOL Decimal Digits
Totalizer Units
TOT Decimal Digits
Mass Flow Units
MDOT Decimal Digits
Mass Units Pounds
Mass Decimal Digits
PIPE PARAMETERS:
Transducer number
Pipe OD
Pipe Wall
Path Length
Axial Dimension L
Multi K-factors OFF
Burst
Skan Only
ENGLISH
Automatic
Thousands ACF
/min
0
Actual cubic ft
0
Pounds
0
0
81
12.000 inches
0.200 inches
16.97 inches
12.00 inches
Figure 4-5: Typical Site File Printout
Printing Data 4-7
Page 100

April 2008
Stop Printing Use the STOP submenu to terminate the printing of live, logged or site
data. To stop any active printing activity, see Figure A-6 on page A-6
and complete the following steps:
IMPORTANT: Make sure that a printer has been properly set up
before proceeding with this section.
1. To access the Print Menu, press the
Note: The Print Menu is not
protected by the security feature and a
[PRNT] key.
password is never required to access this menu.
2. Press
3. Press
[F4] = STOP.
[F1] to continue printing or press [F2] to Stop the currently
active printing job.
Note: After the STOP command has been issued, the printer will
complete the printing of any data already in the printer buffer.
Either wait for the printer to finish or turn the printer off to
empty the buffer immediately.
The Model GC868 returns to the standard data display screen and
normal measurement taking.
4-8 Printing Data
 Loading...