

Page 1
M5APGT00
CONFIDENTIAL
Owner’s Manual
December 2014 Printed in Taiwan 190-01841-00_0A
Page 2

All rights reserved. Under the copyright laws, this manual may not be copied, in whole or in part, without the written consent of Garmin. Garmin reserves the
CONFIDENTIAL
right to change or improve its products and to make changes in the content of this manual without obligation to notify any person or organization of such
changes or improvements. Go to www.garmin.com for current updates and supplemental information concerning the use of this product.
Garmin®, the Garmin logo,
other countries. echoMAP™GMR™,
be used without the express permission of Garmin.
The
Bluetooth
trademark of Cisco Systems, Inc. used under license by Apple Inc. The SDHC logo is a trademark of SD-3C, LLC. NMEA®, NMEA 2000®, and the NMEA 2000
logo are registered trademarks of the National Marine Electronics Association. SiriusXM® is a registered trademark of SiriusXM Radio Inc. Wi‑Fi® is a registered
mark of Wi-Fi Alliance Corporation. Windows® is a registered trademark of Microsoft Corporation in the United States and other countries. All other trademarks
and copyrights are the property of their respective owners.
®
word mark and logos are owned by the Bluetooth SIG, Inc. and any use of such marks by Garmin is under license. iOS® is a registered
BlueChart
®
, g2 Vision®, GPSMAP®, and
™
™
,
GRID
, HomePort™, and
GXM
MapSource
SmartMode
®
are trademarks of Garmin Ltd. or its subsidiaries, registered in the USA and
™
are trademarks of Garmin Ltd. or its subsidiaries. These trademarks may not
Page 3

Table of Contents
CONFIDENTIAL
Introduction.....................................................................1
Front View...................................................................................1
Accessing Owner's Manuals on the Chartplotter........................ 1
Downloading the Manuals.......................................................... 1
Getting More Information............................................................ 1
Software Update......................................................................... 1
Loading the New Software on a Memory Card...................... 1
Updating the Device Software............................................... 1
GPS Satellite Signals..................................................................1
Selecting the GPS Source..................................................... 1
Customizing the Chartplotter........................................ 1
Home Screen.............................................................................. 1
Adding an Item to Favorites................................................... 2
Customizing the Layout of a SmartMode or Combination
Page.......................................................................................2
Adding a SmartMode Layout................................................. 2
Adding a Custom Combination Screen.................................. 2
Resetting the Station Layouts................................................ 2
Setting the Vessel Type.............................................................. 2
Adjusting the Backlight............................................................... 2
Adjusting the Color Mode........................................................... 2
Charts and 3D Chart Views........................................... 2
Navigation Chart and Offshore Fishing Chart............................. 3
Zooming In and Out Using the Touchscreen......................... 3
Selecting a Map..................................................................... 3
Measuring a Distance on the Chart....................................... 3
Chart Symbols....................................................................... 3
Showing a Different Chart...................................................... 3
Creating a Waypoint on the Chart......................................... 3
Viewing Location and Object Information on a Chart............ 3
Viewing Details about Navaids.............................................. 4
Navigating to a Point on the Chart......................................... 4
Premium Charts.......................................................................... 4
Viewing Tide Station Information........................................... 4
Showing Satellite Imagery on the Navigation Chart.............. 5
Viewing Aerial Photos of Landmarks..................................... 5
Automatic Identification System..................................................5
AIS Targeting Symbols.......................................................... 5
Heading and Projected Course of Activated AIS Targets...... 5
Showing AIS and MARPA Vessels on a Chart or on a 3D
Chart View............................................................................. 5
Activating a Target for an AIS Vessel.................................... 6
Viewing a List of AIS and MARPA Threats............................ 6
Setting the Safe-Zone Collision Alarm................................... 6
AIS Distress Signals.............................................................. 6
Turning Off AIS Reception..................................................... 6
Chart and 3D Chart View Settings.............................................. 6
Navigation and Fishing Chart Setup...................................... 7
Waypoints and Tracks Settings on the Charts and Chart
Views..................................................................................... 7
Chart Appearance Settings.................................................... 7
Other Vessels Settings on the Charts and Chart Views........ 7
Laylines Settings.................................................................... 7
Fish Eye 3D Settings............................................................. 7
Navigation with a Chartplotter...................................... 8
Basic Navigation Questions........................................................ 8
Destinations................................................................................ 8
Searching for a Destination by Name.................................... 8
Selecting a Destination Using the Navigation Chart.............. 8
Searching for a Marine Services Destination......................... 8
Searching for a Volvo Penta® Dealer.................................... 8
Waypoints................................................................................... 8
Marking Your Present Location as a Waypoint...................... 8
Creating a Waypoint at a Different Location.......................... 8
Marking an SOS Location...................................................... 9
Viewing a List of all Waypoints.............................................. 9
Editing a Saved Waypoint...................................................... 9
Moving a Saved Waypoint..................................................... 9
Browsing for and Navigating to a Saved Waypoint................ 9
Deleting a Waypoint or an MOB............................................ 9
Deleting All Waypoints........................................................... 9
Setting and Following a Direct Course Using Go To............. 9
Routes........................................................................................ 9
Creating and Navigating a Route From Your Present
Location................................................................................. 9
Creating and Saving a Route............................................... 10
Viewing a List of Routes...................................................... 10
Editing a Saved Route......................................................... 10
Browsing for and Navigating a Saved Route....................... 10
Browsing for and Navigating Parallel to a Saved Route...... 10
Deleting a Saved Route....................................................... 10
Deleting All Saved Routes................................................... 10
Auto Guidance.......................................................................... 10
Setting and Following an Auto Guidance Path.................... 10
Creating and Saving an Auto Guidance Path...................... 10
Adjusting a Saved Auto Guidance Path............................... 11
Canceling an Auto Guidance Calculation in Progress......... 11
Setting a Timed Arrival.........................................................11
Auto Guidance Line Configurations..................................... 11
Tracks....................................................................................... 12
Showing Tracks................................................................... 12
Setting the Color of the Active Track................................... 12
Saving the Active Track....................................................... 12
Viewing a List of Saved Tracks............................................ 12
Editing a Saved Track.......................................................... 12
Saving a Track as a Route...................................................12
Browsing for and Navigating a Recorded Track.................. 12
Deleting a Saved Track........................................................12
Deleting All Saved Tracks.................................................... 12
Retracing the Active Track................................................... 12
Clearing the Active Track..................................................... 12
Managing the Track Log Memory During Recording........... 12
Configuring the Recording Interval of the Track Log........... 12
Stopping Navigation................................................................. 12
Synchronizing User Data Across the Garmin Marine Network. 12
Deleting All Saved Waypoints, Routes, and Tracks................. 12
Sailing Features............................................................ 13
Setting the Vessel Type............................................................ 13
Sail Racing................................................................................13
Starting Line Guidance........................................................ 13
Setting the Starting Line...................................................... 13
Using the Starting Line Guidance........................................ 13
Starting the Race Timer....................................................... 13
Stopping the Race Timer..................................................... 13
Setting the Distance between the Bow and the GPS
Antenna................................................................................13
Laylines Settings.......................................................................13
Setting the Keel Offset.............................................................. 13
Sailboat Autopilot Operation..................................................... 14
Wind Hold............................................................................ 14
Tack and Gybe.....................................................................14
Sonar............................................................................. 14
Sonar Views..............................................................................14
Traditional Sonar View......................................................... 14
DownVü Sonar View............................................................ 15
SideVü Sonar View.............................................................. 15
Split-Zoom Sonar View........................................................ 15
Split-Frequency Sonar View................................................ 15
Changing the Sonar View.................................................... 15
Table of Contents i
Page 4

Creating a Waypoint on the Sonar Screen............................... 15
CONFIDENTIAL
Pausing the Sonar Display....................................................... 15
Viewing Sonar History.............................................................. 15
Sonar Sharing........................................................................... 15
Selecting a Sonar Source.................................................... 16
Renaming a Sonar Source.................................................. 16
Adjusting the Level of Detail..................................................... 16
Adjusting the Color Intensity..................................................... 16
Adjusting the Range of the Depth or Width Scale.................... 16
Setting the Zoom Level on the Sonar Screen........................... 16
Setting the Scroll Speed........................................................... 16
Sonar Frequencies................................................................... 17
Selecting Frequencies......................................................... 17
Creating a Frequency Preset............................................... 17
Turning On the A-Scope........................................................... 17
Selecting the Transducer Type................................................. 17
Sonar Setup.............................................................................. 17
Sonar Settings..................................................................... 17
Sonar Noise Rejection Settings........................................... 17
Sonar Appearance Settings................................................. 18
Sonar Alarm Settings........................................................... 18
Advanced Sonar Settings.................................................... 18
Transducer Installation Settings.......................................... 18
Sonar Recordings..................................................................... 18
Recording the Sonar Display............................................... 18
Stopping the Sonar Recording............................................. 18
Deleting a Sonar Recording................................................. 18
Playing Sonar Recordings................................................... 19
Radar............................................................................. 19
Radar Display Modes............................................................... 19
Changing the Radar Mode....................................................... 19
Transmitting Radar Signals...................................................... 19
Adjusting the Radar Range...................................................... 19
Tips for Selecting a Radar Range........................................ 19
Zooming In and Out of the Radar Screen................................. 19
Marking a Waypoint on the Radar Screen................................ 19
Sentry Mode............................................................................. 19
Enabling Timed Transmit..................................................... 19
Setting the Standby and Transmit Times............................. 20
Enabling a Guard Zone........................................................ 20
Defining a Circular Guard Zone........................................... 20
Defining a Partial Guard Zone............................................. 20
Radar Targeting and MARPA................................................... 20
MARPA Targeting Symbols................................................. 20
Assigning a MARPA Tag to an Object................................. 20
Viewing a List of AIS and MARPA Threats.......................... 20
Showing AIS Vessels on the Radar Screen........................ 20
VRM and EBL...................................................................... 20
Radar Overlay...........................................................................21
Radar Overlay and Chart Data Alignment........................... 21
Showing the Radar Overlay................................................. 21
Setting a Custom Park Position................................................ 21
Enabling and Adjusting a Radar No Transmit Zone................. 21
Stopping the Transmission of Radar Signals........................... 21
Optimizing the Radar Display................................................... 21
Radar Gain and Clutter........................................................ 21
Echo Trails........................................................................... 22
Radar Display Settings........................................................ 22
Radar Appearance Settings................................................. 23
Front-of-Boat Offset............................................................. 23
Selecting a Different Radar Source.......................................... 23
Autopilot........................................................................ 23
Opening the Autopilot Screen................................................... 23
Autopilot Screen....................................................................... 23
Adjusting the Step Steering Increment................................ 23
Setting the Power Saver...................................................... 23
Enabling Shadow Drive™.................................................... 23
Engaging the Autopilot............................................................. 23
Adjusting the Heading with the Helm................................... 24
Adjusting the Heading with the Chartplotter in Step Steering
Mode.................................................................................... 24
Steering Patterns...................................................................... 24
Following the U-Turn Pattern............................................... 24
Setting Up and Following the Circles Pattern...................... 24
Setting Up and Following the Zigzag Pattern...................... 24
Following the Williamson Turn Pattern................................ 24
Following an Orbit Pattern................................................... 24
Setting Up and Following the Cloverleaf Pattern................. 24
Setting Up and Following a Search Pattern......................... 24
Cancelling a Steering Pattern.............................................. 24
Digital Selective Calling............................................... 24
Networked Chartplotter and VHF Radio Functionality.............. 24
Turning On DSC....................................................................... 25
DSC List....................................................................................25
Viewing the DSC List........................................................... 25
Adding a DSC Contact......................................................... 25
Incoming Distress Calls............................................................ 25
Navigating to a Vessel in Distress....................................... 25
Man-Overboard Distress Calls Initiated from a VHF Radio. 25
Man-Overboard and SOS Distress Calls Initiated from the
Chartplotter.......................................................................... 25
Position Tracking...................................................................... 25
Viewing a Position Report.................................................... 25
Navigating to a Tracked Vessel........................................... 25
Creating a Waypoint at the Position of a Tracked Vessel.... 25
Editing Information in a Position Report.............................. 25
Deleting a Position-Report Call............................................ 25
Viewing Vessel Trails on the Chart...................................... 25
Individual Routine Calls............................................................ 26
Selecting a DSC Channel.................................................... 26
Making an Individual Routine Call....................................... 26
Making an Individual Routine Call to an AIS Target............ 26
Gauges and Graphs..................................................... 26
Viewing the Gauges................................................................. 26
Changing the Data Shown in a Gauge................................ 26
Customizing Engine Gauge and Fuel Gauge Limits............ 26
Viewing Engine and Fuel Gauges............................................ 26
Selecting the Number of Engines Shown in Gauges........... 26
Customizing the Engines Shown in Gauges........................ 26
Enabling Status Alarms for Engine Gauges........................ 26
Enabling Some Engine Gauge Status Alarms..................... 26
Setting the Fuel Alarm.............................................................. 26
Setting the Fuel Capacity of the Vessel............................... 26
Synchronizing the Fuel Data with the Actual Vessel Fuel... 27
Viewing the Wind Gauges........................................................ 27
Configuring the Sailing Wind Gauge.................................... 27
Configuring the Speed Source............................................. 27
Configuring the Heading Source of the Wind Gauge........... 27
Customizing the Close-Hauled Wind Gauge....................... 27
Viewing Trip Gauges................................................................ 27
Resetting Trip Gauges......................................................... 27
Viewing Graphs........................................................................ 27
Setting the Graph Range and Time Scales......................... 27
Tide, Current, and Celestial Information.................... 27
Tide Station Information............................................................27
Current Station Information.......................................................27
Celestial Information................................................................. 27
Viewing Tide Station, Current Station, or Celestial Information
for a Different Date................................................................... 28
Viewing Information for a Different Tide or Current Station...... 28
Viewing Almanac Information from the Navigation Chart......... 28
ii Table of Contents
Page 5

Warning Manager......................................................... 28
CONFIDENTIAL
Viewing Messages.................................................................... 28
Sorting and Filtering Messages................................................ 28
Saving Messages to a Memory Card........................................28
Clearing all of the Messages.................................................... 28
Media Player................................................................. 28
Opening the Media Player........................................................ 28
Icons.................................................................................... 28
Selecting the Media Source...................................................... 28
Playing Music............................................................................28
Browsing for Music...............................................................28
Setting a Song to Repeat..................................................... 28
Setting All Songs to Repeat................................................. 28
Setting Songs to Shuffle...................................................... 28
Listening to the Radio.......................................................... 28
Opening the MTP Source.................................................... 29
Adjusting the Volume................................................................ 29
Enabling and Disabling Zones............................................. 29
Muting the Media Volume.................................................... 29
Scanning VHF Channels.......................................................... 29
Adjusting the VHF Squelch....................................................... 29
SiriusXM® Satellite Radio........................................................ 29
Locating a SiriusXM Radio ID.............................................. 29
Activating a SiriusXM Subscription...................................... 29
Customizing the Channel Guide.......................................... 29
Saving a SiriusXM Channel to the Presets List................... 29
Unlocking SiriusXM Parental Controls................................. 29
Setting the Device Name.......................................................... 30
SiriusXM Weather......................................................... 30
SiriusXM Equipment and Subscription Requirements.............. 30
Weather Data Broadcasts.........................................................30
Changing the Weather Chart.................................................... 30
Viewing Precipitation Information............................................. 30
Precipitation Views...............................................................30
Storm Cell and Lightning Information....................................... 30
Hurricane Information............................................................... 30
Weather Warnings and Weather Bulletins................................ 30
Forecast Information................................................................. 31
Viewing Forecast Information for Another Time Period....... 31
Weather Fronts and Pressure Centers................................ 31
Viewing a Marine Forecast or an Offshore Forecast........... 31
City Forecasts...................................................................... 31
Viewing Sea Conditions............................................................ 31
Surface Winds......................................................................31
Wave Height, Wave Period, and Wave Direction................ 31
Viewing Forecast Sea Conditions Information for Another
Time Period..........................................................................31
Viewing Fishing Information......................................................31
Surface Pressure and Water Temperature Data................. 31
Forecasting Fish Locations.................................................. 32
Changing the Sea Surface Temperature Color Range........ 32
Visibility Information.................................................................. 32
Viewing Forecast Visibility Information for Another Time
Period...................................................................................32
Viewing Buoy Reports.............................................................. 32
Viewing Local Weather Information near a Buoy................. 32
Creating a Waypoint on a Weather Chart................................. 32
Weather Overlay....................................................................... 32
Turning On the Weather Overlay on a Chart....................... 32
Weather Overlay Settings on the Navigation Chart............. 32
Weather Overlay Settings on the Fishing Chart.................. 32
Viewing Weather Subscription Information............................... 32
Viewing Video............................................................... 32
Selecting a Video Source......................................................... 33
Alternating Among Multiple Video Sources......................... 33
Networked Video Devices.........................................................33
Using Video Presets on Networked Video Cameras........... 33
Camera Settings.................................................................. 33
Video Settings...................................................................... 33
Associating the Camera to a Video Source......................... 33
Video Camera Movement Control........................................33
Creating a Combination with Video Functions.......................... 34
Configuring the Video Appearance........................................... 34
Configuring the PC Display.......................................................34
Exiting PC Display Mode..................................................... 34
Device Configuration................................................... 34
Turning On the Chartplotter Automatically............................... 34
System Settings........................................................................ 34
Station Settings.................................................................... 34
Viewing System Software Information................................. 34
Viewing the Event Log......................................................... 34
Preferences Settings................................................................ 34
Units Settings....................................................................... 35
Navigation Settings.............................................................. 35
Communications Settings......................................................... 36
NMEA 0183 Settings............................................................36
NMEA 2000 Settings............................................................36
Garmin Marine Network....................................................... 36
Setting Alarms.......................................................................... 36
Navigation Alarms................................................................ 36
System Alarms..................................................................... 36
Setting the Fuel Alarm......................................................... 36
Setting Weather Alarms....................................................... 36
My Vessel Settings................................................................... 36
Setting the Keel Offset......................................................... 36
Setting the Water Temperature Offset................................. 37
Calibrating a Water Speed Device....................................... 37
Setting the Vessel Type....................................................... 37
Other Vessels Settings............................................................. 37
Restoring the Original Chartplotter Factory Settings................ 37
Communication with Wireless Devices...................... 37
Setting Up the Wi‑Fi® Wireless Network.................................. 37
Connecting a Wireless Device to the Chartplotter.................... 37
Changing the Wireless Channel............................................... 38
Changing the Wi‑Fi Host...........................................................38
Wireless Remote Control.......................................................... 38
Pairing the Wireless Remote Control With the
Chartplotter.......................................................................... 38
Turning On and Off the Remote Backlight........................... 38
Disconnecting the Remote from All Chartplotters................ 38
Using the Garmin Helm Application with the Chartplotter........ 38
Chartplotter Data Management................................... 38
Copying Waypoints, Routes, and Tracks from HomePort to a
Chartplotter............................................................................... 38
Selecting a File Type for Third-Party Waypoints and Routes... 38
Copying Data from a Memory Card.......................................... 38
Copying Waypoints, Routes, and Tracks to a Memory Card.... 38
Copying Waypoints, Routes, and Tracks to or from all
Chartplotters on the Network.................................................... 38
Copying Built-In Maps to a Memory Card................................. 38
Backing Up Data to a Computer............................................... 38
Restoring Backup Data to a Chartplotter.................................. 39
Saving System Information to a Memory Card......................... 39
Appendix....................................................................... 39
Registering Your Device........................................................... 39
Digital Switching....................................................................... 39
Rotating the GRID Joystick.......................................................39
Cleaning the Screen................................................................. 39
Screenshots.............................................................................. 39
Capturing Screenshots........................................................ 39
Table of Contents iii
Page 6

Copying Screenshots to a Computer................................... 39
CONFIDENTIAL
Troubleshooting........................................................................ 39
My device will not acquire GPS signals............................... 39
My device will not turn on or keeps turning off..................... 39
My device is not creating waypoints in the correct
location.................................................................................40
NMEA 0183 Information........................................................... 40
NMEA 2000 PGN Information...................................................40
Software License Agreement................................................... 40
Index.............................................................................. 42
iv Table of Contents
Page 7
Introduction
CONFIDENTIAL
WARNING
See the Important Safety and Product Information guide in the
product box for product warnings and other important
information.
The Garmin® website at www.garmin.com presents up-to-date
information about your product. The support pages will provide
answers to frequently asked support questions, and you can
download software and chart updates. There is also contact
information to Garmin support should you have any questions.
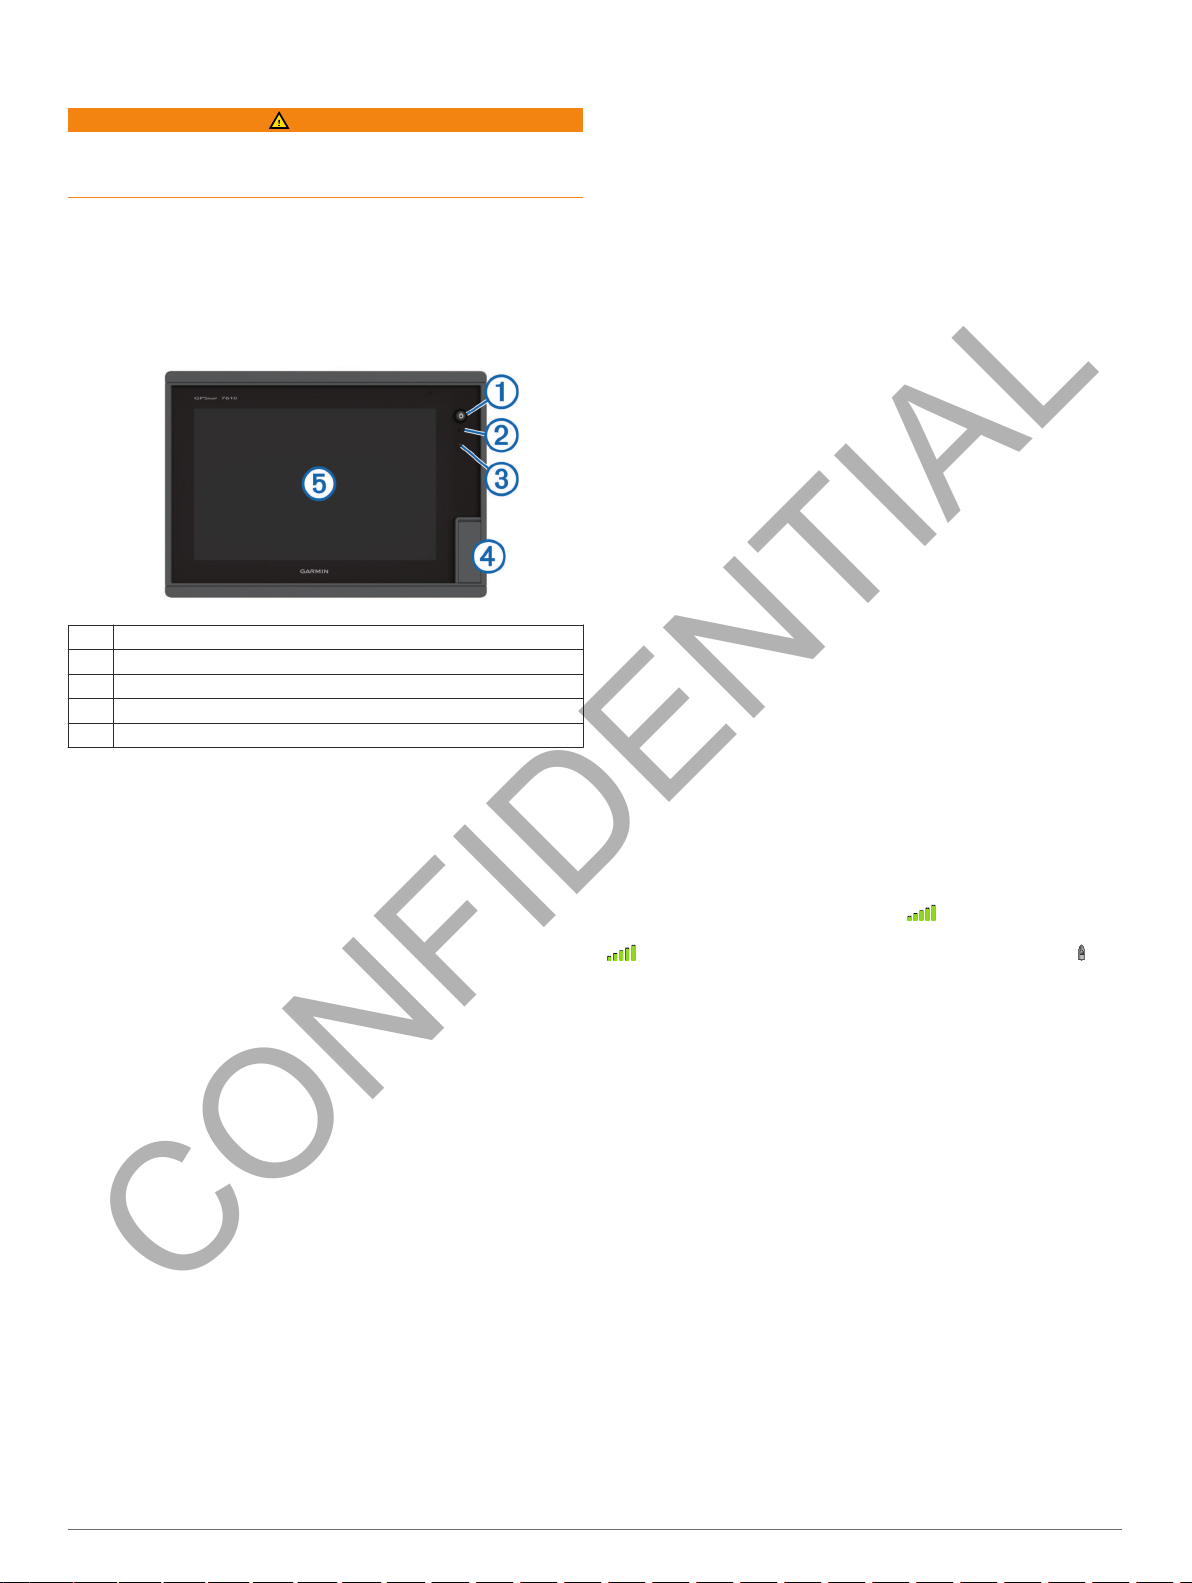
Front View
Power key
À
Automatic backlight sensor
Á
Beeper
Â
SD or microSD™* memory card slot
Ã
Touchscreen
Ä
*Seven-inch models have microSD card slots.
Accessing Owner's Manuals on the Chartplotter
Select Info > Owner's Manual.
1
Select a manual.
2
Select Open.
3
Downloading the Manuals
You can get the latest owner's manual and translations of
manuals from the web.
TIP: To quickly open this web page, scan this code:
Download the manual.
2
Software Update
You may need to update the device software when you install
the device or add an accessory to the device.
Loading the New Software on a Memory Card
Insert a memory card into the card slot on the computer.
1
Go to www.garmin.com/support/software/marine.html.
2
Select Download next to Garmin Marine Network with SD
3
card.
Read and agree to the terms.
4
Select Download.
5
Select Run.
6
Select the drive associated with the memory card, and select
7
Next >
Updating the Device Software
Before you can update the software, you must obtain a
software-update memory card or load the latest software onto a
memory card.
Turn on the chartplotter.
1
After the home screen appears, insert the memory card into
2
the card slot.
NOTE: In order for the software update instructions to
appear, the device must be fully booted before the card is
inserted.
Follow the on-screen instructions.
3
Wait several minutes while the software update process
4
completes.
The device returns to normal operation after the software
update process is complete.
Remove the memory card.
5
NOTE: If the memory card is removed before the device
restarts fully, the software update is not complete.
Finish
.
GPS Satellite Signals
When you turn on the chartplotter, the GPS receiver must collect
satellite data and establish the current location. When the
chartplotter acquires satellite signals, appears at the top of
the Home screen. When the chartplotter loses satellite signals,
disappears and a flashing question mark appears over on
the chart.
For more information about GPS, go to www.garmin.com
/aboutGPS.
Selecting the GPS Source
You can select your preferred source for GPS data, if you have
more than one GPS source.
Select Settings > System > GPS
1
Select the source for GPS data.
2
> Source
.
Getting More Information
If you have any questions about your device, you can contact
Garmin Product Support.
The website, www.garmin.com/support, offers many different
troubleshooting tips to help resolve most issues and answer
most questions.
• Frequently-asked questions (FAQs)
• Software updates
• Owner's and installation manuals
• Service alerts
• Video
• Contact numbers and addresses
Introduction 1
Home Screen
The chartplotter home screen provides access to all of the
features in the chartplotter. The features are dependant on the
accessories you have connected to the chartplotter. You may
not have all of the options and features discussed in this
manual.
The categories along the right of the screen provide quick
access to the main features of your chartplotter. For example,
the Sonar category displays the views and pages related to the
sonar feature. You can save items you commonly access to the
Favorites category.
Customizing the Chartplotter
Page 8

All of the options along the bottom of the home screen are
CONFIDENTIAL
visible on all other screens, except for the Settings button. The
Settings button is accessible only from the home screen.
When viewing another screen, you can return to the home
screen by selecting Home.
When multiple displays are installed on the Garmin Marine
Network, you can group them together into a station. A station
enables the displays to work together, instead of as several
separate displays. When you select Home on one display, each
display in the station returns to the home screen. You can
customize the layout of the pages on each display, making each
page different on each display. When you change the layout of a
page in one display, the changes appear on only that display.
When you change the name and symbol of the layout, those
changes appear on all displays in the station, to maintain a
consistent appearance.
The
SmartMode
cruising or docking. When a SmartMode button is selected from
the home screen, each display in the station can show unique
information. For example, when Cruising is selected from the
home screen, one display can show the navigation chart and
another display can show the radar screen.
™
items are geared toward an activity, such as
Adding an Item to Favorites
From the home screen, select a category from the right.
1
Hold a button.
2
The item is added to the Favorites home screen category.
Customizing the Layout of a SmartMode
or
Combination Page
You can customize the layout and data shown in the
combination pages and SmartMode
the layout of a page in a display you are interacting with, the
change appears only on that display, except for the SmartMode
name and symbol. When you change the SmartMode name or
symbol for the layout, the new name or symbol appears on all
displays in the station.
Open a page to customize.
1
Select
2
Select
3
Select an option:
4
• To change the name, select Name or Name & Symbol
Name
• To change the SmartMode symbol, select Name &
Symbol
• To change the number of functions shown, select
Functions, and select a number.
• To change the function of the portion of the screen, select
the area to change, and select a function from the list on
the right.
• To change the vertical or horizontal split orientation of a
multi-function display, select Split, and select an option.
• To change how data appears on the page, select
Overlays, and select an option.
• To change the type of data shown, select Overlays, select
a data field, and select the new data type.
Adding a SmartMode
You can add
customization made to one SmartMode layout for the home
screen in a station appears on all displays in the station.
From the home screen, select SmartMode™
1
Layout
Select an option:
2
• To change the name, select Name & Symbol > Name,
enter a new name, and select Done.
.
Menu
Edit Layout or Edit Combo
, enter a new name, and select Done.
> Symbol
, and select a new symbol.
Layout
SmartMode
.
layouts to suit your needs. Each
layouts. When you change
.
>
> Menu > Add
• To change the symbol, select Name & Symbol > Symbol,
and select a new symbol.
• To change the number of functions shown, select
Functions, and select a number.
• To change the function of the portion of the screen, select
the area to change, and select a function from the list on
the right.
• To change the vertical or horizontal split orientation of a
multi-function display, select Split, and select an option.
• To change how data appears on the page, select
Overlays, and select an option.
• To change the type of data shown, select
a data field, and select the new data type.
Overlays
, select
Adding a Custom Combination Screen
You can create a custom combination screen to suit your needs.
Select Combos
1
Select an option:
2
• To change the name, select Name, enter a new name,
and select Done.
• To change the number of functions shown, select
Functions, and select a number.
• To change the function of the portion of the screen, select
the area to change, and select a function from the list on
the right.
• To change the vertical or horizontal split orientation of a
multi-function display, select Split, and select an option.
• To change how data appears on the page, select
Overlays, and select an option.
• To change the type of data shown, select Overlays, select
a data field, and select the new data type.
> Menu > Add Combo
.
Resetting the Station Layouts
You can restore the factory default layouts for all stations.
Select Settings
Stations
> System > Station Information > Reset
.
Setting the Vessel Type
You can select your boat type to configure the chartplotter
settings and to use features customized for your boat type.
Select Settings
1
Select Powerboat or
2
> My Vessel > Vessel Type
Sailboat
.
.
Adjusting the Backlight
Select Settings > System >
1
Backlight
TIP: Press from any screen to open the backlight settings.
Select an option:
2
• Adjust the backlight level.
• Select
.
Auto
.
Beeper and Display >
Adjusting the Color Mode
Select Settings
1
2
.
Mode
TIP:
Press
Select an option.
> System > Beeper and Display > Color
from any screen to access the color settings.
Charts and 3D Chart Views
The charts and 3D chart views that are available depend on the
map data and accessories used.
You can access the charts and 3D chart views by selecting
Charts.
2 Charts and 3D Chart Views
Page 9
Navigation Chart: Shows navigation data available on your pre-
CONFIDENTIAL
loaded maps and from supplemental maps, if available. The
data includes buoys, lights, cables, depth soundings,
marinas, and tide stations in an overhead view.
Perspective 3D: Provides a view from above and behind the
boat (according to your course) and provides a visual
navigation aid. This view is helpful when navigating tricky
shoals, reefs, bridges, or channels, and is beneficial when
trying to identify entry and exit routes in unfamiliar harbors or
anchorages.
Mariner’s Eye 3D: Shows a detailed, three-dimensional view
from above and behind the boat (according to your course)
and provides a visual navigation aid. This view is helpful
when navigating tricky shoals, reefs, bridges, or channels,
and when trying to identify entry and exit routes in unfamiliar
harbors or anchorages.
NOTE: Mariner's Eye 3D and Fish Eye 3D chart views are
available with premium charts, in some areas.
Fish Eye 3D: Provides an underwater view that visually
represents the sea floor according to the chart information.
When a sonar transducer is connected, suspended targets
(such as fish) are indicated by red, green, and yellow
spheres. Red indicates the largest targets and green
indicates the smallest.
Fishing Chart: Provides a detailed view of the bottom contours
and depth soundings on the chart. This chart removes
navigational data from the chart, provides detailed
bathymetric data, and enhances bottom contours for depth
recognition. This chart is best for offshore deep-sea fishing.
NOTE: The offshore Fishing chart is available with premium
charts, in some areas.
Radar Overlay: Superimposes radar information on the
Navigation chart or the Fishing chart, when the chartplotter is
connected to a radar. This feature is not available with all
models.
Navigation Chart and Offshore Fishing Chart
NOTE: The offshore Fishing chart is available with premium
charts, in some areas.
The Navigation and Fishing charts allow you to plan your
course, view map information, and follow a route. The Fishing
chart is for offshore fishing.
To open the Navigation chart, select Charts
To open the Fishing chart, select Charts
> Nav Chart
> Fishing Chart
Zooming In and Out Using the Touchscreen
You can quickly zoom in and out of many screens, such as the
charts and sonar views.
• Pinch two fingers together to zoom out.
• Spread two fingers apart to zoom in.
Selecting a Map
If your product has both BlueChart® g2 and
maps, you can select which map to use. Not all models have
both types of built-in maps.
From the Navigation chart, select Menu > Built-In Map.
1
Select an option:
2
• When you are on an inland lake, select LakeVü™ HD.
LakeVü
.
.
™
HD built-in
• When you are offshore, select
BlueChart® g2
.
Measuring a Distance on the Chart
From a chart or the Radar overlay, select a location.
1
Select
2
TIP:
the cursor, select Set Reference
Measure Distance
A push pin appears on the screen at your present location.
The distance and angle from the pin is listed in the upper-left
corner.
To reset the pin and measure from the current location of
.
.
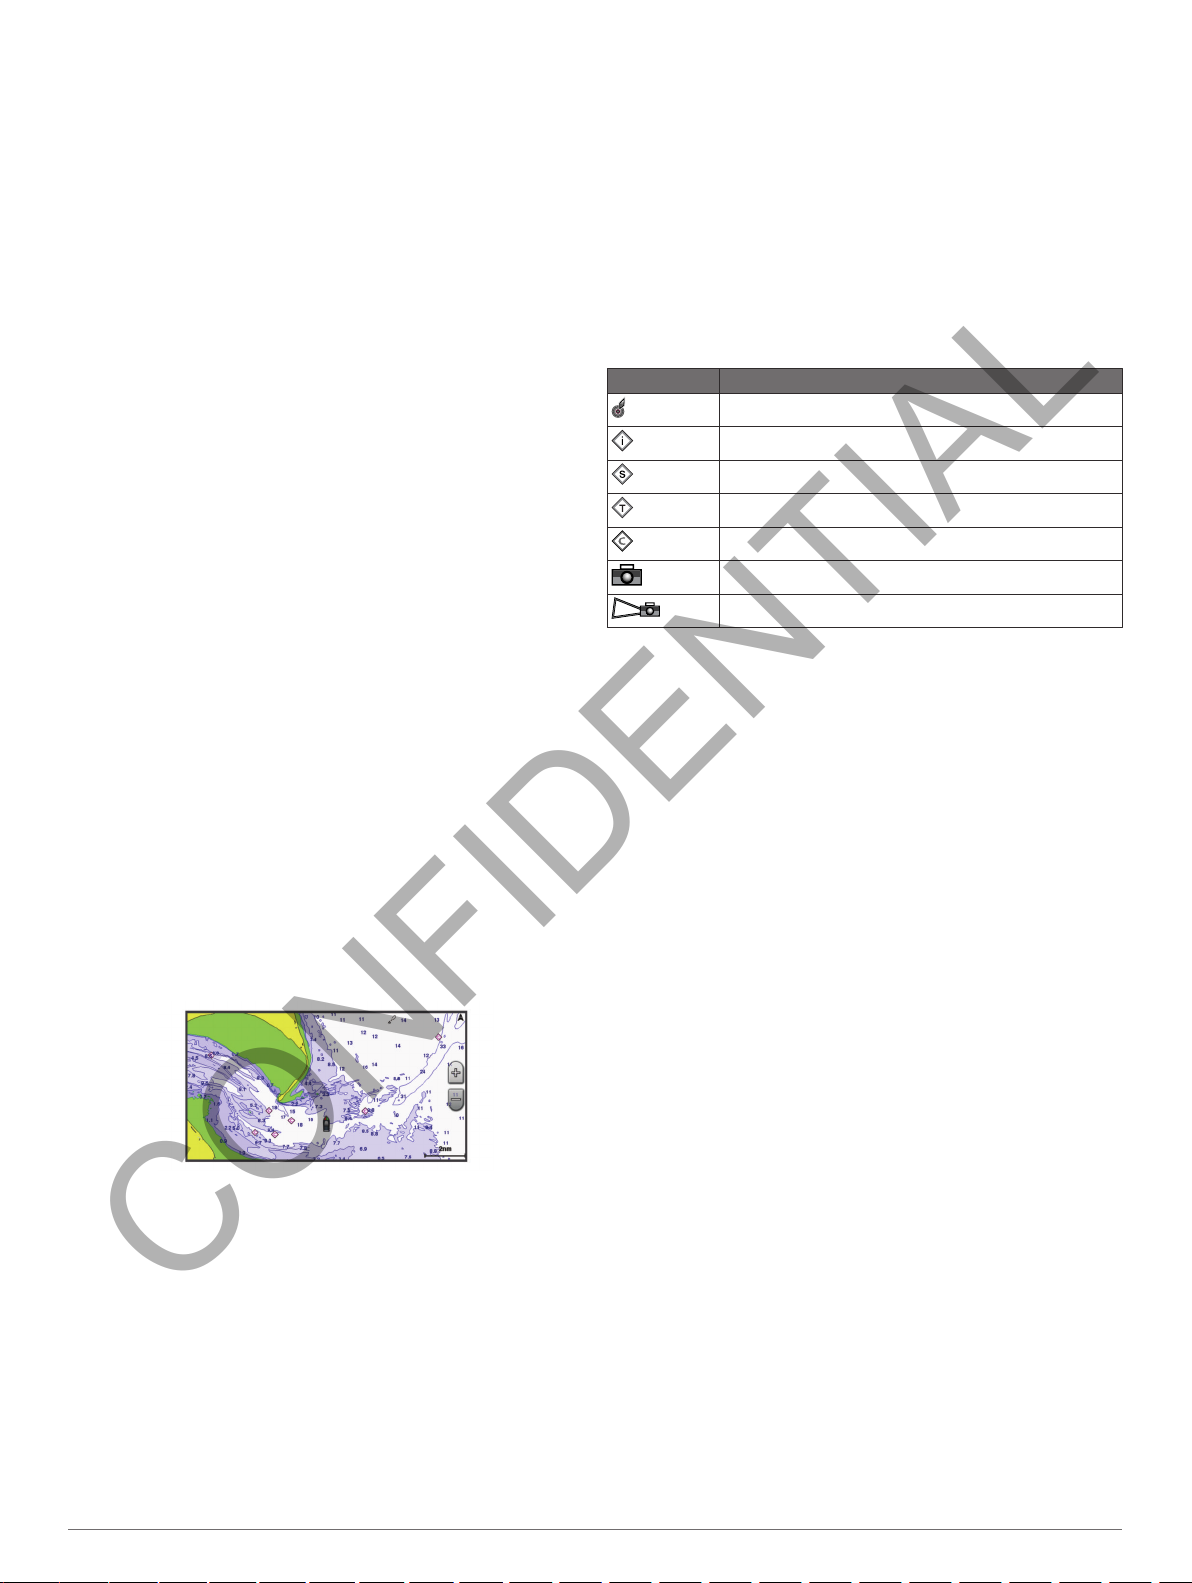
Chart Symbols
This table contains some of the common symbols you might see
on the detailed charts.
Icon Description
Buoy
Information
Marine services
Tide station
Current station
Overhead photo available
Perspective photo available
Other features common to most charts include depth contour
lines, intertidal zones, spot soundings (as depicted on the
original paper chart), navigational aids and symbols,
obstructions, and cable areas.
Showing a Different Chart
From a combination screen or SmartMode
1
chart, select
Select a chart or 3D chart view.
2
Menu > Chart Menu > Change Chart.
layout with a
Creating a Waypoint on the Chart
From a chart or a 3D chart view, select a location or object.
1
A list of options appears along the right side of the chart. The
options that appear vary based on the location or object you
selected.
Create Waypoint
2
Select
.
Viewing Location and Object Information on a Chart
You can view information about a location or an object on the
Navigation chart or the Fishing chart.
NOTE: The offshore Fishing chart is available with premium
charts, in some areas.
From the Navigation chart or Fishing chart, select a location
1
or object.
A list of options appears along the right side of the chart. The
options that appear vary based on the location or object you
selected.
Select an option:
2
• To navigate to the selected location, select Navigate To.
• To mark a waypoint at the cursor location, select Create
Waypoint.
• To view the distance and bearing of the object from your
current location, select Measure Distance.
The distance and bearing appear on the screen. Select
Select to measure from a location other than your current
location.
• To view tide, current, celestial, chart notes, or local
services information near the cursor, select Information.
Charts and 3D Chart Views 3
Page 10
Viewing Details about Navaids
CONFIDENTIAL
From the Navigation chart, Fishing chart, Perspective 3D chart
view, or Mariner’s Eye 3D chart view, you can view details about
various types of navigation aids, including beacons, lights, and
obstructions.
NOTE: The offshore Fishing chart is available with premium
charts, in some areas.
NOTE: Mariner's Eye 3D and Fish Eye 3D chart views are
available with premium charts, in some areas.
From a chart or 3D chart view, select a navaid.
1
Select the name of the navaid.
2
Navigating to a Point on the Chart
CAUTION
The Auto Guidance feature is based on electronic chart
information. That data does not ensure obstacle and bottom
clearance. Carefully compare the course to all visual sightings,
and avoid any land, shallow water, or other obstacles that may
be in your path.
When using Go To, a direct course and a corrected course may
pass over land or shallow water. Use visual sightings, and steer
to avoid land, shallow water, and other dangerous objects.
NOTE: The offshore Fishing chart is available with premium
charts, in some areas.
NOTE: Auto Guidance is available with premium charts, in some
areas.
From the Navigation chart or Fishing chart, select a location.
1
If necessary, select
2
Navigate To
Select
3
Select an option:
4
• To navigate directly to the location, select Go To.
• To create a route to the location, including turns, select
Route To.
• To use Auto Guidance, select Auto Guidance.
Review the course indicated by the magenta line.
5
NOTE: When using Auto Guidance, a gray segment within
any part of the magenta line indicates that Auto Guidance
cannot calculate part of the Auto Guidance line. This is due to
the settings for minimum safe water depth and minimum safe
obstacle height.
Follow the magenta line, steering to avoid land, shallow
6
water, and other obstacles.
Select
.
.
Premium Charts
CAUTION
The Auto Guidance feature is based on electronic chart
information. That data does not ensure obstacle and bottom
clearance. Carefully compare the course to all visual sightings,
and avoid any land, shallow water, or other obstacles that may
be in your path.
NOTE: Not all models support all charts.
Optional premium charts, such as BlueChart g2 Vision®, allow
you to get the most out of your chartplotter. In addition to
detailed marine charting, premium charts may contain these
features, which are available in some areas.
Mariner’s Eye 3D: Provides a view from above and behind the
boat for a three-dimensional navigation aid.
Fish Eye 3D: Provides an underwater, three-dimensional view
that visually represents the sea floor according to the
information on the chart.
Fishing Charts: Shows the chart with enhanced bottom
contours and without navigational data. This chart works well
for offshore deep-sea fishing.
High Resolution Satellite Imagery: Provides high-resolution
satellite images for a realistic view of the land and water on
the Navigation chart (Showing Satellite Imagery on the
Navigation Chart).
Aerial Photos
significant aerial photos to help you visualize your
surroundings (
Detailed Roads and POI data: Shows detailed road and point
of interest (POI) data, which includes highly detailed coastal
roads and POIs such as restaurants, lodging, and local
attractions.
Auto Guidance: Uses specified safe depth, safe height, and
chart data to determine the best course to your destination.
Auto Guidance is available when you navigate to a
destination using Guide To.
: Shows marinas and other navigationally
Viewing Aerial Photos of Landmarks).
Viewing Tide Station Information
on the chart indicates a tide station. You can view a detailed
graph for a tide station to help predict the tide level at different
times or on different days.
NOTE: This feature is available with premium charts, in some
areas.
From the Navigation chart or Fishing chart, select a tide
1
station.
Tide direction and tide level information appear near .
Select the station name.
2
Animated Tide and Current Indicators
NOTE: This feature is available with premium charts, in some
areas.
You can view indicators for animated tide station and current
direction on the Navigation chart or the Fishing chart. You must
also enable animated icons in the chart settings (Showing and
Configuring Tides and Currents).
An indicator for a tide station appears on the chart as a vertical
bar graph with an arrow. A red arrow pointing downward
indicates a falling tide, and a blue arrow pointing upward
indicates a rising tide. When you move the cursor over the tide
station indicator, the height of the tide at the station appears
above the station indicator.
Current direction indicators appear as arrows on the chart. The
direction of each arrow indicates the direction of the current at a
specific location on the chart. The color of the current arrow
indicates the range of speed for the current at that location.
When you move the cursor over the current direction indicator,
the specific current speed at the location appears above the
direction indicator.
Color Current Speed Range
Yellow 0 to 1 knot
Orange 1 to 2 knots
Red 2 or more knots
Showing and Configuring Tides and Currents
NOTE: This feature is available with premium charts, in some
areas.
You can show static or animated tide and current station
indicators on the Navigation chart or Fishing chart.
From the Navigation or Fishing chart, select Menu > Chart
1
Menu > Chart Setup > Tides & Currents.
Select an option:
2
• To show current station indicators and tide station
indicators on the chart, select On.
• To show animated tide station indicators and animated
current direction indicators on the chart, select Animated.
4 Charts and 3D Chart Views
Page 11
Showing Satellite Imagery on the Navigation Chart
CONFIDENTIAL
NOTE: This feature is available with premium charts, in some
areas.
You can overlay high-resolution satellite images on the land or
on both land and sea portions of the Navigation chart.
NOTE: When enabled, high-resolution satellite images are
present only at lower zoom levels. If you cannot see highresolution images in your optional chart region, you can select
to zoom in. You also can set the detail level higher by changing
the map zoom detail.
From the Navigation chart, select Menu > Chart Menu >
1
Chart Setup > Satellite Photos.
Select an option:
2
• Select
• Select
Land Only
the water, with photos overlaying the land.
Photo Map
the land at a specified opacity. Use the slider bar to adjust
the photo opacity. The higher you set the percentage, the
more the satellite photos cover both land and water.
to show standard chart information on
to show photos on both the water and
Viewing Aerial Photos of Landmarks
Before you can view aerial photos on the Navigation chart, you
must turn on the
NOTE: This feature is available with premium charts, in some
areas.
You can use aerial photographs of landmarks, marinas, and
harbors to help orient yourself to your surroundings or to
acquaint yourself with a marina or a harbor prior to arrival.
From the Navigation chart, select a camera icon:
1
• To view an overhead photo, select .
• To view a perspective photo, select . The photo was
taken from the location of the camera, pointed in the
direction of the cone.
Select
2
Satellite Photos
Aerial Photo
.
setting in the chart setup.
Automatic Identification System
The Automatic Identification System (AIS) enables you to
identify and track other vessels, and alerts you to area traffic.
When connected to an external AIS device, the chartplotter can
show some AIS information about other vessels that are within
range, that are equipped with a transponder, and that are
actively transmitting AIS information.
The information reported for each vessel includes the Maritime
Mobile Service Identity (MMSI), location, GPS speed, GPS
heading, time that has elapsed since the last position of the
vessel was reported, nearest approach, and time to the nearest
approach.
Some chartplotter models also support Blue Force Tracking.
Vessels being tracked with Blue Force Tracking are indicated on
the chartplotter with a blue-green color.
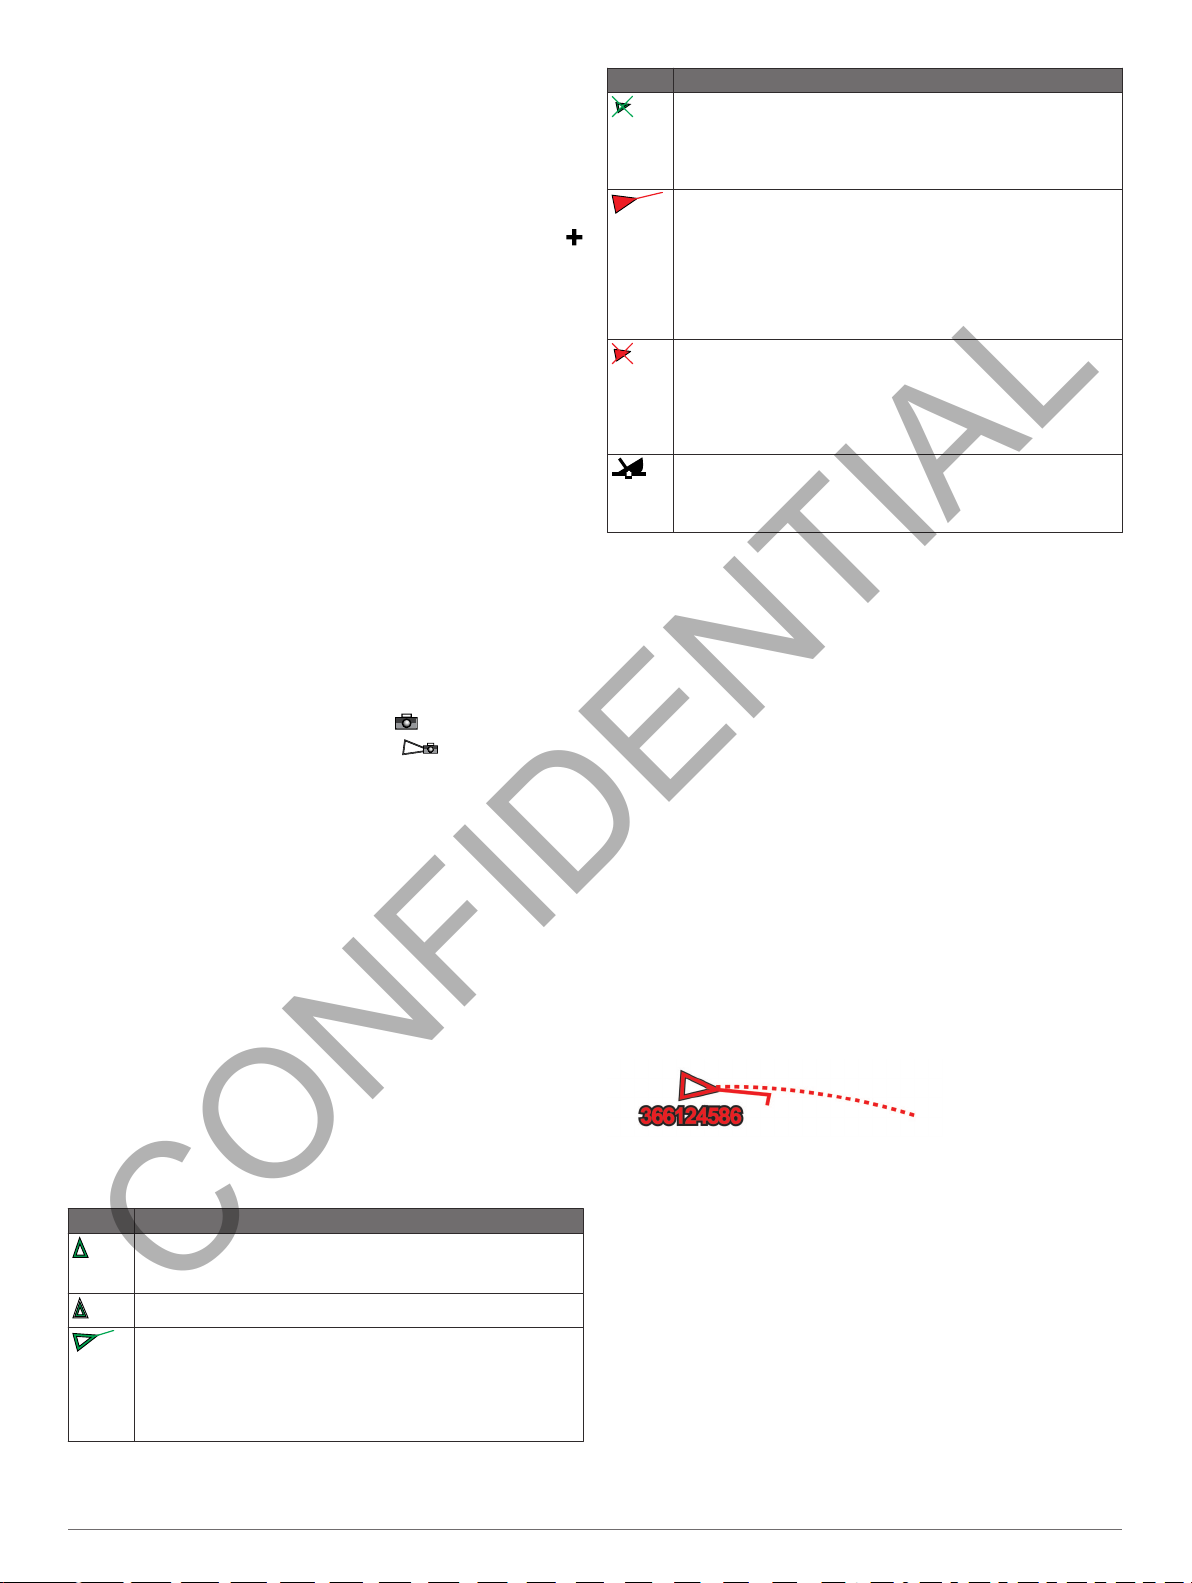
AIS Targeting Symbols
Symbol Description
AIS vessel. The vessel is reporting AIS information. The
direction in which the triangle is pointing indicates the
direction in which the AIS vessel is moving.
Target is selected.
Target is activated. The target appears larger on the chart. A
green line attached to the target indicates the heading of the
target. The MMSI, speed, and direction of the vessel appear
beneath the target, if the details setting has been set to Show.
If the AIS transmission from the vessel is lost, a message
banner appears.
Symbol Description
Target is lost. A green X indicates that the AIS transmission
from the vessel is lost, and the chartplotter displays a
message banner asking whether the vessel should continue
to be tracked. If you discontinue vessel tracking, the lost
target symbol disappears from the chart or the 3D chart view.
Dangerous target in range. The target flashes while an alarm
sounds and a message banner appears. After the alarm has
been acknowledged, a solid red triangle with a red line
attached to it indicates the location and the heading of the
target. If the safe-zone collision alarm has been set to Off, the
target flashes, but the audible alarm does not sound and the
alarm banner does not appear. If the AIS transmission from
the vessel is lost, a message banner appears.
Dangerous target is lost. A red X indicates that the AIS
transmission from the vessel is lost, and the chartplotter
displays a message banner asking whether the vessel should
continue to be tracked. If you discontinue vessel tracking, the
lost dangerous target symbol disappears from the chart or the
3D chart view.
The location of this symbol indicates the closest point of
approach to a dangerous target, and the numbers near the
symbol indicate the time to the closest point of approach to
that target.
NOTE: Vessels being tracked with the Blue Force Tracking
feature are indicated with a blue-green color regardless of their
status.
Heading and Projected Course of Activated AIS Targets
When heading and course over ground information are provided
by an activated AIS target, the heading of the target appears on
a chart as a solid line attached to the AIS target symbol. A
heading line does not appear on a 3D chart view.
The projected course of an activated AIS target appears as a
dashed line on a chart or a 3D chart view. The length of the
projected course line is based on the value of the projected
heading setting. If an activated AIS target is not transmitting
speed information, or if the vessel is not moving, a projected
course line does not appear. Changes in the speed, course over
ground, or rate of turn information transmitted by the vessel can
impact the calculation of the projected course line.
When course over ground, heading, and rate of turn information
are provided by an activated AIS target, the projected course of
the target is calculated based on the course over ground and the
rate of turn information. The direction in which the target is
turning, which is also based on the rate of turn information, is
indicated by the direction of the barb at the end of the heading
line. The length of the barb does not change.
When course over ground and heading information are provided
by an activated AIS target, but rate of turn information is not
provided, the projected course of the target is calculated based
on the course over ground information.
Showing AIS and MARPA Vessels on a Chart or on a 3D Chart View
Before you can show AIS vessels on a chart, you must have an
external AIS device and active transponder signals from other
vessels. Mini Automatic Radar Plotting Aid (MARPA)
functionality works with radar.
You can configure how other vessels appear on a chart or on a
3D chart view. The display range and MARPA settings
configured for one chart or one 3D chart view are applied only to
that chart or to that 3D chart view. The details, projected
heading, and trails settings configured for one chart or one 3D
chart view are applied to all charts and to all 3D chart views.
Charts and 3D Chart Views 5
Page 12
From a chart or a 3D chart view, select Menu > Chart Menu
CONFIDENTIAL
1
> Other Vessels > Display Setup.
Select an option:
2
• To indicate the distance from your location in which AIS
vessels appear, select Display Range, and select a
distance.
• To show MARPA-tagged vessels, select MARPA >
• To show details about AIS-activated and MARPA-tagged
vessels, select Details
• To set the projected heading time for AIS-activated and
MARPA-tagged vessels, select Proj. Heading, and enter
the time.
• To show the tracks of AIS vessels, select the length of the
track that appears using a trail, select
the length.
> Show
.
, and select
Trails
Show
Activating a Target for an AIS Vessel
From a chart or a 3D chart view, select an AIS vessel.
1
Select AIS Vessel
2
Viewing Information about a Targeted AIS Vessel
You can view the AIS signal status, MMSI, GPS speed, GPS
heading, and other information that is reported about a targeted
AIS vessel.
From a chart or a 3D chart view, select an AIS vessel.
1
Select
2
Deactivating a Target for an AIS Vessel
1
2
AIS Vessel
From a chart or a 3D chart view, select an AIS vessel.
Select AIS Vessel > Deactivate.
> Activate Target
.
.
Viewing a List of AIS and MARPA Threats
From a chart or a 3D chart view, select Menu > Other
1
Vessels > List
Select the type of threats to include in the list.
2
> Show
.
Setting the Safe-Zone Collision Alarm
Before you can set a collision alarm, you must have a
compatible chartplotter connected to an AIS device or radar.
The safe-zone collision alarm is used only with AIS and MARPA.
MARPA functionality works with radar. The safe zone is used for
collision avoidance and can be customized.
Select Settings > Alarms > AIS > Collision Alarm > On.
1
A message banner appears and an alarm sounds when a
MARPA-tagged object or an AIS-activated vessel enters the
safe-zone area around your boat. The object is also labeled
as dangerous on the screen. When the alarm is off, the
message banner and audible alarm are disabled, but the
object is still labeled as dangerous on the screen.
Select
2
Select a distance for the safe-zone radius around your
3
vessel.
Select
4
Select a time at which the alarm will sound if a target is
5
determined to intersect the safe zone.
For example, to be notified of a pending intersection 10
minutes before it will likely occur, set Time To to 10, and the
alarm will sound 10 minutes before the vessel intersects the
safe zone.
Range
Time To
.
.
AIS Distress Signals
Self-contained AIS distress signal devices transmit emergency
position reports when activated. The chartplotter can receive
signals from Search and Rescue Transmitters (SART),
Emergency Position Indicating Radio Beacons (EPIRB), and
other man overboard signals. Distress signal transmissions are
different than standard AIS transmissions, so they appear
differently on the chartplotter. Instead of tracking a distress
signal transmission for collision avoidance, you track a distress
signal transmission to locate and assist a vessel or person.
Navigating to a Distress Signal Transmission
When you receive a distress signal transmission, a distress
signal alarm appears.
Select Review > Go To to begin navigation to the
transmission.
.
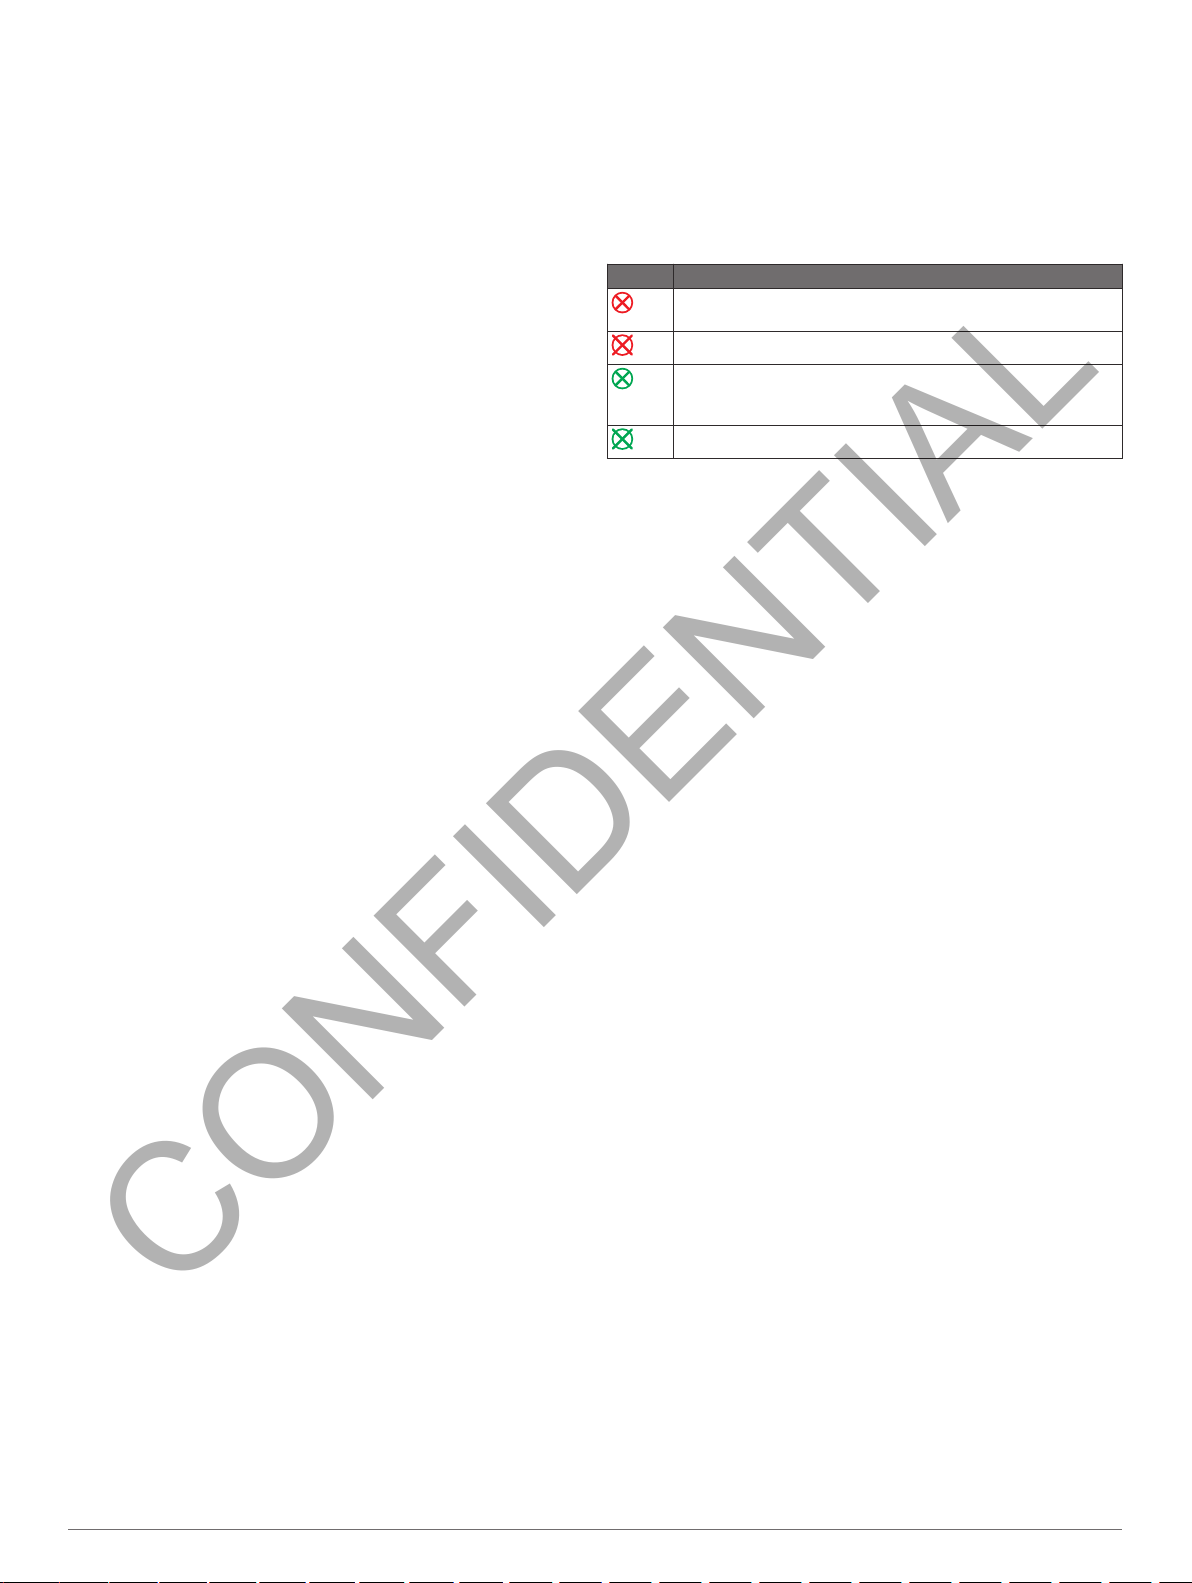
AIS Distress Signal Device Targeting Symbols
Symbol Description
AIS distress signal device transmission. Select to see more
information about the transmission and begin navigation.
Transmission lost.
Transmission test. Appears when a vessel initiates a test of
their distress signal device, and does not represent a true
emergency.
Transmission test lost.
Enabling AIS Transmission Test Alerts
To avoid a large number of test alerts and symbols in crowded
areas such as marinas, you can select to receive or ignore AIS
test messages. To test an AIS emergency device, you must
enable the chartplotter to receive test alerts.
Select Settings > Alarms > AIS.
1
Select an option:
2
• To receive or ignore Emergency Position Indicating Radio
Beacon (EPRIB) test signals, select AIS-EPIRB Test.
• To receive or ignore Man Overboard (MOB) test signals,
select AIS-MOB Test.
• To receive or ignore Search and Rescue Transponder
(SART) test signals, select AIS-SART Test.
Turning Off AIS Reception
AIS signal reception is turned on by default.
Select Settings > Other Vessels > AIS > Off.
All AIS functionality on all charts and 3D chart views is
disabled. This includes AIS vessel targeting and tracking,
collision alarms that result from AIS vessel targeting and
tracking, and the display of information about AIS vessels.
Chart and 3D Chart View Settings
NOTE: Not all settings apply to all charts and 3D chart views.
Some options require premium maps or connected accessories,
such as radar.
These settings apply to the charts and 3D chart views, except
the radar overlay and Fish Eye 3D (Fish Eye 3D Settings).
From a chart or a 3D chart view, select Menu > Chart Menu.
Waypoints and Tracks: See Waypoints and Tracks Settings on
the Charts and Chart Views.
Other Vessels: See Other Vessels Settings on the Charts and
Chart Views.
Surface Radar: Shows surface radar details on the Perspective
3D or Mariner's Eye 3D chart views.
Weather Radar: Shows weather radar imaging on the
Perspective 3D or Mariner's Eye 3D chart views.
Navaids: Shows navigational aids on the Fishing chart.
Laylines: Adjusts the laylines, when in sailing mode (Laylines
Settings).
Chart Setup: See Navigation and Fishing Chart Setup.
Chart Appearance: See Chart Appearance Settings. This might
appear in the Chart Setup menu.
6 Charts and 3D Chart Views
Page 13

Navigation and Fishing Chart Setup
CONFIDENTIAL
NOTE: Not all settings apply to all charts and 3D chart views.
Some settings require external accessories or applicable
premium charts.
From the Navigation chart or Fishing chart, select Menu > Chart
Menu > Chart Setup.
Satellite Photos: Shows high-resolution satellite images on the
land or on both land and sea portions of the Navigation chart,
when certain premium maps are used (Showing Satellite
Imagery on the Navigation Chart).
Water Overlay: Enables relief shading, which shows the
gradient of the bottom with shading, or sonar imagery, which
helps identify the density of the of the bottom. This feature is
available only with some premium maps.
Tides & Currents: Shows current station indicators and tide
station indicators on the chart (Showing and Configuring
Tides and Currents) and enables the tides and current slider,
which sets the time for which tides and currents are reported
on the map.
Roses: Shows a compass rose around your boat, indicating
compass direction oriented to the heading of the boat. A true
wind direction or apparent wind direction indicator appears if
the chartplotter is connected to a compatible marine wind
sensor. When in sailing mode, true and apparent wind are
shown on the wind rose.
Lake Level: Sets the present water level of the lake. This
feature is available only with some premium maps.
Inset Map: Shows a small map centered on your present
location.
Weather: Sets which weather items are shown on the chart,
when the chartplotter is connected to a compatible weather
receiver with an active subscription. Requires a compatible,
connected antenna and an active subscription.
Chart Appearance: See Chart Appearance Settings.
Waypoints and Tracks Settings on the Charts and Chart Views
From a chart or a 3D chart view, select Menu > Chart Menu >
Waypoints and Tracks.
Tracks: Shows tracks on the chart or 3D chart view.
Waypoints: Shows the list of waypoints (Viewing a List of all
Waypoints).
Create Waypoint: Creates a new waypoint.
Waypoint Display: Sets how to display waypoints on the chart.
Active Tracks: Shows the active track options menu.
Saved Tracks: Shows the list of saved tracks (Viewing a List of
Saved Tracks).
Tracks Display: Sets which tracks to display on the chart based
on track color.
Chart Appearance Settings
You can adjust the appearance of the different chart views.
Each setting is specific for the type of chart view that you are in.
NOTE: Not all settings apply to all charts and 3D chart views
and chartplotter models. Some options require premium maps or
connected accessories, such as radar.
From a chart or 3D chart view, select Menu > Chart Menu >
Chart Setup > Chart Appearance.
Orientation: Sets the perspective of the map.
Detail: Adjusts the amount of detail shown on the map, at
different zoom levels.
Heading Line: Shows and adjusts the heading line, which is a
line drawn on the map from the bow of the boat in the
direction of travel, and sets the data source for the heading
line.
World Map: Uses either a basic world map or a shaded relief
map on the chart. These differences are visible only when
zoomed out too far to see the detailed charts.
Spot Depths: Turns on spot soundings and sets a dangerous
depth. Spot depths that are equal to or more shallow than the
dangerous depth are indicated by red text.
Safety Shading: Sets the shades from the shoreline to the
specified depth.
Depth Range Shading: Specifies an upper and lower depth to
shade between.
Symbols: Shows and configures the appearance of various
symbols on the chart, such as the vessel icon, navaid
symbols, land POIs, and light sectors.
Inset Map: Shows a map zoomed in on the vessel's location in
the corner of the main map.
Style: Sets how the chart appears over 3D terrain.
Hazard Colors: Shows shallow water and land with a color
scale. Blue indicates deep water, yellow is shallow water, and
red is very shallow water.
Safe Depth: Sets the appearance of a safe depth for Mariner’s
Eye 3D.
NOTE: This setting affects only the appearance of hazard
colors in Mariner’s Eye 3D. It does not affect the safe water
depth Auto Guidance setting or the sonar shallow water
alarm setting.
Range Rings: Shows and configures the appearance of range
rings, which help you to visualize distances in some chart
views.
Lane Width: Specifies the width of the navigation lane, which is
the magenta line in some chart views that indicates the
course to your destination.
Other Vessels Settings on the Charts and Chart Views
NOTE: These options require connected accessories, such as
an AIS receiver or VHF radio.
From a chart or a 3D chart view, select Menu >
Other Vessels
List: Shows a list of AIS and MARPA vessels.
DSC: Shows the DSC list and sets the DSC trails on the chart.
Collision Alarm: Sets the safe-zone collision alarm (Setting the
Safe-Zone Collision Alarm).
Display Setup: See Showing AIS and MARPA Vessels on a
Chart or on a 3D Chart View.
.
Chart Menu >
Laylines Settings
When in sailing mode (Setting the Vessel Type), you can display
laylines on the navigation chart. Laylines can be very helpful
when racing.
From the navigation chart, select Menu > Chart Menu > Sailing
>
Laylines
Display: Sets how the laylines and vessel are shown on the
chart, and sets the length of the laylines.
Sailing Ang.: Allows you to select how the device calculates
laylines. The Actual option calculates the laylines using the
measured wind angle from the wind sensor. The Manual
option calculates the laylines using manually entered
windward and leeward angles.
Tide Correction: Corrects the laylines based on the tide.
.
Fish Eye 3D Settings
NOTE: This feature is available with premium charts, in some
areas.
From the Fish Eye 3D chart view, select Menu > Chart Menu.
View: Sets the perspective of the 3D chart view.
Tracks: Shows tracks.
Charts and 3D Chart Views 7
Page 14
Sonar Cone: Shows a cone that indicates the area covered by
CONFIDENTIAL
the transducer.
Fish Symbols: Shows suspended targets.
Navigation with a Chartplotter
CAUTION
If your vessel has an autopilot system, a dedicated autopilot
control display must be installed at each steering helm in order
to disable the autopilot system.
The Auto Guidance feature is based on electronic chart
information. That data does not ensure obstacle and bottom
clearance. Carefully compare the course to all visual sightings,
and avoid any land, shallow water, or other obstacles that may
be in your path.
When using Go To, a direct course and a corrected course may
pass over land or shallow water. Use visual sightings, and steer
to avoid land, shallow water, and other dangerous objects.
NOTE: Auto Guidance is available with premium charts, in some
areas.
NOTE: Mariner's Eye 3D and Fish Eye 3D chart views are
available with premium charts, in some areas.
NOTE: The offshore Fishing chart is available with premium
charts, in some areas.
To navigate, you must choose a destination, set a course or
create a route, and follow the course or route. You can follow
the course or the route on the Navigation chart, Fishing chart,
Perspective 3D chart view, or Mariner’s Eye 3D chart view.
You can set and follow a course to a destination using one of
three methods:
Go To: Takes you directly to the destination. This is the
standard option for navigating to a destination. The
chartplotter creates a straight-line course or navigation line to
the destination. The path may run over land and other
obstacles.
Route To: Creates a route from your location to a destination,
allowing you to add turns along the way. This option provides
a straight-line course to the destination, but allows you to add
turns into the route to avoid land and other obstacles.
Auto Guidance: Creates a path to a destination using Auto
Guidance. This option is available only when using a
compatible premium chart in a compatible chartplotter. It
provides a turn-by-turn navigation line to the destination,
avoiding land and other obstacles. The navigation line is
based on the chart data and the safe depth, safe height, and
shoreline distance user-defined chartplotter settings. Using
these settings and chart data, the chartplotter creates a
navigation line that avoids all areas that cannot be navigated
between the present location and the destination.
When you are using a compatible Garmin autopilot
connected to the chartplotter using NMEA 2000®, the
autopilot follows the Auto Guidance route.
Basic Navigation Questions
Question Answer
How do I make the chartplotter
point me in the direction in
which I want to go (bearing)?
How do I make the device
guide me along a straight line
(minimizing cross track) to a
location using the shortest
distance from the present
location?
Go To, Route To, or Auto Guidance
Navigate using Go To. See Setting
and Following a Direct Course Using
Go To.
Build a single-leg route and navigate it
using Route To. See Creating and
Navigating a Route From Your
Present Location.
.
Question Answer
How do I make the device
guide me to a location while
avoiding charted obstacles?
How do I make the device
steer my automatic pilot?
Can the device create a path
for me?
How do I change the Auto
Guidance settings for my boat?
Build a multi-leg route and navigate it
using Route To. See Creating and
Navigating a Route From Your
Present Location.
Navigate using Route To. See
Creating and Navigating a Route From
Your Present Location.
If you have premium maps that
support Auto Guidance and are in an
area covered by Auto Guidance,
navigate using Auto Guidance. See
Setting and Following an Auto
Guidance Path.
See Auto Guidance Line
Configurations.
Destinations
You can select destinations using various charts and 3D chart
views or using the lists.
Searching for a Destination by Name
You can search for saved waypoints, saved routes, saved
tracks, and marine services destinations by name.
Select Info
1
Enter at least a portion of the name of your destination.
2
If necessary, select
3
The 50 nearest destinations that contain your search criteria
appear.
Select the destination.
4
> Services > Search by Name
.
Done
.
Selecting a Destination Using the Navigation Chart
From the Navigation chart, select a destination.
Searching for a Marine Services Destination
NOTE: This feature is available with premium charts, in some
areas.
The chartplotter contains information for thousands of
destinations offering marine services.
Select Info
1
Select
2
If necessary, select the marine service category.
3
The chartplotter shows a list of the nearest locations and the
distance and bearing to each.
Select a destination.
4
You can select Next Page or Previous Page to view
additional information or to show the location on a chart.
> Services
Offshore Services or Inland Services
Searching for a
Select Info
> Services > Volvo Penta Dealers
.
Volvo Penta
®
Dealer
.
.
Waypoints
Waypoints are locations you record and store in the device.
Marking Your Present Location as a Waypoint
From any screen, select
Creating a Waypoint at a Different Location
Select Info
1
Select an option:
2
• To create the waypoint by entering position coordinates,
select
• To create the waypoint using a chart, select Use Chart,
select the location, and select Select.
> User Data > Waypoints > Create Waypoint
Enter Coordinates
.
Mark
, and enter the coordinates.
.
8 Navigation with a Chartplotter
Page 15

Marking an SOS Location
CONFIDENTIAL
You can mark an SOS location. When a Garmin
connected using NMEA 2000
types, such as Man Overboard and Piracy.
From the Home screen, select SOS.
1
Select the SOS type.
2
If necessary, select OK to navigate to the man overboard
3
location.
If you selected OK, the chartplotter sets a direct course back to
the location. If you selected another type of SOS, the call details
are sent to the VHF radio. You must send the call using the
radio.
, you can select different SOS
VHF radio is
Viewing a List of all Waypoints
Select Info
> User Data > Waypoints
.
Editing a Saved Waypoint
Select Info >
1
Select a waypoint.
2
Select Review
3
Select an option:
4
• To add a name, select Name, and enter a name.
• To change the symbol, select Symbol.
• To change the depth, select Depth.
• To change the water temperature, select Water Temp..
• To change the comment, select Comment.
User Data > Waypoints
.
> Edit
.
Moving a Saved Waypoint
Select Info >
1
Select a waypoint.
2
Select Review > Move.
3
Indicate a new location for the waypoint:
4
• To move the waypoint while using the chart, select Use
Chart
Move Waypoint
• To move the waypoint using coordinates, select Enter
Coordinates, and enter the new coordinates.
User Data > Waypoints
, select a new location on the chart, and select
.
.
Browsing for and Navigating to a Saved Waypoint
CAUTION
The Auto Guidance feature is based on electronic chart
information. That data does not ensure obstacle and bottom
clearance. Carefully compare the course to all visual sightings,
and avoid any land, shallow water, or other obstacles that may
be in your path.
When using Go To, a direct course and a corrected course may
pass over land or shallow water. Use visual sightings, and steer
to avoid land, shallow water, and other dangerous objects.
NOTE: Auto Guidance is available with premium charts, in some
areas.
Before you can navigate to a waypoint, you must create a
waypoint.
Select Info >
1
Select a waypoint.
2
Select
3
Select an option:
4
• To navigate directly to the location, select Go To.
• To create a route to the location, including turns, select
Route To.
• To use Auto Guidance, select Auto Guidance.
Review the course indicated by the magenta line.
5
User Data > Waypoints
Navigate To
.
.
NOTE: When using Auto Guidance, a gray segment within
any part of the magenta line indicates that Auto Guidance
cannot calculate part of the Auto Guidance line. This is due to
the settings for minimum safe water depth and minimum safe
obstacle height.
Follow the magenta line, steering to avoid land, shallow
6
water, and other obstacles.
Deleting a Waypoint or an MOB
Select Info
1
Select a waypoint or an MOB.
2
Select Review > Delete.
3
> User Data > Waypoints
.
Deleting All Waypoints
Select Info
.
All
> User Data > Clear User Data > Waypoints >
Setting and Following a Direct Course Using Go To
CAUTION
When using Go To, a direct course and a corrected course may
pass over land or shallow water. Use visual sightings, and steer
to avoid land, shallow water, and other dangerous objects.
You can set and follow a direct course from your current location
to a selected destination.
Select a destination (Destinations).
1
Select Navigate To > Go To.
2
A magenta line appears. In the center of the magenta line is
a thinner purple line that represents the corrected course
from your current location to the destination. The corrected
course is dynamic, and it moves with your boat when you are
off course.
Follow the magenta line, steering to avoid land, shallow
3
water, and other obstacles.
If you are off course, follow the purple line (corrected course)
4
to go to your destination, or steer back to the magenta line
(direct course).
Routes
Creating and Navigating a Route From Your Present Location
You can create and immediately navigate a route on the
Navigation chart or the Fishing chart. This procedure does not
save the route or the waypoint data.
NOTE: The offshore Fishing chart is available with premium
charts, in some areas.
From the Navigation chart or Fishing chart, select a
1
destination.
Select Navigate To
2
Select the location of the last turn before the destination.
3
Select Add Turn.
4
If necessary, repeat step 3 and 4 to add additional turns,
5
working backward from the destination to the present location
of your vessel.
The last turn you add should be the first turn you make,
starting from your present location. It should be the turn
closest to your vessel.
If necessary, select
6
Navigate Route
Select
7
Review the course indicated by the magenta line.
8
Follow the magenta line, steering to avoid land, shallow
9
water, and other obstacles.
> Route To
Menu
.
.
.
Navigation with a Chartplotter 9
Page 16

Creating and Saving a Route
CONFIDENTIAL
This procedure saves the route and all the waypoints in it. The
starting point can be your present location or another location.
Select Info > User Data > Routes & Auto Guidance Paths
1
>
New > Use Chart
Select the starting location of the route.
2
Select Add Turn.
3
Select the location of the next turn on the chart.
4
Select
5
6
7
Add Turn
The chartplotter marks the location of the turn with a
waypoint.
If necessary, repeat steps 4 and 5 to add more turns.
Select the final destination.
.
.
Viewing a List of Routes
Select Info > User Data > Routes & Auto Guidance Paths.
Editing a Saved Route
You can change the name of a route or change the turns the
route contains.
Select Info >
1
Select a route.
2
Select Review
3
Select an option:
4
• To change the name, select Name, and enter the name.
• To select a waypoint from the turn list, select Edit Turns >
Use Turn List, and select a waypoint from the list.
• To select a turn using the chart, select Edit Turns
Chart
User Data > Routes & Auto Guidance Paths
> Edit Route
, and select a location on the chart.
.
> Use
Browsing for and Navigating a Saved Route
Before you can browse a list of routes and navigate to one of
them, you must create and save at least one route.
Select Info > User Data >
1
Select a route.
2
Select
3
4
5
6
7
Navigate To
Select an option:
• To navigate the route from the starting point used when
the route was created, select Forward.
• To navigate the route from the destination point used
when the route was created, select Backward.
A magenta line appears. In the center of the magenta line is
a thinner purple line that represents the corrected course
from your present location to the destination. The corrected
course is dynamic, and it moves with your boat when you are
off course.
Review the course indicated by the magenta line.
Follow the magenta line along each leg in the route, steering
to avoid land, shallow water, and other obstacles.
If you are off course, follow the purple line (corrected course)
to go to your destination, or steer back to the magenta line
(direct course).
Routes & Auto Guidance Paths
.
Browsing for and Navigating Parallel to a Saved Route
Before you can browse a list of routes and navigate to one of
them, you must create and save at least one route.
Select Info > User Data > Routes & Auto Guidance Paths.
1
Select a route.
2
Select
3
4
5
Navigate To
Select
Offset
by a specific distance.
Indicate how to navigate the route:
.
to navigate parallel to the route, offset from it
• To navigate the route from the starting point used when
the route was created, to the left of the original route,
select Forward – Port.
• To navigate the route from the starting point used when
the route was created, to the right of the original route,
select
Forward – Starboard
• To navigate the route from the destination point used
when the route was created, to the left of the original
route, select
• To navigate the route from the destination point used
when the route was created, to the right of the original
route, select Backward – Starboard.
If necessary, select
6
A magenta line appears. In the center of the magenta line is
a thinner purple line that represents the corrected course
from your present location to the destination. The corrected
course is dynamic, and it moves with your boat when you are
off course.
Review the course indicated by the magenta line.
7
Follow the magenta line along each leg in the route, steering
8
.
to avoid land, shallow water, and other obstacles.
If you are off course, follow the purple line (corrected course)
9
to go to your destination, or steer back to the magenta line
(direct course).
Backward – Port
Done
.
.
.
Deleting a Saved Route
Select Info >
1
Select a route.
2
Select Review
3
User Data > Routes & Auto Guidance Paths
> Delete
.
Deleting All Saved Routes
Select Info >
Auto Guidance Paths
Auto Guidance
.
The Auto Guidance feature is based on electronic chart
information. That data does not ensure obstacle and bottom
clearance. Carefully compare the course to all visual sightings,
and avoid any land, shallow water, or other obstacles that may
be in your path.
NOTE: Auto Guidance is available with premium charts, in some
areas.
You can use Auto Guidance to plot the best path to your
destination. Auto Guidance uses your chartplotter to scan chart
data, such as water depth and known obstacles, to calculate a
suggested path. You can adjust the path during navigation.
User Data > Clear User Data > Routes &
.
CAUTION
Setting and Following an Auto Guidance Path
Select a destination (Destinations).
1
Select Navigate To > Auto Guidance.
2
Review the path, indicated by the magenta line.
3
Start Navigation
Select
4
Follow the magenta line, steering to avoid land, shallow
5
water, and other obstacles.
NOTE: When using Auto Guidance, a gray segment within
any part of the magenta line indicates that Auto Guidance
cannot calculate part of the Auto Guidance line. This is due to
the settings for minimum safe water depth and minimum safe
obstacle height.
Creating and Saving an
Select Info
1
> New > Auto Guidance
Select a starting point, and select Next.
2
> User Data > Routes & Auto Guidance Paths
.
Auto Guidance Path
.
.
10 Navigation with a Chartplotter
Page 17

Select a destination, and select Next.
CONFIDENTIAL
3
Select an option:
4
• To view a hazard and adjust the hazard path, select
Hazard Review.
• To adjust the path, select
screen instructions.
• To delete the path, select Cancel Auto Guidance.
• To save the path, select
Adjust Path
.
Done
, and follow the on-
Adjusting a Saved Auto Guidance Path
Select Info
1
Select a path, and select Review > Edit >
2
TIP: When navigating an Auto Guidance path, select the path
on the navigation chart, and select Adjust Path.
Select a location on the path.
3
Drag the point to a new location.
4
If necessary, select a point, and select Remove.
5
Select
6
Canceling an Auto Guidance
From the Navigation chart, select
TIP: You can select Back to quickly cancel the calculation.
> User Data > Routes & Auto Guidance Paths
Adjust Path
.
Done
Calculation in Progress
Menu >
Cancel
.
.
Setting a Timed Arrival
You can use the Timed Arrival feature on a route or an Auto
Guidance path to get feedback regarding when you should
arrive at a selected point. This allows you to time your arrival at
a location, such as a bridge opening or a race starting line.
From the Navigation chart, select Menu.
1
If necessary, select
2
Select Timed Arrival.
3
TIP: You can quickly open the Timed Arrival menu by
selecting a point on the Auto Guidance path.
Navigation Options
.
Auto Guidance Line Configurations
CAUTION
The Safe Depth and Safe Height settings influence how the
chartplotter calculates an Auto Guidance line. If an area has an
unknown water depth or an unknown obstacle height, the Auto
Guidance line is not calculated in that area. If an area at the
beginning or the end of an Auto Guidance line is shallower than
the safe water depth or lower than the safe obstacle height, the
Auto Guidance line is not calculated in that area. On the chart,
the course through those areas appears as a gray line. When
your boat enters one of those areas, a warning message
appears.
NOTE: Auto Guidance is available with premium charts, in some
areas.
You can set the parameters the chartplotter uses when
calculating an Auto Guidance line.
Safe Depth: Sets the minimum depth (chart depth datum) the
chartplotter uses when calculating an Auto Guidance line.
NOTE: The minimum safe depth for the premium charts is 3
feet. If you enter a Safe Depth value of less than 3 feet, the
charts only use depths of 3 feet for Auto Guidance route
calculations.
Safe Height: Sets the minimum height (chart height datum) of a
bridge that your boat can safely travel under.
Shoreline Distance: Sets how close to the shore you want the
Auto Guidance line to be placed. The Auto Guidance line
may move if you change this setting while navigating. The
available values for this setting are relative, not absolute. To
ensure that the Auto Guidance line is placed the appropriate
distance from shore, you can assess the placement of the
Auto Guidance line using one or more familiar destinations
that require navigation through a narrow waterway (Adjusting
the Distance from Shore).
Adjusting the Distance from Shore
The
Shoreline Distance setting indicates how close to the shore
you want the Auto Guidance
Guidance line may move if you change this setting while
navigating. The available values for the Shoreline Distance
setting are relative, not absolute. To ensure the Auto Guidance
line is placed the appropriate distance from shore, you can
assess the placement of the Auto Guidance line using one or
.
more familiar destinations that require navigation through a
narrow waterway.
Dock your vessel or drop the anchor.
1
Select Settings > Preferences >
2
Guidance > Shoreline Distance > Normal
Select a destination that you have navigated to previously.
3
Select Navigate To
4
Review the placement of the Auto Guidance line, and
5
determine whether the line safely avoids known obstacles
and the turns enable efficient travel.
Select an option:
6
• If the placement of the Auto Guidance line is satisfactory,
select Menu
and proceed to step 10.
• If the Auto Guidance line is too close to known obstacles,
select Settings > Preferences > Navigation > Auto
Guidance
• If the turns in the Auto Guidance line are too wide, select
Settings
> Shoreline Distance > Near
If you selected
7
the Auto Guidance line, and determine whether the line
safely avoids known obstacles and the turns enable efficient
travel.
Auto Guidance maintains a wide clearance from obstacles in
open water, even if you set the Shoreline Distance setting to
Near or
reposition the Auto Guidance line, unless the destination
selected requires navigation through a narrow waterway.
Select an option:
8
• If the placement of the Auto Guidance line is satisfactory,
select Menu
and proceed to step 10.
• If the Auto Guidance line is too close to known obstacles,
select Settings > Preferences >
Guidance > Shoreline Distance > Farthest
• If the turns in the Auto Guidance line are too wide, select
Settings > Preferences >
> Shoreline Distance > Nearest
If you selected
9
placement of the Auto Guidance
whether the line safely avoids known obstacles and the turns
enable efficient travel.
Auto Guidance maintains a wide clearance from obstacles in
open water, even if you set the Shoreline Distance setting to
Near or
reposition the Auto Guidance line, unless the destination
selected requires navigation through a narrow waterway.
Repeat steps 3 through 9 at least once more, using a
10
different destination each time, until you are familiar with the
functionality of the Shoreline Distance setting.
> Navigation Options > Stop Navigation
> Shoreline Distance > Far
> Preferences > Navigation > Auto Guidance
Near or Far
Nearest
Nearest
. As a result, the chartplotter may not
> Navigation Options > Stop Navigation
Nearest or Farthest in step 8, review the
. As a result, the chartplotter may not
line to be placed. The Auto
Navigation > Auto
> Auto Guidance
.
in step 6, review the placement of
Navigation > Auto Guidance
line, and determine
.
.
.
Navigation > Auto
.
.
,
,
Navigation with a Chartplotter 11
Page 18

Tracks
CONFIDENTIAL
A track is a recording of the path of your boat. The track
currently being recorded is called the active track, and it can be
saved. You can show tracks in each chart or 3D chart view.
Showing Tracks
From a chart or a 3D chart view, select Menu
> Waypoints and Tracks > Tracks > On
A trailing line on the chart indicates your track.
Setting the Color of the Active Track
Select Info >
1
Track Color
Select a track color.
2
User Data > Tracks > Active Track Options >
.
Saving the Active Track
The track currently being recorded is called the active track.
Select Info >
1
Select an option:
2
• Select the time the active track began.
• Select Entire Log.
Select Save.
3
User Data > Tracks > Save Active Track
Viewing a List of Saved Tracks
Select Info >
User Data > Tracks > Saved Tracks
Editing a Saved Track
Select Info > User Data >
1
Select a track.
2
Select
3
4
Edit Track
Select an option:
• Select Name, and enter the new name.
• Select Track Color, and select a color.
.
Tracks > Saved Tracks
Saving a Track as a Route
Select Info > User Data > Tracks > Saved Tracks.
1
Select a track.
2
Select Select >
3
Edit Track > Save Route
Browsing for and Navigating a Recorded Track
Before you can browse a list of tracks and navigate to them, you
must record and save at least one track (Tracks).
Select Info > User Data >
1
Select a track.
2
Select
3
4
5
6
Follow Track
Select an option:
• To navigate the track from the starting point used when
the track was created, select Forward.
• To navigate the track from the destination point used
when the track was created, select Backward.
Review the course indicated by the colored line.
Follow the line along each leg in the route, steering to avoid
land, shallow water, and other obstacles.
Tracks > Saved Tracks
.
Deleting a Saved Track
Select Info
1
Select a track.
2
Select Select
3
> User Data > Tracks > Saved Tracks
> Delete
.
Deleting All Saved Tracks
Select Info > User Data > Clear User Data > Saved Tracks.
Retracing the Active Track
The track currently being recorded is called the active track.
Select Info > User Data >
1
Tracks > Follow Active Track
> Chart Menu
.
.
.
.
.
.
.
.
Select an option:
2
• Select the time the active track began.
• Select
Review the course indicated by the colored line.
3
Follow the colored line, steering to avoid land, shallow water,
4
and other obstacles.
Entire Log
.
Clearing the Active Track
Select Info > User Data > Tracks > Clear Active Track.
The track memory is cleared, and the active track continues
to be recorded.
Managing the Track Log Memory During Recording
Select Info >
1
Select Record Mode.
2
Select an option:
3
• To record a track log until the track memory is full, select
Fill.
• To continuously record a track log, replacing the oldest
track data with new data, select Wrap.
User Data > Tracks > Active Track Options
.
Configuring the Recording Interval of the Track Log
You can indicate the frequency at which the track plot is
recorded. Recording more frequent plots is more accurate but
fills the track log faster. The resolution interval is recommended
for the most efficient use of memory.
Select Info
1
Interval > Interval
Select an option:
2
• To record the track based on a distance between points,
select Distance > Change, and enter the distance.
• To record the track based on a time interval, select Time >
Change, and enter the time interval.
• To record the track plot based on a variance from your
course, select Resolution > Change, and enter the
maximum error allowed from the true course before
recording a track point.
> User Data > Tracks > Active Track Options >
.
Stopping Navigation
While navigating, from the Navigation or Fishing chart, select
an option:
• Select Menu
• When navigating with Auto Guidance, select Menu >
Navigation Options >
> Stop Navigation
Stop Navigation
.
.
Synchronizing User Data Across the Garmin Marine Network
NOTICE
Before you synchronize the user data across the network, you
should backup your user data to prevent possible data loss. See
Backing Up Data to a Computer.
You can share waypoints, tracks, and routes with all compatible
devices connected to the Garmin Marine Network (Ethernet)
automatically.
NOTE: This feature is not available on all models.
Select Settings
If a change is made to a waypoint, track, or route on one
chartplotter, that data is synchronized automatically across all
chartplotters on the Ethernet network.
> Preferences > User Data Sharing > On
.
Deleting All Saved Waypoints, Routes, and Tracks
Select
Info
> User Data > Clear User Data > All > OK
.
12 Navigation with a Chartplotter
Page 19

Sailing Features
CONFIDENTIAL
Setting the Vessel Type
You can select your boat type to configure the chartplotter
settings and to use features customized for your boat type.
Select Settings > My Vessel > Vessel Type.
1
Select
2
Powerboat or Sailboat
Sail Racing
You can use the device to increase the likelihood that your boat
will cross the start line of a race exactly when the race begins.
When you synchronize the race timer with the official race
countdown timer, you are alerted at one-minute intervals as the
race start approaches. When you combine the race timer with
the virtual start line, the device measures your speed, bearing,
and remaining time on the countdown timer. The device uses
this data to indicate whether your boat will cross the start line
before, after, or at the correct time to start the race.
Starting Line Guidance
Sailing start line guidance is a visual representation of the
information you need to cross the start line at the optimal time
and speed.
After you set the starboard and port start line pins, and the
target speed and time, and after you start the race timer, a
predictor line appears. The predictor line extends from your
current location toward the start line and the laylines that extend
from each pin.
The end point and color of the predictor line indicate where the
boat will be when the timer expires, based on your current boat
speed.
When the end point is before the start line, the line is white. This
indicates the boat must increase speed to reach the start line on
time.
When the end point is past the start line, the line is red. This
indicates the boat must reduce speed to avoid a penalty for
reaching the start line before the timer expires.
When the end point is on the start line, the line is white. This
indicates the boat is moving at an optimal speed to reach the
start line when the timer expires.
By default, the start line guidance window and the race timer
window appear in the Sail Racing combination screen.
Setting the Starting Line
The start line guidance window is added to the Sail Racing
combination screen by default.
From the Sail Racing combination screen, select Menu >
1
Start Line Guidance
Select an option:
2
• To mark the port and starboard starting line marks as you
sail past them, select Ping Marks.
• To mark the port and starboard starting line marks by
entering their coordinates, select Enter Coordinates.
• To switch the position of the port and starboard marks
after you have set them, select Swap Port & Starbd.
Marks.
Using the Starting Line Guidance
You can use the starting line guidance feature to help get you
cross the start line, at the optimal speed during a sailing race.
Mark the starting line (Setting the Starting Line).
1
From the Sail Racing combination screen, select Menu >
2
Start Line Guidance > Target Speed, and select your target
speed when crossing the starting line.
Select
3
Target Time
starting line.
> Start Line
, and select the target time to cross the
.
.
Select
4
Start the racing timer (Starting the Race Timer).
5
Back
.
Starting the Race Timer
The race timer is added to the Sail Racing combination screen
by default.
From the Sail Racing combination screen, select Start.
1
NOTE: You can also access this from the Sailing
screen and the navigation chart.
When necessary, select Sync to synchronize with the official
2
race timer.
SmartMode
Stopping the Race Timer
From the Sail Racing combination screen, select Stop.
Setting the Distance between the Bow and the GPS Antenna
You can enter the distance between the bow of your boat and
the location of your GPS antenna. This helps ensure the bow of
your boat crosses the starting line at the precise start time.
From a navigation chart, select Sailing > Start Line > GPS
1
Bow Offset.
Enter the distance.
2
Select Done.
3
Laylines Settings
When in sailing mode (
laylines on the navigation chart. Laylines can be very helpful
when racing.
From the navigation chart, select Menu > Chart Menu > Sailing
> Laylines.
Display: Sets how the laylines and vessel are shown on the
chart, and sets the length of the laylines.
Sailing Ang.: Allows you to select how the device calculates
laylines. The Actual option calculates the laylines using the
measured wind angle from the wind sensor. The Manual
option calculates the laylines using manually entered
windward and leeward angles.
Tide Correction: Corrects the laylines based on the tide.
Setting the Vessel Type), you can display
Setting the Keel Offset
You can enter a keel offset to compensate the surface reading
for the depth of a keel, making it possible to measure depth from
the bottom of the keel instead of from the transducer location.
Enter a positive number to offset for a keel. You can enter a
negative number to compensate for a large vessel that may
draw several feet of water.
Complete an action, based on the location of the transducer:
1
• If the transducer is installed at the water line À, measure
the distance from the transducer location to the keel of the
boat. Enter this value in steps 3 and 4 as a positive
number.
• If the transducer is installed at the bottom of the keel Á,
measure the distance from the transducer to the water
line. Enter this value in steps 3 and 4 as a negative
number.
Sailing Features 13
Page 20
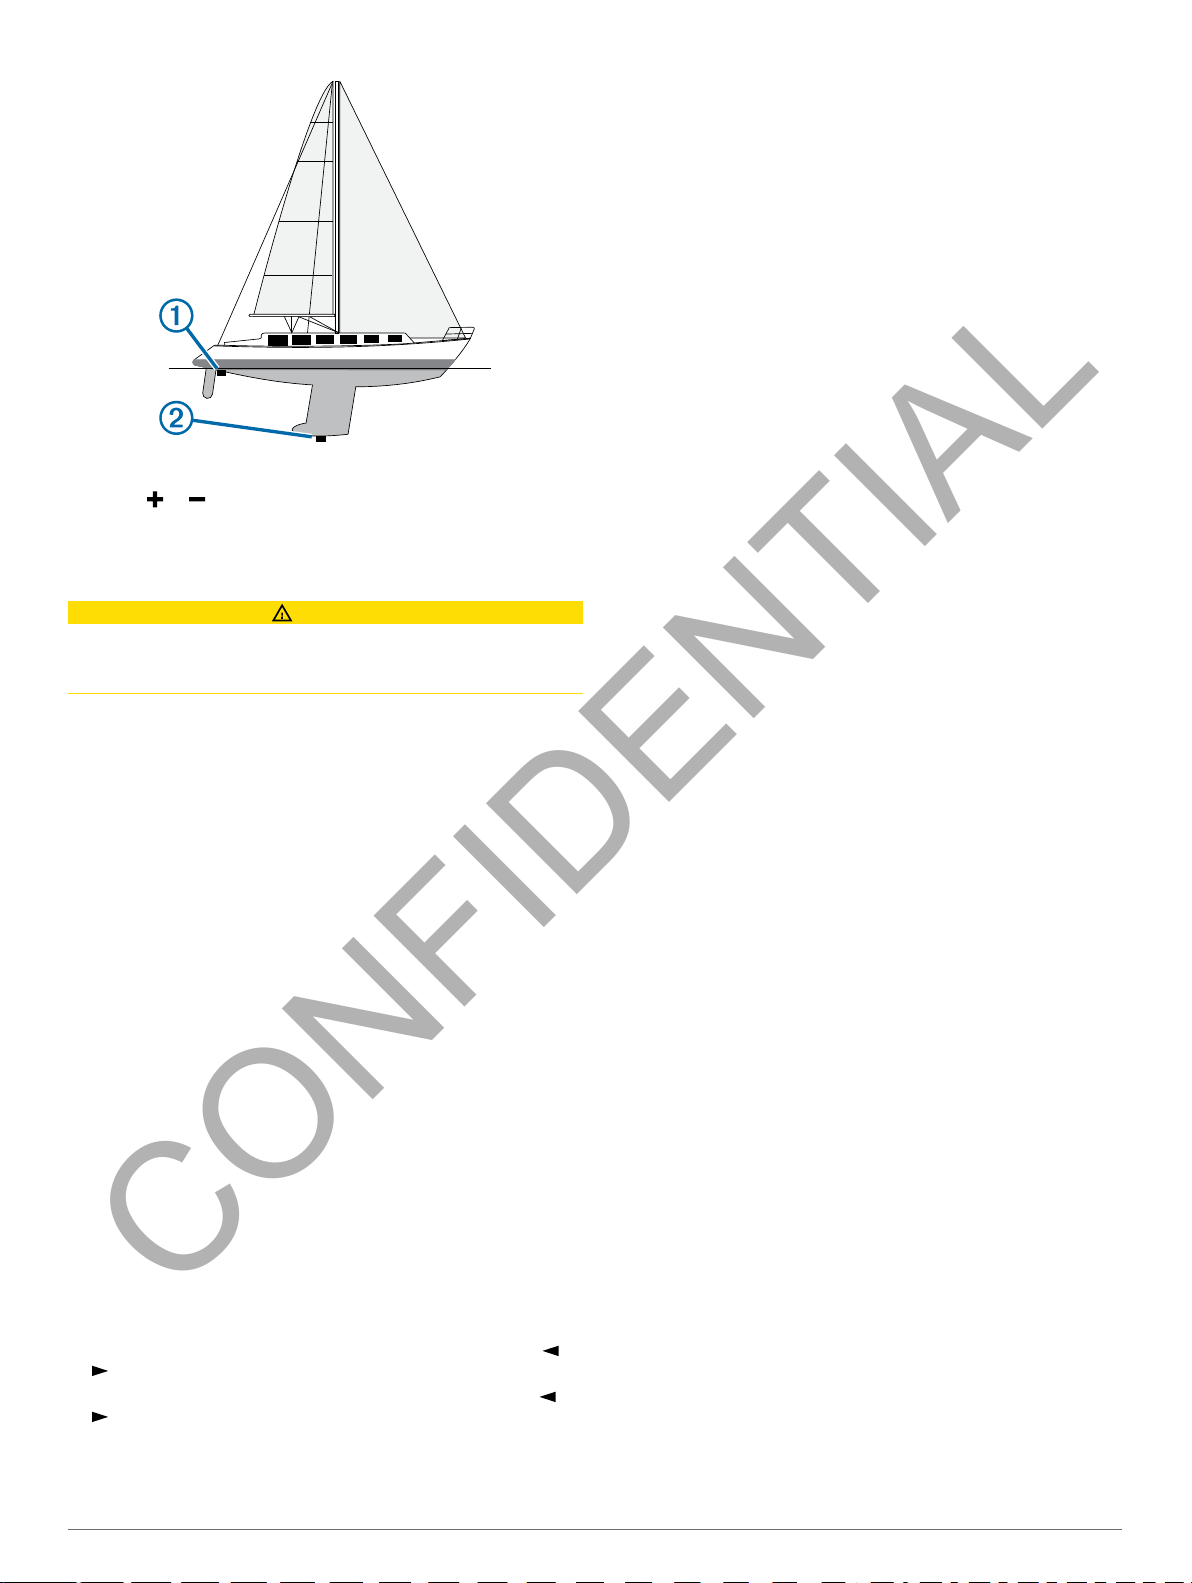
Select Settings
CONFIDENTIAL
2
Select or based on the location of the transducer.
3
Enter the distance measured in step 1.
4
> My Vessel > Keel Offset
.
Sailboat Autopilot Operation
CAUTION
When engaged, the autopilot controls only the rudder. You and
your crew remain responsible for the sails while the autopilot is
engaged.
In addition to heading hold, you can use the autopilot to maintain
a wind hold. You can also use the autopilot to control the rudder
while tacking and gybing.
Wind Hold
You can set the autopilot to maintain a specific bearing relative
to the current wind angle. Your device must be connected to a
NMEA 2000
a wind hold or a wind-based tack or gybe.
Setting the Wind Hold Type
Before you can enable the wind hold type, you must connect a
NMEA 2000
For advanced autopilot configuration, see the installation
instructions included with your autopilot.
From the autopilot screen, select
1
Autopilot Setup > Wind Hold Type
Select
2
Engaging Wind Hold
Before you can enable the wind hold type, you must connect a
NMEA 2000 or NMEA 0183 wind sensor to the autopilot.
When the autopilot is in standby mode, select Wind Hold.
Engaging Wind Hold from Heading Hold
Before you can enable the wind hold type, you must connect a
NMEA 2000 or
With heading hold engaged, select Menu
Adjusting the Wind Hold Angle with the Autopilot
You can adjust the wind hold angle on the autopilot when wind
hold is engaged.
• To adjust the wind hold angle in increments of 1°, select or
• To adjust the wind hold angle in increments of 10°, hold or
or NMEA
or NMEA
Apparent or True
.
.
Tack and Gybe
You can set the autopilot to perform a tack or gybe while
heading hold or wind hold is engaged.
®
0183 compatible wind sensor to perform
0183 wind sensor to the autopilot.
Menu
> Autopilot Menu >
.
.
0183 wind sensor to the autopilot.
NMEA
> Wind Hold
.
Tacking and Gybing from Heading Hold
Engage heading hold (Engaging the Autopilot).
1
Select Menu
2
Select a direction.
3
The autopilot steers your boat through a tack or gybe.
Tacking and Gybing from Wind Hold
Before you can engage wind hold, you must have a wind sensor
installed.
Engage wind hold (Engaging Wind Hold).
1
Select Menu
2
Select
3
The autopilot steers your boat through a tack or gybe, and
information about the progress of the tack or gybe appears
on the screen.
Setting a Tack and Gybe Delay
The tack and gybe delay allows you to delay steering a tack and
gybe after you initiate the maneuver.
From the autopilot screen, select Menu > Autopilot Menu >
1
Autopilot Setup >
Select the length of the delay.
2
If necessary, select
3
Enabling the Gybe Inhibitor
NOTE: The gybe inhibitor does not prevent you from manually
performing a gybe using the helm or step steering.
The gybe inhibitor prevents the autopilot from performing a
gybe.
Select Menu
1
Setup > Gybe Inhibitor
Select
2
> Autopilot Menu > Tack Gybe
> Tack Gybe
Tack or Gybe
> Autopilot Menu > Autopilot Setup > Sailing
Enabled
.
.
.
Sailing Setup > Tack Delay
.
Done
.
.
.
Sonar
When properly connected to a compatible transducer, your
chartplotter can be used as a fishfinder. Different sonar views
can help you view the fish in the area.
The adjustments you can make to each sonar view vary
depending on the view you are in and the chartplotter model and
transducer you have connected.
Sonar Views
The sonar views available vary depending on the type of
transducer and optional sounder module connected to the
chartplotter. For example, you can view the Split Frequency
view only if you have a dual-frequency transducer connected.
There are four basic styles of sonar views available: a fullscreen view, a split-screen view that combines two or more
views, a split-zoom view, and a split-frequency view that
displays two different frequencies. You can customize the
settings for each view in the screen. For example, if you are
viewing the split-frequency view, you can adjust the gain for
each of the frequencies separately.
If you do not see an arrangement of sonar views to suit your
needs, you can create a custom screen (Adding a Custom
Combination Screen).
Traditional Sonar View
There are several full-screen views available, depending on the
equipment connected.
The full-screen Traditional sonar view show a large image of the
sonar readings from a transducer. The range scale along the
right side of the screen shows the depth of detected objects as
the screen scrolls from the right to the left.
14 Sonar
Page 21
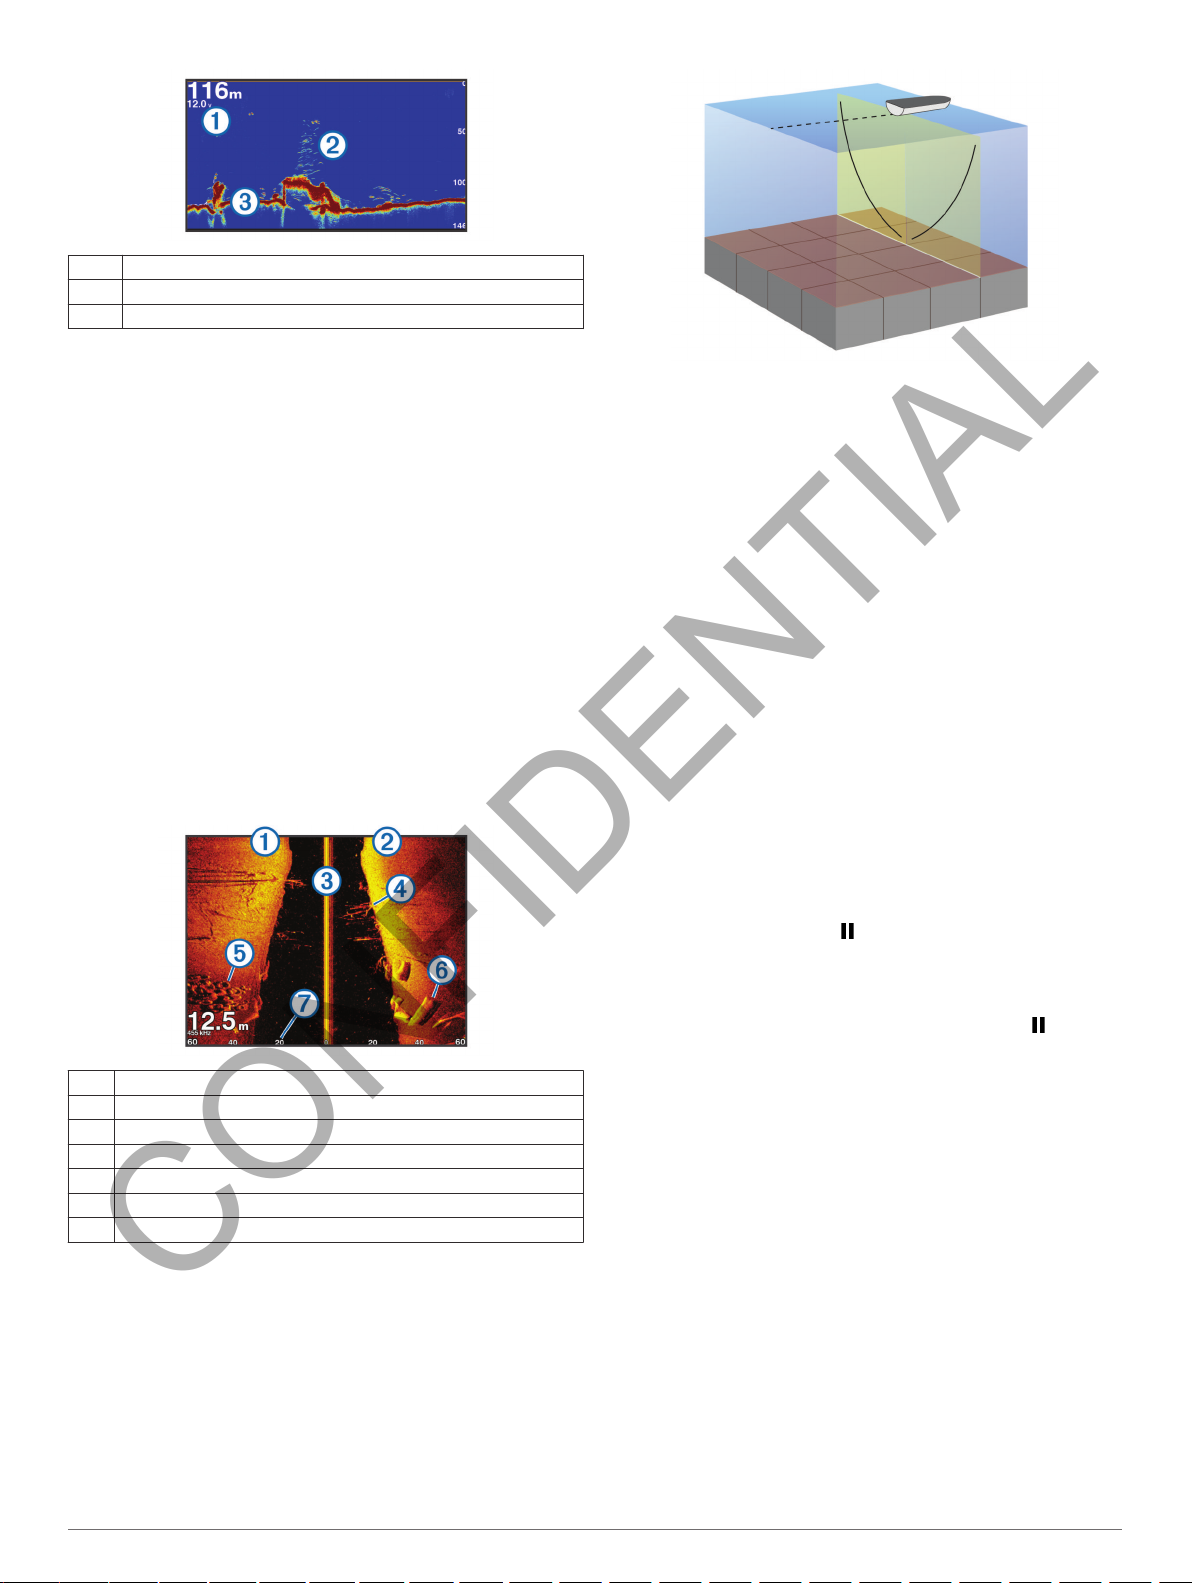
Depth information
CONFIDENTIAL
À
Suspended targets or fish
Á
Bottom of the body of water
Â
DownVü
NOTE: Not all models support DownVü sonar technology and
transducers.
NOTE: To receive DownVü scanning sonar, you need a
compatible chartplotter or fishfinder and a compatible
transducer.
DownVü high-frequency sonar provides a clearer picture below
the boat, providing a more detailed representation of structures
the boat is passing over.
Traditional transducers emit a conical beam. The DownVü
scanning sonar technology emits a narrow beam, similar to the
shape of the beam in a copying machine. This beam provides a
clearer, picture-like image of what is beneath the boat.
Sonar View
SideVü Sonar View
NOTE:
transducers.
NOTE:
compatible chartplotter and a compatible transducer.
SideVü scanning sonar technology shows you a picture of what
lies to the sides of the boat. You can use this as a search tool to
find structures and fish.
Not all models support SideVü
To receive SideVü
scanning sonar, you need a
sonar and scanning
Split-Zoom Sonar View
The split-zoom sonar view shows a full-view graph of sonar
readings, and a magnified portion of that graph, on the same
screen.
Split-Frequency Sonar View
In the split-frequency sonar view, one side of the screen shows
a full-view graph of high frequency sonar data, and the other
side of the screen shows a full-view graph of lower frequency
sonar data.
NOTE: The split-frequency sonar view requires the use of a
dual-frequency transducer.
Changing the Sonar View
From a combination screen or SmartMode layout with sonar,
1
select the window to change.
Select Menu
2
Select a sonar view.
3
> Change Sonar
.
Creating a Waypoint on the Sonar Screen
From a sonar view, select a location.
1
Select New Wpt.
2
If necessary, edit the waypoint information.
3
Pausing the Sonar Display
From a sonar view, select .
Viewing Sonar History
You can scroll the sonar display to view historical sonar data.
From a sonar view, select Menu > Sonar Menu > .
1
Drag the screen.
2
Left side of the boat
À
Right side of the boat
Á
The transducer on your vessel
Â
Trees
Ã
Old tires
Ä
Logs
Å
Distance from the side of the boat
Æ
SideVü/DownVü Scanning Technology
Instead of a more common conical beam, the SideVü/DownVü
transducer uses a flat beam to scan the water and ground to the
sides of your boat.
Sonar 15
Sonar Sharing
This feature may not be available on all chartplotter models.
You can view the sonar data from all compatible sources on the
Garmin Marine Network. You can view sonar data from a
compatible external sonar module, such as a GCV™ sonar
module. In addition, you can view the sonar data from other
chartplotters that have a built-in sonar module.
Each chartplotter on the network can display sonar data from
every compatible sonar module and transducer on the network,
no matter where the chartplotters and transducers are mounted
on your boat. For example, from a transducer with DownVü
mounted at the back of the boat, you can view the sonar data
using the GPSMAP 7407xsv mounted at the front of your boat.
Chartplotters can display only compatible types of sonar. For
example, GPSMAP
DownVü data, but not SideVü
When sharing sonar data, the values of some sonar settings,
such as
on the network. The values of other sonar settings, such as the
Range and Gain
547 models can display traditional and
data.
, are synchronized across the devices
Page 22

Appearance settings, are not synchronized and should be
CONFIDENTIAL
configured on each individual device. In addition, the scroll rates
of the various traditional and DownVü sonar views are
synchronized to make the split views more cohesive.
NOTE: Using multiple transducers simultaneously can create
cross talk, which can be removed by adjusting the Interference
sonar setting.
Selecting a Sonar Source
This feature may not be available with all models.
When you are using more than one sonar data source for a
particular sonar view, you can select the source to use for that
sonar view. For example, if you have two sources for DownVü,
you can select the source to use from the DownVü sonar view.
Open the sonar view for which you will change the source.
1
Select Menu
2
Select the source for this sonar view.
3
> Sonar Menu > Sonar Setup > Source
.
Renaming a Sonar Source
You can rename a sonar source to easily identify that source.
For example, you use "Bow" as the name of the transducer on
the bow of your boat.
The source is renamed for the present view only. For example,
to rename the DownVü sonar source, you must open the
DownVü sonar view.
From the sonar view, select Menu > Sonar Menu
1
Setup > Source > Rename Sources
Enter the name.
2
.
> Sonar
Adjusting the Level of Detail
You can control the level of detail and noise shown on the sonar
screen either by adjusting the gain for traditional transducers, or
by adjusting the brightness for DownVü and SideVü/DownVü
transducers.
If you want to see the highest intensity signal returns on the
screen, you can lower the gain or brightness to remove lower
intensity returns and noise. If you want to see all return
information, you can increase the gain or brightness to see more
information on the screen. This also increases noise, and can
make it more difficult to recognize actual returns.
From a sonar view, select Menu
1
Select Gain or
2
Select an option:
3
• To increase or decrease the gain or brightness manually,
select
• To allow the chartplotter to adjust the gain or brightness
automatically, select an automatic option.
Brightness
Up or Down
.
> Sonar Menu
.
.
Adjusting the Color Intensity
You can adjust the intensity of colors and highlight areas of
interest on the sonar screen by adjusting the color gain for
traditional transducers or the contrast for
DownVü
adjusted the level of detail shown on the screen using the gain
or brightness settings.
If you want to highlight smaller fish targets or create a higher
intensity display of a target, you can increase the color gain or
contrast setting. This causes a loss in the differentiation of the
high intensity returns at the bottom. If you want to reduce the
intensity of the return, you can reduce the color gain or contrast.
1
2
transducers. This setting works best after you have
From a sonar view, select Menu
Select an option:
• While in the DownVü or SideVü sonar view, select
Contrast.
• While in another sonar view, select Sonar Setup
Advanced > Color Gain
.
DownVü and SideVü/
> Sonar Menu
.
>
Select an option:
3
• To increase or decrease the color intensity manually,
select Up or Down.
• To use the default setting, select Default.
Adjusting the Range of the Depth or Width Scale
You can adjust the range of the depth scale traditional and
DownVü
SideVü
Allowing the device to adjust the range automatically keeps the
bottom within the lower or outer third of the sonar screen, and
can be useful for tracking a bottom that has minimal or moderate
terrain changes.
Manually adjusting the range enables you to view a specified
range, which can be useful for tracking a bottom that has large
terrain changes, such as a drop-offs or cliffs. The bottom can
appear on the screen as long as it appears within the range you
have set.
1
2
sonar views and the range of the width scale for the
sonar view.
From a sonar view, select Menu > Sonar Menu > Range.
Select an option:
• To allow the chartplotter to adjust the range automatically,
select
• To increase or decrease the range manually, select Up or
Down.
TIP:
From the sonar screen, you can select
manually adjust the range.
TIP:
When viewing multiple sonar screens, you can select
to choose the active screen.
Select
Auto
.
or to
Setting the Zoom Level on the Sonar Screen
From a sonar view, select Menu
1
Select an option:
2
• To zoom in on the sonar data from the bottom depth,
select Bottom Lock.
• To set the depth range of the magnified area manually,
select
Set Zoom, select View Up or View Down to set the
depth range of the magnified area, and select Zoom In or
Zoom Out
the magnified area.
• To set the depth and zoom automatically, select Set
Zoom
• To cancel the zoom, select No Zoom.
to increase or decrease the magnification of
> Auto
.
> Sonar Menu > Zoom
.
Setting the Scroll Speed
You can set the rate at which the sonar image moves across the
screen. A higher scroll speed shows more detail, especially
while moving or trolling. A lower scroll speed displays sonar
information on the screen longer. Setting the scroll speed on
one sonar view applies to all the sonar views.
From a sonar view, select Menu > Sonar Menu > Sonar
1
Setup
> Scroll Speed
Select an option:
2
• To adjust the scroll speed automatically using speed-overground or water speed data, select Auto.
The Auto setting selects a scroll rate to match the boat
speed, so targets in the water are drawn with the correct
aspect ratio and appear less distorted. When viewing
DownVü or SideVü sonar views, it is recommend to use
the Auto setting.
• To use a very fast scroll speed, select Ultrascroll®.
The Ultrascroll option quickly scrolls new sonar data, but
with a reduced image quality. For most situations, the Fast
.
16 Sonar
Page 23

option provides a good balance between a quickly
CONFIDENTIAL
scrolling image and targets that are less distorted.
Sonar Frequencies
NOTE: The frequencies available depend on the chartplotter,
sounder modules, and transducer being used.
Adjusting the frequency helps adapt the sonar for your particular
goals and the present depth of the water.
Higher frequencies use narrow beam widths, and are better for
high-speed operation and rough sea conditions. Bottom
definition and thermocline definition can be better when using a
higher frequency.
Lower frequencies use wider beam widths, which can let the
fisherman see more targets, but could also generate more
surface noise and reduce bottom signal continuity during rough
sea conditions. Wider beam widths generate larger arches for
fish target returns, making them ideal for locating fish. Wider
beam widths also perform better in deep water, because the
lower frequency has better deep water penetration.
Chirp frequencies allow you to sweep each pulse through a
range of frequencies, resulting in better target separation in
deep water. Chirp can be used to distinctly identify targets, like
individual fish in a school, and for deep water applications. Chirp
generally performs better than single frequency applications.
Because some fish targets may show up better using a fixed
frequency, you should consider your goals and water conditions
when using Chirp.
Some sonar black boxes and transducers also provide the ability
to customize preset frequencies for each transducer element,
which enables you to change the frequency quickly using the
presets as the water and your goals change.
Viewing two frequencies concurrently using the split-frequency
view allows you to see deeper with the lower frequency return
and, at the same time, see more detail from the higher
frequency return.
Selecting Frequencies
NOTE: You cannot adjust the frequency for all sonar views and
transducers.
You can indicate which frequencies appear on the sonar screen.
From a sonar view, select Menu > Sonar Menu >
1
Frequency.
Select a frequency suited to your needs and water depth.
2
For more information on frequencies, see Sonar
Frequencies.
Creating a Frequency Preset
NOTE: Not available with all transducers.
You can create a preset to save a specific sonar frequency,
which allows you to change frequencies quickly.
From a sonar view, select Menu
1
Frequency
Select Manage Frequencies
2
Enter a frequency.
3
.
> Sonar Menu >
> New Preset
.
Turning On the A-Scope
NOTE: This feature is not available in all sonar views.
The a-scope is a vertical flasher along the right side of the fullscreen sonar view. This feature expands the most recently
received sonar data so that it is easier to see. It can also be
helpful for detecting fish that are close to the bottom.
From a sonar view, select Menu >
Setup > Appearance > A-Scope > On
Sonar Menu > Sonar
.
Selecting the Transducer Type
Before you can select the transducer type, you must know what
kind of transducer you have.
If you are connecting a transducer that was not included with the
chartplotter, you may need to set the transducer type to make
the sonar function properly. If the device automatically detected
your transducer, this option does not appear.
From a sonar view, select Menu
1
Installation > Transducer Type
Select an option:
2
• If you have a 200/77 kHz, dual-beam transducer, select
Dual Beam (200/77 kHz).
• If you have a 200/50 kHz, dual-frequency transducer,
select Dual Frequency (200/50 kHz).
• If you have another type of transducer, select it from the
list.
> Sonar Setup >
.
Sonar Setup
NOTE: Not all options and settings apply to all models and
transducers.
Sonar Settings
From a sonar view, select Menu
Scroll Speed: Sets the rate at which the sonar scrolls from right
to left (Setting the Scroll Speed).
In shallow water, you can select a slower scroll speed to
extend the length of time the information is displayed on
screen. In deeper water, you can select a faster scroll speed.
Automatic scroll speed adjusts the scrolling speed to the
speed the boat is traveling.
Noise Reject: Reduces the interference and the amount of
clutter shown on the sonar screen (Sonar Noise Rejection
Settings).
Appearance: Configures the appearance of the sonar screen
(Sonar Appearance Settings).
Alarms: Sets sonar alarms (Sonar Alarm Settings).
Advanced: Configures various sonar display and data source
settings (Advanced Sonar Settings).
Installation: Configures the transducer (Transducer Installation
Settings).
Sonar Noise Rejection Settings
From a sonar view, select Menu
> Noise Reject
Interference: Adjusts the sensitivity to reduce the effects of
interference from nearby sources of noise.
The lowest interference setting that achieves the desired
improvement should be used to remove interference from the
screen. Correcting installation issues that cause noise is the
best way to eliminate interference.
Color Limit: Hides part of the color palette to help eliminate
fields of weak clutter.
By setting the color limit to the color of the undesired returns,
you can eliminate the display of undesired returns on the
screen.
Smoothing: Removes noise that is not part of a normal sonar
return, and adjusts the appearance of returns, such as the
bottom.
When smoothing is set to high, more of the low-level noise
remains than when using the interference control, but the
noise is more subdued because of averaging. Smoothing can
remove speckle from the bottom. Smoothing and interference
work well together to eliminate low-level noise. You can
adjust the interference and smoothing settings incrementally
to remove undesirable noise from the display.
.
> Sonar Menu > Sonar Setup
> Sonar Menu > Sonar Setup
.
Sonar 17
Page 24

Surface Noise: Hides surface noise to help reduce clutter.
CONFIDENTIAL
Wider beam widths (lower frequencies) can show more
targets, but can generate more surface noise.
TVG: Adjusts the time varying gain, which can reduce noise.
This control is best used for situations when you want to
control and suppress clutter or noise near the water surface.
It also allows for the display of targets near the surface that
are otherwise hidden or masked by surface noise.
Sonar Appearance Settings
NOTE: Not all options and settings apply to all models and
transducers.
From a Sonar view, select Menu
> Appearance
Color: Sets the color scheme and color gain.
Overlay Data: Sets the data shown on the sonar screen.
A-Scope: Displays a vertical flasher along the right side of the
screen that shows instantaneously the range to targets along
a scale.
Depth Line: Shows a quick-reference depth line.
Edge: Highlights the strongest signal from the bottom to help
define the hardness or softness of the signal.
Pic. Advance: Allows the sonar picture to advance faster by
drawing more than one column of data on the screen for
each column of sounder data received. This is especially
helpful when you are using the sounder in deep water,
because the sonar signal takes longer to travel to the water
bottom and back to the transducer.
The 1/1 setting draws one column of information on the
screen per sounder return. The 2/1 setting draws two
columns of information on the screen per sounder return, and
so on for the 4/1 and 8/1 settings.
.
> Sonar Menu > Sonar Setup
Sonar Alarm Settings
NOTE: Some settings require external accessories.
Select Settings >
Shallow Water: Sets an alarm to sound when the depth is less
than the specified value.
Deep Water: Sets an alarm to sound when the depth is greater
than the specified value.
Water Temp.: Sets an alarm to sound when the transducer
reports a temperature that is 2°F (1.1°C) above or below the
specified temperature.
Contour: Sets an alarm to sound when the transducer detects a
suspended target within the specified depth from the surface
of the water and from the bottom.
Fish Alarm: Sets an alarm to sound when the transducer
detects a suspended target within the specified depth range
and the specified color range.
Alarms > Sonar
.
Advanced Sonar Settings
From a sonar view, select Menu
> Advanced
Transmit: Stops the transducer from transmitting.
Shift: Allows you to set the depth range on which the sonar is
focused. This allows you to zoom in a higher resolution in the
focused depth.
When using shift, bottom tracking may not work effectively,
because the sonar looks for data within the depth range of
the focused area, which may not include the bottom. Using
shift also can impact the scroll speed, because data outside
the depth range of the focused area is not processed, which
reduces the time required to receive and display the data.
You can zoom in to the focused area, which enables you to
evaluate target returns more closely at a higher resolution
than just zooming alone.
.
> Sonar Menu > Sonar Setup
Echo Stretch: Adjusts the size of the echoes on the screen to
make it easier to see separate returns on the screen.
When targets are difficult to see, echo stretch makes the
target returns more pronounced and easier to see on the
screen. If the echo stretch value is too high, the targets blend
together, and if the value is too low, the targets might be
small and difficult to see.
You can use echo stretch and filter width together to obtain
the preferable resolution and noise reduction. With echo
stretch and filter width set to low, the display has the highest
resolution, but is the most susceptible to noise. With echo
stretch set to high and filter width set to low, the display has a
lower resolution, but has wider targets. With echo stretch and
filter width set to high, the display has the lowest resolution,
but is the least susceptible to noise. It is not recommended to
set echo stretch to low and filter width to high.
Bottom Track: Sets the frequency used for determining depth.
The bottom tracking control allows you to select the specific
channel that is used to track the bottom. For example, you
can set the bottom tracking for the low frequency for deep
water operation.
Temp. Source: Sets the channel for the water temperature log
when more than one water-temperature sensor or
temperature-capable transducer is connected.
Transducer Installation Settings
From a sonar view, select Menu > Sonar Menu > Sonar Setup
> Installation.
Transmit Rate: Sets the length of time between sonar pings.
Increasing the transmit rate increases the scroll speed, but it
may also increase self-interference.
Reducing the transmit rate increases the spacing between
transmit pulses and can resolve self-interference.
Transmit Power: Reduces transducer ringing near the surface.
A lower transmit power value reduces transducer ringing.
Filter Width: Defines the edges of the target. A shorter filter
defines the edges of the targets, but may allow more noise. A
longer filter creates softer target edges, and may also reduce
noise.
Transducer Diagnostics: Shows details about the transducer.
Flip Left/Right: Changes the SideVü view orientation from left
to right.
Sonar Recordings
Recording the Sonar Display
NOTE: Not all models support sonar recording.
Insert a memory card into the card slot.
1
From a sonar view, select Menu > Sonar Setup > Sonar
2
Recording
15 minutes of sonar recording uses approximately 200 MB of
space of the inserted memory card. You can record sonar
until the card reaches capacity.
> Record Sonar
Stopping the Sonar Recording
Before you can stop recording sonar, you must begin recording
it (Recording the Sonar Display).
From a sonar view, select Menu
Recording > Stop Recording
Deleting a Sonar Recording
Insert a memory card into the card slot.
1
From a sonar view, select Menu > Sonar Setup > Sonar
2
Recordings
Select a recording.
3
Select
4
> View Recordings
.
Delete
.
> Sonar Setup > Sonar
.
.
18 Sonar
Page 25
Playing Sonar Recordings
CONFIDENTIAL
Before you can play back the sonar recordings, you must
download and install the HomePort™ application and record
sonar data onto a memory card.
Remove the memory card from the device.
1
Insert the memory card into a card reader attached to a
2
computer.
Open the
3
Select a sonar recording from your device list.
4
Right-click the sonar recording in the lower pane.
5
Select Playback.
6
HomePort
application.
Radar
Transmitting Radar Signals
NOTE: As a safety feature, the radar enters standby mode after
it warms up. This gives you an opportunity to verify the area
around the radar is clear before beginning radar transmission.
With the chartplotter off, connect your radar as described in
1
the radar installation instructions.
Turn on the chartplotter.
2
The radar warms up and a countdown alerts you when the
radar is ready.
Select
3
Select a radar mode.
4
A countdown message appears while the radar is starting up.
Select Menu
5
.
Radar
> Transmit Radar
.
WARNING
The marine radar transmits microwave energy that has the
potential to be harmful to humans and animals. Before
beginning radar transmission, verify that the area around the
radar is clear. The radar transmits a beam approximately 12°
above and below a line extending horizontally from the center of
the radar.
When the radar is transmitting, do not look directly at the
antenna at close range; eyes are the most sensitive part of the
body to electromagnetic energy.
NOTE: Not all models support radar.
When you connect your compatible chartplotter to an optional
marine radar, such as a
Garmin
HD, you can view more information about your surroundings.
GMR
The
rotates to a 360° pattern. When the transmitted energy contacts
a target, some of that energy is reflected back to the radar.
transmits a narrow beam of microwave energy as it
GMR™ 1226 xHD2 or a
GMR
24
Radar Display Modes
NOTE: Not all modes are available with all radar devices and all
chartplotters.
Radar
Select
Cruising Mode: Shows a full-screen image of the gathered
radar information.
Harbor Mode: Intended for use in inland waters, this mode
works best with short-range signals (2 nm or less).
Offshore Mode: Intended for use in open waters, this mode
works best with long-range signals.
Sentry Mode: Allows you to put the radar into timed-transmit
mode, in which you can configure a radar transmit and
standby cycle to conserve power. You can also enable a
guard zone in this mode, which identifies a safe zone around
your boat. If you switch from Sentry mode to another mode,
the radar switches to full-time transmission and disables all
guard zones.
Radar Overlay Mode: Shows a full-screen image of the
gathered radar information on top of the Navigation chart.
The Radar overlay displays data based on the most recently
used radar mode.
Dual Range Mode: Provides a side-by-side view of both short-
range and long-range radar data.
.
Changing the Radar Mode
From a combination screen or SmartMode layout with radar,
1
select Menu
Select a radar mode.
2
> Radar Menu > Change Radar
.
Adjusting the Radar Range
The range of the radar signal indicates the length of the pulsed
signal transmitted and received by the radar. As the range
increases, the radar transmits longer pulses in order to reach
distant targets. Closer targets, especially rain and waves, also
reflect the longer pulses, which can add noise to the Radar
screen. Viewing information about longer-range targets can also
decrease the amount of space available on the Radar screen for
viewing information about shorter-range targets.
• Select to decrease the range.
• Select to increase the range.
Tips for Selecting a Radar Range
• Determine what information you need to see on the Radar
screen.
For example, do you need information about nearby weather
conditions or targets and traffic, or are you more concerned
about distant weather conditions?
• Assess the environmental conditions where the radar is being
used.
Especially in inclement weather, longer-range radar signals
can increase the clutter on the Radar screen and make it
more difficult to view information about shorter-range targets.
In rain, shorter-range radar signals can enable you to view
information about nearby objects more effectively, if the rain
clutter setting is configured optimally.
• Select the shortest effective range, given your reason for
using radar and the present environmental conditions.
Zooming In and Out of the Radar Screen
• Pinch two fingers together to zoom out.
• Spread two fingers apart to zoom in.
• Drag the screen to pan, and then select or to zoom, if
necessary.
Marking a Waypoint on the Radar Screen
From a Radar screen or the Radar overlay, select a location.
1
2
Select
Create Waypoint
.
Sentry Mode
Sentry mode allows you to put the radar into timed-transmit
mode, in which you can configure a radar transmit and standby
cycle to conserve power. You can also enable a guard zone in
this mode, which identifies a safe zone around your boat and
sounds an alarm when a radar object enters the zone. Sentry
mode works with all Garmin
Enabling Timed Transmit
From the sentry screen, select Menu > Radar Menu >
Sentry Setup >
Timed Transmit > On
model radars.
GMR
.
Radar 19
Page 26
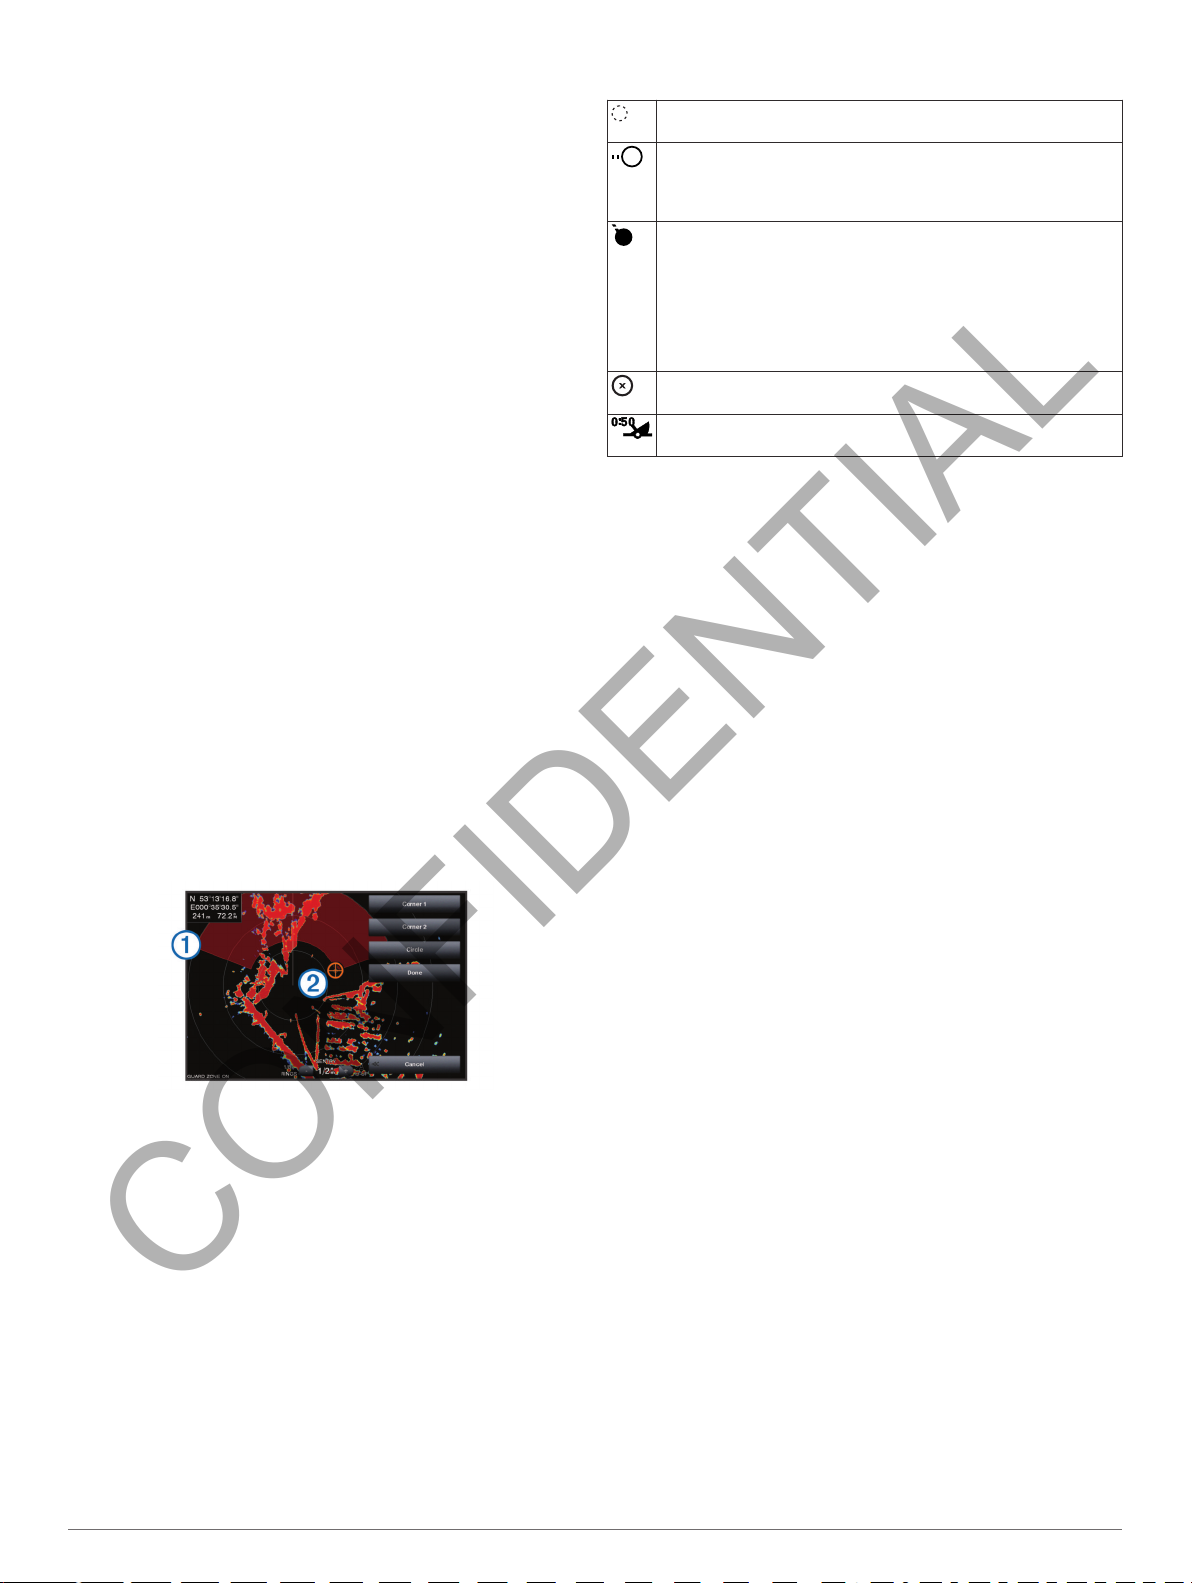
Setting the Standby and Transmit Times
CONFIDENTIAL
Before you can set the standby and transmit times, you must
enable timed transmit (Enabling Timed Transmit).
To help conserve power, you can indicate the radar standby
time and the transmit time to implement periodic radar signal
transmissions at set intervals.
From the sentry screen, select Menu
1
Sentry Setup
Select
2
Enter the time interval between radar signal transmissions.
3
Select
4
Enter the duration of each radar signal transmission.
5
.
Stdby Time
Transmit Time
.
.
> Radar Menu >
Enabling a Guard Zone
From the sentry screen, select Menu > Radar Menu >
Sentry Setup > Enable Guard Zone.
Defining a Circular Guard Zone
Before you can define the boundaries of the guard zone, you
must enable a guard zone (Enabling a Guard Zone).
You can define a circular guard zone that completely
encompasses your boat.
From the sentry screen, select Menu
1
Sentry Setup > Adjust Guard Zone > Adjust Guard Zone
> Circle
Select the location of the outer guard zone circle.
2
Select the location of the inner guard zone circle to define the
3
width of the guard zone.
.
> Radar Menu >
Defining a Partial Guard Zone
You can define the boundaries of a guard zone that does not
completely encompass your boat.
From the sentry screen, select Menu > Radar Menu >
1
Sentry Setup
> Corner 1
Touch and drag the location of the outer guard-zone corner
2
.
À
Select
3
Touch the location of the inner guard-zone corner Á to define
4
the width of the guard zone.
> Adjust Guard Zone > Adjust Guard Zone
.
Corner 2
.
Radar Targeting and MARPA
Radar targeting enables you to identify and track objects.
Mini-automatic radar plotting aid (MARPA) is primarily used for
collision avoidance. To use MARPA, you assign a MARPA tag
to a target. The radar system automatically tracks the tagged
object and provides you with information about the object,
including the range, bearing, speed, GPS heading, nearest
approach, and time to nearest approach. MARPA indicates the
status of each tagged object (acquiring, lost, tracking, or
dangerous), and the chartplotter can sound a collision alarm if
the object enters your safe zone.
MARPA Targeting Symbols
Acquiring a target. Concentric, dashed green rings radiate from
the target while the radar is locking onto it.
Target has been acquired. A solid green ring indicates the
location of a target that the radar has locked onto. A dashed
green line attached to the circle indicates the projected course
over ground or the GPS heading of the target.
Dangerous target is in range. A red ring flashes from the target
while an alarm sounds and a message banner appears. After
the alarm has been acknowledged, a solid red dot with a dashed
red line attached to it indicates the location and the projected
course over ground or the GPS heading of the target. If the safezone collision alarm has been set to Off, the target flashes, but
the audible alarm does not sound and the alarm banner does
not appear.
Target has been lost. A solid green ring with an X through it
indicates that the radar could not lock onto the target.
Closest point of approach and time to closest point of approach
to a dangerous target.
Assigning a MARPA Tag to an Object
Before you can use MARPA, you must have a heading sensor
connected and an active GPS signal. The heading sensor must
provide the NMEA 2000 parameter group number (PGN)
127250 or the
From the Harbor, Offshore, or Cruising Radar screen, select
1
an object or location.
Select Acquire Target > MARPA Target.
2
Viewing Information about a MARPA-tagged Object
You can view the range, bearing, speed, and other information
about a MARPA-tagged object.
From a radar screen, select a targeted object.
1
Select
2
Removing a MARPA Tag from a Targeted Object
1
2
MARPA Target
From the Radar screen, select a MARPA target.
Select MARPA Target
0183 HDM or HDG output sentence.
NMEA
.
> Remove
.
Viewing a List of AIS and MARPA Threats
From any Radar screen or the Radar overlay, you can view and
customize the appearance of a list of AIS and MARPA threats.
From a Radar screen, select Menu
1
Vessels > List > Show
Select the type of threats to include in the list.
2
.
> Radar Menu > Other
Showing AIS Vessels on the Radar Screen
AIS requires the use of an external AIS device and active
transponder signals from other vessels.
You can configure how other vessels appear on the Radar
screen. If any setting (except the AIS display range) is
configured for one radar mode, the setting is applied to every
other radar mode. The details and projected heading settings
configured for one radar mode are applied to every other radar
mode and to the Radar overlay.
From a Radar screen or the Radar overlay, select Menu >
1
Radar Menu
Select an option:
2
• To indicate the distance from your location within which
AIS vessels appear, select Display Range, and select a
distance.
• To show details about AIS-activated vessels, select
Details > Show.
• To set the projected heading time for AIS-activated
vessels, select Proj. Heading, and enter the time.
> Other Vessels > Display Setup
.
VRM and EBL
The variable range marker (VRM) and the electronic bearing line
(EBL) measure the distance and bearing from your boat to a
20 Radar
Page 27

target object. On the Radar screen, the VRM appears as a circle
CONFIDENTIAL
that is centered on the present location of your boat, and the
EBL appears as a line that begins at the present location of your
boat and intersects the VRM. The point of intersection is the
target of the VRM and the EBL.
Showing the VRM and the EBL
The VRM and the EBL configured for one mode are applied to
other radar modes.
NOTE: The VRM and the EBL cannot be changed in sentry
mode.
From a Radar screen, select Menu > Radar Menu > Show
VRM/EBL.
Adjusting the VRM and the EBL
Before you can adjust the VRM and the EBL, you must show
them on the Radar screen (Showing the VRM and the EBL).
You can adjust the diameter of the VRM and the angle of the
EBL, which moves the intersection point of the VRM and the
EBL. The VRM and the EBL configured for one mode are
applied to all other radar modes.
From a Radar screen, select a new location for the
1
intersection point of the VRM and the EBL.
Select
2
3
Measuring the Range and Bearing to a Target Object
Before you can adjust the VRM and the EBL, you must show
them on the Radar screen (Showing the VRM and the EBL).
1
2
Drop VRM/EBL
Select
Stop Pointing
From a Radar screen, select the target location.
Select
Measure Distance
The range and the bearing to the target location appear in the
upper-left corner of the screen.
.
.
.
Radar Overlay
When you connect your chartplotter to an optional Garmin
marine radar, you can use the Radar overlay to overlay radar
information on the Navigation chart or on the Fishing chart.
The Radar overlay superimposes radar information on the
Navigation chart or the Fishing chart. Data appears on the
Radar overlay based on the most recently used radar mode
(such as Harbor, Offshore, or Sentry), and all settings
configurations applied to the Radar overlay are also applied to
the last-used radar mode. For example, if you use Harbor mode
and then you switch to the Radar overlay, the Radar overlay
would show Harbor mode radar data. If you changed the gain
setting using the Radar overlay menu, the gain setting for
Harbor mode would change automatically.
Radar Overlay and Chart Data Alignment
When using the Radar overlay, the chartplotter aligns radar data
with chart data based on the boat heading, which is based by
default on data from a magnetic heading sensor connected
using a
is not available, the boat heading is based on GPS tracking
data.
GPS tracking data indicates the direction in which the boat is
moving, not the direction in which the boat is pointing. If the boat
is drifting backward or sideways due to a current or wind, the
Radar overlay may not perfectly align with the chart data. This
situation should be avoided by using boat-heading data from an
electronic compass.
If the boat heading is based on data from a magnetic heading
sensor or an automatic pilot, the heading data could be
compromised due to incorrect setup, mechanical malfunction,
magnetic interference, or other factors. If the heading data is
compromised, the Radar overlay may not align perfectly with the
chart data.
NMEA 0183 or NMEA 2000
network. If a heading sensor
Showing the Radar Overlay
The radar overlay displays data based on the most recently
used radar mode.
Select Charts
The radar picture appears in orange and overlays the
navigation chart.
> Radar Overlay
.
Setting a Custom Park Position
If you have more than one radar on your boat, you must be
viewing the radar screen for the radar you want to adjust.
By default, the antenna is stopped perpendicular to the pedestal
when it is not spinning. You can adjust this position.
From the radar screen, select Menu
1
Antenna Configuration > Park Position
Use the slider bar to adjust the position of the antenna when
2
stopped, and select Back.
> Radar Setup >
.
Enabling and Adjusting a Radar No Transmit Zone
You can indicate an area within which the radar scanner does
not transmit signals.
NOTE: This feature is not available on all radar and chartplotter
models.
From a radar screen, select Menu > Radar Menu > Radar
1
Setup > Enable No Transmit Zone.
The no-transmit zone is indicated by a shaded area on the
radar screen.
Select Adjust No Transmit Zone >
2
3
4
5
Zone
Select
angle.
Select
angle.
Select
.
Angle 1
Angle 2
Done
, and select the new location for the first
, and select the new location for the second
.
Move No Transmit
Stopping the Transmission of Radar Signals
From a Radar screen, select
To Standby
TIP: Press from any screen to quickly stop radar
transmission.
.
Menu > Radar Menu
> Radar
Optimizing the Radar Display
You can adjust the radar display settings for reduced clutter and
increased accuracy.
NOTE: You can optimize the radar display for each radar mode.
Select a radar range (Adjusting the Radar Range).
1
Restore the default value of the gain setting (Adjusting Gain
2
on the Radar Screen Automatically).
Adjust the gain setting manually (Adjusting Gain on the
3
Radar Screen Manually).
Radar Gain and Clutter
Adjusting Gain on the Radar Screen Automatically
The automatic gain setting for each radar mode is optimized for
that mode, and may differ from the automatic gain setting used
for another mode.
NOTE: Depending upon the radar in use, the gain setting
configured for use in one radar mode may or may not be applied
to other radar modes or to the Radar overlay.
NOTE: Not all options and settings are available on all radar and
chartplotter models.
From a radar screen or the radar overlay, select Menu
1
Radar Menu > Gain
.
>
Radar 21
Page 28

Select an applicable option for the connected radar:
CONFIDENTIAL
2
• To set the gain automatically once, based on average
conditions, the range of the radar signal, and the selected
radar mode, select
The chartplotter does not adjust the gain automatically in
response to changing conditions.
• To adjust the gain automatically for changing conditions,
select
Auto Low or Auto High
• To adjust the gain automatically to show birds over the
surface of the water, select Auto Bird.
Adjusting Gain on the Radar Screen Manually
For optimal radar performance, you can manually adjust the
gain.
NOTE: Depending upon the radar in use, the gain setting
configured for use in one radar mode may or may not be applied
to other radar modes or to the Radar overlay.
From a Radar screen or the Radar overlay, select Menu >
1
Radar Menu
Select Up to raise the gain, until light speckles appear across
2
the Radar screen.
Data on the Radar screen is refreshed every few seconds. As
a result, the effects of manually adjusting the gain may not
appear instantly. Adjust the gain slowly.
Select
3
If boats, land, or other targets are within range, select Down
4
to lower the gain until the targets begin to blink.
Select Up to raise the gain until the boats, land, or other
5
targets appear steadily lit on the Radar screen.
Minimize the appearance of nearby large objects, if
6
necessary.
Minimize the appearance of side-lobe echoes, if necessary.
7
Minimizing Nearby Large-Object Interference
Nearby targets of significant size, such as jetty walls, can cause
a very bright image of the target to appear on the Radar screen.
This image can obscure smaller targets located near it.
NOTE: Depending upon the radar in use, the gain setting
configured for use in one radar mode may or may not be applied
to other radar modes or to the Radar overlay.
From a Radar screen or the Radar overlay, select Menu >
1
Radar Menu > Gain.
Select
2
clearly visible on the Radar screen.
Reducing the gain to eliminate nearby large-object
interference may cause smaller or distant targets to blink or
disappear from the Radar screen.
Minimizing Side-Lobe Interference on the Radar Screen
Side-lobe interference may appear to streak outward from a
target in a semi-circular pattern. Side-lobe effects can be
avoided by reducing the gain or reducing the radar range.
NOTE: Depending upon the radar in use, the gain setting
configured for use in one radar mode may or may not be applied
to other radar modes or to the Radar overlay.
From a Radar screen or the Radar overlay, select Menu >
1
Radar Menu > Gain.
Select
2
streaked pattern disappears from the Radar screen.
Reducing the gain to eliminate side-lobe interference may
cause smaller or distant targets to blink or disappear from the
Radar screen.
Adjusting Sea Clutter on the Radar Screen Automatically
You can set the chartplotter to automatically adjust the
appearance of clutter caused by choppy sea conditions.
> Gain
to lower the gain until the speckles disappear.
Down
to lower the gain until the smaller targets are
Down
to lower the gain until the semi-circular,
Down
.
Auto
.
.
NOTE: Depending upon the radar in use, the sea clutter setting
configured for use in one radar mode may or may not be applied
to other radar modes or to the radar overlay.
NOTE: Not all options and settings are available on all radar and
chartplotter models.
From a radar screen or the radar overlay, select Menu >
1
Radar Menu
Select
2
Select a setting that reflects the present sea conditions.
3
When using a compatible radar model, the chartplotter adjusts
the sea clutter based on the sea conditions automatically.
Adjusting Rain Clutter on the Radar Screen
You can adjust the appearance of clutter caused by rain.
Reducing the radar range also can minimize rain clutter
(Zooming In and Out of the Radar Screen).
The rain clutter setting affects the appearance of nearby rain
clutter and targets more than it affects the appearance of distant
rain clutter and targets. A higher rain clutter setting reduces the
appearance of clutter caused by nearby rain, but it can also
reduce or eliminate the appearance of nearby targets.
NOTE: Depending upon the radar in use, the rain clutter settings
configured for use in one radar mode may or may not be applied
to other radar modes or to the Radar overlay.
From a Radar screen or the Radar overlay, select Menu >
1
Radar Menu
Select
2
of nearby rain clutter until other targets are clearly visible on
the Radar screen.
Clutter caused by rain may still be visible.
Reducing Cross Talk Clutter on the Radar Screen
You can reduce the appearance of clutter caused by
interference from another nearby radar source, when the cross
talk reject setting is on.
NOTE: Depending upon the radar in use, the cross talk reject
setting configured for use in one radar mode may or may not be
applied to other radar modes or to the Radar overlay.
From a Radar screen or the Radar overlay, select Menu >
Radar Menu
> Noise Rejection > Sea Clutter
Presets or Auto
> Noise Rejection > Rain Clutter
Up or Down
> Noise Rejection >
.
to decrease or increase the appearance
Crosstalk Rej..
.
.
Echo Trails
The echo trails feature enables you to track the movement of
vessels on the radar display. You can change the length of time
the trail is displayed.
NOTE: Depending upon the radar in use, the settings configured
for use in one radar mode may or may not be applied to other
radar modes or to the radar overlay.
NOTE: Not all options and settings are available on all radar and
chartplotter models.
Turning on Echo Trails
From a radar screen or the radar overlay, select Menu
Radar Menu > Radar Setup > Echo Trails > Display
Adjusting the Length of the Echo Trails
From a radar screen or the radar overlay, select Menu >
1
Radar Menu
Select the length of the trail.
2
Clearing the Echo Trails
You can remove the echo trails from the radar screen to reduce
the clutter the screen.
From a radar screen or the radar overlay, select Clear Trails.
> Radar Setup > Echo Trails > Time
>
.
.
Radar Display Settings
From any Radar screen or the Radar overlay, select Menu >
Radar Menu
> Radar Setup
.
22 Radar
Page 29
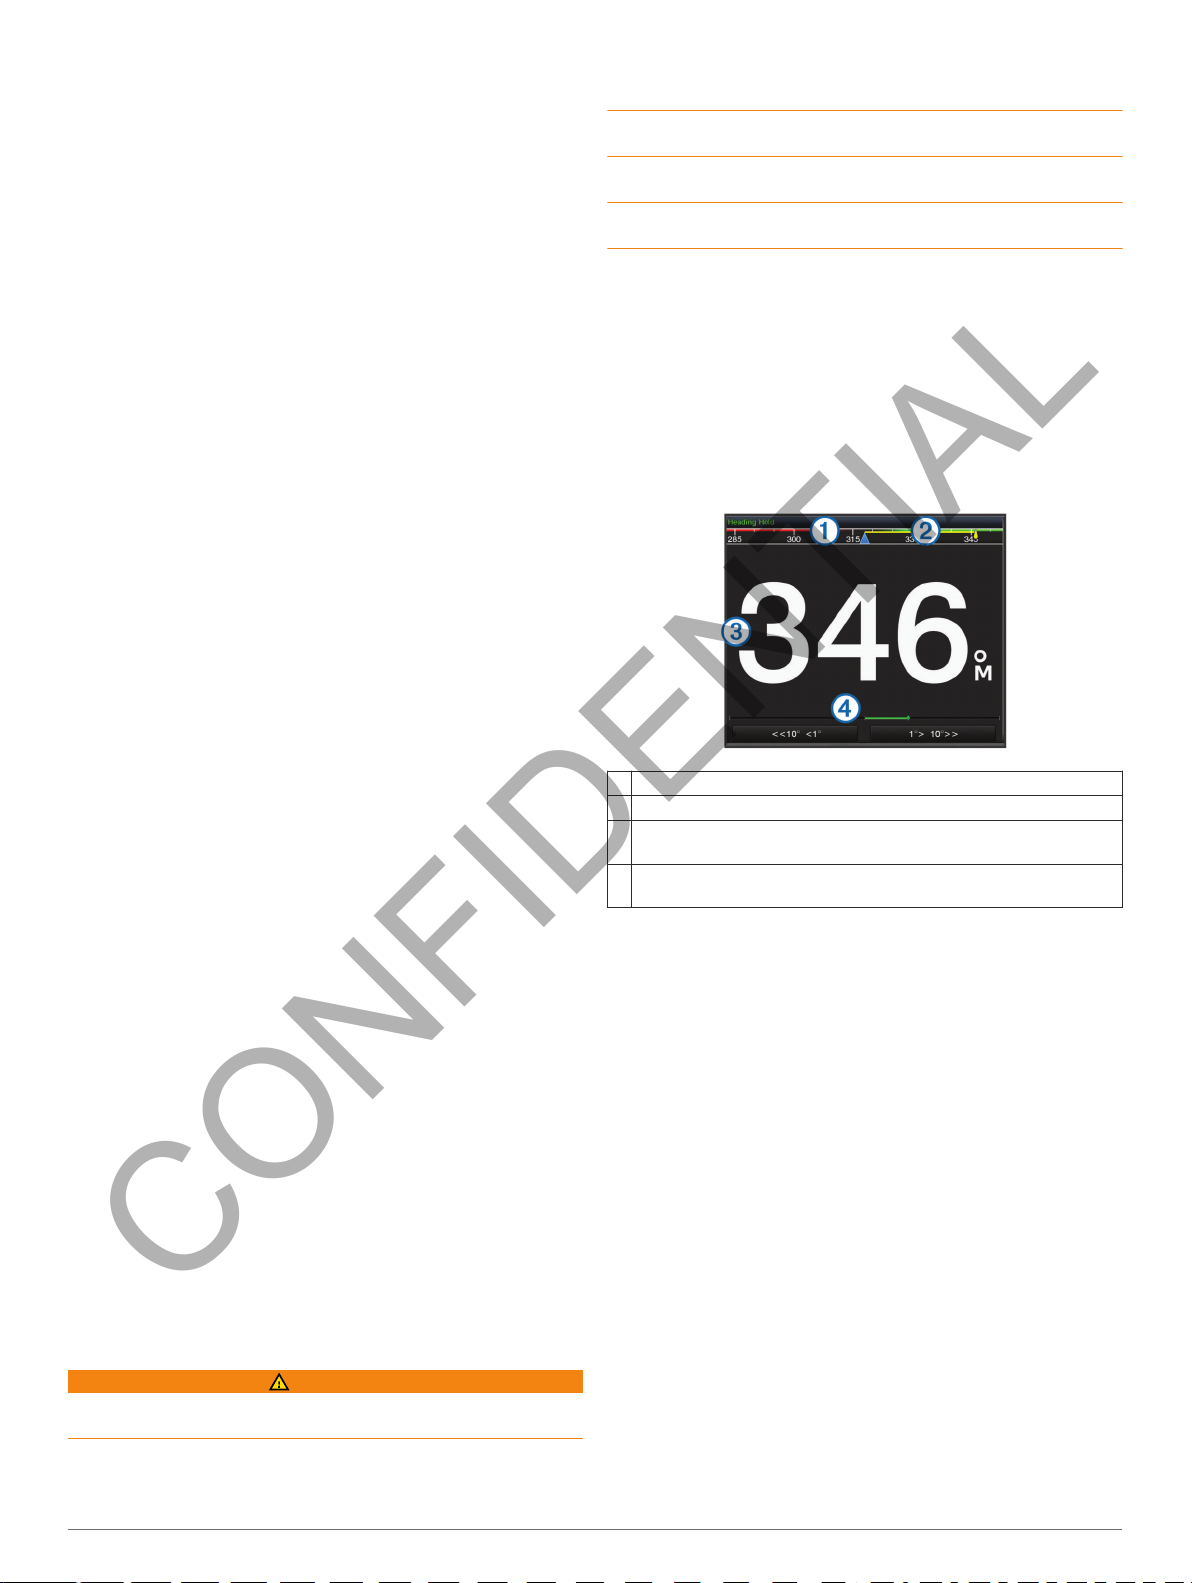
Orientation: Sets the perspective of the radar display. The
CONFIDENTIAL
orientation setting applies to every radar mode. This setting
does not apply to the Radar overlay.
Appearance: Sets the color scheme, look-ahead speed, and
navigation appearance.
Front of Boat: Compensates for the physical location of the
radar scanner on a boat, if the radar scanner does not align
with the bow-stern axis.
Radar Appearance Settings
From a Radar screen, select Menu
Setup > Appearance
NOTE: These settings do not apply to the Radar overlay.
Color Scheme: Sets the color scheme.
Look-Ahead Speed: Shifts your present location toward the
bottom of the screen automatically as your speed increases.
Enter your top speed for the best results.
Heading Line: Shows an extension from the bow of the boat in
the direction of travel on the radar screen.
Rings: Shows the range rings that help you to visualize
distances on the radar screen.
Nav Lines: Shows the navigation lines that indicate the course
you have set using Route To, Guide To, or Go To.
Waypoints: Shows waypoints on the radar screen.
.
> Radar Menu > Radar
Front-of-Boat Offset
The front-of-boat offset compensates for the physical location of
the radar scanner on a boat, if the radar scanner does not align
with the bow-stern axis.
Measuring the Potential Front-of-Boat Offset
The front-of-boat offset compensates for the physical location of
the radar scanner on a boat, if the radar scanner does not align
with the bow-stern axis.
Using a magnetic compass, take an optical bearing of a
1
stationary target located within viewable range.
Measure the target bearing on the radar.
2
If the bearing deviation is more than +/- 1°, set the front-of-
3
boat offset.
Setting the Front-of-Boat Offset
Before you can set the front-of-boat offset, you must measure
the potential front-of-boat offset.
The front-of-boat offset setting configured for use in one radar
mode is applied to every other radar mode and to the Radar
overlay.
From a Radar screen or the Radar overlay, select Menu >
1
Radar Menu
Select
2
> Radar Setup > Front of Boat
Up or Down
to adjust the offset.
.
Selecting a Different Radar Source
Select an option:
1
• From a radar screen or the radar overlay, select Menu >
Radar Menu >
• Select Settings >
Source > Radar
Select the radar source.
2
Radar Setup > Source
Communications > Preferred Data
.
.
Autopilot
WARNING
You can use the autopilot feature only at a station installed next
to a helm, throttle, and helm control device.
You are responsible for the safe and prudent operation of your
vessel. The autopilot is a tool that enhances your capability to
operate your boat. It does not relieve you of the responsibility of
safely operating your boat. Avoid navigational hazards and
never leave the helm unattended.
Always be prepared to promptly regain manual control of your
boat.
Learn to operate the autopilot on calm and hazard-free open
water.
Use caution when operating the autopilot near hazards in the
water, such as docks, pilings, and other boats.
The autopilot system continuously adjusts the steering of your
boat to maintain a constant heading (heading hold). The system
also allows manual steering and several modes of automaticsteering functions and patterns.
Opening the Autopilot Screen
Before you can open the autopilot screen, you must have a
compatible autopilot installed and configured.
Select A/V, Gauges, Controls > Autopilot.
Autopilot Screen
Actual heading
À
Intended heading (heading the autopilot is steering toward)
Á
Actual heading (when in standby mode)
Â
Intended heading (when engaged)
Rudder position indicator (This functionality is available only when a
Ã
rudder sensor is connected.)
Adjusting the Step Steering Increment
From the Autopilot screen, select Menu > Autopilot Setup >
1
Steering Mode >
Select an increment.
2
Step Turn Size
.
Setting the Power Saver
You can adjust the level of rudder activity.
From the Autopilot screen, select Menu > Autopilot Menu >
1
Autopilot Setup >
Select a percentage.
2
Selecting a higher percentage reduces rudder activity at the
expense of heading performance. The higher the percentage,
the more the course deviates before the autopilot corrects it.
TIP: In choppy conditions at low speeds, increasing the
Power Saver percentage reduces rudder activity.
Enabling Shadow Drive
NOTE: The Shadow Drive feature is available only on hydraulic
steering systems.
From the Autopilot screen, select Menu
Autopilot Setup > Shadow Drive > Enabled
Power Saver
™
.
> Autopilot Menu >
.
Engaging the Autopilot
When you engage the autopilot, the autopilot takes control of the
helm and steers the boat to maintain your heading.
From any screen, select
Engage
.
Autopilot 23
Page 30
Your intended heading shows in the center of the Autopilot
CONFIDENTIAL
screen.
Adjusting the Heading with the Helm
NOTE:
can adjust the heading using the helm (
Drive™).
You must enable the Shadow Drive feature before you
Enabling Shadow
With the autopilot engaged, manually steer the boat.
The autopilot activates Shadow Drive mode.
When you release the helm and manually maintain a specific
heading for a few seconds, the autopilot resumes a heading
hold at the new heading.
Adjusting the Heading with the Chartplotter in Step Steering Mode
Before you can steer your boat using the keys at the bottom of
the autopilot screen, you must engage the autopilot (Engaging
the Autopilot).
• Select
• Select
• Hold <1°
• Hold <<10° or
<1° or 1°>
<<10° or 10°>>
or 1°>
The boat continues to turn until you let go of the key.
to initiate a single 1° turn.
to initiate a single 10° turn.
to initiate a rate-controlled turn.
to initiate a sequence of 10° turns.
10°>>
Steering Patterns
WARNING
You are responsible for the safe operation of your boat. Do not
begin a pattern until you are certain that the water is clear of
obstacles.
The autopilot can steer the boat in preset patterns for fishing,
and it can also perform other specialty maneuvers such as Uturns and Williamson turns.
Following the U-Turn Pattern
You can use the u-turn pattern to turn the boat around 180° and
maintain the new heading.
Form the autopilot screen, select Menu > Autopilot Menu >
1
Pattern Steering
Engage Port or Engage Starboard
Select
2
Setting Up and Following the Circles Pattern
You can use the circles pattern to steer the boat in a continuous
circle, in a specified direction, and at a specified time interval.
From the Autopilot screen, select Menu > Autopilot Menu >
1
Pattern Steering >
If necessary, select
2
to steer one complete circle.
Engage Port or Engage Starboard
Select
3
Setting Up and Following the Zigzag Pattern
You can use the zigzag pattern to steer the boat from port to
starboard and back, over a specified time and angle, across
your present heading.
From the Autopilot screen, select Menu > Autopilot Menu >
1
Pattern Steering >
If necessary, select
2
If necessary, select
3
Engage Zigzag
Select
4
Following the Williamson Turn Pattern
You can use the Williamson turn pattern to steer the boat
around with the intent of running alongside the location where
the Williamson turn pattern was initiated. The Williamson turn
pattern can be used in man overboard situations.
> U-Turn > Engage
Circles
Time
Zigzag
Amplitude
Period
.
, and select a time for the autopilot
.
, and select a degree.
, and select a length of time.
.
.
.
.
From the Autopilot screen, select Menu > Autopilot Menu >
1
Pattern Steering
Select
2
Engage Port or Engage Starboard
> Williamson Turn
.
.
Following an Orbit Pattern
You can use the orbit pattern to steer the boat in a continuous
circle around the active waypoint. The size of the circle is
defined by your distance from the active waypoint when you
begin the orbit pattern.
From the Autopilot screen, select Menu > Autopilot Menu >
1
Pattern Steering > Orbit.
2
Select
Engage Port or Engage Starboard
.
Setting Up and Following the Cloverleaf Pattern
You can use the cloverleaf pattern to steer the boat to
repeatedly pass over an active waypoint. When you begin the
cloverleaf pattern, the autopilot drives the boat toward the active
waypoint and begins the cloverleaf pattern.
You can adjust the distance between the waypoint and the
location where the autopilot turns the boat for another pass over
the waypoint. The default setting turns the boat at a range of
1000 ft. (300 m) from the active waypoint.
From the Autopilot screen, select Menu > Autopilot Menu >
1
Pattern Steering > Cloverleaf.
If necessary, select
2
Select
3
Engage Port or Engage Starboard
, and select a distance.
Length
.
Setting Up and Following a Search Pattern
You can use the search pattern to steer the boat in increasingly
larger circles outward from the active waypoint, forming a spiral
pattern. When you begin the search pattern, the autopilot drives
the boat to the active waypoint and begins the pattern.
You can adjust the distance between each circle in the spiral.
The default distance between circles is 50 ft. (20 m).
From the Autopilot screen, select Menu > Autopilot Menu >
1
Pattern Steering
If necessary, select
2
Select Engage Port or Engage Starboard.
3
> Search
.
Search Spacing
, and select a distance.
Cancelling a Steering Pattern
• Physically steer the boat.
NOTE: Shadow Drive must be enabled to cancel a steering
pattern by physically steering the boat.
• Select or to cancel a pattern using step steering mode.
• Select
Standby
.
Digital Selective Calling
Networked Chartplotter and VHF Radio Functionality
If you have a
radio connected to your chartplotter, these features are enabled.
• The chartplotter can transfer your GPS position to your radio.
If your radio is capable, GPS position information is
transmitted with DSC calls.
• The chartplotter can receive digital selective calling (DSC)
distress and position information from the radio.
• The chartplotter can track the positions of vessels sending
position reports.
If you have a Garmin NMEA 2000 VHF radio connected to your
chartplotter, these features are also enabled.
• The chartplotter allows you to quickly set up and send
individual routine call details to your Garmin VHF radio.
NMEA 0183 VHF radio or a NMEA 2000
VHF
24 Digital Selective Calling
Page 31

• When you initiate a man-overboard distress call from your
CONFIDENTIAL
radio, the chartplotter shows the man-overboard screen and
prompts you to navigate to the man-overboard point.
• When you initiate a man-overboard distress call from your
chartplotter, the radio shows the Distress Call page to initiate
a man-overboard distress call.
Turning On DSC
Select
Settings
> Other Vessels > DSC
.
DSC List
The DSC list is a log of the most recent DSC calls and other
DSC contacts you have entered. The DSC list can contain up to
100 entries. The DSC list shows the most recent call from a
boat. If a second call is received from the same boat, it replaces
the first call in the call list.
Viewing the DSC List
Before you can view the DSC list, the chartplotter must be
connected to a VHF radio that supports DSC.
Select Info > DSC List.
Adding a DSC Contact
You can add a vessel to your DSC list. You can make calls to a
DSC contact from the chartplotter.
Select Info > DSC List > Add Contact.
1
Enter the Maritime Mobile Service Identity (MMSI) of the
2
vessel.
Enter the name of the vessel.
3
Incoming Distress Calls
If your compatible chartplotter and VHF radio are connected
using NMEA 0183 or NMEA 2000
when your VHF radio receives a DSC distress call. If position
information was sent with the distress call, that information is
also available and recorded with the call.
designates a distress call in the DSC list and marks the
position of the vessel on the Navigation chart at the time of the
DSC distress call.
Navigating to a Vessel in Distress
designates a distress call in the DSC list and marks the
position of a vessel on the Navigation chart at the time of the
DSC distress call.
Select Info > DSC List.
1
Select a position-report call.
2
Select Review > Navigate To.
3
Select Go To or
4
Route To
Man-Overboard Distress Calls Initiated from a VHF Radio
When the chartplotter is connected to a compatible VHF radio
with
NMEA 2000
distress call from the radio, the chartplotter shows the manoverboard screen and prompts you to navigate to the manoverboard point. If you have a compatible autopilot system
connected to the network, the chartplotter prompts you to start a
Williamson’s turn to the man-overboard point.
If you cancel the man-overboard distress call on the radio, the
chartplotter screen prompting you to activate navigation to the
man-overboard location disappears.
, and you initiate a man-overboard DSC
Man-Overboard and SOS Distress Calls Initiated from the Chartplotter
When your chartplotter is connected to a Garmin
compatible radio and you mark an SOS or man-overboard
location, the radio shows the Distress Call page so you can
quickly initiate a distress call.
, your chartplotter alerts you
.
NMEA 2000
For information on placing distress calls from your radio, see the
VHF radio owner’s manual. For information about marking an
MOB or SOS location, see Marking an SOS Location.
Position Tracking
When you connect the chartplotter to a VHF radio using NMEA
0183, you can track vessels that send position reports.
This feature is also available with NMEA 2000, when the vessel
sends the correct PGN data (PGN 129808; DSC Call
Information).
Every position report call received is logged in the DSC list
(DSC List).
Viewing a Position Report
Select Info
1
Select a position-report call.
2
Select Review.
3
Select an option:
4
• To switch to a Navigation chart marking the location,
select Next Page.
• To view the position report details, select Previous Page.
> DSC List
Navigating to a Tracked Vessel
Select Info
1
Select a position-report call.
2
Select Review
3
Select
4
> DSC List
> Navigate To
Go To or Route To
Creating a Waypoint at the Position of a Tracked Vessel
Select Info >
1
Select a position-report call.
2
Select Review >
3
DSC List
Editing Information in a Position Report
Select Info >
1
Select a position-report call.
2
Select Review >
3
• To enter the name of the vessel, select Name.
• To select a new symbol, select Symbol, if available.
• To enter a comment, select Comment.
• To show a trail line for the vessel if your radio is tracking
the position of the vessel, select Trail.
• To select a color for the trail line, select Trail Line.
DSC List
Deleting a Position-Report Call
Select Info
1
Select a position-report call.
2
Select Review
3
> DSC List
> Clear Report
Viewing Vessel Trails on the Chart
You can view trails for all tracked vessels on some chart views.
By default, a black line indicates the path of the vessel, a black
dot indicates each previously reported position of a tracked
vessel, and a blue flag indicates the last reported position of the
vessel.
From a chart or 3D chart view, select Menu > Chart Setup >
1
Other Vessels
Select the number of hours to show tracked vessels on the
2
chart.
For example, if you select
less than four hours old appear for all tracked vessels.
> DSC > DSC Trails
.
.
.
.
.
Create Waypoint
.
.
Edit
.
.
4 Hours
.
.
, all trail points that are
Digital Selective Calling 25
Page 32

Individual Routine Calls
CONFIDENTIAL
When you connect the chartplotter to a Garmin
can use the chartplotter interface to set up an individual routine
call.
When setting up an individual routine call from your chartplotter,
you can select the DSC channel on which you want to
communicate. The radio transmits this request with your call.
Selecting a DSC Channel
NOTE: The selection of a DSC channel is limited to those
channels that are available in all frequency bands. The default
channel is 72. If you select a different channel, the chartplotter
uses that channel for subsequent calls until you call using
another channel.
Select Info >
1
Select a vessel or a station to call.
2
Select Review >
3
Select an available channel.
4
DSC List
.
Call with Radio > Channel
Making an Individual Routine Call
NOTE: When initiating a call from the chartplotter, if the radio
does not have an MMSI number programmed, the radio will not
receive call information.
Select Info >
1
Select a vessel or a station to call.
2
Select Review > Call with Radio.
3
If necessary, select
4
Select
5
The chartplotter sends information about the call to the radio.
On your
6
DSC List
.
Send
Garmin VHF radio, select Call
.
Channel
, and select a new channel.
Making an Individual Routine Call to an AIS Target
From a chart or 3D chart view, select an AIS target.
1
Select AIS Vessel
2
If necessary, select
3
Select
4
5
Send
The chartplotter sends information about the call to the radio.
On your Garmin VHF radio, select
> Call with Radio
Channel
.
, and select a new channel.
Call
VHF radio, you
.
.
.
.
Gauges and Graphs
The gauges and graphs provide various information about the
engine and environment. To view the information, a compatible
transducer or sensor must be connected to the network.
Viewing the Gauges
Select
1
2
3
A/V, Gauges, Controls
Select a gauge.
Select or to view a different gauge page.
Changing the Data Shown in a Gauge
From a gauges screen, hold a gauge.
1
Select a data type.
2
Select the data to display.
3
Customizing Engine Gauge and Fuel Gauge Limits
You can configure the upper and lower limits and the range of
desired standard operation of a gauge. When a value exceeds
the range of standard operation, the gauge becomes red.
NOTE: Not all options are available for all gauges.
From the engine gauges screen, select Menu >
1
Setup > Set Gauge Limits
Select a gauge.
2
.
Gauge
.
Select Mode
3
Select an option:
4
• To set the minimum value of the standard operating
range, select Rated Min..
• To set the maximum value of the standard operating
range, select Rated Max..
• To set the lower limit of the gauge lower than the rated
minimum, select Scale Min..
• To set the upper limit of the gauge higher than the rated
maximum, select Scale Max..
Select the limit value.
5
Repeat steps 4 and 5 to set additional gauge limits.
6
> Custom
.
Viewing Engine and Fuel Gauges
Before you can view engine and fuel gauges, you must be
connected to a
and fuel data. See the installation instructions for details.
Select A/V, Gauges, Controls >
NMEA 2000
Selecting the Number of Engines Shown in Gauges
You can show information for up to four engines.
From the engine gauges screen, select Menu > Gauge
1
Setup >
Select an option:
2
• Select the number of engines.
• Select Auto Configure to automatically detect the number
Engine Selection >
of engines.
Customizing the Engines Shown in Gauges
Before you can customize how the engines are shown in the
gauges, you must manually select the number of engines
(Selecting the Number of Engines Shown in Gauges).
From the engine gauges screen, select Menu >
1
Setup > Engine Selection > Edit Engines
Select
2
3
4
First Engine
Select the engine to display in the first gauge.
Repeat for the remaining engine bars.
Enabling Status Alarms for Engine Gauges
You can enable the chartplotter to display engine status alarms.
From the engine gauges screen, select Menu > Gauge
Setup > Status Alarms > On.
When an engine alarms is triggered, a gauge status alarm
message appears and the gauge may become red depending
on the type of alarm.
Enabling Some Engine Gauge Status Alarms
From the engine gauges screen, select Menu > Gauge
1
Setup >
Select one or more engine gauge alarms to turn on or off.
2
Status Alarms > Custom
network capable of sensing engine
Engines
Num. Engines.
.
.
Gauge
.
.
Setting the Fuel Alarm
Before you can set a fuel level alarm, a compatible fuel flow
sensor must be connected to the NMEA 2000
You can set an alarm to sound when the total amount of
remaining onboard fuel reaches the level you specify.
Select Settings > Alarms >
1
Enter the remaining amount of fuel that triggers the alarm.
2
Fuel > Fuel Level Alarm > On
Setting the Fuel Capacity of the Vessel
Select Settings > My Vessel > Fuel Capacity.
1
Enter the combined total capacity of the fuel tanks.
2
network.
.
26 Gauges and Graphs
Page 33

Synchronizing the Fuel Data with the Actual Vessel
CONFIDENTIAL
Fuel
You can synchronize the fuel levels in the chartplotter with the
actual fuel in the vessel when you add fuel to your vessel.
Select A/V, Gauges, Controls > Engines
1
Select an option:
2
• After you have filled up all the fuel tanks on the vessel,
select Fill Up All Tanks. The fuel level is reset to
maximum capacity.
• After you have added less than a full tank of fuel, select
Add Fuel to Boat, and enter the amount added.
• To specify the total fuel in the vessel tanks, select Set
Total Fuel Onboard, and enter the total amount of fuel in
the tanks.
> Menu
.
Viewing the Wind Gauges
Before you can view wind information, you must have a wind
sensor connected to the chartplotter.
Select A/V, Gauges, Controls > Wind.
Configuring the Sailing Wind Gauge
You can configure the sailing wind gauge to show true or
apparent wind speed and angle.
From the wind gauge, select Menu > Sailing Wind Gauge.
1
Select an option:
2
• To show true or apparent wind angle, select Needle, and
select an option.
• To show true or apparent wind speed, select Wind
Speed, and select an option.
Configuring the Speed Source
You can specify whether the vessel speed data displayed on the
gauge and used for wind calculations is based on water speed
or GPS speed.
From the wind gauge, select Menu > Compass Gauge >
1
Speed Display.
Select an option:
2
• To calculate the vessel speed based on data from the
water-speed sensor, select Water Speed.
• To calculate the vessel speed based on GPS data, select
GPS Speed.
Configuring the Heading Source of the Wind Gauge
You can specify the source of the heading displayed on the wind
gauge. Magnetic heading is the heading data received from a
heading sensor, and GPS heading is calculated by your
chartplotter GPS (course over ground).
From the wind gauge, select Menu > Compass Gauge >
1
Heading Source.
Select GPS Hdg. or
2
NOTE: When moving at low speeds or when stationary, the
magnetic compass source is more accurate than the GPS
source.
Magnetic
Customizing the Close-Hauled Wind Gauge
You can specify the range of the close-hauled wind gauge for
both the upwind scale and the downwind scale.
From the wind gauge, select Menu > Compass Gauge >
1
Gauge Type > Close Hauled Gauge.
Select an option:
2
• To set the maximum and minimum values that appear
when the upwind close-hauled wind gauge appears, select
Change Upwind Scale, and set the angles.
• To set the maximum and minimum values that appear
when the downwind close-hauled wind gauge appears,
select Change Downwind Scale, and set the angles.
.
• To view true or apparent wind, select Wind, and select an
option.
Viewing Trip Gauges
Trip gauges show information for odometer, speed, time, and
fuel for your present trip.
Select Info
> Trip & Graphs > Trip
.
Resetting Trip Gauges
Select Info
1
Select an option:
2
• To set all the readings for the present trip to zero, select
Reset Trip.
• To set the maximum speed reading to zero, select Reset
Maximum Speed.
• To set the odometer reading to zero, select Reset
Odometer.
• To set all the readings to zero, select Reset All.
> Trip & Graphs > Trip
.
Viewing Graphs
Before you can view graphs of various environmental changes,
such as temperature, depth, and wind, you must have an
appropriate transducer or sensor connected to the network.
Select Info > Trip & Graphs >
Graphs
.
Setting the Graph Range and Time Scales
You can indicate the amount of time and the range of depth that
appear in the depth and water temperature graphs.
From a graph, select Graph Setup.
1
Select an option:
2
• To set a time-elapsed scale, select Duration. The default
setting is 10 minutes. Increasing the time-elapsed scale
allows you to view variations over a longer period of time.
Decreasing the time-elapsed scale allows you to view
more detail over a shorter period of time.
• To set the graph scale, select
allows you to view more variation in readings. Decreasing
the scale allows you to view more detail in the variation.
. Increasing the scale
Scale
Tide, Current, and Celestial
Information
Tide Station Information
You can view information about a tide station for a specific date
and time, including the tide height, and when the next high and
low tides will occur. By default, the chartplotter shows tide
information for the most recently viewed tide station and for the
present date and time.
Select Info >
Tides & Currents > Tides
Current Station Information
NOTE: Current station information is available with certain
detailed maps.
You can view information about a current station for a specific
date and time, including the current speed and level of the
current. By default, the chartplotter shows current information for
the most recently viewed current station and for the present date
and time.
Select Info >
Tides & Currents > Currents
Celestial Information
You can view information about sunrise, sunset, moonrise,
moonset, moon phase, and the approximate sky view location of
the sun and moon. The center of the screen represents the sky
.
.
Tide, Current, and Celestial Information 27
Page 34
overhead, and the outermost rings represent the horizon. By
CONFIDENTIAL
default, the chartplotter shows celestial information for the
present date and time.
Select Info
> Tides & Currents > Celestial
.
Viewing Tide Station, Current Station, or Celestial Information for a Different Date
Select Info
1
Select
2
Select an option.
3
• To view information for a different date, select Change
Date >
• To view information for today, select Change Date >
Current.
• If available, to view information for the day after the date
shown, select Next Day.
• If available, to view information for the day before the date
shown, select Previous Day.
> Tides & Currents
Tides, Currents, or Celestial
Manual
, and enter a date.
.
.
chartplotter and iPod® can be connected using a FUSION-Link
capable stereo.
Opening the Media Player
Before you can open the media player, you must connect a
compatible device to the chartplotter.
Select A/V, Gauges, Controls > Media.
Icons
NOTE: Not all devices have these icons.
Icon Description
Saves or deletes a channel as a preset
Repeats all songs
Repeats one song
Searches for stations or skips songs
Shuffles
Viewing Information for a Different Tide or Current Station
Select Info
1
Select
2
3
4
Tides or Currents
Select
Nearby Stations
Select a station.
> Tides & Currents
.
.
.
Viewing Almanac Information from the Navigation Chart
From a chart or 3D chart view, select a location.
1
2
3
Select
Information
Select
Tides, Currents, or Celestial
.
.
Warning Manager
Viewing Messages
Select Info >
1
Select a message.
2
Select
3
Review
Warning Manager
.
.
Sorting and Filtering Messages
Select Info >
1
Select an option to sort or filter the message list.
2
Warning Manager > Sort/Filter
.
Saving Messages to a Memory Card
Insert a memory card into the card slot.
1
Select Info >
2
Warning Manager > Save to Card
.
Clearing all of the Messages
Info > Warning Manager > Clear Warning Manager.
Select
Media Player
NOTE: The media player feature is not compatible with all
chartplotter models.
If you have a
NMEA 2000 network, you can control the stereo using the
chartplotter. The chartplotter should automatically detect the
media player when it is first connected.
You can play media from sources connected to the media player
and sources connected to the NMEA 2000 network. Your
FUSION-Link
™
capable stereo connected to the
Selecting the Media Source
When you have multiple media devices connected on a network,
such as the
source you want to control from your chartplotter.
NOTE: You can play media only from sources that are
connected to the device.
NOTE: Not all features are available on all media sources.
From the media screen, select
1
NOTE: The source menu appears only for devices that
support multiple media sources.
Select a source.
2
NMEA 2000
network, you can select the media
Source
.
Playing Music
Browsing for Music
From the media screen, select Browse
1
Select
Select
2
Enabling Alphabetical Search
You can enable the alphabetical search feature to find a song or
album in a large list.
From the media screen, select Menu
Installation > Alpha Search
or select an option.
.
Setting a Song to Repeat
While playing a song, select Menu
1
If necessary, select
2
Single
.
Setting All Songs to Repeat
From the media screen, select Menu
Repeat > All
.
Setting Songs to Shuffle
From the media screen, select Menu > Media Menu >
1
Shuffle.
If necessary, select an option.
2
Listening to the Radio
Saving a Channel as a Preset
You can save up to 15 AM stations and 15 FM stations as
presets.
From the AM, FM, or VHF page, tune the device to a
1
channel.
Select Presets >
2
Removing a Channel Preset
Tune the device to a channel.
1
Add Current Channel
or
Menu > Browse.
> Media Menu >
> Media Menu > Repeat
> Media Menu >
.
.
28 Warning Manager
Page 35

Select Menu
CONFIDENTIAL
2
Channel
Changing the Tuning Mode
You can change how you select a station for some media types,
such as FM or AM radio.
NOTE: Not all tuning modes are available for all media sources.
From the media screen, select Menu >
1
Tuning Mode
Select an option.
2
If necessary, select
3
Setting the Tuner Region
From the media screen, select Menu > Media Menu
1
Installation > Tuner Region
Select an option.
2
> Media Menu > Presets > Remove Current
.
.
.
Select
.
Media Menu >
>
Opening the MTP Source
Before you can open the MTP source, you must connect your
MTP device to a compatible media device.
You can access music on your Media Transfer Protocol (MTP)
device, such as an Android™ device. You can also charge your
phone or media player while it is connected and playing music.
Connect your MTP source through USB, such as the stereo,
1
the external USB plug, or an external dock.
From the media screen, select Source > MTP.
2
Adjusting the Volume
Enabling and Disabling Zones
If you have wired your vessel's speakers into zones, you can
enable needed zones and disable unused zones.
From the media screen, select Menu >
1
Levels > Enable/Disable Zones
Select a zone.
2
Media Menu > Audio
.
Muting the Media Volume
From the media screen, select .
1
If necessary, select
2
Select
.
Scanning VHF Channels
Before you can scan VHF channels, you must set the source to
VHF.
You can monitor VHF channels saved as presets for activity and
automatically switch to an active channel.
From the VHF media screen, select Scan.
Adjusting the VHF Squelch
NOTE: Your media player must support VHF radio to use this
feature.
From the VHF source page, select Menu > Media Menu >
1
Squelch.
Use the slider bar to adjust the VHF squelch.
2
SiriusXM® Satellite Radio
When you have a FUSION-Link capable stereo and SiriusXM
Connect Tuner installed and connected to the chartplotter, you
may have access to
subscription.
Locating a
Before you can activate your SiriusXM
have the radio ID of your SiriusXM
You can locate the SiriusXM
SiriusXM
tuning your chartplotter to channel 0.
1
Connect Tuner, on the back of its packaging, or by
Select Media > Source >
SiriusXM
SiriusXM Radio ID
satellite radio, depending on your
subscription, you must
Connect Tuner.
Radio ID on the back of the
SiriusXM
.
Tune to channel 0.
2
The
SiriusXM
F.
Activating a
Before you can activate the SiriusXM
have the Radio ID (
With the
1
You should be able to hear the preview channel. If not, check
the SiriusXM Connect Tuner and antenna installation and
connections, and try again.
Tune to channel 0 to locate the Radio ID.
2
Contact
3
4
5
www.siriusxm.com/activatenow to subscribe in the
go to
United States. Contact SiriusXM by phone at (877) 438-9677
or go to www.siriusxm.ca/activatexm to subscribe in Canada.
Provide the Radio ID.
The activation process usually takes 10 to 15 minutes, but
can take up to an hour. For the SiriusXM
receive the activation message, it must be turned on and
receiving the SiriusXM
If the service is not activated within the hour, go to
http://care.siriusxm.com/refresh or contact
at 1-855-MYREFRESH (697-3373).
radio ID does not include the letters I, O, S, or
SiriusXM Subscription
Locating a SiriusXM Radio ID).
SiriusXM
SiriusXM listener care by phone at (866) 635-2349 or
source selected, tune to channel 1.
signal.
subscription, you must
Connect Tuner to
SiriusXM
by phone
Customizing the Channel Guide
SiriusXM radio channels are grouped in categories. You can
select the categories of channels that appear in the channel
guide.
NOTE: This feature is available with a GXM™ 52 antenna.
Select Media > Category.
1
Select a category.
2
Saving a
You can save your favorite channels to the presets list.
Select
1
Select the channel you want to save as a preset.
2
Select Menu
3
Unlocking
From the media screen, select Browse > Parental > Unlock.
1
Enter your passcode.
2
The default passcode is 0000.
Setting Parental Controls on SiriusXM Radio Channels
Before you can set parental controls, the parental controls must
be unlocked.
The parental control feature allows you to limit access to any
SiriusXM channels, including those with mature content. When
enabled, the parental control feature requires you to enter a
passcode to tune to the locked channels.
Select Browse >
A list of channels appears. A checkmark indicates a locked
channel.
NOTE:
controls, the display changes:
• indicates a locked channel.
• indicates an unlocked channel.
Changing a Parental Passcode on a SiriusXM
Before you can change the passcode, the parental controls must
be unlocked.
From the media screen, select Browse > Parental > Change
1
PIN.
Enter your passcode and select Done.
2
Enter a new passcode.
3
SiriusXM Channel to the Presets List
.
Media
> Presets > Add Current Channel
.
SiriusXM Parental Controls
Parental > Lock/Unlock
When you view the channels after setting parental
.
Radio
Media Player 29
Page 36
Confirm the new passcode.
CONFIDENTIAL
4
Restoring Default Parental Control Settings Values
This process deletes all the settings information you have
entered. When you restore the parental control settings to their
default values, the passcode value is reset to 0000.
From the media menu, select Installation > Factory
1
Defaults.
Select
2
Clearing All Locked Channels on a SiriusXM
Before you can clear all locked channels, the parental controls
must be unlocked.
From the media screen, select Browse > Parental > Clear
1
All Locked.
Enter your passcode.
2
Yes
.
Radio
Setting the Device Name
From the media screen, select Menu
1
Installation > Set Device Name
Enter a device name.
2
Select
3
Select or Done
SiriusXM
The weather information provided through this product is subject
to service interruptions and may contain errors, inaccuracies, or
outdated information, and consequently should not be relied
upon exclusively. Always use common sense while navigating,
and check alternate weather information sources prior to making
safety-related decisions. You acknowledge and agree that you
shall be solely responsible for use of the weather information
and all decisions taken with respect to navigating in weather.
will not be responsible for any consequences of using
Garmin
SiriusXM
NOTE: SiriusXM data is not available in all regions.
A
receives satellite weather data and shows it on various Garmin
devices, including the Navigation chart on a compatible
chartplotter. The weather data for each feature comes from
reputable weather data centers such as the National Weather
Service and the Hydrometeorological Prediction Center. For
more information, go to www.siriusxm.com/sxmmarine.
weather information.
Garmin SiriusXM satellite weather receiver and antenna
.
Weather
WARNING
> Media Menu >
.
Changing the Weather Chart
From a combination screen or SmartMode layout with a
1
weather chart, select Menu
Weather
Select a weather chart.
2
.
> Weather Menu > Change
Viewing Precipitation Information
Precipitation ranging from very light rain and snow, up to strong
thunderstorms, is indicated in varying shades and colors.
Precipitation is shown either independently or with other weather
information.
Select Charts >
The time stamp in the upper-left corner of the screen
indicates the elapsed time since the weather data provider
last updated the information.
Precipitation
.
Precipitation Views
From the precipitation weather chart, select Menu > Weather
Menu.
Radar Loop: Shows precipitation information as an image of the
latest update or as an animated loop of the latest updates.
The time stamp indicates the elapsed time since the service
provider generated the weather radar frame currently
displayed on the screen.
Cloud Cover: Shows cloud cover data.
Waypoints: Shows waypoints.
Legend: Shows the weather legend.
Storm Cell and Lightning Information
Storm cell are represented by
chart. They indicate both the present position of a storm and the
projected path of that storm in the immediate future.
Red cones appear with a storm cell icon, and the widest part of
each cone points in the direction of the projected path of the
storm cell. The red lines in each cone indicate where the storm
will most likely be in the near future. Each line represents 15
minutes.
Lightning strikes are represented by . Lightning appears on the
weather precipitation chart if strikes were detected within the last
seven minutes. The ground-based lightning detection network
detects cloud-to-ground lightning only.
NOTE: This feature is not available on all devices and in all
subscriptions.
on the weather precipitation
SiriusXM Equipment and Subscription Requirements
To use satellite weather, you must have a compatible satellite
weather receiver. To use SiriusXM satellite radio, you must have
a compatible satellite radio receiver. Go to www.garmin.com for
more information. You must also have a valid subscription to
receive satellite weather and radio. For more information, refer
to the instructions for your satellite weather and radio
equipment.
Weather Data Broadcasts
Weather data is broadcast at different intervals for each weather
feature. For example, radar is broadcast at five-minute intervals.
When the Garmin receiver is turned on, or when a different
weather feature is selected, the receiver must receive new data
before it can be shown. You might experience a delay before
weather data or a different feature appears on the chart.
NOTE: Any weather feature can change in appearance if the
source that provides the information changes.
30 SiriusXM Weather
Hurricane Information
The weather Precipitation chart can show the present position of
a hurricane
line stemming from a hurricane icon indicates the projected path
of the hurricane. Darkened dots on the red line indicate the
projected locations through which the hurricane will pass, as
received from the weather data provider.
, a tropical storm, or a tropical depression. A red
Weather Warnings and Weather Bulletins
When a marine weather warning, weather watch, weather
advisory, weather bulletin, or other weather statement is issued,
shading indicates the area to which the information applies. The
aqua lines on the chart indicate the boundaries of marine
forecasts, coastal forecasts, and offshore forecasts. Weather
bulletins may consist of either weather watches or weather
advisories.
To view information about the warning or bulletin, select the
shaded area.
Color Marine Weather Group
Cyan Flash Flood
Blue Flood
Page 37
Color Marine Weather Group
CONFIDENTIAL
Red Marine
Yellow Severe Storm
Red Tornado
Forecast Information
The Forecast chart shows city forecasts, marine forecasts,
warnings, hurricane warnings, METARS, county warnings,
weather fronts and pressure centers, surface pressure, and
weather buoys.
Viewing Forecast Information for Another Time Period
Select Charts >
1
Select an option:
2
• To view the weather forecast for the next 48 hours, in 12hour increments, select Next Forecast multiple times.
• To view the weather forecast for the previous 48 hours, in
12-hour increments, select Previous Forecast multiple
times.
Forecast
Weather Fronts and Pressure Centers
Weather fronts appear as lines that indicate the leading edge of
an air mass.
Front Symbol Description
Pressure-center symbols often appear near weather fronts.
PressureCenter
Symbol
Description
Indicates a low-pressure center, which is a region of
relatively lower pressure. Moving away from a lowpressure center results in increased pressure. Winds
flow counterclockwise around low-pressure centers in
the northern hemisphere.
Indicates a high-pressure center, which is a region of
relatively higher pressure. Moving away from a highpressure center results in decreased pressure. Winds
flow clockwise around high-pressure centers in the
northern hemisphere.
Viewing a Marine Forecast or an Offshore Forecast
Select Charts
1
Pan the chart to an offshore location.
2
The Marine Forecast or Offshore Forecast options appear
when forecast information is available.
Select
3
> Forecast
Marine Forecast or Offshore Forecast
City Forecasts
City forecasts appear as weather symbols. The forecast is
viewed in 12-hour increments.
Symbol Weather Symbol Weather
Partly cloudy Fair (sunny, hot, clear)
Cloudy Rain (drizzle, sleet, showers)
Windy Foggy
.
Cold front
Warm front
Stationary front
Occluded front
Trough
.
.
Symbol Weather Symbol Weather
Thunderstorms Snow (snow showers, flurries,
Smoke (dusty, hazy)
blizzard, blowing snow, sleet,
freezing rain, freezing drizzle)
Viewing Sea Conditions
Sea Conditions
The
conditions, including winds, wave height, wave period, and wave
direction.
Select Charts
feature shows information about surface
> Sea Conditions
.
Surface Winds
Surface wind vectors appear on the Sea Conditions chart using
wind barbs that indicate the direction from which the wind is
blowing. A wind barb is a circle with a tail. The line or flag
attached to the tail of the wind barb indicates the wind speed. A
short line represents 5 knots, a long line represents 10 knots,
and triangle represents 50 knots.
Wind Barb Wind Speed Wind Barb Wind Speed
Calm 20 knots
5 knots 50 knots
10 knots 65 knots
15 knots
Wave Height, Wave Period, and Wave Direction
Wave heights for an area appear as variations in color. Different
colors indicate different wave heights, as shown in the legend.
The wave period indicates the time (in seconds) between
successive waves. Wave period lines indicate areas that have
the same wave period.
Wave directions appear on the chart using red arrows. The
direction of each arrow pointer indicates the direction in which a
wave is moving.
Viewing Forecast Sea Conditions Information for Another Time Period
Select Charts
1
Select an option:
2
• To view forecasted sea conditions for the next 36 hours, in
12-hour increments, select Next Forecast multiple times.
• To view the forecasted sea conditions for the previous 36
hours, in 12-hour increments, select Previous Forecast
multiple times.
> Sea Conditions
.
Viewing Fishing Information
The weather Fishing chart shows present water temperature,
present surface pressure conditions, and fishing forecasts.
Select Charts
Surface Pressure and Water Temperature Data
Surface-pressure information appears as pressure isobars and
pressure centers. Isobars connect points of equal pressure.
Pressure readings can help to determine weather and wind
conditions. High-pressure areas are generally associated with
fair weather. Low-pressure areas are generally associated with
clouds and the chance of precipitation. Isobars packed closely
together show a strong pressure gradient. Strong pressure
gradients are associated with areas of stronger winds.
Pressure units are shown in millibars (mb), inches of Mercury
(inHg), or hectopascals (hPa).
Colored shading indicates the surface temperature of the water,
as shown in the legend in the corner of the display.
> Fishing
.
SiriusXM Weather 31
Page 38

Forecasting Fish Locations
CONFIDENTIAL
You can show areas that contain optimal weather conditions for
specific species of fish.
NOTE: This feature is not available on all devices and in all
subscriptions.
From the weather Fishing chart, select Menu > Weather
1
Menu
> Fish Species
Select a species of fish.
2
Select On.
3
Repeat steps 2 and 3 to show areas with optimal weather
4
conditions for additional species of fish.
Shaded areas indicate optimal fishing areas. If you have
selected more than one species of fish, you can select a
shaded area to view the fish species that are included in the
shaded area.
.
Changing the Sea Surface Temperature Color Range
You can change the color range dynamically to view higher
resolution sea surface temperature readings.
From the weather Fishing chart, select Menu > Weather
1
Menu
> Sea Temperature
Select an option:
2
• To allow the chartplotter to adjust the temperature range
automatically, select Auto Configure.
The chartplotter automatically finds the lower and upper
limits for the current screen, and updates the temperaturecolor scale.
• To enter the lower and upper limits for the temperature
range, select Lower Limit or Upper Limit, and enter the
lower or upper limit.
.
Visibility Information
Visibility is the forecast maximum horizontal distance that can be
seen at the surface, as shown in the legend on the left of the
screen. Variations in the visibility shading show the forecast
change in surface visibility.
NOTE: This feature is not available on all devices and in all
subscriptions.
Select Charts > Visibility.
Viewing Forecast Visibility Information for Another Time Period
Select Charts >
1
Select an option:
2
• To view the visibility forecast for the next 36 hours, in 12hour increments, select
• To view the visibility forecast for the previous 36 hours, in
12-hour increments, select Previous Forecast multiple
times.
Visibility
.
Next Forecast
multiple times.
Viewing Buoy Reports
Report readings are taken from buoys and coastal observation
stations. These readings are used to determine air temperature,
dew point, water temperature, tide, wave height and period,
wind direction and speed, visibility, and barometric pressure.
From a weather chart, select .
1
Select
2
Viewing Local Weather Information near a Buoy
You can select an area near a buoy to view forecast information.
From a weather chart, select a location on the chart.
1
Select
2
Select an option:
3
• To view present weather conditions from a local weather
service, select Current Cond..
.
Buoy
Local Weather
.
• To view a local weather forecast, select Forecast.
• To view surface wind and barometric pressure
information, select
• To view wind and wave information, select Marine
Bulletin.
Sea Surface
.
Creating a Waypoint on a Weather Chart
From a weather chart, select a location.
1
2
Select
Create Waypoint
.
Weather Overlay
The weather overlay superimposes weather and weather-related
information on the Navigation chart, the Fishing chart, and the
Perspective 3D chart view. The Navigation chart and the Fishing
chart can show weather radar, height of cloud tops, lightning,
weather buoys, county warnings, and hurricane warnings. The
Perspective 3D chart view can show weather radar.
Weather overlay settings configured for use on one chart are not
applied to another chart. The weather overlay settings for each
chart must be configured separately.
NOTE: The offshore Fishing chart is available with premium
charts, in some areas.
Turning On the Weather Overlay on a Chart
From the Navigation chart or Fishing chart, select Menu >
Chart Setup
> Weather > Weather > On
.
Weather Overlay Settings on the Navigation Chart
From the Navigation chart, select Menu
Weather
Weather: Turns on and off the weather overlay.
Precipitation: Shows precipitation data.
Cloud Cover: Shows cloud cover data.
Visibility: Shows visibility data.
Buoys: Shows weather buoys.
Legend: Shows the weather legend.
.
> Chart Setup >
Weather Overlay Settings on the Fishing Chart
NOTE: Available settings depend on the receiver connected to
your device.
From the Fishing chart, select Menu
Precipitation: Shows precipitation radar.
Fish Species: Shows locations of a specific species of fish.
Sea Temperature: Shows sea temperature data.
Buoys: Shows weather buoys.
Legend: Shows the weather legend.
> Chart Setup > Weather
.
Viewing Weather Subscription Information
You can view information about the weather services you have
subscribed to and how many minutes have passed since the
data for each service was updated.
From a weather chart, select Menu > Weather
Subscription.
Viewing Video
Before you can view video, you must connect to a compatible
source.
Compatible devices include video devices connected to the
ports on the chartplotter, as well as supported network (IPbased) video cameras, encoders, and thermal cameras.
Select A/V, Gauges, Controls > Video.
32 Viewing Video
Page 39
Selecting a Video Source
CONFIDENTIAL
From the video screen, select Menu > Source.
1
Select the source of the video feed.
2
Alternating Among Multiple Video Sources
If you have two or more video sources, you can alternate
between them using a specific time interval.
From the video screen, select Menu > Source > Alternate.
1
Select Time, and select the amount of time each video
2
appears.
Select
3
Source
alternating sequence.
, and select the video sources to add to the
Networked Video Devices
NOTICE
A
Garmin Power over Ethernet (PoE) Isolation Coupler (P/N
010-10580-10) must be used when connecting a PoE device,
such as a FLIR
Connecting a PoE device directly to a Garmin
chartplotter damages the Garmin
the PoE device.
Before you can view and control video devices such as IP
cameras, encoders, and thermal cameras using your
chartplotter, you must have a compatible video device
connected to your chartplotter, and you must have a marine
network cable Power over Ethernet (PoE) isolation coupler. Go
to www.garmin.com for a list of compatible devices or to
purchase a PoE Isolation Coupler.
You can connect multiple supported video cameras and up to
two video encoders to the Garmin Marine Network. You can
select and view up to four video sources at once. Chartplotters
with multiple composite built-in video inputs can display a single
built-in video input only. When the cameras are connected, the
network detects them automatically and displays them in the
source list.
Using Video Presets on Networked Video Cameras
You can save, name, and activate video presents for each
networked video source.
Saving Video Presets on a Networked Video Camera
From a video screen, touch the screen.
1
The video controls appear on the screen.
Hold a video preset button.
2
A green light indicates the setting is stored.
Naming Video Presets on a Networked Video Camera
From a video screen, select Menu > Video Setup > Presets.
1
Select a preset.
2
Select Rename.
3
Enter preset name.
4
Activating Video Presets on a Networked Video Camera
You can quickly return networked cameras to preset values.
From a video screen, touch the screen.
1
The video controls appear on the screen.
Select a video preset.
2
The camera restores the video settings saved for that preset.
TIP: You can also save and activate presets using the video
menu.
Camera Settings
Some cameras provide additional options to control the camera
view.
NOTE: Not all options are available on all camera models and
chartplotter models. Refer to the camera manual for a list of
®
camera, to a
Marine Network.
Garmin
chartplotter and may damage
Marine Network
available features. You may need to update the camera
software to use this feature.
From the infrared video screen, select Menu.
IR/Visible: Displays an infrared or visible camera image.
Scan: Surveys the surrounding area.
Freeze: Pauses the camera image.
Change Colors: Selects the color scheme of the infrared image.
Change Scene: Selects the infrared image mode, such as day,
night, MOB, or docking.
Video Setup: Opens more video options.
Video Settings
Some cameras provide additional setup options.
NOTE: Not all options are available on all camera models and
chartplotter models. You may need to update the camera
software to use this feature.
From the video screen, select Menu > Video Setup.
Set Input: Associates the camera with a video source.
Mirror: Reverses the image like a rearview mirror.
Standby: Places the camera in standby mode to conserve
power and protect the lens when not in use.
Home Position: Sets the home position of the camera.
Scan Speed: Sets how quickly the camera moves during a
scan.
Scan Width: Sets the width of the image captured by the
camera during a scan.
Name: Allows you to enter a new name for this camera.
FLIR™ Menu: Provides access to the settings for the camera.
Associating the Camera to a Video Source
You may need to associate the camera with a video source.
From the video screen, select Menu > Video Menu >
1
Source.
Select the camera.
2
Select Video Setup >
3
Select the video input.
4
Set Input
.
Video Camera Movement Control
NOTICE
Do not aim the camera at the sun or extremely bright objects.
Damage to the lens may occur.
Always use the chartplotter controls or buttons to pan and tilt the
camera. Do not manually move the camera unit. Manually
moving the camera may damage the camera.
NOTE: This feature is available only when a compatible camera
is connected. You may need to update the camera software to
use this feature.
You can control the movements of the connected video cameras
that support panning, tilting, and zooming.
Controlling Video Cameras Using On-Screen Controls
On-screen controls allow you to control pan-tilt-zoom (PTZ)
cameras. Refer to the camera manual for a list of available
features.
From a video screen, touch the screen.
1
The video controls appear on the screen.
Select an option:
2
• To zoom in and out, use the zoom button.
• To pan or tilt the camera, use the compass rose.
TIP: Hold in the compass rose to continue to move the
camera in the desired direction.
Viewing Video 33
Page 40

Controlling a Video Camera Using Gestures
CONFIDENTIAL
When a networked video camera supports gesture responses,
you can control pan-tilt-zoom cameras using gestures directly on
the chartplotter screen. Check your camera user manual for a
list of available features.
TIP: Using gestures allows video control without displaying the
video controls.
From a video screen, touch the screen.
1
Select an option:
2
• To zoom in and out with the camera, use pinch and zoom
gestures.
• To pan or tilt the camera, swipe the screen in the desired
direction.
Creating a Combination with Video Functions
You can include up to four video functions in a custom
combination screen.
If your device has multiple built-in video connections, you can
use one built-in source for one function within each combination.
NOTE: The video source displays all connected, supported
video devices. You can select Show All to see a list of all
possible video inputs or video encoder channels that are not
connected to a video input source.
Select Combos > Menu
1
Select
2
3
4
5
Functions
Select an area to assign a function to, select
select a video source.
Repeat step 3 for all video functions in the combination
screen.
If necessary, customize the combination screen (Adding a
Custom Combination Screen).
> Add Combo
, and select a number.
.
, and
Video
Configuring the Video Appearance
NOTE: Not all options are available on all camera models and
chartplotter models.
From the video screen, select Menu
1
Select an option:
2
• To show the video using a stretched aspect ratio, select
Aspect
> Stretch
the dimensions provided by the connected video device,
and it may not fill the entire screen.
• To show the video using a standard aspect ratio, select
Aspect
> Standard
• To adjust the brightness, select
Up, Down, or Auto
• To adjust the color saturation, select Saturation
select Up, Down, or Auto
• To adjust the contrast, select
Down, or Auto
• To allow the chartplotter to automatically select the source
format, select Standard
. The video cannot be stretched beyond
.
.
.
> Auto
> Video Setup
Brightness, and select
.
Contrast, and select Up,
.
.
, and
Configuring the PC Display
Before you can configure the PC display mode, you must set the
video source to analog or digital PC.
When in PC display mode, select anywhere on the screen.
1
Select an option:
2
• To adjust the screen brightness, select the brightness
arrows.
• To adjust the screen contrast, select the contrast arrows.
Exiting PC Display Mode
When in PC display mode, select anywhere on the screen.
1
Select the display mode icon in the upper-left corner.
2
The video source changes to Video 1.
Device Configuration
Turning On the Chartplotter Automatically
You can set the chartplotter to turn on automatically when the
power is applied. Otherwise, you must turn on the chartplotter by
pressing .
Select Settings
NOTE:
turned off using
within less than two minutes, you may need to press to
restart the chartplotter.
When Auto Power Up is On, and the chartplotter is
> System > Auto Power Up
, and power is removed and reapplied
System Settings
Settings
Select
Simulator: Turns the simulator on or off and allows you to set
the time, date, speed, and simulated location.
Beeper and Display: Adjusts the display and sound settings.
GPS: Provides information about the GPS satellites and
settings.
System Information: Provides information about the devices on
the network and the software version.
Station Information: Adjusts the setup of the station.
Auto Power Up: Turns the device on automatically when power
is applied.
> System
Station Settings
Select Settings > System >
Change Station: Sets the entire station to a new set of defaults
based on the location of this station. You can also select to
use this display as a stand-alone, individual display, instead
of grouping it with other displays to make a station.
GRID™ Pairing: Allows you to pair a GRID™ remote input device
with this station.
Display Order: Sets the order of the displays, which is
important when using a GRID remote input device.
Reset Stations: Restores the factory default layouts for all
displays in the station.
Viewing System Software Information
You can view the software version, the basemap version, any
supplemental map information (if applicable), the software
version for an optional Garmin radar (if applicable), and the unit
ID number. You may need this information to update the system
software or to purchase additional map data information.
Select Settings >
Viewing the Event Log
The event log shows a list of system events.
Select Settings >
.
Log
.
Station Information
System > System Information
System > System Information > Event
Preferences Settings
Settings
Select
Units: Sets units of measure.
Language: Sets the on-screen text language.
Navigation: Sets navigation preferences.
Keyboard Layout: Arranges the keys on the on-screen
keyboard.
> Preferences
.
.
.
.
34 Device Configuration
Page 41

Screenshot Capture: Allows the device to save images of the
CONFIDENTIAL
screen.
User Data Sharing: Allows you to share waypoints and routes
over the
waypoints and routes must have this setting turned on.
Menu Bar Display: Shows or automatically hides the menu bar
when it is not needed.
Marine Network. All chartplotters that share
Garmin
Units Settings
Select Settings
System Units: Sets the unit format for the device.
Variance: Sets the magnetic declination, the angle between
magnetic north and true north, for your present location.
North Reference: Sets the direction references used in
calculating heading information. True sets geographic north
as the north reference. Grid sets grid north as the north
reference (000º). Magnetic sets the magnetic north as the
north reference.
Position Format: Sets the position format in which a given
location reading appears. Do not change this setting unless
you are using a map or chart that specifies a different
position format.
Map Datum: Sets the coordinate system on which the map is
structured. Do not change this setting unless you are using a
map or chart that specifies a different map datum.
Time: Sets the time format, time zone, and daylight saving time.
> Preferences > Units
.
Navigation Settings
NOTE: Some settings and options require additional charts or
hardware.
Select Settings
Route Labels: Sets the type of labels shown with route turns on
the map.
Turn Transition: Adjusts how the chartplotter transitions to the
next turn or leg or the route. You can set the transition to be
based on time or distance before the turn. You can increase
the time or distance value to help improve the accuracy of the
autopilot when navigating a route or an Auto Guidance line
with many frequent turns or at higher speeds. For straighter
routes or slower speeds, lowering this value can improve
autopilot accuracy.
Auto Guidance: Sets the measurements for the
Safe Height, and Shoreline Distance
some premium maps.
Route Start: Selects a starting point for route navigation.
Auto Guidance Line Configurations
The Safe Depth and Safe Height settings influence how the
chartplotter calculates an Auto Guidance line. If an area has an
unknown water depth or an unknown obstacle height, the Auto
Guidance line is not calculated in that area. If an area at the
beginning or the end of an Auto Guidance line is shallower than
the safe water depth or lower than the safe obstacle height, the
Auto Guidance line is not calculated in that area. On the chart,
the course through those areas appears as a gray line. When
your boat enters one of those areas, a warning message
appears.
NOTE: Auto Guidance is available with premium charts, in some
areas.
You can set the parameters the chartplotter uses when
calculating an Auto Guidance line.
Safe Depth: Sets the minimum depth (chart depth datum) the
chartplotter uses when calculating an Auto Guidance line.
NOTE: The minimum safe depth for the premium charts is 3
feet. If you enter a Safe Depth value of less than 3 feet, the
> Preferences > Navigation
CAUTION
.
Safe Depth,
, when you are using
charts only use depths of 3 feet for Auto Guidance route
calculations.
Safe Height: Sets the minimum height (chart height datum) of a
bridge that your boat can safely travel under.
Shoreline Distance: Sets how close to the shore you want the
Auto Guidance line to be placed. The Auto Guidance line
may move if you change this setting while navigating. The
available values for this setting are relative, not absolute. To
ensure that the Auto Guidance line is placed the appropriate
distance from shore, you can assess the placement of the
Auto Guidance line using one or more familiar destinations
that require navigation through a narrow waterway (Adjusting
the Distance from Shore).
Adjusting the Distance from Shore
The
Shoreline Distance setting indicates how close to the shore
you want the Auto Guidance
Guidance line may move if you change this setting while
navigating. The available values for the Shoreline Distance
setting are relative, not absolute. To ensure the Auto Guidance
line is placed the appropriate distance from shore, you can
assess the placement of the Auto Guidance line using one or
more familiar destinations that require navigation through a
narrow waterway.
Dock your vessel or drop the anchor.
1
Select Settings > Preferences >
2
Guidance > Shoreline Distance > Normal
Select a destination that you have navigated to previously.
3
Select Navigate To
4
Review the placement of the Auto Guidance line, and
5
determine whether the line safely avoids known obstacles
and the turns enable efficient travel.
Select an option:
6
• If the placement of the Auto Guidance line is satisfactory,
select Menu
and proceed to step 10.
• If the Auto Guidance line is too close to known obstacles,
select Settings > Preferences > Navigation > Auto
Guidance
• If the turns in the Auto Guidance line are too wide, select
Settings
> Shoreline Distance > Near
If you selected
7
the Auto Guidance line, and determine whether the line
safely avoids known obstacles and the turns enable efficient
travel.
Auto Guidance maintains a wide clearance from obstacles in
open water, even if you set the Shoreline Distance setting to
Near or
reposition the Auto Guidance line, unless the destination
selected requires navigation through a narrow waterway.
Select an option:
8
• If the placement of the Auto Guidance line is satisfactory,
select Menu
and proceed to step 10.
• If the Auto Guidance line is too close to known obstacles,
select Settings > Preferences >
Guidance > Shoreline Distance > Farthest
• If the turns in the Auto Guidance line are too wide, select
Settings > Preferences >
> Shoreline Distance > Nearest
If you selected
9
placement of the Auto Guidance
whether the line safely avoids known obstacles and the turns
enable efficient travel.
Auto Guidance maintains a wide clearance from obstacles in
open water, even if you set the Shoreline Distance setting to
> Navigation Options > Stop Navigation
> Shoreline Distance > Far
> Preferences > Navigation > Auto Guidance
Near or Far
Nearest
. As a result, the chartplotter may not
> Navigation Options > Stop Navigation
Nearest or Farthest in step 8, review the
line to be placed. The Auto
Navigation > Auto
> Auto Guidance
.
in step 6, review the placement of
Navigation > Auto Guidance
line, and determine
.
.
.
Navigation > Auto
.
,
,
.
Device Configuration 35
Page 42

Near or
CONFIDENTIAL
reposition the Auto Guidance line, unless the destination
selected requires navigation through a narrow waterway.
Repeat steps 3 through 9 at least once more, using a
10
different destination each time, until you are familiar with the
functionality of the Shoreline Distance setting.
Nearest
. As a result, the chartplotter may not
Communications Settings
NMEA
0183 Settings
Settings
Select
Port Types: See Setting the Communication Format for Each
NMEA
Output Sentences: See Configuring NMEA 0183 Output
Sentences.
Position Precision: Adjusts the number of digits to the right of
the decimal point for transmission of NMEA output.
XTE Precision: Adjusts the number of digits to the right of the
decimal point for
Waypoint IDs: Sets the device to transmit waypoint names or
numbers via
may resolve compatibility issues with older NMEA 0183
autopilots.
Defaults: Restores the
factory defaults.
Diagnostics: Displays NMEA 0183 diagnostic information.
Configuring NMEA 0183 Output Sentences
You can enable and disable NMEA 0183 output sentences.
Select Settings
1
Output Sentences
Select an option.
2
Select one or more NMEA 0183 output sentences, and select
3
Back.
Repeat steps 2 and 3 to enable or disable additional output
4
sentences.
Setting the Communication Format for Each NMEA 0183 Port
You can configure the communication format for each internal
NMEA
0183 port when connecting your chartplotter to external
NMEA 0183 devices, a computer, or other Garmin
Select Settings >
1
Port Types
Select an input or output port.
2
Select a format:
3
• To support the input or output of standard NMEA 0183
data, DSC, and sonar NMEA input support for the DPT,
MTW, and VHW sentences, select NMEA Std..
• To support the input or output of standard
data for most AIS receivers, select NMEA High Speed
• To support the input or output of Garmin
for interfacing with Garmin software, select Garmin
Repeat steps 2–3 to configure additional input or output
4
ports.
> Communications > NMEA 0183 Setup
0183 Port
.
crosstalk error output.
NMEA
0183 while navigating. Using numbers
NMEA
0183 settings to the original
NMEA
> Communications > NMEA 0183 Setup >
.
Communications > NMEA 0183 Setup >
.
devices.
NMEA 0183
proprietary data
NMEA 2000 Settings
Select Settings
Device List: Displays the devices connected to the network.
Label Devices: Changes the labels for available connected
devices.
> Communications > NMEA 2000 Setup
Garmin Marine Network
The
Garmin Marine Network allows you to share data from
peripheral devices with the chartplotters quickly and
Garmin
easily. You can connect a chartplotter to a Garmin
Marine
.
.
.
.
Network to receive data from and share data with other Garmin
Marine Network-compatible devices and chartplotters.
Setting Alarms
Navigation Alarms
Select Settings
Arrival: Sets an alarm to sound when you are within a specified
distance or time from a turn or a destination.
Anchor Drag: Sets an alarm to sound when you exceed a
specified drift distance while anchored.
Off Course: Sets an alarm to sound when you are off course by
a specified distance.
> Alarms > Navigation
.
System Alarms
Alarm Clock: Sets an alarm clock.
Unit Voltage: Sets an alarm to sound when the battery reaches
a specified low voltage.
GPS Accuracy: Sets an alarm to sound when the GPS location
accuracy falls outside the user-defined value.
Setting the Fuel Alarm
Before you can set a fuel level alarm, a compatible fuel flow
sensor must be connected to the NMEA 2000 network.
You can set an alarm to sound when the total amount of
remaining onboard fuel reaches the level you specify.
Select Settings > Alarms >
1
Enter the remaining amount of fuel that triggers the alarm.
2
Fuel > Fuel Level Alarm > On
.
Setting Weather Alarms
Before you can set weather alarms, you must have a compatible
chartplotter connected to a weather device, such as a GXM
device, and have a valid weather subscription.
Select Settings > Alarms >
1
Turn on alarms for specific weather events.
2
Weather
.
My Vessel Settings
NOTE: Some settings and options require additional charts or
hardware.
Select Settings
Keel Offset: Offsets the surface reading for the depth of a keel,
making it possible to measure depth from the bottom of the
keel instead of from the transducer location (Setting the Keel
Offset).
Temperature Offset: Compensates for the water temperature
reading from a NMEA
temperature-capable transducer (
Temperature Offset).
Calibrate Water Speed: Calibrates the speed-sensing
transducer or sensor (Calibrating a Water Speed Device).
Fuel Capacity: Sets the combined fuel capacity of all the fuel
tanks on your vessel (Setting the Fuel Capacity of the
Vessel).
Vessel Type: Enables some chartplotter features based on the
boat type.
> My Vessel
Setting the Keel Offset
You can enter a keel offset to compensate the surface reading
for the depth of a keel, making it possible to measure depth from
the bottom of the keel instead of from the transducer location.
Enter a positive number to offset for a keel. You can enter a
negative number to compensate for a large vessel that may
draw several feet of water.
Complete an action, based on the location of the transducer:
1
• If the transducer is installed at the water line À, measure
the distance from the transducer location to the keel of the
.
0183 water-temperature sensor or a
Setting the Water
36 Device Configuration
Page 43
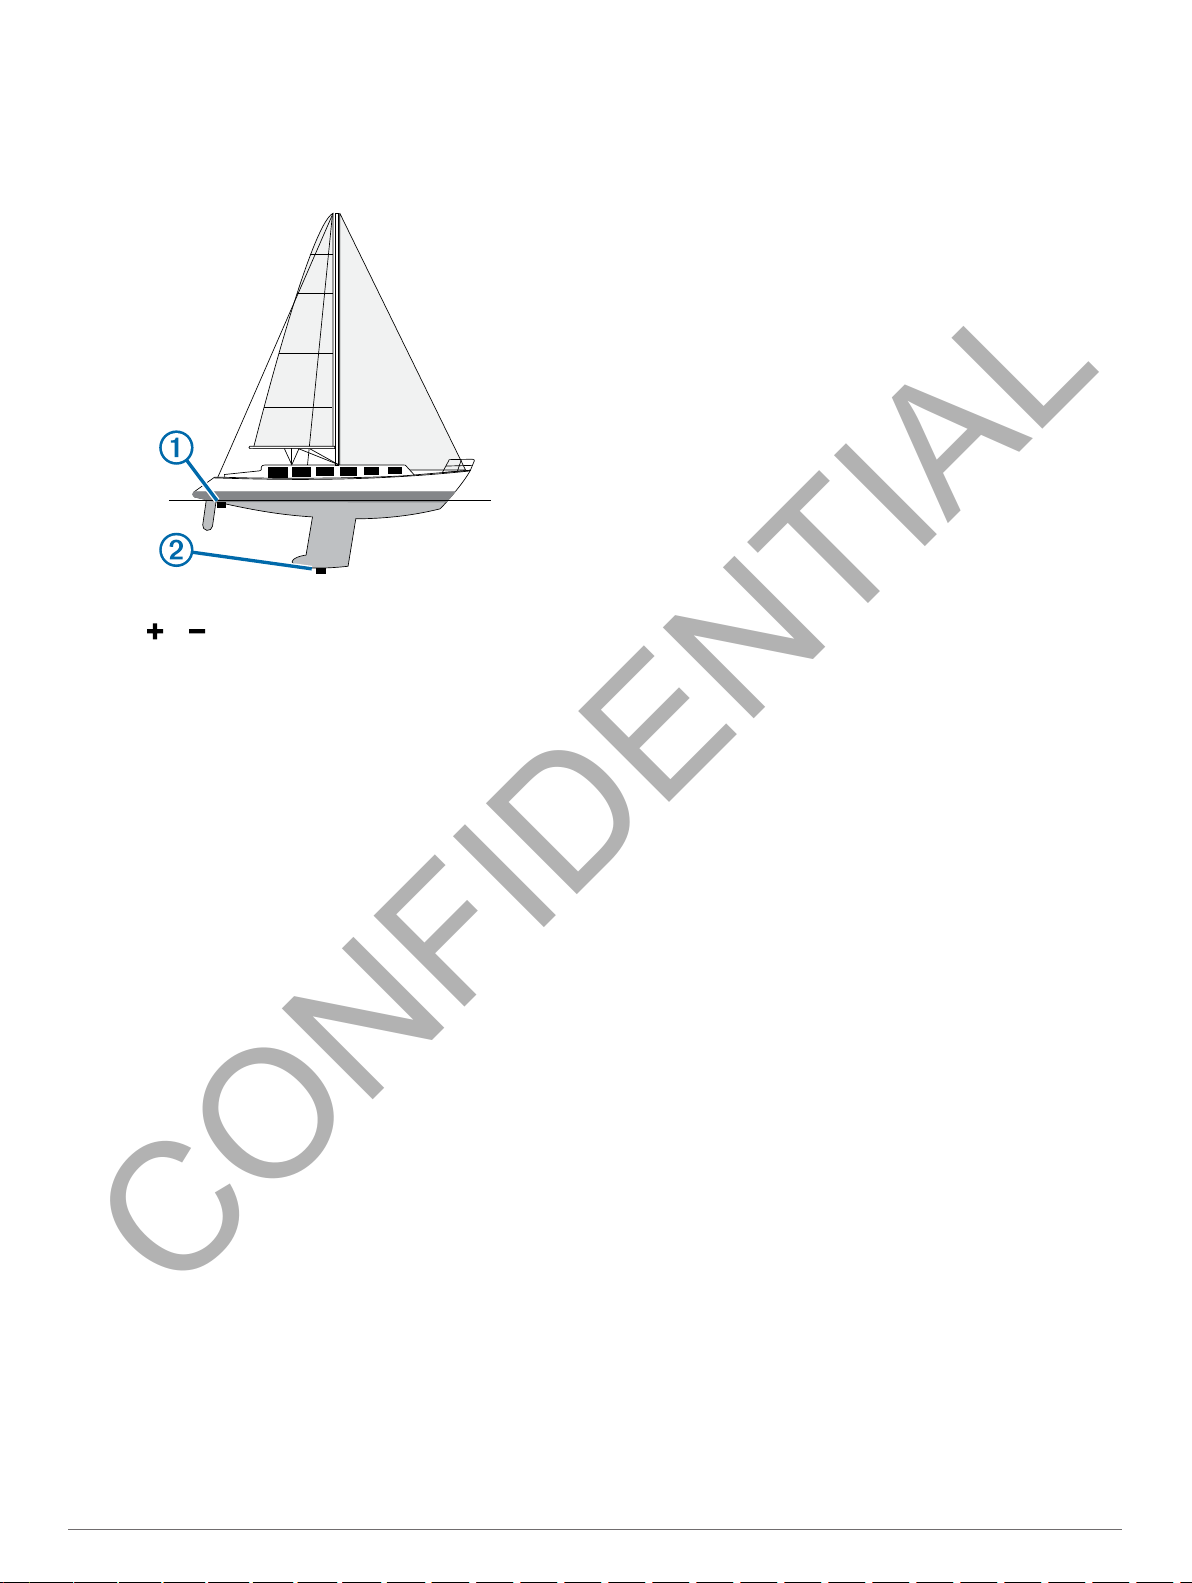
boat. Enter this value in steps 3 and 4 as a positive
CONFIDENTIAL
number.
• If the transducer is installed at the bottom of the keel Á,
measure the distance from the transducer to the water
line. Enter this value in steps 3 and 4 as a negative
number.
Setting the Vessel Type
You can select your boat type to configure the chartplotter
settings and to use features customized for your boat type.
Select Settings > My Vessel >
1
Select
2
Powerboat or Sailboat
Vessel Type
.
.
Other Vessels Settings
When your compatible chartplotter is connected to an AIS
device or VHF radio, you can set up how other vessels are
displayed on the chartplotter.
Select Settings
AIS: Enables and disables AIS signal reception.
DSC: Enables and disables digital selective calling (DSC).
Collision Alarm: Sets the collision alarm (Setting the Safe-Zone
Collision Alarm).
AIS-EPIRB Test: Enables test signals from Emergency Position
Indicating Radio Beacons (EPRIB).
AIS-MOB Test: Enables test signals from man overboard (MOB)
devices.
AIS-SART Test: Enables test transmissions from Search and
Rescue Transponders (SART).
> Other Vessels
.
Select Settings
2
Select or based on the location of the transducer.
3
Enter the distance measured in step 1.
4
> My Vessel > Keel Offset
.
Setting the Water Temperature Offset
Before you can set the water temperature offset, you must have
a
capable transducer to measure water temperature.
The temperature offset compensates for the temperature
reading from a temperature sensor.
1
2
3
4
5
0183 water-temperature sensor or a temperature-
NMEA
Measure the water temperature using the temperature sensor
or temperature-capable transducer that is connected to the
chartplotter.
Measure the water temperature using a different temperature
sensor or a thermometer that is known to be accurate.
Subtract the water temperature measured in step 1 from the
water temperature measured in step 2.
This is the temperature offset. Enter this value in step 5 as a
positive number if the sensor connected to the chartplotter
measures the water temperature as being colder than it
actually is. Enter this value in step 5 as a negative number if
the sensor connected to the chartplotter measures the water
temperature as being warmer than it actually is.
Select Settings > My Vessel >
Enter the temperature offset calculated in step 3.
Temperature Offset
.
Calibrating a Water Speed Device
If you have a speed-sensing transducer connected to the
chartplotter, you can calibrate that speed-sensing device to
improve the accuracy of water-speed data displayed by the
chartplotter.
Select Settings
1
Follow the on-screen instructions.
2
If the boat is not moving fast enough or the speed sensor is
not registering a speed, a message appears.
Select OK, and safely increase the boat speed.
3
If the message appears again, stop the boat, and ensure the
4
speed-sensor wheel is not stuck.
If the wheel turns freely, check the cable connections.
5
If you continue to get the message, contact
6
support.
> My Vessel > Calibrate Water Speed
Garmin
.
product
Restoring the Original Chartplotter Factory Settings
NOTE: This will delete all settings information you have entered.
Select Settings
Settings > Reset
> System > System Information > Factory
.
Communication with Wireless Devices
The chartplotters can create a wireless network to which you
can connect wireless devices.
Connecting wireless devices allows you to use Garmin
including BlueChart Mobile and Garmin Helm
www.garmin.com for more information.
™
. See
Setting Up the Wi‑Fi® Wireless Network
network to which you can
The chartplotters can create a
connect wireless devices. The first time you access the wireless
network settings, you are prompted to set up the network.
Select Settings
1
Wi-Fi® > On > OK
If necessary, enter a name for this wireless network.
2
Enter a password.
3
You will need this password to access the wireless network
from a wireless device. The password is case-sensitive.
> Communications > Wi-Fi® Network >
.
Wi‑Fi
Connecting a Wireless Device to the Chartplotter
Before you can connect a wireless device to the chartplotter
wireless network, you must configure the chartplotter wireless
network (
You can connect multiple wireless devices to the chartplotter to
share data.
1
2
3
Setting Up the Wi‑Fi® Wireless Network).
From the wireless device, turn on the Wi‑Fi technology and
search for wireless networks.
Select the name of your chartplotter wireless network (Setting
Up the Wi‑Fi® Wireless Network).
Enter the network password.
apps,
Communication with Wireless Devices 37
Page 44

Changing the Wireless Channel
CONFIDENTIAL
You can change the wireless channel if you have trouble finding
or connecting to a device, or if you experience interference.
Select Settings > Communications > Wi-Fi® Network >
1
Advanced
Enter a new channel.
2
You do not need to change the wireless channel of devices
connected to this network.
> Channel
.
Selecting a File Type for Third-Party Waypoints and Routes
You can import and export waypoints and routes from third-party
devices.
Select Info
1
Select
2
To transfer data with
type.
> User Data > Data Transfer > File Type
.
GPX
Garmin devices again, select the ADM
.
file
Changing the Wi‑Fi Host
You can change which chartplotter is serving as the Wi‑Fi
The can be helpful if you are having trouble with Wi‑Fi
communications. Changing the Wi‑Fi host allows you to select a
chartplotter that is physically closer to your mobile device.
Select Settings > Communications
1
Advanced > Wi-Fi Host
Follow the on-screen instructions.
2
.
> Wi-Fi® Network >
host.
Wireless Remote Control
Pairing the Wireless Remote Control With the Chartplotter
Before you can use the wireless remote control with a
chartplotter, you must pair the remote with the chartplotter.
You can connect a single remote to multiple plotters, and then
press the pairing key to switch between the chartlotters.
Select Settings > Communications > Wireless Devices >
1
Wireless Remote.
Select
2
3
New Connection
Follow the on-screen instructions.
.
Turning On and Off the Remote Backlight
Turning off the remote backlight can significantly increase the
battery life.
On the chartplotter, select Settings
1
Wireless Devices > Wireless Remote > Backlight
Follow the on-screen instructions.
2
> Communications >
.
Disconnecting the Remote from All Chartplotters
On the chartplotter, select Settings > Communications >
1
Wireless Devices >
Follow the on-screen instructions.
2
Wireless Remote > Disconnect All
Using the Garmin Helm
Application with the
.
Chartplotter
Before you can control the chartplotter with the Garmin Helm
application, you must download and install the application, and
connect the chartplotter to a
Select Settings > Communications
1
Helm App
Select an option.
2
Use the application to view or control the chartplotter.
3
.
Wi‑Fi
router.
> Wireless Devices >
Chartplotter Data Management
Copying Waypoints, Routes, and Tracks
from
Before you can copy data to the chartplotter, you must have the
latest version of the HomePort
computer and a memory card installed in the chartplotter.
HomePort to a Chartplotter
software program loaded on your
Copy the data from HomePort to the prepared memory card.
For more information, see the HomePort help file.
Copying Data from a Memory Card
Insert a memory card into a card slot.
1
Select Info >
2
If necessary, select the memory card to copy data to.
3
Select an option:
4
• To transfer data from the memory card to the chartplotter
and combine it with existing user data, select Merge from
Card.
• To transfer data from the memory card to the chartplotter
and overwrite existing user data, select Replace from
Card.
Select the file name.
5
User Data > Data Transfer
.
Copying Waypoints, Routes, and Tracks to a Memory Card
Insert a memory card into the card slot.
1
Select Info
2
If necessary, select the memory card to copy data to.
3
Select an option:
4
• To create a new file, select Add New File, and enter a
name.
• To add the information to an existing file, select the file
from the list.
> User Data > Data Transfer > Save to Card
.
Copying Waypoints, Routes, and Tracks to or from all Chartplotters on the Network
You can transfer information for waypoints, routes, and tracks
from one chartplotter connected to the Garmin
to every other chartplotter connected to the network. The
transfer may take a long time, depending on the number of
waypoints being transferred.
Select Info > User Data >
1
Select an option:
2
• To transfer data from the chartplotter to the other
chartplotters connected to the network, select Clone User
Data. Existing data is overwritten on those chartplotters.
• To transfer data between all the chartplotters connected to
the network, select Merge User Data. Unique data is
combined with existing data on every chartplotter.
Data Transfer > Network
Marine Network
.
Copying Built-In Maps to a Memory Card
You can copy maps from the chartplotter to a memory card for
use with
1
2
3
HomePort
Insert a memory card into the card slot.
Select Info >
Select
Copy Built-In Map
.
User Data > Data Transfer
.
.
Backing Up Data to a Computer
Insert a memory card into the card slot.
1
Select Info >
2
Select a file name from the list, or select
3
Select
4
User Data > Data Transfer > Save to Card
Save to Card
.
Add New File
.
.
38 Chartplotter Data Management
Page 45

Remove the memory card, and insert it into a card reader
CONFIDENTIAL
5
attached to a computer.
Open the Garmin\UserData folder on the memory card.
6
Copy the backup file on the card and paste it to any location
7
on the computer.
Restoring Backup Data to a Chartplotter
Insert a memory card into a card reader that is attached to
1
the computer.
Copy a backup file from the computer to the memory card,
2
into a folder named Garmin\UserData.
Insert a memory card into the card slot.
3
Select Info >
4
Card
.
User Data > Data Transfer > Replace from
Saving System Information to a Memory Card
You can save system information to a memory card as a
troubleshooting tool. A product support representative may ask
you to use this information to retrieve data about the network.
Insert a memory card into the card slot.
1
Select Settings > System >
2
Devices > Save to Card
If necessary, select the memory card to save system
3
information to.
Remove the memory card.
4
System Information > Garmin
.
Appendix
Registering Your Device
Help us better support you by completing our online registration
today.
• Go to http://my.garmin.com.
• Keep the original sales receipt, or a photocopy, in a safe
place.
Digital Switching
Your chartplotter can be used to monitor or control circuits when
a compatible system is connected.
For example, you can control the interior lights and navigation
lights on the vessel. You can also monitor live well circuits.
To access the digital switching controls, select Info > Circuit
Control.
For more information about purchasing and configuring a digital
switching system, contact your
Rotating the GRID
For certain installation situations, you can rotate the orientation
of the
Select Settings > Communications
1
Select the
2
GRID
joystick.
GRID
Joystick
device.
Cleaning the Screen
NOTICE
Cleaners containing ammonia will harm the anti-reflective
coating.
The device is coated with a special anti-reflective coating which
is very sensitive to skin oils, waxes, and abrasive cleaners.
Apply an eyeglass lens cleaner specified as safe for anti-
1
reflective coatings to the cloth.
Gently wipe the screen with a soft, clean, lint-free cloth.
2
Garmin
dealer.
> Marine Network
.
Screenshots
You can capture a screenshot of any screen shown on your
chartplotter as a bitmap (.bmp) file. You can transfer the
screenshot to your computer.
Capturing Screenshots
Insert a memory card into the card slot.
1
Select Settings >
2
.
On
Go to a screen you want to capture.
3
Hold Home for at least six seconds.
4
Preferences > Screenshot Capture >
Copying Screenshots to a Computer
Remove the memory card from the chartplotter, and insert it
1
into a card reader that is attached to a computer.
From
2
3
Windows
memory card.
Copy a .bmp file from the card and paste it to any location on
the computer.
®
Explorer, open the Garmin\scrn folder on the
Troubleshooting
My device will not acquire GPS signals
If the device is not acquiring satellite signals, there could be few
causes. If the device has moved a large distance since the last
time it has acquired satellites or has been turned off for longer
than a few weeks or months, the device may not be able to
acquire the satellites correctly.
• Ensure the device is using the latest software. If not, update
the device software (Updating the Device Software).
• If the device is using an internal GPS antenna, make sure the
device has a clear view of the sky so that the internal
antenna can receive the GPS signal. If it is mounted inside of
a cabin, it should be close to a window so it can receive the
GPS signal. If the device is mounted inside a cabin and
cannot be placed in a location where the device can acquire
satellites, use an external GPS antenna.
• If the device is using an external GPS antenna, make sure
the antenna is connected to the chartplotter or the NMEA
network.
• If the device has more than one GPS antenna source, select
a different source (Selecting the GPS Source).
My device will not turn on or keeps turning off
Devices erratically turning off or not turning on could indicate an
issue with the power supplied to the device. Check these items
to attempt to troubleshoot the cause of the power issue.
• Make sure the power source is generating power.
You can check this several ways. For example, you can
check whether other devices powered by the source are
functioning.
• Check the fuse in the power cable.
The fuse should be located in a holder that is part of the red
wire of the power cable. A 3 Amp fuse is used in this power
cable. Check the fuse to make sure there is still a connection
inside of the fuse. You can test the fuse using a multimeter. If
the fuse is good, the multimeter reads 0 ohms.
• Check to make sure the device is receiving is at least 10
volts, but 12 volts is recommended.
To check the voltage, measure the female sockets 8 (power)
and 2 (ground) of the power cable for DC voltage. If the
voltage is less than 10 volts, the device will not turn on.
• If the device is receiving enough power but does not turn on,
contact Garmin product support at www.garmin.com/support.
Appendix 39
Page 46
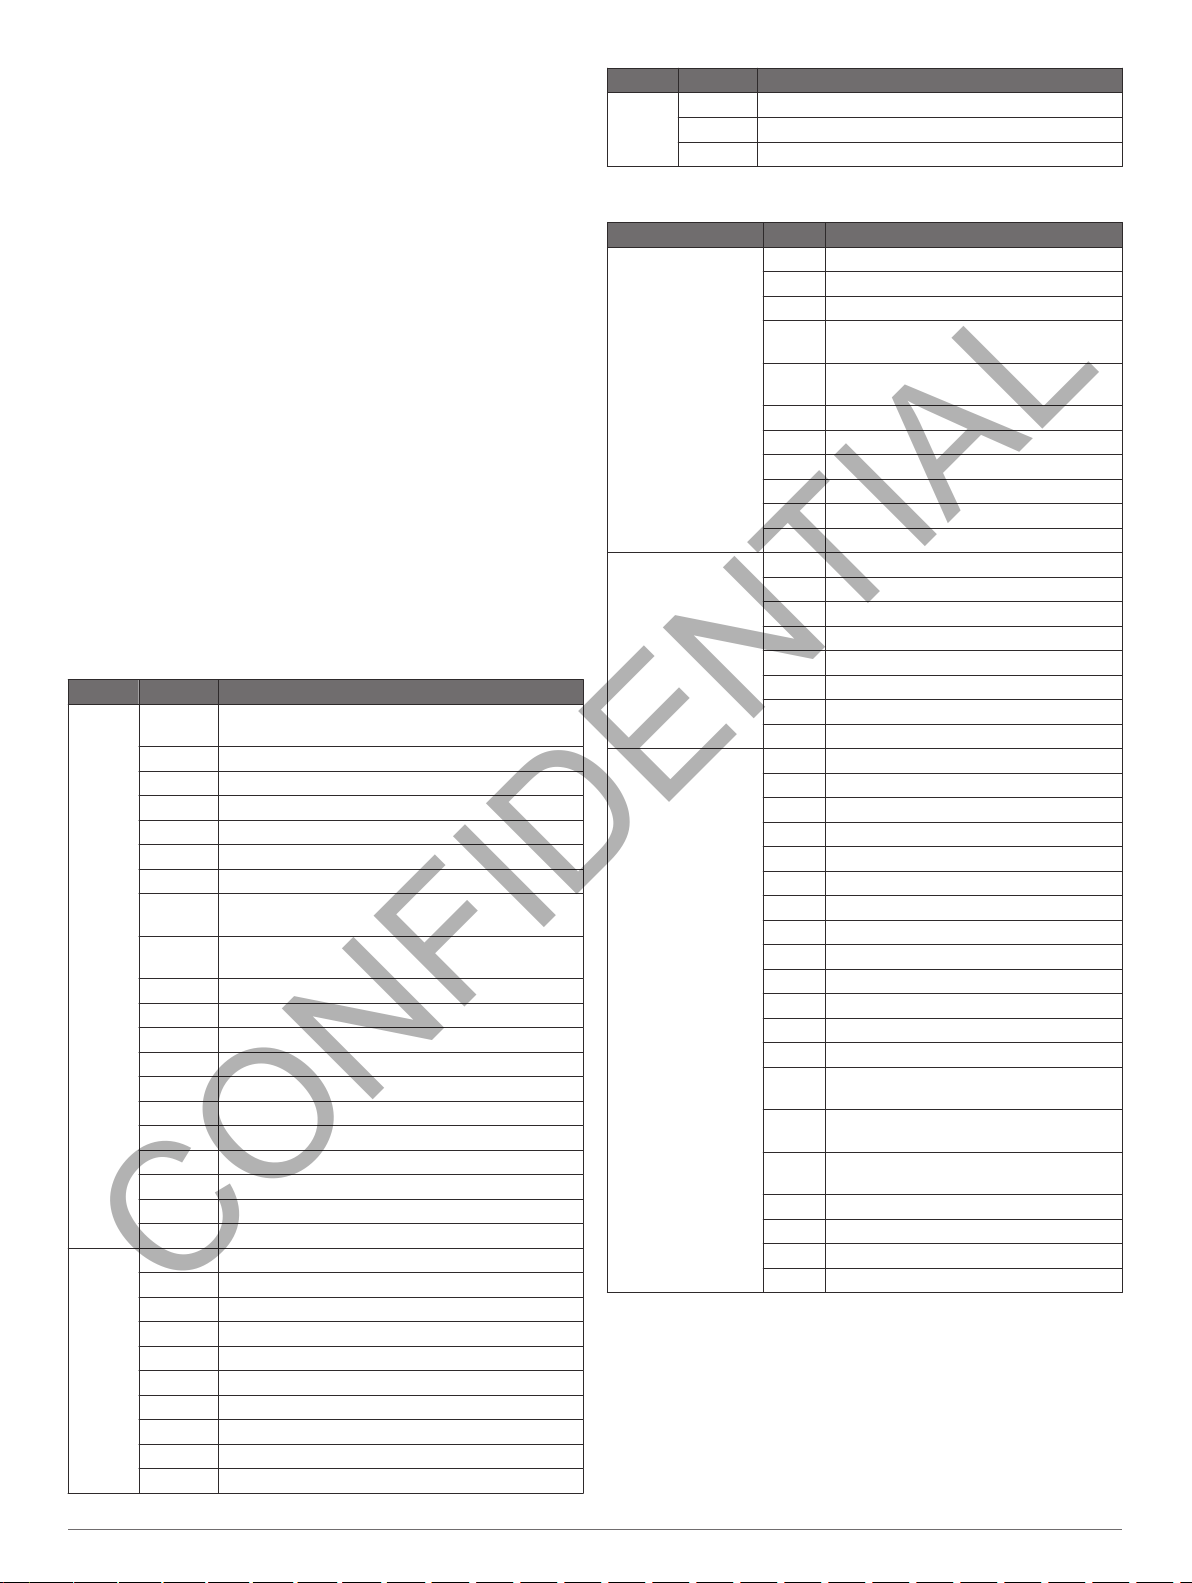
My device is not creating waypoints in the correct
CONFIDENTIAL
location
You can manually enter a waypoint location to transfer and
share data from one device to the next. If you have manually
entered a waypoint using coordinates, and the location of the
point does not appear where the point should be, the map
datum and position format of the device may not match the map
datum and position format originally used to mark the waypoint.
Position format is the way in which the GPS receiver's position
appears on the screen. Commonly displayed as latitude/
longitude in degrees and minutes, with options for degrees,
minutes and second, degrees only, or one of several grid
formats.
Map datum is a math model which depicts a part of the surface
of the earth. Latitude and longitude lines on a paper map are
referenced to a specific map datum.
Find out which map datum and position format was used
1
when the original waypoint was created.
If the original waypoint was taken from a map, there should
be a legend on the map that lists the map datum and position
format used to create that map. Most often this is found near
the map key.
On the chartplotter, select Settings > Preferences > Units.
2
Select the correct map datum and position format settings.
3
Create the waypoint again.
4
NMEA 0183 Information
Type Sentence Description
Transmit GPAPB APB: Heading or track controller (autopilot)
GPBOD BOD: Bearing (origin to destination)
GPBWC BWC: Bearing and distance to waypoint
GPGGA GGA: Global positioning system fix data
GPGLL GLL: Geographic position (latitude and longitude)
GPGSA GSA: GNSS DOP and active satellites
GPGSV GSV: GNSS satellites in view
GPRMB RMB: Recommended minimum navigation
GPRMC RMC: Recommended minimum specific GNSS
GPRTE RTE: Routes
GPVTG VTG: Course over ground and ground speed
GPWPL WPL: Waypoint location
GPXTE XTE: Cross track error
PGRME E: Estimated error
PGRMM M: Map datum
PGRMZ Z: Altitude
SDDBT DBT: Depth below transducer
SDDPT DPT: Depth
SDMTW MTW: Water temperature
SDVHW VHW: Water speed and heading
Receive DPT Depth
DBT Depth below transducer
MTW Water temperature
VHW Water speed and heading
WPL Waypoint location
DSC Digital selective calling information
DSE Expanded digital selective calling
HDG Heading, deviation, and variation
HDM Heading, magnetic
MWD Wind direction and speed
sentence "B"
information
data
Type Sentence Description
MDA Meteorological composite
MWV Wind speed and angle
VDM AIS VHF data-link message
NMEA 2000 PGN Information
Type PGN Description
Transmit and
receive
Transmit 127250 Vessel heading
Receive 126992 System time
059392 ISO acknowledgment
059904 ISO request
060928 ISO address claim
126208 NMEA
126464 Transmit and receive PGN list group
126996 Product information
129026 COG and SOG : Rapid update
129029 GNSS position data
129540 GNSS satellites in view
130306 Wind data
130312 Temperature
127258 Magnetic variance
128259 Speed: Water referenced
128267 Water depth
129025 Position: Rapid update
129283 Cross track error
129284 Navigation data
129285 Navigation route and waypoint info
127250 Vessel heading
127489 Engine parameters: Dynamic
127488 Engine parameters: Rapid update
127493 Transmission parameters: Dynamic
127505 Fluid level
128259 Speed: water referenced
128267 Water depth
129025 Position: rapid update
129038 AIS class A position report
129039 AIS class B position report
129040 AIS class B extended position report
129539 GNSS DOPs
129794 AIS class A static and voyage related
129809 AIS class B "CS" static data report, part
129810 AIS class B "CS" static data report, part
130310 Environmental parameters
130311 Environmental parameters
130313 Humidity
130314 Actual pressure
: Command, request, and
acknowledge group function
function
data
A
B
Software License Agreement
BY USING THE DEVICE, YOU AGREE TO BE BOUND BY THE
TERMS AND CONDITIONS OF THE FOLLOWING SOFTWARE
LICENSE AGREEMENT. PLEASE READ THIS AGREEMENT
CAREFULLY.
Garmin Ltd. and its subsidiaries (“Garmin”) grant you a limited
license to use the software embedded in this device (the
“Software”) in binary executable form in the normal operation of
the product. Title, ownership rights, and intellectual property
40 Appendix
Page 47

rights in and to the Software remain in Garmin and/or its third-
CONFIDENTIAL
party providers.
You acknowledge that the Software is the property of Garmin
and/or its third-party providers and is protected under the United
States of America copyright laws and international copyright
treaties. You further acknowledge that the structure,
organization, and code of the Software, for which source code is
not provided, are valuable trade secrets of Garmin and/or its
third-party providers and that the Software in source code form
remains a valuable trade secret of Garmin and/or its third-party
providers. You agree not to decompile, disassemble, modify,
reverse assemble, reverse engineer, or reduce to human
readable form the Software or any part thereof or create any
derivative works based on the Software. You agree not to export
or re-export the Software to any country in violation of the export
control laws of the United States of America or the export control
laws of any other applicable country.
Appendix 41
Page 48

Index
CONFIDENTIAL
A
aerial photos
AIS 5–7
distress signal device
radar
SART
targeting 5, 6
threats 6, 20
turning on
alarms
anchor drag
arrival
collision 6, 37
deep water
engine
gauges
navigation
off course
shallow water
sonar
water temperature
weather
anchor drag alarm
animated currents, tides
antenna, GPS
arrival alarm
Auto Guidance 8, 10, 11, 35
line 11, 35
paths
shoreline distance 11, 35
autopilot
adjusting the heading
circles pattern 24
cloverleaf pattern
engaging
orbit pattern
pattern steering
power saver
reducing rudder activity
search pattern
Shadow Drive 23
steering increment
steering patterns
u-turn pattern
Williamson turn pattern
zigzag pattern
B
backlight 2, 38
buoy reports
C
camera
configuration
controlling
home position 33
pausing
standby
celestial information 27, 28
charts 2–4, 6, 7
appearance
built-in
details
heading, line
measuring distance 3
navigation 4, 5
selecting
symbols
circuits
clock
36
alarm
collision alarm 6, 37
color mode
combinations, customizing 2, 34
compass, rose
courses
36
39
8
20
6
18
10
23
36
5
6
37
36
36
18
26
26
36
36
18
18
36
36
4
1
36
, 11
24
24
23
24
24
23
23
24
23
24
24
24
24
32
33
33
33
33
7
3
3
7
3
3
2
7
current stations
indicators
, 28
27
4
D
data
backup 38, 39
copying
data management
dealer
deleting, all user data
depth log
destinations
navigation chart
selecting
device
cleaning
registration
digital selective calling 24, 25
channels
contacts
individual routine call
turning on 25, 37
digital switching
distress call
distress signal device
DownVü
DSC.
38
8
27
15
digital selective calling
See
38
12
8
8
39
39
26
25
39
25
26
6
E
EBL
20
adjusting
measuring
showing
engine gauges
configuring
status alarms
EPIRB
event log
21
21
21
26
26
26
6
34
F
factory settings
stations
favorites
Fish Eye 3D
sonar cone
suspended targets 7
tracks
fishing chart 3, 32
setup
fuel alarm 26, 36
fuel capacity 26, 36
fuel gauges
status alarm
synchronizing with actual fuel
fuel onboard
2
7
7
2
26
36
37
7
26
, 36
27
G
Garmin Marine Network 12, 36
Garmin product support, contact information
gauges
26
engine
26
fuel
, 27
26
limits
26
status alarms
trip
27
wind
Go To
9
GPS
39
signals
source
GPS accuracy
graphs
air temperature
atmospheric pressure
configuring
depth
water temperature
wind angle
wind speed
GRID
39
GRID pairing
26
27
1
1
36
27
27
27
27
27
27
27
34
gybing. See tacking and gybing
H
hazard colors
heading
adjusting
heading hold
holding
Shadow Drive 24
helm application
help. See product support
home screen
customizing
7
24
24
14
23
38
1
2
J
jibing.
joystick
tacking and gybing
See
39
K
keel offset
keyboard
13
34
, 36
L
lane width
language
7
34
M
man overboard 9, 24, 25
manual viewer
marine services
mark location
MARPA
navigation chart
tagged object
targeting
threats 6, 20
measuring distance, charts
media player
alphabetical search
Android device
device name
FUSION-Link
iPod
MTP
muting
preset
radio 28, 29
repeating
shuffling
SiriusXM Satellite Radio
source
tuner region
tuning mode
VHF
Windows phone
zones
memory card
detailed maps
MOB, device
1
music player 28–30. See media player
5
28
29
29
29
28
28
29
8
20
28
, 33
28
28
38
6
1
8
30
28
29
29
, 39
7
20
28
29
, 29
29
38
N
navaids
navigation alarms
navigation chart 3, 5, 8, 32
networking.
NMEA 0183 24, 36
NMEA 2000 24, 36
4
aerial photos
marine service points 8
MARPA
radar overlay
setup 7
vessel trails 7, 25
36
7
7
21
Marine Network
See
O
off course alarm
offset, front of boat
other vessels
AIS
7
trails
7
36
23
3
29
42 Index
Page 49

P
CONFIDENTIAL
Perspective 3D
photos, aerial
position, tracking
position report
power key
powerboat 2, 13, 37
preferred data source
premium charts 4, 5, 7
aerial photos
Fish Eye 3D
tide and current indicators
product registration
product support
contact information
32
5
25
25
34
23
5
7
39
1
1
R
radar
radar overlay
radio, SiriusXM 29, 30
range rings
registering the device
remote control
resetting
Route To
routes
–21
19
AIS
20
bird mode
clutter
color scheme
custom park position
echo trails
field of view
front-of-boat offset
gain 21, 22
MARPA
optimizing display
overlay screen
range
range rings
sentry mode
source
timed transmit 19
transmitting
waypoints 19, 23
zoom scale
disconnecting
settings
station layouts
copying
creating 9, 10
deleting
editing
navigating
navigating parallel to
synchronizing 12
viewing list of
waypoints
21
22
23
22
23
23
6
22
21
19
23
19
23
19
19
21
7
39
38
38
30
2
8
38
10
10
10
10
38
21
10
S
safe depth
safe height
safe-zone collision alarm 6, 37
sailboat 2, 13, 37
sailing 7, 13
sailing gauges
sailingstarting line
SART 6
satellite imagery
satellite signals, acquiring
screen, brightness
screenshots
sentry mode
settings
35
35
race timer
starting line
capturing
guard zone
timed transmit
radar display
34
13
39
39
19
–36
27
20
13
5
19
22
13
1
2
, 20
system information
Shadow Drive, enabling
shoreline distance 11, 35
SideVü
15
SiriusXM
SiriusXM Satellite Radio 29, 30
software
software license agreement
4
sonar
SOS 9, 25
stations
suspended targets
symbols
synchronizing, user data 12
system information 34, 39
30
Satellite Radio
updates
updating
a-scope 17, 18
alarms
appearance
bottom lock
color gain
color rejection
cone
depth
depth scale
DownVü
frequencies
gain
interference
noise 16
recording 18, 19
scroll speed
sharing 15, 16
SideVü
source
surface noise
suspended targets 18
views 14, 15
waypoint
whiteline
zoom
changing the station
customizing the home screen of
ordering the displays
restoring the layout 2, 34
14
, 15, 18
18
7
16
16
15
16
1
5
1
1
16
15
15
, 16
15
18
T
tacking and gybing
heading hold
wind hold
targeting
temperature log
tide stations 4, 27, 28
indicators
tracks
clearing
copying
deleting
editing
list
navigating
recording
saving
saving as route
showing 7, 12
transducer 14, 17, 18
trip gauges
troubleshooting 39, 40
14
20
4
12
12
38
12
12
12
12
12
12
27
U
unit ID
34
units of measure
updates, software
user data
deleting
synchronizing
12
16
16
17
18
17
17
27
14
35
17
18
12
29
1
7
14
12
34
23
34
34
40
V
vessel trails 7, 25
VHF radio
video 32–34
voltage
Volvo Penta dealer
VRM
24
calling an AIS target
distress calls
DSC channel
individual routine call
configuring 33, 34
source
viewing
36
20
adjusting
measuring
showing
33
25
26
, 34
33
8
21
21
21
26
26
W
warning manager
messages
water
speed
temperature log
temperature offset
waypoints 8, 40
copying
creating 3, 8, 32
deleting
editing
man overboard
navigating to
radar
19
showing
sonar
15
synchronizing
tracked vessel 25
viewing list of
weather
weather 7, 30, 31
alarms
2
Wi‑Fitechnology
wind angle graph
wind gauges
wind hold
wind speed graph
wireless devices 37, 38
36
broadcasts
charts
30
fishing 31, 32
fishing chart
forecast
navigation chart
overlay
precipitation
sea conditions
subscription 30, 32
surface pressure
visibility
water temperature 31, 32
wave information
winds
31
adjusting
connecting a wireless device 37, 38
network configuration 37, 38
37
14
38
9
9
7
32
30
32
32
28
28
27
37
9
9
12
9
30
, 32
32
–32
32
30
31
31
31
37
27
27
14
27
Z
zoom
chart
3
radar
19
sonar
16
Index 43
Page 50

www.garmin.com/support
CONFIDENTIAL
+43 (0) 820 220230 + 32 2 672 52 54
0800 770 4960 1-866-429-9296
+385 1 5508 272
+385 1 5508 271
+ 45 4810 5050 + 358 9 6937 9758
+ 331 55 69 33 99 + 39 02 36 699699
(+52) 001-855-792-7671 0800 0233937
+47 815 69 555
(+35) 1214 447 460 +386 4 27 92 500
0861 GARMIN (427 646)
+27 (0)11 251 9999
+ 46 7744 52020 +886 2 2642-9199 ext 2
+420 221 985466
+420 221 985465
00800 4412 454
+44 2380 662 915
+34 93 275 44 97
0808 238 0000
+44 (0) 870 8501242
913-397-8200
1-800-800-1020
+49 (0)180 6 427646
20 ct./Anruf. a. d.
deutschen Festnetz,
Mobilfunk max. 60 ct./Anruf
© 2014 Garmin Ltd. or its subsidiaries
 Loading...