

Page 1

COLOR SOUNDER
Back
FCV-30
Page 2

9-52 Ashihara-cho,9-52 Ashihara-cho,
A
A
*
00015183503
**00015183503
*
*
00015183503
**00015183503
*
*
OME
23730
D
00
**OME
23730
D
00
**OME
23730
D
00
**OME
23730
D
00
*
Nishinomiya 662-8580, JAPANNishinomiya 662-8580, JAPAN
Telephone :Telephone : 0798-65-21110798-65-2111
FaxFax 0798-65-42000798-65-4200
::
The paper used in this manual
is elemental chlorine free.
FURUNO Authorized Distributor/DealerFURUNO Authorized Distributor/Dealer
ll rights reserved.
ll rights reserved.
Pub. No.Pub. No. OME-23730OME-23730
(( DAMIDAMI ))
FCV-30FCV-30
Printed in JapanPrinted in Japan
FIRST EDITION :FIRST EDITION : FEB.FEB. 20052005
DD :: MAY.MAY. 16, 200616, 2006
* 0 0 0 1 5 1 8 3 5 0 3 ** 0 0 0 1 5 1 8 3 5 0 3 *
* O M E 2 3 7 3 0 D 0 0 ** O M E 2 3 7 3 0 D 0 0 *
Page 3

IMPORTANT NOTICES
• No part of this manual may be copied or reproduced without written permission.
• If this manual is lost or worn, contact your dealer about replacement.
• The contents of this manual and equipment specifications are subject to change without
notice.
• The example screens (or illustrations) shown in this manual may not match the screens
you see on your display. The screen you see depends on your system configuration and
equipment settings.
• This manual is intended for use by native speakers of English.
• FURUNO will assume no responsibility for the damage caused by improper use or
modification of the equipment or claims of loss of profit by a third party.
• Dispose of the equipment according to appropriate regulations.
i
Page 4
SAFETY INSTRUCTIONS
WARNING
ELECTRICAL SHOCK HAZARD
Do not open the equipment.
Only qualified personnel
should work inside the
equipment.
Immediately turn off the power at the
switchboard if water leaks into the
equipment or something is dropped in
the equipment.
Continued use of the equipment can cause
fire or electrical shock. Contact a FURUNO
agent for service.
Do not disassemble or modify the
equipment.
Fire, electrical shock or serious injury can
result.
Do not place liquid-filled containers on
the top of the equipment.
Fire or electrical shock can result if a liquid
spills into the equipment.
Immediately turn off the power at the
switchboard if the equipment is emitting
smoke or fire.
WARNING
Keep heater away from equipment.
A heater can melt the equipment's power
cord, which can cause fire or electrical
shock.
Use the proper fuse.
Fuse rating is shown on the equipment.
Use of a wrong fuse can result in damage
to the equipment.
Do not operate the equipment with wet
hands.
Electrical shock can result.
Warning Labels
Warning labels are attached to the equipment. Do not remove the labels. If a
label is missing or damaged, contact
a FURUNO agent or dealer about replacement.
WARNING
To avoid electrical shock, do not
remove cover. No user-serviceable
parts inside.
Name: Warning Label (1)
Type: 86-003-1011-1
Code No.: 100-236-231
Location: Processor Unit,
Junction Box
Continued use of the equipment can cause
fire or electrical shock. Contact a FURUNO
agent for service.
Make sure no rain or water splash leaks
into the equipment.
Fire or electrical shock can result if water
leaks in the equipment.
ii
Electrical shock hazard.
Do not remove cover.
No user-serviceable parts inside.
Turn off power before servicing.
And wait until charge lamp (green)
goes off and then remove cover.
DANGER
Name: Danger Label
Type: 10-079-6144
Code No.: 100-310-880
Location: Transceiver
Unit
Page 5
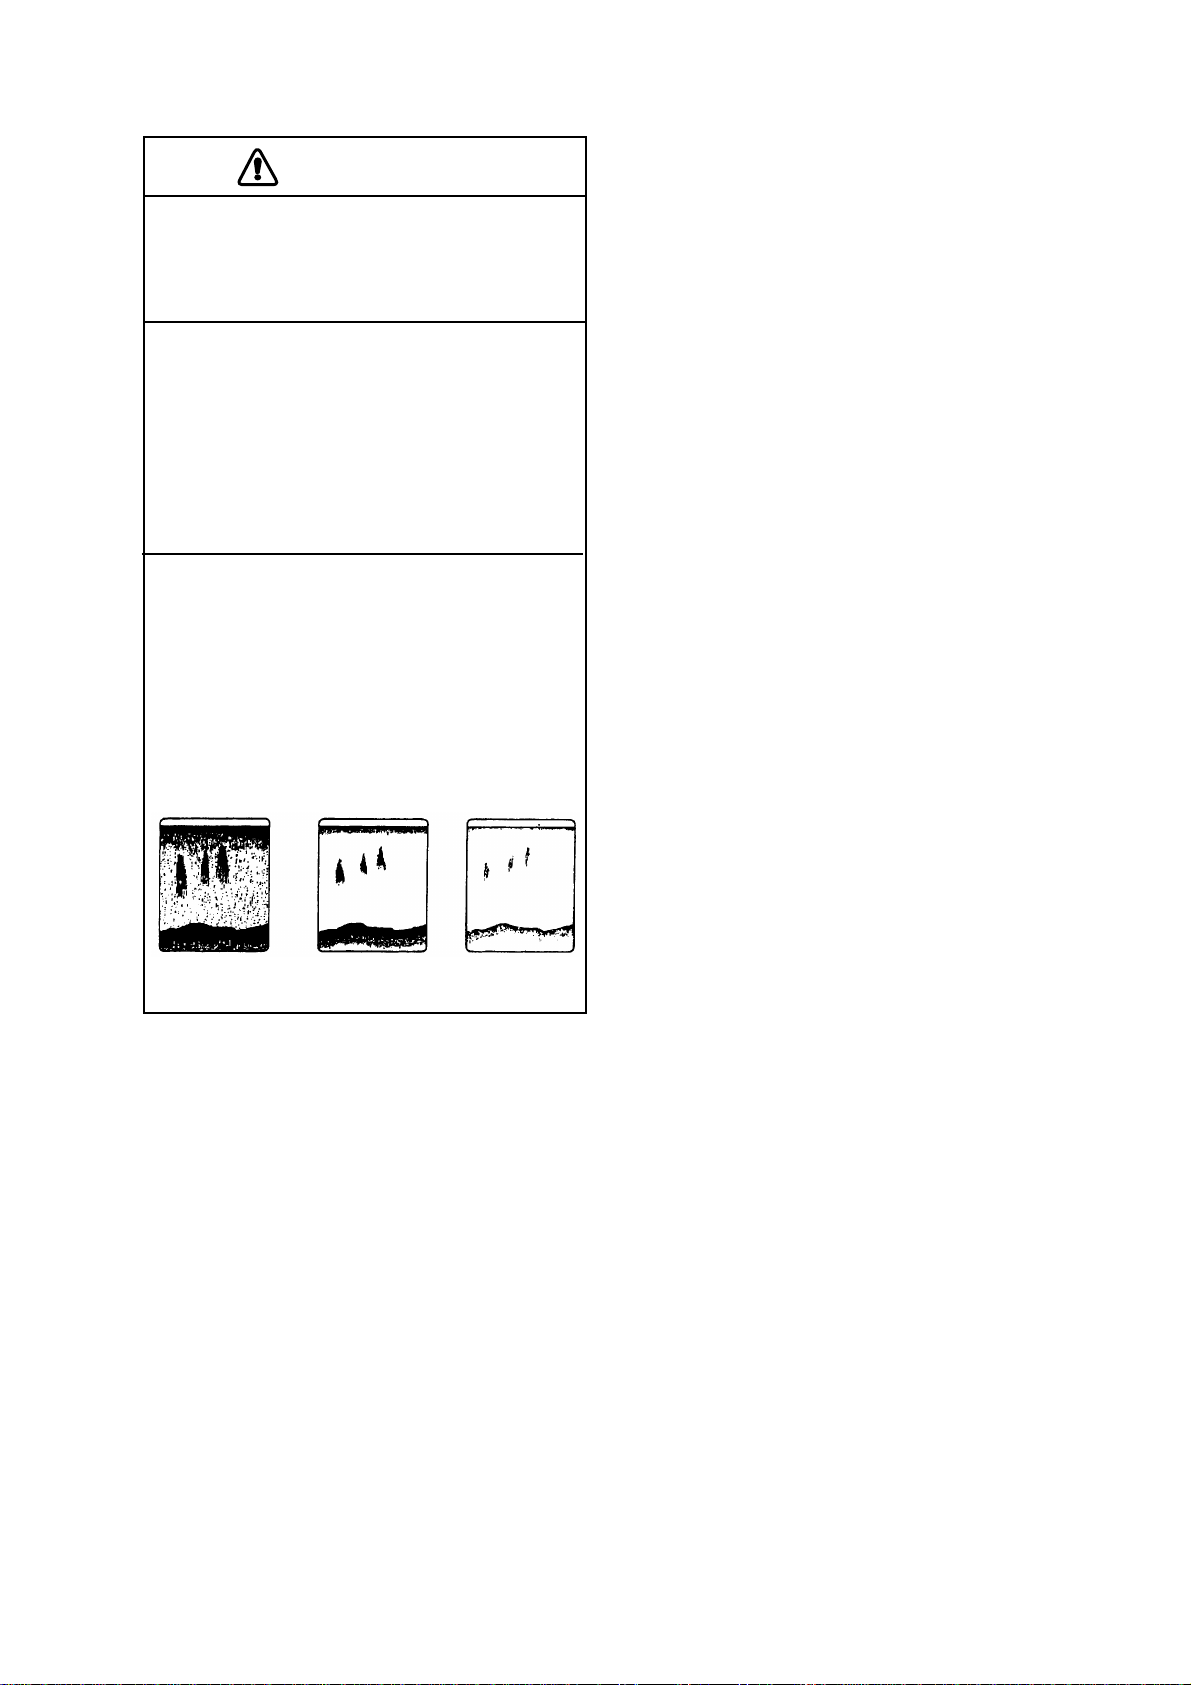
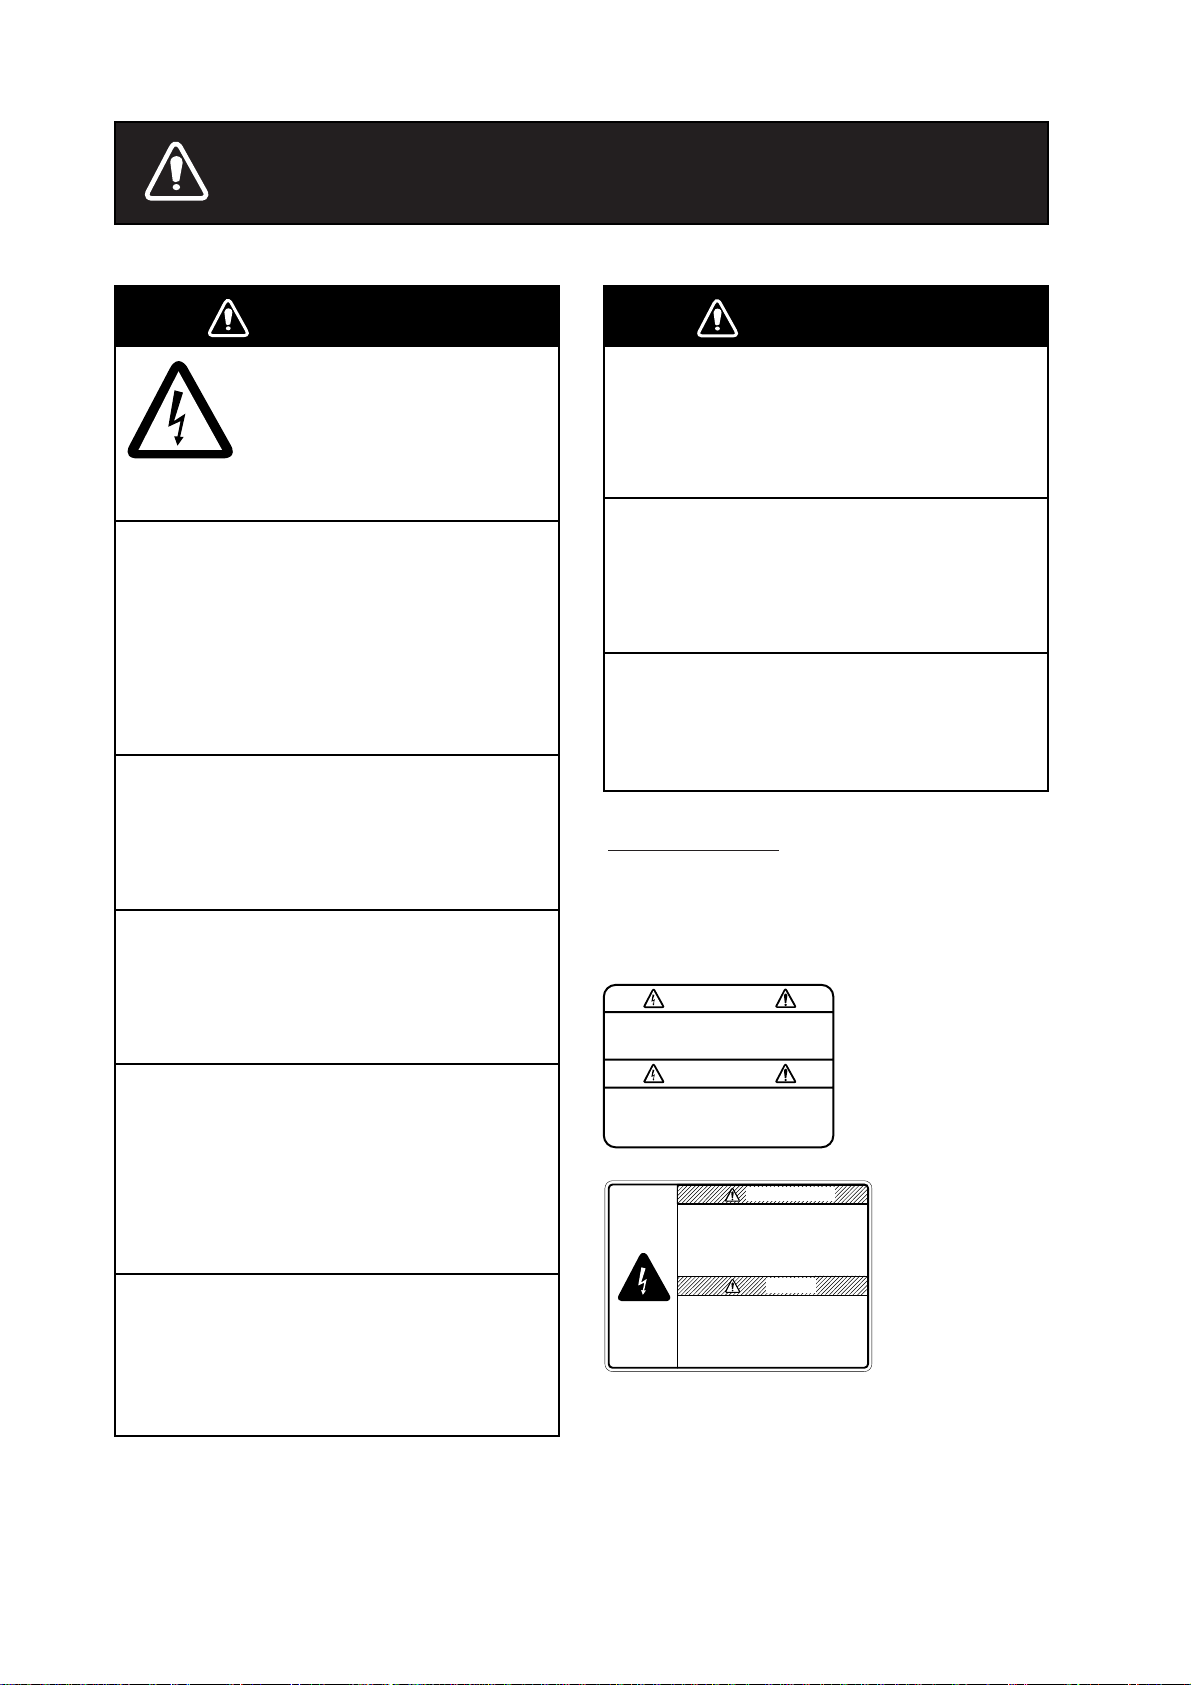
CAUTION
Do not transmit when the transducer is
out of water.
The transducer may become damaged.
The picture does not advance when the
picture advance speed is set for
"STOP".
A dangerous situation may result if the
vessel is navigated while monitoring
the depth indication since it is not updated
when the picture is stopped.
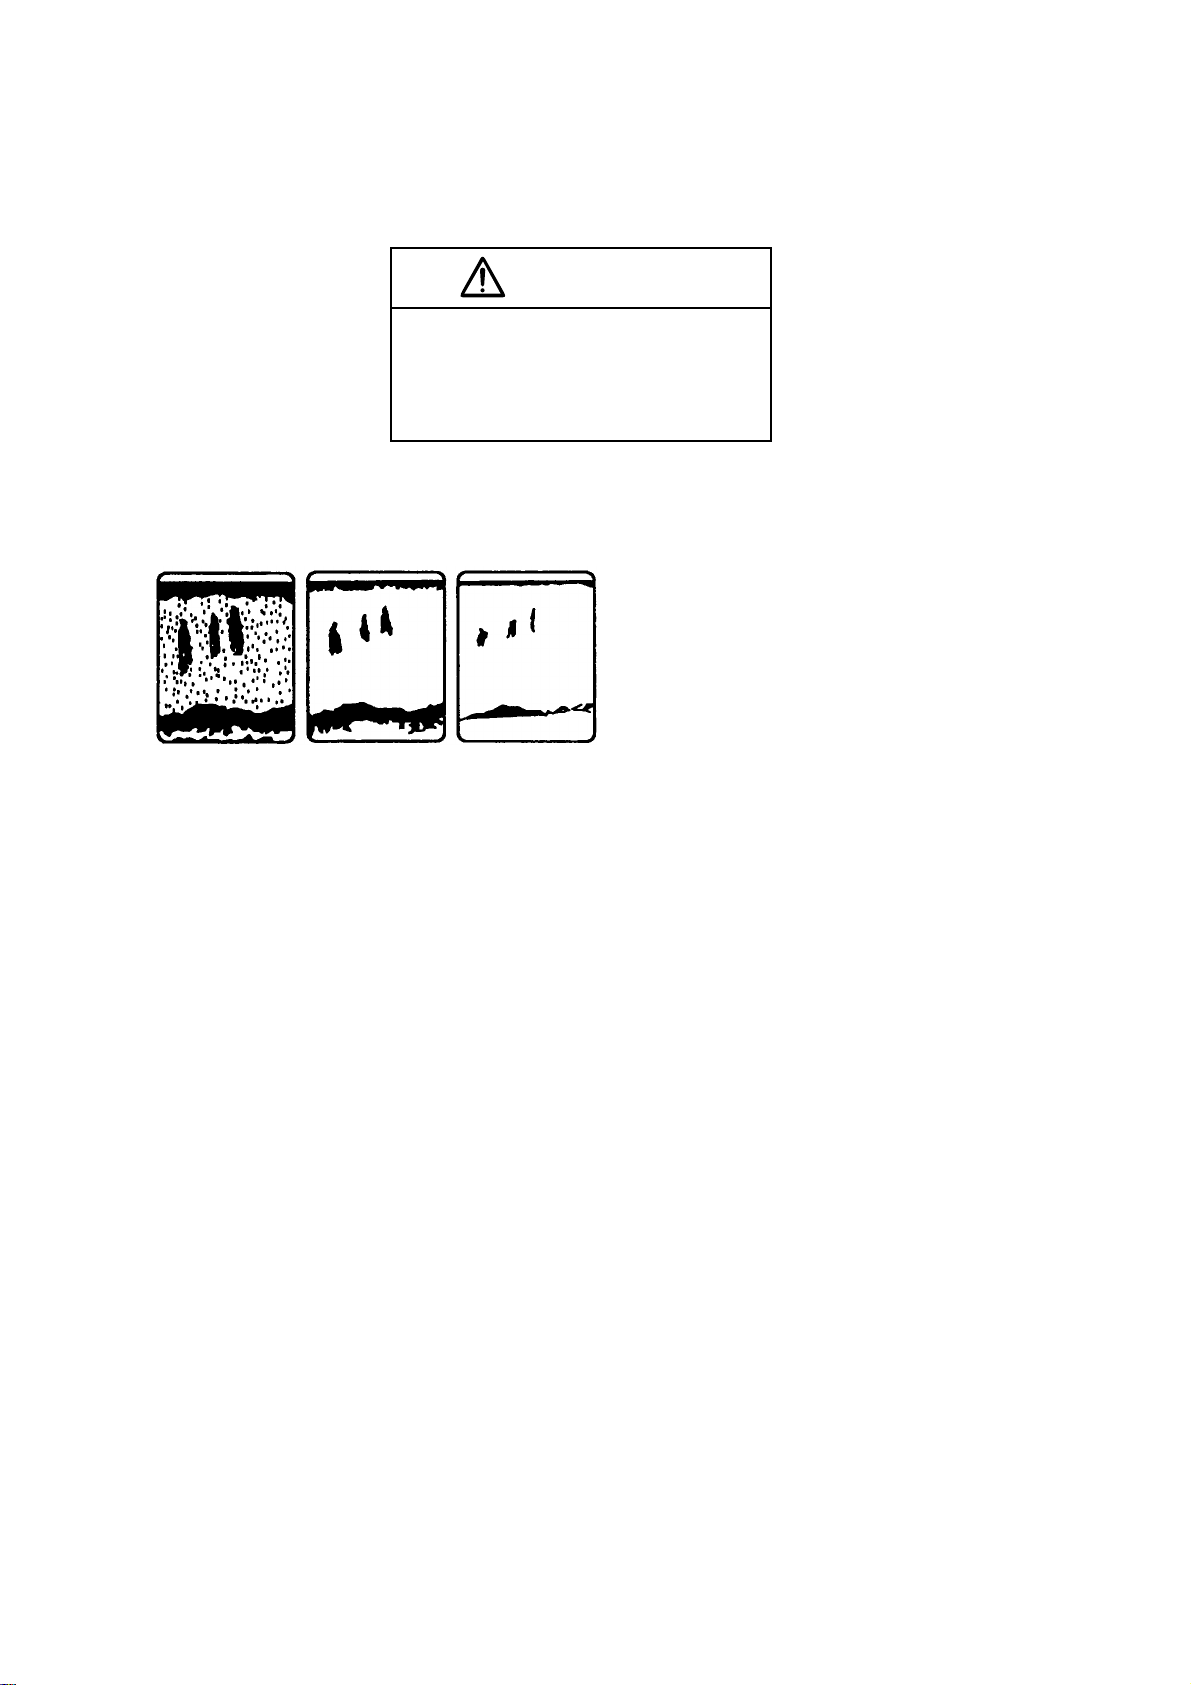
Set the gain properly.
No picture appears if the gain setting is
too low, and noise appears when the gain
is too high. If the gain is set improperly,
the depth indication may be wrong,
resulting in a potentially dangerous situation
if the vessel is navigated by monitoring
the depth indication.
Gain too high Proper gain Gain too low
iii
Page 6

v
TABLE OF CONTENTS
FOREWORD ........................................................................................................ vi
SYSTEM CONFIGURATION ............................................................................... vii
1. OPERATIONAL OVERVIEW ......................................................................... 1-1
1.1 Controls..................................................................................................................... 1-1
1.2 Menu Operation ........................................................................................................ 1-2
1.2.1 How to use the main menu ............................................................................ 1-2
1.2.2 How to use the pop-up menus ....................................................................... 1-5
1.3 Turning the Power On/Off.......................................................................................... 1-6
1.4 Transmitting, Receiving............................................................................................. 1-7
1.5 Displays .................................................................................................................... 1-8
1.5.1 Choosing a display......................................................................................... 1-8
1.5.2 Split-beam display.......................................................................................... 1-9
1.5.3 Three-beam display..................................................................................... 1-10
1.5.4 Split-beam + two-beam display .....................................................................1-11
1.5.5 User 1, User 2, User 3 display ..................................................................... 1-12
1.6 Choosing a Display Range ...................................................................................... 1-13
1.7 Shifting the Display Range ...................................................................................... 1-15
1.8 Adjusting the Gain................................................................................................... 1-16
1.9 Find Depth and Position of a Fish Echo................................................................... 1-17
1.10 Inscribing Lines ....................................................................................................... 1-18
1.11 Fish Size Histogram ................................................................................................ 1-18
1.12 Setting Measuring Area ........................................................................................... 1-20
1.12.1 Measuring fish in a specific location............................................................. 1-20
1.12.2 Measuring fish in all areas ........................................................................... 1-21
1.12.3 Measuring fish in a specific depth range ...................................................... 1-21
1.12.4 Measuring bottom fish.................................................................................. 1-21
1.13 Suppressing Low Level Noise (Clutter suppression)................................................ 1-23
1.14 Eliminating Weak Echoes........................................................................................ 1-24
1.15 Suppressing Unwanted Noise ................................................................................. 1-24
1.16 Picture Advance Speed ........................................................................................... 1-25
1.17 A-scope Display ...................................................................................................... 1-27
1.18 Alarms..................................................................................................................... 1-28
1.18.1 Alarm description ......................................................................................... 1-28
1.18.2 Enabling, disabling an alarm ........................................................................ 1-29
1.18.3 Setting audio alarm volume.......................................................................... 1-30
1.19 Function Keys ......................................................................................................... 1-31
1.19.1 Using the function keys................................................................................ 1-31
1.19.2 Programming the function keys.................................................................... 1-31
1.20 Saving, Recalling User Settings .............................................................................. 1-32
1.20.1 Saving user settings..................................................................................... 1-32
1.20.2 Loading user settings................................................................................... 1-33
1.21 Recording, Replaying Data...................................................................................... 1-35
1.21.1 Choosing where to record data .................................................................... 1-35
1.21.2 Recording data............................................................................................. 1-37
i
Page 7

v
1.21.3 Converting recorded data to HAC format......................................................1-38
1.21.4 Playing back data......................................................................................... 1-39
1.21.5 Saving screen shot.......................................................................................1-41
1.21.6 Loading a screen shot.................................................................................. 1-42
2. WINDOW DISPLAYS.....................................................................................2-1
2.1 Turning on Window Displays......................................................................................2-1
2.2 Interpreting the Window Displays............................................................................... 2-3
2.2.1 Status window ................................................................................................ 2-3
2.2.2 Fish size histogram window............................................................................ 2-6
2.2.3 Target graph window ......................................................................................2-8
2.2.4 V-temperature graph window........................................................................2-10
2.2.5 Bottom-lock zoom window ............................................................................ 2-11
2.2.6 Bottom zoom window ...................................................................................2-12
2.2.7 Marker zoom window.................................................................................... 2-13
2.2.8 Bottom discrimination graph window ............................................................2-14
3. CHANGING SETTINGS ................................................................................ 3-1
3.1 Mode Dialog Box ....................................................................................................... 3-1
3.2 Display Item Dialog Box............................................................................................. 3-3
3.3 Echo Image Dialog Box .............................................................................................3-4
3.4 Multi beam Dialog Box............................................................................................... 3-6
3.5 Temp Dialog Box........................................................................................................ 3-7
3.6 Color Dialog Box........................................................................................................ 3-8
3.7 Unit Dialog Box........................................................................................................3-10
3.8 Target Sphere Calibration Dialog Box ...................................................................... 3-11
3.9 External Echo Sounder............................................................................................3-13
3.9.1 Displaying image from external echo sounder.............................................. 3-13
3.9.2 File menu .....................................................................................................3-14
3.9.3 Display menu ...............................................................................................3-15
3.9.4 Setting menu ................................................................................................ 3-17
3.9.5 System menu ............................................................................................... 3-19
4. MAINTENANCE & TROUBLESHOOTING ...................................................4-1
4.1 Maintenance .............................................................................................................. 4-1
4.1.1 Check points...................................................................................................4-1
4.1.2 Cleaning.........................................................................................................4-1
4.1.3 Replacing fuses.............................................................................................. 4-2
4.1.4 Transducer ..................................................................................................... 4-2
4.1.5 Trackball......................................................................................................... 4-3
4.2 Troubleshooting.........................................................................................................4-4
4.3 Restoring Default Settings ......................................................................................... 4-5
4.4 Finding Software Version ........................................................................................... 4-6
APPENDIX ......................................................................................................AP-1
Menu Tree....................................................................................................................... AP-1
Screen Division............................................................................................................... AP-7
SPECIFICATIONS ........................................................................................... SP-1
INDEX............................................................................................................... IN-1
Page 8

FOREWORD
Introduction
FURUNO Electric Company thanks you for considering and purchasing the FCV-30 Color
Sounder. We are confident you will discover why the FURUNO name has become
synonymous with quality and reliability.
For over 50 years FURUNO Electric Company has enjoyed an enviable reputation for
quality and reliability throughout the world. This dedication to excellence is furthered by our
extensive global network of agents and dealers.
Your equipment is designed and constructed to meet the rigorous demands of the marine
environment. However, no machine can perform its intended function unless properly
installed and maintained. Please carefully read and follow the operation and maintenance
procedures set forth in this manual.
We would appreciate feedback from you, the end-user, about whether we are achieving our
purposes.
Thank you for considering and purchasing FURUNO.
Features
The FCV-30 is a high-performance echo sounder designed for fishing as well as
oceanographic research. Its newly developed multi-beam transducer provides
multi-directional and long-range detection. Consisting of a processor unit, control unit,
transceiver unit and transducer, the FCV-30 provides high definition underwater images on
the monitor of your choice.
The main features of the FCV-30 are
• Stabilization compensation in all directions (all directions ±20°) provides stable images in
rough seas.
• Fish distribution and size can easily be found using the fish histogram display.
• Detection in multi-direction or desired direction to help discern fish school density.
• Target graph lets you monitor fish movement.
• Bottom hardness and roughness graph provides intuitive data on bottom composition.
• User programmable display (three types) divides the screen in two, three, four or five
displays.
• Various alarms: bottom, bottom fish, fish, temperature, vertical temperature. (Temperature
alarms requires appropriate sensor. The vertical temperature alarm additionally requires a
net sonde or trawl sonar.)
• USB port provided to save data to USB hard disk.
vi
Page 9
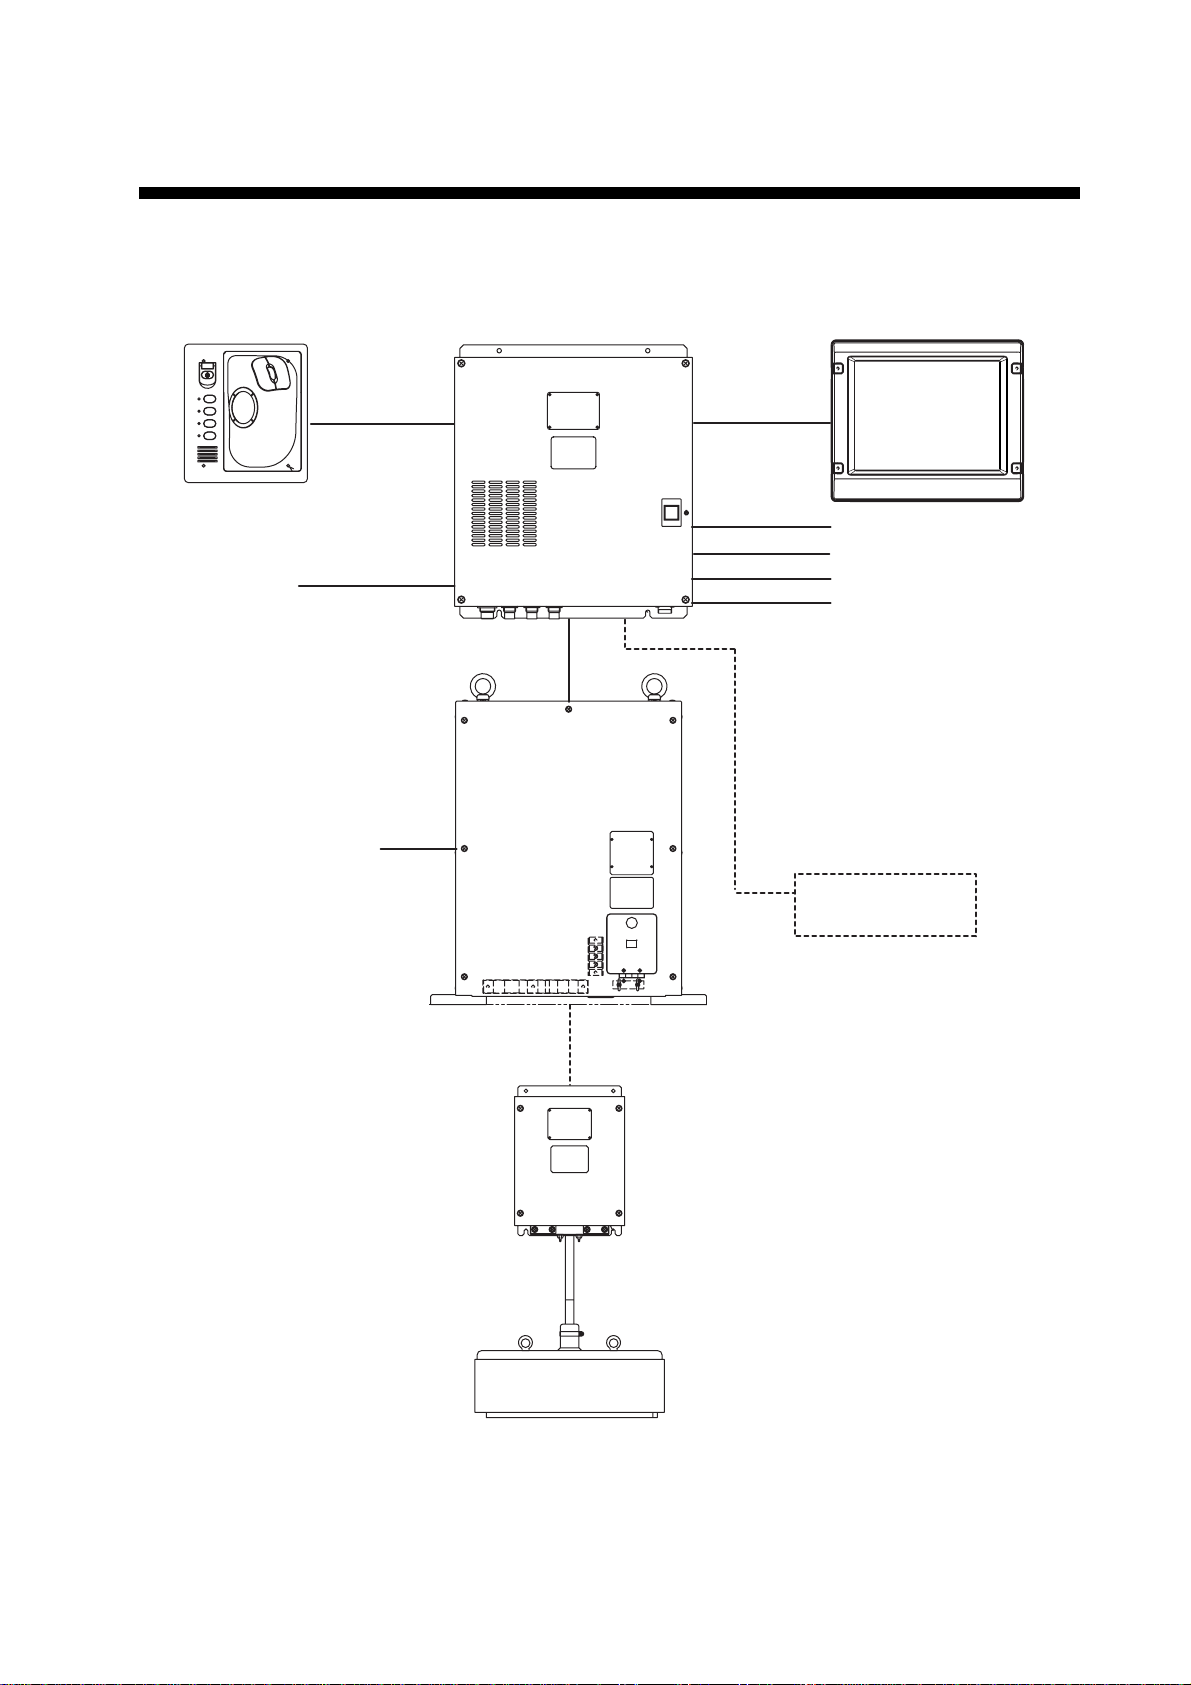
SYSTEM CONFIGURATION
Monitor Unit
Control Unit
CV-301
F1
F2
F3
F4
100-240 V AC
φ
, 50/60 Hz
1
Processor Unit
CV-300
POWER
Transceiver Unit
CV-302
MU-151C/MU-201C (option) OR
commercially available monitor
Navigator
Satellite Compass
Net Sonde
Hard Disk
USB Memory
100-120/200-240 V AC
φ
, 50/60 Hz
1
Network Sounder
ETR-30N
Junction Box
(option)
CV-304
Transducer
CV-303
System configuration
.
vii
Page 10

This page intentionally left blank.
viii
Page 11
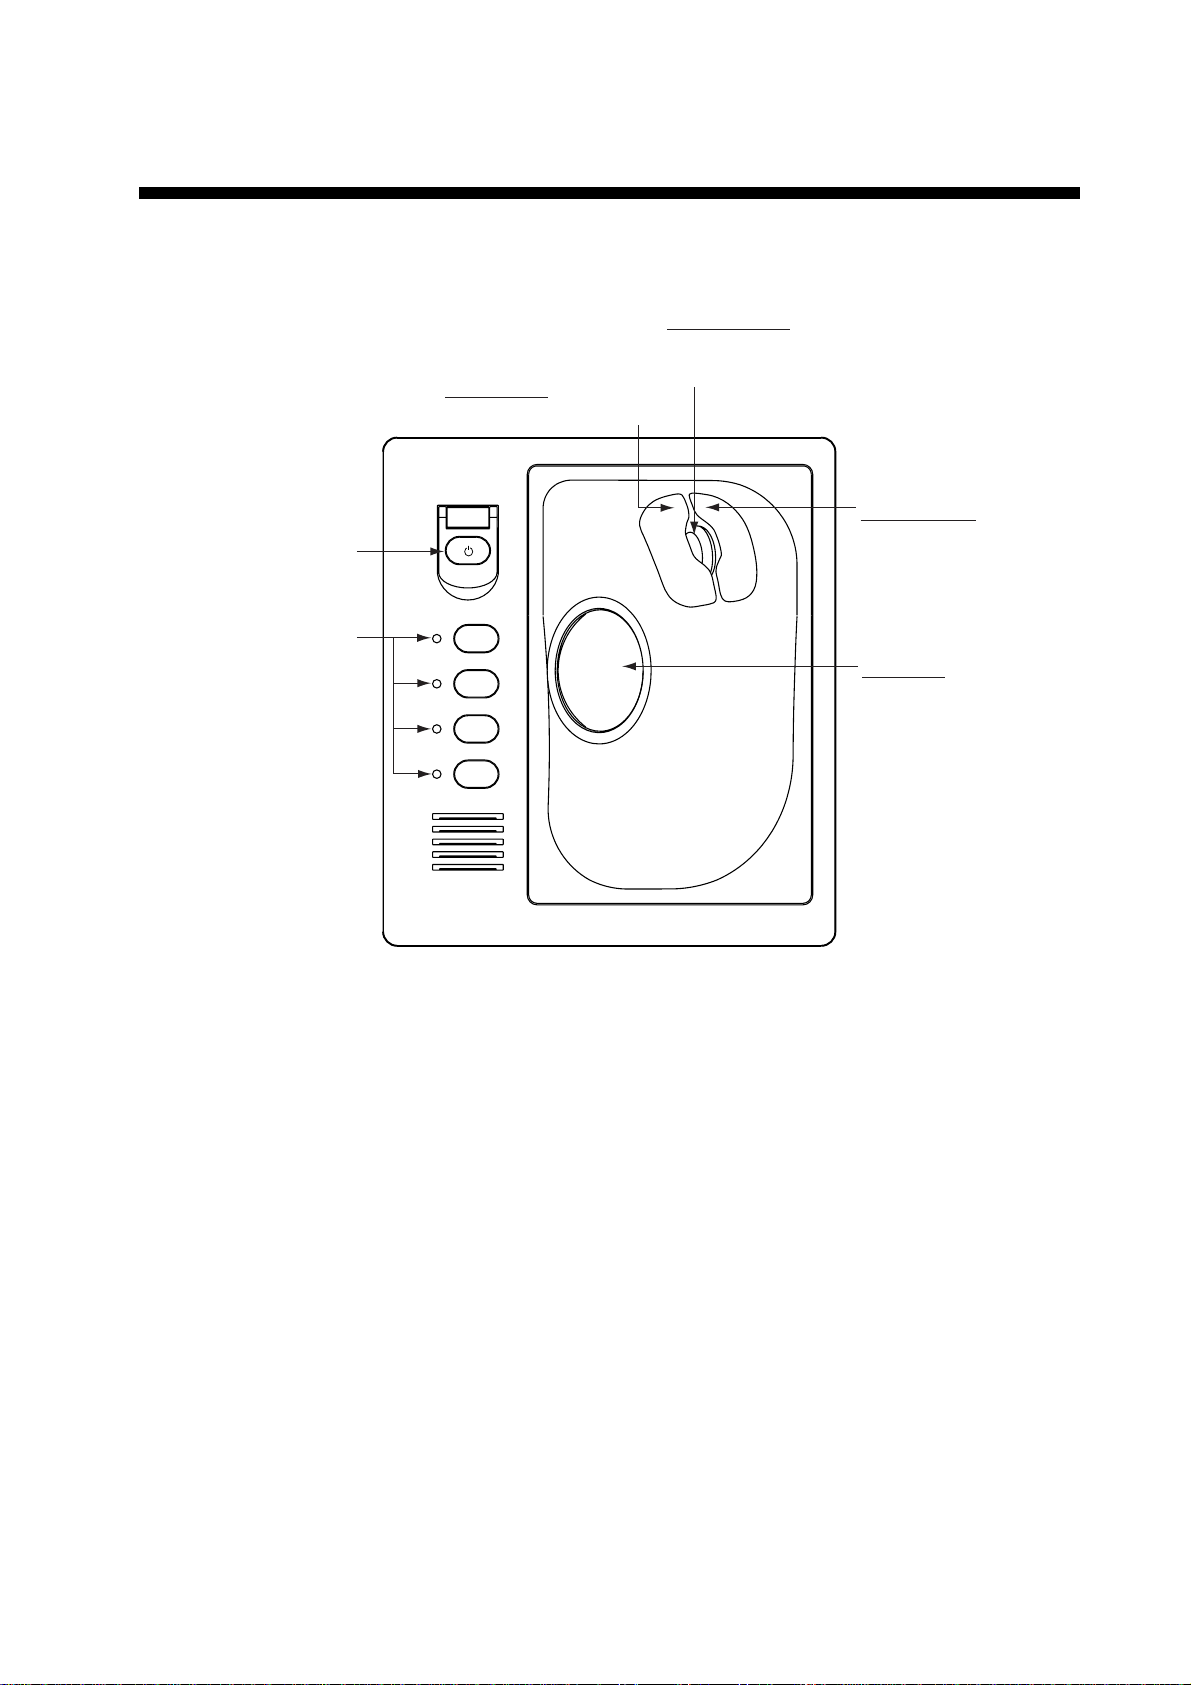
1. OPERATIONAL OVERVIEW
1.1 Controls
Thumbwheel
Shifts cursor position in
Left button
Confirms menu selection.
Turns the power
on/off.
setting window.
Right button
Displays pop-up
menu.
User-programmable
function keys.
F1
F2
F3
F4
Trackball
Moves trackball
pointer.
Control unit
1-1
Page 12

1. OPERATIONAL OVERVIEW
1.2 Menu Operation
The FCV-30 is controlled from a menu system. Two types of menus are available:
Main menu: All menu options are contained in pull-down menus.
Pop-up menu: Contains most frequently used menu functions.
1.2.1 How to use the main menu
Close button
Menu bar Title bar
File Disp Setting System Window Marker line Monday, April 10, 2006 15:01
Trackball pointer
Date and time
Menu bar
1. Roll the trackball to choose menu desired (File, Disp, Setting, System, etc.) from the
menu bar at the top of the screen and the click it with the left button.
Ellipsis indicates a
dialog box is available
Setting menu
2. Roll the trackball to choose menu item desired and then click with the left button. A
menu item which contains an ellipsis (…) indicates a dialog box is available.
Tenkey
button
Multi beam dialog box
1-2
Page 13
1. OPERATIONAL OVERVIEW
3. Change settings as appropriate, referring to the information below.
4. After changing settings, roll the trackball to place the pointer on the OK button and then
push the left button to save settings and close the dialog box. (See Note 3 below.)
Note 1: To restore previous settings, click the Cancel button instead of the OK button at
step 4.
Note 2: To see the result of a change without closing a dialog box, click the Apply button.
Note 3: Unless otherwise noted, the phrase “click…” means to click the object with the left
mouse button.
Changing setting using radio buttons
Enabled Disabled
Radio buttons
Click the item desired. A black dot appears when the item selected is enabled.
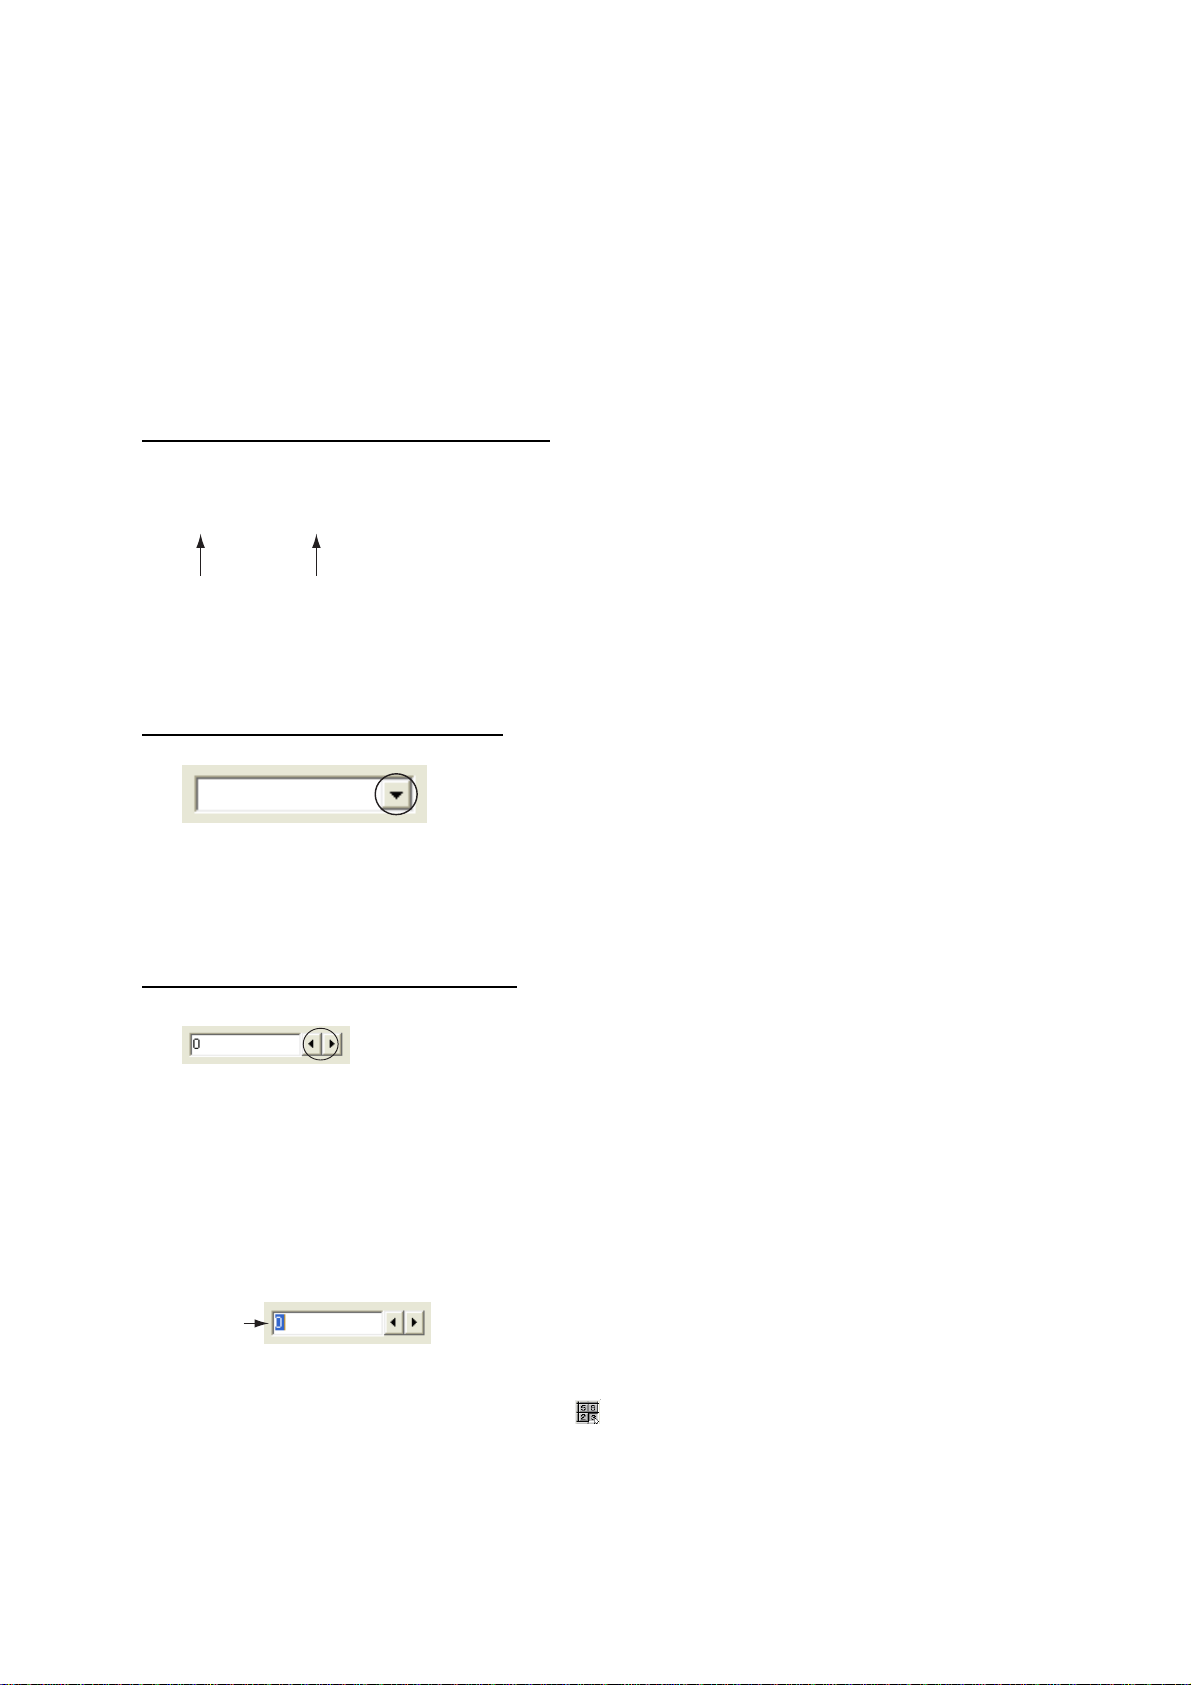
Changing setting using a list box
Normal
List box
1. Click ▼ in the list box or click the box itself to show a list of options.
2. Click the desired setting.
Changing setting using a spin box
Spin box
A setting may be changed from a spin box two ways depending on contents of the spin box:
1) Click ◄ or ► successively in the spin box to choose the setting desired. Each click
increments the setting downward or upward depending on arrow clicked.
2) Spin the thumbwheel to choose value with the cursor.
Cursor
Spin box
Place the pointer on the “tenkey” button ( ) at the lower left-hand corner and then push the
left button to show the tenkey panel.
1-3
Page 14
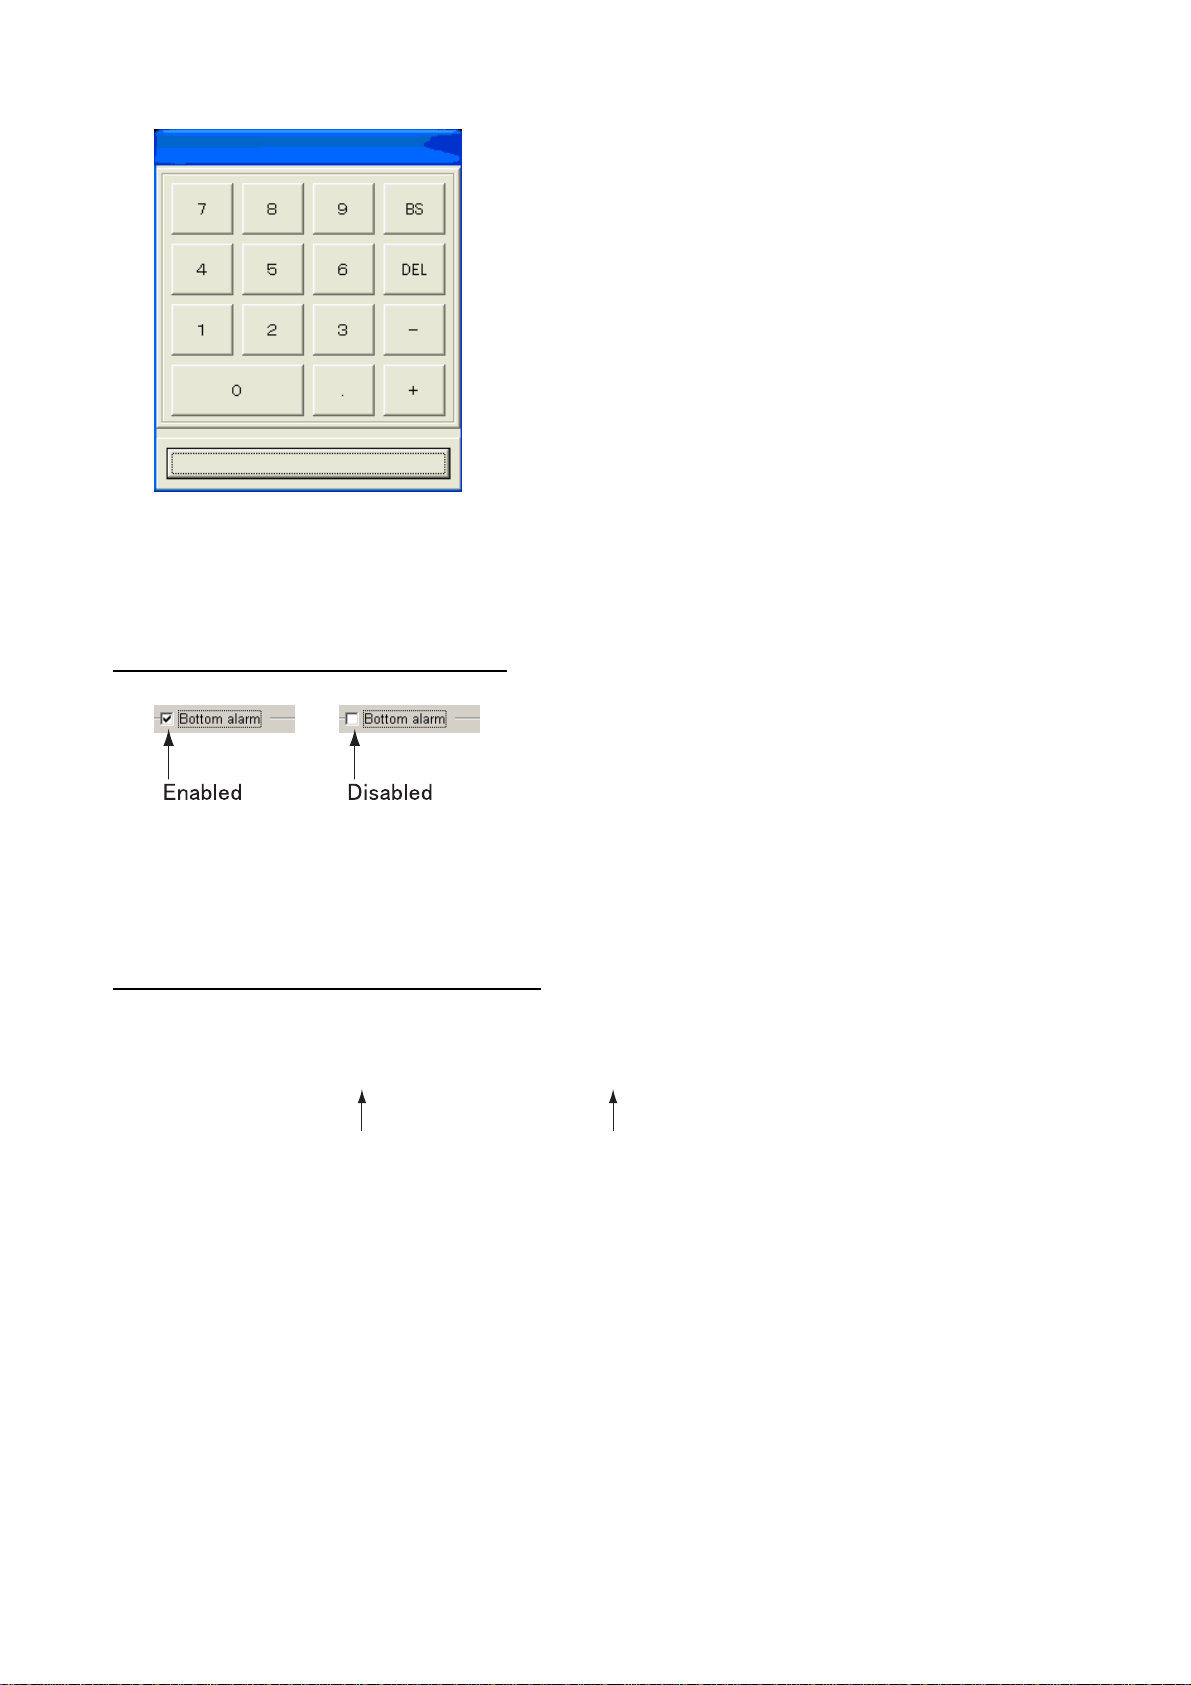
1. OPERATIONAL OVERVIEW
Tenkey
Close
Tenkey panel
Place the cursor on the desired numeric key and then push the left button. Repeat to enter
all data required.
Changing setting using a check box
Bottom alarm
1. Place the pointer on the check box of the item you want to enable or disable.
2. Push the left button to remove or insert the check mark as appropriate. An item is
enabled when the check mark is present.
Changing setting using a toggle button
Enabled (highlighted in blue) Disabled
1. Click the item desired.
2. Each click enables or disables your selection alternately. When the item selected is
enabled it is highlighted in dark blue and when disabled it is colored gray.
1-4
Page 15

1. OPERATIONAL OVERVIEW
1.2.2 How to use the pop-up menus
1. Right-click anywhere on the screen, and a pop-up menu appears.
Indicates an
option menu
is available
Pop-up menu
2. Click the item desired. An item with ► indicates an option window; “…” (ellipsis) a
setting window. Currently selected option is marked with a filled circle.
Option window for "Mode".
Sliding
bar
Track
bar
Close button
Pop-up menu and shift setting window
3. Do one of the following according to item selected.
Operation from an options window
Roll the trackball to execute appropriate operation and then push the left button.
Operation from a setting window
There are three settings methods:
• Drag the sliding bar: Place the pointer on the sliding bar and hold down the left button
while rolling the trackball.
• Place the pointer on the track bar and then click with the left button
• With the track bar selected, spin the thumbwheel and roll the thumbwheel downward to
increment figure upward; upward to increment figure downward. If the drag bar is not
selected, place the pointer on it and push the left button.
Finally, click the Close button.
1-5
Page 16
1. OPERATIONAL OVERVIEW
1.3 Turning the Power On/Off
Turning on the power
1. Turn on the monitor.
2. Open the power switch cover on the Control Unit and push the
comes on, Windows
display appears.
Windows is the registered trademark of Microsoft, Inc.
Note that the Windows
Turning off the power
®
* starts up, the FCV30 application launches and then the last-used
®
Help feature is not available with this equipment.
switch. The power
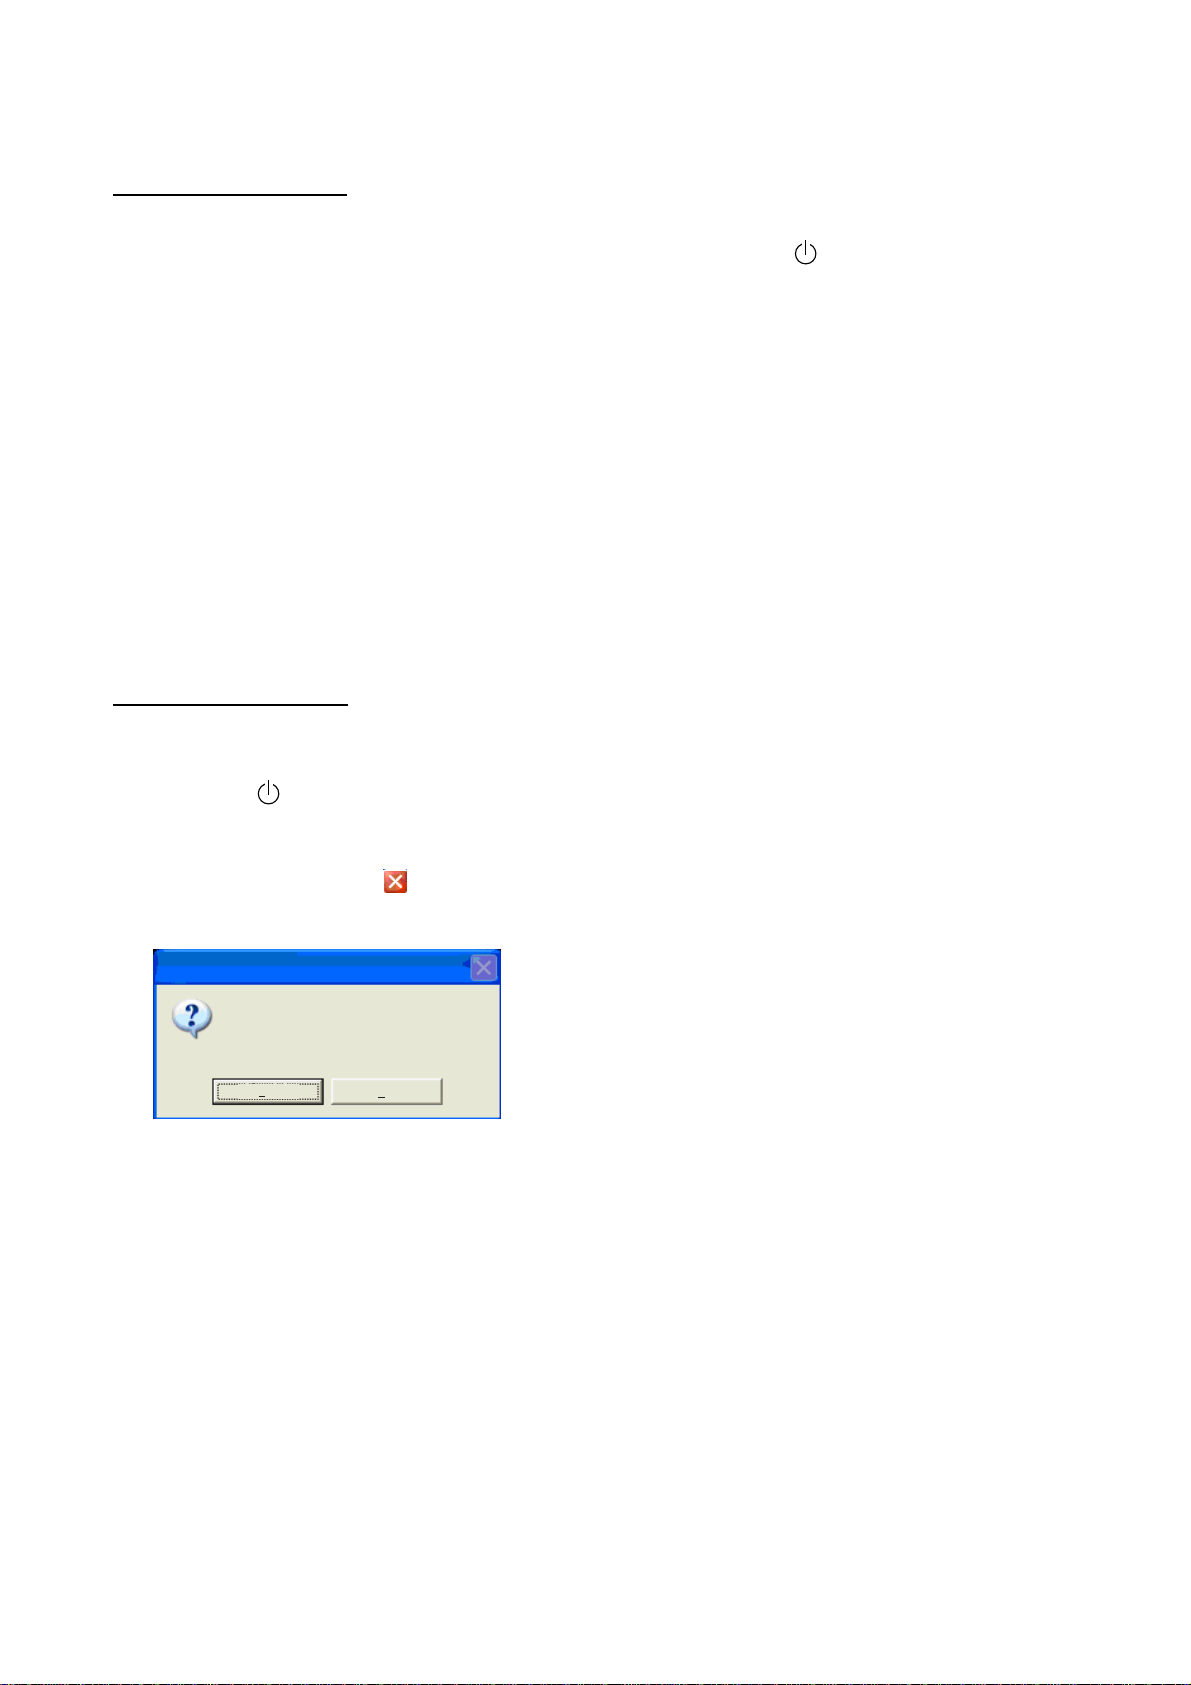
There are two methods to turn off the power.
a) Press the
switch. Do not press the switch more than four seconds; last-used
settings will not be memorized.
b) Click the close button (
). The following window appears. Then, click the Yes button to
quit.
Confirmation
Are you sure to quit?
[Yes]-> Shutdown
[No ]-> Cancel
Yes No
Shutdown confirmation window
Note: Power is automatically turned off anytime the processor unit is disconnected from the
control unit.
1-6
Page 17

1. OPERATIONAL OVERVIEW
1.4 Transmitting, Receiving
Follow the procedure below to start transmitting and receiving, after turning on the power.
1. Click File.
File menu
2. Click TX Start. Transmission starts and images from underwater appear.
To stop transmission, choose TX Stop at step 2. It is recommended that, after stopping
transmission, wait three seconds before using the menu.
1-7
Page 18

1. OPERATIONAL OVERVIEW
1.5 Displays
1.5.1 Choosing a display
Six display modes are available. Choose the display mode which matches your current
needs.
1. Click Disp.
Disp menu
2. Click Mode.
Mode dialog box
3. In the Display Mode window choose the mode you wish to use. See the next several
sections for display descriptions. To divide the screen, go to step 4. Otherwise go to step
5.
4. In the Screen Layout window, click the screen division you wish to use. The Preview
window shows the results of your selection. Note that the split-beam display cannot be
divided.
5. Click the OK button to finish.
1-8
Page 19
1. OPERATIONAL OVERVIEW
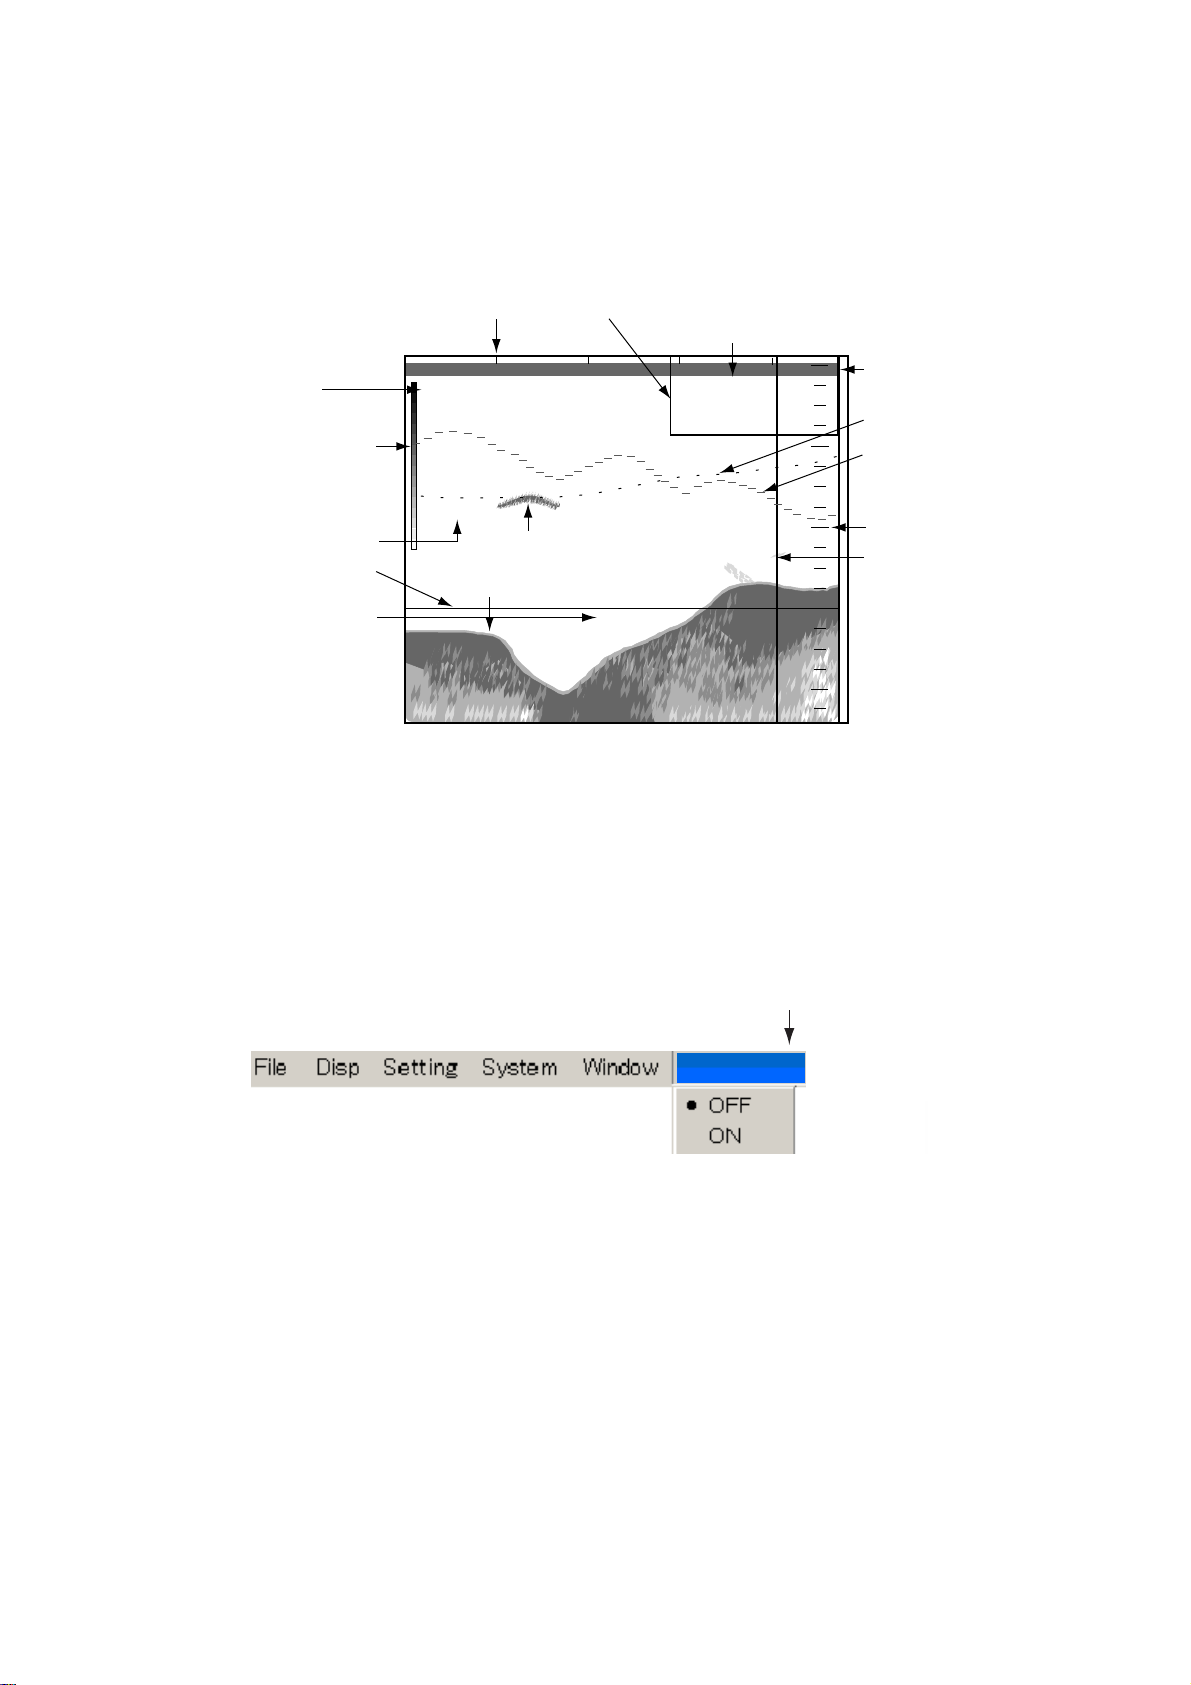
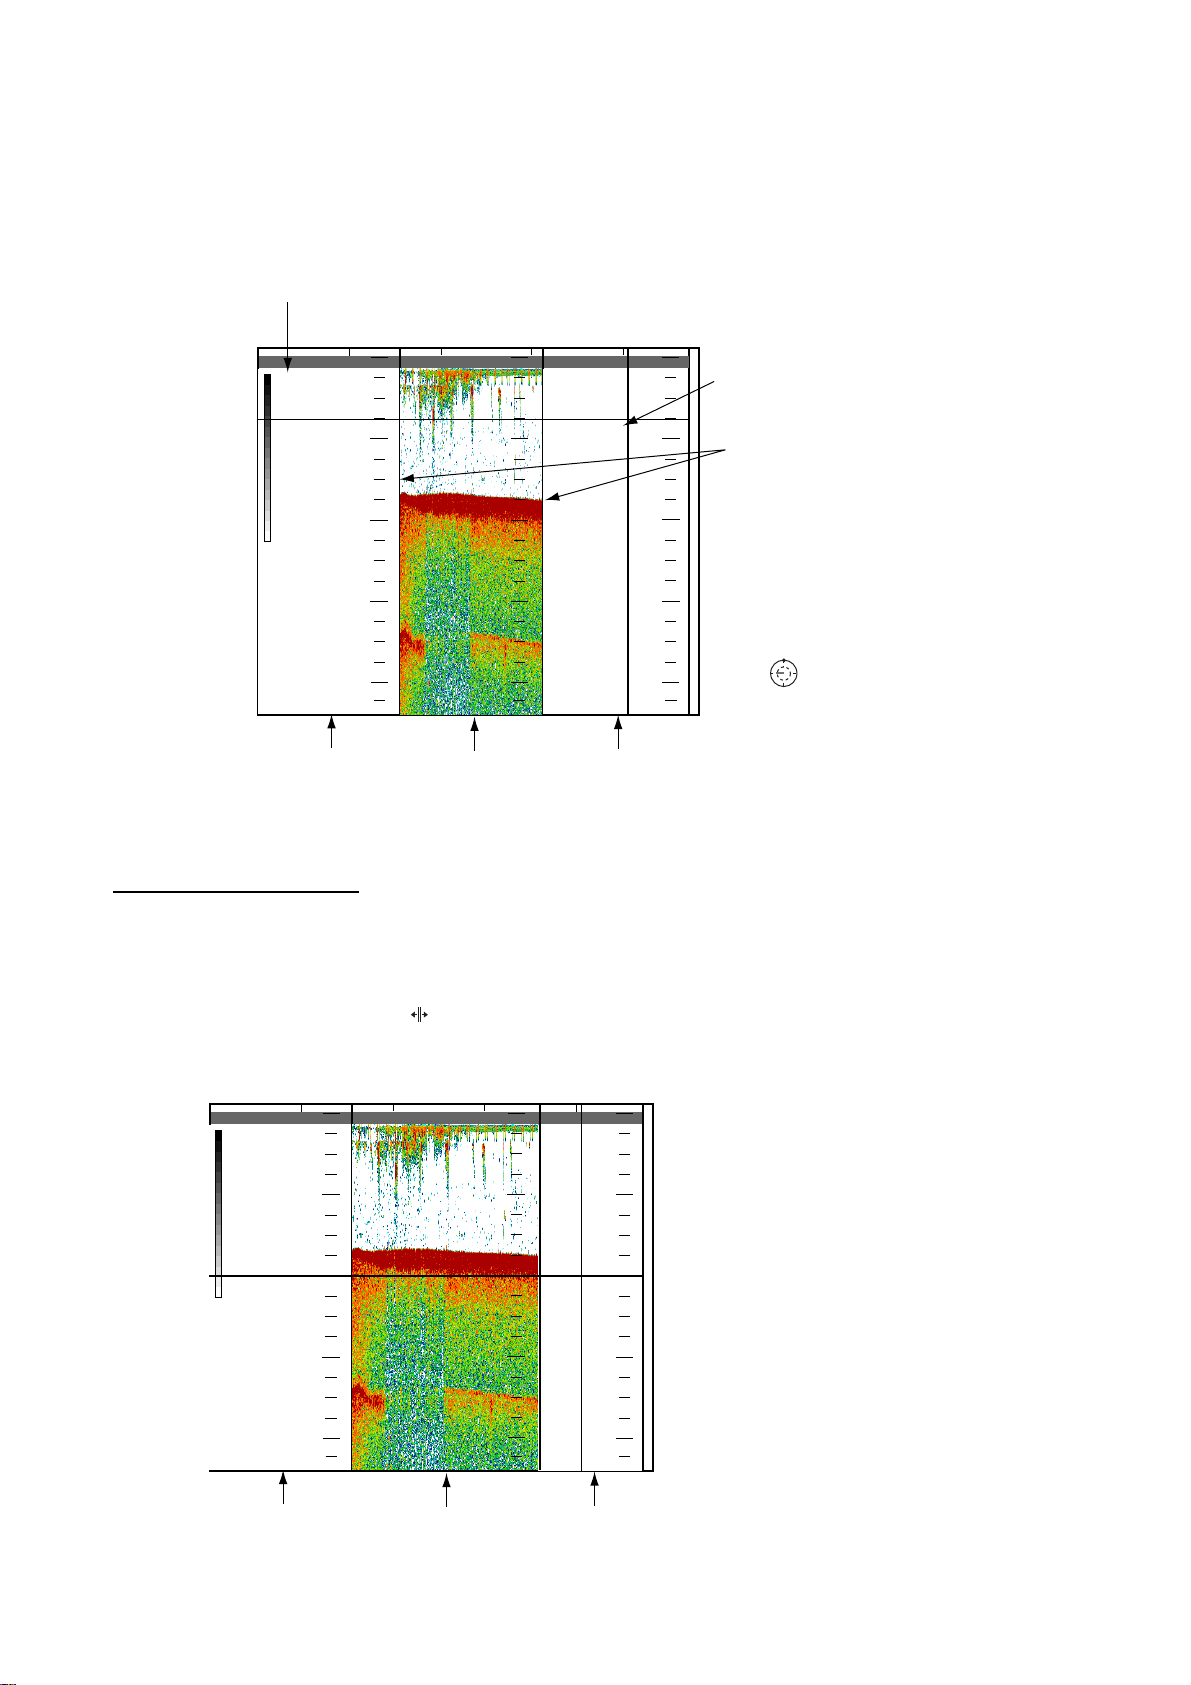
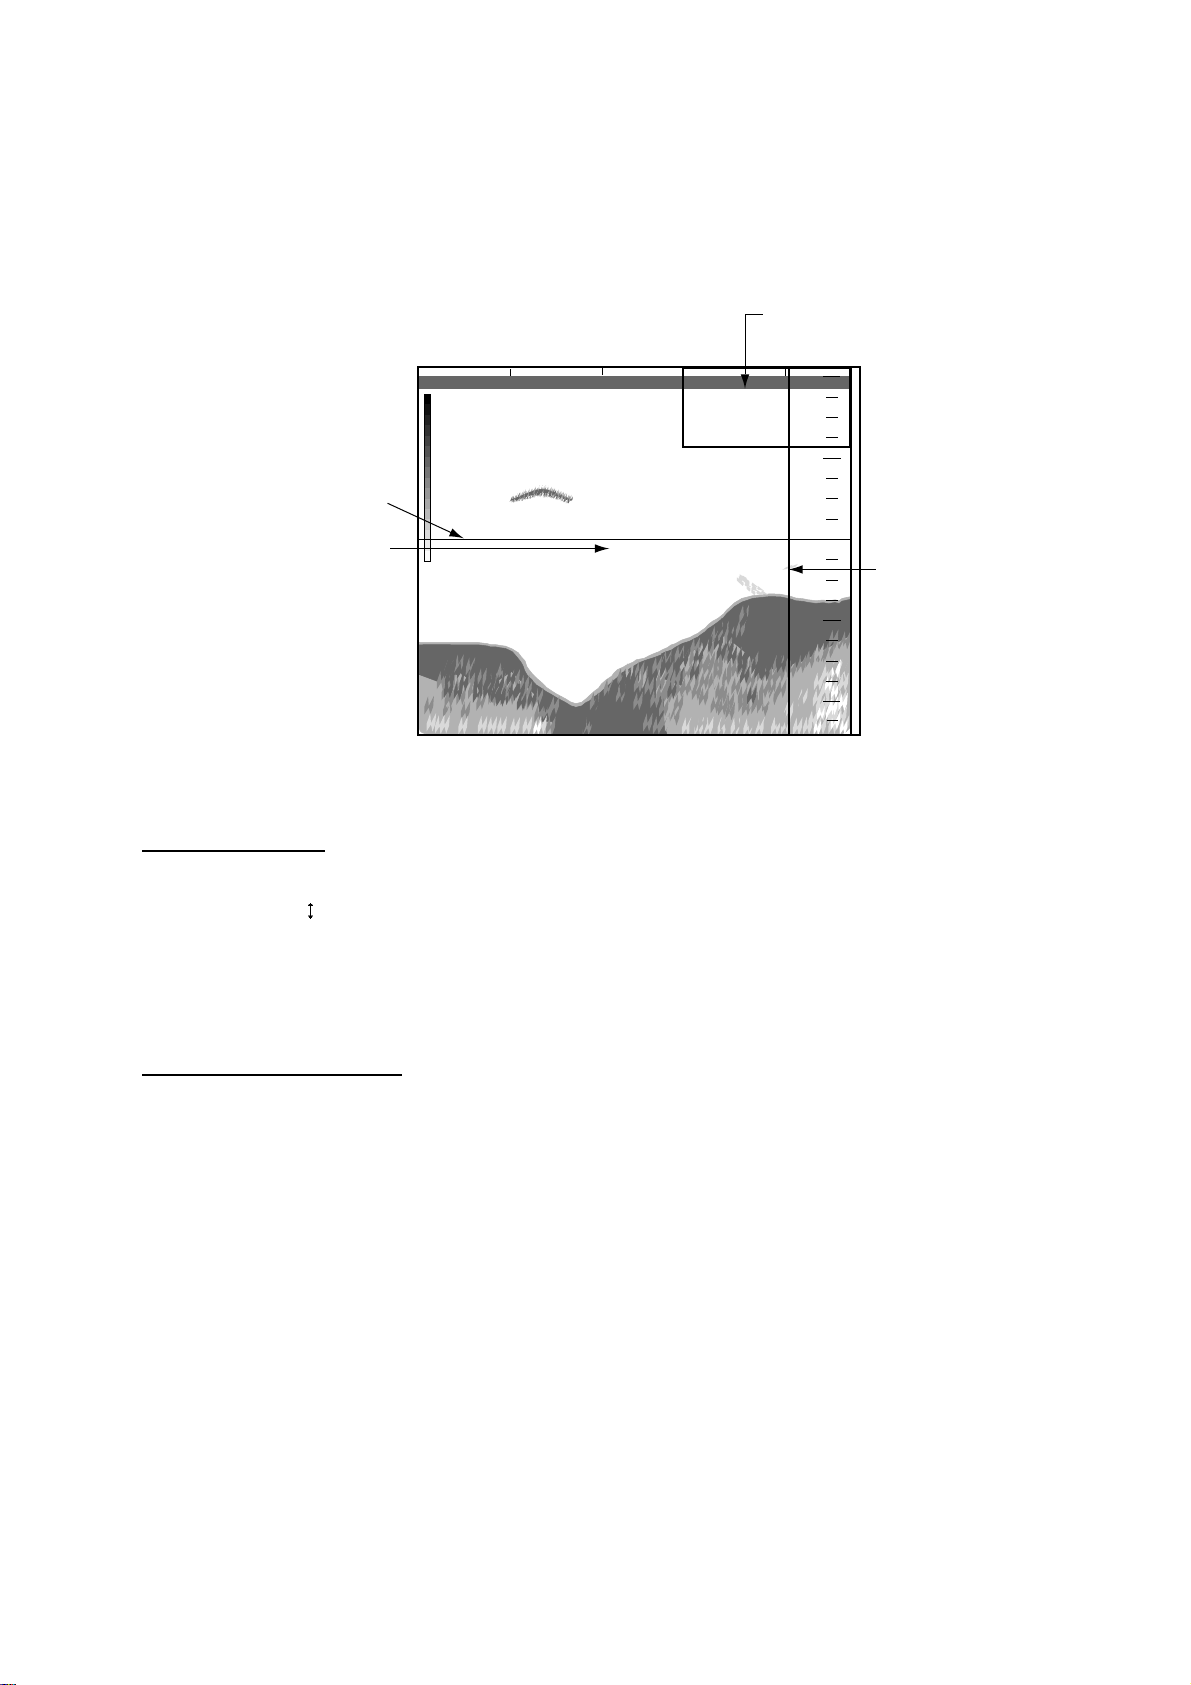
1.5.2 Split-beam display
The split-beam display shows the underwater images captured with the split-beam. With
display of appropriate window you can discern single fish distribution (with the fish size
histogram) and monitor fish movement (with the target graph).
Timer marker
(each 30 sec.)
Measuring range
Elapsed time and postion
of vertical VRM
Mode indicator
Color bar
Temperature scale
Horizontal VRM
Depth of horizontal
TS
4.0
2.0
0.0
-2.0
-4.0
−
−
−
−
−
Fish echo
Bottom echo
60
00:00:28
34 42.616' N
135 19.740' E
0
20
40
60
Zero line
Temperature graph
Net marker
Depth scale
V ertical VRM
VRM marker
80
Split-beam display
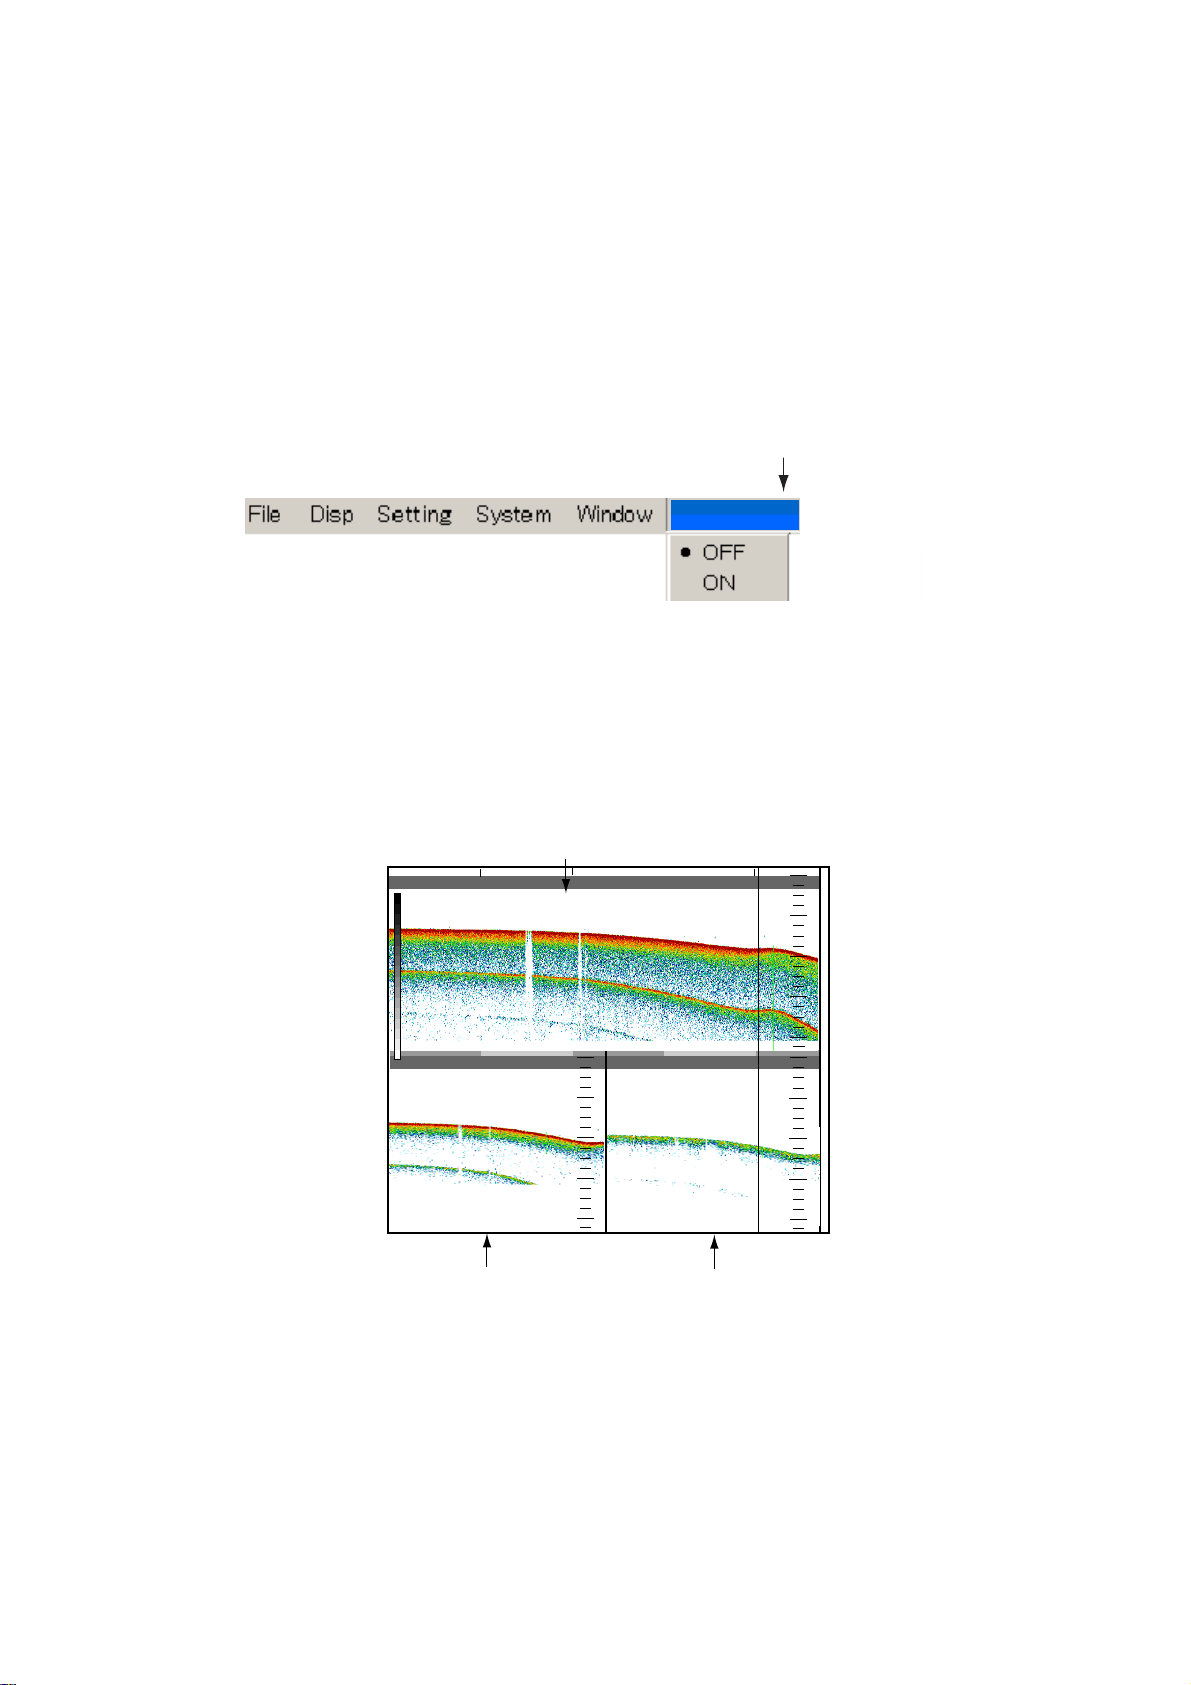
Note: When the display range for the split-beam presentation is 500 m or higher, the
indication “Deep mode” appears in the menu bar. To enable deep mode detection,
click Deep Mode on the menu bar followed by clicking ON. The default deep mode
detection range is 500 m. For further details, contact your dealer.
Deep mode
Deep mode detection options
Menu for turning
deep mode
on or off
1-9
Page 20
1. OPERATIONAL OVERVIEW
1.5.3 Three-beam display
The three-beam display shows the images captured from the port, downward and starboard
directions.
* Beam direction
B: Bearing (angle from bow direction)
T: Tilt angle (angle from downward direction)
<3>
20
0
Horizontal range
from transducer
Dividing
B:270
T: 10
20
0
B: 0
T: 0
0
B: 90
T: 10
<0><3>
20
15
line
40
60
40
60
40
60
* Beam direction can
be shown with an
80
Beam 3
(Port)
80
Beam 2
(Downward)
80
Beam 1
(Starboard)
icon ( ). See
paragraph 3.2.
Three-beam display
Changing display area
The width of each display can be adjusted as follows:
1. Place the trackball pointer on a dividing line between displays, and the pointer changes
to a double-ended arrow (
).
2. Hold the left button while dragging the double-ended arrow with the trackball to adjust
width.
1-10
20
40
60
80
0
0
20
40
60
80
40
20
40
60
80
0
Beam 2 picture width widened
Beam 1 picture width decreased
Beam 1Beam 3 Beam 2
Page 21
1. OPERATIONAL OVERVIEW
Note: Normally, pulses are fired from beam 1, beam 2 and beam 3 in that order and
displayed on the screen as the port, downward and starboard images. When the
display range of the 3-beam display is higher than 1000 m, the menu bar shows
“Simul. TX”. To fire pulses from beam 1 – 3 simultaneously click the Simul TX
indication to show ON. When this is done the picture advance speed quickens.
However, the display becomes susceptible to unwanted echoes. The default Simul
TX detection range is 1000 m. This value can be set between 100 and 5000 m. For
further details, see page 3-6.
Menu for turning
simultaneous
transmission on or off
Simul. TX
Simultaneous transmission options
1.5.4 Split-beam + two-beam display
The split-beam + two-beam display provides a split-beam plus images captured from the
port and starboard sides.
Split-beam display
0
TS
B:270.0
T: 10.0
0
B: 90.0
20
T: 10.0
40
60
80
20
40
60
80
0
20
40
60
80
Beam 2
(Port)
Beam 1
(Starboard)
Split-beam + two-beam display
Note: When the display range for the split beam + two beam presentation is 1000 m or
higher, “Deep Mode” and “Simul Tx” appear in the menu bar. To enable the deep
mode or simultaneous transmission, click the appropriate item on the menu bar
followed by clicking ON.
1-11
Page 22

1. OPERATIONAL OVERVIEW
Deep mode, Simul. TX
Menu bar
1.5.5 User 1, User 2, User 3 display
These displays show the product of displays created with “Display mode change” button in
the Mode window. The default settings are as follows:
User 1: Split beam display
User 2: 3-beam (port, starboard and downward directions)
User 3: Split beam + two-beam (port and starboard directions)
For how to customize the User displays see paragraph 3.1.
1-12
Page 23
1. OPERATIONAL OVERVIEW
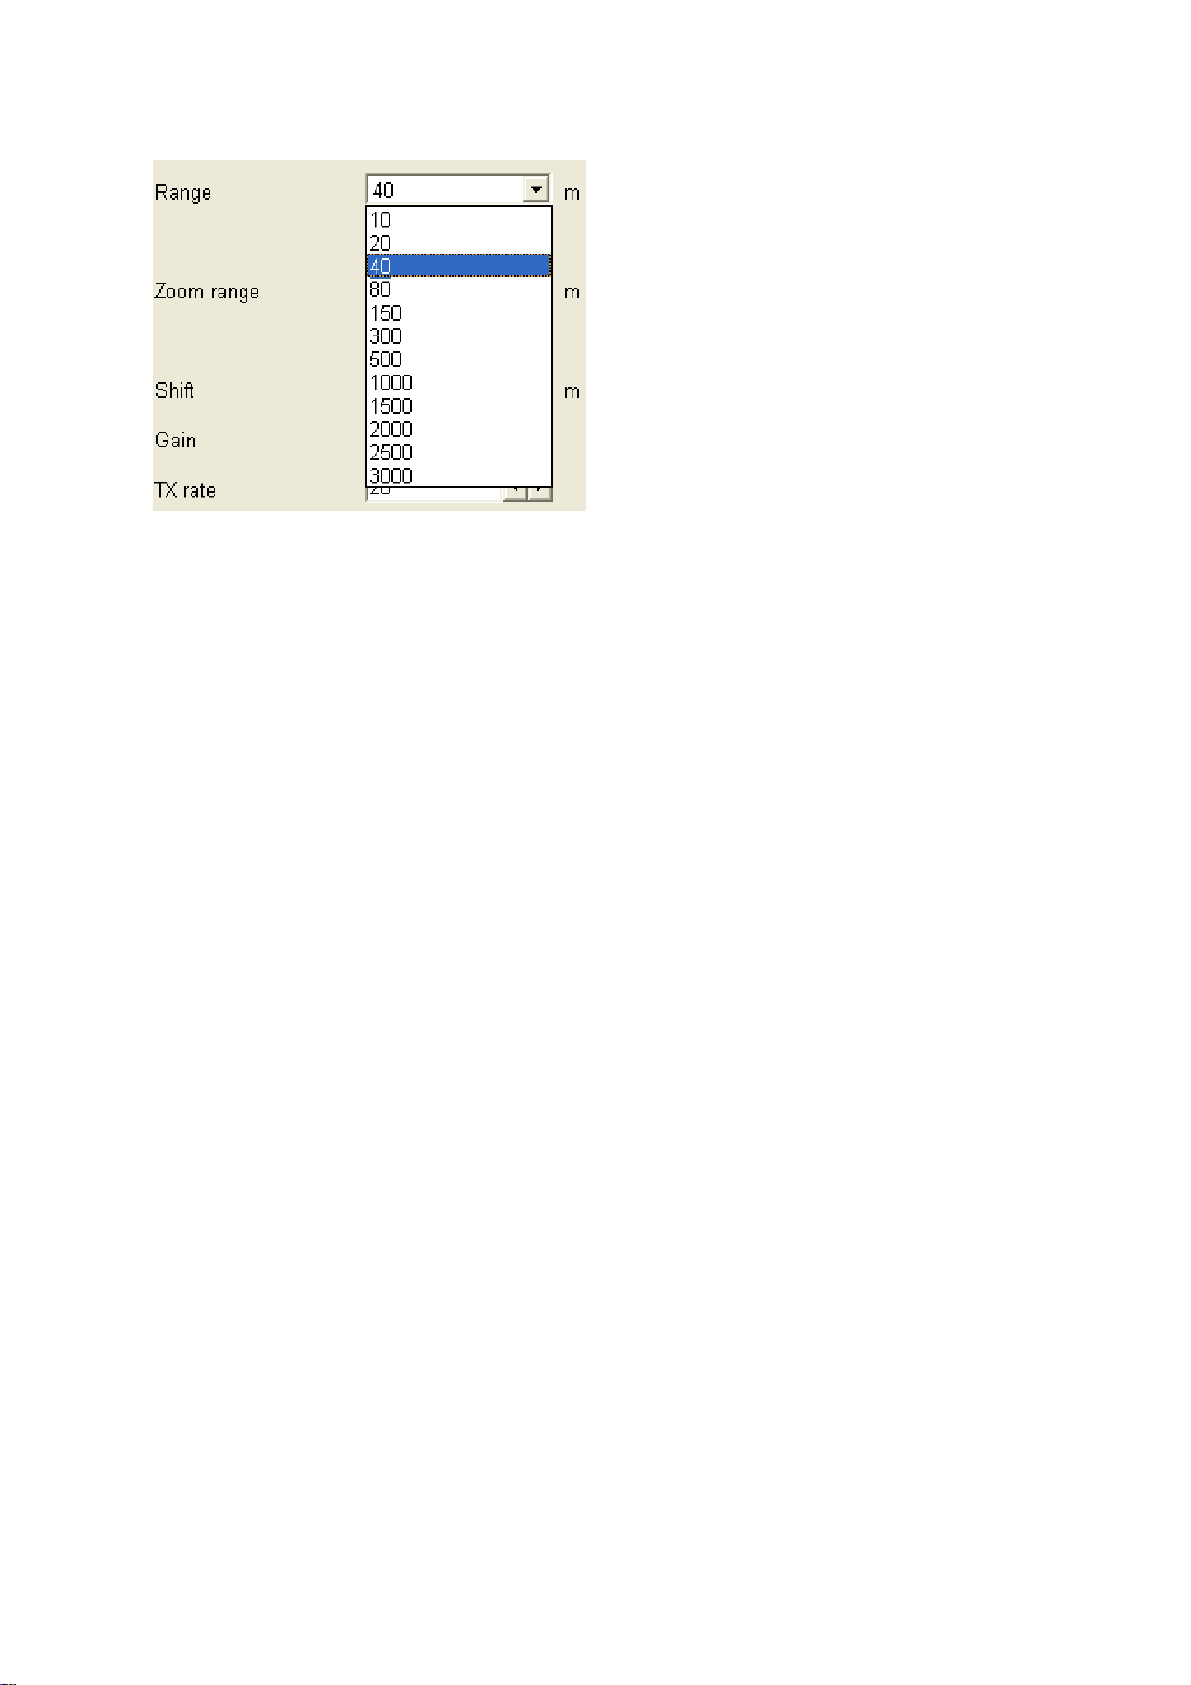
1.6 Choosing a Display Range
Choose the detection range (from the transducer to the bottom), in 12 preset choices. The
default ranges are shown in the table below.
Display ranges
Unit
1 2 3 4 5 6 7 8 9 10 11 12
m 10 20 40 80 150 300 500 1000 1500 2000 2500 3000
Note: You may set ranges as desired. For further details, see Chapter 3.
1. Click Setting.
Setting menu
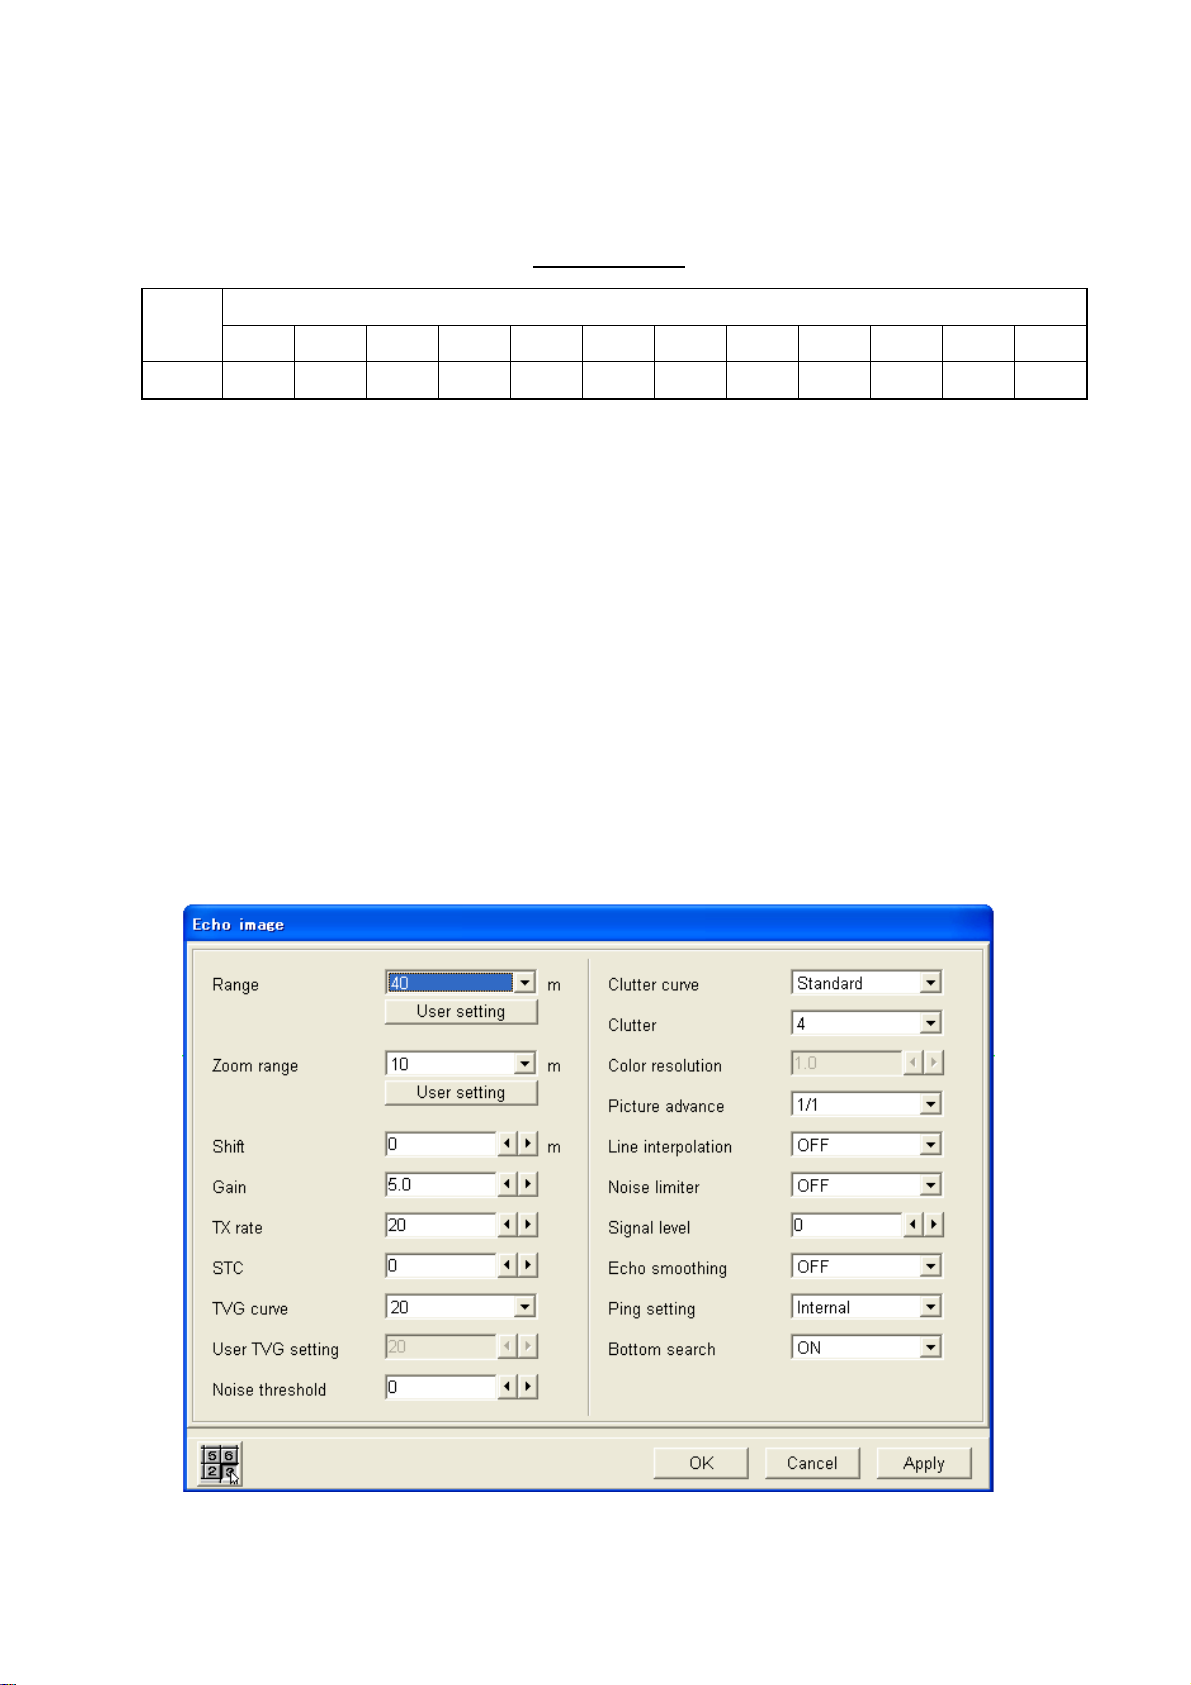
2. Click Echo image.
Display Range
Echo image dialog box
1-13
Page 24
1. OPERATIONAL OVERVIEW
3. Click ▼ in the Range box.
Range options
4. Click the range you wish to use. For example, choosing “80”, the display will show
underwater conditions from the transducer down to 80 m.
5. Click the OK button.
1-14
Page 25
1. OPERATIONAL OVERVIEW
1.7 Shifting the Display Range
You may shift the display in order to look at a shallower or deeper depth without changing
the current range.
Shift the start
depth to watch
shallow or deep
Shift principle
1. Click Setting.
2. Click Echo image.
3. Click ◄ or ► in the Shift box to choose shift value.
4. Click the OK button.
Picture
1-15
Page 26
1. OPERATIONAL OVERVIEW
1.8 Adjusting the Gain
Adjust the gain according to signal strength. Adjust so noise just disappears from the
screen.
CAUTION
Use the proper gain setting.
Incorrect gain may produce wrong depth
indication, possibly resulting in a
dangerous situation.
1. Click Setting.
2. Click Echo image.
3. Click ◄ or ► in the Gain box to choose the gain setting desired.
Gain too high Gain proper Gain too low
Examples of gain settings and resulting pictures
4. Click the OK button.
1-16
Page 27
1. OPERATIONAL OVERVIEW
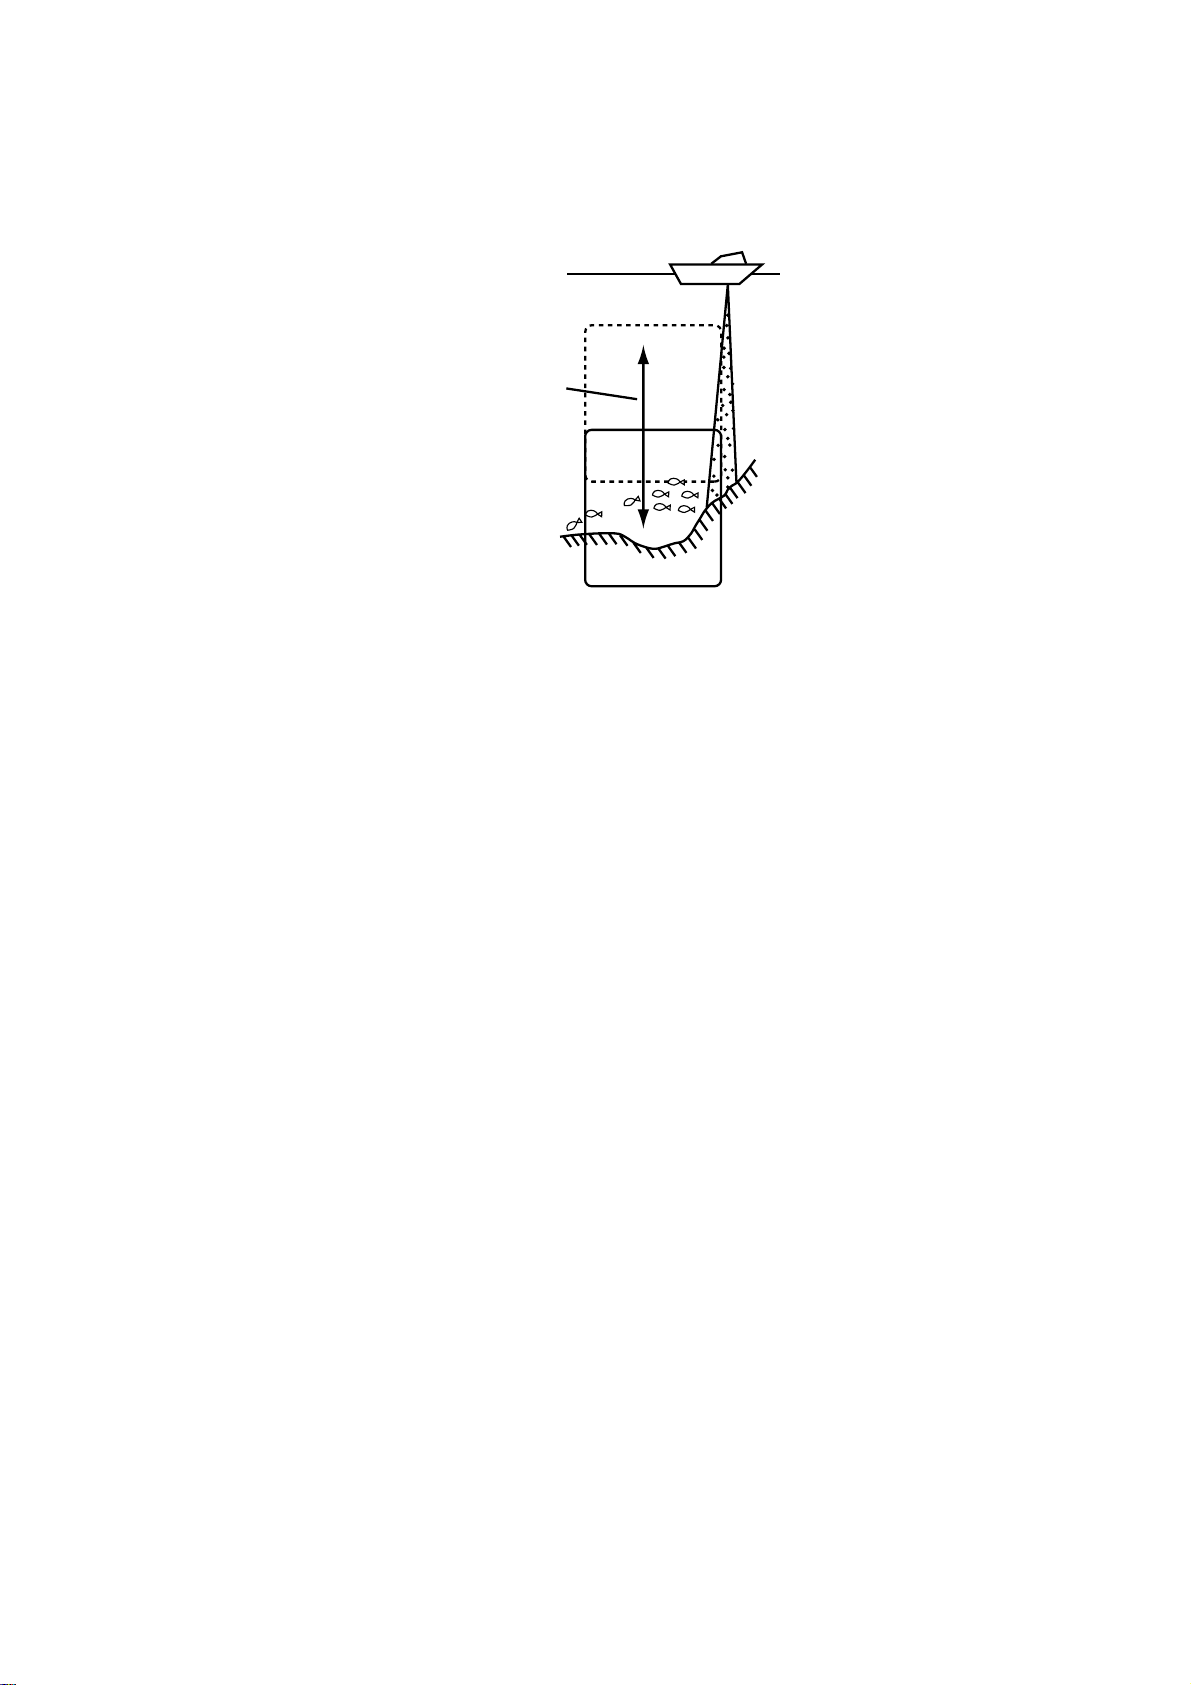
1.9 Find Depth and Position of a Fish Echo
You may measure the depth to a fish school or bottom with the horizontal line marker, called
the horizontal VRM (Variable Range Marker) marker. Further, you may measure elapsed
time with the vertical VRM. For example, you can measure how many minutes before the
current time a fish echo appeared.
Elapsed time and
postion* to vertical VRM
0
20
40
Vertical
VRM
60
80
Horizontal VRM
Depth to
horizontal VRM
TS
40
* Position shown in red when position data is lost.
00:00:28
34 42.616' N
135 19.740' E
Measuring depth, elapsed time and position with the VRMs
Measuring depth
1. Roll the trackball to place the pointer on the horizontal VRM. The shape of the pointer
changes to (
).
2. Hold down the left button while rolling the trackball upward or downward to place the
horizontal VRM on the object that you wish to measure the depth.
3. Read the depth indication (on the horizontal VRM).
Measuring elapsed time
1. Roll the trackball to place the pointer on the vertical VRM.
2. Hold down the left button while rolling the trackball leftward or rightward to place the
VRM on the object that you wish to find position.
3. Read the elapsed time and position (on the vertical VRM).
Note 1: The color of the VRMs can be changed. See paragraph 3.5
Note 2: You may change the location of the depth indication on the horizontal VRM. For
further details see paragraph 3.2.
1-17
Page 28

1. OPERATIONAL OVERVIEW
1.10 Inscribing Lines
You may inscribe vertical lines on the display to mark fish schools, shoals, etc.
When an echo of interest appears, click Marker line on the menu bar to inscribe a vertical
line on the display. If TIMER is turned on in the Status window, elapsed time is counted from
the moment the mark is inscribed.
Note that color of the marker line can be changed. For details, see paragraph 3.5.
1.11 Fish Size Histogram
The fish size histogram display shows single fish size within the area measured. You may
set up this display as follows:
1. Display the split-beam display. See paragraph 1.5.
2. Click Disp.
3. Click Display Window.
Display window dialog box
4. Click Fish size histogram. The toggle button is then colored in purple (ON state). Each
click turns the display on or off alternately.
5. Click the OK button. The fish size histogram appears and measuring begins.
1-18
Page 29
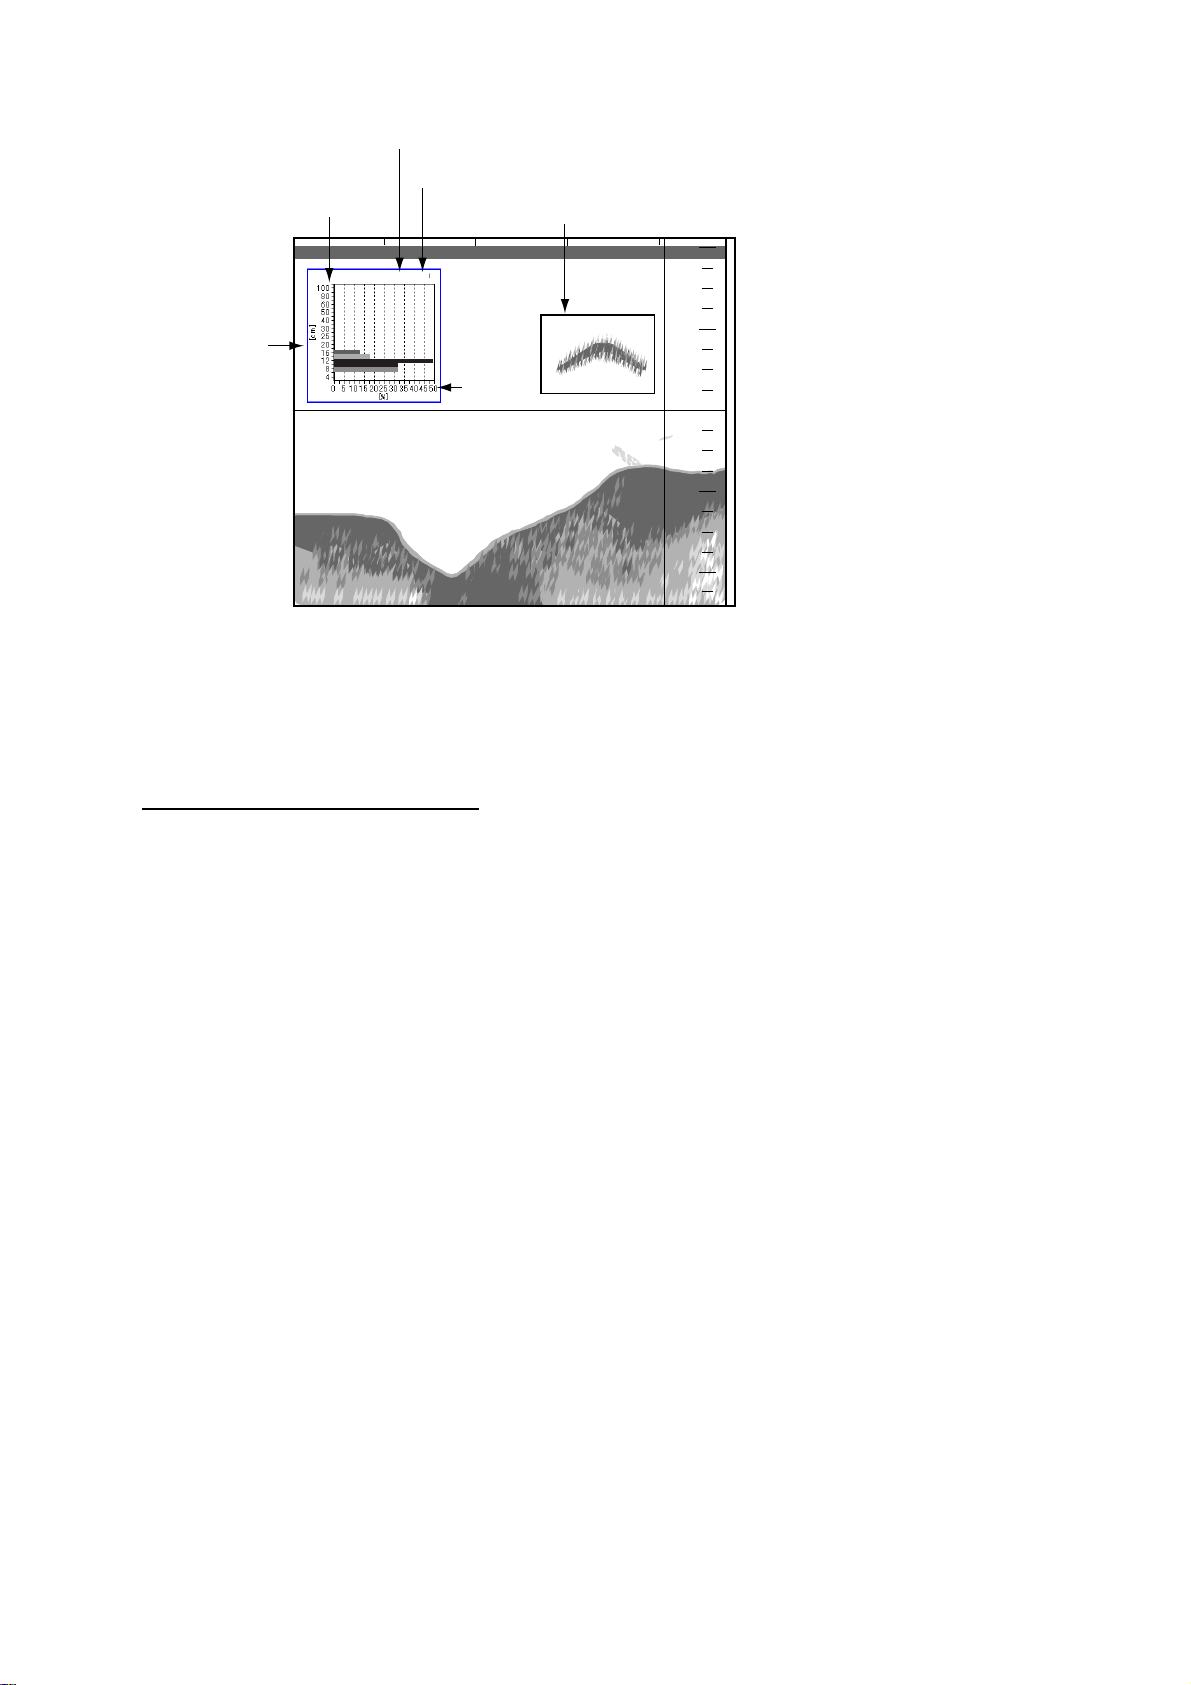
Vert. axis
1. OPERATIONAL OVERVIEW
Number of fish within vertical axis
Number of fish within measuring area
Area of measurement
0
20
40
60
80
Fish size
histogram
window
125/247
Hor. axis
40
00:00:28
34 42.616' N
135 19.740' E
Fish size histogram window
Note 1: The fish size histogram window can be moved as desired. For details, see Chapter
2.
Note 2: When the fish size histogram window is closed, all data measured is deleted.
How to read the fish histogram
The bar graph shows size and proportion of fish in measuring area. The vertical axis shows
fish length (default setting) and the horizontal axis shows distribution. In the fish size
histogram display above, more than 50% of the fish in the measuring area are 10 cm in
length.
1-19
Page 30
1. OPERATIONAL OVERVIEW
1.12 Setting Measuring Area
There are four ways to set the measurement area for the fish size histogram:
• Measure fish at specific location
• Measuring depth shallower than bottom in all directions
• Measure specific depth range
• Measure bottom fish
1.12.1 Measuring fish in a specific location
1. Click Setting.
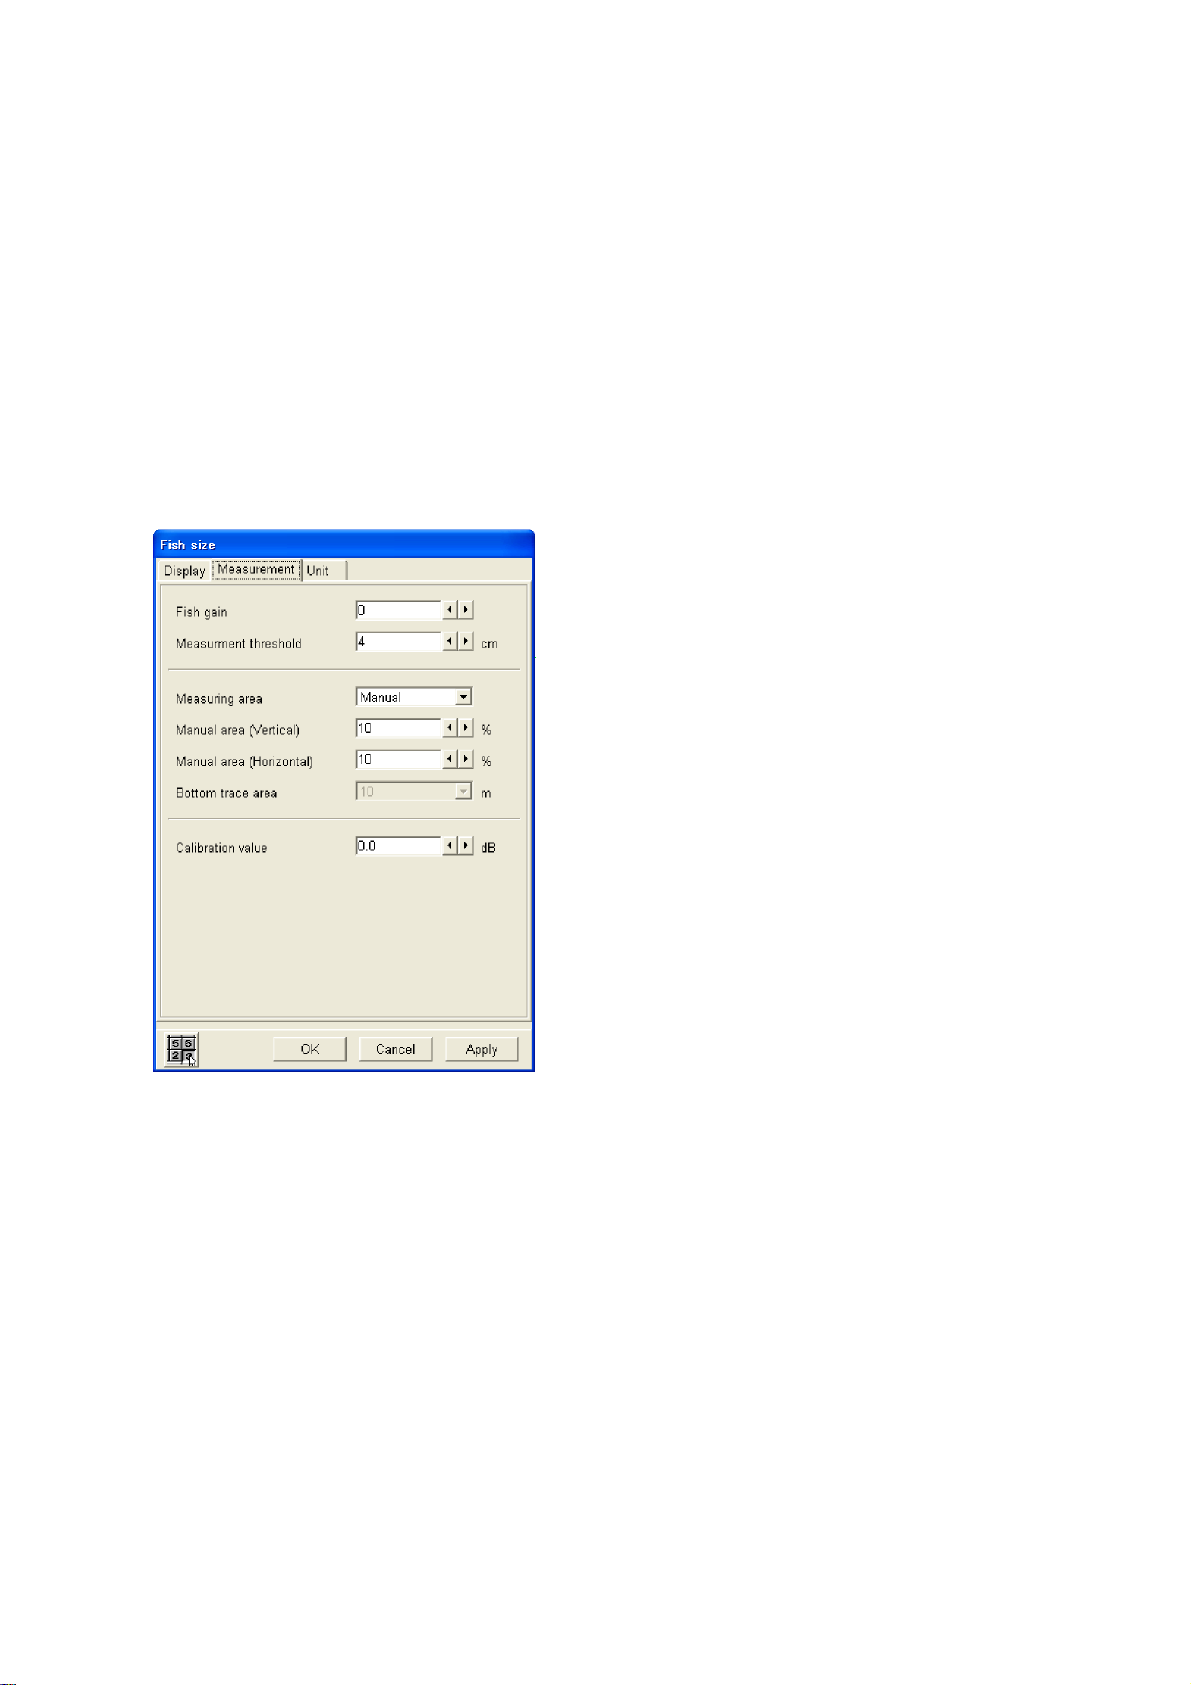
2. Click Fish size. Click the Fish size histogram tab if necessary to show the fish size
dialog box.
Fish size dialog box, measurement
If the Unit or Display dialog box is shown, click the Measurement tab.
3. Click ▼ in the Measuring area box.
Area options
4. Click Manual.
1-20
Page 31

1. OPERATIONAL OVERVIEW
5. Click ◄ or ► in the Area Vertical box to set the vertical width of the area marker.
(Setting range: 10-100(%)). Represents the percentage of the vertical width of the fish
histogram display.
6. Click ◄ or ► in the Area Horizontal box to set the horizontal width of the area marker.
(Setting range: 10-100(%)). Represents the percentage of the horizontal width of the fish
histogram display.
7. Click the OK button.
8. Use the trackball to place the pointer on the area marker (yellow frame). The shape of
the pointer changes to (
9. Hold down the left button while using the trackball to position the marker.
).
1.12.2 Measuring fish in all areas
1. Click Setting.
2. Click Fish size.
3. Click ▼ in the Measuring area box.
4. Click All.
5. Click the OK button.
1.12.3 Measuring fish in a specific depth range
1. Click Setting.
2. Click Fish size.
3. Click ▼ in the Measuring area box.
4. Click Specific range.
5. Click the OK button.
6. Use the trackball to place the pointer on the measurement area boundary line.
7. Hold down the left button while rolling the trackball upward or downward to position the
boundary line where desired.
1.12.4 Measuring bottom fish
1. Click Setting.
2. Click Fish size.
3. Click ▼ in the Measuring area box.
4. Click Bottom trace.
5. Click ▼ in the Bottom trace area box.
6. Click measurement range desired. The measurement range starts from the bottom.
7. Click the OK button Measurement range markers (1) and (2) appear as in the figure at
the top of the next page.
1-21
Page 32

1. OPERATIONAL OVERVIEW
Measurement range marker(2)
ashed yellow vertical line)
0
20
40
Range of
measurement
Bottom
40
Measurement range marker(1)
(Short yellow horizontal dashes)
60
80
Measurement range markers on the fish size display
8. Place the cursor on the measurement range marker(2) (yellow vertical line). The shape
of the cursor changes from an arrow (
to double-ended arrow (
)
)
9. Using the left button, drag the measurement range marker(2) to the location desired and
the release the left button. Measurement range marker(1) (short yellow horizontal dash)
automatically traces the bottom.
1-22
Page 33

1. OPERATIONAL OVERVIEW
1.13 Suppressing Low Level Noise (Clutter suppression)
Light-blue dots may appear over most of screen. This is mainly due to dirty water or noise.
This noise can be suppressed by adjusting the Clutter suppression function.
Appearance of clutter on the display
1. Click Settings.
2. Click Echo image.
3. Click ▼ in the Clutter curve box.
Clutter curve options
4. Click the setting desired, referring to the description below.
Standard: With “high” clutter level setting, strong colors are untouched while weak echo
colors are suppressed.
Straight: With “high” clutter level setting, weak-to-strong echoes are suppressed by
averaging.
OFF: Clutter suppression function is disabled.
5. Click ▼ in the Clutter box.
Clutter options
6. Click the setting desired.
7. Click the OK button.
1-23
Page 34

1. OPERATIONAL OVERVIEW
1.14 Eliminating Weak Echoes
Sedimented water or reflections from plankton may be painted on the display in green or
light-blue. These weak echoes may be erased with the signal level function.
1. Click Settings.
2. Click Echo image.
3. Click ◄ or ► in the Signal level box to choose the echo strength you wish to erase. The
higher the number the stronger the echo that will be erased.
4. Click OK button.
1.15 Suppressing Unwanted Noise
Noise from other echo sounder or electrical interference may show itself on the screen. Use
the noise limiter to suppress unwanted noise.
Interference from
other sounder
Examples of noise
1. Click Setting.
2. Click Echo image.
3. Click ▼ in the Noise limiter box.
Noise limiter options
4. Click the setting desired. The higher the number the greater the degree of suppression.
Choose OFF when no noise exists, so as not to miss small targets.
5. Click the OK button.
Electrical interference
1-24
Page 35

1. OPERATIONAL OVERVIEW
1.16 Picture Advance Speed
The picture advance speed determines how quickly the vertical scan lines run across the
screen. When selecting a picture advance speed, keep in mind that a fast advance speed
will expand the size of the fish school horizontally on the screen and a slow advance speed
will contract it.
FAST SLOW
The advancement speed may be set independent of or synchronized with ship’s speed.
1. Click Settings.
2. Click Echo image.
3. Click ▼ in the Picture advance box. The fractions in the window denote the number of
scan lines produced per transmission. For example, 1/8 means one scan line is
produced every eight transmissions. STOP freezes the display and it is convenient for
observing an echo. SYNC advances the picture according to ship’s speed. See the next
page.
Picture advance options
4. Click the setting desired.
5. Click the OK button.
1-25
Page 36

1. OPERATIONAL OVERVIEW
Ship’s speed dependent picture advance
With speed data provided by a speed-measuring device, picture advance speed may be set
according to ship’s speed, the ship’s speed dependent mode. As shown in the figure below
the horizontal scale of the display is not influenced by the change of ship’s speed, thus the
speed-dependent picture advance permits judgment of fish school size and abundance at
any speed.
Note: This feature is available with ship’s speed between 2 and 20 kts. If ship’s speed is
above or below those values, the picture is advanced using the upper or lower limit
whichever is closest to the actual ship’s speed.
Fish school shrinks as speed
is increased; expanded
as speed is decreased.
Same size
fish schools
Speed
Normal Mode
FULL
SPEED
Actual Movement
HALF
SPEED
Fish schools are shown
same size regardless
of ship’s speed.
Speed-Dependent Picture Advance Mode
How the ship’s speed dependent picture advance mode works
1-26
Page 37

1. OPERATIONAL OVERVIEW
1.17 A-scope Display
The A-scope display shows echoes at least at each transmission with amplitudes and tone
proportional to their intensities. It is useful for estimating fish specifies and bottom
composition.
1. Click Disp.
2. Click Mode.
3. Use the trackball to choose the desired A-scope display and then push the left button.
Small: A-scope display shown on right 1/10 of the screen.
Standard: A-scope display shown on right 1/8 of the screen.
Large: A-scope display shown on right 1/6 of the screen.
4. Click the OK button.
20
40
60
80
0
A-scope display
Weak reflection
(small fish or noise)
Strong reflection
(fish school)
Strong reflection
(bottom)
TS
00:00:28
34 42.616' N
135 19.740' E
40
A-scope display
To turn off the A-scope display, choose OFF at step 3 in the above procedure.
1-27
Page 38

1. OPERATIONAL OVERVIEW
1.18 Alarms
This sounder has four alarms: bottom alarm, bottom fish alarm, water temperature alarm
and vertical temperature alarm. When the bottom echo or fish echo comes into the alarm
range or the water temperature is within or out of the range of the temperature value set,
the equipment generates audio and visual alarms to alert you. If “Alarm” is enabled on the
Status window, the offending is shown in red, in reverse video. To silence the audio alarm,
press any function key. The audio and video alarms will be released anytime the alarm
conditions are violated.
1.18.1 Alarm description
Bottom alarm
The bottom alarm alerts you when the bottom echo enters the alarm area. The audio alarm
sounds and the visual alarm “BOTTOM” appears in red reverse video and flashes when the
bottom alarm is violated.
Fish alarm
The fish alarm alerts you when fish echoes enter into the set alarm range. The audio alarm
sounds and the visual alarm “FISH” appears in red reverse video and flashes when the
bottom alarm is violated. This alarm is useful when targeting a specific fish specie, since
each fish specie is known to inhabit certain depths.
Bottom fish alarm
The bottom-fish alarm sounds when a fish echo is within a predetermined distance from the
bottom. The audio alarm sounds and the visual alarm “BL-FISH” appears in red reverse
video and flashes when the bottom fish alarm is violated.
Temp alarm (requires temperature sensor)
There are two types of temperature alarms: within range and out of range. The audio alarm
sounds and the visual alarm “TEMP” appears in red reverse video and flashes when the
temperature alarm is violated. The temperature alarm may be used to target specific fish
species, as each fish specie is know to inhabit certain temperature ranges.
V-temp alarm (requires net sonde or trawl sonar)
There are two types of v-temp alarms: within range and out of range. The audio alarm
sounds and the visual alarm “V-TEMP” appears in red reverse video and flashes when the
v-temp alarm is violated.
1-28
Page 39

1.18.2 Enabling, disabling an alarm
1. Click Settings.
2. Click Alarm.
1. OPERATIONAL OVERVIEW
Alarm dialog box
3. Check the box in Bottom alarm, Fish alarm, Temp alarm or V-temp alarm as appropriate.
4. For the Fish alarm, choose alarm type with the radio buttons Fish or Bottom fish.
For the temp alarm or v-temp alarm, choose alarm type with the radio buttons Out of
range or Within range.
5. Click ◄ or ► in the Alarm depth box (for bottom alarm or fish alarm) or Temp limit box
(for temperature alarm or v-temp alarm) to set alarm depth (or temperature limit).
6. Click ◄ or ► in the Alarm zone box to set the width of the alarm from the starting point.
1-29
Page 40

1. OPERATIONAL OVERVIEW
7. Click the OK button.
20
40
60
80
0
Starting point
Alarm marker
Green: Bottom alarm
Orange: Fish alarm, Bottom fish alarm
Purple: Temperature alarm
(Temperature graph turned on
from DIsplay item dialog box)
Alarm range
50
00:00:28
34 42.616' N
135 19.740' E
Alarm marker
The alarm marker appears at the right edge of the display, and the color is green for the
bottom fish alarm and orange for the fish alarm.
To disable an alarm, remove the check mark from the box at step 3 in the above procedure.
1.18.3 Setting audio alarm volume
You may set the volume of the audio alarm as follows:
1. Click Settings.
2. Click Alarm.
3. Click ▼ in the Volume box.
4. Click the setting desired. (setting range: 0-7).
5. Click the OK button.
1-30
Page 41

1. OPERATIONAL OVERVIEW
1.19 Function Keys
The function keys on the control unit provide for one-touch access to the setting window of
your choice.
1.19.1 Using the function keys
The default program for each function key is as shown in the table below. Press the
appropriate function to access the setting window programmed for it.
Function key Default program displays;
F1 Echo image dialog box
F2 Shift dialog box
F3 Gain dialog box
F4 Mode dialog box
1.19.2 Programming the function keys
1. Press the appropriate function key until the menu title looks something like the one
shown below.
Pressed function key
FCV-30 [F1 Key Registration]
File Disp Setting System Window
2. Click the item on the menu bar which you want to use. For example, “Alarm” in the
Setting menu. Note that neither “Load user setting” nor “Save user setting” (in the File
menu) can be used.)
Confirmation
Assign the [ Alarm...] menu to the [F1] key?
Yes No
3. Click the Yes button. The item selected at step 2 appears.
4. Click the OK button.
1-31
Page 42

1. OPERATIONAL OVERVIEW
1.20 Saving, Recalling User Settings
You may save echo sounder settings, and recall them when desired. This is useful when
you want to set up the equipment quickly for a specific objective; for example, certain fish
species.
1.20.1 Saving user settings
1. Adjust settings according to targeted fish or objective.
2. Click File.
3. Click Save user setting.
Selected (dark blue)
Save
area
Scroll bar
Save user setting
4. Click the ◄ or ► button to choose an empty save area. The chosen save area is
highlighted in dark blue. You also may the scroll bar to choose a save.
Note: If 20 areas are already saved, choose an unnecessary one to write over it.
5. Click the Save button.
1-32
Page 43

1.20.2 Loading user settings
Note that you cannot load user settings while transmitting.
1. Click File.
2. Click Load user setting.
This window
shows chosen
display settings
1. OPERATIONAL OVERVIEW
Thumbnail
of display
settings
Read display
3. Click the ◄ or ► button to choose the display settings you wish to display. The chosen
display setting is highlighted in dark blue.
1-33
Page 44

1. OPERATIONAL OVERVIEW
Note: You may use the Details button to display detailed information about the chosen
display settings.
Asterisk indicates
saved display settings
This window
shows display
settings in detail
Read display, details shown
4. Click the Read button to activate chosen settings.
Details button
1-34
Page 45

1. OPERATIONAL OVERVIEW
1.21 Recording, Replaying Data
The USB port on the processor unit connects to a USB 2.0 hard disk (user supplied) to
record and replay raw data and picture data.
USB
Processor
Unit
* USB 1.1 Cannot be used.
Hard Disk
(USB 2.0)*
Power
Connecting a hard disk
1.21.1 Choosing where to record data
1. Connect a USB hard disk to the USB port on the processor unit.
2. Click Setting.
3. Click Record.
Not displayed
during TX or
RX.
Record dialog box
1-35
Page 46

1. OPERATIONAL OVERVIEW
4. Click the Reference button.
Volume (E):
5. Choose location of data recording and then close the Reference window.
6. Click ◄ or ► successively in the Recording time box to set recording time (1-24 hours).
7. Click ◄ or ► successively in the Recording free space box to set required free space
(512-32767 MB).
8. Click the OK button.
Data recording information
Data recording information can be confirmed in the Record info sub window. In “Data view”
in the Record info sub window, choose file to find its size or recording time by clicking its
check box to show the check mark (9). The size or recording time for the file selected
appears in the Disk space info sub window. To change the display content, click Time or
Size at “Unit” in the Disk space info sub window.
Deleting recorded data
Data can be deleted from the Record window as follows:
1. In the Data view sub window, check the data you wish to delete. To delete all files, click
the Select all button. To deselect all files, click the Release all button.
2. Click the Delete button. A confirmation window asks if it is OK to delete files.
3. Click the Yes button.
4. Click the Yes button. The bar at the bottom of the window now reads “100%”.
1-36
Page 47

1. OPERATIONAL OVERVIEW
1.21.2 Recording data
1. Connect a USB hard disk to the USB port on the processor unit.
3. Click File.
File menu
3. Click Record.
When a file is recorded it is automatically assigned a file name comprised of date and time
of the recording plus the extension .lst. An example file name is shown below.
2005_03_01_05_50_32.lst
Extension
Seconds
Minutes
Hours
Day
Month
Year
To stop recording data, choose Stop at step 3 in the above procedure.
1-37
Page 48

1. OPERATIONAL OVERVIEW
1.21.3 Converting recorded data to HAC format
Recorded data can be converted to HAC format data, the standard archiving and playback
format for fisheries acoustics data. This HAC format is nonrestrictive and independent of the
computer platform. It can accommodate most echo sounders. Note that this feature is not
available when transmitting or receiving.
1. Connect USB hard disk to the USB port on the processor unit.
2. Click File.
3. Click TX Stop.
4. Click File.
5. Click Convert to HAC format.
Convert to HAC format dialog box
6. Click the Reference button
7. Choose the file (LST file) you wish to convert.
8. Click the Open button.
Location of
LST file
Location of
HAC file
Progress bar
(Blue bar extends rightward as conversion progresses.)
C:\Documents and Settings\FCV30\2005_03_01_05_50_32.lst
C:\Documents and Settings\FCV30\2005_03_01_05_50_32.hac
C:\Documents and Settings\FCV30\2005_03_01_05_50_32.hac
Total no. of pings in .lst file
Left figure: Ping number
Right figure: Recording time
1-38
Page 49

1. OPERATIONAL OVERVIEW
9. With the slider bars, choose start position and end position.
10. Click the Start button to start the conversion. The progress bar extends rightward as the
conversion progresses. When the conversion has been completed the message “End of
conversion” appears. Click the OK button to finish.
11. Click the Close button.
1.21.4 Playing back data
1. Connect a USB hard disk to the USB port on the processor unit.
2. Click File.
3. Click TX Stop.
4. Click Play.
File location box
Open
E: Removable disk
File
box
Choosing file to replay
5. Click ▼ in the file location box.
6. Click the hard disk drive connected to the FCV-30. Folder(s) showing year, month and
as folder name appear.
7. Double-click desired folder, and “EchoData” folder appears.
8. Double-click the EchoData folder, and “hour, minute, second” folder appears.
9. Double-click the hour, minute, second folder you wish to playback. A list of LST files
appears.
10. Click an LST file to show file name in reverse video. Chosen LST file appears in the file
box.
1-39
Page 50

1. OPERATIONAL OVERVIEW
11. Click the Open button to start playback.
Sliding bar
Check to
repeat
playback.
Play dialog box
Notes on playing back data
• Use the Play Mode Manual and Play Mode Auto radio buttons to change setting data:
Auto: Use settings used at the time of the recording.
Manual: Apply current settings.
• To playback a file manually, use the sliding bar to choose the location where to start
playback and then hit the Restart button.
• Click the Pause button to temporarily stop playback. To restart playback use the Restart
button.
• Use the Stop button to stop playback.
1-40
Page 51

1. OPERATIONAL OVERVIEW
1.21.5 Saving screen shot
You may take a screen shot to save the current window. Compared to raw data, the size of
the screen shot is small, thus loading time is much shorter.
1. Connect a USB hard disk to the USB on the processor unit.
2. Click File.
3. Click Save the screen shot.
The screen shot is saved to the location designated at step 5 in paragraph 1.21.1. This
data is automatically assigned a file name and extension as below.
05_50_32.jpg
Extension
Seconds
Minutes
Hours
File name for screen shot
1-41
Page 52

1. OPERATIONAL OVERVIEW
1.21.6 Loading a screen shot
1. Connect hard drive to the USB on the processor unit.
2. Click File.
3. Click Load the screen shot.
File location box
Open
E: Removable disk
2006_04_10
File
box
Image(*.jpg)
4. Click ▼ in the file location box.
5. Click the hard disk drive connected to the FCV-30. Folder(s) showing year, month and
as folder name appear.
6. Double-click desired folder, and “ImageData” folder appears.
7. Double-click the EchoData folder, and “hour, minute” folder appears.
8. Double-click the “hour, minute” folder you wish to playback. A list of JPG files appears.
9. Click a JPG file to show file name in reverse video. Chosen JPG file appears in the file
box.
10. Click the Open button to load the screen shot.
1-42
Page 53

1. OPERATIONAL OVERVIEW
11. To erase the screen shot. click the Close button.
1-43
Page 54

1. OPERATIONAL OVERVIEW
This page intentionally left blank.
1-44
Page 55

2. WINDOW DISPLAYS
The FCV-30 has eight window displays: status, fish size histogram, target graph, V-temp
graph, bottom zoom, bottom lock, marker zoom, and bottom discrimination.
You may locate these windows anywhere on the screen. Further, right clicking at the upper
right side of a window displays associated pop-up menu.
2.1 Turning on Window Displays
1. Click Disp.
Disp menu
2. Click Display Window.
Display window dialog box
One zoom window
may be enabled.
3. Choose item(s) to enable or disable in the Display item window and then push the left
button. Items which are enabled are highlighted in blue and those which are disabled
are grey.
Note: Only one among bottom lock, bottom zoom and marker zoom may be enabled.
4. To change size of bottom lock, bottom zoom and marker zoom windows, click
appropriate radio button in the Zoom window size window.
5. Click the OK button.
2-1
Page 56

2. WINDOW DISPLAYS
Automatically arranging windows
1. Click Window on the menu bar.
Window currently
displayed. (Click
to bring window
to front.)
2. Click Auto arrange to relocate windows to their default locations.
Moving windows
1. Use the trackball to place the pointer in the window.
2. Roll the trackball while holding down the left button to move the window.
2-2
Page 57

2. WINDOW DISPLAYS
2.2 Interpreting the Window Displays
2.2.1 Status window
The Status window shows current settings and data input from external sensors. You may
choose the items to display in the Status window by selecting them from the status setting
window. Depth is indicated at the lower left-hand corner regardless of Status window
presence or absence.
Status
ALARM PICTURE TIMER COURSE HEAVE
OFF
GAIN SHIFT TEMPERATURE SPEED ROLL PITCH
00:10
15.3 C
DEPTH LATITUDE P/B
275.0
17.8
34 21.5912' N
LONGITUDE TD
40.6
136 08.4732' E
deg
-32.77m
1.6
deg
32.7m
13234.5
2.1
265.1deg
32234.7
deg
DEPTH GAIN SHIFT ALARM PICTURE LATITUDE LONGITUDE TEMPERATURE
40.6
SPEED TIMER COURSE TD P/B ROLL PITCH HEAVE
17.8
00:10
275.0
deg
13234.5
OFF
32234.7
32.7m
34 21.5912' N
265.1
deg
136 08.4732' E
1.6
deg
2.1
deg
-32.77m
Status windows (Top: Enabled with Status in Display Window, Bottom: Fixed at screen bottom)
How to setup the Status window
1. Click Settings.
2. Click Status.
2-3
Page 58

2. WINDOW DISPLAYS
This window shows which indications are currently displayed.
Status dialog box
3. Click items in the Display Item window as appropriate. Enabled items are highlighted in
blue.
Note 1: “Default” restores default Status window items; “Select all” enables all items;
Release all disables all items.
Note 2: You may change the location of items in the Status window freely:
1) Click the item in the Layout window which you want to change its location.
2) Click the box in the Layout window which corresponds to the location where
you want to location the item clicked at step 1.
4. To change the transparency of the Status window, choose Opaque or Transparent from
“Window”.
5. To choose Status window type, choose Window or Fixed at bottom in the Display
window. Choose Window to get a moveable window, or Fixed at bottom to anchor the
Status display at the bottom of the screen.
6. To choose the size of the characters for the Status window, click Small, Standard or
Large in the Font size window.
7. To display the draft indication, click ON in the Draft indication window.
8. After setting up the Status window, click the OK button.
2-4
Page 59

2. WINDOW DISPLAYS
Data display description
Item Description
Picture
advance
Shift Show current shift value.
Alarm Show current alarm content.
Gain Show current gain setting.
Timer
Temperature
L/L
Speed
Course
Roll
Pitch
Heave
Range/Bearing
Time
difference
Draft Draft calibration method is shown; below surface or below transducer.
Show current picture advance setting.
Choose Marker line from the menu bar and push the left button. The timer
then counts up the number of minutes (max. 99 min. 59 sec.) since the left
button was pushed.
Water temperature data, fed from external temperature sensor, is shown.
Temperature range: -99.9°C to 99.9°C
Position data, fed from a navigator, is shown.
Latitude and longitude range:
Latitude: 90°00.000’S to 90°00.000’N
Longitude: 180°00.000’W to 180°00.000’E
Speed, fed from speed log, is shown.
Speed range: 0.0 kt to 99.9 kt
Course, fed from a navigator, is shown.
Course range: 0°-359°
Roll angle, fed from appropriate sensor, is shown.
Roll angle range: -90.0° to 90.0°
Pitch angle, fed from appropriate sensor, is shown.
Pitch angle range: -90.0° to 90.0°
Heave, fed from a satellite compass, is shown.
Heave range: -99.m to 99.0 m
Range and bearing to a TO waypoint, fed from a navigator, is shown.
Range and bearing: 0°-360°
Time difference, fed from a Loran C navigator, is shown
Time difference range: 00000.0 to 99999.9
2-5
Page 60

2. WINDOW DISPLAYS
2.2.2 Fish size histogram window
The fish size histogram shows fish size within the selected measuring area. The SPLIT
(split beam) display must be active to show the fish size histogram window.
Number of fish
within vertical axis
Number of fish
Vertical range
Unit of
measurement
within measuring area
Fish size histogram window
Setting up the fish size histogram dialog box
1. Click Setting.
2. Click Fish size.
Horizontal axis
2-6
Fish size histogram dialog box
Page 61

2. WINDOW DISPLAYS
Note: If the Target graph dialog box appears, click the Fish size histogram tab.
Description of Fish size dialog box
Menu item Description
Display tab
Horizontal axis scale
Vertical axis area Choose the vertical axis scale from 1-6.
Vertical zoom rate Choose the vertical zoom rate for the fish histogram display from
Vertical zoom area Choose center position of vertical zoom on the fish histogram
White mark Turn the white mark on or off. When turned on, the bar graph within
White mark area
(Min and Max)
Peak Turn peak display on or off. When turned on, the representative
Measurement tab
Fish gain The strength of the returning echo varies with fish species. Adjust
Measurement threshold Set measurement threshold (2-20(cm)) for the fish histogram
Calibration value Set TS (echo strength of individual fish) value. If a calibration
Unit tab
Unit Choose the unit of measurement for the fish size histogram; TS or
Choose the horizontal axis scale, from 10-100(%).
100, 200 or 400(%).
display among 1-7. 1 is the shortest, 7 is the longest.
the white mark range is displayed in white if the background is
black, or black if the background is white.
Choose the minimum and maximum range of the white mark. The
setting range is 2-1000(cm)
peak value on the bar graph is displayed.
the fish gain according to fish species to get actual fish length
distribution on the fish histogram display.
display. For example, if you do not want to measure fish less than
10 cm in length, enter 10.
sphere was used its value is shown. This value may be fine tuned.
For further details, see paragraph 3.8. The larger the calibration
figure the longer the length of individual fish, even if received signal
is the same.
L(cm) or L(inch). TS: Displays echo strength from single fish.
L(cm): Displays fish length in centimeters.
L(inch): Displays fish length in inches.
2-7
Page 62

2. WINDOW DISPLAYS
2.2.3 Target graph window
The target graph window plots fish echo position (latest three scans). It is available when
the SPLIT display is active.
Target graph
Own ship
Radius scale
Latest three data are shown.
Color of circle indicates strength of individual fish echo.
(Large circle): latest data
(Medium circle): 2nd latest data
(Small circle): 3rd latest data
Target graph window
Setting up the target graph window
1. Click Setting.
2. Click Fish size. If the Fish size histogram dialog box is shown, click the Target graph tab
to show the Target graph dialog box.
2-8
Page 63

2. WINDOW DISPLAYS
Fish size dialog box, Display tab
Note 1: If the Measurement or Unit dialog box appears, click the Display tab to open the
Display dialog box.
Note 2: “Radius scale” sets the width of the area in degrees (2-5) to display below the
transducer (beam center). The larger the figure, the greater the area in which a single fish
can be tracked.
2-9
Page 64

2. WINDOW DISPLAYS
2.2.4 V-temperature graph window
The V-temperature graph window plots depth and water temperature data fed from a net
sonde or trawl sonar. (Max. 6 units.) Water temperature is plotted on the horizontal axis;
depth on the vertical axis. You may adjust the minimum and maximum horizontal axis
figures on the Net dialog box. Further, the temperature/depth line color may be chosen on
the Color dialog box. A pop-up window lets you adjust the horizontal axis figures (with
sliding bars) and reset data; click the v-temp graph window with the right button to show the
pop-up window.
Horizontal axis
(depth)
V-temperature graph
Horizontal axis
(temperature)
2-10
Page 65

Setting up the v-temp graph
1. Click System.
2. Click Net.
2. WINDOW DISPLAYS
Input data: Choose the format of data fed from net sonde or trawl sonar.
CIF: Water temperature and net depth fed from net sonde.
NMEA: Water temperature and net depth fed from trawl sonar
Horizontal axis Min and Horizontal axis Max: These set the minimum and maximum
temperature scale, and the range is –5 to 35(°C).
2.2.5 Bottom-lock zoom window
The bottom-lock zoom window zooms echoes within the user-set distance from the bottom.
Since the bottom is shown as flat, this window is useful for discriminating bottom fish from
the bottom echo.
0
TS
Fish school
30
00:00:28
34 42.616' N
135 19.740' E
20
40
60
Bottom
displayed
as flat
Zoomed fish Bottom lock zoom window
Alarm marker
Bottom-lock zoom window
2-11
Page 66

2. WINDOW DISPLAYS
Setting bottom lock zoom range
1. Click Setting.
2. Click Echo image.
3. Click ▼ in the Zoom range box and push the left button.
Zoom range options
4. Click the setting you wish to use.
5. Click the OK button.
2.2.6 Bottom zoom window
The bottom zoom window expands bottom and bottom fish echoes by the zoom range
selected. It is useful for determining bottom hardness. A bottom displayed with a short echo
tail usually means it is a soft, sandy bottom. A long echo tail means a hard bottom.
0
TS
Fish school
30
00:00:28
34 42.616' N
135 19.740' E
20
40
60
41
43
45
47
49
51
Bottom zoom window
2-12
Page 67

2. WINDOW DISPLAYS
2.2.7 Marker zoom window
The marker zoom window zooms echoes within the expansion marker (blue dashed line).
This marker is operated the same as the horizontal VRM.
20
40
60
0
30
32
34
36
38
40
Marker change
button
TS
Fish school
Marker pos change
Zoomed fish school
00:00:28
34 42.6163' E
135 19.7405' E
Expansion marker
30
Marker zoom window
Marker zoom window
Note: When the divided screen is in use, click the Marker change button to shift the
expansion marker between beams.
2-13
Page 68

2. WINDOW DISPLAYS
2.2.8 Bottom discrimination graph window
The bottom discrimination graph plots bottom nature, and it can be plotted on the bottom
zoom, bottom lock and zoom marker windows. Right click one of those windows to show a
pop-up menu, and choose (check) Hardness and/or Roughness from the menu to show
respective graph.
Hardness: Plots bottom hardness. “H” appears at the left side of the window when the
Hardness feature is active.
Roughness: Plots bottom roughness. “R” appears at the left side of the window when the
Roughness feature is active.
The higher the figure, the harder or more uneven the bottom.
The color of the graph may be chosen from the Color dialog box. The icon color indicates
color of respective graph.
Bottom discrimination (hardness)
Icons
10.0
8.0
6.0
4.0
H
2.0
R
0.0
10
8
6
4
2
0
Bottom discrimination
(roughness)
Bottom discrimination graph
2-14
Page 69

3. CHANGING SETTINGS
This chapter provides the information necessary for changing equipment settings. For
details about specific dialog boxes, see the table below.
Dialog box See para.;
Display window 2.1
Status 2.2.1
Record 1.21
Fish size 2.2.2, 2.2.3
Alarm 1.18
External output, calibration, comm. settings, date Installation manual
Net 2.2.4
3.1 Mode Dialog Box
The Mode dialog box lets you choose an A-scope format and the displays to show. The
procedure below describes how to choose what settings to display on the User1-User3
displays.
1. Click Disp.
2. Click Mode.
Mode dialog box
3. In the Display Mode window, enable User1, User2 or User3 as appropriate.
3-1
Page 70

3. CHANGING SETTINGS
4. Click the Display mode change button.
Shows direction of detection beam.
Display mode change dialog box
5. In the Display Item window, blue-highlight the display(s) you wish to use. In the Beam
information window you may set the tilt angle and bearing for beams 1 through 5.
6. Click ◄ or ► successively in a Tilt box to set tilt angle (0-degree is vertical).
7. Click ◄ or ► successively in a Bearing box to set bearing (0-degree is ship’s bow).
8. Repeat steps 6 and 7 to set tilt and bearing for other beams.
9. You can change the location of a display screen as follows:
a) In the Layout window, blue-highlight the display you want to change.
b) Blue-highlight the location in the Layout window where you want to move the display
selected at a).
10. Click the OK button to close the display mode change dialog box.
11. If you want to change screen layout format, choose Vertical, Horizontal or Combination
from the Screen layout window.
12. To choose the size of the A-scope display, choose OFF, Small, Standard or Large from
the A-scope window.
13. Click the OK button.
3-2
Page 71

3. CHANGING SETTINGS
3.2 Display Item Dialog Box
The Display Item dialog box lets you choose what indications to display.
1. Click Disp.
2. Click Display Item.
Display item dialog box
3. In the Display Item window, blue-highlight the items you wish to display..
4. Click the OK button.
Display item dialog box description
Normal display: Choose items to show or hide: V-VRM, H-VRM, Color bar, Time marker,
Alarm marker, Mode indicator, Beam direction, White line (marks bottom position), Net mark
(requires net sonde or trawl sonar), Temp graph.
Zoom display: (bottom discrimination graph): Show Hardness and/or Roughness of
bottom on bottom discrimination graph. Bottom zoom, Bottom lock or Marker zoom must be
active.
H-VRM depth: Choose where to display the horizontal VRM depth indication: Left, Left-Mid,
Center, Right-Mid, Right.
3-3
Page 72

3. CHANGING SETTINGS
Temp graph scale: Choose where to display the temperature graph scale: Left, Left-Mid,
Center, Right-Mid, Right.
Bottom discrimination scale: Choose where to display the bottom discrimination scale:
Left, Left-Mid, Center, Right-Mid, Right.
Beam direction: Choose how to show beam direction: Letters, Figures or Letters +
Figures.
Line length: Shows default angle.
10 deg: Radius of inner circle
Light-blue
line
Line direction: Shows bearing.
20 deg: Radius of outer circle
3.3 Echo Image Dialog Box
The Echo Image dialog box provides for control of echo sounder functions.
1. Click Setting.
2. Click Echo image.
Echo image dialog box
3-4
Page 73

3. CHANGING SETTINGS
User ranges
If the factory-prepared display ranges or zoom ranges are not to your liking, you may use
your own ranges, by following the procedure below.
1. Click the User Setting button below the Range box or Zoom range box.
User range dialog boxes
2. Click ◄ or ► successively in the appropriate Range box to set range.
Note: To restore factory-prepared ranges, click the Default button. To sort ranges in
order of low to high, click the Sort button.
3. Click the OK button.
Echo image dialog box description
TX rate: 20 TX rates are available. Normally, the highest rate (20) is used. When in shallow
waters second reflection echoes may appear between surface and actual bottom echo. In
this case, lower the rate.
STC: STC is useful for suppressing surface noise (plankton or bubble, etc.) The setting
range is 0-10; the higher the setting the greater the extent of suppression. Setting 10
suppresses noise up to 5 m. Turn off the STC when there is no noise on the screen,
otherwise weak echoes may be missed.
TVG curve: Choose the TVG curve to use. The higher the numeric the higher the gain with
depth.
User TVG setting: Effective when “TVG curve” is set for Manual. This allows you to set a
different TVG from those provided.
Noise threshold: Adjusts noise present on long range (deep depth). The larger the figure,
the more noise is erased.
3-5
Page 74

3. CHANGING SETTINGS
Color resolution: Effective when “Clutter curve” is turned off. You may set display width dB
for colors. Set display width dB for one color.
Line interpolation: Smoothes picture when picture advance speed is 2/1, 4/1 or 8/1.
Echo smoothing: When echoes look “spotty”, adjust this setting. The higher the setting the
greater the smoothing.
Ping setting: Chooses source of keying pulse, external (for use only when external echo
sounder is used) or internal.
Bottom search: Turns bottom detection feature on or off. When turned off, “-.-“ appears as
the depth indication in the status window.
3.4 Multi beam Dialog Box
This Multi beam dialog box sets up the multi-beam display.
1. Click Setting.
2. Click Multi beam.
Multi beam dialog box
Multi beam dialog box description
TX frequency: Sets Tx frequency, and the choices are Low, Standard and High. For normal
use, choose Standard. When interference exists because your vessel is near another vessel
whose echo sounder operates on the same frequency as the FCV-30, choose Low or High
as appropriate to remove this interference.
TX pulse width: Pulse width is automatically changed with display range and shift. A
shorter pulse offers better resolution, while a longer pulse is useful for long-range detection.
Choose Standard for general sounding; Long, for longer detection range (about twice that of
the Standard setting).
3-6
Page 75

3. CHANGING SETTINGS
Depth/Distance: This function compensates for depth difference between the picture from
the downward beam and other that from other directions when the sonar beam is oriented
in a direction other than downward.
Depth: Compensation applied (range scale shows depth)
Distance: No compensation (range scale shows distance from transducer)
TX power: Sets output power. The higher the number the greater the output power.
Simul. TX start Rng: Sets start range for simultaneous transmission. The setting range is
100-5000 m. Note however that simultaneous transmission is not available with the 5000 m
range.
3.5 Temp Dialog Box
The temp dialog box sets up temperature data (fed from temperature sensor). With
connection of a temperature sensor, temperature change over time can be plotted on a
graph.
1. Click System in the menu bar.
2. Click Temp.
Temp dialog box description
Temp input: Choose the data format of temperature data.
CIF: Temperature data fed from net sonde
NMEA: Temperature data fed from navigation equipment.
Temp adjust: An offset may be applied CIF temperature data to correct it.
Offset range: -20.0°C - +20.0°C, -4°F - +68°F
3-7
Page 76

3. CHANGING SETTINGS
3.6 Color Dialog Box
The Color dialog box lets you set the colors to use.
1. Click System.
2. Click Color.
Color dialog box
Day/Night
Chooses window background color. Daytime color provides a white background; Nighttime
color a black background.
Hue
You may adjust colors to meet various operating environments. User1 and User2 let you
custom-adjust colors to suit your needs.
1. Choose User1 or User2 as appropriate.
2. Click the Change button corresponding to the color you want to adjust.
3-8
Page 77

3. CHANGING SETTINGS
Color
Basic colors:
Custom colors
Define Custom Colors >>
OK Cancel
Standard color choices
3. Choose a color from the Basic colors. If the color is suitable to you, go to step 7. To
further customize the color, go to the next step.
4. Click the Define Custom Colors button.
Place pointer here.
Color
Custom colors
5. Place the pointer on the arrow at right-hand side of the window.
6. Hold down the left button while dragging the arrow to choose color desired.
7. Click the OK button. The window closes and the color selected at step 2 is changed.
Note: To restore all default colors for a User color set, click the Default button.
8. Click the OK button.
Marker line: Choose color of marker line. The procedure is the same as for “Hue”.
VRM: Choose the color of the VRM.
3-9
Page 78

3. CHANGING SETTINGS
Temp graph: Choose the color of the graph line in temperature graph.
Bottom discrimination: Choose the color of the graph line in bottom discrimination graph.
Net: Choose the color of the color of each net sonde or trawl sonar marker.
Pane: Choose the color of the border around windows.
3.7 Unit Dialog Box
The Unit dialog box lets you choose various units of measurement.
1. Click System on the menu.
2. Click Unit.
Unit dialog box
Unit dialog box description
Depth: Choose unit of depth measurement from among meters, feet, fathoms, hiro, and
passi/braza.
Temperature: Choose unit of temperature measurement between °C and °F.
Speed: Choose unit of speed measurement among knots, km/h and mph.
Bearing: Choose bearing format between True and Magnetic.
3-10
Page 79

3. CHANGING SETTINGS
3.8 Target Sphere Calibration Dialog Box
To accurately analyze fish distribution, it is necessary to calibrate target strength using a
calibration sphere. The calibration is done to jibe the target strength (TS) value displayed in
the fish histogram dialog box with the TS of the calibration sphere.
Follow the procedure below to perform the calibration.
1. Suspend a calibration sphere at least 3 m directly below the transducer.
2. Open the fish histogram dialog box.
3. While observing the echo sounder image, adjust the area marker (yellow rectangle) to
place the echo of the calibration sphere within the area marker. (See paragraph 1.12.1
for details.)
Set the marker at the right edge of the screen in order to measure with most recent data.
It is recommended to make the measuring area as small as possible to keep unwanted
echoes out of the measuring area, however the calibration can be performed with any
size measuring area.
4. Note the TS value in the fish histogram dialog box.
There is no problem if the TS value and the TS value of the calibration sphere do not
agree. Ideally, it is desirable if the distribution graph in the fish histogram window shows
only one bar for the calibration sphere, however the calibration can be executed
regardless of distribution.
5. Confirm that the echo from the calibration sphere appears in the area marker in
consecutive scans.
6. Click System on the menu bar.
7. Click Test/Initialization.
3-11
Page 80

3. CHANGING SETTINGS
8. Click Target sphere calibration.
9. In the Target sphere TS box, use ◄ or ► to set the TS value (fixed value) of the target
sphere.
10. Click the Start measurement button.
The TS value of the calibration sphere inside the area marker is calculated and is
displayed in the Setting value box.
11. If necessary you may fine tune the found value.
12. Click the OK button to finish.
3-12
Page 81

3. CHANGING SETTINGS
3.9 External Echo Sounder
This equipment can show the image from the FURUNO echo sounder ETR-30N.
3.9.1 Displaying image from external echo sounder
1. Click File on the menu bar.
2. Click ETR. The ETR-30N starts transmitting and the image from it appears in the
“external echo sounder” window. The message “ETR connection confirmed…” appears
at the top of the window until transmission starts.
Time marker
(every 30 seconds)
Mode marker*
Color bar
Horizontal
VRM
Depth
0
LF
10
20
25.8
* HF: High frequency
LF: Low frequency
B/L: Bottom lock
B/Z: Bottom zoom
M/Z: Zoom marker
m
20
30
40
HF
20
10
20
30
40
0
Transmission line
V ertical VRM
Depth to horizontal
VRM
Note: A pop-up menu for the external echo sounder display is available by right clicking that
display.
See the next several paragraphs for menus available with the external echo sounder
display.
3-13
Page 82

3. CHANGING SETTINGS
3.9.2 File menu
Click File on the external echo sounder window’s menu bar.
Load user setting: Recall saved user settings.
Save user settings: Three sets of user settings can be saved. For further details, see
paragraph 1.20.1.
Close: Stop Tx/Rx by ETR-30N and close external echo sounder window.
3-14
Page 83

3.9.3 Display menu
Click Display on the external echo sounder window’s menu bar.
3. CHANGING SETTINGS
ETR setting window
Display mode: Choose display mode among High frequency-single, Low frequency-single,
Dual frequency, High frequency-zoom and Low frequency-zoom.
Zoom mode: Choose the zoom mode among Bottom lock, Bottom zoom and Marker zoom.
The display mode must be high frequency zoom or low frequency zoom, otherwise this
feature is inoperative.
Screen layout: Show the external echo sounder image in horizontal or vertical split. The
low frequency-zoom, high frequency-zoom display or dual frequency display must be active,
otherwise this feature is inoperative.
A-scope: Turn the A-scope display on or off.
3-15
Page 84

3. CHANGING SETTINGS
ETR display item dialog box
Show or hide Color bar, Time marker, Mode indicator, V-VRM, H-VRM and Depth indication.
Display item: Choose to display or hide color bar, time marker, mode indicator, horizontal
VRM, vertical VRM and depth.
Display size: The size of the external echo sounder window may be set to small, medium
or large.
3-16
Page 85

3.9.4 Setting menu
1. Click Setting on the echo sounder window’s menu bar.
2. Click Echo image.
3. CHANGING SETTINGS
Range: Choose display range among eight ranges. Display range is automatically chosen
when the Auto mode (Fishing or Cruising) is active.
Shift: Set amount of display range shift.
Gain: Set gain. Gain is automatically chosen when the Auto mode (Fishing or Cruising) is
active.
TVG level: Compensate for propagation attenuation of the ultrasonic waves. It does this by
equalizing echo presentation so that fish schools of the same size appear in the same
density in both shallow and deep waters. The higher the figure, the lower the gain on near
range.
TVG distance: Set effective range of TVG.
Bottom level: If the depth indication is unstable in automatic or manual gain adjustment,
adjust bottom level to get stable depth indication.
3-17
Page 86

3. CHANGING SETTINGS
STC: Help distinguish surface fish from surface echoes. The setting range is 0-10; the
higher the setting the greater the extent of suppression. Setting 10 suppresses noise up to
5 m. Turn off the STC when there is no noise on the screen, otherwise weak echoes may be
missed.
Range details: If the factory-set ranges are not to your liking, you may change them as
desired.
Zoom range: Set zoom ranges.
Zoom range details: f the factory-set zoom ranges are not to your liking, you may change
them as desired.
Clutter: Adjust to suppress on-screen clutter. The higher the figure, the stronger the amount
of clutter suppression. “0” turns off the clutter feature. Clutter is automatically adjusted when
the Auto mode (Fishing or Cruising) is active.
Picture advance: Choose the speed of picture advancement.
Noise limiter: Turn on to reject noise. The settings are OFF, NL1, NL2 and NL3, and NL3
provides the highest degree of noise suppression.
Echo smoothing: Adjust this item when echoes appear “spotty”. The higher the setting the
greater the smoothing.
Signal level: Sedimented water or reflections from plankton may be painted on the display
in green or light-blue. These weak echoes may be erased with the signal level function.
Tx rate: Choose the interval between transmissions. The smaller the figure the longer the
time between transmissions and thus the longer an image remains on the screen.
Ping setting: Interference from another echo sounder or a scanning sonar may be
suppressed by synchronizing transmission with the offending echo sounder or scanning
sonar. Choose External to synchronize transmission. Select Internal when no echo sounder
or scanning sonar is connected, or to synchronize and transmit with the TX signal from this
equipment.
Auto mode: Turn the auto mode ON or OFF. When activated display range, gain and
clutter are automatically adjusted, for virtually hands-free operation.
Display range: Adjusted to display bottom echo on the screen.
Gain: Adjusted to display the bottom echo in reddish-brown color.
Clutter: Adjusted to suppress weak echoes (such as those from sedimented water).
Two auto modes are available: Cruising and Fishing. “Cruising” suppresses weak echoes to
show the bottom echo clearly. “Fishing” displays weak echoes clearly.
Target echo: The default setting is “Standard”, which is useful for general fishing. If the
objective is whitebait, choose “Surface”.
3-18
Page 87

3.9.5 System menu
1. Click Setting on the menu bar
2. Click System.
3. CHANGING SETTINGS
ETR TX/RX dialog box
Click TX/RX on the System menu to show this dialog box.
Gain adjustment: Compensate for too high or too low gain and adjust gain balance of low
and high frequency. Setting range: -50 to 50.
Freq adjustment: Fine tune the Tx frequency when interference cannot be rejected
otherwise. Setting range: -10.0 to 10.0.
TX power reduction: This setting is normally “OFF”. However, if an echo sounder of the
same frequency as your own is being operated nearby, interference may appear on your
display. In this case, both parties should lower their TX power
Turn this item ON to lower TX power.
Tx pulse length: Pulse length is automatically selected according to display range and
display shift settings. For manual selection, choose a short pulse when resolution is
important and choose a long pulse when long-range detection is your objective. To improve
resolution on zoom displays, choose the pulse length setting Short1, Short 2 or Manual.
Short1: Detection resolution is improved, however detection range is shorter (1/4 of
standard) compared to Short2.
Short2: Detection resolution is improved, however detection range is shorter (1/2 of
standard).
Standard: Use for general fishing operations.
Long: Detection resolution is lower, however detection range is longer (2x normal).
Depending on the range, the Tx rate is 1/2 of the normal.
Manual: Operator chooses pulse length.
to remove the interference.
3-19
Page 88

3. CHANGING SETTINGS
Tx pulse length (Manual): Operative when TX pulse length is set to Manual. The pulse
length range is 0.2-5(ms). The smaller the figure, the better the resolution, however the
detection range is shorter. Conversely the larger the figure, the better the detection but the
lower the resolution.
ETR Compensation dialog box
Draft: To get depth from the sea surface (rather than the transducer), enter ship’s draft.
Setting range: -15.0-60.0(m).
Sound velocity: Adjust the sound velocity of the Tx pulse if the depth indication is incorrect.
Setting range: 200-2000(m/s).
3-20
Page 89

ETR Color dialog box
3. CHANGING SETTINGS
Day/Night: Choose background color of the echo sounder window. Choose “Day” for white
background; “Night” for black background.
Hue: Choose color arrangement for the echo sounder image. The procedure is the same as
that shown in paragraph 3.6.
VRM: Choose color for the horizontal and vertical VRMs.
3-21
Page 90

3. CHANGING SETTINGS
Unit menu
Choose unit of depth measurement.
Test/Initialization menu
Simulation: The simulation mode provides simulated echo sounder operation to help
acquaint with the features of this equipment, without the need for connecting the transducer.
The echo sounder image stored in the memory is played back on the echo sounder window.
“Demo” appears on the title bar of the echo sounder window when the simulation mode is
active.
Self test: Display the program no. of the ETR-30N’s ROM, RAM and E2PROM and the
depth.
0252310-XX.XX
OK
OK
OK
OK
Default setting: Restore the ETR-30N’s default settings.
3-22
Page 91

4. MAINTENANCE &
TROUBLESHOOTING
4.1 Maintenance
Regular maintenance is important for maintaining good performance. Follow the
recommended procedures to keep the equipment in good working order.
WARNING
Do not open the equipment.
Hazardous voltage which can
cause electrical shock exists
inside the equipment. Only
qualified personnel should
work inside the equipment.
4.1.1 Check points
The items to check on a regular basis are tabulated below.
Check point Action, remedy Frequency
Cabling Check for damage. Replace if
damaged.
Connectors on units Check for tight connection.
Reconnect as necessary.
Ground on units Check for corrosion. Remove
corrosion as necessary.
Monthly
Monthly
Monthly
4.1.2 Cleaning
Dust on the equipment should be removed with a soft, dry cloth. For stubborn dirt,
water-diluted mild detergent may be used. DO NOT use chemical cleaners to clean the
equipment; they can remove paint and markings.
4-1
Page 92

4. MAINTENANCE & TROUBLESHOOTING
4.1.3 Replacing fuses
Fuses protect the processor unit and transceiver unit from overvoltage and internal fault. If a
fuse blows find the cause before replacing it. If it blows again after replacement, request
service.
WARNING
Use the proper fuse.
Use of a wrong fuse can result in damage
to the equipment or cause fire.
Unit
Processor unit In fuse holder
Location of
fuse
How to replace Rating Code No.
Unscrew the fuse
holder (on rear
panel) and replace
fuse. Screw in fuse
holder
FGMB 5A
AC250V
000-148-280
Transceiver unit In fuse holder
Open the power
switch cover at
bottom of unit.
Unscrew the fuse
holder and replace
fuse. Screw in fuse
holder
100 VAC:
FGMB 10A
250 VAC
200 VAC:
FGMB 5A
AC125V
100 VAC:
000-104-815
200 VAC:
000-148-280
4.1.4 Transducer
Remove marine life and growth from the transducer face, using a piece of wood. DO NOT
paint the transducer face. Handle the transducer carefully.
4-2
Page 93

4. MAINTENANCE & TROUBLESHOOTING
4.1.5 Trackball
If the trackball does not roll smoothly it may require cleaning. Do the following to clean the
trackball.
1. Turn the ring on the trackball 45°.
Trackball
Ring
Trackball
2. Clean the ball with a soft lint-free cloth, and then blow carefully into the ball-cage to
dislodge dust and lint.
3. Look for a build-up of dirt on the metal rollers. If dirty, clean the rollers using a cotton
swab moistened lightly with isopropyl-rubbing alcohol.
4. Make sure that fluff from the swab is not left on the rollers.
5. Replace the ball and retainer ring. Be sure the retainer ring is not inserted reversely.
4-3
Page 94

4. MAINTENANCE & TROUBLESHOOTING
4.2 Troubleshooting
The section provides information which the user can follow to restore normal operation. If
normal operation cannot be restored, do not attempt to check inside any unit. Any repair
work is best left to a qualified technician.
Troubleshooting
Symptom Cause Remedy
No echo sounder
image or depth
scale
image but
characters and
markers appear.
Echo sounder
image appears but
no zero line.
Sensitivity is low.
No depth indication
Heavy noise and
interference
is not shown
(external input of
said data)
Battery may be dead.
Fuse may have blown.
Power cable may
have become
disconnected.
Picture advance may
have been stopped.
Transducer cable may
have become
disconnected.
Display start position
may have been
shifted.
Gain setting is too low.
Marine life is adhering
to transducer face.
Vessel is in heavily
sedimented water
Bottom is too soft to
return an echo.
Bottom is off the
screen.
Bottom search is
turned off.
Transducer located
too close to engine.
Earth connection has
loosened.
Same-frequency echo
sounder being
operated nearby.
Connector from
navigator may have
become disconnected.
Navigator may be
malfunctioning
Check battery voltage.
Check fuse in processor and transceiver units.
Connect power cable firmly.
Set picture advance speed to other than STOP. No echo sounder
Reconnect transducer cable.
Set scale to show zero line.
Raise the gain.
Clean the transducer face.
No remedy available.
No remedy available
Change the range in order to display the bottom
echo.
Turn on Bottom Search, in the Echo image
dialog box.
Relocate the transducer.
Reconnect earth.
Contact the vessel and request that they lower
the gain on their sounder.
Activate the noise limiter.
Reconnect cable Position is wrong or
Check navigator.
4-4
Page 95

4. MAINTENANCE & TROUBLESHOOTING
4.3 Restoring Default Settings
You may wish to restore all default settings to start operation afresh or to clear stray data. If
you want to restore your previous settings, jot them down and restore them after clearing
the memory.
1. Click System.
System menu
2. Click Test/Initialization.
3. Click Default setting.
Yes No
4-5
Page 96

4. MAINTENANCE & TROUBLESHOOTING
4. Click the Yes button.
Yes No
5. Click the Yes button to restore all default settings.
4.4 Finding Software Version
1. Click System > Test/Initialization > Version Information.
0252349-XX.XX
Version information
2. Click the Close button to quit.
0252336-XX.XX
0252337-XX.XX
0252338-XX.XX
0252339-XX.XX
X
X
X
X
X
XX.XX = Version and version no.
X
X
X
X
X
X = Board version no.
4-6
Page 97

A
APPENDIX
Menu Tree
Menu bar
File
Display Mode Display Mode (
Screen layout (
A-scope (
TX Start
TX Stop
Record
Play
Stop
Pause
Load the screen shot
Save the screen shot
Load user setting (1 - 20)
Save user setting (1 - 20)
Convert to HAC format
ETR
Quit
USER 1, USER 2, USER 3)
OFF
SPLIT
, 3 BEAM, SPLIT + 2 BEAM
Display mode DIsplay Item
change (SPLIT, BEAM1, BEAM2,
BEAM3, BEAM4, BEAM5)
Beam Tilt (0-20;
Vertical
, Horizontal, Combination)
, Small, Standard, Large)
information
Bearing
(0-359;
0
)
0
)
Display Item Normal display (V
marker, Mode indicator, Beam direction
Temp graph)
Zoom display (Bottom discrimination (Hardness, Roughness)),
Layout H-VRM depth (Left, Left-Mid,
Temp graph scale (
Bottom discrimination scale (
Display switch (
DIsplay
window lock, Bottom zoom, Marker zoom
Setting Echo image Range (10m, 20m,
1
2
Status, Fish size historgram, Target graph
Zoom window size (
2000m, 2500m, 3000m)
User setting Range 1 (10-5000:
3
-VRM, H-VRM, Color bar, Time marker, Alarm
, White line, Net mark,
Center
, Right-Mid, Right)
Left
, Left-Mid, Center, Right-Mid, Right)
Left
, Left-Mid, Center, Right-Mid, Right)
Letters
, Fig, Letters + Fig)
, V-temp graph, Bottom
Small
, Medium, Large)
40m
, 80m, 150m, 300m, 500m, 1000m, 1500m,
10m
)
20m
Range2 (10-5000:
Range3 (10-5000:
Range4 (10-5000:
Range5 (10-5000:
Range6 (10-5000:
Range7 (10-5000:
Range8 (10-5000:
Range9 (10-5000:
Range10 (10-5000:
Range11 (10-5000:
Range12 (10-5000:
)
40m
)
80m
)
150m
300m
500m
1000m
1500m
2000m
2500m
3000m
)
)
)
)
)
)
)
)
P-1
Page 98

APPENDIX
1
2
Multi-beam TX frequency (Low,
Depth/distance (Depth,
Status Display item (
Fish size Fish size histogram Horizontal axis scale (10, 20, 30, 40,
(Display)
3
Zoom range (2m, 5m,
User setting Range1 (2-200:
Shift (0-5000;
Gain (0.0-10.0;
TX rate (0-20;
0
STC (0-10;
TVG curve (10,
Noise threshold (-30 - +30,
Clutter curve (
Clutter (
Color resolution ( OFF (0.1-3.0;
Picture advance (STOP, 1/8, 1/4, 1/2,
LIne interpolation (
Noise limiter (
Signal level (0-14;
Echo smoothing (
Ping setting (
Bottom search (
TX pulse length (
TX power (Level1, Level2, Level3, Level4,
Simul. TX start Rng (100-5000;
)
0
, 1, 2, 3, 4, 5, 6, 7)
OFF
Internal
ADVANCE, SHIFT, ALARM
,
L/L
Window (
Display (
Font size (Small,
Draft indication (
Target graph Radius scale (2, 3,
SPEED
Opaque
Window
10m
, 20m, 40m)
2m
0m
)
5.0
)
20
)
20
, 30, 40, manual)
Standard
, Straight, OFF)
OFF
, ON)
, NL1, NL2, NL3)
0
)
OFF
, 1, 2, 3, 4)
, External)
ON
, OFF)
Standard
Standard
Range2 (2-200:
Range3 (2-200:
Range4 (2-200:
Range5 (2-200:
User TVG setting (0-40;
0
)
1.0
, High)
, Long)
5m
10m
20m
40m
)
1/1
, 2/1, 4/1, 8/1, SYNC)
Level5
Distance
, COURSE, ROLL, PITCH, HEAVE, P/B, TD)
, T r ansparent)
, Fixed at bottom)
Standard
OFF
, ON)
)
1000
)
, GAIN, TIMER,
, Large)
50
, 60, 70, 80 90, 100(%))
Vertical axis area (1, 2,
Vertical zoom rate (
Vertical zoom area )7, 6, 5,
OFF
OFF
, ON)
White mark (
White mark area (Min) (2-1000m;
White mark area (Max) (2-1000m;
Peak (
)
)
100
, ON)
4
)
)
)
, 5)
20
)
)
TEMP,
3
, 4, 5, 6)
, 200, 400(%))
4
, 3, 2, 1)
20cm
20cm
)
)
AP-2
4
5
6
Page 99

APPENDIX
A
4
Alarm Volume (0, 1, 2, 3, 4, 5, 6, 7)
5
(Measurement)
(Unit)
Record Recording setting Recording location
6
Fish gain (-12.0-12.0; 0)
Measurement threshold (2-20;
Measuring area (Manual, All, Specific range, Bottom trace)
Manual area (Vertical) (10-100;
Manual area (Horizontal) (10-100;
Bottom trace area (2m, 5m,
Calibration value (-30.0-30.0;
Unit (TS,
Bottom alarm Alarm depth (0-10000;
Fish alarm Alarm depth (Fish: 0-10000;
Temp alarm Temp limit
V-temp alarm Temp limit
Record info Data view
L(cm)
, L(inch))
4
(cm))
10
(%))
10
(%))
10m
, 20m, 50m, 100m, 200m)
0
(db))
0m
)
Alarm zone (1-10000:
Alarm depth
(Bottom fish: 0.0-200.0;
Alarm zone (Fish: 1-10000;
Alarm zone (Bottom fish: 1.0-200.0;
(Within range, Out of range: -5.0-35.0;
Alarm zone
(Within range, Out of range: 0.1-30.0;
(Within range, Out of range: -5.0-35.0;
Alarm zone
(Within range, Out of range: 0.1-30.0;
Recording time (1-24;
Required free space (512-32767;
Disk space info (
Time
1m
)
0.0m
24
(hr))
, Size)
0m
1m
)
)
)
1.0m
1024
)
20.0°C
1.0°C
20.0°C
1.0°C
(MB))
)
)
)
)
System Output TLL (
Compensation Stabilization (OFF,
Temp Temp input (CIF,
Net Input data (CIF,
7 8
OFF
, ON)
OFF
)
)
0.0 deg
0.0 deg
)
)
, ON)
Version 2.0
1500m/s
)
)
)
0m
0 deg
0
)
, V ersion 3.0)
)
0m
)
0m
)
)
)
Bottom discrimination (
NMEA version (Version 1.5,
ON
ON
Heave (OFF,
Sound veolocity (1400-1600;
Draft (-6.0-60.0;
Roll offset (-10.0-10.0;
Pitch offset (-10.0-10.0;
Motion sensor (SC,
SC-TD in longitudinal dir (-100.0-100.0;
SC-TD in port/stdb dir (-100.0-100.0;
SC-TD in up/down dir (-100.0-100.0;
Internal sensor in bow dir (0-360;
)
0.0m
Internal sensor
NMEA
Temp adjust (-20.0 to 20.0,
NMEA
V-temp graph Horizontal axis (Min) (-5.0-35.0;
Horizontal axis (Max) (-5.0-35.0;
-5.0
-35.0
°(C))
°(C))
P-3
Page 100

APPENDIX
7 8
Color Day/Night (Day,
Hue (
Marker line (Change color.)
VRM (Change color.)
Temp graph (Change color.)
Bottom discrimination (Change color of Hardness and Flatness graph lines.)
Net (Change color of Net marks 1-6.)
Pane (Change color of window border.)
Unit Depth (
Temperature (°
Speed (
Bearing (
Communication Network IP address (
NMEA Port (COM1,
Date (Year/Month/Day/Hr/Min/Sec)
Test/ Version information
Initialization Target sphere calibration
Default settings
Standard
m
kt
SC Port (COM1, NMEA1,
CIF Port (COM1, NMEA1, NMEA2,
Night
)
, Mono, USER1, USER2)
, ft, fa, hiro, P/B)
C
, °F)
, km/h, mph)
TRUE
, Magnetic)
Port (5001-30000;
Baud rate
(
4800 Bps
Bit rate (7 Bit,
Stop bit (
Parity bit (
Baud rate
(4800 bps, 9600 bps, 19200 bps,
Bit rate (7 Bit,
Stop bit (
Parity bit (
Baud rate
(600 Bps, 1200 bps, 2400 bps,
Bit rate (
Stop bit (1 Bit, 1.5 Bit,
Parity bit (None, Even,
1 Bit
None
1 Bit
None
7bit
192. 168. 2. 3
NMEA1
, 9600 Bps, 19200 Bps, 38400 Bps)
8 Bit
, 1.5 Bit, 2 Bit)
, Even, Odd)
)
10000
)
, NMEA2, CIF)
)
NMEA2
, CIF)
38400 bps
8 Bit
)
, 1.5 Bit, 2 Bit)
, Even, Odd)
CIF
)
, 8bit)
2 Bit
Odd
4800 bps
)
)
)
)
Window Auto arrange
Deep mode
Simul. TX
Marker line
AP-4
 Loading...