

Page 1

SPARC Enterprise T5440 Server
Service Manual
Manual Code C120-E512-03EN,
Part No. 875-4392-12
June 2011, Revision A
Page 2

Copyright © 2008, 2011 , Oracle and/or its affiliates. All rights reserved.
FUJITSU LIMITED provided technical input and review on portions of this material.
Oracle and/or its affiliates and Fujitsu Limited each own or control intellectual property rights relating to products and technology described in this
document, and such products, technology and this document are protected by copyright laws, patents, and other intellectual property laws and
international treaties.
This document and the product and technology to which it pertains are distributed under licenses restricting their use, copying, distribution, and
decompilation. No part of such product or technology, or of this document, may be reproduced in any form by any means without prior written
authorization of Oracle and/or its affiliates and Fujitsu Limited, and their applicable licensors, if any. The furnishings of this document to you does not
give you any rights or licenses, express or implied, with respect to the product or technology to which it pertains, and this document does not contain or
represent any commitment of any kind on the part of Oracle or Fujitsu Limited, or any affiliate of either of them.
This document and the product and technology described in this document may incorporate third-party intellectual property copyrighted by and/or
licensed from the suppliers to Oracle and/or its affiliates and Fujitsu Limited, including software and font technology.
Per the terms of the GPL or LGPL, a copy of the source code governed by the GPL or LG PL, as applicable, is available upon request by the End User. Please
contact Oracle and/or its affiliates or Fujitsu Limited.
This distribution may include materials developed by third parties.
Parts of the product may be derived from Berkeley BSD systems, licensed from the University of California. UNIX is a registered trademark in the U.S. and
in other countries, exclusively licensed through X/Open Company, Ltd.
Oracle and Java are registered trademarks of Oracle and/or its affiliates. Fujitsu and the Fujitsu logo are registered trademarks of Fujitsu Limited.
All SPARC trademarks are used under license and are registered trademarks of SPARC International, Inc. in the U.S. and other countries. Products bearing
SPARC trademarks are based upon architectures developed by Oracle and/or its affiliates. SPARC64 is a trademark of SPARC International, Inc. , used
under license by Fujitsu Microelectronics, Inc. and Fujitsu Limited. Other names may be trademarks of their respective owners.
United States Government Rights - Commercial use. U.S. Government users are subject to the standard government user license agreements of Oracle
and/or its affiliates and Fujitsu Limited and the applicable provisions of the FAR and its supplements.
Disclaimer: The only warranties granted by Oracle and Fujitsu Limited, and/or any affiliate of either of them in connection with this document or any
product or technology described herein are those expres sly set forth in the license agreement pursuant to which the product or technology is provided.
EXCEPT AS EXPRESSLY SET FORTH IN SUCH AG REEMENT, ORACLE OR FUJITSU LIMITED, AND/OR THEIR AFFILIATES MAKE NO
REPRESENTATIONS OR WARRANTIES OF ANY KIND (EXPRESS OR IMPLIED) REGARDING SUCH PRODUCT OR TECHNOLOGY OR THIS
DOCUMENT, WHICH ARE ALL PROVIDED AS IS, AND ALL EXPRESS OR IMPLIED CONDITIONS, REPRESENTATIONS AND WARRANTIES,
INCLUDING WITHOUT LIMITATION ANY IMPLIED WARRANTY OF MERCHANTABILITY, FITNESS FOR A PARTICULAR PURPOSE OR NONINFRINGEMENT, ARE DISCLAIMED, EXCEPT TO THE EXTENT THAT SUCH DISCLAIMERS ARE HELD TO BE LEGALLY INVALID. Unless
otherwise expressly set forth in such agreement, to the extent allowed by applicable law, in no event shall Oracle or Fujitsu Limited, and/or any of their
affiliates have any liability to any third party under any legal theory for any loss of revenues or profits, loss of use or data, or business interruptions, or for
any indirect, special, incidental or consequential damages, even if advised of the possibility of such damages.
DOCUMENTATION IS PROVIDED “AS IS” AND ALL EXPRESS OR IMPLIED CONDITIONS, REPRESENTATIONS AND WARRANTIES,
INCLUDING ANY IMPLIED WARRANTY OF MERCHANTABILITY, FITNESS FOR A PARTICULAR PURPOSE OR NON-INFRINGEMENT, ARE
DISCLAIMED, EXCEPT TO THE EXTENT THAT SUCH DISCLAIMERS ARE HELD TO BE LEGALLY INVALID.
Please
Recycle
Page 3

Copyright © 2008, 2011, Oracle et/ou ses sociétés affiliées. Tous droits réservés.
FUJITSU LIMITED a fourni et vérifié des données techniques de certaines parties de ce composant.
Oracle et/ou ses sociétés affiliées et Fujitsu Limited détiennent et contrôlent chacune des droits de propriété intellectuelle relatifs aux produits et
technologies décrits dans ce document. De même, ces produits, technologies et ce document sont protégés par des lois sur le copyright, des brevets,
d’autres lois sur la propriété intellectuelle et des traités internationaux.
Ce document, le produit et les technologies afférents sont exclusivement distribués avec des licences qui en restreignent l’utilisation, la copie, la
distribution et la décompilation. Aucune partie de ce produit, de ces technologies ou de ce document ne peut être reproduite sous quelque forme que ce
soit, par quelque moyen que ce soit, sans l’autorisation écrite préalable d’Oracle et/ou ses sociétés affiliées et de Fujitsu Limited, et de leurs éventuels
bailleurs de licence. Ce document, bien qu’il vous ait été fourni, ne vous confère aucun droit et aucune licence, expresses ou tacites, concernant le produit
ou la technologie auxquels il se rapporte. Par ailleurs, il ne contient ni ne représente aucun engagement, de quelque type que ce soit, de la part d’Oracle ou
de Fujitsu Limited, ou des sociétés affiliées de l’une ou l’autre entité.
Ce document, ainsi que les produits et technologies qu’il décrit, peuvent inclure des droits de propriété intellectuelle de parties tierces protégés par
copyright et/ou cédés sous licence par des fournisseurs à Oracle et/ou ses sociétés affiliées et Fujitsu Limited, y compris des logiciels et des technologies
relatives aux polices de caractères.
Conformément aux conditions de la licence GPL ou LGPL, une copie du code source régi par la licence GPL ou LGPL, selon le cas, est disponible sur
demande par l’Utilisateur final. Veuillez contacter Oracle et/ou ses sociétés affiliées ou Fujitsu Limited.
Cette distribution peut comprendre des composants développés par des parties tierces.
Des parties de ce produit peuvent être dérivées des systèmes Berkeley BSD, distribués sous licence par l’Université de Californie. UNIX est une marque
déposée aux États-Unis et dans d’autres pays, distribuée exclusivement sous licence par X/Open Company, Ltd.
Oracle et Java sont des marques déposées d’Oracle Corporation et/ou de ses sociétés affiliées. Fujitsu et le logo Fujitsu sont des marques déposées de
Fujitsu Limited.
Toutes les marques SPARC sont utilisées sous licence et sont des marques déposées de SPARC I nternational, Inc., aux États-Unis et dans d’autres pays. Les
produits portant la marque SPARC reposent sur des architectures développées par Oracle et/ou ses sociétés affiliées. SPARC64 est une marque de SPARC
International, Inc., utilisée sous licence par Fujitsu Microelectronics, Inc. et Fujitsu Limited. Tout autre nom mentionné peut corres pondre à des ma rques
appartenant à d’autres propriétaires.
United States Government Rights - Commercial use. U.S. Government users are subject to the standard government user license agreements of Oracle
and/or its affiliates and Fujitsu Limited and the applicable provisions of the FAR and its supplements.
Avis de non-responsabilité : les seules garanties octroyées par Oracle et Fujitsu Limited et/ou toute société affiliée de l’une ou l’autre entité en rapport avec
ce document ou tout produit ou toute technologie décrits dans les présentes correspondent aux garanties expressément stipulées dans le contrat de licence
régissant le produit ou la technologie fournis. SAUF MENTION CONTRAIRE EXPRESSÉMENT STIPULÉE DANS CE CONTRAT, ORACLE OU FUJITSU
LIMITED ET LES SOCIÉTÉS AFFILIÉES À L’UNE OU L’AUTRE ENTITÉ REJETTENT TOUTE REPRÉSENTATION OU TOUTE GARANTIE, QUELLE
QU’EN SOIT LA NATURE (EXPRESSE OU IMPLICITE) CONCERNANT CE PRODUIT, CETTE TECHNOLOGIE OU C E DOCUMENT, LESQUELS
SONT FOURNIS EN L’ÉTAT. EN OUTRE, TOUTES LES CONDITIONS, REPRÉSENTATIONS ET GARANTIES EXPRESSES OU TACITES, Y COMPRIS
NOTAMMENT TOUTE GARANTIE IMPLICITE RELATIVE À LA QUALITÉ MARCHANDE, À L’APTI TUDE À UNE UTILISATION PARTICULIÈRE
OU À L’ABSENCE DE CONTREFAÇON, SONT EXCLUES , D ANS LA MESURE AUTORISÉE PAR LA LOI APPLICABLE. Sauf mention contraire
expressément stipulée dans ce contrat, dans la mesure autorisée par la loi applicable, en aucun cas Oracle ou Fujitsu Limited et/ou l’une ou l’autre de leurs
sociétés affiliées ne sauraient être tenues responsables envers une quelconque partie tierce, sous quelque théorie juridique que ce soit, de tout manque à
gagner ou de perte de profit, de problèmes d’utilisation ou de perte de données, ou d’interruptions d’activités, ou de tout dommage indirect, spécial,
secondaire ou consécutif, même si ces entités ont été préalablement informées d’une telle éventualité.
LA DOCUMENTATION EST FOURNIE « EN L’ÉTAT » ET TOUTE AUTRE CONDITION, DÉCLARATION ET GARANTIE, EXPRESSE OU TACITE, EST
FORMELLEMENT EXCLUE, DANS LA MESURE AUTORISÉE PAR LA LOI EN VIGUEUR, Y COMPRIS NOTAMMENT TOUTE GARANTIE
IMPLICITE RELATIVE À LA QUALITÉ MARCHANDE, À L’APTITUDE À UNE UTILISATION PARTICULIÈRE OU À L’ABSENCE DE
CONTREFAÇON.
Page 4

Page 5

Contents
Preface xiii
Identifying Server Components 1
Infrastructure Boards and Cables 1
Front Panel Diagram 3
Front Panel LEDs 5
Rear Panel Diagram 6
Rear Panel LEDs 8
Ethernet Port LEDs 9
Managing Faults 11
Understanding Fault Handling Options 11
Server Diagnostics Overview 12
Diagnostic Flowchart 13
Options for Accessing the Service Processor 17
ILOM Overview 18
ALOM CMT Compatibility Shell Overview 20
Predictive Self-Healing Overview 20
Oracle VTS Overview 21
POST Fault Management Overview 22
POST Fault Management Flowchart 23
Memory Fault Handling Overview 24
Connecting to the Service Processor 25
v
Page 6

▼ Switch From the System Console to the Service Processor (ILOM or
ALOM CMT Compatibility Shell) 26
▼ Switch From ILOM to the System Console 26
▼ Switch From the ALOM CMT Compatibility Shell to the System
Console 26
Displaying FRU Information With ILOM 27
▼ Display System Components (ILOM show components
Command) 27
▼ Display Individual Component Information (ILOM show
Command) 28
Controlling How POST Runs 29
POST Parameters 30
▼ Change POST Parameters 31
▼ Run POST in Maximum Mode 32
Detecting Faults 34
Detecting Faults Using LEDs 34
Detecting Faults (ILOM show faulty Command) 36
▼ Detect Faults (ILOM show faulty Command) 37
Detecting Faults (Oracle Solaris OS Files and Commands) 39
▼ Check the Message Buffer 39
▼ View System Message Log Files 40
Detecting Faults (ILOM Event Log) 40
▼ View ILOM Event Log 41
Detecting Faults (Oracle VTS Software) 41
About Oracle VTS Software 42
▼ Verify Installation of Oracle VTS Software 42
▼ Start the Oracle VTS Browser Environment 43
Oracle VTS Software Packages 45
Useful Oracle VTS Tests 46
Detecting Faults Using POST 46
vi SPARC Enterprise T5440 Server Service Manual • June 2011
Page 7

Identifying Faults Detected by PSH 48
▼ Detect Faults Identified by the Oracle Solaris PSH Facility (ILOM
fmdump Command) 49
Clearing Faults 52
▼ Clear Faults Detected During POST 52
▼ Clear Faults Detected by PSH 54
▼ Clear Faults Detected in the External I/O Expansion Unit 55
Disabling Faulty Components 55
Disabling Faulty Components Using Automatic System Recovery 56
▼ Disable System Components 57
▼ Re-Enable System Components 57
ILOM-to-ALOM CMT Command Reference 58
Preparing to Service the System 63
Safety Information 63
Observing Important Safety Precautions 64
Safety Symbols 64
Electrostatic Discharge Safety Measures 65
Handling Electronic Components 65
Antistatic Wrist Strap 65
Antistatic Mat 65
Required Tools 66
▼ Obtain the Chassis Serial Number 66
▼ Obtain the Chassis Serial Number Remotely 66
Powering Off the System 67
▼ Power Off (Command Line) 67
▼ Power Off (Graceful Shutdown) 68
▼ Power Off (Emergency Shutdown) 68
▼ Disconnect Power Cords From the Server 68
Contents vii
Page 8

Extending the Server to the Maintenance Position 69
Components Serviced in the Maintenance Position 69
▼ Extend the Server to the Maintenance Position 70
▼ Remove the Server From the Rack 71
▼ Perform Electrostatic Discharge – Antistatic Prevention Measures 73
▼ Remove the Top Cover 73
Servicing Customer-Replaceable Units 75
Hot-Pluggable and Hot-Swappable Devices 75
Servicing Hard Drives 76
About Hard Drives 76
▼ Remove a Hard Drive (Hot-Plug) 77
▼ Install a Hard Drive (Hot-Plug) 79
▼ Remove a Hard Drive 81
▼ Install a Hard Drive 82
Hard Drive Device Identifiers 83
Hard Drive LEDs 84
Servicing Fan Trays 84
About Fan Trays 85
▼ Remove a Fan Tray (Hot-Swap) 85
▼ Install a Fan Tray (Hot-Swap) 86
▼ Remove a Fan Tray 87
▼ Install a Fan Tray 88
Fan Tray Device Identifiers 88
Fan Tray Fault LED 89
Servicing Power Supplies 89
About Power Supplies 90
▼ Remove a Power Supply (Hot-Swap) 90
▼ Install a Power Supply (Hot-Swap) 91
viii SPARC Enterprise T5440 Server Service Manual • June 2011
Page 9

▼ Remove a Power Supply 92
▼ Install a Power Supply 93
Power Supply Device Identifiers 94
Power Supply LED 95
Servicing PCIe Cards 96
▼ Remove a PCIe Card 96
▼ Install a PCIe Card 97
▼ Add a PCIe Card 98
PCIe Device Identifiers 99
PCIe Slot Configuration Guidelines 100
Servicing CMP/Memory Modules 102
CMP/Memory Modules Overview 102
▼ Remove a CMP/Memory Module 104
▼ Install a CMP/Memory Module 105
▼ Add a CMP/Memory Module 105
CMP and Memory Module Device Identifiers 107
Supported CMP/Memory Module Configurations 107
Servicing FB-DIMMs 108
▼ Remove FB-DIMMs 108
▼ Install FB-DIMMs 109
▼ Verify FB-DIMM Replacement 110
▼ Add FB-DIMMs 113
FB-DIMM Configuration 113
Supported FB-DIMM Configurations 114
Memory Bank Configurations 114
FB-DIMM Device Identifiers 116
FB-DIMM Fault Button Locations 117
Servicing Field-Replaceable Units 119
Contents ix
Page 10

Servicing the Front Bezel 119
▼ Remove the Front Bezel 120
▼ Install the Front Bezel 121
Servicing the DVD-ROM Drive 122
▼ Remove the DVD-ROM Drive 122
▼ Install the DVD-ROM Drive 123
Servicing the Service Processor 124
▼ Remove the Service Processor 124
▼ Install the Service Processor 126
Servicing the IDPROM 127
▼ Remove the IDPROM 127
▼ Install the IDPROM 128
Servicing the Battery 129
▼ Remove the Battery 129
▼ Install the Battery 130
Servicing the Power Distribution Board 130
▼ Remove the Power Distribution Board 130
▼ Install the Power Distribution Board 132
Servicing the Fan Tray Carriage 133
▼ Remove the Fan Tray Carriage 133
▼ Install the Fan Tray Carriage 134
Servicing the Hard Drive Backplane 135
▼ Remove the Hard Drive Backplane 136
▼ Install the Hard Drive Backplane 137
Servicing the Motherboard 139
▼ Remove the Motherboard 139
▼ Install the Motherboard 142
Motherboard Fastener Locations 143
x SPARC Enterprise T5440 Server Service Manual • June 2011
Page 11

Servicing the Flex Cable Assembly 144
▼ Remove the Flex Cable Assembly 145
▼ Install the Flex Cable Assembly 146
Servicing the Front Control Panel 148
▼ Remove the Front Control Panel 148
▼ Install the Front Control Panel 149
Servicing the Front I/O Board 150
▼ Remove the Front I/O Board 150
▼ Install the Front I/O Board 151
Returning the Server to Operation 153
▼ Install the Top Cover 154
▼ Install the Server Into the Rack 154
▼ Slide the Server Into the Rack 155
▼ Connect the Power Cords to the Server 157
▼ Power On the Server 157
Performing Node Reconfiguration 159
I/O Connections to CMP/Memory Modules 160
Recovering From a Failed CMP/Memory Module 161
Options for Recovering From a Failed CMP/Memory Module 161
Reconfiguring I/O Device Nodes 162
Options for Reconfiguring I/O Device Nodes 162
▼ Reconfigure the I/O and PCIe Fabric 163
▼ Temporarily Disable All Memory Modules 164
▼ Re-Enable All Memory Modules 165
▼ Reset the LDoms Guest Configuration 166
System Bus Topology 167
I/O Fabric in 2P Configuration 168
Contents xi
Page 12

I/O Fabric in 4P Configuration 169
Identifying Connector Pinouts 171
Serial Management Port Connector Pinouts 172
Network Management Port Connector Pinouts 173
Serial Port Connector Pinouts 174
USB Connector Pinouts 175
Gigabit Ethernet Connector Pinouts 176
Server Components 177
Customer-Replaceable Units 178
Field-Replaceable Units 180
Index 183
xii SPARC Enterprise T5440 Server Service Manual • June 2011
Page 13

Preface
This manual provides detailed procedures that describe the removal and replacement
of replaceable parts in the SPARC Enterprise T5440 Server. This manual also includes
information about the use and maintenance of the server. This document is written
for technicians, system administrators, authorized service providers (ASPs), and
users who have advanced experience troubleshooting and replacing hardware.
For Safe Operation
This manual contains important information regarding the use and handling of this
product. Read this manual thoroughly. Pay special attention to the section “Notes on
Safety” on page xix. Use the product according to the instructions and information
available in this manual. Keep this manual handy for further reference.
Keep this manual handy for further reference. Fujitsu makes every effort to prevent
users and bystanders from being injured or from suffering damage to their property.
Use the product according to this manual.
Before You Read This Document
To fully use the information in this document, you must have thorough knowledge of
the topics discussed in the SPARC Enterprise T5440 Server Product Notes.
Structure and Contents of This Manual
This manual is organized as described below:
xiii
Page 14

■ “Identifying Server Components” on page 1
Provides an overview of the server, including major boards and components, as
well as front and rear panel features.
■ “Managing Faults” on page 11
Describes the diagnostics that are available for monitoring and troubleshooting
the server.
■ “Preparing to Service the System” on page 63
Describes the steps necessary to prepare the server for service.
■ “Servicing Customer-Replaceable Units” on page 75
Describes how to service customer-replaceable units (CRUs)
■ “Servicing Field-Replaceable Units” on page 119
Describes how to service field-replaceable units (FRUs)
■ “Returning the Server to Operation” on page 153
Describes how to bring the server back to operation after performing service
procedures.
■ “Performing Node Reconfiguration” on page 159
Describes how to perform node reconfiguration.
■ “Identifying Connector Pinouts” on page 171
Contains pinout tables for all external connectors.
■ “Server Components” on page 177
Contains illustrations showing server components.
Related Documentation
The latest versions of all the SPARC Enterprise Series manuals are available at the
following Web sites:
Global Site
(http://www.fujitsu.com/sparcenterprise/manual/)
Japanese Site
xiv SPARC Enterprise T5440 Server Service Manual • June 2011
Page 15

(http://primeserver.fujitsu.com/sparcenterprise/manual/)
Title Description Manual Code
SPARC Enterprise T5440 Server
Getting Started Guide
SPARC Enterprise T5440 Server
Product Notes
Important Safety Information for
Hardware Systems
SPARC Enterprise T5440 Server
Safety and Compliance Guide
SPARC Enterprise/
PRIMEQUEST Common
Installation Planning Manual
SPARC Enterprise T5440 Server
Site Planning Guide
SPARC Enterprise T5440 Server
Installation and Setup Guide
SPARC Enterprise T5440 Server
Service Manual
SPARC Enterprise T5440 Server
Administration Guide
Integrated Lights Out Manager
2.0 User’s Guide
Integrated Lights Out Manager
2.0 Supplement for SPARC
Enterprise T5440 Server
Integrated Lights Out Manager
3.0 Concepts Guide
Integrated Lights Out Manager
3.0 Getting Started Guide
Integrated Lights Out Manager
3.0 Web Interface Procedures
Guide
Integrated Lights Out Manager
3.0 CLI Procedures Guide
Minimum steps to power on and boot the
C120-E504
server for the first time
Information about the latest product
C120-E508
updates and issues
Safety information that is common to all
C120-E391
SPARC Enterprise series servers
Safety and compliance information that is
C120-E509
specific to the server
Requirements and concepts of installation
C120-H007
and facility planning for the setup of
SPARC Enterprise and PRIMEQUEST
Server specifications for site planning C120-H029
Detailed rackmounting, cabling, power on,
C120-E510
and configuring information
How to run diagnostics to troubleshoot the
C120-E512
server, and how to remove and replace
parts in the server
How to perform administrative tasks that
C120-E511
are specific to the server
Information that is common to all
C120-E474
platforms managed by Integrated Lights
Out Manager (ILOM) 2.0
How to use the ILOM 2.0 software on the
C120-E513
server
Information that describes ILOM 3.0
C120-E573
features and functionality
Information and procedures for network
C120-E576
connection, logging in to ILOM 3.0 for the
first time, and configuring a user account
or a directory service
Information and procedures for accessing
C120-E574
ILOM 3.0 functions using the ILOM web
interface
Information and procedures for accessing
C120-E575
ILOM 3.0 functions using the ILOM CLI
Preface xv
Page 16

Title Description Manual Code
Integrated Lights Out Manager
3.0 SNMP and IPMI Procedure
Guide
Integrated Lights Out Manager
3.x Feature Updates and Release
Notes
Integrated Lights Out Manager
3.0 Supplement for SPARC
Enterprise T5440 Server
External I/O Expansion Unit
Installation and Service Manual
External I/O Expansion Unit
Product Notes
Information and procedures for accessing
ILOM 3.0 functions using SNMP or IPMI
management hosts
Enhancements that have been made to
ILOM firmware since the ILOM 3.0 release
How to use the ILOM 3.0 software on the
server
Procedures for installing the External I/O
Expansion Unit on the SPARC Enterprise
T5120/T5140/T5220/T5240/T5440 servers
Important and late-breaking information
about the External I/O Expansion Unit
C120-E579
C120-E600
C120-E587
C120-E543
C120-E544
Note – Product Notes are available on the website only. Please check for the recent
update on your product.
UNIX Commands
This document might not contain information on basic UNIX® commands and
procedures such as shutting down the system, booting the system, and configuring
devices. Refer to the following for this information:
■ Software documentation that you received with your system
■ Sun Oracle software-related manuals (Oracle Solaris OS, and so on):
(http://www.oracle.com/technetwork/documentation/index.html)
xvi SPARC Enterprise T5440 Server Service Manual • June 2011
Page 17

Text Conventions
Typeface* Meaning Examples
AaBbCc123 The names of commands, files,
and directories; on-screen
computer output
AaBbCc123 What you type, when
contrasted with on-screen
computer output
AaBbCc123 Book titles, new words or terms,
words to be emphasized.
Replace command-line
variables with real names or
values.
Edit your .login file.
Use ls -a to list all files.
% You have mail.
% su
Password:
Read Chapter 6 in the User’s Guide.
These are called class options.
To delete a file, type rm filename.
* The settings on your browser might differ from these settings.
Prompt Notations
The following prompt notations are used in this manual.
Shell Prompt Notations
C shell machine-name%
C shell superuser machine-name#
Bourne shell and Korn shell $
Bourne shell and Korn shell superuser #
ILOM service processor ->
ALOM compatibility shell sc>
OpenBoot PROM firmware ok
Preface xvii
Page 18
Conventions for Alert Messages
This manual uses the following conventions to show alert messages, which are
intended to prevent injury to the user or bystanders as well as property damage, and
important messages that are useful to the user.
Caution – This indicates a hazardous situation that could result in death or serious
personal injury (potential hazard) if the user does not perform the procedure
correctly.
Caution – This indicates a hazardous situation that could result in minor or
moderate personal injury if the user does not perform the procedure correctly. This
signal also indicates that damage to the product or other property may occur if the
user does not perform the procedure correctly.
Caution – This indicates that surfaces are hot and might cause personal injury if
touched. Avoid contact.
Caution – This indicates that hazardous voltages are present. To reduce the risk of
electric shock and danger to personal health, follow the instructions.
Tip – This indicates information that could help the user to use the product more
effectively.
Alert Messages in the Text
An alert message in the text consists of a signal indicating an alert level followed by
an alert statement. A space of one line precedes and follows an alert statement.
Caution – The following tasks regarding this product and the optional products
provided from Fujitsu should only be performed by a certified service engineer.
Users must not perform these tasks. Incorrect operation of these tasks may cause
malfunction.
xviii SPARC Enterprise T5440 Server Service Manual • June 2011
Page 19

Also, important alert messages are shown in “Important Alert Messages” on
page xix.
Notes on Safety
Important Alert Messages
This manual provides the following important alert signals:
Caution – This indicates a hazardous situation could result in minor or moderate
personal injury if the user does not perform the procedure correctly. This signal also
indicates that damage to the product or other property may occur if the user does not
perform the procedure correctly.
Task Warning
Maintenance Damage
Two people must dismount and carry the chassis.
The weight of the server on extended slide rails can be enough to
overturn an equipment rack. Before you begin, deploy the antitilt feature
on your cabinet.
The server weighs approximately 88 lb (40 kg). Two people are required
to lift and mount the server into a rack enclosure when using the
procedures in this chapter.
Caution – This indicates that hazardous voltages are present. To reduce the risk of
electric shock and danger to personal health, follow the instructions.
Preface xix
Page 20

Task Warning
Maintenance Electric shock
Never attempt to run the server with the covers removed. Hazardous
voltage present.
Because 3.3v standby power is always present in the system, you must
unplug the power cords before accessing any cold-serviceable
components.
Caution – This indicates that surfaces are hot and might cause personal injury if
touched. Avoid contact.
Task Warning
Maintenance Extremely hot
FB-DIMMs may be hot. Use caution when servicing FB-DIMMs.
Product Handling
Maintenance
Caution – Certain tasks in this manual should only be performed by a certified
service engineer. User must not perform these tasks. Incorrect operation of these
tasks may cause electric shock, injury, or fire.
■ Installation and reinstallation of all components, and initial settings
■ Removal of front, rear, or side covers
■ Mounting/de-mounting of optional internal devices
■ Plugging or unplugging of external interface cards
■ Maintenance and inspections (repairing, and regular diagnosis and maintenance)
xx SPARC Enterprise T5440 Server Service Manual • June 2011
Page 21
Caution – The following tasks regarding this product and the optional products
provided from Fujitsu should only be performed by a certified service engineer.
Users must not perform these tasks. Incorrect operation of these tasks may cause
malfunction.
■ Unpacking optional adapters and such packages delivered to the users
■ Plugging or unplugging of external interface cards
Remodeling/Rebuilding
Caution – Do not make mechanical or electrical modifications to the equipment.
Using this product after modifying or reproducing by overhaul may cause
unexpected injury or damage to the property of the user or bystanders.
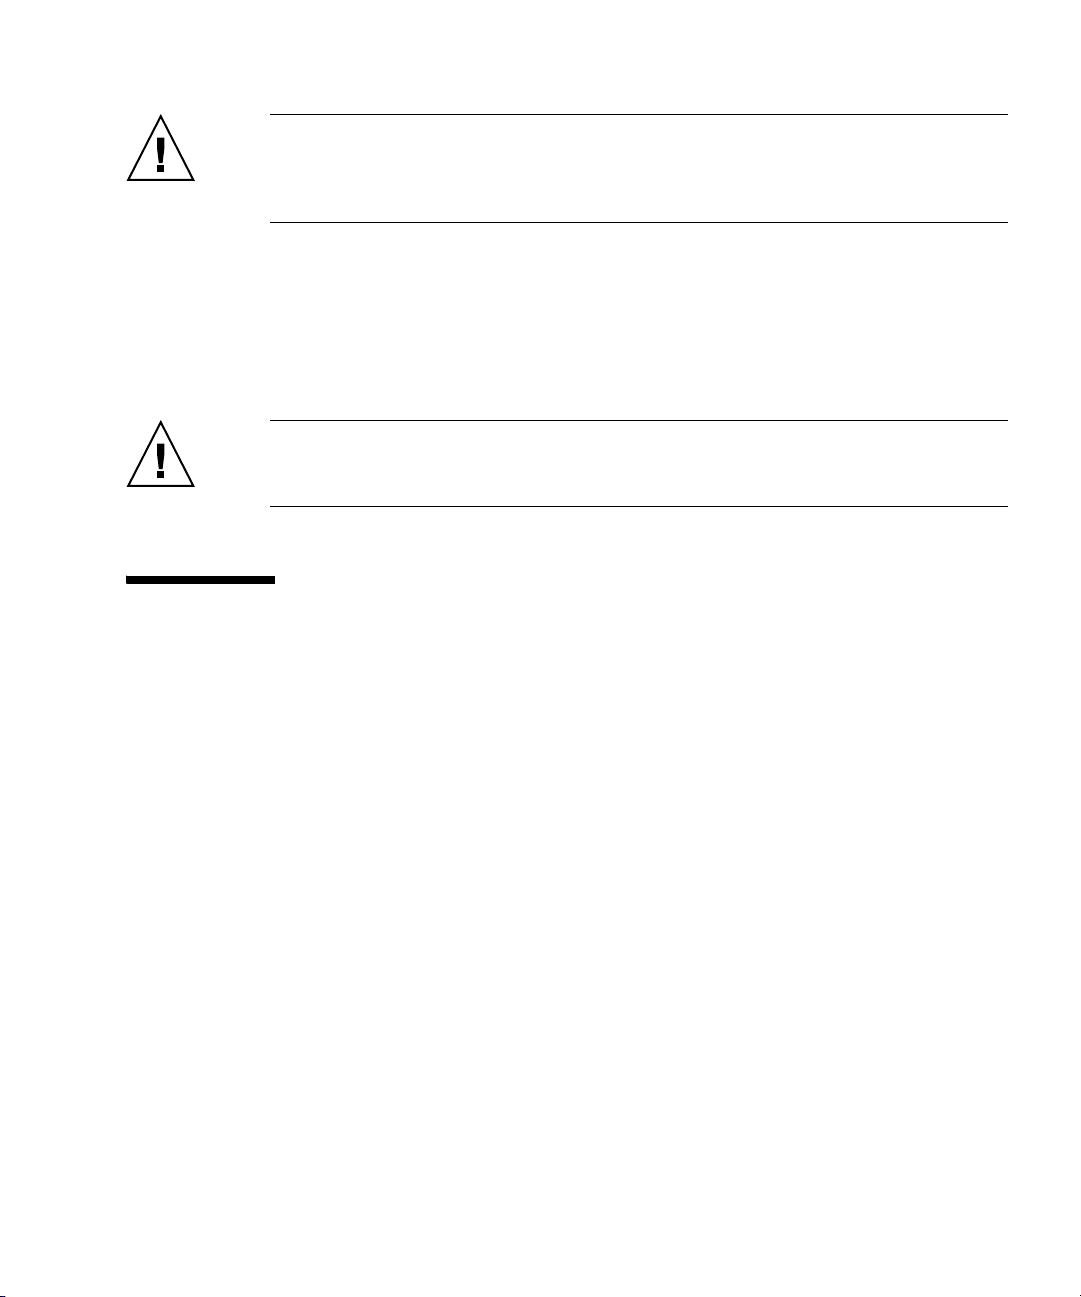
Alert Label
The following is a label attached to this product:
■ Never peel off the label.
■ The following label provides information to the users of this product.
Preface xxi
Page 22
Documentation Feedback
If you have any comments or requests regarding this document, or if you find any
unclear statements in the document, please state your points specifically on the form
at the following URL.
(http://www.fujitsu.com/global/contact/computing/sparce_index.ht
ml)
xxii SPARC Enterprise T5440 Server Service Manual • June 2011
Page 23

Identifying Server Components
These topics provide an overview of the server, including major boards and
components, as well as front and rear panel features.
Description Links
Review the infrastructure boards and cables
in the server.
Review the front panel features. “Front Panel Diagram” on page 3
Review the rear panel features. “Rear Panel Diagram” on page 6
Related Information
■ “Server Components” on page 177
“Infrastructure Boards and Cables” on
page 1
“Front Panel LEDs” on page 5
“Rear Panel LEDs” on page 8
“Ethernet Port LEDs” on page 9
Infrastructure Boards and Cables
The server is based on a 4U chassis and has the following boards installed:
■ Motherboard – The motherboard includes slots for up to four CMP modules and
four memory modules, memory control subsystem, up to eight PCIe expansion
slots, and a service processor slot. The motherboard also contains a top cover
safety interlock (“kill”) switch.
Note – 10-Gbit Ethernet XAUI cards are shared in Slots 4 and 5.
■ CMP module – Each CMP module contains an UltraSPARC T2 Plus chip, slots for
four FB-DIMMs, and associated DC-DC converters.
1
Page 24

■ Memory module – A memory module containing slots for an additional 12
FB-DIMMs is associated with each CMP module.
■ Service processor – The service processor (ILOM) board controls the server power
and monitors server power and environmental events. The service processor
draws power from the server’s 3.3V standby supply rail, which is available
whenever the system is receiving main input power, even when the system is
turned off.
A removable IDPROM contains MAC addresses, host ID, and ILOM and
OpenBoot PROM configuration data. When replacing the service processor, the
IDPROM can be transferred to a new board to retain system configuration data.
■ Power supply backplane – This board distributes main 12V power from the
power supplies to the rest of the system. The power supply backplane is
connected to the motherboard and the disk drive backplane via a flex cable. High
voltage power is provided to the motherboard via a bus bar assembly.
■ Hard drive backplane – This board includes the connectors for up to four hard
drives. It is connected to the motherboard via a flex cable assembly.
Each drive has its own Power/Activity, Fault, and Ready-to-Remove LEDs.
■ Front control panel – This board connects directly to the motherboard, and serves
as the interconnect for the front I/O board. It contains the front panel LEDs and
the Power button.
■ Front I/O board – This board connects to the front control panel interconnect. It
contains two USB ports.
■ Flex cable assembly – The flex cable assembly serves as the interconnect between
the power supply backplane, motherboard, hard drive backplane, and DVD-ROM
drive.
■ Power supply backplane I2C cable – This cable transmits power supply status to
the motherboard.
Related Information
■ SPARC Enterprise T5440 Server Site Planning Guide
■ “Managing Faults” on page 11
■ “Servicing Customer-Replaceable Units” on page 75
■ “Servicing Field-Replaceable Units” on page 119
2 SPARC Enterprise T5440 Server Service Manual • June 2011
Page 25
Front Panel Diagram
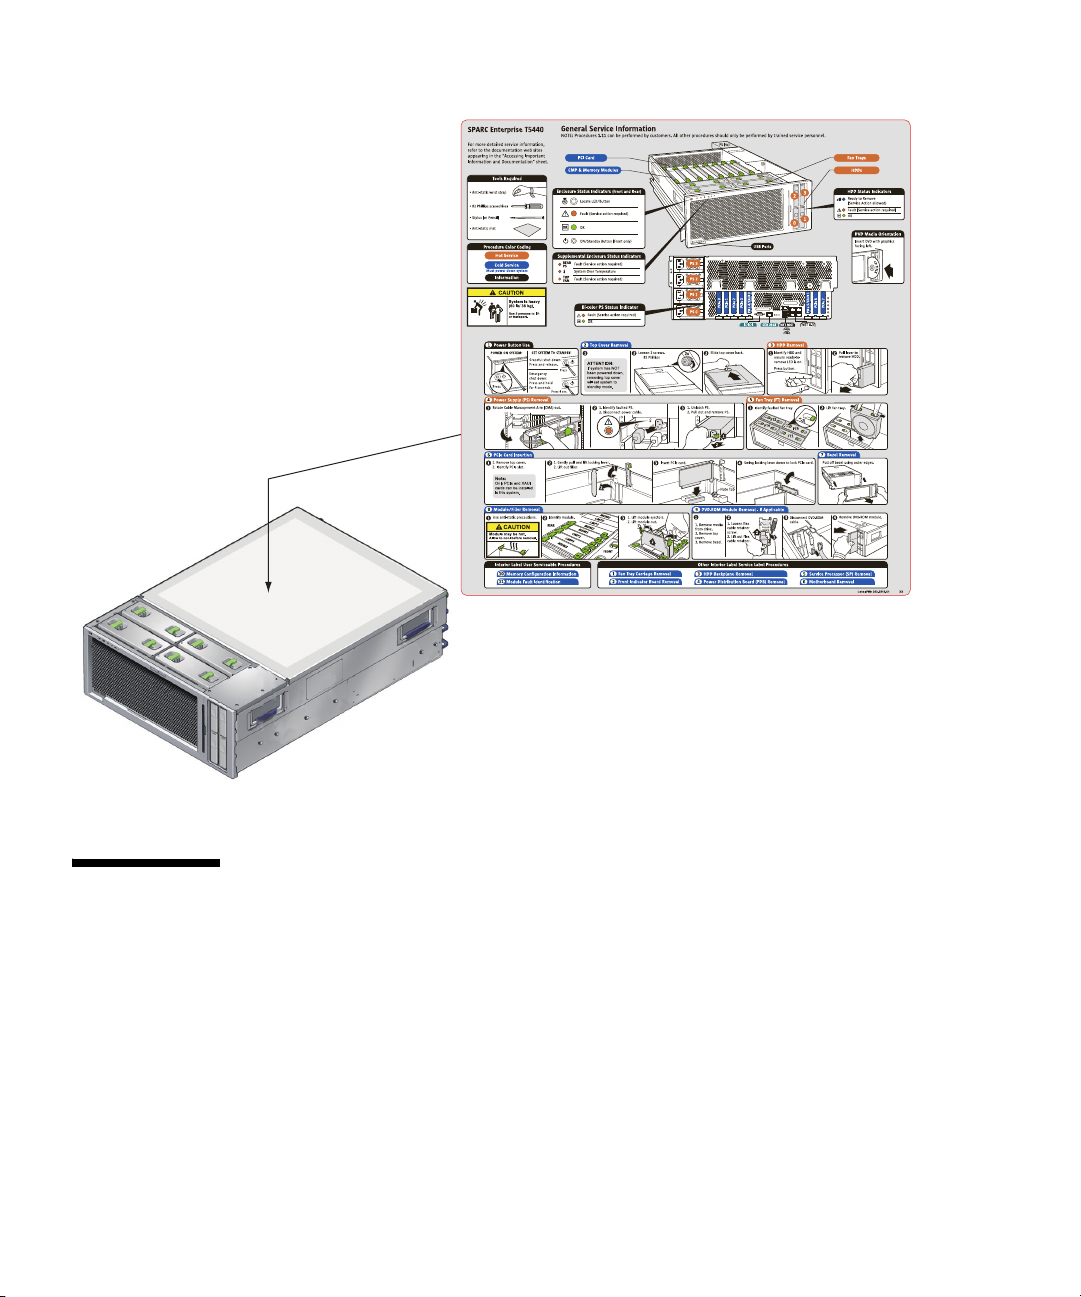
The server front panel contains a recessed system power button, system status and
fault LEDs, Locator button and LED. The front panel also provides access to internal
hard drives, the DVD-ROM drive (if equipped), and the two front USB ports.
The following illustration shows front panel features on the server front panel. For a
detailed description of front panel controls and LEDs, see “Front Panel LEDs” on
page 5.
FIGURE: Front Panel Features
Figure Legend
1 Locator Button/LED 5 Component Fault LEDs
2 Service Required LED 6 DVD-ROM Drive
3 Po we r/ OK LED 7 USB Ports
4 Power Button 8 Hard Drives
Related Information
■ “Front Panel LEDs” on page 5
Identifying Server Components 3
Page 26

■ “Rear Panel Diagram” on page 6
■ “Servicing the Front Bezel” on page 119
4 SPARC Enterprise T5440 Server Service Manual • June 2011
Page 27
Front Panel LEDs
LED or Button Icon Description
Locator LED
and button
(white)
Service
Required LED
(amber)
Power OK
LED
(green)
Power button The recessed Power button toggles the system on or off.
The Locator LED enables you to find a particular system. The LED is activated
using one of the following methods:
• The ALOM CMT command setlocator on.
• The ILOM command set /SYS/LOCATE value=Fast_Blink
• Manually press the Locator button to toggle the Locator LED on or off.
This LED provides the following indications:
• Off – Normal operating state.
• Fast blink – System received a signal as a result of one of the methods
previously mentioned, indicating that it is active.
If on, indicates that service is required. POST and ILOM are two diagnostics
tools that can detect a fault or failure resulting in this indication.
The ILOM show faulty command provides details about any faults that cause
this indicator to light.
Under some fault conditions, individual component fault LEDs are lit in
addition to the system Service Required LED.
Provides the following indications:
• Off – Indicates that the system is not running in its normal state. System
power might be off. The service processor might be running.
• Steady on – Indicates that the system is powered on and is running in its
normal operating state. No service actions are required.
• Fast blink – Indicates the system is running at a minimum level in standby
and is ready to be quickly returned to full function. The service processor is
running.
• Slow blink – Indicates that a normal transitory activity is taking place. Slow
blinking could indicate that the system diagnostics are running, or that the
system is booting.
• If the system is powered off, press once to power on.
• If the system is powered on, press once to initiate a graceful system shutdown.
• If the system is powered on, press and hold for 4 seconds to initiate an
emergency shutdown.
For more information about powering on and powering off the system, see the
SPARC Enterprise T5440 Server Administration Guide.
Identifying Server Components 5
Page 28

LED or Button Icon Description
Fan Fault LED
(amber)
Power Supply
Fault LED
(amber)
Overtemp LED
(amber)
TOP
FAN
REAR
PS
Provides the following operational fan indications:
• Off – Indicates a steady state, no service action is required.
• Steady on – Indicates that a fan failure event has been acknowledged and a
service action is required on at least one of the fan modules.
Provides the following operational PSU indications:
• Off – Indicates a steady state, no service action is required.
• Steady on – Indicates that a power supply failure event has been
acknowledged and a service action is required on at least one PSU.
Provides the following operational temperature indications:
• Off – Indicates a steady state, no service action is required.
• Steady on – Indicates that a temperature failure event has been acknowledged
and a service action is required.
Related Information
■ “Front Panel Diagram” on page 3
■ “Rear Panel LEDs” on page 8
■ “Detecting Faults Using LEDs” on page 34
Rear Panel Diagram
The rear panel provides access to system I/O ports, PCIe ports, Gigabit Ethernet
ports, power supplies, Locator button and LED, and system status LEDs.
FIGURE: Rear Panel Features on page 7 shows rear panel features on the SPARC
Enterprise T5440 server. For more detailed information about ports and their uses,
see the SPARC Enterprise T5440 Server Installation and Setup Guide. For a detailed
description of PCIe slots, see “PCIe Device Identifiers” on page 99.
6 SPARC Enterprise T5440 Server Service Manual • June 2011
Page 29
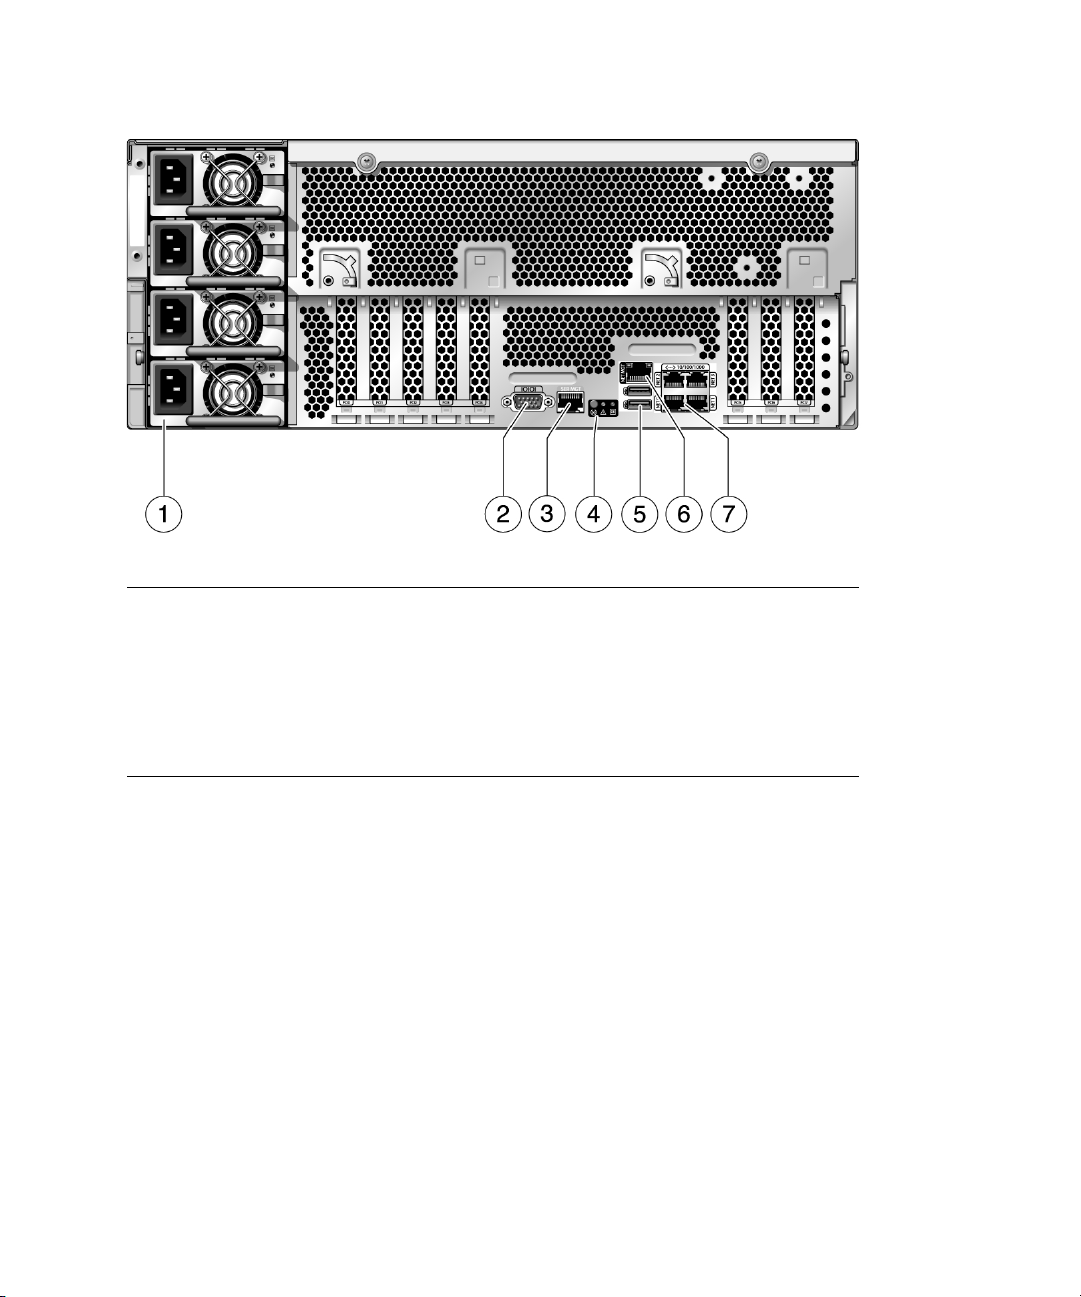
FIGURE: Rear Panel Features
Figure Legend
1 Power supplies
2 Serial port
3 Serial management port
4 System status LEDs
5 USB ports
6 Network management port
7 Gigabit ethernet ports
Related Information
■ “Front Panel Diagram” on page 3
■ “Rear Panel LEDs” on page 8
■ “Ethernet Port LEDs” on page 9
■ “Detecting Faults Using LEDs” on page 34
Identifying Server Components 7
Page 30
Rear Panel LEDs
LED Icon Description
Locator LED
and button
(white)
Service
Required LED
(amber)
Power OK LED
(green)
The Locator LED enables you to find a particular system. The LED is
activated using one of the following methods:
• The ALOM CMT command setlocator on.
• The ILOM command set /SYS/LOCATE value=Fast_Blink
• Manually press the Locator button to toggle the Locator LED on or off.
This LED provides the following indications:
• Off – Normal operating state.
• Fast blink – System received a signal as a result of one of the methods
previously mentioned, indicating that it is active.
If on, indicates that service is required. POST and ILOM are two diagnostics
tools that can detect a fault or failure resulting in this indication.
The ILOM show faulty command provides details about any faults that
cause this indicator to light.
Under some fault conditions, individual component fault LEDs are lit in
addition to the system Service Required LED.
Provides the following indications:
• Off – Indicates that the system is not running in its normal state. System
power might be off. The service processor might be running.
• Steady on – Indicates that the system is powered on and is running in its
normal operating state. No service actions are required.
• Fast blink – Indicates the system is running at a minimum level in standby
and is ready to be quickly returned to full function. The service processor is
running.
• Slow blink – Indicates that a normal transitory activity is taking place. Slow
blinking could indicate the system diagnostics are running, or that the
system is booting.
Related Information
■ “Rear Panel Diagram” on page 6
■ “Ethernet Port LEDs” on page 9
■ “Detecting Faults Using LEDs” on page 34
8 SPARC Enterprise T5440 Server Service Manual • June 2011
Page 31

Ethernet Port LEDs
The service processor network management port and the four 10/100/1000 Mbps
Ethernet ports each have two LEDs.
LED Color Description
Left LED Amber
or
green
Right LED Green Link/Activity indicator:
* The NET MGT port only operates in 100-Mbps or 10-Mbps so the speed indicator LED will be green or off (never
amber).
Related Information
■ “Rear Panel Diagram” on page 6
■ “Rear Panel LEDs” on page 8
■ “Detecting Faults Using LEDs” on page 34
Speed indicator:
• Amber on – The link is operating as a Gigabit connection
(1000-Mbps).
• Green on – The link is operating as a 100-Mbps connection.
• Off – The link is operating as a 10-Mbps connection.
• Steady on – A link is established.
• Blinking – There is activity on this port.
• Off – No link is established.
*
Identifying Server Components 9
Page 32

10 SPARC Enterprise T5440 Server Service Manual • June 2011
Page 33

Managing Faults
These topics describe the diagnostics tools that are available for monitoring and
troubleshooting the server.
These topics are intended for technicians, service personnel, and system
administrators who service and repair computer systems. It contains the following
topics:
■ “Understanding Fault Handling Options” on page 11
■ “Connecting to the Service Processor” on page 25
■ “Displaying FRU Information With ILOM” on page 27
■ “Controlling How POST Runs” on page 29
■ “Detecting Faults” on page 34
■ “Clearing Faults” on page 52
■ “Disabling Faulty Components” on page 55
■ “ILOM-to-ALOM CMT Command Reference” on page 58
Understanding Fault Handling Options
This topic contains the following:
■ “Server Diagnostics Overview” on page 12
■ “Diagnostic Flowchart” on page 13
■ “Options for Accessing the Service Processor” on page 17
■ “ILOM Overview” on page 18
■ “ALOM CMT Compatibility Shell Overview” on page 20
■ “Predictive Self-Healing Overview” on page 20
■ “Oracle VTS Overview” on page 21
■ “POST Fault Management Overview” on page 22
■ “POST Fault Management Flowchart” on page 23
11
Page 34

■ “Memory Fault Handling Overview” on page 24
Server Diagnostics Overview
You can use a variety of diagnostic tools, commands, and indicators to monitor and
troubleshoot a server:
■ LEDs – Provide a quick visual notification of the status of the server and of some
of the FRUs. See “Detecting Faults Using LEDs” on page 34.
■ ILOM firmware – This system firmware runs on the service processor. In addition
to providing the interface between the hardware and OS, ILOM also tracks and
reports the health of key server components. ILOM works closely with POST and
Oracle Solaris Operating System (Oracle Solaris OS) Predictive Self-Healing
technology to keep the system up and running even when there is a faulty
component. See “ILOM Overview” on page 18.
■ Power-on self-test (POST) – POST performs diagnostics on system components
upon system reset to ensure the integrity of those components. POST is
configurable and works with ILOM to take faulty components offline if needed.
See “POST Fault Management Overview” on page 22.
■ Oracle Solaris OS Predictive Self-Healing (PSH) – This technology continuously
monitors the health of the processor and memory, and works with ILOM to take a
faulty component offline if needed. The Predictive Self-Healing technology
enables systems to accurately predict component failures and mitigate many
serious problems before they occur. See “Identifying Faults Detected by PSH” on
page 48.
■ Log files and console messages – Oracle Solaris OS log files and ILOM system
event log can be accessed and displayed on the device of your choice. For more
information, see “Detecting Faults (Oracle Solaris OS Files and Commands)” on
page 39 and “Detecting Faults (ILOM Event Log)” on page 40.
■ Oracle VTS software – The Oracle VTS software exercises the system, provides
hardware validation, and discloses possible faulty components with
recommendations for repair. See “About Oracle VTS Software” on page 42.
The LEDs, ILOM, Oracle Solaris OS PSH, and many of the log files and console
messages are integrated. For example, a fault detected by the Oracle Solaris software
displays the fault, logs it, and passes information to ILOM where it is logged.
Depending on the fault, one or more LEDs might be illuminated.
See TABLE: Diagnostic Flowchart Actions on page 15 and Parameter on page 30 for
an approach for using the server diagnostics to identify a faulty field-replaceable
unit (FRU). The diagnostics you use, and the order in which you use them, depend
on the nature of the problem you are troubleshooting. So you might perform some
actions and not others.
Before referring to the flowchart, perform some basic troubleshooting tasks:
12 SPARC Enterprise T5440 Server Service Manual • June 2011
Page 35

■ Verify that the server was installed properly.
■ Visually inspect cables and power.
■ (Optional) Perform a reset of the server.
Related Information
■ “Diagnostic Flowchart” on page 13
■ SPARC Enterprise T5440 Server Installation and Setup Guide
■ SPARC Enterprise T5440 Server Administration Guide
Diagnostic Flowchart
The following diagnostics are available to troubleshoot faulty hardware. See “Change
POST Parameters” on page 31 for more information about each diagnostic in this
chapter.
Managing Faults 13
Page 36

FIGURE: Diagnostic Flowchart
14 SPARC Enterprise T5440 Server Service Manual • June 2011
Page 37

TAB LE : Diagnostic Flowchart Actions
Action
No. Diagnostic Action Resulting Action For more information
1. Check Power OK
and AC Present
LEDs on the server.
The Power OK LED is located on the front and rear
of the chassis.
The AC Present LED is located on the rear of the
“Detecting Faults” on
page 34
server on each power supply.
If these LEDs are not on, check the power source
and power connections to the server.
2. Run the ILOM
show faulty
command to check
for faults.
The show faulty command displays the following
kinds of faults:
• Environmental faults
• External I/O Expansion Unit faults
“Detect Faults (ILOM show
faulty Command)” on
page 37
• Predictive Self-Healing (PSH) detected faults
• POST-detected faults
Faulty FRUs are identified in fault messages using
the FRU name.
Note - If the ILOM show faulty output includes
an error string such as Ext sensor or Ext FRU, it
indicates a fault in the External I/O Expansion Unit.
3. Check the Oracle
Solaris log files and
ILOM system event
log for fault
information.
The Oracle Solaris log files and the ILOM system
event log record system events, and provide
information about faults.
• Browse the ILOM system event log for major or
critical events. Some problems are logged in the
“Detecting Faults (Oracle
Solaris OS Files and
Commands)” on page 39
event log but not added to the show faulty list
• If system messages indicate a faulty device,
replace the FRU.
• To obtain more diagnostic information, go to
Action No. 4
4. Run Oracle VTS
software.
Oracle VTS is an application you can run to exercise
and diagnose FRUs. To run Oracle VTS, the server
“Detecting Faults (Oracle
VTS Software)” on page 41
must be running the Oracle Solaris OS.
• If Oracle VTS reports a faulty device, replace the
FRU.
• If Oracle VTS does not report a faulty device, go
to Action No. 5.
5. Run POST. POST performs basic tests of the server components
and reports faulty FRUs.
“Detecting Faults Using
POST” on page 46
“Controlling How POST
Runs” on page 29
,
Managing Faults 15
Page 38

TABLE: Diagnostic Flowchart Actions (Continued)
Action
No. Diagnostic Action Resulting Action For more information
6. Determine if the
fault is an
environmental or
configuration
fault.
Determine if the fault is an environmental fault or a
configuration fault.
If the fault listed by the show faulty command
displays a temperature or voltage fault, then the
fault is an environmental fault. Environmental faults
can be caused by faulty FRUs (power supply or fan),
“Detecting Faults (ILOM
show faulty Command)”
on page 36
“Detecting Faults” on
page 34
or by environmental conditions such as when
computer room ambient temperature is too high, or
the server airflow is blocked. When the
environmental condition is corrected, the fault will
automatically clear.
If the fault indicates that a fan or power supply is
bad, you can perform a hot-swap of the FRU. You
can also use the fault LEDs on the server to identify
the faulty FRU (fans and power supplies).
If the FRU displayed by the show faulty
command is /SYS, the fault is a configuration
problem. /SYS indicates no faulty FRU has been
diagnosed, but there is a problem with the system
configuration.
7. Determine if the
fault was detected
in the External I/O
Problems detected in the External I/O Expansion
Unit include the text string Ext FRU or Ext
Sensor at the beginning of the fault description.
“Detecting Faults (ILOM
show faulty Command)”
on page 36
Expansion Unit.
“Clear Faults Detected in
the External I/O Expansion
Unit” on page 55
16 SPARC Enterprise T5440 Server Service Manual • June 2011
Page 39

TAB LE : Diagnostic Flowchart Actions (Continued)
Action
No. Diagnostic Action Resulting Action For more information
8. Determine if the
fault was detected
by PSH.
If the fault displayed included a uuid and
sunw-msg-id property, the fault was detected by the
Predictive Self-Healing software.
“Identifying Faults
Detected by PSH” on
page 48
If the fault is a PSH-detected fault, refer to the PSH
Knowledge Article web site for additional
information. The Knowledge Article for the fault is
“Clear Faults Detected by
PSH” on page 54
located at the following link:
(http://www.sun.com/msg/)message-ID
where message-ID is the value of the sunw-msg-id
property displayed by the show faulty command.
After the FRU is replaced, perform the procedure to
clear PSH-detected faults.
9. Determine if the
fault was detected
by POST.
POST performs basic tests of the server components
and reports faulty FRUs. When POST detects a
faulty FRU, it logs the fault and if possible, takes the
FRU offline. POST detected FRUs display the
following text in the fault message:
“POST Fault Management
Overview” on page 22
“Clear Faults Detected
During POST” on page 52
Forced fail reason
In a POST fault message, reason is the name of the
power-on routine that detected the failure.
10. Contact technical
support.
The majority of hardware faults are detected by the
server’s diagnostics. In rare cases a problem might
“Obtain the Chassis Serial
Number” on page 66
require additional troubleshooting. If you are unable
to determine the cause of the problem, contact your
service representative for support.
Related Information
■ “Server Diagnostics Overview” on page 12
■ SPARC Enterprise T5440 Server Administration Guide
Options for Accessing the Service Processor
There are three methods of interacting with the service processor:
■ Integrated Lights Out Manager (ILOM) shell (default) – Available via the System
Management Port and the Network Management Port.
■ ILOM browser interface (BI) – Documented in the Integrated Lights Out Manager 2.0
User’s Guide.
■ ALOM CMT compatibility shell – Legacy shell emulation of ALOM CMT.
Managing Faults 17
Page 40

The code examples in this document depict use of the ILOM shell.
Note – Multiple service processor accounts can be active concurrently. A user can be
logged in under one account using the ILOM shell, and another account using the
ALOM CMT shell.
Related Information
■ “Diagnostic Flowchart” on page 13
■ SPARC Enterprise T5440 Server Installation and Setup Guide
■ SPARC Enterprise T5440 Server Administration Guide
■ Integrated Lights Out Manager 3.0 Supplement for the SPARC Enterprise T5440 Server
ILOM Overview
The Integrated Lights Out Manager (ILOM) firmware runs on the service processor
in the server, enabling you to remotely manage and administer your server.
ILOM enables you to remotely run diagnostics such as power-on self-test (POST),
that would otherwise require physical proximity to the server’s serial port. You can
also configure ILOM to send email alerts of hardware failures, hardware warnings,
and other events related to the server or to ILOM.
The service processor runs independently of the server, using the server’s standby
power. Therefore, ILOM firmware and software continue to function when the server
OS goes offline or when the server is powered off.
Note – Refer to the Integrated Lights Out Manager 3.0 Concepts Guide for
comprehensive ILOM information.
Faults detected by ILOM, POST, the Predictive Self-Healing (PSH) technology, and
the External IO Expansion Unit (if attached) are forwarded to ILOM for fault
handling (FIGURE: ILOM Fault Management on page 19).
In the event of a system fault, ILOM ensures that the Service Required LED is lit,
FRUID PROMs are updated, the fault is logged, and alerts are displayed. Faulty
FRUs are identified in fault messages using the FRU name.
18 SPARC Enterprise T5440 Server Service Manual • June 2011
Page 41

FIGURE: ILOM Fault Management
The service processor can detect when a fault is no longer present and clears the fault
in several ways:
■ Fault recovery – The system automatically detects that the fault condition is no
longer present. The service processor extinguishes the Service Required LED and
updates the FRU’s PROM, indicating that the fault is no longer present.
■ Fault repair – The fault has been repaired by human intervention. In most cases,
the service processor detects the repair and extinguishes the Service Required
LED. If the service processor does not perform these actions, you must perform
these tasks manually by setting the ILOM component_state or fault_state of the
faulted component.
The service processor can detect the removal of a FRU, in many cases even if the FRU
is removed while the service processor is powered off (for example, if the system
power cables are unplugged during service procedures). This function enables ILOM
to know that a fault, diagnosed to a specific FRU, has been repaired.
Note – ILOM does not automatically detect hard drive replacement.
Many environmental faults can automatically recover. A temperature that is
exceeding a threshold might return to normal limits. An unplugged power supply
can be plugged in, and so on. Recovery of environmental faults is automatically
detected.
Note – No ILOM command is needed to manually repair an environmental fault.
The Predictive Self-Healing technology does not monitor the hard drive for faults. As
a result, the service processor does not recognize hard drive faults, and will not light
the fault LEDs on either the chassis or the hard drive itself. Use the Oracle Solaris
message files to view hard drive faults.
Managing Faults 19
Page 42

Related Information
■ “Diagnostic Flowchart” on page 13
■ “Detecting Faults Using LEDs” on page 34
■ “Detecting Faults (Oracle Solaris OS Files and Commands)” on page 39
■ SPARC Enterprise T5440 Server Installation and Setup Guide
■ SPARC Enterprise T5440 Server Administration Guide
■ Integrated Lights Out Manager 3.0 Supplement for the SPARC Enterprise T5440 Server
ALOM CMT Compatibility Shell Overview
The default shell for the service processor is the ILOM shell. However, you can use
the ALOM CMT compatibility shell to emulate the ALOM CMT interface supported
on the previous generation of CMT servers. Using the ALOM CMT compatibility
shell (with a few exceptions) you can use commands that resemble the commands of
ALOM CMT.
The service processor sends alerts to all ALOM CMT users that are logged in, sends
the alert through email to a configured email address, and writes the event to the
ILOM event log. The ILOM event log is also available using the ALOM CMT
compatibility shell.
See the Integrated Lights Out Manager 3.0 Supplement for the SPARC Enterprise T5440
Server for comparisons between the ILOM CLI and the ALOM CMT compatibility
CLI, and for instructions for adding an ALOM-CMT account.
Related Information
■ “Diagnostic Flowchart” on page 13
■ “Detecting Faults Using LEDs” on page 34
■ “ILOM-to-ALOM CMT Command Reference” on page 58
■ SPARC Enterprise T5440 Server Installation and Setup Guide
■ SPARC Enterprise T5440 Server Administration Guide
■ Integrated Lights Out Manager 3.0 Supplement for the SPARC Enterprise T5440 Server
Predictive Self-Healing Overview
The Predictive Self-Healing (PSH) technology enables the server to diagnose
problems while the Oracle Solaris OS is running, and mitigate many problems before
they negatively affect operations.
20 SPARC Enterprise T5440 Server Service Manual • June 2011
Page 43

The Oracle Solaris OS uses the Fault Manager daemon, fmd (1M), which starts at boot
time and runs in the background to monitor the system. If a component generates an
error, the daemon handles the error by correlating the error with data from previous
errors and other related information to diagnose the problem. Once diagnosed, the
Fault Manager daemon assigns the problem a Universal Unique Identifier (UUID)
that distinguishes the problem across any set of systems. When possible, the Fault
Manager daemon initiates steps to self-heal the failed component and take the
component offline. The daemon also logs the fault to the syslogd daemon and
provides a fault notification with a message ID (MSGID). You can use the message ID
to get additional information about the problem from the knowledge article database.
The Predictive Self-Healing technology covers the following server components:
■ UltraSPARC T2 Plus multicore processor
■ Memory
■ I/O subsystem
The PSH console message provides the following information about each detected
fault:
■ Type
■ Severity
■ Description
■ Automated response
■ Impact
■ Suggested action for system administrator
Related Information
■ “Diagnostic Flowchart” on page 13
■ “Identifying Faults Detected by PSH” on page 48
■ SPARC Enterprise T5440 Server Administration Guide
Oracle VTS Overview
Sometimes a server exhibits a problem that cannot be isolated definitively to a
particular hardware or software component. In such cases, it might be useful to run a
diagnostic tool that stresses the system by continuously running a comprehensive
battery of tests. Oracle VTS software is provided for this purpose.
Related Information
■ “Diagnostic Flowchart” on page 13
Managing Faults 21
Page 44

■ “Oracle VTS Software Packages” on page 45
■ “Useful Oracle VTS Tests” on page 46
■ SPARC Enterprise T5440 Server Administration Guide
POST Fault Management Overview
Power-on self-test (POST) is a group of PROM-based tests that run when the server is
powered on or reset. POST checks the basic integrity of the critical hardware
components in the server (CMP, memory, and I/O subsystem).
POST tests critical hardware components to verify functionality before the system
boots and accesses software. If POST detects a faulty component, the component is
disabled automatically, preventing faulty hardware from potentially harming any
software. If the system is capable of running without the disabled component, the
system will boot when POST is complete. For example, if one of the processor cores
is deemed faulty by POST, the core will be disabled. The system will boot and run
using the remaining cores.
You can use POST as an initial diagnostic tool for the system hardware. In this case,
configure POST to run in maximum mode (diag_mode=service, setkeyswitch=
diag, diag_level=max) for thorough test coverage and verbose output.
22 SPARC Enterprise T5440 Server Service Manual • June 2011
Page 45

POST Fault Management Flowchart
FIGURE: Flowchart of Variables for POST Configuration
Related Information
■ “Diagnostic Flowchart” on page 13
Managing Faults 23
Page 46

■ “Detecting Faults Using POST” on page 46
■ SPARC Enterprise T5440 Server Installation and Setup Guide
■ SPARC Enterprise T5440 Server Administration Guide
Memory Fault Handling Overview
A variety of features plays a role in how the memory subsystem is configured and
how memory faults are handled. Understanding the underlying features helps you
identify and repair memory problems. This section describes how the server deals
with memory faults.
Note – For memory configuration information, see “FB-DIMM Configuration” on
page 113.
The server uses advanced ECC technology that corrects up to 4-bits in error on nibble
boundaries, as long as the bits are all in the same DRAM. On 4 GB FB-DIMMs, if a
DRAM fails, the DIMM continues to function.
The following server features independently manage memory faults:
■ POST – Based on ILOM configuration variables, POST runs when the server is
powered on.
For correctable memory errors (CEs), POST forwards the error to the Predictive
Self-Healing (PSH) daemon for error handling. If an uncorrectable memory fault is
detected, POST displays the fault with the device name of the faulty FB-DIMMs,
and logs the fault. POST then disables the faulty FB-DIMMs. Depending on the
memory configuration and the location of the faulty FB-DIMM, POST disables half
of physical memory in the system, or half the physical memory and half the
processor threads. When this offlining process occurs in normal operation, you
must replace the faulty FB-DIMMs based on the fault message and enable the
disabled FB-DIMMs with the ILOM command set device component_state=
enabled where device is the name of the FB-DIMM being enabled (for example,
set /SYS/MB/CPU0/CMP0/BR0/CH0/D0 component_state=enabled).
■ Predictive Self-Healing (PSH) technology – A feature of the Oracle Solaris OS, PSH
uses the Fault Manager daemon (fmd) to watch for various kinds of faults. When
a fault occurs, the fault is assigned a unique fault ID (UUID), and logged. PSH
reports the fault and identifies the locations of the faulty FB-DIMMs.
If you suspect that the server has a memory problem, follow the flowchart (see
FIGURE: Diagnostic Flowchart on page 14). Run the ILOM show faulty command.
The show faulty command lists memory faults and lists the specific FB-DIMMs
that are associated with the fault.
24 SPARC Enterprise T5440 Server Service Manual • June 2011
Page 47

Note – You can use the FB-DIMM DIAG buttons on the CMP module and memory
module to identify faulty FB-DIMMs. See “FB-DIMM Fault Button Locations” on
page 117.
Once you identify which FB-DIMMs you want to replace, see “Servicing FB-DIMMs”
on page 108 for FB-DIMM removal and replacement instructions. You must perform
the instructions in that section to clear the faults and enable the replaced FB-DIMMs.
Related Information
■ “POST Parameters” on page 30
■ “Displaying FRU Information With ILOM” on page 27
■ “Detecting Faults” on page 34
■ “Servicing FB-DIMMs” on page 108
Connecting to the Service Processor
Before you can run ILOM commands, you must connect to the service processor.
There are several ways to connect to the service processor.
Top ic Li nks
Connect an ASCII terminal directly to the
serial management port.
Use the ssh command to connect to service
processor through an Ethernet connection
on the network management port.
Switch from the system console to the
service processor
Switch from the service processor to the
system console
SPARC Enterprise T5440 Server Installation
and Setup Guide
SPARC Enterprise T5440 Server Installation
and Setup Guide
“Switch From the System Console to the
Service Processor (ILOM or ALOM CMT
Compatibility Shell)” on page 26
“Switch From ILOM to the System Console”
on page 26
“Switch From the ALOM CMT
Compatibility Shell to the System Console”
on page 26
Related Information
■ “Diagnostic Flowchart” on page 13
Managing Faults 25
Page 48

■ “Switch From the System Console to the Service Processor (ILOM or ALOM CMT
Compatibility Shell)” on page 26
■ “Switch From ILOM to the System Console” on page 26
■ “Switch From the ALOM CMT Compatibility Shell to the System Console” on
page 26
■ SPARC Enterprise T5440 Server Installation and Setup Guide
■ SPARC Enterprise T5440 Server Administration Guide
▼ Switch From the System Console to the Service
Processor (ILOM or ALOM CMT Compatibility
Shell)
● To switch from the system console to the service processor prompt, type #.
(Hash-Period).
# #.
->
▼ Switch From ILOM to the System Console
● From the ILOM -> prompt, type start /SP/console.
-> start /SP/console
#
▼ Switch From the ALOM CMT Compatibility
Shell to the System Console
● From the ALOM-CMT sc> prompt, type console.
sc> console
#
26 SPARC Enterprise T5440 Server Service Manual • June 2011
Page 49

Displaying FRU Information With ILOM
■ “Display System Components (ILOM show components Command)” on page 27
■ “Display Individual Component Information (ILOM show Command)” on page 28
▼ Display System Components (ILOM show
components Command)
The show components command displays the system components (asrkeys) and
reports their status.
● At the -> prompt, type the show components command.
The examples below show two possibilities.
Managing Faults 27
Page 50

EXAMPLE: Output of the show components Command With No Disabled Components
-> show components
Target | Property | Value
--------------------+------------------------+------------------------------/SYS/MB/PCIE0 | component_state | Enabled
/SYS/MB/PCIE3/ | component_state | Enabled
/SYS/MB/PCIE1/ | component_state | Enabled
/SYS/MB/PCIE4/ | component_state | Enabled
/SYS/MB/PCIE2/ | component_state | Enabled
/SYS/MB/PCIE5/ | component_state | Enabled
/SYS/MB/NET0 | component_state | Enabled
/SYS/MB/NET1 | component_state | Enabled
/SYS/MB/NET2 | component_state | Enabled
/SYS/MB/NET3 | component_state | Enabled
/SYS/MB/PCIE | component_state | Enabled
EXAMPLE: Output of the show components Command Showing Disabled Components
-> show components
Target | Property | Value
--------------------+------------------------+------------------------------/SYS/MB/PCIE0/ | component_state | Enabled
/SYS/MB/PCIE3/ | component_state | Disabled
/SYS/MB/PCIE1/ | component_state | Enabled
/SYS/MB/PCIE4/ | component_state | Enabled
/SYS/MB/PCIE2/ | component_state | Enabled
/SYS/MB/PCIE5/ | component_state | Enabled
/SYS/MB/NET0 | component_state | Enabled
/SYS/MB/NET1 | component_state | Enabled
/SYS/MB/NET2 | component_state | Enabled
/SYS/MB/NET3 | component_state | Enabled
/SYS/MB/PCIE | component_state | Enabled
▼ Display Individual Component Information
(ILOM show Command)
Use the show command to display information about individual components in the
server.
● At the -> prompt, enter the show command.
In EXAMPLE: show Command Output on page 29, the show command is used to
get information about a memory module (FB-DIMM).
28 SPARC Enterprise T5440 Server Service Manual • June 2011
Page 51

EXAMPLE: show Command Output
-> show /SYS/MB/CPU0/CMP0/BR1/CH0/D0
/SYS/MB/CPU0/CMP0/BR1/CH0/D0
Targets:
R0
R1
SEEPROM
SERVICE
PRSNT
T_AMB
Properties:
type = DIMM
component_state = Enabled
fru_name = 1024MB DDR2 SDRAM FB-DIMM 333 (PC2 5300)
fru_description = FBDIMM 1024 Mbyte
fru_manufacturer = Micron Technology
fru_version = FFFFFF
fru_part_number = 18HF12872FD667D6D4
fru_serial_number = d81813ce
fault_state = OK
clear_fault_action = (none)
Commands:
cd
show
Controlling How POST Runs
This topic contains the following:
■ “POST Parameters” on page 30
■ “Change POST Parameters” on page 31
■ “Run POST in Maximum Mode” on page 32
Managing Faults 29
Page 52

POST Parameters
The server can be configured for normal, extensive, or no POST execution. You can
also control the level of tests that run, the amount of POST output that is displayed,
and which reset events trigger POST by using ILOM command variables.
The keyswitch_state parameter, when set to diag, overrides all the other ILOM
POST variables.
The following table lists the ILOM variables used to configure POST. “POST Fault
Management Flowchart” on page 23 shows how the variables work together.
Parameter Values Description
keyswitch_mode normal The system can power on and run POST (based
on the other parameter settings). For details see
FIGURE: Flowchart of Variables for POST
Configuration on page 23. This parameter
overrides all other commands.
diag The system runs POST based on predetermined
settings.
stby The system cannot power on.
locked The system can power on and run POST, but no
flash updates can be made.
diag_mode off POST does not run.
normal Runs POST according to diag_level value.
service Runs POST with preset values for diag_level
and diag_verbosity.
diag_level max If diag_mode = normal, runs all the minimum
tests plus extensive processor and memory tests.
min If diag_mode = normal, runs minimum set of
tests.
diag_trigger none Does not run POST on reset.
user_reset Runs POST upon user initiated resets.
power_on_reset Only runs POST for the first power on. This
option is the default.
error_reset Runs POST if fatal errors are detected.
all_resets Runs POST after any reset.
diag_verbosity none No POST output is displayed.
min POST output displays functional tests with a
banner and pinwheel.
30 SPARC Enterprise T5440 Server Service Manual • June 2011
Page 53

Parameter Values Description
normal POST output displays all test and informational
messages.
max POST displays all test, informational, and some
debugging messages.
Related Information
■ “Diagnostic Flowchart” on page 13
■ “Change POST Parameters” on page 31
■ “Run POST in Maximum Mode” on page 32
■ “Detecting Faults Using POST” on page 46
■ “Clear Faults Detected During POST” on page 52
■ SPARC Enterprise T5440 Server Installation and Setup Guide
■ SPARC Enterprise T5440 Server Administration Guide
▼ Change POST Parameters
1. Access the ILOM prompt.
See “Connecting to the Service Processor” on page 25.
2. Use the ILOM commands to change the POST parameters.
Refer to Component Fault on page 35 for a list of ILOM POST parameters and
their values.
The set /SYS keyswitch_state command sets the virtual keyswitch
parameter. For example:
-> set /SYS keyswitch_state=Diag
Set ‘keyswitch_state’ to ‘Diag’
To change individual POST parameters, you must first set the keyswitch_state
parameter to normal. For example:
-> set /SYS keyswitch_state=Normal
Set ‘ketswitch_state’ to ‘Normal’
-> set /HOST/diag property=Min
Managing Faults 31
Page 54

▼ Run POST in Maximum Mode
This procedure describes how to run POST when you want maximum testing, as in
the case when you are troubleshooting a server, or verifying a hardware upgrade or
repair.
1. Access the ILOM prompt.
See “Connecting to the Service Processor” on page 25.
2. Set the virtual keyswitch to diag so that POST will run in service mode.
-> set /SYS/keyswitch_state=Diag
Set ‘keyswitch_state’ to ‘Diag’
3. Reset the system so that POST runs.
There are several ways to initiate a reset. EXAMPLE: show Command Output on
page 33 shows a reset using a power cycle command sequence. For other methods,
refer to the SPARC Enterprise T5440 Server Administration Guide.
Note – The server takes about one minute to power off. Use the show /HOST
command to determine when the host has been powered off. The console will display
status=Powered Off
4. Switch to the system console to view the POST output:
-> start /SP/console
If no faults were detected, the system will boot.
EXAMPLE: show Command Output on page 33 depicts abridged POST output.
32 SPARC Enterprise T5440 Server Service Manual • June 2011
Page 55

EXAMPLE: show Command Output
-> stop /SYS
Are you sure you want to stop /SYS (y/n)? y
Stopping /SYS
-> start /SYS
Are you sure you want to start /SYS (y/n)? y
Starting /SYS
EXAMPLE: show Command Output
-> start /SP/console
...
2007-12-19 22:01:17.810 0:0:0>INFO: STATUS: Running RGMII 1G
BCM5466R PHY level Loopback Test
2007-12-19 22:01:22.534 0:0:0>End : Neptune 1G Loopback Test Port 2
2007-12-19 22:01:22.553 0:0:0>
2007-12-19 22:01:22.542 0:0:0>Begin: Neptune 1G Loopback Test Port 3
2007-12-19 22:01:22.556 0:0:0>INFO: STATUS: Running BMAC level
Loopback Test
2007-12-19 22:01:32.004 0:0:0>End : Neptune 1G Loopback Test Port 3
Enter #. to return to ALOM.
2007-12-19 22:01:27.271 0:0:0>
2007-12-19 22:01:32.012 0:0:0>INFO:
2007-12-19 22:01:32.019 0:0:0>POST Passed all devices.
2007-12-19 22:01:27.274 0:0:0>INFO: STATUS: Running RGMII 1G
BCM5466R PHY level Loopback Test
2007-12-19 22:01:32.036 0:0:0>Master set ACK for vbsc runpost
command and spin...
T5440, No Keyboard
OpenBoot ..., 7968 MB memory available, Serial #75916434.
[stacie obp #0]
{0} ok
2007-12-19 22:01:32.028 0:0:0>POST:Return to VBSC.
Ethernet address 0:14:4f:86:64:92, Host ID: xxxxx
Managing Faults 33
Page 56

Detecting Faults
This section describes the different methods you can use to identify system faults in
the server.
Task Topic
Use front panel and back panel LEDs to
identify system faults.
Use the ILOM show faulty command to
detect faults.
Use Oracle Solaris OS files and commands
to detect faults.
Use the ILOM event log to detect faults. “Detecting Faults (ILOM Event Log)” on
Use POST to identify faults. “Detecting Faults Using POST” on page 46
Use Predictive Self-Healing (PSH) to
identify faults.
Detecting Faults Using LEDs
The server provides the following groups of LEDs:
■ Front panel system LEDs. See “Front Panel LEDs” on page 5.
■ Rear panel system LEDs. See “Rear Panel LEDs” on page 8.
■ Hard drive LEDs. See “Hard Drive LEDs” on page 84.
■ Power supply LEDs. See “Power Supply LED” on page 95.
■ Fan tray LEDs. See “Fan Tray Fault LED” on page 89.
■ Rear panel Ethernet port LEDs. See “Ethernet Port LEDs” on page 9.
■ CMP module or memory module LEDs. See “Servicing CMP/Memory Modules”
on page 102
■ FB-DIMM Fault LEDs. See “FB-DIMM Fault Button Locations” on page 117.
“Detecting Faults Using LEDs” on page 34
“Detecting Faults (ILOM show faulty
Command)” on page 36
“Detecting Faults (Oracle Solaris OS Files and
Commands)” on page 39
page 40
“Identifying Faults Detected by PSH” on
page 48
These LEDs provide a quick visual check of the state of the system.
34 SPARC Enterprise T5440 Server Service Manual • June 2011
Page 57

The following table describes which fault LEDs are lit under given error conditions.
Use the ILOM show faulty command to obtain more information about the nature
of a given fault. See “Detect Faults (ILOM show faulty Command)” on page 37.
Component Fault Fault LEDs Lit Additional Information
Power supply • Service Required LED (front and rear
panel)
• Front panel Power Supply Fault LED
• Individual power supply Fault LED
Fan tray • Service Required LED (front and rear
panel)
• Front panel Fan Fault LED
• Individual fan tray Fault LED
• Overtemp LED (if overtemp condition
exists)
Hard drive • Service Required LED (front and rear
panel)
• Individual hard drive Fault LED
CMP module
or memory
module
FB-DIMM • Service Required LED (front and rear
Other
components
• Service Required LED (front and rear
panel)
• CMP Module Fault LED or Memory
Module Fault LED
panel)
• CMP Module Fault LED or Memory
Module Fault LED
• FB-DIMM Fault LED (CMP and
memory modules) (when FB-DIMM
Locate button is pressed)
• Service Required LED (front and rear
panel)
• “Front Panel LEDs” on page 5
• “Rear Panel LEDs” on page 8
• “Power Supply LED” on page 95
• “Servicing Power Supplies” on page 89
• “Front Panel LEDs” on page 5
• “Rear Panel LEDs” on page 8
• “Fan Tray Fault LED” on page 89
• “Servicing Fan Trays” on page 84
See these sections:
• “Front Panel LEDs” on page 5
• “Rear Panel LEDs” on page 8
• “Hard Drive LEDs” on page 84
• “Servicing Hard Drives” on page 76
A lit CMP module or memory module fault LED
might indicate a problem with an FB-DIMM
installed on the CMP module, or a problem with
the CMP module itself.
See these sections:
• “Front Panel LEDs” on page 5
• “Rear Panel LEDs” on page 8
• “Servicing CMP/Memory Modules” on page 102
• “Servicing FB-DIMMs” on page 108
See these sections:
• “Front Panel LEDs” on page 5
• “Rear Panel LEDs” on page 8
• “Servicing FB-DIMMs” on page 108
• “FB-DIMM Fault Button Locations” on page 117
Not all components have an individual component
Fault LED. If the Service Required LED is lit, use
the show faulty command to obtain additional
information about the component affected. See
these sections:
• “Front Panel LEDs” on page 5
• “Rear Panel LEDs” on page 8
Managing Faults 35
Page 58

Related Information
■ “Diagnostic Flowchart” on page 13
■ “Detecting Faults Using LEDs” on page 34
■ “ILOM-to-ALOM CMT Command Reference” on page 58
■ SPARC Enterprise T5440 Server Installation and Setup Guide
■ SPARC Enterprise T5440 Server Administration Guide
■ Integrated Lights Out Manager 3.0 Supplement for the SPARC Enterprise T5440 Server
Detecting Faults (ILOM show faulty Command)
Use the ILOM show faulty command to display the following kinds of faults:
■ Environmental or configuration faults – System configuration faults. Or
temperature or voltage problems that might be caused by faulty FRUs (power
supplies, fans, or blower), or by room temperature or blocked air flow to the
server.
■ POST-detected faults – Faults on devices detected by the POST diagnostics.
■ PSH-detected faults – Faults detected by the Predictive Self-Healing (PSH)
technology.
■ External I/O Expansion Unit faults – Faults detected in the optional External I/O
Expansion Unit.Þ
Use the show faulty command for the following reasons:
■ To see if any faults have been diagnosed in the system.
■ To verify that the replacement of a FRU has cleared the fault and not generated
any additional faults.
Related Information
■ “Diagnostic Flowchart” on page 13
■ “Detecting Faults Using LEDs” on page 34
■ “ILOM-to-ALOM CMT Command Reference” on page 58
■ SPARC Enterprise T5440 Server Installation and Setup Guide
■ SPARC Enterprise T5440 Server Administration Guide
■ Integrated Lights Out Manager 3.0 Supplement for the SPARC Enterprise T5440 Server
36 SPARC Enterprise T5440 Server Service Manual • June 2011
Page 59

▼ Detect Faults (ILOM show faulty Command)
● At the -> prompt, type the show faulty command.
The following show faulty command examples show the different kinds of
output from the show faulty command:
■ Example of the show faulty command when no faults are present:
-> show faulty
Target | Property | Value
--------------------+------------------------+-------------------------------
-----------------------------------------------------------------------------
■ Example of the show faulty command displaying an environmental fault:
-> show faulty
Target | Property | Value
--------------------+------------------------+------------------------------/SP/faultmgmt/0 | fru | /SYS/MB/FT1
/SP/faultmgmt/0 | timestamp | Dec 14 23:01:32
/SP/faultmgmt/0/ | timestamp | Dec 14 23:01:32 faults/0
/SP/faultmgmt/0/ | sp_detected_fault | TACH at /SYS/MB/FT1 has
faults/0 | | exceeded low non-recoverable
| | threshold.
■ Example of the show faulty command displaying a configuration fault:
-> show faulty
Target | Property | Value
------------------+----------------------+----------------------------------/SP/faultmgmt/0 | fru | /SYS
/SP/faultmgmt/0 | timestamp | Mar 17 08:17:45
/SP/faultmgmt/0/ | timestamp | Mar 17 08:17:45
faults/0 | |
/SP/faultmgmt/0/ | sp_detected_fault | At least 2 power supplies must
faults/0 | | have AC power
Note – Environmental and configuration faults automatically clear when the
environmental condition returns to the normal range of when the configuration fault
is addressed.
Managing Faults 37
Page 60

■ Example showing a fault that was detected by the PSH technology. These kinds
of faults are distinguished from other kinds of faults by the presence of a
sunw-msg-id and by a UUID.
-> show faulty
Target | Property | Value
--------------------+------------------------+-------------------------------/SP/faultmgmt/0 | fru | /SYS/MB/MEM0/CMP0/BR1/CH1/D1
/SP/faultmgmt/0 | timestamp | Dec 14 22:43:59
/SP/faultmgmt/0/ | sunw-msg-id | SUN4V-8000-DX
faults/0 | |
/SP/faultmgmt/0/ | uuid | 3aa7c854-9667-e176-efe5-e487e520
faults/0 | | 7a8a
/SP/faultmgmt/0/ | timestamp | Dec 14 22:43:59
faults/0 | |
■ Example showing a fault that was detected by POST. These kinds of faults are
identified by the message Forced fail reason where reason is the name of the
power-on routine that detected the failure.
-> show faulty
Target | Property | Value
--------------------+------------------------+--------------------------------
/SP/faultmgmt/0 | fru | /SYS/MB/CPU0/CMP0/BR1/CH0/D0
/SP/faultmgmt/0 | timestamp | Dec 21 16:40:56
/SP/faultmgmt/0/ | timestamp | Dec 21 16:40:56
faults/0 | |
/SP/faultmgmt/0/ | sp_detected_fault | /SYS/MB/CPU0/CMP0/CMP0/BR1/CH0/D0
faults/0 | Forced fail(POST)
■ Example showing a fault in the External I/O Expansion Unit. These faults can
be identified by the text string Ext FRU or Ext sensor at the beginning of the
fault description.
The text string Ext FRU indicates that the specified FRU is faulty and should
be replaced. The text string Ext sensor indicates that the specified FRU
contains the sensor that detected the problem. In this case, the specified FRU
may not be faulty. Contact service support to isolate the problem.
-> show faulty
Target | Property | Value
--------------------+------------------------+-------------------------------/SP/faultmgmt/0 | fru | /SYS/IOX@X0TC/IOB1/LINK
/SP/faultmgmt/0 | timestamp | Feb 05 18:28:20
/SP/faultmgmt/0/ | timestamp | Feb 05 18:28:20
38 SPARC Enterprise T5440 Server Service Manual • June 2011
Page 61

faults/0 | |
/SP/faultmgmt/0/ | sp_detected_fault | Ext FRU /SYS/IOX@X0TC/IOB1/LINK
faults/0 | | SIGCON=0 I2C no device response
Detecting Faults (Oracle Solaris OS Files and Commands)
With the Oracle Solaris OS running on the server, you have the full complement of
Oracle Solaris OS files and commands available for collecting information and for
troubleshooting.
If POST, ILOM, or the Oracle Solaris PSH features do not indicate the source of a
fault, check the message buffer and log files for notifications for faults. Hard drive
faults are usually captured by the Oracle Solaris message files.
Use the dmesg command to view the most recent system message. To view the
system messages log file, view the contents of the /var/adm/messages file.
Related Information
■ “Diagnostic Flowchart” on page 13
■ “Detecting Faults Using LEDs” on page 34
■ “ILOM-to-ALOM CMT Command Reference” on page 58
■ SPARC Enterprise T5440 Server Installation and Setup Guide
■ SPARC Enterprise T5440 Server Administration Guide
■ Integrated Lights Out Manager 3.0 Supplement for the SPARC Enterprise T5440 Server
▼ Check the Message Buffer
1. Log in as superuser.
2. Issue the dmesg command:
# dmesg
The dmesg command displays the most recent messages generated by the system.
Managing Faults 39
Page 62

▼ View System Message Log Files
The error logging daemon, syslogd, automatically records various system warnings,
errors, and faults in message files. These messages can alert you to system problems
such as a device that is about to fail.
The /var/adm directory contains several message files. The most recent messages
are in the /var/adm/messages file. After a period of time (usually every week), a
new messages file is automatically created. The original contents of the messages
file are rotated to a file named messages.1. Over a period of time, the messages are
further rotated to messages.2 and messages.3, and then deleted.
1. Log in as superuser.
2. Type the following command:
# more /var/adm/messages
3. If you want to view all logged messages, type the following command:
# more /var/adm/messages*
Detecting Faults (ILOM Event Log)
Certain problems are recorded in the ILOM event log but not posted to the list of
faults displayed by the ILOM show faulty command. Inspect the ILOM event log
if you suspect a problem, but no entry appears in the ILOM show faulty command
output.
Related Information
■ “Diagnostic Flowchart” on page 13
■ “View ILOM Event Log” on page 41
■ “ILOM-to-ALOM CMT Command Reference” on page 58
■ SPARC Enterprise T5440 Server Installation and Setup Guide
■ SPARC Enterprise T5440 Server Administration Guide
■ Integrated Lights Out Manager 3.0 Supplement for the SPARC Enterprise T5440 Server
40 SPARC Enterprise T5440 Server Service Manual • June 2011
Page 63

▼ View ILOM Event Log
● Type the following command:
-> show /SP/logs/event/list
Note – The ILOM event log can also be viewed through the ILOM BUI or the ALOM
CMT CLI.
If a “major” or “critical” event is found that was not expected and not included
under ILOM show faulty than it may indicate a system fault. The following is an
example of unexpected major events in the log.
-> show /sp/logs/event/list
1626 Fri Feb 15 18:57:29 2008 Chassis Log major
Feb 15 18:57:29 ERROR: [CMP0 ] Only 4 cores, up to 32 cpus are
configured because some L2_BANKS are unusable
1625 Fri Feb 15 18:57:28 2008 Chassis Log major
Feb 15 18:57:28 ERROR: System DRAM Available: 004096 MB
1624 Fri Feb 15 18:57:28 2008 Chassis Log major
Feb 15 18:57:28 ERROR: [CMP1 ] memc_1_1 unused because associated
L2 banks on CMP0 cannot be used
1623 Fri Feb 15 18:57:27 2008 Chassis Log major
Feb 15 18:57:27 ERROR: Degraded configuration: system operating at
reduced capacity
1622 Fri Feb 15 18:57:27 2008 Chassis Log major
Feb 15 18:57:27 ERROR: [CMP0] /MB/CPU0/CMP0/BR1 neither channel
populated with DIMM0 Branch 1 not configured
Detecting Faults (Oracle VTS Software)
This topic includes the following:
■ “About Oracle VTS Software” on page 42
■ “Verify Installation of Oracle VTS Software” on page 42
■ “Start the Oracle VTS Browser Environment” on page 43
■ “Oracle VTS Software Packages” on page 45
■ “Useful Oracle VTS Tests” on page 46
Managing Faults 41
Page 64

About Oracle VTS Software
The Oracle VTS software features a Java-based browser environment, an ASCII-based
screen interface, and a command-line interface. For more information about how to
use the Oracle VTS software, see the Oracle VTS 7.0 User’s Guide.
The Oracle Solaris OS must be running in order to use the Oracle VTS software. You
also must ensure that the Oracle VTS validation test software is installed on your
system.
This section describes the tasks necessary to use Oracle VTS software to exercise your
server.
Related Information
■ “Diagnostic Flowchart” on page 13
■ “Verify Installation of Oracle VTS Software” on page 42
■ “Start the Oracle VTS Browser Environment” on page 43
■ “Oracle VTS Software Packages” on page 45
■ “Useful Oracle VTS Tests” on page 46
▼ Verify Installation of Oracle VTS Software
To perform this procedure, the Oracle Solaris OS must be running on the server, and
you must have access to the Oracle Solaris command line.
Note – The Oracle VTS 7.0 software, and future compatible versions, are supported
on the server.
The Oracle VTS installation process requires that you specify one of two security
schemes to use when running Oracle VTS. The security scheme you choose must be
properly configured in the Oracle Solaris OS for you to run the Oracle VTS software.
For details, refer to the Oracle VTS User’s Guide.
1. Check for the presence of Oracle VTS packages using the pkginfo command.
% pkginfo -l SUNWvts SUNWvtsmn SUNWvtsr SUNWvtss SUNWvtsts
■ If the Oracle VTS software is installed, information about the packages is
displayed.
42 SPARC Enterprise T5440 Server Service Manual • June 2011
Page 65

■ If the Oracle VTS software is not installed, you see an error message for each
missing package, as in EXAMPLE: show Command Output on page 43.
See “Oracle VTS Overview” on page 21 for a list of required Oracle VTS software
packages.
2. If the Oracle VTS software is not installed, you can obtain the installation
packages from the following places:
■ Oracle Solaris Operating System DVDs
■ Download from the web. Refer to the Preface for information on how to access
the web site.
EXAMPLE: show Command Output
ERROR: information for "SUNWvts" was not found
ERROR: information for "SUNWvtsr" was not found
...
▼ Start the Oracle VTS Browser Environment
For information about test options and prerequisites, refer to the Oracle VTS 7.0
User’s Guide.
Note – Oracle VTS software can be run in several modes. You must perform this
procedure using the default mode.
1. Start the Oracle VTS agent and Javabridge on the server.
# cd /usr/Oracle VTS/bin
# ./startOracle VTS
2. At the interface prompt, choose C to start the Oracle VTS client.
3. Start the Oracle VTS browser environment from a web browser on the client
system. Type https://server-name:6789.
The Oracle VTS browser environment is displayed.
Managing Faults 43
Page 66

4. (Optional) Select the test categories you want to run.
Certain test categories are enabled by default. You can choose to accept these.
Note – Oracle VTS Tests on page 46 lists test categories that are especially useful to
run on this server.
5. (Optional) Customize individual tests.
Click on the name of the test to select and customize individual tests.
Tip – Use the System Excerciser – High Stress Mode to test system operations. Use
the Component Stress – High setting for the highest stress possible.
6. Start testing.
Click the Start Tests button. Status and error messages appear in the test messages
area located across the bottom of the window. You can stop testing at any time by
clicking the Stop button.
During testing, the Oracle VTS software logs all status and error messages. To
view these messages, click the Logs tab. You can choose to view the following
logs:
■ Tes t Er ro r – Detailed error messages from individual tests.
44 SPARC Enterprise T5440 Server Service Manual • June 2011
Page 67

■ Oracle VTS Test Kernel (Vtsk) Error – Error messages pertaining to the Oracle
VTS software itself. Look here if the Oracle VTS software appears to be acting
strangely, especially when it starts up.
■ Information – Detailed versions of all the status and error messages that appear
in the test messages area.
■ Oracle Solaris OS Messages (/var/adm/messages) – A file containing
messages generated by the operating system and various applications.
■ Test Messages (/var/Oracle VTS/logs/Oracle VTS.info) – A directory
containing the Oracle VTS log files.
Oracle VTS Software Packages
Package Description
SUNWvts Test development library APIs and Oracle VTS kernel. You must
install this package to run the Oracle VTS software.
SUNWvtsmn Man pages for the Oracle VTS utilities, including the command-line
utility.
SUNWvtsr Oracle VTS framework (root)
SUNWvtss Oracle VTS browser user interface (BUI) components required on
the server system.
SUNWvtsts Oracle VTS test binaries
Related Information
■ “Diagnostic Flowchart” on page 13
■ “Useful Oracle VTS Tests” on page 46
■ SPARC Enterprise T5440 Server Installation and Setup Guide
■ SPARC Enterprise T5440 Server Administration Guide
Managing Faults 45
Page 68

Useful Oracle VTS Tests
Oracle VTS Tests FRUs Exercised by Tests
Memory Test FB-DIMMs
Processor Test CMP, motherboard
Disk Test Disks, cables, disk backplane, DVD drive
Network Test Network interface, network cable, CMP,
motherboard
Interconnect Test Board ASICs and interconnects
IO Ports Test I/O (serial port interface), USB subsystem
Environmental Test Motherboard and service processor
Related Information
■ “Diagnostic Flowchart” on page 13
■ “Oracle VTS Software Packages” on page 45
■ SPARC Enterprise T5440 Server Installation and Setup Guide
■ SPARC Enterprise T5440 Server Administration Guide
Detecting Faults Using POST
Run POST in maximum mode to detect system faults. See “Run POST in Maximum
Mode” on page 32.
POST error messages use the following syntax:
c:s > ERROR: TEST = failing-test
c:s > H/W under test = FRU
c:s > Repair Instructions: Replace items in order listed by H/W under
test above
c:s > MSG = test-error-message
c:s > END_ERROR
In this syntax, c = the core number, s = the strand number.
Warning and informational messages use the following syntax:
INFO or WARNING: message
46 SPARC Enterprise T5440 Server Service Manual • June 2011
Page 69

In the following example, POST reports a memory error at FB-DIMM location
/SYS/MB/CPU0/CMP0/BR1/CH0/D0. The error was detected by POST running on
core 7, strand 2.
EXAMPLE: show Command Output
7:2>
7:2>ERROR: TEST = Data Bitwalk
7:2>H/W under test = /SYS/MB/CPU0/CMP0/BR1/CH0/D0
7:2>Repair Instructions: Replace items in order listed by 'H/W
under test' above.
7:2>MSG = Pin 149 failed on /SYS/MB/CPU0/CMP0/BR1/CH0/D0 (J792)
7:2>END_ERROR
7:2>Decode of Dram Error Log Reg Channel 2 bits
60000000.0000108c
7:2> 1 MEC 62 R/W1C Multiple corrected
errors, one or more CE not logged
7:2> 1 DAC 61 R/W1C Set to 1 if the error
was a DRAM access CE
7:2> 108c SYND 15:0 RW ECC syndrome.
7:2>
7:2> Dram Error AFAR channel 2 = 00000000.00000000
7:2> L2 AFAR channel 2 = 00000000.00000000
Perform further investigation if needed.
■ If POST detects a faulty device, the fault is displayed and the fault information is
passed to the service processor for fault handling. Faulty FRUs are identified in
fault messages using the FRU name.
■ The fault is captured by the service processor, where the fault is logged, the
Service Required LED is lit, and the faulty component is disabled. See EXAMPLE:
Fault Detected by POST on page 54.
■ Run the ILOM show faulty command to obtain additional fault information.
In this example, /SYS/MB/CPU0/CMP0/BR1/CH0/D0 is disabled. The system can
boot using memory that was not disabled until the faulty component is replaced.
Note – You can use ASR commands to display and control disabled components. See
“Disabling Faulty Components” on page 55.
Related Information
■ “Diagnostic Flowchart” on page 13
■ “POST Fault Management Overview” on page 22
Managing Faults 47
Page 70

■ “POST Fault Management Flowchart” on page 23
■ SPARC Enterprise T5440 Server Administration Guide
Identifying Faults Detected by PSH
When a PSH fault is detected, a Oracle Solaris console message is displayed, similar
to the following example.
EXAMPLE: Console Message Showing Fault Detected by PSH
SUNW-MSG-ID: SUN4V-8000-DX, TYPE: Fault, VER: 1, SEVERITY: Minor
EVENT-TIME: Wed Sep 14 10:09:46 EDT 2005
PLATFORM: SUNW,system_name, CSN: -, HOSTNAME: wgs48-37
SOURCE: cpumem-diagnosis, REV: 1.5
EVENT-ID: f92e9fbe-735e-c218-cf87-9e1720a28004
DESC: The number of errors associated with this memory module has exceeded
acceptable levels. Refer to http://sun.com/msg/SUN4V-8000-DX for more
information.
AUTO-RESPONSE: Pages of memory associated with this memory module are being
removed from service as errors are reported.
IMPACT: Total system memory capacity will be reduced as pages are retired.
REC-ACTION: Schedule a repair procedure to replace the affected memory module.
Use fmdump -v -u <EVENT_ID> to identify the module.
Faults detected by the Oracle Solaris PSH facility are also reported through service
processor alerts.
Note – You can configure ILOM to generate SNMP traps or e-mail alerts when a
fault is detected by Oracle Solaris PSH. You can also configure the ALOM CMT
compatibility shell to display Oracle Solaris PSH alerts. See the Integrated Lights Out
Manager 3.0 Concepts Guide.
The following example depicts an ALOM CMT alert of the same fault reported by
Oracle Solaris PSH in EXAMPLE: Console Message Showing Fault Detected by PSH
on page 48.
48 SPARC Enterprise T5440 Server Service Manual • June 2011
Page 71

EXAMPLE: ALOM CMT Alert of PSH Diagnosed Fault
SC Alert: Host detected fault, MSGID: SUN4V-8000-DX
The ILOM show faulty command provides summary information about the fault.
See “Detect Faults (ILOM show faulty Command)” on page 37 for more information
about the show faulty command.
Note – The Service Required LED is also turned on for PSH diagnosed faults.
Related Information
■ “Diagnostic Flowchart” on page 13
■ “Predictive Self-Healing Overview” on page 20
■ “ILOM-to-ALOM CMT Command Reference” on page 58
■ SPARC Enterprise T5440 Server Administration Guide
■ Integrated Lights Out Manager 3.0 Supplement for the SPARC Enterprise T5440 Server
▼ Detect Faults Identified by the Oracle Solaris
PSH Facility (ILOM fmdump Command)
The ILOM fmdump command displays the list of faults detected by the Oracle Solaris
PSH facility and identifies the faulty FRU for a particular EVENT_ID (UUID).
Note – Do not use fmdump to verify that a FRU replacement has cleared a fault,
because the output of fmdump is the same after the FRU has been replaced. Use the
fmadm faulty command to verify that the fault has cleared. See “Clear Faults
Detected by PSH” on page 54.
1. Check the event log using the fmdump command with -v for verbose output.
In the following example, a fault is displayed, indicating the following details.
■ Date and time of the fault (Jul 31 12:47:42.2007)
■ Universal Unique Identifier (UUID). The UUID is unique for every fault
(fd940ac2-d21e-c94a-f258-f8a9bb69d05b)
■ Message identifier, which can be used to obtain additional fault information
(SUN4V-8000-JA)
Managing Faults 49
Page 72

■ Faulted FRU. The information provided in the example includes the part
number of the FRU (part=541215101) and the serial number of the FRU
(serial=101083). The Location field provides the name of the FRU. In
EXAMPLE: Output from the fmdump -v Command on page 50 the FRU name is
MB, meaning the motherboard.
Note – fmdump displays the PSH event log. Entries remain in the log after the fault
has been repaired.
2. Use the message ID to obtain more information about this type of fault.
a. In a browser, go to the Predictive Self-Healing Knowledge Article web site:
http://www.sun.com/msg
b. Obtain the message ID from the console output or the ILOM show faulty
command.
c. Enter the message ID in the SUNW-MSG-ID field, and click Lookup.
In EXAMPLE: PSH Message Output on page 50, the message ID
SUN4V-8000-JA provides information for corrective action:
3. Follow the suggested actions to repair the fault.
EXAMPLE: Output from the fmdump -v Command
# fmdump -v -u fd940ac2-d21e-c94a-f258-f8a9bb69d05b
TIME UUID SUNW-MSG-ID
Jul 31 12:47:42.2007 fd940ac2-d21e-c94a-f258-f8a9bb69d05b SUN4V-8000-JA
100% fault.cpu.ultraSPARC-T2.misc_regs
Problem in: cpu:///cpuid=16/serial=5D67334847
Affects: cpu:///cpuid=16/serial=5D67334847
FRU: hc://:serial=101083:part=541215101/motherboard=0
Location: MB
EXAMPLE: PSH Message Output
CPU errors exceeded acceptable levels
Type
Fault
Severity
Major
Description
The number of errors associated with this CPU has exceeded
acceptable levels.
50 SPARC Enterprise T5440 Server Service Manual • June 2011
Page 73

Automated Response
The fault manager will attempt to remove the affected CPU from
service.
Impact
System performance may be affected.
Suggested Action for System Administrator
Schedule a repair procedure to replace the affected CPU, the
identity of which can be determined using fmdump -v -u <EVENT_ID>.
Details
The Message ID: SUN4V-8000-JA indicates diagnosis has
determined that a CPU is faulty. The Oracle Solaris fault manager
arranged an automated attempt to disable this CPU....
Managing Faults 51
Page 74

Clearing Faults
This section describes how to clear faults.
Note – Some system faults are cleared automatically.
Description Topic
Clear faults detected during POST. “Clear Faults Detected During POST” on
page 52
Clear faults detected by PSH. “Clear Faults Detected by PSH” on page 54
Clear faults detected in the Internal I/O
Expansion Unit
Related Information
■ “Diagnostic Flowchart” on page 13
■ “POST Fault Management Overview” on page 22
■ “Predictive Self-Healing Overview” on page 20
■ SPARC Enterprise T5440 Server Administration Guide
■ Integrated Lights Out Manager 3.0 Supplement for the SPARC Enterprise T5440 Server
■ External I/O Expansion Unit Installation and Service Manual for SPARC Enterprise
T5120/T5240/T5220/T5240/T5440 Servers
“Clear Faults Detected in the External I/O
Expansion Unit” on page 55
▼ Clear Faults Detected During POST
In most cases, when POST detects a faulty component, POST logs the fault and
automatically takes the failed component out of operation by placing the component
in the ASR blacklist. See “Disabling Faulty Components” on page 55.
In most cases, the replacement of the faulty FRU is detected when the service
processor is reset or power cycled. In this case, the fault is automatically cleared from
the system. This procedure describes how to identify a POST-detected fault and, if
necessary, manually clear the fault.
52 SPARC Enterprise T5440 Server Service Manual • June 2011
Page 75

1. After replacing a faulty FRU, at the ILOM prompt use the show faulty
command to identify POST-detected faults.
Faults detected by POST are distinguished from other kinds of faults by the text:
Forced fail. No UUID number is reported. Refer to EXAMPLE: Fault Detected
by POST on page 54.
If no fault is reported, you do not need to do anything else. Do not perform the
subsequent steps.
2. Use the component_state property of the component to clear the fault and
remove the component from the ASR blacklist.
Use the FRU name that was reported in the fault in Step 1:
-> set /SYS/MB/CPU0/CMP0/BR1/CH0/D0 component_state=Enabled
The fault is cleared and should not show up when you run the show faulty
command. Additionally, the Service Required LED is no longer on.
3. Reset the server.
You must reboot the server for the component_state property to take effect.
4. At the ILOM prompt, use the show faulty command to verify that no faults
are reported.
-> show faulty
Target | Property | Value
--------------------+------------------------+------------------
->
Managing Faults 53
Page 76

EXAMPLE: Fault Detected by POST
-> show faulty
Target | Property | Value
----------------------+------------------------+----------------------------
/SP/faultmgmt/0 | fru | /SYS/MB/CPU0/CMP0/BR1/CH0/D0
/SP/faultmgmt/0 | timestamp | Dec 21 16:40:56
/SP/faultmgmt/0/ | timestamp | Dec 21 16:40:56
faults/0 | |
/SP/faultmgmt/0/ | sp_detected_fault | /SYS/MB/CPU0/CMP0/BR1/CH0/D0
faults/0 | | Forced fail(POST)
▼ Clear Faults Detected by PSH
When the Oracle Solaris PSH facility detects faults, the faults are logged and
displayed on the console. In most cases, after the fault is repaired, the corrected state
is detected by the system and the fault condition is repaired automatically. However,
this repair should be verified. In cases where the fault condition is not automatically
cleared, the fault must be cleared manually.
1. After replacing a faulty FRU, power on the server.
2. At the ILOM prompt, use the show faulty command to identify PSH-detected
faults.
■ If no fault is reported, you do not need to do anything else. Do not perform the
subsequent steps.
■ If a fault is reported, perform Step 3 and Step 4.
3. Use the clear_fault_action property of the FRU to clear the fault from the
service processor. For example:
-> set /SYS/MB/CPU0/CMP0/BR0/CH0/D0 clear_fault_action=True
Are you sure you want to clear /SYS/MB/CPU0/CMP0/BR0/CH0/D0 (y/n)? y
Set ’clear_fault_action’ to ’true
4. Clear the fault from all persistent fault records.
In some cases, even though the fault is cleared, some persistent fault information
remains and results in erroneous fault messages at boot time. To ensure that these
messages are not displayed, perform the following Oracle Solaris command:
fmadm repair UUID
Example:
# fmadm repair 7ee0e46b-ea64-6565-e684-e996963f7b86
54 SPARC Enterprise T5440 Server Service Manual • June 2011
Page 77

▼ Clear Faults Detected in the External I/O
Expansion Unit
For service processor detected faults in the External I/O Expansion Unit, the fault
must be manually cleared from ILOM show faulty after the problem has been
repaired.
Note – After the problem has been repaired, the fault will also be cleared from the
ILOM show faulty command by resetting the service processor.
The example below shows a problem detected in the External I/O Expansion Unit:
-> show faulty
Target | Property | Value
--------------------+------------------------+-------------------
------------/SP/faultmgmt/0 | fru | /SYS/IOX@X0TC/IOB1/LINK
/SP/faultmgmt/0 | timestamp | Feb 05 18:28:20
/SP/faultmgmt/0/ | timestamp | Feb 05 18:28:20
faults/0 | |
/SP/faultmgmt/0/ | sp_detected_fault | Ext FRU
/SYS/IOX@X0TC/IOB1/LINK
faults/0 | | SIGCON=0 I2C no
device response
● After the problem is repaired, use the ILOM set clear_fault_action
command to clear a fault in the External I/O Expansion Unit.
-> set clear_fault_action=true /SYS/IOX@X0TC/IOB1/LINK
Are you sure you want to clear /SYS/IOX@X0TC/IOB1/LINK (y/n)? y
Set ’clear_fault_action’ to ’true’
Disabling Faulty Components
This topic contains the following:
■ “Disabling Faulty Components Using Automatic System Recovery” on page 56
■ “Disable System Components” on page 57
■ “Re-Enable System Components” on page 57
Managing Faults 55
Page 78

Disabling Faulty Components Using Automatic System Recovery
You can use the Automatic System Recovery (ASR) feature to configure the server to
automatically disable failed components until they can be replaced. The following
components are managed by the ASR feature:
■ UltraSPARC T2 Plus processor strands
■ Memory FB-DIMMs
■ I/O subsystem
The database that contains the list of disabled components is referred to as the ASR
blacklist (asr-db).
In most cases, POST automatically disables a faulty component. After the cause of the
fault is repaired (FRU replacement, loose connector reseated, and so on), you might
need to remove the component from the ASR blacklist.
Note – For instructions on enabling or disabling ASR, see the SPARC Enterprise
T5440 Server Administration Guide.
The ASR commands (TABLE: ASR Commands on page 56) enable you to view and
manually add or remove components (asrkeys) from the ASR blacklist. You run
these commands from the ILOM -> prompt.
TABLE: ASR Commands
Command Description
show components Displays system components and their current state.
set asrkey component_state=
Enabled
set asrkey component_state=
Disabled
Removes a component from the asr-db blacklist,
where asrkey is the component to enable.
Adds a component to the asr-db blacklist, where
asrkey is the component to disable.
Note – The asrkeys vary from system to system, depending on how many cores and
memory are present. Use the show components command to see the asrkeys on a
given system.
56 SPARC Enterprise T5440 Server Service Manual • June 2011
Page 79

Note – A reset or power cycle is required after disabling or enabling a component. If
the status of a component is changed, there is no effect to the system until the next
reset or power cycle.
Related Information
■ “Diagnostic Flowchart” on page 13
■ “Detecting Faults” on page 34
■ SPARC Enterprise T5440 Server Administration Guide
▼ Disable System Components
The component_state property disables a component by adding it to the ASR
blacklist.
1. At the -> prompt, set the component_state property to Disabled:
-> set /SYS/MB/CPU0/CMP0/BR1/CH0/D0 component_state=Disabled
2. Reset the server so that the ASR command takes effect.
-> stop /SYS
Are you sure you want to stop /SYS (y/n)? y
Stopping /SYS
-> start /SYS
Are you sure you want to start /SYS (y/n)? y
Starting /SYS
Note – In the ILOM shell there is no notification when the system is actually
powered off. Powering off takes about a minute. Use the show /HOST command to
determine if the host has powered off.
▼ Re-Enable System Components
The component_state property enables a component by removing it from the ASR
blacklist.
Managing Faults 57
Page 80

1. At the -> prompt, set the component_state property to Enabled.
-> set /SYS/MB/CPU0/CMP0/BR1/CH0/D0 component_state=Enabled
2. Reset the server so that the ASR command takes effect.
-> stop /SYS
Are you sure you want to stop /SYS (y/n)? y
Stopping /SYS
-> start /SYS
Are you sure you want to start /SYS (y/n)? y
Starting /SYS
Note – In the ILOM shell there is no notification when the system is actually
powered off. Powering off takes about a minute. Use the show /HOST command to
determine if the host has powered off.
ILOM-to-ALOM CMT Command Reference
The following table describes the typical commands for servicing a server. For
descriptions of all ALOM CMT commands, issue the help command or refer to the
following documents:
■ Integrated Lights Out Manager 3.0 Concepts Guide
58 SPARC Enterprise T5440 Server Service Manual • June 2011
Page 81

■ Integrated Lights Out Manager 3.0 Supplement for the SPARC Enterprise T5440 Server
ILOM Command ALOM CMT Command Description
help [command] help [command] Displays a list of all available
commands with syntax and
descriptions. Specifying a command
name as an option displays help for
that command.
set /HOST/send_break_action
true
break [-y][-c][-D]
• -y skips the confirmation
question.
• -c executes a console command
after the break command
Takes the host server from the OS to
either kmdb or OpenBoot PROM
(equivalent to a Stop-A), depending
on the mode Oracle Solaris software
was booted.
completes.
• -D forces a core dump of the
Oracle Solaris OS.
set
/SYS/component/clear_fault_a
ction true
start /SP/console console [-f]
clearfault UUID Manually clears host-detected
faults. The UUID is the unique fault
ID of the fault to be cleared.
Connects you to the host system.
• -f forces the console to have read
and write capabilities.
show /SP/console/history consolehistory [-b lines|-e lines|-v]
[-g lines] [boot|run]
Displays the contents of the
system’s console buffer.
The following options enable you to
specify how the output is
displayed:
• -g lines specifies the number of
lines to display before pausing.
• -e lines displays n lines from the
end of the buffer.
• -b lines displays n lines from the
beginning of the buffer.
• -v displays the entire buffer.
• boot|run specifies the log to
display (run is the default log).
Managing Faults 59
Page 82

ILOM Command ALOM CMT Command Description
set
/HOST/bootmode/value[normal|re
set_nvram|bootscript=string]
bootmode value
[normal|reset_nvram|
bootscript=string]
Enables control of the firmware
during system initialization with
the following options:
• normal is the default boot mode.
• reset_nvram resets OpenBoot
PROM parameters to their
default values.
• bootscript=string enables the
passing of a string to the boot
command.
stop/SYS; start/SYS powercycle [-f]
The -f option forces an immediate
Performs a poweroff followed by
poweron.
poweroff. Otherwise the command
attempts a graceful shutdown.
stop/SYS poweroff [-y] [-f]
Powers off the host server.
• -y enables you to skip the
confirmation question.
• -f forces an immediate
shutdown.
start/SYS poweron [-c]
• -c executes a console command
after completion of the poweron
command.
set
removefru PS0|PS1 Indicates if it is okay to perform a
/SYS/PSx/prepare_to_remove_acti
on true
reset /SYS reset [-y] [-c]
• -y enables you to skip the
confirmation question.
• -c executes a console command
after completion of the reset
command.
reset /SP resetsc [-y]
• -y enables you to skip the
confirmation question.
Powers on the host server.
hot-swap of a power supply. This
command does not perform any
action. But this command provides
a warning if the power supply
should not be removed because the
other power supply is not enabled.
Generates a hardware reset on the
host server.
Reboots the service processor.
60 SPARC Enterprise T5440 Server Service Manual • June 2011
Page 83

ILOM Command ALOM CMT Command Description
set /SYS/keyswitch_state
value
normal | stby | diag |
locked
setkeyswitch [-y] value
normal | stby | diag | locked
• -y enables you to skip the
confirmation question when
Sets the virtual keyswitch.
setting the keyswitch to stby.
set /SUS/LOCATE value=value
[Fast_blink | Off]
setlocator value
[on | off]
Turns the Locator LED on the server
on or off.
(No ILOM equivalent.) showenvironment Displays the environmental status
of the host server. This information
includes system temperatures,
power supply, front panel LED,
hard drive, fan, voltage, and current
sensor status. See “Display
Individual Component Information
(ILOM show Command)” on
page 28.
show faulty showfaults [-v] Displays current system faults. See
“Detecting Faults” on page 34.
(No ILOM equivalent.) showfru [-g lines] [-s | -d] [FRU]
• -g lines specifies the number of
Displays information about the
FRUs in the server.
lines to display before pausing
the output to the screen.
• -s displays static information
about system FRUs (defaults to
all FRUs, unless one is specified).
• -d displays dynamic information
about system FRUs (defaults to
all FRUs, unless one is specified).
See “Display Individual
Component Information (ILOM
show Command)” on page 28.
show /SYS/keyswitch_state showkeyswitch Displays the status of the virtual
keyswitch.
Managing Faults 61
Page 84

ILOM Command ALOM CMT Command Description
show /SYS/LOCATE showlocator Displays the current state of the
Locator LED as either on or off.
show /SP/logs/event/list showlogs [-b lines | -e lines |
-v] [-g lines] [-p
logtype[r|p]]]
Displays the history of all events
logged in the service processor
event buffers (in RAM or the
persistent buffers).
show /SYS showplatform [-v] Displays information about the
operating state of the host system,
the system serial number, and
whether the hardware is providing
service.
The following table shows typical combinations of ALOM CMT variables and
associated POST modes.
Parameter
Normal Diagnostic Mode
(Default Settings) No POST Execution
Diagnostic Service
Mode
Keyswitch Diagnostic
Preset Values
diag mode normal Off service normal
keyswitch_state normal normal normal diag
diag_level max N/a max max
diag_trigger power-on-reset
None all-resets all-resets
error-reset
diag_verbosity normal N/a max max
Description of POST
execution
This is the default POST
configuration. This
configuration tests the
system thoroughly, and
suppresses some of the
detailed POST output.
POST does not
run, resulting in
quick system
initialization. This
is not a suggested
configuration.
POST runs the full
spectrum of tests
with the maximum
output displayed.
POST runs the full
spectrum of tests
with the maximum
output displayed.
Related Information
■ “Diagnostic Flowchart” on page 13
■ “Detecting Faults Using LEDs” on page 34
■ “ILOM-to-ALOM CMT Command Reference” on page 58
■ SPARC Enterprise T5440 Server Administration Guide
■ Integrated Lights Out Manager 3.0 Supplement for the SPARC Enterprise T5440 Server
62 SPARC Enterprise T5440 Server Service Manual • June 2011
Page 85

Preparing to Service the System
These topics describe how to prepare the server for servicing.
■ “Safety Information” on page 63
■ “Required Tools” on page 66
■ “Obtain the Chassis Serial Number” on page 66
■ “Obtain the Chassis Serial Number Remotely” on page 66
■ “Powering Off the System” on page 67
■ “Extending the Server to the Maintenance Position” on page 69
■ “Remove the Server From the Rack” on page 71
■ “Perform Electrostatic Discharge – Antistatic Prevention Measures” on page 73
■ “Remove the Top Cover” on page 73
Related Information
■ “Managing Faults” on page 11
■ “Servicing Customer-Replaceable Units” on page 75
■ “Servicing Field-Replaceable Units” on page 119
■ “Returning the Server to Operation” on page 153
Safety Information
The following topics describe important safety information that you need to know
prior to removing or installing parts in the server:
■ “Observing Important Safety Precautions” on page 64
■ “Safety Symbols” on page 64
■ “Electrostatic Discharge Safety Measures” on page 65
63
Page 86

Observing Important Safety Precautions
For your protection, observe the following safety precautions when setting up your
equipment:
■ Follow all cautions and instructions marked on the equipment and described in
the documentation shipped with your system.
■ Follow all cautions and instructions marked on the equipment and described in
the SPARC Enterprise T5440 Server Safety and Compliance Guide.
■ Ensure that the voltage and frequency of your power source match the voltage
and frequency inscribed on the equipment’s electrical rating label.
■ Follow the electrostatic discharge safety practices as described in this section.
Related Information
■ “Safety Symbols” on page 64
■ “Handling Electronic Components” on page 65
■ “Electrostatic Discharge Safety Measures” on page 65
Safety Symbols
Note the meanings of the following symbols that might appear in this document:
Caution – There is a risk of personal injury or equipment damage. To avoid
personal injury and equipment damage, follow the instructions.
Caution – Hot surface. Avoid contact. Surfaces are hot and might cause personal
injury if touched.
Caution – Hazardous voltages are present. To reduce the risk of electric shock and
danger to personal health, follow the instructions.
Related Information
■ “Safety Information” on page 63
64 SPARC Enterprise T5440 Server Service Manual • June 2011
Page 87

Electrostatic Discharge Safety Measures
This topic includes the following:
■ “Handling Electronic Components” on page 65
■ “Antistatic Wrist Strap” on page 65
■ “Antistatic Mat” on page 65
Handling Electronic Components
Electrostatic discharge (ESD) sensitive devices, such as the motherboard, PCI cards,
hard drives, and memory modules require special handling.
Caution – Circuit boards and hard drives contain electronic components that are
extremely sensitive to static electricity. Ordinary amounts of static electricity from
clothing or the work environment can destroy the components located on these
boards. Do not touch the components along their connector edges.
Caution – You must disconnect both power supplies before servicing any of the
components documented in this chapter.
Antistatic Wrist Strap
Wear an antistatic wrist strap and use an antistatic mat when handling components
such as hard drive assemblies, circuit boards, or PCI cards. When servicing or
removing server components, attach an antistatic strap to your wrist and then to a
metal area on the chassis. Following this practice equalizes the electrical potentials
between you and the server.
Note – An antistatic wrist strap is no longer included in the server accessory kit.
However, antistatic wrist straps are still included with options.
Antistatic Mat
Place ESD-sensitive components such as motherboards, memory, and other PCBs on
an antistatic mat.
Preparing to Service the System 65
Page 88

Required Tools
■ Antistatic wrist strap
■ Antistatic mat
■ No. 1 Phillips screwdriver
■ No. 2 Phillips screwdriver
■ 7 mm hex driver
■ No. 1 flat-blade screwdriver (battery removal)
■ Pen or pencil (power on server)
▼ Obtain the Chassis Serial Number
To obtain support for your system, you need your chassis serial number.
● The chassis serial number is located on a sticker that is on the front of the
server and another sticker on the side of the server.
▼ Obtain the Chassis Serial Number
Remotely
● Use the ILOM show /SYS command to obtain the chassis serial number.
-> show /SYS
/SYS
Targets:
SERVICE
LOCATE
ACT
PS_FAULT
TEMP_FAULT
FAN_FAULT
...
66 SPARC Enterprise T5440 Server Service Manual • June 2011
Page 89

Properties:
type = Host System
keyswitch_state = Normal
product_name = T5440
product_serial_number = 0723BBC006
fault_state = OK
clear_fault_action = (none)
power_state = On
Commands:
cd
reset
set
show
start
stop
Powering Off the System
Note – Additional information about powering off the system is located in the
SPARC Enterprise T5440 Server Administration Guide.
This topic includes the following:
■ “Power Off (Command Line)” on page 67
■ “Power Off (Graceful Shutdown)” on page 68
■ “Power Off (Emergency Shutdown)” on page 68
■ “Disconnect Power Cords From the Server” on page 68
▼ Power Off (Command Line)
1. Shut down the Solaris OS.
At the Solaris prompt, type:
# shutdown -g0 -i0 -y
# svc.startd: The system is coming down. Please wait.
svc.startd: 91 system services are now being stopped.
Jun 12 19:46:57 wgs41-58 syslogd: going down on signal 15
Preparing to Service the System 67
Page 90

svc.stard: The system is down.
syncing file systems...done
Program terminated
r)eboot o)k prompt, h)alt?
2. Switch from the system console prompt to the service processor console prompt.
Typ e:
ok #.
->
3. From the ILOM -> prompt, type:
-> stop /SYS
Are you sure you want to stop /SYS (y/n)? y
Stopping /SYS
->
Note – To perform an immediate shutdown, use the stop -force -script /SYS
command. Ensure that all data is saved before entering this command.
▼ Power Off (Graceful Shutdown)
● Press and release the Power button.
If necessary, use a pen or pencil to press the Power button.
▼ Power Off (Emergency Shutdown)
Caution – All applications and files will be closed abruptly without saving changes.
File system corruption might occur.
● Press and hold the Power button for four seconds.
▼ Disconnect Power Cords From the Server
● Unplug all power cords from the server.
68 SPARC Enterprise T5440 Server Service Manual • June 2011
Page 91

Caution – Because 3.3v standby power is always present in the system, you must
unplug the power cords before accessing any cold-serviceable components.
Extending the Server to the Maintenance Position
This topic includes the following:
■ “Components Serviced in the Maintenance Position” on page 69
■ “Extend the Server to the Maintenance Position” on page 70
Components Serviced in the Maintenance Position
The following components can be serviced with the server in the maintenance
position:
■ Fan trays
■ CMP/memory modules
■ FB-DIMMs
■ PCIe/XAUI cards
■ Service processor
■ Power supply backplane
■ Hard drive backplane
Related Information
■ “Front Panel Diagram” on page 3
■ “Rear Panel Diagram” on page 6
■ “Extend the Server to the Maintenance Position” on page 70
Preparing to Service the System 69
Page 92

▼ Extend the Server to the Maintenance Position
1. (Optional) Use the set /SYS/LOCATE command from the -> prompt to locate
the system that requires maintenance.
-> set /SYS/LOCATE value=Fast_Blink
Once you have located the server, press the Locator LED and button to turn it off.
2. Verify that no cables will be damaged or will interfere when the server is
extended.
Although the cable management arm (CMA) that is supplied with the server is
hinged to accommodate extending the server, you should ensure that all cables
and cords are capable of extending.
3. From the front of the server, release the two slide release latches (FIGURE:
Extending the Server Into the Maintenance Position on page 70).
Squeeze the slide rail locks to release the slide rails.
FIGURE: Extending the Server Into the Maintenance Position
Figure Legend
1 Slide Rail Lock
2 Inner Rail Release Button
70 SPARC Enterprise T5440 Server Service Manual • June 2011
Page 93

4. While squeezing the slide rail locks, slowly pull the server forward until it is
locked in the service position.
▼ Remove the Server From the Rack
The server must be removed from the rack to remove or install the following
components:
■ Motherboard
Caution – Two people must dismount and carry the chassis.
1. Disconnect all the cables and power cords from the server.
2. Extend the server to the maintenance position.
See “Extending the Server to the Maintenance Position” on page 69.
3. Disconnect the CMA.
Pull out the retention pin that secures the cable management arm (CMA) to the
rack rail (FIGURE: Removing the Server From the Rack on page 72). Slide the
CMA out of the end of the inner glide. The CMA is still attached to the cabinet,
but the server is now disconnected from the CMA.
Preparing to Service the System 71
Page 94

FIGURE: Removing the Server From the Rack
Figure Legend
1 Disconnect system cables and CMA.
2 Press inner rail release buttons to remove the server from the rack.
Caution – Use two people to dismount and carry the chassis.
FIGURE: Lift Warning
4. From the front of the server, press inner rail release buttons and pull the server
forward until it is free of the rack rails.
5. Set the server on a sturdy work surface.
72 SPARC Enterprise T5440 Server Service Manual • June 2011
Page 95

▼ Perform Electrostatic Discharge –
Antistatic Prevention Measures
1. Prepare an antistatic surface to set parts on during the removal, installation, or
replacement process.
Place ESD-sensitive components such as the printed circuit boards on an antistatic
mat. The following items can be used as an antistatic mat:
■ Antistatic bag used to wrap a replacement part
■ ESD mat
■ A disposable ESD mat (shipped with some replacement parts or optional
system components)
2. Attach an antistatic wrist strap.
When servicing or removing server components, attach an antistatic strap to your
wrist and then to a metal area on the chassis.
▼ Remove the Top Cover
Before you begin, complete these tasks:
■ Read the section, “Safety Information” on page 63.
■ Power off the server using one of the methods described in the section, “Powering
Off the System” on page 67.
■ “Extend the Server to the Maintenance Position” on page 70
■ “Perform Electrostatic Discharge – Antistatic Prevention Measures” on page 73
1. Loosen the two captive No. 2 Phillips screws at the rear edge of the top panel.
2. Slide the top cover to the rear about 0.5 inch (12.7 mm).
3. Remove the top cover.
Lift up and remove the cover.
Preparing to Service the System 73
Page 96

Caution – If the top cover is removed before the server is powered off, the server
will immediately disable the front panel Power button and shut down. After such an
event, you must replace the top cover and use the poweron command to power on
the server. See “Power On the Server” on page 157.
74 SPARC Enterprise T5440 Server Service Manual • June 2011
Page 97

Servicing Customer-Replaceable Units
These topics describe how to service customer-replaceable units (CRUs) in the server.
Top ic Li nks
Read and learn about components which
can be serviced while the system is in
operation.
Remove, install and add hard drives. “Servicing Hard Drives” on page 76
Remove and install fan trays. “Servicing Fan Trays” on page 84
Remove and install power supplies. “Servicing Power Supplies” on page 89
Remove, install, and add PCIe cards. “Servicing PCIe Cards” on page 96
Remove, install, and add CMP or memory
modules.
Remove, install, and add FB-DIMMs. “Servicing FB-DIMMs” on page 108
Exploded views of CRUs “Customer-Replaceable Units” on page 178
“Hot-Pluggable and Hot-Swappable
Devices” on page 75
“Servicing CMP/Memory Modules” on
page 102
Related Information
■ “Servicing Field-Replaceable Units” on page 119
Hot-Pluggable and Hot-Swappable Devices
Hot-pluggable devices are those devices that you can remove and install while the
server is running. However, you must perform administrative tasks before or after
installing the hardware (for example, mounting a hard drive). The following devices
are hot-pluggable:
75
Page 98

■ Hard drives
Hot-swappable devices are those devices that can be removed and installed while
the server is running without affecting the rest of the server’s capabilities. The
following devices are hot-swappable:
■ Fan trays
■ Power supplies
Note – The chassis-mounted hard drives can be hot-swappable, depending on how
they are configured.
Related Information
■ “Servicing Hard Drives” on page 76
■ “Servicing Fan Trays” on page 84
■ “Servicing Power Supplies” on page 89
■ “Server Components” on page 177
Servicing Hard Drives
This topic includes the following:
■ “About Hard Drives” on page 76
■ “Remove a Hard Drive (Hot-Plug)” on page 77
■ “Install a Hard Drive (Hot-Plug)” on page 79
■ “Remove a Hard Drive” on page 81
■ “Install a Hard Drive” on page 82
■ “Hard Drive Device Identifiers” on page 83
■ “Hard Drive LEDs” on page 84
About Hard Drives
The hard drives in the server are hot-pluggable, but this capability depends on how
the hard drives are configured. To hot-plug a drive you must take the drive offline
before you can safely remove it. Taking a drive offline prevents any applications
from accessing it, and removes the logical software links to it.
76 SPARC Enterprise T5440 Server Service Manual • June 2011
Page 99

Caution – You must use hard drives designed for this server, which have a vented
front panel to allow adequate airflow to internal system components. Installing
inappropriate hard drives could result in an overtemperature condition.
The following situations inhibit your ability to hot-plug a drive:
■ If the hard drive contains the operating system, and the operating system is not
mirrored on another drive.
■ If the hard drive cannot be logically isolated from the online operations of the
server.
If your drive falls into one of these conditions, you must power off the server before
you replace the hard drive.
Related Information
■ “Identifying Server Components” on page 1
■ “Managing Faults” on page 11
■ “Powering Off the System” on page 67
■ “Hot-Pluggable and Hot-Swappable Devices” on page 75
■ “Hard Drive Device Identifiers” on page 83
■ “Hard Drive LEDs” on page 84
■ “Server Components” on page 177
▼ Remove a Hard Drive (Hot-Plug)
Removing a hard drive from the server is a three-step process. You must first identify
the drive you want to remove, unconfigure that drive from the server, and then
manually remove the drive from the chassis.
Note – See “Hard Drive Device Identifiers” on page 83 for information about
identifying hard drives.
Before you begin, complete these tasks:
■ Read the section, “Safety Information” on page 63.
Servicing Customer-Replaceable Units 77
Page 100

1. At the Solaris prompt, issue the cfgadm -al command to list all drives in the
device tree, including drives that are not configured. Type:
# cfgadm -al
This command should identify the Ap_id for the hard drive you wish to remove,
as in EXAMPLE: Sample Ap_id Output on page 79.
2. Issue the cfgadm -c unconfigure command to unconfigure the disk.
For example, type:
# cfgadm -c unconfigure c0::dsk/d1t1d1
where c0:dsk/c0t1d1 is the disk that you are trying to unconfigure.
3. Wait until the blue Ready-to-Remove LED lights.
This LED will help you identify which drive is unconfigured and can be removed.
4. On the drive you plan to remove, push the hard drive release button to open the
latch.
Caution – The latch is not an ejector. Do not bend the latch too far. Doing so can
damage the latch.
5. Grasp the latch and pull the drive out of the drive slot.
78 SPARC Enterprise T5440 Server Service Manual • June 2011
 Loading...