

Page 1
ServerView Resource Orchestrator
Cloud Edition V3.1.1
User's Guide
for Infrastructure Administrators
Windows/Linux
J2X1-7613-05ENZ0(01)
March 2013
Page 2
Preface
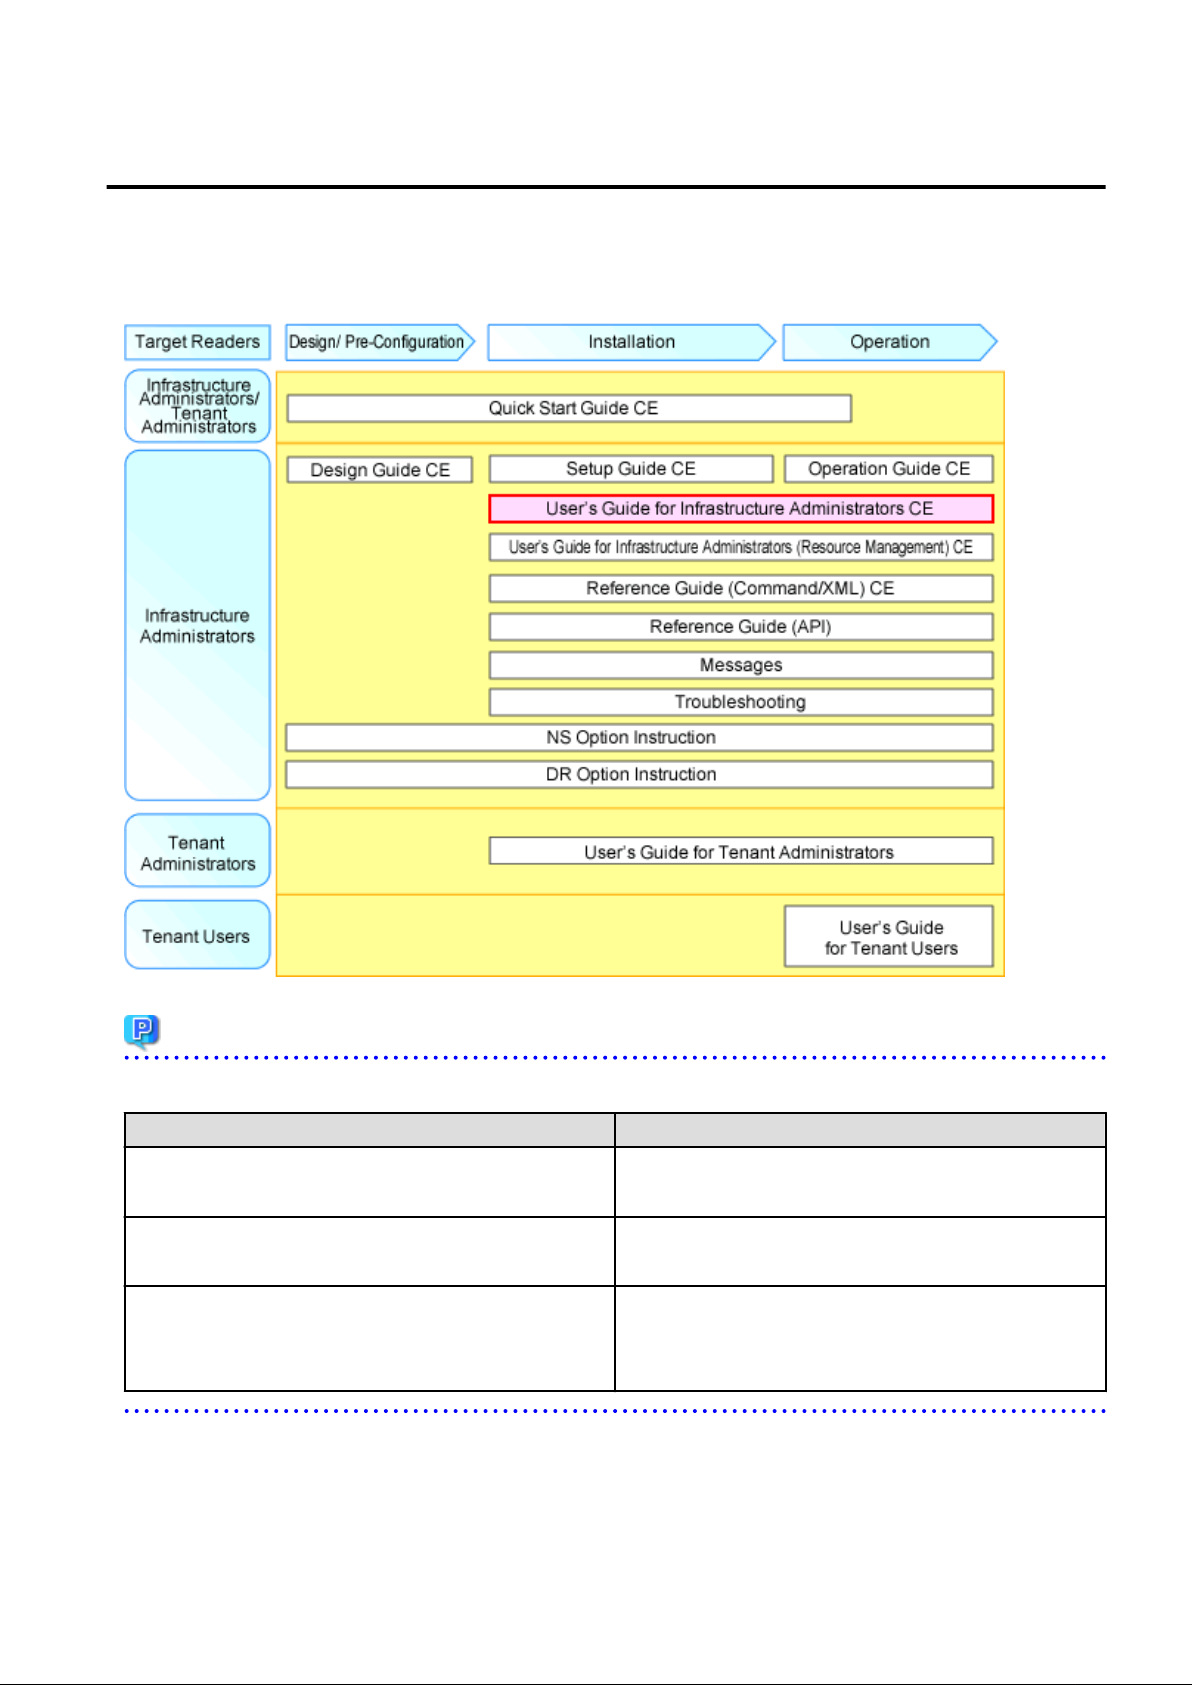
Resource Orchestrator Documentation Road Map
The documentation road map for Resource Orchestrator is as shown below.
Resource Orchestrator Documentation Road Map
Point
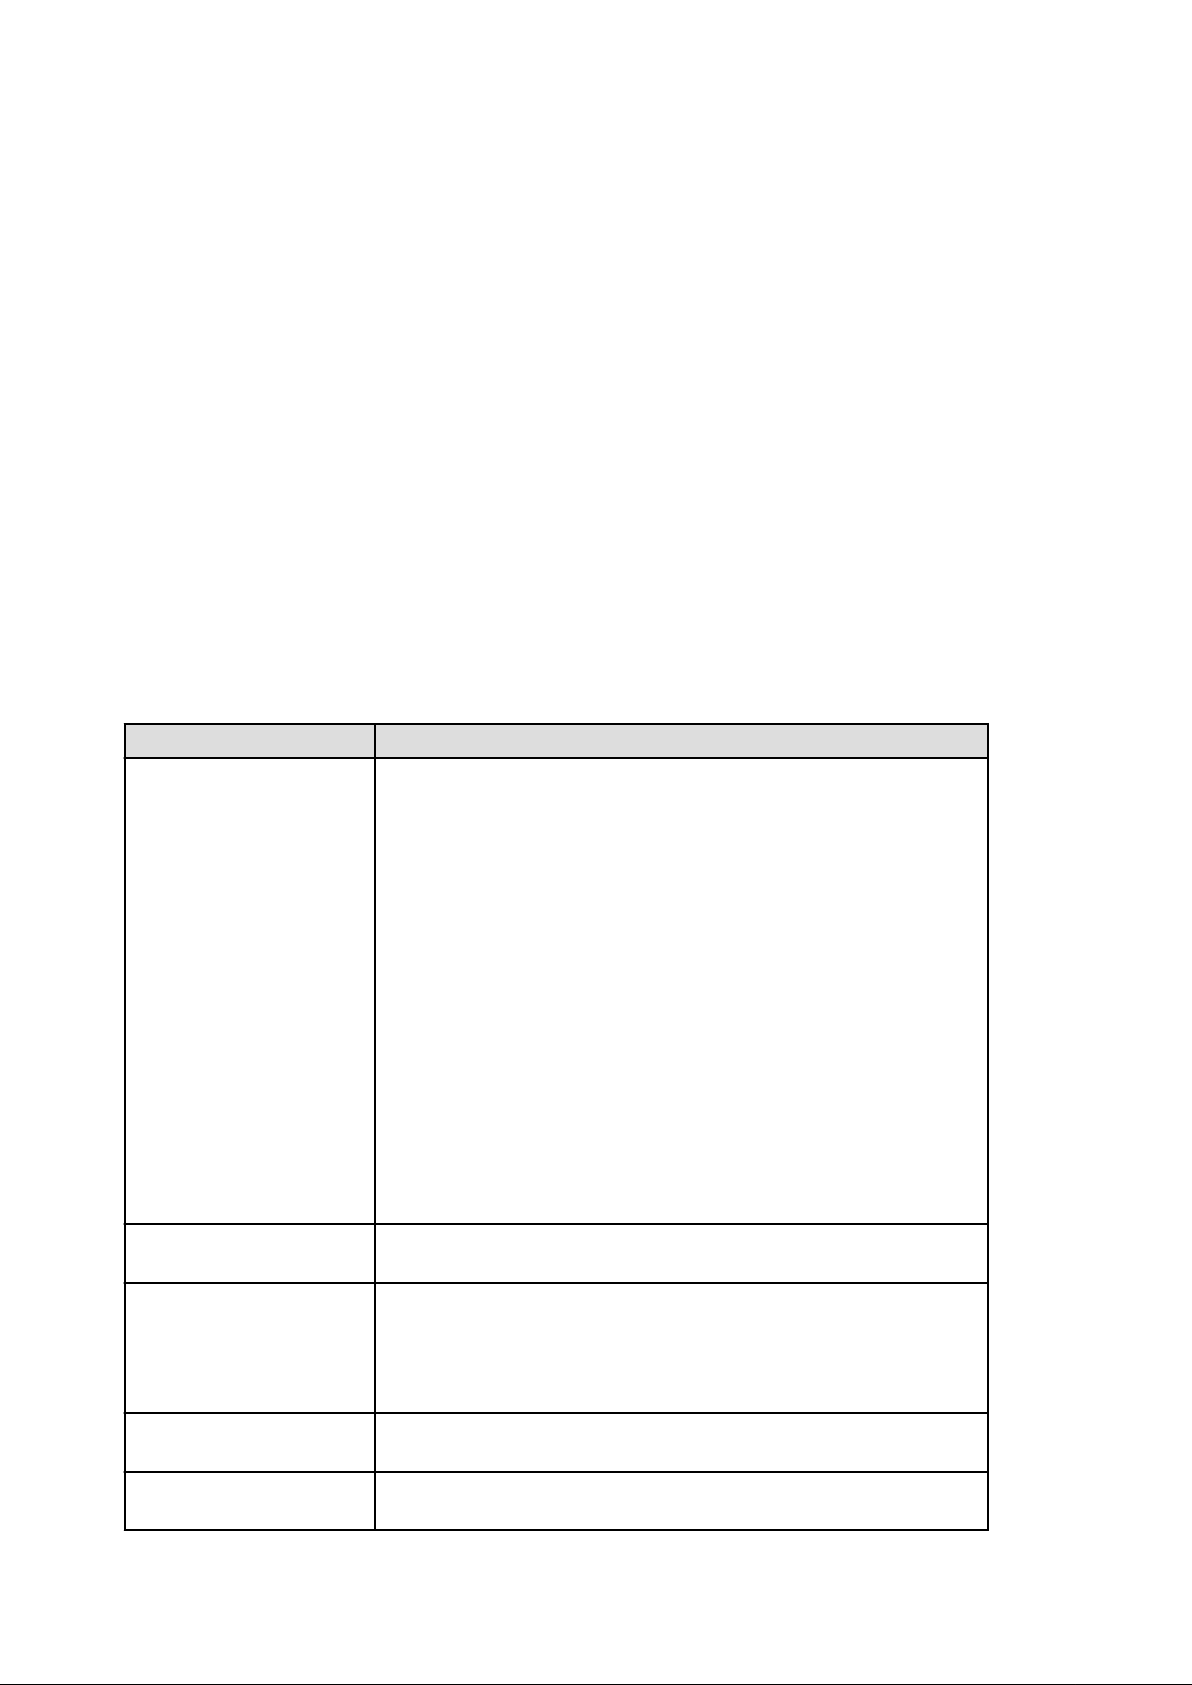
Refer to the user role manuals displayed in the table below for roles that are not in the diagram.
Roles that are not in the diagram Roles that are in the diagram
Infrastructure operator
Infrastructure monitor
Tenant operator
Tenant monitor
(Dual-Role) Administrator
(Dual-Role) Operator
(Dual-Role) Monitor
For information about the documents for Resource Orchestrator, please refer to "Chapter 1 Documentation Road Map" in the "Design
Guide CE".
Infrastructure administrator
Tenant administrator
Infrastructure administrator and Tenant administrator
- i -
Page 3

Purpose
This manual provides an outline of ServerView Resource Orchestrator (hereinafter Resource Orchestrator) and the operations and settings
required for setup.
Target Readers
This document is intended for Infrastructure Administrator who display L-Platforms, manage tenant information, or use the dashboard or
operation status to monitor resources.
It is assumed that these users have a general knowledge of server virtualization software products and directory services such as Active
Directory and LDAP.
Organization
This manual is composed as follows:
Chapter 1 Overview
Explains an overview of the ROR Console
Chapter 2 Login and Logout
Explains how to log in and out of the ROR console.
Chapter 3 Home
Explains the ROR Console Home window display.
Chapter 4 Dashboard (Pool Conditions)
Explains how to use pool conditions operations
Chapter 5 Dashboard (System Conditions)
Explains how to monitor system conditions
Chapter 6 Dashboard (Capacity Planning)
Explains how to operate capacity planning.
Chapter 7 Resource
For details , refer to "User's Guide for Infrastructure Administrators (Resource Management) CE".
Chapter 8 Template
Explains how to create and manage L-Platform templates
Chapter 9 L-Platform
Explains how to use the L-Platform
Chapter 10 Request
Explains how to operate the application list
Chapter 11 Tenant
Explains how to manage tenants
Chapter 12 Accounting
Explains how to operate the usage charge.
Chapter 13 Account
Explains how to perform account operations
Appendix A Using Commands to Register and Delete L-Platform Templates
Explains the procedures for using commands to register and delete L-Platform templates
Appendix B Applying (Subscribe) for L-Platform Usage by Dual-Role Administrators
Explains L-Platform usage applications by dual-role administrators
- ii -
Page 4

Appendix C Tenant Operation by Dual-Role Administrators
Explains tenant operation by dual-role administrators
Glossary
Explains the terms used in this manual. Please refer to it when necessary.
Notational Conventions
The notation in this manual conforms to the following conventions.
- When using Resource Orchestrator and the functions necessary differ due to the necessary basic software (OS), it is indicated as
follows:
[Windows Manager]
[Linux Manager] Sections related to Linux manager
[Windows] Sections related to Windows (When not using Hyper-V)
[Linux] Sections related to Linux
[Solaris] Sections related to Solaris
[VMware] Sections related to VMware
[Hyper-V] Sections related to Hyper-V
[Xen] Sections related to RHEL5-Xen
[KVM] Sections related to RHEL-KVM
Sections related to Windows manager
[Solaris Zones] Sections related to Solaris zones
[OVM for x86] Sections related to Oracle VM Server for x86
[OVM for SPARC] Sections related to Oracle VM Server for SPARC
[Physical Servers] Sections related to physical servers
[VM host]
Sections related to VMware, Windows Server 2008 with Hyper-V enabled,
Xen, RHEL-KVM, Solaris zones, and OVM for SPARC
- Unless specified otherwise, the blade servers mentioned in this manual refer to PRIMERGY BX servers.
- Oracle Solaris may also be indicated as Solaris, Solaris Operating System, or Solaris OS.
- Oracle Solaris Zones may also be indicated as Solaris Containers or Solaris Container.
- Oracle VM Server for x86 may also be indicated as Oracle VM.
- In Resource Orchestrator the following servers are referred to as SPARC Enterprise.
- SPARC Enterprise M3000/M4000/M5000/M8000/M9000
- SPARC Enterprise T5120/T5140/T5220/T5240/T5440
- References and character strings or values requiring emphasis are indicated using double quotes ( " ).
- Window names, dialog names, menu names, and tab names are shown enclosed by brackets ( [ ] ).
- Button names are shown enclosed by angle brackets (< >) or square brackets ([ ]).
- The order of selecting menus is indicated using [ ]-[ ].
- Text to be entered by the user is indicated using bold text.
- Variables are indicated using italic text and underscores.
- The ellipses ("...") in menu names, indicating settings and operation window startup, are not shown.
- The ">" used in Windows is included in usage examples. When using Linux, read ">" as meaning "#".
- iii -
Page 5
- The URLs in this manual were correct when the manual was written.
Menus in the ROR console
Operations on the ROR console can be performed using either the menu bar or pop-up menus.
By convention, procedures described in this manual only refer to pop-up menus.
Regarding Installation Folder Paths
The installation folder path may be given as C:\Fujitsu\ROR in this manual.
Replace it as shown below.
When using Windows 64-bit (x64)
C:\Program Files (x86)\Resource Orchestrator
When using Windows 32-bit (x86)
C:\Program Files\Resource Orchestrator
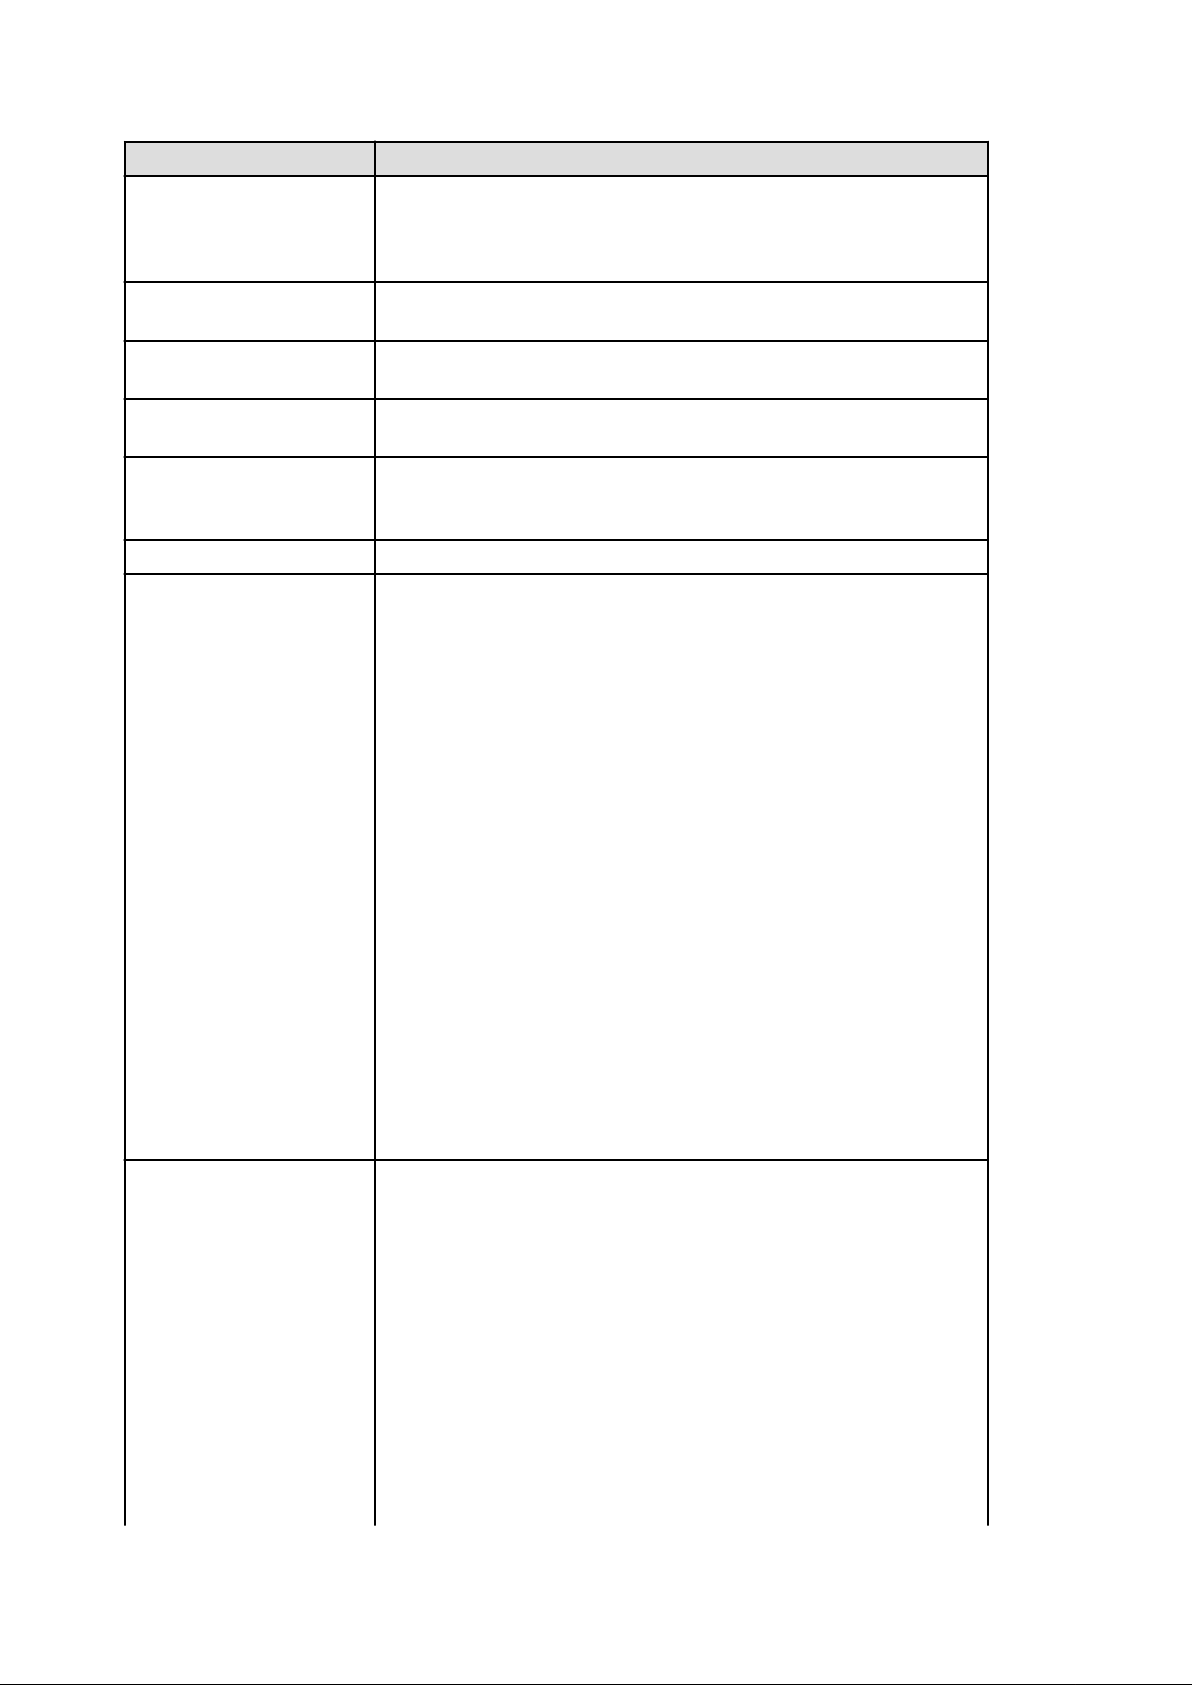
Abbreviations
The following abbreviations are used in this manual:
Abbreviation Products
Windows
Windows Server 2012
Windows Server 2008
Microsoft(R) Windows Server(R) 2012 Standard
Microsoft(R) Windows Server(R) 2012 Datacenter
Microsoft(R) Windows Server(R) 2008 Standard
Microsoft(R) Windows Server(R) 2008 Enterprise
Microsoft(R) Windows Server(R) 2008 R2 Standard
Microsoft(R) Windows Server(R) 2008 R2 Enterprise
Microsoft(R) Windows Server(R) 2008 R2 Datacenter
Microsoft(R) Windows Server(R) 2003 R2, Standard Edition
Microsoft(R) Windows Server(R) 2003 R2, Enterprise Edition
Microsoft(R) Windows Server(R) 2003 R2, Standard x64 Edition
Microsoft(R) Windows Server(R) 2003 R2, Enterprise x64 Edition
Windows(R) 8 Pro
Windows(R) 8 Enterprise
Windows(R) 7 Professional
Windows(R) 7 Ultimate
Windows Vista(R) Business
Windows Vista(R) Enterprise
Windows Vista(R) Ultimate
Microsoft(R) Windows(R) XP Professional operating system
Microsoft(R) Windows Server(R) 2012 Standard
Microsoft(R) Windows Server(R) 2012 Datacenter
Microsoft(R) Windows Server(R) 2008 Standard
Microsoft(R) Windows Server(R) 2008 Enterprise
Microsoft(R) Windows Server(R) 2008 R2 Standard
Microsoft(R) Windows Server(R) 2008 R2 Enterprise
Microsoft(R) Windows Server(R) 2008 R2 Datacenter
Windows 2008 x86 Edition
Windows 2008 x64 Edition
Microsoft(R) Windows Server(R) 2008 Standard (x86)
Microsoft(R) Windows Server(R) 2008 Enterprise (x86)
Microsoft(R) Windows Server(R) 2008 Standard (x64)
Microsoft(R) Windows Server(R) 2008 Enterprise (x64)
- iv -
Page 6
Abbreviation Products
Windows Server 2003
Microsoft(R) Windows Server(R) 2003 R2, Standard Edition
Microsoft(R) Windows Server(R) 2003 R2, Enterprise Edition
Microsoft(R) Windows Server(R) 2003 R2, Standard x64 Edition
Microsoft(R) Windows Server(R) 2003 R2, Enterprise x64 Edition
Windows 2003 x64 Edition
Windows 8
Windows 7
Windows Vista
Windows XP
Linux
Microsoft(R) Windows Server(R) 2003 R2, Standard x64 Edition
Microsoft(R) Windows Server(R) 2003 R2, Enterprise x64 Edition
Windows(R) 8 Pro
Windows(R) 8 Enterprise
Windows(R) 7 Professional
Windows(R) 7 Ultimate
Windows Vista(R) Business
Windows Vista(R) Enterprise
Windows Vista(R) Ultimate
Microsoft(R) Windows(R) XP Professional operating system
Red Hat(R) Enterprise Linux(R) 5 (for x86)
Red Hat(R) Enterprise Linux(R) 5 (for Intel64)
Red Hat(R) Enterprise Linux(R) 5.1 (for x86)
Red Hat(R) Enterprise Linux(R) 5.1 (for Intel64)
Red Hat(R) Enterprise Linux(R) 5.2 (for x86)
Red Hat(R) Enterprise Linux(R) 5.2 (for Intel64)
Red Hat(R) Enterprise Linux(R) 5.3 (for x86)
Red Hat(R) Enterprise Linux(R) 5.3 (for Intel64)
Red Hat(R) Enterprise Linux(R) 5.4 (for x86)
Red Hat(R) Enterprise Linux(R) 5.4 (for Intel64)
Red Hat(R) Enterprise Linux(R) 5.5 (for x86)
Red Hat(R) Enterprise Linux(R) 5.5 (for Intel64)
Red Hat(R) Enterprise Linux(R) 5.6 (for x86)
Red Hat(R) Enterprise Linux(R) 5.6 (for Intel64)
Red Hat(R) Enterprise Linux(R) 5.7 (for x86)
Red Hat(R) Enterprise Linux(R) 5.7 (for Intel64)
Red Hat(R) Enterprise Linux(R) 5.8 (for x86)
Red Hat(R) Enterprise Linux(R) 5.8 (for Intel64)
Red Hat(R) Enterprise Linux(R) 6.2 (for x86)
Red Hat(R) Enterprise Linux(R) 6.2 (for Intel64)
Red Hat(R) Enterprise Linux(R) 6.3 (for x86)
Red Hat(R) Enterprise Linux(R) 6.3 (for Intel64)
SUSE(R) Linux Enterprise Server 11 for x86
SUSE(R) Linux Enterprise Server 11 for EM64T
Red Hat Enterprise Linux
Red Hat(R) Enterprise Linux(R) 5 (for x86)
Red Hat(R) Enterprise Linux(R) 5 (for Intel64)
Red Hat(R) Enterprise Linux(R) 5.1 (for x86)
Red Hat(R) Enterprise Linux(R) 5.1 (for Intel64)
Red Hat(R) Enterprise Linux(R) 5.2 (for x86)
Red Hat(R) Enterprise Linux(R) 5.2 (for Intel64)
Red Hat(R) Enterprise Linux(R) 5.3 (for x86)
Red Hat(R) Enterprise Linux(R) 5.3 (for Intel64)
Red Hat(R) Enterprise Linux(R) 5.4 (for x86)
Red Hat(R) Enterprise Linux(R) 5.4 (for Intel64)
Red Hat(R) Enterprise Linux(R) 5.5 (for x86)
Red Hat(R) Enterprise Linux(R) 5.5 (for Intel64)
Red Hat(R) Enterprise Linux(R) 5.6 (for x86)
Red Hat(R) Enterprise Linux(R) 5.6 (for Intel64)
Red Hat(R) Enterprise Linux(R) 5.7 (for x86)
- v -
Page 7
Abbreviation Products
Red Hat Enterprise Linux 5
Red Hat(R) Enterprise Linux(R) 5.7 (for Intel64)
Red Hat(R) Enterprise Linux(R) 5.8 (for x86)
Red Hat(R) Enterprise Linux(R) 5.8 (for Intel64)
Red Hat(R) Enterprise Linux(R) 6.2 (for x86)
Red Hat(R) Enterprise Linux(R) 6.2 (for Intel64)
Red Hat(R) Enterprise Linux(R) 6.3 (for x86)
Red Hat(R) Enterprise Linux(R) 6.3 (for Intel64)
Red Hat(R) Enterprise Linux(R) 5 (for x86)
Red Hat(R) Enterprise Linux(R) 5 (for Intel64)
Red Hat(R) Enterprise Linux(R) 5.1 (for x86)
Red Hat(R) Enterprise Linux(R) 5.1 (for Intel64)
Red Hat(R) Enterprise Linux(R) 5.2 (for x86)
Red Hat(R) Enterprise Linux(R) 5.2 (for Intel64)
Red Hat(R) Enterprise Linux(R) 5.3 (for x86)
Red Hat(R) Enterprise Linux(R) 5.3 (for Intel64)
Red Hat(R) Enterprise Linux(R) 5.4 (for x86)
Red Hat(R) Enterprise Linux(R) 5.4 (for Intel64)
Red Hat(R) Enterprise Linux(R) 5.5 (for x86)
Red Hat(R) Enterprise Linux(R) 5.5 (for Intel64)
Red Hat(R) Enterprise Linux(R) 5.6 (for x86)
Red Hat(R) Enterprise Linux(R) 5.6 (for Intel64)
Red Hat(R) Enterprise Linux(R) 5.7 (for x86)
Red Hat(R) Enterprise Linux(R) 5.7 (for Intel64)
Red Hat(R) Enterprise Linux(R) 5.8 (for x86)
Red Hat(R) Enterprise Linux(R) 5.8 (for Intel64)
Red Hat(R) Enterprise Linux(R) 6.2 (for x86)
Red Hat Enterprise Linux 6
RHEL5-Xen
RHEL-KVM
DOS
SUSE Linux Enterprise Server
OVM for x86 Oracle VM Server for x86
OVM for SPARC Oracle VM Server for SPARC
ESC ETERNUS SF Storage Cruiser
GLS PRIMECLUSTER GLS
Navisphere EMC Navisphere Manager
Solutions Enabler EMC Solutions Enabler
MSFC Microsoft Failover Cluster
Red Hat(R) Enterprise Linux(R) 6.2 (for Intel64)
Red Hat(R) Enterprise Linux(R) 6.3 (for x86)
Red Hat(R) Enterprise Linux(R) 6.3 (for Intel64)
Red Hat(R) Enterprise Linux(R) 5.4 (for x86) Linux Virtual Machine Function
Red Hat(R) Enterprise Linux(R) 5.4 (for Intel64) Linux Virtual Machine Function
Red Hat(R) Enterprise Linux(R) 6.2 (for x86) Virtual Machine Function
Red Hat(R) Enterprise Linux(R) 6.2 (for Intel64) Virtual Machine Function
Red Hat(R) Enterprise Linux(R) 6.3 (for x86) Virtual Machine Function
Red Hat(R) Enterprise Linux(R) 6.3 (for Intel64) Virtual Machine Function
Microsoft(R) MS-DOS(R) operating system, DR DOS(R)
SUSE(R) Linux Enterprise Server 11 for x86
SUSE(R) Linux Enterprise Server 11 for EM64T
Solaris
SCVMM
Oracle Solaris10 05/09 (Update7) Media Pack
Oracle Solaris11 11/11 Media Pack
Oracle Solaris11.1 Media Pack
System Center Virtual Machine Manager 2008 R2
System Center 2012 Virtual Machine Manager
- vi -
Page 8
VMware
Abbreviation Products
VMware vSphere(R) 4
VMware vSphere(R) 4.1
VMware vSphere(R) 5
VMware vSphere(R) 5.1
VMware ESX
VMware ESX 4 VMware(R) ESX(R) 4
VMware ESXi VMware(R) ESXi(TM)
VMware ESXi 5.0 VMware(R) ESXi(TM) 5.0
VMware Tools VMware(R) Tools
VMware vSphere 4.0 VMware vSphere(R) 4.0
VMware vSphere 4.1 VMware vSphere(R) 4.1
VMware vSphere 5 VMware vSphere(R) 5
VMware vSphere 5.1 VMware vSphere(R) 5.1
VMware vSphere Client VMware vSphere(R) Client
VMware vCenter Server VMware(R) vCenter(TM) Server
VMware vClient VMware(R) vClient(TM)
VMware FT VMware(R) Fault Tolerance
VMware DRS VMware(R) Distributed Resource Scheduler
VMware DPM VMware(R) Distributed Power Management
VMware vDS VMware(R) vNetwork Distributed Switch
VMware Storage VMotion VMware(R) Storage VMotion
VMware(R) ESX(R)
VIOM ServerView Virtual-IO Manager
BladeLogic BMC BladeLogic Server Automation
Windows(R) Internet Explorer(R) 8
Internet Explorer
ServerView Agent
RCVE
ROR ServerView Resource Orchestrator
ROR VE ServerView Resource Orchestrator Virtual Edition
ROR CE ServerView Resource Orchestrator Cloud Edition
Resource Coordinator
Windows(R) Internet Explorer(R) 9
Windows(R) Internet Explorer(R) 10
ServerView SNMP Agents for MS Windows (32bit-64bit)
ServerView Agents Linux
ServerView Agents VMware for VMware ESX Server
ServerView Resource Coordinator VE
Systemwalker Resource Coordinator
Systemwalker Resource Coordinator Virtual server Edition
Export Administration Regulation Declaration
Documents produced by FUJITSU may contain technology controlled under the Foreign Exchange and Foreign Trade Control Law of
Japan. Documents which contain such technology should not be exported from Japan or transferred to non-residents of Japan without first
obtaining authorization from the Ministry of Economy, Trade and Industry of Japan in accordance with the above law.
- vii -
Page 9
Trademark Information
- BMC, BMC Software, and the BMC Software logo are the exclusive properties of BMC Software, Inc., are registered with the U.S.
Patent and Trademark Office, and may be registered or pending registration in other countries.
- EMC, EMC2, CLARiiON, Symmetrix, and Navisphere are trademarks or registered trademarks of EMC Corporation.
- HP is a registered trademark of Hewlett-Packard Company.
- Linux is a trademark or registered trademark of Linus Torvalds in the United States and other countries.
- Microsoft, Windows, MS-DOS, Windows Server, Windows Vista, Excel, Active Directory, and Internet Explorer are either registered
trademarks or trademarks of Microsoft Corporation in the United States and other countries.
- NetApp is a registered trademark of Network Appliance, Inc. in the US and other countries. Data ONTAP, Network Appliance, and
Snapshot are trademarks of Network Appliance, Inc. in the US and other countries.
- Oracle and Java are registered trademarks of Oracle and/or its affiliates in the United States and other countries.
- Oracle is a registered trademark of Oracle Corporation and/or its affiliates.
- Red Hat, RPM and all Red Hat-based trademarks and logos are trademarks or registered trademarks of Red Hat, Inc. in the United
States and other countries.
- SUSE is a registered trademark of SUSE LINUX AG, a Novell business.
- VMware, the VMware "boxes" logo and design, Virtual SMP, and VMotion are registered trademarks or trademarks of VMware, Inc.
in the United States and/or other jurisdictions.
- ServerView and Systemwalker are registered trademarks of FUJITSU LIMITED.
- All other brand and product names are trademarks or registered trademarks of their respective owners.
Notices
- The contents of this manual shall not be reproduced without express written permission from FUJITSU LIMITED.
- The contents of this manual are subject to change without notice.
Month/Year Issued,
Edition
November 2011, First
Edition
December 2011, 1.1
January 2012, 1.2
February 2012, 1.3
March 2012, 1.4
April 2012, 1.5
July 2012,
Second Edition
October 2012,
Third Edition
J2X1-7613-01ENZ0(00)
J2X1-7613-01ENZ0(01)
J2X1-7613-01ENZ0(02)
J2X1-7613-01ENZ0(03)
J2X1-7613-01ENZ0(04)
J2X1-7613-01ENZ0(05)
J2X1-7613-02ENZ0(00)
J2X1-7613-03ENZ0(00)
Manual Code
December 2012,
Fourth Edition
January 2013,
Fifth Edition
March 2013, 5.1 J2X1-7613-05ENZ0(01)
Copyright 2011-2013 FUJITSU LIMITED
J2X1-7613-04ENZ0(00)
J2X1-7613-05ENZ0(00)
- viii -
Page 10

Contents
Chapter 1 Overview..................................................................................................................................................................1
1.1 Function List........................................................................................................................................................................................1
1.2 Flow of Operations..............................................................................................................................................................................2
Chapter 2 Login and Logout.....................................................................................................................................................5
Chapter 3 Home.......................................................................................................................................................................7
3.1 Setup Wizard........................................................................................................................................................................................7
3.2 Editing the Home Messages..............................................................................................................................................................11
Chapter 4 Dashboard (Pool Conditions).................................................................................................................................14
4.1 Pool Conditions Overview.................................................................................................................................................................14
4.2 Pool Conditions Display....................................................................................................................................................................14
4.3 Chart Display.....................................................................................................................................................................................18
4.4 Alert List Display ..............................................................................................................................................................................20
4.4.1 Alert List (All)............................................................................................................................................................................20
4.4.2 Alert List (for Each Chart)..........................................................................................................................................................22
4.4.3 Alert Resolve .............................................................................................................................................................................23
Chapter 5 Dashboard (System Conditions)............................................................................................................................24
5.1 System Conditions Display Range....................................................................................................................................................24
5.2 L-Platform System Conditions Display.............................................................................................................................................24
5.2.1 System Conditions Display.........................................................................................................................................................26
5.2.2 Configuration Information Display............................................................................................................................................33
5.3 VM Hosts System Conditions Display..............................................................................................................................................35
5.3.1 System Conditions Display.........................................................................................................................................................36
5.4 Server List Display............................................................................................................................................................................39
Chapter 6 Dashboard (Capacity Planning).............................................................................................................................42
6.1 Report Types......................................................................................................................................................................................42
6.2 Capacity Planning Operations...........................................................................................................................................................43
6.2.1 Scenario......................................................................................................................................................................................45
6.2.2 Conditions...................................................................................................................................................................................46
6.2.2.1 Target Settings.....................................................................................................................................................................46
6.2.2.2 View Settings.......................................................................................................................................................................48
6.2.3 Period..........................................................................................................................................................................................49
6.2.4 Operation Buttons (Display).......................................................................................................................................................50
6.2.5 Results Window..........................................................................................................................................................................50
6.2.6 CSV File Items............................................................................................................................................................................51
6.2.6.1 Effective resource use (VMware virtual machine relocation) ............................................................................................51
6.2.6.2 Effective resource use (VMware resource allocation optimization)...................................................................................58
6.2.6.3 Demand Forecast (ServerView Resource Orchestrator Resource pool)..............................................................................59
6.3 Operations Using Scenarios...............................................................................................................................................................62
6.3.1 Simulating the Reallocation of Virtual Machines : [VMware virtual machine relocation]........................................................62
6.3.2 Optimization of Resources Allocated to a Virtual Machine : [VMware resource allocation optimization]..............................67
6.3.3 Anticipating the Future Demand for Resources : [ServerView Resource Orchestrator Resource pool]....................................69
Chapter 7 Resource...............................................................................................................................................................70
Chapter 8 Template ...............................................................................................................................................................71
8.1 L-Platform Template Components....................................................................................................................................................71
8.2 Explanation of Windows...................................................................................................................................................................71
8.2.1 Menu...........................................................................................................................................................................................72
8.2.2 Startup Window..........................................................................................................................................................................72
8.2.3 L-Platform Template Window....................................................................................................................................................72
8.2.3.1 Template Tab.......................................................................................................................................................................73
- ix -
Page 11

8.2.3.2 Segment Tab........................................................................................................................................................................74
8.2.3.3 Image Tab............................................................................................................................................................................76
8.2.3.4 Software Tab........................................................................................................................................................................77
8.3 L-Platform Template Operations.......................................................................................................................................................79
8.3.1 L-Platform Template Operations and Roles...............................................................................................................................79
8.3.2 Creating New L-Platform Template...........................................................................................................................................79
8.3.3 Copying L-Platform Template....................................................................................................................................................80
8.3.4 Editing L-Platform Template......................................................................................................................................................80
8.3.5 Deleting L-Platform Template....................................................................................................................................................81
8.3.6 Publishing and Hiding L-Platform Template..............................................................................................................................82
8.3.7 Publishing Image Information....................................................................................................................................................82
8.3.8 Synchronizing Image Information..............................................................................................................................................82
8.4 Items to Set for Each Type of L-Platform Template Information.....................................................................................................83
8.4.1 Software Information..................................................................................................................................................................83
8.4.2 Image Information......................................................................................................................................................................84
8.4.2.1 Select Image Page................................................................................................................................................................84
8.4.2.2 Set Basic Info Page..............................................................................................................................................................85
8.4.2.3 Select Software Page...........................................................................................................................................................87
8.4.2.4 Add Patch Info Page............................................................................................................................................................87
8.4.2.5 Confirm Page.......................................................................................................................................................................89
8.4.3 Segment Information..................................................................................................................................................................90
8.4.4 Template Information.................................................................................................................................................................90
8.4.4.1 Set Basic Info Page..............................................................................................................................................................91
8.4.4.2 Configure Page....................................................................................................................................................................92
8.4.4.3 Confirm Page.....................................................................................................................................................................100
Chapter 9 L-Platform............................................................................................................................................................101
9.1 Display L-Platform..........................................................................................................................................................................101
9.2 L-Platform Management..................................................................................................................................................................102
9.2.1 L-Platform Management Display Page.....................................................................................................................................102
9.2.2 L-Platform Detailed Information Display.................................................................................................................................106
9.2.3 Display Details on a Disk.........................................................................................................................................................108
9.3 Display Event Logs..........................................................................................................................................................................109
Chapter 10 Request.............................................................................................................................................................110
10.1 Checking an Application Status.....................................................................................................................................................110
10.2 Assessing an Application...............................................................................................................................................................112
Chapter 11 Tenant................................................................................................................................................................118
11.1 Overview of Tenant Management.................................................................................................................................................118
11.2 Displaying a Tenant List................................................................................................................................................................119
11.3 Creating a Tenant...........................................................................................................................................................................120
11.4 Modifying a Tenant.......................................................................................................................................................................123
11.5 Deleting a Tenant...........................................................................................................................................................................124
11.6 Displaying a User List...................................................................................................................................................................125
11.7 Registering a User..........................................................................................................................................................................126
11.8 Modifying a User...........................................................................................................................................................................129
11.9 Deleting a User..............................................................................................................................................................................130
11.10 Moving a User.............................................................................................................................................................................130
11.11 Changing a User Password..........................................................................................................................................................131
11.12 Displaying an L-Platform List.....................................................................................................................................................131
11.13 Changing an Owner.....................................................................................................................................................................133
11.14 Moving an L-Platform.................................................................................................................................................................134
Chapter 12 Accounting ........................................................................................................................................................137
12.1 Usage Charge Window..................................................................................................................................................................137
12.2 Usage Charge List .........................................................................................................................................................................139
12.3 Usage Charge Detail......................................................................................................................................................................140
- x -
Page 12

Chapter 13 Account..............................................................................................................................................................142
13.1 Referencing User Information.......................................................................................................................................................142
13.2 Changing User Information...........................................................................................................................................................142
13.3 Changing Passwords......................................................................................................................................................................143
Appendix A Using Commands to Register and Delete L-Platform Templates.....................................................................144
A.1 Registering L-Platform Templates..................................................................................................................................................144
A.1.1 Procedure for Registering L-Platform Templates....................................................................................................................144
A.2 Deleting L-Platform Templates......................................................................................................................................................146
A.2.1 Procedure for Deleting L-Platform Templates........................................................................................................................146
Appendix B Applying (Subscribe) for L-Platform Usage by Dual-Role Administrators.........................................................148
Appendix C Tenant Operation by Dual-Role Administrators................................................................................................150
Glossary...............................................................................................................................................................................151
- xi -
Page 13
Chapter 1 Overview
This chapter explains the ROR Console.
1.1 Function List
This section explains the functions provided by ROR Console.
ROR Console has two parts: "operation windows for tenant administrators and tenant users" and "operation windows for infrastructure
administrators".
Windows intended for Tenant Administrators and tenant users are provided for L-Platform and user information operations. These windows
are configured by Tenant Administrators themselves, and have been provided to reduce the Infrastructure Administrator workload.
Operation windows and dashboard windows intended for Infrastructure Administrators are also provided for L-Platform and user
information operations. These windows are provided to enable Infrastructure Administrators to display and operate all L-Platform and
tenant information and to access important information quickly.
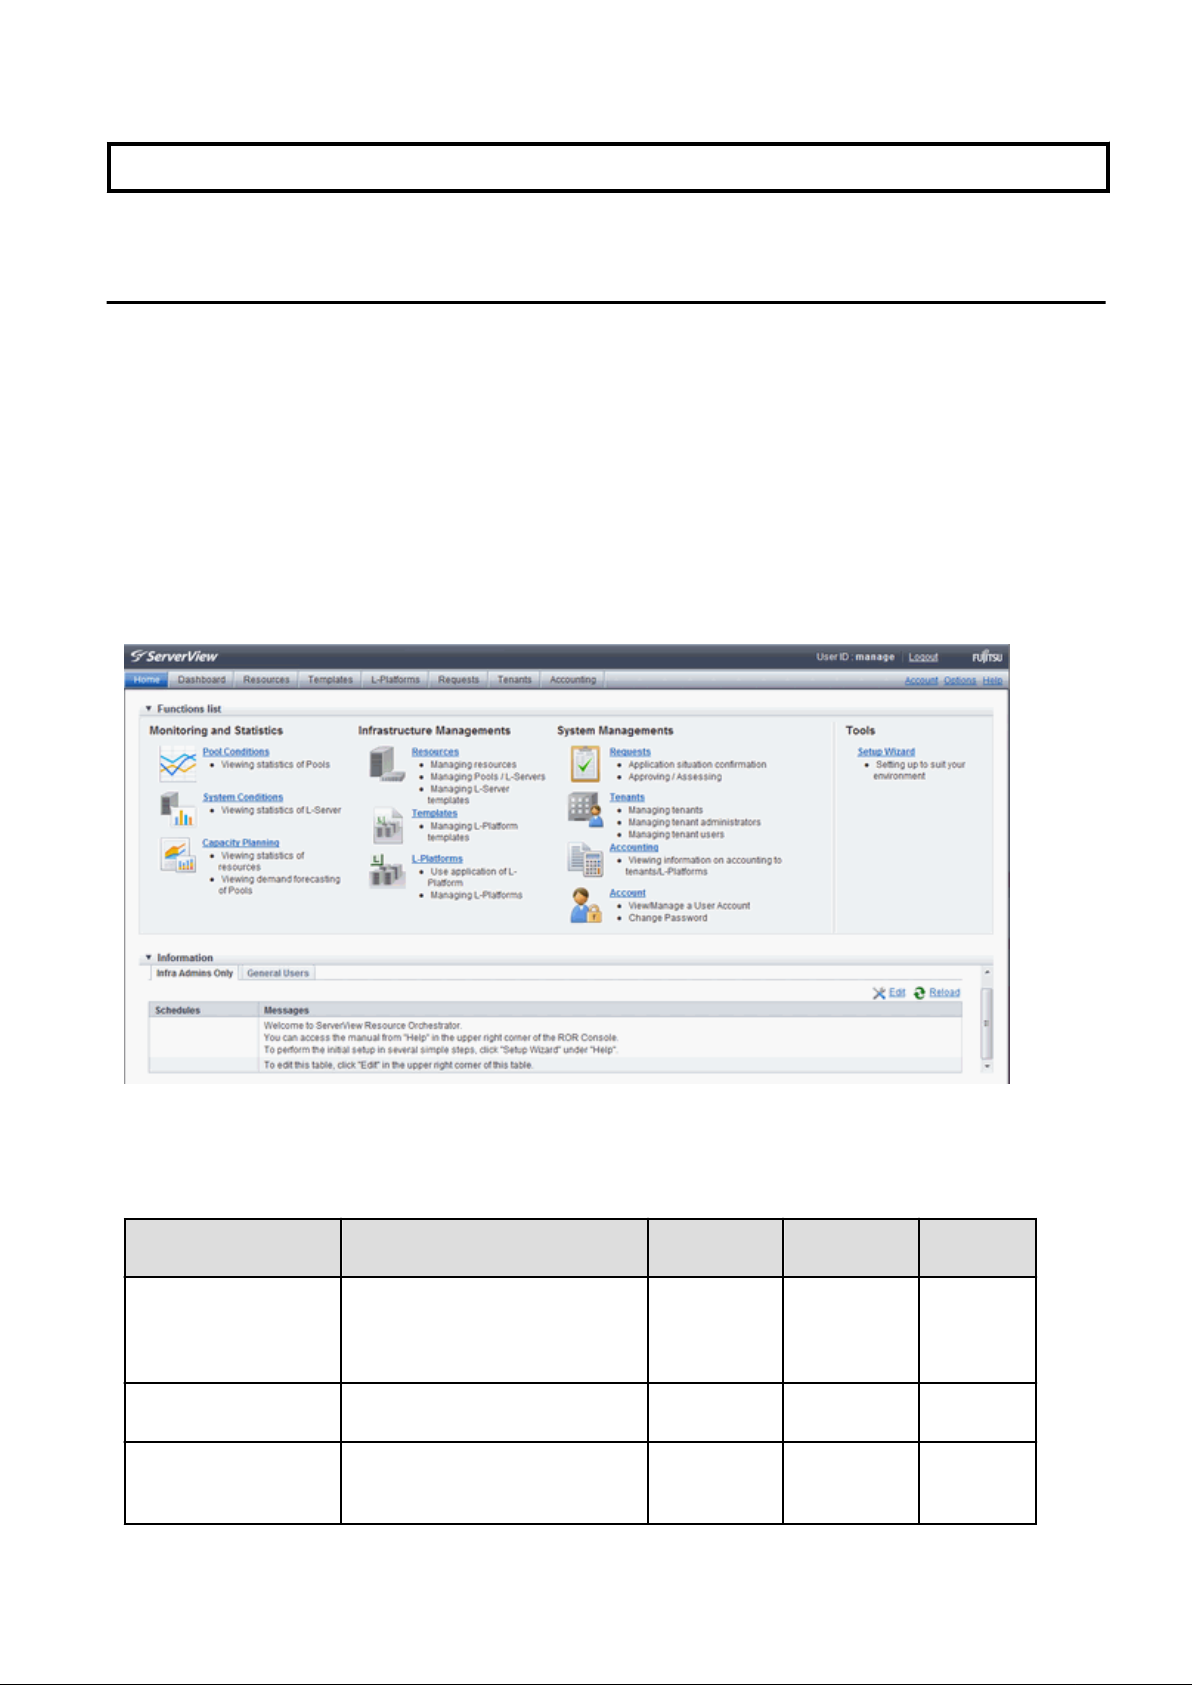
The ROR Console displays are customized for the user's role, to provide appropriate functions to each user. For example, tabs that the
current user cannot operate are not displayed.
Figure 1.1 ROR Console
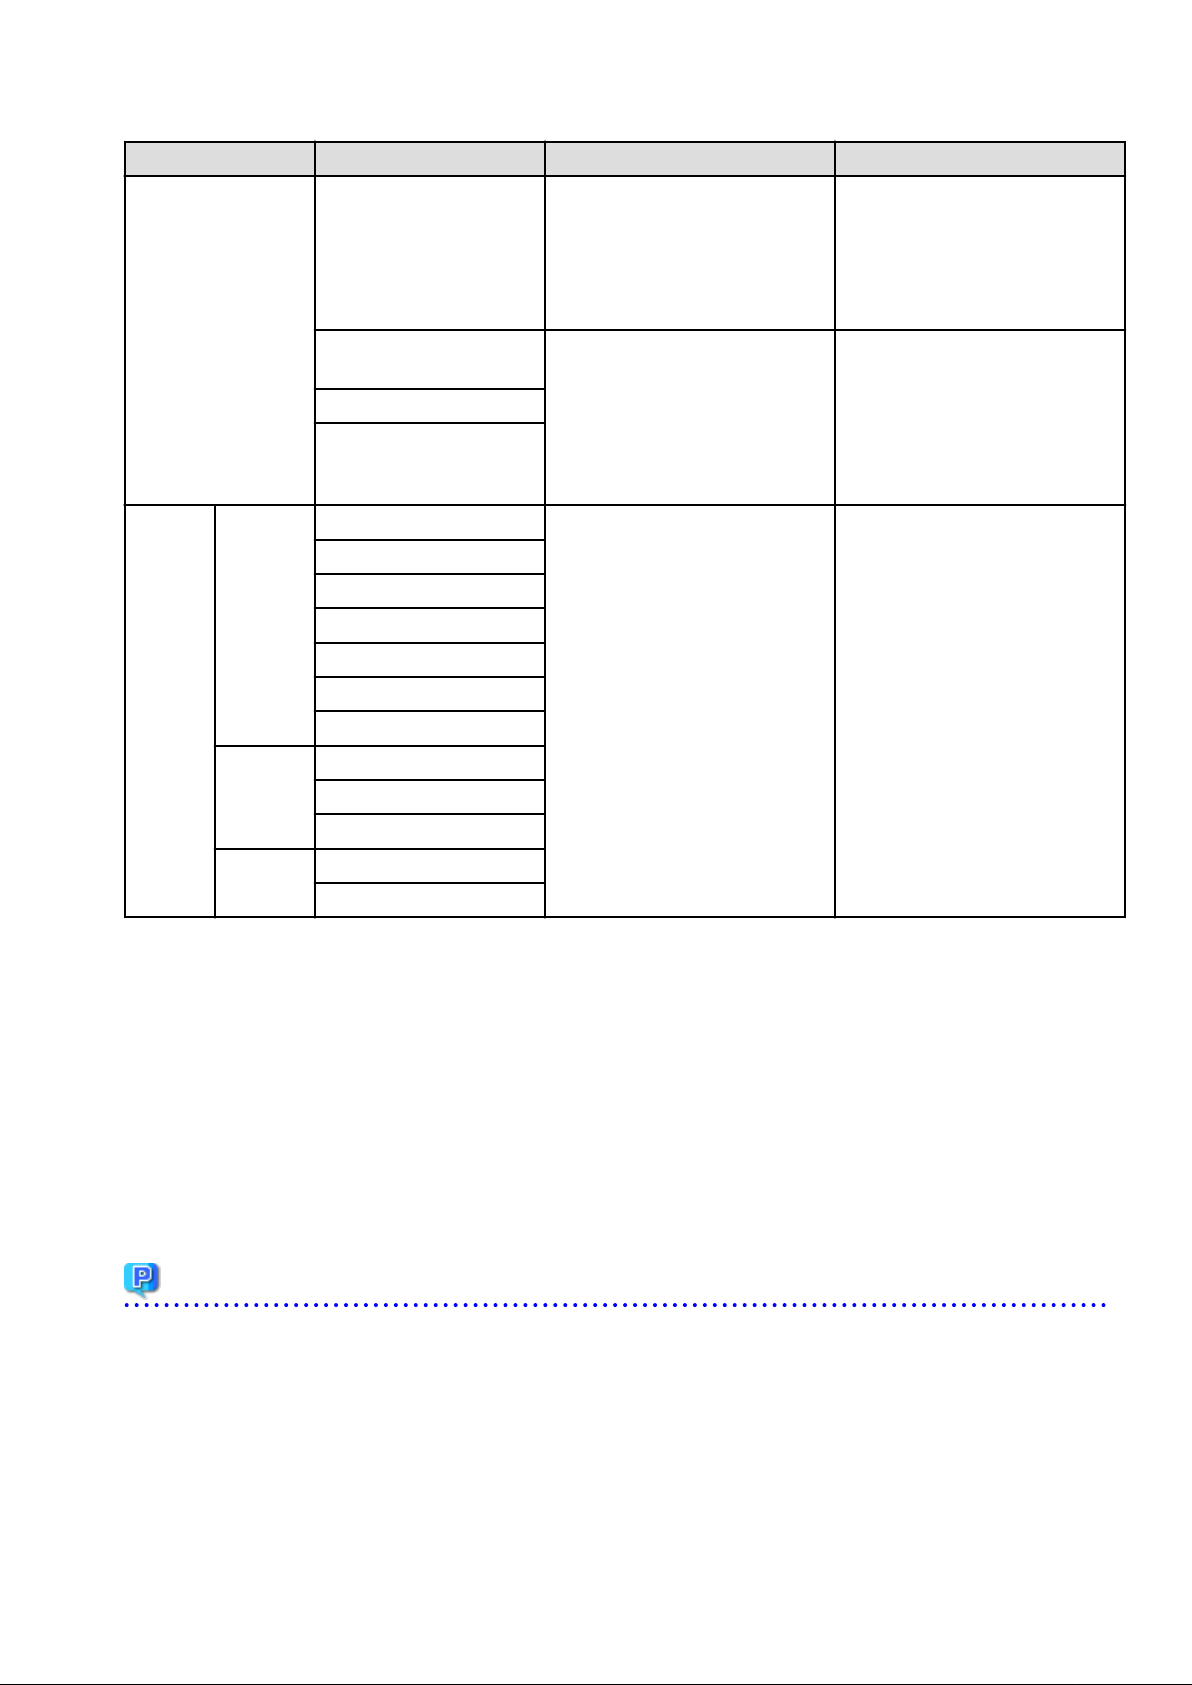
The table below shows the functions provided by the ROR Console.
These functions correspond to the tabs displayed at the top of the ROR Console.
Function Overview Infrastructure
Administrator
Home The window displayed immediately
after login to the ROR Console. A
function list and notifications are
displayed.
Dashboard(Pool
Conditions)
Dashboard (System
Conditions)
Displays the resource pool usage status Yes Yes No
Displays L-Server performance
information and configuration
information
- 1 -
Tenant
Administrator
Yes Yes Yes
Yes Yes Yes
Tenant user
Page 14
Function Overview Infrastructure
Administrator
Tenant
Administrator
Tenant user
Dashboard (Capacity
Planning)
Resource A window for managing the resource
Template A window for managing L-Platform
L-Platform A window for managing L-Platform Yes Yes Yes
Request A window for assessing and approving
Accounting Usage charge for L-Platforms is
Tenant A window for managing tenants and
Account A window for changing a logged in
Option Sets the [Home] Tab as the window
Help Displays this product's manual Yes Yes Yes
Anticipate the demand for resource
pools and perform simulations of VM
guest reallocations.
pool and the relationship of resources to
L-Server
Templates
L-Platform usage applications and other
applications from tenant users
displayed.
users belonging to tenants
user's information and password
displayed at login.
Yes Yes No
Yes No No
Yes Yes No
Yes Yes Yes
Yes Yes No
Yes Yes No
Yes Yes Yes
Yes Yes Yes
Yes: Displayed (However, some functions may not be displayed according to the user's access rights.)
No: Not displayed
Refer to "Chapter 2 Home", and subsequent chapters for details on these functions.
However, refer to the "User's Guide for Infrastructure Administrators (Resource Management) CE" for information on the "Resource"
function.
1.2 Flow of Operations
This section explains the flow of operations using the ROR Console, from construction to operation, maintenance, and monitoring.
- 2 -
Page 15
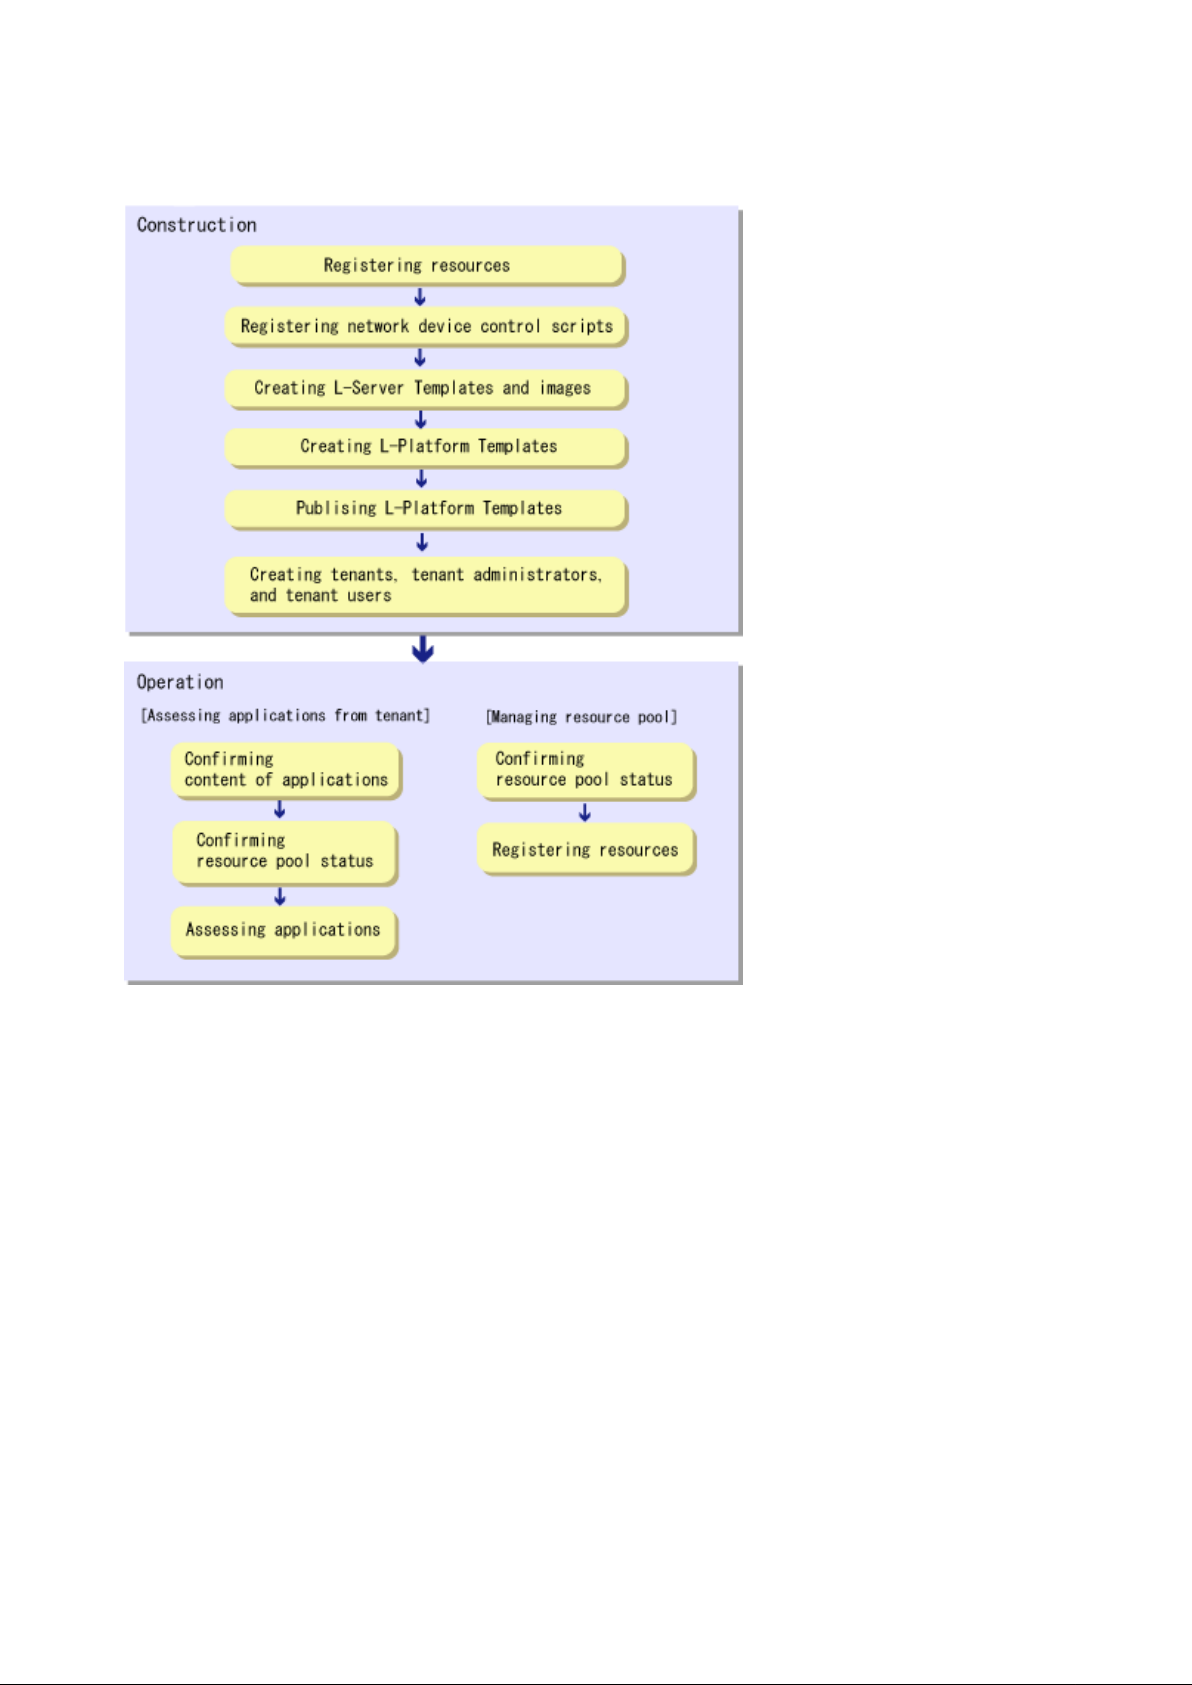
Flow from Construction to Operation (Infrastructure Administrator)
Construction
1. Registering resources
Register resources.
Refer to "Chapter 5 Registering Resources" in the "User's Guide for Infrastructure Administrators (Resource Management) CE" for
details.
2. Registering network device control scripts
Deploy the network device control scripts.
Refer to "5.7 Registering Network Devices" in the "Registering Resources" in the "User's Guide for Infrastructure Administrators
(Resource Management) CE" for details.
3. Creating L-Server Templates and images
Create L-Server Templates and images.
Refer to "Chapter 15 L-Server Template Operations" in the "User's Guide for Infrastructure Administrators (Resource Management)
CE" for details.
4. Creating L-Platform Templates
Create L-Platform Templates.
Refer to "8.3.2 Creating New L-Platform Template" for details.
- 3 -
Page 16

5. Publishing L-Platform Templates
Publish the created L-Platform Template.
Refer to "8.3.6 Publishing and Hiding L-Platform Template" for details.
6. Creating tenants, tenant administrators, and tenant users
Register the tenant, Tenant Administrator, and tenant users.
Refer to "Chapter 11 Tenant" for details.
Operation
[Assessing Applications from Tenant]
1. Confirming content of applications
Check the content of applications, such as L-Platform usage applications, reconfigurations, cancellations, and so on, received from
Tenant Administrators and tenant users.
Refer to "9.2 L-Platform Management" for details.
2. Confirming resource pool status
Check the resource pool usage status in order to confirm whether or not the requested necessary resources can be guaranteed.
Refer to "Chapter 4 Dashboard (Pool Conditions)" for details.
3. Assessing applications
Assessment the contents of applications from Tenant Administrators and tenant users.
Refer to "10.2 Assessing an Application" for details.
[Managing Resource Pool]
1. Confirming resource pool status
Check the resource pool usage status to confirm that there are sufficient unused resources in the resource pool.
Refer to "Chapter 4 Dashboard (Pool Conditions)" for details.
2. Registering resources
If necessary, Register resources to the resource pool to ensure sufficient free capacity.
Refer to "Chapter 5 Registering Resources" in the "User's Guide for Infrastructure Administrators (Resource Management) CE" for
details.
- 4 -
Page 17

Chapter 2 Login and Logout
This chapter describes how to open and close the ROR console.
Preparations
Before opening the ROR console, be sure to read the following instructions and restrictions.
- When accessing the ROR console, be sure to enable the Compatibility View in Internet Explorer. Select [View]-[Encoding] in Internet
Explorer, and check if [Auto-Select] is checked. If [Auto-Select] is not checked, select it.
- When downloading files using the ROR console, it is necessary to disable [Do not save encrypted pages to disk] in the Advanced
Settings of the browser.
- The ROR console uses the Web browser's standard fonts and is designed to be viewed in a window of 1024 by 768 pixels or larger.
When using a monitor with a higher resolution than this, it is recommended to enlarge the screen size. If the Web browser is resized
by a significant amount, the display quality may deteriorate.
- The ROR console uses JavaScript, Active Script, Cookies, and IFRAMEs. These must be enabled in the Web browser settings before
using the ROR console. Use SSL 3.0 and TLS 1.0.
- Specify either one of the following for the Web browser pop-up blocker:
- Disable the pop-up blocker
- Add the URL of the ROR Console to the Address of web site to allow setting.
Check with the system administrator for the URL of the ROR Console.
- Surrogate pair characters cannot be used on the ROR Console.
- When opening the ROR console right after launching a Web browser, a warning window concerning the site's security certificate will
be displayed.
The following message is displayed: "There is a problem with this web site's security certificate." This warns the user that Resource
Orchestrator uses a self-signed certificate to encrypt its HTTPS (SSL) communication with the Web browser.
Resource Orchestrator generates a unique, self-signed certificate for each admin server during manager installation.
Within a firewall-protected intranet, a network where the risk of identity theft is low, or where all correspondents are trusted, there is
no risk in using self-signature certificates for communications. Accept the warning to display the Resource Orchestrator login screen.
The login screen can be displayed by selecting the following option: "Continue to this web site (not recommended)."
- The background of the address bar will become red and the words "Certificate Error" will be displayed on the right side of the address
bar of the login screen, the ROR console, and BladeViewer.
Furthermore, the Phishing Filter may show a warning on the status bar. These warnings are referring to the same self-signed certificate
issue discussed in the previous bullet. It is safe to continue with the current browser settings.
- To stop displaying the security certificate warning screen and the certificate error icon, create a certificate associated with the IP
address or hostname of the admin server and add it to the Web browser.
A login window with a URL differing from the address bar's URL in which the IP address or host name (FQDN) may be displayed
depending on the OS configuration. There are no problems with using the displayed window.
Refer to "Appendix B HTTPS Communication" in the "Design Guide CE" for details.
Opening the ROR Console
This section explains how to access the ROR console.
Add the URL of the ROR console to the "Trusted sites" of the browser.
Start a Web browser from an admin client and specify the URL of the ROR console for connection.
If the port number was changed, specify the new port number.
When the ROR console is connected, the login window is displayed.
When Single Sign-On authentication has already been performed, the ROR console can be started without displaying the login window.
Refer to "Chapter 12 Installing and Defining Single Sign-On" in the "Design Guide CE" for details on Single Sign-On.
- 5 -
Page 18

URL: https://
On a Windows admin server, the ROR console can also be opened by selecting [start]-[All Programs]-[Resource Orchestrator]-[ROR
console].
Admin_server_FQDN
:23461/
Note
- If the login screen is not displayed, confirm the following.
- URL entered in address bar of the Web browser.
- The proxy settings of the Web browser are correct.
- The firewall settings on the admin server are correct.
- If already logged in from another Web browser window, login may be performed automatically (without displaying the login screen).
Login
In the login screen, enter the following items, and click <Login>.
The ROR console or BladeViewer is displayed after a successful login.
- User ID
- Password
However, opening multiple Web browsers from an already opened browser window (e.g. using the [File]-[New Window] menu from a
Web browser) may disable logging in as a different user.
To log in as a different user, start up a new Web browser from the Windows start menu.
When logging in for the first time, the [Home] tab is displayed. When logging in for the second time and successive times, the tab that
was displayed at the last logout is displayed.
It is also possible for each user to set whether the [Home] tab is to be displayed at login. To change the option, click "Options" in the upper
right corner of the ROR Console. This option is not reflected on the backup site during switchover due to Disaster Recovery. Each user
has to change the option individually after switchover.
Logout
To log out, select "Logout" in the global header, and click <OK> in the confirmation dialog.
Note
- If the Web browser is closed without logging out first, user authentication may be skipped the next time Resource Orchestrator is
accessed. In that case, users will be automatically logged in using the previously used session.
It is advised that the users log out properly after using the ROR console or BladeViewer.
- If the ROR console or BladeViewer has been opened simultaneously in several Web browser windows, those login sessions may be
terminated.
- 6 -
Page 19

Chapter 3 Home
This chapter explains the ROR Console Home window.
When the ROR Console is started, the Home window is displayed. Refer to "Chapter 2 Login and Logout" for information on how to start
the ROR Console.
The elements of the Home window are explained below.
- Functions list
The functions list displays the items that can be operated using ROR Console tabs.
Click the triangle icon next to the Function list to toggle Display/Hide.
- Information
Information from the System Administrator and Infrastructure Administrator is displayed.
3.1 Setup Wizard
This section explains the initial setup using the Setup Wizard.
Use the following procedure:
1. Select the [Home] tab from the ROR Console, and then click [Setup Wizard] displayed on the Tools of the Functions list.
2. Start the initial setup from the displayed window.
The following eight steps are required.
In each step, click <Next> to move to the next step, and click <Back> to return to the previous step. In the last step, click <Finish>
to complete the initial setup. To move to the next step without changing the current settings in each step, simply click <Next>.
Perform the following settings in each step. For details of the setting items for each step, refer to the table below.
Application Process
Select whether approval and assessment (application process) should be performed for L-Platform usage application,
configuration modification, and cancellation.
Email
Enter the SMTP server name, port number, and sender's email address.
Tenant
Enter the parameters for tenant management settings.
L-Platform1/2
Enter the parameters for L-Platform settings.
L-Platform2/2
Enter the parameters for L-Platform settings.
Accounting
Enter the parameters for usage fees for the L-Platform and Accounting Tabs.
OS Property
Enter the parameters to set for the OS when creating the virtual L-Server.
Confirm
The content of the settings can be checked.
- 7 -
Page 20
Note
- If the application process checkbox is being changed from on to off after the manager starts its operation, make sure that there
are no pending processes before changing it. If there are pending processes, finish all of them by cancelling, approving, rejecting,
accepting, or dismissing each of them.
- Set the following settings on "L-Platform 1/2" and "L-Platform 2/2" before operations commence. This attribute cannot be
switched once operations have commenced.
- Overcommit function
- System disk for physical L-Servers
- Setting method for host name
- Setting method for L-Server's resource name
- Setting method for folder's resource name
3. Restart the manager for the settings (except OS Property) to take effect.
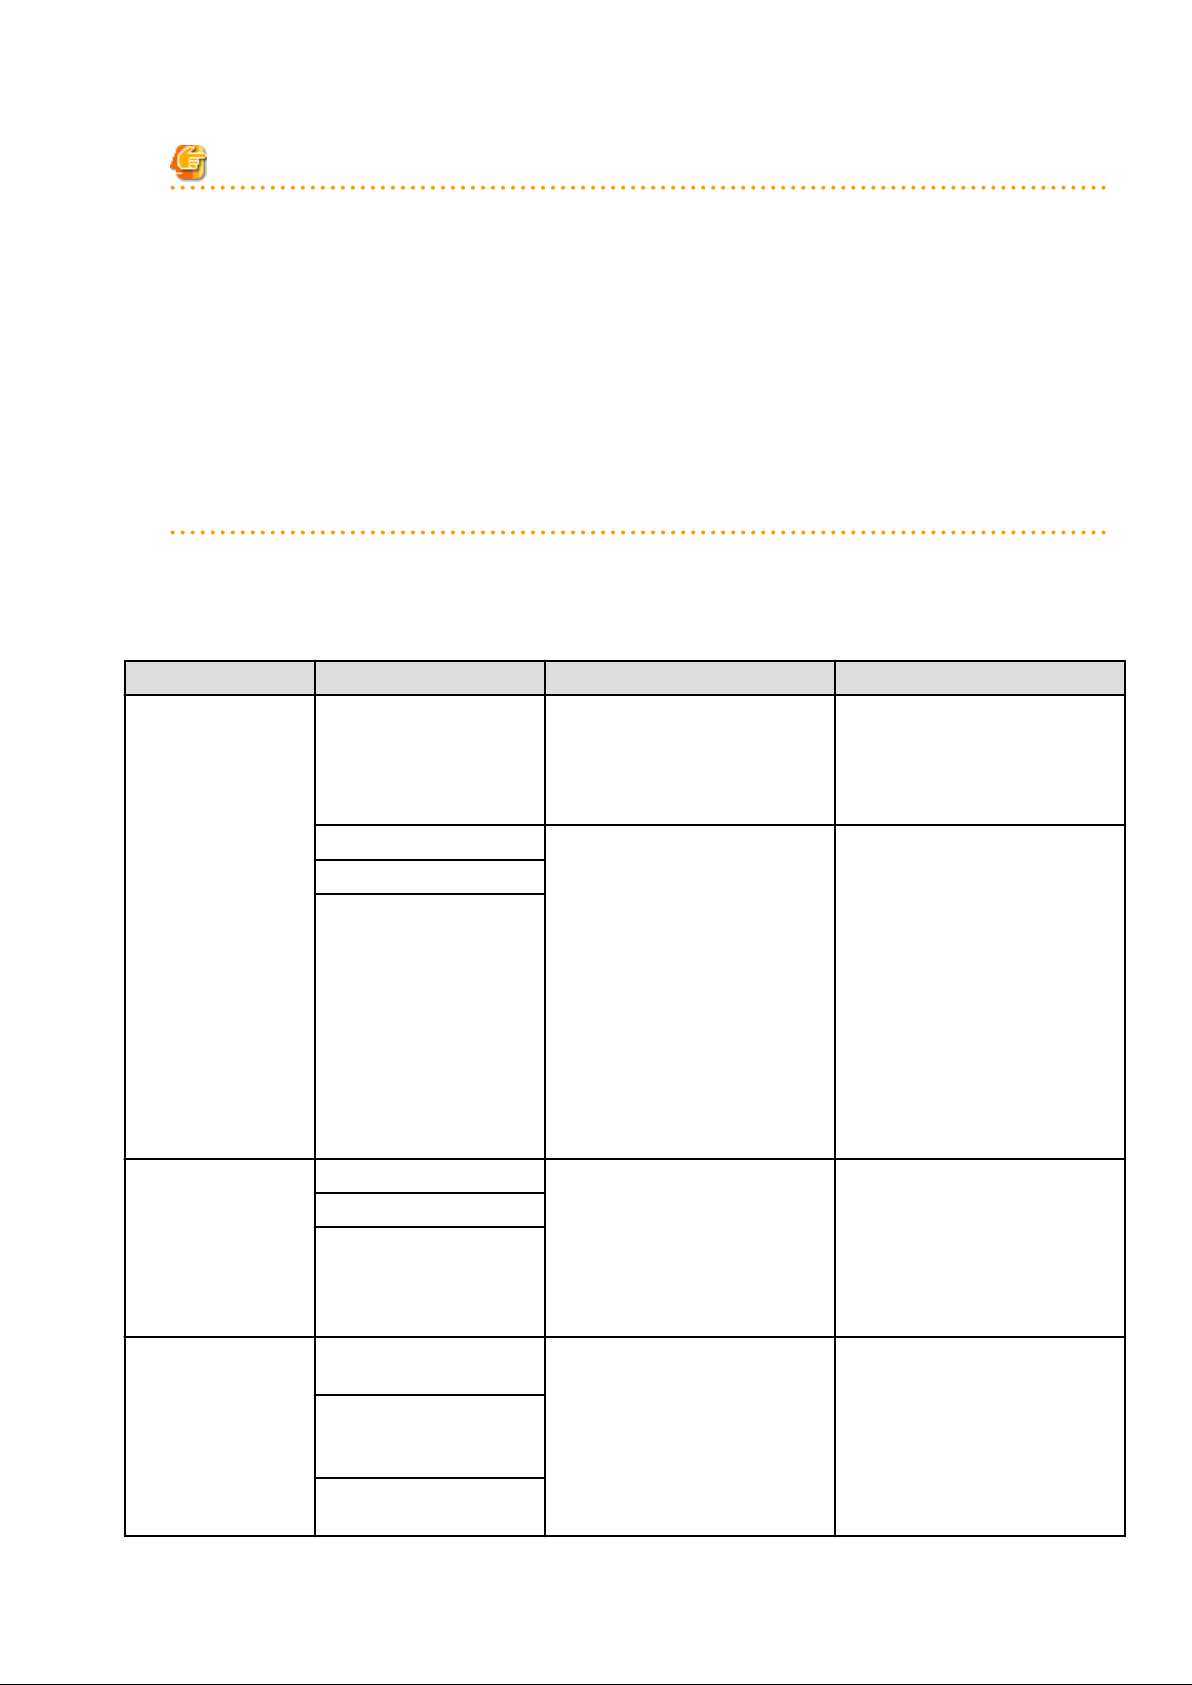
This table contains the settings involved for each step.
Step Setting Items Description Definition file reference
Step 1 Application
Process
Step 2 Email
Application process function Select whether to use the application
process. (*1)
If "Disable" has been specified, the
Request Tab will not be displayed on
the ROR Console.
L-Platform subscription The Application Process regarding LL-Platform reconfiguration
L-Platform cancellation
SMTP server name The host name and port number of the
Port number
Sender's email address
Platforms can be set. (*1)
If "Enable" is selected in Application
process and all these settings are
cleared, the Request tab will be
displayed on the ROR Console, but it
will not be possible to use the
application process. However, if
"Enable" is selected in the
Application process, these settings
can be modified for each tenant using
the tenant management windows of
the ROR Console.
SMTP server, and the sender's mail
address can be set. Also, when all
parameters are defined, the Mail
Sending function is enabled, and
SMTP server authentication is
defined as none.
-
Refer to "18.2.3 Setting Application
process settings" and "18.2.4 Setting
Application process to be used" in the
"Setup Guide CE". (*2)
Refer to each setting of "18.1 Settings
for Sending Email" in the "Setup
Guide CE".
Step 3 Tenant
Perform user management by
tenant administrator
Setting method for
registering a tenant user by
tenant administrator
Update user information to
the directory service
Settings for management of users by
the tenant administrator and the
reflection of information on the
directory service when registering
users can be set.
- 8 -
Refer to each setting of "8.6.1 Settings
for Tenant Management and Account
Management" in the "Operation
Guide CE".
Page 21
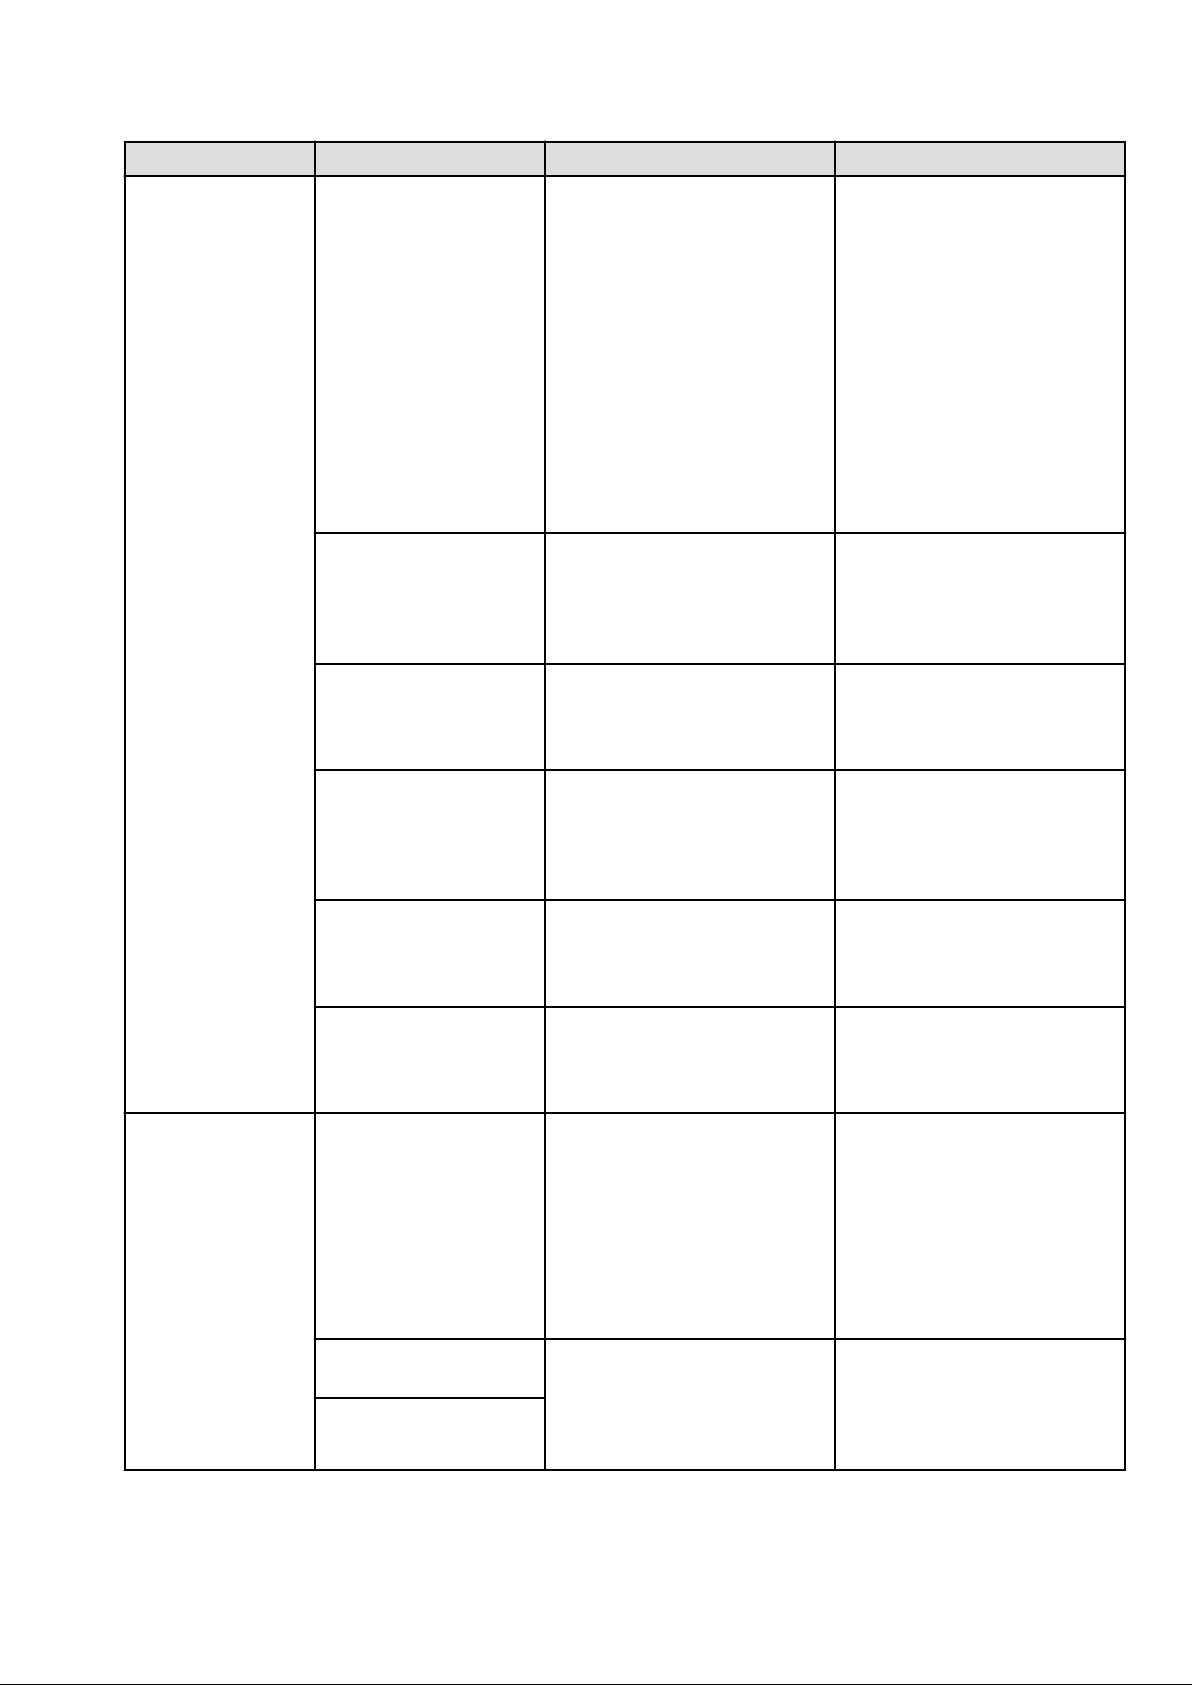
Step Setting Items Description Definition file reference
Step 4 L-Platform1/2
Overcommit function The L-Platform Management
overcommit function can be set.
When "Enable" is selected, the
definition for displaying the reserved
CPU frequency and memory in the
System Condition Server List is also
made.
Neither the number of CPUs nor the
memory size set in "Display Function
Settings for Estimated Price" and
"Usage Charge Calculator Settings",
which are settings related to the
overcommit function, are set here.
Please change the setting if necessary.
Distribution ratio setting
method
Reconfigure an L-Platform
from the template
The simple selection method for the
distribution ratios of CPUs and
memory that corresponds to the
distribution ratio settings of VMware
can be set.
When making an L-Platform usage
application, the value specified in the
L-Platform template can be modified.
Refer to "18.6 Settings for the
Overcommit Function" in the "Setup
Guide CE" and "8.8 System
Condition Server List Setting" in the
"Operation Guide CE".
Refer to "8.5.4 Distribution Ratio
Setting" in the "Operation Guide CE".
Refer to "8.5.1 Settings for
Permissions to Change L-Platform
Templates" in the "Operation Guide
CE".
Step 5 L-Platform2/2
Server specification setting
method
Segment display method When performing an application to
System disk for physical LServers
Setting method for host
names
Setting method for the LServer's resource name
Setting method for the
folder's resource name
When making an L-Platform usage
application, or when changing the
configuration of an L-Platform, the
server specification setting method
can be set.
use an L-Platform, the method for
setting up the subnets that are
allocated to segments be can set.
When a physical L-Server is deployed
from the L-Platform window, the disk
to use as the system disk for the
physical L-Server can be set.
The Host Name of the virtual server
can be set.
"Tenant name + sequential number" is
displayed, only when "tenant name +
sequential number" is specified in the
host name settings for virtual servers.
The settings cannot be modified from
other settings to "tenant name +
sequential number".
The setting method for the resource
names of the folders and the L-Server
of the L-Platform created when
applying to use an L-Platform can be
set.
Refer to "8.5.3 Settings for the
Simplified Reconfiguration
Function" in the "Operation Guide
CE".
Refer to "8.5.2 Subnet Settings at
Segment Editing" in the "Operation
Guide CE".
Refer to "18.9 System Disk Settings
for Physical L-Servers" in the "Setup
Guide CE".
Refer to "18.4 Setting the Host Names
for Virtual Servers" in the "Setup
Guide CE".
Refer to "18.5 Setting the Method for
Setting Resource Names" in the
"Setup Guide CE".
- 9 -
Page 22
Step Setting Items Description Definition file reference
Step 6 Accounting
Windows
Step 7
OS
Propertie
s
Usage fee (estimated price)
for L-Platform Tab
Display of the Accounting
tab
Default cut-off date
Default receiver's email
address for usage fee
information
Domain name The default values of the information
Full name
Organization name
Product key
License mode
Administrator password
Confirm password
Domain name
It is possible to set whether to display
the Usage fee (the estimated price) on
the L-Platform Tab in the L-Platform
Management window based on L-
Platform template accounting
information.
The usage charge calculator function
can be set.
on the [OS] tab, etc. can be set when
creating a virtual L-Server.
Refer to "8.7.1 Display Function
Settings for Estimated Price" in the
"Operation Guide CE".
Refer to "8.7.3 Usage Charge
Calculator Settings" in the "Operation
Guide CE".
Refer to "Appendix C.1.7 OS
Property Definition File" in the
"Setup Guide CE".
Linux
Windows/
Linux
*1: "Global settings" common across systems are used for the application process instead of "Unique settings" for each tenant. Refer to
"11.3 Creating a Tenant" for information on " Unique settings".
*2: Regarding the use of the setup wizard and definition file:
DNS search path
Hardware clock setting
Primary DNS server
Secondary DNS server
- In the setup wizard, the six items explained in "18.2.3 Setting Application process settings" and "18.2.4 Setting Application process
to be used" in the "Setup Guide CE" are displayed grouped into three items.
- When the items in the setup wizard are not checked, "false" is set for the corresponding item described in "18.2.3 Setting Application
process settings". When the items are checked, "true" is set.
- For the items described in "18.2.4 Setting Application process to be used", the definitions corresponding to the items checked in the
setup wizard are configured.
Point
In the setup wizard, the items explained in the sections indicated below are configured.
- "Chapter 8 Changing Settings" in the "Operation Guide CE"
- "Chapter 18 Post-Installation Procedures" in the "Setup Guide CE"
- "C.1.8 OS Property Definition File" in the "Setup Guide CE"
Start the setup wizard, and configure any items that need to be changed but are not configured in the setup wizard.
- 10 -
Page 23

"Setup Guide CE"
"Chapter 8 Creating Definition Files"
8.1 Definition Files (For Both Physical L-Servers and Virtual L-Servers)
8.2 Definition Files (For Physical L-Servers)
8.3 Definition Files (For Virtual L-Servers)
8.4 Definition Files (Network)
"Chapter 18 Post-Installation Procedures"
18.2.1 Registering an Application Process Assessor
18.3 Customizing the Dashboard
18.10 Setting for the Restarting Managers
18.11 Changing Multiple Operations of Managers
18.12 Edit the License Agreement
18.13 Editing the User Agreement when Registering a User
"Operation Guide CE"
"Chapter 8 Changing Settings"
8.5.6 Editing the Environment Setup File for the L-Platform API
8.5.7 Edit the License Agreement
8.5.8 Settings when RHEL5-Xen is used
8.5.9 Default Password Setting for Sent Emails
8.5.10 Settings for the Maximum Number of Connections for the L-Platform Template
8.5.11 Customizing the User Rights for L-Platform Operations
8.6 Settings for Tenant Management and Account Management
8.7 Accounting Settings
8.8 System Condition Server List Settings
8.9 Settings for Event Log Output for CMDB Agent
3.2 Editing the Home Messages
This section explains how to edit the messages that are shown in the lower section of the home window of the ROR console.
Information can be edited from the ROR console using the following procedure:
1. To edit the message, select the tab from the following:
- For the Infra Admins Only
Edit messages sent to only the infrastructure administrator.
- For the General Users
Edit messages sent to the tenant administrator and to tenant users.
Point
The tenant administrator and the tenant user can only refer to the messages labeled General Users.
2. Click [Edit] on the upper-right side of the table.
- 11 -
Page 24

3. The [Edit - Information] window is displayed.
To add information, click [Add] on the [Edit - Information] window.
To perform other operations, select information from the list, and then click [Move up]/[Move down], [Edit], or [Delete].
Click [Save] to save the changes after operations have been completed.
Adding Information
This section explains how to add information.
Perform the following procedure to add information.
a. Click [Add] on the [Edit - Information] window.
The [Add entry] dialog is displayed.
b. Set the following items:
Schedule
There is no specified format.
When not displaying the date, leave this field blank.
Enter up to 30 alphanumeric characters or symbols. Commas (",") cannot be used.
Messages
Enter up to 250 alphanumeric characters or symbols.
c. Click [OK].
The entered information is added.
Editing Information
This section explains how to edit information.
Perform the following procedure to edit information:
a. Select the information to edit from the list.
b. Click [Edit].
The [Edit entry] dialog is displayed.
c. Set the following items:
Schedule
There is no specified format.
When not displaying the date, leave this field blank.
Enter up to 30 alphanumeric characters or symbols. Commas (",") cannot be used.
Messages
Enter up to 250 alphanumeric characters or symbols.
d. Click [OK].
The information is updated.
Moving Information
This section explains how to move information in the list.
Perform the following procedure to move information:
a. Select the information to move from the list.
b. Click [Move up] or [Move down].
The selected information is moved up or down one line.
- 12 -
Page 25

Deleting Information
This section explains how to delete information.
Perform the following procedure to delete information:
a. Select the information to delete from the list.
b. Click [Delete].
The [Delete entry] dialog is displayed.
c. Click [Yes].
The selected information is deleted.
4. Click [Save] to save the changes after operations have been completed.
Click [Cancel] to discard the changes and return to the [Information] window.
- 13 -
Page 26

Chapter 4 Dashboard (Pool Conditions)
This chapter explains how to use pool condition operations.
4.1 Pool Conditions Overview
The Pool Conditions can be used to monitor resource pool use.
This section provides an overview of the Pool Conditions.
Pool Conditions window
The Pool Conditions displays charts for each of the following resource pools:
- VM pool (CPU) (*1)
- VM pool (memory) (*1)
- Storage pool
- Network pool
- Server pool (*2)
- Address pool (*2)
*1: The charts for overall volume, used volume, and L-Servers available for deployment will not consider VM hosts installed on
physical L-Servers and registered in VM pools, and that operate on a physical server released during physical server reconfiguration.
* 2: Only displayed if physical servers are registered to the server pool.
Resource pool types
There are two types of resource pool:
- Infrastructure administrator: Global pools
- Tenant Administrator: Local pools managed by the Tenant Administrator
- Dual-role administrator: Global pools and local pools
Items displayed in charts
The following items are displayed in each of the resource pool charts:
- Vertical axis: Resource pool use rate (%)
- Horizontal axis: Date and time (Three months)
- Polyline graph: If there are multiple resource pools, the five with the highest use rate (the five with the highest total values of the
series) are displayed.
4.2 Pool Conditions Display
Perform the following steps to display the Pool Conditions:
- 14 -
Page 27
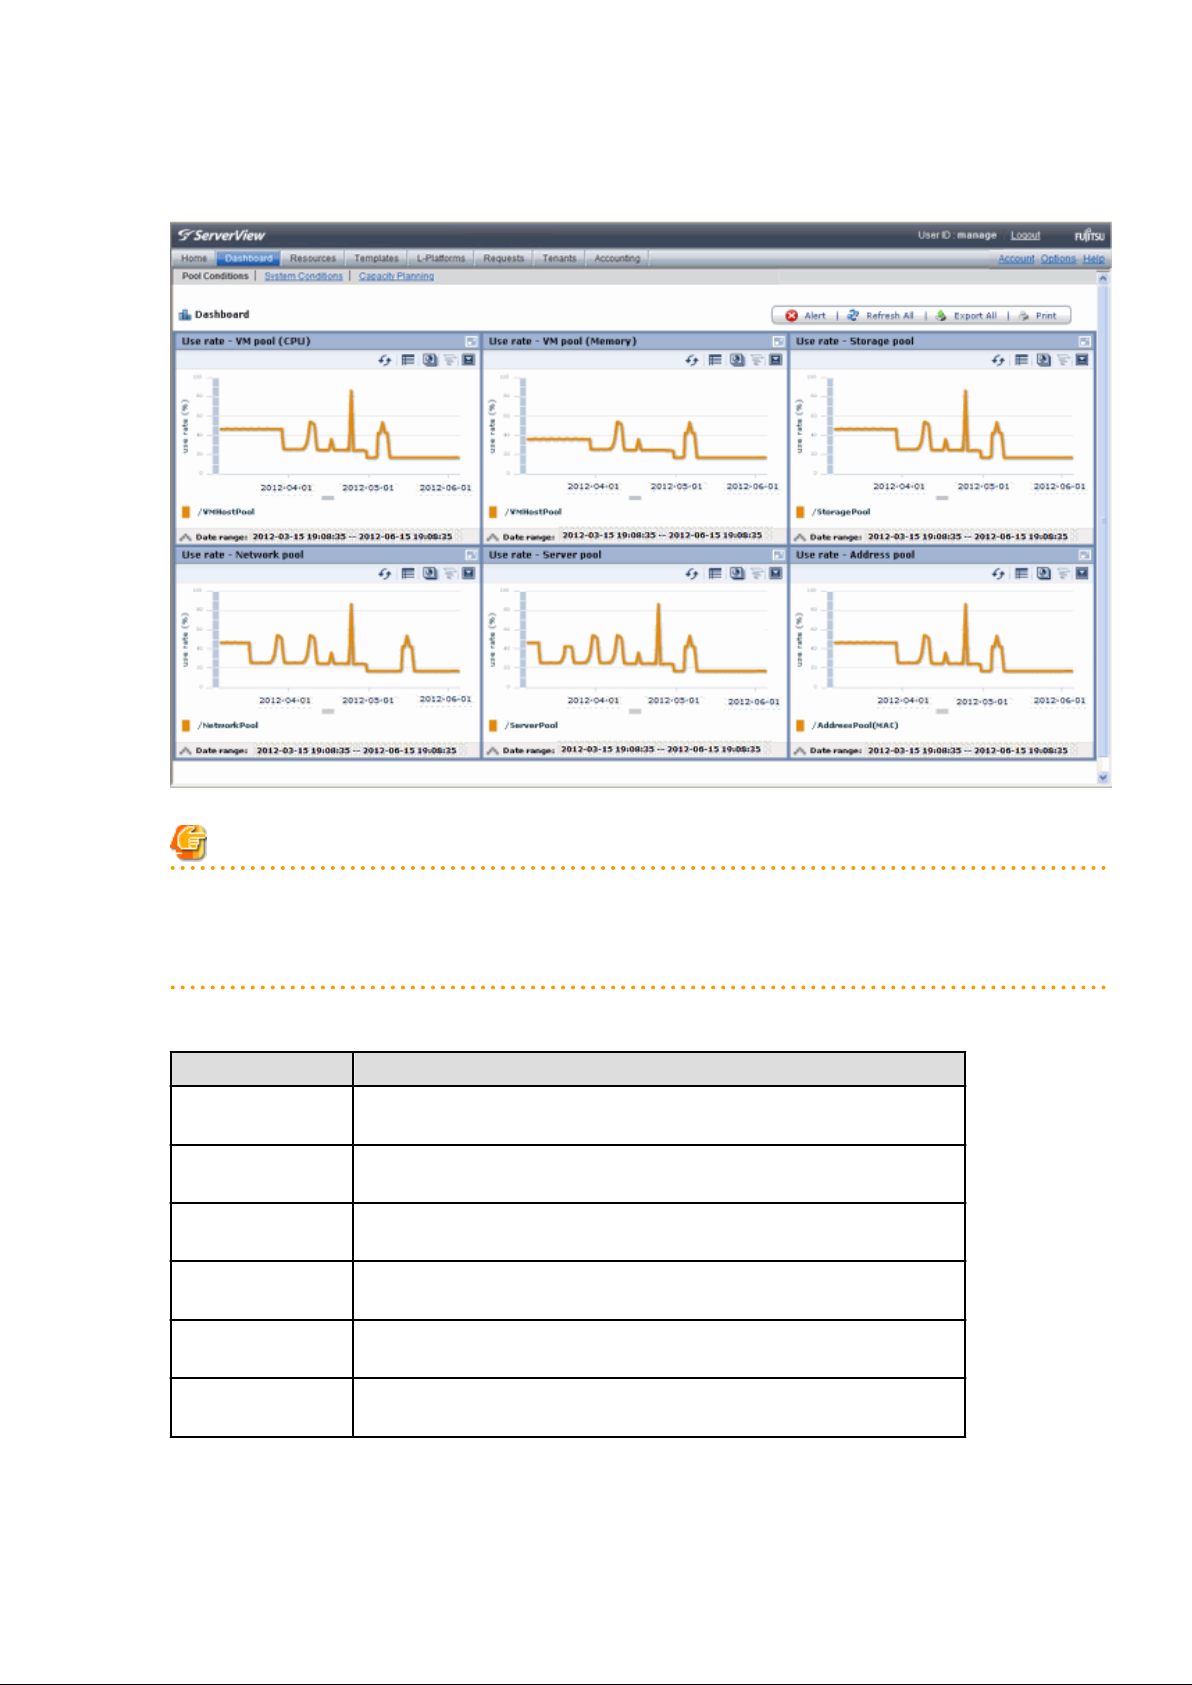
1. From the ROR console, select the Dashboard tab, then select Pool Conditions in the displayed sub tab.
Charts are displayed for use rate of each resource pool.
Note
Dual-role administrator privileges
Global pool is displayed by default when logging in as the dual-role administrator.
To reference another pool, use the Tenant ID menu at the top right of the window.
The following table lists the six types of charts available.
Chart
VM pool (CPU) Displays the VM pool (CPU) use rate of each pool as polyline graphs. Always
displayed.
VM pool (memory) Displays the VM pool (memory) use rate of each pool as polyline graphs. Always
displayed.
Storage pool Displays the storage pool use rate of each pool as polyline graphs. Always
displayed.
Network pool Displays the network pool use rate of each pool as polyline graphs. Always
displayed.
Server pool Displays the server pool use rate of each pool as polyline graphs. This is only
displayed if physical servers are registered to the server pool.
Address pool Displays the address pool use rate of each pool as polyline graphs. This is only
displayed if physical servers are registered to the server pool.
Explanation
The table below shows the icons displayed in charts.
- 15 -
Page 28
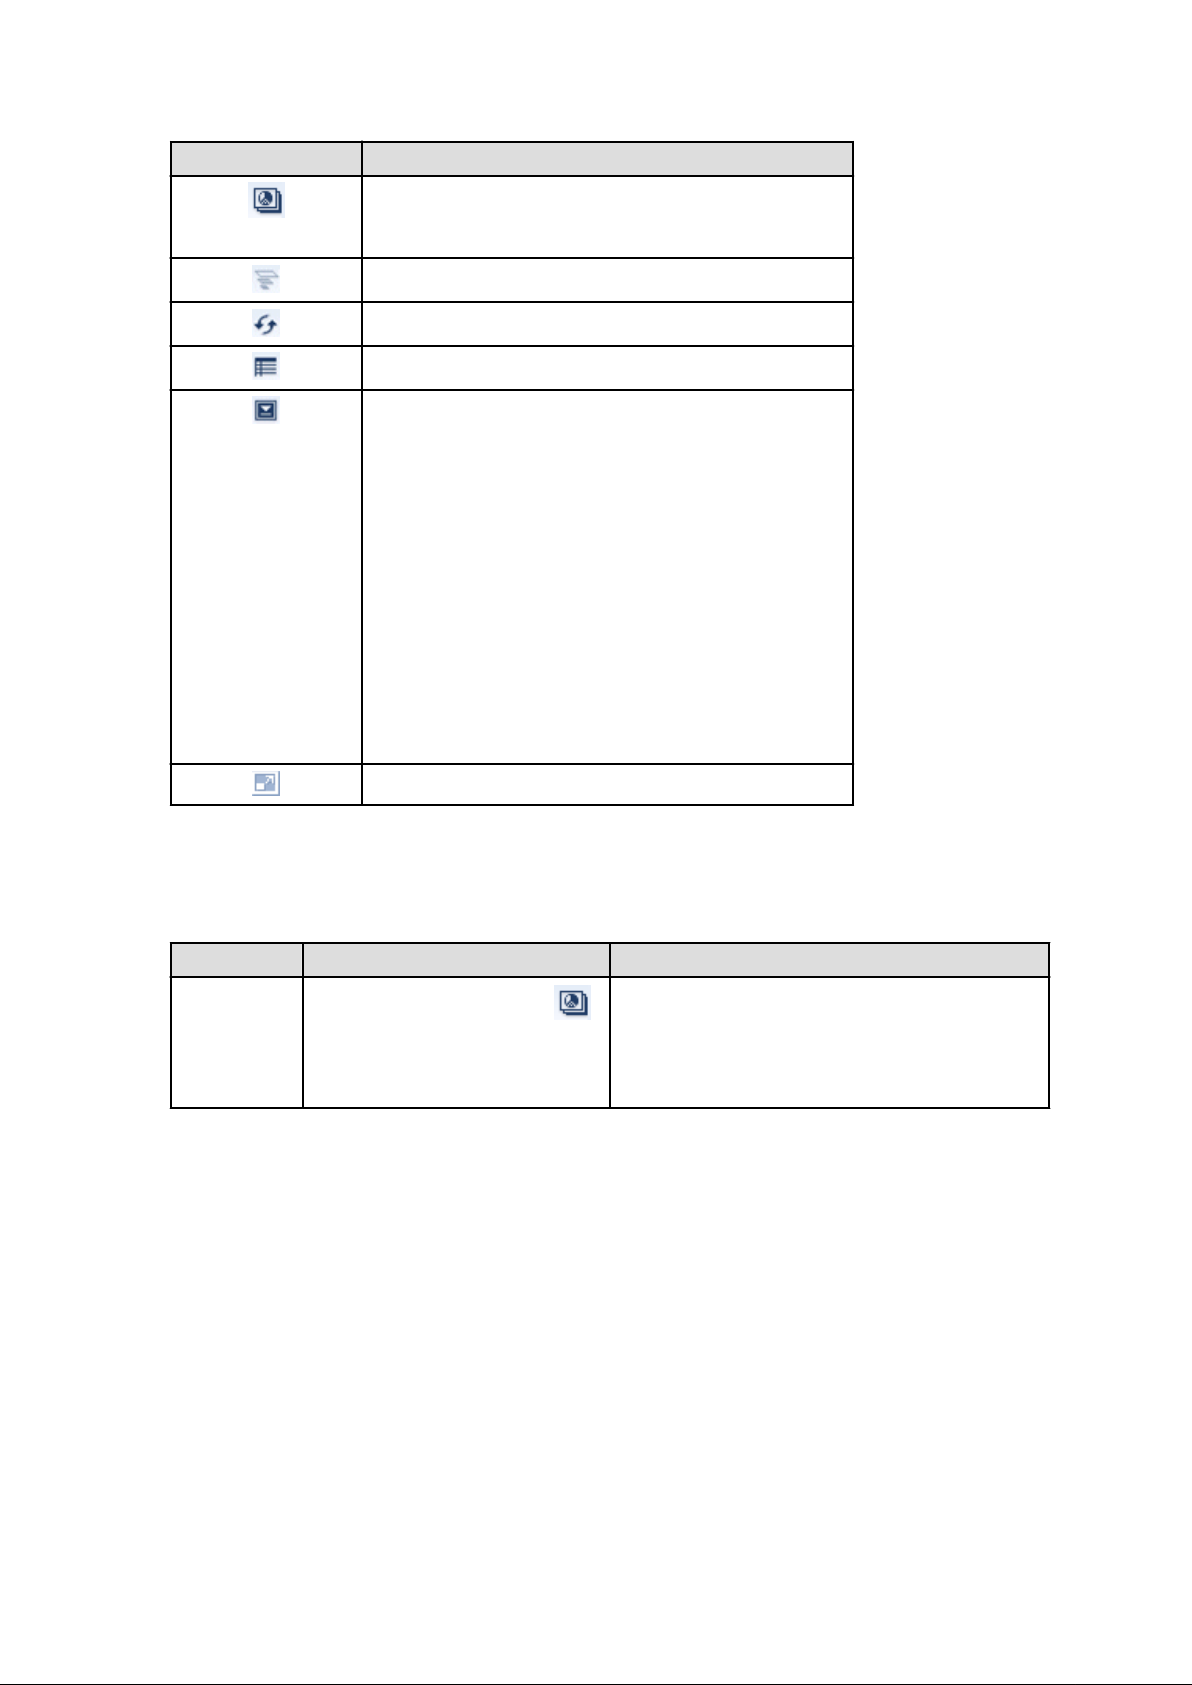
Icon Explanation
Displays the relationship chart menu
Selects the relationship chart for either "Use state" or "Allocatable
L-Servers".
Switches between the use rate chart and the relationship chart.
Updates the chart with the most recent information
Toggles between table and polyline graph displays
Displays a list of functions
The following functions may be used:
- Refresh: Updates the chart to the latest information.
- Change table/graph: Switches between the table and the graph.
- Drill up: If the relationship chart is displayed, this function
will switch to the use rate chart.
- Comments: Comments related to charts can be registered.
Related comments can also be referred to.
-
Export CSV: Data from the displayed chart can be output as a
CSV file.
- Configure: The chart's appearance can be modified
temporarily. Modified content will not be saved.
Enlarges the chart display
2. Display detailed information in other charts.
If required, display detailed information in other charts.
Refer to "4.3 Chart Display" for details of the information displayed in other charts.
The table below shows how to display detailed information.
Item
Relationship
chart
Click the relationship chart icon ( )
and select the chart to display from the
drop-down menu.
Display method Contents displayed
Displays a relationship chart in which the focus is switched
to a display of resource pool absolute values or similar.
The chart displayed varies depending on the resource pool.
For example, the overall amount and used amount are
displayed for the selected resource pool.
- 16 -
Page 29
A window example is shown below.
Point
When returning to the use rate window from the relationship chart window, click on the icon to move the displayed slider to the top.
Note
- If the Pool Conditions window is left open in a Web browser, the connection to the server may time-out and an error may display in
the window. If this occurs, close the Web browser, and then display the Pool Conditions window again.
- If the administrator changes the setting of the Pool Conditions while the ROR console window is displayed, the following messages
are displayed.
- The graph cannot be displayed.
- The table cannot be displayed.
- Failed to display Analytics screen.
- The Analytics Server is not started.
- The connection to the Analytics Server failed.
- Session is invalid.
- Unexpected error has occurred.
If this occurs, refresh the window of the Web browser or close the Web browser and then display the Dashboard window again.
When the same message is displayed, try it again a few minute later.
- When a linked service is stopped, just a border may be displayed, or the display may indicate that there is no data Check logs such as
the operating system logs, and restart the Manager. Refer to "2.1 Starting and Stopping the Manager" in the "Operation Guide CE"
for information on stopping and starting the Manager.
- 17 -
Page 30
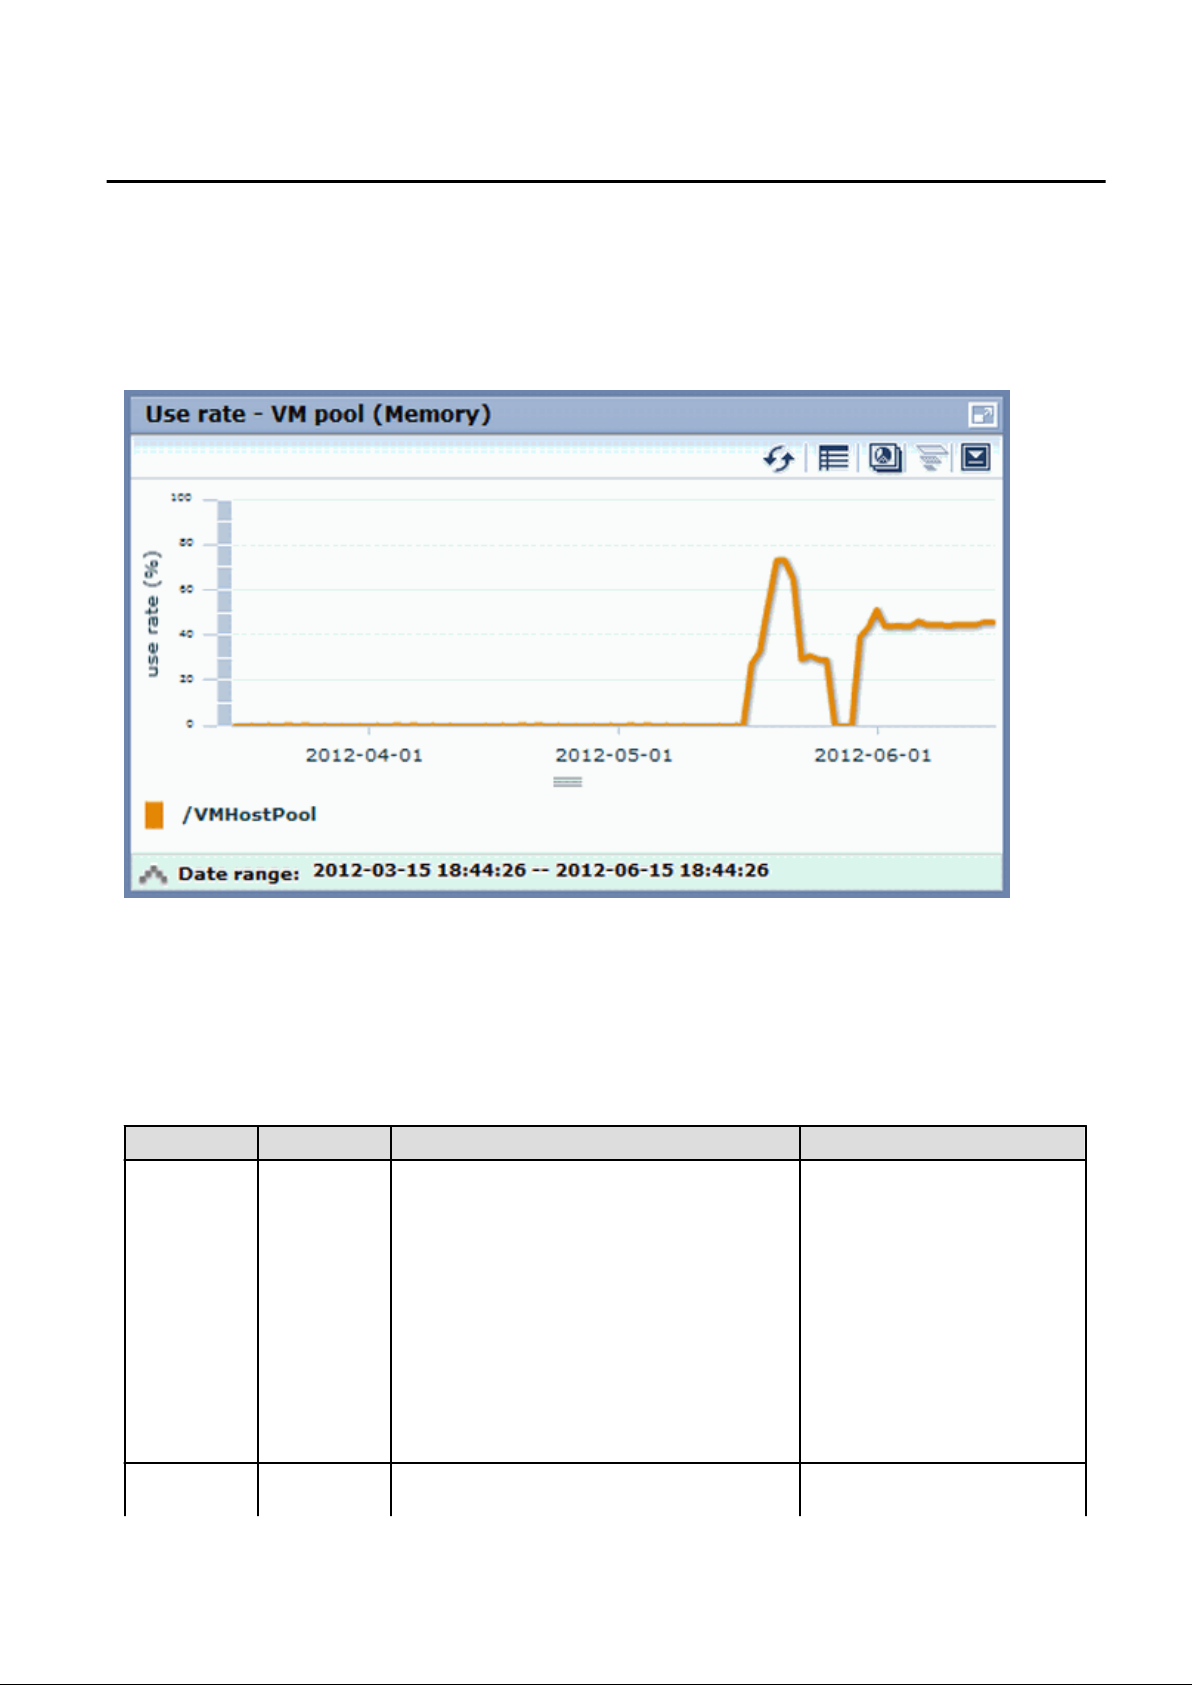
4.3 Chart Display
This section explains the charts for each resource pool.
The resource pool charts display resource pool use rates as polyline graphs for each resource pool. If there are multiple resource pools,
the use rates of the display periods of each of the resource pools are added together, and the top five are displayed in order, starting with
the one with the highest total.
The use rate graph displays the daily average. The displayed data will be updated every five minutes.
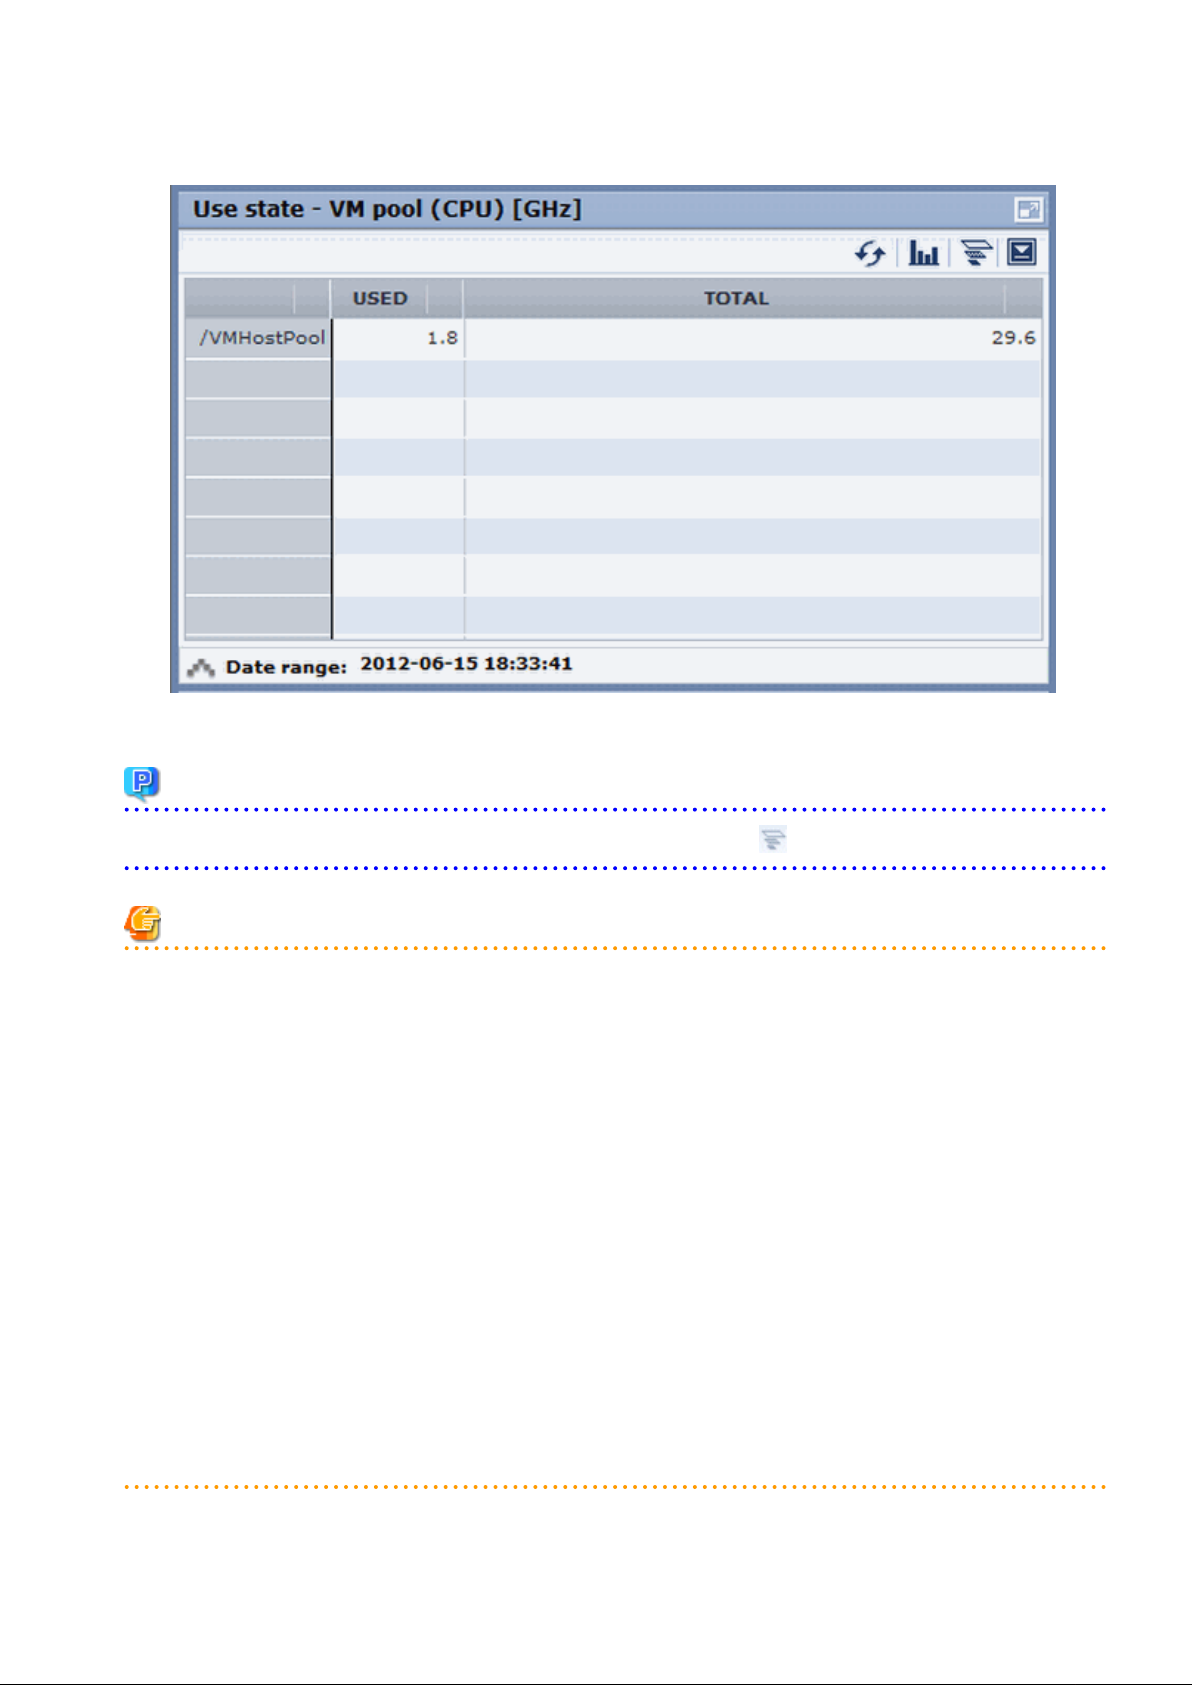
A VM pool (Memory) window example is shown below.
Detailed information can be displayed in other charts in the resource pool charts.
The data displayed in the detailed information will be updated every five minutes.
The table below shows the detailed information and usage scenarios. Refer to Step 2 under "4.2 Pool Conditions Display" for the operation
method.
The table below shows the other charts.
Display format Detailed information Usage scenario
Relationship
chart (Usage
state)
Table Displays the total amount and the used amount of the
resource pool.
The units are as follows:
- VM pool (CPU): GHz
Use this chart to check the number
values (absolute values) for the used
amount and number of networks/
servers/addresses.
- VM pool (memory): GB
- Storage pool: GB
- Network pool: Number of networks
- Server pool: Number of physical servers
- Address pool: Number of addresses
Relationship
chart
Table Displays the number of L-Servers that can be deployed
to the resource pool (*2)
If there is insufficient free space or
too few servers, use this chart to
- 18 -
Page 31

Display format Detailed information Usage scenario
(Allocatable LServers) (*1)
*1: The relationship chart that displays the number of deployable L-Servers is not displayed for network pools and address pools. LServers can be deployed even if the network pool and address pool are exhausted.
*2: For all storage pools that have thin provisioning function enabled, zero is displayed as the number of L-Servers that can be deployed,
regardless of the L-Platform Template type. Specify thin provisioning function enable/disable separately for each storage pool.
VM pool (CPU) relationship chart windows are shown below.
check the number of L-Servers that
can be deployed.
- Example: The number values (absolute values) for the used amount and number is shown below.
Example: L-Servers that can be deployed is shown below.
-
- 19 -
Page 32

4.4 Alert List Display
This section explains the Alert list.
If an alert has occurred in a resource pool, detailed information on the alert that has occurred can be checked by the Alert List.
The methods of checking detailed information on alerts are the method of displaying all alerts and the method of displaying alerts for each
chart.
Information
Refer to "Appendix E To Customize Dashboard" in the "Setup Guide CE" for information on how to customize alert information.
4.4.1 Alert List (All)
When the Alert button is clicked from the Pool Conditions window, the Alert list (all) window will be displayed.
Figure 4.1 Alert List (All)
The table below explains the buttons at the top right of the Alert list window.
- 20 -
Page 33

Button Description
Refresh Updates the Alert list to the latest status.
Comments The Comment dialog box will be displayed.
Adds a comment on an alert selected from the Alert list.
Allows a history of past comments to be viewed.
In addition, changes the status of an alert to "Resolve Alert" in accordance with the addition of the
comment.
Configure The Alert Configure dialog box will be displayed.
Sets the alert display.
Modifies search conditions and customizes the display result.
The changes of setting in the Alert list are applied until the window is closed. When the Alert list is
closed and opened again, the setting will be reset to the default values.
Print Outputs an image of the Alert list.
The table below explains the tab at the bottom of the Alert list window.
Tab Description
Details Displays detailed information on an alert selected from the Alert list.
The background of the attributes specified as the alert conditions will be displayed in yellow.
Refer to "E.2.2 Customizing Threshold Values" in the "Setup Guide CE" for information on setting
conditions.
[Comment] dialog box
This section explains the Comment dialog box.
Item Description
Add Comment Adds a comment on the selected alert.
Comment history Allows a history of past comments to be viewed.
Button Description
Resolve Alert Changes an alert to resolve alert.
A comment is entered in the Add Comment column beforehand.
Add Comment Adds a comment on an alert that has occurred.
[Alert configuration] dialog box (Search Fields)
Item Description
Time Select the date and time at which the alert to be searched for occurred.
Alert solved status Select the status.
Message Enter the message to be searched for.
Alert type Select "Critical".
Target Events
(Mandatory item)
Select the events to be searched, "System [Business process]".
Alert Name
(Mandatory item)
Alert level This is fixed at "100".
Select the alert name.
- 21 -
Page 34

[Alert configuration] dialog box (Custom Columns)
Set the contents of the items in the table below that are displayed in the Alert list window.
Item Description
Auto Refresh Specify the interval at which the window is to be updated.
The default is "5".
Number of results Specify the number of items to be displayed in the Alert list.
Custom Columns Select the items to be displayed in the Alert list from "Available Custom Columns".
4.4.2 Alert List (for Each Chart)
Use either of the following methods to display an Alert list (for each chart):
- Click the alert icon ( ) that is displayed in each chart.
- Select Show relational alerts from the Show function menu of each chart.
Figure 4.2 Alert List(for Each Chart)
- 22 -
Page 35

The table below explains the buttons at the top right of the Alert list window.
Button Description
Comments The Comment dialog box will be displayed.
Adds a comment on an alert selected from the Alert list.
Allows a history of past comments to be viewed.
In addition, changes the status of an alert to resolve in accordance with the addition of the
comment.
Print Outputs an image of the Alert list.
The table below explains the tab at the bottom of the Alert list window.
Tab Description
Details Displays detailed information on an alert selected from the Alert list.
The background of the attributes specified as the alert conditions will be displayed in yellow.
Refer to "E.2.2 Customizing Threshold Values" in the "Setup Guide CE" for information on
setting conditions.
4.4.3 Alert Resolve
When an alert occurs, an alert icon ( ) will be displayed at the top left of the charts. When the alert has been changed to resolve all of
the alerts for the chart, the alert icon displayed at the top left of the charts will disappear.
The procedure for changing a displayed alert to resolve the alert is shown below.
1. Click the Alert button. Alternatively, use the method explained in "4.4.2 Alert List (for Each Chart)" to display the Alert list window.
2. Select the alert to be changed to resolve and click the Comments button.
The Comment dialog box will be displayed.
3. Enter a comment in the "Add Comment" column and then click the Resolve Alert button.
The comment entered in the "Comment history" column will be displayed.
4. Click the Close button and close the Comment dialog box.
When the alert is changed to "Resolve alert, a check mark (
) will be added to the "Status" column of the list.
Note
- If the window display does not change even if the alert has been changed to "resolve alert", click the Refresh button.
- The Alert list for each chart will only display unresolved alerts, and will not display alerts that have been resolved.
Information
The following procedure can be used to return an alert that was changed to resolve back to having alert status once again:
1. Select the resolving alert and then open the Comment dialog box.
2. Enter a comment, click the Reopen Alert button, and then close the dialog box.
- 23 -
Page 36

Chapter 5 Dashboard (System Conditions)
This chapter explains how to monitor system conditions.
Note
The following message may be displayed during monitoring of system conditions:
The authority error occurred. Closing the browser.
This error occurs if, for example, the same user ID is used to log in from a different client. In this case, log in again correctly.
5.1 System Conditions Display Range
The system conditions can display the following information for all tenants and VM hosts:
- CPU utilization
- Disk R/W usage
- Disk R/W count
- Memory usage
- Network usage
Note
For tenants
- The above information is not displayed for L-Servers incorporated in the system using the L-Server import function of this product.
- Disk R/W usage, disk R/W count, memory usage, and network usage are not displayed if the virtualization software is Hyper-V.
However, if the dynamic memory setting is enabled, memory usage is displayed.
- Disk R/W usage is not displayed if the virtualization software is RHEL5-Xen.
- Disk R/W usage is not displayed if the virtualization software is RHEL-KVM.
- The performance graph (disk R/W usage, disk R/W count, and network usage) will not be displayed if the virtualization software used
is Solaris Zones.
- Network usage is not displayed if the physical L-Server is Linux/Solaris.
For VM hosts
- Network usage is not displayed if the VM host virtualization software used is either RHEL5-Xen, RHEL-KVM, or Solaris Zones.
5.2 L-Platform System Conditions Display
Perform the following steps to display the L-Platform system conditions:
1. From the ROR console, select the Dashboard tab, then select System Conditions in the displayed sub tab.
The System Conditions window is displayed.
2. In the System Conditions window, select the Tree Display tab.
The configuration of all tenants is displayed in the tree at the left.
At View, the "Tenant" showing a tree configuration is displayed.
Users can toggle between "Tenant" and "Tenant (History)".
- 24 -
Page 37

- Tenant
Displays the L-Platforms and L-Servers currently in use.
- Tenant (History)
The L-Platforms and L-Servers, including ones used in the past, are displayed.
Those that were cancelled over a year ago are no longer displayed in the history.
Point
The following describes how to find an L-Platform to display when there are a large number of L-Platforms.
1. Select the tenant in the pane on the left. When there are a large number of tenants, use the browser's "find on this page" feature
to find the tenant while the tenant list is displayed in the pane on the left.
2. Expand the tree of the tenant found in step 1, then use the browser's "find on this page" feature to find the L-Platform while
the L-Platform list is displayed.
3. From the tree at the left, select the L-Platform for which to display the system conditions.
The selected L-Platform is displayed in the CI list on the right.
If the "L-Platform" folder is selected in the tree, all L-Platforms under the folder are displayed in the CI list.
If an L-Server is selected in the tree, information about the selected server is displayed in the CI list.
The L-Platforms and L-Servers under each folder in the tree are displayed in descending order based on their update date and
time.
4. Select an L-Platform in the CI list, and then click the Show Graph button.
The system conditions is displayed in the lower part of the CI list. Refer to "5.2.1 System Conditions Display" for details on the
displayed system conditions.
The table below explains the displayed items.
Item Explanation
Nickname Displays the display name of the configuration item.
If the CI list Nickname link is clicked, the configuration information of the target
tenant, L-Platform or L-Server is displayed in a separate window. Refer to "5.2.2
- 25 -
Page 38

Item Explanation
Configuration Information Display" for the displayed configuration information.
The following display names are displayed in accordance with the CI type:
- For the tenant CI type: The tenant name determined during tenant registration
("tenant name (tenant ID)")
- For the L-Platform CI type: The L-Platform subscription name set during L-
Platform subscription
- For the L-Server CI type: The L-Server name set during L-Platform subscription
or L-Platform reconfiguration ("server name (host name)")
CI Type This column displays the configuration item type.
The CI type displayed depends on the element selected in the tree at the left.
The CI types are as follows:
- Tenant: If a tenant is selected
- L-Platform: If an L-Platform is selected
- L-Server: If an L-Server is selected
Note
Clicking the CI list column headers to sort the columns is effective only for the range displayed in that page. The sorting specification is
reset when the next or previous page is displayed. Sorting spanning multiple pages is not available.
5.2.1 System Conditions Display
The system conditions of the L-Platforms selected in the system conditions window CI list is displayed as a graph at System Conditions
in the lower part of the window. Up to five L-Servers can be displayed at once in the graphs. If more than five L-Servers are selected, the
first five are displayed.
The system conditions contents can be switched by clicking the System Conditions tabs.
The table below shows the contents under the System Conditions tabs.
Tab name Display content (*1) Graph type Display interval Display
interval
switching (*2)
Total Totals for each status Vertical bar graph 30 minutes, starting from the current time Not possible
CPU CPU utilization Horizontal
polyline graph
Disk Disk R/W usage (*3) Horizontal
polyline graph
Disk R/W count (*4) Horizontal
polyline graph
Memory Memory usage (*5) Horizontal
polyline graph
Network Network usage (*6) Horizontal
polyline graph
One hour/day/month/year from the current
time
One hour/day/month/year from the current
time
One hour/day/month/year from the current
time
One hour/day/month/year from the current
time
One hour/day/month/year from the current
time
Possible
Possible
Possible
Possible
Possible
All Overview of all the above
statuses
*1: Information is displayed using a different color for each L-Server.
Horizontal
polyline graph
- 26 -
One hour/day/month/year from the current
time
Possible
Page 39

*2: The display interval can be switched to a shorter interval by clicking the data plotting area of a horizontal polyline graph, or switched
to a longer interval by clicking outside the data plotting area.
*3: Disk usage and network usage are not displayed if the virtualization software is Hyper-V, RHEL5-Xen, and Solaris Zones.
*4: The disk R/W count is not displayed if the virtualization software is Hyper-V, RHEL-KVM, and Solaris Zones.
*5: The memory usage is not displayed if the virtualization software is Hyper-V. However, it is displayed if the dynamic memory
setting is enabled.
*6: The network usage is not displayed if the virtualization software is Hyper-V, and Solaris Zones. It is also not displayed if the
physical L-Server is Linux/Solaris.
Note
- Information obtained from virtualization software is displayed in the system conditions. Virtual Memory usage is not included.
- The system conditions data is not reflected in the display until collection at the fixed intervals shown below is completed.
Check the display after the fixed intervals shown below.
Tab name Display period (*) Collection time required before displaying
Total 30 days one whole day (from 0:00 to 23:59)
CPU
Disk
Memory
Network
* Note: The display period in each tab except for Total tab can be selected from one hour, one day, one month, or one year.
one hour ten whole minutes (from 0 minutes to 9 minutes)
one day one whole hour (from 0 minutes to 59 minutes)
one month/one year one whole day (from 0:00 to 23:59)
- System conditions data is not displayed if the power is off at the monitored L-Server.
- If the CPU utilization status continues at 100% at the monitored L-Server, data collection timing may be delayed and an error of about
one second may occur. This may cause CPU utilization (average value for a specified unit of time) to exceed 100%.
Take into account the possibility of data errors when using this display.
Example:
If a monitored L-Server has one CPU and is displayed in units of one hour, the value in the system conditions graphs and CSV file
data may be displayed as 100.03% (60.02 minutes (near equal 3601 seconds)/60 minutes) even though the upper limit for CPU
utilization is 100%.
Display examples for the Total tab and the All tab are shown below.
- 27 -
Page 40

- Total tab
- All tab
At each tab, the following icons displayed in the title bar can be used:
Icon Tool tip Explanation
Update Updates the displayed contents
- 28 -
Page 41

Icon Tool tip Explanation
Download CSV file Downloads the graph data in CSV format
Minimize Minimizes the specified window
Maximize Maximizes the specified window
Restore Restores the maximized window
The table below shows the CSV file items if data is downloaded from each graph.
Note that the CSV file encoding is Shift-JIS.
Graph type Column name Explanation Unit Description
CPU utilization
sdattim
resrcid Resource ID
recid Record ID
consintl Interval time second
Collection start time
(*)
yyyy-mm-dd HH:mm:ss
- in case of physical servers and
Windows:
"#" + CPU number or _Total
- in case of physical servers and Linux/
Solaris:
CPU number or _Total
- in case of Hyper-V:
VM name + ":Hv VP" + virtual
Processer number
Output any of the following
- WIN_CPUBUSY
- UX_CPUBUSY
- VMW_GCPU
- HV_VCPU
- XEN_CPU
- KVM_CPU
- in case of interval time is 10 minutes:
600
- in case of 1 hour: 3600
coverage
cpupcent CPU utilization %
vmgcused CPU utilization %
physres
ptrtim CPU utilization %
Data coverage (0 to 1)
Physical CPU
information or virtual
CPU information
- 29 -
- in case of 24 hour: 86400
Output for physical servers
Processer utilization
Output only for VMware
Physical CPU utilization per virtual
machine
Output only for VMware
Output only for Hyper-V
Utilization of virtual processors allocated to
a virtual machine and consumed by
hypervisor code
Page 42

Graph type Column name Explanation Unit Description
Output only for RHEL5-Xen
xenpcused CPU utilization %
CPU utilization (total utilization of virtual
CPUs set in the domain)
Disk R/W usage
xencpun
Nickname VM name
kvmcpupcent CPU utilization %
kvmcpus
zonecpucappct CPU utilization %
sdattim
resrcid Resource ID
recid Record ID
Number of virtual
CPUs in the domain
Number of virtual
CPUs in the domain
Collection start time
(*)
number Output only for RHEL5-Xen
Output only for RHEL-KVM
CPU utilization (total utilization of virtual
CPUs set in the domain)
Output only for RHEL-KVM
Output for Solaris Zones
CPU utilization (utilization of virtual CPUs
set in the zone)
yyyy-mm-dd HH:mm:ss
- in case of physical servers and
Windows: drive name or _Total
- in case of physical servers and Linux/
Solaris: device name
Output any of the following
- WIN_PHYDISKBUSY
- UX_DISKBUSY
- VMW_DISK
- KVM_DISK
- in case of interval time is 10 minutes:
600
consintl Interval time second
- in case of 1 hour: 3600
- in case of 24 hour: 86400
coverage
preadbyt Disk read usage bytes Output only for Windows
pwritbyt Disk write usage bytes Output only for Windows
iokreads Disk read usage Kbytes Output only for Linux/Solaris
iokwrite Disk write usage Kbytes Output only for Linux/Solaris
vmdmbread Disk read usage Mbytes
vmdmbwrt Disk write usage Mbytes
Nickname
Data coverage (0 to 1)
VM name
Output only for VMware
Disk read usage for virtual machine and
storage device units
Output only for VMware
Disk write usage for virtual machine and
storage device units
Output for VMware/RHEL5-KVM/
physical server
kvmdiskblockrdby Disk read usage bytes
- 30 -
Output only for RHEL-KVM
Disk read usage in the domain
Page 43

Graph type Column name Explanation Unit Description
Disk R/W count
kvmdiskblockwrby Disk write usage bytes
sdattim
resrcid Resource ID
recid Record ID
consintl Interval time second
coverage
preadsec Disk read count
Collection start time
(*)
Data coverage (0 to 1)
Output only for RHEL-KVM
Disk write usage in the domain
yyyy-mm-dd HH:mm:ss
- in case of physical servers and
Windows: drive name or _Total
- in case of physical servers and Linux/
Solaris: device name
Output any of the following
- WIN_PHYDISKBUSY
- UX_DISKBUSY
- VMW_DISK
- in case of interval time is 10 minutes:
600
- in case of 1 hour: 3600
- in case of 24 hour: 86400
Output only for Windows
Physical disk read operation count
Memory usage
pwritsec Disk write count
ioreads Disk read count
iowrite Disk write count
vmdreads Disk read count
vmdwrites Disk write count
vbdrd
vbdwr Disk write count
Nickname VM name
sdattim
resrcid Resource ID
Disk read count
Collection start time
(*)
Output only for Windows
Physical disk write operation count
Output only for Linux/Solaris
read count
Output only for Linux/Solaris
write count
Output only for VMware
Disk read count for virtual machine and
storage device units
Output only for VMware
Disk write count for virtual machine and
storage device units
Output only for RHEL5-Xen
Virtual block device read count
Output only for RHEL5-Xen
Virtual block device write count
Output for VMware/RHEL5-Xen/physical
server
yyyy-mm-dd HH:mm:ss
- in case of physical servers and
Windows: MEMORY
- in case of physical servers and Linux/
Solaris: FREEMEM
recid
Record ID
Output any of the following
- WIN_MEMORY
- 31 -
Page 44

Graph type Column name Explanation Unit Description
- UX_MEMFREE
- VMW_MEM
- HV_DMEM_VM
- XEN_MEM
- KVM-MEM
- in case of interval time is 10 minutes:
600
consintl Interval time
- in case of 1 hour: 3600
- in case of 24 hour: 86400
Network
utilization
coverage
comtot Memory usage bytes
freememp Memory usage bytes
memuse Memory usage percent Output only for Linux
Vmgmtm Memory usage Mbytes
ppmemdmvm
xenavm Memory usage Mbytes
Nickname VM name
kvmmemused Memory usage Mbytes
zonepmemused Memory usage Kbytes
sdattim
Data coverage (0 to 1)
Memory usage Mbytes
Collection start time
(*)
Output only for Windows
Commit size
Output only for Linux
Memory size utilization for user processes
Output only for VMware
Estimated working set size of resource pool
and virtual machine units
Output only for Hyper-V
Current memory capacity of virtual machine
Output only for RHEL5-Xen
Memory capacity allocated to domain
Output only for RHEL-KVM
Memory capacity allocated to domain
Output for Solaris Zones
Memory capacity allocated to zone
yyyy-mm-dd HH:mm:ss
resrcid Resource ID
recid Record ID
consintl Interval time
coverage
Data coverage (0 to 1)
Output only for Windows
Network device name
Output any of the following
- WIN_NET_INTERFACE
- VMW_NET
- XEN_NET
- KVM-NET
- in case of interval time is 10 minutes:
600
- in case of 1 hour: 3600
- in case of 24 hour: 86400
- 32 -
Page 45

Graph type Column name Explanation Unit Description
ifbytin
ifbytot Network usage (sent) bytes
vmnpmvtr Network usage (sent) Mbits
vmnpmbrecv
xenkbtx Network usage (sent) Kbytes
xenkbrx
Nickname VM name
kvmnetrxby
Network usage
(received)
Network usage
(received)
Network usage
(received)
Network usage
(received)
bytes
Mbits
Kbytes
bytes
Output only for Windows
Amount of received data(byte)
Output only for Windows
Amount of sent data(byte)
Output only for VMware
Amount of data transferred by virtual
network device port unit
Output only for VMware
Amount of data received by virtual network
device port unit
Output only for RHEL5-Xen
Amount of data sent by virtual network
interface
Output only for RHEL5-Xen
Amount of data received by virtual network
interface
Output for VMware/RHEL5-Xen/RHELKVM/and physical servers with Windows
OS
Output only for RHEL-KVM
Amount of data sent by virtual network
interface
Output only for RHEL-KVM
kvmnettxby Network usage (sent) bytes
* Note: When the information from the virtual L-server where the live migration was performed is output to CSV, the following phenomena
may occur:
Amount of data received by virtual network
interface
- Information for a certain point of time is output twice
- Information for a certain point of time is not output
If there is a large difference in the time and date in the VM host where the live migration was performed, the above phenomena will be
more likely to occur.
5.2.2 Configuration Information Display
The tenant, L-Platforms and L-Servers displayed in the CI list of the system conditions window are managed as configuration items (CIs).
When the Nickname link in the CI list of the system conditions window is clicked, the configuration information of the target tenant, L-
Platform or L-Server is displayed in a separate window.
A display example is shown below.
- 33 -
Page 46

The table below explains the displayed items.
Item Explanation
Selected
Information
GID Displays the identifier set by the system to identify the configuration item.
CI Type Displays the configuration item type.
The CI types are as follows:
- Tenant: If a tenant is selected
- L-Platform: If an L-Platform is selected
- L-Server: If an L-Server is selected
Nickname Displays the display name of the configuration item.
The following display names are displayed in accordance with the CI type:
- For the tenant CI type: The tenant name determined during tenant
registration ("tenant name (tenant ID)")
- For the L-Platform CI type: The L-Platform subscription name set during
L-Platform subscription
- For the L-Server CI type: The L-Server name set during L-Platform
subscription or L-Platform reconfiguration ("server name (host name)")
Record Displays the type of records held by the configuration item.
[0], indicating the actual information, is displayed.
Record Detailed Tree This is a tree of the elements comprising the configuration item.
The following elements are displayed in accordance with the CI type:
- For the tenant CI type: Tenants
- For the L-Platform CI type: Instances
- For the L-Server CI type: L-Server node information
When an element is selected, the element attribute values are displayed in the
basic information.
Values are displayed as attribute values, and differ depending on the element:
-
If the element is a tenant: The value determined during tenant registration
- 34 -
Page 47
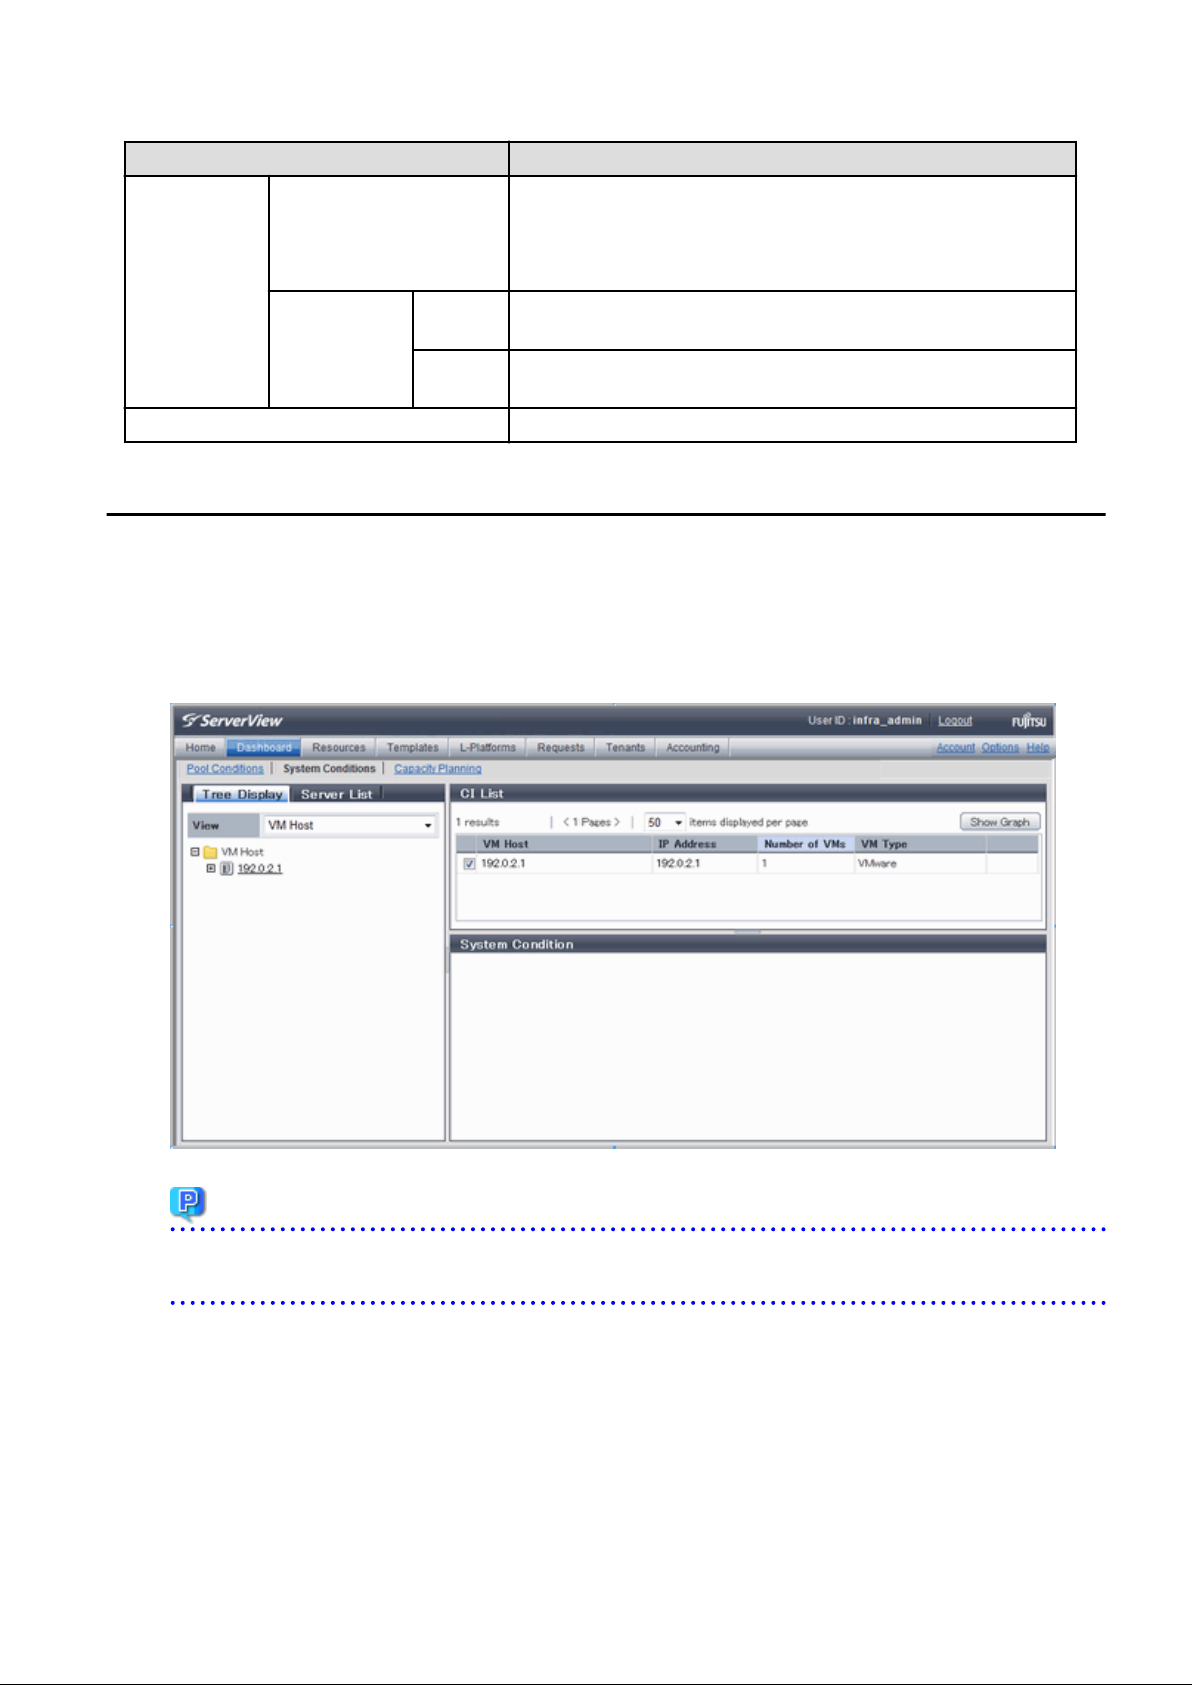
Item Explanation
- If the element is an instance: The value set during L-Platform
subscription
- If the element is L-Server node information: The value set during L-
Platform subscription or L-Platform reconfiguration
Basic
Information
Close button When this button is clicked, the window closes.
Attribute Displays the attribute name. When the label in the upper part is clicked, items
can be sorted by attribute name.
Value Displays the attribute value. When the label in the upper part is clicked, items
can be sorted by attribute value.
5.3 VM Hosts System Conditions Display
Perform the following steps to display the VM hosts system conditions:
1. From the ROR console, select the Dashboard tab, then select System Conditions in the displayed sub tab.
The System Conditions window is displayed.
2. In the System Conditions window, select the Tree Display tab.
Select the "VM Host" under View.
Point
If there are several VM hosts, search for the desired VM host by displaying the list of VM hosts and then using the web browser's
'Find on this Page' function.
3. From the tree at the left, select the VM hosts for which to display the system conditions.
The selected VM hosts are displayed in the CI list on the right.
If the "VM hosts" folder is selected in the tree, all VM hosts under the folder are displayed in the CI list.
4. Select a VM hosts in the CI list, and then click the Show Graph button.
The system conditions is displayed in the lower part of the CI list. Refer to "5.3.1 System Conditions Display" for details on the
displayed system conditions.
The table below explains the displayed items.
- 35 -
Page 48

Item Explanation
VM Host Displays the VM host name displayed at Resource tab - Trees pain in ROR console
display.
Note that name change is not always reflected immediately in some cases, for example,
when you change the VM host name on the VM Management Software. The change
is usually reflected within five minutes.
IP Address Displays the IP address of the VM host.
Number of VMs Displays the number of the running VM guests that was deployed on the VM host in
the L-Platform management page.
VM Type Displays the type of the VM host.
Example:
- "VMware": VMware
- "Hyper-V": Hyper-V
- "RHEL-KVM": RHEL-KVM
- "Solaris Containers": Solaris Zones
Note
Clicking the CI list column headers to sort the columns is effective only for the range displayed in that page. The sorting specification is
reset when the next or previous page is displayed. Sorting spanning multiple pages is not available.
5.3.1 System Conditions Display
The system conditions of the VM hosts selected in the system conditions window CI list is displayed as a graph at System Conditions in
the lower part of the window. Up to five VM hosts can be displayed at once in the graphs. If more than five VM hosts are selected, the
first five are displayed.
The system conditions contents can be switched by clicking the System Conditions tabs.
The table below shows the contents under the System Conditions tabs.
Tab name Display content (*1) Graph type Display interval Display
interval
switching (*2)
Total Totals for each status Vertical bar graph 30 minutes, starting from the current time Not possible
CPU CPU utilization Horizontal
polyline graph
Disk Disk R/W usage Horizontal
polyline graph
Disk R/W count Horizontal
polyline graph
Memory Memory usage Horizontal
polyline graph
Network Network usage (*3) Horizontal
polyline graph
One hour/day/month/year from the current
time
One hour/day/month/year from the current
time
One hour/day/month/year from the current
time
One hour/day/month/year from the current
time
One hour/day/month/year from the current
time
Possible
Possible
Possible
Possible
Possible
All Overview of all the above
statuses
*1: Information is displayed using a different color for each L-Server.
Horizontal
polyline graph
- 36 -
One hour/day/month/year from the current
time
Possible
Page 49

*2: The display interval can be switched to a shorter interval by clicking the data plotting area of a horizontal polyline graph, or switched
to a longer interval by clicking outside the data plotting area.
*3: Will not display if the VM host virtualization software used is either RHEL5-Xen, RHEL-KVM, or Solaris Zones.
Note
- The system conditions data is not reflected in the display until collection at the fixed intervals shown below is completed.
Check the display after the fixed intervals shown below.
Tab name Display period (*) Collection time required before displaying
Total 30 days one whole day (from 0:00 to 23:59)
CPU
Disk
Memory
Network
* Note: The display period in each tab except for Total tab can be selected from one hour, one day, one month, or one year.
one hour ten whole minutes (from 0 minutes to 9 minutes)
one day one whole hour (from 0 minutes to 59 minutes)
one month/one year one whole day (from 0:00 to 23:59)
- System conditions data is not displayed if the power is off at the monitored L-Server.
- Proper data collection cannot take place if the VM host to be monitored continuously indicates CPU utilization of 100%. Accordingly,
a display resembling one of the examples below may appear.
Example:
- CPU utilization rate displays as exceeding 100%.
- Data cannot be collected, graph does not display.
- If the virtualization software of the VM host is Hyper-V, network usage of a virtual network is the sum of network usage of the physical
NICs that are registered with the virtual network. Because of this, in a system environment where each physical NIC of a teaming
configuration is registered with virtual networks, each NIC is included for the calculation, therefore network usage is doubly added
up.
- To provide a viewpoint of hosts, memory usage is displayed as the total memory usage of a host including usage in the VM kernel
and the service console. The memory usage of the system conditions display can be used to check the total memory usage of a host
at that moment.
Display examples for the Total tab and the All tab are shown below.
- 37 -
Page 50

- Total tab
- All tab
At each tab, the following icons displayed in the title bar can be used:
Icon Tool tip Explanation
Update Updates the displayed contents
Download CSV file Downloads the graph data in CSV format
Minimize Minimizes the specified window
- 38 -
Page 51

Icon Tool tip Explanation
Maximize Maximizes the specified window
Restore Restores the maximized window
The table below shows the CSV file items if data is downloaded from each graph.
Note that the CSV file encoding is Shift-JIS.
Graph type Column name Explanation Unit Description
CPU utilization
Disk R/W usage
Disk R/W count
Memory usage
Network utilization
date_time Collection start time yyyy-mm-dd HH:mm:ss
Nickname VM host Nickname
value
date_time Collection start time yyyy-mm-dd HH:mm:ss
Nickname VM host Nickname
value Disk R/W usage Mbytes
date_time Collection start time yyyy-mm-dd HH:mm:ss
Nickname VM host Nickname
value
date_time Collection start time yyyy-mm-dd HH:mm:ss
Nickname VM host Nickname
value Memory usage Mbytes
date_time Collection start time yyyy-mm-dd HH:mm:ss
Nickname VM host Nickname
value
5.4 Server List Display
CPU utilization
Disk R/W count
Network usage (sent and
received)
%
Mbytes
Perform the following steps to display the server list:
1. From the ROR console, select the Dashboard tab, then select System Conditions in the displayed sub tab.
The System Conditions window is displayed.
2. In the System Conditions window, select the Server List tab.
3. Enter the search conditions in the left pane.
Select or enter the following item, and then click the Search button.
Item Explanation
Tenant In the displayed tenant list, select the checkbox of the tenant to display. Use the
browser's "find on this page" feature to find a tenant when there are a large number
of tenants.
The Select/Deselect All button checkbox can be used to switch between selecting and
deselecting all tenant checkboxes.
- 39 -
Page 52

4. A list of servers that match the search conditions is displayed.
The table below explains the items displayed in the server list.
Item Explanation
Tenant Name The tenant name of the tenant related to the L-Server
Example: First Business Department
L-Server Name The server name of the L-Server
Example: ID015-WEB-001
Host Name The host name of the L-Server
Example: V4KRXZS6R60001
Type The L-Server type
Example: economy
IP Address IP address of the L-Server control NIC
Example: 192.0.2.10
Number of CPUs Number of CPUs
Example: 2
CPU Clock (GHz) The CPU clock rate, in GHz units
Example: 2.0
Reserved CPU Clock
(GHz)
Memory (GB) The memory size allocated to the L-Server, in GB units
Reserved Memory
(GB)
The minimum applied value of the CPU clock rate reserved for the L-Server, in GHz units
Example: 1.6
The CPU reserve clock rate is displayed only if the over-commit display function of the
viewlist_ja.xml file is enabled. Refer to "8.8 System Conditions Server List Settings" in the
"Operation Guide CE" for the viewlist_ja.xml file setting method.
Example: 4.0
The minimum applied value of the memory size rate reserved for the L-Server, in GB units
Example: 2.0
The memory reserve size is displayed only if the over-commit display function of the
viewlist_ja.xml file is enabled. Refer to "8.8 System Conditions Server List Settings" in the
"Operation Guide CE" for the viewlist_ja.xml file setting method.
System Disk (GB) The disk size used as the system disk, in GB units
Example: 30.0
- 40 -
Page 53

Item Explanation
Total Added Disk(GB) The total value of the disk size for added disks. If there are multiple added disks, the total
value for those disks is output. The unit is GB.
Example: 60.0
Note
Clicking the server list column headers to sort the columns is effective only for the range displayed in that same page. The sorting
specification is reset when the next or previous page is displayed. Sorting spanning multiple pages is not available.
Point
The following describes how to find an L-Server to display when there are a large number of servers in the server list.
1. Select the checkbox for the tenant in the pane on the left. If you do not know the tenant name, select the Select/Deselect
All checkbox so that all tenant checkboxes are checked.
2. Click the Search button in the pane on the left.
3. Use the browser's "find on this page" feature to find the L-Server to display while the server list for the tenant found in step
2 is displayed in the pane on the right. You can change the number of items displayed per page with the drop-down list at the
top of the pane on the right. For example, change the number of results displayed from 50 to 300.
- 41 -
Page 54

Chapter 6 Dashboard (Capacity Planning)
This chapter describes capacity planning operations. Scenarios are prepared in the Capacity Planning window to suit any operational
purpose. Analysis and planning are facilitated by checking each report in turn
Note
If the character " ' " is used in the display name of a tenant, it is displayed as the character "_" on the Capacity Planning window.
6.1 Report Types
This section describes the types of reports for each category. Refer to "6.3 Operations Using Scenarios" for information on the categories.
VMware virtual machine relocation
Reports Display item Description
VMware rsc. usage cond.(List
of host)
VMware rsc. usage cond.
(Virtual machine stack)
VMware virtual machine
relocation simulation
- CPU usage amount and rate
- Memory usage amount and rate
- Disk I/O count
- Disk throughput
- Network send and receive count
- Network throughput
- Built-in resource information
- CPU usage amount
- Memory usage amount
- Disk I/O count
- Disk throughput
- Network send and receive count
- Network throughput
- CPU usage amount
- Memory usage amount
- Disk I/O count
Understand the use of resources on the VM host
(VMware) registered in the pool.
VM hosts with available resources will be detected
as VM hosts that might be consolidated.
Check the virtual machines located in the VM host
and their resource usage for the VM hosts considered
as migration sources in "VMware rsc. usage cond.
(List of host)".
Check the resource usage in each virtual machine in
the migration source, and use this information to
ascertain which virtual machine should be allocated
to which destination candidate VM host.
Simulate the resource usage if virtual machines
considered as migration candidates are reallocated to
VM hosts considered as migration targets.
- Disk throughput
- Network send and receive count
- Network throughput
VMware resource allocation optimization
Reports Display item Description
VMware res. usage cond. (List
of virtual machine)
- CPU (usage amount and rate)
- Memory (usage amount and rate)
Displays the virtual machines located in VM
hosts and the resource usage status.
- 42 -
Page 55

ServerView Resource Orchestrator Resource pool
Reports Reports Display item Description
VM pool(CPU) (demand forecast) VM pool(CPU) (demand forecast) Perform regression analysis based on historical
VM pool(Memory) (demand
forecast)
Storage pool (demand forecast) Storage pool (demand forecast)
Network pool (demand forecast) Network pool (demand forecast)
Server pool (demand forecast) Server pool (demand forecast)
Address pool (demand forecast) Address pool (demand forecast)
VM pool(Memory) (demand
forecast)
CPU usage and memory usage to anticipate
future resources that will be used.
6.2 Capacity Planning Operations
This section explains capacity planning operations.
How to open the Configuration Management screens
From the ROR console, select the Dashboard tab, then select Capacity Planning in the displayed sub tab.
1.
2. The Capacity Planning window will be displayed.
Note
Do not perform operations in the Capacity Planning window using the right-click shortcut menu.
Capacity planning layout
When started, the following Capacity Planning window is displayed:
The Capacity Planning window is made up of the following elements:
- 43 -
Page 56

Item
No.
(1) Conditions window Set categories, reports, and the analysis conditions for the various
(2) Results window The contents of the reports are displayed.
Component Description
reports. Operations in this window are described in following sections:
Conditions window layout
- 44 -
Page 57

Basic operations in the conditions window
Item
No.
(1) Category Select a category that matches the purpose of operation.
(2) Report Select a report that matches the purpose of operation.
(3) Target Settings A specification relating to the target of the report.
(4) View Settings Specify report data intervals, number of display items, and file output.
(5) Period Specify the periods for analysis.
Component Description
The way to specify the number of display items depends on the type of report.
Available memory capacity is used to avoid system stoppages due to extremely low memory
availability, so is extracted from the lowest up.
The number of data items that can be displayed in the graph is approximately up to 10..
(6) Operation
button(Display)
Button for displaying the results of analysis as a report (content).
6.2.1 Scenario
Scenarios are prepared in the Capacity Planning window to suit any operational purpose. Analysis and planning is possible by checking
each report in turn.
Category
Categories are divided into types to match different purposes of operation.
The reports can be selected once the category is selected.
Report
Select the appropriate report.
The items in Conditions depend on the report selected.
- 45 -
Page 58

6.2.2 Conditions
6.2.2.1 Target Settings
When a report is specified, the following items are displayed: The items displayed are report specific.
The following is an example window when Tenant and Host are specified:
The items that are specified are explained below for the different types.
Tenant specified
Item Description
Tenant Select the tenant to be analyzed from the tenant menu.
Tenant and Host specified
Item Description
Tenant Select the tenant to be analyzed from the tenant menu.
Host Select the host to be analyzed from the host menu.
The host menu displays the hosts that have been registered with the selected tenant.
This will be empty if a host is not registered in the tenant. Select the tenant where the host is registered.
VMware virtual machine relocation
- 46 -
Page 59
Item Description
Tenant Select the tenant to be used for VMware virtual machine simulation from
the tenant menu.
Relocation
candidate
Relocation candidate To add a candidate for reallocation, click Add, then add using the Add
Relocation candidate dialog that is displayed.
A list of candidates for reallocation is shown when making additions.
The display format is "host name:virtual machine name".
The maximum number of relocation candidates is 50.
The maximum number of selectable hosts that contain the virtual
machines of a relocation candidate is 5.
To delete a candidate for reallocation, click Delete for the relevant
virtual machine and delete it.
However, as there is no data for L-Servers that have not been run during
the specified analysis period, they are not displayed in the results
window.
Also, while it is possible to configure without using this product and
select a virtual machine that is not being managed as an L-Server,
perform one of the following if executing a reallocation:
- Reallocate using VMware's own functionality
- After importing as an L-Server, reallocate using this product
Add
Relocation
candidate
Host Select the source host from the host menu.
Virtual
machine
Select the virtual machine that is the candidate for reallocation.
Multiple options can be selected.
Relationship information with the VM host for virtual machines that
have performed migration, deployment, and release operations may not
be updated immediately after the operations. The relationship between
the VM host and the VM guest may require up to 1 hour to be updated
on the screen.
For example, if the migration operation is not reflected, after specifying
the pre-migration VM host on the host, select the virtual machine.
Aggregation
target's
information
Direct input of installed resource
Aggregate to a host in operation
Host If Aggregate to a host in operation was selected, select the
CPU
Core Number
Memory
If the consolidation destination host has already been registered in the
tenant, select Aggregate to a host in operation.
The number of CPUs and amount of memory in the specified host are
shown as black lines in the displayed graph.
If the host to be consolidated is not registered, select Direct input of
installed resource.
consolidation destination host from the menu.
Hosts chosen for consolidation cannot be specified.
If Direct input of installed resource was selected, specify the
consolidation destination server CPU clock number (GHz), number of
cores in the CPU, and loaded memory capacity (GB) as numbers.
- Specify a number between 0.001 and 1000 for CPU (clock count).
- Specify an integer between 1 and 1000 for Core Number for the
number of cores in the CPU.
- Specify a number between 0.001 and 1000000 for the memory.
The specified number of CPUs and amount of memory are shown as
black lines in the displayed graph.
- 47 -
Page 60

Note
Virtual hosts that have been stopped for more than 5 hours do not display virtual machine candidates for reallocation.
6.2.2.2 View Settings
The following explains specifications relating to the number of display items, data intervals, and file output:
The items to be set differ depending upon the report type.
Item Description
Threshold Specify the CPU and memory usage rates that will be tolerated on the consolidation destination server
(optional).
If this is specified, it is shown as a red line in the graph.
Analysis mode Specify the analysis method.
- Hourly
The maximum value for resource usage by time slot is calculated for each consolidation candidate
server and displayed as a stack.
Check that there is no problem with the resources by time unit after consolidation.
- Weekly
The maximum value for resource usage by day of the week is calculated for each consolidation
candidate server and displayed as a stack.
Check that there is no problem with the resources by day of the week unit after consolidation.
- time-line
The maximum value for resource usage calculated for each consolidation candidate server and
displayed as a stack.
Number of Items
Displayed
Select the number of data items to use for analysis.
The number of data items can be selected as follows:
- Top (Bottom)
An integer between 1 and 1000 can be entered.
Only the entered number of data items will be displayed.
If there is a large amount of data to be displayed, it may be difficult to read the graphs. Therefore,
it is recommended you specify 10 items only.
- All
All data will be displayed.
Operating time Specify the time period to output the results of the analysis.
Analysis data Select the data interval to use for analysis.
The following data intervals can be selected:
- 10 min
Data retention period: 7 days
Appropriate for analysis of about one day's worth of data.
- 1 hour
Data retention period: 6 weeks
Appropriate for analysis of about one week's worth of data.
- 1 day
Data retention period: 13 months
Appropriate for analysis of one month or mores' worth of data.
It may not be possible to select this with some report types or methods of analysis.
Output to File The content of the results window is output as an Excel file.
- 48 -
Page 61

Item Description
If the Creates an Excel(R) file check box is selected, the Save in Excel(R) format button becomes
active at the bottom of the results window. Click this button and the displayed content can be
downloaded in Excel format.
Disable clipboard redirection if operation is to be performed using a remote desktop connection.
If downloading files from the Save in Excel(R) format button, the "xlsx" or "xlsm" extension files
can be downloaded. Note that you must enable the macro if the "xlsm" extension file is opened.
Detail Settings
As, depending on the report type, the Detail Settings area may be displayed, the items to be set may differ.
The Detail Settings area is shown closed when a report is selected. Click the title bar of the Detail Settings to edit advanced settings.
Item Description
Aggregation
method
Output object Analyze according to the disk
Threshold (Arbitrariness) Specify the pool usage rates that will be tolerated on the
Analyze by maximum value. The maximum values in the data interval are displayed.
Analyze by mean value. The average values in the data interval are displayed.
Select to display a distribution graph and table showing reads and
reading and writing.
Analyze according to the network
sending and receiving.
writes.
Select to display a distribution graph and table showing sends and
receives.
consolidation destination server (optional).
If this is specified, it is shown as a red line in the graph.
6.2.3 Period
This section explains periods.
Analysis Period
Item Description
Start date
End date
Note
Specify the period of the analysis.
Select the minute, hour, day, month and year using a drop-down list box to select the date and time that
analysis will start and stop.
If a period prior to the data retention period is specified, no data will be displayed.
Refer to Analysis data in "6.2.2.2 View Settings" for information on data retention periods.
Forecast Date
This can be specified for the following reports:
- VM pool(CPU) (demand forecast)
- VM pool(Memory) (demand forecast)
- Storage pool (demand forecast)
- Network pool (demand forecast)
- Server pool (demand forecast)
- 49 -
Page 62

- Address pool (demand forecast)
Item Description
Date Forecasting is performed up to the specified date.
Select the day, month and year using a drop-down list box to select the date.
6.2.4 Operation Buttons (Display)
The operation buttons are explained below.
Button Description
Display Report is created based on the specified conditions.
Reports are displayed in the results window.
The message "Loading..." is displayed while the content is being generated. While this message is displayed, the Display button will be
disabled.
6.2.5 Results Window
This section describes the operations that can be performed on the displayed content, including displayed report content.
Table sorting
When a column header is selected in the table in the results window, the table is resorted using the selected column as the key.
Sorting can be toggled between ascending and descending order.
Note
Numerical sorting works correctly only when all values in the specified column are numerical values. Sorting cannot be performed correctly
if the column includes non-numerical data such as null values.
Save in CSV format / Save in Excel(R) format / Print
The following buttons are displayed at the bottom of the results window.
Button Description
Save in CSV format This link enables the displayed range of data to be downloaded in CSV format.
Refer to "6.2.6 CSV File Items" for information on the downloaded CSV file items.
Save in Excel(R) format This is displayed if the Creates an Excel(R) file checkbox is selected in the display
settings for the condition settings window. This link enables the displayed content to be
downloaded in Excel(R) format.
Display in separate window It is possible to show the currently displayed content in a separate window. Additionally,
you can display other content in multiple windows to facilitate side-by-side comparison.
Print This button appears when you click the Display in separate window button.
It prints the displayed content.
When the VMware virtual machine relocation category is selected
The strings shown in the results window are described as follows.
- 50 -
Page 63

String Description
VMW_GCPU CPU usage
VMW_MEM Memory usage
VMW_DISK Disk I/O count, disk throughput
VMW_NET Network send and receive count, network throughput
Note
The memory usage displayed in the report for the VMware rsc. usage cond.(List of host) in the VMware virtual machine relocation
category is the "Total value of memory usage by all currently operating virtual machines and memory usage for vSphere services". Use
this to check the increase or decrease of memory usage due to adding or reallocating virtual machines.
When the ServerView Resource Orchestrator Resource pool category is selected
The table with the latest information for the resource pool shows the value at the point of Date and time/Date time. However, it changes
as shown below depending upon the specification of [Conditions]-[View Setting]-[Analysis data].
- "10min" is specified:
"Date and time" in the extreme right column is the average value of the time period after 10 minutes have elapsed.
- "1hour" is specified:
"Date and time" in the extreme right column is the average value of the time period after 1 hour has elapsed.
- "1day" is specified:
"Date time" in the extreme right column is the average value of the time period after 1 day has elapsed.
Point
ALL_ROR_SERVER, which includes all servers within tenants, is displayed in Host Name at the top of the results window.
6.2.6 CSV File Items
Use the Save in CSV format button to display downloaded CSV file items by category.
Note that the CSV file encoding is Shift-JIS.
6.2.6.1 Effective resource use (VMware virtual machine relocation)
This section describes CSV file items for different reports.
VMware rsc. usage cond. (List of host)
Item Column name Explanation Unit Description
CPU(VMW_P
CPU)
sdattim Collection start time
sysname System name
yyyy/mm/dd HH:mm:ss
resrcid Resource ID Physical.CPU
recid Record ID VMW_PCPU
consflag Interval (flag
displayed)
- If collection interval is 10 minutes: 1
- If collection interval is 1 hour: 2
- If collection interval is 24 hours: 3
- 51 -
Page 64

Item Column name Explanation Unit Description
CPU(VMW_P
CPU2)
consintl Interval second
- If collection interval is 10 minutes: 600
- If collection interval is 1 hour: 3600
- If collection interval is 24 hours:86400
coverage Data coverage ratio Displays the ratio of data collected during the
interval from 0 through 1
vmpcpul CPU utilization % Average CPU usage ratio for physical CPUs
sdattim Collection start time
sysname System name
resrcid Resource ID _Total
recid Record ID VMW_PCPU2
consflag Interval (flag
displayed)
yyyy/mm/dd HH:mm:ss
- If collection interval is 10 minutes: 1
- If collection interval is 1 hour: 2
- If collection interval is 24 hours: 3
consintl Interval second
- If collection interval is 10 minutes: 600
- If collection interval is 1 hour: 3600
- If collection interval is 24 hours:86400
coverage Data coverage ratio Displays the ratio of data collected during the
interval from 0 through 1
Memory
(VMW_PME
M)
vmpcusemhz CPU usage MHz
vmpccorenum CPU core Number number
vmpccoremhz CPU speed per core MHz
sdattim
sysname System name
resrcid Resource ID Physical.Memory
recid Record ID VMW_PMEM
consflag Interval (flag
Collection start time
displayed)
yyyy/mm/dd HH:mm:ss
- If collection interval is 10 minutes: 1
- If collection interval is 1 hour: 2
- If collection interval is 24 hours: 3
consintl Interval second
- If collection interval is 10 minutes: 600
- If collection interval is 1 hour: 3600
- If collection interval is 24 hours:86400
coverage Data coverage ratio Displays the ratio of data collected during the
interval from 0 through 1
vmpmemm Physical memory size Mbytes
vmpmusedmem Memory usage Mbytes
Disk(VMW_P
DISK)
sdattim Collection start time
sysname System name
resrcid Resource ID Name of the device inside VMware
recid Record ID VMW_PDISK
- 52 -
yyyy/mm/dd HH:mm:ss
Page 65

Item Column name Explanation Unit Description
Network
(VMW_NET)
consflag Interval (flag
displayed)
- If collection interval is 10 minutes: 1
- If collection interval is 1 hour: 2
- If collection interval is 24 hours: 3
consintl Interval second
- If collection interval is 10 minutes: 600
- If collection interval is 1 hour: 3600
- If collection interval is 24 hours:86400
coverage Data coverage ratio Displays the ratio of data collected during the
interval from 0 through 1
vmpdreads Disk reading count reads Physical disk
vmpdwrites Disk writing count writes Physical disk
vmpdmbread Read size Mbytes Physical disk
vmpdmbwrt Write size Mbytes Physical disk
sdattim Collection start time
sysname System name
resrcid Resource ID Names beginning with "vmnic" are physical NIC
recid Record ID VMW_NET
yyyy/mm/dd HH:mm:ss
names; additionally, if the virtual machine name
follows a colon, it is a virtual NIC.
Hardware
resources
information
(VMW_PCPU
2)
consflag Interval (flag
displayed)
- If collection interval is 10 minutes: 1
- If collection interval is 1 hour: 2
- If collection interval is 24 hours: 3
consintl Interval second
- If collection interval is 10 minutes: 600
- If collection interval is 1 hour: 3600
- If collection interval is 24 hours:86400
coverage Data coverage ratio Displays the ratio of data collected during the
interval from 0 through 1
vmnppckttr No. of outbound
packets
vmnpmvtr Send size Mbits Physical or virtual network device port units
vmnppcktrecv No. of inbound packets packets Physical or virtual network device port units
vmnpmbrecv Receive size Mbits Physical or virtual network device port units
vmnvmname Virtual machine name If it is a virtual NIC, the virtual machine name is
sdattim
sysname System name
resrcid Resource ID _Total
recid Record ID VMW_PCPU2
Collection start time
packets Physical or virtual network device port units
included.
yyyy/mm/dd HH:mm:ss
consflag Interval (flag
displayed)
- If collection interval is 10 minutes: 1
- If collection interval is 1 hour: 2
- If collection interval is 24 hours: 3
- 53 -
Page 66

Item Column name Explanation Unit Description
Hardware
resources
information
(VMW_PME
M)
consintl Interval second
- If collection interval is 10 minutes: 600
- If collection interval is 1 hour: 3600
- If collection interval is 24 hours:86400
coverage Data coverage ratio Displays the ratio of data collected during the
interval from 0 through 1
vmpcusemhz CPU usage MHz
vmpccorenum CPU core Number number
vmpccoremhz CPU speed per core MHz
sdattim
sysname System name
resrcid Resource ID Physical.Memory
recid Record ID VMW_PMEM
consflag Interval (flag
Collection start time
displayed)
yyyy/mm/dd HH:mm:ss
- If collection interval is 10 minutes: 1
- If collection interval is 1 hour: 2
- If collection interval is 24 hours: 3
consintl Interval second
- If collection interval is 10 minutes: 600
- If collection interval is 1 hour: 3600
coverage Data coverage ratio Displays the ratio of data collected during the
vmpmemm Memory size Mbytes Physical memory size
vmpmusedmem Memory usage Mbytes
VMware rsc. usage cond. (Virtual machine stack)
Item Column name Explanation Unit Description
CPU
sdattim Collection start time
sysname System name
resrcid Resource ID VMware unique ID is specified before the colon,
recid Record ID VMW_GCPU
consflag Interval (flag
displayed)
consintl Interval second
- If collection interval is 24 hours:86400
interval from 0 through 1
yyyy/mm/dd HH:mm:ss
and the virtual machine name is specified after the
colon.
- If collection interval is 10 minutes: 1
- If collection interval is 1 hour: 2
- If collection interval is 24 hours: 3
- If collection interval is 10 minutes: 600
- If collection interval is 1 hour: 3600
- If collection interval is 24 hours:86400
coverage Data coverage ratio Displays the ratio of data collected during the
interval from 0 through 1
- 54 -
Page 67

Item Column name Explanation Unit Description
Memory
vmgcusemhz Virtual machine CPU
usage
vmname Virtual machine name
sdattim Collection start time
sysname System name
resrcid Resource ID VMware unique ID is specified before the colon,
recid Record ID VMW_MEM
consflag Interval (flag
displayed)
MHz
yyyy/mm/dd HH:mm:ss
and the virtual machine name is specified after the
colon.
- If collection interval is 10 minutes: 1
- If collection interval is 1 hour: 2
- If collection interval is 24 hours: 3
consintl Interval
- If collection interval is 10 minutes: 600
- If collection interval is 1 hour: 3600
- If collection interval is 24 hours:86400
coverage Data coverage ratio Displays the ratio of data collected during the
interval from 0 through 1
vmgmtm Estimated size of the
working set of a
resource pool or a
virtual machine
Mbytes
Disk
vmmvmname Virtual machine name
sdattim Collection start time
sysname System name
resrcid Resource ID
recid Record ID VMW_DISK
consflag Interval (flag
displayed)
yyyy/mm/dd HH:mm:ss
- If collection interval is 10 minutes: 1
- If collection interval is 1 hour: 2
- If collection interval is 24 hours: 3
consintl Interval second
- If collection interval is 10 minutes: 600
- If collection interval is 1 hour: 3600
- If collection interval is 24 hours:86400
coverage Data coverage ratio Displays the ratio of data collected during the
interval from 0 through 1
vmdreads Disk reading count reads Physical disk
vmdwrites Disk writing count writes Physical disk
vmdmbread Read size Mbytes Physical disk
vmdmbwrt Write size Mbytes Physical disk
Network
vmdvmname Virtual machine name
sdattim Collection start time
sysname System name
yyyy/mm/dd HH:mm:ss
- 55 -
Page 68

Item Column name Explanation Unit Description
resrcid Resource ID
recid Record ID VMW_NET
consflag Interval (flag
displayed)
consintl Interval second
coverage Data coverage ratio Displays the ratio of data collected during the
vmnppckttr No. of outbound
packets
vmnpmvtr Send size Mbits Physical or virtual network device port units
vmnppcktrecv No. of inbound packets packets Physical or virtual network device port units
vmnpmbrecv Receive size Mbits Physical or virtual network device port units
vmnvmname Virtual machine name If it is a virtual NIC, the virtual machine name is
VMware virtual machine relocation simulation
Item Column name Explanation Unit Description
- If collection interval is 10 minutes: 1
- If collection interval is 1 hour: 2
- If collection interval is 24 hours: 3
- If collection interval is 10 minutes: 600
- If collection interval is 1 hour: 3600
- If collection interval is 24 hours:86400
interval from 0 through 1
packets Physical or virtual network device port units
included.
CPU
Memory
sdattim Collection start time
sysname System name
resrcid Resource ID
recid Record ID VMW_GCPU
consflag Interval (flag
displayed)
yyyy/mm/dd HH:mm:ss
- If collection interval is 10 minutes: 1
- If collection interval is 1 hour: 2
- If collection interval is 24 hours: 3
consintl Interval second
- If collection interval is 10 minutes: 600
- If collection interval is 1 hour: 3600
- If collection interval is 24 hours:86400
coverage Data coverage ratio Displays the ratio of data collected during the
interval from 0 through 1
vmgcusemhz Virtual machine CPU
usage
sdattim Collection start time
sysname System name
resrcid Resource ID
recid Record ID VMW_MEM
MHz
yyyy/mm/dd HH:mm:ss
consflag Interval (flag
displayed)
- If collection interval is 10 minutes: 1
- If collection interval is 1 hour: 2
- 56 -
Page 69

Item Column name Explanation Unit Description
- If collection interval is 24 hours: 3
Disk
consintl Interval second
- If collection interval is 10 minutes: 600
- If collection interval is 1 hour: 3600
- If collection interval is 24 hours:86400
coverage Data coverage ratio Displays the ratio of data collected during the
interval from 0 through 1
vmgmtm Estimated size of the
working set of a
resource pool or a
virtual machine
sdattim Collection start time
sysname System name
resrcid Resource ID
recid Record ID VMW_DISK
consflag Interval (flag
displayed)
Mbytes
yyyy/mm/dd HH:mm:ss
- If collection interval is 10 minutes: 1
- If collection interval is 1 hour: 2
- If collection interval is 24 hours: 3
consintl Interval second
- If collection interval is 10 minutes: 600
- If collection interval is 1 hour: 3600
Network
- If collection interval is 24 hours:86400
coverage Data coverage ratio Displays the ratio of data collected during the
interval from 0 through 1
vmdreads Disk reading count reads Physical disk
vmdwrites Disk writing count writes Physical disk
vmdmbread Read size Mbytes Physical disk
vmdmbwrt Write size Mbytes Physical disk
sdattim Collection start time
sysname System name
resrcid Resource ID
recid Record ID VMW_NET
consflag Interval (flag
displayed)
yyyy/mm/dd HH:mm:ss
- If collection interval is 10 minutes: 1
- If collection interval is 1 hour: 2
- If collection interval is 24 hours: 3
consintl Interval second
- If collection interval is 10 minutes: 600
- If collection interval is 1 hour: 3600
- If collection interval is 24 hours:86400
coverage Data coverage ratio Displays the ratio of data collected during the
interval from 0 through 1
vmnppckttr No. of outbound
packets
vmnpmvtr Send size Mbits Physical or virtual network device port units
packets Physical or virtual network device port units
- 57 -
Page 70

Item Column name Explanation Unit Description
vmnppcktrecv No. of inbound packets packets Physical or virtual network device port units
vmnpmbrecv Receive size Mbits Physical or virtual network device port units
Note
About the data output as CSV
At the collection start time, information for the analysis period is output. Data for anticipated periods in the future is not output.
6.2.6.2 Effective resource use (VMware resource allocation optimization)
This section describes CSV file items for different reports.
VMware rsc. usage cond. (List of virtual machine)
Item Column name Explanation Unit Description
CPU
sdattim Collection start time
sysname System name
resrcid Resource ID VMware unique ID is specified before the colon,
recid Record ID VMW_GCPU
consflag Interval (flag
displayed)
yyyy/mm/dd HH:mm:ss
and the virtual machine name is specified after the
colon.
- If collection interval is 10 minutes: 1
- If collection interval is 1 hour: 2
- If collection interval is 24 hours: 3
consintl Interval second
- If collection interval is 10 minutes: 600
- If collection interval is 1 hour: 3600
- If collection interval is 24 hours:86400
coverage Data coverage ratio Displays the ratio of data collected during the
interval from 0 through 1
vmgcused CPU utilization %
vmgcallmin resource allocation
(reserved) of a
resource pool or a
virtual machine
MHz
Memory
vmgcallmax resource allocation
(Limit) of a resource
pool or a virtual
machine
vmgcallshrs resource allocation
(Shared) of a resource
pool or a virtual
machine
vmgcnumcpu CPU number number
vmgcusemhz Virtual machine CPU
usage
sdattim Collection start time
MHz If there is no limit, -1 will be displayed.
MHz The value for the shared memory of a VMware
MHz
- 58 -
virtual machine
yyyy/mm/dd HH:mm:ss
Page 71

Item Column name Explanation Unit Description
sysname System name
resrcid Resource ID VMware unique ID is specified before the colon,
and the virtual machine name is specified after the
colon.
recid Record ID VMW_MEM
consflag Interval (flag
displayed)
- If collection interval is 10 minutes: 1
- If collection interval is 1 hour: 2
- If collection interval is 24 hours: 3
consintl Interval second
- If collection interval is 10 minutes: 600
- If collection interval is 1 hour: 3600
- If collection interval is 24 hours:86400
coverage Data coverage ratio Displays the ratio of data collected during the
interval from 0 through 1
vmgmallim reserved memory of a
resource pool or a
virtual machine
vmgmallmax upper limit memory
size of a resource pool
or a virtual machine
vmgmallsh shared memory of a
resource pool or a
virtual machine
vmgmmems Physical memory size
vmgmtm Estimated size of the
working set
Kbytes
Kbytes If there is no limit, -1 will be displayed.
Kbytes The value for the shared memory of a VMware
virtual machine
Mbytes
Mbytes
resource pool or virtual machine units
resource pool or virtual machine units
vmgmacest Ratio of physical
memory in use
% resource pool or virtual machine units (instant
value)<VMware ESX>
Note
About the data output as CSV
At the collection start time, information for the analysis period is output. Data for anticipated periods in the future is not output.
6.2.6.3 Demand Forecast (ServerView Resource Orchestrator Resource pool)
This section describes CSV file items for different reports.
VM pool (CPU) (demand forecast)
Column name Explanation Unit Description
sdattim Collection start time
sysname System name
resrcid Resource ID tenanl name:/pool name
recid Record ID ROR_VMPOOLCPU
consflag Interval (flag displayed)
yyyy/mm/dd HH:mm:ss
- If collection interval is 10 minutes: 1
- 59 -
Page 72
Column name Explanation Unit Description
- If collection interval is 1 hour: 2
- If collection interval is 24 hours: 3
consintl Interval second
- If collection interval is 10 minutes: 600
- If collection interval is 1 hour: 3600
- If collection interval is 24 hours:86400
coverage Data coverage ratio Displays the ratio of data collected during the
interval from 0 through 1
vmpoolprocused VMPool CPU usage GHz
vmpoolproctotal VMPool CPU total size GHz
VM pool (Memory) (demand forecast)
Column name Explanation Unit Description
sdattim Collection start time
sysname System name
resrcid Resource ID tenanl name:/pool name
recid Record ID ROR_VMPOOLMEM
consflag Interval (flag displayed)
yyyy/mm/dd HH:mm:ss
- If collection interval is 10 minutes: 1
- If collection interval is 1 hour: 2
- If collection interval is 24 hours: 3
consintl Interval second
- If collection interval is 10 minutes: 600
- If collection interval is 1 hour: 3600
- If collection interval is 24 hours:86400
coverage Data coverage ratio Displays the ratio of data collected during the
interval from 0 through 1
vmpoolmemused VMPool memory usage Gbytes
vmpoolmemtotal VMPool total memory Gbytes
Storage pool (demand forecast)
Column name Explanation Unit Description
sdattim Collection start time
sysname System name
resrcid Resource ID tenanl name:/pool name
recid Record ID ROR_STORAGEPOOL
consflag Interval (flag displayed)
yyyy/mm/dd HH:mm:ss
- If collection interval is 10 minutes: 1
- If collection interval is 1 hour: 2
- If collection interval is 24 hours: 3
consintl Interval second
- 60 -
- If collection interval is 10 minutes: 600
- If collection interval is 1 hour: 3600
Page 73

Column name Explanation Unit Description
- If collection interval is 24 hours:86400
coverage Data coverage ratio Displays the ratio of data collected during the
interval from 0 through 1
vmpoolserverused StoragePool usage Gbytes
vmpoolservertotal StoragePool total capacity Gbytes
Network pool (demand forecast)
Column name Explanation Unit Description
sdattim Collection start time
sysname System name
resrcid Resource ID tenanl name:/pool name
recid Record ID ROR_NETWORKPOOL
consflag Interval (flag displayed)
yyyy/mm/dd HH:mm:ss
- If collection interval is 10 minutes: 1
- If collection interval is 1 hour: 2
- If collection interval is 24 hours: 3
consintl Interval second
- If collection interval is 10 minutes: 600
- If collection interval is 1 hour: 3600
- If collection interval is 24 hours:86400
coverage Data coverage ratio Displays the ratio of data collected during the
interval from 0 through 1
vmpoolnetworkused Number of addresses being used by
NetworkPool
vmpoolnetworktotal Total number of NetworkPool
addresses
number
number
Server pool (demand forecast)
Column name Explanation Unit Description
sdattim Collection start time
sysname System name
resrcid Resource ID tenanl name:/pool name
recid Record ID ROR_SERVERPOOL
consflag Interval (flag displayed)
yyyy/mm/dd HH:mm:ss
- If collection interval is 10 minutes: 1
- If collection interval is 1 hour: 2
- If collection interval is 24 hours: 3
consintl Interval second
- If collection interval is 10 minutes: 600
- If collection interval is 1 hour: 3600
- If collection interval is 24 hours:86400
coverage Data coverage ratio Displays the ratio of data collected during the
interval from 0 through 1
- 61 -
Page 74

Column name Explanation Unit Description
vmpoolserverused Number of servers used by
ServerPool
vmpoolservertotal Total number of ServerPool servers number
number
Address pool (demand forecast)
Column name Explanation Unit Description
sdattim Collection start time
sysname System name
resrcid Resource ID tenanl name:/pool name
recid Record ID ROR_ADDRESSPOOL
consflag Interval (flag displayed)
yyyy/mm/dd HH:mm:ss
- If collection interval is 10 minutes: 1
- If collection interval is 1 hour: 2
- If collection interval is 24 hours: 3
consintl Interval second
- If collection interval is 10 minutes: 600
- If collection interval is 1 hour: 3600
- If collection interval is 24 hours:86400
coverage Data coverage ratio Displays the ratio of data collected during the
interval from 0 through 1
vmpooladdressused Number of addresses used by
AddressPool
vmpooladdresstotal Total number of AddressPool
addresses
number
number
Note
About the data output as CSV
At the collection start time, information for the analysis period is output. Data for anticipated periods in the future is not output.
6.3 Operations Using Scenarios
6.3.1 Simulating the Reallocation of Virtual Machines : [VMware virtual machine relocation]
It is possible to perform a simulation of the resource usage if a virtual machine is migrated to a host with CPU and memory overcommit
applied from another host. By migrating virtual machines based on the simulation, hosts can be made available.
- 62 -
Page 75

This section describes the procedure for simulating using a [VMware virtual machine reallocation] category scenario.
Understanding the current status
In the Capacity Planning window, select the VMware rsc. usage cond. (List of host) report of the VMware virtual machine
relocation category, set the analysis conditions and display the report.
Refer to "6.2 Capacity Planning Operations" for information on how to configure analysis conditions.
- 63 -
Page 76

A list of resources allocated to each host and resource usage is displayed.
Sort by CPU usage and memory usage where overcommit is enabled to check which hosts have available resources. For example, consider
the host with the lowest amount of resource usage as the migration source, and the host with the next lowest rate as the migration target.
Also check the hosts that are being considered as a migration source and target to see whether the disk and network throughput is acceptable.
Considering reallocation
In the Capacity Planning window, select the VMware rsc. usage cond. (Virtual machine stack) report of the VMware virtual machine
relocation category, set the analysis conditions and display the report.
Refer to "6.2 Capacity Planning Operations" for information on how to configure analysis conditions.
- 64 -
Page 77

- 65 -
Page 78
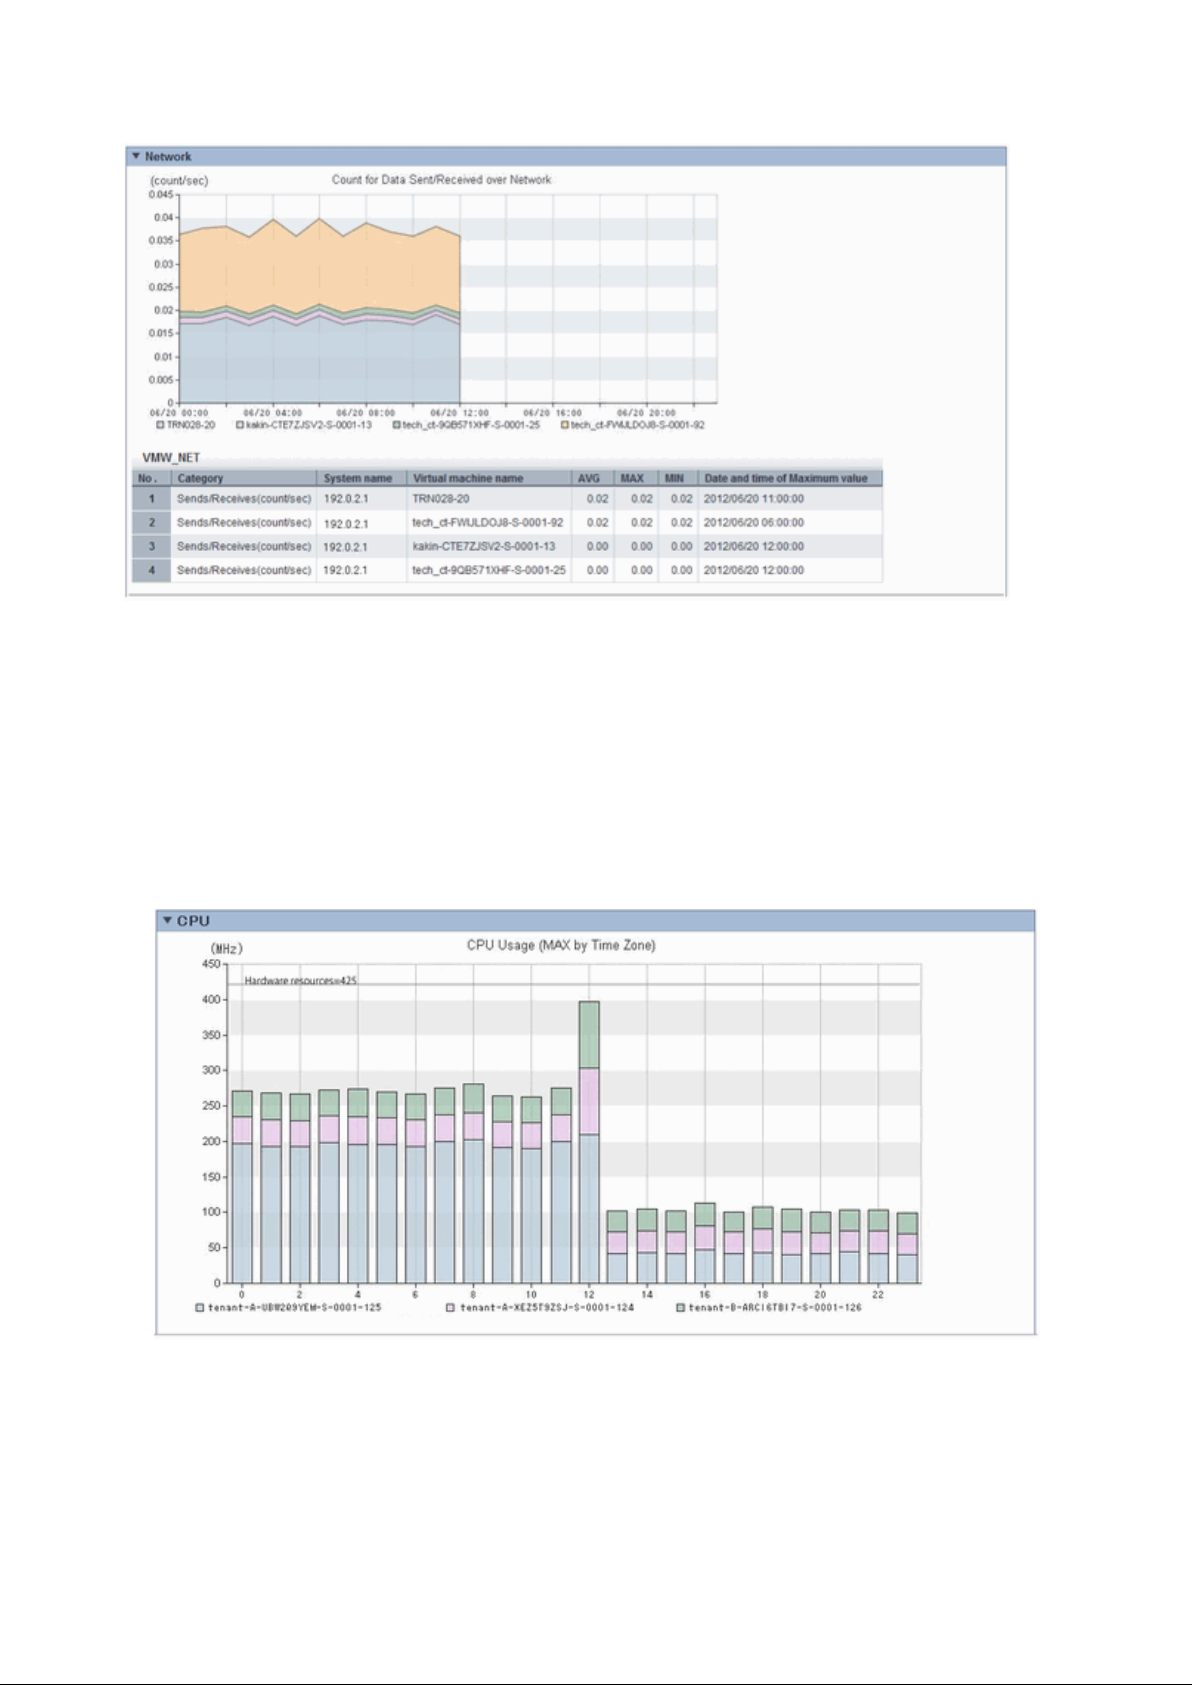
The resource usage information for all virtual machines on the migration source host are displayed in a stack graph.
Check the resource usage in each virtual machine, and use this information to ascertain which virtual machine should go to which destination
candidate host.
Simulation of reallocation
In the Capacity Planning window, select the VMware virtual machine relocation simulation report of the VMware virtual machine
relocation category, set the analysis conditions and run the simulation.
Refer to "6.2 Capacity Planning Operations" for information on how to configure analysis conditions.
- Hourly display
- 66 -
Page 79

- Weekly display
- Time-line display
The information about virtual machines to be consolidated and all virtual machines in the consolidation destination are displayed in a stack
graph. Tables are also displayed along with the above graphs.
If a value will be too great throughout a period of time or there is a bias for certain time slots or days of the week, consider the combinations
of the virtual machines to be reallocated.
If a tolerated threshold value was set, check that the value is not exceeded.
6.3.2 Optimization of Resources Allocated to a Virtual Machine : [VMware resource allocation optimization]
The virtual machines with low resource usage rates are detected from the L-Servers held. Using the results, any excess resources that have
been allocated can be reviewed, or added to where they are lacking, thereby optimizing resource allocations.
- 67 -
Page 80

This section describes the procedure for attempting to optimize resource by using the VMware resource allocation optimization category
scenario.
Understanding the current status
In the Capacity Planning window, select the VMware rsc. usage cond. (List of virtual machine) report of the VMware resource
allocation optimization category, set the analysis conditions and display the report.
Refer to "6.2 Capacity Planning Operations" for information on how to configure analysis conditions.
Sort by CPU usage and memory usage to detect virtual machines with available resources and reduce the allocation of resources to virtual
machines with low usage rates.
- 68 -
Page 81

6.3.3 Anticipating the Future Demand for Resources : [ServerView Resource Orchestrator Resource pool]
Use the past resource pool usage to anticipate the demand for resource pools.
By determining inadequate resource amounts beforehand, it is possible to plan for the expansion of facilities.
This section describes the procedure for anticipating future resource demand for resources by using the ServerView Resource
Orchestrator Resource pool category scenarios.
Demand Forecast
In the Capacity Planning window, select the appropriate report of the ServerView Resource Orchestrator Resource pool category, set
the analysis conditions and display the report.
Refer to "6.2 Capacity Planning Operations" for information on how to configure analysis conditions.
Perform regression analysis based on past CPU usage and memory usage to anticipate the resources that will be used.
- 69 -
Page 82

Chapter 7 Resource
Refer to the "User's Guide for Infrastructure Administrators (Resource Management) CE" for information on the Resources tab in the
ROR console.
- 70 -
Page 83

Chapter 8 Template
This chapter explains how to create and manage L-Platform templates.
8.1 L-Platform Template Components
This section explains the types of information comprising an L-Platform template.
The table below shows the information comprising an L-Platform template.
Table 8.1 Information comprising an L-Platform template
Information Description
Template information Defines the L-Platform template configuration
Segment information Defines the network resource configuration
Image information Defines the cloning image configuration
Software information Defines the software configuration contained in the cloning image
The relationship between information comprising the L-Platform template is shown below.
8.2 Explanation of Windows
This section explains the ROR Console Template tab window.
The following figure shows the ROR Console Template tab window.
- 71 -
Page 84

8.2.1 Menu
The following are the menus displayed in the Templates tab of the ROR console:
Template Builder
The L-Platform Template window will be displayed.
Startup
The Startup window is displayed.
Note
- During L-Platform template operations, if stoppage of the admin server or something similar inhibits connection, the lamp on the
menu changes to grey and "Not Operating" is displayed. If this occurs, contact the system administrator.
8.2.2 Startup Window
The steps to compile the information that makes up L-Platform templates are displayed as buttons in the Startup window displayed in
the Templates tab of the ROR console.
When the button image for each type of information is clicked, the corresponding tab of the L-Platform Template window is displayed.
8.2.3 L-Platform Template Window
The L-Platform template window is displayed according to one of the following methods:
- Selecting Template builder from the menu
- Clicking the button image of an information type on the Startup window
The L-Platform Template window is comprised of four tabs. The table below shows the correspondences between the tab names and the
information comprising the L-Platform template.
- 72 -
Page 85

Table 8.2 Correspondences between tab names and the information comprising the L-Platform template
Tab Name Information
Template Template information
Segment Segment information
Image Image information
Software Software information
8.2.3.1 Template Tab
The following figure shows the Template tab of the L-Platform Template window.
Window Explanation
The following explains the Template tab window:
- The left side of the page displays a list of L-Platform templates.
- When an L-Platform template is selected in the L-Platform template list, the right side of the page displays an image of the selected
L-Platform template configuration (upper part) and template information details (lower part).
- Tenants and keywords can be used as L-Platform template list filters.
- Clicking the reload button (
) resets sorting, pages, and selected states.
Point
Strings included in the keyword filter are those that were specified in "keyword" in basic information of the template information.
- 73 -
Page 86

Explanation of Buttons
The following explains the buttons in the Template tab:
- Create
Creates new template information.
Refer to "8.3.2 Creating New L-Platform Template" for details.
- Edit
Edits the contents of existing registered template information.
Refer to "8.3.4 Editing L-Platform Template" for details.
- Copy
Creates new template information based on existing registered template information.
Refer to "8.3.3 Copying L-Platform Template" for details.
- Delete
Deletes template information.
Refer to "8.3.5 Deleting L-Platform Template" for details.
- Publish
Publishes an L-Platform template.
Refer to "8.3.6 Publishing and Hiding L-Platform Template" for details.
- Hide
Hides an L-Platform template.
Refer to "8.3.6 Publishing and Hiding L-Platform Template" for details.
8.2.3.2 Segment Tab
The following figure shows the Segment tab of the L-Platform Template window.
- 74 -
Page 87

Window Explanation
The following explains the Segment tab window:
- The upper part of the page displays a list of segment information.
- When segment information is selected in the segment information list, the lower part of the page displays details of the selected segment
information.
- The display sequence in the segment information list can be changed to ascending order or descending order. To change the sequence,
click the header (Category, Network resource name, etc.).
- Tenants and categories (Business, Management) can be used as segment information list filters.
- Clicking the reload button (
) resets sorting and selected states.
- Icons displayed in this window are as follows:
Icon Explanation
Management segment
Business segment
Management segment with admin LAN allocated
The associated network resource does not exist.
Explanation of Buttons
The following explains the buttons in the Segment tab:
- Create
Creates new segment information.
- 75 -
Page 88

Refer to "8.3.2 Creating New L-Platform Template" for details.
- Edit
Edits the contents of existing registered segment information.
Refer to "8.3.4 Editing L-Platform Template" for details.
- Delete
Deletes segment information.
Refer to "8.3.5 Deleting L-Platform Template" for details.
8.2.3.3 Image Tab
The following figure shows the Image tab of the L-Platform Template window.
Window Explanation
The following explains the Image tab window:
- The upper part of the page displays a list of image information. Note that the software information and patch information included in
the image information is displayed in a tree format.
- When image information is selected in the image information list, the lower part of the page displays details of the selected information.
If the cloning image associated with image information includes a data disk, a Disk tab is displayed.
Note that if software information or patch information is selected in the image information list, details of that selected information
are displayed.
- The display sequence in the image information list can be changed to ascending order or descending order. To change the sequence,
click the header (Name, ID, etc).
- Tenants, the OS, and Usage can be used as image information list filters.
- Clicking the reload button (
) resets sorting and selected states.
- Icons displayed in this window are as follows:
Icon Explanation
Virtual image information without data disks
- 76 -
Page 89

Icon Explanation
Physical image information without data disks
Virtual image information with data disks
The associated cloning image does not exist.
Explanation of Buttons
The following explains the buttons in the Image tab:
-
Create
Creates new image information.
Refer to "8.3.2 Creating New L-Platform Template" for details.
- Copy
Creates new image information based on existing registered image information.
Refer to "8.3.3 Copying L-Platform Template" for details.
- Publish
Publishes image information.
Refer to "8.3.7 Publishing Image Information" for details.
- Hide
Hides image information.
Refer to "8.3.7 Publishing Image Information" for details.
- Edit
Edits the contents of existing registered image information.
Refer to "8.3.4 Editing L-Platform Template" for details.
- Synchronize
Updates the image information if the cloning image has been updated.
This button is enabled only if image information synchronization is necessary.
Refer to "8.3.8 Synchronizing Image Information" for details.
- Delete
Deletes image information.
Refer to "8.3.5 Deleting L-Platform Template" for details.
8.2.3.4 Software Tab
The following figure shows the Software tab of the L-Platform Template window.
- 77 -
Page 90

Window Explanation
The following explains the Software tab window:
- The upper part of the page displays a list of software information.
- When software information is selected in the software information list, the lower part of the page displays details of the selected
software information.
- The display sequence in the software information list can be changed to ascending order or descending order. To change the sequence,
click the header (category, software name, etc.).
- Tenants can be used as software information list filters.
- Clicking the reload button (
) resets sorting and selected states.
Explanation of Buttons
The following explains the buttons in the Software tab:
- Create
Creates new software information.
Refer to "8.3.2 Creating New L-Platform Template" for details.
- Copy
Creates new software information based on existing registered software information.
Refer to "8.3.3 Copying L-Platform Template" for details.
- Edit
Edits the contents of existing registered software information.
Refer to "8.3.4 Editing L-Platform Template" for details.
- Delete
Deletes the software information.
- 78 -
Page 91

Refer to "8.3.5 Deleting L-Platform Template" for details.
8.3 L-Platform Template Operations
This section explains L-Platform template operations.
8.3.1 L-Platform Template Operations and Roles
Infrastructure Administrators and Tenant Administrators can perform L-Platform template operations.
There are two types of L-Platform templates: tenant-specific templates that can be used only by a specific tenant, and global templates
that can be used by all tenants.
The Infrastructure Administrator can perform operations for both tenant-specific templates and global templates.
8.3.2 Creating New L-Platform Template
For the various types of information comprising an L-Platform template, the following information can be newly created:
- Template information
- Segment information
- Image information
- Software information
Follow the procedure below to newly create the above information:
1. On the L-Platform Template window, select the tab (Template, Segment, Image, or Software) of the information to be newly
created.
1. Click the Create button.
2. Set information in the new creation window.
Refer to "8.4 Items to Set for Each Type of L-Platform Template Information" for details on the information to be set.
3. Click the Create button.
A message indicating that the template has been created is displayed and the template is created.
Note that information must be created in the following sequence if all types of information comprising an L-Platform template are being
newly created:
1. Software information
2. Image information
3. Segment information
4. Template information
However, Item 3 can be created before Item 1.
Point
- Note the following points when the L-Platform template you are creating includes a server load balancer:
- The server load balancer needs to be configured after the L-Platform is deployed
Explain this point to the tenant administrator. Also explain the virtual IP address, any other parameters, and the values to be set
in them to the tenant administrator so that the server load balancer is configured properly.
- 79 -
Page 92

- Server load balancer operations use rulesets
Explain the rulesets used during operation to the tenant administrator. Also explain parameters and the values to be set in the
rulesets to the tenant administrator.
- In case of L-Platform templates, a server NIC is only located if it is allocated. When defining multiple NICs, click the target server,
and then click the Add NIC button to add the required number of NICs.
The number of server NICs that can be allocated is the maximum number allowed for image information.
Information
Commands can also be used to create new L-Platform templates.
Refer to "Appendix A Using Commands to Register and Delete L-Platform Templates" for details.
8.3.3 Copying L-Platform Template
For the various types of information comprising an L-Platform template, the following information can be copied:
- Template information
- Image information
- Software information
Follow the procedure below to copy the above information:
1. On the L-Platform Template window, select the tab (Template, Image, or Software) of the information to be copied.
2. From the list, select the information to be referenced.
3. Click the Copy button.
4. The information set in the copy window is the same as the referenced information. If required, change this information.
Refer to "8.4 Items to Set for Each Type of L-Platform Template Information" for details on the information to be set.
5. Click the Create button.
A message indicating that the template has been created is displayed and the template is created.
Point
- In case of L-Platform templates, a server NIC is only located if it is allocated. When defining multiple NICs, click the target server,
and then click the Add NIC button to add the required number of NICs.
The number of server NICs that can be allocated is the maximum number allowed for image information.
8.3.4 Editing L-Platform Template
For the various types of information comprising an L-Platform template, the following information can be edited:
- Template information
- Segment information
- Image information
- Software information
Follow the procedure below to edit the above information:
- 80 -
Page 93

1. On the L-Platform Template window, select the tab (Template, Segment, Image, or Software) of the information to be edited.
2. From the list, select the information to be edited.
3. Click the Edit button.
4. Change the information on the edit window.
Refer to "8.4 Items to Set for Each Type of L-Platform Template Information" for details on the information to be set.
5. Click the OK button.
A message indicating that the template has been edited is displayed and the template is changed.
Point
- Image information cannot be edited if it is in use by published template information or if it is published.
- Software information cannot be edited if it is in use by published template information.
- When image information is edited, it is updated to the latest cloning image resource ID.
- In case of L-Platform templates, a server NIC is only located if it is allocated. When defining multiple NICs, click the target server,
and then click the Add NIC button to add the required number of NICs.
The number of server NICs that can be allocated is the maximum number allowed for image information.
8.3.5 Deleting L-Platform Template
For the various types of information comprising an L-Platform template, the following information can be deleted:
- Template information
- Segment information
- Image information
- Software information
Follow the procedure below to delete the above information:
1. On the L-Platform Template window, select the tab (Template, Segment, Image, or Software) of the information to be deleted.
2. From the list, select the information to be deleted.
3. Click the Delete button.
A deletion confirmation message is displayed.
4. Click the Yes button.
The selected information is deleted.
Note that information must be deleted in the following sequence if all types of information comprising an L-Platform template are being
deleted:
1. Template information
2. Segment information
3. Image information
4. Software information
However, the order of Items 2 and 3 can be reversed.
- 81 -
Page 94

Point
- Image information cannot be deleted if it is in use by any template information, or if it is published.
- Software information cannot be deleted if it is in use by any image information.
Information
Commands can also be used to delete L-Platform templates.
Refer to "Appendix A Using Commands to Register and Delete L-Platform Templates" for details.
8.3.6 Publishing and Hiding L-Platform Template
An L-Platform template can be published or hidden.
Publication enables an L-Platform to be created on the basis of the L-Platform template.
If hidden, an L-Platform cannot be created on the basis of the L-Platform template.
Follow the procedure below to publish or hide an L-Platform template:
1. On the L-Platform Template window, select the Template tab.
2. From the L-Platform template list, select the L-Platform template to be published or hidden.
3. Click the Publish button or the Hide button.
The selected L-Platform template is published or hidden.
8.3.7 Publishing Image Information
Create an L-Platform on the basis of an L-Platform template.
An L-Platform can be created with the same configuration as the L-Platform template, or the configuration can be changed.
Normally, when changing a configuration, only the image information defined in the L-Platform template is displayed as a usable server
list. However, by publishing the image information, the published image information can also be displayed in the server list as usable
information regardless of the definitions in the L-Platform template.
This enables image information other than the image information defined in the L-Platform template to be added when creating an LPlatform.
Follow the procedure below to publish or hide image information:
1. On the L-Platform Template window, select the Image tab.
2. From the image information list, select the image information to be published or hidden.
3. Click the Publish button or the Hide button.
The selected image information is published or hidden.
8.3.8 Synchronizing Image Information
Cloning image resource IDs are held in the image information.
If a cloning image is updated, the resource IDs are changed. Therefore, the resource IDs held in the image information must be updated.
This is known as image information synchronization.
Follow the procedure below to synchronize image information:
- 82 -
Page 95

1. On the L-Platform Template window, select the Image tab.
2. From the image information list, select the cloning image to be synchronized.
3. Click the Synchronize button.
4. If required, change the information on the Synchronize Image Information window.
Refer to "8.4 Items to Set for Each Type of L-Platform Template Information" for details of the information to be set.
5. Click the OK button.
A message indicating that the image information has been edited is displayed and the image information is changed.
8.4 Items to Set for Each Type of L-Platform Template Information
This section explains to items to be set in the various types of information comprising an L-Platform template.
Refer to the settings items explained here when performing the following L-Platform template operations:
- Creating New L-Platform Template
- Copying L-Platform Template
- Editing L-Platform Template
- Synchronizing Image Information
Note that only those items that can be set are explained here. Items that cannot be changed are not explained.
8.4.1 Software Information
This section explains software information.
Explanation of Items
The following explains software information items:
- Tenant
Click Set and select the tenant to which the software information belongs in the Select Tenant window. A tenant can be selected only
if information is being created or copied.
Note that, when copying an L-Platform template, a global template can be changed into a tenant-specific template but, conversely, a
tenant-specific template cannot be changed into a global template.
- OS
Select one of the following software operating systems:
Windows
-
- Linux
- Windows (64 bit)
- Linux (64 bit)
- Solaris
- Other
- Software name
Enter up to 85 characters (excluding <, >, &, ", and ') for the software name
If this is filtered by category and operating system, the list of registered software information will be displayed. The software name
can also be selected from the list and edited.
- 83 -
Page 96

- Version
Enter up to 10 bytes (excluding <, >, &, ", and ') for the software version
- License
Enter up to 85 characters (excluding <, >, &, ", and ') for the software license information
If OS was specified for Category, specify the product key for the Windows operating system. This can be specified only when the
operating system is Windows.
- When the virtualization software is VMware
For Windows Server 2003, specify the product key for the Windows operating system.
For an operating system that is not Windows Server 2003, specify " " (an empty string).
- When the virtualization software is Hyper-V
Specify the product key for the Windows operating system.
- Support
Enter up to 85 characters (excluding <, >, &, ", and ') for the software support information.
Operation Procedure
Follow the procedure below for operations at the window for setting software information:
1. Set each of the software information items.
2. Click the Create button.
The Software tab list window is displayed.
Note
When the Software tab list window is displayed, tenant and keyword filtering, sorting, pages, and selected states are all reset.
8.4.2 Image Information
Set image information on the following five pages:
1. Select Image page (this page is only seen when creating new image information)
2. Set Basic Info page
3. Select Software page
4. Add Patch Info page
5. Confirm page
Note that the windows displayed when new image information is being created are used as examples in this explanation.
8.4.2.1 Select Image Page
On the Select Image page, select the cloning image that will be used.
Operation Procedure
Follow the procedure below for operations at the Select Image page:
1. Select a cloning image from the list.
2. Click the Next button.
The Set Basic Info page is displayed.
- 84 -
Page 97

8.4.2.2 Set Basic Info Page
On the Set Basic Info page, set the basic information for the image information.
Explanation of Items
The following explains the items in the Set Basic Info page:
- Tenant
Click the Set button, and then select the tenant to which the image information belongs from the Tenant Select window. A tenant can
be selected only if information is being created or copied.
Note that, when copying an L-Platform template, a global template can be changed into a tenant-specific template but, conversely, a
tenant-specific template cannot be changed into a global template.
- Image information name
Enter up to 85 characters (excluding <, >, &, ", and ') for the image information name
- Type
Selects the registered L-Server template.
L-Server templates in which a model name is specified are not displayed. An L-Server template that does not specify a model name
must be prepared before image information can be created for a physical L-Server.
- Usage
Selects the usage of the server included in the image from those shown below. Multiple options can be selected.
- WEB: Web Server
- AP: Application Server
- DB: DB Server
- System disk
Specify the size of the system disk for the server to be deployed. Range: 0.1-99999.9 GB.
- Maximum number of CPUs
Specifies the maximum number of CPUs that can be specified when creating a new L-Platform.
Specify a value in the range from 1 to the upper limit value for the registered VM pool.
When the Don't set upper value check box is selected, behavior will be as if the maximum value of the registered VM pool has been
specified.
- Maximum CPU performance
Specifies the maximum CPU performance in GHz, which can be specified when creating a new L-Platform.
Specify a value in the range from 0.1 to the upper limit value for the registered VM pool.
When the Don't set upper value check box is selected, behavior will be as if the maximum value of the registered VM pool has been
specified.
- Maximum memory
Specifies the maximum memory size in GB, which can be specified when creating a new L-Platform.
Specify a value in the range from 0.1 to the upper limit value for the registered VM pool.
When the Don't set upper value check box is selected, behavior will be as if the maximum value of the registered VM pool has been
specified.
If the virtualization software is RHEL-KVM, the value must be less than or equal to max_definable_memory_size when memory hot
plug is enabled in a VM specific information definition file.
Notify the tenant administrator to specify a value less than max_definable_memory_size.
Refer to "C.1.2 VM Specific Information Definition File" in the "Setup Guide CE" for information on the VM specific information
definition file.
- 85 -
Page 98

- Maximum number of data disks
Specifies the maximum number of data disks that can be added to the server. Range: 0-99.
However, if the image includes a data disk, the minimum will be the maximum value of the data disk number.
- Maximum data disk size
Specifies the maximum size of the data disk size in GB, which can be specified when creating a new L-Platform.
Specify a value in the range from 0.1 to the upper limit value for the registered storage pool.
However, if the image includes a data disk, the minimum will be the largest disk capacity of all appended data disks.
When the Don't set upper value check box is selected, behavior will be as if the maximum value of the registered storage pool has
been specified.
- Maximum system disk size
Specifies the maximum size of the system disk size in GB, which can be specified when creating a new L-Platform.
The minimum allowed value is the disk size of the cloning image, and the maximum allowed value is the upper limit of the registered
storage pool.
When the Don't set upper value check box is selected, behavior will be as if the maximum value of the registered storage pool has
been specified.
- Maximum number of NICs
Specifies the number of NICs. Range: 1-99.
- Initial password
Enter up to 85 characters (excluding <, >, &, ", and ') for the password for the users below.
[Windows]
Specified password is set to OS.
Can be omitted. if omitted, it is generated automatically.
- When the virtualization software is VMware
Specifies the password for the user name "Administrator".
- When the virtualization software is Hyper-V
Specifies the password for the local administrator account used in the L-Server that will be created.
- When the virtualization software is RHEL-KVM
Specifies the password for the Administrator.
The password entered here is not set in the OS. Please specify the same password as the one that has been set in the cloning image.
[Linux]
Specifies the superuser password.
The password specified here is not set to OS.
Please specify the same password as the one that has been set in the cloning image.
[Solaris]
Specified password is set to OS.
Can be omitted. If omitted, it is generated automatically.
[Other]
Specify the password for default users (such as the super user) that can log in.
The password specified here is not set to OS.
Please specify the same password as the one that has been set in the cloning image.
- 86 -
Page 99

- Initial password (confirm)
Specifies the same value as Initial password.
- Resource tags
Enter up to 85 characters (excluding <, >, &, ", and ') for the character string that filters the resources to be displayed as deployment
destination VM pool/server pool options when creating a new L-Platform
The only resources displayed as options are those for which the character string in the VM pool/server pool comment field contains
the character string specified as the resource tags.
Example
Example: If the specification is as follows, only /VMPool1 and /VMPool2 are displayed as options:
/VMPool1 comment: web
/VMPool2 comment: web
/VMPool3 comment: ap
Resource tags: web
Operation Procedure
The operation procedure on the Basic information page is as follows:
1. Set the various basic information items for the image information.
2. Click the Next button.
The Select Software page is displayed.
Point
If an input item contains an error, and error message is displayed. If an error message is displayed, refer to the error message and correct
the setting.
8.4.2.3 Select Software Page
On the Select Software page, set the software used in the cloning image in the image information.
Operation Procedure
The operation procedure on the Select Software page is as follows:
1. Select the check box for the software that will be set.
2. Click the Next button.
The Add Patch Info page is displayed.
Point
If no selection is made or if multiple selections are made, an error message is displayed. Ensure that one selection is made.
8.4.2.4 Add Patch Info Page
Add, change, or delete software patch information at the Add Patch Info page.
The Add Patch Info page is shown below.
- 87 -
Page 100

Window Explanation
The following explains the Add Patch Info page:
The upper part of the page displays a list of software information or patch information.
When software information or patch information is selected in the list, the lower part of the page displays details of the selected information.
Explanation of Buttons
The following explains the buttons in the Add Patch Info page:
- Add Patch
Adds patch information.
When the software or patch information is selected from the list at the top of the page, the Add Patch button will be displayed.
Refer to "Add Patch Information" for details.
- Up, Down
When the patch information is selected from the list at the top of the page and the Up or Down button is clicked, the patch information
that was selected moves up or down.
- Delete
Deletes patch information.
When the patch information is selected from the list at the top of the page, the Delete button will be displayed.
Refer to "Delete Patch Information" for details.
Add Patch Information
The procedure to add patch information is as follows:
1. From the list at the top of the page, select the software or patch information for which the patch is to be added.
2. Click the Add Patch Button.
The patch information will be added below the selected software information or patch information.
- 88 -
 Loading...