

Page 1
Fujitsu Microelectronics Europe
User Guide
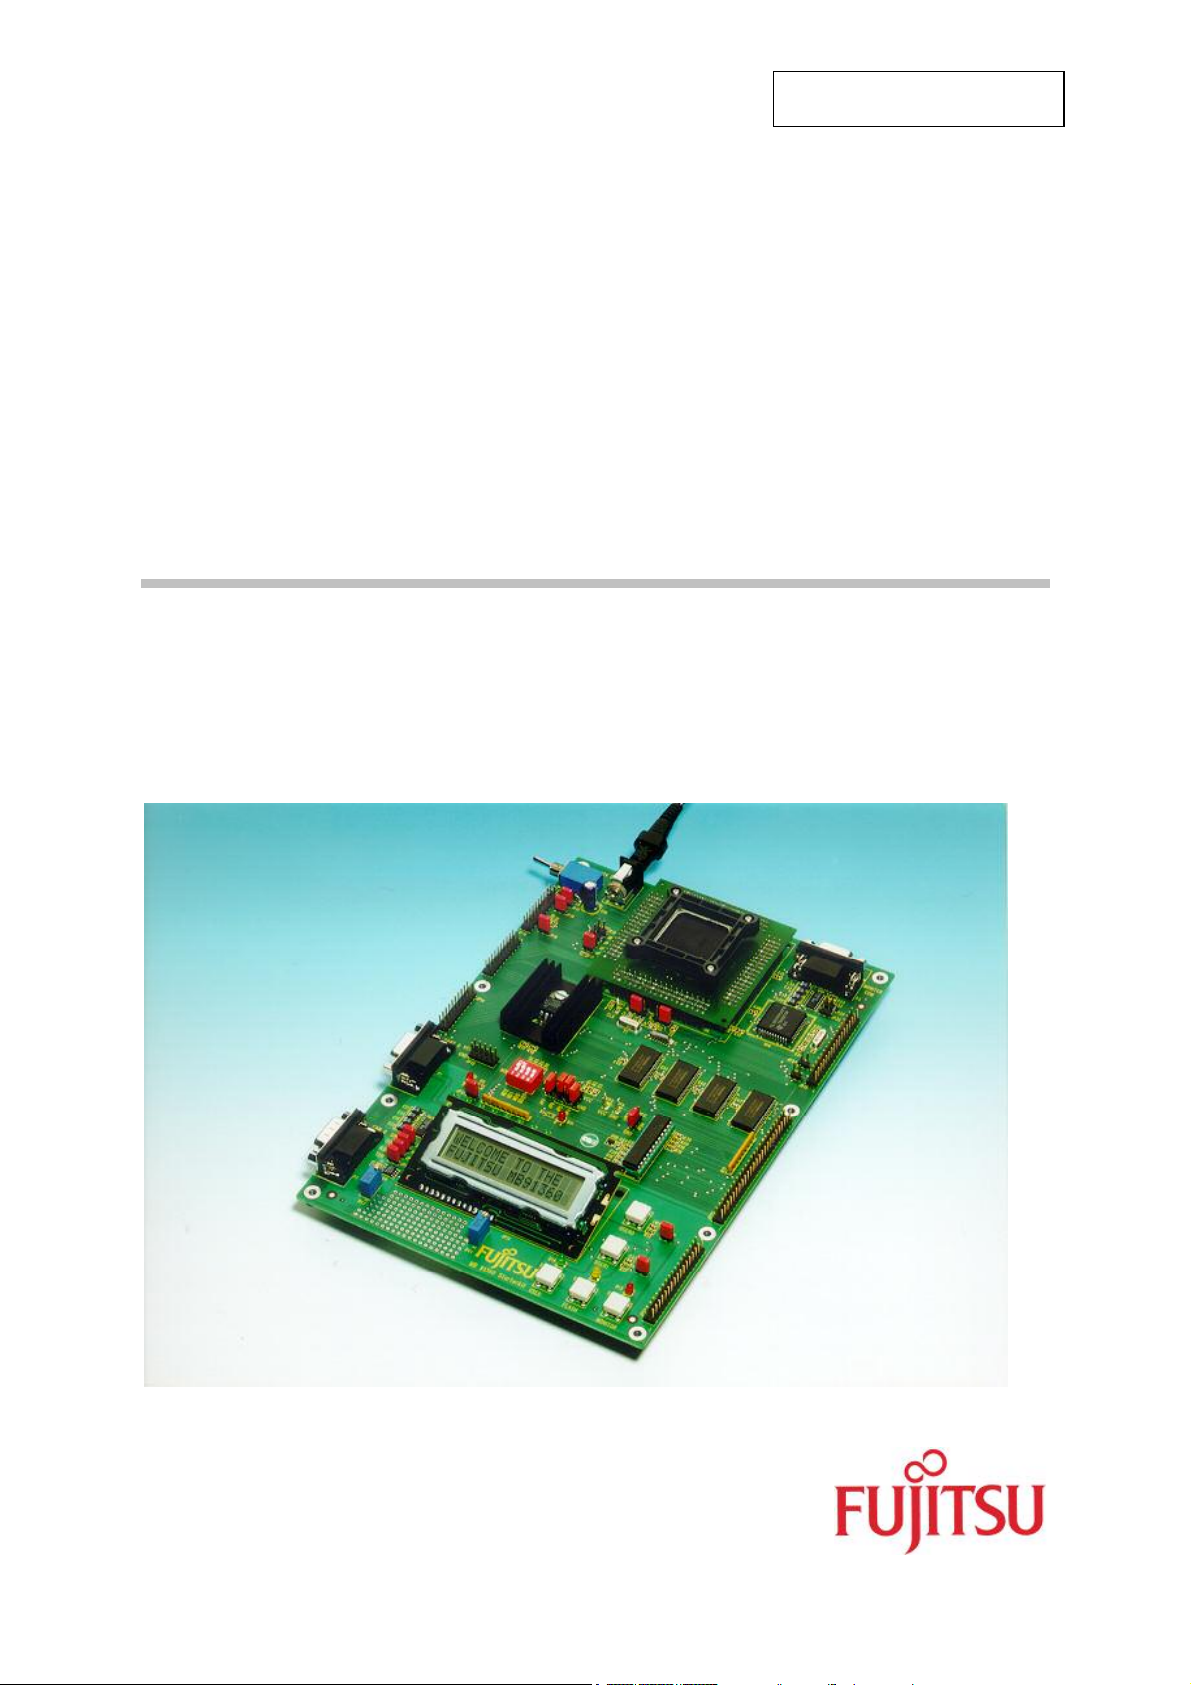
STARTERKIT MB91360
FMEMCU- UG-910006-13
MB91360 SERIES
EVALUATION BOARD
USER GUIDE
Page 2

Revision History
STARTERKIT MB91360
Revision History
ate
D
1999 1.0 MM
First draft
2001 1.2 MM
09 July 2003 V1.3, MSt
new format, Info about MB91F361 removed
This document contains 43 pages.
ssue
I
UG-910006-13 - 2 - © Fujitsu Microelectronics Europe GmbH
Page 3

STARTERKIT MB91360
Warranty and Disclaimer
Warranty and Disclaimer
To the maximum extent permitted by applicable law, Fujitsu Microelectronics Europe GmbH restricts
its warranties and its liability for STARTERKIT MB91360 and all its deliverables (eg. software
include or header files, application examples, target boards, evaluation boards, engineering samples
of IC’s etc.), its performance and any consequential damages, on the use of the Product in
accordance with (i) the terms of the License Agreement and the Sale and Purchase Agreement under
which agreements the Product has been delivered, (ii) the technical descriptions and (iii) all
accompanying written materials. In addition, to the maximum extent permitted by applicable law,
ujitsu Microelectronics Europe GmbH disclaims all warranties and liabilities for the performance of
F
the Product and any consequential damages in cases of unauthorised decompiling and/or reverse
engineering and/or disassembling. Note, the STARTERKIT MB91360 and all its deliverables are
intended and must only be used in an evaluation laboratory environment.
1. Fujitsu Microelectronics Europe GmbH warrants that the Product will perform substantially in
accordance with the accompanying written materials for a period of 90 days form the date of
receipt by the customer. Concerning the hardware components of the Product, Fujitsu
Microelectronics Europe GmbH warrants that the Product will be free from defects in material
and workmanship under use and service as specified in the accompanying written materials
for a duration of 1 year from the date of receipt by the customer.
2. Should a Product turn out to be defect, Fujitsu Microelectronics Europe GmbH´s entire liability
and the customer´s exclusive remedy shall be, at Fujitsu Microelectronics Europe GmbH´s
sole discretion, either return of the purchase price and the license fee, or replacement of the
Product or parts thereof, if the Product is returned to Fujitsu Microelectronics Europe GmbH in
original packing and without further defects resulting from the customer´s use or the transport.
However, this warranty is excluded if the defect has resulted from an accident not attributable
to Fujitsu Microelectronics Europe GmbH, or abuse or misapplication attributable to the
customer or any other third party not relating to Fujitsu Microelectronics Europe GmbH.
3. To the maximum extent permitted by applicable law Fujitsu Microelectronics Europe GmbH
disclaims all other warranties, whether expressed or implied, in particular, but not limited to,
warranties of merchantability and fitness for a particular purpose for which the Product is not
designated.
4. To the maximum extent permitted by applicable law, Fujitsu Microelectronics Europe GmbH´s
and its suppliers´ liability is restricted to intention and gross negligence.
NO LIABILITY FOR CONSEQUENTIAL DAMAGES
To the maximum extent permitted by applicable law, in no event shall Fujitsu
Microelectronics Europe GmbH and its suppliers be liable for any damages whatsoever
(including but without limitation, consequential and/or indirect damages for personal
injury, assets of substantial value, loss of profits, interruption of business operation,
loss of information, or any other monetary or pecuniary loss) arising from the use of
the Product.
Should one of the above stipulations be or become invalid and/or unenforceable, the remaining
stipulations shall stay in full effect
© Fujitsu Microelectronics Europe GmbH - 3 - UG-910006-13
Page 4

STARTERKIT MB91360
Contents
Contents
REVISION HISTORY............................................................................................................ 2
WARRANTY AND DISCLAIMER ......................................................................................... 3
CONTENTS .......................................................................................................................... 4
1 INTRODUCTION.............................................................................................................. 6
1.1 Abstract................................................................................................................... 6
1.2 Key Features........................................................................................................... 6
1.3 General Board Usage.............................................................................................. 7
1.4 Mode Selection ....................................................................................................... 8
2 INSTALLATION ............................................................................................................... 9
2.1 Hardware Installation............................................................................................... 9
2.2 Software Installation.............................................................................................. 10
3 GETTING STARTED...................................................................................................... 11
3.1 Softune Workbench Development Introduction...................................................... 11
3.2 Softune Workbench Debugging Introduction ......................................................... 13
4 DETAILS OF THE INCLUDED MONITOR-DEBUGGER................................................ 15
4.1 Basic debugger features........................................................................................ 15
4.2 Advanced debugger features................................................................................. 17
5 FLASH PROGRAMMING............................................................................................... 20
5.1 Generic Flash Programmer ................................................................................... 20
6 EVALUATION BOARD HARDWARE ............................................................................ 22
6.1 Board Components ............................................................................................... 22
6.2 Overview of Jumpers............................................................................................. 23
6.3 Connectors for resources and IO-signals............................................................... 25
7 APPENDIX..................................................................................................................... 29
7.1 Memory Mappings MB91F362............................................................................... 29
7.1.1 MODE 000 (Single-Chip / Monitor Mode)................................................. 29
7.1.2 MODE 001 (External Bus / User Mode) ................................................... 30
7.2 Tool options for own projects................................................................................. 31
7.3 Starterkit limitations............................................................................................... 32
7.4 Board Schematics ................................................................................................. 33
7.5 Silk Screen............................................................................................................ 36
7.6 PAL Listing .......................................................................................................... 37
UG-910006-13 - 4 - © Fujitsu Microelectronics Europe GmbH
Page 5

STARTERKIT MB91360
Contents
7.7 Development tools and accessories.................................................................. 39
.8
7
elated Documents............................................................................................. 40
R
7.9 Trouble Shooting................................................................................................. 41
7.10 Figures 43
7.11 Tables 43
© Fujitsu Microelectronics Europe GmbH - 5 - UG-910006-13
Page 6

STARTERKIT MB91360
Chapter 1 Introduction
1 Introduction
1.1 Abstract
The Fujitsu MB91360 evaluation board is a stand-alone application board that makes it easy
to evaluate and demonstrate almost all features of the MB91360 microcontroller series.
Along with the supplied Windows-based development tools, it can be used as a system for
user program developments.
The board can be configured as a target for the MB91360 emulation-system or as a standalone evaluation unit. When using the system in stand-alone mode, a monitor debugger is
available to allow high-level debugging using Softune Workbench.
All peripheral functions are available on external pin-headers in order to design and test user
applications cost- and time-effectively. For some resource functions, additional hardware is
already present on the board (e.g. CAN- and UART-transceivers, LEDs, Buttons, etc).
The included Windows-based Software “Softune Workbench” is an integrated front-end for
development and debugging. It allows fast development of “ANSI C”-based applications for
the evaluationboard. To get started quickly, a number of example projects and templates are
available.
Related documents such as “MB91360 Hardware Manual” are available and should always
be used in addition to this manual (see appendix).
1.2 Key Features
< Footprint QFP208 (0.5mm pitch) + socket for MB91F362 (or emulation socket),
surrounded by headers for test-pins etc.
< 4MHz and 32kHz crystal
< DC Power-supply circuit (incl. testpins for Vcc, GND, LED and switch)
< 512kB external SRAM available for user code and data
< External 16550 UART (supports transfer-rates up to 115.2 kBaud)
< 22V10-PAL for various control functions
< Resets (“Monitor”=Start monitor mode, “User”=exec user program from external
RAM, “Flash”=exec user program from flash-ROM)
< MAX232 + DB9 (female) connectors for monitor and internal UART
< CAN tranceiver and DB9 (male) for internal CAN0
< External Interrupt 0 and 1 connected to buttons for user interaction
< Various jumpers for individual configuration
< 2x16 char LCD (on Port G)
< 8 LEDs (on Port J)
< External bus and all resources logically grouped on pin-headers
UG-910006-13 - 6 - © Fujitsu Microelectronics Europe GmbH
Page 7
STARTERKIT MB91360
Chapter 1 Introduction
< Area for extensions (2.54mm grid)
< Standard Euro-format (16x20 cm)
< Built-in monitor debugger (in Flash)
< Software includes Softune Workbench, a set of tools (e.g. flashloader) and example
projects.
1.3 General Board Usage
The MB91360 Starterkit can be used as stand-alone evaluation board or as a target system
for the MB2197-01 In-Circuit-Emulator.
To use the board as stand-alone evaluation board, a pre-programmed flash device
(MB91F362 with monitor software) must be present inside the QFP-208 socket. The chip will
use the built-in monitor to handle communication with the PC and makes use of the 512k
SRAM onboard as program-memory for user’s application. This manual explains how to use
the MB91360 Starterkit as a stand-alone evaluation board.
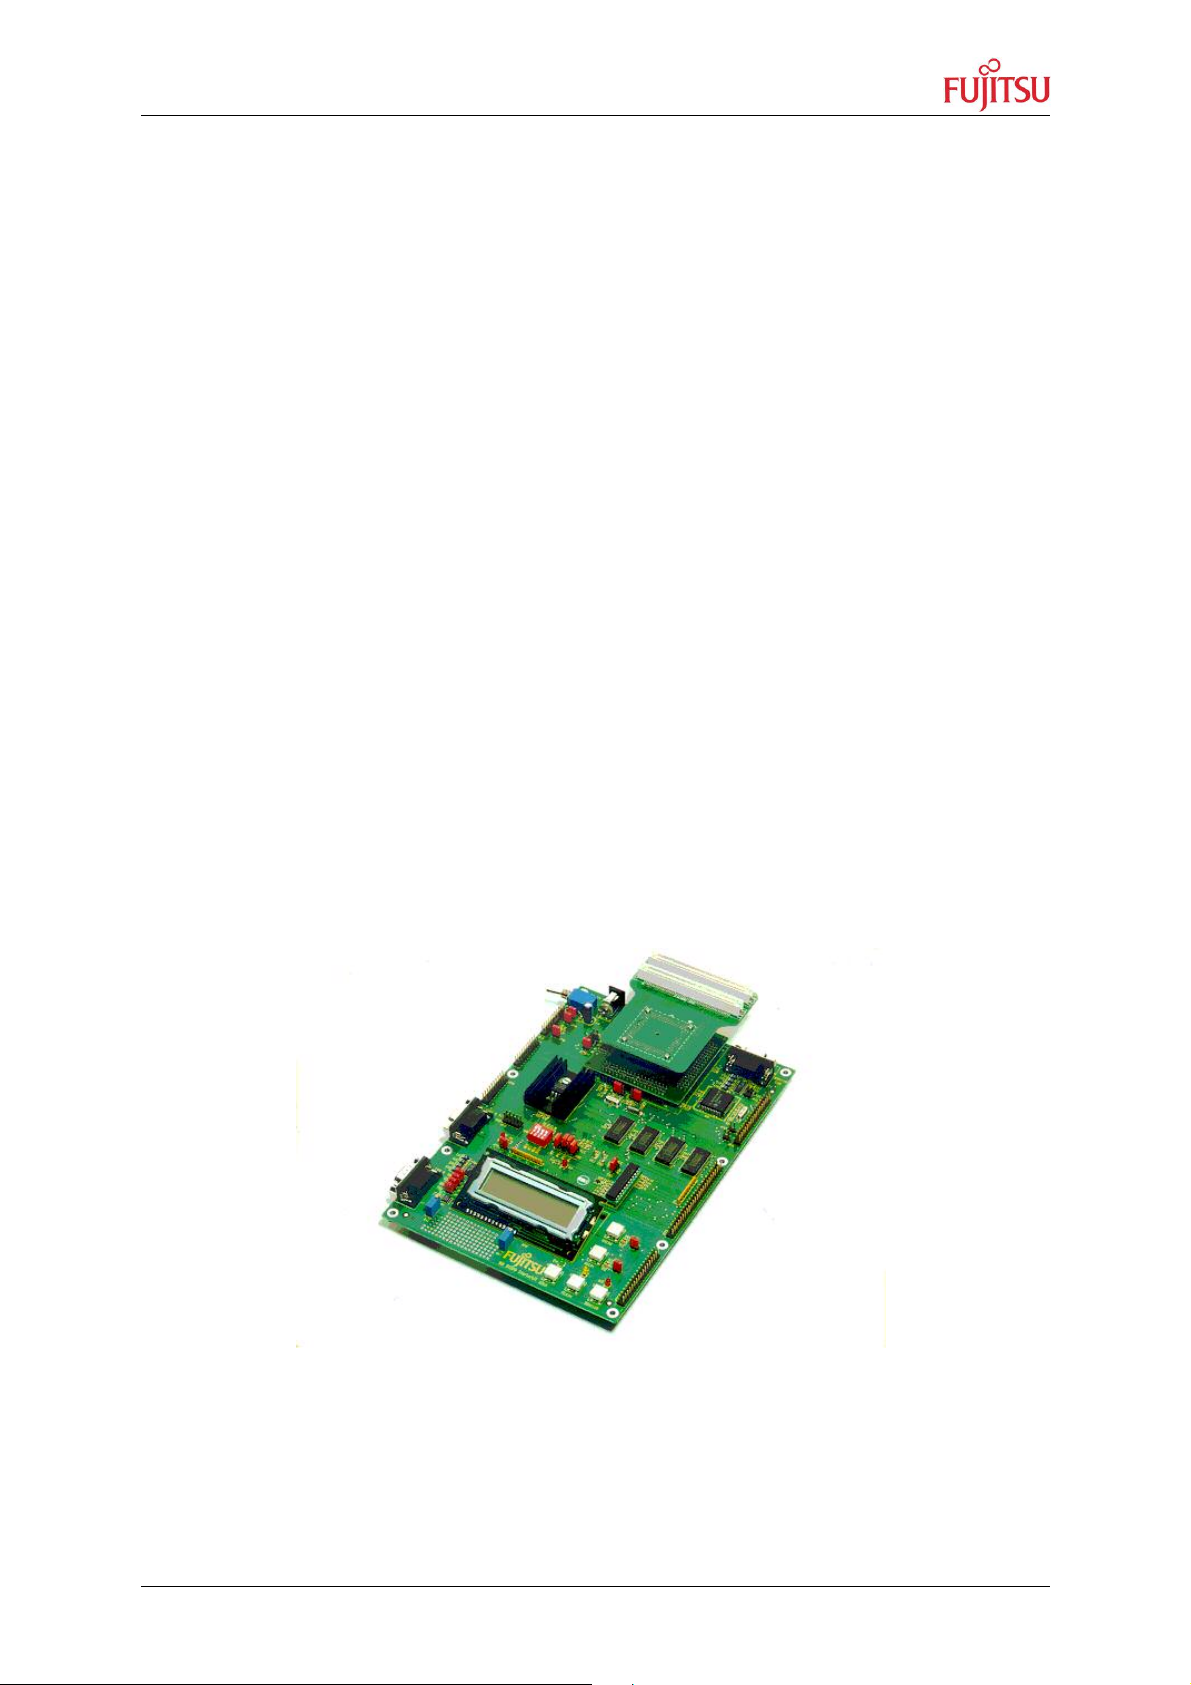
To use the board as target for the In-Circuit-Emulator, unscrew the socket and remove the
MB91F362 from the socket. Be careful not to bend any pins of the chip! Using a vacuum
chip-handler is highly recommended.
Then mount the emulator probe-cable on top of the QFP-socket. Use the provided screws
and make sure the cable has the right orientation. Follow the emulator set-up manual on the
CD-ROM for any further steps.
Figure 1: Using the Starterkit as target board for the ICE
© Fujitsu Microelectronics Europe GmbH - 7 - UG-910006-13
Page 8

STARTERKIT MB91360
Chapter 1 Introduction
1.4 Mode Selection
The board has three different “modes”, which are represented by the three reset-buttons
“USER”, “FLASH” and “MONITOR”.
By default, the board will startup in the “MONITOR”-mode, which automatically invokes the
debugger kernel. The board now can communicate with Softune Workbench. This means,
any application can be downloaded and debugged with all provided features such as
breakpoints, watches, single step etc. (see chapter “Softune Debugging Features”).
Once any code has been downloaded to SRAM, the application can also be executed
directly from a “USER” reset. The application will run without any intervention from the host
(e.g. breakpoints). This mode should mainly be used to test the application before
programming the entire contents to flash.
If finally the application has been transferred to flash-ROM, execution can start from the
flash-ROM using the “FLASH”-reset. This is the stand-alone mode for any user application.
As a last step, the board can be configured to start directly in the “FLASH”-mode after
power-on (by jumper JP34). This allows creating of a “real” stand-alone application.
UG-910006-13 - 8 - © Fujitsu Microelectronics Europe GmbH
Page 9
STARTERKIT MB91360
Chapter 2 Installation
2 Installation
2.1 Hardware Installation
What you’ll need :
< Host : IBM(-comp) PC with Windows 9x or Windows NT ; 1 COM-port
< Power Requirements: A power supply, capable of supporting 9-12V DC at about 500
mA. Note that the power connector must be + at the shield and - in the centre. Power
supplies are available from Fujitsu.
< RS232 : An ‘extension’ (1:1) RS232 cable with DB9 m+f connectors
Connect the power-supply (9-12V DC-input) and the RS232-cable
and switch on the Starterkit.
LED D10 should light up (power-indicator)
and LED D11 flashing (reset indicator).
During the initialization phase
the red monitor LED is on.
After that, a start message from the monitor
(“91360-STARTERKIT MONITOR VxLx”)
will be displayed on the LCD and the green user LED will light up.
The board is now ready to use.
© Fujitsu Microelectronics Europe GmbH - 9 - UG-910006-13
Page 10

STARTERKIT MB91360
Chapter 2 Installation
2.2 Software Installation
Insert the provided CD-ROM, browse to the installation page and select the Installation
option for Softune Workbench. Follow the instructions to unpack and install Softune
Workbench for FR ,as well as some example projects and additional tools for the MB91360
Starterkit. It is recommended to use the default installation path C:\Softune.
After the installation, you will find all language tools, the IDE and other system files within the
directory Softune\Bin. Samples for the Starterkit can be found in the \smplFR directory. The
\tools directory contains additional software tools (flashloader etc.).
Execute “FR Family Softune Workbench” from your Start-Menu.
If any errors occur during installation, remove any previous versions of Softune Workbench
from your PC and retry. Make sure you have enough disk space available and you have a
supported Windows OS installed. For more information see the provided installation
information and last-minute information.
Refer to the getting started session (next chapter) for more details on how to use Softune
Workbench for developing and debugging.
UG-910006-13 - 10 - © Fujitsu Microelectronics Europe GmbH
Page 11
STARTERKIT MB91360
Chapter 3 Getting Started
3 Getting Started
Make sure you have Softune Workbench for FR installed on your PC and the evaluation
board is ready to use. For details refer to the Hardware and Software Installation chapters.
This chapter uses the available examples to illustrate some features of Softune Workbench.
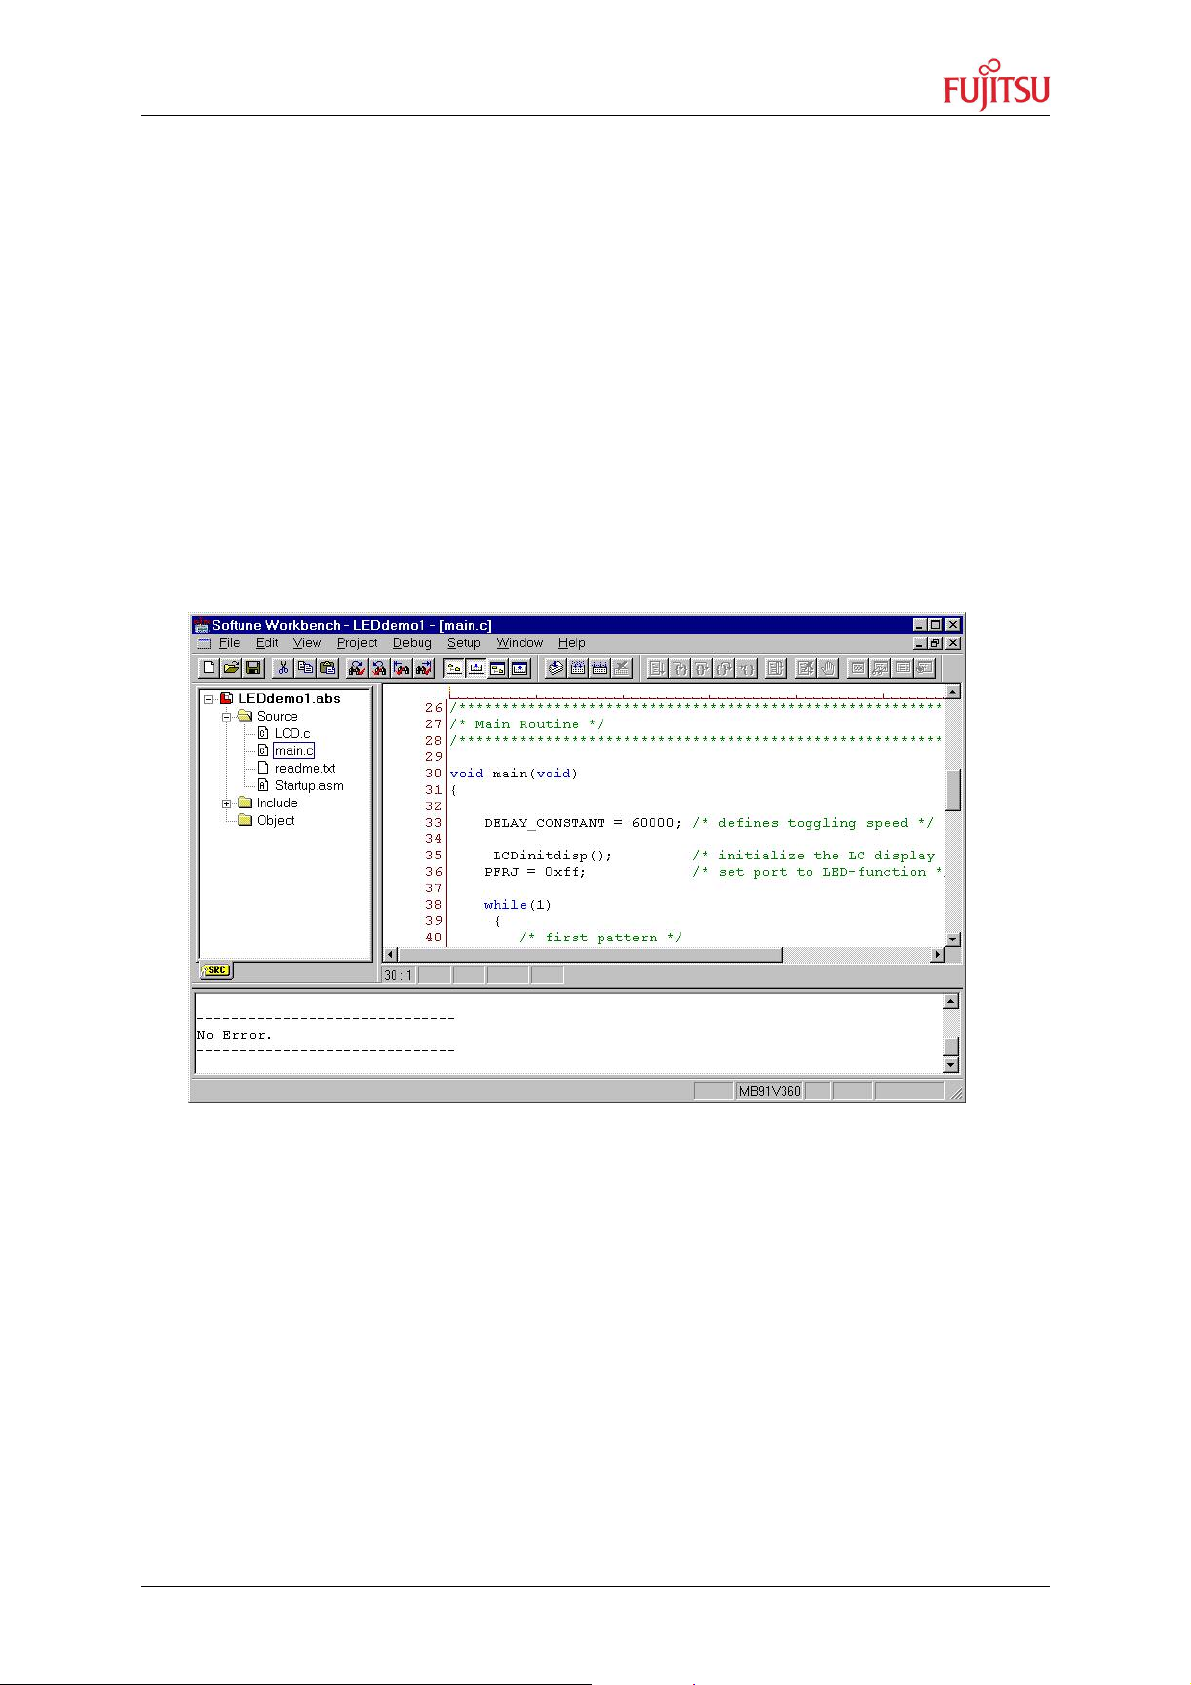
3.1 Softune Workbench Development Introduction
Start Softune Workbench. Select “File – Open Project” to load the first example
“LEDdemo1.Prj”. In the project tree on the left side, you can open the “source”-folder which
contains the source-files registered to this project. A double-click on one of the files will
invoke the built-in editor, which supports syntax-highlighting, tags and various other
functions.
Figure 2: Softune Workbench Editor
You may customize the editor by a right-click on the editor window.
Whenever you make changes to your source-files, you have to re-compile and link the
related files to produce a valid loadmodule (ABS-file). This is done using the MAKE-function.
MAKE invokes the assembler, C-compiler and linker for FR whenever necessary (only the
changed files will be re-compiled).
If you wish to re-compile the entire project regardless of any changes, you can use the
BUILD-function. To check for syntax-errors on a specific source-file, use the
COMPILE/ASSEMBLE function.
© Fujitsu Microelectronics Europe GmbH - 11 - UG-910006-13
Page 12
STARTERKIT MB91360
Chapter 3 Getting Started
These three functions are available on the button-bar or from the main menu (Project –
Compile / Make / Build / Abort).
Click on MAKE or BUILD. Messages from the individual language tools will be fed into the
output window at the bottom of the main screen. If the tool chain (C-compiler R Assembler
R Linker) was completed successfully, the message “No Error” will appear.
If you get any errors during compilation, an appropriate message will be generated. Try this
with a simple syntax-error (e.g. delete a semicolon “;” from the end of a C-line) and click on
MAKE again. You will now see a message like this:
Now Making...
main.c
*** c:\softune\sample\..\leddemo1\src\main.c(43) E4062C: syntax error near `for'
------------------------------
Error detected.
------------------------------
To locate the position in the source-file, where the error has occurred, double-click on the
message. The editor will open the appropriate source-file, indicating the error highlighted in
red, depending on the customise settings of the editor. Correct the error and re-compile the
project as explained above.
If more errors occurred, you can go through the error list step by step using the menu “Edit –
Top/Previous/Next/Bottom Error” or using the appropriate buttons which have the same
functions:
To get on-line help about a specific error, select the error message and press F1. In many
cases, you can get some useful hints how to solve the problem. Of cource, you can also
use the HELP-menu anytime during development or debugging.
UG-910006-13 - 12 - © Fujitsu Microelectronics Europe GmbH
Page 13

STARTERKIT MB91360
Chapter 3 Getting Started
3.2 Softune Workbench Debugging Introduction
Whenever you have successfully created a valid load module, you may switch from the
development mode to the debugging mode of Softune Workbench.
Basically, there are 3 types of debugging systems supported :
1. The software simulator: This type of debugger is always present and does not
require any special hardware extensions. The simulator will cover the FR-core
features, but no peripheral functions. Therefore, you can use the simulator to
verify program flow, check for dynamic errors, look at the generated assembler
code and so on.
2. The monitor debugger: This debugger type requires an evaluation board like the
MB91360 Starterkit connected to one of the COM-ports of your PC. Therefore,
make sure you have the evaluation board connected and powered-up as
described before. Explanations in this manual refer to the monitor debugger only.
3. The emulator debugger: The in-circuit-emulator (ICE) is a system, which allows a
connection to any target system using a probe-cable. The appropriate system for
the MB91360 series is the MB2197-01 system. More information about this
system can be found on the Fujitsu Micros CD-ROM or on our website.
Which debugger is used for the actual project can be configured in the “Project – Setup –
Debug” menu:
Always verify the settings before you start debugging a new project ! The current “setup” is
indicated by the selected item in the “Available Setup Name” dropdown-box. The provided
examples contain 3 setups (simulate, emulate and monitor). Ensure “monitor” is selected.
Click on “monitor” in the “Setup Name List” and click “Change”. A debug setup wizard will
appear to guide you through the possible settings.
Make sure you are using the right COM-port number and Baudrate !
The default-settings for the monitor-debugger are fixed to :
COM-Port1 and 38400 Baud. Change the settings if necessary.
© Fujitsu Microelectronics Europe GmbH - 13 - UG-910006-13
Page 14

STARTERKIT MB91360
Chapter 3 Getting Started
If these settings are correct, start the debugger using “Debug – Start Debug”. You should
see a progress bar indicating the download process.
If nothing happens, there will be an error message after some time (“Invalid communication
status”). Double-check the settings again as explained above. Also make sure the
evaluation-board is powered on, ready to use and the RS232-cable is connected properly.
Also see the trouble-shooting section in the appendix.
After starting the debugger, additional windows will appear which contain
locate-arrows for each (possible) source-line, the original source-code,
Figure 3: SWB Debugging window
breakpoint-indicators and the assembler code (in “mixed view”). The actual program position
will be indicated by a yellow line.
You can choose “mixed view” from the context menu (right-click) to display source
and assembly code at the same time. To easily locate the actual line, use “go to current” !
UG-910006-13 - 14 - © Fujitsu Microelectronics Europe GmbH
Page 15

STARTERKIT MB91360
Chapter 4 Details of the included Monitor-Debugger
4 Details of the included Monitor-Debugger
4.1 Basic debugger features
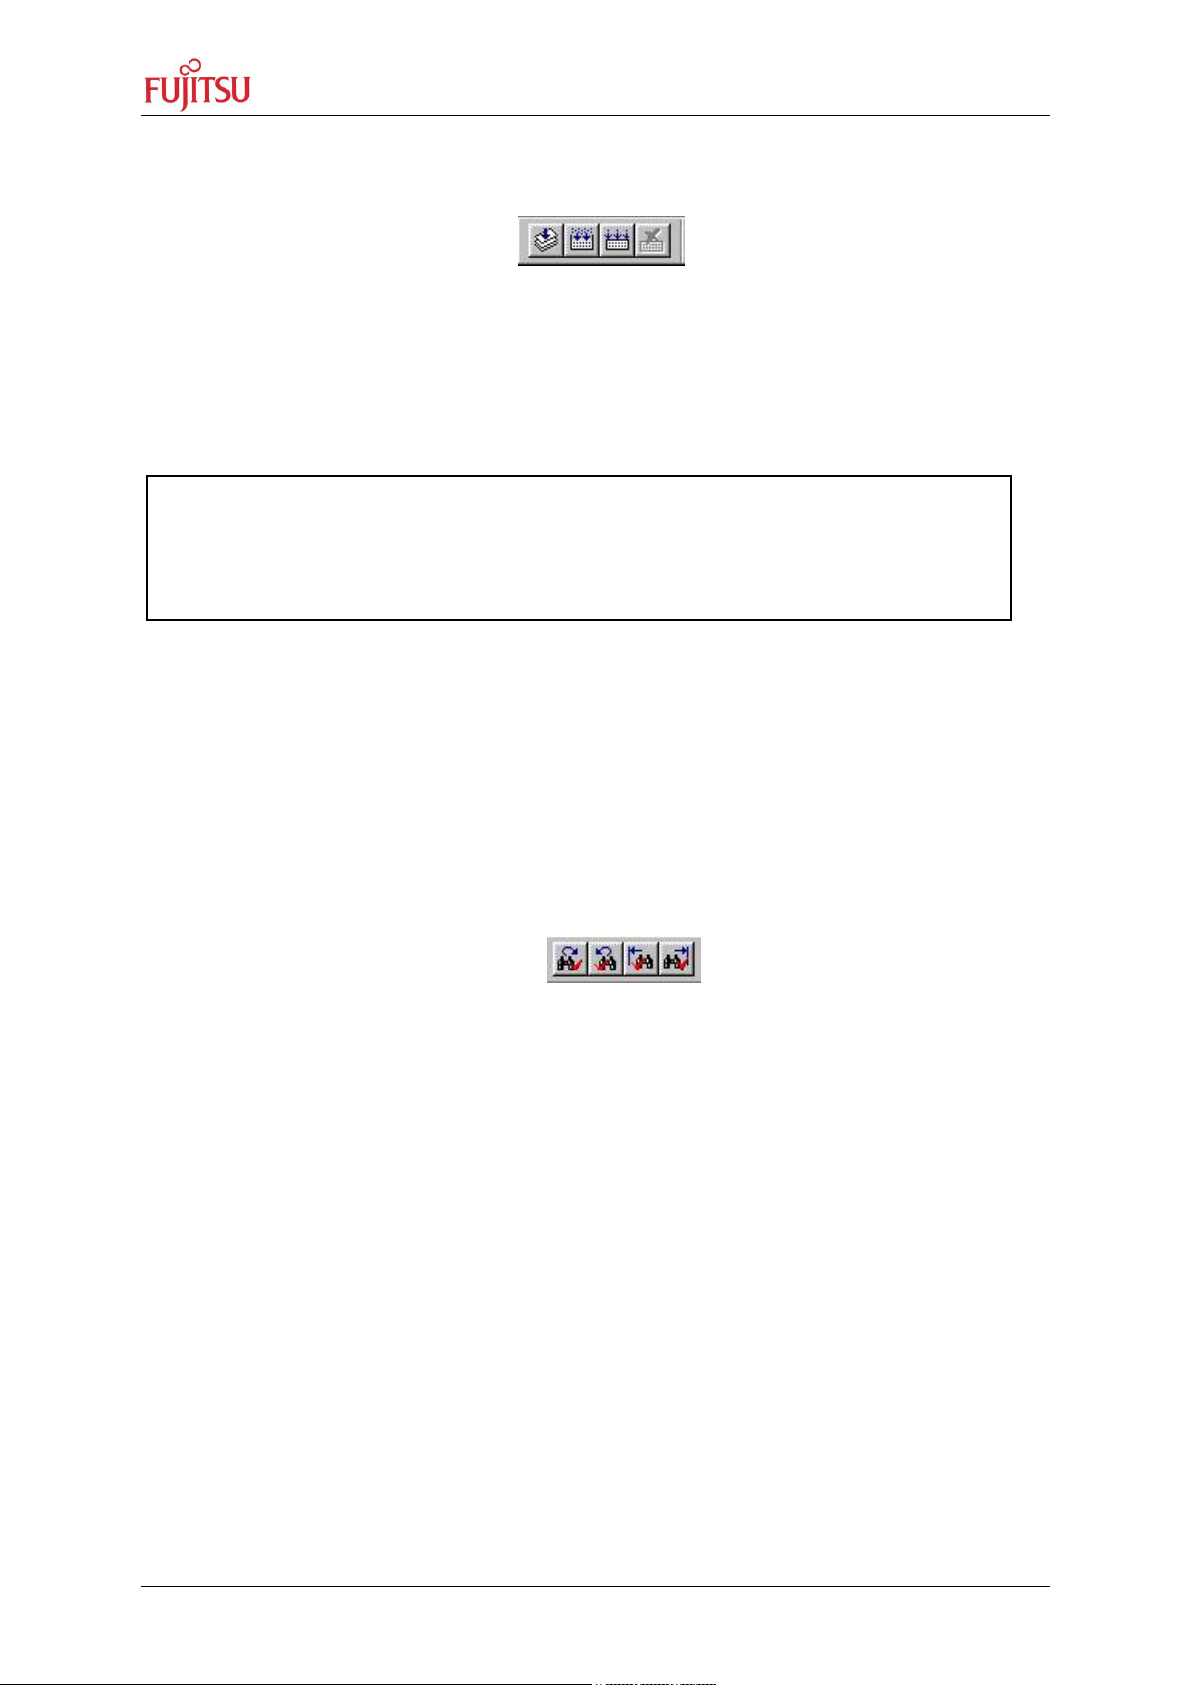
GO: Executes the program continuously from the memory location pointed to by the
current program counter (PC) until a termination factor occurs.
STEP IN: Executes the program stepwise according to the listing in the source
window (steps in C- or ASM). Note that Interrupts are disabled during step execution !
STEP OVER: Executes the program stepwise except call-instructions (which will be
executed until return). Interrupts are not disabled during a continuous CALL...RETURN
execution.
STEP OUT: Executes the program continuously to the parent function (until
RETURN). Interrupts are enabled. Note, that debug information is required for this function.
EXECUTE UNTIL CURSOR: Automatically sets a breakpoint at the actual cursor
position and executes continuously until this breakpoint, which will be deleted
afterwards.
Each valid code line in a debugger window automatically has a locator (blue arrow) and a
breakpoint-option (circle). Note that some C-lines may not be displayed with locators and
breakpoints, because the compiler has created “optimized” assembler-code. Select “mixed
view” in order to check the compiler output.
Instead of single-steps, you may also use the arrows to directly execute your program until a
certain line of your source-code :
© Fujitsu Microelectronics Europe GmbH - 15 - UG-910006-13
Page 16

STARTERKIT MB91360
Chapter 4 Details of the included Monitor-Debugger
ABORT: Forcibly terminates execution.
CAUTION: This function can be used in single code line operations only
(example: for(k=DELAY_CONSTANT; k>0; k--); ) !!
To abort continous execution on the Starterkit, you have to use an external
interrupt. All examples provided use the „USER0“-button for this purpose. If you
wish to use the „USER0“-button for Abort, make sure you have the ABORT-option in
STARTUP.ASM enabled :
#define ABORT 1
The USER0-button is an external interrupt source which will be initialized at the highest
priority. In the interrupt service routine (located in STARTUP.ASM) you will find a software
trap (INTE), which will force the debugger to stop at this specific point. You may use traps
also to intentionally stop in your code for debugging purposes.
UG-910006-13 - 16 - © Fujitsu Microelectronics Europe GmbH
Page 17

STARTERKIT MB91360
Chapter 4 Details of the included Monitor-Debugger
4.2 Advanced debugger features
TOGGLE BREAKPOINT: Sets or deletes breakpoint at the current source line or :
To set or delete a breakpoint, click the circles at the beginning of a source-line. A
indicates an active breakpoint. Hit “go” to execute until this line. A list of all breakpoints
can be found under the “Debug – Breakpoint” menu. 255 Software-Breakpoints (using TRAP
replacement) are possible.
To set breakpoints at positions which are currently not visible (e.g. because the source-
window of that module is not open), you can also enter a symbolic label directly in the
“Breakpoint” menu. Example: Enter “main” in the address-field and confirm. The new
breakpoint will automatically be assigned to the address of the “main()”-function.
REGISTER WINDOW: Displays the CPU-register window. Updated registers appear
in red. Setup in context menu defines which Registers should be displayed.
WATCH WINDOW: Displays the current variables to „watch“. Double-click on any
variable in your code then specify watch in context menu to add to watch window. All listed
variables in a watch window can be displayed in any number format. Use Edit to directly
change the contents.
Example: Open the Leddemo1-Project and execute until you see the first LED-pattern. Then
double-click on PDRJ in the debugger-window and select „watch“ in the context-menu. The
watch-window will appear and PDRJ will be added to any existing variables. Select PDRJ in
the watch window and choose „Edit“. Enter any value and confirm. You will now see the (8Bit) value displayed on the LEDs directly as binary code. This is because PDRJ is the output
latch of the LED-port (J).
MEMORY WINDOW: Displays memory areas in various formats defined by Setup
(context menu). Changing of address/data is possible when debugger is not executing.
Note : If you make changes to the ROM-area (080000..0FFFFF) it can affect the currently
loaded program !
DISASSEMBLER: Disassembles the contents of the code memory beginning from
actual PC position and displays the result in a separate window. Individual
assembler-lines can be changed using the „inline assemble“-function.
© Fujitsu Microelectronics Europe GmbH - 17 - UG-910006-13
Page 18

STARTERKIT MB91360
Chapter 4 Details of the included Monitor-Debugger
DEBUG - STACK: Displays the current stack contents in terms of function calls.
Parameters, if any, are given in brackets.
DEBUG - VECTOR: Reads out and displays the actual interrupt-vector table. Use the „jump“
function to display any code areas pointed to by an interrupt vector (e.g. interrupt service
routines used in your program).
DEBUG - CALL: This function can be used to „call“ any routine defined in your code when
the debugger is halted.
Example: Enter „LCDprinthex(0x1234,4)“ from any example project. The number 1234 will
appear on the LCD. The function-call will be terminated by showing the result (here : none).
You may restore the debugging context by „Clear call“ if execution was stopped during the
function-call. Note that this example assumes that „LCDinitdisp“ was executed before.
DEBUG – LOAD TARGET FILE: Starts a new download of the current load module (ABS
file). Usually this function will be executed automatically after starting the debugger (defined
in debug settings ; see „Project-Setup-Debug“). However, this function can be useful to reinitialize the debugger for the current debug session.
VIEW - SYMBOL: This function displays all (global) symbols of the current project.
Information about the type (char, integer etc.) and the location (address in RAM or register)
can be shown using „detail“.
VIEW - LOCAL: Similar to View-Symbol, but only local variables of the current function are
shown.
VIEW - COMMAND: From this window, the debugger can be controlled using a command
line input. All GUI functions are available as individual commands.
Examples :
go
step
examine PDRJ
set break main
Dump/Halfword 100000..1000ff
Shortcuts to complex commands can be defined (“alias”) and parameter strings can be
substituted by variables.
Example: candump = Dump/Halfword 100000..1000ff
A set of commands can be combined to a “macro”. Aliases and macros can be defined
using the command window context menu.
UG-910006-13 - 18 - © Fujitsu Microelectronics Europe GmbH
Page 19

STARTERKIT MB91360
Chapter 4 Details of the included Monitor-Debugger
Example: restart: set register PC=1f4000
set break main
go
In order to document or save debugging details such as memory contents, all outputs fed to
the command console can be written to a file (“logging”).
A whole “program” of commands (incl. flow control) can be written to a PRC-file and
executed. Procedure-files are simple text-files with the extension “.PRC” and can be created
by the Softune Workbench editor or any other text editor. To execute a procedure-file, use
the command window menu or the “file-open” menu during debugging.
Procedure-files can be very helpful to automatically configure the debug-environment,
perform automated tests (e.g. when a new C-module has to be tested) or to enhance
basic emulator functions such as breakpoints. Using a procedure file, breakpoints can be
dynamically defined depending on program conditions. See the “Command Reference
Manual” (on-line help) for detailed information about the available command and
parameter syntax.
© Fujitsu Microelectronics Europe GmbH - 19 - UG-910006-13
Page 20

STARTERKIT MB91360
Chapter 5 Flash Programming
5 Flash Programming
Whenever your application has been developed, debugged and tested as explained in the
last chapter, it can be programmed to the internal flash ROM using the „MB91360 Flash
Programmer“. This tool is a general flash programming utility, which allows programming the
internal flash ROM without any restrictions given by the starterkit.
5.1 Generic Flash Programmer
The tool „MB91360 Flash Programmer“ is a general flash programming tool which does not
take care of the special features of this Starterkit. Therefore, it should be used to re-program
the monitor-kernel. On the CD-ROM, you will find some kernel files (MHX-format) which are
fixed for various baud rates. Make sure, you have the latest version available!
The tool can also be used to program any applications directly (without the possibility to
have any debugging functions later on). In this case, the evaluation board will act as a target
system only.
CAUTION: Take special care not to write anything to location 0FFEF4, the „security vector“.
If you do, you will not be able to re-program the device ever again! See the hardware manual
for details!
Make sure you have installed the Flash Programmer from your CD-ROM. The package
includes the executable (Flashprg.exe) as well as some binary files (Brloadxx.bin) and a
user’s guide (Flashprg.pdf).
Figure 4: MB91360 Flash Programmer
UG-910006-13 - 20 - © Fujitsu Microelectronics Europe GmbH
Page 21

STARTERKIT MB91360
Chapter 5 Flash Programming
Follow these steps to use the MB91360 Flash Programmer :
1. Be sure to have the starterkit in Monitor (single-chip) mode. Check the position of the
jumpers and dip-switches onboard according to table1.
2. Connect the RS232-cable from any PC-COM-port to “UART0” (female UART
connector on the left side of the Starterkit - do NOT use the monitor COM
connector!).
3. Specify a (hex-)file in the “file to program”-field (use the browse-button to select).
This file must be a converted linker output file from Softune in the Motorola HexFormat “*.MHX” (for programming your own applications, be sure to have the load
module converter started in Softune Workbench to generate MHX-files !). For kernel
updates, select a MONxxx.MHX-file (xxx is the Starterkit-baudrate. E.g. :
MON115.MHX is the kernel for 115200 Baud).
4. Specify the COM-port and the desired baud rate for programming.
5. Click on Automatic Mode and press monitor reset on the Starterkit. The programming
sequence will be executed automatically.
CAUTION : DO NOT INTERRUPT THE FLASH PROGRAMMING OR CUT OFF THE
POWER DURING PROGRAMMING !
IT CAN DAMAGE THE FLASH ROM PERMANTENTLY !!!
6. After a successful programming procedure, hit monitor reset to re-initialize the
Starterkit and close the program. Do not forget to plug the RS232-cable back to
„Monitor COM“ if you want to use the monitor debugger again.
The Flash Programmer uses the internal Boot-ROM functions instead of the monitor
kernel for flash programming.
For more information and trouble shooting, see the „MB91360 Serial flash programmer
user’s guide“ (Flashprg.pdf) which is included in the installation.
© Fujitsu Microelectronics Europe GmbH - 21 - UG-910006-13
Page 22

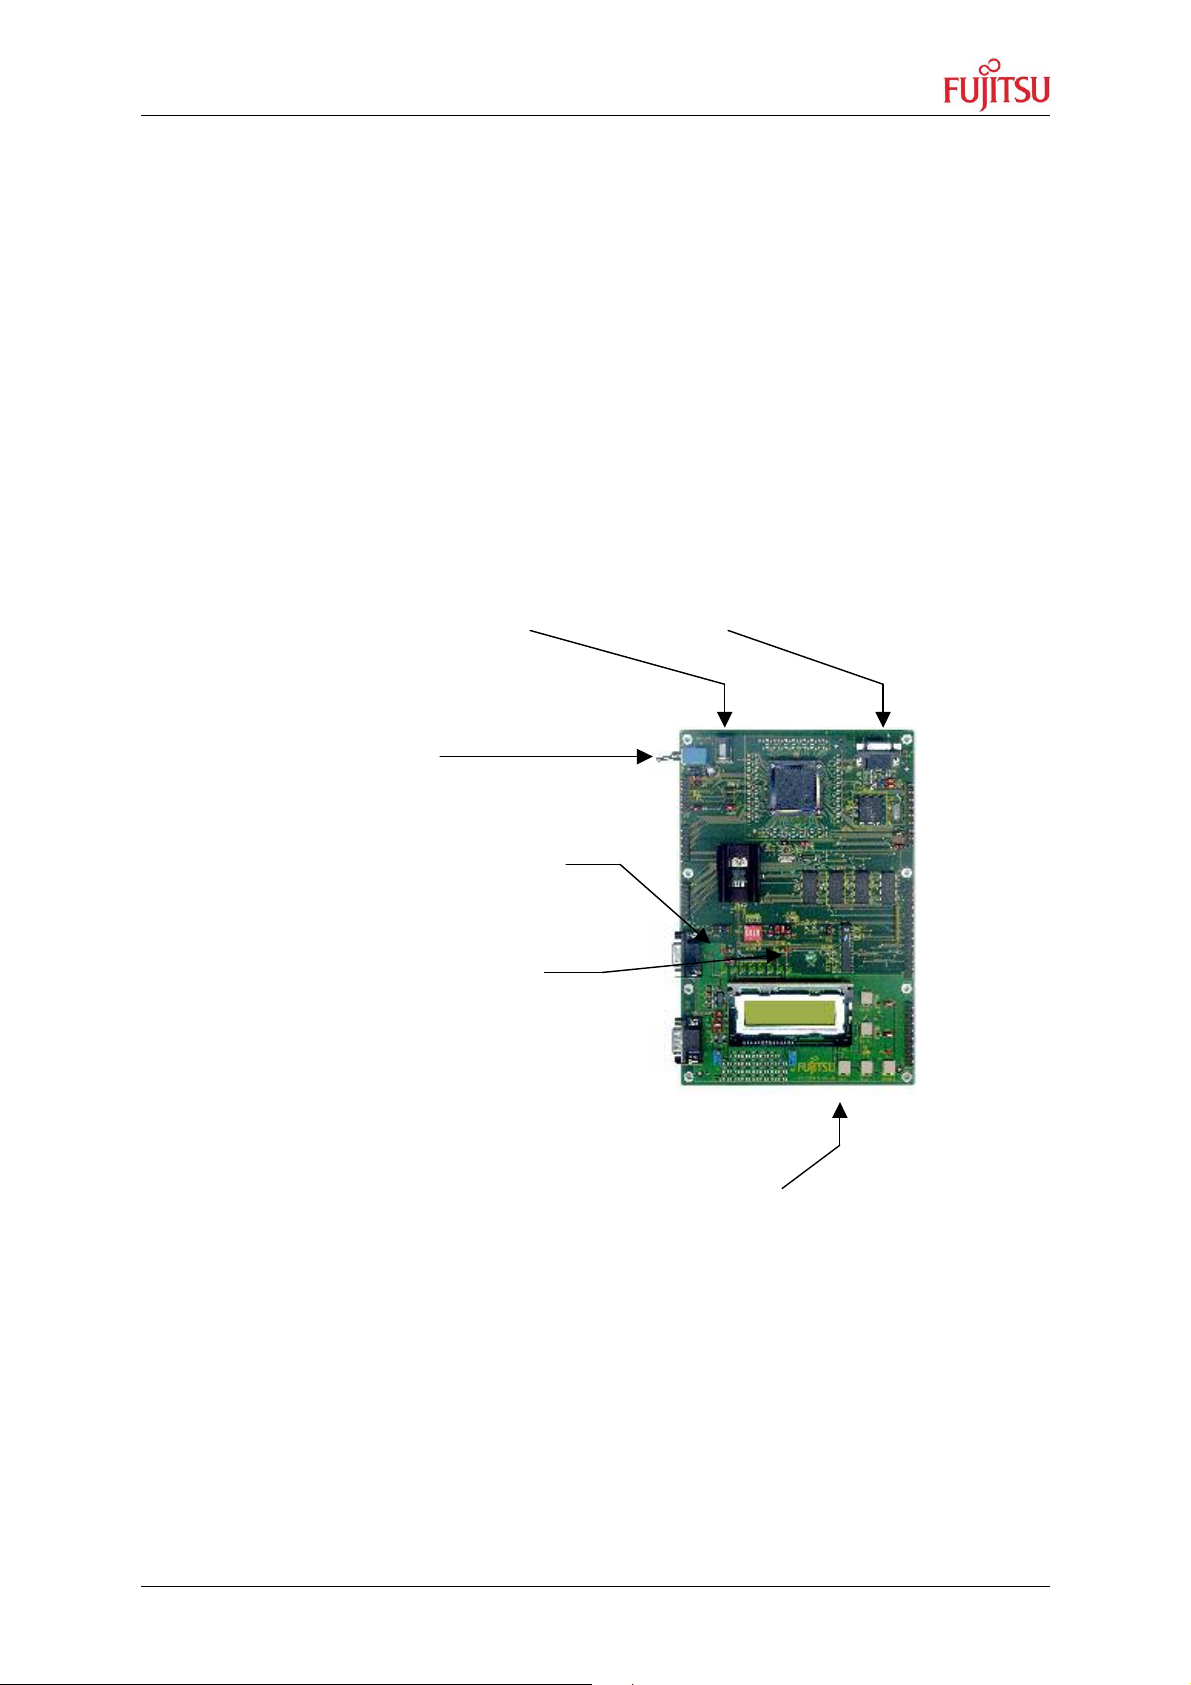
STARTERKIT MB91360
Socket QFP208 for
Monitor UART and
tranceiver and
LEDs on
Port J
JP15 : PWM and
JP24 : Databus
JP16 : Analog
Reset Circuit and
Reset
-
LED
Chapter 6 Evaluation Board Hardware
6 Evaluation Board Hardware
6.1 Board Components
Microcontroller
On/Off
Ports (AD/DA)
DC input
MB91F361/2
RS232-connector
Pulsgen. outputs
JP20 : INTs,
ICU and
5V Regulator
JP14 : Serial
Interfaces
MCU
Power-on LED
User-
RS232 driver
and connector
CAN
Oscillators
512k SRAM
JP25 :
Addressbus and
PAL
User buttons on
external Ints 0,1
LCD on Port
Mode LCD Prototyping CAN line slew rate
UG-910006-13 - 22 - © Fujitsu Microelectronics Europe GmbH
Page 23

STARTERKIT MB91360
Chapter 6 Evaluation Board Hardware
The evaluation board provides various IO-signals, which can be connected to external
devices. The controller resource functions are available on the connectors JP14, JP15, JP16
and JP20.
External peripheral devices can be connected via the address/data bus on JP24 and JP25.
For more information please refer to the following pin assignments and the schematics in the
appendix.
6.2 Overview of Jumpers
Jumper Description Standard Setting Jumper Position
JP1 Main Vcc Net for MCU Closed (Vcc supplied) Closed
JP2 32kHz-Oscillator GND (X0A disabled) (2-3 closed) Right
JP3 4 MHz-Oscillator X0 (Active) (1-2 closed) Left
JP4 LPF for 32kHz-Oscillator Vcc (Enabled) (2-3 closed) Up
JP5 Clock Select Pin Vcc (4 MHz) (2-3 closed) Up
JP6 Hardware Standby Pin Vcc (Disabled) (2-3 closed) Up
JP7 Select Source MD0 Vcc (PAL) (2-3 closed) Up
JP8-10 Test Mode Enable Open (no test mode) Open
JP13 LED enable Closed (LEDs active) Closed
JP17-19 Analog Supply Voltage Closed (A/D active) Closed
JP22-23 Driver Supply Voltage Closed (Driver active) Closed
JP26 Serial Output 0 enable Closed (enabled) Closed
JP27 Serial Input 0 enable Closed (enable) Closed
JP28-29 CAN0 driver enable Closed (enable) Closed
JP30,31 USER-buttons enable Closed (enable) Closed
JP32 Ext. UART int. enable Open (disable) Open
JP33 DTR reset enable Open (disable) Open
JP34 Power-up mode GND (Monitor mode) (1-2 closed) Down
MD2 Mode-Pin 2 GND On (Upper Dip Pos)
MD1 Mode-Pin 1 GND On
MD0 Mode-Pin 0 GND On
BOOT Boot-Pin GND On
Table 1: Selection jumpers on MB91360 Starterkit
© Fujitsu Microelectronics Europe GmbH - 23 - UG-910006-13
Page 24

STARTERKIT MB91360
Chapter 6 Evaluation Board Hardware
Jumper Description
JP12 Vcc/Gnd array for testpurposes
JP14 Serial communication pins (UART0-3 , CAN0-2)
JP15 Puls generator outputs 0-7, Stepper motor (PWM) outputs 0-4
JP16 A/D inputs 0-7, Alarm comp. Input, Sound gen. Output, D/A outputs 0-1
JP20 External Interrupts 0-7, Input Capture 0-3, Output Compare 0-3, I2C
JP25 Adressbus A0-A20 and Bus-control signals
JP24 Databus D0-D31
Table 2: Grouped jumpers on MB91360 Starterkit
UG-910006-13 - 24 - © Fujitsu Microelectronics Europe GmbH
Page 25

STARTERKIT MB91360
Chapter 6 Evaluation Board Hardware
6.3 Connectors for resources and IO-signals
MCU-pins are grouped according to their logical functions. See the hardware manual for
details on the resource functions.
JP16 :
Analog Inputs (ADC)
Analog Outputs (DAC)
Sound Generator
Alarm Comparator
JP20 :
External Interrupts,
Input Capture Units
Output Compare Units
I²C Interface
JP14 :
UARTs
Sync. serial interfaces
CANs
JP15 :
Stepper Motor Drivers
PWMs
Puls Generators
The available resource pins can also be used as general purpose IO-ports (using the Portfunction registers PFRx). See table below for details.
© Fujitsu Microelectronics Europe GmbH - 25 - UG-910006-13
Page 26

STARTERKIT MB91360
Chapter 6 Evaluation Board Hardware
Note: Address bus and data bus pins (JP24,25) cannot be used as IO-ports.
Jumper Pin-No. Pin Name IO-Port Resource Function
JP16
064 AVCC - Analog Vcc
065 AVRH - Analog Reference High
066 AN0 PH0 ADC Input Channel 0
067 AN1 PH1 ADC Input Channel 1
068 AN2 PH2 ADC Input Channel 2
069 AN3 PH3 ADC Input Channel 3
070 AN4 PH4 ADC Input Channel 4
071 AN5 PH5 ADC Input Channel 5
072 AN6 PH6 ADC Input Channel 6
073 AN7 PH7 ADC Input Channel 7
074 AVSS - Analog Reference Low
077 ALARM - Alarm Comparator Input
080 ATGX PI3 ADC Trigger Input
126 SGO PM0 Sound Generator Output
127 SGA PM1 Sound Generator Amplitude
JP20
075 DA0 - DAC Output Channel 0
076 DA1 - DAC Output Channel 1
094 INT0 PK0 Ext. Interrupt 0
095 INT1 PK1 Ext. Interrupt 1
096 INT2 PK2 Ext. Interrupt 2
097 INT3 PK3 Ext. Interrupt 3
098 INT4 PK4 Ext. Interrupt 4
099 INT5 PK5 Ext. Interrupt 5
100 INT6 PK6 Ext. Interrupt 6
101 INT7 PK7 Ext. Interrupt 7
102 IN0 PL0 ICU Input 0
103 IN1 PL1 ICU Input 1
104 IN2 PL2 ICU Input 2
105 IN3 PL3 ICU Input 3
106 OUT0 PL4 OCU Output 0
UG-910006-13 - 26 - © Fujitsu Microelectronics Europe GmbH
Page 27

STARTERKIT MB91360
Chapter 6 Evaluation Board Hardware
Jumper Pin-No. Pin Name IO-Port Resource Function
107 OUT1 PL5 OCU Output 1
108 OUT2 PL6 OCU Output 2
109 OUT3 PL7 OCU Output 3
128 SDA PM2 I2C-Interface SDA
129 SCL PM3 I2C-Interface SCL
JP14 146 TX0 PP0 CAN 0 TX
147 RX0 PP1 CAN 0 RX
148 TX1 PP2 CAN 1 TX
149 RX1 PP3 CAN 1 RX
150 TX2 PP4 CAN 2 TX
151 RX2 PP5 CAN 2 RX
152 SIN0 PQ0 UART 0 Input
153 SOT0 PQ1 UART 0 Output
154 SIN1 PQ2 UART 1 Input
155 SOT1 PQ3 UART 1 Output
156 SIN2 PQ4 UART 2 Input
157 SOT2 PQ5 UART 2 Output
130 SOT4 PN0 SIO Output
131 SIN4 PN1 SIO Input
132 SCK4 PN2 SIO Clock
133 SIN3 PN3 SIO Input
134 SOT3 PN4 SIO Output
135 SCK3 PN5 SIO Clock
JP15 136 OCPA0 PO0 PPG Output 0
137 OCPA1 PO1 PPG Output 1
138 OCPA2 PO2 PPG Output 2
139 OCPA3 PO3 PPG Output 3
140 OCPA4 PO4 PPG Output 4
141 OCPA5 PO5 PPG Output 5
142 OCPA6 PO6 PPG Output 6
143 OCPA7 PO7 PPG Output 7
© Fujitsu Microelectronics Europe GmbH - 27 - UG-910006-13
Page 28

STARTERKIT MB91360
Chapter 6 Evaluation Board Hardware
Jumper Pin-No. Pin Name IO-Port Resource Function
162 PWM1P0 PR0 SMC 0
163 PWM1M0 PR1 SMC 0
164 PWM2P0 PR2 SMC 0
165 PWM2M0 PR3 SMC 0
166 HVDD - SMC Driver Vdd
167 PWM1P1 PR4 SMC 1
168 PWM1M1 PR5 SMC 1
169 PWM2P1 PR6 SMC 1
170 PWM2M1 PR7 SMC 1
171 HVSS - SMC Driver Vss
172 PWM1P2 PS0 SMC 2
173 PWM1M2 PS1 SMC 2
174 PWM2P2 PS2 SMC 2
175 PWM2M2 PS3 SMC 2
177 PWM1P3 PS4 SMC 3
178 PWM1M3 PS5 SMC 3
179 PWM2P3 PS6 SMC 3
180 PWM2M3 PS7 SMC 3
Table 3: Overview of available resource-functions and IO-ports on jumpers
UG-910006-13 - 28 - © Fujitsu Microelectronics Europe GmbH
Page 29

STARTERKIT MB91360
Chapter 7 Appendix
7 Appendix
7.1 Memory Mappings MB91F362
7.1.1 MODE 000 (Single-Chip / Monitor Mode)
MB91F362 Memory Map Recommended Mappings
Figure 5: Memory Mapping Single Chip Mode / Monitor Mode
© Fujitsu Microelectronics Europe GmbH - 29 - UG-910006-13
Page 30

STARTERKIT MB91360
Chapter 7 Appendix
7.1.2 MODE 001 (External Bus / User Mode)
MB91F362 Memory Map Recommended Mappings
Figure 6: Memory Mapping External Mode / User Mode
UG-910006-13 - 30 - © Fujitsu Microelectronics Europe GmbH
Page 31

STARTERKIT MB91360
Chapter 7 Appendix
7.2 Tool options for own projects
Valid load module files for MB91360 devices can only be achieved if the language tool
configuration is appropriate. If you use the provided samples or templates, you do not have
to worry about these settings.
The most convenient way to create own projects is to copy the provided Template-Project
from the sample-directory and use it as “blank sheet”. However, if you intend to create
projects “from scratch” without the template, the following settings are important.
Target MCU (“Project – Setup” menu) : make sure “MB91FV360” or “MB91F362” is selected
as the target MCU device.
Linker Settings (“Project – Setup tool options – Linker – Disposition”) : MB91360 devices
use a fixed memory map for code stored in Flash-ROM or data assigned to the internal
RAM. In addition, certain Flash-sectors have special meanings, such as the boot-sector
(application always starts from 0F4000) or the kernel of the debugger stored from 0F0000.
Therefore, make sure the following memory map is applied:
Memory Type Used for Area Sections
Data RAM Stack 3D000..3DFFF STACK
Data RAM Variables 3E000..3FFFF DATA, INIT
Flash ROM User Code 080000..0EFFFF CODE
FlashROM Kernel 0F0000..0F3FFF
1.1.1.1.1 Reserved !
FlashROM Boot-Sector,
constants and
0F4000..0FFFFF START, CONST,
@INIT, VECTORS
vectors
Table 4: Memory Map
Your linker settings should look like this:
-ro CODE_AREA=0x00080000/0x000EFFFF
-ro ROM_AREA=0x000F4000/0x000FFFFF
-ra STACK_AREA=0x0003D000/0x0003DFFF
-ra RAM_AREA=0x0003E000/0x0003FFFF
-sc STACK/Stack=STACK_AREA
-sc DATA/Data+INIT=RAM_AREA
-sc CODE/Code=CODE_AREA
-sc START+CONST+@INIT=ROM_AREA
Also refer to the detailed memory maps in the appendix.
Always check the “map”-file (use the context menu in the project-view and select “open
list file”) to see the used sections and addresses !
© Fujitsu Microelectronics Europe GmbH - 31 - UG-910006-13
Page 32

STARTERKIT MB91360
Chapter 7 Appendix
7.3 Starterkit limitations
If creating new projects, be sure not to use the following functions, which are reserved for
the MB91360 Starterkit:
< Flash-ROM area 0F0000..0F3FFF (reserved for Monitor kernel)
< Port G / upper ADC inputs (used for LCD and mode input)
< Security-Vector (used to call the kernel in Monitor mode)
< External Interrupt 0 (used for Abort function)
< Chip selects 0,2 and 7 (used for MCU and board hardware)
< External memory space 200000..3FFFFF (used for board hardware)
UG-910006-13 - 32 - © Fujitsu Microelectronics Europe GmbH
Page 33

7.4 Board Schematics
STARTERKIT MB91360
Chapter 7 Appendix
© Fujitsu Microelectronics Europe GmbH - 33 - UG-910006-13
Page 34

STARTERKIT MB91360
Chapter 7 Appendix
UG-910006-13 - 34 - © Fujitsu Microelectronics Europe GmbH
Page 35

STARTERKIT MB91360
Chapter 7 Appendix
© Fujitsu Microelectronics Europe GmbH - 35 - UG-910006-13
Page 36

7.5 Silk Screen
STARTERKIT MB91360
Chapter 7 Appendix
UG-910006-13 - 36 - © Fujitsu Microelectronics Europe GmbH
Page 37

STARTERKIT MB91360
Chapter 7 Appendix
7.6 PAL Listing
;PALASM Design Description
;---------------------------------- Declaration Segment ------------
TITLE STK360_1.PDS
PATTERN A
REVISION 1.3
AUTHOR M.MIERSE
COMPANY FUJITSU MIKROELEKTRONIK GMBH
DATE 20/09/99
CHIP STK360 PAL22V10
; -------------------------------- Revision History ----------------
;
; 20.11.98 V1.0 First Version
; 17.02.99 V1.1 Rem-Req and ext. UART Mapping changed
; 16.03.99 V1.2 UART-Reset changed to high-active
; 20.09.99 V1.3 UART-CS changed for ext.bus mode
;
;---------------------------------- PIN Declarations ---------------
PIN 1 RESETIN COMBINATORIAL ; INPUT
PIN 2 DEFAULT COMBINATORIAL ; INPUT
PIN 3 AUXIN COMBINATORIAL ; INPUT
PIN 4 A19 COMBINATORIAL ; INPUT
PIN 5 A20 COMBINATORIAL ; INPUT
PIN 6 CS0 COMBINATORIAL ; INPUT
PIN 7 CS2 COMBINATORIAL ; INPUT
PIN 8 MONRES COMBINATORIAL ; INPUT
PIN 9 FLASHRES COMBINATORIAL ; INPUT
PIN 10 USERRES COMBINATORIAL ; INPUT
PIN 11 DTR COMBINATORIAL ; INPUT
PIN 13 UNUSED1 COMBINATORIAL ;
PIN 12 GND
PIN 14 UARTRES COMBINATORIAL ; OUTPUT
PIN 15 MASTRES COMBINATORIAL ; OUTPUT
PIN 16 CSRAM COMBINATORIAL ; OUTPUT
PIN 17 CSUART COMBINATORIAL ; OUTPUT
PIN 18 MODE COMBINATORIAL ; OUTPUT
PIN 19 PG5 COMBINATORIAL ; OUTPUT
PIN 20 PONFLAG REGISTERED ; INT. FLAG
PIN 21 LEDGRN COMBINATORIAL ; OUTPUT
PIN 22 LEDYEL COMBINATORIAL ; OUTPUT
PIN 23 LEDRED COMBINATORIAL ; OUTPUT
PIN 24 VCC
; -----------------------------------------------------------------------
; --------------------- OUTPUT EQUATIONS ------------------------------
; -----------------------------------------------------------------------
© Fujitsu Microelectronics Europe GmbH - 37 - UG-910006-13
Page 38

STARTERKIT MB91360
Chapter 7 Appendix
EQUATIONS
; -----------------------------------------------------------------------
; Power-on Indicator (Flip-Flop) :
; -----------------------------------------------------------------------
PONFLAG.CLKF = RESETIN ; Power-on-Flag ist 0 at Pon ; otherwise 1
PONFLAG := 1
; -----------------------------------------------------------------------
; Equations for Modes (Reset-States) :
; -----------------------------------------------------------------------
; --------------------> LEDRED is indicating the Monitor-Reset state, if
LEDRED = USERRES * FLASHRES * /MONRES ; Mon-reset button pressed
+ /DTR ; or uart-reset (DTR line low)
+ (/PONFLAG * /DEFAULT) ; or Power-on (Default-Mode=Mon)
+ /LEDGRN * /LEDYEL ; (hold-condition)
; --------------------> LEDGRN is indicating the User-Reset state, if
LEDGRN = /USERRES * FLASHRES * MONRES ; User-Reset button pressed
+ (A20 * /A19 * /CS2) ; or Remote-User-reset request
+ /LEDYEL * /LEDRED ; (hold-condition)
; --------------------> LEDYEL is indicating the Flash-Reset state, if
LEDYEL = USERRES * /FLASHRES * MONRES ; Flash-Reset button pressed
+ (/PONFLAG * DEFAULT) ; or Power-on (Default-Mode=Flash)
+ /LEDGRN * /LEDRED ; (hold-condition)
MODE = LEDGRN ; Mode-Pin (MD0) is 1, if User-Reset state, otherwise 0
PG5 = LEDYEL ; Flash-Ind-Pin is 1, if Flash-Reset state, otherwise 0
UARTRES = /RESETIN * LEDRED ; UART-reset only if Monitor-Reset
; -----------------------------------------------------------------------
; Reset-Request : Toggles the Masterreset-input (MAX811), if
; -----------------------------------------------------------------------
/MASTRES = ((/MONRES + /USERRES + /FLASHRES) * RESETIN) ; Buttons pressed
+ (( LEDGRN * /A19 * A20 ) * RESETIN) ; or Rem-Request
+ ((/DTR ) * RESETIN) ; or DTR low
; -----------------------------------------------------------------------
; Memory-Mapping Equations :
; -----------------------------------------------------------------------
UG-910006-13 - 38 - © Fujitsu Microelectronics Europe GmbH
Page 39

STARTERKIT MB91360
Chapter 7 Appendix
; SRAMS active in areas :
/CSRAM = (/A20 * A19 * /CS0) ; 08:0000...0F:FFFF (CS0)
+ ( A20 * A19 * /CS0) ; 18:0000...1F:FFFF (CS0)
+ ( A20 * A19 * /CS2) ; 38:0000...3F:FFFF (CS2)
; UART-Area = 20:0000...27:FFFF (CS0 in Monitor-mode or CS2 in USER mode)
/CSUART = (LEDRED * /A20 * /A19 * /CS0) ; CS0 in Mon-Mode
+ (LEDGRN * /A20 * /A19 * /CS2) ; CS2 in User-Mode
7.7 Development tools and accessories
In-Circuit Emulation Tools for MB91360 Series:
Emulation Main Unit MB2197-01
Emulation Board MB2197-120
Emulation Header (Probe) MB2197-127
Evaluation Device MB91FV360GCR
Evaluation Board StarterkitMB91360
In-Circuit Emulation Tools for MB91100 Series:
Emulation Main Unit MB2197-01
RAM Stack FR-RAM-STACK1-100P-M06
Header MB2197-111
Header MB2197-112
Header MB2197-115
Evaluation Device MB91V10x(A)CR
Evaluation Board StarterkitMB91100
Accessories:
Serial Cable Extension type
QFP208 Socket NQ-PACK208SD
Socket IC Lid HQ-PACK208SD
ICE-socket adapter YQ-PACK208SD
Test-PCB for Starterkit QFP208 footprint to 2.54mm pin rows
Power supply 9-12V DC (0.5A)
© Fujitsu Microelectronics Europe GmbH - 39 - UG-910006-13
Page 40

STARTERKIT MB91360
Chapter 7 Appendix
7.8 Related Documents
Available manuals for MB91360 series :
1. MB91360 Hardware Manual
2. MB91F36X Datasheet (General Specification)
3. FR Family C-Compiler Manual
4. FR Family Instruction Manual
5. FR Family Assembler Manual
6. FR Family Simulator Manual
7. FR Family Emulator Manual
8. FR Family Linkage Kit Manual
9. FR Family Softune Workbench Manual
Note : All documents are available from the provided CD-ROM, Fujitsu’s Microcontroller CDROMs or from our web-site.
UG-910006-13 - 40 - © Fujitsu Microelectronics Europe GmbH
Page 41

STARTERKIT MB91360
Chapter 7 Appendix
7.9 Trouble Shooting
Problem Solution
Evaluationboard does not
initialize after power-on.
LED D10 (Power indicator) does
not light up and the LC-display
remains empty.
Check voltage supply and jumpers :
The voltage on DC-Power plug
☛
should be in the range of 9-12V. The
plug should have + on shield and – on
the center. LED D10 should light up
after switching on the board. Use a
multimeter to see whether 5V are
present on the Vcc/Gnd terminals (TP2
and TP3).
Check jumper positions according to
☛
table 1 (Esp. : JP1 – JP7) !
Remove all user extensions on the
☛
board to avoid shorts !
Evaluationboard stays in reset.
LED D11 (Reset indicator) ligths
up permanently.
LED D11 (Reset) should flash. If D11
☛
lights up permantantly, the voltage is too
low (below 4.25V) - Increase the voltage
to solve the problem.
JP33 (DTR reset) should be left
☛
open. This option allows to reset the
board from a connected PC using the
DTR line (not used by Softune WB).
Remove all user extensions on the
☛
board to avoid shorts or leakage
currents !
After power-on, the initial
monitor-message is not shown
on the LCD.
Check JP34 (default-mode) : This
☛
jumper should be in the lower position
(Monitor mode). In the upper position,
the board will call the user program in
Flash-ROM directly and will not show
the message.
Maybe the monitor-kernel has been
☛
destroyed. Try to re-program the kernel
as desribed in the „flash programming“-
section.
Check all jumper positions (table 1).
☛
Adjust the LCD contrast using
☛
potentiometer RV1.
The communication from
Softune Workbench to the
Make sure your COM-port number
☛
and the baudrate settings are correct
© Fujitsu Microelectronics Europe GmbH - 41 - UG-910006-13
Page 42

STARTERKIT MB91360
Chapter 7 Appendix
Problem Solution
evaluation board fails
(Communication errors)
(see debugger introduction).
Make sure no other programs are
☛
using the same COM-port on your PC.
Close all other applications (e.g. Flash
programmer utilities, terminals etc.)
Use the provided RS232-cable (1:1
☛
extension type) to connect from your PC
to the „Monitor COM“ connector.
If you are using a PC without a fast
☛
UART (16550 type), you have to switch
to a lower baudrate (e.g. 38400 Baud)
and re-program the kernel according to
this baudrate (see „flash programming“
section).
The program stops at the label
„uninitialized interrupt !“
Before downloading a new project to
☛
the evaluation board, re-initialize using
the Monitor-Reset. This will erase all
valid interrupt definitions from previous
programs executed on the starterkit.
Make sure you haven’t enabled any
☛
interrupts that have no interrupt handler
(see the INTVECT.INC file) !
Note : Since the „Abort“-function uses
the external interrupt 0, interrupts are
usually enabled !
Hardware units such as LEDs,
user buttons, UART0 or CAN are
not working.
Make sure you have enabled these
☛
units on the evaluation board using the
appropriate jumpers (e.g. JP13 for
LEDs). See the provided examples and
the hardware manual for information on
how to control the peripherals.
CAN devices do not respond
Adjust the potentiometer RV2 (slew
☛
rate) according to the line.
Table 5: Trouble Shooting
For more information see the Softune Workbench on-line help, the provided manuals, last
minute information and additional or updated documentation on our web-site.
UG-910006-13 - 42 - © Fujitsu Microelectronics Europe GmbH
Page 43

7.10 Figures
STARTERKIT MB91360
Chapter 7 Appendix
Figure 1: Using the Starterkit as target board for the ICE....................................................... 7
Figure 2: Softune Workbench Editor .................................................................................... 11
Figure 3: SWB Debugging window....................................................................................... 14
Figure 4: MB91360 Flash Programmer ................................................................................ 20
Figure 5: Memory Mapping Single Chip Mode / Monitor Mode............................................. 29
Figure 6: Memory Mapping External Mode / User Mode ...................................................... 30
7.11 Tables
Table 1: Selection jumpers on MB91360 Starterkit...............................................................23
Table 2: Grouped jumpers on MB91360 Starterkit ............................................................... 24
Table 3: Overview of available resource-functions and IO-ports on jumpers ........................ 28
Table 4: Memory Map .......................................................................................................... 31
Table 5: Trouble Shooting....................................................................................................42
-- END --
© Fujitsu Microelectronics Europe GmbH - 43 - UG-910006-13
 Loading...