

Page 1

Microcontrollers
Debugger Manual
Revised: 22 October 2007
Page 2
Freescale™ and the Freescale logo are trademarks of Freescale Semiconductor, Inc. CodeWarrior is a trademark or registered trademark of Freescale Semiconductor, Inc. in the United States and/or other countries. All other product or service names are the property of their respective owners.
Copyright © 1989–2007 by Freescale Semiconductor, Inc. All rights reserved.
Information in this document is provided solely to enable system and software implementers to use Freescale Semiconductor products. There are no express or implied copyright licenses granted hereunder to design or fabricate any integrated circuits or integrated circuits based on the information in this document.
Freescale Semiconductor reserves the right to make changes without further notice to any products herein. Freescale
Semiconductor makes no warranty, representation or guarantee regarding the suitability of its products for any particular purpose, nor does Freescale Semiconductor assume any liability arising out of the application or use of any product
or circuit, and specifically disclaims any and all liability, including without limitation consequential or incidental damages. “Typical” parameters that may be provided in Freescale Semiconductor data sheets and/or specifications can and
do vary in different applications and actual performance may vary over time. All operating parameters, including “Typicals”, must be validated for each customer application by customer's technical experts. Freescale Semiconductor does
not convey any license under its patent rights nor the rights of others. Freescale Semiconductor products are not designed, intended, or authorized for use as components in systems intended for surgical implant into the body, or other
applications intended to support or sustain life, or for any other application in which the failure of the Freescale Semiconductor product could create a situation where personal injury or death may occur. Should Buyer purchase or use
Freescale Semiconductor products for any such unintended or unauthorized application, Buyer shall indemnify and hold
Freescale Semiconductor and its officers, employees, subsidiaries, affiliates, and distributors harmless against all
claims, costs, damages, and expenses, and reasonable attorney fees arising out of, directly or indirectly, any claim of
personal injury or death associated with such unintended or unauthorized use, even if such claim alleges that Freescale
Semiconductor was negligent regarding the design or manufacture of the part.
How to Contact Us
Corporate Headquarters Freescale Semiconductor, Inc.
7700 West Parmer Lane
Austin, TX 78729
U.S.A.
World Wide Web
Technical Support
http://www.freescale.com/codewarrior
http://www.freescale.com/support
Page 3

Table of Contents
Introduction
Manual Contents. . . . . . . . . . . . . . . . . . . . . . . . . . . . . . . . . . . . . . . . . . . . . . . . . 21
Book I - Debugger Engine
Book I Contents . . . . . . . . . . . . . . . . . . . . . . . . . . . . . . . . . . . . . . . . . . . . . . . . . 23
1 Introduction 25
Freescale Debugger. . . . . . . . . . . . . . . . . . . . . . . . . . . . . . . . . . . . . . . . . . . . . . . 25
Debugger Application. . . . . . . . . . . . . . . . . . . . . . . . . . . . . . . . . . . . . . . . . . . . . 25
Debugger Features . . . . . . . . . . . . . . . . . . . . . . . . . . . . . . . . . . . . . . . . . . . . . . . 26
Demo Version Limitations on Components . . . . . . . . . . . . . . . . . . . . . . . . .26
2 Debugger Interface 27
Introduction. . . . . . . . . . . . . . . . . . . . . . . . . . . . . . . . . . . . . . . . . . . . . . . . . . . . . 27
Application Programs . . . . . . . . . . . . . . . . . . . . . . . . . . . . . . . . . . . . . . . . . . . . . 27
Starting the Debugger . . . . . . . . . . . . . . . . . . . . . . . . . . . . . . . . . . . . . . . . . . . . . 28
Starting from within the IDE. . . . . . . . . . . . . . . . . . . . . . . . . . . . . . . . . . . . . 28
Debugger Command Line Start. . . . . . . . . . . . . . . . . . . . . . . . . . . . . . . . . . . 29
Debugger Main Window. . . . . . . . . . . . . . . . . . . . . . . . . . . . . . . . . . . . . . . . . . . 32
Debugger Main Window Toolbar . . . . . . . . . . . . . . . . . . . . . . . . . . . . . . . . . 33
Debugger Main Window Status Bar . . . . . . . . . . . . . . . . . . . . . . . . . . . . . . . 33
Main Window Menu Bar. . . . . . . . . . . . . . . . . . . . . . . . . . . . . . . . . . . . . . . . 33
Component Menu . . . . . . . . . . . . . . . . . . . . . . . . . . . . . . . . . . . . . . . . . . . . . 47
Window Menu. . . . . . . . . . . . . . . . . . . . . . . . . . . . . . . . . . . . . . . . . . . . . . . . 50
Help Menu. . . . . . . . . . . . . . . . . . . . . . . . . . . . . . . . . . . . . . . . . . . . . . . . . . . 51
Component Associated Menus . . . . . . . . . . . . . . . . . . . . . . . . . . . . . . . . . . . . . . 52
Component Main Menu . . . . . . . . . . . . . . . . . . . . . . . . . . . . . . . . . . . . . . . . 52
Microcontrollers Debugger Manual
3
Page 4

Table of Contents
Component Windows Object Info Bar . . . . . . . . . . . . . . . . . . . . . . . . . . . . .53
Component Context Menu. . . . . . . . . . . . . . . . . . . . . . . . . . . . . . . . . . . . . . .53
Highlights of the User Interface . . . . . . . . . . . . . . . . . . . . . . . . . . . . . . . . . . . . .54
Activating Services with Drag and Drop. . . . . . . . . . . . . . . . . . . . . . . . . . . .54
To Drag and Drop an Object . . . . . . . . . . . . . . . . . . . . . . . . . . . . . . . . . . . . .55
Drag and Drop Combinations . . . . . . . . . . . . . . . . . . . . . . . . . . . . . . . . . . . .55
3 Debugger Components 61
Component Introduction . . . . . . . . . . . . . . . . . . . . . . . . . . . . . . . . . . . . . . . . . . .61
CPU Components . . . . . . . . . . . . . . . . . . . . . . . . . . . . . . . . . . . . . . . . . . . . .61
Window Components. . . . . . . . . . . . . . . . . . . . . . . . . . . . . . . . . . . . . . . . . . .61
Connection Components . . . . . . . . . . . . . . . . . . . . . . . . . . . . . . . . . . . . . . . .62
Loading Component Windows . . . . . . . . . . . . . . . . . . . . . . . . . . . . . . . . . . .62
General Debugger Components . . . . . . . . . . . . . . . . . . . . . . . . . . . . . . . . . . . . .64
Assembly Component . . . . . . . . . . . . . . . . . . . . . . . . . . . . . . . . . . . . . . . . . .64
Command Line Component. . . . . . . . . . . . . . . . . . . . . . . . . . . . . . . . . . . . . .69
Coverage Component . . . . . . . . . . . . . . . . . . . . . . . . . . . . . . . . . . . . . . . . . .73
DA-C Link Component . . . . . . . . . . . . . . . . . . . . . . . . . . . . . . . . . . . . . . . . .76
Data Component . . . . . . . . . . . . . . . . . . . . . . . . . . . . . . . . . . . . . . . . . . . . . .79
Memory Component . . . . . . . . . . . . . . . . . . . . . . . . . . . . . . . . . . . . . . . . . . .90
Module Component . . . . . . . . . . . . . . . . . . . . . . . . . . . . . . . . . . . . . . . . . . .102
Procedure Component . . . . . . . . . . . . . . . . . . . . . . . . . . . . . . . . . . . . . . . . .104
Profiler Component . . . . . . . . . . . . . . . . . . . . . . . . . . . . . . . . . . . . . . . . . . .106
Recorder Component. . . . . . . . . . . . . . . . . . . . . . . . . . . . . . . . . . . . . . . . . .109
Register Component . . . . . . . . . . . . . . . . . . . . . . . . . . . . . . . . . . . . . . . . . .111
Source Component . . . . . . . . . . . . . . . . . . . . . . . . . . . . . . . . . . . . . . . . . . .115
Terminal Component . . . . . . . . . . . . . . . . . . . . . . . . . . . . . . . . . . . . . . . . . .125
Trace Component. . . . . . . . . . . . . . . . . . . . . . . . . . . . . . . . . . . . . . . . . . . . .130
Visualization Utilities . . . . . . . . . . . . . . . . . . . . . . . . . . . . . . . . . . . . . . . . . . . .133
Inspector Component. . . . . . . . . . . . . . . . . . . . . . . . . . . . . . . . . . . . . . . . . .133
Visualization Tool Component . . . . . . . . . . . . . . . . . . . . . . . . . . . . . . . . . .141
4 Control Points 157
Introduction . . . . . . . . . . . . . . . . . . . . . . . . . . . . . . . . . . . . . . . . . . . . . . . . . . . .157
Breakpoints . . . . . . . . . . . . . . . . . . . . . . . . . . . . . . . . . . . . . . . . . . . . . . . . . . . .158
4
Microcontrollers Debugger Manual
Page 5

Table of Contents
Breakpoints Tab. . . . . . . . . . . . . . . . . . . . . . . . . . . . . . . . . . . . . . . . . . . . . .160
Multiple Selections in List Box. . . . . . . . . . . . . . . . . . . . . . . . . . . . . . . . . .161
Checking Expressions . . . . . . . . . . . . . . . . . . . . . . . . . . . . . . . . . . . . . . . . . 161
Saving Breakpoints . . . . . . . . . . . . . . . . . . . . . . . . . . . . . . . . . . . . . . . . . . . 162
Setting Breakpoints. . . . . . . . . . . . . . . . . . . . . . . . . . . . . . . . . . . . . . . . . . . . . . 164
Positions Where a Breakpoint Is Definable . . . . . . . . . . . . . . . . . . . . . . . .164
Temporary Breakpoints. . . . . . . . . . . . . . . . . . . . . . . . . . . . . . . . . . . . . . . . 165
Permanent Breakpoints . . . . . . . . . . . . . . . . . . . . . . . . . . . . . . . . . . . . . . . .165
Counting Breakpoints . . . . . . . . . . . . . . . . . . . . . . . . . . . . . . . . . . . . . . . . . 166
Conditional Breakpoints . . . . . . . . . . . . . . . . . . . . . . . . . . . . . . . . . . . . . . . 167
Deleting Breakpoints. . . . . . . . . . . . . . . . . . . . . . . . . . . . . . . . . . . . . . . . . .168
Associate a Command with a Breakpoint . . . . . . . . . . . . . . . . . . . . . . . . . .169
Watchpoints. . . . . . . . . . . . . . . . . . . . . . . . . . . . . . . . . . . . . . . . . . . . . . . . . . . . 170
Watchpoints Tab . . . . . . . . . . . . . . . . . . . . . . . . . . . . . . . . . . . . . . . . . . . . .172
Multiple Selections . . . . . . . . . . . . . . . . . . . . . . . . . . . . . . . . . . . . . . . . . . . 173
Checking Syntax . . . . . . . . . . . . . . . . . . . . . . . . . . . . . . . . . . . . . . . . . . . . . 173
Setting Watchpoints . . . . . . . . . . . . . . . . . . . . . . . . . . . . . . . . . . . . . . . . . . . . .174
Setting a Read Watchpoint . . . . . . . . . . . . . . . . . . . . . . . . . . . . . . . . . . . . .174
Setting a Write Watchpoint . . . . . . . . . . . . . . . . . . . . . . . . . . . . . . . . . . . . . 175
Defining a Read/Write Watchpoint. . . . . . . . . . . . . . . . . . . . . . . . . . . . . . . 175
Defining a Counting Watchpoint. . . . . . . . . . . . . . . . . . . . . . . . . . . . . . . . . 176
Defining a Conditional Watchpoint. . . . . . . . . . . . . . . . . . . . . . . . . . . . . . . 177
Deleting a Watchpoint. . . . . . . . . . . . . . . . . . . . . . . . . . . . . . . . . . . . . . . . .178
Associate a Command with a Watchpoint. . . . . . . . . . . . . . . . . . . . . . . . . . 178
Markpoints . . . . . . . . . . . . . . . . . . . . . . . . . . . . . . . . . . . . . . . . . . . . . . . . . . . .179
Markpoints Tab . . . . . . . . . . . . . . . . . . . . . . . . . . . . . . . . . . . . . . . . . . . . . . 181
Setting Markpoints . . . . . . . . . . . . . . . . . . . . . . . . . . . . . . . . . . . . . . . . . . . . . . 182
Setting a Source Markpoint . . . . . . . . . . . . . . . . . . . . . . . . . . . . . . . . . . . . 182
Setting a Data Markpoint . . . . . . . . . . . . . . . . . . . . . . . . . . . . . . . . . . . . . . 183
Setting a Memory Markpoint . . . . . . . . . . . . . . . . . . . . . . . . . . . . . . . . . . . 183
Deleting a Markpoint . . . . . . . . . . . . . . . . . . . . . . . . . . . . . . . . . . . . . . . . . 184
Halting on a Control Point . . . . . . . . . . . . . . . . . . . . . . . . . . . . . . . . . . . . . . . . 184
5 Real Time Kernel Awareness 185
Introduction. . . . . . . . . . . . . . . . . . . . . . . . . . . . . . . . . . . . . . . . . . . . . . . . . . . . 185
Microcontrollers Debugger Manual
5
Page 6

Table of Contents
Inspecting Task State . . . . . . . . . . . . . . . . . . . . . . . . . . . . . . . . . . . . . . . . . .186
Task Description Language. . . . . . . . . . . . . . . . . . . . . . . . . . . . . . . . . . . . . . . .186
Application Example. . . . . . . . . . . . . . . . . . . . . . . . . . . . . . . . . . . . . . . . . . . . .188
Inspecting Kernel Data Structures. . . . . . . . . . . . . . . . . . . . . . . . . . . . . . . . . . .189
OSEK Kernel Awareness. . . . . . . . . . . . . . . . . . . . . . . . . . . . . . . . . . . . . . . . . .190
OSEK Run Time Interface. . . . . . . . . . . . . . . . . . . . . . . . . . . . . . . . . . . . . .191
ORTI File and Filename . . . . . . . . . . . . . . . . . . . . . . . . . . . . . . . . . . . . . . .191
OSEK RTK Inspector Component. . . . . . . . . . . . . . . . . . . . . . . . . . . . . . . .193
6 How To... 199
How To Configure the Debugger . . . . . . . . . . . . . . . . . . . . . . . . . . . . . . . . . . .199
For Use from Desktop . . . . . . . . . . . . . . . . . . . . . . . . . . . . . . . . . . . . . . . . .199
Starting Debugger from CodeWarrior IDE . . . . . . . . . . . . . . . . . . . . . . . . . . . .200
Automating Debugger Startup. . . . . . . . . . . . . . . . . . . . . . . . . . . . . . . . . . . . . .201
How To Load an Application . . . . . . . . . . . . . . . . . . . . . . . . . . . . . . . . . . . . . .202
How to Start an Application . . . . . . . . . . . . . . . . . . . . . . . . . . . . . . . . . . . . . . .202
How to Stop an Application . . . . . . . . . . . . . . . . . . . . . . . . . . . . . . . . . . . . . . .203
How to Step in the Application. . . . . . . . . . . . . . . . . . . . . . . . . . . . . . . . . . . . .203
On Source Level . . . . . . . . . . . . . . . . . . . . . . . . . . . . . . . . . . . . . . . . . . . . .203
Step Over a Function Call (Flat Step) . . . . . . . . . . . . . . . . . . . . . . . . . . . . .204
Step on Assembly Level . . . . . . . . . . . . . . . . . . . . . . . . . . . . . . . . . . . . . . .205
How to Work on Variables . . . . . . . . . . . . . . . . . . . . . . . . . . . . . . . . . . . . . . . .205
Display Local Variable from a Function . . . . . . . . . . . . . . . . . . . . . . . . . . .205
Display Global Variable from a Module . . . . . . . . . . . . . . . . . . . . . . . . . . .206
Change Format for Variable Value Display . . . . . . . . . . . . . . . . . . . . . . . . .207
Modify a Variable Value . . . . . . . . . . . . . . . . . . . . . . . . . . . . . . . . . . . . . . .208
Get the Address Where a Variable is Allocated. . . . . . . . . . . . . . . . . . . . . .208
Inspect Memory Starting at a Variable Location Address. . . . . . . . . . . . . .209
Load an Address Register with the Address of a Variable . . . . . . . . . . . . .209
How to Work on the Register . . . . . . . . . . . . . . . . . . . . . . . . . . . . . . . . . . . . . .209
Change Format of Register Display. . . . . . . . . . . . . . . . . . . . . . . . . . . . . . .209
Modify a Register Content. . . . . . . . . . . . . . . . . . . . . . . . . . . . . . . . . . . . . .210
Start Memory Dump at Address Where Register is Pointing . . . . . . . . . . .211
Modify Content of Memory Address . . . . . . . . . . . . . . . . . . . . . . . . . . . . . . . .212
How to Consult Assembler Instructions Generated by a Source Statement . . .212
6
Microcontrollers Debugger Manual
Page 7

Table of Contents
How to View Code . . . . . . . . . . . . . . . . . . . . . . . . . . . . . . . . . . . . . . . . . . . . . . 213
How to Communicate with the Application . . . . . . . . . . . . . . . . . . . . . . . . . . . 214
7 CodeWarrior IDE Integration 215
Debugger Configuration . . . . . . . . . . . . . . . . . . . . . . . . . . . . . . . . . . . . . . . . . .215
8 Debugger DDE Capabilities 217
Introduction . . . . . . . . . . . . . . . . . . . . . . . . . . . . . . . . . . . . . . . . . . . . . . . . . 217
DDE Implementation . . . . . . . . . . . . . . . . . . . . . . . . . . . . . . . . . . . . . . . . . 217
9 Synchronized Debugging Through DA-C IDE 219
Configuring DA-C IDE for Freescale Tool Kit. . . . . . . . . . . . . . . . . . . . . . . . . 219
Create New Project . . . . . . . . . . . . . . . . . . . . . . . . . . . . . . . . . . . . . . . . . . . 220
Configuring The Tools . . . . . . . . . . . . . . . . . . . . . . . . . . . . . . . . . . . . . . . . 226
Debugger Interface . . . . . . . . . . . . . . . . . . . . . . . . . . . . . . . . . . . . . . . . . . . . . . 230
DA-C IDE and Debugger Communication . . . . . . . . . . . . . . . . . . . . . . . . . 230
Synchronized Debugging . . . . . . . . . . . . . . . . . . . . . . . . . . . . . . . . . . . . . . . . . 233
Troubleshooting . . . . . . . . . . . . . . . . . . . . . . . . . . . . . . . . . . . . . . . . . . . . . . . .234
Book II - HC08 Debug Connections
Book II Contents. . . . . . . . . . . . . . . . . . . . . . . . . . . . . . . . . . . . . . . . . . . . . . . .237
10 Microcontroller Debugging First Steps 239
Technical Considerations . . . . . . . . . . . . . . . . . . . . . . . . . . . . . . . . . . . . . . . . .239
Full Chip Simulation Considerations . . . . . . . . . . . . . . . . . . . . . . . . . . . . .239
HC08 Serial Monitor Considerations . . . . . . . . . . . . . . . . . . . . . . . . . . . . . 240
ICS MON08 Interface Connection . . . . . . . . . . . . . . . . . . . . . . . . . . . . . . .240
P&E Multilink/Cyclone Pro Considerations. . . . . . . . . . . . . . . . . . . . . . . . 240
ICS P&E Multilink/Cyclone Pro Considerations . . . . . . . . . . . . . . . . . . . . 240
SofTec HC08 Considerations . . . . . . . . . . . . . . . . . . . . . . . . . . . . . . . . . . . 240
Debugging First Steps Using the Wizard . . . . . . . . . . . . . . . . . . . . . . . . . . . . . 241
Switching Connections . . . . . . . . . . . . . . . . . . . . . . . . . . . . . . . . . . . . . . . . . . . 246
Microcontrollers Debugger Manual
7
Page 8

Table of Contents
Loading the Full Chip Simulation Connection . . . . . . . . . . . . . . . . . . . . . .246
Loading the P&E Multilink/Cyclone Pro Connection. . . . . . . . . . . . . . . . .248
Loading the HC(S)08 or RS08 Open Source BDM Connection. . . . . . . . .251
11 HC08 Full Chip Simulation 253
Configuration Procedure . . . . . . . . . . . . . . . . . . . . . . . . . . . . . . . . . . . . . . . . . .253
Select Device Option . . . . . . . . . . . . . . . . . . . . . . . . . . . . . . . . . . . . . . . . . .255
Full Chip Simulation Module Commands. . . . . . . . . . . . . . . . . . . . . . . . . .255
Peripheral Modules Options . . . . . . . . . . . . . . . . . . . . . . . . . . . . . . . . . . . .257
ADC Module Option . . . . . . . . . . . . . . . . . . . . . . . . . . . . . . . . . . . . . . . . . .258
Clock Generation Module Option . . . . . . . . . . . . . . . . . . . . . . . . . . . . . . . .260
High-Resolution PWM Module. . . . . . . . . . . . . . . . . . . . . . . . . . . . . . . . . .262
Input/Output (I/O) Ports Module. . . . . . . . . . . . . . . . . . . . . . . . . . . . . . . . .265
External Interrupt Module . . . . . . . . . . . . . . . . . . . . . . . . . . . . . . . . . . . . . .268
Keyboard Interrupt Module . . . . . . . . . . . . . . . . . . . . . . . . . . . . . . . . . . . . .269
Multi-Master Inter-Integrated Circuit Module . . . . . . . . . . . . . . . . . . . . . .272
FCSMSCAN Controller Module . . . . . . . . . . . . . . . . . . . . . . . . . . . . . . . . .276
FCS Programmable Timer Interrupt Module. . . . . . . . . . . . . . . . . . . . . . . .291
FCS Serial Communications Interface Module. . . . . . . . . . . . . . . . . . . . . .292
FCS Slave LIN Interface Controller Module. . . . . . . . . . . . . . . . . . . . . . . .296
FCS Serial Peripheral Interface Module . . . . . . . . . . . . . . . . . . . . . . . . . . .300
FCSTimer Interface Module . . . . . . . . . . . . . . . . . . . . . . . . . . . . . . . . . . . .304
FCS Universal Serial Bus (USB) Module . . . . . . . . . . . . . . . . . . . . . . . . . .309
12 MON08 Interface Connection 333
Connection Procedure . . . . . . . . . . . . . . . . . . . . . . . . . . . . . . . . . . . . . . . . . . . .333
Advanced Settings Tab . . . . . . . . . . . . . . . . . . . . . . . . . . . . . . . . . . . . . . . .335
Target MCU Security Bytes. . . . . . . . . . . . . . . . . . . . . . . . . . . . . . . . . . . . .338
Active Mode Connection Menu Options. . . . . . . . . . . . . . . . . . . . . . . . . . .342
Device Class Description . . . . . . . . . . . . . . . . . . . . . . . . . . . . . . . . . . . . . . . . .346
13 ICS MON08 Interface Connection 349
ICS Mode . . . . . . . . . . . . . . . . . . . . . . . . . . . . . . . . . . . . . . . . . . . . . . . . . . . . .349
Connection Procedure . . . . . . . . . . . . . . . . . . . . . . . . . . . . . . . . . . . . . . . . . . . .350
Advanced Settings Tab . . . . . . . . . . . . . . . . . . . . . . . . . . . . . . . . . . . . . . . .352
8
Microcontrollers Debugger Manual
Page 9

Table of Contents
Cycle Power Radio Button . . . . . . . . . . . . . . . . . . . . . . . . . . . . . . . . . . . . . 354
Target MCU Security Bytes . . . . . . . . . . . . . . . . . . . . . . . . . . . . . . . . . . . . 355
STATUS Area . . . . . . . . . . . . . . . . . . . . . . . . . . . . . . . . . . . . . . . . . . . . . . . 355
Active Mode Connection Menu Options. . . . . . . . . . . . . . . . . . . . . . . . . . . 358
Device Class Description . . . . . . . . . . . . . . . . . . . . . . . . . . . . . . . . . . . . . . . . . 361
14 HC08 P&E Multilink/Cyclone Pro Connection 365
Connection Procedure. . . . . . . . . . . . . . . . . . . . . . . . . . . . . . . . . . . . . . . . . . . .365
Advanced Settings Tab . . . . . . . . . . . . . . . . . . . . . . . . . . . . . . . . . . . . . . . .368
Target MCU Security Bytes . . . . . . . . . . . . . . . . . . . . . . . . . . . . . . . . . . . . 371
STATUS Area . . . . . . . . . . . . . . . . . . . . . . . . . . . . . . . . . . . . . . . . . . . . . . . 372
Connection (MultilinkCyclonePro) Menu . . . . . . . . . . . . . . . . . . . . . . . . . 374
Active Mode Menu Options . . . . . . . . . . . . . . . . . . . . . . . . . . . . . . . . . . . . 375
Debugging Limitations . . . . . . . . . . . . . . . . . . . . . . . . . . . . . . . . . . . . . . . . 379
Debugging Tips . . . . . . . . . . . . . . . . . . . . . . . . . . . . . . . . . . . . . . . . . . . . . . 379
Device Class Description . . . . . . . . . . . . . . . . . . . . . . . . . . . . . . . . . . . . . . . . . 380
Class 5 Device. . . . . . . . . . . . . . . . . . . . . . . . . . . . . . . . . . . . . . . . . . . . . . . 380
Class 7 Device. . . . . . . . . . . . . . . . . . . . . . . . . . . . . . . . . . . . . . . . . . . . . . . 380
Class 8 Device. . . . . . . . . . . . . . . . . . . . . . . . . . . . . . . . . . . . . . . . . . . . . . . 380
15 HC08 ICS P&E Multilink/Cyclone Pro Connections 381
Connection Procedure. . . . . . . . . . . . . . . . . . . . . . . . . . . . . . . . . . . . . . . . . . . .382
Advanced Settings Tab . . . . . . . . . . . . . . . . . . . . . . . . . . . . . . . . . . . . . . . .384
Target MCU Security Bytes . . . . . . . . . . . . . . . . . . . . . . . . . . . . . . . . . . . . 387
STATUS Area . . . . . . . . . . . . . . . . . . . . . . . . . . . . . . . . . . . . . . . . . . . . . . . 387
Active Mode Menu Options . . . . . . . . . . . . . . . . . . . . . . . . . . . . . . . . . . . . 390
Device Class Description . . . . . . . . . . . . . . . . . . . . . . . . . . . . . . . . . . . . . . . . . 393
Class 5 Device. . . . . . . . . . . . . . . . . . . . . . . . . . . . . . . . . . . . . . . . . . . . . . . 393
Class 7 Device. . . . . . . . . . . . . . . . . . . . . . . . . . . . . . . . . . . . . . . . . . . . . . . 393
Class 8 Device. . . . . . . . . . . . . . . . . . . . . . . . . . . . . . . . . . . . . . . . . . . . . . . 394
16 SofTec HC08 Connection 395
SofTec HC08 Technical Considerations . . . . . . . . . . . . . . . . . . . . . . . . . . . . . . 395
CodeWarrior IDE and SofTec HC08 Connection . . . . . . . . . . . . . . . . . . . . . . .395
Using the Stationery Wizard. . . . . . . . . . . . . . . . . . . . . . . . . . . . . . . . . . . . . . . 396
Microcontrollers Debugger Manual
9
Page 10

Table of Contents
From Within an Existing Project. . . . . . . . . . . . . . . . . . . . . . . . . . . . . . . . . . . .397
inDart-HC08 Menu Options . . . . . . . . . . . . . . . . . . . . . . . . . . . . . . . . . . . .398
MCU Configuration Dialog Box . . . . . . . . . . . . . . . . . . . . . . . . . . . . . . . . .399
Communication Settings Dialog Box . . . . . . . . . . . . . . . . . . . . . . . . . . . . .399
About Dialog Box . . . . . . . . . . . . . . . . . . . . . . . . . . . . . . . . . . . . . . . . . . . .400
17 HC08 FSICEBASE Emulator 401
FSICEBASE Overview . . . . . . . . . . . . . . . . . . . . . . . . . . . . . . . . . . . . . . . . . . .401
System Requirements . . . . . . . . . . . . . . . . . . . . . . . . . . . . . . . . . . . . . . . . .402
System Features. . . . . . . . . . . . . . . . . . . . . . . . . . . . . . . . . . . . . . . . . . . . . .402
System Components . . . . . . . . . . . . . . . . . . . . . . . . . . . . . . . . . . . . . . . . . .403
Setting Up the FSICEBASE System. . . . . . . . . . . . . . . . . . . . . . . . . . . . . . . . .405
Setting Up the Hardware . . . . . . . . . . . . . . . . . . . . . . . . . . . . . . . . . . . . . . .405
Establishing Communication . . . . . . . . . . . . . . . . . . . . . . . . . . . . . . . . . . . . . .407
Communication Through Ethernet Port . . . . . . . . . . . . . . . . . . . . . . . . . . .407
Communication Through USB Port . . . . . . . . . . . . . . . . . . . . . . . . . . . . . .408
Setting Up the System. . . . . . . . . . . . . . . . . . . . . . . . . . . . . . . . . . . . . . . . . . . .409
Specifying A Connection. . . . . . . . . . . . . . . . . . . . . . . . . . . . . . . . . . . . . . .409
Specifying Communication Information. . . . . . . . . . . . . . . . . . . . . . . . . . .410
Assigning an IP Address to FSICEBASE . . . . . . . . . . . . . . . . . . . . . . . . . .412
Specifying a Memory Map . . . . . . . . . . . . . . . . . . . . . . . . . . . . . . . . . . . . . . . .414
Specifying the Clock Speed. . . . . . . . . . . . . . . . . . . . . . . . . . . . . . . . . . . . .417
Emulation System Reset . . . . . . . . . . . . . . . . . . . . . . . . . . . . . . . . . . . . . . .419
Setting Up Logic Cables and Connectors . . . . . . . . . . . . . . . . . . . . . . . . . . . . .419
Bus State Analyzer (BSA). . . . . . . . . . . . . . . . . . . . . . . . . . . . . . . . . . . . . . . . .421
Using BSA. . . . . . . . . . . . . . . . . . . . . . . . . . . . . . . . . . . . . . . . . . . . . . . . . .421
Book III - HCS08 Debug Connections
Book III Contents . . . . . . . . . . . . . . . . . . . . . . . . . . . . . . . . . . . . . . . . . . . . . . .429
18 HCS08 Full Chip Simulation 431
Configuration Procedure . . . . . . . . . . . . . . . . . . . . . . . . . . . . . . . . . . . . . . . . . .431
10
Microcontrollers Debugger Manual
Page 11

Table of Contents
Connection (HCS08FCS) Menu . . . . . . . . . . . . . . . . . . . . . . . . . . . . . . . . . 432
Peripheral Modules Commands . . . . . . . . . . . . . . . . . . . . . . . . . . . . . . . . . . . . 435
ADC Module. . . . . . . . . . . . . . . . . . . . . . . . . . . . . . . . . . . . . . . . . . . . . . . .436
Clock Generation Module . . . . . . . . . . . . . . . . . . . . . . . . . . . . . . . . . . . . . . 438
Inter-Integrated Circuit Module . . . . . . . . . . . . . . . . . . . . . . . . . . . . . . . . . 440
Input/Output (I/O) Ports Module. . . . . . . . . . . . . . . . . . . . . . . . . . . . . . . . . 444
External Interrupt (IRQ) Module . . . . . . . . . . . . . . . . . . . . . . . . . . . . . . . . 447
Keyboard Interrupt Module. . . . . . . . . . . . . . . . . . . . . . . . . . . . . . . . . . . . . 450
Modulo Timer Interrupt Module . . . . . . . . . . . . . . . . . . . . . . . . . . . . . . . . . 452
Serial Communications Interface Module. . . . . . . . . . . . . . . . . . . . . . . . . .453
Serial Peripheral Interface Module . . . . . . . . . . . . . . . . . . . . . . . . . . . . . . . 457
Timer Interface Module. . . . . . . . . . . . . . . . . . . . . . . . . . . . . . . . . . . . . . . .461
19 HCS08 P&E Multilink/Cyclone Pro Connection 467
Connection Procedure. . . . . . . . . . . . . . . . . . . . . . . . . . . . . . . . . . . . . . . . . . . .467
MultilinkCyclonePro Menu Description. . . . . . . . . . . . . . . . . . . . . . . . . . .470
Active Mode Menu Options . . . . . . . . . . . . . . . . . . . . . . . . . . . . . . . . . . . . 471
20 HCS08 Open Source BDM Connection 477
HCS08 Open Source BDM Technical Considerations . . . . . . . . . . . . . . . . . . . 477
CodeWarrior IDE and HCS08 Open Source BDM Connection . . . . . . . . . . . . 477
First Steps Using the Stationery Wizard. . . . . . . . . . . . . . . . . . . . . . . . . . . . . . 478
First Steps From Within an Existing Project . . . . . . . . . . . . . . . . . . . . . . . . . . 479
HCS08 Open Source BDM Menu Options . . . . . . . . . . . . . . . . . . . . . . . . . 480
HCS08 Open Source BDM Setup Dialog Box . . . . . . . . . . . . . . . . . . . . . .482
Select Derivative Dialog Box . . . . . . . . . . . . . . . . . . . . . . . . . . . . . . . . . . . 483
Information Required to Unsecure the Device . . . . . . . . . . . . . . . . . . . . . . 484
Show Status Dialog Box . . . . . . . . . . . . . . . . . . . . . . . . . . . . . . . . . . . . . . .485
21 HCS08 Serial Monitor Connection 487
Serial Monitor Technical Considerations . . . . . . . . . . . . . . . . . . . . . . . . . . . . . 487
CodeWarrior IDE and Serial Monitor Connection . . . . . . . . . . . . . . . . . . . . . .487
First Steps Using the Stationery Wizard. . . . . . . . . . . . . . . . . . . . . . . . . . . . . . 488
First Steps from Within an Existing Project . . . . . . . . . . . . . . . . . . . . . . . . . . . 489
MONITOR-HCS08 Menu Options. . . . . . . . . . . . . . . . . . . . . . . . . . . . . . .492
Microcontrollers Debugger Manual
11
Page 12

Table of Contents
Monitor Setup Window . . . . . . . . . . . . . . . . . . . . . . . . . . . . . . . . . . . . . . . .493
Derivative Selection Dialog Box . . . . . . . . . . . . . . . . . . . . . . . . . . . . . . . . .495
22 SofTec HCS08 Connection 497
SofTec HCS08 Technical Considerations . . . . . . . . . . . . . . . . . . . . . . . . . . . . .497
CodeWarrior IDE and SofTec HCS08 Connection . . . . . . . . . . . . . . . . . . . . . .497
First Steps Using the Stationery Wizard . . . . . . . . . . . . . . . . . . . . . . . . . . . . . .498
First Steps from Within an Existing Project . . . . . . . . . . . . . . . . . . . . . . . . . . .499
SofTec HCS08 Menu Options . . . . . . . . . . . . . . . . . . . . . . . . . . . . . . . . . . .500
MCU Configuration Dialog Box . . . . . . . . . . . . . . . . . . . . . . . . . . . . . . . . .501
Communication Settings Dialog Box . . . . . . . . . . . . . . . . . . . . . . . . . . . . .501
About Dialog Box . . . . . . . . . . . . . . . . . . . . . . . . . . . . . . . . . . . . . . . . . . . .502
23 HCS08 On-Chip DBG Module 503
Reference Document. . . . . . . . . . . . . . . . . . . . . . . . . . . . . . . . . . . . . . . . . . . . .503
DBG Features . . . . . . . . . . . . . . . . . . . . . . . . . . . . . . . . . . . . . . . . . . . . . . . . . .503
Specific Connection Menu Options . . . . . . . . . . . . . . . . . . . . . . . . . . . . . . . . .504
Context Menu Entries in Source, Data, Assembly and Memory Windows . . .505
Source and Assembly Windows . . . . . . . . . . . . . . . . . . . . . . . . . . . . . . . . .505
Trigger Stored as Markpoints . . . . . . . . . . . . . . . . . . . . . . . . . . . . . . . . . . .508
Data and Memory Windows . . . . . . . . . . . . . . . . . . . . . . . . . . . . . . . . . . . .509
Expert Triggers . . . . . . . . . . . . . . . . . . . . . . . . . . . . . . . . . . . . . . . . . . . . . .512
Trigger Settings . . . . . . . . . . . . . . . . . . . . . . . . . . . . . . . . . . . . . . . . . . . . . .514
Trigger Module Usage. . . . . . . . . . . . . . . . . . . . . . . . . . . . . . . . . . . . . . . . .515
DBG Support Status Bar Item. . . . . . . . . . . . . . . . . . . . . . . . . . . . . . . . . . . . . .515
Trigger Module Settings Window . . . . . . . . . . . . . . . . . . . . . . . . . . . . . . . . . . .516
DBG Module Mode Setup. . . . . . . . . . . . . . . . . . . . . . . . . . . . . . . . . . . . . .517
Automatic Mode (Default) . . . . . . . . . . . . . . . . . . . . . . . . . . . . . . . . . . . . .517
Expert Mode . . . . . . . . . . . . . . . . . . . . . . . . . . . . . . . . . . . . . . . . . . . . . . . .518
Expert Mode Tab . . . . . . . . . . . . . . . . . . . . . . . . . . . . . . . . . . . . . . . . . . . . .519
Profiling and Coverage Mode . . . . . . . . . . . . . . . . . . . . . . . . . . . . . . . . . . .519
Disabled Mode. . . . . . . . . . . . . . . . . . . . . . . . . . . . . . . . . . . . . . . . . . . . . . .520
Memory Access Triggers. . . . . . . . . . . . . . . . . . . . . . . . . . . . . . . . . . . . . . .521
Instruction Triggers . . . . . . . . . . . . . . . . . . . . . . . . . . . . . . . . . . . . . . . . . . .523
Capture Triggers . . . . . . . . . . . . . . . . . . . . . . . . . . . . . . . . . . . . . . . . . . . . .526
12
Microcontrollers Debugger Manual
Page 13

Table of Contents
DBG Module Options . . . . . . . . . . . . . . . . . . . . . . . . . . . . . . . . . . . . . . . . . 527
Trigger Editing . . . . . . . . . . . . . . . . . . . . . . . . . . . . . . . . . . . . . . . . . . . . . . 529
Trigger Module Settings Window - Display Information . . . . . . . . . . . . . . 530
General Settings Tab . . . . . . . . . . . . . . . . . . . . . . . . . . . . . . . . . . . . . . . . . .531
Trace Component Window . . . . . . . . . . . . . . . . . . . . . . . . . . . . . . . . . . . . . . . .532
Instructions Display. . . . . . . . . . . . . . . . . . . . . . . . . . . . . . . . . . . . . . . . . . .533
Graphical Display . . . . . . . . . . . . . . . . . . . . . . . . . . . . . . . . . . . . . . . . . . . . 534
Textual Display . . . . . . . . . . . . . . . . . . . . . . . . . . . . . . . . . . . . . . . . . . . . . . 534
Column Display and Moving . . . . . . . . . . . . . . . . . . . . . . . . . . . . . . . . . . . 535
Goto Frame . . . . . . . . . . . . . . . . . . . . . . . . . . . . . . . . . . . . . . . . . . . . . . . . . 536
Clearing Frames . . . . . . . . . . . . . . . . . . . . . . . . . . . . . . . . . . . . . . . . . . . . . 536
Limitations . . . . . . . . . . . . . . . . . . . . . . . . . . . . . . . . . . . . . . . . . . . . . . . . . . . .538
HCS08 DBG V3 New Features . . . . . . . . . . . . . . . . . . . . . . . . . . . . . . . . . . . . 538
MMU and Extended Address Space . . . . . . . . . . . . . . . . . . . . . . . . . . . . . .538
LOOP1 mode. . . . . . . . . . . . . . . . . . . . . . . . . . . . . . . . . . . . . . . . . . . . . . . . 538
Ability to record until Reset and from Reset. . . . . . . . . . . . . . . . . . . . . . . . 539
Expert Triggers tab extended. . . . . . . . . . . . . . . . . . . . . . . . . . . . . . . . . . . . 543
Book IV - RS08 Debug Connections
Book IV Contents . . . . . . . . . . . . . . . . . . . . . . . . . . . . . . . . . . . . . . . . . . . . . . . 545
24 RS08 Full Chip Simulation 547
Configuration Procedure. . . . . . . . . . . . . . . . . . . . . . . . . . . . . . . . . . . . . . . . . .547
Connection (RS08FCS) Menu . . . . . . . . . . . . . . . . . . . . . . . . . . . . . . . . . .548
Peripheral Modules Commands . . . . . . . . . . . . . . . . . . . . . . . . . . . . . . . . . . . . 552
25 RS08 P&E Multilink/Cyclone Pro Connection 553
Connection Procedure. . . . . . . . . . . . . . . . . . . . . . . . . . . . . . . . . . . . . . . . . . . .553
MultilinkCyclonePro Menu Description. . . . . . . . . . . . . . . . . . . . . . . . . . .555
Active Mode Menu Options . . . . . . . . . . . . . . . . . . . . . . . . . . . . . . . . . . . . 556
Microcontrollers Debugger Manual
13
Page 14

Table of Contents
26 RS08 Open Source BDM Connection 561
RS08 Open Source BDM Technical Considerations. . . . . . . . . . . . . . . . . . . . .561
CodeWarrior IDE and RS08 Open Source BDM Connection . . . . . . . . . . . . .561
First Steps Using the Stationery Wizard . . . . . . . . . . . . . . . . . . . . . . . . . . . . . .562
First Steps From Within an Existing Project. . . . . . . . . . . . . . . . . . . . . . . . . . .563
RS08 Open Source BDM Menu Options . . . . . . . . . . . . . . . . . . . . . . . . . .564
RS08 Open Source BDM Setup Dialog Box. . . . . . . . . . . . . . . . . . . . . . . .565
Select Derivative Dialog Box . . . . . . . . . . . . . . . . . . . . . . . . . . . . . . . . . . .566
Show Status Dialog Box . . . . . . . . . . . . . . . . . . . . . . . . . . . . . . . . . . . . . . .566
27 SofTec RS08 Connection 567
SofTec RS08 Technical Considerations . . . . . . . . . . . . . . . . . . . . . . . . . . . . . .567
CodeWarrior IDE and SofTec RS08 Connection . . . . . . . . . . . . . . . . . . . . . . .567
First Steps Using the Stationery Wizard . . . . . . . . . . . . . . . . . . . . . . . . . . . . . .568
First Steps From Within an Existing Project. . . . . . . . . . . . . . . . . . . . . . . . . . .570
SofTec RS08 Menu Options . . . . . . . . . . . . . . . . . . . . . . . . . . . . . . . . . . . .571
MCU Configuration Dialog Box . . . . . . . . . . . . . . . . . . . . . . . . . . . . . . . . .572
Communication Settings Dialog Box . . . . . . . . . . . . . . . . . . . . . . . . . . . . .572
About Dialog Box . . . . . . . . . . . . . . . . . . . . . . . . . . . . . . . . . . . . . . . . . . . .573
Book V - ColdFire® V1.0 Debug
Connections
Book V Contents . . . . . . . . . . . . . . . . . . . . . . . . . . . . . . . . . . . . . . . . . . . . . . . .575
28 ColdFire V1 Full Chip Simulation Connection 577
Full Chip Simulation Menu . . . . . . . . . . . . . . . . . . . . . . . . . . . . . . . . . . . . .577
Memory Configuration . . . . . . . . . . . . . . . . . . . . . . . . . . . . . . . . . . . . . . . .580
Clock Frequency Setup . . . . . . . . . . . . . . . . . . . . . . . . . . . . . . . . . . . . . . . .586
Bus Trace. . . . . . . . . . . . . . . . . . . . . . . . . . . . . . . . . . . . . . . . . . . . . . . . . . .587
Full Chip Simulation Warnings . . . . . . . . . . . . . . . . . . . . . . . . . . . . . . . . . .588
FCS and Silicon On-Chip Peripherals Simulation . . . . . . . . . . . . . . . . . . . . . .592
14
Microcontrollers Debugger Manual
Page 15

Table of Contents
FCS Visualization Utilities . . . . . . . . . . . . . . . . . . . . . . . . . . . . . . . . . . . . . . . . 593
Analog Meter Component. . . . . . . . . . . . . . . . . . . . . . . . . . . . . . . . . . . . . . 594
IO_LED Component . . . . . . . . . . . . . . . . . . . . . . . . . . . . . . . . . . . . . . . . . .595
LED Component . . . . . . . . . . . . . . . . . . . . . . . . . . . . . . . . . . . . . . . . . . . . . 597
Phone Component . . . . . . . . . . . . . . . . . . . . . . . . . . . . . . . . . . . . . . . . . . . . 598
ADC/DAC Component . . . . . . . . . . . . . . . . . . . . . . . . . . . . . . . . . . . . . . . .600
Conversion Parameters Dialog Box . . . . . . . . . . . . . . . . . . . . . . . . . . . . . .603
IT_Keyboard Component . . . . . . . . . . . . . . . . . . . . . . . . . . . . . . . . . . . . . . 605
Interruption Keyboard Setup. . . . . . . . . . . . . . . . . . . . . . . . . . . . . . . . . . . . 607
LCD Component . . . . . . . . . . . . . . . . . . . . . . . . . . . . . . . . . . . . . . . . . . . . . 608
Monitor Component . . . . . . . . . . . . . . . . . . . . . . . . . . . . . . . . . . . . . . . . . . 614
Push Buttons Component . . . . . . . . . . . . . . . . . . . . . . . . . . . . . . . . . . . . . . 617
Programmable IO_Ports Component . . . . . . . . . . . . . . . . . . . . . . . . . . . . . 619
7-Segments Display Component. . . . . . . . . . . . . . . . . . . . . . . . . . . . . . . . . 621
Stimulation Component. . . . . . . . . . . . . . . . . . . . . . . . . . . . . . . . . . . . . . . . 624
Terminal Component. . . . . . . . . . . . . . . . . . . . . . . . . . . . . . . . . . . . . . . . . .631
True Time I/O Stimulation . . . . . . . . . . . . . . . . . . . . . . . . . . . . . . . . . . . . . . . . 638
Stimulation Program Examples. . . . . . . . . . . . . . . . . . . . . . . . . . . . . . . . . .638
Stimulation Input File Syntax . . . . . . . . . . . . . . . . . . . . . . . . . . . . . . . . . . .645
Electrical Signal Generators and Signals Application to Device Pins . . . . . . . 647
Signal IO Component . . . . . . . . . . . . . . . . . . . . . . . . . . . . . . . . . . . . . . . . .647
Signal Description File EBNF. . . . . . . . . . . . . . . . . . . . . . . . . . . . . . . . . . . 647
Base Signal Files Provided . . . . . . . . . . . . . . . . . . . . . . . . . . . . . . . . . . . . .652
Virtual Wire Connections with the Pinconn IO Component. . . . . . . . . . . .652
Command Set to Apply Signal on ATD Pin . . . . . . . . . . . . . . . . . . . . . . . .654
FCS Tutorials . . . . . . . . . . . . . . . . . . . . . . . . . . . . . . . . . . . . . . . . . . . . . . . . . . 654
Guess the Number . . . . . . . . . . . . . . . . . . . . . . . . . . . . . . . . . . . . . . . . . . . . 654
PWM Sample . . . . . . . . . . . . . . . . . . . . . . . . . . . . . . . . . . . . . . . . . . . . . . . 663
29 ColdFire P&E Multilink/Cyclone Pro Connection 669
P&E Multilink/Cyclone Pro Technical Considerations . . . . . . . . . . . . . . . . . .669
CodeWarrior IDE and P&E Multilink/Cyclone Pro Connection . . . . . . . . . . . 669
First Steps Using the Stationery Wizard. . . . . . . . . . . . . . . . . . . . . . . . . . . . . . 670
First Steps From Within an Existing Project . . . . . . . . . . . . . . . . . . . . . . . . . . 671
P&E Multilink/Cyclone Pro Menu Options . . . . . . . . . . . . . . . . . . . . . . . . 673
Microcontrollers Debugger Manual
15
Page 16

Table of Contents
P&E Multilink/Cyclone Pro Setup Dialog Box. . . . . . . . . . . . . . . . . . . . . .674
Connection Manager Dialog Box . . . . . . . . . . . . . . . . . . . . . . . . . . . . . . . .675
Set Derivative Dialog Box. . . . . . . . . . . . . . . . . . . . . . . . . . . . . . . . . . . . . .676
30 SofTec ColdFire Connection 677
SofTec ColdFire Technical Considerations. . . . . . . . . . . . . . . . . . . . . . . . . . . .677
CodeWarrior IDE and SofTec ColdFire Connection. . . . . . . . . . . . . . . . . . . . .677
First Steps Using the Stationery Wizard . . . . . . . . . . . . . . . . . . . . . . . . . . . . . .678
First Steps From Within an Existing Project. . . . . . . . . . . . . . . . . . . . . . . . . . .679
SofTec ColdFire Menu Options. . . . . . . . . . . . . . . . . . . . . . . . . . . . . . . . . .681
SofTec Coldfire Setup Dialog Box . . . . . . . . . . . . . . . . . . . . . . . . . . . . . . .682
Target Connection Dialog Box . . . . . . . . . . . . . . . . . . . . . . . . . . . . . . . . . .683
Communication Settings Dialog Box . . . . . . . . . . . . . . . . . . . . . . . . . . . . .684
Set Derivative Dialog Box. . . . . . . . . . . . . . . . . . . . . . . . . . . . . . . . . . . . . .685
About Dialog Box . . . . . . . . . . . . . . . . . . . . . . . . . . . . . . . . . . . . . . . . . . . .686
31 ColdFire On-Chip DBG Module 687
DBG Features . . . . . . . . . . . . . . . . . . . . . . . . . . . . . . . . . . . . . . . . . . . . . . . . . .687
Context Menu Entries in Source, Data, Assembly and Memory Windows . . .688
Trigger Module Settings Window . . . . . . . . . . . . . . . . . . . . . . . . . . . . . . . . . . .689
Trigger Module Usage/DBG Module Setup . . . . . . . . . . . . . . . . . . . . . . . .689
General Settings. . . . . . . . . . . . . . . . . . . . . . . . . . . . . . . . . . . . . . . . . . . . . .695
Book VI - Connection Common
Features
Book VI Contents . . . . . . . . . . . . . . . . . . . . . . . . . . . . . . . . . . . . . . . . . . . . . . .697
32 Flash Programming 699
Non-Volatile Memory Control Utility Introduction . . . . . . . . . . . . . . . . . . . . .699
Automated Application Programming . . . . . . . . . . . . . . . . . . . . . . . . . . . . . . .699
Setup . . . . . . . . . . . . . . . . . . . . . . . . . . . . . . . . . . . . . . . . . . . . . . . . . . . . . .700
16
Microcontrollers Debugger Manual
Page 17

Table of Contents
Advanced Options: Erase Prevention . . . . . . . . . . . . . . . . . . . . . . . . . . . . . 701
NVMC Graphical User Interface . . . . . . . . . . . . . . . . . . . . . . . . . . . . . . . . . . . 702
Modules and Module States . . . . . . . . . . . . . . . . . . . . . . . . . . . . . . . . . . . .702
NVMC Dialog Box . . . . . . . . . . . . . . . . . . . . . . . . . . . . . . . . . . . . . . . . . . . 703
Flash Module Handling. . . . . . . . . . . . . . . . . . . . . . . . . . . . . . . . . . . . . . . .705
MCU Speed Information. . . . . . . . . . . . . . . . . . . . . . . . . . . . . . . . . . . . . . . 706
Configuration: FPP File Loading . . . . . . . . . . . . . . . . . . . . . . . . . . . . . . . .706
Loading an Application in Flash. . . . . . . . . . . . . . . . . . . . . . . . . . . . . . . . .708
Hardware Considerations . . . . . . . . . . . . . . . . . . . . . . . . . . . . . . . . . . . . . . . . . 709
HCS08 CPU devices . . . . . . . . . . . . . . . . . . . . . . . . . . . . . . . . . . . . . . . . . . 709
HCS08 CPU devices with banked/paged EEPROM. . . . . . . . . . . . . . . . . . 709
ColdFire CPU devices. . . . . . . . . . . . . . . . . . . . . . . . . . . . . . . . . . . . . . . . . 709
NVMC Commands . . . . . . . . . . . . . . . . . . . . . . . . . . . . . . . . . . . . . . . . . . . . . .710
33 Debugging Memory Map 715
Introduction. . . . . . . . . . . . . . . . . . . . . . . . . . . . . . . . . . . . . . . . . . . . . . . . . . . . 715
The DMM GUI . . . . . . . . . . . . . . . . . . . . . . . . . . . . . . . . . . . . . . . . . . . . . . . . . 715
Edition dialog and memory range edition. . . . . . . . . . . . . . . . . . . . . . . . . . 717
Remarks. . . . . . . . . . . . . . . . . . . . . . . . . . . . . . . . . . . . . . . . . . . . . . . . . . . .720
CPU Core Types and Priorities . . . . . . . . . . . . . . . . . . . . . . . . . . . . . . . . . .721
DMM Commands . . . . . . . . . . . . . . . . . . . . . . . . . . . . . . . . . . . . . . . . . . . . . . .722
Debugging Memory Map Manager command set. . . . . . . . . . . . . . . . . . . . 722
Book VII - Commands
Book VII Contents . . . . . . . . . . . . . . . . . . . . . . . . . . . . . . . . . . . . . . . . . . . . . .729
34 Debugger Engine Commands 731
Commands Overview . . . . . . . . . . . . . . . . . . . . . . . . . . . . . . . . . . . . . . . . . . . .731
Available Command Lists . . . . . . . . . . . . . . . . . . . . . . . . . . . . . . . . . . . . . .732
Command Syntax Terms . . . . . . . . . . . . . . . . . . . . . . . . . . . . . . . . . . . . . . . 740
Debugger Commands . . . . . . . . . . . . . . . . . . . . . . . . . . . . . . . . . . . . . . . . . . . . 742
Microcontrollers Debugger Manual
17
Page 18

Table of Contents
Book VIII - Environment Variables
Book VIII Contents. . . . . . . . . . . . . . . . . . . . . . . . . . . . . . . . . . . . . . . . . . . . . .839
35 Debugger Engine Environment Variables 841
Debugger Environment . . . . . . . . . . . . . . . . . . . . . . . . . . . . . . . . . . . . . . . . . . .842
The Current Directory . . . . . . . . . . . . . . . . . . . . . . . . . . . . . . . . . . . . . . . . .842
Global Initialization File (MCUTOOLS.INI - PC Only) . . . . . . . . . . . . . .843
Local Configuration File (usually project.ini). . . . . . . . . . . . . . . . . . . . . . . . . .844
Default Layout Configuration (PROJECT.INI) . . . . . . . . . . . . . . . . . . . . . .845
Environment Variable Paths. . . . . . . . . . . . . . . . . . . . . . . . . . . . . . . . . . . . .848
Environment Variables . . . . . . . . . . . . . . . . . . . . . . . . . . . . . . . . . . . . . . . . . . .850
Search Order for Source Files. . . . . . . . . . . . . . . . . . . . . . . . . . . . . . . . . . . . . .857
In the Debugger for C Source Files (*.c, *.cpp) . . . . . . . . . . . . . . . . . . . . .857
In the Debugger for Assembly Source Files (*.dbg) . . . . . . . . . . . . . . . . . .857
In the Debugger for Object Files (HILOADER) . . . . . . . . . . . . . . . . . . . . .858
Debugger Files . . . . . . . . . . . . . . . . . . . . . . . . . . . . . . . . . . . . . . . . . . . . . . . . .858
36 Connection-Specific Environment Variables 861
Connection-Specific Environment Variables . . . . . . . . . . . . . . . . . . . . . . . . . .861
Book IX - Debugger Legacy
Book IX Contents . . . . . . . . . . . . . . . . . . . . . . . . . . . . . . . . . . . . . . . . . . . . . . .863
37 Legacy PEDebug Target Interface 865
New P&E Connections for HC(S)08. . . . . . . . . . . . . . . . . . . . . . . . . . . . . . . . .865
“Revert to Full Chip Simulator” Feature Removed . . . . . . . . . . . . . . . . . . . . .865
Connection Selection or Change Always Available within IDE. . . . . . . . . . . .866
Automatic Upgrade Path for Projects Previously Created . . . . . . . . . . . . . . . .866
18
Microcontrollers Debugger Manual
Page 19

Table of Contents
38 Legacy Target Interfaces Removed 867
39 HC(S)08 Full-Chip Simulator Components No Longer
Supported 869
List of HC(S)08 FCS Components No Longer Supported . . . . . . . . . . . . . . . . 869
Index 871
Microcontrollers Debugger Manual
19
Page 20

Table of Contents
20
Microcontrollers Debugger Manual
Page 21

Introduction
Manual Contents
The Microcontrollers Debugger Manual consists of the following books:
Book 1: Debugger engine - defines the HC08 and HC(S)08 common and base features,
their functionality, and a description of the components that are available in the debugger.
• Introduction
• Debugger Interface
• Debugger Components
• Control Points
• Real Time Kernel Awareness
• How To...
• CodeWarrior IDE Integration
• Debugger DDE Capabilities
• Synchronized Debugging Through DA-C IDE
Book 2: HC08 Debugger Connections - defines the connections available for debugging
code written for HC08 CPUs.
• Microcontroller Debugging First Steps
• HC08 Full Chip Simulation
• MON08 Interface Connection
• ICS MON08 Interface Connection
• HC08 P&E Multilink/Cyclone Pro Connection
• HC08 ICS P&E Multilink/Cyclone Pro Connections
• SofTec HC08 Connection
• HC08 FSICEBASE Emulator
Book 3: HCS08 Debugger Connections - defines the connections available for debugging
code written for HCS08 CPUs
• HCS08 Full Chip Simulation
• HCS08 P&E Multilink/Cyclone Pro Connection
• HCS08 Open Source BDM Connection
• HCS08 Serial Monitor Connection
• SofTec HCS08 Connection
Microcontrollers Debugger Manual
21
Page 22

Manual Contents
Book 4: RS08 Debug Connections
Book 5: ColdFire V1.0 Debug Connections
Book 6: Connection Common Features
Book 7: Commands
Book 8: Environment Variables
Book 9: Debugger Legacy
• HCS08 On-Chip DBG Module
• RS08 Full Chip Simulation
• RS08 P&E Multilink/Cyclone Pro Connection
• RS08 Open Source BDM Connection
• SofTec RS08 Connection
• ColdFire V1 Full Chip Simulation Connection
• ColdFire P&E Multilink/Cyclone Pro Connection
• SofTec ColdFire Connection
• ColdFire On-Chip DBG Module
• Flash Programming
• Debugging Memory Map
• Debugger Engine Commands
• Debugger Engine Environment Variables
• Connection-Specific Environment Variables
• Legacy PEDebug Target Interface
• Legacy Target Interfaces Removed
• HC(S)08 Full-Chip Simulator Components No Longer Supported
22
NOTE The Flexis series of devices is the 8- to 32-bit connection point on the Freescale
Controller Continuum, where complementary families of HCS08 and ColdFire
V1 microcontrollers share a common set of peripherals and development tools
to deliver migration flexibility.
These devices include the MC9S08QE128, MC9S08QE64, MC9S08QE96,
MCF51QE128, MCF51QE64, and MCF51QE96, which are covered in Book 3
and Book 5 respectively.
Microcontrollers Debugger Manual
Page 23

Book I - Debugger Engine
Book I Contents
Each section of the Debugger manual includes information to help you become more
familiar with the Debugger, to use all its functions and help you understand how to use the
environment. This book, the Debugger engine, defines the HC(S)08, RS08, and
ColdFire® common and base features and their functionality, and gives a description of
the components that are available in the debugger.
This book is divided into the following chapters:
• This chapter describes the manual and special features of the Debugger.
•The Introduction
•The Debugger Interface
interface environment i.e., menus, toolbars, status bars and drag and drop facilities.
•The Debugger Components
and visualization utility.
•The Control Points
windows.
•The Real Time Kernel Awareness Chapter contains descriptions of the Real Time
concept and related applications.
•The How To...
to use advanced features of the Debugger.
•The CodeWarrior IDE Integration
for use with the CodeWarrior IDE.
•The Debugger DDE Capabilities chapter describes the debugger DDE features.
•The Synchronized Debugging Through DA-C IDE
with the DA-C IDE from RistanCase
Chapter introduces the Debugger concept.
Chapter provides all details about the Debugger user
Chapter contains descriptions of each basic component
Chapter is dedicated to the control points and associated
Chapter provides answers for common questions and describes how
chapter explains how to configure the Debugger
chapter explains the use of tools
Microcontrollers Debugger Manual
23
Page 24

Book I Contents
24
Microcontrollers Debugger Manual
Page 25

Introduction
This section is an introduction to the Debugger from Freescale used in 8/16 bit embedded
applications.
Freescale Debugger
The Debugger is a member of the tool family for Embedded Development. It is a
Multipurpose Tool that you can use for various tasks in the embedded system and
industrial control world. Some typical tasks are:
• Simulation and debugging of an embedded application.
• Simulation and debugging of real-time embedded applications.
• Simulation and/or cross-debugging of an embedded application.
• Multi-Language Debugging: Assembly, C and C++
• True-Time Simulation
• User Components creation with the Peripheral Builder
• Simulation of a hardware design (e.g., board, processor, I/O chip).
• Building a target application using an object oriented approach.
• Building a host application controlling a plant using an object oriented approach.
1
Debugger Application
A Debugger Application contains the Debugger Engine and a set of debugger components
bound to the task that the components must perform (for example a simulation and
debugging session). The Debugger Engine is the heart of the system. It monitors and
coordinates the tasks of the components. Each Debugger Component has its own
functionality (e.g., source level debugging, profiling, I/O stimulation).
You can adapt your Debugger application to your specific needs. Integrating or removing
the Debugger Components is very easy. You can add additional Debugger Components
(for example, for simulation of a specific I/O peripheral chip) and integrate them with
your Debugger Application.
You can also open several components of the same type.
Microcontrollers Debugger Manual
25
Page 26

Introduction
Debugger Features
Debugger Features
• True 32-bit application
• Powerful features for embedded debugging
• Special features for real time embedded debugging
• Powerful features for True Time Simulation
• Various and Same look Target Interfaces
• User Interface
• Versatile and intuitive drag and drop functions between components
• Folding and unfolding of objects like functions, structures, classes
• Graphical editing of user defined objects
• Visualization functions
• Smart interactions with objects
• Extensibility function
• Both Powerful Simulation & Debugger
• Show Me How Tool
• GUI (graphical user interface) version including command line
• Context sensitive help
• Configurable GUI with Tool Bar
• Smooth integration into third party tools
• Supports both Freescale and ELF/DWARF Object File Format and S-Records.
26
Demo Version Limitations on Components
When the Debugger is started in demo mode or with an invalid engine license, then all
components that are protected with FLEXlm are in demo mode. The limitations of all
components are described in their respective chapter.
Microcontrollers Debugger Manual
Page 27

Debugger Interface
This chapter describes the Debugger Graphical User Interface (GUI). Topics include:
• Introduction
• Application Programs
• Starting the Debugger
• Debugger Main Window
• Component Associated Menus
• Highlights of the User Interface
Introduction
The CodeWarrior™ IDE main window acts as a container for windows of debugger
components. The main window provides a main menu bar, a tool bar, a status bar for
status information, and object information bars for several components.
The Debugger main window allows you to manage the layout of the different component
windows (Window menu of the Debugger application). Component windows are
organized as follows:
• Tiled arrangement - Auto tiled, component windows are automatically resized when
the main window is resized
• Component windows are overlapped
• Component windows that are currently minimized are Debugger Main window
icons.
2
Application Programs
The CodeWarrior IDE installer places executable programs in the prog subdirectory of
the CodeWarrior IDE installation directory. For example, installing the CodeWarrior IDE
software in C:\Program Files\Freescale, locates all program files in the folder
C:\Program Files\Freescale\CodeWarrior for Microcontrollers
V6.1\prog.
Microcontrollers Debugger Manual
27
Page 28
Debugger Interface
Starting the Debugger
The following list is an overview of files that the CodeWarrior IDE uses for C/C++
debugging:
• hiwave.exe Debugger executable file
• hibase.dll Debugger main function dll
• elfload.dll Debugger loader dll
• *.wnd Debugger component
• *.tgt Debugger target file
• *.cpu Debugger CPU awareness file
Starting the Debugger
This section explains how you can start the debugger from within the CodeWarrior IDE or
from a DOS command line.
Starting from within the IDE
There are two ways to start the debugger from within the IDE, from a Project window
icon, or from the IDE Main Window menu bar.
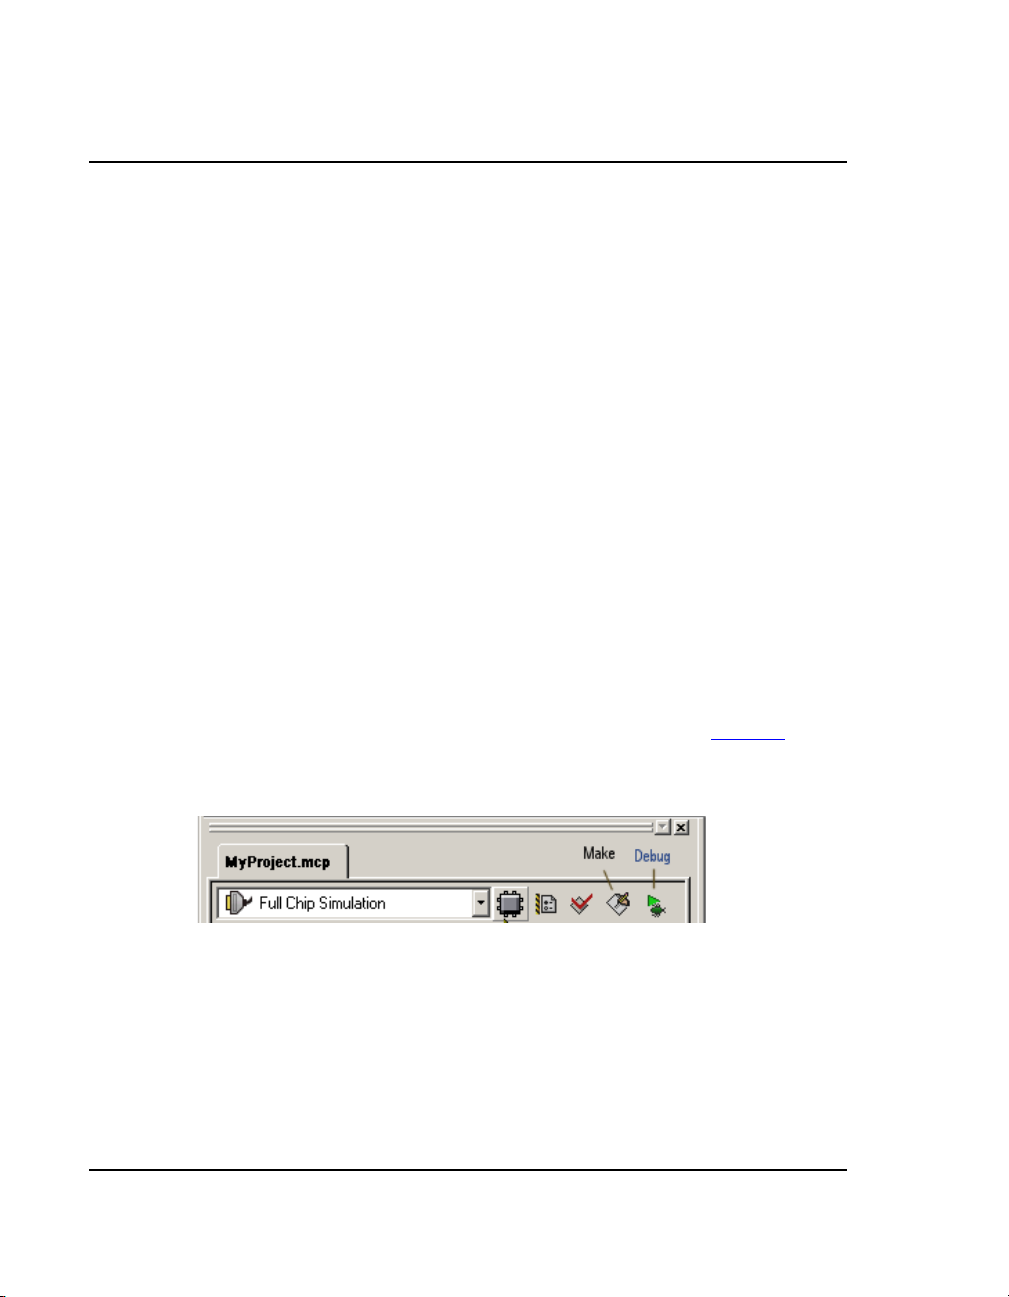
Starting Debug from the Project Window
To start the debugger from the Project window, click the Debug icon (Figure 2.1), at the
top of the Project window.
Figure 2.1 Project Window Make and Debug Icons
28
Microcontrollers Debugger Manual
Page 29
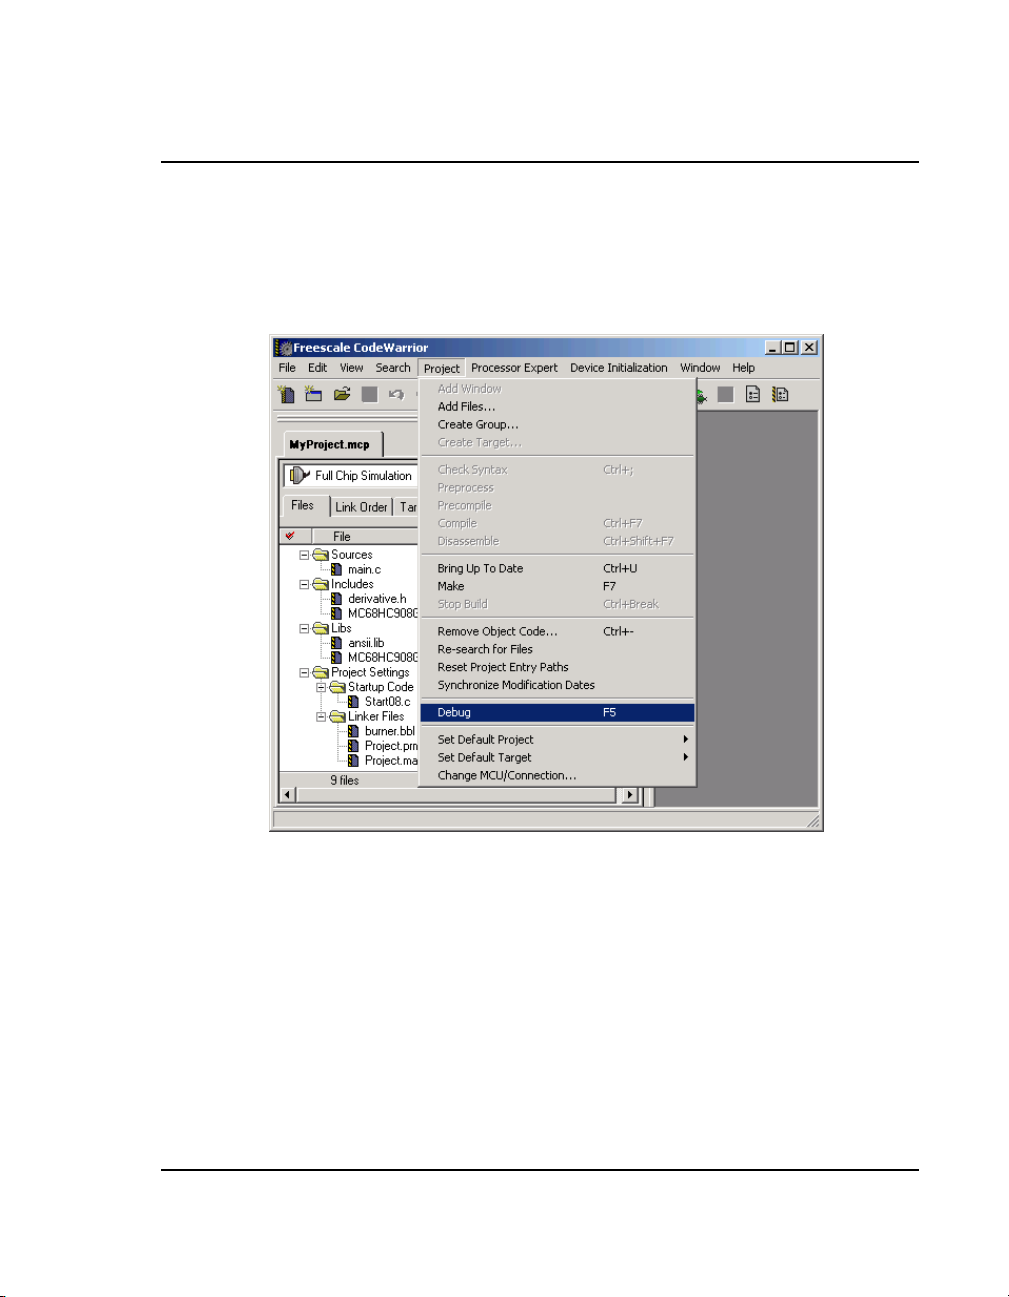
Starting Debug from the Main Window Menu Bar
You can also start the debugger from the main menu bar of the CodeWarrior IDE. To start
the debugger from the main menu bar, select Debug from the Project menu:
(Project > Debug.)
Figure 2.2 Main Window Project Menu
Debugger Interface
Starting the Debugger
Debugger Command Line Start
You can start the debugger from a DOS command line. The command syntax is as
follows:
HIWAVE.EXE [<AbsFileName> {-<options>}]
where AbsFileName is the name of the application to load in the debugger. Precede
each option with a dash.
Microcontrollers Debugger Manual
29
Page 30

Debugger Interface
Starting the Debugger
Command Line Options
DOS command line options are:
-T=<time>: Test mode
The debugger terminates after the specified time (in seconds). The default value is 300
seconds. For example:
c:\Program Files\Freescale\CodeWarrior for Microcontrollers
V6.1\prog\hiwave.exe -T=10
The above example instructs the debugger to terminate after 10 seconds.
-Target=<targetname>
This option sets the specified connection. For example:
C:\Program Files\Freescale\CodeWarrior for Microcontrollers
V6.1\prog\hiwave.exe c:\Program Files\Freescale\CodeWarrior
for Microcontrollers V6.1\demo\hc12\sim\fibo.abs -w
Target=sim
The command in the above example starts the debugger and loads fibo.abs file.
-W: Wait mode
Debugger waits even when a <exeName> is specified.
-
30
-Instance=%currentTargetName
This option defines a build instance name. Once you define a build instance, the debugger
uses same build instance the next time you start the debugger. For example:
c:\Program Files\Freescale\CodeWarrior for Microcontrollers
V6.1\prog\hiwave.exe
If you attempt to start the debugger again, the existing instance of the debugger is brought
to the foreground.
-Instance=%currentTargetName
-Prod= <fileName>
This option specifies the project directory and/or project file to be used at start-up. For
example:
c:\Program Files\Freescale\CodeWarrior for Microcontrollers
V6.1\prog\hiwave.exe
-Prod=c:\demoproject\test.pjt
Microcontrollers Debugger Manual
Page 31

Debugger Interface
Starting the Debugger
-Nodefaults
This prevents the debugger from loading the default layout. For example:
c:\Program Files\Freescale\CodeWarrior for Microcontrollers
V6.1\prog\hiwave.exe
-nodefaults
-Cmd = <Command>
This option specifies a command to be executed at start-up: -cmd = {command}. For
example:
c:\Program Files\Freescale\CodeWarrior for Microcontrollers
V6.1\prog\hiwave.exe -cmd="open recorder"
-C <cmdFile>
This option specifies a command file to be executed at start-up. For example:
c:\Program Files\Freescale\CodeWarrior for Microcontrollers
V6.1\prog\hiwave.exe -c c:\temp\mycommandfile.txt
-ENVpath: "-Env" <Environment Variable> "=" <Variable
Setting>
This option sets an environment variable. This environment variable may be used to
overwrite system environment variables. For example:
c:\Program Files\Freescale\CodeWarrior for Microcontrollers
V6.1\prog\hiwave.exe -EnvOBJPATH=c:\sources\obj
NOTE Options are not case sensitive.
Order of Commands
Commands specified by options are executed in the following order:
1. Load (activate) the project file (see below). If the project file is not specified,
project.ini is used by default.
2. Load <exeFile> if available and start running unless option |(W) was specified
3. Execute command file <cmdFile> if specified
4. Execute command if specified
5. Start running unless option |(W) was specified
NOTE In version 6.1 of the debugger, the loaded program starts after all command and
command files are executed.
Microcontrollers Debugger Manual
31
Page 32

Debugger Interface
Debugger Main Window
NOTE The function Open in the File menu interprets any file without an .ini
extension as a command file and not a project file.
Example
C:\Program Files\Freescale\CodeWarrior for Microcontrollers
V6.1\PROG\DEMO\TEST.ABS -w -d
Debugger Main Window
Once you start the debugger, the True Time Simulator & Real Time Debugger window
opens in the right side of the IDE Main Window.
Figure 2.3 Debugger Main Window
32
Microcontrollers Debugger Manual
Page 33

Debugger Main Window Toolbar
The Debugger Main Window toolbar is the default toolbar. Most of the Main Window
menu commands have a related shortcut icon on this toolbar. Figure 2.4
default icon.
Figure 2.4 Debugger Main Window Toolbar
Debugger Interface
Debugger Main Window
identifies each
Ne
w
Open
Save
Cut
y
Cop
A tool tip is available when you point the mouse at an icon.
Debugger Main Window Status Bar
The status bar at the bottom of the Debugger Main Window, shown in Figure 2.5 contains
a context sensitive help line for connection specific information, e.g., number of CPU
cycles for the Simulator connection and execution status.
Figure 2.5 The Debugger Status Bar
Main Window Menu Bar
The Debugger Main Window Menu Bar, shown in Figure 2.6 is associated with the main
function of the debugger application, connection, and selected windows.
Figure 2.6 Debugger Window Menu Bar
t
as
He
P
t
on
p
el
H
un
pi
o
ep
t
R
s
Step over
Step out
em
s
s
A
S
ingle
alt
ep
t
H
s
bly
Reset target
c
p
e
l
NOTE You can select menu commands by pressing the ALT key to select the menu
bar then press the key corresponding to the underlined letter in the menu
command.
Table 2.1
describes menu entries available in the menu bar.
Microcontrollers Debugger Manual
33
Page 34

Debugger Interface
Debugger Main Window
Table 2.1 Description of the Main Menu Toolbar Entries
Menu entry Description
File Contains entries to manage debugger configuration files.
View Contains entries to configure the toolbar.
Run Contains entries to monitor a simulation or debug session.
Connection Contains entries to select the debugger connection. Once a
connection has been selected, the name of this heading
changes.
Component Contains entries to select and configure extra component
Data Contains entries to select Data component functions.
Window Contains entries to set the component windows.
Help A standard Windows Help menu.
File Menu
The File menu shown in Figure 2.7 is dedicated to the debugger project.
Figure 2.7 File Menu
window.
34
Microcontrollers Debugger Manual
Page 35

Table 2.2 describes File Menu entries.
Table 2.2 File Menu Entry Description
Menu Entry Description
New Creates a new project.
Load Application Loads an executable file (or debugger connection if nothing is
selected).
Debugger Interface
Debugger Main Window
...\restart.abs
...\await.abs
...
Open Configuration Opens the debugger project window. You can load a project file
Save Configuration Saves the project file.
Save Project As Opens the debugger project window to save the project file
Configuration Opens the Preferences window to set environment variables for
1.Project.ini
2.Test.ini
3...
Exit Quits the Debugger.
Recent applications list
.PJT or .INI. Additionally you can load an existing .HWC file
corresponding to a debugger configuration file. You can load a
project .INI file containing component names, associated
window positions and parameters, window parameters (fonts,
background colors, etc.), connection name (e.g., Simulator)
and the .ABS application file to load.
under a different path and name, and format (PJT; INI...).
current project.
Recent project file list.
You can shortcut some of these functions by clicking toolbar icons (refer to the Debugger
Main Window Toolbar section).
Microcontrollers Debugger Manual
35
Page 36

Debugger Interface
Debugger Main Window
Configuration Window
Open the Configuration window by selecting Configuration from the Files menu. With
this window (Figure 2.8
project. New variables are saved in the current project file when you click the OK button.
NOTE The corresponding menu entry (File > Configuration) is only enabled if a
project file is loaded.
Figure 2.8 Configuration Window - Environment Tab
) it is possible to set up environment variables for the current
36
The Configuration Window - Environment tab contains the following controls:
• A list box containing all available environment variables. You can select a variable
with the mouse or Up/Down buttons.
• Command Line Arguments are displayed in the text box. You can add, delete, or
modify options, and specify a directory with the browse button (...).
• A second list box contains the arguments for all of the environment variables defined
in the corresponding Environment section. Select a variable with the mouse or Up/
Down buttons.
Microcontrollers Debugger Manual
Page 37

Command Buttons:
• OK: Changes are confirmed and saved in current project file.
• Cancel: Closes dialog box without saving changes.
• Help: Opens the help file.
Figure 2.9 Configuration Window - Load Tab
Debugger Interface
Debugger Main Window
The Configuration Window - Load tab contains the following controls:
• Automatically erase and program into FLASH and EEPROM checkbox.
• A Verify memory image after loading code checkbox, with two radio buttons that let
you define the memory image.
• Run after successful load checkbox.
• A Stop at Function checkbox with a textbox that lets you define the function.
Command Buttons:
OK: Changes are confirmed and saved in current project file.
Cancel: Closes dialog box without saving changes.
Help: Opens the help file.
Microcontrollers Debugger Manual
37
Page 38

Debugger Interface
Debugger Main Window
View Menu
In the Main Window View menu (Figure 2.10) you can choose to show or hide the toolbar,
status bar, window component titles and headlines (see the Component Windows Object
Info Bar). You can select smaller window borders and customize the toolbar. Table 2.3
describes the View Menu entries.
Figure 2.10 View Menu
Table 2.3 View Menu Description
Menu Entry Description
Toolbar Check / uncheck Toolbar if you want to display or hide it.
Status Bar Check / uncheck Status Bar if you want to display or hide it.
38
Hide Tile Check / uncheck Hide Title if you want to hide or display the
Hide Headline Check / uncheck Hide Headline if you want to hide or display the
Small Borders Check / uncheck Small Border if you want to display or hide
Customize Opens the debugger Customize Toolbar window.
window title.
headline.
small window borders.
Customizing the Toolbar
When you select Customize from the View menu, the Customize Toolbar dialog box
appears. You can customize the toolbar of the Debugger, adding and removing component
shortcuts and action shortcuts in this dialog box. You can also insert separators to separate
icons. Almost all functions in View, Run and Window menus are available as shortcut
buttons, as shown in Figure 2.11
.
Microcontrollers Debugger Manual
Page 39

Figure 2.11 Customize Toolbar Dialog Box
• Select the desired shortcut button in the Available buttons list box and click Add to
install it in the toolbar.
• Select a button in the Toolbar buttons list box and click Remove to remove it from
the toolbar.
Demo Version Limitations
The default toolbar cannot be configured.
Examples of View Menu Options
Figure 2.12 shows a typical component window display.
Debugger Interface
Debugger Main Window
Figure 2.12 Typical Component Window Display
Figure 2.13
Microcontrollers Debugger Manual
shows a component window without a title and headline.
39
Page 40

Debugger Interface
Debugger Main Window
Figure 2.13 Component Window without Title and Headline
Figure 2.14
border.
Figure 2.14 Component Window without Title and Headline, and with Small Border
Figure 2.15
shows a component window without a title and headline, and with a small
shows a component window without headline and small border
40
Microcontrollers Debugger Manual
Page 41

Debugger Main Window
Figure 2.15 Component Window without Headline and Small Border
Run Menu
The Main Window Run menu, shown in Figure 2.16 is associated with the debug session.
You can monitor a simulation or debug session from this menu. Run menu entries are
described in Table 2.4.
Figure 2.16 Run Menu
Debugger Interface
Microcontrollers Debugger Manual
41
Page 42

Debugger Interface
Debugger Main Window
Table 2.4 Run Menu Description
Menu entry Description
Start/Continue Starts or continues execution of the loaded application from the
current program counter (PC) until a breakpoint or watchpoint is
reached, runtime error is detected, or user stops the application by
selecting
Shortcut: F5 key
Restart Starts execution of the loaded application from its entry point.
Shortcut: CTRL + Shift + F5 keys
Halt Interrupts and halts a running application. You can examine the state
of each variable in the application, set breakpoints, watchpoints, and
inspect source code.
Shortcut: F6 key
Run > Halt
.
Single Step If the application is halted, this command performs a single step at the
Step Over Similar to the Single Step command, but does not step into called
Step Out If the application is halted inside of a function, this command continues
Assembly
Step
source level. Execution continues until the next source reference is
reached. If the current statement is a procedure call, the debugger
“steps into” that procedure. The Single Step command does not treat
a function call as one statement, therefore it steps into the function.
Shortcut: F11 key
functions. A function call is treated as one statement.
Shortcut: F10 key
execution and then stops at the instruction following the current
function invocation. If no function calls are present, then the Step Out
command is not performed.
Shortcut:
If the application is halted, this command performs a single step at the
assembly level. Execution continues for one CPU instruction from the
point it was halted. This command is similar to the Single Step
command, but executes one machine instruction rather than a high
level language statement.
Shortcut: CTRL + F11 keys
Shift + F11 keys
42
Microcontrollers Debugger Manual
Page 43

Debugger Interface
Debugger Main Window
Table 2.4 Run Menu Description (
Menu entry Description
Assembly
Step Over
Assembly
Step Out
Control Points Opens the Controlpoints Configuration Window that contains tabs that
Similar to the Step Over command, but steps over subroutine call
instructions.
Shortcut: CRTL + F10 keys
If the application is halted inside a function, this command continues
execution and stops on the CPU instruction following the current
function invocation. This command is similar to the Step Out
command, but stops before the assignment of the result from the
function call.
Shortcut:
allow you to control Breakpoints, Watchpoints and Markpoints (refer to
Control Points
You can provide shortcuts for some of these functions using the toolbar. Refer to the
Debugger Main Window Toolbar
You can also set breakpoints and watchpoints from within the Source and Assembly
component windows.
NOTE For more information about breakpoints and watchpoints, refer to the Control
Points chapter.
continued
)
CTRL + Shift + F11 keys
chapter).
and Customizing the Toolbar sections for details.
Connection Menu
This menu entry (Figure 2.17) appears between the Run and Component menus when no
connection is specified in the PROJECT.INI file and no connection has been set. The
Connection name is replaced by an actual connection name when the connection is set. If
a connection has been set, the number of menu entries is expanded, depending on the
connection. To set the connection, select Component > Set Connection. Refer to the
Component Menu
Figure 2.17 Connection Menu
Table 2.5
describes the Connection Menu entries.
Microcontrollers Debugger Manual
section for details.
43
Page 44

Debugger Interface
Debugger Main Window
Table 2.5 Connection Menu Common Option Description
Menu Entry Description
Load Loads a connection.
Reset Resets the current connection.
Loading an Executable File
Use the Connection menu to load a debugger connection:
• Choose Connection > Load
The Load Executable File window shown in Figure 2.18
Load Executable File Window
From the Load Executable File window, set the load options and choose a Simulation
Execution Framework (an .ABS application file).
Figure 2.18 Load Executable File Window
appears.
44
Open Button
Pressing this button loads the application code and symbols.
Microcontrollers Debugger Manual
Page 45

Debugger Interface
Debugger Main Window
Load Options Buttons
These three buttons allow you to select which part of the executable file to load:
• Load Code Button: Loads the application code only. Loads only the application into
the target system. Use this button if no debugging is needed.
• Load Symbols Button: Loads symbols only. Loads only debugging information.
This button can be used if the code is already loaded into the target system or
programmed into a non-volatile memory device (ROM/FLASH).
• Verify Code Button: Loader loads no data into memory. However, it reads back
current data matching the same areas from the target memory and compares all data
with the data from the selected file.
Open and Load Code Options Area
The checkboxes and buttons of this area of the Load Executable File window offer the
following options:
• A checkbox to Automatically erase and program into FLASH and EEPROM.
• A Verify memory image after loading code checkbox, with two radio buttons that let
you define the memory image.
• Run after successful load checkbox.
• A Stop at Function checkbox with a textbox that lets you define the function.
Command Buttons:
OK: Changes are confirmed and saved in current project file.
Cancel: Closes dialog box without saving changes.
Help: Opens the help file.
Connection Command File Window
From the Connection menu, choose Command File to open the Connection Command
File window. Each tab of this window, shown in Figure 2.19
which a command file can be automatically run.
See the Startup Command File
Postload Command File
generated automatically, you can install them when installing a new connection. However,
the Debugger recognizes these command files and executes them. Depending on the
connection used, other command files can be recognized by the Debugger. Refer to the
appropriate connection chapter for command file information and properties.
Microcontrollers Debugger Manual
corresponds to an event on
, Reset Command File, Preload Command File, and
, sections that follow. Although these command files are not
45
Page 46

Debugger Interface
Debugger Main Window
Figure 2.19 Connection Command File Window
The command file in the edit box is executed when the corresponding event occurs. Click
the Browse button to set the path and name of the command file.
The Enable Command File check box allows you to enable/disable a command file on an
event. By default, all command files are enabled:
• The default Startup command file is STARTUP.CMD
• The default Reset command file is RESET.CMD
• The default Preload command file is PRELOAD.CMD
• The default Postload command file is POSTLOAD.CMD
46
NOTE Startup settings performed in this dialog box are stored for subsequent
debugging sessions in the [Simulator] section of the PROJECT file using the
variable CMDFILE0.
NOTE When a CPU is set, the settings performed in this dialog box are stored for
subsequent debugging sessions in the [Simulator XXX] (where XXX is the
processor) section of the PROJECT file using variables CMDFILE0,
CMDFILE1 ... CMDFILEn.
Startup Command File
The startup.cmd command file is a Debugger system command file. The Startup
command file executes after you load the connection (the target defined in the project.ini
file or when you select Component > Set Connection).
You can specify the Startup command file full name and status (enable/disable) either
with the CMDFILE STARTUP Command Line command or using the Startup property
tab of the Connection Command File Window
.
Microcontrollers Debugger Manual
Page 47

Debugger Interface
Debugger Main Window
The default settings enable the STARTUP.CMD file located in the current project directory
as the current Startup command file.
Reset Command File
The reset.cmd command file is a Debugger system command file. The Reset
command file executes after clicking the reset button, selecting Connection Name > Reset
in the menu (Connection Name is the real name of the connection, such as MMDS0508
or SDI) reset.cmd or selecting Command Line command.
Specify the Reset command file full name and status (enable/disable) either with the
CMDFILE RESET Command Line command or using the Reset property tab of the
Connection Command File Window
The default settings enable the RESET.CMD file located in the current project directory as
the current Reset command file.
.
Preload Command File
The preload.cmd command file is a Debugger system command file. The Preload
command file executes before an application loads to the target system through the
connection, or by selecting Connection Name > Load.
Specify the Preload command file full name and status (enable/disable) either with the
CMDFILE PRELOAD Command Line command or using the Preload property tab of the
Connection Command File Window
The default settings enable the PRELOAD.CMD file located in the current project directory
as the current Preload command file.
.
Postload Command File
The postload.cmd command file is a Debugger system command file. Postload
executes after an application loads to the target system through the connection, or by
selecting Connection Name > Load.
Specify the Postload command file full name and status (enable/disable) either with the
CMDFILE POSTLOAD Command Line command or by using the Postload property tab
of the Connection Command File Window
The default settings enable the POSTLOAD.CMD file located in the current project
director as the current Postload command file.
Component Menu
The Component menu is shown in Figure 2.20.
Microcontrollers Debugger Manual
.
47
Page 48

Debugger Interface
Debugger Main Window
Figure 2.20 Component Menu
Table 2.6 describes the Component Menu entries.
Table 2.6 Component Menu Description
Menu entry Description
Open Loads an extra component window that has not been loaded by
Set Connection Sets the Debugger connection.
Fonts Opens a standard Font Selection dialog box, where you can set
Background Color Opens a standard Color Selection dialog box, where you can
the Debugger at startup. The context-sensitive dialog box
presents a set of different components that are introduced in the
Typical Component Window Display
the font used by Debugger components.
set the background color used by the Debugger component
windows.
section.
NOTE For a readable display, we recommend using a proportional font (e.g., Courier,
Terminal, etc.).
Select Component > Open to load an extra component window that has not been loaded by
the Debugger at startup. The context-sensitive dialog box presents a set of different
components that are introduced in Debugger Components
.
Select Component > Set Connection and the Set Connection dialog box shown in Figure
2.21 is opened.
48
Microcontrollers Debugger Manual
Page 49

Figure 2.21 Set Connection Dialog Box
6. Use the Processor list menu to select the desired processor.
7. Use the connection list menu to select the desired connection.
A text panel displays information about the selected connection.
NOTE When a connection cannot be loaded, the combo box displays the correct path
for you to install the missing DLL.
Debugger Interface
Debugger Main Window
8. Click OK to load connection in debugger.
NOTE For more information about which connection to load and how to set/reset a
connection, refer to the other sections of this manual.
Microcontrollers Debugger Manual
49
Page 50

Debugger Interface
Debugger Main Window
Window Menu
In this menu, shown in Figure 2.22, you can set the component windows general
arrangement. The Submenu Window > Options is shown in Figure 2.23
Window > Layout in Figure 2.24
Figure 2.22 Window Menu
Figure 2.23 Window Menu Options SubMenu
Figure 2.24 Window Menu Layout SubMenu
.
and the Submenu
50
Table 2.7 specifies the Window Menu entries.
Microcontrollers Debugger Manual
Page 51

Table 2.7 Window Menu Description
Menu entry Description
Cascade Option to arrange all open windows in cascade (so they
overlap).
Debugger Interface
Debugger Main Window
Tile Option to display all open windows in tile format (non
Arrange Icons Arranges icons at the bottom of windows.
Options - Autosize Component windows always fit into the debugger window
Options Component Menu
Layout - Load/Store Option to Load / Store your arrangements from a .HWL file.
NOTE Autosize and Component Menu are checked by default.
Help Menu
This is the Debugger Main window Help menu (Figure 2.25). Table 2.8 shows menu
entries.
Figure 2.25 Help Menu
overlapping).
whenever you modify the debugger window size.
When a component window is selected, the associated menu is
displayed in the main menu. For example if you select the
Source window, the Source menu is displayed in the main
menu.
Table 2.8 Help Menu Description
Menu entry Description
Help Topics Choose Help Topics in the menu for online help or if you need
About Information about the debugger version and copyright, and
Microcontrollers Debugger Manual
specific information about a topic.
license information is displayed.
51
Page 52

Debugger Interface
Component Associated Menus
About Box
Select Help > About to display the About box. The about box lists directories for the
current project, system information, program information, version number and copyright.
It contains information to send for Registration. You can copy this information and send to
license@freescale.com.
For more information on all components, click on the Extended Information button.
Two hypertext links allow you to send an E-mail for a license request or information, and
open the Freescale internet home page.
Click on OK to close this dialog box.
Component Associated Menus
Various Debugger Component windows are shown in Figure 2.3. Each component
window loaded by default or that you have loaded has two menus. One menu is in the
main menu and the other one is a context menu (also called Associated Context Menu) that
you can open by right-clicking in a window component. Note that before right-clicking,
the component window has to be active.
Component Main Menu
This menu, shown in Figure 2.26 is always between the Component entry and the Window
entry of the Debugger main window toolbar. It contains general entries of the current
active component. You can hide this menu by unchecking Window > Options >
Component Menu.
Figure 2.26 Example of Component Main Menu
52
Microcontrollers Debugger Manual
Page 53

Component Associated Menus
Component Files
Each component is a windows file with a .wnd extension
Component Windows Object Info Bar
The object info bar of the debugger window, as shown in Figure 2.27, provides
information about the selected object.
Figure 2.27 Object Info Bar of Debugger Component Windows
Component Context Menu
The context menu is a dynamic context sensitive menu. It contains entries for additional
facilities available in the current component. Depending on the position of the mouse in
the window and what is being pointed to, context menu entries differ.
Debugger Interface
Figure 2.28 Example of Component Context Menu
For example, if you click the mouse on a breakpoint, menu options allow you to delete,
enable, or disable the breakpoint.
Microcontrollers Debugger Manual
53
Page 54

Debugger Interface
Highlights of the User Interface
Highlights of the User Interface
This section describes some of the main features of the Debugger user interface.
Activating Services with Drag and Drop
You can activate services by dragging objects from one component window to another.
This is known as drag and drop, an example is shown in Figure 2.29
Figure 2.29 Drag and Drop Example
When the dragged item is not allowed in the destination to which you are dragging the
item, the following cursor symbol is displayed:
Example:
You can activate the display of coverage information on assembler and C statements by
dragging the chosen procedure name from the Coverage component to the Source and
Assembly components (Figure 2.30
).
.
Figure 2.30 Dragging Procedure Name from Coverage to Source Component Window
You can display the memory layout corresponding to the address held in a register by
dragging the address from the Register Component to the Memory Component.
54
Microcontrollers Debugger Manual
Page 55

Debugger Interface
Highlights of the User Interface
To Drag and Drop an Object
To drag an object from one component window to another:
1. Select the component containing the object you want to drag.
2. Make sure the destination component window where you want to drag the object is
visible.
3. Select the object you want.
4. Press and hold the left mouse button, drag the object into the destination component
window and then release the mouse button.
Drag and Drop Combinations
Dragging and dropping objects is possible between different component windows and are
introduced in each component description section.
See below, the possible combinations of drag and drop between components and
associated actions. When additional components are available, new combinations might
be possible and described in the component’s information manual.
Dragging from Assembly Component Window
Table 2.9 summarizes dragging from the Assembly Component.
Table 2.9 Dragging from the Assembly Component Window
Destination
Component Window
Command Line The Command Line component appends the address of
Memory Dumps memory starting at the selected instruction PC.
Register Loads the destination register with the PC of the selected
Source Source component scrolls up to the source statements
Microcontrollers Debugger Manual
Action
the “pointed to” instruction to the current command.
The PC location is selected in the memory component.
instruction.
and highlights it.
55
Page 56

Debugger Interface
Highlights of the User Interface
Dragging from Data Component Window
Table 2.10 summarizes dragging from the Data Component.
Table 2.10 Dragging from the Data Component Window
Destination
Action
Component Window
Command Line Dragging the name appends the address range of the
variable to the current command in the Command Line
Window. Dragging the value appends the variable value
to the current command in the Command Line Window.
Memory Dumps memory starting at the address where the
selected variable is located. The memory area where the
variable is located is selected in the memory component.
Register Dragging the name loads the destination register with the
Source Dragging the name of a global variable in the source
address of the selected variable. Dragging the value
loads the destination register with the value of the
variable.
window displays the module where the variable is defined
and the source text is searched for the first occurrence of
the variable and highlighted.
NOTE It is not possible to drag an expression defined with the Expression Editor. The
“forbidden” cursor is displayed.
56
Microcontrollers Debugger Manual
Page 57

Dragging from Source Component Window
Table 2.11 summarizes dragging from the Source Component.
Table 2.11 Dragging from the Source Component Window
Debugger Interface
Highlights of the User Interface
Destination Component
Action
Window
Assembly Displays disassembled instructions starting at the first
Register Loads the destination register with the PC of the first
Memory Displays the memory area corresponding with the high
Data A selection in the Source window is considered an
high level language instruction selected. The assembler
instructions corresponding to the selected high level
language instructions are highlighted in the Assembly
component
instruction selected.
level language source code selected. The memory area
corresponding to the selected instructions are grayed in
the memory component.
expression in the Data window, as if it was entered
through the Expression Editor of the Data component.
(See Data Component
and Expression Editor.)
Microcontrollers Debugger Manual
57
Page 58

Debugger Interface
Highlights of the User Interface
Dragging from the Memory Component Window
Table 2.12 summarizes dragging from the Memory Component.
Table 2.12 Dragging from the Memory Component Window
Destination
Action
Component Window
Assembly Displays disassembled instructions starting at the first
Command Line Appends the selected memory range to the Command
Register Loads the destination register with the start address of the
Source Displays high level language source code starting at the
address selected. Instructions corresponding to the
selected memory area are highlighted in the Assembly
component.
Line window.
selected memory block.
first address selected. Instructions corresponding to the
selected memory area are grayed in the source
component.
Dragging from Procedure Component Window
Table 2.13 summarizes dragging from the Procedure Component.
Table 2.13 Dragging from the Procedure Component Window
Destination
Component Window
Data > Local Displays local variables from the selected procedure in
Action
the data component.
58
Source Displays source code of the selected procedure. Current
instruction inside the procedure is highlighted in the
Source component.
Assembly The current assembly statement inside the procedure is
highlighted in the Assembly component.
Dragging from Register Component Window
Table 2.14 summarizes dragging from the Register Component Window.
Microcontrollers Debugger Manual
Page 59

Table 2.14 Dragging from the Register Component Window
Debugger Interface
Highlights of the User Interface
Destination
Action
Component Window
Assembly Assembly component receives an address range, scrolls
Memory Dumps memory starting at the address stored in the
to the corresponding instruction and highlights it.
selected register. The corresponding address is selected
in the memory component.
Dragging from Module Component Window
Table 2.15 summarizes dragging from the Register Component.
Table 2.15 Dragging from the Module Component Window
Destination
Component Window
Data > Global Displays global variables from the selected module in the
Memory Dumps memory starting at the address of the first global
Source Displays source code from selected module.
Action
data component.
variable in the module. The memory area where this
variable is located is selected in the memory component.
Selection Dialog Box
This dialog box is used in the Debugger for opening general components or source files.
You can select the desired item with the arrow keys or mouse and then the OK button to
accept or CANCEL to ignore your choice. The HELP button opens this section in the
Help File.
This dialog box is used for the following selections:
• Set Connection
• Open IO component
• Open Source File
• Open Module
• Individual component window
Microcontrollers Debugger Manual
59
Page 60

Debugger Interface
Highlights of the User Interface
60
Microcontrollers Debugger Manual
Page 61

Debugger Components
This chapter explains how the different components of the Debugger work. This chapter
contains the following sections:
• Component Introduction
• Loading Component Windows
• General Debugger Components
• Visualization Utilities
Component Introduction
The Debugger kernel includes various components.
CPU Components
CPU components handle processor-specific properties such as register naming, instruction
decoding (disassembling), and stack tracing. A specific implementation of the CPU
module must be provided for each processor type that is supported in the debugger. The
CPU-related component is not introduced in this section. However, the Register
component, Memory component, and all other Connection-dependent components reflect
this system component. The appropriate CPU component loads automatically when
loading an application or executable file (.ABS file), therefore it is possible to mix
applications for different MCUs. The Debugger automatically detects the MCU type and
loads the appropriate CPU component, if available on your environment.
3
Window Components
The Debugger main window components are small applications loaded into the debugger
framework at run-time. Window components can access all global facilities of the
debugger engine, such as the connection (to communicate with different connections), and
the symbol table. The Debugger window components are implemented as dynamic link
libraries (DLLs) with extension .WND. These components are introduced in this section.
Microcontrollers Debugger Manual
61
Page 62

Debugger Components
Component Introduction
Connection Components
Different debugger connections are available. For example, you can set a CPU awareness
to simulate your .ABS application files, and also set a background debugger.
Different connections are available to connect the target system (hardware) to the
debugger. For example, the connection may be connected using a Full Chip Simulator, an
Emulator, a ROM monitor, a BDM pod cable, or any other supported device.
NOTE Connection components are introduced in their respective manuals.
Loading Component Windows
In the Debugger Main Window Menu Bar, shown in Figure 3.1, you can use the
Component menu to load all framework components. Each Debugger component you
select appears as a window in the Debugger main window.
Figure 3.1 Debugger Window Menu Bar
62
To open the window that lets you choose one or more components:
1. Choose Component > Open
2. In the Open Window Component window shown in Figure 3.2
component.
NOTE To open more than one component, select multiple components.
Microcontrollers Debugger Manual
, select the desired
Page 63

Figure 3.2 Open Window Component Window
3. In the Open Window Component window, use the mouse to select a component.
4. Click the OK button to open the selected component.
There are three tabs in the Open Window Component window:
•The Icon tab shows components with large icons.
•The List tab shows components with small icons.
•The Details tab shows components with their description.
Debugger Components
Component Introduction
Demo Version Limitations
The demo version limits the number of components you can open at a time. If you use the
demo version, you can open a maximum of eight components.
Microcontrollers Debugger Manual
63
Page 64

Debugger Components
General Debugger Components
General Debugger Components
This section describes the various features and usage of the debugger components.
Assembly Component
The Assembly window, shown in Figure 3.3, displays program code in disassembled
form. It has a function very similar to that of the Source component window but on a much
lower abstraction level. Thus it is therefore possible to view, change, monitor and control
the current location of execution in a program.
Figure 3.3 Assembly Window
64
This window contains all on-line disassembled instructions generated by the loaded
application. Each displayed disassembled line in the window can show the following
information: the address, machine code, instruction and absolute address in case of a
branch instruction. By default, the user can see the instruction and absolute address.
If breakpoints have been set in the application, they are marked in the Assembly
component with a special symbol, depending on the kind of breakpoint.
If execution has stopped, the current position is marked in the Assembly component by
highlighting the corresponding instruction.
The Object Info Bar of the component window contains the procedure name, which
contains the currently selected instruction. When a procedure is double clicked in the
Procedure component, the current assembly statement inside this procedure is highlighted
in the Assembly component.
Microcontrollers Debugger Manual
Page 65

Assembly Menu
The Assembly menu shown in Figure 3.4 contains all functions associated with the
assembly component. Table 3.1
Figure 3.4 Assembly Menu
Table 3.1 Assembly Menu Description
Menu Entry Description
Debugger Components
General Debugger Components
describes these menu entries.
Address Opens a dialog box prompting for an address: Show PC.
Display
Code Displays machine code in front of each disassembled instruction.
Symbolic Displays symbolic names of objects.
Address Displays the location address at the beginning of each disassembled
instruction.
Absolute
Address
Format Select formatting; choose Auto, Hexadecimal, Octal, Binary, Decimal,
Freeze Both the Assembly and Source components can be frozon. These
In a branch instruction, displays the absolute address at the end of
the disassembled instruction.
or Unsigned Decimal
components usually display the code execution from the current PC.
When you freeze these components, they no longer follow the current
PC but are frozen to their current displays.
Microcontrollers Debugger Manual
65
Page 66

Debugger Components
General Debugger Components
Setting Breakpoints
Breakpoints can be set, edited and deleted when using the context menu. Right-click on
any statement in the Source component window, then choose Set Breakpoint, Delete
Breakpoint, etc.
NOTE For information on using breakpoints, see Control Points chapter.
Show PC Dialog Box
If a hexadecimal address is entered in the Show PC dialog box shown in Figure 3.5,
memory contents are interpreted and displayed as assembler instructions starting at the
specified address.
Figure 3.5 Show PC Dialog Box
Associated Context Menu
To open the context menu right-click in the text area of the Assembly component window.
The context menu contains default menu entries for the Assembly component. It also
contains some context dependent menu entries described in Table 3.2
current state of the debugger. Menu contents vary when the DBG module is available.
Figure 3.6 Assembly Context Menu
66
; depending on the
Microcontrollers Debugger Manual
Page 67

Table 3.2 Assembly Context Menu Description
Menu Entry Description
Set Breakpoint Appears only in the context menu if no breakpoint is set or
disabled on the pointed to instruction. When selected, sets a
permanent breakpoint on this instruction. When program
execution reaches this instruction, the program is halted and the
current program state is displayed in all window components.
Debugger Components
General Debugger Components
Delete Breakpoint Appears in context menu if a breakpoint is set or disabled on the
Enable Breakpoint Appears only in context menu if a breakpoint is disabled on an
Disable Breakpoint Appears in the context menu if a breakpoint is set on an
Run To Cursor When selected, sets a temporary breakpoint on a specified
Show Breakpoints Opens the Controlpoints Configuration Window Breakpoints
Show Location When selected, highlights the source statement that generated
Set Markpoint When selected, enables you to set a markpoint at this location.
Delete Markpoint Appears in the Context Menu only if a markpoint is set at the
specified instruction. When selected, deletes this breakpoint.
instruction. When selected, enables this breakpoint.
instruction. When selected, disables this breakpoint.
instruction and continues execution of the program. Disabling a
permanent breakpoint at this position disables the temporary
breakpoint as well and does not halt the program. Temporary
breakpoints are automatically removed when they are reached.
Tab and displays list of breakpoints defined in the application
(refer to Control Points
the pointed to assembler instruction. The assembler instruction
is also highlighted. The memory range corresponding to this
assembler instruction is also highlighted in the memory
component.
nearest code position (visible with marks). When selected,
disables this markpoint.
).
Show Markpoints Opens the Controlpoints Configuration Window Markpoints Tab
Address For a description of the remaining context menu entries see
Microcontrollers Debugger Manual
and displays list of markpoints defined in the application (refer to
Control Points
Table 3.1
).
.
67
Page 68

Debugger Components
General Debugger Components
Retrieving Source Statement
• Point to an instruction in the Assembly component window, drag and drop it into the
Source component window. The Source component window scrolls to the source
statement generating this assembly instruction and highlights it.
• Left clicking the mouse and clicking the L key Highlights a code range in the
Assembly component window corresponding to the first line of code selected in the
Source component window where the operation is performed. This line or code range
is also highlighted.
Drag Out
Table 3.3 shows the drag actions possible from the Assembly component.
Table 3.3 Assembly Component Drag Actions
Destination Component
Window
Command Line The Command Line component appends the address of
Memory Dumps memory starting at the selected instruction PC.
Register Loads the destination register with the PC of the
Source Source component scrolls to the source statements and
Action
the pointed to instruction to the current command.
The PC location is selected in the memory component.
selected instruction.
highlights it.
Drop Into
Table 3.4 shows the drop actions possible in the Assembly component
68
Microcontrollers Debugger Manual
Page 69

Table 3.4 Drop Into Assembly Component
Debugger Components
General Debugger Components
Source Component
Action
Window
Source Displays disassembled instructions starting at the first high
Memory Displays disassembled instructions starting at the first
Register Displays disassembled instructions starting at the address
Procedure The current assembly statement inside the procedure is
level language instruction selected. The assembler
instructions corresponding to the selected high level
language instructions are highlighted in the Assembly
component
address selected. Instructions corresponding to the
selected memory area are highlighted in the Assembly
component.
stored in the source register. The instruction starting at the
address stored in the register is highlighted.
highlighted in the Assembly component.
Demo Version Limitations
No limitation
Associated Commands
Following commands are associated with the Assembly component:
ATTRIBUTES
, SMEM, SPC.
Command Line Component
The Command Line window shown in Figure 3.7 interprets and executes all Debugger
commands and functions. The command entry always occurs in the last line of the
Command component. Characters can be input or pasted on the edit line.
Figure 3.7 Command Line Window
Microcontrollers Debugger Manual
69
Page 70

Debugger Components
General Debugger Components
Keying In Commands
You can type Debugger commands after the in> terminal prompt in the Command Line
Component window.
Recalling a Line from the Command Line History
To recall a command in the DOS window use either the up or down arrow, or the F3
function key, to retype the previous command.
Scrolling the Command Component Window Content
Use the left and right arrow keys to move the cursor on the line, the HOME key to move
the cursor to the beginning of the line, or the END key to move the cursor to the end of the
line. To scroll a page, use the PgDn (scroll down a page) or PgUp keys (scroll up a page).
Clearing the Line or a Character of the Command Line
Selected text can be deleted by pressing the left arrow. To clear the current line, press the
ESC key.
Command Interpretation
The component executes the command entered and displays results or error messages, if
any. Ten previous commands can be recalled using the up arrow key to scroll up or the
down arrow key to scroll down. Commands are displayed in blue. Prompts and command
responses are displayed in black. Error messages are displayed in red.
When a command is executed and running from the Command Line component, the
component cannot be closed. In this case, if the Command Line component is closed with
the window close button (X) or with the Close entry of the system menu, the following
message is displayed:
Command Component is busy. Closing will be delayed
The Command Line component is closed as soon as command execution is complete. If
the CLOSE
another Command Line component), the component is closed as soon as command
execution is finished.
command is applied to this Command Line component (for example, from
70
Variable Checking in the Command Line
When specifying a single name as an expression in the command line, this expression is
first checked as a local variable in the current procedure. If not found, it is checked as a
global variable in the current module. If not found, it is checked as a global variable in the
application. If not found, it is checked as a function in the current module. If not found, it
is checked as a function in the application, finally if not found an error is generated.
Microcontrollers Debugger Manual
Page 71

Closing the Command Line During Execution
When a command is executed from a Command Line component, it cannot be closed. If
the Command Line component is closed with the close button or with the 'Close' entry of
the system menu, the following message is displayed 'Command Component is
busy. Closing will be delayed' and the Command component is closed as
soon as command execution is complete. If the 'Close' command is applied to this
Command component, the Command component is closed as soon as command execution
is complete.
Command Menu
Figure 3.8 shows the Command menu, which is identical to the Command Context menu.
Figure 3.8 Command Menu
Clicking Execute File opens a dialog box where you can select a file containing Debugger
commands to be executed. These files generally have a .cmd extension by default.
Selected text in the Command Line window can be copied to the clipboard by:
• Selecting the menu entry Command > Copy.
• Pressing the CTRL + C key.
Debugger Components
General Debugger Components
• Clicking the button in the toolbar.
The Command > Copy menu entry and the button are only enabled if something is
selected in the Command Line window.
The first line of text contained in the clipboard can be pasted where the caret is blinking
(end of current line) by:
• Selecting the menu entry Command > Paste
• Pressing CTRL + V simultaneously.
• Clicking the icon in the toolbar.
Microcontrollers Debugger Manual
71
Page 72

Debugger Components
General Debugger Components
Cache Size
Select Cache Size in the menu to bring up the Size of the Cache dialog box and set the
cache size in lines for the Command Line window, as shown in Figure 3.9
Figure 3.9 Cache Size Dialog Box
This Cache Size dialog box is the same for the Terminal Component and the TestTerm
Component.
Drag Out
Nothing can be dragged out.
Drop Into
Memory range, address, and value can be dropped into the Command Line Component
window, as described in Table 3.5
items of the current command.
.
. The command line component appends corresponding
Table 3.5 Drop Into Command Component
Source Component
Window
Assembly The Command Line component appends the address of the
Data Dragging the name appends the address range of the
Memory Appends the selected memory range to the Command Line
Register The address stored in the pointed to register is appended to
72
Action
pointed to instruction to the current command.
variable to the current command in the Command Line
Window. Dragging the value appends the variable value to
the current command in the Command Line Window.
window.
the current command.
Microcontrollers Debugger Manual
Page 73

Debugger Components
General Debugger Components
Demo Version Limitations
Only 20 commands can be entered and then command component is closed and it is no
longer possible to open a new one in the same Debugger session.
Command files with more than 20 commands cannot be executed.
Associated Commands
BD, CF, E, HELP, NB, LS, SREC, SAVE.
NOTE For more details about commands, refer to Debugger Engine Commands.
Coverage Component
The Coverage window, shown in Figure 3.10 contains source modules and procedure
names as well as percentage values representing the proportion of executed code in a
given source module or procedure.
NOTE In cases of advanced code optimizations (like linker overlapping ROM/code
areas) the coverage output/data is affected. In such a case, it is recommended to
switch linker optimizations.
Figure 3.10 Coverage Window
The Coverage window contains percentage numbers and graphic bars. From this
component, you can split views in the Source window and Assembly window, as shown in
Figure 3.11
that has been executed. Split views are removed when the Coverage window is closed or
by selecting Delete in the split view context menu.
Microcontrollers Debugger Manual
. A red check mark is displayed in front of each source or assembler instruction
73
Page 74

Debugger Components
General Debugger Components
Figure 3.11 Split Views
Coverage Operations
Click the folded/unfolded icons to unfold/fold the source module and display/hide
the functions defined.
Coverage Menu
The Coverage menu and submenus are shown in Figure 3.12.
Figure 3.12 Coverage Menu
Table 3.6 Coverage Menu Description
Menu Entry Description
Reset Resets all simulator statistic information.
Details Opens a split view in the chosen component (Source or Assembly).
Graphics Toggles the graphic bars.
Timer Update Switches the periodic update on/off. If activated, statistics are
updated each second.
Output File Opens the Output File options.
74
Microcontrollers Debugger Manual
Page 75

Output File
You can redirect Coverage component results to an output file by selecting Output File >
Save As in the menu or context menu.
Output File Filter
Select Output Filter to display the dialog box shown in Figure 3.13. Select what you want
to display, i.e. modules only, modules and functions, or modules, functions and code lines.
You can also specify a range of coverage to be logged in your file.
Figure 3.13 Output File Filter Dialog Box
Debugger Components
General Debugger Components
Output File Save
The Save As entry opens a Save As dialog box where you can specify the output file name
and location, an example is shown in Listing 3.1
Listing 3.1 Example Output File with Modules and Functions:
-----------------------------------------------------------Coverage: Item:
------------------------------------------------------------
94.4 % Application
FULL fibo.c
FULL Fibonacci()
FULL main()
86.0 % startup.c
80.5 % Init()
FULL _Startup()
Microcontrollers Debugger Manual
.
75
Page 76

Debugger Components
General Debugger Components
Split View Associated Context Menu
The context menu for the split view (Figure 3.14) contains the Delete entry, which is used
to remove the split view.
Figure 3.14 Coverage Split View Associated Context Menu
Drag Out
All displayed items can be dragged into a Source or Assembly component. Destination
component displays marks in front of the executed source or assembler instruction.
Drop Into
Nothing can be dropped into the Coverage Component window.
Demo Version Limitations
Only modules are displayed and the Save function is disabled.
Associated Commands
DETAILS, FILTER, GRAPHICS, OUTPUT, RESET, TUPDATE
DA-C Link Component
The DA-C Link window shown in Figure 3.15 is an interface module between the DA-C
(Development Assistant for C - from RistanCASE GmbH) and the IDE, allowing
synchronized debugging features.
Figure 3.15 DA-C Link Window
76
Microcontrollers Debugger Manual
Page 77

DA-C Link Operation
When you load the DA-C Link component, communication is established with DA-C (if
open) in order to exchange synchronization information.
The Setup entry of the DA-C Link main menu allows you to define the connection
parameters.
NOTE For related information refer to the Chapter Synchronized Debugging Through
DA-C IDE.
DA-C Link Menu
Selecting Setup from the DA-C Link menu opens the Connection Specification dialog
box.
Figure 3.16 DA-C Link Menu
Table 3.7 DA-C Link Menu Description
Debugger Components
General Debugger Components
Menu Entry Description
Setup Opens the Connection Specification dialog box.
Microcontrollers Debugger Manual
77
Page 78

Debugger Components
General Debugger Components
Connection Specification Dialog Box
In the Connection Specification dialog box you can set the DA-C debugger name.
Figure 3.17 Connection Specification Dialog Box
The DA-C debugger name must be the same as the one selected in the DA-C IDE. Check
the Show Protocol checkbox to display the communication protocol in the Command
component of the Debugger. To validate the settings, click the OK button. A new
connection is established and the Connection Specification is saved in the current
Project.ini file. The HELP button opens the help topic for this dialog box.
NOTE If problems exist, refer to the Troubleshooting section in the DA-C
documentation.
78
Drag Out
Nothing can be dragged out.
Drop Into
Nothing can be dropped into the DAC Component window.
Demo Version Limitations
None.
Microcontrollers Debugger Manual
Page 79

Data Component
The Data window shown in Figure 3.18 contains the names, values and types of global or
local variables.
Figure 3.18 Data Window
The Data window shows all variables present in the current source module or procedure.
Changed values are in red.
The Component Windows Object Info Bar
variable. It also contains the module name or procedure name where the displayed
variables are defined, the display mode (automatic, locked, etc.), the display format
(symbolic, hex, bin, etc.), and current scope (global, local or user variables).
Various display formats, such as symbolic representation (depending on variable types),
and hexadecimal, octal, binary, signed and unsigned formats may be selected.
Structures can be expanded to display their member fields and pointers can be traversed to
display data they are pointing to.
Watchpoints can be set in this component. Refer to Control Points
Debugger Components
General Debugger Components
contains the address and size of the selected
chapter.
Data Operations
• Double-click a variable line to edit the value.
• Click the folded/unfolded icons to unfold/fold the structured variable.
• Double-click a blank line: Opens the Expression editor to insert an expression in the
Data Component window.
• Select a variable in the Data component, and left mouse button + R key to set a Read
watchpoint on the selected variable. A green vertical bar is displayed on the left side
of the variables on which a read watchpoint has been defined. If a read access on the
variable is detected during execution, the program is halted and the current program
state is displayed in all window components.
Microcontrollers Debugger Manual
79
Page 80

Debugger Components
General Debugger Components
• Select a variable in the Data component, and left mouse button + W key to set a
Write watchpoint on the selected variable. A red vertical bar is displayed on the left
side of the variables on which a write watchpoint has been defined. If write access is
detected on the variable during execution, the program is halted and the current
program state is displayed in all window components.
• Select a variable in the Data component, and left mouse button + B key to set a Read/
Write watchpoint on the selected variable. A yellow vertical bar is displayed for the
variables on which a read/write watchpoint has been defined. If the variable is
accessed during execution, the program is halted and the current program state is
displayed in all window components.
• Select a variable on which a watchpoint was previously defined in the Data
component, and left mouse button + D key to delete the watchpoint on the selected
variable. The vertical bar previously displayed for the variables is removed.
• Select a variable in the Data component, and left mouse button + S key to set a
watchpoint on the selected variable. The Watchpoints Setting dialog box opens. A
gray vertical bar displays for the variables on which an watchpoint has been defined.
Expression Editor
To add your own expression (in EBNF notation) double-click a blank line in the Data
component window to open the Edit Expression dialog box shown in Figure 3.19
point to a blank line as shown below and right-click to select Add Expression in the
context menu shown in the figure below.
You may enter a logical or numerical expression in the edit box, using the Ansi-C syntax.
In general, this expression is a function of one or several variables from the current Data
component window.
, or
Figure 3.19 Edit Expression Dialog Box
80
Microcontrollers Debugger Manual
Page 81

Debugger Components
General Debugger Components
Example:
With two variables variable_1, variable_2;
expression entered: (variable_1<<variable_2)+ 0xFF) <= 0x1000 results in a boolean
type.
expression entered: (variable_1>>~variable_2)* 0x1000 results in an integer type.
NOTE It is not possible to drag an expression defined with the Expression Editor. The
forbidden cursor is displayed.
Expression Command file
The Expression Command file is automatically generated when a new application is
loaded or exiting from the Debugger. User defined expressions are stored in this command
file. The name of the expression command file is the name of the application with a .xpr
extension (.XPR file). When loading a new user application, the debugger executes the
matching expression command file to load the user defined expression into the data
component.
Example: When loading fibo.abs, the debugger executes Fibo.xpr
Data Menu
Figure 3.20 shows the Data component menu, the Zoom submenu is shown in Figure 3.29,
the Scope submenu is shown in Figure 3.21
submenu in Figure 3.24
submenus in Figure 3.29
Figure 3.20 Data Menu
Microcontrollers Debugger Manual
, the Format submenu in Figure 3.22, the Mode
, the Options submenu in Figure 3.26 and the Zoom and Sort
. Table 3.8 describes the Data Menu entries.
81
Page 82

Debugger Components
General Debugger Components
Table 3.8 Data Menu Entry Description
Menu Entry Description
Zoom Zooms in or out of the selected structure. The member field of
the structure replaces the variable list.
Scope Opens a variable display submenu.
Format Symb, Hex (hexadecimal), Oct (octal), Bin (binary), Dec (signed
Mode Switches between Automatic, Periodical, Locked, and Frozen
Options Opens an options menu for data, for example, Pointer as Array
Scope Submenu
The Scope Submenu is activated by highlighting the Scope entry on the Data menu:
Figure 3.21 Scope Submenu
Table 3.9
Table 3.9 Scope Submenu Entries
describes the Scope submenu entries.
Menu Entry Description
Global Switches to Global variable display in the Data component.
Local Switches to Local variable display in the Data component.
decimal), UDec (unsigned decimal) display format.
update mode.
facility.
82
User Switches to User variable display in the Data component.
Displays user defined expression (variables are erased).
NOTE If the data component mode is not automatic, entries are grayed (because it is
not allowed to change the scope).
Microcontrollers Debugger Manual
Page 83

In Local Scope, if the Data component is in Locked or Periodical mode, values of the
displayed local variables may be invalid (since these variables are no longer defined in the
stack).
Format Submenu
The Format Submenu is activated by highlighting the format entry on the Data menu:
Figure 3.22 Format Submenu
Table 3.10 describes the Format submenu entries.
Table 3.10 Format Submenu Entries
Menu Entry Description
Selected Applies changes to the selection only
All Applies changes to all items
Debugger Components
General Debugger Components
Format Selected and All Sub Menu
The Format Selected and All submenu is activated by highlighting this entry on the Data
Component menu:
Figure 3.23 Format Selected and All Submenus
Table 3.11
Microcontrollers Debugger Manual
describes the Format Selected Mode and Format All Mode Submenu entries.
83
Page 84

Debugger Components
General Debugger Components
Table 3.11 Format Selected and All Submenu
Menu entry Description
Symbolic Select the Symbolic (display format depends on the variable
type) display format. This is the default display.
Hex Select the hexadecimal data display format
Bin Select the binary data display format
Oct Select the octal data display format
Dec Select the signed decimal data display format
UDec Select the unsigned decimal data display format
Bit Reverse Select the bit reverse data display format (each bit is reversed).
Mode Submenu
The Mode Submenu is activated by highlighting the Mode entry on the Data menu:
Figure 3.24 Mode Submenu
Table 3.12 describes the Mode submenu entries.
Table 3.12 Mode Submenu
Menu Entry Description
Automatic Switches to Automatic mode (default); variables are updated
Periodical Switches to Periodical mode; variables are updated at regular
84
when the connection is stopped. Variables from the currently
executed module or procedure are displayed in the data
component.
time intervals when the connection is running. The default
update rate is 1 second, but can be modified by steps of up to
100 ms using the associated dialog box (see below).
Microcontrollers Debugger Manual
Page 85

Debugger Components
General Debugger Components
Table 3.12 Mode Submenu (
Menu Entry Description
Locked Switches to Locked mode; value from variables displayed in the
Frozen Switches to Frozen mode; value from variables displayed in the
NOTE In Locked and Frozen mode, variables from a specific module are displayed in
continued
the data component. The same variables are always displayed in the data
component.
Update Rate Dialog Box
The Update Rate dialog box shown in Figure 3.25 allows you to modify the default update
rate using steps of 100 ms.
Figure 3.25 Update Rate Dialog Box
)
data component are updated when the connection is stopped.
data component are not updated when the connection is
stopped.
Options Submenu
The Options submenu is activated by highlighting the Options entry on the Data menu:
Figure 3.26 Options Submenu
Microcontrollers Debugger Manual
85
Page 86

Debugger Components
General Debugger Components
Pointer as Array Option
In the Data menu’s Options submenu, choose Options > Pointer as Array to open the
dialog box shown in Figure 3.27
Figure 3.27 Pointer as Array Dialog Box
Within this dialog box, you can display pointers as arrays, assuming that the pointer points
to the first item (pointer[0]). Note that this setup is valid for all pointers displayed in the
Data window. Check the Display Pointer as Array checkbox and set the number of items
that you want to be displayed as array items.
Name Width Option
In the Data Menu’s Options submenu, choose Options > Name Width to open the dialog
box shown in Figure 3.28
Figure 3.28 Edit Name Width Dialog Box
.
.
This dialog box allows you to adjust the width of the variable name displayed in the Data
window. This string is cut off if longer than 16 characters. Thus, by enlarging the value
you can adapt the window to longer names.
Zoom and Sort Submenus
Figure 3.29 Zoom and Sort Submenus
86
Microcontrollers Debugger Manual
Page 87

Associated Context Menu
This section describes the context menus associated with each debug component. Menu
contents vary when the DBG module is available.
Figure 3.30 Data Context Menu
Debugger Components
General Debugger Components
Table 3.13
describes the Data Context Menu entries.
Table 3.13 Data Context Menu
Menu Entry Description
Open Module Opens the Open Module dialog box.
Set
Watchpoint
Delete
Watchpoint
Enable
Watchpoint
Disable
Breakpoint
Appears only in the context menu if no watchpoint is set or disabled on
the pointed to variable. When selected, sets a read/write watchpoint on
this variable. A yellow vertical bar is displayed for the variables on
which a read/write watchpoint has been defined. If the variable is
accessed during execution, the program is halted and the current
program state is displayed in all window components.
Appears only in the context menu if a watchpoint is set or disabled on
the pointed to variable. When selected, deletes this watchpoint.
Appears only in the context menu if a watchpoint is disabled on the
pointed to variable. When selected, enables this watchpoint.
Appears only in the context menu if a breakpoint is set on the pointed to
instruction. When selected, disables this watchpoint.
Microcontrollers Debugger Manual
87
Page 88

Debugger Components
General Debugger Components
Table 3.13 Data Context Menu (
continued
Menu Entry Description
Show
Watchpoints
Show
location
Opens the Watchpoints Setting dialog box and allows you to view the
list of watchpoints defined in the application. (Refer to Control Points
Forces all open components to display information about the pointed to
variable (e.g., the Memory component selects the memory range where
the variable is located).
SUBMENU Open Module
The dialog box shown in Figure 3.31 lists all source files bound to the application. Global
variables from the selected module are displayed in the data component. This is only
supported when the component is in Global scope mode.
Figure 3.31 Open Modules Dialog Box
)
.)
Drag Out
Table 3.14 describes the drag actions possible from the Data component.
Table 3.14 Dragging Data Possibilities
Destination
Component Window
Command Line Dragging the name appends the address of the variable to
Memory Dumps memory starting at the address where the selected
88
Action
the current command in the Command Line Window.
Dragging the value appends the variable value to the
current command in the Command Line Window.
variable is located. The memory area where the variable is
located is selected in the memory component.
Microcontrollers Debugger Manual
Page 89

Debugger Components
General Debugger Components
Table 3.14 Dragging Data Possibilities (
Destination
Component Window
Source Dragging the name of a global variable in the source
Register Dragging the name loads the destination register with the
NOTE It is important to distinguish between dragging a variable name and dragging a
variable value. Both operations are possible. Dragging the name drags the
address of the variable. Dragging the variable value drags the value.
NOTE Expressions are evaluated at run time. They do not have a location address, so
you cannot drag an expression name into another component. Values of
expressions can be dragged to other components.
Drop Into
Table 3.15 describes the drop actions possible in the Data component.
continued
)
Action
Window displays the module where the variable is defined
and highlights the first occurrence of the variable.
address of the selected variable. Dragging the value loads
the destination register with the value of the variable.
Table 3.15 Data Drop Possibilities
Source Component
Window
Source A selection in the Source window is considered an
Module Displays the global variables from the selected module in
Demo Version Limitations
Only two variables can be displayed.
Only two members of a structure are visible when unfolded.
Only one expression can be defined.
Microcontrollers Debugger Manual
Action
expression in the Data window, as if it was entered through
the Expression Editor of the Data component. Refer to Data
Component, Expression Editor.
the data component.
89
Page 90

Debugger Components
General Debugger Components
Associated Commands
ADDXPR, ATTRIBUTES, DUMP, PTRARRAY, SMOD, SPROC, UPDATERATE,
.
ZOOM
Memory Component
The Memory window shown in Figure 3.32 displays unstructured memory content or
memory dump, that is continuous memory words without distinction between variables.
Figure 3.32 Memory Window
Various data formats (byte, word, double) and data displays (hexadecimal, binary, octal,
decimal, unsigned decimal) can be specified for display and editing of memory content.
Watchpoints can be defined in this component.
90
NOTE Refer to Control Points for more information about watchpoints.
Memory areas can be initialized with a fill pattern using the Fill Memory box.
An ASCII dump can be added/removed on the right side of the numerical dump when
checking/unchecking ASCII in the Display menu entry.
The location address may also be added/removed on the left side of the numerical dump
when checking/unchecking Address in the Display menu entry.
To specify the start address for the memory dump use the Address menu entry.
The Component Windows Object Info Bar
structure field and memory range matching the first selected memory word.
"uu" memory value means: not initialized.
"pp" memory value means: protected from being read, or protected from being read and
written.
"rr" memory value means: not accessible because the hardware is running.
"--" memory values mean: not configured (no memory available)
contains the procedure or variable name,
Microcontrollers Debugger Manual
Page 91

General Debugger Components
NOTE Memory values that have changed since the last refresh status are displayed in
red. However, if a memory item is edited or rewritten with the same value, the
display for this memory item remains black.
Memory Address Spaces
Some devices might have one or more additional address spaces, and the Memory window
can display the different address spaces when selecting the Address Space menu entry.
When several address spaces are available, address numbers on the left side of the window
‘
are extended with the “
TIP HCS08 devices with Memory Management Unit (MMU) have two address spaces.
The Paged address space covers regular, that is, physical/local and logical displays
(see Banked/Window Paged Memory: Physical/Local vs. Logical display for
further details). The Flash address space covers the Extended Address range
(covering the Flash memory as one single linear range), as accessed by the Linear
Address Space Pointer of the chip MMU.
Figure 3.33 HCS08 device with MMU Address Space selection
” sign and the space letter, to avoid confusion.
Debugger Components
Microcontrollers Debugger Manual
91
Page 92

Debugger Components
General Debugger Components
Banked/Window Paged Memory: Physical/Local
vs. Logical display
This section applies only to devices having on-chip program pages or data pages. For
Legacy reasons, the debugger provides two ways to display the banked/window paged
memory, such as the PPAGE window $8000-$BFFF range with HCS08 devices with onchip MMU, or EEPROM windows bit selectable:
• The default display is called the physical display in the Debugging Memory Map
(DMM) interface. It is sometimes called the local display in device specifications
and matches exactly what the CPU “sees” for silicon memory. This means that what
is displayed in the Memory window at a specific suspended time (debugger halted)
matches the current setup of Page registers (like PPAGE) or selection bit like
EPGSEL for EEPROM, etc. Changing the page registers or selection bit and then
refreshing the Memory window immediately shows changes in the window range.
• The logical display gives a constant Memory view at a specific address. For example,
if we define, in a window address range, the concatenation of PPAGE<<16 added
with the physical/local address, we obtain a 24-bit address that does not represent
anything for the CPU, but that is directly readable by the user in the Memory
window.
By default, for 8/16-bit devices, the debugger displays memory addresses above address
0xFFFF as logical. These addresses do not represent actual addresses anymore, but are
still required by the debugger to synchronize the program flow display and data accesses
within all windows.
The debugger defines page range accessibility in the DMM interface. Also, for 8/16-bit
devices, in the physical/local $0000-$FFFF, the window ranges can be also defined as
logical in the DMM interface, to make them constant at display. For example, the range
$8000-$BFFF program window can be changed from physical to paged (also EEPROM
paged for paged EEPROM) in the DMM graphical user interface, and the debugger no
longer displays what the CPU “sees”, but always displays PPAGE $00 when looking at
addresses in the $008000-$00BFFF range.
The debugger provides by default a mixed display, that can be quickly changed when
editing the module setup in the DMM interface. Refer to Debugging Memory Map
further details.
for
92
Memory Operations
• Double-click a memory position to edit it. If the memory is not initialized, this
operation is not possible.
• Drag the mouse in the memory dump to select a memory range.
Microcontrollers Debugger Manual
Page 93

Debugger Components
General Debugger Components
• Hold down the left mouse button + A key to jump to a memory address. The pointed
to value is interpreted as an address and the memory component dumps memory
starting at this address.
• Select a memory range, and hold down the left mouse button + R key to set a Read
watchpoint for the selected memory area. Memory ranges where a read watchpoint
has been defined are underlined in green. If read access on the memory area is
detected during execution, the program is halted and the current program state is
displayed in all window components.
• Select a memory range, and hold down the left mouse button + W key to set a Write
watchpoint on the selected memory area. Memory ranges where a write watchpoint
has been defined are underlined in red. If write access on the memory area is detected
during execution, the program is halted and the current program state is displayed in
all window components.
• Select a memory range, and hold down the left mouse button + B key to set a Read/
Write watchpoint on the selected memory area. Memory ranges where a read/write
watchpoint has been defined are underlined in black. If the memory area is exceeded
during execution, the program is halted and the current program state is displayed in
all window components.
• Select a memory range on which a watchpoint was previously defined, and hold
down the left mouse button + D key to delete the watchpoint on the selected memory
area. The memory area is no longer underlined.
• Select a memory range, and hold down the left mouse button + S key to set a
watchpoint on the selected memory area. The Watchpoints Setting dialog box is
opened. Memory ranges where a watchpoint has been defined are underlined in
black.
Memory Menu
The Memory Menu shown in Figure 3.34 provides access to memory commands. Table
3.16 describes the menu entries.
Figure 3.34 Memory Menu
Microcontrollers Debugger Manual
93
Page 94

Debugger Components
General Debugger Components
Table 3.16 Memory Menu Description
Menu Entry Description
Word size Opens a submenu to specify the display unit size.
Format Opens a submenu to select the format to display items.
Mode Opens a submenu to choose the update mode.
Display Opens a submenu to toggle the display of addresses and ASCII
dump.
Fill Opens the Fill Memory
Address Opens the memory dialog box and prompts for an address.
CopyMem Opens the CopyMem dialog box that allows you to copy memory
Search Pattern Opens the Search Pattern dialog box.
range values to a specific location.
Word Size Submenu
With the Word Size submenu shown in Figure 3.35, you can set the memory display unit.
Table 3.17
Figure 3.35 Word Size Submenu
Table 3.17 Word Size Submenu Description
Menu Entry Description
Byte Sets display unit to byte size.
Word Sets display unit to word size (=2 bytes).
describes the menu entries.
to fill a memory range with a bit pattern.
94
Lword Sets display unit to Lword size (=4 bytes).
Microcontrollers Debugger Manual
Page 95

Format Submenu
With the Format Submenu shown in Figure 3.36, you can set the memory display format.
Table 3.18
Figure 3.36 Format Submenu
Table 3.18 Format Submenu Description
Menu Entry Description
Hex Selects the hexadecimal memory display format
Bin Selects the binary memory display format
Oct Selects the octal memory display format
describes the menu entries.
Debugger Components
General Debugger Components
Dec Selects the signed decimal memory display format
UDec Selects the unsigned decimal memory display format
Bit Reverse Selects the bit reverse memory display format (each bit is reversed).
Mode Submenu
With the Mode submenu shown in Figure 3.37, you can set the memory mode format.
Table 3.19
Figure 3.37 Mode Submenu
Microcontrollers Debugger Manual
describes the menu entries.
95
Page 96

Debugger Components
General Debugger Components
Table 3.19 Mode Submenu Description
Menu Entry Description
Automatic Selects Automatic mode (default), memory dump is updated when
the connection is stopped.
Periodical Selects the Periodical mode, memory dump is updated at regular
Frozen Selects the Frozen mode, memory dump displayed in the memory
time intervals when the connection is running. The default update rate
is 1 second, but it can be modified by steps of up to 100 ms using the
associated dialog box (see below).
component is not updated when the connection is stopped.
Display Submenu
With the Display submenu shown in Figure 3.38, you can set the memory display
(address/ASCII). Table 3.20
Figure 3.38 Display Submenu
Table 3.20 Display Submenu Description
Menu Entry Description
Address Allows you to toggle the display of address dump.
ASCII Allows you to toggle the display of ASCII dump.
describes the menu entries.
96
Microcontrollers Debugger Manual
Page 97

Fill Memory
The Fill Memory dialog box shown in Figure 3.39 allows you to fill a memory range
(from Address edit box and to Address edit box) with a bit pattern (value edit box).
Figure 3.39 Fill Memory dialog box
NOTE If Hex Format is checked, numbers and letters are interpreted as hexadecimal
numbers. Otherwise, type expressions and prefix Hex numbers with 0x or $.
Debugger Components
General Debugger Components
Display Address
With the Display Address dialog box, shown in Figure 3.40, the memory component
dumps memory starting at the specified address.
Figure 3.40 Display Address Dialog Box
NOTE The Show PC dialog box is the same as the Display Address dialog box. In this
dialog box, the Assembly component dumps assembly code starting at the
specified address.
Microcontrollers Debugger Manual
97
Page 98

Debugger Components
General Debugger Components
CopyMem Submenu
The CopyMem dialog box shown in Figure 3.41 allows you to copy a memory range to a
specific address.
Figure 3.41 CopyMem Dialog Box
To copy a memory range to a specific address, enter the source range and the destination
address. Press the OK button to copy the specified memory range. Press the Cancel
button to close the dialog box without changes. Press the Help button to open the help file
associated with this dialog box.
If Hex Format is checked, all given values are in Hexadecimal Format. You don't need to
add 0x. For instance, type 1000 instead of 0x1000.
NOTE If you try to read or write to an unauthorized memory address, an error dialog
box appears.
Search Pattern
The Search Pattern dialog box shown in Figure 3.42 allows you to search memory or a
memory range for a specific expression.
Figure 3.42 Search Pattern Dialog Box
98
Microcontrollers Debugger Manual
Page 99

Refresh
Select the Refresh menu entry to refresh the Memory window current data cache. The
debugger refreshes the data cache as if the debugger was halted or stepped.
Note that only memory ranges defined with the Refresh memory when halting option in
the Debugging Memory Map (DMM) interface are refreshed. The Refresh menu entry
addresses, by DMM factory setup, the volatile memory, i.e. the RAM and on-chip I/O
Registers.
TIP To refresh other memory ranges, either set the Refresh memory when halting
option for wanted ranges in the DMM dialog, or type/enter the DMM
RELEASECACHES command in the Command window. You can disable caching
for the debug session when typing/entering the DMM CACHINGOFF command in
the Command window.
Update Rate
This dialog box, shown in Figure 3.43, allows you to modify the update rate in steps of
100ms.
Figure 3.43 Update Rate Dialog Box
Debugger Components
General Debugger Components
NOTE Periodical mode is not available for all hardware connections or some
additional configuration may be required in order to make it work.
When you check the Refresh memory periodically when halted checkbox, the debugger
keeps on refreshing caches even when it is not running. This allows you to see I/O
Register changes even if the CPU is not running.
Microcontrollers Debugger Manual
99
Page 100

Debugger Components
General Debugger Components
Memory Context Menu
The Memory Context menu allows you to execute memory associated commands. Figure
3.44 shows the Memory Context menu and Table 3.21 describes the menu entries. Menu
contents vary when the DBG module is available.
Figure 3.44 Memory Context Menu
Table 3.21
explains the menu entries in the Memory Context menu.
Table 3.21 Memory Context Menu Description
Menu Entry Description
Set Watchpoint Appears in the context menu only if no watchpoint is set or disabled
Delete
Watchpoint
on the selected memory range. When selected, sets a Read/Write
watchpoint at this memory area. Memory ranges where a read/write
watchpoint has been defined are underlined in yellow. If the memory
area is accessed during execution of the application, the program is
halted and the current program state is displayed in all window
components.
Appears in the context menu only if a watchpoint is set or disabled
on the selected memory range. When selected, deletes this
watchpoint.
100
Microcontrollers Debugger Manual
 Loading...