

Page 1
R8100 SERIES
COMMUNICATIONS SYSTEM ANALYZER
OPERATOR’S MANUAL
Documentation for firmware version 2.0.0.0
Freedom Communication Technologies
2002 Synergy Blvd. Suite 200
Kilgore Texas 75662 USA
Tel/Fax: +1-844-903-7333
Freedom Communication Technologies 2015
All Rights Reserved
FCT-1365
Printed in U.S.A
Page 2

Table of Contents
Topic Page
LIMITED WARRANTY ............................................................................................................................................. 11
SOFTWARE LICENSE AGREEMENT ................................................................................................................. 12
1 PRE-OPERATION OVERVIEW ............................................................................................................... 13
1.1 SCOPE OF MANUAL ..................................................................................................................... 13
1.2 SAFETY SUMMARY ....................................................................................................................... 13
1.2.1 Analyzer Grounding ...................................................................................... 13
1.2.2 Unit is Live When Plugged In ....................................................................... 13
1.2.3 Keep Away From Live Circuits ..................................................................... 13
1.2.4 Explosive Atmosphere .................................................................................. 13
1.3 WARNINGS AND CAUTIONS ................................................................................................... 14
1.3.1 Analyzer Operating Voltage .......................................................................... 14
1.3.2 DC Power Source ......................................................................................... 14
1.3.3 Maximum Meter In Voltages ......................................................................... 14
1.3.4 Replacement Fuses ........................................................................................ 15
1.3.5 Other Cautions ............................................................................................. 15
1.3.6 User Maintenance of exterior surfaces ........................................................... 15
1.4 SERVICE ............................................................................................................................................ 16
1.5 REPLACEMENT PARTS ORDERS ............................................................................................ 16
1.6 INSTALLATION .............................................................................................................................. 16
1.6.1 Packing ......................................................................................................... 16
1.6.2 Initial Set-up.................................................................................................. 16
1.6.3 Warm-up ....................................................................................................... 16
1.7 Description .......................................................................................................................................... 16
1.8 Technical Specifications .................................................................................................................... 20
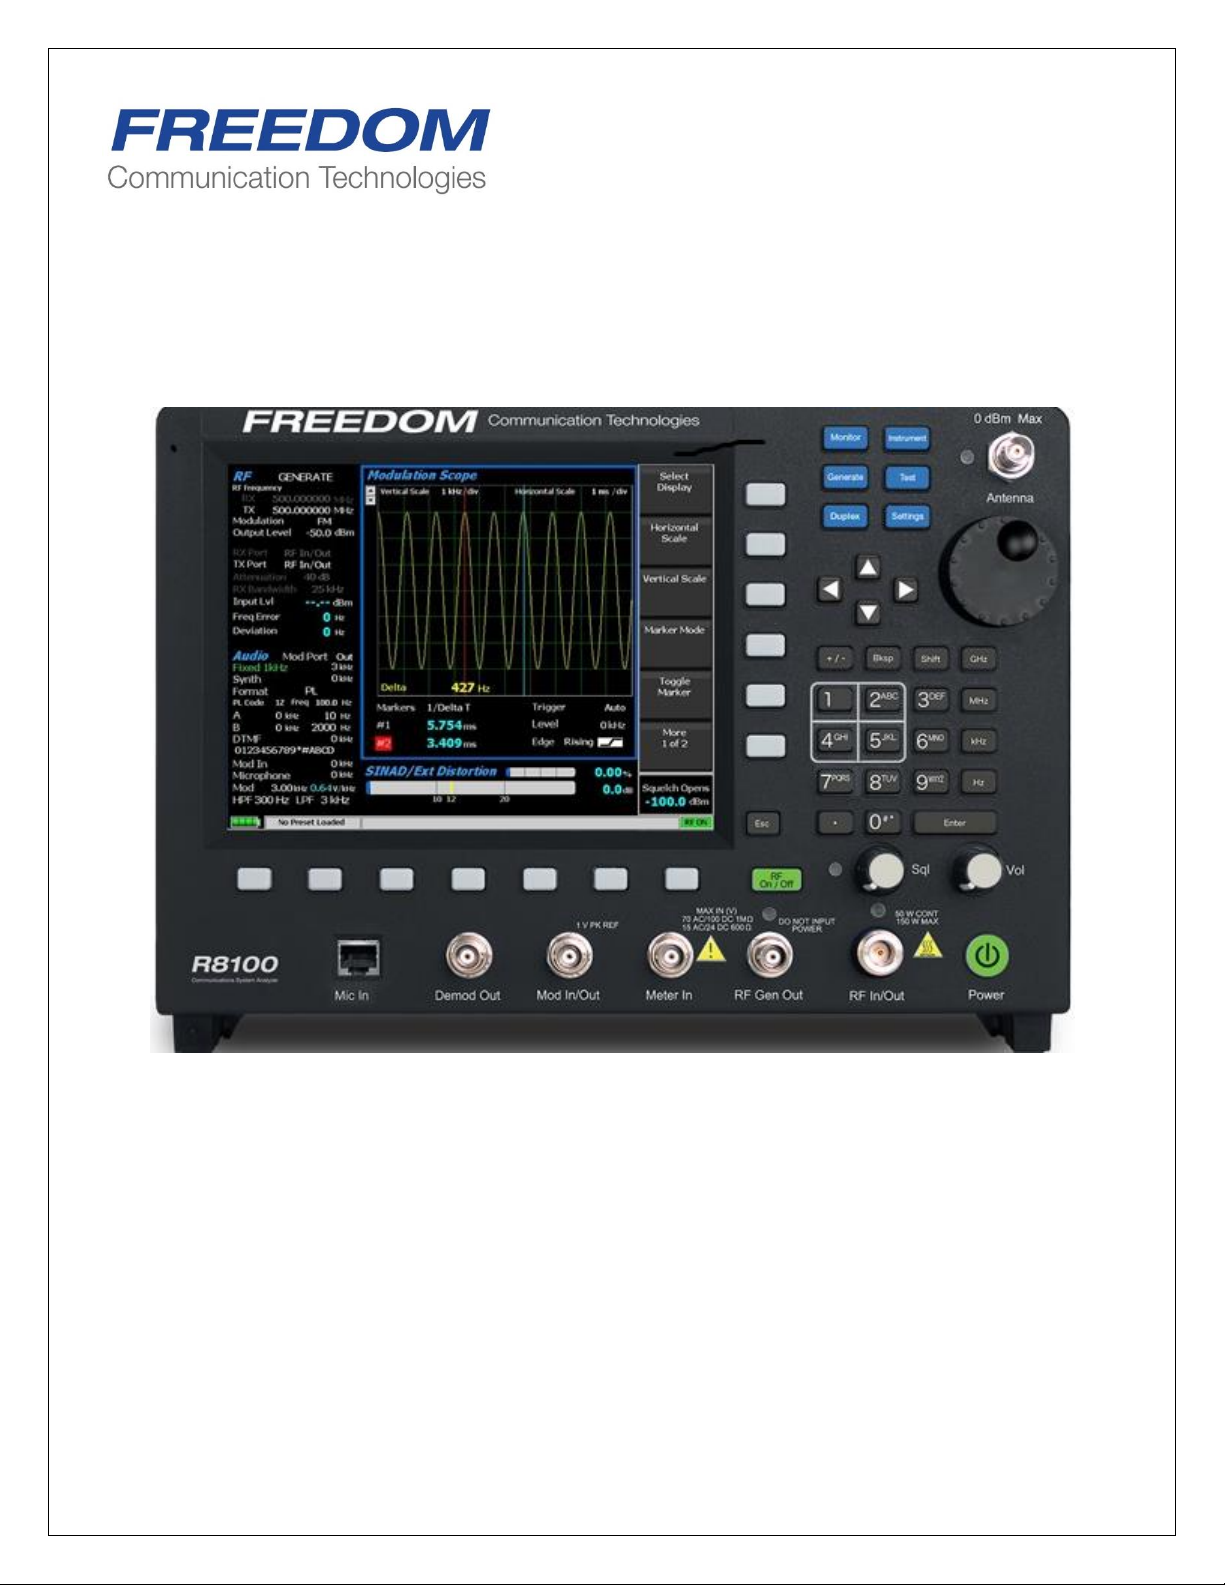
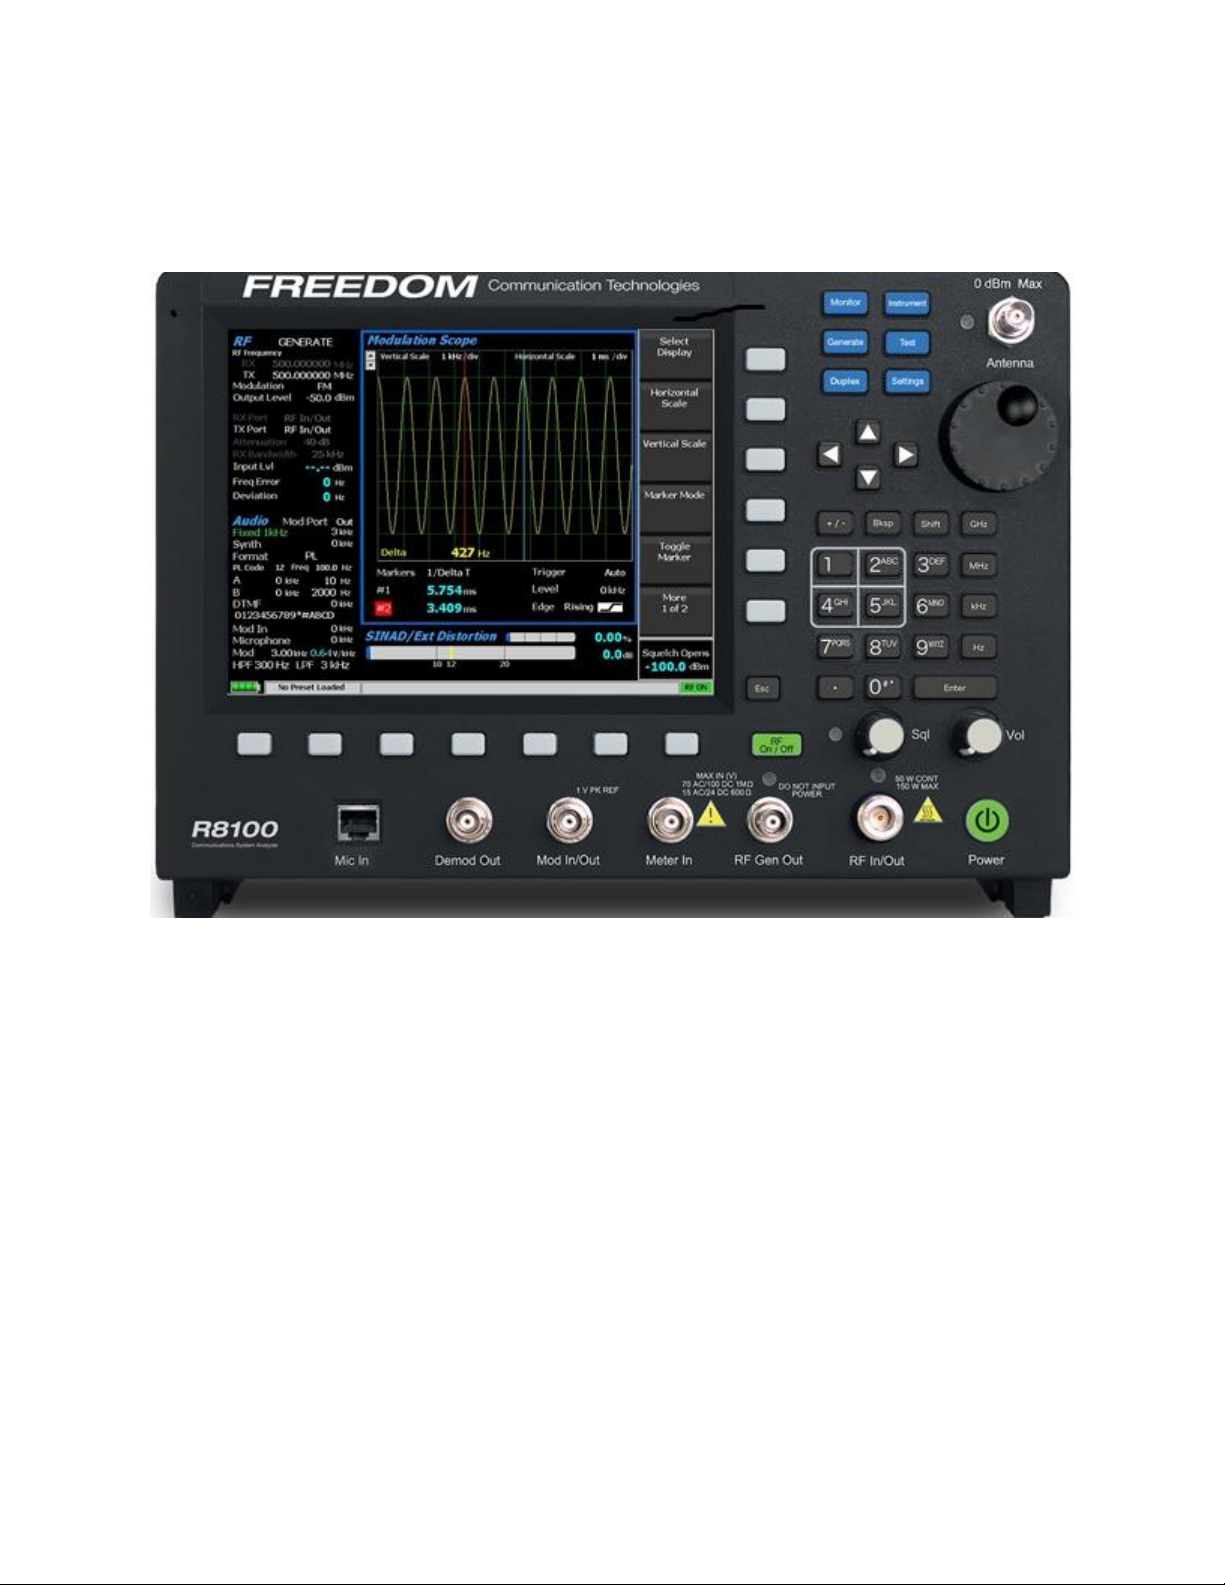
1.9 Operator Interface and Controls...................................................................................................... 21
1.9.1 Front Panel Control Keys ............................................................................. 22
1.9.2 Front Panel Control Knobs ........................................................................... 25
1.9.3 Front Panel Display and Indicators ............................................................... 26
2 OPERATION .................................................................................................................................................. 30
2.1 Overview .............................................................................................................................................. 30
2
Page 3

3
2.1.1 Basic navigation and operator control ........................................................... 30
2.1.2 Hot keys for fast navigation in Monitor, Audio, Display and Meter zones ..... 33
2.2 Operating Instructions ....................................................................................................................... 34
2.2.1 RF Zone / Monitor Mode ............................................................................ 34
2.2.2 RF Zone / Generate Mode ........................................................................... 39
2.2.3 RF Zone / Duplex Mode .............................................................................. 41
2.2.4 Display Zone ................................................................................................ 60
2.2.5 Meter Zone ................................................................................................... 73
2.2.6 Instrument Menu .......................................................................................... 81
2.2.7 Test Menu ..................................................................................................... 92
2.2.8 Settings Menu ............................................................................................. 211
2.2.9 Screen Capture ............................................................................................ 225
3 REMOTE OPERATION ........................................................................................................................... 226
3.1 BIOS Power-loss Setup .................................................................................................................. 226
3.2 DHCP Server Setup ........................................................................................................................ 227
3.3 Network Port Setup ........................................................................................................................ 228
3.4 Computer Setup ............................................................................................................................... 229
3.4.1 Setup ........................................................................................................... 229
3.4.2 Control ....................................................................................................... 230
3.5 Disable Remote Access .................................................................................................................. 230
3.6 Verification / Troubleshooting Information .............................................................................. 230
4 TEST APPLICATIONS.............................................................................................................................. 232
4.1 FM Transmitter Testing ................................................................................................................. 232
4.1.1 Basic FM Transmitter Testing – initial setup ............................................... 232
4.1.2 Transmit Power, Frequency, and Frequency Deviation Measurements ........ 233
4.1.3 Modulation Measurements .......................................................................... 233
4.1.4 Off-The-Air Measurements ......................................................................... 234
4.2 FM Receiver Testing ....................................................................................................................... 234
4.2.1 Basic FM Receiver Testing – initial setup .................................................... 234
4.2.2 Receiver Distortion Measurement ............................................................... 235
4.2.3 SINAD Measurement ................................................................................. 236
4.2.4 Modulation Acceptance Bandwidth ............................................................. 236
Page 4

4.2.5 Receiver Sensitivity Testing (20 dB Quieting) .............................................. 236
4.2.6 Squelch Sensitivity Test ............................................................................... 236
4.3 Cable Fault Testing ......................................................................................................................... 237
4.3.1 Cable Fault Locator Setup and Operation ................................................... 237
Appendix A – Glossary (List of Abbreviations and Acronyms) ......................................................................... 246
Appendix B – Tone and Code Specifications ........................................................................................................ 249
Appendix C – R8100 Field Calibration Procedure ................................................................................................ 254
4
Page 5

5
List of Figures
Page
Figure 2.1-1 Front Panel Controls, Indicators, and Connectors ..................................................... 18
Figure 2.1-2 Left and Right Sides of the R8100 Needs new photo ................................................. 19
Figure 3.1.1-1 Main screen in Monitor mode showing related information in grouped display zones .. 31
Figure 3.1.1-2 Main display area after Audio Zone soft key press .................................................. 32
Figure 3.1.1-4 Audio Zone data entry for Fixed 1 kHz Level ........................................................ 33
Figure 3.1.2-1 Outline around Numeric Keypad Hot Keys ........................................................... 34
Figure 3.2.1-1 RF Zone display area showing Monitor Mode data ................................................. 35
Figure 3.2.1-2 Monitor Mode submenu after RF Zone soft key press ............................................ 36
Figure 3.2.1-3 Data entry window before and after Monitor frequency change ................................ 38
Figure 3.2.1-4 RF Zone display area after Monitor frequency change ............................................. 38
Figure 3.2.2-1 RF Zone display area showing Generator Mode data .............................................. 39
Figure 3.2.2-2 Generator Mode submenu after RF Zone soft key press .......................................... 40
Figure 3.2.3-1 RF Zone display after Duplex key press ................................................................ 42
Figure 3.2.4-1 Audio Zone display with the R8100 in Generate mode ............................................ 44
Figure 3.2.4-2 Audio Zone display with the R8100 in Monitor mode ............................................. 44
Figure 3.2.4.1-1 Audio Zone submenu in Monitor mode ............................................................. 45
Figure 3.2.4.2-1 Format submenu in Audio Zone ....................................................................... 46
Figure 3.2.4.2-2 DTMF Table providing additional code sequence control. .................................... 48
Figure 3.2.4.3-1 PL Table showing highlighted entry code. .......................................................... 50
Figure 3.2.4.3-2 A/B Sequence table showing highlighted sequence. ............................................. 51
Figure 3.2.4.3-3 A/B Sequence table submenu for user programmable entries ................................ 52
Figure 3.2.4.3-4 5/6 Tone entry submenu ................................................................................. 53
Figure 3.2.4.3-5 POCSAG Table submenu ................................................................................ 54
Figure 3.2.4.3-6 General Sequence Table submenu ..................................................................... 56
Figure 3.2.4.4-1 Audio Zone submenu in Generator mode .......................................................... 59
Figure 3.2.5-1 Display Zone submenu after Select Display soft key press ....................................... 61
Figure 3.2.5.1-1 Trace Math Display ......................................................................................... 63
Figure 3.2.5.1-2 Demod At Marker submenu ............................................................................. 65
Figure 3.2.5.2-1 Display Zone submenu for the Mod Scope ......................................................... 66
Figure 3.2.5.3-1 Display Zone submenu for the Oscilloscope ....................................................... 68
Page 6

Figure 3.2.5.4-1 Bar Graphs screen in Display Zone ................................................................... 71
Figure 3.2.5.5-1 General Seq screen in Display Zone .................................................................. 73
Figure 3.2.6-1 Meter Zone submenu showing RF Scan meter ....................................................... 74
Figure 3.2.6-2 Meter Zone submenu after Select Meter soft key press ............................................ 74
Figure 3.2.6.1-1 RF Power Meter screen ................................................................................... 75
Figure 3.2.6.2-1 AC Volts display ............................................................................................. 75
Figure 3.2.6.2-2 DC Volts display ............................................................................................ 75
Figure 3.2.6.3-1 SINAD display ............................................................................................... 76
Figure 3.2.6.3-2 Internal Distortion display ............................................................................... 76
Figure 3.2.6.4-1 PL/Period Counter screen ............................................................................... 77
Figure 3.2.6.4-2 DPL Decode screen ........................................................................................ 77
Figure 3.2.6.4-3 DTMF Decode screen ..................................................................................... 77
Figure 3.2.6.4-4 2-Tone Decode screen .................................................................................... 78
Figure 3.2.6.4-5 5/6-Tone Decode screen ................................................................................. 78
Figure 3.2.6.4-6 General Sequence decode screen ....................................................................... 79
Figure 3.2.6.5-1 Frequency Counter screen ................................................................................ 80
Figure 3.2.6.6-1 RF Scan display .............................................................................................. 81
Figure 3.2.7-1 Submenu after pressing Instrument navigation key ................................................. 82
Figure 3.2.7.1-1 Submenu in Spectrum Analyzer Instrument mode ............................................... 83
Figure 3.2.7.2-1 Dual Display mode ......................................................................................... 84
Figure 3.2.7.3-1 Tracking Generator mode ................................................................................ 85
Figure 3.2.7.3-2 Normalized Spectrum Analyzer trace ................................................................. 88
Figure 3.2.7.4-1 Cable Fault Locator mode ................................................................................ 89
Figure 3.2.7.4-2 Frequency and Attenuation entries in the Add Cable Type submenu ...................... 92
Figure 3.2.8-1 Submenu after pressing Test navigation key ........................................................... 93
Figure 3.2.8.1-1 Submenu after pressing Presets soft key ............................................................. 94
Figure 3.2.8.1-2 Data entry mode after pressing Save Configuration soft key .................................. 95
Figure 3.2.8.2-1 Test Mode submenu ....................................................................................... 96
Following Sections to be Completed. Method TBD....................... Error! Bookmark not defined.
DMR Test Mode with MOTOTRBO™ ......................................................................................... 96
Figure 3.2.8.3-1 ........................................................................................................................... 97
DMR transmitter tests ................................................................................................................. 97
6
Page 7

7
Figure 3.2.8.3.1-1 Submenu after pressing DMR soft key in Generator mode................................ 98
Figure 3.2.8.3.1.2-1 Voice Loopback Recording ...................................................................... 100
Figure 3.2.8.3.1.3-1 Power Profile Slot ................................................................................... 102
Figure 3.2.8.3.1.3-2 Power Profile Frame with Markers ............................................................ 104
Figure 3.2.8.3.1.4-1 Submenu after pressing DMR soft key in Monitor mode .............................. 105
Figure 3.2.8.3.2-1 Submenu after pressing DMR soft key in Generate mode ............................... 106
Figure 3.2.8.3.2-2 Voice Loopback Playing ............................................................................. 107
Figure 3.2.8.4.1-1 Main screen in Monitor mode Voice Frame Decode ....................................... 110
Figure 3.2.8.4.1-2 Main screen in Monitor mode after pressing the PROJECT 25 soft key ............ 111
Figure 3.2.8.4.1.2-1 Test Pattern submenu in P25 Monitor mode............................................... 112
Figure 3.2.8.4.1.2-2 P25 Voice Recording ............................................................................... 114
Figure 3.2.8.4.1.2-3 P25 Voice Loopback ............................................................................... 115
Figure 3.2.8.4.1.3-1 P25 Eye Diagram selection in Display Zone ............................................... 116
Figure 3.2.8.4.1.3-2 Eye Diagram with Mon Mod Type WCQPSK and Display Mode Fade Away .. 117
Figure 3.2.8.4.1.3-3 P25 Voice Frame Decode ........................................................................ 118
Figure 3.2.8.4.1.3-4 P25 Voice Frame Decode Unit to Unit ...................................................... 120
Figure 3.2.8.4.1.3-5 Constellation Plot (Symbols) .................................................................... 121
Figure 3.2.8.4.1.3-6 Ideal Constellation .................................................................................. 122
Figure 3.2.8.4.1.3-7 Constellation Plot (Samples / Trajectories) ................................................. 123
Figure 3.2.8.4.1.3-8 Distribution Plot of 1011 Hz Tone ............................................................ 124
Figure 3.2.8.4.2-1 Main screen in Generate mode after pressing the PROJECT 25 soft key ........... 125
Figure 3.2.8.4.2-2 P25 Generate mode test patterns ................................................................. 125
Figure 3.2.8.4.2-3 P25 Voice Frame Encoder submenu ............................................................ 127
Figure 3.2.8.5-1 Main screen after selecting P25 Trunk Test Mode ............................................. 134
Figure 3.2.8.5-2 Main screen after pressing P25 Trunk soft key ................................................. 135
Figure 3.2.8.5-4 P25 Trunk Band Plan submenu ..................................................................... 137
Figure 3.2.8.5-3 P25 Trunk submenu after starting BER test after registration ............................. 140
Figure 3.2.8.6-1 Main screen in Monitor mode after selecting NXDN™ Test Mode ..................... 142
Figure 3.2.8.6.1-1 NXDN™ Monitor mode ........................................................................... 145
Figure 3.2.8.6.1-2 NXDN™ Voice Recording ........................................................................ 146
Figure 3.2.8.6.1-3 NXDN™ Eye Diagram in Display Zone ..................................................... 147
Figure 3.2.8.6.1-4 NXDN™ Eye Diagram with display in Fade Away mode ............................... 148
Page 8

Figure 3.2.8.6.2-1 NXDN™ Generate mode ......................................................................... 149
Figure 3.2.8.6.3-1 Main screen after selecting NXDN Trunk Test Mode .................................... 152
Figure 3.2.8.6.3-2 Main screen after pressing NXDN™ Trunk soft key ..................................... 153
Figure 3.2.8.6.3-3 NXDN™ Trunk submenu after starting BER test ......................................... 154
Figure 3.2.8.6.1.4-1 NXDN Eye Diagram in Display Zone ....................................................... 157
Figure 3.2.8.8-1. Main screen in Monitor mode after selecting TETRA Test Mode .............................. 158
Figure 3.2.8.8-2. Submenu after pressing TETRA soft key in Monitor mode ...................................... 159
Figure 3.2.8.8-3. Error Vector Diagram ........................................................................................ 161
Figure 3.2.8.8-4. Power Profile Slot .............................................................................................. 162
Figure 3.2.8.8-5. Power Profile Frame with Markers ....................................................................... 164
Figure 3.2.8.8-6. Mod Spec / Constellation (Symbols) ..................................................................... 165
Figure 3.2.8.8-7. Ideal Constellation ............................................................................................. 166
Figure 3.2.8.8-8. Constellation (Samples / Trajectories) ................................................................... 166
Figure 3.2.8.8-9. Submenu after pressing TETRA soft key in Generate mode ..................................... 167
Figure 3.2.8.9-2 dPMR Monitor mode ................................................................................... 171
Figure 3.2.8.9-3 dPMR Voice Recording ................................................................................. 173
Figure 3.2.8.9-4 dPMR Eye Diagram in Display Zone ............................................................... 174
Figure 3.2.8.9-5 dPMR Eye Diagram with display in Fade Away mode ....................................... 175
Figure 3.2.8.9-6 dPMR Generate mode ................................................................................... 176
Figure 3.2.8.10.1-1 Main screen in Monitor mode after selecting the P25 II Test Mode ................. 179
Figure 3.2.8.10.1-2 Main screen in Monitor mode after pressing the P25 II soft key ..................... 180
Figure 3.2.8.10.1.2-1 Test Pattern submenu in P25 II Monitor mode ......................................... 181
Figure 3.2.8.10.1.3-1 HDQPSK Eye Diagram selection in Display Zone .................................... 183
Figure 3.2.8.10.1.3-2 Eye Diagram of HCPM and Display Mode Fade Away............................... 184
Figure 3.2.8.10.1.3-3 Distribution Plot of HDQPSK 1031 Hz Tone .......................................... 185
Figure 3.2.8.10.1.3-4 Distribution Plot of HCPM 1031 Hz Tone ............................................... 185
Figure 3.2.8.10.1.3-5 Power Profile Frame ............................................................................. 186
Figure 3.2.8.10.1.3-6 Power Profile Slot with Markers .............................................................. 188
Figure 3.2.8.10.1.4-1 HDQPSK Frequency Constellation ......................................................... 188
Figure 3.2.8.10.1.4-2 HCPM Frequency Constellation ............................................................. 189
Figure 3.2.8.10.1.4-3 P25 Phase 2 Symbol Rate Measurement ................................................... 190
Figure 3.2.8.10.2-1 Main screen in Generate mode after selecting the P25 II soft key .................... 191
8
Page 9

9
Figure 3.2.8.10.2-2 P25 II Generate mode test patterns ............................................................ 191
Figure 3.2.8.11-1. AutoTune submenu .......................................................................................... 194
Figure 3.2.8.11-2. AutoTune radio test setup ................................................................................. 195
Figure 3.2.8.11-3 AutoTune Activity display. ................................................................................. 196
Figure 3.2.8.11-4. AutoTune test in progress ................................................................................. 197
Figure 3.2.8.11-5. AutoTune Test Limits submenu ......................................................................... 199
Figure 3.2.8.11-6. AutoTune Test Results submenu ........................................................................ 200
Figure 3.2.8.11-7. AutoTune Test Preferences submenu .................................................................. 201
Figure 3.2.8.12-1. AutoScript submenu with no scripts or procedures imported .................................. 204
Figure 3.2.8.12-2. View, Results submenu with results from a procedure execution displayed................ 205
Figure 3.2.8.12-3. Use Toggle Selection to enable or disable script execution ...................................... 206
Figure 3.2.8.12-4. Use Toggle Selection to enable or disable script execution ...................................... 208
Figure 3.2.8.12-5. Example script showing commands for finding a local FM radio station ................... 209
Figure 3.2.8.12-6. Example procedure containing several scripts ....................................................... 210
Figure 3.2.9-1 Submenu after pressing Settings navigation button on R8100 front panel ................. 211
Figure 3.2.9.2-1 Submenu after pressing System Settings soft key in the Settings menu .................. 213
Figure 3.2.9.2-2 Pre-Amplifier alert when broadband measurements are active ............................. 215
Figure 3.2.9.3-1 Submenu after pressing Network Setup soft key in the Settings menu .................. 218
Figure 3.2.9.4-1 Submenu after pressing Messages soft key in the Settings menu ........................... 220
Figure 3.2.9.5-1 Submenu after pressing About soft key in the Settings menu ............................... 221
Figure 3.2.9.5-2 Settings/About/Protocols screen .................................................................... 221
Figure 3.2.9.5-3 Settings/About/Versions screen ................................................................ ..... 222
Figure 3.2.9.5.1-1 Alert screen as R8100 finds a valid update on a USB flash drive ........................ 223
Figure 3.2.9.6-1 Submenu after pressing Options soft key in the Settings menu ............................ 224
Figure 3.2.10-1 File folder location and names for R8100 Screen Captures ................................... 225
Figure 4-1 Remote Front Panel ............................................................................................ 226
Figure 4.3-1 Network Connection Security Alert ...................................................................... 228
Figure 5.1.1-1 Setup for FM Transmitter testing ....................................................................... 232
Figure 5.2.1-1 Setup for FM Receiver testing ........................................................................... 235
Figure 5.3-1 Connections for Cable Fault testing ...................................................................... 237
Figure 5.3.1-1 Cable Fault Instrument Display ......................................................................... 239
Page 10

List of Tables
Page
Table 3.2.8.3.1.4-1. DMR Symbols ............................................................................................... 105
Table 3.2.8.4.1.2-1. P25 Symbols ................................................................................................. 113
Table 3.2.8.4.1.3-1. P25 Voice Frame Fields .................................................................................. 119
Table 3.2.8.4.1.3-2. P25 Status Symbol Codes ................................................................................ 119
Table 3.2.8.4.1.3-3. P25 Data Unit Identifier Values ....................................................................... 120
Table 3.2.8.4.1.3-4. P25 Service Options ....................................................................................... 121
Table 3.2.8.4.1.4-1. P25 Voice Frame Fields .................................................................................. 129
Table 3.2.8.4.1.4-2. P25 Link Control Fields for LCO=1 ................................................................. 130
Table 3.2.8.4.1.4-3. P25 Link Control Fields for LCO=3 ................................................................. 131
Table 3.2.8.5-1 P25 Trunk Band Plan Defaults ........................................................................ 138
Table 3.2.8.6.1.2-1. NXDN™ Symbols......................................................................................... 144
Table 3.2.8.9.1.2-1. dPMR Symbols .............................................................................................. 170
Table 3.2.8.9.1.4-1. P25 Phase 2 Logical Channels .......................................................................... 178
Table 3.2.8.10.1.2-1. HDQPSK Symbols....................................................................................... 182
Table B-1 Standard DTMF Tones ....................................................................................... 249
Table B-2 DTMF Frequency Coding* .................................................................................. 249
Table B-3 Private-Line (PL) Codes ...................................................................................... 250
Table B-4 5/6 Tone Paging Tones ....................................................................................... 251
Table B-5 DPL Standard Codes .......................................................................................... 251
Table B-6 Select V Frequencies ........................................................................................... 252
Table B-7 POCSAG Numeric Character Set ......................................................................... 252
Table B-8 POCSAG Alpha-numeric Character Set (7-bit ASCII) ............................................. 252
10
Page 11

11
Freedom Communication Technologies – R8100 Series Communications System Analyzer
LIMITED WARRANTY
Freedom Communication Technologies Test Equipment Products (herein the "product") that are manufactured by Freedom
Communication Technologies are warranted by Freedom Communication Technologies for a period of two (2) years from date
of shipment against defects in material and workmanship. This express limited warranty is extended to the original purchaser
(herein the "buyer") only and applies only to such defects that: (1) produce repeatable failures resulting in product lock-ups or
power downs rendering the product inoperable, or (2) cause the product to perform outside of Freedom Communication
Technologies-published specifications.
In the event of such a defect during the period of warranty, the buyer may return the product, transportation prepaid, to Freedom
Communication Technologies, 2002 Synergy Blvd. Suite 200, Kilgore Texas 75662. The buyer must include written notice
specifying the nature of the defect and proof of purchase and evidence of the date of shipment (dated packing list or invoice).
Freedom Communication Technologies, at its option, will either repair or replace the product. If Freedom Communication
Technologies elects to repair a defective product by replacing a module or subassembly, Freedom Communication
Technologies, at its option, may replace such defective module or subassembly with a new or reconditioned replacement. This
Limited Warranty is not extended beyond two years from original date of shipment if Freedom Communication Technologies
repairs a product. Transportation charges for the return of the product will be paid by Freedom Communication Technologies.
This Limited Warranty is void if FCT determines:
(1) The product has not been operated in accordance with the procedures in the operating instructions; or
(2) The seals on non-user serviceable components or modules are broken; or
(3) The product has been subject to misuse, abuse, damage, accident, negligence, attempted repair or alteration.
Freedom Communication Technologies does not warrant that the product will meet buyer's requirements or that the
operation of the product will be uninterrupted or error free.
No other warrantees, whether express, implied or statutory, including implied warrantees or merchantability or fitness
for particular purpose, are granted to buyer, or buyer's transferees, customers, or users of the product.
In no event shall Freedom Communication Technologies be liable for any special, incidental, or consequential damages
arising from this agreement or use of the product.
Page 12

SOFTWARE LICENSE AGREEMENT
PLEASE READ THIS LICENSE AGREEMENT CAREFULLY BEFORE USING THE SOFTWARE. BY USING
THE SOFTWARE, YOU AGREE TO THE TERMS OF THIS LICENSE. IF YOU DO NOT AGREE, PROMPTLY
RETURN THE HARDWARE AND SOFTWARE FOR A REFUND.
1. LICENSE GRANT: As used in this Agreement, the term “Software” means the software embedded in the unit of R8100 Series
communications system analyzer (the “Instrument”) sold by Freedom Communication Technologies Inc. (“Licensor”) to you (“Licensee”)
either directly or through Licensor’s distribution network. Subject to your acceptance of these terms, Licensor grants to Licensee a non-
exclusive license to use the Software and related documentation (the “Documentation”) only in connection with your use of the unit of the
Instrument in which the Software is embedded.
2 OWNERSHIP: This is not a sale of the Software. Licensor and/or its licensors retain ownership of all rights in and to the Software,
including all patent, copyrights, and other intellectual property rights.
Licensee may transfer the original Software and Documentation to another entity only in connection with the sale of the unit of the
Instrument in which the Software is embedded, on the condition that the transferee agrees in writing to be bound by the terms of this
agreement and Licensee provides to Licensor a copy of such agreement by the transferee.
Licensee will not reproduce, copy, decompile, disassemble, reverse engineer, modify, rent, lease, or create derivative works of the
Software, transmit the Software electronically or provide anyone with access to the Software over a network or otherwise.
Licensee will not export, re-export, resell, ship, or divert or cause to be exported, re-exported, resold, shipped, or diverted, directly or
indirectly, the Software or Documentation to any country where the United States or Licensee's government or any agency thereof at the
time of export or re-export requires an export license or other government approval without first obtaining such license or approval.
3. SCOPE OF USE: Licensee may use the Software only on the specific unit of the Instrument in which the Software is embedded.
This license will terminate automatically if Licensee fails to comply with any term or condition of the license.
4. LIMITED WARRANTY: Licensor warrants that under normal use, the Software will perform the functions specified in the
Documentation. If the Software does not conform to the Documentation such that its functional performance is significantly impaired and
Licensee notifies Licensor in writing within ninety (90) days after the date of purchase and provides to Licensor a copy of the receipt of
purchase, Licensor will have the option of refunding the purchase price or replacing the Software as Licensee’s exclusive remedy.
5. LIABILITY: THE WARRANTY SET FORTH IN SECTION 4 IS EXCLUSIVE AND IN LIEU OF ALL OTHER
WARRANTIES WHETHER STATUTORY, EXPRESS, OR IMPLIED (INCLUDING ALL WARRANTIES OF MERCHANTABILITY
AND FITNESS FOR A PARTICULAR PURPOSE). LICENSOR WILL NOT BE LIABLE FOR INDIRECT, INCIDENTAL, SPECIAL
OR CONSEQUENTIAL DAMAGES.
6. By using the Software, Licensee acknowledges that Licensee has read this agreement and agrees to be bound by its terms and
conditions. LICENSEE FURTHER AGREES THAT THIS AGREEMENT CONSTITUTES THE ENTIRE UNDERSTANDING OF
LICENSEE AND LICENSOR WITH RESPECT TO THE SUBJECT MATTER HEREOF AND COMPLETELY SUPERSEDES ANY
PRIOR UNDERSTANDING, EITHER ORAL OR WRITTEN. ANY MODIFICATION OF THIS AGREEMENT SHALL BE MADE
ONLY BY MUTUAL AGREEMENT AND EVIDENCED BY WRITTEN AMENDMENT SIGNED BY BOTH PARITIES. This
agreement shall be governed and interpreted by the laws of the State of Delaware.
7. U.S. GOVERNMENT: Licensor represents that the Software is either Commercial Computer Software as defined under DFARS
252.227-7014 (June 1995), or non-commercial computer software developed at private expense. If this license is acquired under a U.S.
Government civilian agency contract, the Government's rights to use, modify, reproduce, release, perform, display or disclose the Software
are subject to restrictions set forth in FAR 52.227-19. If this license is acquired under a U.S. Government Department of Defense contract,
the Government's rights to use, modify, reproduce, release, perform, display or disclose the Software are subject to this license agreement.
The License Fees identified in Exhibit A and the restrictions set forth in either FAR 52.227-19 or this license agreement do not apply to
portions of the Software, if any, in which the U.S. Government has acquired Unlimited Rights.
TRADEMARK NOTICE
MOTOTRBO™ Professional Digital Two-Way Radio System
Motorola, MOTOTRBO, Private-Line, and Digital Private-Line are registered in the U.S. Patent and Trademark Office. by Motorola.
NXDN™ is a trademark of Icom Incorporated and Kenwood Corporation
All other product and service names are the property of their registered owners
12
Page 13

13
PRE-OPERATION OVERVIEW
1.1 SCOPE OF MANUAL
This manual contains information for R8100 Series Communications System Analyzer. The R8100
incorporates many devices and functions, permitting a technician to completely monitor and service radio
communications equipment in the shop and in the field.
1.2 SAFETY SUMMARY
The following general safety precautions must be observed during all phases of operation, service and
repair of this equipment. Failure to comply with these precautions or warnings violates safety standards
of design, manufacture, and intended use of the equipment. Freedom Communication Technologies
assumes no liability for the customer's failure to comply with these requirements.
The safety precautions and warnings listed below represent warnings of certain dangers of which Freedom
Communication Technologies is aware. You as the user of the product should follow these warnings and
all other safety precautions necessary for the safe operation of the equipment in your operating
environment.
1.2.1 Analyzer Grounding
The R8100 is powered by a provided AC to DC converter connected to a grounded 3 wire AC outlet. The
negative (or “-“) output of the converter is internally connected to AC ground. Since the R8100 uses the
converter’s DC negative as system ground the analyzer is also connected to AC ground at the power outlet.
As a result most of the external connectors on the R8100 chassis are also at AC ground potential.
Warning: To minimize shock hazard it is critical to operate the R8100 with the provided converter and
three wire AC power cable. The power cable must be plugged into an approved three-contact electrical
outlet. If the unit is not operated from a properly grounded AC power source, any voltage potential
between it and earth ground may cause an electrical shock.
1.2.2 Unit is Live When Plugged In or when Battery is Installed
Internal circuits are live when the DC power cable is plugged in even when the R8100 has been placed in
a non-operating mode using the front panel Power switch. To completely remove power from the analyzer
internal circuits disconnect the DC power plug and remove the battery. Do not position the equipment
such that it is difficult to remove the DC power plug.
1.2.3 Keep Away From Live Circuits
Operating personnel must not remove equipment covers. Only Factory and Authorized Service Personnel
may remove equipment covers for internal subassembly, component replacement, or any internal
adjustment. Disconnect Analyzer from all voltage sources before removing covers for adjustments,
maintenance or repairs. Capacitors inside may still be charged even if the Analyzer is disconnected from
the voltage source.
1.2.4 Explosive Atmosphere
Do not operate the equipment in the presence of flammable gases or fumes. Operation of any electrical
equipment in such an environment constitutes a definite safety hazard.
Page 14
1.3 WARNINGS AND CAUTIONS
You should observe several precautions when handling this equipment.
WARNING
The R8100 analyzer is designed to operate with a provided power adapter connected to a properly
grounded 3 wire AC power source. This configuration provides an earth ground connection to the
R8100 internal ground and chassis. If the unit is not operated with the above configuration any volt-
age potential between it and earth ground may cause an electrical shock.
CAUTION
This equipment contains internal parts that are subject to damage by static electricity (ESDS
sensitive). Factory and authorized service personnel must follow proper ESDS precautions when
handling internal components during repair or calibration.
CAUTION
The AC/DC adapter provided with this equipment is not rated for outdoor use. Do not use this
adapter outdoors, especially where water or rain could be present.
CAUTION
This equipment contains a Rechargeable Smart Lithium Ion Battery. Only use a model RRC2020
battery in the R8100. Do not attempt to insert any other type of battery into the battery enclosure of
the R8100.
1.3.1 Analyzer Operating Voltage
The R8100 is powered by 15-16 VDC and operates from a three-wire AC outlet using an AC to DC
adapter. Warning: it is critical that only the adapter provided by Freedom Communication
Technologies and shipped with the analyzer is used to power the R8100. Do not substitute other
adapters without first consulting Freedom Communication Technologies support personnel or a
factory authorized service center. Make certain to plug the adapter into a properly grounded three-wire
AC outlet.
1.3.2 DC Power Source
Warning: Connecting the Analyzer DC input to an external Power Supply can, in the event of a power
supply fault, cause hazardous voltages to be present on the low voltage circuits of the Analyzer.
1.3.3 Battery
Battery Type
Rechargeable Lithium Ion (Li Ion) Battery pack
9x18650 cells (3S3P) with
11.25V / 8850mAh / 99.6 Wh
Compliance information
CE/ UL2054 / UL1642 / FCC IEC 62133 / EN6095 / ROHS UN 38.3 / PSE / RCM
14
Page 15
15
Shipping
Remove battery from unit before shipment. See shipping requirements of your carrier.
See “Technical Specifications” for more details about the battery
The maximum input levels are:
70 VAC RMS /100 VDC (R8100 input impedance set to 1 MΩ).
15 VAC RMS /24 VDC (R8100 input impedance set to 600 Ω).
1.3.4 Maximum Meter In Voltages
WARNING
To ensure the safety of the user the Meter In port should not be used to measure equipment
containing mains voltages.
The maximum input levels are:
33 VAC RMS /70 VDC (R8100 input impedance set to 1 MΩ).
15 VAC RMS /24 VDC (R8100 input impedance set to 600 Ω).
1.3.5 Replacement Fuses
There are no user serviceable fuses on the R8100. The unit is internally protected against overloads and
risk of fire. If the R8100 fails to operate return it to the factory or an authorized repair center for diagnosis
and repair.
The R8100 Generate Output Port provides port protection against RF power input up to 5 W continuous.
Power levels above 5 W may damage the port if applied for a significant amount of time. If the operator
desires further port protection the 50RF-038 fuse may be obtained from JFW Industries and attached to
the Generate Output Port.
1.3.6 Other Cautions
Other cautions relating to the operation of the Analyzer are stated in Italics throughout this manual.
CAUTION – HOT SURFACES
The RF I/O Port connector may become hot when inputting power. Exercise caution when removing
cabling from the RF I/O Port.
1.3.7 User Maintenance of exterior surfaces
Clean only with a damp cloth and a mild detergent. Do not use abrasives, solvents or alcohol. If the
Analyzer is used in a relatively dust free environment, no other periodic maintenance should be required.
Page 16

1.4 SERVICE
All R8100 Series Communications System Analyzers are calibrated and repaired at the Freedom
Communication Technologies factory:
FREEDOM COMMUNICATION TECHNOLOGIES
2002 Synergy Blvd. Suite 200
Kilgore Texas 75662 USA
Tel/Fax: 1-844-903-7333
1.5 REPLACEMENT PARTS ORDERS
Send orders for user serviceable replacement parts to the Freedom Communication Technologies factory
listed in section 1.4. Be sure to include the complete identification number located on the equipment.
1.6 INSTALLATION
1.6.1 Packing
Foam pieces protect the Analyzer, which is packed inside a carton. Save the packing container and
materials for future use.
1.6.2 Initial Set-up
1. Place the Analyzer on a workbench in the shop or mobile repair unit.
2. Flip out the two lever actuated foot extensions underneath the front of the unit to raise the
Analyzer for easier viewing.
3. Take the power cord of the AC to DC adapter and connect to a 3-wire 100-240 VAC power
source. Attach the cord's DC plug to the mating connector on the R8100 side panel.
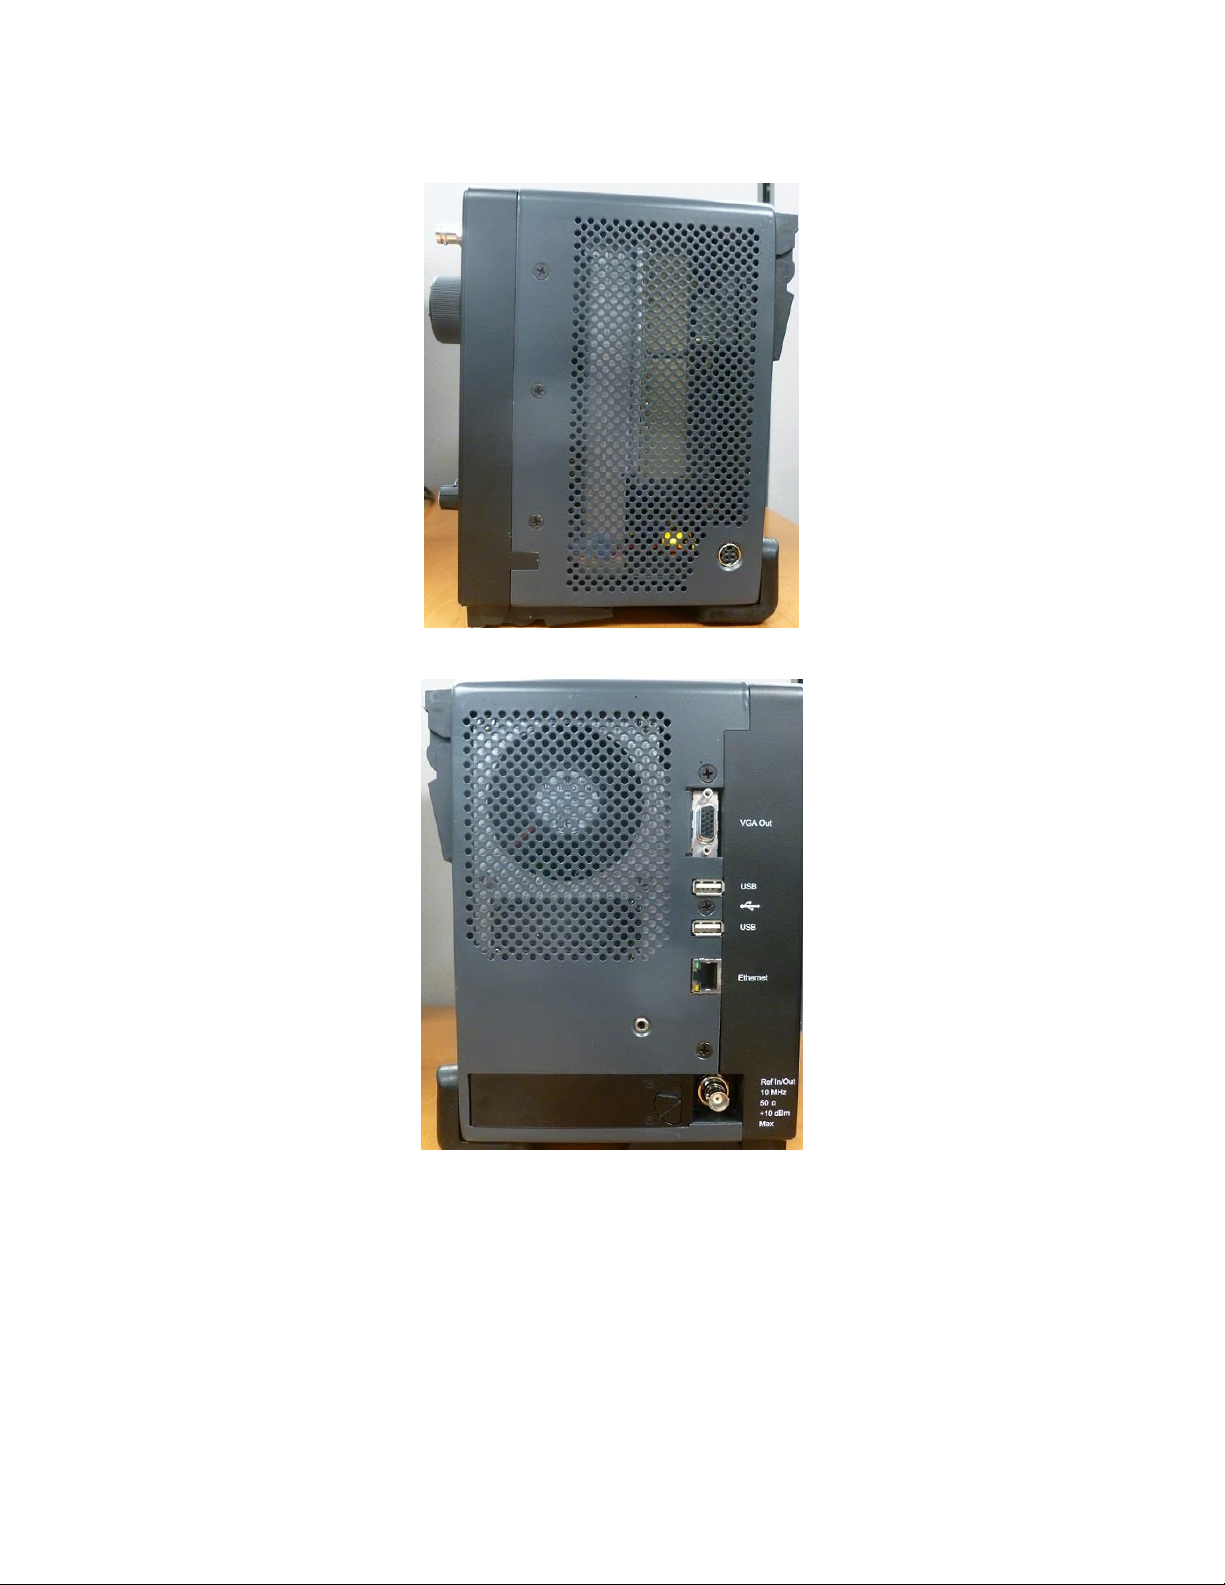
4. Remove battery from separate box and install at door on lower left side of unit. See Figure 2.1-2.
5. Remove accessories from the soft carry case (if provided).
6. Insert the whip antenna into the Antenna port, located to the right of the tuning knob on the front
panel.
7. Press the Power switch ON and allow the R8100 to boot up.
1.6.3 Warm-up
The analyzer can be used immediately after boot up with best accuracy achieved after a suitable warm-up
period. The OCXO time base stabilizes within 5 minutes of operation permitting frequency dependent
measurements at the specified accuracy of the analyzer, e.g., operating frequency, frequency error, audio
tone generation, etc. For all other measurements a minimum warm-up of 15 minutes is recommended to
be within specifications. Full measurement stability is reached after 30 minutes of running in the operation
environment. Before using the Analyzer review the operating procedures described in this manual.
ANALYZER OVERVIEW
1.7 Description
The R8100 Communication System Analyzer is a portable test instrument designed to monitor and service
radio communications equipment over the frequency range of 250 kHz to 3 GHz. The R8100 generates
and receives signals, measures modulation and frequency, and performs a variety of tests normally
associated with the following equipment:
16
Page 17

17
RF Signal Generator
Sensitive Measurement Receiver
Spectrum Analyzer
Duplex Offset Generator
Oscilloscope
Frequency Counter
AC/DC Voltmeter
RF Wattmeter
Cable Fault Analyzer (optional)
Tracking Generator (optional)
Signaling Encoder/Decoder
Signal Strength Meter
SINAD Meter
Distortion Analyzer
Page 18
Firmware options provide test capability for advanced digital radio protocols such as P25 1&11,
DMR, NXDN™, dPMR, TETRA, PTC and others as developed. The analyzer’s controls, indicators
and connectors are shown in Figures 2.1-1 and 2.1-2, with a description of these physical features
detailed in section 2.3
Figure 2.1-1 Front Panel Controls, Indicators, and Connectors
18
Page 19
19
Figure 2.1-2 Left and Right Sides of the R8100
Page 20

1.8 Technical Specifications
1.8.1 AC Adapter Specifications
Input Voltage: 100-240 VAC
Input Current: 2.5A Max
Input Frequency: 50-60 Hz
Operating Temp: 0° to +40° C
Storage Temp: -20° to +85° C
1.8.2 Port Specifications
Demod Out: ±8V PK (600 Ohms), 13.3 mA
Mod In: 1V PK REF; ±1.5V PK MAX (600 Ohms), 2.5 mA
Mod Out: ±8V PK (100 Ohms), 80 mA
Meter In: 33 VAC RMS/70 VDC (1M Ohm) Max; 15 VAC RMS/24 VDC (600
Ohms) Max, 40 mA
RF Gen Out: Do Not Input Power; +5 dBm Max Out, 250 kHz - 3 GHz (50 Ohms)
Port Protection: 5 Watts/30 seconds Max
RF In: Absolute Max Power (250 kHz to 3 GHz) – 150 Watts (50 Ohms), 1.7A
50 Watts - 5 minutes ON Max/5 minutes OFF Min (0° to 50° C)
150 Watts - 30 seconds ON Max/5 minutes OFF Min (25° to 50° C)
150 Watts - 1.5 minutes ON Max/15 minutes OFF Min (0° to 25° C)
RF Out: -30 dBm Max Out, 250 kHz - 3 GHz (50 Ohms), 0.142 mA
Antenna: 0 dBm Max, 250 kHz - 3 GHz (50 Ohms), 4.5 mA
Port Protection: 5 Watts Max
1.8.3 Mechanical Specifications
Weight: < 14 lbs (6.4 kg)
Dimensions: 9.4” (23.9 cm) high, 12.7” (32.3 cm) wide, 7.5” (19.1 cm) deep
Operating Temp: 0° to 40° C
Storage Temp: -30° to 80° C
Altitude: Up to 2,000 m
Humidity: 80% maximum relative humidity
1.8.4 Battery Specifications
Battery Type
Rechargeable Lithium Ion (Li Ion) Battery pack
9x18650 cells (3S3P) with
11.25V / 8850mAh / 99.6 Wh
Compliance information
CE/ UL2054 / UL1642 / FCC IEC 62133 / EN6095 / ROHS UN 38.3 / PSE / RCM
Operating temperature
0c to 45 C (charging)
-20C to 55C (discharging)
20
Page 21

21
Storage temperature
-20c to 50c max
Do not subject the battery to temperatures below -20C nor above +50C
For additional technical specifications of the R8100, refer to the R8100 Datasheet located on the Freedom
website, www.freedomcte.com.
1.9 Operator Interface and Controls
The R8100 was designed to be intuitive and easy to operate. A large LCD display screen shows the current
operating mode along with associated settings, readings, and additional test submenus. Information about
monitor settings and test results is visually grouped in outlined panels. The panels are highlighted when
active for accepting data entries or changes in settings. Test results are shown numerically in labeled text
fields and/or displayed graphically when appropriate.
The primary operating modes of the R8100 are Monitor, Generator, Duplex, Instrument, Test, and
Settings. These are accessed with dedicated navigation keys near the main tuning knob on the front panel
(see Figure 2.1-1). Commonly used operating adjustments are made with a few simple keystrokes. Several
methods are available for entering numeric values and adjusting user settings. These include:
Function soft keys - Two groups of non-dedicated (soft) keys are located at the bottom and right side of
the main LCD display. The current key function is shown in the adjacent screen area and changes with
the operating mode of the R8100 and the specific test in progress. Pressing a soft key executes one of
several possible actions. These include: opening a numeric data entry window; providing additional
selections for user settings; activating new submenus; or performing a single measurement task (peak
search, etc). Multiple presses of the same key will toggle through all available selections for the setting.
Direct Entry - Numeric values can be entered directly using the digital keypad when a data entry window
is shown on the display. Existing values are modified using the Left/Right (◄►) keys to move a
highlighted cursor over the desired number. The cursor automatically steps to the right after a keypress.
Pressing Enter completes the entry while the Esc key cancels the change. In the case of entering an RF
frequency, pressing a scaling unit key (like “kHz”) also completes the numeric entry. Note: You can also
adjust highlighted values using the Up/Down keys (▲▼) and tuning knob, but the R8100 will respond in
real time as the changes are made.
Tuning (Spin) Knob - A separate tuning knob allows real time rotational adjustment of numeric values,
simulating the smooth continuous operation of an analog tuning control. For example, you can manually
scan an RF frequency segment for an unknown carrier. The spin knob adjusts whichever digit is
highlighted in the data entry window by the Left/Right (◄►) keys. Continuous rotation of the knob
provides a step change equal to the smallest value of the highlighted digit. The knob also cycles through
the selections available when a soft key activates a window that displays user determined settings.
Selections can also be chosen using the Up/Down (▲▼) keys. The spin knob has a “Press to Enter”
function that has the same result as pressing the Enter key.
Page 22
1.9.1 Front Panel Control Keys
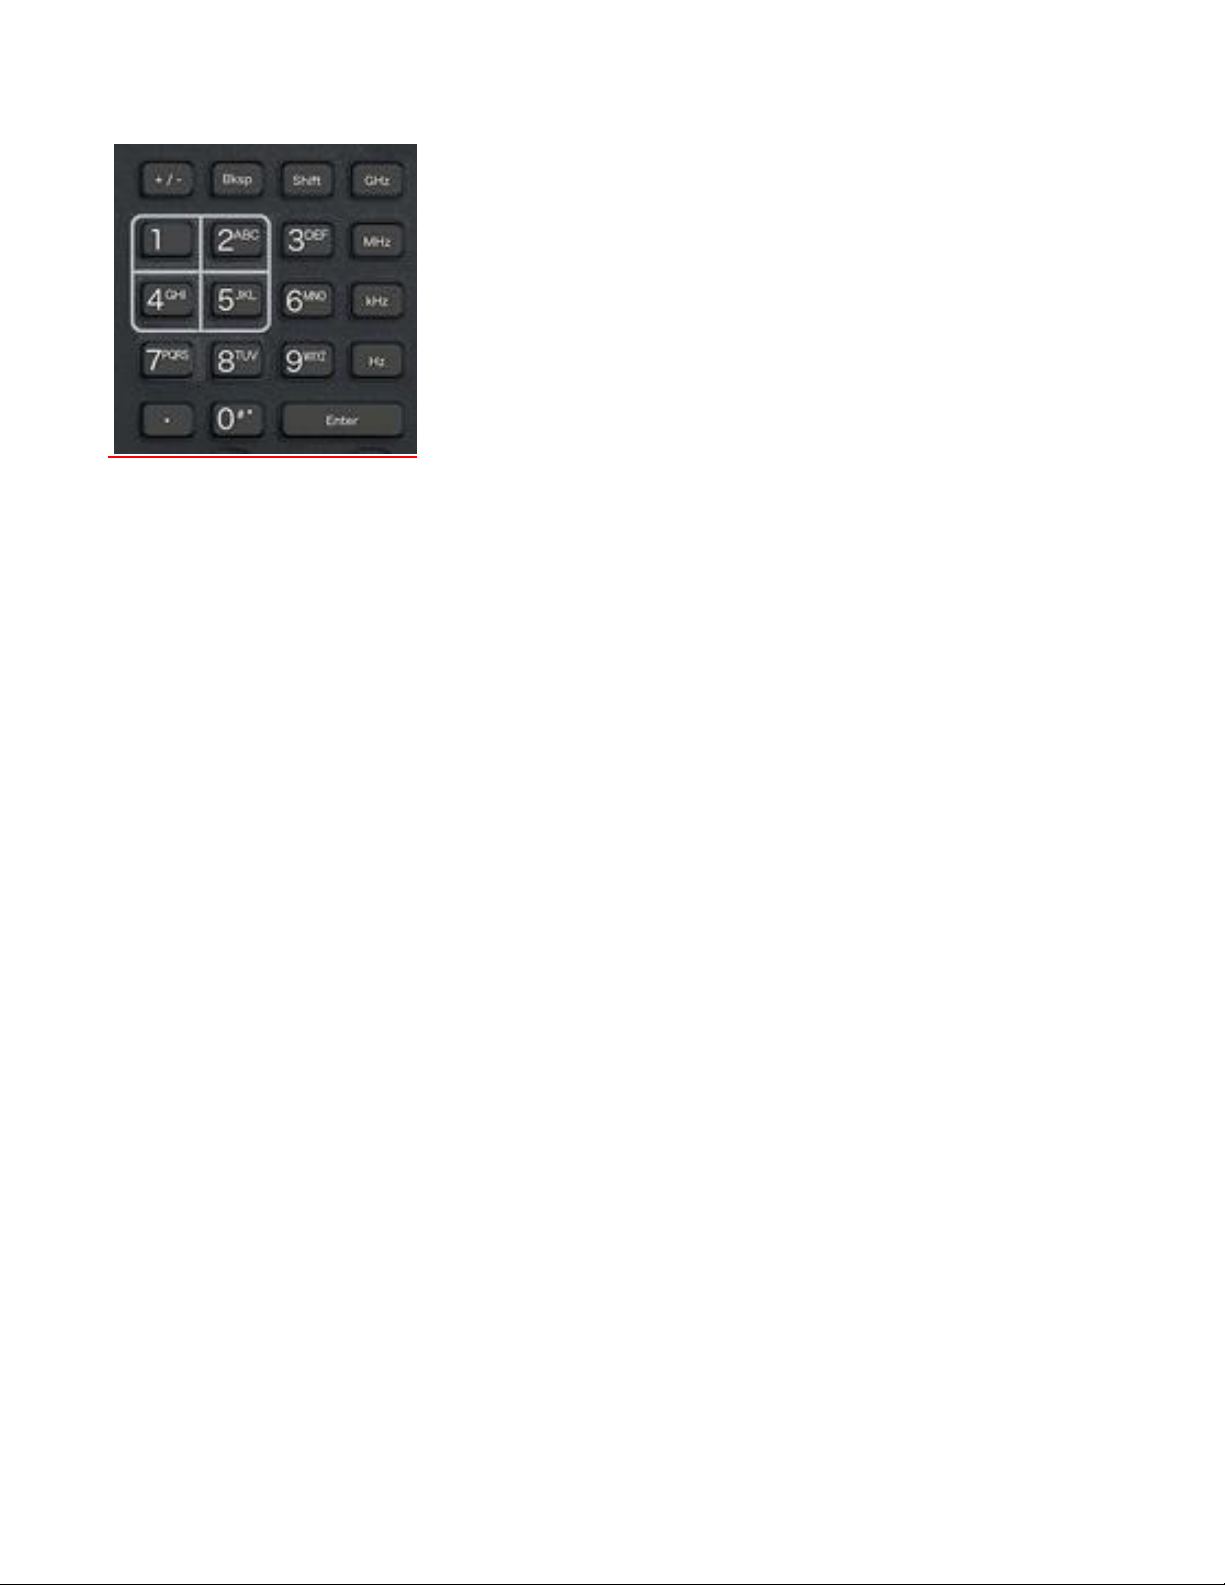
Power Switch
Press to turn the R8100 on and cycle through the boot-up sequence. When operating, pressing the switch
for 3 seconds or less turns the R8100 off with an orderly power down sequence (recommended). Pressing
the switch for 4 seconds or more forces an abrupt shutdown (should be avoided).
Navigation Keys (Monitor, Generate, Duplex, Instrument, Test, Settings)
These keys determine the operating mode of the R8100. The current RF operating mode (Monitor,
Generate, Duplex) is shown in a tab displayed at the bottom left of the main screen. An adjacent tab shows
the current Test mode (Standard or optional modes like DMR, Project 25, NXDN, dPMR, TETRA, etc).
Soft Keys (unlabeled groups of 7 buttons below and 6 buttons to the right of the LCD display)
Each soft key function is determined by the operating mode of the R8100 and the specific test in progress
as indicated by an adjacent label on the LCD display.
Numeric Key Pad Area
22
Page 23
23
For entering and controlling the format of alphanumeric data used by the R8100. Specific key functions
are as follows:
Keys (0-9) and (shifted letters A–Z).
These keys enter alphanumeric information into the analyzer. Pressing a key during data entry places
a new value into the highlighted symbol or number on the analyzer screen. The analyzer then reacts
to the new information just entered. If an invalid entry is attempted, the key press is ignored and the
numeral on the screen remains unchanged.
“Hot keys” 1, 2, 4/5, & 7/8 also serve as shortcuts that directly activate the 4 “Operating Zones” used
for settings and metering in the R8100 Monitor, Generator, and Duplex modes – see paragraph 3.1.2.
The zone displays are arranged on the R8100 main screen just like the outline around the hot keys.
Pressing the hot key activates the zone and displays the associated settings submenu. Hot keys allow
jumping from one zone to another while in Monitor, Generator, or Duplex mode without navigating
back to the main screen.
+/- Key
Toggles the numeric sign from its present value to the negative of its present value.
Bksp Key
Moves the display highlight to a previously entered alphanumeric entry to allow editing.
Shift Key
Changes the function of some numeric keys on the R8100 to alpha or letter designation (A-Z). May
also activate a special function on analyzer when appropriate.
GHz, MHz, KHz, Hz Keys
Apply the indicated scaling units to numeric RF frequency entries.
Enter Key
Equivalent to an “execute” key. It completes an entry from the alphanumeric keypad or a setting
change so the R8100 will operate with the new value..
Esc Key
Cancels an action before it is completed or returns to a previous menu. For example, pressing Esc
while entering a value with the numeric keypad closes the direct entry window and leaves the original
Page 24
value unchanged. Esc also returns to previous modes or windows when navigating the R8100’s
operational menus.
▲▼ (Up/Down), and ◄► (Left/Right) Keys
The arrow keys move a highlighted cursor over the alphanumeric digits in data entry windows to allow
changes. They also step through the available selections in windows that display user determined settings.
The R8100 responds in real time to changes made by the arrow keys.
RF On/Off Key
Disconnects the internal RF Generator from the RF In/Out and RF Gen Out ports. The current RF state is
displayed at the bottom right of the screen next to the message bar. The key does not function in the
Monitor operational mode.
24
Page 25
25
1.9.2 Front Panel Control Knobs
Mon Port
Minimum
Maximum
Antenna
-130 dBm
-20 dBm
RF In/Out
-100 dBm
+10 dBm
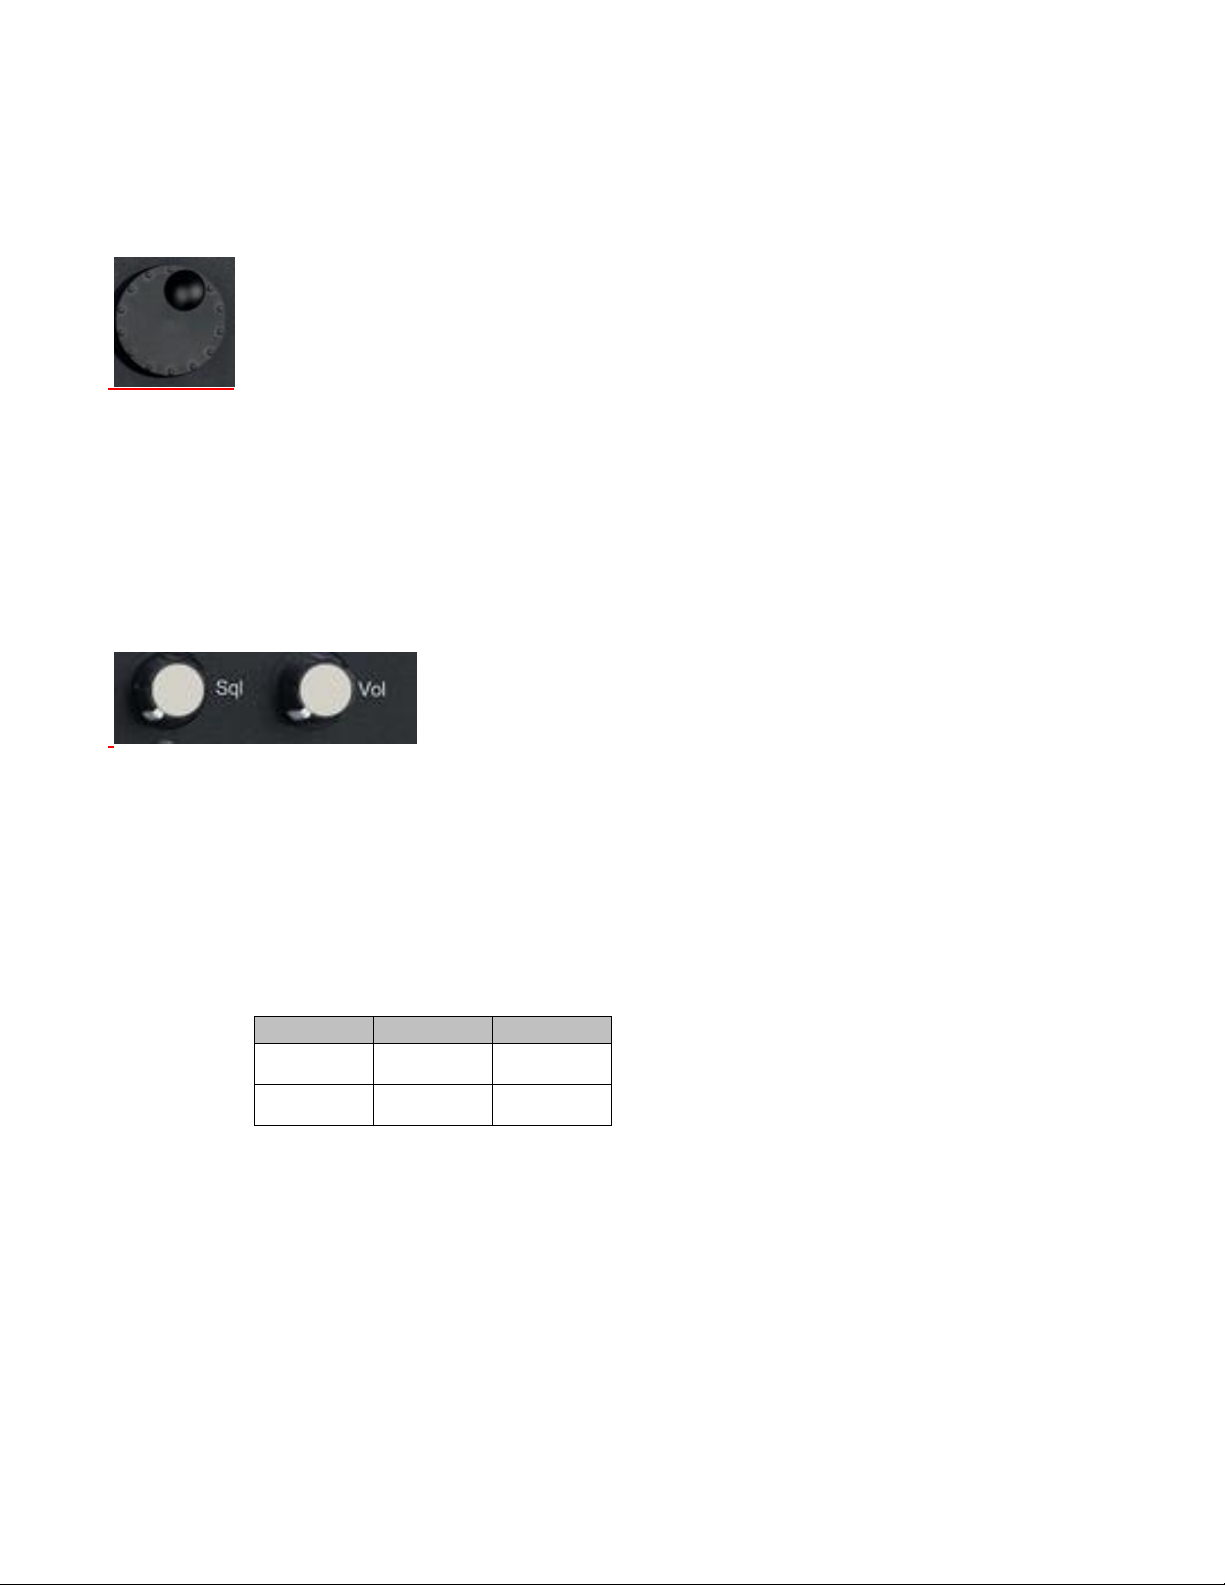
Tuning (Spin) Knob
Incrementally changes the value of the highlighted digit in an alphanumeric entry field. Clockwise
rotation increases the value, counter-clockwise rotation decreases the value. The Tuning Knob affects the
R8100 in real time providing the equivalent of an analog rotational control at the cursor location for a
numeric entry. The knob also cycles through the selections available when a soft key activates a window
displaying user determined settings. The knob may be pushed (click) to perform the same function as the
Enter key
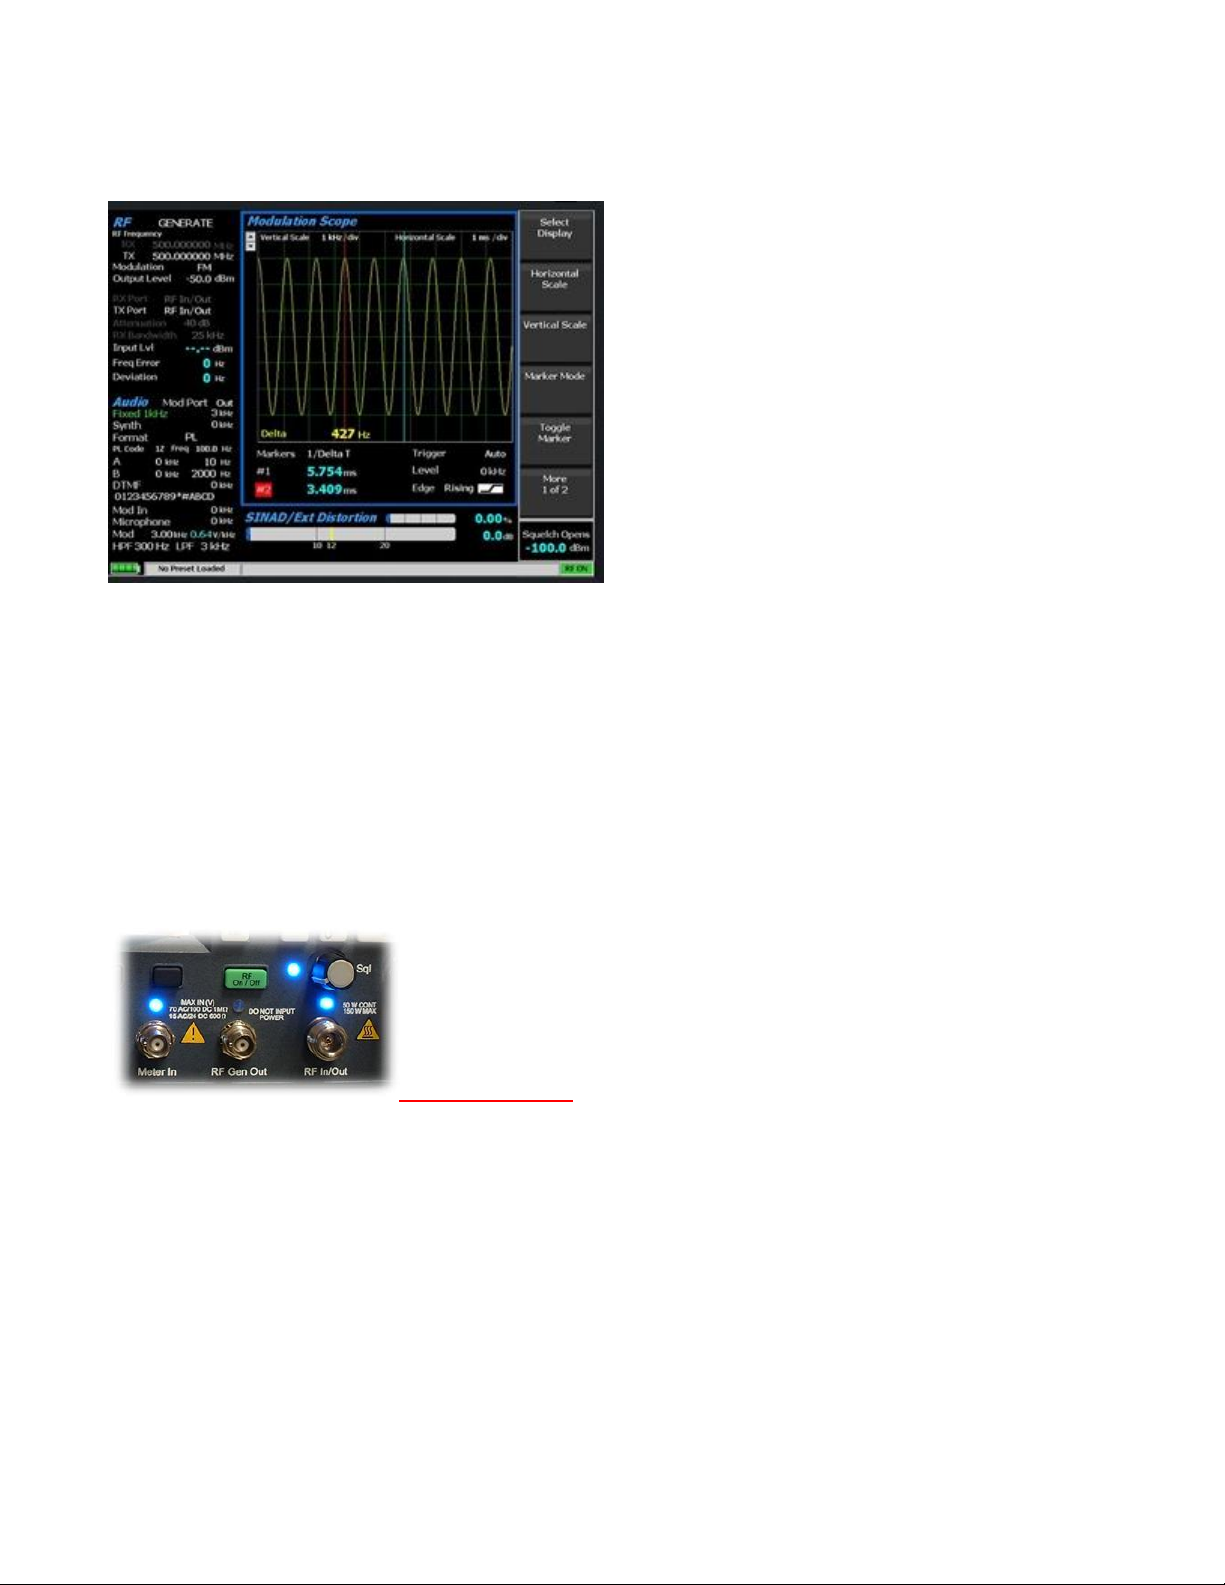
Sql. Knob
Squelch control. Clockwise rotation increases the receiver signal threshold level required to open the
squelch. The fully counter-clockwise position disabled squelch, i.e. forced open. The level in dBm is
displayed in the lower right corner of the main display. The level is applied to the input signal strength of
the RF carrier (not the recovered audio) so that measurements can be performed on un-modulated carriers.
For signals below the level, various demodulation operations cease, e.g. speaker audio is muted and the
Frequency Error and Deviation readings are blanked out.
The squelch threshold level range is based on RF Zone RF Zone / Monitor Mode Mon Port setting: Knob
tolerance is 4 dB.
Note: Additional functions utilize squelch; see RF Scan and Voice Loopback for various test modes.
Vol. Knob
Controls volume of the speaker audio - a clockwise rotation increases the volume. Fully counter-clockwise
is muted.
Page 26
1.9.3 Front Panel Display and Indicators
LCD Display
8.4 inch diagonal bit-mapped LCD. Provides operational status, data, soft key driven menu based
operating controls, and instructional information. Displays in digital, analog, and bar graph forms.
NOTE
The LCD has a screen/power saver feature that reduces intensity after approximately 30 minutes of
inactivity. Press any key to restore the display.
LED Indicators
Needs new photo
The status of certain ports and controls is displayed by an adjacent LED indicator. An illuminated
indicator means the port is active and is either accepting an input or providing an output signal. This
applies to the Antenna, Demod Out, Mod In/Out, Meter In, RF In/Out, and RF Gen Out ports. An
LED indicator next to the Sql. knob illuminates when the RF input signal to the R8100 is above the set
squelch threshold.
Front Panel Connectors
Antenna
26
Page 27
27
Low level RF input port for the sensitive receiver monitor on the R8100. Used for off-the-air and other
low level measurements where the RF power is below 0 dBm.
CAUTION
Do not apply high level RF Power to the Antenna port.
Lower front panel connectors Needs new photo
RF In/Out
Bidirectional port that routes RF input signals to the analyzer's internal monitor or output signals from the
analyzer's internal generator. Also provides combined input/output in Duplex mode and contains the RF
wattmeter load. Note: This is the only front panel connector to which high level RF power may be applied.
RF Gen Out
A high level generator RF output port isolated from the Monitor input.
CAUTION
Do not apply RF Power to the Generator port.
Meter In
Combined input port for oscilloscope vertical, SINAD meter, Distortion meter, and DVM/counter
functions,
Mod In/Out
When configured as an output, this port provides a composite sum of all internally generated modulation
signals applied to the R8100 RF carrier. When set as an input, audio signals external to the R8100 can be
used to modulate the RF carrier. Note: The audio signals must equal +/- 1Vpk to provide a reference for
accurate display of the applied modulation level.
Page 28

CAUTION
Do not exceed +/- 1.5 Vpk on the Mod In/Out port or damage may occur to internal circuitry.
Demod Out
Provides the demodulated (recovered) audio output from a received carrier when the R8100 is in Monitor
or Duplex mode.
Mic In
RJ-45 connector for external accessory microphone.
28
Page 29
29
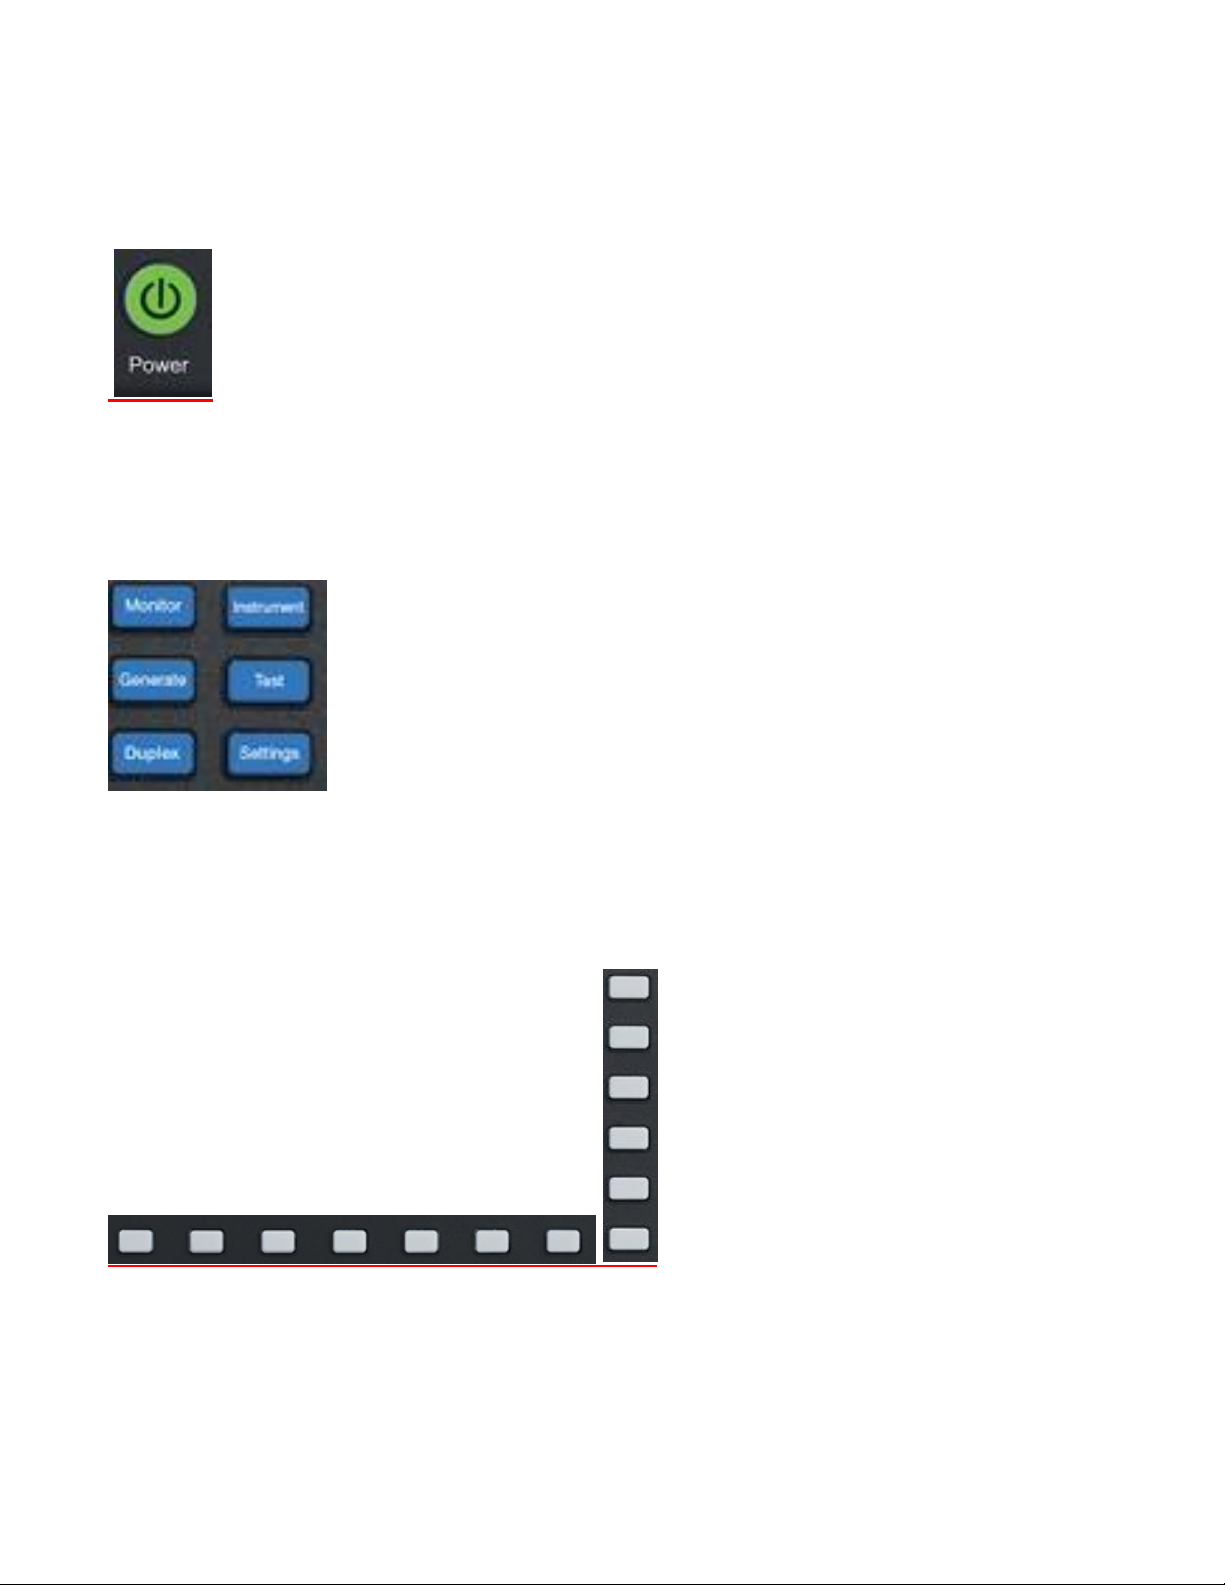
1.9.3.1 Side Panel Connectors
Needs new photo
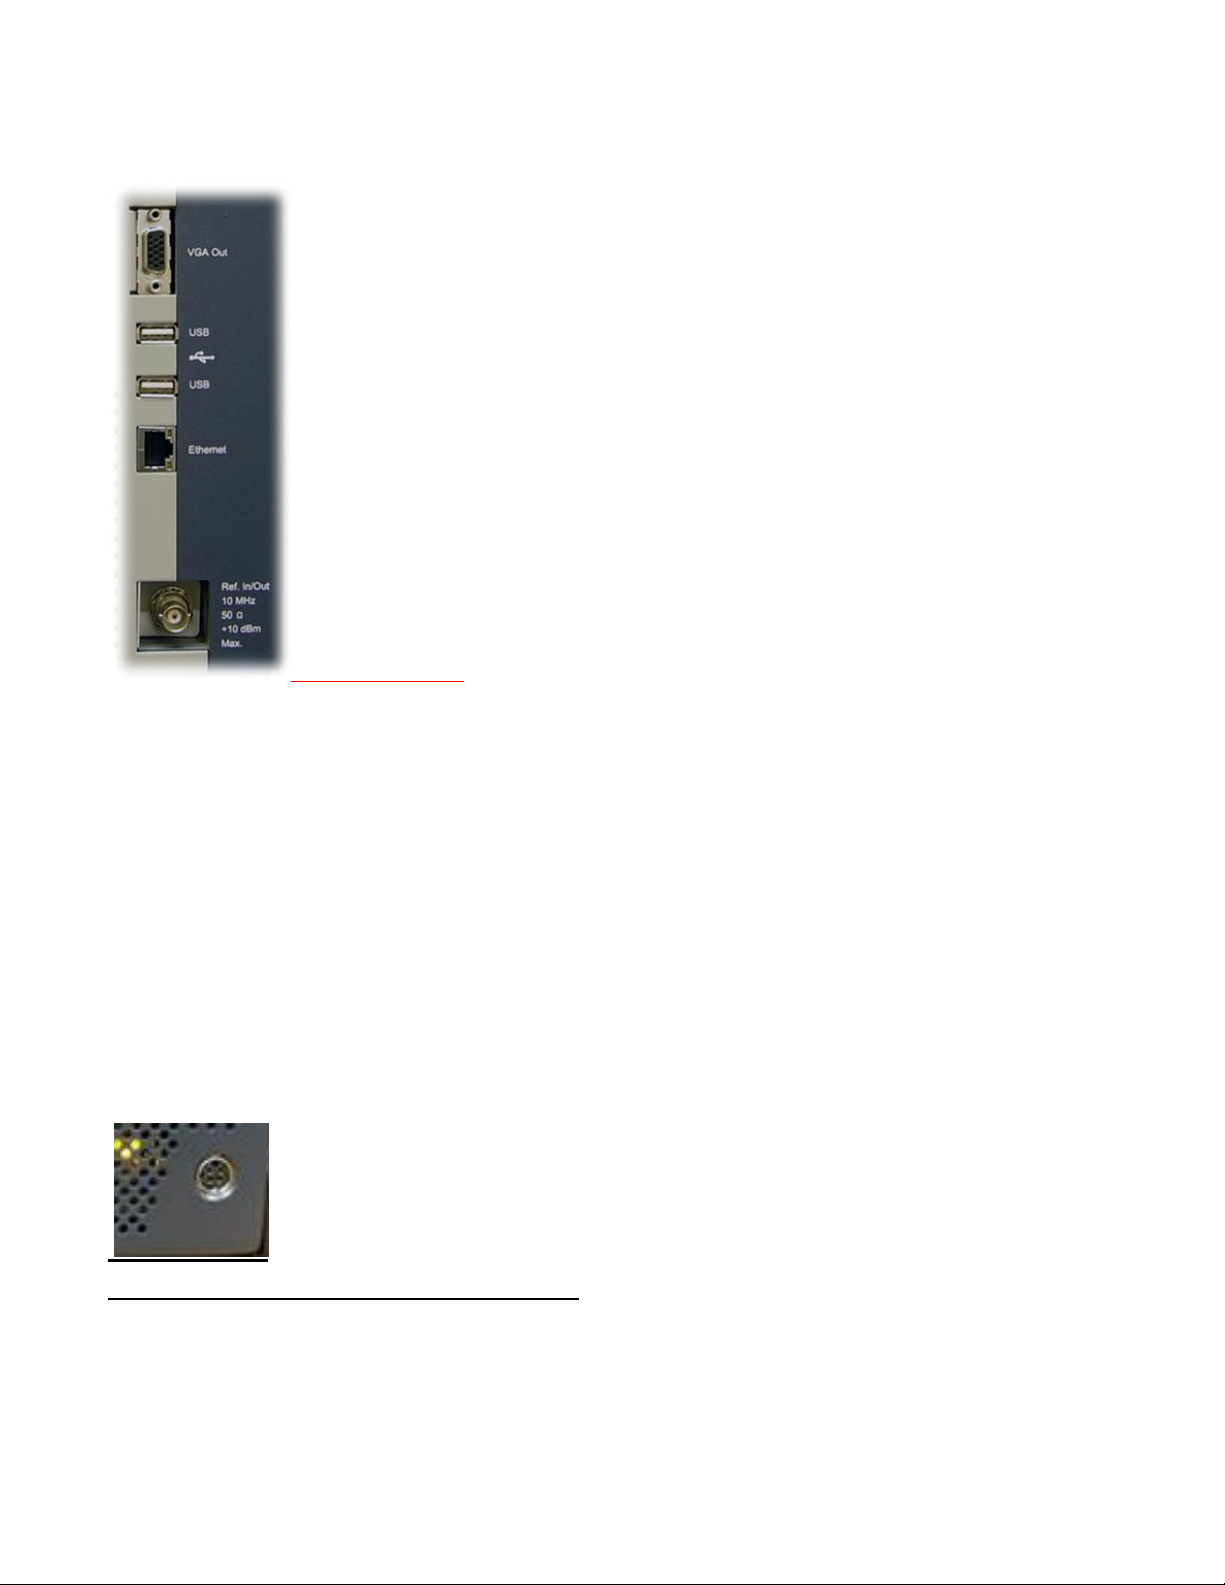
VGA Out
Provides a 15 pin connection to external VGA format color monitor.
USB (2)
USB serial ports for external peripheral devices such as keyboard or flash drive.
Ethernet
RJ-45 connector for 10/100 Mbps Ethernet LAN port for computer network interface.
Ref. In/Out
BNC connector provides input/output for 10 MHz reference frequency. Input impedance is 50 Ω. Input
level requirement is 70 mV to 1V RMS. Output level is approximately 250mV RMS.
DC Power
Primary DC power input port. Note: The R8100 requires 24 VDC – connect only the AC to DC adapter
provided by Freedom Communication Technologies to this port. Do not substitute other adapters without
first consulting Freedom Communication Technologies support personnel or a factory authorized service
center.
Page 30

2 OPERATION
2.1 Overview
The R8100 is operated using an intuitive and easy to navigate system of front panel keys and menu driven
display interface. Dedicated navigation (BLUE) keys on the front panel enable the primary operating
modes. Functions within the main operating modes have an associated display area where important
operational settings and measurements are grouped for easy viewing (see figure 3.1.1-1). The groupings
include the RF Zone, Audio Zone, Display Zone and Meter Zone. These “Operating Zones” are
highlighted when active for user entry as shown in figure 3.1.1-2 for the RF Zone. Menus next to the soft
keys on the right and bottom of the display show the Zone settings available for adjustment. Pressing a
soft key menu brings up a data entry window or additional submenus as required.
The primary operating modes of the R8100 are controlled by the following blue navigation buttons left of
the ANTENNA port on the front panel:
Monitor
RF receiver mode with frequency coverage from 250 kHz to 3 GHz. Provides signal strength, frequency
accuracy, and other metering results while decoding the modulation content of incoming RF carriers to
produce a recovered baseband signal. Additional analysis provided by spectrum analyzer and modulation
scopes.
Generate
RF generator mode with frequency coverage from 250 kHz to 3 GHz. Produces an RF carrier with user
selected output level, modulation type (AM, FM, etc), and tone encoding formats.
Duplex
Duplex mode allowing simultaneous operation and independent control of the generator and receiver.
Instrument
Directly accesses a full screen version of graphically displayed test functions such as the spectrum
analyzer, tracking generator and oscilloscope.
Test
Recall or save operator preset analyzer settings and access application specific test functions.
Settings
System configuration mode for viewing and entering general operating parameters for the R8100 such as
the date/time, network/port settings for remote control, etc.
2.1.1 Basic navigation and operator control
Status information is displayed at the bottom of the display, listed from left to right:, battery state, current
test mode, message bar, and RF On/Off state.
Pressing a navigation button places the R8100 into the labeled operating mode or screen and presents
related information on the display. Figure 3.1.1-1 shows the R8100 in Monitor mode after pressing the
Monitor navigation button
30
Page 31

31
The RF Zone upper left display area shows the RF settings and measured results during monitor
operation. This includes the frequency of operation (Mon Freq), the signal input port (Mon Port), the
input Attenuation, and other relevant data.
Figure 3.1.1-1 Main screen in Monitor mode showing related information in grouped display zones
Six soft keys to the right enable selection and adjustment of monitor specific modes and parameters.
Figure 3.1.1-1 shows the R8100 display after pressing hard key No1 on the numerical keyboard while in
Monitor or Duplex mode – note the RF Zone section is highlighted. This indicates it is active for user
entry and a new submenu with related selections appears next to the soft keys on the right. Pressing the
Esc key returns the R8100 to the previous menu.
Page 32

Figure 3.1.1-2 Main display area after Audio Zone soft key press
Figure 3.1.1-2 shows the R8100 display after pressing the after pressing hard key No4 on the numerical
keyboard Pressing the Fixed 1kHz Level soft key brings up a data entry window for user entered data as
shown in Figure 3.1.1-4. The value can be adjusted with the front panel keypad and tuning controls. The
Left/Right (◄►) keys move the highlight over the desired number field. Numeric changes are entered
directly via the keypad, or in steps using the Up/Down (▲▼) keys or Tuning Knob.
32
Page 33

33
Figure 3.1.1-4 Audio Zone data entry for Fixed 1 kHz Level
Data entry windows always start with the left most numeric field highlighted. Entering a value with the
numeric keypad automatically steps the highlight to the right to speed the entry process. Pressing the
Up/Down (▲▼) keys or rotating the Tuning Knob adjusts the value in step increments. If the value in
the numeric field rises above 9 or goes below zero the excess is rolled over into the base number. The
R8100 stops accepting numeric changes when the value reaches the maximum or minimum allowed for
that parameter. During the entry process pressing Enter completes the entry and pressing Esc cancels the
input.
2.1.2 Hot keys for fast navigation in Monitor, Audio, Display and Meter zones
“Hot keys” 1, 2, 4 & 5 on the numeric keypad are shortcuts that directly activate the 4 “Operating
Zones” used for settings and metering in the R8100 Monitor, Generator, and Duplex modes. The outline
around the hot keys is drawn to match the arrangement of the Operating Zone displays on the R8100
main screen – see Figure 3.1.2-1.
Page 34

Pressing a hot key directly activates the Operating Zone and displays its associated settings submenu.
This allows jumping from one zone to another while in Monitor, Generator, or Duplex mode without
navigating back to the main screen. The hot keys activate the respective zones and submenu as follows:
RF Zone – Press numeric hot key 1
Audio Zone – Press numeric hot key 4
Display Zone – Press numeric hot key 2
Meter Zone – Press numeric hot key 5
Figure 3.1.2-1 Outline around Numeric Keypad Hot Keys
Note: Hot keys are inactive whenever there is a data entry window open or the horizontal soft key menu
below the display is shown. Press the Esc key to close data entry windows or horizontal soft key menus
before using hot keys in Monitor, Generator, or Duplex mode.
2.2 Operating Instructions
The main operating modes of the R8100 are oriented towards testing 2-way radios and related
infrastructure. So for a majority of applications the R8100 will either receive or generate an RF carrier
and display carrier specific information such as power level, modulation content, spectral content, etc.
The description of R8100 operation will initially focus on basic use as a monitor and generator then expand
into more detail on associated functions.
2.2.1 RF Zone / Monitor Mode
The R8100 Monitor mode provides the analyzer's receiver function used for testing radio transmitters. It
is capable of monitoring over the air (OTA) RF signals through its ANTENNA port or with a direct
connection to the transmitter at the RF In/Out port. The operating frequency range is from 250 kHz to 3.0
GHz in 1 Hz increments with selectable bandwidths between 6.25 kHz and 200 kHz. The analyzer
processes AM and FM modulated carriers and a variety of audio encoding formats. Once set to an RF
carrier’s center frequency the R8100 accurately determines the frequency error, power level, and
modulation characteristics. These are shown at the bottom of the RF Zone section of the main display,
below the separator line – see Figure 3.2.1-1. Expanded versions of these measurements are also available
in the Bar Graphs selection in the Display Zone.
34
Page 35

35
Figure 3.2.1-1 RF Zone display area showing Monitor Mode data
To enable the R8100 Monitor mode press the Monitor navigation button from within any menu and
confirm that “Monitor” is indicated in the lower left corner of the R8100 main display. Then press the
Esc button repeatedly until the soft keys to the right of the display area indicate RF Zone, Audio Zone,
Display Zone, and Meter Zone. This places the R8100 at the entry point for adjusting basic Monitor mode
settings such as frequency, modulation type, etc. Note: In Monitor mode you can bypass standard menu
navigation and jump directly to another Zone and its settings submenu with the appropriate hot key - see
paragraph 3.1.2.
Input Level
Displays the RF input level of the received carrier. Different units may be selected with the Input Level
Units setting.
Note: When the RF input power on the RF In/Out port is above +20 dBm (100 mW), the R8100 utilizes a
broadband power detector for the measurement. The “Input Lvl” field in the RF Zone changes to “Watt
Meter” to indicate this measurement mode
Watt Meter
Displays the level of broadband power applied to the RF In/Out port. Different units may be selected with
the Input Level Units setting in the RF Zone submenu.
Note: For best Watt Meter accuracy disable the Pre-amplifier in Monitor Mode, and set the Gen Port in
Generate Mode to RF In/Out.
Freq Error
Displays the frequency difference of the received carrier frequency minus the R8100 Monitor Frequency.
Page 36

Deviation
Displays the positive peak frequency deviation of the received modulated carrier (i.e. from the Frequency
Error mean) - available when Modulation mode is FM. See negative peak frequency deviation with
Display Zone Bar Graphs.
%AM
Displays the positive peak AM percentage of the received modulated carrier - available when Modulation
mode is AM.
Setting the Monitor’s RF operating parameters in the RF Zone
To adjust the RF settings press the hot key 1. The RF Zone area of the display highlights and the soft key
submenu shown in Figure 3.2.1-2 appears with the following selections:
Figure 3.2.1-2 Monitor Mode submenu after RF Zone soft key press
36
Page 37

37
Monitor Frequency
Input Port
Maximum input level for using pre-amplifier
Antenna
(Input signal in dBm – Attenuator setting) is equal or less than -40 dBm
RF In/Out
(Input signal in dBm – Attenuator setting) is equal or less than -10 dBm
Sets the desired monitor frequency in a data entry window from 250 kHz to 3 GHZ using the arrow keys,
keypad, or tuning knob. Pressing Enter completes the change and Esc cancels the entry.
Copy Frequency to Generator
Sets the R8100 Generator to the same frequency as the Monitor
Modulation Type
Activates a horizontal submenu with selections for the signal demodulation mode of the R8100 receiver either FM or AM.
Bandwidth
Selects the IF detection bandwidth via horizontal soft keys from 6.25 kHz (narrow) to 200 kHz (wide).
Note: For best measurement quality always set an IF bandwidth no wider than necessary for the signal
carrier of interest. Example: Typical channel spacing for modern narrowband 2-way radio is 12.5 kHz.
Monitor IF bandwidths that are wider than needed for the channel spacing allow more noise in the
measurement and degrade the quality of readings for deviation, frequency error, SINAD, etc.
Attenuation
Adjusts the RF input signal attenuation in 2 dB steps from 0 to 90 dB in a selection table window using
the Up/Down (▲▼) keys or spin knob.
Pre-Amplifier
Enables a supplementary input amplifier that extends the sensitivity of the RF Monitor by improving the
S/N ratio for low signal levels. Green highlighted “AMP” text appears in the RF Display zone whenever
the Pre-Amplifier is active.
Note: By default the R8100 Pre-Amplifier Auto-Off feature disables the Pre-Amplifier for best accuracy
during broadband power (Watt Meter) measurements (see section 3.2.9.2). When enabled, avoid input
overload and erroneous signal strength readings by using the pre-amplifier only under the following
conditions:
Mon Port
Monitors the RF input signal from either the ANTENNA or the RF In/Out front panel connectors. Choose
in a selection table window using the Up/Down (▲▼) keys or spin knob.
CAUTION
Do not apply input power to the Antenna input port.
Page 38

Note: If RF Level Offset is enabled, the Mon Port label is cyan-colored indicating that RX measurements
are adjusted by the Mon Port-specific offset. See section 2.2.8.2 for details.
Input Level Units
Selects the measuring units for the RF Zone input level display (“Input Lvl”) via horizontal soft keys.
Choices are Volts, Watts, or dBm.
Direct entry example:
Figures 3.2.1-3 and 3.2.1-4 show the data entry and RF Zone windows after pressing the Monitor
Frequency soft key and entering 501.234567 MHz via the numeric keypad. The data entry window starts
with the left most numeric field highlighted. As the value is entered on the keypad the highlight
automatically steps to the right. Pressing Enter or a units key (MHz, etc) completes the change while Esc
cancels the entry.
Figure 3.2.1-3 Data entry window before and after Monitor frequency change
Figure 3.2.1-4 RF Zone display area after Monitor frequency change
Real time adjustments using the tuning knob and arrow keys.
In many data entry windows the R8100 will respond immediately before the Enter key is pressed if the
Up/Down (▲▼) keys or tuning (spin) knob are used to change the numeric value. An example of this is
the frequency entry adjustment in Monitor mode. Here the operator can use the tuning (spin) knob to
38
Page 39

39
manually scan an RF frequency segment for an unknown carrier, with the smooth action associated with
an analog control. The spin knob adjusts whichever digit is highlighted in the data entry field by the
Left/Right (◄►) cursor control buttons. Continuous rotation of the knob steps the frequency adjustment
by the smallest value of the highlighted digit. Moving the highlight to a different field allows coarse
(faster) or fine (slower) tuning as desired. The tuning knob may be pressed at any time to Enter the
current value The Up/Down (▲▼) keys provide precise step changes for final adjustment after the
R8100 is quickly dialed close to the desired frequency.
2.2.2 RF Zone / Generate Mode
The R8100 Generator mode is the analyzer's transmitter function used for testing radio receivers over a
frequency range of 250 kHz to 3.0 GHz in 1 Hz increments. The RF carrier output is accessible through
the RF Gen Out or RF In/Out ports for over the air (OTA) operation or direct coupling into a receiver.
The output level is adjustable from -95 dBm to +5 dBm on the RF Gen Out port, and -130 dBm to -30
dBm on the RF In/Out port. A variety of modulation types and encoding formats are available for the RF
carrier. Figure 3.2.2-1 shows the R8100 in the generate mode in the RF Zone section of the main display.
Figure 3.2.2-1 RF Zone display area showing Generator Mode data
To enable the R8100 Generate mode press the Generate navigation button from within any menu and
confirm that “Generate” is indicated in the lower left corner of the R8100 main display. Then press the
Esc button repeatedly until the soft keys to the right of the display area indicate RF Zone, Audio Zone,
Display Zone, and Meter Zone. This places the R8100 at the entry point for adjusting basic Generate
mode settings such as frequency, modulation type etc. Note: In Generate mode you can bypass standard
menu navigation and jump directly to a Zone and its settings submenu with the appropriate hot key – see
paragraph 3.1.2.
Output Level
Output Lvl (gray) displays the Generator RF output level. Volts, Watts, or dBm units may be selected
with the Output Level Units setting in the RF Zone submenu.
Page 40

Setting the Generator’s RF operating parameters in the RF Zone
To adjust the RF settings press the RF Zone soft key or hot key 1. The RF Zone area of the display
highlights and a new soft key submenu appears as shown in Figure 3.2.2-2. The soft key selections are as
follows:
Figure 3.2.2-2 Generator Mode submenu after RF Zone soft key press
Generator Frequency
Sets the desired monitor frequency in a data entry window from 250 kHz to 3 GHZ using the arrow keys,
keypad, or tuning knob. Pressing Enter completes the change and Esc cancels the entry.
Copy Frequency to Monitor
Sets the R8100 Monitor to the same frequency as the Generator.
Modulation Type
Activates a horizontal submenu with selections for the carrier modulation mode of the R8100 – either FM
or AM. Note: Output Level upper limits are reduced in AM to accommodate peak power levels.
40
Page 41

41
Output Level
Output Level (white) adjusts the RF level of the transmitted carrier for the active output port. Range is
from -95 dBm to +5 dBm on the RF Gen Out port, and -130 dBm to -30 dBm on the RF In/Out port. When
Modulation Type is AM, the upper limits are -1 dBm and -36 dBm respectively.
Gen Port
Choose the active port (RF In/Out or Gen Out) for the R8100 carrier output in a selection table using the
Up/Down (▲▼) keys or spin knob.
Note: If RF Level Offset is enabled, the Gen Port label is cyan-colored indicating that Output Level
amplitudes are adjusted by the Gen Port-specific offset. See section 2.2.8.2 for details.
Bandwidth
Sets the maximum occupied bandwidth in kHz for the R8100’s carrier via a set of horizontal soft keys.
The range is from 6.25 kHz (narrow) to 200 kHz (wide).
Output Level Units
Selects the measurement units for setting the Generator RF output level via horizontal soft keys. Choices
are Volts, Watts, or dBm, and the level is displayed in the Output Level field in the RF Zone display
window.
2.2.3 RF Zone / Duplex Mode
The R8100 Duplex mode provides simultaneous generator and monitor operation for testing radio
transceivers with full duplex capability, or radio systems with offset transmit and receive frequencies. All
RF parameters of the R8100 generator and monitor are independently adjustable during Duplex operation
except the shared functions of modulation type and bandwidth. Duplex mode provides offset frequency
operation of the generator and monitor over the full frequency range of the R8100. Figure 3.2.3-1 shows
Duplex operation of the R8100 in the RF Zone section of the main display.
Note: If RF Level Offset is enabled, the Gen Port and Mon Port labels are cyan-colored indicating that
Output Level amplitudes and RX measurements are adjusted by the Gen Port and Mon Port-specific
offsets. See section 2.2.8.2 for details.
Page 42

Figure 3.2.3-1 RF Zone display after Duplex key press
To enable the R8100 Generate mode press the Duplex navigation button from within any menu and
confirm that “Duplex” is indicated in the lower left corner of the R8100 main display. Then press the Esc
button repeatedly until the soft keys to the right of the display area indicate RF Zone, Audio Zone, Display
Zone, and Meter Zone. This places the R8100 at the entry point for adjusting basic Duplex mode settings
such as frequency, modulation type etc. Note: In Duplex mode you can bypass standard menu navigation
and jump directly to a Zone and its settings submenu with the appropriate hot key – see paragraph 3.1.2.
Setting RF operating parameters in Duplex mode in the RF Zone
To adjust the RF settings press the RF Zone soft key or hot key 1. The RF Zone area of the display
highlights and the soft key submenu shown in Figure 3.2.3-2 appears. Most of the soft keys duplicate the
independent generator and monitor adjustments described in sections 3.2.1 and 3.2.2. The Modulation
Type and Bandwidth settings are common and simultaneously applied to the generator and monitor.
42
Page 43

43
Figure 3.2.3-2 Duplex Mode submenu after RF Zone soft key press
Audio Zone
The R8100 Generate and Monitor modes have a variety of audio settings and encoding/decoding features,
many of which are associated with modulation of the carrier transmitted from the R8100. The
audio/modulation sources include a fixed 1 kHz tone generator, independent variable frequency Tone
A/Tone B generators, a dedicated DTMF (Dual Tone Multi-Frequency) generator, and a synthesizer for
generating various other encoding formats used in 2-way radio testing. The Audio Zone also has the
baseband filter settings for the R8100 Monitor mode. Decoding function displays for the carrier recovered
audio are primarily located in the Meter Zone.
The display presentation for the Audio Zone on the R8100 main screen changes depending on the R8100
mode. Figure 3.2.4-1 shows the Audio Zone display area with the R8100 in Generate mode. Note the
field description of “Mod Sum” towards the upper right, and that the level is in kHz. In Generate mode
this synthesizer generated composite audio modulates the internally generated RF carrier on the R8100.
The carrier modulation level is indicated in units of deviation for FM (kHz) or percent for AM. The
composite audio modulation is also available on the Mod In/Out connector.
Page 44

Figure 3.2.4-1 Audio Zone display with the R8100 in Generate mode
Figure 3.2.4-2 shows the Audio Zone display area with the R8100 in Monitor mode. In Monitor mode
the audio synthesizers operate like a standalone audio generator since they’re not modulating a carrier
internal to the R8100. Note the field description of “Audio Sum” towards the upper right and that the
level is in Volts (V). This level is the composite sum of all audio sources enabled. The composite audio
signal is available on the Mod In/Out connector.
Figure 3.2.4-2 Audio Zone display with the R8100 in Monitor mode
2.2.3.1 Setting audio operating parameters in Monitor mode
Figure 3.2.4.1-1 shows page 1 of the Audio Zone submenu in Monitor mode after the soft key press.
Recall that the R8100 audio synthesizers operate like a standalone audio generator in this mode and the
signal is directed to the Mod In/Out connector. This is the first of several menu pages with settings mainly
associated with the audio synthesizer. The number of menu pages varies with the selected audio format.
44
Page 45

45
The last page of the Audio Zone submenu also contains the baseband filter settings for the R8100 Monitor
mode.
Note: Audio Zone submenu screens display common settings along with menu choices that change to
reflect the Format (signal type) chosen for the audio synthesizer. Different submenu screens and settings
appear when other encoding types such as DPL, A/B Sequence, or 5/6 Tone are selected with the Format
soft key. The following sections will first describe the common settings, followed by the alternate settings
specific to each encoding format.
Figure 3.2.4.1-1 Audio Zone submenu in Monitor mode
2.2.3.2 Common Audio Settings for the Audio Zone submenu
Fixed 1kHz Level
Adjusts the fixed 1 kHz tone generator amplitude from 0 to 8V Peak in a data entry window using the
arrow keys, keypad, or spin knob. Pressing Enter completes the change and Esc cancels the entry.
Page 46

Fixed 1 kHz Mode
Activates a horizontal submenu with an Off or Continuous selection for the 1 kHz tone generator. When
the tone is activated the Fixed 1kHz field is highlighted in green.
Synth Level
Adjusts the synthesized audio generator amplitude from 0 to 8V Peak in a data entry window using the
arrow keys, keypad, or spin knob. This is an independent generator used for encoded audio such as PL,
DPL, A/B Sequence, etc.
Synth Format
Activates a horizontal submenu with selections for the Synth encoding format – PL, DPL, DPL Invert,
A/B Sequence, 5/6 Tone, POCSAG, and General Sequence – see Figure 3.2.4.2-1. Selecting the format
makes it the active encoding type for the audio synthesizer. Note: See paragraph 3.2.4.3 for specific
submenu selections for these formats.
Figure 3.2.4.2-1 Format submenu in Audio Zone
46
Page 47

47
Synth Mode
Activates a horizontal submenu with an Off or Continuous selection for the Synth generator.
Tone A Level
Adjusts the “A” variable tone generator amplitude from 0 to 8V Peak in a data entry window using the
arrow keys, keypad, or spin knob. Pressing Enter completes the change and Esc cancels the entry.
Tone A Frequency
Adjusts the “A” variable tone generator frequency from 0 to 19999 Hz in a data entry window using the
arrow keys, keypad, or tuning knob. Pressing Enter completes the change and Esc cancels the entry.
Tone A Mode
Activates a horizontal submenu with an Off or Continuous selection for the Tone A generator.
Tone B Level
Adjusts the “B” variable tone generator amplitude from 0 to 8V Peak in a data entry window using the
arrow keys, keypad, or spin knob. Pressing Enter completes the change and Esc cancels the entry.
Tone B Frequency
Adjusts the “B” variable tone generator frequency from 0 to 19999 Hz in a data entry window using the
arrow keys, keypad, or tuning knob. Pressing Enter completes the change and Esc cancels the entry.
Tone B Mode
Activates a horizontal submenu with an Off or Continuous selection the Tone B generator.
DTMF Level
Adjusts the DTMF (Dual Tone Multi-frequency) tone generator amplitude from 0 to 8V Peak in a data
entry window using the arrow keys, keypad, or spin knob. Pressing Enter completes the change and Esc
cancels the entry. DTMF is used for testing telephone interfaced systems.
DTMF Mode
Activates a horizontal submenu with an Off, Continuous, or Burst selection for the DTMF tone generator.
DTMF Code
Enters a DTMF Code sequence in a data entry window using the alphanumeric keypad. The Left/Right
(◄►) keys move the highlight to the desired field. The code is entered either of several ways. The
Up/Down (▲▼) keys or spin knob cycles the highlighted field through the entire DTMF Code table.
Pressing the alphanumeric keypad allows direct numeric entry and alpha characters are entered by cycling
through repeated presses of the appropriate numeric key.
DTMF Table
Activates soft keys and a table that provide more control when generating a DTMF Code sequence – see
Figure 3.2.4.2-2. In addition to the DTMF Code data entry window there are selections permitting
Page 48

adjustment of the Tone Duration and Inter-digit Delay. A Single Digit mode also allows single key press
tone generation similar to a telephone keypad.
Figure 3.2.4.2-2 DTMF Table providing additional code sequence control.
Microphone Mode
Enables or disables modulation from an external microphone attached to the Mic In port of the R8100.
Note: Pressing the PTT button on the external microphone switches the R8100 into Generate mode.
Modulation from the microphone is applied to the carrier when the mode is set to Continuous.
Microphone Level
Sets the modulation level for the external microphone attached to the R8100. The displayed units reflect
the modulation mode chosen in the RF Zone, either deviation in kHz for FM or % modulation for AM.
High Pass Filter
Activates a horizontal submenu with audio filter selections that determine the high pass frequency for the
R8100’s baseband response to recovered audio. The “cut-on” frequency selections are 5 Hz, 300 Hz, and
48
Page 49

49
3 kHz. This setting is used in conjunction with the Low Pass Filter to determine the audio pass band for
the R8100 baseband circuitry.
Low Pass Filter
Activates a horizontal submenu with audio filter selections that determine the low pass frequency for the
R8100’s baseband response to recovered audio. The “cut-off” frequency selections are 300 Hz, 3 kHz,
and 20 kHz. This setting is used in conjunction with the High Pass Filter to determine the audio pass band
for the R8100 baseband circuitry.
Note: For best audio and measurement quality always set an audio pass band no wider than necessary
for the signal of interest. Example: A typical 2-way radio audio pass band is 300 Hz to 3 kHz. Pass
bands wider than necessary allow more noise in the measurement and degrade the audio quality and the
readings for deviation, frequency error, SINAD, etc. The default settings for the R8100 High and Low
Pass filters are 300 Hz and 3 kHz respectively.
2.2.3.3 Settings for PL, DPL, DPL Invert A/B Sequence, 5/6 Tone, POCSAG and General Sequence
Formats
The following settings appear in Audio Zone submenu pages when specific encoding formats are chosen
in the Format horizontal menu - see Figure 3.2.4.2-1.
PL Table (displayed in Audio Zone submenu when synthesizer Format selected is PL)
Activates a selection table Motorola Private-Line tone coded squelch signaling and provides a listing of
valid codes/frequencies – see Figure 3.2.4.3-1. The codes and associated frequencies are selected using
the Up/Down (▲▼) and Left/Right (◄►) keys to scroll through the table and pressing Enter to complete
the entry. Choosing a blank field removes PL coding from the Audio Sum. For valid codes see Table B3 in Appendix B.
Page 50

Figure 3.2.4.3-1 PL Table showing highlighted entry code.
DPL Code (displayed when synthesizer Format selected is DPL or DPL Invert)
Activates a data entry window to enter codes for the Motorola Digital Private-Line coded squelch
signaling format. Code entries are made using the cursor control, numeric keypad, and spin knob. See
Table B-5 in Appendix B for a selection table with a listing of valid DPL codes.
A/B Sequence (displayed when synthesizer Format selected is A/B Sequence)
This soft key brings up a horizontal menu to select one of 4 timing sequences for the two-tone sequential
paging format. The sequences are programmed and appear in the A/B Sequence Table – see next setting.
A/B Sequence Table (displayed when synthesizer Format selected is A/B Sequence)
Activates a programming table for the two-tone sequential paging format – see Figure 3.2.4.3-2, The A/B
Sequence encoding mode uses the Tone A and Tone B generators and one of four selectable timing
sequences determined by the Sequence soft key. Sequences 1 and 2 utilize fixed timing for standard
"tone" and "tone/voice" pagers, while sequences 3 and 4 may be customized through numeric entries by
the user. When the Up/Down (▲▼) keys highlight the programmable sequences (3 and 4) a new submenu
50
Page 51

51
appears as shown in Figure 3.2.4.3-3. The tone frequencies, durations and delays are entered using this
submenu.
Figure 3.2.4.3-2 A/B Sequence table showing highlighted sequence.
Page 52

Figure 3.2.4.3-3 A/B Sequence table submenu for user programmable entries
5/6 Tone (displayed when synthesizer Format selected is 5/6 Tone)
Activates a data entry window and horizontal menu to enter tones for the 5/6 Tone paging format – See
Figure 3.2.4.3-4. Tone entries are made using the cursor control, numeric keypad, and spin knob. See
Table B-4 in Appendix B for a selection table with a listing of valid 5/6 Tone tones.
The first digit preceding the hyphen is the preamble tone for activating one of ten battery-saver groups.
The R-Repeat key or “R” tone is used in place of a repeated digit – when this tone is heard it is assumed
the prior digit is being transmitted again. If the digit is repeated a third time the original tone is transmitted.
A sixth or “X” tone is optional for pagers that support this function. The “X” tone indicates a different
beep pattern is used in place of that used for the standard 5 tone response. Pressing the 6-Tone soft key
adds the “X” tone to the transmission.
52
Page 53

53
Figure 3.2.4.3-4 5/6 Tone entry submenu
POCSAG Message (displayed when synthesizer Format selected is POCSAG)
This soft key brings up a horizontal menu to select one of 8 transmission strings under the Numeric or
Alphanumeric POCSAG formats. These include: Tone Only; Numeric number; Numeric set;
Alphanumeric upper case; Alphanumeric lower case; Alphanumeric special character; Numeric custom;
Alphanumeric custom.
POCSAG Table (displayed when synthesizer Format selected is POCSAG)
Activates a submenu with a programming table for the POCSAG (ITU-R M.584) digital paging format)
– see Figure 3.2.4.3-5.
Page 54

Figure 3.2.4.3-5 POCSAG Table submenu
2.2.3.3.1 Settings in the POCSAG Table submenu
Synth Mode
Activates a horizontal submenu to select Off, Continuous, or Burst mode for the POCSAG synthesizer.
Capcode
Select the Capcode for the specific pager from 0 through 2097151 using arrow keys, keypad, or spin knob.
Function Bits
Activates a horizontal submenu for choosing the function bits indicating the type and format of the
message data page (00; 01; 10; 11).POCSAG Message
Use the arrow keys or spin knob to select one of 8 transmission strings under the Numeric or Alphanumeric
POCSAG formats. There are 6 factory set and 2 custom messages. Note: Anytime the POCSAG Table
submenu is displayed you can use the Up/Down (▲▼) keys to highlight the Msg/String table entries
54
Page 55

55
desired for the POCSAG Msg. Highlighting the NumericCust or AlphaNumCust selections allows editing
of the respective custom Numeric or Alpha-numeric strings. Up to 16 characters may be entered. Entered
NumericCust and AlphaNumCust strings are truncated or expanded to match Message Length.
Tone Only: <empty string>
NumericNum: 0123456789
NumericSet: The used characters in the Numeric set. See Table B-7.
AlphaNumUC: ABCDEFGHIJKLMNOPQRSTUVWXYZ
AlphaNumLC: abcdefghijklmnopqrstuvwxyz
AlphaNumSP: space!”#$%’()*+, -./:;<=>?@[\]^_`{|}~
NumericCust: Anything in the Numeric set. See Table B-7.
AlphaNumCust: Anything in the Alpha-numeric set. See Table B-8
Message Length
Use the arrow keys, spin knob, or numeric pad to set the message length from 0 to 60 characters.
Data Rate
Use the arrow keys, spin knob, or numeric pad to set the communication data rate from 400 to 4800 bps.
Polarity
Activates a horizontal submenu for choosing the polarity of the POCSAG data stream, either Normal or
Inverted. When set to Normal, a logic high (1) results in a more positive frequency deviation in FM mode.
A logic low (0) results in a more negative frequency deviation in FM mode. When set to Inverted, a logic
high (1) results in more negative frequency deviation in FM mode. A logic low (0) results in a more
positive frequency deviation in FM mode.
Error Bit
Use the arrow keys, spin knob, or numeric pad to set the error bit at the specified location in the POCSAG
page bit stream. The error bit allows targeted insertion of an error into the page to test a POCSAG decoder's
error correction capability. The setting toggles the Error Bit bit in the POCSAG page bit stream, where
the bit stream uses a 1-based index. If Error Bit is set to 0(default), no bits are toggled. If Error Bit is set
>= 1, then bit stream[Error Bit] is toggled.
2.2.3.3.2 Settings in the General Sequence Table submenu
Code Sequence (displayed when synthesizer Format selected is General Sequence)
Activates a data entry window and horizontal menu for entering an audio tone sequence for encoding on
either the RF carrier or Mod Out port. Each entry can be one of 20 Tone Codes (0 to 9 and A to J) with
the frequency, duration, and post tone delay specified in the General Sequence Table. Tone entries are
made using the ▲▼ (Up/Down), and ◄► (Left/Right) keys, numeric keypad, and spin knob. “Clear to
End” clears the highlighted entry and all others to the right.
Page 56

General Sequence Table (displayed when synthesizer Format selected is General Sequence)
Displays a programming table for the General Sequence encoder (see Figure 3.2.4.3-6. The table is
populated with 20 Tone Codes (0 to 9 and A to J) with preset data for frequency, duration, and post-tone
delay. The selected Tone Standard determines the preset data for each tone code. Regardless of the
standard selected, each Tone Code can be edited by the operator for the current operating session or saved
as a customized Sequence.
Figure 3.2.4.3-6 General Sequence Table submenu
Code Sequence (also appears in Audio Zone submenu)
Activates a data entry window and horizontal menu for entering a tone sequence. Each entry can be one
of 20 Tone Codes (0 to 9 and A to J) with the frequency, duration, and post tone delay specified in the
General Sequence Table. The Tone Code entries are made using the ▲▼ (Up/Down), and ◄►
(Left/Right) keys, numeric keypad, and spin knob. “Clear to End” clears the highlighted entry and all
others to the right.
56
Page 57

57
Select Tone Standard
Choose which Tone Standard is used for the preset Tone Code entries on the General Sequence table.
“None” populates the table with the factory default values shown in Figure 3.2.4.3-6. The remaining
selections are SelCall (Selective Calling) tone standards: CCIR1; CCIR2; PCCIR; CCITT; EEA; EIA;
Euro; NATEL; MODAT; ZVEI1; ZVEI2; ZVEI3; PZVEI; DVZEI; PDZVEI. Regardless of which
standard is chosen, each Tone Code can be selected and edited by positioning the blue highlighting arrow
using the Up/Down (▲▼) keys, or spin knob. Edited tables can be saved as a user defined Sequence
Definition. Reselecting and entering any Tone Standard restores the original table entries.
Synth Mode (also appears in Audio Zone submenu)
Activates a horizontal submenu with an Off, Continuous, or single Burst selection for the Synth generator
transmitting the tone. The status of the Synth Mode is shown in the “Mode” field.
Tone Frequency
Activates a data entry window for customizing the Tone Frequency of the highlighted Tone Code.
Highlight a Tone Code to edit with the blue selection arrow using the Up/Down (▲▼) keys. The
adjustment range is from 0 to 20 kHz in 0.1 Hz steps.
Tone Duration
Activates a data entry window for customizing the Tone Duration of the highlighted Tone Code. Highlight
a Tone Code to edit with the blue selection arrow using the Up/Down (▲▼) keys. The adjustment range
is from 0 to 10 seconds in 0.001 second steps.
Post Tone Delay
Activates a data entry window for customizing the duration of the delay following the transmitted tone.
Highlight a Tone Code to edit with the blue selection arrow using the Up/Down (▲▼) keys. The
adjustment range is from 0 to 10 seconds in 0.01 second steps.
Save Sequence Definition
Activates a data entry window for entering a title and saving the user customized General Sequence Table.
Alpha numeric entries are made using the ▲▼ (Up/Down), and ◄► (Left/Right) keys, numeric keypad,
and spin knob.
Load Sequence Definition
Choose a previously saved Sequence Definition in a selection window using the ▲▼ (Up/Down) keys
and spin knob, then press Enter.
Export Sequence Definition
Save a Sequence Definition stored on the R8100 to an external USB Flash Drive. Choose it in a selection
window using the ▲▼ (Up/Down) keys or spin knob, then press Enter.
Delete Sequence Definition
Delete a Sequence Definition stored on the R8100. Choose it in a selection window using the ▲▼
(Up/Down) keys or spin knob, then press Enter.
Page 58

Sync to Code Entry
When set to “Yes” any Tone Code alphanumeric value entered into the Code Sequence field is initially
populated into the associated position in the Duration and Delay Sequence fields - Figure 3.2.4.3-6 shows
an example of this. This matches the frequency, duration, and delay values for each tone in the Code
Sequence to that shown on the Tone Code line entry in the table. If desired these initially synchronized
Duration and Delay sequence entries can be changed to other values from the table. When set to “No” the
entries for the Duration and Delay Sequences are set independently of the Code Sequence, with duration
and delay values from any Tone Code on the table. Figure 3.2.4.3-6 shows an example of this.
Duration Sequence
Activates a data entry window and horizontal menu for entering a duration sequence. The duration value
from any of the 20 Tone Codes (0 to 9 and A to J) specified in the General Sequence Table can be used.
The Tone Code entries are made using the ▲▼ (Up/Down), and ◄► (Left/Right) keys, numeric keypad,
and spin knob. “Clear to End” clears the highlighted entry and all others to the right. Each entry in the
Duration Sequence is paired in positional order with the associated entry in the Code Sequence, which
provides the tone frequency, and the Delay Sequence, which provides the post tone delay. A duration of
zero is used for Code Sequence entries that do not have an associated Duration Sequence entry. Duration
Sequence entries that do not have an associated Code Sequence entry are ignored.
Delay Sequence
Activates a data entry window and horizontal menu for entering a post tone delay sequence. The delay
value from any of the 20 Tone Codes (0 to 9 and A to J) specified in the General Sequence Table can be
used. The Tone Code entries are made using the ▲▼ (Up/Down), and ◄► (Left/Right) keys, numeric
keypad, and spin knob. “Clear to End” clears the highlighted entry and all others to the right. Each entry
in the Delay Sequence is paired in positional order with the associated entry in the Code Sequence, which
provides the tone frequency, and the Duration Sequence, which provides the tone duration. A delay of
zero is used for Code Sequence entries that do not have an associated Delay Sequence entry. Delay
Sequence entries that do not have an associated Code Sequence entry are ignored.
2.2.3.4 Setting audio operating parameters in Generator mode
The audio settings in Generator mode replicate those in Monitor mode with two key differences. In
Generator mode the audio signal is simultaneously applied as a modulation to the RF carrier and the Mod
In/Out connector. Also, Mod Sum level is shown in units of FM deviation (kHz) or AM modulation depth
(%), depending on the Modulation Type setting in the RF Zone. See Figure 3.2.4.4-1
58
Page 59

59
Figure 3.2.4.4-1 Audio Zone submenu in Generator mode
The additional submenu choices for the Audio Zone in Generate mode are as follows:
Mod Port Mode
This soft key determines the signal routing for the Mod In/Out port on the front panel. Choosing “In”
directs an externally applied signal to the modulation circuitry of the R8100. When switched to “Out”,
internally generated audio modulation is routed to the Mod In/Out port for use by an external radio or
instrument. Note: Remove voltage sources before selecting “Out”. If input voltage is detected at the port
the “Out” selection is ignored and an alert is displayed at the bottom of the display.
Mod In Port Level
Sets the modulation level for the external signal applied to the Mod In/Out port on the R8100. The
displayed units reflect the modulation mode chosen in the RF Zone, either deviation in kHz for FM, or %
modulation for AM. Note: The audio signals must equal +/- 1Vpk to provide a reference for accurate
display of the applied modulation level.
Page 60

CAUTION
Do not exceed +/- 1.5 V
on the Mod In/Out port or damage may occur to internal circuitry.
pk
Mod In Port Mode
Activates a horizontal submenu with an Off or Continuous selection for the external signal applied to the
Mod In/Out port on the front panel.
2.2.3.5 Setting audio operating parameters in Duplex mode
The audio settings in Duplex mode replicate those in Generate mode - see section 3.2.4.4.
2.2.4 Display Zone
The R8100 has several graphical displays providing a visual presentation of received RF signal
measurements, recovered audio, internally generated audio, and externally measured audio signals. These
include a Spectrum Analyzer, Modulation Scope, and Oscilloscope, along with Bar Graphs for RF signal
deviation, frequency error and input level. The displays are accessed from the main menu with the Display
Zone soft key – see Figure 3.2.5-1. Note: General Sequence appears as a display choice if General
Sequence is enabled in the Meter Zone.
The vertical submenu selections below the “Select Display” soft key change depending on the chosen
display - in this case the Spectrum Analyzer is highlighted in blue on the “Select Display” horizontal
menu. The vertical soft key menu now has several pages of Spectrum Analyzer settings including Center
Frequency, Span, Start and Stop frequencies, etc.
60
Page 61

61
Figure 3.2.5-1 Display Zone submenu after Select Display soft key press
The following sections detail the submenu and soft key selections for the graphical displays on the R8100
analyzer.
2.2.4.1 Spectrum Analyzer settings
Access the Spectrum Analyzer using the Select Display soft key to bring up the horizontal submenu
display choices. The available adjustments are as follows:
Center Frequency
Sets the center frequency from 250 kHz to 3 GHz for the Spectrum Analyzer in a data entry window using
the arrow keys, keypad, or tuning knob. Pressing Enter completes the change and Esc cancels the entry.
Span
Sets the total frequency window displayed on the Spectrum Analyzer in MHz. The Span entry total is
automatically split evenly on each side of the current center frequency. Note: Receiver demodulated audio
Page 62

is inhibited at spans above 158 kHz. Switch display to Mod Scope or use Demod at Marker function to
hear audio at wider spans.
Start Frequency
Sets the display start frequency in MHz. Use with the Stop Frequency to establish a desired frequency
range for the Spectrum Analyzer display. The R8100 automatically centers the frequency display midway
between Start and Stop frequencies.
Stop Frequency
Sets the display stop frequency in MHz. Use with the Start Frequency to establish a desired frequency
range for the Spectrum Analyzer display. The R8100 automatically centers the frequency display midway
between Start and Stop frequencies
Reference Level
Adjusts the maximum level for the vertical scale of the display (top line) from -120 dBm to +60 dBm in
1 dB increments.
Vertical Scale
Selects the vertical scale resolution for the display’s major grid lines from 1 dB/div to 10 dB/div via a
horizontal soft key list.
Display Mode
Selects the display presentation with the following horizontal menu choices:
Normal – The display updates continuously.
Freeze – Provides a snapshot of the current display indication and stops additional updates. Note: In
Freeze mode the R8100 reacquires data and updates the display whenever “Center Marker” or “Center
Peak” is pressed.
Max Hold – The display retains the highest peak signal amplitudes measured during successive sweeps.
Average – The displayed signal amplitudes are a rolling average of the peak amplitudes measured on each
successive sweep. The average consists of 1 to 5 sweeps, shown beside the mode indication.
Trace Math
Selects an equation to use for the computation of the spectrum trace (white) from the Display Mode trace
and reference trace (cyan). Setting Display Mode to Average minimizes effects of a low level / high
variance signal such as the noise floor. Note: The underlying units of the result are no longer dBm but dB
for the displayed spectrum and thus marker power.
The following are horizontal menu choices.
None – Hides the reference trace and displays the spectrum resulting from the Display Mode unmodified.
Spec-Ref (log) – Displays the difference of the Display Mode spectrum in dBm minus the reference trace
in dBm, which normalizes the spectrum to 0 on the Y-axis. Subsequently, spectrum power is shown on
the display and measured by absolute markers relative to the reference trace, i.e. correctly interpreted as
dBm above the reference.
62
Page 63

63
|Spec-Ref| (lin) – Displays the logarithm of the absolute value of the difference of the Display Mode
spectrum in volts² minus the reference trace in volts². Note: Although the absolute value of the difference
avoids logarithm of negatives, it has the side-effect of increasing the apparent noise power.
Spec+Ref (lin) – Displays the logarithm of the sum of the Display Mode spectrum in volts² plus the
reference trace in volts².
Figure 2.2.4.1-1 Trace Math Display
Set Reference Trace
Copies the current spectrum trace (white) and shows it in a static trace (cyan) behind the spectrum trace.
The trace is copied from what is currently shown, which is after any Display Mode processing as well as
Trace Math computations. Therefore, ensure that both of those settings are set appropriately (i.e. Trace
Math is None); setting the reference when Trace Math is active may yeild incoherent results. Setting
Display Mode to Average minimizes effects of a low level / high variance signal such as the noise floor.
This static trace is used for computations when a Trace Math equation is specified; and may simply be
viewed even when one is not. It can be hidden by selecting Trace Math None. Note: System changes that
may invalidate the reference trace include port, amplification, attenuation, frequency, span, temperature,
and calibration.
Page 64

3 dB Marker
Selects the 3 dB marker with the following horizontal menu choices:
Off – Function is off
Frequency – Places a marker above and below center frequency where the signal is -3 dB below the peak
amplitude measured at center frequency. The upper and lower frequencies are shown on the display.
Delta – Places a marker above and below center frequency where the signal is -3 dB below the peak
amplitude measured at center frequency. The difference between these two frequencies is shown on the
display.
Marker Mode
Provides display marker control via a horizontal soft key menu. Markers can be turned off or on with a
choice of numeric readout for the signal measurements. “Absolute” provides actual peak readings while
“Delta” measures the relative difference of both power and frequency between the markers. Note:
Depending on the installed options up to 4 markers can be enabled and selected for positioning while in
Instrument Mode.
Find Peak
Moves the cursor to the highest signal peak in the display window and provides a numeric readout of the
amplitude and frequency.
Toggle Marker
Cycles through the available markers to select the active one (yellow) for positional adjustment on the
display. The active marker is moved using the Left/Right (◄►) cursor control buttons.
Center Marker
Centers the operating frequency and display of the R8100 Spectrum Analyzer around the frequency of the
active marker.
Center Peak
Centers the operating frequency and display of the R8100 Spectrum Analyzer around the highest peak
signal within the display range.
Demod At Marker
When the Marker Mode is Absolute, this function demodulates the carrier and provides audio for the
signal at the marker location with the following horizontal menu choices (see Figure 2.2.4.1-2):
Off – Function is off.
Single – Provides a one-time demodulation of the carrier signal located at the marker position for a quick
listen at the marker frequency. Moving the marker or changing the monitor frequency, mode, or Display
Zone selection switches the Demod At Marker function Off.
Continuous – Continuous mode allows users to move the selected marker to demodulate carriers across
the entire displayed spectrum. On full-screen instruments, the user can setup several markers on various
64
Page 65

65
peaks and use the marker selection to quickly demodulate and listen to those peaks. Additionally, on the
Dual Display, the user can simultaneously also view the demodulation scope while tuning the marker
positions.
Note: To ensure audio is demodulated, the marker must be close enough to overlap the R8100 Monitor
Bandwidth around the carrier frequency. Large Span settings increase marker frequency step size,
limiting how close the marker can get to the actual frequency. To minimize step size use the narrowest
span practical when displaying multiple carriers.
Figure 2.2.4.1-2 Demod At Marker submenu
2.2.4.2 Modulation Scope settings
The Modulation Scope displays the internally-processed RF modulation waveforms. It automatically
switches between Generator and Monitor modulation depending on which mode is selected. In Duplex
mode an additional soft key allows manual selection of the Monitor or Generator modulation waveform.
Access the Modulation Scope using the Select Display soft key to bring up the horizontal submenu display
choices. The available adjustments are as follows:
Page 66

Figure 2.2.4.2-1 Display Zone submenu for the Mod Scope
Vertical Scale
Selects the vertical scale resolution for the display’s major grid lines via a horizontal submenu. The
display units presented are dependent on the R8100’s modulation setting in the RF Zone. For FM mode
the units are in Hz and kHz deviation, ranging from 100 Hz/div to 50 kHz/div. In AM mode the units are
in % modulation depth and range from 1%/div to 50%/div.
Horizontal Scale
Selects the horizontal time scale resolution for the display’s major grid lines in a dialog entry box using
the Up/Down (▲▼) keys or spin knob. The units range from 20 uS/div to 1 sec/div.
Marker Mode
Provides display marker control via a horizontal soft key menu. Markers can be turned off or on with a
choice of numeric readout for the signal measurements as follows:
Delta V – The numeric reading shows the difference in amplitude between marker positions.
Delta T – The numeric reading shows the difference in time between marker positions.
66
Page 67

67
1/DeltaT – The numeric reading shows the inverse of the time difference between markers which can be
used to determine the frequency of a repetitive waveform.
Toggle Marker
Cycles through the available markers to select the active one (yellow) for positional adjustment on the
display. The active marker is moved using the Left/Right (◄►) cursor control buttons.
Trigger Mode
Selects the trigger mode for the horizontal sweep via a submenu. The choices are as follows:
Auto – If a signal satisfying the Trigger Edge and Trigger Level settings is present the display will sweep
as in Normal mode. If no signal satisfying the Trigger Edge and Trigger Level settings is present then the
display sweeps continuously until a signal satisfying the settings is acquired.
Normal – The display sweeps only when the input signal satisfies the Trigger Edge and Trigger Level
settings.
Single – The display sweeps once after a key press is performed on the Single soft key if the signal satisfies
the Trigger Edge and Trigger level settings.
Trigger Level
Adjusts the signal threshold at which a horizontal sweep is initiated. The soft key activates a numeric
entry box and the Left/Right (◄►) keys move the highlight over the desired number field. Numeric
changes are entered directly using the keypad, or in steps with the Up/Down (▲▼) keys or spin knob.
Trigger Position
Adjusts the amount of pre-trigger waveform displayed on the screen via selections on a horizontal
submenu. The choices are 10%, 50%, or 90% of the display allocated to the waveform preceding the
trigger threshold.
Trigger Edge
Determines which waveform edge is used to trigger the modulation scope sweep via selections on a
horizontal submenu. The selections are Rising, Falling, or Either.
Scope Mode
Selection of the Monitor or Generator modulation waveform in Duplex mode.
Vertical Position
Adjusts the vertical position of the waveform on the display using a horizontal submenu. Pressing the
Move Up and Move Down soft keys shifts the waveform position by fixed increments.
2.2.4.3 Oscilloscope settings
The R8100 analyzer provides a general purpose oscilloscope with calibrated vertical input sensitivities
and automatic or triggered horizontal sweep rates. Use the scope to analyze waveforms, detect asymmetric
modulation or audio distortion, trace signals, and troubleshoot subsystems or circuits. The Meter In port
serves as the vertical input for the Oscilloscope.
Page 68

Access the external Oscilloscope using the Select Display soft key to bring up the horizontal submenu
display choices shown in Figure 3.2.5.3-1. The available adjustments are as follows:
Figure 3.2.5.3-1 Display Zone submenu for the Oscilloscope
Coupling
Selects the input coupling for the external signal applied to the Meter In port with a user entry window.
Choose DC or AC coupling by pressing the Coupling soft key, the Up/Down (▲▼) keys, or rotating the
spin knob.
Vertical Scale
Selects the vertical scale resolution for the display’s major grid lines with a user entry window. The
available selections range from 10 mV/div to 25 V/div and can be changed by pressing the Vertical Scale
soft key, the Up/Down cursor keys (▲▼), or rotating the spin knob.
Horizontal Scale
Selects the horizontal time scale resolution for the display’s major grid lines in a dialog entry box using
the Up/Down (▲▼) keys or spin knob. The units range from 20 uS/div to 1 sec/div.
68
Page 69

69
Note: Digital oscilloscopes are susceptible to aliasing which can cause inaccurate signal reconstruction.
Horizontal
Scale
Maximum
Signal
Frequency
Maximum
Recommended
Signal Frequency
20 us
50000
Hz
50000
Hz
50 us
50000
Hz
20000
Hz
100 us
50000
Hz
10000
Hz
200 us
25000
Hz
5000
Hz
500 us
10000
Hz
2000
Hz
1 ms
5000
Hz
1000
Hz
2 ms
2500
Hz
500
Hz
5 ms
1000
Hz
200
Hz
10 ms
500
Hz
100
Hz
20 ms
250
Hz
50
Hz
50 ms
100
Hz
20
Hz
100 ms
50
Hz
10
Hz
200 ms
25
Hz 5 Hz
500 ms
10
Hz 2 Hz
1 s 5 Hz 1 Hz
The Maximum Recommended Input frequency for each horizontal scale setting is shown in the display
area. For best results follow the guidelines shown in the table below:
Marker Mode
Provides display marker control with a horizontal soft key menu. Markers can be turned off or on with a
choice of numeric readout for the signal measurements as follows:
Delta V – The numeric reading shows the difference in amplitude between marker positions.
Delta T – The numeric reading shows the difference in time between marker positions.
1/DeltaT – The numeric reading shows the inverse of the time difference between markers which can be
used to determine the frequency of a repetitive waveform.
Absolute – The numeric reading shows the absolute amplitude at the marker position
Toggle Marker
Cycles through the available markers to select the active one (yellow) for positional adjustment on the
display. The active marker is moved with the Left/Right (◄►) keys
Trigger Mode
Submenu selections for the horizontal sweep trigger mode. The choices are as follows:
Page 70

Auto – If a signal satisfying the Trigger Edge and Trigger Level settings is present the display will sweep
as in Normal mode. If no signal satisfying the Trigger Edge and Trigger Level settings is present then the
display sweeps continuously until a signal satisfying the settings is acquired.
Normal – The display sweeps only when the input signal satisfies the Trigger Edge and Trigger Level
settings.
Single – The display sweeps once after a key press is performed on the Single soft key.
Freeze – The display sweeps stop, allowing further analysis of the captured input signal.
Trigger Level
Adjusts the signal threshold at which a horizontal sweep is initiated. The soft key activates a numeric
entry box and the Left/Right (◄►) keys move the highlight over the desired number field. Numeric
changes are entered directly with the keypad, or in steps using the Up/Down (▲▼) keys or spin knob.
Trigger Position
Submenu selections for the amount of pre-trigger waveform displayed on the screen. The choices are
10%, 50%, or 90% of the display allocated to the waveform preceding the trigger threshold.
Trigger Edge
Submenu for choosing which waveform edge triggers the modulation scope sweep. The selections are
Rising, Falling, or Either.
Vertical Position
Adjusts the vertical position of the waveform on the display using a horizontal submenu. Pressing the
Move Up and Move Down soft keys shifts the waveform position by fixed increments.
Set DC Offset
Pressing this soft key zeros or compensates for any accumulated DC offset caused by drift in the input
amplifier of the R8100 over long periods of time. This may show up as a DC level indicated on the
Oscilloscope and DC Voltmeter when no input is connected to the Meter In port. With the Meter In port
disconnected press the soft key to eliminate the offset. The compensation is stored permanently in the
R8100 until the next time this soft key is pressed.
2.2.4.4 Bar Graphs settings
The R8100 Bar Graph display provides a simultaneous analog and digital readout of critical signal
characteristics. The analog display facilitates real time tuning adjustments of 2-way radios while the
digital reading provides precision in the measured result. Access the Bar Graphs using the Select Display
soft key to bring up the horizontal submenu display choices. Three bar graphs are displayed for the
received carrier while in Monitor mode (see Figure 3.2.5.4-1):
Monitor Deviation
Displays the negative and positive peak frequency deviation of a modulated carrier (i.e. from the
Frequency Error mean), available when Modulation mode is FM.
70
Page 71

71
Monitor AM%
Displays the negative and positive peak AM percentages of a modulated carrier, available when
Modulation mode is AM.
Frequency Error
Shows the frequency difference (error) of the input carrier minus the programmed frequency of the R8100
(i.e. Monitor Frequency).
Input Level
Input Lvl displays the RF input level of the carrier. Indicated units are Volts, Watts or dBm as set with
“Input Level Units” soft key in the RF Zone.
Note: When the RF input power on the RF In/Out port is above +20 dBm (100 mW), the R8100 utilizes a
broadband power detector for the measurement. The “Input Lvl” field in the RF Zone changes to “Watt
Meter” to indicate this measurement mode.
Figure 3.2.5.4-1 Bar Graphs screen in Display Zone
Page 72

Deviation Average
The Bar Graph display can be adjusted to smooth the response using horizontal submenu selections
activated with the Deviation Average soft key on the vertical menu. The Deviation Average settings are:
Normal – No smoothing is engaged, which provides the quickest measurement response.
Peak Average – The deviation peaks are averaged over a time window which smoothes the reading but
slows the response.
Pwr-Weight Average – The deviation measurement is processed with an RMS converter, but the display
calibration remains in peak units – i.e. a deviation of 3 kHz pk will read 3 kHz on the numeric readout and
bar graph. This type of processing significantly reduces the effect of narrow deviation spikes and noise
while providing a speed of response similar to the normal mode. Note: Scale calibration and the peak
readings are only valid for single tone repetitive sine wave modulation. For the RMS value of any
modulation waveform divide the displayed peak reading by 1.414.
RMS Average – The deviation measurement is the square root of the mean of the squares of the deviation
values. This type of processing significantly reduces the effect of narrow deviation spikes and noise while
providing a speed of response similar to the normal mode. Note: Scale calibration and the RMS readings
are valid for any wave modulation (e.g. sawtooth).
2.2.4.5 General Sequence settings (appears when General Sequence is selected in Meter Zone)
Decode to Standard
Choose which SelCall (Selective Calling) tone standard is used to display the code symbols associated
with the frequency and duration of decoded sequential audio tone bursts. Select using the Up/Down (▲▼)
keys or rotating the spin knob, then press Enter. If “None” is selected the decoder assigns sequential codes
1 through 20 for each successive tone. Otherwise the codes are matched to the frequencies decoded per
the following standards: CCIR1; CCIR2; PCCIR; CCITT; EEA; EIA; Euro; NATEL; MODAT; ZVEI1;
ZVEI2; ZVEI3; PZVEI; DVZEI; PDZVEI (see Figure 3.2.5.5-1). Note: For correct operation, input tones
should have a duration of 0.5 seconds or less.
72
Page 73

73
Figure 3.2.5.5-1 General Seq screen in Display Zone
2.2.5 Meter Zone
The R8100 has several metering functions consisting of general purpose and specialized instruments
providing detailed analysis of the recovered baseband content from RF signals. They are accessed from
the main menu with the Meter Zone soft key and displayed in a dedicated area on the main screen below
the Display Zone – see Figure 3.2.6-1 which shows the RF Scan meter.
Page 74

Figure 3.2.6-1 Meter Zone submenu showing RF Scan meter
Pressing the Select Meter soft key displays the available metering functions on a horizontal submenu (see
Figure 3.2.6-2). They include Power Meter, Voltmeter, SINAD/Distortion, Decoder, Frequency Counter,
and RF Scan.
Figure 3.2.6-2 Meter Zone submenu after Select Meter soft key press
2.2.5.1 Power Meter
Provides a bar graph display and numeric readout in Watts of the broadband input power applied to the
RF In/Out port (Figure 2.2.5.1-1). Note: For best accuracy disable the Pre-amplifier in Monitor Mode,
and set the Gen Port in Generate Mode to RF In/Out.
74
Page 75

75
Figure 2.2.5.1-1 RF Power Meter screen
2.2.5.2 Voltmeter
Provides an AC and DC voltmeter mode for measuring the amplitude of electrical voltages at the Meter
In port with the following menu selections:
Select Voltmeter Mode
Choose AC Volts or DC Volts on a horizontal menu
AC Volts – Measures AC voltage applied to the Meter In port. The dBm computation assumes an
impedance of 600 Ohms. The full scale AC Range is selectable via a horizontal submenu.
Figure 2.2.5.2-1 AC Volts display
DC Volts – Measures DC voltage applied to the Meter In port. The full scale DC Range is selectable via
a horizontal submenu. Note: If there is a DC offset apparent with no input connected it can be zeroed out
by using the Set DC Offset function.
Note: Pressing Display Zone, Oscilloscope, Set DC Offset soft key zeros or compensates for any
accumulated DC offset caused by drift in the input amplifier of the R8100 over long periods of time. This
may show up as a DC level indicated on the Oscilloscope and DC Voltmeter when no input is connected
to the Meter In port. With the Meter In port disconnected press the soft key to eliminate the offset. The
compensation is stored permanently in the R8100 until the next time this soft key is pressed.
Figure 2.2.5.2-2 DC Volts display
AC Range
Available when Select Voltmeter Mode is AC Volts. Choices include Auto (auto-ranging), 1 Volt, 10
Volts, and 70 Volts RMS. Note: The range on AC and DC must be 1 or 10 Volts to use 600 Ohm Input
Impedance (see System Settings).
Set dBr Reference
Page 76

Available when Select Voltmeter Mode is AC Volts and a reference input voltage is not set. When
selected, dBm measurements are frozen and a dBr indicator appears. The dBr indicates the normalized
measurement between the reference input voltage and the current input voltage.
Clear dBr Reference
Available when Select Voltmeter Mode is AC Volts and a reference input voltage is set. When selected,
dBm measurements are resumed and the dBr indicator disappears.
DC Range
Available when Select Voltmeter Mode is DC Volts. Choices include Auto (auto-ranging), 1 Volt, 10
Volts, 100 Volts and the Battery voltage when that upcoming option is installed. Note: The range on AC
and DC must be 1 or 10 Volts to use 600 Ohm Input Impedance (see System Settings).
2.2.5.3 SINAD/Distortion
Provides Signal in Noise and Distortion (SINAD) and audio distortion measurements for a radio under
test – see Figure 2.2.5.3-1.
Figure 2.2.5.3-1 SINAD display
Select Audio Measurement
Choose SINAD/Ext Distortion or Internal Distortion on a horizontal menu.
SINAD/Ext Distortion – Provides a SINAD and External Distortion measurement of the recovered audio
signal applied to the Meter In port from an external radio (Figure 2.2.5.3-1). The test is performed using
a 1 kHz modulated RF carrier applied to the radio’s antenna port by the R8100. The RF level is adjusted
in the RF Zone while monitoring the SINAD meter to determine the receiver sensitivity per EIA (12 dB
yellow tick mark) and other standards (See SINAD Measurement).
Internal Distortion – Measures the distortion in percent of the internally recovered audio from a transmitter
modulated with a 1 kHz sine wave when the R8100 is in Monitor mode (Figure 2.2.5.3-2).
Figure 2.2.5.3-2 Internal Distortion display
2.2.5.4 Decoder
This is the entry point for the suite of tone decoding functions on the R8100
Select Decoder Type
76
Page 77

77
Choose from the available decoding functions on a horizontal menu. These include PL/Period Counter,
DPL Decode, DTMF Decode, 2-Tone Decode, 5/6 Decode, and General Sequence.
PL/Period Counter – Displays the frequency and numeric code of the recovered audio from a radio
modulated with the Motorola Private-Line (PL) format (Figure 2.2.5.4-1). The period counter allows
rapid high resolution measurements of non-PL low frequency modulation without the long gate times
associated with frequency counting. A vertical submenu provides adjustment of the Low and High Pass
filters to reduce noise for more accurate measurements. Recommended filter settings for PL: HP= 1 Hz;
LP = 300 Hz.
Figure 2.2.5.4-1 PL/Period Counter screen
DPL Decode – Provides a numeric code readout from the recovered audio of a radio modulated with the
Motorola Digital Private-Line (DPL) format (Figure 2.2.5.4-2). A vertical submenu provides adjustment
of the Low and High Pass filters to reduce noise for more accurate measurements. Recommended filter
settings for DPL: HP= 1 Hz; LP = 3 kHz.
Figure 2.2.5.4-2 DPL Decode screen
DTMF Decode – Decodes DTMF (Dual Tone Multi Frequency) signals used in testing telephone
interfaced systems (Figure 2.2.5.4-3). A vertical submenu provides adjustment of the Low and High Pass
filters to reduce noise for more accurate measurements. Recommended filter settings for DTMF: HP= 1
Hz; LP = 3 kHz. Note: The R8100 displays the history of previously decoded DTMF codes, with the
right-most code digit being replaced by the most recently decoded tone. The DTMF Code field appears
static when the transmitted code isn’t changing or nothing is being decoded. Press the Reset soft key to
clear the history.
Figure 2.2.5.4-3 DTMF Decode screen
2-Tone Decode – Decodes the two-tone sequential paging format. The meter displays the Tone A/Tone
B (Tone 1 and Tone 2) frequencies and durations (Figure 2.2.5.4-4). A vertical submenu provides
adjustment of the Low and High Pass filters to reduce noise for more accurate measurements. The Decode
soft key is used to start or stop decoding. Recommended filter settings for 2-Tone decode: HP= 1 Hz; LP
= 3 kHz.
Page 78

Figure 2.2.5.4-4 2-Tone Decode screen
5/6 Tone Decode – Decodes the 5/6 tone sequential paging format (Figure 2.2.5.4-5). The meter displays
a table with the decoded cap code along with the individual tone frequencies and durations. A vertical
submenu allows selection of the meter sensitivity from MIN to MAX via the spin knob, Up/Down (▲▼)
keys, or repeated presses of the Sensitivity soft key. A vertical submenu provides adjustment of the Low
and High Pass filters to reduce noise for more accurate measurements. Recommended filter settings for
5/6 Tone: HP= 1 Hz; LP = 3 kHz.
Figure 2.2.5.4-5 5/6-Tone Decode screen
General Sequence – Decodes the individual frequency and time duration for each of up to 20 tones in a
tone sequence. This function overwrites the entire Display Zone section of the main screen and provides
a detailed display of data (Figure 2.2.5.4-6). A vertical submenu provides adjustment of the Low and
High Pass filters to reduce noise for more accurate measurements, an Input Decoding selection key to
select internal or external decoding, a Decode key with start and stop settings to control the decode
function, and a selection window to choose the SelCall standard (or none) used for decoding.
When a standard is selected the decoded tones are mapped to the selected standard and the Tone Code is
listed with each tone in the table. When no standard is selected the decoded tones are listed in numerical
order. The recommended filter settings on the R8100 are: HP= 1 Hz; LP = 3 kHz. Note: For correct
operation input tones should have a duration of 0.5 seconds or less.
78
Page 79

79
Figure 2.2.5.4-6 General Sequence decode screen
High Pass Filter
Activates a horizontal submenu with audio filter selections that determine the high pass frequency for the
R8100’s baseband response to recovered audio. The “cut-on” frequency selections are 5 Hz, 300 Hz, and
3 kHz. This setting is used in conjunction with the Low Pass Filter to determine the audio pass band for
the R8100 baseband circuitry.
Low Pass Filter
Activates a horizontal submenu with audio filter selections that determine the low pass frequency for the
R8100’s baseband response to recovered audio. The “cut-off” frequency selections are 300 Hz, 3 kHz,
and 20 kHz. This setting is used in conjunction with the High Pass Filter to determine the audio pass band
for the R8100 baseband circuitry.
Input Decoding
Page 80

Selects the signal source used for the R8100 frequency counter and decode functions. When set to Internal
the recovered audio or tones from a demodulated received signal are used as the signal source. The
External setting directs an externally applied signal at the Meter In port to the R8100 frequency counter
and decode circuits.
2.2.5.5 Frequency Counter
In Monitor mode, this soft key enables a general-purpose frequency counter for the recovered baseband
audio or IF frequency displayed in the modulation scope (Figure 2.2.5.5-1 Frequency Counter screen).
In Generator mode the counter measures the frequency of the internal or external modulation applied to
the RF carrier. In External Scope mode the counter measures the frequency of signals applied to the Meter
In port.
Input Decoding
Selects the signal source used for the R8100 frequency counter and decode functions. When set to Internal
the recovered audio or tones from a demodulated received signal are used as the signal source. The
External setting directs an externally applied signal at the Meter In port to the R8100 frequency counter
and decode circuits.
Resolution
Activates a horizontal submenu with selections for the counter resolution. The settings include 0.1 Hz,
1.0 Hz, and 10 Hz resolution.
Figure 2.2.5.5-1 Frequency Counter screen
2.2.5.6 RF Scan
Searches for the strongest RF signal that is above the “Squelch Opens @” setting on the active RF input
port. The R8100 locks onto and automatically centers its operating frequency on this carrier (Figure
2.2.5.6-1). The search frequency range in MHz is entered using Start Frequency and Stop Frequency soft
keys. Scanning begins once the Scan, Start soft keys are selected. Scanning can be manually stopped by
selecting the Scan, Stop soft keys. The meter graph displays an automatically-scaled spectrum of the entire
scan range. Once a signal is acquired the RF Scan meter stays locked on that frequency even if the carrier
disappears. It resumes scanning once the Scan, Start soft keys are selected. The RF Scan meter operates
only when it is highlighted; otherwise it becomes inactive.
80
Page 81

81
Figure 2.2.5.6-1 RF Scan display
2.2.6 Instrument Menu
The Instrument menu provides several of the measurement functions on the R8100 in a dedicated full
screen display. This makes it easier to view smaller waveform details and provide more numeric fields
with instrument specific data. Figure 3.2.7-1 shows the submenu after pressing the Instrument navigation
button. The vertical soft key submenu lists the instruments available in a full screen display. While the
Spectrum Analyzer, Modulation Scope, and Oscilloscope displays are available elsewhere on the R8100,
the size is limited in those areas since they are shared with other measuring functions The optional Dual
Display, Tracking Generator, and Cable Fault Locator functions are full screen instruments and only
available from the Instrument menu. For convenience the other meters on the R8100 such as RF Scan,
AC Volts, etc can also be directly accessed in Instrument menu.
Page 82

Figure 3.2.7-1 Submenu after pressing Instrument navigation key
The sub-menus, control, and settings for the full screen instruments duplicate those of the limited screen
versions in the Display Zone. When applicable, additional soft keys appear to exploit the extra display
area.
2.2.6.1 Full-screen Spectrum Analyzer mode
With the Enhanced Spectrum Analyzer option, 4 markers and associated data can be displayed in the
Spectrum Analyzer Instrument mode as shown in Figure 2.2.6.1-1. A “Select Marker” soft key allows
selection of each marker for movement across the screen. Note: For an R8100 without the Enhanced
Spectrum Analyzer option, the Toggle Marker soft key activates the 2 available markers.
82
Page 83

83
Figure 2.2.6.1-1 Submenu in Spectrum Analyzer Instrument mode
2.2.6.2 Dual Display mode
The optional Dual Display mode provides a convenient one screen presentation of two instruments often
used together, the Spectrum Analyzer and Modulation Scope. This gives a user control and a simultaneous
view of the results from both measurement functions. Figure 2.2.6.2-1 shows the R8100 screen after
pressing the Dual Display soft key.
Page 84

Figure 2.2.6.2-1 Dual Display mode
In Dual Display mode the submenus, control, and parameter entry are unchanged from the full screen
versions of the Spectrum Analyzer and Modulation Scope.
Gen Port
Selects the active port (RF In/Out or Gen Out) for the swept R8100 tracking generator output in a selection
table using the Up/Down (▲▼) keys or spin knob.
Note: If RF Level Offset is enabled, the Gen Port label is cyan-colored indicating that Output Level
amplitudes are adjusted by the Gen Port-specific offset. See section 2.2.8.2 for details.
Monitor Port
Selects the port monitored by the Spectrum Analyzer as either the ANTENNA or the RF In/Out front
panel connector. Choose in a list entry window using the Up/Down (▲▼) keys or spin knob.
84
Page 85

85
Note: If RF Level Offset is enabled, the Mon Port label is cyan-colored indicating that RX measurements
are adjusted by the Mon Port-specific offset. See section 2.2.8.2 for details.
2.2.6.3 Tracking Generator mode
The optional Tracking Generator function sets up the R8100 RF generator in a sweeping mode for
simultaneous use with the spectrum analyzer display. This delivers a valuable capability for measuring
and servicing a wide variety of RF filtering and combining networks. Pressing the Tracking Generator
key provides the full screen display shown in Figure 2.2.6.3-1. Note: Enabling the Tracking Generator
suspends the Standard zone operation of the R8100 (e.g. RF Zone, Audio Zone, etc.). To restore Standard
zone operation, press the appropriate mode key such as Monitor, Generate, Duplex, etc.
Figure 2.2.6.3-1 Tracking Generator mode
The Tracking Generator settings are similar to those used when operating the RF Generator and Spectrum
Analyzer independently. An exception is the frequency setting which is common to both, since the
Spectrum analyzer is lock stepped to and tracks the swept RF Generator. Get pic of a filter
Page 86

Center Frequency
Sets the tracking generator center frequency from 250 kHz to 3 GHz in a data entry window using the
arrow keys, keypad, or tuning knob. Pressing Enter completes the change and Esc cancels the entry.
Span
Sets the total frequency window for tracking generator operation in MHz. The Span entry total is
automatically split on each side of the current center frequency.
Start Frequency
Sets the tracking generator start frequency in MHz. Use with the Stop Frequency to establish a desired
frequency range for tracking generator operation. The R8100 automatically centers the frequency display
midway between Start and Stop frequencies.
Stop Frequency
Sets the tracking generator stop frequency in MHz. Use with the Start Frequency to establish a desired
frequency range for tracking generator operation. The R8100 automatically centers the frequency display
midway between Start and Stop frequencies.
Vertical Scale
Selects the vertical scale resolution for the display’s major grid lines from 1 dB/div to 10 dB/div via a
horizontal soft key menu.
Reference Level
Adjusts the maximum level (top line) for the vertical scale of the Spectrum Analyzer in Tracking
Generator mode from -120 dBm to + 60 dBm in 1 dB increments.
# of Points
Adjusts the number of data points acquired and displayed. Higher settings increase the trace resolution
for viewing signal detail but also slow the update rate.
Display Mode
Selects the display presentation with the following horizontal menu choices:
Normal – The display updates continuously.
Freeze – Provides a snapshot of the current display indication and stops additional updates. Note: In
Freeze mode the R8100 reacquires data and updates the display whenever “Center Marker” or “Center
Peak” is pressed.
Max Hold – The display retains the highest peak signal amplitudes measured during successive sweeps.
Average – The displayed signal amplitudes are a rolling average of the peak amplitudes measured on each
successive sweep. The average consists of 1 to 5 sweeps, shown beside the mode indication.
86
Page 87

87
Marker Mode
Provides display marker control via a horizontal soft key menu. Markers can be turned off or on with a
choice of numeric readout for the signal measurements.
Absolute – Displays the frequency and absolute signal amplitude for each marker selected (total of 4).
Delta – Displays the frequency and amplitude difference between each pair of markers selected (1-2 & 3-
4).
Marker Type
Sets the display marker type in a horizontal menu with selections including point cross, vertical bar,
horizontal bar, and full cross.
Select Marker
Selects 1 of 4 available markers on a horizontal submenu for position adjustment on the display.
Set Marker Frequency
Directly sets the frequency of the selected marker in MHz via a data entry window.
Center Marker
Centers the operating frequency and display of the R8100 Spectrum Analyzer around the frequency of the
active marker.
Find Peak
Moves the cursor to the highest signal reading in the display window and provides a numeric readout of
the amplitude and frequency
Find Valley
Moves the cursor to the lowest signal reading in the display window and provides a numeric readout of
the amplitude and frequency
3 dB Marker
Frequency – Places a marker above and below center frequency where the signal is -3 dB below the peak
amplitude measured at center frequency. The upper and lower frequencies are shown on the display.
Delta – Places a marker above and below center frequency where the signal is -3 dB below the peak
amplitude measured at center frequency. The difference between these two frequencies is shown on the
display.
Output Level
Adjusts the RF level of the tracking generator output at the active output port. From -95 dBm to 5 dBm
on the RF Gen Out port and -130 dBm to -30 dBm on the RF In/Out port.
Page 88

Attenuation
Input Port
Maximum input level for using pre-amplifier
Antenna
(Input signal in dBm – Attenuator setting) is equal or less than -40 dBm
RF In/Out
(Input signal in dBm – Attenuator setting) is equal or less than -10 dBm
Adjusts the Monitor Port RF input signal attenuation in 2 dB steps from 0 to 62 dB. Select in a list entry
window using the Up/Down (▲▼) keys or spin knob.
Pre-Amplifier
Enables a supplementary input amplifier that extends the sensitivity of the RF Monitor by improving the
S/N ratio for low signal levels. Note: To avoid input overload and erroneous signal strength readings use
the pre-amplifier only under the following conditions:
Gen Port
Selects the active port (RF In/Out or Gen Out) for the swept R8100 tracking generator output in a selection
table using the Up/Down (▲▼) keys or spin knob.
Note: If RF Level Offset is enabled, the Gen Port label is cyan-colored indicating that Output Level
amplitudes are adjusted by the Gen Port-specific offset. See section 2.2.8.2 for details.
Monitor Port
Selects the port monitored by the Spectrum Analyzer as either the ANTENNA or the RF In/Out front
panel connector. Choose in a list entry window using the Up/Down (▲▼) keys or spin knob.
Note: If RF Level Offset is enabled, the Mon Port label is cyan-colored indicating that RX measurements
are adjusted by the Mon Port-specific offset. See section 2.2.8.2 for details.
Normalize
Creates a baseline for measuring system under test response by zeroing out the Spectrum Analyzer trace.
When enabled, a visual indicator appears and the trace color changes similar to Figure 2.2.6.3-2. To reset
the baseline after changing any Tracking Generator parameters, select Off and then On again.
Figure 2.2.6.3-2 Normalized Spectrum Analyzer trace
2.2.6.4 Cable Fault Locator mode
The optional Cable Fault Locator mode uses the R8100 Tracking Generator along with FFT analysis to
determine distance to a fault or termination mismatch in RF cables. Pressing the Cable Fault Locator soft
key provides the full screen display shown in Figure 2.2.6.4-1. The Cable Fault Locator is used with an
optional directional coupler or splitter. Note: Enabling the Cable Fault Locator mode suspends the
88
Page 89

89
Standard zone operation of the R8100 (e.g. RF Zone, Audio Zone, etc.). To restore Standard zone
operation press an associated mode key such as Monitor, Generate, Duplex, etc. NewPic
Figure 2.2.6.4-1 Cable Fault Locator mode
The Cable Fault Locator has settings for entering cable parameters and display specifics. Several standard
cable selections provide predetermined settings. A user can also enter specific data for a cable under test
and save these settings for future use. See Cable Fault Testing
Cable Type
Choose from factory provided or user saved cable selections. This automatically populates the Cable Loss
and Velocity Factor. If No Selection is chosen the user should enter the specific data for the cable under
test.
Center Frequency
Sets the Cable Fault Locator center frequency from 250 kHz to 1 GHz in a data entry window using the
arrow keys, keypad, or tuning knob. Pressing Enter completes the change and Esc cancels the entry.
Page 90

Maximum Length
Sets the maximum cable length in a data entry window so that the R8100 can optimize the RF parameters
and FFT calculations. The entry units are determined by the setting in the Distance Units submenu.
Analyze
Determines the Cable Fault Locator operating mode with a horizontal soft key menu.
Off – The Cable Fault Locator is disabled to allow parameter entry.
Continuous – The display provides continuous measurement updates.
Single Sweep – The display provides one measurement update after a key press is performed on the Single
Sweep soft key.
Calibrate – The Cable Fault Locator performs a calibration to nullify effects from the RF directional
coupler/splitter.
Cable Loss
Shows the cable loss in dB per unit length at the Center Frequency for the selected Cable Type in a numeric
entry window. Also allows a user to override that value or enter one for the specific cable under test. The
entry units are determined by the setting in the Distance Units submenu.
Velocity Factor
Shows the velocity factor for the selected Cable Type in a numeric entry window. Also allows a user to
override that value or enter one for the specific cable under test.
Display Mode
Selects the display presentation with the following horizontal menu choices:
Normal – The display updates continuously.
Freeze – Provides a display snapshot of the first measurement sweep started by a Continuous or Single
Sweep key press in the Analyze submenu, then stops additional display updates. If a measurement sweep
is already in process during the key press, the display updates when complete, and then freezes. Note:
Measurement sweeps completed and displayed before the Freeze key press are not frozen and will be
overwritten by the first subsequent sweep.
Max Hold – The display retains the highest peak signal amplitudes measured during successive sweeps.
Average – Displays a rolling average of the peak return loss amplitude measured on each successive
sweep. The average consists of 1 to 5 sweeps, shown beside the mode indication.
Marker Mode
Provides display marker control via a horizontal soft key menu.
Off – No markers are displayed
Absolute – Enables one marker with peak return loss and distance readings.
Delta – Enables a second marker with peak return loss and distance readings. The distance between the
first and second marker is shown in the main display area.
90
Page 91

91
Toggle Marker
Cycles through the available markers to select the active one (yellow) for positional adjustment on the
display. The active marker is moved using the Left/Right (◄►) cursor control buttons.
Find Peak
Moves the cursor to the highest peak in the display window and provides a numeric readout of the distance
and return loss.
Distance Units
Select units of distance for cable length in either meters or feet.
Add Cable Type
Allows custom entry of parameters for a user defined cable not on the standard selection list. The soft
key activates a new submenu for entering a Cable Description and the associated cable specifications.
These include the cable Velocity Factor along with the Nominal Attenuation Units for three frequency
points. Pressing the Next soft key advances the menu to each successive Frequency/Nominal Attenuation
entry – see Figure 2.2.6.4-2. The Back soft key returns to the previous entry menu.
Once the entries are completed for three frequency points, pressing the Save New Cable soft key loads the
user defined cable into R8100 memory. The Return key brings the display back to the main Cable Fault
Locator menu. The saved cable entry is now available on the Cable Type selection window.
Page 92

Figure 2.2.6.4-2 Frequency and Attenuation entries in the Add Cable Type submenu
Edit Cable
Allows parameter changes for the currently selected cable type. Note: This function is not available for
factory provided selections.
Delete Cable
Removes the currently selected cable type from R8100 memory if it was stored as a user defined cable.
2.2.6.5 Other Meters
Pressing the “Other Meters” soft key provides a shortcut to the Meter Zone operation of the R8100. The
screen displays the same horizontal menu of meter selections shown when the “Select Meter” soft key in
the Meter Zone is pressed.
2.2.7 Test Menu
The R8100 Test Menu provides operator presets, optional dedicated test modes for advanced transmission
protocols, and optional AutoTune automated test and alignment software for manufacturer specific radios.
92
Page 93

93
The presets permit storage or recall of R8100 operational settings allowing an operator to quickly recreate
specific test conditions. Dedicated test modes such as DMR, P25, NXDN, dPMR and TETRA provide
the ability to analyze advanced transmission protocols using digital modulation (see section 2.2.7.2) for
the supported optional protocols. The embedded AutoTune software application allows the R8100 to test
and align a variety of manufactured radios without the need for an external computer. Figure 3.2.8-1
shows the submenu screen after pressing the dedicated Test navigation key.
Figure 3.2.8-1 Submenu after pressing Test navigation key
2.2.7.1 Presets
Presets are a convenient tool for storing and recalling R8100 operational settings. They are especially
useful when several unique operating configurations are required in a test environment. Presets ensure a
fast and accurate method of configuring the analyzer for multiple test applications. To save time and
avoid errors the R8100 can store over 100 preset operating configurations. Figure 3.2.8.1-1 shows the
submenu after pressing the Presets soft key. If there are any Presets present they can be highlighted for
further action by using the Up/Down keys (▲▼) or spin knob. In Figure 3.2.8.1-1 the TEST1 Preset is
highlighted (blue border).
Page 94

2.2.7.1.1 Power Up Configuration
If no presets are present the R8100 powers up in the default factory configuration. Otherwise the power
up configuration becomes that of the last Preset loaded or saved before the unit was powered down.
Figure 3.2.8.1-1 Submenu after pressing Presets soft key
Save Configuration As
This soft key saves the current R8100 operational settings into a memory Preset. Label the Preset in the
data entry window using the Left/Right (◄►) keys and the numeric keypad as shown in Fig 3.2.8.1-2.
You can cycle through the alphanumeric sequence marked on the keys with repeated keypad presses or
by using the Up/Down keys (▲▼) and spin knob. Names can’t have spaces or blanks between characters.
Pressing Enter adds the new Preset to the list while Esc cancels the entry.
94
Page 95

95
Figure 3.2.8.1-2 Data entry mode after pressing Save Configuration soft key
Load Selected Preset
Pressing this soft key configures the R8100 to the settings saved under the highlighted Preset. Use the
Up/Down keys (▲▼) or spin knob to scroll through the available selections. Note: The selected Preset
becomes the new default configuration on power up unless a different one is chosen or saved before
powering down the analyzer.
Save As Selected Preset
Pressing this soft key saves the current R8100 operational settings to the highlighted Preset. Use the
Up/Down keys (▲▼) or spin knob to scroll through the available selections. Any existing operational
settings under that Preset name are overwritten by the current R8100 settings. Note: The saved Preset
becomes the new default configuration on power up unless a different one is chosen or saved before
powering down the analyzer.
Import Presets
Imports presets from an external memory storage device attached to a USB port on the R8100.
Export Presets
Saves presets stored on the R8100 to an external memory storage device attached to a USB port on the
R8100.
Delete Selected Preset
Erases the highlighted Preset from the R8100 memory.
Load Factory Configuration
Loads and configures the R8100 to the as shipped factory settings. Note: These become the default on
power up unless a different Preset is loaded or saved before powering down the analyzer.
2.2.7.2 Test Mode submenu
The Test Mode soft key displays the available transmission protocol or radio specific test modes on a
horizontal submenu as shown in Figure 3.2.8.2-1. The R8100’s current operating mode (e.g. Monitor or
Generator) is always shown in the left tab of the message bar at the bottom of the main display, with the
Test Mode shown immediately to the right. The active test mode is also indicated by the blue highlighted
horizontal soft key in the Test Mode submenu, along with the other available test modes. The test mode
options for the R8100 include the DMR (ETSI Digital Mobile Radio) protocol with Motorola
MOTOTRBO™ as the initial compliant offering, Project 25 phase 1 conventional and trunking, P25 phase
Page 96

1 and phase 2, NXDN™ conventional and trunking, dPMR and TETRA. Other test mode options are
under development and will be provided as firmware upgrades.
Figure 3.2.8.2-1 Test Mode submenu
2.2.7.2.1 DMR Test Mode with MOTOTRBO™
The R8100 DMR Test Package option / DMR Test Mode allows testing of repeater/subscriber radios
compliant with the ETSI Digital Mobile Radio (DMR) Tier 2 conventional (non-trunked) radio transmission
protocol. DMR radios use a digital transmission format employing 4-Level Frequency Shift Keying
(4FSK) modulation with a channel access method of Time Division Multiple Access (TDMA) technology
with two slots per frame. Pressing the DMR soft key initiates the DMR test mode. On the R8100 main
display the Standard mode’s Audio Zone and Audio Zone soft key are replaced by a DMR soft key and
DMR specific content – see Figure 3.2.8.3-1. In addition, a Power Profile display is available in Display
Zone and a Constellation display is automatically selected in Meter Zone as a convenience.
The manufacturer’s Radio Service Software (RSS), Motorola MOTOTRBO™ Radio Tuner software, is
required to perform some tests in DMR mode because certain measurements (BER) require placing the
radio in a special test mode. The Tuner software places the radio in specific test modes, while the role of
the R8100 service monitor is to transmit and receive test patterns compliant to the DMR physical layer.
Tests that don’t require RSS include subscriber slot power, Frequency Error, Symbol Deviation, FSK
Error, Magnitude Error, Power Profile, and Constellation. Averaging can be applied to some
measurements by the System Settings. Figure 3.2.8.3-1 shows the R8100 main screen after choosing the
DMR Test Mode in Monitor mode.
96
Page 97

97
Figure 3.2.8.3-1 DMR transmitter tests
2.2.7.2.2 DMR transmitter tests
These tests are performed with the R8100 in Monitor mode – see Figure 3.2.8.3.1-1. During
repeater/subscriber radio transmission the R8100 continuously measures the quality of the
radio’s transmitted 4FSK signal over the 132 symbols (264 bits) that comprise an entire DMR
TDMA burst. Although the service monitor synchronizes to the first burst, it can measure the
quality of any of the 6 bursts transmitted by the radio.
Page 98

Figure 3.2.8.3.1-1 Submenu after pressing DMR soft key in Generator mode
2.2.7.2.3 RF Zone
Input Level
Input Lvl displays the average power in the specified Burst of the synchronized TDMA slot of the received
signal.
Note: Although Input Level is used for Squelch, Squelch has no effect on measurement updates.
Note: When the RF input power on the RF In/Out port is above +20 dBm (100 mW), the R8100 utilizes a
broadband power detector for the measurement. The “Input Lvl” field in the RF Zone changes to “Watt
Meter” to indicate this measurement mode. For best accuracy disable the Pre-amplifier in Monitor Mode,
and set the Gen Port in Generate Mode to RF In/Out.
Note: The TDMA transmission alternates between a used and unused time slot so the RF Zone field will
switch between the two. An unused slot has no power, so the display will flash between “Input Lvl” and
“Watt Meter”. In this condition the Input Level reading should be used since null slots can cause the Watt
Meter indication to read approximately 3 dB less than the power in the used slots.
98
Page 99

99
Freq Error
Freq Error displays the frequency difference of the received DMR transmission carrier minus the R8100
Monitor Frequency.
Note: For other standard RF Zone settings see RF Zone / Monitor Mode.
2.2.7.2.3.1 DMR Zone
Count
Increments each time the specified SYNC Pattern is detected, thus the R8100 synchronizes to that TDMA
slot.
Note: Test measurements are only displayed if two consecutive SYNC patterns are detected; this
maximizes the accuracy of the measurement.
Source ID
Displays the Source Identifier (ID) which identifies the individual address of the transmitter. This is
obtained from bytes 7-9 of the Full Link Control message composed by four 32-bit embedded signaling
fields at the center of bursts B to F of a voice superframe. The Source ID is displayed in base 10 and base
16 format
CC
Displays the 4-bit color code (0 to 15) of the synchronized TDMA slot of the received signal transmission.
CC is digital ID information equivalent to CTCSS/PL and CDCSS/DPL of analog FM radio systems.
Symbol Deviation
Displays the symbol deviation estimated by averaging the normalized frequency deviations at symbol
times in the specified burst of the synchronized TDMA slot of the received signal and then scaling by the
maximum symbol value. The normalized frequency deviation is computed as the ratio of the actual
frequency measurement at a given symbol or deviation state by the corresponding symbol value. The ideal
is 1944 Hz.
FSK Error
Displays the percentage computed from the symbols in the specified Burst of the synchronized TDMA
slot of the received signal. The FSK Error is computed relative to the Symbol Deviation measurement.
Magnitude Error
Displays the percentage computed from the symbols in the specified Burst of the synchronized TDMA
slot of the received signal.
BER
Displays the bit error rate percentage of bit differences between the O.153 pattern and the bits of the
synchronized TDMA slot of the received signal. For example, if 13 of the 1296 super frame payload bits
do not match the predefined pattern, the rate will be 1.0030864% (13/1296*100%). Assurance of the
computation may be gained by transmitting a different calibration test pattern (e.g. BER of 1031 Hz vs.
O.153 is 47.299381%).
Page 100

Brand (DMR submenu)
Choose DMR compliant manufacturer brand for specific testing by the R8100. The tests and display may
change to address unique aspects of each manufacturer’s radio series.
Figure 3.2.8.3.1.2-1 Voice Loopback Recording
Voice Loopback (DMR submenu)
This enables the Voice Loop feature in DMR mode (U.S. patent 5703479). Once enabled the R8100
automatically records an input message when the radio under test transmits a signal above the squelch
level setting (see Front Panel Control Knobs). A Voice Loop progress bar in the test mode zone is bold
when Voice Loopback is enabled. The maximum length of the recording is 10 seconds and a light green
progress bar shows the recording’s progress (see Figure 3.2.8.3.1.2-1). The recording continues if the
transmission is longer, but only the most recent is retained. When the radio is un-keyed the R8100
automatically switches to Generate mode and transmits the captured input message back to the radio (see
Figure 3.2.8.3.2-2). The position of the recording being played back is displayed with a dark green
progress bar. When the recorded message has been played and a 3-second settling delay has passed, the
operation mode automatically switches back to Monitor mode so another message can be recorded. This
100
 Loading...