

Page 1

R8000 Series
Communications Systems Analyzer
AUTOTUNE USER GUIDE
Motorola ASTRO® XTL™ Series
Motorola ASTRO® XTS™ Series
Freedom Communication Technologies
2002 Synergy Blvd, Suite 200
Kilgore, Texas 75662
Copyright 2015 Freedom Communication Technologies
All Rights Reserved
Printed in U.S.A.
CG-1148 Rev. C
Page 2

AutoTune™ User Guide
i
AUTOTUNE™ SOFTWARE LICENSE AGREEMENT
The software license agreement governing use of the R8000 Series
Communications Systems Analyzer AutoTune™ software is located in CG-1365
R8000 Series Communications Systems Analyzer Operator’s Manual.
TRADEMARKS
The Freedom Communication Technologies logo and Freedom Communication
Technologies are registered ® trademarks of Freedom Communication
Technologies.
MOTOROLA, the Stylized M logo, ASTRO, and FLASHport are registered in the
US Patent & Trademark Office. All other product or service names are the
property of their respective owners.
© Motorola, Inc. 2005.
OpenG License
Copyright (c) 2002, Cal-Bay Systems, Inc. <info@calbay.com>
Copyright (c) 2002, Jean-Pierre Drolet <drolet_jp@hotmail.com>
Copyright (c) 2002-2007, Jim Kring <jim@jimkring.com>
Copyright (c) 2002-2005, Rolf Kalbermatter <rolf.kalbermatter@citeng.com>
Copyright (c) 2003-2004, Paul F. Sullivan <Paul@SULLutions.com>
Copyright (c) 2004, Enrique Vargas <vargas@visecurity.com>
Copyright (c) 2004, Heiko Fettig <heiko.fettig@gmx.net>
Copyright (c) 2004, Michael C. Ashe <michael.ashe@imaginatics.com>
Copyright (c) 2005-2006, MKS Instruments, Inc., author: Doug Femec
<doug_femec@mkinst.com>, IM dafemec
Copyright (c) 2006, JKI <info@jameskring.com>
Copyright (c) 2006, JKI <info@jameskring.com>; Authors: Jim Kring
<jim@jimkring.com>, Philippe Guerit <pjm_labview@yahoo.com>
Copyright (c) 2007, JKI <info@jameskring.com> (Author: Jim Kring
<jim.kring@jameskring.com>)
Copyright (c) 2008, Ton Plomp <t.c.plomp@gmail.com>
All rights reserved.
Redistribution and use in source and binary forms, with or without modification,
are permitted provided that the following conditions are met:
- Redistributions of source code must retain the above copyright notice, this
list of conditions and the following disclaimer.
- Redistributions in binary form must reproduce the above copyright notice, this
list of conditions and the following disclaimer in the documentation and/or
other materials provided with the distribution.
Page 3

AutoTune™ User Guide
ii
- Neither the name of the SciWare, James Kring, Inc., nor the names of its
contributors may be used to endorse or promote products derived from this
software without specific prior written permission.
THIS SOFTWARE IS PROVIDED BY THE COPYRIGHT HOLDERS AND
CONTRIBUTORS "AS IS" AND ANY EXPRESS OR IMPLIED WARRANTIES,
INCLUDING, BUT NOT LIMITED TO, THE IMPLIED WARRANTIES OF
MERCHANTABILITY AND FITNESS FOR A PARTICULAR PURPOSE ARE
DISCLAIMED. IN NO EVENT SHALL THE COPYRIGHT HOLDER OR
CONTRIBUTORS BE LIABLE FOR ANY DIRECT, INDIRECT, INCIDENTAL,
SPECIAL, EXEMPLARY, OR CONSEQUENTIAL DAMAGES (INCLUDING, BUT
NOT LIMITED TO, PROCUREMENT OF SUBSTITUTE GOODS OR SERVICES;
LOSS OF USE, DATA, OR PROFITS; OR BUSINESS INTERRUPTION)
HOWEVER CAUSED AND ON ANY THEORY OF LIABILITY, WHETHER IN
CONTRACT, STRICT LIABILITY, OR TORT (INCLUDING NEGLIGENCE OR
OTHERWISE) ARISING IN ANY WAY OUT OF THE USE OF THIS
SOFTWARE, EVEN IF ADVISED OF THE POSSIBILITY OF SUCH DAMAGE.
EXPORT CONTROL
EXPORT CONTROL WARNING – Do not disclose or provide this document or item
(including its contents) to non-U.S. Citizens or non-U.S. Permanent Residents, or
transmit this document or item (including its contents) outside the U.S. without the
written permission of Freedom Communication Technologies and required U.S.
Government export approvals.
Page 4

AutoTune™ User Guide
iii
TABLE OF CONTENTS
1. Introduction .................................................................................................... 1
2. Scope ............................................................................................................ 1
3. Motorola ASTRO® XTL™ Series Radio Test Setup ...................................... 2
3.1. ASTRO® XTL™ Series Test Setup ......................................................... 2
3.2. ASTRO® XTL™ Series High Power Test Setup ...................................... 2
4. Motorola ASTRO® XTL™ Series Alignment and Test Descriptions .............. 4
4.1. Reference Frequency .............................................................................. 4
4.2. TX Power Out .......................................................................................... 6
4.3. Deviation Balance .................................................................................... 8
4.4. Deviation Limit ......................................................................................... 9
4.5. Distortion ................................................................................................ 10
4.6. Sensitivity (SINAD) ................................................................................ 11
4.7. Noise Squelch Threshold ....................................................................... 12
4.8. P25 Tx Tests .......................................................................................... 13
4.9. Digital Sensitivity (BER) ......................................................................... 14
4.10. Ext Mic Voice Modulation ................................................................... 15
5. Motorola ASTRO® XTS™ Series Radio Test Setup .................................... 17
5.1. ASTRO® XTS™ Series Test Setup ....................................................... 17
6. Motorola ASTRO® XTS™ Series Alignment and Test Descriptions ............ 18
6.1. Reference Frequency ............................................................................ 18
6.2. TX Power Out ........................................................................................ 20
6.3. Deviation Balance .................................................................................. 21
6.4. Deviation Limit ....................................................................................... 22
6.5. Distortion ................................................................................................ 23
6.6. Sensitivity (SINAD) ................................................................................ 24
6.7. Noise Squelch Threshold ....................................................................... 25
6.8. P25 Tx Tests .......................................................................................... 26
6.9. Digital Sensitivity (BER) ......................................................................... 27
6.10. Internal Voice Modulation ................................................................... 28
6.11. External Voice Modulation ................................................................ .. 30
7. Basic Troubleshooting ................................................................................. 31
8. Support Information ..................................................................................... 32
8.1. Technical Support .................................................................................. 32
8.2. Sales Support ........................................................................................ 32
9. References .................................................................................................. 33
APPENDIX A. Test Limits .............................................................................. A-1
APPENDIX B. Sample Test Result Report ..................................................... B-1
APPENDIX C. Revision History ...................................................................... C-1
LIST OF FIGURES
Page 5

AutoTune™ User Guide
iv
Figure 3-1. ASTRO® XTL™ Series Mid Power Test Setup Diagram ................... 2
Figure 3-2. ASTRO® XTL™ Series High Power Test Setup Diagram ................. 3
Figure 4-1. Place keyed microphone next to analyzer speaker. ......................... 16
Figure 4-2. Adjust analyzer volume until about 4 kHz deviation is measured. .... 16
Figure 5-1. ASTRO® XTS™ Series Test Setup Diagram .................................. 17
Figure 6-1. Place keyed radio next to analyzer speaker. .................................... 28
Figure 6-2. Adjust analyzer volume until about 4 kHz deviation is measured. .... 29
Figure B-1. Sample Test Result Report ............................................................ B-1
Page 6

AutoTune™ User Guide
v
LIST OF TABLES
Table 4-1. Analyzer Configuration for Reference Frequency ................................ 4
Table 4-2. Reference Frequency alignment results .............................................. 4
Table 4-3. Reference Frequency test results ........................................................ 5
Table 4-4. Analyzer Configuration for TX Power Out ............................................ 6
Table 4-5. Power Detection Calibration alignment results .................................... 6
Table 4-6. TX Power Out alignment results .......................................................... 6
Table 4-7. TX Power Out test results .................................................................... 7
Table 4-8. Analyzer Configuration for Deviation Balance test, alignment ............. 8
Table 4-9. Deviation Balance alignment results .................................................... 8
Table 4-10. Deviation Balance test results ............................................................ 8
Table 4-11. Analyzer Configuration for Deviation Limit ......................................... 9
Table 4-12. Deviation Limit alignment results ....................................................... 9
Table 4-13. Deviation Limit test results ................................................................. 9
Table 4-14. Analyzer Configuration for Distortion Test ....................................... 10
Table 4-15. Distortion test results ....................................................................... 10
Table 4-16. Analyzer Configuration for Sensitivity (SINAD) test ......................... 11
Table 4-17. Sensitivity (SINAD) test results ........................................................ 11
Table 4-18. Analyzer Configuration for Noise Squelch Threshold test ................ 12
Table 4-19. Noise Squelch Threshold test results .............................................. 12
Table 4-20. Analyzer Configuration for P25 Tx Tests ......................................... 13
Table 4-21. P25 Modulation Fidelity test results ................................................. 13
Table 4-21. P25 Symbol Deviation test results ................................................... 13
Table 4-20. Analyzer Configuration for Digital Sensitivity (BER) test .................. 14
Table 4-21. Digital Sensitivity (BER) test results ................................................. 14
Table 4-22. Analyzer Configuration for Ext Mic Voice Modulation test................ 15
Table 4-23. Ext Mic Voice Modulation test results .............................................. 15
Table 6-1. Analyzer Configuration for Reference Frequency .............................. 18
Table 6-2. Reference Frequency alignment results ............................................ 18
Table 6-3. Reference Frequency test results ...................................................... 19
Table 6-4. Analyzer Configuration for TX Power Out .......................................... 20
Table 6-5. TX Power Out alignment results ........................................................ 20
Table 6-6. TX Power Out test results .................................................................. 20
Table 6-7. Analyzer Configuration for Deviation Balance test, alignment ........... 21
Table 6-8. Deviation Balance alignment results .................................................. 21
Table 6-9. Deviation Balance test results ............................................................ 21
Table 6-10. Analyzer Configuration for Deviation Limit ....................................... 22
Table 6-11. Deviation Limit alignment results ..................................................... 22
Table 6-12. Deviation Limit test results ............................................................... 22
Table 6-13. Analyzer Configuration for Distortion Test ....................................... 23
Table 6-14. Distortion test results ....................................................................... 23
Table 6-15. Analyzer Configuration for Sensitivity (SINAD) test ......................... 24
Table 6-16. Sensitivity (SINAD) test results ........................................................ 24
Table 6-17. Analyzer Configuration for Noise Squelch Threshold test ................ 25
Table 6-18. Noise Squelch Threshold test results .............................................. 25
Page 7

AutoTune™ User Guide
vi
Table 4-20. Analyzer Configuration for P25 Tx Tests ......................................... 26
Table 4-21. P25 Modulation Fidelity test results ................................................. 26
Table 4-21. P25 Symbol Deviation test results ................................................... 26
Table 6-19. Analyzer Configuration for Digital Sensitivity (BER) test .................. 27
Table 6-20. Digital Sensitivity (BER) test results ................................................. 27
Table 6-21. Analyzer Configuration for Internal Voice Modulation test ............... 28
Table 6-22. Internal Voice Modulation test results .............................................. 28
Table 6-23. Analyzer Configuration for External Voice Modulation test .............. 30
Table 6-24. External Voice Modulation test results ............................................. 30
Table 9-1. AutoTune Troubleshooting Chart ....................................................... 31
Table A-1. Default Motorola ASTRO® XTL™ Series Limits .............................. A-3
Table A-2. Default Motorola ASTRO® XTS™ Series Limits ............................. A-5
Page 8

AutoTune™ User Guide
1
1. Introduction
The Freedom Communication Technologies R8000 Series Communications Systems
Analyzer AutoTune™ (hereafter “AutoTune”) is designed to provide an automated test
and alignment solution for supported two-way radios.
2. Scope
This document is intended to provide information regarding the tests and alignments
performed for supported radios by AutoTune. This document is restricted to radiospecific information for Motorola ASTRO® XTL™ Series and ASTRO® XTS™ Series
two-way radios.
Please refer to the R8000 Series Communications System Analyzer Owner’s Manual
(CG-1365) for an overview and basic operating instructions for AutoTune itself.
Page 9
AutoTune™ User Guide
2
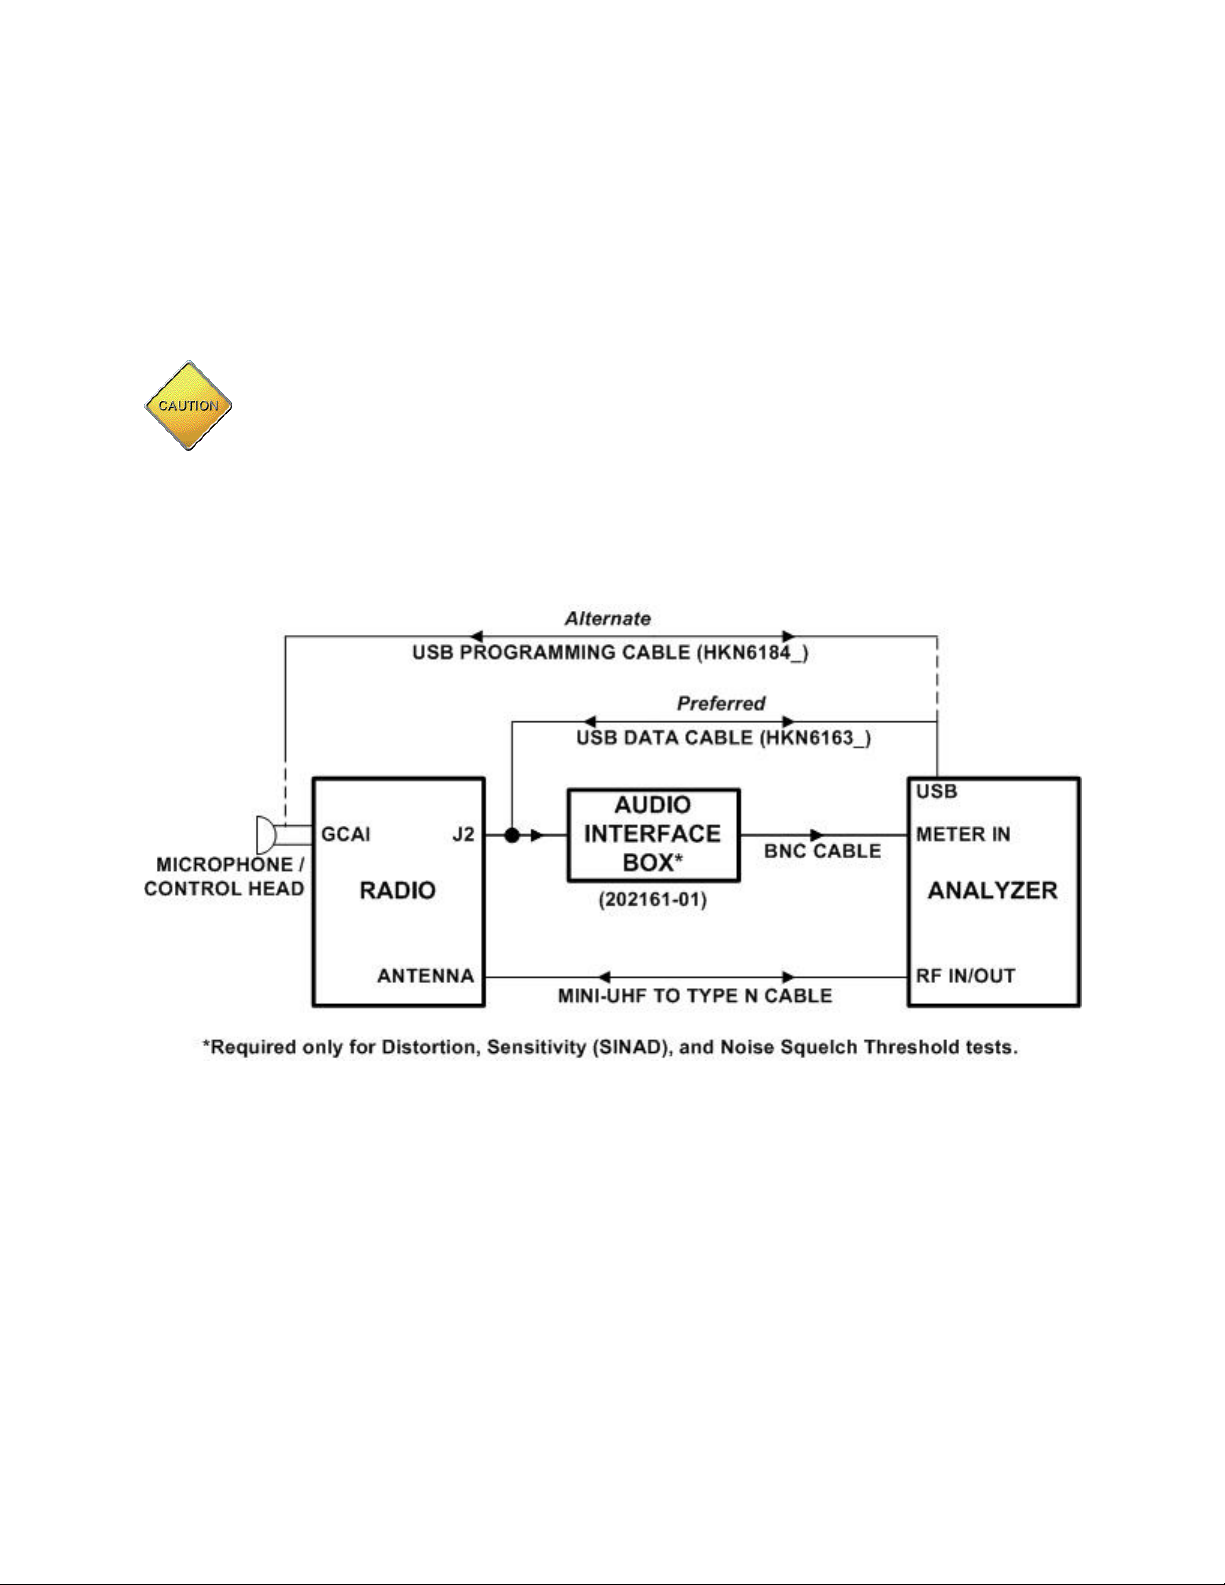
3. Motorola ASTRO® XTL™ Series Radio Test Setup
In order to perform the test and alignment procedures, the ASTRO® XTL™ Series radio
must be connected to the R8000 Communications Systems Analyzer as shown in the
figure below. Use of USB radio programming cables indicated are required to perform
all tests.
Make certain that the radio under test is configured as described in the
corresponding diagram before attempting to perform an alignment or test.
Failure to do so may result in poor radio performance and/or damage to the
analyzer or radio equipment under test.
3.1. ASTRO® XTL™ Series Test Setup
Refer to the diagram below for the proper test setup.
Figure 3-1. ASTRO® XTL™ Series Mid Power Test Setup Diagram
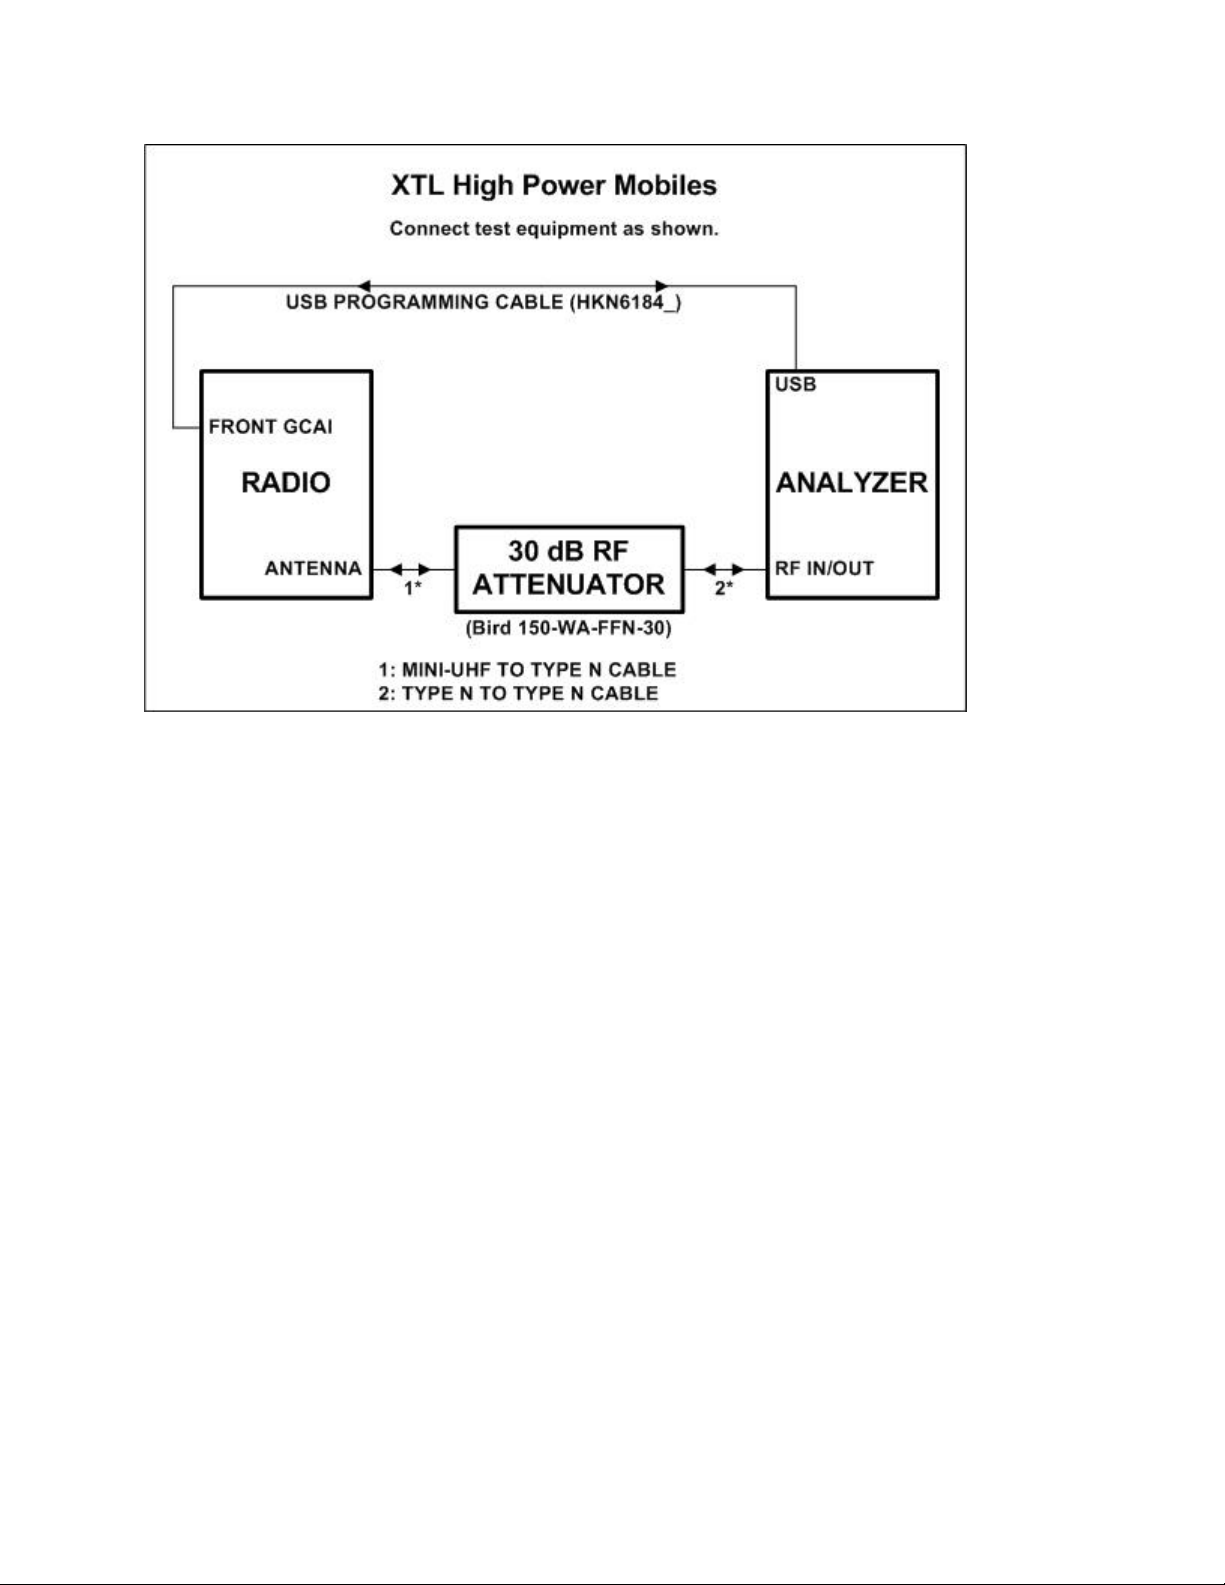
3.2. ASTRO® XTL™ Series High Power Test Setup
Refer to the diagram below for the proper test setup.
Page 10
AutoTune™ User Guide
3
Figure 3-2. ASTRO® XTL™ Series High Power Test Setup Diagram
Page 11
AutoTune™ User Guide
4
RF Control
Port
Frequency
Modulation
Attenuation
Monitor
RF IN/OUT
Test Frequency
FM
20 dB
Name
Description
Result
Pass or Fail. Frequency Error within Max Limit, Min Limit
Frequency
Test Frequency
Freq Error
Measured frequency error after alignment
Min Limit
Minimum Limit (inclusive) for frequency error
Max Limit
Maximum Limit (inclusive) for frequency error
Old Softpot
Original radio softpot setting
New Softpot
Radio softpot after alignment
4. Motorola ASTRO® XTL™ Series Alignment and Test
Descriptions
Note: Throughout this section are references to Test Frequency. Test Frequencies are
band- and mode -specific. A table of the frequencies used by each band may be found
in the respective radio service manual. See the References section for more details.
Note: All analyzer Mode settings are Standard unless otherwise indicated.
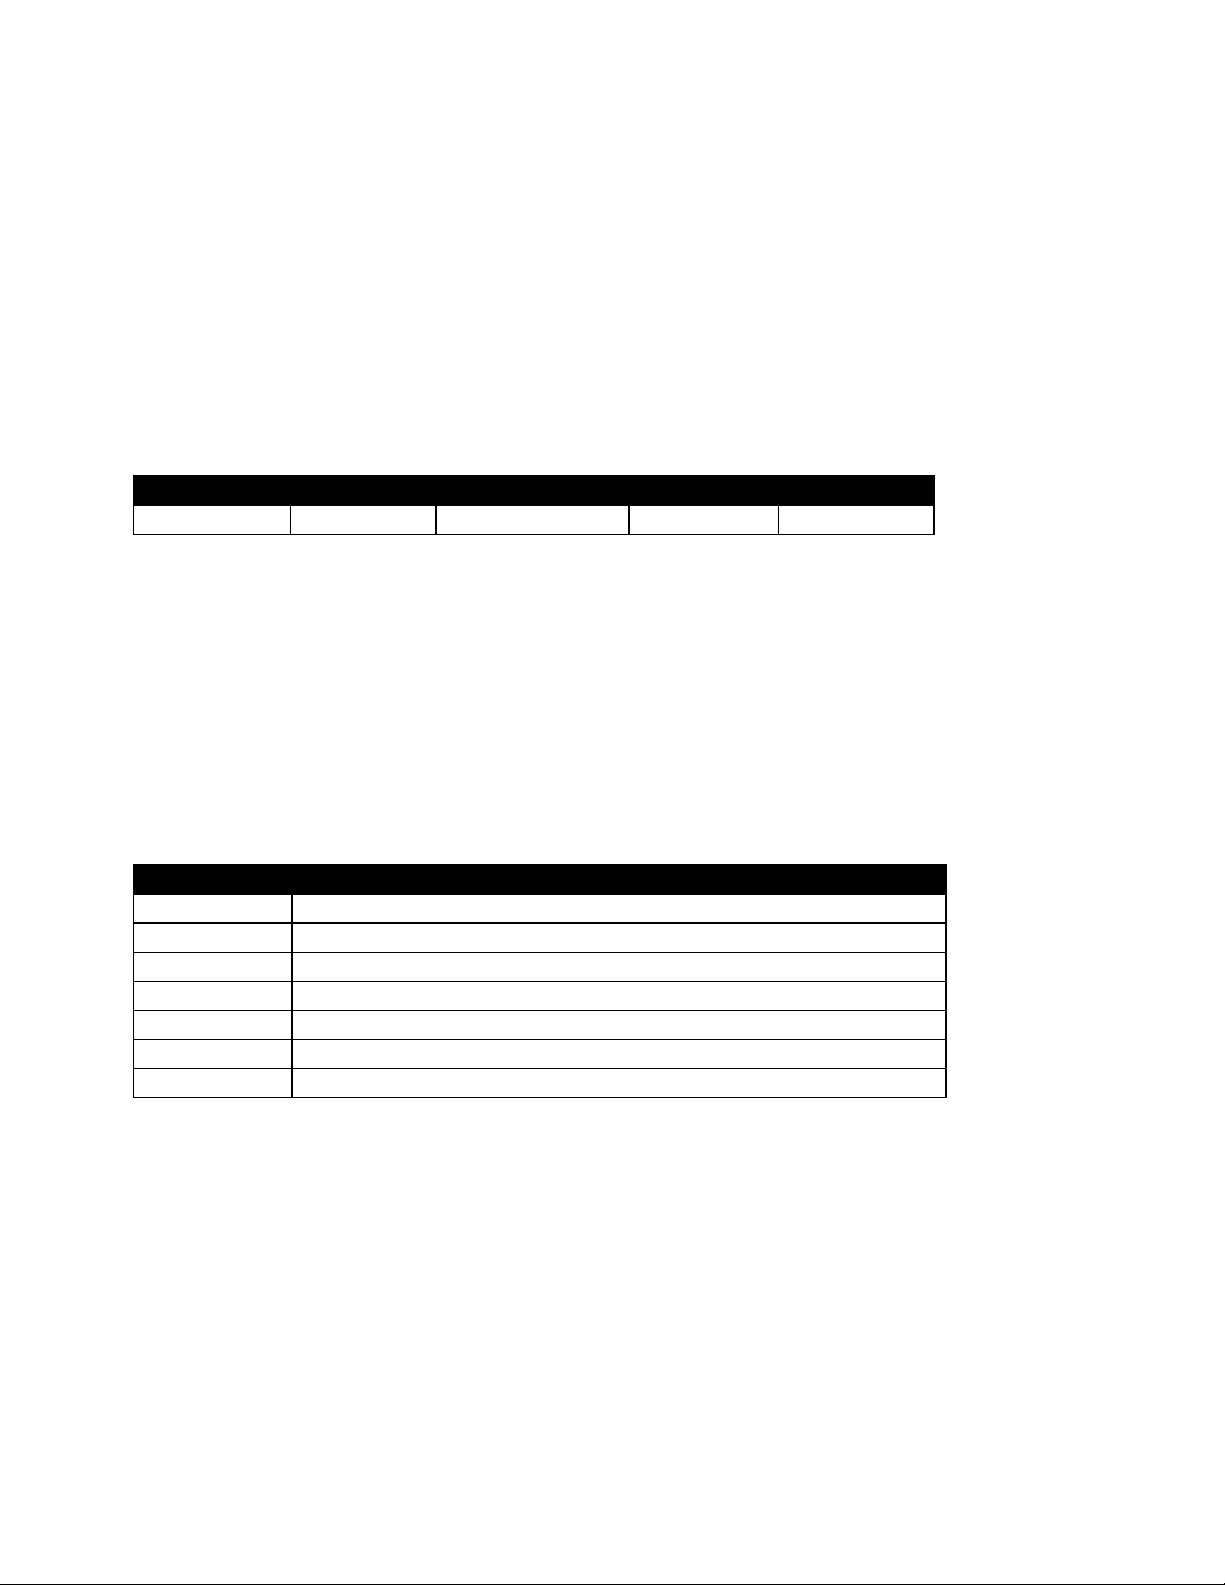
4.1. Reference Frequency
Table 4-1. Analyzer Configuration for Reference Frequency
4.1.1. Alignment
The radio is placed into Test Mode at the highest TX Test Frequency and commanded
to transmit. Using a best linear fit algorithm, two frequency error measurements are
taken at two different radio softpot values. These frequency error measurements are
used to calculate the softpot value which minimizes frequency error. After programming
this new softpot value into the radio, the radio softpot is fine tuned until minimum
frequency error is detected. The frequency error is compared against test limits and the
final results written to the log file.
Table 4-2. Reference Frequency alignment results
4.1.2. Test
The radio is placed into Test Mode at the highest TX Test Frequency and commanded
to transmit. The frequency error is measured by the analyzer and compared to test
limits. The final results are written to the log file.
Page 12

AutoTune™ User Guide
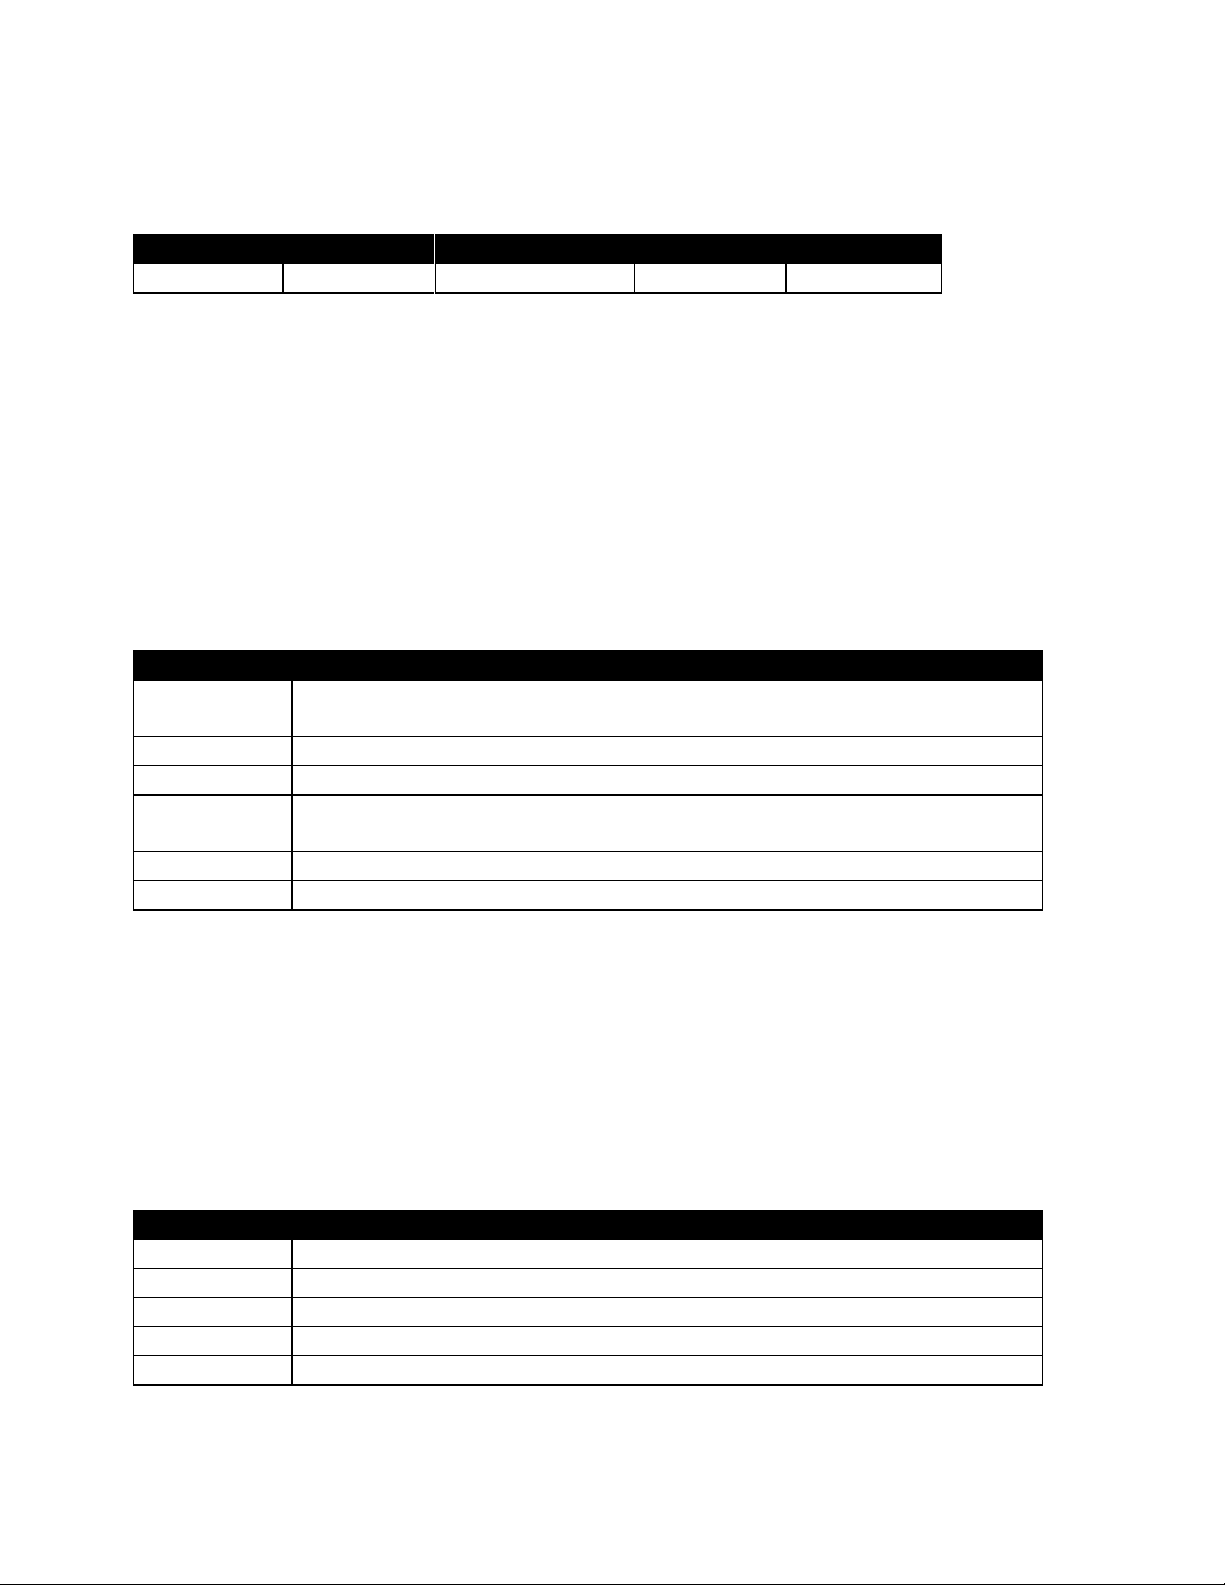
5
Name
Description
Result
Pass or Fail. Frequency Error within Max Limit, Min Limit
Frequency
Test Frequency
Freq Error
Measured frequency error
Max Limit
Maximum Limit (inclusive) for frequency error
Min Limit
Minimum Limit (inclusive) for frequency error
Softpot
Radio softpot which yields Freq Error
Table 4-3. Reference Frequency test results
Page 13
AutoTune™ User Guide
6
RF Control
Port
Frequency
Modulation
Attenuation
Monitor
RF IN/OUT
Test Frequency
FM
40 dB
Name
Description
Result
Pass or Fail. Meas Power AND New Softpot within manufacturer
limits
Frequency
Test Frequency
Meas Power
Measured radio output level
Target
Power
Ideal Meas Power
Old Softpot
Original radio softpot setting
New Softpot
Radio softpot after alignment
Name
Description
Result
Pass or Fail. Power Out within Max Limit, Min Limit
Frequency
Test Frequency
Power Out
Measured radio output level
Min Limit
Minimum Limit (inclusive) for Power Out
Max Limit
Maximum Limit (inclusive) for Power Out
4.2. TX Power Out
Table 4-4. Analyzer Configuration for TX Power Out
4.2.1. Alignment
The TX Power Out alignment is composed of two parts: Power Detection Calibration
and TX Power Out. Power Detection Calibration is performed first, and only during
alignment; it is not performed during a test.
Power Detector Calibration adjusts the radio power detector to minimize the power
output variation across radios. The radio is placed into Test Mode and commanded to
transmit at a mid-band Test Frequency. The output level is measured and then adjusted
until near to a band-specific output level defined by the radio itself. The final results are
written to the log file.
Table 4-5. Power Detection Calibration alignment results
TX Power Out characterizes the power output level of the radio. The radio is placed into
Test Mode and commanded to transmit. Beginning at the lowest TX Test Frequency,
the output level is measured at two different points for each TX Test Frequency. These
measurements are used to align the radio power output level across the radio band as
specified by the radio basic service manual. After the alignment is complete, the power
output level is measured again at each TX Test Frequency and compared against test
limits. The final results are written to the log file.
Table 4-6. TX Power Out alignment results
Page 14
AutoTune™ User Guide
7
Name
Description
Result
Pass or Fail. Power Out within Max Limit, Min Limit
Frequency
Test Frequency
Power Out
Measured radio output level
Min Limit
Minimum Limit (inclusive) for Power Out
Max Limit
Maximum Limit (inclusive) for Power Out
4.2.2. Test
The radio is placed into Test Mode and commanded to transmit. Beginning at the lowest
TX Test Frequency, the output level is measured at each TX Test Frequency and
compared against test limits. The final results are written to the log file.
Table 4-7. TX Power Out test results
Page 15
AutoTune™ User Guide
8
RF Control
Port
Frequency
Modulation
Attenuation
Monitor
RF IN/OUT
Test Frequency
FM
20 dB
Name
Description
Result
Pass or Fail. Percent difference between low and high tone
deviation less than or equal to Variance.
Frequency
Test Frequency
Variance
Measured difference between low and high tone deviation
Max Limit
Maximum passable percent difference (inclusive) between low and
high tone deviation
Old Softpot
Original radio softpot setting
New Softpot
Radio softpot setting after alignment
Name
Description
Result
Pass or Fail. Percent difference between low and high tone
deviation less than or equal to Variance.
Frequency
Test Frequency
Variance
Measured difference between low and high tone deviation
Max Limit
Maximum passable percent difference (inclusive) between low and
high tone deviation
4.3. Deviation Balance
Table 4-8. Analyzer Configuration for Deviation Balance test, alignment
4.3.1. Alignment
The radio is placed into Test Mode at the highest TX Test Frequency and commanded
to transmit. The radio generates an 80 Hz modulation tone and the deviation of this tone
is measured with the analyzer. The radio then generates a 3 kHz modulation tone and
the deviation of this tone is measured with the analyzer. The radio softpot is adjusted
until the deviation difference between the first and second tones is within test limits. This
adjustment is performed for each TX Test Frequency and the percent difference is
compared against test limits. The results for each TX Test Frequency are written to the
log file.
Table 4-9. Deviation Balance alignment results
4.3.2. Test
The radio is placed into Test Mode at the highest TX Test Frequency and commanded
to transmit. The radio generates an 80 Hz modulation tone and the deviation of this tone
is measured with the analyzer. The radio then generates a 3 kHz modulation tone and
the deviation of this tone is measured with the analyzer. The percent difference is
compared against test limits and written to the log file. This test is performed for each
remaining TX Test Frequency.
Table 4-10. Deviation Balance test results
Page 16

AutoTune™ User Guide
9
RF Control
Port
Frequency
Modulation
Level
Monitor
RF IN/OUT
Test Frequency
FM
20 dB
Name
Description
Result
Pass or Fail. Deviation level within Max Limit, Min Limit
Frequency
Test Frequency
Deviation
Measured deviation level
Min Limit
Minimum Limit (inclusive) for Deviation
Max Limit
Maximum Limit (inclusive) for Deviation
Old Softpot
Original radio softpot setting
New Softpot
Radio softpot after alignment
Name
Description
Result
Pass or Fail. Deviation level within Max Limit, Min Limit
Frequency
Test Frequency
Deviation
Measured deviation level
Min Limit
Minimum Limit (inclusive) for Deviation
Max Limit
Maximum Limit (inclusive) for Deviation
4.4. Deviation Limit
Table 4-11. Analyzer Configuration for Deviation Limit
4.4.1. Alignment
The radio is placed into Test Mode at the highest TX Test Frequency and commanded
to transmit. The radio generates a digital test pattern at high deviation. This deviation is
measured with the analyzer and adjusted until it is close to the midpoint between the
test limits. The resulting deviation measurement is compared against test limits and
written to the log file. This adjustment is repeated for each remaining TX Test
Frequency.
Table 4-12. Deviation Limit alignment results
4.4.2. Test
The radio is placed into Test Mode at the highest TX Test Frequency and commanded
to transmit. The radio generates a digital test pattern at high deviation. This deviation is
measured and compared against test limits. The final results are written to the log file.
This test is repeated for each remaining TX Test Frequency.
Table 4-13. Deviation Limit test results
Page 17

AutoTune™ User Guide
10
RF Control
Port
Frequency
Modulation
Level
Generate
RF IN/OUT
Test Freq
FM, 1 kHz @ 3 kHz deviation
-50 dBm
Name
Description
Result
Pass or Fail. Distortion level within Max Limit, Min Limit
Frequency
Test Frequency
Distortion
Measured audio signal distortion level
Max Limit
Maximum Limit (inclusive) for Distortion to Pass
4.5. Distortion
Note: This test is not supported for Motorola ASTRO® XTL™ Series High Power
models.
This is a test only; there is no alignment.
Table 4-14. Analyzer Configuration for Distortion Test
4.5.1. Alignment
No alignment is needed.
4.5.2. Test
The analyzer is setup as specified in this section’s Analyzer Configuration table. The
radio is placed into Test Mode at the lowest RX Test Frequency. The radio audio output
level is tested and if insufficient to measure distortion the volume is increased until
sufficient to measure distortion. The audio signal’s distortion level is then measured and
compared to test limits. The final results are written to the log file.
Table 4-15. Distortion test results
Page 18

AutoTune™ User Guide
11
RF Control
Port
Frequency
Modulation
Level
Generate
RF IN/OUT
Test Freq
FM, 1 kHz @ 3kHz deviation
-50 dBm
Name
Description
Result
Pass or Fail. Sensitivity (SINAD) level within Max Limit
Frequency
Test Frequency
12dB SINAD
Analyzer output level at which the radio SINAD level measures 12 dB
Max Limit
Maximum Limit (inclusive) for Sensitivity (SINAD) to Pass
4.6. Sensitivity (SINAD)
Note: This test is not supported for Motorola ASTRO® XTL™ Series High Power
models.
This is a test only; there is no alignment.
Table 4-16. Analyzer Configuration for Sensitivity (SINAD) test
4.6.1. Alignment
No alignment is needed.
4.6.2. Test
The analyzer is setup as specified in this section’s Analyzer Configuration table. The
radio is placed into Test Mode at the lowest RX Test Frequency. The radio audio output
level is tested and if insufficient to measure SINAD the volume is increased until
sufficient to measure SINAD. The output level of the analyzer is then adjusted until the
radio audio signal’s SINAD level measures about 12 dB. The current analyzer output
level is then compared against test limits. The final results are written to the log file.
Table 4-17. Sensitivity (SINAD) test results
Page 19

AutoTune™ User Guide
12
RF Control
Port
Frequency
Modulation
Level
Generate
RF IN/OUT
Test Freq
FM, 1 kHz @ 3kHz deviation
-50 dBm
Name
Description
Result
Pass or Fail. Noise Squelch Threshold level within Max Limit
Frequency
Test Frequency
Unsquelch
Analyzer output level at which the radio unsquelches
Max Limit
Maximum Limit (exclusive) for Noise Squelch Threshold to Pass
4.7. Noise Squelch Threshold
Note: This test is not supported for Motorola ASTRO® XTL™ Series High Power
models.
This is a test only; there is no alignment.
Table 4-18. Analyzer Configuration for Noise Squelch Threshold test
4.7.1. Alignment
No alignment is needed.
4.7.2. Test
The purpose of this procedure is to verify that the squelch circuit operation performs as
expected, blocking noise but allowing stronger signals to be heard. The analyzer is
setup as specified in this section’s Analyzer Configuration table. The radio is placed into
Test Mode at the lowest RX Test Frequency. The radio audio output level is tested and
if insufficient to measure the unsquelched condition the volume is increased. Beginning
at -125 dBm, the analyzer output level is slowly increased until the radio unsquelches
OR is 6 dBm above the Max Limit, whichever comes first. The Unsquelch analyzer
output level is compared against test limits and the final results written to the log file.
Table 4-19. Noise Squelch Threshold test results
Page 20

AutoTune™ User Guide
13
RF Control
Port
Frequency
Modulation Type
Test Pattern
Monitor
RF IN/OUT
Test Frequency
C4FM
Standard Tx
(O.153/V.52)
Name
Description
Result
Pass or Fail. Digital Sensitivity (BER) output level within Max Limit
Frequency
Test Frequency
Mod Fidelity
RMS error magnitude difference (%) between actual signal and ideal
C4FM signal
Max Limit
Maximum Limit (inclusive) for Modulation Fidelity test to Pass
Name
Description
Result
Pass or Fail. Digital Sensitivity (BER) output level within Max Limit
Frequency
Test Frequency
Symbol Dev
Deviation (Hz) from transmitting the Standard Tx test pattern
Min Limit
Minimum Limit (inclusive) for Symbol Deviation test to Pass
Max Limit
Maximum Limit (inclusive) for Symbol Deviation test to Pass
4.8. P25 Tx Tests
NOTE: This test requires an analyzer with P25 Conventional (R8-P25) test mode
capability.
The purpose of this procedure is to measure the radio transmitter performance at
several given frequencies per the TIA/EIA 102.CAAB standard. These are tests only;
there are no alignments.
Table 4-20. Analyzer Configuration for P25 Tx Tests
4.8.1. Alignment
No alignment is needed.
4.8.2. Test
The analyzer is setup as specified in this section’s Analyzer Configuration table. The
radio is placed into Test Mode at the lowest Tx Test Frequency, ready to transmit a
C4FM-modulated signal to the analyzer. The radio is keyed and for each test frequency
the following digital measurements are taken: Modulation Fidelity and Symbol Deviation.
These measurement results are compared against test limits and the final results written
to the log file.
Table 4-21. P25 Modulation Fidelity test results
Table 4-22. P25 Symbol Deviation test results
Page 21

AutoTune™ User Guide
14
RF Control
Port
Frequency
Modulation
Level
Generate
RF IN/OUT
Test Frequency
Framed 1011 Hz Pattern,
2.83 kHz deviation
-116.0 dBm
Name
Description
Result
Pass or Fail. Digital Sensitivity (BER) output level within Max Limit
Frequency
Test Frequency
5% BER
Analyzer output level at which the radio BER measures 5%
Max Limit
Maximum Limit (inclusive) for Digital Sensitivity (BER) to Pass
4.9. Digital Sensitivity (BER)
NOTE: This test requires an analyzer with P25 Conventional (R8-P25) test mode
capability.
The purpose of this procedure is to measure the radio receiver’s Bit Error Rate at a
given frequency. The TIA/EIA standard BER rate is 5%. This is a test only; there is no
alignment.
Table 4-23. Analyzer Configuration for Digital Sensitivity (BER) test
4.9.1. Alignment
No alignment is needed.
4.9.2. Test
The analyzer is setup as specified in this section’s Analyzer Configuration table. The
radio is placed into Test Mode at the lowest RX Test Frequency, ready to receive a
C4FM-modulated signal from the analyzer. Once BER synchronization is detected, the
analyzer output level is decreased until a BER of 5% is measured. The analyzer output
level at 5% BER is compared against test limits and the final results are written to the
log file.
Table 4-24. Digital Sensitivity (BER) test results
Page 22

AutoTune™ User Guide
15
RF Control
Port
Frequency
Modulation
Attenuation
Monitor
RF IN/OUT
Test Frequency
FM
40 dB
Name
Description
Result
Pass or Fail. Deviation within Min Limit, Max Limit
Frequency
Test Frequency
Deviation
Measured modulation deviation level
Min Limit
Minimum Limit (inclusive) for Deviation to Pass
Max Limit
Maximum Limit (inclusive) for Deviation to Pass
4.10. Ext Mic Voice Modulation
Note: This test is not supported for Motorola ASTRO® XTL™ Series High Power
models.
The purpose of this procedure is to test the ability of the radio’s external microphone
audio circuit to accurately transfer the received microphone signal.
Table 4-25. Analyzer Configuration for Ext Mic Voice Modulation test
Table 4-26. Ext Mic Voice Modulation test results
4.10.1. Alignment
No alignment is needed.
4.10.2. Test
The radio is placed into Test Mode at the lowest TX Test Frequency. The analyzer is
setup as specified in this section’s Analyzer Configuration table. The user is instructed
to key the connected radio microphone and place the microphone next to the analyzer
speaker (see Figure 4-1). The user is also instructed to adjust the analyzer volume until
about 4 kHz deviation is seen on the analyzer display (see Figure 4-2). The deviation
level is then measured by the analyzer and the user is instructed when to un-key the
microphone. The measured deviation is compared against test limits and the final
results are written to the log file.
Page 23

AutoTune™ User Guide
16
Figure 4-1. Place keyed microphone next to analyzer speaker.
Figure 4-2. Adjust analyzer volume until about 4 kHz deviation is measured.
Page 24

AutoTune™ User Guide
17
5. Motorola ASTRO® XTS™ Series Radio Test Setup
In order to perform the test and alignment procedures, the ASTRO® XTL™ Series radio
must be connected to the R8000 Communications Systems Analyzer as shown in the
figure below.
Make certain that the radio under test is configured as described in the
corresponding diagram before attempting to perform the indicated alignment
or test. Failure to do so may result in poor radio performance and/or damage
to the analyzer or radio equipment under test.
5.1. ASTRO® XTS™ Series Test Setup
Refer to the diagram below for the proper test setup. Note that the correct setting for
each RLN4460 test set control is highlighted in yellow.
Figure 5-1. ASTRO® XTS™ Series Test Setup Diagram
Page 25

AutoTune™ User Guide
18
RF Control
Port
Frequency
Modulation
Attenuation
Monitor
RF IN/OUT
Test Frequency
FM
20 dB
Name
Description
Result
Pass or Fail. Frequency Error within Max Limit, Min Limit
Frequency
Test Frequency
Freq Error
Measured frequency error after alignment
Min Limit
Minimum Limit (inclusive) for frequency error
Max Limit
Maximum Limit (inclusive) for frequency error
Old Softpot
Original radio softpot setting
New Softpot
Radio softpot after alignment
6. Motorola ASTRO® XTS™ Series Alignment and Test
Descriptions
Note: Throughout this section are references to Test Frequency that are band- and
mode -specific. A table of the frequencies used by each band may be found in the
respective radio service manual. See the References section for more details.
Note: All analyzer Mode settings are Standard unless otherwise indicated.
6.1. Reference Frequency
Table 6-1. Analyzer Configuration for Reference Frequency
6.1.1. Alignment
The radio is placed into Test Mode at the highest TX Test Frequency and commanded
to transmit. Using a best linear fit algorithm, two frequency error measurements are
taken at two different radio softpot values. These frequency error measurements are
used to calculate the softpot value which minimizes frequency error. After programming
this new softpot value into the radio, the radio softpot is fine tuned until minimum
frequency error is detected. The frequency error is compared against test limits and the
final results written to the log file.
Table 6-2. Reference Frequency alignment results
6.1.2. Test
The radio is placed into Test Mode at the highest TX Test Frequency and commanded
to transmit. The frequency error is measured by the analyzer and compared to test
limits. The final results are written to the log file.
Page 26

AutoTune™ User Guide
19
Name
Description
Result
Pass or Fail. Frequency Error within Max Limit, Min Limit
Frequency
Test Frequency
Freq Error
Measured frequency error
Min Limit
Minimum Limit (inclusive) for frequency error
Max Limit
Maximum Limit (inclusive) for frequency error
Softpot
Radio softpot which yields Freq Error
Table 6-3. Reference Frequency test results
Page 27

AutoTune™ User Guide
20
RF Control
Port
Frequency
Modulation
Attenuation
Monitor
RF IN/OUT
Test Frequency
FM
30 dB
Name
Description
Result
Pass or Fail. Power Out within Max Limit, Min Limit
Frequency
Test Frequency
Power Out
Measured radio output level
Min Limit
Minimum Limit (inclusive) for Power Out
Max Limit
Maximum Limit (inclusive) for Power Out
Old Softpot
Original radio softpot setting
New Softpot
Radio softpot setting after alignment
Name
Description
Result
Pass or Fail. Power Out within Max Limit, Min Limit
Frequency
Test Frequency
Power Out
Measured radio output level
Min Limit
Minimum Limit (inclusive) for Power Out
Max Limit
Maximum Limit (inclusive) for Power Out
Softpot
Radio softpot setting
6.2. TX Power Out
Table 6-4. Analyzer Configuration for TX Power Out
6.2.1. Alignment
TX Power Out aligns the power output level of the radio. The radio is placed into Test
Mode and commanded to transmit. Beginning at the highest TX Test Frequency and
Low power setting, the output level is measured and then adjusted until about midway
between the two test limits. The sequence is repeated twice more, for Mid and High
power settings, at all Test Frequencies. The final results are written to the log file.
Table 6-5. TX Power Out alignment results
6.2.2. Test
TX Power Out tests the power output level of the radio. The radio is placed into Test
Mode and commanded to transmit. Beginning at the highest TX Test Frequency and
Low power setting, the output level is measured at each TX Test Frequency and
compared against test limits. The sequence is repeated twice more, for Mid and High
power settings, at all Test Frequencies. The final results for all power levels and Test
Frequencies are written to the log file.
Table 6-6. TX Power Out test results
Page 28

AutoTune™ User Guide
21
RF Control
Port
Frequency
Modulation
Attenuation
Monitor
RF IN/OUT
Test Frequency
FM
30 dB
Name
Description
Result
Pass or Fail. Percent difference between low and high tone
deviation less than or equal to Variance.
Frequency
Test Frequency
Variance
Measured difference between low and high tone deviation
Max Limit
Maximum passable percent difference (inclusive) between low and
high tone deviation
Old Softpot
Original radio softpot setting
New Softpot
Radio softpot setting after alignment
Name
Description
Result
Pass or Fail. Percent difference between low and high tone
deviation less than or equal to Variance.
Frequency
Test Frequency
Variance
Measured difference between low and high tone deviation
Max Limit
Maximum passable percent difference (inclusive) between low and
high tone deviation
Softpot
Radio softpot setting
6.3. Deviation Balance
Table 6-7. Analyzer Configuration for Deviation Balance test, alignment
6.3.1. Alignment
The radio is placed into Test Mode at the highest TX Test Frequency and commanded
to transmit. The radio generates an 80 Hz modulation tone and the deviation of this tone
is measured with the analyzer. The radio then generates a 3 kHz modulation tone and
the deviation of this tone is measured with the analyzer. The radio softpot is adjusted
until the deviation difference between the first and second tones is within test limits. This
adjustment is performed for each TX Test Frequency and the percent difference is
compared against test limits. The results for each TX Test Frequency are written to the
log file.
Table 6-8. Deviation Balance alignment results
6.3.2. Test
The radio is placed into Test Mode at the highest TX Test Frequency and commanded
to transmit. The radio generates an 80 Hz modulation tone and the deviation of this tone
is measured with the analyzer. The radio then generates a 3 kHz modulation tone and
the deviation of this tone is measured with the analyzer. The percent difference is
compared against test limits and written to the log file. This test is performed for each
remaining TX Test Frequency.
Table 6-9. Deviation Balance test results
Page 29

AutoTune™ User Guide
22
RF Control
Port
Frequency
Modulation
Level
Monitor
RF IN/OUT
Test Frequency
FM
30 dB
Name
Description
Result
Pass or Fail. Deviation level within Max Limit, Min Limit
Frequency
Test Frequency
Deviation
Measured deviation level
Min Limit
Minimum Limit (inclusive) for Deviation
Max Limit
Maximum Limit (inclusive) for Deviation
Old Softpot
Original radio softpot setting
New Softpot
Radio softpot after alignment
Name
Description
Result
Pass or Fail. Deviation level within Max Limit, Min Limit
Frequency
Test Frequency
Deviation
Measured deviation level
Min Limit
Minimum Limit (inclusive) for Deviation
Max Limit
Maximum Limit (inclusive) for Deviation
Softpot
Radio softpot setting
6.4. Deviation Limit
Table 6-10. Analyzer Configuration for Deviation Limit
6.4.1. Alignment
The radio is placed into Test Mode at the highest TX Test Frequency and commanded
to transmit. The radio generates a digital test pattern at high deviation. This deviation is
measured with the analyzer and adjusted until it is close to the midpoint between the
test limits. The resulting deviation measurement is compared against test limits and
written to the log file. This adjustment is repeated for each remaining TX Test
Frequency.
Table 6-11. Deviation Limit alignment results
6.4.2. Test
The radio is placed into Test Mode at the highest TX Test Frequency and commanded
to transmit. The radio generates a digital test pattern at high deviation. This deviation is
measured and compared against test limits. The final results are written to the log file.
This test is repeated for each remaining TX Test Frequency.
Table 6-12. Deviation Limit test results
Page 30

AutoTune™ User Guide
23
RF Control
Port
Frequency
Modulation
Level
Generate
RF IN/OUT
Test Freq
FM, 1 kHz @ 3 kHz deviation
-50 dBm
Name
Description
Result
Pass or Fail. Distortion level within Max Limit, Min Limit
Frequency
Test Frequency
Distortion
Measured audio signal distortion level
Max Limit
Maximum Limit (inclusive) for Distortion to Pass
6.5. Distortion
This is a test only; there is no alignment.
Table 6-13. Analyzer Configuration for Distortion Test
6.5.1. Alignment
No alignment is needed.
6.5.2. Test
The analyzer is setup as specified in this section’s Analyzer Configuration table. The
radio is placed into Test Mode at the lowest RX Test Frequency. The radio audio output
level is tested and if insufficient to measure distortion the volume is increased until
sufficient to measure distortion. The audio signal’s distortion level is then measured and
compared to test limits. The final results are written to the log file.
Table 6-14. Distortion test results
Page 31

AutoTune™ User Guide
24
RF Control
Port
Frequency
Modulation
Level
Generate
RF IN/OUT
Test Freq
FM, 1 kHz @ 3kHz deviation
-50 dBm
Name
Description
Result
Pass or Fail. Sensitivity (SINAD) level within Max Limit
Frequency
Test Frequency
12dB SINAD
Analyzer output level at which the radio SINAD level measures 12 dB
Max Limit
Maximum Limit (inclusive) for Sensitivity (SINAD) to Pass
6.6. Sensitivity (SINAD)
This is a test only; there is no alignment.
Table 6-15. Analyzer Configuration for Sensitivity (SINAD) test
6.6.1. Alignment
No alignment is needed.
6.6.2. Test
The analyzer is setup as specified in this section’s Analyzer Configuration table. The
radio is placed into Test Mode at the lowest RX Test Frequency. The radio audio output
level is tested and if insufficient to measure SINAD the volume is increased until
sufficient to measure SINAD. The output level of the analyzer is then adjusted until the
radio audio signal’s SINAD level measures about 12 dB. The current output level is then
compared against test limits. The final results are written to the log file.
Table 6-16. Sensitivity (SINAD) test results
Page 32

AutoTune™ User Guide
25
RF Control
Port
Frequency
Modulation
Level
Generate
RF IN/OUT
Test Freq
FM, 1 kHz @ 3kHz deviation
-50 dBm
Name
Description
Result
Pass or Fail. Noise Squelch Threshold level within Max Limit
Frequency
Test Frequency
Unsquelch
Analyzer output level at which the radio unsquelches
Max Limit
Maximum Limit (exclusive) for Noise Squelch Threshold to Pass
6.7. Noise Squelch Threshold
This is a test only; there is no alignment.
Table 6-17. Analyzer Configuration for Noise Squelch Threshold test
6.7.1. Alignment
No alignment is needed.
6.7.2. Test
The purpose of this procedure is to verify that the squelch circuit operation performs as
expected, blocking noise but allowing stronger signals to be heard. The analyzer is
setup as specified in this section’s Analyzer Configuration table. The radio is placed into
Test Mode at the lowest RX Test Frequency. The radio audio output level is tested and
if insufficient to measure the unsquelched condition the volume is increased. Beginning
at -125 dBm, the analyzer output level is slowly increased until the radio unsquelches
OR is 6 dBm above the Max Limit, whichever comes first. The analyzer output level is
compared against test limits and the final results written to the log file. The radio audio
output level is tested and the volume is increased if insufficient to measure unsquelch
condition. Beginning at -125 dBm, the analyzer output level is slowly increased until the
radio unsquelches OR 6 dBm above the Max Limit, whichever comes first. The
unsquelch output level is compared against test limits and the final results written to the
log file.
Table 6-18. Noise Squelch Threshold test results
Page 33

AutoTune™ User Guide
26
RF Control
Port
Frequency
Modulation Type
Test Pattern
Monitor
RF IN/OUT
Test Frequency
C4FM
Standard Tx
(O.153/V.52)
Name
Description
Result
Pass or Fail. Digital Sensitivity (BER) output level within Max Limit
Frequency
Test Frequency
Mod Fidelity
RMS error magnitude difference (%) between actual signal and ideal
C4FM signal
Max Limit
Maximum Limit (inclusive) for Modulation Fidelity test to Pass
Name
Description
Result
Pass or Fail. Digital Sensitivity (BER) output level within Max Limit
Frequency
Test Frequency
Symbol Dev
Deviation (Hz) from transmitting the Standard Tx test pattern
Min Limit
Minimum Limit (inclusive) for Symbol Deviation test to Pass
Max Limit
Maximum Limit (inclusive) for Symbol Deviation test to Pass
6.8. P25 Tx Tests
NOTE: This test requires an analyzer with P25 Conventional (R8-P25) test mode
capability.
The purpose of this procedure is to measure the radio transmitter performance at
several given frequencies per the TIA/EIA 102.CAAB standard. These are tests only;
there are no alignments.
Table 6-19. Analyzer Configuration for P25 Tx Tests
6.8.1. Alignment
No alignment is needed.
6.8.2. Test
The analyzer is setup as specified in this section’s Analyzer Configuration table. The
radio is placed into Test Mode at the lowest Tx Test Frequency, ready to transmit a
C4FM-modulated signal to the analyzer. The radio is keyed and for each test frequency
the following digital measurements are taken: Modulation Fidelity and Symbol Deviation.
These measurement results are compared against test limits and the final results written
to the log file.
Table 6-20. P25 Modulation Fidelity test results
Table 6-21. P25 Symbol Deviation test results
Page 34

AutoTune™ User Guide
27
RF Control
Port
Frequency
Modulation
Level
Generate
RF IN/OUT
Test Frequency
Framed 1011 Hz Pattern,
2.83 kHz deviation
-116.0 dBm
Name
Description
Result
Pass or Fail. Digital Sensitivity (BER) output level within Max Limit
Frequency
Test Frequency
5% BER
Analyzer output level at which the radio BER measures 5%
Max Limit
Maximum Limit (inclusive) for Digital Sensitivity (BER) to Pass
6.9. Digital Sensitivity (BER)
NOTE: This test requires an analyzer with P25 Conventional test mode capability.
The purpose of this procedure is to measure the radio receiver’s Bit Error Rate at a
given frequency. The TIA/EIA standard BER rate is 5%. This is a test only; there is no
alignment.
Table 6-22. Analyzer Configuration for Digital Sensitivity (BER) test
6.9.1. Alignment
No alignment is needed.
6.9.2. Test
The analyzer is setup as specified in this section’s Analyzer Configuration table. The
radio is placed into Test Mode at the lowest RX Test Frequency, ready to receive a
C4FM-modulated signal from the analyzer. Once BER synchronization is detected, the
analyzer output level is decreased until a BER of 5% is measured. The analyzer output
level at 5% BER is compared against test limits and the final results are written to the
log file.
Table 6-23. Digital Sensitivity (BER) test results
Page 35

AutoTune™ User Guide
28
RF Control
Port
Frequency
Modulation
Attenuation
Monitor
RF IN/OUT
Test Frequency
FM
40 dB
Name
Description
Result
Pass or Fail. Deviation within Min Limit, Max Limit
Frequency
Test Frequency
Deviation
Measured modulation deviation level
Min Limit
Minimum Limit (inclusive) for Deviation to Pass
Max Limit
Maximum Limit (inclusive) for Deviation to Pass
6.10. Internal Voice Modulation
The purpose of this procedure is to test the ability of the radio’s internal microphone
audio circuit to accurately transfer the received signal.
Table 6-24. Analyzer Configuration for Internal Voice Modulation test
Table 6-25. Internal Voice Modulation test results
6.10.1. Alignment
No alignment is needed.
6.10.2. Test
The radio is placed into Test Mode at the lowest TX Test Frequency. The analyzer is
setup as specified in this section’s Analyzer Configuration table. The user is instructed
to key the connected radio and place it next to the analyzer speaker (see Figure 6-1).
The user is also instructed to adjust the analyzer volume until about 4 kHz deviation is
seen on the analyzer display (see Figure 6-2). The deviation level is then measured by
the analyzer and the user is instructed when to un-key the radio. The measured
deviation is compared against test limits and the final results are written to the log file.
Figure 6-1. Place keyed radio next to analyzer speaker.
Page 36

AutoTune™ User Guide
29
Figure 6-2. Adjust analyzer volume until about 4 kHz deviation is measured.
Page 37

AutoTune™ User Guide
30
RF Control
Port
Frequency
Modulation
Attenuation
Monitor
RF IN/OUT
Test Frequency
FM
40 dB
Name
Description
Result
Pass or Fail. Deviation within Min Limit, Max Limit
Frequency
Test Frequency
Deviation
Measured modulation deviation level
Min Limit
Minimum Limit (inclusive) for Deviation to Pass
Max Limit
Maximum Limit (inclusive) for Deviation to Pass
6.11. External Voice Modulation
The purpose of this procedure is to test the ability of an external microphone attached to
the radio to effectively transfer the received signal.
Table 6-26. Analyzer Configuration for External Voice Modulation test
Table 6-27. External Voice Modulation test results
6.11.1. Alignment
No alignment is needed.
6.11.2. Test
The radio is placed into Test Mode at the lowest TX Test Frequency. The analyzer is
setup as specified in this section’s Analyzer Configuration table. The analyzer generates
a 1 kHz signal at 800 mV into the radio’s external microphone accessory port via the
radio test set. The radio is commanded to transmit and the resulting deviation level is
then measured by the analyzer. The measured deviation is compared against test limits
and the final results are written to the log file.
Page 38

AutoTune™ User Guide
31
Symptom
Possible Cause(s)
Possible Solution(s)
Radio repeatedly fails
communication
initialization.
Serial link corruption
Retry communicating with the
radio after each of the following
steps:
Power cycle the radio.
Restart the analyzer.
Radio won’t power up.
Loose HKN6163_
cable connection.
Verify cable connection is OK.
Motorola CPS
Ignition Switch
setting.
Use Motorola CPS software to set
Radio Wide, Advanced, Ignition
Switch setting to “Blank”. This
setting lets radio power up for
testing without an ignition signal
present. Be sure to return this
setting to its original value when
testing completed.
Radio consistently fails TX
Power Out test and/or
alignment.
ASTRO 25 Mobile
CPS TX/Transmit
Power Level settings
limiting radio output
power.
Using ASTRO 25 Mobile CPS,
adjust Radio Configuration>Radio
Wide>TX/Transmit Power Level
settings to factory defaults. This
change lets radio output expected
power levels for correct AutoTune
TX Power Out testing and
alignment.
Deviation Balance test
following a Deviation
Balance alignment
occasionally fails at one or
more test frequencies.
Both XTL and XTS
series radios have
narrow “good” softpot
ranges. These radios
are designed such
that softpot settings
giving deviation
balance
measurements within
test limits are few,
likely one or two
softpot values.
Rerun the Deviation Balance
alignment.
7. Basic Troubleshooting
Table 7-1. AutoTune Troubleshooting Chart
Page 39

AutoTune™ User Guide
32
8. Support Information
8.1. Technical Support
Telephone/Fax: 844.903.7333
Email: service@freedomcte.com
Web: freedomcte.com/service-support/
8.2. Sales Support
Telephone/Fax: 844.903.7333
Email: sales@freedomcte.com
Web: freedomcte.com/sales/
Page 40

AutoTune™ User Guide
33
9. References
Motorola, Inc. ASTRO® Digital XTL™ 5000 VHF/UHF Range 1/UHF Range 2/700-800
MHz Mobile Radio Basic Service Manual, REV A. Schaumburg: Motorola, Inc.,
IL. Motorola Online Resource Center. Motorola, Inc., 19 Jan. 2007. Web. 27 July
2009.
<https://businessonline.motorola.com/DOCS/US/ProductInformation_Manuals_T
wo-WayMobile_ASTROXTL5000/6871769L01-A.pdf>.
Motorola, Inc. ASTRO® Digital XTL™ 2500 VHF/UHF Range 1/UHF Range 2/700-800
MHz Mobile Radio Basic Service Manual, REV B. Schaumburg: Motorola, Inc.,
IL. Motorola Online Resource Center. Motorola, Inc., 27 July 2006. Web. 27 July
2009.
<https://businessonline.motorola.com/DOCS/US/ProductInformation_Manuals_T
wo-WayMobile_ASTROXTL2500/6816532H01-B_082707.pdf>.
Motorola, Inc. ASTRO® Digital XTL™ 1500 VHF/UHF Range 1/UHF Range 2/700-800
MHz Mobile Radio Basic Service Manual, REV B. Schaumburg: Motorola, Inc.,
IL. Motorola Online Resource Center. Motorola, Inc., 24 Aug. 2007. Web. 27 July
2009.
<https://businessonline.motorola.com/DOCS/US/ProductInformation_Manuals_T
wo-WayMobile_ASTROXTL1500/6815853H01-B.pdf>.
Page 41

AutoTune™ User Guide
34
Motorola, Inc. ASTRO® XTS™ 5000 VHF/UHF Range 1/UHF Range 2/700–800 MHz
Digital Portable Radios Basic Service Manual, REV E. Schaumburg: Motorola,
Inc., IL. Motorola Online Resource Center. Motorola, Inc., 29 Dec. 2009. Web. 27
July 2011.
<https://businessonline.motorola.com/DOCS/US/ProductInformation_Manuals_T
wo-WayPortable_ASTRODigitalXTS5000-PortableRadio/6881094C28_E_
XTS5000_BSM_print.pdf>.
Motorola, Inc. ASTRO® XTS™ 2500 XTS 2500 /XTS 2500I / XTS 2250 / XTS 1500 /
MT 1500 / PR 1500 Portable Radios Basic Service Manual, REV C.
Schaumburg: Motorola, Inc., IL. Motorola Online Resource Center. Motorola,
Inc., 26 Feb. 2010. Web. 27 July 2011.
<https://businessonline.motorola.com/DOCS/US/ProductInformation_Manuals_T
wo-WayPortable_ASTRODigitalXTS2500-PortableRadio/6816984H01_c.pdf>.
Page 42

AutoTune™ User Guide
A-1
APPENDIX A. Test Limits
The factory limits contain the default limits as defined by the radio manufacturer
and generally should not be modified. However, if extenuating circumstances
cause a need to modify the limits this is accommodated by AutoTune. Refer to
the R8000 Series Communications System Analyzer Owner’s Manual (CG-1365)
for modification instructions.
The following tables list the default test limits for each radio model supported by
AutoTune.
Page 43

AutoTune™ User Guide
A-2
Section
Test Name
Limit
Default Value
4.1
Reference Frequency
Reference Frequency
XTL 1500 VHF
Min: -435 Hz
Max: 435 Hz
Reference Frequency
XTL 1500 UHF1
Min: -940 Hz
Max: 940 Hz
Reference Frequency
XTL 1500 UHF2
Min: -1040 Hz
Max: 1040 Hz
Reference Frequency
XTL 1500 700800MHz
Min: -1305 Hz
Max: 1305 Hz
Reference Frequency
XTL 1500 900MHz
Min: -1410 Hz
Max: 1410 Hz
Reference Frequency
XTL 2500 VHF
Min: -435 Hz
Max: 435 Hz
Reference Frequency
XTL 2500 UHF1
Min: -940 Hz
Max: 940 Hz
Reference Frequency
XTL 2500 UHF2
Min: -1040 Hz
Max: 1040 Hz
Reference Frequency
XTL 2500 700800MHz
Min: -1305 Hz
Max: 1305 Hz
Reference Frequency
XTL 2500 900MHz
Min: -1410 Hz
Max: 1410 Hz
Reference Frequency
XTL 5000 VHF
Min: -348 Hz
Max: 348 Hz
Reference Frequency
XTL 5000 UHF1
Min: -940 Hz
Max: 940 Hz
Reference Frequency
XTL 5000 UHF2
Min: -1040 Hz
Max: 1040 Hz
Reference Frequency
XTL 5000 700800MHz
Min: -1305 Hz
Max: 1305 Hz
4.2
TX Power Out
TX Power VHF
Min=50 W
Max=57 W
TX Power VHF High
Power
Min=100 W
Max=120 W
TX Power UHF1
Min=40 W
Max=48 W
TX Power UHF1 High
Power
Min=100 W
Max=120 W
TX Power UHF2
Channel 1-8
Min=45 W
Max=54 W
TX Power UHF2
Channel 9
Min=40 W
Max=48 W
TX Power UHF2
Min=25 W
Page 44

AutoTune™ User Guide
A-3
Channel 10
Max=48 W
TX Power 700800MHz Channel 1-5
Min=31.5 W
Max=34.7 W
TX Power 700800MHz Channel 6-10
Min=36.6 W
Max=40.5 W
TX Power 900MHz
Min=31.5 W
Max=34.7 W
4.3
Deviation Balance
Deviation Balance
Max=1.5 %
4.4
Deviation Limit
Deviation Limit
Min=2.785 kHz
Max=2.885 kHz
4.5
Distortion
Distortion
3 %
4.6
Sensitivity (SINAD)
Sensitivity VHF
Max=-117.5
dBm
Sensitivity UHF1
Max=-117.5
dBm
Sensitivity UHF2
Max=-117.5
dBm
Sensitivity 700800MHz
Max=-119 dBm
Sensitivity 900MHz
Max=-119 dBm
4.7
Noise Squelch
Threshold
Noise Squelch
Max=-119 dBm
4.8
P25 Tx Tests
Modulation Fidelity
Max=5%
Symbol Deviation
Min=1620 Hz
Max=1980 Hz
4.9
Digital Sensitivity
(BER)
BER VHF
Max=-117.5
dBm
BER UHF1
Max=-117.5
dBm
BER UHF2
Max=-117.5
dBm
BER 700-800MHz
Max=-119 dBm
BER 900MHz
Max=-119 dBm
4.10
Ext Mic Voice
Modulation
Ext Mic Voice
Modulation
Min=3.8 kHz
Max=5.0 kHz
Ext Mic Voice
Modulation 900MHz
Min=1.9 kHz
Max=2.5 kHz
Table A-1. Default Motorola ASTRO® XTL™ Series Limits
Page 45

AutoTune™ User Guide
A-4
Section
Test Name
Limit
Default Value
6.1
Reference Frequency
Reference Frequency
XTS 5000 VHF
Min: -348 Hz
Max: 348 Hz
Reference Frequency
XTS 5000 UHF1
Min: -940 Hz
Max: 940 Hz
Reference Frequency
XTS 5000 UHF2
Min: -1040 Hz
Max: 1040 Hz
Reference Frequency
XTS 5000 700800MHz
Min: -1305 Hz
Max: 1305 Hz
6.2
TX Power Out
TX Power VHF High
Min=6.2 W
Max=6.4 W
TX Power UHF1 High
Min=5.2 W
Max=5.4 W
TX Power UHF2 High
Min=5.0 W
Max=5.3 W
TX Power 700 MHz
High
Min=2.5 W
Max=2.7 W
TX Power 800 MHz
High
Min=3.2 W
Max=3.4 W
TX Power 900 MHz
High
Min=2.5 W
Max=2.7 W
TX Power 700 MHz
Mid
Min=2.5 W
Max=2.7 W
TX Power 800 MHz
Mid
Min=2.5 W
Max=2.7 W
TX Power VHF Low
Min=1.2 W
Max=1.4 W
TX Power UHF1 Low
Min=1.2 W
Max=1.4 W
TX Power UHF2 Low
Min=1.2 W
Max=1.4 W
TX Power 700 MHz
Low
Min=1.2 W
Max=1.4 W
TX Power 800 MHz
Low
Min=1.2 W
Max=1.4 W
TX Power 900 MHz
Low
Min=1.2 W
Max=1.4 W
6.3
Deviation Balance
Deviation Balance
Max=1.5 %
6.4
Deviation Limit
Deviation Limit
Min=2.780 kHz
Max=2.880 kHz
6.5
Distortion
Distortion
3 %
6.6
Sensitivity (SINAD)
Sensitivity VHF
Max=-116 dBm
Sensitivity UHF1
Max=-116 dBm
Sensitivity UHF2
Max=-116 dBm
Page 46

AutoTune™ User Guide
A-5
Sensitivity 700800MHz
Max=-116 dBm
Sensitivity 900MHz
Max=-116 dBm
6.7
Noise Squelch
Threshold
Noise Squelch
-119 dBm
6.8
P25 Tx Tests
Modulation Fidelity
Max=5%
Symbol Deviation
Min=1620 Hz
Max=1980 Hz
6.9
Digital Sensitivity
(BER)
BER VHF
Max=-116 dBm
BER UHF1
Max=-116 dBm
BER UHF2
Max=-116 dBm
BER 700-800MHz
Max=-116 dBm
BER 900MHz
Max=-116 dBm
6.10
Internal Voice
Modulation
Internal Voice
Modulation
Min=3.6 kHz
Max=5.0 kHz
Internal Voice
Modulation 900 MHz
Min=1.8 kHz
Max=2.5 kHz
6.11
External Voice
Modulation
External Voice
Modulation
Min=3.8 kHz
Max=5.0 kHz
External Voice
Modulation 900MHz
Min=1.9 kHz
Max=2.5 kHz
Table A-2. Default Motorola ASTRO® XTS™ Series Limits
Page 47

AutoTune™ User Guide
B-1
APPENDIX B. Sample Test Result Report
=================================================================================
Test Result Report
=================================================================================
Model #: M20URS9PW1AN Date/Time: 7/28/2011 9:18 AM
Serial #: 500CHP0075 Operator ID: TECH42
Comments:
Reference Frequency Align
==========================
Result Frequency Freq Error Min Limit Max Limit Old Softpot New Softpot
------ --------- ---------- --------- --------- ----------- -----------
Pass 869.8875 MHz -12 Hz -600 Hz 600 Hz 199 197
Power Detection Calibration
============================
Result Frequency Meas Power Target Power Old Softpot New Softpot
------ --------- ---------- ------------ ----------- -----------
Pass 806.0125 MHz 16.9 W 17.1 W 115 111
TX Power Out Align
===================
Result Frequency Power Out Min Limit Max Limit
------ --------- --------- --------- ---------
Pass 762.0125 MHz 32.7 W 31.5 W 34.7 W
Pass 769.0125 MHz 32.8 W 31.5 W 34.7 W
Pass 775.9875 MHz 33.0 W 31.5 W 34.7 W
Pass 794.0125 MHz 33.0 W 31.5 W 34.7 W
Pass 805.9875 MHz 33.0 W 31.5 W 34.7 W
Pass 806.0125 MHz 38.1 W 36.6 W 40.5 W
Pass 823.9875 MHz 38.3 W 36.6 W 40.5 W
Pass 851.0125 MHz 38.6 W 36.6 W 40.5 W
Pass 860.0125 MHz 38.6 W 36.6 W 40.5 W
Pass 869.8875 MHz 38.4 W 36.6 W 40.5 W
Deviation Balance Align
========================
Result Frequency Variance Max Limit Old Softpot New Softpot
------ --------- -------- --------- ----------- -----------
Pass 869.8875 MHz 0.5 % 1.5 % 24 24
Pass 860.0125 MHz 0.7 % 1.5 % 25 25
Pass 851.0125 MHz 0.7 % 1.5 % 26 26
Pass 823.9875 MHz 0.9 % 1.5 % 28 28
Pass 806.0125 MHz 0.7 % 1.5 % 25 25
Pass 805.9875 MHz 0.2 % 1.5 % 32 32
Pass 794.0125 MHz 0.9 % 1.5 % 33 33
Pass 775.9875 MHz 1.2 % 1.5 % 35 35
Pass 769.0125 MHz 0.0 % 1.5 % 35 35
Pass 762.0125 MHz 0.3 % 1.5 % 34 34
Deviation Limit Align
======================
Result Frequency Deviation Min Limit Max Limit Old Softpot New Softpot
------ --------- --------- --------- --------- ----------- -----------
Pass 869.8875 MHz 2.836 kHz 2.785 kHz 2.885 kHz 19944 20136
Pass 860.0125 MHz 2.849 kHz 2.785 kHz 2.885 kHz 19560 19752
Pass 851.0125 MHz 2.851 kHz 2.785 kHz 2.885 kHz 19560 19752
Pass 823.9875 MHz 2.817 kHz 2.785 kHz 2.885 kHz 19624 19496
Pass 806.0125 MHz 2.832 kHz 2.785 kHz 2.885 kHz 20072 19944
Pass 805.9875 MHz 2.826 kHz 2.785 kHz 2.885 kHz 19624 19560
Pass 794.0125 MHz 2.827 kHz 2.785 kHz 2.885 kHz 19560 19496
Pass 775.9875 MHz 2.859 kHz 2.785 kHz 2.885 kHz 19560 19688
Pass 769.0125 MHz 2.810 kHz 2.785 kHz 2.885 kHz 19624 19560
Pass 762.0125 MHz 2.841 kHz 2.785 kHz 2.885 kHz 19816 19944
Distortion Test
================
Result Frequency Distortion Max Limit
------ --------- ---------- ---------
Pass 762.0625 MHz 1.2 % 3.0 %
Sensitivity (SINAD) Test
=========================
Result Frequency 12dB SINAD Max Limit
------ --------- ---------- ---------
Pass 762.0625 MHz -120.7 dBm -119.0 dBm
Noise Squelch Threshold Test
=============================
Result Frequency Unsquelch Max Limit
------ --------- --------- ---------
Pass 762.0625 MHz -121.0 dBm -119.0 dBm
Digital Sensitivity (BER) Test
===============================
Result Frequency 5% BER Max Limit
------ --------- ------ ---------
Pass 762.0625 MHz -120.9 dBm -119.0 dBm
External Microphone Voice Modulation Test
==========================================
Result Frequency Deviation Min Limit Max Limit
------ --------- --------- --------- ---------
Pass 762.0125 MHz 4.149 kHz 3.800 kHz 5.000 kHz
Tests performed by AutoTune - © 2011 Freedom Communication Technologies. All Rights Reserved.
Figure B-1. Sample Test Result Report
Page 48

AutoTune™ User Guide
C-1
1.18 Updates – Rev B
L. Shirey
1/9/15
M. Mullins
1/9/15
14440
Original Release – Rev A
B. Tanner
9/30/11
M. Mullins
9/30/11
11025
Rev. No/change
Revised By
Date
Approved By
Date
ECO#
APPENDIX C. Revision History
 Loading...