

Page 1

ADMINISTRATION GUIDE
FortiAnalyzer
Version 3.0 MR7
www.fortinet.com
Page 2

FortiAnalyzer Administration Guide
!
Version 3.0 MR7
08 September 2008
05-30007-0082-20080908
© Copyright 2008 Fortinet, Inc. All rights reserved. No part of this
publication including text, examples, diagrams or illustrations may be
reproduced, transmitted, or translated in any form or by any means,
electronic, mechanical, manual, optical or otherwise, for any purpose,
without prior written permission of Fortinet, Inc.
Trademarks
Dynamic Threat Prevention System (DTPS), APSecure, FortiASIC,
FortiBIOS, FortiBridge, FortiClient, FortiGate®, FortiGate Unified Threat
Management System, FortiGuard®, FortiGuard-Antispam, FortiGuardAntivirus, FortiGuard-Intrusion, FortiGuard-Web, FortiLog, FortiAnalyzer,
FortiManager, Fortinet®, FortiOS, FortiPartner, FortiProtect,
FortiReporter, FortiResponse, FortiShield, FortiVoIP, and FortiWiFi are
trademarks of Fortinet, Inc. in the United States and/or other countries.
The names of actual companies and products mentioned herein may be
the trademarks of their respective owners.
Regulatory compliance
FCC Class A Part 15 CSA/CUS
CAUTION: Risk of Explosion if Battery is replaced by an Incorrect Type.
Dispose of Used Batteries According to the Instructions.
Page 3

Contents
Contents
Introduction ........................................................................................ 9
About this document......................................................................................... 9
Fortinet documentation................................................................................... 10
Fortinet Tools and Documentation CD ........................................................ 10
Fortinet Knowledge Center ......................................................................... 11
Comments on Fortinet technical documentation......................................... 11
Customer service and technical support ...................................................... 11
What’s new for 3.0 MR7................................................................... 13
3.0 MR7 new features and changes ............................................................... 15
Power supply monitoring for FortiAnlayzer-2000A and 4000A ................... 15
Registered devices’ hard limits ................................................................... 15
CLI displays the tasks in the upload queue................................................. 15
Dashboard enhancements .......................................................................... 15
Custom fields for log messages .................................................................. 16
Reports........................................................................................................ 16
Report configuration enhancements..................................................... 16
VoIP reports.......................................................................................... 17
Alert email configuration changes ............................................................... 17
Administrative Domains (ADOMs).................................................. 19
About administrative domains (ADOMs)....................................................... 19
Configuring ADOMs ........................................................................................ 22
Accessing ADOMs as the admin administrator............................................ 23
Assigning administrators to an ADOM.......................................................... 24
System .............................................................................................. 25
Dashboard........................................................................................................ 25
Tabs ............................................................................................................ 27
RAID Monitor............................................................................................... 28
System Information ..................................................................................... 29
Setting the time..................................................................................... 29
Changing the host name....................................................................... 30
Changing the firmware.......................................................................... 30
License Information..................................................................................... 30
System Resources ...................................................................................... 31
Viewing operational history................................................................... 32
System Operation ....................................................................................... 33
Formatting the log disks........................................................................ 33
Resetting to the default configuration ................................................... 33
Alert Message Console ............................................................................... 34
Viewing alert console messages .......................................................... 34
Statistics...................................................................................................... 35
FortiAnalyzer Version 3.0 MR7 Administration Guide
05-30007-0082-20080908 3
Page 4

Contents
Viewing session information ................................................................. 35
Filtering session information................................................................. 36
Report Engine ............................................................................................. 36
Log Receive Monitor ................................................................................... 37
Intrusion Activity.......................................................................................... 38
Virus Activity ............................................................................................... 39
Top FTP Traffic ........................................................................................... 40
Top Email Traffic......................................................................................... 41
Top IM/P2P Traffic ...................................................................................... 42
Top Traffic................................................................................................... 43
Top Web Traffic .......................................................................................... 44
Network ............................................................................................................ 45
Interface ...................................................................................................... 45
Changing interface settings .................................................................. 45
About Fortinet Discovery Protocol ........................................................ 47
DNS ............................................................................................................ 47
Routing........................................................................................................ 47
Adding a route ...................................................................................... 48
Admin ............................................................................................................... 48
Adding or editing an administrator account................................................. 49
Changing an administrator’s password ................................................ 50
Access Profile ............................................................................................. 50
Auth Group.................................................................................................. 51
RADIUS Server........................................................................................... 51
Administrator Settings................................................................................. 52
Monitor ........................................................................................................ 52
Network Sharing.............................................................................................. 53
Adding share users ..................................................................................... 53
Adding share groups................................................................................... 54
Configuring Windows shares ...................................................................... 54
Assigning user permissions.................................................................. 55
Configuring NFS shares.............................................................................. 55
Default file permissions on NFS shares ............................................... 56
Config ............................................................................................................... 56
Automatic file deletion and local log settings .............................................. 57
Configuring log aggregation........................................................................ 58
Configuring an aggregation client......................................................... 59
Configuring an aggregation server ....................................................... 59
Configuring log forwarding .......................................................................... 60
Configuring IP aliases ................................................................................. 60
Importing an IP alias list file.................................................................. 61
IP alias ranges...................................................................................... 62
Configuring RAID ........................................................................................ 62
RAID levels........................................................................................... 62
Hot swapping hard disks ...................................................................... 64
FortiAnalyzer Version 3.0 MR7 Administration Guide
4 05-30007-0082-20080908
Page 5

Contents
Hot swapping the FortiAnalyzer-2000/2000A and FortiAnalyz-
er-4000/4000A................................................................................... 66
Configuring RAID on the FortiAnalyzer-400 and FortiAnalyzer-800/800B.
67
Configuring RAID on the FortiAnalyzer-2000/2000A and FortiAnalyz-
er-4000/4000A ................................................................................... 67
Configuring LDAP connections ................................................................... 68
Maintenance..................................................................................................... 69
Backup & Restore ....................................................................................... 69
FortiGuard Center ....................................................................................... 70
Device................................................................................................ 73
Viewing the device list .................................................................................... 73
Maximum number of devices ...................................................................... 76
Unregistered vs. registered devices............................................................ 77
Configuring unregistered device connection attempt handling ................. 79
Manually adding a device ............................................................................... 80
Classifying FortiGate network interfaces..................................................... 84
Manually adding a FortiGate unit using the Fortinet Discovery Protocol (FDP)
85
Blocking device connection attempts ........................................................... 86
Configuring device groups............................................................................. 88
Log..................................................................................................... 91
Viewing log messages .................................................................................... 91
Viewing current log messages .................................................................... 91
Viewing historical log messages ................................................................. 92
Browsing log files............................................................................................ 93
Viewing log file contents.............................................................................. 94
Importing a log file....................................................................................... 95
Downloading a log file ................................................................................. 96
Customizing the log view................................................................................ 97
Displaying and arranging log columns ........................................................ 97
Filtering logs................................................................................................ 98
Filtering tips .......................................................................................... 99
Searching the logs......................................................................................... 100
Search tips ................................................................................................ 102
Printing the search results......................................................................... 103
Downloading the search results ................................................................ 103
Rolling and uploading logs........................................................................... 104
Content Archive ............................................................................. 107
Viewing content archives.............................................................................. 107
FortiAnalyzer Version 3.0 MR7 Administration Guide
05-30007-0082-20080908 5
Page 6

Contents
Customizing the content archive view ........................................................ 108
Displaying and arranging log columns ...................................................... 109
Filtering logs.............................................................................................. 110
Filtering tips ........................................................................................ 110
Searching full email content archives......................................................... 111
Reports ........................................................................................... 113
Configuring reports....................................................................................... 113
Configuring report layout........................................................................... 114
Editing charts in a report layout ................................................................ 116
Configuring report schedules .................................................................... 118
Configuring data filter templates ............................................................... 121
Configuring report output templates.......................................................... 123
Configuring language................................................................................ 126
Browsing reports........................................................................................... 130
Quarantine...................................................................................... 131
Viewing quarantined files ............................................................................. 131
Alert................................................................................................. 133
Alert Events.................................................................................................... 133
Adding an alert event ................................................................................ 133
Output............................................................................................................. 135
Configuring alerts by email server ............................................................ 135
Testing the mail server configuration.................................................. 136
Configuring SNMP traps and alerts .......................................................... 136
Adding an SNMP server ..................................................................... 137
FortiAnalyzer SNMP support.............................................................. 138
Configuring alerts by Syslog server .......................................................... 140
Adding a Syslog server....................................................................... 140
Network Analyzer........................................................................... 141
Connecting the FortiAnalyzer unit to analyze network traffic................... 141
Viewing Network Analyzer log messages ................................................... 142
Viewing current Network Analyzer log messages..................................... 143
Viewing historical Network Analyzer log messages.................................. 143
Browsing Network Analyzer log files .......................................................... 144
Viewing Network Analyzer log file contents .............................................. 145
Downloading a Network Analyzer log file.................................................. 147
Customizing the Network Analyzer log view .............................................. 148
Displaying and arranging log columns ...................................................... 148
Filtering logs.............................................................................................. 149
Filtering tips ........................................................................................ 150
FortiAnalyzer Version 3.0 MR7 Administration Guide
6 05-30007-0082-20080908
Page 7

Contents
Searching the Network Analyzer logs ......................................................... 150
Search tips ................................................................................................ 152
Printing the search results......................................................................... 153
Downloading the search results ................................................................ 153
Rolling and uploading Network Analyzer logs ........................................... 153
Tools................................................................................................ 157
Preparing for the vulnerability scan job ...................................................... 157
Preparing Windows target hosts ............................................................... 158
Preparing Unix target hosts....................................................................... 160
Viewing vulnerability scan modules............................................................ 161
Configuring vulnerability scan jobs............................................................. 162
Viewing vulnerability scan reports .............................................................. 166
File Explorer................................................................................................... 167
Managing firmware versions......................................................... 169
Backing up your configuration..................................................................... 169
Backing up your configuration using the web-based manager ................. 170
Backing up your configuration using the CLI............................................. 170
Backing up your log files ........................................................................... 170
Testing firmware before upgrading ............................................................. 172
Upgrading your FortiAnalyzer unit .............................................................. 174
Upgrading to FortiAnalyzer 3.0 ................................................................. 174
Upgrading using the web-based manager.......................................... 174
Upgrading using the CLI ..................................................................... 175
Verifying the upgrade ................................................................................ 176
Reverting to a previous firmware version................................................... 177
Downgrading to FortiLog 1.6..................................................................... 177
Verifying the downgrade ........................................................................... 178
Downgrading to FortiLog 1.6 using the CLI............................................... 178
Restoring your configuration ....................................................................... 180
Restoring configuration settings on a FortiAnalyzer unit........................... 180
Restoring your configuration settings using the web-based manager ...... 182
Restoring your configuration settings using the CLI.................................. 182
FortiAnalyzer Version 3.0 MR7 Administration Guide
05-30007-0082-20080908 7
Page 8

Contents
Appendix: FortiAnalyzer reports in 3.0 MR7 ............................... 185
FortiGate reports ........................................................................................... 185
Intrusion Activity........................................................................................ 186
Antivirus Activity........................................................................................ 186
Webfilter Activity ....................................................................................... 189
Antispam Activity....................................................................................... 190
IM Activity.................................................................................................. 191
VoIP reports .............................................................................................. 192
Content Activity ......................................................................................... 193
Network Activity ........................................................................................ 194
Web Activity .............................................................................................. 195
Mail Activity ............................................................................................... 196
FTP Activity............................................................................................... 196
Terminal Activity........................................................................................ 197
VPN Activity .............................................................................................. 197
Event Activity ............................................................................................ 198
P2P Activity............................................................................................... 199
Audit Activity ............................................................................................. 200
Summary Reports.......................................................................................... 201
Forensic Reports........................................................................................... 202
Audit.......................................................................................................... 202
Detailed..................................................................................................... 202
Summary................................................................................................... 203
FortiMail Reports........................................................................................... 203
Mail High Level ......................................................................................... 203
Mail Sender............................................................................................... 205
Mail Recipient Activity ............................................................................... 206
Mail Destination IP .................................................................................... 206
Spam Sender ............................................................................................ 207
Spam Recipient......................................................................................... 208
Spam Destination IP ................................................................................. 209
Virus Sender ............................................................................................. 209
Virus Recipient.......................................................................................... 211
Virus Destination IP .................................................................................. 212
FortiClient Reports........................................................................................ 212
Index................................................................................................ 213
FortiAnalyzer Version 3.0 MR7 Administration Guide
8 05-30007-0082-20080908
Page 9

Introduction About this document
Introduction
FortiAnalyzer units are network appliances that provide integrated log collection
and reporting tools. Reports analyze logs for email, FTP, web browsing, security
events, and other network activity to help identify security issues and reduce
network misuse and abuse.
In addition to logging and reporting, FortiAnalyzer units also have several major
features that augment or enable certain FortiGate unit functionalities, such as
content archiving and quarantining, and improve your ability to stay informed
about the state of your network.
This chapter contains the following topics:
• About this document
• Fortinet documentation
• Customer service and technical support
About this document
This document describes how to configure and use FortiAnalyzer units through
their web-based manager.
Note: The recommended minimum screen resolution for the management computer
connecting to the web-based manager is 1280 by 1024 pixels.
This document contains the following chapters:
• What’s new for 3.0 MR7 describes what the new maintenance release
contains.
• Administrative Domains (ADOMs) describes how to enable and configure
domain-based access to data and configurations for connected devices and
the FortiAnalyzer unit itself.
• System describes how to configure FortiAnalyzer system settings, such as
network interfaces, system time, administrators, network shares (NAS), and
local logging.
• Device describes how to configure and manage connections to the
FortiAnalyzer unit from FortiGate, FortiMail, FortiClient, FortiManager, and
Syslog device types.
• Log describes how to view logs from devices or the FortiAnalyzer unit itself. It
also describes how to customize the log view.
• Content Archive describes how to view logs and files that have been full and/or
summary content archived by FortiGate units using the FortiGate content
archiving feature.
• Quarantine describes how to view files quarantined by FortiGate units, and to
configure the quarantine disk space quota.
FortiAnalyzer Version 3.0 MR7 Administration Guide
05-30007-0082-20080908 9
Page 10

Fortinet documentation Introduction
• Reports describes how to configure report profiles for one-time or scheduled
reports on your network devices, users, or groups.
• Alert describes how define log message criteria that signify critical network
events. As log messages arrive, if they meet those criteria, FortiAnalyzer units
send alert messages using a method of your choice: email, SNMP, or Syslog.
This chapter also lists SNMP traps that the FortiAnalyzer unit supports.
• Network Analyzer describes how to connect the FortiAnalyzer unit to a span or
mirror port on a network switch to analyze, or sniff, the network traffic passing
through the FortiAnalyzer unit.
• Tools describes how to configure vulnerability scans and view the resulting
reports as well as viewing all files on the FortiAnalyzer unit.
• Managing firmware versions describes how to properly back up your current
configuration, upgrade/downgrade firmware, and restore your configuration.
This chapter also describes how to test a firmware image before installing the
image on the FortiAnalyzer unit.
• Appendix: FortiAnalyzer reports in 3.0 MR7 describes the FortiAnalyzer reports
that changed or were moved to other categories or both. This appendix also
includes what reports were removed and what were unchanged in
FortiAnalyzer 3.0 MR7.
Fortinet documentation
The most up-to-date publications and previous releases of Fortinet product
documentation are available from the Fortinet Technical Documentation web site
at http://docs.forticare.com.
The following FortiAnalyzer product documentation is available:
• FortiAnalyzer Administration Guide
Describes how to use the web-based manager of the FortiAnalyzer unit to
configure all available features.
• FortiAnalyzer CLI Reference
Describes how to use the command line interface of the FortiAnalyzer unit to
configure all available features, CLI structure and available commands.
• FortiAnalyzer online help
Provides a searchable version of the Administration Guide in HTML format.
You can access context-appropriate online help using the online help button in
the web-based manager as you work.
• FortiAnalyzer QuickStart Guides
Describes how to install and set up the FortiAnalyzer unit.
• FortiAnalyzer Install Guide
Describes in detail how to install and set up the FortiAnalyzer unit, how to
connect to the CLI and web-based manager, default settings, and how to
manage firmware.
FortiAnalyzer Version 3.0 MR7 Administration Guide
10 05-30007-0082-20080908
Page 11

Introduction Customer service and technical support
Fortinet Tools and Documentation CD
All Fortinet documentation is available from the Fortinet Tools and Documentation
CD shipped with your Fortinet product. The documents on this CD are current at
shipping time. For up-to-date versions of Fortinet documentation, see the Fortinet
Technical Documentation web site at http://docs.forticare.com.
Fortinet Knowledge Center
The knowledge center contains short how-to articles, FAQs, technical notes,
product and feature guides, and much more. Visit the Fortinet Knowledge Center
at http://kc.forticare.com.
Comments on Fortinet technical documentation
Please send information about any errors or omissions in this document, or any
Fortinet technical documentation, to techdoc@fortinet.com.
Customer service and technical support
Fortinet Technical Support provides services designed to make sure that your
Fortinet systems install quickly, configure easily, and operate reliably in your
network.
Visit the Fortinet Technical Support web site at http://support.fortinet.com to learn
about the technical support services that Fortinet provides.
FortiAnalyzer Version 3.0 MR7 Administration Guide
05-30007-0082-20080908 11
Page 12

Customer service and technical support Introduction
FortiAnalyzer Version 3.0 MR7 Administration Guide
12 05-30007-0082-20080908
Page 13

What’s new for 3.0 MR7
What’s new for 3.0 MR7
This section lists and describes the new features and changes in FortiAnalyzer
3.0 MR7. The chapter, “Managing firmware versions” on page 169, provides
detailed information about how to properly upgrade to FortiAnalyzer 3.0 MR7.
New CLI commands, as well as changes to existing CLI commands, are found in
the What’s new chapter of the FortiAnalyzer CLI Reference.
The following bulleted list includes links to other sections in this document where
you can find additional information about these new features and changes.
New features and changes for FortiAnalyzer 3.0 MR7 are:
• High-end FortiAnalyzer units support additional
terabytes (TB) of space – The higher-end FortiAnalyzer units, such as the
FortiAnalyzer-2000/2000A and FortiAnalyzer-4000/4000A, now support up to
8 TB for log disk file systems. There is no additional information available.
• Power supply monitoring feature – A new feature, power supply monitoring,
provides a notification when a power supply failure occurs or an administrator
adds a power supply to the FortiAnalyzer unit. See “Power supply monitoring
for FortiAnlayzer-2000A and 4000A” on page 15 for more information.
• Registered devices’ limits changed – Registered device limits have
increased. See “Maximum number of devices” on page 76 for more
information.
• Web-based manager change – The Action column is now an unnamed
column across all menus and tabs within the web-based manager. There is no
additional information on this change.
• CLI displays tasks in the upload queue – The command, diagnose
upload status, displays what files are waiting to be uploaded. See “CLI
displays the tasks in the upload queue” on page 15 for more information.
• Dashboard enhancements – There are several new widgets added to the
Dashboard in FortiAnalyzer, including a widget for configuring and displaying
RAID status. See “Dashboard” on page 25 for more information.
• Administration admin name enhancement – Administrators can now
configure names with the @ symbol. For additional information, see “Admin”
on page 48 in the System chapter.
• HTTPS certificates – Administrators can now change and customize (text
only) HTTPS certificates. This is only available in the CLI. See the
FortiAnalyzer CLI Reference for additional information.
• Security engine removed – The security engine feature has been removed
for FortiAnalyzer 3.0 MR7. There is no additional information available.
• Software RAID changes – When using software RAID5, the system becomes
overloaded on units with software RAID. If redundancy is required, Fortinet
now recommends RAID 10. RAID 5, unless selected from the CLI, will not
appear on the web-based manager. For additional information, see
“Configuring RAID” on page 62 in the System chapter.
FortiAnalyzerVersion 3.0 MR7 Administration Guide
05-30007-0082-20080908 13
Page 14

What’s new for 3.0 MR7
• Network Summary menu removed – The Network Summary menu was
removed in FortiAnalyzer 3.0 MR7. This menu was removed because most of
the information that previously displayed, now displays as widgets on the
Dashboard. See “Dashboard” on page 25 for more information about these
new widgets that have replaced the Network Summary menu.
• Log Viewer menu enhancements – When viewing real-time logs or historical
logs, the options Resolve Host and Resolve Service are no longer available.
From within the Real-time tab, you can now view up to 1000 log messages;
you can also view up to 1000 log messages from the Historical tab as well. See
“Viewing log messages” on page 91 for more information.
• Custom fields for log messages – You can now enable custom fields for log
messages that are received from FortiGate units from the CLI. See “Custom
fields for log messages” on page 16 for more information.
• Report configuration enhancements – Reports contain several
enhancements in FortiAnalyzer 3.0 MR7, as well as the additional of VoIP
reports. See both “Report configuration enhancements” on page 16 and
“Reports” on page 113 for more information.
• Logs for HA members – Logs that are viewed on the FortiGate unit now
contain device ID fields for HA members. See the FortiGate Administration
Guide and the FortiGate Log Message Reference for additional information.
• Log search results enhancement – You can now view log search results in
both Format and Raw formats. See “Searching the logs” on page 100 for more
information.
• Alert email configuration changes – When configuring an alert email, you
are now required to enter information in the alert name field, destination field,
and device field and a drop-down list is included for selecting a destination.
See “Alert” on page 133 for more information.
• Alert emails – Alert emails now contain the FortiAnalyzer serial number in the
Source Device field in the body of the email. The FortiAnalyzer serial number
replaces the IP address of port 1 (FortiAnalyzer unit), which was used to
identify the FortiAnalyzer unit that sent the alert email. See “Alert” on page 133
for additional information about configuring alert emails.
• SNMP enhancements – When configuring SNMP communities in Alert >
Output > SNMP Access List, you can now specify that traps for certain local
system events will be generated that meet certain criteria. See “Configuring
SNMP traps and alerts” on page 136 for more information.
• File directory menu – You can now access all files that are on the
FortiAnalyzer unit in Tools > File Directory. See “File Explorer” on page 167
for more information.
FortiAnalyzerVersion 3.0 MR7 Administration Guide
14 05-30007-0082-20080908
Page 15

What’s new for 3.0 MR7 3.0 MR7 new features and changes
3.0 MR7 new features and changes
The following descriptions includes only menus containing new features, changes
to features, or both. Additional information is provided within this document.
Power supply monitoring for FortiAnlayzer-2000A and 4000A
In FortiAnalyzer 3.0 MR7, the new feature power supply monitoring provides a
notification when a power supply fails or an administrator adds a power supply to
the system. This notification is sent by the hardware monitoring daemon and in
the following forms:
• Log – a log message is recorded at the system level
• Email – an email is sends out a critical event email message
• SNMP trap – a power supply event trap is sent
Both the web-based manager and CLI include settings for this new feature.
Registered devices’ hard limits
In previous FortiAnalyzer 3.0 releases, the license limits of registered devices was
reduced, causing those registered devices to not carry forward. The limit is now
back to the maximum limit in FortiAnalyzer 3.0 MR4. This limit number prevents
any loss of registered devices during upgrade. You can view the limits for
registered devices on “Maximum number of devices” on page 76 in the Device
chapter.
CLI displays the tasks in the upload queue
A new diagnose command, diagnose upload status, has been added in
FortiAnalyzer 3.0 MR7 for displaying files that are in the upload queue. Previously,
in FortiAnalyzer 3.0 MR6, a queue maintained the upload’s tasks but there was no
way of verifying what was and what was not included in the queue.
Dashboard enhancements
The Dashboard contains nine new widgets in FortiAnalyzer 3.0 MR7.
Administrators can have up to five tabs to the Dashboard as well.
Tabs allow administrators to customize what widgets display, for example, if
administrators only need to view traffic widgets a tab can be configured so that it
only displays all the traffic widgets.
The following are the new widgets that are available for display on the Dashboard:
• Log Receive Monitor
• RAID Monitor (if RAID is available on the FortiAnalyzer unit)
•Top Traffic
• Top Web Traffic
• Top Email Traffic
•Top FTP Traffic
• Top IM/P2P Traffic
• Virus Activity
• Intrusion Activity
FortiAnalyzerVersion 3.0 MR7 Administration Guide
05-30007-0082-20080908 15
Page 16
3.0 MR7 new features and changes What’s new for 3.0 MR7
For the Log Receive Monitor widget, a diagnose command will be introduced to
provide information about total message rate, message rate per-protocol, and
message rate per-device in the CLI.
See “System” on page 25 for information about the new widgets for FortiAnalyzer
3.0 MR7.
Custom fields for log messages
In FortiAnalyzer 3.0 MR7, you can now enable custom fields for log messages so
that when the FortiAnalyzer unit receives these types of log messages, it can
index them properly for reports or searching logs.
This feature is enabled only in the CLI using the following command syntax:
config log settings
set custom-field<1-5>
The previous logs require re-indexing for this feature to be effective on them, and
is only available in the CLI using the diagnose log-indexer command. This
particular command can index per device and type, or all devices.
Reports
Reports have been enhanced and modified for FortiAnalyzer 3.0 MR7. VoIP report
charts were also included in FortiAnalyzer 3.0 MR7. These changes are also
reflected in the CLI. See the FortiAnalyzer CLI Reference for additional
information about the associated commands.
Report configuration enhancements
Report configuration has changed dramatically from FortiAnalyzer 3.0 MR6 to
FortiAnalyzer 3.0 MR7. These changes are also reflected in the FortiGate unit’s
web-based manager and CLI. These dramatic changes do not affect previously
configured reports in FortiAnalyzer 3.0 MR6 and earlier; however, you may want
to reconfigure certain settings to simplify the previously configured reports.
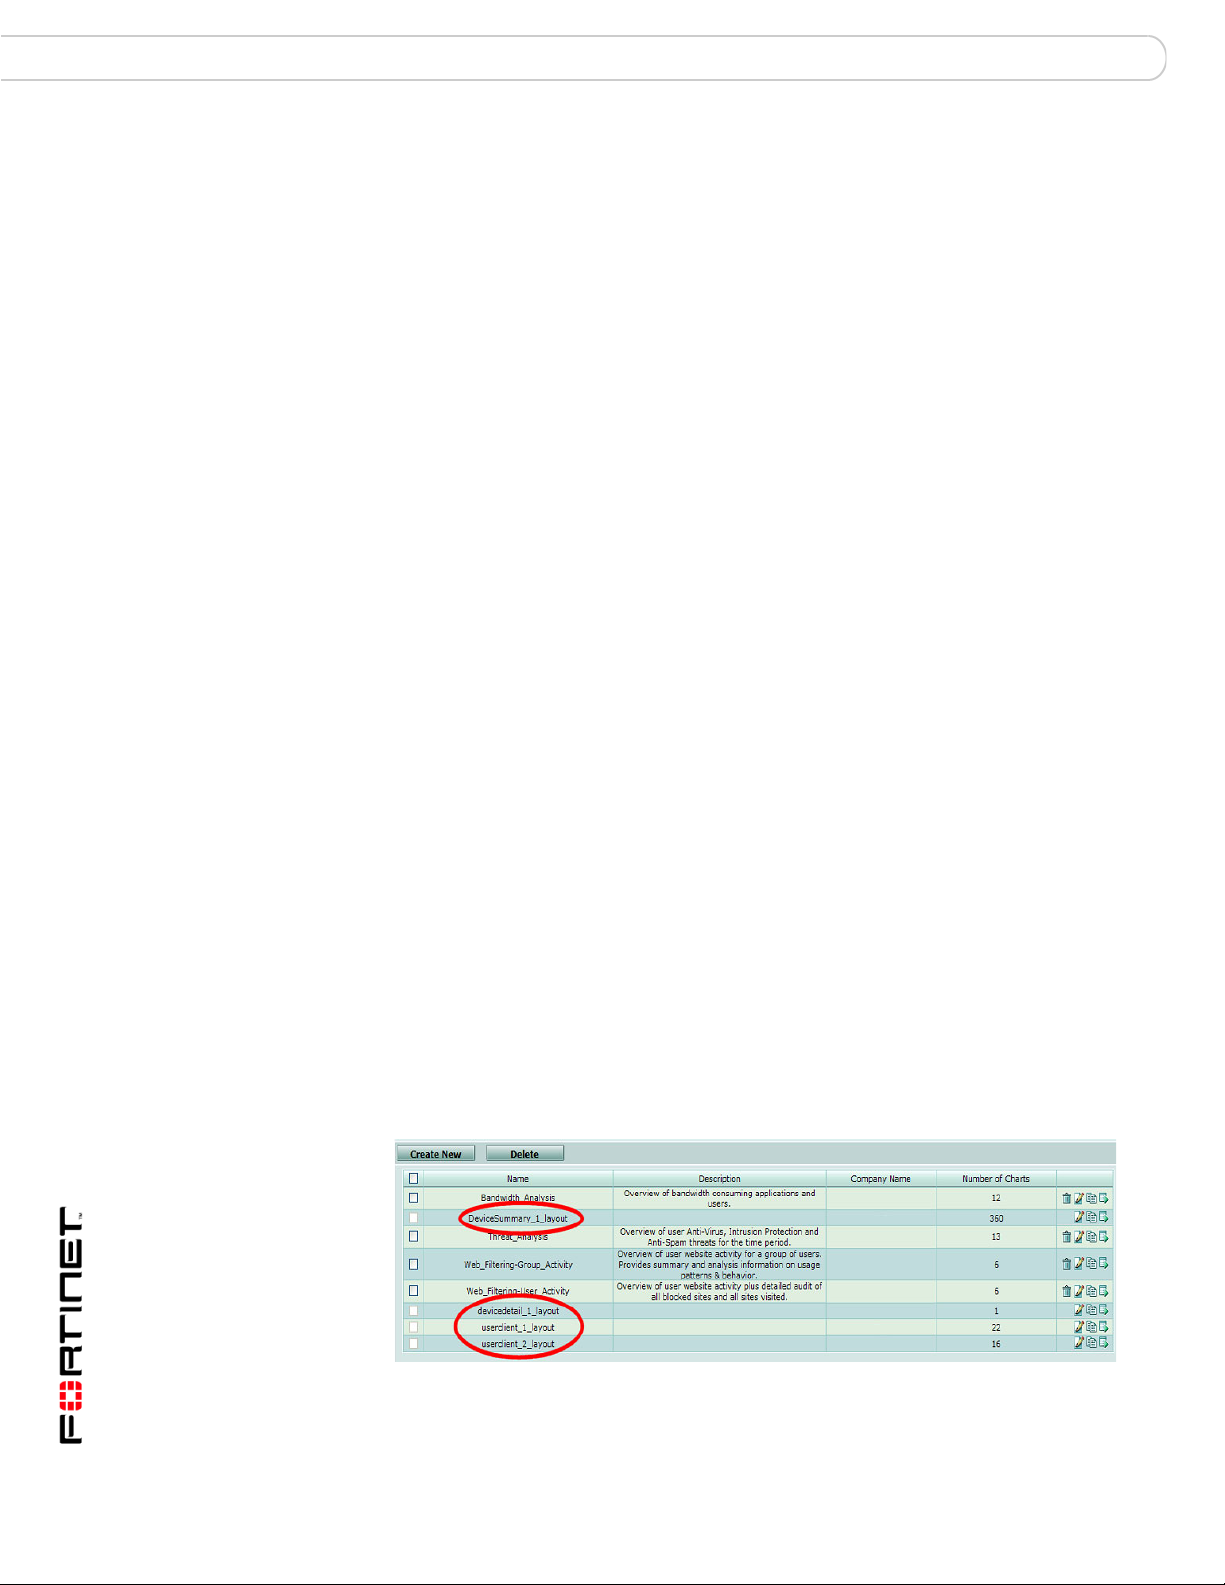
These previously configured reports are separated based on what is included; for
example, if DeviceSummary1_layout contains filters and output settings, the filters
will be put in the Data Filter tab and given a name, and the output settings will be
put in the Output tab and also given a name.
Figure 1: The previous FortiAnalyzer 3.0 MR6 reports, outlined in red, carried
forward to FortiAnalyzer 3.0 MR7 and displayed in Layout with default
report layouts
FortiAnalyzerVersion 3.0 MR7 Administration Guide
16 05-30007-0082-20080908
Page 17

What’s new for 3.0 MR7 3.0 MR7 new features and changes
Fortinet recommends configuring a test report layout and report schedule to
familiarize yourself with how reports are configured in FortiAnalyzer 3.0 MR7. See
“Reports” on page 113 about how to configure reports in FortiAnalyzer 3.0 MR7.
In Report > Config, new tabs were added: Layout, Data Filter, Output, and
Language. These new tabs allow you to configure multiple data filters, output
destinations, report layouts (previously referred to as report profiles), and
languages. The new menu, Schedule, provides settings and options for
configuring a scheduled report.
Previously, you could configure specific report layouts such as Device Summary,
Forensic, and User/Client report profiles. These report types were combined with
other report types and removed from their respective tabs, which now provide
greater flexibility for configuring report layouts. Forensic report options are now
available when you select [Add Chart(s)] from the Chart List section of Report
Layout.
Report schedules should be configured after configuring the report layout
because you need to apply the report layout to the report schedules. Report
schedules can also be configured from the FortiGate unit’s web-based manager.
After configuring a report, you can generate that report immediately by selecting
Run Now and view it in Report > Browse. You can also generate scheduled
reports this way in Report > Schedule.
When viewing generated reports in Report Browse, the naming scheme is
changed to the following:
• On-Demand-<name of report>-<yyyy-mm-dd>-<time initiated by
admin_hhmm> – for reports that are generated immediately, for example:
On-Demand-Report_Headquarters-2008-06-03-0830
• <name of scheduled report>-<yyyy-mm-dd>-<time_scheduled>
– all other reports, for example:
Report_Headquarters-2008-05-26-1030
These generated reports in Report Browse also contain only one rolled report
when you expand a report. The name of rolled reports has changed as well and
each is named after the section title that was configured in Layout. For example, if
you had two section titles, Top Web Attacks and Top Viruses, the rolled reports
would be named Top Web Attacks and Top Viruses. The default name for the
rolled report is FortiAnalyzer Report. If generated reports carry forward from
FortiAnalyzer 3.0 MR6, rolled reports might be renamed to the default name,
FortiAnalyzer Report.
VoIP reports
VoIP activities and events are now available in reports. There are three log files
that contain VoIP activity and event information: tlog.log, plog.log and clog.log.
These log will be used for the following information:
• tlog.log – number of bytes pass per session
• plog.log – blocked VoIP activity
• clog.log – user registration information and call duration information
The individual reports that you select when configuring a report are available in
the Fortinet Knowledge Center article, FortiAnalyzer Reports in 3.0 MR7, on the
Fortinet Knowledge Center website.
FortiAnalyzerVersion 3.0 MR7 Administration Guide
05-30007-0082-20080908 17
Page 18
3.0 MR7 new features and changes What’s new for 3.0 MR7
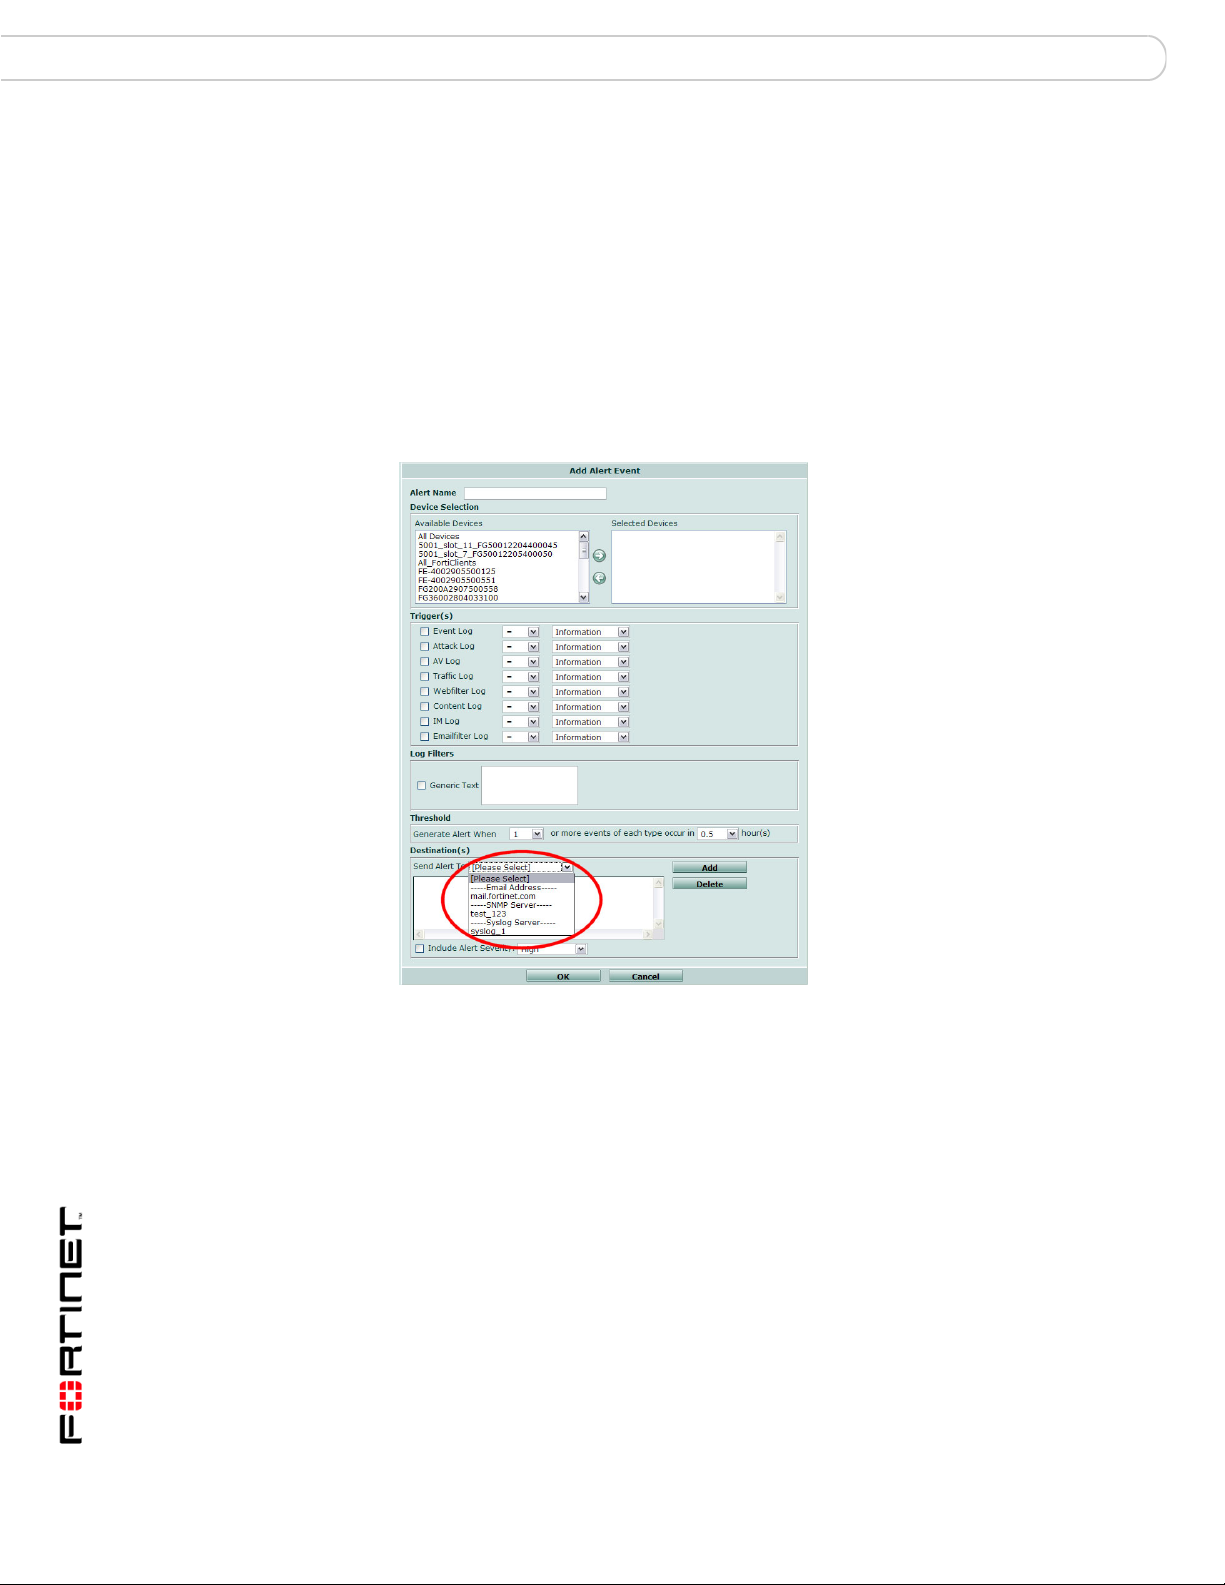
Alert email configuration changes
When configuring an alert email in Alert > Alert Event, you now are required to
enter information in the following fields:
•alert name
• destination (or destinations)
• device
Another configuration change is a drop-down list, providing the destinations of
syslog servers, mail servers and SNMP access lists. The Syslog servers and
SNMP access lists only display in the list when configured in Alert > Output.
Figure 2: The Destination drop-down list, circled, provides three destinations
FortiAnalyzerVersion 3.0 MR7 Administration Guide
18 05-30007-0082-20080908
Page 19

Administrative Domains (ADOMs) About administrative domains (ADOMs)
Administrative Domains (ADOMs)
Administrative Domains (ADOMs) enable the admin administrator to constrain
other FortiAnalyzer unit administrators’ access privileges to a subset of devices in
the device list. For FortiGate devices with virtual domains (VDOMs), ADOMs can
further restrict access to only data from a specific FortiGate VDOM.
This section includes the following topics:
• About administrative domains (ADOMs)
• Configuring ADOMs
About administrative domains (ADOMs)
Enabling ADOMs alters the structure and available functionality of the web-based
manager and CLI according to whether you are logging in as the admin
administrator, and, if you are not logging in as the admin administrator, the
administrator account’s assigned access profile.
Table 1: Characteristics of the CLI and web-based manager when ADOMs are
enabled
admin administrator account Other administrators
Access to Global
Configuration
Access to Administrative
Domain Configuration (can
create ADOMs)
Can create administrator
accounts
Can enter all ADOMs Yes No
Yes No
Yes No
Yes No
FortiAnalyzer Version 3.0 MR7 Administration Guide
05-30007-0082-20080908 19
Page 20

About administrative domains (ADOMs) Administrative Domains (ADOMs)
Table 2: Configuration locations when ADOMs are enabled
Within Global Configuration: Within each ADOM:
System > Dashboard (includes tabs, if
configured)
System > Network > Interface
System > Network > DNS
System > Network > Routing
System > Admin > Administrator
System > Admin > Access Profile
System > Admin > Auth Group
System > Admin > RADIUS Server
System > Admin > Settings
System > Admin > Monitor
System > Network Sharing > Windows
Share
System > Network Sharing > NFS Export
System > Network Sharing > User
System > Network Sharing > Group
System > Config > Log Setting
System > Config > Log Aggregation
System > Config > Log Forwarding
System > Config > RAID
System > Maintenance > Backup &
Restore
System >
Center
Device > All > Device (devices assigned to
an ADOM other than root cannot be
deleted)
Device > All > Blocked Device
Log > Config > Log Config
Report > Config > Language
Quarantine > Config > Quarantine Config
Alert > Alert Event > Alert Event
Alert > Output > SNMP Access List
Alert > Output > Syslog Server
Too ls > Vulnerability Scan > Module
Tools > File Explorer > File Explorer
Maintenance > FortiGuard
System > Config > IP Alias
System > Config > LDAP
Device > All > Device (read only)
Device > All > Group
Log > Log Viewer > Real-time
Log > Log Viewer > Historical
Log > Search > Log Search
Log > Browse > Log Browser
Content Archive > Web Archive
Content Archive >
Content Archive > File Transfer
Content Archive > IM Chat
Content Archive > VoIP Archive
Report > Browse > Result
Report > Schedule > Schedule
Report > Config > Layout
Report > Config > Data Filter
Report > Config > Output
Quarantine > Repository > Repository
Alert > Output > Mail Server
Tools > Vulnerability Scan > Job
Tools > Vulnerability Scan > Report
Tools > File Explorer > File Explorer
Email Archive
• If ADOMs are enabled and you log in as admin, you first access
Administration Domain Configuration. A superset of the typical menus and CLI
commands appear, allowing unrestricted access and ADOM configuration.
• Global Configuration contains settings used by the FortiAnalyzer unit itself
and settings shared by ADOMs, such as the device list, RAID, and
administrator accounts. It does not include ADOM-specific settings or data,
such as logs and reports. When configuring other administrator accounts,
an additional option appears allowing you to restrict other administrators to
an ADOM.
If you enter Global Configuration, a Main Menu item appears in the menu,
enabling you to return to the top level menu area, Administrative Domain
Configuration.
• Administrative Domains allows you to configure or access ADOMs. You can
add a device to one or more ADOMs. If you enter an ADOM, a Main Menu
item appears in the menu, enabling you to return to the top level menu
area, Administrative Domain Configuration.
FortiAnalyzer Version 3.0 MR7 Administration Guide
20 05-30007-0082-20080908
Page 21

Administrative Domains (ADOMs) About administrative domains (ADOMs)
• If ADOMs are enabled and you log in as any other administrator, you enter the
ADOM assigned to your account. A subset of the typical menus or CLI
commands appear, allowing access only to only logs, reports, quarantine files,
content archives, IP aliases, and LDAP queries specific to your ADOM. You
cannot access Global Configuration, or enter other ADOMs.
By default, administrator accounts other than the admin account are assigned
to the root ADOM, which includes all devices in the device list. By creating
ADOMs that contain a subset of devices in the device list, and assigning them
to administrator accounts, you can restrict other administrator accounts to a
subset of the FortiAnalyzer unit’s total devices or VDOMs.
The admin administrator account cannot be restricted to an ADOM. Other
administrators are restricted to their ADOM, and cannot configure ADOMs or
Global Configuration.
The maximum number of ADOMs varies by FortiAnalyzer model.
FortiAnalyzer Model Number of Administrative Domains
FortiAnalyzer-400 10
FortiAnalyzer-800/800B 50
FortiAnalyzer-2000/2000A 100
FortiAnalyzer-4000/4000A 250
Note: ADOMs are not available on the FortiAnalyzer-100 or FortiAnalyzer-100A/100B.
The admin administrator can further restrict other administrators’ access to specific
configuration areas within their ADOM by using access profiles. For more information, see
“Access Profile” on page 50
FortiAnalyzer Version 3.0 MR7 Administration Guide
05-30007-0082-20080908 21
Page 22
Configuring ADOMs Administrative Domains (ADOMs)
!
Configuring ADOMs
Administrative domains (ADOMs) are disabled by default. To use administrative
domains, the admin administrator must first enable the feature, create ADOMs,
and assign other FortiAnalyzer administrators to an ADOM.
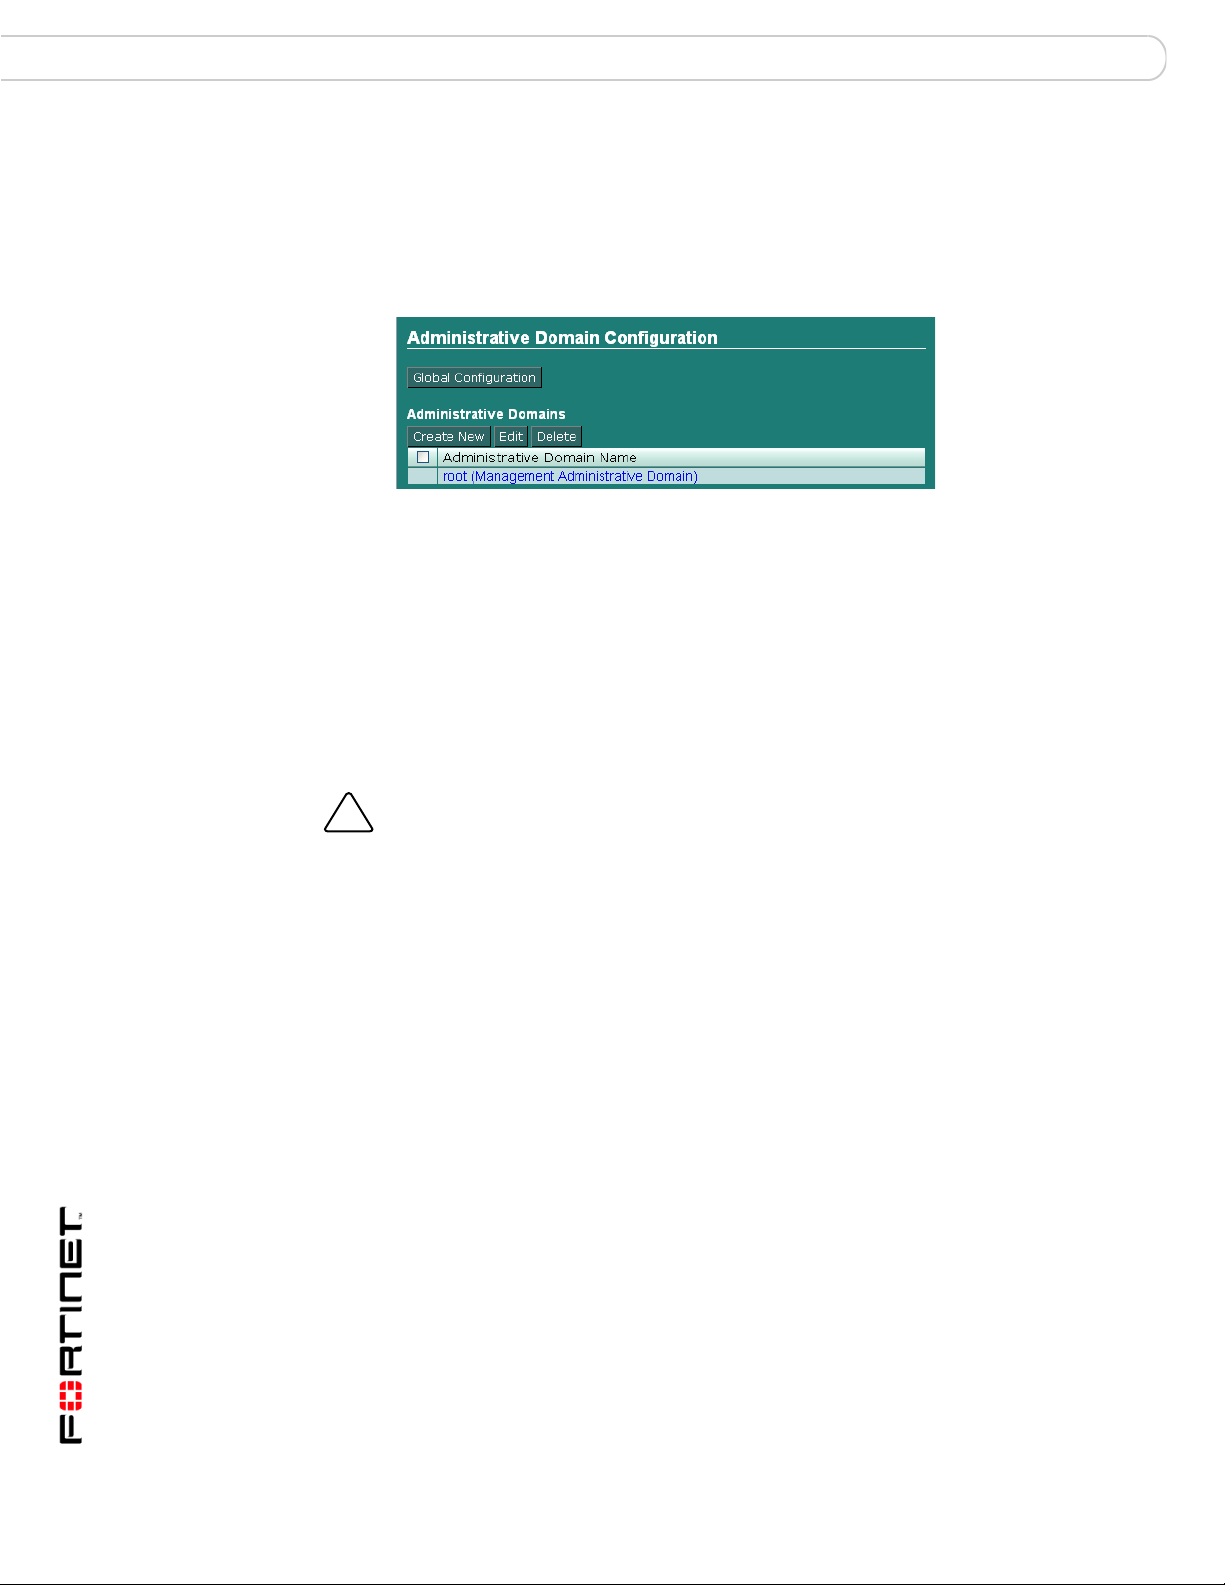
Figure 1: Administrative Domain Configuration
Global Configuration The admin administrator can access the global configuration.
Select Main Menu to return to the Admin Domain Configuration
page.
Create New Select to create a new ADOM.
Edit Select an ADOM’s check box, then select Edit to change the name
Delete Select an ADOM’s check box, then select Delete to remove the
Name Select a name to enter that ADOM.
or member devices and VDOMs of the selected ADOM.
selected ADOM.
Select Main Menu to return to Admin Domain Configuration.
Caution: Enabling ADOMs moves non-global configuration items to the root ADOM. Back
up the FortiAnalyzer unit configuration before beginning the following procedure, To enable
ADOMs. For more information about backing up your configuration, see “Backup &
Restore” on page 69.
To enable ADOMs
1 Log in as admin.
Other administrators cannot enable, disable, or configure ADOMs.
2 Go to System > Admin > Settings.
3 Enable Admin Domain Configuration.
4 Select OK.
A message appears:
Enabling/Disabling the admin domain configuration will
require you to re-login. Are you sure you want to continue?
5 Select OK.
The FortiAnalyzer unit logs you out.
6 To confirm that ADOMs are enabled, log in as admin.
Administrative Domain Configuration appears, providing access to both Global
Configuration and ADOM configuration. See “To add or edit an ADOM” on
page 22 to create ADOMs. See “Assigning administrators to an ADOM” on
page 24 to assign an administrator to an ADOM.
FortiAnalyzer Version 3.0 MR7 Administration Guide
22 05-30007-0082-20080908
Page 23

Administrative Domains (ADOMs) Configuring ADOMs
!
To add or edit an ADOM
1 Log in as admin.
Other administrators cannot enable, disable, or configure ADOMs.
2 Select Create New, or select the check box next to an ADOM and select Edit.
3 Enter a Name for the ADOM.
4 Select which devices to associate with the ADOM from Available Devices, then
select the right arrow to move them to Selected Devices.
You can move multiple devices at once. To select multiple devices, select the first
device, then hold the Shift key while selecting the last device in a continuous
range, or hold the Ctrl key while selecting each additional device.
To remove a device from Selected Devices, select one or more devices, then
select the left arrow to move them to Available Devices.
5 If the ADOM includes a FortiGate unit and you want to restrict the ADOM to a
specific VDOM, enable Restrict to a FortiGate VDOM, then enter the VDOM
name.
6 Select OK.
Caution: Deleting ADOMs, which can occur when disabling the ADOM feature, removes
administrator accounts assigned to ADOMs other than the root ADOM. Back up the
FortiAnalyzer unit configuration before beginning this procedure. For more information, see
“Backup & Restore” on page 69.
If you do not wish to delete those administrator accounts, assign them to the root ADOM
before disabling ADOMs.
To disable ADOMs
1 Log in as admin.
Other administrators cannot enable, disable, or configure ADOMs.
2 Select the check boxes next to each ADOM except the root (Management
Administrative Domain) ADOM, then select Delete.
If any other ADOMs except the root ADOM remain, the option to disable ADOMs
will not appear.
3 Go to Global Configuration > System > Admin > Settings.
4 Disable Admin Domain Configuration.
5 Select OK.
A message appears:
Enabling/Disabling the admin domain configuration will
require you to re-login. Are you sure you want to continue?
6 Select OK.
The FortiAnalyzer unit logs you out.
FortiAnalyzer Version 3.0 MR7 Administration Guide
05-30007-0082-20080908 23
Page 24

Accessing ADOMs as the admin administrator Administrative Domains (ADOMs)
Accessing ADOMs as the admin administrator
When ADOMs are enabled, additional ADOM items become available to the
admin administrator and the structure of the web-based manager menu changes.
After logging in, other administrators implicitly access the subset of the web-based
manager that pertains only to their ADOM, while the admin administrator
accesses the root of the web-based manager and can use all menus. The admin
administrator must explicitly enter the part of the web-based manager that
contains an ADOM’s settings and data to configure items specific to an ADOM.
To access an ADOM
1 Log in as admin.
Other administrators can access only the ADOM assigned to their account.
2 In the Administrative Domains area, select the name of the ADOM you want to
enter.
The ADOM-specific menu subset appears. While in this menu subset, any
changes you make affect this ADOM only, and do not affect devices in other
ADOMs or global FortiAnalyzer unit settings.
You can return to Administrative Domain Configuration by going to Main Menu.
Assigning administrators to an ADOM
The admin administrator can create other administrators and assign an ADOM to
their account, constraining them to configurations and data that apply only to
devices in their ADOM.
Note: By default, when ADOMs are enabled, existing administrator accounts other than
admin are assigned to the root ADOM, which contains all devices in the device list. For
more information about creating other ADOMs, see “Configuring ADOMs” on page 22.
To assign an administrator to an ADOM
1 Log in as admin.
Other administrators cannot configure administrator accounts when ADOMs are
enabled.
2 Go to Global Configuration > System > Admin > Administrator.
3 Configure the administrator account as described in “Adding or editing an
administrator account” on page 49, selecting the Admin Domain that the
administrator will be able to access.
Do not select Edit for the admin account. The admin administrator account
cannot be restricted to an ADOM.
FortiAnalyzer Version 3.0 MR7 Administration Guide
24 05-30007-0082-20080908
Page 25

System Dashboard
System
The System menu contains basic FortiAnalyzer unit system settings, such as
network interfaces, DNS, routing, local logging, administrators, and network
shares, and displays system statistics and provides basic system operations from
the Dashboard. From the System menu, you can also back up or restore a
configuration, or update the firmware on the FortiAnalyzer unit.
This section includes the following topics:
• Dashboard
• Network
• Admin
• Network Sharing
• Config
• Maintenance
Dashboard
Dashboard provides a summary view of the current operating status of the
FortiAnalyzer unit, including any additional information happening on the network,
such as top attacks or what types of logs were received.
The Dashboard also provides tabs so that you can customize different widget
displays. For example, if administrators want to view only traffic activity, a tab
called Traffic Activity would be added to the Dashboard with only the traffic activity
widgets displaying on that tab.
The following widgets are available on the Dashboard:
• System Information • Log Receive Monitor
• License Information • Virus Activity
• CLI Console • Intrusion Activity
• System Resources • Top Traffic
• System Operation • Top FTP Traffic
• Alert Message Console • Top Email Traffic
• Statistics • Top Web Traffic
• Report Engine • Top IM/P2P Traffic
• RAID Monitor
FortiAnalyzer Version 3.0 MR7 Administration Guide
05-30007-0082-20080908 25
Page 26
Dashboard System
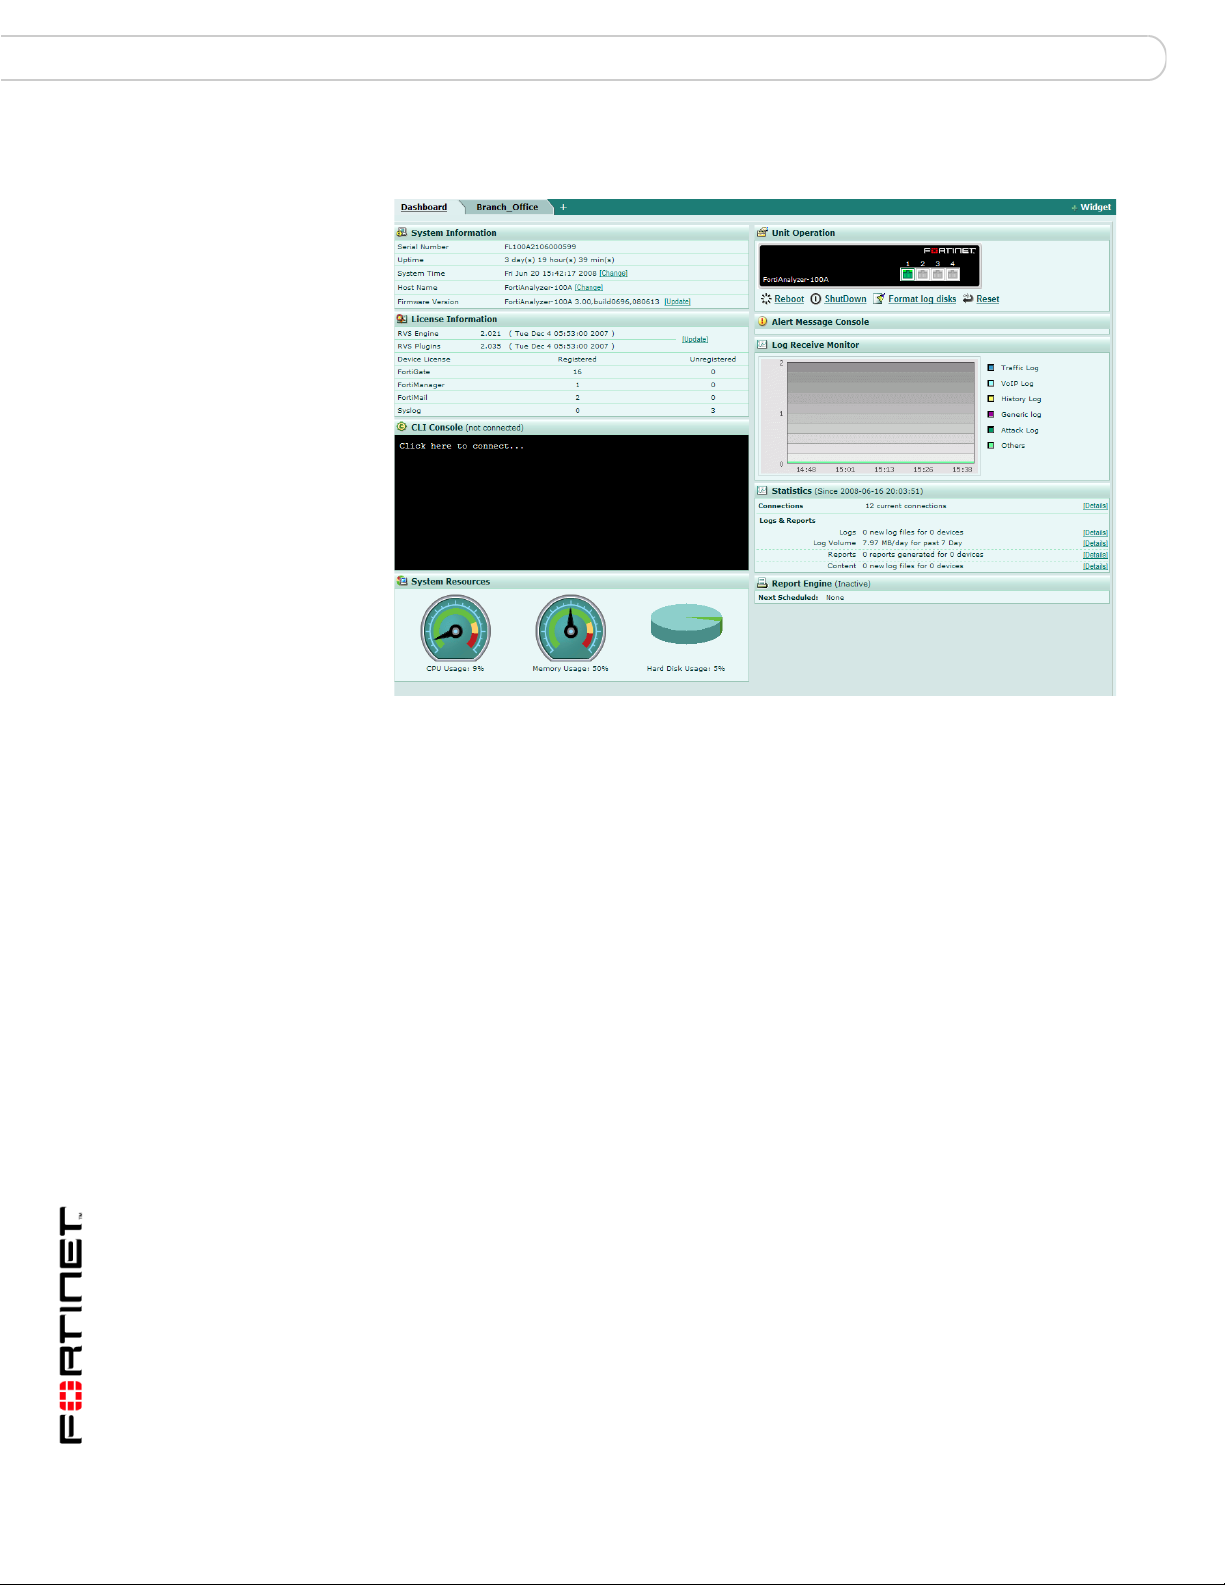
Figure 1: Dashboard of a FortiAnalyzer-100A unit displaying one of the new widgets
Log Receive Monitor and a tab, Branch Office
To rearrange a Dashboard widget
1 Go to System > Dashboard.
2 Place your mouse cursor over the widget’s title bar area, but not over buttons such
as Hide or Close.
The cursor changes to a multidirectional arrow.
3 Select and drag the widget to its new location.
While dragging the widget, a red dashed line outlines the widget’s current
destination, and other widgets reposition themselves to display the resulting
layout.
To refresh a Dashboard widget
1 Go to System > Dashboard.
2 Place your mouse cursor over the widget’s title bar area.
Refresh Now appears on the right side of the title bar.
3 Select Refresh Now.
The widget refreshes with current data.
To minimize or expand a Dashboard widget
1 Go to System > Dashboard.
2 Place your mouse cursor over the widget’s icon, located on the right side of the
title bar area.
• If the widget is currently minimized, the arrow appears on its side, pointing to
the right.
• If the widget is currently expanded, the arrow appears pointing downward.
FortiAnalyzer Version 3.0 MR7 Administration Guide
26 05-30007-0082-20080908
Page 27

System Dashboard
3 Select Show or Hide.
The widget toggles between showing the full widget and being minimized to show
only its title bar.
To include a Dashboard widget
1 Go to System > Dashboard.
2 Select “+ Widget”.
3 A widget selection overlay appears.
4 Select one or more widgets. Alternatively, to restore the default set of widgets,
select Back to Default.
The selected widgets appear on the Dashboard layout. Widgets whose names are
gray are already included on the Dashboard layout, and cannot be included more
than once.
5 Select “X” in the upper right corner.
The widget selection overlay closes.
To omit a Dashboard widget
1 Go to System > Dashboard.
Tabs
2 Place your mouse cursor over the widget’s title bar area.
Close appears on the right side of the title bar.
3 Select Close.
A confirmation dialog appears.
4 Select OK.
The widget is removed from the Dashboard layout.
Tabs provide a way to customize what widgets administrators view, for example,
administrators only need to view traffic widgets. You can add, delete, or rename
tabs.
When adding widgets to tabs, you cannot have duplicate widgets on multiple tabs.
For example, if you have the RAID Monitor widget in the Dashboard and you want
to add the same widget to your new tab, Office_1, the RAID Monitor widget will
only display in the Dashboard.
To add a tab
1 Go to System > Dashboard.
2 Select the plus (+) symbol beside the Dashboard tab.
3 Enter a name for the new tab.
4 Select +Widget to add the widgets you want to the new tab.
5 If applicable, edit the widgets to customize what each displays.
To rename a tab
1 Go to System > Dashboard.
2 Double-click on the name of the tab and press Delete.
FortiAnalyzer Version 3.0 MR7 Administration Guide
05-30007-0082-20080908 27
Page 28
Dashboard System
Drive Status
Indicator
Array
Status
Array
Capacity
Graph
Warning symbol in
Drive Status
Indicator indicating
Disk 1 has
problems
3 Enter a new name and press Enter.
To delete a tab
1 Go to System > Dashboard.
2 Double-click on the name of the tab and select the (X) symbol.
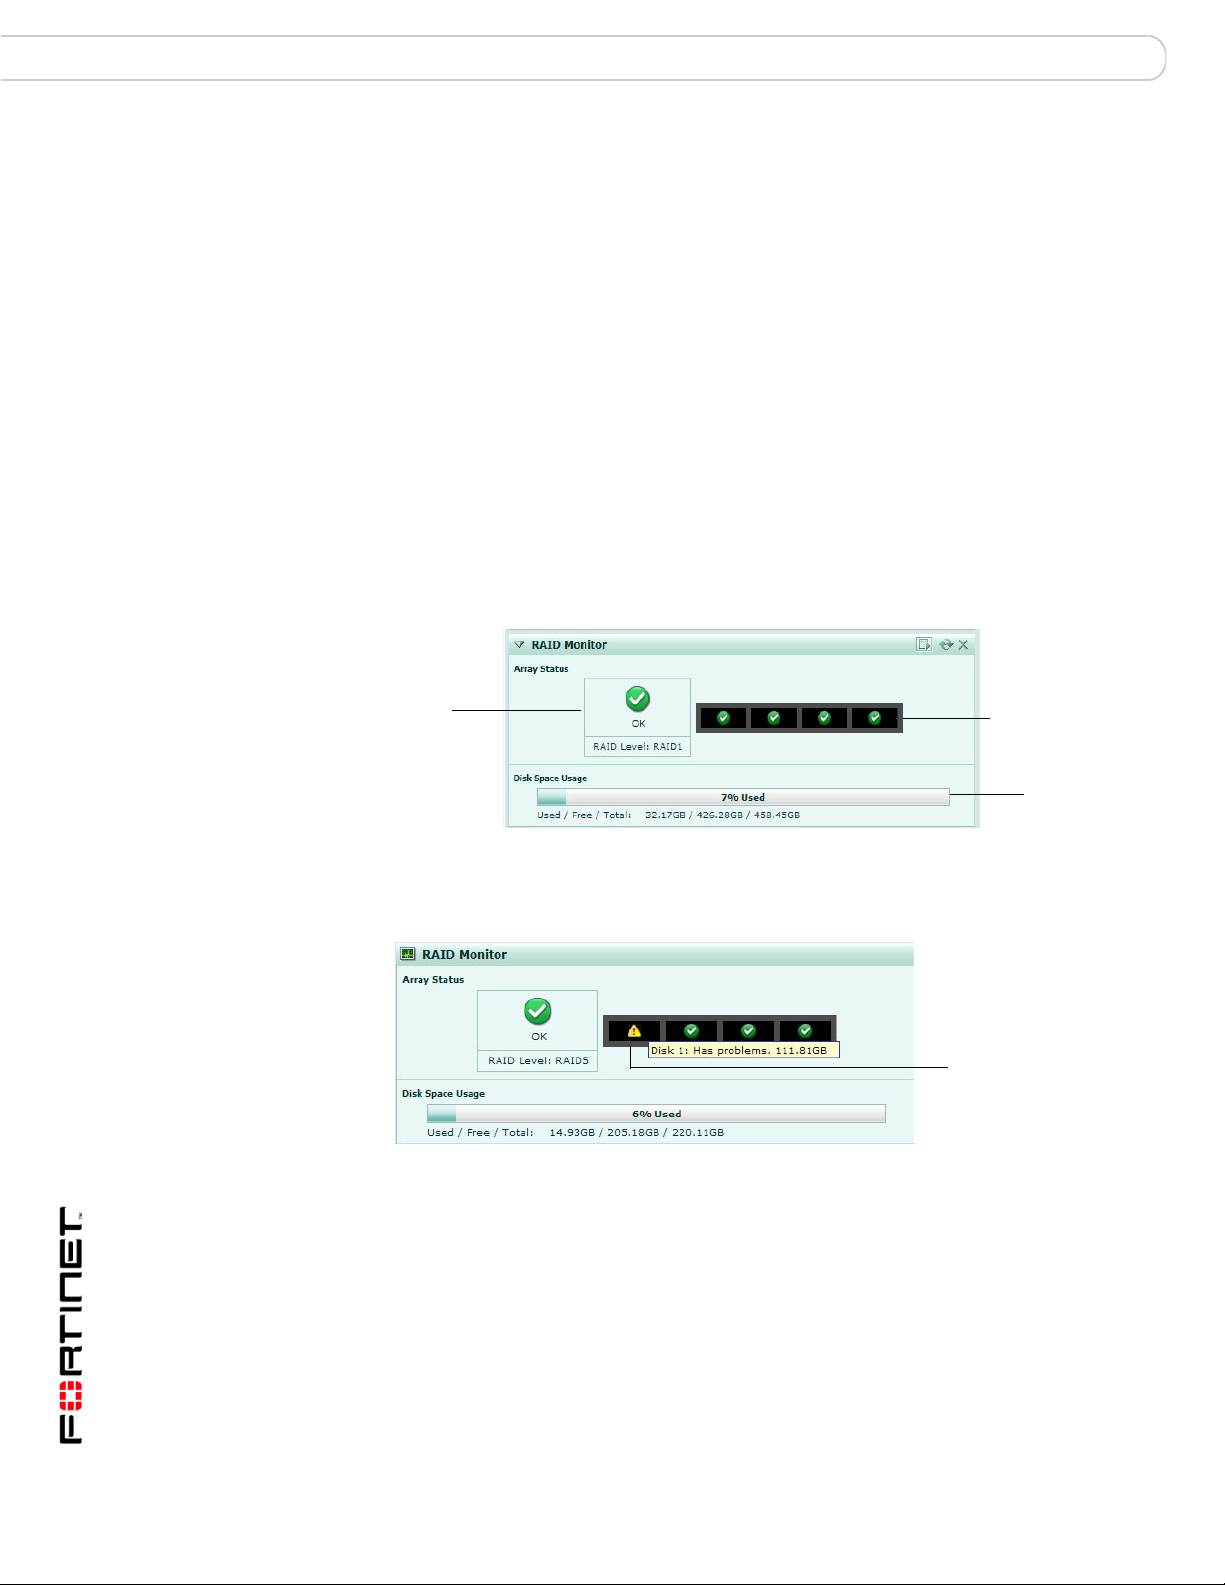
RAID Monitor
The RAID Monitor area of the Dashboard displays information about the status of
RAID disks as well as what RAID level has been selected. The RAID Monitor also
displays how much disk space is being used.
The RAID Monitor layout is similar to the look of the front panel. The Device Status
Indicator allows you to view each disk’s name and the amount of space in GB
each has. For example, Disk 2: Ready 465.76GB.
You can configure RAID settings from the RAID Monitor area as well by selecting
RAID Settings. This option is only available when you move your mouse over the
title bar.
Figure 2: RAID Monitor displaying a RAID array without any failures
Figure 3: RAID Monitor displaying a failed disk
In Figure 5, the Drive Status Indicator is indicating that Disk 1 has problems. This
is displayed by both a warning symbol and text. The text appears when you hover
your mouse over the warning symbol; the text also indicates the amount of space
in GB. When a disk has failed, a circle with an X appears in Drive Status Indicator.
28 05-30007-0082-20080908
FortiAnalyzer Version 3.0 MR7 Administration Guide
Page 29
System Dashboard
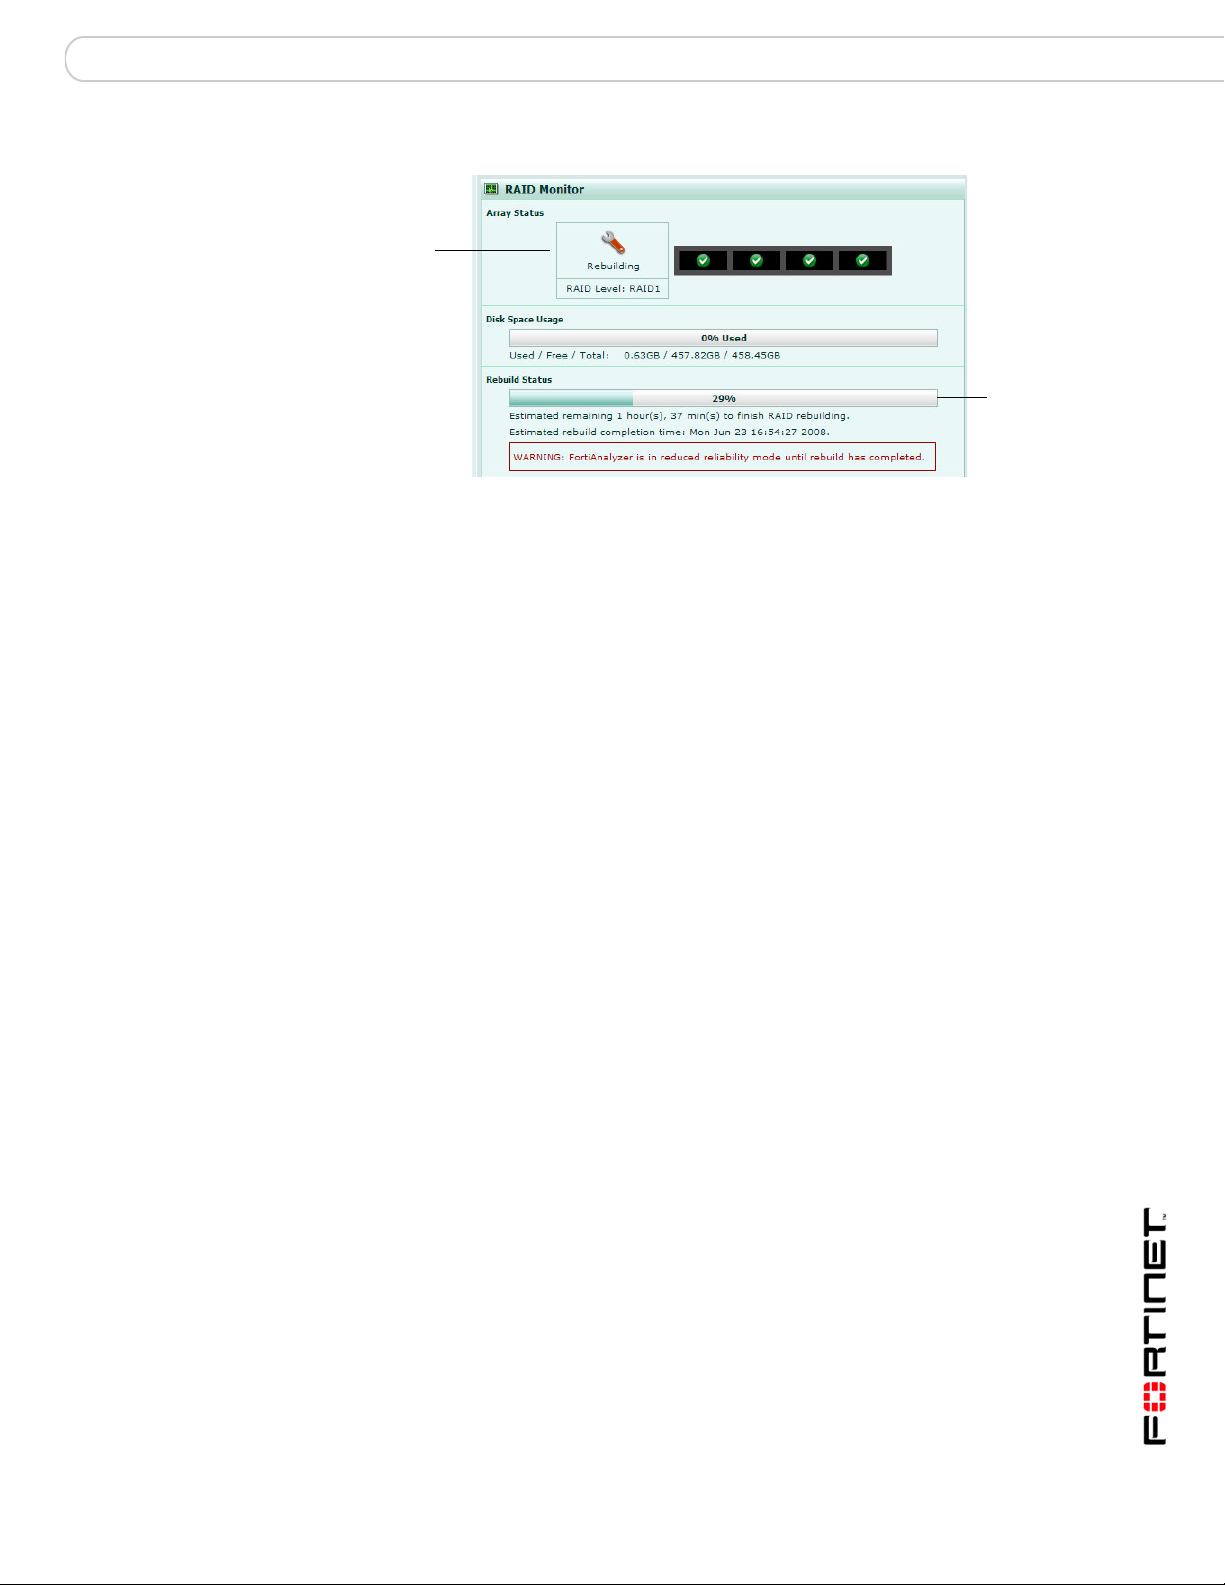
Rebuild
Status bar
Rebuilding
icon
Figure 4: RAID Monitor displaying a disk that is being rebuilt
Array Status Displays the following icons and status text when the RAID disk is
Disk space usage Displays the amount of disk used in both percentage and a fill line.
Used/Free/Total Displays the amount of used disk space, available or free disk
Rebuild Status
progress bar
Estimated rebuild
time
[start and end time]
(For software RAID
only)
Rebuild Warning A bar and text reminding you the system has no redundancy
okay, failed or being rebuilt:
• green checkmark (OK) – indicates that the RAID disk has no
problems
• warning symbol (Warning) – indicates that there is a problem
with the RAID disk, such as a failure, and needs replacing. The
RAID disk is also in reduced reliability mode when this status is
indicated in the widget.
• wrench symbol (Rebuilding) – indicates that a drive has been
replaced and the RAID array is being rebuilt; it is also in
reduced reliability mode
• exclamation point (Failure) – indicates that multiple drives
have failed and the RAID array is corrupted and that the drive
must be reinitialized
space, and the total available disk space. These numbers are
displayed in GB.
A bar indicating the progress of the rebuilding of a RAID array.
This bar displays the progress in percent. This bar displays only
when a RAID array is being rebuilt.
The time period of when the rebuild will be complete. The time is
displayed by the number of hours, minutes and seconds. The time
period also indicates when the rebuilding process will end,
displaying the name of the day, and the time in 12-hour format, for
example, Friday at 3:14 pm.
This time period displays only when an array is being rebuilt.
This time period will not display in hardware RAID, such as
FortiAnalyzer-2000/2000A, and FortiAnalyzer-4000/4000A.
protection until the rebuilding process is complete. This text
displays only when an array is being rebuilt.
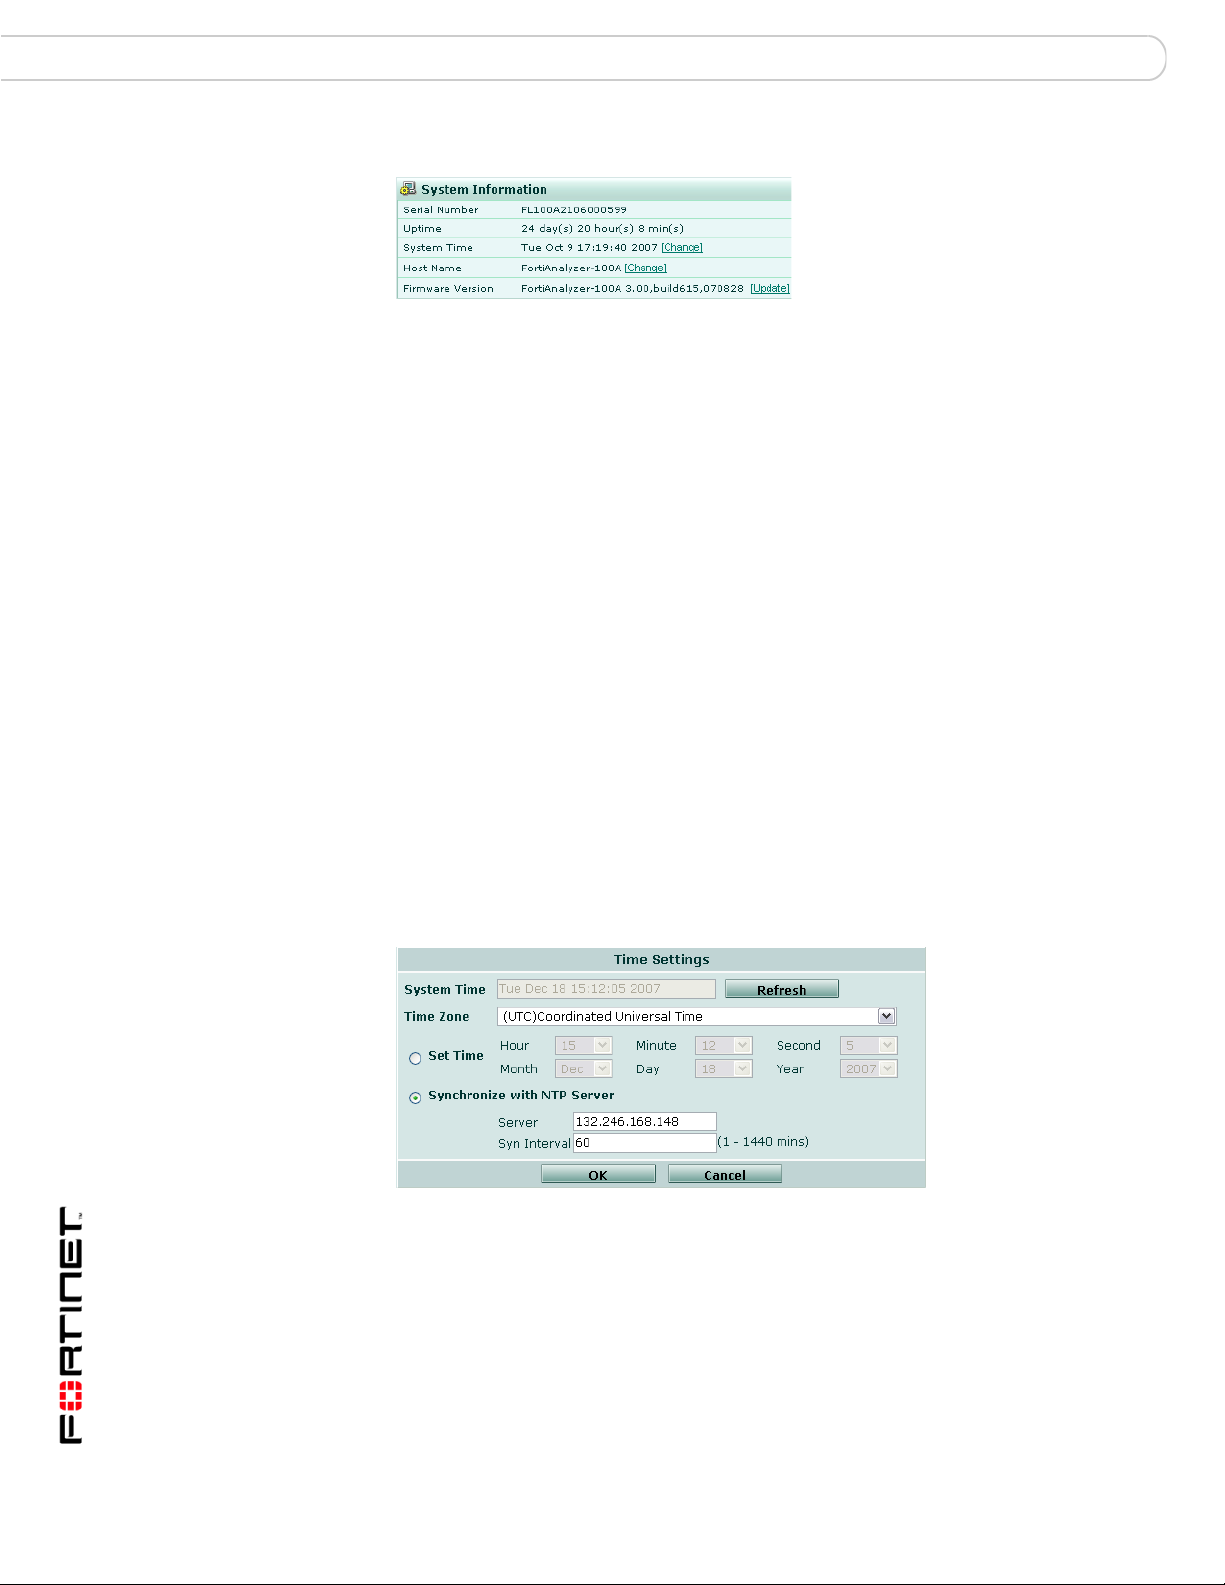
System Information
The System Information area of the Dashboard displays basic information about
the FortiAnalyzer unit, such as up time and firmware version.
FortiAnalyzer Version 3.0 MR7 Administration Guide
05-30007-0082-20080908 29
Page 30
Dashboard System
Figure 5: System Information
Serial Number The serial number of the FortiAnalyzer unit. The serial number is
Uptime The time in days, hours and minutes since the FortiAnalyzer was
System Time The current time according to the FortiAnalyzer internal clock.
Host Name The name of the FortiAnalyzer unit. For more information about
Firmware Version The version of the firmware installed on the FortiAnalyzer unit.
unique to the FortiAnalyzer unit and does not change with
firmware updates. Use this number when registering your
FortiAnalyzer unit with Fortinet.
started or last rebooted.
Select Change to change the time or configure the FortiAnalyzer
unit to obtain the time from an NTP server. For more information,
see “Setting the time” on page 29.
changing the name, see “Changing the host name” on page 30.
Select Update to upload a new version of the firmware. For more
information about updating the firmware, see “Changing the
firmware” on page 30.
Setting the time
Set the system time to ensure correct report time ranges and scheduling and
accurate logging. You can either manually set the FortiAnalyzer system time or
you can configure the FortiAnalyzer unit to automatically keep its system time
correct by synchronizing with a Network Time Protocol (NTP) server.
To set the system time, go to System > Dashboard and select Change for the
System Time.
Figure 6: Time Settings
System Time The current FortiAnalyzer system date and time.
Refresh Update the display of the current FortiAnalyzer system date and
Time Zone Select the FortiAnalyzer unit’s time zone.
Set Time Select to set the FortiAnalyzer system date and time to the values
30 05-30007-0082-20080908
time.
you set in the Year, Month, Day, Hour, Minute and Second fields.
Alternatively, select Synchronize with NTP Server.
FortiAnalyzer Version 3.0 MR7 Administration Guide
Page 31

System Dashboard
Synchronize with
NTP Server
Server Enter the IP address or domain name of an NTP server. See
Sync Interval Specify how often the FortiAnalyzer unit should synchronize its time
Select to use an NTP server to automatically set the system date
and time. You must specify the server and synchronization interval.
Alternatively, select Set Time.
http://www.ntp.org to find an NTP server that you can use.
with the NTP server. For example, a setting of 1440 minutes causes
the FortiAnalyzer unit to synchronize its time once a day.
Changing the host name
Change the FortiAnalyzer host name to differentiate the FortiAnalyzer from other
FortiAnalyzer units or other devices on your network.
To change the host name
1 Go to System > Dashboard.
2 In the System Information area, select Change for the Host Name.
3 Enter a new name for the FortiAnalyzer unit.
4 Select OK.
Changing the firmware
A FortiAnalyzer unit may be upgraded to a newer firmware version, or reverted to
a previous firmware version by selecting Update in System Information. For more
information about changing the firmware in the web-based manager, see
“Managing firmware versions” on page 169.
License Information
The License Information area of the Dashboard displays information on features
that vary by a purchased license or contract.
For more information about RVS (remote vulnerability scanning) updates, see
“FortiGuard Center” on page 70.
Figure 7: License Information
RVS Engine The version of the RVS engine, and the date of its last update.
Select Update to upload a new version of the engine. For more
information on RVS, see “FortiGuard Center” on page 70.
This feature is not available on the FortiAnalyzer-100.
FortiAnalyzer Version 3.0 MR7 Administration Guide
05-30007-0082-20080908 31
Page 32

Dashboard System
RVS Plug-ins The version of the RVS plug-in, and the date of its last update.
This feature is not available on the FortiAnalyzer-100.
Device License
A total of the number of each device type connecting or attempting
to connect to the FortiAnalyzer unit. For more information about
the maximum numbers of devices of each type and/or VDOMs
that are permitted to connect to the FortiAnalyzer unit, see
“Maximum number of devices” on page 76.
• Registered is the number of devices that you have added to
the FortiAnalyzer unit’s device list, either manually or
automatically.
• Unregistered is the number of devices attempting to connect to
the FortiAnalyzer unit that are not yet registered. To configure
the FortiAnalyzer unit to accept data from a device, see
“Manually adding a device” on page 80.
System Resources
The System Resources area of the Dashboard displays use of the FortiAnalyzer
unit’s resources, including CPU, memory (RAM) and hard disk.
Figure 8: System Resources
CPU Usage The current CPU usage status. The web-based manager displays
Memory Usage The current memory status. The web-based manager displays
Hard Disk Usage /
RAID status
History icon Select History, which appears when placing the mouse cursor
CPU usage for core processes only. CPU usage for management
processes (for example, for HTTPS connections to the web-based
manager) is excluded.
memory usage for core processes only. Memory usage for
management processes (for example, for HTTPS connections to
the web-based manager) is excluded.
For the FortiAnalyzer-100 and FortiAnalyzer-100A/100B, the
current status of the hard disk. The web-based manager displays
the amount of hard disk space used.
For the FortiAnalyzer-400, FortiAnalyzer-800/800B,
FortiAnalyzer-2000/2000A and FortiAnalyzer-4000/4000A, the
current RAID status of the hard disks. Each circle indicates the
status of a hard disk. Green indicates the hard disk is functioning
normally. If the disk is flashing red and yellow, there is a problem
with the hard disk.
The hard disks on the FortiAnalyzer-2000/2000A and
FortiAnalyzer-4000/4000A are hot swappable. For more
information, see “Hot swapping the FortiAnalyzer-2000/2000A and
FortiAnalyzer-4000/4000A” on page 66.
over the title bar, to view a graphical representation of the last
minute of CPU, memory, sessions, and network usage. For more
information, see “Viewing operational history” on page 32.
Viewing operational history
The System resource history page displays four graphs representing system
resources and network utilization history, updated every three seconds.
FortiAnalyzer Version 3.0 MR7 Administration Guide
32 05-30007-0082-20080908
Page 33

System Dashboard
To view the FortiAnalyzer operational history
1 Go to System > Dashboard.
2 Select History in the upper right corner of the System Resources area.
CPU Usage The CPU usages for the previous minute.
Memory Usage The memory usages for the previous minute.
Session The session history for the previous minute.
Network Utilization The network use for the previous minute.
System Operation
Some basic operations can be performed directly from the Dashboard in the
System Operation area.
Note: These operations are available only to users with the read and write access profile.
Figure 9: System Operation
Reboot Restart the FortiAnalyzer unit.
ShutDown Halt all processes on the FortiAnalyzer unit in preparation to
Format log disks Format the FortiAnalyzer hard disk. Selecting this option will
Reset to factory
default
power off the hardware. To restart the FortiAnalyzer unit after
shutdown, perform a power cycle.
delete all log files and reports from the hard disk. Ensure that you
back up all information before selecting this option. Formatting the
hard disk will also interrupt FortiAnalyzer operations for several
minutes.
Reset the FortiAnalyzer unit to the default configuration for its
firmware version.
Caution: This option resets all FortiAnalyzer settings to their
default state. This includes the interface IP addresses, as well as
HTTP, HTTPS, SSH, and Telnet access. You will need to
reconnect to the FortiAnalyzer device using the default IP address
of 192.168.1.99.
Formatting the log disks
You can use the system dashboard to format the FortiAnalyzer log disks.
Remember to back up and log data before formatting the hard disks. The
FortiAnalyzer unit will be unavailable for the duration of the format process.
To format the log disks
1 Go to System > Dashboard.
2 In the Systems Operations area, select Format Log Disks.
3 Select OK.
FortiAnalyzer Version 3.0 MR7 Administration Guide
05-30007-0082-20080908 33
Page 34

Dashboard System
!
Resetting to the default configuration
You can reset the FortiAnalyzer unit to its default configuration.
Resetting the configuration does not restore the original firmware. Configuration
and firmware are distinct. Use the procedures in “Managing firmware versions” on
page 169 for managing firmware.
Caution: Back up the configuration before resetting. Resetting the configuration deletes all
changes you have made to the FortiAnalyzer configuration, reverting it to the firmware’s
default configuration, including resetting interface IP addresses.
To reset to the default configuration
1 Go to System > Dashboard.
2 In the System Operations area, select Reset.
3 Select OK to confirm.
The FortiAnalyzer unit restarts with the default configuration for the currently
installed firmware version.
Alert Message Console
The Alert Message Console displays alert messages for the FortiAnalyzer unit
and connected devices, including hard disk failure messages, virus outbreak, or
suspicious event warnings.
To set the threshold for Alert Message Console, or to view all the alert messages
recorded by the FortiAnalyzer unit, select More alerts. For more information about
viewing alert messages, see “Viewing alert console messages” on page 34.
Viewing alert console messages
Alert console messages provides a window on what is occurring on the
FortiAnalyzer and other FortiGate devices. These messages allow you to view
issues on your network, including network attacks and virus warnings.
The Alert messages window provides a complete list of alert messages. You can
view the alert messages by level or acknowledge the messages as required.
Acknowledging an alert message removes it from the list of alerts.
Alert messages can also be delivered by email, Syslog or SNMP. For more
information, see “Alert Events” on page 133.
To view alert console messages
1 Go to System > Dashboard.
2 Select More Alerts in the upper right corner of the Alert Message Console area.
3 Select the column headers to sort the column in ascending or descending order.
FortiAnalyzer Version 3.0 MR7 Administration Guide
34 05-30007-0082-20080908
Page 35

System Dashboard
Figure 10: Alert messages
Statistics
Page Select the page of alerts to view. Use the arrows to move forward
Include...and higher Select an alert level to view. The level you select and those alert
Keep
Unacknowledged
Alerts for
formatted | raw Select to view the alert messages in a formatted or raw format.
Device The device where the alert message is originating.
Event Details of the event causing the alert message.
Severity The level of the alert message.
Time The date and time of the alert message.
Counter The number of occurrences of the alert event.
Delete Select the check box for alert messages you want to delete, then
and back through the pages or enter a page number and press
Enter.
messages higher than selected will appear in the alert list.
Select the number of previous days of alert messages to display.
Selecting a number of days lower than what you are currently
viewing deletes the older alerts. For example, if you are viewing
alerts for seven days, and change the alerts to two days, the
FortiAnalyzer unit deletes the other five days of alert messages.
select the delete icon.
The Statistics area of the Dashboard counts the numbers of sessions, logs, and
reports handled by the FortiAnalyzer unit.
Figure 11: Statistics
Since The date and time when the statistics were last reset.
Connections The number of communication sessions occurring on the
Logs & Reports The log file volume received per day.
FortiAnalyzer unit. Select Details for more information on the
connections. For more information about the session information,
see “Viewing session information” on page 35. For administrative
sessions only, see “Monitor” on page 52.
Viewing session information
Session information displays information about the current communications
sessions on the FortiAnalyzer unit, including devices that connect to send logs or
quarantine files.
FortiAnalyzer Version 3.0 MR7 Administration Guide
05-30007-0082-20080908 35
Page 36

Dashboard System
To view the session information
1 Go to System > Dashboard.
2 In the Statistics area, next to Connections, select Details.
Resolve Host Name Select to display host names by a recognizable name rather than
Resolve Service Select to display network service names rather than port numbers,
Refresh Time Select the frequency of the refresh of the Connections page to
Stop Refresh When the refresh is started, select to stop the refreshing of the
Start Refresh When the refresh is stopped, select to start the refreshing of the
View n per page Select the number of rows to display per page.
Page n of n Enter a page number, then press Enter to go to the page.
Search Enter a keyword to perform a simple search on the session
Protocol The service protocol of the connection, such as UDP or TCP.
From IP The source IP address of the connection.
From Port The source port of the connection.
To IP The destination IP address of the connection.
To Port The destination port of the connection.
Expires (Secs) The time in seconds remaining before the connection terminates.
IP addresses. For more information about on configuring IP
address host names see “Configuring IP aliases” on page 60.
such as HTTP rather than port 80.
view the connection activity.
connections page. To re-start the refresh, select Start Refresh.
connections page. To stop the refresh, select Stop Refresh.
information available. Select Go to begin the search. The number
of matches appears above the Search field.
Report Engine
Filtering session information
You can filter the contents to find specific content. Each column of data includes a
gray filter icon. Select the icon to filter the contents of the column.
When applying a column filter, the filter icon appears green.
To turn off the filter, select the filter icon for the column, and select Clear all Filters.
The Report Engine display shows the FortiAnalyzer report generation activity. The
report engine activity information includes whether the report engine is active or
inactive, what reports are running when active and the percentage completed.
Select the Generate report button to create a new report profile.
Figure 12: Report Engine
FortiAnalyzer Version 3.0 MR7 Administration Guide
36 05-30007-0082-20080908
Page 37

System Dashboard
Log Receive Monitor
The Log Receive Monitor displays historical analysis of the rate at which logs are
received. This widget displays this information in a graphical format.
You can display information by the type of logs or by device and you can also
specify the time period. A new diagnose command was also added to display
this information in the CLI.
You can edit the Log Receive Monitor to display specific information. The
following procedure describes how to edit the Log Receive Monitor widget.
Figure 13: Log Receive Monitor widget
To edit information for Log Receive Monitor
1 Go to System > Dashboard.
2 On the Log Receive Monitor, select Edit in the title bar area.
3 Enter the appropriate information for the following:
Type Select either Log Type or Device.
If you choose Log Type, the monitor displays the type of logs that
are received from all registered devices and separates them into
categories, for example top 5 traffic logs, antivirus logs.
If you choose Device, the monitor displays the logs that received
by each registered device and separates the devices into the top
number of devices.
Top N Select one number from the drop-down list to display the top log
Period The time range for monitoring the logs received. You can select
Automatically
Refresh
types. If you select only one number from the drop-down list, only
the top log type will display, for example, the traffic log.
one of the following:
• Hour – monitors the rate at which logs are received within a
period of one hour
• Day – monitors the rate at which logs are received within a
period of one day
• Week – monitors the rate at which logs are received within a
period of one week
Select the check box if you want to have the monitor automatically
refresh the information.
4 Select OK.
FortiAnalyzer Version 3.0 MR7 Administration Guide
05-30007-0082-20080908 37
Page 38

Dashboard System
Intrusion Activity
Intrusion Activity displays the top attacks that occurred on the network. This
information is gathered from attack logs.
You can edit the Intrusion Activity widget to display specific information by using
the following procedure.
Figure 14: Intrusion Activity widget
To edit the information for Intrusion Activity
1 Go to System > Dashboard.
2 In Intrusion Activity, select Edit in the title bar area.
3 Enter the appropriate information for the following:
Device Select the registered device or device group from the drop-down
Display by Select one of the following to filter the log information:
Time Scope Select one of the following for the time range:
No. Entries Select the number of entries to display. For example, if you want
list.
• Top Sources (to any) – filters any top source IP addresses
• Top Destinations (from any) – filters any top destination IP
addresses
• Top Intrusions – filters the top intrusion activity
• Time Period – filters the top intrusion activity by period of time,
from 00:00:00 to 23:59:59 (24 hours).
• Hour – filters the time by hour
• Day – filters the time by the current day
• Week – filters the time by the current week
• Month – filters the time by the current month
to display 10 entries, select 10 from the drop-down list. You can
specify only 5, 10, or 20.
4 Select OK.
You can view the log messages that are associated with the information that
displays in Intrusion Activity by selecting the links.
Virus Activity
Virus Activity displays the virus activity that has occurred on the devices. This
information is gathered from virus logs. You can edit Virus Activity to display
specific information.
The following procedure describes how to edit the Virus Activity widget.
FortiAnalyzer Version 3.0 MR7 Administration Guide
38 05-30007-0082-20080908
Page 39

System Dashboard
Figure 15: Virus Activity widget
To edit the information for Virus Activity
1 Go to System > Dashboard.
2 In Virus Activity, select Edit in the title bar area.
3 Enter the appropriate information for the following:
Device Select the registered device or device group from the drop-down
Display by Select one of the following to filter the information:
Time Scope Select one of the following for the time range:
No. Entries Select the number of entries to display. For example, if you want
list.
• Time Period – filters virus activity by time period
• Top Viruses – filters top virus activity only
• Top Sources (to any) – filters top sources
• Top Destinations (from any) – filters top destinations
• Protocol break down for virus incidents – filters by protocol
• Hour – filters the time by hour
• Day – filters the time by the current day
• Week – filters the time by the current week
• Month – filters the time by the current month
to display 10 entries, select 10 from the drop-down list. You can
specify only 5, 10, or 20.
4 Select OK.
Top FTP Traffic
Top FTP Traffic displays the total amount of file transfers that occur, using a bar
chart. This information is gathered from traffic logs.
You can edit Top FTP Traffic to customize the information that displays. The
following procedure describes how to edit the Top FTP Traffic widget.
Figure 16: Top FTP Traffic widget
FortiAnalyzer Version 3.0 MR7 Administration Guide
05-30007-0082-20080908 39
Page 40

Dashboard System
To edit the information for Top FTP Traffic
1 Go to System > Dashboard.
2 In Top FTP Traffic, select Edit in the title bar area.
3 Enter the appropriate information for the following:
Device Select the registered device or device group from the drop-down
Display by Select one of the following to filter the information:
Time Scope Select one of the following for the time range:
No. Entries Select the number of entries to display. For example, if you want
list.
• Top Sources (to any) – filters only the top sources
• Top Destinations (from any) – filters only the top destinations
• Top Source and Destination (unique) – filters the top sources
to unique destinations
• Hour – filters the time by hour
• Day – filters the time by the current day
• Week – filters the time by the current week
• Month – filters the time by the current month
to display 10 entries, select 10 from the drop-down list. You can
specify only 5, 10, or 20.
4 Select OK.
Top Email Traffic
Top Email Traffic displays the total amount of email traffic happening on the
FortiGate units. Top Email Traffic (By Volume) uses traffic logs to determine the
total amount of email traffic and Top Email Traffic (By Request) uses content logs
to determine the total amount of email requests. This information is displayed
using a bar chart.
You can edit Top Email Traffic to customize the information that displays. The
following procedure describes how to edit the Top Email Traffic widget.
Figure 17: Top Email Traffic widget
To edit the information for Top Email Traffic
1 Go to System > Dashboard.
2 In Top Email Traffic, select Edit.
FortiAnalyzer Version 3.0 MR7 Administration Guide
40 05-30007-0082-20080908
Page 41

System Dashboard
3 Enter the appropriate information for the following:
Device Select the registered device or device group from the drop-down
Display by Select one of the following to filter the information:
FIlter Protocol Select one of the following to filter by email protocol:
Filter Domain Enter the domain name for filtering the information, for example
Time Scope Select one of the following for the time range:
No. Entries Select the number of entries to display. For example, if you want
list.
• Top Sources (to any) – filters only the top sources
• Top Destinations (from any) – filters only the top destinations
• Top Source and Destination (unique) – filters the top sources
to unique destinations
• POP3
• IMAP
• SMTP
the email server, mail.example.com
• Hour – filters the time by hour
• Day – filters the time by the current day
• Week – filters the time by the current week
• Month – filters the time by the current month
to display 10 entries, select 10 from the drop-down list. You can
specify only 5, 10, or 20.
4 Select OK.
Top IM/P2P Traffic
Top IM/P2P Traffic displays the top instant messaging and P2P programs used,
using a bar chart. The information displays each IM and P2P program separately
by user. IM programs used display the top number of messages sent or received
and P2P programs used display the top bandwidth of files sent or received.
You can edit Top IM/P2P Traffic to customize the information that displays. The
following procedure describes how to edit the Top IM/P2P Traffic widget.
Figure 18: Top IM/P2P Traffic widget
To edit information for Top IM/P2P Traffic
1 Go to System > Dashboard.
2 In Top IM/P2P Traffic, select Edit in the title bar area.
FortiAnalyzer Version 3.0 MR7 Administration Guide
05-30007-0082-20080908 41
Page 42

Dashboard System
3 Enter the appropriate information for the following:
Typ e Select the type of program you want displayed, either IM or P2P.
Device Select the registered device or device group from the drop-down
Display by Select one of the following to filter the information:
Protocol Select the protocol
Time Scope Select one of the following for the time range:
No. Entries Select the number of entries to display. For example, if you want
list.
• Top Sources (to any) – filters only the top sources
• Top Destinations (from any) – filters only the top destinations
• Top Source and Destination (unique) – filters the top sources
to unique destinations
• Hour – filters the time by hour
• Day – filters the time by the current day
• Week – filters the time by the current week
• Month – filters the time by the current month
to display 10 entries, select 10 from the drop-down list. You can
specify only 5, 10, or 20.
Top Traffic
4 Select OK.
Top Traffic displays the total amount of traffic for FortiGate units. Top Traffic uses
traffic logs in determining the total amount of traffic. This information displays as a
bar chart and only displays by volume.
You can edit Top Traffic to customize the information that displays. The following
procedure describes how to edit the Top Traffic widget.
Figure 19: Top Traffic widget
To edit information for Top Traffic
1 Go to System > Dashboard.
2 In Top Traffic, select Edit in the title bar area.
FortiAnalyzer Version 3.0 MR7 Administration Guide
42 05-30007-0082-20080908
Page 43

System Dashboard
3 Enter the appropriate information for the following:
Device Select the registered device or device group from the drop-down
Display by Select one of the following to filter the information:
Filter Port Select the type of port, TCP or UDP, and then enter the port
Time Scope Select one of the following for the time range:
No. Entries Select the number of entries to display. For example, if you want
list.
• Top Sources (to any) – filters only the top sources
• Top Destinations (from any) – filters only the top destinations
• Top Source and Destination (unique) – filters the top sources
to unique destinations
number. The port number can be from 1 - 65535.
• Hour – filters the time by hour
• Day – filters the time by the current day
• Week – filters the time by the current week
• Month – filters the time by the current month
to display 10 entries, select 10 from the drop-down list. You can
specify only 5, 10, or 20.
4 Select OK.
Top Web Traffic
1 Go to System > Dashboard.
2 In Top Web Traffic, select Edit.
Top Web Traffic displays the total web traffic usage on the network. This
information is displayed as a bart chart. Information for this widget is gathered
from the Web Filter logs, if you selected By Requests, or, if you selected By
Volume, from the traffic logs.
You can edit Top Web Traffic to customize the information displayed. The
following procedure describes how to edit the Top Web Traffic widget.
Figure 20: Top Web Traffic widget
To edit information for Top Web Traffic
FortiAnalyzer Version 3.0 MR7 Administration Guide
05-30007-0082-20080908 43
Page 44

Network System
3 Enter the appropriate information for the following:
Device Select the registered device or device group from the drop-down
Display by Select one of the following to filter the information:
FIlter Source IP
Address
Filter Destination IP
Address
Time Scope Select one of the following for the time range:
No. Entries Select the number of entries to display. For example, if you want
list.
• Top Sources (to any) – filters only the top sources
• Top Destinations (from any) – filters only the top destinations
• Top Source and Destination (unique) – filters the top sources
to unique destinations
Enter the source IP address.
Enter the destination IP address.
• Hour – filters the time by hour
• Day – filters the time by the current day
• Week – filters the time by the current week
• Month – filters the time by the current month
to display 10 entries, select 10 from the drop-down list. You can
specify only 5, 10, or 20.
Network
Interface
4 Select OK.
Use the network settings to configure the FortiAnalyzer unit to operate in your
network. Basic network settings include configuring interfaces, DNS settings and
static routes.
You can configure the interfaces on the FortiAnalyzer unit, including their IP
address, and permitted remote administration protocols.
Figure 21: Interface list
Name The name of the network interface on the FortiAnalyzer unit.
IP/Netmask The IP address and network mask configured for the interface.
Access A list of the administrative access methods available on the
interface. For more information, see “Administrative Access” on
page 46.
FDP Fortinet Discovery Protocol (FDP) indicator. When Fortinet
Discovery Protocol is enabled for an interface, a green check
appears. For more information about FDP, see “About Fortinet
Discovery Protocol” on page 47 and “Manually adding a FortiGate
unit using the Fortinet Discovery Protocol (FDP)” on page 85.
FortiAnalyzer Version 3.0 MR7 Administration Guide
44 05-30007-0082-20080908
Page 45

System Network
Status The status of the network interface.
• A green arrow indicates the interface is up. Select Bring Down
to disable the port.
• A red arrow indicates the interface is down. Select Bring up to
enable the port.
Modify Select Modify to change the interface settings.
Changing interface settings
To change the interface settings
1 Go to System > Network > Interface.
2 In the row corresponding to the interface you want to change, select Modify.
3 Configure the following options:
Interface Name The interface name is cannot be changed.
Fortinet Discovery
Protocol
IP/Netmask Enter an IP address and network mask.
Administrative
Access
Select Enabled to allow responses to Fortinet Discovery Protocol
(FDP) on the interface, allowing FortiGate devices to find the
FortiAnalyzer unit automatically. For more information about FDP,
see “About Fortinet Discovery Protocol” on page 47 and “Manually
adding a FortiGate unit using the Fortinet Discovery Protocol
(FDP)” on page 85.
Select which methods of administrative access should be
available on this interface.
• HTTPS allows secure HTTPS connections to the FortiAnalyzer
web-based manager.
• PING allows response to ICMP pings, which are useful for
testing connectivity.
• HTTP allows HTTP connections to the FortiAnalyzer
web-based manager.
HTTP connections are not secure and can be intercepted by a
third party.
• SSH allows SSH connections to the FortiAnalyzer CLI.
• TELNET allows Telnet connections to the FortiAnalyzer CLI.
Telnet connections are not secure, and can be intercepted by a
third party.
• AGGREGATOR assigns the port to be the sender or receiver
of log aggregation transmissions. For more information about
aggregation, see “Configuring log aggregation” on page 58.
• WEBSERVICES allows web service (SOAP) connections.
FortiManagerunits require web service connections for remote
management of FortiAnalyzer units. If this option is not
enabled, the FortiManager unit will not be able to install a
configuration on the FortiAnalyzer unit.
4 Select OK.
FortiAnalyzer Version 3.0 MR7 Administration Guide
05-30007-0082-20080908 45
Page 46

Network System
About Fortinet Discovery Protocol
FortiGate units running FortiOS version 3.0 or greater can use Fortinet Discovery
Protocol (FDP), a UDP protocol, to locate a FortiAnalyzer unit.
When a FortiGate administrator selects Automatic Discovery, the FortiGate unit
attempts to locate FortiAnalyzer units on the network within the same subnet. If
FDP has been enabled for its interface to that subnet, the FortiAnalyzer unit will
respond. Once the FortiGate unit discovers a FortiAnalyzer unit, the FortiGate unit
automatically enables logging to the FortiAnalyzer and begins sending log data.
Depending on its configuration, the FortiAnalyzer unit may then automatically
register the device and save its data, add the device but ignore its data, or ignore
the device entirely. For more information, see “Configuring unregistered device
connection attempt handling” on page 79.
DNS
Configure primary and secondary DNS servers to provide name resolution
required by FortiAnalyzer features such as NFS shares.
Note: Configure and verify your DNS settings. Incorrect DNS settings can cause other
features.
Routing
To configure DNS settings
1 Go to System > Network > DNS.
2 Enter an IP address for a primary and secondary DNS server.
Primary DNS Server Enter the primary DNS server IP address.
Secondary DNS
Server
Enter a secondary DNS server IP address.
3 Select Apply.
The route list displays the static routes on the FortiAnalyzer unit.
To view the routing list, go to System > Network > Routing.
Figure 22: Route list
Destination
IP/Netmask
Gateway The IP address of the router where the FortiAnalyzer unit forwards
Interface The names of the FortiAnalyzer interfaces through which
Modify Select to change the route configuration.
Create New Add a route to the route list.
The destination IP address and netmask of packets that the
FortiAnalyzer unit wants to send to.
packets.
intercepted packets are received and sent.
FortiAnalyzer Version 3.0 MR7 Administration Guide
46 05-30007-0082-20080908
Page 47

System Admin
Delete
Edit
Change Password
Adding a route
Static routes provide the FortiAnalyzer unit with the information it needs to forward
a packet to a particular destination other than the default gateway.
To add a static route
1 Go to System > Network > Routing.
2 Select Create New.
3 Configure the following options:
Admin
Destination IP Enter the destination IP address network mask of packets that the
FortiAnalyzer unit has to intercept.
Mask Enter a netmask to associate with the IP address.
Gateway Enter the IP address of the gateway where the FortiAnalyzer unit
will forward intercepted packets.
Interface Select a port from the list of available ports.
4 Select OK.
Use the Admin option to configure and maintain FortiAnalyzer administrators,
administrative domains (ADOMs), set a user’s administrative access and maintain
passwords.
When the FortiAnalyzer unit is initially installed, it is configured with a single
master administrator account with the user name of “admin”. From this account,
you can add and edit administrator accounts, control the access level of each
administrator account and control the IP address for connecting to the
FortiAnalyzer unit. This account is permanent, and cannot be deleted from the
FortiAnalyzer unit.
When configuring administrators, you can add ‘@’ symbol in the name. For
example, admin_1@headquarters, to identify an administrator that will access the
FortiAnalyzer unit from the headquarters office of their organization.
To view a list of administrators for the FortiAnalyzer unit, go to System > Admin >
Administrators.
Figure 23: Administrator account list
FortiAnalyzer Version 3.0 MR7 Administration Guide
05-30007-0082-20080908 47
Page 48

Admin System
Name The assigned name for the administrator.
Trusted Hosts The IP address and netmask of acceptable locations for the
Profile The access profile assigned to the administrator.
Typ e Type can be either local, as a configured administrator on the
Delete Select to remove the administrator account. You cannot delete the
Edit Select to modify the account information.
Change Password Select to change the account password. For more information,
administrator to log in to the FortiAnalyzer unit.
If you want the administrator to be able to access the
FortiAnalyzer unit from any address, use the IP address and
netmask 0.0.0.0/0.0.0.0. To limit the administrator to only
access the FortiAnalyzer unit from a specific network or host,
enter that network’s IP and netmask.
FortiAnalyzer unit or RADIUS if you are using a RADIUS server on
your network.
account named admin.
see “Changing an administrator’s password” on page 50.
Adding or editing an administrator account
You can add, edit or delete a FortiAnalyzer administrator account, except the
default administrator admin administrator account.
When configuring the administrator’s information, you can add the @ symbol to
the administrator’s name. For example, jb@headquarters. The @ symbol is also
useful to those administrators who require RADIUS authentication.
To add or edit an administrator account
1 Go to System > Admin > Administrators.
2 Select Create New.
3 Configure the following options and select OK.
Administrator Enter the administrator name. You can now add the @ symbol, if
Remote Auth Select if you are using a RADIUS server group on your network.
Auth Group Select which RADIUS server group to use when authenticating
Password Enter a password. For security reasons, a password should be a
Confirm Password Re-enter the password to confirm its spelling.
Trusted Host Enter the IP address and netmask of acceptable locations for the
required.
this administrator account.
This option only appears if Remote Auth is enabled.
mixture of letters and numbers and longer than six characters.
If a user attempts to log in and mis-types the password three
times, the user is locked out of the system from that IP address for
a short period of time.
This does not appear when editing the account.
This does not appear when editing the account.
administrator to log in to the FortiAnalyzer unit.
If you want the administrator to be able to access the
FortiAnalyzer unit from any address, use the IP address and
netmask 0.0.0.0/0.0.0.0. To limit the administrator to only
access the FortiAnalyzer unit from a specific network, enter that
network’s IP and netmask.
FortiAnalyzer Version 3.0 MR7 Administration Guide
48 05-30007-0082-20080908
Page 49

System Admin
Access Profile Select an access profile from the list. Access profiles define
Admin Domain Select an administrative domain (ADOM) from the list. ADOMs
administrative access permissions to areas of the configuration by
menu item. For more information, see “Access Profile” on
page 50.
define administrative access permissions to areas of the
configuration and device data by device or VDOM. For more
information, see “Administrative Domains (ADOMs)” on page 19.
This option does not appear when ADOMs are disabled, or for the
admin administrator.
Changing an administrator’s password
The admin administrator and administrators with read and write permissions can
change their own account passwords.
Administrators with read-only permissions cannot change their own password.
Instead, the admin administrator must change the password for them.
To change the administrator account password
1 Go to System > Admin > Administrators.
2 Select the Change Password icon.
3 Enter the old password for confirmation.
4 Enter the new password and confirm the spelling by entering it again.
5 Select OK.
Access Profile
Only the admin administrator has access to all configuration areas of a
FortiAnalyzer unit by default. Every other administrator must be assigned an
access profile.
Access profiles define administrator privileges to parts of the FortiAnalyzer
configuration. For example, you can have a profile where the administrator only
has read and write access to the reports, or assign read-only access to the
content archive logs.
You can create any number of access profiles. For each profile, you can define
what access privileges are granted. Administrator accounts can only use one
access profile at a time.
FortiAnalyzer Version 3.0 MR7 Administration Guide
05-30007-0082-20080908 49
Page 50

Admin System
Figure 24: Access Profile
Auth Group
Note: Administrator accounts can also be restricted to specific devices or VDOMs in the
FortiAnalyzer device list. For more information, see “Administrative Domains (ADOMs)” on
page 19.
To create an access profile
1 Go to System > Admin > Access Profile.
2 Select Create New.
3 Enter a name for the profile.
4 Select a filter for each option:
None The administrator has no access to the function.
Read Only The administrator can view pages, menus and information, but
cannot modify any settings.
Read-Write The administrator can view pages, menus and information as well
as change configurations.
Auth Group enables you to group RADIUS servers in to logical arrangements for
administrator authentication.
You must first configure at least one RAIDUS server before you can create an
authorization group.
To add a group
1 Go to System > Admin > Auth Group.
2 Select Create New.
3 Select the servers from Available Auth Servers to add to the group and select the
right arrow.
4 Select OK.
FortiAnalyzer Version 3.0 MR7 Administration Guide
50 05-30007-0082-20080908
Page 51

System Admin
RADIUS Server
RADIUS servers authenticate administrators. The following procedure explains
how to add a RADIUS server for authenticating administrators.
To add a RADIUS server
1 Go to System > Admin > RADIUS Server.
2 Select Create New.
3 Configure the following and select OK:
Name Enter a name to identify the server.
Server IP/Name Enter the IP address for the server.
Shared Secret Enter the password for the server.
Authentication
Protocol
Select which protocol the FortiAnalyzer unit will use to
communicate with the RADIUS server.
Administrator Settings
Administrators Settings enables you to configure some common settings for all
administrator accounts, including the idle timeout (how much time must pass
without activity before the FortiAnalyzer unit logs out an administrator), the
language for the web-based manager, and the PIN for the LCD panel. You can
also enable or disable administrative domains (ADOMs).
To configure administrators, go to System > Admin.
Note: Only the admin administrator can add or change administrator account information.
Figure 25: Administrators Settings
Idle Timeout Set the idle timeout to control the amount of inactive time before
Web Administration
Language
the administrator must log in again. To improve security keep the
idle timeout to a low value (for example, five minutes).
Note that sessions will not time out when viewing real-time logs.
Set the language for the web-based manager.
FortiAnalyzer Version 3.0 MR7 Administration Guide
05-30007-0082-20080908 51
Page 52

Network Sharing System
Monitor
Network Sharing
PIN Protection Enable then enter a Personal Identification Number (PIN) to
Admin Domain
Configuration
secure the LCD access to FortiAnalyzer units with an LCD panel.
The PIN must be six numbers.
This option only appears on models with an LCD panel.
Enable or disable administrative domains (ADOMs). For more
information on ADOMs, see “Administrative Domains (ADOMs)”
on page 19.
This option does not appear if ADOMs are currently enabled and
ADOMs other than the root ADOM exist.
This option does not appear on FortiAnalyzer-100 or
FortiAnalyzer-100A/100B models.
The Monitor page enables the admin administrator to view other administrators
currently logged in to the FortiAnalyzer unit. The admin administrator can
disconnect other administrators, should the need arise.
To monitor current administrators, go to System > Admin > Monitor.
To disconnect an administrator, select a check box next to the administrator’s user
name and select Disconnect.
The FortiAnalyzer hard disk can be used as an NFS or Windows network share to
store and share user files, as well as sharing FortiAnalyzer reports and logs.
Use Network Sharing to configure network share users and access.
When selecting a network share style, consider the access methods available to
your users:
• Microsoft Windows users could connect to a FortiAnalyzer Windows network
share by mapping a drive letter to a network folder
• Apple Mac OS X, Unix or Linux users:
• could mount a FortiAnalyzer Windows network share using smbfs
• could mount a FortiAnalyzer NFS network share
Before a user can access files on the FortiAnalyzer network share:
• network share user accounts and groups must be created
• network sharing (Windows or NFS) must be enabled
• the share folder and its file permissions (user access) must be set
Adding share users
You can create network share user accounts to provide non-administrative access
to the log, reports and hard disk storage of the FortiAnalyzer unit.
Users added will not have administrative access to the FortiAnalyzer hard disk or
FortiAnalyzer unit. To add administrative users, see “Admin” on page 48.
To add a user account
1 Go to System > Network Sharing > User.
2 Select Create New.
FortiAnalyzer Version 3.0 MR7 Administration Guide
52 05-30007-0082-20080908
Page 53

System Network Sharing
Delete
Edit
3 Enter the following information for the user account and select OK:
User name Enter a user name.
The name cannot include spaces.
UID (NFS only) Enter a user ID.
Use this field only if you are using NFS shares. The NFS protocol uses the
UID to determine the permissions on files and folders.
Password Enter a password for the user.
Description Enter a description of the user. For example, you might enter the users
name or a position such as IT Manager.
Adding share groups
You can create network share user groups to maintain access privileges for a
large number of users at once.
To add a user group
1 Go to System > Network Sharing > Group.
2 Select Create New.
3 Enter the following information for the group account:
Group Enter a user name. For example, Finance. The name cannot include
GID (NFS only) Enter a Group ID. Use this field if you are using NFS shares. The NFS
spaces.
protocol uses the GID to determine the permissions on files and folders.
4 Select the users from the Available Users area and select the Right arrow to add
them to the group.
To remove a user, select a user from the Members area and select the Left arrow.
5 Select OK.
Configuring Windows shares
You can configure the FortiAnalyzer unit to provide folder and file sharing using
Windows sharing.
To view users with Windows share access to the FortiAnalyzer unit, go to
System > Network Sharing > Windows Share.
Figure 26: Windows network shares
Local Path The shared file or folder path.
Share as The share name.
User/Group A list of users or groups that have access to the folder or files.
FortiAnalyzer Version 3.0 MR7 Administration Guide
05-30007-0082-20080908 53
Page 54

Network Sharing System
Local Path
button
Permissions Permissions for the user or groups. This can be either Read Only
Modify Select Edit to change any of the options for file sharing.
or Read Write.
Select Delete to remove the file share.
To enable Windows shares
1 Go to System > Network Sharing > Windows Share.
2 Select Enable Windows Network Sharing.
3 Enter a Workgroup name.
4 Select Apply.
5 Configure a share folder and user permissions to access that share. For more
information, see “Assigning user permissions” on page 55.
Assigning user permissions
After configuring users and user groups, configure the files and folders the users
can access, and their Windows share read/write access privileges.
Figure 27: Windows share configuration
To add a new Windows share configuration
1 Go to System > Network Sharing > Windows Share.
2 Select Create New.
3 Select the Local Path button to define which folder on the FortiAnalyzer unit hard
disk to share.
Note: The default permissions for files and folders is read and execute privileges. The
owner of the document also has write privileges. You must select the write permission for
the folder, user and the group to enable write permissions. For more information, see
“Default file permissions on NFS shares” on page 56.
4 Select OK.
5 Enter the Share Name to describe the shared folder.
6 Select user and group names from the Available Users & Groups box. Hold the
Ctrl key to select multiple users or groups.
FortiAnalyzer Version 3.0 MR7 Administration Guide
54 05-30007-0082-20080908
Page 55

System Network Sharing
Edit
Delete
Local Path
button
7 Select the type of access rights the users and groups will have and select the
appropriate right arrow to move the user or group name to the Read-Only Access
or Read-Write Access boxes.
8 Select Ok.
Configuring NFS shares
You can configure the FortiAnalyzer unit to provide folder and file sharing using
NFS sharing.
To view a list of users with NFS share access to the FortiAnalyzer unit, including
access privileges, go to System > Network Sharing > NFS Export.
Figure 28: NFS shares
Local Path The path the user has permission to connect to.
Remote Clients A list of users that have access to the folder or files.
Permissions Permissions for the user. This can be either Read Only or Read
Modify Select Edit to change any of the options for file sharing.
Write.
Select Delete to remove the file sharing permissions.
To add a new NFS share configuration
1 Go to System > Network Sharing > NFS Export.
2 Select Enable NFS Exports and select Apply.
3 Select Create New.
Figure 29: NFS share configuration
4 Select the Local Path button to define which folder on the FortiAnalyzer unit hard
disk to share.
FortiAnalyzer Version 3.0 MR7 Administration Guide
05-30007-0082-20080908 55
Page 56

Config System
Note: The default permissions for files and folders is read and execute privileges. The
owner of the document also has write privileges. To enable write access for users and
groups, you must select the write permission for the folder and for the user and the group.
For more information, see “Default file permissions on NFS shares” on page 56.
5 Select OK.
6 In Remote Clients, enter the IP address or domain name of the remote system or
user ID.
7 Select the type of Permission required and select Add.
8 Select OK.
Default file permissions on NFS shares
By default, when a user adds a new file or folder, the permissions are:
• read, write, execute for the owner (user)
• read and execute for the Admin group and Others group.
You can set file permissions in the CLI. For more information, see the config
nas share command in the FortiAnalyzer CLI Reference.
Config
You can use System > Config to setup and maintain miscellaneous features,
such as local logging, log aggregation, log forwarding, IP aliases, and LDAP
connections.
Automatic file deletion and local log settings
The FortiAnalyzer unit creates its own system log messages to provide
information on system events occurring on the unit, such as system activity,
administration events and IPSec negotiations with configured devices.
To configure logging behavior for your FortiAnalyzer unit, go to System >
Config > Log Setting.
FortiAnalyzer Version 3.0 MR7 Administration Guide
56 05-30007-0082-20080908
Page 57

System Config
Figure 30: FortiAnalyzer unit log settings
Log Locally Select to save the FortiAnalyzer log messages on the FortiAnalyzer
Log Level Select the severity level for the log messages recorded to the
Allocated Disk
Space (MB)
Log options when
log disk is full
Use System Device
Log Settings
Log file should not
exceed
hard disk.
FortiAnalyzer hard disk. The FortiAnalyzer unit logs all levels of
severity down to, but not less severe than, the level you select. For
example, if you want to record emergency, critical, and error
messages, select Error.
The maximum size of the FortiAnalyzer log file that the FortiAnalyzer
unit saves to the hard disk.
When the log file reaches the specified maximum size, the
FortiAnalyzer unit saves current network traffic log file with an
incremental number and starts a new active log file.
The policy to follow for saving the current log and starting a new
active log when the FortiAnalyzer disk is full.
Select Overwrite Oldest Files to delete the oldest log entry when the
disk is full.
Select Stop Logging to stop logging messages when the disk is full.
Enable to use the same settings for local FortiAnalyzer logs as device
logs. For information about device log settings, see “Rolling and
uploading logs” on page 104.
Enter the maximum size of the current log file that the FortiAnalyzer
unit will save to the hard disk. When the log file reaches the specified
maximum size, the FortiAnalyzer unit saves the current log file and
starts a new active log file.
When a log file reaches its maximum size, the FortiAnalyzer unit
saves the log files with an incremental number, and starts a new log
file with the same name.
This option appears only when Use System Device Log Settings is
disabled.
FortiAnalyzer Version 3.0 MR7 Administration Guide
05-30007-0082-20080908 57
Page 58

Config System
Log file should be
rolled... even if size
is not exceeded
Log to Host Select to send log messages generated by the FortiAnalyzer unit to
IP Enter the IP address of the Syslog server.
Port Enter the Syslog port. The default port is 514.
Log Level Select the severity level for the log messages recorded to the Syslog
Format Enable CSV format to record log messages in comma-separated
Event Log Select to configure which FortiAnalyzer unit events the FortiAnalyzer
Automatcially
Delete
Select the frequency of when the FortiAnalyzer unit renames the
current log file and starts a new active log file.
•Daily: Roll log files daily, even if the log file has not yet reached
maximum file size.
• Weekly: Roll log files weekly, even if the log file has not yet
reached maximum file size.
•Optional: Roll log files only when the log file reaches the
maximum file size, regardless of time interval.
This option appears only when Use System Device Log Settings is
disabled.
another host, such as a Syslog server.
server. The FortiAnalyzer unit logs all levels of severity down to, but
not less severe than, the level you select. For example, if you want to
record emergency, critical, and error messages, select Error.
value (CSV) formatted files. Log message fields are separated by
commas. When disabled, logs are recorded as standard log files.
unit records to the log. Events can be logged locally on the
FortiAnalyzer unit, or to the host indicated in Log to Host. Loggable
event types include When configuration has changed, IPSec
negotiation event, Admin login/logout event, and System activity
event.
Select to configure automatic deletion of older logs. Enable the type
of log or report you wish to automatically delete (Logs older than,
Network analyzer logs older than, Local logs older than, Reports
older than, Content archive files older than), then select from Hours,
Weeks, Days or Months, and enter the value for the age unit.
Configuring log aggregation
Log aggregation is a method of collecting log data from one or more FortiAnalyzer
units to a central FortiAnalyzer unit.
Log aggregation involves one or more FortiAnalyzer units configured to act as
aggregation clients, and a FortiAnalyzer unit configured to act as an aggregation
server. The aggregation client sends all of its device logs, including quarantined or
content archived files, to the aggregation server. The transfer includes the active
log to the point of aggregation (for example, tlog.log) and all rolled logs stored
on the aggregation client (tlog.1.log, tlog.2.log, tlog.3.log …).
Subsequent log aggregations include only changes; the aggregation client does
not re-send previously aggregated logs.
On the aggregation server, additional devices will appear in the device list,
corresponding to those devices which log to the aggregation clients. You can
easily identify these devices, as they do not have Rx and Tx permissions.
FortiAnalyzer Version 3.0 MR7 Administration Guide
58 05-30007-0082-20080908
Page 59

System Config
For example, a company may have a headquarters and a number of branch
offices. Each branch office has a FortiGate unit and a FortiAnalyzer-100A/100B to
collect local log information. Those branch office FortiAnalyzer units are
configured as log aggregation clients. The headquarters has a
FortiAnalyzer-2000/2000A which is configured as a log aggregator. The log
aggregator collects logs from each of the branch office log aggregation clients,
enabling headquarters to run reports that reflect all offices.
Note: For more information about log aggregation port numbers, see the Knowledge
Center article Traffic Types and TCP/UDP Ports used by Fortinet Products.
Figure 31: Example log aggregation topology
All FortiAnalyzer models can be configured as a log aggregation client, but log
aggregation server support varies by FortiAnalyzer model, due to storage and
resource requirements.
FortiAnalyzer Model Aggregation Client Aggregation Server
FortiAnalyzer-100A/100B Yes N o
FortiAnalyzer-400 Ye s N o
FortiAnalyzer-800/800B Ye s Ye s
FortiAnalyzer-2000/2000A Ye s Ye s
FortiAnalyzer-4000/4000A Ye s Ye s
FortiAnalyzer Version 3.0 MR7 Administration Guide
05-30007-0082-20080908 59
Page 60

Config System
Configuring an aggregation client
An aggregation client is a FortiAnalyzer unit that sends logs to a aggregation
server. These include models such as the FortiAnalyzer-100A/100B and
FortiAnalyzer-400.
To configure the aggregation client
1 Go to System > Config > Log Aggregation.
2 Select Enable log aggregation TO remote FortiAnalyzer.
3 Set the following settings and select OK:
Remote FortiAnalyzer IP Enter the IP address of the FortiAnalyzer unit acting as the
Password Enter the password for the aggregation server.
Confirm Password Enter the password again for the aggregation server.
Aggregation daily at Select the time of the day when the aggregation client uploads
Aggregate Now Select to send the logs to the aggregation server immediately.
aggregation server.
the logs to the aggregation server.
Use this when you want to create a report on the server with the
most current log data.
Configuring an aggregation server
An aggregation server is a FortiAnalyzer unit that receives the logs sent from an
aggregation client. FortiAnalyzer-800/800B models and higher can be configured
as aggregation servers.
To configure the aggregation server
1 Go to System > Config > Log Aggregation.
2 Select Enable log aggregation TO this FortiAnalyzer.
3 Set the following settings and select OK:
Password Enter the password for the aggregation server.
Confirm Password Enter the password again for the aggregation server.
Configuring log forwarding
Log forwarding sends duplicates of log messages received by the FortiAnalyzer
unit to a separate Syslog server. This can be useful for additional log storage or
processing.
The log forwarding destination (Remote device IP) may receive either a full
duplicate or a subset of those log messages that are received by the FortiAnalyzer
unit. Log messages are forwarded only if they meet or exceed the Minimum
Severity threshold.
Log forwarding is similar to log uploading or log aggregation, but log forwards are
sent as individual Syslog messages, not whole log files over FTP, SFTP, or SCP,
and not as batches of log files.
To forward log events
1 Go to System > Config > Log Forwarding.
2 Select Enable log forwarding to remote log server.
FortiAnalyzer Version 3.0 MR7 Administration Guide
60 05-30007-0082-20080908
Page 61

System Config
3 Enter the IP address of the external syslog server in Remote device IP.
4 Select whether to Forward all incoming logs or Forward only authorized logs
(authorized according to a device’s permissions in the device list).
5 Select the Minimum Severity threshold.
All log events of equal or greater servers will be transmitted.
For example, if the selected Minimum Severity is Critical, all Emergency, Alert and
Critical log events will be forwarded; other log events will not be forwarded.
6 Select Apply.
Configuring IP aliases
Use IP Alias to assign a meaningful name to IP addresses. When configuring
reports, or viewing logs and content archives, select Resolve Host Name to view
the alias rather than the IP address.
IP aliases can make logs and reports easier to read and interpret. For example,
you could create an IP alias to display the label mailserver1 instead of its IP
address, 10.10.1.54.
To add an IP alias
1 Go to System > Config > IP Alias.
2 Enter a nickname for the IP address in Alias.
3 Enter the IP address or range in Host(Subnet / IP Range).
4 Select Add.
To edit an IP alias
1 Go to System > Config > IP Alias.
2 In the Action column, select Edit.
3 Modify the nickname for the IP address in Alias.
4 Modify the IP address or range in Host(Subnet / IP Range).
5 Select Update Now.
Importing an IP alias list file
To create a large number of IP aliases as a single batch, you can import a text file
containing this information.
The contents of the text file should be in the format:
<ip address> <alias_name>
For example:
10.10.10.1 User_1
There can be only one IP address/user name entry per line.
To import the alias file
1 Go to System > Config > IP Alias.
2 Select Import.
FortiAnalyzer Version 3.0 MR7 Administration Guide
05-30007-0082-20080908 61
Page 62

Config System
!
3 Enter the path and file name or select Browse to locate the file.
4 Select OK.
IP alias ranges
When adding an IP alias you can include an IP address range as well as individual
addresses. For example:
• 10.10.10.1 - 10.10.10.50
• 10.10.10.1 - 10.10.20.100
Configuring RAID
FortiAnalyzer units containing multiple hard disks can store data using a RAID
array to provide redundant storage, data protection, faster hard disk access, or a
larger storage capacity.
RAID settings can be configured from the Dashboard, in the RAID Monitor widget
as well as from System > Config > RAID.
Caution: Fortinet recommends using RAID 10 if your FortiAnalyzer unit uses software
RAID and redundancy is required. Using RAID 5 causes system performance issues.
Note: RAID functionality is only available on the FortiAnalyzer-400,
FortiAnalyzer-800/800B, FortiAnalyzer-2000/2000A and FortiAnalyzer-4000/4000A. These
units include multiple hard disks for RAID support.
Array capacity is limited to 8 TB. This limit is included only in the following previous
releases:
• FortiAnalyzer 3.0 MR6 patch release 1
• FortiAnalyzer 3.0 MR5 patch release 5
RAID levels
All FortiAnalyzer units support standard RAID levels 0, 1, 5 and 10. Other RAID
support varies by model:
• FortiAnalyzer-100A/100B: none
• FortiAnalyzer-400: Linear, 0, 1, 5, 10 (RAID5 is configured in the CLI)
• FortiAnalyzer-800/800B: Linear, 0, 1, 5, 10 (RAID5 is configured in the CLI)
• FortiAnalyzer-2000/2000A: 0, 10 5, 50, 5 with hot spare
• FortiAnalyzer-4000/4000A: 0, 10 5, 50, 5 with hot spare
If a hard disk fails, and the selected RAID level cannot be accomplished using the
number of remaining hard disks, the FortiAnalyzer unit rebuilds the RAID using
the default RAID level. Default RAID level varies by model. By default,
FortiAnalyzer models with hardware RAID controllers use RAID 5; models with
software RAID controllers use RAID 10.
FortiAnalyzer units that contain software RAID are the FortiAnalyzer-400,
FortiAnalyzer-800/800B units. Hardware RAID is found on higher-end models,
such as FortiAnalyzer-2000/2000A, FortiAnalyzer-4000/4000A.
You can find out information about RAID from the get system status
command or diag raid info in the CLI.
FortiAnalyzer Version 3.0 MR7 Administration Guide
62 05-30007-0082-20080908
Page 63

System Config
Note: Fortinet recommends having an Uninterruptible Power Supply (UPS) in the event of
a power failure. UPS is recommended because when a power failure occurs, data in the
write cache is lost. Write cache is used to store data locally in memory before being written
to the disk drive media, and then continuing on to the next task.
Linear
A linear RAID level combines all hard disks into one large virtual disk. It is also
known as concatenation or JBOD (Just a Bunch of Disks). The total space
available in this option is the capacity of all disks used. There is very little
performance changes when using this RAID format, including any redundancy
available at this level. If any of the drives fails, the entire set of drives is unusable
until the faulty drive is replaced. All data will be lost. Linear RAID is available on
FortiAnalyzer-400 and FortiAnalyzer-800/800B units.
RAID 0
A RAID 0 array is also referred to as striping. The FortiAnalyzer unit writes
information evenly across all hard disks. The total space available is that of all the
disks in the RAID array. There is no redundancy available. If any of the drives fail,
the data cannot be recovered. This RAID level is beneficial because it provides
better performance, since the FortiAnalyzer unit can distribute disk writing across
multiple disks.
RAID 1
A RAID 1 array is also referred to as mirroring. The FortiAnalyzer unit writes
information to one hard disk, and writes a copy (a mirror image) of all information
to all other hard disks. The total disk space available is that of only one hard disk,
as the others are solely used for mirroring. This provides redundant data storage
with no single point of failure. Should any of the hard disks fail, there are several
backup hard disks available. With a FortiAnalyzer-400 for example, if one disk
fails, there are still three other hard disks the FortiAnalyzer unit can access and
continue functioning.
RAID 5
A RAID 5 array employs striping with a parity check. The FortiAnalyzer unit writes
information evenly across all drives. Additional parity blocks are written on the
same stripes. The parity block is staggered for each stripe. The total disk space is
the total number of disks in the array, minus one disk for parity storage. For
example, on a FortiAnalyzer-400 with four hard disks, the total capacity available
is actually the total for three hard disks. RAID 5 performance is typically better
with reading than writing, although performance is degraded when one disk has
failed or is missing. RAID 5 also ensures no data loss. If a drive fails, it can be
replaced and the FortiAnalyzer unit will restore the data on the new disk using
reference information from the parity volume.
Note: RAID 5 appears in the web-based manager only for FortiAnalyzer units with
hardware RAID.
FortiAnalyzer Version 3.0 MR7 Administration Guide
05-30007-0082-20080908 63
Page 64

Config System
RAID 10
RAID 10 (or 1+0), includes nested RAID levels 1 and 0, or a stripe (RAID 0) of
mirrors (RAID 1). The total disk space available is the total number of disks in the
array (a minimum of 4) divided by 2. Any drive from a RAID 1 array can fail without
loss of data. However, should the other drive in the RAID 1 array fail, all data will
be lost. In this situation, it is important to replace a failed drive as quickly as
possible.
Note: Fortinet recommends using RAID 10 for redundancy instead of RAID 5 on
FortiAnalyzer units with software RAID. RAID 5 causes system performance issues.
RAID 50
RAID 50 (or 5+0) includes nested RAID levels 5 and 0, or a stripe (RAID 0) and
stripe with parity (RAID 5). RAID 50 provides increased performance and also
ensures no data loss for the same reasons as RAID 5. For the following
FortiAnalyzer units, data is recoverable when:
• up to three disks fail (FortiAnalyzer-4000/4000A)
• up to two disks fail (FortiAnalyzer-2000/2000A).
RAID 5 with hot spare
FortiAnalyzer-2000/2000A and FortiAnalyzer-4000/4000A units can use one of
their hard disks as a hot spare (a stand-by disk for the RAID), should any of the
other RAID hard disks fail. If a hard disk fails, within a minute of the failure, the
FortiAnalyzer unit begins to automatically substitute the hot spare for the failed
drive, integrating it into the RAID array, and rebuilding the RAID’s data.
When you replace the failed hard disk, the FortiAnalyzer unit uses the new hard
disk as the new hot spare.
Note: RAID 10 requires an even number of disks. For example, on the
FortiAnalyzer-2000/2000A, when selecting RAID 10 with hot spare, the FortiAnalyzer unit
will use four of the six disks in the RAID 10 array, keeping one as a hot spare. The
additional hard disk will be defined as idle.
The FortiAnalyzer-2000/2000A and FortiAnalyzer-4000/4000A also supports hot swapping
of hard drive disks during operation. For more information, see “Hot swapping the
FortiAnalyzer-2000/2000A and FortiAnalyzer-4000/4000A” on page 66.
Hot swapping hard disks
Hot swapping refers to removing a failed hard disk and replacing it with a new one
while the FortiAnalyzer unit remains in operation.
FortiAnalyzer-100A/100B and FortiAnalyzer-100 units have a single hard disk. Hot
swapping is not available on these models.
FortiAnalyzer-400 models and higher can hot swap hard disks. For more
information, see the Knowledge Center article Replacing Hard Disks on the
FortiAnalyzer.
Hot swapping is supported only in FortiAnalyzer firmware 3.0 MR1 (build 292) and
higher. Hard disks in FortiAnalyzer units running firmware 3.0 (build 219) or earlier
are not hot swappable. Before replacing a disk, verify your firmware version in the
Dashboard of the web-based manager.
FortiAnalyzer Version 3.0 MR7 Administration Guide
64 05-30007-0082-20080908
Page 65

System Config
!
!
You can use any brand of hard disk to replace a failed hard disk, as long as it has
the same capacity or greater. For example, if replacing a 120 GB hard drive, you
could use either a 120 GB or 250 GB hard drive.
Caution: Do not replace a failed RAID hard disk with a smaller capacity hard disk. Using a
smaller capacity hard disk will reduce the RAID’s total capacity, resulting in data loss when
the RAID is reconfigured for its smallest drive.
Hot swapping in the FortiAnalyzer-400 and FortiAnalyzer-800/800B
The following diagram indicates the drive number and their location in the
FortiAnalyzer unit when you are looking at the front of the unit. Refer to this
diagram before removing the disk drive to ensure you remove the correct one.
Table 3: FortiAnalyzer-400 disk drive configuration.
Drive 1 (p1)
Drive 2 (p2)
Drive 3 (p3)
Drive 4 (p4)
Table 4: FortiAnalyzer-800/800B disk drive configuration.
Drive 1 Drive 2 Drive 3 Drive 4
Caution: Hot swapping is supported in RAID 1, 5, 10, 50, and 5 with hot spare.
To swap a FortiAnalyzer-400 or FortiAnalyzer-800/800B hard disk
1 Go to System > Config > RAID.
If you are using the RAID Monitor widget, select RAID Settings in the title bar
area. The RAID Monitor widget displays a warning symbol next to the failed disk.
2 Select Remove for the failed hard disk.
A message displays indicating it is safe to remove the disk from the drive.
3 Remove the hard disk from the drive bay on the FortiAnalyzer unit
• On the FortiAnalyzer-400, open the faceplate, remove the screws for the drive
and pull out the drive.
• On the FortiAnalyzer-800/800B, pull open the face place, unlock the drive and
pull out the drive.
4 Insert the new hard disk into the empty drive bay on the FortiAnalyzer unit,
reversing the steps above.
5 Refresh the RAID page.
The FortiAnalyzer disk controller will scan the available hard disks and update its
information with the new hard disk.
6 Select Add to add the hard disk to the RAID array.
The FortiAnalyzer unit rebuilds the RAID array with the new hard disk.
FortiAnalyzer Version 3.0 MR7 Administration Guide
05-30007-0082-20080908 65
Page 66

Config System
Hot swapping the FortiAnalyzer-2000/2000A and FortiAnalyzer-4000/4000A
The following diagram indicates the drive number and their location in the
FortiAnalyzer unit when you are looking at the front of the unit. Refer to this
diagram before removing the disk drive to ensure you remove the correct one.
You can use any brand of hard disk to replace a failed hard disk; however, you
must ensure that the hard disk size is the same size or larger as the remaining
working drives. Using a smaller drive will affect the RAID setup. The FortiAnalyzer
unit will reconfigure the RAID for the smallest drive, potentially causing data loss.
Table 5: FortiAnalyzer-2000/2000A disk drive configuration
Drive 1 (p1) Drive 4 (p4)
Drive 2 (p2) Drive 5 (p5)
Drive 3 (p3) Drive 6 (p6)
Table 6: FortiAnalyzer-4000 disk drive configuration
Drive 1 (p1) Drive 4 (p4) Drive 7 (p7) Drive 10 (p10)
Drive 2 (p2) Drive 5 (p5) Drive 8 (p8) Drive 11 (p11)
Drive 3 (p3) Drive 6 (p6) Drive 9 (p9) Drive 12 (p12)
The FortiAnalyzer-4000A can have different disk drive configurations because the
disk layout depends on the RAID controller model.
To swap a hard disk
1 Go to System > Config > RAID.
If you are using the RAID Monitor widget, select RAID Settings in the title bar
area. The RAID Monitor widget displays which hard disk has failed, displaying a
warning symbol next to the failed disk.
2 Select Remove for the failed hard disk.
3 Remove the hard disk from the drive bay on the FortiAnalyzer unit.
• On the FortiAnalyzer-2000/2000A, press in the tab and pull the drive handle to
remove the dive.
• On the FortiAnalyzer-4000/4000A, using a screw driver, turn the handle lock so
it is horizontal. Push the blue latch right and pull the drive handle to remove the
drive.
4 Select Click to start the controller re-scan.
The FortiAnalyzer disk controller scans the available hard disks and updates the
RAID array for the remaining hard disks. The RAID array status will be
“Degraded”.
5 Insert the new hard disk into the empty drive bay on the FortiAnalyzer unit.
6 Select Click to start controller re-scan.
The FortiAnalyzer disk controller will scan the available hard disks and update its
information with the new hard disk.
7 Select Add to add the hard disk to the RAID array.
The FortiAnalyzer unit rebuilds the RAID array with the new hard disk.
FortiAnalyzer Version 3.0 MR7 Administration Guide
66 05-30007-0082-20080908
Page 67

System Config
!
The options available here will depend on the RAID level selected. For most RAID
levels, you can only add the new hard disk back into the RAID array. If you are
running a RAID level with hot spare, you can also add the new hard disk as the
hot spare.
Configuring RAID on the FortiAnalyzer-400 and FortiAnalyzer-800/800B
The FortiAnalyzer-400 and FortiAnalyzer-800/800B have four hot swappable hard
disks. Hot swapping is available when running the FortiAnalyzer unit with RAID
level 1 and 5.
RAID settings can be configured from the Dashboard, in the RAID Monitor widget
as well as from System > Config > RAID.
For more information about the different RAID levels, see “RAID levels” on
page 62.
Caution: Back up all data before changing the RAID level. If you change RAID levels, the
FortiAnalyzer unit reformats the hard disks to support the new setting, which may result in
data loss.
Figure 32: RAID settings
RAID Level Select a RAID level and select Apply.
Total Disk Space The amount of disk space available within the RAID array. This
Free Disk Space The amount of free disk space.
Disk # The number identifying the disk.
Size The total size of the unit for the RAID level or the size of the spare
Status The status of the hard disk. For example, when functioning
Apply Select to apply a change to the settings.
value will change depending on the RAID type selected.
hard disk.
normally, “OK” appears.
Configuring RAID on the FortiAnalyzer-2000/2000A and FortiAnalyzer-4000/4000A
The FortiAnalyzer-2000/2000A has six hard disks and the
FortiAnalyzer-4000/4000A has 12 hard disks. For both units, the disks are
hot-swappable. This provides additional RAID options for greater flexibility for
data recovery, should a hard disk fail.
FortiAnalyzer Version 3.0 MR7 Administration Guide
05-30007-0082-20080908 67
Page 68

Config System
!
!
RAID settings can be configured from the Dashboard, in the RAID Monitor widget
as well as from System > Config > RAID.
Caution: Back up all data before changing the RAID level. If you change RAID levels, the
FortiAnalyzer unit reformats the hard disks to support the new setting, which may result in
data loss.
Figure 33: FortiAnalyzer-2000/2000A RAID settings
RAID Level Select a RAID level from the list. The current RAID level is shown
Total Disk Space The amount of disk space available within the RAID array.
Free Disk Space The amount of free disk space.
Disk # The number identifying the disk. These numbers reflect what disks
Size (GB) The size of the hard disk.
Status The current status of the hard disk. For example, OK indicates that
Apply Select to apply changes to RAID settings.
Configuring LDAP connections
On the LDAP tab, you can configure an LDAP query to an industry standard LDAP
or Windows Active Directory (AD) server.
LDAP queries can be used to create reports whose scope is restricted to include
only log messages whose user= field matches user names retrieved from an
LDAP server. For more information, see “Configuring reports” on page 113.
as the first RAID level in the list.
are available on the FortiAnalyzer unit. For example, on a
FortiAnalyzer-4000/4000A, there would be 1-12, whereas on a
FortiAnalyzer-2000 there would be 1-6.
the hard disk is okay and working normally; Not Present indicates
that the hard disk is not being detected by the FortiAnalyzer unit or
has been removed and no disk is available; Failed indicates that
the hard disk is not working properly.
Caution: By default, the LDAP query occurs over a standard LDAP connection. For secure
query (TLS or LDAPS) options, see the FortiAnalyzer CLI Reference.
FortiAnalyzer Version 3.0 MR7 Administration Guide
68 05-30007-0082-20080908
Page 69

System Config
LDAP Distinguished Name
Query
Figure 34: LDAP settings
To define an LDAP server query
1 Go to System > Config > LDAP.
2 Select Create New. Complete the following:
Name Enter the name for the LDAP server query.
Server Name/IP Enter the LDAP server domain name or IP address.
Server Port Enter the port number. By default, the port is 389.
Server Type Select whether to use anonymous or authenticated (regular)
Bind DN Enter an LDAP user name in DN format to authenticate as a
Bind Password Enter the LDAP user’s password.
Common Name
Identifier
Base DN Enter the Distinguished Name of the location in the LDAP
LDAP Distinguished
Name Query
queries.
If selecting Anonymous, your LDAP server must be configured to
allow unauthenticated anonymous queries.
If selecting Regular, you must also enter the Bind DN and Bind
Password.
specific LDAP user, and bind the query to a DN.
This option appears only when the Server Type is Regular.
This option appears only when the Server Type is Regular.
Enter the attribute identifier used in the LDAP query filter. By
default, the identifier is cn.
For example, if the Base DN contains several objects, and you
want to include only objects whose cn=Admins, enter the
Common Name Identifier cn and enter the Group(s) value
Admins when configuring report profiles. For more information,
see “Configuring reports” on page 113.
Report scopes using this query require Common Name Identifier.
If this option is blank, the LDAP query for reports will fail.
directory which will be searched during the query.
To improve query speed, enter a more specific DN to constrain
your search to the relevant subset of the LDAP tree.
For example, instead of entering dc=example,dc=com you
might enter the more specific DN
ou=Finance,dc=example,dc=com. This restricts the query to
the “Finance” organizational unit within the tree.
Report scopes using this query require Base DN. If this option is
blank, the LDAP query for reports will fail.
Select to test the query.
Entries in the Base DN appear; if the query results contains
multiple levels, entries appear under their parent object.
FortiAnalyzer Version 3.0 MR7 Administration Guide
05-30007-0082-20080908 69
Page 70

Maintenance System
!
3 Select OK.
The LDAP query becomes an available option when configuring variables for
report profiles. For more information, see “Configuring reports” on page 113.
Maintenance
Maintenance enables you to backup and restore configuration files for the
FortiAnalyzer unit, to upload firmware, and to configure automatic RVS updates.
Backup & Restore
Backup & Restore displays the date and time of the last configuration backup and
the last firmware upload. It also enables you to:
• download and back up a FortiAnalyzer unit’s configuration
• upload and restore a FortiAnalyzer unit’s configuration
• upload a firmware update
Backup copies of the FortiAnalyzer unit configuration file can be encrypted with a
password. When restoring encrypted configuration files, the password must be
entered to decrypt the file.
Caution: Do not forget the password to the backup configuration file. A passwordencrypted backup configuration file cannot be restored without the password.
For additional information about backing up and restoring configuration, see
“Managing firmware versions” on page 169.
Figure 35: Backup & Restore options
Last Backup The date and time of the last backup to local PC
Backup Back up the current configuration.
Backup configuration to: Currently, the only option is to back up to your local PC.
FortiAnalyzer Version 3.0 MR7 Administration Guide
70 05-30007-0082-20080908
Page 71

System Maintenance
Encrypt configuration
file
Backup Select to back up the configuration.
Restore Restore the configuration from a file.
Restore configuration
from:
Filename Enter the configuration file name or use the Browse
Password Enter the password if the backup file is encrypted.
Restore Select to restore the configuration from the selected file.
Firmware
Partition A partition can contain one version of the firmware and
Active A green check mark indicates which partition contains the
Last Upgrade The date and time of the last update to this partition.
Firmware Version The version and build number of the FortiAnalyzer
Select to encrypt the backup file. Enter a password in the
Password field and enter it again in the Confirm field. You
will need this password to restore the file.
You must encrypt the backup file if you are using a
secure connection to a FortiGate or FortiManager device.
Currently the only option is to restore from a PC.
button if you are restoring the configuration from a file on
the management. computer.
the system configuration.
firmware and configuration currently in use.
firmware. On the backup partition, you can:
• Select Upload to replace with firmware from the
management computer.
• Select Upload and Reboot to replace the firmware.
FortiGuard Center
You can update the engine and vulnerability scan modules in one of the following
ways:
• manually upload update packages to the FortiAnalyzer unit from your
• configure the FortiAnalyzer unit to periodically request updates from the
You must first register the FortiAnalyzer unit with the Fortinet Technical Support
web site, https://support.fortinet.com/ to receive RVS updates from the FDN. The
FortiAnalyzer unit must also have a valid Fortinet Technical Support contract,
which includes RVS update subscriptions, and be able to connect to the FDN or
the IP address that you have configured to override the default FDN addresses.
For port numbers required for license validation and update connections, see the
Fortinet Knowledge Center article FDN Services and Ports.
For more information about configuring vulnerability scan jobs and viewing
vulnerability scan reports, see “Tools” on page 157.
To manually upload RVS updates or to configure scheduled RVS updates, go to
System > Maintenance > FortiGuard Center.
management computer
Fortinet Distribution Network (FDN)
FortiAnalyzer Version 3.0 MR7 Administration Guide
05-30007-0082-20080908 71
Page 72

Maintenance System
Figure 36: FortiGuard Center
FortiGuard
Subscription
Services
Manual Update Select to upload an RVS upgrade file from your management computer.
Remote
Vulnerability
Scan (RVS)
Use override
server address
Use Web Proxy Select to enable the FortiAnalyzer unit to connect to the FDN through a
IP Enter the IP address of the web proxy.
The RVS (remote vulnerability scan) engine and module version number,
date of last update, and status of the connection to the Fortinet
Distribution Network (FDN).
A green indicator means that the FortiAnalyzer unit can connect to the
FDN or override server.
A grey indicator means that the FortiAnalyzer unit cannot connect to the
FDN or override server. Check the configuration of the FortiAnalyzer unit
and any NAT or firewall devices that exist between the FortiAnalyzer unit
and the FDN or override server. For example, you may need to add
routes to the FortiAnalyzer unit’s routing table.
To obtain an RVS upgrade file, contact Fortinet Technical Support.
You might upload an RVS file if you want to provide an immediate
update, or use an RVS version other than the one currently provided by
the FDN. If you want to use an RVS file other than the one currently
provided by the FDN, also disable scheduled updates.
Note: Manual updates are not a substitute for a connection to the FDN.
Like scheduled updates, manual updates require that the FortiAnalyzer
unit be able to connect to the FDN to validate its RVS license.
Select the blue arrow to expand this FortiAnalyzer unit’s FortiGuard RVS
subscription service options.
Enable Use override server address and enter the IP address and port
number of an FDS in the format <IP>:<port>, such as
10.10.1.10:8889.
If you want to connect to a specific FDN server other than the one to
which the FortiAnalyzer unit would normally connect, you can override
the default IP addresses by configuring an override server.
If, after applying the override server address, the FDN status icon
changes to indicate availability (a green check mark), the FortiAnalyzer
unit has successfully connected to the override server. If the icon still
indicates that the FDN is not available, the FortiAnalyzer unit cannot
connect to the override server. Check the FortiAnalyzer configuration
and the network configuration to make sure you can connect to the FDN
override server from the FortiAnalyzer unit.
web proxy, then enter the IP, Port, and (if required) Name and Password.
FortiAnalyzer Version 3.0 MR7 Administration Guide
72 05-30007-0082-20080908
Page 73

System Maintenance
Port Enter the port number of the web proxy.
This is usually 8080.
Name If your web proxy requires a login, enter the user name that your
Password If your web proxy requires a login, enter the password that your
Scheduled
Update
Every Select to update once every n hours, then select the number of hours in
Daily Select to update once every day, then select the hour. The update
Weekly Select to update once a week, then select the day of the week and the
Request Update
Now
FortiAnalyzer unit should use when connecting to the FDN through the
web proxy.
FortiAnalyzer unit should use when connecting to the FDN through the
web proxy.
Enable scheduled updates, then select the frequency of the update
(Every, Daily or Weekly).
the interval.
attempt occurs at a randomly determined time within the selected hour.
hour of the day. The update attempt occurs at a randomly determined
time within the selected hour.
Select to immediately request an update.
FortiAnalyzer Version 3.0 MR7 Administration Guide
05-30007-0082-20080908 73
Page 74

Maintenance System
FortiAnalyzer Version 3.0 MR7 Administration Guide
74 05-30007-0082-20080908
Page 75

Device Viewing the device list
Device
The Device menu controls connection attempt handling, permissions, disk space
quota, and other aspects of devices connecting to the FortiAnalyzer unit for
remote logging, content archiving, quarantining, and/or remote management.
For a diagram of traffic types, ports and protocols that FortiAnalyzer units use to
communicate with other devices and services, see the Knowledge Center article
Traffic Types and TCP/UDP Ports used by Fortinet Products.
This section includes the following topics:
• Viewing the device list
• Configuring unregistered device connection attempt handling
• Manually adding a device
• Blocking device connection attempts
• Configuring device groups
Note: Connection attempts not handled by the device list include log aggregation, log
forwarding, and SNMP traps. For more information about configuring connection handling
for those types, see “Configuring log aggregation” on page 58, “Configuring log forwarding”
on page 60, and “Configuring SNMP traps and alerts” on page 136.
Viewing the device list
The device list displays devices allowed to connect to the FortiAnalyzer unit and
their connection permissions. It may also display unregistered devices attempting
to connect.
Connection attempts occur when a device sends traffic to the FortiAnalyzer unit
before you have added the device to device list on the FortiAnalyzer unit.
FortiAnalyzer units either ignore the connection attempt, or automatically add the
device to its device list. This connection attempt handling depends on the type of
the device attempting to connect, your selections in Unregistered Device Options,
and whether or not the maximum number of devices has been reached on the
FortiAnalyzer unit.
• For more information about connection attempt handling, see “Configuring
unregistered device connection attempt handling” on page 79.
• For more information about the device number maximum, see “Maximum
number of devices” on page 76.
• For more information about manually adding a device to the device list, see
“Manually adding a device” on page 80.
You may want to block connection attempts from devices that you do not want to
add to the device list since connection attempts must be reconsidered with each
attempt. For more information, see “Blocking device connection attempts” on
page 86.
FortiAnalyzer Version 3.0 MR7 Administration Guide
05-30007-0082-20080908 73
Page 76

Viewing the device list Device
Delete
Block
Edit
Add
Devices may automatically appear on the device list when the FortiAnalyzer
receives a connection attempt, according to your configuration of Unregistered
Device Options, but devices may also automatically appear as a result of
importing log files. For more information, see “Importing a log file” on page 95.
To view the device list, go to Device > All.
Figure 1: Devices list
Add Device Select to manually add a new device to the device list.
For instructions on manually adding devices, see “Manually
adding a device” on page 80.
Show Select the type of devices to display in the list. You can select
Page Enter a page number, then press Enter to display that page
Unregistered Device
Options
Name The name of the device in the device list. This can be any
Hardware The model of the device. For example, the device list displays a
IP Address The IP address of the device. If the device has not recently
Administrative
Domains
Log Tx Rx
Content Tx Rx
Quar Tx Rx
Report Tx Rx
devices by type or by group, or select Unregistered to display
devices that are attempting to connect but that have not yet been
added.
number of the device list.
Select the options to instruct the FortiAnalyzer unit on how to
handle connection attempts from unregistered devices. For more
information, see “Configuring unregistered device connection
attempt handling” on page 79.
descriptive name that you want assign to it, and does not need to
be its host name.
FortiGate-300A model as FGT300A.
established a connection, 0.0.0.0 appears.
The ADOM(s) to which the device is assigned.
This column does not appear on FortiAnalyzer-100/A/B models.
Indicates connection permissions. Green check mark icons in:
• Tx indicates the device is allowed to transmit to the
FortiAnalyzer unit.
• Rx indicates the device is allowed to view or retrieve items
stored on the FortiAnalyzer unit.
Types of connections supported by each device type vary, and so
it is normal for some device types to have no permission in
Content (content archive), Quar (quarantine), and Report
columns, or to have Tx but not Rx permission in the Log column.
For example, Syslog devices are not capable of retrieving logs,
and so have no associated Rx permission in the Log column.
For FortiManager units, Tx and Rx indicators in the Log column
differ in meaning.
74 05-30007-0082-20080908
FortiAnalyzer Version 3.0 MR7 Administration Guide
Page 77

Device Viewing the device list
• Tx indicates logging access for all devices managed by the
FortiManager system.
• Rx indicates that the FortiManager system can remotely
administer the FortiAnalyzer unit.
For more information about on configuring device connection
permissions, see “Devices Privileges” on page 82.
Secure Connection Indicates whether an IPSec VPN tunnel has been enabled for
Disk Space (MB)
Used/Allocated
Action Select Edit to reconfigure the device connection.
secure transmission of logs, content and quarantined files. A
locked icon indicates that Secure Connection is enabled.
Enable and configure secure connections in the CLI. The secure
tunnel must be configured on both ends of the tunnel: the
FortiAnalyzer unit and the device.
Secure Connections cannot be configured with FortiMail units,
FortiClient installations, or Syslog devices. For more information
on the CLI command, see the FortiAnalyzer CLI Reference.
On a FortiAnalyzer unit:
config log device
edit <devname_str>
set secure psk
set psk <presharedkey_str>
set id <devid_str>
end
On a FortiGate unit:
config system fortianalyzer
set encrypt enable
set psksecret <presharedkey_str>
set localid <devname_str>
end
On a FortiManager unit:
config fmsystem log fortianalyzer
set secure_connection enable
set psk <presharedkey_str>
set localid <devname_str>
end
Caution: The locked icon does not indicate successful secure
transmission — it only indicates whether the Secure Connection
feature is enabled.
For example, if Secure Connection is enabled but not yet
configured, the locked icon will appear, but the FortiAnalyzer unit
cannot create a secure tunnel without being configured first.
For more information on the secure connection and fallback
behavior, see “Unregistered vs. registered devices” on page 77
Caution: Changing a device’s FortiAnalyzer settings clears
sessions to its FortiAnalyzer unit’s IP address. If the FortiAnalyzer
unit is behind a NAT device, such as a FortiGate unit, this also
resets sessions to other hosts behind that same NAT.
To prevent disruption of other devices’ traffic, on the NAT device,
create a separate virtual IP for the FortiAnalyzer unit.
The amount of the FortiAnalyzer disk space allocated for the
device and how much of that space is used. For more information
about on disk space usage by quarantine files, see “Viewing
quarantined files” on page 131.
Select Delete to remove a device from the list. If the Delete option
does not appear for the device, first remove it from all device
groups, then delete the device.
FortiAnalyzer Version 3.0 MR7 Administration Guide
05-30007-0082-20080908 75
Page 78

Viewing the device list Device
For unregistered devices, additional icons appear.
Select Add to add the device to the device list and to configure the
connection, or select Block to stop further connection attempts.
For instructions on manually adding devices, see “Manually
adding a device” on page 80. For more information about on
blocking a device, see “Blocking device connection attempts” on
page 86.
To delete a device
1 Go to Device > All > Device.
2 In the row corresponding to the device that you want to delete, in the Action
column, select Delete.
A confirmation dialog appears.
The Delete option may not appear if the device is referenced elsewhere in the
configuration, such as by being assigned to a device group. To delete the device,
first remove all configuration references to that device.
3 Select OK.
The device is removed from the device list and associated log and other data,
such as content archives and the default report profile for the device (that is, the
device summary report Default_<device-id>) are deleted. Reports that may
have been already generated from the device’s log data, however, are not
deleted.
If the device is still configured to attempt to connect to the FortiAnalyzer unit and
you have configured Unregistered Device Options to display connection attempts
from unregistered devices, the device may reappear in the device list.
Maximum number of devices
Each FortiAnalyzer model is designed to support and provide effective logging
and reporting capabilities for up to a certain maximum number of devices
(registered and unregistered combined). The following table details these
maximums.
Table 7: FortiAnalyzer device limits
FortiAnalyzer-100A/100B 100 100 FortiGate-50A to
FortiAnalyzer-400/400B 200 2000 FortiGate-50A to
FortiAnalyzer-800 500 5000 FortiGate-50A to
FortiAnalyzer-800B 500 5000 FortiGate-50A to
FortiAnalyzer2000/2000A
FortiAnalyzer-4000 500 10 000 All
FortiAnalyzer-4000A 700 10 000 All
Maximum number
of devices and / or
VDOMs allowed
500 5000 All
Maximum
number of
FortiClient
installations
allowed
FortiGate
models
supported
FortiGate-100A
FortiGate-800
FortiGate-800
FortiGate-3000
FortiAnalyzer Version 3.0 MR7 Administration Guide
76 05-30007-0082-20080908
Page 79

Device Viewing the device list
For networks with more demanding logging scenarios, an appropriate device ratio may be
less than the allowed maximum. Performance will vary according to your network size,
device types, logging thresholds, and many other factors. When choosing a FortiAnalyzer
model, consider your network’s log frequency, and not only your number of devices.
A VDOM or high availability (HA) cluster counts as a single “device” towards to
maximum number of allowed devices. Multiple FortiClient installations (which can
number up to the limit of allowed FortiClient installations) also count as a single
“device.”
For example, a FortiAnalyzer-100B could register up to either:
• 10 devices
• 9 devices and 100 FortiClient installations
• 9 devices and one HA pair
• 1 device and 9 VDOMs
but could not register 1 device and 900 FortiClient installations.
When devices attempt to connect to a FortiAnalyzer unit that has reached its
number of maximum number of allowed devices, the FortiAnalyzer unit will reject
connection attempts by excess devices, and automatically add those excess
devices to the list of blocked devices. For more information about on blocked
devices, see “Blocking device connection attempts” on page 86.
Once the FortiAnalyzer unit has exceeded its maximum number of allowed
devices, you will not be able to add devices to the device list. To resume adding
devices, you must first block a device that is currently on your device list, then
unblock the device you want to add and add it to the device list.
Unregistered vs. registered devices
The FortiAnalyzer device list can display both registered and unregistered
devices.
If you have configured Unregistered Device Options to do so, unregistered
devices appear in the device list when the FortiAnalyzer unit receives a
connection attempt. However, a device will not be able to use most of the
FortiAnalyzer unit’s features until you register the device, either manually or
automatically.
If you want to configure connection attempt handling, including whether or not a
device is automatically added to the device list as a registered or unregistered
device, see “Configuring unregistered device connection attempt handling” on
page 79.
For more information about manually registering a device, see “Manually adding a
device” on page 80.
Note: Both registered and unregistered devices count towards the maximum number of
devices available for a FortiAnalyzer unit. Too many unregistered devices will prevent you
from adding a device. For more information, see “Maximum number of devices” on
page 76.
FortiAnalyzer Version 3.0 MR7 Administration Guide
05-30007-0082-20080908 77
Page 80

Configuring unregistered device connection attempt handling Device
Configuring unregistered device connection attempt handling
You can configure the FortiAnalyzer unit to accept and handles connection
attempts automatically, or to allow connections only from devices that you have
manually added.
Allowing the connection and registering the device enables certain FortiAnalyzer
features. For example, registering known-type devices, either manually or
automatically, configures the FortiAnalyzer unit for features such as device-
specific reports and remote browsing of log messages. Manually adding unknown-
type devices allows you to browse their logs.
Device connection attempt handling and other FortiAnalyzer features vary by
device type. There are two types of devices:
• known device types (FortiGate, FortiManager, FortiClient, FortiMail)
• unknown device type (generic Syslog devices)
Connection attempt handling options for known and unknown device types are
separate.
Depending on your settings in Unregistered Device Options, and whether the
device type is known or unknown, the FortiAnalyzer unit handles connection
attempts in one of these ways:
• ignore the connection (only allow connections from manually added devices)
• allow the connection, add as an unregistered device, but do not keep the
device’s log data (add devices automatically, but do not keep data until you
manually register them)
• if the device is an unknown type, allow the connection, add as an unregistered
device, and keep a specified amount of the device’s log data
• if the device is a known type, allow the connection, add as a registered device,
and keep a specified amount of the device’s log data
If you have specified that connections from unregistered devices will not be
allowed until you manually add them, you must manually configure the connection
before the device will be allowed to connect to the FortiAnalyzer unit.
When devices attempt to connect to a FortiAnalyzer unit that has reached its
number of maximum number of allowed devices, the FortiAnalyzer unit will reject
connection attempts by excess devices, and automatically add those excess
devices to the list of blocked devices. For more information about on blocked
devices, see “Blocking device connection attempts” on page 86.
To view the current connection handling settings, go to Device > All > Device and
select Unregistered Device Options.
Note: Many FortiAnalyzer features are not available for unregistered devices of unknown
types. For more information about on the differences between unregistered and registered
devices, see “Unregistered vs. registered devices” on page 77.
Both registered and unregistered devices count towards the maximum number of devices
available for a FortiAnalyzer unit. Too many unregistered devices will prevent you from
adding a device. For more information, see “Maximum number of devices” on page 76.
FortiAnalyzer Version 3.0 MR7 Administration Guide
78 05-30007-0082-20080908
Page 81

Device Configuring unregistered device connection attempt handling
Figure 2: Unregistered Device Options
To configure device connection attempt handling
1 Go to Device > All > Device.
2 Select Unregistered Devices Options.
3 Select from the following options for known device types:
Ignore connection and log data Do not accept connection attempts, and do not add
Allow connection, add to
unregistered table, but ignore log
data
Allow connection, register
automatically, and store up to N
MB data
devices to the device list.
Add the device to the unregistered device list for
future configuration and addition to the FortiAnalyzer
unit, but do not save the incoming log messages to
the hard disk.
Add the device to the registered device list for future
configuration and addition to the FortiAnalyzer unit,
and save the log messages to the hard disk, but only
up to N MB disk space.
or the following options for unknown device types:
Ignore all unknown unregistered
devices
Add unknown unregistered device
to unregistered table, but ignore
data
Add unknown unregistered
devices to unregistered table, and
store up to N MB data
Do not accept any unknown, unregistered incoming
device requests, and do not add them to the
unregistered device list.
Add the device to the unregistered device list for
future configuration and addition to the FortiAnalyzer
unit, but do not save the incoming log messages to
the hard disk.
Add the device to the unregistered device list for
future configuration and addition to the FortiAnalyzer
unit, and save the log messages to the hard disk, but
only up to N MB disk space. Logs cannot be
displayed until you add the device to the device list.
4 Select OK.
FortiAnalyzer Version 3.0 MR7 Administration Guide
05-30007-0082-20080908 79
Page 82

Manually adding a device Device
Manually adding a device
You can add devices to the FortiAnalyzer unit’s device list either manually or
automatically. If you have configured Unregistered Device Options to
automatically register known-type devices, you may only need to manually add
unknown-type devices such as a generic Syslog server. If you have configured
Unregistered Device Options to require it, you may be required to add all devices
manually. For more information, see “Configuring unregistered device connection
attempt handling” on page 79.
If the device has already been automatically added, the device was added to the
device list using default settings. You can reconfigure the device connection by
manually editing the device in the device list.
Manually adding a device to the device list, or editing its configuration, configures
connections from the device but does not automatically establish a connection.
You need to configure the device to send traffic to the FortiAnalyzer unit to
establish a connection. For more information, see the FortiGate Administration
Guide, FortiMail Administration Guide, FortiManager Administration Guide,
FortiClient Administrator’s Guide, or your Syslog server’s documentation. If there
is no explicit option to log specifically to a FortiAnalyzer unit, you can use options
for remote logging to a Syslog server.
Due to the nature of connectivity for certain high availability (HA) modes,
FortiGate units in an HA cluster may not be able to send full content archives and
quarantine data. For more information, see the FortiGate HA Overview.
All FortiClient installations are added as a single device, rather than as one device
configuration per FortiClient installation, and their log messages are stored
together. Use the FortiAnalyzer reporting features, to obtain network histories for
individual FortiClient installations.
You must add the FortiManager system to the FortiAnalyzer device list to remotely
administer the FortiAnalyzer unit using a FortiManager system. Additionally, you
must also:
• enable web services on the FortiAnalyzer network interface that will be
connected to the FortiManager system
• register the FortiAnalyzer unit with the FortiManager system
• be able to connect from your computer to the web-based manager of both the
FortiManager system and the FortiAnalyzer unit.
For more information on enabling web services, see “Administrative Access” on
page 45. For more information on configuring remote management of
FortiAnalyzer units using a FortiManager system, see the FortiManager
Administration Guide.
Note: Remote logging from FortiClient installations requires FortiClient 3.0 MR2 or later.
FortiAnalyzer Version 3.0 MR7 Administration Guide
80 05-30007-0082-20080908
Page 83

Device Manually adding a device
Figure 3: Configuring a device
Device Type Select the device type.
The type is automatically pre-selected if you are adding an
unregistered device from the device list, or if you are editing an
existing device.
Other device options vary by the device type.
Device Name Enter a name to represent the FortiGate unit, such as FG-1000-
IP Address Enter the IP address of the device.
Device ID Enter the device ID. Device IDs are usually the serial number of
Mode Select the high availability (HA) mode of the device. If you are
Member IDs For each member in the HA cluster, enter the device ID of the
Description Enter any additional information on the device. Description
Allocated Disk Space
(MB)
1.This can be any descriptive name that you want assign to it, and
does not need to be its host name.
The device name is automatically pre-entered if you are adding a
FortiClient installation.
This option appears only if Device Type is Syslog.
the device, and usually appear on the dashboard of the device’s
web-based manager.
The device ID is automatically pre-entered if you are adding an
unregistered device from the device list, or if you are editing an
existing device.
This option does not appear if Device Type is Syslog or FortiClient.
adding a single unit, select Standalone. If you are adding an HA
cluster, select HA, then add the device ID of each unit in the
cluster to Member IDs.
This option appears only if Device Type is FortiGate or
FortiManager.
member and select Add.
This option appears only if Mode is HA.
information appears when you hover the mouse over a device
name in the device list.
Enter the amount of FortiAnalyzer hard disk space allocated to the
device’s log and content messages, including quarantined files.
For more information about on quarantine file disk quota, see
“Viewing quarantined files” on page 131.
The allocated space should be at least 10 times the log rolling size
for the Log and Content Archive. For example, if you set the log
and content archive log file roll size to 50 MB, allocate at least
500 MB of disk space for the device.
FortiAnalyzer Version 3.0 MR7 Administration Guide
05-30007-0082-20080908 81
Page 84

Manually adding a device Device
Amounts following the disk space allocation field indicate the
amount of disk space currently being used by the device, and the
total amount of disk space currently available on the FortiAnalyzer
unit.
When Allocated Disk
Space is All Used
Devices Privileges Select the blue arrow to expand the area, then select which types
Group Membership Select the blue arrow to expand the area, then assign the device
FortiGate Interface
Specification
Select to either overwrite older files or stop logging to indicate
what the FortiAnalyzer unit should do when the allocated disk
space has been used.
of connections the device is permitted to make. Available
permissions vary by device type.
to a device group or groups. For more information, see
“Configuring device groups” on page 88.
This option does not appear if Device Type is FortiClient.
Select the blue arrow to expand the area, then assign each
network interface to a network interface class. Traffic between
classes determines traffic flow directionality for reports. For more
information, see “Classifying FortiGate network interfaces” on
page 84.
To manually add a device or HA cluster
1 Go to Device > All > Device.
2 If the device appears in the device list but is unregistered, from Show, select
Unregistered, then in row corresponding to the device, in the Action column,
select Add.
Otherwise, select Add Device.
3 Select the Device Type.
4 If Device Type is not FortiClient, enter the Device Name.
5 If Device Type is not Syslog or FortiClient, enter the Device ID.
If the device is a high availability (HA) cluster, enter the device ID of the primary
unit.
6 If Device Type is Syslog, enter the IP address of the Syslog device.
7 If Device Type is FortiGate or FortiManager, from Mode, select either Standalone
or HA to indicate the high availability (HA) mode of the device.
If Mode is HA, also add the device ID of each member unit other than the primary
unit to Members IDs.
8 Enter the Description, if any.
9 Enter the device’s disk space quota in Allocated Disk Space.
10 Select from When Allocated Disk Space is All Used to either Overwrite Oldest Log
Files or to Stop Logging.
11 Select the blue arrow to expand Devices Privileges.
12 Select the connection privileges (Tx
and Rx) of the device, such as for sending and
viewing log files, content archives and quarantined files. Available device
connection privileges vary by Device Type.
Note: Remotely accessing logs, content logs and quarantined files is available on FortiGate
units running firmware version 3.0 or later.
FortiAnalyzer Version 3.0 MR7 Administration Guide
82 05-30007-0082-20080908
Page 85

Device Manually adding a device
13 Select the blue arrow to expand Group Membership.
This option does not appear if Device Type is FortiClient. In that case, also skip
the following step.
14 From the Available Groups area, select a device group or groups, if any, to which
you want to assign the device, then select the right arrow button to move the
group name into the Membership area.
Devices can belong to multiple groups. You can also add the device to a group
later, or change the assigned group. For more information, see “Configuring
device groups” on page 88.
15 Select the blue arrow to expand FortiGate Interface Specification.
This option appears only if Device Type is FortiGate. If this option does not
appear, proceed to the following step.
16 Define the functional class of each network interface or VLAN sub-interface.
For more information about how to define the functional class of each network
interface or VLAN sub-interface, see “Classifying FortiGate network interfaces” on
page 84.
17 Select OK.
The device appears in the device list. After registration, some device types can be
configured for Secure Connection. For more information, see “Secure
Connection” on page 74.
Classifying FortiGate network interfaces
The FortiGate Interface Specification area enables you to functionally classify
network interfaces and VLAN subinterfaces according to their connections in your
network topology. Functionally classifying the device’s network interfaces and
VLAN subinterfaces as None, LAN, WAN or DMZ indirectly defines the
directionality of traffic flowing between those network interfaces. For example,
FortiAnalyzer units consider log messages of traffic flowing from a WAN class
interface to a LAN or DMZ class interface to represent incoming traffic.
Some report types for FortiGate devices include traffic direction — inbound or
outbound traffic flow. When the FortiAnalyzer unit generates reports involving
traffic direction, the FortiAnalyzer unit compares values located in the source and
destination interface fields of the log messages with your defined network
interface classifications to determine the traffic directionality.
The table below illustrates the traffic directionality derived from each possible
combination of source and destination interface class.
Table 8: Traffic directionality by class of the source and destination interface
Source interface class Destination interface class Traffic direction
None All types Unclassified
All types None Unclassified
WAN LAN, DMZ Incoming
WAN WAN External
LAN, DMZ LAN, DMZ Internal
LAN, DMZ WAN Outgoing
FortiAnalyzer Version 3.0 MR7 Administration Guide
05-30007-0082-20080908 83
Page 86

Manually adding a device Device
To classify network interfaces and VLAN subinterfaces of a FortiGate unit
1 Go to Device > All > Device.
2 Configure the FortiGate device.
For more information, see “Manually adding a device” on page 80.
3 Select the blue arrow to expand FortiGate Interface Specifications.
This area may be automatically pre-configured with default classifications. In this
case, verify that the network interface classifications match your network topology.
If no modification is necessary, select OK, and do not perform the following steps.
4 For each network interface, in Available Interfaces, enter the name of the network
interface as it appears in log messages, then select Add.
The name of each network interface appears in the Available Interfaces area.
5 For each network interface name in the Available Interfaces area, select the name
of the network interface, then either leave it in Available Interfaces (which results
in a class of None), or move it to the LAN, DMZ, or WAN area using the right arrow
for that class.
6 From Default type for interfaces not listed here, select None, LAN, WAN, or DMZ
to indicate the default class of any network interfaces that you have not manually
classified.
7 Select OK.
Manually adding a FortiGate unit using the Fortinet Discovery Protocol (FDP)
If you configure the FortiAnalyzer unit to respond to Fortinet Discovery Protocol
(FDP) packets, FortiGate units running FortiOS version 3.0 or greater can use
FDP to locate a FortiAnalyzer unit. To use FDP, both units must be on the same
subnet, and they must be able to connect using UDP.
When a FortiGate administrator selects Automatic Discovery, the FortiGate unit
sends FDP packets to locate FortiAnalyzer units on the same subnet. If FDP has
been enabled for its interface to that subnet, the FortiAnalyzer unit will respond.
Upon receiving an FDP response, the FortiGate unit knows the IP address of the
FortiAnalyzer unit, and the administrator can configure the FortiGate unit to begin
sending log, content archive, and/or quarantine data to that IP address. When the
FortiGate unit attempts to send data to the FortiAnalyzer unit, the FortiAnalyzer
unit detects the connection attempt.
Connection attempts from devices not registered with the FortiAnalyzer unit’s
device list may not be automatically accepted. In this case, you may need to
manually add the device to the device list. For more information, see “Configuring
unregistered device connection attempt handling” on page 79.
For a diagram of traffic types, ports and protocols that FortiAnalyzer units use to
communicate with other devices and services, see the Knowledge Center article
Traffic Types and TCP/UDP Ports used by Fortinet Products.
Note: Due to the nature of connectivity for certain high availability (HA) modes, full content
archiving and quarantining may not be available for FortiGate units in an HA cluster. For
more information, see the FortiGate HA Overview.
Unregistered Device Options apply to all device types attempting to connect, not just
FortiGate units.
FortiAnalyzer Version 3.0 MR7 Administration Guide
84 05-30007-0082-20080908
Page 87

Device Manually adding a device
To enable the FortiAnalyzer unit to reply to FDP packets
1 On the FortiAnalyzer unit, go to Device > All.
2 Go to System > Network.
3 Select Modify for the network interface that should reply to FDP packets.
4 Enable Fortinet Discovery Protocol.
5 Select OK.
The FortiAnalyzer unit is now configured to respond to FDP packets on that
network interface, including those from FortiGate units’ Automatic Discovery
feature. For more information about connecting the FortiGate unit using FDP, see
“To connect a FortiGate unit to a FortiAnalyzer unit using FDP” on page 85.
To connect a FortiGate unit to a FortiAnalyzer unit using FDP
1 On the FortiGate unit, go to Log&Report > Log Config > Log Setting.
2 Select Remote Logging.
3 Select FortiAnalyzer.
4 From Minimum log level, select the severity threshold that log messages must
meet or exceed to be remotely logged to the FortiAnalyzer unit.
5 In the FortiAnalyzer IP area, select Automatic Discovery.
6 If the FortiAnalyzer unit does not appear in the Connect To list, select Discover.
The FortiGate unit sends FDP packets to other hosts on the FortiGate unit’s
subnet. If a FortiAnalyzer unit exists on the subnet and is configured to reply to
FDP packets, it sends a reply, and its IP address appears in the Connect To list.
If your FortiGate unit is connecting to a FortiAnalyzer unit from another network,
such as through the Internet or through other firewalls, this may fail to locate the
FortiAnalyzer unit, and you may need to configure an IPSec VPN tunnel to
facilitate the connection. For more information and examples, see the Fortinet
Knowledge Center article Sending remote FortiGate logs to a FortiAnalyzer unit
behind a local FortiGate unit.
7 From the Connect To list, select a FortiAnalyzer unit.
8 Select Apply.
9 To verify connectivity with the FortiAnalyzer unit, select Test Connectivity.
Test Connectivity verifies connectivity by OFTP. OFTP is required by device
registration, content archiving, quarantining, and remote viewing of logs and
reports, and display connection permissions, but not to send log messages. If Test
Connectivity fails, the FortiAnalyzer unit’s Unregistered Device Options may
require that you manually register the FortiGate unit with the device list. For more
information, see “Configuring unregistered device connection attempt handling”
on page 79. For more information about manually registering the device, see
“Manually adding a device” on page 80. If the FortiGate unit is registered but Test
Connectivity still fails, verify configurations of any intermediate devices such as
routers or firewalls.
FortiAnalyzer Version 3.0 MR7 Administration Guide
05-30007-0082-20080908 85
Page 88

Blocking device connection attempts Device
Delete
Unblock
Test Connectivity does not verify connectivity by Syslog. Syslog is required to
send log messages. To verify Syslog connectivity, trigger FortiGate logs, then go
to Log&Report > Log Access > Remote. Steps required to trigger sending log
messages from the FortiGate unit varies by the log type. For example, event logs
are not configured in the same location as logs resulting from firewall policies and
protection profiles. For more information, see the FortiGate Administration Guide.
When full connectivity is verified, the FortiGate unit can send log and other data to
the FortiAnalyzer unit. For more information about configuring FortiGate unit
quarantining, content archiving, and/or remote logging, see the FortiGate
Administration Guide.
Blocking device connection attempts
Blocking devices prevents them from being able to attempt connections to the
FortiAnalyzer unit.
FortiAnalyzer units support a maximum number of devices, including registered
and unregistered devices combined. For more information, see “Maximum
number of devices” on page 76. You can manually block unregistered devices that
you do not want in the FortiAnalyzer device list to free a spot in the device list.
Devices may automatically appear on your list of blocked devices. This can occur
when devices attempt to connect after the maximum number of allowed devices
has been reached. To resume adding devices, you must first block a device that is
currently on your device list, then unblock the device you want to add, and add it
to the device list.
To view blocked devices, go to Device > All > Blocked Devices.
Note: See “Configuring unregistered device connection attempt handling” on page 79 to
prevent unregistered devices from automatically appearing in the device list.
Figure 4: List of blocked devices
Device ID The name or serial number of the blocked device.
Hardware Model The type of device, such as FortiGate, FortiManager, FortiMail, or
IP Address The IP address of the blocked device.
Action Select Delete to remove the device from the list of blocked
Syslog server.
devices. If the device attempts to connect to the FortiAnalyzer
unit, it may appear in the device list as an Unregistered device,
according to your configuration of Unregistered Device Options.
For more information, see “Configuring unregistered device
connection attempt handling” on page 79.
Select Unblock to add the device to the FortiAnalyzer unit’s device
list. For more information, see “Viewing the device list” on
page 73.
FortiAnalyzer Version 3.0 MR7 Administration Guide
86 05-30007-0082-20080908
Page 89

Device Configuring device groups
To block a device
1 Go to Device > All > Device.
2 From Show, select Unregistered.
If the device is currently registered, you must first delete the device before you
can block it. For more information, see “Viewing the device list” on page 73.
3 In the row corresponding to the device that you want to block, in the Action
column, select Block.
The device appears in the list of blocked devices.
To unblock a device
1 Go to Device > All > Blocked Device.
2 In the row corresponding to the device that you want to remove from the list of
blocked devices, select Delete.
A confirmation dialog appears.
3 Select OK.
The device is removed from the list of blocked devices. If the device attempts to
connect to the FortiAnalyzer unit, it may appear in the device list as an
Unregistered device, according to your configuration of Unregistered Device
Options. For more information, see “Configuring unregistered device connection
attempt handling” on page 79.
To unblock and add a device to the device list
1 Go to Device > All > Blocked Device.
2 In the row corresponding to the device that you want to remove from the list of
blocked devices, select Unblock.
A dialog appears, allowing you to add the device to the device list. If the device is
a known type, this also registers the device. To add the device to the device list,
see “To manually add a device or HA cluster” on page 82.
Configuring device groups
When you have multiple devices belonging to a department or section of your
organization, you may want to create device groups to simplify log browsing or
report configuration.
A device can belong to multiple groups. However, the device cannot be deleted
from the device list until it is removed from all groups.
To view device groups, go to Device > Group > Device Group.
FortiAnalyzer Version 3.0 MR7 Administration Guide
05-30007-0082-20080908 87
Page 90

Configuring device groups Device
Delete
Edit
Figure 5: List of device groups
Create New Select to configure a new device group.
Show Select the type of device groups to display, such as FortiGate,
Group Name The name of the device group.
Members The device names of devices that are members of the device
Modify Select Delete to remove the device group.
FortiManager, FortiMail or Syslog groups.
group.
Select Edit to reconfigure the device group.
To configure a device group
1 Go to Device > Group > Device Group.
2 Select Create New to configure a new device group, or select Edit to reconfigure
an existing device group.
3 In Group Name, enter a name for the group.
4 From Group Type, select the type of devices in the group.
FortiClient installations are treated as a single device, and so cannot be
configured as a device group.
5 Select the devices to include in the group from the list of Available Devices and
select the right-pointing arrow.
6 Select OK.
To delete a device group
1 Go to Device > Group > Device Group.
2 In the row corresponding to the device group that you want to delete, in the Modify
column, select Delete.
A confirmation dialog appears.
3 Select OK.
FortiAnalyzer Version 3.0 MR7 Administration Guide
88 05-30007-0082-20080908
Page 91

Log Viewing log messages
Log
FortiAnalyzer units collect logs from network hosts such as FortiGate, FortiMail,
FortiClient, FortiManager, and Syslog devices. By using the Log menu, you can
view both device and FortiAnalyzer log files and messages, as well as content
archive summaries. The FortiAnalyzer unit can display device logs in real-time,
enabling you to view log messages as the FortiAnalyzer unit receives them.
This section includes the following topics:
• Viewing log messages
• Browsing log files
• Customizing the log view
• Searching the logs
• Rolling and uploading logs
Note: FortiAnalyzer units cannot display logs from unregistered devices of unknown types.
Add the device first to view the logs of an unknown type device. For more information about
adding a device to the device list, see “Manually adding a device” on page 80.
Viewing log messages
The Log Viewer displays logs for devices that were added to the device list, as
well as the FortiAnalyzer unit itself, focusing on specific log types and time
frames.
The Log Viewer has two types of log viewing options:
• The Real-time tab displays the log messages most recently received by the
FortiAnalyzer unit. The display refreshes every few seconds, and contains only
the most current entries.
• The Historical tab displays all log messages for the selected log type whose
time stamps are within your specified time frame.
Viewing current log messages
The Real-time tab in Log > Log Viewer updates continually, displaying the most
recent log messages received from the selected device.
To view the most recent logs as they are received from Log > Log Viewer > Real-
time.
For more information about log messages, see the FortiGate Log Message
Reference.
FortiAnalyzer Version 3.0 MR7 Administration Guide
05-30007-0082-20080908 91
Page 92

Viewing log messages Log
Column Settings
Figure 1: Viewing current logs
Devices Select the type of device you want to view logs from. If you select
Log types Select to view a different device’s logs, or a different log type.
Stop Select to stop refreshing the log view.
Start Select to start refreshing the log view.
Column Settings Select to change the columns to view and the order they appear
Formatted | Raw Select a view of the log file. Selecting Formatted (the default)
View n per page Select the number of rows of log entries to display per page. You
Note: Log messages that are received from a log aggregation device are scheduled
transfers, and not real-time messages, because log aggregation devices do not appear in
the Real-time tab. Individual high availability (HA) cluster members also do not appear in
the Real-time tab because HA members are treated as a single device.
Viewing historical log messages
The Historical tab in Log > Log Viewer displays logs for a selected device and log
type for a specific time range. When viewing log messages, you can filter the
information to find specific event information.
For more information about log messages, see the FortiGate Log Message
Reference.
All FortiGates, all log messages from all registered FortiGate units
appear.
This option appears only when refreshing is started.
This option appears only when refreshing is stopped.
on the page. For more information, see “Displaying and arranging
log columns” on page 97.
displays the log files in columnar format. Selecting Raw, displays
the log information as it actually appears in the log file.
can choose up to 1000 entries.
FortiAnalyzer Version 3.0 MR7 Administration Guide
92 05-30007-0082-20080908
Page 93

Log Viewing log messages
Printable Version
Column
Settings
Figure 2: Viewing historical logs
Devices Select the type of device you want to view logs from. If you select
Log Types Select to view a different device’s logs, or a different log type.
Formatted | Raw Select a view of the log file. Selecting Formatted (the default)
View n per page Select the number of rows of log entries to display per page. You
Page n of n Enter a log page number, then press Enter to go to that page.
Column Settings Select to change the columns to view and the order they appear
Search Enter a keyword to perform a simple search on the log information
Printable Version Select to download an HTML file containing all log messages that
Download Current
View
All FortiGates, all log messages from all registered FortiGate units
appear.
displays the log files in columnar format. Selecting Raw, displays
the log information as it actually appears in the log file.
can choose up to 1000 entries.
on the page. For more information, see “Displaying and arranging
log columns” on page 97.
available. Select Go to begin the search. The number of matches
appears above the Search field.
The FortiAnalyzer unit will search the entire log data for the
keyword you enter.
match the current filters. The HTML file is formatted to be
printable.
Time required to generate and download large reports varies by
the total amount of log messages, the complexity of any search
criteria, the specificity of your column filters, and the speed of your
network connection.
Select to download only those log messages which are currently
visible, according to enabled filters.
This button appears only when the current view is filtered. The
downloaded version will match the current log view, containing
only log messages that match your current filter settings.
FortiAnalyzer Version 3.0 MR7 Administration Guide
05-30007-0082-20080908 93
Page 94

Browsing log files Log
Delete
Download
Display
Clear All Logs
To view historical logs
1 Go to Log > Log Viewer > Historical.
2 From Devices, select the device whose logs you want to view.
Unregistered devices will not appear in the list. To view a device’s logs, you must
register the device first.
3 From Log types, select the type of log file.
Log types options vary by device type. If you have reason to expect log messages
to appear for the selected log type, but none appear, verify connectivity and the
device’s logging configuration.
4 Select OK.
Browsing log files
The Log Browser tab enables you to see all stored log files for all devices and the
FortiAnalyzer itself. In this window, you can view the log information, download log
files to your hard disk, or delete unneeded files.
When a log file reaches its maximum size, the FortiAnalyzer unit saves the log
files with an incremental number and starts a new log file with the same name.
The current attack log is alog.log. Any subsequent saved logs appear as
alog.n.log, where n is the number of rolled logs.
For information about setting the maximum file size and log rolling options, see
“Rolling and uploading logs” on page 104.
To browse the log files, go to Log > Browse.
Figure 3: Log file list
Import Select to import older log files to view and run log reports. For more
Device Type Select a device category to view its related log files.
information about on importing log files, see “Importing a log file” on
page 95.
94 05-30007-0082-20080908
FortiAnalyzer Version 3.0 MR7 Administration Guide
Page 95

Log Browsing log files
Column Settings
Printable Version
Log files A list of available log files for each device or device group. Select the
# The number of devices in a group, and the number of logs for a device.
Last Modified The last time the log was updated from the device.
Size (bytes) The size of the log file.
Action Select Delete to remove the log file from the FortiAnalyzer hard disk.
Viewing log file contents
The Log Browser tab enables you to view all log messages within local or device
log files.
If you display the log messages in Formatted view, you can display and arrange
columns and/or filter log messages by column contents. For more information,
see “Customizing the log view” on page 97.
For more information about log messages, see the FortiGate Log Message
Reference.
group name to expand the list of devices within the group, and to view
their log files.
The current, or active, log file appears as well as rolled log files. Rolled
log files include a number in the file name (alog.2.log). If you
configure the FortiAnalyzer unit to upload rolled logs to an FTP site, only
the current log will appear in the log browser.
Select Clear All Logs to delete all log messages within the log file.
Select Download to save the log file to your local hard disk.
Select Display to view the contents of the log file.
Note: For content archive logs, the log browser only displays the device’s clog.log file. It
does not provide access to download the archived files. To both view content archive logs
and download the associated content archived files, instead go to Content Archive. For
more information, see “Content Archive” on page 107.
To view a log file
1 Go to Log > Browse.
2 Select the blue arrows to expand the group name and device name to see the list
of available log files.
3 In the Action column, select Display for that log file’s row.
The log file’s contents appear.
Figure 4: Viewing logs
FortiAnalyzer Version 3.0 MR7 Administration Guide
05-30007-0082-20080908 95
Type The type of log you are viewing and the device where it originated.
Change Select to view a different log file.
Page 96

Browsing log files Log
Formatted | Raw Select a view of the log file. Selecting Formatted (the default)
Resolve Host Name Select to display host names by a recognizable name rather than
Resolve Service Select to display the network service names rather than the port
View n per page Select the number of rows of log entries to display per page.
Page n of n Enter a log page number, then press Enter to go to that page.
Column Settings Select to change the columns to view and the order they appear
Search Enter a keyword to perform a simple search for that term, then
Printable Version Select to download an HTML file containing all log messages that
Download Current
View
displays the log files in columnar format. Selecting Raw, displays
the log information as it actually appears in the log file.
IP addresses. For more information about on configuring IP
address host names see “Configuring IP aliases” on page 61.
numbers, such as HTTP rather than port 80.
This option does not appear when the logs do not have service
information to display, which can occur in the event log.
on the page. For more information, see “Displaying and arranging
log columns” on page 97.
select Go to begin the search. The FortiAnalyzer unit searches the
entire log file for the keyword you enter. The number of matches
appears above the Search field.
match the current filters. The HTML file is formatted to be
printable.
Time required to generate and download large reports varies by
the total amount of log messages, the complexity of any search
criteria, the specificity of your column filters, and the speed of your
network connection.
Select to download only those log messages which are currently
visible, according to enabled filters.
This button only appears when the current log view is filtered. The
downloaded version will match the current log view, containing
only log messages that match your current filter settings.
Importing a log file
You can import devices’ log files. This can be useful when restoring data or
loading log data for temporary use.
For example, if you have older log files from a device, you can import these logs
onto the FortiAnalyzer unit in order to generate reports on older data. Importing
log files is also useful when changing your RAID configuration. Changing your
RAID configuration reformats the hard disk, erasing log files. If you back up the log
files, after changing the RAID configuration, you can import logs to restore them to
the FortiAnalyzer unit.
You can import logs in normal log, compressed log (.log.gz) or comma
separated value (CSV) format.
To import a log file
1 Go to Log > Browse.
2 Select the Device Type.
3 Select Import.
4 Select from Device to which device in the device list the imported log file belongs,
or select Take From Imported File to read the device ID from the log file.
If you select Take From Imported File, your log file must contain a device_id
field in its log messages.
FortiAnalyzer Version 3.0 MR7 Administration Guide
96 05-30007-0082-20080908
Page 97

Log Browsing log files
5 In Filename, enter the path and file name of the log file, or select Browse.
6 Select OK.
A message appears, stating that the upload is beginning, but will be cancelled if
you leave the page.
7 Select OK.
Upload time varies by the size of the file and the speed of the connection.
After the log file successfully uploads, the FortiAnalyzer unit inspects the log file.
•If the device_id field in the uploaded log file does not match the device, the
import will fail. Select Return to attempt another import.
• If you selected Take From Imported File, and the FortiAnalyzer unit’s device list
does not currently contain that device, a message appears after the upload.
Select OK to import the log file and automatically add the device to the device
list, or select Cancel.
Downloading a log file
You can download a log file to save it as a backup or for use outside the
FortiAnalyzer unit. The download consists of either the entire log file, or a partial
log file, as selected by your current log view filter settings.
To download a whole log file
1 Go to Log > Browse.
2 In the Log Files column, locate a device and log type and then select blue arrows
to expand and reveal the specific log file (wlog.log, elog.log, etc.) that you
want to download.
3 In the Action column, select Download for that log file’s row.
4 Select any download options you want and select OK.
Convert to CSV
format
Compress with gzip Compress the .log or .csv file with gzip compression. For
Downloads the log format as a comma-separated value (.csv) file
instead of a standard .log file. Each log element is separated by
a comma. CSV files can be viewed in spreadsheet applications.
example, downloading a log-formatted file with gzip compression
would result in a download with the file extension .log.gz.
5 If prompted by your web browser, select a location to save the file, or open it
without saving.
To download a partial log file
1 Go to Log > Browse.
2 In the Log Files column, locate a device and log type and then select blue arrows
to expand and reveal the specific log file (wlog.log, elog.log, etc.) that you
want to download.
3 In the Action column, select Display for that log file’s row.
4 Select a filter icon to restrict the current view to only items which match your
criteria, then select OK.
Filtered columns have a green filter icon, and Download Current View appears
next to Printable Version. For more information about filtering log views, see
“Filtering logs” on page 98.
FortiAnalyzer Version 3.0 MR7 Administration Guide
05-30007-0082-20080908 97
Page 98

Customizing the log view Log
5 Select Download Current View.
6 Configure the following:
Convert to CSV
format
Compress with gzip Compress the .log or .csv file with gzip compression. For
7 Select OK.
8 If prompted by your web browser, select a location to save the file, or open it
without saving.
Customizing the log view
Log messages can be displayed in either Raw or Formatted view.
• Raw view displays log messages exactly as they appear in the log file.
• Formatted view displays log messages in a columnar format. Each log field in a
log message appears in its own column, aligned with the same field in other
log messages, for rapid visual comparison. When displaying log messages in
Formatted view, you can customize the log view by hiding, displaying and
arranging columns and/or by filtering columns, refining your view to include
only those log messages and fields that you want to see.
To display logs in Raw or Formatted view
Downloads the log format as a comma-separated value (.csv) file
instead of a standard .log file. Each log element is separated by
a comma. CSV files can be viewed in spreadsheet applications.
example, downloading a log-formatted file with gzip compression
would result in a download with the file extension .log.gz.
1 Go to a page which displays log messages, such as Log > Log Viewer > Real-
time.
2 Select Formatted or Raw.
If you select Formatted, options appear that enable you to display and arrange log
columns and/or filter log columns.
Displaying and arranging log columns
When viewing logs in Formatted view, you can display, hide and re-order columns
to display only relevant categories of information in your preferred order.
For most columns, you can also filter data within the columns to include or exclude
log messages which contain your specified text in that column. For more
information, see “Filtering logs” on page 98.
FortiAnalyzer Version 3.0 MR7 Administration Guide
98 05-30007-0082-20080908
Page 99

Log Customizing the log view
Figure 5: Displaying and arranging log columns
To display or hide columns
1 Go to a page which displays log messages, such as Log > Log Viewer > Real-
time.
2 Select Column Settings.
Lists of available and displayed columns for the log type appear.
3 Select which columns to hide or display.
• In the Available Fields area, select the names of individual columns you want
to display, then select the single right arrow to move them to the Display Fields
area.
Alternatively, to display all columns, select the double right arrow.
• In the Display Fields area, select the names of individual columns you want to
hide, then select the single left arrow to move them to the Available Fields
area.
Alternatively, to hide all columns, select the double left arrow.
• To return all columns to their default displayed/hidden status, select Default.
4 Select OK.
To change the order of the columns
1 Go to a page which displays log messages, such as Log > Log Viewer > Real-
time.
2 Select Column Settings.
Lists of available and displayed columns for the log type appear.
3 In the Display Fields area, select a column name whose order of appearance you
want to change.
4 Select the up or down arrow to move the column in the ordered list.
Placing a column name towards the top of the Display Fields list will move the
column to the left side of the Formatted log view.
5 Select OK.
Filtering logs
When viewing log messages in Formatted view, you can filter columns to display
only those log messages that do or do not contain your specified content in that
column. By default, most column headings contain a gray filter icon, which
becomes green when a filter is configured and enabled.
FortiAnalyzer Version 3.0 MR7 Administration Guide
05-30007-0082-20080908 99
Page 100

Customizing the log view Log
Filter icon Filter in use
Note: Filters do not appear in Raw view, or for unindexed log fields in Formatted view.
When viewing real-time logs, you cannot filter on the time column: by definition of the realtime aspect, only current logs are displayed.
Figure 6: Filter icons
To filter log messages by column contents
1 In the heading of the column that you want to filter, select the filter icon.
2 Select Enable.
3 If you want to exclude log messages with matching content in this column, select
NOT.
If you want to include log messages with matching content in this column,
deselect NOT.
4 Enter the text that matching log messages must contain.
Matching log messages will be excluded or included in your view based upon
whether you have selected or deselected NOT.
5 Select OK.
A column’s filter icon is green when the filter is currently enabled. A Download
Current View icon also appears, enabling you to download only log messages
which meet the current filter criteria.
To disable a filter
1 In the heading of the column whose filter you want to disable, select the filter icon.
A column’s filter icon is green when the filter is currently enabled.
2 To disable the filter on this column, deselect Enable.
Alternatively, to disable the filters on all columns, select Clear All Filters. This
disables the filter; it does not delete any filter text you might have configured.
3 Select OK.
A column’s filter icon is gray when the filter is currently disabled.
Filtering tips
When filtering by source or destination IP, you can use the following in the filtering
criteria:
• a single address (2.2.2.2)
• an address range using a wild card (1.2.2.*)
• an address range (1.2.2.1-1.2.2.100)
You can also use a Boolean operator (or) to indicate mutually exclusive choices:
• 1.1.1.1 or 2.2.2.2
• 1.1.1.1 or 2.2.2.*
FortiAnalyzer Version 3.0 MR7 Administration Guide
100 05-30007-0082-20080908
 Loading...