

Fortinet FortiAnalyzer-4000A, FortiAnalyzer-100B, FortiAnalyzer-400, FortiAnalyzer-4000, FortiAnalyzer-2000 Administration Manual
...Page 1

ADMINISTRATION GUIDE
FortiAnalyzer
Version 3.0 MR3
www.fortinet.com
Page 2

FortiAnalyzer Administration Guide
!
Version 3.0 MR3
25 September 2006
05-30003-0082-20060925
© Copyright 2006 Fortinet, Inc. All rights reserved. No part of this
publication including text, examples, diagrams or illustrations may be
reproduced, transmitted, or translated in any form or by any means,
electronic, mechanical, manual, optical or otherwise, for any purpose,
without prior written permission of Fortinet, Inc.
Trademarks
ABACAS, APSecure, FortiASIC, FortiBIOS, FortiBridge, FortiClient,
FortiGate, FortiGuard, FortiGuard-Antispam, FortiGuard-Antivirus,
FortiGuard-Intrusion, FortiGuard-Web, FortiLog, FortiAnalyzer,
FortiManager, Fortinet, FortiOS, FortiPartner, FortiProtect, FortiReporter,
FortiResponse, FortiShield, FortiVoIP, and FortiWiFi are trademarks of
Fortinet, Inc. in the United States and/or other countries. The names of
actual companies and products mentioned herein may be the trademarks
of their respective owners.
Regulatory compliance
FCC Class A Part 15 CSA/CUS
Caution: If you install a battery that is not the correct type, it could
explode. Dispose of used batteries according to local regulations.
Page 3

Contents
Contents
Introduction ...................................................................................... 11
The FortiAnalyzer Unit .................................................................................... 11
FortiAnalyzer-100A/100B ............................................................................ 11
FortiAnalyzer-400........................................................................................ 12
FortiAnalyzer-800........................................................................................ 12
FortiAnalyzer-2000...................................................................................... 13
FortiAnalyzer-4000...................................................................................... 13
FortiAnalyzer-4000A ................................................................................... 13
FortiAnalyzer features..................................................................................... 14
Reporting..................................................................................................... 14
Data mining ................................................................................................. 14
Network analyzer ........................................................................................ 14
Log viewer................................................................................................... 15
Real-time log viewing .................................................................................. 15
Log Aggregation.......................................................................................... 15
Quarantine .................................................................................................. 15
Network Attached Storage .......................................................................... 15
About this guide .............................................................................................. 15
FortiAnalyzer documentation......................................................................... 16
Fortinet Tools and Documentation CD ........................................................ 17
Fortinet Knowledge Center ......................................................................... 17
Comments on Fortinet technical documentation......................................... 17
Customer service and technical support ...................................................... 17
Installing the FortiAnalyzer unit ..................................................... 19
Planning the installation ................................................................................. 19
Connecting the FortiAnalyzer unit ................................................................. 20
Environmental specifications....................................................................... 20
Air flow ........................................................................................................ 20
Mechanical loading ..................................................................................... 20
Connecting to the network .......................................................................... 20
Configuring the FortiAnalyzer unit ................................................................ 21
Using the web-based manager ................................................................... 23
Using the command line interface............................................................... 24
Using the front panel buttons and LCD ....................................................... 25
Upgrading the FortiAnalyzer firmware .......................................................... 25
Backing up the FortiAnalyzer hard disk........................................................ 26
Shutting down the FortiAnalyzer unit............................................................ 26
FortiAnalyzer Version 3.0 MR3 Administration Guide
05-30003-0082-20060925 3
Page 4

Contents
Configure the FortiAnalyzer unit .................................................... 27
Dashboard........................................................................................................ 27
System Information ..................................................................................... 28
System Resources...................................................................................... 28
License Information..................................................................................... 29
Alert Message Console............................................................................... 29
Statistics...................................................................................................... 29
Report Engine ............................................................................................. 29
Automatic Refresh Interval.......................................................................... 29
System Operation ....................................................................................... 29
Viewing operational history ......................................................................... 30
Viewing Session information....................................................................... 30
Filtering session information................................................................. 31
Viewing Alert messages.............................................................................. 31
Setting the time ........................................................................................... 32
Restore factory default system settings ...................................................... 32
Format the log disks.................................................................................... 33
Restoring a FortiAnalyzer unit..................................................................... 33
Restoring a FortiAnalyzer-100 or FortiAnalyzer-400 ............................ 33
Restoring a FortiAnalyzer-100A/100B, 800, 2000 and 4000/4000A..... 34
Changing the firmware................................................................................ 35
Changing the host name............................................................................. 36
Network settings.............................................................................................. 36
Interface ...................................................................................................... 36
Changing the interface settings ............................................................ 37
About FortiDiscovery ............................................................................ 37
DNS ............................................................................................................ 38
Routing........................................................................................................ 38
Adding a route ...................................................................................... 38
Administrator settings .................................................................................... 39
Adding a new administrator ........................................................................ 39
Changing the administrator password .................................................. 40
Access Profile ............................................................................................. 40
Auth Groups................................................................................................ 41
RADIUS Server........................................................................................... 42
Administrator Settings................................................................................. 42
Monitor ........................................................................................................ 42
Administrative domains.................................................................................. 43
Enabling administrative domains ................................................................ 43
Disabling administrative domains ............................................................... 44
Configuring ADOM settings ........................................................................ 44
Creating a new ADOM ................................................................................ 45
Adding a device to an ADOM...................................................................... 45
FortiAnalyzer Version 3.0 MR3 Administration Guide
4 05-30003-0082-20060925
Page 5

Contents
Network sharing............................................................................................... 45
Adding users ............................................................................................... 46
Adding groups ............................................................................................. 46
Configuring Windows shares ...................................................................... 46
Assigning user access ................................................................................ 47
Configuring NFS shares.............................................................................. 48
Setting folder and file privileges .................................................................. 49
Configuring the FortiAnalyzer unit ................................................................ 49
Log Settings ................................................................................................ 50
Log Aggregation.......................................................................................... 51
Configuring an aggregation client ......................................................... 52
Configuring an aggregation server ....................................................... 53
IP Aliases .................................................................................................... 53
Importing an IP alias list file.................................................................. 53
IP alias ranges ...................................................................................... 54
RAID............................................................................................................ 54
Configuring RAID on the FortiAnalyzer-400 and FortiAnalyzer-800..... 54
Configuring RAID on the FortiAnalyzer-2000 and FortiAnalyz-
er-4000/4000A ................................................................................... 55
Maintenance..................................................................................................... 57
Backup & Restore ....................................................................................... 57
Update center.............................................................................................. 58
RAID levels....................................................................................................... 59
Linear .......................................................................................................... 60
RAID 0......................................................................................................... 60
RAID 1......................................................................................................... 60
RAID 5......................................................................................................... 60
RAID 10....................................................................................................... 61
RAID 50....................................................................................................... 61
RAID 5 and RAID 10 with hot spare............................................................ 61
Hot swapping hard disks ............................................................................. 61
Hot swapping in the FortiAnalyzer-400 and FortiAnalyzer-800 ............ 61
Hot swapping the FortiAnalyzer-2000 and FortiAnalyzer-4000/4000A. 62
Devices.............................................................................................. 65
Devices List...................................................................................................... 65
Device interaction with a FortiAnalyzer unit ................................................ 66
Maximum allowed devices .......................................................................... 66
Unregistered device options........................................................................ 67
FortiGate units connecting with FortiDiscovery........................................... 67
Unknown devices connecting to the FortiAnalyzer unit............................... 68
Adding a FortiGate unit................................................................................... 68
Defining FortiGate port interfaces ............................................................... 70
Adding an HA cluster .................................................................................. 70
Adding FortiClient installations ..................................................................... 71
FortiAnalyzer Version 3.0 MR3 Administration Guide
05-30003-0082-20060925 5
Page 6

Contents
Adding a FortiManager unit............................................................................ 72
Adding a Syslog server................................................................................... 73
Device Groups ................................................................................................. 74
Blocked Devices.............................................................................................. 74
Viewing blocked devices............................................................................. 75
Logs .................................................................................................. 77
Log Viewer ....................................................................................................... 77
Real-time log viewer ................................................................................... 77
Historical log viewer .................................................................................... 78
Browse.............................................................................................................. 80
Browsing log files ........................................................................................ 81
Importing a log file....................................................................................... 82
Downloading a log file................................................................................. 82
Customizing the log view ............................................................................... 83
Customizing the log column views.............................................................. 83
Filtering logs................................................................................................ 84
Filtering tip............................................................................................ 84
Search the logs................................................................................................ 84
Basic search ............................................................................................... 85
Advanced search ........................................................................................ 85
Search tips .................................................................................................. 86
Printing the search results .......................................................................... 86
Log rolling........................................................................................................ 86
Content archive................................................................................ 89
Content viewer................................................................................................. 89
Customizing the content log view ................................................................. 90
Customizing the log column views.............................................................. 90
Filtering content logs................................................................................... 91
Filtering tip............................................................................................ 91
Log rolling........................................................................................................ 91
Quarantine........................................................................................ 95
Configuring quarantine settings .................................................................... 95
Viewing the quarantined files list................................................................... 96
Forensic Analysis ............................................................................ 97
Users and groups............................................................................................ 97
Adding users ............................................................................................... 97
Creating groups .......................................................................................... 98
Lookup ........................................................................................................ 98
Where does FortiAnalyzer get this information?................................... 99
FortiAnalyzer Version 3.0 MR3 Administration Guide
6 05-30003-0082-20060925
Page 7

Contents
Searching user data ...................................................................................... 100
Saving search results................................................................................ 100
Local archive ............................................................................................ 101
Forensic Reports ........................................................................................... 101
Configuring reports.................................................................................... 101
Customizing the report properties....................................................... 102
Configuring the report criteria ............................................................. 102
Configuring the time period................................................................. 104
Configuring the report types ............................................................... 104
Configuring the report output .............................................................. 104
Viewing Forensic Reports ......................................................................... 106
Traffic summary and security events........................................... 107
Traffic Summaries ......................................................................................... 107
Top Users.................................................................................................. 107
Viewing Web traffic ............................................................................. 107
Viewing Email traffic ........................................................................... 108
Viewing FTP traffic.............................................................................. 109
Viewing Instant Messaging and P2P traffic ........................................ 109
Filtering traffic summaries ......................................................................... 110
Filtering tip .......................................................................................... 111
Device Summary....................................................................................... 111
Traffic Report ............................................................................................ 112
Configuring a traffic report .................................................................. 112
Viewing traffic summary reports ......................................................... 112
Security event summaries ............................................................................ 113
Adding a security event report .................................................................. 113
Viewing the security event reports ............................................................ 113
Viewing virus activity ................................................................................. 114
Viewing Intrusion activity........................................................................... 115
Viewing Suspicious activity ....................................................................... 116
Viewing administrative activities................................................................ 117
Reports............................................................................................ 119
Configuring reports....................................................................................... 119
Configuring a report profile........................................................................ 120
Customizing the report properties....................................................... 121
Configuring the report devices............................................................ 122
Configuring the report scope .............................................................. 122
Configuring the report types ............................................................... 124
Configuring the report Format............................................................. 124
Configuring the report schedule.......................................................... 125
Configuring the report output .............................................................. 125
FortiAnalyzer Version 3.0 MR3 Administration Guide
05-30003-0082-20060925 7
Page 8

Contents
Browsing reports........................................................................................... 127
Viewing reports ......................................................................................... 128
Default reports .......................................................................................... 128
Report types.............................................................................................. 129
Roll up report...................................................................................... 129
Individual reports ................................................................................ 129
Event activity codes............................................................................ 129
Alerts............................................................................................... 131
Alert Events.................................................................................................... 131
Adding an alert event ................................................................................ 131
Output............................................................................................................. 132
Mail server ................................................................................................ 133
Testing the Mail server configuration.................................................. 133
SNMP access ........................................................................................... 133
Adding an SNMP server ..................................................................... 134
Syslog Servers.......................................................................................... 134
Adding a Syslog server....................................................................... 135
FortiAnalyzer SNMP support.............................................................. 135
FortiAnalyzer traps.................................................................................... 136
FortiGate MIB System Traps .............................................................. 136
FortiGate MIB Logging Traps ............................................................. 136
FortiGate MIB VPN Traps................................................................... 136
Fortinet MIB System fields.................................................................. 136
Fortinet Administrator Accounts ......................................................... 136
Fortinet Options .................................................................................. 136
Fortinet Active IP Sessions................................................................. 137
RFC-1213 (MIB II) .............................................................................. 137
RFC-2665 (Ethernet-like MIB) ............................................................ 137
Network Analyzer........................................................................... 139
Connecting the FortiAnalyzer for analyzing network traffic ..................... 139
Traffic viewer ................................................................................................. 140
Real-time traffic viewer ............................................................................. 140
Historical traffic viewer .............................................................................. 141
Changing the historical view criteria................................................... 142
Browsing network traffic logs ...................................................................... 142
Browsing network traffic log files............................................................... 143
Downloading a network traffic log file ....................................................... 144
Customizing the traffic analyzer log view ................................................... 145
Customizing the log column views............................................................ 145
Filtering network traffic logs ...................................................................... 145
Filtering tip.......................................................................................... 146
FortiAnalyzer Version 3.0 MR3 Administration Guide
8 05-30003-0082-20060925
Page 9

Contents
Search the network traffic logs .................................................................... 146
Basic search.............................................................................................. 146
Advanced search ...................................................................................... 146
Search tips ................................................................................................ 147
Printing the search results......................................................................... 147
Log rolling ...................................................................................................... 147
Vulnerability scan .......................................................................... 151
Modules .......................................................................................................... 151
Jobs ................................................................................................................ 152
Adding a new vulnerability scan job .......................................................... 153
Reports ........................................................................................................... 155
Index................................................................................................ 157
FortiAnalyzer Version 3.0 MR3 Administration Guide
05-30003-0082-20060925 9
Page 10

Contents
FortiAnalyzer Version 3.0 MR3 Administration Guide
10 05-30003-0082-20060925
Page 11
Introduction The FortiAnalyzer Unit
Introduction
FortiAnalyzer units are network appliances that provides robust reporting, data
analysis and integrated log collection tools. Detailed log reports provide historical
as well as current analysis of network traffic, such as email, FTP and web
browsing activity, to help identify security issues and reduce network misuse and
abuse.
The FortiAnalyzer unit provides a robust selection of reporting tools from detailed
reports that can be scheduled or generated on demand, to basic traffic sniffing
and real-time network monitoring.
This section introduces you to the FortiAnalyzer appliance and includes the
following topics:
• The FortiAnalyzer Unit
• About this guide
• FortiAnalyzer documentation
• Customer service and technical support
The FortiAnalyzer Unit
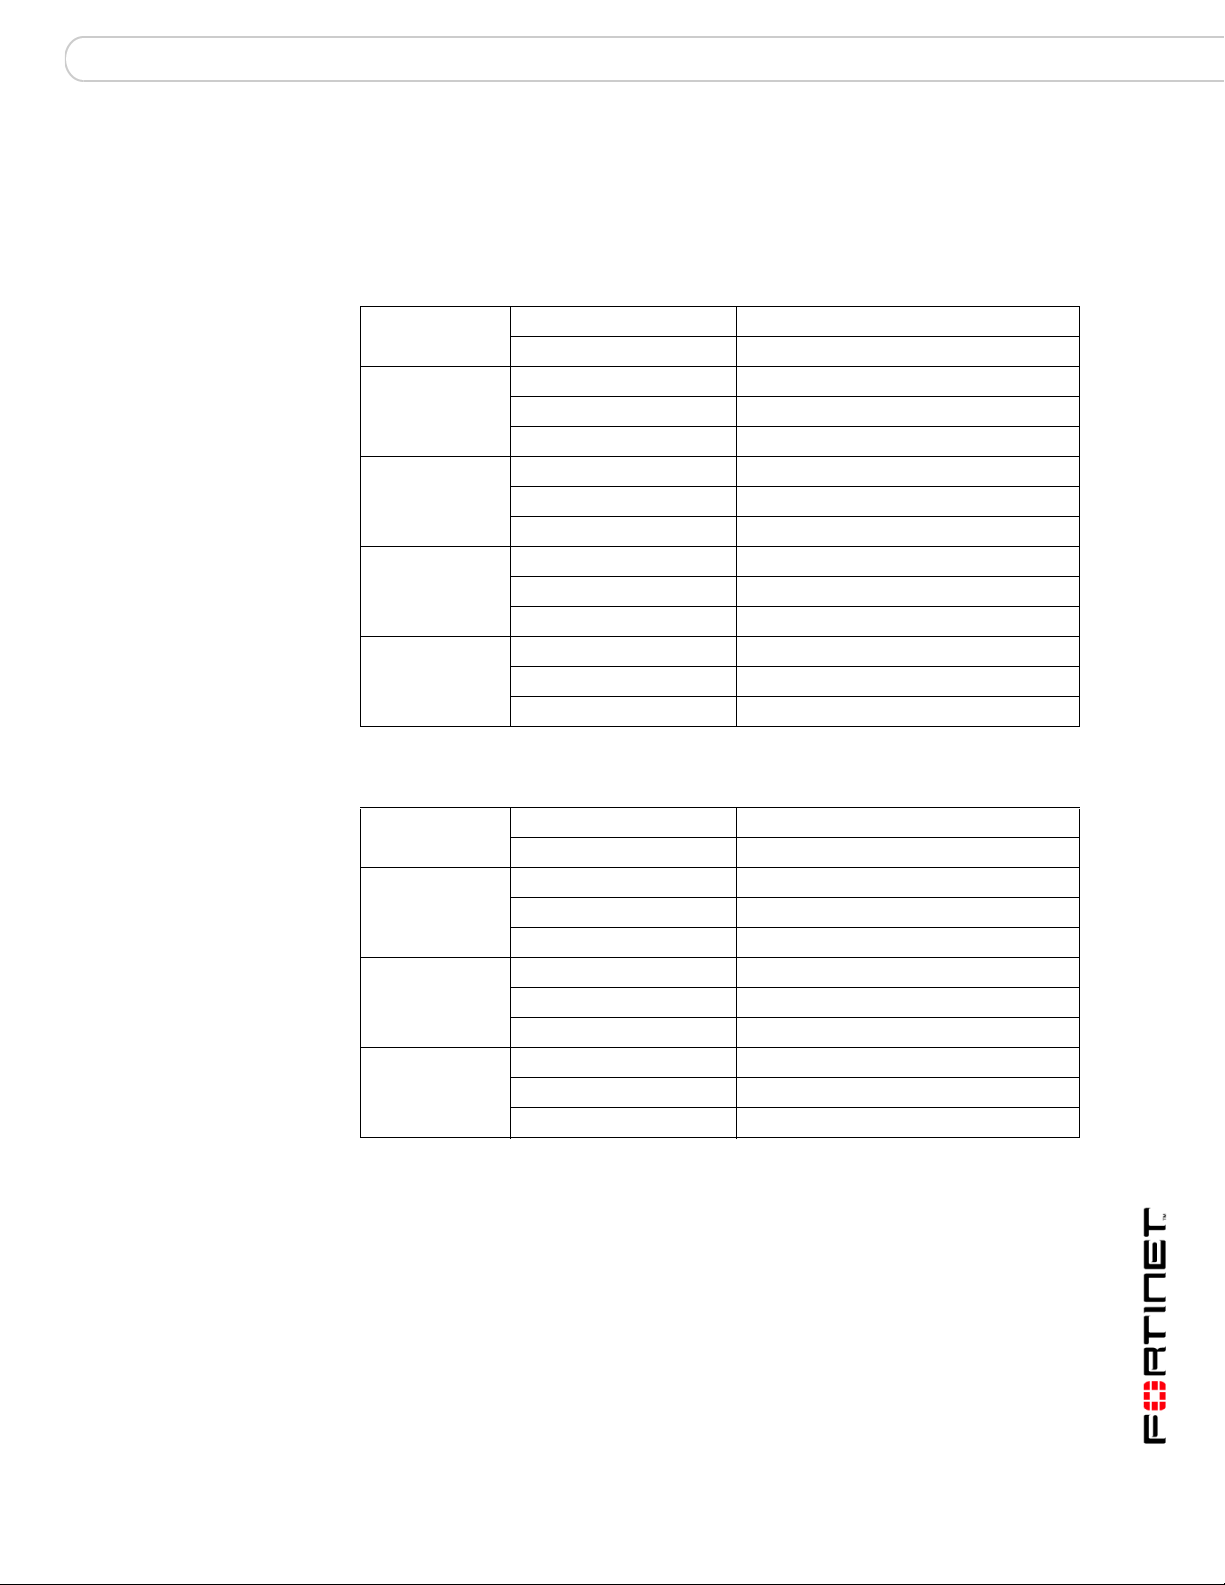
The FortiAnalyzer family includes the following models:
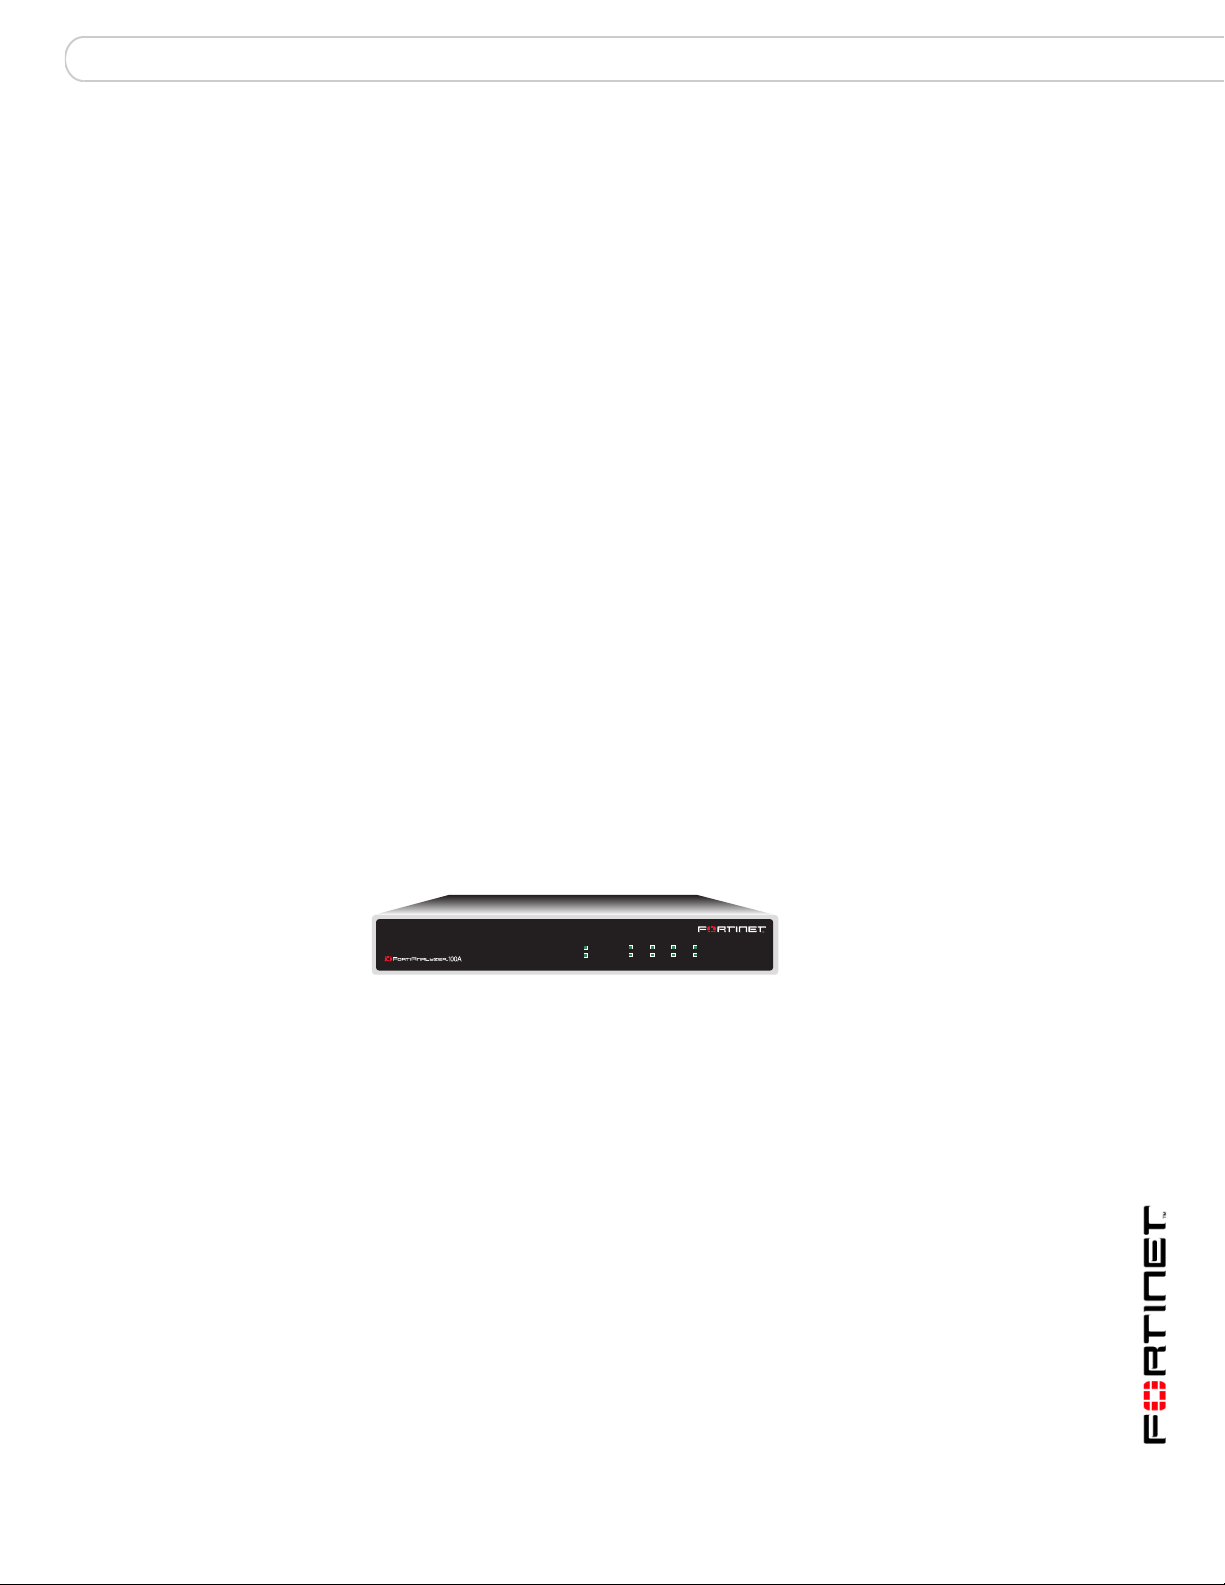
FortiAnalyzer-100A/100B
Ports 4 10/100 Ethernet ports
Memory 256 MB
Disk Drives 1
Disk Drive Capacity 120 GB
FortiGate Devices Supported 10 FortiGate devices or VDOM licenses.
FortiClient installations Supported None
AC Input Voltage 100-240V 0.8Amp Max
4321
POWER
STATUS
10/100
LINK / ACT
Supports FortiGate-50A to FortiGate-100A
only.
FortiAnalyzer Version 3.0 MR3 Administration Guide
05-30003-0082-20060925 11
Page 12
The FortiAnalyzer Unit Introduction
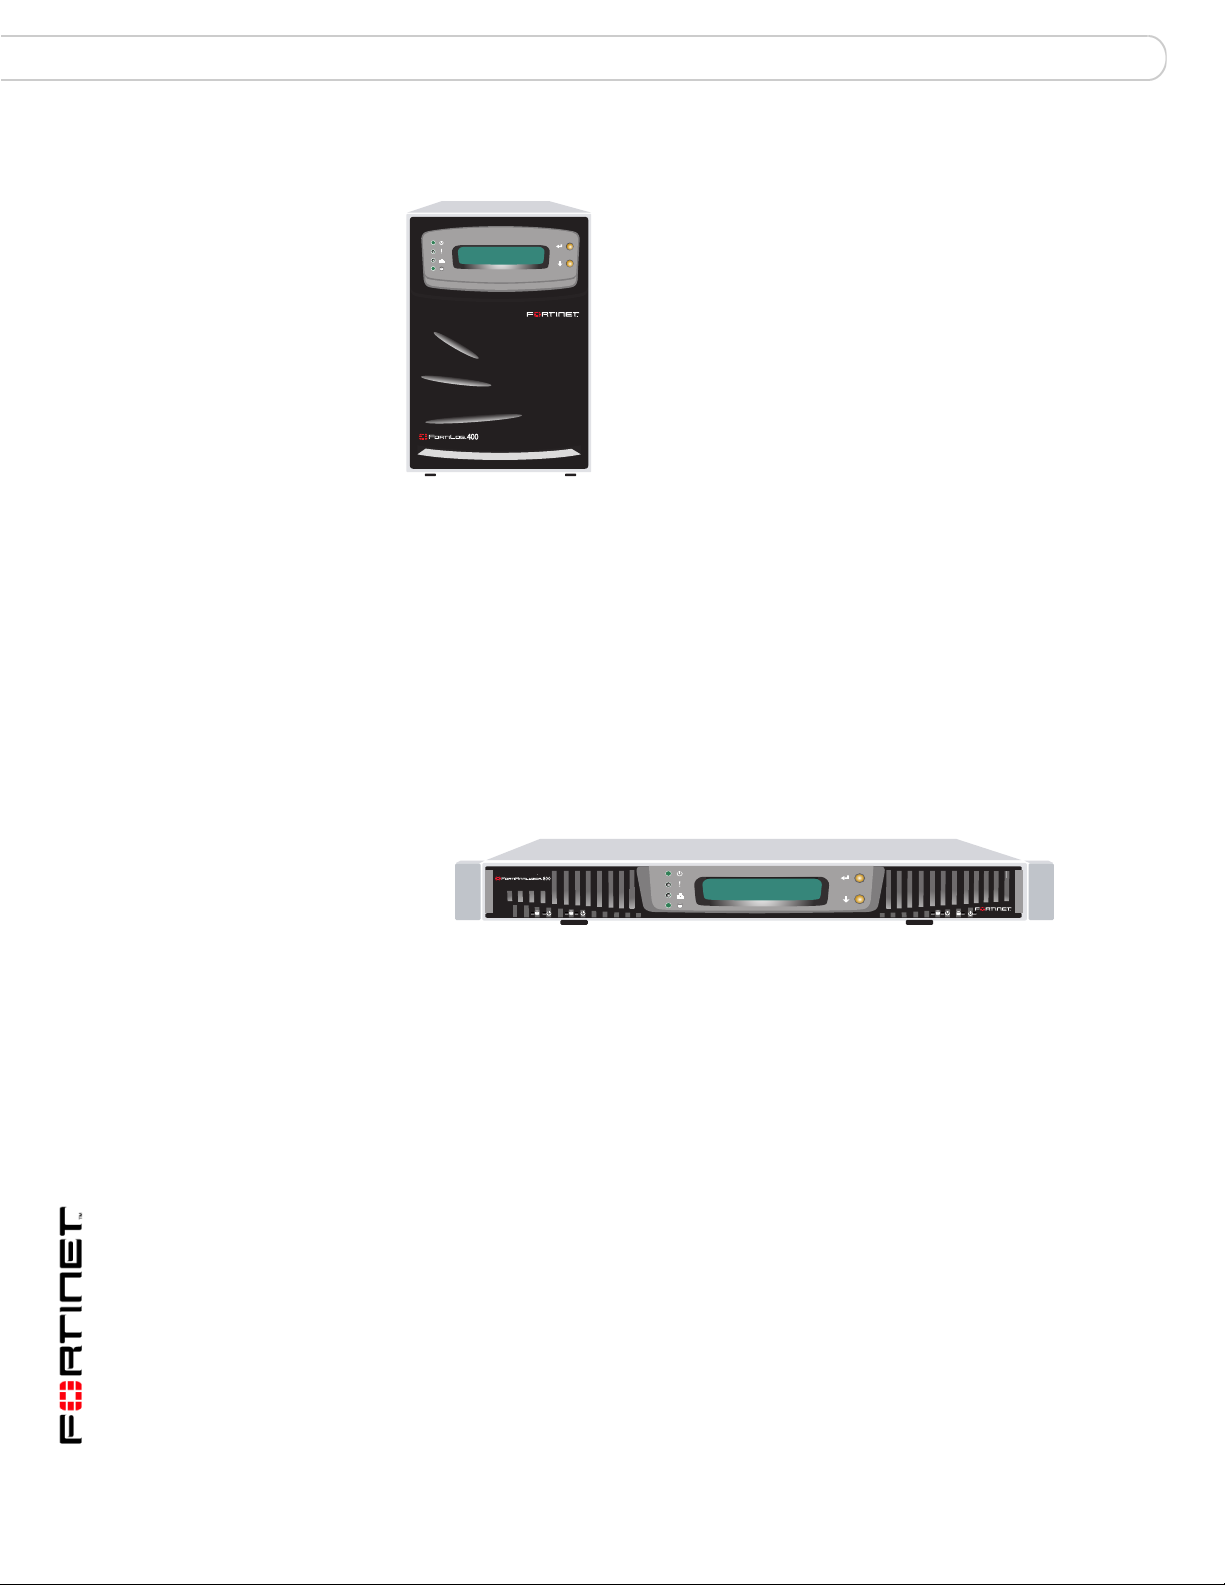
FortiAnalyzer-400
Ports 3 10/100 Ethernet ports
Memory 256 MB
Disk Drives 4 x 120MB hot-swappable (3.0 MR1)
Disk Drive Capacity 480 GB
FortiGate Devices Supported 200 FortiGate units or VDOM licenses.
Supports FortiGate-50A to FortiGate-800 only.
FortiClient installations Supported 2000
AC Input Voltage 100-240V 4Amp Max
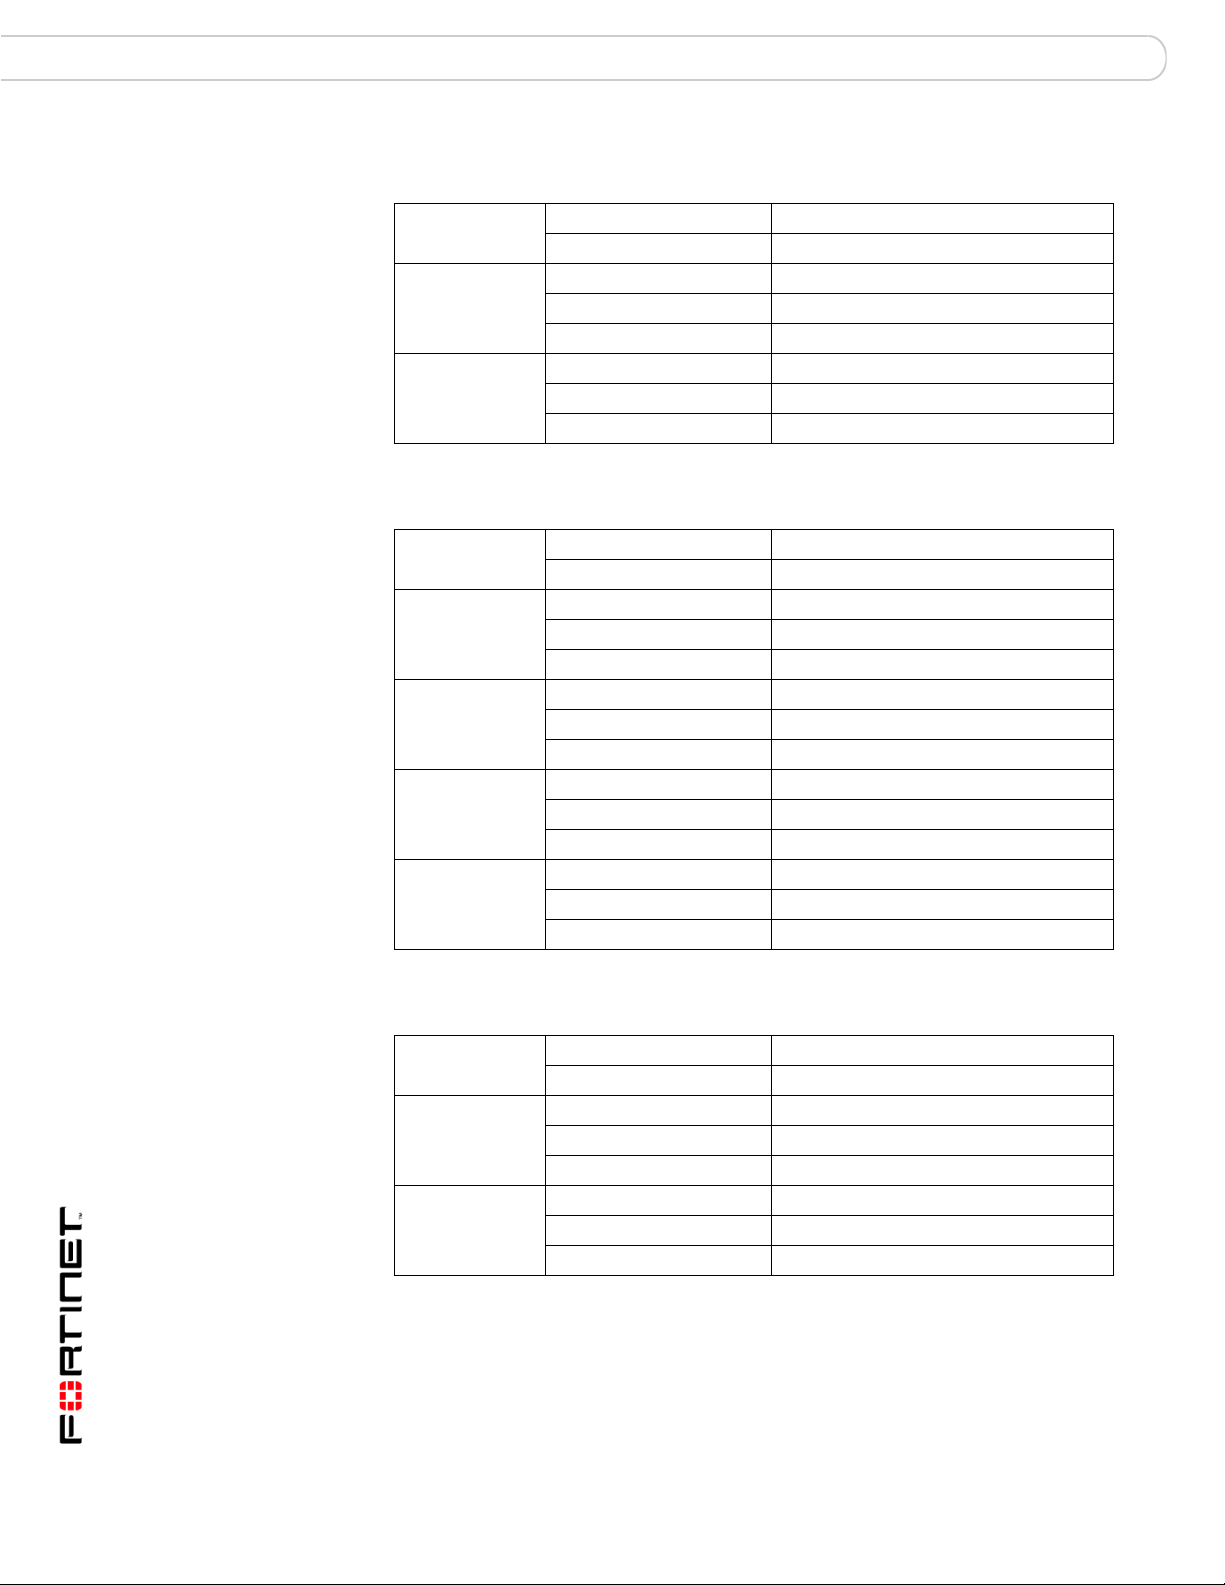
FortiAnalyzer-800
Ports 2 10/100 Ethernet ports
Memory 512 MB
Disk Drives 4 x 120MB hot-swappable (3.0 MR1)
Disk Drive Capacity 480 GB
FortiGate Devices Supported 250 FortiGate units or VDOM licenses.
FortiClient installations Supported 2500
AC Input Voltage 100-240V 04Amp Max
Supports FortiGate-50A to FortiGate-800 only.
FortiAnalyzer Version 3.0 MR3 Administration Guide
12 05-30003-0082-20060925
Page 13
Introduction The FortiAnalyzer Unit
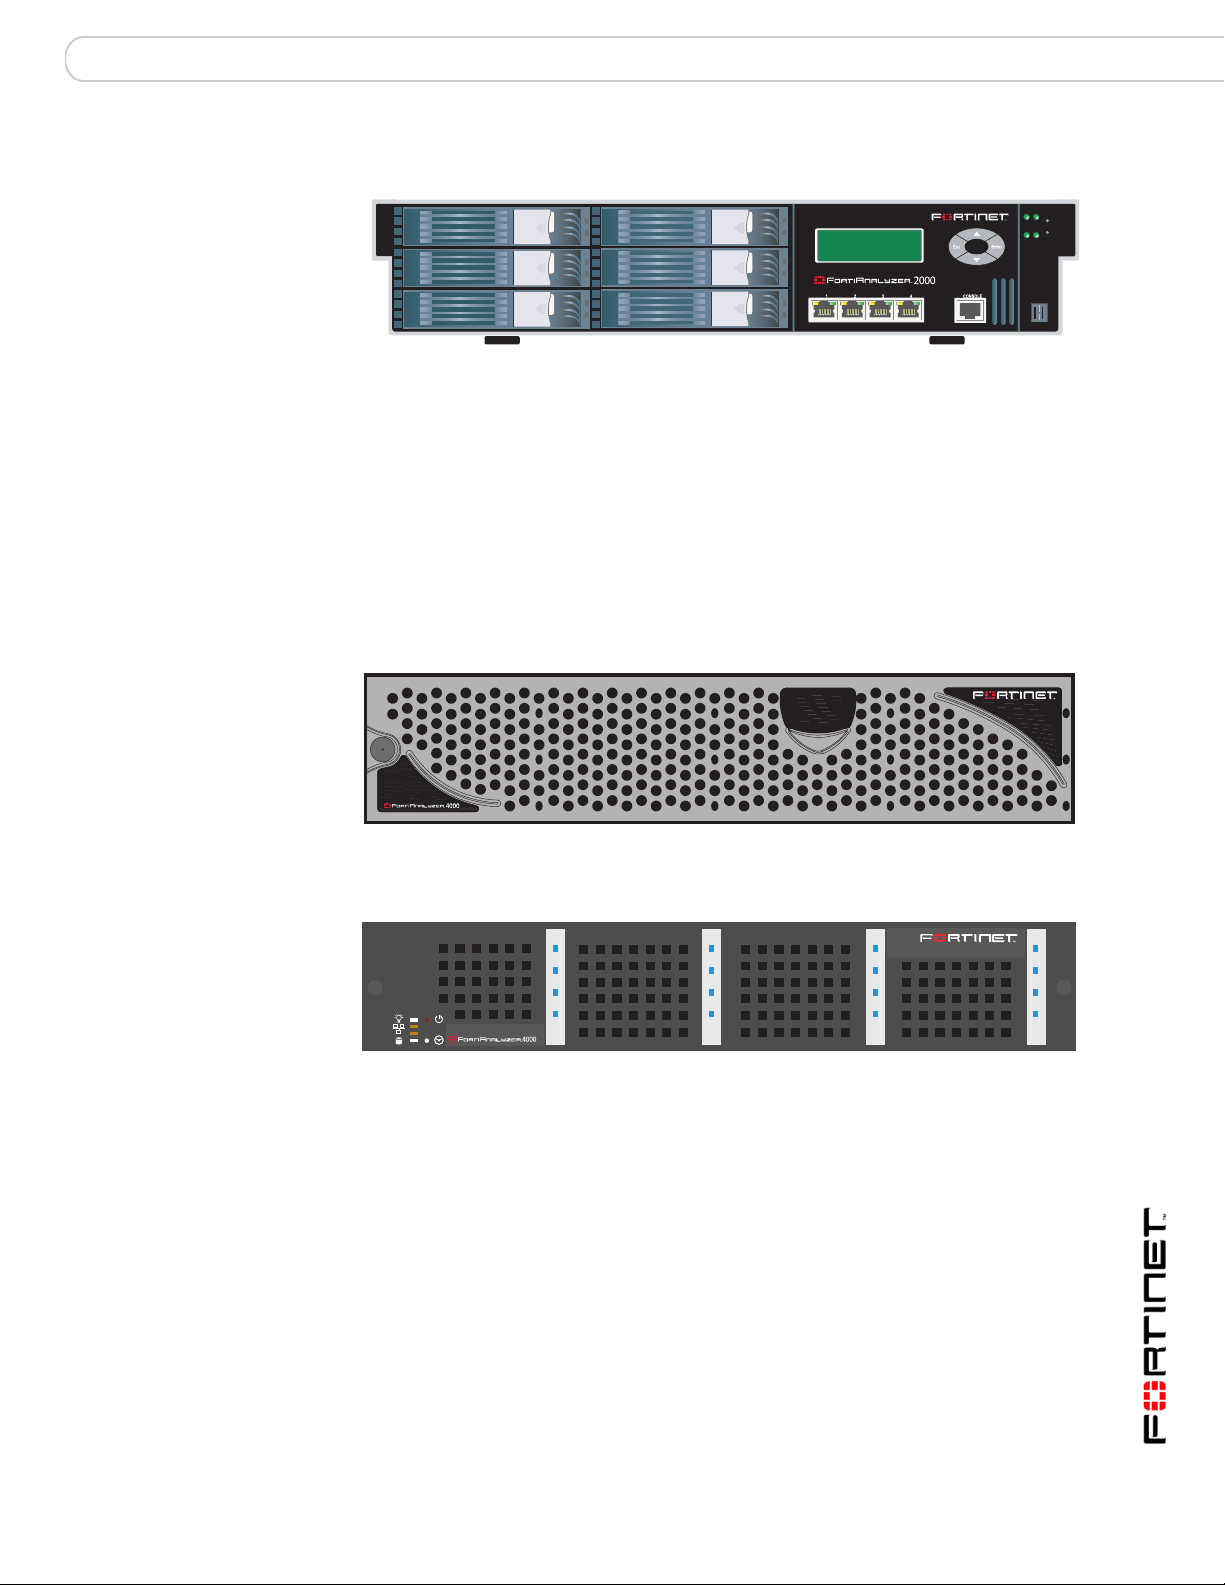
FortiAnalyzer-2000
Ports 4 gigabit Ethernet ports
Memory 2 GB
Disk Drives 6 x 400GB hot-swappable
Disk Drive Capacity 2.4 TB
FortiGate Devices Supported 500 FortiGate units or VDOM licenses.
Supports all FortiGate models.
FortiClient installations Supported 5000
AC Input Voltage 100-240V 9Amp Max
FortiAnalyzer-4000
FortiAnalyzer-4000A
1
2
Ports 2 gigabit ethernet ports
Memory 1 GB
Disk Drives 12 x 250GB - hot-swappable
Disk Drive Capacity 3 TB
FortiGate Devices Supported 500 FortiGate units or VDOM licenses.
FortiClient installations Supported 5
AC Input Voltage 100-240V 9Amp Max
Ports 2 gigabit ethernet ports
Memory 1 GB
Disk Drives 12 x 250GB - hot-swappable
Disk Drive Capacity 3 TB
A
Supports all FortiGate models.
FortiAnalyzer Version 3.0 MR3 Administration Guide
05-30003-0082-20060925 13
Page 14

FortiAnalyzer features Introduction
FortiGate Devices Supported 500 FortiGate units or VDOM licenses.
Supports all FortiGate models.
FortiClient installations Supported 5
AC Input Voltage 100-240V 9Amp Max
FortiAnalyzer features
The FortiAnalyzer unit receives log files from multiple FortiGate and syslog
devices. Using the FortiAnalyzer unit’s robust reporting capabilities, you can
monitor the traffic, attacks, and misuses from network users. The FortiAnalyzer
unit includes the following features:
Reporting
The FortiAnalyzer reporting includes:
• Log analysis and reporting
Analyze logs submitted from multiple devices and generate a variety of reports
that enables you to proactively secure networks as threats arise, avoid network
abuses, manage bandwidth requirements, monitor Web site visits, and ensure
appropriate usage of the network. Analysis includes by firewall and by user or
group of users.
• Vulnerability reports
Vulnerability reports show potential weaknesses to attacks that may exist for a
selected device. The FortiAnalyzer unit queries for open ports, and where
possible, gathers information about the running services. Known vulnerabilities
that exist for a service or version of the service is included in the report.
Note: Vulnerability reports are not available on the FortiAnalyzer-100.
Data mining
The FortiAnalyzer unit provides data mining features that enables you to easily
access simple reports to obtain information on the intrusion attempts on your
network as well as the types of traffic occurring on your network. Security event
summaries provide a snapshot of what unwanted traffic is attempting to breach
the firewall and the top traffic producers on the network, while traffic summaries
provide a snapshot of the traffic passing through the firewall on your network.
These reports can help you identify the high volume users, or attack events that
may be slowing down overall network traffic.
Network analyzer
The FortiAnalyzer network analyzer enables you to reach areas of the network
where FortiGate firewalls are not employed, or if you do not have a FortiGate unit
as a firewall. The FortiAnalyzer network analyzer functions as a sniffer to capture
traffic data, save it to the FortiAnalyzer hard disk, and display it or generate
reports using the data.
Note: The network analyzer is not available on the FortiAnalyzer-100.
FortiAnalyzer Version 3.0 MR3 Administration Guide
14 05-30003-0082-20060925
Page 15

Introduction About this guide
Log viewer
The log browser, enables you to view the log messages sent to the FortiAnalyzer
unit from registered devices. With the log viewer you can view any log file and
messages saved on the FortiAnalyzer hard disk. All log files and messages are
searchable and can be filtered to drill down and locate specific information.
Real-time log viewing
The FortiAnalyzer unit provides real-time logging of web, FTP and email traffic
through content logs.The content viewer provides a real-time display of
meta-information from registered devices. Meta-information includes where the
information is coming from and going to. For example, HTTP content includes the
source IP address and the destination URL to allow you to follow real-time trends
in network usage.
Log Aggregation
Log aggregation is a method of collating log data from remote FortiAnalyzer units
or other third party network devices that support the syslog format to a central
FortiAnalyzer unit. For example, a company may have a headquarters and a
number of branch offices. Each branch office has a FortiGate unit and a
FortiAnalyzer-100A/100B to collect local log information. The headquarters has a
FortiAnalyzer-2000 as the central log aggregator.
Quarantine
Network Attached Storage
About this guide
For FortiGate units that do not have a hard disk, the FortiAnalyzer unit offers the
ability to quarantine infected or suspicious files entering your network
environment. Use the quarantine browser on the FortiAnalyzer unit to view the
files to determine whether they are dangerous or not. Set the option on the
FortiGate unit to send the quarantined files to the FortiAnalyzer unit.
The FortiAnalyzer unit also acts as a Network Attached Storage (NAS) device.
Use the FortiAnalyzer unit as a means of backing up or storing important
information or using the extra hard disk space as a file server or repository. Any
computer using NFS or Windows sharing can mount the FortiAnalyzer hard drive
to save and retrieve files.
This guide describes how to set up, configure and use the FortiAnalyzer unit to
collect logs and generate reports on network use.
This guide has the following sections:
• Installing the FortiAnalyzer unit describes how to set up and install the
FortiAnalyzer unit in your network environment.
• Configure the FortiAnalyzer unit describes how to configure the FortiAnalyzer
system settings, such as system time, session information, and user
management.
FortiAnalyzer Version 3.0 MR3 Administration Guide
05-30003-0082-20060925 15
Page 16

FortiAnalyzer documentation Introduction
• Devices describes how to add and configure FortiGate, FortiManager units and
Syslog servers so that the FortiAnalyzer unit can maintain a connection with
the device.
• Alerts describes how to set up alert messages and configure the FortiAnalyzer
unit to send messages via email through a mail server, to a syslog server or
using SNMP traps. This chapter also lists the SNMP traps supported by the
FortiAnalyzer unit.
• Traffic summary and security events describes how to configure and view
reports on intrusion attempts against your network as well as viewing the types
of traffic occurring on your network.
• Content archive describes how to monitor metadata content for all users using
email, FTP, Instant Messages and web browsing.
• Logs describes how to select and view device and FortiAnalyzer log files. It
also describes customizing the log views using filters and columns settings to
find information in the logs easier, as well as watch logs in real time.
• Quarantine describes how to configure the FortiAnalyzer unit to receive
quarantined files from a FortiGate unit and view them on the FortiAnalyzer
hard disk.
• Vulnerability scan describes how to set up vulnerability scans and view the
generated reports.
• Reports describes how to create report profiles for running regular reports on
the log information collected by the FortiAnalyzer unit. It also describes how to
view the generated reports.
• Network Analyzer describes how to connect the FortiAnalyzer unit to a SPAN
or mirror port on a network switch to analyze, or sniff, the network traffic
passing through it.
• Forensic Analysis describes how to view and report on an individuals network
habits and activities and generate reports for analysis.
FortiAnalyzer documentation
• FortiAnalyzer Administration Guide
Describes how to install and configure a FortiAnalyzer unit to collect FortiGate,
and Syslog log files, and connect to a FortiManager device for management
purposes. It also describes how to view log files, generate and view reports on
various network activities, and use the FortiAnalyzer unit as a NAS server.
• FortiAnalyzer CLI Reference
Describes how to use the command line interface of the FortiAnalyzer unit, and
describes all the commands available.
• FortiAnalyzer online help
Provides a searchable version of the Administration Guide in HTML format.
You can access online help from the web-based manager as you work.
• FortiAnalyzer QuickStart Guides
Explains how to install and set up the FortiAnalyzer unit.
FortiAnalyzer Version 3.0 MR3 Administration Guide
16 05-30003-0082-20060925
Page 17

Introduction Customer service and technical support
Fortinet Tools and Documentation CD
All Fortinet documentation is available from the Fortinet Tools and Documentation
CD shipped with your Fortinet product. The documents on this CD are current at
shipping time. For up-to-date versions of Fortinet documentation see the Fortinet
Technical Documentation web site at http://docs.forticare.com.
Fortinet Knowledge Center
The knowledge center contains short how-to articles, FAQs, technical notes,
product and feature guides, and much more. Visit the Fortinet Knowledge Center
at http://kc.forticare.com.
Comments on Fortinet technical documentation
Please send information about any errors or omissions in this document, or any
Fortinet technical documentation, to techdoc@fortinet.com.
Customer service and technical support
Fortinet Technical Support provides services designed to make sure that your
Fortinet systems install quickly, configure easily, and operate reliably in your
network.
Please visit the Fortinet Technical Support web site at http://support.fortinet.com
to learn about the technical support services that Fortinet provides.
FortiAnalyzer Version 3.0 MR3 Administration Guide
05-30003-0082-20060925 17
Page 18

Customer service and technical support Introduction
FortiAnalyzer Version 3.0 MR3 Administration Guide
18 05-30003-0082-20060925
Page 19
Installing the FortiAnalyzer unit Planning the installation
Installing the FortiAnalyzer unit
This section describes the FortiAnalyzer hardware and how to connect the
FortiAnalyzer unit to the network. This section includes the following topics:
• Planning the installation
• Connecting the FortiAnalyzer unit
• Configuring the FortiAnalyzer unit
• Upgrading the FortiAnalyzer firmware
• Backing up the FortiAnalyzer hard disk
• Shutting down the FortiAnalyzer unit
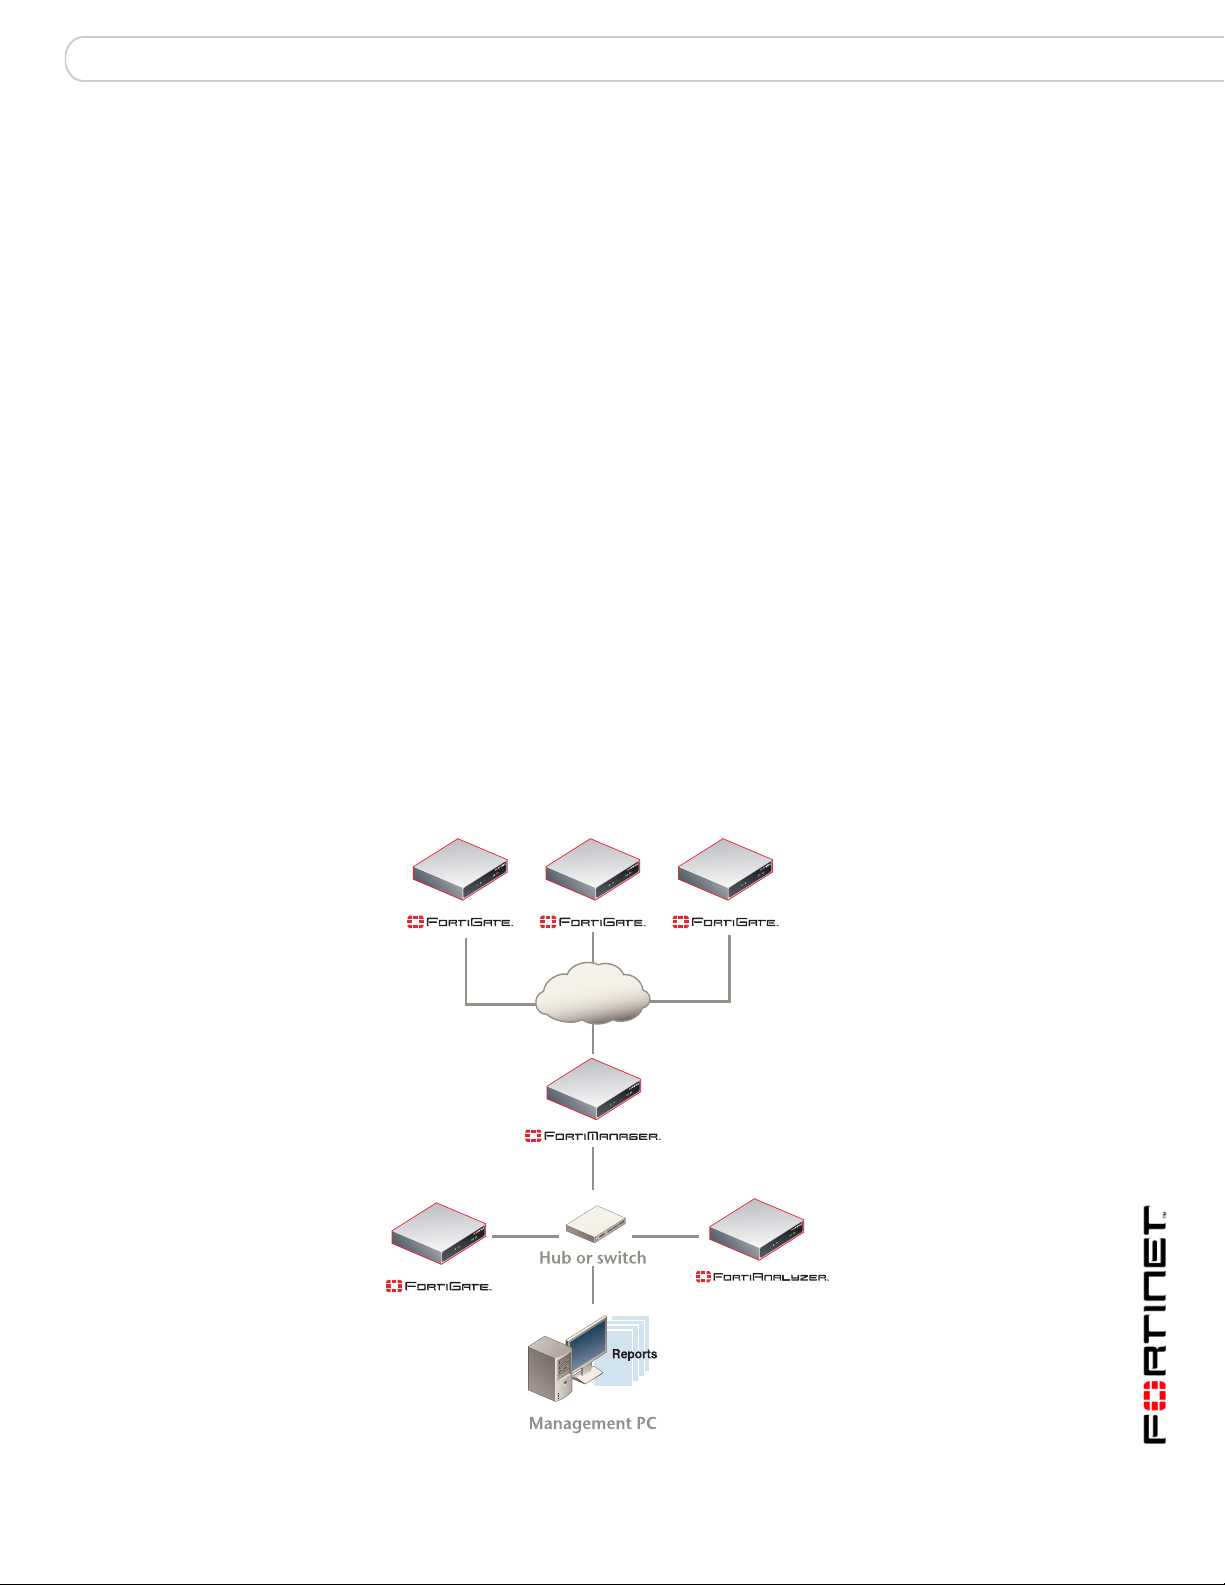
Planning the installation
You can add the FortiAnalyzer unit to your local network to receive log message
packets from FortiGate and Syslog devices.
You can connect the FortiAnalyzer unit locally or remotely through the Internet. To
connect the FortiAnalyzer unit to devices remotely, you must configure the DNS
server and the default gateway. To manage the FortiAnalyzer unit, you can use a
computer within the local network or over the Internet.
Figure 1: FortiAnalyzer connection option
Internet
FortiAnalyzer Version 3.0 MR3 Administration Guide
05-30003-0082-20060925 19
Page 20

Connecting the FortiAnalyzer unit Installing the FortiAnalyzer unit
Connecting the FortiAnalyzer unit
You can install the FortiAnalyzer unit as a free-standing appliance on any stable
surface. You can also mount the FortiAnalyzer-800, FortiAnalyzer-2000 and
FortiAnalyzer-4000/4000A onto a rack unit.
Environmental specifications
• Operating temperature: 41 to 95°F (5 to 35°C)
If you install the FortiAnalyzer unit in a closed or multi-unit rack assembly, the
operating ambient temperature of the rack environment may be greater than
room ambient temperature. Therefore, make sure to install the equipment in an
environment compatible with the manufacturer's maximum rated ambient
temperature.
• Storage temperature: -4 to 176°F (-20 to 80°C)
• Humidity: 10 to 90% non-condensing
Note: The FortiAnalyzer unit may overload your supply circuit and impact your surge
protection and supply wiring. Use appropriate equipment nameplate ratings to address this
concern.
Make sure that the FortiAnalyzer unit has reliable grounding. Fortinet recommends direct
connections to the branch circuit.
Air flow
• For rack installation, make sure that the amount of air flow required for safe
operation of the equipment is not compromised.
• For free-standing installation, make sure that the appliance has at least 1.5 in.
(3.75 cm) of clearance on each side to allow for adequate air flow and cooling.
Mechanical loading
You can mount the FortiAnalyzer-800, FortiAnalyzer-2000 and
FortiAnalyzer-4000/4000A units in a standard 19-inch rack. The FortiAnalyzer-800
requires 1U of vertical space and the FortiAnalyzer-2000 and
FortiAnalyzer-4000/4000A requires 2U of vertical space in the rack.
For rack installation, ensure an even mechanical loading of the FortiAnalyzer-800,
FortiAnalyzer-2000 and FortiAnalyzer-4000/4000A to avoid a hazardous
condition.
Connecting to the network
To connect the FortiAnalyzer unit to the network
1 Place the unit on a stable surface, or in a 19-inch rack unit.
2 Make sure the power of the unit is turned off.
3 Connect the network cable to the LAN or Port 1 interface.
4 Connect the power cable to a power outlet.
5 Turn on the power switch.
FortiAnalyzer Version 3.0 MR3 Administration Guide
20 05-30003-0082-20060925
Page 21
Installing the FortiAnalyzer unit Configuring the FortiAnalyzer unit
Configuring the FortiAnalyzer unit
Use the web-based manager or the Command Line Interface (CLI) to configure the
FortiAnalyzer unit IP address, netmask, DNS server IP address, and default gateway IP
address.
Table 1: FortiAnalyzer-100A and FortiAnalyzer-100B factory defaults
Administrator
account
Port 1
Port 2
Port 3
Port 4
Table 2: FortiAnalyzer-400 factory defaults
Administrator
account
Port 1
Port 2
Port 3
User name: admin
Password: (none)
IP: 192.168.1.99
Netmask: 255.255.255.0
Management Access: HTTP, HTTPS, PING, SSH
IP: 192.168.2.99
Netmask: 255.255.255.0
Management Access: HTTP, HTTPS, PING, SSH
IP: 192.168.3.99
Netmask: 255.255.255.0
Management Access: HTTP, HTTPS, PING, SSH
IP: 192.168.4.99
Netmask: 255.255.255.0
Management Access: HTTP, HTTPS, PING, SSH
User name: admin
Password: (none)
IP: 192.168.1.99
Netmask: 255.255.255.0
Management Access: HTTP, HTTPS, PING, SSH
IP: 192.168.2.99
Netmask: 255.255.255.0
Management Access: HTTP, HTTPS, PING, SSH
IP: 192.168.3.99
Netmask: 255.255.255.0
Management Access: HTTP, HTTPS, PING, SSH
FortiAnalyzer Version 3.0 MR3 Administration Guide
05-30003-0082-20060925 21
Page 22
Configuring the FortiAnalyzer unit Installing the FortiAnalyzer unit
Table 3: FortiAnalyzer-800 factory defaults
Administrator
account
Port 1
Port 2
Table 4: FortiAnalyzer-2000 factory defaults
Administrator
account
Port 1
Port 2
Port 3
Port 4
User name: admin
Password: (none)
IP: 192.168.1.99
Netmask: 255.255.255.0
Management Access: HTTP, HTTPS, PING, SSH
IP: 192.168.2.99
Netmask: 255.255.255.0
Management Access: HTTP, HTTPS, PING, SSH
User name: admin
Password: (none)
IP: 192.168.1.99
Netmask: 255.255.255.0
Management Access: HTTP, HTTPS, PING, SSH
IP: 192.168.2.99
Netmask: 255.255.255.0
Management Access: HTTP, HTTPS, PING, SSH
IP: 192.168.3.99
Netmask: 255.255.255.0
Management Access: HTTP, HTTPS, PING, SSH
IP: 192.168.4.99
Netmask: 255.255.255.0
Management Access: HTTP, HTTPS, PING, SSH
Table 5: FortiAnalyzer-4000/4000A factory defaults
Administrator
account
Port 1
Port 2
22 05-30003-0082-20060925
User name: admin
Password: (none)
IP: 192.168.1.99
Netmask: 255.255.255.0
Management Access: HTTP, HTTPS, PING, SSH
IP: 192.168.2.99
Netmask: 255.255.255.0
Management Access: HTTP, HTTPS, PING, SSH
FortiAnalyzer Version 3.0 MR3 Administration Guide
Page 23

Installing the FortiAnalyzer unit Configuring the FortiAnalyzer unit
Using the web-based manager
The web-based manager provides a GUI interface to configure and administer the
FortiAnalyzer unit.
Use the web-based manager to:
• configure most FortiAnalyzer settings
• monitor the status of the FortiAnalyzer unit
• configure and view reports
• view log files and messages
• administer users, groups and set access rights.
You can configure and manage the FortiAnalyzer unit using a secure HTTPS
connection from any computer running Internet Explorer 6.0 or other current
browser.
Configuration changes made using the web-based manager are effective
immediately without resetting the firewall or interrupting service.For all
FortiAnalyzer models, use the following procedure to connect to the web-based
manager for the first time.
To connect to the web-based manager, you need:
• An Ethernet connection between the FortiAnalyzer unit and management
computer.
• Internet Explorer version 6.0 or higher or other current popular web browser on
the management computer.
To connect to the web-based manager
1 Connect the Port1 interface of the FortiAnalyzer unit to the Ethernet port of the
management computer.
2 Use a cross-over Ethernet cable to connect the devices directly. Use
straight-through Ethernet cables to connect the devices through a hub or switch.
3 Configure the management computer to be on the same subnet as the
FortiAnalyzer LAN interface.
4 To do this, change the IP address of the management computer to 192.168.1.2
and the netmask to 255.255.255.0.
5 To access the FortiAnalyzer web-based manager, start your browser and browse
to https://192.168.1.99 (remember to include the “s” in https://).
6 Type admin in the Name field and select Login.
After connecting to the Web-based manager, you can configure the FortiAnalyzer
unit IP address, DNS server IP address, and default gateway to connect the
FortiAnalyzer unit to the network.
To configure the FortiAnalyzer unit using the web-based manager
1 In the web-based manager, go to System > Network > Interface.
2 Select Edit for Port1.
3 Enter the IP address and netmask and select OK.
If the FortiAnalyzer unit will be connected to the internet:
4 Go to System > Network > DNS.
FortiAnalyzer Version 3.0 MR3 Administration Guide
05-30003-0082-20060925 23
Page 24

Configuring the FortiAnalyzer unit Installing the FortiAnalyzer unit
5 Enter the, primary DNS server IP address, secondary DNS server IP address
(optional).
6 Select Apply.
7 Got to System > Network > Routing.
8 Select Create New and add the default gateway IP address and any other routes
as required.
9 Select OK.
Using the command line interface
You can also use terminal emulation software to connect to the command line
interface (CLI) from any network that is connected to the FortiAnalyzer unit,
including the Internet. This applies to all FortiAnalyzer models.
You can also access the FortiAnalyzer-100A/100B, FortiAnalyzer-800 and
FortiAnalyzer-4000/4000A CLI by using the null-modem cable provided to connect
to the unit’s console port.
The CLI supports the same configuration and monitoring functionality as the
web-based manager.
To connect to the FortiAnalyzer unit through the console
1 Use a null-modem cable to connect the serial port on the
FortiAnalyzer-100A/100B, FortiAnalyzer-800 and FortiAnalyzer-4000/4000A to
the management computer serial port.
2 Start a terminal emulation program (such as HyperTerminal) on the management
computer. Use these settings:
• Baud Rate (bps) 9600
• Data bits 8
•Parity None
• Stop bits 1
• Flow Control None.
3 At the login: prompt, type admin and press Enter twice.
4 (The
login
prompt is preceded by the server IP address.)
After connecting to the CLI, you can configure the unit IP address, DNS server IP
address, and default gateway to connect the FortiAnalyzer unit to the network.
To configure the FortiAnalyzer unit using the CLI
1 Set the IP address and netmask of the LAN interface:
config system interface
edit port1
set ip <ip_address><netmask>
end
2 Confirm that the address is correct:
get system interface
FortiAnalyzer Version 3.0 MR3 Administration Guide
24 05-30003-0082-20060925
Page 25
Installing the FortiAnalyzer unit Upgrading the FortiAnalyzer firmware
3 Set the primary and optionally the secondary DNS server IP address:
config system dns
set primary <dns-server_ip>
set secondary <dns-server_ip>
end
4 Set the default gateway:
config system route
edit 1
set device port1
set dst <destination_ip><netmask>
set gateway <gateway_ip>
end
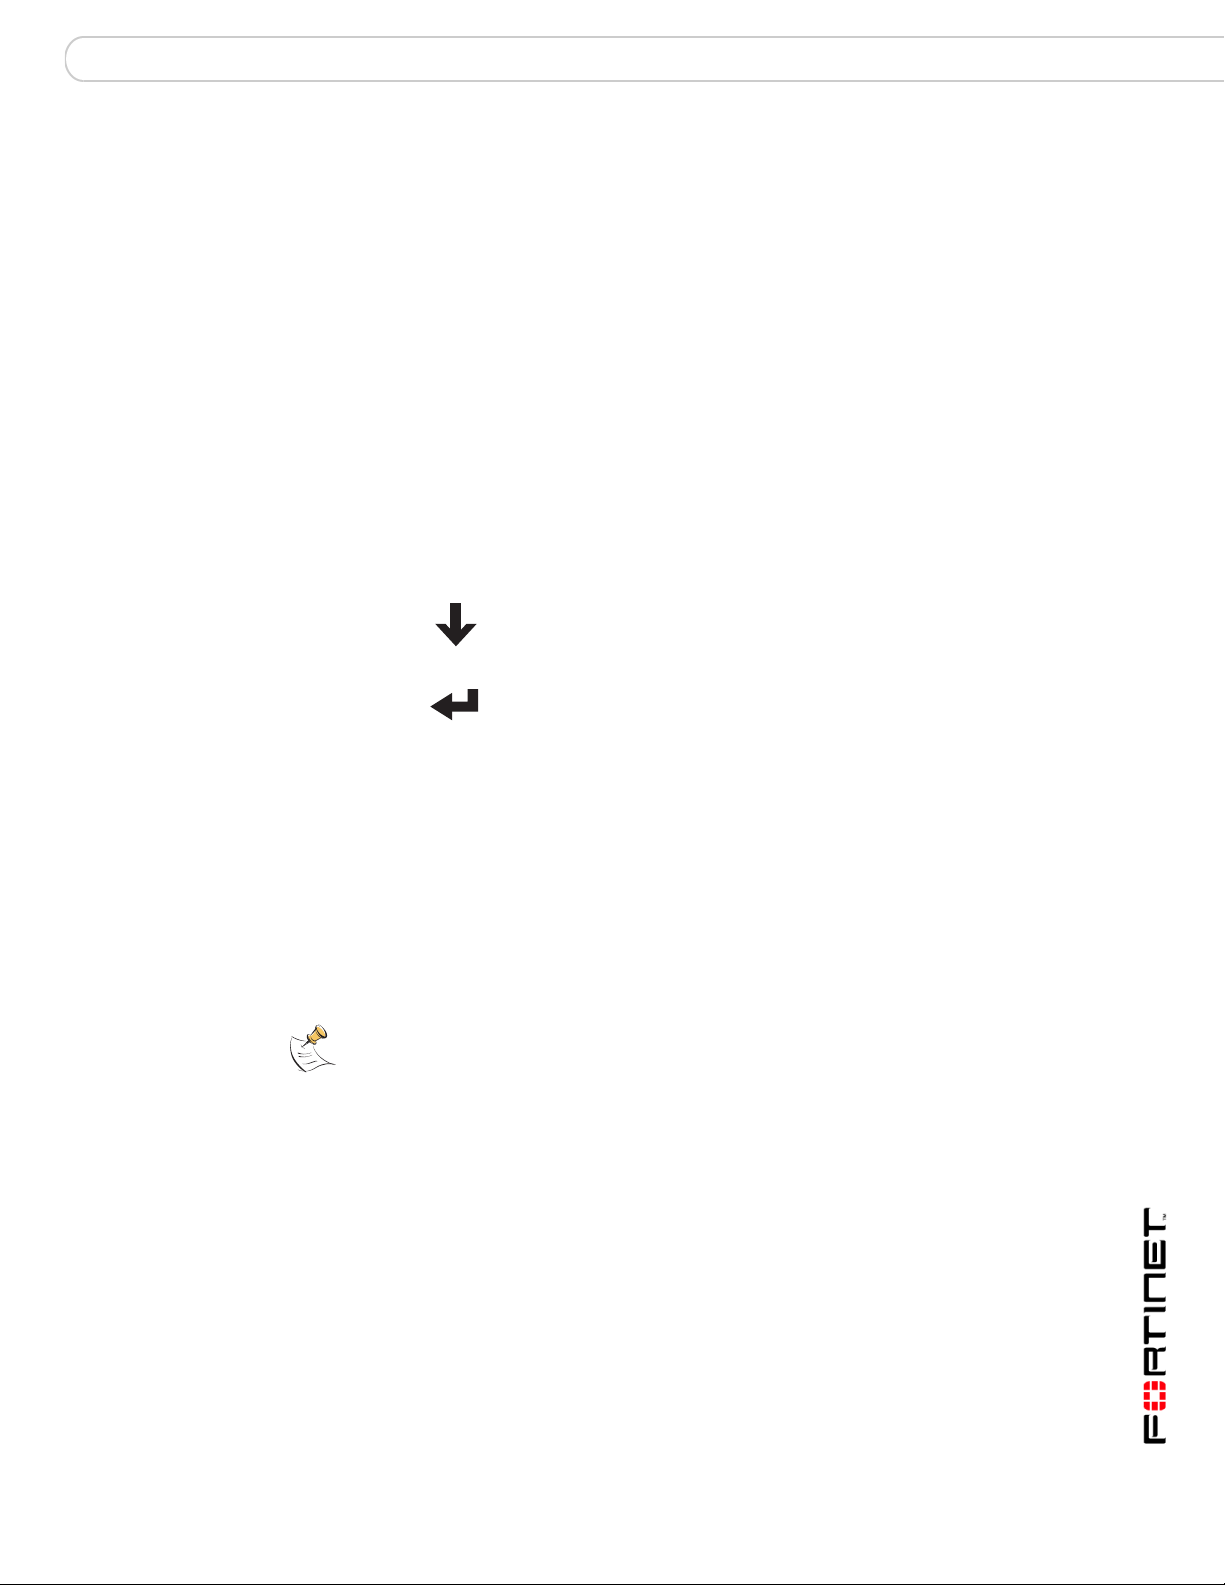
Using the front panel buttons and LCD
You can use the front panel buttons on the FortiAnalyzer-400 and
FortiAnalyzer-800 to set up the unit’s IP address, netmask, and default gateway.
Press the cycle button to cycle through options and select the IP
address information.
Press the enter button to select a menu option or number in the IP
address.
On the FortiAnalyzer-2000, use the up and down arrow buttons to cycle through
the options and enter the IP address information, and select Enter to select a
menu option or number in the IP address.
Upgrading the FortiAnalyzer firmware
Upgrade the FortiAnalyzer firmware using the instructions in the topic “Changing
the firmware” on page 35. Ensure you backup all configuration settings and log
files before upgrading the firmware.
Note: If you are upgrading from FortiAnalyzer firmware version 0.8, the file system has
changed. After upgrading the firmware, all log data will be destroyed. Ensure you backup all
log information before proceeding with the upgrade. When upgrading from FortiLog 0.8 to
FortiAnalyzer
To format the hard disk, go to System > Dashboard. Select Format Log Disks for the
System Operation.
3.0, the FortiAnalyzer hard disks must be reformatted.
FortiAnalyzer Version 3.0 MR3 Administration Guide
05-30003-0082-20060925 25
Page 26

Backing up the FortiAnalyzer hard disk Installing the FortiAnalyzer unit
Backing up the FortiAnalyzer hard disk
Before upgrading the FortiAnalyzer firmware, formatting the log disk or changing
the RAID configuration (on a FortiAnalyzer-400, FortiAnalyzer-800,
FortiAnalyzer-2000 and FortiAnalyzer-4000/4000A), it is extremely important that
you back up the log data first. Using the CLI, you can perform a global backup of
all log information to an FTP server.
Note: In the case of changing RAID configurations and formatting log disks, this command
is designed to backup and restore all logs from the FTP server.
To backup the log information on the FortiAnalyzer hard disk, use the CLI to enter
the following command:
execute backup logs <ftp_ip_address> <ftp_username>
<ftp_password> <ftp_dir>
Once the firmware upgrade or the RAID configuration is complete, you can restore
the log information to the FortiAnalyzer hard disk.
Note: Before using the restore CLI command, ensure you add the devices for the logs first.
The command will not function without the devices to associate with the logs. For details on
adding devices, see the chapter “Devices” on page 65.
execute restore logs <device> <ftp_ip_address>
<ftp_username> <ftp_password> <ftp_dir>
Shutting down the FortiAnalyzer unit
When powering off the FortiAnalyzer unit, always shut down the unit using the
following procedures before disconnecting the power supply. By not following this
procedure you risk damaging the FortiAnalyzer hard disk.
To power off the FortiAnalyzer unit
1 From the web-based manager, go to System > Dashboard.
2 In the System Operation list, select Shut Down and select Go.
OR
from the CLI, enter:
execute shutdown
3 Disconnect the power supply.
FortiAnalyzer Version 3.0 MR3 Administration Guide
26 05-30003-0082-20060925
Page 27
Configure the FortiAnalyzer unit Dashboard
Configure the FortiAnalyzer unit
The FortiAnalyzer unit provides a number of configuration options to customize
the FortiAnalyzer unit using the System settings.
This section describes the configuration settings you can apply to use the
FortiAnalyzer in your network environment.
This section includes the following topics:
• Dashboard
• Network settings
• Administrator settings
• Network sharing
• Configuring the FortiAnalyzer unit
• Maintenance
• RAID levels
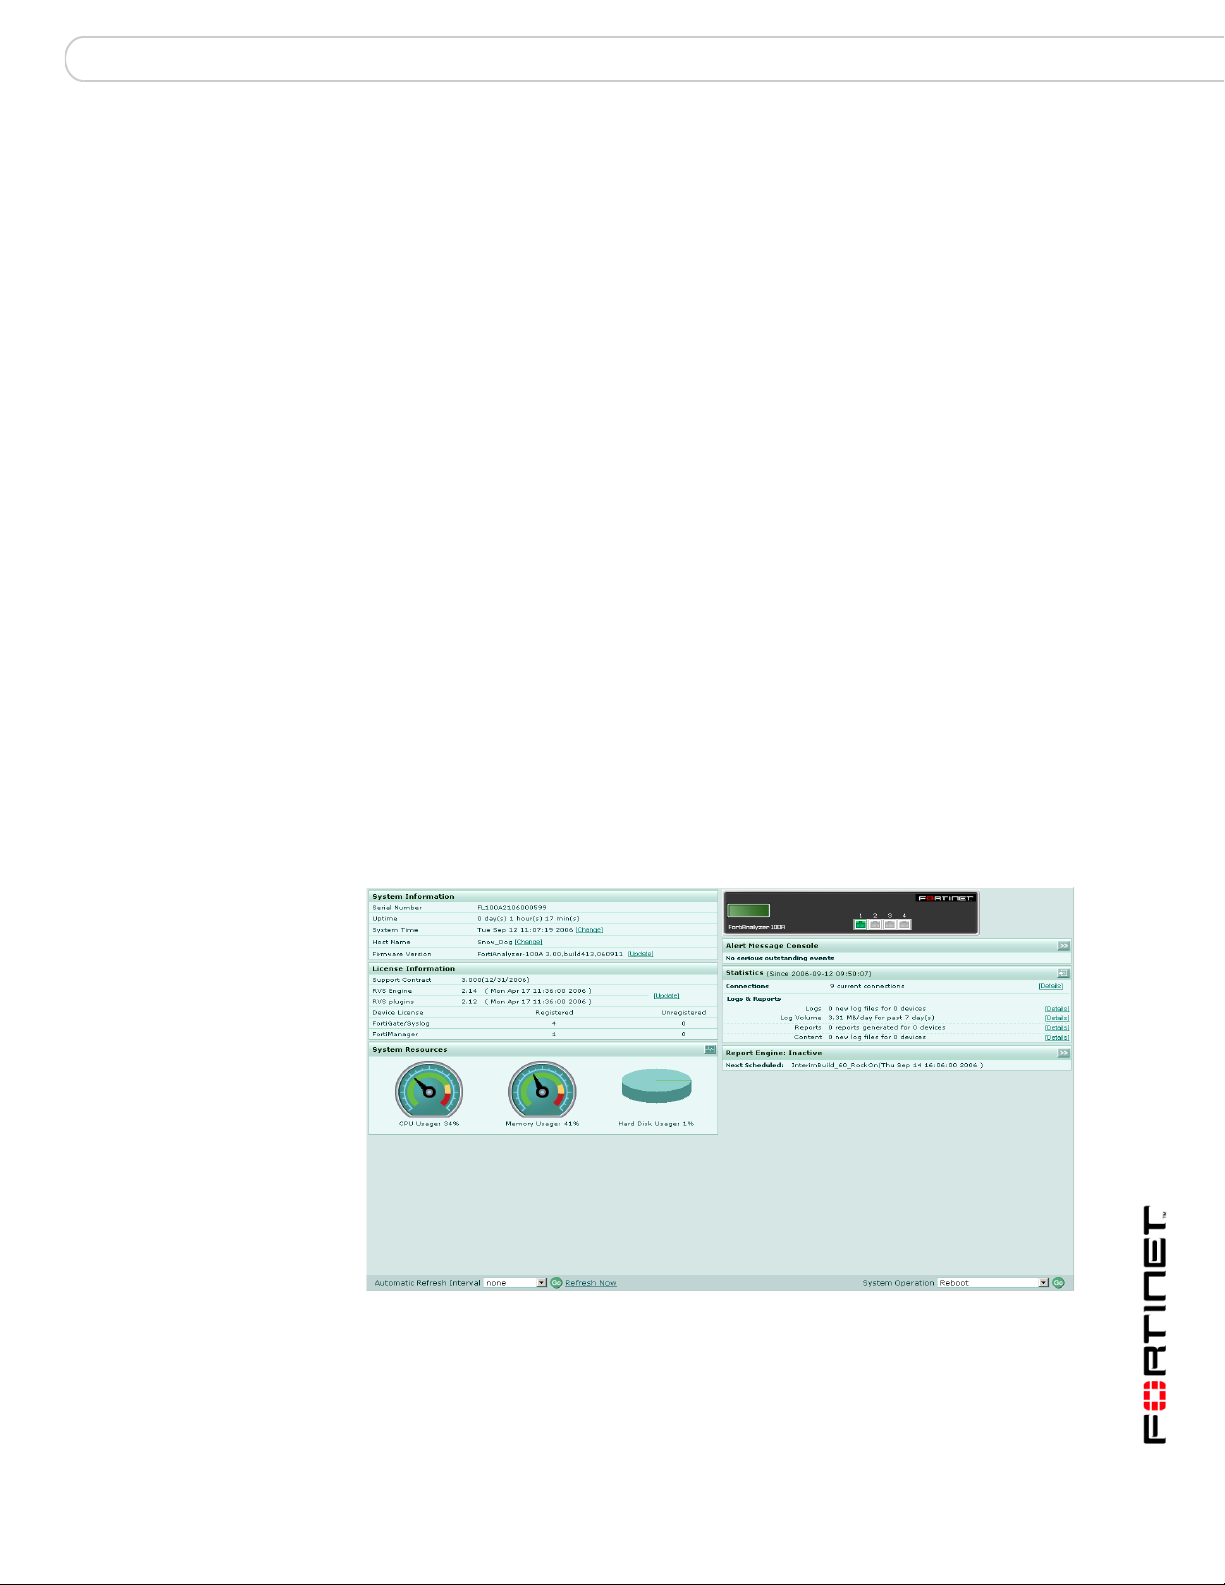
Dashboard
The system dashboard provides a view of the current operating status of the
FortiAnalyzer unit. All FortiAnalyzer administrators with read access to system
configuration can view system status information.
Figure 2: FortiAnalyzer-400 dashboard
Connect to the web-based manager to view the current system status of the
FortiAnalyzer unit, and modify the system information. The status information that
appears includes the system information, alert messages, system resources,
license information and session statistics.
FortiAnalyzer Version 3.0 MR3 Administration Guide
05-30003-0082-20060925 27
Page 28

Dashboard Configure the FortiAnalyzer unit
System Information
The System Information area of the Dashboard displays the current state of the
FortiAnalyzer unit. The System Status area includes the following information:
Serial Number The serial number of the FortiAnalyzer unit. The serial number is
Uptime The time in days, hours and minutes since the FortiAnalyzer was
System Time The current time according to the FortiAnalyzer internal clock.
Host Name The name of the FortiAnalyzer unit. For details on changing the
Firmware Version The version of the firmware installed on the FortiAnalyzer unit.
System Resources
The system resources displays how the FortiAnalyzer unit’s resources are being
used. You can monitor the CPU, memory and hard disk use and quickly see at
what capacity the FortiAnalyzer unit is running. System resources includes the
following information:
CPU Usage The current CPU status. The web-based manager displays CPU
Memory Usage The current memory status. The web-based manager displays
Hard Disk Usage /
RAID status
History icon Select History to view a graphical representation of the last minute
unique to the FortiAnalyzer unit and does not change with
firmware updates. Use this number when registering your
FortiAnalyzer unit with Fortinet.
started or last rebooted.
Select Change to change the time or configure the FortiAnalyzer
unit to obtain the time from an NTP server. For details see “Setting
the time” on page 32.
name see “Changing the host name” on page 36.
Select Update to upload a new version of the firmware. For details
on updating the firmware see “Changing the firmware” on
page 35.
usage for core processes only. CPU usage for management
processes (for example, for HTTPS connections to the web-based
manager) is excluded.
memory usage for core processes only. Memory usage for
management processes (for example, for HTTPS connections to
the web-based manager) is excluded.
For the FortiAnalyzer-100 and FortiAnalyzer-100A/100B, the
current status of the hard disk. The web-based manager displays
the amount of hard disk space used.
For the FortiAnalyzer-400, FortiAnalyzer-800, FortiAnalyzer-2000
and FortiAnalyzer-4000/4000A, the current RAID status of the
hard disks. Each circle indicates the status of a hard disk. Green
indicates the hard disk is functioning normally. If the disk is
flashing red and yellow, there is a problem with the hard disk.
The hard disks on the FortiAnalyzer-2000 and
FortiAnalyzer-4000/4000A are hot swappable. For details see “Hot
swapping the FortiAnalyzer-2000 and FortiAnalyzer-4000/4000A”
on page 62.
of CPU, memory, sessions, and network usage. For more
information see “Viewing operational history” on page 30.
FortiAnalyzer Version 3.0 MR3 Administration Guide
28 05-30003-0082-20060925
Page 29

Configure the FortiAnalyzer unit Dashboard
License Information
Support Contract The support contract number and expiry date.
RVS Engine The version of the RVS engine. Select Update to upload a new
RVS Plug-ins The version of the RVS plug-in.
Device License A listing of the number of devices connected to the FortiAnalyzer
version of the engine.
This feature is not available on the FortiAnalyzer-100.
This feature is not available on the FortiAnalyzer-100.
unit.
Registered is the number of devices added to the FortiAnalyzer
unit.
Unregistered is the number of devices attempting to connect to
the FortiAnalyzer unit that need configuring. To configure the
FortiAnalyzer unit to accept logs from a device see “Devices List”
on page 65.
Alert Message Console
The Alert display shows alert messages for the FortiAnalyzer and connected
FortiGate units. The Alerts display shows hard disk failure messages, virus
outbreak, or suspicious event warnings. To view all the alert messages recorded
by the FortiAnalyzer unit, select More Alerts. For details on viewing alert
messages see “Viewing Alert messages” on page 31.
Statistics
Since The date and time when the statistics were last reset.
Connections The number of communication sessions occurring on the
Logs & Reports A display of the log file activity and volume delivered to the
Report Engine
The Report Engine display shows the FortiAnalyzer report generation activity. The
report engine activity information includes whether the report engine is active or
inactive, what reports are running when active and the percentage completed.
Select the Generate report button to create a new report profile.
Automatic Refresh Interval
Select how often the Status page automatically updates. Select Refresh Now to
update the status page immediately.
System Operation
Perform the following operations from the Status page. These options are not
available if your access privileges include write permissions.
FortiAnalyzer unit. Select Details for more information on the
connections. For details on the session information, see “Viewing
Session information” on page 30.
FortiAnalyzer unit.
Reboot Restart the FortiAnalyzer unit.
ShutDown Shut down the FortiAnalyzer unit. You can only restart the
FortiAnalyzer Version 3.0 MR3 Administration Guide
05-30003-0082-20060925 29
FortiAnalyzer unit by turning the power off and then on again.
Page 30

Dashboard Configure the FortiAnalyzer unit
Format log disks Format the FortiAnalyzer hard disk. Selecting this option will
Reset to factory
default
Viewing operational history
The System resource history page displays four graphs representing system
resources and network utilization history, updated every three seconds.
To view the FortiAnalyzer operational history
1 Go to System > Dashboard.
2 Select History in the upper right corner of the System Resources area.
CPU Usage The CPU usages for the previous minute.
Memory Usage The memory usages for the previous minute.
Session The session history for the previous minute.
Network utilization The network use for the last minute.
delete all log files and reports from the hard disk. Ensure that you
back up all information before selecting this option. Formatting the
hard disk will also interrupt FortiAnalyzer operations for several
minutes.
Restart the FortiAnalyzer unit with its original configuration when it
was initially powered on. This will delete all configuration changes
you have made, but does not changes the firmware version. This
also includes resetting the IP address and netmask. You will need
to reconnect to the FortiAnalyzer device using the default IP
address of 192.168.1.99.
Viewing Session information
Session information displays information about the current communication
sessions on the FortiAnalyzer unit.
To view the session information
1 Go to System > Dashboard.
2 In the Statistics area, select Details for the Connection information.
Resolve Host Name Select to display host names by a recognizable name rather than
Resolve Service Select to display network service names rather than port numbers.
Refresh Time Select the frequency of the refresh of the Connections page to
Stop Refresh Select to stop the refreshing of the connections page. To start the
View per page Select the number of rows to display per page.
Page n of n Enter a page number to jump to and press Enter.
Search Enter a keyword to perform a simple search on the session
Protocol The service protocol of the connection. For example, udp and tcp.
From IP The source IP address of the connection.
From Port The source port of the connection.
To IP The destination IP address of the connection.
IP addresses. For details on configuring IP address host names
see “IP Aliases” on page 53.
For example, HTTP rather than port 80.
view the connection activity.
refresh, select a refresh time.
information available. Select Go to begin the search. The number
of matches appears above the Search field.
FortiAnalyzer Version 3.0 MR3 Administration Guide
30 05-30003-0082-20060925
Page 31

Configure the FortiAnalyzer unit Dashboard
To Port The destination port of the connection.
Expires (Secs) The time in seconds remaining before the connection terminates.
Filtering session information
You can filter the contents to find specific content. Each column of data includes a
gray filter icon. Select the icon to filter the contents of the column.
When applying a column filter, the filter icon appears green.
To turn off the filter, select the filter icon for the column, and select Clear all Filters.
Viewing Alert messages
Alert messages provides a window on what is occurring on the FortiAnalyzer and
other FortiGate devices. It enables you to view issues on your network, including
network attacks and virus warnings. The Alert messages window provides a
complete list of alert messages. You can view the alert messages by level and
delete the messages as required.
To view the alert messages
1 Go to System > Dashboard.
2 Select More Alerts in the upper right corner of the Alert Message Console area.
Figure 3: Alert messages
Page Select the page of alerts to view. Use the arrows to move forward
Include...and higher
in alerts
Keep
unacknowledged
alerts for
Formatted | Raw Select to view the alert messages in a formatted or raw format.
Device The device where the alert message is originating.
Event Details of the event causing the alert message.
Severity The level of the alert message.
Time The date and time of the alert message.
and back through the pages or enter a page number and press
Enter.
Select an alert level to view. The level you select and those alert
messages higher than selected will appear in the alert list.
Select the number of previous days of alert messages to display.
Selecting a number of days lower than what you are currently
viewing deletes the older alerts. For example, if you are viewing
alerts for seven days, and change the alerts to two days, the
FortiAnalyzer unit deletes the other five days of alert messages.
FortiAnalyzer Version 3.0 MR3 Administration Guide
05-30003-0082-20060925 31
Page 32

Dashboard Configure the FortiAnalyzer unit
!
Counter The number of occurrences of the alert event.
Delete icon Select the check box for alert messages you want to delete and
select the delete icon.
Clicking the column headers sorts the information in ascending or descending
order for that column.
Setting the time
Set the system time to ensure effective scheduling and accurate logging of
information. You can either manually set the FortiAnalyzer system time or you can
configure the FortiAnalyzer unit to automatically keep its system time correct by
synchronizing with a Network Time Protocol (NTP) server.
To set the system time, go to System > Dashboard and select Change for the
System Time.
Figure 4: Time Settings
System Time The current FortiAnalyzer system date and time.
Refresh Update the display of the current FortiAnalyzer system date and
Time Zone Select the current FortiAnalyzer system time zone.
Set Time Select to set the FortiAnalyzer system date and time to the values
Synchronize with
NTP Server
Server Enter the IP address or domain name of an NTP server. To find an
Sync Interval Specify how often the FortiAnalyzer unit should synchronize its time
time.
you set in the Year, Month, Day, Hour, Minute and Second fields.
Select to use an NTP server to automatically set the system date
and time. You must specify the server and synchronization interval.
NTP server that you can use, see http://www.ntp.org.
with the NTP server. For example, a setting of 1440 minutes causes
the FortiAnalyzer unit to synchronize its time once a day.
Restore factory default system settings
You can restore the FortiAnalyzer unit to its factory default. This procedure does
not change the firmware version.
Caution: This procedure deletes all changes you have made to the FortiAnalyzer
configuration and reverts the system to its original configuration, including resetting
interface addresses.
FortiAnalyzer Version 3.0 MR3 Administration Guide
32 05-30003-0082-20060925
Page 33

Configure the FortiAnalyzer unit Dashboard
!
To restore system settings to factory defaults
1 Go to System > Dashboard.
2 In the System Operations area, select Reset to Factory Default and select Go.
3 Select OK to confirm.
The FortiAnalyzer unit restarts with the configuration it had when it was first
powered on.
Format the log disks
Use the system dashboard to format the FortiAnalyzer log disks. Remember to
back up and log data before formatting the hard disks. The FortiAnalyzer unit is
unavailable for the duration of the format process.
To format the log disks
1 Go to System > Dashboard.
2 In the Systems Operations area, select Format Log Disks and select Go.
3 Select OK to begin the format.
Restoring a FortiAnalyzer unit
Use the following procedure if the FortiAnalyzer unit cannot complete the startup
procedure. When this event occurs, the FortiAnalyzer unit is unresponsive to the
web-based manager or the CLI. The cause may be a corrupted firmware image.
Restoring a FortiAnalyzer-100 or FortiAnalyzer-400
To use the following procedure you must have a TFTP server that the
FortiAnalyzer unit can connect to. The TFTP server IP address must be set to
192.168.1.168.
Caution: This procedure resets all FortiAnalyzer settings to their default state. This
includes the interface IP addresses, as well as HTTP, HTTPS, SSH, and telnet access.
See “Configuring the FortiAnalyzer unit” on page 21.
To upload the firmware image to the FortiAnalyzer unit
1 Make sure the TFTP server is running.
2 Copy the firmware image file to the root directory of the TFTP server. Ensure the
file name is image.out.
3 Start the FortiAnalyzer unit.
As the FortiAnalyzer unit starts, the following message appears on the LCD:
Press any key to begin download.....
4 Immediately press any key to begin the automatic download.
The FortiAnalyzer unit connects to the TFTP server and begins downloading the
firmware image. Once downloaded, the FortiAnalyzer unit loads the firmware and
proceeds with the system startup.
FortiAnalyzer Version 3.0 MR3 Administration Guide
05-30003-0082-20060925 33
Page 34

Dashboard Configure the FortiAnalyzer unit
!
Restoring a FortiAnalyzer-100A/100B, 800, 2000 and 4000/4000A
Caution: This procedure resets all FortiAnalyzer settings to their default state. This
includes the interface IP addresses, as well as HTTP, HTTPS, SSH, and telnet access.
See “Configuring the FortiAnalyzer unit” on page 21.
Note: When connecting the Ethernet cable to the FortiAnalyzer-800, insert the cable into
the LAN2 port.
To upload a firmware image to the FortiAnalyzer unit
1 Connect to the CLI using the null-modem cable and FortiAnalyzer console port.
2 Make sure the TFTP server is running.
3 Copy the new firmware image file to the root directory of the TFTP server.
4 To confirm the FortiAnalyzer unit can connect to the TFTP server, use the
following command to ping the computer running the TFTP server. For example, if
the IP address of the TFTP server is 192.168.1.168, enter:
execute ping 192.168.1.168
5 Enter the following command to restart the FortiAnalyzer unit:
execute reboot
As the FortiAnalyzer units starts, a series of system startup messages is
displayed.
When one of the following messages appears:
Press any key to display configuration menu...
Immediately press any key to interrupt the system startup.
If you successfully interrupt the startup process, the following messages appears:
[G]: Get firmware image from TFTP server.
[F]: Format boot device.
[B]: Boot with backup firmware and set as default.
[Q]: Quit menu and continue to boot with default firmware.
[H]: Display this list of options.
Enter G,F,B,Q,or H:
6 Type G to get the new firmware image from the TFTP server.
The following message appears:
Enter TFTP server address [192.168.1.168]:
7 Type the address of the TFTP server and press Enter.
The following message appears:
Enter Local Address [192.168.1.188]:
8 Type an IP address that the FortiAnalyzer unit can use to connect to the TFTP
server.
FortiAnalyzer Version 3.0 MR3 Administration Guide
34 05-30003-0082-20060925
Page 35

Configure the FortiAnalyzer unit Dashboard
9 The IP address can be any IP address that is valid for the network the interface is
connected to. Make sure you do not enter the IP address of another device on this
network.
The following message appears:
Enter File Name [image.out]:
10 Enter the firmware image file name and press Enter.
The TFTP server uploads the firmware image file to the FortiAnalyzer unit and
displays the following message:
Save as Default firmware/Backup firmware/Run image without
saving:[D/B/R]
11 Type D.
The FortiAnalyzer unit installs the new firmware image and restarts.
Changing the firmware
Use the following procedure to upgrade the FortiAnalyzer unit to a newer firmware
version or revert to a previous firmware version.
If you are reverting to a previous firmware version, the procedure reverts the
FortiAnalyzer unit to its factory default configuration.
When you upgrade the firmware, the FortiAnalyzer unit maintains the your
configuration settings.
Back up the FortiAnalyzer unit configuration before beginning this procedure. For
information, see “Backup & Restore” on page 57.
Note: If you revert to a previous firmware version, because the configuration is reset, you
will need to reconfigure the IP address from the front panel of the FortiAnalyzer-100 and
FortiAnalyzer-400, and the console for the FortiAnalyzer-800 and
FortiAnalyzer-100A/100B.
To change the firmware using the web-based manager
1 Copy the firmware image file to your management computer.
2 Log on to the web-based manager as the administrative user.
3 Go to System > Dashboard.
4 Select Update in the System Information area.
5 Type the path and file name of the firmware image file, or select Browse and
locate the firmware image file.
6 Select OK.
If you are reverting to a previous version of the firmware, a message appears
informing you the system configuration will be set to default and all the original
configuration will be lost.
7 Select OK.
• If you upgrade the firmware, the FortiAnalyzer unit uploads the firmware image
file, upgrades to the new firmware version, restarts, and displays the
FortiAnalyzer login. This process takes a few minutes.
FortiAnalyzer Version 3.0 MR3 Administration Guide
05-30003-0082-20060925 35
Page 36

Network settings Configure the FortiAnalyzer unit
• If you revert to a previous firmware version, the FortiAnalyzer unit uploads the
firmware image file, reverts to the old firmware version, resets the
configuration, restarts, and displays the FortiAnalyzer unit login. This process
takes a few minutes.
8 Restore your configuration. See “Backup & Restore” on page 57.
9 Enter the file name or select Browse to locate the signature file and select OK.
Changing the host name
Change the FortiAnalyzer host name to differentiate the FortiAnalyzer from other
FortiAnalyzer units or other devices on your network.
To change the host name
1 Go to System > Dashboard.
2 In the System Information area, select Change for the Host Name.
3 Enter a new name for the FortiAnalyzer unit and select OK. A host name can be
up to 20 characters long.
Network settings
Interface
Use the network settings to configure the FortiAnalyzer unit to operate in your
network. Basic network settings include configuring FortiAnalyzer interfaces, DNS
settings and static routes.
Use the interface configuration to set up the ports on your FortiAnalyzer unit. This
includes the IP address, administrator access and Maximum Transmission Unit
(MTU) settings.
To configure the interfaces of the FortiAnalyzer unit, go to System > Network >
Interface.
Figure 5: FortiAnalyzer-400 interface list
Name The name of the physical port on the FortiAnalyzer unit.
IP/Netmask The IP address and netmask configured for the interface.
Access A list of the administrative access available to the interface.
FDP FortiDiscovery protocol indicator. When FortiDiscovery is enabled
for a port, a green check appears.
Status The status of the port:
• a green arrow indicates the port is up. Select Bring Down to
close the port.
• a red arrow indicates the port is down. Select Bring up ot open
the port.
Modify Select Modify to change the interface settings.
FortiAnalyzer Version 3.0 MR3 Administration Guide
36 05-30003-0082-20060925
Page 37

Configure the FortiAnalyzer unit Network settings
Changing the interface settings
To change the interface settings
1 Go to System > Network > Interface.
2 Select Modify for the port.
3 Set the following options and select OK:
Interface name The interface name is hard coded and cannot be changed.
FortiDiscovery
Protocol
IP/Netmask Enter an IP address and netmask.
Administrative
Access
MTU To improve network performance, you can change the maximum
Select Enable to use the FortiDiscovery Protocol for the port to
enable FortiGate devices to find the FortiAnalyzer unit
automatically and establish a connection for sending log packets.
See “About FortiDiscovery” on page 37 for more information.
Configure administrative access to an interface to control how
administrators access the FortiAnalyzer unit and the FortiAnalyzer
interfaces that administrators can connect to. Select from the
following administrative access options:
• HTTPS to allow secure HTTPS connections to the web-based
manager through this interface.
• PING to enable the interface to respond to pings. Use this
setting to verify your installation and for testing.
• HTTP to allow HTTP connections to the web-based manager
through this interface. HTTP connections are not secure and
can be intercepted by a third party.
• SSH to allow SSH connections to the CLI through this
interface.
• TELNET to allow Telnet connections to the CLI through this
interface. Telnet connections are not secure and can be
intercepted by a third party.
• AGREGGATOR to set the port to be the sender or receiver of
log aggregation transmissions. For more information on
aggregation see “Log Aggregation” on page 51.
transmission unit (MTU) of the packets that the FortiAnalyzer unit
transmits from any physical interface. Ideally, this MTU should be
the same as the smallest MTU of all the networks between the
FortiAnalyzer unit and the destination of the packets. If the
packets that the FortiAnalyzer unit sends are larger, they are
broken up or fragmented, which slows down transmission.
Experiment by lowering the MTU to find an MTU size for best
network performance.
To change the MTU, select Override default MTU value (1500)
and enter the maximum packet size.
About FortiDiscovery
FortiDiscovery is a method of FortiGate units running FortiOS 3.0 establishing a
connection to a FortiAnalyzer unit. When a FortiGate administrator selects
Automatic Discovery, the FortiGate unit uses HELLO packets to locate any
FortiAnalyzer units on the network within the same subnet. Once the FortiGate
unit discovers the FortiAnalyzer unit, the fortigate unit automatically enables
logging to the FortiAnalyzer and begins sending log data.
The FortiGate unit will only find the FortiAnalyzer unit when the FortiDiscovery is
enabled on a port on the FortiAnalyzer unit.
FortiAnalyzer Version 3.0 MR3 Administration Guide
05-30003-0082-20060925 37
Page 38

Network settings Configure the FortiAnalyzer unit
DNS
Configure the primary and secondary DNS settings.
To configure network settings, go to System > Network > DNS.
Routing
Primary DNS Server Enter the primary DNS server IP address that the FortiAnalyzer
Secondary DNS
Server
unit can connect to. Several of the FortiAnalyzer functions use
DNS.
Enter a secondary DNS server IP address.
The Route list displays information that the FortiAnalyzer unit compares to
packets headers in order to route packets, and enables you to add static routes to
the FortiAnalyzer unit.
To view the routing list, go to System > Network > Routing.
Figure 6: FortiAnalyzer routing list
Destination
IP/Netmask
Gateway The IP addresses of a router where the FortiAnalyzer unit
Interface The names of the FortiAnalyzer interfaces through which
Modify Select to change the route configuration settings.
Create New Add a route to the route list.
The destination IP address and netmask of packets that the
FortiAnalyzer unit wants to send to.
forwards the packet.
intercepted packets are received and sent.
Adding a route
A static route provides the FortiAnalyzer unit with the information it needs to
forward a packet to a particular destination other than the default gateway.
To add a static route
1 Go to System > Network > Routing.
2 Select Create New.
3 Set the following options and select OK:
Destination IP Enter the destination IP address network mask of packets that the
Mask Enter a netmask to associate with the IP address.
Gateway Enter the IP address of the gateway where the FortiAnalyzer unit
Interface Select a port from the list of available ports.
38 05-30003-0082-20060925
FortiAnalyzer unit has to intercept.
will forward intercepted packets.
FortiAnalyzer Version 3.0 MR3 Administration Guide
Page 39

Configure the FortiAnalyzer unit Administrator settings
Administrator settings
Use the Admin option to configure and maintain FortiAnalyzer administrators,
administrator domains (ADOMs), set a user’s administrative access and maintain
passwords.
When the FortiAnalyzer unit is initially installed, it is configured with a single
master administrator account with the user name of “admin”. From this account,
you can add and edit administrator accounts, control the access level of each
administrator account and control the IP address for connecting to the
FortiAnalyzer unit. This account is permanent, and cannot be deleted from the
FortiAnalyzer unit.
Adding a new administrator
To view a list of administrators for the FortiAnalyzer unit, go to System > Admin >
Administrators.
Figure 7: Listing of FortiAnalyzer administrators
Delete
Change Password
Name The assigned name for the administrator.
Trusted Hosts The IP address where the administrator can log into the
Profile The access profile assigned to the administrator.
Type Type can be either local, as a configured administrator on the
Delete icon Select to remove the administrator entry. You cannot delete the
Edit icon Select to modify the Administration information.
Change Password
icon
FortiAnalyzer unit. Using an IP address and netmask of 0.0.0.0
enables the administrator to access the FortiAnalyzer unit from
any address.
FortiAnalyzer unit or Radius if you are using a Radius server on
your network.
admin account.
Select to change the administrator password. For more
information, see “Changing the administrator password” on
page 40.
To add a new administrator
1 Go to System > Admin > Administrators.
2 Select Create New.
3 Configure the following options and select OK
Administrator Enter the administrator name.
Remote Auth Select if you are using a Radius server group on your network.
Password Enter a password. For security reasons, a password should be a
Confirm Password Re-enter the password.
mixture of letters and numbers and is longer than six characters.
Edit
FortiAnalyzer Version 3.0 MR3 Administration Guide
05-30003-0082-20060925 39
Page 40

Administrator settings Configure the FortiAnalyzer unit
User information Enter the administrator name, email and other contact
Trusted Host Enter the IP address where the administrator can log into the
Access Profile Select an access profile from the list. You define the administrative
information.
FortiAnalyzer unit.
If you want the administrator to be able to access the
FortiAnalyzer unit from any address, use the IP address 0.0.0.0
and netmask 0.0.0.0. To limit the administrator to only access the
FortiAnalyzer unit from a specific network, enter that network’s IP
and netmask.
access permissions and save them as access profiles. For more
information, see “Access Profile” on page 40.
Changing the administrator password
The “admin” administrator and administrators with read and write permissions can
change their administrator account passwords. Administrators with read only
permissions must get their passwords changed by the “admin” administrator.
To change the administrator account password
1 Go to System > Admin > Administrators.
2 Select the Change Password Icon in the Action column.
3 Enter the old password for confirmation.
4 Enter the new password and confirm it by entering it again.
5 Select OK.
Access Profile
An Access Profile is the group of access rights assigned to an administrator. You
can create any number of access profiles that you assign to administrators. For
each profile, you can define what access privileges are granted. For example, you
can have a profile where the administrator only has read and write access to the
reports, or assign read-only access to the content archive logs. Only one access
profile can by assigned to any given administrator.
FortiAnalyzer Version 3.0 MR3 Administration Guide
40 05-30003-0082-20060925
Page 41

Configure the FortiAnalyzer unit Administrator settings
Figure 8: FortiAnalyzer access privileges
1 Go to System > Admin > Access Profile.
2 Select Create New.
3 Enter a name for the profile.
4 Select a filter for each option:
Auth Groups
1 Go to System > Admin > Auth Groups.
Only the admin administrator has access to the Global Configuration of a
FortiAnalyzer unit. Every other administrator must be assigned an access profile.
To create an access profile
None The administrator has no access to the function.
Read Only The administrator can view pages, menus and information, but
cannot modify any settings.
Read-Write The administrator can view pages, menus and information as well
as change configurations.
The Auth Groups page enables you to group RADIUS servers in to logical
arrangements. To add a group you must first have at least one RADIUS server
configured.
To add a group
2 Select Create New.
3 Select the servers to add to the group and select the right arrow.
4 Select OK.
FortiAnalyzer Version 3.0 MR3 Administration Guide
05-30003-0082-20060925 41
Page 42

Administrator settings Configure the FortiAnalyzer unit
RADIUS Server
Add RADIUS servers to the FortiAnalyzer unit for administrator authorization.
To add a RADIUS server
1 Go to System > Admin > RADIUS Servers.
2 Select Create New.
3 Configure the following and select OK:
Name Enter a name to identify the server.
Server IP/Name Enter the IP address for the server.
Shared Secret Enter the password for the server.
Administrator Settings
Administrator settings enable you to configure the idle time when the
FortiAnalyzer unit logs out an administrator, the language for the web-based
manager and to enable administrative domains.
To configure administrators, go to System > Admin.
Note: Only the “admin” user can add or change administrator account information.
Figure 9: Administrators settings
Idle Timeout Set the idle timeout to control the amount of inactive time before
Web Administration
Language
Admin Domain
Configuration
the administrator must log in again. To improve security keep the
idle timeout to a low value, for example five minutes.
Set the language for the web-based manager.
Select to enable administrative domains (ADOMs). For more
information on ADOMs, see “Administrative domains” on page 43.
If you want to disable the ADOM feature, you must first delete all
ADOM entries from the FortiAnalyzer unit. Until you do this, the
Admin Domain Configuration option will not appear in this window.
Note that the Admin Domain Configuration option is not available
on the FortiAnalyzer-100 or FortiAnalyzer-100A/100B.
Monitor
The Monitor page enables the admin account to view other administrators
currently logged in to the FortiAnalyzer unit. The admin account can disconnect
other administrators, should the need arise.
To monitor current administrators go to System > Admin > Monitor.
FortiAnalyzer Version 3.0 MR3 Administration Guide
42 05-30003-0082-20060925
Page 43

Configure the FortiAnalyzer unit Administrative domains
To disconnect an administrator, select a check box next to the administrator name
and selecting Disconnect.
Administrative domains
Administrative Domains (ADOMs) enable the FortiAnalyzer administrator to
create and manage access for multiple domains, and can comprise multiple
devices on a single device. The admin administrator can configure administrative
profiles to grant administrators access to specific log data, reports, alerts, and
options and menus in the web-based manager.
Each ADOM is independent of other domains in the system. When the
FortiAnalyzer administrator assigns customers separate and unique ADOMs,
administrators or users on each ADOM will not be aware of other devices or
ADOMs on the FortiAnalyzer unit.
Similar to the web-based manager, users who access the CLI for their ADOM are
not able to see data or configuration settings for other ADOMs.
Note: Administrative Domains are not available on the FortiAnalyzer-100 or
FortiAnalyzer-100A/100B.
Enabling administrative domains
Using the default admin account, you can enable multiple ADOM operation on the
FortiAnalyzer unit.
To enable administrative domains
1 Go to System > Admin > Settings.
2 Select Admin Domain Configuration.
3 Select OK.
The FortiAnalyzer logs you out. You can now log in again as admin. When you log
in as admin with Admin Domain Configuration enabled, you see the Administrative
Domain Configuration page.
The default domain is the Global Configuration, which grants access to all
devices, data and reports on the FortiAnalyzer unit. You must enable
administrative domains to configure access privileges for ADOMs.
Figure 10: The Administrative Domain Configuration page
FortiAnalyzer Version 3.0 MR3 Administration Guide
05-30003-0082-20060925 43
Page 44

Administrative domains Configure the FortiAnalyzer unit
Global Configuration The admin administrator can access the global configuration.
Select Main Menu to return to the Admin Domain Configuration
page.
Create New Create a new ADOM.
Delete Delete the selected ADOM.
Selection Enable to select the ADOM for deletion.
Name The name of the ADOM.
Select the name to configure the ADOM.
Select Main Menu item to return to the Admin Domain
Configuration page.
After enabling the Admin Domain Configuration, the web-based manager and CLI
display the following changes:
• Global and ADOM configurations are separated
• Only the admin administrator has access to the Global Configuration
• The admin account can configure all ADOM configurations
• Administrators can see and configure only options defined in their
administrative profiles
Disabling administrative domains
Should you decide to turn off the ADOM setting, you must first remove any
ADOMs created. If any ADOMs, excluding the root domain, remain, the option to
unset the ADOM option will not appear.
To disable the ADOM feature
1 Go to System > Admin > Settings.
2 Select Admin Domain Configuration to clear the check box.
3 Select OK.
Configuring ADOM settings
The default configuration of a FortiAnalyzer contains only the Global
Configuration. You must create and configure new ADOMs.
When Admin Domain Configuration is enabled, only the default admin
administrator account can:
• configure global settings
• create or delete ADOMs
• configure multiple ADOMs
• assign interfaces to ADOMs
• assign an administrator to an ADOM
Configuring ADOM settings includes the following steps:
• Creating a new ADOM
• Creating an Access Profile
• Adding a new administrator and assigning an ADOM and access profile to the
administrator
• Adding a device to an ADOM
FortiAnalyzer Version 3.0 MR3 Administration Guide
44 05-30003-0082-20060925
Page 45

Configure the FortiAnalyzer unit Network sharing
Creating a new ADOM
Creating a new ADOM will enable the FortiAnalyzer administrator to configure
access privileges for a group of administrators and users.
To create a new ADOM
1 Select Main Menu.
2 Select Create New.
3 Enter a name for the new ADOM.
4 Select OK.
Adding a device to an ADOM
An ADOM can include multiple devices. Users of an ADOM can access
information such as logs and alerts, and change configurations for devices on
their ADOM according to their access profile.
To add a device to an ADOM
1 Go to Device > All > Device.
2 Select Edit for the device you want to add to the ADOM.
3 Select the Administrative Domain.
Network sharing
Users can save, store and access information on the FortiAnalyzer hard disk as
an alternate means of storing important files and work. Users can also access the
reports and logs saved on the FortiAnalyzer hard disk.
Use network sharing to configure users and user access to the FortiAnalyzer
folders and files on its hard disk and set file properties.
When users connect to the FortiAnalyzer unit, consider the following:
• Microsoft Windows users connect to the FortiAnalyzer hard disk by mapping a
drive letter to a network folder.
• For Macintosh users, enable the FortiAnalyzer Windows networking selection.
Macintosh users can use the SMB sharing protocol to connect to the
FortiAnalyzer unit.
• UNIX or Linux users:
• mount the FortiAnalyzer hard disk as smbfs if you are using Windows
Networking.
• mount the FortiAnalyzer hard disk as nfs if you select Network File System.
Before a user can access files on the FortiAnalyzer hard disk, create user and
group accounts and set their access permissions.
FortiAnalyzer Version 3.0 MR3 Administration Guide
05-30003-0082-20060925 45
Page 46

Network sharing Configure the FortiAnalyzer unit
Adding users
Create user accounts to give users access to the log, reports and hard disk
storage of the FortiAnalyzer unit. Users added will not have administrative access
to the FortiAnalyzer hard disk or FortiAnalyzer unit. To add administrative users
see “Administrator settings” on page 39.
To add a user account
1 Go to System > Network Sharing > User.
2 Select Create New.
3 Enter the following information for the user account and select OK:
User name Enter a user name. For example, twhite. The name cannot include
UID (NFS only) Enter a user ID.
Password Enter a password for the user.
Description Enter a description of the user. For example, the users name or a position
spaces.
Use this field only if you are using the NFS protocol. The NFS protocol
uses the UID to determine the permissions on files and folders.
such as IT Manager.
Adding groups
Create user groups to maintain directory access to a large number of users at
once.
To add a user group
1 Go to System > Network Sharing > Group.
2 Select Create New.
3 Enter the following information for the group account:
Group Enter a user name. For example, Finance. The name cannot include
GID (NFS only) Enter a Group ID. Use this field if you are using Network File System.
spaces.
4 Select the users from the Available Users area and select the Right arrow to add
them to the group.
To remove a user, select a user from the Members area and select the Left arrow.
5 Select OK.
Configuring Windows shares
Configure the FortiAnalyzer unit to provide folder and file sharing using Windows
sharing. To view users with Windows share access to the FortiAnalyzer unit, go to
System > Network Sharing > Windows Share.
FortiAnalyzer Version 3.0 MR3 Administration Guide
46 05-30003-0082-20060925
Page 47

Configure the FortiAnalyzer unit Network sharing
Figure 11: Viewing user access
Edit
Delete
Local Path The path the user has permission to connect to.
Share as The name of the shared folder or file.
User/Group A list of users or groups that have access to the folder or files.
Permissions Permissions for the user or groups. This can be either Read Only
Modify Select Edit to change any of the options for file sharing.
or Read Write.
Select Delete to remove the file sharing permissions.
To configure windows shares
1 Go to System > Network Sharing > Windows Share.
2 Select Enable Windows Network Sharing.
3 Enter a Workgroup name.
4 Select Apply.
Assigning user access
After configuring users and user groups, configure the files and folders the users
can access, and their read and read/write access privileges.
Figure 12: Windows sharing configuration
Local Path
Button
FortiAnalyzer Version 3.0 MR3 Administration Guide
05-30003-0082-20060925 47
Page 48

Network sharing Configure the FortiAnalyzer unit
To add a new Windows share configuration
1 Go to System > Network Sharing > Windows Share.
2 Select Create New.
3 Select the Local Path button to select the folder for the users or groups to access.
Note: The default permissions for files and folders is read and execute privileges. The
owner of the document also has write privileges. To enable write permissions for users and
groups, you must select the write permission for the folder and for the user and the group.
For details see “Setting folder and file privileges” on page 49.
4 Select OK.
5 Enter the Share Name to describe the shared folder.
6 Select user and group names from the Available Users & Groups box. Hold the
Ctrl key to select multiple users or groups.
7 Select the type of access rights the users and groups will have and select the
appropriate right arrow to move the user or group name to the Read-Only Access
or Read-Write Access boxes.
8 Select Ok.
Configuring NFS shares
Configure the FortiAnalyzer unit to provide folder and file sharing using Windows
sharing.
To view a list of users with NFS share access to the FortiAnalyzer unit, including
access privileges, go to System > Network Sharing > NFS Export.
Figure 13: Viewing user access
Local Path The path the user has permission to connect to.
Remote Clients A list of users that have access to the folder or files.
Permissions Permissions for the user. This can be either Read Only or Read
Modify Select Edit to change any of the options for file sharing.
Edit
Delete
Write.
Select Delete to remove the file sharing permissions.
To add a new NFS share configuration
1 Go to System > Network Sharing > NFS Export.
2 Select Enable NFS Exports and select Apply.
3 Select Create New.
FortiAnalyzer Version 3.0 MR3 Administration Guide
48 05-30003-0082-20060925
Page 49

Configure the FortiAnalyzer unit Configuring the FortiAnalyzer unit
Figure 14: NFS share configuration
Local Path
Button
4 Select the Local Path button to select the folder for the users or groups to access.
Note: The default permissions for files and folders is read and execute privileges. The
owner of the document also has write privileges. To enable write permissions for users and
groups, you must select the write permission for the folder and for the user and the group.
For details see “Setting folder and file privileges” on page 49.
5 Select OK.
6 Enter the IP address of the remote system or user ID.
7 Select the type of access rights required and select Add.
8 Select OK.
Note: When sharing a file or folder using NFS, and the user attempts to mount the
FortiAnalyzer hard disk on UNIX, the mount operation may fail. If this occurs, rebooting the
UNIX system corrects this, and the system can mount the FortiAnalyzer hard disk.
Setting folder and file privileges
By default, when a user adds a new file or folder, the access rights are Read,
Write, Execute for the owner (user), and Read and Execute for the Admin group
and Others.
The FortiAnalyzer unit enables you to administer the folders and files on the
FortiAnalyzer hard disk as you are setting the access rights. These options are set
in the CLI. For more information, see the config nas share command in the
FortiAnalyzer CLI Reference.
Configuring the FortiAnalyzer unit
Use the system config to setup and maintain the FortiAnalyzer unit’s internal
system configuration.
This section includes the following topics:
• Log Settings
• Log Aggregation
• IP Aliases
• RAID
FortiAnalyzer Version 3.0 MR3 Administration Guide
05-30003-0082-20060925 49
Page 50

Configuring the FortiAnalyzer unit Configure the FortiAnalyzer unit
Log Settings
The FortiAnalyzer unit creates its own system log messages to provide
information on system events occurring on the unit, such as system activity,
administration events and IPSec negotiations for secure transfers of log message
packets.
To configure where the FortiAnalyzer unit saves its own log messages, go to
System > Config > Log Setting.
Figure 15: System settings
Log Locally Select this option to save the FortiAnalyzer log messages on the
Log Level Select the severity level for the log messages recorded to the
Config Policy Select to configure the events the FortiAnalyzer unit records to the
Allocated Disk
Space (MB)
Log options when
log disk is full
50 05-30003-0082-20060925
FortiAnalyzer hard disk.
FortiAnalyzer hard disk. The FortiAnalyzer unit logs all levels of
severity down to, but not lower than, the level you select. For
example, if you want to record emergency, critical, and error
messages, select Error.
log.
The maximum size of the FortiAnalyzer log file that the FortiAnalyzer
unit saves to the hard disk.
When the log file reaches the specified maximum size, the
FortiAnalyzer unit saves current network traffic log file with an
incremental number and starts a new active log file.
The policy to follow for saving the current log and starting a new
active log when the FortiAnalyzer disk is full.
Select Overwrite oldest logs to delete the oldest log entry when the
disk is full. Select Do not log to stop logging messages when the disk
is full.
FortiAnalyzer Version 3.0 MR3 Administration Guide
Page 51

Configure the FortiAnalyzer unit Configuring the FortiAnalyzer unit
Reuse Settings
from Standard
Logs
Log file should not
exceed
Log file should be
rolled
Log to Host Select to send FortiAnalyzer log messages to a Syslog server.
IP Enter the IP address of the Syslog server.
Port Enter the Syslog port. The default port is 514.
Log Level Select the severity level for the log messages recorded to the Syslog
CSV format Enable CSV format to record log messages in comma-separated
Event Log Select to configure the events the FortiAnalyzer unit records to the
Automatcially
Delete
Select to use configured options for device logs settings. See “Log
rolling” on page 86.
The maximum size of the current log file that the FortiAnalyzer unit
saves to the disk. When the log file reaches the specified maximum
size, the FortiAnalyzer unit saves the current log file and starts a new
active log file.
When a log file reaches its maximum size, the FortiAnalyzer unit
saves the log files with an incremental number, and starts a new log
file with the same name.
Set the frequency of when the FortiAnalyzer unit saves the current
log file and starts a new active log file. Select this option if you want to
start new log files even if the maximum log file size has not been
reached. For example, you want to roll a daily log on a FortiAnalyzer
unit that does not see a lot of activity.
server. The FortiAnalyzer unit logs all levels of severity down to, but
not lower than, the level you select. For example, if you want to
record emergency, critical, and error messages, select Error.
value (CSV) formatted files. Log message fields are separated by
commas.
log.
Select the age unit for the specific log or report files. Select from
hours, weeks, days or months, and enter the value for the age unit.
Log Aggregation
Log aggregation is a method of collating log data from remote FortiAnalyzer units
to a central FortiAnalyzer unit.
For example, a company may have a headquarters and a number of branch
offices. Each branch office has a FortiGate unit and a FortiAnalyzer-100A/100B to
collect local log information. The headquarters has a FortiAnalyzer-2000 as the
central log aggregator.
You can also use the FortiAnalyzer unit to aggregate logs for third party network
devices or server/work stations that supports syslog log messaging.
FortiAnalyzer Version 3.0 MR3 Administration Guide
05-30003-0082-20060925 51
Page 52

Configuring the FortiAnalyzer unit Configure the FortiAnalyzer unit
Figure 16: Log aggregation diagram
Log aggregation enables the branch office FortiAnalyzer units to send or upload
their logs at regular intervals to the headquarter FortiAnalyzer unit. This provides a
central storage location as well as a method of running reports that include data
from all branch offices in a single report.
Log aggregation involves an aggregation client (branch office) and an aggregation
server (headquarters). The aggregation client sends all log information for the
registered devices using SSH on port 22. This does not include quarantined files.
It does include the active log to the point of aggregation (tlog.log for example) and
all rolled logs available on the client hard disk (tlog.1.log, tlog.2.log, etc.).
Subsequent log uploads will only include the most recent updates. The
FortiAnalyzer unit will not resend all logs again.
On the aggregation server, additional devices will appear in the devices list. You
can easily identify these devices as the Rx and Tx icons are empty.
Configuring an aggregation client
The aggregation client is the FortiAnalyzer unit that sends logs to a aggregation
server. These would include units such as the FortiAnalyzer-100A/100B or
FortiAnalyzer-400.
To configure the aggregation client
1 Go to System > Config > Log Aggregation.
2 Select Enable log aggregation TO remote FortiAnalyzer
FortiAnalyzer Version 3.0 MR3 Administration Guide
52 05-30003-0082-20060925
Page 53

Configure the FortiAnalyzer unit Configuring the FortiAnalyzer unit
3 Set the following settings and select OK:
Remote FortiAnalyzer IP Enter the IP address of the FortiAnalyzer unit acting as the
Password Enter the password for the aggregation server.
Confirm Password Enter the password again for the aggregation server.
Aggregation daily at Select the time of the day when the aggregation client uploads
Aggregate now Select to send the logs to the aggregation server immediately.
aggregation server.
the logs to the aggregation server.
Use this when you want to create a report on the server with the
most current log data.
Configuring an aggregation server
The aggregation server is the FortiAnalyzer unit that receives the logs sent from
an aggregation client. FortiAnalyzer units such as the FortiAnalyzer-800 and
higher can be configured as aggregation servers.
To configure the aggregation client
1 Go to System > Config > Log Aggregation.
2 Select Enable log aggregation TO this FortiAnalyzer
3 Set the following settings and select OK:
Password Enter the password for the aggregation server.
Confirm Password Enter the password again for the aggregation server.
IP Aliases
Use IP Aliases to assign a meaningful name to IP addresses. When configuring
reports, and viewing logs and content archives, select Resolve Host Name to view
the alias name rather than the IP address.
To define IP aliases
1 Go to System > Config > IP Aliases.
2 Select Create New.
3 Enter a name for the IP address in the Alias box.
4 Enter the IP address and select OK.
Importing an IP alias list file
For large listings of IP address and names, you can also import a text file
containing this information. This facilitates easier updating of large lists.
The contents of the text file should be in the format:
<ip address> <alias_name>
For example:
10.10.10.1 User_1
There should only be one IP address/user name entry per line.
FortiAnalyzer Version 3.0 MR3 Administration Guide
05-30003-0082-20060925 53
Page 54

Configuring the FortiAnalyzer unit Configure the FortiAnalyzer unit
!
To import the alias file
1 Go to System > Config > IP Aliases.
2 Select Import.
3 Enter the path and file name or select Browse to locate the file.
4 Select OK.
IP alias ranges
When adding an IP alias you can include an IP address range as well as individual
addresses. The range can include an address range and wild cards. For example:
• 10.10.10.1 - 10.10.10.50
• 10.10.10.1 - 10.10.20.100
• 10.10.10.*
RAID
Configuring RAID on the FortiAnalyzer-400 and
FortiAnalyzer-800
The FortiAnalyzer-400 and FortiAnalyzer-800 have four hot swappable hard disks.
Hot swapping is available when running the FortiAnalyzer unit with RAID level 1
and 5.
Caution: Note that if you change RAID levels, the FortiAnalyzer unit reformats the hard
disks to support the new setting. It is extremely important that you back up all information
before changing the RAID level.
To set the RAID level, go to System > Config > RAID.
For details on the different RAID levels, see “RAID levels” on page 59.
Figure 17: FortiAnalyzer-400 RAID settings
FortiAnalyzer Version 3.0 MR3 Administration Guide
54 05-30003-0082-20060925
Page 55

Configure the FortiAnalyzer unit Configuring the FortiAnalyzer unit
!
RAID Level Select a RAID level and select Apply.
Free Disk Space The amount of free disk space.
Total Disk Space The amount of disk space available within the RAID array. This
Type The setting for the unit. When employing a RAID level that
Status The status of the RAID. For example, when starting a RAID array,
Size The total size of the unit for the RAID level or the size of the spare
No. The hard disk number.
Member of RAID Indicates if the hard disk is a part of the RAID array.
Status The current state of the hard disk.
Size (GB) The size of the hard disk.
Action Action icons appear when the FortiAnalyzer unit detects a faulty
value will change depending on the RAID type selected.
includes a hot spare, the hard disk assigned as a hot spare
appears as a separate unit.
“Initializing” appears. When the RAID disk is functioning normally,
“OK” appears.
hard disk.
hard disk.
To change a failed hard disk, select Remove to inform the
FortiAnalyzer unit that the hard disk will be removed. After
removing, the selection will become Add. Once the hard disk is
replaced, select Add.
For details on swapping hard disks, see “Hot swapping in the
FortiAnalyzer-400 and FortiAnalyzer-800” on page 61.
Configuring RAID on the FortiAnalyzer-2000 and FortiAnalyzer-4000/4000A
The FortiAnalyzer-2000 has six hard disks and the FortiAnalyzer-4000/4000A has
12 hard disks. For both units, the disks are hot-swappable. This provides
additional RAID options for greater flexibility for data recovery, should a hard disk
fail.
Caution: It is important to note that if you change RAID levels, the FortiAnalyzer unit
reformats the hard disks to support the new setting. It is extremely important that you back
up all information before changing the RAID level.
To set the RAID level, go to System > Config > RAID.
FortiAnalyzer Version 3.0 MR3 Administration Guide
05-30003-0082-20060925 55
Page 56

Configuring the FortiAnalyzer unit Configure the FortiAnalyzer unit
Figure 18: FortiAnalyzer-2000 RAID settings
Enable RAID Select to enable RAID 5. To enable other RAID levels, use the
Enable Hot Spare Select to enable the use of a hot spare with the RAID array.
Total Disk Space The amount of disk space available within the RAID array.
Available Disk Space The amount of free disk space.
Click to start
controller rescan
Unit The hard disk grouping.
Typ e The setting for the unit. When employing a RAID level that
Status The status of the unit. For example, when starting a RAID array,
Size The total size of the unit for the RAID level or the size of the spare
Port The hard disk number.
Part of Unit Indicates if the hard disk is a part of the RAID array.
Status The current state of the hard disk.
Size (GB) The size of the hard disk.
Remove / Add To change a failed hard disk, select Remove to inform the
command line interface. For command details see the
FortiAnalyzer CLI Reference.
Additional RAID levels are set in the CLI.
Select after removing or adding a hard disk to the unit. This
enables the FortiAnalyzer unit to update the status of the hard disk
configurations.
includes a hot spare, the hard disk assigned as a hot spare
appears as a separate unit.
“Initializing” appears. When the hard disk if functioning normally,
“OK” appears.
hard disk.
FortiAnalyzer unit that the hard disk will be removed. After
removing, the selection will become Add. Once the hard disk is
replaced, select Add.
For details on hot swapping hard disks, see “Hot swapping the
FortiAnalyzer-2000 and FortiAnalyzer-4000/4000A” on page 62.
FortiAnalyzer Version 3.0 MR3 Administration Guide
56 05-30003-0082-20060925
Page 57

Configure the FortiAnalyzer unit Maintenance
Maintenance
The maintenance page enables you to backup and restore configuration files and
maintain and review FortiGuard information for the FortiAnalyzer unit.
Backup & Restore
Go to System > Maintenance > Backup & Restore to back up and restore the
system configuration and to manage firmware.
You can back up the system configuration and also restore the system
configuration from previously downloaded backup files. This page also displays
the last backup and firmware upgrade time and date.
Figure 19: Backup and restore options
Last Backup The date and time of the last backup to local PC
Backup Back up the current configuration.
Backup configuration to: Currently, the only option is to back up to your local PC.
Encrypt configuration
file
Backup Select to back up the configuration.
Restore Restore the configuration from a file.
Restore configuration
from:
Filename Enter the configuration file name or use the Browse
Password Enter the password if the backup file is encrypted.
Restore Select to restore the configuration from the selected file.
Firmware
Partition A partition can contain one version of the firmware and
FortiAnalyzer Version 3.0 MR3 Administration Guide
05-30003-0082-20060925 57
Select to encrypt the backup file. Enter a password in the
Password field and enter it again in the Confirm field. You
will need this password to restore the file.
You must encrypt the backup file if you are using a
secure connection to a FortiGate or FortiManager device.
Currently the only option is to restore from a PC.
button if you are restoring the configuration from a file on
the management. computer.
the system configuration.
Page 58

Maintenance Configure the FortiAnalyzer unit
Update center
Active A green check mark indicates which partition contains
the firmware and configuration currently in use.
Last Upgrade The date and time of the last update to this partition.
Firmware Version The version and build number of the FortiAnalyzer
firmware. On the backup partition, you can:
• Select Upload to replace with firmware from the
management computer.
• Select Upload and Reboot to replace the firmware.
You can configure the FortiAnalyzer unit to connect to the FortiProtect Distribution
Network (FDN) to update the IPS attack definitions for the vulnerability scanner.
The FDN is a world-wide network of FortiProtect Distribution Servers (FDSs).
When the FortiAnalyzer unit connects to the FDN it connects to the nearest FDS.
To do this, all FortiAnalyzer units are programmed with a list of FDS addresses
sorted by nearest time zone according to the time zone configured for the
FortiAnalyzer unit.
The FortiAnalyzer unit supports the following definition update features:
• User-initiated updates from the FDN,
• Hourly, daily, or weekly scheduled antivirus and attack definition updates from
the FDN,
• Update status including version numbers, expiry dates, and update dates and
times,
To receive scheduled updates and push updates, you must register the
FortiAnalyzer unit on the Fortinet support web page.
Figure 20: Update center
FortiAnalyzer Version 3.0 MR3 Administration Guide
58 05-30003-0082-20060925
Page 59

Configure the FortiAnalyzer unit RAID levels
FortiProtect
Distribution
Network
Refresh Select Refresh, to test the FortiAnalyzer unit connection to the FDN. The
Use override
server address
Update The RVS engine and plug-in definitions for which update information is
Version The version numbers of the files currently installed on the FortiAnalyzer
Expiry date The expiry date of your license for RVS engine updates.
Last update
attempt
Last update
status
Scheduled
Update
Every Attempt to update once every 1 to 23 hours. Select the number of hours
Daily Attempt to update once a day. You can specify the hour of the day to
Weekly Attempt to update once a week. You can specify the day of the week and
Update Now Select Update Now to manually initiate an update.
Apply Select Apply to save update settings.
The status of the connection to the FortiProtect Distribution Network
(FDN).
A green indicator means that the FortiAnalyzer unit can connect to the
FDN. You can configure the FortiAnalyzer unit for scheduled updates.
A red-yellow flashing indicator means that the FortiAnalyzer unit cannot
connect to the FDN. Check your configuration. For example, you may
need to add routes to the FortiAnalyzer routing table. To set the routing
see “Routing” on page 38.
test results are displayed at the top of the System Update page.
If you cannot connect to the FDN or if your organization provides attack
updates using their own FortiProtect server, you can configure an
override server.
Select the Use override server address check box and enter the IP
address of a FortiProtect server.
If after applying the override server address, the FortiProtect Distribution
Network setting changes to available, the FortiAnalyzer unit has
successfully connected to the override server. If the FortiProtect
Distribution Network stays set to not available, the FortiAnalyzer unit
cannot connect to the override server. Check the FortiAnalyzer
configuration and the network configuration to make sure you can
connect to the override FortiProtect server from the FortiAnalyzer unit.
displayed.
unit.
The date and time on which the FortiAnalyzer unit last attempted to
download the updates.
The result of the last update attempt. No updates means the last update
attempt was successful but no new updates were available. Update
succeeded or similar messages mean the last update attempt was
successful and new updates were installed. Other messages can
indicate that the FortiAnalyzer was not able to connect to the FDN and
other error conditions.
Select this check box to enable scheduled updates.
between each update request.
check for updates. The update attempt occurs at a randomly determined
time within the selected hour.
the hour of the day to check for updates. The update attempt occurs at a
randomly determined time within the selected hour.
RAID levels
FortiAnalyzer units containing multiple hard disks can store log data using a RAID
array to provide redundant storage, data protection, faster hard disk access or a
larger storage capacity.
FortiAnalyzer Version 3.0 MR3 Administration Guide
05-30003-0082-20060925 59
Page 60

RAID levels Configure the FortiAnalyzer unit
To configure the RAID settings, go to System > Config > RAID.
Note: RAID functionality is only available on the FortiAnalyzer-400, FortiAnalyzer-800,
FortiAnalyzer-2000 and FortiAnalyzer-4000/4000A. These units include multiple hard disks
for RAID support.
The FortiAnalyzer unit support standard RAID levels linear, 0, 1 and 5. The
FortiAnalyzer-2000 and FortiAnalyzer-4000/4000A supports additional RAID level
10 (1+0), and 50 (5+0), as well as 5 +hot spare and 10 + hot spare.
Linear
A linear RAID level combines all hard disks into one large virtual disk. It is also
known as concatenation or JBOD (Just a Bunch of Disks). The total space
available in this option is the capacity of all disks used. There is very little
performance changes when using this RAID format, including any redundancy
available at this level. If any of the drives fails, the entire set of drives is unusable
until the faulty drive is replaced. All data will be lost.
Note: This RAID level is not available on the FortiAnalyzer-2000 and
FortiAnalyzer-4000/4000A.
RAID 0
RAID 1
RAID 5
A RAID 0 array is also referred to as striping. The FortiAnalyzer unit writes
information evenly across all hard disks. The total space available is that of all the
disks in the RAID array. There is no redundancy available. If any of the drives fail,
the data cannot be recovered. This RAID level is beneficial because it provides
better performance, since the FortiAnalyzer unit can distribute disk writing across
multiple disks.
A RAID 1 array is also referred to as mirroring. The FortiAnalyzer unit writes
information to one hard disk, and writes a copy (a mirror image) of all information
to all other hard disks. The total disk space available is that of only one hard disk,
as the others are solely used for mirroring. This provides redundant data storage
with no single point of failure. Should any of the hard disks fail, there are several
backup hard disks available. With a FortiAnalyzer-400 for example, if one disk
fails, there are still three other hard disks the FortiAnalyzer unit can access and
continue functioning.
A RAID 5 array employs striping with a parity check. The FortiAnalyzer unit writes
information evenly across all drives. Additional parity blocks are written on the
same stripes. The parity block is staggered for each stripe. The total disk space is
the total number of disks in the array, minus one disk for parity storage. For
example, on a FortiAnalyzer-400 with four hard disks, the total capacity available
is actually the total for three hard disks. RAID 5 performance is typically better with
reading than writing, although performance is degraded when one disk has failed
or is missing. RAID 5 also ensures no data loss. If a drive fails, it can be replaced
and the FortiAnalyzer unit will restore the data on the new disk using reference
information from the parity volume.
FortiAnalyzer Version 3.0 MR3 Administration Guide
60 05-30003-0082-20060925
Page 61

Configure the FortiAnalyzer unit RAID levels
RAID 10
RAID 10 is only available on the FortiAnalyzer-2000. RAID 10 (or 1+0), includes
nested RAID levels 1 and 0, or a stripe (RAID 0) of mirrors (RAID 1). The total disk
space available is the total number of disks in the array (a minimum of 4) divided
by 2. Any drive from a RAID 1 array can fail without loss of data. However, should
the other drive in the RAID 1 array fail, all data will be lost. In this situation, it is
important to replace a failed drive as quickly as possible.
RAID 50
RAID 50 is only available on the FortiAnalyzer-2000. RAID 50 (or 5+0) includes
nested RAID levels 5 and 0, or a stripe (RAID 0) and stripe with parity (RAID 5).
RAID 50 provides increased performance and also ensures no data loss for the
same reasons as RAID 5. Data can be recovered even when up to four drives fail.
RAID 5 and RAID 10 with hot spare
The FortiAnalyzer-2000 and FortiAnalyzer-4000/4000A enables hot spare of hard
disk drives automatically by using one drive as a stand-by unit. When you select
one of these two options, the FortiAnalyzer unit uses five hard disks in the RAID
array, and the sixth hard disk is used as a spare, should any of the other five fail.
In the event that a hard disk fails, within a minute of the failure, the FortiAnalyzer
unit automatically substitutes the hot spared disk drive and rebuilds the data to
integrate the hard disk into the RAID array.
When you replace the hard disk with a new one, the FortiAnalyzer unit keeps the
new hard disk as the hot spare.
Note: RAID 10 requires an even number of disks. For example, on the FortiAnalyzer-2000,
when selecting RAID 10 with hot spare, the FortiAnalyzer unit will use four of the six disks
in the RAID 10 array, keeping one as a hot spare. The additional hard disk will be defined
as idle. The total disk space available is 240 GB.
The FortiAnalyzer-2000 and FortiAnalyzer-4000/4000A also supports the hot
swapping of hard disks during operation. For details see “Hot swapping the
FortiAnalyzer-2000 and FortiAnalyzer-4000/4000A” on page 62.
Hot swapping hard disks
The hard disks on the FortiAnalyzer-400 and higher are hot swappable. Hot
swapping refers to removing a failed hard disk and replacing it with a new one
while the FortiAnalyzer unit remains in operation.
The FortiAnalyzer-100A/100B and FortiAnalyzer-100 units each have a single
hard disk. Hot swapping is not available on these units.
Hot swapping in the FortiAnalyzer-400 and FortiAnalyzer-800
The following diagram indicates the drive number and their location in the
FortiAnalyzer unit when you are looking at the front of the unit. Refer to this
diagram before removing the disk drive to ensure you remove the correct one.
FortiAnalyzer Version 3.0 MR3 Administration Guide
05-30003-0082-20060925 61
Page 62

RAID levels Configure the FortiAnalyzer unit
You can use any brand of hard disk to replace a failed hard disk. However, you
must ensure that the hard disk size is the same size as the remaining working
drives. Using a smaller drive will affect the RAID setup. The FortiAnalyzer unit will
reconfigure the RAID to the smaller drive, potentially causing data loss.
Note: Only perform a hot swap with a RAID setting of either 1 or 5. Hot swapping on any
other RAID settings will result in data loss.
Table 6: FortiAnalyzer-400 disk drive configuration.
Drive 1 (p1)
Drive 2 (p2)
Drive 3 (p3)
Drive 4 (p4)
Table 7: FortiAnalyzer-800 disk drive configuration.
Drive 1 Drive 2 Drive 3 Drive 4
To swap a FortiAnalyzer-400 or FortiAnalyzer-800 hard disk
1 Go to System > Config > RAID.
The web-based manager displays which hard disk has failed. A trash can icon
appears next to the failed disk drive.
2 Select Remove for the failed hard disk.
A message displays indicating it is safe to remove the disk from the drive.
3 Remove the hard disk from the drive bay on the FortiAnalyzer unit
• On the FortiAnalyzer-400, open the faceplate, remove the screws for the drive
and pull out the drive.
• On the FortiAnalyzer-800, pull open the face place, unlock the drive and pull
out the drive.
4 Insert the new hard disk into the empty drive bay on the FortiAnalyzer unit,
reversing the steps above.
5 Select Return from the web-based manager.
The FortiAnalyzer disk controller will scan the available hard disks and update its
information with the new hard disk.
6 Select Add to add the hard disk to the RAID array.
The FortiAnalyzer unit rebuilds the RAID array with the new hard disk.
Hot swapping the FortiAnalyzer-2000 and FortiAnalyzer-4000/4000A
The following diagram indicates the drive number and their location in the
FortiAnalyzer unit when you are looking at the front of the unit. Refer to this
diagram before removing the disk drive to ensure you remove the correct one.
You can use any brand of hard disk to replace a failed hard disk. However, you
must ensure that the hard disk size is the same size as the remaining working
drives. Using a smaller drive will affect the RAID setup. The FortiAnalyzer unit will
reconfigure the RAID to the smaller drive, potentially causing data loss.
FortiAnalyzer Version 3.0 MR3 Administration Guide
62 05-30003-0082-20060925
Page 63

Configure the FortiAnalyzer unit RAID levels
Table 8: FortiAnalyzer-2000 disk drive configuration
Drive 1 (p1) Drive 4 (p4)
Drive 2 (p2) Drive 5 (p5)
Drive 3 (p3) Drive 6 (p6)
Table 9: FortiAnalyzer-4000/4000A disk drive configuration
Drive 1 (p1) Drive 4 (p4) Drive 7 (p7) Drive 10 (p10)
Drive 2 (p2) Drive 5 (p5) Drive 8 (p8) Drive 11 (p11)
Drive 3 (p3) Drive 6 (p6) Drive 9 (p9) Drive 12 (p12)
To swap a FortiAnalyzer-2000 or FortiAnalyzer-4000 hard disk
1 Go to System > Config > RAID.
The web-based manager displays which hard disk has failed.
2 Select Remove for the failed hard disk.
3 Remove the hard disk from the drive bay on the FortiAnalyzer unit
• On the FortiAnalyzer-2000, press in the tab and pull the drive handle to
remove the dive.
• On the FortiAnalyzer-4000/4000A, using a screw driver, turn the handle lock
so it is horizontal. Push the blue latch right and pull the drive handle to remove
the drive.
4 Select Click to start controller rescan.
The FortiAnalyzer disk controller scans the available hard disks and updates the
RAID array for the remaining hard disks. The RAID array status will be
“Degraded”.
5 Insert the new hard disk into the empty drive bay on the FortiAnalyzer unit.
6 Select Click to start controller rescan.
The FortiAnalyzer disk controller will scan the available hard disks and update its
information with the new hard disk.
7 Select Add to add the hard disk to the RAID array.
The FortiAnalyzer unit rebuilds the RAID array with the new hard disk.
The options available here will depend on the RAID level selected. For most RAID
levels, you can only add the new hard disk back into the RAID array. If you are
running a RAID level with hot spare, you can also add the new hard disk as the
hot spare.
FortiAnalyzer Version 3.0 MR3 Administration Guide
05-30003-0082-20060925 63
Page 64

RAID levels Configure the FortiAnalyzer unit
FortiAnalyzer Version 3.0 MR3 Administration Guide
64 05-30003-0082-20060925
Page 65

Devices Devices List
Devices
The power of the FortiAnalyzer centers on reporting, data and network analysis
capability. The FortiAnalyzer unit collects log messages from multiple FortiGate
devices and Syslog servers, which it then uses for generating many different
report types.
This section describes how to add and configure FortiGate, FortiManager units
and Syslog servers so they can communicate with the FortiAnalyzer unit
This section includes the following topics
• Devices List
• Adding a FortiGate unit
• Adding a FortiManager unit
• Adding a Syslog server
• Device Groups
• Blocked Devices
Devices List
The devices list displays a listing of devices configured to connect and send log
packets, or messages, to the FortiAnalyzer unit.
Note: The device administrator must also configure the device to send log messages and
other logging information to the FortiAnalyzer unit.
Figure 21: Devices list
Edit
Delete
Page Enter a page number press Enter when you have multiple pages
Show Select the type of devices to display in the list. You can select
Unregistered Device
Options
Add Device Select to add and configure a new device to the list.
of devices.
devices by type or by group.
Set the options to instruct the FortiAnalyzer unit what to do when
encountering an unregistered device attempting to connect to the
unit. For details see “Unregistered device options” on page 67.
FortiAnalyzer Version 3.0 MR3 Administration Guide
05-30003-0082-20060925 65
Page 66

Devices List Devices
Name The name of the device.
Hardware The model of the device. For example, FortiGate-300A appears as
IP Address The IP address of the device.
Administrative
Domains
Log Tx Rx
Report Tx Rx
Content Tx Rx
Quar Tx Rx
Secure Connection Indicates there is an IPSec tunnel connection between the device
Disk Space (MB)
Used/Allocated
Action Select Edit to edit the device configuration.
FGT300A.
The ADOM configured for the device.
Displays the permissions that each device has for sending and
viewing logs and reports when connected to the FortiAnalyzer
unit.
• Tx indicates the device is configured to transmit log packets to
the FortiAnalyzer unit.
• Rx indicates the device is allowed to view reports and logs
stored on the FortiAnalyzer unit directly from the device. This
feature is only available on FortiGate units running FortiOS
3.0. This permission will appear red (unavailable) for Syslog
devices by default.
For a FortiManager unit, Tx indicates full access for all devices
managed by the FortiManager unit; Rx indicates that the
FortiManager unit can configure the FortiAnalyzer unit.
and the FortiAnalyzer unit for the transmission of logs, content and
quarantined files. For details on creating a secure connection, see
“Adding a FortiGate unit” on page 68.
Displays the amount of the FortiAnalyzer disk space is allocated
for the device and how much of that space is used.
Select Delete to remove a device from the list.
Select to add register an unregistered device so the FortiAnalyzer
unit can begin receiving the device’s log messages.
For an unregistered device, select Block to stop the device from
attempting to connect to the FortiAnalyzer unit to send log
messages. For details on blocking a device see “Blocked Devices”
on page 74.
Device interaction with a FortiAnalyzer unit
FortiGate, FortiManager and Syslog devices use the syslog protocol, sending log
packets using udp port 514,when sending log packets to the FortiAnalyzer unit.
When the FortiAnalyzer unit receives the packet, the FortiAnalyzer unit adds the
device to the list of unregistered devices.
Maximum allowed devices
Each FortiAnalyzerunit has a maximum number of device licenses it can support
and still provide effective logging and reporting capabilities. The following table
details these maximums.
Table 10: FortiAnalyzer Maximum supported devices
FortiGate and/or Syslog FortiManager FortiClient
FortiAnalyzer-100 10 (FortiGate-50A to
FortiGate-100A only)
FortiAnalyzer-100A/100B 10 (FortiGate-50A to
FortiGate-100A only)
FortiAnalyzer-400 200 (FortiGate-50A to
FortiGate-800 only)
FortiAnalyzer Version 3.0 MR3 Administration Guide
66 05-30003-0082-20060925
1 None
1 None
1 2000
Page 67

Devices Devices List
FortiAnalyzer-800 250 (FortiGate-50A to
FortiAnalyzer-2000 500 (All FortiGate models) 1 5000
FortiAnalyzer-4000/4000A 500 (All FortiGate models) 1 5000
The maximums indicate a combined total of added and unregistered devices. If
there are more than the maximum allowed, the FortiAnalyzer unit will not allow
you to add more devices. You must either remove or block some devices.
When new devices attempt to connect to a FortiAnalyzer unit at its maximum
allowed devices, the FortiAnalyzer unit will reject the attempt by the device to
connect and automatically add the device to the list of blocked devices.
For details on blocked devices see “Blocked Devices” on page 74.
Unregistered device options
As devices are configured to send log packets to the FortiAnalyzer unit, you can
configure how the FortiAnalyzer unit handles the connection requests until you
can verify that they should be accepted. You can define what the FortiAnalyzer
unit does when it receives a request for a connection from a device.
Unregistered devices are included in the maximum devices available for a
FortiAnalyzer unit. Too many unregistered devices may prevent you from adding
a specific device. For details see “Maximum allowed devices” on page 66.
There are two options when configuring the unregistered device options:
FortiGate-800 only)
12500
• known devices
• unknown devices.
FortiGate units connecting with FortiDiscovery
FortiDiscovery is a feature within FortiOS 3.0 for all FortiGate units. It is a protocol
where a FortiGate unit and a FortiAnalyzer unit are able to discover one another
and configure themselves automatically.
On the FortiGate unit, the FortiGate administrator sets the option to use automatic
discovery to connect and send log packets to the FortiAnalyzer unit. On the
FortiAnalyzer unit, you configure the FortiAnalyzer unit to accept the connection
request. Once configured, the FortiGate unit automatically sets up the
FortiAnalyzer connection and begin sending log data and other FortiAnalyzer
reports and log files. For details see “Unregistered device options” on page 67.
To configure unregistered FortiGate units with FortiDiscovery
1 Go to Device > All.
2 Select Unregistered Device Options.
3 Select from the following options in the Unregistered FortiGates (connect via
Auto-Discovery area:
Ignore Connection and Log Data All incoming FortiGate requests are not
Allow connection, add to unregistered
table, but ignore the data
Allow connection, register
automatically, and store up to N MB of
data
accepted and the FortiAnalyzer will not add
them to the registered devices list.
Add the device to the list of unregistered device
list but do not store log data.
Add the device to the registered devices list,
and save the log packets to the hard disk, using
the defined amount of disk space.
FortiAnalyzer Version 3.0 MR3 Administration Guide
05-30003-0082-20060925 67
Page 68

Adding a FortiGate unit Devices
Unknown devices connecting to the FortiAnalyzer unit
Select what the FortiAnalyzer unit should do with the connection request for an
unknown device. These devices include FortiGate units running FortiOS 2.8 or
lower, FortiManager or Syslog servers.
To configure unregistered device options
1 Go to Device > All.
2 Select Unregistered Device Options.
3 Select from the following options for either known devices (FortiGate 2.8,
FortiManager) or unknown devices (syslog):
Ignore all unknown unregistered
devices
Add unknown unregistered device
to unregistered table, but ignore
data
Add unknown unregistered
devices to unregistered table, and
store up to N MB of data
Adding a FortiGate unit
Before adding a FortiGate unit to the FortiAnalyzer unit, you must first configure
the FortiGate unit to send log packets to the FortiAnalyzer unit. To configure the
FortiGate unit to send log packets to the FortiAnalyzer unit, on the FortiGate unit
go to Log&Report > Log Config.
For full details on configuring a FortiGate unit, see the Log&Report chapter of the
FortiGate Administration Guide or the FortiGate Online Help.
When the FortiAnalyzer unit initially receives message packets from a FortiGate
unit, the FortiAnalyzer unit adds the FortiGate unit to the list of unregistered
devices.
All incoming device requests are not accepted and
the FortiAnalyzer will not add them to the
unregistered devices list.
Add the device to the unregistered devices list for
future configuration and addition to the FortiAnalyzer
unit, but do not save the incoming log packets to the
hard disk.
Add the device to the unregistered devices list for
future configuration and addition to the FortiAnalyzer
unit, and save the log packets to the hard disk, but
only to a defined amount of disk space.
To register a FortiGate unit to send log messages to the FortiAnalyzer unit
1 Go to Device > All
2 Select Unregistered from the Show list, and select Add from the Action column.
or
Select Add Device.
3 Set the following options.
Device Type Select FortiGate from the device list. It is selected by default when
Device Name Enter a name to represent the FortiGate unit. For example,
68 05-30003-0082-20060925
selecting a FortiGate unit from the unregistered list.
FortiGate-300A.
FortiAnalyzer Version 3.0 MR3 Administration Guide
Page 69

Devices Adding a FortiGate unit
Device ID When selecting a FortiGate unit from the unregistered list, the
Mode Select the mode of the FortiGate unit. Leave the selection as
Description Enter additional information for the FortiGate unit up to 128
Administrative
Domain
Secure Connection Select this option to set up a secure connection between the
By Key Enter a pre-shared key for the secure connection when you select
Allocated Disk Space
(MB)
When Allocated Disk
Space is All Used
FortiAnalyzer unit automatically adds the FortiGate unit’s serial
number. If you are adding a new FortiGate unit that is not already
in the unregistered list, enter the FortiGate unit’s serial number.
The FortiGate unit’s serial number is available on the System
menu in the Web-based GUI.
Standalone when adding a single unit. If you are adding an HA
cluster, select HA. For more details on adding an HA cluster see
“Adding an HA cluster” on page 70.
characters long. Description information appears when you hover
the mouse over the FortiGate unit’s name in the devices list.
Select the administrative domain (ADOM) that the device will be
associated with. This selection is visible when using the ADOM
feature. For more information on ADOMs, see “Administrator
settings” on page 39.
FortiAnalyzer unit and the FortiGate unit.
To ensure a correct secure connection, the Device Name entered
above and the Local ID setting on the FortiGate unit must match
exactly. You set this in the FortiGate CLI in config system
fortianalyzer.
You must also enter a pre-shared key that matches the pre-shared
key entered on the FortiGate unit.
Secure Connection. You must select the Secure Connection check
box to enable this option. The key you enter must match the key
set on the FortiGate unit to ensure the logs and files are sent over
a secure connection.
Set the allocated amount of the FortiAnalyzer hard disk to log and
content messages for the device. The amount allocated will also
include disk space set aside for quarantined files. For details on
quarantine file disk allocation, see “Configuring quarantine
settings” on page 95.
A disk space setting of zero is unlimited.
Select what the FortiAnalyzer unit should do when the allocated
disk space has been reached. Select either overwriting older files
or stop logging.
4 Expand the Devices Privileges settings.
5 Set the privileges the FortiGate unit has when sending and viewing log files,
archived content and quarantined files.
Note: Accessing logs, content logs and quarantined files is available on FortiGate units
running firmware version 3.0 or later.
6 Expand the Group Membership settings.
7 Select the group where you want to include the FortiGate unit, and select the right
arrow button to add the FortiGate unit to the group. A FortiGate unit can belong to
multiple groups.
You can also add the FortiGate unit to a group later or change the group you
assigned. For details see “Device Groups” on page 74.
8 Expand the FortiGate Interface Specification settings.
FortiAnalyzer Version 3.0 MR3 Administration Guide
05-30003-0082-20060925 69
Page 70

Adding a FortiGate unit Devices
9 Define the port interface options using the arrow buttons. For details on port
interface settings see “Defining FortiGate port interfaces” on page 70.
If you want to add a VLAN or other interface, type the name of the interface and
select Add.
10 Select OK.
Defining FortiGate port interfaces
FortiAnalyzer Network activity reports include information on inbound and
outbound traffic flow. Traffic flow information is based on the source and
destination interfaces of the device and how they are configured to send and
receive information.
To ensure that the traffic information is represented correctly in these reports, you
need to assign the FortiGate interfaces to an interface type. The device interface
can include an interface name or a defined VLAN on the device.
You can classify the device interfaces as one of None, LAN, WAN or DMZ to
match the type of traffic the interface will process. When the FortiAnalyzer unit
generates the traffic log report, the FortiAnalyzer unit compares the source and
destination interface classifications and determines the traffic direction. The traffic
direction is one of:
• Incoming
• Outgoing
• Internal
• External
• Unclassified.
The table below illustrates how the source and destination interface types are
represented in the log report as traffic direction.
Table 11: Log report traffic direction identification
Source Destination Traffic Direction
None All types Unclassified
All types None Unclassified
WAN LAN, DMZ Incoming
WAN WAN External
LAN, DMZ LAN, DMZ Internal
LAN, DMZ WAN Outgoing
Adding an HA cluster
Adding an High Availability (HA) cluster enables you to enable an HA cluster to
send log packets to the FortiAnalyzer unit. The log messages sent are maintained
as a cluster rather than a number of individual log files for each unit in the cluster.
This also enables you to view the cluster traffic and run reports on the cluster.
When adding an HA cluster, add the primary device.
FortiAnalyzer Version 3.0 MR3 Administration Guide
70 05-30003-0082-20060925
Page 71

Devices Adding FortiClient installations
To add an HA cluster
1 Go to Device > All
2 Select Unregistered from the Show list, and select Add from the Action column.
or
Select Add Device.
3 Configure the same settings as indicated in the section “Adding a FortiGate unit”
on page 68, using the information for the primary unit, with the following
exceptions:
• Set the Mode to HA.
• Enter the device IDs (serial numbers) for each subordinate unit in the cluster
and select Add.
Adding FortiClient installations
The FortiAnalyzer unit can store FortiClient log messages for reporting purposes.
Unlike logging FortiGate units, you configure the FortiAnalyzer unit to accept all
FortiClient log messages, rather than individual users. To obtain network histories
for individual users, use the FortiAnalyzer reporting features.
To register a FortiClient installation to send log messages to the
FortiAnalyzer unit
1 Go to Device > All.
2 Select Unregistered from the Show list, and select Add from the Action column.
or
Select Add Device.
3 Set the following options and select OK.
Device Type Select FortiClient from the device list. It is selected by default
Device Name The default selection is for all FortiClients.
Description by default, the description indicates that the FortiClient selection is
Administrative
Domain
Allocated Disk Space
(MB)
When Allocated Disk
Space is All Used
when selecting a FortiClient installation from the unregistered list.
for all connected FortiClient installations.
Select the administrative domain (ADOM) that the device will be
associated with. This selection is visible when using the ADOM
feature. For more information on ADOMs, see “Administrator
settings” on page 39.
Set the allocated amount of the FortiAnalyzer hard disk to log and
content messages for the device. The amount allocated will also
include disk space set aside for quarantined files. For details on
quarantine file disk allocation, see “Configuring quarantine
settings” on page 95.
A disk space setting of zero is unlimited.
Select what the FortiAnalyzer unit should do when the allocated
disk space has been reached. Select either overwriting older files
or stop logging.
Unlike other devices, a FortiClient connection can only send log messages to the
FortiAnalyzer unit. You cannot configure it so that a user can view their log
messages or specific reports.
FortiAnalyzer Version 3.0 MR3 Administration Guide
05-30003-0082-20060925 71
Page 72

Adding a FortiManager unit Devices
Adding a FortiManager unit
Before adding a FortiManager unit to the FortiAnalyzer, you must first configure
the FortiManager to connect to the FortiAnalyzer unit.
To configure the FortiManager unit
1 On the FortiManager unit, select System Settings from the Dashboard.
2 Go to Local Logs > Log Config.
For details on configuring the FortiManager, see the FortiManager Administration
Guide or the FortiManager Online Help.
When the FortiManager connects to the FortiAnalyzer unit, the FortiAnalyzer unit
adds the FortiManager to the list of unregistered devices. The FortiAnalyzer unit
does not actually receive any log packets from the FortiManager device. The
connection is for management purposes only.
To register a FortiManager unit
1 Go to Device > All.
2 Select Unregistered from the Show list, and select Add from the Action column for
the FortiManager unit.
or
Select Add Device.
3 Set the following options.
Device Type Select FortiManager from the device list. It is selected by default
Device Name Enter a name to represent the device.
Device ID When selecting a FortiManager unit from the unregistered list, the
Description Enter additional information for the FortiManager unit up to 128
Administrative
Domain
Secure Connection Select this option to set up a secure connection between the
By Key Enter a preshared key for the secure connection. You must select
Allocated Disk Space
(MB)
When Allocated Disk
Space is All Used
when selecting a FortiManager unit from the unregistered list.
FortiAnalyzer unit automatically adds the FortiManager unit’s
serial number. If you are adding a new FortiManager unit that is
not already in the unregistered list, enter the FortiManager unit’s
serial number. The FortiManager unit’s serial number is available
on the System menu in the web-based manager.
characters long. Description information appears when you hover
the mouse over the FortiManager unit’s name in the devices list.
Select the administrative domain (ADOM) that the device will be
associated with. This selection is visible when using the ADOM
feature. For more information on ADOMs, see “Administrator
settings” on page 39.
FortiAnalyzer unit and the FortiManager unit.
To ensure a correct secure connection, the Device ID entered
above and the Local ID setting must match exactly
the Secure Connection check box to select this option. The key
you enter must match the key set on the FortiManager unit to
ensure the log files are send over a secure connection.
Set the amount of the FortiAnalyzer hard disk is allocated to log
and content files for the device. A disk space setting of zero is
unlimited.
Select what the FortiAnalyzer unit should do once the allocated
disk space has been reached. Select from overwriting older files or
stop logging.
FortiAnalyzer Version 3.0 MR3 Administration Guide
72 05-30003-0082-20060925
Page 73

Devices Adding a Syslog server
4 Expand the Devices Privileges settings.
5 Set the privileges the FortiManager unit has to the FortiAnalyzer unit.
Select Allow all devices managed by FortiManager to have full access to the
FortiAnalyzer unit and to Allow the FortiManager to configure the FortiAnalyzer
unit.
6 Expand the Group Membership settings.
7 Select the group or groups where you want to include the FortiManager unit, and
select the right arrow button to add the FortiManager unit to the group.
8 Select OK.
Adding a Syslog server
Before adding a syslog server to the FortiAnalyzer unit, you must first configure
the server to send log packets to the FortiAnalyzer unit. See your syslog server
documentation for information on directing log packets.
The FortiAnalyzer unit adds the syslog server to the list of unregistered devices.
The FortiAnalyzer unit will not accept the log packets until you configure the
FortiAnalyzer unit to accept the connection form the server.
To add a syslog server to the FortiAnalyzer
1 Go to Device > All.
2 Select Unregistered from the Show list, and select Add from the Action column for
the syslog device.
or
Select Add Device.
3 Set the following options.
Device Type Select Syslog from the device list. It is selected by default when
Device Name Enter a name to represent the Syslog server.
IP Address Enter the IP address of the Syslog server. The IP address will
Description Enter additional information for the Syslog server up to 128
Administrative
Domain
Allocated Disk Space
(MB)
When Allocated Disk
Space is All Used
selecting a syslog server from the unregistered list.
already appear when selecting a syslog server from the
unregistered list.
characters long. Description information appears when you hover
the mouse over the Syslog server’s name in the devices list.
Select the administrative domain (ADOM) that the device will be
associated with. This selection is visible when using the ADOM
feature. For more information on ADOMs, see “Administrator
settings” on page 39.
Set the amount of the FortiAnalyzer hard disk is allocated to log
and content files for the device. A disk space setting of zero is
unlimited.
Select what the FortiAnalyzer unit should do once the allocated
disk space has been reached. Select from overwriting older files or
stop logging.
FortiAnalyzer Version 3.0 MR3 Administration Guide
05-30003-0082-20060925 73
Page 74

Device Groups Devices
4 Expand the Group Membership settings.
5 Select the group or groups where you want to include the Syslog server, and
select the right arrow button to add the Syslog servers to the group.
6 Select OK.
Device Groups
When you have multiple devices belonging to a department or section of the
company, you can create groups to keep the devices together for easier
monitoring. A device can belong to multiple groups. Once you create a group you
can add or remove devices as required.
Note: You can delete groups without removing devices from the group. When adding a
device to a group, it is like a Windows shortcut. Removing a group will not remove the
device configuration from the FortiAnalyzer unit.
To add a device group and add devices
1 Go to Device > Groups.
2 Select Create New.
3 Enter a name for the group.
4 Select the devices to include in the group from the list of Available Devices and
5 Select OK.
Blocked Devices
1 Go to Device > All.
2 Select Unregistered from the Show list.
3 Select Block from the Action column.
select the right-pointing arrow.
Blocking devices are a way to control the number of device licenses available on
the FortiAnalyzer unit. The FortiAnalyzer unit supports a maximum number of
devices. To free up license spots, you can block devices that you do not want in
the FortiAnalyzer devices lists.
To block a device
FortiAnalyzer Version 3.0 MR3 Administration Guide
74 05-30003-0082-20060925
Page 75

Devices Blocked Devices
Viewing blocked devices
To view blocked devices on the FortiAnalyzer unit, go to Device > All > Blocked
Devices.
Figure 22: List of blocked devices
Device ID The name or serial number of the blocked device.
Hardware Model The type of device, for example FortiGate, FortiManager or Syslog
IP Address The IP Address of the blocked device.
Action Select Delete to remove access from the device from the
server.
FortiAnalyzer unit.
Select Unblock to add the device to the FortiAnalyzer unit.
FortiAnalyzer Version 3.0 MR3 Administration Guide
05-30003-0082-20060925 75
Page 76

Blocked Devices Devices
FortiAnalyzer Version 3.0 MR3 Administration Guide
76 05-30003-0082-20060925
Page 77

Logs Log Viewer
Logs
The FortiAnalyzer unit collects log message packets from FortiGate,
FortiManager, FortiClient and Syslog devices. Using the log browser, you can
view device and FortiAnalyzer log files and log messages. The FortiAnalyzer unit
can also view device logs in real-time, enabling you to see events and traffic
occurring on a device as it happens.
This section includes the following topics:
• Log Viewer
• Browse
• Customizing the log view
• Search the logs
• Log rolling
Log Viewer
Real-time log viewer
The log viewer enables you to view logs from registered devices. The Log Viewer
has two types of log viewing options:
• Real-time logs display log message updates as the log message packets are
sent to the FortiAnalyzer unit. The display refreshes every 10 seconds to
display the most current entries.
• Historical logs provides a method of viewing log messages by focusing on
specific log types and time frames.
To view real-time logs, go to Log > Log Viewer.
Real-time logs display log information and updates continually, to provide the
most recent updates and events occurring on a selected device.
To view real-time logs, go to Log > Log Viewer > Real-time, select a device and
log type and select OK.
FortiAnalyzer Version 3.0 MR3 Administration Guide
05-30003-0082-20060925 77
Page 78

Log Viewer Logs
Figure 23: Viewing logs in real time
Column Settings
Typ e The log type you are viewing and the device where it is originating
Change Select to change the log type to view or the device.
Stop Select to stop the FortiAnalyzer unit from refreshing the log view.
Column Settings Select to change the columns to view and the order they appear
Formatted | Raw Select a view of the log file. Selecting Formatted (the default)
Resolve Host Name Select to display host names by a recognizable name rather than
Resolve Service Select to display the network service names rather than the port
For information about log messages, see the FortiGate Log Message Reference.
Historical log viewer
The Historical log viewer enables you to view log information for a selected device
and log type for a specific time range. When viewing log messages, you can filter
the information to find specific event information.
from.
on the page. For details see “Customizing the log column views”
on page 83.
displays the log files in columnar format. Selecting Raw, displays
the log information as it actually appears in the log file.
IP addresses. For details on configuring IP address host names
see “IP Aliases” on page 53.
numbers. For example, HTTP rather than port 80. This option
does not appear when the logs do not have service information to
display. For example, the event log.
To select a historical log to view
1 Go to Log > Log Viewer > Historical.
2 Select a device. All registered devices appear in the list.
3 Select the log type.
4 Set the Start time by selecting the following:
Unspecified Select to view log messages from the earliest date and time
Specified Select to set a specific start date and time for the log messages.
Date Enter a start date. Use the format YYYY/MM/DD. Alternatively,
Time Select a starting time for the log messages. Leave the time at
78 05-30003-0082-20060925
available in the logs.
select the Calendar icon and select a start date.
00:00 to view log messages starting at 12:00 midnight for the
selected date.
FortiAnalyzer Version 3.0 MR3 Administration Guide
Page 79

Logs Log Viewer
5 Select the End time by selecting the following:
Current Select to include up to the minute log messages.
Specified Select to set a specific end date and time for the log messages.
Date Enter an end date. Use the format DD/MM/YYYY. Alternatively,
Time Select a ending time for the log messages. Leave the time at
select the Calendar icon and select a start date.
00:00 to view log messages ending at 12:00 midnight for the
selected date.
6 Select OK.
Figure 24: Viewing historical log data
Column Settings
Type The type of log you are viewing and the device where it originated.
Change Select to change the log, time frame or a different device.
Formatted | Raw Select a view of the log file. Selecting Formatted (the default)
Resolve Host Name Select to display host names by a recognizable name rather than
Resolve Service Select to display the network service names rather than the port
View per page Select the number of rows of log entries to display per page.
Page n of n Enter a page number to jump to in the log information. Press Enter
Column Settings Select to change the columns to view and the order they appear
displays the log files in columnar format. Selecting Raw, displays
the log information as it actually appears in the log file.
IP addresses. For details on configuring IP address host names
see “IP Aliases” on page 53.
numbers. For example, HTTP rather than port 80. This option
does not appear when the logs do not have service information to
display. For example, the event log.
to jump to the page.
on the page. For details see “Customizing the log column views”
on page 83.
FortiAnalyzer Version 3.0 MR3 Administration Guide
05-30003-0082-20060925 79
Page 80

Browse Logs
Browse
Search Enter a keyword to perform a simple search on the log information
available. Select Go to begin the search. The number of matches
appears above the Search field.
The FortiAnalyzer unit will search the entire log file for the keyword
you enter.
Printable Version Select to generate a report that captures the current log
messages. The web browser prompts you to save the report file
for viewing or printing. The report saved is in HTML format. Note
that large log messages can take a long time to load.
The printable version takes all filter settings into account when
generating a printable version.
For information about log messages, see the FortiGate Log Message Reference.
Note: Searches using characters will not include results from the Traffic logs. Traffic logs
include information for source and destination IP addresses and ports which is strictly
numerical information.
For example, if you are searching on User1, you may get results for User1, however, none
of the results will include entries from the Traffic log. To get results from the traffic log, you
must search on the IP address of User1. For example, 10.10.10.1.
The log browser enables you to see all stored log files for all devices and
FortiAnalyzer logs. In this window, you can view the log information, download log
files to your hard disk or delete unneeded files.
To browse the log files, go to Log > Browse.
Figure 25: Browsing log files
Delete
Download
Display
Device Type Select a device category to view its related log files.
Import Select to import older log files to view and run log reports. For details on
Log files A list of available log files. Any device groups you create also appear
# The number of devices in a group, and the number of logs for a device.
importing log files see “Importing a log file” on page 82.
here. Select the group name to expand the list of devices within the
group.
The current, or active, log file appears as well as rolled log files. Rolled
log files include a number in the file name. For example, alog.2.log. If
you configure the FortiAnalyzer unit to upload rolled logs to an FTP site,
only the current log will appear in the log browser.
FortiAnalyzer Version 3.0 MR3 Administration Guide
80 05-30003-0082-20060925
Page 81

Logs Browse
Last Modified The last time the log was updated from the device.
Size (bytes) The size of the log file.
Action Select Delete to remove the log file from the FortiAnalyzer hard disk.
Select Download to save the log file to your local hard disk.
Select Display to view the contents of the log file.
When a log file reaches its maximum size, the FortiAnalyzer unit saves the log
files with an incremental number, and starts a new log file with the same name.
For example, the current attack log is alog.log. Any subsequent saved logs
appear as alog.n.log, where n is the number of rolled logs.
For details on setting the maximum file size and log rolling options, see “Log
rolling” on page 86.
Browsing log files
The log viewer enables you to view log information for a selected device’s log file.
This enables you to view all traffic that occurred on a device. You can also filter
the information to see specific event information.
To view a log file
1 Go to Log > Browse.
2 Expand the group name and device name to see the list of available logs.
3 In the Action column, select Display for the desired log file.
Figure 26: Viewing log data
Column Settings
Type The type of log you are viewing and the device where it originated.
Change Select to view a different log file.
Formatted | Raw Select a view of the log file. Selecting Formatted (the default)
Resolve Host Name Select to display host names by a recognizable name rather than
Resolve Service Select to display the network service names rather than the port
View per page Select the number of rows of log entries to display per page.
Page n of n Enter a page number to jump to in the log information. Press Enter
displays the log files in columnar format. Selecting Raw, displays
the log information as it actually appears in the log file.
IP addresses. For details on configuring IP address host names
see “IP Aliases” on page 53.
numbers. For example, HTTP rather than port 80. This option
does not appear when the logs do not have service information to
display. For example, the event log.
to jump to the page.
FortiAnalyzer Version 3.0 MR3 Administration Guide
05-30003-0082-20060925 81
Page 82

Browse Logs
Column Settings Select to change the columns to view and the order they appear
Search Enter a keyword to perform a simple search on the log information
Printable Version Select to generate a report that captures the current log
For information about log messages, see the FortiGate Log Message Reference.
Note: Searches using characters will not include results from the Traffic logs. Traffic logs
include information for source and destination IP addresses and ports which is strictly
numerical information.
For example, if you are searching on User1, you may get results for User1, however, none
of the results will include entries from the Traffic log. To get results from the traffic log, you
must search on the IP address of User1. For example, 10.10.10.1.
Importing a log file
If you have older log files from a device, you can import these logs onto the
FortiAnalyzer unit for generating log reports.
Importing log files is also useful when changing your RAID configuration (for the
FortiAnalyzer-400, 800, 2000 and 4000/4000A). Changing your RAID
configuration wipes the hard disk. If you backup your FortiAnalyzer log, you can
import the FortiAnalyzer log onto the device.
on the page. For details see “Customizing the log column views”
on page 83.
available. Select Go to begin the search. The number of matches
appears above the Search field.
The FortiAnalyzer unit will search the entire log file for the keyword
you enter.
messages. The web browser prompts you to save the report file
for viewing or printing. The report saved is in HTML format. Note
that large log messages can take a long time to load.
The printable version takes all filter settings into account when
generating a printable version.
You can also import normal Fortinet logs or logs in CSV format.
To import a log file
1 Go to Log > Browse.
2 Select Import.
3 Select the device from the Device list that the log file is associated with.
4 Enter the path and file name of the log file, or select Browse.
5 Select OK.
Downloading a log file
Download a log file to save it as a backup or for use outside the FortiAnalyzer unit.
To download a log file
1 Go to Log > Browse.
2 In the Log Files column, locate a device and log type.
3 In the Action column, select Download.
FortiAnalyzer Version 3.0 MR3 Administration Guide
82 05-30003-0082-20060925
Page 83

Logs Customizing the log view
4 Select one of the following and select OK.
Convert to CSV
format
Compress with gzip Download the log file in its native format with gzip compression.
Downloads the log format as a commas separated file with an
extension of .csv. Each data element is separated by a comma.
5 The web browser prompts you for a location to save the file.
Customizing the log view
The FortiAnalyzer unit enables you to customize the way you view the logs to
enable you to narrow down the information to exactly what you want to see.
Customizing the log column views
Customize the columns to view only the information relevant to you. You can add,
remove and change the position of each column.
Note: You must be viewing the log contents in the formatted view to use the filters.
Figure 27: Customizing the columns
To add or remove columns
1 When viewing a log file, select Column Settings.
A list of columns available for the log type appears.
2 In the Available Fields area, select a column name and select the right arrow to
move the column name into the Display Fields area.
To change the positioning of the columns
1 When viewing a log file, select Column Settings.
A list of columns available for the log type appears.
2 Select a column name.
3 Select the up and down arrows to change the position of the column in the list.
FortiAnalyzer Version 3.0 MR3 Administration Guide
05-30003-0082-20060925 83
Page 84

Search the logs Logs
Filtering logs
When viewing log files both real-time and historical, you can filter the contents to
find specific content. Log filters appear when you are viewing real-time and
historical data in the Log Viewer or when browsing log files on the FortiAnalyzer
hard disk.
Note: You must be viewing the log contents in the formatted view to use the filters.
Figure 28: Filter icons for logs
Filter icon Filter in use
Each column of data includes a gray filter icon. Select the icon to filter the
contents of the column.
When applying a column filter, the filter icon appears green.
To turn off the filter, select the filter icon for the column, and select Reset Filter.
Search the logs
Note: When viewing real-time logs, you cannot filter the time column because the time will
always be the current time.
Filtering tip
When filtering by source or destination IP, you can use the following in the filtering
criteria:
• a single address (2.2.2.2)
• an address range using a wild card (1.2.2.*)
• an address range (1.2.2.1-1.2.2.100)
You can also use the boolean operator "or" to indicate multiple choices:
• 1.1.1.1 or 2.2.2.2
• 1.1.1.1 or 2.2.2.*
• 1.1.1.1 or 2.2.2.1-2.2.2.10
The FortiAnalyzerunit provides search capabilities for locating specific information
within the stored log files. The FortiAnalyzer unit provides two log searches:
• Basic search
• Advanced search
FortiAnalyzer Version 3.0 MR3 Administration Guide
84 05-30003-0082-20060925
Page 85

Logs Search the logs
Basic search
The basic search performs a simple search of all log files on the FortiAnalyzer
unit. The FortiAnalyzer unit maintains a search history for reference should you
need to use the search keywords again. The FortiAnalyzer searches all log files
and data for matches.
To perform a search, go to Log > Search. Enter the keywords for the search.
Separate multiple keywords with a space.
Search results appear below the search entry fields.
Note: Searches using characters will not include results from the Traffic logs. Traffic logs
include information for source and destination IP addresses and ports which is strictly
numerical information.
For example, if you are searching on User1, you may get results for User1, however, none
of the results will include entries from the Traffic log. To get results from the traffic log, you
must search on the IP address of User1. For example, 10.10.10.1.
Advanced search
The advanced search provides more options to narrow your search criteria.
To perform an advanced search, go to Log > Search, and select Advanced
search.
Figure 29: FortiAnalyzer advanced search
Search Select to begin searching the logs.
Basic search Select to perform a basic search.
Find results with all
of the words
Find results with at
least one of the
words
Find results without
the words
Log types Select the log types that you want to search. Hold the CTRL or
Devices Select the devices’ logs to search. Hold the CTRL or SHIFT keys
Dated within Select a time frame of the log entries to search within.
Enter all the keywords you want to use in your search. The
FortiAnalyzer search engine will return all log entries that contain
all keywords entered. Separate keywords with a space.
Enter all the keywords you want to use in your search. The
FortiAnalyzer search engine will return all log entries that contain
one or more of the keywords. Separate keywords with a space.
Enter the keywords that you do not want included in your search
results. If a log entry contains the keywords you are searching on
and includes a keyword from this field, the log entry will not be
included in the search results.
SHIFT keys to select multiple log types.
to select multiple devices.
FortiAnalyzer Version 3.0 MR3 Administration Guide
05-30003-0082-20060925 85
Page 86

Log rolling Logs
Note: Searches using characters will not include results from the Traffic logs. Traffic logs
include information for source and destination IP addresses and ports which is strictly
numerical information.
For example, if you are searching on User1, you may get results for User1, however, none
of the results will include entries from the Traffic log. To get results from the traffic log, you
must search on the IP address of User1. For example, 10.10.10.1.
Search tips
The FortiAnalyzer search feature includes a robust search index that enables you
to find any information by including specific information in your search criteria.
Consider the following when searching the logs:
• The search is case-insensitive.
• Use the “*” character as a wild card. For any partial term or IP address, enter
as much as you can and use the “*” to search all terms related to what you
entered.
• To find how often an IP address is attacked, enter the IP and the attack type.
For example 10.10.10.1 slammer. Or, to see how often a user logs into the
FortiGate unit, enter 10.10.10.1 login.
• You can search for IP ranges, including subnets. For example:
• 172.20.110.0-255 matches all IP addresses in the
172.20.110.0/255.255.255.0 or 172.20.110.0/24 subnet
• 172.20.110.0-140.255þ matches all IP addresses from 172.20.110.0 to
172.20.140.255
• 172.16.0.0-20.255.255 matches all IP addresses from 172.16.0.0 to
172.20.255.255)
Printing the search results
Log rolling
The FortiAnalyzer unit enables you to produce a hard copy of the results of a
search, which you can email, save to a local hard disk or print.
After completing a search, the results include a Printable Version link. Select the
link to create an HTML version of the results.
Log rolling is a way to control the log file size and manage the FortiAnalyzer. You
can configure the frequency of the log rolling and what to do with the log file when
rolled.
When a log file reaches its maximum size, the FortiAnalyzer unit saves the log
files with an incremental number, and starts a new log file with the same name.
For example, the current attack log is alog.log. Any subsequent saved logs appear
as alog.n.log, where n is the number of rolled logs.
To enable log rolling, go to Log > Config.
FortiAnalyzer Version 3.0 MR3 Administration Guide
86 05-30003-0082-20060925
Page 87

Logs Log rolling
Figure 30: Log rolling settings
Log file should not
exceed
Log file should be
rolled
Enable log uploading Select to upload log files to an FTP server when a log file rolls.
Server type Select the type of uploading server. Select from:
Server IP address Enter the IP address of the FTP server.
Username Enter the user name to connect to the FTP server. The user name
Password Enter the password required to connect to the FTP server.
Confirm Password Re-enter the password to ensure it is entered correctly.
Directory Enter a specific directory on the FTP server to save the log file.
Upload Log files Select when the FortiAnalyzer unit uploads files to the FTP server.
Upload rolled files in
gzipped format
Delete files after
uploading
The maximum size of a log file that the FortiAnalyzer unit saves to
the hard disk.
When the log file reaches the specified maximum size, the
FortiAnalyzer unit saves the current log file with an incremental
number and starts a new active log file.
Set the time of day, when the FortiAnalyzer unit saves the current
log file and starts a new active log file. Select either Daily or
Weekly. If you only want the FortiAnalyzer unit to roll log files
when the file size is reached, select Optional.
• File Transfer Protocol (FTP)
• Secure File Transfer Protocol (SFTP)
• Secure Copy Protocol (SCP)
has a default of “anonymous”.
• Select When rolled to upload as soon as the FortiAnalyzer unit
rolls the log file, based on the settings above.
• Select a specific time of the day when the FortiAnalyzer unit
rolls the log file. The FortiAnalyzer unit will upload at the
configured time no matter what the size of the log file is or
when it may be configured to roll to a new file.
Select to compress the content log files in gzipped format before
uploading to the FTP server.
Select to remove the log file from the FortiAnalyzer hard disk once
the FortiAnalyzer unit completes the upload.
FortiAnalyzer Version 3.0 MR3 Administration Guide
05-30003-0082-20060925 87
Page 88

Log rolling Logs
FortiAnalyzer Version 3.0 MR3 Administration Guide
88 05-30003-0082-20060925
Page 89

Content archive Content viewer
Content archive
A FortiGate unit can monitor and log metadata content for all users using email,
FTP and Instant Messages. The metadata content includes information such as
the senders and recipients of email and instant messages and the content of
those messages.
Using standard data filtering, you can track and locate specific email or
messaging communications occurring on your network.
For details on how to configure the FortiGate unit to send content archive
information to the FortiAnalyzer unit, see the FortiGate Administration Guide.
This section includes the following topics:
• Content viewer
• Customizing the content log view
• Log rolling
Content viewer
The content viewer displays metadata from devices connected to the
FortiAnalyzer unit. Metadata includes where the information is coming from and
going to.
The content viewer enables you to view and filter on three content types:
•email
•FTP
• Instant Messaging conversations
To view content archive log information, go to the Content Archive menu, select
the content to view. Each log type has a similar viewing controls.
Figure 31: Viewing file transfer logs
Column Settings
Show Select the FortiGate device from the list.
Timeframe Select the time span for the log data you want to view.
FortiAnalyzer Version 3.0 MR3 Administration Guide
05-30003-0082-20060925 89
Page 90

Customizing the content log view Content archive
Resolve Host Name Select to view the client IP address as a real name. You must
Formatted | Raw Select a view of the content log file. Selecting Formatted (the
View per page Select the number of rows of log entries to display per page.
Page n of n Enter a page number to jump to in the log information. Press Enter
Column Settings Select to change the columns to view and the order they appear
Search Enter a keyword to perform a simple search on the available log
configure the IP aliases on the FortiAnalyzer for this setting to be
effective. For details see “IP Aliases” on page 53.
Note this option is not available when viewing the email content
archive.
default) displays the content log files in columnar format. Selecting
Raw, displays the content log information as it actually appears in
the content log file.
to jump to the page.
on the page. For details see “Customizing the log column views”
on page 90.
information. Select Go to begin the search. The number of
matches appears above the Search field.
Customizing the content log view
The FortiAnalyzer unit enables you to customize the way you view the content
logs to enable you to narrow down the information to exactly what you want to
see.
Customizing the log column views
When viewing log information in formatted view, customize the columns to fit your
requirements. You can add, remove and change the position of each column.
Figure 32: Customizing the column view
To add or remove columns
1 When viewing a historical content log file, select Column Settings.
A list of available columns for the log type appears.
2 In the Show column, select or clear the check boxes for your column selections.
To change the positioning of the columns
1 When viewing a historical content log file, select Column Settings.
A list of available columns for the log type appears.
FortiAnalyzer Version 3.0 MR3 Administration Guide
90 05-30003-0082-20060925
Page 91

Content archive Log rolling
2 Select a column name.
3 Select the up and down arrows to change the position of the column in the list.
Filtering content logs
When looking at content logs for both real-time and historical, you can filter the
information to find specific information. Filters are available when you are viewing
historical data in the Content Viewer or when browsing content log files on the
FortiAnalyzer hard disk.
Note: You must be viewing the log contents in the formatted view to use the filters.
Figure 33: Filter icons in the Historical content logs
Filter icon
Each column of data includes a gray filter icon. Select the icon to filter the
contents of the column. Enter the information you are looking for in the field
provided and select OK.When a filter is applied to a column, the filter icon appears
green.
To turn off the filter, select the filter icon and select Reset Filter. When viewing
real-time logs, you cannot filter on the time column because the time will always
be the current time.
Filter in use
Filtering tip
When filtering by source or destination IP, you can use the following in the filtering
criteria:
• a single address (2.2.2.2)
• an address range using a wild card (1.2.2.*)
• an address range (1.2.2.1-1.2.2.100)
You can also use the boolean operator "or" to indicate multiple choices:
• 1.1.1.1 or 2.2.2.2
• 1.1.1.1 or 2.2.2.*
• 1.1.1.1 or 2.2.2.1-2.2.2.10
Log rolling
Log rolling is a way to control the content log file size and space used on the
FortiAnalyzer hard disk. You can configure the frequency of the log rolling and
what to do with the
As the FortiAnalyzer unit receives log messages, it performs the following tasks:
• verifies whether the log file has exceeded its file size limit
• if the file size is not exceeded, checks to see if it is time to roll the log file
FortiAnalyzer Version 3.0 MR3 Administration Guide
05-30003-0082-20060925 91
content log file when rolled.
Page 92

Log rolling Content archive
When a content log file reaches its maximum size, or reaches the scheduled log
rolling time, the FortiAnalyzer unit saves the content
number, and starts a new content
log file with the same name. For example, the
current content log is clog.log. Any subsequent saved content
log files with an incremental
logs appear as
clog.n.log, where n is the number of rolled logs. For example, clog.4.log.
To enable log rolling, go to Content Archive > Config.
Figure 34: Log rolling settings
Reuse Settings from
Standard Logs
Log file should not
exceed
Log file should be
rolled
Enable log uploading Select to upload content log files to an FTP server whenever a
Server type Select the type of uploading server. Select from:
Server IP address Enter the IP address of the FTP server.
Username Enter the user name required to connect to the FTP server. The
Password Enter the password required to connect to the FTP server.
Confirm Password Re-enter the password to ensure it is entered correctly.
Directory Enter a specific directory on the FTP server to save the log file.
Select to use the same settings that you set for standard log files,
set in Log > Config.
The maximum size of a content log file that the FortiAnalyzer unit
saves to the hard disk.
When the content log file reaches the specified maximum size, the
FortiAnalyzer unit saves current content log file with an
incremental number and starts a new active log file.
Set the time of day, when the FortiAnalyzer unit saves the current
content log file and starts a new active log file. Select Optional if
you do not want to use this option.
content log file rolls.
• File Transfer Protocol (FTP)
• Secure File Transfer Protocol (SFTP)
• Secure Copy Protocol (SCP)
user name has a default of “anonymous”. Click the field to enter a
different user name.
FortiAnalyzer Version 3.0 MR3 Administration Guide
92 05-30003-0082-20060925
Page 93

Content archive Log rolling
Upload Log files Select when the FortiAnalyzer unit should upload files to the FTP
Upload rolled files in
gzipped format
Delete files after
uploading
server.
• Select When rolled to upload as soon as the FortiAnalyzer unit
rolls the content log file, based on the settings above.
• Select a specific time of the day when the FortiAnalyzer unit
rolls the content log file. The FortiAnalyzer unit will upload at
the configured time no matter what the size of the log file is or
when it may be configured to roll to a new file.
Select to compress the content log files in gzipped format before
uploading to the FTP server.
Select to remove the content log file from the FortiAnalyzer hard
disk once the FortiAnalyzer unit completes the upload.
FortiAnalyzer Version 3.0 MR3 Administration Guide
05-30003-0082-20060925 93
Page 94

Log rolling Content archive
FortiAnalyzer Version 3.0 MR3 Administration Guide
94 05-30003-0082-20060925
Page 95

Quarantine Configuring quarantine settings
Quarantine
The FortiAnalyzer unit provides a repository for files quarantined by a FortiGate
unit. These files are considered a threat to the network, suspicious or of a
questionable nature. You can use the FortiAnalyzer quarantine support as a
central management location for all suspicious files under quarantine.The
communication between the two units is the same IPSec tunnel a FortiGate unit
uses when sending log files.
Note: Sending quarantine files to the FortiAnalyzer unit is only available on FortiGate units
running FortiOS 3.0.
This section describes how to configure the FortiAnalyzer unit to receive these
quarantined files and view them on the FortiAnalyzer hard disk.
For details on configuring the FortiGate unit to send quarantined files to the
FortiAnalyzer unit, see the FortiGate Administration Guide.
This section includes the following topics:
• Configuring quarantine settings
• Viewing the quarantined files list
Configuring quarantine settings
Configure the quarantine settings to define the amount of hard disk space
allocated on the FortiAnalyzer unit for suspicious files.
To set the quarantine options, go to Quarantine > Config, and enter the amount
of disk space to allocate for storing quarantine files sent from the FortiGate units.
The FortiAnalyzer unit divides the amount of disk space you allocated for files
evenly between all registered FortiGate devices. For example, if you allocate 500
MB to quarantine files and you have five registered FortiGate units, each
FortiGate unit has 100 MB of space available for quarantined files. If you add
another FortiGate unit, each FortiGate unit will have less space available because
the allocated amount is now divided between more units.
The amount of disk space for quarantine files is allotted from the total disk space
allocated for the device. For example, if you allocate 500 MB for a FortiGate unit,
and 100 MB is allocated for quarantined files, the total space available for log files
is 400MB. For details see “Adding a FortiGate unit” on page 68.
Note: The FortiAnalyzer unit is simply a recipient, or holding place of quarantined files from
the FortiGate unit. You need to configure the action the FortiGate unit performs when the
allocated disk space is filled with quarantined files. You can choose to overwrite older files
or drop the new quarantine files. For details on configuring the quarantine options, see the
FortiGate Administration Guide.
FortiAnalyzer Version 3.0 MR3 Administration Guide
05-30003-0082-20060925 95
Page 96

Viewing the quarantined files list Quarantine
Viewing the quarantined files list
The quarantined files repository displays a list of quarantined files on the
FortiAnalyzer hard disk and information about each quarantined file.
To view quarantined files, go to Quarantine > Repository.
Figure 35: Viewing quarantined files
Show Select a device from the list of available devices to display the list
Time frame Select a span of time when quarantined files were sent to the
Automatic Refresh
Interval
Delete Select a file from the list by selecting the check box next to the
Page n of n Select a page number x from the list of pages y and press Enter to
View..per page Select the number of quarantined files to view on a single page.
From Device The name of the device where the quarantined file originated.
File Name The processed file name of the quarantined file.
Date & Time The date and time the FortiGate quarantined the file, in the format
Service The service where the file was quarantined (HTTP, FTP, IMAP,
Ticket # A 32-bit checksum the FortiGate unit performed on the file.
Status Description A short description of the reason why the FortiGate unit
DC Duplicate count. A count of how many duplicates of the same file
Size (Bytes) The file size of the quarantined file.
Action Select Delete to remove the quarantined file from the
of quarantined files for a specific device, and select Go.
FortiAnalyzer unit and select Go.
Select how often the quarantine page automatically updates.
Select Refresh Now to update the status page immediately.
name and select Delete to remove the quarantined file from the
FortiAnalyzer hard disk.
see the page.
yyyy/mm/dd hh:mm:ss. The time and date indicates the time that
the first file was quarantined, if duplicate files are quarantined.
POP3, SMTP).
quarantined the file.
were quarantined. A rapidly increasing number can indicate a
virus outbreak.
FortiAnalyzer hard disk.
Select Download to save the file to another location when it is
deemed safe for the recipient to collect.
Select Detail to view more information about the file including the
date and time of the quarantine and the sender and intended
recipient of the file.
FortiAnalyzer Version 3.0 MR3 Administration Guide
96 05-30003-0082-20060925
Page 97

Forensic Analysis Users and groups
Forensic Analysis
Forensic analysis provides a method of monitoring and reporting on individuals or
groups of individuals on their internet traffic, email and Instant Messaging (IM)
patterns within an organization.
While the Reports and other log data also provide this information, the forensic
analysis enables the administrator to narrow the information to specific individuals
or groups of individuals.
This section describes how to set up users and groups, search logs for user
activity and how to generate and view analysis reports.
Note: The forensic analysis feature is not available on the FortiAnalyzer-100.
This section includes the following topics:
• Users and groups
• Searching user data
• Forensic Reports
Users and groups
Use forensic analysis to view the network and Internet usage habits of individual
users or groups of users. To do this, you must first add a list of users and their
network information. This includes the users’ IP address, user name, IM name(s)
and email address(es).
Adding users
Add users to the FortiAnalyzer analysis list for tracking. When adding a user, you
include their username, IP address, email address and IM names (if applicable). If
you only know part of the information you want to add, use Lookup to find
additional user information. For details on finding additional user information, see
“Lookup” on page 98.
To add a user to the forensic analysis list
1 Go to Forensic Analysis > Lookup > User.
2 Select Create New.
3 Enter the following information and select OK:
Name Enter the name of the user. The name cannot include spaces.
Username (in Logs) Enter the username as it will appear in the logs.
IP Address Enter the IP address of the user.
Email Address(es) Enter the email address for the user and select Add. For
IM Name(s) Enter the instant message name for the user if applicable and
completeness of the reports, add all known email addresses for
the user.
select Add. For completeness of the reports, add all known IM
names.
FortiAnalyzer Version 3.0 MR3 Administration Guide
05-30003-0082-20060925 97
Page 98

Users and groups Forensic Analysis
Creating groups
Create user groups to obtain analysis information for a selection of users, rather
than running reports for a number of individuals. You must add individual users
before you can add them to a group.
To add a forensic analysis group
1 Go to Forensic Analysis > Lookup > Group.
2 Select Create New.
3 Enter the name of the group.
4 Select the users from the Available Users list, and select the right arrow to add
them to the group.
To remove a member, select a user from the Members list on the right and select
the left arrow.
5 Select OK.
Lookup
The Lookup provides a method of finding additional user information. For
example, if you know the user’s email address, you can use the lookup to find the
IP address or instant message user names. The User Lookup enables you to
have a complete user information base for forensic analysis reports.
To perform a user lookup, go to Forensic Analysis > Lookup > Lookup.
The following table describes what information you can find when you have partial
information.
Table 12: User lookup matrix
Lookup Using Result
IP address Username Returns all IP addresses where defined username
Username IP address Returns all user names that logged on at the
Email address IP address Returns all email originating from a defined
IM name IP address Returns all IM names that logged on at a defined
logged on.
defined address.
address.
IP address.
FortiAnalyzer Version 3.0 MR3 Administration Guide
98 05-30003-0082-20060925
Page 99

Forensic Analysis Users and groups
Figure 36: Lookup user information
Lookup Select the information to look for in the log data.
Username / IP
Address
Time frame Select the time range in the logs that the FortiAnalyzer unit
All xx logged on yy
within the last zz
User Select to add any of the results to an existing user in the forensic
Create User / Add to
user
Depending on the Lookup selection, enter either the username or
IP address to find the associated information.
searches.
A visual indication of what you have selected and its relationship
to each other. Below this statement a list of available data will
appear. Select the check box beside each entry to add the data to
the user information.
analysis user table.
This button selection depends on whether you select a user from
the list.
Select Add to User when you select a user from the User list. The
FortiAnalyzer unit adds the information selected from the results to
the selected user information.
Select Create User to use the information entered above and
selected from the results, to create a new forensic analysis user
entry.
Where does FortiAnalyzer get this information?
The FortiAnalyzer unit obtains user information from the FortiGate logs. The
following table outlines what logs the FortiAnalyzer refers to when retrieving user
information.
User Name Web filter log
IP Address Web filter log
Email address Email filter log. If not found, the FortiAnalyzer unit uses the content
IM name IM log. If not found, the FortiAnalyzer unit uses the content logs.
FortiAnalyzer Version 3.0 MR3 Administration Guide
05-30003-0082-20060925 99
logs.
Page 100

Searching user data Forensic Analysis
To enable these log types on the FortiGate unit
1 Go to Firewall > Protection Profile
2 Select a protection profile.
3 Select Logging.
4 Select the activities to log and select OK.
Searching user data
The user data search enables you to perform a quick search on selected activity
of a specific user. Use the search to quickly see a user’s email, IM chat, FTP and
HTML activities for a selected time period.
To perform a user data search
1 Go to Forensic Analysis > Search > Search.
2 Set the following options and select Search:
Search based on Select a search based on the user name or the IP address.
User / IP Address Select the search criteria. Depending on your search selection,
Time frame Select the span of time to view for the user’s activity.
Search for Select the information on the user or IP address that you want to
enter a user name or an IP address.
search for.
After selecting Search, the FortiAnalyzer unit scans the content log data (data
from the Content Archive from a FortiGate unit) on its hard disk for all information
based on the criteria entered, and displays the number if results for each criteria.
Figure 37: Search results
Select View for the log information you want to view in detail. The search results
open in a new browser window.
Select download to save a specific log result to your local hard disk.
Saving search results
If you want to save these results for future reference, you can save the results to
the FortiAnalyzer hard disk. You can view the saved search results by selecting
Local Archive. For details see “Local archive” on page 101.
FortiAnalyzer Version 3.0 MR3 Administration Guide
100 05-30003-0082-20060925
 Loading...