

Page 1

QUICKSTART GUIDE
FORTIANALYZER
Page 2

REGISTER YOUR FORTINET
PRODUCT TO RECEIVE:
• Technical Support
• New product features
• Protection from new threats
VOUS DEVEZ ENREGISTRER
LE PRODUIT POUR
RECEVOIR:
• Support technique
• Nouvelles fonctionnalitées du produit
• Protection contre de nouvelles menaces
LA REISTRAZIONE TI
PERMETTE DI USUFRUIRE
DI:
• Supporto Tecnico
• Nuove funzionalita
• Proteezione dalle ultime minaccce
DEBE REGISTRAR EL
PRODUCTO PARA RECIBIR:
• Apoyo técnico
• Nuevas funcionalidades del producto
• Protección contra ataques
登録のお願い
本日、フォーティネット製品の登録をしてください。
登録すると次のメリットがあります。
テクニカルサポート • 新機能の追加 • 新しい脅威
への防御
请马上注册
您的飞塔产品
您在注册以后才能得到技术支持、新产品特
点信息、最新威胁防护
SUPPORT
http://forti.net/support
Toll free: 1 866 648 4638
Phone: 1 408 486 7899
Fax: 1 408 235 7737
Email: register@fortinet.com
REGISTER FOR SUPPORT
October 1, 2015
01-000-245798-20151001
Copyright© 2015 Fortinet, Inc. All rights reserved. Fortinet®, FortiGate®, FortiCare® and FortiGuard®, and certain other marks are registered
trademarks of Fortinet, Inc., and other Fortinet names herein may also be registered and/or common law trademarks of Fortinet. All other
product or company names may be trademarks of their respective owners. Performance and other metrics contained herein were attained in
internal lab tests under ideal conditions, and actual performance and other results may vary. Network variables, different network environments
and other conditions may affect performance results. Nothing herein represents any binding commitment by Fortinet, and Fortinet disclaims all
warranties, whether express or implied, except to the extent Fortinet enters a binding written contract, signed by Fortinet’s General Counsel,
with a purchaser that expressly warrants that the identied product will perform according to certain expressly-identied performance metrics
and, in such event, only the specic performance metrics expressly identied in such binding written contract shall be binding on Fortinet. For
absolute clarity, any such warranty will be limited to performance in the same ideal conditions as in Fortinet’s internal lab tests. Fortinet disclaims
in full any covenants, representations,and guarantees pursuant hereto, whether express or implied. Fortinet reserves the right to change, modify,
transfer, or otherwise revise this publication without notice, and the most current version of the publication shall be applicable.
HTTP://FORTI.NET/DOCS/FAZ
DEVICE GUIDE
INCLUDED ACCESSORIES LIST
PORT GUIDE
LED GUIDE
MOUNTING GUIDE
Page 3

DSL PPPOE
BEFORE YOU BEGIN
CABLE MODEM DHCP
Password
T1/E1, STATIC BROADBAND, CABLE,
OR DSL WITH A STATIC IP ADDRESS
IP Address
Username
It is normal to not require a hostname, but your ISP may require it.
Hostname
Write down details that you may need from your network administrator or ISP.
Subnet Mark
Default Gateway
Primary/Secondary DNS
DAY 1
FORTIANALYZER SETUP
Page 4
.
.
5 4
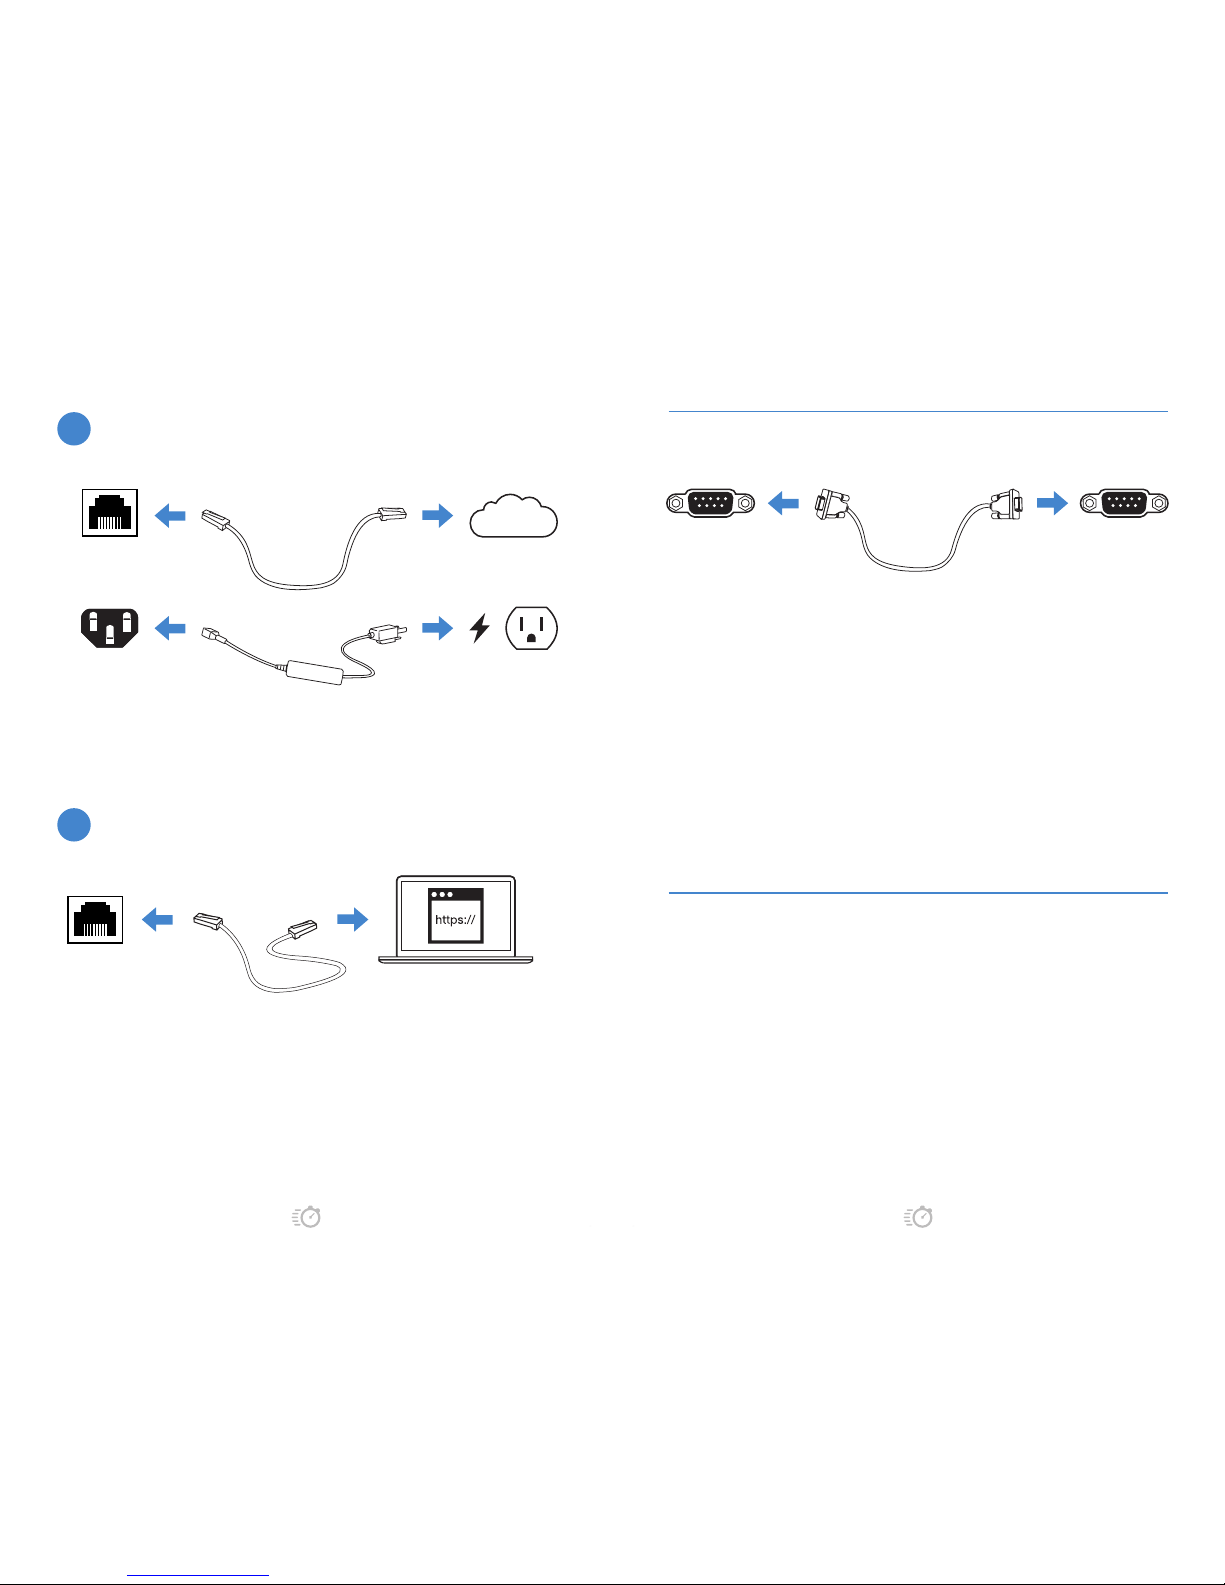
1. Connect the Ethernet cable.
2. Congure the management computer to
be on the same subnet as the internal
interface as the FortiAnalyzer unit:
IP address: 192.168.1.2
Netmask: 255.255.255.0
Ethernet Port
Internet
Connect your device to a power outlet and an Internet connection. This is
usually a modem, but could also be another device on your network.
Power Connection
Ethernet Port
BASIC CONNECTIONS
3. Visit 192.168.1.99 in your web browser.
4. Login using username “admin” and no
password.
5. Congure your device and save your
settings.
6. Register your device from the dashboard
page.
WEB-BASED MANAGER SETUP
2
1
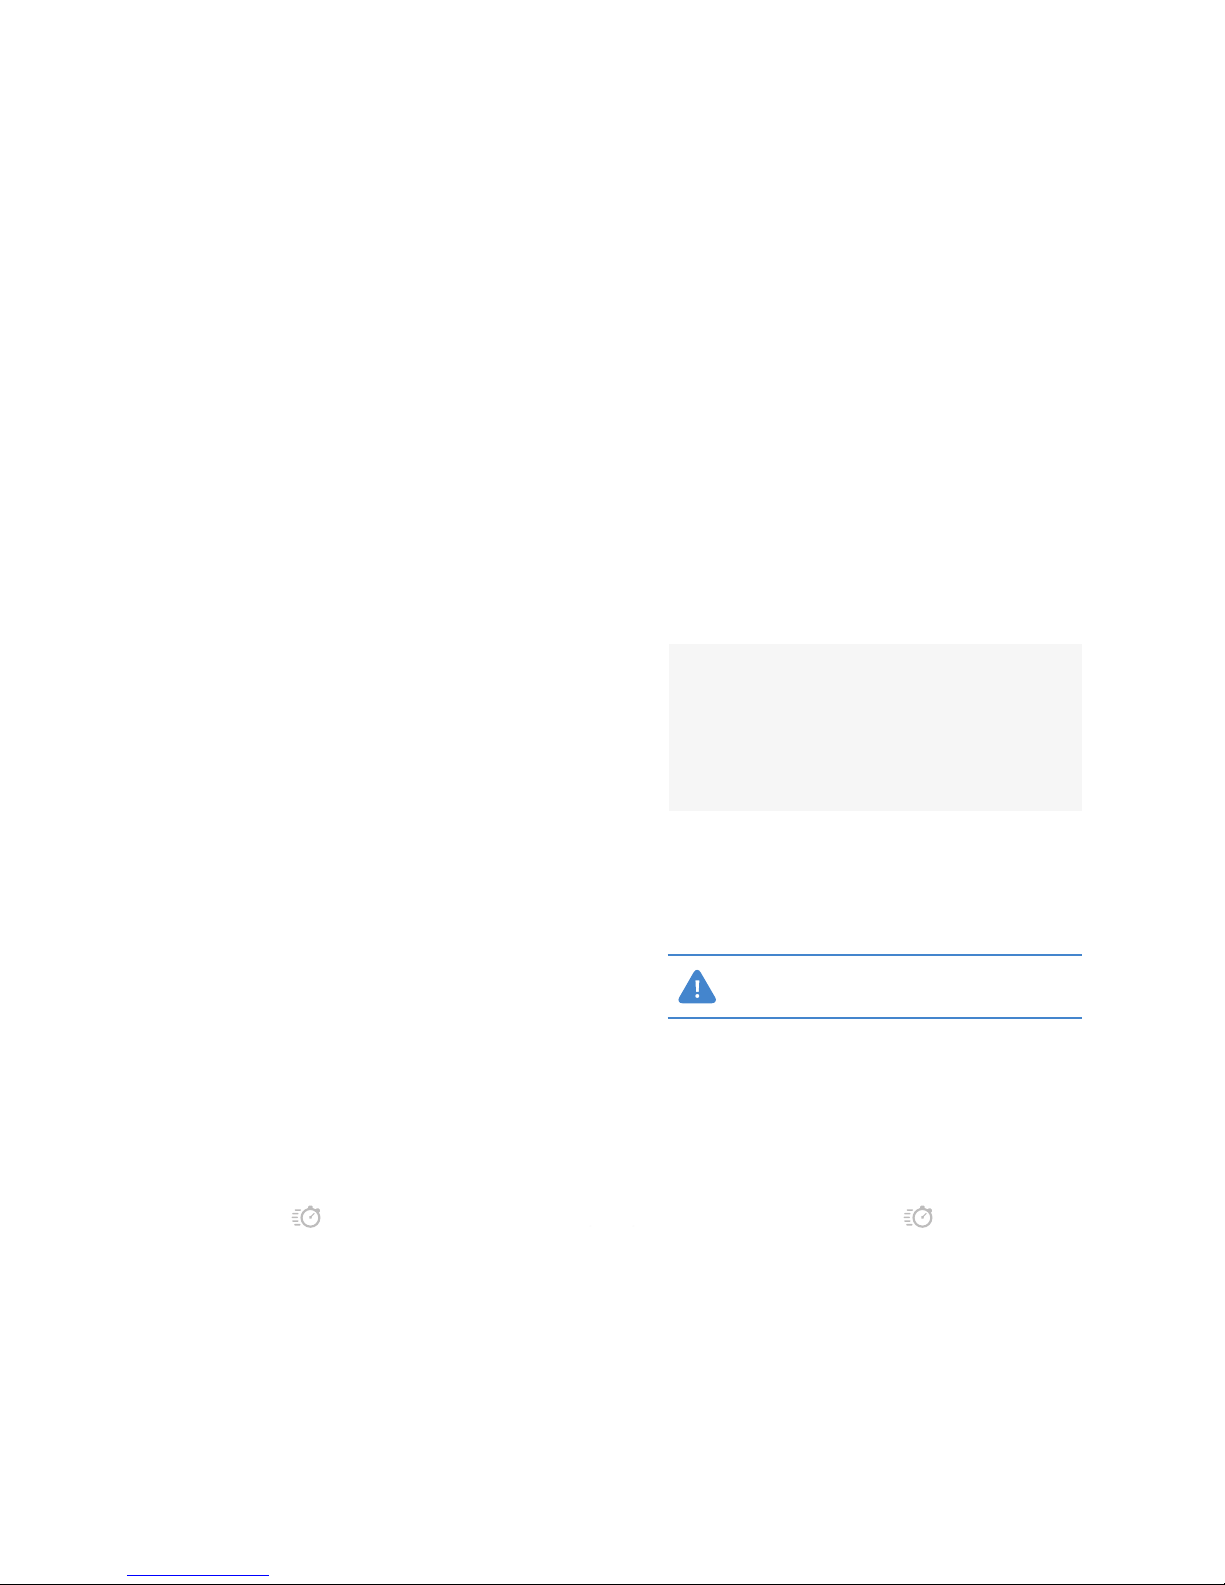
1. Connect the device’s console port to
the management computer using the
provided console cable.
2. Start a terminal emulation program
on the management computer, select
the COMport, and use the following
settings:
Baud Rate: 9600
Data bits: 8
Parity: None
Stop bits: 1
Flow Control: None
Console Port Serial Port
3. Press Enter on your keyboard to connect
to the CLI.
4. Login using username “admin” and no
password. You can now proceed with
conguring your device.
5. Get started by typing “?” for a list of
available commands.
6. Begin typing a command then type “?”
for a list of available ways to complete.
7. For example “cong ?” will show the
lowest level of conguration options.
For a detailed CLI guide visit
http://forti.net/cli.
ALTERNATIVE SETUP: CONNECT TO THE CLI
Page 5

.
.
7 6
SETTING UP FORTIANALYZER
Following is an overview of how to congure a FortiAnalyzer unit in
analyzer mode with ADOMs enabled. Analyzer mode is the default mode.
After the summary procedure are the details of each step.
1. Connect to the GUI by using the default admin account.
2. Congure IP addresses and administrator access.
3. Congure administrator accounts.
4. Log in again by using the new IP address and your new administrator
account.
5. Congure the RAID level, if the FortiAnalyzer unit supports RAID.
6. (Optional) Create administrative domains (ADOMs).
7. Add devices to the FortiAnalyzer unit. The devices send logs to the
FortiAnalyzer unit.
8. Promote devices to ADOMs.
9. Back up the system conguration.
FortiAnalyzer is congured to collect and analyze the logs it receives from
the devices that you added.
CONNECTING TO THE GUI
1. Connect the FortiAnalyzer unit to a management computer by using an
Ethernet cable.
2. Congure the management computer to be on the same subnet as the
internal interface of the FortiAnalyzer unit:
IP address: 192.168.1.2
Netmask: 255.255.255.0
3. On the management computer, start a supported web browser, and
browse to https://192.168.1.99.
4. Type admin in the User Name eld, leave the Password eld blank, and
select “Login”.
5. You should now be able to use the FortiAnalyzer GUI.
If the URL is correct and you still cannot access the GUI, you
may also need to congure static routes.
CONFIGURING IP ADDRESSES AND
ADMINISTRATOR ACCESS
You must congure one or more ports for the FortiAnalyzer unit. You must
also specify what port and methods that administrators can use to access
the FortiAnalyzer unit. You can also congure static routes if required.
1. Go to System Settings > Network.
2. Congure the settings for port1, and click “Apply”.
3. Congure additional ports as needed:
a. Click “All Interfaces”.
b. Right-click a port, and select “Edit”.
c. Complete the settings, and click “OK”.
d. Repeat step 3 for each port that you want to congure.
TO ADD A STATIC ROUTE
1. Go to System Settings > Network.
2. Select the Routing Table button to add an IPv4 static route or the IPv6
Routing Table button to add an IPv6 static route.
3. Select “Create New”.
4. Congure the settings, and select “OK” to create the new static route.
PLACE IMAGE HERE
Page 6
.
.
9 8
CONFIGURING ADMINISTRATOR ACCOUNTS
The administrator settings are used to control and monitor administrator
access to the FortiAnalyzer unit. Local and remote authentication is
supported as well as two-factor authentication.
FortiAnalyzer includes administrator proles that dene different types of
administrators and what level of access each type of administrator has
to devices connected to the FortiAnalyzer unit and to the FortiAnalyzer
features. You can assign an administrator prole to each administrator
account.
When you create an administrator account in FortiAnalyzer, you can
specify the following items for the administrator:
• Authentication method
• Administrator prole
• ADOMs that the administrator can access
You are currently logged into FortiAnalyzer by using the default
administrator account named admin, which is assigned the administrative
prole named Super_User that gives the admin administrator account full
privileges. In addition to any administrator accounts you create for others,
you should create an administrator account for yourself and assign the
Super_User prole to it.
TO CREATE ADMINISTRATOR ACCOUNTS
1. Go to System Settings > Admin > Administrator and select “Create
New”. The New Administrator dialog box appears.
2. Complete the options, and select “OK” to create the new administrator
account.
LOGGING INTO FORTIANALYZER
After conguring the network for the FortiAnalyzer unit and creating an
administrator account for yourself, you should log into the FortiAnalyzer
unit by using the new IP address and your new administrator account to
complete the conguration.
1. On the management computer, browse to the IP address that you
congured for the FortiAnalyzer unit.
2. Type your user name and password, and select “Login”. You are no
longer logged into the FortiAnalyzer unit with the default administrator
account named admin. You are now logged in under your administrator
account.
CONFIGURING THE RAID
If the FortiAnalyzer unit supports RAID, you can choose a RAID level.
1. Go to System Settings > RAID Management, in the RAID Level eld,
select “Change”.
2. The RAID Settings dialog box opens.
3. From the RAID Level list, select the RAID level, and select “OK”. Once
selected, depending on the RAID level, it may take a signicant amount
of time to generate the RAID array.
CREATING ADOMS
FortiAnalyzer administrative domains (ADOMs) enable the admin
administrator to create groupings of devices for congured administrators
to monitor and manage. You must enable the ADOM feature before you
can create ADOMs.
If you change the RAID settings, all data will be deleted.
PLACE IMAGE HERE
Page 7

.
.
11 10
TO ENABLE THE ADOM FEATURE
1. Go to System Settings > Dashboard.
2. In the System Information widget, select “Enable” next to Administrative
Domain.
3. Select “OK” in the conrmation dialog box.
4. Type your login and password.
TO ADD AN ADOM
1. Go to System Settings > All ADOMs and select “Create New” in the
toolbar. The Create ADOM dialog box opens.
2. Complete the options, and select “OK” to create the ADOM.
ADDING DEVICES
You must add devices to FortiAnalyzer to enable the FortiAnalyzer unit to
collect logs from the devices. You can use the Add Devicewizard to add
devices.
1. Go to the Device Manager tab.
2. Select “Add Device” from the toolbar.
PLACE IMAGE HERE
PLACE IMAGE HERE
The Add Device wizard opens.
3. Complete the options, and select “Next” to continue through all of the
pages of the wizard.
4. Select “Finish” to add the device.
PROMOTING DEVICES TO ADOMS
After adding a device to the FortiAnalyzer unit, you must promote the
device to an ADOM, when ADOMs are enabled.
When a device is successfully promoted to an ADOM, the device status is
green, which indicates that the device is sending logs to the FortiAnalyzer
unit.
1. Go to the Device Manager tab.
2. Right-click the device, and select “Promote”.
3. TBA
BACKING UP THE SYSTEM CONFIGURATION
Fortinet recommends that you back up your FortiAnalyzer conguration to
your management computer on a regular basis
This operation does not back up log les.
TO BACK UP THE FORTIANALYZER
CONFIGURATION
1. Go to System Settings > Dashboard.
2. In the System Information widget, in the System Conguration eld,
select Backup. The Backup dialog box appears.
3. Congure the options, and select “OK” and save the backup le on your
management computer.
PLACE IMAGE HERE
Page 8

.
.
13
DAY 2
ANALYZED LOG DATA
VIEWING ANALYZED LOG DATA
After the FortiAnalyzer unit is congured and receiving logs, you can start
monitoring data. You can:
• View summary views of threats, trafc, and so on the FortiView tab
• View logs collected by the FortiAnalyzer unit on the FortiView tab.
• View events on the Event Management tab.
• Generate reports on the Reports tab
USING THE FORTIVIEW SUMMARY VIEW
The FortiView tab offers centralized logging of multiple record types,
including trafc activity, system events, viruses, attacks, web ltering
events, and messaging. Data is aggregated and categorized to provide
real-time views of all network activity.
The FortiView tab includes the following views:
• Summary View
• Log View
• Custom View
On the Summary View, you can view different summaries of analyzed data,
such as Top Sources, Top Applications, Top Destinations, Top Websites,
Top Threats and so on.
On the Log View, you can view all the logs for managed devices as well as
lter, display, download, import, and delete logs.
On the Custom View, you can access searches and views saved by
administrators.
You can view information about specic devices and time periods by
selecting options from the dropdown
lists in the toolbar.
PLACE IMAGE HERE
Page 9

.
.
15 14
USING FORTIVIEW SUMMARY VIEW
When ADOMs are enabled, the FortiView tab displays information for
each ADOM. As a result, you must select an ADOM before you can view
contents of the FortiView tab for the ADOM.
TO VIEW SUMMARY INFORMATION FOR AN ADOM
1. In the ADOM list, select an ADOM, if using ADOMs. Otherwise, skip this
step.
2. Go to FortiView > Summary View , and select a summary item, such
as “Top Applications”.
VIEWING SUMMARY INFORMATION IN TABULAR
FORMAT
Tabular format is the default setting for viewing summary information. You
can also view the information in graphical format.
You can refresh information on the FortiView tab by clicking the “Refresh”
button in the toolbar.
1. For the selected summary, choose the tabular view by selecting the
Table icon from the drop-down list in the top-right corner.
2. Sort entries in a column by clicking the column heading.
3. Double-click an entry to view its details. You can continue drilling down
into details by double-clicking an entry. You can also view different
details by clicking the different tabs at the top of the content pane.
4. Click the Back button in the toolbar to return to the previous screen.
PLACE IMAGE HERE
VIEWING SUMMARY INFORMATION IN
GRAPHICAL FORMAT
1. For the selected summary, choose the graphical view by selecting the
Bubble icon from the drop-down list in the top-right corner.
2. Sort entries in a column by clicking the column heading.
3. Double-click an entry to view its details.
You can continue drilling down into details by double-clicking an entry.
You can also view different details by clicking the different tabs at the
top of the content pane.
4. Click the “Back” button in the toolbar to return to the previous screen.
VIEWING SUMMARY INFORMATION IN
GRAPHICAL FORMAT
1. For the selected summary, choose the graphical view by selecting the
“Bubble” icon from the drop-down list in the top-right corner.
PLACE IMAGE HERE
Page 10

.
.
17 16
2. Choose a sort method for the graphic be choosing an option from the
“Sort By” list in the top-right corner.
3. Hover the mouse over a graphical element to view more information.
4. Click an element to view its details.
You can continue drilling down into details by clicking an entry. You can
also view different details by clicking the different tabs at the top of the
content pane.
5. Click the “Back” button in the toolbar to return to the previous screen.
EXPORTING INFORMATION TO PDF
You can export to PDF information in both the tabular and graphical view.
You can export a summary
1. For the selected summary, export the summary view to PDF by clicking
the PDF button in the top-right corner.
2. View the details of an element.
3. Export the detailed view to PDF by clicking the PDF button in the top-
right corner.
PLACE IMAGE HERE
SEARCHING INFORMATION
You can search information in both the tabular and graphical view formats.
1. For the selected summary, click the Search box, select a search term,
and type the value. Click the “X” to delete the selected search term, and
select another search term.
2. (Optional) In the Device list, select a device.
3. (Optional) In the Time list, select a time.
4. Click “Go”.
5. Click “Log View”.
6. In the log message list, select Tools, then either select or deselect Case
Sensitive Search from the drop-down menu to enable or disable case
sensitivity in the search string.
7. In the log message list, enter a text string in the search eld in the
following ways:
• Manually type in the text that you are searching for. Wildcard
characters are accepted.
• Right-click on the element in the list that you would like to add to the
search and select to search for strings that either match or don’t match
that value.
• Select a previous search or default lter, using the history icon.
The available lters will vary depending on the selected log type and
displayed columns.
• Paste a saved search into the search eld.
8. Select “GO” to search the log message list.
PLACE IMAGE HERE
Page 11

.
.
19 18
USING THE FORTIVIEW LOG VIEW
You can view the trafc log, event log, or security log information per
device or per log array. For more information on FortiGate raw logs, see
the FortiGate Log Message Reference in the Fortinet Document Library.
For more information on other device raw logs, see the Log Message
Reference for the platform type.
VIEWING LOG MESSAGES AND MESSAGE
DETAILS
By default, historical log les are displayed. However, you can change the
view to real-time logs.
1. Go to FortiView > Log View, and choose one of the following types of
log messages: Trafc, Event, or Security.
2. Select a log message, and click the “Display Details” button in the
bottom-right corner.
VIEWING HISTORICAL AND REAL-TIME LOGS
You can view historical or real-time logs. By default historical logs are
displayed.You can also view logs in the following formats: formatted and
raw.
The selected log view will affect the other options that are available in the
View drop-down menu.
PLACE IMAGE HERE
TO VIEW HISTORICAL AND REAL-TIME LOGS
1. View messages from real-time logs by selecting “Real-time Log” from
the Tools menu.
2. View messages from historical logs by selecting “Historical Log” from
the Tools menu.
3. View messages from raw logs by selecting “Display Raw” from the
Tools menu.
4. View the logs without formatting by selecting “Display Formatted” from
the Tools menu.
FILTERING COLUMN DATA
1. In the log message list, select “Enable Column Filter” from the Tools
menu.
2. In the heading of the column you want to lter, select the lter icon. The
lter icon will only be shown on columns that can ltered. The Filter
Settings dialog box opens.
3. Enable the lter, then enter the required information to lter the selected
column. The lter settings will vary based on the selected column.
4. Select “Apply” to apply the lter to the data.
The column’s lter icon will turn green when the lter is enabled,
Downloading the current view will only download the log messages that
meet the current lter criteria.
PLACE IMAGE HERE
Page 12

.
.
21 20
USING EVENT MANAGEMENT
The Event Management tab offers a view into all of the network events.
You dene what log messages display as events by conguring event
handlers.
ENABLING PREDEFINED EVENT HANDLERS
Event handlers dene events. You can enable predened event handlers
to start retrieving information as dened by the predened event handlers
from managed devices. Events display on the Event Management tab.
TO ENABLE EVENT HANDLERS
1. In the ADOM list, select an ADOM, if using ADOMs. Otherwise, skip this
step.
2. Go to Event Management > Event Handler.
PLACE IMAGE HERE
PLACE IMAGE HERE
3. Right-click an event handler entry, and select “Enable” in the pop-up
menu. The event handler starts generating events.
VIEWING EVENTS
The events page provides a list of the generated events. Right-clicking
on an event in the table gives you the option of viewing event details,
including the raw log entries associated with that event, adding review
notes, and acknowledging the event.
1. If using ADOMs, select an ADOM from the ADOM list. Otherwise, skip
this step.
2. Go to Event Management > Events, and select “All Events”, “Events
by Severity”, or “Events by Handler”.
VIEWING EVENT DETAILS
Event details provides a summary of the event including the event name,
severity, type, count, additional information, last occurrence, device, event
handler, raw log entries, and review notes. You can also acknowledge and
print events in this page.
TO VIEW LOG MESSAGES ASSOCIATED WITH AN
EVENT
1. If using ADOMs, select an ADOM from the ADOM list. Otherwise, skip
this step.
2. Go to Event Management > Events.
PLACE IMAGE HERE
Page 13

.
.
23 22
3. Double-click an event. The Event Details page opens.
4. Select the return icon to return to the All Events page.
USING REPORTS
The Reports tab offers predened reports that you can run to extract
information from logs about security, application risk, users, and so on to
produce reports. You can also create custom reports to extract data of
your choice and create a report layout of your choice.
GENERATING PREDEFINED REPORTS
You can generate reports by using one of the predened reports.
1. In the ADOM list, select an ADOM, if using ADOMs. Otherwise, skip this
step.
2. Go to the Reports tab.
3. In the Reports tree menu, select a report.
PLACE IMAGE HERE
4. (Optional) Edit settings on the Conguration tab, Advanced Settings tab,
and Layout tab.
5. Click the “Run Report Now” button.
VIEWING COMPLETED REPORTS
You can view completed reports in the following formats: HTML, PDF,
XML, and CSV.
1. In the ADOM list, select an ADOM, if using ADOMs. Otherwise, skip this
step.
2. Go to the Reports tab.
3. In the Reports tree menu, select a report.
4. On the View Report tab, click the format in which you want to view the
report. For example, if you want to review the report in HTML format,
click the HTML link.
DOWNLOADING COMPLETED REPORTS
You can download completed reports to the management computer. The
report is saved as a PDF le. You cannot download reports that are not yet
completed.
1. In the ADOM list, select an ADOM, if using ADOMs. Otherwise, skip this
step.
2. Go to the Reports tab.
3. In the Reports tree menu, select a report.
4. On the View Report tab, select a report, and click “Download”. The
report is saved as a PDF on the management computer.
PLACE IMAGE HERE
Page 14

.
FORTICLOUD 1GB
Generate reports, backup congurations and
more with easy-to-use cloud based portal.
FREE LICENSES &
SERVICES FOR FORTICARE
REGISTERED FORTIGATES
FORTINET DDNS SERVICE
Make remote access simple. Use yourcompany.fortiddns.com
instead of hard-to-remember or changing IP addresses.
10 FORTICLIENT ENDPOINT LICENSES
Manage security on your endpoints. Keep your network clean and
allow employees to bring devices. Add more client licenses via
your reseller.
2 FORTITOKEN MOBILE LICENSES
Stay extra secure by using your phone as second-factor
authentication for remote administration.
Get extra tokens from your reseller.
Page 15

USB MODEM DATABASE UPDATES
Use cellphone technology as backup Internet connection. We are always adding
support for new third party 3G/4G + modems.
DEVICE SIGNATURES DATABASE UPDATES
Identify device type and OS information. Great for organizations that allow
employees to bring in devices and want to enforce device based policies.
.
SERVICES INCLUDED WITH
FORTICARE SUBSCRIPTION
FORTICARE IS GLOBAL 24/7 SUPPORT FOR
YOUR FORTINET HARDWARE & SOFTWARE
.
FIRMWARE UPDATES
Get the latest product security updates and features. Stay with us and see the
product evolve.
GEO-IP DATABASE UPDATES
Setup policies and track activities based on geography. Your FortiGate will intelligently
identify where an IP is originated or destined.
Page 16

.
Most affordable enterprise-grade network security protection
Best mid-range device
Powerful and balanced desktop UTM
Storage for internal logging with accelerated Intrusion Prevention and Antivirus
Powerful and balanced desktop UTM, extra storage for internal logging
60D
30D
80D
70D
90D
..
BANDWIDTH
USERS
IPS
VPN
ANTIVIRUS
PORTS
STORAGE
PRICE
DEVICE COMPARISON
Page 17

..
SECURITY HUB
FORTIGATE
WIRED NEWORKING
FORTISWICH
RELATED PRODUCTS
..
3G/4G LINK
FORTIEXTENDER
VOIP
FORTIVOICE
WIFI
FORTIAP
Page 18

FORTIMANAGER
Deploy thousands of FortiGates, distribute updates, or
install security policies across managed assets.
FORTIANALYZER
Network security logging, analysis, and reporting.
Securely aggregate data from your FortiGates.
FORTIMANAGER 300D
FORTIANALYZER 300D
FORTIVOICE
Complete control of your business telephone communications.
Easy to use, affordable and reliable.
FORTIEXTENDER
Transmit a 3G/4G connection from the best
location on your premise to your FortiGates
as backup or primary WAN.
FORTIAP
Setup WiFi networks with as many access
points as you need. Manage them with
your FortiGate.
FORTIVOICE
TELEPHONE SYSTEM
HANDSET
Page 19

“
WORKING WITH FORTINET, VERIZON
BUSINESS IS GIVING CUSTOMERS AN
ALL-IN-ONE SOLUTION THAT EASES THE
BURDEN ASSOCIATED WITH MANAGING THE
COMPLEX SECURITY RISKS OF THE EXTENDED
ENTERPRISE.
”
- Kerry Bailey, Vice President. Verizon Business Security Solutions
FORTISWITCH 224B-POE
FORTIFONE
FORTICAM
FORTIAP
INTRODUCING
FORTISWITCH SERIES
KNOW YOUR NETWORK
WITH A FORTISWITCH, YOU CAN EASILY
IDENTIFY, MONITOR AND MANAGE ALL YOUR
DEVICES, DIRECTLY FROM YOUR FORTIGATE
FortiSwitch Secure Access series of Ethernet LAN switches deliver
outstanding network security, performance and manageability for threat
conscious small to mid-sized businesses, distributed enterprises and
branch ofces.
• Authenticate and monitor specic devices
• Up to 48 ports in a compact 1U form factor
• PoE capable
POWER OVER ETHERNET (POE) SAVES
THE NEED FOR ADDTIONAL ELECTRICAL
WIRING. GREAT FOR TELEPHONES AND
SECURITY CAMERAS. MANY FORTIGATES
AND FORTISWITCHES HAVE A POE
OPTION.
Page 20

FORTIGATE-1000 TO 3000 SERIES.
HIGH SPEED INTERFACES.
POWERED BY MULTIPLE NP6
NETWORK PROCESSORS.
SUPERCHARGE
NETWORK
SEGMENTATION
OF 100 GBPS FIREWALL
PERFORMANCE
DATACENTER
FORTIGATE-5000 SERIES.
HIGHLY SCALABLE CHASSIS-BASED SOLUTION.
SCALE UP TO 1 TBPS
FIREWALL
PERFORMANCE
CARRIER
Page 21

FORTIGATE-100 AND 200 SERIES.
HIGH PORT DENSITY AND POE VARIANTS.
CONSOLIDATE
NETWORK
SECURITY
FOR LOWER TCO
BRANCH OFFICE
FORTIGATE-300 TO 800 SERIES.
COMPACT. SUPERIOR PRICE AND PERFORMANCE.
POWERED BY THE LATEST FORTINET ASIC
NETWORK PROCESSOR, THE NP
POWER UP SECURITY
FOR INTERNET ACCESS
MID ENTERPRISE
Page 22

..
FORTINET PIONEERED AN INNOVATIVE,
HIGH PERFORMANCE NETWORK SECURITY
SOLUTION. WE ADDRESS THE
FUNDAMENTAL PROBLEMS OF AN
INCREASINGLY BANDWIDTH-INTENSIVE
NETWORK ENVIRONMENT AND A MORE
SOPHISTICATED IT THREAT LANDSCAPE.
WE ARE A LEADING PROVIDER OF
NETWORK SECURITY APPLIANCES AND THE
LEADER IN UNIFIED THREAT MANAGEMENT,
OR UTM SOLUTIONS.
FORTINET IS A WORLDWIDE LEADING
PROVIDER OF UTM APPLIANCES, WITH A
16% YEAR OVER YEAR GROWTH IN THE
UTM SECURITY APPLIANCE MARKET
ACCORDING TO IDC Q3 2013.
FORWARD LOOKING
MARKET LEADERSHIP
MOST CERTIFIED IN THE
INDUSTRY
FORTINET IS THE ONLY NETWORK
SECURITY VENDOR TO EARN INDEPENDENT
CERTIFICATIONS ACROSS ALL CORE
SECURITY TECHNOLOGIES
Fortinet demonstrates our ability to consolidate multiple security
technologies while still meeting the highest standards of
performance and accuracy.
FORTIASIC
SPECIALIZED CHIP DESIGN DELIVERS
MORE PROCESSING POWER
Fortinet’s purpose-built architecture delivers extremely high
throughput and exceptionally low latency and the world’s fastest
rewall. Computationally intensive security tasks demand ASIC
acceleration. Sub 10 microseconds latency beats the competition.
.
Page 23

FORTINET.COM
FORTINET CUSTOMER SERVICE
AND SUPPORT
Create a support account, register and manage your products,
download updates, rmware images and release notes, and
create technical support tickets.
https://support.fortinet.com
FORTINET DOCUMENT LIBRARY
Up-to-date versions of Fortinet publications for the entire family of
Fortinet products.
http://docs.fortinet.com
TRAINING SERVICES
Course descriptions, availability, schedules, and location of
training programs in your area.
http://www.fortinet.com/support/training.html
TECHNICAL DISCUSSION FORUMS
Communicate with other customers and Fortinet partners about
Fortinet products, services, and conguration issues.
https://support.fortinet.com/forum
FORTIGUARD THREAT RESEARCH
AND RESPONSE
Up-to-date information on vulnerabilities and threats, includes a
virus scanner, IP signature look-up, and web ltering tools.
http://www.fortiguard.com
.
 Loading...