

Page 1

®
SW43W
FlukeView Power Quality Analyzer Software
Version 3.20 onwards
Users Manual
4822 872 30778
December 2005, Rev.1, 04/06
© 2005 Fluke Corporation, All rights reserved.
All product names are trademarks of their respective companies.
Page 2

Page 3

Table of Contents
Chapter Title Page
Installing FlukeView........................................................................................ 1
Installing the FlukeView Software ....................................................................1
Running the FlukeView Software......................................................................1
Connecting the Power Quality Analyzer ...........................................................1
Selecting the Baud Rate.................................................................................2
PC USB and COM port .....................................................................................3
Determining the USB Cable COM port ........................................................3
Changing the COM port # .............................................................................3
Using FlukeView.............................................................................................. 5
Using Online Help .............................................................................................5
Introducing the FlukeView Software.................................................................5
Display Instrument Screens ...........................................................................6
Display Waveforms .......................................................................................7
Display Trend ................................................................................................8
Display Spectrum/Harmonics........................................................................9
Display Limits (Fluke 43x) ...........................................................................9
Display Setup (Fluke 43B) ............................................................................10
Display Datasets (not for Fluke43B) .............................................................10
Start Logging of Readings.............................................................................11
Display Events (not for Fluke 43B)...............................................................12
Display Quality (not for Fluke 43B)..............................................................13
Multiple Transfers of Screens/Windows .......................................................14
Remote Control (not for Fluke 43B) .............................................................15
Window Properties ........................................................................................15
Documenting Screens ........................................................................................16
Displaying an Instrument Screen on the PC..................................................16
Inserting Screens into a Document................................................................16
Analyzing Waveforms and Trends ....................................................................17
Displaying Waveforms on the PC .................................................................17
Zooming In and Out on a Waveform.............................................................19
Select the Active Waveform..........................................................................19
i
Page 4

SW43W
Users Manual
Scaling a Waveform ......................................................................................19
Change Waveform Colors and Titles ............................................................19
Moving waveforms........................................................................................19
Deleting waveforms.......................................................................................19
Copying Waveforms to Other Applications ..................................................19
Analyzing Harmonics ........................................................................................20
Displaying Harmonics on the PC ..................................................................20
Scaling a Spectrum ........................................................................................21
Copying Harmonics Data to Other Applications...........................................21
Using Datasets (not for Fluke 43B) ...................................................................22
Retrieving, Saving, Sending Back a Dataset .................................................22
Analyzing a Dataset.......................................................................................22
Example: Export a Waveform from a Dataset to Windows Excel ................23
Example: Export a Vrms Trend from a Monitor Dataset to Windows Excel25
Limit Sets (not for Fluke 43B)...........................................................................27
Retrieving, Saving, Sending Back a Limit set...............................................27
Viewing and Editing a Limit set....................................................................27
Logging Readings ..............................................................................................29
Graphing Readings ........................................................................................29
Inserting Logged Data into a Spreadsheet.....................................................31
Example: Graphing Harmonics from the Fluke 434......................................31
Graphing Harmonics from the Fluke 43B .....................................................33
Transferring Fluke 43B Instrument Setups........................................................34
Printing Windows ..............................................................................................35
Saving Windows to a File..................................................................................36
Copying Data via the Clipboard ........................................................................36
ii
Page 5

Installing FlukeView
Installing the FlukeView Software
FlukeView® software offers you simple mouse-controlled tools to work with your Power
Quality Analyzer.
Chapter 1
For an optimal use of the FlukeView software install it on PC’s running Windows 2000
and Windows XP.
To install FlukeView, insert the CD ROM into the CD ROM drive, and run SETUP.
The setup program starts up and prompts you for information to complete the installation.
Running the FlukeView Software
Choose from Start - Programs - FlukeView – Power Quality
Analyzer to run the FlukeView software.
Connecting the Power Quality Analyzer
The FlukeView software communicates with your Power Quality Analyzer via the
optically isolated OC4USB adapter/cable connected to the USB of the PC.
The OC4USB driver creates a virtual COM port. FlukeView will handle the USB port as
a COM port.
Note
The optional RS-232 adapter/cable PM9080 allows you to communicate via
a COM port of your PC.
During startup (except for the first time), the FlukeView software automatically tries to
make a connection with the instrument according to the last valid connection.
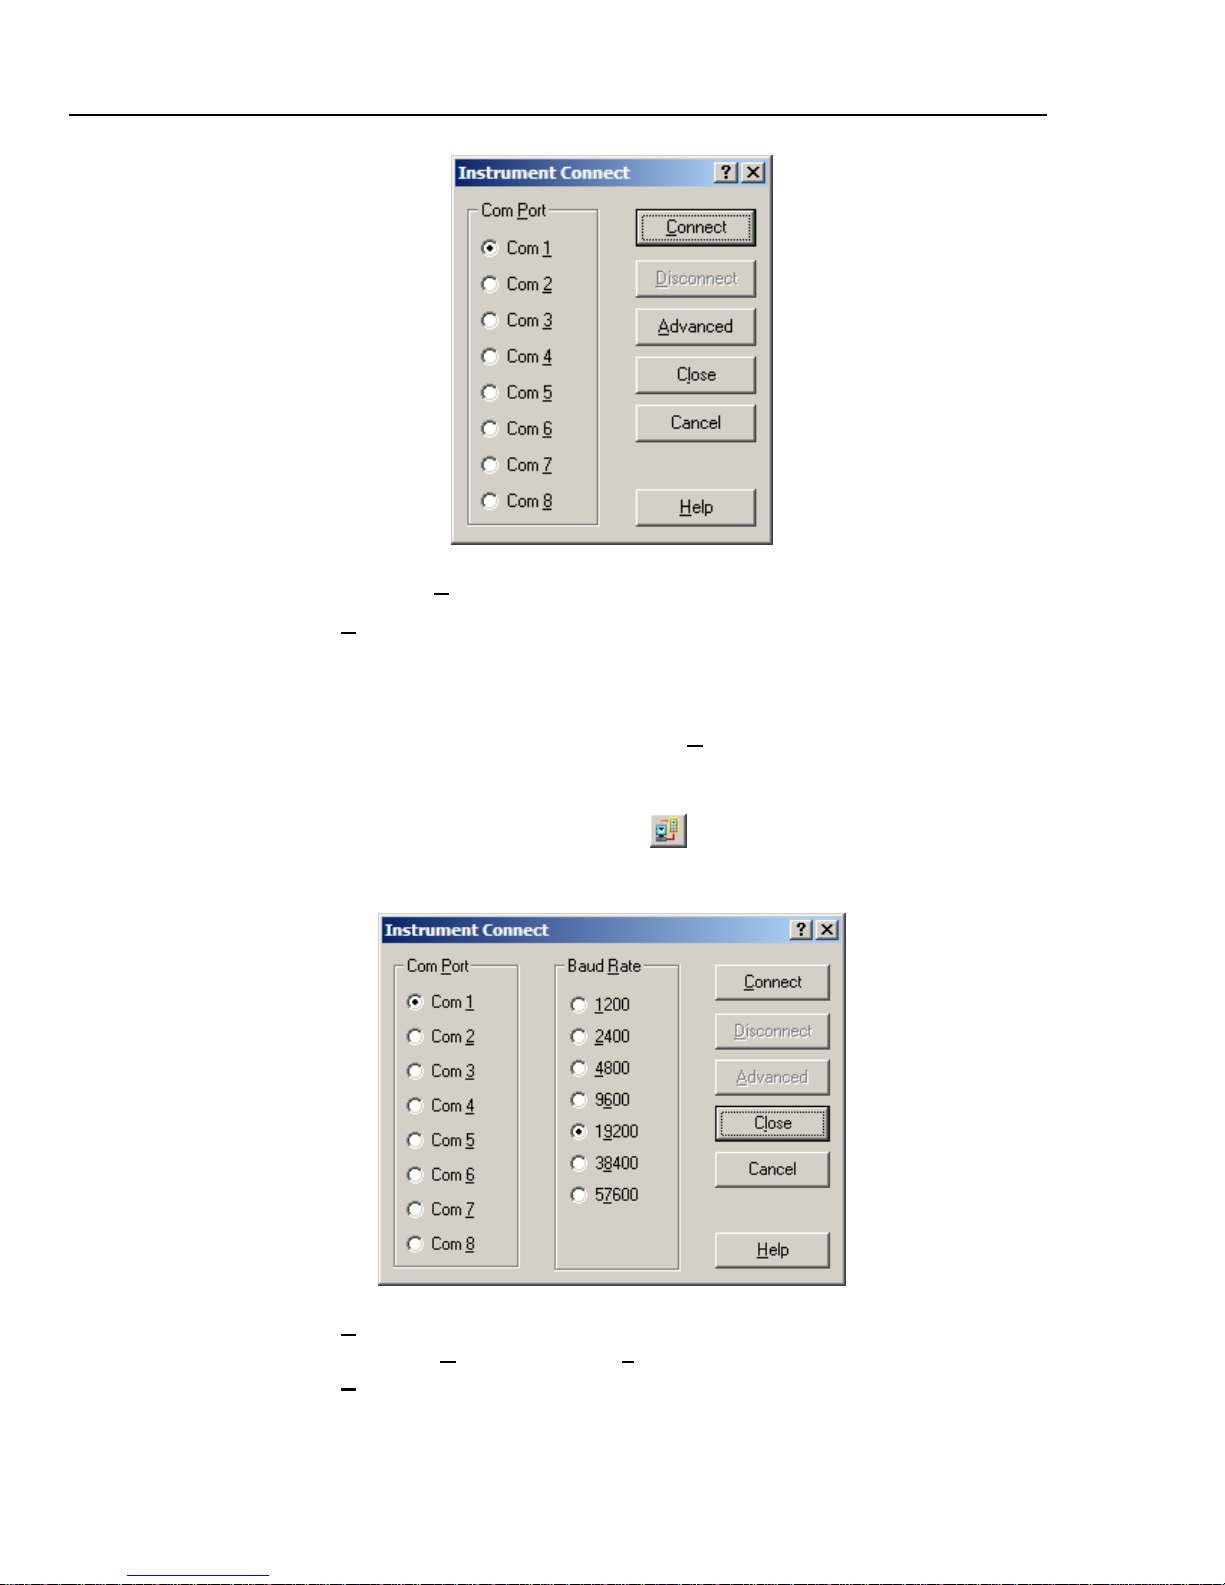
If automatic connection is not successful, the dialog box shown below appears, allowing
you to make a connection.
1
Page 6
SW43W
Users Manual
1. Select the Com Port that connects the instrument to the PC.
2. Click Connect to establish a connection with the instrument.
Selecting the Baud Rate
If you want FlukeView to communicate at another baud rate do the following:
1. In the Instrument Connect menu click on Advanced. The dialog box shown
below appears .
To see the Instrument Connect menu click
toolbar button (most left button):
Note:
(connect/disconnect) in the
2. Click Disconnect if you are connected.
3. Select the Baud Rate, for example 57600.
4. Click Connect to establish a connection with the instrument.
2
Page 7

Installing FlukeView
PC USB and COM port 1
PC USB and COM port
Determining the USB Cable COM port
1. Attach the cable to the PC.
2. Go to the Windows Control Panel.
3. Open the "System Properties" dialog box.
4. Open the Device Manager:
On Windows 2000/XP, click on the "Hardware" tab of the "System Properties" dialog
box and click on the "Device Manager" button,
On Windows 98SE/Me, click the "Device Manager" tab.
5. On the "Device Manager" dialog box, look under the "Ports (COM & LPT)" tree. The
COM port associated with the USB-IR cable is listed there, as:
"Prolific USB-to-serial bridge" (Windows 2000/XP),
"USB to Serial Port" (Windows 98SE/Me).
Changing the COM port #
Some programs require COM 1, 2, 3 or 4 and the USB cable is often installed as COM 5
or higher. To change the assigned COM port number, do the following:
1. Open Device Manager.
2. On the "Device Manager" dialog box, look under the "Ports (COM & LPT)" tree.
3. Click on the "Port Settings" tab. Click on the "Advanced" button.
4. On the bottom left side pull down the bar and select COM 1, 2, 3 or 4 (NOTE:
Choose one that does not say "in use" next to it). Click "OK".
5. Click "OK" again. Notice that the device will show up as being on the same COM
port that it was before (i.e., COM5), but will show up on the new port if you close the
Device Manager and open it again.
6. Close the Device Manager.
3
Page 8

SW43W
Users Manual
4
Page 9

Using Online Help
The FlukeView software offers you access to online help by using the F1 key, a Help
button, “What’s This?” help, or the Help menu:
Chapter 2
Using FlukeView
Press to get online help for the topic that has the focus.
or Shift+
Click, move the mouse pointer on a topic, and click again to
or
To show help items on a help page, do one of the following:
• move the mouse pointer (changes to
• press Tab (changes the
get “What’s This” help.
Click to get help in dialog and error boxes.
Note
above a help item);
of a help item).
Introducing the FlukeView Software
By clicking the buttons on the toolbar or by using the Instrument pull down menu, you
can read data from the Power Quality Analyzer.
Clicking a button will directly start reading the instrument data. Using the pull down
menu enables you to make a selection (if applicable) of data to be read.
5
Page 10

SW43W
Users Manual
Buttons Instrument Pull Down menu
Display Screen
Display Waveforms
Display Trend
Display Harmonics
Display Setup/Limits
Display Dataset
Start Logging of readings
You can save, open, and print the data, or export it to other programs.
FlukeView software enables you to read the following types of data from the Power
Quality Analyzer into a window on the PC screen:
Display Instrument Screens
or Instrument – Display Screen
Transfers the instrument screen to the PC and displays the screen (bitmap) in a screen
window.
The screen picture can be used to create documents, see also Documenting Screens on
page 16.
6
Page 11
Using FlukeView
Introducing the FlukeView Software 2
Display Waveforms
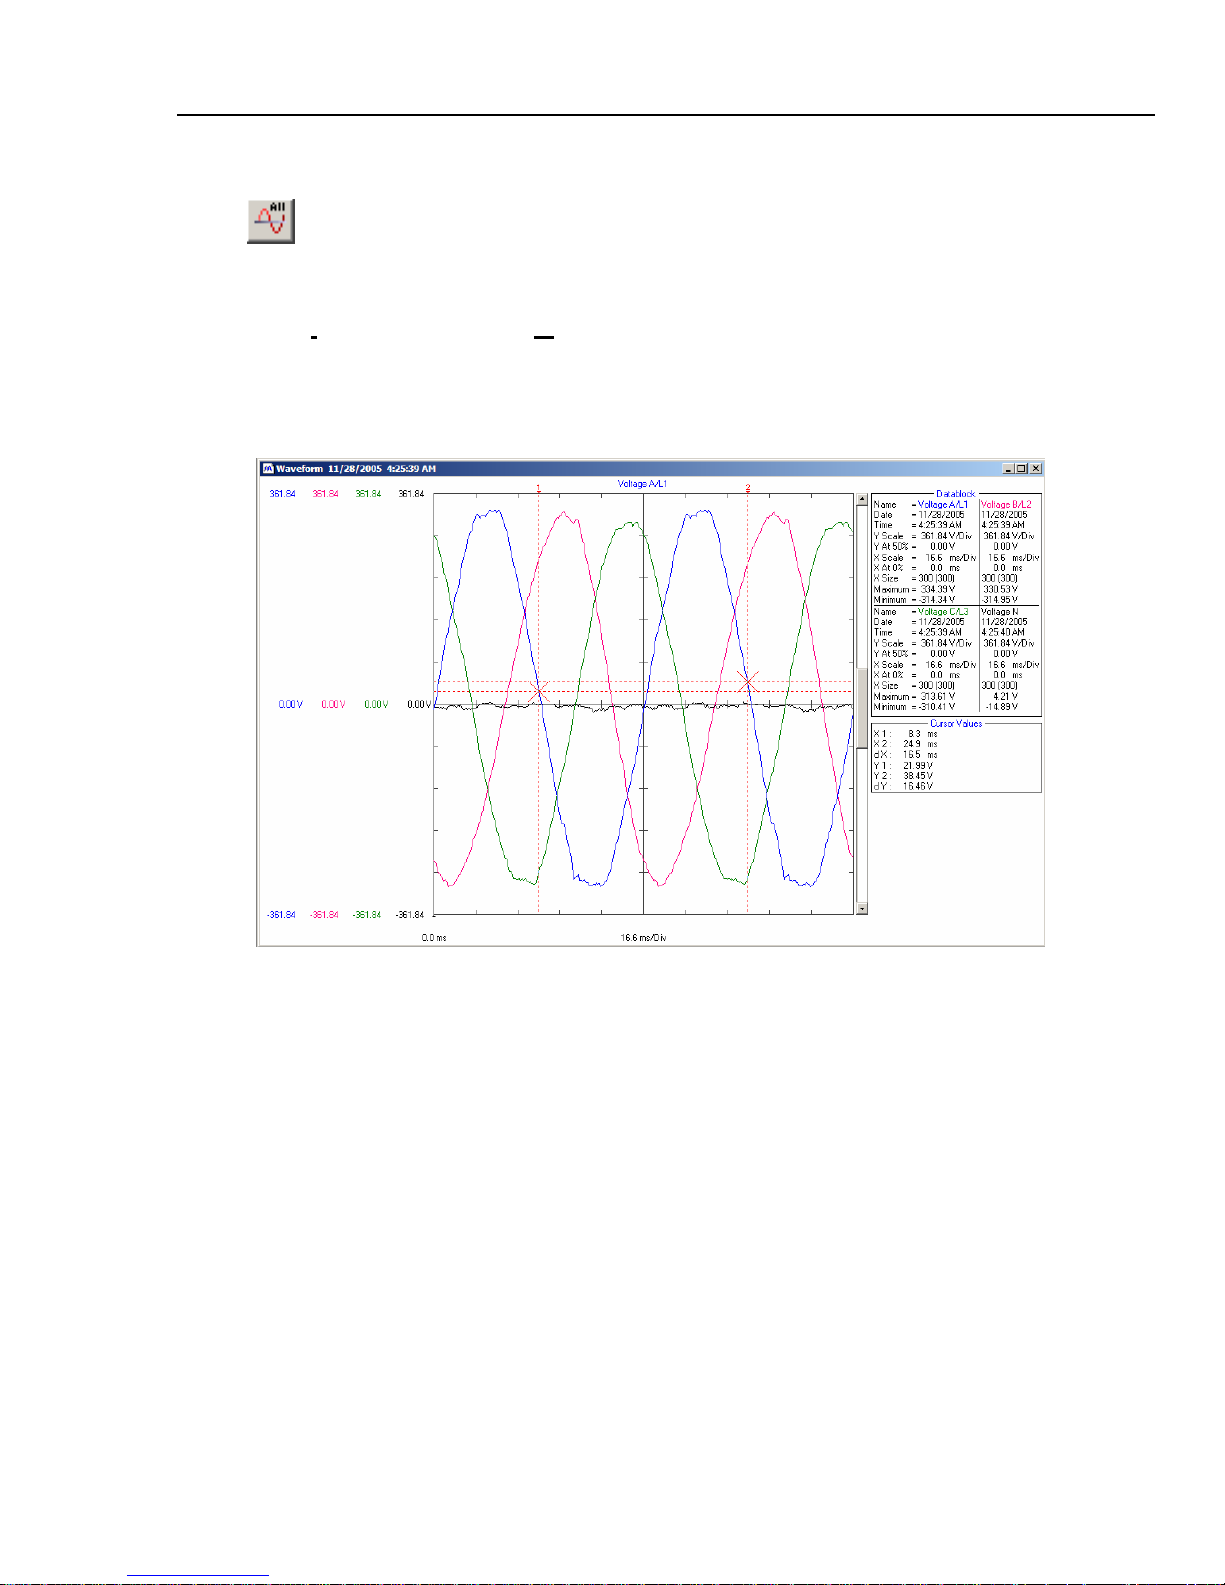
Transfers waveform sample data of all waveforms on the Power Quality Analyzer display
to the PC and displays the waveform-points graphically in a waveform window.
Select I
nstrument – Display Waveform if you want to select the waveforms to be
transferred.
You can zoom and scale the waveforms to analyze them, see Analyzing Waveforms and
Trends on page 17.
7
Page 12
SW43W
Users Manual
Display Trend
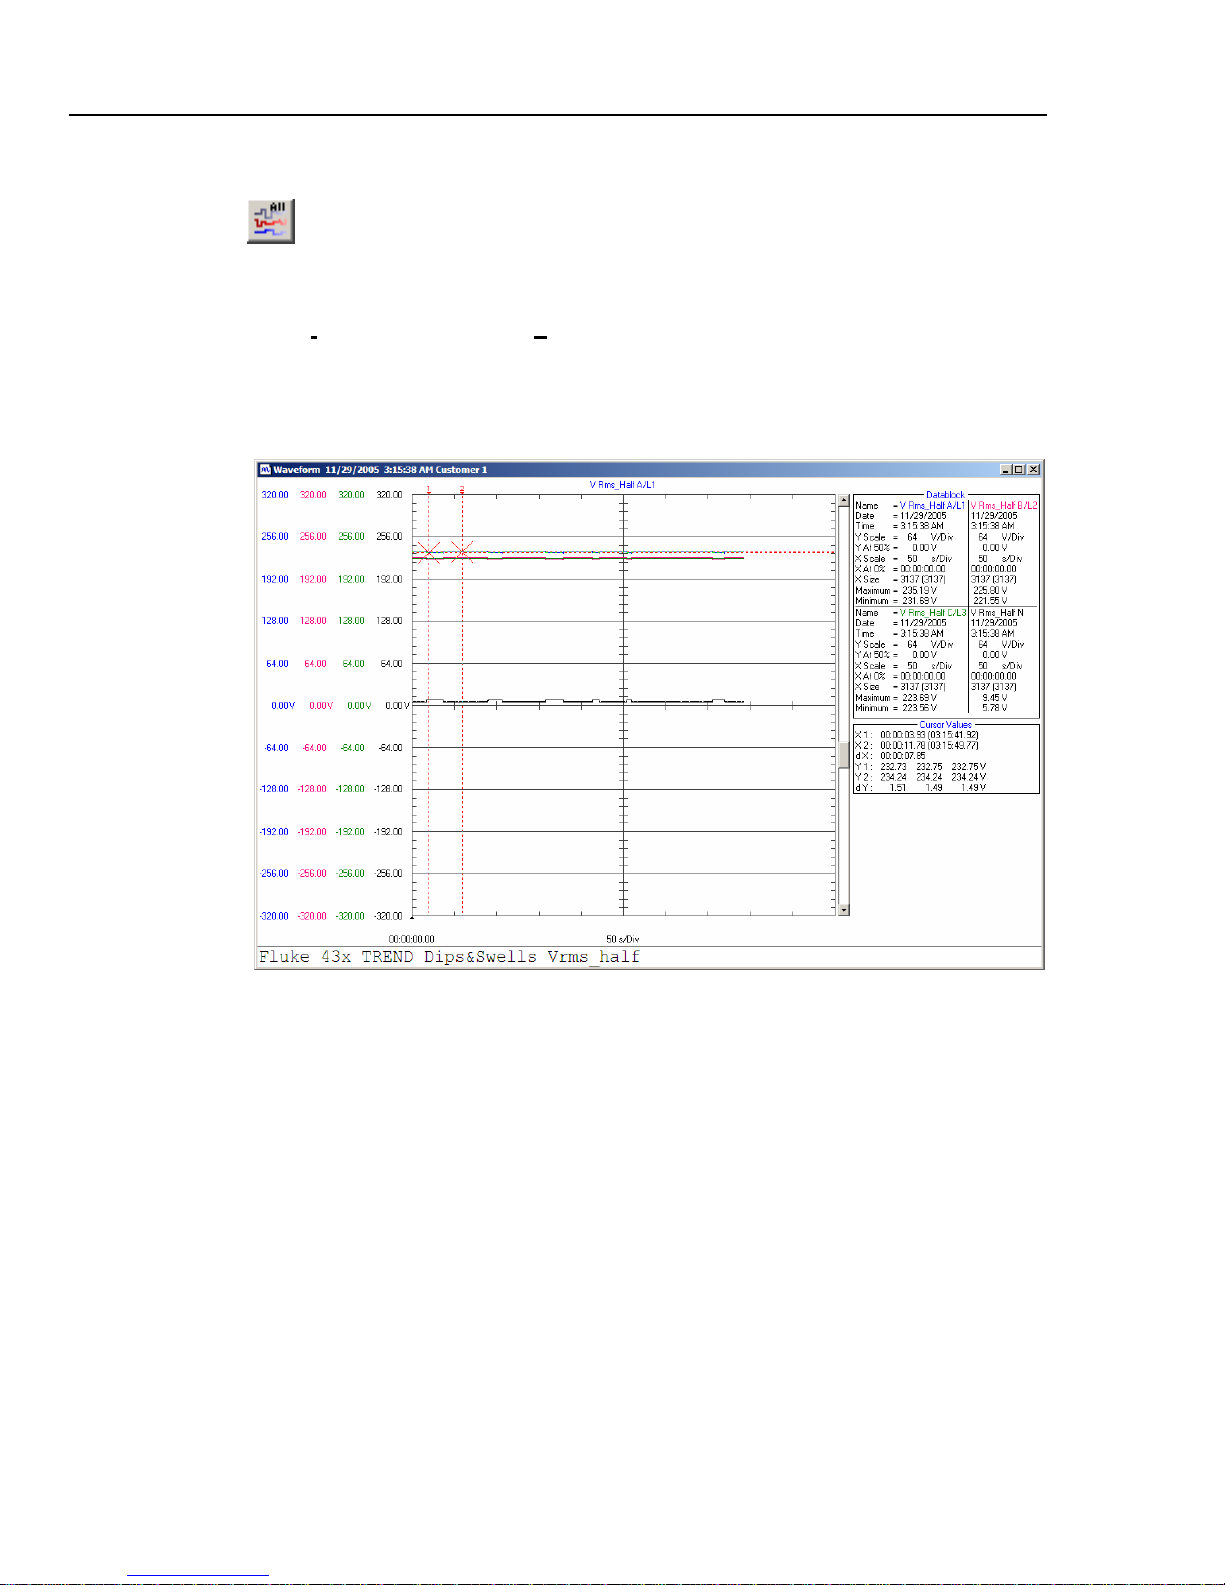
Transfers trend sample data to the PC and displays the data graphically in a waveform
window.
Select I
nstrument – Display Trend if you want a trend of a particular function to be
transferred.
You can zoom and scale the trend graphs to analyze them, see Analyzing Waveforms and
Trends on page 17
8
Page 13
Using FlukeView
Introducing the FlukeView Software 2
Display Spectrum/Harmonics
or Instrument – Display Harmonics
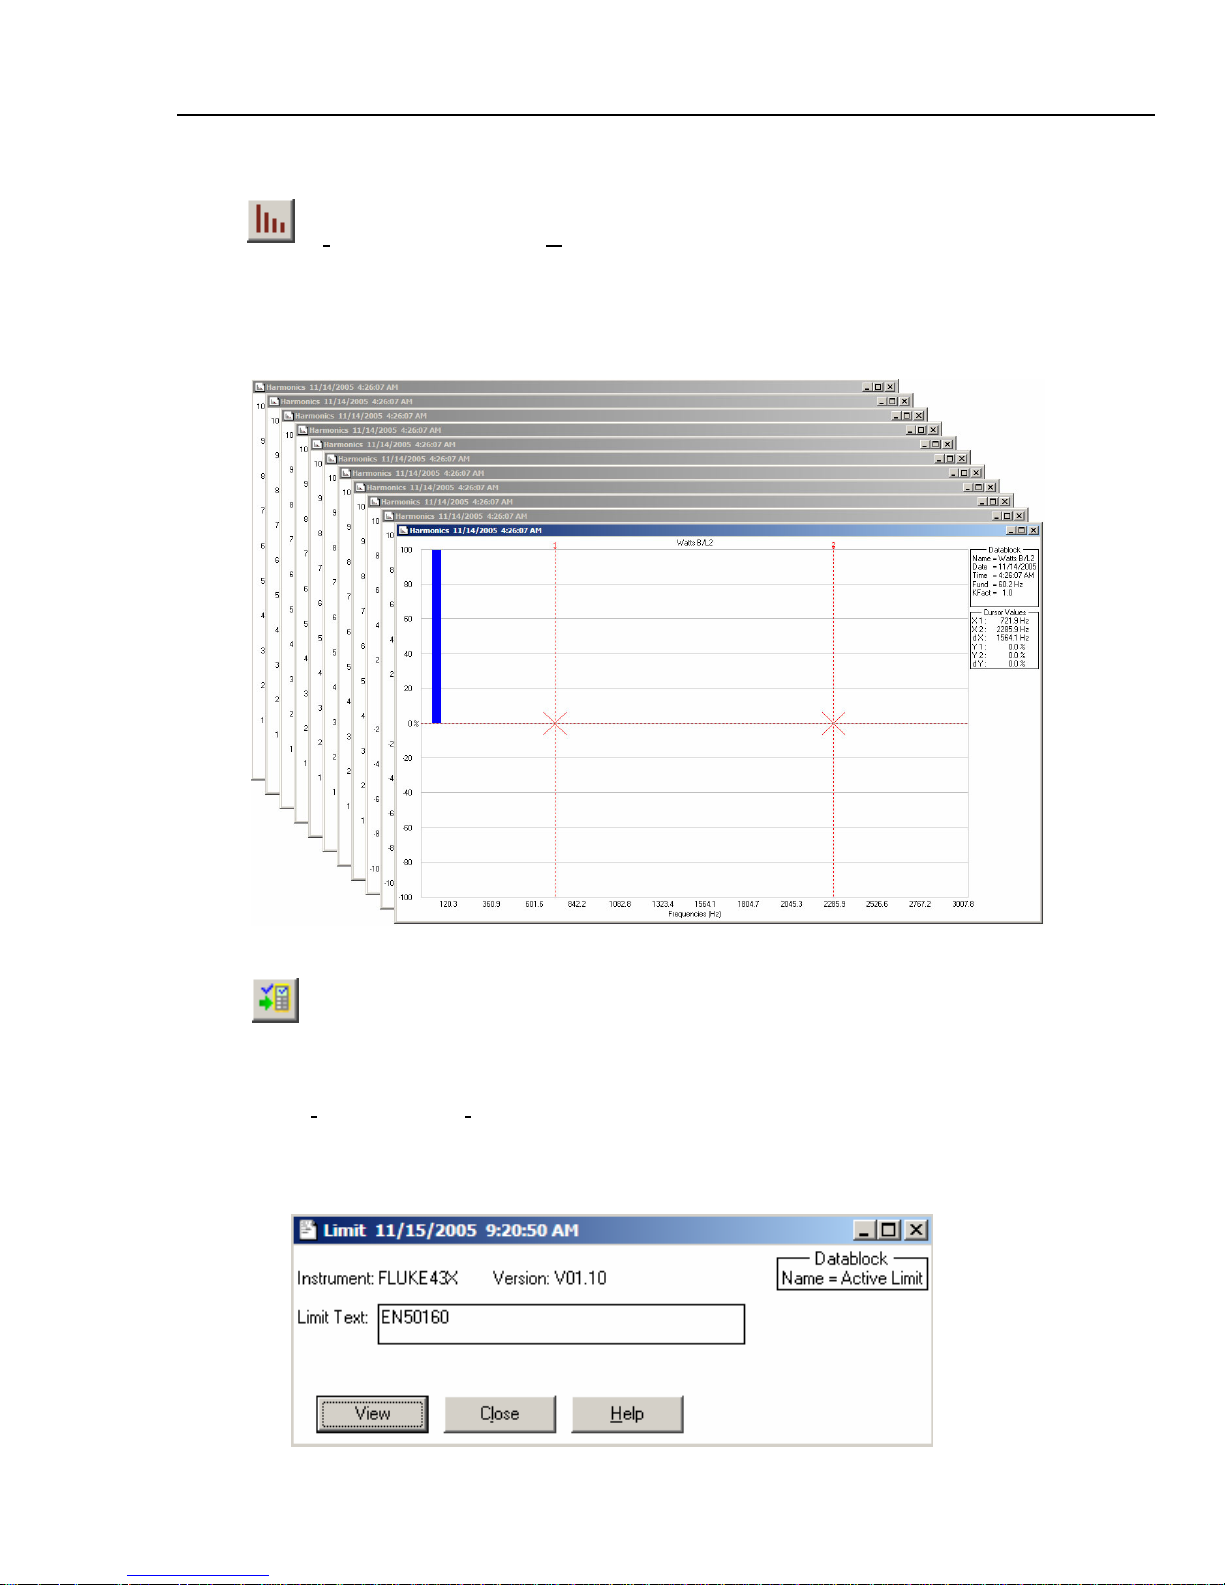
Transfers all harmonics data from the Power Quality Analyzer to the PC and displays the
data in a harmonics window.
You can perform frequency analysis on the data, see Analyzing Harmonics on page 20.
Display Limits (Fluke 43x)
Retrieves the actual instrument limit set from the Fluke 43x Power Quality Analyzer. An
instrument limit set contains all limits used for power quality monitoring.
Select I
nstrument – Display Setup/Limits to retrieve the actual or a stored limit set.
You can view, edit, and send back an instrument limit set, see Limit Sets (not for Fluke
43B) on page 26.
9
Page 14
SW43W
Users Manual
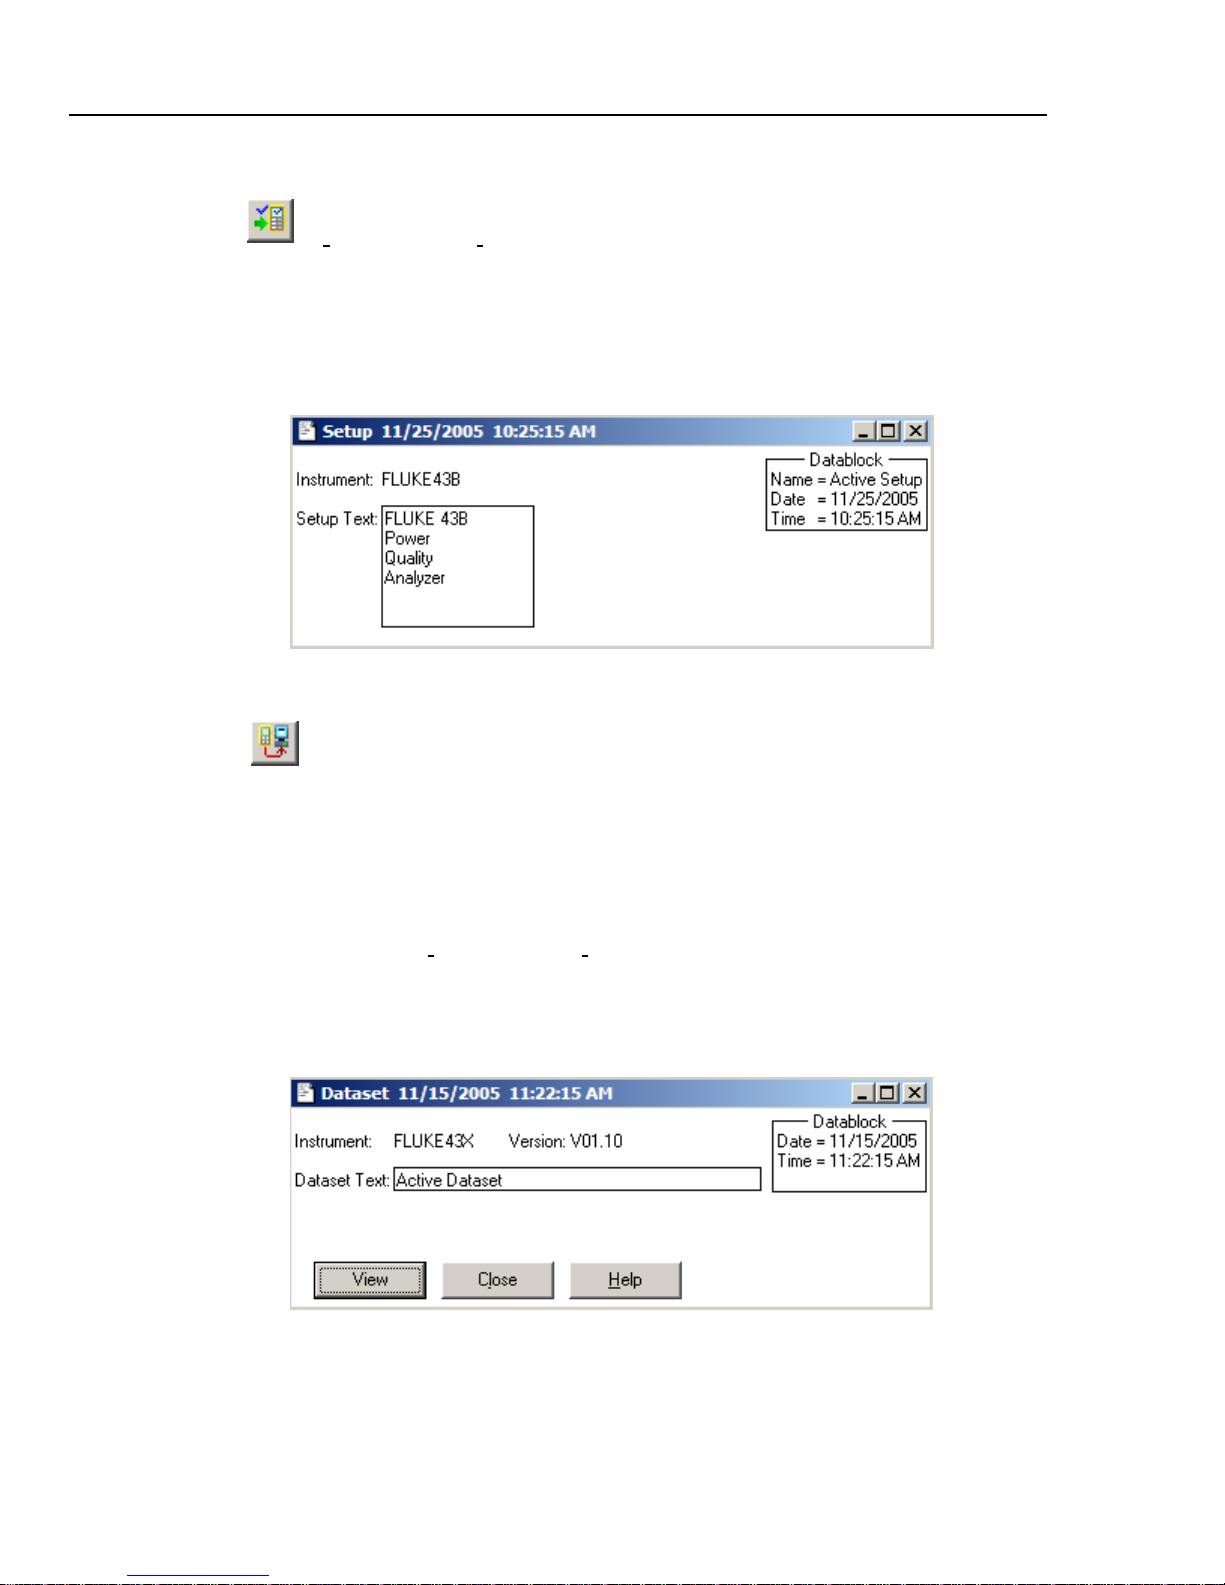
Display Setup (Fluke 43B)
or Instrument – Display Setup/Limits
Retrieves the actual instrument setup from a Fluke 43B Power Quality Analyzer. An
instrument setup contains all instrument settings.
You can send back an instrument setup to the Power Quality Analyzer.
See also Transferring Fluke 43B Instrument Setups on page 34.
Display Datasets (not for Fluke43B)
Transfers the actual measurement dataset to the PC.
A dataset contains all data belonging to a power quality measurement, including trend
data and instrument setup data.
For the Logger function the dataset contains only the setup data. Dedicated software
(Power-Log) is available for advanced analysis and reporting of logger data.
You can also select I
nstrument – Display Dataset to retrieve the actual measurement
dataset or to retrieve a dataset from the Power Quality Analyzer’s memory.
You can view, store, and send back measurement data sets. For detailed information see
Using Datasets on page 22.
10
Page 15
Using FlukeView
Introducing the FlukeView Software 2
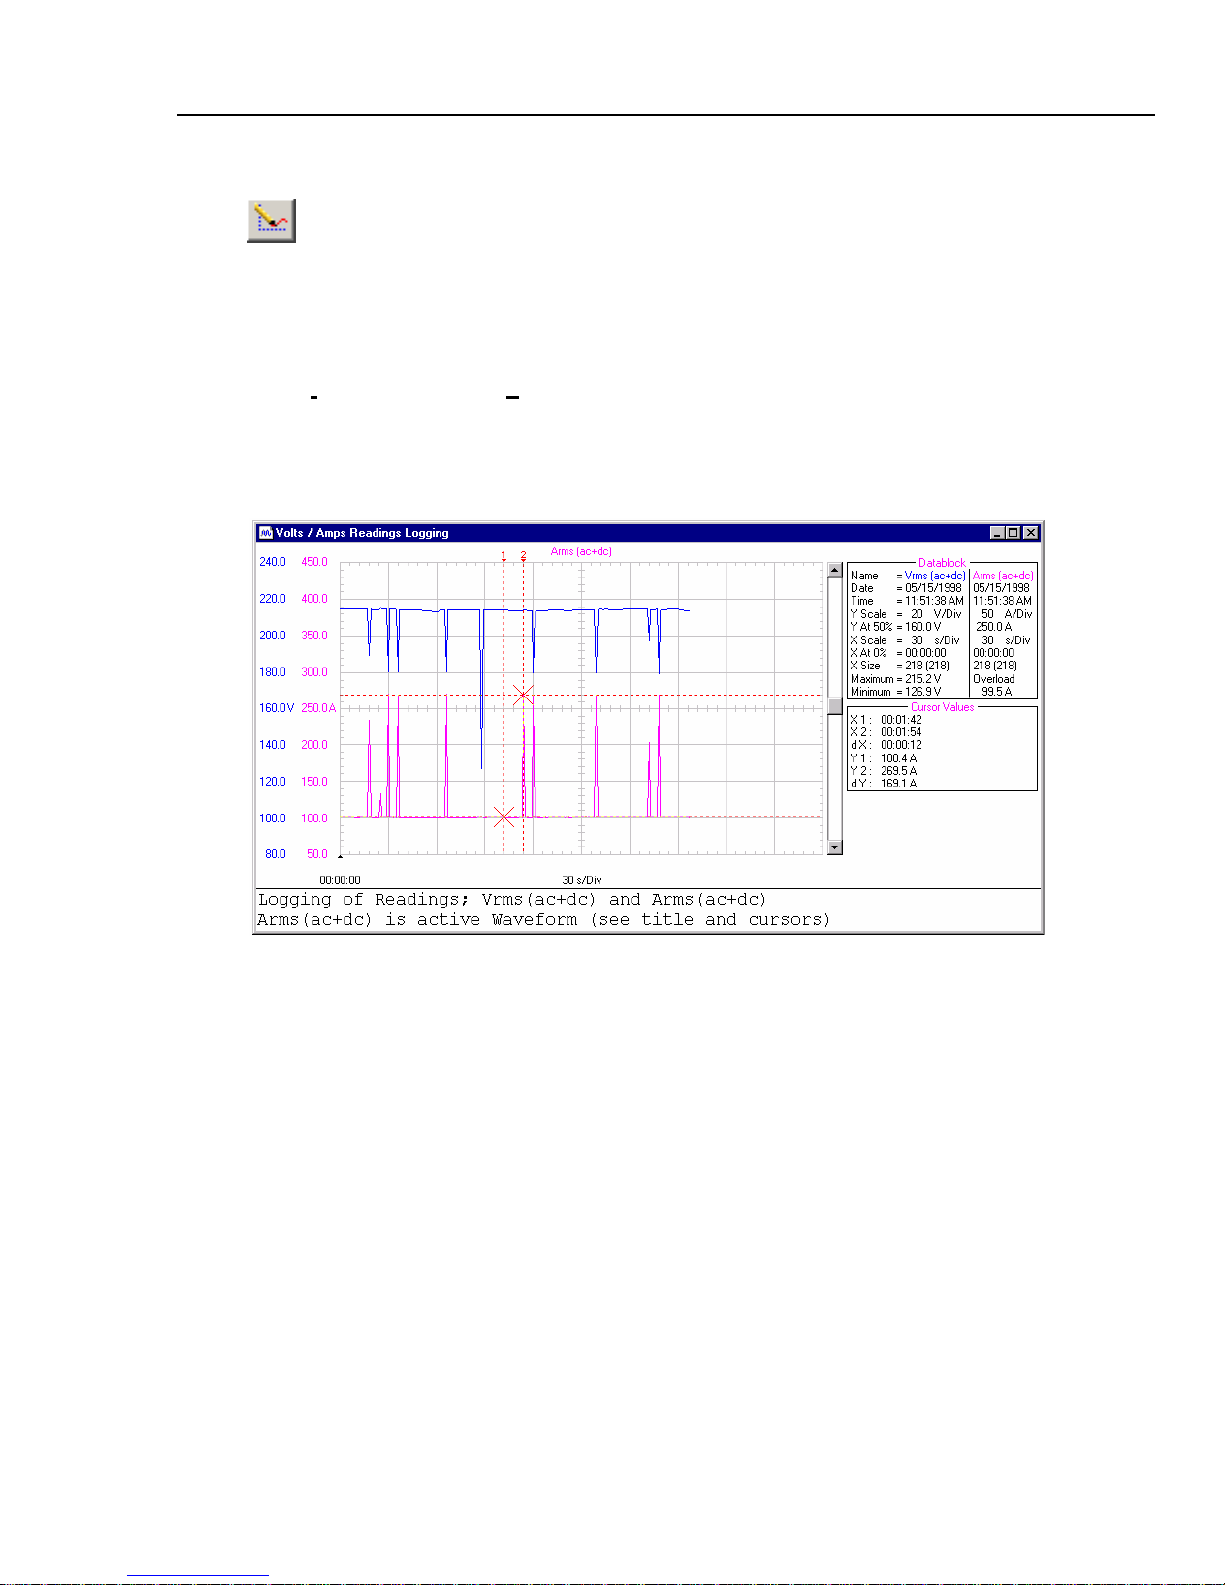
Start Logging of Readings
Transfers all numerical readings from the Power Quality Analyzer and displays them
graphically in a readings window.
A reading is a numerical value from a single measurement by the Power Quality
Analyzer.
Select I
nstrument – Start Logging of Readings to select readings from one or more
functions to be transferred.
You can analyze the graphed readings by zooming or scaling. See also Logging Readings
on page 29.
11
Page 16
SW43W
Users Manual
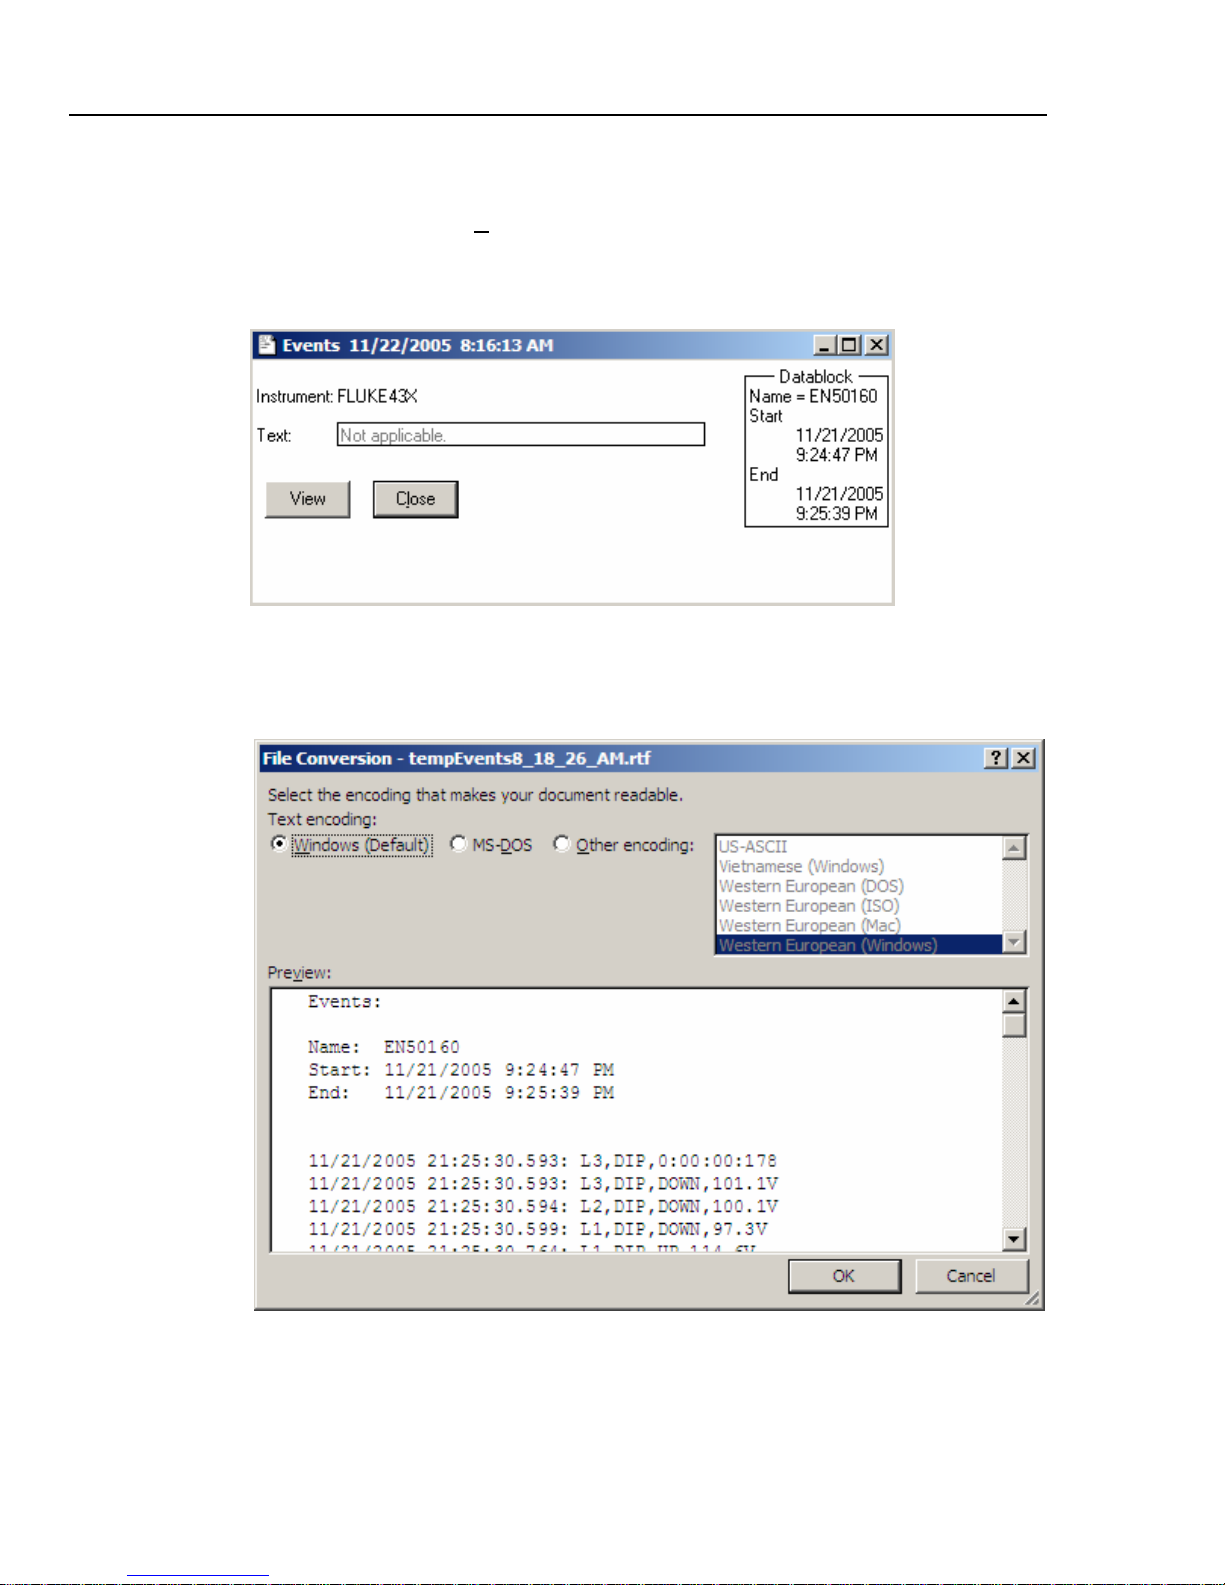
Display Events (not for Fluke 43B)
Instrument – Display E
vents
Transfers the active events list from the Power Quality Analyzer to the PC and displays
name, date, and time of the events list in a window.
Click the View button to open the list in your default rtf (rich text format) viewer for
Windows:
You can edit and save the events list for documenting purposes.
12
Page 17
Using FlukeView
Introducing the FlukeView Software 2
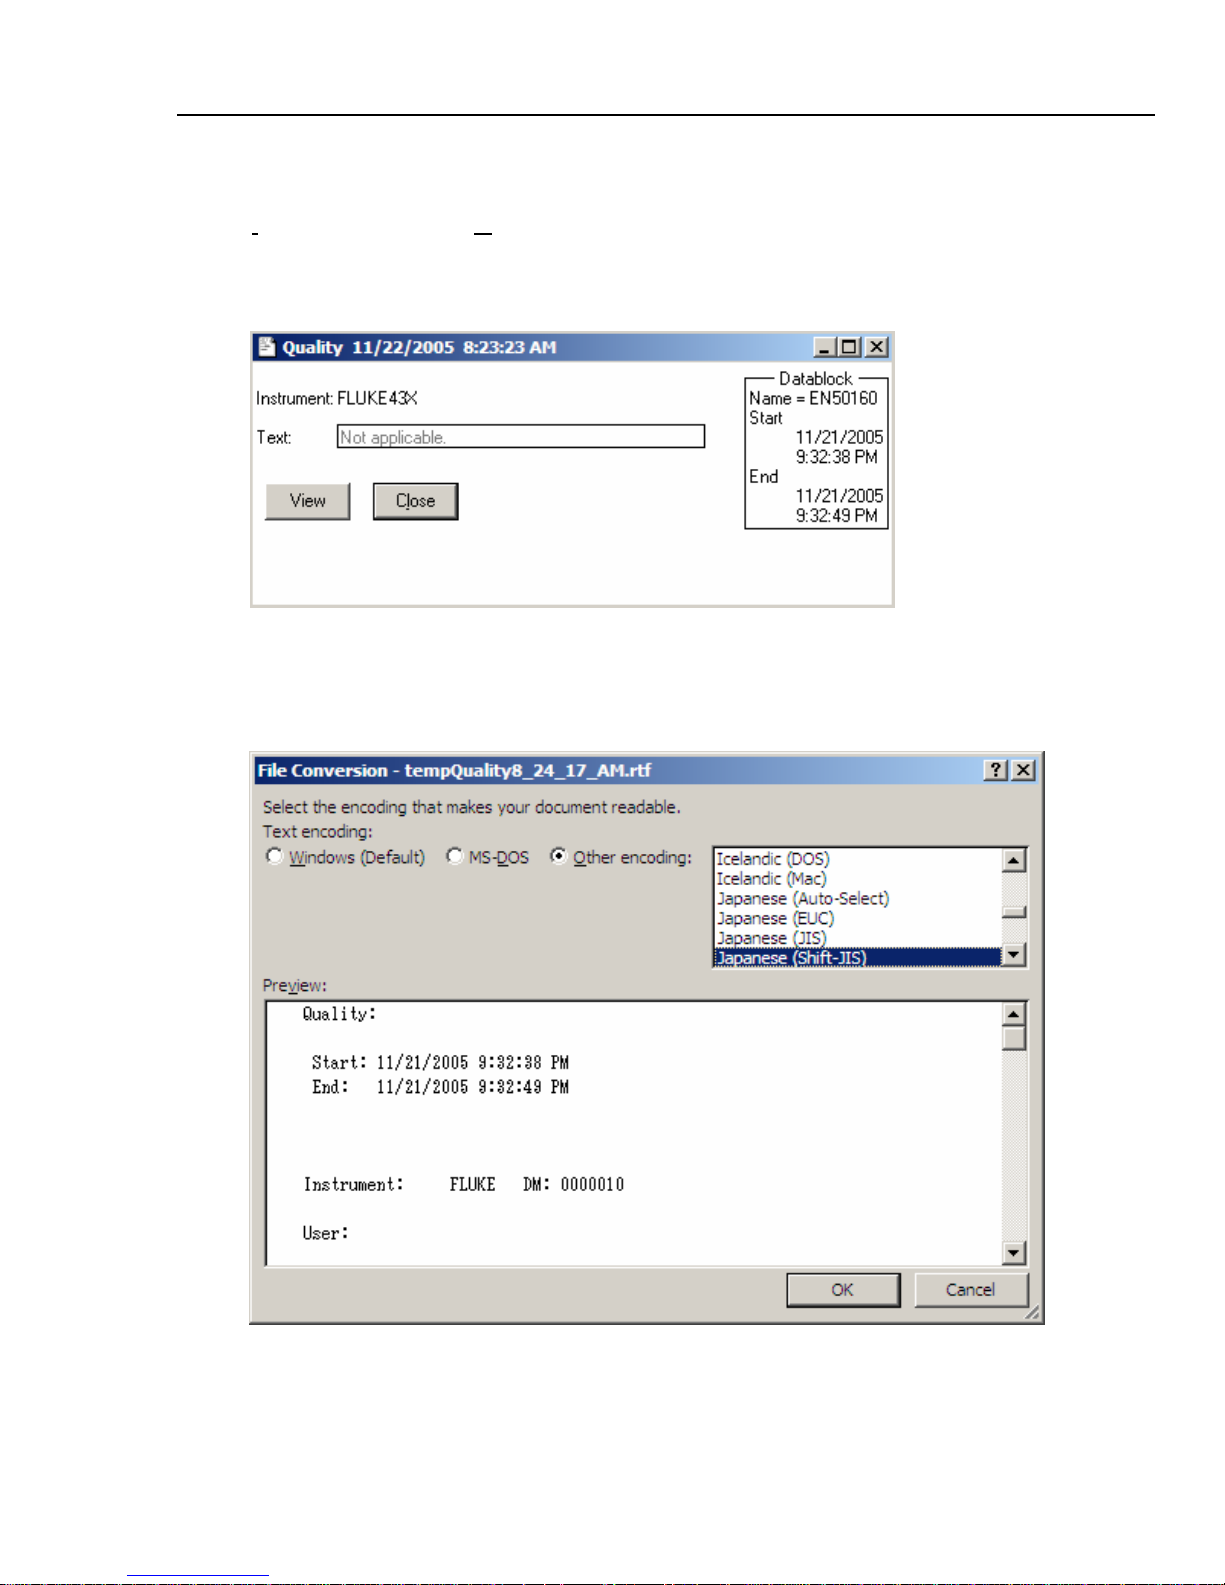
Display Quality (not for Fluke 43B)
I
nstrument – Display Quality
Transfers the Monitor mode quality data from the Power Quality Analyzer to the PC and
displays name, date, and time of the quality list in a window.
Click the View button to open the list in your default rtf (rich text format) viewer for
Windows:
You can edit and save the events list for documenting purposes.
13
Page 18
SW43W
Users Manual
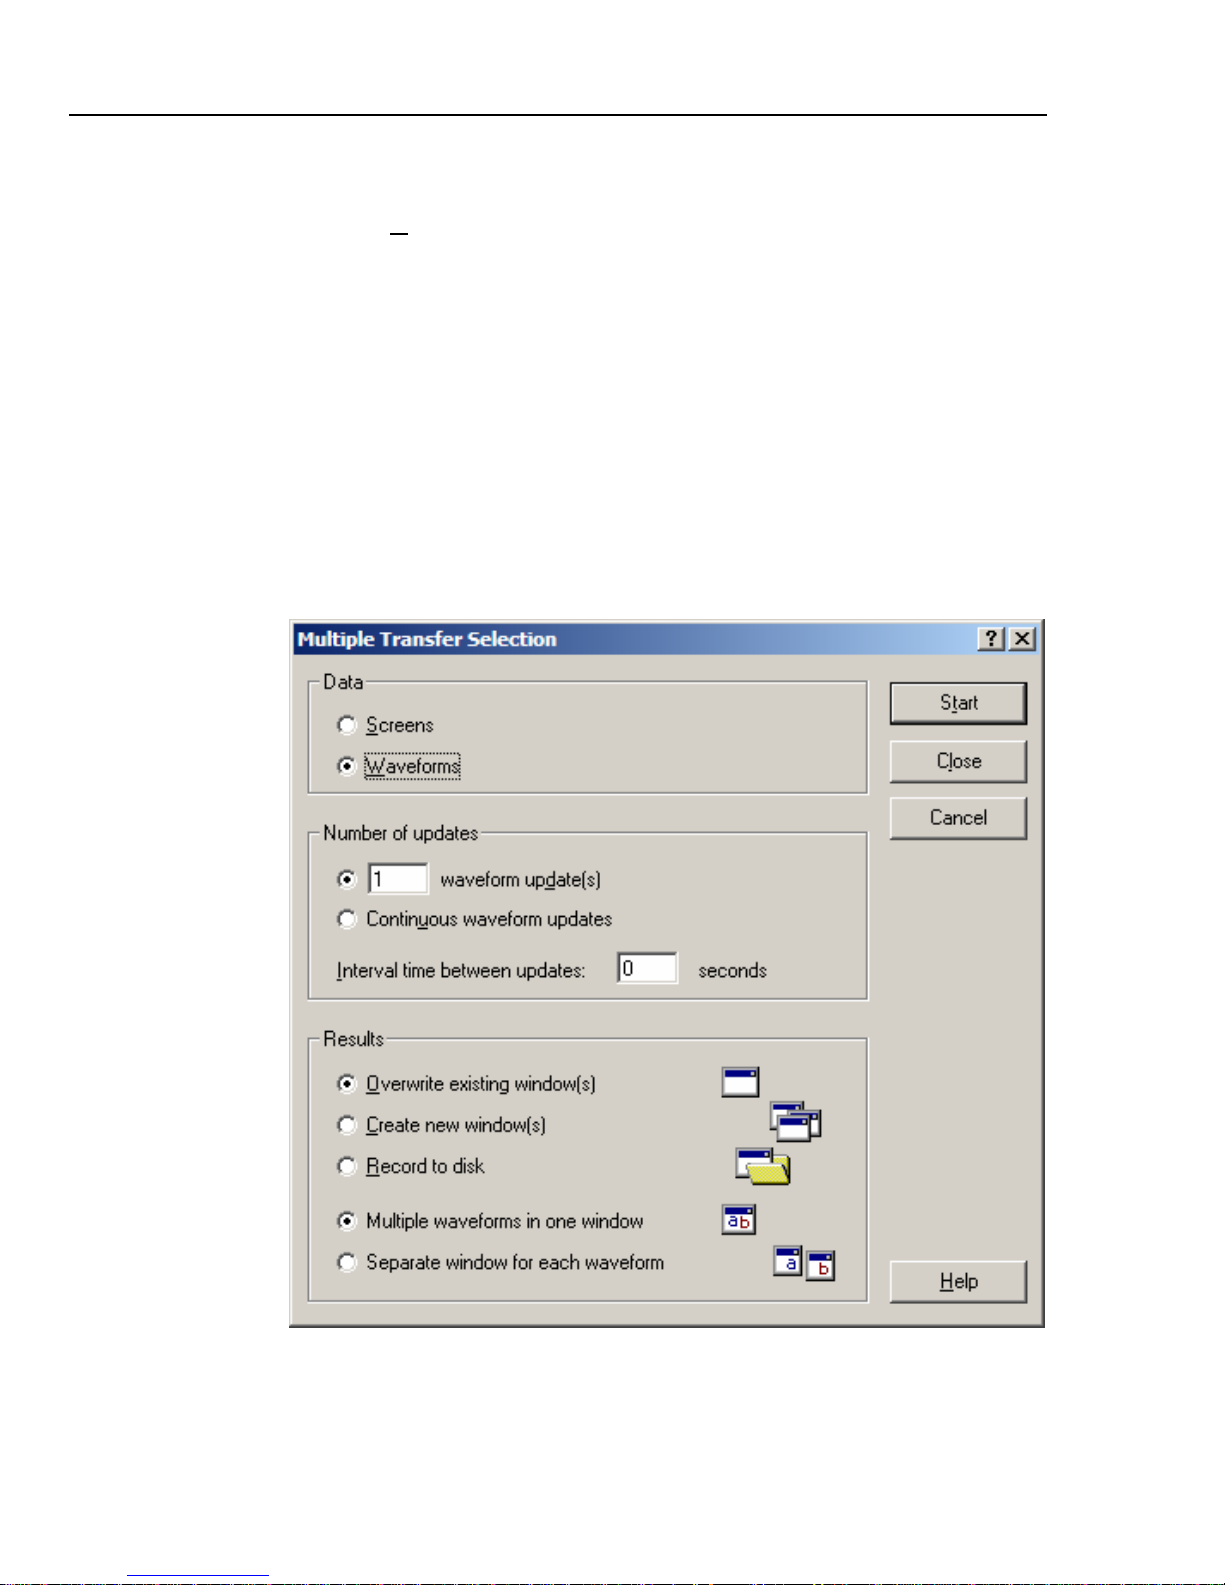
Multiple Transfers of Screens/Windows
Instrument – M
ultiple Transfers
Allows you to select transfer possibilities for reading data from the Power Quality
Analyzer,
for screens and waveforms:
• Whether the transferred data will be displayed in a new window, will overwrite the
existing window, or will be recorded to disk.
• The number of times the data will be transferred from the Power Quality Analyzer to
the PC.
• The interval time between two subsequent data transfers.
for waveforms:
• To display a maximum of 4 waveforms in one window or each waveform in a
separate window.
14
Page 19

Using FlukeView
Introducing the FlukeView Software 2
Remote Control (not for Fluke 43B)
Instrument – R
emote Control
FlukeView will open an instrument remote control screen. The instrument remote control
screen is a copy of the Power Quality Analyzer front. It allows you to operate the Power
Quality Analyzer on your PC (remote control).
To operate the connected Power Quality Analyzer via this screen click on the simulated
keys. In addition, your PC F1…F5 keys, arrow keys, and Enter key will perform the same
action as corresponding instrument keys.
Fluke 43x keys PC keyboard
Softkeys F1…F5 F1…F5 or mouse click on Fluke 43x screen
Blue arrow keys Arrow keys
Enter Enter
After each remote control action the updated Power Quality Analyzer screen will be
transferred to the PC screen.
The Power Quality Analyzer can still be operated with its own keys (local operation is
not locked out). If you do this, the PC screen can be updated via the Update Screen
button.
Click on Close to close the remote control screen.
Window Properties
To change the window to your preference do the following:
• Select O
ptions - Add Description and type a description in the text box below the
window (max. 10 lines).
• Select O
• Select O
• Select O
• Select V
• Select V
• Select V
ptions - Colors to change waveform colors.
ptions - Titles to change window titles.
ptions – Scales to change the scaling of a waveform.
iew - Description to show or hide the description,.
iew - Datablock to show or hide the data block.
iew – Cursors to show or hide the cursors.
Use the mouse or (Shift) Å Æ keys to move the cursors.
• Click
• Click
You can also right click in the window to change the window properties.
or select View – Zoom In to zoom in on a waveform
or select View – Zoom Out to zoom out on a waveform.
15
Page 20
SW43W
Users Manual
Documenting Screens
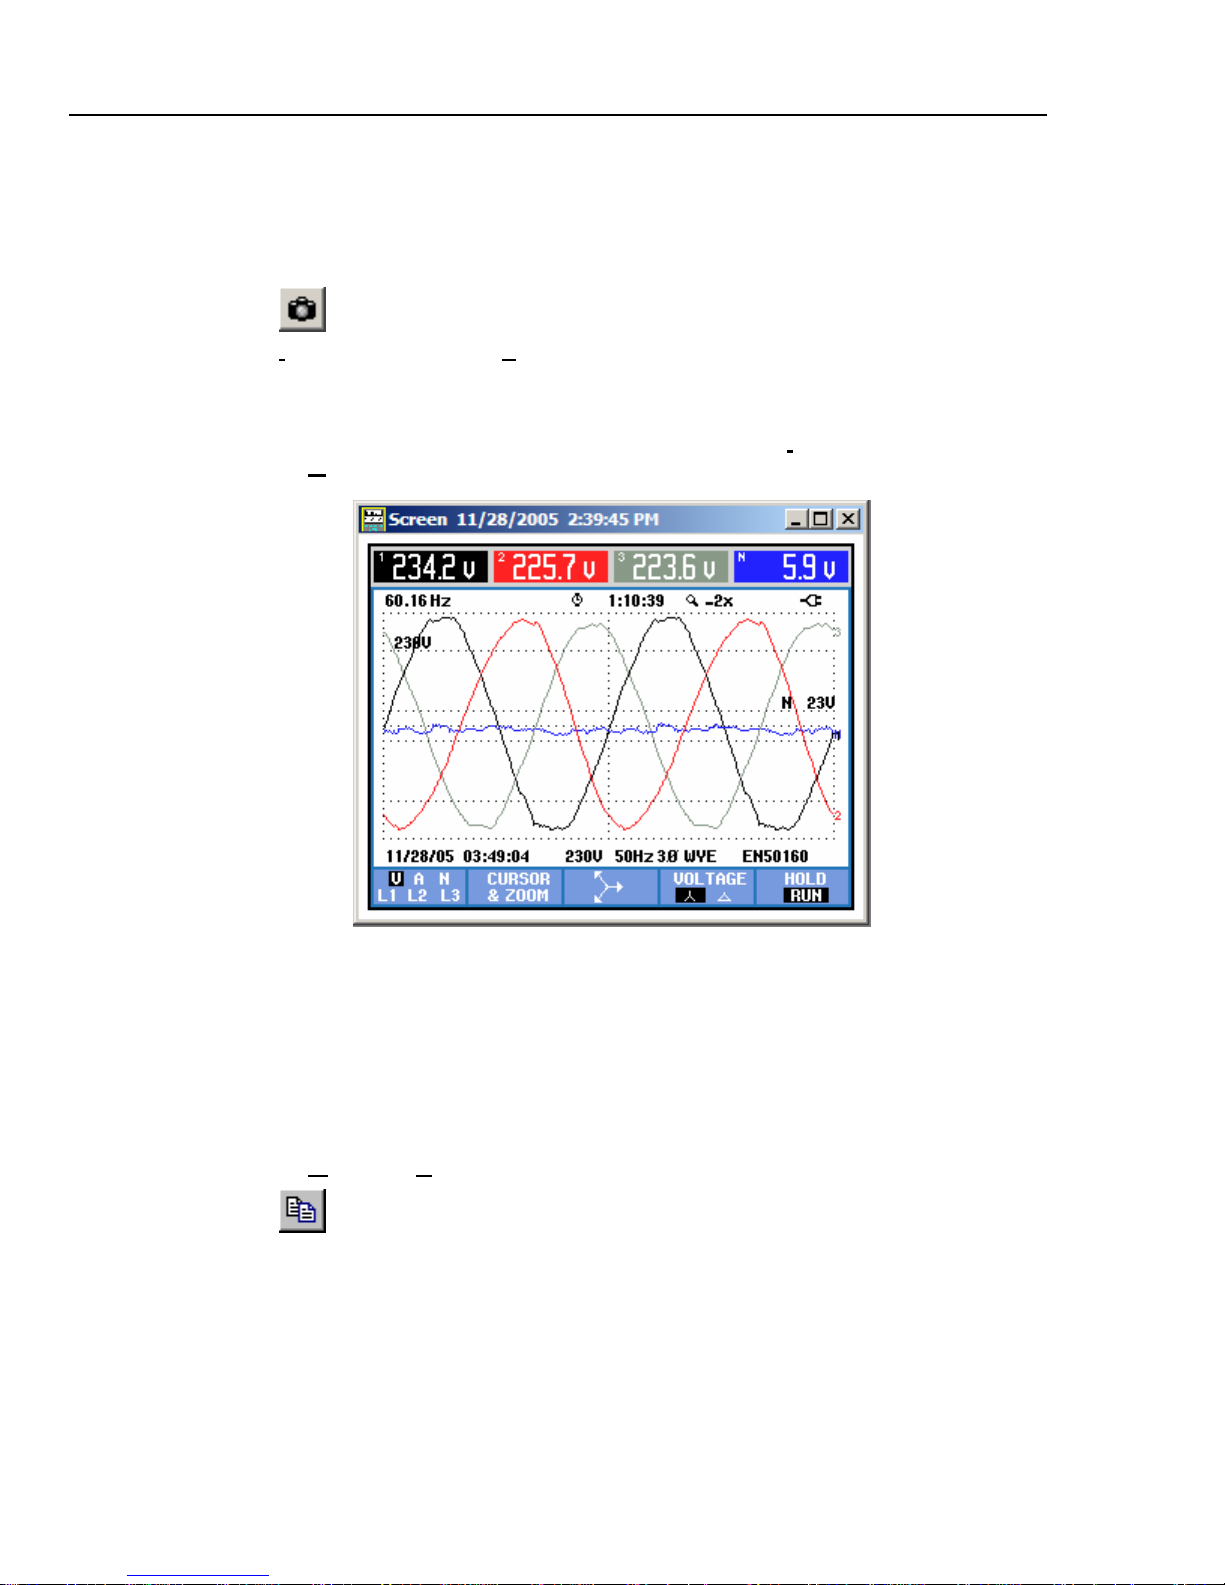
Displaying an Instrument Screen on the PC
1. Click to display the active ScopeMeter screen in a screen window. Select
nstrument – Display Screen to select the actual screen or a screen from the
I
Analyzer memory.
Tip
To specify conditions for transferring screens, choose I
ultiple Transfers
M
nstrument -
Each Power Quality Analyzer screen appears in a separate screen window
To change the window to your preference see Window Properties on page 15.
Inserting Screens into a Document
1. Click on the screen window you want to insert.
To avoid losing resolution because of copying to the clipboard, choose
W
indow – Default Size.
2. Click to copy the window to the clipboard.
3. Switch to a word processor, open or create a document and place the cursor where you
want to insert the window.
4. Paste the screen window into the document.
In the same way, you can insert waveform and harmonics/spectrum
windows into a document.
Tip
Note
16
Page 21
Using FlukeView
Analyzing Waveforms and Trends 2
Analyzing Waveforms and Trends
You can read numerical waveform samples from the Power Quality Analyzer and display
these samples in a waveform window.
Note
You can analyze Trends in the same way as analyzing waveforms.
Displaying Waveforms on the PC
To demonstrate this select for example
(Fluke 43x)
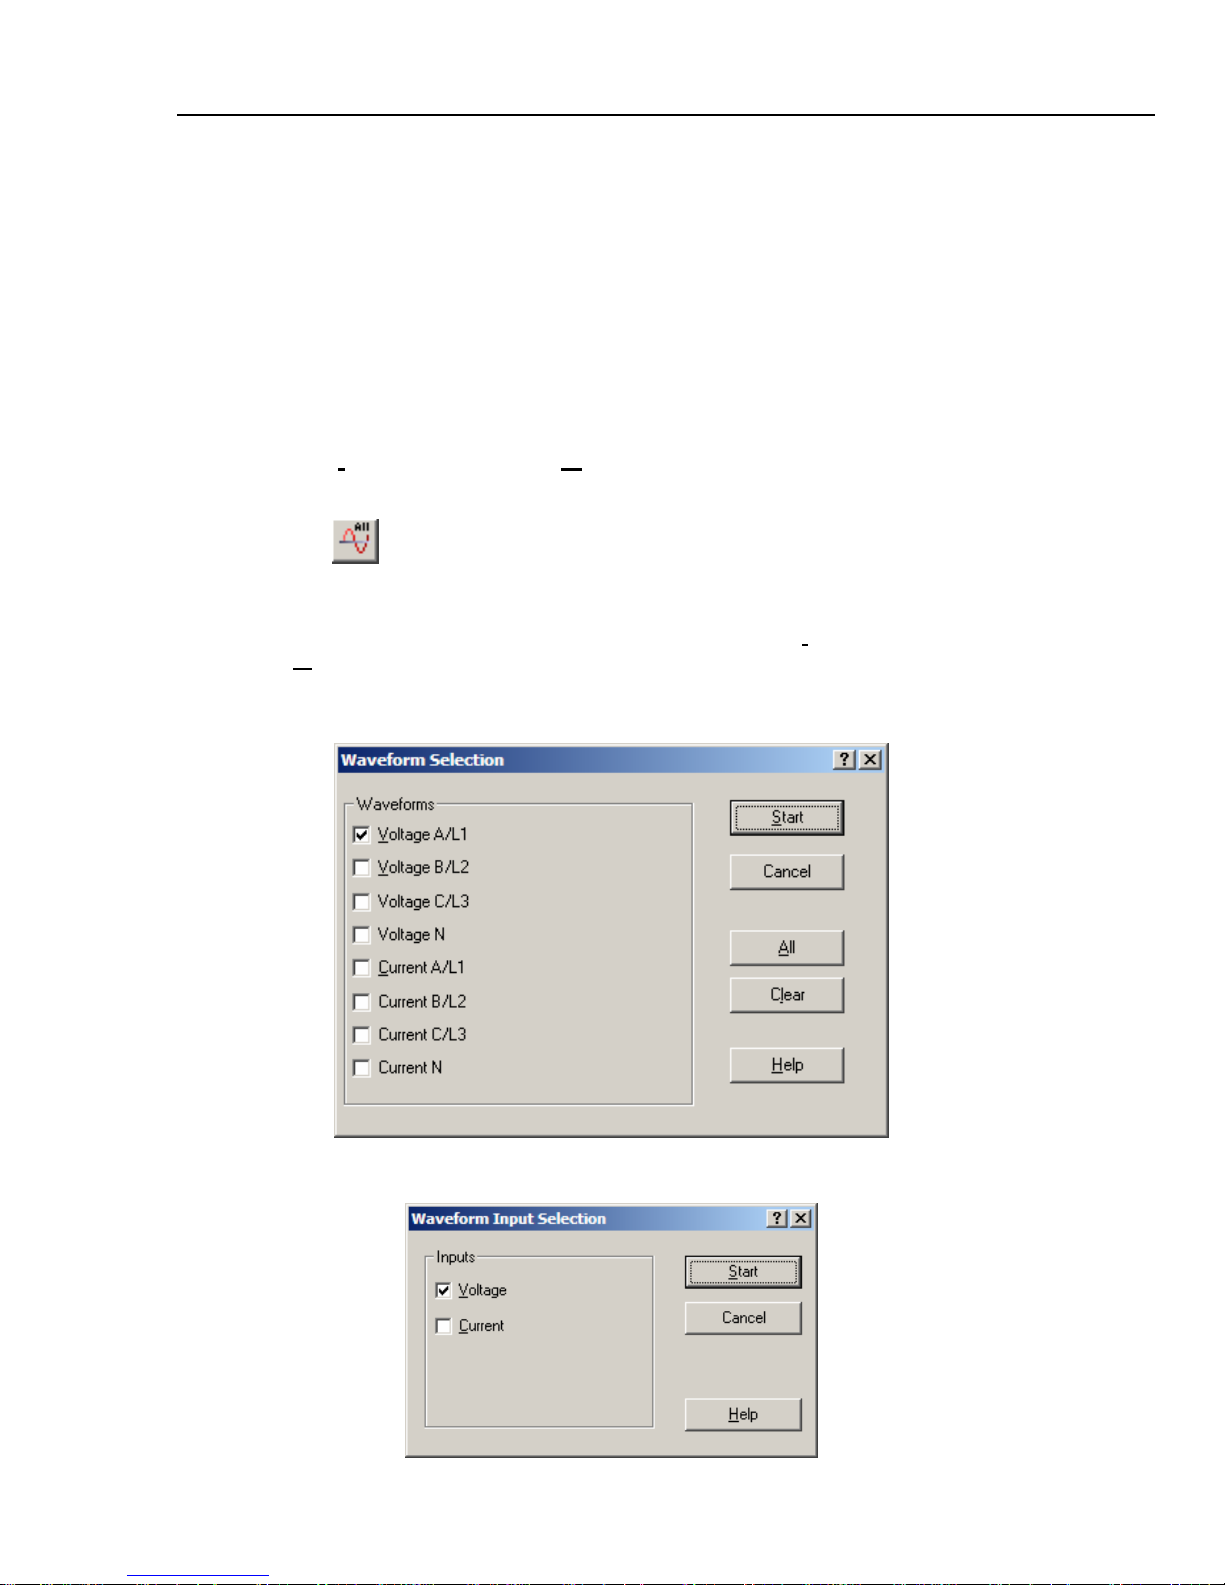
1. Select Instrument – Display Waveform.
A dialog box appears allowing you to select the waveforms you want to read.
VOLTS/AMPS/HERTZ (Fluke 43B) or SCOPE
Click
to retrieve all waveforms (no dialog box).
Tip
To specify conditions for transferring waveforms, choose I
ultiple Transfers
M
Fluke 43x Waveform Selection dialog box:
nstrument -
Fluke 43B Waveform Selection dialog box:
17
Page 22
SW43W
Users Manual
2. Choose for example Voltage (Fluke43B) or Voltage A/L1 (Fluke 43x).
3. Click Start to read and display the selected waveforms.
To change the window to your preference see Window Properties on page 15.
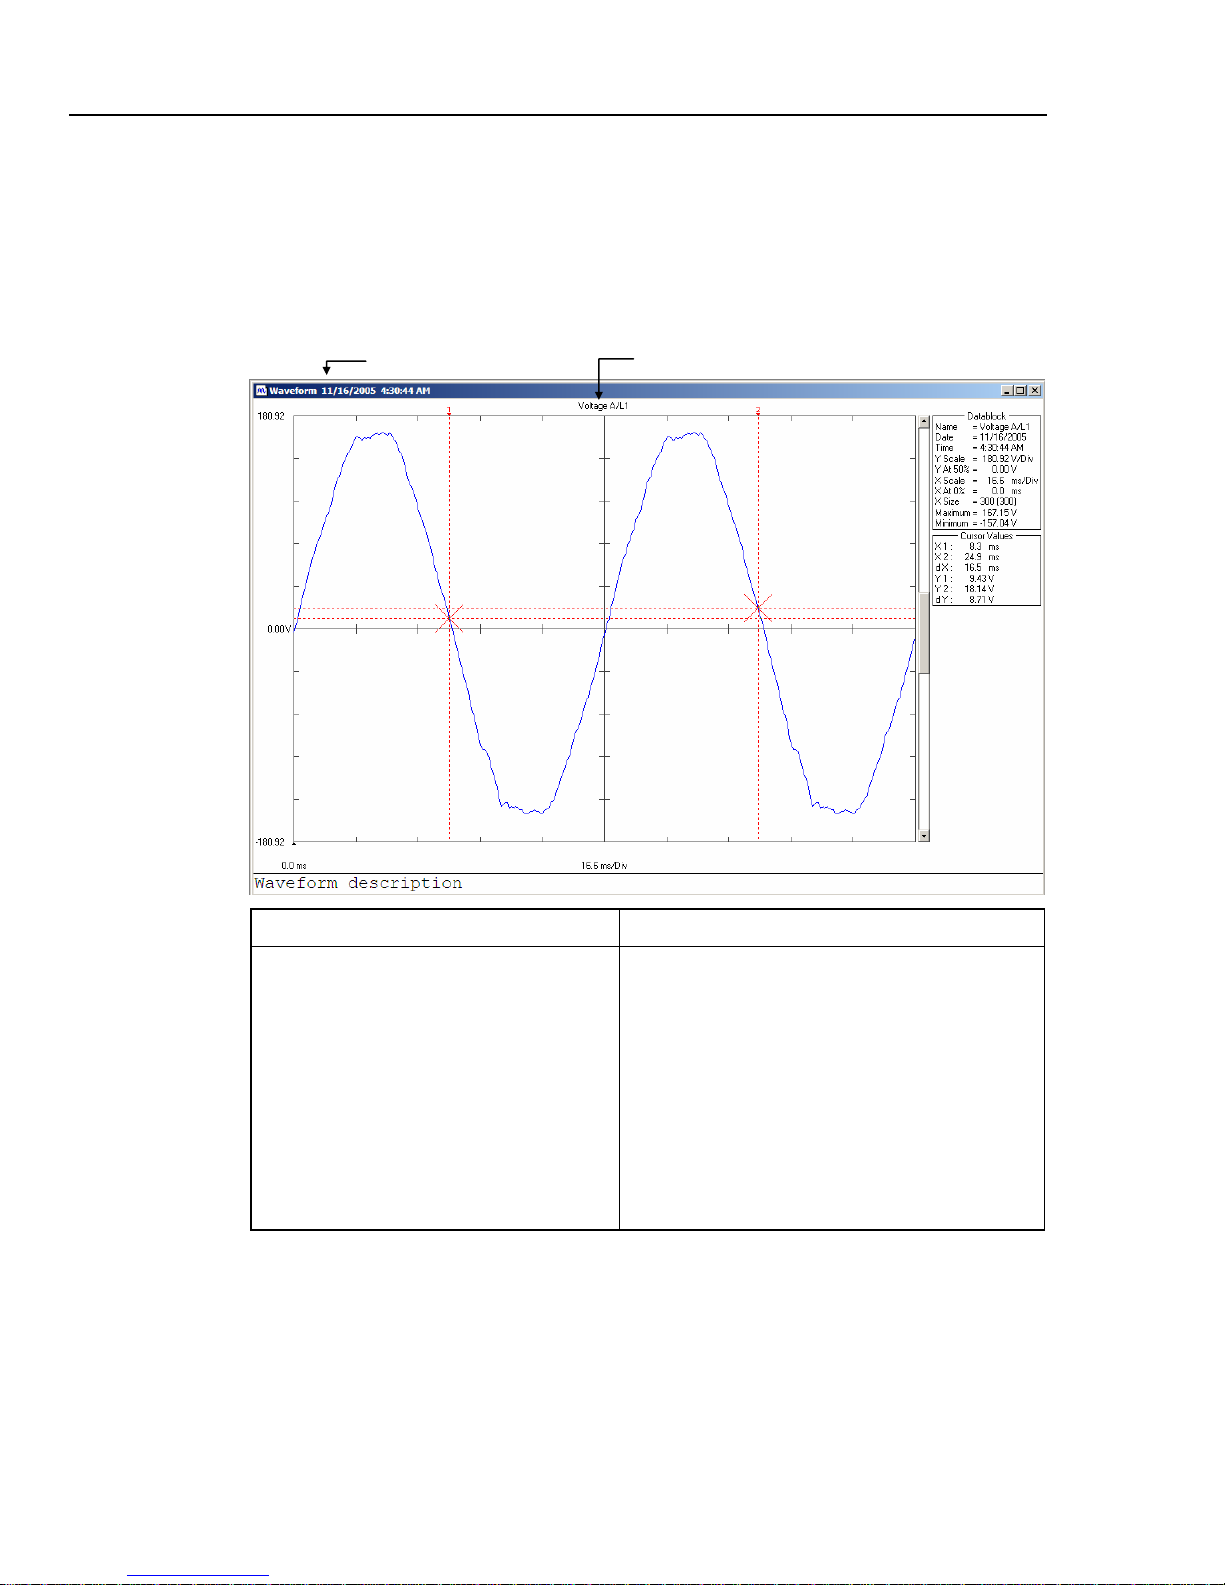
Fluke 43x waveform example:
Window Title
Waveform Title
Datablock Cursor Values
Name : Name of the waveform
Date : Start date of the waveform
Time : Start time of the waveform
Y Scale : Vertical scale
Y At 50 : Vertical position
X Scale : Horizontal scale
X At 0% : Horizontal position
X Size : Shown (Total) number of
waveform points
Maximum : Maximum value
Minimum : Minimum value
X1 : Time at cursor 1
X2 : Time at cursor 2
dX : X2 - X1
Y1 : Minimum and maximum value at cursor 1
Y2 : Minimum and maximum value at cursor 2
dY : Minimum and maximum Y2 - Y1
Notice that values apply to the active waveform.
Note
The Date and Time formats depend on the Windows® settings.
Tip
Right click in the window to see the View/Options menu, for example to
show or hide the datablock, cursors and description.
18
Page 23

Using FlukeView
Zooming In and Out on a Waveform
Drag with the mouse in the graph to select and zoom in on the part of the waveform you
want to enlarge.
Click to zoom in on a waveform.
Use the scroll bar to select the part you want to view.
Click to zoom out on a waveform (undoes one ‘zoom in’ step).
Select the Active Waveform
If multiple waveforms are displayed in one window, the active waveform can be changed
(scale, colors), moved or deleted.
To select the active waveform do one of the following:
Analyzing Waveforms and Trends 2
• select V
OR
• move the cursor on a waveform until you will see the
The
Click when you see the inactive waveform sign
the active one.
Scaling a Waveform
If a waveform is not completely shown in a window, a scroll bar is displayed. Use this
scroll bar to select the part you want to view.
Select O
• horizontal scaling (Time axis) of all waveforms
• vertical scaling (Y axis) of the active waveform
Change Waveform Colors and Titles
Select O
Select O
Moving waveforms
You can move a waveform up or down within a window. If multiple waveform windows
are displayed you can move a waveform from one window to another:
iew – Active Waveform, select the waveform to be made active
↕ sign indicates the active waveform.
ptions – Scales or right click in the active window, to change the following:
ptions – Colors or right click in the active window and select Colors…
ptions – Titles or right click in the active window and select Titles…
or the ↕ sign.
I
to make the belonging waveform
I,
• Select the active waveform, click and hold the mouse button and drag the waveform it
to another window.
Deleting waveforms
To delete the active waveform press the PC keyboard Delete key.
Copying Waveforms to Other Applications
You can export waveform data (sample values) or the waveform window (bitmap) to
other applications like Windows Excel or Word. Proceed as follows:
• Select E
copy the waveform data or the waveform window to the clipboard.
• Open another application, e.g. windows Excel or Word, and paste the data or graphics
into this application.
19
dit – Copy Data or Edit - Copy Graphics (or right click in the window) to
Page 24
SW43W
Users Manual
Analyzing Harmonics
Displaying Harmonics on the PC
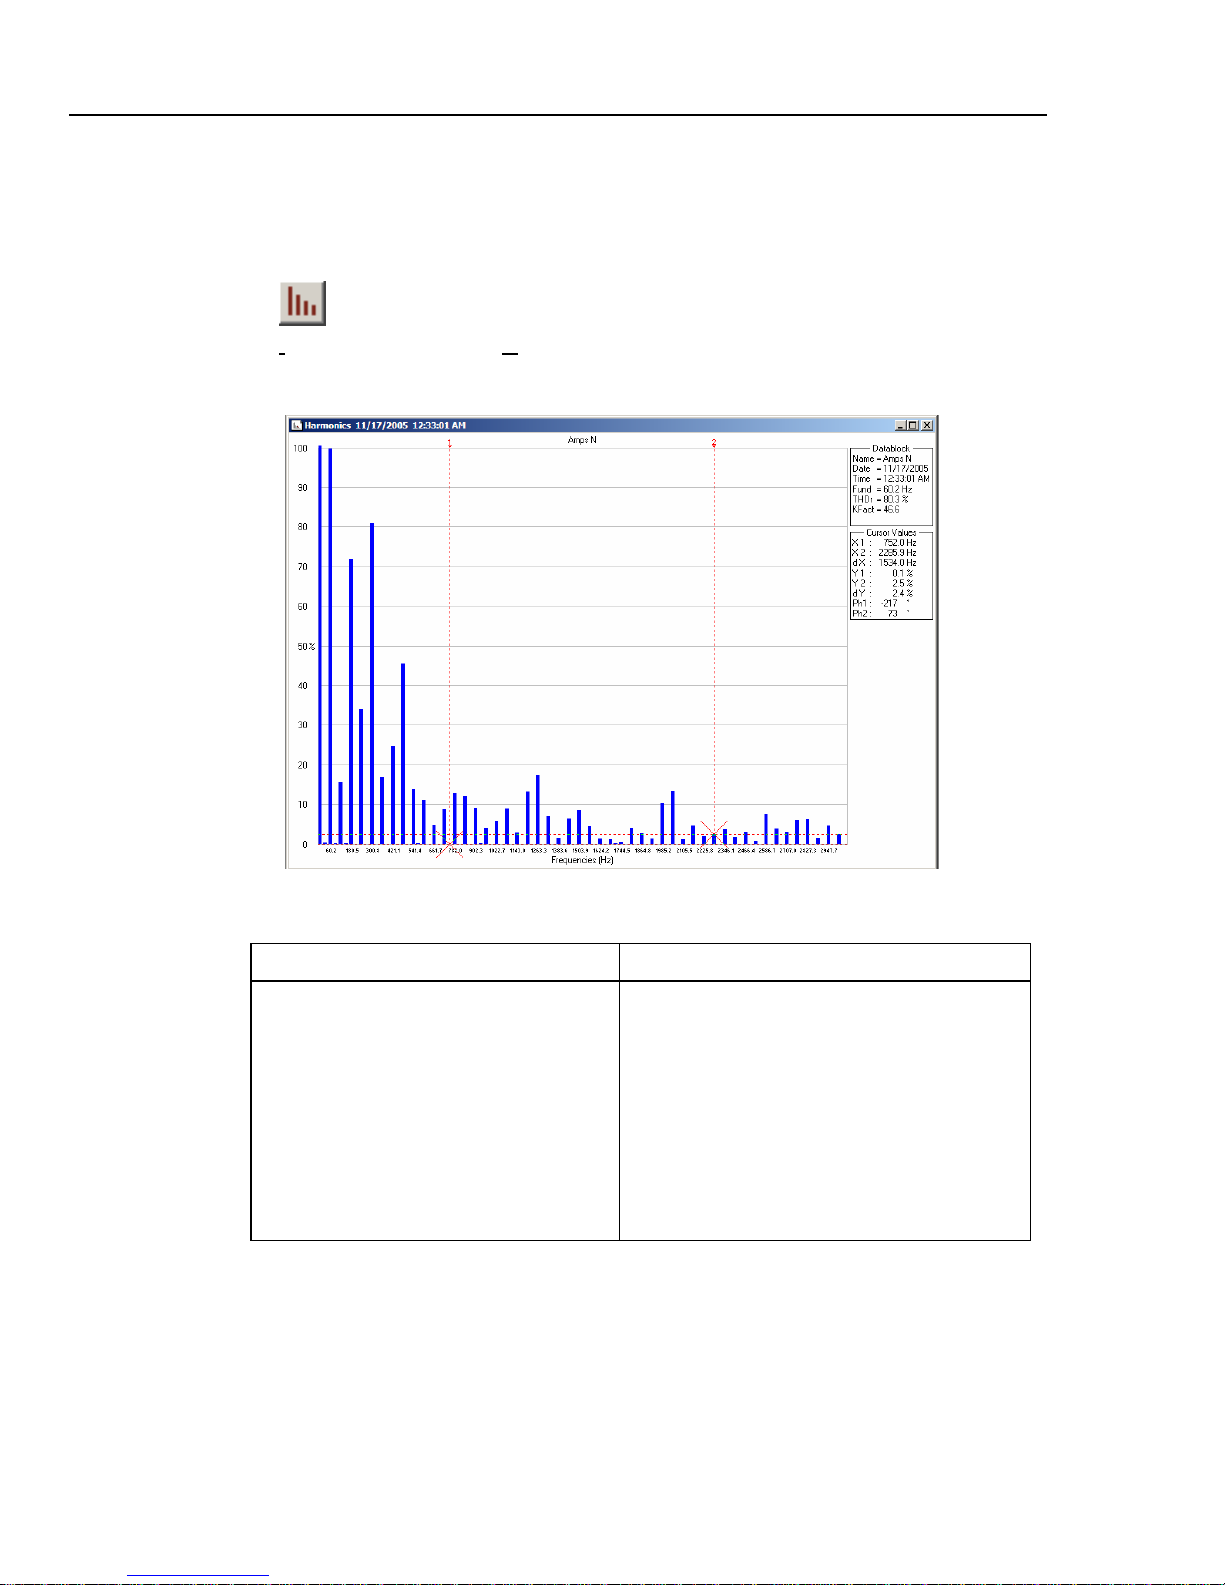
To demonstrate this start the
1. Click to display the harmonics from the Power Quality Analyzer (or select
nstrument – Display Harmonics). All harmonics will be retrieved.
I
Example of a harmonics window:
HARMONICS function on your Power Quality Analyzer.
Example for Harmonics – Amps:
Datablock Cursor Values
Name : Name of the harmonics
Date : Date of the harmonics
Time : Time of the harmonics
Fund : Fundamental frequency
RMS : Root Mean Square
THDr : Total Harmonic Distortion
compared to RMS
THDf : Total Harmonic Distortion
compared to fundamental
KFact : K-factor
X1 : Frequency (or Harmonic Number) at
cursor 1
X2 : Frequency (or Harmonic Number) at
cursor 2
dX : X2 - X1
Y1 : Spectrum value at cursor 1
Y2 : Spectrum value at cursor 2
dY : Y2 - Y1
Ph1 : Phase at cursor 1
Ph2 : Phase at cursor 2
Note
The Date and Time formats depend on the Windows® settings.
To change the window to your preference see Window Properties on page 15
Tip
Right click in the window to see the View/Options menu
20
Page 25

Using FlukeView
Scaling a Spectrum
Select O
ptions - Scales, to change the following in the active window:
Analyzing Harmonics 2
• horizontal scaling (frequency or harmonics number) of the spectrum
• vertical scaling (Y axis) of the spectrum
Copying Harmonics Data to Other Applications
You can export harmonics
other applications like Windows Excel or Word. Proceed as follows:
1. Select Edit – Copy Data or Edit - Copy Graphics to copy the harmonics data or
the harmonics window to the clipboard.
2. Open another application, e.g. Windows Excel or Word, and paste the data or graphics
into this application.
data (rms values) or the waveform window (bitmap) to
21
Page 26

SW43W
Users Manual
Using Datasets (not for Fluke 43B)
A dataset contains all data belonging to a measurement, including trend data and
instrument setup data.
For the Logger function the dataset contains only the setup data. Dedicated software
(Power-Log) is available for advanced analysis and reporting of logger data.
Retrieving, Saving, Sending Back a Dataset
Proceed as follows to retrieve, save, and send back a dataset:
1. Click to retrieve the dataset of the actual measurement
Select I
from the Power Quality Analyzer memory.
nstrument – Display Dataset to retrieve the actual dataset or a dataset
2. Select the required dataset and click on Start.
Retrieving one dataset can take up to 2 minutes at the highest baud rate.
When ready, the dataset window will be displayed:
3. Select File – Save As to save the dataset.
Use .fvf (FlukeView format) to save the dataset window and the dataset data.
A dataset that has been saved as a .fvf file can be opened again, can be viewed using
the viewer, and can be send back to the Analyzer.
4. Click to send the active dataset to the Power Quality Analyzer.
Select I
nstrument – Send Dataset to select the dataset to be send to the Analyzer.
Analyzing a Dataset
1. Retrieve a dataset or open a saved dataset.
2. In the Dataset window click View to open the dataset viewer.
The dataset viewer disconnects the instrument and connects to a virtual Power Quality
Analyzer that has been provided with the data retrieved from the instrument. The virtual
Analyzer shows a Fluke 43x screen.
The viewer allows you:
• to view the dataset as on the instrument, see step 3 below
• to display waveforms, trends, events, quality, and harmonics from the dataset, see
step 4 below.
22
Page 27

Using FlukeView
Using Datasets (not for Fluke 43B) 2
Notes:
Click on Close to close the
viewer and to re-connect the
instrument.
The Viewer has a high process
priority on your PC and may
slow down other applications.
3. To view the dataset follow the procedure described in the Fluke 43x Users Manual,
but use your PC keyboard to operate the viewer:
Fluke 43x keys PC keyboard
Softkeys F1…F5 F1…F5 or mouse click on Fluke 43x screen
Blue arrow keys Arrow keys
SETUP Click on Setup
4. To display waveforms, trends, events, quality, and harmonics you can use the
FlukeView I
a real Power Quality Analyzer, see the example below.
The viewer will hide a warning message when you try to perform an illegal
action. Move the viewer window to see the warning messages.
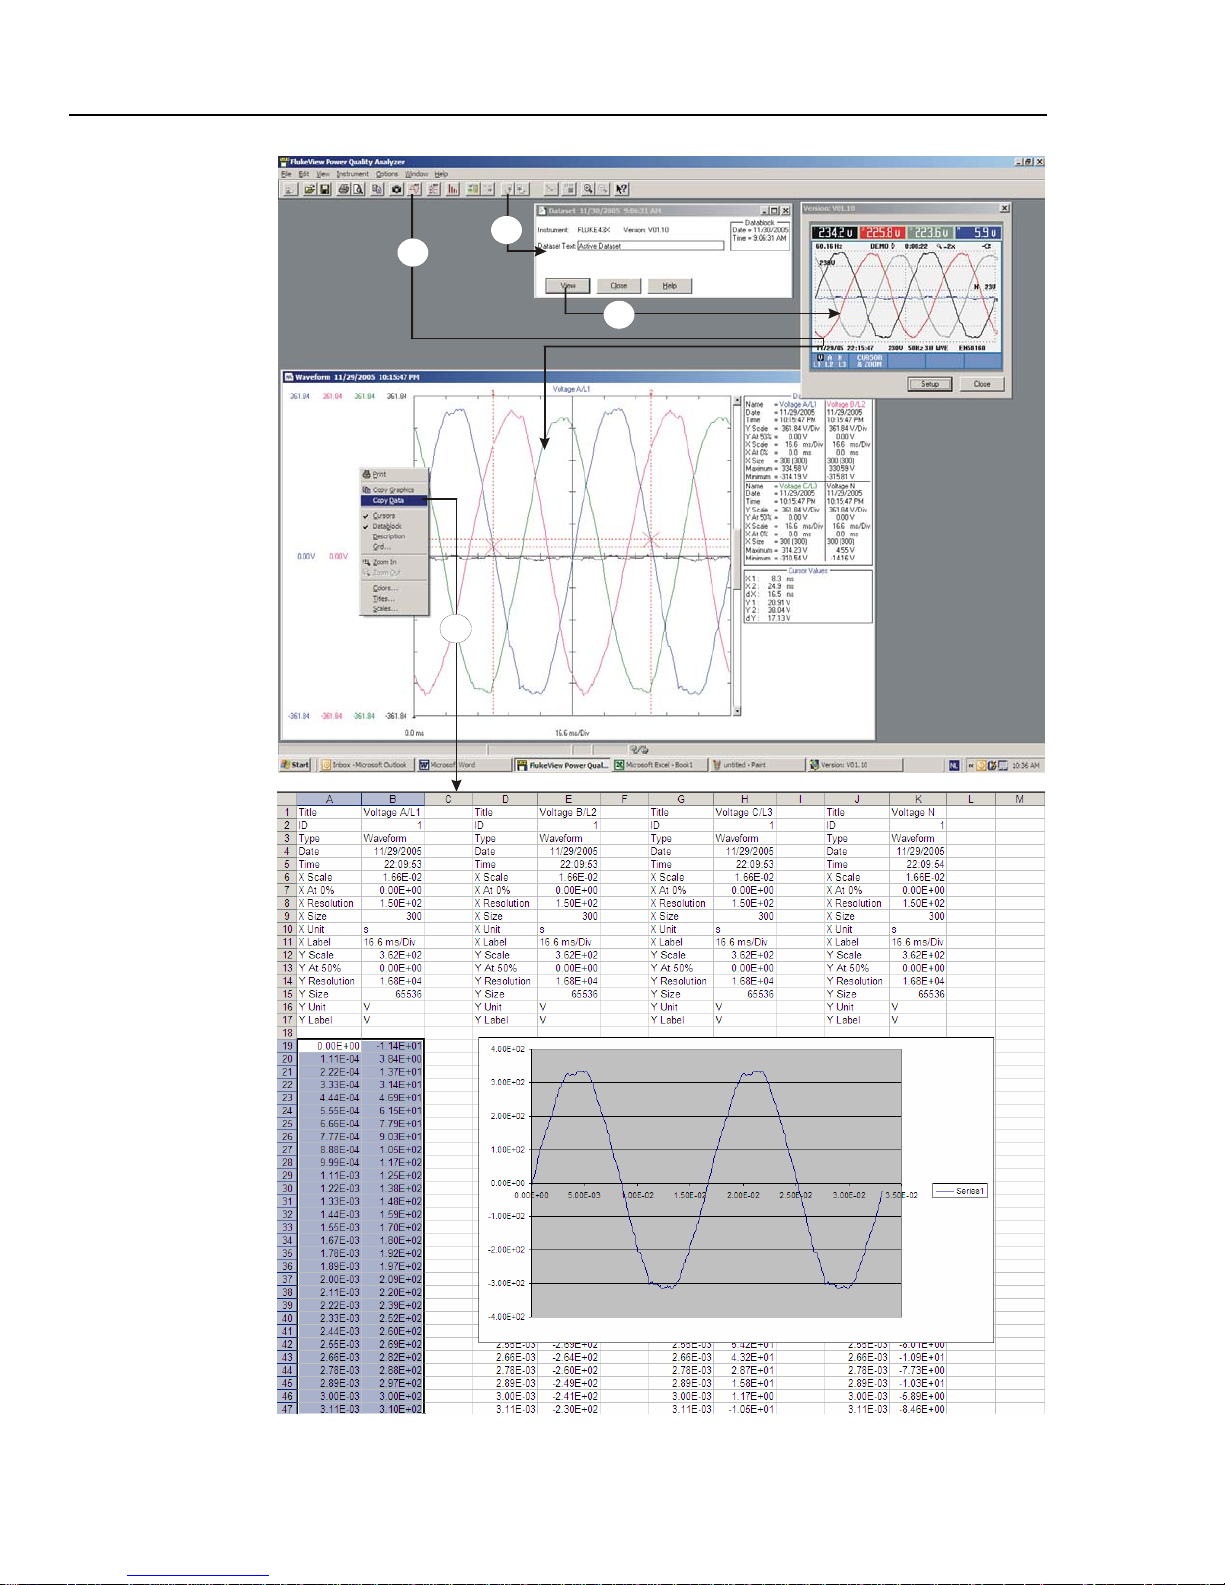
Example: Export a Waveform from a Dataset to Windows Excel
For this example the connected Power Quality Analyzer should be in the Scope mode
Volts, and the viewer must be closed. See also the picture on the next page.
nstrument - Display xxxxxxx commands. The viewer will behave like
Note:
1. Click to retrieve the dataset
2. Click View in the Dataset window to open the viewer.
3. Click to retrieve all waveforms from the viewer.
To analyze the waveforms see Analyzing Waveforms (page 17).
To save the windows see Saving Windows to a File (page 36).
4. Right Click in the Waveform window and click Copy Data to copy data to the
clipboard. Then paste the data into for example an Excel sheet. See also Copying Data
via the Clipboard (page 36).
23
Page 28
SW43W
Users Manual
1
3
2
4
In this example column A (time axis) and column B (Voltage A/L1) are graphed using
the Excel Chart Wizard.
24
Page 29

Using FlukeView
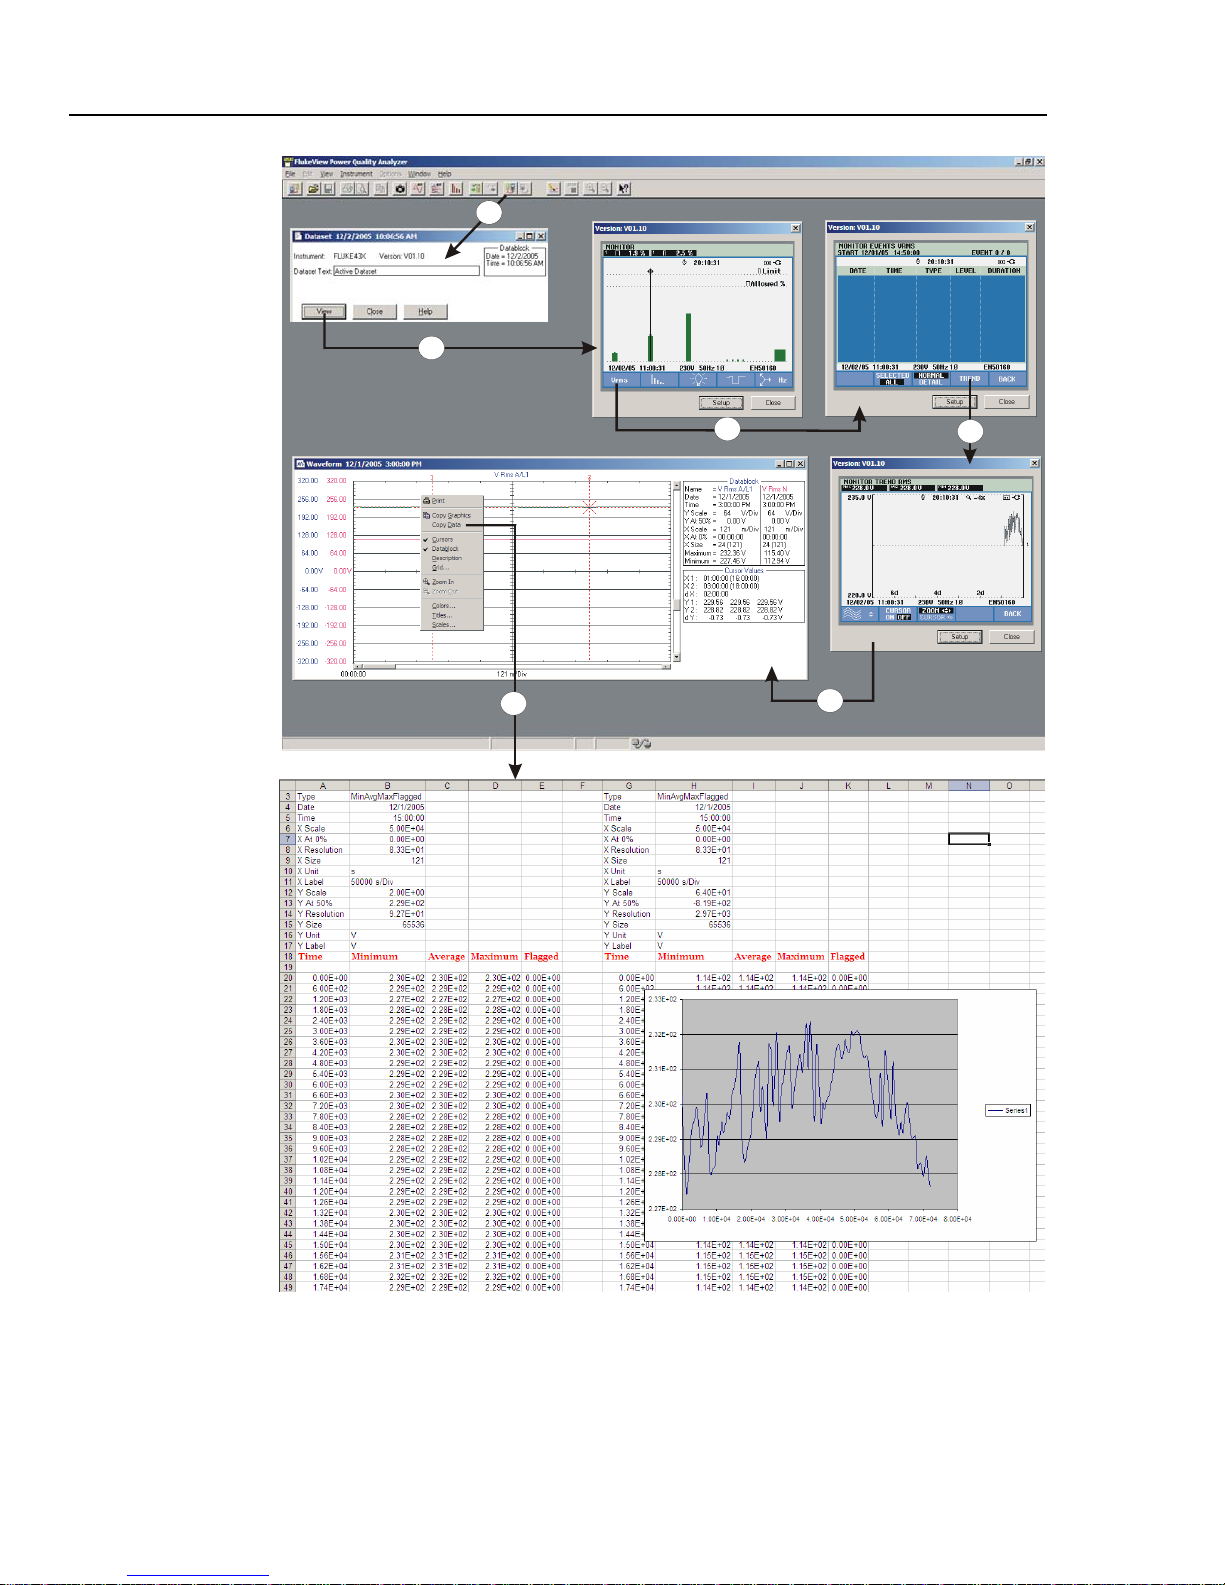
Example: Export a Vrms Trend from a Monitor Dataset to Windows Excel
For this example the connected Power Quality Analyzer should be in the Monitor mode,
and the viewer must be closed. See also the pictures on the next page.
Using Datasets (not for Fluke 43B) 2
1. Click to retrieve the actual dataset
2. Click View in the Dataset window to open the viewer.
3. Click the Vrms softkey F1 in the viewer to select the Vrms events
4. Click the TREND softtkey F4 in the viewer to see the trend
5. Click or select Instrument – Display Trend to retrieve trendplot(s) from the
viewer.
6. Select Edit – Copy Data, or right click in the Trend window and select Copy Data
to copy the trend data to the clipboard.
Open Excel and paste the clipboard data into the Excel sheet.
25
Page 30
SW43W
Users Manual
1
2
3
6
5
4
In this example column A (time axis) and column B (Min. Voltage trend 1) are graphed
using the Excel Chart Wizard.
26
Page 31
Using FlukeView
Limit Sets (not for Fluke 43B) 2
Limit Sets (not for Fluke 43B)
An instrument limit set contains all limits used for power quality monitoring.
Retrieving, Saving, Sending Back a Limit set
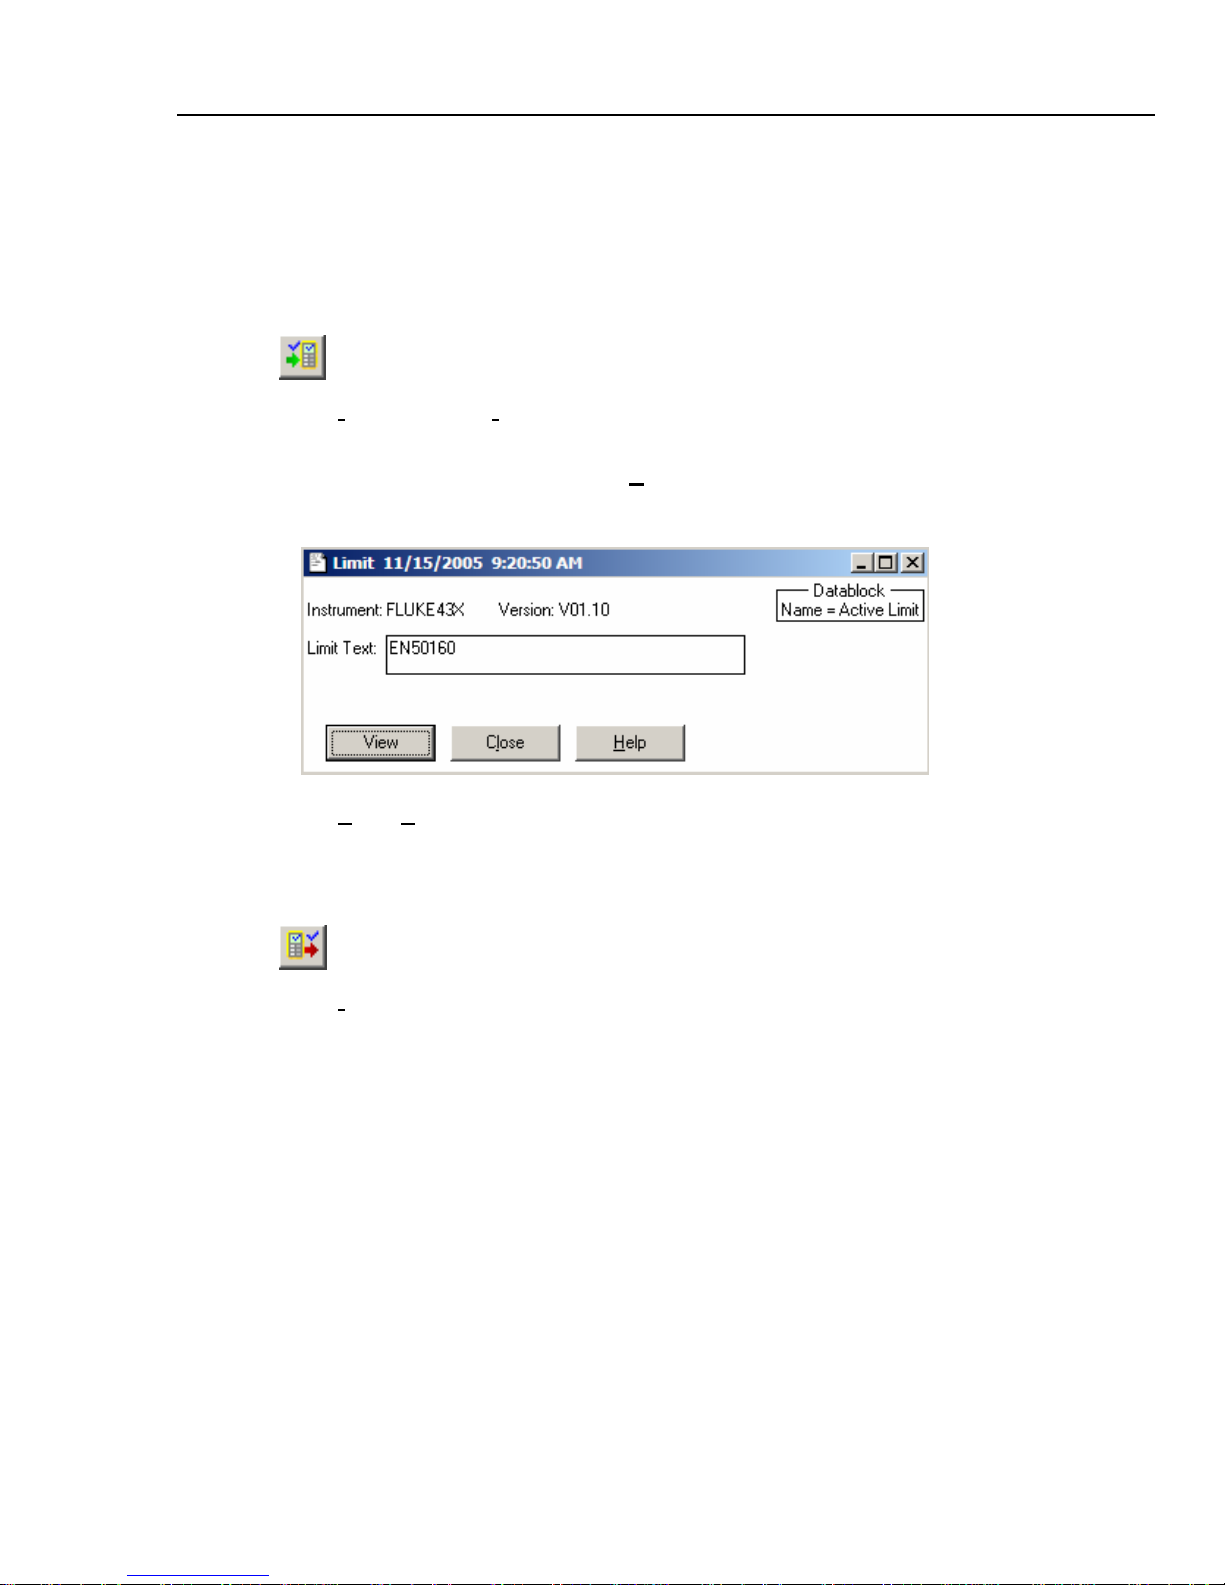
Proceed as follows to retrieve, save, and send back a limit set:
1. Click to retrieve the limit set of the actual measurement
Select I
set from the Power Quality Analyzer memory.
nstrument – Display Setup/Limits to retrieve the actual limit set or a limit
2. Select the required dataset and click on Start .
When ready, the limit window will be displayed:
3. Select File – Save as to save the limit set.
Use .fvf (FlukeView format) to save the limit set window and the limit set data.
A limit set that has been saved as a .fvf file can be opened again, can be viewed using
the viewer, and can be send back the Analyzer.
4. Click to send the active limit set to the Power Quality Analyzer.
Select I
Viewing and Editing a Limit set
nstrument – Send Setup/Limits to select the limit set to be send to the Analyzer.
1. Retrieve a limit set or open a saved limit set.
2. In the Limit window click View to open the limit viewer.
The limit viewer disconnects the instrument and connects to a virtual Power Quality
Analyzer that has been provided with the limits retrieved from the instrument. The virtual
Analyzer shows a Fluke 43x screen.
The viewer allows you:
• to view the limits as on the instrument.
• to edit the limits, save edited limit set and send it back to the analyzer.
Click on Close to close the viewer and to re-connect the instrument.
27
Note:
Page 32
SW43W
Users Manual
3. To view and edit the limits follow the procedure described in the Fluke 43x Users
Manual (Setting up the Analyzer), but use your PC keyboard to operate the viewer:
Fluke 43x keys PC keyboard
Softkeys F1…F5 F1…F5 or mouse click on Fluke 43x screen
Blue arrow keys Arrow keys
SETUP Click on Setup
4. Close the viewer after editing the limits, the Limit text in the limit window will be
provided with an *, e.g. EN50160 will become EN50160*.
5. Click to save the edited limit set.
6. Click to send the limit set to the Analyzer.
28
Page 33

Using FlukeView
Logging Readings 2
Logging Readings
Graphing Readings
You can transfer and graph readings taken by the Power Quality Analyzer over a period of
time. Up to four types of readings can be displayed in one window.
Note
Harmonics data from the Fluke 43B are not retrieved as readings, but are
retrieved as screens. To log the 43B harmonics see page 33
To demonstrate graphing readings, V
the Power Quality Analyzer and start the
rms and Arms readings will be logged. Press MENU on
VOLTS/AMPS/HERTZ function.
1. Click or select Instrument - Start Logging of Readings . A dialog box
appears allowing you to select the logging parameters.
2. Set Interval time to three seconds, and choose Continuous logging, Overwrite
existing window(s) and Multiple readings in one window.
3. Click Start. A dialog box appears allowing you to select the type of readings you
want to log (only if you selected I
4. Click Start to start logging. The status bar at the bottom of the screen shows the
logging progress.
5. Click to stop logging.
29
nstrument - Start Logging of Readings ) .
Countdown of the interval time
Number of readings so far
Page 34
SW43W
Users Manual
To change the window to your preference see Window Properties on page 15.
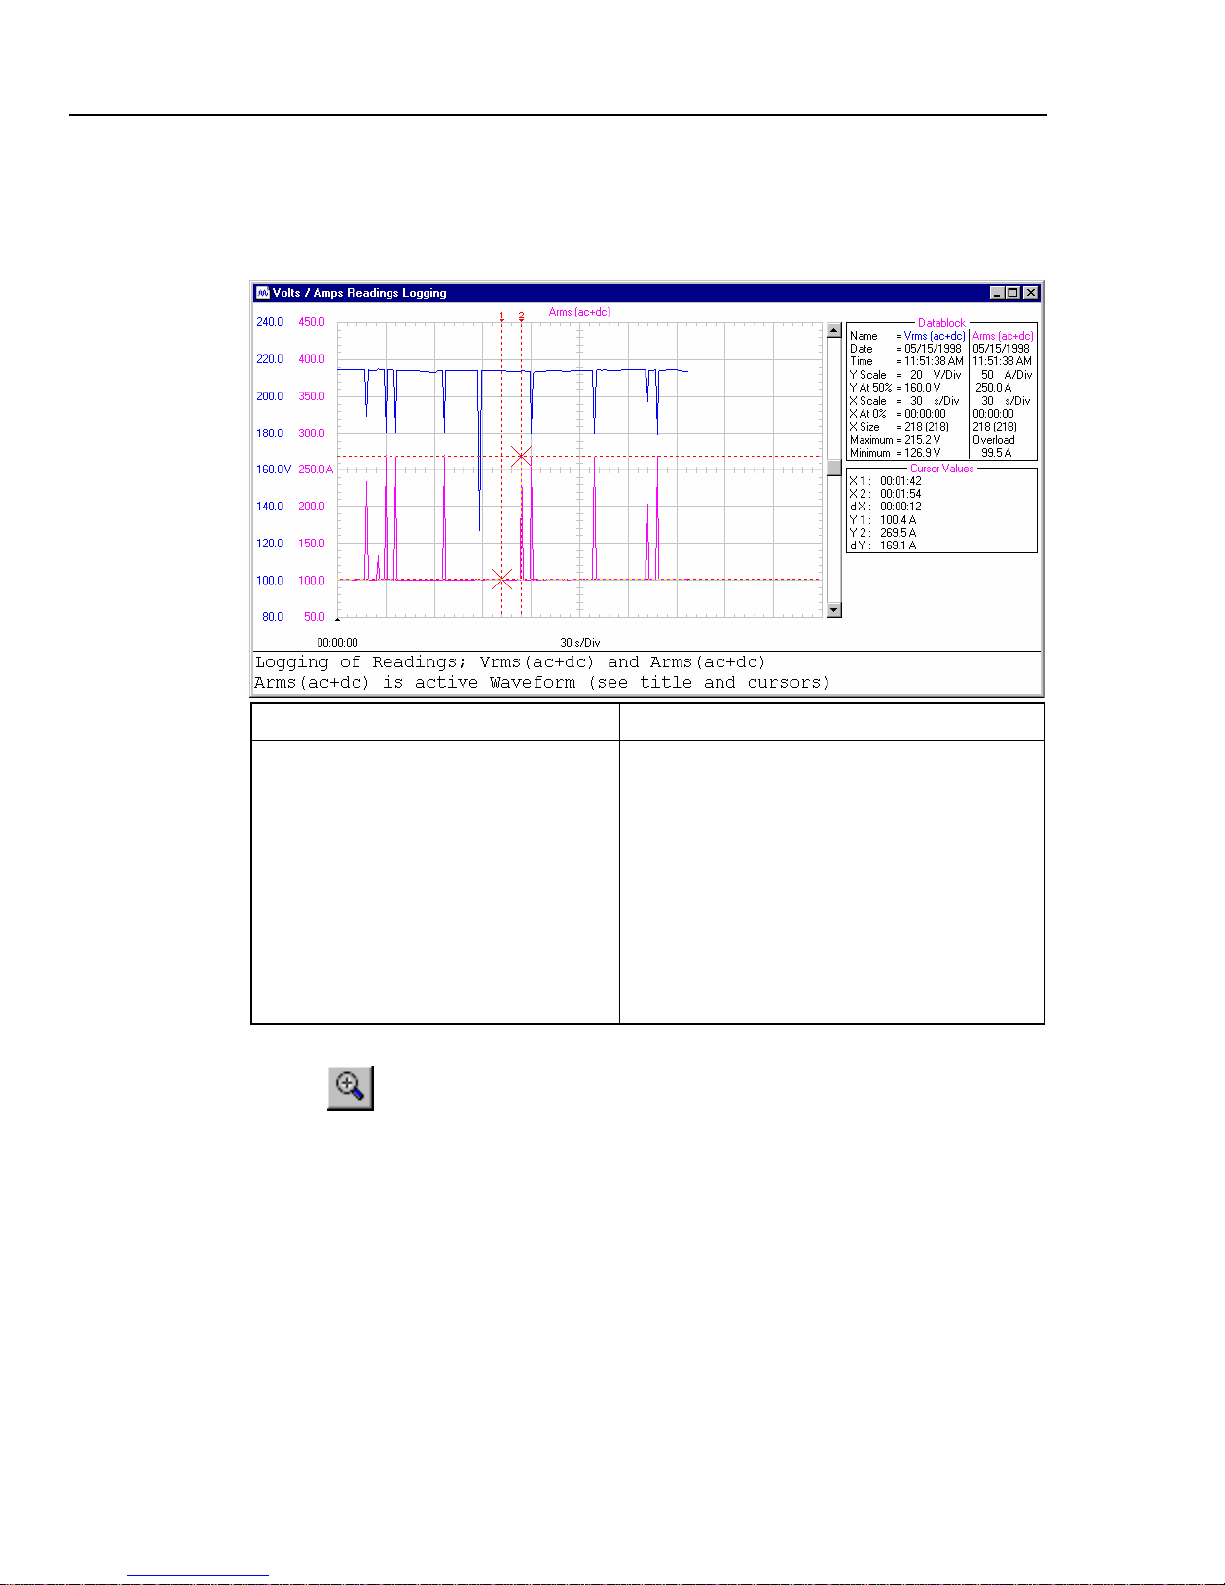
See below for an example of logged readings in a waveform window.
Datablock of Vrms and Arms Cursor Values
Name : Name of the waveform
Date : Date of the waveform
Time : Time of the waveform
Y Scale : Vertical scale
Y At 50% : Vertical position
X Scale : Horizontal scale
X At 0% : Horizontal position
X Size : Shown (Total) number of
waveform points
Maximum : Maximum value
Minimum : Minimum value
X1 : Time at cursor 1
X2 : Time at cursor 2
dX : X2 - X1
Y1 : Readings value at cursor 1
Y2 : Readings value at cursor 2
dY : Y2 - Y1
Notice that values apply to the active waveform.
Tips
•
• Use the mouse or (Shift)
Click to zoom in on a part of a waveform.
Å Æ
keys to move the cursors.
Note
The Date and Time formats depend on the Windows® settings.
30
Page 35

Using FlukeView
Inserting Logged Data into a Spreadsheet
Logging Readings 2
1. Click on the window you want to insert.
2. Select Edit - Copy Data to copy the reading's data to the clipboard.
3. Switch to a spreadsheet program.
4. Open or create a worksheet and place the cursor where you want to insert the data.
5. Insert the data into the worksheet. The numerical readings will be arranged in
columns.
Note
You can insert waveform and spectrum points into a spreadsheet in the
same way.
Example: Graphing Harmonics from the Fluke 43x
Proceed as follows to graph harmonics from
the Fluke 43x:
1. On the Fluke 43x select Harmonics, then select the TABLE screen (softkey F3).
2. Start logging of readings.
3. Select from the Logging of Readings window:
- continuous logging
- interval 0
- create new windows
- multiple readings in one window
4. Click on Start.
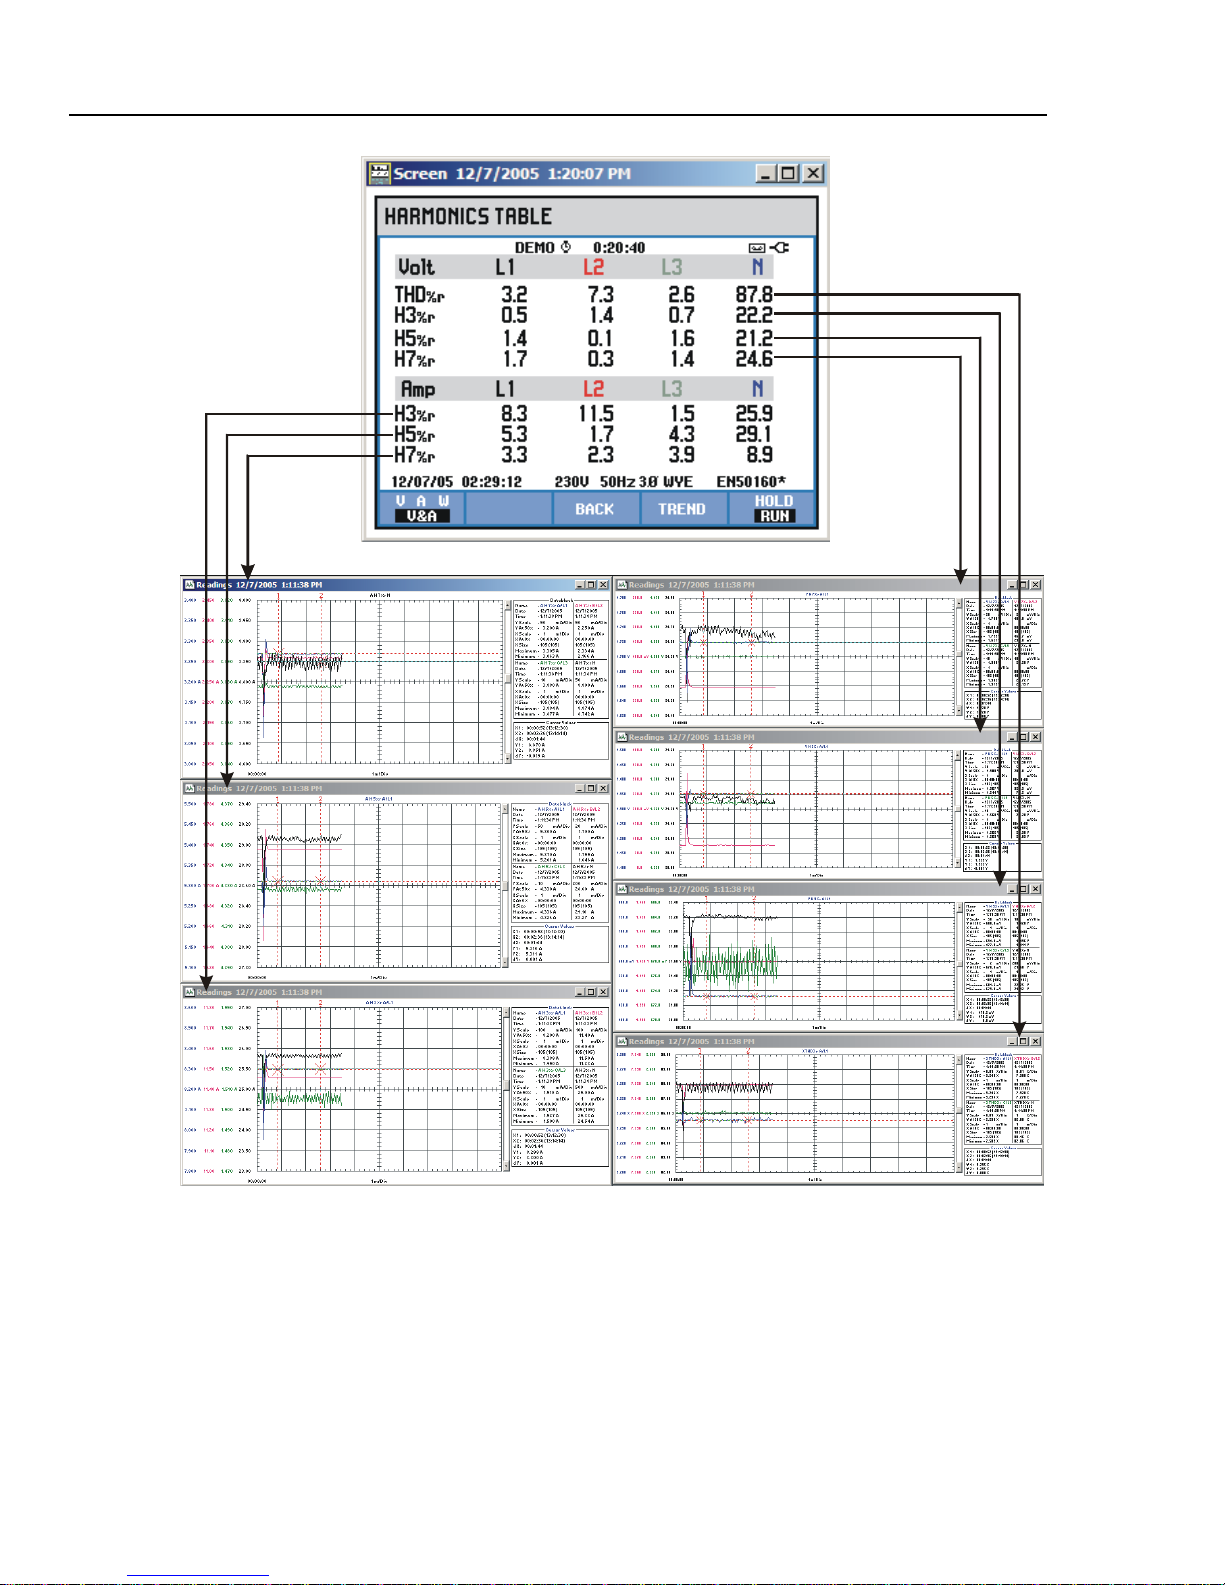
FlukeView will open seven new windows to graph the harmonics readings in. The
readings of each row in the HARMONICS TABLE screen will be graphed in one
window, see the picture on the next page.
31
Page 36
SW43W
Users Manual
32
Page 37
Using FlukeView
Logging Readings 2
Graphing Harmonics from the Fluke 43B
You can transfer and graph harmonics taken by the Fluke 43B over a period of time.
To demonstrate this, press
MENU on the Power Quality Analyzer and start the HARMONICS
function.
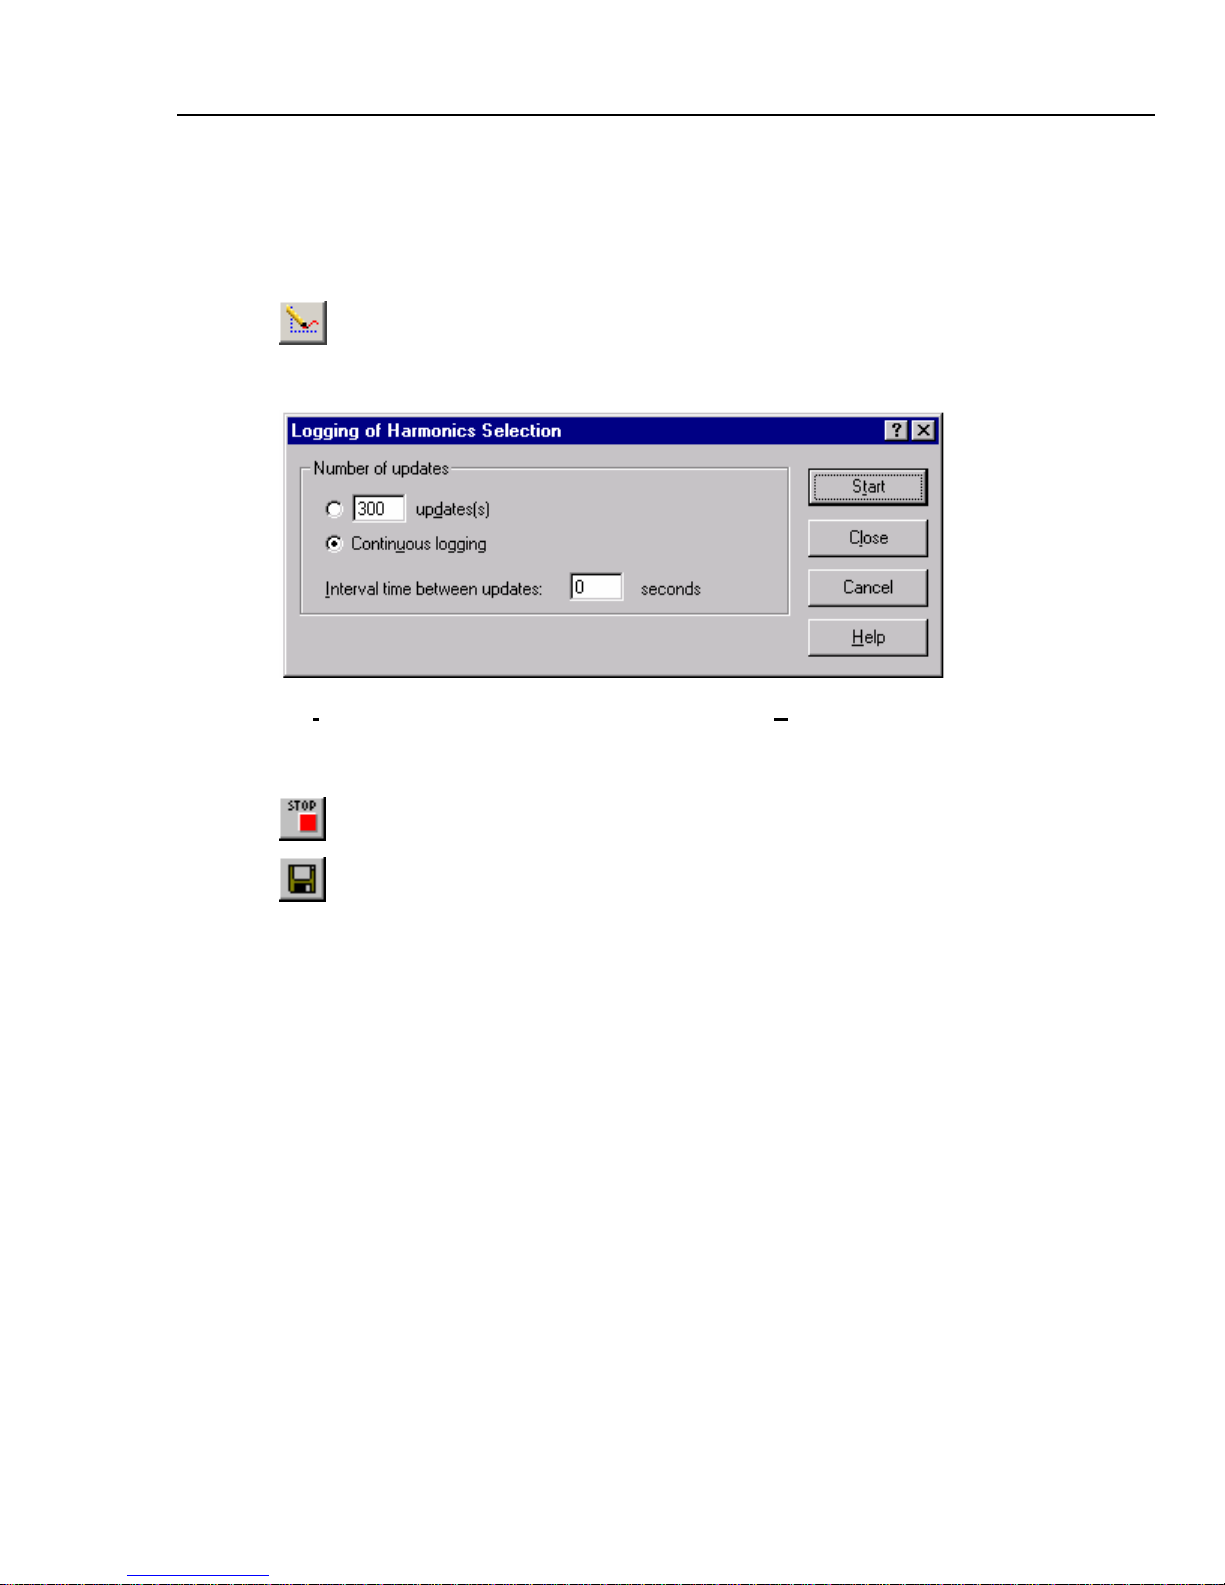
1. Click to start logging. A dialog box appears allowing you to select the logging
parameters.
2. Set Interval time to three seconds, and choose Continuous logging.
3. Click Start. All harmonics are logged, but only the actual harmonics are shown in a
harmonics window.
4. Click to stop logging.
5. Click to save all logged harmonics to a FVF, CSV, or TXT file.
To graph the harmonics use for example windows Excel, see Inserting Logged Data into a
Spreadsheet on page 31.
33
Page 38

SW43W
Users Manual
Transferring Fluke 43B Instrument Setups
1. Click to read the active setup.
2. Select Options - Add Description and type a description in the text box below the
window (max. 10 lines).
3. Select Options - Titles to change the title of the window.
4. Select View - Datablock to show the datablock.
5. Select Options - Colors to change window colors.
Each setup appears in a separate setup window.
If available from the Power Quality Analyzer, the Setup Text box shows setup
information.
6. Click to send the setup from the selected setup window to the Power Quality
Analyzer.
34
Page 39
Using FlukeView
Printing Windows 2
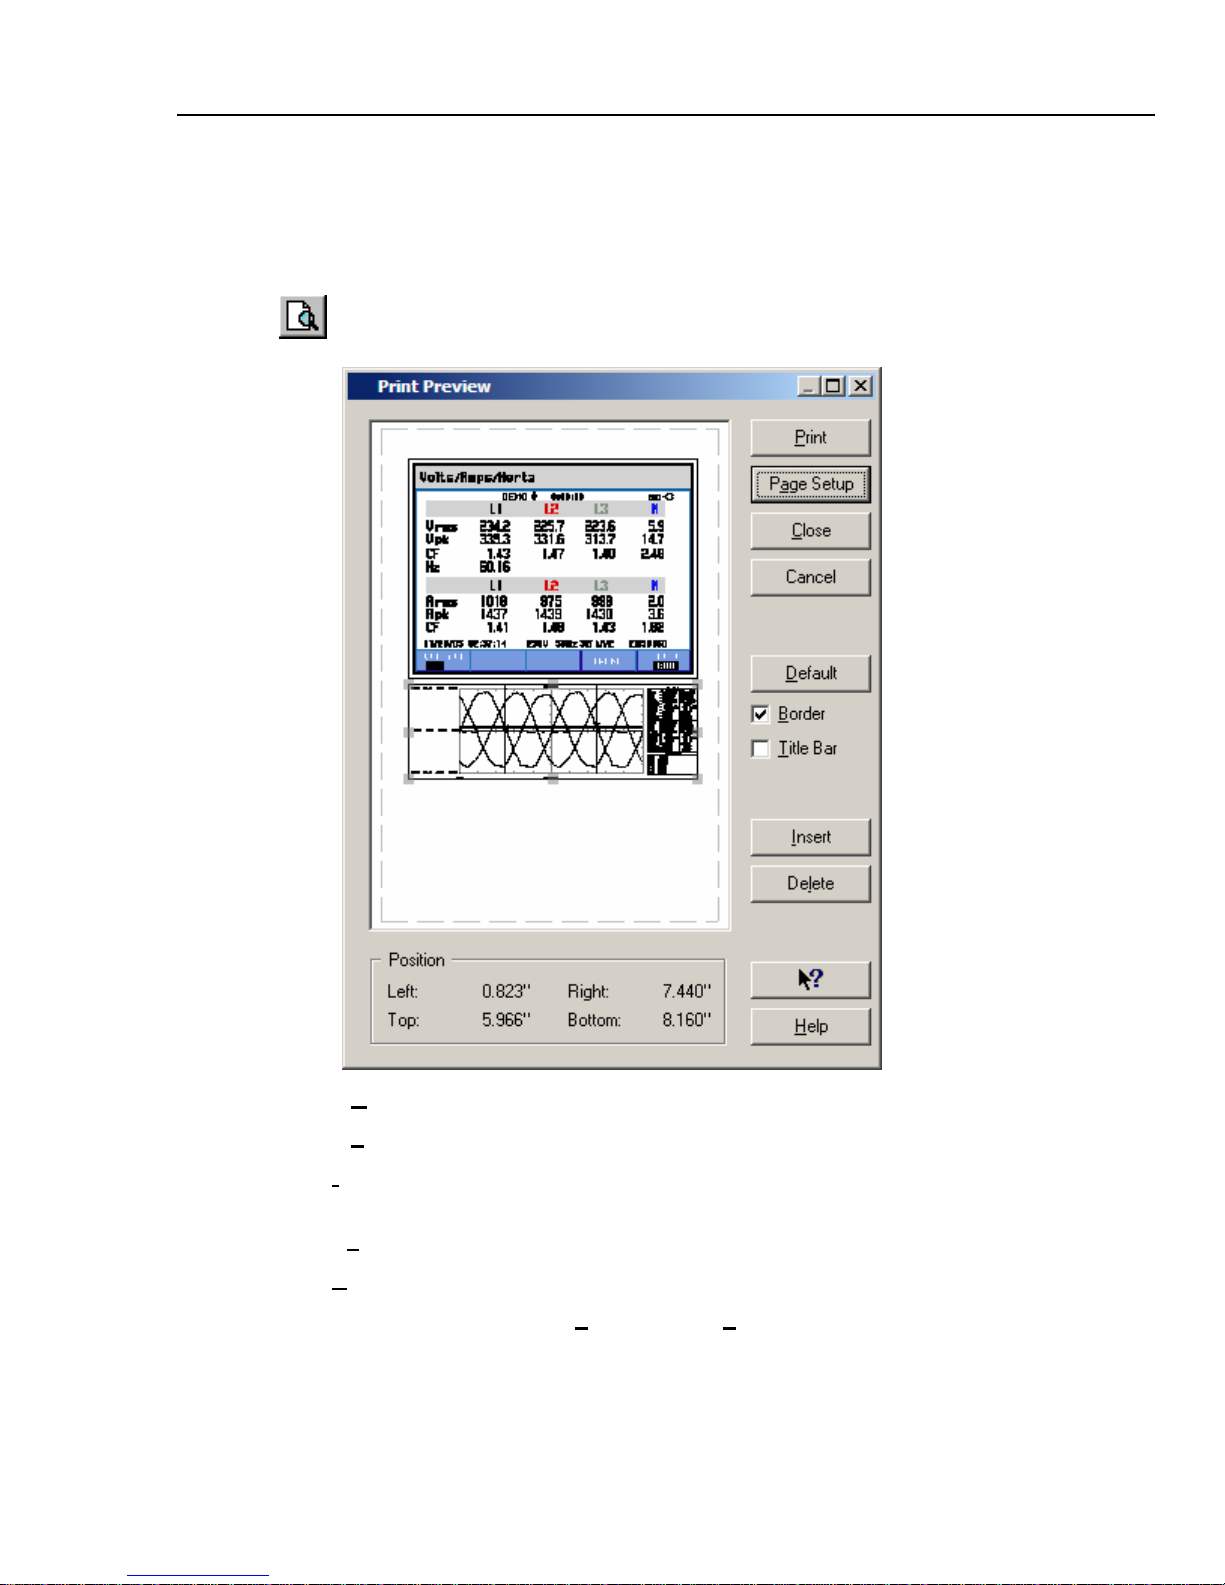
Printing Windows
The Print Preview function enables you to preview any combination of screen, waveform,
readings, harmonics, and setup windows on a page before printing.
1. Click on the window you want to print.
2. Click to preview the window on the page.
3. Choose Border to add a border around the active window.
4. Choose Title Bar to add the title of the active window.
5. Click Insert to add more windows on a page. A dialog box appears allowing you to
select another window.
6. Click Page Setup to change the page setup
7. Click Print to start printing the window(s).
8. To change printer settings, select File - Print Setup.
35
Page 40

SW43W
Users Manual
Saving Windows to a File
You can save any combination of screen, waveform, readings, harmonic, and setup
windows to an FVF file.
1. Click on the window you want to save.
2. Click. If there are more windows, a dialog box appears.
3. Select the windows of your choice or click All to select all windows.
4. Click Save. Another dialog box appears.
5. Enter a name for the file in the File name box (FVF is default file type).
6. Click OK to start saving the windows you selected to the file.
For more information on saving to a file, select Help - Index and look for File
Formats.
Copying Data via the Clipboard
You can export data belonging to the selected window, for example a waveform window,
to other applications like Windows Excel or Word via the clipboard.
Proceed as follows:
1. Select Edit – Copy Data or Edit - Copy Graphics
You can also right click the mouse in the window and select Copy D
raphics
G
Copy D
copy the picture (bitmap).
ata will copy the measured values (numerical data), Copy Graphics will
ata or Copy
2. Open the application where you want to use the data and paste the clipboard contents
into it.
36
 Loading...