

Page 1

COMPASS® for molbox™
Flow Calibration Software
User’s Manual
© 1998-2003 DH Instruments, Inc.
Page 2

COMPASS for molbox™ User’s Manual
© 1998 - 2003 DH Instruments, Inc. All rights reserved.
Information in this document is subject to change without notice. No part of this document may be reproduced or transmitted in any
form or by any means, electronic or mechanical, for any purpose, without the express written permission of DH Instruments, Inc.
4765 East Beautiful Lane, Phoenix AZ 85044-5318 USA.
DH Instruments makes sincere efforts to the ensure accuracy and quality of its’ published materials; however, no warranty,
expressed or implied, is provided. DH Instruments disclaims any responsibility or liability for any direct or indirect damages
resulting from the use of the information in this manual or products described in it. Mention of any product does not constitute an
endorsement by DH Instruments of that product. This manual was originall y composed in English and subsequently translated into
other languages. The fidelity of the translations cannot be guaranteed. In case of conflict between the English version and other
language versions, the English version takes precedence.
DH Instruments, DH, DHI, molbox, molbloc and COMPASS are trademarks, registered and otherwise, of DH Instruments, Inc.
Windows is a registered trademark of Microsoft Corporation.
030918
550087h
Printed in the USA.
© 1998-2003 DH Instruments, Inc.
Page 3

COMPASS for molbox™ User’s Manual
T
AABBLLEE OOFF
T
C
OONNTTEENNTTS
C
S
TABLE OF CONTENTS................................................................................I
TABLES................................................................................................... VI
FIGURES ............................................................................................... VIII
USER REGISTRATION ..............................................................................XI
ABOUT THIS MANUAL ............................................................................. XII
1. INTRODUCTION.................................................................................................................1
1.1 PRODUCT OVERVIEW.........................................................................................................................1
2. GETTING STARTED...........................................................................................................3
2.1 OVERVIEW............................................................................................................................................3
2.2 SYSTEM REQUIREMENTS...................................................................................................................3
2.3 INSTALLING COMPASS FOR molbox................................................................................................3
2.3.2 UPGRADING FROM VERSIONS LOWER THAN 4.00.............................................................................3
2.3.3 [TOOLS], [FILE UPGRADE WIZARD]......................................................................................................5
2.4 RUNNING THE PROGRAM ..................................................................................................................5
2.5 UNINSTALLING....................................................................................................................................5
2.3.1.1.1.1 OR..........................................................................................................................................3
3. OPERATING PRINCIPLES.................................................................................................7
3.1 OVERVIEW............................................................................................................................................7
3.1.1 BASICS SUMMARY..................................................................................................................................7
4. QUICK TIPS........................................................................................................................9
4.1 HOW DO I?............................................................................................................................................9
5. A P P L I CA T I O N E X A M PL E S ..........................................................................................13
5.1 OVERVIEW..........................................................................................................................................13
Page i © 1998-2003 DH Instruments, Inc.
5.1.1 EXAMPLE #1...........................................................................................................................................13
5.1.1.1 SET UP AN RS-232 DUT ........................................................................................................14
5.1.1.2 SET UP A molbox AS THE REFERENCE...............................................................................15
5.1.1.3 RUN THE TEST.......................................................................................................................16
5.1.2 EXAMPLE #2...........................................................................................................................................18
5.1.2.1 SETUP <VOLTAGE/CURRENT> OUTPUT TYPE..................................................................18
5.1.2.2 REFERENCE SETUP..............................................................................................................18
5.1.2.3 RUN THE TEST.......................................................................................................................18
5.1.3 EXAMPLE #3...........................................................................................................................................19
5.1.3.1 DUT DEFINITION SETUP.......................................................................................................19
5.1.3.2 DMM CONFIGURATION SETUP............................................................................................19
5.1.3.3 RUN THE TEST.......................................................................................................................20
5.1.4 EXAMPLE #4...........................................................................................................................................20
5.1.4.1 DUT DEFINITION SETUP.......................................................................................................20
5.1.4.2 TEST DEFINITION SETUP .....................................................................................................21
5.1.4.3 TEST HARDWARE SETUP.....................................................................................................21
5.1.4.4 RUN THE TEST.......................................................................................................................22
5.1.5 EXAMPLE #5...........................................................................................................................................22
5.1.5.1 DUT DEFINITION SETUP.......................................................................................................22
5.1.5.2 TEST DEFINITION SETUP .....................................................................................................23
5.1.5.3 TEST HARDWARE SETUP.....................................................................................................23
5.1.5.4 RUN THE TEST.......................................................................................................................24
5.1.6 EXAMPLE #6...........................................................................................................................................24
5.1.6.1 DUT DEFINITION SETUP.......................................................................................................24
5.1.6.2 TEST DEFINITION SETUP .....................................................................................................24
5.1.6.3 RUN THE TEST.......................................................................................................................25
5.1.6.4 PLOT THE DATA.....................................................................................................................25
5.1.7 EXAMPLE #7...........................................................................................................................................25
5.1.7.1 DUT DEFINITION SETUP.......................................................................................................25
Page 4

COMPASS for molbox™ User’s Manual
5.1.7.2 TEST DEFINITION SETUP .....................................................................................................25
5.1.8 EXAMPLE #8...........................................................................................................................................26
5.1.7.3 RUN THE TEST.......................................................................................................................26
5.1.8.1 DUT DEFINITION SETUP.......................................................................................................26
5.1.8.2 TEST DEFINITION SETUP .....................................................................................................27
5.1.8.3 TEST HARDWARE SETUP.....................................................................................................27
5.1.8.4 SET UP DATA GRID ...............................................................................................................27
5.1.8.5 RUN THE TEST.......................................................................................................................28
6. MAIN SCREEN .................................................................................................................29
6.1 OVERVIEW..........................................................................................................................................29
6.2 MAIN MENU BAR................................................................................................................................29
6.3 STATUS BAR......................................................................................................................................29
6.4 RUN MODES.......................................................................................................................................30
6.5 RUN TOOLBAR...................................................................................................................................31
6.6 CONTROL TOOLBAR.........................................................................................................................33
6.7 RUN SCREENS...................................................................................................................................42
6.5.1 RUN TOOLS............................................................................................................................................31
6.5.2 DISPLAY TOOLS ....................................................................................................................................32
6.6.1 CHANGE/RELOAD molbloc...................................................................................................................34
6.6.2 TARE molbox..........................................................................................................................................34
6.6.3 PURGE FUNCTION.................................................................................................................................35
6.6.4 LEAK TEST .............................................................................................................................................35
6.6.5 MODIFY molbox VALVE DRIVERS .......................................................................................................36
6.6.6 FLOW CONDITIONS...............................................................................................................................36
6.6.7 UNITS SELECTION.................................................................................................................................37
6.6.8 FLOW CONTROL....................................................................................................................................38
6.6.9 ENTER FLOW DATA ..............................................................................................................................39
6.6.10 DATA ACQUISITION TOOLS.................................................................................................................39
6.7.1 DUT/REFERENCE COMPARISON RUN SCREEN................................................................................42
6.7.2 molbox OUTPUT RUN SCREEN............................................................................................................43
6.7.3 DUT OUTPUT RUN SCREEN .................................................................................................................45
6.7.4 AVERAGE DATA RUN SCREEN............................................................................................................46
6.7.5 DATA GRID RUN SCREEN ....................................................................................................................47
6.7.6 DATA PLOT RUN SCREEN....................................................................................................................48
6.7.7 SPY WINDOWS.......................................................................................................................................48
7. [RUN] MODES..................................................................................................................51
7.1 OVERVIEW..........................................................................................................................................51
7.2 [RUN], [RUN TEST].............................................................................................................................51
7.2.1 TEST INITIALIZATION............................................................................................................................51
7.2.2 RUN TEST ...............................................................................................................................................57
7.2.3 TEST CONCLUSION...............................................................................................................................59
7.2.1.1 INITIALIZE molbloc/molbox.....................................................................................................52
7.2.1.2 SELECT STARTING molbloc CHANNEL................................................................................52
7.2.1.3 SELECT DUT ..........................................................................................................................53
7.2.1.4 SELECT TEST.........................................................................................................................54
7.2.1.5 SETUP DUT ID/INTERFACE ..................................................................................................55
7.2.1.6 USER ID ..................................................................................................................................57
7.2.2.1 MANUAL ENTRY DATA ACQUISITION..................................................................................59
7.3 [RUN molbox].....................................................................................................................................60
7.3.1.1.1.1 FIGURE 36. <RUN MODE DATA SELECTOR> FORM.....................................................61
7.4 [RUN DUT] ..........................................................................................................................................61
8. [SETUP], [DUT] ................................................................................................................63
8.1 OVERVIEW..........................................................................................................................................63
8.2 CREATING DUT DEFINITIONS..........................................................................................................64
8.3 EDITING DUT DEFINITIONS...............................................................................................................64
8.4 DUT DEFINITION SELECTOR............................................................................................................64
8.5 DUT DEFINITION EDITOR..................................................................................................................65
8.5.1 TOOLBAR................................................................................................................................................66
8.5.2 [HEADER] TAB .......................................................................................................................................67
8.5.3 [CORRECTION] TAB ..............................................................................................................................69
8.5.4 [RANGE] TAB..........................................................................................................................................71
8.5.5 [TOLERANCE] TAB................................................................................................................................73
8.5.6 [TEST] TAB .............................................................................................................................................74
© 1998-2003 DH Instruments, Inc. Page ii
Page 5

COMPASS for molbox™ User’s Manual
8.5.7 [CONDITIONS] TAB................................................................................................................................75
8.5.8 [READ] TAB ............................................................................................................................................76
8.5.9 [SET] TAB................................................................................................................................................78
9. [SETUP], [TEST]...............................................................................................................81
9.1 OVERVIEW..........................................................................................................................................81
9.2 CREATING TEST DEFINITIONS.........................................................................................................81
9.3 EDITING TEST DEFINITIONS.............................................................................................................82
9.4 TEST DEFINITION SELECTOR..........................................................................................................82
9.5 TEST DEFINITION EDITOR................................................................................................................82
9.5.1 TOOLBAR................................................................................................................................................83
9.5.2 <POINTS> TABLE...................................................................................................................................84
9.5.3 [POINTS] TAB.........................................................................................................................................86
9.5.4 [SEQUENCE] TAB ..................................................................................................................................88
9.5.5 [TARE] TAB.............................................................................................................................................89
9.5.6 [CONTROL] TAB.....................................................................................................................................91
9.5.7 [LEAK TEST] TAB ..................................................................................................................................93
9.5.8 [PURGE] TAB..........................................................................................................................................93
9.5.9 [DATA] TAB.............................................................................................................................................94
9.5.10 [AUXILIARY] TAB...................................................................................................................................96
9.5.10.1 AUXILIARY DATA DEVICE SETUP......................................................................................96
10. [SETUP], [SYSTEM]/ [SETUP], [HARDWARE]...............................................................99
10.1 OVERVIEW..........................................................................................................................................99
10.2 [SETUP], [SYSTEM]..........................................................................................................................100
10.3 [SETUP], [HARDWARE] ...................................................................................................................102
10.3.1 TOOLBAR..............................................................................................................................................103
10.3.2 HARDWARE DEFINITION EDITOR......................................................................................................104
10.3.3 [REFERENCE] TAB ..............................................................................................................................104
10.3.4 [DM M ] , [ F R EQ U E N C Y ] , [ P R E S S U R E ] , [ T E M PE R A T U R E ] T AB S...........................................107
10.3.5 [POWER SUPPLY] TAB .......................................................................................................................111
10.3.7 [AUXILIARY]..........................................................................................................................................118
10.3.8 [INTERFACE] TAB................................................................................................................................119
11. [TOOLS], [OPTIONS].....................................................................................................121
11.1 OVERVIEW........................................................................................................................................121
11.2 [molbox] TAB....................................................................................................................................121
11.3 [GRID] TAB .......................................................................................................................................124
11.4 [MAINTAIN LISTS] TAB....................................................................................................................126
11.5 [INITIALIZE TEST] TAB....................................................................................................................127
11.6 [RUN TEST] TAB ..............................................................................................................................128
11.7 [END TEST] TAB...............................................................................................................................130
11.8 [DATA FILE] TAB..............................................................................................................................132
11.9 [DISPLAY] TAB AND [DISPLAY] MENU..........................................................................................134
12. [DATA]............................................................................................................................137
12.1 OVERVIEW........................................................................................................................................137
12.2 [Data], [View Data File] ....................................................................................................................137
12.3 [Data], [Print Test Data] ...................................................................................................................138
12.4 [Data], [Plot Data File]......................................................................................................................138
12.4.2 PLOT PROPERTIES .............................................................................................................................141
12.4.2.1 GENERAL............................................................................................................................141
12.4.2.2 SUBSETS............................................................................................................................142
12.4.2.3 BEST FIT.............................................................................................................................142
12.4.2.4 CUSTOM PLOT...................................................................................................................143
13. REMOTE INTERFACING................................................................................................145
13.1 OVERVIEW........................................................................................................................................145
13.2 REMOTE COMMAND EDITOR .........................................................................................................146
Page iii © 1998-2003 DH Instruments, Inc.
13.2.1 INITIALIZATION COMMANDS..............................................................................................................146
13.2.2 READ COMMANDS...............................................................................................................................146
13.2.3 SET COMMANDS..................................................................................................................................147
13.2.4 EDITOR FEATURES .............................................................................................................................148
13.2.4.1 <LEADING CHARACTERS TO STRIP> .............................................................................148
Page 6
COMPASS for molbox™ User’s Manual
13.2.4.2 <INSERT SPECIAL CHARACTER>....................................................................................149
13.2.4.3 <COMMAND TERMINATOR>.............................................................................................149
13.3 RS-232 INTERFACE .........................................................................................................................149
13.3.1 RS-232 SETUP......................................................................................................................................149
13.4 IEEE-488 INTERFACE ......................................................................................................................150
13.5 DEVICENET INTERFACE.................................................................................................................150
13.6 [TOOLS], [REMOTE COMMUNICATIONS]......................................................................................150
14. [TOOLS], [FLOW UNIT EDITOR]...................................................................................153
14.1 OVERVIEW........................................................................................................................................153
14.2 FLOW UNIT EDITOR.........................................................................................................................154
14.3 UNIT CONVERTER ...........................................................................................................................156
15. [TOOLS], [PROCESS GAS EDITOR] ...........................................................................159
15.1 OVERVIEW........................................................................................................................................159
15.2 FEATURES........................................................................................................................................160
15.3 GAS BLENDS....................................................................................................................................162
16. [DATA], [REPORT EDITOR]..........................................................................................163
16.1 OVERVIEW........................................................................................................................................163
16.2 REPORT PRINCIPLES......................................................................................................................163
16.3 MAIN MENU BAR..............................................................................................................................163
16.4 REPORT EDITOR AUTOMATION ....................................................................................................176
16.3.1 [FILE].....................................................................................................................................................164
16.3.1.1 [FILE ], [ED IT RE P ORT ]................................................................................................165
16.3.1.2 [FILE ], [GE NER A TE RE P ORT ] .................................................................................165
16.3.1.3 [FILE], [EDIT TEMPLATE]...................................................................................................165
16.3.1.4 [FILE], [CREATE TEMPLATE].............................................................................................166
16.3.1.5 [FILE], [SAVE]......................................................................................................................167
16.3.1.6 [FILE], [SAVE AS]................................................................................................................167
16.3.1.7 [FILE], [SAVE ALL] ..............................................................................................................167
16.3.1.8 [FILE], [CLOSE]...................................................................................................................167
16.3.1.9 [FILE], [CLOSE ALL]............................................................................................................167
16.3.1.10 [FILE], [PRINT] ..................................................................................................................168
16.3.1.11 [FILE], [PRINT ALL]...........................................................................................................168
16.3.1.12 [FILE], [EXIT] .....................................................................................................................168
16.3.2 [EDIT].....................................................................................................................................................168
16.3.2.1 [EDIT], [UNDO]....................................................................................................................168
16.3.2.2 [EDIT], [CUT] .......................................................................................................................168
16.3.2.3 [EDIT], [COPY] ....................................................................................................................169
16.3.2.4 [EDIT], [PASTE]...................................................................................................................169
16.3.2.5 [EDIT], [FIND] ......................................................................................................................169
16.3.2.6 [EDIT], [FIND NEXT]............................................................................................................170
16.3.2.7 [EDIT], [SELECT ALL] .........................................................................................................170
16.3.3 [FORMAT]..............................................................................................................................................170
16.3.3.1 [FORMAT], [INSERT DATE/TIME] ......................................................................................170
16.3.3.2 [FORMAT], [INSERT FIELD KEY].......................................................................................170
16.3.3.3 [FORMAT], [SELECT TEMPLATE]......................................................................................171
16.3.3.4 [FORMAT], [MULTIPLE CYCLES].......................................................................................172
16.3.3.5 [FORMAT], [PAGE SETUP].................................................................................................173
16.3.4 [OPTIONS].............................................................................................................................................173
16.3.4.1 [OPTIONS], [TOOLBAR].....................................................................................................173
16.3.4.2 [OPTIONS], [FONT FORMAT BAR]....................................................................................173
16.3.4.3 [OPTIONS], [RULER]..........................................................................................................175
16.3.4.4 [OPTIONS], [PATH].............................................................................................................175
16.3.5 [WINDOW].............................................................................................................................................176
16.3.6 [HELP] ...................................................................................................................................................176
16.4.1 DRAG AND DROP ................................................................................................................................176
16.4.2 COMMAND LINE ARGUMENTS...........................................................................................................177
16.4.3 DDE (DYNAMIC DATA EXCHANGE)...................................................................................................177
17. [HELP].............................................................................................................................179
17.1 OVERVIEW........................................................................................................................................179
© 1998-2003 DH Instruments, Inc. Page iv
Page 7

COMPASS for molbox™ User’s Manual
18. DATA FILES ...................................................................................................................181
18.1 OVERVIEW........................................................................................................................................181
18.2 DATA FILE CREATION.....................................................................................................................181
18.3 NAMING AND STORING DATA FILES ............................................................................................181
18.4 DATA FILE STRUCTURE .................................................................................................................182
18.4.1 DATA FILE FIELDS...............................................................................................................................183
19. CALCULATIONS............................................................................................................187
19.1 OVERVIEW........................................................................................................................................187
19.2 DUT FLOW ........................................................................................................................................187
19.3 DUT SET POINTS .............................................................................................................................188
19.4 DUT ERRORS ...................................................................................................................................188
19.5 DENSITY CORRECTIONS ................................................................................................................189
19.6 TOLERANCE.....................................................................................................................................191
19.7 BEST FIT........................................................................................................................................... 192
19.8 LINEARITY........................................................................................................................................192
19.9 HYSTERESIS ....................................................................................................................................193
19.10 REPEATABILITY...............................................................................................................................193
19.11 MEASUREMENT UNCERTAINTY ....................................................................................................193
19.12 FLOW UNIT CONVERSIONS............................................................................................................194
19.13 PRESSURE UNIT CONVERSIONS...................................................................................................200
19.14 WATER RATIO..................................................................................................................................200
20. TROUBLESHOOTING....................................................................................................203
20.1 OVERVIEW........................................................................................................................................203
21. GLOSSARY ....................................................................................................................207
22. END USER LICENSE AGREEMENT .............................................................................211
Page v © 1998-2003 DH Instruments, Inc.
Page 8

COMPASS for molbox™ User’s Manual
T
AABBLLEES
T
Table 1. COMPASS Version Compatibility..................................................................................................4
Table 2. Tools Available On The Run Toolbar .......................................................................................... 31
Table 3. Tools Available On The Display Toolbar.....................................................................................32
Table 4. <Tare molbox> Panel Fields......................................................................................................35
Table 5. <Flow Conditions> Panel Fields................................................................................................37
Table 6. <Units> Panel Fields...................................................................................................................37
Table 7. <Flow Control> Panel Fields......................................................................................................39
Table 8. <Control Toolbar> Data Acquisition Options.............................................................................40
Table 9. <DUT/Reference Comparison> Run Screen Fields.................................................................. 43
Table 10. <molbox Output> Run Screen Fields......................................................................................44
Table 11. <DUT Output> Run Screen Fields............................................................................................45
Table 12. <Average Flow Data> Run Screen Fields ...............................................................................47
Table 13. <Spy Window> Information......................................................................................................49
Table 14. <Test Complete> Panel Options..............................................................................................60
Table 15. DUT Definition Editor, <Toolbar> Features..............................................................................66
Table 16. DUT Definition Editor, [Header] Tab Fields..............................................................................68
Table 17. DUT Definition Editor, [Correction] Tab Fields ........................................................................ 70
Table 18. DUT Definition Editor, [Range] Tab Fields ............................................................................... 72
Table 19. DUT Definition Editor, [Tolerance] Tab Fields ......................................................................... 74
Table 20. DUT Definition Editor, [Test] Tab Fields...................................................................................75
Table 21. DUT Definition Editor, [Conditions] Tab Fields........................................................................76
Table 22. DUT Definition Editor, [Read] Tab Fields..................................................................................77
Table 23. DUT Definition Editor, [Set] Tab Fields.....................................................................................79
Table 24. Test Definition Editor, <Toolbar> Features ..............................................................................83
Table 25. Test Definition Editor, <Points> Table......................................................................................84
Table 26. Test Definition Editor, [Points] Tab Fields................................................................................87
Table 27. Test Definition Editor, [Sequence] Tab Fields.......................................................................... 88
Table 28. Test Definition Editor, [Tare] Tab Fields...................................................................................90
Table 29. Test Definition Editor, [Control] Tab Fields..............................................................................92
Table 30. Test Definition Editor, [Leak Test] Tab Fields..........................................................................93
Table 31. Test Definition Editor, [Purge] Tab Fields.................................................................................94
Table 32. Test Definition Editor, [Data] Tab Fields...................................................................................95
Table 33. Test Definition Editor, [Auxiliary] Tab Fields............................................................................96
Table 34. <System Configuration> Screen Fields................................................................................ 101
Table 35. Hardware Configuration, <Toolbar> Options..........................................................................104
Table 36. Hardware Definition, <Edit Reference> Screen Fields..........................................................106
Table 37. <Edit DMM>, <Frequency>, <Pressure>, And <Temperature> Screen Fields...................109
Table 38. Hardware Definition, <Edit Power Supply> Screen Fields....................................................112
Table 39. Hardware Definition, <Edit Controller> Screen Fields...........................................................116
Table 40. Hardware Definition, <Edit Controller> Screen Fields...........................................................117
Table 41. Auxiliary Definition, <Edit Controller> Screen Fields.............................................................119
Table 42. [Options], [molbox] Tab Selections.......................................................................................122
Table 43. [Options], [Grid] Tab Selections............................................................................................125
S
© 1998-2003 DH Instruments, Inc. Page vi .
Page 9

COMPASS for molbox™ User’s Manual
Table 44. [O
ptions], [Maintain Lists] Tab Fields ..................................................................................126
Table 45. [Options], [Initialize Test] Tab Fields....................................................................................127
Table 46. [Options], [Run Test] Tab Fields...........................................................................................128
Table 47. [Options], [Run Test] Tab, [Manual DUT P and T Entry Method] Fields...........................130
Table 48. [Options], [End Test] Tab Fields...........................................................................................131
Table 49. [Options], [Data File] Tab Fields...........................................................................................132
Table 50. [Options], [Display] Tab Fields..............................................................................................135
Table 51. Data Plot Types.......................................................................................................................140
Table 52. [Plot Properties], [General] Tab Fields.................................................................................141
Table 53. [Plot Properties], [Best Fit] Tab Fields.................................................................................143
Table 54. [Plot Properties], [Custom Plot] Tab Fields.........................................................................144
Table 55. <Flow Unit Editor> Panel Fields............................................................................................ 155
Table 56. <Flow Unit Converter> Panel Fields .....................................................................................157
Table 57. <Process Gas Editor> Tool Fields.........................................................................................160
Table 58. <Find> Panel Fields................................................................................................................170
Table 59. <Multi Cycle Data File Options> Screen Choices................................................................172
Table 60. COMPASS Report Editor, Font Format Toolbar ................................................................... 174
Table 61. COMPASS Report Editor, Ruler Features ............................................................................ 175
Table 62. Data File/Grid Run Screen Main Sections...............................................................................182
Table 63. Data File/Grid Run Screen Fields/Columns ............................................................................ 183
Table 64. Flow Unit Conversion Formulas ..............................................................................................196
Table 65. Definition Of Terms In Flow Unit Conversion Formulas..........................................................197
Table 66. Flow Unit Conversion Scaling Factors ....................................................................................197
Table 67. Supported Gas Molecular Weights..........................................................................................198
Table 68. Conversions From kg/s To mole/s For Various Gases............................................................199
Table 69. Conversion From mole/s To pccm...........................................................................................199
Table 70. Pressure Unit Conversion Chart..............................................................................................200
Table 71. Troubleshooting.......................................................................................................................203
Page vii © 1998-2003 DH Instruments, Inc.
Page 10

COMPASS for molbox™ User’s Manual
F
IIGGUURREES
F
Figure 1. Example 1, DUT Range Setup...................................................................................................14
Figure 2. Example 1, DUT Read Command Setup...................................................................................15
Figure 3. Example 1, molbox1 Reference Setup ......................................................................................16
Figure 4. Example 1, System Configuration..............................................................................................16
Figure 5. Example 1, DUT Interface Setup...............................................................................................17
Figure 6. Example 1, RS-232 Setup with Ref Com2.................................................................................17
Figure 7. Example 2, DMM Setup.............................................................................................................19
Figure 8. Example 4, DUT Setup..............................................................................................................20
Figure 9. Example 4, System Configuration..............................................................................................21
Figure 10. Example 5, DUT Definition.......................................................................................................23
Figure 11. Example 5, System Configuration............................................................................................24
Figure 12. Example 7, Test Setup.............................................................................................................25
Figure 13. Status Bar ................................................................................................................................30
Figure 14. <Tare molbox> Panel.............................................................................................................34
Figure 15. <Toggle molbox drivers> Form............................................................................................. 36
Figure 16. <Flow Conditions> Panel.......................................................................................................36
Figure 17. <Units> Panel..........................................................................................................................37
Figure 18. <Flow Control> Panel............................................................................................................. 38
Figure 19. <Single Point Average Setup>.............................................................................................. 40
Figure 20. <Auto Point Average Setup> ................................................................................................ 41
Figure 21. <DUT/Reference Comparison> Run Screen.........................................................................42
Figure 22. <molbox Output> Run Screen...............................................................................................44
Figure 23. <DUT Output> Run Screen.....................................................................................................45
Figure 24. <Average Flow Data> Run Screen.........................................................................................46
Figure 25. <Data Grid> Run Screen.........................................................................................................48
Figure 26. <Data Plot> Run Screen.........................................................................................................48
Figure 27. <Spy Window> Screen...........................................................................................................49
Figure 28. <Select molbloc> Panel.........................................................................................................53
Figure 29. <DUT Selection> Tool ............................................................................................................53
Figure 30. <DUT Selector> In DUT Definition Editor...............................................................................54
Figure 31. <Select Test> Tool..................................................................................................................54
Figure 32. <Test Selector> In Test Definition Editor................................................................................55
Figure 33. <Setup DUT ID/Interface> Panel............................................................................................56
Figure 34. <Manual DUT Data Entry> Panel...........................................................................................59
Figure 35. <Test Complete> Panel..........................................................................................................59
Figure 36. <Run Mode Data Selector> Form..........................................................................................61
Figure 37. <DUT Selection> Tool ............................................................................................................65
Figure 38. DUT Definition Editor, <Toolbar>............................................................................................ 66
Figure 39. DUT Definition Editor, [Header] Tab.......................................................................................67
Figure 40. DUT Definition Editor, [Correction] Tab .................................................................................70
Figure 41. DUT Definition Editor, [Range] Tab.........................................................................................71
Figure 42. DUT Definition Editor, [Tolerance] Tab ..................................................................................73
Figure 43. DUT Definition Editor, [Test] Tab............................................................................................74
S
© 1998-2003 DH Instruments, Inc. Page viii
Page 11

COMPASS for molbox™ User’s Manual
Figure 44. DUT Definition Editor, [Conditions] Tab.................................................................................75
Figure 45. DUT Definition Editor, [Read] Tab...........................................................................................76
Figure 46. DUT Definition Editor, [Set] Tab..............................................................................................78
Figure 47. Test Definition Editor, <Toolbar>............................................................................................83
Figure 48. Test Definition Editor, <Test Points> Tab...............................................................................84
Figure 49. Test Definition Editor, [Points] Tab.........................................................................................86
Figure 50. Test Definition Editor, [Sequence] Tab...................................................................................88
Figure 51. Test Definition Editor, [Tare] Tab ............................................................................................ 90
Figure 52. Test Definition Editor, [Control] Tab.......................................................................................91
Figure 53. Test Definition Editor, [Leak Test] Tab...................................................................................93
Figure 54. Test Definition Editor, [Purge] Tab.......................................................................................... 94
Figure 55. Test Definition Editor, [Data] Tab............................................................................................95
Figure 56. Test Definition Editor, [Data] Tab............................................................................................96
Figure 57. Auxiliary Data Device Selector.................................................................................................97
Figure 58. <System Configuration> Screen.........................................................................................100
Figure 59. Hardware Definition, [Reference] Tab..................................................................................105
Figure 60. Hardware Definition, <Edit Reference> Panel......................................................................105
Figure 61. Hardware Definition, [DMM] Tab...........................................................................................108
Figure 62. Hardware Definition, <Edit DMM> Panel .............................................................................. 108
Figure 63. Hardware Definition, [Power Supply] Tab............................................................................111
Figure 64. Hardware Definition, <Edit Power Supply> Panel...............................................................112
Figure 65. Hardware Definition, [Controller] Tab ..................................................................................114
Figure 66. Hardware Definition, <Edit Controller> Panel......................................................................115
Figure 67. Hardware Definition, <Auxiliary Data Device> ....................................................................118
Figure 68. Hardware Definition, [Interface] Tab.....................................................................................120
Figure 69. [Options], [molbox] Tab.......................................................................................................122
Figure 70. [Options], [Grid] Tab............................................................................................................124
Figure 71. [Options], [Maintain Lists] Tab ...........................................................................................126
Figure 72. [Options], [Initialize Test] Tab............................................................................................. 127
Figure 73. [Options], [Run Test] Tab!!!.................................................................................................128
Figure 74. [Options], [End Test] Tab!!!.................................................................................................131
Figure 75. [Options], [Data File] Tab ....................................................................................................132
Figure 76. [Options], [Display] Tab.......................................................................................................134
Figure 77. Data File Viewer.....................................................................................................................138
Figure 78. [Data], [Plot Data File] Screen.............................................................................................139
Figure 79. [Plot Properties], [General] Tab..........................................................................................141
Figure 80. [Plot Properties][Subsets] Tab...........................................................................................142
Figure 81. [Plot Properties], [Best Fit] Tab..........................................................................................142
Figure 82. [Plot Properties], [Custom Plot] Tab..................................................................................143
Figure 83. <Initialization Commands Editor> Panel............................................................................146
Figure 84. <Read Commands Editor> Panel........................................................................................147
Figure 85. <Set Commands Editor> Panel...........................................................................................148
Figure 86. <Insert Special Character> Panel.......................................................................................149
Figure 87. <RS232 Settings> Panel ...................................................................................................... 150
Figure 88. Remote Communications Tool...............................................................................................151
Figure 89. <Flow Unit Editor> Panel.....................................................................................................154
Figure 90. Unit Converter........................................................................................................................156
Figure 91. <Process Gas Editor> Tool..................................................................................................160
Figure 92. <Create Gas Blend> Panel...................................................................................................162
Page ix © 1998-2003 DH Instruments, Inc.
Page 12

COMPASS for molbox™ User’s Manual
Figure 93. COMPASS Report Editor.......................................................................................................164
Figure 94. <Find> Panel.........................................................................................................................169
Figure 95. <Field Insertion Tool> Panel ............................................................................................... 171
Figure 96. <Multi Cycle Data File Options> Panel...............................................................................172
Figure 97. Page Setup Screen................................................................................................................173
Figure 98. Report Editor, Main Toolbar.................................................................................................173
Figure 99. COMPASS Report Editor, Font Format Bar ........................................................................174
Figure 100. COMPASS Report Editor, Ruler........................................................................................175
© 1998-2003 DH Instruments, Inc. Page x
Page 13
COMPASS for molbox™ User’s Manual
U
U
SSEERR
R
EEGGIISSTTRRAATTIIOON
R
N
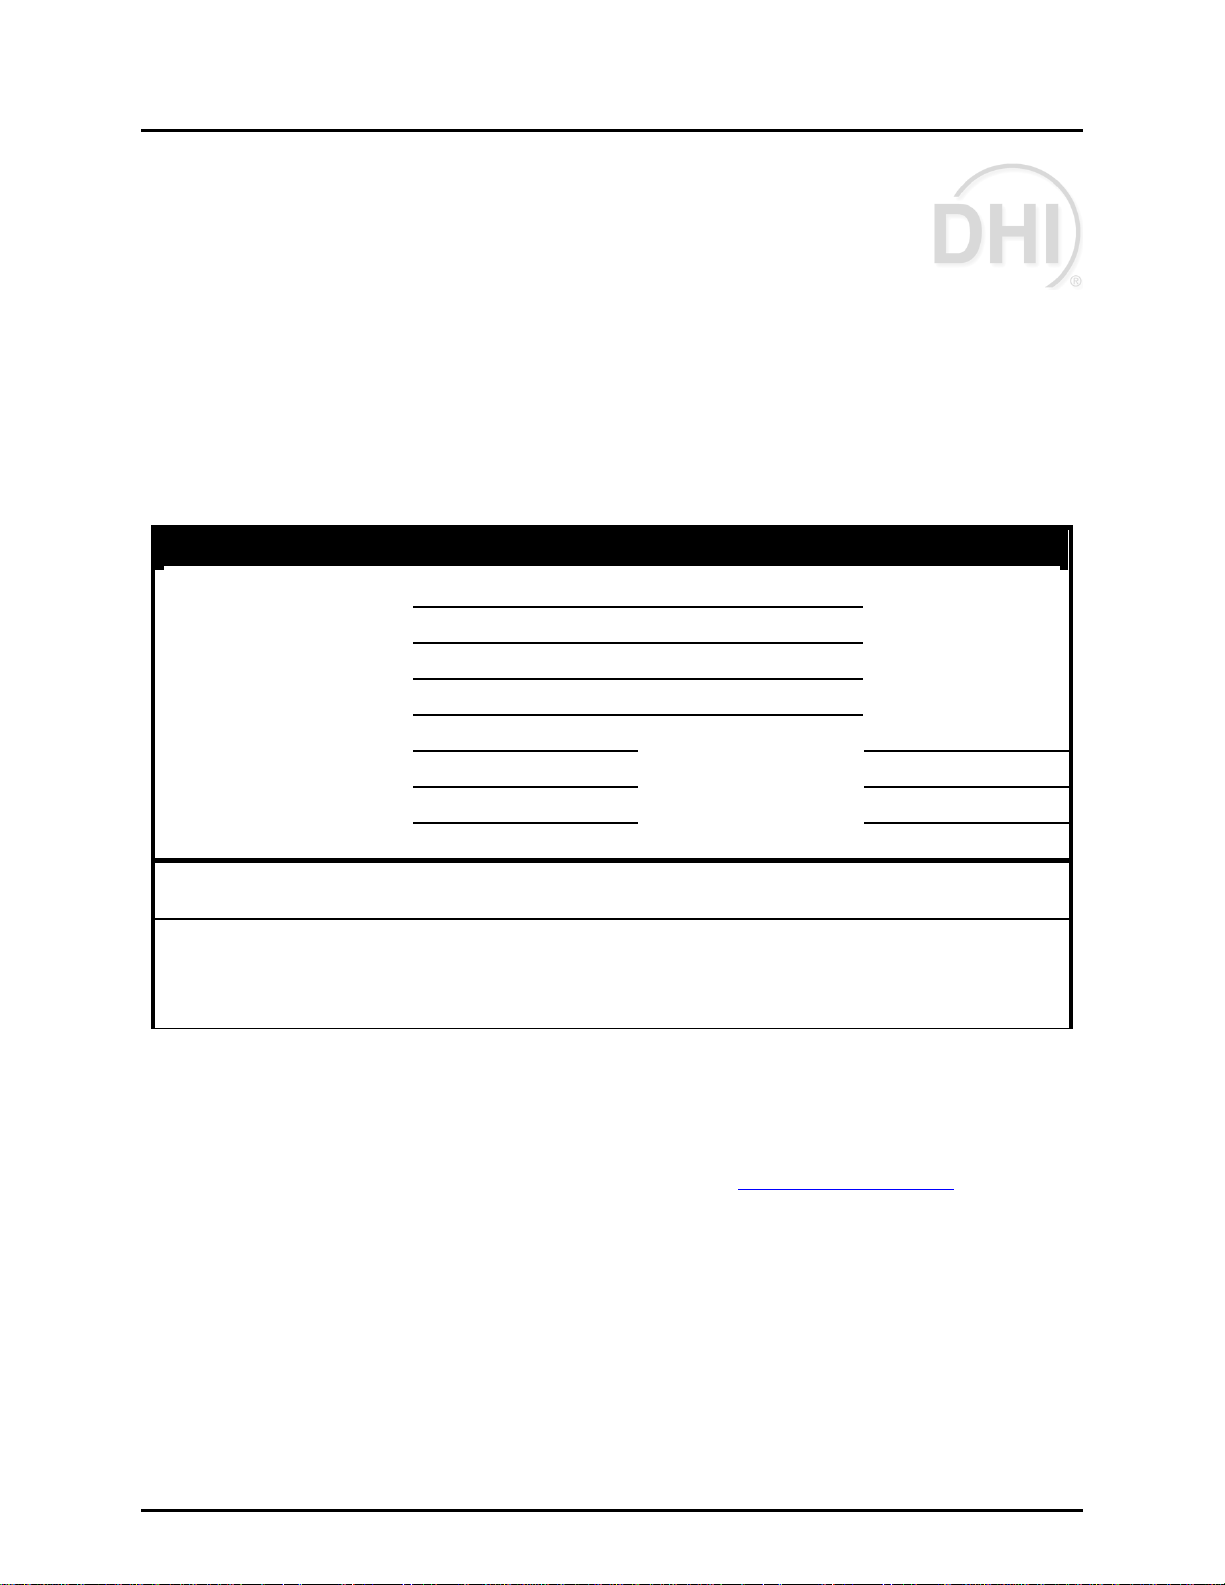
COMPASS® for molbox™
Flow Calibration Software
Please fill out this registration sheet and return it to DH Instruments. Registering as a user will
allow us to contact you with important information about COMPASS
possible recalls and product announcements.
USER CONTACT
Name:
Company/Organization
Address 1:
Address 2:
City: State/Province:
Postal Code: Country:
Tel: Fax:
®
including product upgrades,
Email:
1)
I am using COMPASS
I will run COMPASS
2)
Please return this form by mail or fax to:
NOTE: COMPASS
molbox use. Running COMPASS simultaneously on two computers is a violoation of the license
agreement.
®
for molbox is a licensed software product intended for single computer or
®
for molbox Ver. ______________.
®
on a computer whose operating system is:
(circle one)
Windows 95, 98, ME, NT, 2000, XP Other__________
ATTN: COMPASS Registration
DH Instruments, Inc.
4765 East Beautiful Lane
Phoenix AZ 85044-5318 USA
or via Fax: 602.431.9559
email: dhi@dhinstruments.com
Page xi © 1998-2003 DH Instruments, Inc.
Page 14
COMPASS for molbox™ User’s Manual
A
BBOOUUTT
A
This manual provides the user with the basic information necessary to set up and run COMPASS for molbox.
It also includes a great deal of additional information provided to help you optimize COMPASS use and
take full advantage of its many features and functions.
Before using the manual, take a moment to familiarize yourself with:
• Table of Contents - structure;
• Section 1 – to help you get started
• Section 5 - gives examples of setting up COMPASS for typical applications;
• Section 4 - answers frequently asked questions;
• Section 20 - for troubleshooting;
• Other sections - describe each of the six (6) main menu selections in detail.
Certain words and expressions have specific meaning as they pertain to COMPASS for molbox.
The Glossary (see Section 21) is useful as a quick reference for specific terms and expressions as they
are used in this manual and the program.
T
T
HHIISS
M
AANNUUAAL
M
L
Manual Conventions
For those of you who don’t read manuals, go directly to Section 2.3 to install COMPASS and then
Section 3 for a summary of operating principles. Later … when you have questions or start to wonder
about all the great features you might be missing, get into the manual.
Cross references are used extensively to direct you towards additional information on a topic. Cross
references are generally in parentheses and give the reference’s section number. For example: (see
Section 11).
[ ] indicates COMPASS menu or tab selections (for example [D
always described hierarchically from highest to lowest level. For example: [To
[Maintain Lists].
< > indicates COMPASS text displays such as screen names, field names, prompts, warnings and
instructions. For example: <Enter user ID>.
File names are designated in quotation marks when they do NOT include a file extension. For example:
“dat” file or *.dat.
(CAUTION) is used in the manual to identify user warnings and cautions.
(NOTE) is used in the manual to identify operating and applications advice and additional
explanations.
© 1998-2003 DH Instruments, Inc Page xii .
ata]). Menu or tab selection paths are
ols], [Options],
Page 15

COMPASS for molbox™ User’s Manual
11..
I
NNTTRROODDUUCCTTIIOON
I
N
1.1 PRODUCT OVERVIEW
Welcome to COMPASS® for molbox™, the complete flow calibration software package for users of DHI
molbloc/molbox flow transfer standards. COMPASS for molbox is designed to supply the missing link
needed to get from individual automated hardware components to an automated calibration system and
from owning a great flow standard to performing a wide variety of special calibrations and tests.
Using COMPASS for molbox, you can create any number of calibration test scenarios; define
characteristics of various devices under test (DUT); run tests; analyze test data and generate reports
without ever leaving the program or you can export test data for analysis using other applications.
COMPASS’s flexible approach makes it easily adaptable to a wide variety of hardware and allows you to
adjust the level of automation for many different tasks and Hardware Definitions from manual entry flow
meters to fully automated mass flow controller calibrations.
Please fill in and return the User Registration form located in this manual immediately following the
Table of Contents.
Page 1 © 1998-2003 DH Instruments, Inc.
Page 16

COMPASS for molbox™ User’s Manual
N
N
OOTTEES
S
© 1998-2003 DH Instruments, Inc. Page 2
Page 17

COMPASS for molbox™ User’s Manual
22..
G
EETTTTIINNGG
G
S
TTAARRTTEED
S
D
2.1 OVERVIEW
This section explains how to install COMPASS for molbox on your computer.
2.2 SYSTEM REQUIREMENTS
COMPASS for molbox is an application designed for Windows 32 bit operating systems. This includes
Windows 95, 98 and NT. Although any computer running one of these operating systems has the basic
requirements to run COMPASS, it is recommended that the following minimum configuration be used:
• Windows 95, 98, or NT
• 200 MHz, Pentium processor
• 32 MB RAM
• 10 MB free hard disk space
2.3 INSTALLING COMPASS FOR molbox
Insert the COMPASS for molbox CD into the CD drive. If the auto run feature is enabled on the
PC, the setup application runs automatically.
If the setup program does not run after 10 seconds, press the Windows [Start] button and select
[Run].
In the Run dialog box, type d:\setup or f:\setup, depending on the drive letter of the CD drive of the
installation disk. Select COMPASS for molbox from the list of applications and follow the
installation prompts to install the program.
2.3.1.1.1.1 OR
Insert the COMPASS for molbox CD into the CD drive.
Use the Add/Remove Programs feature in the Windows Control Panel. Press the Windows
[Start] button and select [Settings] followed by [Control Panel].
Double-click the [Add/Remove Programs] icon and click the [Install] button. Follow the prompts
to install COMPASS. Select COMPASS for molbox from the list of applications and follow the
installation prompts to install the program.
2.3.2 UPGRADING FROM VERSIONS LOWER THAN 4.00
During the installation process, choose the directory of any existing version of COMPASS to
automatically upgrade the program. When the new version runs for the first time, the
COMPASS file Upgrade Wizard (see Section 2.3.3) will run to facilitate the conversion of
Page 3 © 1998-2003 DH Instruments, Inc.
Page 18
COMPASS for molbox™ User’s Manual
older DUT and Test Files to the new DUT and Test Definitions format. If the new version of
COMPASS is not installed in the same location as the previous version, the automatic update
option will not occur. Run COMPASS and then select [T
ools], [File Upgrade Wizard] to
convert DUT and Test Files to the new format.
Most aspects of user setup information and Data Files created with COMPASS versions
lower than 4.00 are compatible with release 4.00 and higher. To the extent possible,
COMPASS automatically incorporates older setup information into the required format.
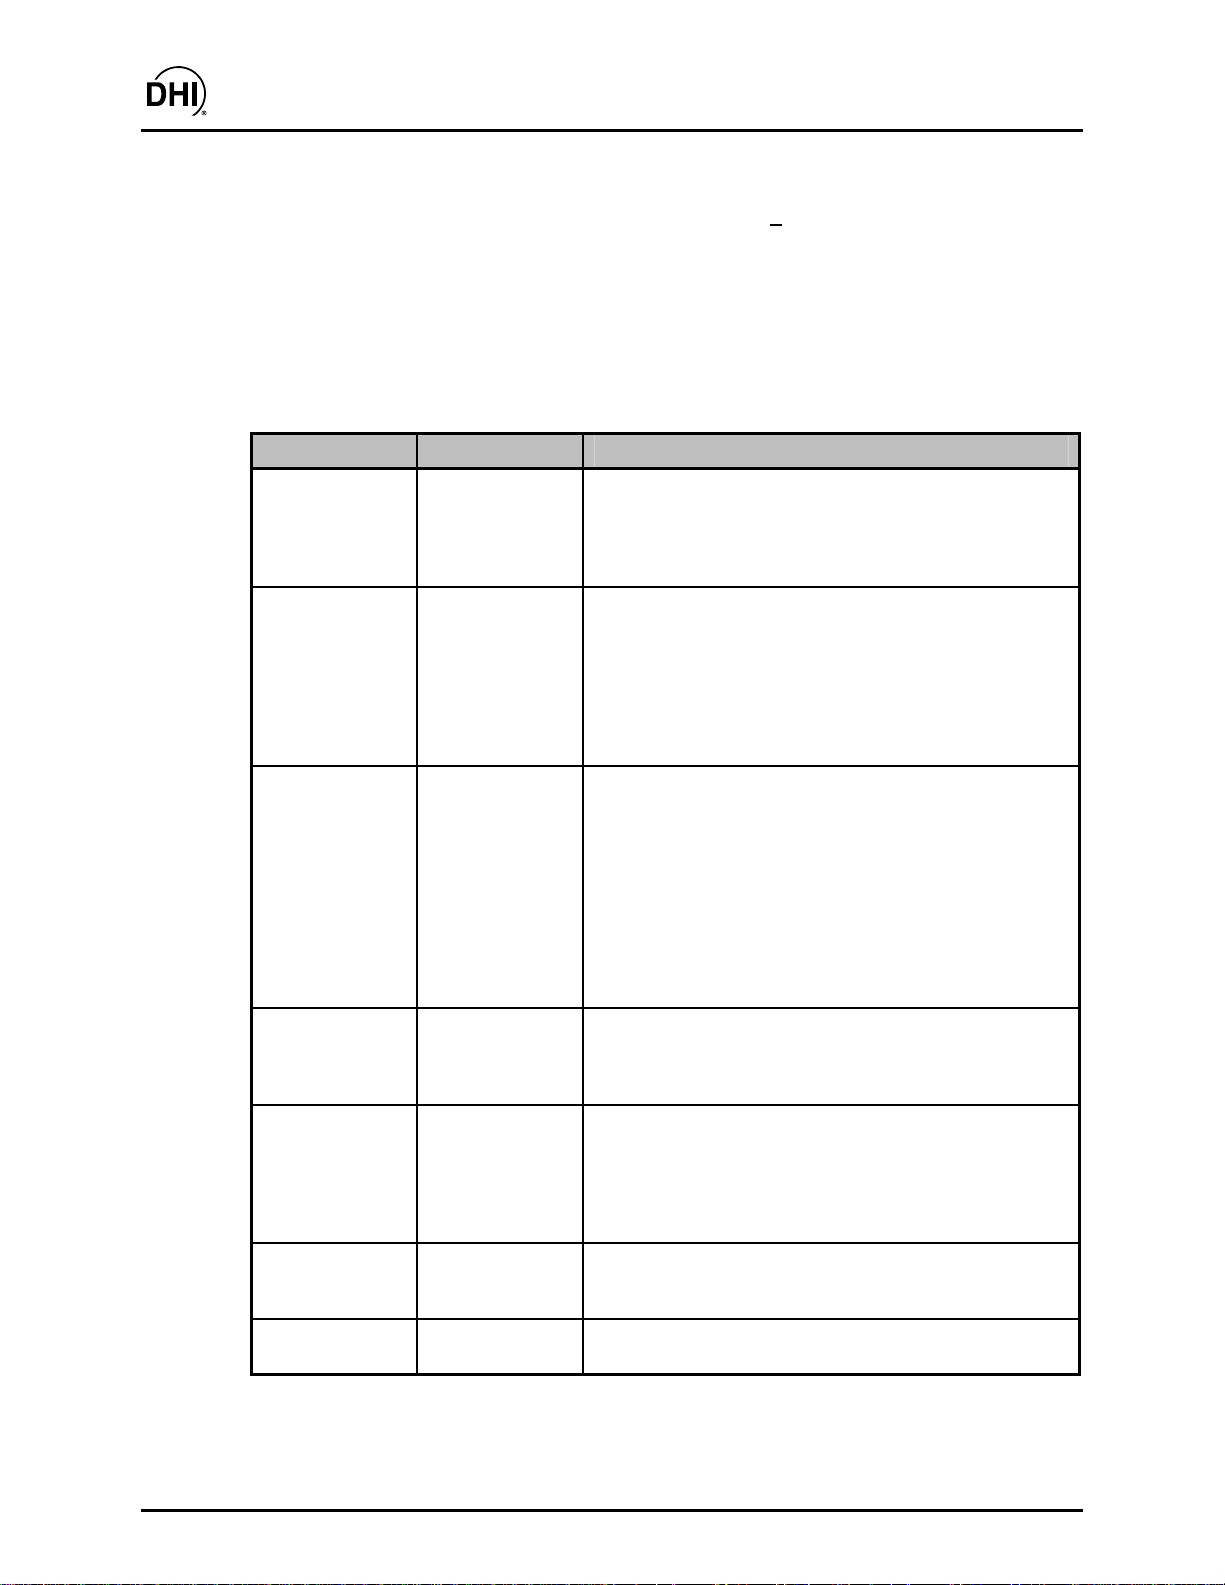
Table 1 summarizes COMPASS version compatibility.
Table 1. COMPASS Version Compatibility
FEATURE COMPATIBILITY COMMENT
Data Files
DUT Files
Test Files
Reports
Automatic (see
Section 12)
Use the Upgrade
Wizard (see
Section 2.3.3)
Use the Upgrade
Wizard (see
Section 2.3.3)
Only *.rtf format
(see Section 16)
Data Files created with COMPASS Ver. 4.00 and higher
contain substantially more data than in previous versions.
For this reason, Data File information such as the molbloc
Tare will display as “N/A” in the <Data Viewer> and
completed reports.
DUT Files are no longer maintained as a directory of
individual files. Instead COMPASS uses a single
database to store all DUTs. The file Upgrade Wizard is
required to incorporate the DUT File information into the
new database format. The Upgrade Wizard assumes that
all DUT’s both control and measure flow. Since this is not
true in the case of MFM (Mass Flow Meters), it may be
necessary to edit the DUT’s after the upgrade process.
Just like DUT Files, Test Files are no longer maintained as
a directory of individual files. Instead COMPASS uses a
single database to store all test records. The file Upgrade
Wizard is required to incorporate the Test File information
into the new database format. COMPASS for molbox
versions 4.00 and higher do not contain DUT data
acquisition information. This information is now contained
in the DUT Definition. The upgraded tests will contain al l
other compatible information. There is no distinction
between validation tests (*.tsv) and adjustment tests
(*.tsa). These files are treated the same.
Only reports specifically saved as *.rtf files are compatible
with the new report Editor. If a specific report is desired,
regenerate it using the original Data File and report
template with the desired format (see Section 16).
Templates
Process Gas
Information
DUT Models
© 1998-2003 DH Instruments, Inc. Page 4
No compatibility
Automatic
Automatic
Report templates from older COMPASS versions are
not supported. The new Data File format contains
substantially more data and requires several more report
template features. The new Report Editor can be used to
create a template with the exact same features as the
older version (see Section 16).
All releases of COMPASS use the same process gas file.
During the installation process, the setup program displays
an overwrite prompt if a progas.txt file is already present.
Any models set up in an existing version of COMPASS are
automatically supported by the new installation.
Page 19

COMPASS for molbox™ User’s Manual
2.3.3 [TOOLS], [FILE UPGRADE WIZARD]
When the COMPASS installation is complete, run the program and select [Tools], [File
Upgrade Wizard] to convert old DUT and Test Files to the new database format. DUT and
Test Files can be selected individually or by directory. All selected files are automatically built
into the appropriate COMPASS database. The file name of the converted file is set to the
<Record Label> of the database equivalent record. Press the <Next> button to proceed
with the next step in the process or press <Back> to repeat a previous step. There are four
(4) sequential steps to the upgrade process as described below.
Select the type of file to upgrade: DUT(*.dut) or Test Files (*.tsv, *.tsa).
Determine whether files should be selected individually or globa lly from a selected directory.
When the individual option is selected, a file dialog box displays allowing the selection of
a single or multiple files. The directory option displays a directory browser that should be
used to locate the target directory to copy from. All files with the proper file extension are
included in the <Files to upgrade> list.
The files selected for upgrade display in the <Files to upgrade> list for final confirmation.
COMPASS converts all listed files into the proper database. The number of files accessed
and the number of files copied is provided for troubleshooting purposes in the event a
DUT or Test File is not converted and an error message is displayed.
The upgrade process is complete. <Back> can be used to select new files or to change from
DUT Files to Test Files.
Selecting DUT and Test Files more than one time will create duplicate entries in the
respective DUT and Test databases.
2.4 RUNNING THE PROGRAM
When the software installation is complete, a new Windows group is created to hold the
COMPASS program. To run the program, select it by pressing the Windows [Start] button, selecting the
[Programs] sub-menu followed by the [COMPA SS fo r mo lbox] grou p. Click the < COMPA SS fo r mo lbox> icon
to start the program.
2.5 UNINSTALLING
To uninstall COMPASS, use the <Remove COMPASS for molbox> icon in the program group created
during installation. As an alternative, use the Add/Remove Programs feature in the Windows Control
Panel and select COMPASS for molbox. In both cases, a series of prompts must be followed in the
application removal program to uninstall COMPASS. All installation files and registry updates are
removed. Data directories created by running COMPASS are not removed by uninstalling. It is up to the
user to manually remove these data directories. The application removal program always displays a
message indicating COMPASS was not completely removed when executed after new Data Files have
been created. Any file management tool such as Windows Explorer can be used to remove these data directories.
Page 5 © 1998-2003 DH Instruments, Inc.
Page 20

COMPASS for molbox™ User’s Manual
N
N
OOTTEES
S
© 1998-2003 DH Instruments, Inc. Page 6
Page 21

COMPASS for molbox™ User’s Manual
33..
O
PPEERRAATTIINNGG
O
P
RRIINNCCIIPPLLEES
P
S
3.1 OVERVIEW
COMPASS for molbox is an application program intended to automate the test and calibration process
to the extent supported by the available calibration hardware and appropriate for the DUT being tested.
COMPASS supports automated operation of DHI molbloc/molbox transfer standards but can also be
use d w it h a ny t yp e of flow measurement system from any manufacturer. This feature allows COMPASS to be
used s ystematically to provide consistent data formats and report generation for all of your flow calibrations.
COMPASS sets up and maintains setup requirements on devices under test (DUTs) (see Section 8) and
testing procedures (see Section 9) to associate with DUTs. This information is recalled to run tests.
Tests are run using the hardware that has been configured (see Section 10) in COMPASS. While running
a test, data is acquired and stored in a delimited Data File (see Section 12). Within COMPASS, Data Files
may be viewed, used to generate plots and to generate reports which can be customized with user
editable templates (see Section 16). COMPASS operations follow conventional Windows protocol for file
management, menu and message formatting, graphics and editing.
To run a test, first a DUT Definition must be created (see Section 8) to define the DUT that will be tested
and a Test Definition must be created (see Section 9) to provide COMPASS with the exact testing
procedure for the DUT. The Hardware Definition, must be set up with the necessary instruments to
support the DUT, including the setup of the molbox remote interface. If the DUT requires voltage or
current measurement, a DMM must be set up using the Hardware Definition Tool (see Section 10).
The devices set up in the Hardware Definition must be selected as the current System Configuration
(see Section 10.2). Once a DUT and test have been set up, and the Hardware Definition has been
defined and selected, tests can be run (see Section 7.2).
The results of the test are stored in a Data File (see Section 18) that is designed to be used by
COMPASS to generate reports or easily exported to other applications by the user for further analysis.
Over 40 individual data items are logged for each test point. COMPASS includes integrated analysis and
reporting functions. Fully customizable reports and plots can be created using Data Files (see Section 16).
Other than running tests, COMPASS supports direct molbox and DUT run options to allow remote control
of the molbox and/or a DUT with all COMPASS features active (see Sections 0, 7.4). This feature
provides a remote interface to all measurement and control instruments required by the DUT and setup in
the current System Configuration (see Section 10.2). The output information displays on various program
run screens. Use this feature to perform tests or operations that do not require creation of a Data File or
execution of a specific test script.
Many operational preferences relating to how tests are initialized and run, and how data is gathered and
stored are configurable with user options (see Section 11). The use of these configurable preferences
results in a customized test environment to meet a very wide variety of testing requirements. By selecting
the proper options, a user can start an automated test and return to a custom formatted report.
Detailed information and assistance on COMPASS application and functions are available in this manual
(see Sections 4, 5 and 20) and with on-line help (accessed by pressing [F1] or selecting [H
elp]).
3.1.1 BASICS SUMMARY
In summary, the following steps and sections should be referred to when setting up and
Page 7 © 1998-2003 DH Instruments, Inc.
Page 22

running a test for the first time. Subsequent tests will only require a selection of the desired
DUT and Test Definitions. The [Run Test] section of this manual has a more detailed
explanation of the requirements to run a test in COMPASS (see Section 7.2). Several COMPASS
examples and frequently asked questions are in the Quick Tips section of this manual
(see Sections 4, 5). These sections are also very useful in getting started.
COMPASS for molbox™ User’s Manual
When first running COMPASS, make the minimum number of changes and modifications until
you are familiar with the program. The default values in all setup screens are designed for the
most common COMPASS uses. This will help to avoid confusion and setup conflicts as you
develop experience in using COMPASS.
Select [Setup], [DUT] to create a DUT Definition (see Section 8.2). A DUT that outputs
an electrical signal such as V, mV or mA will most likely be read using a digital multimeter
(DMM) or the molbox analog option. The DMM must be set up in the Hardware Definition
before it will be available in the System Configuration (see Section 10.3.4). The molbox
analog option does not require any additional setup. Whenever the flow reference is a
molbox1, the analog option is automatically available in the System Configuration.
Select [S
etup], [Test] to create a test script that describes flow points and other aspects
of the testing procedure (see Section 9).
Select [S
etup], [Hardware] to update the Hardware Definition of specific components
available for use by COMPASS (see Section 10.3). This includes setting up the molbox
remote interface as well as any other peripheral devices needed to run the DUT.
This option should be used to set up a DMM, power supply, pressure device, temperature
device and any flow controllers that may be used to control the flow of non-flow
controlling DUT’s. Once these entries are made, there is no need to access the
Hardware Definition unless a change in one of these devices occurs.
Select [S
etup], [System] to set up the System Configuration of specific instruments that
will be used by COMPASS to measure reference flow, pressure, temperature, analog
output and provide analog power (Section 10.2). Not all selections are mandatory.
Only hardware specifically needed to run the test must be selected at any one time.
Select [R
un], [Run Test].
© 1998-2003 DH Instruments, Inc. Page 8
Page 23

COMPASS for molbox™ User’s Manual
44..
Q
UUIICCKK
Q
T
T
4.1 HOW DO I?
Set up and run a test?
Create a Test Definition to define the test procedure (see Section 9).
Create a DUT Definition to define a device under test (see Section 8).
Configure the test hardware to be used to run the test (see Section 10).
Run test (see Section 7.2).
Display the flow unit I want on the molbox1 or molbox RFM front panel display
during COMPASS operation?
The various COMPASS run screens, rather than the molbox display, should be used to
obtain molbox output information. COMPASS sets the molbox to fundamental mass
flow units and then performs conversions to the other units and other operating
conditions when required. Do not refer to the molbox display when you are running
COMPASS.
A list of standard mass flow units available for display on the molbox can be selected using the
ools], [Options, [molbox], <Display mass flow units> units feature (see Section 11.2).
[T
As an alternative, press [AVERAGE], [DISPLAY] on the molbox keypad. Select the unit of
measure that you would like displayed on the second (bottom) line of the front panel display.
(Refer to the molbox Operation and Maintenance Manual, DISPLAY Section, for details.)
Keep in mind that COMPASS does not transmit pressure and temperature values for
volume or actual flow units to the molbox even if COMPASS is making real time measurements.
Therefore, the volume flow units displayed by the molbox and by COMPASS will not agree.
S
IIPPS
Run a test in which the flow at each point is adjusted to a nominal flow value,
for example to the nominal point when calibrating a rotameter?
Specify “jog before dwell” in the Test Definition (see Section 9.5.6). This causes test
execution to pause at each point to allow flow adjustment (jog) prior to taking data at the
point.
Use COMPASS to run tests with a reference other than a DHI molbloc/molbox?
Though COMPASS only supports automated operation with DHI molbloc/molbox mass
flow references, COMPASS can be used to run manual entry tests with any flow reference.
Using the [S
the <Manufacturer> (see Section 10.3.3). A test can then be run in which reference flow
values are entered manually at each point. DUT readings can be automated or not as in
any other test. This feature allows COMPASS to be used to standardize flow calibration
procedures and data reporting even with references with which COMPASS cannot
interface directly. Entry of reference flow values must be in the flow units that are selected
for display on the molbox. To change these units, go to the [T
tab and use <Display mass flow unit>.
Page 9 © 1998-2003 DH Instruments, Inc.
etup], [Hardware], [Reference] tab, set up a reference selecting <Other> as
ools], [Options], [molbox]
Page 24

Set up COMPASS for my volume or actual flow units?
From the [Setup], [DUT], [Range] tab, select the <Unit> drop down under the “Flow
Range” section of the window. Scroll through this list to find the units you desire. If they
COMPASS for molbox™ User’s Manual
do not exist they can be added using the <Edit Units> selection or the [T
low Unit Editor] option (see Section 8.5.4). When selecting volume flow units,
[F
ools], [Options],
COMPASS requires the actual operating conditions (temperature and absolute pressure)
at the DUT. The temperature and pressure can be either acquired automatically or
entered manually by the user. The [S
acquisition method for pressure and temperature (see Section 10.2). The [T
ptions], [Run Test] tab controls manual entry (see Section 11.6).
[O
etup], [System] selections determine the data
ools],
Test one specific DUT without having to enter its serial number and ID during
test initialization?
Set the DUT up as an individual DUT (see Section 8.5.2). Individual DUTs define unique
DUTs and include the DUT’s serial and ID number. When a DUT definition is run, it is
assumed there is only one DUT with the specified serial number and ID.
Repeat a point in a test?
Use the [Skip Back] and [Skip Forward] keys from the Run Test Toolba r (see Se ction 6. 5.1).
Check what DUT or Test Definition is being run and check DUT and Test Definition
details while a test is running?
Click on the [View DUT] or [View Test] Run Test Toolbar keys to cause the DUT or Test
Definition screen for the current DUT or test to appear without affecting test execution.
Close or move the display to view the previous run screens (see Section 6.5.1).
Repeat the same test several times without having to pause or restart the test?
Specify multiple test cycles in the Test Definition. In the [S eque nce ] tab of the Test Definition
(see Section 9.5.4) specify a number >1 under <Number of Test Cycles>. The complete flow
point sequence will run for the number of times specified without initializing between runs.
If all test operation aspects are automated, and [T
ools], [Options], [ End Test], <Prompt
to repeat last test point> is NOT checked, the cycles will run without interruption
(see Section 11.7).
Create a custom plot of data logged in the data file?
There are two ways of going about this. First, COMPASS provides the ability to create
custom plots within the [Plot Properties] toolbar option (see Section 12.4.2). A label for the
plot as well as the X and Y data can be set up. The second method requires the use of a
third party spreadsheet application, MS Excel for example. Import the delimited COMPASS
data file and use plot functions within the tool to create a plot.
Avoid having to go through undesired initialization steps each time a test is started?
Use the [Tools], [Options], [Initialize Test] tab to set preferences to include or exclude
the various test initialization steps (see Section 11.7).
Abort a test that is running?
Press the [Abort] key on the Run Test Toolbar (see Section 6.5.1) or use the [Run],
bort Run Mode] menu option while the test is running.
[A
Change the default RS-232 port for reading DUTs so that I don’t have to re-select the
port manually every time in the <Setup DUT> screen of test initialization?
Use [Setup], [System], <Default DUT RS232 Port> to edit the default DUT RS-232 port
(see Section 10.2).
© 1998-2003 DH Instruments, Inc. Page 10
Page 25

COMPASS for molbox™ User’s Manual
Add or remove a test point while editing a test definition?
In the Test Definition <Points> Table, double clicking any test point automatically removes
it from the test point list. All subsequent test points are shifted up. To add a test point
press the <Insert> button and drag the pencil icon to the point location to insert. All test
points will shift down leaving an opening to enter a new test point (see Section 9.5.2).
Change the resolution with which the reference and/or DUT readings are displayed
while running and recorded in the Data File?
DUT resolution is determined in the DUT Definition (see Section 9.5.8). To change the
DUT resolution, edit the DUT <Range> tab. Select both the <Flow> and <Output>
resolution that are appropriate for the DUT. By default reference resolution is one digit
greater than the specified DUT resolution.
Run an automated test if my computer has only one COM port and the molbox
reference and DUT (or DMM) are both RS-232?
Connect the computer COM port to COM1 of the molbox . Connect the DUT (or DMM) to COM2
of the molbox and set the DUT or DMM to be read on Ref COM2 (see Section 10.3.4
and/or 13.3.1). This solution is only possible with DHI molbox references that have a COM2.
Troubleshoot communications with remote devices (references, DMMs, DUTs, etc.)?
Use [Tools], [Remote Communications] (see Section 13.6) to interface directly with the
device, send command strings and display the responses. Be sure to refer to the device’s
User’s Manual for assistance specific to the device. Changes to interface settings made in
ools], [Remote Communications] are temporary. If changes were necessary to
[T
establish communications, these changes must be made in the device’s Hardware
Definition (see Section 10.3).
Reposition the main program toolbars?
Right click the <Main Toolbar> or the <Control Toolbar> to get a popup menu of options
to reposition the toolbars (see Sections 6.5 and 6.6).
Determine the “characters to strip” from the response of a remote DUT or DMM?
Use [Tools], [Remote Communications] (see Section 10.3) to query the device and
observe its response string.
Use the same device for more than one task in the Hardware Definition (e.g., DMM
also measure frequency)?
Set up the instrument in both Hardware Definitions and select it for both functions in the
System Configuration (see Section 10). Make sure the same remote interface selection is
used in both setups.
Log data not already logged by COMPASS?
Use [Setup][Hardware]<Auxiliary> (see Section 10.3.7) to create the interface for the
device that will be used to measure the desired output. An example Auxiliary Data setup
of the valve voltage measuring ability of the molbox was installed with COMPASS. After the
device has been setup, select it in a Test Definition (see Section 9.5.10) or select the
device in initialization of [Run DUT] or [Run molbox].
Log data without running a test or take data over an extended period of time?
Use [Run],[Run DUT] or [Run molbox] (see Section 7.3) to begin data acquisition with
the molbox, (and DUT) and other support devices. Select the [Create data file] option on
the <Run Toolbar>. Then use the data acquisition options to log discrete data points or
take points over time (see Section 6.5).
Page 11 © 1998-2003 DH Instruments, Inc.
Page 26

Customize the test report created by COMPASS to my own requirements?
Modify the report template to reflect your requirements (see Section 16.3.1.3). It is best to
select an existing template, then use the <Save As> option to create a copy of the
template under a different name. Then edit the template as required to get the desired
report output.
Remove items from drop down lists?
Certain COMPASS drop down lists are built automatically from operator entries. Items can
COMPASS for molbox™ User’s Manual
be removed from these lists if desired. Use the [T
ools], [Options], [Maintain Lists] tab
(see Section 11.4).
Use the molbox1 MFC control option to control flow and an external DMM to
measure the DUT output?
Set up a DUT Definition with a <Voltage/Current> <Output Type> (see Section 8.5.8).
Set up the DMM in the Hardware Definition and specify the remote commands necessary
to read the output (see Section 10.3.4). In [S
etup], [System], select the DMM in the
System Configuration as the <DUT Output DMM>. On the same form, select the
<Reference molbox> item as the <Set Point Power Supply> (see Section 10.2). When a test
is run or [Run D
UT] is selected, the DMM specified in the System Configuration will be
used to measure the DUT output. This example requires that a molbox1 with the MFC
control optional installed be selected as the <Reference> in the Hardware Configuration.
Update my existing DUT and Test Files to work with this version of COMPASS?
Select [Tools], [File Upgrade Wizard] (see Section 2.3.3). Select the type of file to
upgrade, either DUT or Test File. In either case you will be prompted to select whether
you would like to convert all files in a directory or an individual file. Choose the target
directory or the target file(s) to convert. The old file name will automatically be saved as
the <Record Label> of the new DUT or Test Definition.
Import COMPASS Data Files into Excel?
From within Excel select [File], [Open], locate and select the Data File that you would like
to import. Excel will open the Text Import Wizard. Select the “Delimited” option, and the
“Next” button. Choose the “semicolon” delimiter (or other selected delimiter see Section 12)
and complete the action by pressing the “F
inish” button. Be careful that you do not
overwrite your COMPASS Data File with an Excel written file, it will no longer be
compatible with COMPASS.
© 1998-2003 DH Instruments, Inc. Page 12
Page 27

COMPASS for molbox™ User’s Manual
55..
A
PPPPLLIICCAATTIIOONN
A
E
XXAAMMPPLLEES
E
S
5.1 OVERVIEW
This section contains several generic application examples that cover many common COMPASS setups.
Using these examples and the How Do I? tips in Section 4.1 will greatly simplify the learning process to
get a test started. Although each example may not include explicit instructions on all test steps, there are
three required steps that must always be followed before a test can be run:
Create (or select) a DUT Definition.
Create (or select) a Test Definition.
Set up the Hardware Configuration to support the DUT and Test Definitions.
Each of the examples in Sections 5.1.1 to 5.1.6 uses generic DUT command information. Refer to the
actual DUT documentation when trying to run a test following any of these examples.
5.1.1 EXAMPLE #1
“How do I use a molbox1 reference to automatically calibrate a DUT that has a range of
0 to 50 sccm and uses an RS485 or digital interface?”
Most manufacturers that use RS485 and digital interfaces also supply a converter box that
transforms the communications interface into RS-232. If this converter is available, set up
the DUT Definition with an RS-232 as its <Output Type> on the DUT Definition [Read] tab.
Without this converter box, COMPASS cannot communicate with this type of DUT.
For this example, assume the Test Definition “Test1” was previously set up for DUT control
and a sequence of test points that fit the requirements of the DUT has been set up (see Section 9).
The DUT in this example outputs in the format “N+24.55” as 24.55 % (correspon ding to 12.28 sccm)
when passed the command (02H)“01RFX.” The (02H) is a non printable ASCII control code
that has a hexidecimal value of 2 (see Section 8.5.8). These codes are sometimes required
by DUTs when using an RS-232 converter. The DUT set command is “(02H)”01STD###”
where” ###” represents the numerical target flow value as a percentage of full scale. The objective
of this example is to demonstrate the basic requirements of a direct flow output DUT using a
remote command and how to use [S
The DUT in this example uses an RS-232 interface, however changing the DUT <Output Type>
on the DUT Definition [Read] tab to IEEE-488 is all that is required to use IEEE-488.
etup], [System] to configure the system hardware.
Page 13 © 1998-2003 DH Instruments, Inc.
Page 28
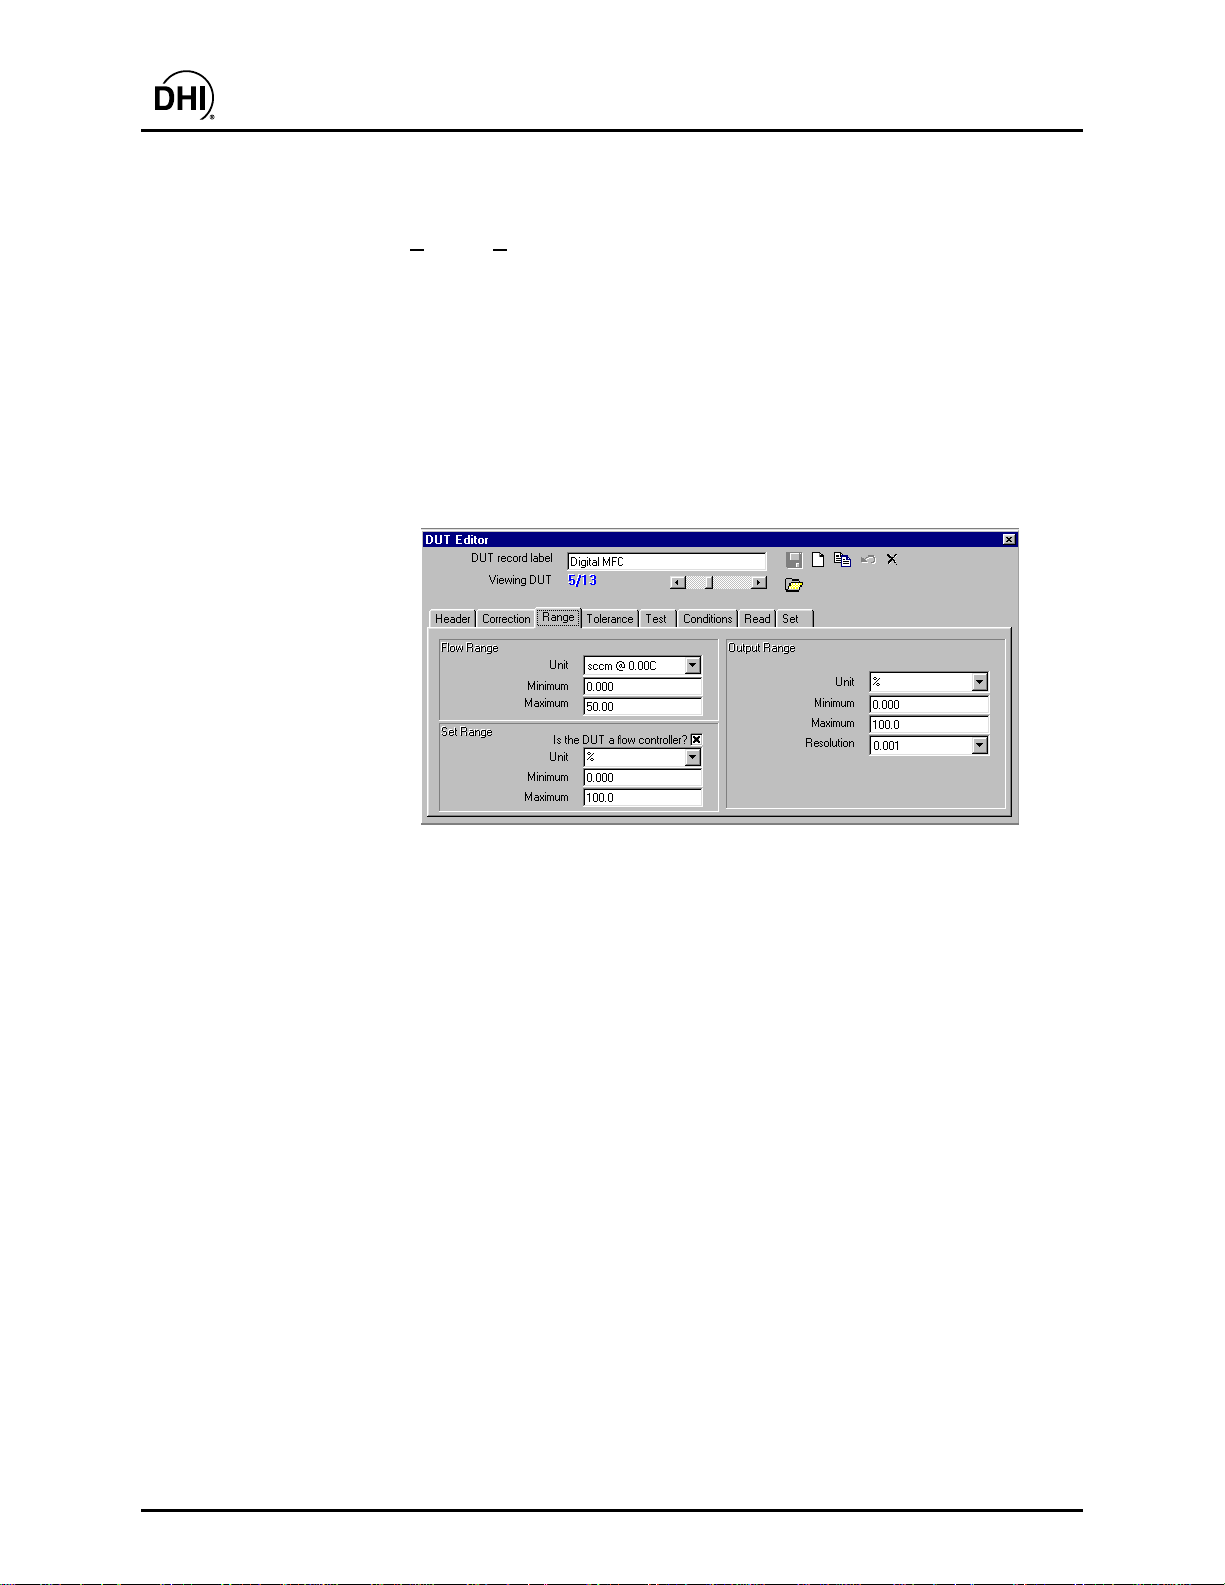
5.1.1.1 SET UP AN RS-232 DUT
Use [Setup], [DUT] to create a new DUT Definition (see Section 8). If a DUT
with similar characteristics already exists, it is easier to copy and edit the existing
DUT than to start from scratch. Before attempting to set up the RS-232 DUT,
refer to the DUT documentation to determine the commands used to measure
and control flow as well as the RS-232 interface settings. The first step is to enter
all of the DUT header information and decide whether to make this an <Individual DUT>
or a <DUT Profile>. If the DUT is unique, use the <Individual DUT> option to
avoid the need to enter the DUT serial number and identification before starting a
test (see Section 8.5.2). Next, enter the flow range information. In most cases,
if a DUT outputs directly in RS-232 or IEEE-488, it will output in flow units.
However, this is not the case in this example. Note that <Flow Units> are
“sccm @ 0.00C” and <Output Units> are “%” (see Section 8.5.4).
COMPASS for molbox™ User’s Manual
Figure 1. Example 1, DUT Range Setup
Select RS-232 as the DUT <Output Type> on the [Read] tab and enter the RS-232
settings for this DUT: 9600,E,7,1 (see Section 8.5.8). Then click the <Edit> button
next to the <Read Commands> list to display the remote command setup form.
To create the control code (02H), press the <Insert Special Character> button.
Select Hex then scroll to character “02” and press the insert button. The cursor
will turn into a pencil. Go to the first <Remote Command> entry field and click
the mouse in the left most position in the text display. A square or rectangle will
display where the mouse was clicked. Now enter the DUT flow command,
“01RFX” next to the control code. The DUT in this example outputs “N+24.55” as
24.55 %. So enter 1 in the <Leading characters to strip>. Press <OK> to save
the command setup and return to the DUT Definition Editor.
© 1998-2003 DH Instruments, Inc. Page 14
Page 29
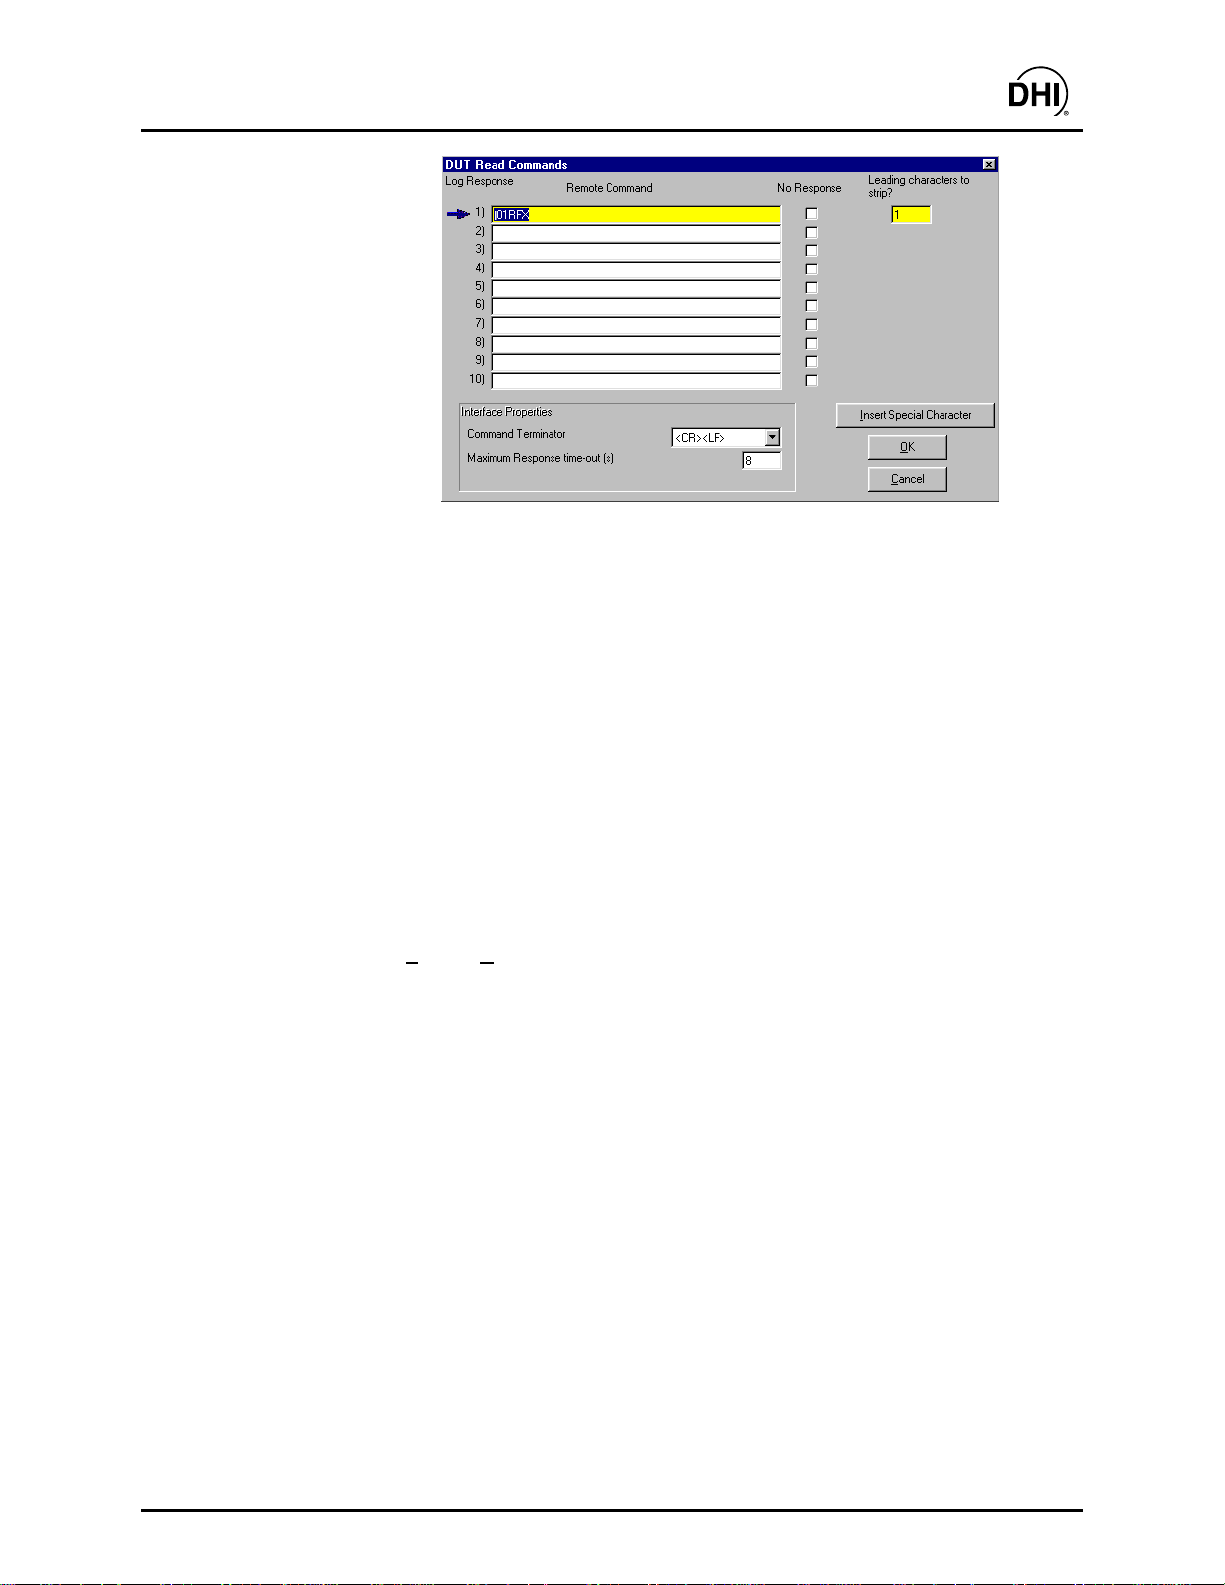
COMPASS for molbox™ User’s Manual
Setting up the <Set Point Type> is similar to setting up the DUT <Output Type>.
On the [Set] tab, first select RS-232 as the <Set Point Type>, then enter the
RS-232 settings for the DUT: 9600,E,7,1. Then click the <Edit> button next to
the <Set Commands> list to display the remote command setup form. Insert the
(02H) control code as previously described. Now enter the DUT Set command,
“01STD” next to the control code. Instead of ## for the numerical set value,
either type or drag and drop the <Set Unit Variable> at the end of the set
command. This tells COMPASS where to place the numerical flow target value.
Figure 2. Example 1, DUT Read Command Setup
Save this DUT using the <Save> toolbar icon. The RS-232 communications port has
not been entered. This selectio n occurs as one of the last steps in test initialization,
<Setup DUT(s) - Data Acquisition> (see Section 7.2.1.5).
5.1.1.2 SET UP A molbox AS THE REFERENCE
Use [Setup], [Hardware] to open the Hardware Definition screen (see Section 10.3.3).
Select the [Reference] tab and check to see if the desired molbox is already in
the list. If so, verify that the remote settings are correct and close the display.
Otherwise press <New> to create a new reference (see Section 10.3.3). Select
DH Instruments as the manufacturer and molbox1 (or RFM) as the model reference.
Then enter all other support information. For this example, the molbox will use
an IEEE-488 interface. The IEEE-488 address of the molbox can be determined
using the molbox’s front panel [Special] key (see the molbox Operation and
Maintenance Manual). In this example, 10 is used. Press <OK> to save this
Reference Definition.
Page 15 © 1998-2003 DH Instruments, Inc.
Page 30
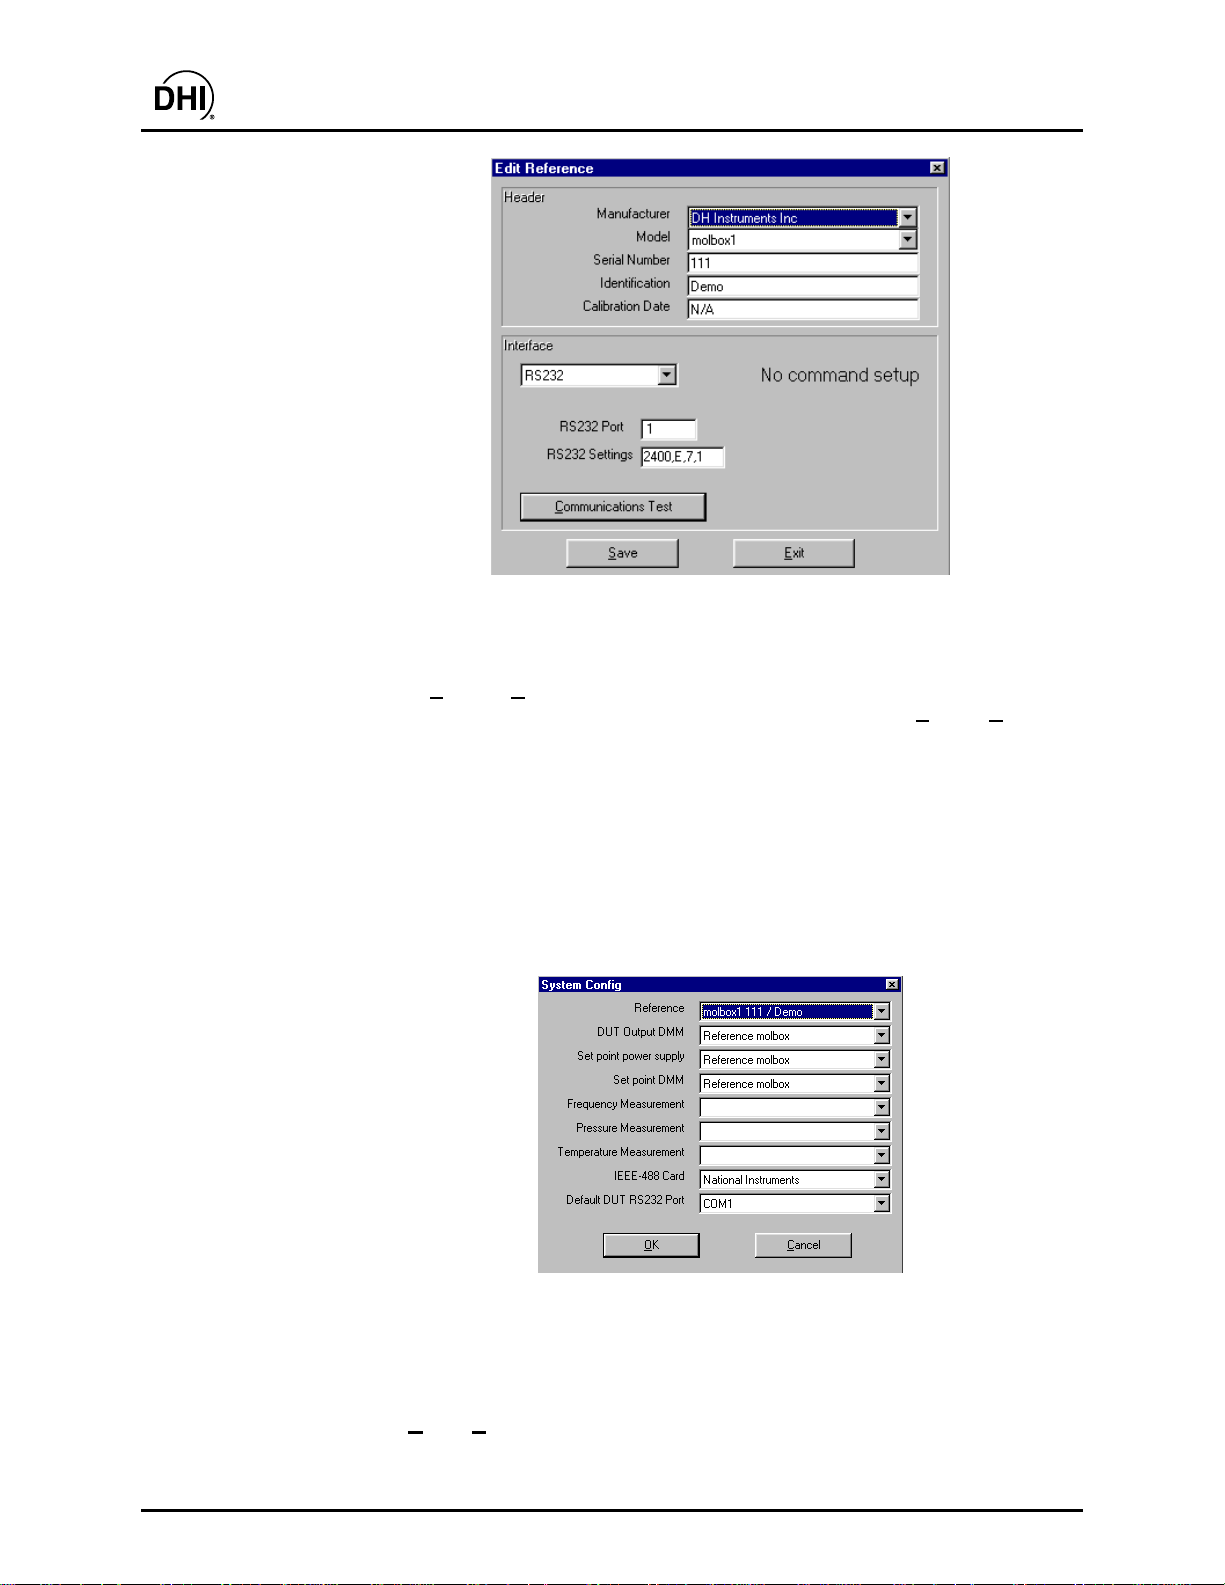
COMPASS for molbox™ User’s Manual
Figure 3. Example 1, molbox1 Reference Setup
Now that the molbox is set up, it must be selected in the System Configuration.
Select [S
the only place the hardware to be used by COMPASS is specified. [S
etup], [System] from the main menu (see Section 10.2). This form is
etup], [Hardware]
creates Hardware Definitions which are lists of supported devices that can be
selected to create the current System Configuration. Select the molbox in the
<Flow Reference> list. Since the molbox will use an IEEE-488 interface, make
sure an <IEEE-488 Card> selection is made. To streamline the setup,
the <Default DUT RS232 Port> can also be selected. All other selections have
no impact when running this example. System Configuration items are only used
as required by the test that is run. When the System Configuration is complete,
there is no reason to change it unless a new DUT to be tested requires a
different System Configuration. Click the <Close> button to store the current
System Configuration and return to the main program.
Figure 4. Example 1, System Configuration
5.1.1.3 RUN THE TEST
Use [Run], [Run Test] to execute a test (see Section 7.2). COMPASS will verify
the interface of the reference molbox and determine which features it supports.
Select the desired DUT and “Test1” in the test initialization (see Section 7.2.1).
© 1998-2003 DH Instruments, Inc. Page 16
Page 31

COMPASS for molbox™ User’s Manual
Next, the <Setup DUT> screen displays for the final setup of the DUT serial
number, identification (for DUT Profiles only) and RS-232 settings. Enter the
DUT serial number and identification if desired then click the <Read Interface>
RS-232 settings display to display the RS-232 setup window. Make the necessary
RS-232 selections and press <OK> (see Section 7.2.1.5). The selected settings
are automatically copied to the <Set Interface>. Press <OK> on the <Setup DUT(s)>
screen to start the test. COMPASS will step through the test point sequence
gathering data from the reference and the DUT (see Section 7.2.2).
Figure 5. Example 1, DUT Interface Setup
The COM2 port of the molbox can be used instead of a communications port
on the PC by selecting <Ref Com2> found at the end of the <COM Port> list.
This selection is valid for any RS-232 device except the molbox itself.
Figure 6. Example 1, RS-232 Setup with Ref Com2
Page 17 © 1998-2003 DH Instruments, Inc.
Page 32

COMPASS for molbox™ User’s Manual
5.1.2 EXAMPLE #2
Assuming the molbox1 from Example 1 is set up and it has the MFC control option,
“How do I calibrate a DUT that outputs 0 to 5 V corresponding to 0 to 1 slm?”
This example demonstrates the setup requirements of a common analog output DUT. The only
setup required to use the molbox MFC control option is to make sure the molbox is set up
with the proper remote interface in a Reference Hardware Definition and select the molbox in
the System Configuration (see Section 10).
5.1.2.1 SETUP <VOLTAGE/CURRENT> OUTPUT TYPE
Use the [Setup], [DUT] menu choice to open the DUT Definition Editor (see Section 8).
Create a new DUT Defini tion and s e t up th e bas ic h eader in forma tion corresp ond ing
to the DUT. In the [Range] tab (see Section 8.5.4), select the flow range units
from the flow units list and enter the flow min and max values; 0 and 1 respectively.
Check the <Controller> checkbox on the <Set Range> panel. Now type or
select “V” as the output and set units. Enter 0 and 5 as the min and max output
and set point values. DUT’s that use voltage or current signals to indicate flow
should use the <Voltage/Current> <Output Type>. This tells COMPASS to use
the instrument currently selected as the <DUT Output DMM> in the System
Configuration to measure the DUT flow. Select <Voltage/Current> as the DUT
<Set Mode>. This tells COMPASS to use the <Set Point Power Supply>
selected in the Hardware Definition to control the DUT flow. Use the <Save>
toolbar icon to save the DUT.
5.1.2.2 REFERENCE SETUP
Since we have assumed the reference molbox in Example #1 is already properly
set up, we only need to make the necessary Hardware Definition selections to
use the MFC control option. Use the [S
the <System Config> form (see Section 10.2). First select the molbox as the
<Reference>. This automatically adds a <Reference molbox> option to the
<Set Point Power Supply>, <Set Point DMM> and <DUT Output DMM> lists.
Select <Reference molbox> in all lists. If it were desired to set with the molbox but
measure with a DMM, the DMM should be selected in the <DUT Output DMM> list.
etup], [System] menu option to display
5.1.2.3 RUN THE TEST
Use [Run], [Run Test] to start a test sequence. Select the DUT just created and
the desired Test Definition when prompted. There is no interface selection
required when setting up the DUT interface during the test initialization.
© 1998-2003 DH Instruments, Inc. Page 18
Page 33

COMPASS for molbox™ User’s Manual
5.1.3 EXAMPLE #3
“How do I use my HP34401A DMM to measure the DUT output?”
The HP34401A is a popular high accuracy Hewlett Packard multimeter that has an IEEE-488 and
RS-232 interface. To read a voltage from this DMM, the command “MEAS:VOLT:DC?” must
be issued. This example demonstrates the basic requirements of setting up a DMM for DUT
data acquisition in the Hardware Definition.
5.1.3.1 DUT DEFINITION SETUP
The only requirement for DUT to be tested using an external DMM is that the output type
of the DUT be <Voltage/Current> in the [Read] tab of the DUT Definition (see Section 8.5.8).
5.1.3.2 DMM CONFIGURATION SETUP
Use [Setup], [Hardware], then select the [DMM] tab and click <New> to create
a new DMM (see Section 10.3.4). Enter the basic DMM setup information at the
top of the form. This particular DMM sup ports both RS-232 and IEEE-488 interfaces.
In this example IEEE-488 is used. If RS-232 were chosen, it is possible to use the
<Ref Com2> option to use the COM2 port of the reference molbox to communicate
with the DMM. Select “Voltage (V)” from the <Output Units> field. Then press the
<Read Commands> button. This displays the remote command Editor. Enter
“MEAS:VOLT:DC?” in the command field then press <OK> to store the setting
and return to the DMM Editor. Now is a good time to find the command to read
current so there is no need to re-configure this DMM in the future. Select “Current (A)”
from the <Output Units> field then again press the <Read Command> button.
Enter “MEAS:CURRENT:DC?” in the first field then press <OK>. This is the command
to read current in Amps should it be needed later. There are no leading characters
to strip and the command terminator is carriage return + line feed. Press <OK>
to save this DMM. This Hardware Definition provides COMPASS with the
necessary information to use a DUT that outputs in V, mV and/or mA.
Figure 7. Example 2, DMM Setup
Access the System Configuration using the [Setup], [System] menu (see Section 10.2).
Select this DMM as the <DUT Output DMM>. Click <Close> to store the
configuration and return to the main program.
Page 19 © 1998-2003 DH Instruments, Inc.
Page 34

COMPASS for molbox™ User’s Manual
5.1.3.3 RUN THE TEST
Now that the COMPASS System Configuration includes the hardware necessary
to run the test, use [R
There is no interface selection required when setting up the DUT interface at the
end of the test initialization. COMPASS will step through the test point sequence
gathering data from the molbox and the DUT.
un], [Run Test ] to start a test sequence (see Section 7.2).
5.1.4 EXAMPLE #4
“How do I set up to calibrate a rotameter?”
Typical rotameters (variable area flowmeters) have scale indications that are either in mass flow units
(sccm or slm, for example) or float position units (such as mm, inches). Since there is no electronic
output of the rotameter’s flow indication, the user must enter this value manually when a test is run.
If the rotameter’s scale is marked in flow units or unitless divisions, the reference pressure and
temperature should also be marked on the scale (or be listed in manufacturer literature).
These values must be entered into th e DUT D efin ition as the Nor mal O perat ing Conditio ns o f the
DUT (see Section 8.5.3).
If the scale is marked in float position units, the DUT Definition output range should be in the
same units (see Section 8.5.4 ).
In either case, when a test is run, the ac tual gas conditions at the rotameter (temperature and
absolute pressure) will need to be measured and supplied to COMPASS.
5.1.4.1 DUT DEFINITION SETUP
Select the [Setup], [DUT], [Header] tab, and select the DUT’s process gas
(see Section 8.5.2).
Select the [S
Correction Type (see Section 8.5.3). You must also enter the Temperature and
Absolute Pressure for th e DUT’s Normal Operating Conditions. The molecular mass
or the specific gravity and the compressibility of the process gas must also be
entered into COMPASS in this location. If the DUT process gas is a gas that is supported
by molbox, these gas properties will be entered for you and cannot be edited.
Select the [S
Range units (these must be units of flow such as accm, or sccm – not scale indication
such as mm or inches) and enter its Flow Range (see Section 8.5.4). Enter the DUT’s
Output Range units, and enter its Output Range (these can be units such as mm or in.).
etup], [DUT, [Correction] tab, and select the “Square Root” Gas Density
etup], [DUT], [Range] tab, and select or create the DUT’s Flow
Figure 8. Example 4, DUT Setup
© 1998-2003 DH Instruments, Inc. Page 20
Page 35

COMPASS for molbox™ User’s Manual
Select the [S
etup], [DUT], [Test] tab, and select the “Calibration Gas” that you
will be using to calibrate the rotameter (see Section 8.5.6).
Select the [S
etup], [DUT, [Read] tab, and select “Manual” for the DUT Output
Type (see Section 8.5.8).
5.1.4.2 TEST DEFINITION SETUP
There is nothing out of the ordinary about setting up a Test Definition for a
rotameter (see Section 9), except that <Jog Before Dwell> should be checked
on the [Control] if you are using the <Other Controller> method of flow controls
and you want to adjust flow to the rotameter ball or cardinal points before taking
data (see Section 9.5.6).
5.1.4.3 TEST HARDWARE SETUP
The installation of the rotameter into the test plumbing should be made following
the manufacturer’s recommendations. In general, if the flow controlling device is upstream
of the rotameter, the gas pressure and temperature measuremen ts should be tak en
on the outlet side of the rotameter. If the flo w control va lve is o n the outl et of the rotamet er,
the pressure and temperature measurement s should be taken at the inlet of the rotameter.
Precise calculation of the flow to take into account that the rotameter is affected
by gas density cannot be made without knowledge of actual gas temperature and
absolute pressure at the rotameter during the test. This information must be
entered manually when a test is run if it can’t be obtained automatically.
The setup of manual entry of pressure and temperature is a two-part process. The [S
ystem], <Pressure Measurement>, and <Temperature Measurement> selections
[S
etup],
should both read <Manual> when not using automated reading devices (see Section 10.2).
Then, use the [T
ools], [COMPASS Options], [Run Test] Tab to specify either
“first point”, “each point” or “use default value” for the manual entry method of the
gas pressure and temperature (see Section 11.6).
The setup of automatic pressure and temperature measurement is a two-step process.
First the Hardware Definitions for the devices used to measure pressure and
temperature must be created using the [S
etup], [Hardware], [Temperature]
and/or [Pressure] tab (see Section 10.3.4). Next the devices must be selected
in the System Configuration using [S
etup], [System], [Temperature] and [Pressure]
pull-down menus (see Section 10.2).
Figure 9. Example 4, System Configuration
Page 21 © 1998-2003 DH Instruments, Inc.
Page 36

COMPASS for molbox™ User’s Manual
5.1.4.4 RUN THE TEST
Now that the COMPASS System Configuration includes the hardware necessary
to run the test, use [R
two (2) flow data fields that are associated with the rotameter test. The field that
contains the flow that is generated using the measured gas pressure and temperature
and the Square Root Density Correction is called “Ref Q DUT Cond”. This is the
flow rate that is in the DUT’s units and co rrected to what the Referen ce flow would be
at the DUT’s normal operating conditions. The other flow value that COMPASS
calculates is the “Ref Q”. This is the Reference flow displayed in the DUT’s flow units,
without any type of gas density correction. “Ref Q DUT Cond” should always be
used as the actual flow through the DUT and in evaluating its performance.
The data field “DUT Q” is the calculated value of flow derived by scaling the
DUT Output Range to the DUT Flow Range. It is calculated at each point
assuming a linear output. This is the value that is used to calculate percent
errors, either as a percent full-scale or of reading.
un], [Run Test] to start a test sequence. COMPASS calculates
5.1.5 EXAMPLE #5
“How do I set up to calibrate a DUT that outputs volume or actual flow units such as
ccm, cfh, or accm, acfh?
Volume or actual flow units of measure are NOT mass flow units. Very few flow
measurements are made in these units even though the unit used may refer to volume
(there are important differences between volume or actual units and volumetrically based
mass flow units such as sccm). Before using volume or actual flow units, be absolutely
sure that this is, in fact, what you want. See the [Unit] Section of the molbox Operation
and Maintenance Manual for complete information on different flow unit types.
COMPASS “axxxx” units correspond to volume or actual flow units in molbox.
Measuring actual or volume flow requires the ac tual pressure and temperature of the gas at the
DUT to be known when a test is run. Current gas pressure and temperature data is indispen sa b l e
to the determination of flow in volumetric or “actual” flow units. COMPASS supports different w ays
of acquiring gas pressure and temperature data including automatic data acquisition and manual entry.
5.1.5.1 DUT DEFINITION SETUP
Select the [Setup], [DUT], [Header] tab, and specify the DUT’s process gas
(see Section 8.5.2).
Select the [S
units (these will be in units of flow such as accm, or acfh) and enter its Flow Range
(see Section 8.5.4). Enter the DUT’s Output Range units, and enter its Output Range.
etup], [DUT], [Range] tab, and select or create the DUT’s Flow Range
© 1998-2003 DH Instruments, Inc. Page 22
Page 37

COMPASS for molbox™ User’s Manual
Select the [Setup], [DUT], [Test] tab, and select the “Calibration Gas” that you
will be using to test the DUT (see Section 8.5.6).
Figure 10. Example 5, DUT Definition
Select the [S
etup], [DUT], [Read] tab, and select the DUT Data Output Type
(see Section 8.5.8). This is <Manual> if the DUT output cannot be read automatically.
5.1.5.2 TEST DEFINITION SETUP
There is nothing out of the ordinary about setting up a test to test a DUT that
outputs volume or actual flow units (see Section 9).
5.1.5.3 TEST HARDWARE SETUP
The installation of a DUT that measures in volume or actual flow units should be made
following the manufacturer’s recommendations for straight piping lengths, etc.
Precise volume or actual flow measurements cannot be made without the knowledge
of the actual temperature and absolute pressure of the gas at the DUT during the test.
This information can be read automatically by COMPASS if the necessary
Hardware Definitions are included in the System Configuration (see Sections
10.3.4, 10.2). If they cannot be read automatically they must be entered manually or
set to a default value (see Section 11.6). Generally, the gas temperature and absolute
pressure measurements should be taken at the inlet side of the DUT. Some manufacturers
supply a test port for the connection of a pressure monitoring device.
The setup of manual entry of pressure and temperature is a two part process.
etup], [System], <Pressure Measurement> and <Temperature Measurement>
The [S
should both be blank when manual entry is to be used (see Section 10.2). Use the
ools], [Options], [Run Test] tab to specify whether temperature and pressure
[T
will be entered at the “first point”, “each point” or by “use default value”.
The setup of automatic pressure and temperature measurement is a two-step process.
First the Hardware Definitions of the mea surin g dev ices nee d to be creat ed u sin g th e
etup], [Hardware], [Temperature] and/or [Pressure] tabs (see Sectio n 10.3.4).
[S
Next they must be selected for use by COMPASS using the [S
etup], [System],
[Temperature] and/or [Pressure] pull-down menus (see Section 10.2).
Page 23 © 1998-2003 DH Instruments, Inc.
Page 38

Figure 11. Example 5, System Configuration
COMPASS for molbox™ User’s Manual
5.1.5.4 RUN THE TEST
Use [Run], [Run Test] to start a test sequence (see Section 7.2).
5.1.6 EXAMPLE #6
“How do I set up to test at a single flow point for an extended period of time?”
You may desire to use COMPASS and the molbox/molbloc t o capture mass flow data at one flo w
point over an extended period of time. This test method could be useful, for instance, to determine
the stability of a DUT over time at a single set point.
5.1.6.1 DUT DEFINITION SETUP
Select or create a DUT Definition that matches the characteristics of the DUT
that you will be running (see Section 8).
5.1.6.2 TEST DEFINITION SETUP
Select the [Setup], [Test], [Points] table, and enter the test point at which you
would like to acquire the data (see Section 9).
Select the [S
parameters. In order to run a long-term test, you can enter up to 100 readings
per flow point. During the test, complete point reading sequences including
averaging time will be made one after another with only the calculations, data
storage, and data plotting operations in between. To make even more readings,
repeat the same point in the <Points> table.
etup], [Test], [Sequence] tab, and enter the test sequence
If your DUT is a controller, or you are using an “other controller”, COMPASS
has an option for two modes of flow regulation. You can select for
COMPASS to make periodic flow control updates, and you can close the control
loop on either the reference flow, or the DUT output (see Section 9.5.6).
© 1998-2003 DH Instruments, Inc. Page 24
Page 39

COMPASS for molbox™ User’s Manual
5.1.6.3 RUN THE TEST
Use [Run], [Run Test] to start the test sequence (see Section 7.2).
5.1.6.4 PLOT THE DATA
Once the test is complete, you can use the Plot options to product a plot of either
Reference flow or DUT output versus point number (see Section 12.4).
5.1.7 EXAMPLE #7
“How do I set up to use COMPASS to compare molbox/molbloc flow to that of a piston
prover or bell prover?”
The flow output of the molbloc can be connected to the input of a piston prover or bell prover and then
their flow indications can be compared. Th is example assumes that the prover’s flow indication
is in mass flow units (such as kg/sec), or volumetrically based mass flow units (such as sccm).
This implies that the prover accessories include density correction hardware and software.
Volume or actual flow units (such as accm o r c f ar e NIT mass flow un its . When run ning this type
of test take extra care to assure that the plumbing used for interconnection is leak-free, and that
the inlet pressure to the molbloc is within its calibration li mits.
5.1.7.1 DUT DEFINITION SETUP
Select the [Setup], [DUT], [Header] tab, and select the DUT’s process gas (see Section 8.5.2).
In this type of comparison the calibration gas should be the same as the process gas.
Piston provers and/or bell provers do not usually have ga s conversi on or “K” factors.
Select the [S
selected for the Gas Density Correction Type (see Section 8.5.3).
Select the [S
and Output Range units (these will be in units of mass flow such as sccm, slm,
kg/sec, etc.). Enter the DUT’s Flow Range and Out put Range (see Secti on 8.5.4).
Select the [S
etup], [DUT], [Correction] tab, and ensure that “None” has been
etup], [DUT], [Range] tab, and select or create the DUT’s Flow Range
etup], [DUT], [Test] tab, and select the calibration gas (see Section 8.5.6).
5.1.7.2 TEST DEFINITION SETUP
Select [Setup], [Test], [Sequence] tab, and enter the test sequence parameters.
Set the Stability time and Dwell time to 0 seconds, and Averaging Time to manual,
this will allow you to control and ensure that the prover is within its test stroke
while the molbox is reading and averaging data (see Section 9.5.4).
Figure 12. Example 7, Test Setup
Page 25 © 1998-2003 DH Instruments, Inc.
Page 40

COMPASS for molbox™ User’s Manual
5.1.7.3 RUN THE TEST
Use [Run], [Run Test] to start the test sequence.
If you are using manual flow control, COMPASS will prompt you to adjust the gas
flow for the given test point. Flow will be set automatically if your test is using the
<Other Controller> (see Section 9.5.6). Generally, the prover is bypassed while
setting the flow. Once you have allowed sufficient time for flow, pressure and
temperature to stabilize, you can initiate the test point.
COMPASS will display the Test Message: “Press <Start> to begin flow averaging”.
It is important the COMPASS averaging time and the prover stroke be synchronized.
Now you can initiate the stroke of your piston or bell prover. Once the prover
system begins taking data, press the COMPASS “S
the completion of data taking by the prover, press the “S
COMPASS. The goal is for COMPASS to take data for as long a period as
possible, but only during the actual measurement stroke of the prover.
tart Avg” button. Just prior to
top Avg” button in
5.1.8 EXAMPLE #8
“How do I set up to calibrate, in units of mass flow, a device that intrinsically measures
volume flow and outputs proportionally to volume flow?”
Some devices (for example bell provers, piston provers, soap film meters, turbine meters)
intrinsically measure volume flow and have an output that is proportional to volume flow .
However, the objective when the instrument is used is to measure mass flow. Volume flow
is converted to mass flow using the density of the flowing gas which requires knowledge of
the gas pressure and temperature. Some devices include a “flow computer” and/or other
accessories to measure the gas pressure and temperature and calculate mass flow from
volume flow. For example, many piston prover systems include hardware and software to
report mass flow. When this is not the case, the device output is proportional to volume flow,
or it outputs volume flow directly. For example, a turbine meter’s frequency output is proportional
to volume flow and most soap film meters output volume flow. If you would like to calibrate
such a device so that it can be used to measure mass flow, COMPASS can do so. This requires
real time measurement of gas pressure and temperature at the DUT while calibrating it and
use of the DUT proportional gas density correction. The limitation is that then the mass flow
calibration will only be valid when the DUT is used in its defined “normal operating conditions”
(i.e., reference gas pressure and temperature conditions).
COMPASS DUT gas density corrections only account for the effects of changing density
on DUT readings and not for other, typically smaller, effects on the DUT that may occur when
operating conditions change. Users should attempt to calibrate at conditions that are close
to the DUT normal operating conditions to minimize the effect of possible non-density influences.
5.1.8.1 DUT DEFINITION SETUP
Set up the DUT record in a similar way to the DUT in Example #5 (Section 5.1.5)
with the following changes:
Select [S
be a mass flow unit (e.g., sccm, mg/s, mol/s).
Select [S
Correction Type. You must also enter the DUT’s normal operating conditions
© 1998-2003 DH Instruments, Inc. Page 26
etup], [DUT], [Range] tab and select the DUT flow unit. The unit will
etup], [DUT], [Correction] tab and select the <Proportional> Gas Density
Page 41

COMPASS for molbox™ User’s Manual
these are the temperature and absolute pressure of the gas that will flow through
the DUT when it is used in the field (this is NOT measured the gas temperature
and pressure during the calibration). If you know the normal operating conditions
that were used for the DUT’s previous calibration, these conditions should be
entered for this calibration to be compared to the previous calibration. If you don’t
know or if you want to change the DUT’s normal operating conditions, enter the
desired normal operating conditions for the DUT and the new calibration will be
valid for the DUT when used under those conditions.
5.1.8.2 TEST DEFINITION SETUP
Generally, when running this type of DUT, the DUT output is adjusted to the DUT
cardinal point at each flow increment. When using an <Other Controller> as the
flow control method, use the <Jog Before Dwell> feature on the Test Definition
[Control] tab to allow this (see Section 9.5.6).
There is nothing out of the ordinary about setting u p a test for this example (see Section 9).
5.1.8.3 TEST HARDWARE SETUP
The flow meter installation should be made following the manufacturer’s recommendations.
The gas pressure and temperature should be measured as close to the DUT as possible.
To correct for the effects of changes in gas density at different flow conditions, the gas
temperature and pressure at the DUT must be known during the test. This information
must be manually entered into COMPASS if it can’t be obtained electronically.
The setup of manual entry of pressure and temperature is a two part process.
etup], [System], [Pressure Measurement] and [Temperature Measurement]
The [S
should both read <Manual> when manual entry is to be used (see Section 10.2).
Use the [T
pressure will be entered at the “first point”, “each point” or by “use default value”
(see Section 11.6).
To set up automatic pressure and temperature measurement first create the
Hardware Definitions of the measuring devices using the [S
[Temperature] and/or [Pressure] tabs (see Section 10.3.4). Next they must be
selected for use by COMPASS using the [S
and/or [Pressure] pull-down menus (see Section 10.2).
ools], [Options], [Run Test] tab to specify whether temperature and
etup], [Hardware],
etup], [System], [Temperature]
5.1.8.4 SET UP DATA GRID
To display appropriate data in the Data Grid during the test, use the [Tools], [Options],
[Grid] tab (see Section 6.7.5) and select the approp ri at e colu mn h eadi ngs. For te st s
using gas density corrections, the proper reference flow value to use is “Ref Q DUT Cond”
(reference flow at DUT conditions). It is the adjusted reference flow value after
making corrections for the effect of density changes on the DUT. This is the value
of the flow that would be going through the DUT if it were currently at its normal
operating conditions. In other words, this is the flow value that would produce the
current DUT output, if the DUT were at its normal operating conditions.
Page 27 © 1998-2003 DH Instruments, Inc.
Page 42

“Ref Q” in the data grid is the reference flow expressed in the DUT flow units
without any Gas Density Correction applied. This is the true value of the flow
that is currently going through the DUT. This value is interesting because it
shows the magnitude of the correction being applied due to the difference
between current gas pressure and temperature conditions and the DUT’s normal
operating conditions. ”Req Q” should NOT be used as the reference flow value
in this example.
When no Gas Density Correction is being applied, the “Ref Q DUT Cond” value
is equal to the “Ref Q” value. Therefore, “Ref Q DUT Cond” can be used as the
reference flow for all tests in both the Data Grid and Report Editor.
5.1.8.5 RUN THE TEST
Generally, in this type of calibration, the flow is adjusted so that the DUT output is
on a cardinal point.
If DUT output, pressure and temperature entries are set up for manual entry,
COMPASS will prompt you to enter them at the appropriate times during the test.
Be sure to enter these values in the units requested. These units can be changed
COMPASS for molbox™ User’s Manual
using [T
ools], [Options], [Run Test] tab.
© 1998-2003 DH Instruments, Inc. Page 28
Page 43

COMPASS for molbox™ User’s Manual
66..
M
M
AAIINN
S
CCRREEEEN
S
N
6.1 OVERVIEW
The main screen contains the interface bet ween the prog ram set up a n d all of the dat a a cqui sitio n run screen s.
When COMPASS is first started up, the main screen displays without any child windows. Only after a
menu option is selected does the screen update to display the corresponding window. The following
features are available on the main screen:
• Main menu bar to access all COMPASS menus and functions (see Section 6.2).
• Status bar at the bottom of the screen that contains information on the current point in a test and the
status of an operation (see Section 6.3).
• Run mode display to indicate the current COMPASS run mode (see Section 6.4).
• Run toolbar that provides quick access to runtime program displays and functions (see Section 6.5).
• Control toolbar that is available on the left of the main screen only in Run DUT and Run molbox
modes (see Section 6.6).
• Several individual run screens that are available when running to provide real time data acquisition
information (see Section 6.7).
6.2 MAIN MENU BAR
The main menu bar is divided into six separate selections. Each menu item is summarized below and
covered in detail in various sections of this manual.
un]: Use this choice to start one of the three COMPASS test running/data acquisition modes.
• [R
un Test] initializes and runs Test Definitions while [Run DUT] and [Run molbox] both provide
[R
monitoring and control features without a pre-defined test script (see Section 7).
etup]: All of the necessary program setup features are contained in this menu choice. The ability
• [S
to create DUT and Test Definitions and to configure and select support hardware are the available
choices (see Section 10).
• [To
• [Da
• [D
• [H
ols]: Access tools to customize COMPASS, convert pressure, temperature and flow units, create
flow units, upgrade files from older COMPASS versions, directly communicate with any of the
supported instruments, or run the Process Gas Editor (see Section 11).
ta]: View, plot or print the raw data contained in the Data Files that result from test execution
(see Section 18). A link to the COMPASS Report Editor is also available in this menu choice (see Section 12).
isplay]: Choose which child windows to display when a run mode has been selected.
The windows can be tiled or cascaded if desired. New custom run displays can be created and
previously saved custom displays can be selected (see Section 11.9).
elp]: Access on-line help (see Section 17).
6.3 STATUS BAR
© 1998-2003 DH Instruments, Inc. Page 29
Page 44

The Status Bar is located at the bottom of the main screen. In all run modes, COMPASS flashes information
related to the current operation on this display. While running tests, two panels and a progress indicator
also display with status information on the current test step and point. The blue panel on the left displays
the current test step or function. Each point of a test sequence has five basic test steps:
molbloc Change (if specified for this point in Test Definition)
• Purge (if specified for this molbloc change)
• Leak Test (if specified for this molbloc change)
Set Flow to flow point specified
Stability Test for flow to st abilize at the set point
• Tare (if specified for this point)
• Jog Flow (if specified for this point)
Dwell for dwell time at the set point
Take Point f or length of averaging time
The red panel displays the current test point during a test. The notation used is “current cycle. current
COMPASS for molbox™ User’s Manual
point <of> total cycles. total points per cycle”. Multiple readings per point information is not included in
this display. For example, if a 2 cycle 10 point te st is execute d, point 3 of the 1
st
cycle displays as “1.3 of 2.10”.
Refer to these displays to determine the new current point, when the <Skip Back> and <Skip Forward>
buttons are used.
The progress indicator is a visual indication of the relationship between the current test point and the
number of points in a test. The left side of the progress bar represents 0 progress and the right side
represents 100 %. Each step and reading of a te st p oint increme nts the progress i ndi cator. Wh en <Skip Ba ck>
and <Skip Forward> buttons are used, the progress indicator also reflects the current position.
Figure 13. Status Bar
6.4 RUN MODES
Run mode describes the automatic execution function that COMPASS is in. Typically, instruments are polled
over their remote interface while in a run mode. The top of the main screen always displays the current
run mode. All run modes support the ability to log data to a data file. COMPASS has four run modes:
1. Idle - No run mode is active. Menu items such is [S
are not available in active run modes.
2. Run molbox - Activated by the [R
un], [Run molbox] menu option. This run mode is to work with the
molbox without a DUT and without a Test Definition (see Section 7.3).
3. Run DUT - Activated by the [R
un], [Run DUT] menu option. This run mode is to work with the
molbox and a DUT Definition, but without a Test Definition (see Section 7.4).
etup] can only be accessed in this mode. They
4. Run Test - Activated by the [R
un], [Run Test] menu option. This run mode is to run a Test
Definition on a DUT (see Section 7.2).
© 1998-2003 DH Instruments, Inc. Page 30
Page 45

COMPASS for molbox™ User’s Manual
6.5 RUN TOOLBAR
This toolbar is only active after one of the [Run] menu choices has been made. Depending on the type of
run mode, some of the toolbar options may be disabled. Unlike the control toolbar, the run toolbar always
displays at the top of the screen regardless of the current run state. To use a tool, click on the tool icon.
Right click the toolbar to display a popup menu of options to reposition the toolbar. The toolbar can
reside on any side of the main program window.
Use the [Toolbar] menu to access the toolbar functions without a mouse. Many toolbar functions
contain shortcuts that can be accessed quickly from a keyboard.
6.5.1 RUN TOOLS
Table 2 describes the run toolbar features not related to run screens.
Table 2. Tools Available On The Run Toolbar
ICON DESCRIPTION
Step Back
Step Forward
Pause
Abort <Abort> causes the <Abort Test> confirmation pop-up to appear to abort the
View DUT
View Test
Causes the current test point to be interrupted and the test point sequence to
step back to the most recent set flow step. Subsequent clicks cause the test to
step back one point for each click. This tool is used to repeat points when
needed. The tool is enabled only in [Run Test] mode.
Causes the current test point to be interrupted and the test point sequence to
step forward to the next step in a point sequence. This feature is available up to
Step of the highest point executed (see Section 6.3). The limitation is to
ensure that data is logged at each point. Most often this tool is used to skip over
previously executed points when the step back key has been used to go back
several points. The tool is enabled only in [Run Test] mode.
Suspends remote communications with all instruments being used by
COMPASS. Use this feature to allow front panel access to an instrument while
COMPASS is in a run mode. This feature is also useful during test execut ion as
it also pauses any test timers currently in operation. Click <Pause> again to
resume operation.
test that is running. When COMPASS is in [Run m
there is no confirmation after the button is pressed.
Causes the DUT Definition Editor to display in the main screen with the
information corresponding to the active DUT Definition (see Section 8.5). No editing
or new DUT selections can be made at this time. This feature is not available
when [Run m
Causes the Test Definition Editor to display in the main screen with the information
corresponding to the active Test Definition (see Section 9.5). This allows
complete information on the current test procedure to be reviewed without
interrupting the test. This feature is available only in [R
olbox] is selected.
olbox] or [Run DUT] mode,
un Test] mode.
Page 31 © 1998-2003 DH Instruments, Inc.
Page 46

6.5.2 DISPLAY TOOLS
Table 3 describes toolbar features that relate to COMPASS run screens. With the exception
of the <Spy> window feature, all of the items listed in this table are also available using the
isplay] menu (see Section 11.9). Each of the toolbar buttons forces the corresponding run
[D
screen to the top of the display.
Table 3. Tools Available On The Display Toolbar
COMPASS for molbox™ User’s Manual
ICON
DUT/Referenc
e Comparison
Display the <DUT/Reference Comparison> run scre en. This display provides
convenient, real time, error information calculated from the DUT and reference
flows (see Section 6.7.1).
DESCRIPTION
Molbox Output Display the <molbox> run screen. This display contains real time updates of al l
of the basic molbloc/molbox conditions and outpu t in forma tion (see Section 6.7 .2).
DUT Output Display the <DUT> run screen. The DUT output, flow, and set point information
display on this run screen (see Section 6.7.3).
Average Data Display the <Average Data> run screen. The average flow and output
information are updated on this run screen each time an averaging cycle is
completed (see Section 6.7.4). This feature is not available in [Run Test] mode.
In this case average results are logged in the data grid.
Data Grid
Display the data grid with the data logged for the current test. The information
displayed in the grid is customizable using the [To
(see Sections 6.7.5 and 0).
ols], [Options], [Grid] tab
Data Plot
Display the plot tool loaded with data from the current test. No ne w Data Files
can be loaded in the plot tool while a test is running (see Section 6.7.6).
I/O Spy
Window
© 1998-2003 DH Instruments, Inc. Page 32
Displays a pop-up window allowing the selection of all acti ve remote int er face sp y
windows (see Section 6.7.7). These windows are useful when troubleshooting
remote communications problems in COMPASS. Each window displays the
exact text used to send a command, the raw response to the command and the
formatted response used by COMPASS. A separate spy window is displayed for
each device even when the interface is shared. For example, a single device can be
setup to read both the DUT pressure and temperature. Since COMPASS treats
these setups as two separate devices, a different spy window will display for each
setup. The spy options are listed below.
• molbox - Displays a spy window listing all command response interaction
with the reference molbox.
• DUT Read – All non-molbox instruments used to read the DUT output display
when selected. Up to three individual spy windows can b e activated by this
function depending on the DUT currently being run. If no remote interfaces
are used to read DUT output information, this selection is not available.
• DUT Set – Displays a spy window of the instrument interface used to set the
DUT flow. This could be the flow controller, power supply or the DUT interface.
If no remote interfaces are used to set the DUT flow, this selection is not available.
• Auxiliary - Displays the spy windows of all active Auxiliary Data devices.
Up to 10 individual spy windows can display.
Page 47

COMPASS for molbox™ User’s Manual
6.6 CONTROL TOOLBAR
This toolbar appears on the left of the main screen in [Run molbox] and [Run DUT] run modes. Since
Test Definitions control many of the control toolbar functions, the toolbar is not available in [R
mode. Each of the tools provides a link to many of the feature supported in the Test Definition and by
molbox. Some toolbar selections trigger a new pop-up with more selections specific to a single function.
These extended tool windows can be placed on any part of the screen but they cannot be scaled or tiled
like the other run screens.
During tests, the <Tare>, <Jog Flow> and <Enter Flow Datay> panels are used to facilitate their
respective functions. Use the information in Sections 6.6.1 to 6.6.9 for specific information on how these
tools function.
Right click the toolbar to display a popup menu of options to reposition the toolbar. The toolbar can
reside on any side of the main program window.
Use the [Toolbar] menu to access the toolbar functions without a mouse. Many toolbar functions
contain shortcuts that can be accessed quickly from a keyboard.
un Test]
Not all options are available in all run modes. In [Run DUT] mode, the DUT Definition controls many values
preventing changes. In some cases entire toolbar functions are disabled based on the DUT Definition.
Page 33 © 1998-2003 DH Instruments, Inc.
Page 48

COMPASS for molbox™ User’s Manual
6.6.1 CHANGE/RELOAD molbloc
This feature is represented by the toolbar icon:
When using molbox1 as a reference, this tool displays a pop-up panel allowing a new molbloc
channel to be selected: A, B or A+B. If the selected channel does not contain a valid molbloc,
an error message displays and the molbox flow displays <Error> until the molbloc channel is
changed back to a valid channel. For all other molbox references, this feature reloads the
current molbloc channel. This feature is not available when the reference is not a molbox.
6.6.2 TARE molbox
The tare molbox feature is represented by the toolbar icon:
See the molbox Operation and Maintenance Manual, Tare Section, for complete information
and recommendations on molbox pressure transducer taring.
This function executes the molbox tare function. When pressed, a message displays allowing
the selection of the tare pressure: upstream or downstream. After this selection, the reference
molbox’s internal valves are actuated to set up the tare configuration. The current pressure
measured by the molbox pressure transducers is displayed on the <Tare molbox> panel.
When the pressure is stable, the circular ready indicator will change to green and the tare
button is enabled. Press <Tare> to activate the current value. The <Status Bar> displays
<Tare Complete> after the tare is set. The <Tare molbox> panel does not automatically
close after the tare function has been executed. This allows the tare to be repeated as many
times as desired. Use the close control box or the <Continue> button to complete the tare
process and activate the new tare values.
See Table 4 for information on each of the tare molbox panel fields.
Figure 14. <Tare molbox> Panel
© 1998-2003 DH Instruments, Inc. Page 34
Page 49

COMPASS for molbox™ User’s Manual
LABEL DESCRIPTION
Table 4. <Tare molbox> Panel Fields
Red/Green
Circular Ready
Indicator
Pressure Rate
(Pa/s)
Differential
Pressure (Pa)
Previous Tare
Microrange
Pressure (Pa)
Previous
Microrange Tare
Downstream
Pressure
Upstream
Pressure
This indicator is green only when the pressure rate of change is within the
molbox’s internal tare rate criterion. In this state, the <Tare> button is enabled.
When the indicator is red, the <Tare> button is disabled.
Current differential pressure rate of change.
Non-tare corrected differential pressure. After taring, this pressure value
should be equivalent to the <Previous Tare> display.
Value of the old tare. This value is upda ted each ti me the ta re button is p res sed.
(Pa)
Current molbox RFM microrange option pressure. If the microrange is not
supported by the molbox, this field displays as N/A. After taring, this pressure
value should be equivalent to the <Previous Microrange Tare> display.
Value of the old microrange tare.
(Pa)
Instantaneous downstream pressure. This value is corrected by ½ of the
current tare value.
Instantaneous upstream pressure. This value is corrected by ½ of the current
tare value.
6.6.3 PURGE FUNCTION
The molbox purge function is represented by the toolbar icon:
See the molbox Operation and Maintenance Manual, Purge Section, for a complete description
and recommendations concerning use of the molbox purge function.
Use this function to purge the molbox of residual gases when flowing a new gas. Before activating
this function make sure a flow has been set. When activated, a prompt allows the entry of
the desired purging time, typically 30s should is sufficient. However, the actual purging time
is dependent on the calibration gas and the volume of the system.
6.6.4 LEAK TEST
The molbox leak test function is represented by the toolbar icon:
See the molbox Operation and Maintenance Manual, Leak Test Section, for a complete
description of the molbox leak check functions and instructions on their use.
COMPASS uses the molbox System Leak Test. The leak test takes 60s. During this time
the molbox embedded software monitors the pressure changes. It then outputs a leak status
based on the results.
Page 35 © 1998-2003 DH Instruments, Inc.
Page 50

6.6.5 MODIFY molbox VALVE DRIVERS
COMPASS for molbox™ User’s Manual
This feature is represented by the toolbar icon:
The state of the optional external molbox valve drivers can be adjusted by using this toolbar function.
molbox valve drivers are commonly used to activate valves that isolate or exposes devices to
the system flow. The <Toggle molbox driver s> form displays to allow valves to be individually
turned on or off. When a button is down, the driver is active otherwise the driver is inactive.
Figure 15. <Toggle molbox drivers> Form
6.6.6 FLOW CONDITIONS
The flow conditions function is represented by the toolbar icon:
The flow conditions function displays a flow conditions pop-up panel that is used to change
the desired conditions. Change the desired value by drop down selection or numerical entry
then press <Enter>. Depending on the current run mode, not all values can be adjusted.
In [Run m
olbox] mode, all conditions are adjustable. However, in [Run DUT] mode, the calibration
gas and K factor are controlled by the active DUT Definition.
See Table 5 for information on each of the flow conditions selection panel fields.
Press <Enter> to activate the change after making a flow conditions selection.
Figure 16. <Flow Conditions> Panel
© 1998-2003 DH Instruments, Inc. Page 36
Page 51

COMPASS for molbox™ User’s Manual
Table 5. <Flow Conditions> Panel Fields
FEATURE DESCRIPTION
Calibration Gas
(drop down list)
Stability Setting
(numeric entry field)
K Factor
(numeric entry field)
Select the calibration gas from the list of molbox supported gases.
molbox stability criterion. The value entered is in the current molbox flow
display units when in [Run m
[Run D
criterion for molbox flow (see the molbox Operation and Maintenance
Manual, Ready/Not Ready Section).
Gas correction factor by which the molbox flow is multiplied when the gas flowing is
not the normal DUT operating gas (process gas). The K factor is specific to the
DUT (see the molbox Operation and Maintenance Manual , K Facto r Section).
UT] mode. The molbox stability criterion is the Ready/Not Ready
olbox] mode and the DUT flow units when in
6.6.7 UNITS SELECTION
The units selection function is represented by the toolbar icon:
Flow, pressure and temperature units of measure can be changed with this function. In [Run D
the flow units are controlled by the DUT Definition. The pressure and temperature units may
also be controlled by the DUT Definition if it specifies a density correction (see Section 8.5.3).
Table 6 provides information on the units selection panel fields.
UT] mode,
Press <Enter> to activate the change after making a units selection.
Figure 17. <Units> Panel
Table 6. <Units> Panel Fields
FEATURE DESCRIPTION
Flow Units
(drop down list)
Pressure Units
(drop down list)
Temperature Units
(drop down list)
Current display flow unit of measure. The value can be changed only in
[Run m
<Edit Units> option at the top of the drop down list. This selection displays
the flow unit Editor (see Section 14).
Select from the list of supported pressure units of meas ure. When in [Run DUT]
mode and the DUT has a density correction, the pressure units are controlled
by the DUT Definition (see Section 8.5.3).
Select from the list of supported temperature units. When in [Run DUT]
mode and the DUT has a density correction, the temperature units are
controlled by the DUT Definition (see Section 8.5.3).
olbox] mode. New flow units can be created by selecting the
Page 37 © 1998-2003 DH Instruments, Inc.
Page 52

6.6.8 FLOW CONTROL
The flow control function is represented by the toolbar icon:
COMPASS for molbox™ User’s Manual
If a non-manual flow control option is specified in [Run D
has the MFC control option in [Run m
flow or molbox output. In [Run D
olbox] mode, this function is enabled to control the
UT] mode, the flow can be changed by directly entering the
UT] mode or the reference molbox
target flow, scrolling to the desired target flow, using the jog function or activating one of the
flow regulation modes. When the target flow is changed, an <Activate Change> button
appears for final confirmation prior to taking action. The <DUT> run screen will display the
resulting new set point when the target is accepted (see Section 6.7.3). Realize that the
target flow value is set in the target flow unit of measure. If these units are changed,
COMPASS converts the current target flow value to the new unit.
The [Tools], [Options], [Run Test] tab contains the overshoot tolerance that limits the
actual minimum and maximum set points based on the DUT’s range (see Section 11.6). To set
flows significantly above the DUT’s defined range, this value must be increased while
COMPASS is idle.
In [Run molbox] mode, there is no DUT information available to define the relationship
between analog output and flow. As a result, flow regulation and jog functions are not available.
The target flow field allows set points in volts and/or mA only based on the reference molbox.
Table 7 provides information on each of the flow control panel fields.
Press the <Activate Change> button to accept a new target flow value.
Figure 18. <Flow Control> Panel
© 1998-2003 DH Instruments, Inc. Page 38
Page 53

COMPASS for molbox™ User’s Manual
FEATURE DESCRIPTION
Table 7. <Flow Control> Panel Fields
Target Flow
(conditional numeric
entry field)
Vertical Scroll Bar
(scroll bar)
Flow Regulation
(slider control)
Jog Up/Down
(action button)
The set point to activate using the currently configured flow control mechanism.
This can be the DUT or a flow controller. The target flow value entered is
assumed to be in the units specified in the drop down lis t box next to the
flow entry field. If these units are changed, the target flow value is converted
to the new unit using the DUT Definition information when available.
Adjust the flow value by moving the scroll position indicator to the new target
flow. Click and drag the indicator to the desired position or use the up and
down arrows to achieve the desired flow. Each scroll position change is
reflected in the target flow field. The top and bottom of the scroll bar
respectively represent the maximum and minimum flo w value including the
configured overshoot tolerance (see Section 11.6).
Turns ON one of the flow regulation modes (see Section 9.5.6). When activated
the flow control is actively adjusted by COMPASS to set the flow to the
target flow point as indicated by either the molbox or the DUT. Regulating to
the DUT flow is not possible if the DUT output is not read remotely by
COMPASS. When regulation mode is active, an asterisk appears next to the
<Set Point> field on the <DUT> run screen. The time parameter to the right
of the display determines the time between flow adjustments. Note that making
the time between adjustments too short can cause unstable flow control.
Changes the last set target flow by the amount specified next to the jog buttons.
The set point resulting from each jog step displays on the <DUT> run screen.
A fixed 2s delay occurs after each jog step. This prevents repeated jog
steps from piling up in the buffer and causing erratic behavior. The jog function
is the only flow control feature that does not require confi rmation using the
<Activate Change> button. Use the jog function when testing or testing DUTs
for which you would like to adjust the flow so the DU T indicates a cardinal poin t.
6.6.9 ENTER FLOW DATA
The flow entry function is represented by the toolbar icon:
This function is available in [Run D
UT] mode for DUTs that cannot be read remotely so their output
must be entered manually. The entry could be the DUT output, current pressure or current temperature.
The value entered is used to calculate the DUT flow so that error information is available on the
<DUT/Reference Comparison> run screen. The values entered remain constant until a new
value is entered.
All entries must be in the units specified next to the entry label. Failure to enter values in
the current units will result in erroneous DUT information.
6.6.10 DATA ACQUISITION TOOLS
In [Run molbox] and [Run DUT] run modes, data can be acquired based on the selection of the
data acquisition options on t he <Control Toolbar>. The first requirement is to open a data file by
using the [Create data file] function. After the file is selected, the data grid will display in place of the
<Average Data> window and the remainder of the data acquisition options are enabled. To take a point,
simply c hoose the app ropriate icon . Points can be taken individually, averaged individually,
automatically and averaged automatically. When the run mode is ended or a new data file is created,
all of the <End Test> and <Data File> options (see Sections 0 and 11.8) are enforced.
Page 39 © 1998-2003 DH Instruments, Inc.
Page 54

When a data file is created in [Run DUT] and [Run molbox] run modes, data points can be taken
without the constraints of a test. The resultant data file is identical to files generated
with the [Run Test] option. Therefore, reports and plots can be created from the data file.
COMPASS for molbox™ User’s Manual
Using any of the <Control Toolbar> automatic data logging options can result in very large
data files. These are files with significantly greater than 1000 data points. COMPASS was not
intended to manipulate such files. Lower performance PC’s will experience significant
delays in generating reports and plots of such data files. Therefore, it is not
recommended to use the plotting and reporting functions with very large data files.
Instead, export the data file to a spread sheet application for further analysis.
Table 8 describes each of the data acquisition toolbar options in detail.
Table 8. <Control Toolbar> Data Acquisition Options
FEATURE DESCRIPTION
Create Data File
Log a single data
point
Press this button to create a new data file. A standard windows filebox allows the
selection of the data file name and location. In [Run molbox] run mode, the <Root
DUT data directory> is used as the default file location. However, any read/write
directory location is valid. [Run DUT] files use the same default naming convention
as tests (see Section 11.8). The file created is identical to files generated during tests.
Only 1 file can be active at a time. If a file is already open when this option is
selected, the file is first closed before the new file is created. Use an <Initialization>
preference to determine whether or not COMPASS automatically prompts for the data
file during the initialization phase of the <Run molbox> and <Run DUT> run modes.
Logs the instantaneous output of all devices to the data file. This is identical in function
as using a 0 averaging time in a test. Any non automated devices must have their
output entered in the <Enter Flow Data> window. If an auxiliary device is not setup
to auto poll (see Section 10.3.7), the device will be read prior to logging the point.
Average and take
1 point
Averages all devices for the specified averaging time then logs the averaged results as
a test point. This is identical to averaging data during a test. Both automatic and manual
averages can be used to average the data (see Section 9.5.4). An automatic average
is based purely on a time specified by the user. Manual averages allow the user to
tell COMPASS when to start and stop averaging. When the <Control Toolbar> is
located horizontally in COMPASS (top or bottom of display), the averaging mode is
specified at the top of the drop down menu next to the average data icon. Use the
<Change Averaging Setup> option to select the type of averaging to use. If the
<Control Toolbar> is located vertically within COMPASS, the <Single Point Average
Setup> (Figure 19) automatically displays providing the option to change settings.
Figure 19. <Single Point Average Setup>
© 1998-2003 DH Instruments, Inc. Page 40
Page 55

COMPASS for molbox™ User’s Manual
FEATURE DESCRIPTION
Log 1 point at
fixed intervals
Average and log
points at fixed
intervals
Logs an instantaneous data point at fixed time intervals. When the icon is pressed,
an input box displays to allow entry of the time interval. Then COMPASS will
automatically log a data point and repeatedly log data points until the <Abort Data
Acquisition> button is pressed or the run mode is closed. Taking data in this way
can be convenient when trying to monitor slowly evolving processes, i.e. the effect of
temperature on a DUT. Realize that taking data at short time intervals can result in a
very large data file.
The output of all manual entry devices must be entered for every data
point logged. This minimizes the automation provided by this function.
Averages all device outputs and logs the results at fixed time intervals. When the
icon is pressed the <Auto Point Average Setup> (see Figure 20) displays to allow
entry of the averaging time and the intervals between averages. Then COMPASS will
automatically begin averaging data. When the average is complete, the results are
logged and the countdown to the next average begins. When the time specified as
the <Restart average every (s)> has been reached, another averaging cycle will
begin. This process is repeated until the <Abort Data Acquisition> button is
pressed or the run mode is closed. Taking data in this way can be convenient when
trying to mimic a test that includes multiple readings per point. Realize that taking
data at short time intervals can result in very large data file.
Press the [Abort Data Acquisition] option to abort fixed interval data
acquisition.
Figure 20. <Auto Point Average Setup>
Abort data
acquisition
Press this icon to abort data acquisition at fixed intervals or a point currently being
averaged.
Never use other <Control Toolbar> features when this icon is visible.
Changing the state of the system while a point is in progress leads to
faulty data logged in the data file.
Page 41 © 1998-2003 DH Instruments, Inc.
Page 56

6.7 RUN SCREENS
COMPASS uses six different run screens and spy windows to d isplay ou tput informa tion while in a run mode.
COMPASS for molbox™ User’s Manual
The [D
in a run mode (see Sections 11.9, 6.6). Clicking and dragging the run screen border to the appropriate
size can scale each of the screens. Closing, minimizing or maximizing any of the run screens has no
affect on the run mode. A test will continue to run even when all run screens are closed. The [D
menu includes cascade and tile options for common default displays. The combination of these features
makes the COMPASS user interface totally customizable.
isplay] menu and the <Control Toolbar> can be used to activate any of these run screens while
isplay]
6.7.1 DUT/REFERENCE COMPARISON RUN SCREEN
This run screen contains a simple display of errors useful when comparing the DUT and reference.
The comparison run screen is considered to be the COMPASS program’s main run screen.
The mouse pointer will change into a wand when the cursor is placed over any of the run
screen fields that support unit changing. Click the field to get a pop-up menu of other
unit of measure available. The DUT flow unit, output unit, set unit, and %DUTFS are the
available choices. Click the DUT or reference output values to change their display units.
Information on each of the <DUT/Reference Comparison> run screen fields is provided in Table 9.
Figure 21. <DUT/Reference Comparison> Run Screen
© 1998-2003 DH Instruments, Inc. Page 42
Page 57

COMPASS for molbox™ User’s Manual
Table 9. <DUT/Reference Comparison> Run Screen Fields
LABEL DESCRIPTION
Red or Green
Circular Indicator
Red or Green Square
Indicator
Reference
Error (%Rdg)
Error (%DUTFS)
Set Error (%Rdg)
Set Error (%DUTFS)
molbox flow Ready/Not Ready indicator (see the molbox Operation and Maintenance
Manual, Ready/Not Ready Section). The circle is green when molbox flow is ready
and red when not ready.
DUT in or out of tolerance indication. The square is green only when the instantaneous
flow error is within the tolerance specified in the DUT Definition (see Section 8.5.5).
Reference flow converted from the molbox display units to the current
<DUT/Reference Comparison> run screen units. If the DUT Definition specifies a
density correction (see Section 8.5.3), the reference flow value is the reference flow
corrected for the DUT normal operating conditions (“Ref Flow DUT Cond” in the Data Gr id).
This allows the reference flow to represent the flow that would be present if the DUT
were at its normal operating conditions. Put another way, reference flow corrected for the
DUT normal operating conditions is what the DUT would indicate if it agreed perfectly with
the reference. To change the display unit of measure, click the value and select the
desired unit from the list.
The DUT flow converted to the current flow display units. When a manual entry DUT
DUT
is used, the last output entry value displays until a new entry is made. The errors are
therefore meaningless between entries. To change the display unit of measure, click
the value and select the desired unit from the list.
DUT percent of reading error (see Section 19.4).
DUT percent of full scale error (see Section 19.4).
DUT percent of reading set point error. If the measured set point is not available, the
nominal value is used (see Section 19.3).
DUT percent of full scale set point error. If the measured set point is not available, the
nominal value is used (see Section 19.3).
6.7.2 molbox OUTPUT RUN SCREEN
If a molbox is set up as the active flow reference, the <molbox output> run screen is an
available choice. The run screen displays a real time update of molbox output information.
The information in this run screen is direct from the molbox with no manipulation or
calculations applied. In fact, no DUT specific information displays in this Run Screen.
The <molbox Output> run screen can be very useful for troubleshooting.
In [Run m
selected on the <Units> panel. In all other run modes, this flow is in the current molbox output unit.
Table 10 provides information on each field of the <molbox Output> run screen.
olbox] mode, the <molbox Output> run screen d isplays flow in the unit of measure
Always use the COMPASS <molbox Output> run screen instead of the molbox front panel
to view real time molbox output information. This display updates the raw output information
from the molbox in [Run D
UT] and [Run Test] modes. In [Run molbox] mode, the current
unit of measure selected on the <Control Toolbar> is displayed instead of the raw values.
When a molblocS does not have a valid back pressure ratio (BPR), the displayed flor is N/A.
Page 43 © 1998-2003 DH Instruments, Inc.
Page 58

Figure 22. <molbox Output> Run Screen
Table 10. <molbox Output> Run Screen Fields
LABEL DESCRIPTION
COMPASS for molbox™ User’s Manual
Red/Green Circle Molbox flow Ready/Not Ready indicator (see the molbox Operation and Maintenance
Flow Molbloc flow. This value is the direct, unmanipulated output of the molbox in all run
Reynolds Number Reynolds number of the flow through the molbloc as calculated by the molbox.
Upstream Pressure Pressure read by the molbox upstream pressure transducer.
Downstream
Pressure
Differential Pressure The pressure drop across the molbloc that is currently being used by the molbox to
Temperature Molbloc temperature as measured by the molbox from the average of the molbloc
Output Active molbox output. As with the <Set>, this value is used only in [Run molbox]
Switchbox Molbox MFC switchbox control and measurement channels. The format is <Set
K Factor Active DUT gas conversion value in use by the molbox. In [Run molbox] mode, this
Manual, Ready/Not Ready Section). The circle is green when molbox flow is ready
and red when not ready.
Rate Instantaneous molbox flow rate of change in unit of flow per second.
modes except [Run m
the molbox output is converted to the currently selected flow unit. In all operating
modes, except [Run m
the ba si c mass flow (mass/time) units. These are the base units COMPASS uses for its
calculations.
Pressure read by the downstream molbox pressure transducer.
calculate flow.
The differential pressure is the difference between the molbox upstream and
downstream RPTs (in molbox RFM, it may be the measurement made by the
microrange RPT). The molbox determines the differential pressure and outputs it to COMPASS.
BPR BPR is the back pressure ratio, downstream pressure/upstream pressure. This field
is present only when the reference is a molblocS. The value displayed is either the
measured ratio or N/A when the value is not measured. The molbox front panel BPR
setting determines whether or not BPR is measured or if the 2 molbox RPTs are
averaged. Refer to the molbox operation and maintenance manual for
upstream and downstream PRT’s.
Set Active molbox flow set point. This value is used only in [Run molbox] mode if the
molbox is equipped with the MFC control option. Change the setting using the flow
control toolbar icon (see Section 6.6.8).
mode if the molbox is equipped with the MFC control option.
Channel . Measurement Channel>. This field has no value if the molbox does n ot
have the MFC control option and an MFC switch box is not in use. Use the flow
control icon in [Run m
value can be changed using the flow conditions toolbar icon (see Section 6.6.5). In all
other run modes, the active DUT determines the K factor. In this case, the value
cannot be changed. See the molbox Operation and Maintenance Manual, K Factor
Section, for details on the use of K factors.
olbox]. In [Run molbox], the flow unit can be selected and
olbox], the flow units available for this display are limited to
olbox] mode to change the current channel.
© 1998-2003 DH Instruments, Inc. Page 44
Page 59

COMPASS for molbox™ User’s Manual
LABEL DESCRIPTION
Gas Active molbox calibration gas. In [Run molbox] mode, this value can be changed
using the flow conditions toolbar icon (see Section 6.6.5). In all other run modes, the active
DUT determines the calibration gas. In this case, the value cannot be changed.
Stability Setting Active Ready/Not Ready stability criterion in the molbox. In [Run Test] mode, this
molbloc The serial number and molbox channel of the active molbloc. The molbloc channel
value is fixed by the Test Definition in use. In all other run modes, the stability setting
can be changed using the flow conditions toolbar icon (see Section 6.6.5). See the
molbox Operation and Maintenance Manual, Ready/Not Ready Section, for additional
information.
displays only when a two channel molbox is the active reference.
6.7.3 DUT OUTPUT RUN SCREEN
The <DUT Output> run screen provides a real time update of all rel evant DUT out put info rmatio n.
Use this display to view raw output information directly from the DUT. Do not confuse this
run screen with the DUT Definition display. The DUT Definition display merely displays the
current DUT Definition in the DUT Definition Editor. Table 11 describes all of the fields on the
<DUT Output> run screen.
Figure 23. <DUT Output> Run Screen
Table 11. <DUT Output> Run Screen Fields
LABEL DESCRIPTION
Flow The top of the <DUT Output> run screen displays the flow measured by the DUT in
Output Raw DUT output. The displayed value is always in the output un it setup in the DUT reco rd.
Pressure DUT gas pressure for DUTs that specify a density correction. If no density correction
Temperature DUT gas temperature for DUTs that specify a density correction. If no density correction
Page 45 © 1998-2003 DH Instruments, Inc.
the current DUT flow units. The value is updated each time the necessary output
information is returned from the DUT. If the DUT is manual entry, this field is updated
only when the user enters new output information.
is set up, the pressure field is N/A (see Section 8.5.3). When specified, the Pressure
Device in the System Configuration is the source of this pressure value (see Section 10.2).
Otherwise the pressure displayed is a default value or the last value manually entered
(see Section 11.6).
is set up, the temperature field is N/A (see Section 8.5.3). When specified, the
Temperature Device in the System Configuration is the source of this temperature
value (see Section 10.2). Otherwise the temperature displayed is a default value or
the last temperature manually entered (see Section 11.6).
Page 60

COMPASS for molbox™ User’s Manual
LABEL DESCRIPTION
Set Point Nominal DUT set point. When an asterisk appears next to the value, automatic flow
Measured Set Point Measured DUT set point for DUTs that control flow with a voltage (V) or current (mA)
regulation is active (see Section 8.5.6).
based set point unit. The Set Point DMM in the System Configuration is the source of
this data (see Section 10.2).
6.7.4 AVERAGE DATA RUN SCREEN
Both [Run molbox] and [Run DUT] run modes provide continuous averaging of
flow information. Each time the averaging time counts down to zero, the <Average Data>
run screen is updated with the new average results. In [R
displays in the <Data Grid> run screen so there is no reason to have an independent averagin g
run screen. To change the averag ing ti m e, clic k t he av era gi ng t im e b ox, ent er th e ne w time v al ue
and press <Enter>. This triggers the beginning of a new averaging cycle. Changing the
current gas or K factor also triggers a new averaging cyc le. When a non-molbox i s u s ed as t h e
flow reference, only the DUT display fields are active and all reference fields display as N/A.
Table 12 provides information on each field of the <Average Data> run screen.
un Test] mode, all averaged data
The mouse pointer changes into a wand when the cursor is placed over any of the fields
that support unit of measure changing. Click the field to get a pop-up menu of other
display unit options. The DUT flow unit, output unit, set unit, and %DUTFS are the
available choices. Click the DUT or reference fields to change their display units.
Figure 24. <Average Flow Data> Run Screen
© 1998-2003 DH Instruments, Inc. Page 46
Page 61

COMPASS for molbox™ User’s Manual
Table 12. <Average Flow Data> Run Screen Fields
LABEL DESCRIPTION
Red/Green Circular
Display
Reference Flow
DUT Flow
DUT Output
Measured Set
Min Flow
Max Flow
molbox flow Ready/Not Ready indicator (see the molbox Operation and Maintenance
Manual, Ready/Not Ready Section). The circle is red when any molbox flow reading
during the averaging cycle was not ready and green when all molbox flow readings
were ready.
Average flow measured by the reference over the last averaging cycle. To change the
display unit of measure, click the value and se lect the desired unit from t he drop down list.
If the DUT Definition [Correction] tab specifies a density correction, the reference flow value is
corrected to express the flow that would be present at the DUT if the DUT were at its
normal operating conditions. This correction allows the reference flow and DUT
indication to be compared even though the DUT is not at its normal operating
conditions (see Section 8.5.3).
Average flow measured by the DUT over the last averaging cycle. To change the di sp l a y
unit of measure, click the value and select the desired unit from the drop down list.
Average DUT output over the last averaging cycle. This averaged output value is
used to calculate the average flow. The output unit is specified in the DUT Definition
(see Section 8.5.4).
Average measured DUT set point for DUTs that control flow with a voltage (V) or
current (mA) based set point unit. The Set Point DMM in the System Configuration is
the source of this data (see Section 10.2).
The minimum reference flow measured during the averaging interval.
The maximum reference flow measured during the averaging interval.
STD
The standard deviation of the reference flow values measured over the averaging period.
6.7.5 DATA GRID RUN SCREEN
In [Run Test] mode, while running tests, the <Data Grid> run screen is available to display
the list of points taken and data associated with each point. Every point up to the current
point in the current test cycle is displayed in this grid. The unit of measure for many columns
is specified in the corresponding column header. As with the other run screens, the grid
display is scalable. However, the individual grid columns do not automatically scale as the
borders of the grid display are scaled. Instead click and hold the separator border between
columns or rows and adjust the scale as desired. Spacing between columns is stored by
COMPASS for display consistency between runs.
As a test progresses, the current point is automatically highlighted and selected in the grid.
Use the options on the [To
the current test point (see Section 11.3). When automatic selection is on, if the grid is
scrolled to the top to view points taken earlier in the test, completion of a new point will force
the grid back to the last point.
The type of data and the ordering of data in the grid can be customized by using the [To
ptions], [Grid] tab (see Section 11.3). Any or all of the different data items logged during
[O
a test can be displayed at run time in the <Data Grid> run screen. The order of points
logged in the Data File is not affected by the grid display. By default, COMPASS displays six
frequently used columns: <Reference Q DUT Cond>, <DUT Out>, <DUT Q>, <%Rdg
Error>, <%FS Error>, and <Status>. The [D
all data columns in the embedded grid (see Section 12.2). View this display to get an idea of
how the grid would display if all test data were included in the grid during tests.
ols], [Options], [Grid] tab to prevent the automatic selection of
ols],
ata], [View Data File] option always displays
Page 47 © 1998-2003 DH Instruments, Inc.
Page 62

See Table 63 in Section 18.4.1 for an exhaustive list and description of all data available for
display in the <Data Grid> run screen.
COMPASS for molbox™ User’s Manual
Figure 25. <Data Grid> Run Screen
6.7.6 DATA PLOT RUN SCREEN
When running a test, the <Data Plot> run screen can be used to display a variety of graphs
of the data currently logged in the Data Grid. The graph can be changed or printed without
affecting the run of the test. Unlike the [D
Data File can be selected. However, all other functions supported by the graphing tool are
available during tests. For complete information on the graphing capabilities of COMPASS
see Section 12.4. Each point taken during a test causes the graph to update with the current
test point information. If the <Force grid selection> option on the [To
tab is not selected, the current cycle test data is not automatically displayed on the plot
unless that cycle is specifically selected for plotting (see Section 11.3). For example, if cycle
3 of a 10 cycle test is currently plotted, and the test is executing cycle 7, the results of cycle 7
will not appear in the plot unless cycle 7 is selected using the <Plot Properties> panel.
ata], [Plot Data File] graphing function, no new
ols], [Options], [Grid]
Figure 26. <Data Plot> Run Screen
6.7.7 SPY WINDOWS
A spy window exists for each instrument interfaced with COMP ASS. Use the <Spy Window>
toolbar icon to determine which window(s) are dis played (see Sectio n 6.7.7). The spy window is
the only run screen that is not sizeable. The window is actually a background display. As a result,
if the window is visible and the COMPASS main screen is selected, the spy window will return
to the background.
© 1998-2003 DH Instruments, Inc. Page 48
Page 63

COMPASS for molbox™ User’s Manual
Spy windows are provided by COMPASS to troubleshoot or analyze remote communications.
The caption of the spy window contains the instrument name and interface being spied on.
Use the information in the <Command>, <Raw Response>, and <COMPASS Uses> fields
to determine if COMPASS is properly configured for the remote device. The command/response
information is updated real time as long as the interface is open. See Section 13.1 for details
on the remote interface concepts used by COMPASS.
See
Table 13 for details on information displayed by spy windows.
Selecting text in any column automatically highlights the corresponding text in the
other columns. If the text width exceeds the column width, a tooltip message will display
with the full text of the column if the mouse is held over the selection.
Figure 27. <Spy Window> Screen
Pay close attention to the instrument interface in the spy window caption. If the interface
displayed does not correspond to the actual instrument interface, there is a configuration
problem in COMPASS. Use [S
instrument and [S
FRAME LABEL DESCRIPTION
Do not auto scroll
lists on new
commands
Command The exact command sent by COMPASS over the instrument interface. The command
Raw Response The unmanipulated response to the <Command> value issued. This field should
COMPASS Uses The <Leading characters to strip> command setup information is used to format the
etup], [System] to specify instruments to be used (see Sections 10.3, 10.2).
Table 13. <Spy Window> Information
When checked, use the scroll bars of any field to view commands previously sent.
The spy window will not auto scroll with each new command. If this option is not
checked, every new command scrolls all three columns of the spy window.
terminator is the only portion of the command that is typically not visible. For set
commands, make sure the command and set value are properly formatted
(see Section 13.2.3).
always be blank if the command has the <No Response> box checked.
<Raw Response>. The result is displayed in this field and logged as COMPASS data.
Responses not specifically used by COMPASS do not have a value in this field.
When troubleshooting, make sure the value displayed is the desired information.
etup], [Hardware] to make interface changes to an
Page 49 © 1998-2003 DH Instruments, Inc.
Page 64

N
N
OOTTEES
COMPASS for molbox™ User’s Manual
S
© 1998-2003 DH Instruments, Inc. Page 50
Page 65

COMPASS for molbox™ User’s Manual
77..
R
[[R
N
UUN
M
]] M
OODDEES
S
7.1 OVERVIEW
COMPASS has four basic run modes: <Idle>, [Run T est], [Run molbox] and [Run DUT]. Other than
<Idle>, which indicates that COMPASS is in a state in which configuration changes can be made, each of
these run modes is found in the [R
make sure that COMPASS has been configured to read the instruments required by the run mode
(see Section 10.1). With the exception of the tests in which all entries are manual, every run mode involves
continuous instrument polling to upda te data on the run screens. Adjust these screens as need to customize
the COMPASS display (see Section 6.7). Sections 7.2 through 7.4 detail the COMPASS run modes.
un] menu on the main program. Before activating any of the run modes,
7.2 [RUN], [RUN TEST]
This menu selection is used to select a DUT Definition execute a test defined by a Test Definition
(see Sections 8, 9). Test execution is divided into three sequential parts:
Test Initialization (see Section 7.2.1): Sets up the molbox interface, selects the DUT and Test
Definition to run and enters user ID. Many of the sequential steps of test initialization can be turned
ON or OFF using the [To
ols], [Options], [Initialize Test] tab (see Section 11.5).
Run Test (see Section 7.2.2): Runs purge (if included) and leak test (if included) followed by the
test flow points taking data at each point based on the test data selections. The details of how a test
runs are defined in the Test Definition (see Section 9). Certain aspects of how a test runs can be
customized using the [To
End Test (see Section 7.2.3): Presents the <Test Notes> screen to record test specific notes and
the <Test Complete> screen with various test conclusion options. Certain aspects of the test
conclusion can be customized using the [To
ols], [Options], [Run Test] and [End Test] tabs (see Sections 11.6, 11.7).
ols], [Options], [End Test] tab (see Section 11.7).
7.2.1 TEST INITIALIZATION
Test initialization is the first part of test execution. With the exception of Step below, all the
sequential steps of test initialization can be turned ON or OFF using the [To
[Initialize Test] tab (see Section 11.5). Test initialization proceeds as follows:
Initialize molbloc/molbox (see Section 7.2.1.1): If the reference specified in the
System Configuration is a molbox, COMPASS loads the molbloc information into memory
and determines which features are supported by the molbox. Depending on the current setup,
this may take several seconds. This is the only Test Initializatio n step that cannot be disabled.
Select starting molbloc channel (see Section 7.2.1.2): When a two channel molbox
reference is used, the initial molbloc channel can be selected if both channels have a
valid molbloc. If this step is turned OFF, the current molbloc channel is automatically used.
Select DUT (see Section 7.2.1.3): The DUT selection tool is presented allowing
selection of the DUT Definition to run. If this step is turned OFF, the screen is not shown and
the last DUT used is automatically selected.
ols], [Options],
Page 51 © 1998-2003 DH Instruments, Inc.
Page 66

Select Test (see Section 7.2.1.4): The test selection tool is presented identifying the
Test Definition associated with the DUT selected in Step . A different Test Definition can be
selected or viewed at this point . If thi s step is turned OFF , the scre en is not shown and the
Test Definition associated with the DUT is automatically selected. If the DUT Definition does
not specify a valid Test Definition, this step must be completed regardless of the initialize options.
Re-select DUT interface settings (see Section 7.2.1.5): When applicable, the DUT
ID/Interface screen is presented with the default interface parameters for the DUT.
Select new settings or accept the default values. If the DUT Definition is a DUT profile
(see Section 8.5.2), the extra step of entering the DUT’s serial number and/or
identification is required. If this step is turned OFF and the DUT Definition is not a DUT profile,
this screen does not display. The screen is automatically skipped if neither RS-232 nor IEEE-488
interfaces are set up for DUT set or read modes and the DUT Defi nition is not a DUT profile.
User ID Entry (see Section 7.2.1.6): The user ID entry screen is presented. The last
user ID can be accepted, a new user ID may be entered, or a previously entered user ID
may be selected from the user ID drop down list. If this step is turned OFF, th e scr een is
not shown and the last user ID selected is automatically used.
Test initialization is complete, run test begins (see Section 7.2.2).
7.2.1.1 INITIALIZE molbloc/molbox
COMPASS for molbox™ User’s Manual
When any model molbox is specified as the reference in the System
Configuration (see Section 10.2), test initialization always begins by loading the
molbloc into memory and determining which features are available. Depending
on the molbox model and the type of interface used, this step may take several
seconds. No user interaction is required while this step is in progress.
COMPASS uses the information loaded to check for conflicts and range issues
that may exist with the DUT Definition subsequently selected. Error messages
are displayed if configuration conflicts or remote communication errors exist.
Common examples are an RS-232 time-out which can occur if the molbox is not
connected to the PC by an RS-232 cable. If the System Configuration specifies
the <Reference molbox> as the <Set Point Power Supply> and the molbox
does not have an analog option, an error will also occur.
The molbox front panel display flow unit of measure is set up during this
initialization step. The unit can be changed using the [T
ools], [Options],
[molbox] tab (see Section 11.2). If for any reason, the unit is changed after this
initialization step, COMPASS will not be able to properly determine the reference flow.
Erroneous data will be logged if the reference molbox flow, pressure or
temperature units are modified after the initialize molbloc/molbox test
initialization step. COMPASS expects the units of measure to remain
constant once the system is initialized.
7.2.1.2 SELECT STARTING molbloc CHANNEL
molbox1 models with two molbloc channels have an option to select the starting
molbloc channel during the test initialization. When this feature is turned ON
(see Section 11.2) and there are two molblocs connected to the molbox, the molbloc
channel selector displays. Select the starting molbloc channel by clicking the A,
B or A+B buttons. Close the channel selector panel to abort the test.
© 1998-2003 DH Instruments, Inc. Page 52
Page 67

COMPASS for molbox™ User’s Manual
7.2.1.3 SELECT DUT
The DUT Definition selection tool is presented allowing browsing of DUT
Definitions available and selection of the DUT to run (see Section 8). If this step
is turned OFF (see Section 11.2), the screen is not shown and the last DUT
Definition used or accessed is automatically selected.
DUTs are listed by manufacturer, model, serial number, identification and record label.
The list is sorted according to the most recently selected sort order. Use your
keyboard’s arrow keys or pointing device to highlight the desired DUT. The highlighted
DUT record label is listed at the bottom of the display. To select a DUT from the DUT list,
double click on the desired listing or press <OK> while the listing is highlighted.
Click <View Selection> to display the current selection or <Cancel> to quit.
Figure 28. <Select molbloc> Panel
Figure 29. <DUT Selection> Tool
The current selection is viewed using the <View Selection> button. This causes
the DUT Definition Editor to display with the selected DUT loaded. The DUT
cannot be modified using this pop-up, but all the characteristics can be viewed by
clicking on the appropriate tabs. Other DUTs can be viewed using the DUT
Definition Editor’s DUT selection options (see Section 8.4). When the desired
DUT is selected, click the <OK> button in the Editor to accept the selection.
Closing the Editor window using the control box <X> is equivalent to a cancel.
Page 53 © 1998-2003 DH Instruments, Inc.
Page 68

COMPASS for molbox™ User’s Manual
Figure 30. <DUT Selector> In DUT Definition Editor
7.2.1.4 SELECT TEST
The Test Definition selection tool is presented identifying the Test Definition
associated with the current DUT Definition (see Sections 8.5.6, 8.5.9). If the
DUT Definition does not specify a test, the last test accessed is selected by
default. If this step is turned OFF (see Section 11.5), the screen is not shown
and the Test Definition specified in the DUT Definition is automatically selected.
COMPASS performs various checks for compatibility between the selected Test Definition
and the DUT. When conflicts are detected, error and warning messages are displayed.
The test selection screen contains the core information about the Test Definitions
available which may be helpful in selecting the test to run. Double click a Test
Definition selection or press <OK> to accept the currently selected Test Definition.
Press <View Test> to display the Test Definition Editor loaded with the information
of the currently selected Test Definition. Close the window using the control box
to abort the test completely.
Figure 31. <Select Test> Tool
© 1998-2003 DH Instruments, Inc. Page 54
Page 69

COMPASS for molbox™ User’s Manual
When <View Test> is pressed, the Test Definition Editor displays loaded with the
currently selected Definition. The test cannot be modified using this pop-up, but
all the characteristics can be viewed by clicking on the appropriate tabs. Use the
Test Definition selection tools in the Test Definition Editor to view other tests.
Press <OK> to accept the displayed Test Definition and continue the test
initialization process. Close the Test Definition Editor using the control box “X”
to abort the test initialization.
Figure 32. <Test Selector> In Test Definition Editor
7.2.1.5 SETUP DUT ID/INTERFACE
The setup DUT ID/Interface scre en is presented. This screen is intended to a llow
input of DUT identification and communication details if necessary. There are some
cases in which this display is not presented regardless of the options selected.
This occurs when the selected DUT Definition is Individual DUT (see Section 8.5.2),
and neither RS-232 nor IEEE-488 are specified to read or set the DUT. The display
will always occur regardless of the state of the initialization option if the DUT Definition
is a DUT Profile. Entry of the serial number and identification information is
required in this case.
See Section 8 for information on Individual vs. Profile DUT Definitions and
the DUT read and set types.
Do not use the following characters in the DUT serial number or
identification fields: \,/, :, *, ?, “, <,>, |, a comma or tab character. These
characters will cause problems when importing the Data File or creating the
Data File directory.
The setup DUT ID/Interface screen’s appearance and operation vary depending
on whether the DUT Definition being run is an Individual DUT or a DUT Profile
and on the DUT’s read and set type (see Sections 8.5.2, 8.5.8, 8.5.9).
Page 55 © 1998-2003 DH Instruments, Inc.
Page 70

• If the DUT Definition is a DUT Profile, the screen sets up with blank
information in the serial number and identification fields. At least one of
these fields must be completed prior to closing the window. This window
COMPASS for molbox™ User’s Manual
displays regardless of the state of the setup DUT option in [T
ptions], [Initialize Test], <Select DUT> (see Section 11.5).
[O
ools],
• If the DUT read or set type is RS-232 or IEEE-488, the default
communications settings for the selected interface type display in the
interface field (see Sections 8.5.8,8.5.9). If the interface is IEEE-488 , enter the
numerical IEEE-488 address. If the interface is RS-232, click the field to
select the RS-232 settings. When both set and read share the same
interface type, a change to the read interface automatically makes the same
change to the set interface. Changes to the set interface do not automatically
update the read interface. It is therefore possible for the set and read in terfaces
to be different. This is an atypical use of this feature but it is supported.
• If the DUT read or set type is neither RS-232 nor IEEE-488, the interface
description contains the text representing the type of interface to use. This can be
<Voltage/Current>, <Frequency>, or <Manual>.
If the DUT is connected to the molbox’s RS-232 COM2 port, use the <Ref COM2>
selection at the bottom of the Com Port drop down list. COMPASS automatically
handles the necessary command formatting to pass commands through the
COM2 port.
When using the <Setup DUT ID/Interface> screen, keep in mind that DUT read
and set types refer to the manner in which data will be gathered from the DUT.
DUTs with electrical outputs are read with a DMM and the read type is
Voltage/Current (it is not the interface on the DMM such as RS-232 or IEEE-488).
Only DUTs read or set directly by RS-232 or IEEE-488 interfaces are
considered to use RS-232 or IEEE interface (see Sections 8.5.8, 8.5.9).
Figure 33. <Setup DUT ID/Interface> Panel
© 1998-2003 DH Instruments, Inc. Page 56
Page 71

COMPASS for molbox™ User’s Manual
7.2.1.6 USER ID
The user ID entry screen is presented. The last user ID can be accepted, a new
user ID may be entered, or a previously entered user ID may be selected from
the user ID drop down list. If this step is turned OFF in [T
[Initialize Test] (see Section 11.5), the screen is not shown and the last user ID
selected is automatically used.
Any time a new user ID is entered, it is automatically added to the user ID list.
Names can be removed from the list using [To
(see Section 11.4).
7.2.2 RUN TEST
After test initialization is complete (see Section 7.2.1), run test begins.
The test procedure is defined by the Test Definition (see Section 9) associated with the
selected DUT Definition (see Section 8). Prior to running a test, various aspects of run
test behavior may be customized (see Section 11.6).
ools], [Options],
ols], [Options], [Maintain Lists]
During run test the main menu bar is disabled but the <Run Toolbar> is active. Use the
<Run Toolbar> keys to view detailed DUT or Test Definition information while the test is
running, to step test points back or forward or to display test run windows (see Section 6.5).
A test that is running can be aborted at any time by pressing the <Abort Test> button on the
<Run Toolbar>. Before aborting the test, COMPASS requ ires con firmation and queries whether
the partial Data File containing the data collected for the test so far should be saved. The Data File
can be automatically deleted by setting Data File Options are set (see Section 11.8).
The run test sequence is as follows:
Run purge: If purge is specified in the Test Definition (see Section 9.5.8), COMPASS will
set the purge flow rate, activate the necessary molbox valves to purge the molbox and
then start the purge count down. When the purge time expires the valves are automatically
adjusted back to normal operation.
Run leak test: If a leak test is specified in the Test Definition (see Section 9.5.7) and the
reference molbox supports leak tests, a message displays to notify the user to make the
necessary preparations for a leak test. After the message is confirmed, the leak time
count down begins. All leak tests last approximately 60s. When the leak time expires,
the status bar displays the Pass or Fail status. The results of the leak tests are also
recorded in the Data File. Unless the <Abort on failure> option is checked on the [Leak Test]
tab of the Test Definition, test execution continues regardless of the leak test results.
Change molbloc: If a molbloc change is specified for the test point in the Test Definition
(see Section 9.5.2), COMPASS displays a prompt to change the molbloc. When the
message is confirmed, the new molbloc information is loaded into memory. If the molbloc
has not changed or an error occurs in loading the new molbloc , an error message displays .
The molbloc range and serial n umber are logged in the <molbloc> column of the data grid.
If purge after molbloc change is specified, the purge function described in Step is repeated.
If leak test after molbloc change is specified in the Test Definition, the leak test described
in Step is repeated. The result of each leak test is logged in the <Status> column of
the data grid as well as in the Data File (see Section 18.4).
Page 57 © 1998-2003 DH Instruments, Inc.
Page 72

Set flow point: The flow test point is set. The method used to set the flow is determined
by the <Flow Control> selection in the Test Definition (see Section 9.5.6). If flow setting
is manual, the user is prompted to set the flow to the flow point value. If flow setting is
automated, flow is set automatically using either the DUT or the selected flow controller.
In manual flow control, once <OK> has been pressed to confirm the flow is set,
test execution continues. If a 0 flow set point is specified and the prompt for manual
COMPASS for molbox™ User’s Manual
valve shut-off option is selected in [T
ools], [Options], [Run Test] (see Section 11.6),
a message displays requesting that the user oper ate the necessa ry valves to achieve 0 flow.
In this case, no automatic flow control is used. When the flow is set, testing for stability
begins (see Section 7.1). In automated control, if the stability test times out, the <Status>
column of the Data Grid and Data File displays <s> (see Section 18.4). After completing
the flow stability test, test execution continues.
Tare molbox: If the current test point requires a tare (see Section 9.5.2) and the
reference is a molbox, the molbox internal valves are adjusted for taring and the <Tare>
window displays. If <Wait for Enter to tare> is checked in the Test Definition, the user
must click the <Tare> button to set the current tare. The <Tare Window> does not
automatically close after the tare is complete. The user must press <Continue> or close
the window to continue test execution. Pressing <Continue> without taring does not
cause an error. If <Wait for Enter to tare> is not checked in the Test Definition,
COMPASS waits for pressure stability then automatically executes the tare function.
COMPASS will repeat the automated tare procedure up to three times if errors are
encountered during taring. If a tare value is set, the new tare information is stored in the
<Tare DP> and <Tare MDP> Grid and Data File columns (see Section 18.4). The <Status>
field also includes a <t> to flag that a tare occurred.
Jog before dwell: If jog mode is selected in the Test Definition (see Section 9.5.6),
the <Flow Control> window displays with only the <Target Flow> and <Jog> buttons
active (see Section 6.6.8). Use these control functions in the necessary combination to
set the desired flow. Typically, <Jog> is used to adjust the flow to put the indication of a
flow meter on its cardinal point if desired. This feature is often used when testing a
rotameter or other visual flow indicator with a graduated scale.
Dwell: If timed dwell is specified in the Test Definition (see Section 9.5.4), the dwell time
counts down and execution continues. If the Test Definition specifies manual dwell,
COMPASS waits for the operator to press <OK> on the <Dwell Complete> dialog box
before test execution continues.
Take data: Following the settings in the Test Definition [Data] tab, the reference, DUT and
measured DUT set point are read as many times as possible for the averaging period
(see Section 9.5.9). If timed averaging is specified in the Test Definition (see Section 9.5.4),
the averaging time counts down as the flow data is averaged. If manual averaging is selected,
a message displays awaiting confirmation of when to start averaging. A fixed averaging
time can be entered in this window if desired. If the fixed time is entered and the <Fixed Average>
button is pressed, the averaging process continues just as though a fixed time were
specified in the Test Definition. If the manual average is used, a new message displays
awaiting confirmation of when to end averaging. The elapsed time displays on the window
until the average is ended. Averaging occurs only for references and DUTs that can be
read automatically. In the event that the current test point is 0 flow and the <Force zero flow>
option is selected in the [To
ols], [Options], [Run Test] tab (see Section 11.6), the reference
flow value logged is 0 regardless of its actual value. Step is repeated for each
reading/point specified in the test.
If this is not the last point in a test cycle, the sequence repeats starting with the Step
Change molbloc. If this is the last point in a test cycle, the [To
ols], [Options],
[End Test] tab (see Section 11.7) last point selection is used to determine what to do
after the last point. During all other test points, pressing the <Step Back> run toolbar
option (see Section 6.5.1) allows points to be repeated by stepping back through the
point sequence. Since a new cycle begins or the test ends immediately following the last
point, this special option is used to allow the user to repeat a point.
When run test is complete, test conclusion begins (see Section 7.2.3).
© 1998-2003 DH Instruments, Inc. Page 58
Page 73

COMPASS for molbox™ User’s Manual
7.2.2.1 MANUAL ENTRY DATA ACQUISITION
When the reference or any portion of the required DUT data requires manual entry,
the <Manual Entry> window displays to allow the necessary data entry. A unit
of measure appears next to each entry field. It is critical that all entries be made
in the specified unit of measure. Failure to due so will result in erroneous data.
This feature is functionally equivalent to clicking the <Enter Flow Data> icon on
the <Control Toolbar> (see Section 6.6.9). Manual entry of pressure and
temperature data for density correction DUTs (see Section
by using the appropriate [To
8.5.3) can be streamlined
ols], [Options], [Run Test] tab selection (see Section 11.6).
Figure 34. <Manual DUT Data Entry> Panel
7.2.3 TEST CONCLUSION
After run test is complete (see Section 7.2.2), test conclusion begins. Other than the repeat
point option, there are two main steps to the test conclusion.
• Test Notes: The <Test Notes> pop-up appears to allow the user to enter notes
concerning the test run that has just completed. The notes are included in the Data File
and can be used in reports. In multi-cycle tests, only one display for the test notes occurs.
The test notes step can be skipped by selection in the [T
(see Section 11.7).
• Test Complete Screen: If the auto generate report option is selected on the [T
ptions], [End Test] tab (see Section 11.7), the current report template is used to
[O
generate a report with the test Data File. Regardless of this selection, the <Test
Complete> screen displays with the name and path of the test Data File and offers
various post test options. Operation always returns to the <Test Complete> screen until
<Exit Test> has been selected.
Table 14 lists the <Test Complete> options.
ools], [Options], [End Test] tab
ools],
Figure 35. <Test Complete> Panel
Page 59 © 1998-2003 DH Instruments, Inc.
Page 74

Table 14. <Test Complete> Panel Options
FEATURE DESCRIPTION
COMPASS for molbox™ User’s Manual
<Rename>
(action button)
<View Test Data>
(action button)
<Generate Report>
(action button)
<Re-Run Test>
(action button)
<Plot Test Data>
(action button)
<Delete File>
(action button)
<Exit Test>
(action button)
Used to override the default name and directory for the Data File resulting from the
test. Brings up a standard Windows Save As file box showing the default directory
and file name. These can be rewritten, if desired.
Used to review raw test data immediately following test completion without exiting the
test completely. This selection causes the Data File viewer to appear with the *.dat
file from the test that has just completed open. This is functionally equivalent to
selecting [D
completed (see Section 12.2). Close the Data File viewer using the control box <X>
or press <Esc> to return to the <Test Complete> selections.
Used as a shortcut to generate a test report immediately following test completion.
The COMPASS Report Editor merges the Data File with the last used report
template to generate a report. Multiple individual reports can automatically be created
with the selected template if the proper report Editor options are selected (see Section
16.3.3.4). The report Editor displays each report generated. This is functionally
equivalent to running the COMPASS Report Editor as a standalone application and
selecting the [F
Used to re-run the exact same test under the exact same conditions without
initialization prompts or selections. This feature does not overwrite the current Data
File, it creates a new Data File.
Used as a shortcut to immediately view plots using the data from the test that just
completed. This choice is functionally equivalent to exiting the test and selecting [D
[P
lot Data File] (see Section 12.4). Close the plot function using the control box <X> or
press <Esc> to return to the <Test Complete> selections.
Used to delete the current test Data File. Use this feature if the data taken will not be
used. When used, a delete confirmation prompt must be answered prior to deleting
the Data File. When confirmed, the file is deleted and the <Test Complete> window
automatically closes.
Exits the test. The <Test Complete> pop-up disappears and the main menu and
associated screen reappear. The current test data remains active until another test is
started.
ata], [View Data File] with the Data File from the test that has just
ile], [Generate Report] option (see Section 16.3.1.2).
ata],
7.3 [RUN molbox]
This run mode is used as a virtual interface to the molbox. Flow, pressure, temperature and analog
output information (if available) are continuously updated on the <molbox Output> run screen (see
Section 6.7.2) while the <Control Toolbar> (see Section 6.6) is available for parameter changes,
auxiliary functions and data acquisition. Since this run mode is molbox specific, a molbox with a remote
interface must be selected as the flow reference in the System Configuration (see Section 10.2) for the
mode to operate.
The Run molbox option is similar to running a test without a DUT and a fixed sequence. All operations
available in the test are available on the <Control Toolbar>. Use the toolbar to change molbox
settings, purge, leak check and tare as desired. Use the data acquisition <Control Toolbar> options to
create a test data file and log test data (see Section 6.6.10).
Provided that a molbox is properly interfaced with the PC and is selected in the System Configuration
as the flow reference; the only initialization step for this run mode is to select the data acquisition
options to use in addition to the molbox. A dialog display (Figure 36) similar to the <Data> and
<Auxiliary> options of the Test Definition allows selection of what data to log (see Sections 9.5.9 and
9.5.10). Pressure, temperature and auxiliary data can be logged if desired. The pressure and
temperature devices to use must be specified in the System Configuration. If no device is selected,
the <Control Toolbar>[Enter Flow Data] option will be available for manual entry of the pressure and/or
temperature outputs. The output of the selected support devices can be logged to the data file in the
© 1998-2003 DH Instruments, Inc. Page 60
Page 75

COMPASS for molbox™ User’s Manual
same fashion as a test if any of the <Control Toolbar> data acquisition options are used. When a point
is taken all averaging and manual entry options follow the same rules as when a test is executed.
If support instrument data is not necessary, simply uncheck all options and press [OK] to close the display
and complete the initialization. After initialization, COMPASS automatically displays the <molbox Output>
and <Average> run screens (see Sections 6.7.2, 6.7.4). If any support device was selected for output,
the <DUT Output> window can be accessed to view the output of the devices. Although no DUT is
specifically setup with this run mode, the support device data still displays on the <DUT Output> window.
Figure 36. <Run Mode Data Selector> Form
Some <Control Toolbar> options will not be available for every molbox reference. In particular,
molboxes that do not have the MFC control option cannot use the <Flow Control> feature. molboxes
running embedded software lower than Ver. 4.00 cannot use the <Purge> or <Leak Tes t> functions.
Using any of the <Control Toolbar> automatic data logging options can result in very large data files.
These are files with significantly greater than 1000 data points. COMPASS was not intended to
manipulate such files. Lower performance PC’s will experience significant delays in generating reports
and plots of such data files. Therefore, it is not recommended to use the plotting and reporting
functions with very large data files. Instead, export the data file to a spread sheet application for
further analysis.
COMPASS polls the molbox and responds to the toolbar options until the <Abort> button is pressed.
7.4 [RUN DUT]
Use this feature to access the predefined settings specified in a DUT Definition (see Section 8) without
running a specific Test Definition. In this run mode, COMPASS provides all of the features of a test in an
easily accessible toolbar. The <molbox Output>, <DUT Output>, <DUT/Ref Comparison> and the
<Average> run screens are all continuously updated with their respective information (see Section 6.7).
As this update progresses, the <Control Toolbar> is available for pa rameter changes and auxiliar y functions
(see Section 6.6). [Run D
a device cannot be easily automated by a Test Definition or when long term DUT data is desired.
UT] can be used in place of a Test Definition when the testing requirements of
This function requires the selection of a DUT Definition as part of the initialization process. If the DUT is
not set up as a controller (see Section 8.5.4), a flow control selection is also required. Flow control can
be manual, or a previously set up flow controller can be selected. The selected DUT must also have the
necessary support instruments configured in the System Configuration (see Section 10.2).
It is also possible to setup support devices to log data from. A dialog display (Figure 36) similar to the
<Data> and <Auxiliary> options of the Test Definition allows selection of what data to log (see Sections
9.5.9 and 9.5.10). The DUT output, measured set point, pressure and temperature can be activated or
Page 61 © 1998-2003 DH Instruments, Inc.
Page 76

deactivated at this time. DUT’s that are setup to use a density correction or DUTs with actual flow units
must use pressure and temperature data acquisition.
The Run DUT option is similar to running a test without a fixed sequence. All operations available in
the test are available on the <Control Toolbar>. Use the toolbar to change molbox settings, purge,
leak check and tare as desired. Use the data acquisition <Control Toolbar> options to create a test
data file and log test data (see Section 6.6.10).
Based on the DUT Definition, not all <Control Toolbar> functions will be available. For example, if manual
flow control is selected, the <Flow Control> option will not be available. Use the available features of the
<Control Toolbar> to purge, leak test, or tare the molbox, change the flow rate and stability criterion and
to log data to a data file. COMPASS polls the System Configuration instruments and responds to the
toolbar options until the [Abort] button is pressed.
Using any of the <Control Toolbar> automatic data logging options can result in very large data files.
These are files with significantly greater than 1000 data points. COMPASS was not intended to
manipulate such files. Lower performance PC’s will experience significant delays in generating reports
and plots of such data files. Therefore, it is not recommended to use the plotting and reporting
functions with very large data files. Instead, export the data file to a spread sheet application for
further analysis.
COMPASS for molbox™ User’s Manual
© 1998-2003 DH Instruments, Inc. Page 62
Page 77

COMPASS for molbox™ User’s Manual
88..
S
[[S
EETTUUP
P
]],, [[DDUUTT]]
8.1 OVERVIEW
COMPASS is organized around the support and testing of Devices Under Test (DUTs). DUTs are defined
in DUT Definitions. The information contained in the DUT Definition determines which System
Configuration devices are required (see Section 10.2) for the COMPASS run modes. DUT Definitions not
only specify the relationship between set point, output and flow; they determine how this data will be
acquired. Some DUTs can output directly using an RS-232 or IEEE-488 interface while others require a
DMM or a manual entry to log their output. Some DUTs are sensitive to the density of the flowing gas so
that gas density corrections must be made to properly evaluate them. There are DUT’s that control flow
and others that measure only. The DUT Definition supports all the necessary features to properly set up a
very wide variety of DUTs.
There are two types of DUT Definitions specified in the DUT [Header] tab (see Section 8.5.2):
• Individual DUT Definitions are intended to define a specific, individual DUT. They include a unique
DUT serial number and identification value. This type of DUT Definition does not require new entries
during test initialization (see Section 7.2.1.5).
• DUT Profile Definitions are intended to define a general DUT type. They do not include serial
number and identification values. DUT profiles are useful when several DUTs of the same type will be
tested. Instead of creating multiple DUTs all differing by serial number and/or identification only, use a
DUT profile. This type of DUT Definition requires that the DUT be identified during test initialization
(see Section 7.2.1.5).
Access the DUT Definition Editor using the [S
accessed DUT Definition displays in the DUT Definition Editor. While in the Editor, use the toolbar options
to create, edit, view and delete DUTs (see Section 8.5.1).
Only one DUT can be edited at a time, however, other DUTs can be viewed prior to completing the
changes on the DUT being edited. The DUT scroll bar and the DUT Selector are available to make new
DUT selections. A flashing indicator displays the ID number of the DUT currently being edited. This ID will
change as the DUT sort order changes. The edited DUT always displays in blue text in the DUT Selector
(see Section 8.4). Use these editing signals to locate the DUT if necessary.
DUT Definitions can be edited only when COMPASS is not in an active run mode. If a run mode is active,
all DUT fields and selection functions are disabled.
etup], [DUT] menu option. When selected, the last
Page 63 © 1998-2003 DH Instruments, Inc.
Page 78

COMPASS for molbox™ User’s Manual
8.2 CREATING DUT DEFINITIONS
Open the DUT Definition Editor using the [Setup], [DUT] menu option. Use the <New> DUT toolbar icon
to create a new DUT Definition. Set up the DUT as desired then press the <Save> icon to store the
DUT information. Any conflicts that exist will cause an error message to display. Resolve the conflicts
before re-saving. The <Restore> icon is nonfunctional for new DUTs (see Section 8.5.1). The feature
only restores to the last saved state. Since new DUTs have not been saved, there is nothing to restore.
If a DUT Definition exists that is similar to the one that will be created, use the <Copy> toolbar feature
to create a new DUT with the same characteristics (see Section 8.5.1). Then make the edits specific to
the new DUT. Don’t forget to change the <Record Label> prior to saving.
8.3 EDITING DUT DEFINITIONS
DUTs can be edited whenever COMPASS is not in an active run mode. Use the [Setup], [DUT] menu
option to display the DUT Definition Editor. Simply changing information in the DUT Definition Editor
places the Editor in the edit mode. No specific option must be selected to begin editing a DUT Definition.
Use the <Save> toolbar button to store the edits or press the <Restore> button to return the DUT to its
original state.
8.4 DUT DEFINITION SELECTOR
The DUT Definition Selector is most frequently used to select DUTs. This tool is used when initializing
[Run D
to sort the DUT Definitions low to high by the data in that column. For example, clicking the <Model>
column header automatically re-sorts the DUTs based on model. If a DUT is being edited, the <Editing>
ID number will most likely change with each new sort. The resulting order of DUT Definitions in the DUT
Selector determines the order used when scrolling through DUT Definitions in the DUT Definition Editor.
Use the search tools on the DUT Definition Selector to locate a DUT when many exist. Use the <Search by>
list box to determine which column heading will be used for the search. Then enter the <Search for> text
and press the [Search] button. If the DUT is located, it is selected on the display, otherwise, a message
displays noting the DUT was not located.
Click, hold and move the separator bar between column headers to expand or contract the column widths.
This may be necessary if a DUT field extends beyond the width of the default column display. The difference
between individual DUTs and DUT Profiles is evident in the Selector. The former displays serial number
and identification information, while the latter does not. Since most frequently the <Record Label> is used
to select DUTs, the label text of any selected DUT always displays in the <Record Label> field at the
bottom left of the window. Press <Select> to select the current DUT or press <Cancel> to return to the
DUT Definition Editor.
The DUT Definition Editor has a scroll feature allowing DUTs to be selected by scrolling (see Section
8.5.1). The ordering of the scrolled DUTs is determined by the last sort order in the DUT Selector.
UT] and [Run Test] run modes (see Sections 7.4, 7.2). Click any of the Selector column headers
An edited DUT Definition displays in blue text in the DUT Selector.
© 1998-2003 DH Instruments, Inc. Page 64
Page 79

COMPASS for molbox™ User’s Manual
Figure 37. <DUT Selection> Tool
8.5 DUT DEFINITION EDITOR
All DUT Definitions are created or edited using the DUT Definition Editor. The Editor also acts as a viewer
in other COMPASS functions. When editing a DUT, verify that each Editor tab contains the proper
information. This will help to avoid conflicts when using the DUT Definition in a COMPASS run mode.
Refer to Sections 8.5.1 through 8.5.9 for detailed information on the features and entry fields of the DUT
Definition Editor.
The DUT Definition Editor is made up of multiple sections:
• <Toolbar> (see Section 8.5.1): Includes tools to identify and select DUT Definitions and icons to
create, save, copy and delete Definitions.
• [Header] Tab (see Section 8.5.2): Contains general DUT identifying information and the Profile or
Individual type choice.
• [Correction] Tab (see Section 8.5.3): Specifies whether a gas density correction should be made for
the DUT and the DUT’s standard operating gas pressure and temperatu re conditions.
• [Range] Tab (see Section 8.5.4): Defines the DUT’s flow and measurement output unit and range.
Specifies if the DUT is a flow controller.
• [Tolerance] Tab (see Section 8.5.5): Specifies the DUT’s measurement tolerance type and
quantifies the tolerance.
• [Test] Tab (see Section 8.5.6): Identifies the default Test Definition to be used when the DUT is
selected in [R
un Test] mode.
• [Conditions] Tab (see Section 8.5.7): Records conditions under which the DUT is tested (orientation,
downstream pressure).
• [Read] Tab (see Section 8.5.8): Defines the DUT’s output type and commands to be used.
Sets resolution to use when running tests.
• [Set] Tab (see Section 8.5.9): If the DUT is a flow controller, defines the set point type and range and
commands to be used in the case of RS-232 or IEEE-488 DUTs.
Page 65 © 1998-2003 DH Instruments, Inc.
Page 80

8.5.1 TOOLBAR
All fields above the tabs on the DUT Definition Editor are considered part of the toolbar.
The toolbar not only identifies which Definition is active, but also provides tools to create,
delete, save, restore, identify and select DUT Definitions. Table 15 identifies the toolbar
features and their functions.
Figure 38. DUT Definition Editor, <Toolbar>
COMPASS for molbox™ User’s Manual
Table 15. DUT Definition Editor, <Toolbar> Features
FEATURE DESCRIPTION
DUT record label
(required text entry
Viewing DUT
(label)
Editing DUT
(label)
Save
(toolbar button)
New
This field is analogous to a file name. The text entered should make the DUT easily
distinguishable from other DUTs. Up to 40 characters can be entered in the label.
In some cases it may be useful to set up a single DUT more than one time, for example
field)
if the DUT supports multiple gases. In this case, a proper use of this field would be to
include the mention of the calibration or process gas as part of the record label.
Do not use the following characters in the DUT record label: \,/, :, *, ?, “, <,>, |, a comma
or tab character. These characters will cause problems when importing the Data File or
creating the Data File directory based on the data directory naming convention
selected using the [To
Identifies the current relative sort position of the DUT in the Editor. As the sort order
changes, this field also changes (see Section 8.4). The notation is “Current DUT/Total
number of DUTs”.
Identifies the sort identification of a DUT that is being edited. This field does not display
unless a DUT is being edited. As the sort order changes, this field also changes (see
Section 8.4).
Saves changes to an edited DUT Definition. This button is not active when no edits
have been made. Any DUT conflicts result in error messages when saving. These
conflicts must be resolved before saving can be completed.
Creates a new DUT Definition with default information (see Section 8.2).
ols], [Options], [Data File] tab (see Section 11.8).
(toolbar button)
Copy
Copies the contents of the current DUT Definition to a new DUT Definition. The
<Record Label> of the copied DUT includes the text “Copy”. This is the only difference
between the original DUT Definition and the copy. Make sure the new DUT is properly
edited before saving.
(toolbar button)
Restore
Restores a DUT Definition that is being edited to the last saved state. Use this feature
to abandon edits made to a DUT before saving. If a new DUT was created using the
<New> option, the restore button is nonfunctional.
(toolbar button)
© 1998-2003 DH Instruments, Inc. Page 66
Page 81

COMPASS for molbox™ User’s Manual
FEATURE DESCRIPTION
Delete
(toolbar button)
Open/Select
(toolbar button)
Scroll Select
(scroll bar)
Deletes the current DUT Definition. A message prompt for confirmation displays prior to
removing the DUT Definition record.
Displays the DUT Selector loaded with a sorted list of the DUTs (see Section 8.4). The
selected DUT will display in the DUT Definition Editor.
Scrolls to the next DUT Definition following the current sort order (see Section 8.4).
8.5.2 [HEADER] TAB
This DUT Definition Editor folder contains common DUT header information. The purpose of
the [Header] fields and settings as well as instructions on how to use them are provided in
Table 16.
Do not use the following characters in any of the <Header> fields: \,/, :, *, ?, “, <,>, |, a
comma or tab character. These characters will cause problems when importing the Data
File or creating the Data File directory based on the data directory naming convention
selected using the [To
ols], [Options], [Data File] tab (see Section 11.8).
Figure 39. DUT Definition Editor, [Header] Tab
Page 67 © 1998-2003 DH Instruments, Inc.
Page 82

Table 16. DUT Definition Editor, [Header] Tab Fields
FEATURE DESCRIPTION
COMPASS for molbox™ User’s Manual
Record Type
(required drop
down list
selection)
Manufacturer
(required drop
down list
selection)
Model
(required drop
down list
selection)
Serial Number
(optional text entry
field, Individual DUT
Definitions only)
Identification
(optional text entry
field, Individual
DUT Definitions
Process Gas
(required drop
down list
selection)
There are two types of DUT Definitions:
• Individual DUT Definitions are intended to define a specific, individual DUT. They
include a unique DUT serial number and identification value. This type of DUT Definit ion
does not require new entries during test initialization (see Section 7.2.1.5).
• DUT Profile Definitions are intended to define a general DUT type. They do not
include serial number and identification values. DUT profiles are useful when several
DUTs of a specific type will be tested. Instead of creating multiple DUTs all
differing by serial number and/or identification only, use a DUT profile. This type of
DUT Definition requires that the DUT be identified during te st initialization ( see Section 7.2.1.5).
One definition type must be selected. Default is Individual DUT.
The DUT manufacturer is selected from the drop down list box. The manufacturer selected
along with the <Process Gas> and <Calibration Gas> determine the default DUT gas
conversion <K Factor>. Therefore, the manufacturer is a required field.
Gas conversion factors, often called K factors, are used when a DUT cannot be tested
with the gas with which it is normally operated. K factor definition and uncertainty are
the responsibility of the DUT manufacturer (see Section 15.1 and the molbox Operation
and Maintenance Manual, [K] Section).
If the desired manufacturer is NOT in the list of manufacturers, then the <Process Gas Editor>
can be used to add this manufacturer and the allowable process gases and associated
K factors (see Section 15). The [To
Alternatively, a new manufacturer can be entered manually by choosing the <Add
Manufacturer> option at the beginning of the list. Manually entered manufacturers are
automatically added to the drop down list (alphabetically). Use the [To
[Maintain Lists] tab to delete unwanted manufacturers added in this fashion (see
Section 11.4). NOTE: Manually added manufacturers do not contain K factor
information as do manufacturers added with the <Process Gas Editor>. As a result,
the <K Factor> field does not automatically refresh with each new <Process Gas> and
<Calibration Gas> selection. Manually added manufacturers are typically used with
DUTs that do not use K factors.
The default Data File directory naming preference can use this entry to create the
directory for Data Files created when this DUT is run (see Section 11.8).
The model number or name for the DUT can be selected from the drop down list or a new
model can be entered manually. Manually entered models are automatically added to the
drop down list (alphabetically). Use the [To
unwanted models from the list (see Section 11.4). DUT Definitions that contain a deleted
model are still valid. The default Data File directory naming preference can use this entry to
create the data directory for Date Files created when this DUT is run (see Section 11.8).
Write in the DUT serial number. DUT Profiles do not include a serial number during the creation
of the DUT. The default Data File directory naming preference can use this entry to
create the data directory for Date Files created when this DUT is run (see Section 11.8).
Write a DUT identification, if desired. This field can be used for internal tracking of
DUTs or to record other information. Any combination of information can be entered
into the ID field. The value entered will be included in the test Data Files and can be
included in reports. The default Data File direc tory naming prefer ence can use this entry
to create the data directory for date files created when this DUT is run (see Section 11.8).
only)
Profile Type DUT Definitions do not include a device ID.
The process gas is the gas with which the DUT is intended to operate in its actual application.
This is a required field since it is used to determine the default gas conversion “K” factor for the
DUT (see Section 15.1). If a gas is not included in the drop down list, the gas can be added in two ways:
1. If the selected <Manufacturer> was created with the <Process Gas Editor>, the
<Process Gas Editor> must be used to add the gas (see Section 15). Use the
link to the Editor found in the [To
2. If the selected <Manufacturer> was manually entered, use the < Add Gas> option at the
top of the list to add the gas. Realize that no K factor information will be provided by
COMPASS for this gas. The K factor must be manually entered in the [Test] tab
(see Section 8.5.6).
ols] menu contains a link to the <Process Gas Editor>.
ols], [Options], [Maintain Lists] tab to delete
ols] menu.
ols], [Options],
© 1998-2003 DH Instruments, Inc. Page 68
Page 83

COMPASS for molbox™ User’s Manual
8.5.3 [CORRECTION] TAB
The [Correction] DUT Definition tab is provided to accommodate DUTs that are sensitive to
gas density. COMPASS can perform a square root or proportional gas density correction
based on the characteristics of the flowing gas, the DUT’s normal operating pressure and
temperature and the current gas pressure and temperature. This feature allows a density
sensitive DUT that is intended to be operated at a given pressure and temperature to be
tested under current pressure and temperature conditions.
In general, gas density corrections do not apply to thermal mass flow controllers and meters
(MFCs and MFMs). A density correction is co mmonly used on ro tameters , turbine me ters and
other devices whose operating principle is the measurement of volume flow and a conversion
to mass flow. If the DUT outputs in mass flow units (e.g., sccm, mol/s, mg/s), density
corrections, if needed, are almost certainly performed by the DUT itself. See the molbox
Operation and Maintenance Manual, Unit Section for additional information and the Section 5
of this manual for examples.
For COMPASS to perform gas density corrections, the normal operating pressure and
temperature of the DUT along with the molecular mass and the compressibility factor of the
DUT’s process gas must be specified in the DUT Definition.
The information entered is used to determine the density of the flowing gas under the normal
operating conditions of the DUT. The density is then applied to the reference flow based on
the density correction method selected, the resultant value is the reference flow under the
DUT’s normal operating conditions. This information is displayed on the <DUT/Ref
Comparison> window and logged in the <Data Grid> (see Sections 19.5, 18.4.1).
The purpose of the [Correction] tab fields and settings as well as instructions on how to use
them are provided in Table 17.
Selecting a <Gas Density Correction Type> other than <None> will cause the reference flow
to be corrected as a function of gas density. This correction is only valid if a) the DUT is
known to be gas density sensitive; b) the DUT’s gas density sensitivity corresponds to one
of the <Gas Density Correction Types>; c) the DUT’s normal operating pressure and
temperature can be correctly specified, d) the pressure and temperature of the gas flowing
when the DUT is tested can be determined. In any other case, specifying a gas density is
likely to cause erroneous data by causing incorrect calculation of <Ref Q DUT Conditions>.
If a density correction is selected and the <Process Gas> is also a COMPASS supported
<Calibration Gas>, all gas specific entries on the <Process Gas> panel are disabled, and
COMPASS will automatically calculate the gas density based on the normal operating
pressure and temperature data entered. Any change in the pressure and temperature
fields triggers the re-calculation of the normal operating gas density.
Page 69 © 1998-2003 DH Instruments, Inc.
Page 84

Figure 40. DUT Definition Editor, [Correction] Tab
Table 17. DUT Definition Editor, [Correction] Tab Fields
FEATURE DESCRIPTION
COMPASS for molbox™ User’s Manual
Gas Density
Correction Type
(required drop
down list
selection)
Absolute
Pressure
(required numeric
entry if a gas
density correction
is used)
Temperature
(required numeric
entry if a density
correction is used)
Determines which type of density correction will be used when the DUT is run. The density
correction selected is applied to the reference flow to correct the reference flow to the
DUT’s normal operating conditions. The DUT flow is still determined by the output to flow
relationship setup on the <Range> tab. Refer to the calculations in Section 19.5 for detail
on how the density correction is applied.
• None - No density correction is applied. Entry in all other fields of this folder
is disabled. This is the normal selection for thermal mass flow controllers and meters
(MFCs, MFMs). This should be the selection for any DUT for which it is not
explicitly known that a proportional or square root gas density correction is
appropriate.
• Proportional - The ratio of the current gas density to the normal operating gas
density is used to determine the reference flow in the DUT’s normal
operating conditions. This type of correction is also used to determine actual or
volumetric flow. Turbine meters that output volume flow typically use this type
of correction. All fields in this tab require an entry when proportional is selected.
• Square Root – The square root of the ratio of the current gas density to the normal
operating density is used to determine the reference flow in the DUT’s normal
operating conditions. Variable area style flow meters (rotameters) typically use this
type of correction. All fields on this tab require an entry when square root is selected.
The normal operating pressure of the DUT. This value is provided by the DUT
manufacturer. It may be marked on the DUT and/or in its calibration report.
Enter the pressure value and select the pressure unit of measure. Note that the pressure
value is an absolute pressure, not a gauge pressure. Gas density is a function of
absolute pressure. If the DUT normal operating pressure is specified as a gauge pressure,
add standard atmospheric pressure of 101.325 kPa (14.696 psi) to determine absolute
pressure. Refer to Section 19.5 for calculation details concerning this parameter.
If the DUT normal operating pressure is not specified at all, consider using standard
atmospheric pressure or the absolute operating pressure at which the DUT is typically
used if you know it.
The normal operating temperature of the DUT. This value is provided by the DUT
manufacturer. It may be marked on the DUT and/or in its calibration report.
Enter the temperature and select the corresponding units of measure. Refer to
Section 19.5 for calculation details concerning this parameter.
If the DUT normal operating temperature is not specified at all, consider using 20 ºC or the
operating temperature at which the DUT is typically used if you know it.
© 1998-2003 DH Instruments, Inc. Page 70
Page 85

COMPASS for molbox™ User’s Manual
FEATURE DESCRIPTION
Process Gas and
Gas Constant
(required entry if a
density correction
is used)
Process Gas
Compressibility
(required entry
if a density
correction
is used)
The currently selected <Process Gas> is the process gas specified in the <Header> tab
(see Section 8.5.2) and cannot be changed here. The gas constant in this panel must
correspond to the process gas. The drop down list should be used to determine how the
gas constant information is entered. In the event the <Process Gas> is also a
COMPASS supported <Calibration Gas>, all gas specific entries are disabled, and
COMPASS will automatically calculate the gas density based on the pressure and
temperature data entered. The choices are:
• Molecular Mass (g/mol) – The entry field should contain the molecular mass in
g/mol units. COMPASS automatically enters this value when the process gas is also
a supported calibration gas.
• Specific Gra vity – The entry field should contain the dimensionless specific gravity
value for the process gas. This value is the ratio of the gas density in standard
conditions to the density of air in standard conditions.
• Density (kg/m³) – The entry field should contain the density of the gas in the
specified normal operating pressure and temperature conditions. COMPASS will not
modify this value when applying the density correction. In the previous cases,
COMPASS must calculate the density using the entered information prior to applying
the density correction.
Refer to Section 19.5 for calculation details concerning this parameter.
In all cases, make absolutely sure that the gas constant value entered is in the proper
units and corresponds to the current <Process Gas>. Failure to due so will result in
erroneous data.
Specifies the compressibility factor of the <Process Gas> at the DUT’s normal operating
conditions (listed in the <Normal Operating Conditions> panel of this tab. The gas
compressibility does not change significantly over a very wide range of pressure and
temperature. For this reason, 1.00 is used as the default value. This entry is used to determine
the density of the <Process Gas> in the DUT’s normal operating conditions. Refer to
Section 19.5 for calculation details concerning this parameter. Wh en the gas c onstant is ent ered as
a density value, this field is disabled.
8.5.4 [RANGE] TAB
The DUT Definition [Range] tab is provided to define the relationship between the DUT flow,
output and set point (if applicable) ranges and units. It is assumed that all of these values are
linearly proportional in the sense there is a constant ratio between output, flow and set point.
Select the units that correspond to each parameter using the drop down list provided.
Table 18 provides details on each of the [Range] tab fields.
Figure 41. DUT Definition Editor, [Range] Tab
Page 71 © 1998-2003 DH Instruments, Inc.
Page 86

Table 18. DUT Definition Editor, [Range] Tab Fields
FEATURE DESCRIPTION
COMPASS for molbox™ User’s Manual
Flow Range Unit
(required drop
down list
selection)
Flow Range Min
Flow
(required numeric
entry field)
Flow Range Max
Flow
(required numeric
entry field)
Resolution
(required list box
selection)
Output Range
Units
(required drop
down list/text entry
Output Range
Min Output
(required numeric
entry field)
Output Range
Max Output
(required numeric
entry field)
Output Range
Resolution
(required drop
down list
selection)
Set Range
Is the DUT a
Controller?
(check box)
Select the DUT flow unit of measure from the drop down list. The final calculated DUT
flow always displays in this unit. The minimum and maximum flow must be entered in the
selected unit.
If the desired flow unit is not on the list, use the <Edit Units> option at the top of the drop
down list to display the <Flow Unit Editor> (see Section 14). All new units created
automatically appear in the list of flow units of measure.
Enter the lowest DUT flow in the flow range unit of measure. Typically this value is 0. In
some special cases, the minimum flow is non-zero. Regardless, the value entered must
correspond to the DUT’s <Min Output> (see below). This is the expected flow when the
DUT’s <Min Output> occurs.
All %DUTFS errors are based on the flow span. Full scale and span are equivalent as long
as the <Min Flow> value is zero. If a non zero value is entered, there will be a discrepancy
between the actual full scale error and the %DUTFS value determined by COMPASS.
If true full scale error is desired, always enter 0 as the <Min Flow> value.
Enter the maximum DUT flow in the flow range unit of measure. This is the expected flow
when the DUT’s <Max Output> occurs.
Sets the resolution with which the calculated DUT flow data will be logged and displayed.
Select the desired resolution from the drop down list. This option should be used to adjust
the resolution to a level that is appropriate for the performance of the DUT. Typically,
resolution is set to one order of magnitude greater than the DUT tolerance. By default,
the reference resolution is set to be 1 order of magnitude greater than the resolution
selected in this field.
Select the DUT output unit from the drop down list. If the unit is not on the list, type the
unit into the list box. If the output range unit is the flow range unit, the min/max output
fields are automatically set to the min/max flow range fields. If the DUT’s <Output Type>
on the [Read] tab is <Voltage/Current>, the output unit must be V, mV, A or mA. If the
DUT’s data acquisition mode is <Frequency>, the output unit must be Hz, kHz, MHz or s.
field)
Enter the lowest output (output corresponding to the <Min Flow>) of the DUT in the
output range unit of measure. If the output unit is the flow range unit, the <Min Flow>
value is copied here and cannot be changed.
Enter the highest output (output corresponding to the <Max Flow >) of the DUT in the
output range unit of measure. If the output unit is the flow range unit, the <Max Flow>
value is copied here and cannot be changed.
Sets the resolution with which DUT output (and set) data will be logged and displayed.
Select the desired resolution from the drop down list. The resolution is applied to all
calculated DUT information. This option should be used to adjust the resolution to a level
that is appropriate for the performance of the DUT. Typically, resolution is set to one
order of magnitude greater than the DUT tolerance.
Check this field if the DUT is a flow controller. This will cause the DUT to be handled as a
flow controller when tests are run.
DUT’s that have a density correction selected in the DUT Definition [Correction] tab
cannot be set up as flow controllers.
© 1998-2003 DH Instruments, Inc. Page 72
Page 87

COMPASS for molbox™ User’s Manual
FEATURE DESCRIPTION
Set Range
Set Units
(conditional drop
down list/
text entry field)
Set Range
Min Set
(conditional
numeric entry
Set Range
Max Set
(conditional
numeric entry
Select the DUT set point unit from the drop down list. If the unit is not in the list, type the
unit into the list box. If the set range unit is the flow range unit, the min/max set point
fields are automatically set to the min/max flow range values. If the DUT’s <Set Point
Type> in the DUT Definition [Set] tab is <Voltage/Current>, the set point unit must be V,
mV, A or mA.
There is no set range if the DUT is NOT a controller.
Enter the lowest set point (set point corresponding to the <Min Flow>) of the DUT in the
set point unit. If the set point unit is the flow range unit, the <Min Flow> value is copied
here and cannot be changed.
There is no set range if the DUT is NOT a controller.
field)
Enter the highest set point (set point corresponding to the <Max Flow>) of the DUT in the
set point unit specified above. If the set point unit is the flow range unit, the <Max Flow>
value is copied here and cannot be changed.
There is no set range if the DUT is NOT a controller.
field)
8.5.5 [TOLERANCE] TAB
The DUT Definition [Tolerance] tab is used to provide a specification for the DUT. The DUT
specification is used in calculating DUT errors and in determining the status of a test point
when tests are run (see Section 7.2), the state of the <Tolerance Indicator> on the <DUT/Ref
Comparison> run screen (see Section 6.7.1) and is applied to test data plots to determine the
tolerance bars on plots (see Section 6.7.6). There are several tolerance formatting options.
Choose the selection appropriate for the DUT.
Table 19 provides details on each of the [Tolerance] tab fields.
%Rdg only tolerances should be avoided if test points at or near 0 will be taken.
The tolerance becomes infinitely small as the reference flow approaches zero. Instead, use a
combination tolerance such as <%DUTFS OR %Reading (Greater of)>.
Figure 42. DUT Definition Editor, [Tolerance] Tab
Page 73 © 1998-2003 DH Instruments, Inc.
Page 88

COMPASS for molbox™ User’s Manual
Table 19. DUT Definition Editor, [Tolerance] Tab Fields
FEATURE DESCRIPTION
Tolerance Type
(required drop
down list
selection)
Tolerance Value
(required numeric
entry field)
Selects the DUT tolerance formula used to calculate DUT error at test points.
Choices are:
• %DUTFS: DUT tolerance is calculated as the flow span of the DUT times the
tolerance value. Span and full scale errors are always the same when the DUT
<Min Flow> value is zero.
• %Reading: DUT tolerance is calculated as the current reading of the DUT times the
tolerance value.
• %DUTFS or %DUTreading (greater of): DUT tolerance is calculated at each point
as both %DUTFS and %reading. The tolerance used is the greater of the two.
• %DUTFS + %Rreading: DUT tolerance is calculated at each point as both
%DUTFS and %Reading. Tolerance used is the sum of the two.
• Flow Units: DUT tolerance is specified as the ± value of the fixed flow value
entered in the DUT flow range unit (from the DUT Definition [Range] tab).
• Output Units: DUT tolerance is specified as the ± value of the fixed output value
entered in the DUT output range unit (from the DUT Definition <Range> tab).
• Set Units: DUT tolerance is specified as the ± value of the fixed set point value
entered in the DUT set range unit (from the DUT Definition [Range] tab).
• None: There is no DUT tolerance specification.
See Section 19.4 for details on error calculations.
Specifies the numeric value used to calculate the DUT tolerance. Combination tolerance
selections provide two entry fields.
8.5.6 [TEST] TAB
The DUT Definition [Test] tab specifies information specific to testing the DUT. These include
the default Test Definition to use to test the DUT as well as the <Calibration Gas> and
<K factor>, if applicable. The current <Process Gas> selection displays at the top of the
folder for reference purposes.
Table 20 provides information on each of the [Test] tab fields.
Figure 43. DUT Definition Editor, [Test] Tab
© 1998-2003 DH Instruments, Inc. Page 74
Page 89

COMPASS for molbox™ User’s Manual
Table 20. DUT Definition Editor, [Test] Tab Fields
FEATURE DESCRIPTION
Calibration Gas
(required drop
down list
selection)
K Factor
(conditional
numeric entry
field)
Default Test
(optional entry
field)
This is the gas that is actually flowed through the reference and the DUT when the DUT
is tested. The value entered is used to determine the default <K Factor> (see
immediately below). All molbox supported gases are selectable as calibration gases.
If a density correction is selected in the DUT Definition <Correction> tab, the calibration
gas is automatically set to the process gas and cannot be changed.
This is the DUT’s gas conversion factor from the calibration gas to the process gas for
the particular manufacturer selected. DUTs that specify a density correction in the DUT
Definition [Correction] tab do not use this field. The value is automatically updated if the
<Manufacturer> was set up using the <Process Gas Editor> and conversion
information is supported for the test gases (see Section 15).
Gas correction factors (K factors) are supplied by DUT manufacturers to allow
calibration of the DUT with a gas other than the process gas. Using incorrect gas
correction factors or failing to properly estimate the uncertainty on gas corrections
factors may lead to erroneous data. molbloc/molbox does not use gas correction
factors. For additional information, see the molbox Operation and Maintenance Manual
Sections concerning [K] and K factors.
Specifies the Test Definition (see Section 9) that is most commonly used to run this DUT.
When a DUT to run is selected in [R
automatically offered as the Test Definition to use (though a different test can be
selected). If test selection in test initialization is turned OFF (see Section 11.5),
the <Defaul t Test> will be used automatically. The association of a test with a DUT
makes it possible to assure that a DUT is always tested with the correct test procedure.
Click the field or press the <Select> button to display the <Test Definition Selector>
(see Section 9.4). Highlight the desired Test Definition and press <OK> to select it.
Right click this field to remove the Test Definition entry.
un Test], the Test Definition specified here is
8.5.7 [CONDITIONS] TAB
The DUT Definition [Conditions] tab is used to record information about the conditions under
which the DUT is normally tested. The information is included in the Data File when tests
are run. No calculations are performed using this [Conditions] tab information and it has no
affect on COMPASS operation.
Table 21 provides information on the various [Conditions] tab selection s.
Figure 44. DUT Definition Editor, [Conditions] Tab
Page 75 © 1998-2003 DH Instruments, Inc.
Page 90

Table 21. DUT Definition Editor, [Conditions] Tab Fields
FEATURE DESCRIPTION
COMPASS for molbox™ User’s Manual
Attitude
(scroll bar)
Description
(optional text entry
field)
Normal Exhaust
Condition
(required drop
down list
selection)
Exhaust
Pressure
(conditional
numeric entry
field)
Defines the orientation of the DUT during a test. This is recorded as descriptive text in the
Data File and can be used in reports. The attitude is selected by using the attitude scroll bar.
The DUT icon to the right of the fields moves to illustrate the current attitude selection.
The text representing the attitude is logged in the Data File. Each attitude has a different
default description, however, any text entered will be used.
Select the pressure conditions downstream of the DUT. The choices include
<Vacuum>, <Atmosphere> or <Pressure>. When <Pressure> is selected, a pressure
value must be entered in the <Exhaust Pressure> field.
Enter the pressure value and select the unit of measure of the pressure just downstream
of the DUT. This field is enabled only when the pressure exhaust condition is selected.
8.5.8 [READ] TAB
The DUT Definition [Read] tab defines how COMPASS acquires data from the DUT.
Whatever the data acquisition method, DUT flow output data must be obtained in the output
units specified on the [Range] tab. DUT’s that interface directly by RS-232 or IEEE-488
require a remote command setup. All other non-manual DUT data acquisition selections
require that the appropriate data acquisition instrument(s) be available to COMPASS by
selection in the <System Configuration> (see Section 10.2).
Table 22 provides information on the individual [Read] tab fields.
Figure 45. DUT Definition Editor, [Read] Tab
© 1998-2003 DH Instruments, Inc. Page 76
Page 91

COMPASS for molbox™ User’s Manual
Table 22. DUT Definition Editor, [Read] Tab Fields
FEATURE DESCRIPTION
Output Type
(required drop
down list
selection)
RS-232 Settings/
IEEE-488 Address
(conditional entry
Initialization
Commands
(conditional drop
down list/action
button)
Read Commands
(conditional drop
down list/action
button)
Communications
(action button)
Specifies what form of data will be acquired from the DUT. The availa ble selection s are:
• Voltage/Current: The DUT outputs an electrical signal that will be acquired by the
<DUT Output DMM> specified in the System Configuration (see Section 10.2). The
output units must be: V, mV, A or mA when this selection is used. COMPASS
automatically makes the necessary conversi ons from the DMM’s output unit, (t ypically
V or A), to the DUT’s output unit. No c ommand informati on is required as com mands
are provided in the DMM Hardware Definition (see Section 10.3.4).
• RS-232: DUT data is gathered directly over the DUT’s RS-232 interface.
The <Initialization Commands> will be issued during run mode initialization, then
the <Read Com mands> will be repeatedly sent to obtain real time output from the
DUT. The <RS232 Settings> must be selected by clicking the field and making the
necessary selections. Information on commands required to read the DUT by RS232 must be provided. Review Section 13.3 for details on the requirements of RS232 data acquisition. This selection is normally used only when the DUT actually
outputs directly by RS-232. However, it can also be used in a variety of situations in
which the DUT does not directly output in RS-232 but the device used to read the
DUT has an RS-232 interface, for example to read DUTs through a co nversion modu le.
• IEEE-488: DUT data is gathered using the IEEE-488 interface provided by the
IEEE-488 card specified in the System Configuration (see Section 10.2).
The <IEEE-488 Address> must be entered before saving the DUT. Information on
the commands required to read the DUT by IEEE-488 must be provided. Review
Section 13.4 for details on the requirements of IEEE-488 data acquisition. This
selection is normally used only when the DUT actually outputs directly by IEEE-488.
However, it can also be used in a variety of situations in which the DUT does not directly
output in IEEE-488 but the device used to read the DUT has an IEEE-488 interface.
• Frequency: The DUT output is a frequency that will be acquired using the
<Frequency Measurement> device selected in the System Configuration (see Section 10.2).
The output units of the DUT must be: Hz, kHz, MHz or s. CO MPASS automatically
makes the necessary conversions from the frequen cy based output unit, (typicall y Hz)
to the DUT’s output units. No command information is required as commands are
provided in the frequency counter Hardware Definition.
• Manual: DUT data must be entered manually in [R
command or interface information is required.
This is the interfacing information for a DUT whose output type is RS-232 or IEEE-488.
An entry in this field is only required if the <Output Type> in this tab is RS-232 or IEEE-488.
field)
These are the commands needed to initialize a DUT whose <Output Type> is RS-232 or IEEE-488.
Click the <Edit> button to display the <Remote Command Editor> form (see Section 13.2).
Enter the desired commands then close the form. These commands will be issued during the
initialization process of [Run D
RS-232 or IEEE-488. If the DUT does not require a specific initialization this field is not used.
Refer to the DUT’s remote interface manual to determine whether initialization commands are
necessary. Possible initialization commands include: setting unit of measure, gas or range. If
initialization commands are needed, enter them in the remote command Editor. All commands
entered will appear in appropriate list box.
These are the commands needed to read a DUT whose <Output Type> is RS-232 or IEEE-488.
Click the <Edit> button to display the <Remote Command Editor> form (see Section 13.2).
Enter the desired read commands then close the form. These commands are continuously sent
to the DUT in all run modes that use the DUT. Up to 10 commands can be issued as part of the
reading process, however only one command can be specified as the actual read command.
The actual read command is the command that causes the DUT to return its output value. The
actual read command is specified by the arrow next to the command, “”. All commands
entered will appear in the appropriate list box.
This feature is used to test communication with a DUT whose <Output Type> is RS-232 or IEEE-488.
Test
Press this button to send the <Initialization Commands> and <Read Commands> to the DUT.
A <Spy Window> will display with the command response information used (see Section 6.7.7).
This feature is designed to provide on the s pot trou bles hooti ng of t he remo te com mands se tup. If a
command is not properly entered or the response format is not correct, the problem should be visible
in the spy window. Use the <Remote Communications> option for further troubleshooting (see Section 13.6).
un Test] and [Run DUT] modes. No
UT] and [Run Test] run modes when the DUT <Output Type> is
Page 77 © 1998-2003 DH Instruments, Inc.
Page 92

8.5.9 [SET] TAB
The DUT Definition [Set] tab defines how COMPASS is to set flow when running test on DUTs
that are set up as flow controllers in the DUT Definition [Range] tab (see Section 8.5.4). If the
DUT is NOT set up as a flow controller, the [Set] tab is not active. If the DUT is NOT a flow
controller, flow may be set manually or by a flow controlling device specified in the Test
Definition [CONTROL] table (see Section 9.5.6).
Choose the manner in which set point commands are given from the <Set Point Type> list.
The set point to flow output relationship defined in the DUT Definition [Range] tab (see
Section 8.5.4) is used to convert set point values to the necessary set point units.
Table 23 provides information on the individual fields of the [Set] tab.
COMPASS for molbox™ User’s Manual
Figure 46. DUT Definition Editor, [Set] Tab
© 1998-2003 DH Instruments, Inc. Page 78
Page 93

COMPASS for molbox™ User’s Manual
Table 23. DUT Definition Editor, [Set] Tab Fields
FEATURE DESCRIPTION
Set Point Type
(conditional drop
down list
selection)
Initialization
Commands
(conditional drop
down list/action
button)
Set Commands
(conditional drop
down list/action
button)
Communications
(action button)
Specifies the manner in which set point commands are given for DUTs that can control flow. If the
DUT is NOT set up as a controller in the DUT Definition [Range] tab (see Section 8.5.4), this field
is disabled and the flow control method will be determined by the Test Definition or a [Run D
initialization selection (see Sections 9.5.6, 11.6). For DUTs that do control own flow, the available
selections are:
• Voltage/Current: The DUT flow setpoint command is an analog electrical value supplied
by an analog power supply. To run tests, the analog power supply that COMPASS is to use
must be specified as the <Set Point Power Supply> in the System Configuration (see Secti on 10.2) .
The analog option of a reference molbox1 is an option in this list. The set point unit must be:
V, mV, A or mA when this selection is used. COMPASS automatically makes the necessary
conversions from the original target flow units, to the set point units to the power supply units.
• RS-232: The DUT flow setpoint command is an ASCII string it receives over its RS-
232 interface. If <RS323> is the <Set Point Type> selection, <RS232 Settings> must
be specified correctly. The [Set] tab <Initialization C omman ds> will be issued during
run mode initialization, then the <Set Commands> will be issued as needed to set the
flow. Responses to set commands are not used or handled by COMPASS. By
default, the RS-232 settings and the initialization commands are the same as those set
up in the DUT Definition [Read] tab <Output Type> when the output type is also RS232 (see Section 8.5.8). See Section 13.3 concerning RS-232 communications.
• IEEE-488: The DUT flow setpoint command is an ASCII string it receives over its
IEEE-488 interface. If <IEEE-488> is the <Set Point T ype> selection, the <IEEE-488
address> of the DUT must be specified correctly. When tests are run, a valid IEEE488 card must be specified in the System Configuration (see Section 10.2). The [Set]
tab <Initialization Comma nds> will be issued during run mode initialization, then the
<Set Commands> will be issued as needed to set the flow. Responses to set
commands are not used or handled by COMPASS. By default, the <IEEE-488
Address> and the <Initialization Commands> are the same as those set up in the
DUT Definition [Read] tab <Output Type> when the output type is als o IEEE-488 (see
Section 8.5.8). See Section 13.4 concerning IEEE-488 communications.
See Section 13 for information on COMPASS remote communications.
These are the commands needed to initialize a DUT whose <Set Point Type> is RS-232 or
IEEE-488.
Click the <Edit> button to display the <Remote Command Editor> form (see Section 13.2).
Enter the desired commands then close the form. These commands will be issued during the
initialization process of [Run D
is RS-232 or IEEE-488. If the DUT does not require a specific initialization this field is not used.
Refer to the DUT’s remote interface manual to determine whether initialization commands are
necessary. Possible initialization commands include: setting unit of measure, gas or range.
If initialization commands are needed, enter them in the remote command Editor. All commands
entered will appear in appropriate list box. Consider that initialization commands may also be included
on the DUT Definition [Read] tab if the DUT uses the same interface for reading and setting.
See Section 13 for information on COMPASS remote communications.
These are the commands needed to set a DUT whose <Set Point Ty pe> is RS-232 or IEEE-488.
Click the <Edit> button to display the <Remote Command Editor> form (see Section 13.2).
Enter the desired set commands then close the form. Up to 10 commands can be included.
All commands entered will appear in the appropriate list box. Refer to the DUT manual for detail s
on how the DUT interface functions.
Set commands typically require the <Set Unit Variable> to specify where the numerical target
flow information should be located in the command string. Enter the command string then drag
and drop or type the <Set Unit Variable> text into the appropriate location in the command
string. COMPASS substitutes the current numerical set point in the <Set Units> for the <Set
Unit Variable> to create the final set command.
The set point command(s) is sent each time a new flow increment or set point is initiated in a
COMPASS run mode.
See Section 13 for information on COMPASS remote communications.
This feature is used to test communication with a DUT whose <Set Point Type> is RS-232 or
IEEE-488. Press this button to send the <Initialization Commands> and <Set Commands> to
Test
the DUT. A <Spy Window> will display with the command response information used (see
Section 6.7.7). This feature is designed to provide on the spot troubleshooting of the remote
commands setup. If a command is not properly entered or the response format is not correct, the
problem should be visible in the spy window. Use the [Remote Communications] tool for
further troubleshooting (see Section 13.6).
UT]
UT] and [Run Test] run modes when the DUT <Set Point Type>
Page 79 © 1998-2003 DH Instruments, Inc.
Page 94

N
N
OOTTEES
COMPASS for molbox™ User’s Manual
S
© 1998-2003 DH Instruments, Inc. Page 80
Page 95

COMPASS for molbox™ User’s Manual
99..
S
[[S
EETTUUP
P
]],, [[T
T
T
EESST
]]
9.1 OVERVIEW
Test Definitions are used to define a specific test procedure including a sequence of flow points and a
large number of operational details. In COMPASS [R
then the Test Definition to be executed is specified. A pointer to a default Test Definition for a DUT is
included in the DUT Definition [Test] tab (see Section 8.5.6).
Access the Test Definition Editor using the [S
accessed Test Definition displays on the Test Definition Editor. While in the Editor, use the toolbar
options to create, edit, view and delete tests (see Section 9.5.1).
The Test Definition Editor is designed with the same editing concepts as the DUT Definition Editor
(see Section 8.5). Only one Test Definition can be edited at a time, however, other Definitions can be
viewed prior to completing the changes. The test scroll bar and the Test Selector are available to make
new test selections. A flashing indicator displays the ID number of the Test Definition currently being edited.
This ID will change as the test sort order changes (see Section 9.4). The edited test always displays in
blue text in the Test Definition Selector (see Section 9.4). Use these editing signals to locate the test that
is being edited if necessary.
Test Definitions can only be edited when COMPASS is not in an active run mode. If a run mode is active,
all Test Definition fields and selection functions are disabled.
un Test] mode, a DUT to be tested is selected an
etup], [Test] menu option. When selected, the last
9.2 CREATING TEST DEFINITIONS
Open the Test Definition Editor using the [Setup], [Test] menu option. Use the <New> test toolbar icon to create a new Test Definition. Set up the test as desired then press the <Save> icon to store the test information. Any conflicts that exist will cause an error message to display. Resolve the conflicts before re-saving. The <Restore> icon is nonfunctional for new tests. The feature only restores to the last saved state. Since new Test Definitions have not been saved, there is nothing to restore.
Familiarity with test execution sequence is necessary for proper creation of Test Definition
(review Section 7.1).
If a Test Definition exists that is similar to the one that will be created, use the <Copy> toolbar
feature to create a new Test Definition with the same characteristics. Then make the edits specific to
the new test. Don’t forget to change the <Record Label> prior to saving.
Page 81 © 1998-2003 DH Instruments, Inc.
Page 96

COMPASS for molbox™ User’s Manual
9.3 EDITING TEST DEFINITIONS
Tests can be edited whenever COMPASS is not in an active run mode. Use the [Setup], [Test] menu
option to display the Test Definition Editor if not already open. Simply changing information in the Test
Definition Editor places the Editor in the edit mode. No specific option must be selected to begin editing a
Test Definition. Other Test Definitions can be viewed while editing a Test Definition. A flashing indicator
displays the ID number of the test currently being edited. Use the <Save> toolbar button to store the
edits or press the <Restore> button to return the test to its original state.
9.4 TEST DEFINITION SELECTOR
The Test Definition Selector is most frequently used to select a Test Definition. This tool can be used
when initializing the [R
Definition (see Section 7.2.1.4). It can also be accessed by clicking the <Select Test> toolbar button in
the Test Definition Editor. The Selector displays a sorted list of tests: test record labels, the number of
flow points in the test and the test control type. This basic information should be enough to easily identify
a specific test. Press <OK> to select the current test or press <X> to return to the Test Definition Editor.
The Test Definition Editor has a test scroll feature allowing tests to be selected by scrolling (see Sectio n 9.5. 1).
The ordering of the scrolled tests is determined by the alphabetical ordering of the <Record Label>.
un Test] mode to select a test other than the test associated with the DUT
Any edited Test Definition displays in blue text in the Test Selector.
9.5 TEST DEFINITION EDITOR
All Test Definitions are created or edited using the Test Definition Editor. The Editor also acts as a viewer
in other COMPASS functions. When editing a test, verify that each Editor tab contains the proper
information. This will help to avoid conflicts when using the Test Definition in [R
Sections 9.5.1 through 9.5.10 for detailed information on the features and entry fields of the Test
Definition Editor.
The Test Definition Editor is made up of multiple sections:
• <Toolbar> (see Section 9.5.1): Includes tools to identify and select Test Definitions and icons to
create, save, copy and delete Definitions.
• <Points> Table (see Section 9.5.2): Lists the flow points, tare points, purge points and molbloc
change points included in the test procedure. Test points can be edited in the table or using the
autofill feature under the [Points] tab.
• [Points] Tab (see Section 9.5.3): Provides a short cut method for filling in the flow <Points> table.
• [Sequence] Tab (see Section 9.5.4): Defines/modifies test point execution aspects including dwell
time, averaging time, number of test cycles and reference resolution.
un Test] mode. Refer to
• [Tare] Tab (see Section 9.5.5): Determine the tare pressure (upstream or downstream) and whether
tare occurs automatically or waits for operator confirmation.
• [Control] Tab (see Section 9.5.6): Specifies how flow will be controlled when the test is run.
• [Leak Test] Tab (see Section 9.5.7): Determines whether a leak test will be included in the test
procedure and defines the leak test parameters.
• [Purge] Tab (see Section 9.5.8): Determines whether purging is included in the test procedure.
© 1998-2003 DH Instruments, Inc. Page 82
Page 97

COMPASS for molbox™ User’s Manual
• [Data] Tab (see Section 9.5.9): Defines what data is collected during tests.
9.5.1 TOOLBAR
All fields above the display tab on the Test Definition Editor are considered part of the toolbar.
The toolbar not only identifies which test is active, but also provides tools to create, delete,
save, restore, identify and select tests.
Table 24 identifies the toolbar features and their functions.
Figure 47. Test Definition Editor, <Toolbar>
Table 24. Test Definition Editor, <Toolbar> Features
FEATURE DESCRIPTION
Test record label
(required text
entry field)
This field is analogous to a file name. The text entered should make the test easily
distinguishable from other tests. Up to 40 characters can be used in the field.
Do not use the following characters: \,/, :, *, ?, “, <,>, |, a comma or tab character.
These characters will cause problems when importing the Data File or creating the Data
File directory based on the data directory naming convention selected using the [To
[O
ptions], [Data File] tab (see Section 11.8).
ols],
Viewing Test
(label)
Editing Test
(label)
Save
(toolbar button)
New
(toolbar button)
Copy
(toolbar button)
Identifies the current relative sort position of the test in the Editor. As the sort order
changes, this field also changes (see Section 9.4). The notation is “Current Test
Definition/Total number of Test Definitions”.
Identifies the sort identification of a test that is being edited. This field does not display
when no edits have been made. As the sort order changes, this field also changes
(see Section 9.4).
Saves changes to an edited Test Definition. This field is not available when no edits have
been made. Any test conflicts result in error messages when saving. These conflicts
must be resolved before saving.
Creates a new Test Definition with default information (see Section 9.2).
Copies the contents of the current Test Definition to a new Test Definition. The <Record Label>
of the copied test includes the text “Copy”. This is the only difference between the original
Test Definition and the copy. Make sure the new Test Definition is properly updated
before saving.
Page 83 © 1998-2003 DH Instruments, Inc.
Page 98

FEATURE DESCRIPTION
COMPASS for molbox™ User’s Manual
Restore
(toolbar button)
Delete
(toolbar button)
Open/Select
(toolbar button)
Scroll Select
(scroll bar)
Restores the Test Definition to the last saved state. Use this feature to abandon edits
made to a Test Definition before saving. If a new test was created using the <New>
option, the restore button is nonfunctional.
Deletes the current Test Definition. A message prompt for confirmation displays prior to
removing the Test Definition.
Displays the Test Definition Selector loaded with a sorted list of the tests (see Section 9.4).
The selected test will display in the Test Definition Editor.
Scrolls to the next Test Definition according to the current sort order (see Section 9.4).
9.5.2 <POINTS> TABLE
The Test Definition <Points> table is used to define and display the flow points, molbox tares
and molbloc changes that make up the test sequence. Flow points, molbloc changes and
tares can be added to the sequence by using the <Insert> button.
The purpose of the <Points> table’s fields and settings as well as instructio ns on how to use
them are provided in Table 25.
Delete test points from the point sequence by double clicking the point. Click on any
molbloc or tare image to remove the feature from the test sequence.
Figure 48. Test Definition Editor, <Test Points> Tab
Table 25. Test Definition Editor, <Points> Table
FEATURE DESCRIPTION
© 1998-2003 DH Instruments, Inc. Page 84
Page 99

COMPASS for molbox™ User’s Manual
Point Type
Indication
(label)
Insert
(action button)
Test Point Table
(numeric entry
fields)
Indicates how the flow point values in the <Points> table will be interpreted when the test
is run. The choices are: <%DUTFS>, <Flow Units>, <Output Units> or <Set Units>. If
the indication is <%DUTFS>, when the test is run, the flow points will be calculated from
the DUT input span defined in DUT Definition [Range] tab (see Section 9.5.4). Specifying
points in <%DUTFS> is useful in setting up a common test procedure that runs the same
point distribution for DUTs with different ranges. All other unit types are run directly as
values in the unit specified in the corresponding DUT Definition tab. To change the point
type, use the Test Definition [Points] tab (see Section 9.5.3).
Clicking <Insert> causes a pop-up window to display with three separate insert options:
• Tare Point changes the cursor into a tare icon that can be dropped onto the desired
point to for a tare of the reference molbox to occur at that point. The tare icon will
remain next to the point unless removed by clicking it. Use the Test Definition [Tare]
tab to specify tare execution details (see Section 9.5.4). If the Test Definition
[Sequence] tab (see Section 9.5.4) specifies a fixed taring sequence, this selection
is disabled.
• Change molbloc changes the cursor into a molbloc icon that can be dropped onto
the point at which a molbloc change should occur. Realize the molbloc change
occurs BEFORE the point is executed. This feature may be used when a molbloc
change during the test is needed to maintain desired reference measurement
uncertainty. Click the molbloc icon to remove the molbloc change from the list.
• Insert Point changes the cursor into a pencil icon that can be dropped on any point
to insert a blank point at that location. The selected point (and all subsequent points)
then shift down, leaving a blank point available for entry. Double click any test point
to remove it from the list.
• Valve Driver Change displays the <Toggle molbox Drivers> form to allow the state
of the external molbox valve drivers to be changed. A depressed button indicates
the valve will be activated. Activate and deactivate the desired valves and press
<OK>. The cursor will change into the valve driver icon. Place it onto any point.
Realize that the valve driver change occurs before the flow is set for the selected
point but after any <Change molbloc>. To view the valve driver state of an existing
<Valve Driver Change>, move the cursor over the icon and the existing state will
display in a tool tip message.
• Timed Delay displays an input box to allow entry of a dela y time. After the delay
time is entered, the cursor will change into a stopwatch that can be dropped onto any
test point. The entered delay will occur at the beginning of the selected point prior to
setting the flow but after any <Valve Driver Change>.
The test point table lists the test flow points that will be run in sequential order when the
Test Definition is executed. The values entered are assumed to be in the unit specified by
the <Point Type Indication> at the top of the table. If the test point s exceed the 22 points
that are normally displayed, the scroll bar at the bottom of the table can be used to scroll
to additional columns of test points. Up to 100 test points can be included. The test point
table can be filled in by placing the cursor in the test point field and editing the desired test
poi nt value. It can also be filled in automatically using the [Points] tab (see Section 9.5.3).
The test point table can be cleared using <Clear> on the [Points] tab.
Page 85 © 1998-2003 DH Instruments, Inc.
Page 100

9.5.3 [POINTS] TAB
The Test Definition [Points] tab is used to se t the <Test Point Type> and provides a short
cut to fill in the <Points> table automatically, if desired (see Section 9.5.2).
The purpose of the [Auto Fill Points] tab’s fields and settings as well as instructions on how
to use them are provided in Table 26.
COMPASS for molbox™ User’s Manual
Figure 49. Test Definition Editor, [Points] Tab
© 1998-2003 DH Instruments, Inc. Page 86
 Loading...